On the Detection of Nonrandom Associations between DNA Polymorphisms in Natural Populations of...
19
On the Detection of Nonrandom Associations between DNA Polymorphisms in Natural Populations of Drosophila ’ C. Zapata * v2 and G. Alvarez? *Museum of Comparative Zoology, Harvard University; and TDepartamento de Biologia Fundamental, Universidad de Santiago de Compostela The capacity to detect nonrandom associations between restriction-map variants was examined in eight gene regions of Drosophila melanogaster (yellow-achaete- scute, white, Zw, Adh, Est6, and rosy) and D. pseudoobscura (Adh and Xdh), on the basis of published population data. The statistical power from individual pairwise tests was both heterogeneous and generally low across gene regions. Sample sizes larger than those currently being used are needed to ensure any power to detect disequilibrium by individual tests. It is found that the heterogeneity in power is mostly explained by large differences in the intensity of sample disequilibrium among regions. The yellow-achaete-scute, Zw, and Adh loci of D. melanogaster displayed both the highest mean power ( -0.4) and a very great disequilibrium (mean absolute values of D’ were 0.8-l ). By contrast, all the other gene regions exhibited lower mean power ( -0.2) and moderate levels of disequilibrium (0.4- 0.6). Although the proportion of significant pairwise associations, especially for white, Est6, and rosy in D. melanogaster and for Adh and Xdh in D. pseudoobscura, is more or less close to the type I error, simultaneous-inference significance tests show that gametic disequilibrium is occurring at the eight DNA regions examined. Introduction The study of nonrandom associations of alleles at different loci (gametic dis- equilibrium) provides information regarding the genetic structure and evolutionary history of populations. The existence of nonrandom associations among genes depends on the relationship between opposing processes operating in populations. Thus, re- combination and gene conversion tend to randomize the associations generated among genes by a variety of evolutionary agents such as selection, migration, mutation, genetic drift, and genetic hitchhiking (Hill and Robertson 1968; Franklin and Lewontin 1970; Nei and Li 1973; Thomson 1977). Disequilibrium studies between allozyme poly- morphisms, carried out during the past 2 decades mainly with Drosophila species, seemed to indicate that nonrandom associations for loosely linked loci are rare in natural populations of outcrossing species (Langley 1977; Hedrick et al. 1978; Barker 1979). However, it has been recently shown that the statistical power of the standard tests used to detect associations between allozyme polymorphisms is very low in Dro- 1. Key words: restriction map variation, ganietic disequilibrium, statistical power, Drosophila. 2. Present address: Departamento de Biologia Fundamental, Santiago de Compostela, Santiago de Compostela, Spain. Facultad de Biologia, Universidad de Address for correspondence and reprints: C. Zapata, Departamento de Biologia Fundamental, de Biologia, Universidad de Santiago de Compostela, Santiago de Compostela, Spain. Facultad Mol. Biol. Evol. 10(4):823-84 1. 1993. 0 1993 by The University of Chicago. All rights reserved. 0137-4038/93/1004-0007$02.00 823 by guest on April 19, 2014 http://mbe.oxfordjournals.org/ Downloaded from
-
Upload
independent -
Category
Documents
-
view
3 -
download
0
Transcript of On the Detection of Nonrandom Associations between DNA Polymorphisms in Natural Populations of...

On the Detection of Nonrandom Associations between DNA Polymorphisms in Natural Populations of Drosophila ’
C. Zapata * v2 and G. Alvarez? *Museum of Comparative Zoology, Harvard University; and TDepartamento de Biologia Fundamental, Universidad de Santiago de Compostela
The capacity to detect nonrandom associations between restriction-map variants was examined in eight gene regions of Drosophila melanogaster (yellow-achaete- scute, white, Zw, Adh, Est6, and rosy) and D. pseudoobscura (Adh and Xdh), on the basis of published population data. The statistical power from individual pairwise tests was both heterogeneous and generally low across gene regions. Sample sizes larger than those currently being used are needed to ensure any power to detect disequilibrium by individual tests. It is found that the heterogeneity in power is mostly explained by large differences in the intensity of sample disequilibrium among regions. The yellow-achaete-scute, Zw, and Adh loci of D. melanogaster displayed both the highest mean power ( -0.4) and a very great disequilibrium (mean absolute values of D’ were 0.8-l ). By contrast, all the other gene regions exhibited lower mean power ( -0.2) and moderate levels of disequilibrium (0.4- 0.6). Although the proportion of significant pairwise associations, especially for white, Est6, and rosy in D. melanogaster and for Adh and Xdh in D. pseudoobscura, is more or less close to the type I error, simultaneous-inference significance tests show that gametic disequilibrium is occurring at the eight DNA regions examined.
Introduction
The study of nonrandom associations of alleles at different loci (gametic dis- equilibrium) provides information regarding the genetic structure and evolutionary history of populations. The existence of nonrandom associations among genes depends on the relationship between opposing processes operating in populations. Thus, re- combination and gene conversion tend to randomize the associations generated among genes by a variety of evolutionary agents such as selection, migration, mutation, genetic drift, and genetic hitchhiking (Hill and Robertson 1968; Franklin and Lewontin 1970; Nei and Li 1973; Thomson 1977). Disequilibrium studies between allozyme poly- morphisms, carried out during the past 2 decades mainly with Drosophila species, seemed to indicate that nonrandom associations for loosely linked loci are rare in natural populations of outcrossing species (Langley 1977; Hedrick et al. 1978; Barker 1979). However, it has been recently shown that the statistical power of the standard tests used to detect associations between allozyme polymorphisms is very low in Dro-
1. Key words: restriction map variation, ganietic disequilibrium, statistical power, Drosophila. 2. Present address: Departamento de Biologia Fundamental,
Santiago de Compostela, Santiago de Compostela, Spain. Facultad de Biologia, Universidad de
Address for correspondence and reprints: C. Zapata, Departamento de Biologia Fundamental, de Biologia, Universidad de Santiago de Compostela, Santiago de Compostela, Spain.
Facultad
Mol. Biol. Evol. 10(4):823-84 1. 1993. 0 1993 by The University of Chicago. All rights reserved. 0137-4038/93/1004-0007$02.00
823
by guest on April 19, 2014
http://mbe.oxfordjournals.org/
Dow
nloaded from

824 Zapata and Alvarez
sophila studies and that moderate gametic disequilibria for loosely linked loci are actually occurring in natural populations of Drosophila (Zapata and Alvarez 1992).
The recent development of molecular techniques that detect the variability in the DNA sequence of the genes brought along novel insights for the study of multilocus genetics systems (Lewontin 1985). Most predictions were that disequilibria would be abundant between nucleotide polymorphisms included in a short piece of DNA, given the tight linkage. In recent years, many investigations have focused on disequilibrium in the DNA sequence, especially between restriction-map variants for Drosophila and mammalian genes (reviewed by Leigh Brown 1989). The estimation of disequilibrium is usually more precise in Drosophila because gametic frequencies are directly ob- servable by means of crossover-suppressor stocks. From genotypic data, it is often not possible to distinguish the coupling and repulsion double heterozygotes, and the es- timation of disequilibrium requires one either to make assumptions about the genetic structure of the populations (Hill 1974) or to use composite measures of disequilibrium (Weir 1979, 1990, pp. 102- 103). The available evidence in Drosophila shows that the amount of disequilibria between restriction-map variants detected by statistical tests for association is heterogeneous over gene regions and is less common than earlier predictions and studies had indicated (see Leigh Brown 1989). Thus, extensive sta- tistically significant associations have been detected at the yellow-achaete-scute, alcohol dehydrogenase, and Zw genes of D. melanogaster, even for yellow-achaete-scute be- tween map variants separated by as much as 80 kb ( Aquadro et al. 1986; Macpherson et al. 1990; Miyashita 1990). By contrast, few significant pairwise disequilibria have been reported for many other gene regions, including the rosy, white, Notch, amylase, and esterase 6 genes of D. melanogaster and the alcohol dehydrogenase and xanthine dehydrogenase genes of D. pseudoobscura, especially between sites separated by more than - l-2 kb (Schaeffer et al. 1987, 1988; Aquadro et al. 1988; Langley et al. 1988; Miyashita and Langley 1988; Riley et al. 1989; Game and Oakeshott 1990).
Disequilibrium at DNA regions is usually judged by the proportion of statistically significant associations between sites and their distribution patterns. Significant as- sociations are commonly detected by the x2 test (Hill 1974; Weir 1979; Lewontin 1988) or by Fisher’s exact test (Dixon and Massey 1985, pp. 278-279; Fu and Arnold 1992). It is well known that the power of these statistical tests is strongly affected by variations in sample size and allelic frequencies, decreasing considerably when the sample size is small and polymorphisms at loci are low (Brown 1975; Chakraborty 1984; Fu and Arnold 1992). The use of small sample sizes is a characteristic feature in most studies about disequilibrium between DNA polymorphisms, and therefore the probability of not detecting disequilibrium when it is present (type II error) may be high. In addition, since sample size and the allelic frequencies are heterogeneous across experimental studies on DNA polymorphisms, the comparisons, among gene regions, based on the proportion of significant tests are not strictly correct. Therefore, it is worthwhile to investigate how sample size and degree of polymorphism affect the power of the statistical tests for detecting disequilibrium in different DNA regions. We approach this problem by using a large number of pairwise comparisons between restriction-map variants corresponding to published data of the yellow-achaete-scute, white, Zw, alcohol dehydrogenase, esterase 6, and rosy gene regions of D. melanogaster and to the alcohol dehydrogenase and xanthine dehydrogenase genes of D. pseudoobscura (Aquadro et al. 1986, 1988; Schaeffer et al. 1987; Miyashita and
by guest on April 19, 2014
http://mbe.oxfordjournals.org/
Dow
nloaded from

Disequilibrium between DNA Polymorphisms 825
Langley 1988; Aguade et al. 1989; Riley et al. 1989; Game and Oakeshott 1990; Miyashita 1990).
Material and Methods Gene Regions and Populations
Associations between restriction-map variants (restriction-site and insertion/de- lection polymorphism) were examined in eight gene regions of Drosophila melanogaster and D. pseudoobscura from published data of natural populations (see table 1, which shows which chromosome these genes are on). We selected these studies on the basis of several criteria. They are studies with samples of haplotypes from natural populations with a minimum number ( -20) of lines and pairwise comparisons per population and reflect the heterogeneity in the detection of significant disequilibria over gene regions. Gametic disequilibrium between restriction-site polymorphisms was only an- alyzed when rare alleles occurred more than once in each sample. Table 1 shows the number of these polymorphic sites, as well as the number of polymorphisms with an expected heterozygosity (H) 2.25. Disequilibrium between restriction-map variants was examined for individual samples, to avoid nonrandom associations due to pooling (Nei and Li 1973). For the same reason, when information for inversions involving the gene regions surveyed was available, disequilibrium was examined without pooling inversions.
Disequilibrium Measures
Disequilibrium between restriction sites is measured by the D and D’ coefficients. The D disequilibrium coefficient for the two-allele, two-locus case is defined as D = f(AB) - pu where f( AB) is the frequency of the AB haplotype and p and u denote the allele frequencies at the loci. The D’ coefficient is the ratio of the D coefficient to its theoretical maximum value, D,,,, given the gene frequencies and the sign of D (Lewontin 1964). The D,,, value is min [p( 1 - u), ( 1 - p) u], when D > 0, or min [pu, ( 1 - p)( 1 - u)], when D < 0. This normalized gametic disequilibrium coefficient, along with all the measures of disequilibrium, depends on gene frequencies, but it has the advantageous property that its range is frequency independent (Lewontin 1988). Thus, the range of D’ varies from - 1 to 1 for all combinations of allele frequencies at two loci. Therefore the D’ coefficient allows us to compare the magnitude of dis- equilibrium for locus pairs differing in allele frequencies within and among populations (Hedrick 1987, 1988; Lewontin 1988). A homogeneous criterion was followed to designate coupling and repulsion gametic classes. Haplotypes carrying the most com- mon variants or the least common variants were considered as the coupling gametes in all instances, according to the suggestion by Langley et al. ( 1974).
The magnitude of disequilibrium at different gene regions was measured by the D’ coefficient in absolute value. The use of measures of disequilibrium in absolute value is required when we are concerned with obtaining global or total measures of the magnitude of disequilibrium, and they have already been used in many other instances (Karlin and Piazza 198 1; Hedrick 1985, 1987; Hedrick and Thomson 1986; Zapata and Alvarez 1992). Means of absolute D’ sample values between sites have been computed for each gene region, and their 95% approximate confidence intervals (CIs) have been obtained by the nonparametric bootstrap technique, a computer- based method for estimating standard errors (SEs) and setting confidence intervals (Efron 1979, 198 1, 1982, pp. 1-3, 27-36, and 75-90; Efron and Tibshirani 1986).
by guest on April 19, 2014
http://mbe.oxfordjournals.org/
Dow
nloaded from

Table 1 Scope of the Analysis
Drosophila Species and Population Gene Region Chromosome
No. of Polymorphic
Sites”
No. of Sites
H 3 0.25b Reference
melanogaster: Texas . . . . . . . . . . . . . . . . . . . . . . . . North Carolina . . . . . . Texas . . . . . . . . . . . . . . . . . . . . . . . . Rhode Island’ . . . . . . . . . . . Coofs Harbour . . . . . . . . . . . . . . North Carolina . . . . . . . . . . . . .
pseudoobscura: California . . . . . . . . . . . . . California, Gundlach-Bundschu . . California, James Reserve . . .
yellow-achaete-scute white ZW
Alcohol dehydrogenase Esterase 6 rosy
X X X II III III
Alcohol dehydrogenase Xanthine dehydrogenase Xanthine dehydrogenase
IV II II
8 6 Aguade et al. 1989 54 44 Miyashita and Langley 1988 26 19 Miyashita 1990
9 9 Aquadro et al. 1986 22 8 Game and Oakeshott 1990
8 2 Aquadro et al. 1988
18 12 Schaeffer et al. 1987 34 9 Riley et al. 1989 27 8 Riley et al. 1989
a Polymorphisms in which rare alleles occurred more than once in the sample. b H is 1 - Cxf , where Xi is the frequency of the ith variant. ’ All lines considered are standard gene arrangment on the left arm of the second chromosome.
by guest on April 19, 2014
http://mbe.oxfordjournals.org/
Dow
nloaded from
Disequilibrium between DNA Polymorphisms 827
Bootstrap estimates were obtained by Monte Carlo simulation. For each set of N estimates of D’, we generated bootstrap samples of size N, putting mass 1 /N at each one of the observed D’ estimates. From distributions of 1,000 bootstrap replicate means of D’, bootstrap CIs (95%) by the bias-corrected percentile method were obtained (Efron 1982, pp. 82-84; Efron and Tibshirani 1986). Random sampling of the observed D’ values at each gene region was performed using a random number generator. We have used the standard multiplicative linear congruential generator implemented by Schrage ( 1979). Schrage’s algorithm uses the multiplier 16807 and prime modulus 23’ - 1 to give very long sequences of pseudorandom numbers (with a full period periodicity ) that have the appearance of randomness (Schrage 1979; Park and Miller 1988; Weir 1990).
Significance Tests and Power
Significance tests of the null hypothesis of random association between poly- morphic restriction sites are usually performed by means of the x2 statistic (Schaeffer et al. 1987; Miyashita and Langley 1988; Game and Oakeshott 1990; Macpherson et al. 1990) or the Fisher’s exact test (Langley and Aquadro 1987; Langley et al. 1988; Schaeffer et al. 1988; Aguade et al. 1989; Riley et al. 1989; Miyashita 1990). The statistical power (Pw ) for these tests is the probability of rejecting the null hypothesis of random association between genes when the alternative is true (Brown 1975; Weir and Cockerham 1978). The adequacy of the x2 approximation depends on the sample size, since it is based on asymptotic theory. Fisher’s exact test is usually suggested when the total number of observations is too small for the x2 statistics to satisfactorily approximate the theoretical x2 distribution, given that the exact test does not rely on asymptotic theory. In current practice, the exact test is used for a fixed significance level such as 5%, and, with discontinuous data, it is often not possible to achieve the exact given nominal level. Then the actual significance level of the exact test may be considerably less than the nominal one, with the result that the test is conservative, thereby raising the risk of type II error (Gail and Gart 1973; Haseman 1978; Dixon and Massey 1985, pp. 278-279; Barnard 1989; Fu and Arnold 1992). Hence, only the x2 test will be considered here. In a 2 X 2 contingency table the x2 statistic is x2 = n D2/p( 1 - p) u( 1 - u), where n is the gamete sample size (Hill 1974; Weir 1979; Lewontin 1988). The statistical power of the test is evaluated from the noncentral x2 distribution, where the noncentrality parameter (h) is defined as h = nD2/ p( 1 - p) u( 1 - U) (Broffitt and Randles 1977; Guenther 1977; Weir and Cockerham 1978). The power of the test for a 5% significance level (we shall consider tests at the 5% level hereafter) is obtained from tables of noncentral x2 (Haynam et al. 1970), given the noncentrality parameter and degrees of freedom (df) (df = 1) . In the present analysis, for each pair-wise comparison the estimate of power was obtained by substi- tuting in the formula of the noncentrality parameter the corresponding p, u, n, and D sample values. Estimates of power necessarily assume that the alternative hypothesis is the observed D sample value.
The minimum sample size ( nmin) required in order to reject the null hypothesis of random association with 90% probability, considering the D sample value as the alternative hypothesis and the allelic frequencies of the sample, was computed as nmin = [ 10.5 1 p( 1 - p)u( 1 - u)]/D2. Note that tables of the noncentral x2 distribution show that a statistical power 20.90 is obtained if h >, 10.5 1, for df = 1. We have also computed for each pairwise comparison what would be the theoretical minimum
by guest on April 19, 2014
http://mbe.oxfordjournals.org/
Dow
nloaded from

828 Zapata and Alvarez
values of disequilibrium (Dmin) necessary to reject the hypothesis of D = 0 with a probability of 0.90, given the allelic frequencies and the size of the sample. The Dmin for90%ofpowerareobtainedasD,i,=*[lOSlp(l -p)u(l -~)/n]“~.TheD,i, values obtained from the formula have no biological meaning when they are higher than the maximum values of D corresponding to the gene frequencies of that sample. In this case, we consider that there is a nonfeasible solution for Dmin. A standardized measure of the theoretical minimum disequilibrium (D&i,) is the ratio Dmin/ D,,, . Note that the two estimates of D’,i, will be different both in sign and also in magnitude, because the D,,, values will be different (unless p and/or u = 0.5 ) . The use of the minimum disequilibrium represents an alternative to the entire power curves. The treatment of the power curves in our case would be very cumbersome, given the large number of pairwise comparisons surveyed. However, the minimum disequilibrium represents simply a particular value of the power curve, which has an important mean- ing, that is, the minimum disequilibrium necessary to achieve 90% power, given the gene frequencies and sample size.
Results
A total of 3,143 pair-wise comparisons involving 206 polymorphic restriction variants of eight gene regions of Drosophila melanogaster and D. pseudoobscura were included in the present analysis (table 1) . Power estimates were obtained by considering the sample disequilibrium (D) as the alternative hypothesis to the null hypothesis of random association between restriction variants, as well as the frequency of variants (p and U) and the number of gametes ( n) of the corresponding sample. Mean estimates of power, with their SEs, to detect negative and positive disequilibria at each region are shown in table 2. For some loci the sum of comparisons with negative and positive disequilibrium do not reflect the total, simply because some combinations have zero disequilibrium. As shown in table 2, the power to detect negative disequilibria is much lower than that to detect positive ones. This is not an unexpected result, because of the asymmetry of D,,, when p and u are different from 0.5 (Brown 1975; Chakraborty 1984; Thompson et al. 1988). That is, if one takes the two gametic classes that have the most extreme expectations, observations cannot deviate to the same degree toward an excess as toward a deficiency. Of course, whether D is positive or negative is an arbitrary matter, because it simply depends on how the alleles are denoted. We have denoted the two classes whose expected value is more extreme as the coupling ones, by convention (see Material and Methods), and therefore greater positive D than negative D can be obtained. In general, the power values are fairly heterogeneous across loci, within both positive and negative disequilibria (see table 2). The average power to detect negative disequilibrium is 0.1 l-O.3 1, being higher in Zw and Adh loci of D. melanogaster. With regard to the positive disequilibria, the mean power is 0.23- 0.98 and is higher in yellow-achaete-scute, Zw, and Adh loci of D. melanogaster. Within each sign of disequilibrium (whether negative or positive) those loci with a higher power are precisely those that exhibit higher values of D (table 2). It seems, therefore, that differences of sample disequilibrium across loci are the major factor explaining the observed heterogeneity of power. Although other parameters, such as frequency of the variants and sample sizes, are also affecting power, they seem to play a secondary role in explaining the observed heterogeneity.
Mean power estimates for each gene region when the positive and negative dis- equilibria are considered together appear to be rather low (table 3). Thus, for six of
by guest on April 19, 2014
http://mbe.oxfordjournals.org/
Dow
nloaded from

zgz=gg dddddd +I fl +I +I +I +I m
wmwoo
r4TToocomcu
-00000 6 d d 6 d 6
---m-e
999999 000000 +I
+I +I
+I +I
+I c‘l~d-Oc1oO 09
? ?
? 09
? 000000
t--4-mom
- 99919-Y 000000 +I
tl +I
+I +I
+I
~&~~%~
dddddd
c-4-mw-t-4
888888 dddddd
+I +I
fl fl
+I +I
---c-q-m
999999 000000 +I
tl +I
44 +I
tl m
-r-mm
m
09 '7
p. '7
09 09
000000
---c-q-m
999999 000000 +I
+I +I
+I +I
+I wm
r- W
OO\ cq
II F.
I- m
e 09
0 d
0 d
0 0
--mm
-m
9 9
9 9
9 9
000000 +I
+I +I
+I +I
tl m
a-0-m
+mm
md-
dddddd
:ggT :
:
by guest on April 19, 2014
http://mbe.oxfordjournals.org/
Dow
nloaded from

Table 3 Statistical Significance and Power to Detect Disequilibrium between Restriction-Map Variants at Different Gene Regions of Drosophila
SEQUENTIAL BONFERRONI PROCEDURE
SPECIES AND GENE REGION MEAN Pw f SE
Molecular Distance hnin* SIGNIFICANT x2 TESTS W) (%I 6) Significant
x2 Tests Minimum Maximum >lOO >l,OOO Total D-CO D>O (WI Mean + SE Value Value
melanogaster: yellow-achaete-scute , white . .._.._________._____..._ zw . . . . . . . . . . . . . . . . . . . . . . . . . . Alcohol dehydrogenase Esterase 6 . . rosy . . . . . . . . . . . . . . . . . . . . . . . . .
pseudoobscura: Alcohol dehydrogenase Xanthine dehydrogenase, Gundlach-
Bundschu . Xanthine dehydrogenase, James
Reserve
0.42 f 0.08 68 7 0.23 Z!I 0.01 72 21 0.41 f 0.02 57 11 0.37 f 0.04 44 11 0.22 zk 0.02 86 48 0.21 f 0.04 96 54
32 0 100 32 (9128) 11 5 18 0.3 (5/1,431) 36 21 63 7 (241325) 22 9 46 6 (2136) 16 7 41 3 (7/230)
7 0 25 4 (l/28)
37.2 f 7.0 0.6 70.5 1.1 + 0.6 0.004 2.5 2.0 rk 0.3 0.1 5.4 1.2 + 0.4 0.8 1.6 1.5 f 0.8 0.1 6.0
27.5
0.18 -t 0.01 85 16 5 1 9 0.7 (l/153) 19.0
0.23 zk 0.01 83 30 14 0.3 43 5 (27/561) 1.1 * 0.2 0.003 3.2
0.20 2 0.01 85 15 10 0.4 30 2 (6/351) 1.8 -+ 0.8 0.000 4.4
a Data are percentage of pairwise disequilibria where the nmin is > 100 or > 1,000.
by guest on April 19, 2014
http://mbe.oxfordjournals.org/
Dow
nloaded from

Disequilibrium between DNA Polymorphisms 83 I
nine loci regions, the mean power is -0.20, and consequently the probability of not detecting disequilibrium when it is present (type II error) is quite high. Only three gene regions- yellow-achaete-scute, Zw, and Adh of D. melanogaster-have more moderate power (mean w-0.4), about two times greater than that for the other gene regions. We have also estimated the Ylmin needed for the x2 test to reject the null hypothesis of random association of restriction variants with 90% power for each pairwise comparison at each gene region. Table 3 shows that the number of pairwise comparisons (in percentage) that would require an Y2min of > 100 gametes is very high in most of the gene regions examined and that only those loci with higher power exhibit more intermediate percentages. A substantial percentage of cases would require an Y2min of > 1,000 gametes. Altogether, the smallest sample sizes that give a 90% chance of detecting the sample disequilibria generally exceed those employed in the experimental studies (usually <50 gametes). From the same perspective, we can ask what would be the minimum level of disequilibrium (D’,i,) needed to reject the null hypothesis of random association with a power of 0.90, given the observed polymor- phism of the restriction variants and the actual sample sizes. The computation of D’,i, showed that, for a high percentage of pairwise comparisons, there is no negative (96%) and positive (53%) D’ value that allows us reject the null hypothesis with 90% probability. This means that the actual sample sizes are not generally sufficient to ensure that even maximum disequilibrium (D’ = & 1) will be detected.
In good agreement with the power estimates, the highest percentage of significant associations by the x2 statistic is found in the yellow-achaete-scute, Zw, and Adh regions of D. melanogaster (table 3 ) . In the set of cases, when the positive and negative disequilibria are considered together, the percentage of significant associations ranges from 5% (Adh of D. pseudoobscura) to 36% (2~). However, the inferences based on the proportion of significant associations detected by individual significance tests are not very appropriate when our basic concern is to investigate the occurrence of gametic disequilibrium in a given gene region. First of all, the simultaneous tests carried out for each gene region are not strictly independent, since all the pairwise comparisons are based on the same data set. Second, multiple tests for each gene region could yield far too many significant results, so that an increase in the type I error rate could be produced. These two kinds of problems can be avoided by using the Bonferroni tech- nique, which does not require that individual tests be independent and which controls the groupwide type I error rate by means of a tablewide significance level (Snedecor and Cochran 1980, pp. 115-l 16; Miller 198 1; Rice 1989). In our case, we have em- ployed the sequential Bonferroni method, given that this test has a statistical power higher than the standard Bonferroni technique (Holm 1979; Rice 1989). Simultaneous- inference significance tests by the sequential Bonferroni technique for each gene region are given in table 3. The percentage of significant disequilibria ranges from 0.3% in the white locus to 32% in the yellow-achaete-scute region. In most gene regions it is 2%-7%. Therefore, the null hypothesis of random association among all the pairs of sites in each gene region can be rejected for all regions considered in this study. Most of the significant associations lie within those positive disequilibria, which have a higher chance to be detected, as noted earlier. If we consider only the positive dise- quilibria (without Bonferroni adjustment), the high percentage of significant associ- ations detected in the loci examined is remarkable. This is particularly true for the yellow-achaete-scute complex, where all positive disequilibria are significant. The per-
by guest on April 19, 2014
http://mbe.oxfordjournals.org/
Dow
nloaded from

832 Zapata and Alvarez
centage of significant positive disequilibria is 9%~ 100%; at most (seven of nine) regions, it is 225%.
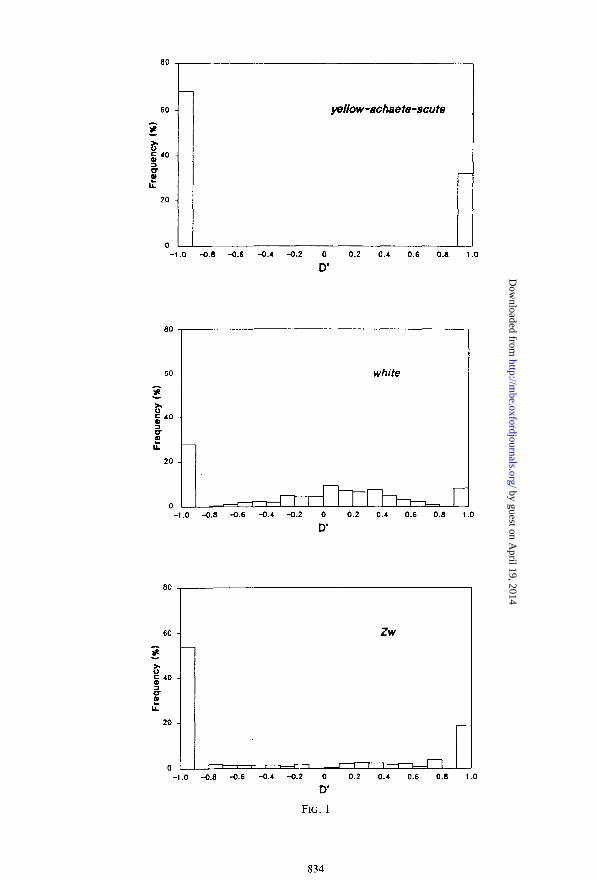
The magnitude of disequilibrium at different gene regions, as measured by the D’ coefficient in absolute value, together with the corresponding bootstrap CIs (95’S), is presented in table 4. The magnitude of disequilibrium over regions is fairly high, with the mean absolute value of D’ almost always (i.e., seven of nine cases) ~0.75. The lowest values are displayed by the white locus of D. melanogaster (0.54 k 0.0 1) and by the Adh locus of D. pseudoobscura (0.63 I+ 0.03). Distributions of D’ values between restriction variants for each gene region are shown in figures 1 and 2. In general, it is appreciated that the proportion of D’ values that are +l is substantial across loci (notably D’ = - 1) . However, because D’ = & 1 when at least one gametic class is missing, the high number of D’ = -t 1 could occur by sampling error, because the probability of sampling all four gamete types between any two restriction sites is low when small sample sizes and /or variants weakly polymorphic are used. A larger proportion of D’ = - 1 than of D’ = 1 can be the result of how the alleles have been denoted. Ifp and u are different from 0.5, the coupling class carrying the least common variants has the lowest expectation and can be responsible for the large proportion of D’ = - 1. An excess of extreme values of D’, caused by sampling error, can lead to a erroneous quantification of the disequilibrium intensity. To alleviate this effect, we compute the disequilibrium only between those variants where H > 0.25 (this analysis excludes the rosy locus of D. melanogaster because only two sites have H > 0.25). When we do so, the levels of disequilibrium remain, on the whole, quite large, but the heterogeneity of disequilibrium over loci increases considerably (table 4). Three sets of loci are clearly differentiated with regard to their levels of disequilibrium: ( 1) the yellow-achaete-scute region, (2) the Zw and Adh loci of D. melanogaster, and (3) the white, Est6, and rosy genes of D. melanogaster and the Adh and Xdh loci of D. pseudoobscura. The CIs (95%) for mean absolute values of D’ (H > 0.25) reveal significant differences among the three loci sets (table 4). The yellow-achaete-scute, Zw, and Adh loci of D. melanogaster displayed the highest absolute mean values of the D’ coefficient ( 1 .O, 0.80 f 0.02, and 0.82 + 0.06, respectively), whereas the Est6 locus of D. melanogaster exhibited the lowest value (0.37 f 0.0 1).
The comparison of the observed disequilibrium distributions with those expected by sampling error under the null hypothesis of random association can also be used to test for gametic disequilibrium. The effect of sampling error at each locus was evaluated by taking 1,000 randomly drawn gamete samples of size n from populations with the observed mean gene frequencies and gametic equilibrium and then calculating the distribution of D’ that results (data not shown). Then we examined whether 95% bootstrap CIs for the observed mean absolute values of D’ include the mean absolute values of D’ expected by sampling error. This analysis showed that the yellow-achaete- scute, Adh, Zw, and rosy regions of D. melanogaster display observed mean absolute values of D’ that are clearly higher than those expected by sampling error. For the other loci (white, and Est6 in D. melanogaster and for Adh and Xdh in D. pseudoob- scura), the result was unclear.
Discussion
The proportion of significant associations between sites detected by individual significance tests at DNA regions is commonly used in the literature, in two ways: first, to detect the occurrence of gametic disequilibrium within gene regions and, second,
by guest on April 19, 2014
http://mbe.oxfordjournals.org/
Dow
nloaded from

Table 4 Extent of Gametic Disequilibrium between Restriction Variants at Different Gene Regions of Drosophila
MEAN + SE
SPECIES AND GENE REGION (na)
Molecular Distance
WI P U ID’ 1 (bootstrap CIb) IDI for Ha 0.25 (bootstnrap CIb)
melanogaster: yellow-achaete-scute(27) . . . white(20) . . . . . . . .._ . . . . . . . . . . . Zw(27) . . . . . . . . . . . . . . . . . . . . . . Alcohol dehydrogenase (18) . . . . . . Esterase 6 (42) . . . . . . . . . . rosy(60) . . . . . . . . . . . . . . . . . . . . . .
pseudoobscura: Alcohol dehydrogenase (19) . . . . Xanthine dehydrogenase, Gundlach-
Bundschu (29) . . . . . Xanthine dehydrogenase, James
Reserve (26) . . . . . . . . . . . . .
36.6 + 4.7 0.84 f 0.01 0.83 -+ 0.01 1.00 7.9 + 0.2 0.75 Ik 0.004 0.70 AI 0.003 0.54 + 0.01 (0.52,0.56) 2.1 + 0.1 0.76 f 0.01 0.76 f 0.01 0.85 f 0.02 (0.81,0.87) 4.8 _t 0.5 0.70 f 0.02 0.77 f 0.01 0.82 z!z 0.06 (0.70, 0.91) 7.6 f 0.4 0.87 f 0.01 0.87 + 0.01 0.77 f 0.02 (0.72, 0.81)
13.3 + 1.7 0.86 z!I 0.03 0.88 k 0.02 0.86 -t 0.06 (0.74, 0.96)
10.3 + 0.6 0.81 + 0.01 0.77 + 0.01 0.63 + 0.03 (0.57, 0.69) 0.48 f 0.04 (0.40, 0.56)
1.7 + 0.1 0.86 + 0.004 0.88 + 0.003 0.83 t- 0.01 (0.80, 0.85) 0.41 f 0.06 (0.30,0.53)
1.7 k 0.1 0.86 + 0.01 0.86 + 0.01 0.80 f 0.02 (0.76, 0.83) 0.56 + 0.08 (0.40, 0.70)
1 .oo 0.46 + 0.01 (0.44, 0.48) 0.80 + 0.02 (0.75, 0.83) 0.82 + 0.06 (0.70, 0.91) 0.37 +- 0.01 (0.27, 0.48)
c . . .
p Sample size. b 95%. ’ Only a pairwise comparison available.
by guest on April 19, 2014
http://mbe.oxfordjournals.org/
Dow
nloaded from
80
60
-1.0 -0.8 -0.6 6.4 -0.2 0 0.2 0.4 0.6 0.8 1.0
D’
8ol
-1.0 -0.8 -0.6 -0.4 -0.2 0 0.2 0.4 0.6 0.8 1.0
D
0
FIG. 1
834
by guest on April 19, 2014
http://mbe.oxfordjournals.org/
Dow
nloaded from

80
60
20
0
Alcohol dehyckogenare
n -1.0 -0.8 -0.6 -0.4 -0.2 0 0.2 0.4 0.6 0.8 1.0
D’
80 _
60 - Esterase 6
z 0” E* 8 t L
20 -
-1 .o -0.8 -0.6
D’
80
60
D
rosy
01 1 n I t-l
n II I
r- I .
-1.0 -0.8 -0.6 -0.4 -0.2 0 0.2 0.4 0.6 Oh 1.0
FIG. 1 .-Relative frequency distribution of the magnitude of disequilibrium (D’) between restriction map variants at different gene regions of Drosophila melanogaster.
835
by guest on April 19, 2014
http://mbe.oxfordjournals.org/
Dow
nloaded from

80
60 - Alcohol dehykogenase
2 6 c40 -- J :
I;:
20 -
0 -1.0 -0.8 a.6 -0.4 a.2 0 0.2 0.4 0.6 0.8 1.0
D’
80
60
-1.0 -0.8 -0.6 -0.4 -0.2 0 0.2 0.4 0.6 0.8
D’
80
60 l-l XanthAe dehydrogenase (JR)
-1.0 4.8 -0.6 -0.4 -0.2 0 0.2 0.4 0.6 0.8 1.0
D’
FIG. 2.-Relative frequency distribution of the magnitude of disequilibrium (II’) between restriction map variants at different gene regions of Drosophila pseudoobscura.
by guest on April 19, 2014
http://mbe.oxfordjournals.org/
Dow
nloaded from

Disequilibrium between DNA Polymorphisms 837
to compare the magnitude of disequilibrium among different gene regions. The gene regions involved in the present analysis reflect the divergence in the proportion of significant pairwise disequilibria existing among gene regions of Drosophila. Thus, many statistically significant nonrandom associations between polymorphic sites have been reported for the yellow-achaete-scute, Zw, and Adh gene regions of D. melano- gaster. On the other hand, the occurrence of such significant disequilibria is lower in relation to the number of tests performed at the white, Est6, and rosy genes of D. melanogaster and at the Adh and Xdh genes of D. pseudoobscura (for references, see Introduction). Our analysis reveals that the power of the tests to detect gametic dis- equilibrium is nonuniform and generally low for the eight gene regions of D. mela- nogaster and D. pseudoobscura examined. Only the yellow-achaete-scute, Zw, and Adh regions in D. melanogaster displayed a moderate mean power, two times higher than that for all the other regions ( -0.4 vs. 0.2, respectively). These differences in power are primarily associated with the differential extent of disequilibrium among gene regions (table 2). Indeed, yellow-achaete-scute, Zw, and Adh in D. melanogaster displayed extensive disequilibrium between polymorphic sites (D’ mean absolute values were 1 .O, 0.80 f 0.02, and 0.82 -t 0.06, respectively). Extensive significant disequilibria in yellow-achaete-scute have been interpreted as a consequence of the reduced level of crossing-over per kilobase ( Aguade et al. 1989; Eanes et al. 1989; Macpherson et al. 1990; Begun and Aquadro 199 1) . By contrast, all the other gene regions examined exhibited much disequilibrium, although it was comparatively lower (D’ mean values were 0.38-0.56). The variations in either sample size or level of polymorphism at sites across regions have a minor effect in explaining the observed heterogeneity in power. These results demonstrate that the variable proportion of significant pairwise tests previously reported among those regions examined reflect real differences in the magnitude of disequilibrium. It does not exclude the possibility that, for other gene regions, the inferences on disequilibrium that are based on the proportion of significant tests are not extensively distorted by variations in either sample size or degree of polymorphism at sites.
Our analysis reveals that the detection of disequilibrium from individual tests is generally associated with low power and therefore with high type II error probabilities. This lack of power is caused by the small sample sizes used in the studies. The sample sizes that would be required to detect (with 90% probability) the sample disequilibria, given the observed polymorphism at sites, are substantially higher than those currently used. A great sampling effort must be carried out in future studies, to get, from evidence based on individual tests, insight into whether disequilibria are occurring at DNA regions, especially in those regions with a moderate magnitude of sample disequilibrium.
The low proportion of significant associations detected by single tests for white, Est6, and rosy in D. melanogaster and for Adh and Xdh in D. pseudoobscura produces much uncertainty about the existence of disequilibrium in these gene regions. It is mainly due to the lack of statistical power of the single tests in these regions, which present a moderate magnitude of sample disequilibrium. In fact, the proportion of significant tests approaches the type I error of 0.05. Moreover, it should be noted that, if the number of pair-wise comparisons is large, the probability of some statistically significant nonrandom associations could be greater than the type I error expected rate, even when the null hypothesis is true. When a family of tests (multiple tests) is carried out for testing whether disequilibrium occurs for a given gene region, the
by guest on April 19, 2014
http://mbe.oxfordjournals.org/
Dow
nloaded from

838 Zapata and Alvarez
statistical inference based on single-test significance values is clearly inappropriate, and a simultaneous-inference significance test is required. It must also be considered that all pairwise comparisons at each gene region are performed on the same data set and thus are not independent. This last point can be an additional problem, because there is the potential for correlated type I error, although recent evidence shows, for disequilibrium, that correlated type I errors between marker pairs could not be high (Zerba et al. 199 I ). In our analysis, adjustment for multiple comparisons by the sequential Bonferroni procedure was used in order to protect against mistakenly re- jecting the hypothesis of random association among all the pairwise comparisons at each gene region. However, that adjustment for multiple comparisons can inflate greatly the type II error rate when the null hypothesis of random association between pairs is not true (see Rothman 1990; Zerba et al. 199 1). Therefore, the number of significant pairwise comparisons obtained by the Bonferroni technique is a conservative estimate of the frequency of disequilibrium between restriction-map polymorphisms. The analysis showed that disequilibrium statistically significant by the Bonferroni criterion occurs in all the gene regions examined (percentage of significant pairwise is 0.3%-32% across gene regions), including those that exhibited moderate levels of disequilibrium (white, E’s16, and rosy in D. mclanc~gaster and Adh and Xdh in DI. pseudoobscwa). The existence of disequilibrium at the white locus was previously detected by Miyashita and Langley ( 1988), since the low number of significant as- sociations between sites was nonrandomly distributed throughout but was clustered at the 3’ end of the large intron. Most of the significant disequilibria detected in regions other than ye/louJ-achaL’te-.sCzltC occur between sites separated by <2 kb. However, the maximum molecular distance between sites, for which significant disequilibrium was detected by the Bonferroni criterion, occurred across gene regions of 1.6-70.5 kb.
It may be argued that, in spite of the disequilibrium that exists for all gene regions considered, the number of significant tests is not generally high. However, a closer inspection shows that this is true only for the negative pairwise disequilibria. The capacity for detection of negative disequilibria is very low, compared with the capacity for detection of positive ones, which agrees with previous observations (Brown 1975; Thompson et al. 1988; Walter and Cox 199 1). Thus, the average percentage of positivle significant disequilibrium (without Bonferroni adjustment) over gene regions is 4 1.‘7 t 9.1. When only the positive disequilibria are considered, the picture that arises is that significant disequilibrium between sites is extensive over most gene regions.
Acknowledgments
C.Z. wishes to express gratitude for the generosity and advice of Professor R. C. Lewontin of Harvard University, in whose laboratory he did parts of this work, and for support by a Direction General de Investigation Cientifica y Tecnica (Spain) Fellowship. J. Arnold provided an unpublished manuscript.
LITERATURE CITED
AGUAD~, M., N. MIYASHITA, and C. H. LANGLEY. 1989. Reduced variation in the yellow- achaete-scute region in natural populations of Drosophila wzelanogaster. Genetics 122:607- 615.
AQUADRO, C. F., S. F. DESSE, M. M. BLAND, C. H. LANGLEY, and C. C. LAURIE-AHLBERG. 1986. Molecular population genetics of the Alcohol dehydrogenase gene region of Drosophila melanogaster. Genetics 114: 1 165- 1190.
by guest on April 19, 2014
http://mbe.oxfordjournals.org/
Dow
nloaded from

Disequilibrium between DNA Polymorphisms 839
AQUADRO, C. F., K. M. LADO, and W. A. NOON. 1988. The rosy region of Drosophila mela- nogaster and Drosophila simulans. I. Contrasting levels of naturally occurring DNA restriction map variation and divergence. Genetics 119:875-888.
BARKER, J. S. F. 1979. Inter-locus interactions: a review of experimental evidence. Theor. Popul. Biol. 16:323-346.
BARNARD, G. A. 1989. On alleged gains in power from lower P-values. Stat. Med. 8:1469- 1477.
BEGUN, D. J., and C. F. AQUADRO. 199 1. Molecular population genetics of the distal portion of the X chromosome in Drosophila: evidence for genetic hitchhiking of the yellow-achaete region. Genetics 129:1147-l 158.
BROFFITT, J. D., and R. H. RANDLES. 1977. A power approximation for the chi-square goodness- of-fit test: simple hypothesis case. J. Am. Stat. Assoc. 72:604-607.
BROWN, A. H. D. 1975. Sample sizes required to detect linkage disequilibrium between two or three loci. Theor. Popul. Biol. 8: 184-20 1.
CHAKRABORTY, R. 1984. Detection of nonrandom association of alleles from the distribution of the number of heterozygous loci in a sample. Genetics 108:719-73 1.
DIXON, W. F., and F. J. MASSEY, JR. 1985. Introduction to statistical analysis. McGraw-Hill, London.
EANES, W. F., J. LABATE, and J. W. AJIOKA. 1989. Restriction-map variation with the yellow- achaete-scute region in five populations of Drosophila melanogaster. Mol. Biol. Evol. 6:492- 502.
EFRON, B. 1979. Computers and the theory of statistics: thinking the unthinkable. SIAM Rev. 21:460-480.
-. 198 1. Nonparametric estimates of standard error: the jackknife, the bootstrap and other methods. Biometrika 68:589-599.
-. 1982. The jackknife, the bootstrap and other resampling plans. CBMS-NSF Regional Conference Series in Applied Mathematics, no. 38. Society for Industrial and Applied Math- ematics, Philadelphia.
EFRON, B., and R. TIBSHIRANI. 1986. Bootstrap methods for standard errors, confidence intervals, and other measures of statistical accuracy. Stat. Sci. 1:54-77.
FRANKLIN, I., and R. C. LEWONTIN. 1970. Is the gene the unit of selection? Genetics 65:707- 734.
Fu, Y. X., and J. ARNOLD. 1992. A table of exact sample sizes for the use with Fisher’s exact test for 2 X 2 tables. Biometrics 48: 1103-l 112.
GAIL, M., and J. J. GART. 1973. The determination of sample sizes for use with the exact conditional test in 2 X 2 comparative trials. Biometrics 29:44 l-448.
GAME, A. Y., and J. G. OAKESHOTT. 1990. Associations between restriction site polymorphism and enzyme activity variation for Esterase 6 in Drosophila melanogaster. Genetics 126: 1021-1031.
GUENTHER, W. C. 1977. Power and sample size for approximate chi-square tests. Am. Stat. 31:83-85.
HASEMAN, J. K. 1978. Exact sample sizes for use with the Fisher-Irwing test for 2 X 2 tables. Biometrics 34: 106- 109.
HAYNAM, G. E., Z. GOVINDARAJULU, and F. C. LEONE. 1970. Tables of the cumulative non- central chi-square distribution. Pp. l-78. in H. L. HARTER and D. B. OWEN, eds. Selected tables in mathematical statistics. Vol. 1. American Mathematical Society, Providence.
HEDRICK, P. W. 1985. Coat variants in cats: gametic disequilibrium between unlinked loci. J. Hered. 76: 127- 13 1.
- 1987. Gametic disequilibrium measures: proceed with caution. Genetics 117:33 l-34 1. . -. 1988. Inference of recombinational hotspots using gametic disequilibrium values.
Heredity 60:435-438.
by guest on April 19, 2014
http://mbe.oxfordjournals.org/
Dow
nloaded from

840 Zapata and Alvarez
HEDRICK, P., S. JAIN, and L. HOLDEN. 1978. Multilocus systems in evolution. Evol. Biol. 11: 101-184.
HEDRICK, P. W., and G. THOMSON. 1986. A two-locus neutrality test: applications to humans, E. coli and lodgepole pine. Genetics 112: 135- 156.
HILL, W. G. 1974. Estimation of linkage disequilibrium in randomly mating populations. Heredity 33:229-239.
HILL, W. G., and A. ROBERTSON. 1968. Linkage disequilibrium in finite populations. Theor. Appl. Genet. 38:226-23 1.
HOLM, S. 1979. A simple sequentially rejective multiple test procedure. Stand. J. Stat. 6:65- 70.
KARLIN, S., and A. PIAZZA. 198 1. Statistical methods for assessing linkage disequilibrium at the HLA-A, B, C loci. Ann. Hum. Genet. 45:79-94.
LANGLEY, C. H. 1977. Nonrandom associations between allozymes in natural populations of Drosophila melunogaster. Pp. 265-273 in F. B. CHRISTIANSEN and T. M. FENCHEL, eds. Lecture notes in biomathematics. Vol. 19: Measuring selection in natural populations. Springer, New York.
LANGLEY, C. H., and C. F. AQUADRO. 1987. Restriction-map variation in natural populations of Drosophila melanoguster: white-locus region. Mol. Biol. Evol. 4:65 l-663.
LANGLEY, C. H., A. E. SHRIMPTON, T. YAMAZAKI, N. MIYASHITA, Y. MATSUO, and C. F. AQUADRO. 1988. Naturally occurring variation in the restriction map of the Amy region of Drosophila melanogaster. Genetics 119:6 19-629.
LANGLEY, C. H., Y. N. TOBARI, and K. KOJIMA. 1974. Linkage disequilibrium in natural populations of Drosophila melanogaster. Genetics 78:92 l-936.
LEIGH BROWN, A. J. 1989. Population genetics at the DNA level: a review of the contribution of restriction enzyme studies. Oxf. Surv. Evol. Biol. 6:207-242.
LEWONTIN, R. C. 1964. The interaction of selection and linkage. I. General considerations: heterotic models. Genetics 49:49-67.
-. 1985. Population genetics. Annu. Rev. Genet. 19:8 l-102. -. 1988. On measures of gametic disequilibrium. Genetics 120:849-852. MACPHERSON, J. N., B. S. WEIR, and A. J. LEIGH BROWN. 1990. Extensive linkage disequilibrium
in the achaete-scute complex of Drosophila melanogaster. Genetics 126: 12 1 - 129. MILLER, R. G., JR. 198 1. Simultaneous statistical inference. Springer, New York. MIYASHITA, N. T. 1990. Molecular and phenotypic variation at the Zw locus region in Drosophila
melanogaster. Genetics 125:407-4 19. MIYASHITA, N., and C. H. LANGLEY. 1988. Molecular and phenotypic variation of the white
locus region in Drosophila melanogaster. Genetics 120: 199-2 12. NEI, M., and W.-H. LI. 1973. Linkage disequilibrium in subdivided populations. Genetics 75:
213-219. PARK, S. K., and K. W. MILLER. 1988. Random number generators: good ones are hard to
find. Commun. ACM 31: 1192- 120 1. RICE, W. R. 1989. Analyzing tables of statistical tests. Evolution 43:223-225. RILEY, M. A., M. E. HALLAS, and R. C. LEWONTIN. 1989. Distinguishing the forces controlling
genetic variation at the Xdh locus in Drosophila pseudoobscura. Genetics 123:359-369. ROTHMAN, K. J. 1990. No adjustments are needed for multiple comparisons. Epidemiology 1:
43-46. SCHAEFFER, S. W., C. F. AQUADRO, and W. W. ANDERSON. 1987. Restriction-map variation
in the alcohol dehydrogenase region of Drosophila pseudoobscura. Mol. Biol. Evol. 4:254- 265.
SCHAEFFER, S. W., C. F. AQUADRO, and C. H. LANGLEY. 1988. Restriction-map variation in the Notch region of Drosophila melanogaster. Mol. Biol. Evol. 5:30-40.
SCHRAGE, L. 1979. A more portable Fortran random number generator. ACM Trans. Math. Software 5: 132- 138.
by guest on April 19, 2014
http://mbe.oxfordjournals.org/
Dow
nloaded from

Disequilibrium between DNA Polymorphisms 841
SNEDECOR, G. W., and W. G. COCHRAN. 1980. Statistical methods. The Iowa State University Press, Ames.
THOMPSON, E. A., S. DEEB, D. WALKER, and A. G. MOTULSKY. 1988. The detection of linkage disequilibrium between closely linked markers: RFLPs at the AI-C111 apolipoprotein genes. Am. J. Hum. Genet. 42: 113- 124.
THOMSON, G. 1977. The effect of a selected locus on linked neutral loci. Genetics 85:753-788. WALTER, M. A., and D. W. Cox. 199 1. Nonuniform linkage disequilibrium within a 1,500-kb
region of the human immunoglobulin heavy-chain complex. Am. J. Hum. Genet. 49:9 17- 931.
WEIR, B. S. 1979. Inferences about linkage disequilibrium. Biometrics 35:235-254. p. 1990. Genetic data analysis. Sinauer, Sunderland, Mass. WEIR, B. S., and C. C. COCKERHAM. 1978. Testing hypotheses about linkage disequilibrium
with multiple alleles. Genetics 88:633-642. ZAPATA, C., and G. ALVAREZ. 1992. The detection of gametic disequilibrium between allozyme
loci in natural populations of Drosophila. Evolution 46: 1900- 19 17. ZERBA, K. E., A. M. KESSLING, J. DAVIGNON, and C. F. SING. 199 1. Genetic structure and the
search for genotype-phenotype relationships: an example from disequilibrium in the Apo B gene region. Genetics 129: 525-533.
MARTIN KREITMAN, reviewing editor
Received July 24, 1992; revision received January 27, 1993
Accepted January 27, 1993
by guest on April 19, 2014
http://mbe.oxfordjournals.org/
Dow
nloaded from