Assessment of Destination Brand Associations - CiteSeerX
156
Clemson University TigerPrints All Dissertations Dissertations 8-2010 Assessment of Destination Brand Associations: An Application of Associative Network eory and Network Analysis Methods Xu Chen Clemson University, [email protected] Follow this and additional works at: hp://tigerprints.clemson.edu/all_dissertations Part of the Recreation, Parks and Tourism Administration Commons is Dissertation is brought to you for free and open access by the Dissertations at TigerPrints. It has been accepted for inclusion in All Dissertations by an authorized administrator of TigerPrints. For more information, please contact [email protected]. Recommended Citation Chen, Xu, "Assessment of Destination Brand Associations: An Application of Associative Network eory and Network Analysis Methods" (2010). All Dissertations. Paper 591.
-
Upload
khangminh22 -
Category
Documents
-
view
0 -
download
0
Transcript of Assessment of Destination Brand Associations - CiteSeerX
Clemson UniversityTigerPrints
All Dissertations Dissertations
8-2010
Assessment of Destination Brand Associations: AnApplication of Associative Network Theory andNetwork Analysis MethodsXu ChenClemson University, [email protected]
Follow this and additional works at: http://tigerprints.clemson.edu/all_dissertations
Part of the Recreation, Parks and Tourism Administration Commons
This Dissertation is brought to you for free and open access by the Dissertations at TigerPrints. It has been accepted for inclusion in All Dissertations byan authorized administrator of TigerPrints. For more information, please contact [email protected].
Recommended CitationChen, Xu, "Assessment of Destination Brand Associations: An Application of Associative Network Theory and Network AnalysisMethods" (2010). All Dissertations. Paper 591.

ASSESSMENT OF DESTINATION BRAND ASSOCIATIONS:
AN APPLICATION OF ASSOCIATIVE NETWORK THEORY AND NETWORK
ANALYSIS METHODS
A Dissertation
Presented to
the Graduate School of
Clemson University
In Partial Fulfillment
of the Requirements for the Degree
Doctor of Philosophy
Parks, Recreation and Tourism Management
by
Xu Chen
August 2010
Accepted by:
Sheila J. Backman, Committee Chair
Kenneth F. Backman
William C. Norman
John D. Mittelstaedt

ii
ABSTRACT
Recent tourism management research has seen increasing discussions of applying
branding concepts into destination marketing. However, brand association and its
importance in creating strong and unique brands have not been studied adequately. The
purpose of this study was to identify the underlying dimensions that people use to describe
destination brands and examine the structural relations of the destination‟s brand
association.
Brand association focuses on analyzing the characteristics consumers‟ knowledge,
perceptions and attitudes associated with a brand and how brand associations interact with
each other. Research on brand association provides measurement constructs to evaluate
branding effectiveness and offers marketing professionals the strategic information to build
strong and unique brand identity.
Through two surveys (n=29) and individual interviews (n=13) using repertory grid
method, the study elicited the brand associations of four golf destinations. Applying
network analysis methods, the study examined the centralities and cohesion measures of
those brand associations. The results identified brand associations that are critical in
creating strong brand identities, controlling the activation other brand associations, or
complement to each other. The study demonstrated the ability of network analysis in
destination brand association research and provided an analytical tool for destination brand
management.

iii
ACKNOWLEGEMENT
I wish to thank my dissertation advisory committee: Dr. Sheila Backman, Dr.
Kenneth Backman, Dr. Bill Norman, and Dr. John Mittelstaedt. I owe much appreciation
to Dr. Sheila Backman, who has continuously guided and encouraged me through my
academic studies; Dr. Sheila Backman trained me to be an independent and confident
thinker and researcher. Dr. Ken Backman has always been supportive and patient with the
dissertation progress, and offered me numerous insightful suggestions when I needed
guidance. Dr Norman provided me with important opportunities to grow through my
engagement in several research projects; Dr. Norman encouraged me to strive for high
academic achievements. Dr. Mittelstaedt devoted many hours of his time in assisting me
with the dissertation and kindly lent his expertise by reviewing the methods of this study.
I would also like to thank my best friend and colleague Cinzia Mancini-Cross for
her support, encouragement, and thought-provoking discussions, often carried out during
delicious and authentic Italian pasta dinners she prepared in our graduate years together. I
am also appreciative that Cinzia patiently proofread the manuscripts of this study many
times. Her encouragement, advice and friendship are invaluable to my success.
I am also grateful to Mr. Adam Savedra, Mr. Richard Lucas and selected PGM
students whose help was essential. The study would have not been possible without their
participation and assistance.

iv
TABLE OF CONTENTS
Page
ABSTRACT ........................................................................................................................ ii
ACKNOWLEGEMENT .................................................................................................... iii
LIST OF TABLES ............................................................................................................ vii
LIST OF FIGURES ......................................................................................................... viii
CHAPTER
I. INTRODUCTION ......................................................................................................1
Justification for the Study ....................................................................................1
Problem Statement ..............................................................................................9
Purpose and objectives of the Study ..................................................................10
Research Questions ...........................................................................................11
Significance of the Study ..................................................................................11
Definitions .........................................................................................................12
Outline of the Dissertation ................................................................................13
II. LITERATURE REVIEW ........................................................................................15
Brand Equity ......................................................................................................15
Brand Association .............................................................................................18
Destination Branding Research .........................................................................27
Destination Brand Equity Research ..................................................................33
Summary ...........................................................................................................39
III. CONCEPTUAL DEVELOPMENT........................................................................40
Associative Network Theory .............................................................................40
Repertory Grid Technique .................................................................................45

v
Table of Contents (Continued)
Network Analysis Method .................................................................................49
Proposed Conceptual Framework .....................................................................55
Summary ...........................................................................................................57
IV. RESEARCH METHODS .......................................................................................58
Selection of Destinations ...................................................................................58
Study Participants ..............................................................................................61
Instrument Development ...................................................................................63
Brand-Construct Matrix Conversion .................................................................63
Summary ...........................................................................................................67
V. PILOT TESTING ....................................................................................................68
Survey for Typical Golf Vacation Destinations ................................................68
Destination Brand Elicitation and Modification of Analysis Methods .............70
Revised Pilot Testing with Laddering Technique .............................................71
Laddering .......................................................................................................... 71
Study Participants ............................................................................................. 73
Interview Method ............................................................................................. 74
Brand Association Analysis Results ................................................................. 79
Summary ...........................................................................................................81
VI. RESULTS ...............................................................................................................82
Survey Results ...................................................................................................82
Interviews Results .............................................................................................83
Dimensions of the Destination Brand Associations ......................................... 84
Separating first-order and second-order associations ....................................... 87
Network Analysis Results ................................................................................ 90
vi
Table of Contents (Continued)
Summary ...........................................................................................................94
VII. DISCUSSION AND CONCLUSIONS ..................................................................95
Answering the Research Questions ...................................................................95
Question One .................................................................................................... 96
Question Two ................................................................................................... 99
Question Three ............................................................................................... 101
Implications .....................................................................................................105
Limitations .......................................................................................................107
Future Research ...............................................................................................109
Conclusion .......................................................................................................110
APPENDICES .................................................................................................................111
A: Survey Questionnaire ...............................................................................112
B: Interview Instrument .................................................................................114
C: Pilot testing of the SSCP Conversions .....................................................115
D: List of the 66 Destinations from the Survey .............................................126
E: Complete List of the 46 Elicited Constructs .............................................127
F: DL Format Data of the 1st and 2
nd Order Constructs ................................129
G: Coding Rules ............................................................................................131
H: An Example of Interview Recording ........................................................134
REFERENCES ................................................................................................................138

LIST OF TABLES
Table Page
2.1 List of selected brand association studies ...................................................... 22
2.2 Research papers on destination branding in 2008 and 2009 .......................... 29
2.3 Destination brand equity studies .................................................................... 34
4.1 An example of coding brand-construct relationships .................................... 64
4.2 Brand-to-brand matrix ................................................................................... 65
5.1 Destinations yielded from the pilot testing survey ........................................ 69
5.2 Example of marking first and second order constructs .................................. 75
5.3 First-order associations .................................................................................. 78
5.4 Second-order associations .............................................................................. 78
5.5 Centrality measures of the association network ............................................. 80
6.1 Participant reported past destination visits .................................................... 84
6.2 Dimension of the brand associations ............................................................. 85
6.3 First-order and their second-order constructs ................................................ 88
6.4 First-order brand associations of the four destinations .................................. 89
6.5 Centrality measures of the brand associations ............................................... 92
C.1 Frequency distribution of elicited brand associations .................................. 116
C.2 Destination brand- construct matrix ............................................................. 117
C.3 Destination brand – brand matrix ................................................................. 118
C.4 Destination construct – construct matrix ...................................................... 120
C.5 Full association matrix ................................................................................. 121

viii
LIST OF FIGURES
Figure Page
1.1 Developments of branding and tourism branding research ....................................... 4
2.1 Keller's classification of brand associations ............................................................ 20
3.1 Example of the New York City brand network ....................................................... 41
3.2 Flow chart of the conceptual framework ................................................................. 56
5.1 Flowchart for marking second-order construct ........................................................ 77
5.2 Destination brand concept network from laddering technique ................................ 79
6.1 Aggregated brand association map of the four destinations .................................... 90
C.1 Destination brand concept network ....................................................................... 122

1
CHAPTER ONE
INTRODUCTION
The purpose of this study is to identify the underlying dimensions that people use
to describe destination brands and examine the structural relations of the destinations‟
brand association. Recognizing they are information networks stored in consumers‟
memory, brand associations are best studied as networks. Associative Network Theories
provide the theoretical framework for this study to identify the underlying dimensions of
destination brand associations, and network analysis methods offers the tool to examine
the relationships among them. This chapter introduces the brief background of the study
topic, justifies its important role in destination branding and destination branding
research, as well as presents the research questions of this study.
Justification for the Study
The application of branding in tourism management is a relatively new area of
destination management research (Blain, Levy, & Ritchie, 2005). The destination
branding concept emerged in the late 1990s. It is believed that, like most branded
products, a brand power can facilitate a destination to create unique market positioning
when the service and products are similar to its competitors‟ on the market (Morgan,
Pritchard, & Piggott, 2002). The values of creating a destination brand are similar to
those of general business branding: a brand creates business identity and adds value to
the product or service by increasing economic asset, reducing market communication
costs, and cultivating consumer loyalty (Keller & Lehmann, 2006).
2
In spite of the growing importance of destination branding, research on this topic
has been limited to case studies, conceptual exploration, and branding principles. Brand
association – a construct that focuses on what tourists know about a destination brand and
how they feel and evaluate the destination brand – has not received much attention from
academic researchers.
Generally speaking, the notion “brand association” refers to consumers‟
knowledge associated with a given brand (Aaker, 1991). Take the Coca-Cola‟s brand as
an example, consumers may associate “red”, “bubble water”, “quench thirsty”, “contour
bottle design” and “upbeat and young” with the Coca-Cola‟s brand. One or several of
those associations may drive them to choose Coca-Cola over Pepsi. Thus knowing brand
associations and how they are preferred by the consumer is pivotal to brand management.
Brand associations have been recognized as the “heart and soul of the brand” (Aaker,
1991, p. 8).
A concept closely related to brand association is consumer-based brand equity,
which is defined as the “marketing effects uniquely attributable to the brand” (Keller,
1993, p. 1). Consumer-based brand equity looks into the consumer‟s mind-set of the
brand and functions as the measurement of branding effectiveness. The notion of brand of
brand association is often integrated with brand equity both in concept and research.
Because it probes into the constructs of a brand that the consumer has, brand
equity is the foundation for other branding research in the behavioral domain to build on.
Accordingly, the investigation of consumer-based brand equity is typically conducted
before the application of branding principles. However, destination branding research has
largely focused on case studies and the applications of brand principles before the

3
investigating what a destination brand means to the tourist (Konecnik & Gartner, 2007).
Boo, Busser and Baloglu (2009) criticized that the academic lacks a systematic
investigation of destination branding. Figure 1.1 compares the developments of branding
knowledge between general marketing research and destination marketing research.
Keller (2003b) suggested that a systematic branding research shall first clarify and
create its brand equity before any branding techniques can be applied (as illustrated in the
left side pyramid in Figure 1.1). He suggested that consumer-based brand equity is the
foundation of the branding studies and practices in the consumer-behavior related
branding research domain. Brand equity research identifies the constructs that critically
influence consumers‟ evaluation of brands. Analyzing those constructs provides the
measurement construct on which various branding principles can be applied. Then after
applying branding principles, consistent and continuous brand management and
monitoring are required to ensure sustainable branding effects.
The tourism branding research has been taking an opposite approach. Most studies
were firstly concerned with incorporating the branding concepts into destination
marketing and discussing branding‟s importance in creating unique identity.
Consequently, newly emerged branding techniques and principles were borrowed and
applied to tourism. Only recently, a few researchers (see Boo et al, 2009 and Konecnik &
Gartner 2007) have argued that tourism branding shall follow a similar systematic fashion
as in the general branding research.

4
FIGURE 1.1: Developments of branding and tourism branding research
Currently, there are only four published articles that empirically examined
destination brand equity from the consumers‟ perspective. The scarce amount of research
regarding consumer-based destination brand equity indicates it is complex to
conceptualize how tourists interpret destination brands.
Pike (2007, 2009), Konecnik and Gartner (2007), and Boo, Busser and Baloglu
(2009) are the first authors that empirically measured consumer-based brand equity of
destinations. Their measurements of consumer-based destination brand equity followed
the Aaker (1991) conceptualization.
Branding Execution & Tracking
Branding Principles
Consumer-based Brand Equity
Destination Brand Equity
Application of Branding Priciples
Case studies on Desitnation Branding
Practices
Systematic Development
Recommended in Branding
Research
Current Destination Branding
Research Development

5
There are two schools of influential conceptualizations of what consumer-based
brand equity is. One is Aaker‟s (1991): consumer-based brand equity is composed of five
dimensions: brand awareness, brand associations, brand loyalty, brand quality, and other
proprietary brand asset. Brand awareness is the ability of potential customers to recall the
brand or recognize the brand, such as given “soft drink” category consumers can recall
the “Coca-Cloa” brand. Brand quality is consumers‟ overall perception towards the
quality of the product or service, such as “Coca-Cola is better than Pepsi”. Brand loyalty
is a measure of consumers‟ attachment to a brand, such as “I only buy Coca-Cola”.
Lastly, other brand assets include monetary value, trademarks or patent. In the Aaker
conceptualization, brand awareness and association tell what consumers know about the
brand, while brand quality and loyalty tell how consumers feel about and how they react
towards the brand.
Another school of consumer-based brand equity research is Keller‟s (1993)
conceptualization. He defined consumer-based brand equity as “the differential effect of
brand knowledge on consumer response to the marketing of the brand”. Consumers‟
brand knowledge has two major components: brand awareness and brand image. The
brand image component in his definition is actually brand association as Keller clearly
stated that brand image is defined as “perceptions about a brand as reflected by the brand
associations held in consumer memory” (p. 2).
The difference between these two conceptualizations is on their emphasis areas.
The Aaker conceptualization focuses on contributions of each component to the asset of
brand equity, while the Keller conceptualization emphasizes more on the cognitive (what
do consumers know) memory network of consumers brand knowledge.

6
Pike (2007, 2009), Konecnik and Gartner (2007), and Boo et al. (2009) studies
applied Aaker‟s conceptualization and aimed at identifying the structures of destination
brand equities. However, none of the studies examined in-depth destination brand
association. In fact, Konecnik and Gartner, and Boo et al. left out the brand association
component from their proposed brand equity models and replaced it with destination
image, while Pike simplified brand association into importance-performance in his
studies. However, either destination image or importance-performance analysis cannot
sufficiently substitute brand association because (1) they lacked of brand identity, and (2)
they identified several images that overlap with brand association but they certainly did
not provide insights related to how associations are configured.
The tourism studies closely related to the concept of destination brand association
are destination brand image studies. However, most of these brand image studies used
predefined items that were typically used in destination image studies to measure brand
images. For instance, Kneesel, Baloglu and Millar (2010) considered that a person‟s
destination brand image is composed of his or her cognitive and affective attitudes
towards a destination‟s brand. Kneesel et al. used predefined items that were selected
from relative studies and measured destination brand images of four casino cities in the
US among an adult Americans sample. They used general linear model repeated measure
to test the difference among the four destinations. There are two limitations of such
conceptualization and measurement. First, the researchers assume that all the predefined
items already exist in the consumer‟s mind and compose a brand image. Second, the
measurement items in the predefined list exist independently and cannot identify the
7
inter-linkages among them. Thus using traditional sorting and scaling tasks cannot
represent a multimodal image of a brand (Teichert & Schöntag, 2010).
In sum, the major contributions of the research discussed, is that the findings
showed that destination brand equity exists and the components that influence behavioral
intention (i.e. brand loyalty) are present. According to Aaker‟s conceptualization, brand
awareness and association tell what consumers know about the brand, while brand value
and loyalty tell how consumers feel and react towards the brand. Consequently, the above
destination brand equity studies focused on consumer and brand relationships, not what
consumers knew about the brand. Brand association – the concept that underlies people‟s
perceptions about destination brand – still has not been investigated in-depth. Recently,
Teichert and Schöntag (2010) criticized that methods used in the traditional approaches in
consumer-behavior related brand analysis only functioned as sorting and scaling tools,
such as factor analysis and multidimensional scaling, which were unable to reflect the
mental connections of consumers‟ brand knowledge. They called for a new brand
analysis method that could go beyond sorting and scaling and reveal the mental network
structure of consumers‟ brand knowledge.
To study brand association, it is important to recognize that a basic function of
brand is to act as a cue for consumers to retrieve information in memory related to the
branded product or service. As it is commonly agreed that consumer store information in
memory in the form of networks (Henderson, Iacobucci, & Calder, 1998, 2002), it would
be appropriate to analyze the brand association as a memory network.
A generally used method to study brand association is the Associative Network
Theory (e.g. Anderson, 1983; Janiszewski & Van Osselaer, 2000; Roedder-John, Loken,

8
Kim, & Monga, 2006), which is based on the psychological theory of memory retrieval
and provides a tool to map consumers‟ brand concept. The Associative Network Theory
is grounded in the cognitive psychology of memory retrieval, and generally holds that
human‟s memory network is comprised of nodes, which correspond to particular pieces
of information, and links that connect various nodes. When a person receives a stimulus,
certain nodes are activated corresponding to the stimulus. These nodes become activation
nodes and spread the activation to other nodes through the links between them. The depth
and breadth of the activation depend on the distance of the to-be-activated node to the
stimulus.
Henderson et al. (1998, 2002) advanced brand association analysis by
incorporating network analysis methods into the associative network theory. Network
analysis examines the relationships between nodes and links, and nodes and nodes by
examining the indices of “centrality”, and “cohesion”. Centrality is a set of indices to
measure the properties of an individual node relative to other nodes. Cohesion is to
measure the equivalence of structural position among groups of nodes. Henderson et al.‟s
advancement in brand association network provides an analytical tool that goes beyond
the basic applications of associative network theory, such as brand concept mapping and
eyeball analysis of brand associations.
Instead of focusing on the technical tutorial, Teichert and Schöntag (2010)
discussed the limitations of the traditional approach using predefined scales and
explained applicability of network analysis measures in branding research and practices.
They also emphasized the centrality and cohesion measures that are similar with
Henderson et al.‟s (1998) discussion. Teichert and Schöntag suggested that brand

9
network analysis can be done on the individual, group and holistic network levels to
provide insights for brand management with short-term, mid-term and long term goals.
The discussions above show that the investigation of destination brand association
provides the most fundamental knowledge in the development of academic destination
branding research. However, this construct has been largely overlooked in destination
branding research. Therefore the primary focus of the current research is on destination
brand association from a theoretical and practical perspective to improve the analysis of
tourism destination brands, and provide an analytical tool for strategic brand management.
The emerging interest in applying branding principles to destination management
has drawn the attention from researchers and practitioners. The challenge for research is
to clarify the construct of destination brand. For destination branding practice, the
challenge is to determine what resources a destination has can be used to make a strong
brand. An analysis of consumer-based brand equity through investigating brand
association proved advantageous to the theoretical development of destination branding
research as well as to marketing practice.
Problem Statement
The lack of research regarding the destination branding measurement may be an
indication of the complexity involved in understanding how tourists evaluate a
destination brand. Unlike general products, a destination is a much more complex
multidimensional entity consisting of various components that have no obvious core that
anchors them (Pike, 2008).

10
The limited amount of research on consumer-based destination brand equity
employed the Aaker (1991, 1996) conceptualization and focused on the investigating the
relationship among the components of brand equity, with the ultimate goal of creating
brand loyalty. Although brand loyalty is the long-term goal of branding, one must begin
with perception before moving onto ultimate choice. Brand association has not received
attention in destination branding research, especially from a network perspective. As
brand association portrays the underlying dimensions that people use to describe
destinations, it is critical for destination branding research to thoroughly investigate brand
association before moving onto other branding concepts that are built on it.
Purpose and objectives of the Study
The purpose of this dissertation study is to identify the underlying dimensions that
people use to describe destination brands and examine the structural relations of the
destination‟s brand association. To reach this purpose, associative network theory serves
as the theoretical foundation and network analysis method provides analytical tool for the
research. Specifically, the dissertation has the following objectives:
To identify brand associations of a destination‟s brand,
To categorize the dimensions of destination brand associations, and
To examine the relationships within the brand association network,
focusing on centrality and cohesion measures.
The first two objectives aim at underlying the dimensions of a destination brand
construct. The third objective aims at the deeper understanding of brand association
structure and identifying the core associations that are critical within the network.

11
Research Questions
To reach the research objectives, this study answers three research questions:
What are the associations people use to describe a destination brand?
What are the categories of these associations?
What are the structural relationships among these associations?
Significance of the Study
The result of this study advances the current understanding of destination brand
equity, as well as provides practical implications for destination branding practice.
For academic research, as its role is to create and maintain the brand equity (Aaker,
1996a), brand association underlies the elements that constitute a brand. Thus, any insight
into the measurement of brand association is beneficial to brand equity research. This
dissertation study contributes to the understanding of the nature of destination brand, and
provides foundational elements for the development of brand construct theories.
For practitioners, brand associations analysis offers explicit information about the
core elements in a brand, the strengths and weaknesses of a brand, and the associations
that are crucial to create unique brands. Thus, such analysis provides strategic
information such as brand identity, driver association, and complementary associations,
for the branding practice. The study also provides an example of measurement method
for conducting similar research in the future.
12
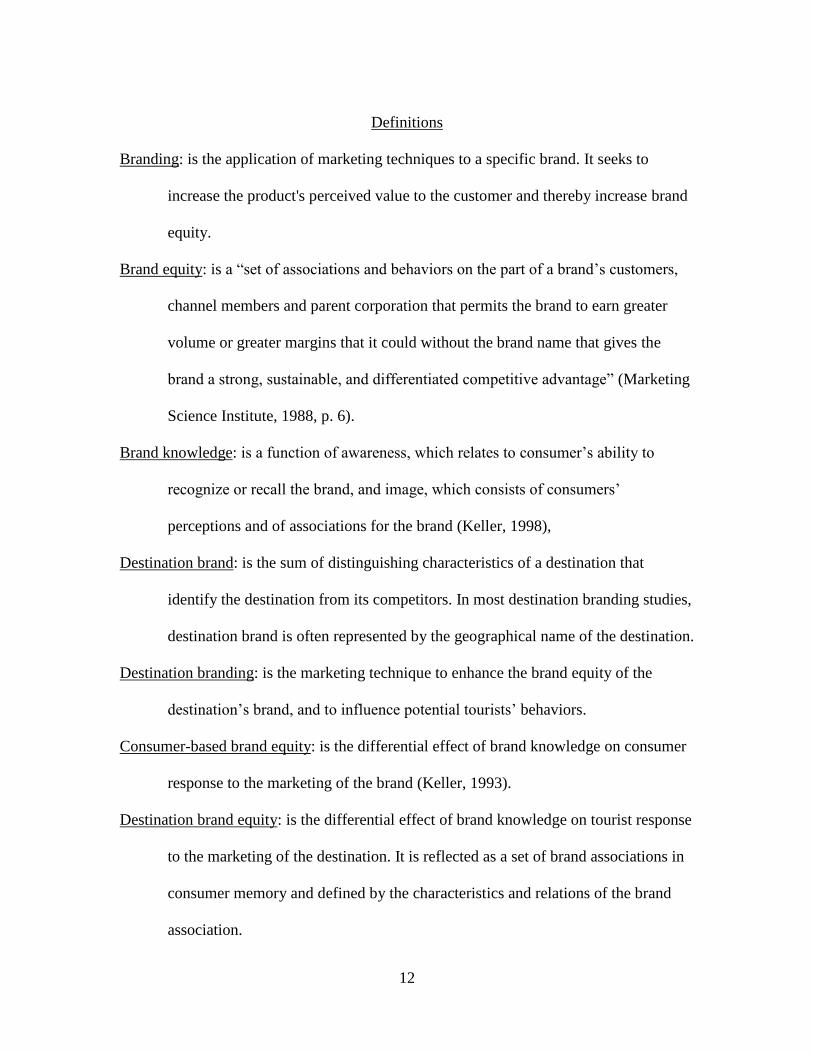
Definitions
Branding: is the application of marketing techniques to a specific brand. It seeks to
increase the product's perceived value to the customer and thereby increase brand
equity.
Brand equity: is a “set of associations and behaviors on the part of a brand‟s customers,
channel members and parent corporation that permits the brand to earn greater
volume or greater margins that it could without the brand name that gives the
brand a strong, sustainable, and differentiated competitive advantage” (Marketing
Science Institute, 1988, p. 6).
Brand knowledge: is a function of awareness, which relates to consumer‟s ability to
recognize or recall the brand, and image, which consists of consumers‟
perceptions and of associations for the brand (Keller, 1998),
Destination brand: is the sum of distinguishing characteristics of a destination that
identify the destination from its competitors. In most destination branding studies,
destination brand is often represented by the geographical name of the destination.
Destination branding: is the marketing technique to enhance the brand equity of the
destination‟s brand, and to influence potential tourists‟ behaviors.
Consumer-based brand equity: is the differential effect of brand knowledge on consumer
response to the marketing of the brand (Keller, 1993).
Destination brand equity: is the differential effect of brand knowledge on tourist response
to the marketing of the destination. It is reflected as a set of brand associations in
consumer memory and defined by the characteristics and relations of the brand
association.

13
Brand association: is anything linked in consumer memory to a brand. It creates meaning
for consumers and is the core of consumer-based brand equity (Aaker, 1991).
Centrality: is a measurement index based on the location of a node within a network
relative to other nodes. It has three types: degree, betweenness, and closeness.
Centrality indices aim to uncover the brand associations that are most pivotal to
create strong brand images.
Degree centrality: is a measurement to identify core nodes that can activate most
associations.
Betweenness centrality: reflects the likelihood that a node will be activated as
associations spread out throughout the network.
Closeness centrality: measures how close a node is to other nodes. It represents
independence of a node from the control of other nodes in a network.
Cohesion: is a measure of the subgroups within a social network. It provides the
implication as to what brand associations are complementary to each other.
Social network: is a network structure composed of individuals, also known as “nodes”
and the links that tie nodes. Social network analysis aims at understanding the
network structure by description, visualization and statistical modeling (van Duijn
& Vermunt, 2006).
Outline of the Dissertation
The dissertation is organized into six chapters. Chapter One provides an overview of
branding, its application in destination marketing, and justifies the rationale and
significance of the dissertation study. Chapter Two examines the related literature in

14
branding and destination branding research, and explains the theoretical models for this
study. Chapter Three presents the conceptual framework for this study. Chapter Four
presents the research design and methods that are used to conduct the study. Chapter Five
records the pilot testing and justifies the modification on research methods. Chapter Six
provides the analysis of the research questions. Chapter Seven reviews the study,
discusses the meaning of the findings, its theoretical contributions and managerial
implications, recognizes the limitations, and makes recommendations for future research.
15
CHAPTER TWO
LITERATURE REVIEW
This chapter provides an examination of current branding studies in marketing and
destination marketing research. This chapter is divided into five sections. The first section
discusses the concept of consumer-based brand equity, its definitions and components, as
well as the role of brand equity in branding research. The second section examines the
concept of brand association, its position in consumer-based brand equity, and its
measurement methods. The third section reviews the current research of destination
branding, different foci areas in tourism branding research. The fourth section reviews
consumer-based brand equity research in destination branding setting. The fifth section
provides a summary of this chapter.
Brand Equity
As one the fundamental concepts of brand, research of consumer-based brand
equity is essential and fundamental to branding research (Cai, 2002). The word “equity”
originates from the field of accounting and refers to the difference between the value of
the net tangible assets of a company and the higher price that a buyer will pay to acquire
the company (Keller, 2001). The importance of brand equity can be seen from its
marketing implication and its role in branding studies.
Being a leverage of a brand, brand equity is considered a source of firm
competitive advantages (Aaker, 1996a; Farquhar, 1989). Such advantages include
effective market communication, price premium attained, possibility to retain brand

16
loyalty, increased customer demand and satisfaction, increased brand health and
facilitation in brand extension. Keller (1993), for example, proposed that creating a high
brand equity favors market communication efficiency, thus reduces marketing cost and
increase the power of influencing purchase behavior. Brand equity provides value to
customers by enhancing their interpretation/processing of information, confidence in the
purchase decision, and use satisfaction (Aaker, 1991).
For the development of branding studies, consumer-based brand equity is
fundamental to other branding constructs related to consumer behaviors. Keller (1993, p.
2) stated that consumer-based brand equity reveals what consumers know about brands
and “suggests both specific guidelines for marketing strategies and tactics and areas
where research can be useful in assisting managerial decision making”. In this sense,
consumer-base brand equity identifies a set of brand constructs, which are the
measurement objects in consumer behavior related branding research areas and branding
principles.
The Marketing Science Institute (Anantachart, 1998, p. 13) defined brand equity as
a “set of associations and behaviors on the part of a brand‟s customers, channel members
and parent corporation that permits that brand to earn greater volume or greater margins
that it could without the brand name and that gives the brand a strong, sustainable, and
differentiated competitive advantages.” This definition has lead to a wide range of
conceptualizations of what brand equity is. Generally it can be defined from the
perspectives of financial trade, and consumer marketing. From financial trade
perspective, brand equity is the incremental discounted future cash flows that would
result from a product having its brand name compared to the same product without the

17
presence of its brand name (Simon & Sullivan, 1993), such as the estimated $68 billion
worth of the Coca-Cola brand (InterBrand, 2009). From consumers‟ perspective, brand
equity is a function of associations that have built and nurtured around the branded
product or service (Anantachart, 1998). This function may simply represent what the
product or service is, or reflect the value of a brand, such as product performance (e.g.
Nike running shoes are comfortable and durable), emotional benefits (e.g. I like Nike),
and consumer‟s lifestyle (e.g. Nike fits my active lifestyle).
Because of its important role in consumer branding, brand equity has become a
major issue in brand research. Research has been concentrated on the conceptualization
as well as the measurement of brand equity. The most influential works are Aaker (1991,
1996b) and Keller‟s (1993) research on consumer-based brand equity conceptualization.
Aaker (1991, p. 4) defined consumer-based brand equity as “a set of assets …that
are linked to the brand…and add (or subtract) value to the product or service being
offered”. He stated that the assets and liabilities on which brand equity is based can be
grouped into five categories: brand loyalty, name awareness, perceived quality, brand
association, and other proprietary brand asset such as patent, trademarks, channel
relationships, etc. Brand loyalty reduces the brand‟s vulnerability to competitive action.
Name awareness put the brand into the consideration set of consumer decision making.
Perceived quality influences purchase decision, supports a premium price and becomes a
basis for brand extension (such as the “Apple” brand extends from computer
manufacturing into cell phone and online entertainment businesses), while brand
association provides direct input for branding strategies as well as the basis of a brand
extension, such as identifying most important associations that influence brand

18
evaluations. Aaker proposed that these five components are the underlying bases of
consumer-based brand equity.
Keller (1993) conceptualized consumer-based brand equity as the differential
effect of brand knowledge. He posited that consumer-based brand equity occurs when
“the consumer is familiar with the brand and holds some favorable strong and unique
brand associations in memory” (Keller, 1993, p. 2). According to Keller, the brand
knowledge is comprised of brand awareness and brand images. Brand awareness consists
of brand recognition and brand recall. Brand recognition refers to the consumer‟s ability
to correctly discriminate the brand as having been seen or heard previously (e.g. a person
has heard of “Coca-Cola”). Brand recall is the consumer‟s ability to retrieve the brand in
the presence of the product category or some other type of probe as a cue (e.g. given “soft
drink” as a cue, a consumer can recall “Coca-Cola”). Brand image, in Keller‟s definition,
is essentially brand association. He defined brand image as “reflected by the brand
associations held in consumer memory” (Keller, 1993, p. 3).
Aaker and Keller both emphasized that brand association is a most important
component of brand equity. Because brand associations are anything linked to a brand
(Aaker, 1991), and are consumers‟ knowledge about a brand (Keller, 1993), measuring
brand associations is to understand the meaning of the brand, and underlie the basic
elements in brand knowledge.
Brand Association
Aaker (1991) and Keller (1993) both had thorough discussion on brand
associations. Aaker (1991, p. 114) categorized 11 types of associations that can be

19
generated from brand names or symbols. They are: 1) product attributes, 2) intangibles,
3) customer benefits, 4) relative price, 5) use/applications, 6) user/customer, 7)
celebrity/person, 8) life-style/personality, 9) product class, 10) competitors, and 11)
country/geographic area. Aaker (1991) posited that these associations create values to a
brand by helping process and retrieve information, providing a basis for differentiation,
offering a reason-to-buy, creating positive attitudes and feelings, and building the basis
for extensions.
Keller (1993) presented a different classification of brand associations based on
their increasing abstraction: attributes, benefits, and attitudes (see Figure 2.1). Attributes
are descriptive features of a product or service, and can be broken down to product
related (e.g. “sports apparel” associated to “Nike”) and non-product related attributes
(e.g. “Tiger Wood in Nike commercials”). Benefits are personal values consumers attach
to the attributes, including functional benefits (e.g. “durable running shoes”), experiential
benefits that are related to what feels like of using the product (“feels good wearing
Nike”), and symbolic benefits that are related to underlying needs for social approval or
personal expression and outer-directed self-esteem (e.g. “standard golfing attire for
professionals”). Brand attitudes are consumers‟ overall evaluations of a brand (e.g. “I
prefer Nike to other brands when it comes to sportswear and equipment).

20
FIGURE 2.1: Keller's classification of brand associations
Keller (1993) stated that brand associations differs not only just on types, but also
vary according to their favorability, strength, and uniqueness. Favorability is the
consumer‟s predispositions toward a brand. Strength refers how strong a consumer feels
that a particular association is linked to a brand. Uniqueness refers to the portion of brand
associations shared by other competing brands or are common to the category of the
branded product or service. Keller provided an exhaustive discussion on the structure and
characteristics of brand association, but the discussion stayed on the conceptual level.
Keller did not apply these discussions into empirical measurements.
brand image
types of BAs
attributes
non-product-related
price
packaging
user imagery
usage imagery
product-related
benefits
functional
experiential
symbolicattitudes
favorability of BAs
strength of BAs
uniqueness of BAs

21
Empirically, the brand association measurement has two goals. One is to identify
the associations, and the other is to evaluate these associations as the measure of brand
equity performance. Although the concept of brand association is developed from the
associative memory network model, the measurement methods in brand association
studies did not necessarily follow this theoretical model. Table 2.1 presents a selected
amount of studies on brand association studies.
To measure brand associations, one must begin with eliciting brand associations.
Two methods are commonly used in brand association elicitation and measurement: free
association, and perceptual mapping (Henderson, 1995). Free association method asks
respondent to “describe that the brand means to them in an unstructured formation, either
individually or in small groups” (Keller, 1993, p. 12). Using free association allows the
researcher to “indentify the range of possibilities…in consumers‟ minds”, but is limited
to provide a “rough indication of their relative strength, favorability, and uniqueness”
(Keller, 1998, p. 312).

22
TABLE 2.1: List of selected brand association studies Authors Title Research
Questions
Variables
Measured
Methods Suggestions
Krishnan
(1996)
Characteristics of
memory
associations: a
consumer-based
brand equity
perspective
To identify
various
associations
characteristic
underlying BE
Set size
Valence
Uniqueness
Origin
Free
association
Frequency
T-test
Advance this
model for
brand equity
measurement
Inter-brand
analysis
Brand
association
variation
across market
segments
Henderson
et al. (1998)
Brand
diagnostics:
Mapping
branding effects
using consumer
associative
networks
To
demonstrate
network
analysis
methods in
BA research
Centrality
Cohesion
Position
Density
Structure
equivalence
Repertory grid
Network
algorithm analysis
To empirically
test these
methods in
intra-brand
and inter-
brand analyses
Low &
Lamb
(2000)
The
measurement and
dimensionality of
brand
associations
To test a BA
conceptualizat
ion that
consists of B-
image, B-
attitude, and
perceived
quality
Brand
image
Brand
attitude
Perceived
quality
Structured
measureme
nt items
CFA
Incorporate
company
BAs
Test B-
personality
dimension
Supphellen
(2000)
Understanding
core brand
equity:
Guidelines for
in-depth
elicitation of
brand
associations.
To comment
on techniques
for gaining in-
depth BAs
N/A N/A Long-personal
interviews
Metaphor
Visualization
&
verbalization
validate
Gladden &
Funk,(2001)
Understanding
brand loyalty in
professional
sport: Examining
the link between
brand
associations and
brand loyalty
To investigate
the sports
fans‟ BA and
B-loyalty of
their sports
team
BA
B-loyalty
Structured
measureme
nt
regression
re-test the
same scale in
long terms
and cross
cultures
Chen
(2001)
Using free
association to
examine the
relationship
between the
characteristics of
brand
associations and
brand equity
To identify the
types of BAs,
and
To examine
the
relationships
between BA
characteristics
and BE
Type
Set size
favorability
Free
association
Frequency
T-test
Cross cultural
re-
examination
Re-
examination
of the BA
model through
other research
design

23
Table 2.1(Continued)
Cai (2002) Cooperative
branding for
rural destinations
To test a
conceptual
model of
destination
branding
Perception
of
destinations
associations
, including:
attributes,
benefits and
attitudes
Structured
measures
MDS
Refining and
modifying the
model beyond
the rural
setting
Note: B- (Brand-), BA (brand association), BE (brand equity)
Perceptual mapping is another method to study brand association. Strictly
speaking, perceptual mapping is not a tool to elicit associations but a method to explore
similarities and dissimilarities among provided associations. Perceptual mapping with
multidimensional scaling technique is based on the pairwise similarity judgments. To
compare the similarities and dissimilarities, the researcher must provide participants with
an exhaustive list of attributes upon which to base their assessment of the product or
service. Using Henderson‟s (1995) example, the perceptual mapping technique gives
seven sports car brands and asks participants to evaluate how similar each pair is on a 1-
to-9 scale. Since there are seven brands, then on the brand name, there will be 21 pairs to
compare, let alone other attributes such as performance and country of origins that can be
compared across different car brands. Thus this list can be exhaustive and the workload
participation is heavy. Steenkamp and Van Trijp (1994) mentioned two issues that are
critical to assure validity of this method. First, the researcher must be able to provide a
complete, valid, and exhaustive set of pre-determined attributes. Second, all attributes
must be relevant to all consumers, non-specific to a certain group of consumers, and must
attach the same meaning to all consumers.

24
A less used but strongly advocated method in brand association research is the
Repertory Grid Technique (RGT). Similar to free association technique, RGT is also a
qualitative technique to elicit brand associations from the subject rather than the
researcher. Kelly (1959) created this method for the psychological measurement of
personal constructs. RGT has a power to build the gap between qualitative data collection
and quantitative analysis techniques (Fransella, Bell, & Bannister, 2004). As the current
study will use RGT to collect data, this technique will be discussed in detail in the next
chapter – Conceptual Development.
After eliciting brand associations, the next question is how to measure them. Based
on Keller‟s (1993) conceptualization, Krishnan‟s (1996) research focused on examining
the characteristics of brand associations. Krishnan considers that brand associations can
be measured on four features: number, valence, uniqueness, and origin. Number is the
quantity of associations consumers can think of upon given the brand name. Valence is
the net value of brand association as being positive, neutral or negative compared to the
overall valence score. For instance, for the Nike brand mentioned earlier, “durability” and
“soft-to-run-in” may be positive, but “expensive” may be perceived as negative”. If each
valence is measured as positive being 1, neutral being 0, ad negative being -1, without
considering weightings, then based on the three associations above, this consumer has a
valence of 1 towards the Nike brand. Uniqueness has two measures: one is the ratio
between number of the associations that are not shared by competing brand and the
number of all associations. The other is the ratio between the associations unrelated to
product category and the number of all associations. For example, “Nike” may be
associated to “athletic”, “apparel”, “Michael Jordan” and “swoosh”. The “apparel”

25
association is common to all sportswear brands, while “athletic” may be shared with
“Reebok”, only “Michael Jordan” and “swoosh” are unique to the “Nike” brand. Then
Nike shares three unique associations (45%, i.e. 3 out of 4) unrelated to the product
category and two associations (50%, i.e. 2 out 4) unrelated to its competing brand
“Reebok”, noting “apparel” is also associated to “Reebok”. Origin refers to whether the
source of brand association perception is direct (i.e. personal experience, trial, usage), or
indirect (i.e. advertising, word-of-mouth). Direct sources have stronger positions in the
brand association than indirect sources. Krishnan suggested that a brand with high equity
shall have a greater number of associations, more net positive associations, more unique
associations and origins more from direct sources.
To study the relationship among brand associations, brand concept mapping is a
commonly used approach. The advantage of using brand maps is that “brand map not
only identifies important associations, but also conveys how these associations are
connected to the brand and to one another” (Roedder-John et al., 2006). The limitation
for this method is that most analyses are so call “eyeball analyses” that are conducted at
surface level.
Other analyses of brand association relations concentrate on its relationship with
other components in brand equity incorporating complex statistical modeling. For
instance, Low and Lamb (2000) measured three types of associations – image, attitude,
and perceived quality – with free association method for a fictitious brand calculator, and
used structural equation modeling to confirm that brand associations are
multidimensional.

26
Different from individualistic, variable-based approach in sociological and
management studies, social network analysis assumes that individuals in a given social
entity are most likely connected and co-exist in intricate networks. The presence of
regular patterns in relationship is known as structure or structure relations. The focuses of
social network analysis are to “measure and represent these structural relations
accurately, and to explain both why they occur and what are their consequences” (Knoke
& Yang, 2007, p. 4).
Social network analysis has been studied more than fifty years. It gained more
attention only in recent years when computer aided analysis software flourished (Knoke
& Yang, 2007). Social network analysis has been an interdisciplinary/multidisciplinary
method (Wasserman & Faust, 1994). It has been applied to many research fields. Several
searches using keyword “social network analysis” in Proquest Dissertation/Thesis
Database found 949 documents, covering the research fields of sociology, marketing,
psychology, computer sciences, media communications and political sciences. Limiting
the field to marketing science, the search in the database returned 18 dissertations/theses.
The topics ranged from advertising to organization behaviors. However, there were no
found studies on the topic of tourism branding using network analysis method.
In tourism research, associative network models have been rarely used. Similar
related approaches included destination image studies using multidimensional scaling or
repertory grid methods to elicit image associations. For instance, Hankinson (2004)
studied the salient brand images of 25 cities the UK using repertory grid to elicit
similarities and differences then applied exploratory factor analysis to draw the salient
image factors. Although the studies either investigated either image associations, or

27
tested a few features of brand associations, those scholars did not put these associations
in the perspective of an associative network.
Destination Branding Research
Destination branding studies have a much shorter history than that of the
marketing literature. Prior to the branding emphasis, tourism research closely related to
this topic included destination image and destination positioning, although they were not
probed in the branding context. Pike (2009) stated that Dosen, Vransevic, and Prebezac
(1998 cited in Pike) published a paper in 1998 that firstly used branding concepts in a
destination management, almost half a century after the marketing literature had started
branding research in the 1940s. The first case study in tourism branding is Pritchard and
Morgan‟s (1998) mood-marketing as a branding strategy for Wales. Since then,
destination branding has gained more attention in tourism research. Conferences and
special issues of journals have since addressed the destination branding topic.
The Tourism and Travel Research Association (TTRA) 1998 annual conference
themed: “Branding the Travel Market” featured eight destination branding papers. In the
following year, TTRA‟s European chapter organized a “Destination Marketing”
conference. In Macau China, the Instituto De Formacaco Turistica (Institute for Tourism
Studies), in conjunction with Purdue University, initiated the first “International
Conference on Destination Branding and Marketing” in 2005, which is every two years.
Several academic journals also focused on destination branding. Journal of
Vacation Marketing published the first special issues (1999, Vol.5, Iss.3) dedicated to
destination branding, followed by Journal of Brand Management (2002, Vol.9, Iss.4-5)

28
and Tourism Analysis (2007, Vol.12 Iss.4). In 2004 a new journal, Place Branding and
Public Diplomacy, was published and entirely dedicated to place branding.
Pike (2009) conducted an extensive review of 74 published papers on destination
branding between 1998 and 2007. He categorized these papers into four concentrations:
1) 33 case studies, 2) 10 conceptual papers, 3) 28 research-based papers, and 4) three web
content analyses. He noted that “the most popular type of destination branding paper has
been case studies [emphasis added]” (p. 858). Most conceptual and case study papers
were published before 2006, while most research-based papers were published in and
after 2006 (see Pike 2009 for the list of these papers). This dissertation research
conducted a survey of the destination branding papers published between January 2008
and September 2009 in Academic Search Premier, Web of Science, and Google Scholar,
and found 35 research or case study papers published during this time period. In the
journal of Place Branding and Public Policy, there are over 60 articles published in these
21 months. Most of them are reports but ten articles are original papers or case studies.
Table 2.2 summarizes these 35 research publications. Publications in nearly two years
show that: 1) destination branding papers have seen a rapid increase; 2) case study and
research-based studies are popular, 3) stakeholders analysis started to gain more
attention; and 4) political influence is emphasized in place branding.
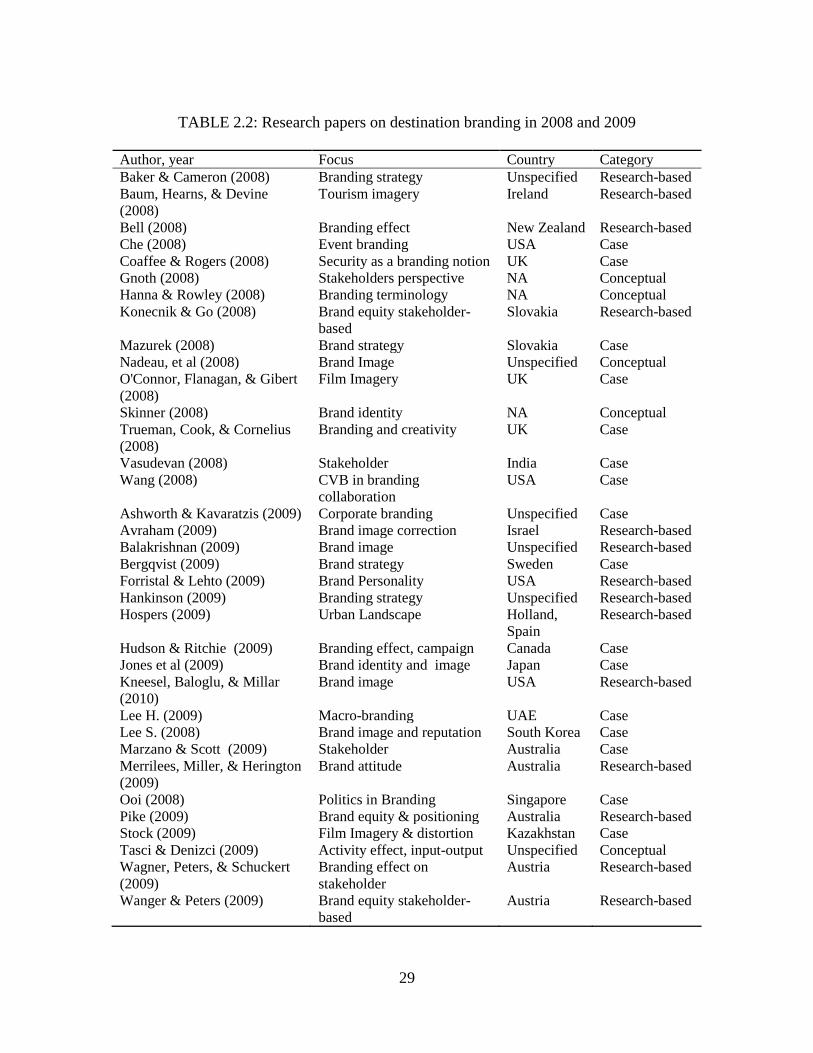
29
TABLE 2.2: Research papers on destination branding in 2008 and 2009
Author, year Focus Country Category
Baker & Cameron (2008) Branding strategy Unspecified Research-based
Baum, Hearns, & Devine
(2008)
Tourism imagery Ireland Research-based
Bell (2008) Branding effect New Zealand Research-based
Che (2008) Event branding USA Case
Coaffee & Rogers (2008) Security as a branding notion UK Case
Gnoth (2008) Stakeholders perspective NA Conceptual
Hanna & Rowley (2008) Branding terminology NA Conceptual
Konecnik & Go (2008) Brand equity stakeholder-
based
Slovakia Research-based
Mazurek (2008) Brand strategy Slovakia Case
Nadeau, et al (2008) Brand Image Unspecified Conceptual
O'Connor, Flanagan, & Gibert
(2008)
Film Imagery UK Case
Skinner (2008) Brand identity NA Conceptual
Trueman, Cook, & Cornelius
(2008)
Branding and creativity UK Case
Vasudevan (2008) Stakeholder India Case
Wang (2008) CVB in branding
collaboration
USA Case
Ashworth & Kavaratzis (2009) Corporate branding Unspecified Case
Avraham (2009) Brand image correction Israel Research-based
Balakrishnan (2009) Brand image Unspecified Research-based
Bergqvist (2009) Brand strategy Sweden Case
Forristal & Lehto (2009) Brand Personality USA Research-based
Hankinson (2009) Branding strategy Unspecified Research-based
Hospers (2009) Urban Landscape Holland,
Spain
Research-based
Hudson & Ritchie (2009) Branding effect, campaign Canada Case
Jones et al (2009) Brand identity and image Japan Case
Kneesel, Baloglu, & Millar
(2010)
Brand image USA Research-based
Lee H. (2009) Macro-branding UAE Case
Lee S. (2008) Brand image and reputation South Korea Case
Marzano & Scott (2009) Stakeholder Australia Case
Merrilees, Miller, & Herington
(2009)
Brand attitude Australia Research-based
Ooi (2008) Politics in Branding Singapore Case
Pike (2009) Brand equity & positioning Australia Research-based
Stock (2009) Film Imagery & distortion Kazakhstan Case
Tasci & Denizci (2009) Activity effect, input-output Unspecified Conceptual
Wagner, Peters, & Schuckert
(2009)
Branding effect on
stakeholder
Austria Research-based
Wanger & Peters (2009) Brand equity stakeholder-
based
Austria Research-based

30
Definitions of destination branding are rooted in marketing research. However,
they are not as clearly defined as product branding. So far, tourism research has not come
to a consensus regarding the definition of destination brand. Kotler Bowen and Maken
(2003) provided a general description of what attributes support a good destination‟s
brand: easy identification, perception of good value for price, easy maintenance of quality
and standards. Morgan et al. (2002) defined destination brand with the emphasis on
branding meaning and brand recall. They conceptualize that destination brand is a
“unique combination of product characteristics and added value, both functional and non-
functional, which have taken on a relevant meaning that is inextricably linked to the
brand, awareness of which might be conscious or intuitive” (p. 335). Blain Levy and
Ritchie (2005) stressed the experience aspect in defining destination brand, that a
destination brand is
a name, symbol, logo, word mark or other graphic that both identifies and
differentiates the destination; furthermore, it conveys the promise of a
memorable travel experience that is uniquely associated with the destination;
it also serves to consolidate and reinforce the recollection of pleasurable
memories of the destination experience. (p. 329)
This definition has a background in Echtner and Ritchie‟s (1993) definition of destination
image, which is considered as attribute-based and has psychological, functional, common
and unique characteristics.
Destination brand image studies have the root in destination image research.
Often, destination image is used to understand destination branding (Cai, 2002).
Consequently, destination image has often been used to substitute brand image in

31
destination branding studies (Tasci & Kozak, 2006). This confusion is largely due to the
fact that the definitions of destination image and brand image are both highly similar.
Hunt (1975) coined the term “destination image” and defined it as people‟s impression of
the regions that do not reside in. Crompton (1979, p. 18) proposed that destination image
is “the sum of beliefs, ideas, and impressions that a person has of a destination”. While
brand image “refers to the set of association linked to the brand that consumers hold in
memory” (Keller, 1993, p. 2). Baloglu and McCleary (1999) proposed a different model
of destination image formation. They suggest that a destination image consists of three
components: perceptual, affective, and global. The perceptual component refers to a
person‟s beliefs and knowledge of the destination. The affective component is a person‟s
evaluative attitudes and feelings towards the destination. The global image refers to a
person‟s overall evaluation about the destination. Baloglu and McCleary point out that
those perceptual components determine the favorability and strength of affective
components. This suggestion coincides with Gartner‟s destination image formation model
that has been used as the prototype for Konecnik and Gartner‟s (2007) destination brand
equity research. As destination image research has a relatively long history and a strongly
developed conceptualization, most conceptual and empirical destination branding
research has focused on destination image to imply destination‟s brand image (Boo,
2006). However, such an approach overlooked one of the fundamental function of
branding – the differentiation ability. Cai (2002, p. 722) highlighted the differences
between the concepts that “image formation is not branding, albeit the former constitutes
the core of the latter. Image building is one step closer, but still remains a critical missing
link: brand identity”. Thus what identified by destination image construct do not

32
necessarily equal to that of the destination brand. For instance, a functional image of
“destination A has lot of natural trails” does not necessarily mean that “natural trail” is a
suitable attribute for constructing a strong brand if its competitor destination B is also
rich in natural trails.
Destination personality is another stream in the destination branding research. It
borrows the branding personality concept from marketing research. J. Aaker (Aaker,
1997) posited that like humans, brands have distinct characters too. Therefore, brand
personality is a “set of human characteristics associated with a brand” and consists five
dimensions: sincerity, excitement, competence, sophistication, and ruggedness (Aaker,
1997, p. 347). Branding researchers believe that brand personality helps to establish the
emotional attachment between the brand and its users, serves as the symbolic function of
a brand meaning, and enables the consumer to express his or her own self, an ideal self
and the specific dimensions of the self (J. L. Aaker, 1997).
Adapting Aaker‟s (1997) brand personality measurement scale, Hosany and Ekinci
(2003) firstly applied it to destination personality research. Since then, they and a few
other tourism scholars have used Aaker‟s (1997) scale on various destinations and tested
the relationship among brand personality, destination images and purchase intention.
However, the brand personality scale did not appear reliable as the no studies have been
able to completely replicate the original five dimensions and the cross loadings are often
seen in the factor structures (e.g. Austin, Siguaw, & Mattila, 2003; Bartra, Lenk, &
Wedel, 2003; Caprara, Barbaranelli, & Guido, 2001; Wee, 2004) . These studies also
found that the effects of brand personality on purchase intention was low, and the ability
to differentiate destination‟s uniqueness was weak as most traits only describes the

33
personality characters of the product category rather than the individual brand (e.g. Bartra
et al., 2003). Azoulay and Kapfere‟s (2003, p. 150) criticism of Aaker‟s brand personality
definition provides an insight to those outcomes: the brand personality is loosely defined
as an “all-encompassing potpourri” , therefore, the subsequent works that followed
Aaker‟s conception and measurement scale “shared the same flaw in their conceptual
basis”. In other words, we do not know what brand personality measures since its
construct has never been clearly identified. What constitutes a destination‟s brand had not
been indentified before the measurements of subordinate brand structures were carried
out. Konecnik and Gartner (2007) pointed out that much destination branding research
applied branding principles before investigating the characteristics of a destination‟s
brand. Similarly, Boo (2006) criticized that the academic destination branding research
lacks of systematic investigation of the branding knowledge.
Destination Brand Equity Research
Compared to the studies that focused on applying branding principles to
destination context or destination branding case studies, destination branding research has
not sufficiently investigated consumer-based brand equity of destinations. A review of
current destination branding literature found only four published articles (see Boo et al.,
2009; Konecnik & Gartner, 2007; Pike, 2007, 2009) that explicitly investigated
consumer-based brand equity. Table 2.3 presents the four articles with their research
topic, variables examined, methods and future research recommendations.

34
TABLE 2.3: Destination brand equity studies
Authors Title Research
Questions
Variables
Measured
Methods Suggestions
Boo,
Busser,
&
Baloglu
(2009)
Multidimensional
model of
Destination
brands: An
application of
customer-based
brand equity
Variables
comprise
CBBE,
Variables‟
relationship
IVs:
DBA
DBI
DBQ
DVs:
DBV
DBL
Survey
SEM
To consider
variables not
researched in
the study but
related to
destination
characteristics
To conduct
longitudinal
study
Konecnik
&
Gartner
(2007)
Customer-based
brand equity for a
destination
Dimensions
of CBBE,
If DI is the
most vital
element in
DB
Factors to
draw
DBA
DBI
DBQ
DBL
Content
analysis
Free
association
EFA
CFA
To examine
the causality
among
dimensions
To test the
variation of
dimension
among
different
target groups
Pike
(2007)
Consumer-based
equity for
destinations:
practical DMO
performance
measures
Dimensions
of CBBE
Hierarchical
relations
among the
dimensions
Salience
Association
Resonance
Loyalty
Free
association
Repertory
grid
Frequency
Percentage
To repeat the
same
measures in a
longitudinal
study for
brand
assessment
Pike
(2009)
Destination brand
positions of a
competitive set of
near-home
destinations
Longitudinal
re-test of
Pike (2007)
Same as
Pike (2007)
Same as
Pike
(2007)
Identified nine
research gaps
that need to be
filled
Adapting both Aaker‟s (1991) and Keller‟s (1993) conceptualizations, Konecnik
and Gartner (2007) were probably among the first scholars who investigated consumer-
based brand equity of tourism destinations. Konecnik and Gartner‟s survey instrument

35
was a close-end questionnaire with 32 items that were mostly based on previous
destination image research. They applied this instrument to measure Slovenia‟s brand
equity among visitors from Germany and Croatia. The purpose of their study was to
propose this destination brand equity model and test to see whether the brand equity
components (i.e. awareness, image, quality, loyalty) adopted from marketing literature
are valid for being the components for measuring brand equity.
Konecnik and Gartner argued that destination‟s name is a brand. When the name is
mentioned, tourists start to form mental images about the destination. These images have
four dimensions - brand awareness, brand image, brand experience, and brand loyalty.
Konecnik and Gartner also incorporated Gartner‟s (1993) conception of destination
image formation process. Gartner (1993, p. 193) posited that destination image is formed
by “three distinctly different but hierarchically interrelated components: cognitive,
affective and conative”. Cognitive components are internally accepted pictures of
destination attributes (e.g. scenic natural attractions); affective components are motives
that can be satisfied from visiting the destination (e.g. a person would feel satisfied by
visiting the attractions); and conative components are actions and behavior after cognitive
and affective evaluations (e.g. a person would like to go to visit those attractions). The
formation of destination images follows the sequence of these three dimensions.
Konecnik and Gartner stated brand equity is gained when positive conative images are
formed. Combining these two conceptions, Konecnik and Gartner stated that brand
awareness affects the cognitive and conative component in image formation process,
while brand image and brand quality influence more on the affect component of
destination image formation. However, their proposed brand equity formation structure

36
is bit confusing. First, they did not identify between destination image and destination
brand equity, which one forms first. Is it that brand equity leads to destination image
formation, or destination image comprises brand equity? Second, they did not clarify the
difference between the “destination‟s name induced image” and the “cognitive, affective
and conative” destination images. Konecnik and Gartner did not consider brand
association as one of the brand equity component.
Konecnik and Gartner used confirmatory factor analysis and higher-order factor
analysis structure to test the model‟s invariance across the two participant groups. They
found moderately stable factor structure with slightly invariant factor loadings.
Destination brand image and brand quality were the major components that accounted for
the most variance in brand equity. These findings suggested that consumer-based
destination brand equity may encompass these four components, but the effect of each
component on brand equity varies across different market segments.
Boo et al. (2009) also conducted consumer-based destination brand equity
research, basing on the Aaker (1991) conceptualization. While Konenick and Gartern‟s
(2007) study aimed at testing the validity of the four equity components, Boo et al.
focused on identifying the internal relationship among the different components of the
brand equity. Boo et al. posited that the destination brand equity has five components:
brand awareness, brand image, brand quality, brand value, and brand loyalty. Noticeably,
they did not consider brand association as a brand equity component either. Boo et al.
proposed that the first three components are exogenous variables that influence the
perception of brand value, the endogenous variable they defined as the perceived “value
for money”. As to brand image, Boo et al. stated that this concept is multi-dimensional of

37
various branding constructs, including product attributes, brand personality, and self-
concept. Since there was no consensus on how to measure it, they defined brand image as
the “social image and self-image of brand personality” (p. 221), and brand loyalty as
favorability and intention to recommend. Boo et al.‟s created their measurement
instrument from related destination image and destination personality studies and
contained 21 items, about four items for each brand equity component.
Boo et al. chose Las Vegas and Atlantic City as the study areas and applied their
proposed model to compare the model‟s fit and invariance. Through the testing with the
structural equation modeling method, Boo et al. found that the hypothesized model did
not hold. Brand image and brand quality were highly correlated. Boo et al. added a latent
construct, destination brand experience as the second-order factor, to capture brand image
and quality. They proposed that brand awareness affects brand experience. Brand
experience then has direct influence and indirect influence via brand value onto brand
loyalty. The model‟s goodness-of-fit was relatively improved, but destination brand
experience still failed to predict brand loyalty. Boo et al. however did suggest that a
respecification of the destination brand measurement model should be free of established
relationships in marketing literature such as image and quality would lead to loyalty.
Pike (2007) proposed four components for consumer-based destination brand
equity. The primary purpose of Pike‟s study was to report a trial measurement of the
proposed consumer-based destination brand equity. His proposition is also based on the
Aaker (1991) conception. Pike stated that the consumer-based destination brand equity is
a hierarchy of four assets: brand salience, brand associations, brand resonance, and brand
loyalty. Pike‟s study asked participants to identify the destinations within Australia they

38
would like to travel for a short vacation. Pike then defined brand salience as the Top-of-
Mind destinations, brand association as “anything linked in memory to the destination”
(p. 54) but operationalized as the “perceived performance of a competitive set of five
destinations…with cognitive and affective scales” (p.56). Brand resonance was defined
as the willingness to engage with the destination, which mirrors Gartner‟s (1993)
conative image formation process. Lastly, brand loyalty, the highest level of the
hierarchy, was represented by repeat visitation and word of mouth recommendations.
Pike proposed that these components were hierarchically related. However, he did not
test the relationships among those components.
None of the destination brand equity studies sufficiently investigated the
component of brand association, albeit it is “fundamental to the understanding of
customer-based brand equity” (Hsieh, 2004, p. 33). If compared to the Keller description
of brand association, Gartner‟s (1993) image formation process with the three
components (cognitive, affective, and conative) could be the closest toward a model of
destination branding (Cai, 2002). Cai (2002) pointed out that these three components are
similar to Keller‟s (1993) categorization of brand association that brand associations
include attributes, benefits, and attitudes. Attributes are descriptive features of a product
or service (e.g. Coca-Cola makes soda); benefits are personal value and meaning attached
to the attributes (e.g. Coca-Cola is classic), and attitudes are the overall evaluation and
basis for action and behavior (e.g. I prefer Coca-Cola to either Pepsi or Dr. Pepper).
Although the Gartner image formation process is very close to the brand
association categorizations, the image formation model cannot function adequately to
represent how people make destination brand associations. Cai (2002, p. 724) clearly

39
stated that “the Gartner framework falls short of linking image formation and components
of a destination to a brand identity”.
The review of current destination branding studies shows that the consumer based
destination brand equity has been gaining more attention in recent years. Much of the
attention has been given on identifying the relationships among brand equity components.
However, brand association, the “heart and soul” of consumer-based brand equity, has
not been investigated sufficiently, especially from a network perspective.
Summary
This chapter reviewed brand and consumer-based brand equity research in
marketing, its application and its current situation in destination branding research. The
conceptions of consumer-based brand equity and its components were discussed. The
chapter presented empirical studies on consumer-based brand equity measurement in
destination branding. It has been noticed that the limited amount of empirical research on
consumer-based brand equity research was based on the Aaker conceptualization, and
focused on the relationship between different components, especially on their influence
on the ultimate goal of creating brand loyalty. Although brand loyalty is the long-term
goal of branding, one must begin with perception before moving onto ultimate choice.
On the other hand, the Keller conception, which considered brand association from a
network perspective and focused on brand association characteristics and structure, has
not been fully applied to destination brand equity research.

40
CHAPTER THREE
CONCEPTUAL DEVELOPMENT
While the review of the tourism branding literature in Chapter Two indicates that
consumer-based brand equity has been largely overlooked in destination branding
research, marketing and management research has shown that brand equity is a
fundamental construct in branding research. Within the limited amount of destination
brand-equity studies, most of them focused on relationships between the different
components of brand equity. One of the most important measurements for brand equity,
brand association – a construct that investigates what exists in the consumers‟ mind set –
has not been given much attention in destination branding research, especially from a
network perspective.
This chapter presents the theoretical foundation and its operationalization in
branding research. The chapter is organized into five sections. The first section introduces
the Associative Network Theories that the dissertation research is based on. The second
section presents repertory grid technique that is used to elicit brand associations in these
investigations. The third section discusses network analysis methods and the fourth
section illustrates the conceptual framework and flow chart for this study. The chapter
concludes with a summary in the fifth section.
Associative Network Theory
Most brand association research is rooted in the Associative Network Theories
(ANT), which is concerned with the organization of human semantic memory. Research

41
on ANT emerged in cognitive psychology in the late 1960s. Cognitive psychologists
generally believe that human knowledge is stored in memory and represented as
associative networks (Collins & Loftus, 1975). Consider the associative network
example of the New York City brand in Figure 3.1.
FIGURE 3.1: Example of the New York City brand network
The associative network is comprised of two elements: node and link between
nodes. A node is a unit of information. It represents a concept that can be either an object
such as a person, place or thing (e.g. “New York City”), or a proposition such as “New
York has cultural attractions”. Association is created when two nodes are connected (e.g.
“New York” and “Statue of Liberty”). By their positions around a focal node,

42
associations can be differentiated as primary and secondary associations. Associations
that are centered on a node are called the primary or first-order associations of that focal
node (e.g. “cultural attractions” and “metropolitan” are first-order associations around the
“New York City”). Further associations built on the primary associations are second-
order associations (e.g. “museums”, “shopping” and “a wide range of selection” are the
second-order associations to the “New York City” node).
One of the influential ANT theories is Quillian‟s (1969) Teachable Language
Comprehender (TLC) model. Quillian explained how associations are linked within the
network. He posited that the associations vary from each other in terms of their
hierarchical level in the network. By hierarchical, it is meant that some associations are at
a higher level or more basic than others (e.g. “metropolitan” is on a higher level than
“shopping” and “a wide range of selection”).
Considering that his model was designed for computer simulating human learning,
Quillian put strict rules on the hierarchical orders. He stated that “any unit‟s first element
must always be a pointer to some other unit, referred to as that unit‟s „superset‟, [and] a
unit‟s superset will in general represent some more generic concept than the unit itself
represents” (p. 462). Quillian original example is used in here to illustrate the hierarchical
orders, as they are difficult to understand if illustrated with the New York City example.
Quillian exemplified that if JOE-SMITH is a “unit”, then the superset of JOE-SMITH
might be a MAN, that of MAN might be PERSON, that of PERSON might be ANIMAL,
etc. The strict hierarchical order differentiates the associations based on their level of
abstract or inclusiveness, but is difficult in explaining parallel associations (e.g.
associations between “cultural diversity”, “metropolitan” and “Statue of Liberty”), or

43
associations that do not necessarily follow hierarchical orders (say, “New York City” and
“Washington DC” if the latter were in the map).
Collins and Loftus (1975) extended Quillian‟s (1969) model around the concept of
“spreading-activation”. They illustrated how the memory search spreads upon the
activation of stimuli. When a person receives a stimulus, a node is activated
corresponding to the stimulus. This node soon becomes the focal node and spread the
activation to other nodes through the links between them. The search in memory between
nodes traces out in parallel along the links from the focal node. Then the activated nodes
become stimulus nodes, expanding and spreading the activation. The spreading of
activation constantly expands, and the degree of spreading depends on the distance of
between the to-be-activated-node to the first stimulus node. Collins and Loftus also
eliminated the strict hierarchical structure in Quillian‟s model and replaced it with the
strength of associations. Strength is represented by the distance of the link between two
nodes. The farther the distance is, the weaker the association is (e.g. the “a wide range of
selection”-“New York City” association is weaker than “Statue of Liberty”-“New York
City”).
Keller‟s (1993) conceptualization of brand equity is based on the ANT theory.
Especially, his discussion on brand associations reflects the theoretical underpinnings of
the ANT theories. Keller differentiated associations into primary associations and
secondary associations. The former are those belief associations created on the basis of
direct perceptions and experiences with the product or service. The latter are created on
the “basis of inferences from some existing brand associations… [and] may arise from
primary attributes associations related to the company, the country of origin, the

44
distribution channels, a celebrity or an event” (p. 11). The secondary associations are not
particular to the brand, but refer to independent entities. A person‟s attitude towards those
entities may be transferred to the branded product or service through those secondary
associations. Thus, secondary associations are important in that they can either dilute a
brand or can be leveraged to create favorable, strong and unique associations that
otherwise may not be presented by the brand itself (Keller, 1993). Henderson et al.
(1998) suggested that the association between brand and attributes can be considered as
first-order association, and attribute-to-attribute associations are considered as secondary
associations.
Much of brand association research applying ANTs only stayed on the level of
descriptive analysis, such as brand concept mapping and identifying the primary and
secondary associations (Henderson et al., 1998). However, this “naïve eyeball” method
analyzes only the surface of brand association network, and may overlook the valuable
information that is hidden on a deeper level in the network. Note that in Figure 3.1, when
the “New York City” brand is presented, the consumer will make primary associations to
“cultural diversity” and “metropolitan”, and a secondary association to “shopping”. It
appears that “cultural diversity” is more important than “shopping” as the former is
closed related to the “New York City” brand. However, “cultural diversity” does not
control the links to any other associations, but “shopping” makes the association to “a
wide range of selection”, which makes “shopping” an important control node in this
brand association network. Using the eyeball method solely may generate illusions that
mislead the investigation of important brand associations.

45
Henderson et al. (1998, 2002) applied network analysis methods to brand
associative network. The network analysis methods so far are largely used in social
network analysis. Nevertheless, the basic concepts between associative network theories
and social network are similar. Henderson et al.‟s methods add strong analytical power
into the analyses of sophisticated brand-to-association networks, as well as brand-to-
brand, and association-to-association networks.
One may notice that not many branding studies conducted network analysis
methods after Henderson et al.‟s works. This may be largely because of the lack of
appropriate computational tool for network analysis. van Dujn and Vermun (2006) noted
that the increase of social network research emerged around 2005 as a result of the
increase and advance of social network software that can handle complex networks.
Nevertheless, more marketing researchers (Henderson et al., 1998, 2002; Keller, 2003a;
Keller, 2008; Lawson, 2002; Teichert & Schöntag, 2010) have come to agreement that
associative network models are suitable for studying knowledge structures.
Before analyzing brand association, one must first obtain brand associations. The
following section discusses the brand association elicitation method that was used for this
study.
Repertory Grid Technique
Repertory Grid Technique is an interpretive research method that aims at
extracting personal meanings about objects of research interest. Repertory grid technique
is based on Kelly‟s (1955) personal construct theory. Consistent with the interpretive
paradigm, personal construct theory holds that a person‟s understanding of the world is
46
the result of a constructive process of contrast and similarity rather than a passive
reaction to external realities (Marsden & Littler, 2000). Kelly termed the process of
contrast and similarity as “construing”. Eden and Jones (1984, p. 779) explained the
construing process that “we construe situations by seeking to differentiate them from
others and see them as similar to others; it is only through such a process that we give
meaning to events, that they have significance”. Similar to other interpretive diagrams,
personal construct theory has been accused of focusing on the individual‟s subjective
consciousness and being “solipsistic” (Marsden & Little). The response to that accusation
is that personal construct theory in fact avoids “solipsism”. The theory maintains that
people are similar not because they have identical experience, but rather because they
construe their experience in a similar way (Marsden & Little).
The interpretive paradigm and theoretical underpinnings in fact respond to the
marketing research emphasis on “seeing the voice of the consumer” (Henderson, 1995).
The theoretical underpinnings also match the research purpose of the current study: to
identify the underlying dimensions of associations that people use to describe destination
brands. Thus, repertory grid technique is an appropriate method for this study to elicit
brand associations.
A repertory grid contains two main components: “element” and “construct”. An
element is the object that is the focus of the research, which can be a person, a place, or
any phenomena that the research concentrates on. A construct is defined as “a way in
which things are connected as being alike and yet different from others” (Kelly, 1955, p.
105). Thus, a construct is revealed through the process of contrast and similarity that
people make among the elements given to them to assess. For instance, using the example

47
in Figure 3.1, in a repertory grid investigating brands, New York City, and other
destinations (e.g. Washington DC and Los Angeles) are “elements”. While there is no
association can be correctly used to illustrate a construct here, suppose “metropolitan”
were also connected to “Washington DC” and “Los Angeles”, and is a construct of these
three destinations.
There are several ways to extract the elements and constructs. The elements in the
repertory can be either supplied by the investigator or elicited through discussions as in
interviews or focus groups. When the constructs are prepared by the investigator (usually
known as the rating grid), however, it is reminiscent of the traditional multidimensional
scaling method and removes the benefits of the freedom of qualitative elicitation
(Henderson 1995). For instance, Wooten and Norman (2008) used rating grid method to
study visitors‟ personal meaning of attending the Kentuck Festival of Arts. They
provided the measurement constructs and elements and asked the respondents to evaluate
each element by rating their personal fitting on the corresponding constructs. Wooten and
Norman acknowledged that the rating grid added the ease in data collection, but could
also overlook the elements that are important to the respondents. They recommended
allowing respondents to generate their own personal constructs and elements through in-
depth interviews, and then using the interview results to inform the development of a
rating grid for large quantitative data collection.
Triadic method is the most common approach used in repertory grid to elicit
constructs because it matches well with the construing idea of comparing similarity and
dissimilarity (Marsden & Littler, 2000). With this approach, the subject is presented with
three elements (a triad), such as the names of people or places, and asked to specify in

48
what way that the two elements are alike and in what way the third is different from the
other two (i.e. the constructs). For instance, participants say “New York city and Los
Angeles are alike because they both have large scale metropolitan areas than Washington
DC”. Then “large scale metropolitan” is an elicited construct. Hankinson (2005) used
triadic method to elicit destination images of 15 cities in the UK from a business tourist
perspective and generated a total of 246 different images. He suggested that using
repertory method placed as few constraints as possible on the way in which respondents
communicate their views and avoided the imposition of pre-determined attributes in the
form of Likert and semantic differential scales.
Depending on the research goals, triad elicitation sometimes combines “laddering
method” to elicit more abstract values associated with the constructs. Laddering method
asks participants which “pole of the construct” they prefer (using sportswear brands as
examples here and below, whether participants prefer expensive or inexpensive tennis
shows), and why it is important to them (e.g. participant may feel that expensiveness is an
assurance of quality, or may prefer inexpensiveness because limited budget). However,
probing into deeper meaning of brand associations is not the intention of the current
study, which focuses on top-of-mind evaluations. Also abstract meanings elicited are
unnecessarily specific to the brand (e.g. if a person believes expensiveness assuring
quality, then this construct is not specific to Nike or Reebok brands, but also applies to
his or her attitudes towards the Sony brand vs. low profile brand electronics).After
eliciting brand associations of destinations, the study analyzes them with network
analysis methods.

49
Network Analysis Method
Henderson et al. (1998) applied network analysis methods to associative memory
network models, which added more power and sophistication to analyze branding effects.
Their investigation focused on the measurement and structure of brand association
networks. They identified three types of brand networks analyses: analysis of brand
association network, analysis of brand to brand network, and analysis across brand
association networks. Using network analysis method provides the advantages that
cannot be achieve with simply eye-ball analysis methods. First, network analysis can
analyze how people make brand associations by identify the relationships among
different brand associations and finding the important associations that control the recall
of other associations. Second network analysis method offers applicable managerial
information for brand management. Henderson et al. (1998, pp. 315-317) listed 10
possible managerial issues that can be answered using network analysis methods:
1. Branded feature – what features of my brand are perceived by consumers to be the
most important?
2. Driver brands – is there some brand in my company portfolio that also attracts
customers and drivers them to purchase other brands?
3. Complements – what complementary combination of features might be leveraged
best for the ultimate success of the brand and firm?
4. Co-branding – what other brands exist that might be a good candidate for co-
branding?
5. Cannibalization – How can we minimize cannibalization in our product portfolio?

50
6. Brand parity – how can I assess consumers‟ perceived parity between my brand
and its competition?
7. Brand dilution – is my brand‟s equity in jeopardy of being diluted if we were to
introduce a brand- or line – extension that is not congruent with my existing brand
image and positioning
8. Brand confusion – to what extent is there brand confusion in the consumers‟
perception of the competitive field?
9. Counter-brands – what are the brands consumers are most likely to choose as
alternatives to the market leader brand? And
10. Segmentation – how can the market be segmented to take advantage of the
existing perceptions of consumers with respect to my brand relative to other
brands?
Teichert and Schöntag (2010) offered similar discussion on the insightsthat
network analysis can provide for brand management. They demonstrated that brand
association analysis can be studies at three levels: node level, group of nodes level, and
network level.
Node level analysis deals with the measures of “mentioning probability, “net
degree”, “average tie strength”, “eigenvector centrality”, “unique nodes”, and “cut
points”. These measures provides the insights to answer short-term brand management
questions such as salient branded features, brand differentiation, and the probability of
activation of an associations. These questions are equivalent to the managerial issues of
“branded features” and “driver brand” in Henderson et al.‟s (1998) study.

51
Group level analysis focuses on using ego networks (also known as sub-networks)
analysis to provide implications for mid-term brand management. An ego network is “a
group of nodes that contain one central node and all of its directly linked neighbor nodes”
(Teichert & Schöntag, 2010, p. 380). This level of analysis identifies the congruence of
brand associations, referring to the “extend to which a brand association shares content
and meaning with another brand associations” (Keller, 1993, p. 7). This question
addresses the similar issues of “brand cannibalization”, “co-branding”, and “brand
complements” in Henderson et al.‟s (1998) study.
Network level analysis concentrates on the holistic view of the network and
comparison between networks. The measures at this level of analysis include “number of
nodes”, “average number of mentions”, “network density”, “average tie strength” and
“average geodesic distance”. Analysis at this level can provide insights for long-term
brand management such as the consistence in brand image, brand image richness, and
also the managerial issues such as “brand dilution”, “brand parity” and “counter brands”
that Henderson et al. (1998) addressed in their study.
Although it is important for this study to provide practical implications, analyzing
all ten issues list above is beyond the scope of this study. Furthermore, the primary goal
of the study is to understand how people make associations and the relationships among
associations. Thus this study focuses on the analysis methods that can be used analyze the
structure of brand association network than focusing on answer each question above for
practical implications. Because once the relationships are identified, the managerial
implication can also be interpreted accordingly. In reference to Teichert and Schöntag‟s

52
(2010) classification of levels of analysis, the measures and analyses of brand association
in this study are also limited to the node-level instead of looking at all three levels.
The focus of this study is the notions of centrality and cohesion as the indices to
measure the relationships of brand associations. By measuring the relative location of a
node within a network, centrality measurements determine the relative importance of this
node within the network (Knoke & Kuklinski, 1982; Knoke & Yang, 2007). Cohesion is
a measure of the subgroups within the network. It provides the implication as to what
brand associations are complementary to each other. Centralities can be measured
through mathematical formulas based on graphic-theory, while cohesion analysis is
identified by counting the mutual connections between nodes. When most nodes are
mutual connected (also known as the clique), the cohesion exists among these
associations (Knoke & Yang, 2007; Wasserman & Faust, 1994).
There are three types of centrality: degree centrality, betweenness centrality, and
closeness centrality. Henderson et al. (1998) provided the formulas to calculate and
examples to illustrate.
Degree centrality
Degree centrality is the number of other points that have a direct tie to that node.
A node with high degree centrality is more likely to generate more immediate
associations. Degree centrality is computed as
Where,
n is the number of nodes in the network

53
= 1, if and only if pi, and pk are connected by a line, or = 0 otherwise.
Degree centrality of a node controls the communication activities through that particular
node (Freeman, 1979). A node with high degree centrality can influence the network by
withholding or distorting information in transmission (Freeman, 1979; Knoke & Yang,
2007). For instance, in Figure 3.1, the node “New York City” has the degree centrality of
five, while “museums”, “hustle and bustle”, “Statue of Liberty”, and “9/11” each only
has one degree centrality.
Betweenness centrality
When a node is connected through multiple paths, betweenness centrality
represents the probability of a node being activated using a particular path. It reflects the
likelihood that some node will be activated as associations spread throughout the network
(Henderson et al., 1998). The formula for betweenness centrality is:
For all (i < j) ≠ k, and where,
and
the number of geodesics linking pi and pj that contain pk
= the number of geodesic paths from point i to point j
A geodesic is the shortest path(s) between two pairs of nodes.
In Figure 3.1, the node “museums” is not between any pairs of associations, so it
has a zero degree of betweenness centrality. “metropolitan” is between the nodes of

54
“New York City”, “shopping” and “a wide range of selection” indicating that the
betweenness centrality of “metropolitan” is higher than that of “museum”. It makes sense
that because “metropolitan” controls the path between “a wide range of selection” to
other nodes.
Closeness centrality
The third type of centrality is closeness centrality, which measures how close a
node is to the other nodes. It is also a measurement of control. However, closeness
centrality differs from between centrality in that it measures to what extent a node can
avoid the control of others in the network. In other words, closeness centrality represents
the independence of a node from the control of other nodes in a network. The more
independence, the more efficiently a node reaches its related nodes. The formula to
compute closeness centrality is:
where,
= the number of paths in the geodesic linking pi and pk
In Figure 3.1, the nodes “metropolitan”, “shopping”, “cultural diversity”, and
“cultural attraction” all have two direct links in the network. However, “metropolitan” is
surround by high dense of links, which makes it closer to the majority of the nodes in the
network than the other three nodes.

55
These three centrality indices are distinctive measures. They together provide a
helpful tool for identifying central nodes that are important in consumers‟ associative
network of the brand.
Cohesion
Centralities focus on individual nodes within the network, while cohesion
identifies whether subgroups exists within the network. The primary measure for
cohesion within networks is clique. Although there is widely accepted unique definition
of what a clique is, it is usually defined as a group of nodes that densely related
(Wasserman & Faust, 1994). A perfect clique is a subgroup that consists of three or
more nodes and in which all nodes are mutually connected with each other (Henderson et
al., 1998). In branding, a clique represents the features with the strongest mutual
associations. When consumers think of one of the association, they almost automatically
think of another.
Proposed Conceptual Framework
Based on previous discussion, tourists may retrieve the knowledge of a destination
stored in memory upon the stimulation of the brand. To identify the brand association in
the consumer-based brand equity of a destination brand, the associative memory theories
provide the theoretical framework for this dissertation research.
Based on the identified associations, this dissertation study looks further to identify
the relationship among the brand associations. The interpretation of brand association is
also an indication of branding effect, which is considered as the consumer-based brand
equity. This dissertation study employs Henderson et al.‟s (1998, 2002) methods and

56
focuses on the centrality and cohesion issues of the brand associations. Figure 3.2
visually presents the flow chart of the conceptual framework of the study.
FIGURE 3.2: Flow chart of the conceptual framework
The first task of the study is to generate appropriate destination brands for brand
association elicitation and analysis in the next stages. Those destination brands shall be
familiar to the study participants. The method of generating destination brand is free
association method which allows participants to freely offer their destination choice
based on given criteria. Then the next stage is brand association elicitation, in which the
ANT conception and repertory grid methods are used. After the brand associations have
been elicited, the study use Keller‟s (1993) categorization to classify the types of those
brand associations and network analysis method to examine the structure of the brand
association map and the relationships among those brand associations.
generate destination
brands
elicit associations
categorize associations
analyze associations
Free Association
Method
Keller‟s (1993)
categorization
ANT Conception &
Repertory Grid
Technique
Network Analysis
Methods

57
Summary
This chapter introduced the theoretical framework of the study, and discussed its
application in branding research. The chapter also reviewed the method used in eliciting
brand associations, as well as the network analysis methods that focus on the structure
within the brand association network.

58
CHAPTER FOUR
RESEARCH METHODS
This chapter discusses the procedures that were used to conduct this study. The
chapter is divided into five sections. The first section describes the destination selection
for this research. The second section presents the selection of study participants. The
development of the research instrument is the focus of the third section. The fourth
section explains the analytic methods employed to solve the research questions. Finally,
the fifth section provides a summary of the chapter.
Because the network analysis method has not been widely applied in published
destination branding research before, it is important to conduct thorough pilot tests to
examine the methods‟ applicability. Therefore, the study uses the next chapter to present
the pilot test procedures and findings.
Selection of Destinations
Destinations vary in terms of their geographical locations, major attractions,
services provided, typical user images, and seasonality. The current study focused on one
type of destinations because including a range of destinations in the study may lead the
participants to concentrate on the similarities and dissimilarities of destination‟s type
rather than the destination brand association itself. For instance, a comparison between
New York City and Yellow Stone National Park is likely to result in a comparison
between urban and natural environments. While a comparison between New York and
Los Angeles is more likely to focus on the cities themselves.
59
Cook, Yale and Marqua (2008) categorized six types of destinations based on
seasonality and level of development. They are “links to the past”, “far from the
maddening crowd”, “seasonal delights”, “spotlight on sporting activities”, “year-round
playgrounds”, and “bright lights and city sights”. Cook et al. suggested that “seasonal
delights” and spotlight on sporting activities are the most common vacation destinations
for most people. Examples of this type of destinations include seaside resorts, and golf
resorts. To identify the dimensions of a destination‟s brand associations, the destination‟s
brand must be familiar to the participants in the study. Furthermore most destinations
may have multiple resources to cater various vacation needs, and also a tourist may take a
vacation for multiple reasons. Consequently, asking a person to compare multiple
destinations without a context would leave the participant a too large scope to have a
focused discussion. As discussed earlier, golf resorts and activities are common vacation
activities for many people, thus the study decided to use typical golf vacation destinations
for the settings of this study.
Based on Kwon‟s (2003) research on the tourists‟ choice of typical destinations
under different situational factors, the current study used her method of generating
representative destinations among the seaside destinations on the US east coast. Her
selection method for generating example destinations is largely based on top-of-mind
awareness. To generate example destinations, Kwon gave participants a vignette first and
then asked them to list as many typical destinations fitting the vignette context as
possible. Adapting Kwon‟s method, the study provided the instructions to the
participants:
This study has to do with what we have in mind when we use words, which
refer to categories. Let‟s take the word red as an example. Close your eye,

60
and imagine a true red. Now imagine an orangish red. Imagine a purple red.
Although you might still name the orange-red or the purple-red using the
term red, they are not as good examples of red (i.e., as clear a case of what
red refers to) as the clear true red. In short, some reds are redder than
others. The same is true for other kinds of categories. Think of dogs. You
have some notion of what a real dog, a doggy dog is. To me a retriever or
German Sheppard is a very doggy dog while a Pekiness is a less doggy
dog. Notice that this kind of judgment has nothing to do with how well you
like the things; you can like a purple-red better than a true red but still
recognize that the color you like not a true red. You may prefer to own a
Pekinese without thinking that it is the breed that best represents what
people mean by dogginess. On this form, you are asked to provide
examples of a category for top destinations with golf resorts [this part is
adjusted for this study]. Don‟t worry about why you feel that something is
or isn‟t a good example of the category. And don‟t worry about whether
it‟s just your or people in general who feel that way. Just provide names the
way you see it (Kwon, 2003, p. 100).
The reason of adding “golf resorts” here and “golf vacation” in the next stage of
brand association elicitation was to put the brand selection in context. Fransella, Bell and
Bannister (2004) suggested that constructs differ in the way they are used in different
context. They pointed out that contextual confusion can give rise to implicative dilemmas
and conflict that can cause low construct interrelationships or ambiguous implication
interaction. Backman (1994) also suggested that tourists usage of destinations are person-
situation specific. She found that benefits sought by visitors were significantly different
by season, usage of different tourist resources within one destination, and different
locations within the same destination. Thus, putting the destination brand evaluations in
context minimizes ambiguous interpretations.
After the destination names had been collected, the investigator chose the four
most frequently mentioned destination names to elicit brand associations. Ideally, it
would be more representative to include all destinations elicited for the next phases of
brand association elicitation and network analysis. However, as the number of destination

61
brands increases, the number of possible triad combinations of brands increases
substantially:
Where N = the total number of destination brands
Having the amount of the combination of three would inevitably cause participants
to evaluate a destination repeatedly whenever it shows up in a combination. The repeat
evaluations and large amount of tasks could make the elicitation tedious and strenuous
for the participants.
Study Participants
The study recruited students in the professional golf management (PGM) major at
Clemson University as the study participants. Petrick and Backman (2002a) pointed out
that golf has evolved into a major industry in the United State in the late 1990s. The
National Golf Foundation (2010) reported that the total size of US golf economy in 2005
was %75.9 billion; 28.6 million golfers played in the US in 2008; as of January 1, 2010,
there were 15,979 golf facilities in the US, 11,637 of which were open to the public. The
golf game attracts affluent class society who generates above-average per capita revenues
for the destination they visit (Shani, Wang, Hutchinson, & Lai, 2009). The golf travel
market has gained increasing attention in tourism research (see Kim, Chun, & Petrick,
2005; Petrick & Backman, 2002b; Petrick, Backman, Bixler, & W.C., 2001; Shani et al.,
2009). Aside from the growing importance of golf traveler market, the study also
recognized the expertise that PGM students have. The PGM classes at Clemson offers a

62
series of class covering from golfing skills to golf course management. It is logical to
consider that in general that the PGM students have more knowledge than average
students of non-PGM majors. Mitchell and Dacin‟s (1996) research showed that
consumers‟ expertise in a product significantly increased the breadth and depth of their
brand association network, creating more complex structures than those of the consumers
with less knowledge in the product. Thus, having the PGM students as the study subjects
could achieve a large number of brand associations and provide more insightful
evaluations for the destination brands than using participant with little knowledge in the
golf tourism area.
It could be argued that a heterogeneous sample may represent a higher level of
generalizability, however, heterogeneity increases the error variance, declines the
preciseness in analysis and makes results surface only on the general level (Calder,
Phillips, & Tybout, 1981). Backman (1994) suggested that tourism market segmentation
should be personal-situation specific. Although the trade off of using a student sample is
the lack of generalizablity to a heterogeneous population, the homogenous sample helps
to reduce measurement error and improve the analysis accuracy of the study population
(Calder et al.).
The sample size for the current study depends on when the data reach saturation.
Considered as a qualitative data collection method, the past repertory grid analyses in
both the marketing and tourism fields have typically been small and most studies did not
mention how they determined their sample size (Naoi, Airey, Iijima, & Niininen, 2006).
Pike (2003) found that destination studies, using repertory grid, have sample sizes from
one person to 25 people. Naoi et al. (2006) suggested that a large sample for repertory

63
grid elicitation is probably unrealistic because each interview is usually around 40 to 60
minutes. The current study chooses the data saturation point as the cutoff point for data
collection. That is, the interview stops when no new constructs are elicited.
Instrument Development
This study developed two research instruments in accord with the research design.
In the first phase, the questionnaire was designed as an adaption of Kwon‟s vignette.
After the vignette, the participants are asked to write down the destination names on an
attached paper (see Appendix A for the survey questionnaire).
In the elicitation phase, the instrument applies repertory grid method to elicit brand
associations. Because four destinations were chosen for eliciting brand associations, there
were four combinations of triads. On presentation of each triad, the participant was
asked: “Think about what you know or have heard about these three destinations. If your
friend was seeking your advice for a golf vacation at a seaside destination, in what way
do you think two of the destinations are alike, and how the third destination is different
from the other two?” Upon finishing the comparison, the participants were asked for their
demographics and the number of their previous golfing trips to the four destinations (see
Appendix B for the interview instrument).
Brand-Construct Matrix Conversion
After eliciting brand associations, there are three types of matrices that can be
generated from the repertory grid. To avoid confusion, here the brand association is
referred to as the “construct”. The three types of networks are destination-to-construct

64
matrix, construct-to-construct matrix, and destination-to-destination matrix. The coding
for these matrices follows Henderson et al.‟s (1998) methods. The destination-construct
network can be generated directly off the grid. A destination associated to a construct is
marked with a “1” to indicate the existence of this association. If the association does not
exist, a “0” is marked. Table 4.1 presents an example of the relationship coding.
TABLE 4.1: An example of coding brand-construct relationships
Destination A Destination B Destination C Destination D
Construct 1 1 0 0 1
Construct 2 1 1 1 0
Construct 3 0 0 1 1
In this example, construct 1 is associated to destinations A and D; construct 2 is
associated to Destinations A, B and D; construct 3 is associated to destinations C and D.
To convert this brand-constructs matrix (i.e. repertory grid matrix) into brand-to-
brand and construct-to-construct matrices, the above matrix is decomposed and
restructured into raw Sums-of-Squares and Cross-Product (SSCP) matrices. As the
formulas for SSCP are the same for transforming the matrices, the following formulas‟
illustration uses transforming brand-to-brand matrix as the example. The sums-of-square
formula is
Where, i refers to destination brand i
k = the index of the constructs brand i has

65
Y = 1 if brand i has construct k
uii = sum of square of brand i
The formula for calculating the sum of cross products is:
Where, j refers to brand j
Accordingly, Table 4.1 can be transformed into the brand-to-brand matrix (Table
4.2). In the new matrix, the sums-of-square values are located on diagonals, representing
the total number of constructs associated with destination brand i. The off diagonals are
the sums of cross product, representing the number of constructs shared by both
destination brand i and brand j.
TABLE 4.2: Brand-to-brand matrix
Destination A Destination B Destination C Destination D
Destination A 2
Destination B 1 1
Destination C 1 1 2
Destination D 1 0 1 2
After converting generating all brand-to-brand and construct-to-construct matrices,
the network analyses can be conducted at the individual participant‟s level. Brand
association maps can also be created accordingly. However, the individual level analysis
may offer limited implications as it only reflects an individual‟s view. An aggregated
level of analysis may reflect the shared views of destination brand assoiations among this
study population.

66
To produce an aggregated matrix, each of the individual brand-to-construct
matrices is dichotomized. The formula for transferring each cell from individual matrices
is:
Where, Yjip represents each cell in brand-construct (repertory grid) matrix,
i = the index for constructs,
j = the index for destination brands,
p = the index for participants
At the aggregated-level, the three types of associations can be aggregated into one
matrix. Depending on the number of participants and constructs that could be elicited,
producing one holistic network, with all three types of associations, may not be desirable
because such a matrix can include a substantially large amount of associations (i.e. nodes
in the network), making the interpretation very difficult. If a large amount of data points
exists, it is clearer to interpret the aggregated data at component matrix level, i.e. brand-
to-brand, construct-to-construct, and brand-to-construct.
The network analysis methods explicitly examine the structure of the brand
concept map. The mathematical formulas for calculating three types of centrality are
discussed in the previous chapter – Conceptual Development. The cohesion measure is
descriptive in nature, and can be measured by counting the presence of cliques. A clique
is formed when there are at least three brand associations (nodes) that are mutually
connected to each other.

67
There is some network analysis software available on the Internet. The study used
two software programs for this study. One is Cytoscope, which is free for download. The
other is UCINET, which grants a 60-day trial period and relatively inexpensive price for
students. Cytoscape has a better visual presentation of the network than UCINET, but
requires add-on software to run network analysis. UCINET has an abundant amount of
network analysis functions. The study used the two pieces of software to create visual
network and cross validate the results.
Summary
This chapter focused on the research method used in the study. The chapter first
discussed the justification for the selecting of destinations and study participants. The
chapter then explained the instrument development. Then, the methods for aggregating
and analyzing destination brand associations were introduced.

68
CHAPTER FIVE
PILOT TESTING
This dissertation study explores the feasibility and applicability of using network
approach to examine destination‟s brand, for such a method has never been tested in
tourism research before. A thorough pilot study was conducted to analyze the clarity of
the scripts, examine the applicability of the repertory grid method, and to test the
feasibility of the network approach. This chapter describes the procedures used in the
pilot testing, presents the results from the pilot testing, and rationalizes the modifications
made afterwards.
Survey for Typical Golf Vacation Destinations
The pilot tests were conducted in late January and early February 2010 after
receiving the IRB‟s approval. As stated in the previous chapter, the research was
designed in two stages: surveys and interviews. During the survey stage, the task was to
generate typical golf vacation destinations. The pilot test collected 29 responses from a
non PGM class at Clemson University. Most participants in this pilot testing has no or
very limited golf experience: twenty people reported that they had never played golf in
the past 12 months; eight people reported that they had played once or twice in the past
12 months; and only one person said that he played more than 10 times in the past 12
months.
Participants in the pilot testing listed 22 destinations they considered as top
choices for a golf vacation. The mostly mentioned four destinations were: Myrtle Beach,

69
South Carolina; Augusta National, Georgia; Hilton Head, South Carolina; and Pebble
Beach, California. Table 5.1 lists the frequencies of these 26 destinations.
TABLE 5.1: Destinations yielded from the pilot testing survey
Destination Frequency Destination Frequency
Myrtle Beach, SC 24 Palm Springs, CA 3
Augusta National, GA 22 Valley Ranch, Dallas, TX 3
Hilton Head, SC 21 Atlanta, GA 3
Pebble Beach, CA 15 Jacksonville 2
The Cliffs 11 Bethpage Black, Farmingdale, NY 2
Kiawah Island, SC 9 Torry Pines, CA 2
Wild Dunes, SC 9 Wade Hampton, Cashiers 1
Clemson, SC 7 Amelia Island, FL 1
TPC Scottsdale AZ 7 Kauai Islands, HI 1
TPC Sawgrass, FL 7 orlando, FL 1
Pinehurst, NC 3 Tampa, FL 1
The pilot testing revealed that a few participants used private golf club brands as
the vacation places rather than a destination‟s name. A private club such as the Augusta
National requires exclusive membership that it is likely not accessible to most
vacationers. A golf club‟s brand, without being given a specific location, makes the
research focus deviate from describing the location to describing the club. To correct this
problem, the scripts were revised to bold the word “vacation”. Another paragraph of
instruction was also added to clearly state the exclusion of private clubs:
Please, write down the names of destinations including states, but not club names
or resorts. If you feel that a destination is on your top list because of certain
clubs, write down the destination first, then the club(s). Please, do not repeat a
destination simply because of different clubs in that location. Destinations
considered mainly for private clubs shall NOT be included in your list.

70
Six graduate students of the tourism major with English as the mother tongue read
the new scripts and confirmed the emphasis was on vacation with golf experience, rather
than on listing well-know club names.
The study took out the private clubs in the frequency ranking and chose the four
mostly mentioned destinations as the research locations. These four destinations were:
Myrtle Beach, SC (MB); Hilton Head, SC (HH); Pebble Beach, CA (PB); and Kiawah
Island, SC (KI).
Destination Brand Elicitation and Modification of Analysis Methods
Seven students in the survey stage indicated that they would participate in the
interview. However, only five students responded and scheduled for the interviews. The
interviews with the five students were then conducted one week after the survey. Based
on the four destinations selected, four triad cards were created with each one having a
combination of three destinations. The investigator presented the cards one at a time to
the participant and asked him or her in what way the two destinations were similar and
the third one was different. Each interview lasted five to eight minutes.
Follow Henderson et al‟s (1998) step by step rules of brand – association matrix
conversion, the pilot study did not yield interpretable results. The brand – brand matrices
and association – association matrices obtained from mathematical conversions created
linkages between almost every pair of nodes.
The reasons causing these problems lay in the SSCP conversion, which
mathematically creates a direct link between two nodes as long as there is at least one
node mutually connected to the two nodes. The SSCP conversion is mostly used in

71
network studies of inter-organizational relationship(Burt, 1980). Breiger (1974)
instructed that two criteria that must be met for SSCP to be valid are symmetry
membership and transitivity. He explained that symmetry membership is a mutual
connection between person a and b if they have a shared membership. However, whether
to assign this symmetry relationship is “a fundamental theoretical issue, not a technicality
of computation” (Breiger, 1974, p.184). Transitivity requires that “two nodes must be
mutually „reachable‟ along the path of length n if there exists a sequence of n contiguous
ties between them” (Breiger, 1974, p. 185).
Considering these drawbacks and difficulties in data analysis and results
interpretation, the study did not use SSCP conversion to generate second-order
associations, but used the laddering technique with the repertory grid method to elicit
second-order associations. Detailed SSCP conversion steps, analysis methods and results
interpretation were discussed as Appendix C.
Revised Pilot Testing with Laddering Technique
Laddering
Laddering is a technique that identifies hierarchical relations between attributes,
evaluations and higher levels of abstract mental states (Fransella et al., 2004). This
technique is often used with repertory grid method to extract associated constructs. The
investigator first uses triad card and asks participants to compare the similarities and
dissimilarities among three objects. After they provide the response, laddering technique
follows. This technique can be either laddering up or laddering down. Laddering up is

72
used to elicit abstract ideals from concrete attributes by asking the respondents to choose
whether or not they prefer the concrete association they just said and explain why.
Laddering down – sometimes called pyramiding – works the opposite way to elicit
concrete attributes from abstract ideals (Marsden & Littler, 2000; Naoi et al., 2006).
Marsden and Littler (2000) provided examples of the laddering up and down technique:
When asked how the services in restaurant, newspaper, and shoe stores are alike
and different, if the participant answers that good staff service is important for the
restaurant and shoes but not for newspapers…then the laddering [up] method can
be used which involves asking the participant which pole of the construct they
prefer and why it is important to them (e.g. “Good staff service lets you browse,
really decide, not make spur of the moment decision”). Conversely, the concrete
benefits associated with each construct can be elicited using the pyramiding
method [laddering down] involving asking the participant what defined their
preferred construct pole (p. 823).
The investigator decided only to use laddering down to elicit concrete constructs
when the participants answer an abstract or less concrete construct (e.g. what makes good
staff?). The rationale was that the participants were given the task to compare the
destinations without having to making a final choice destination for golf vacation. If the
investigator asked them why a specific construct was important, then this question can
force the participants to put user and usage situations into consideration, in relation to t in
order to formulate a judgment. While user and usage situations, and personal income
levels are critical factors in shaping buying decision making, these factors were not the
concerns of this study and would add complexity to the data structure.
This laddering process is similar to the means-end chain approach, which seeks to
understand the meanings that people associate with production consumption (Klenosky,
2002). A product and the attributes it has are the “means” in consumption process. The
outcomes such as benefits and personal values from consuming the product or a service

73
are the “end” of the consumption. Consequently, means-end chain focuses on
categorizing the relationships between the behavior and its objects (Goldenberg,
Klenosky, O'Leary, & Templin, 2000). Gutman (1982) developed the means-end theory
and suggested three levels of “end” meanings associated with consumption: attributes,
consequences, and values. Attributes are the concrete characteristics associated with a
product. Consequence refers to the benefits and risks associated with consuming a
product. Values are highly abstract and positive consequences. Gutman suggests that
these three levels are hierarchical. Thus the means-end chain approach inevitability
assumes that the relationships are strictly hierarchical and directional. However, some
researchers (Scholderer & Grunert, 2005; Teichert & Schöntag, 2010) questioned that the
hierarchicity may not be correct, and the spreading of “end” meanings may be much
more complex that the hierarchical relationship.
Study Participants
To test the laddering technique‟s applicability for this research, the investigator
contacted the two students David and Emily (both are pseudonyms), who agreed to
participate in the interview, but did not respond to the first invitation email. This time
they both responded and agreed to participate. The two interviews were conducted in mid
February, 2010. David played golf in Myrtle Beach once during the past 12 months, but
had never played in the other three places. Emily had never played golf but had heard
about all four destinations. However, she was not quite familiar with Pebble Beach and
Kiawah Island compared to her knowledge about the other two destinations. .

74
Interview Method
The two interviews used the same four destinations and then asked the participants
to contrast and compare the similarities and dissimilarities among a group of three
destinations. After a participant offered his or her answer, the investigator asked a
laddering question to extract relations between constructs. Table 5.2 uses a section of the
interview with David as an example to illustrate the interview recoding process. The
constructs that the participant directly spoke of were considered as the first-order
component and marked a 1 to indicate the presence of that construct and the specific
destination. The constructs that were laddered were considered as the second-order
constructs of that first-order construct, and marked with a “-1” to indicate that it was
associated with that destination, but also laddered from the first-order construct. During
the interview David said Pebble Beach and Kiawah Island were similar because they both
were upscale destinations. Then upscale destination is the first-order association and
marked with 1s below Pebble Beach and Kiawah Island. Then the laddering question
followed to ask what made them upscale destinations. David answered that they both had
upscale golf course facilities, the players at both location most likely were wealthy, and
the two places hold PGA tours and the US Open tours. These three constructs were
marked with a “-1” under “upscale destinations”. David continued comparing the
similarities and dissimilarities and stated that Pebble Beach and Kiawah Island were also
similar in that they neither of them seemed like a family vacation place (first-order),
because golfing was probably the only activity there (second-order), and there were no
other activities suitable for family time (second-order).

75
TABLE 5.2: Example of marking first and second order constructs
Constructs MB PB KI
Upscale destinations 1 1
Upscale golf course facilities -1 -1
Wealthy clientele -1 -1
PGA/US Open -1 -1
Not a family vacation place 1 1
Exclusive in golfing -1 -1
Lack of family activities -1 -1
Famous 1 1
Golf Capital of the World -1, 1
Upscale destination -1
When a second-order construct laddered was unique to a specific location, a direct
link between this construct and the destination was added to make this construct both a
first-order and second-order construct. For instance, David said that Myrtle Beach and
Pebble Beach were similar in that they both were famous. When asked what made the
two places famous, David answered that “Myrtle Beach is known as the Golf Capital of
the world and Pebble Beach is just so famous because of the upscale stuff like I said
before”. Consequently, although Golf Capital and famous were all second-order to
“Famous”, direct links were added between “Golf Capital” and “Myrtle Beach” (marked
as -1, 1), and “upscale destination” and “Pebble Beach”. There is no need to add a direct
link on the latter relation for it has already been elicited as a first-order association
previously in the interview. The reason for adding direct links is to constrain those
constructs to their specific location, so that the powers of “famous” that would be
otherwise increased by false linkages such as “Myrtle Beach – famous –upscale
destination” can be removed. Figure 5.1 presents the flowchart to determine the marking
of second-order associations.
76
Using the Microsoft Office Excel Spreadsheet, the investigator was able to
separate the first-order constructs by replacing all values less or equal to 0 with 0s. First,
it was needed to set all the values in the matrix as “text” than “number”. Second, using
the formula IF(CELL=”-1,1”,1,IF(CELL=”1”,1,0)), the study extracted all first-order
constructs. Extracting first-order and second-order associations required more handwork
and computerize calculation. A second-order construct was only allowed to connect to
the first-order construct from which the second-order construct was induced. Through
this method, a construct-construct matrix was generated.
After separating the two orders of constructs, individual responses were aggregated
based on Henderson et al.‟s (1998) integration method. Since there were only two
interviews, all elicited constructs were aggregated. Table 5.3 presents the aggregated
first –order constructs. Table 5.4 shows the aggregated second-order constructs.

77
FIGURE 5.1: Flowchart for marking second-order construct
Is the first -order construct abstract?
Yes.
Then ladder down
Is the second order construct shared by at least two destinations?
Yes.
Then mark a "-1" corresponding to the
construct and the destinations
No.
Then, is its first-order construct single unique
to one destination?
No.
Then mark a "-1, 1" corresponding to the
second-order construct and the destination
Yes.
Then mark a "-1" corresponding to the
second-order construct and destination
No.
It is conrete
Stop at first order

78
TABLE 5.3: First-order associations
Constructs MB HH PB KI
Expensive (exp) 1 1 1
Family vacation (family) 1 1
Famous (fame) 1 1
Golf Capital of the World (cap) 1
Non-golfing Activities (nongolf) 1
Not a family vacation place (notfam) 1 1
Spring Break Destination (spring)
Upscale destinations (upd) 1 1
TABLE 5.4: Second-order associations
Exp Family Fame Nongolf Notfam spring upd
Beach (beach) 1 1 1
Party (party) 1 1
Exclusive in golfing (exc) 1
Golf Capital of the World (cap) 1
Lack of family activities (lac) 1
PGA/US Open (PGA) 1
Shopping (shop) 1 1
Upscale destination (upd) 1 1
Upscale golf course facilities (ups) 1 1
Wealthy clientele (wea) 1 1
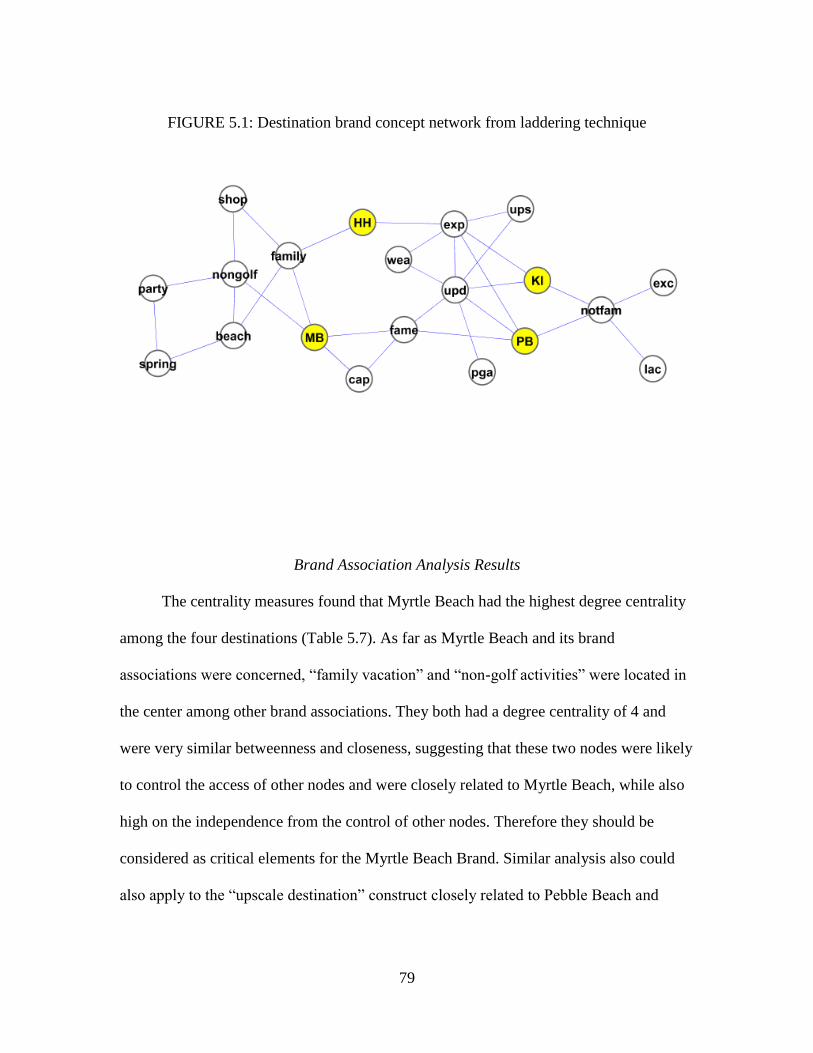
79
FIGURE 5.1: Destination brand concept network from laddering technique
Brand Association Analysis Results
The centrality measures found that Myrtle Beach had the highest degree centrality
among the four destinations (Table 5.7). As far as Myrtle Beach and its brand
associations were concerned, “family vacation” and “non-golf activities” were located in
the center among other brand associations. They both had a degree centrality of 4 and
were very similar betweenness and closeness, suggesting that these two nodes were likely
to control the access of other nodes and were closely related to Myrtle Beach, while also
high on the independence from the control of other nodes. Therefore they should be
considered as critical elements for the Myrtle Beach Brand. Similar analysis also could
also apply to the “upscale destination” construct closely related to Pebble Beach and

80
Kiawah Island. The cohesion analysis found six three-member cliques in the network.
They were:
1: KI expensive(exp), upscale destination(upd)
2: PB expensive(exp),upscale destination
3: expensive(exp),upscale destination (upd), upscale golf course facilities(ups)
4: expensive(exp),upscale destination (upd), wealthy clientele(wea)
5: PB, famous(fame), upscale destination(upd)
6: MB, famous (fame), golf capital (cap)
All the results suggest that the second-order associations elicited through the
laddering technique are valid and interpretable.
TABLE 5.5: Centrality measures of the association network
Cd Cb Cc
MB 4 0.275731 0.422222
HH 2 0.164035 0.395833
PB 4 0.204289 0.422222
KI 3 0.07076 0.38
Beach (beach) 3 0.093665 0.306452
Exclusive in golfing (exc) 1 0 0.253333
Expensive (exp) 6 0.22193 0.422222
Family vacation (family) 4 0.219688 0.38
Famous (fame) 4 0.303801 0.452381
Golf Capital of the World (cap) 2 0 0.365385
Lack of family activities (lac) 1 0 0.253333
Non-golfing Activities (nongolf) 4 0.164912 0.345455
Not a family vacation place (notfam) 4 0.206628 0.333333
Party (party) 2 0.018616 0.267606
PGA/US Open (PGA) 1 0 0.306452
Shopping (shop) 2 0.008967 0.296875
Spring Break Destination (spring) 2 0.006823 0.24359
Upscale destinations (upd) 7 0.238986 0.431818
Upscale golf course facilities (ups) 2 0 0.339286
Wealthy clientele (wea) 2 0 0.339286

81
Summary
In summary, the pilot testing tested the clarity of the scripts and applicability of the
research methods. Through the pilot tests, two areas were adjusted or changed. First, the
instructions of the survey question were clarified to the focus of destination instead of
private clubs. Second, the study would use the laddering method technique to elicit
second-order brand associations instead of using the SSCP conversion. Then, this chapter
reviewed the method used for data collection.

82
CHAPTER SIX
RESULTS
This chapter provides a detailed description of the survey and interview results.
The first section reports the participants‟ selection of top destinations for golf vacations.
The second section reports the analysis and results of the brand association interviews,
including the category of brand associations and the network measurement indices of
degree centrality and cohesion measurement. Detailed coding rules and an example of the
interview recording sheet are attached as Appendix G and H.
Survey Results
After the pilot testing, data were collected during late February and early March,
2010. The survey was conducted in two PGM classes at Clemson University and
collected 29 responses. On average these participants played golf 120 times during the
past 12 months. In total the participants named 66 destinations that they considered as top
places for golf vacations (see Appendix D for a complete list of the 66 destinations). The
four mostly referred destinations were: Myrtle Beach, SC (MB) with19 counts;
Monterey/Pebble Beach, CA (MT) with16 counts; Orlando, FL (OL) with16 counts; and
Las Vegas, NV (LV) with 14 counts. These four destinations then were printed on four
triad cards. Each card had a combination of three destinations.
Out of the 29 participants, seven people indicated that they would participate in the
interview. The investigator then recruited another six PGM students from an additional
Parks Recreation and Tourism Management (PRTM) class. The 13 participants all

83
indicated that they were familiar with and had some knowledge of the four destinations
and their golf facilities.
Interviews Results
The interviews were conducted one week after the surveys and lasted for three
weeks to fit each participant‟s schedule. Each interview lasted between 15 and 30
minutes. Demographic data showed that the participants were largely males (11 people,
84%). Most participants were in their junior or senior college year and from the states of
North Carolina, South Carolina, and Virginia. All the participants played golf at least 50
times during the past 12 months and many played over 150 times. To protect the
participants‟ anonymity, all participants were assigned pseudonyms. As the PGM classes
were small, providing detailed demographic information was likely to reveal the
participants‟ identity. Thus, such information was omitted in the study to protect the
participants‟ anonymity. Most participants reported that they had visited at least one of
the four locations during the past 12 months (Table 6.1).
The interviews with the PGM students enumerated more brand associations than
those from the pilot testing. Each participant mentioned anywhere from 9 to 22
associations for the four destinations. The study conducted 13 interviews. At the
conclusion of the 10th
interviews, the findings already showed the signs of saturation. The
10th
interview results repeated similar brand associations and did not elicit any new brand
association. The remaining three interviews did not add any new findings into the data
either. Therefore, the investigator decided that it was unnecessary to conduct more

84
interviews. The amount of data should provide adequate information to answer the
research questions.
TABLE 6.1: Participant reported past destination visits
MB MT OL LV
visits golfing visits golfing visits golfing visits golfing
Amanda 1 3 1
Andrew 1 1 1
Ben 6 6 2
Bryan 3 8 1 1 2 2
Chris 1 2 1
Derrick 2 2
Gabe 1 1
Gerald 2 2 1 1 1
Jake 2 1
John 2 2
Lee 1
Mack 1 2 2
Nicole 3
Dimensions of the Destination Brand Associations
The results of the 13 interviews were then aggregated. To minimize trivial
associations and redundancy, an association must be agreed upon by at least two people
in order to be taken into account. Associations using different words, but have similar
meanings, were counted as one, such as “many golf courses” and “over 100 golf courses”
(see Appendix E for a complete list of the 46 elicited attributes). Table 6.2 lists the 35
brand associations, including both first-order and second-order associations. These
associations were categorized based on Keller‟s (1993) classification of brand association
dimensions.

85
TABLE 6.2: Dimension of the brand associations
MB MT OL LV
Attributes
1. Non-product related
1.1 Price
Expensive 9 1
Affordable 4 3
Deals 6 5
Golf-packages 6 6
1.2 User Imagery
Adult vacation 8
Amateur/intermediate players 3 2
Cater to everyone 5 4
Skilled players 7
Wealthy clientele 10
1.3 Usage Imagery
Buddy outing 3 2 3
Business outing 2 2 2
Family getaway 4 5
Party 7 11
Single's outing 3
Social outing 3 2 1
2. Product-related
Beach 6
Casinos 21*
Convention centers 2 2 2
Disney 26*
Hard accessibility 3
Long waiting period 3
Many golf courses 7 2
Many non-golf activities 7 18* 12
Upscale courses 10
Wide-range of Selection 8 4 2
Benefits
1. Functional
Responds to product-related
attributes
2. Experiential
Family friendly 5 9
Not family friendly 2 12

86
TABLE 6.2: Continued
MB MT OL LV
Primary reason is golfing 3 5
Pure golfing experience 2
Touristic destinations 4 6 6
3. Symbolic
Frequent PGA tours 4
Golf capital of the world 4
Holds the US Open 5
Mystique and fame 10
Sin city 4
The numbers under each destination indicated the total number of that particular
construct mentioned in the 13 interviews. There were few constructs that had a
frequency greater than 13, such as “Disney”. This was because a participant used Disney
as a second construct for different first-order construct (such as “more non-golf
activities” and “family vacation destination”). Therefore, the “Disney” construct could be
counted more than once in a single interview.
Among these four destinations, Myrtle Beach had a total of 18 different brand
association elicited, followed by Las Vegas (n = 17), Monterey/Pebble Beach (n = 15)
and Orlando (n = 11). It should be noted that although Las Vegas ranked the second in
terms of total number of elicited brand associations, most of its brand Las Vegas were
tourism related rather than golf specific.
The most frequently mention brand associations for Myrtle Beach were “wide-
range of selection”, “many golf courses” and “many non-golf activities”. For
Monterey/Pebble Beach, the mostly mentioned brand associations were its “upscale golf
course”, “mystique and fame”, and “wealthy clientele image”. In Orlando, the “Disney”

87
image was particularly strong, followed by “many non-golf activities”. Similarly, Las
Vegas was strongly perceived of its “casino” image.
Separating first-order and second-order associations
Table 6.3 shows the first-order constructs and the laddered second-order
constructs, which are indented under the first-order constructs. Following the same
methods used in the second pilot testing interviews, the study separated the first-order
from the second-order brand constructs, and turned the second-order constructs that were
unique to only one destination into first-order constructs. These first-ordered constructs
are listed in Table 6.4.
The associations between first-order and second-order associations were organized
into a matrix, which is too large to fit into the page layout. Instead the coded relations
between the two orders of associations were written to a DL format data file for the
UCINET software to process. This file is attached as Appendix F.
The relations in Table 6.2 were then translated into a diagram using the Cytoscope
software (Figure 6.1). This diagram was laid out by edge betweenness to detect and
visually present the subgroups in the network. The brand association map showed three
distinctive subgroups: Monterey/Pebble Beach and Las Vegas stood alone by themselves,
while Myrtle Beach and Orlando shared more similar attributions.
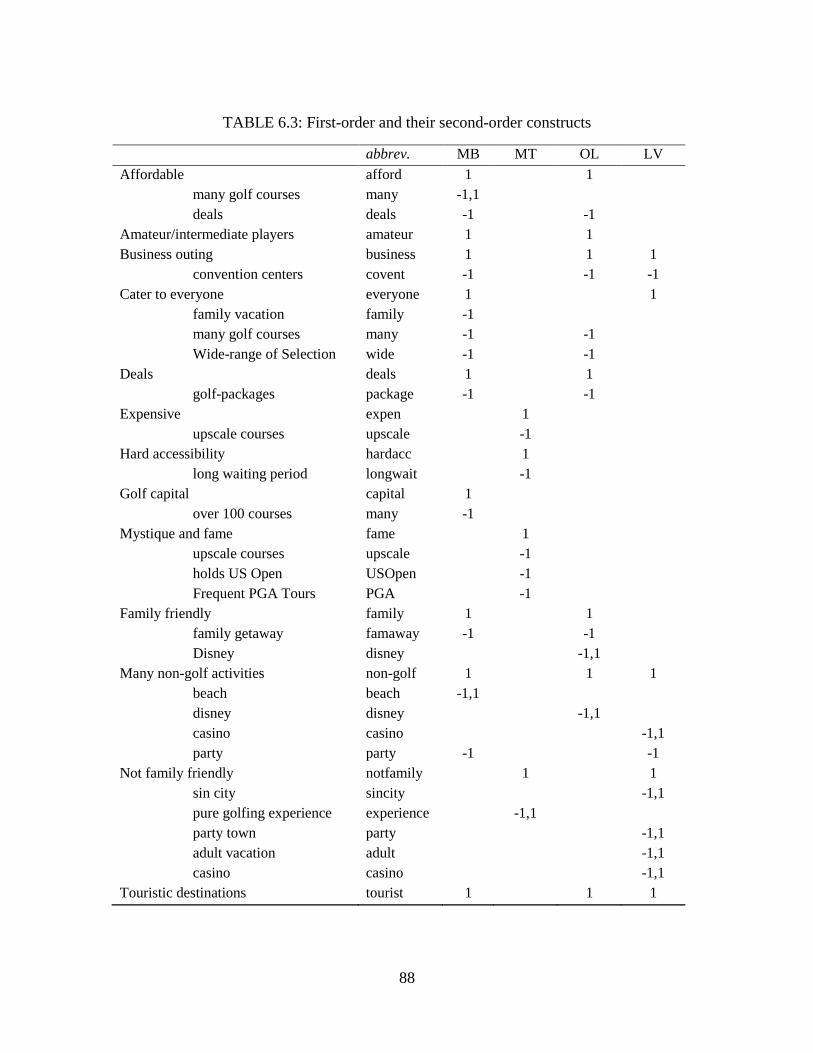
88
TABLE 6.3: First-order and their second-order constructs
abbrev. MB MT OL LV
Affordable afford 1 1
many golf courses many -1,1
deals deals -1 -1
Amateur/intermediate players amateur 1 1
Business outing business 1 1 1
convention centers covent -1 -1 -1
Cater to everyone everyone 1 1
family vacation family -1
many golf courses many -1 -1
Wide-range of Selection wide -1 -1
Deals deals 1 1
golf-packages package -1 -1
Expensive expen 1
upscale courses upscale -1
Hard accessibility hardacc 1
long waiting period longwait -1
Golf capital capital 1
over 100 courses many -1
Mystique and fame fame 1
upscale courses upscale -1
holds US Open USOpen -1
Frequent PGA Tours PGA -1
Family friendly family 1 1
family getaway famaway -1 -1
Disney disney -1,1
Many non-golf activities non-golf 1 1 1
beach beach -1,1
disney disney -1,1
casino casino -1,1
party party -1 -1
Not family friendly notfamily 1 1
sin city sincity -1,1
pure golfing experience experience -1,1
party town party -1,1
adult vacation adult -1,1
casino casino -1,1
Touristic destinations tourist 1 1 1

89
TABLE 6.3 (Continued)
abbrev. MB MT OL LV
beach beach -1
disney disney -1,1
casino casino -1,1
party party -1 -1
Primary reason is golfing primary 1 1
many golf courses many -1,1
upscale courses upscale -1,1
Fame fame -1,1
Skilled players skillplay 1
Wealthy clientele wealthy 1
Wide-range of Selection wide 1 1 1
social outing social 1 1 1
buddy outing buddy -1 -1
single's outing single -1,1
TABLE 6.4: First-order brand associations of the four destinations
MB MT OL LV
Affordable (afford) 1 1
Amateur/intermediate players (amateur) 1 1
Business outing (business) 1 1 1
Cater to everyone (everyone) 1 1
Expensive (expen) 1
Fame (fame) 1
Family friendly (family) 1 1
Golf capital (capital) 1
Hard accessibility (hardacc) 1
Many non-golf Activities (nongolf) 1 1 1
Not family friendly (notfamily) 1 1
Primary reason is golfing (primary) 1 1
Skilled players (skillplay) 1
Social outing (social) 1 1 1
Touristic destinations (tourist) 1 1 1
Wealthy clientele (wealthy) 1
Wide-range of selection (wide) 1 1 1

90
FIGURE 6.1: Aggregated brand association map of the four destinations
Network Analysis Results
The nodes‟ position and structural importance within the network were seen
through their centralities measures. Table 6.3 provides the degree centrality, betweenness
centrality and closeness centrality for all the four destinations and the 35 brand
association constructs.
Among the four destinations, Myrtle Beach had the highest values on all the three
centrality measures. The degree centrality for MB is 14, meaning that it has 14 first-order
associations. Las Vegas is the second destination high on degree centrality (Cd = 11). Las
Vegas had most first-order associations related to tourism rather than golf.

91
The top four brand associations with the highest degree centrality were “more non-
golfing activities” (Cd = 7), “touristic destinations” (Cd = 7), “not a family friendly
destination” (Cd = 7), and “wide range of selection” (Cd = 5). The top four associations
that were high on the betweenness centrality were “golfing is the primary reason for
visiting” (Cb = .257), “not family friendly” (Cb = .163), “mystique and fame” (Cb = .104),
and “social outing place” (Cb = .071). The top four associations that were high on
closeness centrality were “golfing is the primary reason to go” (Cc = .452), “many golf
courses” (Cc = .418), “more non-golf activities” (Cc = .413), and “touristic destinations”
(Cc = .413). The importance of brand associations and their branding implications will be
discussed in the next chapter.
Cohesion tests were carried out using UCINET software. There were 20 cliques
within the network. Two of them were four member cliques, the rest were all three-
member cliques.

92
TABLE 6.5: Centrality measures of the brand associations
Nodes Cd Cb Cc
MB 14 0.401 0.514
MT 9 0.289 0.413
OL 9 0.060 0.358
LV 11 0.186 0.447
adult 2 0.000 0.352
affordable 3 0.002 0.358
amateur 2 0.002 0.352
beach 3 0.000 0.376
buddy 1 0.000 0.284
business 4 0.062 0.400
capital 2 0.000 0.345
casino 4 0.013 0.392
covent 1 0.000 0.288
deals 4 0.055 0.362
disney 4 0.004 0.333
everyone 5 0.025 0.404
expen 3 0.001 0.302
experience 2 0.000 0.339
famaway 1 0.000 0.277
fame 5 0.104 0.369
family 5 0.062 0.380
hardacc 3 0.053 0.302
longwait 1 0.000 0.233
many 5 0.026 0.418
non-golf 7 0.054 0.413
notfamily 7 0.163 0.409
package 1 0.000 0.268
party 3 0.013 0.362
PGA 1 0.000 0.271
primary 5 0.257 0.452
sincity 2 0.000 0.352
single 2 0.000 0.336
skillplay 1 0.000 0.295
social 4 0.071 0.392
tourist 7 0.054 0.413
upscale 4 0.014 0.365
USOpen 1 0.000 0.271
wealthy 1 0.000 0.295
wide 5 0.018 0.400

93
These 20 cliques were:
1. everyone -- many -- MB -- wide
2. fame -- MT -- primary -- upscale
3. adult -- LV -- notfamily
4. beach -- MB -- non-golf
5. beach -- MB -- tourist
6. capital -- many -- MB
7. casino -- LV -- non-golf
8. casino -- LV -- notfamily
9. casino -- LV -- tourist
10. disney -- family -- OL
11. disney -- non-golf -- OL
12. disney -- OL -- tourist
13. everyone -- family -- MB
14. everyone -- LV -- wide
15. experience -- MT -- notfamily
16. expen -- hardacc -- MT
17. expen -- MT -- upscale
18. LV -- notfamily -- sincity
19. LV -- single -- social
20. many -- MB -- primary
The largest two cliques were formed around Myrtle Beach and Monterey/Pebble
Beach. These two destinations also generated most primary associations. These two
cliques showed clear common denominations within their groups. The brand associations
around Myrtle Beach all pointed to the abundance of the golf courses, which also
suggested that these brand associations are compliment to each other. For instance,
Myrtle Beach had “many golf courses”, which led to “there is a wide range of selection”
so that “everyone can play”. The large clique around Monterey/Pebble Beach pointed to
the “fame” and “upscale” brand associations, suggesting that if one of those brand
94
associations is activated, likely the rest brand associations within the clique will be
automatically activated as well. Same principles can be applied to the rest three-member
cliques. The existence of those cliques suggested that most those brand associations were
related and pointed to similar connotations.
Summary
This chapter reports the network analyses results. The results provide mathematical
measures of the structural relations of the brand associations among the four golf
vacation destinations.

95
CHAPTER SEVEN
DISCUSSION AND CONCLUSIONS
This chapter discusses the findings of the research and their theoretical and
practical implications. The chapter is divided into five sections. First, the study reviews
the data collection and results are reviewed to answer the three research questions.
Second, the theoretical and practical implications of the research findings are discussed.
Third, the limitations of this study are examined. Fourth, based on implications and
limitations, recommendations for future research are made. Fifth, the theory, method and
implications are summarized.
Answering the Research Questions
Brand association focuses on analyzing the characteristics and relations of
consumers‟ knowledge, perceptions and attitudes associated with a brand. Research on
brand association provides measurement constructs for branding effect evaluation and
offers marketing professionals the strategic information to build strong and unique brand
identity. The purpose of this study is to identify the underlying dimensions that people
use to describe destination brands and examine the structural relations of the destination‟s
brand association. Accordingly three research questions were designed to explore the
brand associations, identify the dimensions and analyze the structural relations. Through
two surveys with 29 PGM students, the study selected four destinations that the
participants considered prototypical for golf vacations. Through 13 one-on-one

96
interviews with the PGM students, the study used repertory grid method and elicited the
brand associations of the four destinations and the network structures of the brand
associations. The study applied network analysis method to analyze the brand
associations and their network structures. The results are discussed to answer the three
research questions.
Question One
The first research question asks to identify the associations people use to describe
destination. This question is equivalent to the unaided free association method used by
most brand association studies. The free association method allows participants to
describe what a brand means to them in an unstructured way (Keller, 1993). Through this
method, the contents and strengths of brand associations can be analyzed.
Among the 46 brand associations, a large portion describe the scale and the
quality of golf facilities, user image and usage occasions. For instance, in Myrtle Beach,
the mostly referred brand association is “many golf courses” which may directly lead to
the consequences that there is a “wide-range selection of different golf courses” so that
this place “caters to everyone” and “everybody can play”. Similar results are also found
in Orlando and Las Vegas. Between the two destinations, one is considered family
friendly, and the other is mainly for adult outings and not so family friendly. Most of
these brand associations are specific in what activities a destination may offer and to
whom the activities are offered.

97
The reasons why the brand associations largely concentrate on activities and user
image per se can be found in Pearce‟s (2005) explanation of his activity mediated
destination choice model. Pearce suggests that activities are the mediating medium in
tourists‟ decision making. He postulates that perceivable activities and user images are
parts of a destination‟s image in tourist‟s minds. Tourists must be able to image
themselves and their potential behaviors at that destination before they can move the
destination into the choice set in their decision making. The results from this study
provide empirical support to Pearce‟s argument.
Besides the content of brand associations, strengths of the brand associations were
also analyzed. By counting the frequencies of the brand associations for each destination,
the strength of brand associations can be studied either at the brand level to indicate high
or low brand equity or at the individual brand association‟s level to reveal the salient
brand features.
At the brand level, Krishnan (1996) suggests that a brand with high number of
brand associations, comparing to other brands in the same product category, has
relatively high brand equity. Myrtle Beach has a total of 18 different brand associations
and more than the other three destinations (Monterey/Pebble Beach, Orlando and Las
Vegas), suggesting that its brand equity is relatively high when compared to the other
three destinations. This result is probably due to the participant‟s familiarity with Myrtle
Beach. Krishnan (1996) emphasizes that awareness and familiarity are the two
determining factors in the levels of consumer-based brand equity. In this study, Myrtle
Beach is located in the same state as the participants‟ residence at the time of the study.

98
Ten participants in this study had been to Myrtle Beach previously and nine had played
golf during their visits. The participants of this study had fewer experiences in the other
three locations. It is reasonable that the interviews elicited more brand associations
related to Myrtle Beach than those of the other three destinations.
At the individual brand association level, the findings related to the strength of
brand associations reveals the most salient brand features of each destination. Myrtle
Beach‟s brand associations are almost evenly distributed between the golfing-related and
the touristic related activities. Differently, although being considered as top destinations
for golf vacations by the participants, Orlando and Las Vegas have much more touristic
activities related associations than the golf related. The “Disney” image of Orlando and
the “casino” image of Las Vegas are predominantly strong. Only Monterey/Pebble Beach
has the largest amount of golf specific brand associations.
The implications of these findings are mainly marketing practice orientated.
Henderson et al. (1998) and Baack (2006) all indicate that one of the central goals of any
marketing campaign is to influence the strength of the consumer‟s association with the
brand. Depending on marketing goals, the already formed strong associations can either
facilitate or hinder the marketing information delivery. Park, Milberg and Lawson (1991)
and Reddy et al. (1994) postulate that if the campaigned information is consistent with
the image that the consumer has in mind, then the new information is easy to be accepted
and reinforce the old image. However, when the campaigned information is inconsistent
with the destination already formed image, then the consumer becomes skeptical and to
change or modify the brand image requires much effort.

99
Question Two
The second research question asks for the underlying dimensions of brand
associations that people use to describe destinations. Commonly used statistical methods
for identifying the dimensions of destination images include exploratory and/or
confirmatory factor analysis, cluster analysis and multidimensional scaling. All these
methods require a predefined item list for participants to evaluate each item on
predefined scales. The data of this study were elicited through qualitative approach and
do not contain such information. Thus, the common statistical approaches are
inapplicable to answering this research question.
Alternatively, this study used Keller‟s (1993) dimensionality of brand associations
as the theoretical conceptualization to answer this research question. Keller proposes four
dimensions of brand associations: type, favorability, strength and uniqueness. Along the
type dimension, brand associations can be further classified into three categories:
attributes, benefits, and attitudes.
The study results can be summarized into three dimensions: type, strength and
uniqueness (see Table 6.1 in the previous chapter). Under the type dimension, the brand
associations fall into the categories of attributes and benefits. The attribute type of brand
association include product related, such as the ones related to golf courses‟ scale and
quality, and the non-product related such as the expensiveness, the destination‟s typical
clientele, and usage occasions. There were few benefits brand associations found in this
study, such as the “going for a pure golf experience” at Monterey/Pebble Beach
(experiential benefit), or seeking the “mystique and fame at Monterey/Pebble Beach”

100
because it is a “lifetime experience for any true golfer” (i.e. symbolic benefits).
Additionally, the results of this study did not find any brand association that was
categorized as attitude.
Analysis on the strength of brand associations was discussed in the previous
section. The notion of uniqueness, although not a focus of this study, was examined in
this network. Each destination‟s uniqueness can be calculated by counting its total
number of unique brand associations over the total number of brand associations the
destination brand has. Alternatively, the diagram 6.01 provides a visual representation of
the uniqueness of each destination. Monterey/Pebble Beach enjoys a large amount of
unique brand associations, while the other three destinations share most common
attributes, suggesting they could be complement brands with each other.
Favorability can be considered as a person‟s simplified and holistic evaluation
towards a brand (Keller, 1993). The favorability dimension did not emerge from the
study. The lack of favorability dimension could be due to the fact that the scenarios
provided to the participants did not require them to evaluate the importance of each brand
association for them to choose a vacation destination. Since evaluative judgment, such as
favorability, is conceptually and empirically related to attribute importance (MacKenzie,
1986), it is reasonable that the participants were less likely to provide favorability
judgment on brand associations that they did not feel of personally related importance.

101
Question Three
The third research question asks for the structural relations among the destinations‟
brand associations. Those relations are examined through measuring each node‟s
centralities and network cohesions. The centrality measures include three indices: degree,
betweenness and closeness. Henderson et al.‟s (1996) discussion on the meanings of
these indices‟ measure provided the guide for interpretation for this part of the study.
Nodes with high degree centrality are likely to be activated upon receiving a stimulus.
Nodes with high betweenness centrality are critical in controlling the spreading-activation
passage to other nodes. Nodes with high closeness centrality are close to the majority of
the nodes in the network and tend to be independent from the control of other nodes.
Cohesions form when three or more nodes are mutually connected to each other, making
them complementary. All the three centrality indices are helpful tools to identify
“central” nodes that are important for examining branded features and identifying driver
brand. Cohesion measures help to uncover brand association complements and select the
critical features as brand identities.
Branded Feature
Brand managers can study the centrality measures to determine if their branded
features have gained any expected effect among the consumers or to identify which
features can be strengthened or weakened to create their desired brand identity. This
study results show that “more non-golfing activities”, “touristic destinations”, and “not a
family friendly destination” all have a degree centrality of 7, higher than any other brand
association in the network. These brand associations are not unique to a specific

102
destination, but shared by Myrtle Beach, Orlando and Las Vegas. The results suggest
both advantages and disadvantages if brand managers focus on branding those features.
On one hand, those features are important because they have the most number of direct
links to other nodes within the network, meaning that they can increase the breadth of the
spreading-activation, in turn, more nodes will be activated. On the other hand, simply
focusing on strengthening those brand features does not help to create the uniqueness for
any of the three destinations in terms of golf tourism marketing. Other unique brand
associations shall be considered and incorporated into creating distinctiveness.
Comparatively, many brand associations related to Monterey/Pebble Beach are
unique. For this golf course, “mystique and fame” and “golfing is the primary reason for
visiting” have the highest degree centralities. The former is unique to Monterey/Pebble
Beach and has direct linkage to four other brand features. The latter is shared by Myrtle
Beach, but for different causes – Myrtle Beach has “many golf courses” and it is the “golf
capital in the US”, but Monterey/Pebble Beach has its “fame” and is a “lifetime
experience”. Furthermore, the concept of golfing being the primary reason for visiting is
also high on betweenness centrality and closeness centrality. It is reasonable to consider
this brand association as a critical feature to draw tourists‟ attention.
For Las Vegas, the centrality measurements are distinctive. The concept of “not a
family friendly destination” is high on all three centrality measures, and has a very high
strength measure, as discussed in the previous section. Depending on the marketers‟
branding goal, this brand feature is so distinctive and strong that it may be a barrier to
market Las Vegas as a place for family golf vacationers. Yet, it may also be ideal to

103
market as a singles outing and adult social place. It shall be noted that brand associations
with low centrality measures do not necessarily mean that they are unimportant. Tourists
may still consider those associations important. It is likely that consumers have different
weightings for different associations. Brand managers may need to take perceived
importance into consideration in order to achieve a more thorough analysis.
Driver Brand
A driver brand “represents the value proposition that is central to [consumers‟]
purchase decision and use experience” (Aaker, 1996a, p. 243). This study results show
that Myrtle Beach is high on all three centrality measures among the four destinations.
Furthermore, looking at the brand association map (Figure 6.01 in Chapter Six), one may
notice that Myrtle Beach, Orlando and Las Vegas are close together, while
Monterey/Pebble Beach is unique in its own style. This finding suggests that Myrtle
Beach is closer to a majority of brand associations, which makes it the most prototypical
selection for a golf vacation. It shall be noticed that this prototype is probably limited to a
mid level and family fun market, but does not represent the market that seeks a true and
distinguishing golf experience. For that market, although no other upscale golf
destinations to compare against in this study, Monterey/Pebble Beach may have more
competitive advantages as its brand associations clearly portray an upscale golf
destination.
Brand feature complements
The centrality measures focus on the individual node level. Cohesions or cliques
are group level analysis. At the group level, single brand associations are combined into a

104
superordinate entity that reflects areas of strong mental connectedness of brand
associations (Teichert & Schöntag, 2010). Consequently, those strongly and mutually
connected brand associations form complements. When consumers think of one feature,
they almost automatically think of another (Henderson et al. 1998).
There are 20 cliques in the brand association network. Two of them are four-
member cliques: one is in the Myrtle Beach brand (Myrtle Beach, many golf courses,
wide range of selection, caters to everyone), and the other is in the Monterey/Pebble
Beach brand (Monterey/Pebble Beach, upscale courses, mystique and fame, golfing is the
primary reason for visiting). Each of the two cliques shows a unified facet of the
destination‟s brand images. In the Myrtle Beach brand, this clique concentrates on large
amount of golf courses in Myrtle Beach, which logically leads to the presence of other
brand associations within this clique. In turn, when one of the brand associations in this
clique is activated, other brand associations are likely to be activated as well. This
complement characteristic makes it possible and feasible to include only the most
important brand associations in the clique for creating brand identity. Considering that
the centrality analysis shows that “wide range of selection” is critical, it makes sense to
keep this brand feature for branding purpose instead of including all three brand
associations. In the Monterey/Pebble Beach, it can be easily noticed that “mystique and
fame” is the most critical brand feature that complements other related brand associations
and controls the activation of other nodes. All the three-member cliques have a
destination as a member of the clique, which suggests that there are only two complement
brand associations in each clique. Each of the three-member cliques has a brand

105
association that functions as both a first-order and a second-order association. For
instance, the clique of “Orlando”, “Disney”, and “family friendly” suggest that when
tourists think of Orlando, almost simultaneously they think of it as a family friendly
destination and the Disney World Resort. One may consider focusing on the “family
friendly” association as it has relatively higher centralities measures than the “Disney”
association.
Implications
Using the network analysis approach to study destination brands provides several
theoretical and practical implications for academic research and destination branding
practices. There are four theoretical implications.
First, this study shows that people‟s knowledge of brand is constructed as a
network, in which there are multimodal brand associations (i.e. nodes). These nodes can
be activated upon an external stimulus and spread the activation to a certain depth and
breadth. The study results also show that these nodes can either be hierarchically linked
(e.g. the relations of first-order and second-order associations), or, more often, are
complex and interlinked (e.g. an association can be both a first and second-order
association). This finding suggests that a strict hierarchical relation model, such as the
means-end chain, may not correctly reflect the true mental connection of people‟s
knowledge about destination brands. The study‟s results also show that there is relative
importance of mental connections between individual nodes. A node‟s relative
importance is built on its connection to other nodes in a complex network. Traditional

106
sorting and scaling tasks such as factor analysis and MDS cannot identify the relative
importance of each node (Teichert & Schöntag, 2010).
Second, the findings from this research provide partial support for Keller‟s (1993)
classification of brand association dimensions: brand associations are mainly composed
of attributes and benefits and vary on strength and uniqueness. The failure for favorability
dimension to emerge in this study may be attributed to the study design, because the
participants did not have to make a choice decision. Future research should focus on the
elicitation of this dimension and examine its importance for the final decision making.
Third, the study results reveal a large number of concrete destinations activities
and specific user and usage images. This finding provides empirical support for Pearce‟s
(2005) argument that tourists inevitably consider specific activities and potential
behaviors they may have at the destination in order to make a decision. Pearce refers to
Krippendorf‟s (1987) explanation that commonly adopted motives in tourist motivation
studies are inherently vague and empty boxes that individuals can fill quite different
content. For instance, in this study, “golfing is the primary reason for visiting” can be
considered as a motive for visiting either Myrtle Beach or Monterey. However, the
specific reasons are quite different: one is for the wide range of selection, and the other is
for the fame. A statement such as “I choose this destination because it fits my
personality” (Boo et al., 2009, p. 223) may be largely true for most destinations surveys
that are conducted on location, but it does not tell what the respondent‟s personality is,
nor does it provide specific content on what the destination offers to fit the personality
specific to that tourist. Alternatively, recognizing tourists‟ destination brand perceptions
107
as knowledge networks and studying them as a networks provides more concrete and
accurate results than using predefined items which may incorporated researcher bias.
This study also provides meaningful and applicable implications for destination
branding practices. First, the study presents a new methodological tool for brand analysis.
The network analysis uses repertory grid method and laddering technique to generate
detailed brand association information and closely mirror people‟s mental image of the
brand. The network analysis approach map an array of branding effects: brand features,
driver brand, and complements. The network analysis also has room for further branding
effect analysis, such as brand parity and brand dilution. These effects can be analyzed
through examining structural equivalence and the density of individual brand association
networks. All those analyses can identify pivotal brand associations and critical relations
that will provide strategic information for brand management.
Second, the interview recording and data process can be computerized in the
future. Although the recording process for laddering is rigorous and strenuous, and the
aggregating process is tedious, the rules for recording and for aggregating are in the “if-
then-else” format, which can be easily programmed for computer processes.
Limitations
There are a few limitations that need to be considered when interpreting and
applying the study‟s results. First, this study does not consider the function of
participants‟ perceived importance of brand associations. Thus, a brand feature that is not
considered critical in this study result can still be critical if it possesses great value to the

108
brand equity. For example, the “Disney” brand association in Orlando has nearly a zero
degree of betweenness. However, it can be an important reason for family vacationers,
considering Disney‟s four theme parks and several high-end golf courses in Orlando.
Second, the findings may not hold valid across different travel situation. In this
case, golfing is the major travel motivation. If for social outing, tourists may value the
brand association differently. Thus the brand associations critical in this study probably
will not still be important in the other travel scenario.
Third, as many researchers (Aaker, 1996b; Keller, 1993; Keller & Lehmann, 2006;
Krishnan, 1996) have emphasized familiarity being one of the most important factors in
raising high brand equity. Considering participants in this study having a relative high
familiarity with Myrtle Beach, it is not surprising that Myrtle Beach has the highest brand
equity among the four destinations. This result may be largely different if the same study
is repeated on the west coast as people‟s familiarity with the destination can change quite
differently.
All the limitations do not devalue the contributions of the study, but emphasize
that marketing research shall be specific to the target market. There are no general rules
that are applicable across every single market segment, but finding an effective marketing
research tool to better answer marketing questions and achieve marketing goals is more
valuable. This study provides such a tool and demonstrates that it can be valuable for
destination branding research.

109
Future Research
This dissertation study provides insights for destination brand research, presents a
new tool for effective brand and brand association analyses, and provides opportunities
for future destination brand analysis. A number of future research directions can be
examined.
A comparison between less knowledgeable tourists‟ brand concept maps and that
of knowledgeable tourists will be insightful for the analyzing the underlying dimensions
of brand associations. The pilot testing results from this study show much less brand
associations that those yielded from the interview with the PGM students. A comparison
analysis shall be able to reveal information on how people evaluate destination brands
when they do not have sufficient knowledge. Consequently, further research can be
designed to investigate what dimensions of brand association people with less expertise
will firstly seek in order to construct a brand network with adequate information so that
they can make a selection decision.
Another research direction can be a replication of this research method with the
addition of the variables of travel motives, usage situation, and user income levels and
psychographics. Those variables have been proven influential on purchase decision
making. Taking those variables into consideration allows the examination of the network
differences across different market segments. In this way, researchers can analyze more
complicated decision making processes and provide more accurate marketing guidance
for brand management.

110
Conclusion
This study presents an application of the associative network theory and network
analysis methods in the field of destination branding research. Recent destination
marketing research has indicated the importance of destination branding. However, most
destination branding research focused on the application of branding practices. Few
studies have investigated how tourists describe the brands and the structural relations
among brand associations. The limited amount of destination brand equity studies have
used sorting and scaling approach such as exploratory or confirmatory factor analysis to
analyze brand associations. However, the sorting and scaling using predefined items
cannot provide an adequate measure of the complex nature of brand associations.
As Teichert and Schöntag (2010) stated, methods for measuring consumer
knowledge structure shall go beyond the predefined items and reveal the mental
connections between those individual associations. This dissertation study uses the
associative network theory as the theoretical conception and repertory grid method with
laddering technique to mirror the mental connections people make of brand associations.
The study identifies the underlying dimensions of brand associations using Keller‟s (1993)
classification. More importantly, the study demonstrates a network analysis method that
can be applied to a series of destination branding studies and produces practical
implications for brand management.

111
APPENDICES

112
APPENDIX A: Survey Questionnaire
This study has to do with what we have in mind when we use words, which refer to categories.
Let‟s take the word “dogginess” as an example. Think of dogs. You have some notion of what a
real dog, a doggy dog is. To me a retriever or German Sheppard is a very doggy dog while a
Pekiness is a less doggy dog. Notice that this kind of judgment has nothing to do with how well
you like the things. You may prefer to own a Pekinese without thinking if it is the breed that best
represents what people mean by dogginess.
Next, you are asked to provide as many examples as possible of destinations within the US that
you think are the best for golf vacations. Don‟t worry about why you feel that something is or
isn‟t a good example of the category. And don‟t worry about whether it‟s just you or people in
general who feel that way. Just provide names the way you see it.
Please, write down the names of destinations including states, but not club names or resorts. If
you feel that a destination is on your top list because of certain clubs, write down the destination
first, then the club(s). Please, do not repeat a destination simply because of different clubs in that
location. Destinations considered mainly for private clubs shall NOT be included in your list.
The destination numbering does not indicate a ranking.
Destination 1
Location State
Destination 6
Location State
Destination 2
Location State
Destination 7
Location State
Destination 3
Location State
Destination 8
Location State
Destination 4
Location State
Destination 9
Location State
Destination 5
Location State
Destination 10
Location State
How many times did you play golf for leisure in the past 12 months? ______________
In general, how many times per year do you play golf? ________________

113
Thank you for filling out the survey. We‟d like to ask you whether you would be interested in
participating in the next stage of this study. The next stage is a one-on-one interview about what
you think of these golf destinations, and why you choose them. Each interview will last about 15
minutes. We will conduct the interview starting the next week.
If you would like to participate in the interview, please leave your contact information below. We
will contact you through email in one week to let your know the times and locations. The
interviews will be scheduled off your class time.
Thank you for participating in our study.
Sincerely,
Sheila J. Backman PhD (Principal Investigator)
Xu Chen (Co-Investigator)
******************************************
□ Yes, I‟d like to participate in the interview,
Name: _________________________________________________
Email: _________________________________________________
□ No, I do not want to participate in the interview.

114
APPENDIX B: Interview Instrument
During the one-on-one interview, the participant will be presented with the following
triad cards, one at a time.
After presenting a card to the participant, the co-investigator will ask the participant the
following question:
Think about what you know or have heard about the above three destinations. If your
friend was seeking your advice for a golf vacation, in what way do you think two of the
destinations are alike, and how the third destination is different from the other two?”
After completing the interview, the participant will be asked to fill out the following
questions.
Q1. We would like to have some information about you. Please circle the one which best describe
you:
You are:
1. Freshman, Sophomore, Junior, Senior, Graduate
2. Female, Male,
3. Unmarried, Married
Q2. How many times did you travel for these four golf destinations during the past 12 months?
Destination Myrtle Beach, SC ( ) did you golf there? How many times ____
Destination Monterey, CA ( ) did you golf there? How many times ____
Destination Orlando, FL ( ) did you golf there? How many times ____
Destination Las Vegas, NV ( ) did you golf there? How many times ____
Q3. Who is your usual travel party? ( )
Q4. How many times did you play golf in the past 12 months? ( )
Q5. Please provide your state of origin ( )
Q6. Age ( )
Card 1:
Destination A
Destination B
Destination C
Card 2:
Destination A
Destination B
Destination D
Card 3:
Destination A
Destination C
Destination D
Card 4:
Destination B
Destination C
Destination D

115
APPENDIX C: Pilot testing of the SSCP Conversions
Seven students in the survey stage indicated that they would participate in the
interview. However, only five students responded and scheduled for the interviews. The
interviews with the five students were then conducted one week after the survey. Based
on the four destinations selected, four triad cards were created with each one having a
combination of three destinations. The investigator presented the cards one at a time to
the participant and asked him or her in what way the two destinations were similar and
the third one was different. Each interview lasted five to eight minutes.
None of the five participants played golf in any of the four destinations in the past
12 months, although they all acknowledged that they had heard the names of the places
before. Four participants from South Carolina were females and had never played golf in
general. The male participant was from Texas and played golf occasionally.
On average, each interview elicited about seven destination associations. A large
amount of brand associations were repeated by each participant. The individual tests were
then aggregated based on the Henderson et al.‟s (1998) aggregation formula stated in the
Research Methods Chapter. Henderson et al. (1998) and John et al. (2006) recommend to
eliminate associations that have a very low frequency to avoid redundancy. However, due
to the small amount of interview responses in the pilot test, all elicited brand associations
that described different meanings were kept in the integrated matrix. Associations having
similar meanings were revised using a consistent description. For instance, “upper class
golfers” showed in interview one, while “wealthy players” showed in interview two.

116
These two descriptions were both turned into “upper class clientele” and counted twice as
they were mentioned twice. After aggregating all the responses, the five interviews
elicited 16 unique brand associations (Table C.1).
One participant referred to Pebble Beach as “less well-known”. This description
was contradictory to all the other participants‟ views. At the aggregated level, this
association was removed from further analysis as the individual difference was not the
study concern at the aggregated level.
TABLE C.1: Frequency distribution of elicited brand associations
MB HH PB KI
Product attributes
A lot of resort golf courses 3 1
1
Best golf courses
3 3 3
Island destinations
3
4
Located in SC 5 5
5
More non-golf attractions 3 Spectacular views
2 Non-product related attributes
1. Price
Expensive
4 1
2. User imager
Cater to everyone 2 Experienced golfers
1 4 2
Family and friends 4 Higher-end and low-end clientele 1 2
1
Upper class clientele 2 3 3
3. Usage imagery
Frequent PGA tours
1 1 Not for family vacation
2 3
Attitudes
Less well-known
1

117
Table C.1 is also a brand-construct relation matrix. For the simplicity and ease of
data manipulation, all values greater than 0 were set to 1. Category labels of these
associations were also removed. Table C.2 shows the brand-construct matrix after data
cleaning.
By calculating the sum of square and cross product (SSCP) on the columns of
destination brands, the study derived the relations of brand-brand (Table C.3). In this
matrix, values on the diagonals represent the total number of constructs that a destination
had. The off-diagonals represent the total number of constructs jointly valued between
destination i and destination j.
TABLE C.2: Destination brand- construct matrix
Construct MB HH PB KI
A lot of resort golf courses 1 1 1
Best golf courses 1 1 1
Cater to everyone 1
Expensive 1 1
Experienced golfers 1 1 1
Family and friends 1
Frequent PGA tours 1 1
Higher-end and low-end clientele 1 1 1
Island destinations 1 1
Located in SC 1 1 1
More non-golf attractions 1
Not for family vacation 1 1
Spectacular views 1
Upper class clientele 1 1 1

118
TABLE C.3: Destination brand – brand matrix
MB HH PB KI
MB 6
HH 3 8
PB 0 4 7
KI 3 7 5 9
Similar to the conversion in the brand – brand matrix, by calculating the SSCP on
the rows, the study derivates the construct – construct relationship (Table C.4). In this
matrix, the diagonal values represent the total number of destination brands for which
construct i is perceived as appropriate. The off-diagonal values represent the number of
destination brands that both show the characteristics of construct i and construct j.
For simplicity and ease of data manipulation, all entries equal or greater than 1
were set equal to 1 to indicate the presence of an association. Then the three matrices
above could be aggregated into one full matrix (Table C.5).
Diagrams can be drawn based on each of the four matrices. However, the study
only drew the full matrix diagram (Figure C.1) as the full matrix diagram incorporates the
relationships represented in all the three matrices.
The layout of this diagram was arranged according to “edge betweenness”. Edge
betweenness is a clustering process to detect sub-groups (also called community) within a
network (see Girvan & Newman, 2002 for detailed discussion and calculation methods).
The diagram showed that Myrtle Beach stood out from the other three locations, while
Pebble Beach, Hilton Head and Kiawah Island shared most common brand associations.
Thus, those three destinations may be considered as highly similar golf vacation
destinations.

119
The centrality measures of all the 19 nodes showed that among the four
destinations (Table C.6), Kiawah Island had the highest on all three centralities measures.
The diagram also showed that Kiawah Island was most central to the constructs that
describe a high-end market, such as “upper class clientele” and “upscale golf courses”.

120
TABLE C.4: Destination construct – construct matrix
reso
rt
up
scale
any
one
expensi
ve
experi
enced family PGA
wide
range island SC
non-
golf
Not
family views upper
resort 3 2 1 1 2 1 1 3 3 3 1 1 0 2
upscale 2 3 0 2 3 0 2 2 2 2 0 2 1 3
everyone 1 0 1 0 0 1 0 1 1 1 1 0 0 0
expensive 1 2 0 2 2 0 1 1 1 1 0 2 1 2
experienced 2 3 0 2 3 0 2 2 2 2 0 2 1 3
family 1 0 1 0 0 1 0 1 1 1 1 0 0 0
PGA 1 2 0 1 2 0 2 1 1 1 0 1 1 2
widerange 3 2 1 1 2 1 1 3 3 3 1 1 0 2
island 2 2 0 1 2 0 1 2 2 2 0 1 0 2
SC 3 2 1 1 2 1 1 3 3 3 1 1 0 2
non-golf 1 0 1 0 0 1 0 1 1 1 1 0 0 0
notfamily 1 2 0 2 2 0 1 1 1 1 0 2 1 2
views 0 1 0 1 1 0 1 0 0 0 0 1 1 1
upper 2 3 0 2 3 0 2 2 2 2 0 2 1 3
The constructs (i.e. associations) in this table were replaced with one-word names without spacing to fit the layout of the paper
and meet the requirement for software processing. The abbreviations correspond to the full construct descriptions in Table 5.3
accordingly.
120

121
TABLE C.5: Full association matrix
MB HH PB KI resort
Up
scale
Any-
one
exp
ensi
ve
exper
ience
famil
y
PG
A
wider
ange
Is-
land SC
non-
golf
Not-
family
vie
w upper
MB 1
HH 1 1
PB 0 1 1
KI 1 1 1 1
resort 1 1 0 1 1
upscale 0 1 1 1 1 1
anyone 1 0 0 0 1 0 1
expensive 0 0 1 1 1 1 0 1
experienced 0 1 1 1 1 1 0 1 1
family 1 0 0 0 1 0 1 0 0 1
PGA 0 1 1 0 1 1 0 1 1 0 1
widerange 1 1 0 1 1 1 1 1 1 1 1 1
island 0 1 0 1 1 1 0 1 1 0 1 1 1
SC 1 1 0 1 1 1 1 1 1 1 1 1 1 1
non-golf 1 0 0 0 1 0 1 0 0 1 0 1 1 1 1
notfamily 0 0 1 1 1 1 0 1 1 0 1 1 1 1 0 1
view 0 0 1 0 0 1 0 1 1 0 1 0 0 0 0 1 1
upper 0 1 1 1 1 1 0 1 1 0 1 1 1 1 0 1 1 1
121

122
FIGURE C.1: Destination brand concept network
122

123
TABLE C.6: Centralities measures – destination brands and associations
Construct Degree Betweenness Closeness
MB 11 0.020108 0.73913
HH 8 0.011858 0.62963
PB 9 0.005342 0.607143
KI 12 0.023002 0.772727
A lot resort type golf courses (resorts) 15 0.082219 0.894737
Best golf courses (upscale) 13 0.02092 0.809524
Cater to everyone (everyone) 6 0 0.566667
Expensive (expensive) 12 0.017725 0.772727
Experienced golfers (experienced) 13 0.02092 0.809524
Family and friends (family) 6 0 0.566667
Frequent PGA tours (PGA) 12 0.018772 0.772727
Higher-end and low-end clienteles (widerange) 15 0.082219 0.894737
Island destinations (island) 12 0.019678 0.772727
Located in SC (SC) 15 0.082219 0.894737
More non-golf attractions (nongolf) 7 0.004902 0.586207
Not for family vacation (notfamily) 12 0.017725 0.772727
Spectacular views (views) 7 0 0.548387
Upper class clienteles (upper) 13 0.02092 0.809524
The analyses on the brand associations prove problematic. On one hand some measures
still provide meaningful insight. For instance, the results suggest that “a lot of resort golf
courses”, “higher-end and low-end clienteles” and “located in South Carolina” all have the
highest measures on all the three centrality indices. These three associations also have the
highest edge betweenness because they are the only common attributes that Myrtle Beach shares
with a higher-end market. On the other hand, using these three constructs as the most branded
features may not be ideal for the following reasons. First, all the three constructs are shared by
either two or three destinations, in other words, none of the constructs is unique. Second,
construct “located in South Carolina” seems odd to be used as an important branding construct.
This construct‟s centrality measures are higher than those of “experience golfers” or “frequent

124
PGA tours”, which are likely more appropriate to be used as meaningful branding constructs
considering that the three destinations are both located in South Carolina.
Testing of cohesions found five cliques. Each clique was formed when at least three brand
associations were mutually connected. These cliques are:
1: resorts, upscale, expensive, experienced, PGA, widerange, island, South Carolina,
notfamily, upper
2: resorts, anyone, family, widerange, SC, non-golf
3: HH, PB, KI
4: MB, HH, KI
5: upscale, expensive, experienced, PGA, notfamily, view, upper
The first one encloses 10 constructs. Members within a clique indicate that they are
complementary and can replace each other. However, what the mathematical results hold may
not always seem logical in the sense of branding practice. It is reasonable to think of
“expensive”, “upscale” and “PGA tours” being complementary as Pebble Beach‟s branded
features. However, in the case of clique 1, in which “upscale”, “island”, “SC”, “wide range of
selection” and a few other constructs are grouped, mutual and complementary relationships
probably do not necessarily hold but seem farfetched. Furthermore it is difficult to decide which
ones of the 10 constructs should be emphasized in a branding strategy, because their centrality
measures are all very close.
The reasons causing these problems lay in the SSCP conversion, which mathematically
creates a direct link between two nodes as long as there is at least one node mutually connected
to the two nodes. The SSCP conversion is mostly used in network studies of inter-organizational
relationship(Burt, 1980). Breiger (1974) instructed that two criteria that must be met for SSCP to
be valid are symmetry membership and transitivity. He explained that symmetry membership is a
mutual connection between person a and b if they have a shared membership. However, whether

125
to assign this symmetry relationship is “a fundamental theoretical issue, not a technicality of
computation” (Breiger, 1974, p.184). Transitivity requires that “two nodes must be mutually
„reachable‟ along the path of length n if there exists a sequence of n contiguous ties between
them” (Breiger, 1974, p. 185). In the case of the pilot testing data, these transitivity relations may
not always hold true. For instance, “not family friendly” and “located in South Carolina” are
both mutually and directly related to “Kiawah Island”. However, it is awkward to say that those
two constructs should be directly connected because they have a shared membership in “Kiawah
Island”. The relation between “not family friendly” and Kiawah Island is descriptive in nature
rather than a person-group, which indicates that two descriptive features can lose their meaning
if not attached to the subject they describe. Using the SSCP conversion can force such two
features into a direct connection, which may not either be valid in real sense or correctly reflect
what the participant has in mind. Considering these drawbacks and difficulties in data analysis
and results interpretation, the study did not use SSCP conversion to generate second-order
associations, but used the laddering technique with the repertory grid method to elicit second-
order associations.

126
APPENDIX D: List of the 66 Destinations from the Survey
Destination Counts Destination Counts
MYRTLE BEACH, SC 19 ANAPOLIS, MD 1
MONTEREY/PEBBLE BEACH, CA 16 AMELIA ISLAND, FL 1
ORLANDO, FL 16 BANGOR, ME 1
LAS VEGAS, NV 14 BETHPAGE BLACK, NY 1
SCOTTSDALE, AZ 13 CATSKILL MOUNTAINTS., NY 1
CHARLESTON, SC 12 COEUR D'ALENE, ID 1
PINEHURST, NC 12 DAVIS, WV 1
SAN DIEGO, CA 11 DAYTON, OH 1
HILTON HEAD, SC 9 DESTIN, FL 1
MIAMI, FL 8 DUBLIN, OH 1
BANDON DUNES, OR 6 EL PASO, TX 1
DALLAS, TX 6 FARMINGDALE, NY 1
ATLANTIC CITY, NJ 5 FLAGSTAFF, AZ 1
JACKSONVILLE, FL 5 FOREST DUNES CPT, MI 1
PALM SPRINGS, CA 5 FOXWOODS, CT 1
LOS ANGELAS, CA 4 GREENBRIER, WV 1
NAPLES, FL 4 HERSHEY, PA 1
SEA ISLAND, GA 4 HOT SPRINGS, VA 1
MAUI, HI 3 JEKYLL ISLAND, GA 1
OCEAN CITY, MD 3 JERSY SHORE, NJ 1
SAN FRANCISCO, CA 3 KAPALUA, HI 1
WASHINGTON, DC 3 KILLINGTON, VT 1
AUGUSTA, GA 2 LONG ISLAND, NY 1
BOSTON, MA 2 MESQUITE, NV 1
CHICAGO, IL 2 RALEIGH-DURHAN, NC 1
DENVER, CO 2 ROBERT T. JONES TRL, AL 1
FORT MYERS, FL 2 ROCKVILLE, MD 1
HONOLULU,HI 2 SAN ANTONIO, TX 1
NEW YORK, NY 2 SOUTHERN PINES, NC 1
PONTE VERDE BEACH, FL 2 VERO BEACH, FL 1
VIRGINIA BEACH, VA 2 VERONA, NY 1
WILLIAMSBURG, VA 2 WINGED FOOT, NY 1
ALBEQURQUE, NM 1 WISTON-SALEM, NC 1

127
APPENDIX E: Complete List of the 46 Elicited Constructs
MB MT OL LV
Adult vacation 8
Affordable 4 3
Amateur/intermediate players 3 2
Beach 6
Big private facilities 1 1
Buddy outing 3 2 3
Business outing 2 2 2
Casinos 21*
Cater to everyone 5 4
Convention centers 2 2 2
Course itself is an attraction 1
Deals 6 5
Disney 26*
Expensive 9 1
Fame 3
Family friendly 5 9
Family getaway 4 5
Frequent PGA Tours 4
Golf capital of the world 4
Golf-packages 6 6
Hard accessibility 3
Holds the US Open 5
Long waiting period 3
Lots of restaurant 1 1 1
Many golf courses 7 2
Many non-golf activities 7 18* 12
Moving to low-end market 1
Mystique and Fame 10
Not family friendly 2 12
Over 100 courses 2
Party 7 11
Primary reason is golfing 3 5
Pure golfing experience 2
Saturated with employees 1
Seasonal golf course 1
Shared membership 1 1
Shopping 1 1

128
Complete List of the 46 Elicited Constructs (Continued)
MB MT OL LV
Sin city 4
Single's outing 3
Skilled players 7
Social outing 3 2 1
Touristic destinations 4 6 6
Upscale courses 10
Wealthy clientele 10
Weekend getaway 1
Wide-range of Selection 8 4 4
* The frequencies in this number do not represent the amount of people mentioned those
constructs, but the total number of times that those constructs were referred as both a first-order
and second-order associations. Therefore their values are greater than 13.

129
APPENDIX F: DL Format Data of the 1st and 2
nd Order Constructs
dl n=39, format=edgelist1
labels:
adult,affordable,amateur,beach,buddy,business,capital,casino,covent,deals,dis
ney,everyone,expen,experience,famaway,fame,family,hardacc,longwait,LV,many,MB
,MT,nongolf,notfamily,OL,package,party,PGA,primary,sincity,single,skillplay,s
ocial,tourist,upscale,USOpen,wealthy,wide
data:
1 25 1
2 26 1
2 22 1
2 9 1
3 22 1
3 26 1
4 24 1
4 35 1
5 34 1
6 26 1
6 20 1
6 22 1
7 22 1
7 21 1
8 20 1
8 35 1
8 24 1
8 25 1
9 6 1
10 22 1
10 26 1
11 35 1
11 24 1
11 17 1
12 22 1
12 20 1
13 23 1
14 25 1
16 30 1
16 23 1
17 12 1
17 15 1
17 22 1
17 26 1
18 19 1
18 13 1
18 23 1
20 1 1
20 32 1
20 31 1
21 12 1
21 30 1
22 21 1
22 4 1
23 14 1
23 36 1

130
24 20 1
24 26 1
24 22 1
25 20 1
25 23 1
26 11 1
27 10 1
28 35 1
28 25 1
28 24 1
29 16 1
30 22 1
30 23 1
31 25 1
32 34 1
33 23 1
34 22 1
34 20 1
35 22 1
35 20 1
35 26 1
36 30 1
36 16 1
36 13 1
37 16 1
38 23 1
39 21 1
39 12 1
39 22 1
39 26 1
39 20 1
Note: Data in this file format that denotes directed or asymmetrical associations between nodes, meaning
each link has only one direction and is not reciprocal. The directions of the links originate from the nodes
in the first column and point to the corresponding nodes in the second column. However, many of the
measures of network properties computed by UCINET are defined only for symmetric data. To adjust this
problem, the data were symmetrized using the UCINET software.

131
APPENDIX G: Coding Rules
Data are firstly coded on the individual response level and then aggregated to generate a
consensus response of the four destinations‟ brand associations.
Stage1: Generate a dictionary of brand association constructs
During the interviews, participants used different expressions to describe same or very similar
concepts. A participant might also use different words and phrases interchangeably to repeat
similar brand associations. Therefore it is necessary to compile a dictionary that summarizes and
labels the words and phrases have the same or similar meanings. This dictionary shall include all
the brand associations elicited in all 13 interviews.
Example: (note: phrases in UPPER CASES are the labels for their group of brand associations)
RESORT DESTINATION
Resort destinations, hotels affiliated with golf, big resort courses, country club resorts
GOLF CAPITAL
Golf Capital of the US, Golf Capital of the world
MANY COURSES:
Hundred of course, over 100 courses, many courses, lots of courses
MYSTIQUE AND FAME
Mysterious, famous, renowned, golfer‟s dream place, once in a life experience
AFFORDABLE
Affordable, cheap, inexpensive, budget, reasonably priced
PRIMARY REASON GOLFING
Golfing is the primary reason to go, go there just for golf
THEME PARKS
Theme parks, roller coasters
Brand associations that belong to a specific destination shall not be summarized but kept to
preserve the destination‟s salient and unique attributes. For instance, among the brand
associations of “Disney”, “theme park”, “roller coaster” and “casino”, “Disney” and “Casino”
shall be kept because they are unique to specific destinations. However, “theme park” and “roller
coaster” can be aggregated because these phrases are general descriptions and not as specific as
“Disney” or “casino”.

132
Stage 2: Organize each individual‟s response
During the interview, the participant‟s responses were written down on a recording sheet, which
was arranged in the way matching the presentation sequence of the four triadic cards. Since all
destinations were compared against each other three times throughout an interview, consequently
quite a few band associations repeatedly mentioned several times during the interview. Thus,
responses from each personal interview must be organized to reduce redundancy and generate an
aggregated brand association table for the four destinations.
In this stage, three rules shall be followed.
2.1 Create a five-column table, with multiple rows. Create this table in MS-Excel if possible to
provide the ease for data aggregation in the next stage.
Example:
Brand Associations MB MT OL LV
2.2 Read a brand association on the recording sheet, and then find its matching label in the
dictionary. Write down the label in the brand association column and finding its corresponding
destination(s), and use its original marker (i.e. 1; -1; -1,1) on the recording sheet to mark the
relation.
Example:
Brand Associations MB MT OL LV
Resort destination 1 1
Many courses 1 1
2.3 A brand association is only marked once if it is a first-order brand association, but can be
marked multiple times if it is used as a second-order brand association. In the example below, the
association “Many courses” is marked three times. In the first time, it is a first-order brand
association. In the second and third times it is a second order brand association.
Example:
Brand Associations MB MT OL LV
Resort destination 1 1
Many courses 1 1
Affordable 1 1 1
Many courses -1
Primary reason golfing 1 1
Many courses -1,1
Once all 13 interviews were organized and cleaned, individual responses can be aggregated.

133
Stage 3: Aggregate Individual Responses
To generate the aggregated responses, firstly we need to separate the first-order brand
associations from the second-orders.
3.1 In the Excel spread sheet, set all cells‟ property as “TEXT” instead of “NUMBER”. Use the
formula IF(CELL=”-1,1”,1,IF(CELL=”1”,1,0)) to extract all first-order associations.
3.2 The second-order associations cannot be separated from their corresponding first-order
associations. Otherwise, the meaning of being a “second-order” will not exist. Aggregating the
second-order association largely requires manual work.
3.3 A brand association is taken into account only when it had been mentioned by at least two
participants, regardless it is a first or second order association.

134
APPENDIX H: An Example of Interview Recording
ID: __JAKE (pseudonym)___ Date:___02/19/2010_______
Think about what you know or have heard about the above three destinations. If your friend was
seeking your advice for a golf vacation, in what way do you think two of the destinations are
alike, and how the third destination is different from the other two? You may group them
differently based on different criteria
A
Construct Myrtle Monterey Orlando
Host PGAs 1 1
US Capital of golf 1
Famous b/c of 1 or 2 courses 1 1
Golfer‟s paradise 1
Fame and mystique -1
Mecca of the golf world -1
Men‟s social gathering place (buddies hang out) 1
Expensive 1
Upscale golf facility -1
Famous, world renown -1
Family gathering 1 1
Not just golfing, also tourist activities -1 -1
Beach front, grand strand -1,1
Disney -1,1

135
B
Construct Myrtle Monterey Las Vegas
Men‟s gathering, buddies hang out place 1 1
Casinos -1,1
Nothing for kids or women -1,1
Numerous bars 1 1
Tourist destination first, then golf destination 1 1
Pure golfing experience 1
Sin city 1

136
C
Construct Myrtle Orlando Las Vegas
Classic golf destination 1
So many of golf courses -1
Golf capital -1
They are all tourist destinations 1 1 1
Beach -1,1
Boardwalk -1,1
Theme parks -1 -1
Shopping -1 -1 -1
Family friendly destination 1 1
Beach -1,1
Many non-golfing activities -1 -1
Disney -1,1
Not family friendly destination 1
What happens in Vegas stays in Vegas -1
Singles outing place -1
Men/women adult outing place -1
A place you don‟t want to take kids with you -1
Less expensive for golfing 1 1
Often you can get deals -1 -1
- So many to choose from -1,1

137
D
Construct Monterey Las Vegas Orlando
Family friendly destination 1
Disney -1
Shopping -1
The place where you take kids to -1
Not quite a family vacation place 1 1
Nothing for non-golfers, maybe some spas -1,1
Casinos -1,1
Adult nightlife -1,1
Nothing for kids -1 -1
Couples outing place -1,1
Singles outing place -1,1
Expensive 1 1
High-end facilities -1,1
One or two famous courses -1,1
Less expensive, most people can afford 1
Deals -1

138
REFERENCES
Aaker, D. A. (1991). Management brand equity: Capitalizing on the value of a brand
name. New York: Free Press.
Aaker, D. A. (1996a). Building strong brands. New York, NY: Free Press.
Aaker, D. A. (1996b). Measuring brand equity across products and markets. California
Management Review, 38(3), 102-120.
Aaker, J. L. (1997). Dimensions of brand personality. Journal of Marketing Research,
34(3), 347-356.
Anantachart, S. (1998). A theoretical study of brand equity: Reconceptualizing and
measuring the construct from an individual consumer perspective. Unpublished
Doctoral dissertation, University of Florida.
Anderson, J. R. (1983). The architecture of cognition. Cambridge MA: Harvard
University Press.
Ashworth, G., & Kavaratzis, M. (2009). Beyond the logo: Brand management for cities.
The Journal of Brand Management, 16, 520-531.
Austin, J. R., Siguaw, J. A., & Mattila, A. S. (2003). A re-examination of the
generalizability of the aaker brand personality measurement framework. Journal
of Strategic Marketing, 11(2), 77.
Avraham, E. (2009). Marketing and managing nation branding during prolonged crisis:
The case of Israel. Place Branding and Public Diplomacy, 5(3), 202-211.
Azoulay, A., & Kapferer, J.-N. (2003). Do brand personality scales really measure brand
personality? Journal of Brand Management, 11(2), 143-155.
Backman, S. J. (1994). Using a person-situation approach to market segmentation.
Journal of Park and Recreation Association, 12(1), 1-16.
Baker, M. J., & Cameron, E. (2008). Critical success factors in destination marketing.
Tourism and Hospitality Research, 8, 79-97.
Balakrishnan, M. S. (2009). Strategic branding of destinations: A framework. European
Journal of Marketing, 43(5/6), 611-629.
Baloglu, S., & McCleary, K. W. (1999). A model of destination image formation. Annals
of Tourism Research, 26(4), 868-897.

139
Bartra, R., Lenk, P., & Wedel, M. (2003). Separating brand from category personality,
working paper Retrieved March 20, 2009, from
http://webuser.bus.umich.edu/plenk/Brand%20Personality.pdf
Baum, T., Hearns, N., & Devine, F. (2008). Place branding and the representation of
people at work: Exploring issues of tourism imagery and migrant labour in the
republic of ireland. Place Branding and Public Diplomacy, 4, 45-60.
Bell, C. (2008). 100% pure New Zealand: Branding for back-packers. Journal of
Vacation Marketing, 14(4), 345-355.
Bergqvist, R. (2009). Place marketing in a logistics context: A swedish case study and
discourse.(original article)(case study). Place Branding and Public Diplomacy,
5(1), 54-66.
Blain, C., Levy, S. E., & Ritchie, J. R. B. (2005). Destination branding: Insights and
practices from destination management organizations. Journal of Travel
Research, 43(4), 328-338.
Boo, S. (2006). Multidimensional model of destination brands: An application of
customer-based brand equity. University of Nevada, Las Vegas, Las Vegas, NV.
Boo, S., Busser, J., & Baloglu, S. (2009). A model of customer-based brand equity and its
application to multiple destinations. Tourism Management, 30(2), 219-231.
Breiger, R. L. (1974). The duality of persons and groups. Social Forces, 53(2), 10p.
Burt, R. S. (1980). Models of network structure. Annual Review of Sociology, 6(1), 79-
141.
Cai, L. A. (2002). Cooperative branding for rural destinations. Annals of Tourism
Research, 29(3), 720-742.
Calder, B. J., Phillips, L. W., & Tybout, A. M. (1981). Designing research for
application. Journal of Consumer Research, 8(2), 197-207.
Caprara, G. V., Barbaranelli, C., & Guido, G. (2001). Brand personality: How to make
the metaphor fit? Journal of Economic Psychology, 22(3), 377-395.
Che, D. (2008). Sports, music, entertainment and the destination branding of post-fordist
detroit. Tourism Recreation Research, 33(2), 195-206.
Chen, A. C.-H. (2001). Using free association to examine the relationship between the
characteristics of brand associations and brand equity. Journal of Product &
Brand Management, 10(7), 439.

140
Coaffee, J., & Rogers, P. (2008). Reputational risk and resiliency: The branding of
security in place-making. Place Branding and Public Diplomacy, 4, 205-217.
Collins, A. M., & Loftus, E. F. (1975). A spreading activation theory of semantic
processing. Psychological Review, 82(6), 407-428.
Cook, R. A., Yale, L. J., & Marqua, J. J. (2008). Tourism: The business of travel (4th
ed.). Upper Saddle River, NJ: Prentice Hall.
Cromption, J. L. (1979). An assessment of the image of mexico as a vacation destination
and the influence of geographical location upon that image. Journal of Travel
Research, 17(1), 18-23.
Dosen, D. O., Vranesevic, T., & Prebezac, D. (1998). The importance of branding in the
development of marketing strategy of croatia as tourist destination. Acta Turistica,
10(2), 93-182.
Echtner, C. M., & Ritchie, J. R. B. (1993). The measurement of destination image: An
empirical assessment. Journal of Travel Research, 31(4), 3-13.
Eden, C., & Jones, S. (1984). Using repertory grids for problem construction. Journal of
the Operational Research Society, 35, 779-790.
Farquhar, P. H. (1989). Managing brand equity. Marketing Research, 1(3), 24-33.
Forristal, L. J., & Lehto, X. Y. (2009). Place branding with native species: Personality as
a criterion.(original article). Place Branding and Public Diplomacy, 5(3), 213-
226.
Fransella, F., Bell, R., & Bannister, D. (2004). A manual for repertory grid technique.
West Sussex, England: John Wiley & Sons, Ltd.
Freeman, L. C. (1979). Centrality in social networks conceptual clarification. Social
Networks, 1(3), 215-239.
Gartner, G. (1993). Image formation process. Journal of Travel & Tourism Marketing,
2(2/3), 191-215.
Girvan, M., & Newman, E. J. (2002). Community structure in social and biological
networks. Proceedings of the National Academy of Sciences of the United States
of America, 99(12), 7821-7826.
Gladden, J. M., & Funk, D. C. (2001). Understanding brand loyalty in professional sport:
Examining the link between brand associations and brand loyalty. International
Journal of Sports Marketing & Sponsorship, 3(1), 67(28).

141
Gnoth, J. (2008). Buillding control mechanisms into destination branding. Romanian
Marketing Review, 3(4), 100-119.
Goldenberg, M. A., Klenosky, D. B., O'Leary, J. T., & Templin, T. J. (2000). a means-
end investigation of ropes course experiences. Journal of Leisure Research, 32(2),
208-224.
Gutman, J. (1982). A means-end chain model based on consumer categorization
processes. Journal of Marketing, 46(2), 60-72.
Hankinson, G. (2004). The brand images of tourism destinations: A study of the saliency
of organic images. Journal of Product & Brand Management, 13(1), 6-14.
Hankinson, G. (2005). Destination brand images: A business tourism perspective.
Journal of Service Marketing, 19(1), 24-32.
Hankinson, G. (2009). Managing destination brands: Establishing a theoretical
foundation. Journal of Marketing Management, 25, 97-115.
Hanna, S., & Rowley, J. (2008). An analysis of terminology use in place branding. Place
Branding and Public Diplomacy, 4(1), 61-75.
Henderson, G. R., Iacobucci, D., & Calder, B. J. (1998). Brand diagnostics: Mapping
branding effects using consumer associative networks. European Journal of
Operational Research, 111(2), 306-327.
Henderson, G. R., Iacobucci, D., & Calder, B. J. (2002). Using network analysis to
understand brands. Advances in Consumer Research, 29(1), 397-405.
Hosany, S., & Ekinci, Y. (2003). An application of the brand personality scale to tourist
destinations: Can destinations be branded? Paper presented at the the 34th
Annual Travel and Tourism Research Asscoiation Conference, St. Louis, MO,
USA.
Hospers, G.-J. (2009). Lynch, urry and city marketing: Taking advantage of the city as a
built and graphic image.(original article). Place Branding and Public Diplomacy,
5(3), 226-233.
Hsieh, M.-H. (2004). Measuring global brand equity using cross-national survey data.
Journal of International Marketing, 12(2), 28-57.
Hudson, S., & Ritchie, J. R. B. (2009). Branding a memorable destination experience.
The case of lsquobrand canadarsquo. International Journal of Tourism Research,
11(2), 217-228.
142
Hunt, J. D. (1975). Image as a factor in tourist development. Journal of Travel Research,
13(3), 1-7.
InterBrand (2009). Best global brands Retrieved November 25, 2009, from
http://www.interbrand.com/best_global_brands.aspx
Janiszewski, C., & Van Osselaer, Stijn M. J. (2000). A connectionist model of brand-
quality associations. Journal of Marketing Research, 37(3), 331-350.
Jones, T., Nagata, S., Nakajima, M., & Masuyama, K. (2009). Prefectural branding in
japan--tourism, national parks and the shinshu brand.(original article). Place
Branding and Public Diplomacy, 5(3), 192-201.
Keller, Kevin L. (1993). Conceptualizing, measuring, and managing customer-based
brand equity. Journal of Marketing, 57(1), 1-22.
Keller, Kevin L. (1998). Strategic brand management: Building, measuring and
managing brand equity. Upper Sadle River, NJ: Prentice Hall.
Keller, Kevin L. (2001). Building customer-based brand equity: A blueprint for creating
strong brands. Boston, MA: Marketing Science Institute.
Keller, Kevin L. (2003a). Brand synthesis: The multidimensionality of brand knowledge.
Journal of Consumer Research, 29(4), 595-600.
Keller, Kevin L. (2003b). Strategic brand management (2nd ed.). Upper Saddle River,
NJ: Pearson Education.
Keller, K. L. (2008). Strategic brand management: Building, measuring and managing
brand equity. Upper Saddle River, NJ: Prentice Hall.
Keller, Kevin L., & Lehmann, D. R. (2006). Brands and branding: Research findings and
future priorities. Marketing Science, 25(6), 740-759.
Kelly, G. A. (1955). The psychology of personal construct. New York: Norton.
Kim, S. K. S., Chun, H., & Petrick, J. F. (2005). Positioning analysis of overseas golf tour
destinations by korean golf tourists. Tourism Management, 26(6), 905-917.
Klenosky, D. (2002). The "Pull" Of tourism destinations: A means-end investigation.
Journal of Travel Research, 40(4), 385.
Kneesel, E., Baloglu, S., & Millar, M. (2010). Gaming destination images: Implications
for branding. Journal of Travel Research, 49(1), 68-78.

143
Knoke, D., & Kuklinski, J. H. (1982). Network analysis (3rd ed.). Berverly Hills, CA:
Sage.
Knoke, D., & Yang, S. (2007). Social network analysis (2nd ed.). Thousand Oaks, CA:
Sage.
Konecnik, M., & Gartner, W. C. (2007). Customer-based brand equity for a destination.
Annals of Tourism Research, 34(2), 400-421.
Konecnik, M., & Go, F. (2008). Tourism destination brand identity: The case of Slovenia.
The Journal of Brand Management, 15, 177-189.
Kotler, P., Bowen, J., & Maken, J. (2003). Marketing for hospitality and tourism (3rd
ed.). Upper Saddle River, NJ: Pearson Education Inc.
Krippendorf, J. (1987). The holiday makers: Understanding the impact of leisure and
travel. London: William Heinemann.
Krishnan, H. S. (1996). Characteristics of memory associations: A consumer-based brand
equity perspective. International Journal of Research in Marketing, 13(4), 389-
405.
Kwon, H. J. (2003). The effects of prototypicality on vacation destination choice
behavior. Unpublished Doctoral Dissertation, Clemson University, Clemson, SC.
Lawson, R. (2002). Consumer knowledge structures: Background issues and
introduction. Psychology & Marketing, 19(6), 447-455.
Lee, H., & Jain, D. (2009). Dubai's brand assessment success and failure in brand
management--part 1.(student's corner). Place Branding and Public Diplomacy,
5(3), 234-246.
Lee, S., Toth, E. L., & Shin, H. (2008). Cognitive categorisation and routes of national
reputation formation: Us opinion leaders' views on south korea.(papers). Place
Branding and Public Diplomacy, 4(4), 272-286.
Low, G. S., & Lamb, C. W. J. (2000). The measurement and dimensionality of brand
associations. Journal of Product & Brand Management, 9(6), 350 - 370.
MacKenzie, S. B. (1986). The role of attention in mediating the effect of advertising on
attribute importance. Journal of Consumer Research, 13, 174-195.
Marketing Science Institute (1988). Marketing research institute research topics:1988-
90. Cambridge, MA: Marketing Science Institute.

144
Marsden, D., & Littler, D. (2000). Repertory grid technique an interpretive research
framework. European Journal of Marketing, 34(7), 816-834.
Marzano, G., & Scott, N. (2009). Power in destination branding. Annals of Tourism
Research, 36(2), 247-267.
Mazurek, M. (2008). Tourism destination branding: A competitive marketing strategy -
does it really matter? A case study of kremnica, slovakia. Paper presented at the
Proceedings of the 4th Graduate Student Research Symposium, Victoria, BC,
Canada.
Merrilees, B., Miller, D., & Herington, C. (2009). Antecedents of residents' city brand
attitudes. Journal of Business Research, 62(3), 362-367.
Mitchell, A. A., & Dacin, P. A. (1996). The assessment of alternative measures of
consumer expertise. Journal of Consumer Research, 23(3), 219-239.
Morgan, N., Pritchard, A., & Piggott, R. (2002). New Zealand, 100% pure. The creation
of a powerful niche destination brand. Journal of Brand Management, 9(4/5),
335-354.
Nadeau, J., Heslop, L., O'Reilly, N., & Luk, P. (2008). Destination in a country image
context. Annals of Tourism Research, 35(1), 84-106.
Naoi, T., Airey, D., Iijima, S., & Niininen, O. (2006). Visitors' evaluation of an historical
district: Repertory grid analysis and laddering analysis with photographs. Tourism
Management, 27(3), 420-436.
National Golf Foundation (2010). Research faq's. Retrieved February 12, 2010, from
http://www.ngf.org/cgi/faqa.asp?
O'Connor, N., Flanagan, S., & Gibert, D. (2008). The integration of film-induced tourism
and destination branding in yorkshire, uk. International Journal of Tourism
Research, 10, 423-437.
Ooi, C.-S. (2008). Reimagining singapore as a creative nation: The politics of place
branding. Place Branding and Public Diplomacy, 4(4), 287-302.
Park, C. W., Milberg, S., & Lawson, R. (1991). Evaluation of brand extensions - the role
of product feature similarity and brand concept consistency. Journal of Consumer
Research, 18(2), 185-193.
Pearce, P. (2005). Tourist behavior: Themes and conceptual schemes. Clevedon, UK:
Channel View Publications.

145
Petrick, J. F., & Backman, S. J. (2002a). An examination of the construct of perceived
value for the prediction of golf travelers' intentions to revisit. Journal of Travel
Research, 41(1), 38.
Petrick, J. F., & Backman, S. J. (2002b). An examination of the determinants of golf
travelers' satisfaction. Journal of Travel Research, 40(3), 252.
Petrick, J. F., Backman, S. J., Bixler, R., & W.C., N. (2001). Analysis of golfer
motivations and constraints by experience use history. Journal of Leisure
Research, 33(1), 57-70.
Pike, S. (2003). The use of repertory grid analysis to elicit salient short-break holiday
destination attributes in New Zealand. Journal of Travel Research, 41(3), 315-
319.
Pike, S. (2007). Consumer-based brand equity for destinations -- practical dmo
performance measures. Journal of Travel & Tourism Marketing, 22(1), 51 - 61.
Pike, S. (2008). Destination marketing: An integrated marketing communication
approach. Burlington, MA: Butterworth-Heinemann.
Pike, S. (2009). Destination brand positions of a competitive set of near-home
destinations. Tourism Management, 30(6), 857-866.
Pritchard, A., & Morgan, N. (1998). 'mood marketing' -- the new destination branding
strategy: A case study of 'wales' the brand. Journal of Vacation Marketing, 4(3),
215-229.
Quillian, M. R. (1969). The teachable language comprehender: A simulation program and
theory of language. Communications of the ACM, 12(8), 459-476.
Reddy, S. K., Holak, S. L., & Bhat, S. (1994). To extend or not to extend - success
determinants of line extensions. Journal of Marketing Research, 31(2), 243-262.
Roedder-John, D., Loken, B., Kim, K., & Monga, A. B. (2006). Brand concept maps: A
methodology for identifying brand association networks. Journal of Marketing
Research (JMR), 43(4), 549-563.
Scholderer, J., & Grunert, K. G. (2005). Do means-end chains exist? Experimental tests
of their hierarchicity, automatic spreading activation, directionality, and self-
relevance. Advances in Consumer Research, 32(1), 530-530.
Shani, A., Wang, Y., Hutchinson, J., & Lai, F. (2009). Applying expenditure-based
segmentation on special-interest tourists: The case of golf travelers. Journal of
Travel Research, 0047287509346852.

146
Simon, C. J., & Sullivan, M. W. (1993). The measurement and determinants of brand
equity - a financial approach. Marketing Science, 12(1), 28-52.
Skinner, H. (2008). The emergence and development of place marketing's confused
identity. Journal of Marketing Management, 24, 915-928.
Steenkamp, J.-B. E., & Van Trijp, H. C. M. (1994). Perceptual mapping based on
idiosyncratic sets of attributes. Journal of Marketing Research, 31(1), 15-27.
Stock, F. (2009). The borat effect.(original article). Place Branding and Public
Diplomacy, 5(3), 180-191.
Supphellen, M. (2000). Understanding core brand equity: Guidelines for in-depth
elicitation of brand associations. International Journal of Market Research, 42(3),
319-338.
Tasci, A. D. A., & Denizci, B. (2009). Destination branding inputoutput analysis: A
method of evaluating productivity. Tourism Analysis, 14, 65-83.
Tasci, A. D. A., & Kozak, M. (2006). Destination brands vs destination images: Do we
know what we mean? Journal of Vacation Marketing, 12(4), 299-317.
Teichert, T. A., & Schöntag, K. (2010). Exploring consumer knowledge structures using
associative network analysis. Psychology and Marketing, 27(4), 369-398.
Trueman, M., Cook, D., & Cornelius, N. (2008). Creative dimensions for branding and
regeneration: Overcoming negative perceptions of a city. Place Branding and
Public Diplomacy, 4, 29-44.
van Duijn, M. A. J., & Vermunt, J. K. (2006). What is special about social network
analysis? Methodology: European Journal of Research Methods for the
Behavioral and Social Sciences, 2(1), 2-6.
Vasudevan, S. (2008). The role of internal stakeholders in destination branding:
Observations from kerala tourism. Place Branding and Public Diplomacy, 4, 331-
335.
Wagner, O., & Peters, M. (2009). Can association methods reveal the effects of internal
branding on tourism destination stakeholders? Journal of Place Management and
Development, 2(1), 52-69.
Wagner, O., Peters, M., & Schuckert, M. R. (2009). Internal branding in tourism
destinations: Implications for tourism policy and research. International Journal
of Tourism Policy, 2(4), 274 - 288.

147
Wang, Y. (2008). Collaborative destination marketing: Roles and strategies of convention
and visitors bureaus. Journal of Vacation Marketing, 14(3), 191-209.
Wasserman, S., & Faust, K. (1994). Social network analysis: Methods and applications.
New York: Cambridge University Press.
Wee, T. T. T. (2004). Extending human personality to brands: The stability factor.
Journal of Brand Management, 11(4), 317-330.
Wooten, M. H., & Norman, W. C. (2008). Interpreting and managing special events and
festivals. In A. G. Woodside & D. Martin (Eds.), Tourism management: Analysis,
behaviour and strategy (pp. 197-217). Cambridge, MA: CAB International.