Counter-Selection of Antimalarial Resistance Polymorphisms ...
Upload
khangminh22Category
view
1download
0
https://doi.org/10.33805/2690-2613.103 Volume 1 Issue 1 | PDF 103 | Pages 7
Edelweiss Journal of Biomedical Research and Review
Citation: Chen LR, Trejaut JA, Lai YH, Chen ZS, Huang JY, et al. Mitochondrial DNA polymorphisms of the saisiyat Indigenious group of Taiwan, search for a negrito signature (2019) Edel J Biomed Res Rev 1: 12-18. 12
Research Article ISSN 2690-2613
Mitochondrial DNA Polymorphisms of the
Saisiyat Indigenous Group of Taiwan,
Search for a Negrito Signature Lan-Rong Chen, Jean Alain Trejaut
*, Ying-Hui Lai, Zong-Sian Chen,
Jin-Yuan Huang, Marie Lin and Jun-Hun Loo Affiliation: Molecular Anthropology and Transfusion Medicine Research Laboratory, Mackay Memorial Hospital, Taipei, Taiwan *Corresponding author: Trejaut Jean Alain, Molecular Anthropology and Transfusion Medicine Research Laboratory, Mackay Memorial
Hospital, #45, Min-Sheng Road, Tamsui, New Taipei City, 25115, Taiwan, Tel: +886-2-2809-4661, Fax: +886-2-2809-8746,
E-mail: [email protected]
Citation: Chen LR, Trejaut JA, Lai YH, Chen ZS, Huang JY, et al. Mitochondrial DNA polymorphisms of the saisiyat Indigenious group of
Taiwan, search for a negrito signature (2019) Edel J Biomed Res Rev 1: 12-18.
Received: Sep 20, 2019
Accepted: Oct 17, 2019
Published: Oct 24, 2019
Copyright: © 2019 Chen LR, et al., This is an open-access article distributed under the terms of the Creative Commons Attribution License,
which permits unrestricted use, distribution, and reproduction in any medium, provided the original author and source are credited.
Abstract The genetic profile of Negritos of the Philippines differs from the non-Negrito groups with mitochondrial DNA haplogroups B4b1a2, B5, D6a,
M, M52a, and N11b. Although Negritos are not seen in Taiwan, the strong genetic affinity between the Philippines and Taiwan Mountain Tribe
Aborigines (TwMtA), and Folks tales of TwMtA, Saisiyat and Atayal recounting past contacts with Negritos, warrant the search for a Negrito
signature in Taiwan.
Material and Method: Discriminant Analysis of Principal Component (DAPC) was used to determine the genetic relationship between TwMtA,
Filipino and non-TwMtA groups.
Results: The deep coalescence of B4b1a2 in the Philippine Negritos, Saisiyat, Atayal, Island Southeast Asia, and SEA (Southeast Asia)
suggested a deeply rooted common ancestry, but could not support a past Negrito presence in Taiwan. Conversely, the sharing of cultural
components and mtDNA (mitochondrial DNA) haplogroup D6a2 in Saisiyat, Atayal and Philippine Negritos may characterize a Negrito signature
in Taiwan. Although the molecular variation of D6a2 determines its presence in Taiwan back to middle Neolithic, other markers, Y-SNP
haplogroups C-M146 and K-M9, warrant further analysis.
Conclusion: Most likely, the physical characteristics, languages, and the genetic makeup of the Negritos in Taiwan have been diluted as the
result of heavy migration from the mainland in the last 400 years.
Keywords: Molecular Anthropology, Negrito, Austronesian, Population genetics, Saisiyat, Taiwan aborigines, Mitochondrial DNA.
Abbreviations: TwMtA-Taiwan Mountain Tribe Aborigines, DAPC-Discriminant Analysis of Principal Components, SEA-Southeast Asia,
mtDNA-mitochondrial DNA, NRY-Non-Recombination Y-chromosome, BSP-Bayesian Skyline Plot, MMDA-Mismatch Distribution Analysis,
Y-SNP-Y-chromosome Single Nucleotide Polymorphism, NTwMtA-North Taiwan Mountain Tribe Aborigines, MSEA-Mainland Southeast
Asia, HVS-I-Hypervariable Segment I, STR-Short Tandem Repeat, SNP-Single Nucleotide Polymorphism, ISEA-Island Southeast Asia, CTwMtA-Central TwMtA, STwMtA-Southern TwMtA.
Introduction
The Saisiyat tribe is an Austronesian speaking group, a member of the
Taiwan Mountain Tribe Aborigines. In the year 2018 April, the
Saisiyat numbered 6,607, making them one of the third smallest
indigenous groups on the island [1]. Its people live in the North West
flank of the Taiwan mountain range, between Hsinchu and Miaoli
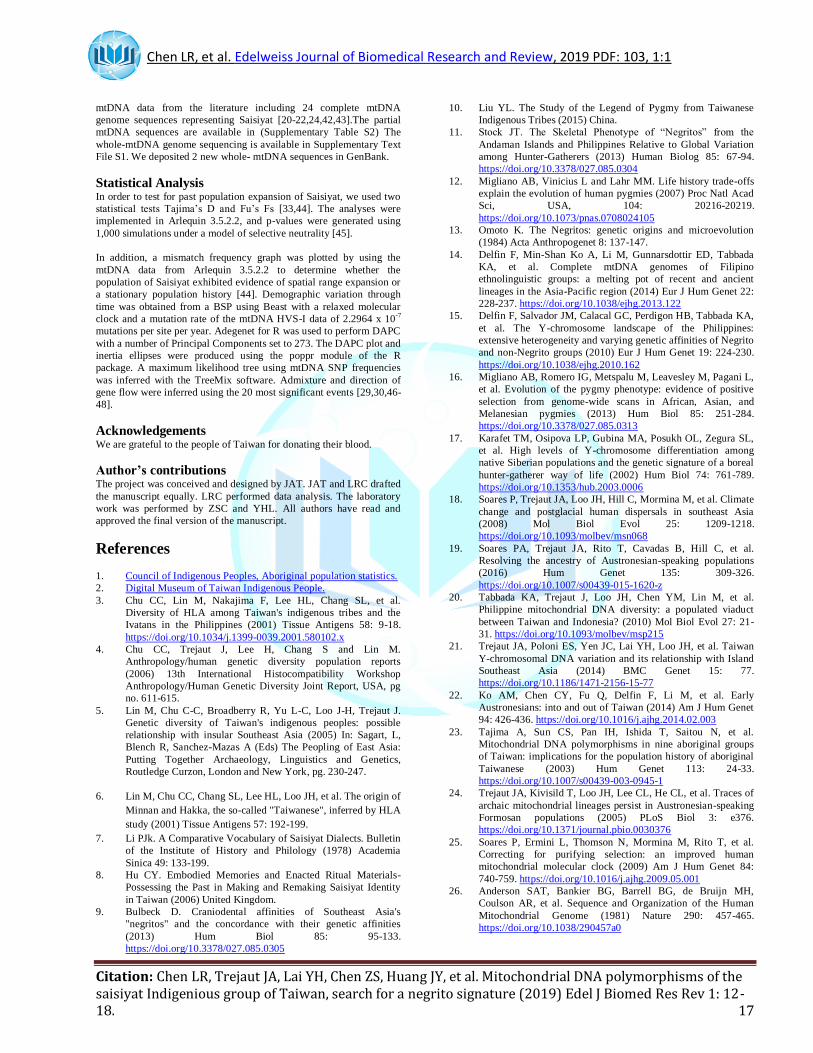
(Figure 1). The geography of this region, which comprises the Egongji
and Hengpingbei Mountains, forced Saisiyat to divide into two groups,
the Sai-Kirapa in the north and the Sai-Maghahyobun in the south.
Historically Sai-Kirapa has had significant interaction with the
northeastern Atayal tribe while the Sai-Maghahyobun has had more
contacts with the Hakka who migrated there from East China in the last
400 years [2-6]. Similarly, Saisyat has two main dialects: the Taai
Dialect in the North, and the Tungho Dialect in the south [7]. While
Saisiyat has traditional views that mix aspects of ancestor worship and
animism where all things are considered being alive and possess a
distinct character, other Saisiyat people also practice Christianity [2].
Figure 1: Saisiyat distribution map.

Chen LR, et al. Edelweiss Journal of Biomedical Research and Review, 2019 PDF: 103, 1:1
Citation: Chen LR, Trejaut JA, Lai YH, Chen ZS, Huang JY, et al. Mitochondrial DNA polymorphisms of the saisiyat Indigenious group of Taiwan, search for a negrito signature (2019) Edel J Biomed Res Rev 1: 12-18. 13
Most TwMtA tribes have kept folktales and myths that relate to past
contacts with Negritos. In particular, Saisiyat is the only tribe in
Taiwan that has rituals every two years honoring the memory of “the
Short People or Pas-ta'ai” [8]. The Short People in these folktales are
described as short-statured, dark-skinned and frizzy-haired and have
the same anthropometric characteristics as Negritos in the Philippines.
Some anthropologists believe these may have been Proto-Australoid
people who possibly arrived from Africa during the early Southern
Dispersal 60,000 years ago, but to this day, no archeological evidence
has ever revealed the past presence of Negritos in Taiwan [9,10]. It
now proposed that, instead of a shared ancestral phenotype from an
ancient and well-distributed population, the resemblance of Negrito
with other Negritos of Asia and Pygmies in Africa is the result of
convergent evolution in the different parts of the word under equivalent
environmental conditions [11,12]. This is supported by genetic
evidence showing that Negritos of different parts of the world region
have different genetic structures [13]. Further, other genetic studies
observed that there is no simple dichotomy between Negrito and non-
Negrito groups of the Philippines [14,15].
Most Negrito groups share genetic variations with neighbor
populations while they have more deeply rooted variants that suggest a
much earlier arrival in the region, isolation, and admixture with later
arrivals [16]. Many studies using mitochondrial DNA (mtDNA) and Y-
chromosome variation have established a significant common ancestry
between the populations of Taiwan and the Philippines, it is therefore
expected to find a Negrito signature in Taiwan[14,15,17-21]. Although
Atayal and Saisiyat have a genetic profile that distinguishes them from
the southern TwMtA, the polymorphism is homogenously distributed
through all the tribes. [2,3,6,21-24].In this study, we analyze the
mitochondrial genetic polymorphism of the Saisiyat tribe and search
genetic evidence of the speculated presence of Negritos in all Taiwan
indigenous groups. The mitochondrial molecular clock is faster than
the molecular clock of Non-Recombination Y-chromosome (NRY)
haplogroups determined using Single Nucleotide Polymorphisms
(SNPs) and slower for NRY haplotypes determined using Short
Tandem Repeats (STRs) [25]. The rate of mtDNA is, therefore, most
appropriate to measure and trace evolutionary human changes
phylogenetically in time and space. Further, its short length (16,569
base pairs), its presence in both males and females, its high
polymorphism and the higher concentration than genomic DNA, makes
it a most effective material, practically and financially, to use in a small
laboratory [26]. However, we will use NRY in our comparative
analysis with the Philippines.
Results
Mitochondrial DNA Diversity Compared to the mtDNA genetic diversity of all Taiwan groups
(h=0.717 to 0.991), the Saisiyat tribe (h=0.864) was lower than in
Fujian and Taiwan Han (Minnan and Hakka, TwH) (~ 0.99), and in
range with other TwMtA (h=0.717 to 0.942) (Table 1) [27]. Similarly,
the number of mtDNA haplogroups observed in Saisiyat (n=20) was in
range with the number of haplogroups seen in other TwMtA (n=7 to
55) and contrasted strongly with the number seen in Fujian, Minnan
and Hakka (n=87, 95 and 226 respectively). Further, the tests of
neutrality for Saisiyat, Tajima’s D (D=-0.438; p=0.365) and the more
powerful Fu’s Fs test (Fs=-24.275; p<0.0001) indicated a departure
from neutrality expectation, and were in range with most value
observed among other TwMtA groups (Data not shown).
East
Asia
Taiwan Mainland
Southeast
Asia
Philippines Taiwan Han
Taiwan Mountain Tribes Aborigines (TwMtA)
Fujian Hakka Minnan Northern tribes Central tribes Southern tribes
Vietnam
(n=58)
Thailand
(n=77)
Akka
(n=42)
Filipinos
Atayal Taroko Saisiyat Thao Tsou Bunun Rukai Paiwan Puyuma Amis Yami
Sample size 149 153 599 109 54 88 30 60 181 77 168 107 292 88 177 372
Total
number of
mtDNA
haplogroups
(n)
87 95 226 21 7 20 15 16 40 22 35 26 55 9 96 72
Haplogroup
diversity (h)
(Nei et al.
1987)
0.984 0.983 0.991 0.814 0.717 0.864 0.907 0.89 0.911 0.915 0.925 0.923 0.942 0.843 0.981 0.955
± SD 0.001 0.002 0 0.021 0.025 0.013 0.012 0.012 0.008 0.009 0.005 0.007 0.004 0.009 0.002 0.002
Table 1: Mitochondrial DNA diversity of the Taiwan groups.
Demographic Analysis A bimodal curve was observed between 11 and 21 basepair differences
in the mismatch distribution analysis of Saisiyat for 88 mtDNA
sequences (Figure 2). The bimodal mismatch curve may have been the
result of admixture. Further, in contrast with the Fu’s Fs test, the plot
did not support population sudden expansion [28]. Similarly, the
hypothesis of sudden expansion was rejected by two demographic
indexes, the Sum of Squared Deviation (SSD) test (SSD=0.008,
P<0.001) and the raggedness (r=0.011, P<0.001) (Harpending 1994)
indicating that the data deviated from the simulation expected under
the model of expansion (Figure 2, blue line). The analysis (Number of
pairs vs. Base pair differences) was obtained from 88 mtDNA Saisiyat
sequences using nucleotide positions (nps) 8,000-9,000, nps 10,000-
11,000, and hyper variable segment I (HVS-I) nps 16040-16390
[22,24]. Using the Bayesian Skyline method, patterns of historical
demography can also be inferred from estimates of the effective
population size over time.
Figure 2: Mismatch Distribution Analysis (MMDA) of Saisiyat.

Chen LR, et al. Edelweiss Journal of Biomedical Research and Review, 2019 PDF: 103, 1:1
Citation: Chen LR, Trejaut JA, Lai YH, Chen ZS, Huang JY, et al. Mitochondrial DNA polymorphisms of the saisiyat Indigenious group of Taiwan, search for a negrito signature (2019) Edel J Biomed Res Rev 1: 12-18. 14
Accordingly, we constructed a Bayesian Skyline Plot (BSP) plot
(Figure 3) from 88 Saisiyat sequences of the mtDNA hyper variable
segment I (HVS-I) data, with 20 million Markov Chain Monte Carlo
(MCMC) iterations, sampled every 3,000 steps, using a relaxed
molecular clock and a mutation rate of 2.2964 x 10⁻⁷ mutations per site
per year. The BSP showed an early Neolithic signature of population
expansion, followed by a long phase of relatively constant population
size and a sudden steep population reduction around 500 years BP. The
Saisiyat present-day effective population obtained in Figure 3 is
approximately 340 women (CI 100 to 1120 women) [29].
Figure 3: Bayesian Coalescent Skyline analysis of the Saisiyat tribe.
Bayesian Skyline Plot (BSP) plot based on the mtDNA obtained from
88 Saisiyat sequences for the HVS-I control region. BSP was
calculated using a relaxed molecular clock and a mutation rate of
2.2964 x 10⁻⁷
mutations per site per year and estimated with 20 million
MCMC iterations sampled every 3,000 steps. The dark blue line
represents the posterior median of the effective population size through
Time (one generation=25 years). The light blue lines represent the 95%
confidence interval.
MtDNA Haplogroup Distribution Out of 20 mitochondrial haplogroups seen in Saisiyat (Figure 4), 15
were uniquely shared with the other the Austronesian speaking groups
of Taiwan, and five haplogroups (B5a2a2a2, E1a1a1, F4b1', M7b1a2a
and Y2) had a frequency greater than 8% representing 75% of the
Saisiyat gene pool. Interestingly, haplogroups D6a2 was only seen in
Saisiyat (1.1%), Atayal (4.6%), reported in a single individual of the
Pazeh plain tribe, and the Mamanwa Negritos from the Philippines
(3.3%) [14,24].
Figure 4: Haplogroup frequency in Saisiyat shared with other
populations.
Distribution of shared mtDNA haplogroups of Saisiyat constructed
using Taiwan data and other relevant populations [24]. Haplogroups
with a shade of grey represent sharing with non-Indigenous groups of
Taiwan (Minnan and Hakka). All haplogroups not seen in Saisiyat but
present in other groups are represented by “other”.
Population Differentiation Discriminant Analysis of Principal Components (Figure 5) showed a
clear geographic divide along the first Discriminant component (the X
axis), which form a separates the Austronesian-speaking groups on the
right, from the Han, the TwH, and MSEA (Indochina) on the left.
Further, although individuals were not tightly grouped, the Northern
and Central TwMtA form a cluster that clearly separates them from a
lower cluster encompassing Southern TwMtA and the Philippines.
Finally, we note that the Southern Austronesian cluster (Southern
TwMtA and the Philippines) shows more admixtures with TwH than
the Northern cluster.
Figure 5: Scatter plot from DAPC from SNPs of mitochondrial DNA
of Taiwan and the East Asian populations.
The dots represents individual from eight different groups and
locations whose inertia ellipses are characterized by a color as
indicated in the insert on the left. Sampling locations are: NTwMtA:
North Taiwan Mountain Tribe Aborigines (TwMtA); CTwMtA:
Central TwMtA; STwMtA: Southern TwMtA; TwH: Taiwan Han
(Minnan and Hakka); MSEA: Mainland Southeast Asia (Indochina);
Ph: Philippines; Han: Fujian.
Phylogenetic Analysis A maximum-likelihood tree using mtDNA haplogroup frequencies was
inferred with the TreeMix software (Figure 6A). The tree was
consistent with the geographical distribution of populations in Taiwan;
it places Saisiyat in a strong relationship with the Northern tribes
(Atayal and Taroko). Further, migration arrows were first limited to 20
migration events in the analysis and only the three most significant
gene flow events were retained for clarity of (Figure 6B). The
relationship delineated between Saisiyat and the central TwMtA (Thao
and Bunun) was expected from the DAPC clustering shown in Figure
5. More interesting, was a significant input from the Philippines to
Taiwan, consistent with a previous study [20]. And here seen as gene
flow to Saisiyat with a migration weight of ~ 0.65 (Figure 6). Most
likely, this result is the effect of the sharing of haplogroups B4a2a,
E2b, M7b1a2a, D6a2, R9c1a and Y2 between Saisiyat and the
Philippines (Figure 4).
6A: Maximum-Likelihood tree inferred by TreeMix for all Taiwan and
SEA populations assuming 20 significant gene-flow events, only the
three most significant gene-flow events are shown for clarity, they are
colored according to their weight on a zero to one scale [30]. 6B:
Residual fit from A. Shaded colored cells represent Standard error for
admixture events across all pairs of populations. Population pairs with
a residual above zero are more closely related and more likely to
correspond to an admixture event.
Discussion
In the first stage of this work, we examined the genetic variability
using mitochondrial nucleotide positions (nps) 8000 to 9000 and nps
10,000 to 11,000 of the coding regions, and the HVS-I segment of the
D-loop region to determine the genetic diversity and origin of the
Saisiyat tribe of Taiwan. In the second stage, we investigated the

Chen LR, et al. Edelweiss Journal of Biomedical Research and Review, 2019 PDF: 103, 1:1
Citation: Chen LR, Trejaut JA, Lai YH, Chen ZS, Huang JY, et al. Mitochondrial DNA polymorphisms of the saisiyat Indigenious group of Taiwan, search for a negrito signature (2019) Edel J Biomed Res Rev 1: 12-18. 15
general believed that Negrito groups predating the Lower Glacial
Maximum period were associated with the first settlers of
Sunderland/Island Southeast Asia (ISEA) [9].
Figure 6: Derived origin of admixture for Taiwan populations using
TreeMix.
Although there are some Chinese accounts of small, dark-skinned
people with curly hair in Taiwan, to date, Taiwan has no archeological
human remains supporting this hypothesis. Interestingly, most Taiwan
Mountain tribes have kept folk tales describing past contacts with
Negrito groups, most particularly the Saisiyat tribe of Hsinchu and
Miaoli (Figure 1) who still perform solemn rites to commemorate this
past. On the other hand, the presence of Negrito is still existent in the
Philippines and other parts of peninsular East Asia, but not in Taiwan.
If there is any truth in these TwMtA folk tales, then a small number of
Negrito in Taiwan must have interacted with Neolithic agriculturalist
migrants from the Southeast Asian mainland and most likely shaped
their genetic diversity. In this regard, it is sensible to expect that these
early contacts must have left some genetic traces. Here, our analysis of
mtDNA polymorphisms tries to provide new insights into the history of
the Saisiyat tribe [31,32].
Genetic Structure of Saisiyat
To investigate the mtDNA structure of Saisiyat, we first generated a
mismatch distribution (Figure 3). A bimodal curve was obtained, and
the two demographic indexes, the SSD test (SSD=0.008, P<0.001) and
the raggedness (r=0.011, P<0.001) were significantly different to
expectation. These results did not support expansion. Further, the
Bayesian Skyline plot (Figure 4) along with previous results from Ko’s
research group did not reveal sufficient structure to visualize a recent
population expansion. These results were in contrast with a highly
significant Fu's Fs test for the Saisiyat tribe [22,28,33].
It possible these results are revealing a sign that the Saisiyat tribe
experienced prehistorically a rapid population growth from an ancestral
population with a small effective population size. Alternatively, the
excess of rare mutations indicated by the significant negative Fu's Fs
test could be the result of recent gene flow introduced by non- indigenous groups of Taiwan, such as the Minnan and Hakka. Finally,
The BSP indicated an effective population of approximately 1400
women. This number may actually be inflated since our data set was
collected by LM in 2004, but does not conflict with previously
published BPSs, nor with the actual present-day number of Saisiyat
women indicated in the last Census from the Taiwan Council of
Indigenous Peoples [1,2,22].
Distribution
The mtDNA composition of the Saisiyat: Out of 21 different mtDNA
haplogroups, 15 haplogroups were characterized as northern TwMtA
haplogroups. Four haplogroups, F2a, E1a1a1, M7b1a2a and Y2 (Figure
4), constituted 75% of the Saisiyat genome. Consistent with other
extant Taiwan Mountain tribes, the Saisiyat tribe 29% of its mtDNA
genome was shared with Non-Taiwan Aborigines (Supplementary
Table S1) and were most likely acquired from migrants of Mainland
East Asia in the last 400 years.
Most of the remaining haplogroups were commonly seen throughout
Taiwan Northern tribes. Among them, B4a2a, E2b, M7b1a2a, R9c1a,
and Y2 were also seen in the Philippines. They are thought to represent
a plausible signal for a mid-Holocene out-of-Taiwan expansion or a
signal for a bidirectional migration between Taiwan and the Philippines
[18,20,22,24,34-37]. The distribution of haplogroup D6 was intriguing.
With a coalescence time of 14,390 years BP (Supplementary Table S1
and Figure S1) haplogroup D6 was seen at low frequency as D6c in
East Asia and Southeast Asia (SEA). The presence of D6a2 as a single
individual in the Pazeh plain tribe, in Saisiyat (1.1%), in Atayal (4.6%)
and in the Mamanwa Negrito group of Mindanao in the Philippines
(3.03%) could represent a genetic indicator of a past Negrito presence
in Taiwan. However, a coalescence age estimate of D6a2 (2,626 years
BP, CI 0-5,850) makes this supposition doubtful. It is possible the
sharing of D6a2 between Saisiyat/Atayal and the Mamanwa must be
the result of more recent gene flow.
It is conceivable that the bearers of D6a have experienced a bottleneck
between 2,600 and 12,000 years BP, as suggested by the long stretch of
nucleotide variation between D6a and D6a2 in their mtDNA genome
(Supplementary Table S1 and Supplementary Figure S1). Lastly,
mtDNA haplogroup Y2 is also shared between the Mamanwa and the
Saisiyat and Atayal tribes. Nonetheless, its distribution in the
Philippines (Negritos and non-Negritos) and its coalescence age
estimate (5216 years BP, CI: 529-10046), characterize Y2 as a
signature of the Neolithic expansion of Austronesian agriculturists in
insular East Asia rather than a Negrito signature [14,15,17-
21,24,34,38,39].
Principal Component Analysis To characterize population structure across Saisiyat, other Taiwan
groups, and their relationship with neighboring populations in MSEA
and the Philippines, we performed a DAPC (Figure 5). The first
component captured a clear geographical divide between Austronesian
speaking groups and non-TwA groups including Fujian, Minnan, and
Hakka. Component 2 in Figure 5 disclosed a strong affinity between
Northern and Central TwMtA, and between the Philippines and the
Southern TwMtA, suggesting that all these Austronesian-speaking
populations have a common origin. However, the mtDNA composition
of the Saisiyat suggested evidence supporting genetic affinity between
Saisiyat and Negrito and non-Negrito groups of the Philippines.
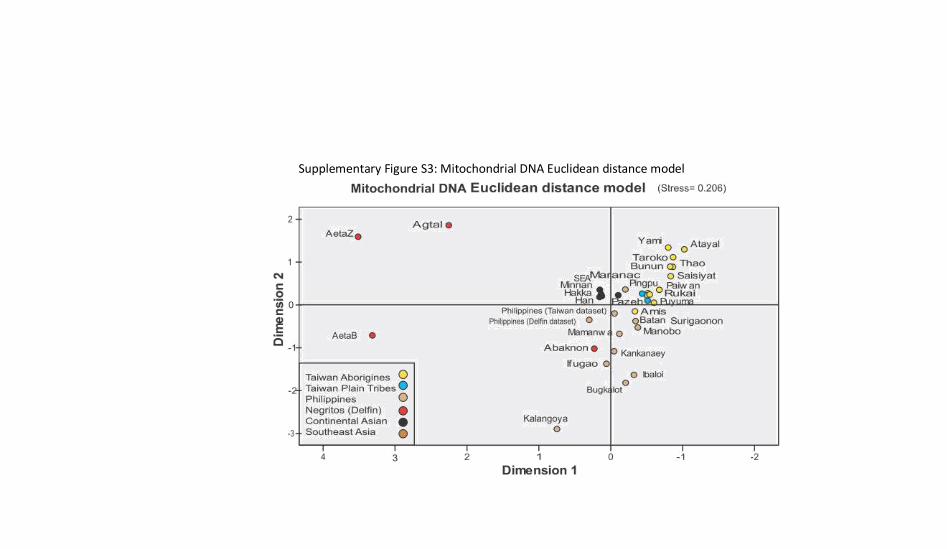
Using Delfin mtDNA and our Taiwan data set we constructed a
Multidimensional scaling plot to establish this relationship
(Supplementary Figure S3). While the relationship between
populations was the same as in the DAPC plot, the Aeta and Agta
Negrito groups were outbound, most likely because of the conjoint
results of drift, the presence of high frequency haplogroups such as P
and M52 in Aeta and Agta, and long isolation [14]. On the other hand,
haplogroup B4b1a2, E1a1a1, Y2, and D6a in the Mamawan group
inferred strong affinity of the Mamanwa Negritos with other
Austronesian groups, suggesting a more recent gene-flow of
Austronesian-speakers in the Mamawa.
Maximum Likelihood Tree from TreeMix TreeMix results inferred mtDNA gene-flow events (Figure 6)
potentially summarizing patterns of population in the history of Taiwan
such as bottlenecks, isolation, consanguinity within populations, here
Saisiyat was characterized as a northern Taiwan tribe. Further, the
gene-flow from Saisiyat (or the Northern TwMtA) to the Central
TwMtA (Bunun, Thao, and Tsou) was previously foreseen in Figure 4
and 5, and is confirmed in Figure 6 [30]. Moreover, the strong
migration event depicted by TreeMix from the Philippines to Saisiyat

Chen LR, et al. Edelweiss Journal of Biomedical Research and Review, 2019 PDF: 103, 1:1
Citation: Chen LR, Trejaut JA, Lai YH, Chen ZS, Huang JY, et al. Mitochondrial DNA polymorphisms of the saisiyat Indigenious group of Taiwan, search for a negrito signature (2019) Edel J Biomed Res Rev 1: 12-18. 16
indicates genetic interflow. The mtDNA haplogroups possibly
associated with this event, and seen in Saisiyat/Atayal and the
Mamanwa Negrito group of the Philippines, can only be attributed to
subtypes of haplogroups B4b1a2, E1a1a1, Y2, and D6a2.
These findings substantiate a possible past existence of Negritos in
Taiwan. They suggest that the Mamanwa are intermediate between
Austronesian and Negritos (Supplementary Figure S3) and possibly
experienced several admixture events in the past. This option is
nonetheless not supported by the age estimate of molecular variation
obtained for any of the haplogroups of the same clade between
Mamanwa and Saisiyat/Atayal. For example, D6a2 dates only to 2600
± 1500 yrs BP (Supplementary figure S1) and Y2 dates 3956 ± 2455
yrs BP (Supplementary figure S2). One possible way to demonstrate a
Negrito ancestry in Taiwan associated to D6 or Y2 would be to find
sister branches of these haplogroups in Taiwan and/or the Philippines
that would allow a coalescent node in the pre-Holocene period.
Other Gene Systems Supporting this last observation, our previous Y chromosome analysis
observed 4 Y-chromosome single nucleotide polymorphism (Y-SNP)
haplogroups out of 24 unrelated Saisiyat males (Supplementary Table
S1). Only one major haplogroup O1a1* (P203) had a frequency of
87.5%, while all other haplogroups (O1a2 (M50/110, O3a1* (KL1/122)
and O3a2c1a (M133/M7/M134) were seen only once (4.2%) [21].
When compared to the Y haplogroup profile of the Philippines, O1a1*
(P203) was prevalent in all Filipino ethnolinguistisc groups, Negritos
and non-Negrito and its presence in any Negrito groups was regarded
as an admixture with the former. Most interestingly, Negrito groups in
the Philippines invariably possessed, to various levels, haplogroup
haplogroups C-RPS4Y/M216, K-M9, and O3-M122 [15]. These
haplogroups have not been seen in Saisiyat, but single observations of
C-RPS4Y/M216 and K-M9 have been seen in the Taiwan plain tribes
and could support a past presence of Negrito in Taiwan [15,21].
Lastly, to our knowledge, no previous studies associating the Filipino
Negrito groups and the HLA gene system have yet been published;
accordingly, no Negrito HLA inferences could be used for Taiwan.
Nonetheless, several HLA*A-B-DRB1 haplotypes were unique to
Saisiyat and 1/3 of Saisiyat haplotypes were shared with Atayal
(Supplementary Table S1). Lastly, the sharing of haplotype HLA
A*34:01-B
*56:01 or simply the sole presence of A
*34:01 between
Amis, Papua New Guinea highlanders, Maoris of New Zealand, and
Australian Aborigines is intriguing. These findings suggest that HLA
A*34:01 could be a genetic indicator of the pre-dispersal period of the
Negrito throughout ISEA in the late Pleistocene era and should warrant
further HLA analysis of the Philippines Negritos [3,6,40,41].
Summary
This investigation has contributed substantially more insights into the
population groups in Taiwan and the Philippines. Further, while the
physical appearance of Negritos has never been seen in Taiwan, few
Taiwan Mountain tribes, such as the Saisiyat and the Atayal tribes,
have conserved folktales inferring prehistoric co-habitation with them,
and to this day, still celebrate this period bi-annually. Among the few
mtDNA haplogroups shared between Taiwan Northern tribes and the
Mamanwa Negritos (B4b1a2, E1a1a1, Y2 and D6a) only D6a may
represent a common Negrito genetic legacy of the Saisiyat and Atayal
tribes. This finding must be taken with caution, as the mid-Neolithic
coalescence age estimate of D6a is too shallow. Further, no support
was given from the Y chromosome analysis for Saisiyat and Atayal.
Although the apparent affinity between the Taiwan Northern tribes and
the Mamanwa Negritos of the southern Philippines could be the result
of gene flow brought upon by bidirectional population movements at
the time of the out of Taiwan, the presence of C-RPS4Y/M216 and K-
M9 in Taiwan were scarce, and warrant more extensive studies of the
Taiwan gene pool in the future.
Material and Method
Samples Whole blood or saliva specimens were collected from 2704 unrelated
individuals (Table 2) comprising Austronesian speaking groups from
the Philippines (n=372), 251 TwMtA consisting of Saisiyat (n=88),
Atayal (n=109 ) and Taroko (n=54), 271 central TwMtA consisting of
Thao (n=30), Tsou (n=60) and Bunun (n=181), and 732 southern
TwMtA consisting of Rukai (n=77), Paiwan (n=168), Puyuma (n=107),
Amis (n=92) and the Yami islanders (n=88). The sampling also
included 752 Taiwanese of Han descent (TwH) namely Minnan
(n=599) and Hakka (n=153). Samples from neighbor populations
included Han individuals from the east coast of China (Fujian, n=149),
groups from Mainland Southeast Asia (MSEA, n=177), namely
Vietnam (n=58), Thailand (n=77) and Akka (n=42), and finally 372
individuals from the Philippines as described in Tabbada. All samples
above were collected from volunteers with individual written informed
consent during the period of 2001 to 2004 by ML under approval of the
Ethics Committee of the Mackay memorial hospital after giving
information regarding the origins of their parents and grandparents
[3,6,20].
Country Population Size Groups References
Taiwan Saisiyat 88 Northern
TwMtA1
Trejaut 2005; This
study
Taiwan Atayal 109 Northern
TwMtA Trejaut 2005
Taiwan Taroko 54 Northern
TwMtA
Trejaut 2005,
Trejaut 2019
Taiwan Thao 30 Central
TwMtA
Trejaut 2005,
Trejaut 2019
Taiwan Tsou 60 Central
TwMtA Trejaut 2005
Taiwan Bunun 181 Central
TwMtA Trejaut 2005
Taiwan Rukai 77 Southern
TwMtA Trejaut 2005
Taiwan Paiwan 168 Southern
TwMtA Trejaut 2005
Taiwan Puyuma 107 Southern
TwMtA Trejaut 2005
Taiwan Amis 292 Southern
TwMtA Trejaut 2005
Taiwan Yami 88 Southern
TwMtA
Trejaut 2005; Loo
2014
Taiwan Minnan 599 TwH2 Trejaut 2005
Taiwan Hakka 153 TwH Trejaut 2005
China Fujian 149 Han (EA3) Trejaut 2005
Vietnam Vietnam 58 MSEA4 This study
Thailand Thailand
urban 77 MSEA This study
Thailand Akka 42 MSEA This study
Philippin
es Filipinos 372 Ph5
Tabbada and
Trejaut 2010
Total 2704
Note: 1TwMtA: Taiwan Mountain Aborigines, 2TwH-Taiwan Han, 3EA-East Asia, 4MSEA-
Mainland Southeast Asia (Indochina) 5Ph-Philippines.
Table 2: Population samples.
Data Analysis
All collected samples in our dataset were typed for Human leukocyte
antigens (HLA-A, -B and -DRB1) and described in the
Anthropology/HLA diversity component of the 13th international
histocompatibility workshop. Specimen typed for mtDNA had
haplogroups assigned according to Build 17 of Phylotree. Y
haplogroups of the non-recombining part of the Y-chromosome (NRY)
were determined using 81 Y-SNPs, and further analyzed using 17 Y-
chromosome short tandem repeats (Y-STRs): DYS19, DYS385I,
DYS385II, DYS389I, DYS389II, DYSS390, DYS391, DYS392,
DYS393, DYS437, DYS438, DYS439, DYS448, DYS456, DYS458,
DYS635, and Y GATA-H4. Additionally, we used corresponding
Chen LR, et al. Edelweiss Journal of Biomedical Research and Review, 2019 PDF: 103, 1:1
Citation: Chen LR, Trejaut JA, Lai YH, Chen ZS, Huang JY, et al. Mitochondrial DNA polymorphisms of the saisiyat Indigenious group of Taiwan, search for a negrito signature (2019) Edel J Biomed Res Rev 1: 12-18. 17
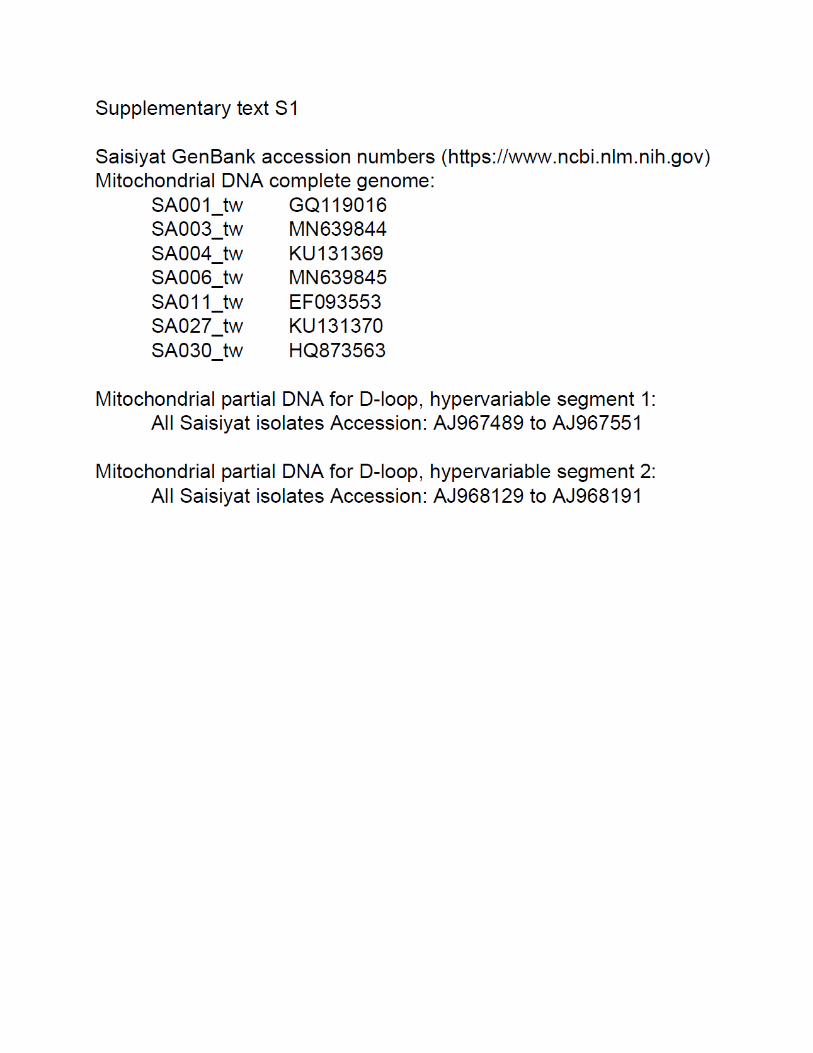
mtDNA data from the literature including 24 complete mtDNA
genome sequences representing Saisiyat [20-22,24,42,43].The partial
mtDNA sequences are available in (Supplementary Table S2) The
whole-mtDNA genome sequencing is available in Supplementary Text
File S1. We deposited 2 new whole- mtDNA sequences in GenBank.
Statistical Analysis
In order to test for past population expansion of Saisiyat, we used two
statistical tests Tajima’s D and Fu’s Fs [33,44]. The analyses were
implemented in Arlequin 3.5.2.2, and p-values were generated using
1,000 simulations under a model of selective neutrality [45].
In addition, a mismatch frequency graph was plotted by using the
mtDNA data from Arlequin 3.5.2.2 to determine whether the
population of Saisiyat exhibited evidence of spatial range expansion or
a stationary population history [44]. Demographic variation through
time was obtained from a BSP using Beast with a relaxed molecular
clock and a mutation rate of the mtDNA HVS-I data of 2.2964 x 10⁻⁷
mutations per site per year. Adegenet for R was used to perform DAPC
with a number of Principal Components set to 273. The DAPC plot and
inertia ellipses were produced using the poppr module of the R
package. A maximum likelihood tree using mtDNA SNP frequencies
was inferred with the TreeMix software. Admixture and direction of
gene flow were inferred using the 20 most significant events [29,30,46-
48].
Acknowledgements We are grateful to the people of Taiwan for donating their blood.
Author’s contributions The project was conceived and designed by JAT. JAT and LRC drafted
the manuscript equally. LRC performed data analysis. The laboratory
work was performed by ZSC and YHL. All authors have read and
approved the final version of the manuscript.
References
1. Council of Indigenous Peoples, Aboriginal population statistics.
2. Digital Museum of Taiwan Indigenous People.
3. Chu CC, Lin M, Nakajima F, Lee HL, Chang SL, et al.
Diversity of HLA among Taiwan's indigenous tribes and the
Ivatans in the Philippines (2001) Tissue Antigens 58: 9-18. https://doi.org/10.1034/j.1399-0039.2001.580102.x
4. Chu CC, Trejaut J, Lee H, Chang S and Lin M.
Anthropology/human genetic diversity population reports
(2006) 13th International Histocompatibility Workshop
Anthropology/Human Genetic Diversity Joint Report, USA, pg
no. 611-615.
5. Lin M, Chu C-C, Broadberry R, Yu L-C, Loo J-H, Trejaut J.
Genetic diversity of Taiwan's indigenous peoples: possible
relationship with insular Southeast Asia (2005) In: Sagart, L,
Blench R, Sanchez-Mazas A (Eds) The Peopling of East Asia:
Putting Together Archaeology, Linguistics and Genetics,
Routledge Curzon, London and New York, pg. 230-247.
6. Lin M, Chu CC, Chang SL, Lee HL, Loo JH, et al. The origin of
Minnan and Hakka, the so-called "Taiwanese", inferred by HLA
study (2001) Tissue Antigens 57: 192-199.
7. Li PJk. A Comparative Vocabulary of Saisiyat Dialects. Bulletin
of the Institute of History and Philology (1978) Academia
Sinica 49: 133-199.
8. Hu CY. Embodied Memories and Enacted Ritual Materials-
Possessing the Past in Making and Remaking Saisiyat Identity
in Taiwan (2006) United Kingdom.
9. Bulbeck D. Craniodental affinities of Southeast Asia's
"negritos" and the concordance with their genetic affinities
(2013) Hum Biol 85: 95-133.
https://doi.org/10.3378/027.085.0305
10. Liu YL. The Study of the Legend of Pygmy from Taiwanese
Indigenous Tribes (2015) China.
11. Stock JT. The Skeletal Phenotype of “Negritos” from the
Andaman Islands and Philippines Relative to Global Variation
among Hunter-Gatherers (2013) Human Biolog 85: 67-94. https://doi.org/10.3378/027.085.0304
12. Migliano AB, Vinicius L and Lahr MM. Life history trade-offs
explain the evolution of human pygmies (2007) Proc Natl Acad
Sci, USA, 104: 20216-20219.
https://doi.org/10.1073/pnas.0708024105
13. Omoto K. The Negritos: genetic origins and microevolution
(1984) Acta Anthropogenet 8: 137-147.
14. Delfin F, Min-Shan Ko A, Li M, Gunnarsdottir ED, Tabbada
KA, et al. Complete mtDNA genomes of Filipino
ethnolinguistic groups: a melting pot of recent and ancient
lineages in the Asia-Pacific region (2014) Eur J Hum Genet 22:
228-237. https://doi.org/10.1038/ejhg.2013.122
15. Delfin F, Salvador JM, Calacal GC, Perdigon HB, Tabbada KA,
et al. The Y-chromosome landscape of the Philippines:
extensive heterogeneity and varying genetic affinities of Negrito
and non-Negrito groups (2010) Eur J Hum Genet 19: 224-230.
https://doi.org/10.1038/ejhg.2010.162
16. Migliano AB, Romero IG, Metspalu M, Leavesley M, Pagani L,
et al. Evolution of the pygmy phenotype: evidence of positive
selection from genome-wide scans in African, Asian, and
Melanesian pygmies (2013) Hum Biol 85: 251-284.
https://doi.org/10.3378/027.085.0313
17. Karafet TM, Osipova LP, Gubina MA, Posukh OL, Zegura SL,
et al. High levels of Y-chromosome differentiation among
native Siberian populations and the genetic signature of a boreal
hunter-gatherer way of life (2002) Hum Biol 74: 761-789.
https://doi.org/10.1353/hub.2003.0006
18. Soares P, Trejaut JA, Loo JH, Hill C, Mormina M, et al. Climate
change and postglacial human dispersals in southeast Asia
(2008) Mol Biol Evol 25: 1209-1218.
https://doi.org/10.1093/molbev/msn068
19. Soares PA, Trejaut JA, Rito T, Cavadas B, Hill C, et al.
Resolving the ancestry of Austronesian-speaking populations
(2016) Hum Genet 135: 309-326.
https://doi.org/10.1007/s00439-015-1620-z
20. Tabbada KA, Trejaut J, Loo JH, Chen YM, Lin M, et al.
Philippine mitochondrial DNA diversity: a populated viaduct
between Taiwan and Indonesia? (2010) Mol Biol Evol 27: 21-
31. https://doi.org/10.1093/molbev/msp215
21. Trejaut JA, Poloni ES, Yen JC, Lai YH, Loo JH, et al. Taiwan
Y-chromosomal DNA variation and its relationship with Island
Southeast Asia (2014) BMC Genet 15: 77.
https://doi.org/10.1186/1471-2156-15-77
22. Ko AM, Chen CY, Fu Q, Delfin F, Li M, et al. Early
Austronesians: into and out of Taiwan (2014) Am J Hum Genet
94: 426-436. https://doi.org/10.1016/j.ajhg.2014.02.003
23. Tajima A, Sun CS, Pan IH, Ishida T, Saitou N, et al.
Mitochondrial DNA polymorphisms in nine aboriginal groups
of Taiwan: implications for the population history of aboriginal
Taiwanese (2003) Hum Genet 113: 24-33.
https://doi.org/10.1007/s00439-003-0945-1
24. Trejaut JA, Kivisild T, Loo JH, Lee CL, He CL, et al. Traces of
archaic mitochondrial lineages persist in Austronesian-speaking
Formosan populations (2005) PLoS Biol 3: e376.
https://doi.org/10.1371/journal.pbio.0030376
25. Soares P, Ermini L, Thomson N, Mormina M, Rito T, et al.
Correcting for purifying selection: an improved human
mitochondrial molecular clock (2009) Am J Hum Genet 84:
740-759. https://doi.org/10.1016/j.ajhg.2009.05.001
26. Anderson SAT, Bankier BG, Barrell BG, de Bruijn MH,
Coulson AR, et al. Sequence and Organization of the Human
Mitochondrial Genome (1981) Nature 290: 457-465.
https://doi.org/10.1038/290457a0

Chen LR, et al. Edelweiss Journal of Biomedical Research and Review, 2019 PDF: 103, 1:1
Citation: Chen LR, Trejaut JA, Lai YH, Chen ZS, Huang JY, et al. Mitochondrial DNA polymorphisms of the saisiyat Indigenious group of Taiwan, search for a negrito signature (2019) Edel J Biomed Res Rev 1: 12-18. 18
27. Nei M. Molecular evolutionary genetics (1987) Columbia
University Press, United States.
28. Harpending HC. Signature of ancient population growth in a
low-resolution mitochondrial DNA mismatch distribution
(1994) Hum Biol 66: 591-600.
29. Drummond AJ and Rambaut A. BEAST: Bayesian evolutionary
analysis by sampling trees (2007) BMC Evol Biol 7: 214.
https://doi.org/10.1186/1471-2148-7-214
30. Pickrell JK and Pritchard JK. Inference of population splits and
mixtures from genome-wide allele frequency data (2012) PLoS
Genet 8: e1002967.
https://doi.org/10.1371/journal.pgen.1002967
31. Quartly J. In honor of the little black people (2004) Taipei
Times.
32. Endicott P. Revisiting the “Negrito” Hypothesis: A
Transdisciplinary Approach to Human Prehistory in Southeast
Asia (2013) Hum Biol 85: 7-20.
https://doi.org/10.3378/027.085.0301
33. Fu YX. Statistical tests of neutrality of mutations against
population growth, hitchhiking and background selection (1997)
Genetics 147: 915-925.
34. Brandao A, Eng KK, Rito T, Cavadas B, Bulbeck D, et al.
Quantifying the legacy of the Chinese Neolithic on the maternal
genetic heritage of Taiwan and Island Southeast Asia (2016)
Hum Genet 135: 363-376. https://doi.org/10.1007/s00439-016-
1653-y
35. Bellwood P. In the origin and dispersals and dispersal of
agricultural communities in Southest Asia, Glover I and
Bellwood P (Ed) (2004) Taylor and Francis group, United
Kingdom, pg no.21-40.
36. Diamond J and Bellwood P. Farmers and their Languages: the
first expansions (2003) Science 300: 597-603.
https://doi.org/10.1126/science.1078208
37. Loo J, Trejaut J, Yen J, Chen Z, Lee C, et al. Genetic affinities
between the Yami tribe people of Orchid Island and the
Philippine Islanders of the Batanes archipelago (2011) BMC
Genet 12: 21. https://doi.org/10.1186/1471-2156-12-21
38. Behar DM, van Oven M, Rosset S, Metspalu M, Loogväli EL, et
al. A “Copernican” reassessment of the human mitochondrial
DNA tree from its root (2012) Am J Hum Genet 90: 675-684.
https://doi.org/10.1016/j.ajhg.2012.03.002
39. Hill C, Soares P, Mormina M, Macaulay V, Clarke D, et al. A
mitochondrial stratigraphy for island southeast Asia (2007) Am
J Hum Genet 80: 29-43. https://doi.org/10.1086/510412
40. Chu CC, Lee HL, Trejaut J, Chang HL and Lin M. HLA-A, -B,
-Cw and -DRB1 allele frequencies in a Pazeh population from
Taiwan Fernandes-Vina (2004) Human Immunol 65: 1102-
1181. https://doi.org/10.1016/j.humimm.2004.08.140
41. Single RS, Meyer D, Mack SJ, lancaster A, Nelson MP, et al.
Immunobiology of the Human MHC (2002) 13th International
Histocompatibility Workshop Anthropology/Human Genetic
Diversity Joint Report, United States, pg no.705-746.
42. Middleton D, Menchaca L, Rood H and Komerofsky R. New
allele frequency database (2003) Tissue Antigens 61: 403-407.
https://doi.org/10.1034/j.1399-0039.2003.00062.x
43. Van Oven M and Kayser M. Updated comprehensive
phylogenetic tree of global human mitochondrial DNA variation
(2009) Hum Mutat 30: E386-394.
https://doi.org/10.1002/humu.20921
44. Tajima F. Statistical method for testing the neutral mutation
hypothesis by DNA polymorphism (1989) Genetics 123: 585-
595.
45. Excoffier L, Laval G and Schneider S. Arlequin (version 3.0):
an integrated software package for population genetics data
analysis (2007) Evol Bioinform Online 1: 47-50.
https://doi.org/10.1177/117693430500100003
46. Jombart T. Adegenet: A R Package for the Multivariate
Analysis of Genetic Markers (2008) Bioinformatics 24: 1403-
1405. https://doi.org/10.1093/bioinformatics/btn129
47. R Development core team. A language and environment for
statistical computing. R foundation for statistical computing
(2013) Vienna, Austria.
48. Kamvar ZN, Tabima JF and Grünwald NJ. Poppr: an R package
for genetic analysis of populations with clonal, partially clonal,
and/or sexual reproduction (2014) Peer J 2: e281.
https://doi.org/10.7717/peerj.281

Supplementary Figure S1: Haplogroup D6
G709A G1719A A3714G A12654G T16311C!
14,390 yrs G16274A CI: 1843-28958
12164 yrs A6701G A7424G A7879G G13194A C16311T!! CI: 1407-23589
G8020A
T4679C T4937C T14530C G16129A! C16189T!! A16317G Sa003 (TA013)AT037AT002 Atayal
2626 yrs a KC993902 (Phil:Aba4956 GU733760 Phil: Man103CI: 0-5850
b TA024 Atayal
8473 TA021 Atayal
c TDC282 Minnan
d GQ119022 (PH128 Luzon panganisan)
204 3510 4652 8952 13962 14783
T14371C
+ Insertion! Reversion
D6
D6a
D6a1 AP011006 (Jap) JN866825 (SEA kunming)
D6a1a JF824913 (SEAChina) AP011054 (Jap)
AY255151 (SEA GD)
D6a2 KF540561 KF540592 (KoAta06. KoAta37)
8468 8655
8414
Putative haplogroups obtained
from incomplete sequence8597
8459
D6c T152C! A5441T A8389G A8521G
86015M complete Minnan
D6c1 GQ119040 (Phil348 Mindanao) GQ119042 Phil361 (Manila)
D6c1a T10007C A15662G
KC994157 (Phil Maranao) KC994145 (Phil Maranao)

Supplementary Figure S2: mtDNA haplogroup Y2
Y2 T482C G5147A T6941C G7859A A14914G A15244G T16311C! 5625 yrs Y2a T12161C CI 620-109
5216 yrs Y2a1 T11299C
CI 529-10046 3956 yrs Y2a1a C2856T G13135A
CI 0-8933
b 2232+A 8870
c 146 298 709
2 7786 11512A 11299
Y2b C338T
+ Insertion ! Reversion
AP008723 Japan EF153812 South Siberia
KF540560 Atayal
GQ119013 Indonesia HM596675 Sumatra
KC994134 North Philippines KC994040 North Philippines
GQ119019 North Philippines
GQ119032 Philippines
GQ119016 Saisiyat (SA001)
AP008764 Japan EF153798 Siberia
Supplementary Figure S3: Mitochondrial DNA Euclidean distance model

Supplementary Table S1: Saisiyat distribution profile of HLA, mtDNA and NRY gene systems
East Taiwan Philippines
Asia Taiwan Han
Taiwan Mountain Tribes Aborigines (TwMtA)
Fujian Hakka Minnan
Northern tribes Central tribes Southern tribes Filipinos
Atayal Taroko Saisiyat Thao Tsou Bunun Rukai Paiwan Puyuma Amis Yami
O1a1* (P203) 0.231 0.029 0.200 0.904 0.950 0.875 0.875 0.902 0.690 0.400 0.478 0.410 0.500 0.156
Y haplogroups O1a2 (M50) 0.029 0.019 0.042 0.063 0.049 0.607 0.241 0.280 0.217 0.179 0.107
O3a1* (KL1)
0.059
0.042
O3a2c1a (M133 0.135 0.294 0.200 0.042 0.025
Sample size 52 34 60 52 20 24 16 41 56 29 25 23 39 30 122
Total number of haplogroups (k) 13 16 16 3 2 4 3 3 3 3 5 5 5 5 26
Haplogroup diversity (h ) 0.852 0.877 0.901 0.180 0.100 0.239 0.242 0.186 0.500 0.478 0.730 0.720 0.687 0.649 0.9021739
SD 0.018 0.028 0.004 0.048 0.062 0.079 0.095 0.056 0.025 0.060 0.029 0.048 0.025 0.040 0.008434
Number of haplotypes shared with Formosan speakers 6 11 4 3 2 4 3 3 3 3 5 5 5 5 9
Number of haplotypes Shared with Han 13 8 8 1 2 2 1 1 0 1 3 2 2 3 10
% contribution from Putative parent populations from Formosan speakers 40.00% 66.51% 41.94% 0.813 59.09% 0.743 81.25% 81.25% 100.00% 81.25% 70.65% 78.31% 0.783 70.65% 56.52%
from Han 60.00% 33.49% 58.06% 0.188 40.91% 0.257 18.75% 18.75% 0.00% 18.75% 29.35% 21.69% 0.217 29.35% 43.48%
A_0201_B_3901_DRB1_0803 0.008 0.015
A_0201_B_4001_DRB1_0405 0.010
A_0201_B_4001_DRB1_1401 0.015 0.009
A_0201_B_4001_DRB1_1405 0.010
A_0201_B_4001_DRB1_1602 0.010
A_0201_B_4801_DRB1_0405 0.005 0.010 0.239
A_0201_B_4801_DRB1_1101 0.012 0.073 0.010 0.010 0.010
A_0201_B_5101_DRB1_1501 0.020
A_0201_B_5502_DRB1_1101 0.019 0.045 0.010 0.050
A_0203_B_3802_DRB1_0901 0.010
A_0206_B_4801_DRB1_1101 0.005
A_0206_B_4801_DRB1_1401 0.071 0.045 0.015 0.033 0.010
A_1101_B_3901_DRB1_1202 0.009 0.005 0.015
A_1101_B_4001_DRB1_1101 0.033 0.009 0.020 0.017 0.029 0.005 0.010
A_1101_B_4001_DRB1_1401 0.008 0.054 0.017
A_1101_B_4002_DRB1_1201 0.010
HLA A,B,DRB1 haplotypes A_1101_B_5502_DRB1_0901 0.010 0.017
A_1101_B_5603_DRB1_0901 0.010
A_1102_B_1301_DRB1_1202 0.016
A_1102_B_3901_DRB1_1202 0.023
A_1102_B_3901_DRB1_1401 0.049
A_1102_B_4001_DRB1_1101 0.005 0.039
A_2402_B_1301_DRB1_1501 0.009 0.013
A_2402_B_3901_DRB1_0803 0.036 0.018 0.103 0.133 0.216 0.056 0.048 0.029 0.020 0.005
A_2402_B_3901_DRB1_1101 0.015 0.016
A_2402_B_3901_DRB1_1202 0.083 0.022 0.010
A_2402_B_3901_DRB1_1401 0.044
A_2402_B_3901_DRB1_1501 0.036
A_2402_B_4001_DRB1_0403 0.008 0.057 0.009 0.020 0.017 0.020 0.073 0.088 0.020 0.036
A_2402_B_4001_DRB1_0901 0.027 0.014 0.066 0.018 0.029 0.015 0.030 0.010
A_2402_B_4001_DRB1_1401 0.090 0.082 0.108 0.050 0.078 0.025 0.010
A_2420_B_3901_DRB1_1202 0.076 0.018 0.118
A_2601_B_3901_DRB1_0803 0.005 0.029 0.027 0.049 0.035 0.019
Sample size 60 56 101 105 55 51 30 51 101 50 51 50 98 50 55
Total Number of HLA(HLA* A-B-DRB1 haplotypes (k) 82 79 123 59 38 33 23 26 48 33 27 39 44 0 76
Haplotype diversity (h ) 0.997 1.000 0.996 0.966 0.976 0.958 0.939 0.918 0.944 0.945 0.917 0.977 0.909 0.8749 0.998
± SD 0.003 0.002 0.002 0.004 0.004 0.008 0.017 0.015 0.009 0.014 0.017 0.006 0.010 0.0188 0.003
Number of haplotypes shared with Formosan speakers 18 12 25 59 38 16 23 26 48 33 27 39 44 19 10
Number of haplotypes shared with Han 81 11 10 3 4 3 6 5 7 3 6 6 3 3 5
% contribution from Putative parent populations from Formosan speakers 8.33% 30.86% 50.56% 88.94% 79.53% 68.57% 61.06% 68.02% 73.72% 81.82% 64.80% 72.67% 85.71% 72.15% 45.00%
from Han 91.67% 69.14% 49.44% 11.06% 20.47% 31.43% 38.94% 31.98% 26.28% 18.18% 35.20% 27.33% 14.29% 27.85% 55.00%
B4a1a4 0.0087 0.0208 0.0015 0.0063 0.0204 0.0114 0.0370 0.0043 0.0157 0.0138 0.1364 0.0093
B4a2a1 0.0052 0.0127 0.0306 0.0227 0.0236 0.0137 0.2273
B4a2a2 0.0063 0.0510 0.0227
B4b1a2x 0.0015 0.0253 0.0204 0.0114 0.0370 0.0130 0.0079 0.0322 0.0559
B4c1b2a 0.0262 0.0313 0.0184 0.1020 0.0114 0.0333 0.0463 0.0236 0.0046 0.0616 0.0029 0.1023 0.0497
B5a2a2a1 0.0052 0.0031 0.0227 0.0130 0.0315 0.0642 0.0137 0.0029
B5a2a2a2 0.0052 0.0031 0.0063 0.1023 0.0079 0.0138
B5a2a2b 0.0046 0.0114 0.1000 0.0833 0.0736
D4b2 0.0131 0.0104 0.0092 0.0114
Mitochondrial DNA D6a2 0.0015 0.0443 0.0114 0.0031
E1a1a1
0.0156 0.0046 0.0253
0.2159
0.0463 0.1039
0.0275 0.0411 0.0205
0.0435
E2b 0.0031 0.0506 0.0204 0.0341 0.0087 0.0092 0.0137 0.0263 0.0568 0.0031
F1a1d 0.0087 0.0104 0.0046 0.1327 0.0227 0.0926 0.0087 0.0315 0.0046 0.0274 0.2045 0.0031
F2a 0.0046 0.0114
F4b1' 0.0087 0.0015 0.1266 0.1837 0.1023 0.1667 0.0278 0.1948 0.0079 0.0092 0.0322
M7b1a2a 0.0104 0.0123 0.3861 0.2143 0.2500 0.0173 0.0315 0.0321 0.0068 0.0058 0.1250 0.0280
M7b1d2b 0.0114
M7c1c3a 0.0102 0.0114 0.1250 0.0093
R9c1a 0.0052 0.0031 0.0204 0.0227 0.2222 0.0043 0.0394 0.0092 0.0068 0.0058 0.0280
Y2 0.0044 0.0052 0.0316 0.0795 0.0373
Sample size 149 153 599 109 54 88 30 60 181 77 168 107 292 88 372
Total number of haplogroups (k) 87 95 225 21 7 21 15 16 40 22 35 26 55 9 72
Haplogroup diversity (h ) 0.990 0.989 0.992 0.821 0.730 0.874 0.938 0.905 0.916 0.927 0.931 0.932 0.945 0.852 0.958
SD 0.001 0.002 0.000 0.021 0.025 0.013 0.012 0.012 0.008 0.009 0.005 0.007 0.004 0.009 0.002
Number of haplotypes shared with Formosan speakers 15 27 57 21 7 21 15 16 40 22 35 26 55 9 37
Number of haplotypes Shared with Han 22 24 54 3 2 6 1 3 3 3 5 5 12 2 17
% contribution from Putative parent populations from Formosan speakers 31.50% 43.14% 41.58% 82.52% 70.24% 70.24% 91.00% 78.25% 89.99% 83.18% 82.52% 77.81% 75.56% 75.22% 59.48%
from Han 68.50% 56.86% 58.42% 17.48% 29.76% 29.76% 9.00% 21.75% 10.01% 16.82% 17.48% 22.19% 24.44% 24.78% 40.52%

Supplementary Table S2: MtDNA raw data
SA001 Y2 Yes 16126 16231 16311 73 263 309+C 315+C 10398 8392 8860 14178 14693 14766 14914 338-veSa002 B5a2a2a2 n No 16140 16189 16245 16266G 16362 73 93 210 263 315+C 9950 9962 10398 9bp 8584 8614 8860 SA003 D6a2 Yes 16129 16223 16274 16311 16317 16362 73 204 207 263 309+CC 315+C 10398 10400 10873 8701 8860 14530 14766 14783SA004 M7b1a2a Yes 16129 16297 16324 73 199 263 315+C 9824 10398 10400 10497 10873 8701 8860 14115 14766 14783SA005 B4a2a2 No 16154 16189 16217 16261 73 263 315+C CRS 9bp 8860 6719-veSA006 F2a Yes 16203 16291 16304 16311 16335 73 249d 263 309+C 315+C 10310 10535 10586 8860 14766SA007 Y2 No 16126 16231 16311 73 263 309+C 315+C 10398 8392 8860 338-veSA008 E1a1a1 No 16093 16223 16291 16362 16390 73 263 309+C 315+C 10003 10398 10400 10834 10873 8701 8860 7598+veSA009 M7b1a2a No 16129 16297 16324 73 199 263 315+C 9824 10398 10400 10497 10873 8701 8860 SA010 E1a1a1 No 16093 16223 16291 16362 16390 73 204 263 315+C 10003 10398 10400 10834 10873 8701 8860 7598+veSA011 E1a1a1 Yes 16140 16223 16291 16362 16390 73 146 263 309insC 315insC 489 750 10398 10400 10834 10873 8701 8860 14577 14783 6719-ve 7598+veSA012 E1a1a1 No 16093 16223 16291 16362 16390 73 263 309+C 315+C 10003 10398 10400 10834 10873 8701 8860 7598+veSA013 E1a1a1 No 16140 16223 16291 16362 16390 73 146 263 309+C 315+C 10398 10400 10834 10873 8701 8860 7598+veSA014 E1a1a1 No 16140 16223 16291 16362 16390 73 146 263 309+C 315+C 10398 10400 10834 10873 8701 8860 7598+veSA015 B5a2a2a2 n No 16140 16189 16245 16266G 16362 73 93 210 263 315iC 9950 9962 10398 9bp 8584 8614 8860 SA016 Y2 No 16126 16231 16311 73 263 309+C 315+C 10398 8392 8860 338-veSa017 M7b1a2a No 16086 16129 16192 16224 16297 16324 73 150 199 263 309+C 315+C 9824 10398 10400 10497 10873 8860SA018 Y2 No 16126 16231 16311 73 263 309+C 315+C 10398 8392 8860 338-veSA019 E1a1a1 No 16093 16223 16291 16362 16390 73 263 309+C 315+C 10003 10398 10400 10834 10873 8701 8860 7598+veSA020 B5a2a2a2 n No 16140 16189 16245 16266G 16362 73 93 210 263 315iC 9950 9962 10398 9bp 8584 8614 8860 SA021 E1a1a1 No 16140 16223 16291 16362 16390 73 146 263 309+C 315+C 10398 10400 10834 10873 8701 8860 7598+veSA022 B5a2a2a2 n No 16140 16189 16245 16266G 16362 73 93 210 263 315iC 9950 9962 10398 9bp 8584 8614 8860 SA023 E1a1a1 No 16140 16223 16291 16362 16390 73 146 263 309+C 315+C 10398 10400 10834 10873 8701 8860 7598+veSA024 E2b No 16051 16086 16223 16362 16390 73 195 263 315+C 10398 10400 10873 8440 8701 8860 7598+veSA025 E1a1a1 No 16093 16223 16291 16362 16390 73 263 309+C 315+C 10003 10398 10400 10834 10873 8701 8860 7598+veSA026 M7b1a2a No 16086 16129 16297 16324 73 199 263 309+C 315+C 9824 10398 10400 10497 10873 8701 8860 SA027 M7b1d2b Yes 16129 16223 16297 73 150 199 263 309+C 315+C 9824 10398 10400 10873 8251 8701 8860 14766 14783 5351+ve 6719-ve 12405+veSA028 B4b1a2x No 16136 16189 16217 73 207 263 309+CC 315+C CRS 8860 14000SA029 M7b1a2a No 16086 16129 16297 16324 73 199 263 315+C 9824 10398 10400 10497 10873 8701 8860 SA030 B4a2a2 Yes 16154 16189 16217 16261 16324 73 263 309+CC 315+C CRS 9bp 8860 14766 6719-veSA031 Y2 No 16126 16231 16311 73 263 309+CC 315+C 10398 8392 8860 338-veSA032 B5a2a2a2 n No 16140 16189 16245 16266G 16362 73 93 210 263 315iC 9950 9962 10398 9bp 8584 8614 8860 SA033 B5a2a2a2 n No 16140 16189 16245 16266G 16362 not done 9950 9962 10398 9bp 8584 8860 SA034 M7b3a No 16129 16297 16324 73 199 263 315+C 9824 10398 10400 10497 10873 8701 8860 SB002 E1a1a1 No 16093 16223 16291 16362 16390 73 263 315+C 10003 10398 10400 10834 10873 8701 8860 7598+veSB003 F4b1a'd-f No 16218 16304 16311 73 249d 263 309+C 315+C 10097C 10310 8020 8575 8603 8860 SB004 M7b1a2a No 16086 16129 16297 16324 73 199 263 315+C 9824 10398 10400 10497 10873 8701 8860 SB005 E1a1a1 No 16223 16291 16362 16390 73 263 309+C 315+C 10398 10400 10834 10873 8701 8860 7598+veSB006 F4b1a'd-f No 16218 16304 16311 73 249d 263 309+C 315+C 10097C 10310 8020 8575 8603 8860 SB007 F4b1a'd-f No 16218 16304 16311 73 249d 263 309+C 315+C 10097C 10310 8020 8575 8603 8860 SB008 M7b1a2a No 16129 16297 16324 73 199 263 315+C 9824 10398 10400 10497 10873 8701 8860 SB009 M7b1a2a No 16086 16129 16192 16224 16297 16324 73 150 199 263 309+CC 315+C 9824 10398 10400 10497 10873 8860SB010 M7b1a2a No 16129 16297 16324 73 199 263 315+C 9824 10398 10400 10497 10873 8701 8860 SB011 F4b1a'd-f No 16218 16304 16311 73 249d 263 309+C 315+C 10097C 10310 8020 8575 8603 8860 SB012 M7b1a2a No 16086 16129 16297 16324 73 199 263 315+C 9824 10398 10400 10497 10873 8701 8860 SB013 M7b1a2a No 16086 16129 16192 16224 16297 16324 73 150 199 263 309+CC 315+C 9824 10398 10400 10497 10873 8860SB014 E1a1a1 No 16223 16291 16295 16362 16390 73 263 309+CC 315+C 10398 10400 10834 10873 8701 8860 7598+veSB015 B5a2a2a2 No 16140 16189 16245 16266G 16362 73 93 210 263 315iC 9950 9962 10398 9bp 8584 8614 8860 SB016 E1a1a1 No 16093 16223 16291 16362 16390 73 204 263 315+C 10003 10398 10400 10834 10873 8701 8860 7598+veSB017 E1a1a1 No 16223 16291 16295 16362 16390 73 263 309+CC 315+C 10398 10400 10834 10873 8701 8860 7598+veSB018 M7b1a2a No 16086 16129 16297 16324 73 199 263 315+C 9824 10398 10400 10497 10873 8701 8860 SB019 F4b1a'd-f No 16218 16304 16311 73 249d 263 309+C 315+C 10097C 10310 8020 8575 8603 8860 SB020 F4b1a'd-f No 16218 16304 16311 73 249d 263 309+CC 315+C 10097C 10310 8020 8575 8603 8860 SB021 E1a1a1 No 16140 16223 16291 16362 16390 73 146 263 309+C 315+C 10398 10400 10834 10873 8701 8860 7598+veSB022 F4b1a'd-f No 16218 16304 16311 73 249d 263 309+C 315+C 10097C 10310 8020 8575 8603 8860 SB023 E1a1a1 No 16140 16223 16291 16362 16390 73 146 263 309+C 315+C 10398 10400 10834 10873 8701 8860 7598+veSB024 E2b No 16051 16086 16223 16362 16390 73 195 263 315+C 10398 10400 10873 8440 8701 8860 7598+veSB025 F4b1a'd-f No 16218 16304 16311 73 249d 263 309+C 315+C 10097C 10310 8020 8575 8603 8860 SB026 M7b1a2a No 16086 16129 16297 16324 73 199 263 315+C 9824 10398 10400 10497 10873 8701 8860 SB027 E1a1a1 No 16140 16223 16291 16362 16390 73 146 263 315+C 10398 10400 10834 10873 8701 8860 7598+veSB028 B5a2a2a2 No 16140 16189 16245 16266G 16362 73 93 210 263 315iC 9950 9962 10398 9bp 8584 8614 8860 SB029 B5a2a2a2 No 16140 16189 16245 16266G 16362 73 93 210 263 315iC 9950 9962 10398 9bp 8584 8614 8860 SB030 Y2a No 16126 16231 16311 73 263 309+C 315+C 10398 8392 8860 SB031 F4b1a'd-f No 16218 16304 16311 73 249d 263 309+C 315+C 10097C 10310 8020 8575 8603 8860
CRS = same as Cambridge reference sequence ' = or9bp = 9 base pairs deletiond = deletionNo Complete mtDNA sequencing not doneYes Complete sequencing available in supplementary Text file S1
8001 to 9000 1400 to 1500 Other SNP testedSaisiyat ID mtDNA Haplogroup
Complete Sequence available
HVS1 (16040 to 16390) or Comple sequence
HVS2 (1 to 350) or complete sequence 9800 to 11000
Copyright © 2022 FDOKUMEN