Who is Hispanic? Hispanic Identity among African Americans, Asian Americans, Others, and Whites

ARTICLE
Mitochondrial DNA and Y Chromosome VariationProvides Evidence for a Recent Common Ancestrybetween Native Americans and Indigenous Altaians
Matthew C. Dulik,1 Sergey I. Zhadanov,1,2 Ludmila P. Osipova,2 Ayken Askapuli,1,3 Lydia Gau,1
Omer Gokcumen,1,4 Samara Rubinstein,1,5 and Theodore G. Schurr1,*
The Altai region of southern Siberia has played a critical role in the peopling of northern Asia as an entry point into Siberia and a possible
homeland for ancestral Native Americans. It has an old and rich history because humans have inhabited this area since the Paleolithic.
Today, the Altai region is home to numerous Turkic-speaking ethnic groups, which have been divided into northern and southern clus-
ters based on linguistic, cultural, and anthropological traits. To untangle Altaian genetic histories, we analyzed mtDNA and Y chromo-
some variation in northern and southern Altaian populations. All mtDNAs were assayed by PCR-RFLP analysis and control region
sequencing, and the nonrecombining portion of the Y chromosomewas scored for more than 100 biallelic markers and 17 Y-STRs. Based
on these data, we noted differences in the origin and population history of Altaian ethnic groups, with northern Altaians appearingmore
like Yeniseian, Ugric, and Samoyedic speakers to the north, and southern Altaians having greater affinities to other Turkic speaking pop-
ulations of southern Siberia and Central Asia. Moreover, high-resolution analysis of Y chromosome haplogroup Q has allowed us to
reshape the phylogeny of this branch, making connections between populations of the New World and Old World more apparent
and demonstrating that southern Altaians and Native Americans share a recent common ancestor. These results greatly enhance our
understanding of the peopling of Siberia and the Americas.
Introduction
The Altai Republic is located in south-central Russia, situ-
ated at the borders of Mongolia, China, and Kazakhstan.
It sits at a crossroads where the Eurasian steppe meets the
Siberian taiga and serves as an entry point into northern
Asia. Having been habitable throughout the last glacial
maximum (LGM), the Altai region has had a human pres-
ence for some 45,000 years.1 The archaeology of the region
shows that, during this time, a number of different cultures
and peoples lived in andmigrated through the area.2–4 The
confirmation of Neanderthals and the recent discovery of
a new hominin at the Denisova cave in the Altai region
indicates that this area has long hosted extremely diverse
populations.5–7 It is also the area from which the ancestors
of Native American populations are thought to have arisen
prior to their expansion into the New World.8–11 In addi-
tion, archaeological evidence suggests that a few of the
later cultural horizons (Afanasievo and Andronovo) arose
in western Eurasia and spread eastward to the Altai region
during the Eneolithic and Bronze Ages, respectively.12,13
Such interactions increased during the Iron Age, as evi-
denced by the frozen Pazyryk kurgans in the southern Altai
Mountains,14 which contained examples of the typical
‘‘Scytho-Siberian animal style’’ observed throughout the
entire Eurasian steppe.3,15 These populations further
intermingled with expanding Altaic speaking groups,
and specifically the movements involving the Xiongnu,
1Department of Anthropology, University of Pennsylvania, Philadelphia, PA 1
630090, Russia; 3Institute of General Genetics and Cytology, Almaty 050060,4Present address: Harvard University Medical School, Brigham and Women’s H5Present address: Sackler Educational Laboratory for Comparative Genomic
NY 10024-5192, USA
*Correspondence: [email protected]
DOI 10.1016/j.ajhg.2011.12.014. �2012 by The American Society of Human
The America
Xianbei, and Yuezhi, as recorded by ancient Chinese histo-
rians in the second century BCE.16,17
Ethnographic studies of Turkic-speaking tribes indige-
nous to the Altai region of southern Siberia noted cultural
differences among ethnic groups such that they could be
classified into northern or southern Altaians.18,19 Northern
Altaian ethnic groups include the Chelkan, Kumandin,
and Tubalar. The Altai-kizhi, Teleut, and Telengit were
grouped together as southern Altaians, along with a few
other smaller populations. Similarly, linguistic studies
have shown that languages from northern and southern
populations are mutually unintelligible, despite their
having similar Turkic roots. The northern Altai languages
also showed greater influences from Samoyedic, Yeniseian,
and Ugric languages, possibly reflecting their origin among
the ancestors of these present-day peoples. By contrast,
southern Altaian languages belong to the Kipchak
branch of Turkic language family and have been greatly
influenced by Mongolian, especially after the expansion
of the Mongol Empire.16,20 These linguistic differences are
further mirrored by differences in anthropometric traits,
traditional subsistence strategies, religious traditions, and
clan names for northern and southern Altaians.18,19,21
Genetic analysis of Altaian populations initially focused
on protein polymorphisms to assess levels of diversity and
the relationships between them and other Siberian popula-
tions by comparing relative proportions of West and East
Eurasian genotypes.22–24 The role that the Altai region
9104-6398, USA; 2Institute of Cytology and Genetics, SB RAS, Novosibirsk
Kazakhstan
ospital, Boston, MA 02115, USA
s and Human Origins, American Museum of Natural History, New York,
Genetics. All rights reserved.
n Journal of Human Genetics 90, 229–246, February 10, 2012 229
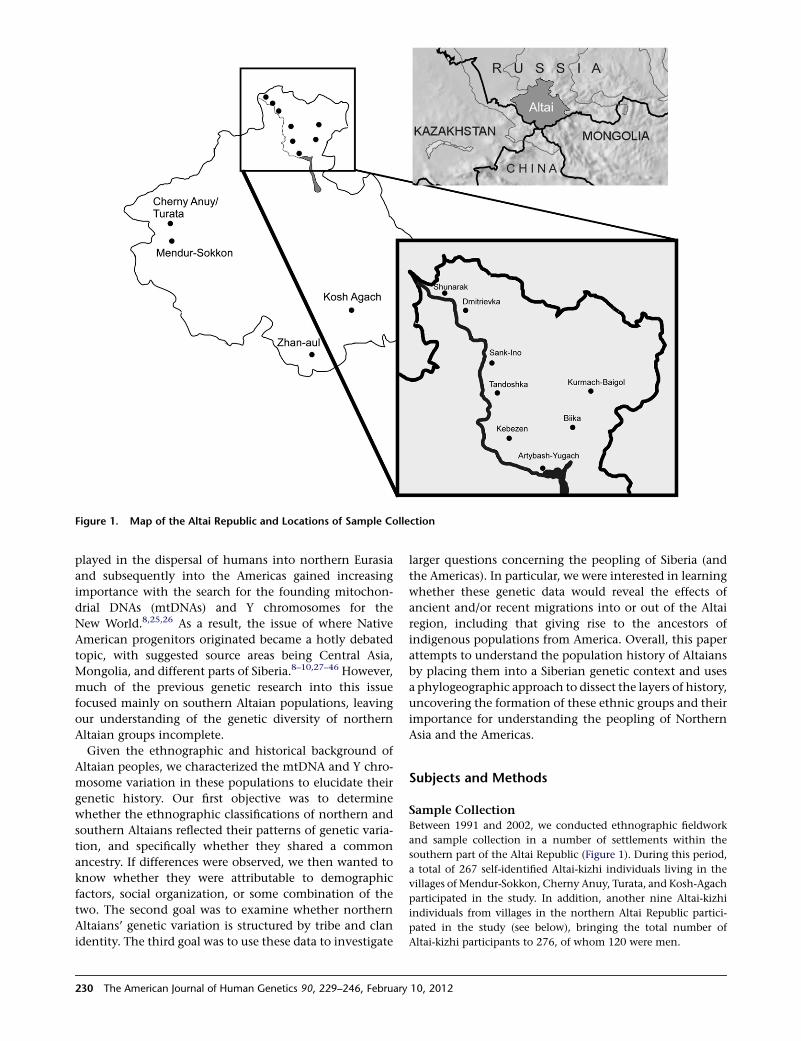
Figure 1. Map of the Altai Republic and Locations of Sample Collection
played in the dispersal of humans into northern Eurasia
and subsequently into the Americas gained increasing
importance with the search for the founding mitochon-
drial DNAs (mtDNAs) and Y chromosomes for the
New World.8,25,26 As a result, the issue of where Native
American progenitors originated became a hotly debated
topic, with suggested source areas being Central Asia,
Mongolia, and different parts of Siberia.8–10,27–46 However,
much of the previous genetic research into this issue
focused mainly on southern Altaian populations, leaving
our understanding of the genetic diversity of northern
Altaian groups incomplete.
Given the ethnographic and historical background of
Altaian peoples, we characterized the mtDNA and Y chro-
mosome variation in these populations to elucidate their
genetic history. Our first objective was to determine
whether the ethnographic classifications of northern and
southern Altaians reflected their patterns of genetic varia-
tion, and specifically whether they shared a common
ancestry. If differences were observed, we then wanted to
know whether they were attributable to demographic
factors, social organization, or some combination of the
two. The second goal was to examine whether northern
Altaians’ genetic variation is structured by tribe and clan
identity. The third goal was to use these data to investigate
230 The American Journal of Human Genetics 90, 229–246, February
larger questions concerning the peopling of Siberia (and
the Americas). In particular, we were interested in learning
whether these genetic data would reveal the effects of
ancient and/or recent migrations into or out of the Altai
region, including that giving rise to the ancestors of
indigenous populations from America. Overall, this paper
attempts to understand the population history of Altaians
by placing them into a Siberian genetic context and uses
a phylogeographic approach to dissect the layers of history,
uncovering the formation of these ethnic groups and their
importance for understanding the peopling of Northern
Asia and the Americas.
Subjects and Methods
Sample CollectionBetween 1991 and 2002, we conducted ethnographic fieldwork
and sample collection in a number of settlements within the
southern part of the Altai Republic (Figure 1). During this period,
a total of 267 self-identified Altai-kizhi individuals living in the
villages of Mendur-Sokkon, Cherny Anuy, Turata, and Kosh-Agach
participated in the study. In addition, another nine Altai-kizhi
individuals from villages in the northern Altai Republic partici-
pated in the study (see below), bringing the total number of
Altai-kizhi participants to 276, of whom 120 were men.
10, 2012

In 2003, we worked with 214 Northern Altaians living in the
Turochak District of the Altai Republic. These persons included
91 Chelkans, 52 Kumandins, and 71 Tubalars living in nine
different villages in the Biya and Lebed’ River basins and
along Teletskoe Lake (Figure 1). The villages included Artybash,
Biika, Dmitrievka, Kebezen, Kurmach-Baigol, Sank-Ino, Shunarak,
Tandoshka, and Yugach. Of the northern Altaian participants, 69
were men.
Blood samples were drawn from all participants with informed
consent written in Russian and approved by the University of
Pennsylvania IRB and the Institute of Cytology and Genetics in
Novosibirsk, Russia. Genealogical data were also obtained from
each person at the time of sample collection to ensure that the
individuals were unrelated through at least three generations
and to assess the level of admixture in these communities. Individ-
uals were categorized by self-identified ethnicity for this study.
Molecular Genetic AnalysisSample Preparation
Bloods were fractionated through low-speed centrifugation to
obtain plasma and red cell fractions. Total genomic DNAs were
isolated from buffy coats with a lysis buffer and standard phenol-
chloroform extraction protocol modified from earlier studies.27,47
mtDNA Analysis
The mtDNA of each sample was characterized by high-resolution
SNP analysis and control region sequencing. PCR-RFLP analysis
was employed to assign individuals to West48–52 and East30,53–56
Eurasian mtDNA haplogroups by screening them for known diag-
nostic markers, as per previous studies57,58 (Table S1 available
online), with the nomenclature used to classify the mitochondrial
haplotype according to PhyloTree.org.59
The hypervariable segment 1 (HVS1) of the control region was
directly sequenced for each sample by published methods,58 and
hypervariable segment 2 (HVS2) was sequenced with the primers
indicated in Table S2. Sequences were read on ABI 3130xl Gene
Analyzers located in the Laboratory of Molecular Anthropology
and the Department of Genetics Sequencing Core Facility at the
University of Pennsylvania and aligned and edited with the
Sequencher 4.8 (Gene Codes Corporation). All polymorphic
nucleotides were reckoned relative to the revised Cambridge refer-
ence sequence (rCRS).60,61 The combination of SNP data and
control region sequences defined maternal haplotypes in these
individuals.
Y Chromosome Analysis
The nonrecombining portion of the Y chromosome (NRY) from
each male participant was characterized by assaying phylogeneti-
cally informative biallelic markers in a hierarchical fashion accord-
ing to published information62,63 and previously published
methods.64 A total of 116 biallelic markers were tested to define
sample membership in respective NRY haplogroups. Most of the
SNPs and fragment length polymorphisms were characterized by
custom TaqMan assays read on an ABI Prism 7900 HT Real-Time
PCR System (Applied Biosystems). These polymorphisms included
L53, L54, L55, L56, L57, L213, L329, L330, L331, L332, L333,
L365, L400, L456, L472, L474, L475, L476, L528, LLY22g, M3,
M9, M12, M15, M18, M20, M25, M35, M45, M55, M56, M69,
M70, M73, M81, M86, M89, M93, M96, M102, M117, M119,
M120, M122, M123, M124, M128, M130, M134, M143, M147,
M157, M162, M170, M172, M173, M174, M178, M186, M201,
M204, M207, M214, M217, M223, M230, M242, M253, M265,
M267, M269, M285, M304, M323, M335, M346, M410, M417,
M434, M458, P15, P25, P31, P36.2, P37.2, P47, P60, P63, P105,
The America
P215, P256, P261, P297, and PK2. Additional markers were
detected through direct sequencing (L191, L334, L401, L527,
L529, M17, M46 [Tat], M343, M407, MEH2, P39, P43, P48,
P53.1, P62, P89, P98, P101, PageS000104, and PK5) and by PCR-
RFLP analysis (M175).65 Seventeen short tandem repeats (STRs)
were characterized with the AmpFlSTR Yfiler PCR Amplification
Kit (ABI) and read on an ABI 3130xl Genetic Analyzer with Gene-
Mapper ID v3.2 software. Each paternal haplotype was designated
by its 17-STR profile. Y chromosome lineages were defined as the
unique combinations of SNP and STR data present in the samples.
DYS389b was calculated by subtracting DYS389I from DYS389II,
which was used for all statistical and network analyses.64
Comparative DataTo place their genetic histories in a broader contextual framework,
we compared Altaian mtDNA and NRY data with those from
populations in southern Siberia, Central Asia, Mongolia, and
East Asia. For the mtDNA analysis, the populations included
Telengits, Teleuts, Shors, Khakass, Tuvinians, Todzhans, Tofalars,
Soyots, Buryats, Khanty, Mansi, Ket, Nganasan, Western Evenks,
Uyghurs, Kazakhs, Kyrgyz, Uzbeks, and Mongolians.41,43,44,66–71
For the NRY analysis, only populations that were represented by
full Y-STR data sets (not just Y-STRs for specific haplogroups)
were used for comparative purposes. These populations included
Teleuts, Khakass, Mansi, Khanty, Kalmyks, Mongolians, and
Uyghurs.68,72–75 The STR haplotypes were reduced to ten loci
(DYS19, DYS389I, DYS398b, DYS390, DYS391, DYS392, DYS393,
DYS437, DYS438, and DYS439) to allow for as broad a comparison
as possible. In the coalescence analysis, we used the 15 Y-STR loci
Q-M3 haplotypes from Geppert et al.76
Data AnalysisSummary statistics, including gene diversity and pairwise differ-
ences, were calculated with Arlequin v3.1177 for mtDNA HVS1
(np 16024-16400) and NRY Y-STRs. FST and RST values between
populations were also calculated with Arlequin v3.11 for the
HVS1 sequences and Y-STRs, respectively. FST values were esti-
mated with the Tamura and Nei model of sequence evolution.78
Pairwise genetic distances were visualized by multidimensional
scaling (MDS) with SPSS 11.0.0.79 In addition, nucleotide diversity,
Tajima’s D, and Fu’s FS were calculated with mtDNA HVS1
sequences.
We analyzed the phylogenetic relationships among Y-STR
haplotypes and complete mtDNA genomes by using Network
4.6.0.0 (Fluxus Technology Ltd). These networks employed a
reduced median-median joining approach and MP post-process-
ing.80–82 The NRY haplotypes used to generate the networks
consisted of 15 Y-STRs. DYS385 was excluded from the network
analysis because differentiation between DYS385a and DYS385b
is not possible with the Y-Filer kit.83 The Y-STR loci were weighted
based on the inverse of their variances. Mitogenomes used in this
analysis came from the published literature and GenBank.
The time to the most recent common ancestor (TMRCA) for mi-
togenomes was estimated with the methods of Soares et al.84 The
Y-STR diversity within each haplogroup was assessed by two
methods.64 The first involved calculation of rho statistics with
Network 4.6.0.0, where the founder haplotype was inferred as
in Sengupta et al.85 The second used Batwing,86 a Bayesian
analysis where the TMRCA and expansion time of each popula-
tion (or haplogroup) were calculated by previously published
methods.64,72,87 Both the evolutionary and the pedigree-based
mutation rates were used to estimate coalescence dates with
n Journal of Human Genetics 90, 229–246, February 10, 2012 231
generation times of 25 and 30 years, respectively.88–90 Because
a definitive consensus does not yet exist as to which rate should
be used, the validity of the resulting estimates are discussed. In
addition, Batwing was used to estimate the split or divergence
times of several haplogroups. Thismethod assumes that, after pop-
ulations split, no further migration occurs between them. In this
case, the haplogroups investigated were not shared between pop-
ulations but derive from a common source, thereby justifying this
approach. Duplicated loci and new STR variants detected in this
study were excluded from statistical analysis.
Results
Mitochondrial DNA and Y Chromosome Diversity
The maternal genetic ancestry of northern and southern
Altaian populations was explored by characterizing coding
region SNPs and control region sequences from 490 inhab-
itants of the Altai Republic, which yielded 99 distinct
mtDNA haplotypes defined by SNP and HVS1 mutations
(Table S3). The majority of mtDNAs were of East Eurasian
origin, although the relative proportion of these haplo-
types was greater in Chelkans (91.5%) compared to other
Altaian populations (75.2% in Tubalars, 75.6% in Kuman-
dins, and 76.4% in Altai-kizhi) (Table 1). Despite exhibit-
ing a lower overall frequency of West Eurasian haplo-
groups, Altaians (specifically, the Altai-kizhi, Tubalar, and
Kumandins) had a higher proportion of them as compared
to other southern Siberians.41,43 Differences in mtDNA
haplogroup profiles were observed among northern
Altaian ethnic groups and between northern Altaians
and Altai-kizhi, with the Chelkans being extraordinarily
distinct. Nevertheless, comparisons among other Altaian
ethnic groups revealed some consistent patterns. mtDNA
haplogroups B, C, D, and U4 were found in all Altaian pop-
ulations, but at varying frequencies, whereas southern
Altaians (Altai-kizhi, Telengits, and Teleuts) tended to
have a greater variety of West Eurasian haplogroups at
low frequencies. Shors, who have sometimes been catego-
rized as northern Altaians,18 exhibited a similar haplo-
group profile to other northern Altaian ethnic groups,
including moderate frequencies of C, D, and F1, although
they lacked others (N9a and U).41
Haplogroups C and D were the most frequent mtDNA
lineages in the Altaians, consistent with the overall picture
of the Siberian mtDNA gene pool. However, phylogeo-
graphic analysis of these lineages showed a greater diver-
sity of haplotypes in the southern Altaians compared to
northern Altaians. Although haplotypes were shared
between regions, northern Altaians largely had C4 with
the root HVS1 motif (16223-16298-16327) and C5c,
whereas the southern Altaians had C4a1 and C4a2.
Although C5c is largely confined to Altaians, it has been
suggested that an early migration from Siberia to Europe
brought haplogroup C west, where the branch differenti-
ated during the Neolithic and then was taken back into
southern Siberia.83 Also noteworthy, D4j7 appears to
be specific to Altaians and Shors.41,91 In addition, a D5a
232 The American Journal of Human Genetics 90, 229–246, February
haplotype was shared by Tubalars and Altai-kizhi, and
a rare D5c2 haplotype was shared by the Chelkans
and Kumandins. Interestingly, complete mtDNA genome
sequencing of a subset of our D5c2 samples showed few
differences from those present in Japan,55 suggesting
a possible connection resulting from the dispersal of Altaic
speaking populations.92 The remainder of the D haplo-
types were found in other southern Siberian and Central
Asian populations.
To explore the NRYvariation in Altaian populations, 116
biallelic polymorphisms were characterized in 189 male
individuals, resulting in 106 Y chromosome lineages
(Table 2). Northern Altaian populations were composed
largely of haplogroups Q and N-P43, whereas southern
Altaians had a higher proportion of R-M417, C-M217/
PK2, C-M86, and D-P47. Haplogroups typical of south
Asia, western Europe, and East Asia were not found in
appreciable frequencies.72,93–99 The haplogroup frequency
differences between northern and southern Altaians were
statistically significant (c2 ¼ 66.03, df ¼ 9, p ¼ 9.09 e�11).
As with the mtDNA data set, we also observed differ-
ences in NRY haplogroup composition among northern
Altaian populations, where each ethnic group shared
haplogroups with the other two, yet had distinct haplo-
group profiles. Overall, Kumandins had the most disparate
haplogroup frequencies of the northern Altaians, exhibit-
ing similar number of N-P43 chromosomes as the
Chelkans, which were quite similar to those found in
Khanty and Mansi populations in northwestern Sibe-
ria.68,100 In addition, a large proportion of Kumandin Y
chromosomes belonged to R-M73. This haplogroup is
largely restricted to Central Asia101 but has also been found
in Altaian Kazakhs and other southern Siberians.64,102 In
fact, Myres et al.101 noted two distinct clusters of R-M73
STR haplotypes, with one of them containing Y chromo-
somes bearing a 19 repeat allele for DYS390, which appears
to be unique to R-M73. Interestingly, the majority of
Kumandin R-M73 haplotypes fell into this category,
although haplotypes from both clusters are found in
southern Siberia.102
In all cases, the haplotypes present in Altaians fit into
known modern human phylogenies. None of the Altaians
had a mitochondrial lineage similar to those of Neander-
thals or the Denisovan hominin. Although there are no
ancient Denisovan or Neanderthal Y chromosome data
to compare with the Altaian data set, the Altaian Y chro-
mosomes clearly derived from more recent expansions of
modern humans out of Africa.
Altaian Genetic Relationships
Summary statistics were calculated to assess the relative
amounts of genetic diversity in Altaian populations
(Table 3). Gene diversities based on HVS1 of the mtDNA
showed that, overall, the Altai-kizhi were more diverse
than the northern Altaians. The average pairwise differ-
ences for the Altai-kizhi were also smaller. In fact, the esti-
mates for the Altai-kizhi and Tubalars were comparable
to other southern Siberians.43 By contrast, those for the
10, 2012

Table 1. mtDNA Haplogroup Frequencies of Altaian Populations
Hg Chelkan Kumandin Tubalar1 Tubalar2 Shor Altai-kizhi1 Altai-kizhi2 Telengit Teleut
# 91 52 71 72 28 276 48 55 33
C 15.1 41.5 35.6 20.8 17.9 31.4 25.0 14.6 24.2
Z 2.7 3.6 4.3 4.2 3.0
M8 3.6 4.2
D4 13.9 15.1 24.7 15.3 25.0 13.0 6.3 18.2 24.2
D5 8.6 3.8 4.1 5.6 3.6 0.7 3.0
G 3.2 4.0 4.2 3.6
M7 1.8
M9 1.4
M10 1.1 3.6 0.4 2.1
M11 2.1 1.8 3.0
M* 1.8
A 1.9 11.1 3.6 2.9 4.7 7.3
I 3.6 1.4 2.1 1.8
N1a 1.8
N1b 0.4
W 1.1
X 3.8 1.4 2.2 2.1 3.0
N9a 19.4 1.9 2.7 6.9 1.8
B 3.2 3.8 2.7 4.2 3.6 1.4 6.3 14.6 6.1
F1 10.8 3.8 1.4 14.3 8.3 4.2 1.8 3.0
F2 15.1 2.7 3.6 2.5 2.1
H 1.1 2.7 1.4 3.6 2.5 8.3 9.1 9.1
H2 3.3 2.1
H8 5.7 2.7 4.2 3.6 1.4
HV 1.8
V 6.1
J 3.6 4.0 6.3 1.8
T 1.9 0.4 3.6 6.1
U2 2.8 0.7 1.8 3.0
U3 2.1
U4 4.3 3.8 15.1 18.1 3.6 0.7 2.1 1.8 3.0
U5 2.2 9.4 4.1 5.6 3.3 2.1 1.8
U8 1.8
K 3.6 3.3 6.3 3.0
R9 1.1 3.8 1.4 2.2 5.5
R11 2.1
Chelkans and Kumandins were lower and more similar to
Soyots, but not as low as that of Tofalars. Mismatch distri-
butions were smooth and bell-shaped for all populations
except the Chelkans, which had a significant raggedness
index. This statistic indicated that Tubalars, Kumandins,
The America
and Altai-kizhi had experienced sudden expansions
or expansions from population bottlenecks.103 Tests of
neutrality confirmed these findings in yielding signifi-
cantly negative Tajima’s D and Fu’s FS estimates for all
populations, except the Chelkans, indicating that this
n Journal of Human Genetics 90, 229–246, February 10, 2012 233

Table 2. High-Resolution NRY Haplogroup Frequencies in AltaianPopulations
Haplogroup Chelkan Kumandin Tubalar Altai-kizhi
C3* 19 (0.158)
C3c1 5 (0.042)
D3a 6 (0.050)
E1b1b1c 1 (0.037)
I2a 1 (0.037)
J2a 3 (0.025)
L 1 (0.040)
N1* 1 (0.059) 3 (0.111)
N1b* 5 (0.200) 8 (0.471) 2 (0.017)
N1c* 1 (0.008)
N1c1 2 (0.017)
O3a3c* 1 (0.008)
O3a3c1 1 (0.037) 1 (0.008)
Q1a2 1 (0.037)
Q1a3a* 15 (0.600) 10 (0.370)
Q1a3a1c* 20 (0.167)
R1a1a1* 4 (0.160) 2 (0.118) 10 (0.370) 60 (0.500)
R1b1a1 6 (0.353)
T
Total 25 17 27 120
particular population probably experienced a reduction in
population size or was subdivided.
To understand Altaian maternal genetic background, we
compared our data with those from other North Asian and
Central Asian populations. FST values between populations
were calculated with HVS1 sequences and viewed through
Table 3. HVS1 Summary Statistics for Altaian Populations
Population
Northern Altaian
Chelkan Kumandi
# of samples 91 52
# of haplotypes 22 18
Haplotype diversity 0.923 5 0.013 0.914 5 0
Nucleotide diversity 0.020 5 0.011 0.022 5 0
Pairwise differences 7.68 5 3.61 8.22 5 3.
Raggedness index 0.032 0.022
Raggedness p value 0.000 0.149
Tajima D 1.201 �0.644
Tajima D p value 0.000 0.000
Fu’s FS 3.417 �0.497
Fu’s FS p value 0.002 0.000
234 The American Journal of Human Genetics 90, 229–246, February
multidimensional scaling (Figure 2). In this analysis,
southern Siberians formed a rather diffuse cluster, with
most Central Asian and Mongolian populations being
separated from them. Altaian populations also did not
constitute a distinct cluster unto themselves. Based on
the FST values, the Chelkans were distinctive from all other
ethnic groups. Although falling closest to the Khakassians
in the MDS plot, they shared a smaller genetic distance
with the Tubalars2, which was expected because of the
inclusion of some Chelkans in that sample set.44 Kuman-
dins and Tubalars1 were not significantly different, and
appeared close to Tuvinians and southern Altaians. In
fact, both populations had smaller FST values with
southern Altaians than they did with the Chelkans,
although the genetic distances between Tubalars1 and
Tubalars2, Altai-kizhi, and Teleuts were also nonsignifi-
cant. Unlike northern Altaians, most of the southern
Altaian populations clustered together. The Altai-kizhi,
Teleuts, and Tubalars1 formed one small cluster with
Kyrgyz, whereas the Telengits showed greater affinities
with Central Asian populations. The southern Altaian
cluster sat near a cluster of Tuvinian populations, suggest-
ing a similar population history and likely gene flow
between these groups.
Summary statistics were calculated to assess the genetic
diversity of paternal lineages in Altaian populations
(Table 4). Gene diversities based on Y-STR haplotypes
(15-loci Y-STR haplotypes; Table S4) showed that the Altai-
kizhi were more diverse than the northern Altaians. Unlike
the mtDNA data, within group pairwise differences were
greater in the southern Altaian and Tubalar Y-STR haplo-
types than in the Chelkans and Kumandins.
Y-chromosomal variation in the four populations in our
data set provided a slightly different picture than the mito-
chondrial data. In this analysis, RST values were calculated
with 15-loci Y-STR haplotypes (Table S6). These estimates
indicated that only the Chelkans and Tubalars were not
Southern Altaian
n Tubalar1 Altai-kizhi1
71 276
26 75
.021 0.953 5 0.010 0.976 5 0.003
.011 0.019 5 0.010 0.018 5 0.009
87 7.03 5 3.34 6.84 5 3.23
0.010 0.011
0.635 0.388
�0.701 �1.180
0.000 0.000
�3.877 �24.416
0.000 0.000
10, 2012

Figure 2. MDS Plot of FST Genetic Distances Generated from mtDNA HVS1 Sequences in Siberian and Central Asian PopulationsCircle, southern Siberian; diamond, northwestern Siberian; square, Central Asian.
significantly different from each other. The Kumandins
were quite distant from all populations, although these
distances were slightly smaller among northern Altaians
than with the Altai-kizhi. The Altai-kizhi were again closest
to the Tubalars.
These relationships were affirmed by the haplotype
sharing between the four populations. The Chelkans and
Tubalars shared a large proportion of their haplotypes,
mostly those from haplogroups Q and R-M417, whereas
the Kumandins shared only one haplotype with Tubalars
(a rare N-LLY22g haplotype). In addition, the northern
and southern Altaians shared only a single haplotype,
belonging to haplogroup O-M117, which is more
commonly found in southern China.104 In fact, these
two Y chromosomes were the only occurrences of hap-
logroup O in our data set.
The Y-STR profiles were reduced to 10-loci STR haplo-
types in order to compare Y chromosome diversity in
Table 4. Y-STR Summary Statistics for Altaian Populations
Population
Northern Altaian
Chelkan Kumandi
# of samples 25 17
# of haplotypes 14 9
Haplotype diversity 0.910 5 0.043 0.912 5 0
Pairwise differences 6.59 5 3.22 6.39 5 3.1
The America
several Siberian and Central Asian populations (Table 5;
Figure 3). The genetic distances in our sample set remained
high despite the greater haplotype sharing that resulted
from this reduction. Overall, the genetic distances were
much greater with the Y-STR haplotypes compared to
mtDNA haplotypes, indicating greater genetic differentia-
tion in paternal lineages compared to maternal lineages.
In addition to the Chelkans and Tubalars, two other groups
of populations exhibited nonsignificant RST values. One
group included Uyghur (from Urumqi and Yili) and
Mongolian (Kalmyks and Mongolians) populations, and
the other included the Mansi and a Sagai population iden-
tified as part of the Khakass ethnic group. In contrast with
their position in the mtDNA MDS plot, northern Altaians
were separated from all other populations, including other
southern Siberians. The three groups of Khakass (Sagai,
Sagai/Shor, and Kachin) fell much closer to the Khanty
and Mansi, which probably indicates a common ancestry
Southern Altaian
n Tubalar Altai-kizhi
27 120
18 62
.042 0.954 5 0.025 0.978 5 0.005
9 7.40 5 3.57 7.58 5 3.56
n Journal of Human Genetics 90, 229–246, February 10, 2012 235

Table 5. Low-Resolution NRY Haplogroup Frequency Comparison of Altaians
Hg Chelkan Kumandin Tubalar Altai-kizhi1 Altai-kizhi2 Teleut1 Teleut2 Shor
C 20.0 13.0 8.5 5.7 2.0
D 5.0 3.3
E 3.7
F (xJ,K) 3.7 3.3 10.7 2.0
J 2.5 2.2 2.1
K (xN1c,O,P) 24.0 52.9 11.1 1.7 2.2 13.7
N1c 2.5 5.4 10.6 28.6 2.0
O 3.7 1.7
P (xR1a1a) 60.0 35.3 40.7 16.7 28.3 34.3 2.0
R1a1a 16.0 11.8 37.0 50.0 42.4 68.1 31.4 78.4
Total 25 17 27 120 92 47 35 51
Figure 3. MDS Plot of RST Genetic Distances Generated from YChromosome STR Haplotypes in Siberian and Central Asian Pop-ulationsCircle, southern Siberian; diamond, northwestern Siberian;square, Central Asian.
for these populations. Unfortunately, more complete
Y-STR data sets were not available for other southern Sibe-
rian populations. Nonetheless, these results indicated a
different history for northern Altaians compared to
Central Asians and even other southern Siberians. A
specific reason for this difference is that Mongolians
had a much greater genetic impact on southern Altaians,
which is expected given the historical and linguistic
evidence.18,19,105
Altaian and Native American Connections
To test the hypothesis that Native Americans share a
more recent common ancestor with Altaians relative
to other Siberian and East Asian populations, we specifi-
cally examined the mtDNA and NRY haplogroups that
appeared in both locations. For the mtDNA, it is well
known that haplogroups A–D and X largely make up the
maternal genetic heritage of indigenous peoples in the
Americas.27,29,39,47,106 Complete mtDNA genome sequenc-
ing has led to a greater comprehension of the phylogeny of
Native American mtDNAs and, consequently, a better
understanding of their origins.107–110 Although Altaians
possess the five primary mtDNA haplogroups found in
the Americas, these lineages are not exactly the same as
those appearing in Native Americans at the subhaplogroup
level. This is also true for other Siberian populations except
in those few instances where gene flow across the Bering
Strait brought some low frequency types back to north-
eastern Siberians.
An example of this pattern is haplogroup C1a.
Southern Altaians possessed C1a, which is an exclusively
Asian branch of the predominately American C1 haplo-
group.107,108 To date, only four complete C1a genomes
have been published. These sequences produced a more
recent TMRCA than other genetic evidence had previously
suggested for the peopling of the Americas. Although
Tamm et al.107 viewed this haplogroup as representing a
back migration into Siberia, it does not occur in Siberian
populations that are geographically closest to the Americas,
236 The American Journal of Human Genetics 90, 229–246, February
but rather those living in southern and southeastern
Siberia.41,89 However, given the small effective population
sizes from the northeastern Siberian groups that have
been studied thus far, this haplogroup could have been
lost because of drift.
The other mtDNA haplogroup found in northern
and southern Altaians that is a close relative of a Native
American lineage is D4b1a2a1a. This haplogroup has
been found in Altaians, Shors, and Uzbeks from north-
western China.41,44,70 Analysis of complete mtDNA
genomes identified a sister branch (D4b1a2a1a1), which
is found only in northeastern Siberian populations
and Inuit from Canada and Greenland.42,45,54,91,111
TMRCAs were calculated from the complete mtDNA
genomes of this branch and those from Native American
D4b1a2a1a1. By analyzing only synonymous mutations
from these sequences with the method of Soares et al.,84
10, 2012

we estimated the TMRCAs of these two branches at
11.8 kya and 15.8 kya, respectively.
For the Y chromosome, indigenous American lineages
are derived mostly from haplogroups C and Q, and, as
such, are crucial for understanding of the genetic histories
of peoples from the Americas and how they relate to
populations of Central Asia and Siberia.9,39,93,98,112,113
Just as Seielstad et al.114 and Bortolini et al.38 used M242
to clarify the genetic relationship between Asian and
American Y chromosomes, the characterization of this
haplogroup at an even higher level of resolution has led
to a much greater understanding of the origins of Native
American Y chromosomes and their connections to Asian
types. In this regard, it was recently shown that the
American Q-M3 SNP is located on an M346-positive
background.63 The presence of M346 in Central Asia and
Siberia has strengthened the argument for a southern
Siberian or Central Asian origin for many American Y chro-
mosomes.85,99,102,115
Given the importance of haplogroup Q for Native
American origins, we subjected samples from this lineage
to high-resolution SNP analysis involving 37 biallelic
markers to better understand the relationship between
Old and New World populations and the migration(s)
that connect them. All Y chromosomes in this study that
belonged to haplogroup Q (as indicated by the presence
of M242) were also found to have the P36.2, MEH2,
L472, and L528 markers (Figure S1). Thus, these haplo-
types fell into the Q1a branch of the Y chromosome
phylogeny. Because Q1b Y chromosomes were not found
in Altaian samples, we were not able to definitively place
the L472 and L528 SNPs at the same phylogenetic position
as MEH2. For this reason, their placement is tentative until
L275/L314/M378 Y chromosomes are screened for these
markers. Furthermore, M120/M265-positive, P48-positive,
and P89-positive samples were not found in the Altai
region. Therefore, the placement of these branches at the
same phylogenetic level as M25/M143 and M346/L56/
L57 should also be considered as provisional (although
see Karafet et al.63).
The M346, L56, and L57 SNPs were positioned as ances-
tral to three derived branches in the Family Tree DNA
phylogeny. We found that the L474, L475, and L476
SNPs were present in all of our M346-positive samples.
However, because M323- and L527/L529-positive samples
were not found in the Altaians, we could not confirm the
exact position of these markers at either the Q1a3 or
Q1a3a level. On the other hand, all Altaians that possessed
the M346, L56, L57, L474, L475, and L476 SNPs also had
L53, L55, L213, and L331.
Interestingly, northern and southern Altaian Q Y chro-
mosomes differed by three markers. L54, L330, and L333
were found in Q haplotypes in the southern Altaians and
one Altaian Kazakh, whereas the northern Altaians Q
haplotypes lacked these derived SNPs. Thus, according to
the standard nomenclature set by the Y Chromosome
Consortium62 and followed by others, the northernAltaian
The America
Q haplotypes belonged to Q1a3a* and the southern
Altaians belonged to Q1a3a1c*. We have further confirmed
that M3 haplotypes belong to L54-derived Y chromosomes
(unpublished data). These alterations in the phylogeny
change the haplogroup name of the Native American
Q-M3 Y chromosomes from Q1a3a to Q1a3a1a. Moreover,
the position of M3 and L330/L333 in the phylogeny indis-
putably showed that the MRCA of most Native American
Y chromosomes was shared with southern Altaians.
The differences between the northern and southern
Altaian Q Y chromosomes were also reflected in the anal-
ysis of high-resolution Y-STR haplotypes (Figure S2).116
Comparisons of Altaian Q-M346 Y chromosomes with
those from southern Siberian, Central Asian, and East
Asian populations revealed affinities between southern
Altaian and these other groups. However, the northern
Altaians remained distinctive, even in networks con-
structed from fewer Y-STR loci (Figure S3).
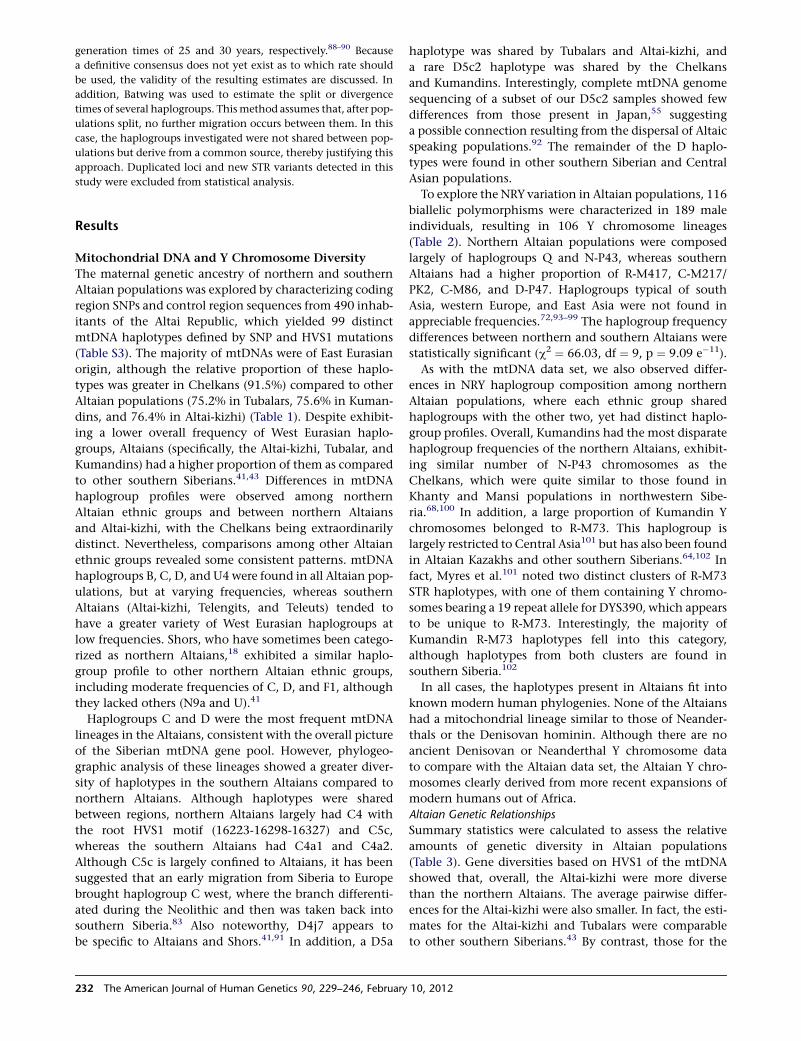
The time required to evolve the extent of haplotypic
diversity observed in each of the subhaplogroups can aid
in determining when particular mutations arose and
possibly when these mutations were carried to other loca-
tions. The TMRCA for the northern Altaian Q1a3a* Y chro-
mosomes indicated a relatively recent origin for them, one
dating to either the Bronze Age or recent historical period,
depending on the Y-STRmutation rate being used (Table 6).
The southern Altaian/Altaian Kazakh Q1a3a1c* Y chromo-
somes had a slightly older TMRCA that dated them to
either the late Neolithic or early Bronze Age. By using
Bayesian analysis, we further estimated the divergence
time of the two Q haplogroups at about 1,000 years after
the TMRCA of all Altaian Q lineages (~20 kya), indicating
an ancient separation of northern and southern Altaian
Q Y chromosomes (Table 7).
A similar analysis was conducted to determine when the
L54 haplogroup arose and gave rise to M3 and L330/L334
subbranches. The indigenous American Y chromosomes
used in this analysis were more diverse than those of
southern Altaians. The resulting TMRCA for the South
American Q1a3a1a* samples was 22.2 kya or 7.6 kya,
depending on the mutation rate used. The divergence
between the M3 and L330/L334 Y chromosomes was
~13.4 kya, with a TMRCA of 22.0 kya, via the evolutionary
rate. By contrast, the TMRCA and divergence time via
a pedigree-based mutation rate were 7.7 kya and 4.9 kya,
respectively.
The time required to generate the haplotypic diversity in
the L54-positive Y chromosomes clearly showed that the
evolutionary rate provided a more reasonable estimate.
The Americas were inhabited well before 5–8 kya, based
on various lines of evidence, making the use of the pedi-
gree-based mutation rate questionable. The estimates
generated with the evolutionary-based mutation rate
provided times that are more congruent with the known
prehistory of the Americas.117 They are also similar to the
TMRCAs calculated for Native American mtDNA haplo-
groups.107,108
n Journal of Human Genetics 90, 229–246, February 10, 2012 237
Table 6. TMRCAs and Expansion Times for Altaian and Native American NRA Haplogroup Q Lineages
Hg N
Network Batwing - TMRCA Batwing - Expansion
r 5 s Median 95% C.I. Median 95% C.I.
Pedigree-Based Mutation Rate
All Q1a3a 97 5,390 5 1,000 8,420 [5,620–14,290] 7,230 [1,220–20,510]
Q1a3a* 25 1,410 5 580 1,480 [680–3,060] 2,100 [380–6,830]
Q1a3a1a* 52 5,820 5 1,280 7,630 [4,870–12,920] 4,680 [480–14,940]
Q1a3a1c* 20 2,420 5 700 2,970 [1,500–5,960] 2,680 [450–8,610]
Evolutionary-Based Mutation Rate
All Q1a3a 97 14,970 5 2,760 25,580 [14,230–51,140] 17,220 [1,380–54,950]
Q1a3a* 25 3,910 5 1,610 5,320 [2,300–12,160] 4,340 [1,000–13,080]
Q1a3a1a* 52 16,170 5 3,550 22,160 [11,960–44,340] 9,800 [620–39,543]
Q1a3a1c* 20 6,750 5 1,950 8,720 [3,960–20,010] 5,600 [1,030–17,910]
Note: r, rho statistic; s, standard error; Q1a3a*, Northern Altaians (this study); Q1a3a1a, Native Americans (Geppert et al.76); Q1a3a1c, Southern Altaians (thisstudy).
Discussion
Origins of Northern and Southern Altaians
In this paper, we characterized mtDNA and NRY variation
in northern and southern Altaians to better understand
their population histories and elucidate the genetic
relationship between Altaians and Native American popu-
lations. The evidence from the mtDNA and NRY data
supports the hypothesis that northern and southern
Altaians generally formed out of separate gene pools.
This complex genetic history involves repeated migrations
into (and probably out of) the Altai-Sayan region. In addi-
tion, the histories as revealed by these data added nuances
that could not be attained through low-resolution charac-
terization alone.
The NRY data provided the clearest evidence for a signif-
icant genetic difference between the two sets of Altaian
ethnic groups. Although sharing certain NRY haplogroups,
the two population groups differed in the frequencies of
these lineages, and, more importantly, shared few haplo-
types with them. By contrast, northern and southern pop-
ulations shared considerably more mtDNA haplotypes,
Table 7. Divergence Times between Haplogroups/Populations
TMRCA
Median 95% Con
Pedigree-Based Mutation Rate
Northern and Southern Altaians 5,490 [3,000–11,
Southern Altaians and Native Americans 7,740 [5,170–12,
Evolutionary-Based Mutation Rate
Northern and Southern Altaians 21,890 [9,900–57,
Southern Altaians and Native Americans 21,960 [12,260–42
238 The American Journal of Human Genetics 90, 229–246, February
indicating that some degree of gene flow had occurred
between them, albeit in a sex-specific manner. As seen in
other populations from Siberia and Central Asia, the patri-
lineality of these groups probably helped to shape this
difference in patterns of mtDNA and Y-chromosomal vari-
ation.64,118
In addition, each northern Altaian ethnic group showed
different genetic relationships with the Altai-kizhi. The
Tubalars consistently grouped closer to the Altai-kizhi
than the other two northern Altaians based on both
mtDNA and NRY data. Thus, the higher genetic diversity
of mtDNA and NRY haplotypes in the Tubalars is probably
the result of admixture with other groups, such as
southern Altaians. The Chelkans, on the other hand,
have the most divergent set of mtDNAs of the three popu-
lations. Mismatch analysis and tests of neutrality indicated
that the Chelkans show signs of decreasing population size
or population structure. Long-term endogamy has prob-
ably also played a role in shifting the pattern of mtDNA
diversity in Chelkans from that seen in other northern
Altaians. Because of this endogamy (and genetic drift),
only a few lineages attained high frequencies, resulting
Split Time
fidence Interval Median 95% Confidence Interval
100] 4,490 [1,730–10,070]
760] 4,950 [2,360–9,490]
440] 19,260 [7,060–54,600]
,690] 13,420 [5,220–30,430]
10, 2012

in reduced mtDNA diversity. Based on the NRY data, the
Kumandins were distinct from both the Chelkans and
Tubalars, who were composed of mostly the same set of
lineages. Thus, the genetic diversity in northern Altaians
is structured by ethnic group membership, and, therefore,
can be viewed as reflecting distinctive histories for each
population.
Not much is known about the ethnogenesis of northern
Altaians. However, it has been suggested that they
descended from groups that historically lived around the
Yenisei River and spoke either southern Samoyedic, Ugric,
or Yeniseian languages.18,19 These populations are the
same ones that later contributed to the formation of the
Kets, Selk’ups, Shors, and Khakass in northwestern Siberia
and the western Sayans of southern Siberia.4,105 Further-
more, the Chelkans and Tubalars possess a large number
of Q1a3a* Y chromosomes with dramatically different
STR profiles compared to other southern Siberians (Altai-
kizhi and Tuvinians) and Mongolians. Thus, it is possible
that similar lineages will be found in the Kets and/or
Sel’kups, where high frequencies of Q1-P36 have already
been noted.119 Should this be the case, it would provide
additional evidence for northern Altaians having common
ancestry with Samoyedic, Yeniseian, and Ugric speakers. In
fact, Chelkans and Kumandins also have N-P43 Y chromo-
somes very similar to ones found in the Ugric-speaking
Khanty. Regardless, there is notable genetic discontinuity
between northern Altaians and other Turkic-speaking
people of southern Siberia.
Southern Altaians share greater affinities with Mongo-
lians and Central Asians than they do with northern
Altaians. This is partly because of the high frequencies of
Y chromosome haplogroup C in these groups. In fact,
present-day Kyrgyz are nearly indistinguishable from the
Altai-kizhi based on their NRY haplogroup profile.120,121
They share similar C-M217 and R-M417 lineages with
the Altai-kizhi, suggesting a recent common ancestry for
the two groups, which further supports the theory of a
recent common ancestry among southern Siberians and
Kyrgyz.122
As evident in the disparities in genetic history between
northern and southern Altaians, the Altai has served as
a long-term genetic boundary zone. These disparities
reflect the different sources of genetic lineages and spheres
of interaction for both groups. The northern Altaians share
clan names, similar languages, subsistence strategies, and
other cultural elements with populations that today live
farther to the north.4 By contrast, southern Altaians share
these same features with populations in Central Asia,
mostly with Turkic- (Kipchak) but also Mongolic-speaking
peoples. Thus, the geography of the Altai (taiga versus
steppe) has helped to maintain these cultural and biolog-
ical (mtDNA, Y chromosome, and cranial-morphological)
differences.
Furthermore, no evidence of Denisovan or Neanderthal
ancestry was found in the Altaian mtDNA and Y chromo-
some data. However, this does not preclude such admix-
The America
ture in the autosomes of Altaian populations. Greater
numbers of derived Denisovan SNPs were found in some
southeastern Asian and Oceanian populations, although
native Siberians were not included in that study.123 There-
fore, this issue requires further investigation.
Native American Origins
Many earlier genetic studies looked for the origins of
Native Americans among the indigenous peoples of Sibe-
ria, Mongolia, and East Asia. Often, the identification of
source populations conflicted between studies, depending
largely on the loci or samples being studied. Cranial
morphology has been used to demonstrate a connection
between the Native Americans and Siberian popula-
tions.124,125 Various researchers have suggested sources
such as the Baikal region of southern Siberia, the Amur
region of southeastern Siberia, and more generally Eurasia
and East Asia.126–128 A study of autosomal loci also showed
an affinity between populations in the New World and
Siberian regions but did not attempt to pinpoint a partic-
ular area of Siberia as the source area.129 In addition,
mtDNA studies have suggested New World origins from
a number of different locations including different parts
of Siberia, Mongolia, and northern China.34,41–45,47,71,130
Our own analysis of Altaian mtDNAs showed that the
five primary haplogroups (A–D, X) were present among
these populations. However, Altaian populations (and
generally all Siberian populations outside of Chukotka)
lack mtDNA haplotypes that are identical to those appear-
ing in the Americas. The only exceptions are the Selk’ups
and Evenks who bear A2 haplotypes, with their presence
in those groups being explained as a result of a back migra-
tion to northeast Asia.107
Despite the general absence of Native American haplo-
types in southern Siberia, there are sister branches whose
MRCAs are shared with those in Native Americans. One
such lineage is C1a, which was found in two Altai-kizhi
individuals and has also been observed at low frequencies
in Mongolia, southeastern Siberia, and Japan.44,46,55,71
Tamm et al.107 attribute its presence in northeast Asia to
a back migration from the NewWorld, where haplogroups
C1b–d are prevalent, whereas Starikovskaya et al.44 argue
that C1a and C1b arose in the Amur region, with C1b
migrating to the Americas later. A similar lineage is
D4b1a2a1a, a sister branch to D4b1a2a1a1, which is found
in northern North America. Although both of these line-
ages date to around 15,000 years ago, additional mitoge-
nome sequences from these haplogroups are needed to
estimate more precise TMRCAs for them and thereby
delineate their putative Asian and American origins.
Results obtained from the Y chromosome analysis
support the view that southern Siberians and Native
Americans share a common source.8,9,11,38,131 This con-
nection was initially suggested by a low-level Y-SNP
resolution and an alphoid heteroduplex system by Santos
et al.8 Subsequently, Zegura et al.11 showed a similarity in
NRY Q and C types among southern Altaians and Native
n Journal of Human Genetics 90, 229–246, February 10, 2012 239

Americans by using only fast evolving Y-STR loci and,
again, low-level Y-SNP resolution. We focused on haplo-
group Q in this study because of the greater number of
new mutations published for this branch and correspond-
ing levels of Y-STR resolution (15–17 loci), which are
currently lacking for published Native American haplo-
group C Y chromosomes. This high-resolution character-
ization is critical because it allows for a more accurate
dating of TMRCAs and estimates of divergence between
the ancestors of Native Americans and indigenous Sibe-
rians. For example, with this approach, Seielstad et al.114
dated the origin of the M242, which defines the NRY
haplogroup Q, and, in turn, provided a more accurate
upper bound to the timing of the initial peopling of the
Western Hemisphere.
Several studies have shown that the American-specific
Q-M3 arose on an M346-positive Y chromosome.63,115,132
The M346 marker was also discovered in Altaians and
other Siberian populations.102,116 However, it has a broad
geographic distribution, being found in Siberia, Central
Asia, East Asia, India, and Pakistan, albeit at lower frequen-
cies.85,99 We have shown that southern Altaians M346 Y
chromosomes also possess L54, a SNP marker that also is
shared by Native Americans who have the M3 marker
and which is more derived than M346. Because L54 is
found in both Siberia and the Americas, it most probably
defines the initial founder haplogroup from which M3
later developed.
Our coalescence analysis suggests that the two derived
branches of L54 (M3 and L330/L334) diverged soon after
this mutation arose. Estimates using the evolutionary
Y-STR mutation rate place the origin of this marker at
around 22,000 years ago, with the two branches diverging
at roughly 13,400 years ago. Although the 95% confidence
intervals for the Bayesian analyses are broad, the median
values of the TMCRAs estimated with this method closely
match those obtained through the analysis with rho statis-
tics. In addition, the coalescence estimates of northern and
southern Altaian Q Y chromosomes show that they, too,
are similar to the overall TMRCA estimates. This concor-
dance suggests that a rapid expansion probably occurred
for this particular Y chromosome branch around 15,000–
20,000 years ago. Given previous estimates for the timing
of the initial peopling of the Americas, this scenario seems
plausible, because these estimates fall in line with recent
estimates of indigenous American mitogenomes.107,133
As in any study, there are limitations to this analysis. The
primary issues are the accuracy and precision of using
microsatellites for dating origins and dispersals of haplo-
types. The stochastic nature of mutational accumulation
will continue to be a source of some uncertainty in any
attempt at dating TMRCAs. For this reason, the question
of which Y-STR mutation rate to use for coalescence esti-
mates has been debated.88,134,135 In this study, the evolu-
tionary rate seems the most realistic, because estimates
generated with the pedigree rate provided times that are
much too recent, given what is known about the peopling
240 The American Journal of Human Genetics 90, 229–246, February
of the New World from nongenetic studies.117 There is no
evidence that the majority of Native Americans (men with
Q-M3 Y chromosomes) derived from a migration less than
8 kya, as would be suggested from the TMRCAs calculated
with the pedigree rate. However, other studies have used
the pedigree mutation rate to explore historical events
with great effect—the most-well-known case being the
Genghis Khan star cluster.136 It is possible that such rates
are, like that of the mtDNA, time dependent or that the
Y chromosomes to which the Y-STRs are linked have
been affected by purifying selection.84,133,137,138 In this
regard, the pedigree-based mutation rate would be more
appropriately used with lower diversity estimates, reflect-
ing recent historical events, while the evolutionary rate
would be used in scenarios with higher diversity estimates,
reflecting more ancient phenomena. Although beyond the
scope of this paper, it is likely that the Y-STR mutation rate
follows a similarly shaped curve as that of the mitochon-
drial genome.
Furthermore, haplogroup divergence dates need not
(and mostly do not) equate with population divergence
dates. In this case, however, the mutations defining the
southern Altaian and Native American branches of the
Q-L54 lineage most probably arose after their ancestral
populations split, given the geographic exclusivity of
each derived marker. Yet, sample sets that are not entirely
representative of a derived branch could potentially skew
the coalescent results. In all likelihood, the L54 marker
will be found in other southern Siberian populations,
because southern Altaians show some genetic affinities
with Tuvinians and other populations from the eastern
Sayan region. Even so, the consistency of TMRCA esti-
mates and the divergence dates for the different Q
branches examined here suggest that our data sets are suffi-
ciently representative. Moreover, even though the M3
haplotypes used in this analysis came exclusively from
indigenous Ecuadorian populations, the diversity found
within this data set is similar to previous estimates of the
age of the Q-M3 haplogroup.11
Although different lines of evidence point to different
source populations for Native Americans, the alternatives
need not be exclusive. The effects of historical and demo-
graphic events and evolutionary processes, particularly
recent gene flow, have shaped modern-day populations
such that we should not expect that any one population
in the Old World would show the same genetic composi-
tion as populations in the New World. That (an) ancestral
population(s) probably differentiated into the numerous
populations of Siberia and Central Asia, which have inter-
acted over the past 15,000 years, is not lost on us. Historical
expansions of people and the effects of animal and plant
domestication have played critical roles in shaping the
genetics of both Old and New World populations, particu-
larly in the past several thousand years. Modern popula-
tions have complex, local histories that need to be under-
stood if these are to be used in larger interregional (or
biomedical) analyses. Through the use of phylogeographic
10, 2012

methods, we can attain a better understanding of these
populations for such purposes. It is through this type of
approach that it becomes quite clear that southern Altaians
and Native Americans share a recent common paternal
ancestor.
Supplemental Data
Supplemental Data include three figures and six tables and can be
found with this article online at http://www.cell.com/AJHG/.
Acknowledgments
The authors would like to thank all of the indigenous Altaian
participants for their involvement in this study. We also thank
Fabricio Santos for his careful review of and helpful suggestions
for the manuscript, and two anonymous reviewers for their
constructive comments. In addition, we would like to acknowl-
edge the people who facilitated and provided assistance with our
field research in the Altai Republic. They include Vasiliy Semeno-
vich Palchikov, the staff of the Biochemistry Lab at the Turochak
Hospital, Dr. Maria Nikolaevna Trishina, Vitaliy Trishin, Alexander
A. Guryanov, the staff of the Native Affairs office in Gorniy
Altaiask, Galina Nikolaevna Makhalina, and Tatiana Kunduchi-
novna Babrasheva. In addition, we received help from a number
of people living in local villages around the Turochakskiy Raion,
particularly Alexander Adonyov. This project was supported by
funds from the University of Pennsylvania (T.G.S.), the National
Science Foundation (BCS-0726623) (T.G.S., M.C.D.), the Social
Sciences and Humanities Research Council of Canada (MCRI
412-2005-1004) (T.G.S.), and the Russian Basic Fund for Research
(L.P.O.). T.G.S. would also like to acknowledge the infrastructural
support provided by the National Geographic Society.
Received: September 15, 2011
Revised: December 6, 2011
Accepted: December 19, 2011
Published online: January 26, 2012
Web Resources
The URLs for data presented herein are as follows:
Arlequin, version 3.11, http://cmpg.unibe.ch/software/arlequin3/
Batwing, http://www.mas.ncl.ac.uk/~nijw/
Network, version 4.6.0.0, http://www.fluxus-engineering.com/
sharenet.htm
Network Publisher, version 1.3.0.0, http://www.fluxus-engineering.
com/nwpub.htm
Y-DNAHaplogroup Tree 2011, version 6.46, http://www.isogg.org/
tree
References
1. Goebel, T. (1999). Pleistocene human colonization of
Siberia and peopling of the Americas: An ecological
approach. Evol. Anthropol. 8, 208–227.
2. Gryaznov, M.P. (1969). The Ancient Civilization of
Southern Siberia (New York: Cowles Book Company, Inc.).
3. Okladnikov, A.P. (1964). Ancient population of Siberia
and its culture. In The Peoples of Siberia, M.G. Levin and
The America
L.P. Potapov, eds. (Chicago: The University of Chicago
Press), pp. 13–98.
4. Levin, M.G., and Potapov, L.P. (1964). The Peoples of Siberia
(Chicago: University of Chicago Press).
5. Reich, D., Green, R.E., Kircher, M., Krause, J., Patterson, N.,
Durand, E.Y., Viola, B., Briggs, A.W., Stenzel, U., Johnson,
P.L.F., et al. (2010). Genetic history of an archaic hominin
group from Denisova Cave in Siberia. Nature 468, 1053–
1060.
6. Krause, J., Fu, Q., Good, J.M., Viola, B., Shunkov, M.V.,
Derevianko, A.P., and Paabo, S. (2010). The complete mito-
chondrial DNA genome of an unknown hominin from
southern Siberia. Nature 464, 894–897.
7. Krause, J., Orlando, L., Serre, D., Viola, B., Prufer, K.,
Richards, M.P., Hublin, J.J., Hanni, C., Derevianko, A.P.,
and Paabo, S. (2007). Neanderthals in central Asia and
Siberia. Nature 449, 902–904.
8. Santos, F.R., Pandya, A., Tyler-Smith, C., Pena, S.D., Schan-
field, M., Leonard, W.R., Osipova, L., Crawford, M.H., and
Mitchell, R.J. (1999). The central Siberian origin for native
American Y chromosomes. Am. J. Hum. Genet. 64, 619–628.
9. Karafet, T.M., Zegura, S.L., Posukh, O., Osipova, L., Bergen,
A., Long, J., Goldman, D., Klitz, W., Harihara, S., de Knijff,
P., et al. (1999). Ancestral Asian source(s) of new world
Y-chromosome founder haplotypes. Am. J. Hum. Genet.
64, 817–831.
10. Lell, J.T., Sukernik, R.I., Starikovskaya, Y.B., Su, B., Jin, L.,
Schurr, T.G., Underhill, P.A., and Wallace, D.C. (2002). The
dual origin and Siberian affinities of Native American Y chro-
mosomes. Am. J. Hum. Genet. 70, 192–206.
11. Zegura, S.L., Karafet, T.M., Zhivotovsky, L.A., and Hammer,
M.F. (2004). High-resolution SNPs and microsatellite haplo-
types point to a single, recent entry of Native American
Y chromosomes into the Americas. Mol. Biol. Evol. 21,
164–175.
12. Anthony, D.W. (2007). The Horse, the Wheel, and Language:
How Bronze-Age Riders from the Eurasian Steppes Shaped
the Modern World (Princeton, N.J.: Princeton University
Press).
13. Kuzmina, E.E., and Mair, V.H. (2008). The Prehistory of the
Silk Road (Philadelphia: University of Pennsylvania Press).
14. Rudenko, S.I. (1970). Frozen Tombs of Siberia, the Pazyryk
Burials of Iron Age Horsemen (Berkeley: University of
California Press).
15. David-Kimball J., Bashilov V.A., and Yablonsky L.T., eds.
(1995). Nomads of the Eurasian Steppes in the Early Iron
Age (Berkeley, CA: Zinat Press).
16. Golden, P.B. (1992). An Introduction to the History of
the Turkic Peoples: Ethnogenesis and State-Formation in
Medieval and Early Modern Eurasia and the Middle East
(Wiesbaden: Otto Harrassowitz).
17. Grousset, R. (1970). The Empire of the Steppes: A History of
Central Asia (New Brunswick, N.J.: Rutgers University Press).
18. Potapov, L.P. (1962). The origins of the Altayans. In Studies
in Siberian Ethnogenesis, H.N. Michael, ed. (Toronto:
University of Toronto Press), pp. 169–196.
19. Potapov, L.P. (1964). The Altays. In The Peoples of Siberia,
M.G. Levin and L.P. Potapov, eds. (Chicago: University of
Chicago Press), pp. 305–341.
20. Menges, K.H. (1968). The Turkic Languages and Peoples:
An Introduction to Turkic Studies (Wiesbaden: Otto Harras-
sowitz).
n Journal of Human Genetics 90, 229–246, February 10, 2012 241

21. Levin, M.G. (1964). The anthropological types of Siberia. In
The Peoples of Siberia, M.G. Levin and L.P. Potapov, eds.
(Chicago: The University of Chicago Press), pp. 99–104.
22. Osipova, L.P., and Sukernik, R.I. (1978). [Polymorphism
of immunoglobulin Gm- and Km-allotypes in northern
Altaians (western Sibiria)]. Genetika 14, 1272–1275.
23. Posukh, O.L., Osipova, L.P., Kashinskaia, IuO., Ivakin, E.A.,
Kriukov, IuA., Karafet, T.M., Kazakovtseva,M.A., Skobel’tsina,
L.M., Crawford, M.G., Lefranc, M.P., and Lefranc, G. (1998).
[Genetic analysis of the South Altaian population of
the Mendur-Sokkon village, Altai Republic]. Genetika 34,
106–113.
24. Sukernik, R.I., Karafet, T.M., Abanina, T.A., Korostyshevskiĭ,M.A., and Bashlaĭ, A.G. (1977). [Genetic structure of 2 iso-
lated populations of native inhabitants of Sibiria (Northern
Altaics) according to the results of a study of blood groups
and isoenzymes]. Genetika 13, 911–918.
25. Sukernik, R.I., Shur, T.G., Starikovskaia, E.B., and Uolles, D.K.
(1996). [Mitochondrial DNA variation in native inhabitants
of Siberia with reconstructions of the evolutional history of
the American Indians. Restriction polymorphism]. Genetika
32, 432–439.
26. Shields, G.F., Schmiechen, A.M., Frazier, B.L., Redd, A.,
Voevoda, M.I., Reed, J.K., and Ward, R.H. (1993). mtDNA
sequences suggest a recent evolutionary divergence for
Beringian and northern North American populations. Am.
J. Hum. Genet. 53, 549–562.
27. Torroni, A., Schurr, T.G., Yang, C.C., Szathmary, E.J.,
Williams, R.C., Schanfield, M.S., Troup, G.A., Knowler,
W.C., Lawrence, D.N., Weiss, K.M., et al. (1992). Native
American mitochondrial DNA analysis indicates that the
Amerind and the Nadene populations were founded by two
independent migrations. Genetics 130, 153–162.
28. Wallace, D.C., and Torroni, A. (1992). American Indian
prehistory as written in the mitochondrial DNA: a review.
Hum. Biol. 64, 403–416.
29. Torroni, A., Schurr, T.G., Cabell, M.F., Brown,M.D., Neel, J.V.,
Larsen, M., Smith, D.G., Vullo, C.M., and Wallace, D.C.
(1993). Asian affinities and continental radiation of the
four foundingNative AmericanmtDNAs. Am. J. Hum. Genet.
53, 563–590.
30. Torroni, A., Sukernik, R.I., Schurr, T.G., Starikorskaya, Y.B.,
Cabell, M.F., Crawford, M.H., Comuzzie, A.G., and Wallace,
D.C. (1993). mtDNA variation of aboriginal Siberians reveals
distinct genetic affinities with Native Americans. Am. J.
Hum. Genet. 53, 591–608.
31. Forster, P., Harding, R., Torroni, A., and Bandelt, H.J. (1996).
Origin and evolution of Native American mtDNA variation:
a reappraisal. Am. J. Hum. Genet. 59, 935–945.
32. Merriwether, D.A., and Ferrell, R.E. (1996). The four founding
lineage hypothesis for the NewWorld: a critical reevaluation.
Mol. Phylogenet. Evol. 5, 241–246.
33. Bonatto, S.L., and Salzano, F.M. (1997). Diversity and age of
the four major mtDNA haplogroups, and their implications
for the peopling of the New World. Am. J. Hum. Genet. 61,
1413–1423.
34. Merriwether, D.A., Hall, W.W., Vahlne, A., and Ferrell, R.E.
(1996). mtDNA variation indicates Mongolia may have
been the source for the founding population for the New
World. Am. J. Hum. Genet. 59, 204–212.
35. Neel, J.V., Biggar, R.J., and Sukernik, R.I. (1994). Virologic and
genetic studies relate Amerind origins to the indigenous
242 The American Journal of Human Genetics 90, 229–246, February
people of the Mongolia/Manchuria/southeastern Siberia
region. Proc. Natl. Acad. Sci. USA 91, 10737–10741.
36. Karafet, T.M., Zegura, S.L., Vuturo-Brady, J., Posukh, O.,
Osipova, L., Wiebe, V., Romero, F., Long, J.C., Harihara, S.,
Jin, F., et al. (1997). Y chromosomemarkers and Trans-Bering
Strait dispersals. Am. J. Phys. Anthropol. 102, 301–314.
37. Lell, J.T., Brown, M.D., Schurr, T.G., Sukernik, R.I., Starikov-
skaya, Y.B., Torroni, A., Moore, L.G., Troup, G.M., and
Wallace, D.C. (1997). Y chromosome polymorphisms in
native American and Siberian populations: identification of
native American Y chromosome haplotypes. Hum. Genet.
100, 536–543.
38. Bortolini, M.C., Salzano, F.M., Thomas, M.G., Stuart, S.,
Nasanen, S.P., Bau, C.H., Hutz, M.H., Layrisse, Z., Petzl-Erler,
M.L., Tsuneto, L.T., et al. (2003). Y-chromosome evidence for
differing ancient demographic histories in the Americas. Am.
J. Hum. Genet. 73, 524–539.
39. Schurr, T.G., and Sherry, S.T. (2004). Mitochondrial DNA and
Y chromosome diversity and the peopling of the Americas:
evolutionary and demographic evidence. Am. J. Hum. Biol.
16, 420–439.
40. Derenko,M.V., Malyarchuk, B., Denisova, G.A.,Wozniak,M.,
Dambueva, I., Dorzhu, C., Luzina, F., Mi�scicka-Sliwka, D.,
and Zakharov, I. (2006). Contrasting patterns of Y-chromo-
some variation in South Siberian populations from Baikal
and Altai-Sayan regions. Hum. Genet. 118, 591–604.
41. Derenko,M.V., Malyarchuk, B., Grzybowski, T., Denisova, G.,
Dambueva, I., Perkova, M., Dorzhu, C., Luzina, F., Lee, H.K.,
Vanecek, T., et al. (2007). Phylogeographic analysis of mito-
chondrial DNA in northern Asian populations. Am. J.
Hum. Genet. 81, 1025–1041.
42. Volodko, N.V., Starikovskaya, E.B., Mazunin, I.O., Eltsov,
N.P., Naidenko, P.V., Wallace, D.C., and Sukernik, R.I.
(2008). Mitochondrial genome diversity in arctic Siberians,
with particular reference to the evolutionary history of
Beringia and Pleistocenic peopling of the Americas. Am. J.
Hum. Genet. 82, 1084–1100.
43. Derenko, M.V., Grzybowski, T., Malyarchuk, B.A., Dam-
bueva, I.K., Denisova, G.A., Czarny, J., Dorzhu, C.M., Kakpa-
kov, V.T., Mi�scicka-Sliwka, D., Wo�zniak, M., and Zakharov,
I.A. (2003). Diversity of mitochondrial DNA lineages in
South Siberia. Ann. Hum. Genet. 67, 391–411.
44. Starikovskaya, E.B., Sukernik, R.I., Derbeneva, O.A., Volodko,
N.V., Ruiz-Pesini, E., Torroni, A., Brown, M.D., Lott, M.T.,
Hosseini, S.H., Huoponen, K., and Wallace, D.C. (2005).
Mitochondrial DNA diversity in indigenous populations of
the southern extent of Siberia, and the origins of Native
American haplogroups. Ann. Hum. Genet. 69, 67–89.
45. Starikovskaya, Y.B., Sukernik, R.I., Schurr, T.G., Kogelnik,
A.M., andWallace, D.C. (1998). mtDNA diversity in Chukchi
and Siberian Eskimos: implications for the genetic history of
Ancient Beringia and the peopling of the New World. Am. J.
Hum. Genet. 63, 1473–1491.
46. Schurr, T.G., and Wallace, D.C. (2003). Genetic prehistory of
Paleoasiatic-speaking populations of northeastern Siberia
and their relationships to Native Americans. In Constructing
cultures then and now: celebrating Franz Boas and the Jesup
North Pacific Expedition, L. Kendall and I. Krupnik, eds.
(Washington, D.C.: Arctic Studies Center, National Museum
of Natural History, Smithsonian Institution), pp. 239–258.
47. Schurr, T.G., Ballinger, S.W., Gan, Y.Y., Hodge, J.A., Merri-
wether, D.A., Lawrence, D.N., Knowler, W.C., Weiss, K.M.,
10, 2012
and Wallace, D.C. (1990). Amerindian mitochondrial DNAs
have rare Asian mutations at high frequencies, suggesting
they derived from four primary maternal lineages. Am. J.
Hum. Genet. 46, 613–623.
48. Macaulay, V., Richards, M., Hickey, E., Vega, E., Cruciani, F.,
Guida, V., Scozzari, R., Bonne-Tamir, B., Sykes, B., and
Torroni, A. (1999). The emerging tree of West Eurasian
mtDNAs: a synthesis of control-region sequences and RFLPs.
Am. J. Hum. Genet. 64, 232–249.
49. Richards, M., Macaulay, V., Hickey, E., Vega, E., Sykes, B.,
Guida, V., Rengo, C., Sellitto, D., Cruciani, F., Kivisild, T.,
et al. (2000). Tracing European founder lineages in the Near
Eastern mtDNA pool. Am. J. Hum. Genet. 67, 1251–1276.
50. Torroni, A., Bandelt, H.J., D’Urbano, L., Lahermo, P., Moral,
P., Sellitto, D., Rengo, C., Forster, P., Savontaus, M.L.,
Bonne-Tamir, B., and Scozzari, R. (1998). mtDNA analysis
reveals a major late Paleolithic population expansion from
southwestern to northeastern Europe. Am. J. Hum. Genet.
62, 1137–1152.
51. Torroni, A., Huoponen, K., Francalacci, P., Petrozzi, M.,
Morelli, L., Scozzari, R., Obinu, D., Savontaus, M.L., and
Wallace, D.C. (1996). Classification of European mtDNAs
from an analysis of three European populations. Genetics
144, 1835–1850.
52. Torroni, A., Lott, M.T., Cabell, M.F., Chen, Y.S., Lavergne, L.,
and Wallace, D.C. (1994). mtDNA and the origin of Cauca-
sians: identification of ancient Caucasian-specific haplo-
groups, one of which is prone to a recurrent somatic duplica-
tion in the D-loop region. Am. J. Hum. Genet. 55, 760–776.
53. Kivisild, T., Tolk, H.V., Parik, J., Wang, Y., Papiha, S.S.,
Bandelt, H.J., and Villems, R. (2002). The emerging limbs
and twigs of the East Asian mtDNA tree. Mol. Biol. Evol.
19, 1737–1751.
54. Schurr, T.G., Sukernik, R.I., Starikovskaya, Y.B., and Wallace,
D.C. (1999). Mitochondrial DNA variation in Koryaks and
Itel’men: population replacement in the Okhotsk Sea-Bering
Sea region during the Neolithic. Am. J. Phys. Anthropol. 108,
1–39.
55. Tanaka, M., Cabrera, V.M., Gonzalez, A.M., Larruga, J.M.,
Takeyasu, T., Fuku, N., Guo, L.J., Hirose, R., Fujita, Y., Kurata,
M., et al. (2004). Mitochondrial genome variation in eastern
Asia and the peopling of Japan. Genome Res. 14 (10A), 1832–
1850.
56. Yao, Y.G., Kong, Q.P., Bandelt, H.J., Kivisild, T., and Zhang,
Y.P. (2002). Phylogeographic differentiation of mitochon-
drial DNA in Han Chinese. Am. J. Hum. Genet. 70, 635–651.
57. Gokcumen, O., Dulik, M.C., Pai, A.A., Zhadanov, S.I., Rubin-
stein, S., Osipova, L.P., Andreenkov, O.V., Tabikhanova, L.E.,
Gubina, M.A., Labuda, D., and Schurr, T.G. (2008). Genetic
variation in the enigmatic Altaian Kazakhs of South-Central
Russia: insights into Turkic population history. Am. J. Phys.
Anthropol. 136, 278–293.
58. Rubinstein, S., Dulik, M.C., Gokcumen, O., Zhadanov, S.,
Osipova, L., Cocca, M., Mehta, N., Gubina, M., Posukh, O.,
and Schurr, T.G. (2008). Russian Old Believers: genetic conse-
quences of their persecution and exile, as shown by mito-
chondrial DNA evidence. Hum. Biol. 80, 203–237.
59. van Oven, M., and Kayser, M. (2009). Updated comprehen-
sive phylogenetic tree of global human mitochondrial DNA
variation. Hum. Mutat. 30, E386–E394.
60. Anderson, S., Bankier, A.T., Barrell, B.G., de Bruijn, M.H.,
Coulson, A.R., Drouin, J., Eperon, I.C., Nierlich, D.P., Roe,
The America
B.A., Sanger, F., et al. (1981). Sequence and organization of
the human mitochondrial genome. Nature 290, 457–465.
61. Andrews, R.M., Kubacka, I., Chinnery, P.F., Lightowlers, R.N.,
Turnbull, D.M., and Howell, N. (1999). Reanalysis and revi-
sion of the Cambridge reference sequence for human mito-
chondrial DNA. Nat. Genet. 23, 147.
62. Y Chromosome Consortium. (2002). A nomenclature system
for the tree of human Y-chromosomal binary haplogroups.
Genome Res. 12, 339–348.
63. Karafet, T.M., Mendez, F.L., Meilerman, M.B., Underhill, P.A.,
Zegura, S.L., and Hammer, M.F. (2008). New binary polymor-
phisms reshape and increase resolution of the human Y chro-
mosomal haplogroup tree. Genome Res. 18, 830–838.
64. Dulik, M.C., Osipova, L.P., and Schurr, T.G. (2011). Y-chro-
mosome variation in Altaian Kazakhs reveals a common
paternal gene pool for Kazakhs and the influence of Mongo-
lian expansions. PLoS ONE 6, e17548.
65. Cox, M.P. (2006). Minimal hierarchical analysis of global
human Y-chromosome SNP diversity by PCR-RFLP. Anthro-
pol. Sci. 114, 69–74.
66. Derbeneva, O.A., Starikovskaia, E.B., Volod’ko, N.V., Wallace,
D.C., and Sukernik, R.I. (2002). [Mitochondrial DNA varia-
tion in Kets and Nganasans and the early peoples of
Northern Eurasia]. Genetika 38, 1554–1560.
67. Derbeneva, O.A., Starikovskaya, E.B., Wallace, D.C., and
Sukernik, R.I. (2002). Traces of early Eurasians in the
Mansi of northwest Siberia revealed by mitochondrial DNA
analysis. Am. J. Hum. Genet. 70, 1009–1014.
68. Pimenoff, V.N., Comas, D., Palo, J.U., Vershubsky, G., Kozlov,
A., and Sajantila, A. (2008). Northwest Siberian Khanty and
Mansi in the junction of West and East Eurasian gene pools
as revealed by uniparental markers. Eur. J. Hum. Genet. 16,
1254–1264.
69. Comas, D., Calafell, F., Mateu, E., Perez-Lezaun, A., Bosch, E.,
Martınez-Arias, R., Clarimon, J., Facchini, F., Fiori, G.,
Luiselli, D., et al. (1998). Trading genes along the silk road:
mtDNA sequences and the origin of central Asian popula-
tions. Am. J. Hum. Genet. 63, 1824–1838.
70. Yao, Y.G., Kong, Q.P., Wang, C.Y., Zhu, C.L., and Zhang, Y.P.
(2004). Different matrilineal contributions to genetic struc-
ture of ethnic groups in the silk road region in china. Mol.
Biol. Evol. 21, 2265–2280.
71. Kolman, C.J., Sambuughin, N., and Bermingham, E. (1996).
Mitochondrial DNA analysis of Mongolian populations and
implications for the origin of New World founders. Genetics
142, 1321–1334.
72. Xue, Y., Zerjal, T., Bao, W., Zhu, S., Shu, Q., Xu, J., Du, R.,
Fu, S., Li, P., Hurles, M.E., et al. (2006). Male demography
in East Asia: a north-south contrast in human population
expansion times. Genetics 172, 2431–2439.
73. Khar’kov, V.N., Medvedeva, O.F., Luzina, F.A., Kolbasko, A.V.,
Gafarov, N.I., Puzyrev, V.P., and Stepanov, V.A. (2009).
[Comparative characteristics of the gene pool of Teleuts
inferred from Y-chromosomal marker data]. Genetika 45,
1132–1142.
74. Khar’kov, V., Khamina, K., Medvedeva, O., Shtygasheva, O.,
and Stepanov, V. (2011). Genetic diversity of the Khakass
gene pool: Subethnic differentiation and the structure of
Y-chromosome haplogroups. Mol. Biol. (Mosk.) 45, 446–458.
75. Roewer, L., Kruger, C., Willuweit, S., Nagy, M., Rodig, H.,
Kokshunova, L., Rothamel, T., Kravchenko, S., Jobling, M.A.,
Stoneking, M., and Nasidze, I. (2007). Y-chromosomal STR
n Journal of Human Genetics 90, 229–246, February 10, 2012 243

haplotypes in Kalmyk population samples. Forensic Sci. Int.
173, 204–209.
76. Geppert, M., Baeta, M., Nunez, C., Martınez-Jarreta, B., Zwey-
nert, S., Cruz, O.W., Gonzalez-Andrade, F., Gonzalez-Solo-
rzano, J., Nagy, M., and Roewer, L. (2011). Hierarchical
Y-SNP assay to study the hidden diversity and phylogenetic
relationship of native populations in South America.
Forensic Sci. Int. Genet. 5, 100–104.
77. Excoffier, L., Laval, G., and Schneider, S. (2005). Arlequin
(version 3.0): an integrated software package for population
genetics data analysis. Evol. Bioinform. Online 1, 47–50.
78. Tamura, K., and Nei, M. (1993). Estimation of the number of
nucleotide substitutions in the control region of mitochon-
drial DNA in humans and chimpanzees. Mol. Biol. Evol.
10, 512–526.
79. SPSS Inc. (2001). SPSS for Windows Release 11.0.0 (Chicago,
IL: SPSS Inc.).
80. Polzin, T., and Daneschmand, S.V. (2003). On Steiner trees
and minimum spanning trees in hypergraphs. Oper. Res.
Lett. 31, 12–20.
81. Bandelt, H.J., Forster, P., and Rohl, A. (1999). Median-joining
networks for inferring intraspecific phylogenies. Mol. Biol.
Evol. 16, 37–48.
82. Bandelt, H.J., Forster, P., Sykes, B.C., and Richards, M.B.
(1995). Mitochondrial portraits of human populations using
median networks. Genetics 141, 743–753.
83. Gusmao, L., Butler, J.M., Carracedo, A., Gill, P., Kayser, M.,
Mayr, W.R., Morling, N., Prinz, M., Roewer, L., Tyler-Smith,
C., and Schneider, P.M.; DNA Commission of the Interna-
tional Society of Forensic Genetics. (2006). DNA Commis-
sion of the International Society of Forensic Genetics
(ISFG): an update of the recommendations on the use of
Y-STRs in forensic analysis. Forensic Sci. Int. 157, 187–197.
84. Soares, P., Ermini, L., Thomson, N., Mormina, M., Rito, T.,
Rohl, A., Salas, A., Oppenheimer, S., Macaulay, V., and
Richards, M.B. (2009). Correcting for purifying selection:
an improved human mitochondrial molecular clock. Am. J.
Hum. Genet. 84, 740–759.
85. Sengupta, S., Zhivotovsky, L.A., King, R., Mehdi, S.Q.,
Edmonds, C.A., Chow, C.E., Lin, A.A., Mitra, M., Sil, S.K.,
Ramesh, A., et al. (2006). Polarity and temporality of high-
resolution y-chromosome distributions in India identify
both indigenous and exogenous expansions and reveal
minor genetic influence of Central Asian pastoralists. Am.
J. Hum. Genet. 78, 202–221.
86. Wilson, I., Balding, D., andWeale, M. (2003). Inferences from
DNA data: population histories, evolutionary processes and
forensic match probabilities. J. R. Stat. Soc. [Ser A] 166,
155–188.
87. Xue, Y., Zerjal, T., Bao, W., Zhu, S., Shu, Q., Xu, J., Du, R., Fu,
S., Li, P., Hurles, M.E., et al. (2008). Modelling male prehis-
tory in east Asia using BATWING. In Simulations, Genetics
and Human Prehistory, S. Matsumura, P. Forster, and C. Ren-
frew, eds. (Cambridge: McDonald Institute for Archaeolog-
ical Research), pp. 79–88.
88. Zhivotovsky, L.A., Underhill, P.A., Cinnio�glu, C., Kayser, M.,
Morar, B., Kivisild, T., Scozzari, R., Cruciani, F., Destro-Bisol,
G., Spedini, G., et al. (2004). The effective mutation rate at
Y chromosome short tandem repeats, with application to
human population-divergence time. Am. J. Hum. Genet.
74, 50–61.
244 The American Journal of Human Genetics 90, 229–246, February
89. Dupuy, B.M., Stenersen, M., Egeland, T., and Olaisen, B.
(2004). Y-chromosomal microsatellite mutation rates: differ-
ences inmutation rate between andwithin loci. Hum.Mutat.
23, 117–124.
90. Fenner, J.N. (2005). Cross-cultural estimation of the human
generation interval for use in genetics-based population
divergence studies. Am. J. Phys. Anthropol. 128, 415–423.
91. Derenko, M., Malyarchuk, B., Grzybowski, T., Denisova, G.,
Rogalla, U., Perkova, M., Dambueva, I., and Zakharov, I.
(2010). Origin and post-glacial dispersal of mitochondrial
DNA haplogroups C and D in northern Asia. PLoS ONE 5,
e15214.
92. Zhadanov, S.I., Dulik, M.C., Markley, M., Jennings, G.W.,
Gaieski, J.B., Elias, G., and Schurr, T.G.; Genographic Project
Consortium. (2010). Genetic heritage and native identity of
the Seaconke Wampanoag tribe of Massachusetts. Am. J.
Phys. Anthropol. 142, 579–589.
93. Hammer, M.F., Karafet, T.M., Redd, A.J., Jarjanazi, H., Santa-
chiara-Benerecetti, S., Soodyall, H., and Zegura, S.L. (2001).
Hierarchical patterns of global human Y-chromosome diver-
sity. Mol. Biol. Evol. 18, 1189–1203.
94. Kivisild, T., Rootsi, S., Metspalu, M., Mastana, S., Kaldma, K.,
Parik, J., Metspalu, E., Adojaan, M., Tolk, H.V., Stepanov, V.,
et al. (2003). The genetic heritage of the earliest settlers
persists both in Indian tribal and caste populations. Am. J.
Hum. Genet. 72, 313–332.
95. Wells, R.S., Yuldasheva, N., Ruzibakiev, R., Underhill, P.A.,
Evseeva, I., Blue-Smith, J., Jin, L., Su, B., Pitchappan, R.,
Shanmugalakshmi, S., et al. (2001). The Eurasian heartland:
a continental perspective on Y-chromosome diversity. Proc.
Natl. Acad. Sci. USA 98, 10244–10249.
96. Rosser, Z.H., Zerjal, T., Hurles, M.E., Adojaan, M., Alavantic,
D., Amorim, A., Amos,W., Armenteros,M., Arroyo, E., Barbu-
jani, G., et al. (2000). Y-chromosomal diversity in Europe is
clinal and influenced primarily by geography, rather than
by language. Am. J. Hum. Genet. 67, 1526–1543.
97. Quintana-Murci, L., Krausz, C., Zerjal, T., Sayar, S.H.,
Hammer, M.F., Mehdi, S.Q., Ayub, Q., Qamar, R., Mohyud-
din, A., Radhakrishna, U., et al. (2001). Y-chromosome line-
ages trace diffusion of people and languages in southwestern
Asia. Am. J. Hum. Genet. 68, 537–542.
98. Underhill, P.A., Passarino, G., Lin, A.A., Shen, P., Mirazon
Lahr, M., Foley, R.A., Oefner, P.J., and Cavalli-Sforza, L.L.
(2001). The phylogeography of Y chromosome binary haplo-
types and the origins of modern human populations. Ann.
Hum. Genet. 65, 43–62.
99. Zhong, H., Shi, H., Qi, X.-B., Duan, Z.-Y., Tan, P.-P., Jin, L., Su,
B., and Ma, R.Z. (2011). Extended Y chromosome investiga-
tion suggests postglacial migrations of modern humans
into East Asia via the northern route. Mol. Biol. Evol. 28,
717–727.
100. Mirabal, S., Regueiro, M., Cadenas, A.M., Cavalli-Sforza, L.L.,
Underhill, P.A., Verbenko, D.A., Limborska, S.A., and Her-
rera, R.J. (2009). Y-chromosome distribution within the
geo-linguistic landscape of northwestern Russia. Eur. J.
Hum. Genet. 17, 1260–1273.
101. Myres, N.M., Rootsi, S., Lin, A.A., Jarve, M., King, R.J.,
Kutuev, I., Cabrera, V.M., Khusnutdinova, E.K., Pshenichnov,
A., Yunusbayev, B., et al. (2011). A major Y-chromosome
haplogroup R1b Holocene era founder effect in Central and
Western Europe. Eur. J. Hum. Genet. 19, 95–101.
10, 2012
102. Malyarchuk, B., Derenko, M., Denisova, G., Maksimov, A.,
Wozniak, M., Grzybowski, T., Dambueva, I., and Zakharov,
I. (2011). Ancient links between Siberians and Native Amer-
icans revealed by subtyping the Y chromosome haplogroup
Q1a. J. Hum. Genet. 56, 583–588.
103. Rogers, A.R., and Harpending, H. (1992). Population growth
makes waves in the distribution of pairwise genetic differ-
ences. Mol. Biol. Evol. 9, 552–569.
104. Shi, H., Dong, Y.L., Wen, B., Xiao, C.J., Underhill, P.A., Shen,
P.D., Chakraborty, R., Jin, L., and Su, B. (2005). Y-chromo-
some evidence of southern origin of the East Asian-specific
haplogroup O3-M122. Am. J. Hum. Genet. 77, 408–419.
105. Forsyth, J. (1992). A History of the Peoples of Siberia: Russia’s
North Asian Colony, 1581–1990 (Cambridge, England:
Cambridge University Press).
106. Brown, M.D., Hosseini, S.H., Torroni, A., Bandelt, H.J., Allen,
J.C., Schurr, T.G., Scozzari, R., Cruciani, F., and Wallace, D.C.
(1998). mtDNA haplogroup X: An ancient link between
Europe/Western Asia and North America? Am. J. Hum.
Genet. 63, 1852–1861.
107. Tamm, E., Kivisild, T., Reidla, M., Metspalu, M., Smith, D.G.,
Mulligan, C.J., Bravi, C.M., Rickards, O., Martinez-Labarga,
C., Khusnutdinova, E.K., et al. (2007). Beringian standstill
and spread of Native American founders. PLoS ONE 2, e829.
108. Achilli, A., Perego, U.A., Bravi, C.M., Coble, M.D., Kong, Q.P.,
Woodward, S.R., Salas, A., Torroni, A., and Bandelt, H.J.
(2008). The phylogeny of the four pan-American MtDNA
haplogroups: implications for evolutionary and disease
studies. PLoS ONE 3, e1764.
109. Perego, U.A., Achilli, A., Angerhofer, N., Accetturo, M., Pala,
M., Olivieri, A., Kashani, B.H., Ritchie, K.H., Scozzari, R.,
Kong, Q.P., et al. (2009). Distinctive Paleo-Indian migration
routes from Beringia marked by two rare mtDNA haplo-
groups. Curr. Biol. 19, 1–8.
110. Perego, U.A., Angerhofer, N., Pala, M., Olivieri, A., Lancioni,
H., Kashani, B.H., Carossa, V., Ekins, J.E., Gomez-Carballa, A.,
Huber, G., et al. (2010). The initial peopling of the Americas:
a growing number of foundingmitochondrial genomes from
Beringia. Genome Res. 20, 1174–1179.
111. Helgason, A., Palsson, G., Pedersen, H.S., Angulalik, E., Gun-
narsdottir, E.D., Yngvadottir, B., and Stefansson, K. (2006).
mtDNA variation in Inuit populations of Greenland and
Canada: migration history and population structure. Am. J.
Phys. Anthropol. 130, 123–134.
112. Bortolini, M.C., Salzano, F.M., Bau, C.H., Layrisse, Z., Petzl-
Erler, M.L., Tsuneto, L.T., Hill, K., Hurtado, A.M., Castro-
De-Guerra, D., Bedoya, G., and Ruiz-Linares, A. (2002).
Y-chromosome biallelic polymorphisms and Native Amer-
ican population structure. Ann. Hum. Genet. 66, 255–259.
113. Underhill, P.A., Shen, P., Lin, A.A., Jin, L., Passarino, G., Yang,
W.H., Kauffman, E., Bonne-Tamir, B., Bertranpetit, J., Franca-
lacci, P., et al. (2000). Y chromosome sequence variation
and the history of human populations. Nat. Genet. 26,
358–361.
114. Seielstad, M., Yuldasheva, N., Singh, N., Underhill, P., Oef-
ner, P., Shen, P., and Wells, R.S. (2003). A novel Y-chromo-
some variant puts an upper limit on the timing of first entry
into the Americas. Am. J. Hum. Genet. 73, 700–705.
115. Schurr, T.G., Osipova, L.P., Zhadanov, S.I., and Dulik, M.C.
(2010). Genetic diversity in Native Siberians: Implications
for the prehistoric settlement of te Cis-Baikal region. In
Prehistoric Hunter-Gatherers of the Baikal Region, Siberia,
The America
A.W.Weber, M.A. Katzenberg, and T.G. Schurr, eds. (Philadel-
phia: University of Pennsylvania Press), pp. 121–134.
116. Dulik, M.C. (2011). A molecular anthropological study
of Altaian histories utilizing population genetics and
phylogeography. PhD thesis, University of Pennsylvania,
Philadelphia, PA.
117. Fiedel, S.J. (2000). The peopling of the New World: present
evidence, new theories, and future directions. J. Archaeol.
Res. 8, 39–103.
118. Martınez-Cruz, B., Vitalis, R., Segurel, L., Austerlitz, F.,
Georges, M., Thery, S., Quintana-Murci, L., Hegay, T., Alda-
shev, A., Nasyrova, F., and Heyer, E. (2011). In the heartland
of Eurasia: the multilocus genetic landscape of Central Asian
populations. Eur. J. Hum. Genet. 19, 216–223.
119. Karafet, T.M., Osipova, L.P., Gubina, M.A., Posukh, O.L.,
Zegura, S.L., and Hammer, M.F. (2002). High levels of Y-chro-
mosome differentiation among native Siberian populations
and the genetic signature of a boreal hunter-gatherer way
of life. Hum. Biol. 74, 761–789.
120. Balaresque, P., Parkin, E.J., Roewer, L., Carvalho-Silva, D.R.,
Mitchell, R.J., van Oorschot, R.A., Henke, J., Stoneking, M.,
Nasidze, I., Wetton, J., et al. (2009). Genomic complexity
of the Y-STR DYS19: inversions, deletions and founder line-
ages carrying duplications. Int. J. Legal Med. 123, 15–23.
121. Underhill, P.A., Myres, N.M., Rootsi, S., Metspalu, M., Zhivo-
tovsky, L.A., King, R.J., Lin, A.A., Chow, C.E., Semino, O.,
Battaglia, V., et al. (2010). Separating the post-Glacial coan-
cestry of European and Asian Y chromosomes within haplo-
group R1a. Eur. J. Hum. Genet. 18, 479–484.
122. Soucek, S. (2000). A History of Inner Asia (Cambridge, New
York: Cambridge University Press).
123. Reich, D., Patterson, N., Kircher, M., Delfin, F., Nandineni,
M.R., Pugach, I., Ko, A.M., Ko, Y.C., Jinam, T.A., Phipps,
M.E., et al. (2011). Denisova admixture and the first modern
human dispersals into Southeast Asia and Oceania. Am. J.
Hum. Genet. 89, 516–528.
124. Hrdli�cka, A. (1942). Crania of Siberia. Am. J. Phys. Anthro-
pol. 29, 435–481.
125. Gonzalez-Jose, R., Bortolini, M.C., Santos, F.R., and Bonatto,
S.L. (2008). The peopling of America: craniofacial shape vari-
ation on a continental scale and its interpretation from an
interdisciplinary view. Am. J. Phys. Anthropol. 137, 175–187.
126. Kozintsev, A.G., Gromov, A.V., and Moiseyev, V.G. (1999).
Collateral relatives of American Indians among the Bronze
Age populations of Siberia? Am. J. Phys. Anthropol. 108,
193–204.
127. Crawford, M.H. (1998). The Origins of Native Americans:
Evidence from Anthropological Genetics (Cambridge: Cam-
bridge University Press).
128. Brace, C.L., Nelson, A.R., Seguchi, N., Oe, H., Sering, L.,
Qifeng, P., Yongyi, L., and Tumen, D. (2001). OldWorld sour-
ces of the first NewWorld human inhabitants: a comparative
craniofacial view. Proc. Natl. Acad. Sci. USA 98, 10017–
10022.
129. Wang, S., Lewis, C.M., Jakobsson, M., Ramachandran, S.,
Ray, N., Bedoya, G., Rojas, W., Parra, M.V., Molina, J.A.,
Gallo, C., et al. (2007). Genetic variation and population
structure in native Americans. PLoS Genet. 3, e185.
130. Horai, S., Kondo, R., Nakagawa-Hattori, Y., Hayashi, S.,
Sonoda, S., and Tajima, K. (1993). Peopling of the Americas,
founded by four major lineages of mitochondrial DNA. Mol.
Biol. Evol. 10, 23–47.
n Journal of Human Genetics 90, 229–246, February 10, 2012 245
131. Kaessmann, H., Zollner, S., Gustafsson, A.C.,Wiebe, V., Laan,
M., Lundeberg, J., Uhlen, M., and Paabo, S. (2002). Extensive
linkage disequilibrium in small human populations in
Eurasia. Am. J. Hum. Genet. 70, 673–685.
132. Bailliet, G., Ramallo, V., Muzzio, M., Garcıa, A., Santos, M.R.,
Alfaro, E.L., Dipierri, J.E., Salceda, S., Carnese, F.R., Bravi,
C.M., et al. (2009). Brief communication: Restricted geo-
graphic distribution for Y-Q* paragroup in South America.
Am. J. Phys. Anthropol. 140, 578–582.
133. Ho, S.Y., and Endicott, P. (2008). The crucial role of calibra-
tion in molecular date estimates for the peopling of the
Americas. Am. J. Hum. Genet. 83, 142–146, author reply
146–147.
134. Zhivotovsky, L.A., and Underhill, P.A. (2005). On the evolu-
tionary mutation rate at Y-chromosome STRs: comments
on paper by Di Giacomo et al. (2004). Hum. Genet. 116,
529–532.
246 The American Journal of Human Genetics 90, 229–246, February
135. Di Giacomo, F., Luca, F., Popa, L.O., Akar, N., Anagnou, N.,
Banyko, J., Brdicka, R., Barbujani, G., Papola, F., Ciavarella,
G., et al. (2004). Y chromosomal haplogroup J as a signature
of the post-neolithic colonization of Europe. Hum. Genet.
115, 357–371.
136. Zerjal, T., Xue, Y., Bertorelle, G., Wells, R.S., Bao, W., Zhu, S.,
Qamar, R., Ayub, Q., Mohyuddin, A., Fu, S., et al. (2003).
The genetic legacy of the Mongols. Am. J. Hum. Genet. 72,
717–721.
137. Zhivotovsky, L.A., Underhill, P.A., and Feldman, M.W.
(2006). Difference between evolutionarily effective and
germ line mutation rate due to stochastically varying haplo-
group size. Mol. Biol. Evol. 23, 2268–2270.
138. Ho, S.Y., Phillips, M.J., Cooper, A., and Drummond, A.J.
(2005). Time dependency of molecular rate estimates and
systematic overestimation of recent divergence times. Mol.
Biol. Evol. 22, 1561–1568.
10, 2012
Copyright © 2022 FDOKUMEN