Worldwide Patterns of Ancestry, Divergence, and Admixture in Domesticated Cattle
Upload
independentCategory
view
0download
0
Genomic Ancestry of the American Puma (Puma concolol1 M. Culver, W. E. Johnson, J. Pecan-Slattery, and S. J. O'Brien
From the Laboratory of Genomic Diversity, National Cancer Institute, Frederick Cancer Research and Development Center, Frederick, MD 21702-1201. We are grateful to acknowledge lull collaborative credit to the investigators listed in Figure lA who supplied biological specimens upon which this study is based. We would like to thank all the collaborators that collected or aided in the collection 01 samples lor this study. We also appreciate the expert technical assistance and insightful advice 01 Marilyn Raymond, Melody RoelkeParker, Victor David, Clay Stephens, Janice Martenson, Stan Cevario, Carlos Driscoll, Al Roca, and Ellen Frazier. The content 01 this publication does not necessarily reflect the views or policies of the Department of Health and Human Services, nor does mention 01 trade names, commercial products, or organizations imply endorsement by the U.S. government. Address correspondence to Stephen J. O'Brien at the address above. This paper was delivered at a symposium entitled "Genetic Diversity and Evolution" sponsored by the American Genetic Association at the Pennsylvania State University, University Park, PA, USA, June 12-13, 1999.
© 2000 The American Genetic Association 91:186--197
Puma conc%r, a large American cat species, occupies the most extensive range of any New World terrestrial mammal, spanning 110 degrees of latitude from the Canadian Yukon to the Straits of Magellan. Until the recent Holocene, pumas coexisted with a diverse array of carnivores inclUding the American lion (Panthera atrox), the North American cheetah (Miracynonyx trumam), and the saber toothed tiger (5mi/odon fatalis). Genomic DNA specimens from 315 pumas of specified geographic origin (261 contemporary and 54 museum specimens) were collected for molecular genetic and phylogenetic analyses of three mitochondrial gene sequences (165 rRNA, ATPase-B, and NADH-5) plus composite microsatellite genotypes (10 feline loci). Six phylogeographic groupings or subspecies were resolved, and the entire North American population (186 individuals from 15 previously named subspecies) was genetically homogeneous in overall variation relative to central and South American populations. The marked uniformity of mtDNA and a reduction in microsatellite allele size expansion indicates that North American pumas derive from a recent (late Pleistocene circa 10,000 years ago) replacement and recolonization by a small number of founders who themselves originated from a centrum of puma genetic diversity in eastern South America 200,000-300,000 years ago. The recolonization of North American pumas was coincident with a massive late Pleistocene extinction event that eliminated 80% of large vertebrates in North America and may have extirpated pumas from that continent as well.
Pumas (also called mountain lions, or cou shall 1981; Webb and Rancy 1996). Algars) occupy a vast range of ecological though the event would suggest that modzones (Figure lA) as diverse as desert, sa ern pumas originated from a North vannah, tropical rain forest, and alpine American ancestry, the puma fossil record steppes (Anderson 1983; Hansen 1992). in South America is so poor that a more Adult size varies from 50 to 70 kg at the recent neotropical origin and northward equator to twice that size in the extreme dispersal cannot be ruled out (Kurten reaches of the Canadian Yukon and Pata 1976; Werdelin 1989). gonian pampas. The puma fossil record is The peopling of North and South Amerless than half a million years old, but both ica clearly diminished puma populations molecular and morphologic studies sug in recent centuries, reducing the range by gest that the puma's origin dates to the two-thirds in North America as a conselate Miocene [5-8 million years before the quence· of habitat destruction and human present (MYBP)], when pumas evolved depredation (Figure lA). Except for the from a common ancestor with the African small endangered population of Florida cheetah (Acinonyx jubatus) and American panther (Puma concolor coryl) living in cyjaguarundi (Herpailurus yaguaroundl) (Jan press swamps of south Florida, pumas are czewski et al. 1995; Johnson and O'Brien extinct east of the Mississippi (Hansen 1997; Pecon-Slattery and O'Brien 1998; Van 1992; Maehr 1998; Roelke et al. 1993). Valkenburgh et al. 1990). Pumas most cer Nonetheless, elimination of bounties and tainly arrived in South America 2-4 MYBP recent legislative protection has led to an during the Great American Interchange, increase in puma numbers in many areas when eutherian carnivores first migrated since 1900. Some 32 separate geographic south from North America with the geo subspecies of puma have been described logic joining of the Panamanian land based on geographic and morphometric bridge (Marshall et al. 1982; Stehli and criteria (Figure lA) (Neff 1983; Young and Webb 1985; Webb 1978; Webb and Mar- Goldman 1946). The eastern cougar (P c.
186

couguar) and the Wisconsin puma (P c. schorgen) are presumed extinct, and three subspecies (P c. coryi, P c. costaricensis, and P c. browni/) are classified as endangered or threatened by the U.S. Fish and Wildlife Service (Hansen 1992).
Here we examine the extent of genetic diversity using three groups of genetic markers (mtDNA coding genes, Y-chromosome Zfy intron sequence, and 10 nuclear feline microsatellite loci) among 315 individual pumas: 261 contemporaryanimals and 54 museum specimens, each of known geographic origin representing 31 of 32 named subspecies. The pattern of variation within and among subspecies was employed to verify phylogeographic subdivision and to interpret the natural history of the species. The cumulative data support the recognition of six operational taxonomic units (OTUs) or subspecies based on their sharing of a "unique geographic range or habitat, a group of phylogenetically concordant" phenotypic characters and "a unique natural history" (Avise and Ball 1990; O'Brien and Mayr 1991). Molecular markers show that individuals from the North American continent comprise a large panmictic population and display reduced genetic variation relative to South American pumas, an indication of an historic founder effect in the North American puma ancestry. Four of the six recognized puma OTUs reflect geographic (potential faunal) boundaries, while the other two are likely hybrid (or intergrade) zones from geographically adjacent subspecies. Consistency of the genetic/phylogenetic results with each category of genetic markers offers confidence in subspecies classification and has implications for natural history and present conservation management of the puma.
Materials and Methods
Samples Biological samples were collected from 315 pumas and were obtained from the wild (n = 148), captive facilities (n = 113), and museums (n = 54) (Figure lA). Samples included 1-35 animals from each of 32 subspecies. Captive animals were wild born and of known geographic origin. Samples were assigned to the nearest subspecies based on geographic location (Cabrera 1963; Jackson 1955; Neff 1983; Young and Goldman 1946). Population samples were selected to exclude known related individuals, or in the case of Florida, known hybrids (O'Brien et al. 1990). Samples of
cheetah, jaguarundi, Geoffroy's cat (Oncifelis geoffroy/), and domestic cat (Felis catus) were included as outgroup species.
DNA was extracted from white blood cells, whole blood, primary fibroblast cultures from skin biopsies, or tissues following a phenol-chloroform protocol (Sambrook et al. 1989). DNA from hide, hair, and bone samples was extracted using a silica based, guanidium extraction method (Hoss and Piiiibo 1993; Johnson et al. 1998; Piiiibo et al. 1988).
mtDNA Markers Products for both single-strand conformation polymorphism (SSCP) and sequencing of mtDNA regions were obtained by PCR amplification of genomic DNA (Saiki et al. 1985) using primers that amplify portions of the 165 rRNA (165), NADH-S (NDS), and ATPase-8 (ATP8) genes (Johnson et al. 1998; Johnson and O'Brien 1997). PCR amplification of museum samples was performed with two pairs of hemi-nested primers for 165 and NDS (Johnson et al. 1998) except 16S-3F-5'GAGACCCATTAATTTCAACCG-3' is substituted for 16S-1NF. PCR reactions were performed using 20 ng of genomic DNA in the presence of 10 mM Tris-HCI (pH 8.3), 50 mM KCI, 1.5 mM MgClz, 200 j.l.M each of dATP, dCTP, dGTP, dTTP, 0.16 mg/ml BSA, 1 j.l.M of each primer, and 1 unit Taq polymerase enzyme in a volume of 10 j.l.1 (2.5 units in 25 j.l.1 for museum specimens). Thermocycling conditions consisted of 0.5 min denaturation at 94°C, 1.5 min annealing at 49°C, and 1 min extension at noc for 30 cycles (35 or 40 cycles for museum samples). Resulting products were visualized on a 2% agarose gel in TBE buffer.
SSCP analyses were performed on mtDNA amplification products from contemporary samples (Orita et al. 1989a;b; Poduslo et al. 1991). PCR was performed as described above with the addition of 1 j.l.Ci of dCTP[o:-32P]. The PCR product was denatured at 95°C and electrophoresed on a 4.5% nondenaturing polyacrylamide gel with 10% glycerol at 60 W for 6 h. Several individuals with identical banding patterns were sequenced to confirm that each had the same allele. PCR products from museum specimens were directly sequenced. The mtDNA PCR products were sequenced in both forward and reverse directions using a Prism Dye Primer kit and were analyzed by an ABI 373A automated DNA sequencer (Applied Biosystems Inc., Foster City, CA). Sequences were deposit
ed in GenBank (accession numbers AF241812-AF241820).
Phylogenetic Analyses of mtDNA Haplotypes Phylogenetic analyses of mtDNA variation were conducted for samples which successfully amplified for all three gene segments (n = 286). Sequences for each gene were combined for a total evidence approach (Huelsenbeck et al. 1996) covering 891 bp. The combined data were edited and aligned using the program SEQUENCHER (version 3.0, Gene Codes Corp., Ann Arbor, MI) and verified visually. Genetic distances were estimated both by absolute number of base pair differences among haplotypes (p distance) and by the Tajima-Nei model of substitution (Tajima and Nei 1984) as implemented in the program PAUP* (used with permission of D. Swofford). Phylogenetic relationships among the haplotypes were estimated using three major methods-minimum evolution estimated by neighbor joining (NJ), maximum parsimony (MP), and maximum likelihood (ML)-using the program PAUP*. Concordance among the resultant topologies was considered to be strong support for the observed phylogeny.
NJ trees were generated with the TajimaNei distance estimates and a general heuristic search with tree bisection-reconnection branch swapping. The MP analysis was conducted by a general' heuristic search using simple sequence addition of sequences and tree bisection-reconnection branch swapping. ML trees were generated using the HKY or F84 model (Hasegawa et al. 1985). The starting tree was obtained from the NJ analysis, the shape parameter (ex) for the gamma distribution of rate heterogeneity among sites and the transition:transversion (Ts:Tv) ratio were set at default values, and base frequencies were empirically derived. An iterative process whereby each successive ML tree incorporated parameters estimated from the preceeding ML analysis continued until an optimal tree was consistently derived. Relationships among mtDNA haplotypes were estimated using a minimum spanning network, computed from the absolute number of differences between haplotypes using the program MINSPNET (Excoffier et al. 1992).
Zfy Intron Sequence The terminal intron of Zfy, located on the Y chromosome, was examined in 14 representative male pumas (and one female for a negative control). PCR was per-
Culver et al • Genomic Ancestry of the American Puma 187

Figure I. (A) Geographic ranges of 32 currently recognized subspecies of puma (Puma conc%r) (Cabrera 1963; Jackson 1955; Neff 1983; Young and Goldman 1946). The subspecies are labeled with a three-letter code, and the total number of samples examined here are indicated. Collaborators and institutions that supplied puma specimens are (listed alphabetically by institution): Alberto Paras, Africam Safari, Mexico; Agustin Iriarte, Agriculture Service SAG, Chile; Charles Land, Alaska Department ot Fish and Game; Ernesto Boede, Aquarium J.y. Seijas, Venezuela; Don Buckley, Arizona; Lisa Haynes, Stan Cunningham, Matt Peirce, and Harley Shaw, Arizona Game and Fish Department; Troy Best, and Ned Gentz, Auburn University, Alabama; Lorenza Calvo, Aurora National Zoo, Guatemala; Nini N. DeBerger, Auto Safari Chapin, Guatemala; Sheila Schmelling, Tony Garel, and Laurie Wilkins, Belize Zoo; Daryl Hebert and Dan Lay, British Columbia Ministry of Environment, Canada; Knut Atkinson, Rick Davies, British Columbia Wildlife Branch, Canada; Juan Romero, Buenos Aires Zoological Park, Argentina; Sue Mainka, Wanda Dwelle, Lori Rogers, and Bob Cooper, Calgary Zoo and Botanical Gardens, Canada; Dr. Hunter, Dave Jessup, Tony Atkinson, Jim Banks, and Kenneth Levine, California Department of Fish and Game; Stan van Zyll de Jong, Canadian Museum of Nature, Quebec; Lilly and Werner Hagnauer, Canas, Las Pumas, Costa Rica; Ramon Quevedo Giorgiana, Dulce Brousset and Enrique Yanto, Centro de Convivencia Infantil, Mexico; Allen Anderson, Colorado Division of Wildlife; Sonia Alcazar and Viviana Quse, Cordoba Zoological Park, Argentina; Rosana Nogueira de Morias, Curitiba Zoo, BraZil; Ricardo Ayala, Durazno Zoological Park, Paraguay; Melody Roelke, Florida Game and Freshwater Fish Commission; Laurie Wilkins, Florida Museum of Natural History, Gainesville; Helida Ferreira, Goiana Zoo, Brazil; Ross Anderson, Hogle Zoo, Salt Lake City, Utah; Kerry Murphy, Linda Sweanor, and Ken Logan, Hornocker Wildlife Research Institute; Joe Flanagan, Houston Zoo, Texas; John Laundre, Idaho State University; Richard Greenwell, International Society of Cryptozoology, Tucson, Arizona; Emerson Suemitsu, Wanderlei de Moraes, Itaipu, Brazil and Paraguay; Miriam Lazo, JUigalpa Zoo, Nicaragua; Melody Roelke, Kamloops Game Farm, Canada; Otto Carlos Jordan, La Paz Zoo, Bolivia; Dr. Marinelli, La Plata Zoological Park, Argentina; Senor Meneses, La Ponderosa, Chile; Warren Johnson and Melanie Culver, Laboratory of Genomic Diversity, National Cancer Institute, Maryland; Melody Roelke, Lima Zoo, Peru; Beverly Fronk, Lycoming County Historical Society Museum, Pennsylvania; Victoriano Corazon, Managua Zoo, Zoologico Nacional, Nicaragua; Jorge Bustelo, Mendoza Zoological Park, Argentina; Jose Olazarri, Mercedes Zoological Park, Uruguay; Ernie Strahm, Mexico; Warren Johnson, Mina EI Soldado, Chile; Maria Rutzmoser, Museum of Comparative Zoology, Cambridge, Massachusetts; James Patton, Museum of Vertebrate Zoology, Berkeley, California; Peter Dratch, National Fish and Wildlife Forensics Lab, Oregon; Alfred Gardner, National Museum of Natural History, Washington, DC; Mike Cox, Nevada Division of Wildlife; Walt Van Dyke, Oregon Department of Fish and Wildlife; Bob Gagliuso, Oregon State University; Fernando Manvel Victoria, Parque Centenario, Merida, Mexico; Melody Roelke and Warren Johnson, Parque de Fauna CONAF, Chile; Peter Crawshaw, Parque Nacional Foz de Iguazu, CENAP, IBAMA; Gambino Vasquez, Parque Zoologico de Leon, Mexico; Vicente Mongrell, Parque Zoologico de Tamatan, Mexico; Kathy Quigley, Petencita Zoological Park, Guatemala; Jean-Christophe Vie, Programme Faune Sauvage, French Guyana; Sandro Jerez, Rawson Zoological Park, Argentina; Matt Peirce and Harley Shaw, Reid Park Zoo, Tucson, Arizona; Dave Gonzalez, Rim County Veterinary Clinic, Nevada; Hector Seuanez, Rio de Janeiro Zoo, Brazil; Roy McBride, San Antonio Zoological Gardens and Aquarium; David F. Johnson, San Diego Mesa College, Animal Health, California; Paul Beier, Santa Ana Mountains Cougar Study, Calilornia; Otto Carlos Jordan, Santa Cruz Zoo, BoliVia; Patricio Yanez, Santiago Museum of Natural History, Chile; Jeffrey Wyatt and Faical Simon, Sao Paulo Zoo, Brazil; Yolanda Matamoros, Simon Bolivar Zoo, Costa Rica; Samuel Ocana, Sonoran Ecological Center, Mexico; Aduato Nunes, Sorocaba Zoo, Brazil; Randall E. Junge, St. Louis Zoological Park, Missouri; Anabel Herrera, Summit Zoo, Panama; Jan Englund and Olavi Gronwald, Swedish Museum of Natural History, Stockholm, Sweden; Bill Franklin, Torres del Paine National Park, Chile; Mike Syvanen, University of California, Davis; Frank Iwen and Adrian Wydeven, University of Wisconsin Zoological Museum, Madison, Wisconsin; Ken Elowe, Utah Division of Wildlife Resources; Esmeralda MUjica, Valencia Aquarium, Venezuela; Melody Roelke, Vancouver Game Farm, Canada; Briggs Hall, Don Magoon. Jim Byse, and Willie Nation, Washington Department of Fish and Game; Scott Citino, White Oak Plantation, Florida; Melody Roelke, Laurie Marker, and Mike Briggs, Wildlife Safari, Oregon; Melody Roelke, Yosemite National Park, Calilornia; Dr. Riveros, Zoologico Nacional de Chile; Miguel Alvarez, Zoomat, Mexico. (B) Distribution of mtDNA haplotypes across the puma's ranges. Letters and pie charts reler to mtDNA haplotypes specified by fifteen single nucleotide polymorphisms defined in pumas (Table I). The geographic ranges of six revised subspecies 01 pumas as defined here by mtDNA and microsatellite analysis are indicated. Dotted lines demarcate former subspecies range (Neff 1983; Young and Goldman 1946). Nx4 and Mx3,4,5 etc., indicates the number of individuals in the defined location that had the N or M haplotype, respectively. Squares around the haplotype letter indicates a museum sample.
formed using first-round primers ZF2F and both forward and reverse directions using edited and aligned using the program SEZFlR, and second round "nested" primers the Dye Terminator Prism sequencing kit QUENCHER (version 3.0, Gene Codes CorZFY2F and ZFYIR (Pecon-Slattery and and analyzed by an ABI 373A automated poration, Ann Arbor, MI). The sequence O'Brien 1998). PCR products of 350 bp DNA sequencer [Applied Biosystems Inc. was deposited in GenBank using accession from the Zfy intron were sequenced in (ABI), Foster City, CAl. Zfy sequences were number AF241870.
188 The Journal of Heredity 200091 (3)

Table I. Geographic location and ancestral inferences of 14 mtDNA haplotypes resulting from 15 polymorphic sites In combined analyses of the 165 (382 bp), ATP8 (191 bp), and ND5 (318 bp) genes, in 286 pumas"
16S ATP8 ND5
Haplotype 3063" 3094 8630 8681 8700 8725 8756 1272312751 12809 12819 128341284012908 12909ANC' Nd Geographic location
A T G C C T T C T A A C C G T A 9 1 Paraguay B C A 9 1 Venezuela C T T G 8 2 Costa Rica, Panama D C G 7 4 Chile E C T 7 2 Bolivia, Peru F C 8 46 nA, Bo, Br, CR, E, G, Pa, Pe, Ve G C C 8 1 Brazil H T 10 9 Brazil, Paraguay I T A G 10 4 Brazil J C T 9 19 Argentina, Chile K C C T 8 1 Brazil L A C 9 2 Fr, Guyana, Brazil M A T T G 9 190 North America, CR, Panama N A T T G C 8 4 Washington, USA
Hya C A C C T T C T A A T C G T A 286 total samples Aju T A C C T T T C A A C C A T A Oge T A C C T T T T A A C C A T A Fcab A A C C T T T C A A T C A T A ancestral state' A C C T T T A A C A T A codon position n/a n/a n/a 3 1 2 3 3 1 2 3 3 3 2 3 aa change n/a n/a n/a S>P V>A I> V Q>R M > [ V>A
" Base pairs that are identical to haplotype A are indicated by a period. b From the complete Felis catus mtDNA sequence (Lopez et al. 1996). 'The number of sites with inferred ancestral state based on occurrence in three of four outgroup species' (Hya, Aju, Oge and Fca) mtDNA homologue. d Number of individuals with each haplotype. e Abbreviations: nA, northern Argentina: Bo, Bolivia; Br, Brazil; CR, Costa Rica; E, Ecuador; G, Guyana; Pa, Paraguay; Pe, Peru; V, Venezuela; (Aju) cheetah, (Hya) jaguarundi,
(Oge) Geoffroy;'s cat, and (Fca) domestic cat.
Microsatellite peR and Length groups of pumas were estimated using range of number of repeats were estimatDetermination the kinship coefficient (Dkf) and propor ed from microsatellite data using the proThe 10 most polymorphic microsatellite tion shared alleles (Dps) algorithms gram MICROSAT (version 1.5, Minch et markers were selected (FCA008, FCA035, (Bowcock et al. 1994) as implemented in aL). Deviations from Hardy-Weinberg FCA043, FCA082, FCA090, FCA096, FCA1l7, the program MICROSAT (version 1.5, equilibrium (Guo and Thompson 1992) FCA166, FCA249, FCA262) from 43 loci ex Minch et al.). These distance estimators, were tested for each microsatellite locus amined which were initially characterized which are based on shared alleles, are hy using the program ARLEQUIN (version
1.1) (Schneider et aL 1997). .in the domestic cat (Menotti-Raymond et pothesized to be more appropriate for aL 1997; Menotti-Raymond et aL 1999). Of comparisons among populations (Dris Population subdivision was estimated
the 10 loci, 7 were unlinked on a genetic coll 1998; Goldstein and Pollock 1997). by FST (Reynolds et aL 1983) and number
recombination map, one (FCA166) was un Phylogenetic relationships were deter of migrants (Slatkin 1994) for both mtDNA sequence data and microsatellite length mapped and two (FCA043 and FCAl17) mined among individuals that amplified variation data, using only the contempowere 20 cM apart (Menotti-Raymond et al. for eight or more loci (n = 262) and rary samples (excluding museum speci1999). PCR amplification was performed as among subspecies incorporating all sammens). Estimates of FST among mtDNAdescribed (Menotti-Raymond et aL 1997), ples that amplified for at least one microhaplotypes were obtained by analysis ofexcept for FCAl16 which amplified using satellite locus (n = 277). Phylogenetic molecular variance (AMOVA) (Excoffier etthe following primers: FCA166F 5'-AGGT trees were constructed from the Dkf and aL 1992) using Tajima-Nei (1984) distances ATTCTTCATCCCTAGGCA-3' and FCA166R Dps distance matrixes using the NEIGHas implemented in the program ARLE
5'-TGTGCTGACAGCACCGAG-3' (Culver BOR option of the program PHYLIP (verQUIN. With microsatellite data, FST esti
1999). Products were electrophoresed on sion 3.572) (Felsenstein 1993). Trees mates were generated by AMOVA with the a 6% polyacrylamide gel using an Applied were drawn using the program TREEVIEW "number of different alleles" distanceBiosystems 373A automated sequencer, (version 1.5) (Page 1996). method using ARLEQUIN. The significance Microsatellite allele sizes were estimated levels of FST were assessed after employing by comparison with a GS350 TAMRA (ABI)
Genetic Diversity and Population a Bonferroni adjustment (Weir 1996) for internal size standard, and two pumas multiple comparisons. Alternative ways ofStructure Analysiswere used as allele size controls on each subdividing the individuals into groupsgeL Data were collected and analyzed us
Measures of genetic diversity were estiwere compared to determine which partimated for individuals, as well as within
ing the programs GENESCAN (version tions best accounted for the genetic variand between subspecies. Nucleotide di1.2.2-1) and GENOTYPER software (ver ance. An AMOVA was also performedversity (7T) (Nei and Li 1979) was estimatsion 1.1) (ABI). among subspecies within groups (Excofed from mtDNA haplotype data, using the
fier et aL 1992).Phylogenetic Analyses of Microsatellite program SENDBS (version 2, National inData stitute of Genetics, Shizuoka, Japan). Av Divergence Time Estimates Pairwise genetic distances among indi erage heterozygosity (Ho), average vari Divergence dates among mtDNA haploviduals, among subspecies, and among ance in number of repeats, and average types and outgroup species were estimat-
Culver e1 al • Genomic Ancestry of the American Puma 189

Table 2. Measures of genetic variation across combined analyses of three mtDNA gene segments 16S (382 bp), ATP8 (191 bp), and ND5 (318 bp), and 10 microsatelIlte loci in pumas grouped by sUbspecies
Microsatellite loci
Number of individual Total
Subspecies, continent, mtDNA/ number or group" iLsatb mtDNA Haplotype of alleles' %P
North American subspecies:
P c. missou/ensis 23/22 M 34 100 P c. oregonensis 16/15 M 32 100 P c. uancouuerensis 6 M 18 50 Pc.o/ympus 4 N 18 50 P c. califomica 25/24 M 32 90 P c. kaibabensis 5 M 32 90 P c. hippo/estes 14 M 32 90 P c. couguar + schorgeri (ancient) 3 + I M II 20 P c. browni 15 M 39 100 P c. browni (ancient) 4 M 13 (3) 80 Pc. azteca 35 M 46 100 P c. stan/eyana 10 M 38 80 Pc. coryi 6 M 12 20 P c. coryi (ancient) 6/4 M 9 (6) 50 P c. improcera (ancient) I/O M P c. mayensis 12 M 49 100 P c. costaricensis 13 M F C 54 100
South American subspecies:
P c. borbensis 2 F H 25 100 P c. borbensis (ancient) I/O L Pc. greeni 1 H 15 50 P c. acrocodia II A F G H K 72 100 P c. capricomensis 8 F H 49 100 P c. bangsi 5 F 43 100 P c. conc%r 3 F B 37 100 P c. conc%r (ancient) 2 L F 19(11) 90 P c. soderstromi (ancient) 4 F 19 90 Pc. incarum 5 F E 55 100 P c. incarum (ancient) I F 2 (0)' 100 Pc. osgoodi 5 F E 49 100 P c. cabrerae 10 J F 57 100 Pc. hudsoni 7 F 51 100 Pc. puma 6 J D 39 100 P c. araucanus 4 J D 30 100 P c. araucanus (ancient) 2 J 18 (5) 100 P c. palagonica 6 J 32 100 P c. pearsoni 4 J F 34 100
" Subspecies ordered in a geographical cline from north to south. ancient samples came from museums. b Number of individuals typed for mtDNA/microsatellite analysis; one value indicates the same number for both. , Alleles found in museum but not in modern samples of the same population are in parentheses. d Variance and range in the number of repeats averaged across all loci. e Average observed heterozygosity across all loci and standard error.
ed by averaging all pairwise (p) distances of 315 pumas, collected from throughout between haplotypes. Feline-specific their range (Figure lA). The sequences of mtDNA divergence rates of 1.39% (ATPff) , three mitochondrial genes [382 bp of 165 1.22% (NDS), and 0.97% (165) per million rRNA (165), 191 bp of ATPase-8 (ATP8) and years (MY) were developed previously 318 bp of (ND5) NADH-5] were determined (Lopez et al. 1997). A weighted average, from pumas using specific primers debased on the number of base pairs used signed from an alignment of available for each gene, was used to obtain the com mammalian mtDNA sequences (Lopez et posite divergence rate of 1.15%/MY. A di al. 1996). Sequence analysis revealed two vergence time was also estimated from Zfy single nucleotide polymorphisms in the sequence data using a rate for felids of 165 gene, five in the ATP8 gene, and eight 0.11 %/MY (Pecon-Slattery and O'Brien in the ND5 gene (Table 1). All polymor1998). From this rate, the estimated time phisms were transitions and 6 of 13 muto acquire one mutation, in the 350 bp of tations in protein coding genes were nonintronic sequence, was approximately 2.5 synonymous. RNA secondary structure MY. estimated by FoldRNA (GCG, Version 8
1994) indicated that the two 16S rRNA varResults iants were noncompensatory. DNA was extracted and amplified by poly SSCP assays (Orita et al. 1989a;b; Podulmerase chain reaction (PCR) from a total so et al. 1991) were developed (Table 1)
Average number
Average Ho of alleles Average Average Maximum (SE)e % per locus varianced ranged range
48 (0.40) 3.4 5.1 5.5 9 35 (0.24) 3.2 4.0 5.2 9
7 (0.35) 1.8 1.1 1.9 5 31 (0.18) 1.8 3.0 2.5 9 27 (0.03) 3.2 2.9 5.1 9 53 (0.35) 3.2 4.4 4.9 9 43 (0.44) 3.2 3.4 4.5 9 22 (0.23) 1.2 2.1 0.8 6 54 (0.45) 3.9 3.8 5.4 9 38 (0.53) 1.6 9.2 4.1 14 50 (0.27) 4.6 4.5 6.4 13 47 (0.18) 3.8 4.1 4.5 9 5 (0.0) 1.2 0.3 0.5 6
42 (0.38) 2.3 9.6 4.8 10
60 (0.0) 4.9 7.2 7.8 17 63 (0.11) 5.4 11.1 8.4 20
72 (0.24) 2.8 10.2 5.6 12
50 (0.0) 1.5 9.5 2.6 II 68 (0.27) 7.2 6.9 8.4 19 77 (0.04) 4.9 8.5 7.9 19 81 (0.18) 4.3 6.9 6.2 18 80 (0.0) 3.7 6.5 5.8 12 69 (0.27) 2.4 5.7 3.3 5 52 (0.15) 1.9 8.9 3.2 12 78 (0.58) 5.5 8.7 5.5 15 na na na na 7 81 (0.0) 4.9 10.3 7.0 18 77 (3.61) 5.7 9.6 8.4 21 74 (2.90) 5.1 8.5 8.1 19 69 (0.35) 3.9 8.0 5.8 II 43 (0.53) 3.0 6.5 5.1 10 83 (0.35) 2.0 5.3 3.0 6 63 (0.35) 3.2 9.4 6.2 20 78 (0.24) 3.8 7.3 6.0 10
and used to screen pumas in Figure lA. The 15 polymorphic sites defined 14 mtDNA haplotypes (Tables 1 and 2, Figure 18). All pumas north of Nicaragua (N =
186), except four from the Pacific Northwest, shared the M haplotype, including historic museum specimens from two possibly extinct North American subspecies (P c. couguar and P c. schorgen). Three haplotypes were present in Central American (C,F,M) pumas and 11 (A,B,D-L) were found in South American pumas. Haplotypes M and F had wide distributions throughout North and South America, respectively, while the other haplotypes were geographically restricted (Table 2, Figure 18). Haplotype L was unique to museum samples, one from French Guyana and a second from Brazil (located at opposite sides of the Amazon River, Figure
190 The Journal of Heredity 200091(3)

1 /1 B Fnezuelaa.
1/0 D
2/0
1/0
-/60 1/0
1/0
1/0
1 /1
F
A
1/0 C
E I Bolivia, Peru
Southern Brazil G
Northern Brazil French Guyana L
Venezuela, Brazil Guyana, Ecuador Paraguay, Peru Northern Argentina Bolivia, Costa Rica
IParaguay
Costa Rica, Panama
M
1/0
-/68 1 /1
1/0
1/0 J
H
1/0
2/1
85/97
I IBrazil
Argentina, Chile
Paraguay, Brazil
Washington State Olympic Penninsula)
N
North America Costa Rica, Panama
Costa Rica Brazil Panama
b. n=4 n~2
I C
North America Costa Rica Panama
n~190
>---tt---@ n=1I Southern Brazil
n=4 Washington State (Olympic Peninsula)
Figure 2. (A) Maximum parsimony topology of the 14 haplotypes from the combined 165 (382 bp), ATP8 (191 bp), and ND4 (318 bp) mitochondrial genes (Table I). The single MP tree (CI = 0.882, total tree length = 17) rooted with the NA clade is depicted. Trees derived from MP, NJ, and ML analyses had identical topologies. Numbers above branches represent the number of steps/number of homoplasies. Numbers below branches are bootstrap values (from 100 replicates) from NJ analysis/MP analysis; dashes indicate a bootstrap value of less than 50%. The NJ analysis generated a single tree (ME = 0.0194). All nodes of the ML tree were significant (a consensus of 100 trees. -In likelihood = 1311.0909). Rooting by outgroup taxa of jaguarundi, cheetah, and Geoflroyi's cat was uninformative due to prohibitively large interspecific genetic distances (0.09-0.12) relative to intraspecific values. Thus trees are unrooted but the arrow indicates position 01 the midpoint. (B) Minimum spanning network of the 14 mitochondrial haplotypes (Table I), consisting of /65, ATP8, and NDS genes using MlN5PNET (Orita et al. 1989a) and the number of individuals with each haplotype. Cross marks on branches define the number of substitutions between connected haplotypes. A hypothetical ancestor (?) likely connects l. C, and H as indicated.
IB). Overall mtDNA diversity among all haplotypes (TI) was 0.318%.
The phylogenetic relationship among the 14 mtDNA haplotypes was examined using maximum parsimony (MP), minimum evolution (ME), and maximum likelihood (ML) algorithms. Each method produced an identical topology which is illustrated by a maximum parsimony tree (Figure 2A). Beyond continental distinctions (M,N versus others; bootstrap proportion 85% MP, 97% NJ) there was little mtDNA defined phylogeographic structure among populations from different regions of the continents. The average amount of mtDNA sequence differences among haplotypes was low among all pumas: 0.1-0.9% as compared to 9.0-11.0% between homologous segments from the cat species listed in Table 1 (http://lgd. ncLnih.gov).
To explore the ancestry of these haplotypes, nucleotide differences among pumas were compared to homologous residues from four outgroup species (cheetah, jaguarundi, Geoffroy's cat, and domestic cat; Table 1). A nucleotide site polymorphism in pumas was considered ancestral if at least three of four outgroup taxa shared the same nucleotide. Using this criterion, ancestral nucleotide states were indicated at 12 of 15 variable sites. The two haplotypes with the most ancestral states (10 of 12), H and I (Table 1), were restricted to Brazil and Paraguay (Figur~ IB). The minimum spanning network (Figure 2B) indicates that all haplotypes are one to four mutational steps from the ancestral central Hand F haplotypes.
The mammalian Zfx and Zfy genes on the respective X and Y chromosomes include introns that have been shown to be powerful nuclear indicators of phylogenetic divergence in cats and other species (Bianchi et al. 1992; Pecon-Slattery and O'Brien 1998; Shimmin et al. 1993). DNA sequence of the more rapidly evolving Zfy intron was determined in 14 puma specimens selected from a wide geographic distribution. Among seven North American and seven South American male pumas, no DNA sequence variation was observed in a 350 bp region of the intron.
fn contrast to limited variation in mtDNA coding genes and Y chromosome Zfy intron sequences, appreciable allelic diversity was apparent in a genotypic screen of 10 unlinked nuclear microsatellite 10cL Ten loci selected from a group of 253 markers that have been isolated from and mapped in domestic cat were typed in 277 pumas (258 contemporary and 19
Culver et al • Genomic Ancestry of the American Puma 191
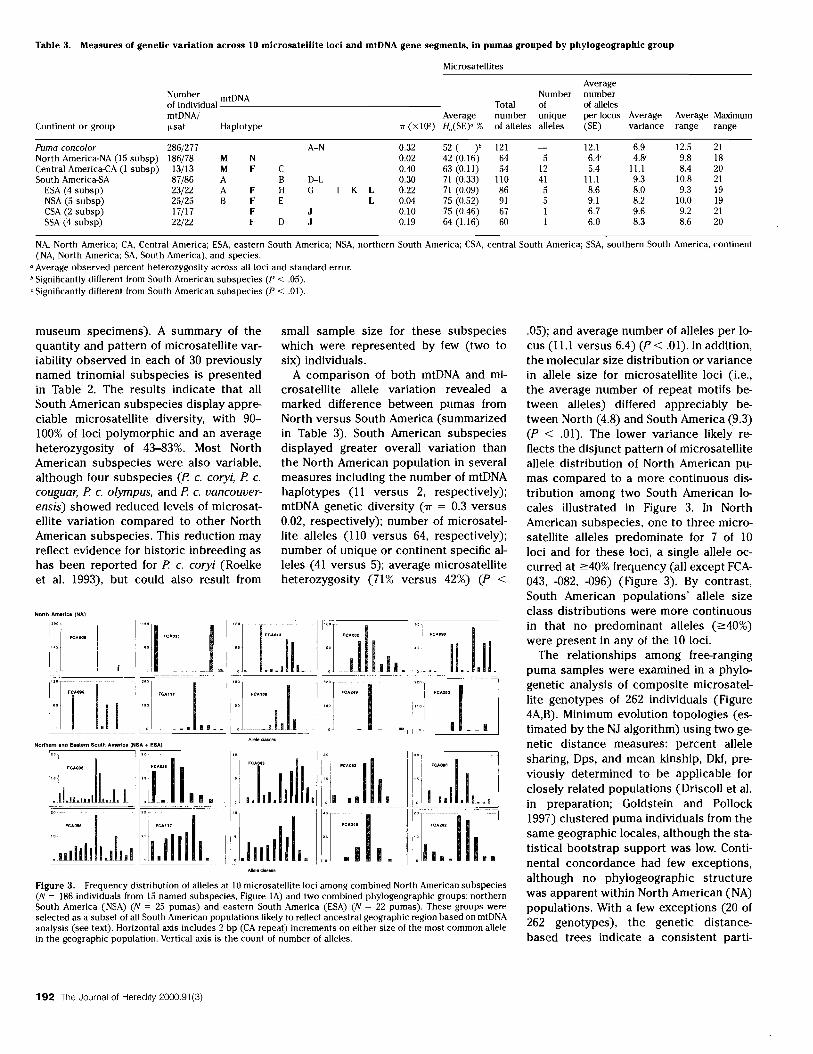
Table 3. Measures of genetic variation across IO microsatellite loci and mtDNA gene segments, in pumas grouped by phylogeographlc group
Microsatellites
Average Number mtDNA Number number of individual Total of of alleles mtDNA/ Average number unique per locus Average Average Maximum
Continent or group fLsat Haplotype 'IT (x 10') Ho(SE)o % of alleles alleles (SE) variance range range
Puma concolor 286/277 A-N 0.32 52 ( )b 121 12.1 6.9 12.5 21 North America-NA (15 subsp) 186/78 M N 0.02 42 (0.16) 64 5 6.4' 4.8' 9.8 18 Central America-CA (I subsp) 13/13 M F C 0.40 63 (0.11) 54 12 5.4 11.1 8.4 20 South America-SA 87/86 A B D-L 0.30 71 (0.33) 110 41 11.1 9.3 10.8 21
ESA (4 subsp) 23/22 A F H G K L 0.22 71 (0.09) 86 5 8.6 8.0 9.3 19 NSA (5 subsp) 25/25 B F E L 0.04 75 (0.52) 91 5 9.1 8.2 10.0 19 CSA (2 subsp) 17/17 F J 0.10 75 (0.46) 67 I 6.7 9.6 9.2 21 SSA (4 subsp) 22/22 F D J 0.19 64 (1.16) 60 I 6.0 8.3 8.6 20
NA, North America; CA, Central America; ESA, eastern South America; NSA, northern South America; CSA, central South America; SSA, southern South America, continent (NA, North America; SA, South America), and species.
a Average observed percent heterozygosity across all loci and standard error. b Significantly different from South American subspecies (P < .05). 'Significantly different from South American subspecies (P < .01).
museum specimens). A summary of the quantity and pattern of microsatellite variability observed in each of 30 previously named trinomial subspecies is presented in Table 2. The results indicate that all South American subspecies display appreciable microsatellite diversity, with 90100% of loci polymorphic and an average heterozygosity of 43-83%. Most North American subspecies were also variable, although four subspecies (P c. coryi, P c. couguar, P c. olympus, and P c. vancouverensis) showed reduced levels of microsatellite variation compared to other North American subspecies. This reduction may reflect evidence for historic inbreeding as has been reported for P c. coryi (Roelke et al. 1993), but could also result from
North Americ8 {NAl
small sample size for these subspecies which were represented by few (two to six) individuals.
A comparison of both mtDNA and microsatellite allele variation revealed a marked difference between pumas from North versus South America (summarized in Table 3). South American subspecies displayed greater overall variation than the North American population in several measures including the number of mtDNA haplotypes (11 versus 2, respectively); mtDNA genetic diversity (rr = 0.3 versus 0.02, respectively); number of microsatellite alleles (110 versus 64, respectively); number of unique or continent specific alleles (41 versus 5); average microsatellite heterozygosity (71% versus 42%) (P <
Figure 3. Frequency distribution of alleles at 10 microsatellite loci among combined North American subspecies (N = 186 individuals from 15 named subspecies, Figure IA) and two combined phylogeographic groups: northern South America (NSA) (N = 25 pumas) and eastern South America (ESA) (N ~ 22 pumas). These groups were selected as a subset of all South American populations likely to reflect ancestral geographic region based on mtDNA analysis (see text). Horizontal axis includes 2 bp (CA repeat) increments on either size of the most common allele in the geographic population. Vertical axis is the count of number of alleles.
.05); and average number of alleles per locus (ILl versus 6.4) (P < .01). In addition, the molecular size distribution or variance in allele size for microsatellite loci (i.e., the average number of repeat motifs between alleles) differed appreciably between North (4.8) and South America (9.3) (P < .01). The lower variance likely reflects the disjunct pattern of microsatellite allele distribution of North American pumas compared to a more continuous distribution among two South American locales illustrated in Figure 3. In North American subspecies, one to three microsatellite alleles predominate for 7 of 10 loci and for these loci, a single allele occurred at ~40% frequency (all except FCA043, -082, -096) (Figure 3). By contrast, South American populations' allele size class distributions were more continuous in that no predominant alleles (~40%)
were present in any of the 10 loci. The relationships among free-ranging
puma samples were examined in a phylogenetic analysis of composite microsatellite genotypes of 262 individuals (Figure 4A,B). Minimum evolution topologies (estimated by the NJ algorithm) using two genetic distance measures: percent allele sharing, Dps, and mean kinship, Dkl, previously determined to be applicable for closely related populations (Driscoll et al. in preparation; Goldstein and Pollock 1997) clustered puma individuals from the same geographic locales, although the statistical bootstrap support was low. Continental concordance had few exceptions, although no phylogeographic structure was apparent within North American (NA) populations. With a few exceptions (20 of 262 genotypes), the genetic distancebased trees indicate a consistent parti
192 The Journal of Heredity 2000:91 (3)

Table 4. Population pairwise FST
below the diagonal
NA
NA CA 0.784* ESA 0.815* NSA 0.958* CSA 0.935* SSA 0.835*
microsatellite estimates above the diagoual and mitochondrial genes
CA ESA NSA CSA SSA
0.110*
0.057 0.492* 0.233 0.240
0.103* 0.179*
0.384 0.177* 0.186*
0.059* 0.126* 0.031*
0.107* 0.526*
0.186* 0.126* 0.094* 0.077*
0.281*
0.367* 0.228* 0.330* 0.316* 0.172*
Below diagonal FST for the combined mitochondrial genes 16S (382 bp). ATP8 (191 bp), NDS (318 bp), and TajimaNei distance method (Tajima and Nei 1984) in the six groups, NA (North America), CA (Central America), ESA (eastern South America), NSA (northern South America), CSA (central South America). and SSA (southern South America). Museum samples were excluded. To equalize sample size among groups, each North American subspecies was limited to only three or fewer randomly chosen contemporary samples (n = 129).
* P < .0033 (after Bonferroni adjustment), based on 100 permutations.
tioning among South and Central American pumas, which correspond to five geographic areas (Figures IB and 4A,B): southern South America (SSA) including Chile and southwestern Argentina (Patagonian/Andean region); eastern South America (ESA) including Brazil (south of Amazon River) and Paraguay; northern South America (NSA) including Venezuela, Ecuador, Bolivia, Guyana, and Colombia; Central South America (CSA) including northeast Argentina; and Central America (CA) including Costa Rica, Panama, and Nicaragua.
Phylogenetic analyses of individual genotypes constrained in accordance with previously named trinomial subspecies reinforced the phylogeographic conclusions (Figure 4C,D). North American subspecies clustered with strong bootstrap support (73% Dkf and 60% Dps). Three subspecies had unusually long branch lengths in the Dkf tree (Figure 4d) due to a small sample size (P c. couguar, P c. greeni, and P c. borbensis) , while others with long branch lengths proved to be homozygous at five to eight loci (P c. olympus, P c. vancouverensis, and P c. COryl).
Population distinctiveness among the six puma groups was examined by Wright's FST values for both mtDNA haplotypes and for composite microsatellite genotypes (Table 4). Significant differences were obtained for all pairwise group comparisons with microsatellites and for 11 of 15 mtDNA comparisons. Similar subdivision was affirmed by calculating M, migrant number (Slatkin 1994), and AMOVA analysis (Excoffier et al. 1992; Schneider et al. 1997). The combined phylogeographic analyses of microsatellite genotypes (Figure 4) and mtDNA coding gene haplotypes (Figures IB and 2) form the basis for recognition of the six taxonomic units or subspecies of modern pumas (Figure IB). Other geographic partitions
were used to test FST and M; however, the six groups described here best explained the observed genetic variation. Boundaries between some of these groups were somewhat arbitrary due to either incomplete sampling in the area or to slight differences between results of the mtDNA and microsatellite analyses. The CSA group was recognized because individuals from this area shared affinities with the other South American groups, but could not be readily assigned to either of these groups. Boundaries of the CSA group were defined as the region between Rio Negro and Rio Parana and included the P c. cabrerae and P c. hudsoni subspecies.
A summary of the distribution of mtDNA and microsatellite variation among pumas considered as a species, as continental populations, and as the six phylogeographic groups is presented in Table 3. The most diverse group based on mtDNA haplotypes was ESA (7 haplotypes; 'IT =
0.02), while NA had the fewest (2 haplotypes; 'IT = 0.22). For microsatellites the groups with the highest diversity (ESA and NSA) were central to the pumas range and, of interest, were the focus of the most ancestral mtDNA haplotypes, H and I (Figure IB). Pumas from ESA or NSA had the greatest number of alleles, the most unique alleles, and the highest heterozygosity (Table 3). A broad continuous distribution of allele size classes was found among pumas from ESA and NSA (Figure 3), in contrast with other groups whose allele sizes were largely a subset of the ESA/NSA size classes.
When the six puma groups were examined phylogenetically using microsatellite genotypes (Figure 4E), we observed strong support for group definition, but some inconsistency in the hierarchical relationships among the groups, particularly in South America. CA and NA clustered together (bootstrap = 98%; 100% for Dkf
and Dps, respectively) as did CSA and SSA (bootstrap = 98% and 91% for Dkf and DPs, respectively), but the relationship of ESA and NSA differed depending on the genetic distance measure employed (Figure 4E). Five of the groups (all except CSA) had at least one unique population specific mtDNA haplotype (Table 3) and each had a distinct frequency distribution of mtDNA haplotype frequencies (Figure IB).
Using previously calibrated divergence rates for the combined three feline mtDNA genes (Lopez et al. 1997)-the composite mutation rate for this combined region of mtDNA was estimated as 1.15%/MY. Using this divergence rate, puma and jaguarundi last shared a common ancestor 4.2 MYBP, while extant puma lineages diverged approximately 390,000 years ago and North American pumas shared a common ancestor less than 20,000 years ago. The Zfy intronic sequence divergence rate in felids has been estimated at one mutation every 2.5 MY (Pecon-Slattery and O'Brien 1998). From this rate, extant puma lineages are probably less than 2.5 MYoId, since no variation was detected among pumas in our sample.
Discussion
Distinguished by a hemispheric distribution from the Arctic tundra of the north to Patagonia in the south, pumas (P concolor) exhibit both broad and fine-scale patterns of genetic differentiation. Concordance between microsateJlite and mitochondrial DNA sequence variation revealed an evolutionary history marked by ancient ancestry and a period of recent North American repopulation. Previous classification into 32 subspecies (Neff 1983; Young and Goldman 1946) was not affirmed; rather modern populations assorted by molecular genetic criteria into six broad phylogeographic regions (Figure IB) with evidence of historic inbreeding in a few isolated localities and admixture in others.
The six regions (Figure IB) were defined based on phylogenetic partitions as indicated by composite individual and population genotypes at 10 unlinked feline microsatellite loci (Figure 4), by the distribution and frequency of mtDNA haplotypes of 15 polymorphic nucleotide sites within three genes (165, ATP8, ND5; Table 1) and by the pattern of diversity indicated by these loci. The puma groups roughly correlate with geographic barriers that could restrict migration and gene flow. North American pumas (NA) are made up
Culver et al • Genomic Ancestry of the American Puma 193

Dps
0.1
Ok!
0.1
Okl
194 The Journal at Heredity 2000:91 (3)

e.
- ESA
98
NSA
CSA _f;;------,, SS\
CA
'0098
NA
0.1 0.1
Dkf Dp>
Figure 4. Continued. (E) ME-NJ tree using Dki and Dp, genetic distance among the six phytogeographic subspecies defined by this study. Numbers on nodes are bootstrap percentages.
of 15 previously named subspecies north of Nicaragua. Central American pumas (CA) inhabit mostly tropical rainforest. Bounded by two major rivers, Rio Negro and Rio Parana, central South American (CSA) pumas include two previously named subspecies from the pampas desert. Eastern South America (ESA) pumas inhabit several biogeographic zones bordered by the Amazon, Rio Parana, and the Paraguay rivers and include four previous subspecies. Demarcated by the Amazon and Paraguay rivers, the northern South American (NSA) region includes six named subspecies distributed across multiple habitat types. Southern South America (SSA) includes four subspecies of puma from Patagonia and the diverse mountainous habitats of Argentina and Chile.
Patterns of mtDNA and microsatellite variation revealed differences in relative
genetic diversity (Table 3) that can be interpreted in the context of geography and puma natural history. As ESA is the population distinguished by the most ancestral (Table 1) and central (Figure 2B) mtDNA haplotypes, modern puma genomic diversity likely traces its origin to near or within the ESA locale. This inference is supported by the observation that ESA has the highest number of mtDNA haplotypes (n = 7), near maximal microsatellite diversity, and the broadest distribution of allele size classes. In contrast, NA had the lowest variation both in mtDNA and in microsatellite measures. NA pumas are predominately one mitochondrial haplotype (M) with an infrequent second haplotype (N) restricted to the Olympic peninsula. The entire NA puma sample (n = 191) possessed less microsatellite diversity than any of the other phylogeographic groups with nearly all al
leles being a subset of those found in Central and South America. Considered together, the reduction in mtDNA and microsatellite variation is indicative of either an historic founder effect or a population bottleneck that effectively reduced overall genomic diversity (Maruyama and Fuerst 1985; Mayr 1970; Nei et al. 1975).
The date for the postulated bottleneck in the history of North American pumas was estimated by comparing the variance in microsatellite allele to that in other populations that have also experienced historic demographic reductions (Driscoll 1998; Menotti-Raymond and O'Brien 1993; O'Brien et al. 1985; O'Brien et al. 1987). Microsatellite allele variance is a measure of the breadth of time-dependent mutational expansion that microsatellites show in a population (Driscoll 1998; Goldstein et al. 1995; Reich and Goldstein 1998). Because allele variance takes longer for reconstitution after a bottleneck than overall heterozygosity or allele number (Driscoll 1998; Goldstein et al. 1995; Goldstein and Pollock 1997; Reich and Goldstein 1998) it is a valuable chronometer for founder events that are older than the period required for reconstitution of heterozygosity.
The average allele variance among the entire North American population was 4.8, compared to 8.2-11.1 for other puma subspecies (Table 3). The observed NA allele variance is equivalent to the restricted allele variance observed in African cheetahs (based on a larger screen of 88 microsatellite loci) (Driscoll 1998), a species documented by several measures to have experienced a severe population bottleneck around 10,000-12,000 years ago, near the end of the Pleistocene (Menotti-Raymond and O'Brien 1993; O'Brien et al. 1985; O'Brien et al. 1987). If microsatellite allele variance reconstitution following demographic homogenization occurred at the same rate in cheetahs and pumas, the results imply that NA pumas are descended
Figure 4. Phylogenetic relationships among 262 individual pumas constructed from 10 microsatellite loci. Unrooted NJ trees estimated using (A) proportion 01 shared alleles, Dps; and (B) mean kinship, Dkf, genetic distances with a I-ps transformation. Individuals, subspecies, or groups are color coded as indicated by geographic area abbreviations defined in text, Figure IB, and Table 3. Numbered taxa indicate exception to phylogeographic clusters and correspond to I, Brazil (Pco-I94); 2, Venezuela (Pco295); 3, Peru (Pco-409); 4, Panama (Pco-542); 5, Brazil (Pco-696); 6, Paraguay (Pco-699); 7, Paraguay (Pco-701); 8, Paraguay (Pco-714); 9, Guyana (Pco-856); 10, Ecuador (Pco867); II, Chile (Pco-215); 12, Chile (Pco-212); 13. Belize (Pco-271); 14, Argentina (Pco-580); IS, Argentina (Pco-574); 16, Argentina (Pco-562). Numbers 16-29 on the Dps tree (A) correspond to 17, Bolivia (Pco-707); 18, Mexico (Pco-757); 19, Argentina (Pco-566); 20, Argentina (Pco-564); 21, Brazil (Pco-I95); 22, Brazil (Pco-I96); 23, Costa Rica (Pco547); 24, Arizona (Pco-604); 25, Mexico (Pco-592); 26, Arizona (Pco-561); 27, Brazil (Pco-697); 28, Costa Rica (Pco-548); 29, Argentina (Pco-576). Numbers 16-35 on the Did tree (5B) correspond to 17, Peru (Pco-406); 18, Peru (Pc0-407); 19, Argentina (Pco-571); 20, Nicaragua (Pco-551); 21, Paraguay (Pco-71O); 22, Argentina (Pco-565); 23, Chile (Pco-597); 24, Costa Rica (Pco-545); 25, Nicaragua (Pco-554); 26, Nicaragua (Pco-549); 27, Nicaragua (Pco-550); 28. Mexico (Pco-593); 29, Argentina (Pco-576); 30, Argentina (Pco-560); 31, Argentina (Pco-568); 32, Argentina (Pco-579); 33, Argentina (Pco-5H); 34, Arizona (Pco-H); 35, Arizona (Pco-I63). Exceptional individuals (11% of total) in some cases can be explained by size homoplasy of microsatellite alleles, demonstrated to occur for some loci based on sequence analysis of 85 microsatellite homozygotes within pumas (Culver et aI., in preparation). (C) NJ-ME analysis using combined population genotypes based on Dps distance between the 29 named subspecies (Neff 1983; Young and Goldman 1946) (Figure IA). Pc. shorgeri and Pc. couguar were combined. Bootstraps values over 40% are indicated on divergence nodes. (0) NJ-ME analysis of combined subspecies genotypes using the Dkr genetic distance as in (C).
Culver et al • Genomic Ancestry of the American Puma 195

Table 5. Trinomial subspecies designation and diagnostic characters for the six phy1ogeographic groups
mtDNA Group Subspecies (citation)a mtDNA sites' haplotypes' Microsatellite alleles Citation
NA P c. couguar 12908 N FCA043-104; FCA082-252; FCA090-95, -122; FCAl17-152 Kerr 1792 CA P c. costaricensis 8630 C FCA082-236; FCA 166-223 Merriam 1901 ESA P c. capricornensis sites 3063, 12723, A, H, G, I, K FCA008-140, -146, -150, -164; FCA043-120 Merriam 1901
and 12819 NSA P c. concolor 12834 and 12840 B, E FCA008-162; FCA035-124; FCA043-142, FCA166-221, FCA249-251 Linneaus 1771 CSA P c. cabrerae None None FCA008-176 Pocock 1904 SSA Pc. puma 12809 D FCA249-239 Molina 1782
a Citation for subspecies designation with the earliest description of those describing subspecies in the geographic locale. b Sites listed relative to domestic cat mtDNA sequence (Lopez et al. 1996). , See Table 1 lor list of haplotypes. Table 3 for unique haplotypes.
from a founder event of approximately the same age as the cheetah's (Le., -10,000 years ago). Since North American puma fossils date to more than 300,000 years ago (Kurten 1976; Savage and Russell 1983; Turner 1997), the interpretation would suggest a recent replacement of North American pumas by a small number of ancestors of modern NA pumas. Toward the end of the late Pleistocene, a massive extinction event abruptly eliminated 80% of large mammal species (N = 35-40 species including cheetahs, lions, and sabertoothed Smilodon) from North America (Martin 1989; Martin and Wright 1967; Pielou 1991). Perhaps NA pumas were eliminated at about the same time by the same event, followed by repopulation and dispersal of a handful of SA migrants who had survived the cataclysm.
Despite apparent phylogenetic uniqueness (Figure 4) and moderate FST distinctiveness (Table 4), two phylogeographic regions (CA and CSA) resemble hybrid zones. CA pumas retain three mtDNA haplotypes: the predominant North American haplotype (M), the ubiquitous South American haplotype (F), and a unique CA haplotype (C) (Figure IB). CA pumas exhibit the largest average variance in microsatellite repeat number (11.1) among the six phylogeographic zones. These patterns suggest recent gene flow to CA from both NA and NSA. The CSA group also shares mtDNA haplotypes (J and F, Figure IB) with neighboring subspecies plus phylogenetic affiliation of microsatellite genotypes (Figure 4), observations consistent with gene flow to CSA populations from adjoining biogeographic regions.
Within modern North American pumas, several smaller populations have unique features (Table 2). The number of polymorphic microsatellite loci and amount of genetic variation were lower in three subspecies (P c. coryi. P c. uancouuerensis, and P c. olympus). In contrast to outbred puma populations in northern Yellow
196 The Journal of Heredity 2000:91(3)
stone, southern Idaho, and the San Andres Mountains, with 9-10 polymorphic microsatellite loci and heterozygosity values of 0.42-0.52 (Culver et aI., in preparation), populations on Vancouver Island, the Olympic Peninsula, and Florida's Big Cypress Swamp contain only 2-5 polymorphic microsatellite loci and heterozygosity values from 0.05 to 0.31. The Florida population is highly inbred (eight fixed loci), which is consistent with its demographic history (Belden 1986; Maehr 1998; Roelke et al. 1993). Museum samples from the Florida population dating to the turn of the 19th century show much higher heterozygosity levels (0.42 versus 0.05), variance in number of repeats (9.6 versus 0.3), and range in number of repeats (4.8 versus 0.5), consistent with a 20th century reduction of genetic diversity in Florida pumas (Table 2).
Conclusions
A molecular genetic analysis of mitochondrial and nuclear genomic variability across intercontinental puma populations has revealed consistent patterns that can be interpreted in the context of demographic and migratory history. Six phylogeographic groups were resolved with no evidence for additional within-group subdivision. We detect little support for the retention of 32 previously named subspecies (Neff 1983; Young and Goldman 1946) and suggest that subspecific taxonomy of the puma be revised to designate six phylogeographic subspecies. This recommendation is based on previous criteria (Avise and Ball 1990; O'Brien and Mayr 1991) which designate that subspecies share a unique range, a group of phylogenetic concordant characters, and a unique natural history relative to other subdivision of the species. We list in Table 5 the proposed Latin trinomial names of the six subspecies and the molecular genetic phenotypic characters specific to each.
Until recently, one subspecies, P c. couguar-NA, occupied the entire North American continent. In spite of its wide distribution, the subspecies shows markedly reduced mtDNA and microsatellite variability relative to the southern subspecies. Most likely modern North American pumas descended from a founder event involving a small number of individuals who migrated "out of South America" approximately 10,000-12,000 years before the present and subsequent to the abrupt Pleistocene extinction of large North American mammal species. The cause of this near global extinction event is still uncertain but may have eliminated not only North American lions, cheetahs, and saber-toothed cats, but also the North American pumas (Martin 1989; Martin and Wright 1967; Pielou 1991). Supplemental tables can be inspected on the LGD web site (http://www.lgd.ncLnih.gov).
References
Anderson AE, 1983. A critical review of literature on puma (Felis concolor). Special report 56. Denver: Colorado Division of Wildlife, Wildlife Research Section.
Avise JC and Ball RM, 1990. Principles of genealogical concordance in species concepts and biological taxonomy. Oxford Surv Evol Bioi 7:45-67.
Belden RC, 1986. Florida panther recovery plan implementation. In: Cats of the world: biology conservation and management, proceedings of the second International cat symposium (Miller SD and Everett DD, eds). Washington, DC: National Wildlife Federation; 159-172.
Bianchi N, Bianchi M, Pamilio P, Vdal-Rioja L, and De La Chapelle A, 1992. Evolution of zinc finger-Y and zinc finger-X genes in oryzomyne-akodontine rodents (Cricetidae). J Mol Evol 34:54--61.
Bowcock AM, Ruiz-Linares A, Tomfohrde J, Minch E, Kidd JR, and Cavalli-Sforza LL, 1994. High resolution of human evolutionary trees with polymorphic microsatellites. Nature 368:45~57.
Cabrera A, 1963. Los felidos vivientes de la Republica Argentina. Ciencias Zoologicas, VI(5).
Culver M, 1999. Molecular geuetic variation, population structure, and natural history of free-ranging pumas (Puma concolor). (PhD Thesis). College Park, MD: University of Maryland.
Driscoll C, 1998. A characterization of microsatellite loci variation in Panthera leo, Acinonyx jubatus, and Fel

is conc%r (Masters thesis). Frederick. MD: Hood College.
Driscoll C, et aI., 1999. Assessing patterns of microsatellite allele reconstitution in natural populations oflions, cheetahs and pumas.
Excoffier L, Smouse PE, and Quattro JM, 1992. Analysis of molecular variance inferred from metric distances among DNA haplotypes: applications to human mitochondrial DNA restriction data. Genetics 131:479-491.
Felsenstein J, 1993. PHYLlP-phylogeny inference package (version 3.5). Seattle, WA: University of Washington.
Genetics Computer Group, 1994. Program manual for the Wisconsin Package, Version 8. Genetics Computer Group.
Goldstein DB and Pollock DD, 1997. Launching microsatellites: a review of mutation processes and methods of phylogenetic inference. J Hered 88:335-342.
Goldstein DB, Ruiz-Linares A, Cavalli-Sforza LL, and Feldman MW, 1995. Genetic absolute dating based on microsatellites and the origin of modern humans. Proc Natl Acad Sci USA 92:6723--6727.
Guo S and Thompson E, 1992. Performing the exact test of Hardy-Weinberg proportion for multiple alleles. Biometrics 48:361-372.
Hansen K, 1992. Cougar, the American lion. Flagstaff, Al.: Northland Publishing.
Hasegawa M, Kishino H, and Yano T, 1985. Dating of the human-ape splitting by a molecular clock of mitochondrial DNA. J Mol Evol 21:160-174.
Hoss M and Paabo S, 1993. DNA extraction from Pleistocene bones by a silica-based purification method. Nucleic Acids Res 21:3913-3914.
Huelsenbeck JP, Bull JJ, and Cunningham CW, 1996. Combining data in phylogenetic analysis. Trends Ecol Evol 11:152-157.
Jackson HHT, 1955. The Wisconsin puma. Proc Bioi Soc Wash 68:149-150.
Janczewski DN, Modi WS, Stephens JC, and O'Brien SJ, 1995. Molecular evolution of mitochondrial 12S RNA and cytochrome b sequences in the Pantherine lineage of Felidae. Mol Bioi Evol 12:690-707.
Johnson W, Culver M, Iriarte JA, Eizirik E, Seymour KL, and O'Brien SJ, 1998. Tracking the evolution of the elusive Andean mountain cat (Oreailurus jacobi/a) from mitochondrial DNA. J Hered 89:227-232.
Johnson Wand O'Brien SJ, 1997. Phylogenetic reconstruction of the Felidae using 16S rRNA and NADH-5 mitochondrial genes. J Mol Evol 44(suppl 1):S9S--S116.
Kerr R, 1792. The animal kingdom, p. 15.
Kurten B, 1976. Fossil puma (Mammalia:Felidae) in North America. Netherlands J Zool 26:502-534.
Linneaus C, 1771. In: Regni Animalis; Appendix to Mantissa Plantarum, p. 522.
Lopez JV, Cevario S, and O'Brien SJ, 1996. Complete nucleotide sequence of the domestic cat (Felis catus) mitochondrial genome and a transposed mtDNA tandem repeat (Numt) in the nuclear genome. Genomics 33:229-246.
Lopez JV, Culver M, Stephens JC, Johnson WE, and O'Brien SJ, 1997. Rates of nuclear and cytoplasmic mitochondrial DNA sequence divergence in mammals. Mol Bioi Evol 14:277-286.
Maehr D, 1998. The Florida panther: life and death of a vanishing carnivore. Washington, DC: Island Press; 357-359.
Marshall LG, Webb SD, Sepkoski JJ, and Raup DM, 1982. Mammalian evolution and the great american interchange. Science 215:1351-1357.
Martin LD, 1989. Fossil history of terrestrial Carnivora.
In: Carnivore behavior, ecology, and evolution (Gittleman JL, ed). Ithaca, NY: Cornell University Press; 536568.
Martin PS and Wright HE, 1967. Pleistocene extinctions: the search for a cause. New Haven, CT: Yale University Press.
Maruyama T and Fuerst PA, 1985. Population bottlenecks and nonequilibrium models in population genetics. II. Number of alleles in a small population that was formed by a recent bottleneck. Genetics 111:675--689.
Mayr E, 1970. Populations, species and evolution. Cambridge, MA: Harvard University Press.
Menotti-Raymond M, David V, Stephens JC, Lyons LA, and O'Brien SJ, 1997. Genetic individualization of domestic cats using feline STR loci for forensic applications. J Foren Sci 42:1037-1050.
Menotti-Raymond M, David VA, Lyons LA, Schaller AA, Tomlin JF, Hutton MK, and O'Brien SJ, 1999. A genetic linkage map of microsatellites in the domestic cat (Felis calUs). Genomics 57:9-23.
Menotti-Raymond M and O'Brien SJ, 1993. Dating the genetic bottleneck of the African cheetah. Proc Natl Acad Sci USA 90:3172-3176.
Merriam CH, 1901. Proc. Was. Acad. Sci. 3:577.
Minch E, Ruiz-Linares A, Goldstein DB, Feldman MW, and Cavalli-Sforza LL, 1995. MICROSAT (Version 1.5d) {http://www.lotka.stanford.edu/microsat.html).
Molina GI, 1782. In: Sazzio sulla storia naturale del Chili, pp. 295.
Nell N, 1983. The big cats: the paintings of Guy Coheleach. New York: Harry N. Abrams.
Nei M and Li W-H, 1979. Mathematical model for studying genetic variation in terms of restriction endonucleases. Proc Natl Acad Sci USA 76:5269-5273.
Nei M, Maruyama T, and Chakraborty R, 1975. The bottleneck ellect and genetic variability in populations. Evolution 29:1-10.
O'Brien SJ and Mayr E, 1991. Bureaucratic mischief: recognizing endangered species and subspecies. Science 1251:1187-1188.
O'Brien SJ, Roelke ME, Marker L, Newman A, Winkler CA, Meltzer D, Colly L, Evermann JF, Bush M, and Wildt DE, 1985. Genetic basis for species vulnerability in the cheetah. Science 227:142S--1434.
O'Brien SJ, Roelke ME, Yuhki N, Richards KW, Johnson WE, Franklin WL, Anderson AE, Bass OL, Jr, Belden RC, and Martenson JS, 1990. Genetic introgression within the Florida panther Felis conc%r cory;' Natl Geogr Res 6:485-494.
O'Brien SJ, Wildt DE, Bush M, Caro TM, FitzGibbon C, Aggundey I, and Leakey RE, 1987. East African cheetahs: evidence for two population bottlenecks? Proc Natl Acad Sci USA 84:50S--511.
Orita M, Iwahana H, Kanazawa H, Hayashi K, and Seika T, 1989a. Detection 01 polymorphisms of human DNA by gel electrophoresis as single strand conformation polymorphisms. Proc Nat1 Acad Sci USA 86:2766-2770.
Orita M, Suzuki Y, Sekiya T, and Hayashi K, 1989b. Rapid and sensitive detection of point mutations and DNA polymorphisms using the polymerase chain reaction. Genomics 5:874-879.
Paabo S, Gillord JA, and Wilson A, 1988. Mitochondrial DNA sequence from a 7000 year old brain. Nucleic Acids Res 16:9775--9787.
Page ROM, 1996. TREEVIEW: An application to display phylogenetic trees on personal computers. Comp Appl Biosciences 12:351-358.
Pecon-Slattery J and O'Brien SJ, 1998. Patterns of Y and X chromosome DNA sequence divergence during the Felidae radiation. Genetics 148:1245-1255.
Pielou EC, 1991. In: After the lee Age, the return of life
to glaciated North America. Chicago: University of Chicago Press.
Pocock RI, 1904. Ann. Mag. Nat. Hist. Ser. 11. 6:307.
Poduslo SE, Dean M, Kolch U, and O'Brien SJ, 1991. Detecting high-resolution polymorphisms in human coding loci by combining PCR and single-strand conformation polymorphism (SSCP) analysis. Am J Hum Genet 49: 106-111.
Reich D and Goldstein DB, 1998. Genetic evidence for a Paleolithic human population expansion in Africa. Proc Natl Acad Sci USA 95:8119-8123.
Reynolds J, Weir BS, and Cockerham CC, 1983. Estimation for the coancestry coefficient: bias for a short term genetic distance. Genetics 105:767-779.
Roelke ME, Martenson JS, and O'Brien SJ, 1993. The consequences of demographic reduction and genetic depletion in the endangered Florida panther. Curr Bioi 3:340-350.
Saiki RK, Scharf S, Fallona F, Mullis KB, Horn GT, Erlich HA, and Arnheim N, 1985. Enzymatic amplification of bglobin genomic sequences and restriction site analysis for diagnosis of sickle-cell anemia. Science 230:13501354.
Sambrook J, Fritsch EF, and Maniatis T, 1989. Molecular cloning: a laboratory manual. Cold Spring Harbor, NY: Cold Spring Harbor Laboratory Press.
Savage DE and Russell DE, 1983. Mammalian paleofaunas of the world. Reading, MA: Addison-Wesley.
Schneider S, Kueller J-M, Roessli D, and Excoffier L, 1997. Arlequin version 1.1: a software for population genetic data analysis. Geneva, SWitzerland: Genetics and Biometry Laboratory, University of Geneva.
Shimmin L, Chang BHJ, and Li WH, 1993. Male-driven evolution of DNA sequences. Nature 362:745--747.
Slatkin M, 1994. A measure of population subdivision based on microsatellite allele frequencies. Genetics 139:457-462.
Stehli FG and Webb SD, 1985. The great American biotic interchange. New York: Plenum Press.
Tajima F and Nei M, 1984. Estimation of evolutionary distance between nucleotide sequences. Mol Bioi Evol 1:269-285.
Turner A, 1997. The big cats and their fossil relatives. New York: Columbia University Press.
Van Valkenburgh B, Grady F, and Kurten B, 1990. The Plio-Pleistocene cheetah-like cat Miracinonyx inexpectatus of North America. J Vert Paleo 10:434-454.
Webb SD, 1978. A history of savanna vertebrates in the new World, part n. South America and the great interchange. Annu Rev Ecol Syst 9:393-426.
Webb SD and Marshall LG, 1981. Historical biogeography of recent South American land mammals. In: Mammalian biology in South America, special publication series (Mares MA and Genoways HH, eds). Pittsburgh, PA: Pymatuning Laboratory of Ecology, University of Pitts burgh; 39-52.
Webb SD and Rancy A, 1996. Late Cenozoic evolution of the neotropical mammal fauna. In: Evolution and environment in tropical America (Jackson JB, Budd AF, and Coates AG, eds). Chicago, IL: University of Chicago Press; 335-358.
Weir B, 1996. Genetic data analysis. Sunderland, MA: Sinauer.
Werdelin L, 1989. The radiation offelids in South America: when and where did it occur? Fifth International Theriological Congress, Rome, Abstract of Papers and Posters; 290-291.
Young SP and Goldman EA, 1946. The puma, mysterious American cat. Washington, DC: American Wildlife Institute.
Corresponding Editor: Masatoshi Nei
Culver et al • Genomic Ancestry of the American Puma 197
Copyright © 2022 FDOKUMEN