Puma Pricelist_1.pdf - Minnesota Department of Transportation
Upload
khangminh22Category
view
1download
0
ANNUAL REPORT 2020
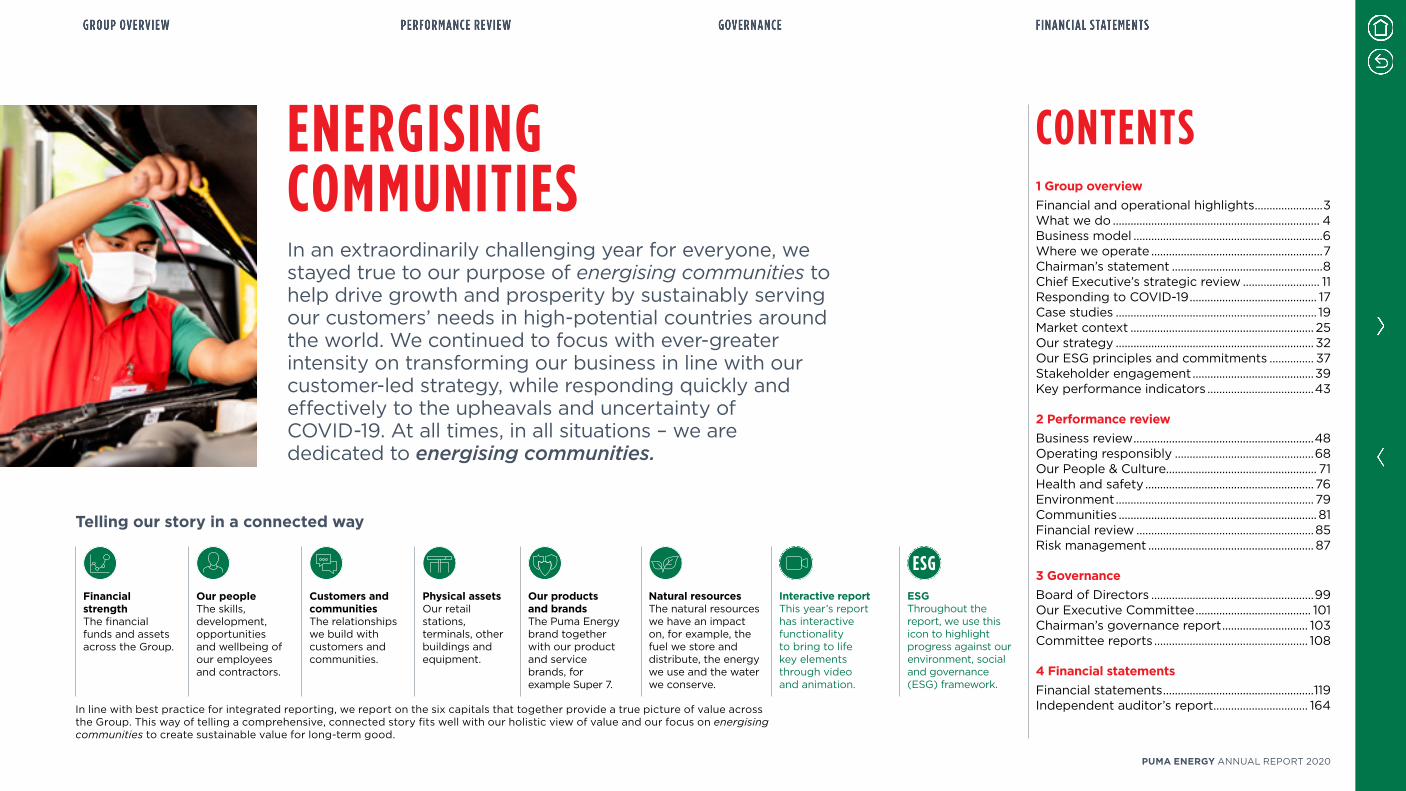
ENERGISING COMMUNITIESIn an extraordinarily challenging year for everyone, we stayed true to our purpose of energising communities to help drive growth and prosperity by sustainably serving our customers’ needs in high-potential countries around the world. We continued to focus with ever-greater intensity on transforming our business in line with our customer-led strategy, while responding quickly and effectively to the upheavals and uncertainty of COVID-19. At all times, in all situations – we are dedicated to energising communities.
Telling our story in a connected way
In line with best practice for integrated reporting, we report on the six capitals that together provide a true picture of value across the Group. This way of telling a comprehensive, connected story fits well with our holistic view of value and our focus on energising communities to create sustainable value for long-term good.
CONTENTS1 Group overviewFinancial and operational highlights .......................3What we do ...................................................................... 4Business model ................................................................6Where we operate ..........................................................7Chairman’s statement ...................................................8Chief Executive’s strategic review .......................... 11Responding to COVID-19 ........................................... 17Case studies .................................................................... 19Market context .............................................................. 25Our strategy ................................................................... 32Our ESG principles and commitments ............... 37Stakeholder engagement .........................................39Key performance indicators ....................................43
2 Performance reviewBusiness review .............................................................48Operating responsibly ...............................................68Our People & Culture................................................... 71Health and safety ......................................................... 76Environment ................................................................... 79Communities ................................................................... 81Financial review ............................................................85Risk management ........................................................ 87
3 GovernanceBoard of Directors .......................................................99Our Executive Committee ....................................... 101Chairman’s governance report ............................. 103Committee reports .................................................... 108
4 Financial statementsFinancial statements ...................................................119Independent auditor’s report ................................ 164
Financial strength The financial funds and assets across the Group.
Our peopleThe skills, development, opportunities and wellbeing of our employees and contractors.
Customers and communitiesThe relationships we build with customers and communities.
Physical assetsOur retail stations, terminals, other buildings and equipment.
Our products and brandsThe Puma Energy brand together with our product and service brands, for example Super 7.
Natural resources The natural resources we have an impact on, for example, the fuel we store and distribute, the energy we use and the water we conserve.
Interactive reportThis year’s report has interactive functionality to bring to life key elements through video and animation.
ESGThroughout the report, we use this icon to highlight progress against our environment, social and governance (ESG) framework.
PUMA ENERGY ANNUAL REPORT 2020
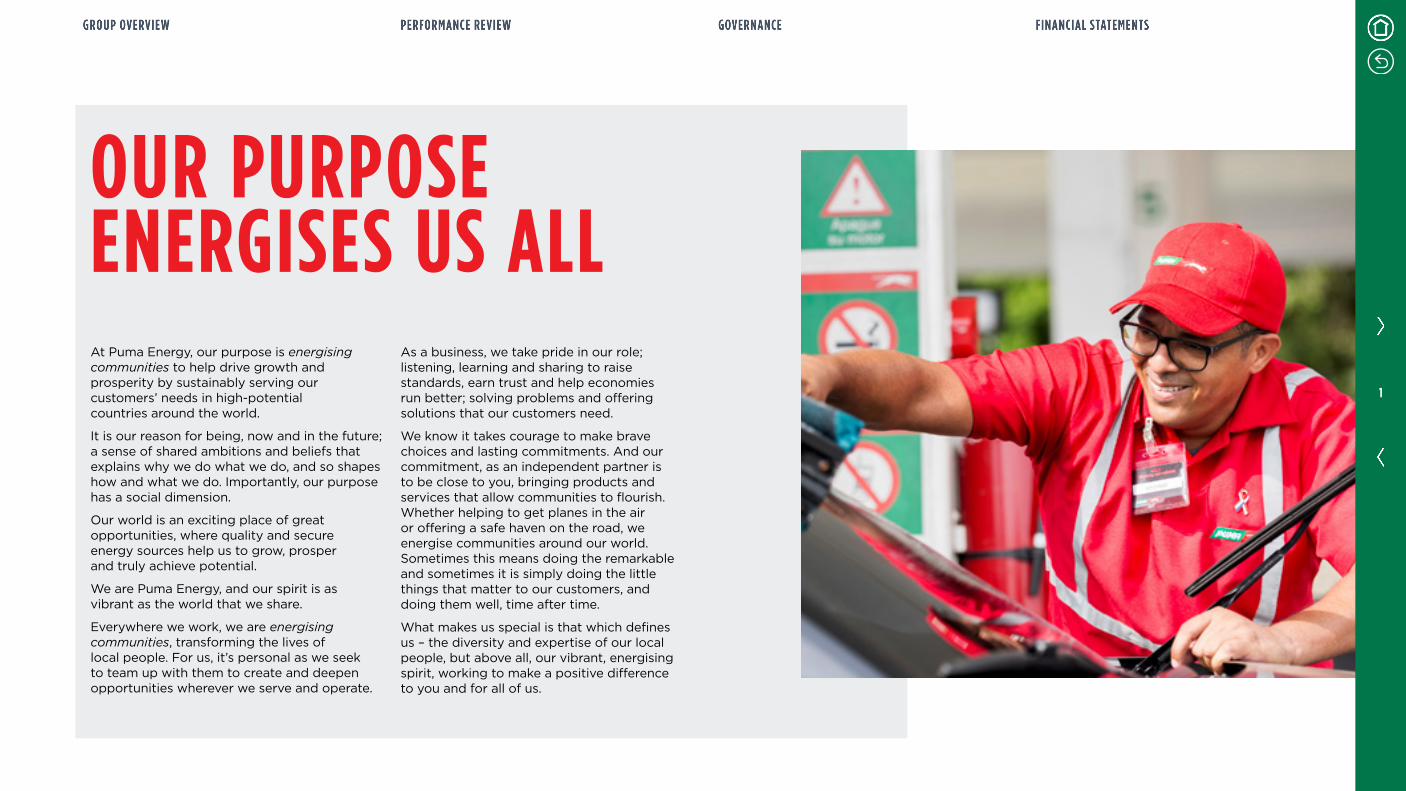
OUR PURPOSE ENERGISES US ALLAt Puma Energy, our purpose is energising communities to help drive growth and prosperity by sustainably serving our customers’ needs in high-potential countries around the world.
It is our reason for being, now and in the future; a sense of shared ambitions and beliefs that explains why we do what we do, and so shapes how and what we do. Importantly, our purpose has a social dimension.
Our world is an exciting place of great opportunities, where quality and secure energy sources help us to grow, prosper and truly achieve potential.
We are Puma Energy, and our spirit is as vibrant as the world that we share.
Everywhere we work, we are energising communities, transforming the lives of local people. For us, it’s personal as we seek to team up with them to create and deepen opportunities wherever we serve and operate.
As a business, we take pride in our role; listening, learning and sharing to raise standards, earn trust and help economies run better; solving problems and offering solutions that our customers need.
We know it takes courage to make brave choices and lasting commitments. And our commitment, as an independent partner is to be close to you, bringing products and services that allow communities to flourish. Whether helping to get planes in the air or offering a safe haven on the road, we energise communities around our world. Sometimes this means doing the remarkable and sometimes it is simply doing the little things that matter to our customers, and doing them well, time after time.
What makes us special is that which defines us – the diversity and expertise of our local people, but above all, our vibrant, energising spirit, working to make a positive difference to you and for all of us.
1
Financial and operational highlights ..........3 What we do ..........................................................4 Business model ...................................................6 Where we operate .............................................7 Chairman’s statement ......................................8 Chief Executive’s strategic review ............. 11 Responding to COVID-19 .............................. 17 Case studies ....................................................... 19 Market context ................................................. 25 Our strategy ...................................................... 32 Our ESG principles and commitments ..... 37 Stakeholder engagement ............................ 39 Key performance indicators .......................43
GROUP OVERVIEW
GROUP OVERVIEW
2
PUMA ENERGY ANNUAL REPORT 2020
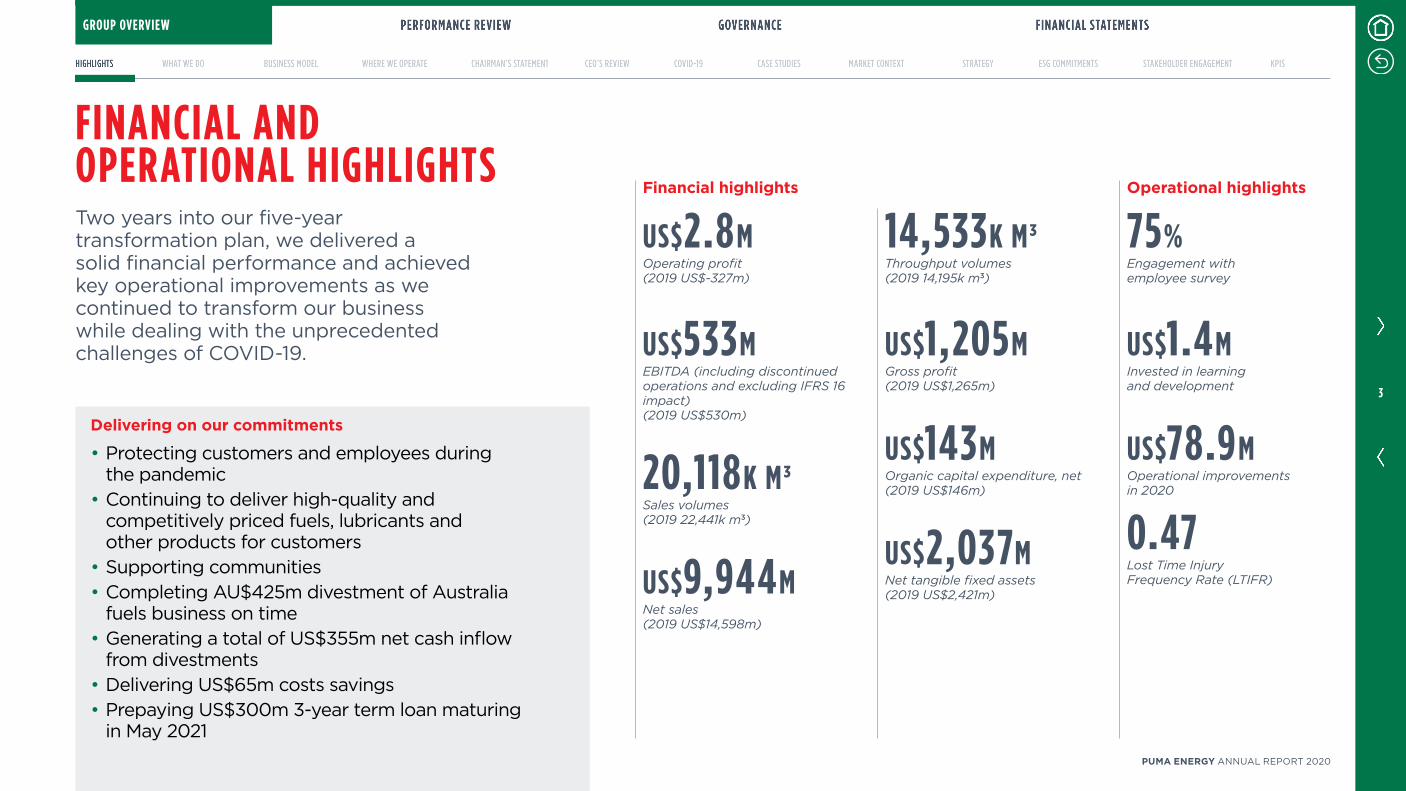
14,533K M3Throughput volumes (2019 14,195k m3)
US$1,205MGross profit (2019 US$1,265m)
US$143MOrganic capital expenditure, net (2019 US$146m)
US$2,037MNet tangible fixed assets (2019 US$2,421m)
Delivering on our commitments
• Protecting customers and employees duringthe pandemic
• Continuing to deliver high-quality andcompetitively priced fuels, lubricants andother products for customers
• Supporting communities• Completing AU$425m divestment of Australia
fuels business on time• Generating a total of US$355m net cash inflow
from divestments• Delivering US$65m costs savings• Prepaying US$300m 3-year term loan maturing
in May 2021
Two years into our five-year transformation plan, we delivered a solid financial performance and achieved key operational improvements as we continued to transform our business while dealing with the unprecedented challenges of COVID-19.
FINANCIAL AND OPERATIONAL HIGHLIGHTS
Operational highlights
75%Engagement with employee survey
US$1.4MInvested in learning and development
US$78.9MOperational improvements in 2020
0.47Lost Time Injury Frequency Rate (LTIFR)
Financial highlights
US$2.8MOperating profit (2019 US$-327m)
US$533MEBITDA (including discontinued operations and excluding IFRS 16 impact) (2019 US$530m)
20,118K M3Sales volumes (2019 22,441k m3)
US$9,944MNet sales (2019 US$14,598m)
GROUP OVERVIEW
3
PUMA ENERGY ANNUAL REPORT 2020
1 2 3
4
6
5
8
9
12
10
11
7
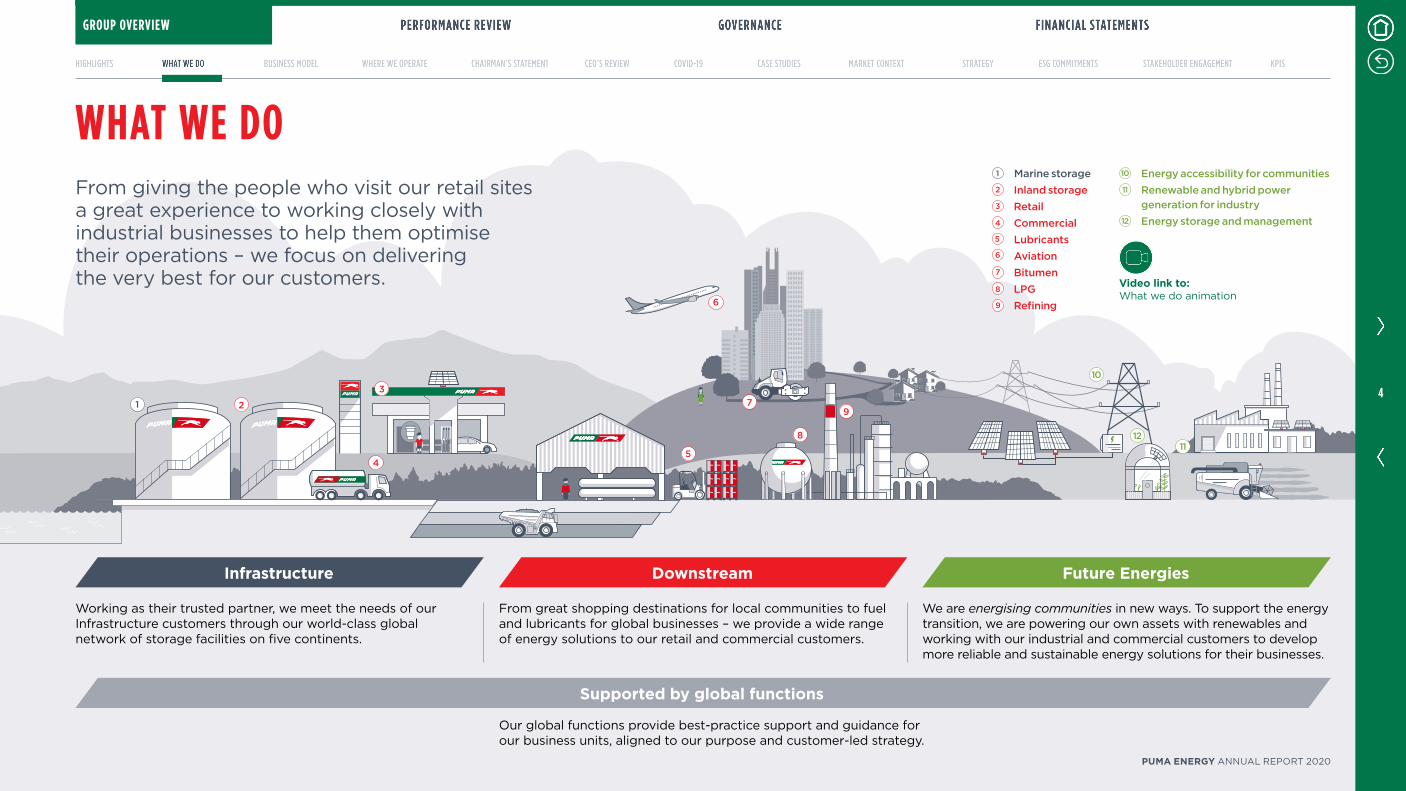
1 Marine storage2 Inland storage3 Retail4 Commercial5 Lubricants6 Aviation7 Bitumen8 LPG9 Refining
10 Energy accessibility for communities11 Renewable and hybrid power
generation for industry12 Energy storage and management
Working as their trusted partner, we meet the needs of our Infrastructure customers through our world-class global network of storage facilities on five continents.
We are energising communities in new ways. To support the energy transition, we are powering our own assets with renewables and working with our industrial and commercial customers to develop more reliable and sustainable energy solutions for their businesses.
From great shopping destinations for local communities to fuel and lubricants for global businesses – we provide a wide range of energy solutions to our retail and commercial customers.
WHAT WE DOFrom giving the people who visit our retail sites a great experience to working closely with industrial businesses to help them optimise their operations – we focus on delivering the very best for our customers.
Supported by global functions
Infrastructure Downstream Future Energies
Our global functions provide best-practice support and guidance for our business units, aligned to our purpose and customer-led strategy.
Video link to: What we do animation
GROUP OVERVIEW
4
PUMA ENERGY ANNUAL REPORT 2020
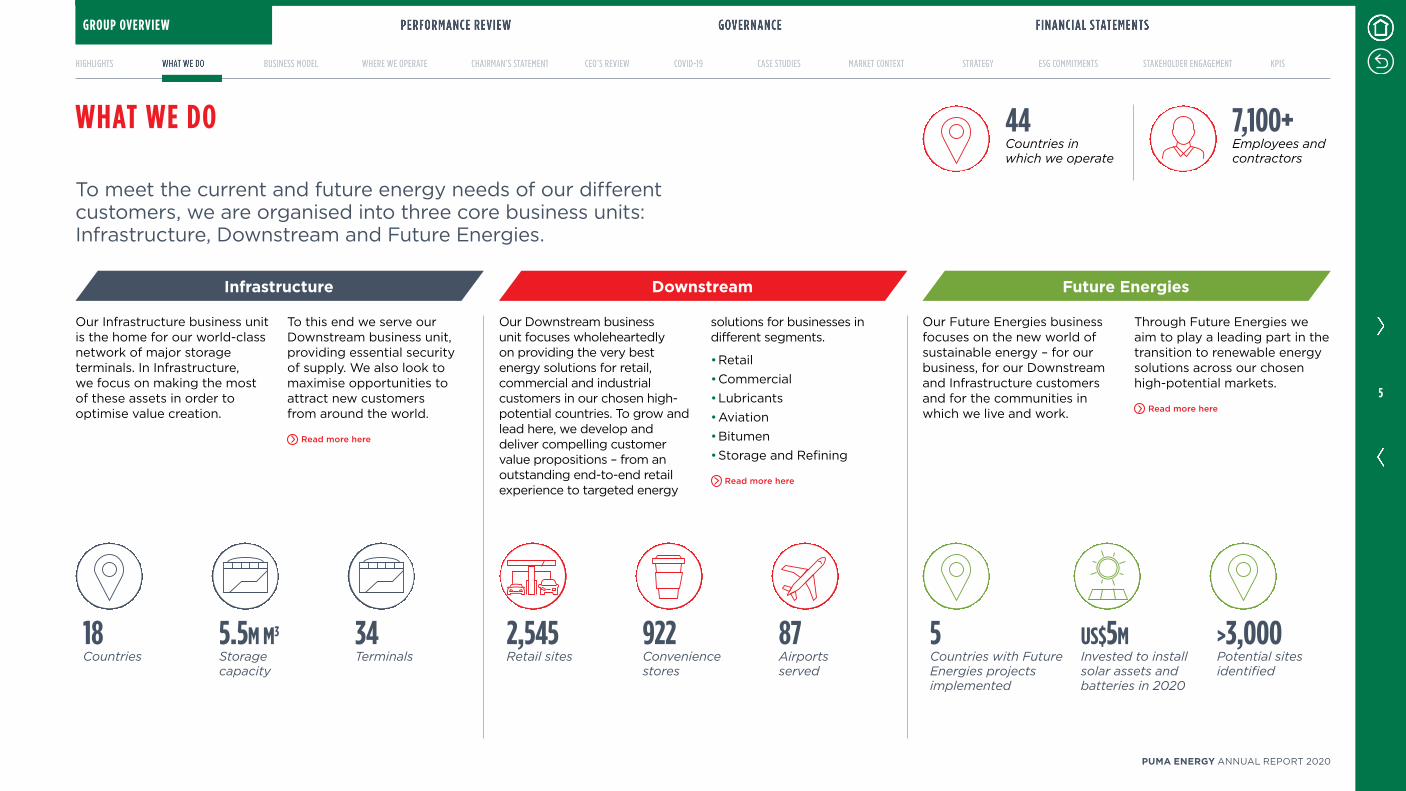
To meet the current and future energy needs of our different customers, we are organised into three core business units: Infrastructure, Downstream and Future Energies.
Our Future Energies business focuses on the new world of sustainable energy – for our business, for our Downstream and Infrastructure customers and for the communities in which we live and work.
Through Future Energies we aim to play a leading part in the transition to renewable energy solutions across our chosen high-potential markets.
Read more here
Our Infrastructure business unit is the home for our world-class network of major storage terminals. In Infrastructure, we focus on making the most of these assets in order to optimise value creation.
To this end we serve our Downstream business unit, providing essential security of supply. We also look to maximise opportunities to attract new customers from around the world.
Read more here
WHAT WE DO
Infrastructure Downstream Future Energies
Our Downstream business unit focuses wholeheartedly on providing the very best energy solutions for retail, commercial and industrial customers in our chosen high-potential countries. To grow and lead here, we develop and deliver compelling customer value propositions – from an outstanding end-to-end retail experience to targeted energy
solutions for businesses in different segments.
• Retail• Commercial• Lubricants• Aviation• Bitumen• Storage and Refining
Read more here
18Countries
5.5M M3
Storage capacity
34Terminals
5Countries with Future Energies projects implemented
US$5MInvested to install solar assets and batteries in 2020
>3,000Potential sites identified
2,545Retail sites
922Convenience stores
87Airports served
7,100+Employees and contractors
44Countries in which we operate
GROUP OVERVIEW
5
PUMA ENERGY ANNUAL REPORT 2020
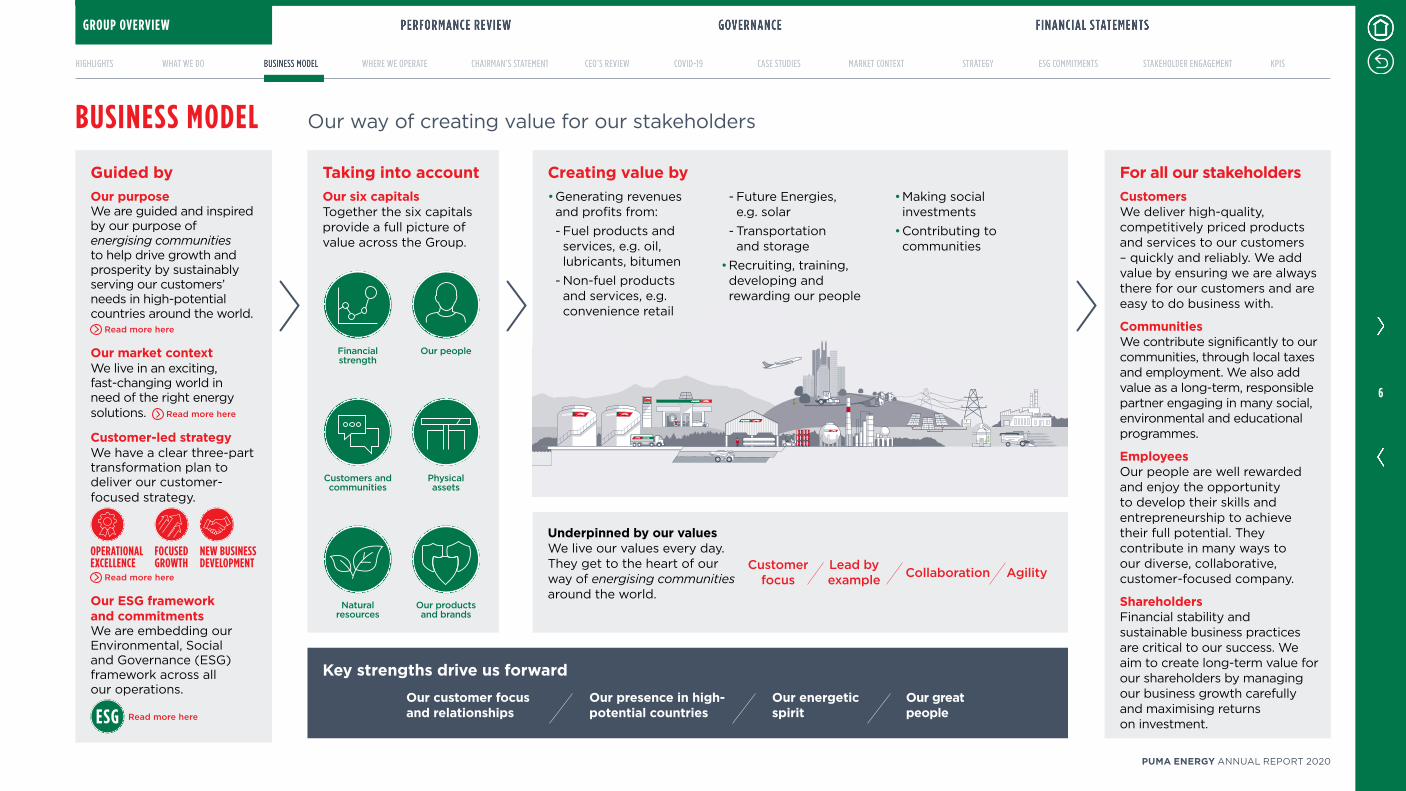
Guided byOur purposeWe are guided and inspired by our purpose of energising communities to help drive growth and prosperity by sustainably serving our customers’ needs in high-potential countries around the world.
Read more here
Our market contextWe live in an exciting, fast-changing world in need of the right energy solutions. Read more here
Customer-led strategyWe have a clear three-part transformation plan to deliver our customer-focused strategy.
OPERATIONAL EXCELLENCE
FOCUSED GROWTH
NEW BUSINESS DEVELOPMENT
Read more here
Our ESG framework and commitmentsWe are embedding our Environmental, Social and Governance (ESG) framework across all our operations.
Read more here
Underpinned by our valuesWe live our values every day. They get to the heart of our way of energising communities around the world.
For all our stakeholdersCustomersWe deliver high-quality, competitively priced products and services to our customers – quickly and reliably. We add value by ensuring we are always there for our customers and are easy to do business with.
CommunitiesWe contribute significantly to our communities, through local taxes and employment. We also add value as a long-term, responsible partner engaging in many social, environmental and educational programmes.
EmployeesOur people are well rewarded and enjoy the opportunity to develop their skills and entrepreneurship to achieve their full potential. They contribute in many ways to our diverse, collaborative, customer-focused company.
ShareholdersFinancial stability and sustainable business practices are critical to our success. We aim to create long-term value for our shareholders by managing our business growth carefully and maximising returns on investment.
Taking into accountOur six capitalsTogether the six capitals provide a full picture of value across the Group.
Financial strength
Our people
Customers and communities
Physical assets
Our products and brands
Natural resources
Lead by example Collaboration AgilityCustomer
focus
BUSINESS MODEL Our way of creating value for our stakeholders
Creating value by• Generating revenues and profits from: - Fuel products and services, e.g. oil, lubricants, bitumen - Non-fuel products and services, e.g. convenience retail
- Future Energies, e.g. solar - Transportation and storage
• Recruiting, training, developing and rewarding our people
• Making social investments
• Contributing to communities
Key strengths drive us forward
Our customer focus and relationships
Our presence in high- potential countries
Our energetic spirit
Our great people
GROUP OVERVIEW
6
PUMA ENERGY ANNUAL REPORT 2020
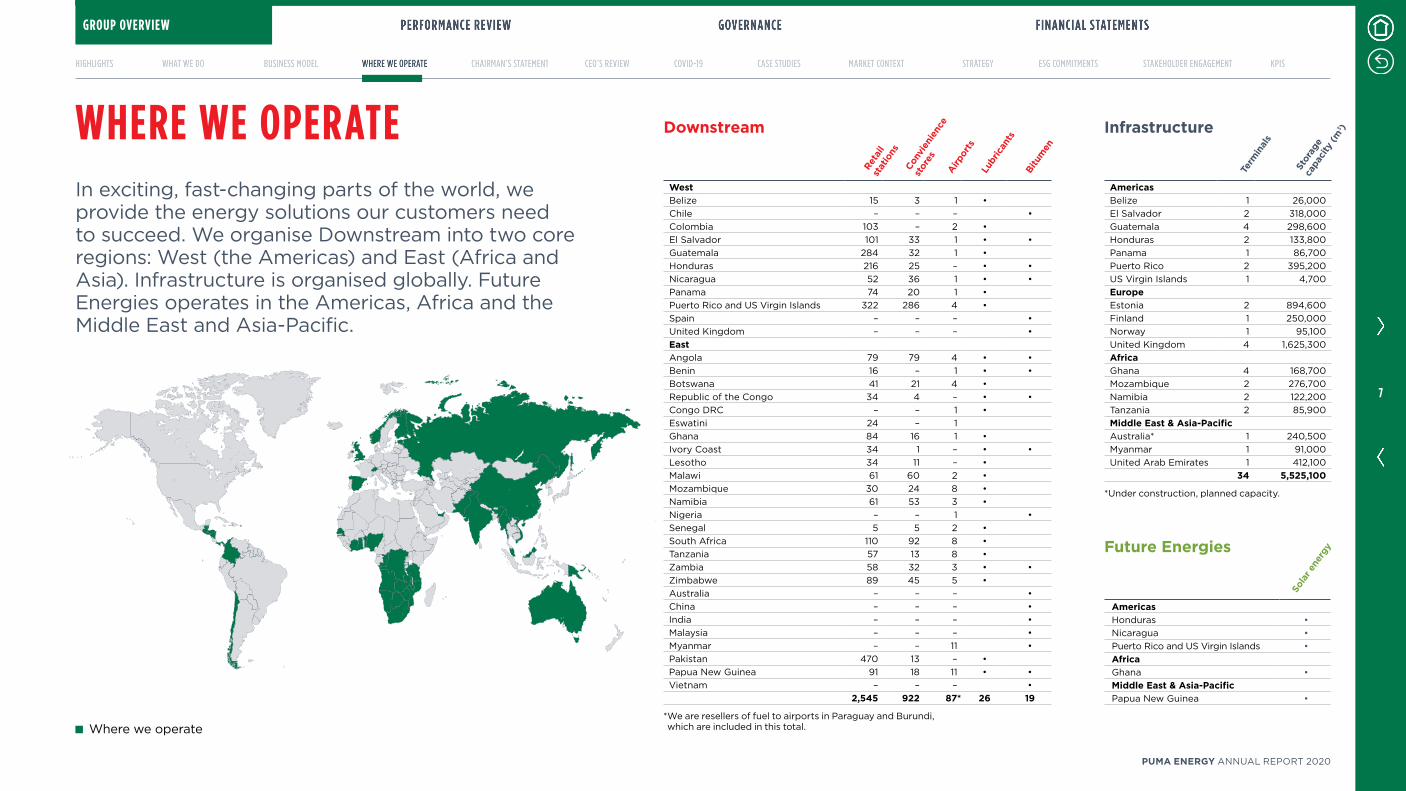
WHERE WE OPERATEIn exciting, fast-changing parts of the world, we provide the energy solutions our customers need to succeed. We organise Downstream into two core regions: West (the Americas) and East (Africa and Asia). Infrastructure is organised globally. Future Energies operates in the Americas, Africa and the Middle East and Asia-Pacific.
Where we operate
Infrastructure
AmericasBelize 1 26,000 El Salvador 2 318,000Guatemala 4 298,600Honduras 2 133,800Panama 1 86,700 Puerto Rico 2 395,200US Virgin Islands 1 4,700 EuropeEstonia 2 894,600Finland 1 250,000 Norway 1 95,100 United Kingdom 4 1,625,300AfricaGhana 4 168,700Mozambique 2 276,700Namibia 2 122,200Tanzania 2 85,900Middle East & Asia-PacificAustralia* 1 240,500 Myanmar 1 91,000 United Arab Emirates 1 412,100
34 5,525,100
*Under construction, planned capacity.
Downstream
WestBelize 15 3 1 •Chile – – – •Colombia 103 – 2 •El Salvador 101 33 1 • •Guatemala 284 32 1 •Honduras 216 25 – • •Nicaragua 52 36 1 • •Panama 74 20 1 •Puerto Rico and US Virgin Islands 322 286 4 •Spain – – – •United Kingdom – – – •EastAngola 79 79 4 • •Benin 16 – 1 • •Botswana 41 21 4 •Republic of the Congo 34 4 – • •Congo DRC – – 1 •Eswatini 24 – 1Ghana 84 16 1 •Ivory Coast 34 1 – • •Lesotho 34 11 – •Malawi 61 60 2 •Mozambique 30 24 8 •Namibia 61 53 3 •Nigeria – – 1 •Senegal 5 5 2 •South Africa 110 92 8 •Tanzania 57 13 8 •Zambia 58 32 3 • •Zimbabwe 89 45 5 •Australia – – – •China – – – •India – – – •Malaysia – – – •Myanmar – – 11 •Pakistan 470 13 – •Papua New Guinea 91 18 11 • •Vietnam – – – •
2,545 922 87* 26 19
* We are resellers of fuel to airports in Paraguay and Burundi, which are included in this total.
Conv
ieni
ence
stor
es
Airpor
tsLu
bric
ants
Bitu
men
Reta
il st
atio
ns
Stor
age
capa
city
(m3 )
Term
inal
s
Future Energies
AmericasHonduras •Nicaragua •Puerto Rico and US Virgin Islands •AfricaGhana •Middle East & Asia-PacificPapua New Guinea •
Sola
r ene
rgy
GROUP OVERVIEW
7
PUMA ENERGY ANNUAL REPORT 2020
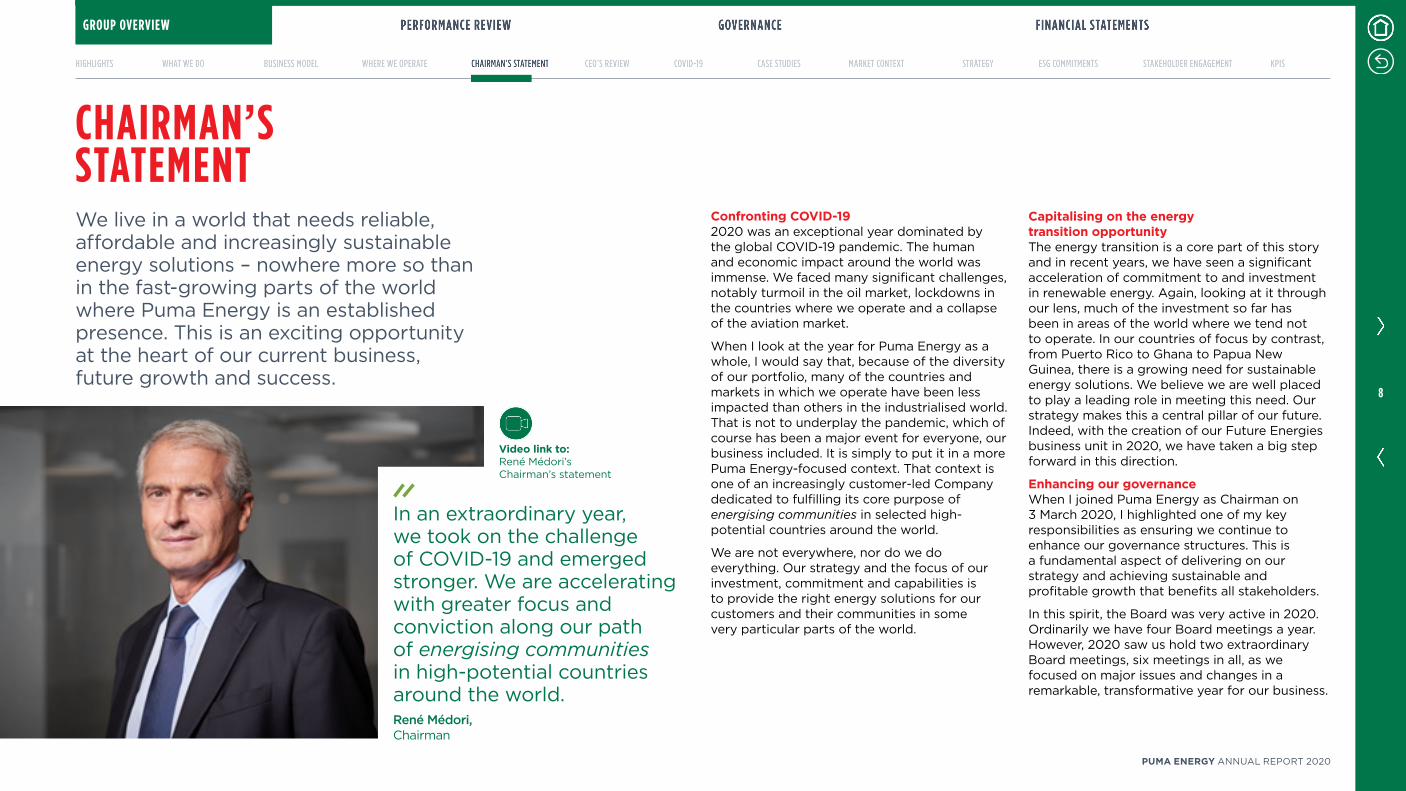
CHAIRMAN’S STATEMENTWe live in a world that needs reliable, affordable and increasingly sustainable energy solutions – nowhere more so than in the fast-growing parts of the world where Puma Energy is an established presence. This is an exciting opportunity at the heart of our current business, future growth and success.
Confronting COVID-192020 was an exceptional year dominated by the global COVID-19 pandemic. The human and economic impact around the world was immense. We faced many significant challenges, notably turmoil in the oil market, lockdowns in the countries where we operate and a collapse of the aviation market.
When I look at the year for Puma Energy as a whole, I would say that, because of the diversity of our portfolio, many of the countries and markets in which we operate have been less impacted than others in the industrialised world. That is not to underplay the pandemic, which of course has been a major event for everyone, our business included. It is simply to put it in a more Puma Energy-focused context. That context is one of an increasingly customer-led Company dedicated to fulfilling its core purpose of energising communities in selected high-potential countries around the world.
We are not everywhere, nor do we do everything. Our strategy and the focus of our investment, commitment and capabilities is to provide the right energy solutions for our customers and their communities in some very particular parts of the world.
Capitalising on the energy transition opportunityThe energy transition is a core part of this story and in recent years, we have seen a significant acceleration of commitment to and investment in renewable energy. Again, looking at it through our lens, much of the investment so far has been in areas of the world where we tend not to operate. In our countries of focus by contrast, from Puerto Rico to Ghana to Papua New Guinea, there is a growing need for sustainable energy solutions. We believe we are well placed to play a leading role in meeting this need. Our strategy makes this a central pillar of our future. Indeed, with the creation of our Future Energies business unit in 2020, we have taken a big step forward in this direction.
Enhancing our governanceWhen I joined Puma Energy as Chairman on 3 March 2020, I highlighted one of my key responsibilities as ensuring we continue to enhance our governance structures. This is a fundamental aspect of delivering on our strategy and achieving sustainable and profitable growth that benefits all stakeholders.
In this spirit, the Board was very active in 2020. Ordinarily we have four Board meetings a year. However, 2020 saw us hold two extraordinary Board meetings, six meetings in all, as we focused on major issues and changes in a remarkable, transformative year for our business.
In an extraordinary year, we took on the challenge of COVID-19 and emerged stronger. We are accelerating with greater focus and conviction along our path of energising communities in high-potential countries around the world.René Médori, Chairman
Video link to: René Médori’s Chairman’s statement
GROUP OVERVIEW
8
PUMA ENERGY ANNUAL REPORT 2020
We strengthened and expanded the role of the Audit Committee. We now have a more systematic view of the entire audit landscape.
The Remuneration Committee continued its focus on aligning the compensation of Puma Energy’s senior leadership to the strategic goals and performance of the business. Through the year, there was a particular emphasis by its shareholders and Board on supporting Puma Energy’s ongoing transformation and the related imperative to retain and attract the very best talent.
We also took a major step forward in enhancing our governance with the launch of our environmental, social and governance (ESG) framework. We are now ensuring it is embedded in every facet of Puma Energy’s operations and gathering examples and data from across our business to show that commitment in action.
Accelerating our transformationAlongside dealing with the unprecedented challenges of COVID-19, we also pressed on with, and indeed accelerated, our strategy. We implemented change at a faster pace across the three pillars of our transformation framework: operational excellence, focused growth and new business development. We undertook a major reorganisation of our operating model to form three customer-focused business units –
Downstream, Infrastructure and Future Energies – supported by global functions. We slimmed down our Executive Committee by a third, to create a leadership structure designed for agile, efficient and effective management. We accelerated the refocusing of our portfolio onto key markets, with divestments of assets within non-core countries.
We now have a clear strategic plan endorsed by the Board and the organisation and leadership to implement it.
Engaging closely with our shareholdersThe level of engagement with our two main shareholders was also very high, as indeed was their support for the business. I would like to take this opportunity to thank Trafigura and Sonangol for their strong and continued backing of Puma Energy. In particular, we greatly appreciate the price adjustment support our core supplier shareholders Trafigura and Sonangol provided in the second quarter of 2020. This was key in enabling us to weather the worst of the COVID-19 storm.
Looking on the bright side, the rollout of vaccines makes the future for everyone less perilous and uncertain. However, I do not underestimate the extent of the crisis and its impact that we faced this year, nor the risks that remain in 2021 and beyond, but
I do believe Puma Energy is increasingly well placed to navigate these risks and challenges through decisive leadership and an appropriate strategy and plan.
Leading us throughOur CEO Emma and her team have done a tremendous job in leading Puma Energy through all the challenges and uncertainties. They were very quick to accelerate the strategy together with a substantial programme of cost reductions, backed by the Board. The highly transparent, collaborative and dynamic style of the senior leadership team and the high degree of engagement with both the Board and employees have been key in enabling Puma Energy to bring stakeholders with them on their journey and achieve ongoing buy-in and support.
Starting to see the benefitsWe are starting to see the benefits of the acceleration. It is about much more than just driving down and managing our costs. The focus is on driving up, in a concerted way, how we choose to work with partners, customers and communities to energise them in the short and long term. We now have a simpler, sharper operating model focused on excelling for our customers and growing value for our stakeholders. We are emerging from COVID-19 stronger, leaner and fitter.
CHAIRMAN’S STATEMENT
We also took a major step forward in enhancing our governance with the launch of our environmental, social and governance (ESG) framework. We are now ensuring it is embedded in every facet of Puma Energy’s operations and gathering examples and data from across our business to show that commitment in action.
GROUP OVERVIEW
9
PUMA ENERGY ANNUAL REPORT 2020
Board changes During 2020, José Larocca stepped down from the Board and I would like to thank him for his contribution and wish him well for the future. We welcomed Hadi Hallouche as a new Board member and look forward to continuing to work closely with him.
Recognising our great peopleThe whole team at Puma Energy has been outstanding. I would like to thank all our people who have shown such resilience, verve and dedication in continuing to deliver for our customers, while facing often extremely tough challenges, and at the same time doing so much to keep transforming Puma Energy for the better.
Strengthening our balance sheetIn June 2020, we completed the sale of our Australian fuels business for AU$425m and we continue to target further proceeds from non-core divestments during 2021. This along with significant cost reductions and a range of operational improvements means that during 2020, we were able to prepay US$300m of the three-year term loan that falls due in May 2021.
With my fellow Board members, I have been evaluating a range of options to address the weakness of our balance sheet and expect to determine a course of action during the first quarter of 2021.
Looking aheadI am proud to say we are a business that plays a critical part in the lives of people, businesses and communities around the world. Looking ahead, we are intent on playing an increasingly valuable and welcome role as we continue to accelerate our strategy and go further, faster in energising communities around the world.
René Médori,Chairman
CHAIRMAN’S STATEMENT
We are starting to see the benefits of the acceleration of our strategy. It is about much more than just driving down and managing our costs. The focus is on driving up how we energise partners, customers and communities.
GROUP OVERVIEW
1 0
PUMA ENERGY ANNUAL REPORT 2020
Key events of the year
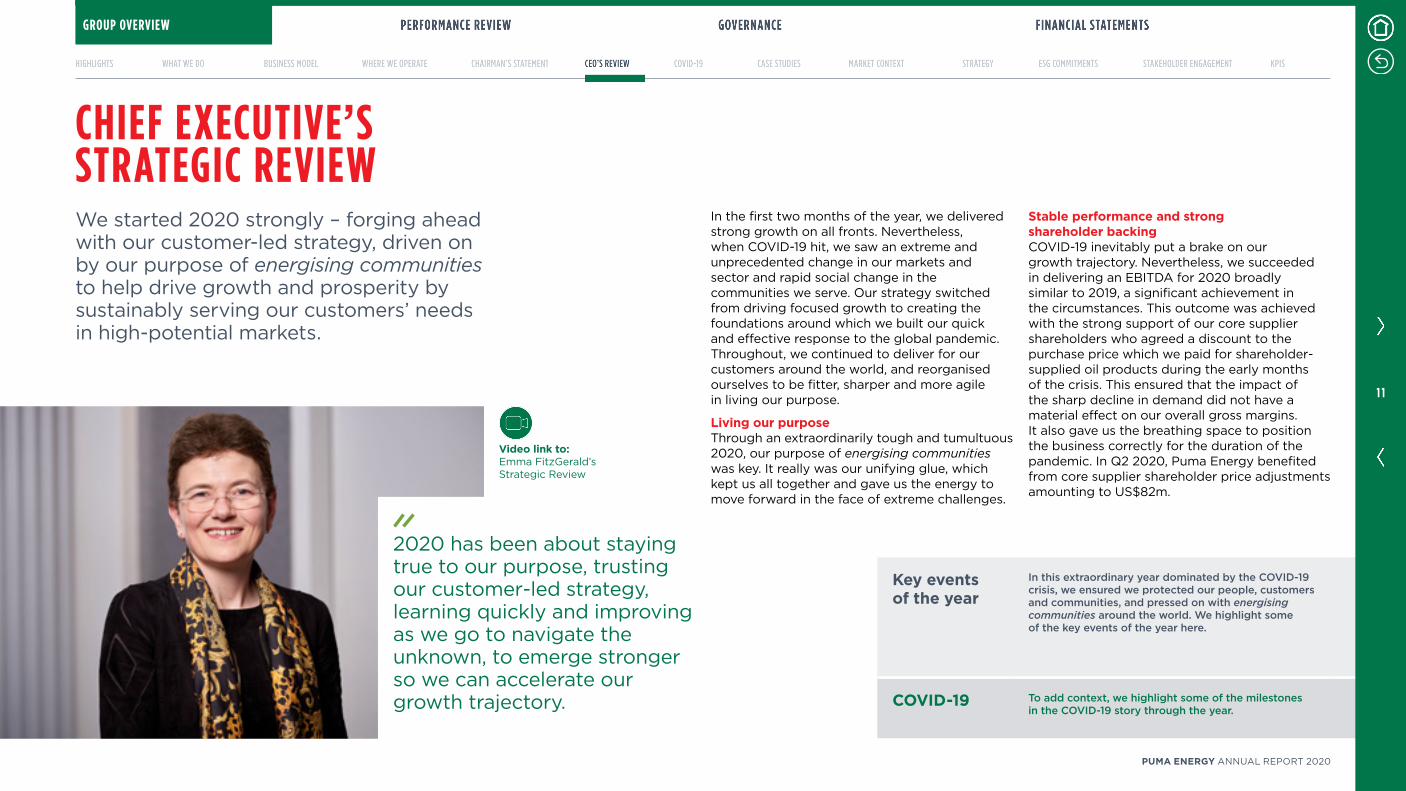
In this extraordinary year dominated by the COVID-19 crisis, we ensured we protected our people, customers and communities, and pressed on with energising communities around the world. We highlight some of the key events of the year here.
COVID-19 To add context, we highlight some of the milestones in the COVID-19 story through the year.
CHIEF EXECUTIVE’S STRATEGIC REVIEWWe started 2020 strongly – forging ahead with our customer-led strategy, driven on by our purpose of energising communities to help drive growth and prosperity by sustainably serving our customers’ needs in high-potential markets.
In the first two months of the year, we delivered strong growth on all fronts. Nevertheless, when COVID-19 hit, we saw an extreme and unprecedented change in our markets and sector and rapid social change in the communities we serve. Our strategy switched from driving focused growth to creating the foundations around which we built our quick and effective response to the global pandemic. Throughout, we continued to deliver for our customers around the world, and reorganised ourselves to be fitter, sharper and more agile in living our purpose.
Living our purposeThrough an extraordinarily tough and tumultuous 2020, our purpose of energising communities was key. It really was our unifying glue, which kept us all together and gave us the energy to move forward in the face of extreme challenges.
Stable performance and strong shareholder backingCOVID-19 inevitably put a brake on our growth trajectory. Nevertheless, we succeeded in delivering an EBITDA for 2020 broadly similar to 2019, a significant achievement in the circumstances. This outcome was achieved with the strong support of our core supplier shareholders who agreed a discount to the purchase price which we paid for shareholder-supplied oil products during the early months of the crisis. This ensured that the impact of the sharp decline in demand did not have a material effect on our overall gross margins. It also gave us the breathing space to position the business correctly for the duration of the pandemic. In Q2 2020, Puma Energy benefited from core supplier shareholder price adjustments amounting to US$82m.
2020 has been about staying true to our purpose, trusting our customer-led strategy, learning quickly and improving as we go to navigate the unknown, to emerge stronger so we can accelerate our growth trajectory.
Video link to: Emma FitzGerald’s Strategic Review
GROUP OVERVIEW
1 1
PUMA ENERGY ANNUAL REPORT 2020
CHIEF EXECUTIVE’S STRATEGIC REVIEW
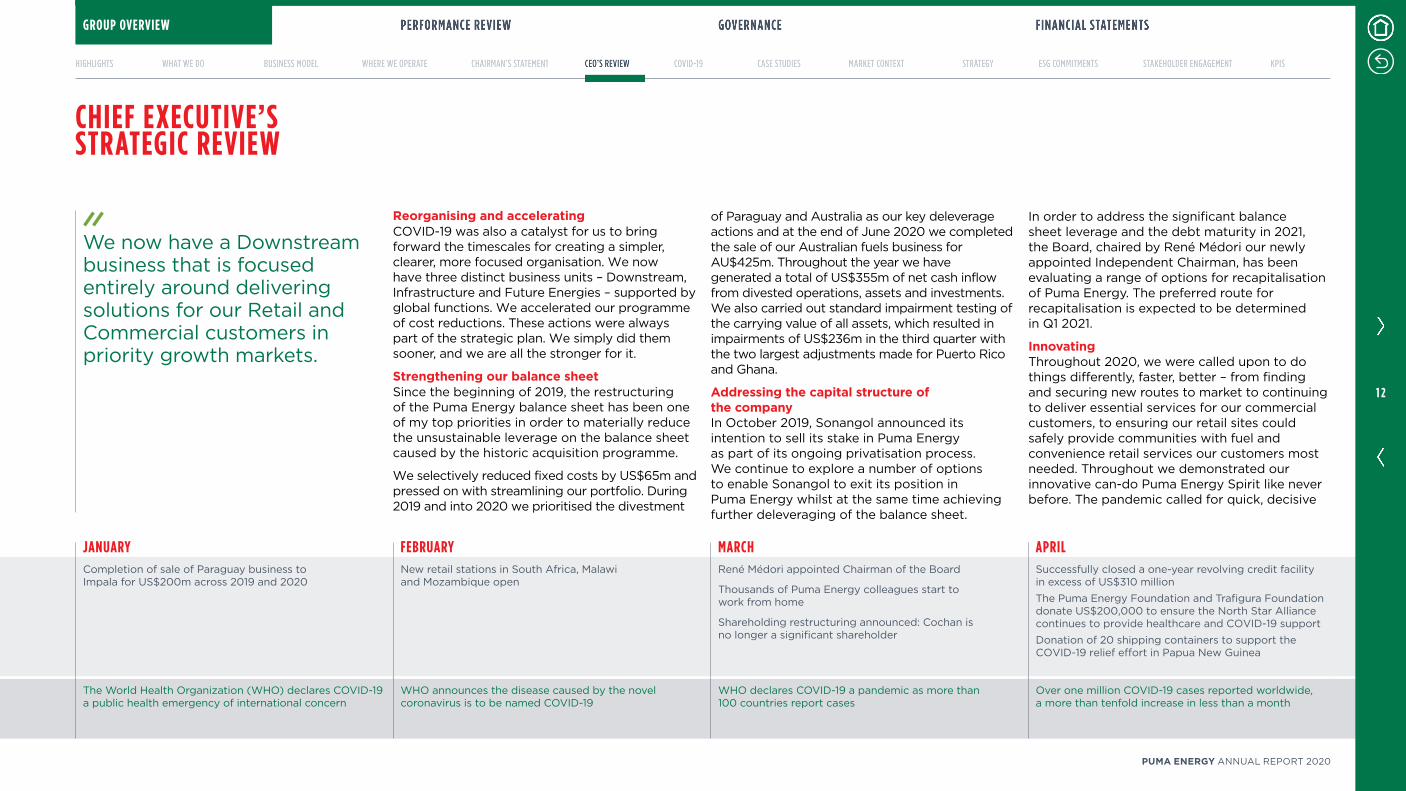
We now have a Downstream business that is focused entirely around delivering solutions for our Retail and Commercial customers in priority growth markets.
Reorganising and acceleratingCOVID-19 was also a catalyst for us to bring forward the timescales for creating a simpler, clearer, more focused organisation. We now have three distinct business units – Downstream, Infrastructure and Future Energies – supported by global functions. We accelerated our programme of cost reductions. These actions were always part of the strategic plan. We simply did them sooner, and we are all the stronger for it.
Strengthening our balance sheet Since the beginning of 2019, the restructuring of the Puma Energy balance sheet has been one of my top priorities in order to materially reduce the unsustainable leverage on the balance sheet caused by the historic acquisition programme.
We selectively reduced fixed costs by US$65m and pressed on with streamlining our portfolio. During 2019 and into 2020 we prioritised the divestment
of Paraguay and Australia as our key deleverage actions and at the end of June 2020 we completed the sale of our Australian fuels business for AU$425m. Throughout the year we have generated a total of US$355m of net cash inflow from divested operations, assets and investments. We also carried out standard impairment testing of the carrying value of all assets, which resulted in impairments of US$236m in the third quarter with the two largest adjustments made for Puerto Rico and Ghana.
Addressing the capital structure of the company In October 2019, Sonangol announced its intention to sell its stake in Puma Energy as part of its ongoing privatisation process. We continue to explore a number of options to enable Sonangol to exit its position in Puma Energy whilst at the same time achieving further deleveraging of the balance sheet.
In order to address the significant balance sheet leverage and the debt maturity in 2021, the Board, chaired by René Médori our newly appointed Independent Chairman, has been evaluating a range of options for recapitalisation of Puma Energy. The preferred route for recapitalisation is expected to be determined in Q1 2021.
InnovatingThroughout 2020, we were called upon to do things differently, faster, better – from finding and securing new routes to market to continuing to deliver essential services for our commercial customers, to ensuring our retail sites could safely provide communities with fuel and convenience retail services our customers most needed. Throughout we demonstrated our innovative can-do Puma Energy Spirit like never before. The pandemic called for quick, decisive
JANUARY FEBRUARY MARCH APRILCompletion of sale of Paraguay business to Impala for US$200m across 2019 and 2020
New retail stations in South Africa, Malawi and Mozambique open
René Médori appointed Chairman of the Board
Thousands of Puma Energy colleagues start to work from home
Shareholding restructuring announced: Cochan is no longer a significant shareholder
Successfully closed a one-year revolving credit facility in excess of US$310 million The Puma Energy Foundation and Trafigura Foundation donate US$200,000 to ensure the North Star Alliance continues to provide healthcare and COVID-19 supportDonation of 20 shipping containers to support the COVID-19 relief effort in Papua New Guinea
The World Health Organization (WHO) declares COVID-19 a public health emergency of international concern
WHO announces the disease caused by the novel coronavirus is to be named COVID-19
WHO declares COVID-19 a pandemic as more than 100 countries report cases
Over one million COVID-19 cases reported worldwide, a more than tenfold increase in less than a month
GROUP OVERVIEW
1 2
PUMA ENERGY ANNUAL REPORT 2020
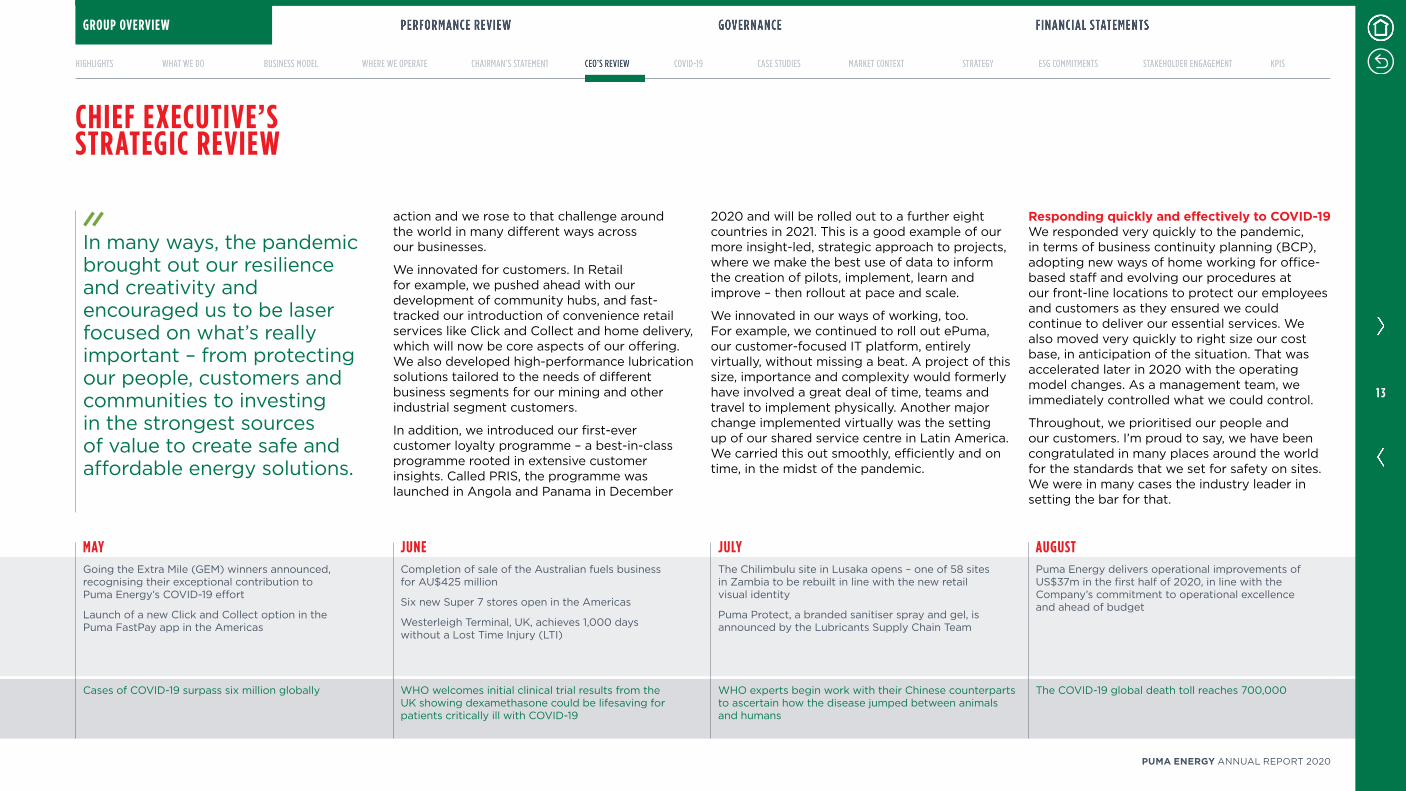
In many ways, the pandemic brought out our resilience and creativity and encouraged us to be laser focused on what’s really important – from protecting our people, customers and communities to investing in the strongest sources of value to create safe and affordable energy solutions.
action and we rose to that challenge around the world in many different ways across our businesses.
We innovated for customers. In Retail for example, we pushed ahead with our development of community hubs, and fast-tracked our introduction of convenience retail services like Click and Collect and home delivery, which will now be core aspects of our offering. We also developed high-performance lubrication solutions tailored to the needs of different business segments for our mining and other industrial segment customers.
In addition, we introduced our first-ever customer loyalty programme – a best-in-class programme rooted in extensive customer insights. Called PRIS, the programme was launched in Angola and Panama in December
2020 and will be rolled out to a further eight countries in 2021. This is a good example of our more insight-led, strategic approach to projects, where we make the best use of data to inform the creation of pilots, implement, learn and improve – then rollout at pace and scale.
We innovated in our ways of working, too. For example, we continued to roll out ePuma, our customer-focused IT platform, entirely virtually, without missing a beat. A project of this size, importance and complexity would formerly have involved a great deal of time, teams and travel to implement physically. Another major change implemented virtually was the setting up of our shared service centre in Latin America. We carried this out smoothly, efficiently and on time, in the midst of the pandemic.
Responding quickly and effectively to COVID-19We responded very quickly to the pandemic, in terms of business continuity planning (BCP), adopting new ways of home working for office-based staff and evolving our procedures at our front-line locations to protect our employees and customers as they ensured we could continue to deliver our essential services. We also moved very quickly to right size our cost base, in anticipation of the situation. That was accelerated later in 2020 with the operating model changes. As a management team, we immediately controlled what we could control.
Throughout, we prioritised our people and our customers. I’m proud to say, we have been congratulated in many places around the world for the standards that we set for safety on sites. We were in many cases the industry leader in setting the bar for that.
CHIEF EXECUTIVE’S STRATEGIC REVIEW
MAY JUNE JULY AUGUSTGoing the Extra Mile (GEM) winners announced, recognising their exceptional contribution to Puma Energy’s COVID-19 effort
Launch of a new Click and Collect option in the Puma FastPay app in the Americas
Completion of sale of the Australian fuels business for AU$425 million
Six new Super 7 stores open in the Americas
Westerleigh Terminal, UK, achieves 1,000 days without a Lost Time Injury (LTI)
The Chilimbulu site in Lusaka opens – one of 58 sites in Zambia to be rebuilt in line with the new retail visual identity
Puma Protect, a branded sanitiser spray and gel, is announced by the Lubricants Supply Chain Team
Puma Energy delivers operational improvements of US$37m in the first half of 2020, in line with the Company’s commitment to operational excellence and ahead of budget
Cases of COVID-19 surpass six million globally WHO welcomes initial clinical trial results from the UK showing dexamethasone could be lifesaving for patients critically ill with COVID-19
WHO experts begin work with their Chinese counterparts to ascertain how the disease jumped between animals and humans
The COVID-19 global death toll reaches 700,000
GROUP OVERVIEW
1 3
PUMA ENERGY ANNUAL REPORT 2020
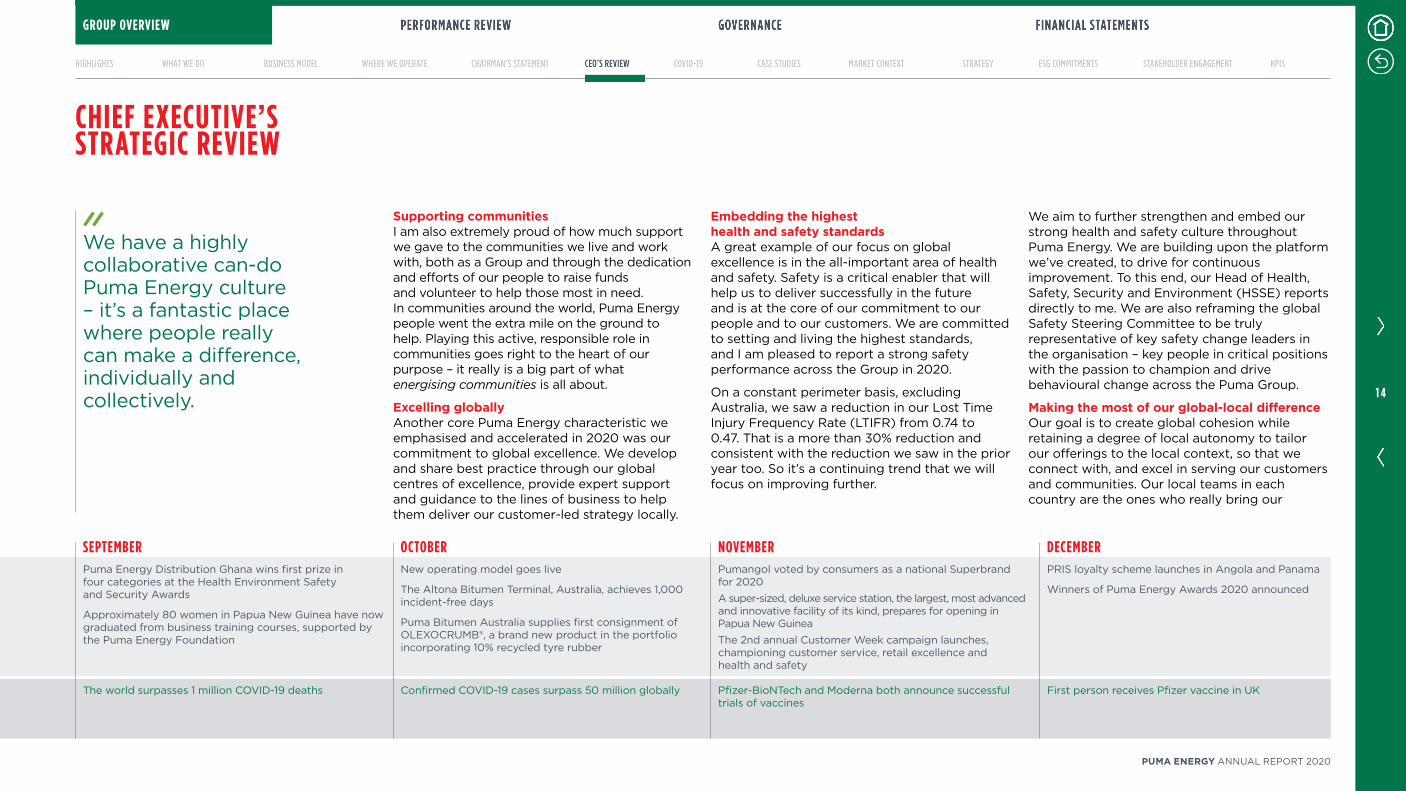
Supporting communitiesI am also extremely proud of how much support we gave to the communities we live and work with, both as a Group and through the dedication and efforts of our people to raise funds and volunteer to help those most in need. In communities around the world, Puma Energy people went the extra mile on the ground to help. Playing this active, responsible role in communities goes right to the heart of our purpose – it really is a big part of what energising communities is all about.
Excelling globallyAnother core Puma Energy characteristic we emphasised and accelerated in 2020 was our commitment to global excellence. We develop and share best practice through our global centres of excellence, provide expert support and guidance to the lines of business to help them deliver our customer-led strategy locally.
Embedding the highest health and safety standardsA great example of our focus on global excellence is in the all-important area of health and safety. Safety is a critical enabler that will help us to deliver successfully in the future and is at the core of our commitment to our people and to our customers. We are committed to setting and living the highest standards, and I am pleased to report a strong safety performance across the Group in 2020.
On a constant perimeter basis, excluding Australia, we saw a reduction in our Lost Time Injury Frequency Rate (LTIFR) from 0.74 to 0.47. That is a more than 30% reduction and consistent with the reduction we saw in the prior year too. So it’s a continuing trend that we will focus on improving further.
We aim to further strengthen and embed our strong health and safety culture throughout Puma Energy. We are building upon the platform we’ve created, to drive for continuous improvement. To this end, our Head of Health, Safety, Security and Environment (HSSE) reports directly to me. We are also reframing the global Safety Steering Committee to be truly representative of key safety change leaders in the organisation – key people in critical positions with the passion to champion and drive behavioural change across the Puma Group.
Making the most of our global-local differenceOur goal is to create global cohesion while retaining a degree of local autonomy to tailor our offerings to the local context, so that we connect with, and excel in serving our customers and communities. Our local teams in each country are the ones who really bring our
CHIEF EXECUTIVE’S STRATEGIC REVIEW
We have a highly collaborative can-do Puma Energy culture – it’s a fantastic place where people really can make a difference, individually and collectively.
SEPTEMBER OCTOBER NOVEMBER DECEMBERPuma Energy Distribution Ghana wins first prize in four categories at the Health Environment Safety and Security Awards
Approximately 80 women in Papua New Guinea have now graduated from business training courses, supported by the Puma Energy Foundation
New operating model goes live
The Altona Bitumen Terminal, Australia, achieves 1,000 incident-free days
Puma Bitumen Australia supplies first consignment of OLEXOCRUMB®, a brand new product in the portfolio incorporating 10% recycled tyre rubber
Pumangol voted by consumers as a national Superbrand for 2020A super-sized, deluxe service station, the largest, most advanced and innovative facility of its kind, prepares for opening in Papua New GuineaThe 2nd annual Customer Week campaign launches, championing customer service, retail excellence and health and safety
PRIS loyalty scheme launches in Angola and Panama
Winners of Puma Energy Awards 2020 announced
The world surpasses 1 million COVID-19 deaths Confirmed COVID-19 cases surpass 50 million globally Pfizer-BioNTech and Moderna both announce successful trials of vaccines
First person receives Pfizer vaccine in UK
GROUP OVERVIEW
1 4
PUMA ENERGY ANNUAL REPORT 2020
purpose alive and deliver the global priorities to build the right relationships on the ground with our stakeholders. There is an important global-local difference to the way we do things here at Puma Energy, which we are keenly focused on optimising.
Valuing and encouraging our people2020 drove the point home intensely – without any doubt, our people really are our key asset. It is the quality and commitment of our people to deliver for our customers, our communities and our stakeholders that makes all the difference. So of course, the calibre of the people we attract, retain and develop and reward could not be more important. When I say calibre, I don’t just mean core skills, capabilities and experience – important though these are. I also mean a passionate mind-set and the adaptability and ability of our people to really contribute towards and thrive in our distinctive and dynamic Puma Energy culture.
Nurturing our cultureWe are immensely proud of our Puma Energy Spirit. We have distilled it down to our four core values: customer focus, lead by example, collaboration and agility. These values are at the heart of how we go about living our purpose of energising communities. Through our People and Culture function, we are focusing on
reinforcing our culture and building our people’s skills, capabilities and opportunities to grow, and creating an employee experience that is attractive for future talent – all in the service of our purpose and our customer-led strategy. We will continue to nurture and channel our energies as One Puma to push on at a higher pace along our chosen path.
Leading in the energy transitionESG and our Future Energies business are critical enablers for our success, and our ambition is exciting and full of great opportunities. Puma Energy is serving our customers with sustainable and profitable energy solutions in high-potential markets – as we help to drive growth and prosperity. In addition, the energy transition presents us with a unique opportunity to create the most relevant and affordable energy solutions for customers.
Our Future Energies business is our way of supporting customers, governments and communities in the countries that we serve to thrive in the context of the energy transition. To this end, we are building on the strong local relationships and trust established through providing essential services to customers and communities over many years. We aim be the partner of choice in their transition to sustainable energy solutions.
We are focusing on three angles. First, we are solarising our own assets, to increase our energy efficiency, drive down our carbon emissions, demonstrate our commitment and capabilities, and learn and improve as we go. Second, we are working closely with our Downstream customers to help them develop their own sustainable energy solutions. We are having many productive conversations with our commercial customers and anticipate this will accelerate in 2021. Third, Future Energies is exploring standalone power generation and battery projects with governments and power generators in some of our key markets to accelerate the supply of electricity to rural areas.
The sky really is the limit here – especially when you consider the great need and demand for reliable, affordable, increasingly off-grid, sustainable energy solutions in the high-potential countries we focus on and care so much about. To date these countries have not yet had the investment in energy transition they deserve. We want to be a catalyst and leader in changing this for the better. Working with key partners who share our vision of energising communities in the most sustainable way, we will make the most of this great Future Energies opportunity.
CHIEF EXECUTIVE’S STRATEGIC REVIEW
Puma Energy is serving our customers with sustainable and profitable energy solutions in high-potential markets – as we help to drive growth and prosperity. In addition, the energy transition presents us with a unique opportunity to create the most relevant and affordable energy solutions for customers.
GROUP OVERVIEW
1 5
PUMA ENERGY ANNUAL REPORT 2020
To share just one example of the potential, take Papua New Guinea, where we have the capability to meet pretty much 100% of the energy needs of the country. Yet currently only around three million of the nine million population are on mains electricity. There is a huge opportunity to close that gap with more innovative and sustainable energy solutions.
We are starting small so that we can demonstrate best practice before we scale up. To this end in 2020, we invested US$5m in Papua New Guinea, Ghana, Honduras, Nicaragua and Puerto Rico. For example, our 1,200kW project in Bayamon Puerto Rico terminal is under construction and will generate 2,050MWh per annum, displacing 92% of the terminal’s energy consumption and reducing CO2-eq by 1,449MT. Smaller rooftop projects in Nicaragua and Honduras are providing proof of concept, producing 98MWh and reducing CO2-eq by 70MT per annum. In Ghana, 10 of our retail stations and four of our terminals and depots will serve as proof of concept. In addition, in Papua New Guinea, the Speybank and Aircorps Terminals in Lae will have 278kW of rooftop solar
and reduce CO2-eq by 284MT. All of these projects mark the start of an exciting new phase in our purpose of energising communities.
Launching our environmental, social and governance (ESG) frameworkFuture Energies is a central tenet of our wider commitment to strong environmental, social and governance (ESG). We launched our ESG framework in 2020 and have begun to embed its principles and commitments throughout Puma Energy. This is a pivotal part of our future and we are identifying and focusing on our most pressing ESG issues, updating our Code of Business Conduct, and establishing measurement protocols. We have also engaged the Carbon Disclosure Project (CDP) and we are participating in the S&P Global Corporate Sustainability Assessment (CSA) to support our implementation, ensuring we focus on the right actions to maximise our impact in our business and in the communities that we serve.
Streamlining our Executive CommitteeTo complement our strategy refresh and the implementation of our new operating model in October 2020, we streamlined the Executive
Committee. I would like to take this opportunity to thank my former ExCom colleagues for their outstanding contributions over the years. They have been instrumental in getting Puma Energy to where it is today and it has been a pleasure to work with them since becoming CEO. I look forward to taking Puma Energy on to new heights with the streamlined ExCom team.
Coming together to deliver for our customers and communities2020 really was extraordinary – an exceptional year of challenge and change. A year where we have all come together to create a sustainable platform for medium term growth – our colleagues, our customers, our communities, our shareholders and investors. I’d like to thank all my colleagues in Puma Energy who have demonstrated such dedication and commitment to our purpose. They have been truly magnificent whilst also juggling unprecedented personal pressures created by the pandemic. I would also like to thank our shareholders and investors who have continued to believe in us and back us throughout very testing times. Without all our stakeholders, we would not be here; and indeed, we are here for our stakeholders.
Looking aheadI am proud of the agility and resilience we have shown, proud of the outstanding contributions our people have made to the business and to our communities. I am also hungry for growth and creating value across all parts of our business. We have a great deal more to do in bringing alive our purpose of energising communities. The focus now is for us to continue to deliver at pace – for ourselves, for our business, for all our stakeholders.
Emma FitzGerald, Chief Executive Officer
CHIEF EXECUTIVE’S STRATEGIC REVIEW
GROUP OVERVIEW
1 6
PUMA ENERGY ANNUAL REPORT 2020
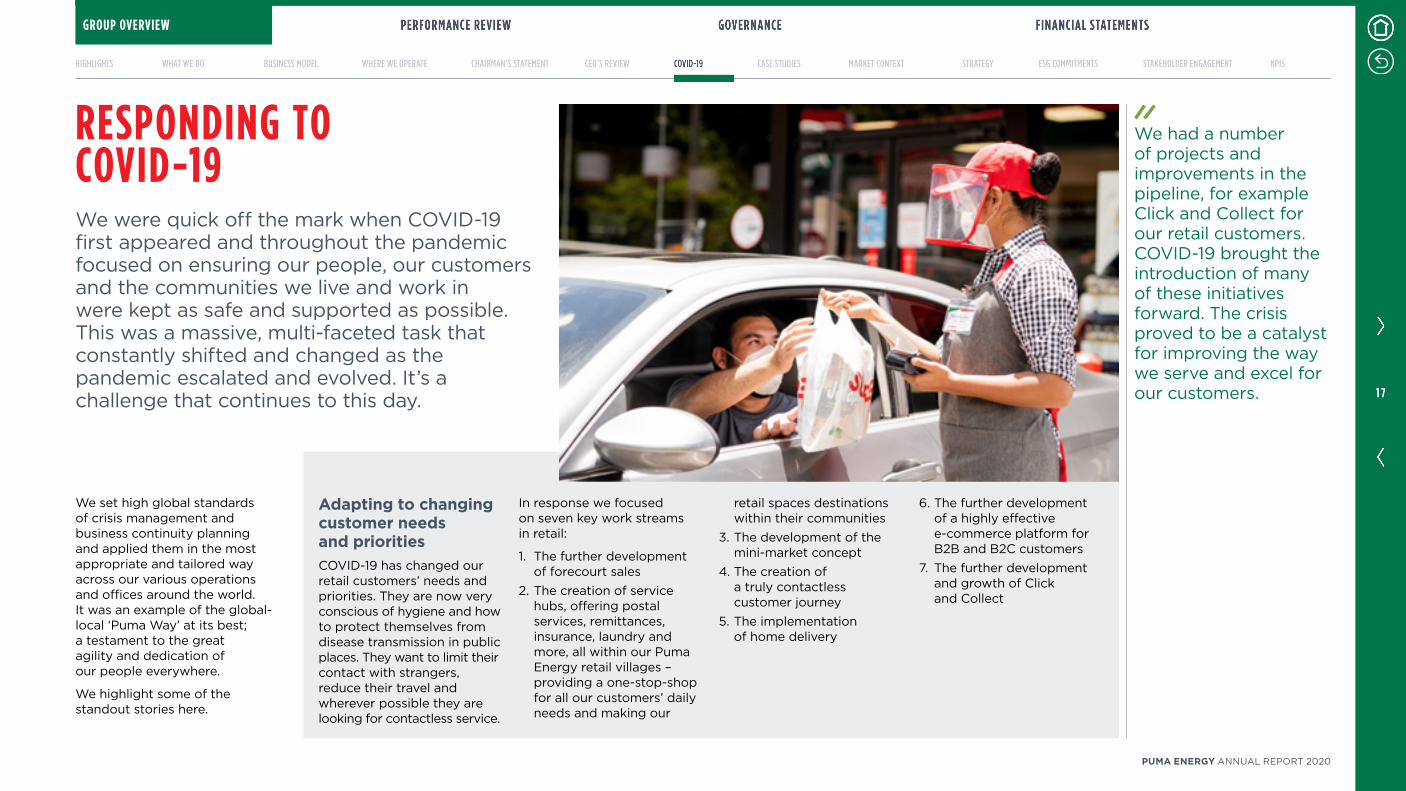
RESPONDING TO COVID-19We were quick off the mark when COVID-19 first appeared and throughout the pandemic focused on ensuring our people, our customers and the communities we live and work in were kept as safe and supported as possible. This was a massive, multi-faceted task that constantly shifted and changed as the pandemic escalated and evolved. It’s a challenge that continues to this day.
We set high global standards of crisis management and business continuity planning and applied them in the most appropriate and tailored way across our various operations and offices around the world. It was an example of the global-local ‘Puma Way’ at its best; a testament to the great agility and dedication of our people everywhere.
We highlight some of the standout stories here.
We had a number of projects and improvements in the pipeline, for example Click and Collect for our retail customers. COVID-19 brought the introduction of many of these initiatives forward. The crisis proved to be a catalyst for improving the way we serve and excel for our customers.
Adapting to changing customer needs and prioritiesCOVID-19 has changed our retail customers’ needs and priorities. They are now very conscious of hygiene and how to protect themselves from disease transmission in public places. They want to limit their contact with strangers, reduce their travel and wherever possible they are looking for contactless service.
In response we focused on seven key work streams in retail:
1. The further development of forecourt sales
2. The creation of service hubs, offering postal services, remittances, insurance, laundry and more, all within our Puma Energy retail villages – providing a one-stop-shop for all our customers’ daily needs and making our
retail spaces destinations within their communities
3. The development of the mini-market concept
4. The creation of a truly contactless customer journey
5. The implementation of home delivery
6. The further development of a highly effective e-commerce platform for B2B and B2C customers
7. The further development and growth of Click and Collect
GROUP OVERVIEW
1 7
PUMA ENERGY ANNUAL REPORT 2020
Read more about how we responded to COVID-19:
Chairman’s statement
Chief Executive’s strategic review
Business review
Our People & Culture
Health and safety
Financial review
Risk management
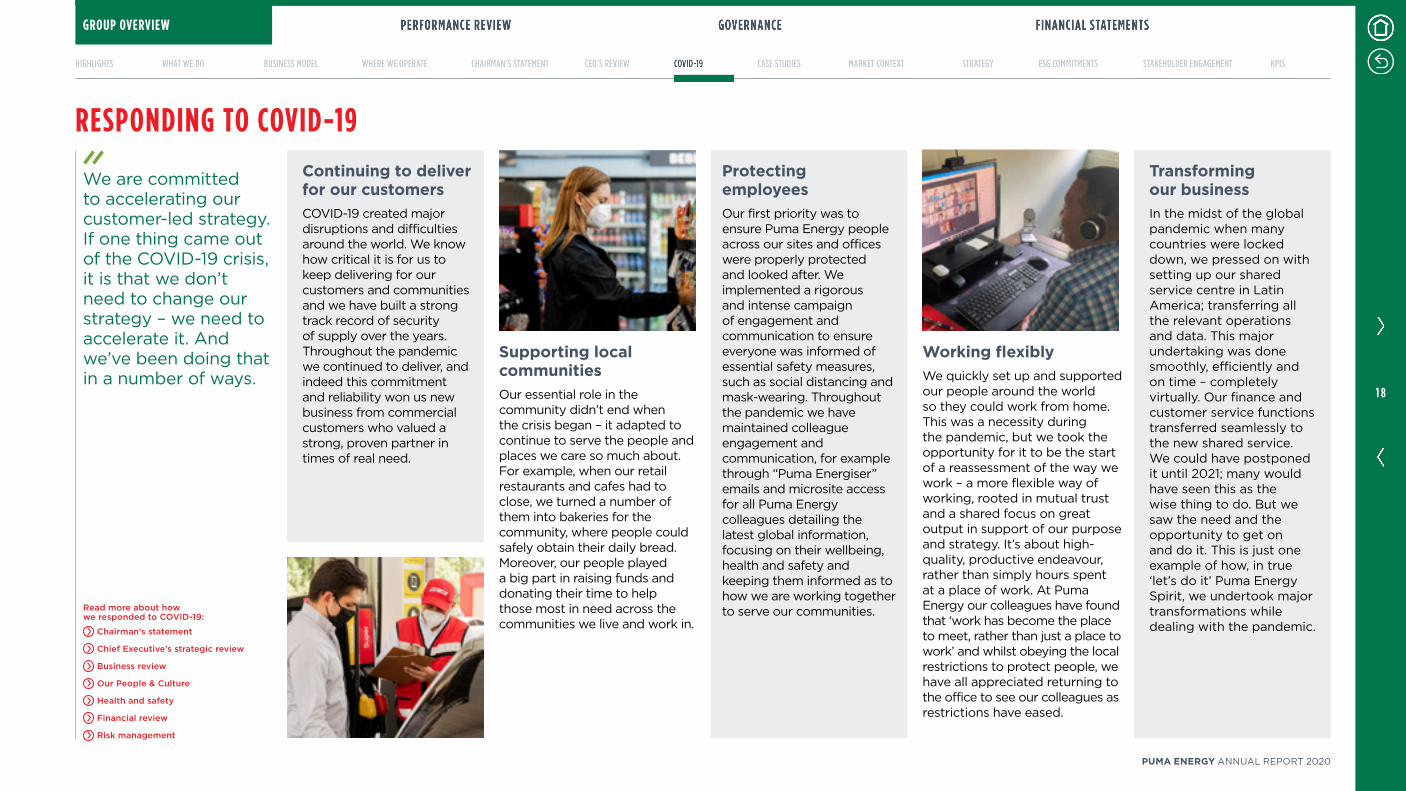
Protecting employeesOur first priority was to ensure Puma Energy people across our sites and offices were properly protected and looked after. We implemented a rigorous and intense campaign of engagement and communication to ensure everyone was informed of essential safety measures, such as social distancing and mask-wearing. Throughout the pandemic we have maintained colleague engagement and communication, for example through “Puma Energiser” emails and microsite access for all Puma Energy colleagues detailing the latest global information, focusing on their wellbeing, health and safety and keeping them informed as to how we are working together to serve our communities.
Working flexiblyWe quickly set up and supported our people around the world so they could work from home. This was a necessity during the pandemic, but we took the opportunity for it to be the start of a reassessment of the way we work – a more flexible way of working, rooted in mutual trust and a shared focus on great output in support of our purpose and strategy. It’s about high-quality, productive endeavour, rather than simply hours spent at a place of work. At Puma Energy our colleagues have found that ‘work has become the place to meet, rather than just a place to work’ and whilst obeying the local restrictions to protect people, we have all appreciated returning to the office to see our colleagues as restrictions have eased.
Supporting local communitiesOur essential role in the community didn’t end when the crisis began – it adapted to continue to serve the people and places we care so much about. For example, when our retail restaurants and cafes had to close, we turned a number of them into bakeries for the community, where people could safely obtain their daily bread. Moreover, our people played a big part in raising funds and donating their time to help those most in need across the communities we live and work in.
Transforming our businessIn the midst of the global pandemic when many countries were locked down, we pressed on with setting up our shared service centre in Latin America; transferring all the relevant operations and data. This major undertaking was done smoothly, efficiently and on time – completely virtually. Our finance and customer service functions transferred seamlessly to the new shared service. We could have postponed it until 2021; many would have seen this as the wise thing to do. But we saw the need and the opportunity to get on and do it. This is just one example of how, in true ‘let’s do it’ Puma Energy Spirit, we undertook major transformations while dealing with the pandemic.
Continuing to deliver for our customersCOVID-19 created major disruptions and difficulties around the world. We know how critical it is for us to keep delivering for our customers and communities and we have built a strong track record of security of supply over the years. Throughout the pandemic we continued to deliver, and indeed this commitment and reliability won us new business from commercial customers who valued a strong, proven partner in times of real need.
RESPONDING TO COVID-19
We are committed to accelerating our customer-led strategy. If one thing came out of the COVID-19 crisis, it is that we don’t need to change our strategy – we need to accelerate it. And we’ve been doing that in a number of ways.
GROUP OVERVIEW
1 8
PUMA ENERGY ANNUAL REPORT 2020
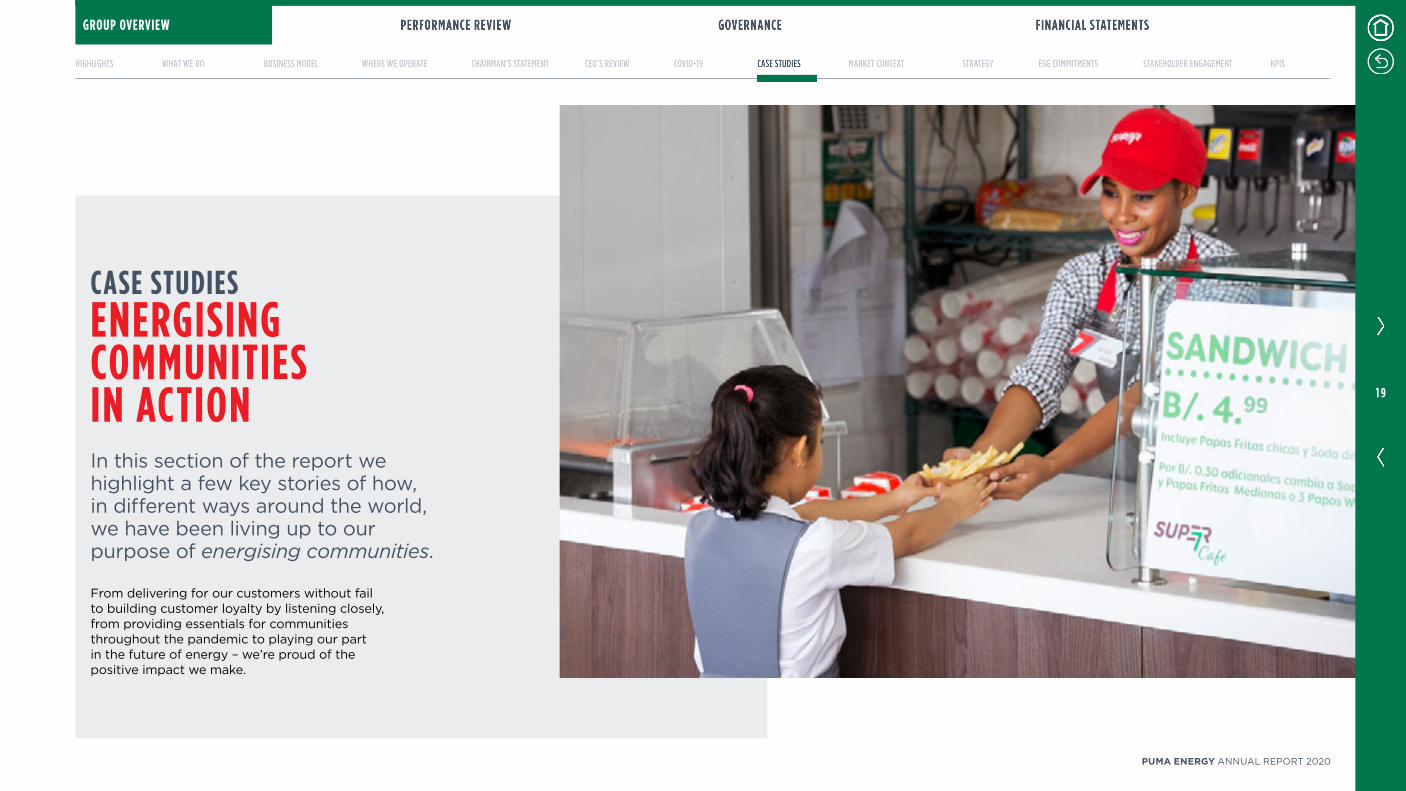
CASE STUDIESENERGISING COMMUNITIES IN ACTIONIn this section of the report we highlight a few key stories of how, in different ways around the world, we have been living up to our purpose of energising communities.
From delivering for our customers without fail to building customer loyalty by listening closely, from providing essentials for communities throughout the pandemic to playing our part in the future of energy – we’re proud of the positive impact we make.
GROUP OVERVIEW
1 9
PUMA ENERGY ANNUAL REPORT 2020
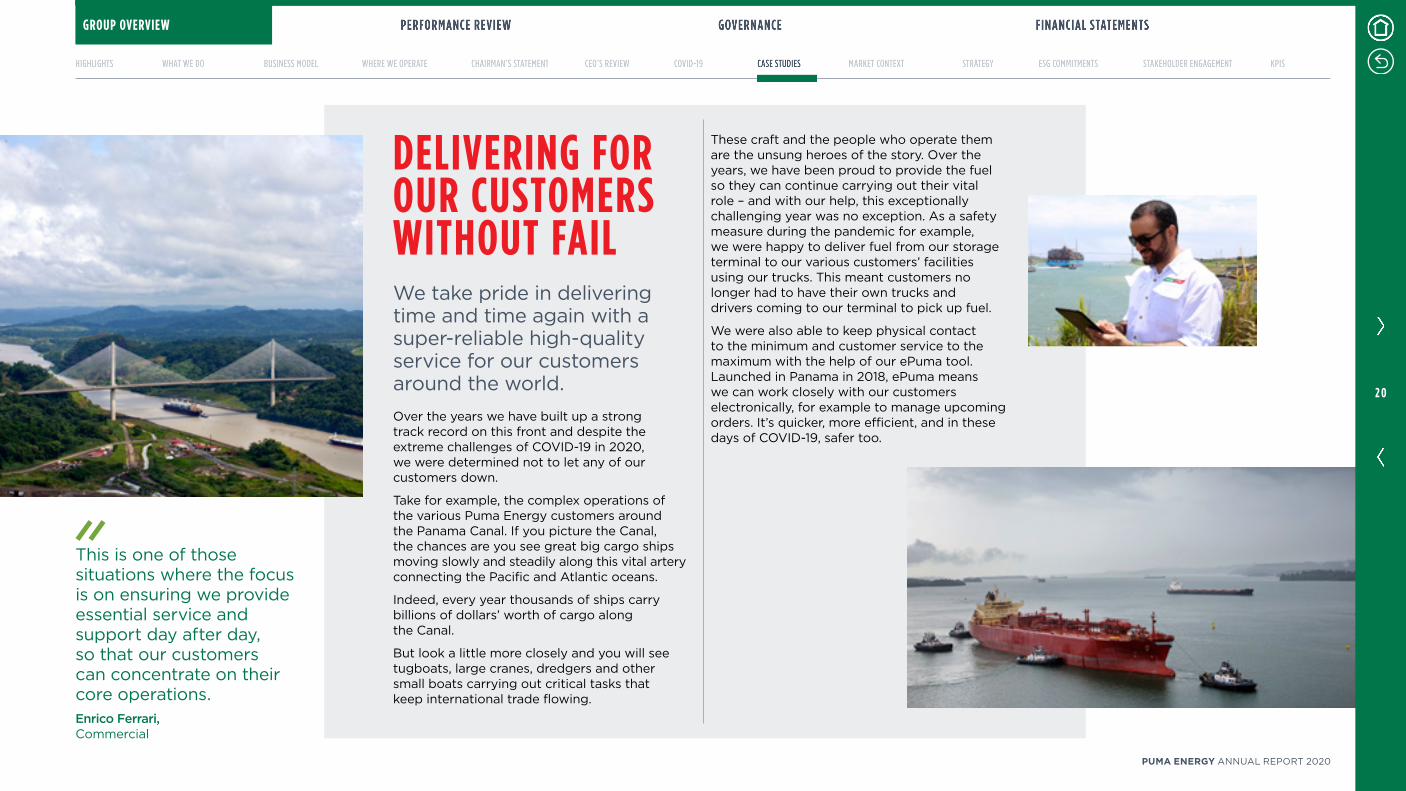
This is one of those situations where the focus is on ensuring we provide essential service and support day after day, so that our customers can concentrate on their core operations.Enrico Ferrari, Commercial
DELIVERING FOR OUR CUSTOMERS WITHOUT FAIL
These craft and the people who operate them are the unsung heroes of the story. Over the years, we have been proud to provide the fuel so they can continue carrying out their vital role – and with our help, this exceptionally challenging year was no exception. As a safety measure during the pandemic for example, we were happy to deliver fuel from our storage terminal to our various customers’ facilities using our trucks. This meant customers no longer had to have their own trucks and drivers coming to our terminal to pick up fuel.
We were also able to keep physical contact to the minimum and customer service to the maximum with the help of our ePuma tool. Launched in Panama in 2018, ePuma means we can work closely with our customers electronically, for example to manage upcoming orders. It’s quicker, more efficient, and in these days of COVID-19, safer too.
We take pride in delivering time and time again with a super-reliable high-quality service for our customers around the world.Over the years we have built up a strong track record on this front and despite the extreme challenges of COVID-19 in 2020, we were determined not to let any of our customers down.
Take for example, the complex operations of the various Puma Energy customers around the Panama Canal. If you picture the Canal, the chances are you see great big cargo ships moving slowly and steadily along this vital artery connecting the Pacific and Atlantic oceans.
Indeed, every year thousands of ships carry billions of dollars’ worth of cargo along the Canal.
But look a little more closely and you will see tugboats, large cranes, dredgers and other small boats carrying out critical tasks that keep international trade flowing.
GROUP OVERVIEW
2 0
PUMA ENERGY ANNUAL REPORT 2020

PRIS is testament to our determination to become a leading customer-driven retailer in our key markets. We appreciate our customer loyalty and the launch of PRIS is an excellent opportunity to reward them in ways that are meaningful to them.Deborah Binks-Moore, Chief Customer Experience and Communications Officer
BUILDING CUSTOMER LOYALTY BY LISTENING CLOSELY
So for example, we’ve made it super easy to sign up and use. And we also enable customers to get more for their money, as they can earn points for fuel discounts, for offers at Super 7 convenience stores and other participating leading merchants from the communities where we operate.
Launched in Angola and Panama this year and set to be rolled out to a further eight countries in 2021 – PRIS is proving very popular. It’s a great example of excelling through engagement.
We are doing everything we can to put our customers at the heart of our business.It starts with listening more intensely to what they really want and need, so we can come up with products and services that truly make them smile. Call it data-driven delight.
The launch of PRIS – our brand new customer loyalty programme – is a good case in point. We took a truly customer-centric, genuinely insights-led approach, creating a best-in-class programme rooted in deep customer insights gathered through extensive qualitative and quantitative research. We listened closely to what people really want and like when it comes to loyalty and built our unique programme around this.
GROUP OVERVIEW
2 1
PUMA ENERGY ANNUAL REPORT 2020
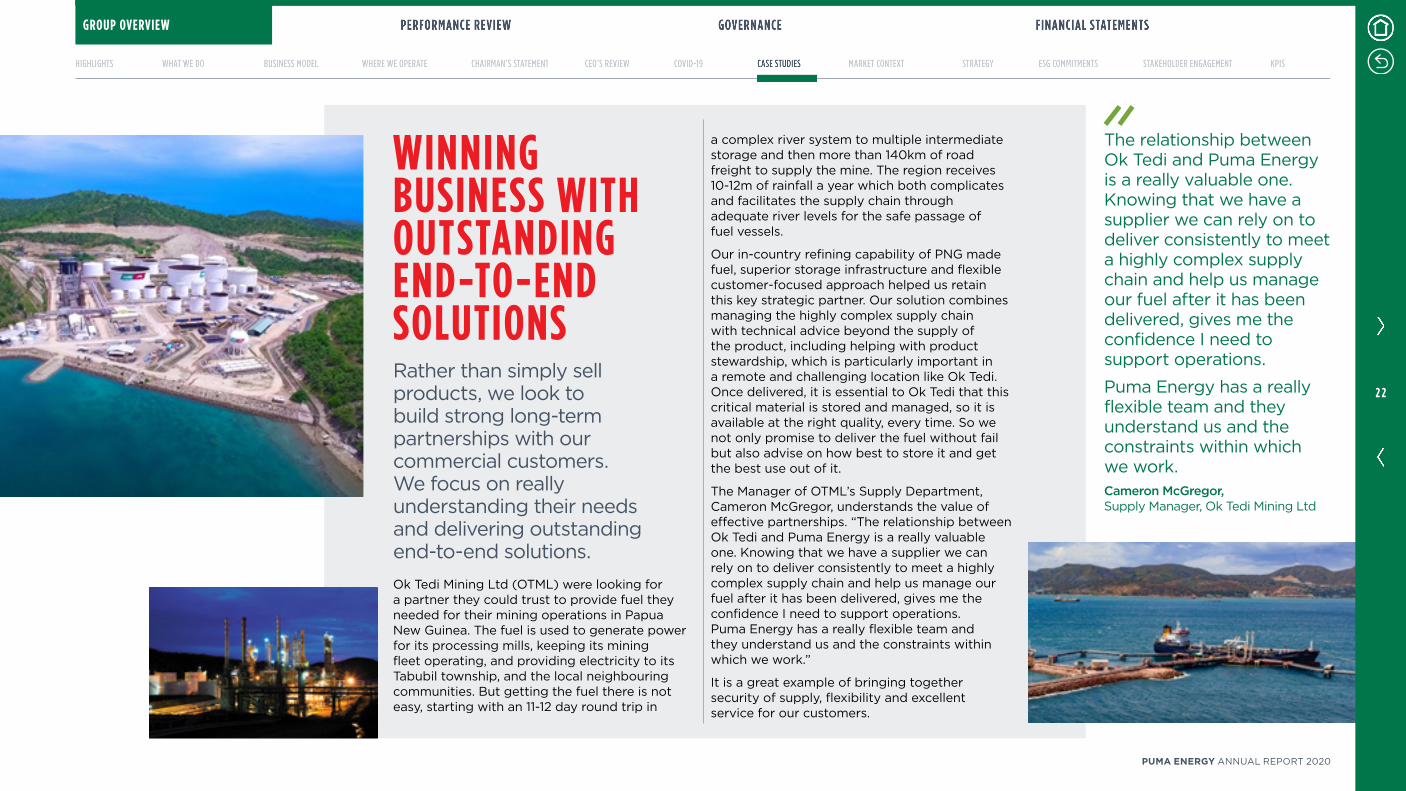
The relationship between Ok Tedi and Puma Energy is a really valuable one. Knowing that we have a supplier we can rely on to deliver consistently to meet a highly complex supply chain and help us manage our fuel after it has been delivered, gives me the confidence I need to support operations.
Puma Energy has a really flexible team and they understand us and the constraints within which we work.Cameron McGregor, Supply Manager, Ok Tedi Mining Ltd
a complex river system to multiple intermediate storage and then more than 140km of road freight to supply the mine. The region receives 10-12m of rainfall a year which both complicates and facilitates the supply chain through adequate river levels for the safe passage of fuel vessels.
Our in-country refining capability of PNG made fuel, superior storage infrastructure and flexible customer-focused approach helped us retain this key strategic partner. Our solution combines managing the highly complex supply chain with technical advice beyond the supply of the product, including helping with product stewardship, which is particularly important in a remote and challenging location like Ok Tedi. Once delivered, it is essential to Ok Tedi that this critical material is stored and managed, so it is available at the right quality, every time. So we not only promise to deliver the fuel without fail but also advise on how best to store it and get the best use out of it.
The Manager of OTML’s Supply Department, Cameron McGregor, understands the value of effective partnerships. “The relationship between Ok Tedi and Puma Energy is a really valuable one. Knowing that we have a supplier we can rely on to deliver consistently to meet a highly complex supply chain and help us manage our fuel after it has been delivered, gives me the confidence I need to support operations. Puma Energy has a really flexible team and they understand us and the constraints within which we work.”
It is a great example of bringing together security of supply, flexibility and excellent service for our customers.
WINNING BUSINESS WITH OUTSTANDING END-TO-END SOLUTIONSRather than simply sell products, we look to build strong long-term partnerships with our commercial customers. We focus on really understanding their needs and delivering outstanding end-to-end solutions.Ok Tedi Mining Ltd (OTML) were looking for a partner they could trust to provide fuel they needed for their mining operations in Papua New Guinea. The fuel is used to generate power for its processing mills, keeping its mining fleet operating, and providing electricity to its Tabubil township, and the local neighbouring communities. But getting the fuel there is not easy, starting with an 11-12 day round trip in
GROUP OVERVIEW
2 2
PUMA ENERGY ANNUAL REPORT 2020
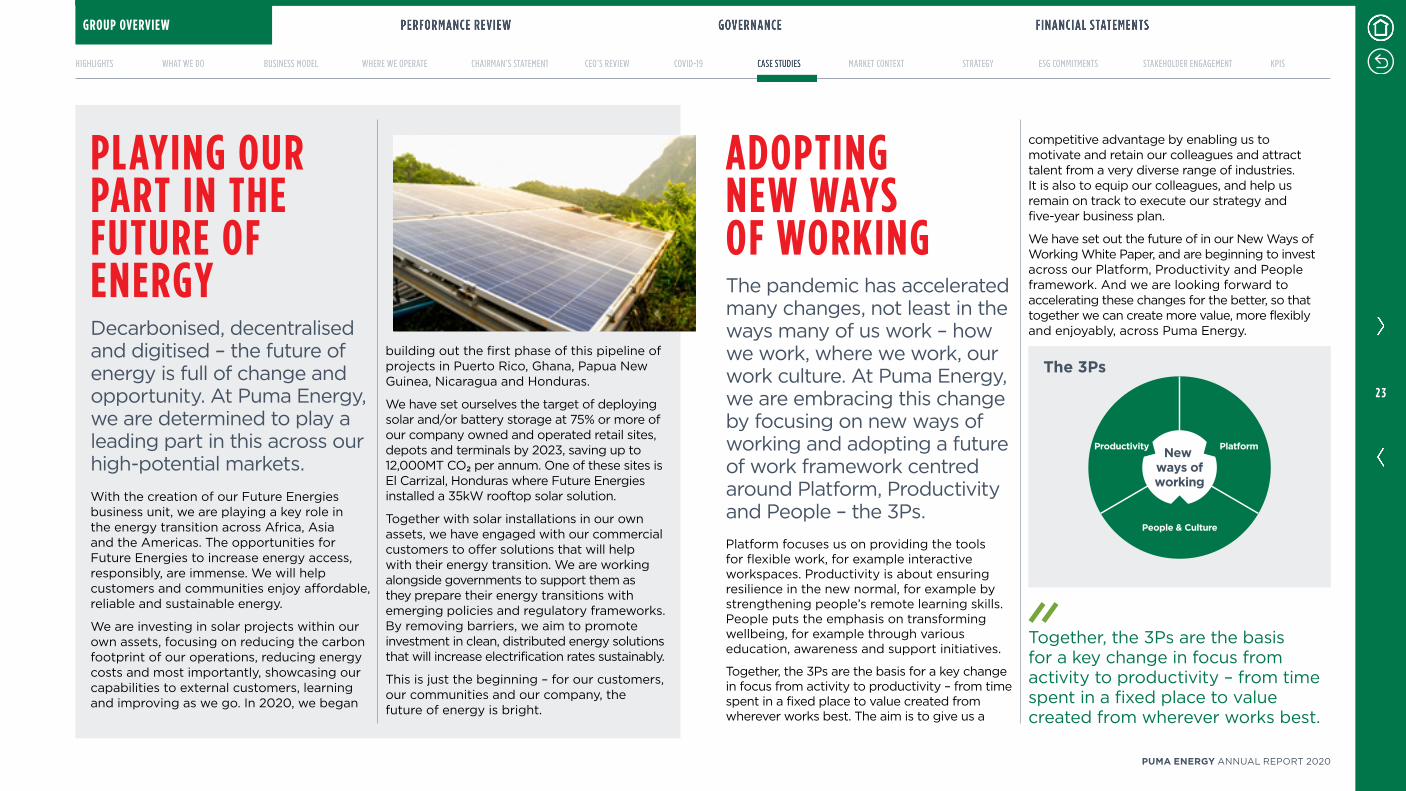
Productivity Platform
People & Culture
New ways ofworking
ADOPTING NEW WAYS OF WORKINGThe pandemic has accelerated many changes, not least in the ways many of us work – how we work, where we work, our work culture. At Puma Energy, we are embracing this change by focusing on new ways of working and adopting a future of work framework centred around Platform, Productivity and People – the 3Ps.Platform focuses us on providing the tools for flexible work, for example interactive workspaces. Productivity is about ensuring resilience in the new normal, for example by strengthening people’s remote learning skills. People puts the emphasis on transforming wellbeing, for example through various education, awareness and support initiatives.
Together, the 3Ps are the basis for a key change in focus from activity to productivity – from time spent in a fixed place to value created from wherever works best. The aim is to give us a
competitive advantage by enabling us to motivate and retain our colleagues and attract talent from a very diverse range of industries. It is also to equip our colleagues, and help us remain on track to execute our strategy and five-year business plan.
We have set out the future of in our New Ways of Working White Paper, and are beginning to invest across our Platform, Productivity and People framework. And we are looking forward to accelerating these changes for the better, so that together we can create more value, more flexibly and enjoyably, across Puma Energy.
PLAYING OUR PART IN THE FUTURE OF ENERGYDecarbonised, decentralised and digitised – the future of energy is full of change and opportunity. At Puma Energy, we are determined to play a leading part in this across our high-potential markets.With the creation of our Future Energies business unit, we are playing a key role in the energy transition across Africa, Asia and the Americas. The opportunities for Future Energies to increase energy access, responsibly, are immense. We will help customers and communities enjoy affordable, reliable and sustainable energy.
We are investing in solar projects within our own assets, focusing on reducing the carbon footprint of our operations, reducing energy costs and most importantly, showcasing our capabilities to external customers, learning and improving as we go. In 2020, we began
building out the first phase of this pipeline of projects in Puerto Rico, Ghana, Papua New Guinea, Nicaragua and Honduras.
We have set ourselves the target of deploying solar and/or battery storage at 75% or more of our company owned and operated retail sites, depots and terminals by 2023, saving up to 12,000MT CO₂ per annum. One of these sites is El Carrizal, Honduras where Future Energies installed a 35kW rooftop solar solution.
Together with solar installations in our own assets, we have engaged with our commercial customers to offer solutions that will help with their energy transition. We are working alongside governments to support them as they prepare their energy transitions with emerging policies and regulatory frameworks. By removing barriers, we aim to promote investment in clean, distributed energy solutions that will increase electrification rates sustainably.
This is just the beginning – for our customers, our communities and our company, the future of energy is bright.
The 3Ps
Together, the 3Ps are the basis for a key change in focus from activity to productivity – from time spent in a fixed place to value created from wherever works best.
GROUP OVERVIEW
2 3
PUMA ENERGY ANNUAL REPORT 2020
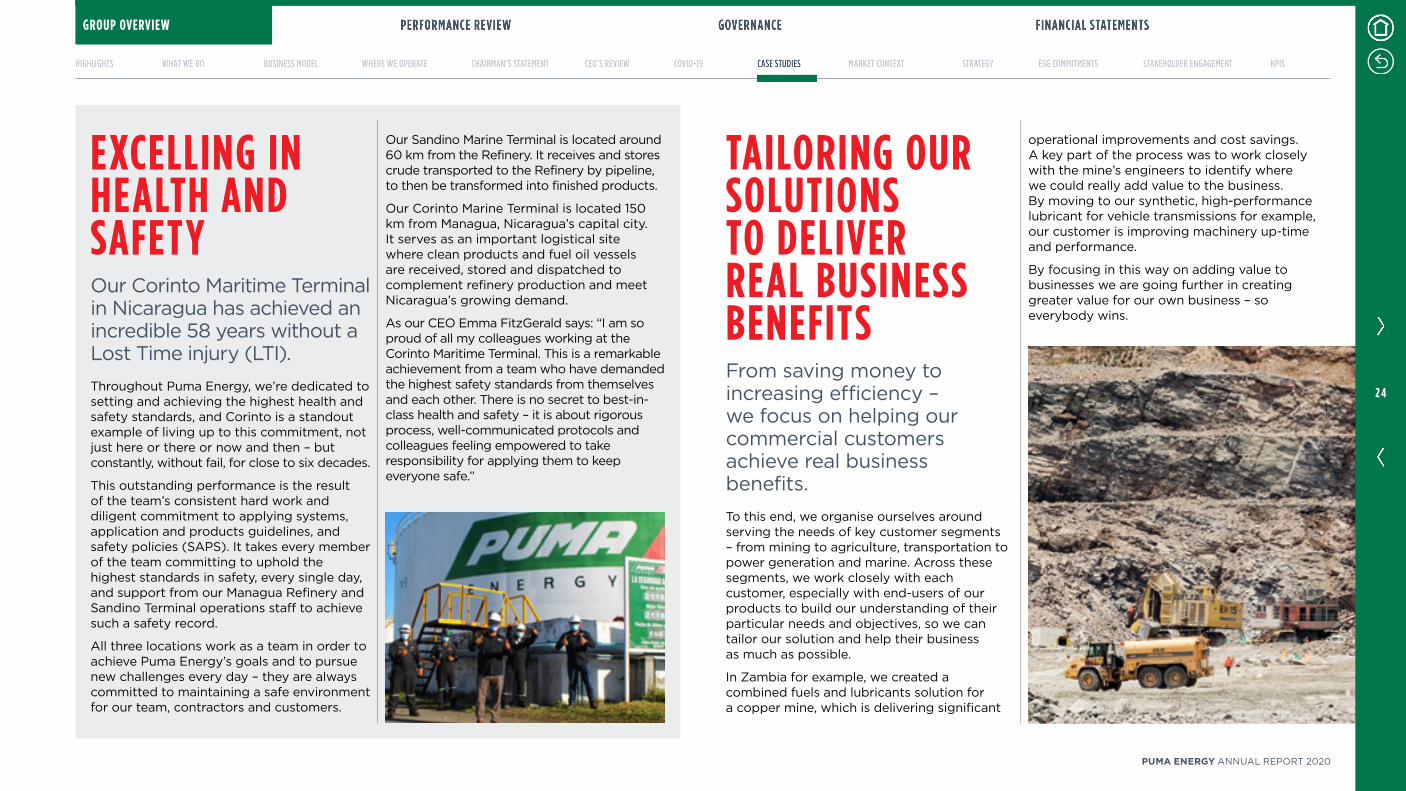
EXCELLING IN HEALTH AND SAFETYOur Corinto Maritime Terminal in Nicaragua has achieved an incredible 58 years without a Lost Time injury (LTI). Throughout Puma Energy, we’re dedicated to setting and achieving the highest health and safety standards, and Corinto is a standout example of living up to this commitment, not just here or there or now and then – but constantly, without fail, for close to six decades.
This outstanding performance is the result of the team’s consistent hard work and diligent commitment to applying systems, application and products guidelines, and safety policies (SAPS). It takes every member of the team committing to uphold the highest standards in safety, every single day, and support from our Managua Refinery and Sandino Terminal operations staff to achieve such a safety record.
All three locations work as a team in order to achieve Puma Energy’s goals and to pursue new challenges every day – they are always committed to maintaining a safe environment for our team, contractors and customers.
Our Sandino Marine Terminal is located around 60 km from the Refinery. It receives and stores crude transported to the Refinery by pipeline, to then be transformed into finished products.
Our Corinto Marine Terminal is located 150 km from Managua, Nicaragua’s capital city. It serves as an important logistical site where clean products and fuel oil vessels are received, stored and dispatched to complement refinery production and meet Nicaragua’s growing demand.
As our CEO Emma FitzGerald says: “I am so proud of all my colleagues working at the Corinto Maritime Terminal. This is a remarkable achievement from a team who have demanded the highest safety standards from themselves and each other. There is no secret to best-in-class health and safety – it is about rigorous process, well-communicated protocols and colleagues feeling empowered to take responsibility for applying them to keep everyone safe.”
TAILORING OUR SOLUTIONS TO DELIVER REAL BUSINESS BENEFITSFrom saving money to increasing efficiency – we focus on helping our commercial customers achieve real business benefits.To this end, we organise ourselves around serving the needs of key customer segments – from mining to agriculture, transportation to power generation and marine. Across these segments, we work closely with each customer, especially with end-users of our products to build our understanding of their particular needs and objectives, so we can tailor our solution and help their business as much as possible.
In Zambia for example, we created a combined fuels and lubricants solution for a copper mine, which is delivering significant
operational improvements and cost savings. A key part of the process was to work closely with the mine’s engineers to identify where we could really add value to the business. By moving to our synthetic, high-performance lubricant for vehicle transmissions for example, our customer is improving machinery up-time and performance.
By focusing in this way on adding value to businesses we are going further in creating greater value for our own business – so everybody wins.
GROUP OVERVIEW
2 4
PUMA ENERGY ANNUAL REPORT 2020
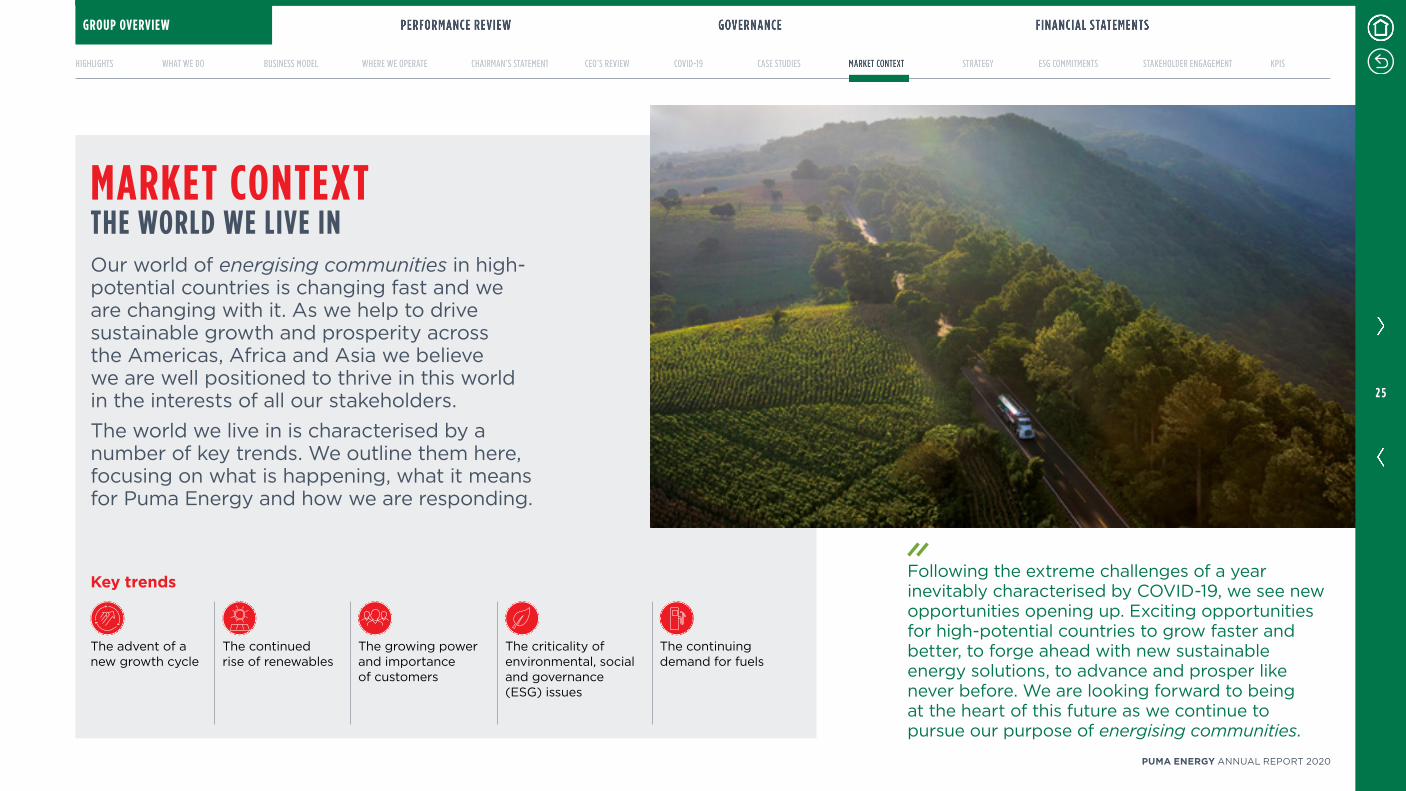
MARKET CONTEXT THE WORLD WE LIVE INOur world of energising communities in high-potential countries is changing fast and we are changing with it. As we help to drive sustainable growth and prosperity across the Americas, Africa and Asia we believe we are well positioned to thrive in this world in the interests of all our stakeholders.The world we live in is characterised by a number of key trends. We outline them here, focusing on what is happening, what it means for Puma Energy and how we are responding.
Key trends
The advent of a new growth cycle
The continued rise of renewables
The growing power and importance of customers
The criticality of environmental, social and governance (ESG) issues
The continuing demand for fuels
Following the extreme challenges of a year inevitably characterised by COVID-19, we see new opportunities opening up. Exciting opportunities for high-potential countries to grow faster and better, to forge ahead with new sustainable energy solutions, to advance and prosper like never before. We are looking forward to being at the heart of this future as we continue to pursue our purpose of energising communities.
GROUP OVERVIEW
2 5
PUMA ENERGY ANNUAL REPORT 2020

The advent of a new growth cycleIn the run-up to 2020, we saw the peak of the last cycle of global growth in 2018, followed by a period of slowing growth through much of 2019, characterised by the trade war between the US and China. However, towards the end of 2019 this began to turn around. Tensions eased; growth picked up. The prospects for 2020 were looking good.
Then COVID-19 hit. This had a devastating impact on societies and economies around the world. Countries were affected in different ways and to different degrees. Looking at the year as a whole, many of the high-potential countries we focus on were relatively less hard hit. Moreover, turning towards 2021 and beyond, the future for global growth looks positive, particularly if the global effort to control COVID-19 remains on track.
Beginning to reboundMany economies started to rebound from the middle of 2020, led by strong growth in China and the rollout of vaccines is another major boost. The new administration in the US has indicated strong support for global efforts to mitigate climate change. So Puma Energy is well set for a new cycle of global growth in the years ahead.
High-potential countries are set to grow fasterIf we focus on Puma Energy’s core high-potential countries, the growth prospects are even more promising. Non-OECD countries are set to grow faster than OECD countries. There are a number of strong drivers for growth here including internal factors such as population growth, urbanisation, income growth and in turn, increased disposable income. Rising commodity prices are also good news for commodity-rich countries, as is a weakening US dollar, which increases purchasing power. Continued low interest rates will also be favourable for debt-financed investment. From China to Japan, from the US to Europe – as the rest of the world returns to growth, our high-potential countries will be major beneficiaries.
High levels of debtGlobal debt reached unprecedented levels in 2020. It was set to exceed US$277tn, equivalent to 365% of global gross domestic product (GDP), according to a report by the Institute of International Finance in November 2020. High levels of personal, corporate and national debt do create significant risks which need to be managed carefully. Indeed, there have been major issues, with Zambia for example becoming the sixth developing country to default or restructure debts in 2020. But broadly speaking, we see debt levels as sustainable, provided they are closely monitored and well managed, not least because interest rates are likely to say lower for longer. 10%
The OECD forecasts that by the end of 2021 China’s economy will be 10% larger than at the end of 2019.
MARKET CONTEXT
GROUP OVERVIEW
2 6
PUMA ENERGY ANNUAL REPORT 2020
A dynamic market attracting many different playersAgainst the broader backdrop of a global recovery, downstream energy in high-potential countries offers a particularly compelling story of dynamic change and great growth. So it is no surprise that it is attracting traditional and new players and prompting continued M&A activity. International Oil Companies (IOCs) continue to expand into emerging markets and to extend their offer beyond oil, to both the fast-growing world of convenience retail and the world of renewables, which is at an earlier stage of development in those markets. At the same time, major retailers are expanding and acquiring convenience stores and petrol stations.
So, the big players are increasingly in action here and there are plenty of small players, too. In this busy market full of opportunity, Puma Energy’s unique blend of global capabilities and expertise and deep-rooted local experience and know-how stands out.
What this means for Puma EnergyWith our geographical footprint, experience and capabilities, strong local presence and relationships, we are well positioned to benefit from the growth in high-potential countries. Our five-year strategy focuses us on sustainable growth, notably by excelling for retail and commercial customers in these high-potential countries.
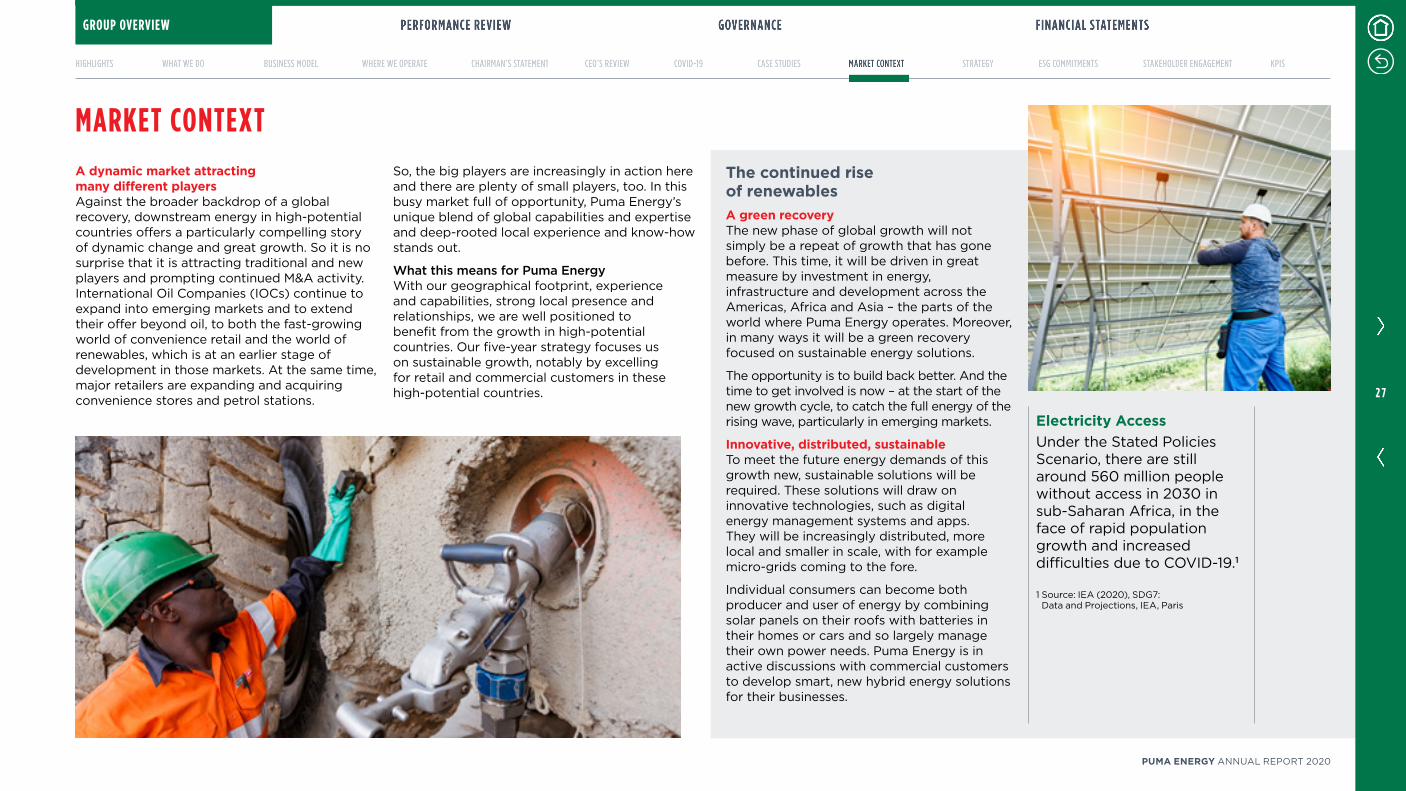
The continued rise of renewablesA green recoveryThe new phase of global growth will not simply be a repeat of growth that has gone before. This time, it will be driven in great measure by investment in energy, infrastructure and development across the Americas, Africa and Asia – the parts of the world where Puma Energy operates. Moreover, in many ways it will be a green recovery focused on sustainable energy solutions.
The opportunity is to build back better. And the time to get involved is now – at the start of the new growth cycle, to catch the full energy of the rising wave, particularly in emerging markets.
Innovative, distributed, sustainableTo meet the future energy demands of this growth new, sustainable solutions will be required. These solutions will draw on innovative technologies, such as digital energy management systems and apps. They will be increasingly distributed, more local and smaller in scale, with for example micro-grids coming to the fore.
Individual consumers can become both producer and user of energy by combining solar panels on their roofs with batteries in their homes or cars and so largely manage their own power needs. Puma Energy is in active discussions with commercial customers to develop smart, new hybrid energy solutions for their businesses.
MARKET CONTEXT
Electricity Access Under the Stated Policies Scenario, there are still around 560 million people without access in 2030 in sub-Saharan Africa, in the face of rapid population growth and increased difficulties due to COVID-19.1
1 Source: IEA (2020), SDG7: Data and Projections, IEA, Paris
GROUP OVERVIEW
2 7
PUMA ENERGY ANNUAL REPORT 2020
The solar boomThe new world of energy will be a mix. Natural gas, for example, has a role to play in helping to provide security of supply. Wind is growing in popularity, for example in the UK, where there is a major commitment to offshore wind. But the real star of the story, particularly in our predominantly sunny parts of the world, is solar. Super-clean and increasingly cheap, solar is now often not just a competitive option but the most cost-effective choice. The economics are aligned with the environment here. Moreover, this is only the beginning – as the technology continues to improve and take up increases, the costs will come down further still.
Solar is being rolled out at an increasing pace across the developed world, but the biggest untapped potential is in emerging markets where there is a real demand for renewable solutions and, to date, little development to meet this demand.
Partnerships are keyPartnerships with technology experts, finance providers, governments, regulators, customers and communities are key for the energy transition. Public private partnerships, for example, will be increasingly important, where governments provide financing and companies provide the expertise, scale and technology.
Partnerships with customers will also be critical. The energy transition puts greater emphasis on customers, as choosers and consumers of energy, and increasingly as producers. Take a mine for example, deciding to produce its own solar energy and feeding excess energy back into the local grid.
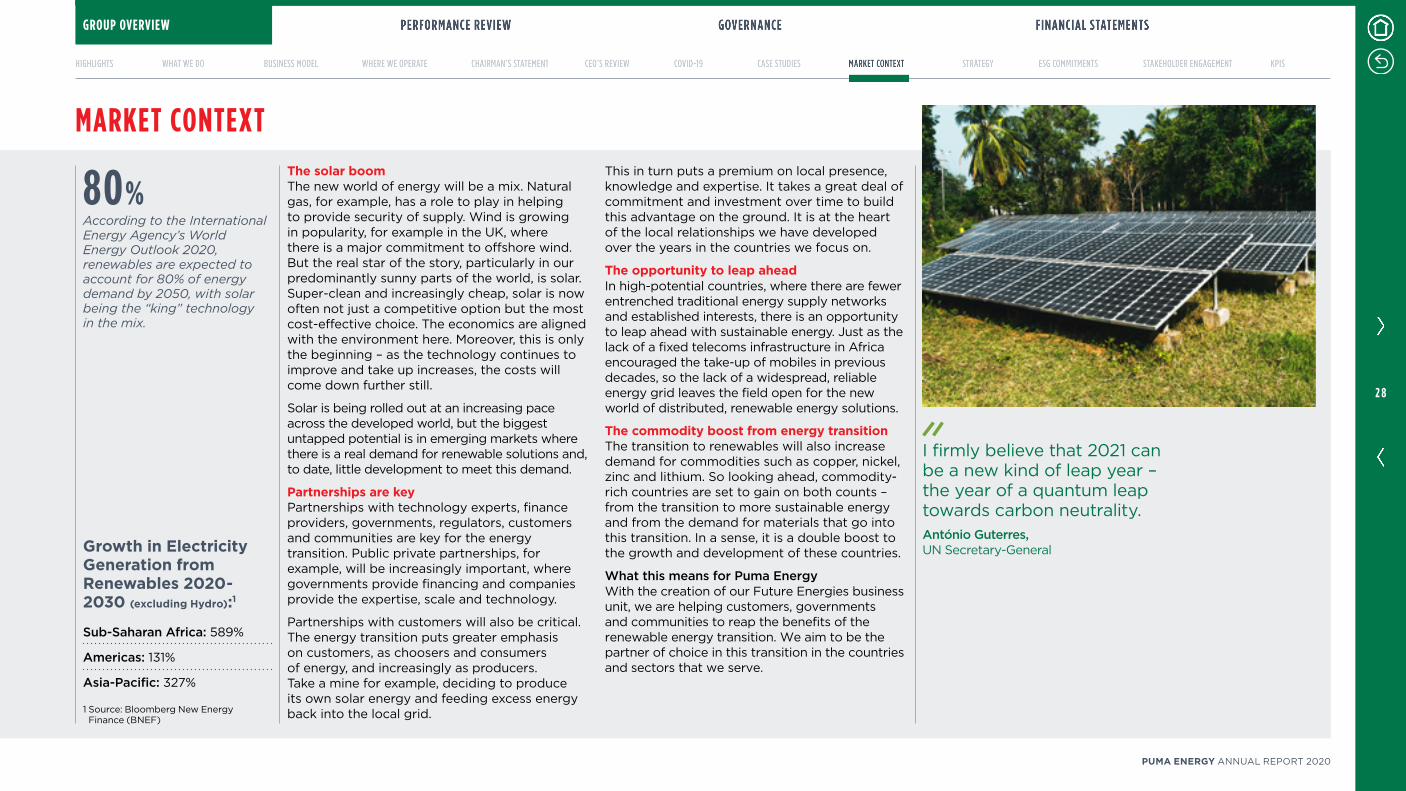
80%According to the International Energy Agency’s World Energy Outlook 2020, renewables are expected to account for 80% of energy demand by 2050, with solar being the “king” technology in the mix.
This in turn puts a premium on local presence, knowledge and expertise. It takes a great deal of commitment and investment over time to build this advantage on the ground. It is at the heart of the local relationships we have developed over the years in the countries we focus on.
The opportunity to leap aheadIn high-potential countries, where there are fewer entrenched traditional energy supply networks and established interests, there is an opportunity to leap ahead with sustainable energy. Just as the lack of a fixed telecoms infrastructure in Africa encouraged the take-up of mobiles in previous decades, so the lack of a widespread, reliable energy grid leaves the field open for the new world of distributed, renewable energy solutions.
The commodity boost from energy transition The transition to renewables will also increase demand for commodities such as copper, nickel, zinc and lithium. So looking ahead, commodity-rich countries are set to gain on both counts – from the transition to more sustainable energy and from the demand for materials that go into this transition. In a sense, it is a double boost to the growth and development of these countries.
What this means for Puma EnergyWith the creation of our Future Energies business unit, we are helping customers, governments and communities to reap the benefits of the renewable energy transition. We aim to be the partner of choice in this transition in the countries and sectors that we serve.
I firmly believe that 2021 can be a new kind of leap year – the year of a quantum leap towards carbon neutrality.António Guterres,UN Secretary-General
MARKET CONTEXT
Growth in Electricity Generation from Renewables 2020- 2030 (excluding Hydro):1
Sub-Saharan Africa: 589%
Americas: 131%
Asia-Pacific: 327%
1 Source: Bloomberg New Energy Finance (BNEF)
GROUP OVERVIEW
2 8
PUMA ENERGY ANNUAL REPORT 2020
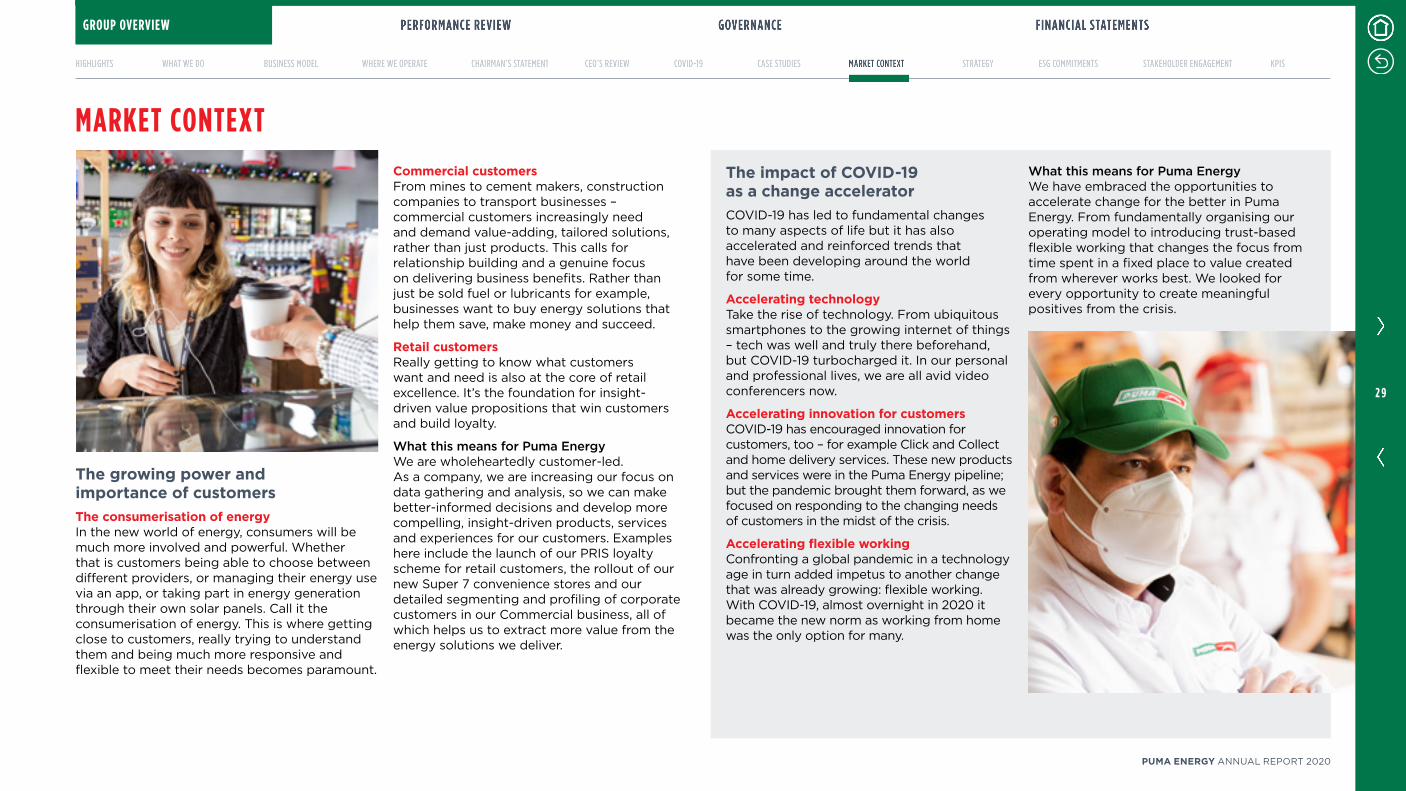
The growing power and importance of customersThe consumerisation of energyIn the new world of energy, consumers will be much more involved and powerful. Whether that is customers being able to choose between different providers, or managing their energy use via an app, or taking part in energy generation through their own solar panels. Call it the consumerisation of energy. This is where getting close to customers, really trying to understand them and being much more responsive and flexible to meet their needs becomes paramount.
Commercial customersFrom mines to cement makers, construction companies to transport businesses – commercial customers increasingly need and demand value-adding, tailored solutions, rather than just products. This calls for relationship building and a genuine focus on delivering business benefits. Rather than just be sold fuel or lubricants for example, businesses want to buy energy solutions that help them save, make money and succeed.
Retail customersReally getting to know what customers want and need is also at the core of retail excellence. It’s the foundation for insight-driven value propositions that win customers and build loyalty.
What this means for Puma EnergyWe are wholeheartedly customer-led. As a company, we are increasing our focus on data gathering and analysis, so we can make better-informed decisions and develop more compelling, insight-driven products, services and experiences for our customers. Examples here include the launch of our PRIS loyalty scheme for retail customers, the rollout of our new Super 7 convenience stores and our detailed segmenting and profiling of corporate customers in our Commercial business, all of which helps us to extract more value from the energy solutions we deliver.
The impact of COVID-19 as a change acceleratorCOVID-19 has led to fundamental changes to many aspects of life but it has also accelerated and reinforced trends that have been developing around the world for some time.
Accelerating technologyTake the rise of technology. From ubiquitous smartphones to the growing internet of things – tech was well and truly there beforehand, but COVID-19 turbocharged it. In our personal and professional lives, we are all avid video conferencers now.
Accelerating innovation for customersCOVID-19 has encouraged innovation for customers, too – for example Click and Collect and home delivery services. These new products and services were in the Puma Energy pipeline; but the pandemic brought them forward, as we focused on responding to the changing needs of customers in the midst of the crisis.
Accelerating flexible workingConfronting a global pandemic in a technology age in turn added impetus to another change that was already growing: flexible working. With COVID-19, almost overnight in 2020 it became the new norm as working from home was the only option for many.
What this means for Puma EnergyWe have embraced the opportunities to accelerate change for the better in Puma Energy. From fundamentally organising our operating model to introducing trust-based flexible working that changes the focus from time spent in a fixed place to value created from wherever works best. We looked for every opportunity to create meaningful positives from the crisis.
MARKET CONTEXT
GROUP OVERVIEW
2 9
PUMA ENERGY ANNUAL REPORT 2020
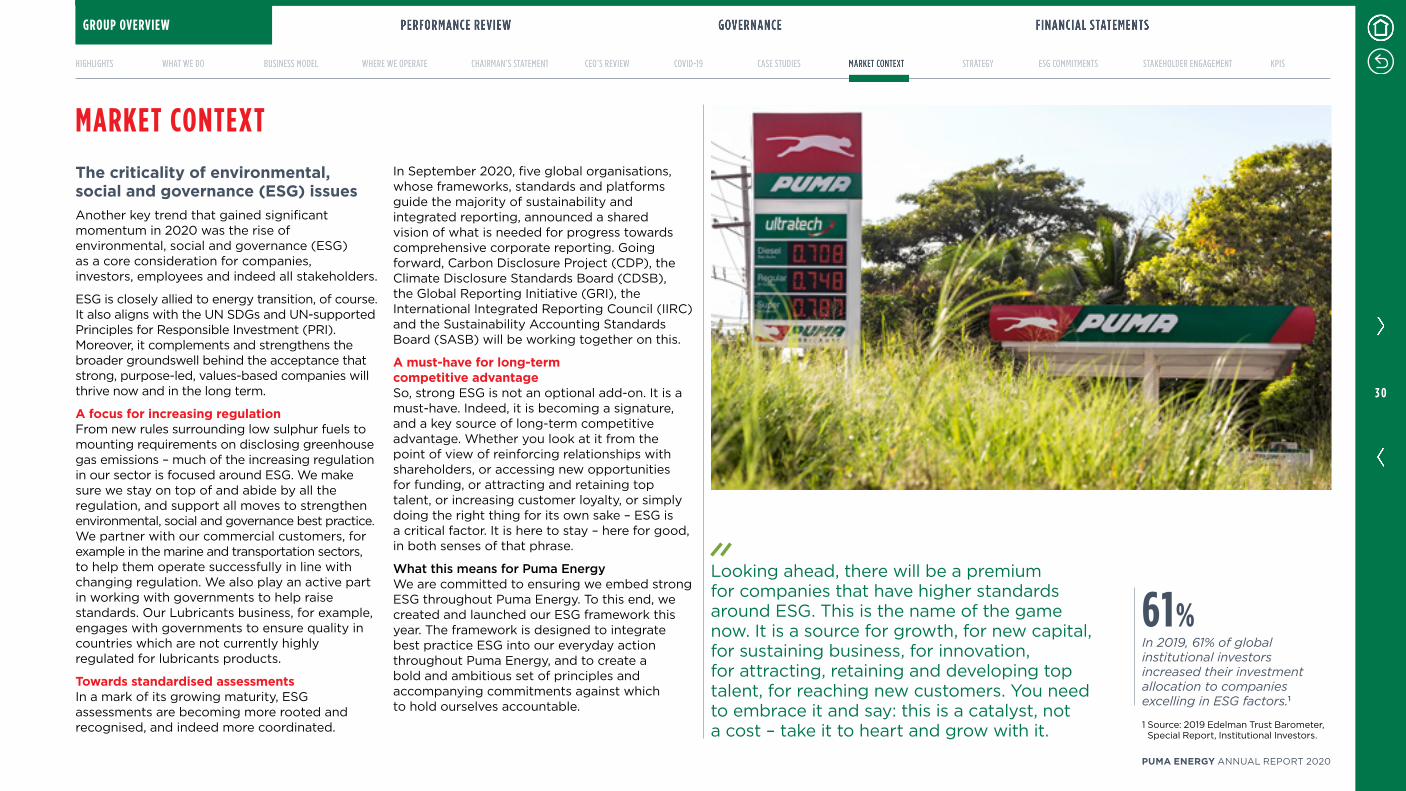
The criticality of environmental, social and governance (ESG) issuesAnother key trend that gained significant momentum in 2020 was the rise of environmental, social and governance (ESG) as a core consideration for companies, investors, employees and indeed all stakeholders.
ESG is closely allied to energy transition, of course. It also aligns with the UN SDGs and UN-supported Principles for Responsible Investment (PRI). Moreover, it complements and strengthens the broader groundswell behind the acceptance that strong, purpose-led, values-based companies will thrive now and in the long term.
A focus for increasing regulationFrom new rules surrounding low sulphur fuels to mounting requirements on disclosing greenhouse gas emissions – much of the increasing regulation in our sector is focused around ESG. We make sure we stay on top of and abide by all the regulation, and support all moves to strengthen environmental, social and governance best practice. We partner with our commercial customers, for example in the marine and transportation sectors, to help them operate successfully in line with changing regulation. We also play an active part in working with governments to help raise standards. Our Lubricants business, for example, engages with governments to ensure quality in countries which are not currently highly regulated for lubricants products.
Towards standardised assessmentsIn a mark of its growing maturity, ESG assessments are becoming more rooted and recognised, and indeed more coordinated.
In September 2020, five global organisations, whose frameworks, standards and platforms guide the majority of sustainability and integrated reporting, announced a shared vision of what is needed for progress towards comprehensive corporate reporting. Going forward, Carbon Disclosure Project (CDP), the Climate Disclosure Standards Board (CDSB), the Global Reporting Initiative (GRI), the International Integrated Reporting Council (IIRC) and the Sustainability Accounting Standards Board (SASB) will be working together on this.
A must-have for long-term competitive advantageSo, strong ESG is not an optional add-on. It is a must-have. Indeed, it is becoming a signature, and a key source of long-term competitive advantage. Whether you look at it from the point of view of reinforcing relationships with shareholders, or accessing new opportunities for funding, or attracting and retaining top talent, or increasing customer loyalty, or simply doing the right thing for its own sake – ESG is a critical factor. It is here to stay – here for good, in both senses of that phrase.
What this means for Puma EnergyWe are committed to ensuring we embed strong ESG throughout Puma Energy. To this end, we created and launched our ESG framework this year. The framework is designed to integrate best practice ESG into our everyday action throughout Puma Energy, and to create a bold and ambitious set of principles and accompanying commitments against which to hold ourselves accountable.
Looking ahead, there will be a premium for companies that have higher standards around ESG. This is the name of the game now. It is a source for growth, for new capital, for sustaining business, for innovation, for attracting, retaining and developing top talent, for reaching new customers. You need to embrace it and say: this is a catalyst, not a cost – take it to heart and grow with it.
MARKET CONTEXT
61%In 2019, 61% of global institutional investors increased their investment allocation to companies excelling in ESG factors.1
1 Source: 2019 Edelman Trust Barometer, Special Report, Institutional Investors.
GROUP OVERVIEW
3 0
PUMA ENERGY ANNUAL REPORT 2020
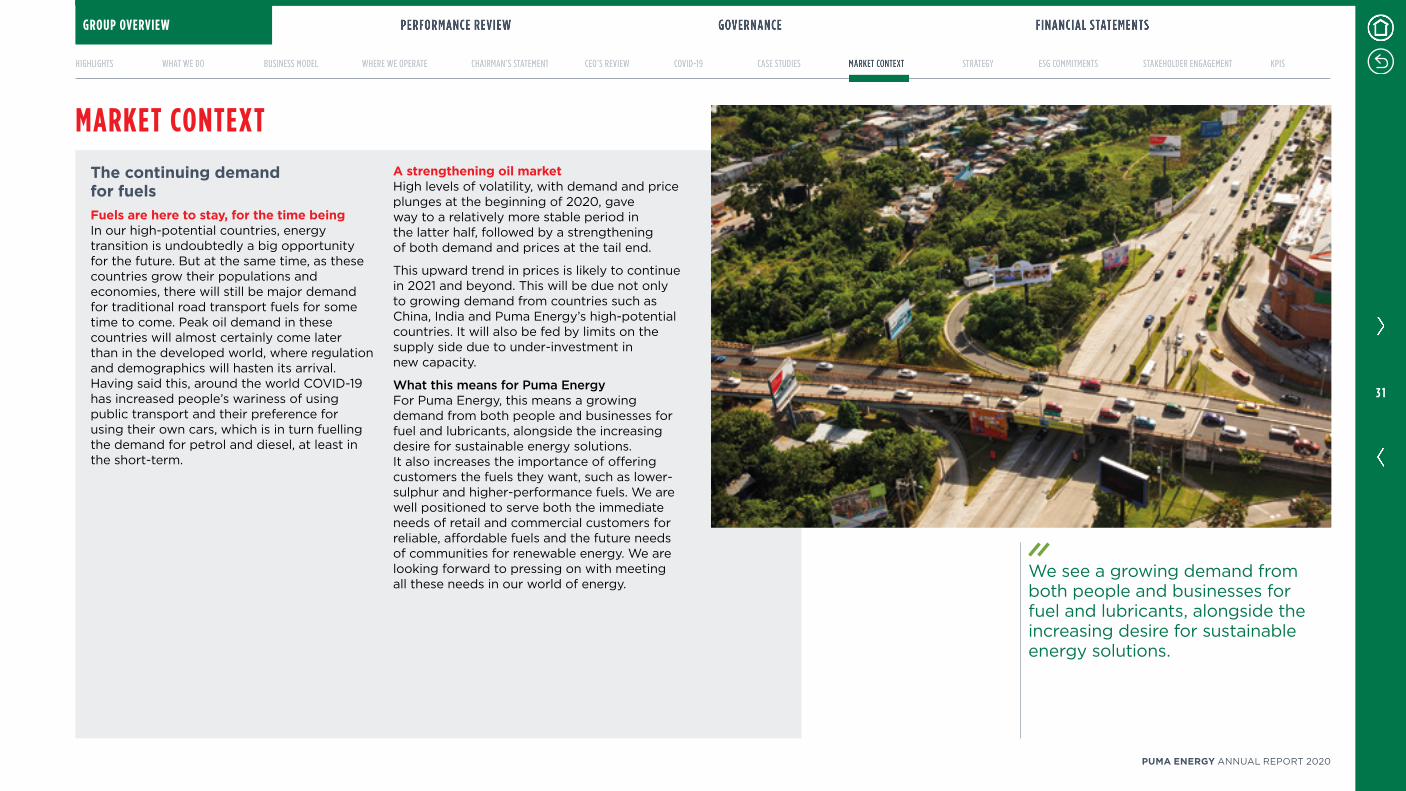
The continuing demand for fuelsFuels are here to stay, for the time beingIn our high-potential countries, energy transition is undoubtedly a big opportunity for the future. But at the same time, as these countries grow their populations and economies, there will still be major demand for traditional road transport fuels for some time to come. Peak oil demand in these countries will almost certainly come later than in the developed world, where regulation and demographics will hasten its arrival. Having said this, around the world COVID-19 has increased people’s wariness of using public transport and their preference for using their own cars, which is in turn fuelling the demand for petrol and diesel, at least in the short-term.
A strengthening oil market High levels of volatility, with demand and price plunges at the beginning of 2020, gave way to a relatively more stable period in the latter half, followed by a strengthening of both demand and prices at the tail end.
This upward trend in prices is likely to continue in 2021 and beyond. This will be due not only to growing demand from countries such as China, India and Puma Energy’s high-potential countries. It will also be fed by limits on the supply side due to under-investment in new capacity.
What this means for Puma EnergyFor Puma Energy, this means a growing demand from both people and businesses for fuel and lubricants, alongside the increasing desire for sustainable energy solutions. It also increases the importance of offering customers the fuels they want, such as lower-sulphur and higher-performance fuels. We are well positioned to serve both the immediate needs of retail and commercial customers for reliable, affordable fuels and the future needs of communities for renewable energy. We are looking forward to pressing on with meeting all these needs in our world of energy.
MARKET CONTEXT
We see a growing demand from both people and businesses for fuel and lubricants, alongside the increasing desire for sustainable energy solutions.
GROUP OVERVIEW
3 1
PUMA ENERGY ANNUAL REPORT 2020
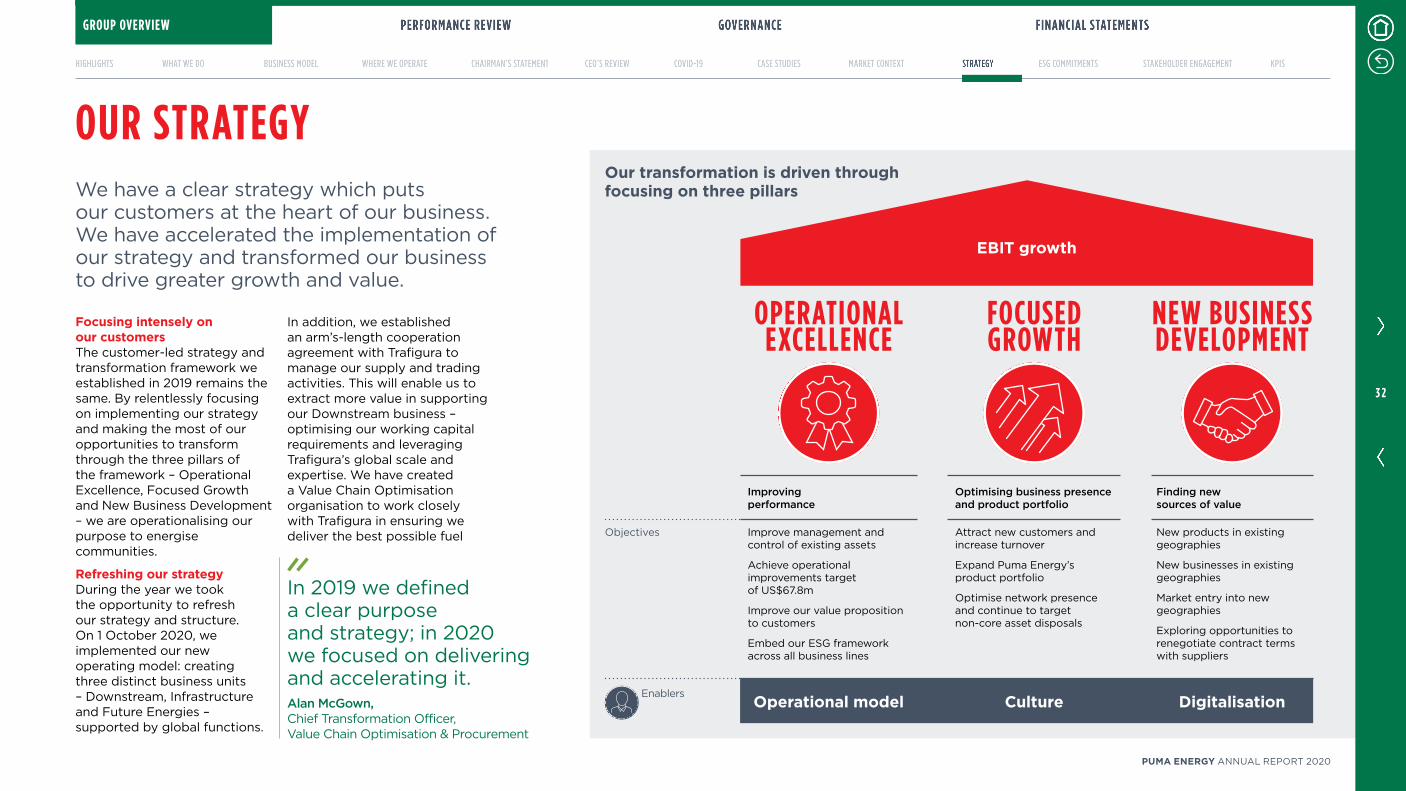
OUR STRATEGYWe have a clear strategy which puts our customers at the heart of our business. We have accelerated the implementation of our strategy and transformed our business to drive greater growth and value.
Focusing intensely on our customersThe customer-led strategy and transformation framework we established in 2019 remains the same. By relentlessly focusing on implementing our strategy and making the most of our opportunities to transform through the three pillars of the framework – Operational Excellence, Focused Growth and New Business Development – we are operationalising our purpose to energise communities.
Refreshing our strategyDuring the year we took the opportunity to refresh our strategy and structure. On 1 October 2020, we implemented our new operating model: creating three distinct business units – Downstream, Infrastructure and Future Energies – supported by global functions.
In addition, we established an arm’s-length cooperation agreement with Trafigura to manage our supply and trading activities. This will enable us to extract more value in supporting our Downstream business – optimising our working capital requirements and leveraging Trafigura’s global scale and expertise. We have created a Value Chain Optimisation organisation to work closely with Trafigura in ensuring we deliver the best possible fuel
EBIT growth
In 2019 we defined a clear purpose and strategy; in 2020 we focused on delivering and accelerating it.Alan McGown,Chief Transformation Officer, Value Chain Optimisation & Procurement
Our transformation is driven through focusing on three pillars
OPERATIONAL EXCELLENCE
FOCUSED GROWTH
NEW BUSINESS DEVELOPMENT
Improving performance
Optimising business presence and product portfolio
Finding new sources of value
Objectives Improve management and control of existing assets
Achieve operational improvements target of US$67.8m
Improve our value proposition to customers
Embed our ESG framework across all business lines
Attract new customers and increase turnover
Expand Puma Energy’s product portfolio
Optimise network presence and continue to target non-core asset disposals
New products in existing geographies
New businesses in existing geographies
Market entry into new geographies
Exploring opportunities to renegotiate contract terms with suppliers
Enablers Operational model Culture Digitalisation
GROUP OVERVIEW
3 2
PUMA ENERGY ANNUAL REPORT 2020
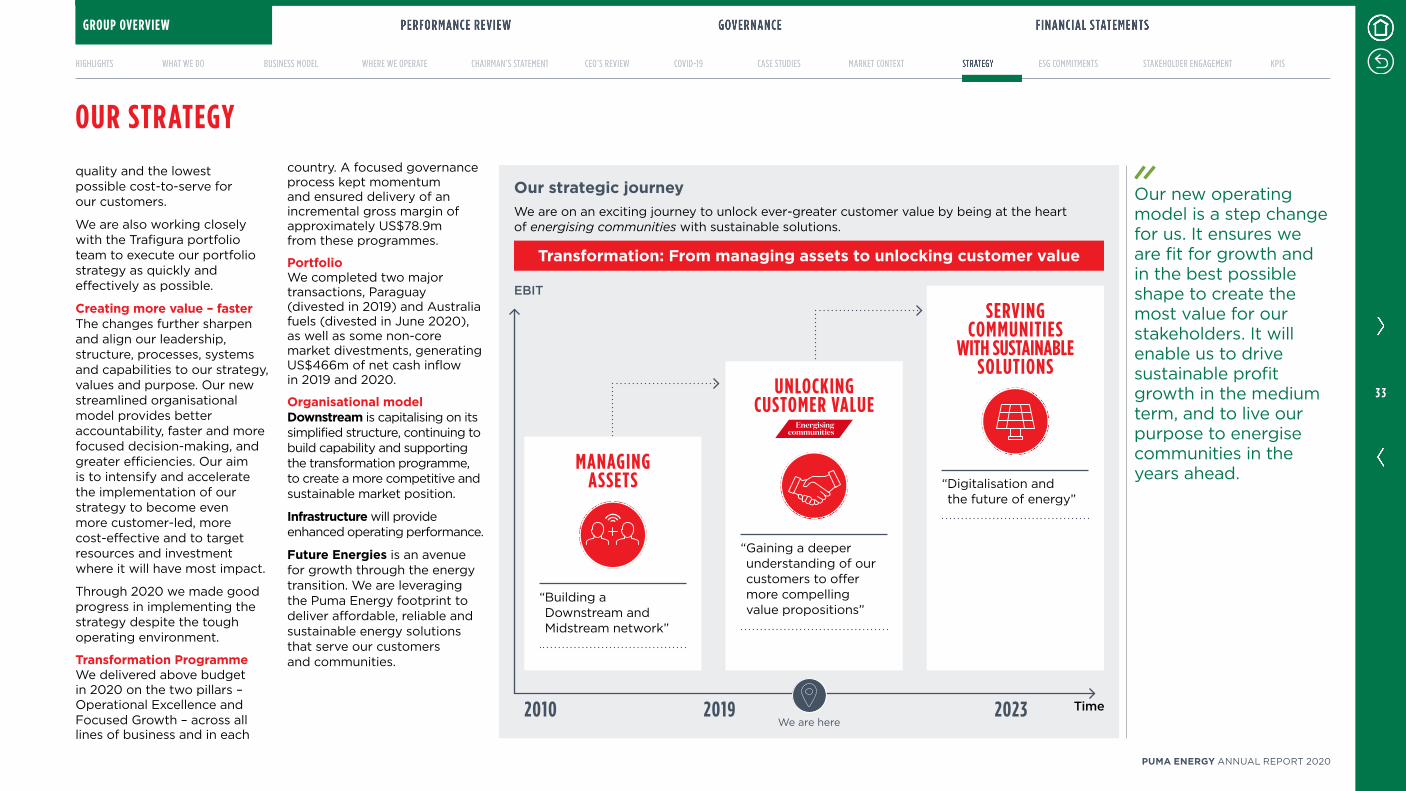
quality and the lowest possible cost-to-serve for our customers.
We are also working closely with the Trafigura portfolio team to execute our portfolio strategy as quickly and effectively as possible.
Creating more value – fasterThe changes further sharpen and align our leadership, structure, processes, systems and capabilities to our strategy, values and purpose. Our new streamlined organisational model provides better accountability, faster and more focused decision-making, and greater efficiencies. Our aim is to intensify and accelerate the implementation of our strategy to become even more customer-led, more cost-effective and to target resources and investment where it will have most impact.
Through 2020 we made good progress in implementing the strategy despite the tough operating environment.
Transformation ProgrammeWe delivered above budget in 2020 on the two pillars – Operational Excellence and Focused Growth – across all lines of business and in each
country. A focused governance process kept momentum and ensured delivery of an incremental gross margin of approximately US$78.9m from these programmes.
PortfolioWe completed two major transactions, Paraguay (divested in 2019) and Australia fuels (divested in June 2020), as well as some non-core market divestments, generating US$466m of net cash inflow in 2019 and 2020.
Organisational modelDownstream is capitalising on its simplified structure, continuing to build capability and supporting the transformation programme, to create a more competitive and sustainable market position.
Infrastructure will provide enhanced operating performance.
Future Energies is an avenue for growth through the energy transition. We are leveraging the Puma Energy footprint to deliver affordable, reliable and sustainable energy solutions that serve our customers and communities.
Our new operating model is a step change for us. It ensures we are fit for growth and in the best possible shape to create the most value for our stakeholders. It will enable us to drive sustainable profit growth in the medium term, and to live our purpose to energise communities in the years ahead.
Our strategic journeyWe are on an exciting journey to unlock ever-greater customer value by being at the heart of energising communities with sustainable solutions.
Transformation: From managing assets to unlocking customer value
2010 2019 2023 Time
EBIT
We are here
OUR STRATEGY
MANAGING ASSETS
“ Building a Downstream and Midstream network”
UNLOCKING CUSTOMER VALUE
“ Gaining a deeper understanding of our customers to offer more compelling value propositions”
SERVING COMMUNITIES
WITH SUSTAINABLE SOLUTIONS
“ Digitalisation and the future of energy”
GROUP OVERVIEW
3 3
PUMA ENERGY ANNUAL REPORT 2020

OUR STRATEGYMaking operational improvementsDespite the challenges of COVID-19, we made substantial progress on several operational improvements (OIs). We focused on optimising our operations, differentiating ourselves from others, increasing the size of our current business, and generating sustained performance.
In total, we achieved US$78.9m of benefits from our OIs in 2020, beating our target of US$67.8m.
Spotlight on transport optimisationWe implemented several actions to optimise our transport and logistics process to be more efficient and reduce our transport costs. These include: • Negotiating lower transport rates
• Enforcing more efficient distribution rules, for example cut-off time for ordering and payment, delivery windows and order size
• Optimising delivery scheduling and the utilisation of trucks
• Streamlining the loading process in terminals
• Implementing a Vendor Management Inventory (VMI) model
It was a true team effort including people from a range of different areas such as business support, credit, procurement, sales and transport. It enabled us to generate US$4m of value in 2020.
Looking aheadWe have a strong pipeline of OIs to support our business transformation. Key initiatives focused on improving Operational Excellence include: method of site operation (MOSO) best practices, transport optimisation, procurement optimisation, and cost reduction and process improvement initiatives in Finance and IT.
In addition to improving our own operations, other strategic initiatives are improving the customer experience and adding value to our business too. These include our Loyalty programme, convenience retail development projects, global fleet card and optimum retail network planning.
OPERATIONAL EXCELLENCE
Communication, cooperation and teamwork have been at the heart of our success in delivering strong results through our operational improvements.
We are working together on a standardised best way that helps us transform our processes and our mind-set – in order to be more efficient and more profitable. The key is to apply these global best ways in the right way locally across our footprint.
US$78.9MValue generated from operational improvements in 2020
Key operational improvements• Transport optimisation
• Optimising returns from our Retail-owned portfolio
• Developing a lubricants distributor network
• Enhancing partner capability to deliver our customer offer
• Increasing lubricants volume in Africa through high-performance lubrication solutions
GROUP OVERVIEW
3 4
PUMA ENERGY ANNUAL REPORT 2020
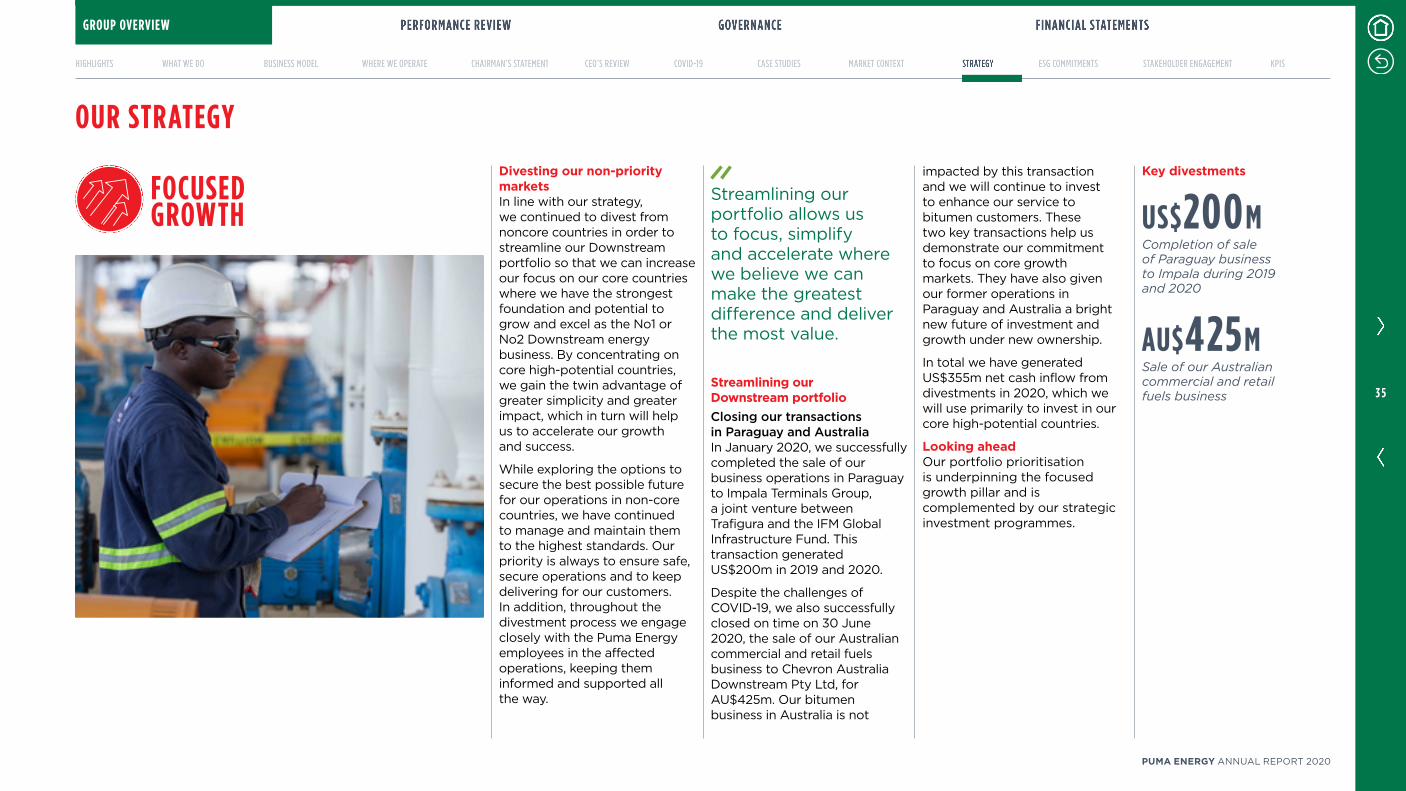
Divesting our non-prioritymarketsIn line with our strategy, we continued to divest from noncore countries in order to streamline our Downstream portfolio so that we can increase our focus on our core countries where we have the strongest foundation and potential to grow and excel as the No1 or No2 Downstream energy business. By concentrating on core high-potential countries, we gain the twin advantage of greater simplicity and greater impact, which in turn will help us to accelerate our growth and success.
While exploring the options to secure the best possible future for our operations in non-core countries, we have continued to manage and maintain them to the highest standards. Our priority is always to ensure safe, secure operations and to keep delivering for our customers. In addition, throughout the divestment process we engage closely with the Puma Energy employees in the affected operations, keeping them informed and supported all the way.
Streamlining our Downstream portfolioClosing our transactions in Paraguay and AustraliaIn January 2020, we successfully completed the sale of our business operations in Paraguay to Impala Terminals Group, a joint venture between Trafigura and the IFM Global Infrastructure Fund. This transaction generated US$200m in 2019 and 2020.
Despite the challenges of COVID-19, we also successfully closed on time on 30 June 2020, the sale of our Australian commercial and retail fuels business to Chevron Australia Downstream Pty Ltd, for AU$425m. Our bitumen business in Australia is not
impacted by this transaction and we will continue to invest to enhance our service to bitumen customers. These two key transactions help us demonstrate our commitment to focus on core growth markets. They have also given our former operations in Paraguay and Australia a bright new future of investment and growth under new ownership.
In total we have generated US$355m net cash inflow from divestments in 2020, which we will use primarily to invest in our core high-potential countries.
Looking aheadOur portfolio prioritisation is underpinning the focused growth pillar and is complemented by our strategic investment programmes.
Streamlining our portfolio allows us to focus, simplify and accelerate where we believe we can make the greatest difference and deliver the most value.
FOCUSED GROWTH
OUR STRATEGYKey divestments
US$200MCompletion of sale of Paraguay business to Impala during 2019 and 2020
AU$425MSale of our Australian commercial and retail fuels business
GROUP OVERVIEW
3 5
PUMA ENERGY ANNUAL REPORT 2020
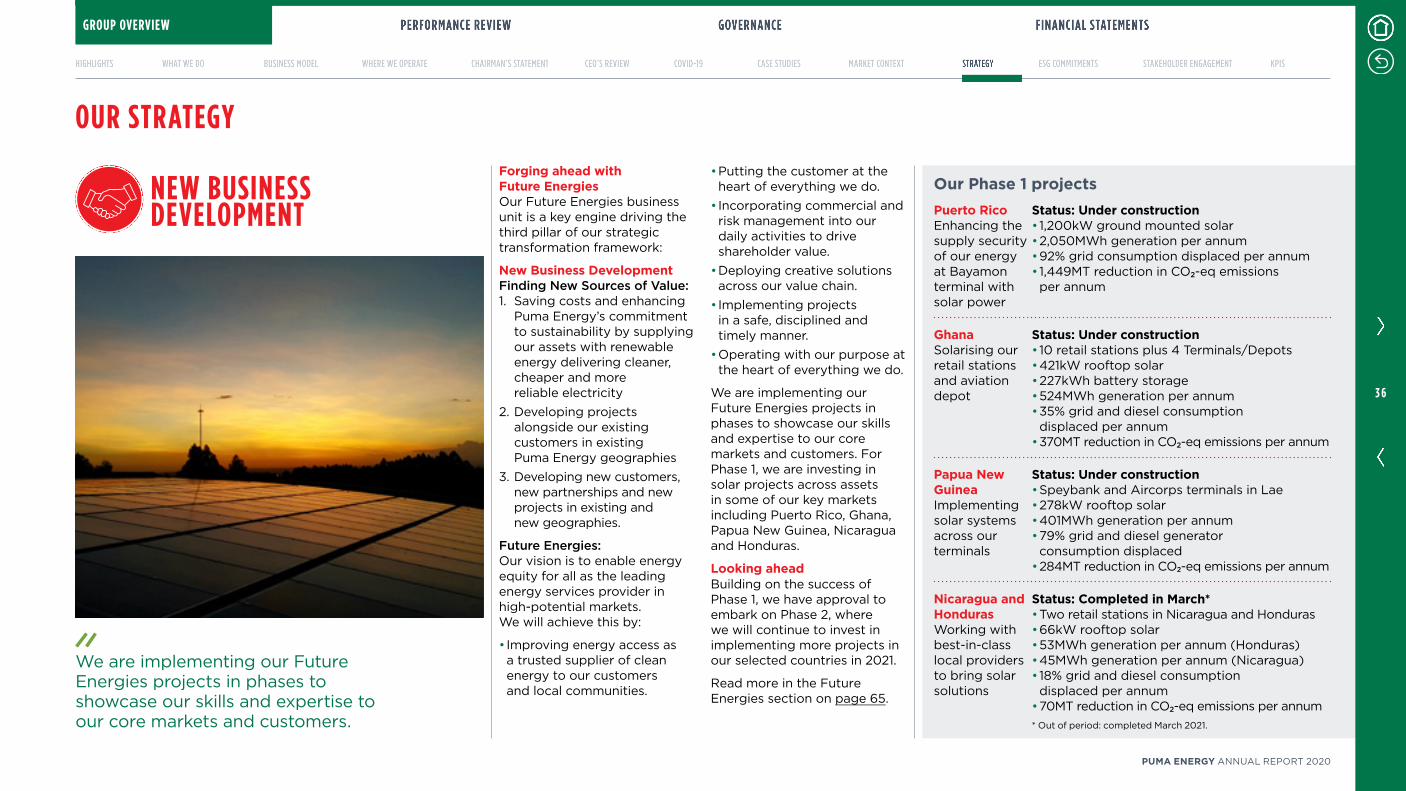
Forging ahead with Future EnergiesOur Future Energies business unit is a key engine driving the third pillar of our strategic transformation framework:
New Business DevelopmentFinding New Sources of Value:1. Saving costs and enhancing
Puma Energy’s commitmentto sustainability by supplyingour assets with renewableenergy delivering cleaner,cheaper and morereliable electricity
2. Developing projectsalongside our existingcustomers in existingPuma Energy geographies
3. Developing new customers,new partnerships and newprojects in existing andnew geographies.
Future Energies:Our vision is to enable energy equity for all as the leading energy services provider in high-potential markets. We will achieve this by:
• Improving energy access asa trusted supplier of cleanenergy to our customersand local communities.
• Putting the customer at theheart of everything we do.
• Incorporating commercial andrisk management into ourdaily activities to driveshareholder value.
• Deploying creative solutionsacross our value chain.
• Implementing projectsin a safe, disciplined andtimely manner.
• Operating with our purpose atthe heart of everything we do.
We are implementing our Future Energies projects in phases to showcase our skills and expertise to our core markets and customers. For Phase 1, we are investing in solar projects across assets in some of our key markets including Puerto Rico, Ghana, Papua New Guinea, Nicaragua and Honduras.
Looking aheadBuilding on the success of Phase 1, we have approval to embark on Phase 2, where we will continue to invest in implementing more projects in our selected countries in 2021.
Read more in the Future Energies section on page 65.
NEW BUSINESS DEVELOPMENT
Our Phase 1 projectsPuerto RicoEnhancing the supply security of our energy at Bayamon terminal with solar power
Status: Under construction• 1,200kW ground mounted solar• 2,050MWh generation per annum• 92% grid consumption displaced per annum• 1,449MT reduction in CO2-eq emissionsper annum
GhanaSolarising our retail stations and aviation depot
Status: Under construction• 10 retail stations plus 4 Terminals/Depots• 421kW rooftop solar• 227kWh battery storage• 524MWh generation per annum• 35% grid and diesel consumptiondisplaced per annum
• 370MT reduction in CO2-eq emissions per annum
Papua New GuineaImplementing solar systems across our terminals
Status: Under construction• Speybank and Aircorps terminals in Lae• 278kW rooftop solar• 401MWh generation per annum• 79% grid and diesel generatorconsumption displaced
• 284MT reduction in CO2-eq emissions per annum
Nicaragua and HondurasWorking with best-in-class local providers to bring solar solutions
Status: Completed in March*• Two retail stations in Nicaragua and Honduras• 66kW rooftop solar• 53MWh generation per annum (Honduras)• 45MWh generation per annum (Nicaragua)• 18% grid and diesel consumptiondisplaced per annum
• 70MT reduction in CO2-eq emissions per annum* Out of period: completed March 2021.
OUR STRATEGY
We are implementing our Future Energies projects in phases to showcase our skills and expertise to our core markets and customers.
GROUP OVERVIEW
3 6
PUMA ENERGY ANNUAL REPORT 2020
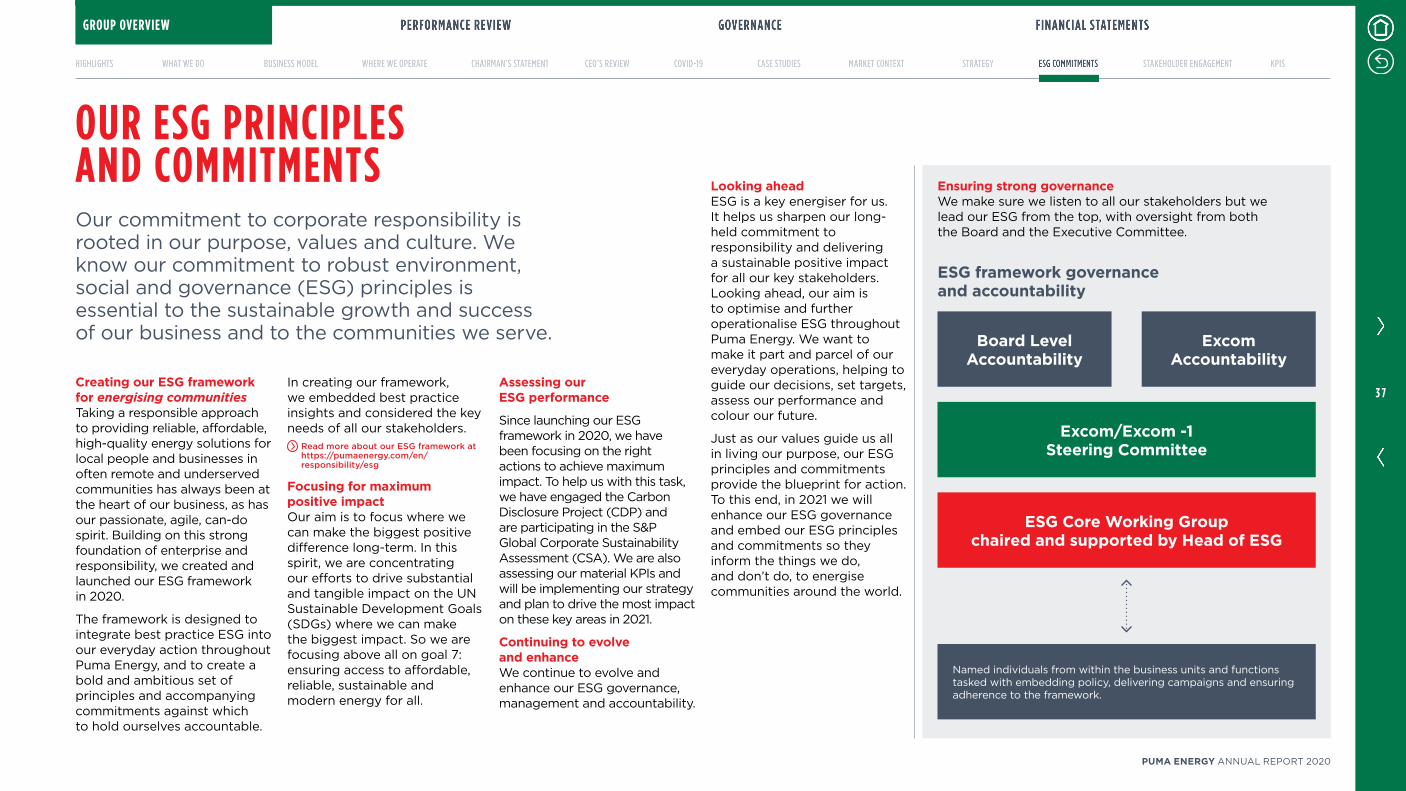
OUR ESG PRINCIPLES AND COMMITMENTSOur commitment to corporate responsibility is rooted in our purpose, values and culture. We know our commitment to robust environment, social and governance (ESG) principles is essential to the sustainable growth and success of our business and to the communities we serve.
Creating our ESG framework for energising communitiesTaking a responsible approach to providing reliable, affordable, high-quality energy solutions for local people and businesses in often remote and underserved communities has always been at the heart of our business, as has our passionate, agile, can-do spirit. Building on this strong foundation of enterprise and responsibility, we created and launched our ESG framework in 2020.
The framework is designed to integrate best practice ESG into our everyday action throughout Puma Energy, and to create a bold and ambitious set of principles and accompanying commitments against which to hold ourselves accountable.
In creating our framework, we embedded best practice insights and considered the key needs of all our stakeholders.
Read more about our ESG framework at https://pumaenergy.com/en/responsibility/esg
Focusing for maximum positive impactOur aim is to focus where we can make the biggest positive difference long-term. In this spirit, we are concentrating our efforts to drive substantial and tangible impact on the UN Sustainable Development Goals (SDGs) where we can make the biggest impact. So we are focusing above all on goal 7: ensuring access to affordable, reliable, sustainable and modern energy for all.
Assessing our ESG performance
Since launching our ESG framework in 2020, we have been focusing on the right actions to achieve maximum impact. To help us with this task, we have engaged the Carbon Disclosure Project (CDP) and are participating in the S&P Global Corporate Sustainability Assessment (CSA). We are also assessing our material KPIs and will be implementing our strategy and plan to drive the most impact on these key areas in 2021.
Continuing to evolve and enhanceWe continue to evolve and enhance our ESG governance, management and accountability.
Ensuring strong governanceWe make sure we listen to all our stakeholders but we lead our ESG from the top, with oversight from both the Board and the Executive Committee.
ESG framework governance and accountability
Board Level Accountability
Excom Accountability
Excom/Excom -1 Steering Committee
ESG Core Working Group chaired and supported by Head of ESG
Named individuals from within the business units and functions tasked with embedding policy, delivering campaigns and ensuring adherence to the framework.
Looking aheadESG is a key energiser for us. It helps us sharpen our long-held commitment to responsibility and delivering a sustainable positive impact for all our key stakeholders. Looking ahead, our aim is to optimise and further operationalise ESG throughout Puma Energy. We want to make it part and parcel of our everyday operations, helping to guide our decisions, set targets, assess our performance and colour our future.
Just as our values guide us all in living our purpose, our ESG principles and commitments provide the blueprint for action. To this end, in 2021 we will enhance our ESG governance and embed our ESG principles and commitments so they inform the things we do, and don’t do, to energise communities around the world.
GROUP OVERVIEW
3 7
PUMA ENERGY ANNUAL REPORT 2020
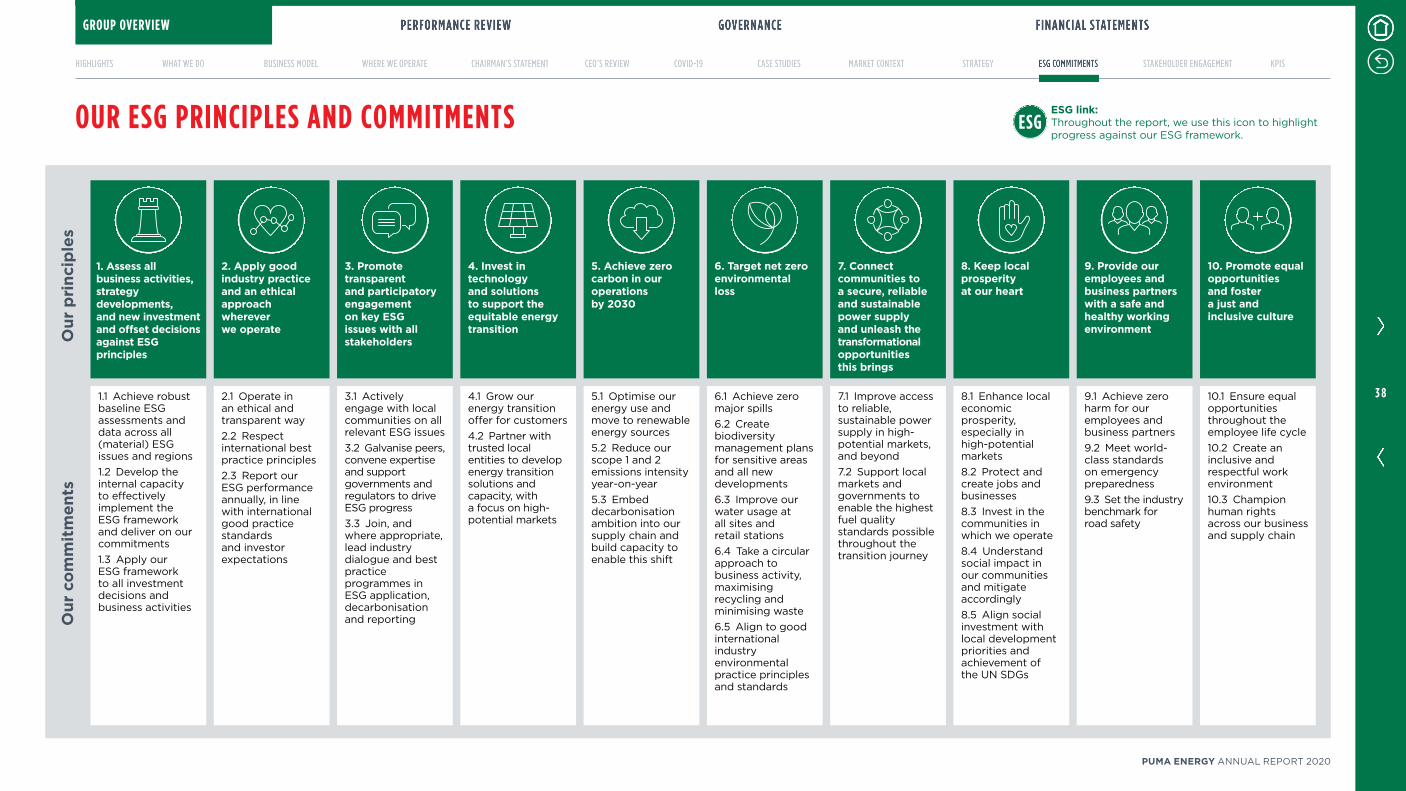
ESG link: Throughout the report, we use this icon to highlight progress against our ESG framework.
OUR ESG PRINCIPLES AND COMMITMENTS
1. Assess all business activities, strategy developments, and new investment and offset decisions against ESG principles
2. Apply good industry practice and an ethical approach wherever we operate
3. Promote transparent and participatory engagement on key ESG issues with all stakeholders
4. Invest in technology and solutions to support the equitable energy transition
5. Achieve zero carbon in our operations by 2030
6. Target net zero environmental loss
7. Connect communities to a secure, reliable and sustainable power supply and unleash the transformational opportunities this brings
8. Keep local prosperity at our heart
9. Provide our employees and business partners with a safe and healthy working environment
10. Promote equal opportunities and foster a just and inclusive culture
1.1 Achieve robust baseline ESG assessments and data across all (material) ESG issues and regions 1.2 Develop the internal capacity to effectively implement the ESG framework and deliver on our commitments 1.3 Apply our ESG framework to all investment decisions and business activities
2.1 Operate in an ethical and transparent way 2.2 Respect international best practice principles 2.3 Report our ESG performance annually, in line with international good practice standards and investor expectations
3.1 Actively engage with local communities on all relevant ESG issues 3.2 Galvanise peers, convene expertise and support governments and regulators to drive ESG progress 3.3 Join, and where appropriate, lead industry dialogue and best practice programmes in ESG application, decarbonisation and reporting
4.1 Grow our energy transition offer for customers 4.2 Partner with trusted local entities to develop energy transition solutions and capacity, with a focus on high-potential markets
5.1 Optimise our energy use and move to renewable energy sources 5.2 Reduce our scope 1 and 2 emissions intensity year-on-year 5.3 Embed decarbonisation ambition into our supply chain and build capacity to enable this shift
6.1 Achieve zero major spills 6.2 Create biodiversity management plans for sensitive areas and all new developments 6.3 Improve our water usage at all sites and retail stations 6.4 Take a circular approach to business activity, maximising recycling and minimising waste 6.5 Align to good international industry environmental practice principles and standards
7.1 Improve access to reliable, sustainable power supply in high-potential markets, and beyond 7.2 Support local markets and governments to enable the highest fuel quality standards possible throughout the transition journey
8.1 Enhance local economic prosperity, especially in high-potential markets 8.2 Protect and create jobs and businesses 8.3 Invest in the communities in which we operate 8.4 Understand social impact in our communities and mitigate accordingly 8.5 Align social investment with local development priorities and achievement of the UN SDGs
9.1 Achieve zero harm for our employees and business partners 9.2 Meet world-class standards on emergency preparedness 9.3 Set the industry benchmark for road safety
10.1 Ensure equal opportunities throughout the employee life cycle 10.2 Create an inclusive and respectful work environment 10.3 Champion human rights across our business and supply chain
Our
co
mm
itm
ents
Our
pri
ncip
les
GROUP OVERVIEW
3 8
PUMA ENERGY ANNUAL REPORT 2020
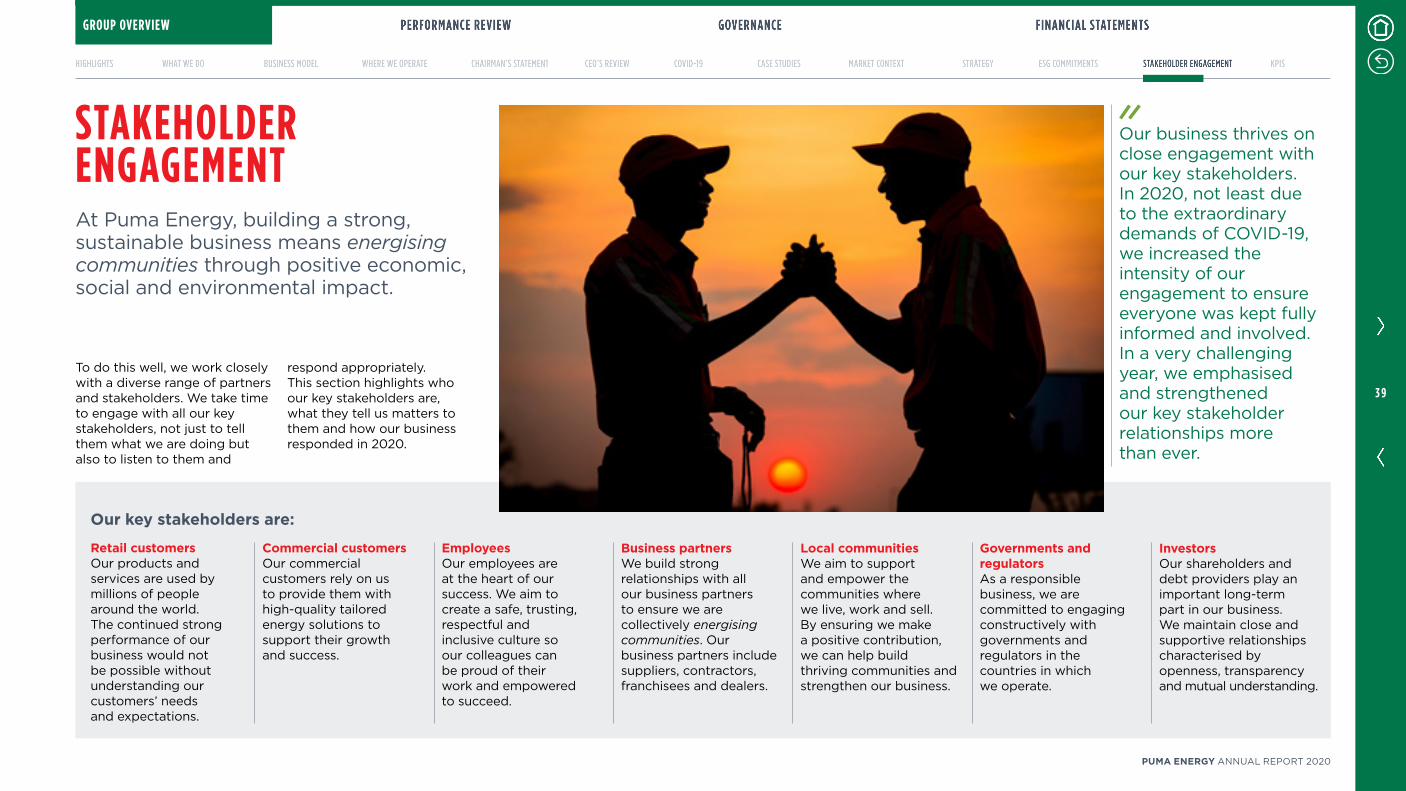
STAKEHOLDER ENGAGEMENTAt Puma Energy, building a strong, sustainable business means energising communities through positive economic, social and environmental impact.
Our business thrives on close engagement with our key stakeholders. In 2020, not least due to the extraordinary demands of COVID-19, we increased the intensity of our engagement to ensure everyone was kept fully informed and involved. In a very challenging year, we emphasised and strengthened our key stakeholder relationships more than ever.
Our key stakeholders are:
Retail customersOur products and services are used by millions of people around the world. The continued strong performance of our business would not be possible without understanding our customers’ needs and expectations.
Commercial customersOur commercial customers rely on us to provide them with high-quality tailored energy solutions to support their growth and success.
EmployeesOur employees are at the heart of our success. We aim to create a safe, trusting, respectful and inclusive culture so our colleagues can be proud of their work and empowered to succeed.
Business partnersWe build strong relationships with all our business partners to ensure we are collectively energising communities. Our business partners include suppliers, contractors, franchisees and dealers.
Local communitiesWe aim to support and empower the communities where we live, work and sell. By ensuring we make a positive contribution, we can help build thriving communities and strengthen our business.
Governments and regulatorsAs a responsible business, we are committed to engaging constructively with governments and regulators in the countries in which we operate.
InvestorsOur shareholders and debt providers play an important long-term part in our business. We maintain close and supportive relationships characterised by openness, transparency and mutual understanding.
To do this well, we work closely with a diverse range of partners and stakeholders. We take time to engage with all our key stakeholders, not just to tell them what we are doing but also to listen to them and
respond appropriately. This section highlights who our key stakeholders are, what they tell us matters to them and how our business responded in 2020.
GROUP OVERVIEW
3 9
PUMA ENERGY ANNUAL REPORT 2020
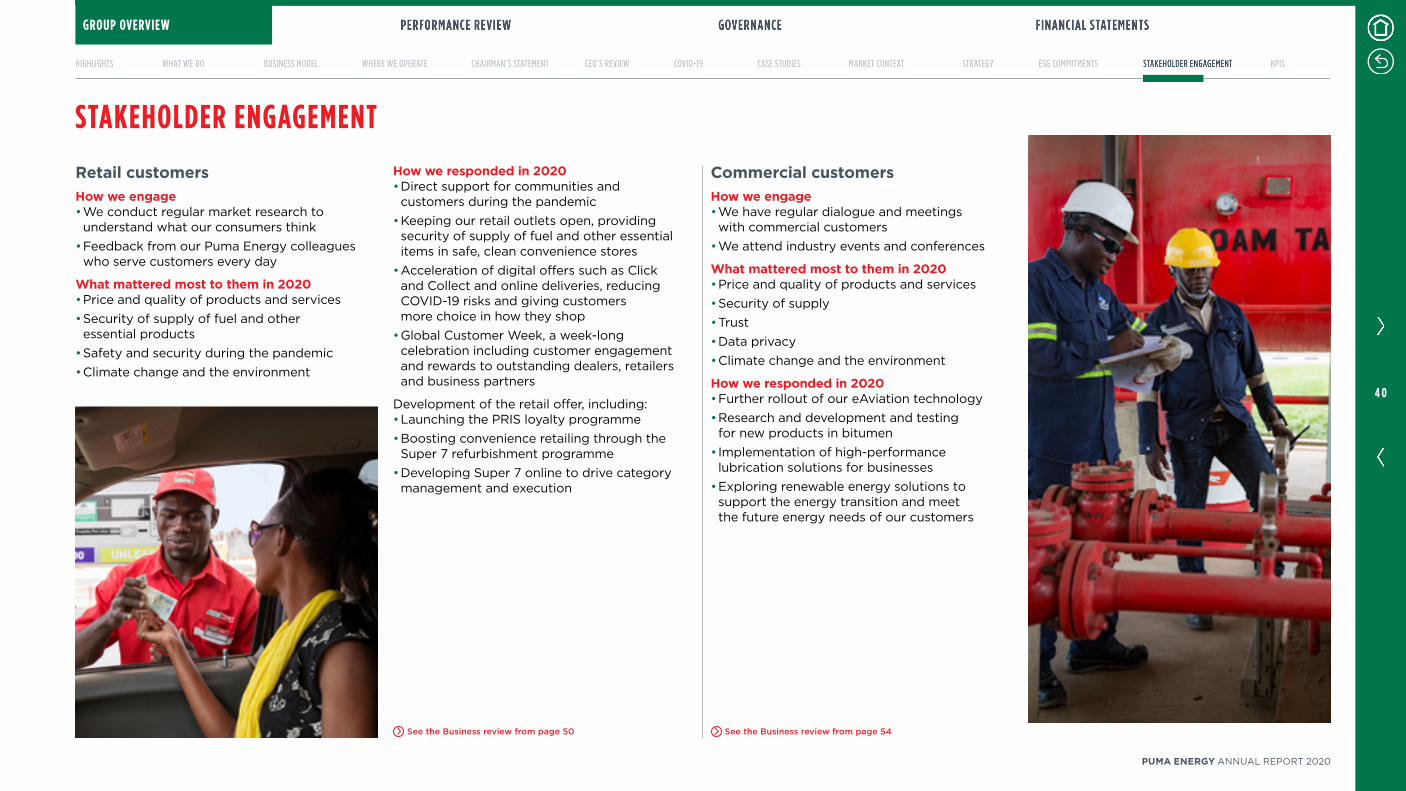
STAKEHOLDER ENGAGEMENT
Retail customersHow we engage• We conduct regular market research to understand what our consumers think
• Feedback from our Puma Energy colleagues who serve customers every day
What mattered most to them in 2020• Price and quality of products and services • Security of supply of fuel and other essential products
• Safety and security during the pandemic• Climate change and the environment
How we responded in 2020• Direct support for communities and customers during the pandemic
• Keeping our retail outlets open, providing security of supply of fuel and other essential items in safe, clean convenience stores
• Acceleration of digital offers such as Click and Collect and online deliveries, reducing COVID-19 risks and giving customers more choice in how they shop
• Global Customer Week, a week-long celebration including customer engagement and rewards to outstanding dealers, retailers and business partners
Development of the retail offer, including:• Launching the PRIS loyalty programme• Boosting convenience retailing through the Super 7 refurbishment programme
• Developing Super 7 online to drive category management and execution
Commercial customersHow we engage• We have regular dialogue and meetings with commercial customers
• We attend industry events and conferences
What mattered most to them in 2020• Price and quality of products and services • Security of supply• Trust• Data privacy• Climate change and the environment
How we responded in 2020• Further rollout of our eAviation technology• Research and development and testing for new products in bitumen
• Implementation of high-performance lubrication solutions for businesses
• Exploring renewable energy solutions to support the energy transition and meet the future energy needs of our customers
See the Business review from page 50 See the Business review from page 54
GROUP OVERVIEW
4 0
PUMA ENERGY ANNUAL REPORT 2020
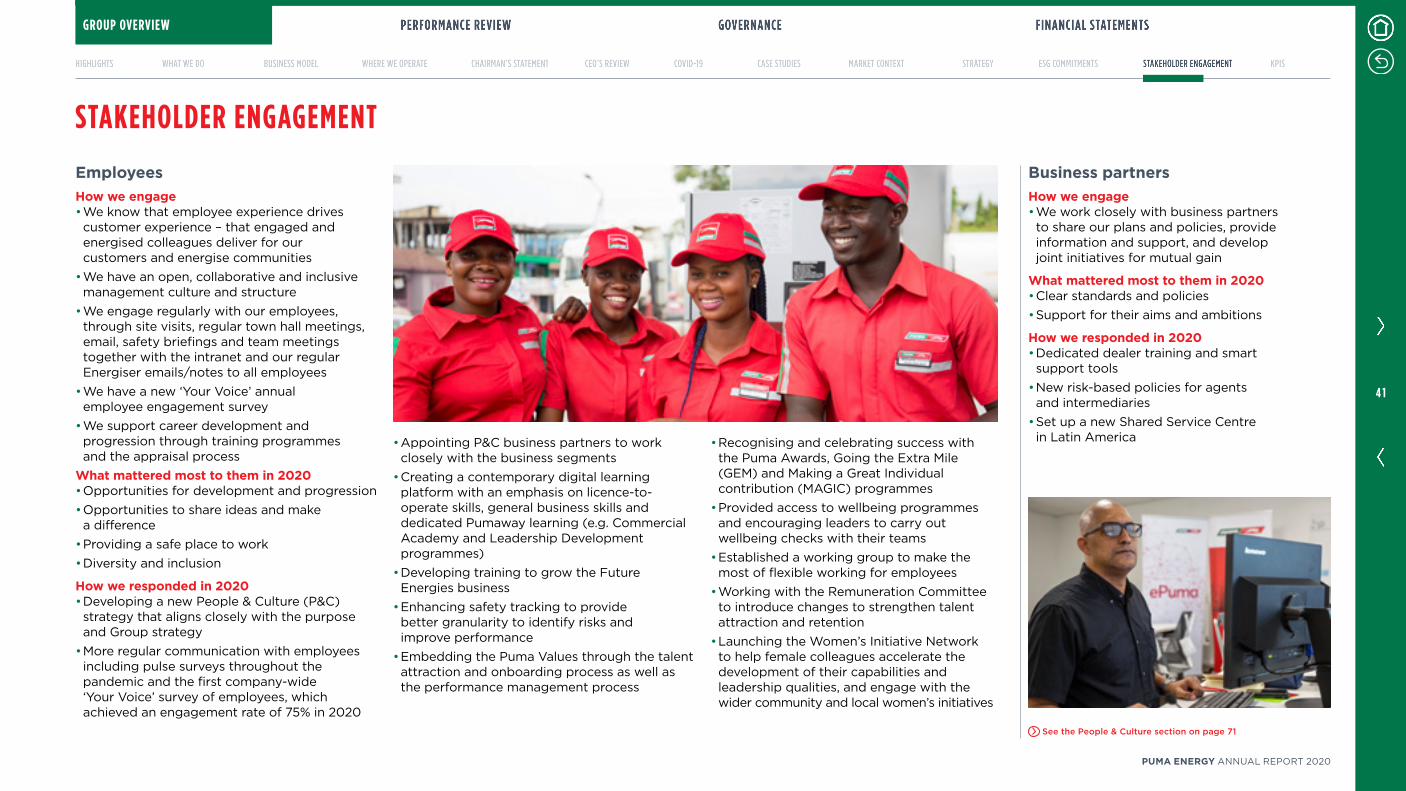
EmployeesHow we engage• We know that employee experience drives customer experience – that engaged and energised colleagues deliver for our customers and energise communities
• We have an open, collaborative and inclusive management culture and structure
• We engage regularly with our employees, through site visits, regular town hall meetings, email, safety briefings and team meetings together with the intranet and our regular Energiser emails/notes to all employees
• We have a new ‘Your Voice’ annual employee engagement survey
• We support career development and progression through training programmes and the appraisal process
What mattered most to them in 2020• Opportunities for development and progression • Opportunities to share ideas and make a difference
• Providing a safe place to work • Diversity and inclusion
How we responded in 2020• Developing a new People & Culture (P&C) strategy that aligns closely with the purpose and Group strategy
• More regular communication with employees including pulse surveys throughout the pandemic and the first company-wide ‘Your Voice’ survey of employees, which achieved an engagement rate of 75% in 2020
• Appointing P&C business partners to work closely with the business segments
• Creating a contemporary digital learning platform with an emphasis on licence-to-operate skills, general business skills and dedicated Pumaway learning (e.g. Commercial Academy and Leadership Development programmes)
• Developing training to grow the Future Energies business
• Enhancing safety tracking to provide better granularity to identify risks and improve performance
• Embedding the Puma Values through the talent attraction and onboarding process as well as the performance management process
• Recognising and celebrating success with the Puma Awards, Going the Extra Mile (GEM) and Making a Great Individual contribution (MAGIC) programmes
• Provided access to wellbeing programmes and encouraging leaders to carry out wellbeing checks with their teams
• Established a working group to make the most of flexible working for employees
• Working with the Remuneration Committee to introduce changes to strengthen talent attraction and retention
• Launching the Women’s Initiative Network to help female colleagues accelerate the development of their capabilities and leadership qualities, and engage with the wider community and local women’s initiatives
Business partnersHow we engage• We work closely with business partners to share our plans and policies, provide information and support, and develop joint initiatives for mutual gain
What mattered most to them in 2020• Clear standards and policies• Support for their aims and ambitions
How we responded in 2020• Dedicated dealer training and smart support tools
• New risk-based policies for agents and intermediaries
• Set up a new Shared Service Centre in Latin America
STAKEHOLDER ENGAGEMENT
See the People & Culture section on page 71
GROUP OVERVIEW
4 1
PUMA ENERGY ANNUAL REPORT 2020
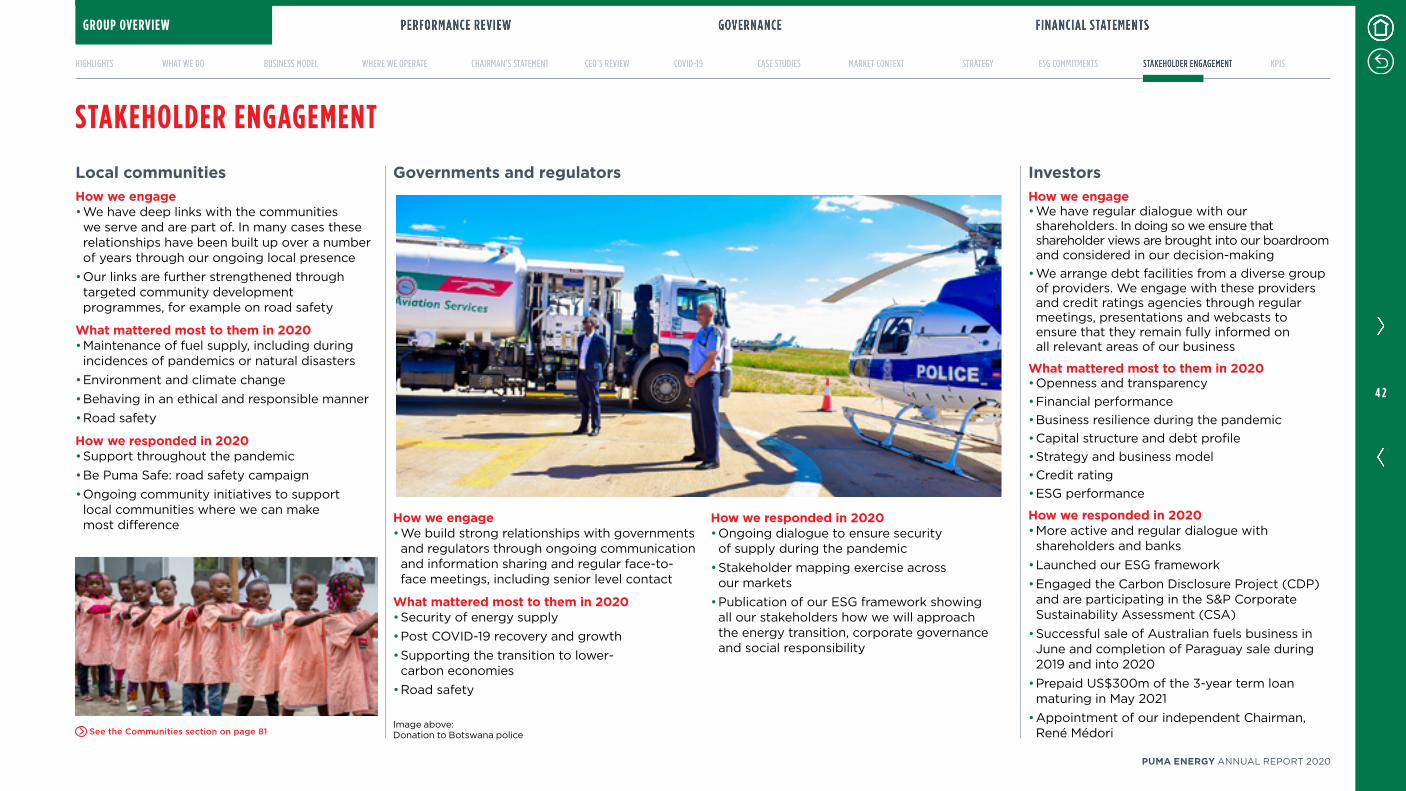
InvestorsHow we engage• We have regular dialogue with our shareholders. In doing so we ensure that shareholder views are brought into our boardroom and considered in our decision-making
• We arrange debt facilities from a diverse group of providers. We engage with these providers and credit ratings agencies through regular meetings, presentations and webcasts to ensure that they remain fully informed on all relevant areas of our business
What mattered most to them in 2020• Openness and transparency• Financial performance• Business resilience during the pandemic• Capital structure and debt profile • Strategy and business model• Credit rating • ESG performance
How we responded in 2020• More active and regular dialogue with shareholders and banks
• Launched our ESG framework• Engaged the Carbon Disclosure Project (CDP) and are participating in the S&P Corporate Sustainability Assessment (CSA)
• Successful sale of Australian fuels business in June and completion of Paraguay sale during 2019 and into 2020
• Prepaid US$300m of the 3-year term loan maturing in May 2021
• Appointment of our independent Chairman, René Médori
How we engage• We build strong relationships with governments and regulators through ongoing communication and information sharing and regular face-to-face meetings, including senior level contact
What mattered most to them in 2020• Security of energy supply• Post COVID-19 recovery and growth• Supporting the transition to lower-carbon economies
• Road safety
How we responded in 2020• Ongoing dialogue to ensure security of supply during the pandemic
• Stakeholder mapping exercise across our markets
• Publication of our ESG framework showing all our stakeholders how we will approach the energy transition, corporate governance and social responsibility
Local communitiesHow we engage• We have deep links with the communities we serve and are part of. In many cases these relationships have been built up over a number of years through our ongoing local presence
• Our links are further strengthened through targeted community development programmes, for example on road safety
What mattered most to them in 2020• Maintenance of fuel supply, including during incidences of pandemics or natural disasters
• Environment and climate change• Behaving in an ethical and responsible manner• Road safety
How we responded in 2020• Support throughout the pandemic• Be Puma Safe: road safety campaign• Ongoing community initiatives to support local communities where we can make most difference
STAKEHOLDER ENGAGEMENT
Governments and regulators
See the Communities section on page 81Image above: Donation to Botswana police
GROUP OVERVIEW
4 2
PUMA ENERGY ANNUAL REPORT 2020
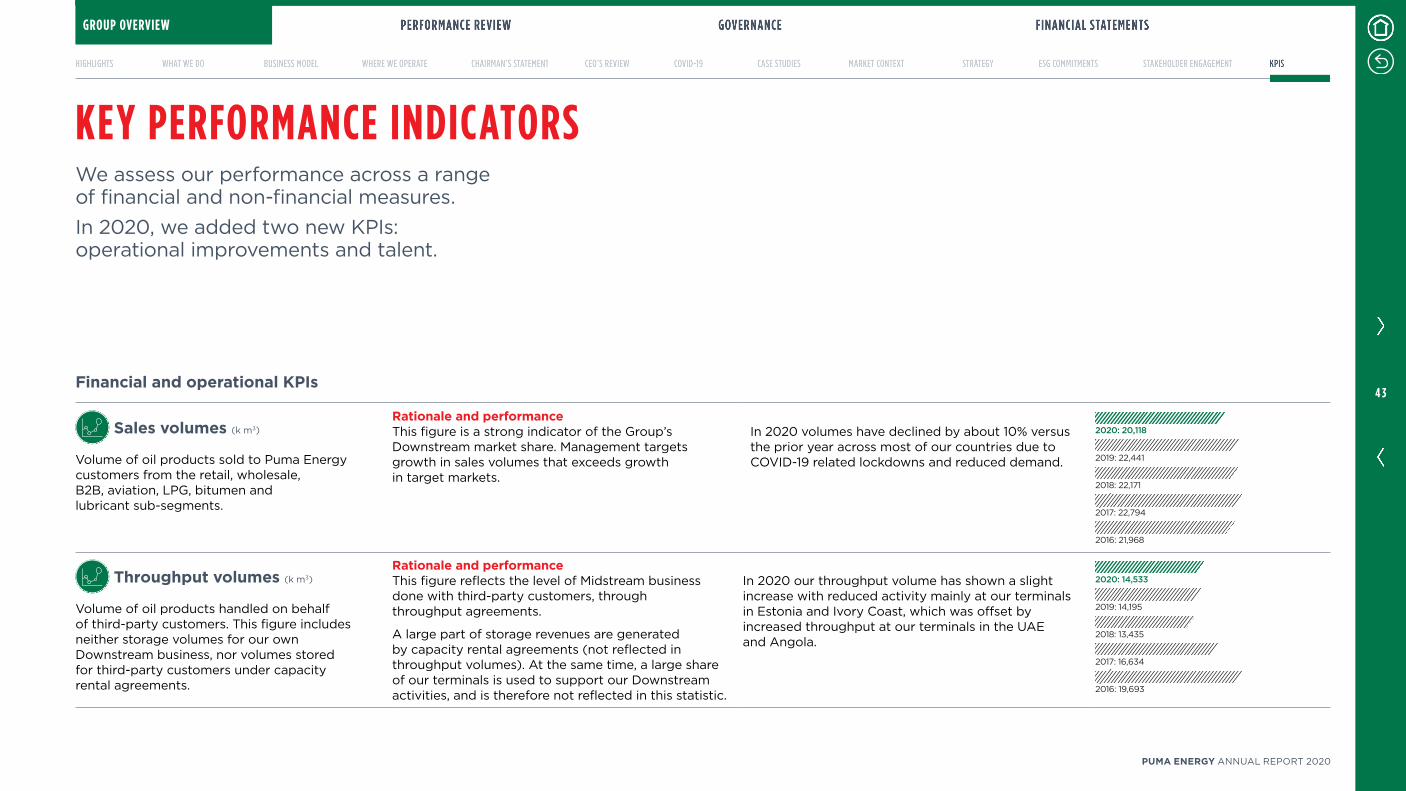
KEY PERFORMANCE INDICATORSWe assess our performance across a range of financial and non-financial measures. In 2020, we added two new KPIs: operational improvements and talent.
Sales volumes (k m3)Rationale and performanceThis figure is a strong indicator of the Group’s Downstream market share. Management targets growth in sales volumes that exceeds growth in target markets.
In 2020 volumes have declined by about 10% versus the prior year across most of our countries due to COVID-19 related lockdowns and reduced demand.
2020: 20,118
2019: 22,441
2018: 22,171
2017: 22,794
2016: 21,968
Volume of oil products sold to Puma Energy customers from the retail, wholesale, B2B, aviation, LPG, bitumen and lubricant sub-segments.
Throughput volumes (k m3)Rationale and performanceThis figure reflects the level of Midstream business done with third-party customers, through throughput agreements.
A large part of storage revenues are generated by capacity rental agreements (not reflected in throughput volumes). At the same time, a large share of our terminals is used to support our Downstream activities, and is therefore not reflected in this statistic.
In 2020 our throughput volume has shown a slight increase with reduced activity mainly at our terminals in Estonia and Ivory Coast, which was offset by increased throughput at our terminals in the UAE and Angola.
2020: 14,533
2019: 14,195
2018: 13,435
2017: 16,634
2016: 19,693
Volume of oil products handled on behalf of third-party customers. This figure includes neither storage volumes for our own Downstream business, nor volumes stored for third-party customers under capacity rental agreements.
Financial and operational KPIs
GROUP OVERVIEW
4 3
PUMA ENERGY ANNUAL REPORT 2020
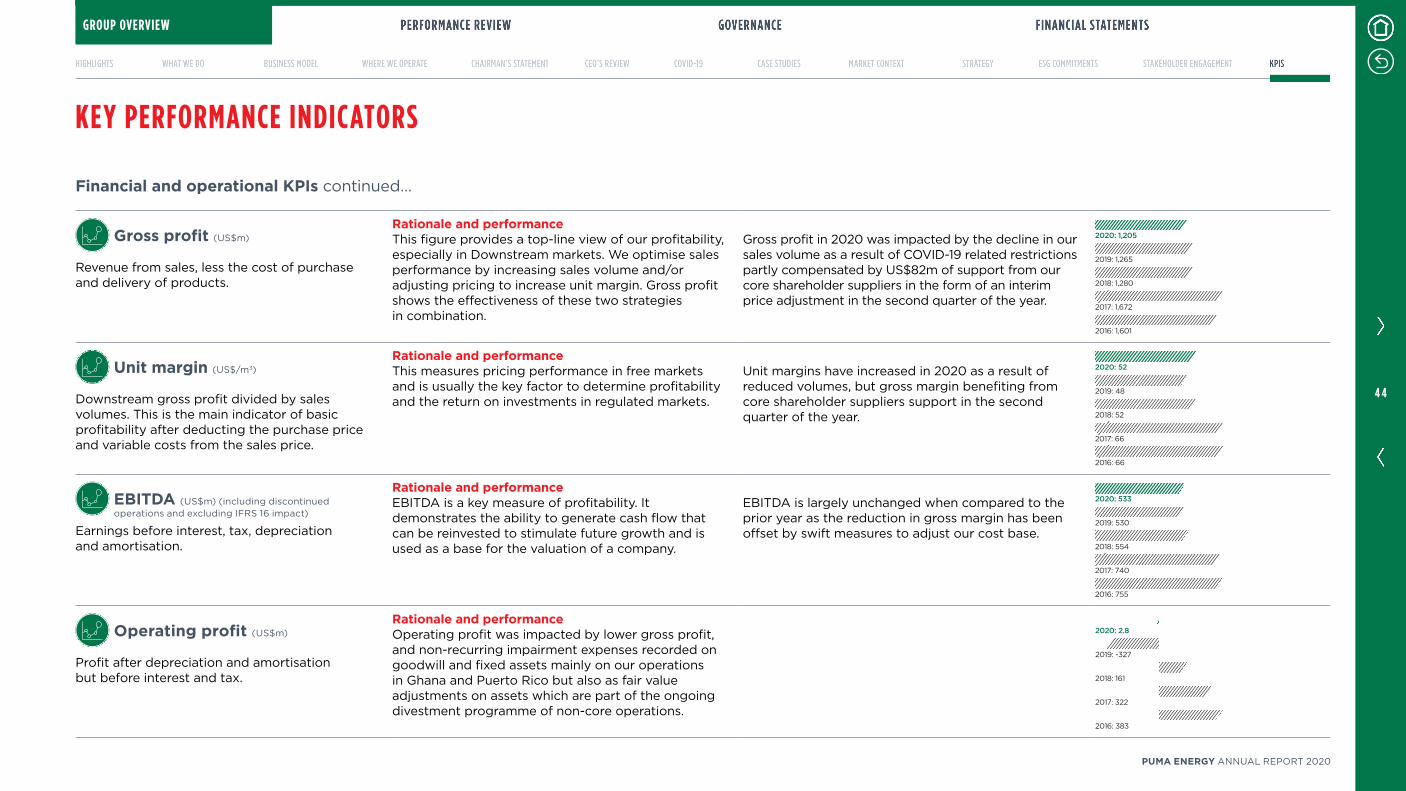
KEY PERFORMANCE INDICATORS
Gross profit (US$m)Rationale and performanceThis figure provides a top-line view of our profitability, especially in Downstream markets. We optimise sales performance by increasing sales volume and/or adjusting pricing to increase unit margin. Gross profit shows the effectiveness of these two strategies in combination.
Gross profit in 2020 was impacted by the decline in our sales volume as a result of COVID-19 related restrictions partly compensated by US$82m of support from our core shareholder suppliers in the form of an interim price adjustment in the second quarter of the year.
2020: 1,205
2019: 1,265
2018: 1,280
2017: 1,672
2016: 1,601
Revenue from sales, less the cost of purchase and delivery of p roducts.
Unit margin (US$/m3)Rationale and performanceThis measures pricing performance in free markets and is usually the key factor to determine profitability and the return on investments in regulated markets.
Unit margins have increased in 2020 as a result of reduced volumes, but gross margin benefiting from core shareholder suppliers support in the second quarter of the year.
2020: 52
2019: 48
2018: 52
2017: 66
2016: 66
Downstream gross profit divided by sales volumes. This is the main indicator of basic profitability after deducting the purchase price and variable costs from the sales price.
EBITDA (US$m) (including discontinued operations and excluding IFRS 16 impact)
Rationale and performanceEBITDA is a key measure of profitability. It demonstrates the ability to generate cash flow that can be reinvested to stimulate future growth and is used as a base for the valuation of a company.
EBITDA is largely unchanged when compared to the prior year as the reduction in gross margin has been offset by swift measures to adjust our cost base.
2020: 533
2019: 530
2018: 554
2017: 740
2016: 755
Earnings before interest, tax, depreciation and amortisation.
Operating profit (US$m)Rationale and performanceOperating profit was impacted by lower gross profit, and non-recurring impairment expenses recorded on goodwill and fixed assets mainly on our operations in Ghana and Puerto Rico but also as fair value adjustments on assets which are part of the ongoing divestment programme of non-core operations.
2020: 2.8
2019: -327
2018: 161
2017: 322
2016: 383
Profit after depreciation and amortisation but before interest and tax.
Financial and operational KPIs continued…
GROUP OVERVIEW
4 4
PUMA ENERGY ANNUAL REPORT 2020
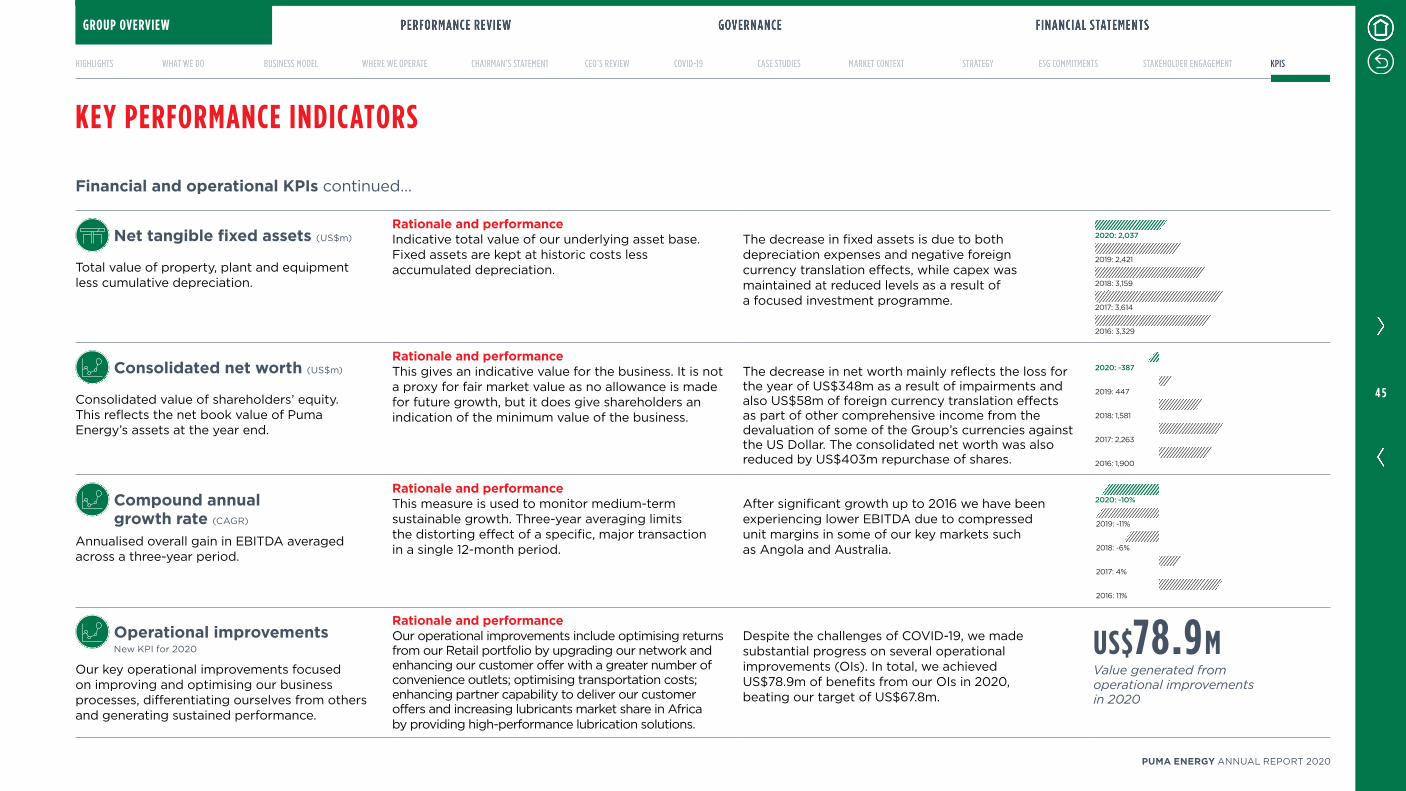
Net tangible fixed assets (US$m)Rationale and performanceIndicative total value of our underlying asset base. Fixed assets are kept at historic costs less accumulated depreciation.
The decrease in fixed assets is due to both depreciation expenses and negative foreign currency translation effects, while capex was maintained at reduced levels as a result of a focused investment programme.
2020: 2,037
2019: 2,421
2018: 3,159
2017: 3,614
2016: 3,329
Total value of property, plant and equipment less cumulative depreciation.
Consolidated net worth (US$m)Rationale and performanceThis gives an indicative value for the business. It is not a proxy for fair market value as no allowance is made for future growth, but it does give shareholders an indication of the minimum value of the business.
The decrease in net worth mainly reflects the loss for the year of US$348m as a result of impairments and also US$58m of foreign currency translation effects as part of other comprehensive income from the devaluation of some of the Group’s currencies against the US Dollar. The consolidated net worth was also reduced by US$403m repurchase of shares.
2020: -387
2019: 447
2018: 1,581
2017: 2,263
2016: 1,900
Consolidated value of shareholders’ equity. This reflects the net book value of Puma Energy’s assets at the year end.
Compound annual growth rate (CAGR)
Rationale and performanceThis measure is used to monitor medium-term sustainable growth. Three-year averaging limits the distorting effect of a specific, major transaction in a single 12-month period.
After significant growth up to 2016 we have been experiencing lower EBITDA due to compressed unit margins in some of our key markets such as Angola and Australia.
2020: -10%
2019: -11%
2018: -6%
2017: 4%
2016: 11%
Annualised overall gain in EBITDA averaged across a three-year period.
Operational improvements New KPI for 2020
Rationale and performanceOur operational improvements include optimising returns from our Retail portfolio by upgrading our network and enhancing our customer offer with a greater number of convenience outlets; optimising transportation costs; enhancing partner capability to deliver our customer offers and increasing lubricants market share in Africa by providing high-performance lubrication solutions.
Despite the challenges of COVID-19, we made substantial progress on several operational improvements (OIs). In total, we achieved US$78.9m of benefits from our OIs in 2020, beating our target of US$67.8m.
US$78.9MValue generated from operational improvements in 2020
Our key operational improvements focused on improving and optimising our business processes, differentiating ourselves from others and generating sustained performance.
KEY PERFORMANCE INDICATORS
Financial and operational KPIs continued…
GROUP OVERVIEW
4 5
PUMA ENERGY ANNUAL REPORT 2020
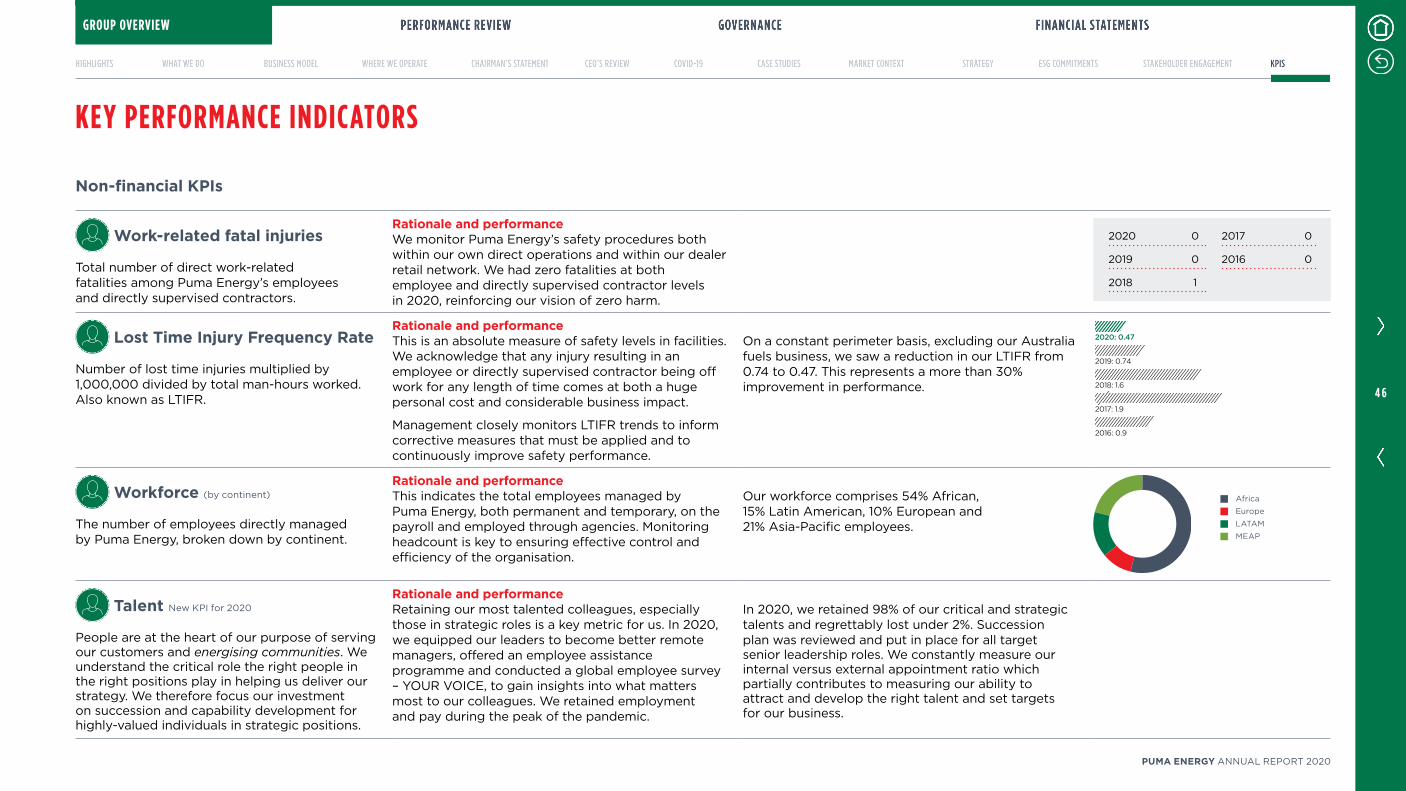
Non-financial KPIs
Work-related fatal injuriesRationale and performanceWe monitor Puma Energy’s safety procedures both within our own direct operations and within our dealer retail network. We had zero fatalities at both employee and directly supervised contractor levels in 2020, reinforcing our vision of zero harm.
2020 0 2017 0
2019 0 2016 0
2018 1Total number of direct work-related fatalities among Puma Energy’s employees and directly supervised contractors.
Lost Time Injury Frequency RateRationale and performanceThis is an absolute measure of safety levels in facilities. We acknowledge that any injury resulting in an employee or directly supervised contractor being off work for any length of time comes at both a huge personal cost and considerable business impact.
Management closely monitors LTIFR trends to inform corrective measures that must be applied and to continuously improve safety performance.
On a constant perimeter basis, excluding our Australia fuels business, we saw a reduction in our LTIFR from 0.74 to 0.47. This represents a more than 30% improvement in performance.
2020: 0.47
2019: 0.74
2018: 1.6
2017: 1.9
2016: 0.9
Number of lost time injuries multiplied by 1,000,000 divided by total man-hours worked. Also known as LTIFR.
Workforce (by continent) Rationale and performanceThis indicates the total employees managed by Puma Energy, both permanent and temporary, on the payroll and employed through agencies. Monitoring headcount is key to ensuring effective control and efficiency of the organisation.
Our workforce comprises 54% African, 15% Latin American, 10% European and 21% Asia-Pacific employees.
Africa
Europe
LATAM
MEAPThe number of employees directly managed by Puma Energy, broken down by continent.
Talent New KPI for 2020Rationale and performanceRetaining our most talented colleagues, especially those in strategic roles is a key metric for us. In 2020, we equipped our leaders to become better remote managers, offered an employee assistance programme and conducted a global employee survey – YOUR VOICE, to gain insights into what matters most to our colleagues. We retained employment and pay during the peak of the pandemic.
In 2020, we retained 98% of our critical and strategic talents and regrettably lost under 2%. Succession plan was reviewed and put in place for all target senior leadership roles. We constantly measure our internal versus external appointment ratio which partially contributes to measuring our ability to attract and develop the right talent and set targets for our business.
People are at the heart of our purpose of serving our customers and energising communities. We understand the critical role the right people in the right positions play in helping us deliver our strategy. We therefore focus our investment on succession and capability development for highly-valued individuals in strategic positions.
KEY PERFORMANCE INDICATORS
GROUP OVERVIEW
4 6
PUMA ENERGY ANNUAL REPORT 2020
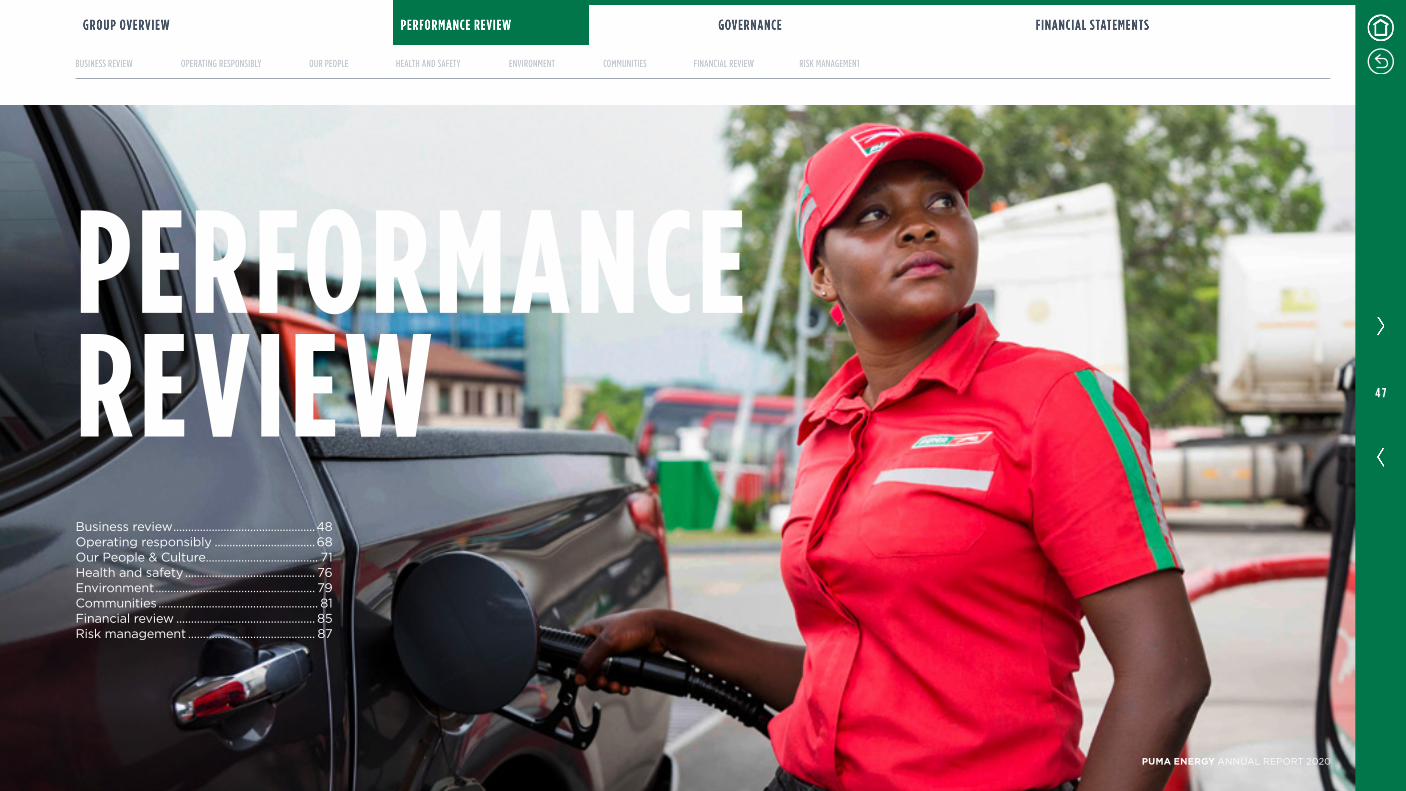
Business review 48Operating responsibly 68Our People & Culture 71Health and safety 76Environment 79Communities 81Financial review 85Risk management 87
PERFORMANCE REVIEW 4 7
PUMA ENERGY ANNUAL REPORT 2020

DownstreamExcelling in providing high-quality, competitively priced energy solutions for people and businesses
RetailPutting retail customers first to provide a great all-round experience all day, every dayCommercial Partnering with commercial customers to provide tailored energy solutions Aviation Serving the world’s airlines and airports safely and reliably
Lubricants Helping businesses and consumers save costs, enhance efficiency and improve machinery life cycles by using the right lubricants in the right wayBitumen Leading in the sourcing and supply of bitumen around the worldStorage and RefiningSupporting our Downstream business with storage terminals and refining assets
InfrastructureOptimising our world-class network of major terminal assets
Future Energies Playing a leading part in the energy transition for our business, customers and communities
We aim to invest in, structure and operate our business in the most effective way to fulfil our core purpose of energising communities and our customer-led strategy to deliver growth and create value for our stakeholders
Operational highlightsDownstream• Enhancing our customer-led experience and offers for retail customers
• Segmenting our commercial customers to create better, more tailored solutions
• Developing bespoke high-performance lubrication solutions
• Winning new aviation business and emerging stronger from the pandemic
• Growing our bitumen business by delivering safely, efficiently and reliably for our customers
Infrastructure• Standing up our world-class infrastructure assets as a standalone business unit
• Continuing to deliver without fail for our infrastructure customers
• Maintaining world-class health and safety standards in the face of the pandemic
Future Energies• Focusing on the energy transition across our high-potential markets
• Implementing Phase 1 of our plan – investing in solar installations across a limited number of assets across five countries: Puerto Rico, Ghana, Papua New Guinea, Nicaragua and Honduras
To this end, we have three business units – Downstream, Infrastructure and Future Energies – supported by Global Functions This enables us clearly to focus our energies and capabilities in distinct but complementary ways We excel for retail and commercial customers We optimise our global network of major terminals through Infrastructure We develop sustainable energy solutions through Future Energies
BUSINESS REVIEW
Financial highlights
20,118K M3
Sales volume
US$533MEBITDA (including discontinued operations and excluding IFRS 16 impact)
US$1,205MGross profit
US$143MOrganic capital expenditure, net
We have a customer-led Downstream business, an asset-rich Infrastructure business and a renewables-focused Future Energies business Three distinct, yet, complementary, businesses that together enable us to leap ahead in energising communities and generating greater value
4 8
PUMA ENERGY ANNUAL REPORT 2020
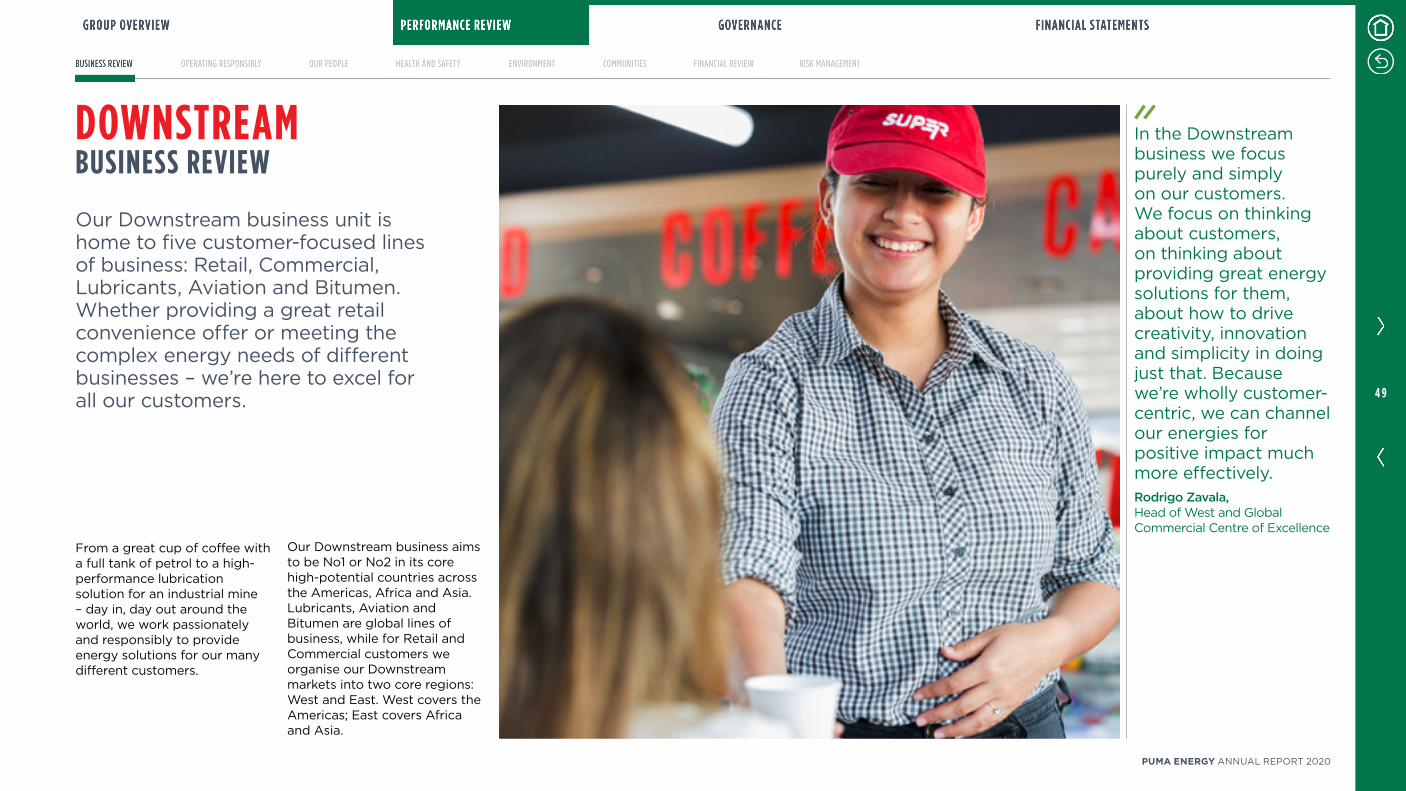
From a great cup of coffee with a full tank of petrol to a high-performance lubrication solution for an industrial mine – day in, day out around the world, we work passionately and responsibly to provide energy solutions for our many different customers
DOWNSTREAMBUSINESS REVIEW
Our Downstream business unit is home to five customer-focused lines of business: Retail, Commercial, Lubricants, Aviation and Bitumen Whether providing a great retail convenience offer or meeting the complex energy needs of different businesses – we’re here to excel for all our customers
In the Downstream business we focus purely and simply on our customers We focus on thinking about customers, on thinking about providing great energy solutions for them, about how to drive creativity, innovation and simplicity in doing just that Because we’re wholly customer-centric, we can channel our energies for positive impact much more effectivelyRodrigo Zavala,Head of West and Global Commercial Centre of Excellence
Our Downstream business aims to be No1 or No2 in its core high-potential countries across the Americas, Africa and Asia Lubricants, Aviation and Bitumen are global lines of business, while for Retail and Commercial customers we organise our Downstream markets into two core regions: West and East West covers the Americas; East covers Africa and Asia
4 9
PUMA ENERGY ANNUAL REPORT 2020
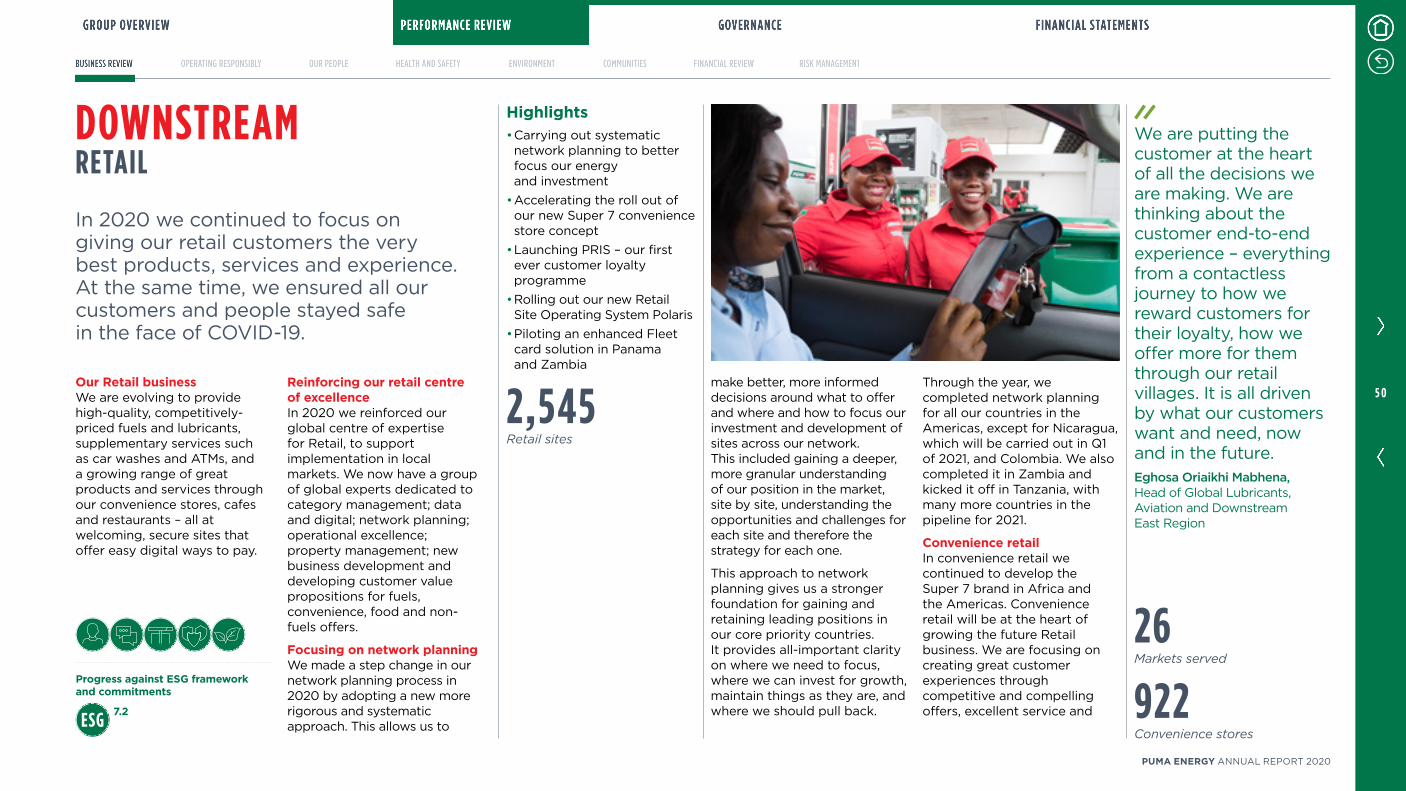
Progress against ESG framework and commitments
7.2
Our Retail businessWe are evolving to provide high-quality, competitively-priced fuels and lubricants, supplementary services such as car washes and ATMs, and a growing range of great products and services through our convenience stores, cafes and restaurants – all at welcoming, secure sites that offer easy digital ways to pay
Reinforcing our retail centre of excellenceIn 2020 we reinforced our global centre of expertise for Retail, to support implementation in local markets We now have a group of global experts dedicated to category management; data and digital; network planning; operational excellence; property management; new business development and developing customer value propositions for fuels, convenience, food and non-fuels offers
Focusing on network planningWe made a step change in our network planning process in 2020 by adopting a new more rigorous and systematic approach This allows us to
DOWNSTREAMRETAIL
make better, more informed decisions around what to offer and where and how to focus our investment and development of sites across our network This included gaining a deeper, more granular understanding of our position in the market, site by site, understanding the opportunities and challenges for each site and therefore the strategy for each one
This approach to network planning gives us a stronger foundation for gaining and retaining leading positions in our core priority countries It provides all-important clarity on where we need to focus, where we can invest for growth, maintain things as they are, and where we should pull back
Through the year, we completed network planning for all our countries in the Americas, except for Nicaragua, which will be carried out in Q1 of 2021, and Colombia We also completed it in Zambia and kicked it off in Tanzania, with many more countries in the pipeline for 2021
Convenience retailIn convenience retail we continued to develop the Super 7 brand in Africa and the Americas Convenience retail will be at the heart of growing the future Retail business We are focusing on creating great customer experiences through competitive and compelling offers, excellent service and
In 2020 we continued to focus on giving our retail customers the very best products, services and experience At the same time, we ensured all our customers and people stayed safe in the face of COVID-19
We are putting the customer at the heart of all the decisions we are making We are thinking about the customer end-to-end experience – everything from a contactless journey to how we reward customers for their loyalty, how we offer more for them through our retail villages It is all driven by what our customers want and need, now and in the futureEghosa Oriaikhi Mabhena,Head of Global Lubricants, Aviation and Downstream East Region
Highlights• Carrying out systematic network planning to better focus our energy and investment
• Accelerating the roll out of our new Super 7 convenience store concept
• Launching PRIS – our first ever customer loyalty programme
• Rolling out our new Retail Site Operating System Polaris
• Piloting an enhanced Fleet card solution in Panama and Zambia
2,545Retail sites
922Convenience stores
26Markets served
5 0
PUMA ENERGY ANNUAL REPORT 2020

RETAIL
Our ambition is to be No1 or No2 in retail in our core priority countries Our network planning is helping us direct our energy and investment to achieve this ambition – faster That’s why we made innovating and investing in our network our number one Retail priorityRodrigo Zavala,Head of West and Global Commercial Centre of Excellence
From a great restaurant, with real barista coffee, eat-in and take-away food options to a wide range of fresh food and chilled drinks – offering more than just fuels at our retail sites is the way of the future
67Restaurants
creating more value for customers and the business through convenience
All the new or updated Super 7 stores have a fresh, modern identity and layout designed to give our customers the best possible end-to-end Puma Energy retail experience
There are four global store formats (kiosk, ready to go, extended coffee, and meal break) which we tailor to local markets based on thorough country market assessment conclusions By implementing our global best-in-class formats locally, we increase impact, simplicity and efficiency and build brand loyalty with our retail customers
We are focusing on a strong food service and hot beverages offer This is a key engine of growth and profit It also adds to the ambience and customer experience, encouraging people to stay longer and shop more
We are also expanding our dry goods offer, including fresh food and chilled beverages One innovation on this front in our larger-format Super 7s is the introduction of walk-in beer caves, giving customers
an inviting way to browse and buy from a bigger selection of chilled drinks
Our plan was to roll out 135 retrofits and new stores in the year COVID-19 unavoidably limited our ability to do this, but we succeeded in completing 67, which was a great achievement under the circumstances
In the Americas, for example, in spite of the pandemic we safely completed 56 stores, so we now have 65 of 170 Super 7 stores with the fresh new look and feel We are not stopping there, in the next three years we plan to have close to 400
sites across the West Region with the new Super 7
Adapting quickly to a COVID-19 worldWe adapted quickly to the changes and demands resulting from COVID-19 Safety was our number one priority We developed a very strong safety and hygiene programme in all our forecourts to ensure our people, customers and the community were protected This included a comprehensive set of new operating procedures, training and equipment, including plexiglass partitions, alcohol gels and floor stickers for social distancing Through our sites
and engagement with local communities, we actively promoted awareness and good practice, which was particularly valuable in places where COVID-19 communication and understanding were variable We were also very pleased to support emergency workers operating in our markets by offering them a complimentary beverage of choice every day
Uninterrupted supply of groceries and other essentials was critical too We made sure our sites continued to receive the deliveries they needed throughout the pandemic by leveraging our contacts with key suppliers for critical
5 1
PUMA ENERGY ANNUAL REPORT 2020
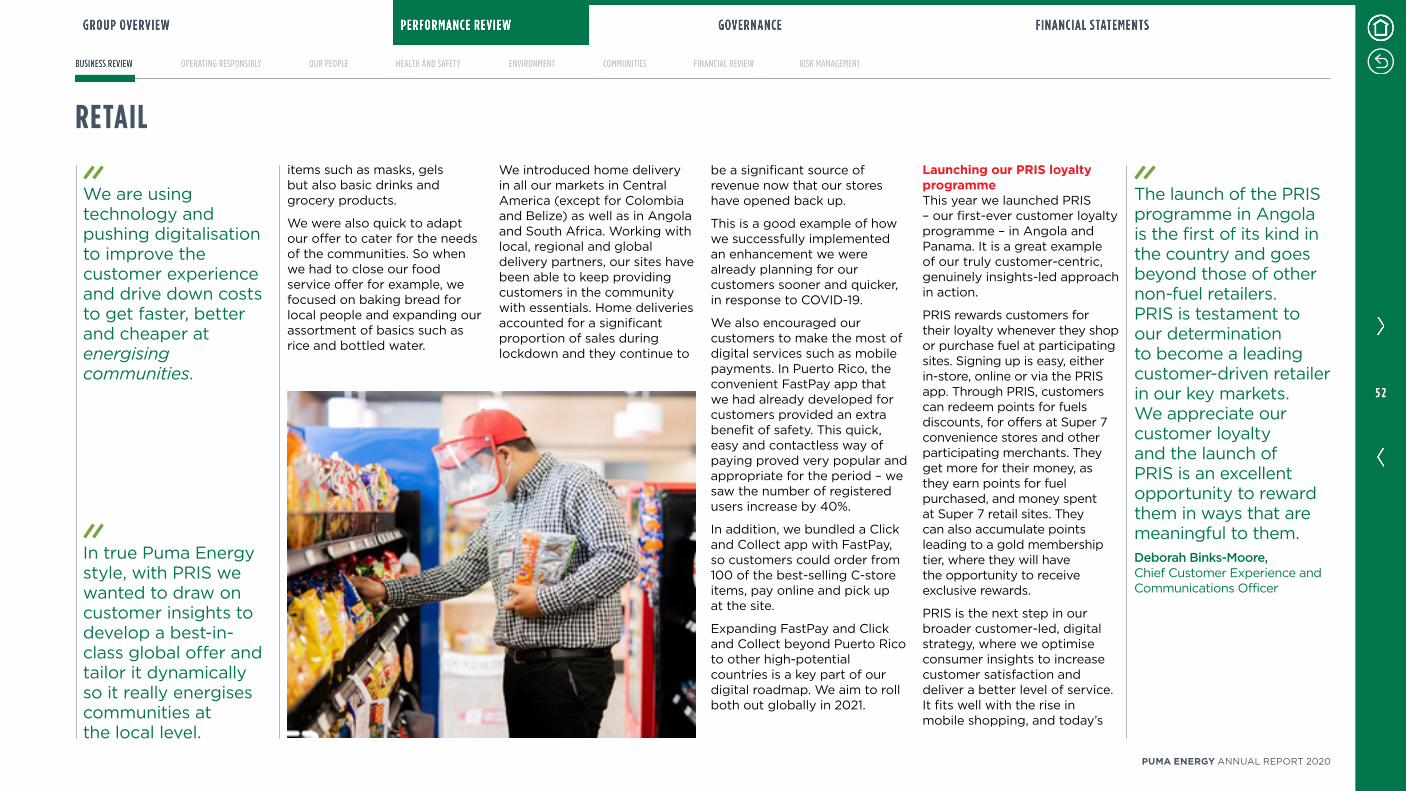
We are using technology and pushing digitalisation to improve the customer experience and drive down costs to get faster, better and cheaper at energising communities
RETAILitems such as masks, gels but also basic drinks and grocery products
We were also quick to adapt our offer to cater for the needs of the communities So when we had to close our food service offer for example, we focused on baking bread for local people and expanding our assortment of basics such as rice and bottled water
Launching our PRIS loyalty programmeThis year we launched PRIS – our first-ever customer loyalty programme – in Angola and Panama It is a great example of our truly customer-centric, genuinely insights-led approach in action
PRIS rewards customers for their loyalty whenever they shop or purchase fuel at participating sites Signing up is easy, either in-store, online or via the PRIS app Through PRIS, customers can redeem points for fuels discounts, for offers at Super 7 convenience stores and other participating merchants They get more for their money, as they earn points for fuel purchased, and money spent at Super 7 retail sites They can also accumulate points leading to a gold membership tier, where they will have the opportunity to receive exclusive rewards
PRIS is the next step in our broader customer-led, digital strategy, where we optimise consumer insights to increase customer satisfaction and deliver a better level of service It fits well with the rise in mobile shopping, and today’s
We introduced home delivery in all our markets in Central America (except for Colombia and Belize) as well as in Angola and South Africa Working with local, regional and global delivery partners, our sites have been able to keep providing customers in the community with essentials Home deliveries accounted for a significant proportion of sales during lockdown and they continue to
be a significant source of revenue now that our stores have opened back up
This is a good example of how we successfully implemented an enhancement we were already planning for our customers sooner and quicker, in response to COVID-19
We also encouraged our customers to make the most of digital services such as mobile payments In Puerto Rico, the convenient FastPay app that we had already developed for customers provided an extra benefit of safety This quick, easy and contactless way of paying proved very popular and appropriate for the period – we saw the number of registered users increase by 40%
In addition, we bundled a Click and Collect app with FastPay, so customers could order from 100 of the best-selling C-store items, pay online and pick up at the site
Expanding FastPay and Click and Collect beyond Puerto Rico to other high-potential countries is a key part of our digital roadmap We aim to roll both out globally in 2021
The launch of the PRIS programme in Angola is the first of its kind in the country and goes beyond those of other non-fuel retailers PRIS is testament to our determination to become a leading customer-driven retailer in our key markets We appreciate our customer loyalty and the launch of PRIS is an excellent opportunity to reward them in ways that are meaningful to themDeborah Binks-Moore,Chief Customer Experience and Communications Officer
In true Puma Energy style, with PRIS we wanted to draw on customer insights to develop a best-in-class global offer and tailor it dynamically so it really energises communities at the local level
5 2
PUMA ENERGY ANNUAL REPORT 2020
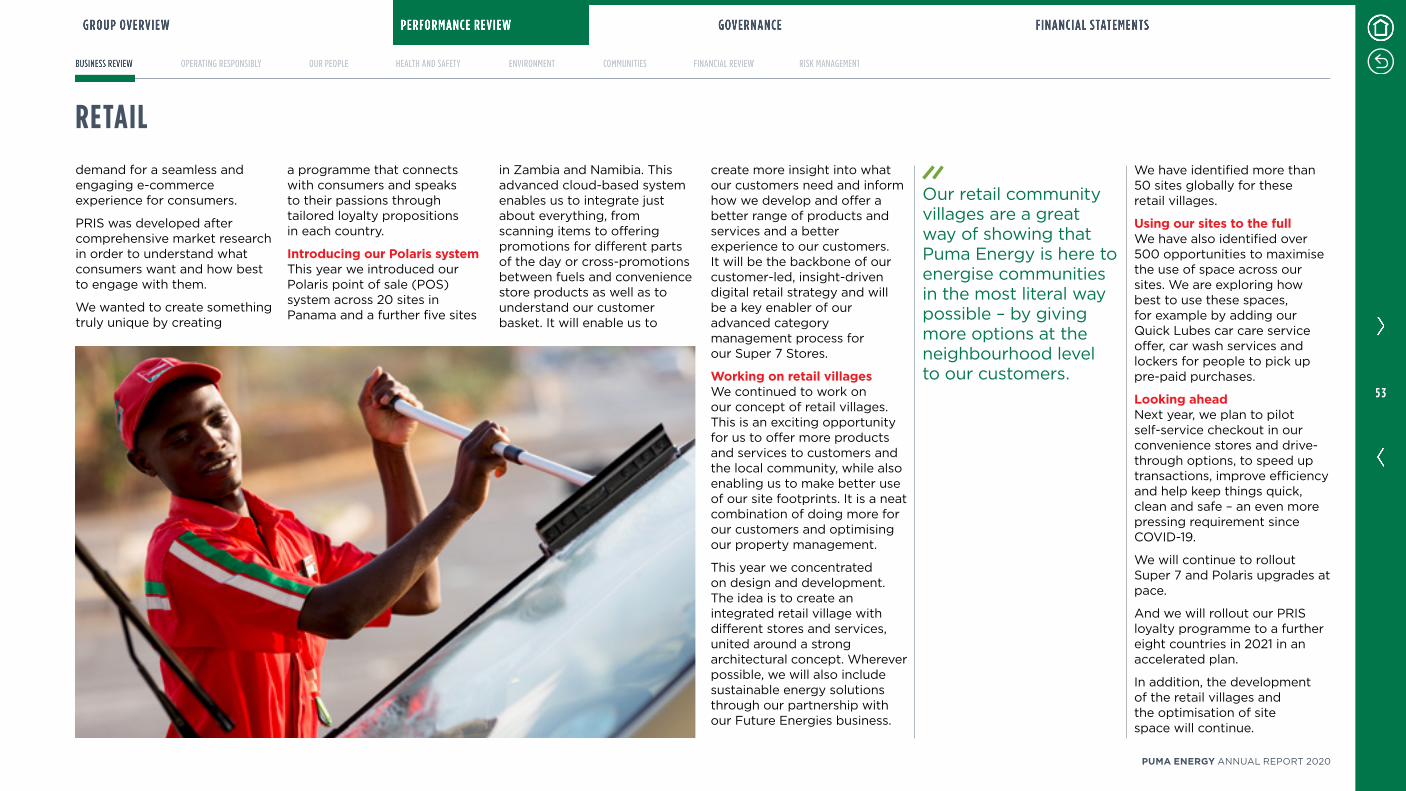
RETAIL
Our retail community villages are a great way of showing that Puma Energy is here to energise communities in the most literal way possible – by giving more options at the neighbourhood level to our customers
demand for a seamless and engaging e-commerce experience for consumers
PRIS was developed after comprehensive market research in order to understand what consumers want and how best to engage with them
We wanted to create something truly unique by creating
a programme that connects with consumers and speaks to their passions through tailored loyalty propositions in each country
Introducing our Polaris systemThis year we introduced our Polaris point of sale (POS) system across 20 sites in Panama and a further five sites
in Zambia and Namibia This advanced cloud-based system enables us to integrate just about everything, from scanning items to offering promotions for different parts of the day or cross-promotions between fuels and convenience store products as well as to understand our customer basket It will enable us to
create more insight into what our customers need and inform how we develop and offer a better range of products and services and a better experience to our customers It will be the backbone of our customer-led, insight-driven digital retail strategy and will be a key enabler of our advanced category management process for our Super 7 Stores
Working on retail villagesWe continued to work on our concept of retail villages This is an exciting opportunity for us to offer more products and services to customers and the local community, while also enabling us to make better use of our site footprints It is a neat combination of doing more for our customers and optimising our property management
This year we concentrated on design and development The idea is to create an integrated retail village with different stores and services, united around a strong architectural concept Wherever possible, we will also include sustainable energy solutions through our partnership with our Future Energies business
We have identified more than 50 sites globally for these retail villages
Using our sites to the fullWe have also identified over 500 opportunities to maximise the use of space across our sites We are exploring how best to use these spaces, for example by adding our Quick Lubes car care service offer, car wash services and lockers for people to pick up pre-paid purchases
Looking aheadNext year, we plan to pilot self-service checkout in our convenience stores and drive-through options, to speed up transactions, improve efficiency and help keep things quick, clean and safe – an even more pressing requirement since COVID-19
We will continue to rollout Super 7 and Polaris upgrades at pace
And we will rollout our PRIS loyalty programme to a further eight countries in 2021 in an accelerated plan
In addition, the development of the retail villages and the optimisation of site space will continue
5 3
PUMA ENERGY ANNUAL REPORT 2020

Progress against ESG framework and commitments
7.2
Our Commercial businessFrom mining to transport, power generation to agriculture – we want to be the preferred energy solutions partner for all commercial customers To this end, we have a relentless focus on adding value to customers’ businesses by genuinely understanding and meeting their needs Working closely with businesses, we tailor our energy solutions to their specific needs for fuels, lubricants and
other services, to deliver real, lasting value for them
We put the customer at the centre of everything we do With this as our foundation stone for living our purpose of energising communities, we made a number of significant changes in 2020
Segmenting customersRather than view and manage commercial customers through the broad areas of B2B, wholesale and bunkering, we are now focusing on 11 specific channels: agriculture, mining, transport, construction, power generation, marine, industrial, government/state-owned enterprises (SOEs), non-Puma branded retail, branded distributors, and unbranded distributors
DOWNSTREAMCOMMERCIAL
This key change enables us to focus on building a detailed understanding of the distinct challenges, opportunities and needs of our different commercial customers, and their particular energy requirements With this understanding, we can tailor our products, services and support to go beyond just fuels, to provide energy solutions that meet their needs and add greater value
We completed the segmentation in 2020, so each customer globally has been assigned to one of the 11 channels In addition, we have carried out a further level of segmentation within each channel, whereby we have profiled customers into groups
based on size and complexity This opens the way for us to be more organised, rigorous and targeted in the way we manage and develop our customer relationships and value creation
Identifying 10 core offer elementsBuilding on this key step, we have developed a set of 10 core offer elements which form the basis for our customer-specific value propositions The elements include security of supply, integrated energy solutions, flexible logistics, customised pricing solutions, dedicated salesforce, global knowledge transfer, product quality, asset management, bespoke credit solutions, and leading with digital
We transformed our Commercial business in 2020 to enable us to focus rigorously on providing bespoke fuels, lubricants and other service solutions to our business customers It was a year of great change and of continuing to deliver without fail for customers
To excel for commercial customers, we are putting them at the centre of our business and doing everything we can to ensure we really understand and meet their specific needs By enhancing our CVPs and developing Champion teams, we want to be the preferred energy solutions partner for all commercial customersRodrigo Zavala,Head of West and Global Commercial Centre of Excellence
Highlights• Segmenting customers into 11 channels to understand and meet their needs better
• Reorganising and equipping the business to develop Champion teams
• Evolving our sales playbook to continuously improve for commercial customers
30Countries served
11Channels served
5 4
PUMA ENERGY ANNUAL REPORT 2020
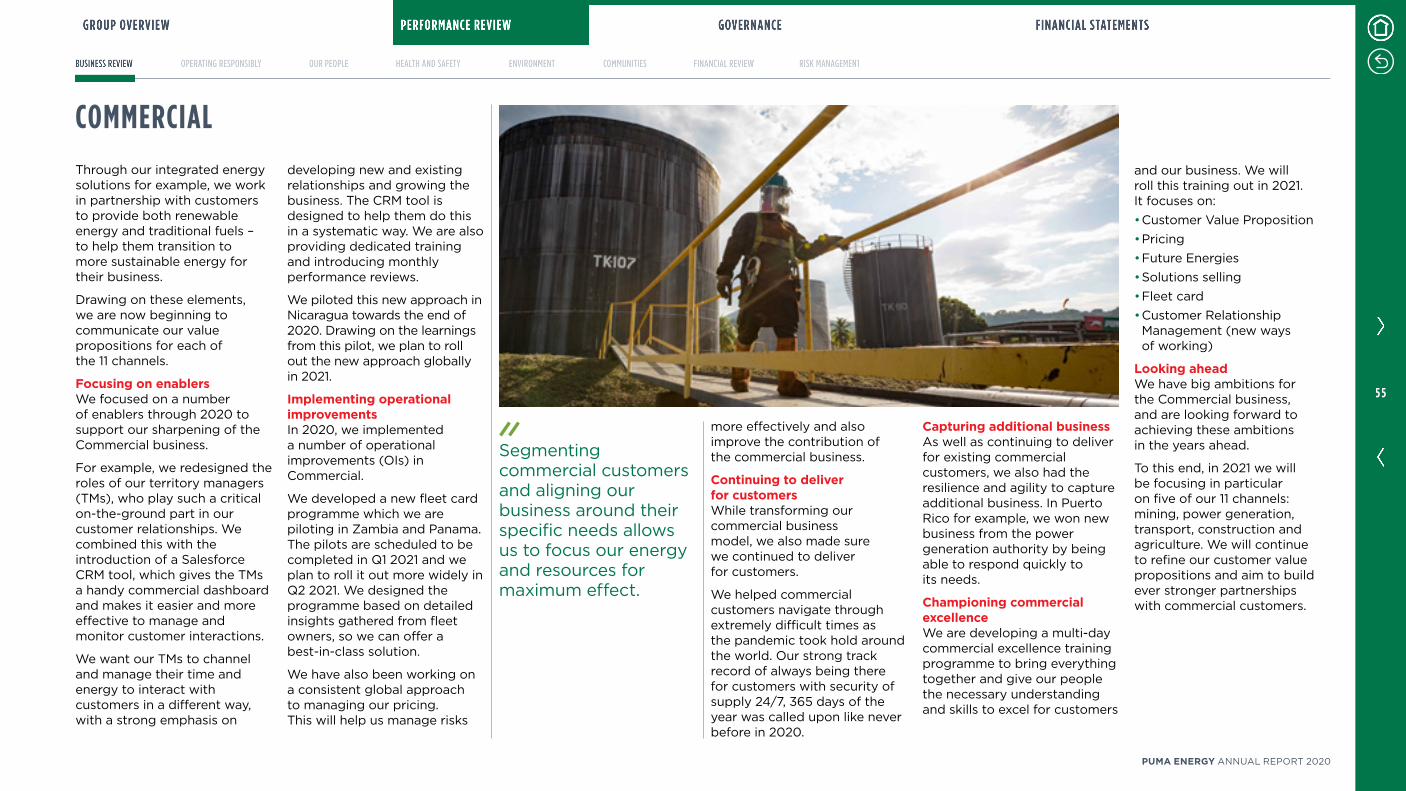
Segmenting commercial customers and aligning our business around their specific needs allows us to focus our energy and resources for maximum effect
COMMERCIALThrough our integrated energy solutions for example, we work in partnership with customers to provide both renewable energy and traditional fuels – to help them transition to more sustainable energy for their business
Drawing on these elements, we are now beginning to communicate our value propositions for each of the 11 channels
Focusing on enablersWe focused on a number of enablers through 2020 to support our sharpening of the Commercial business
For example, we redesigned the roles of our territory managers (TMs), who play such a critical on-the-ground part in our customer relationships We combined this with the introduction of a Salesforce CRM tool, which gives the TMs a handy commercial dashboard and makes it easier and more effective to manage and monitor customer interactions
We want our TMs to channel and manage their time and energy to interact with customers in a different way, with a strong emphasis on
developing new and existing relationships and growing the business The CRM tool is designed to help them do this in a systematic way We are also providing dedicated training and introducing monthly performance reviews
We piloted this new approach in Nicaragua towards the end of 2020 Drawing on the learnings from this pilot, we plan to roll out the new approach globally in 2021
Implementing operational improvementsIn 2020, we implemented a number of operational improvements (OIs) in Commercial
We developed a new fleet card programme which we are piloting in Zambia and Panama The pilots are scheduled to be completed in Q1 2021 and we plan to roll it out more widely in Q2 2021 We designed the programme based on detailed insights gathered from fleet owners, so we can offer a best-in-class solution
We have also been working on a consistent global approach to managing our pricing This will help us manage risks
more effectively and also improve the contribution of the commercial business
Continuing to deliver for customersWhile transforming our commercial business model, we also made sure we continued to deliver for customers
We helped commercial customers navigate through extremely difficult times as the pandemic took hold around the world Our strong track record of always being there for customers with security of supply 24/7, 365 days of the year was called upon like never before in 2020
Capturing additional businessAs well as continuing to deliver for existing commercial customers, we also had the resilience and agility to capture additional business In Puerto Rico for example, we won new business from the power generation authority by being able to respond quickly to its needs
Championing commercial excellenceWe are developing a multi-day commercial excellence training programme to bring everything together and give our people the necessary understanding and skills to excel for customers
and our business We will roll this training out in 2021 It focuses on:• Customer Value Proposition• Pricing• Future Energies• Solutions selling• Fleet card• Customer Relationship Management (new ways of working)
Looking aheadWe have big ambitions for the Commercial business, and are looking forward to achieving these ambitions in the years ahead
To this end, in 2021 we will be focusing in particular on five of our 11 channels: mining, power generation, transport, construction and agriculture We will continue to refine our customer value propositions and aim to build ever stronger partnerships with commercial customers
5 5
PUMA ENERGY ANNUAL REPORT 2020
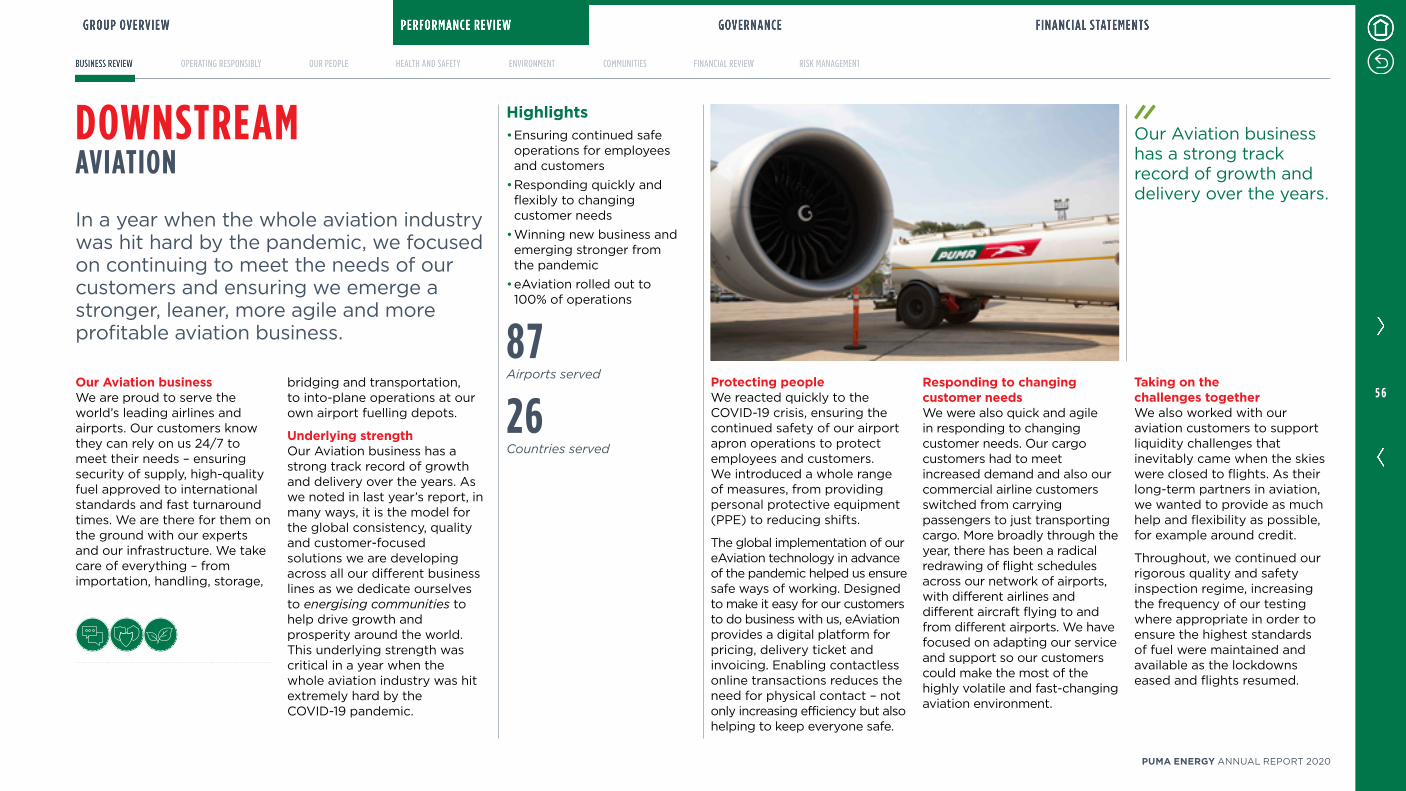
Taking on the challenges togetherWe also worked with our aviation customers to support liquidity challenges that inevitably came when the skies were closed to flights As their long-term partners in aviation, we wanted to provide as much help and flexibility as possible, for example around credit
Throughout, we continued our rigorous quality and safety inspection regime, increasing the frequency of our testing where appropriate in order to ensure the highest standards of fuel were maintained and available as the lockdowns eased and flights resumed
Our Aviation businessWe are proud to serve the world’s leading airlines and airports Our customers know they can rely on us 24/7 to meet their needs – ensuring security of supply, high-quality fuel approved to international standards and fast turnaround times We are there for them on the ground with our experts and our infrastructure We take care of everything – from importation, handling, storage,
bridging and transportation, to into-plane operations at our own airport fuelling depots
Underlying strengthOur Aviation business has a strong track record of growth and delivery over the years As we noted in last year’s report, in many ways, it is the model for the global consistency, quality and customer-focused solutions we are developing across all our different business lines as we dedicate ourselves to energising communities to help drive growth and prosperity around the world This underlying strength was critical in a year when the whole aviation industry was hit extremely hard by the COVID-19 pandemic
DOWNSTREAMAVIATION
Protecting peopleWe reacted quickly to the COVID-19 crisis, ensuring the continued safety of our airport apron operations to protect employees and customers We introduced a whole range of measures, from providing personal protective equipment (PPE) to reducing shifts
The global implementation of our eAviation technology in advance of the pandemic helped us ensure safe ways of working Designed to make it easy for our customers to do business with us, eAviation provides a digital platform for pricing, delivery ticket and invoicing Enabling contactless online transactions reduces the need for physical contact – not only increasing efficiency but also helping to keep everyone safe
Responding to changing customer needsWe were also quick and agile in responding to changing customer needs Our cargo customers had to meet increased demand and also our commercial airline customers switched from carrying passengers to just transporting cargo More broadly through the year, there has been a radical redrawing of flight schedules across our network of airports, with different airlines and different aircraft flying to and from different airports We have focused on adapting our service and support so our customers could make the most of the highly volatile and fast-changing aviation environment
In a year when the whole aviation industry was hit hard by the pandemic, we focused on continuing to meet the needs of our customers and ensuring we emerge a stronger, leaner, more agile and more profitable aviation business
Our Aviation business has a strong track record of growth and delivery over the years
Highlights• Ensuring continued safe operations for employees and customers
• Responding quickly and flexibly to changing customer needs
• Winning new business and emerging stronger from the pandemic
• eAviation rolled out to 100% of operations
87Airports served
26Countries served
5 6
PUMA ENERGY ANNUAL REPORT 2020
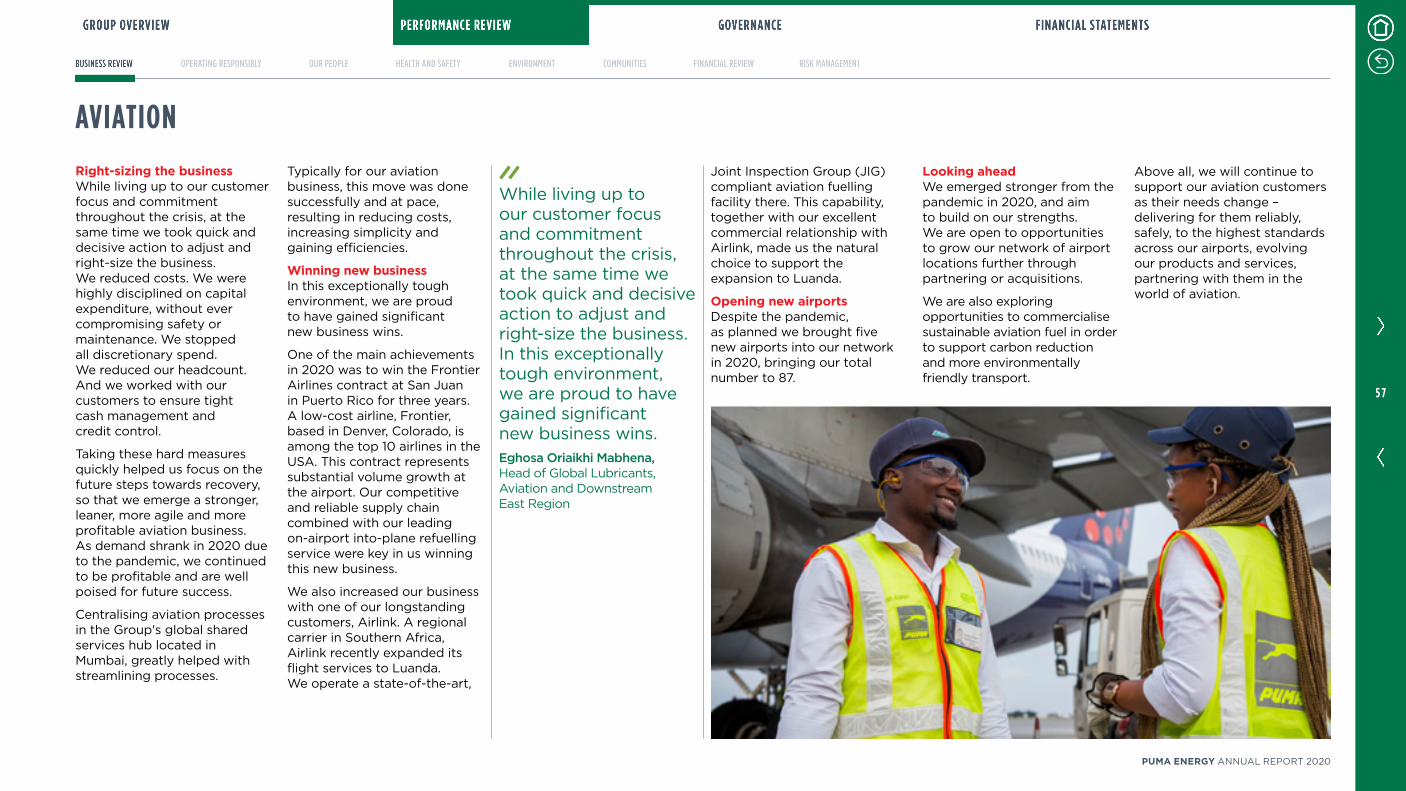
Right-sizing the businessWhile living up to our customer focus and commitment throughout the crisis, at the same time we took quick and decisive action to adjust and right-size the business We reduced costs We were highly disciplined on capital expenditure, without ever compromising safety or maintenance We stopped all discretionary spend We reduced our headcount And we worked with our customers to ensure tight cash management and credit control
Taking these hard measures quickly helped us focus on the future steps towards recovery, so that we emerge a stronger, leaner, more agile and more profitable aviation business As demand shrank in 2020 due to the pandemic, we continued to be profitable and are well poised for future success
Centralising aviation processes in the Group's global shared services hub located in Mumbai, greatly helped with streamlining processes
Typically for our aviation business, this move was done successfully and at pace, resulting in reducing costs, increasing simplicity and gaining efficiencies
Winning new businessIn this exceptionally tough environment, we are proud to have gained significant new business wins
One of the main achievements in 2020 was to win the Frontier Airlines contract at San Juan in Puerto Rico for three years A low-cost airline, Frontier, based in Denver, Colorado, is among the top 10 airlines in the USA This contract represents substantial volume growth at the airport Our competitive and reliable supply chain combined with our leading on-airport into-plane refuelling service were key in us winning this new business
We also increased our business with one of our longstanding customers, Airlink A regional carrier in Southern Africa, Airlink recently expanded its flight services to Luanda We operate a state-of-the-art,
Joint Inspection Group (JIG) compliant aviation fuelling facility there This capability, together with our excellent commercial relationship with Airlink, made us the natural choice to support the expansion to Luanda
Opening new airportsDespite the pandemic, as planned we brought five new airports into our network in 2020, bringing our total number to 87
Looking aheadWe emerged stronger from the pandemic in 2020, and aim to build on our strengths We are open to opportunities to grow our network of airport locations further through partnering or acquisitions
We are also exploring opportunities to commercialise sustainable aviation fuel in order to support carbon reduction and more environmentally friendly transport
Above all, we will continue to support our aviation customers as their needs change – delivering for them reliably, safely, to the highest standards across our airports, evolving our products and services, partnering with them in the world of aviation
AVIATION
While living up to our customer focus and commitment throughout the crisis, at the same time we took quick and decisive action to adjust and right-size the business In this exceptionally tough environment, we are proud to have gained significant new business winsEghosa Oriaikhi Mabhena,Head of Global Lubricants, Aviation and Downstream East Region
5 7
PUMA ENERGY ANNUAL REPORT 2020
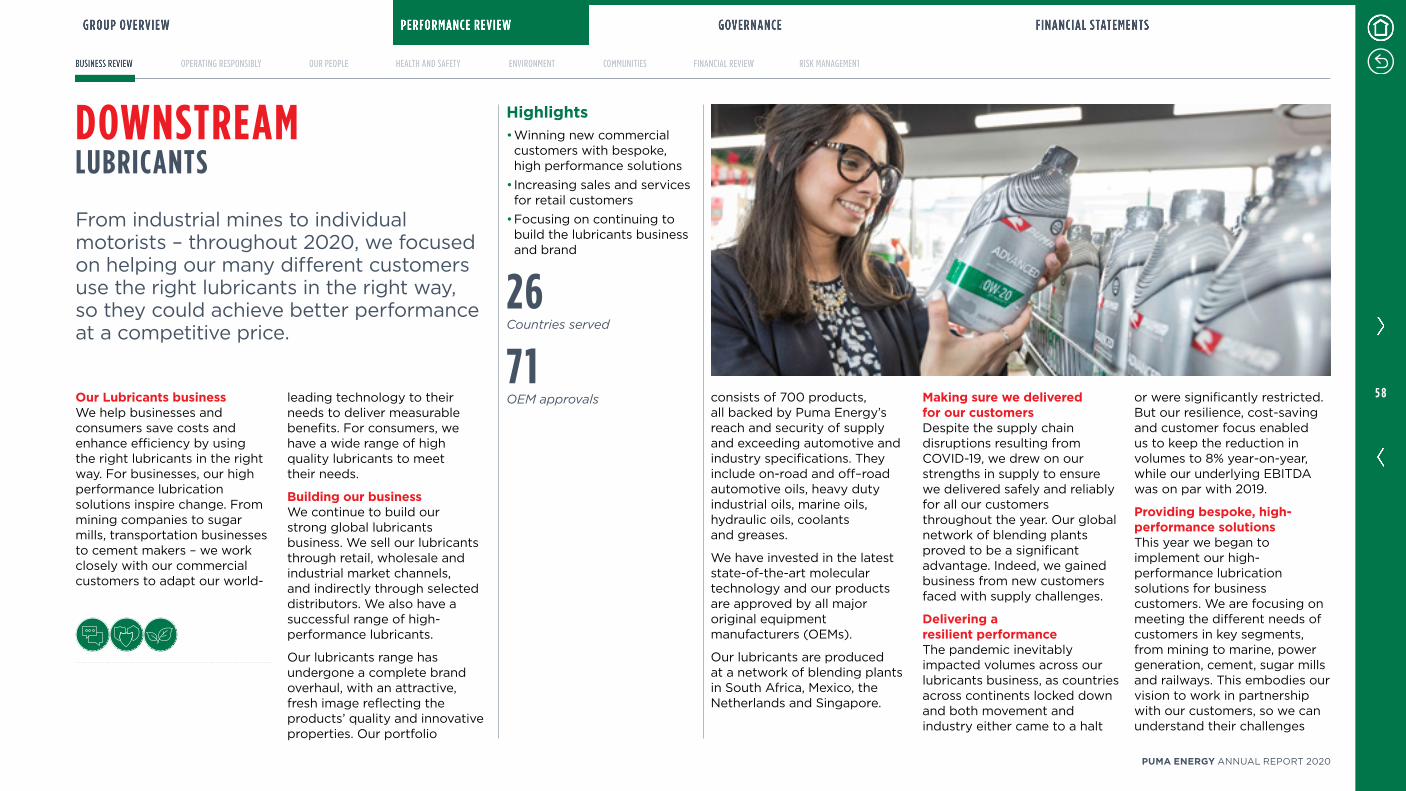
or were significantly restricted But our resilience, cost-saving and customer focus enabled us to keep the reduction in volumes to 8% year-on-year, while our underlying EBITDA was on par with 2019
Providing bespoke, high-performance solutionsThis year we began to implement our high-performance lubrication solutions for business customers We are focusing on meeting the different needs of customers in key segments, from mining to marine, power generation, cement, sugar mills and railways This embodies our vision to work in partnership with our customers, so we can understand their challenges
Our Lubricants businessWe help businesses and consumers save costs and enhance efficiency by using the right lubricants in the right way For businesses, our high performance lubrication solutions inspire change From mining companies to sugar mills, transportation businesses to cement makers – we work closely with our commercial customers to adapt our world-
leading technology to their needs to deliver measurable benefits For consumers, we have a wide range of high quality lubricants to meet their needs
Building our businessWe continue to build our strong global lubricants business We sell our lubricants through retail, wholesale and industrial market channels, and indirectly through selected distributors We also have a successful range of high-performance lubricants
Our lubricants range has undergone a complete brand overhaul, with an attractive, fresh image reflecting the products’ quality and innovative properties Our portfolio
DOWNSTREAMLUBRICANTS
consists of 700 products, all backed by Puma Energy’s reach and security of supply and exceeding automotive and industry specifications They include on-road and off–road automotive oils, heavy duty industrial oils, marine oils, hydraulic oils, coolants and greases
We have invested in the latest state-of-the-art molecular technology and our products are approved by all major original equipment manufacturers (OEMs)
Our lubricants are produced at a network of blending plants in South Africa, Mexico, the Netherlands and Singapore
Making sure we delivered for our customersDespite the supply chain disruptions resulting from COVID-19, we drew on our strengths in supply to ensure we delivered safely and reliably for all our customers throughout the year Our global network of blending plants proved to be a significant advantage Indeed, we gained business from new customers faced with supply challenges
Delivering a resilient performanceThe pandemic inevitably impacted volumes across our lubricants business, as countries across continents locked down and both movement and industry either came to a halt
From industrial mines to individual motorists – throughout 2020, we focused on helping our many different customers use the right lubricants in the right way, so they could achieve better performance at a competitive price
Highlights• Winning new commercial customers with bespoke, high performance solutions
• Increasing sales and services for retail customers
• Focusing on continuing to build the lubricants business and brand
26 Countries served
71 OEM approvals 5 8
PUMA ENERGY ANNUAL REPORT 2020

and provide the right bespoke solutions to improve operational efficiency and deliver immediate and long-term sustainable savings
Winning with high performanceIn 2020, we secured and solidified a number of significant business wins with our high-performance lubrication solutions In Zambia for example, we implemented a tailored product and application approach for a copper mine By moving to our synthetic high performance lubricant for vehicle transmissions, they are saving US$955,000 per year due to improved machinery up-time and performance We also introduced a new grease for pins and bushes at the mine, delivering an estimated annual saving of US$800,000
At the Catoca Mine in Angola, introducing our high performance lubricant for articulated dump trucks has also resulted in a material cost saving
Across South Africa, we delivered seven value added projects to different
mining houses, achieving an additional gross margin of US$15m annually
In Botswana, we are providing a combined high-quality fuels and high-performance lubrication solution for Debswana’s diamond mines
In the Republic of the Congo, the state railway has chosen us to work with it as its partner to meet all lubrication needs for its locomotive engines The quality of our lubrication technology, our security of supply and our customer focus proved to be a winning combination
Increasing our sales to retail customersWe have also focused on growing our business with our retail customers In Angola for example, we implemented an integrated programme across our 79 service stations We improved our logistics to make sure our best-selling products were always available at sites; adjusted our pricing so it was competitive; offered lubricants training and incentives to staff, and nominated lubricants ambassadors As a result, we increased monthly sales by 80%
Building on this success, we plan to implement the same best-practice programme in other countries where we have brand leadership in our retail business through fuels and a big opportunity to create similar success with lubricants In Zimbabwe for example, we have a market share of 25% in fuels and 3% in lubricants By implementing our programme, we intend to close that gap, and this is a key part of our plans for 2021
Offering more for motoristsIn the Americas, we have begun to roll out our Quick Lubes solution, we have 71 locations so far A quick and convenient stop for lubrication and other vehicle care, Quick Lubes provides preventive
maintenance with high-quality products and expert service We have invested in developing a branded best-in-class Quick Lubes solution, including the creation of a master plan design and training employees to provide the best possible service for motorists
To add to the convenience and value, we are alerting customers digitally via apps of offers and opportunities to come for fuel, lubricants and maintenance for their vehicles
It is all part of our ongoing commitment to provide a comprehensive, high-quality, trusted service to customers at our sites – from fuel to lubricants to tyre checks and other complementary services where space and location allow
Looking aheadThrough 2021, we will continue to roll out Quick Lubes at strategic locations We will also extend our integrated retail programme beyond Angola to other high-potential countries
We also plan a number of other key moves in 2021 The migration from Castrol to Puma Lubricants in Botswana, Namibia, Malawi and Tanzania
represents a formidable opportunity for us to build our brand in these countries We are looking forward to selling our own brand of lubricants and leveraging our advantages, notably our more complete range of products, our blending network, and our strong market position in fuels It is an exciting opportunity, which we are determined to make the most of
In addition, we will be focusing on building strong strategic partnerships with selected distributors in key countries and markets We will develop long-term, mutually beneficial commercial relationships with quality partners who have the required expertise and capabilities, so that together, we reach an array of customers and grow our business in the most effective way
LUBRICANTS
From high-performance lubrication solutions for businesses to our Quick Lubes offer for drivers – we are committed to meeting the needs of all our customers
5 9
PUMA ENERGY ANNUAL REPORT 2020

DOWNSTREAMBITUMEN
In a year of great disruption, we grew our Bitumen business by delivering safely, efficiently and on time, every time for our customers
Investing for the futureReflecting our continued commitment to leading in bitumen, in 2020 we made significant investments in upgrading our specialities offering in Australia In a year when capital expenditure across the Group necessarily had to be reined in and highly selective, we saw this bitumen investment as a critical part of being able to meet the current and future needs of our customers with the advanced bitumen solutions they are increasingly looking for
Our Bitumen businessWe are a global market leader in the sourcing and supply of bitumen Our integrated bitumen solutions play a key part in the construction and maintenance of roads that are in turn essential to connecting economies and communities around the world Drawing on our unrivalled global reach, experience and expertise, along with our advanced technologies and customer focus, we supply our customers with the high-quality bitumen they need – safely, efficiently and on time
Growing stronglyBuilding on the steady growth of previous years and despite the disruptions and challenges of COVID-19, our Bitumen business grew strongly in 2020, volumes increased 9% year-on-year
A key international connectorIn an exceptional year, we demonstrated our critical role, our resilience and the strength of our relationships with our bitumen customers As a global market leader in the sourcing and supply of bitumen, we are proud to go further for better performing roads We act as a reliable international connector for bitumen producers and customers
Helping customers deal with disruptionsOur bitumen shipping fleet, one of the largest and most advanced in the world, proved to be an essential asset this year Being able to transport bitumen safely and reliably from producers to customers around the world really came to the fore We were able to meet the demand of all our existing customers in 2020 and also helped new customers facing disruptions with their markets This in turn enabled us to maximise the use and efficiency of our shipping fleet while growing our customer base
Capitalising on rising demandOur Downstream bitumen markets remained relatively strong, particularly in the second half of the year When demand rebounded, our longstanding relationships with customers allied to our reputation for reliability and quality ensured that we were able to capitalise on the upturn
Highlights• Successfully serviced our growing customers' requirements bolstered by the world’s most advanced bitumen fleet
• Continued our significant investment in advanced production facilities and new, sustainable products
50+ Markets served
29Bitumen storage terminals worldwide
6 0
PUMA ENERGY ANNUAL REPORT 2020
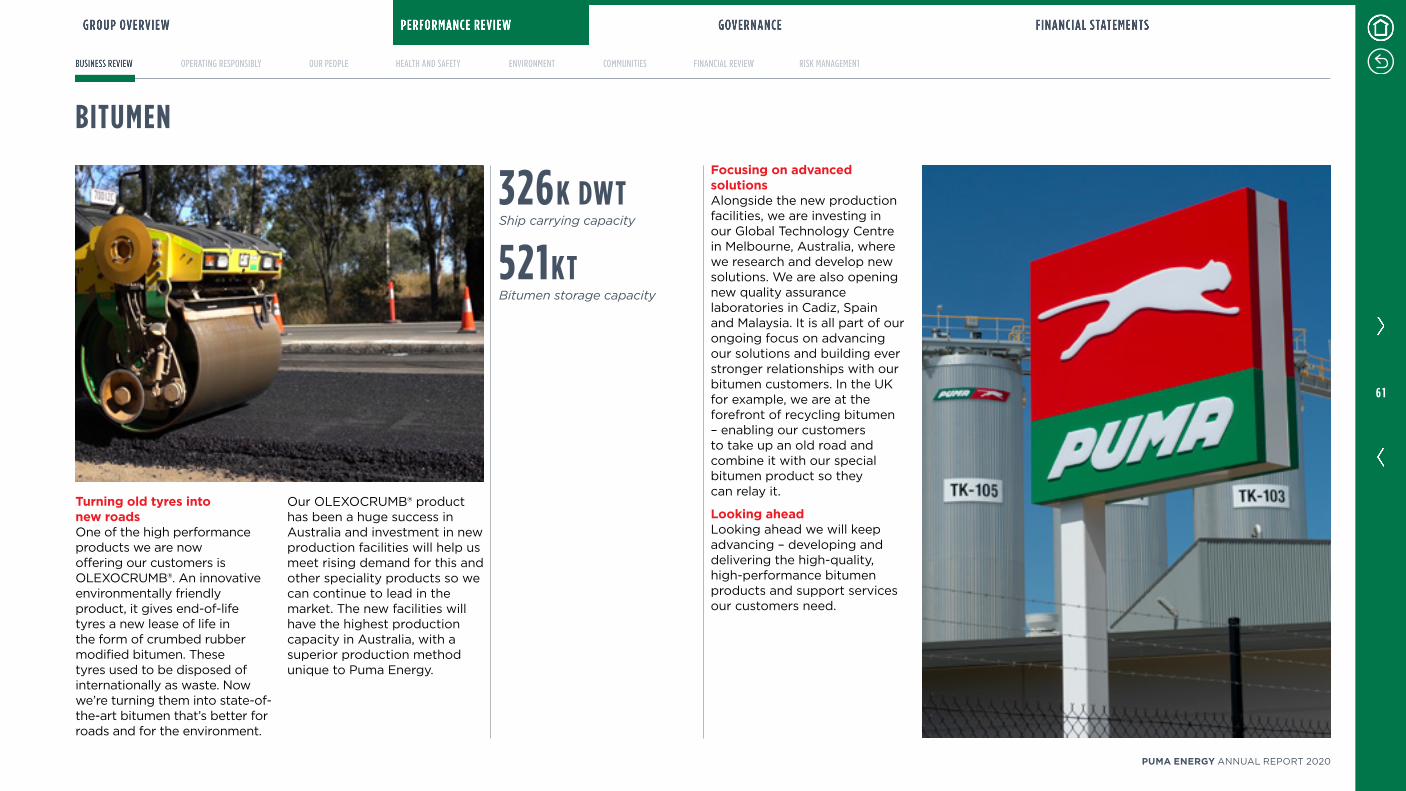
BITUMEN
Turning old tyres into new roadsOne of the high performance products we are now offering our customers is OLEXOCRUMB® An innovative environmentally friendly product, it gives end-of-life tyres a new lease of life in the form of crumbed rubber modified bitumen These tyres used to be disposed of internationally as waste Now we’re turning them into state-of-the-art bitumen that’s better for roads and for the environment
Our OLEXOCRUMB® product has been a huge success in Australia and investment in new production facilities will help us meet rising demand for this and other speciality products so we can continue to lead in the market The new facilities will have the highest production capacity in Australia, with a superior production method unique to Puma Energy
Focusing on advanced solutionsAlongside the new production facilities, we are investing in our Global Technology Centre in Melbourne, Australia, where we research and develop new solutions We are also opening new quality assurance laboratories in Cadiz, Spain and Malaysia It is all part of our ongoing focus on advancing our solutions and building ever stronger relationships with our bitumen customers In the UK for example, we are at the forefront of recycling bitumen – enabling our customers to take up an old road and combine it with our special bitumen product so they can relay it
Looking aheadLooking ahead we will keep advancing – developing and delivering the high-quality, high-performance bitumen products and support services our customers need
326K DWTShip carrying capacity
521KT Bitumen storage capacity
6 1
PUMA ENERGY ANNUAL REPORT 2020
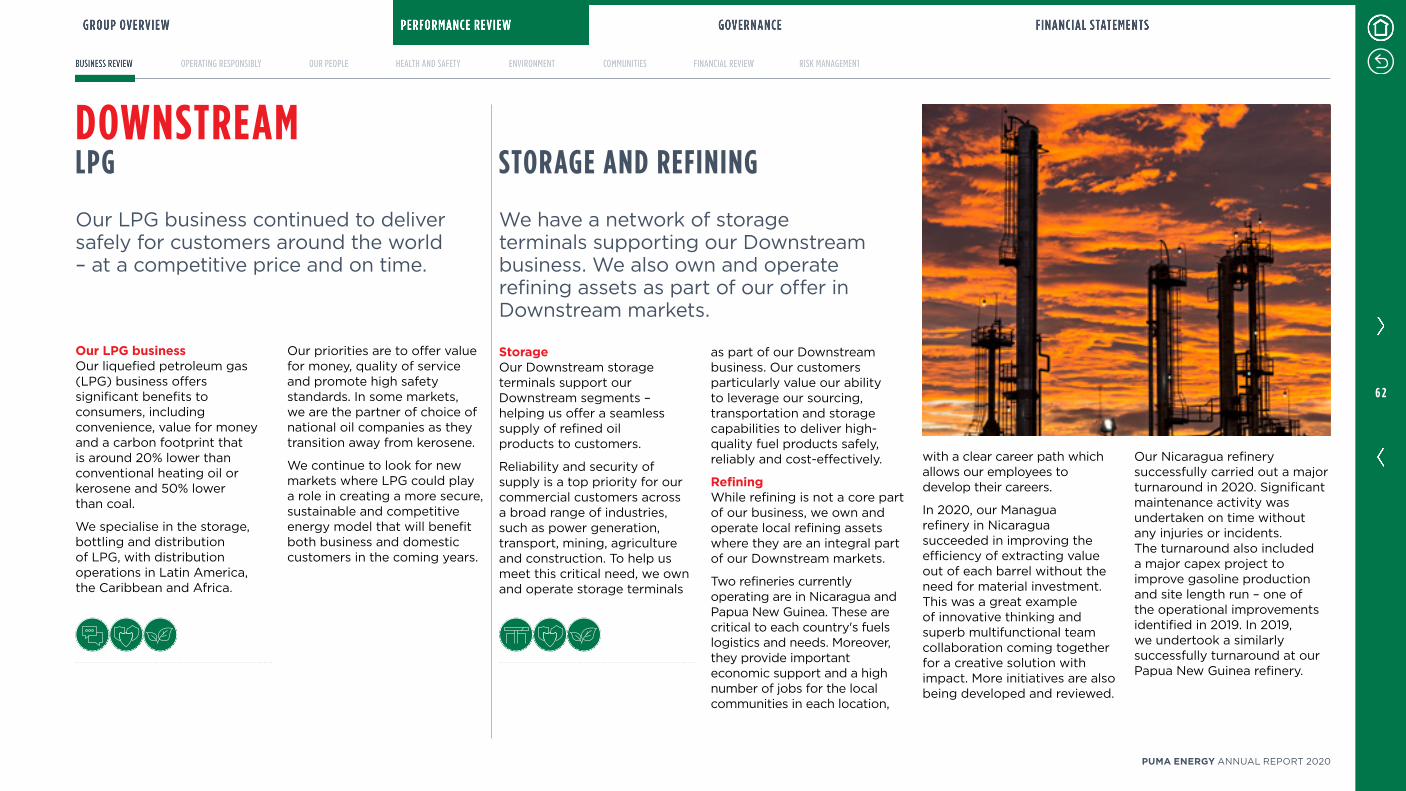
We have a network of storage terminals supporting our Downstream business We also own and operate refining assets as part of our offer in Downstream markets
StorageOur Downstream storage terminals support our Downstream segments – helping us offer a seamless supply of refined oil products to customers
Reliability and security of supply is a top priority for our commercial customers across a broad range of industries, such as power generation, transport, mining, agriculture and construction To help us meet this critical need, we own and operate storage terminals
as part of our Downstream business Our customers particularly value our ability to leverage our sourcing, transportation and storage capabilities to deliver high-quality fuel products safely, reliably and cost-effectively
RefiningWhile refining is not a core part of our business, we own and operate local refining assets where they are an integral part of our Downstream markets
Two refineries currently operating are in Nicaragua and Papua New Guinea These are critical to each country's fuels logistics and needs Moreover, they provide important economic support and a high number of jobs for the local communities in each location,
with a clear career path which allows our employees to develop their careers
In 2020, our Managua refinery in Nicaragua succeeded in improving the efficiency of extracting value out of each barrel without the need for material investment This was a great example of innovative thinking and superb multifunctional team collaboration coming together for a creative solution with impact More initiatives are also being developed and reviewed
Our Nicaragua refinery successfully carried out a major turnaround in 2020 Significant maintenance activity was undertaken on time without any injuries or incidents The turnaround also included a major capex project to improve gasoline production and site length run – one of the operational improvements identified in 2019 In 2019, we undertook a similarly successfully turnaround at our Papua New Guinea refinery
DOWNSTREAMLPG STORAGE AND REFINING
Our LPG businessOur liquefied petroleum gas (LPG) business offers significant benefits to consumers, including convenience, value for money and a carbon footprint that is around 20% lower than conventional heating oil or kerosene and 50% lower than coal
We specialise in the storage, bottling and distribution of LPG, with distribution operations in Latin America, the Caribbean and Africa
Our priorities are to offer value for money, quality of service and promote high safety standards In some markets, we are the partner of choice of national oil companies as they transition away from kerosene
We continue to look for new markets where LPG could play a role in creating a more secure, sustainable and competitive energy model that will benefit both business and domestic customers in the coming years
Our LPG business continued to deliver safely for customers around the world – at a competitive price and on time
6 2
PUMA ENERGY ANNUAL REPORT 2020

INFRASTRUCTUREWith the creation of our Infrastructure business unit, we are intensifying our focus on strengthening and optimising our world-class assets – so that we can create greater value, serve our Downstream customers even better and attract additional customers and investment
Over the years we have invested a great deal in building a world-class network of infrastructure assets It has been a core characteristic and strength of the business, enabling us to live up to our commitment to deliver high-quality and competitively priced energy products for our customers around the world – safely, reliably, without fail
Our Infrastructure businessOur Infrastructure business unit owns and commercially operates a strategically located global network of major infrastructure assets, including some of the newest, most efficient and best-in-class terminals in service today We enable our customers to supply, import, export and trade energy products across their markets We are attracting new customers and enhancing services for existing customers – maximising use of the assets while operating to the highest standards, safely and responsibly
Expertise, services and technologyOur services range from blending to complex logistics, handling and delivery Our advanced Terminal Management System gives our customers direct, online and real-time access to their stored products, so they can track stock movement
Key infrastructure hubsOur global network of import, trading and transhipment terminals plays a critical role for our customers – from being a key part of the value chain supplying high-growth energy markets to providing storage capacity to facilitate global trade flows
Investing in and developing our infrastructureWe continue to invest in and develop our infrastructure – to improve efficiency, expand into new energy solutions and be best positioned to support the energy transition This includes using more efficient and decarbonised power in our assets
Building the business unitWe established the Infrastructure leadership team, strategy and structure in 2020 We are now defining discrete business plans and growth opportunities for Infrastructure These range from adding capability to the platform to looking at new opportunities to grow the footprint
Overview
32Major marine terminals
2Major inland terminals
18Countries
Americas:• Belize• El Salvador• Guatemala• Honduras
• Panama• Puerto Rico• US Virgin Islands
Europe:• UK• Estonia
• Finland• Norway
Africa:• Ghana• Mozambique
• Namibia• Tanzania
Middle-East & Asia-Pacific:• Australia• Myanmar• United Arab Emirates
Infrastructure capabilities and services• Storage capacity rental and throughput
• Blending, additivisation and butanisation
• Vessel discharging, loading and handling
• Rail, truck and pipeline discharging and loading
6 3
PUMA ENERGY ANNUAL REPORT 2020
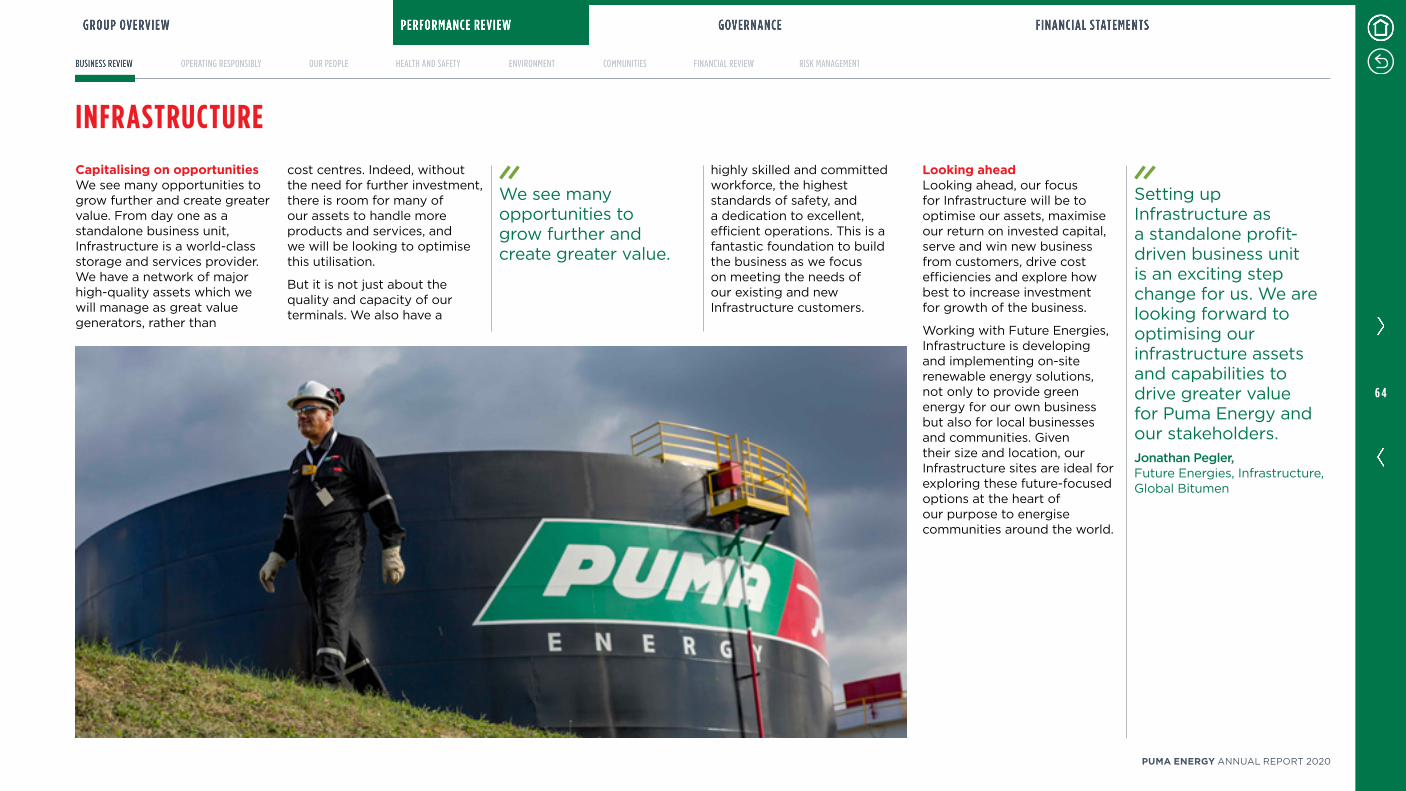
Setting up Infrastructure as a standalone profit-driven business unit is an exciting step change for us We are looking forward to optimising our infrastructure assets and capabilities to drive greater value for Puma Energy and our stakeholdersJonathan Pegler,Future Energies, Infrastructure, Global Bitumen
INFRASTRUCTURECapitalising on opportunitiesWe see many opportunities to grow further and create greater value From day one as a standalone business unit, Infrastructure is a world-class storage and services provider We have a network of major high-quality assets which we will manage as great value generators, rather than
cost centres Indeed, without the need for further investment, there is room for many of our assets to handle more products and services, and we will be looking to optimise this utilisation
But it is not just about the quality and capacity of our terminals We also have a
highly skilled and committed workforce, the highest standards of safety, and a dedication to excellent, efficient operations This is a fantastic foundation to build the business as we focus on meeting the needs of our existing and new Infrastructure customers
Looking aheadLooking ahead, our focus for Infrastructure will be to optimise our assets, maximise our return on invested capital, serve and win new business from customers, drive cost efficiencies and explore how best to increase investment for growth of the business
Working with Future Energies, Infrastructure is developing and implementing on-site renewable energy solutions, not only to provide green energy for our own business but also for local businesses and communities Given their size and location, our Infrastructure sites are ideal for exploring these future-focused options at the heart of our purpose to energise communities around the world
We see many opportunities to grow further and create greater value
6 4
PUMA ENERGY ANNUAL REPORT 2020
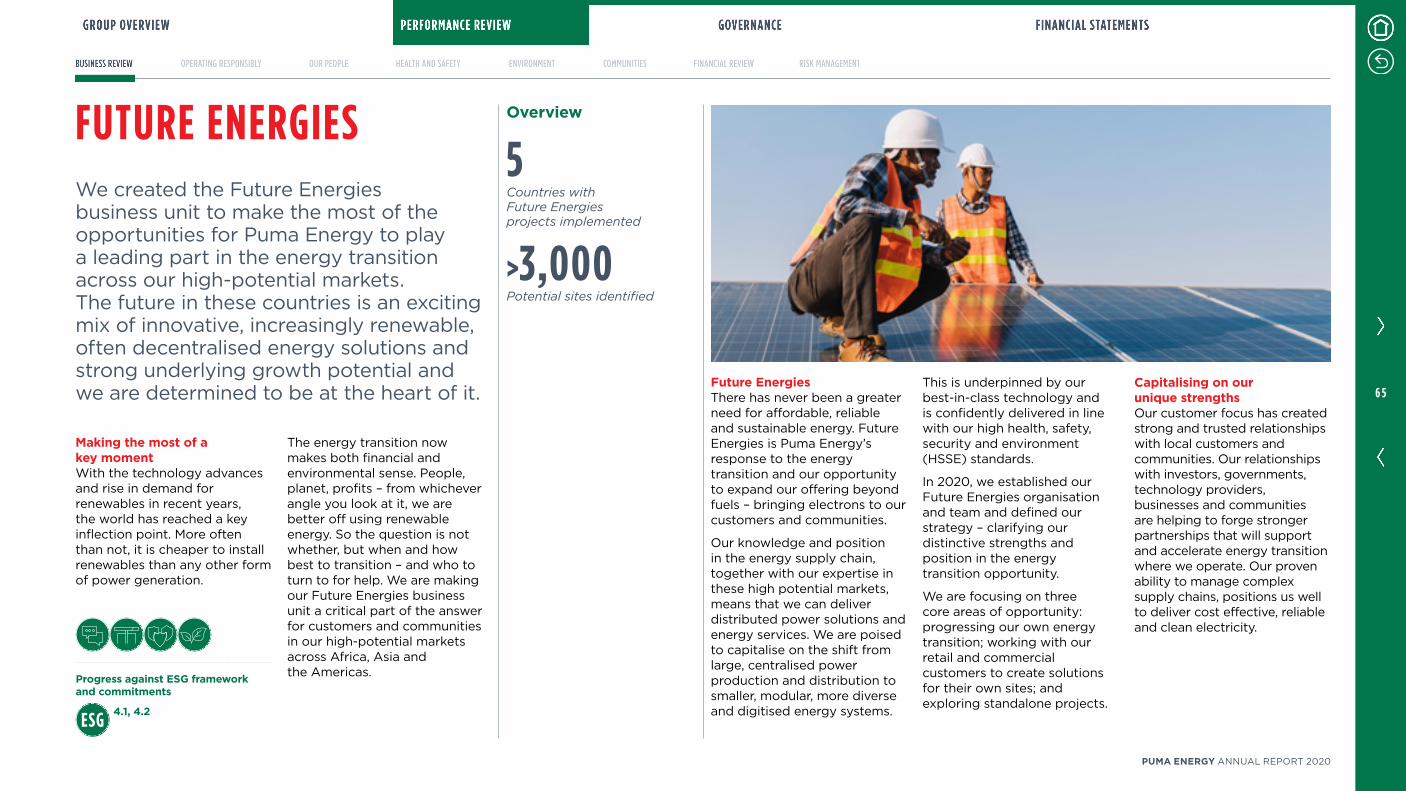
FUTURE ENERGIESWe created the Future Energies business unit to make the most of the opportunities for Puma Energy to play a leading part in the energy transition across our high-potential markets The future in these countries is an exciting mix of innovative, increasingly renewable, often decentralised energy solutions and strong underlying growth potential and we are determined to be at the heart of it
Making the most of a key momentWith the technology advances and rise in demand for renewables in recent years, the world has reached a key inflection point More often than not, it is cheaper to install renewables than any other form of power generation
The energy transition now makes both financial and environmental sense People, planet, profits – from whichever angle you look at it, we are better off using renewable energy So the question is not whether, but when and how best to transition – and who to turn to for help We are making our Future Energies business unit a critical part of the answer for customers and communities in our high-potential markets across Africa, Asia and the Americas
Future EnergiesThere has never been a greater need for affordable, reliable and sustainable energy Future Energies is Puma Energy’s response to the energy transition and our opportunity to expand our offering beyond fuels – bringing electrons to our customers and communities
Our knowledge and position in the energy supply chain, together with our expertise in these high potential markets, means that we can deliver distributed power solutions and energy services We are poised to capitalise on the shift from large, centralised power production and distribution to smaller, modular, more diverse and digitised energy systems
This is underpinned by our best-in-class technology and is confidently delivered in line with our high health, safety, security and environment (HSSE) standards
In 2020, we established our Future Energies organisation and team and defined our strategy – clarifying our distinctive strengths and position in the energy transition opportunity
We are focusing on three core areas of opportunity: progressing our own energy transition; working with our retail and commercial customers to create solutions for their own sites; and exploring standalone projects
Capitalising on our unique strengthsOur customer focus has created strong and trusted relationships with local customers and communities Our relationships with investors, governments, technology providers, businesses and communities are helping to forge stronger partnerships that will support and accelerate energy transition where we operate Our proven ability to manage complex supply chains, positions us well to deliver cost effective, reliable and clean electricity
Overview
5Countries with Future Energies projects implemented
>3,000Potential sites identified
Progress against ESG framework and commitments
4.1, 4.2
6 5
PUMA ENERGY ANNUAL REPORT 2020

FUTURE ENERGIESProgressing our own energy transitionFuture Energies is working very closely with our other two business units, Downstream and Infrastructure, to implement projects that are starting the energy transition throughout Puma Energy Future Energies will exclusively build, own and operate renewable energy solutions in our own assets – helping Puma achieve its goal of net zero carbon in our operations by 2030
Building within our business allows Puma Energy to not only reduce carbon in our operations but also reduce our energy costs, optimise our assets and showcase our capabilities to external customers
Solar energy presents one of our biggest opportunities to reduce CO2 emissions and in turn, deliver ESG benefits We have set ourselves the target of deploying solar and/or battery storage in at least 75% or more of our company owned and operated retail sites, depots and terminals by 2023 We plan to drive economies of scale by combining individual sites into single larger projects and coordinating projects across geographies to drive down implementation costs Alongside these developments, we will gather and analyse data to accurately calculate CO2 emissions and track savings across our portfolio
For example, a large proportion of our pipeline is in Africa In recent years, despite growing demand and a solar-friendly climate, there has been little investment in the energy transition compared to OECD countries With our deep local presence, knowledge and relationships, we are ideally positioned to push for, implement and ultimately champion the transition in Africa, and indeed across all our high-potential countries
Creating solutions for our retail and commercial customersWe are also focused on delivering energy solutions for our Downstream commercial and industrial customers, so that for example our mining, industrial and transport customers can benefit from integrated energy solutions that will also support their own energy transition
Our strong customer focus, technical expertise and local market knowledge allow us to deliver energy solutions for the high-potential markets in which we operate
Our core capabilities
1 Our geographical footprint, local expertise and network of assets across high-potential markets
3 Our ability to direct finance towards commercially viable projects with the greatest impact
2 Our commercial and retail customer base provides an intimate knowledge of their and their local communities’ needs
4 Our reputation for high quality solutions
Electricity AccessDecentralised solutions are the least-cost way to provide power to more than half of the population gaining access by 20301
1 Source: IEA (2020), SDG7: Data and Projections, IEA, Paris
6 6
PUMA ENERGY ANNUAL REPORT 2020
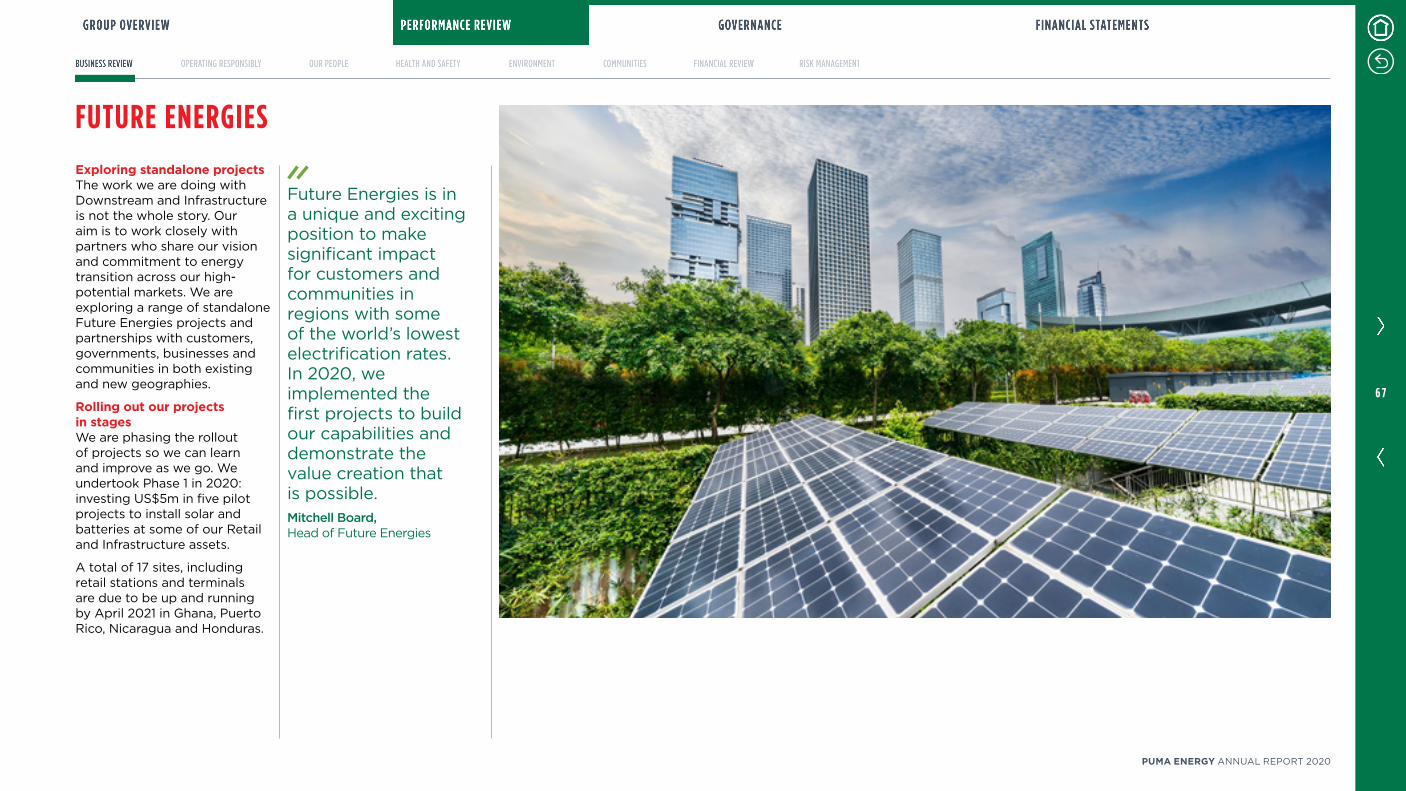
FUTURE ENERGIESExploring standalone projectsThe work we are doing with Downstream and Infrastructure is not the whole story Our aim is to work closely with partners who share our vision and commitment to energy transition across our high-potential markets We are exploring a range of standalone Future Energies projects and partnerships with customers, governments, businesses and communities in both existing and new geographies
Rolling out our projects in stagesWe are phasing the rollout of projects so we can learn and improve as we go We undertook Phase 1 in 2020: investing US$5m in five pilot projects to install solar and batteries at some of our Retail and Infrastructure assets
A total of 17 sites, including retail stations and terminals are due to be up and running by April 2021 in Ghana, Puerto Rico, Nicaragua and Honduras
Future Energies is in a unique and exciting position to make significant impact for customers and communities in regions with some of the world’s lowest electrification rates In 2020, we implemented the first projects to build our capabilities and demonstrate the value creation that is possibleMitchell Board,Head of Future Energies
6 7
PUMA ENERGY ANNUAL REPORT 2020
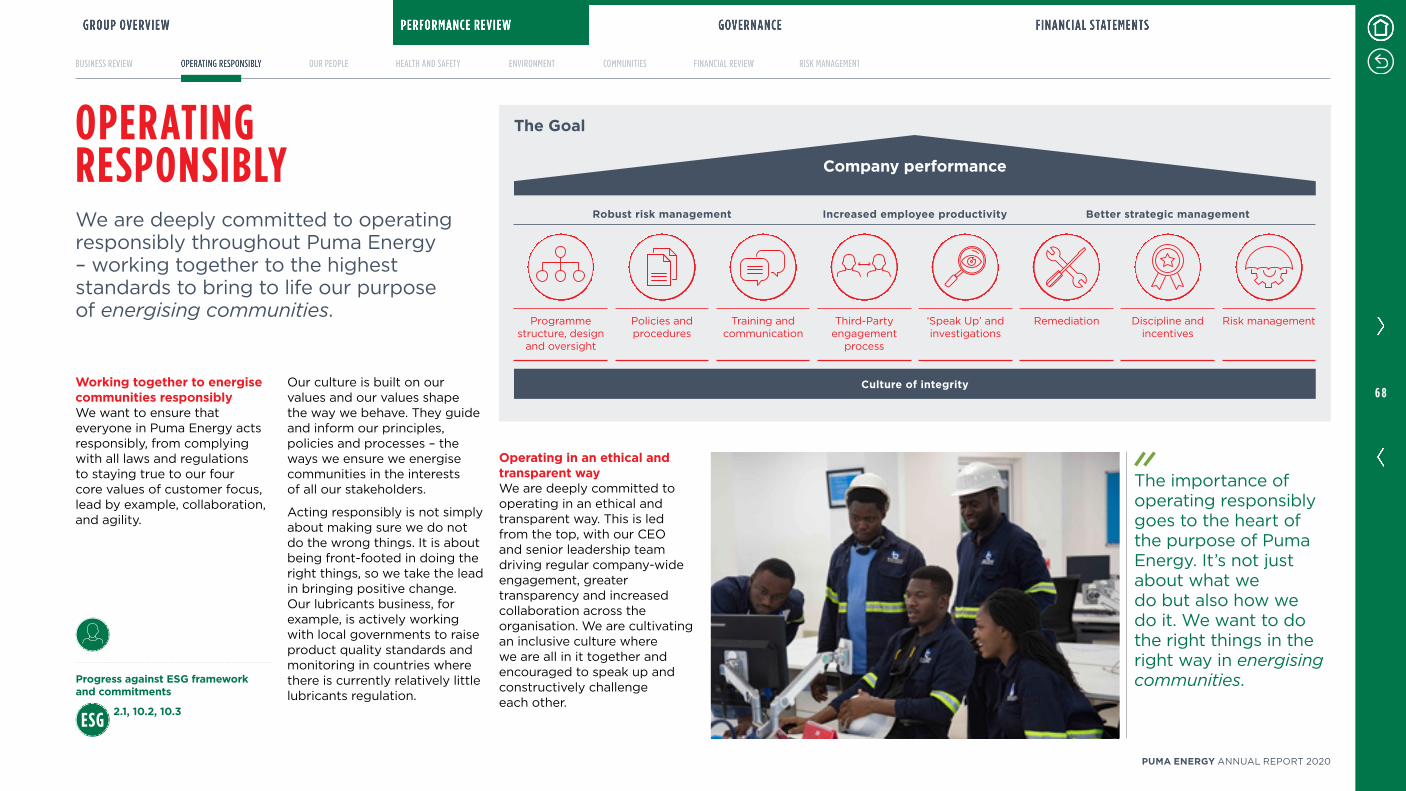
Working together to energise communities responsiblyWe want to ensure that everyone in Puma Energy acts responsibly, from complying with all laws and regulations to staying true to our four core values of customer focus, lead by example, collaboration, and agility
Our culture is built on our values and our values shape the way we behave They guide and inform our principles, policies and processes – the ways we ensure we energise communities in the interests of all our stakeholders
Acting responsibly is not simply about making sure we do not do the wrong things It is about being front-footed in doing the right things, so we take the lead in bringing positive change Our lubricants business, for example, is actively working with local governments to raise product quality standards and monitoring in countries where there is currently relatively little lubricants regulation
Operating in an ethical and transparent wayWe are deeply committed to operating in an ethical and transparent way This is led from the top, with our CEO and senior leadership team driving regular company-wide engagement, greater transparency and increased collaboration across the organisation We are cultivating an inclusive culture where we are all in it together and encouraged to speak up and constructively challenge each other
The importance of operating responsibly goes to the heart of the purpose of Puma Energy It’s not just about what we do but also how we do it We want to do the right things in the right way in energising communitiesProgress against ESG framework
and commitments
2.1, 10.2, 10.3
We are deeply committed to operating responsibly throughout Puma Energy – working together to the highest standards to bring to life our purpose of energising communities
OPERATING RESPONSIBLY
The Goal
Company performance
Programme structure, design
and oversight
Policies and procedures
Training and communication
Third-Party engagement
process
‘Speak Up’ and investigations
Remediation Discipline and incentives
Risk management
Culture of integrity
Robust risk management Increased employee productivity Better strategic management
6 8
PUMA ENERGY ANNUAL REPORT 2020
OPERATING RESPONSIBLYIntroducing our new Code of Business ConductAfter defining our purpose and new values last year, it was a natural and necessary next step for us to review and update our Code of Business Conduct to ensure it aligned with and reinforced the journey we are on at Puma Energy as strongly and effectively as possible
We launched the new comprehensive Code of Business Conduct in 2020 It outlines the common principles and standards expected of those who work for and with Puma Energy
The Code governs how we work and helps everyone in Puma Energy to uphold our values It sets the expectations of everyone who works for Puma Energy, and helps all of us work consistently, to the same high standards It is through our Code that we set out what it means to be part of the Puma Energy family, what our values are, how we expect people to behave
The Code has been produced in English, French, Spanish, Portuguese and Burmese, and is available to download from the Puma Energy intranet and our corporate website
Encouraging everyone in Puma Energy to Speak UpWe see operating responsibly as an active living commitment taken on by everyone every day In line with this commitment, we encourage everyone to Speak Up if they witness a Code breach, or are simply unsure about what to do or what they have been asked to do
In 2020, we focused on training and awareness to further embed our Speak Up culture in the organisation We wanted to make it clear and encourage everyone who works for and with Puma Energy to follow our Code and report actual or suspected breaches The core message was: this is the right thing to do – and the safe thing to do
We provide and promote a range of channels for our colleagues to Speak Up, including their line manager, another member of line management, the People & Culture team, the legal department, the compliance department, a Code Ambassador, compliance officer, or Global Head of Compliance
In addition, our Speak Up! Line gives everyone, both internally and externally, a way to raise concerns about ethics, compliance and the requirements of our Code, online or over the phone – 24/7, 365 days a year
Supply chain and partnersWe undertook an assessment and review of third-party relationships that posed the highest risk to the company, ensuring that all risks were identified, mitigated and continuously monitored
We also built and launched our new risk-based ‘know your counterparty’ process and platform, in addition to hiring a dedicated team tasked with ensuring appropriate screening of third-party relationships
Data privacyMaintaining the privacy of all our data is an important aspect of our responsible operations We undertook a global assessment of our data privacy risk, which will provide us with further clarity on any gaps in our operations The findings of the assessment will form part of our 2021 ethics and compliance plan
Our Code reflects our commitment to living our purpose and our values It goes beyond being a set of rules and legal compliance; it defines the way we energise our internal and external communities It is therefore important everyone in Puma Energy lives the Code – every day, everywhere
Living our purpose and values – the core of our code
1 Our Code of Conduct guides how we do things in Puma Energy It helps us to make the right decisions regardless of whether we work for, with, or on behalf of Puma Energy
2 Obey applicable laws and regulations wherever we operate in the world; never avoid or circumvent them
3 Be honest, straightforward and trustworthy in all Puma Energy activities; everyone, everywhere, every time
4 If you’re not sure what to do, just ask – if you think something doesn’t seem right or conflicts with the law, regulations, policy, safety or this Code – have the courage to speak up
5 Never forget that demonstrating compliant and ethical behaviour is crucial to Puma Energy’s business, integrity and reputation – and those impact our customers, colleagues, investors and shareholders alike
6 9
PUMA ENERGY ANNUAL REPORT 2020
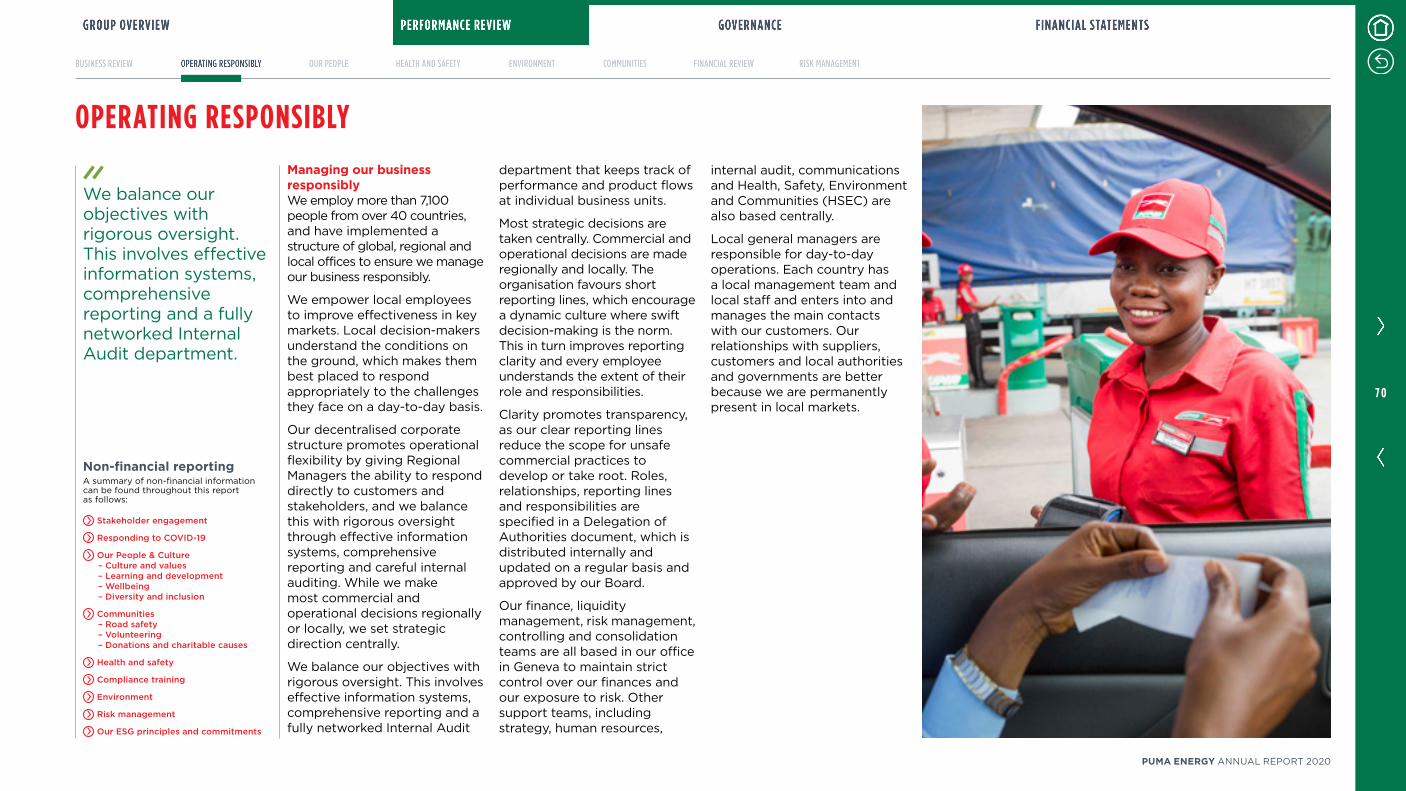
We balance our objectives with rigorous oversight This involves effective information systems, comprehensive reporting and a fully networked Internal Audit department
Managing our business responsibly We employ more than 7,100 people from over 40 countries, and have implemented a structure of global, regional and local offices to ensure we manage our business responsibly
We empower local employees to improve effectiveness in key markets Local decision-makers understand the conditions on the ground, which makes them best placed to respond appropriately to the challenges they face on a day-to-day basis
Our decentralised corporate structure promotes operational flexibility by giving Regional Managers the ability to respond directly to customers and stakeholders, and we balance this with rigorous oversight through effective information systems, comprehensive reporting and careful internal auditing While we make most commercial and operational decisions regionally or locally, we set strategic direction centrally
We balance our objectives with rigorous oversight This involves effective information systems, comprehensive reporting and a fully networked Internal Audit
department that keeps track of performance and product flows at individual business units
Most strategic decisions are taken centrally Commercial and operational decisions are made regionally and locally The organisation favours short reporting lines, which encourage a dynamic culture where swift decision-making is the norm This in turn improves reporting clarity and every employee understands the extent of their role and responsibilities
Clarity promotes transparency, as our clear reporting lines reduce the scope for unsafe commercial practices to develop or take root Roles, relationships, reporting lines and responsibilities are specified in a Delegation of Authorities document, which is distributed internally and updated on a regular basis and approved by our Board
Our finance, liquidity management, risk management, controlling and consolidation teams are all based in our office in Geneva to maintain strict control over our finances and our exposure to risk Other support teams, including strategy, human resources,
internal audit, communications and Health, Safety, Environment and Communities (HSEC) are also based centrally
Local general managers are responsible for day-to-day operations Each country has a local management team and local staff and enters into and manages the main contacts with our customers Our relationships with suppliers, customers and local authorities and governments are better because we are permanently present in local markets
OPERATING RESPONSIBLY
Non-financial reportingA summary of non-financial information can be found throughout this report as follows:
Stakeholder engagement
Responding to COVID-19
Our People & Culture– Culture and values– Learning and development– Wellbeing– Diversity and inclusion
Communities– Road safety– Volunteering– Donations and charitable causes
Health and safety
Compliance training
Environment
Risk management
Our ESG principles and commitments
7 0
PUMA ENERGY ANNUAL REPORT 2020

Progress against ESG framework and commitments
10.1
Creating our People & Culture strategyBuilding on the purpose and customer-led strategy established in 2019, in 2020 we created a People & Culture (P&C) strategy and plan, endorsed by the Board that aligns with and supports the
delivery of Puma Energy’s plans and objectives
It has been designed around supporting the five-year EBITDA target, the new operating model of three business units, the areas of delivering the operational improvements, the customer-led business transformation for Retail and Commercial, the development of Future Energies, and the creation of our new Infrastructure business unit
Our people are the driving force behind the growth and success of Puma Energy Their collaborative entrepreneurial spirit, diverse nationalities, cultures and experiences flow into our culture and make Puma Energy a great place to work, a great place for our customers to develop long-lasting relationships – a great place to energise communities
OUR PEOPLE & CULTURE
Delivering our strategyWe are delivering our strategy through strong business partnering relationships across the regions, lines of business and functions supported by centres of expertise in organsational development including learning, reward, talent attraction and learning and development Shared Services drive our overall colleague experience in support of the business partners and all colleagues around the globe
The strategy revolves around four pillars: ensuring an effective organisation (aligning the hard and soft wiring of the business); evolving our culture (moving our cultural centre of gravity so that we put our customers at the heart of everything); capability and
diverse talent (cultivating strategic roles that have a direct impact on our growth and success); and the P&C operating and delivery model (partnering closely, seamlessly and systematically with the Group and businesses at all levels)
It is supported by four foundations: a P&C organisation aligned to critical business interfaces; a colleague experience that drives customer experience; strong reward governance and philosophy; and digitalisation, notably automation of management information systems and the strengthening of our predictive analytics
In Puma Energy we see the People & Culture function in a true partnership with the businesses around the world To this end, we are implementing our People & Culture strategy to help drive the business forward in living our purpose of energising communities and delivering on our customer-led strategyMichael Schulz,Chief People & Culture Officer
110,500Training hours
Overview
Number of colleagues
2020: 7,155
2019: 9,302*
* The decrease in the number of colleagues is mainly due to the sale of our Australian commercial and retail fuels business in 2020
Investment in training (US$m)
2020: 1.4
2019: 1
Highlights• Creating and aligning our new People & Culture strategy and operating plan to our five-year business plan
• Reinforcing our culture; living our values
• Supporting our people through the COVID-19 pandemic
7 1
PUMA ENERGY ANNUAL REPORT 2020
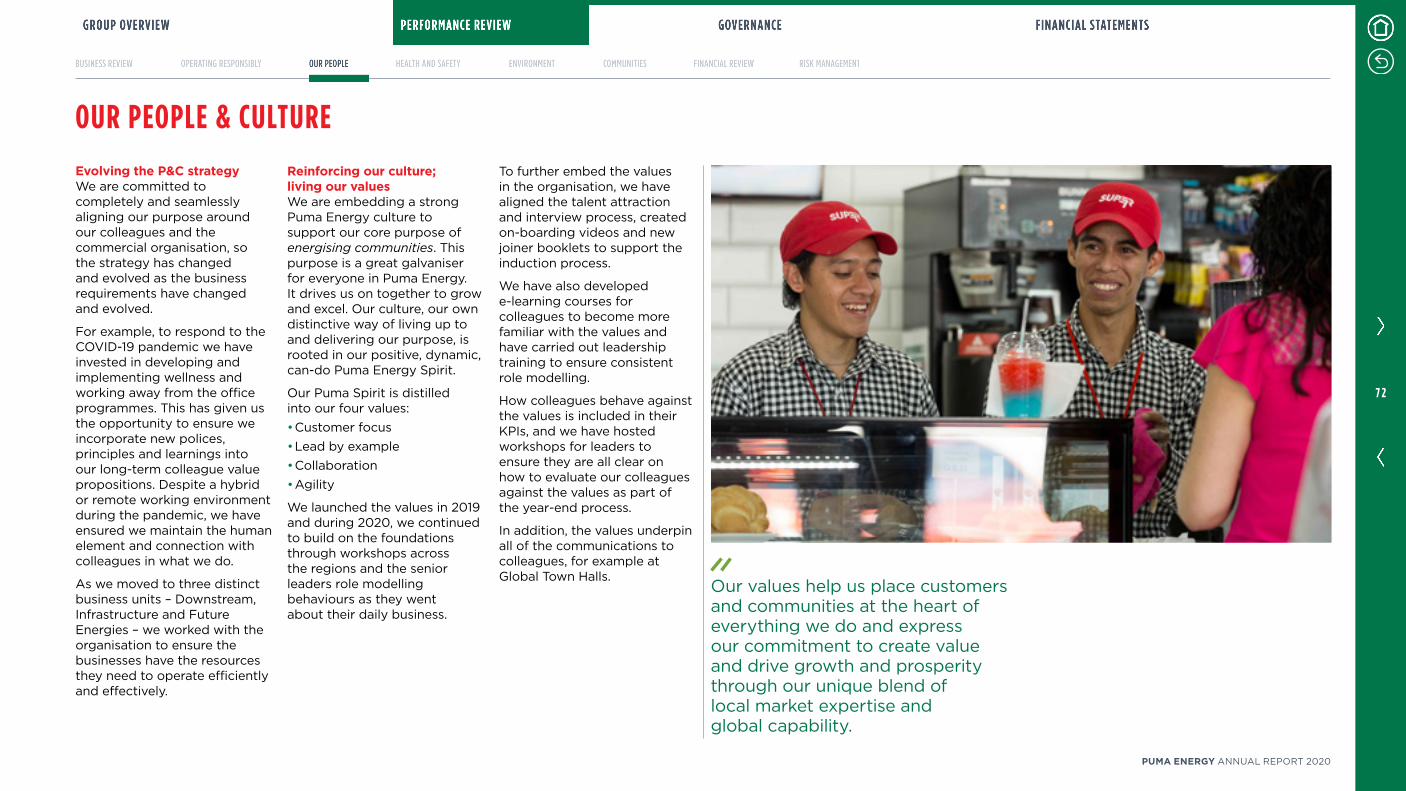
Evolving the P&C strategyWe are committed to completely and seamlessly aligning our purpose around our colleagues and the commercial organisation, so the strategy has changed and evolved as the business requirements have changed and evolved
For example, to respond to the COVID-19 pandemic we have invested in developing and implementing wellness and working away from the office programmes This has given us the opportunity to ensure we incorporate new polices, principles and learnings into our long-term colleague value propositions Despite a hybrid or remote working environment during the pandemic, we have ensured we maintain the human element and connection with colleagues in what we do
As we moved to three distinct business units – Downstream, Infrastructure and Future Energies – we worked with the organisation to ensure the businesses have the resources they need to operate efficiently and effectively
Reinforcing our culture; living our valuesWe are embedding a strong Puma Energy culture to support our core purpose of energising communities This purpose is a great galvaniser for everyone in Puma Energy It drives us on together to grow and excel Our culture, our own distinctive way of living up to and delivering our purpose, is rooted in our positive, dynamic, can-do Puma Energy Spirit
Our Puma Spirit is distilled into our four values:• Customer focus• Lead by example• Collaboration• Agility
We launched the values in 2019 and during 2020, we continued to build on the foundations through workshops across the regions and the senior leaders role modelling behaviours as they went about their daily business
To further embed the values in the organisation, we have aligned the talent attraction and interview process, created on-boarding videos and new joiner booklets to support the induction process
We have also developed e-learning courses for colleagues to become more familiar with the values and have carried out leadership training to ensure consistent role modelling
How colleagues behave against the values is included in their KPIs, and we have hosted workshops for leaders to ensure they are all clear on how to evaluate our colleagues against the values as part of the year-end process
In addition, the values underpin all of the communications to colleagues, for example at Global Town Halls
Our values help us place customers and communities at the heart of everything we do and express our commitment to create value and drive growth and prosperity through our unique blend of local market expertise and global capability
OUR PEOPLE & CULTURE
7 2
PUMA ENERGY ANNUAL REPORT 2020

Engaging with our peopleWe engage with our people closely and dynamically, with a strong emphasis on everyone being open and transparent We encourage people to ask questions and make suggestions, to contribute to the conversation
To understand the issues that matter most to our colleagues, we engage in a number of ways When colleagues began working from home at the start of the pandemic for example, we sent out a pulse survey to ask “How are you doing?” The consolidated responses helped us understand how best to engage with our colleagues as they worked from home and also informed our development of wellbeing programmes and flexible working policies
Our Colleague Value Proposition Ambassadors have provided us with a very useful measurement system this year In addition, in November we launched our first global employee engagement survey called 'Your Voice' It gave us valuable insights into what matters to our colleagues and how they rate us in these areas This in turn will enable us to develop
plans for continuous growth and improvement where we have identified gaps
This allows us to create a baseline and focus on
improvement that will drive our colleague experience and in turn, our customer experience
Recognising contributionsWe are keen to recognise the contributions of our colleagues One of the key ways we do this is through our annual Puma Energy Awards Now in their 5th year, the Awards honour Puma Energy people across six categories: Customer-focused award, Leading by example award, Team collaboration award, Agile Puma award, Country of the year award, and CEO Spirit of Puma Energy award There is also a special award for the most compelling description of what energising communities means The awards get bigger and better each year This year, we had 1,453 entries from Puma Energy colleagues around the world, and a brilliant set of winners
Going the extra mileWe introduced our GEM programme to recognise colleagues who were Going the Extra Mile to help and support their colleagues, communities, customers and stakeholders in dealing with the pandemic It was a great way to shine a light on colleagues who were going above and beyond in living our
purpose of energising communities This year, we gave out 15 GEM awards
Sharing the magicWe also introduced our Making A Great Individual Contribution (MAGIC) online recognition platform, designed to make it easy for colleagues to share instant appreciation of each other MAGIC has encouraged a culture of appreciation and recognition across teams, geographies and businesses Since launch, over 4,000 badges have been awarded by colleagues to colleagues to show appreciation for things they have done that matter to the awarder
Supporting our people through the COVID-19 pandemicWe acknowledged immediately that the COVID-19 isolation measures across the world abruptly changed our colleagues’ ways of working We quickly equipped colleagues with the necessary technology to enable them to continue to work from home and actively encouraged the use of a range of collaborative tools
In partnership with our Communications team we re-invented communications
creating new digital channels and upscaling our content to reach all employees wherever they are We increased our regular communication with our colleagues through virtual Town Halls and Energiser newsletters as frequently as daily at the height of the pandemic In this way, we kept our colleagues informed about the pandemic, with updates, education and information on wellbeing, keeping safe and looking after each other Through webinars, we also invited colleagues to share wellbeing ideas
In addition, we provided access to globally recognised colleague wellness programmes where individuals can engage with experts on different personal issues Wellbeing programmes included, for example, “dealing with stress” and “improving resilience” sessions
We focused on training line managers to support them in leading and managing remote teams Leaders have been encouraged to carry out regular wellbeing checks with their teams Many markets have distributed care packages to their colleagues, for example
OUR PEOPLE & CULTURE
Our People & Culture strategy is a dynamic, living plan of action which we look to optimise to support our core purpose and ambitions at Puma Energy75%
Engagement
89%Participation
'Your Voice' global employee engagement survey
7 3
PUMA ENERGY ANNUAL REPORT 2020
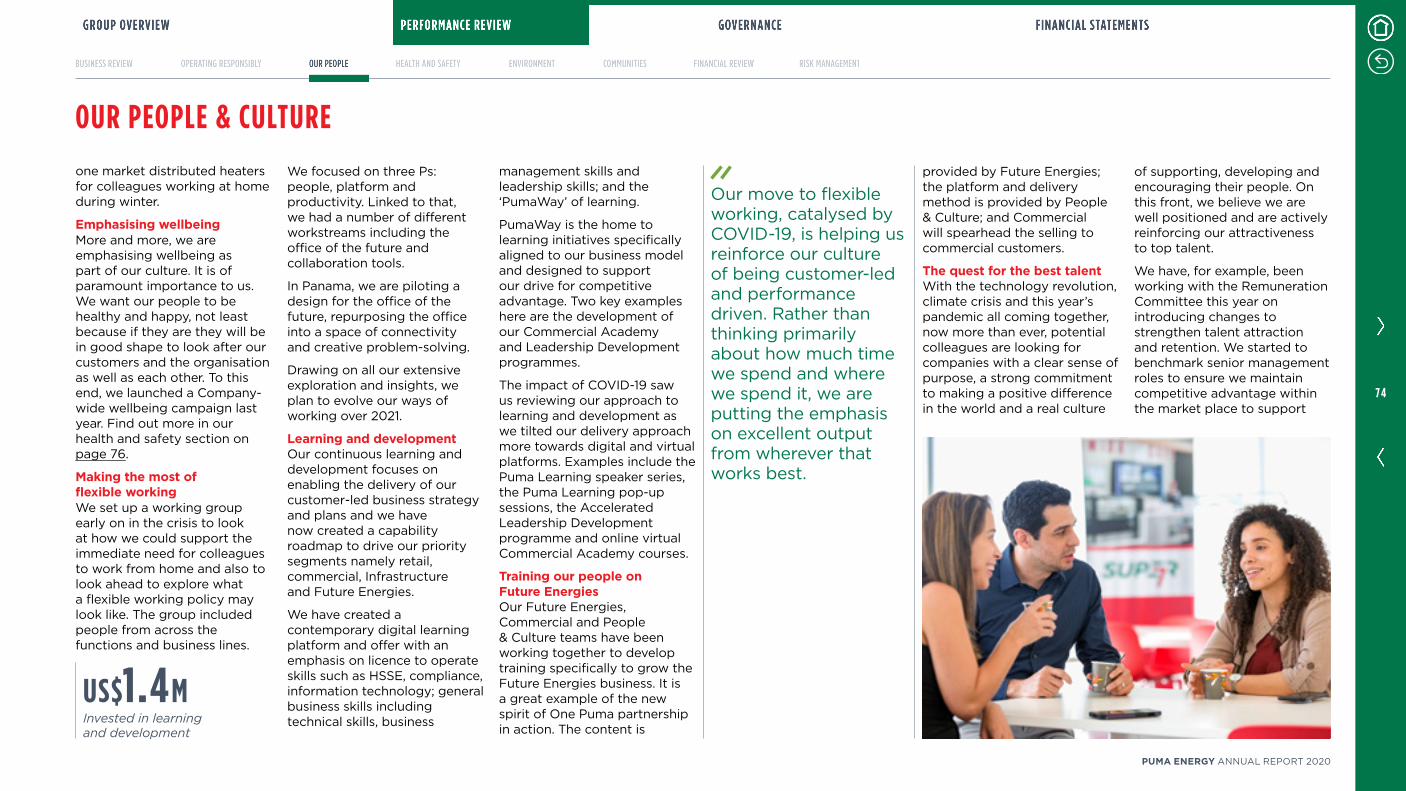
one market distributed heaters for colleagues working at home during winter
Emphasising wellbeingMore and more, we are emphasising wellbeing as part of our culture It is of paramount importance to us We want our people to be healthy and happy, not least because if they are they will be in good shape to look after our customers and the organisation as well as each other To this end, we launched a Company-wide wellbeing campaign last year Find out more in our health and safety section on page 76
Making the most of flexible workingWe set up a working group early on in the crisis to look at how we could support the immediate need for colleagues to work from home and also to look ahead to explore what a flexible working policy may look like The group included people from across the functions and business lines
management skills and leadership skills; and the ‘PumaWay’ of learning
PumaWay is the home to learning initiatives specifically aligned to our business model and designed to support our drive for competitive advantage Two key examples here are the development of our Commercial Academy and Leadership Development programmes
The impact of COVID-19 saw us reviewing our approach to learning and development as we tilted our delivery approach more towards digital and virtual platforms Examples include the Puma Learning speaker series, the Puma Learning pop-up sessions, the Accelerated Leadership Development programme and online virtual Commercial Academy courses
Training our people on Future EnergiesOur Future Energies, Commercial and People & Culture teams have been working together to develop training specifically to grow the Future Energies business It is a great example of the new spirit of One Puma partnership in action The content is
We focused on three Ps: people, platform and productivity Linked to that, we had a number of different workstreams including the office of the future and collaboration tools
In Panama, we are piloting a design for the office of the future, repurposing the office into a space of connectivity and creative problem-solving
Drawing on all our extensive exploration and insights, we plan to evolve our ways of working over 2021
Learning and developmentOur continuous learning and development focuses on enabling the delivery of our customer-led business strategy and plans and we have now created a capability roadmap to drive our priority segments namely retail, commercial, Infrastructure and Future Energies
We have created a contemporary digital learning platform and offer with an emphasis on licence to operate skills such as HSSE, compliance, information technology; general business skills including technical skills, business
provided by Future Energies; the platform and delivery method is provided by People & Culture; and Commercial will spearhead the selling to commercial customers
The quest for the best talent With the technology revolution, climate crisis and this year’s pandemic all coming together, now more than ever, potential colleagues are looking for companies with a clear sense of purpose, a strong commitment to making a positive difference in the world and a real culture
of supporting, developing and encouraging their people On this front, we believe we are well positioned and are actively reinforcing our attractiveness to top talent
We have, for example, been working with the Remuneration Committee this year on introducing changes to strengthen talent attraction and retention We started to benchmark senior management roles to ensure we maintain competitive advantage within the market place to support
Our move to flexible working, catalysed by COVID-19, is helping us reinforce our culture of being customer-led and performance driven Rather than thinking primarily about how much time we spend and where we spend it, we are putting the emphasis on excellent output from wherever that works best
OUR PEOPLE & CULTURE
US$1.4MInvested in learning and development
7 4
PUMA ENERGY ANNUAL REPORT 2020
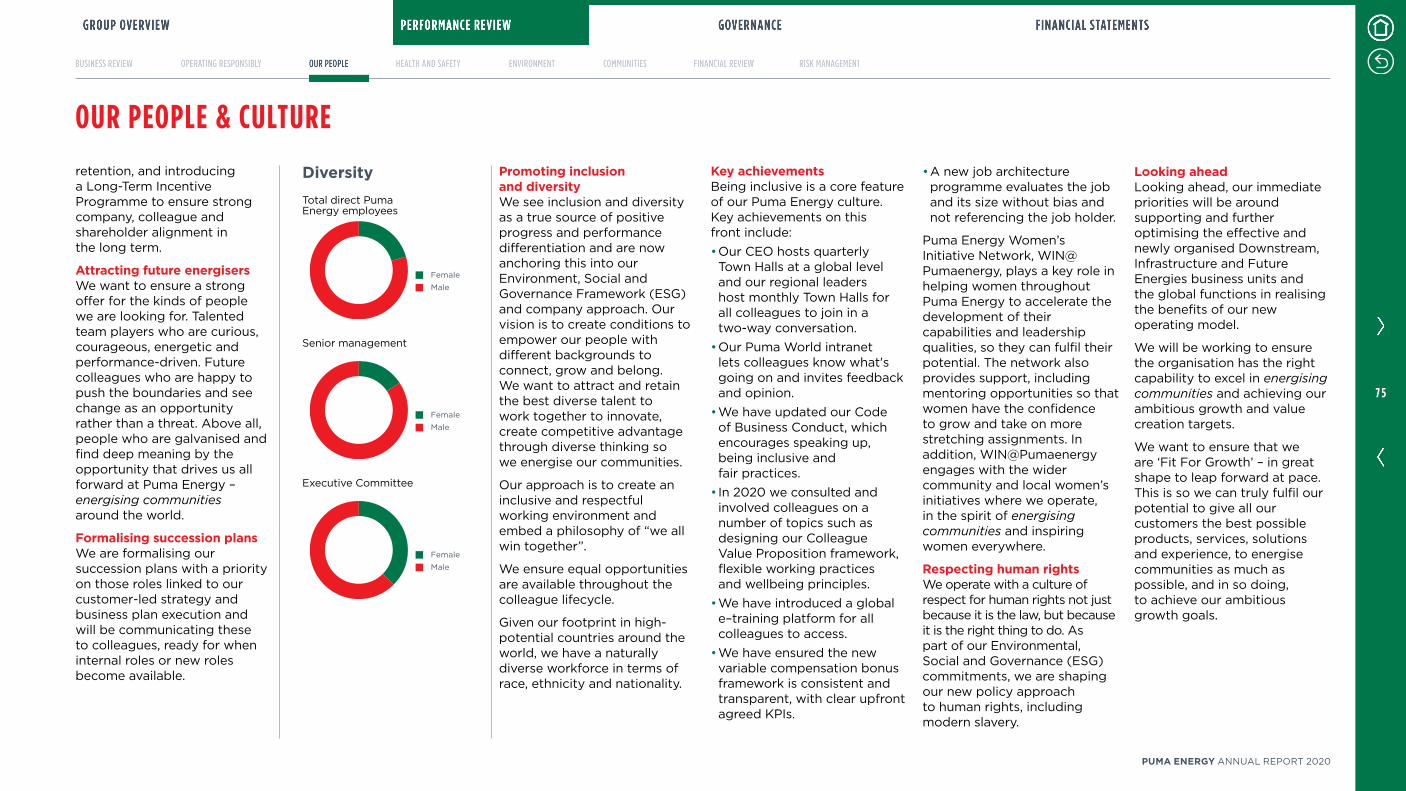
DiversityTotal direct Puma Energy employees
Female
Male
Senior management
Female
Male
Executive Committee
Female
Male
retention, and introducing a Long-Term Incentive Programme to ensure strong company, colleague and shareholder alignment in the long term
Attracting future energisersWe want to ensure a strong offer for the kinds of people we are looking for Talented team players who are curious, courageous, energetic and performance-driven Future colleagues who are happy to push the boundaries and see change as an opportunity rather than a threat Above all, people who are galvanised and find deep meaning by the opportunity that drives us all forward at Puma Energy – energising communities around the world
Formalising succession plansWe are formalising our succession plans with a priority on those roles linked to our customer-led strategy and business plan execution and will be communicating these to colleagues, ready for when internal roles or new roles become available
Key achievementsBeing inclusive is a core feature of our Puma Energy culture Key achievements on this front include:• Our CEO hosts quarterly Town Halls at a global level and our regional leaders host monthly Town Halls for all colleagues to join in a two-way conversation
• Our Puma World intranet lets colleagues know what's going on and invites feedback and opinion
• We have updated our Code of Business Conduct, which encourages speaking up, being inclusive and fair practices
• In 2020 we consulted and involved colleagues on a number of topics such as designing our Colleague Value Proposition framework, flexible working practices and wellbeing principles
• We have introduced a global e–training platform for all colleagues to access
• We have ensured the new variable compensation bonus framework is consistent and transparent, with clear upfront agreed KPIs
Promoting inclusion and diversityWe see inclusion and diversity as a true source of positive progress and performance differentiation and are now anchoring this into our Environment, Social and Governance Framework (ESG) and company approach Our vision is to create conditions to empower our people with different backgrounds to connect, grow and belong We want to attract and retain the best diverse talent to work together to innovate, create competitive advantage through diverse thinking so we energise our communities
Our approach is to create an inclusive and respectful working environment and embed a philosophy of “we all win together”
We ensure equal opportunities are available throughout the colleague lifecycle
Given our footprint in high-potential countries around the world, we have a naturally diverse workforce in terms of race, ethnicity and nationality
• A new job architecture programme evaluates the job and its size without bias and not referencing the job holder
Puma Energy Women’s Initiative Network, WIN@Pumaenergy, plays a key role in helping women throughout Puma Energy to accelerate the development of their capabilities and leadership qualities, so they can fulfil their potential The network also provides support, including mentoring opportunities so that women have the confidence to grow and take on more stretching assignments In addition, WIN@Pumaenergy engages with the wider community and local women’s initiatives where we operate, in the spirit of energising communities and inspiring women everywhere
Respecting human rightsWe operate with a culture of respect for human rights not just because it is the law, but because it is the right thing to do As part of our Environmental, Social and Governance (ESG) commitments, we are shaping our new policy approach to human rights, including modern slavery
Looking aheadLooking ahead, our immediate priorities will be around supporting and further optimising the effective and newly organised Downstream, Infrastructure and Future Energies business units and the global functions in realising the benefits of our new operating model
We will be working to ensure the organisation has the right capability to excel in energising communities and achieving our ambitious growth and value creation targets
We want to ensure that we are ‘Fit For Growth’ – in great shape to leap forward at pace This is so we can truly fulfil our potential to give all our customers the best possible products, services, solutions and experience, to energise communities as much as possible, and in so doing, to achieve our ambitious growth goals
OUR PEOPLE & CULTURE
7 5
PUMA ENERGY ANNUAL REPORT 2020
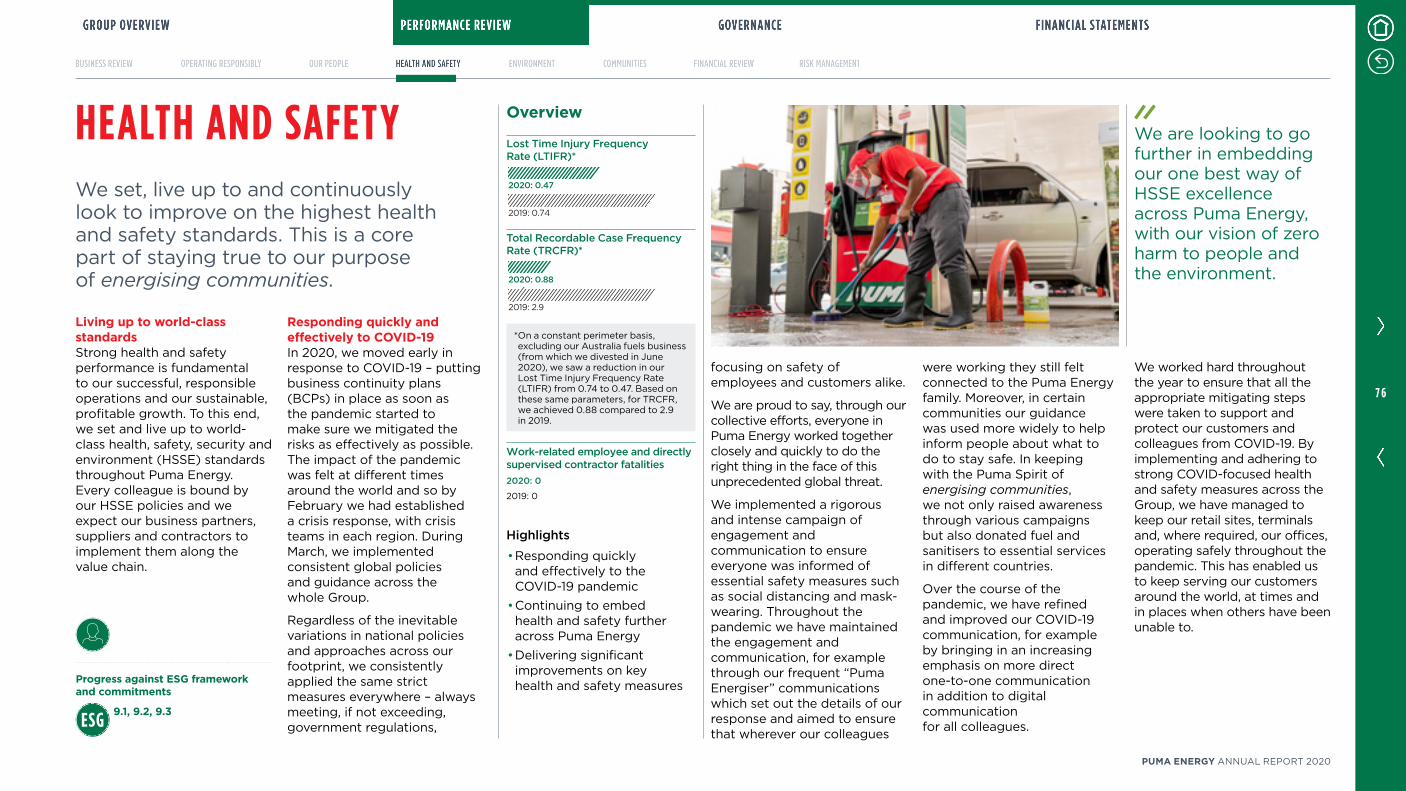
Progress against ESG framework and commitments
9.1, 9.2, 9.3
We worked hard throughout the year to ensure that all the appropriate mitigating steps were taken to support and protect our customers and colleagues from COVID-19 By implementing and adhering to strong COVID-focused health and safety measures across the Group, we have managed to keep our retail sites, terminals and, where required, our offices, operating safely throughout the pandemic This has enabled us to keep serving our customers around the world, at times and in places when others have been unable to
Living up to world-class standardsStrong health and safety performance is fundamental to our successful, responsible operations and our sustainable, profitable growth To this end, we set and live up to world-class health, safety, security and environment (HSSE) standards throughout Puma Energy Every colleague is bound by our HSSE policies and we expect our business partners, suppliers and contractors to implement them along the value chain
Responding quickly and effectively to COVID-19In 2020, we moved early in response to COVID-19 – putting business continuity plans (BCPs) in place as soon as the pandemic started to make sure we mitigated the risks as effectively as possible The impact of the pandemic was felt at different times around the world and so by February we had established a crisis response, with crisis teams in each region During March, we implemented consistent global policies and guidance across the whole Group
Regardless of the inevitable variations in national policies and approaches across our footprint, we consistently applied the same strict measures everywhere – always meeting, if not exceeding, government regulations,
We set, live up to and continuously look to improve on the highest health and safety standards This is a core part of staying true to our purpose of energising communities
HEALTH AND SAFETY
focusing on safety of employees and customers alike
We are proud to say, through our collective efforts, everyone in Puma Energy worked together closely and quickly to do the right thing in the face of this unprecedented global threat
We implemented a rigorous and intense campaign of engagement and communication to ensure everyone was informed of essential safety measures such as social distancing and mask-wearing Throughout the pandemic we have maintained the engagement and communication, for example through our frequent “Puma Energiser” communications which set out the details of our response and aimed to ensure that wherever our colleagues
were working they still felt connected to the Puma Energy family Moreover, in certain communities our guidance was used more widely to help inform people about what to do to stay safe In keeping with the Puma Spirit of energising communities, we not only raised awareness through various campaigns but also donated fuel and sanitisers to essential services in different countries
Over the course of the pandemic, we have refined and improved our COVID-19 communication, for example by bringing in an increasing emphasis on more direct one-to-one communication in addition to digital communication for all colleagues
We are looking to go further in embedding our one best way of HSSE excellence across Puma Energy, with our vision of zero harm to people and the environment
Overview
Lost Time Injury Frequency Rate (LTIFR)*
2020: 0.47
2019: 0.74
Total Recordable Case Frequency Rate (TRCFR)*
2020: 0.88
2019: 2.9
* On a constant perimeter basis, excluding our Australia fuels business (from which we divested in June 2020), we saw a reduction in our Lost Time Injury Frequency Rate (LTIFR) from 074 to 047 Based on these same parameters, for TRCFR, we achieved 088 compared to 29 in 2019
Work-related employee and directly supervised contractor fatalities2020: 0
2019: 0
Highlights
• Responding quickly and effectively to theCOVID-19 pandemic
• Continuing to embedhealth and safety furtheracross Puma Energy
• Delivering significantimprovements on keyhealth and safety measures
7 6
PUMA ENERGY ANNUAL REPORT 2020
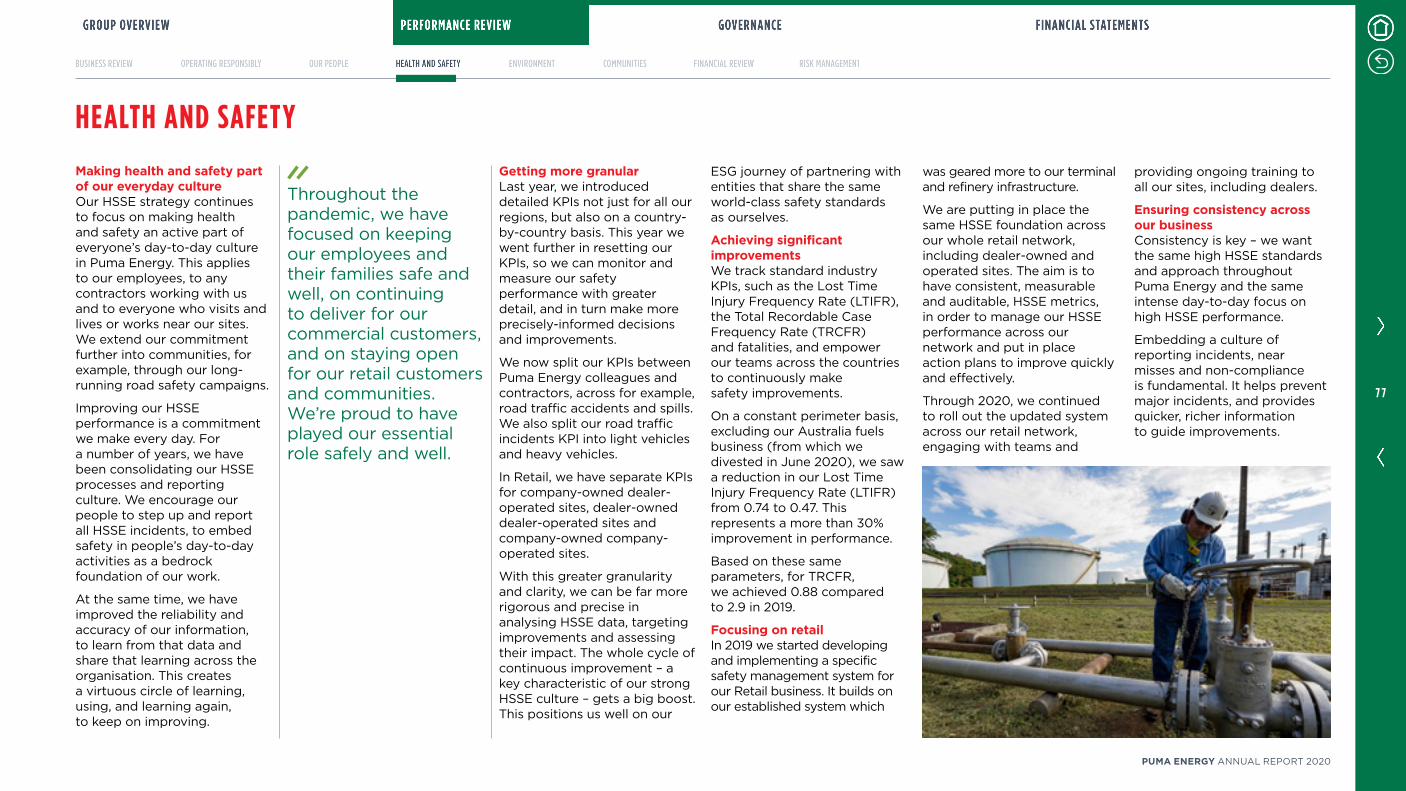
Making health and safety part of our everyday culture Our HSSE strategy continues to focus on making health and safety an active part of everyone’s day-to-day culture in Puma Energy This applies to our employees, to any contractors working with us and to everyone who visits and lives or works near our sites We extend our commitment further into communities, for example, through our long-running road safety campaigns
Improving our HSSE performance is a commitment we make every day For a number of years, we have been consolidating our HSSE processes and reporting culture We encourage our people to step up and report all HSSE incidents, to embed safety in people’s day-to-day activities as a bedrock foundation of our work
At the same time, we have improved the reliability and accuracy of our information, to learn from that data and share that learning across the organisation This creates a virtuous circle of learning, using, and learning again, to keep on improving
Getting more granularLast year, we introduced detailed KPIs not just for all our regions, but also on a country-by-country basis This year we went further in resetting our KPIs, so we can monitor and measure our safety performance with greater detail, and in turn make more precisely-informed decisions and improvements
We now split our KPIs between Puma Energy colleagues and contractors, across for example, road traffic accidents and spills We also split our road traffic incidents KPI into light vehicles and heavy vehicles
In Retail, we have separate KPIs for company-owned dealer-operated sites, dealer-owned dealer-operated sites and company-owned company-operated sites
With this greater granularity and clarity, we can be far more rigorous and precise in analysing HSSE data, targeting improvements and assessing their impact The whole cycle of continuous improvement – a key characteristic of our strong HSSE culture – gets a big boost This positions us well on our
ESG journey of partnering with entities that share the same world-class safety standards as ourselves
Achieving significant improvements We track standard industry KPIs, such as the Lost Time Injury Frequency Rate (LTIFR), the Total Recordable Case Frequency Rate (TRCFR) and fatalities, and empower our teams across the countries to continuously make safety improvements
On a constant perimeter basis, excluding our Australia fuels business (from which we divested in June 2020), we saw a reduction in our Lost Time Injury Frequency Rate (LTIFR) from 074 to 047 This represents a more than 30% improvement in performance
Based on these same parameters, for TRCFR, we achieved 088 compared to 29 in 2019
Focusing on retail In 2019 we started developing and implementing a specific safety management system for our Retail business It builds on our established system which
was geared more to our terminal and refinery infrastructure
We are putting in place the same HSSE foundation across our whole retail network, including dealer-owned and operated sites The aim is to have consistent, measurable and auditable, HSSE metrics, in order to manage our HSSE performance across our network and put in place action plans to improve quickly and effectively
Through 2020, we continued to roll out the updated system across our retail network, engaging with teams and
providing ongoing training to all our sites, including dealers
Ensuring consistency across our businessConsistency is key – we want the same high HSSE standards and approach throughout Puma Energy and the same intense day-to-day focus on high HSSE performance
Embedding a culture of reporting incidents, near misses and non-compliance is fundamental It helps prevent major incidents, and provides quicker, richer information to guide improvements
HEALTH AND SAFETY
Throughout the pandemic, we have focused on keeping our employees and their families safe and well, on continuing to deliver for our commercial customers, and on staying open for our retail customers and communities We’re proud to have played our essential role safely and well
7 7
PUMA ENERGY ANNUAL REPORT 2020
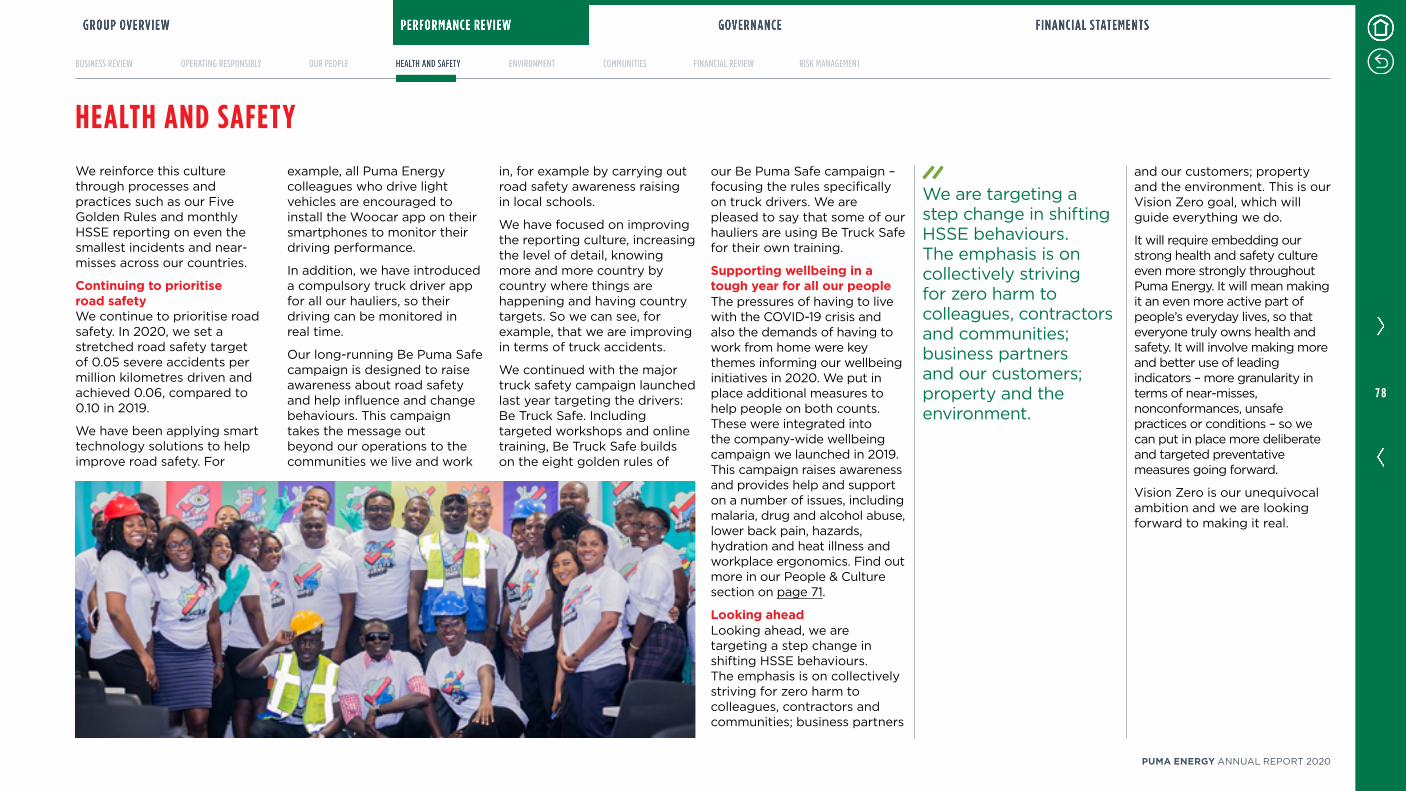
We reinforce this culture through processes and practices such as our Five Golden Rules and monthly HSSE reporting on even the smallest incidents and near-misses across our countries
Continuing to prioritise road safety We continue to prioritise road safety In 2020, we set a stretched road safety target of 005 severe accidents per million kilometres driven and achieved 006, compared to 010 in 2019
We have been applying smart technology solutions to help improve road safety For
example, all Puma Energy colleagues who drive light vehicles are encouraged to install the Woocar app on their smartphones to monitor their driving performance
In addition, we have introduced a compulsory truck driver app for all our hauliers, so their driving can be monitored in real time
Our long-running Be Puma Safe campaign is designed to raise awareness about road safety and help influence and change behaviours This campaign takes the message out beyond our operations to the communities we live and work
in, for example by carrying out road safety awareness raising in local schools
We have focused on improving the reporting culture, increasing the level of detail, knowing more and more country by country where things are happening and having country targets So we can see, for example, that we are improving in terms of truck accidents
We continued with the major truck safety campaign launched last year targeting the drivers: Be Truck Safe Including targeted workshops and online training, Be Truck Safe builds on the eight golden rules of
our Be Puma Safe campaign – focusing the rules specifically on truck drivers We are pleased to say that some of our hauliers are using Be Truck Safe for their own training
Supporting wellbeing in a tough year for all our people The pressures of having to live with the COVID-19 crisis and also the demands of having to work from home were key themes informing our wellbeing initiatives in 2020 We put in place additional measures to help people on both counts These were integrated into the company-wide wellbeing campaign we launched in 2019 This campaign raises awareness and provides help and support on a number of issues, including malaria, drug and alcohol abuse, lower back pain, hazards, hydration and heat illness and workplace ergonomics Find out more in our People & Culture section on page 71
Looking ahead Looking ahead, we are targeting a step change in shifting HSSE behaviours The emphasis is on collectively striving for zero harm to colleagues, contractors and communities; business partners
and our customers; property and the environment This is our Vision Zero goal, which will guide everything we do
It will require embedding our strong health and safety culture even more strongly throughout Puma Energy It will mean making it an even more active part of people’s everyday lives, so that everyone truly owns health and safety It will involve making more and better use of leading indicators – more granularity in terms of near-misses, nonconformances, unsafe practices or conditions – so we can put in place more deliberate and targeted preventative measures going forward
Vision Zero is our unequivocal ambition and we are looking forward to making it real
We are targeting a step change in shifting HSSE behaviours The emphasis is on collectively striving for zero harm to colleagues, contractors and communities; business partners and our customers; property and the environment
HEALTH AND SAFETY
7 8
PUMA ENERGY ANNUAL REPORT 2020
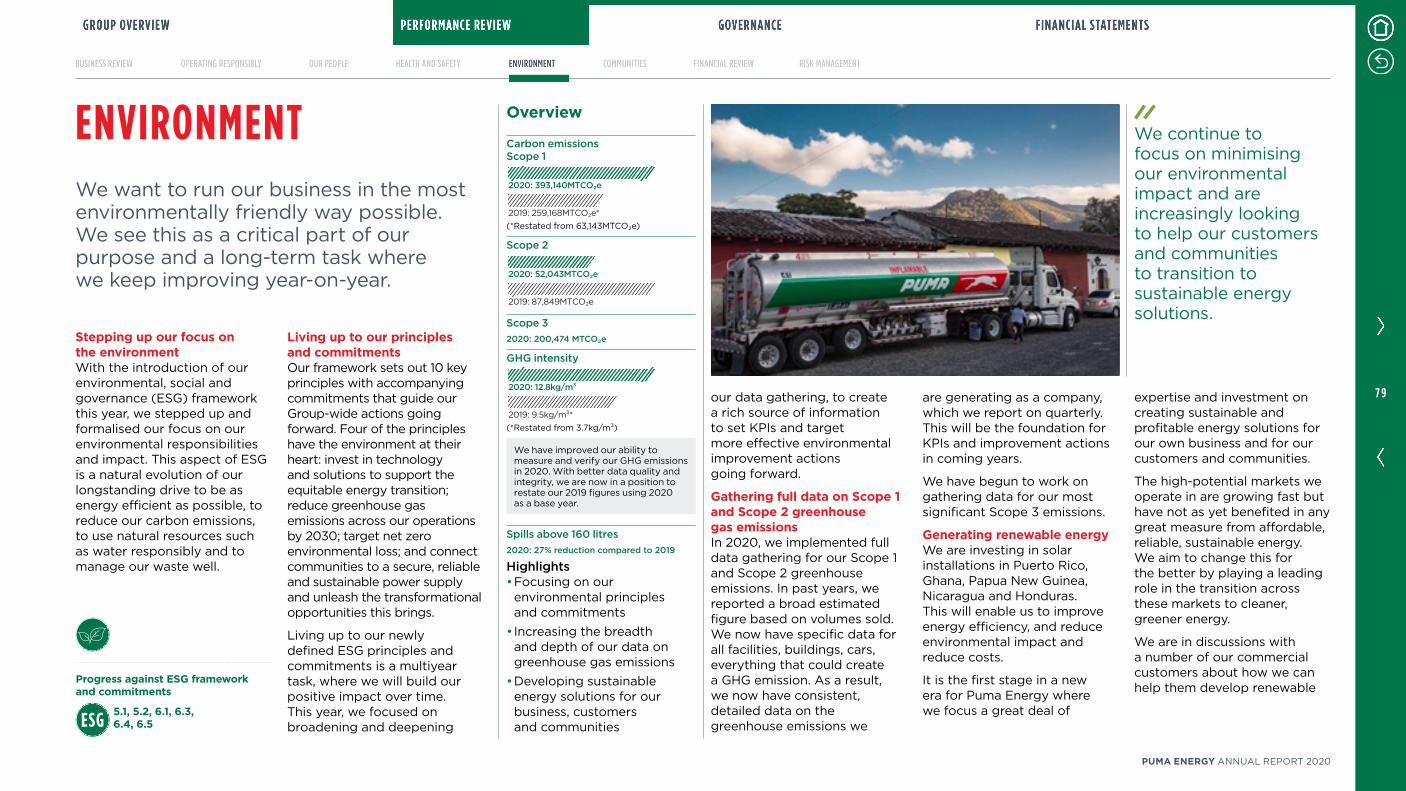
Progress against ESG framework and commitments
5.1, 5.2, 6.1, 6.3, 6.4, 6.5
expertise and investment on creating sustainable and profitable energy solutions for our own business and for our customers and communities
The high-potential markets we operate in are growing fast but have not as yet benefited in any great measure from affordable, reliable, sustainable energy We aim to change this for the better by playing a leading role in the transition across these markets to cleaner, greener energy
We are in discussions with a number of our commercial customers about how we can help them develop renewable
Stepping up our focus on the environmentWith the introduction of our environmental, social and governance (ESG) framework this year, we stepped up and formalised our focus on our environmental responsibilities and impact This aspect of ESG is a natural evolution of our longstanding drive to be as energy efficient as possible, to reduce our carbon emissions, to use natural resources such as water responsibly and to manage our waste well
Living up to our principles and commitmentsOur framework sets out 10 key principles with accompanying commitments that guide our Group-wide actions going forward Four of the principles have the environment at their heart: invest in technology and solutions to support the equitable energy transition; reduce greenhouse gas emissions across our operations by 2030; target net zero environmental loss; and connect communities to a secure, reliable and sustainable power supply and unleash the transformational opportunities this brings
Living up to our newly defined ESG principles and commitments is a multiyear task, where we will build our positive impact over time This year, we focused on broadening and deepening
We want to run our business in the most environmentally friendly way possible We see this as a critical part of our purpose and a long-term task where we keep improving year-on-year
ENVIRONMENT
our data gathering, to create a rich source of information to set KPIs and target more effective environmental improvement actions going forward
Gathering full data on Scope 1 and Scope 2 greenhouse gas emissionsIn 2020, we implemented full data gathering for our Scope 1 and Scope 2 greenhouse emissions In past years, we reported a broad estimated figure based on volumes sold We now have specific data for all facilities, buildings, cars, everything that could create a GHG emission As a result, we now have consistent, detailed data on the greenhouse emissions we
are generating as a company, which we report on quarterly This will be the foundation for KPIs and improvement actions in coming years
We have begun to work on gathering data for our most significant Scope 3 emissions
Generating renewable energyWe are investing in solar installations in Puerto Rico, Ghana, Papua New Guinea, Nicaragua and Honduras This will enable us to improve energy efficiency, and reduce environmental impact and reduce costs
It is the first stage in a new era for Puma Energy where we focus a great deal of
We continue to focus on minimising our environmental impact and are increasingly looking to help our customers and communities to transition to sustainable energy solutions
Overview
Carbon emissions Scope 1
2020: 393,140MTCO2e
2019: 259,168MTCO2e*(*Restated from 63,143MTCO₂e)
Scope 2
2020: 52,043MTCO2e
2019: 87,849MTCO2e
Scope 3 2020: 200,474 MTCO₂e
GHG intensity
2020: 12.8kg/m3
2019: 9.5kg/m3*(*Restated from 37kg/m³)
We have improved our ability to measure and verify our GHG emissions in 2020 With better data quality and integrity, we are now in a position to restate our 2019 figures using 2020 as a base year
Spills above 160 litres2020: 27% reduction compared to 2019
Highlights• Focusing on our environmental principles and commitments
• Increasing the breadth and depth of our data on greenhouse gas emissions
• Developing sustainable energy solutions for our business, customers and communities
7 9
PUMA ENERGY ANNUAL REPORT 2020
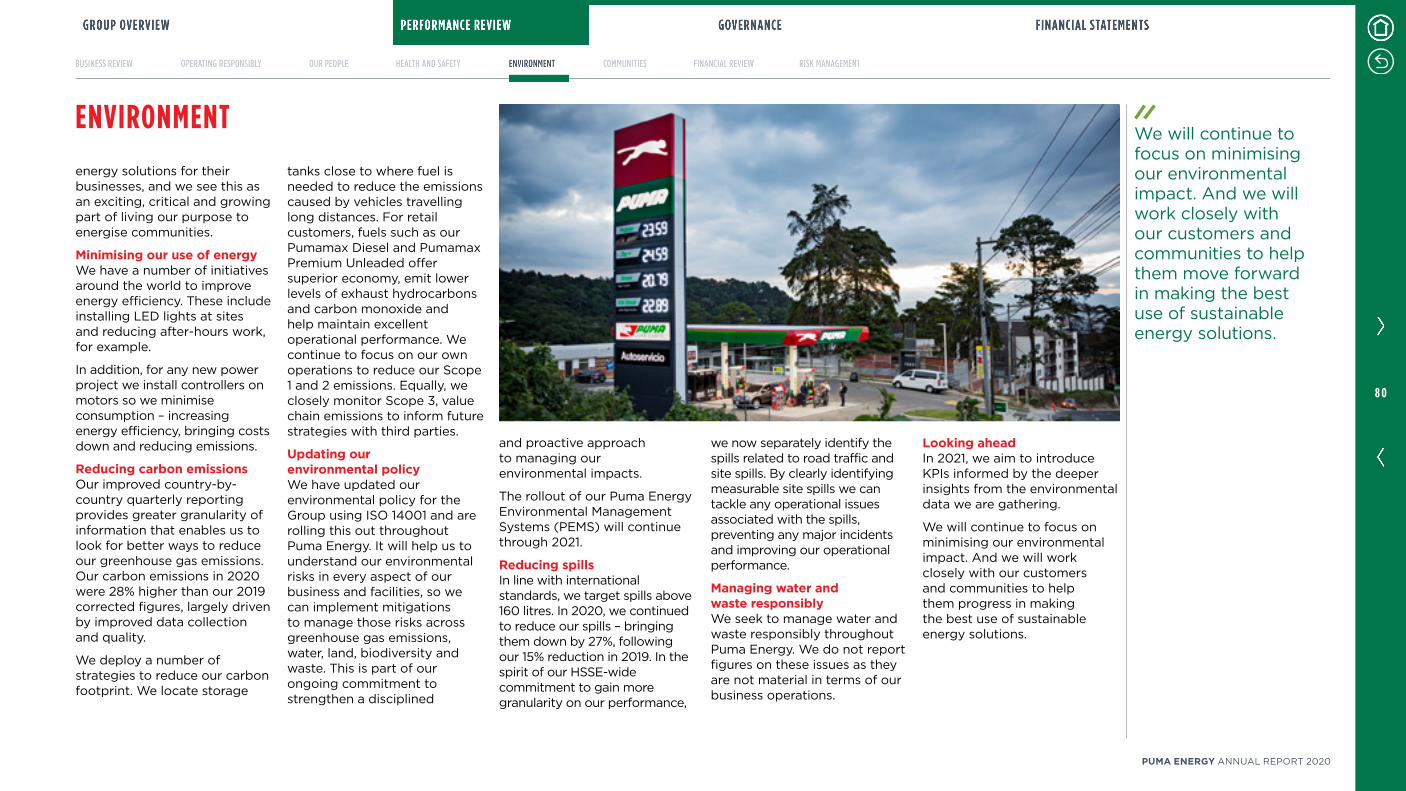
energy solutions for their businesses, and we see this as an exciting, critical and growing part of living our purpose to energise communities
Minimising our use of energyWe have a number of initiatives around the world to improve energy efficiency These include installing LED lights at sites and reducing after-hours work, for example
In addition, for any new power project we install controllers on motors so we minimise consumption – increasing energy efficiency, bringing costs down and reducing emissions
Reducing carbon emissionsOur improved country-by-country quarterly reporting provides greater granularity of information that enables us to look for better ways to reduce our greenhouse gas emissions Our carbon emissions in 2020 were 28% higher than our 2019 corrected figures, largely driven by improved data collection and quality
We deploy a number of strategies to reduce our carbon footprint We locate storage
tanks close to where fuel is needed to reduce the emissions caused by vehicles travelling long distances For retail customers, fuels such as our Pumamax Diesel and Pumamax Premium Unleaded offer superior economy, emit lower levels of exhaust hydrocarbons and carbon monoxide and help maintain excellent operational performance We continue to focus on our own operations to reduce our Scope 1 and 2 emissions Equally, we closely monitor Scope 3, value chain emissions to inform future strategies with third parties
Updating our environmental policyWe have updated our environmental policy for the Group using ISO 14001 and are rolling this out throughout Puma Energy It will help us to understand our environmental risks in every aspect of our business and facilities, so we can implement mitigations to manage those risks across greenhouse gas emissions, water, land, biodiversity and waste This is part of our ongoing commitment to strengthen a disciplined
and proactive approach to managing our environmental impacts
The rollout of our Puma Energy Environmental Management Systems (PEMS) will continue through 2021
Reducing spills In line with international standards, we target spills above 160 litres In 2020, we continued to reduce our spills – bringing them down by 27%, following our 15% reduction in 2019 In the spirit of our HSSE-wide commitment to gain more granularity on our performance,
we now separately identify the spills related to road traffic and site spills By clearly identifying measurable site spills we can tackle any operational issues associated with the spills, preventing any major incidents and improving our operational performance
Managing water and waste responsibly We seek to manage water and waste responsibly throughout Puma Energy We do not report figures on these issues as they are not material in terms of our business operations
Looking aheadIn 2021, we aim to introduce KPIs informed by the deeper insights from the environmental data we are gathering
We will continue to focus on minimising our environmental impact And we will work closely with our customers and communities to help them progress in making the best use of sustainable energy solutions
ENVIRONMENT We will continue to focus on minimising our environmental impact And we will work closely with our customers and communities to help them move forward in making the best use of sustainable energy solutions
8 0
PUMA ENERGY ANNUAL REPORT 2020
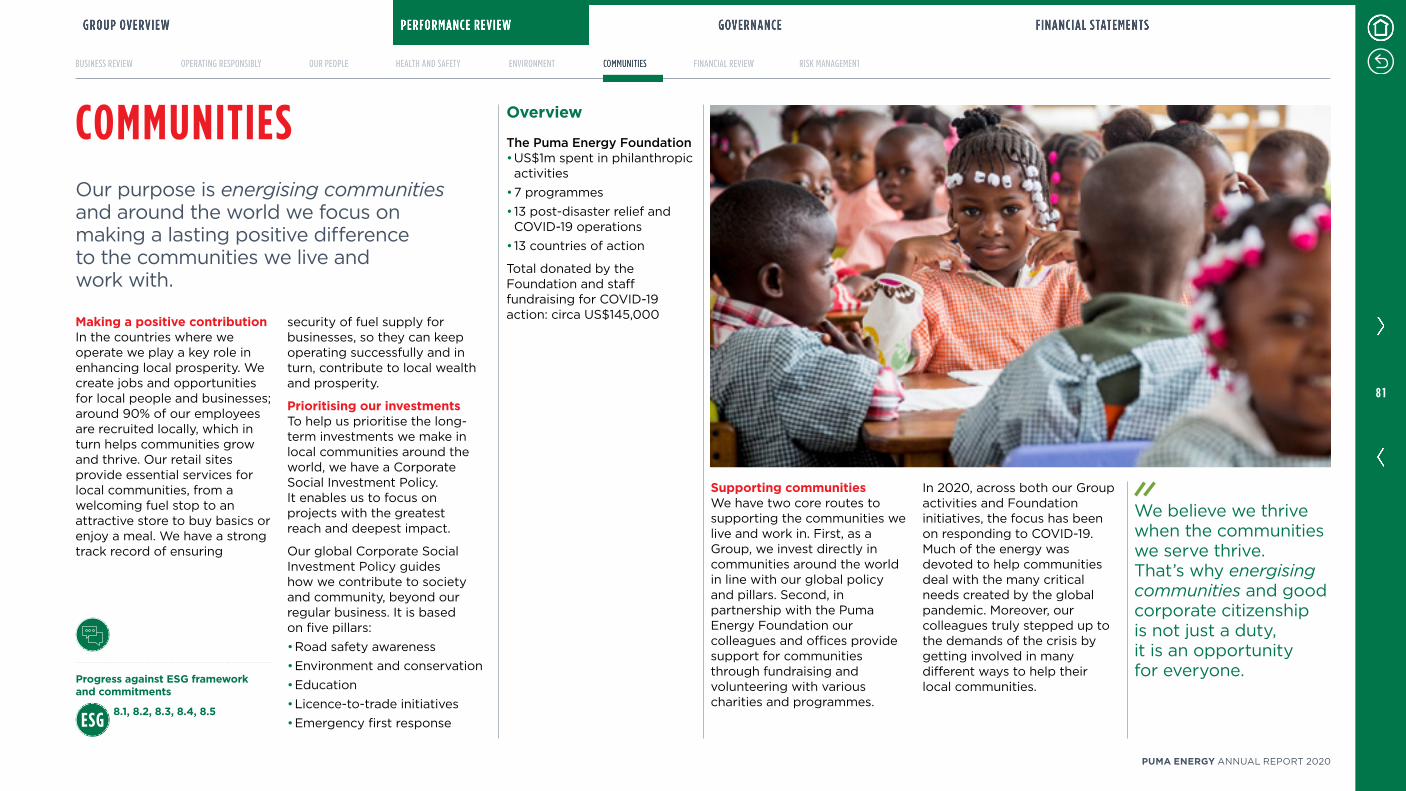
Progress against ESG framework and commitments
8.1, 8.2, 8.3, 8.4, 8.5
Supporting communitiesWe have two core routes to supporting the communities we live and work in First, as a Group, we invest directly in communities around the world in line with our global policy and pillars Second, in partnership with the Puma Energy Foundation our colleagues and offices provide support for communities through fundraising and volunteering with various charities and programmes
In 2020, across both our Group activities and Foundation initiatives, the focus has been on responding to COVID-19 Much of the energy was devoted to help communities deal with the many critical needs created by the global pandemic Moreover, our colleagues truly stepped up to the demands of the crisis by getting involved in many different ways to help their local communities
Overview
The Puma Energy Foundation• US$1m spent in philanthropic activities
• 7 programmes• 13 post-disaster relief and COVID-19 operations
• 13 countries of action
Total donated by the Foundation and staff fundraising for COVID-19 action: circa US$145,000
We believe we thrive when the communities we serve thrive That’s why energising communities and good corporate citizenship is not just a duty, it is an opportunity for everyone
COMMUNITIES
Making a positive contributionIn the countries where we operate we play a key role in enhancing local prosperity We create jobs and opportunities for local people and businesses; around 90% of our employees are recruited locally, which in turn helps communities grow and thrive Our retail sites provide essential services for local communities, from a welcoming fuel stop to an attractive store to buy basics or enjoy a meal We have a strong track record of ensuring
security of fuel supply for businesses, so they can keep operating successfully and in turn, contribute to local wealth and prosperity
Prioritising our investments To help us prioritise the long-term investments we make in local communities around the world, we have a Corporate Social Investment Policy It enables us to focus on projects with the greatest reach and deepest impact
Our global Corporate Social Investment Policy guides how we contribute to society and community, beyond our regular business It is based on five pillars: • Road safety awareness• Environment and conservation• Education• Licence-to-trade initiatives• Emergency first response
Our purpose is energising communities and around the world we focus on making a lasting positive difference to the communities we live and work with
8 1
PUMA ENERGY ANNUAL REPORT 2020
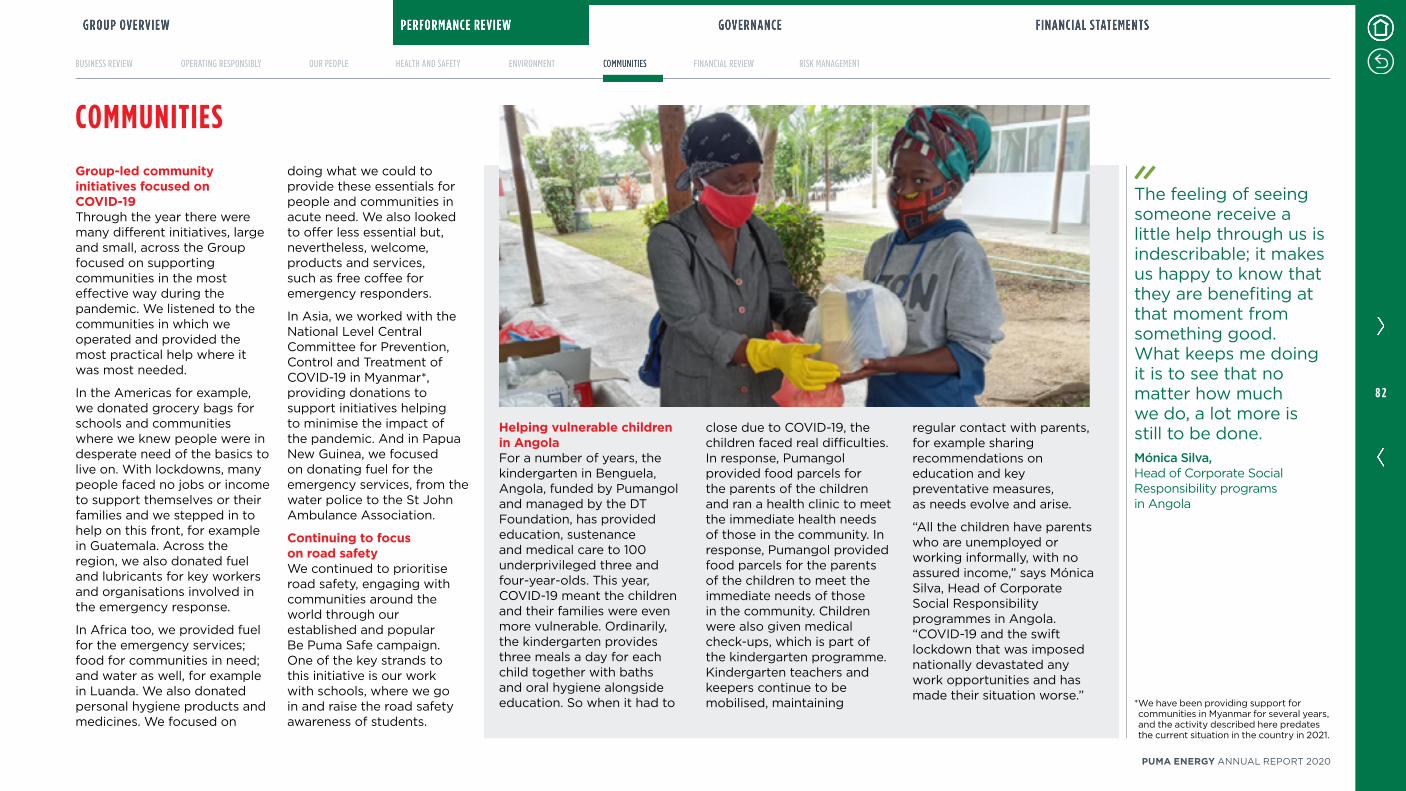
doing what we could to provide these essentials for people and communities in acute need We also looked to offer less essential but, nevertheless, welcome, products and services, such as free coffee for emergency responders
In Asia, we worked with the National Level Central Committee for Prevention, Control and Treatment of COVID-19 in Myanmar*, providing donations to support initiatives helping to minimise the impact of the pandemic And in Papua New Guinea, we focused on donating fuel for the emergency services, from the water police to the St John Ambulance Association
Continuing to focus on road safetyWe continued to prioritise road safety, engaging with communities around the world through our established and popular Be Puma Safe campaign One of the key strands to this initiative is our work with schools, where we go in and raise the road safety awareness of students
The feeling of seeing someone receive a little help through us is indescribable; it makes us happy to know that they are benefiting at that moment from something good What keeps me doing it is to see that no matter how much we do, a lot more is still to be doneMónica Silva,Head of Corporate Social Responsibility programs in Angola
Group-led community initiatives focused on COVID-19Through the year there were many different initiatives, large and small, across the Group focused on supporting communities in the most effective way during the pandemic We listened to the communities in which we operated and provided the most practical help where it was most needed
In the Americas for example, we donated grocery bags for schools and communities where we knew people were in desperate need of the basics to live on With lockdowns, many people faced no jobs or income to support themselves or their families and we stepped in to help on this front, for example in Guatemala Across the region, we also donated fuel and lubricants for key workers and organisations involved in the emergency response
In Africa too, we provided fuel for the emergency services; food for communities in need; and water as well, for example in Luanda We also donated personal hygiene products and medicines We focused on
COMMUNITIES
Helping vulnerable children in Angola For a number of years, the kindergarten in Benguela, Angola, funded by Pumangol and managed by the DT Foundation, has provided education, sustenance and medical care to 100 underprivileged three and four-year-olds This year, COVID-19 meant the children and their families were even more vulnerable Ordinarily, the kindergarten provides three meals a day for each child together with baths and oral hygiene alongside education So when it had to
close due to COVID-19, the children faced real difficulties In response, Pumangol provided food parcels for the parents of the children and ran a health clinic to meet the immediate health needs of those in the community In response, Pumangol provided food parcels for the parents of the children to meet the immediate needs of those in the community Children were also given medical check-ups, which is part of the kindergarten programme Kindergarten teachers and keepers continue to be mobilised, maintaining
regular contact with parents, for example sharing recommendations on education and key preventative measures, as needs evolve and arise
“All the children have parents who are unemployed or working informally, with no assured income,” says Mónica Silva, Head of Corporate Social Responsibility programmes in Angola “COVID-19 and the swift lockdown that was imposed nationally devastated any work opportunities and has made their situation worse”
* We have been providing support for communities in Myanmar for several years, and the activity described here predates the current situation in the country in 2021
8 2
PUMA ENERGY ANNUAL REPORT 2020
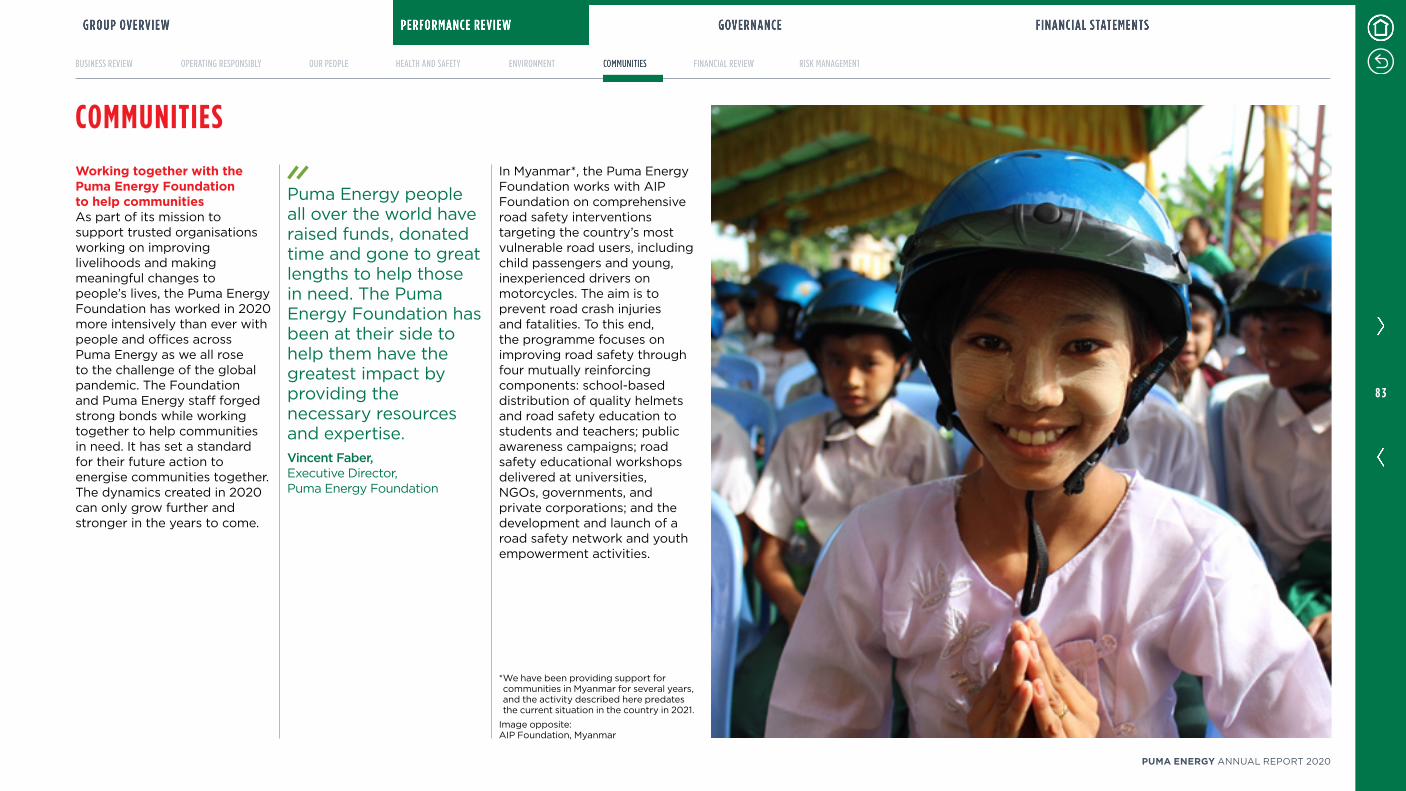
Puma Energy people all over the world have raised funds, donated time and gone to great lengths to help those in need The Puma Energy Foundation has been at their side to help them have the greatest impact by providing the necessary resources and expertiseVincent Faber,Executive Director, Puma Energy Foundation
Working together with the Puma Energy Foundation to help communitiesAs part of its mission to support trusted organisations working on improving livelihoods and making meaningful changes to people’s lives, the Puma Energy Foundation has worked in 2020 more intensively than ever with people and offices across Puma Energy as we all rose to the challenge of the global pandemic The Foundation and Puma Energy staff forged strong bonds while working together to help communities in need It has set a standard for their future action to energise communities together The dynamics created in 2020 can only grow further and stronger in the years to come
In Myanmar*, the Puma Energy Foundation works with AIP Foundation on comprehensive road safety interventions targeting the country’s most vulnerable road users, including child passengers and young, inexperienced drivers on motorcycles The aim is to prevent road crash injuries and fatalities To this end, the programme focuses on improving road safety through four mutually reinforcing components: school-based distribution of quality helmets and road safety education to students and teachers; public awareness campaigns; road safety educational workshops delivered at universities, NGOs, governments, and private corporations; and the development and launch of a road safety network and youth empowerment activities
COMMUNITIES
* We have been providing support for communities in Myanmar for several years, and the activity described here predates the current situation in the country in 2021
Image opposite: AIP Foundation, Myanmar
8 3
PUMA ENERGY ANNUAL REPORT 2020
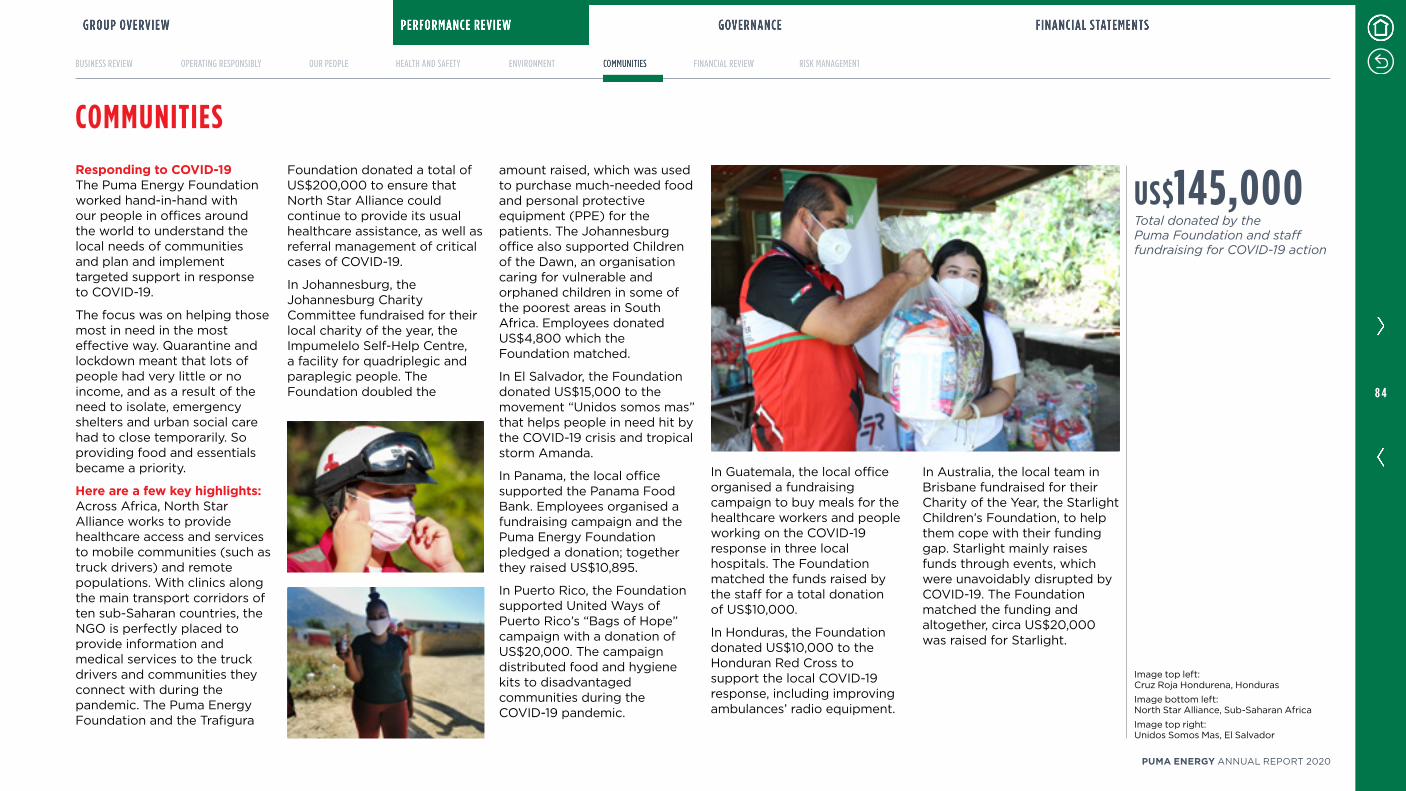
Responding to COVID-19The Puma Energy Foundation worked hand-in-hand with our people in offices around the world to understand the local needs of communities and plan and implement targeted support in response to COVID-19
The focus was on helping those most in need in the most effective way Quarantine and lockdown meant that lots of people had very little or no income, and as a result of the need to isolate, emergency shelters and urban social care had to close temporarily So providing food and essentials became a priority
Here are a few key highlights:Across Africa, North Star Alliance works to provide healthcare access and services to mobile communities (such as truck drivers) and remote populations With clinics along the main transport corridors of ten sub-Saharan countries, the NGO is perfectly placed to provide information and medical services to the truck drivers and communities they connect with during the pandemic The Puma Energy Foundation and the Trafigura
Foundation donated a total of US$200,000 to ensure that North Star Alliance could continue to provide its usual healthcare assistance, as well as referral management of critical cases of COVID-19
In Johannesburg, the Johannesburg Charity Committee fundraised for their local charity of the year, the Impumelelo Self-Help Centre, a facility for quadriplegic and paraplegic people The Foundation doubled the
amount raised, which was used to purchase much-needed food and personal protective equipment (PPE) for the patients The Johannesburg office also supported Children of the Dawn, an organisation caring for vulnerable and orphaned children in some of the poorest areas in South Africa Employees donated US$4,800 which the Foundation matched
In El Salvador, the Foundation donated US$15,000 to the movement “Unidos somos mas” that helps people in need hit by the COVID-19 crisis and tropical storm Amanda
In Panama, the local office supported the Panama Food Bank Employees organised a fundraising campaign and the Puma Energy Foundation pledged a donation; together they raised US$10,895
In Puerto Rico, the Foundation supported United Ways of Puerto Rico’s “Bags of Hope” campaign with a donation of US$20,000 The campaign distributed food and hygiene kits to disadvantaged communities during the COVID-19 pandemic
In Guatemala, the local office organised a fundraising campaign to buy meals for the healthcare workers and people working on the COVID-19 response in three local hospitals The Foundation matched the funds raised by the staff for a total donation of US$10,000
In Honduras, the Foundation donated US$10,000 to the Honduran Red Cross to support the local COVID-19 response, including improving ambulances’ radio equipment
In Australia, the local team in Brisbane fundraised for their Charity of the Year, the Starlight Children’s Foundation, to help them cope with their funding gap Starlight mainly raises funds through events, which were unavoidably disrupted by COVID-19 The Foundation matched the funding and altogether, circa US$20,000 was raised for Starlight
US$145,000Total donated by the Puma Foundation and staff fundraising for COVID-19 action
COMMUNITIES
Image top left: Cruz Roja Hondurena, Honduras
Image bottom left: North Star Alliance, Sub-Saharan Africa
Image top right: Unidos Somos Mas, El Salvador
8 4
PUMA ENERGY ANNUAL REPORT 2020
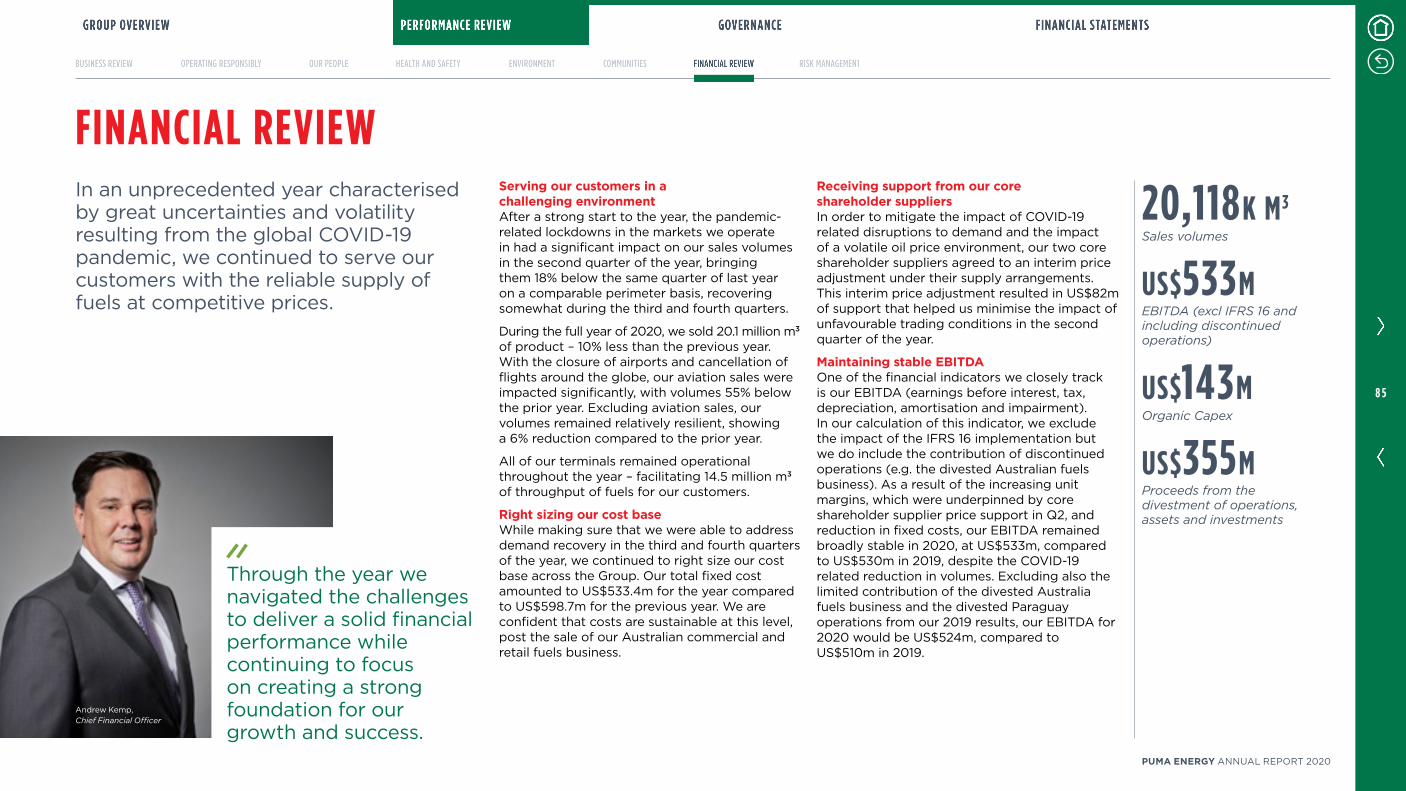
FINANCIAL REVIEWIn an unprecedented year characterised by great uncertainties and volatility resulting from the global COVID-19 pandemic, we continued to serve our customers with the reliable supply of fuels at competitive prices
Through the year we navigated the challenges to deliver a solid financial performance while continuing to focus on creating a strong foundation for our growth and success
Serving our customers in a challenging environmentAfter a strong start to the year, the pandemic-related lockdowns in the markets we operate in had a significant impact on our sales volumes in the second quarter of the year, bringing them 18% below the same quarter of last year on a comparable perimeter basis, recovering somewhat during the third and fourth quarters
During the full year of 2020, we sold 201 million m3 of product – 10% less than the previous year With the closure of airports and cancellation of flights around the globe, our aviation sales were impacted significantly, with volumes 55% below the prior year Excluding aviation sales, our volumes remained relatively resilient, showing a 6% reduction compared to the prior year
All of our terminals remained operational throughout the year – facilitating 145 million m3 of throughput of fuels for our customers
Right sizing our cost baseWhile making sure that we were able to address demand recovery in the third and fourth quarters of the year, we continued to right size our cost base across the Group Our total fixed cost amounted to US$5334m for the year compared to US$5987m for the previous year We are confident that costs are sustainable at this level, post the sale of our Australian commercial and retail fuels business
Receiving support from our core shareholder suppliersIn order to mitigate the impact of COVID-19 related disruptions to demand and the impact of a volatile oil price environment, our two core shareholder suppliers agreed to an interim price adjustment under their supply arrangements This interim price adjustment resulted in US$82m of support that helped us minimise the impact of unfavourable trading conditions in the second quarter of the year
Maintaining stable EBITDAOne of the financial indicators we closely track is our EBITDA (earnings before interest, tax, depreciation, amortisation and impairment) In our calculation of this indicator, we exclude the impact of the IFRS 16 implementation but we do include the contribution of discontinued operations (eg the divested Australian fuels business) As a result of the increasing unit margins, which were underpinned by core shareholder supplier price support in Q2, and reduction in fixed costs, our EBITDA remained broadly stable in 2020, at US$533m, compared to US$530m in 2019, despite the COVID-19 related reduction in volumes Excluding also the limited contribution of the divested Australia fuels business and the divested Paraguay operations from our 2019 results, our EBITDA for 2020 would be US$524m, compared to US$510m in 2019
20,118K M3
Sales volumes
US$533MEBITDA (excl IFRS 16 and including discontinued operations)
US$143MOrganic Capex
US$355MProceeds from the divestment of operations, assets and investments
Andrew Kemp, Chief Financial Officer
8 5
PUMA ENERGY ANNUAL REPORT 2020
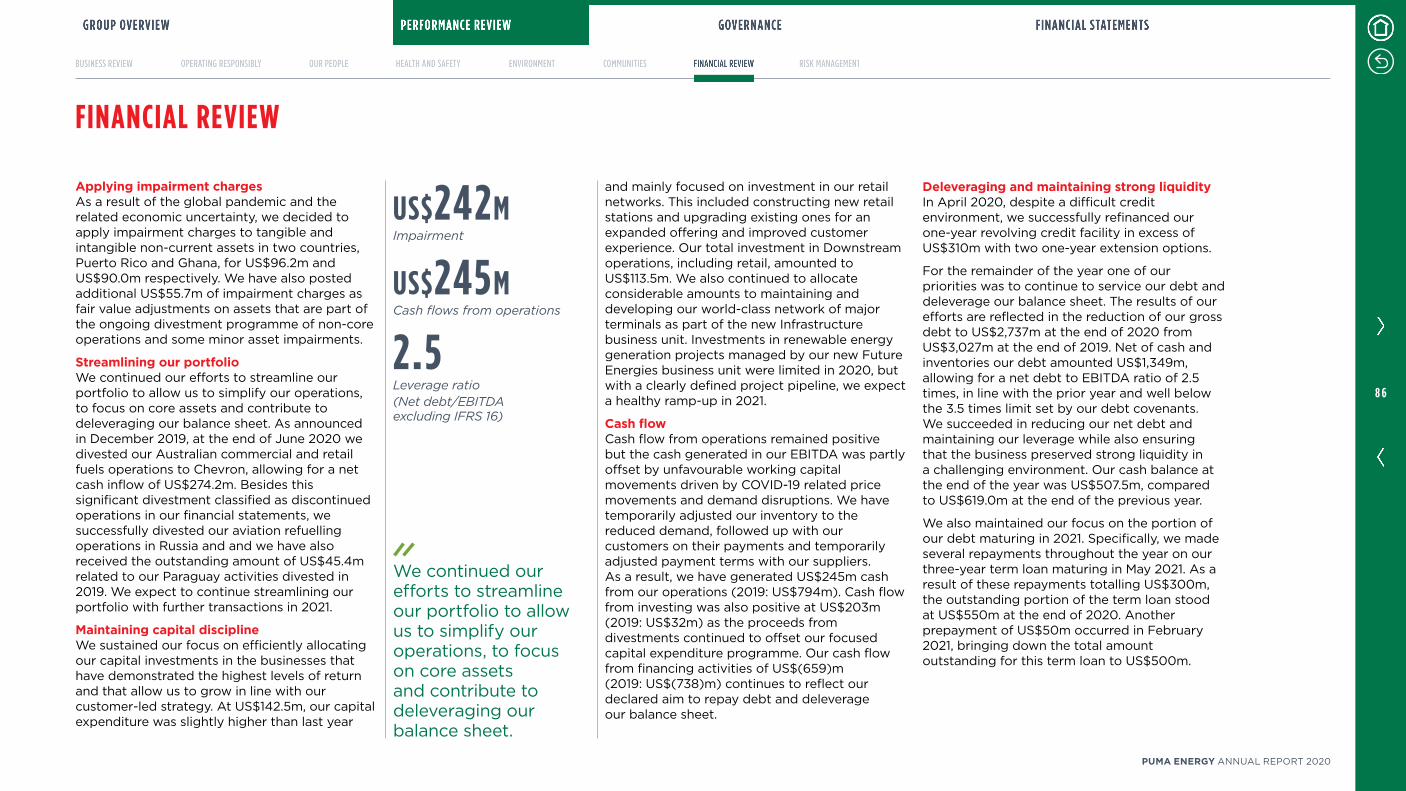
FINANCIAL REVIEW
Applying impairment chargesAs a result of the global pandemic and the related economic uncertainty, we decided to apply impairment charges to tangible and intangible non-current assets in two countries, Puerto Rico and Ghana, for US$962m and US$900m respectively We have also posted additional US$557m of impairment charges as fair value adjustments on assets that are part of the ongoing divestment programme of non-core operations and some minor asset impairments
Streamlining our portfolioWe continued our efforts to streamline our portfolio to allow us to simplify our operations, to focus on core assets and contribute to deleveraging our balance sheet As announced in December 2019, at the end of June 2020 we divested our Australian commercial and retail fuels operations to Chevron, allowing for a net cash inflow of US$2742m Besides this significant divestment classified as discontinued operations in our financial statements, we successfully divested our aviation refuelling operations in Russia and and we have also received the outstanding amount of US$454m related to our Paraguay activities divested in 2019 We expect to continue streamlining our portfolio with further transactions in 2021
Maintaining capital disciplineWe sustained our focus on efficiently allocating our capital investments in the businesses that have demonstrated the highest levels of return and that allow us to grow in line with our customer-led strategy At US$1425m, our capital expenditure was slightly higher than last year
and mainly focused on investment in our retail networks This included constructing new retail stations and upgrading existing ones for an expanded offering and improved customer experience Our total investment in Downstream operations, including retail, amounted to US$1135m We also continued to allocate considerable amounts to maintaining and developing our world-class network of major terminals as part of the new Infrastructure business unit Investments in renewable energy generation projects managed by our new Future Energies business unit were limited in 2020, but with a clearly defined project pipeline, we expect a healthy ramp-up in 2021
Cash flowCash flow from operations remained positive but the cash generated in our EBITDA was partly offset by unfavourable working capital movements driven by COVID-19 related price movements and demand disruptions We have temporarily adjusted our inventory to the reduced demand, followed up with our customers on their payments and temporarily adjusted payment terms with our suppliers As a result, we have generated US$245m cash from our operations (2019: US$794m) Cash flow from investing was also positive at US$203m (2019: US$32m) as the proceeds from divestments continued to offset our focused capital expenditure programme Our cash flow from financing activities of US$(659)m (2019: US$(738)m) continues to reflect our declared aim to repay debt and deleverage our balance sheet
Deleveraging and maintaining strong liquidity In April 2020, despite a difficult credit environment, we successfully refinanced our one-year revolving credit facility in excess of US$310m with two one-year extension options
For the remainder of the year one of our priorities was to continue to service our debt and deleverage our balance sheet The results of our efforts are reflected in the reduction of our gross debt to US$2,737m at the end of 2020 from US$3,027m at the end of 2019 Net of cash and inventories our debt amounted US$1,349m, allowing for a net debt to EBITDA ratio of 25 times, in line with the prior year and well below the 35 times limit set by our debt covenants We succeeded in reducing our net debt and maintaining our leverage while also ensuring that the business preserved strong liquidity in a challenging environment Our cash balance at the end of the year was US$5075m, compared to US$6190m at the end of the previous year
We also maintained our focus on the portion of our debt maturing in 2021 Specifically, we made several repayments throughout the year on our three-year term loan maturing in May 2021 As a result of these repayments totalling US$300m, the outstanding portion of the term loan stood at US$550m at the end of 2020 Another prepayment of US$50m occurred in February 2021, bringing down the total amount outstanding for this term loan to US$500m
We continued our efforts to streamline our portfolio to allow us to simplify our operations, to focus on core assets and contribute to deleveraging our balance sheet
US$242MImpairment
US$245MCash flows from operations
2.5Leverage ratio(Net debt/EBITDA excluding IFRS 16)
8 6
PUMA ENERGY ANNUAL REPORT 2020

RISK MANAGEMENT
To this end, we take a rigorous and robust approach to managing our risks, including ensuring that we not only have strong structures and processes in place but also a clear and up-to-date view of our current risk landscape
Ensuring strong risk governanceOur risk governance structure is designed to ensure we continue to provide clear business ownership and oversight, helping us make the right decisions at the right time Regional and Country Risk Champions provide support to leaders in embedding the risk management programme They also provide risk advice, as well as coordinating, facilitating and periodically reviewing the risk management process
Our Risk Management Framework enables us to deploy our mitigation strategy, helping us deliver financial targets, enhance our reputation, safeguard our employees and assets, and protect future financial security
Governance and culture Governance sets the Group’s tone, reinforcing the importance of, and establishing oversight responsibilities for, our risk management Culture describes our ethical values, desired behaviours and the understanding of risk in our business entities
Strategy and objective-settingWe combine enterprise risk management, strategy and objective-setting during our strategic planning process Our risk appetite is established and
aligned with strategy; we put our strategy into practice through our business objectives, which serve as a basis for identifying, assessing, and responding to risk
PerformanceWe need to identify and assess risks that may affect the achievement of our strategy and business objectives Risks are prioritised by severity and we then select the appropriate risk responses The results of this are reported to key risk stakeholders
Review and revisionBy reviewing the performance of our business entities, the Group can consider how well the risk management components are functioning over time, against a backdrop of what can be substantial changes, and assess what revisions are needed
Information, communication and reporting
Review and revision Performance
Governance and culture
Strategy and objective-setting
Ensuring strong risk governance
We align our risk management closely to our purpose and strategy and the world we live and work in We see this a core part of being a dynamic and responsible high-growth business committed to energising communities
Applying our risk management principlesWe have a clear and established set of risk management principles which we apply throughout the business:
8 7
PUMA ENERGY ANNUAL REPORT 2020
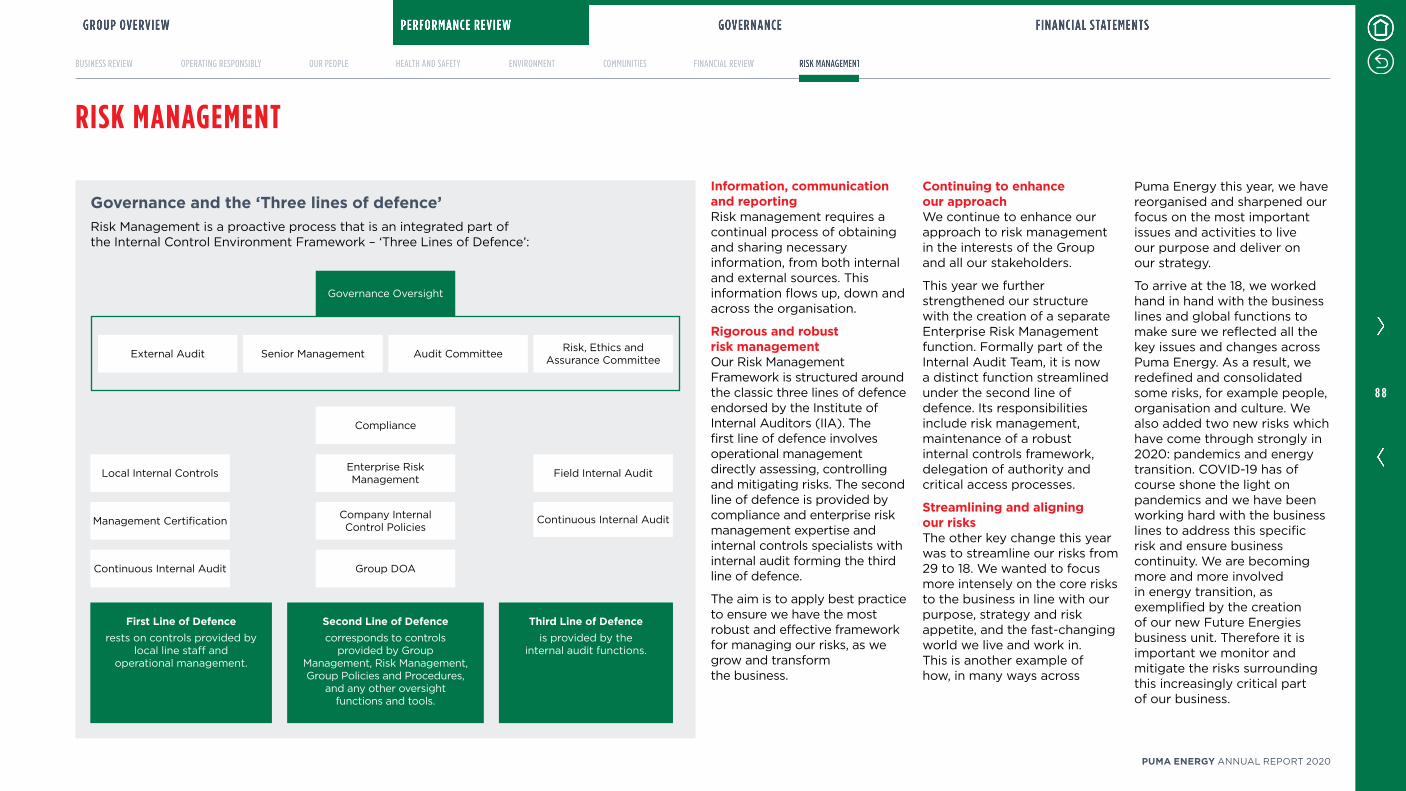
RISK MANAGEMENT
Information, communication and reportingRisk management requires a continual process of obtaining and sharing necessary information, from both internal and external sources This information flows up, down and across the organisation
Rigorous and robust risk managementOur Risk Management Framework is structured around the classic three lines of defence endorsed by the Institute of Internal Auditors (IIA) The first line of defence involves operational management directly assessing, controlling and mitigating risks The second line of defence is provided by compliance and enterprise risk management expertise and internal controls specialists with internal audit forming the third line of defence
The aim is to apply best practice to ensure we have the most robust and effective framework for managing our risks, as we grow and transform the business
Continuing to enhance our approachWe continue to enhance our approach to risk management in the interests of the Group and all our stakeholders
This year we further strengthened our structure with the creation of a separate Enterprise Risk Management function Formally part of the Internal Audit Team, it is now a distinct function streamlined under the second line of defence Its responsibilities include risk management, maintenance of a robust internal controls framework, delegation of authority and critical access processes
Streamlining and aligning our risksThe other key change this year was to streamline our risks from 29 to 18 We wanted to focus more intensely on the core risks to the business in line with our purpose, strategy and risk appetite, and the fast-changing world we live and work in This is another example of how, in many ways across
Puma Energy this year, we have reorganised and sharpened our focus on the most important issues and activities to live our purpose and deliver on our strategy
To arrive at the 18, we worked hand in hand with the business lines and global functions to make sure we reflected all the key issues and changes across Puma Energy As a result, we redefined and consolidated some risks, for example people, organisation and culture We also added two new risks which have come through strongly in 2020: pandemics and energy transition COVID-19 has of course shone the light on pandemics and we have been working hard with the business lines to address this specific risk and ensure business continuity We are becoming more and more involved in energy transition, as exemplified by the creation of our new Future Energies business unit Therefore it is important we monitor and mitigate the risks surrounding this increasingly critical part of our business
Governance and the ‘Three lines of defence’Risk Management is a proactive process that is an integrated part of the Internal Control Environment Framework – ‘Three Lines of Defence’:
First Line of Defencerests on controls provided by
local line staff and operational management
Second Line of Defencecorresponds to controls
provided by Group Management, Risk Management, Group Policies and Procedures,
and any other oversight functions and tools
Third Line of Defenceis provided by the
internal audit functions
Senior Management Risk, Ethics and Assurance CommitteeExternal Audit Audit Committee
Governance Oversight
Local Internal Controls Enterprise Risk Management Field Internal Audit
Management Certification Company Internal Control Policies
Group DOAContinuous Internal Audit
Continuous Internal Audit
Compliance
8 8
PUMA ENERGY ANNUAL REPORT 2020
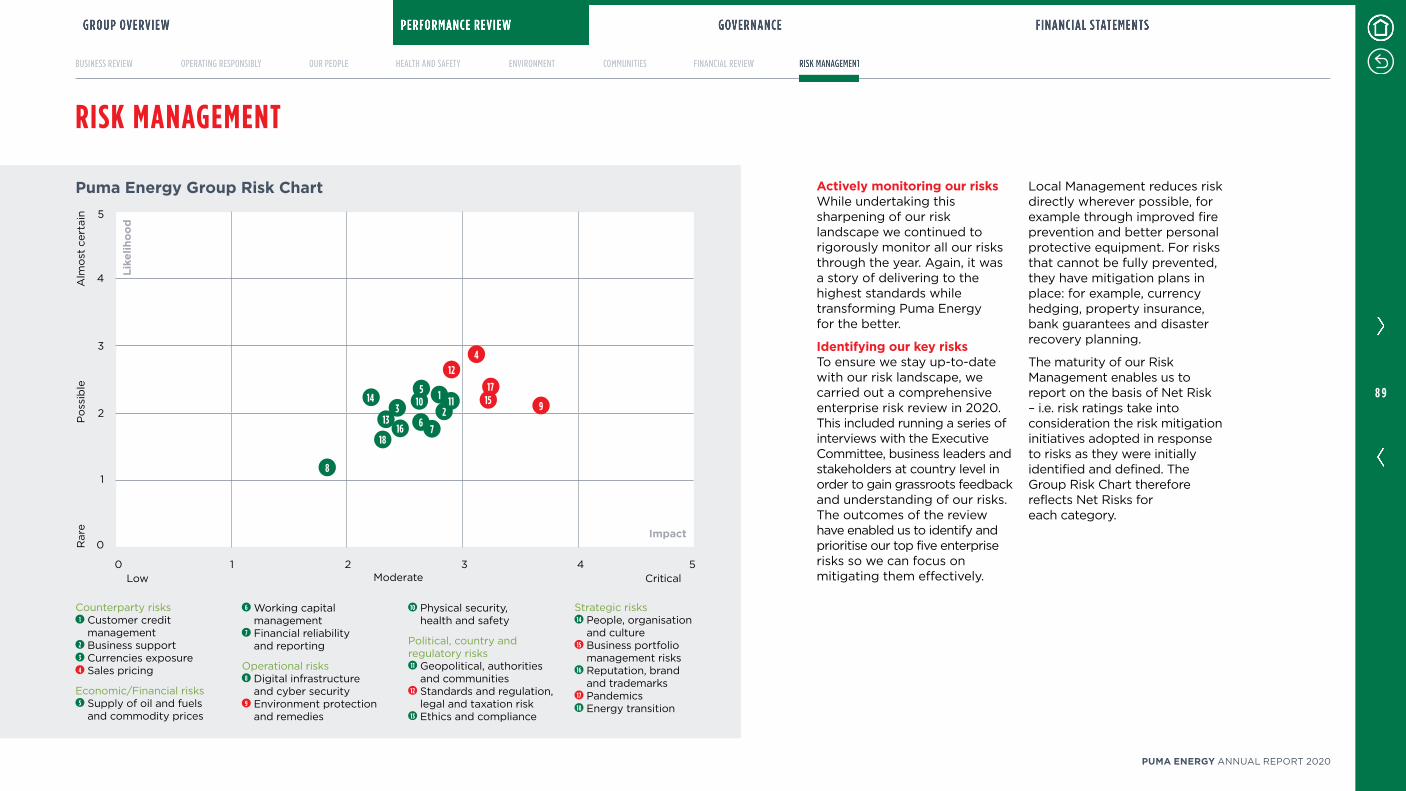
Actively monitoring our risksWhile undertaking this sharpening of our risk landscape we continued to rigorously monitor all our risks through the year Again, it was a story of delivering to the highest standards while transforming Puma Energy for the better
Identifying our key risksTo ensure we stay up-to-date with our risk landscape, we carried out a comprehensive enterprise risk review in 2020 This included running a series of interviews with the Executive Committee, business leaders and stakeholders at country level in order to gain grassroots feedback and understanding of our risks The outcomes of the review have enabled us to identify and prioritise our top five enterprise risks so we can focus on mitigating them effectively
Local Management reduces risk directly wherever possible, for example through improved fire prevention and better personal protective equipment For risks that cannot be fully prevented, they have mitigation plans in place: for example, currency hedging, property insurance, bank guarantees and disaster recovery planning
The maturity of our Risk Management enables us to report on the basis of Net Risk – ie risk ratings take into consideration the risk mitigation initiatives adopted in response to risks as they were initially identified and defined The Group Risk Chart therefore reflects Net Risks for each category
RISK MANAGEMENT
Counterparty risks1 Customer credit
management2 Business support3 Currencies exposure4 Sales pricing
Economic/Financial risks5 Supply of oil and fuels
and commodity prices
6 Working capital management
7 Financial reliability and reporting
Operational risks8 Digital infrastructure
and cyber security9 Environment protection
and remedies
10 Physical security, health and safety
Political, country and regulatory risks
11 Geopolitical, authorities and communities
12 Standards and regulation, legal and taxation risk
13 Ethics and compliance
Strategic risks14 People, organisation
and culture15 Business portfolio
management risks16 Reputation, brand
and trademarks17 Pandemics18 Energy transition
Puma Energy Group Risk Chart
0 1 2 3 4 5
0
1
2
3
4
5
13
4
3 2
12
6
149
8
1017
1816 7
5 1 11 15
Rar
e P
oss
ible
A
lmo
st c
erta
in
ModerateLow Critical
Impact
Like
lihoo
d
8 9
PUMA ENERGY ANNUAL REPORT 2020

1. Counterparty risks: Sales pricingSales pricing is of critical importance to our business performance Indeed, inability to position pricing by segment correctly may result in lost market share and volume-margin imbalance
We ensure the risk is well under control by providing high standards of service, building the Puma Energy brand and introducing customer loyalty initiatives We also ensure tight management on the supply side; together with cost-control policies and procedures on local overheads, we lower the break-even point We actively monitor our competitors and the market and have strategies in place to react to pricing fluctuations
2. Operational risks:Environment protection and remedies risksWe strive to operate in line with international best practice, including where this exceeds local expectations We apply the same strict health, safety and environmental standards across our operations around the world – from manufacturing right through to distribution and delivery We invest in modern equipment, and have well-defined IT security, business continuity and disaster recovery plans in place We also use common ERP (Enterprise Resource Planning) and terminal management applications We use a bespoke safety management system, SAPS (Systems, Application and Products), at all our terminals to monitor the frequency and severity of accidents and lost-time incidents This helps us assess safety levels and identify potential risk factors We are an active member of Oil Spill
Response Ltd, an organisation that shares effective responses to oil spills worldwide ISO accreditation: 60% of our terminals hold ISO 9001 certification and 60% hold ISO 14001 certification In 2020, 94% of our operations were API 650-compliant
Furthermore, we continuously promote Puma Energy’s Safety Management System to improve industrial safety
3. Political, country and regulatory risks:Standards and regulation, legal and taxation riskThe markets we focus on tend to be highly regulated and can feature political instability as well as geopolitical risks such as possible international sanctions We actively monitor financial, regulatory and political developments, both at an international level and through our local businesses, and put in place measures to mitigate these risks Our local employees are well placed to
react promptly to local challenges and opportunities In some jurisdictions, we operate through subsidiaries and joint ventures that are partially owned by state-backed organisations – both a constraint in terms of operating autonomy and an opportunity in terms of political risk management We engage in dialogue with relevant expert third parties and local authorities continually, to promote high standards across our operations and ensure readiness to conform with the legal norms and tax requirements globally In addition, we are well diversified in terms of geographies, lines of business and customers and have a unique expertise in sourcing and supplying a wide range of products, all of which mitigate our political risks Since our foundation in 1997, we have built a successful track record of managing regulatory, public infrastructure and communities risks where
we operate, and have consequently not suffered from any material losses due to these risks
4. Strategic risks:Business portfolio management riskThe Group has a proven track record of successful acquisitions and completion of major construction projects An accurate and proper management of the integration process and the continuous monitoring of costs effectively limit the potential financial losses Lately, strategic decisions also led the Group to divest certain non-performing businesses Additionally, Puma Energy mitigates strategic business portfolio risks that may arise from the loss of key customers, through a large and diversified customer base and long-term relationships with customers
PandemicsPandemics is clearly one of the key risks faced in 2020 We have been successful at keeping the risk under control through effective and timely implementation of our Business continuity protocols while also following Government and Public Health instructions We worked hard at minimising the negative impact on health and safety of our key stakeholders – employees, customers and suppliers and ensured the execution of Puma Energy’s strategic objectives was not compromised even during these unprecedented times
There are some key themes underlying our risk landscape:
RISK MANAGEMENT
9 0
PUMA ENERGY ANNUAL REPORT 2020
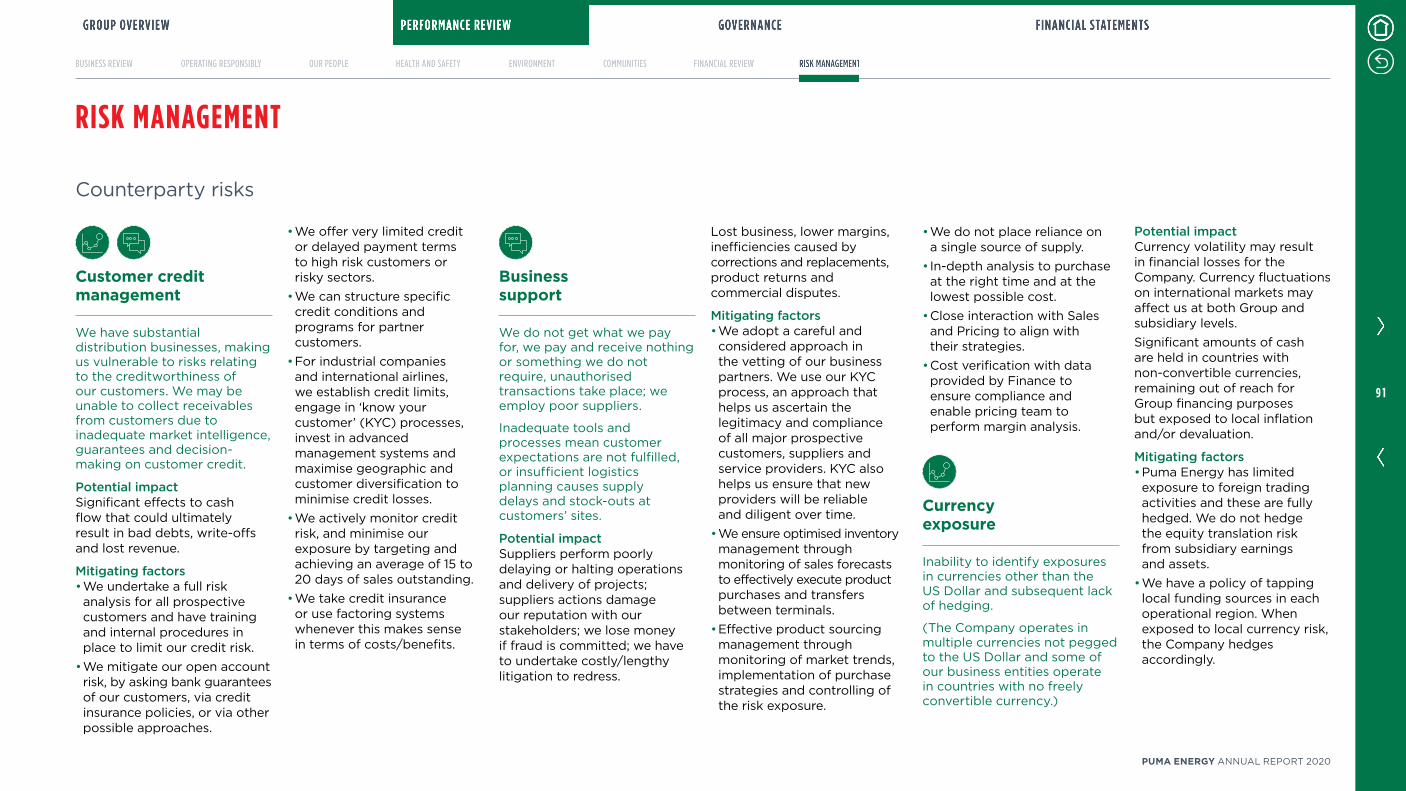
RISK MANAGEMENT
Counterparty risks
Business support
We do not get what we pay for, we pay and receive nothing or something we do not require, unauthorised transactions take place; we employ poor suppliers
Inadequate tools and processes mean customer expectations are not fulfilled, or insufficient logistics planning causes supply delays and stock-outs at customers’ sites
Potential impactSuppliers perform poorly delaying or halting operations and delivery of projects; suppliers actions damage our reputation with our stakeholders; we lose money if fraud is committed; we have to undertake costly/lengthy litigation to redress
Customer credit management
We have substantial distribution businesses, making us vulnerable to risks relating to the creditworthiness of our customers We may be unable to collect receivables from customers due to inadequate market intelligence, guarantees and decision-making on customer credit
Potential impactSignificant effects to cash flow that could ultimately result in bad debts, write-offs and lost revenue
Mitigating factors• We undertake a full risk analysis for all prospective customers and have training and internal procedures in place to limit our credit risk
• We mitigate our open account risk, by asking bank guarantees of our customers, via credit insurance policies, or via other possible approaches
• We offer very limited credit or delayed payment terms to high risk customers or risky sectors
• We can structure specific credit conditions and programs for partner customers
• For industrial companies and international airlines, we establish credit limits, engage in ‘know your customer’ (KYC) processes, invest in advanced management systems and maximise geographic and customer diversification to minimise credit losses
• We actively monitor credit risk, and minimise our exposure by targeting and achieving an average of 15 to 20 days of sales outstanding
• We take credit insurance or use factoring systems whenever this makes sense in terms of costs/benefits
Lost business, lower margins, inefficiencies caused by corrections and replacements, product returns and commercial disputes
Mitigating factors• We adopt a careful and considered approach in the vetting of our business partners We use our KYC process, an approach that helps us ascertain the legitimacy and compliance of all major prospective customers, suppliers and service providers KYC also helps us ensure that new providers will be reliable and diligent over time
• We ensure optimised inventory management through monitoring of sales forecasts to effectively execute product purchases and transfers between terminals
• Effective product sourcing management through monitoring of market trends, implementation of purchase strategies and controlling of the risk exposure
• We do not place reliance on a single source of supply
• In-depth analysis to purchase at the right time and at the lowest possible cost
• Close interaction with Sales and Pricing to align with their strategies
• Cost verification with data provided by Finance to ensure compliance and enable pricing team to perform margin analysis
Currency exposure
Inability to identify exposures in currencies other than the US Dollar and subsequent lack of hedging
(The Company operates in multiple currencies not pegged to the US Dollar and some of our business entities operate in countries with no freely convertible currency)
Potential impactCurrency volatility may result in financial losses for the Company Currency fluctuations on international markets may affect us at both Group and subsidiary levelsSignificant amounts of cash are held in countries with non-convertible currencies, remaining out of reach for Group financing purposes but exposed to local inflation and/or devaluation
Mitigating factors• Puma Energy has limited exposure to foreign trading activities and these are fully hedged We do not hedge the equity translation risk from subsidiary earnings and assets
• We have a policy of tapping local funding sources in each operational region When exposed to local currency risk, the Company hedges accordingly
9 1
PUMA ENERGY ANNUAL REPORT 2020
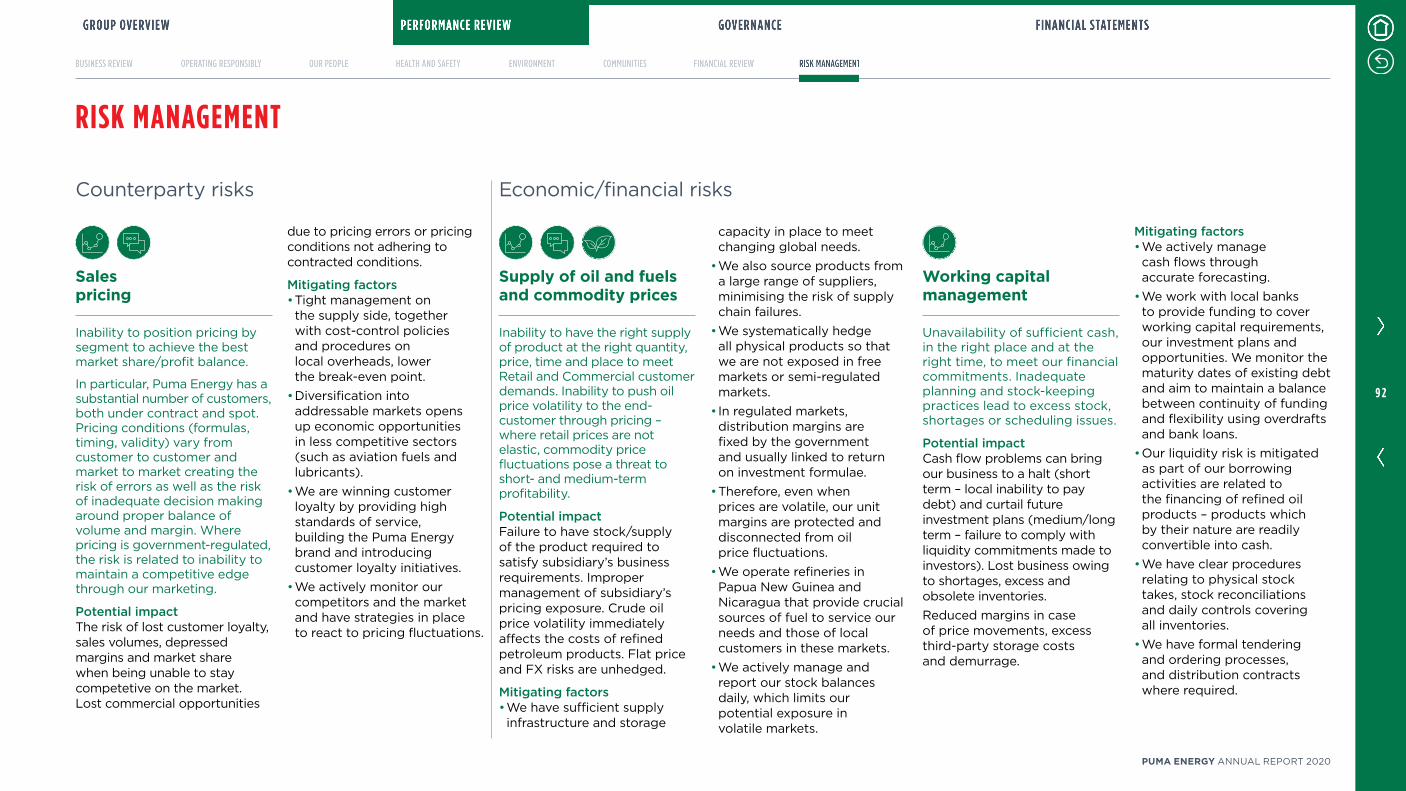
RISK MANAGEMENT
Counterparty risks
Supply of oil and fuels and commodity prices
Inability to have the right supply of product at the right quantity, price, time and place to meet Retail and Commercial customer demands Inability to push oil price volatility to the end-customer through pricing – where retail prices are not elastic, commodity price fluctuations pose a threat to short- and medium-term profitability
Potential impactFailure to have stock/supply of the product required to satisfy subsidiary’s business requirements Improper management of subsidiary’s pricing exposure Crude oil price volatility immediately affects the costs of refined petroleum products Flat price and FX risks are unhedged
Mitigating factors• We have sufficient supply infrastructure and storage
Sales pricing
Inability to position pricing by segment to achieve the best market share/profit balance
In particular, Puma Energy has a substantial number of customers, both under contract and spot Pricing conditions (formulas, timing, validity) vary from customer to customer and market to market creating the risk of errors as well as the risk of inadequate decision making around proper balance of volume and margin Where pricing is government-regulated, the risk is related to inability to maintain a competitive edge through our marketing
Potential impactThe risk of lost customer loyalty, sales volumes, depressed margins and market share when being unable to stay competetive on the market Lost commercial opportunities
due to pricing errors or pricing conditions not adhering to contracted conditions
Mitigating factors• Tight management on the supply side, together with cost-control policies and procedures on local overheads, lower the break-even point
• Diversification into addressable markets opens up economic opportunities in less competitive sectors (such as aviation fuels and lubricants)
• We are winning customer loyalty by providing high standards of service, building the Puma Energy brand and introducing customer loyalty initiatives
• We actively monitor our competitors and the market and have strategies in place to react to pricing fluctuations
capacity in place to meet changing global needs
• We also source products from a large range of suppliers, minimising the risk of supply chain failures
• We systematically hedge all physical products so that we are not exposed in free markets or semi-regulated markets
• In regulated markets, distribution margins are fixed by the government and usually linked to return on investment formulae
• Therefore, even when prices are volatile, our unit margins are protected and disconnected from oil price fluctuations
• We operate refineries in Papua New Guinea and Nicaragua that provide crucial sources of fuel to service our needs and those of local customers in these markets
• We actively manage and report our stock balances daily, which limits our potential exposure in volatile markets
Working capital management
Unavailability of sufficient cash, in the right place and at the right time, to meet our financial commitments Inadequate planning and stock-keeping practices lead to excess stock, shortages or scheduling issues
Potential impactCash flow problems can bring our business to a halt (short term – local inability to pay debt) and curtail future investment plans (medium/long term – failure to comply with liquidity commitments made to investors) Lost business owing to shortages, excess and obsolete inventoriesReduced margins in case of price movements, excess third-party storage costs and demurrage
Mitigating factors• We actively manage cash flows through accurate forecasting
• We work with local banks to provide funding to cover working capital requirements, our investment plans and opportunities We monitor the maturity dates of existing debt and aim to maintain a balance between continuity of funding and flexibility using overdrafts and bank loans
• Our liquidity risk is mitigated as part of our borrowing activities are related to the financing of refined oil products – products which by their nature are readily convertible into cash
• We have clear procedures relating to physical stock takes, stock reconciliations and daily controls covering all inventories
• We have formal tendering and ordering processes, and distribution contracts where required
Economic/financial risks
9 2
PUMA ENERGY ANNUAL REPORT 2020
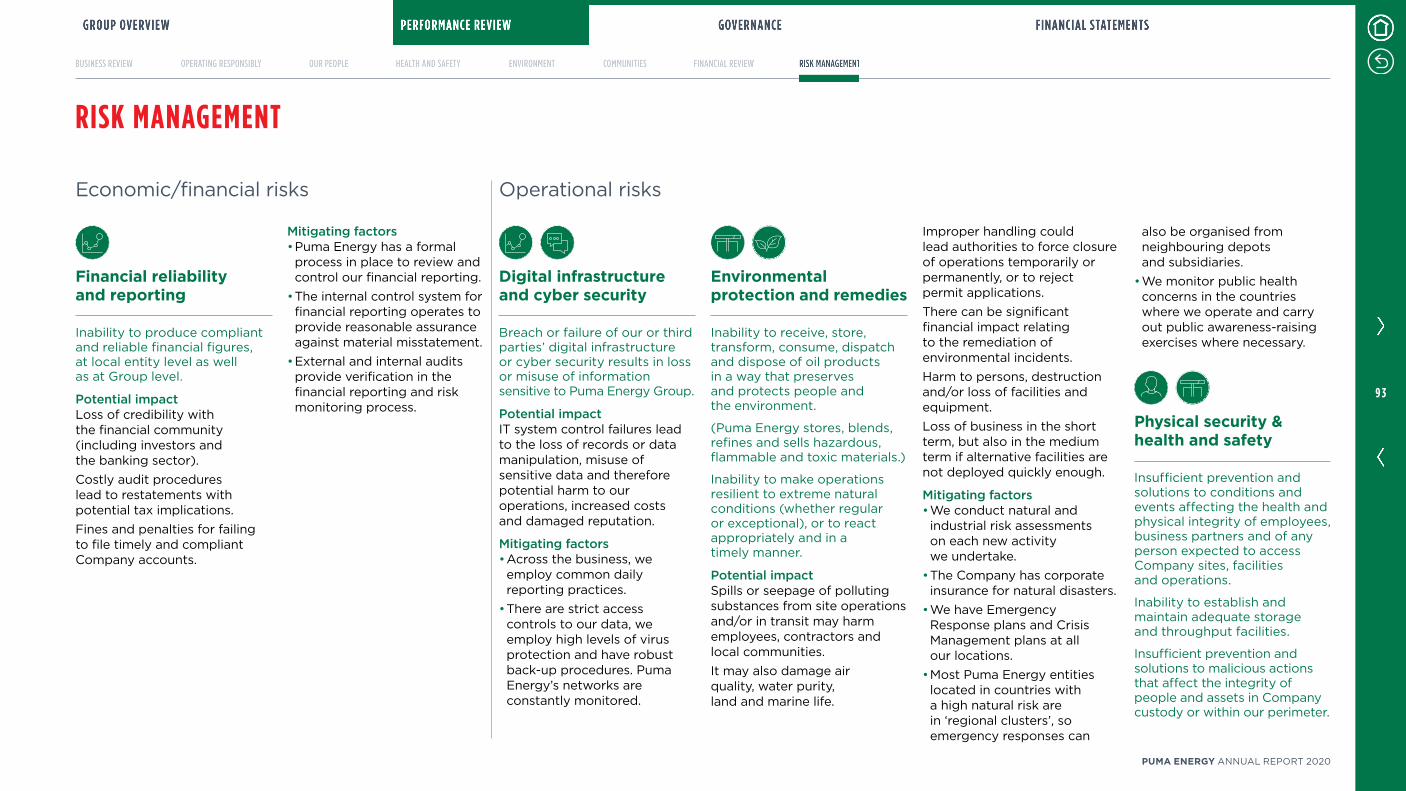
RISK MANAGEMENT
Economic/financial risks
Digital infrastructure and cyber security
Breach or failure of our or third parties’ digital infrastructure or cyber security results in loss or misuse of information sensitive to Puma Energy Group
Potential impactIT system control failures lead to the loss of records or data manipulation, misuse of sensitive data and therefore potential harm to our operations, increased costs and damaged reputation
Mitigating factors• Across the business, we employ common daily reporting practices
• There are strict access controls to our data, we employ high levels of virus protection and have robust back-up procedures Puma Energy’s networks are constantly monitored
Financial reliability and reporting
Inability to produce compliant and reliable financial figures, at local entity level as well as at Group level
Potential impactLoss of credibility with the financial community (including investors and the banking sector)Costly audit procedures lead to restatements with potential tax implicationsFines and penalties for failing to file timely and compliant Company accounts
Mitigating factors• Puma Energy has a formal process in place to review and control our financial reporting
• The internal control system for financial reporting operates to provide reasonable assurance against material misstatement
• External and internal audits provide verification in the financial reporting and risk monitoring process
Environmental protection and remedies
Inability to receive, store, transform, consume, dispatch and dispose of oil products in a way that preserves and protects people and the environment
(Puma Energy stores, blends, refines and sells hazardous, flammable and toxic materials)
Inability to make operations resilient to extreme natural conditions (whether regular or exceptional), or to react appropriately and in a timely manner
Potential impactSpills or seepage of polluting substances from site operations and/or in transit may harm employees, contractors and local communitiesIt may also damage air quality, water purity, land and marine life
Improper handling could lead authorities to force closure of operations temporarily or permanently, or to reject permit applicationsThere can be significant financial impact relating to the remediation of environmental incidentsHarm to persons, destruction and/or loss of facilities and equipmentLoss of business in the short term, but also in the medium term if alternative facilities are not deployed quickly enough
Mitigating factors• We conduct natural and industrial risk assessments on each new activity we undertake
• The Company has corporate insurance for natural disasters
• We have Emergency Response plans and Crisis Management plans at all our locations
• Most Puma Energy entities located in countries with a high natural risk are in ‘regional clusters’, so emergency responses can
also be organised from neighbouring depots and subsidiaries
• We monitor public health concerns in the countries where we operate and carry out public awareness-raising exercises where necessary
Physical security & health and safety
Insufficient prevention and solutions to conditions and events affecting the health and physical integrity of employees, business partners and of any person expected to access Company sites, facilities and operations
Inability to establish and maintain adequate storage and throughput facilities
Insufficient prevention and solutions to malicious actions that affect the integrity of people and assets in Company custody or within our perimeter
Operational risks
9 3
PUMA ENERGY ANNUAL REPORT 2020

RISK MANAGEMENT
Operational risks
Geopolitical, authorities and communities
Our business may be affected by political developments in any of the countries and jurisdictions in which Puma Energy operates Governmental instability could adversely affect economies in corresponding markets and hence the Company’s business, financial conditions and results
Failure to manage relationships with local communities, interest groups and NGOs leading to business disruptions
Potential impactPolitical instability may lead to the suspension of operations, enforced divestment, expropriation of property, cancellation of contract rights, additional taxes, import and export restrictions, foreign exchange constraints and sudden changes in industrial regulations or laws
Potential impactInjuries and health issues, fines and penalties, liability to employees or third parties and harm to Puma Energy’s reputationAuthorities could force the closure of our operations temporarily or permanently, or reject permit applicationsNon-compliant storage and transfer equipment could lead to product downgrading, spills or lossesBreakdowns could complicate receipts and/or deliveries, with increased costs and lost businessInadequate security measures may result in harm to our employees, destruction and/or loss of material and/or financial assets
Mitigating factors• One of our major risks is fire in our terminals, which we seek to mitigate by implementing regular operational controls, and by installing effective fire-fighting systems We also contract top industry experts to help on the ground should a major incident occur
• We work with transporters to improve their own HSEC performance and encourage them to train their drivers properly, control driving hours and educate drivers on fatigue management
• We train our employees in line with the highest international standards and actively promote a highly safety aware culture
• We run campaigns across our markets promoting greater safety awareness both at our operations and among the wider community
• We provide and mandate the use of personal protective equipment (PPE)
• Puma Energy always looks for solutions to avoid bottlenecks – for instance, by identifying multiple logistics routes and supply schemes to any major location and maintaining solid relationships with third-party transport companies
• Sufficient supply infrastructure/storage capacity is in place and strategically located to service our customers
• Our quality testing of fuel adheres to standards laid down by the American Society for Testing Materials (ASTM)
• We have access controls and alarms at our depots, facilities and offices
• We have CCTV at depots and retail sites to deter potential intruders and actively monitor and safeguard our employees and assets
• We monitor and control in-transit product losses
Disruptions to day-to-day operations; hostility to the Company and its employees and business partners; adverse media coverage and damage to our public image; inability to expand existing sites or open new ones
Mitigating factors• Puma Energy seeks to maintain a politically neutral stance in all our operating jurisdictions
• Puma Energy’s geographic diversification limits the overall risk to the business
• We work proactively with communities, empowering and encouraging managers at a local level to engage in continuous dialogue with our communities
• The Puma Energy Foundation supports local community projects and shows our dedication and commitment to Corporate Social Responsibility
• We promote initiatives to hire people from surrounding local communities
Standards and regulation, legal and taxation risk
The standards, regulations and legal risk involves inability to conform to the increasingly stringent legal norms, regulations, regulatory framework and agreements that govern Puma Energy business
Puma Energy does not adhere to applicable local and international tax law in the countries where it operates, including legislation on transfer pricing Changes in the application of tax legislation, differences in interpretation of the profit level of the underlying business operating model as well as one-off transactions may create tax risks and uncertainties By failing to effectively and efficiently manage transactional, operational, compliance and financial accounting tax risks tax disputes with tax administrations may arise
Political/country/regulatory risks
9 4
PUMA ENERGY ANNUAL REPORT 2020
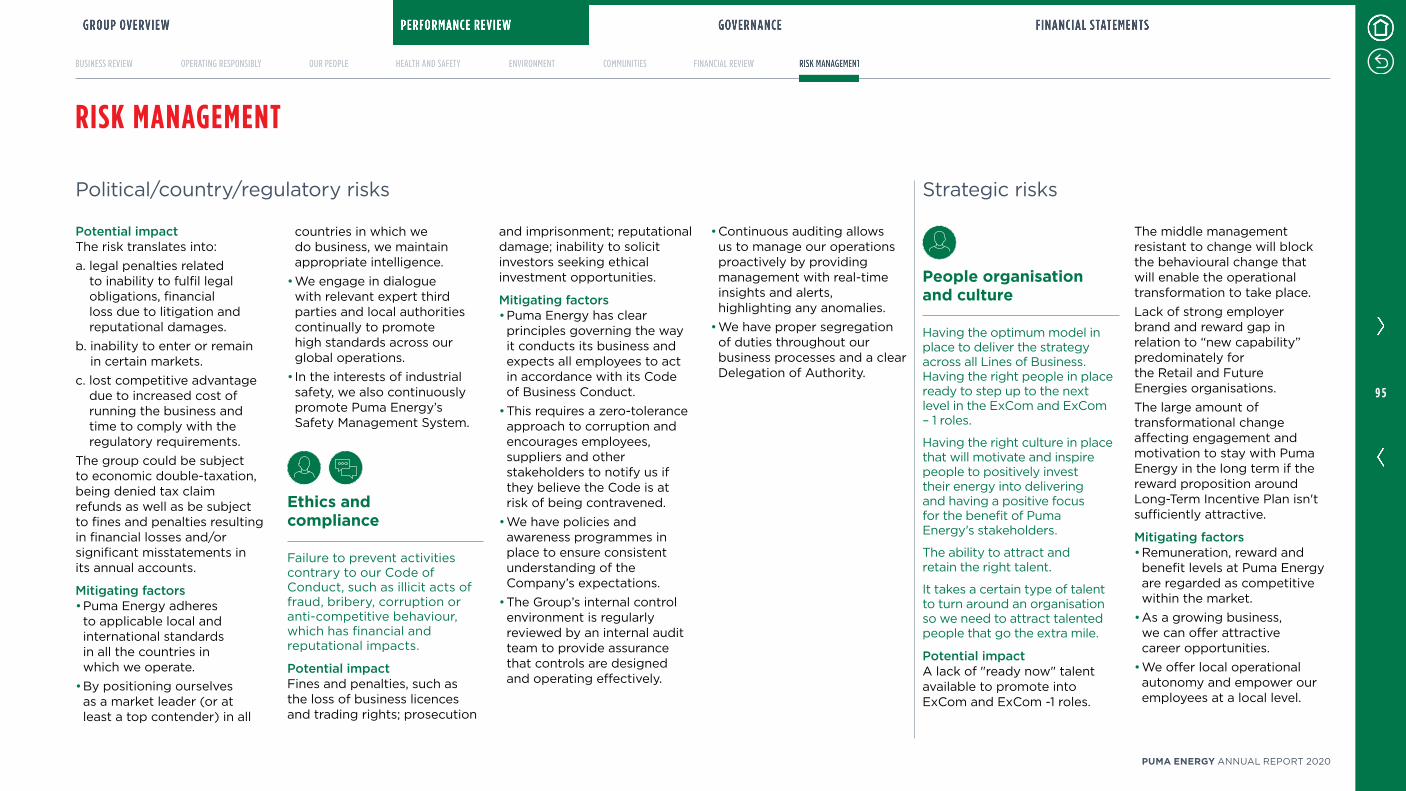
RISK MANAGEMENT
Political/country/regulatory risks
• Continuous auditing allows us to manage our operations proactively by providing management with real-time insights and alerts, highlighting any anomalies
• We have proper segregation of duties throughout our business processes and a clear Delegation of Authority
Potential impactThe risk translates into:a legal penalties related
to inability to fulfil legal obligations, financial loss due to litigation and reputational damages
b inability to enter or remain in certain markets
c lost competitive advantage due to increased cost of running the business and time to comply with the regulatory requirements
The group could be subject to economic double-taxation, being denied tax claim refunds as well as be subject to fines and penalties resulting in financial losses and/or significant misstatements in its annual accounts
Mitigating factors• Puma Energy adheres to applicable local and international standards in all the countries in which we operate
• By positioning ourselves as a market leader (or at least a top contender) in all
countries in which we do business, we maintain appropriate intelligence
• We engage in dialogue with relevant expert third parties and local authorities continually to promote high standards across our global operations
• In the interests of industrial safety, we also continuously promote Puma Energy’s Safety Management System
Ethics and compliance
Failure to prevent activities contrary to our Code of Conduct, such as illicit acts of fraud, bribery, corruption or anti-competitive behaviour, which has financial and reputational impacts
Potential impactFines and penalties, such as the loss of business licences and trading rights; prosecution
and imprisonment; reputational damage; inability to solicit investors seeking ethical investment opportunities
Mitigating factors• Puma Energy has clear principles governing the way it conducts its business and expects all employees to act in accordance with its Code of Business Conduct
• This requires a zero-tolerance approach to corruption and encourages employees, suppliers and other stakeholders to notify us if they believe the Code is at risk of being contravened
• We have policies and awareness programmes in place to ensure consistent understanding of the Company’s expectations
• The Group’s internal control environment is regularly reviewed by an internal audit team to provide assurance that controls are designed and operating effectively
People organisation and culture
Having the optimum model in place to deliver the strategy across all Lines of Business Having the right people in place ready to step up to the next level in the ExCom and ExCom – 1 roles
Having the right culture in place that will motivate and inspire people to positively invest their energy into delivering and having a positive focus for the benefit of Puma Energy's stakeholders
The ability to attract and retain the right talent
It takes a certain type of talent to turn around an organisation so we need to attract talented people that go the extra mile
Potential impactA lack of "ready now" talent available to promote into ExCom and ExCom -1 roles
The middle management resistant to change will block the behavioural change that will enable the operational transformation to take placeLack of strong employer brand and reward gap in relation to “new capability” predominately for the Retail and Future Energies organisationsThe large amount of transformational change affecting engagement and motivation to stay with Puma Energy in the long term if the reward proposition around Long-Term Incentive Plan isn't sufficiently attractive
Mitigating factors• Remuneration, reward and benefit levels at Puma Energy are regarded as competitive within the market
• As a growing business, we can offer attractive career opportunities
• We offer local operational autonomy and empower our employees at a local level
Strategic risks
9 5
PUMA ENERGY ANNUAL REPORT 2020
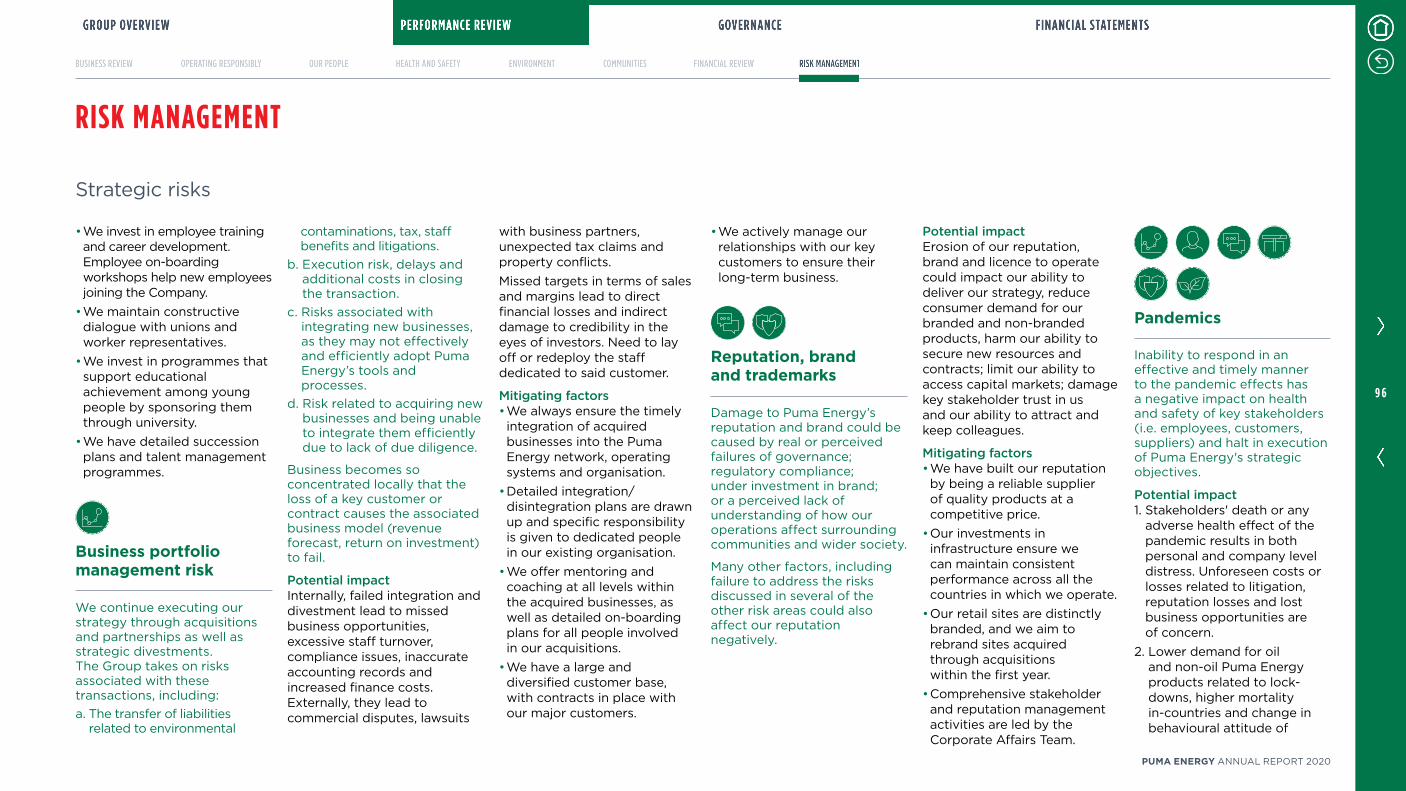
RISK MANAGEMENT
Strategic risks
• We invest in employee training and career development Employee on-boarding workshops help new employees joining the Company
• We maintain constructive dialogue with unions and worker representatives
• We invest in programmes that support educational achievement among young people by sponsoring them through university
• We have detailed succession plans and talent management programmes
Business portfolio management risk
We continue executing our strategy through acquisitions and partnerships as well as strategic divestments The Group takes on risks associated with these transactions, including:a The transfer of liabilities
related to environmental
contaminations, tax, staff benefits and litigations
b Execution risk, delays and additional costs in closing the transaction
c Risks associated with integrating new businesses, as they may not effectively and efficiently adopt Puma Energy’s tools and processes
d Risk related to acquiring new businesses and being unable to integrate them efficiently due to lack of due diligence
Business becomes so concentrated locally that the loss of a key customer or contract causes the associated business model (revenue forecast, return on investment) to fail
Potential impactInternally, failed integration and divestment lead to missed business opportunities, excessive staff turnover, compliance issues, inaccurate accounting records and increased finance costs Externally, they lead to commercial disputes, lawsuits
with business partners, unexpected tax claims and property conflictsMissed targets in terms of sales and margins lead to direct financial losses and indirect damage to credibility in the eyes of investors Need to lay off or redeploy the staff dedicated to said customer
Mitigating factors• We always ensure the timely integration of acquired businesses into the Puma Energy network, operating systems and organisation
• Detailed integration/disintegration plans are drawn up and specific responsibility is given to dedicated people in our existing organisation
• We offer mentoring and coaching at all levels within the acquired businesses, as well as detailed on-boarding plans for all people involved in our acquisitions
• We have a large and diversified customer base, with contracts in place with our major customers
• We actively manage our relationships with our key customers to ensure their long-term business
Reputation, brand and trademarks
Damage to Puma Energy’s reputation and brand could be caused by real or perceived failures of governance; regulatory compliance; under investment in brand; or a perceived lack of understanding of how our operations affect surrounding communities and wider society
Many other factors, including failure to address the risks discussed in several of the other risk areas could also affect our reputation negatively
Potential impactErosion of our reputation, brand and licence to operate could impact our ability to deliver our strategy, reduce consumer demand for our branded and non-branded products, harm our ability to secure new resources and contracts; limit our ability to access capital markets; damage key stakeholder trust in us and our ability to attract and keep colleagues
Mitigating factors• We have built our reputation by being a reliable supplier of quality products at a competitive price
• Our investments in infrastructure ensure we can maintain consistent performance across all the countries in which we operate
• Our retail sites are distinctly branded, and we aim to rebrand sites acquired through acquisitions within the first year
• Comprehensive stakeholder and reputation management activities are led by the Corporate Affairs Team
Pandemics
Inability to respond in an effective and timely manner to the pandemic effects has a negative impact on health and safety of key stakeholders (ie employees, customers, suppliers) and halt in execution of Puma Energy's strategic objectives
Potential impact1 Stakeholders' death or any
adverse health effect of the pandemic results in both personal and company level distress Unforeseen costs or losses related to litigation, reputation losses and lost business opportunities are of concern
2 Lower demand for oil and non-oil Puma Energy products related to lock-downs, higher mortality in-countries and change in behavioural attitude of
9 6
PUMA ENERGY ANNUAL REPORT 2020
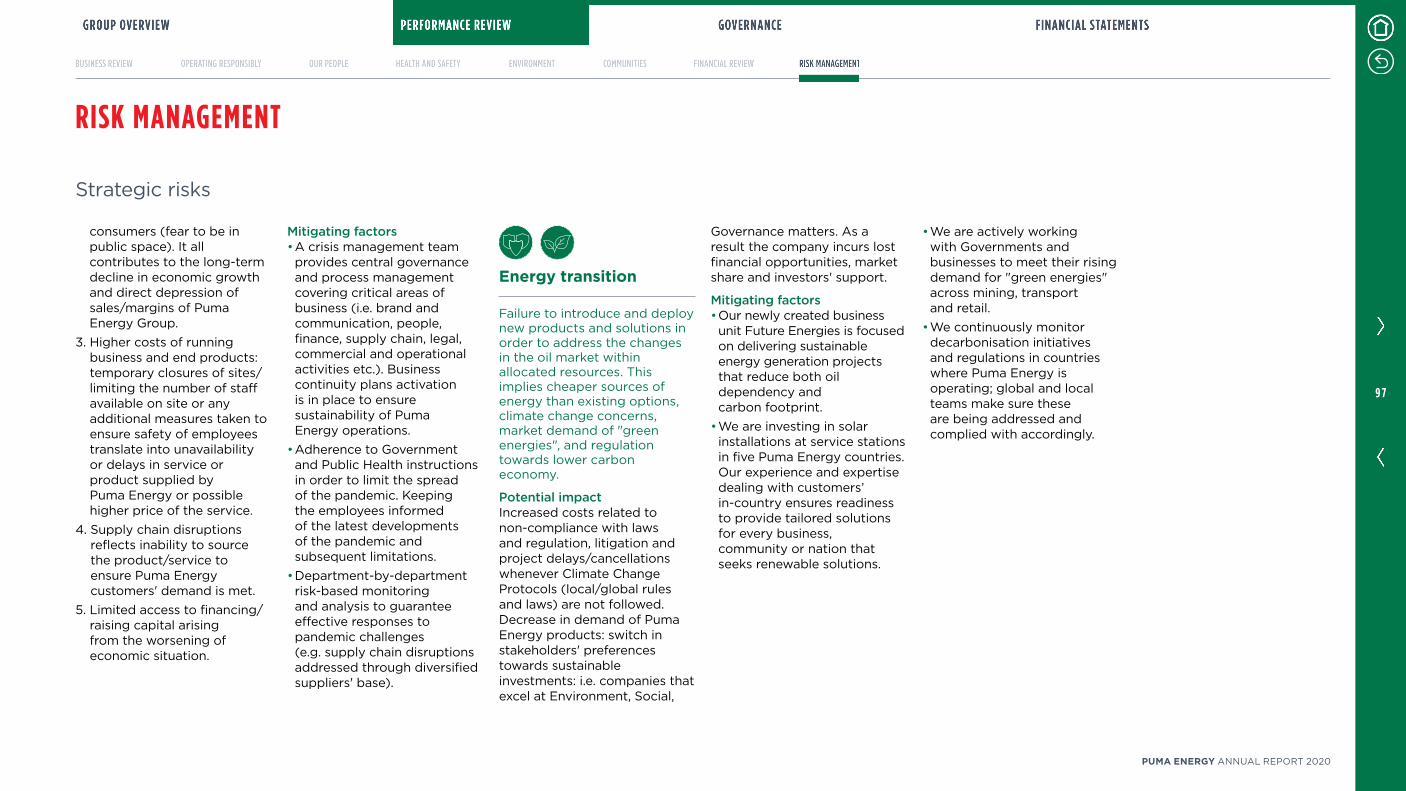
RISK MANAGEMENT
Strategic risks
consumers (fear to be in public space) It all contributes to the long-term decline in economic growth and direct depression of sales/margins of Puma Energy Group
3 Higher costs of running business and end products: temporary closures of sites/limiting the number of staff available on site or any additional measures taken to ensure safety of employees translate into unavailability or delays in service or product supplied by Puma Energy or possible higher price of the service
4 Supply chain disruptions reflects inability to source the product/service to ensure Puma Energy customers' demand is met
5 Limited access to financing/raising capital arising from the worsening of economic situation
Mitigating factors• A crisis management team provides central governance and process management covering critical areas of business (ie brand and communication, people, finance, supply chain, legal, commercial and operational activities etc) Business continuity plans activation is in place to ensure sustainability of Puma Energy operations
• Adherence to Government and Public Health instructions in order to limit the spread of the pandemic Keeping the employees informed of the latest developments of the pandemic and subsequent limitations
• Department-by-department risk-based monitoring and analysis to guarantee effective responses to pandemic challenges (eg supply chain disruptions addressed through diversified suppliers' base)
Energy transition
Failure to introduce and deploy new products and solutions in order to address the changes in the oil market within allocated resources This implies cheaper sources of energy than existing options, climate change concerns, market demand of "green energies", and regulation towards lower carbon economy
Potential impactIncreased costs related to non-compliance with laws and regulation, litigation and project delays/cancellations whenever Climate Change Protocols (local/global rules and laws) are not followed Decrease in demand of Puma Energy products: switch in stakeholders' preferences towards sustainable investments: ie companies that excel at Environment, Social,
Governance matters As a result the company incurs lost financial opportunities, market share and investors' support
Mitigating factors• Our newly created business unit Future Energies is focused on delivering sustainable energy generation projects that reduce both oil dependency and carbon footprint
• We are investing in solar installations at service stations in five Puma Energy countries Our experience and expertise dealing with customers’ in-country ensures readiness to provide tailored solutions for every business, community or nation that seeks renewable solutions
• We are actively working with Governments and businesses to meet their rising demand for "green energies" across mining, transport and retail
• We continuously monitor decarbonisation initiatives and regulations in countries where Puma Energy is operating; global and local teams make sure these are being addressed and complied with accordingly
9 7
PUMA ENERGY ANNUAL REPORT 2020
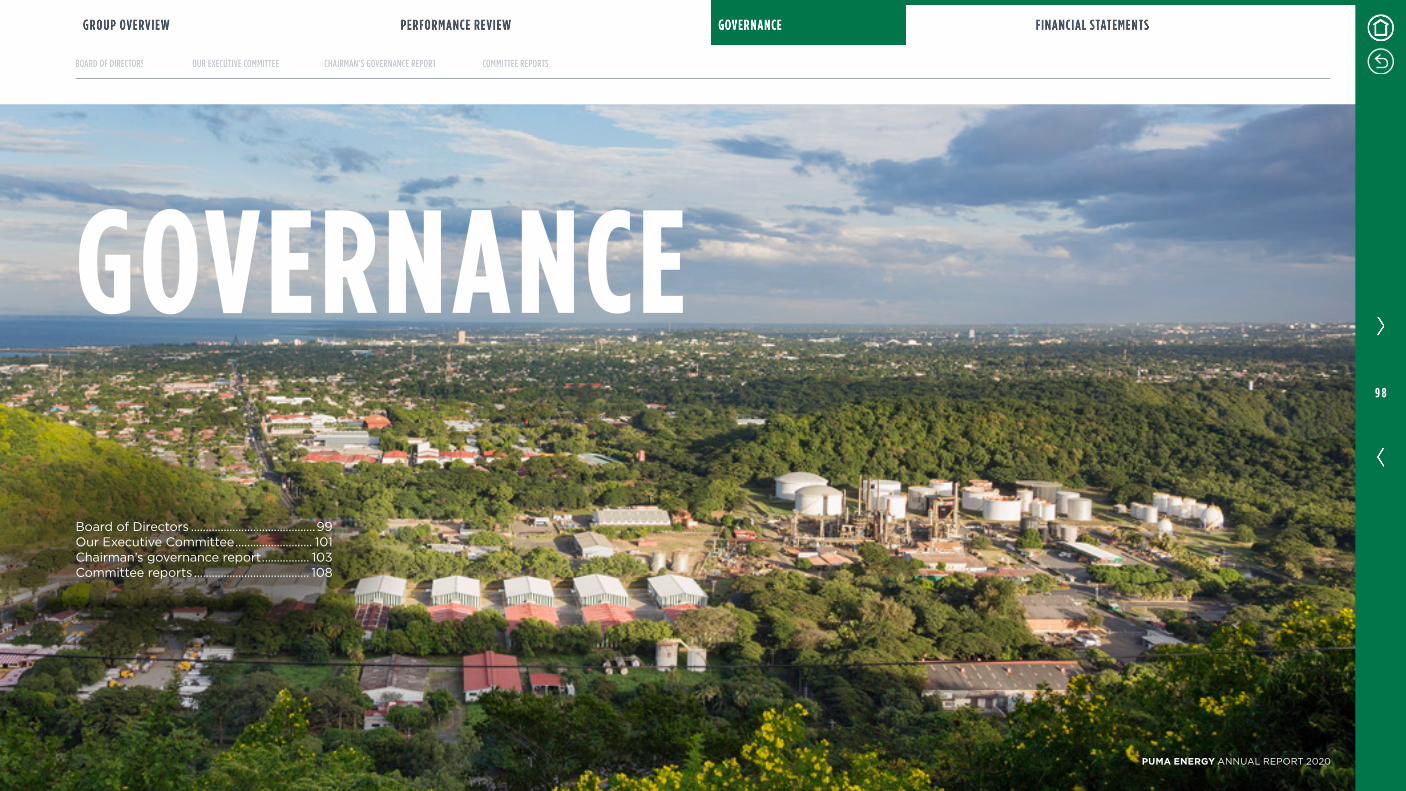
GOVERNANCE
Board of Directors 99Our Executive Committee 101Chairman’s governance report 103Committee reports 108
9 8
PUMA ENERGY ANNUAL REPORT 2020

Baltazar Agostinho Gonçalves Miguel (i) (iii)
Executive Board Member, Sonangol EP
3 years at Puma Energy
Baltazar joined Sonangol in 1997 and has held various senior management positions in Accounting, Finance and Human Resources for Sonangol Distribuidora SA and Sonangol Refinaria de Luanda SA He was a member of the Executive Committee of the Board of Directors of Sonangol Luanda Refinery between 2009 and 2012 and Chairman of the Executive Committee of Sonangol Academia between 2014 and 2017 In November 2017, he was appointed to the Executive Board of Sonangol EP Baltazar holds a BSc in Business Economics from the University of Salford and an MA in Money, Banking and Finance from the University of Sheffield/Sheffield Management School
Emma FitzGerald (ii)
Chief Executive Officer
2 years at Puma Energy
Emma joined Puma Energy in January 2019 Previously, she spent many years running downstream Retail, Lubricants and LPG businesses for Shell around the world Before joining, Emma was immersed in the UK utility industry running gas and water and waste networks for National Grid and Severn Trent Water She has served on boards in both an Executive and Non Executive Director capacity including Severn Trent plc, Cookson Group plc, Alent plc and DCC plc She sits on the advisory board of Oxford Science Innovation Emma holds a doctorate in Surface Chemistry from Oxford University and an MBA from Manchester Business School
Hadi HalloucheCo-Head of Oil Trading, Trafigura
In October 2019 Hadi was appointed Co-Head of Trafigura’s Oil Trading Division This follows his two-year tenure as Head of Oil Singapore where he was responsible for managing the company’s oil and gas trading activity across the Asia Pacific region Hadi joined Trafigura in 2011 as an LNG Trader Prior to joining Trafigura, Hadi spent seven years in Royal Dutch Shell Hadi, an Algerian national, holds a PhD in Economics
Pierre Lorinet (iii) (v)
Director, Trafigura
16 years at Puma Energy
Pierre is a non-executive Director of Trafigura He holds other independent non-executive Director roles including with Cofco International Limited and Singapore government agencies such as Enterprise Singapore and the National Art Council of Singapore Until September 2015 Pierre was the Chief Financial Officer and Managing Director Asia-Pacific for Trafigura Pierre joined Trafigura in 2002 and became CFO and Board Director in January 2007 In August 2012 he also became MD for the Asia-Pacific region Before joining Trafigura, Pierre worked for Merrill Lynch and at Banque Indosuez Pierre graduated from Ecole Supérieure de Commerce de Paris in France and holds an MSc in Finance with distinction from Lancaster University in the UK He is a French citizen and resides in Singapore
(i) Audit Committee (ii) Ethics and Compliance Committee (iii) Finance and Investment Committee (iv) Health, Safety, Security,
Environment Committee(v) Remuneration Committee
OUR BOARD OF DIRECTORSOur Board of Directors brings together diverse energy industry professionals from around the world, who are committed to practising and promoting good governance throughout the Group
9 9
PUMA ENERGY ANNUAL REPORT 2020

OUR BOARD OF DIRECTORS
(i) Audit Committee (ii) Ethics and Compliance Committee (iii) Finance and Investment Committee (iv) Health, Safety, Security,
Environment Committee(v) Remuneration Committee
René MédoriNon-Executive Chairman, Puma Energy
1 year at Puma Energy
René joined the Puma Energy Board as Non-Executive Chairman on 3 March 2020 René holds dual French and British nationality He brings significant experience to the Board from his executive roles in the energy and natural resources sectors He also has invaluable direct experience of international best practice in corporate governance and operating responsibly in emerging markets René was previously Chief Financial Officer of Anglo American, and Group Finance Director of The BOC Group He currently holds Non-Executive Directorships at Newmont and Vinci and he is also Chairman of Petrofac
Graham Sharp (i) (iii)
Non-Executive Board Member, Puma Energy
8 years at Puma Energy
Graham joined the Puma Energy Board on 27 May 2012 as its independent Non- Executive Chairman, handing over to René Médori on 3 March 2020 He spent his early career advising multinational clients such as Shell Following a period trading clean petroleum products worldwide, Graham was a co-founding Board member of Trafigura Upon his retirement in 2007, Graham continued to advise Oliver Wyman Associates and Galena Asset Management, among others He holds a first-class honours degree in engineering, economics and management from Oxford University
Mike Wainwright (iii) (v)
Director, Trafigura
13 years at Puma Energy
Mike was appointed Chief Operating Officer and Trafigura Management Board member in January 2008 His principal focus is the management of the middle and back office support teams for the trading division, direct responsibility for the Group’s P&L and responsibility for the Finance function at Board level Mike joined Trafigura in 1996 He has held various roles within the Group, covering accounting, deals desk and middle office IT development Mike holds a BSc in Mathematics and Actuarial Studies from Southampton University
Filomena Maria Gamboa Carvalho dos Santos e Oliveira (v)
Executive Board Member, Sonangol Hidrocarbonetos Internacional
3 years at Puma Energy
Filomena serves as a member of the Executive Committee of Sonangol EP subsidiary for upstream activities Her previous roles include serving as a member of the Sonangol Hidrocarbonetos Internacional Executive Committee, as coordinator of the Sonangol EP Regeneration Program, as a member of the Sonangol Pesquisa e Produção Executive Committee, as a Development and Operations Manager of Sonangol EP, and as Head of Reservoirs Department for the National Concessionaire Filomena joined Sonangol EP in 1982 Filomena holds a Mining/Petroleum Engineering degree from Agostinho Neto University, Angola
1 0 0
PUMA ENERGY ANNUAL REPORT 2020
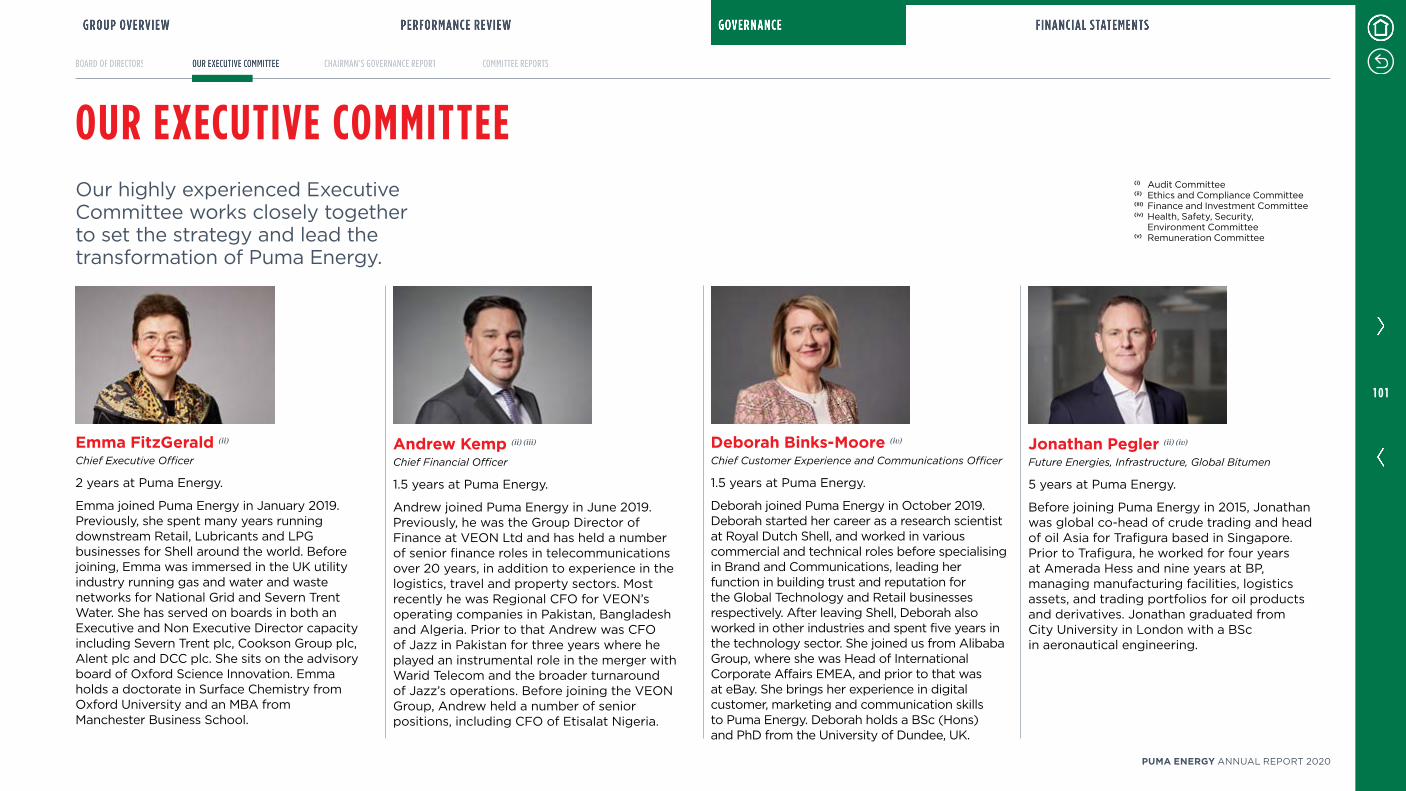
Jonathan Pegler (ii) (iv)
Future Energies, Infrastructure, Global Bitumen
5 years at Puma Energy
Before joining Puma Energy in 2015, Jonathan was global co-head of crude trading and head of oil Asia for Trafigura based in Singapore Prior to Trafigura, he worked for four years at Amerada Hess and nine years at BP, managing manufacturing facilities, logistics assets, and trading portfolios for oil products and derivatives Jonathan graduated from City University in London with a BSc in aeronautical engineering
Emma FitzGerald (ii)
Chief Executive Officer
2 years at Puma Energy
Emma joined Puma Energy in January 2019 Previously, she spent many years running downstream Retail, Lubricants and LPG businesses for Shell around the world Before joining, Emma was immersed in the UK utility industry running gas and water and waste networks for National Grid and Severn Trent Water She has served on boards in both an Executive and Non Executive Director capacity including Severn Trent plc, Cookson Group plc, Alent plc and DCC plc She sits on the advisory board of Oxford Science Innovation Emma holds a doctorate in Surface Chemistry from Oxford University and an MBA from Manchester Business School
Andrew Kemp (ii) (iii)
Chief Financial Officer
15 years at Puma Energy
Andrew joined Puma Energy in June 2019 Previously, he was the Group Director of Finance at VEON Ltd and has held a number of senior finance roles in telecommunications over 20 years, in addition to experience in the logistics, travel and property sectors Most recently he was Regional CFO for VEON’s operating companies in Pakistan, Bangladesh and Algeria Prior to that Andrew was CFO of Jazz in Pakistan for three years where he played an instrumental role in the merger with Warid Telecom and the broader turnaround of Jazz’s operations Before joining the VEON Group, Andrew held a number of senior positions, including CFO of Etisalat Nigeria
Deborah Binks-Moore (iv)
Chief Customer Experience and Communications Officer
15 years at Puma Energy
Deborah joined Puma Energy in October 2019Deborah started her career as a research scientist at Royal Dutch Shell, and worked in various commercial and technical roles before specialising in Brand and Communications, leading her function in building trust and reputation for the Global Technology and Retail businesses respectively After leaving Shell, Deborah also worked in other industries and spent five years in the technology sector She joined us from Alibaba Group, where she was Head of International Corporate Affairs EMEA, and prior to that was at eBay She brings her experience in digital customer, marketing and communication skills to Puma Energy Deborah holds a BSc (Hons) and PhD from the University of Dundee, UK
(i) Audit Committee (ii) Ethics and Compliance Committee (iii) Finance and Investment Committee (iv) Health, Safety, Security,
Environment Committee(v) Remuneration Committee
OUR EXECUTIVE COMMITTEEOur highly experienced Executive Committee works closely together to set the strategy and lead the transformation of Puma Energy
1 0 1
PUMA ENERGY ANNUAL REPORT 2020
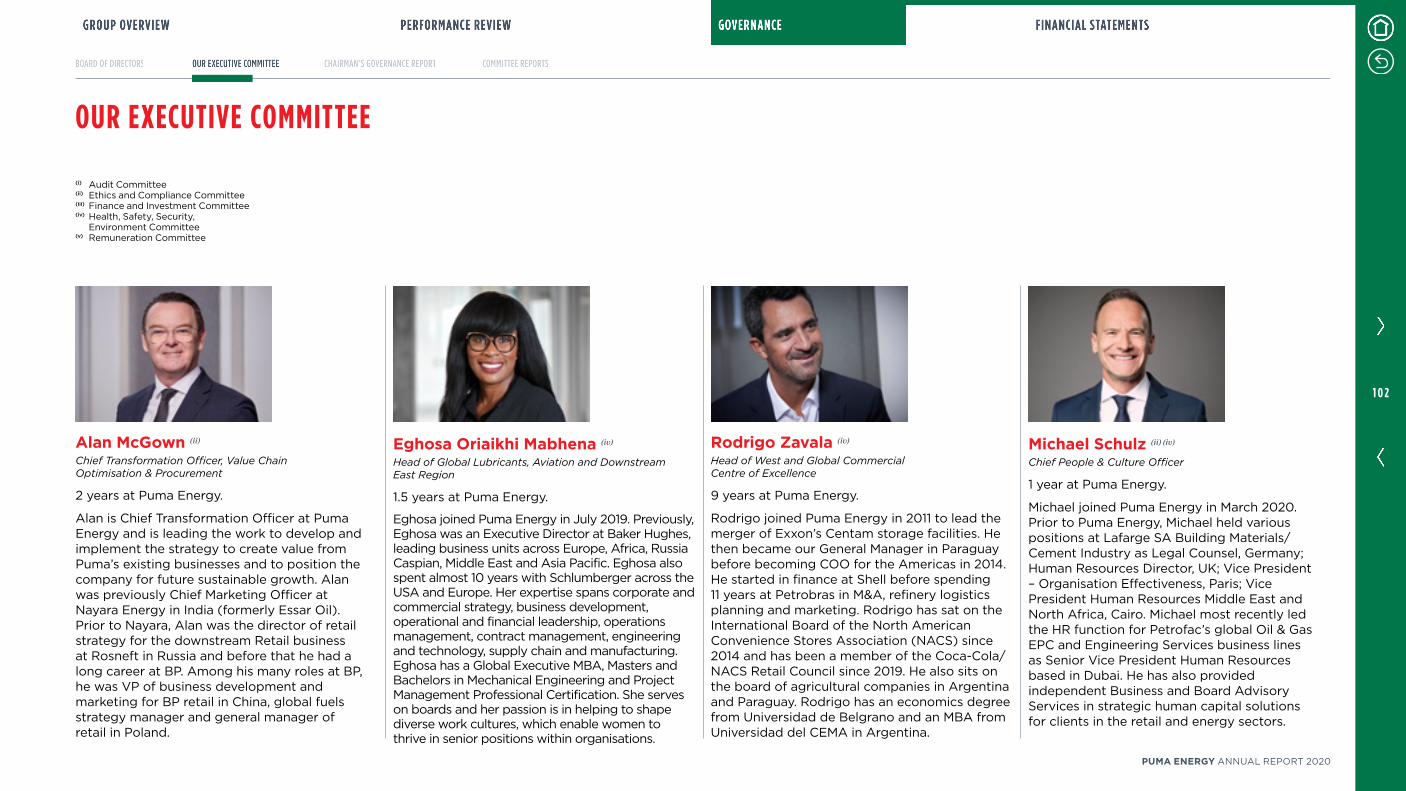
OUR EXECUTIVE COMMITTEE
(i) Audit Committee (ii) Ethics and Compliance Committee (iii) Finance and Investment Committee (iv) Health, Safety, Security,
Environment Committee(v) Remuneration Committee
Michael Schulz (ii) (iv)
Chief People & Culture Officer
1 year at Puma Energy
Michael joined Puma Energy in March 2020 Prior to Puma Energy, Michael held various positions at Lafarge SA Building Materials/Cement Industry as Legal Counsel, Germany; Human Resources Director, UK; Vice President – Organisation Effectiveness, Paris; Vice President Human Resources Middle East and North Africa, Cairo Michael most recently led the HR function for Petrofac’s global Oil & Gas EPC and Engineering Services business lines as Senior Vice President Human Resources based in Dubai He has also provided independent Business and Board Advisory Services in strategic human capital solutions for clients in the retail and energy sectors
Alan McGown (ii)
Chief Transformation Officer, Value Chain Optimisation & Procurement
2 years at Puma Energy
Alan is Chief Transformation Officer at Puma Energy and is leading the work to develop and implement the strategy to create value from Puma’s existing businesses and to position the company for future sustainable growth Alan was previously Chief Marketing Officer at Nayara Energy in India (formerly Essar Oil) Prior to Nayara, Alan was the director of retail strategy for the downstream Retail business at Rosneft in Russia and before that he had a long career at BP Among his many roles at BP, he was VP of business development and marketing for BP retail in China, global fuels strategy manager and general manager of retail in Poland
Eghosa Oriaikhi Mabhena (iv)
Head of Global Lubricants, Aviation and Downstream East Region
15 years at Puma Energy
Eghosa joined Puma Energy in July 2019 Previously, Eghosa was an Executive Director at Baker Hughes, leading business units across Europe, Africa, Russia Caspian, Middle East and Asia Pacific Eghosa also spent almost 10 years with Schlumberger across the USA and Europe Her expertise spans corporate and commercial strategy, business development, operational and financial leadership, operations management, contract management, engineering and technology, supply chain and manufacturing Eghosa has a Global Executive MBA, Masters and Bachelors in Mechanical Engineering and Project Management Professional Certification She serves on boards and her passion is in helping to shape diverse work cultures, which enable women to thrive in senior positions within organisations
Rodrigo Zavala (iv)
Head of West and Global Commercial Centre of Excellence
9 years at Puma Energy
Rodrigo joined Puma Energy in 2011 to lead the merger of Exxon’s Centam storage facilities He then became our General Manager in Paraguay before becoming COO for the Americas in 2014 He started in finance at Shell before spending 11 years at Petrobras in M&A, refinery logistics planning and marketing Rodrigo has sat on the International Board of the North American Convenience Stores Association (NACS) since 2014 and has been a member of the Coca-Cola/NACS Retail Council since 2019 He also sits on the board of agricultural companies in Argentina and Paraguay Rodrigo has an economics degree from Universidad de Belgrano and an MBA from Universidad del CEMA in Argentina
1 0 2
PUMA ENERGY ANNUAL REPORT 2020
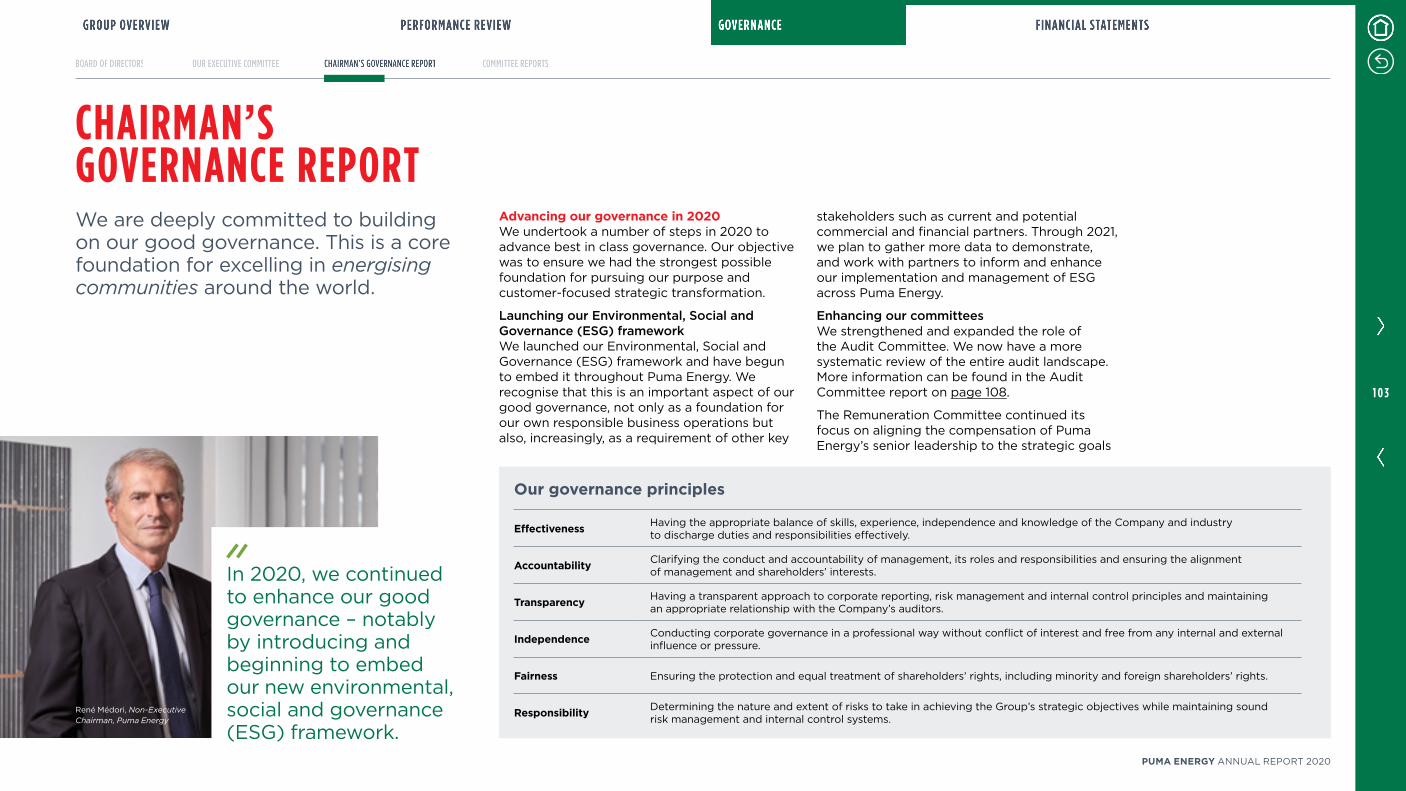
CHAIRMAN’S GOVERNANCE REPORTWe are deeply committed to building on our good governance This is a core foundation for excelling in energising communities around the world
Advancing our governance in 2020 We undertook a number of steps in 2020 to advance best in class governance Our objective was to ensure we had the strongest possible foundation for pursuing our purpose and customer-focused strategic transformation
Launching our Environmental, Social and Governance (ESG) frameworkWe launched our Environmental, Social and Governance (ESG) framework and have begun to embed it throughout Puma Energy We recognise that this is an important aspect of our good governance, not only as a foundation for our own responsible business operations but also, increasingly, as a requirement of other key
stakeholders such as current and potential commercial and financial partners Through 2021, we plan to gather more data to demonstrate, and work with partners to inform and enhance our implementation and management of ESG across Puma Energy
Enhancing our committees We strengthened and expanded the role of the Audit Committee We now have a more systematic review of the entire audit landscape More information can be found in the Audit Committee report on page 108
The Remuneration Committee continued its focus on aligning the compensation of Puma Energy’s senior leadership to the strategic goals
In 2020, we continued to enhance our good governance – notably by introducing and beginning to embed our new environmental, social and governance (ESG) framework
Our governance principles
Effectiveness Having the appropriate balance of skills, experience, independence and knowledge of the Company and industry to discharge duties and responsibilities effectively
Accountability Clarifying the conduct and accountability of management, its roles and responsibilities and ensuring the alignment of management and shareholders’ interests
Transparency Having a transparent approach to corporate reporting, risk management and internal control principles and maintaining an appropriate relationship with the Company’s auditors
Independence Conducting corporate governance in a professional way without conflict of interest and free from any internal and external influence or pressure
Fairness Ensuring the protection and equal treatment of shareholders’ rights, including minority and foreign shareholders’ rights
Responsibility Determining the nature and extent of risks to take in achieving the Group’s strategic objectives while maintaining sound risk management and internal control systems
René Médori, Non-Executive Chairman, Puma Energy
1 0 3
PUMA ENERGY ANNUAL REPORT 2020
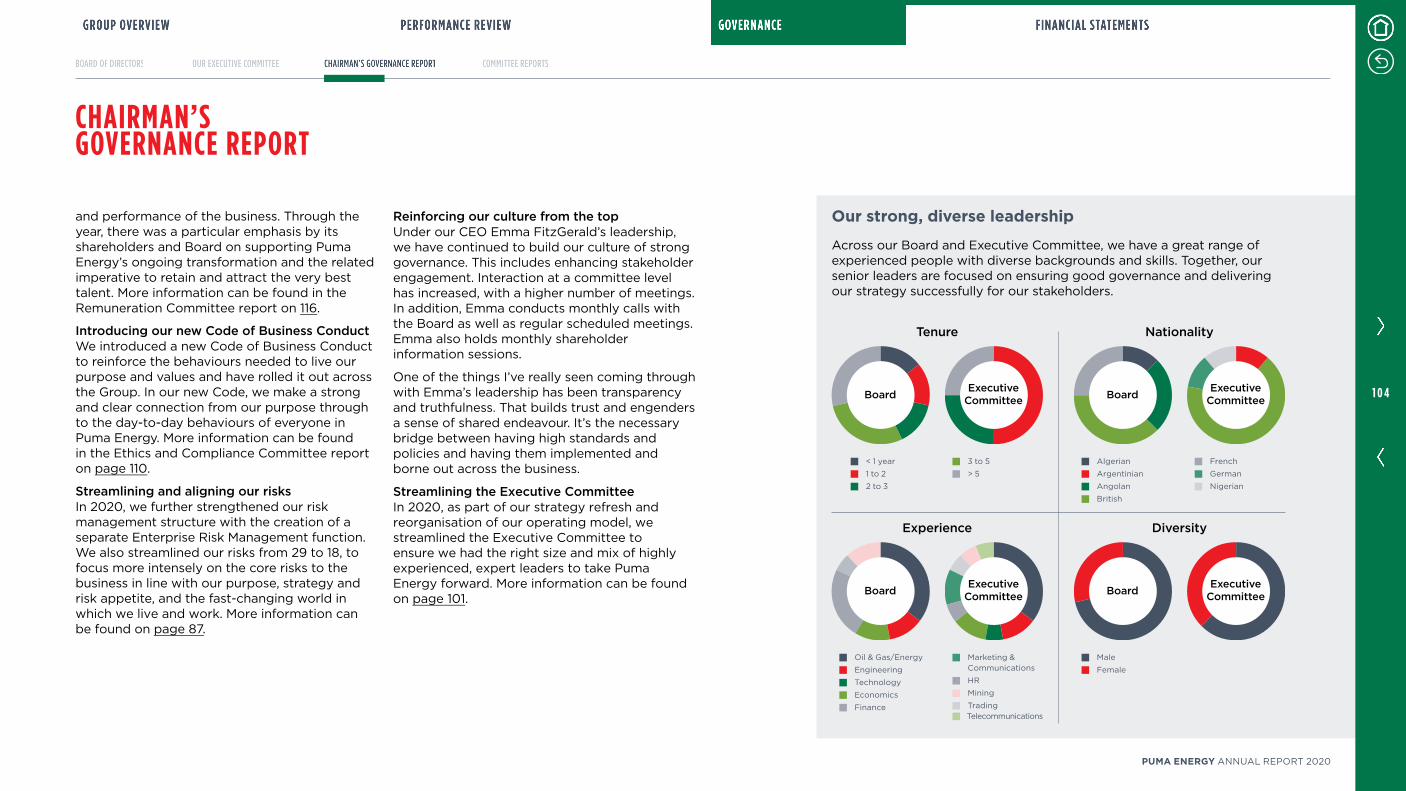
CHAIRMAN’S GOVERNANCE REPORT
and performance of the business Through the year, there was a particular emphasis by its shareholders and Board on supporting Puma Energy’s ongoing transformation and the related imperative to retain and attract the very best talent More information can be found in the Remuneration Committee report on 116
Introducing our new Code of Business Conduct We introduced a new Code of Business Conduct to reinforce the behaviours needed to live our purpose and values and have rolled it out across the Group In our new Code, we make a strong and clear connection from our purpose through to the day-to-day behaviours of everyone in Puma Energy More information can be found in the Ethics and Compliance Committee report on page 110
Streamlining and aligning our risksIn 2020, we further strengthened our risk management structure with the creation of a separate Enterprise Risk Management function We also streamlined our risks from 29 to 18, to focus more intensely on the core risks to the business in line with our purpose, strategy and risk appetite, and the fast-changing world in which we live and work More information can be found on page 87
Reinforcing our culture from the topUnder our CEO Emma FitzGerald’s leadership, we have continued to build our culture of strong governance This includes enhancing stakeholder engagement Interaction at a committee level has increased, with a higher number of meetings In addition, Emma conducts monthly calls with the Board as well as regular scheduled meetings Emma also holds monthly shareholder information sessions
One of the things I’ve really seen coming through with Emma’s leadership has been transparency and truthfulness That builds trust and engenders a sense of shared endeavour It’s the necessary bridge between having high standards and policies and having them implemented and borne out across the business
Streamlining the Executive CommitteeIn 2020, as part of our strategy refresh and reorganisation of our operating model, we streamlined the Executive Committee to ensure we had the right size and mix of highly experienced, expert leaders to take Puma Energy forward More information can be found on page 101
Our strong, diverse leadership
< 1 year
1 to 2
2 to 3
3 to 5
> 5
Tenure
Board Executive Committee
Oil & Gas/Energy
Engineering
Technology
Economics
Finance
Marketing & Communications
HR
Mining
Trading Telecommunications
Experience
Board Executive Committee
Algerian
Argentinian
Angolan
British
French
German
Nigerian
Nationality
Board Executive Committee
Male
Female
Diversity
Board Executive Committee
Across our Board and Executive Committee, we have a great range of experienced people with diverse backgrounds and skills Together, our senior leaders are focused on ensuring good governance and delivering our strategy successfully for our stakeholders
1 0 4
PUMA ENERGY ANNUAL REPORT 2020
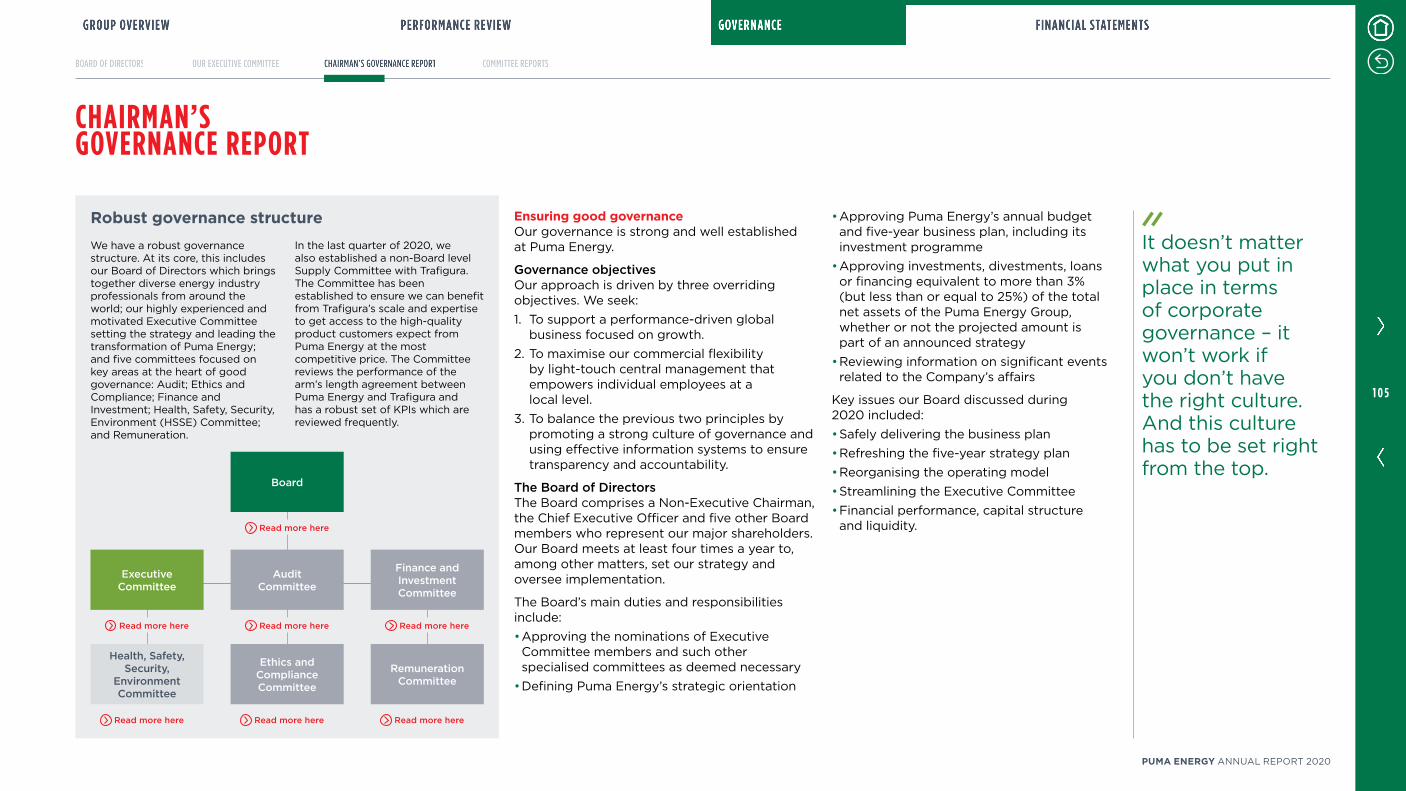
Ensuring good governance Our governance is strong and well established at Puma Energy
Governance objectives Our approach is driven by three overriding objectives We seek: 1 To support a performance-driven global
business focused on growth 2 To maximise our commercial flexibility
by light-touch central management that empowers individual employees at a local level
3 To balance the previous two principles by promoting a strong culture of governance and using effective information systems to ensure transparency and accountability
The Board of Directors The Board comprises a Non-Executive Chairman, the Chief Executive Officer and five other Board members who represent our major shareholders Our Board meets at least four times a year to, among other matters, set our strategy and oversee implementation
The Board’s main duties and responsibilities include: • Approving the nominations of Executive Committee members and such other specialised committees as deemed necessary
• Defining Puma Energy’s strategic orientation
• Approving Puma Energy’s annual budget and five-year business plan, including its investment programme
• Approving investments, divestments, loans or financing equivalent to more than 3% (but less than or equal to 25%) of the total net assets of the Puma Energy Group, whether or not the projected amount is part of an announced strategy
• Reviewing information on significant events related to the Company’s affairs
Key issues our Board discussed during 2020 included: • Safely delivering the business plan• Refreshing the five-year strategy plan• Reorganising the operating model• Streamlining the Executive Committee• Financial performance, capital structure and liquidity
CHAIRMAN’S GOVERNANCE REPORT
We have a robust governance structure At its core, this includes our Board of Directors which brings together diverse energy industry professionals from around the world; our highly experienced and motivated Executive Committee setting the strategy and leading the transformation of Puma Energy; and five committees focused on key areas at the heart of good governance: Audit; Ethics and Compliance; Finance and Investment; Health, Safety, Security, Environment (HSSE) Committee; and Remuneration
In the last quarter of 2020, we also established a non-Board level Supply Committee with Trafigura The Committee has been established to ensure we can benefit from Trafigura’s scale and expertise to get access to the high-quality product customers expect from Puma Energy at the most competitive price The Committee reviews the performance of the arm’s length agreement between Puma Energy and Trafigura and has a robust set of KPIs which are reviewed frequently
Robust governance structure
Remuneration Committee
Executive Committee
Audit Committee
Finance and Investment Committee
Read more here
Read more here
Ethics and Compliance Committee
Board
Read more here
Read more here
Read more here Read more here
Read more here
It doesn’t matter what you put in place in terms of corporate governance – it won’t work if you don’t have the right culture And this culture has to be set right from the top
Health, Safety, Security,
Environment Committee
1 0 5
PUMA ENERGY ANNUAL REPORT 2020

Roles and responsibilities of our Chairman and CEOPuma Energy has had separate Chair and Chief Executive functions since 2012
Our Chairman, René Médori, is responsible for: • Leading our Board and ensuring it makes effective decisions
• Maintaining good relations between our Board and shareholders
• Representing us in high-level discussions with governments and other important partners
• Chairing the Board’s activities and our Finance, Supply and Audit Committees
Our Chief Executive, Emma FitzGerald, chairs our Executive Committee Emma is responsible for: • Managing the Company• Reporting the Company’s results and outlook to shareholders and the financial community
• Overseeing the strategic direction of the Company
Executive team Our highly experienced executive team, which was streamlined in 2020, takes decisions to grow our business effectively and profitably Puma Energy has a lean and agile management structure that enables us to make quick, robust decisions in a transparent way
The main duties and responsibilities of the executive team include: • Implementing the strategic vision defined by the Board of Directors
• Providing organisational direction on behalf of the Board
• Advising the Board on decisions and business matters, ranging from strategy planning and policy to investment and risk
• Setting financial plans, monitoring and evaluating the implementation of these plans and ensuring that any necessary adjustments are made if required
Good governance is at the core of Puma Energy It gives us strength, it reinforces our relationships with stakeholders and provides the foundation for fulfilling our core purpose: to energise communities to serve our customers’ needs and drive sustainable growth
CHAIRMAN’S GOVERNANCE REPORT
Areas of focus in 2020Strategy acceleration• Reorganising the operating model• Streamlining the Executive Committee• Pressing on with operational improvements
Executive Committee
Environmental, social and governance (ESG)• Launching the ESG framework• Consolidating ESG principles
and commitments
People and Culture• Setting a new People & Culture strategy• Further embedding our purpose and values
Financial strength• Cost reductions• Deleveraging• Liquidity• Trafigura support
During the year, the Board paid particular attention to the following activities:
1 0 6
PUMA ENERGY ANNUAL REPORT 2020
• Ensuring that systems and structures are in place to provide effective management and support for employees
• See our executive team section on page 101 for details of our leadership team
Our committees We have appointed the following committees to ensure the smooth and effective running of our business: • Audit Committee• Ethics and Compliance Committee• Finance and Investment Committee• Health, Safety, Security, Environment(HSSE) Committee
• Remuneration Committee• Supply Committee (Q4 2020)
Managing our business responsibly We employ more than 7,100 people from over 40 countries, and have implemented a structure of global, regional and local offices to ensure we manage our business responsibly
We are committed to diversity and inclusion Our approach is to create an inclusive and respectful working environment and embed a philosophy of “we all win together”
Find out more in our section on operating responsibly on page 68
Subsidiaries and joint ventures In most countries, we operate through a local subsidiary We have more than 200 companies in more than 60 jurisdictions around the world Most subsidiaries are either wholly owned or majority owned In some countries, we have joint ventures with local or state-owned businesses A General Manager oversees each local business, supported by regional and central functions, and they are accountable to their regional Chief Operating Officer
Unless contrary to local requirements, each subsidiary’s Board includes at least one member of the executive team The General Manager is not normally on the Board, unless there is a local requirement For our investments in associates, the executive team chooses a Puma Energy representative on a case-by-case basis
Ownership and shareholdersWe operate independently of our main shareholders and strategic partners, Trafigura and Sonangol; however, we can draw on their management expertise and market knowledge
Trafigura Trafigura is one of the world’s leading international commodity traders, specialising in the oil, minerals and metals markets, with 8,619 employees across 48 countries
Founded in 1993, Trafigura is owned by its management and employees It has achieved substantial growth in recent years, growing turnover from US$18bn in 2004 to US$147bn in 2020
Trafigura’s primary trading businesses are involved in the supply and transport of crude oil, petroleum products, renewable energies, coal, refined metals, ferrous and non-ferrous ores and concentrates It is the world’s second-largest independent non-ferrous trading company and the third-largest independent oil trader
We are one of Trafigura’s largest suppliers of Midstream services, such as storage and bunkering, which in turn provides Puma Energy with stable cash flows Trafigura is a preferred supplier of petroleum products to Puma Energy and accounts for roughly two-thirds of our supply
This special relationship provides Puma Energy with preferential access to the international markets
For more information about Trafigura, visit: wwwtrafiguracom
Sonangol Established in 1976, Sonangol is ultimately a state-owned company whose mission is the management of hydrocarbon resource exploration and production in Angola Sonangol Holdings Lda, the direct shareholder of the Puma Energy Group, is governed as a private company and has strict standards to ensure efficiency and productivity
In this context, Sonangol works to become a reference in the international market The company’s activities include exploration, development, marketing, production, transportation and refining of hydrocarbons
and their derivatives Sonangol gives us crucial expertise and knowledge of Sub-Saharan African markets
Change in shareholding structureIn March 2020 a shareholding restructuring transaction was initiated between Trafigura and Cochan Holdings to reduce Cochan Holdings stake in Puma Energy by selling shares in our Group to Trafigura Hereafter, Puma Energy bought back and cancelled these shares We funded the repurchase with a subordinated shareholder loan amounting to US$390m from Trafigura with an initial tenor of seven years
As a result of this transaction, Cochan Holdings ceased to be a significant shareholder in Puma Energy and Trafigura’s shareholding in Puma Energy increased to 556 percent Based on agreement between the shareholders, the power to direct the relevant activities of Puma Energy lies solely with its Board of Directors, and shareholders’ rights are only protective in nature Trafigura appoints three out of eight directors, and decisions by our Board of Directors are taken by simple majority Trafigura therefore does not have the majority of decision-making power in our Board of Directors The transaction did not alter the existing shareholder agreement Therefore, the increase in Trafigura’s shareholding did not result in Trafigura gaining control over Puma Energy Regulatory approval for the restructuring was granted in June 2020
CHAIRMAN’S GOVERNANCE REPORT
1 0 7
PUMA ENERGY ANNUAL REPORT 2020
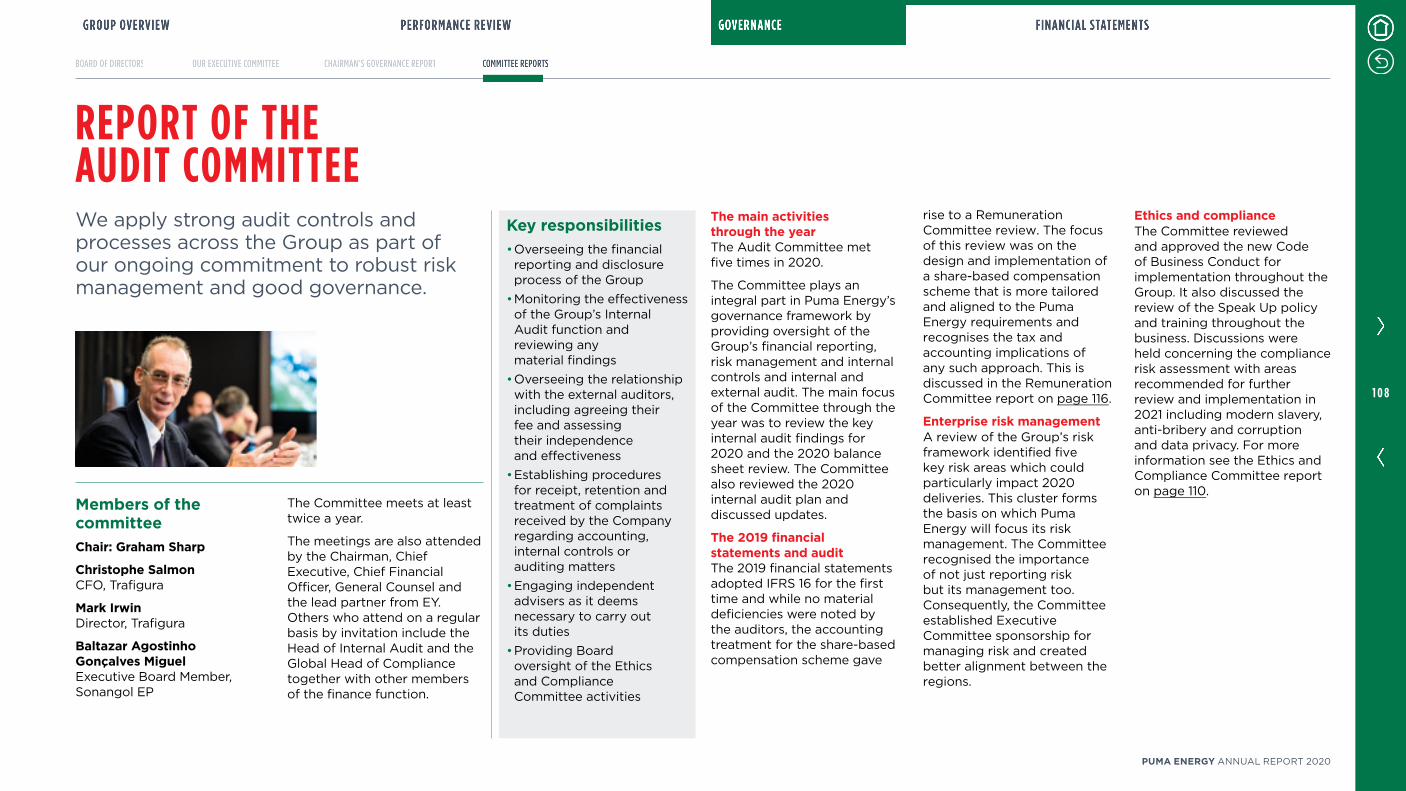
REPORT OF THE AUDIT COMMITTEEWe apply strong audit controls and processes across the Group as part of our ongoing commitment to robust risk management and good governance
Members of the committeeChair: Graham Sharp
Christophe Salmon CFO, Trafigura
Mark Irwin Director, Trafigura
Baltazar Agostinho Gonçalves Miguel Executive Board Member, Sonangol EP
Key responsibilities• Overseeing the financialreporting and disclosureprocess of the Group
• Monitoring the effectivenessof the Group’s InternalAudit function andreviewing anymaterial findings
• Overseeing the relationshipwith the external auditors,including agreeing theirfee and assessingtheir independenceand effectiveness
• Establishing proceduresfor receipt, retention andtreatment of complaintsreceived by the Companyregarding accounting,internal controls orauditing matters
• Engaging independentadvisers as it deemsnecessary to carry outits duties
• Providing Boardoversight of the Ethicsand ComplianceCommittee activities
The Committee meets at least twice a year
The meetings are also attended by the Chairman, Chief Executive, Chief Financial Officer, General Counsel and the lead partner from EY Others who attend on a regular basis by invitation include the Head of Internal Audit and the Global Head of Compliance together with other members of the finance function
The main activities through the yearThe Audit Committee met five times in 2020
The Committee plays an integral part in Puma Energy’s governance framework by providing oversight of the Group’s financial reporting, risk management and internal controls and internal and external audit The main focus of the Committee through the year was to review the key internal audit findings for 2020 and the 2020 balance sheet review The Committee also reviewed the 2020 internal audit plan and discussed updates
The 2019 financial statements and auditThe 2019 financial statements adopted IFRS 16 for the first time and while no material deficiencies were noted by the auditors, the accounting treatment for the share-based compensation scheme gave
rise to a Remuneration Committee review The focus of this review was on the design and implementation of a share-based compensation scheme that is more tailored and aligned to the Puma Energy requirements and recognises the tax and accounting implications of any such approach This is discussed in the Remuneration Committee report on page 116
Enterprise risk management A review of the Group’s risk framework identified five key risk areas which could particularly impact 2020 deliveries This cluster forms the basis on which Puma Energy will focus its risk management The Committee recognised the importance of not just reporting risk but its management too Consequently, the Committee established Executive Committee sponsorship for managing risk and created better alignment between the regions
Ethics and complianceThe Committee reviewed and approved the new Code of Business Conduct for implementation throughout the Group It also discussed the review of the Speak Up policy and training throughout the business Discussions were held concerning the compliance risk assessment with areas recommended for further review and implementation in 2021 including modern slavery, anti-bribery and corruption and data privacy For more information see the Ethics and Compliance Committee report on page 110
1 0 8
PUMA ENERGY ANNUAL REPORT 2020
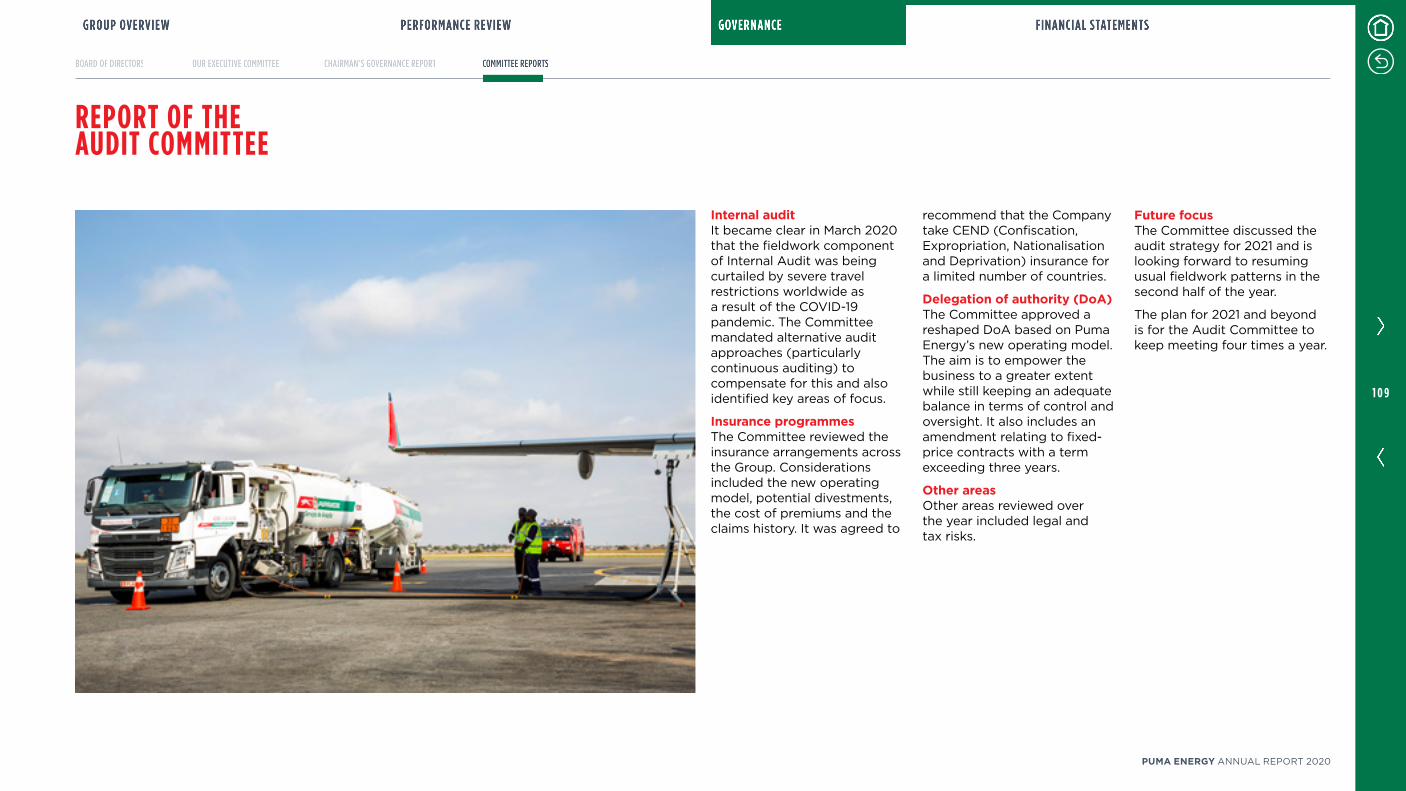
REPORT OF THE AUDIT COMMITTEE
Internal auditIt became clear in March 2020 that the fieldwork component of Internal Audit was being curtailed by severe travel restrictions worldwide as a result of the COVID-19 pandemic The Committee mandated alternative audit approaches (particularly continuous auditing) to compensate for this and also identified key areas of focus
Insurance programmesThe Committee reviewed the insurance arrangements across the Group Considerations included the new operating model, potential divestments, the cost of premiums and the claims history It was agreed to
recommend that the Company take CEND (Confiscation, Expropriation, Nationalisation and Deprivation) insurance for a limited number of countries
Delegation of authority (DoA)The Committee approved a reshaped DoA based on Puma Energy’s new operating model The aim is to empower the business to a greater extent while still keeping an adequate balance in terms of control and oversight It also includes an amendment relating to fixed-price contracts with a term exceeding three years
Other areasOther areas reviewed over the year included legal and tax risks
Future focusThe Committee discussed the audit strategy for 2021 and is looking forward to resuming usual fieldwork patterns in the second half of the year
The plan for 2021 and beyond is for the Audit Committee to keep meeting four times a year
1 0 9
PUMA ENERGY ANNUAL REPORT 2020

Members of the committeeChair: Emma FitzGerald Chief Executive Officer
Andrew Kemp Chief Financial Officer
Michael Schulz Chief People & Culture Officer
Key responsibilities• Reviewing, approving and overseeing the Company’s programme for ethics and compliance
• Reviewing significant ethics and compliance risks and confirming that appropriate risk management activities and plans are in place
• Monitoring the overall ethics and compliance performance in the Company
• Reviewing the systems in place to enable staff to speak up about potential breaches of the Code of Business Conduct
• Reviewing significant investigations and outcomes to identify lessons learned and opportunities for systemic remediation
• Reviewing and resolving significant ethics and compliance matters that have the potential to adversely and materially impact the Company’s reputation
Jonathan Pegler Future Energies, Infrastructure, Global Bitumen
Alan McGown Chief Transformation Officer, Value Chain Optimisation & Procurement
Rhibetnan Yaktal Global Head of Compliance
The Committee meets at least twice a year
Our approachWe take a robust and rigorous approach to ethics and compliance – championing one best way throughout Puma Energy
We recognise that our long-term success relies not only on conducting business in a legally compliant, safe and ethical manner, but also in going further, indeed as far as we can go, to consistently set the highest standards and act with the greatest integrity to energise communities All of which is in line with, and supported by, our ESG framework
Our ongoing commitment to enhancing the rigour and structure of our ethics and compliance is in line with our broader focus across Puma Energy to strengthen and sharpen the way we live our purpose
Meetings and attendeesThe Committee met four times during the year
Key areas of focus in the yearWe undertook a number of key ethics and compliance initiatives through the year, focused on our core areas: programme structure design and oversight; policies and procedures; training and communication; third-party engagement process; Speak Up and investigations; Remediation; Discipline and incentives; and risk management
Introducing our new Code of Business ConductWe introduced our new Code of Business Conduct, reflecting the purpose and values we defined last year In our new Code, we make a strong and clear connection from our purpose through to the day-to-day behaviours of everyone in Puma Energy
Our purpose of energising communities is lived through our four values: customer focus, lead by example, collaboration, and agility We bring our values to life in the way we conduct ourselves, every day, everywhere, and that conduct is set out clearly in our new Code
REPORT OF THE ETHICS AND COMPLIANCE COMMITTEEAcross Puma Energy around the world, we are embedding a strong ethics and compliance culture so that it is part of our everyday way of doing business – a core part of the way we energise communities
We made great progress this year in ensuring that strong ethics and compliance is an integral part of everyone’s daily working lives in Puma Energy We are making it central to the way we all work together to live our purposeRhibetnan Yaktal, Global Head of Compliance
1 1 0
PUMA ENERGY ANNUAL REPORT 2020

We want the Code to be a daily lived experience for our people, rather than an occasional reference So we have produced a handy pocketbook version of the Code, a Z-card for all our people, available in English, French, Spanish, Portuguese and Burmese
Encouraging our people to Speak UpWe put a lot of focus through the year on encouraging everyone in Puma Energy to Speak Up This included training on the policy, so people are clear on what they are expected to speak up about, how to do it, as well being assured that we will not tolerate any retaliation
Speak Up was the highlight of our first-ever Compliance Day, held on 17 November 2020 This virtual event engaged everyone in Puma Energy It featured a dance video bringing to life how, by everyone taking the right steps together, we can build a good rhythm of compliance across Puma Energy It was a fun and engaging way to emphasise
the everyday essential nature of ethics and compliance
Focusing on risk managementWe conducted a detailed compliance risk assessment, carrying out hundreds of granular interviews across the Group This enabled us fully to understand our compliance risks and pinpoint the critical areas, so we could share these valuable insights with the business
We have focused the risk assessment on five areas:• Anti-bribery and corruption• Anti-money laundering• Modern slavery• Data privacy• Third-party engagement
Refreshing our network of Code AmbassadorsWe refreshed our network of Code Ambassadors to ensure we had the best possible people from across the business helping to champion ethics and compliance alongside our functional experts We also provided training for the Ambassadors
Setting up regional Ethics and Compliance CommitteesTo further strengthen our oversight, we set up regional Ethics and Compliance Committees to support the global Ethics and Compliance Committee This adds a layer of rigour giving us more granular oversight of what is happening on the ground in our countries and communities
Enhancing Know Your Counterparty (KYC)We built and launched globally a new risk-based Know Your Counterparty (KYC) process and platform We also hired a dedicated KYC team
Declaring conflicts of interestWe rolled out conflicts of interest certification to all employees online This gives everyone a clear and easy way to declare any conflicts of interest, enhances oversight and enables us to manage and mitigate conflicts effectively
We also designed and launched a gifts and entertainment register towards the end of the year
Updating policiesWe updated a number of policies through the year, including the conflicts of interest policy and the gifts and entertainment policy
Future focusThrough 2021, we will carry on building our team and expertise across ethics and compliance
Drawing on the learnings and insights from our compliance risk assessment, we will focus on key priority areas and implement further improvement initiatives
Above all, we will continue our journey to embed ethics and compliance throughout Puma Energy – so it truly is an active everyday part of our people’s quest to energise communities
REPORT OF THE ETHICS AND COMPLIANCE COMMITTEE
KNOW OUR CODEYou can raise concerns through the following channels: • Your line manager• Another manager• Your Code Ambassador• Your Compliance representative • Your Legal representative • Your People and culture representative
Live our purpose and valuesContact us through the anonymous channels below:www.PumaEnergySpeakUp.com
Call your local hotline number:+44 0000000000
BOUNDBY OUR INTEGRITY
You can raise concerns through the following channels: • Your line manager• Another manager• Your Code Ambassador• Your Compliance representative • Your Legal representative • Your People and culture representative
Contact us through the anonymous channels below:www.PumaEnergySpeakUp.com
Call your local hotline number:+44 0000000000
KNOW YOUR CODE AMBASSADOR
NAME GOES HEREE-mail: [email protected]
Phone number: +44 0000000000
You can raise concerns through the following channels: • Your line manager• Another manager• Your Code Ambassador• Your Compliance representative • Your Legal representative • Your People and culture representative
Contact us through the anonymous channels below:www.PumaEnergySpeakUp.com
Call your local hotline number:+44 0000000000
KEEPINTEGRITY FLYING HIGH
If you hear or see something that seems wrong, you must speak up.
SPEAK UP. WE’LL LISTEN.
Are you aware of a potential ethical legal or business conduct violation?
Contact us through the anonymous channels below:www.PumaEnergySpeakUp.com
Call your local hotline number:+44 0000000000
You can raise concerns through the following channels: • Your line manager• Another manager• Your Code Ambassador• Your Compliance representative • Your Legal representative • Your People and culture representative
Contact us through the anonymous channels below:www.PumaEnergySpeakUp.com
Call your local hotline number:+44 0000000000
OPERATING SMOOTHLYAND WITHINTEGRITY
Spreading the word around the businessThrough the year we produced a series of posters linking integrity to different business lines, in order to reinforce the message across every aspect of Puma Energy So for example, for aviation the message was: Keep integrity flying high For lubricants, it was: Operating smoothly and with integrity
1 1 1
PUMA ENERGY ANNUAL REPORT 2020

Members of the committeeChair: Graham Sharp
Andrew Kemp Chief Financial Officer
Pierre Lorinet Director, Trafigura
Mike Wainwright Director, Trafigura
Baltazar Agostinho Gonçalves Miguel Executive Board Member, Sonagol EP
Key responsibilitiesThe key responsibilities of the Finance and Investment Committee include: • Reviewing and making recommendations in relation to matters affecting our capital structure and financing, on tax and treasury aspects
• Validating our external financing principles
• Reviewing KPIs and monitoring rating policies
• Overseeing the governance and activities of our treasury functions
• Overseeing portfolio management
The Committee met four times during the year
The main activities through the yearThe main priority of the Committee in 2020 was to ensure sufficient liquidity for Puma Energy in the face of the COVID-19 crisis, which saw a significant drop in petroleum products consumption in our markets, especially during Q2 2020
The Committee also maintained its focus on portfolio management and supervised the sales of our Australian commercial and retail fuels business; shares in a real estate programme in Australia; the Rostov aviation business in Russia, lands in Nigeria, and other small terminals The Committee also advanced the portfolio optimisation of our non-core countries with more to come in 2021 In the course of 2020, the Company used US$300m from assets disposal to prepay bank term debt and also organised a small bonds buy back in April to support Puma Energy’s bonds trading performance
In addition, the Committee supervised the establishment of the Infrastructure business unit, which includes 32 marine and two inland terminals
The Committee also allocated resources to launch the Future Energies business unit, which in 2020 started to equip retail stations with solar panels in a number of countries
The Committee also successfully supervised Puma Energy’s programme to reduce costs Initiatives on this front in 2020 included reorganising the Group’s operating model, staff rationalisation, renegotiation of lease contracts, and the reorganisation of the procurement team
Future focusIn 2021, the Committee will focus on completing the Group’s global assets sale programme; establishing the Infrastructure business unit as an investable platform for new investors; and ensuring Puma Energy has an appropriate capital structure to realise its customer-led strategy
The Committee will also supervise and approve the implementation of an updated Treasury Policy for the Group
REPORT OF THE FINANCE AND INVESTMENT COMMITTEEFrom reviewing our financial structure to optimising our portfolio, we are dedicated to managing our finance and investments in line with our customer-led growth strategy
1 1 2
PUMA ENERGY ANNUAL REPORT 2020
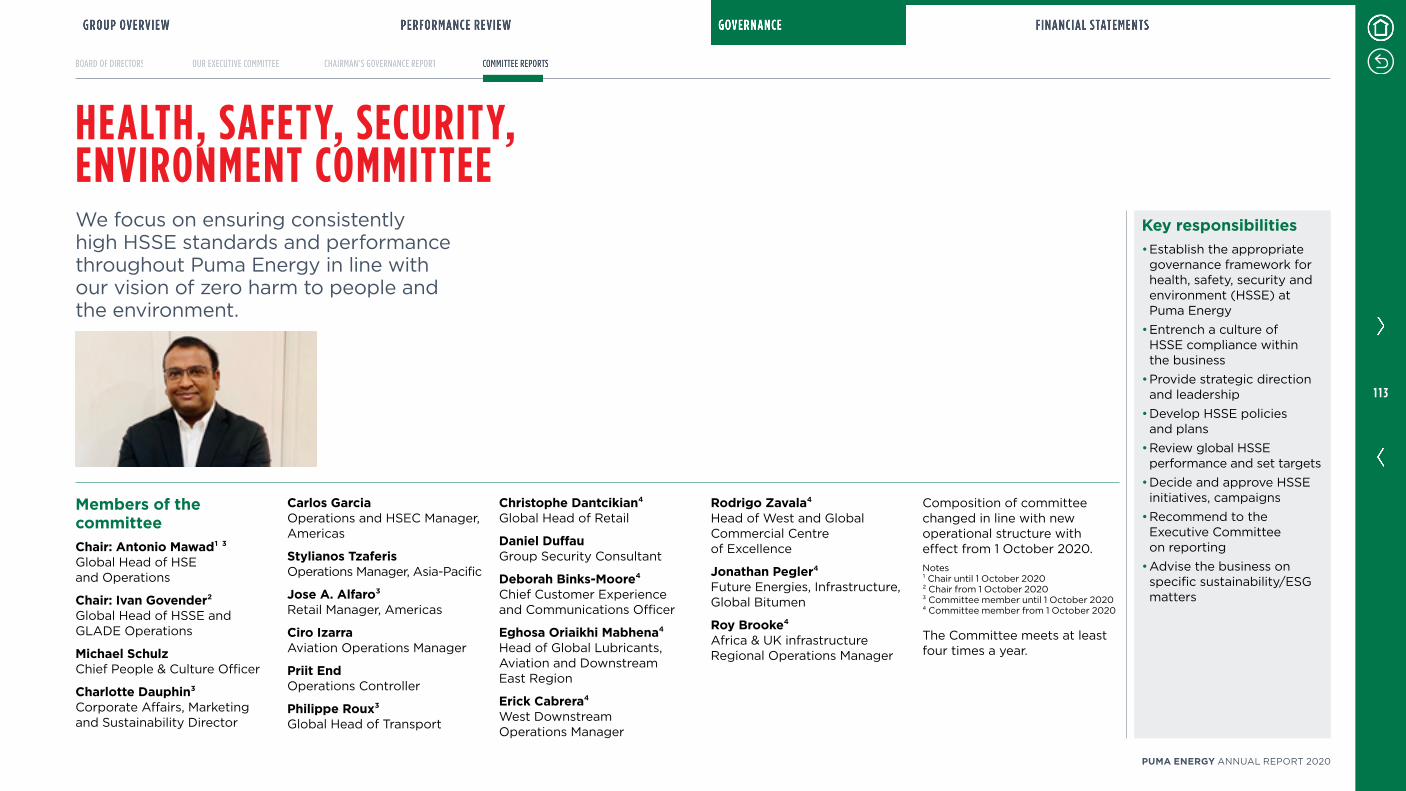
HEALTH, SAFETY, SECURITY, ENVIRONMENT COMMITTEEWe focus on ensuring consistently high HSSE standards and performance throughout Puma Energy in line with our vision of zero harm to people and the environment
Members of the committeeChair: Antonio Mawad¹ ³ Global Head of HSE and Operations
Chair: Ivan Govender² Global Head of HSSE and GLADE Operations
Michael Schulz Chief People & Culture Officer
Charlotte Dauphin³ Corporate Affairs, Marketing and Sustainability Director
Christophe Dantcikian⁴ Global Head of Retail
Daniel Duffau Group Security Consultant
Deborah Binks-Moore⁴ Chief Customer Experience and Communications Officer
Eghosa Oriaikhi Mabhena⁴ Head of Global Lubricants, Aviation and Downstream East Region
Erick Cabrera⁴ West Downstream Operations Manager
Carlos Garcia Operations and HSEC Manager, Americas
Stylianos Tzaferis Operations Manager, Asia-Pacific
Jose A. Alfaro³ Retail Manager, Americas
Ciro Izarra Aviation Operations Manager
Priit End Operations Controller
Philippe Roux³ Global Head of Transport
Rodrigo Zavala⁴ Head of West and Global Commercial Centre of Excellence
Jonathan Pegler⁴ Future Energies, Infrastructure, Global Bitumen
Roy Brooke⁴ Africa & UK infrastructure Regional Operations Manager
Composition of committee changed in line with new operational structure with effect from 1 October 2020Notes¹ Chair until 1 October 2020² Chair from 1 October 2020³ Committee member until 1 October 2020⁴ Committee member from 1 October 2020
The Committee meets at least four times a year
Key responsibilities• Establish the appropriate governance framework for health, safety, security and environment (HSSE) at Puma Energy
• Entrench a culture of HSSE compliance within the business
• Provide strategic direction and leadership
• Develop HSSE policies and plans
• Review global HSSE performance and set targets
• Decide and approve HSSE initiatives, campaigns
• Recommend to the Executive Committee on reporting
• Advise the business on specific sustainability/ESG matters
1 1 3
PUMA ENERGY ANNUAL REPORT 2020
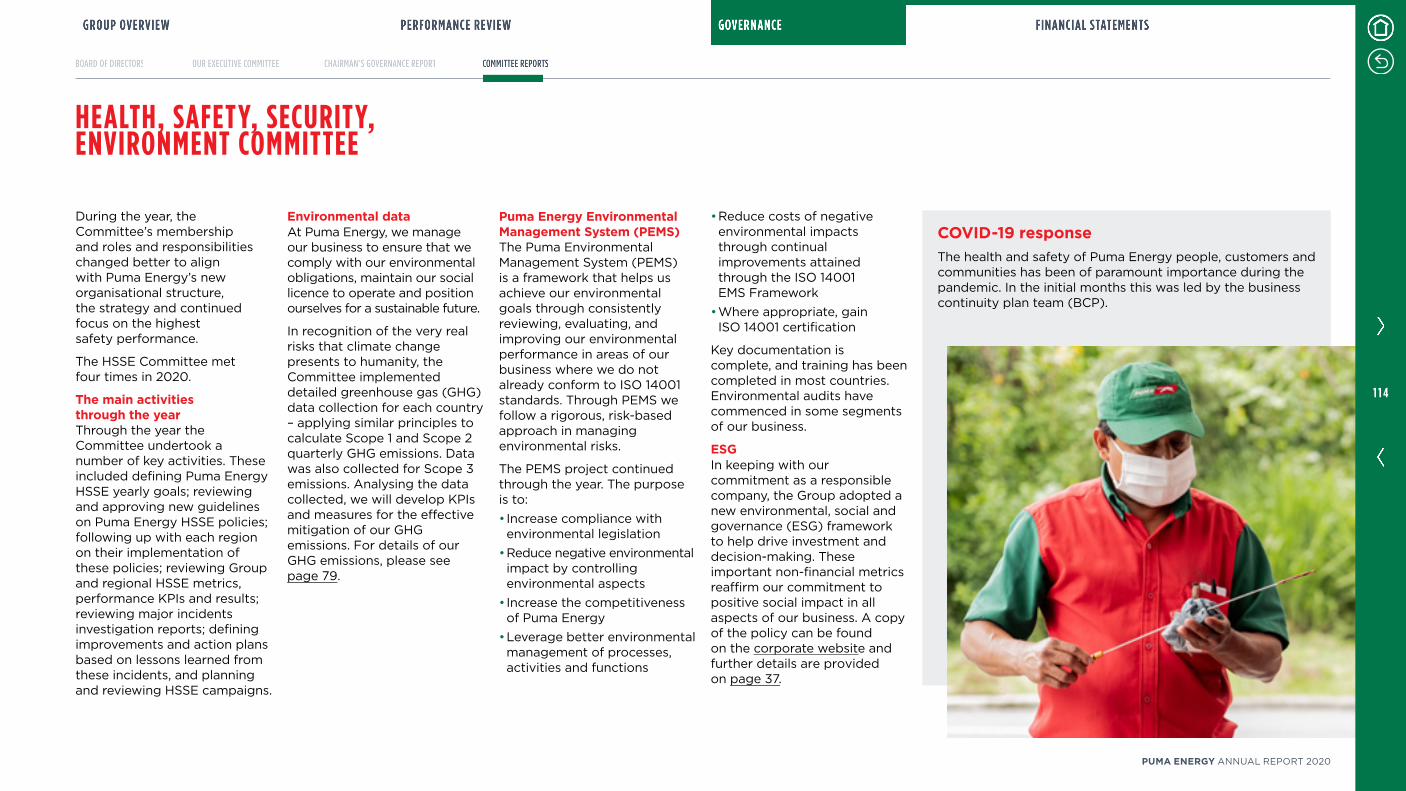
HEALTH, SAFETY, SECURITY, ENVIRONMENT COMMITTEE
During the year, the Committee’s membership and roles and responsibilities changed better to align with Puma Energy’s new organisational structure, the strategy and continued focus on the highest safety performance
The HSSE Committee met four times in 2020
The main activities through the yearThrough the year the Committee undertook a number of key activities These included defining Puma Energy HSSE yearly goals; reviewing and approving new guidelines on Puma Energy HSSE policies; following up with each region on their implementation of these policies; reviewing Group and regional HSSE metrics, performance KPIs and results; reviewing major incidents investigation reports; defining improvements and action plans based on lessons learned from these incidents, and planning and reviewing HSSE campaigns
Environmental dataAt Puma Energy, we manage our business to ensure that we comply with our environmental obligations, maintain our social licence to operate and position ourselves for a sustainable future
In recognition of the very real risks that climate change presents to humanity, the Committee implemented detailed greenhouse gas (GHG) data collection for each country – applying similar principles to calculate Scope 1 and Scope 2 quarterly GHG emissions Data was also collected for Scope 3 emissions Analysing the data collected, we will develop KPIs and measures for the effective mitigation of our GHG emissions For details of our GHG emissions, please see page 79
Puma Energy Environmental Management System (PEMS)The Puma Environmental Management System (PEMS) is a framework that helps us achieve our environmental goals through consistently reviewing, evaluating, and improving our environmental performance in areas of our business where we do not already conform to ISO 14001 standards Through PEMS we follow a rigorous, risk-based approach in managing environmental risks
The PEMS project continued through the year The purpose is to:• Increase compliance withenvironmental legislation
• Reduce negative environmentalimpact by controllingenvironmental aspects
• Increase the competitivenessof Puma Energy
• Leverage better environmentalmanagement of processes,activities and functions
• Reduce costs of negativeenvironmental impactsthrough continualimprovements attainedthrough the ISO 14001EMS Framework
• Where appropriate, gainISO 14001 certification
Key documentation is complete, and training has been completed in most countries Environmental audits have commenced in some segments of our business
ESGIn keeping with our commitment as a responsible company, the Group adopted a new environmental, social and governance (ESG) framework to help drive investment and decision-making These important non-financial metrics reaffirm our commitment to positive social impact in all aspects of our business A copy of the policy can be found on the corporate website and further details are provided on page 37
COVID-19 responseThe health and safety of Puma Energy people, customers and communities has been of paramount importance during the pandemic In the initial months this was led by the business continuity plan team (BCP)
1 1 4
PUMA ENERGY ANNUAL REPORT 2020

Our holistic approach to Vision ZeroSafety performance The Committee uses data analysis and insights to prioritise efforts to improve HSSE performance, both through technology and culture change Through 2020, the Committee noted improvement in a number of metrics across the Group
Key safety-focused matters through the year included:• Improving our reporting practices, systems and analysis tools following a comprehensive review of peer companies and best in class approaches
• Implementing the Woocar driving safety app to improve driver security and safety
• Reviewing all our safety campaigns to strengthen and embed our safety culture in line with our commitment to Vision Zero – making each day free of incidents, where our people, customers and contractors go home safely to their families and communities energised by our safety culture
SecurityWe are acutely aware that the very nature of our business exposes us to certain security risks We have taken reasonable measures to ensure that our employees, customers, stakeholders and our assets are not exposed to such threats We continuously review our security protocols and implement strategies to mitigate against security breaches
Future focusThe Committee plans to meet monthly as part of the Group’s continued focus on further improving and embedding HSSE excellence throughout Puma Energy
More detailed metrics will be developed to analyse safety performance across the business, particularly in the retail business and for contractors
PEMS training in the remaining countries will also be completed Once training is complete, the PEMS implementation phase will start, beginning with Puma Energy terminals followed by the Retail business
Vision Zero continues to be developed and embedded across Puma Energy, to drive culture change and a further step in improving performance
End state ZERO HARM
Culture Shift
Policy & regulatory
requirements
Continuous monitoring
and reporting
Behavioural Based Safety
Leading Indicators
Benchmarks, standards, continuous
improvement
HEALTH, SAFETY, SECURITY, ENVIRONMENT COMMITTEE
1 1 5
PUMA ENERGY ANNUAL REPORT 2020
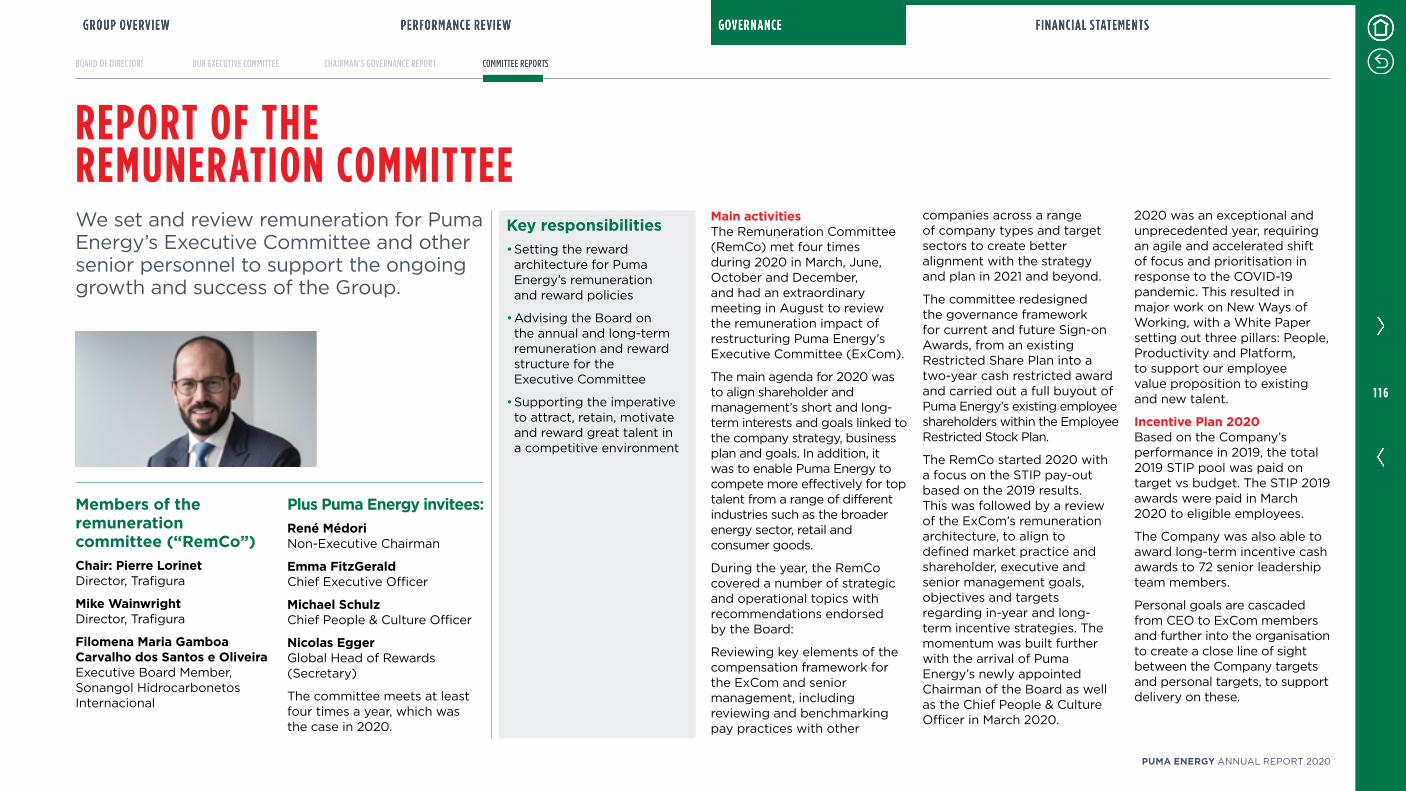
Members of the remuneration committee (“RemCo”)Chair: Pierre Lorinet Director, Trafigura
Mike Wainwright Director, Trafigura
Filomena Maria Gamboa Carvalho dos Santos e Oliveira Executive Board Member, Sonangol Hidrocarbonetos Internacional
Key responsibilities• Setting the reward architecture for Puma Energy’s remuneration and reward policies
• Advising the Board on the annual and long-term remuneration and reward structure for the Executive Committee
• Supporting the imperative to attract, retain, motivate and reward great talent in a competitive environment
Plus Puma Energy invitees:René Médori Non-Executive Chairman
Emma FitzGerald Chief Executive Officer
Michael Schulz Chief People & Culture Officer
Nicolas Egger Global Head of Rewards (Secretary)
The committee meets at least four times a year, which was the case in 2020
Main activitiesThe Remuneration Committee (RemCo) met four times during 2020 in March, June, October and December, and had an extraordinary meeting in August to review the remuneration impact of restructuring Puma Energy’s Executive Committee (ExCom)
The main agenda for 2020 was to align shareholder and management’s short and long-term interests and goals linked to the company strategy, business plan and goals In addition, it was to enable Puma Energy to compete more effectively for top talent from a range of different industries such as the broader energy sector, retail and consumer goods
During the year, the RemCo covered a number of strategic and operational topics with recommendations endorsed by the Board:
Reviewing key elements of the compensation framework for the ExCom and senior management, including reviewing and benchmarking pay practices with other
companies across a range of company types and target sectors to create better alignment with the strategy and plan in 2021 and beyond
The committee redesigned the governance framework for current and future Sign-on Awards, from an existing Restricted Share Plan into a two-year cash restricted award and carried out a full buyout of Puma Energy’s existing employee shareholders within the Employee Restricted Stock Plan
The RemCo started 2020 with a focus on the STIP pay-out based on the 2019 results This was followed by a review of the ExCom’s remuneration architecture, to align to defined market practice and shareholder, executive and senior management goals, objectives and targets regarding in-year and long-term incentive strategies The momentum was built further with the arrival of Puma Energy’s newly appointed Chairman of the Board as well as the Chief People & Culture Officer in March 2020
2020 was an exceptional and unprecedented year, requiring an agile and accelerated shift of focus and prioritisation in response to the COVID-19 pandemic This resulted in major work on New Ways of Working, with a White Paper setting out three pillars: People, Productivity and Platform, to support our employee value proposition to existing and new talent
Incentive Plan 2020Based on the Company’s performance in 2019, the total 2019 STIP pool was paid on target vs budget The STIP 2019 awards were paid in March 2020 to eligible employees
The Company was also able to award long-term incentive cash awards to 72 senior leadership team members
Personal goals are cascaded from CEO to ExCom members and further into the organisation to create a close line of sight between the Company targets and personal targets, to support delivery on these
REPORT OF THE REMUNERATION COMMITTEEWe set and review remuneration for Puma Energy’s Executive Committee and other senior personnel to support the ongoing growth and success of the Group
1 1 6
PUMA ENERGY ANNUAL REPORT 2020
REPORT OF THE REMUNERATION COMMITTEE
Employee shareholder share buy backsAs a result of a number of internal and external factors including a change in the Company valuation method with a corresponding impact on share price, the RemCo decided in December 2020 to undertake a full buyback of employee shareholdings, and replace them with deferred cash pay-outs linked to the share-vesting period of each grant/tranche
As Puma Energy is a privately held company, the RemCo decided that a cash long-term incentive would be more appropriate given the turnaround and transition Puma Energy is currently undergoing
Sign-On Awards Sign-On Awards granted in past years under the Puma Energy Restricted Stock Plan to newly joining ExCom and Senior
Executives were converted to cash with a vesting period reduced from three years to two years, taking into account the nature of other long-term incentive and value creation plans This policy came into effect from January 2021
This affected 14 employees in 2020, with new Sign-On cash awards to be delivered-on or after 1 January 2021
Recognition at Puma EnergyThe Company has put significant effort into recognition programmes for all colleagues worldwide, notably the Puma Energy Awards, Making A Great Individual Contribution (MAGIC) and Going the Extra Mile (GEM) Particularly through March to July 2020 at the height of the pandemic, this kept the Puma Energy spirit alive and helped to bring everyone in the Company closer together
Restructuring the ExCom The restructuring of the Company into the new operating model to support and execute its business strategy came into effect in October 2020 This resulted in a restructuring of the ExCom team from 12 to eight members For the remaining eight members no amendments were made to base pay but variable compensation was reviewed in light of the ExCom compensation benchmarking exercise, gearing and aligning variable pay towards the new goals set out by the Board
ExCom compensation industry benchmarkIn August 2020, in partnership with Hay/Korn Ferry, the Global Rewards team conducted a full review of the overall total compensation of each of the ExCom members
Future focusThe Company is now embarking on a Gender Pay Index in accordance with Swiss regulations in 2021 In 2021, this study will be extended to capture the different countries Puma Energy operates in, as part of the Group’s long-term ESG commitments It will also place more emphasis on reviewing Puma Energy’s position and potential adjustment in relation to its Colleague Value Proposition (CVP) This will include many elements as part of competitive remuneration and overall in its priority markets
In 2020, the Remuneration Committee continued to focus on aligning the compensation of Puma Energy’s senior leadership to the strategy, goals and performance of the business Through the year, there was a particular emphasis by its shareholders and Board on supporting Puma Energy’s ongoing transformation and the related imperative to retain and attract the very best talent Pierre Lorinet, Chair of the Remuneration Committee
1 1 7
PUMA ENERGY ANNUAL REPORT 2020

FINANCIAL STATEMENTSFinancial statements 119Independent auditor’s report 164
1 1 8
PUMA ENERGY ANNUAL REPORT 2020
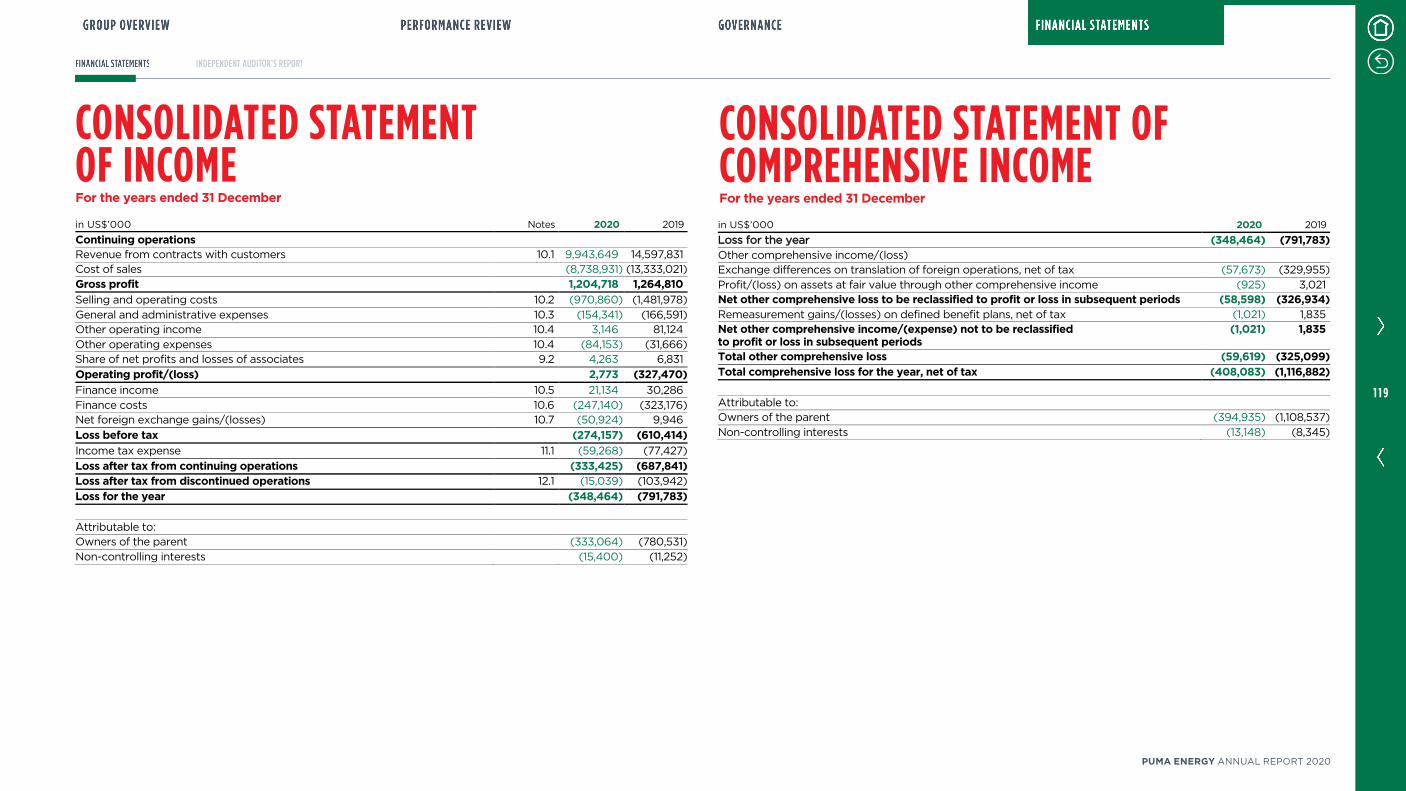
CONSOLIDATED STATEMENT OF INCOME For the years ended 31 December
CONSOLIDATED STATEMENT OF COMPREHENSIVE INCOME For the years ended 31 December
in US$’000 Notes 2020 2019
Continuing operations Revenue from contracts with customers 10.1 9,943,649 14,597,831 Cost of sales (8,738,931) (13,333,021)
Gross profit 1,204,718 1,264,810 Selling and operating costs 10.2 (970,860) (1,481,978)
General and administrative expenses 10.3 (154,341) (166,591) Other operating income 10.4 3,146 81,124
Other operating expenses 10.4 (84,153) (31,666) Share of net profits and losses of associates 9.2 4,263 6,831
Operating profit/(loss) 2,773 (327,470) Finance income 10.5 21,134 30,286
Finance costs 10.6 (247,140) (323,176) Net foreign exchange gains/(losses) 10.7 (50,924) 9,946
Loss before tax (274,157) (610,414) Income tax expense 11.1 (59,268) (77,427)
Loss after tax from continuing operations (333,425) (687,841) Loss after tax from discontinued operations 12.1 (15,039) (103,942)
Loss for the year (348,464) (791,783)
Attributable to: Owners of the parent (333,064) (780,531)
Non-controlling interests (15,400) (11,252)
in US$’000 2020 2019
LLoossss ffoorr tthhee yyeeaarr (348,464) (791,783) Other comprehensive income/(loss) Exchange differences on translation of foreign operations, net of tax (57,673) (329,955)
Profit/(loss) on assets at fair value through other comprehensive income (925) 3,021 Net other comprehensive loss to be reclassified to profit or loss in subsequent periods (58,598) (326,934) Remeasurement gains/(losses) on defined benefit plans, net of tax (1,021) 1,835 Net other comprehensive income/(expense) not to be reclassified to profit or loss in subsequent periods
(1,021) 1,835
Total other comprehensive loss (59,619) (325,099) Total comprehensive loss for the year, net of tax (408,083) (1,116,882)
Attributable to: Owners of the parent (394,935) (1,108,537)
Non-controlling interests (13,148) (8,345)
1 1 9
PUMA ENERGY ANNUAL REPORT 2020
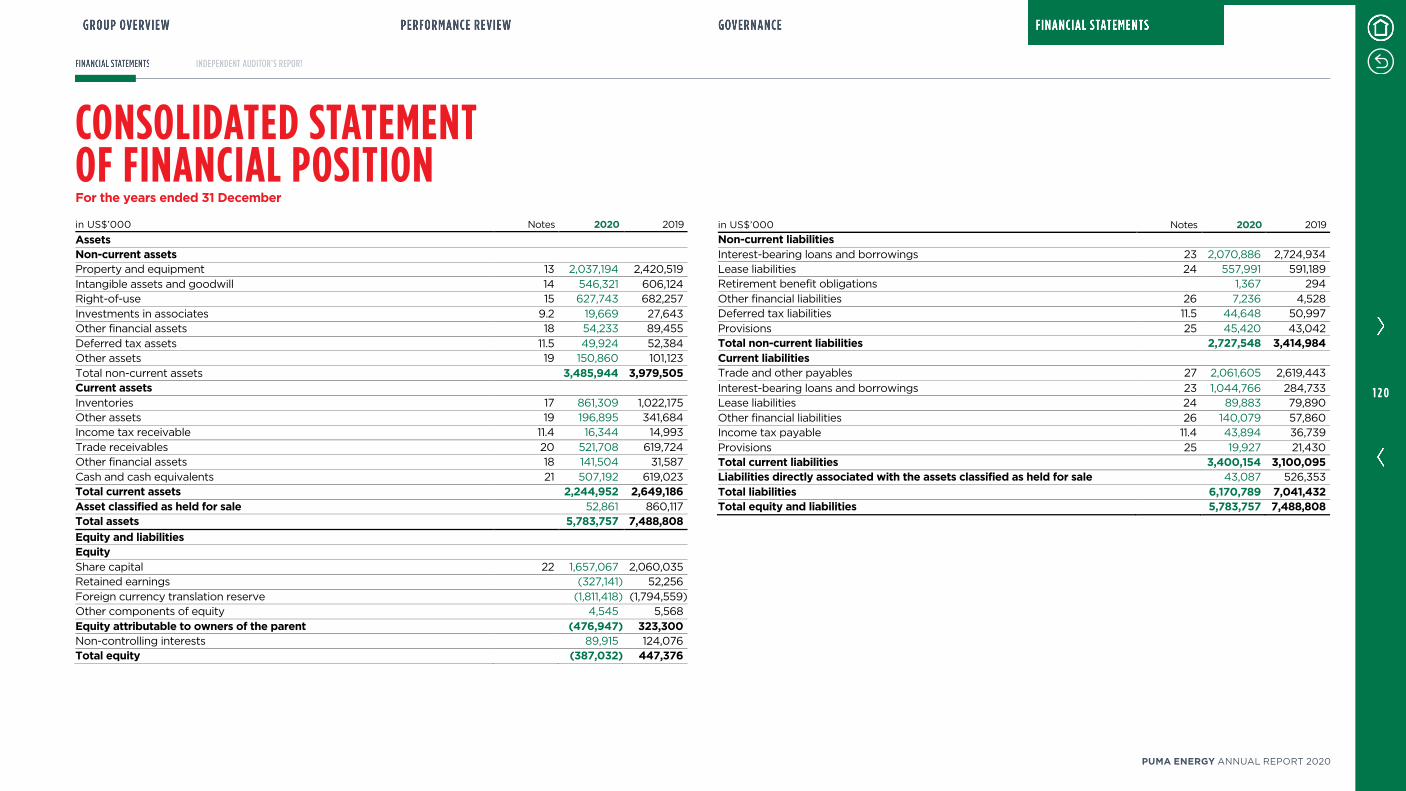
CONSOLIDATED STATEMENT OF FINANCIAL POSITION For the years ended 31 December
in US$’000 Notes 2020 2019
Assets Non-current assets Property and equipment 13 2,037,194 2,420,519
Intangible assets and goodwill 14 546,321 606,124 Right-of-use 15 627,743 682,257
Investments in associates 9.2 19,669 27,643 Other financial assets 18 54,233 89,455
Deferred tax assets 11.5 49,924 52,384 Other assets 19 150,860 101,123
Total non-current assets 3,485,944 3,979,505 Current assets
Inventories 17 861,309 1,022,175 Other assets 19 196,895 341,684 Income tax receivable 11.4 16,344 14,993
Trade receivables 20 521,708 619,724 Other financial assets 18 141,504 31,587
Cash and cash equivalents 21 507,192 619,023 Total current assets 2,244,952 2,649,186 Asset classified as held for sale 52,861 860,117
Total assets 5,783,757 7,488,808 Equity and liabilities Equity
Share capital 22 1,657,067 2,060,035 Retained earnings (327,141) 52,256
Foreign currency translation reserve (1,811,418) (1,794,559) Other components of equity 4,545 5,568
Equity attributable to owners of the parent (476,947) 323,300 Non-controlling interests 89,915 124,076 Total equity (387,032) 447,376
in US$’000 Notes 2020 2019
Non-current liabilities
Interest-bearing loans and borrowings 23 2,070,886 2,724,934 Lease liabilities 24 557,991 591,189 Retirement benefit obligations 1,367 294
Other financial liabilities 26 7,236 4,528 Deferred tax liabilities 11.5 44,648 50,997
Provisions 25 45,420 43,042 Total non-current liabilities 2,727,548 3,414,984 Current liabilities Trade and other payables 27 2,061,605 2,619,443
Interest-bearing loans and borrowings 23 1,044,766 284,733 Lease liabilities 24 89,883 79,890
Other financial liabilities 26 140,079 57,860 Income tax payable 11.4 43,894 36,739
Provisions 25 19,927 21,430 Total current liabilities 3,400,154 3,100,095 Liabilities directly associated with the assets classified as held for sale 43,087 526,353
Total liabilities 6,170,789 7,041,432 Total equity and liabilities 5,783,757 7,488,808
1 2 0
PUMA ENERGY ANNUAL REPORT 2020
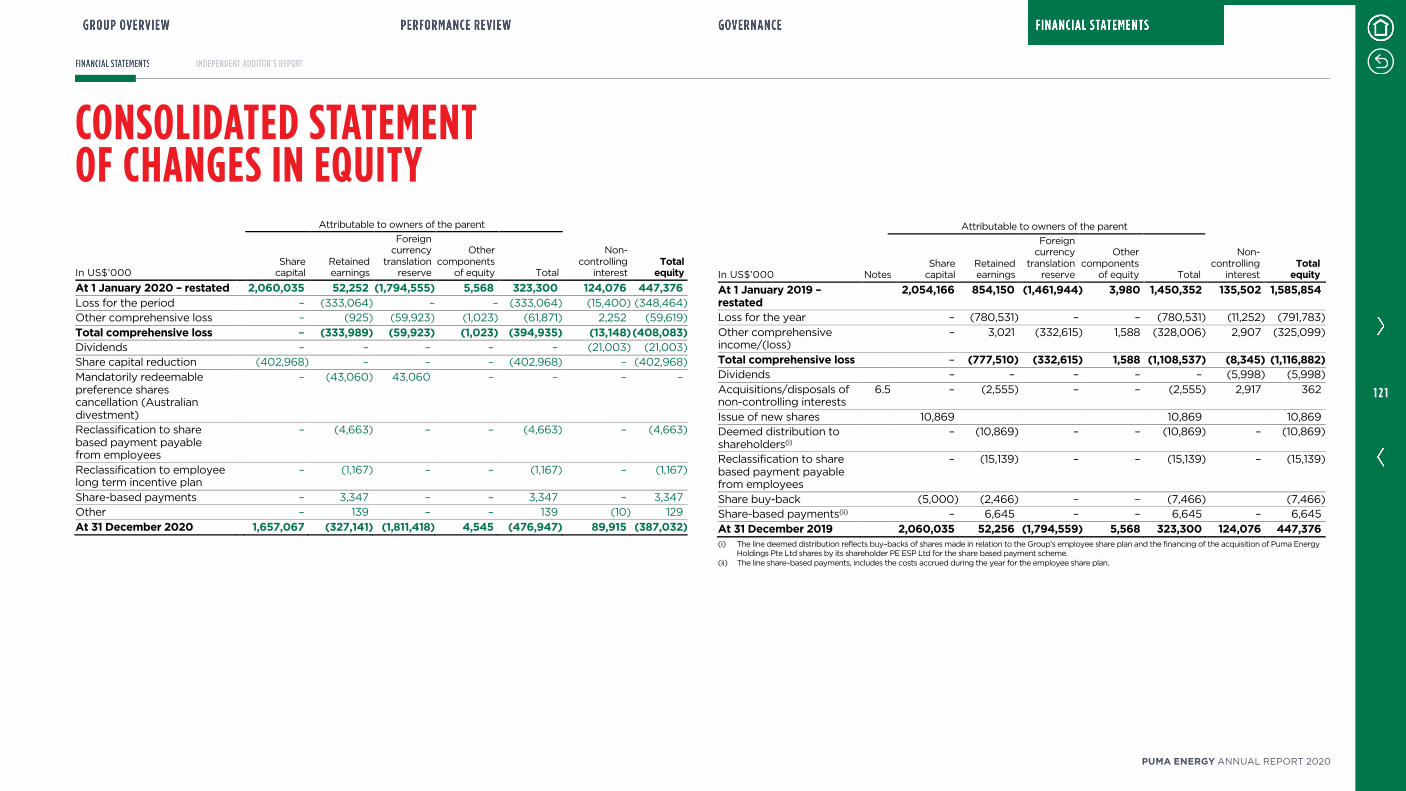
CONSOLIDATED STATEMENT OF CHANGES IN EQUITY
Attributable to owners of the parent
In US$’000 Share
capital Retained earnings
Foreign currency
translation reserve
Other components
of equity Total
Non- controlling
interest Total
equity At 1 January 2020 – restated 2,060,035 52,252 (1,794,555) 5,568 323,300 124,076 447,376 Loss for the period – (333,064) – – (333,064) (15,400) (348,464) Other comprehensive loss – (925) (59,923) (1,023) (61,871) 2,252 (59,619)
Total comprehensive loss –– (333,989) (59,923) (1,023) (394,935) (13,148) (408,083) Dividends – – – – – (21,003) (21,003) Share capital reduction (402,968) – – – (402,968) – (402,968)
Mandatorily redeemable preference shares cancellation (Australian divestment)
– (43,060) 43,060 – – – –
Reclassification to share based payment payable from employees
– (4,663) – – (4,663) – (4,663)
Reclassification to employee long term incentive plan
– (1,167) – – (1,167) – (1,167)
Share-based payments – 3,347 – – 3,347 – 3,347 Other – 139 – – 139 (10) 129
At 31 December 2020 1,657,067 (327,141) (1,811,418) 4,545 (476,947) 89,915 (387,032)
Attributable to owners of the parent
In US$’000 Notes Share
capital Retained earnings
Foreign currency
translation reserve
Other components
of equity Total
Non- controlling
interest Total
equity At 1 January 2019 – restated
2,054,166 854,150 (1,461,944) 3,980 1,450,352 135,502 1,585,854
Loss for the year – (780,531) – – (780,531) (11,252) (791,783)
Other comprehensive income/(loss)
– 3,021 (332,615) 1,588 (328,006) 2,907 (325,099)
Total comprehensive loss – (777,510) (332,615) 1,588 (1,108,537) (8,345) (1,116,882) Dividends – – – – – (5,998) (5,998)
Acquisitions/disposals of non-controlling interests
6.5 – (2,555) – – (2,555) 2,917 362
Issue of new shares 10,869 10,869 10,869 Deemed distribution to shareholders(i)
– (10,869) – – (10,869) – (10,869)
Reclassification to share based payment payable from employees
– (15,139) – – (15,139) – (15,139)
Share buy-back (5,000) (2,466) – – (7,466) (7,466) Share-based payments(ii) – 6,645 – – 6,645 – 6,645
At 31 December 2019 2,060,035 52,256 (1,794,559) 5,568 323,300 124,076 447,376 (i) The line deemed distribution reflects buy–backs of shares made in relation to the Group’s employee share plan and the financing of the acquisition of Puma Energy
Holdings Pte Ltd shares by its shareholder PE ESP Ltd for the share based payment scheme. (ii) The line share–based payments, includes the costs accrued during the year for the employee share plan.
1 2 1
PUMA ENERGY ANNUAL REPORT 2020
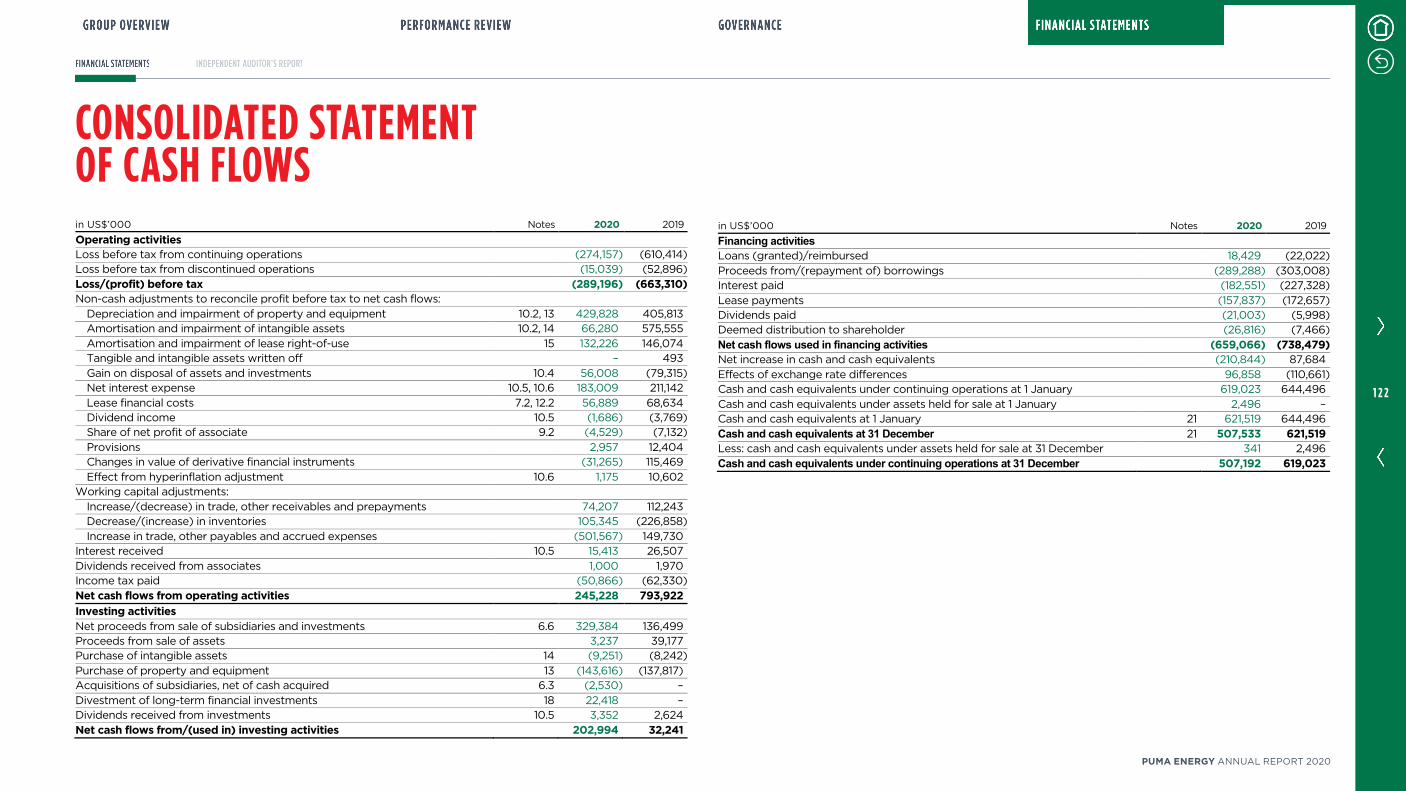
CONSOLIDATED STATEMENT OF CASH FLOWS
in US$’000 Notes 2020 2019
Operating activities Loss before tax from continuing operations (274,157) (610,414) Loss before tax from discontinued operations (15,039) (52,896)
Loss/(profit) before tax (289,196) (663,310) Non-cash adjustments to reconcile profit before tax to net cash flows:
Depreciation and impairment of property and equipment 10.2, 13 429,828 405,813 Amortisation and impairment of intangible assets 10.2, 14 66,280 575,555
Amortisation and impairment of lease right-of-use 15 132,226 146,074 Tangible and intangible assets written off – 493
Gain on disposal of assets and investments 10.4 56,008 (79,315) Net interest expense 10.5, 10.6 183,009 211,142
Lease financial costs 7.2, 12.2 56,889 68,634 Dividend income 10.5 (1,686) (3,769) Share of net profit of associate 9.2 (4,529) (7,132)
Provisions 2,957 12,404 Changes in value of derivative financial instruments (31,265) 115,469
Effect from hyperinflation adjustment 10.6 1,175 10,602 Working capital adjustments:
Increase/(decrease) in trade, other receivables and prepayments 74,207 112,243 Decrease/(increase) in inventories 105,345 (226,858)
Increase in trade, other payables and accrued expenses (501,567) 149,730 Interest received 10.5 15,413 26,507
Dividends received from associates 1,000 1,970 Income tax paid (50,866) (62,330)
Net cash flows from operating activities 245,228 793,922 Investing activities
Net proceeds from sale of subsidiaries and investments 6.6 329,384 136,499 Proceeds from sale of assets 3,237 39,177 Purchase of intangible assets 14 (9,251) (8,242)
Purchase of property and equipment 13 (143,616) (137,817) Acquisitions of subsidiaries, net of cash acquired 6.3 (2,530) –
Divestment of long-term financial investments 18 22,418 – Dividends received from investments 10.5 3,352 2,624
Net cash flows from/(used in) investing activities 202,994 32,241
in US$’000 Notes 2020 2019
Financing activities Loans (granted)/reimbursed 18,429 (22,022)
Proceeds from/(repayment of) borrowings (289,288) (303,008) Interest paid (182,551) (227,328)
Lease payments (157,837) (172,657) Dividends paid (21,003) (5,998) Deemed distribution to shareholder (26,816) (7,466)
Net cash flows used in financing activities (659,066) (738,479) Net increase in cash and cash equivalents (210,844) 87,684
Effects of exchange rate differences 96,858 (110,661) Cash and cash equivalents under continuing operations at 1 January 619,023 644,496
Cash and cash equivalents under assets held for sale at 1 January 2,496 – Cash and cash equivalents at 1 January 21 621,519 644,496
Cash and cash equivalents at 31 December 21 507,533 621,519 Less: cash and cash equivalents under assets held for sale at 31 December 341 2,496
Cash and cash equivalents under continuing operations at 31 December 507,192 619,023
1 2 2
PUMA ENERGY ANNUAL REPORT 2020
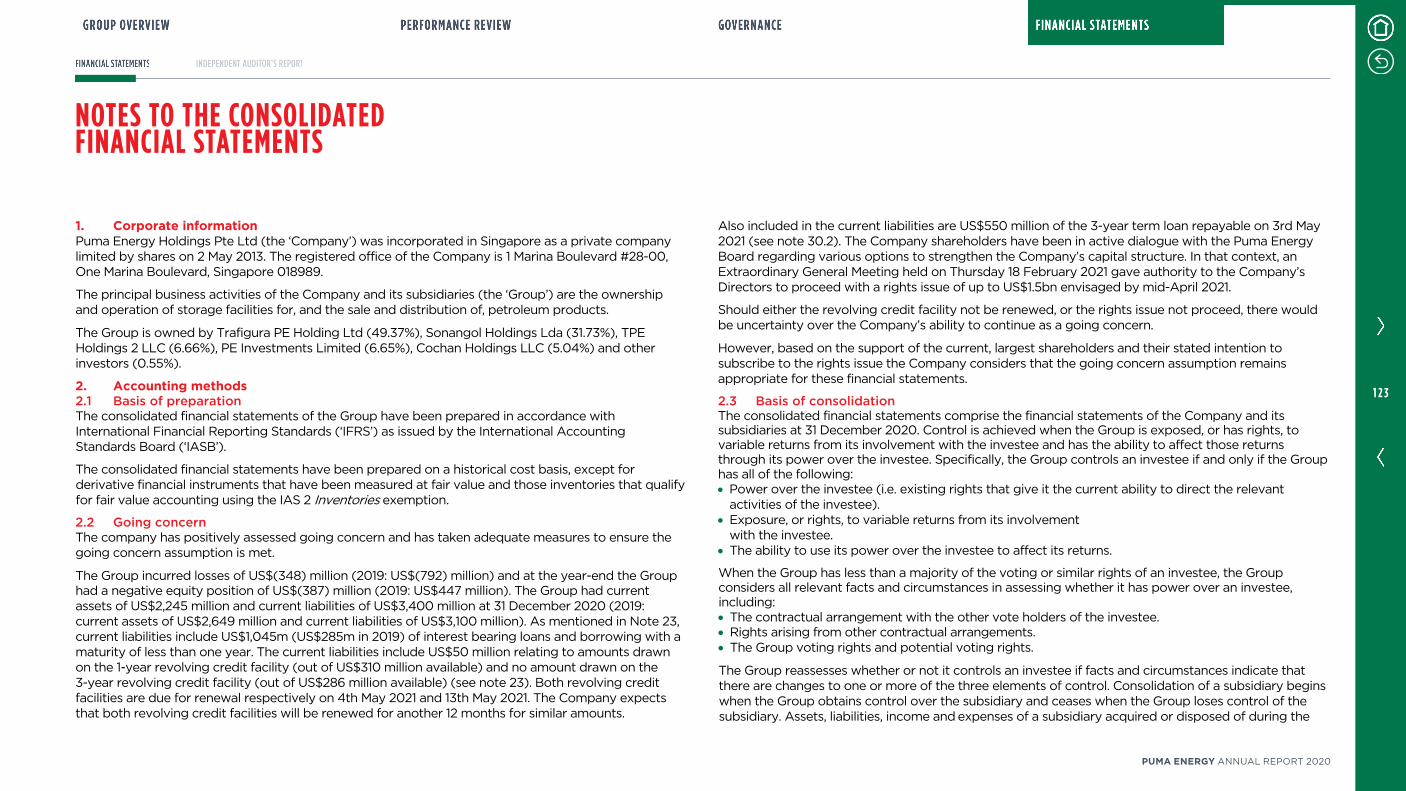
NOTES TO THE CONSOLIDATED FINANCIAL STATEMENTS
1. Corporate information Puma Energy Holdings Pte Ltd (the ‘Company’) was incorporated in Singapore as a private company limited by shares on 2 May 2013. The registered office of the Company is 1 Marina Boulevard #28-00, One Marina Boulevard, Singapore 018989.
The principal business activities of the Company and its subsidiaries (the ‘Group’) are the ownership and operation of storage facilities for, and the sale and distribution of, petroleum products.
The Group is owned by Trafigura PE Holding Ltd (49.37%), Sonangol Holdings Lda (31.73%), TPE Holdings 2 LLC (6.66%), PE Investments Limited (6.65%), Cochan Holdings LLC (5.04%) and other investors (0.55%).
2. Accounting methods 2.1 Basis of preparation The consolidated financial statements of the Group have been prepared in accordance with International Financial Reporting Standards (‘IFRS’) as issued by the International Accounting Standards Board (‘IASB’).
The consolidated financial statements have been prepared on a historical cost basis, except for derivative financial instruments that have been measured at fair value and those inventories that qualify for fair value accounting using the IAS 2 Inventories exemption.
2.2 Going concern The company has positively assessed going concern and has taken adequate measures to ensure the going concern assumption is met.
The Group incurred losses of US$(348) million (2019: US$(792) million) and at the year-end the Group had a negative equity position of US$(387) million (2019: US$447 million). The Group had current assets of US$2,245 million and current liabilities of US$3,400 million at 31 December 2020 (2019: current assets of US$2,649 million and current liabilities of US$3,100 million). As mentioned in Note 23, current liabilities include US$1,045m (US$285m in 2019) of interest bearing loans and borrowing with a maturity of less than one year. The current liabilities include US$50 million relating to amounts drawn on the 1-year revolving credit facility (out of US$310 million available) and no amount drawn on the 3-year revolving credit facility (out of US$286 million available) (see note 23). Both revolving credit facilities are due for renewal respectively on 4th May 2021 and 13th May 2021. The Company expects that both revolving credit facilities will be renewed for another 12 months for similar amounts.
Also included in the current liabilities are US$550 million of the 3-year term loan repayable on 3rd May 2021 (see note 30.2). The Company shareholders have been in active dialogue with the Puma Energy Board regarding various options to strengthen the Company’s capital structure. In that context, an Extraordinary General Meeting held on Thursday 18 February 2021 gave authority to the Company’s Directors to proceed with a rights issue of up to US$1.5bn envisaged by mid-April 2021.
Should either the revolving credit facility not be renewed, or the rights issue not proceed, there would be uncertainty over the Company’s ability to continue as a going concern.
However, based on the support of the current, largest shareholders and their stated intention to subscribe to the rights issue the Company considers that the going concern assumption remains appropriate for these financial statements.
2.3 Basis of consolidation The consolidated financial statements comprise the financial statements of the Company and its subsidiaries at 31 December 2020. Control is achieved when the Group is exposed, or has rights, to variable returns from its involvement with the investee and has the ability to affect those returns through its power over the investee. Specifically, the Group controls an investee if and only if the Group has all of the following: • Power over the investee (i.e. existing rights that give it the current ability to direct the relevant
activities of the investee). • Exposure, or rights, to variable returns from its involvement
with the investee. • The ability to use its power over the investee to affect its returns.
When the Group has less than a majority of the voting or similar rights of an investee, the Group considers all relevant facts and circumstances in assessing whether it has power over an investee, including: • The contractual arrangement with the other vote holders of the investee. • Rights arising from other contractual arrangements. • The Group voting rights and potential voting rights.
The Group reassesses whether or not it controls an investee if facts and circumstances indicate that there are changes to one or more of the three elements of control. Consolidation of a subsidiary begins when the Group obtains control over the subsidiary and ceases when the Group loses control of the subsidiary. Assets, liabilities, income and expenses of a subsidiary acquired or disposed of during the
1 2 3
PUMA ENERGY ANNUAL REPORT 2020

NOTES TO THE CONSOLIDATED FINANCIAL STATEMENTS
year are included in the consolidated financial statements from the date the Group gains control until the date the Group ceases to control the subsidiary.
Profit or loss and each component of other comprehensive income are attributed to the equity holders of the parent of the Group and to the non-controlling interests, even if this results in the non-controlling interests having a deficit balance. When necessary, adjustments are made to the financial statements of subsidiaries to bring their accounting policies into line with the Group accounting policies. All intra-Group assets, liabilities, equity, income, expenses and cash flows relating to transactions between members of the Group are eliminated in full on consolidation.
A change in the ownership interest of a subsidiary, without a loss of control, is accounted for as an equity transaction. If the Group loses control over a subsidiary, it: • Derecognises the assets (including goodwill) and liabilities of the subsidiary. • Derecognises the carrying amount of any non-controlling interests. • Derecognises the cumulative translation differences recorded in equity. • Recognises the fair value of the consideration received. • Recognises the fair value of any investment retained. • Recognises any surplus or deficit in profit or loss. • Reclassifies the parent’s share of components previously recognised in other comprehensive income
to profit or loss or retained earnings, as appropriate, as would be required if the Group had directly disposed of the related assets or liabilities.
Subsidiaries whose functional currencies have experienced a cumulative inflation rate of close to 100% over the past three years apply the rules of IAS 29 Financial Reporting in Hyperinflationary Economies. Gains or losses incurred upon adjusting the carrying amounts of non-monetary assets and liabilities for inflation are recognised in the income statement. The subsidiaries in Angola and Zimbabwe restate non-monetary items in the balance sheet in line with the requirements of IAS 29.
The only hyperinflationary economy applicable to the Group is Zimbabwe. The hyperinflationary treatment previously applicable to Angola was ceased at 31 March 2019. For Zimbabwe the hyperinflationary treatment has been applied starting with 1 January 2019. The financial statements of the major subsidiaries in Zimbabwe are first adjusted for the effect of inflation with any gain or loss on the net monetary position recorded in the related functional lines in the consolidated income statement and then translated into US Dollars.
2.4 Summary of significant accounting policies a) Business combinations Acquisitions of businesses are accounted for using the acquisition method. The consideration transferred in a business combination is measured at fair value, which is calculated as the sum of the acquisition-date fair values of the assets transferred by the Group, liabilities incurred by the Group to the former owners of the acquiree and the equity interests issued by the Group in exchange for control of the acquiree. Acquisition-related costs are generally recognised in profit or loss as incurred.
At the acquisition date, the identifiable assets acquired, and the liabilities assumed, are recognised at their fair value, except that: • Deferred tax assets or liabilities, and assets or liabilities related to employee benefit arrangements are
recognised and measured in accordance with IAS 12 Income Taxes and IAS 19 Employee Benefits respectively.
• Assets (or disposal groups) that are classified as held for sale in accordance with IFRS 5 Non-current Assets Held for Sale and Discontinued Operations are measured in accordance with that standard.
Non-controlling interests that are present ownership interests and entitle their holders to a proportionate share of the entity’s net assets in the event of liquidation may be initially measured either at fair value or at the non-controlling interests’ proportionate share of the recognised amounts of the acquiree’s identifiable net assets. The choice of measurement basis is made on a transaction-by-transaction basis. Other types of non-controlling interests are measured at fair value or, when applicable, on the basis specified in another IFRS.
When the consideration transferred by the Group in a business combination includes assets or liabilities resulting from a contingent consideration arrangement, the contingent consideration is measured at its acquisition-date fair value and included as part of the consideration transferred in a business combination. Changes in the fair value of the contingent consideration that qualify as measurement period adjustments are adjusted retrospectively, with corresponding adjustments against goodwill. Measurement period adjustments are adjustments that arise from additional information obtained during the ‘measurement period’ (which cannot exceed one year from the acquisition date) about facts and circumstances that existed at the acquisition date.
When a business combination is achieved in stages, the Group’s previously held equity interest in the acquiree is remeasured to fair value at the acquisition date (e.g. the date when the Group obtains control) and the resulting gain or loss, if any, is recognised in profit or loss. Amounts arising from interests in the acquiree prior to the acquisition date that have previously been recognised in other
1 2 4
PUMA ENERGY ANNUAL REPORT 2020
NOTES TO THE CONSOLIDATED FINANCIAL STATEMENTS
comprehensive income are reclassified to profit or loss where such treatment would be appropriate if that interest were disposed of.
If the initial accounting for a business combination is incomplete by the end of the reporting period in which the combination occurs, the Group reports provisional amounts for the items for which the accounting is incomplete. Those provisional amounts are adjusted during the measurement period, or additional assets or liabilities are recognised, to reflect new information obtained about facts and circumstances that existed at the acquisition date that, if known, would have affected the amounts recognised at that date.
b) Foreign currency translation Each entity in the Group determines its own functional currency and items included in the financial statements of each entity are measured using that functional currency.
Transactions and balances Transactions in foreign currencies are initially recorded by the Group entities at their respective functional currency spot rates prevailing at the date the transaction first qualifies for recognition.
Monetary assets and liabilities denominated in foreign currencies are converted at the exchange rate in effect at the closing date of each reporting period. These items are recorded, according to their nature, either as components of finance income or finance costs in profit or loss.
Non-monetary items that are measured in terms of historical cost in a foreign currency are translated using the exchange rates at the dates of the initial transactions. Non-monetary items measured at fair value in a foreign currency are translated using the exchange rates at the date when the fair value is determined. The gain or loss arising on translation of non-monetary items is recognised in line with the gain or loss of the item that gave rise to the translation difference (translation differences on items whose gain or loss is recognised in other comprehensive income or profit or loss are also recognised in other comprehensive income or profit or loss, respectively).
Group companies The presentation currency of the Group is the US Dollar. Consolidated statement of financial position items are translated into US Dollars at the exchange rate applicable on the date of closure of the reporting period, and consolidated statement of income items are translated using the average exchange rate over the reporting period. Foreign exchange differences arising on translation for consolidation are recognised in other comprehensive income and included in consolidated
shareholders’ equity. On disposal of a foreign operation, the component of other comprehensive income relating to that particular foreign operation is recognised in profit or loss.
c) Non-current assets held for sale Non-current assets and disposal groups classified as held for sale are measured at the lower of their carrying amount and fair value less costs to sell. Non-current assets and disposal groups are classified as held for sale if their carrying amounts will be recovered principally through a sale transaction rather than through continuing use. This condition is regarded as met only when the sale is highly probable and the asset or disposal group is available for immediate sale in its present condition. Management must be committed to the sale, which should be expected to qualify for recognition as a completed sale within one year from the date of classification.
When the Group is committed to a sale plan involving loss of control of a subsidiary, all of the assets and liabilities of that subsidiary are classified as held for sale when the criteria described above are met, regardless of whether the Group will retain a non-controlling interest in its former subsidiary after the sale.
d) Investment in associates and joint ventures An associate is an entity over which the Group has significant influence and that is neither a subsidiary nor an interest in a joint venture. Significant influence is the power to participate in the financial and operating policy decisions of the investee but is not control or joint control over those policies.
A joint venture is a type of joint arrangement whereby the parties that have joint control of the arrangement have rights to the net assets of the joint venture. Joint control is the contractually agreed sharing of control of an arrangement, which exists only when decisions about the relevant activities require unanimous consent of the parties sharing control. Interest in joint operations are recorded according to IFRS 11 Joint Arrangements: • Assets, including its share of any assets held jointly. • Liabilities, including its share of any liabilities incurred jointly. • Revenue from the sale of its share of the output arising from the joint operation. • Share of the revenue from the sale of the output by the joint operation. • Expenses, including its share of any expenses incurred jointly.
The results of associates are incorporated in these consolidated financial statements using the equity method of accounting, except when the investment is classified as held for sale, in which case it is accounted for in accordance with IFRS 5 Non-current Assets Held for Sale and Discontinued
1 2 5
PUMA ENERGY ANNUAL REPORT 2020
NOTES TO THE CONSOLIDATED FINANCIAL STATEMENTS
Operations. Under the equity method, an investment in an associate is initially recognised in the consolidated statement of financial position at cost and adjusted thereafter to recognise the Group’s share of the profit or loss and other comprehensive income of the associate. When the Group’s share of losses of an associate exceeds the Group’s interest in that associate (which includes any long-term interests that, in substance, form part of the Group’s net investment in the associate), the Group discontinues recognising its share of further losses. Additional losses are recognised only to the extent that the Group has incurred legal or constructive obligations or made payments on behalf of the associate.
The requirements of IAS 39 Financial Instruments: Recognition and Measurement are applied to determine whether it is necessary to recognise any impairment loss with respect to the Group’s investment in an associate. When necessary, the entire carrying amount of the investment (including goodwill) is tested for impairment in accordance with IAS 36 Impairment of Assets as a single asset by comparing its recoverable amount (higher of value in use and fair value less costs to sell) with its carrying amount. Any impairment loss recognised forms part of the carrying amount of the investment. Any reversal of that impairment loss is recognised in accordance with IAS 36 Impairment of Assets to the extent that the recoverable amount of the investment subsequently increases.
Upon disposal of an associate that results in the Group losing significant influence over that associate, any retained investment is measured at fair value at that date and the fair value is regarded as its fair value on initial recognition as a financial asset in accordance with IAS 39 Financial Instruments: Recognition and Measurement. The difference between the previous carrying amount of the associate attributable to the retained interest and its fair value is included in the determination of the gain or loss on disposal of the associate. In addition, the Group accounts for all amounts previously recognised in other comprehensive income in relation to that associate on the same basis as would be required if that associate had directly disposed of the related assets or liabilities. Therefore, if a gain or loss previously recognised in other comprehensive income by that associate would be reclassified to profit or loss on the disposal of the related assets or liabilities, the Group reclassifies the gain or loss from equity to profit or loss (as a reclassification adjustment) when it loses significant influence over that associate.
When a Group entity transacts with its associate, profits and losses resulting from the transactions with the associate are recognised in the Group’s consolidated financial statements only to the extent of interests in the associate that are not related to the Group.
e) Goodwill Goodwill is measured as being the excess of the aggregate of the consideration transferred, the amount recognised for any non-controlling interest and the acquisition-date fair values of any previously held interest in the acquiree over the fair value of the identifiable assets acquired and liabilities assumed at the acquisition date.
At the acquisition date, any goodwill acquired is allocated to each of the cash-generating units (CGUs) or group of CGUs expected to benefit from the combination’s synergies.
Following initial recognition, goodwill is measured at cost less any impairment losses. Goodwill is reviewed for impairment annually or more frequently if events or changes in circumstances indicate that the carrying value may be impaired. Impairment is determined by assessing the recoverable amount of the CGU or group of CGUs to which the goodwill relates. Where the recoverable amount of the CGU or group of CGUs is less than the carrying amount, an impairment loss is recognised. An impairment loss recognised for goodwill is not reversed in a subsequent period. For the impairment test, see note 16.
Goodwill may also arise upon investments in associates, being the surplus of the cost of investments in associates. Goodwill is included in the carrying amount of the investment in an associate and is neither amortised nor individually tested for impairment.
f) Intangible assets Intangible assets acquired separately are measured on initial recognition at cost. The cost of intangible assets acquired in a business combination is their fair value at the date of acquisition. Following initial recognition, intangible assets are carried at cost less accumulated amortisation and accumulated impairment losses, if any. The useful lives of intangible assets are assessed as either finite or indefinite.
Intangible assets with finite lives are amortised according to the straight-line method for the periods corresponding to their expected useful lives. Intangible assets are mainly comprised of software licences (useful lives ranging from three to five years) and certain long-term concession rights related to land usage (useful lives ranging from 33 to 99 years).
Intangible assets with indefinite useful lives are not amortised, but are tested for impairment annually, either individually or at the CGU level. The assessment of indefinite life is reviewed annually to determine whether the indefinite life continues to be supportable. If not, the change in useful life from indefinite to finite is made on a prospective basis.
1 2 6
PUMA ENERGY ANNUAL REPORT 2020
NOTES TO THE CONSOLIDATED FINANCIAL STATEMENTS
Gains or losses arising from derecognition of an intangible asset are measured as the difference between the net disposal proceeds and the carrying amount of the asset and are recognised in profit or loss when the asset is derecognised.
g) Property and equipment Property and equipment is stated at cost, less accumulated depreciation and accumulated impairment losses. The initial cost of an asset comprises its purchase price or construction cost, any costs directly attributable to bringing the asset into operation, the initial estimate of any decommissioning obligation, if any, and, for qualifying assets, borrowing costs. The purchase price or construction cost is the aggregate amount paid and the fair value of any other consideration given to acquire the asset. The capitalised value of a finance lease is also included within property and equipment. Land and buildings are accounted for under the cost model. Hence no revaluation is carried out, in line with IAS 16 Property, Plant and Equipment.
Depreciation is provided on a straight-line basis over estimated useful lives of the respective assets, taking into account the residual value. The estimated useful lives are:
Buildings 33 years
Machinery and equipment 3 to 20 years
Other fixed assets 1 to 5 years
The expected useful lives of property and equipment are reviewed on an annual basis and, if necessary, changes in useful lives are accounted for prospectively.
The carrying value of property and equipment is reviewed for impairment whenever events or changes in circumstances indicate the carrying value may not be recoverable.
When significant parts of property and equipment are required to be replaced at intervals, the Group recognises such parts as individual assets with specific useful lives and depreciates them accordingly. Likewise, when a major inspection is performed, its cost is recognised in the carrying amount of the property and equipment as a replacement if the recognition criteria are satisfied. All other repair and maintenance costs are recognised in profit or loss as incurred.
An item of property and equipment is derecognised upon disposal or when no future economic benefits are expected to arise from the continued use of the asset. Any gain or loss arising on
derecognition of the asset (calculated as the difference between the net disposal proceeds and the carrying amount of the item) is included in profit or loss in the period in which the item is derecognised.
h) Impairment of non-financial assets The Group assesses its non-financial assets at each reporting date for possible impairment if there are events or changes in circumstances that indicate that carrying values of the assets may not be recoverable and, as a result, charges for impairment are recognised in the Group results from time to time.
Such indicators include changes in the Group business plans, changes in commodity prices leading to sustained unprofitable performance, an increase in the discount rate, low asset utilisation, evidence of physical damage and, for petroleum-related properties, significant downward or upward revisions of estimated volumes.
The assessment for impairment entails comparing the carrying value of the asset or CGU with its recoverable amounts being the higher of fair value less costs to sell and value in use. A CGU is the smallest group of assets whose continued use generates cash inflows that are largely independent of cash inflows generated by other groups of assets. Value in use is usually determined on the basis of discounted estimated future net cash flows. When the carrying amount of an asset or a CGU exceeds the recoverable amount, the asset or CGU is considered impaired and is written down to its recoverable amount. Determination as to whether and how much an asset is impaired involves management estimates on highly uncertain matters such as future commodity prices, the effects of inflation on operating expenses, discount rates and the outlook for global or regional market supply and demand conditions for petroleum products. The Group bases its impairment calculation on detailed budgets and forecast calculations, which are prepared separately for each of the Group’s CGUs to which the individual assets are allocated. These budgets and forecast calculations generally cover a period of five years.
Goodwill and intangible assets with an indefinite useful life are subject to an annual impairment test or, more frequently, if there are indications of a loss in value.
For assets, excluding goodwill and intangible assets with an indefinite life, an assessment is made at each reporting date of whether there is an impairment and if such an indication exists, an impairment test is carried out. If such indication exists, the Group estimates the asset’s or CGU’s recoverable amount. A previously recognised impairment loss is reversed only if there has been a change in the
1 2 7
PUMA ENERGY ANNUAL REPORT 2020
NOTES TO THE CONSOLIDATED FINANCIAL STATEMENTS
assumptions used to determine the asset’s recoverable amount since the last impairment loss was recognised. The reversal is limited so that the carrying amount of the asset does not exceed its recoverable amount, nor exceed the carrying amount that would have been determined, net of depreciation, had no impairment loss been recognised for the asset in prior years. Impairment losses relating to goodwill cannot be reversed in future periods.
i) Financial assets Financial assets are classified, at initial recognition, as subsequently measured at amortised cost, fair value through other comprehensive income (OCI), and fair value through profit or loss. The classification of financial assets at initial recognition depends on the financial asset’s contractual cash flow characteristics and the Group’s business model for managing them.
The subsequent measurement of financial assets depends on their classification as follows:
Financial assets at amortised cost (debt instruments) The Group measures financial assets (debt instruments) at amortised cost if both of the following conditions are met: • The financial asset is held in order to collect contractual cash flows, and, • The contractual terms of the financial asset give rise on specified dates to cash flows that are solely
payments of principal and interest on the principal amount outstanding.
They are subsequently measured using the effective interest (EIR) method and are subject to impairment. Gains and losses are recognised in profit or loss when the asset is derecognised, modified or impaired.
Financial assets at fair value through OCI (debt instruments) The Group measures debt instruments at fair value through OCI if both of the following conditions are met: • The financial asset is held with the objective of both holding to collect contractual cash flows and
selling, and • The contractual terms of the financial asset give rise on specified dates to cash flows that are solely
payments of principal and interest on the principal amount outstanding
For debt instruments at fair value through OCI, interest income, foreign exchange revaluation and impairment losses or reversals are recognised in the statement of profit or loss and computed in the same manner as for financial assets measured at amortised cost. The remaining fair value changes are
recognised in OCI. Upon derecognition, the cumulative fair value change recognised in OCI is recycled to profit or loss.
Financial assets designated at fair value through OCI (equity instruments) Upon initial recognition, the Group can elect to classify irrevocably its equity investments as equity instruments designated at fair value through OCI when they meet the definition of equity under IAS 32 and are not held for trading. The classification is determined on an instrument-by-instrument basis.
Gains and losses on these financial assets are never recycled to profit or loss. Dividends are recognised as other income in the statement of profit or loss when the right of payment has been established, except when the Group benefits from such proceeds as a recovery of part of the cost of the financial asset, in which case, such gains are recorded in OCI.
Financial assets at fair value through profit or loss Financial assets at fair value through profit or loss include financial assets held for trading, financial assets designated upon initial recognition at fair value through profit or loss, or financial assets mandatorily required to be measured at fair value. Financial assets are classified as held for trading if they are acquired for the purpose of selling or repurchasing in the near term. Derivatives, including separated embedded derivatives, are also classified as held for trading. Financial assets with cash flows that are not solely payments of principal and interest are classified and measured at fair value through profit or loss, irrespective of the business model.
Financial assets at fair value through profit or loss are carried in the statement of financial position at fair value with net changes in fair value recognised in the statement of profit or loss
Derecognition A financial asset (or, where applicable, a part of a financial asset or part of a group of similar financial assets) is primarily derecognised (i.e., removed from the Group’s consolidated statement of financial position) when: • The rights to receive cash flows from the asset have expired, or • The Group has transferred its rights to receive cash flows from the asset or has assumed an obligation
to pay the received cash flows in full without material delay to a third party under a ‘pass-through’ arrangement; and either (a) the Group has transferred substantially all the risks and rewards of the asset, or (b) the Group has transferred control of the asset
When the Group has neither transferred nor retained substantially all of the risks and rewards of the asset, nor transferred control of the asset, the Group continues to recognise the transferred asset to the
1 2 8
PUMA ENERGY ANNUAL REPORT 2020
NOTES TO THE CONSOLIDATED FINANCIAL STATEMENTS
extent of its continuing involvement. In that case, the Group also recognises an associated liability. The transferred asset and the associated liability are measured on a basis that reflects the rights and obligations that the Group has retained.
Continuing involvement that takes the form of a guarantee over the transferred asset is measured at the lower of the original carrying amount of the asset and the maximum amount of consideration that the Group could be required to repay.
Impairment of financial assets The Group recognises an allowance for expected credit losses (ECLs) for all debt instruments not held at fair value through profit or loss. ECLs are based on the difference between the contractual cash flows due in accordance with the contract and all the cash flows that the Group expects to receive, discounted at an approximation of the original effective interest rate. The expected cash flows will include cash flows from the sale of collateral held or other credit enhancements that are integral to the contractual terms.
For trade receivables and contract assets, the Group applies a simplified approach in calculating ECLs. Therefore, the Group does not track changes in credit risk, but instead recognises a loss allowance based on lifetime ECLs at each reporting date. The Group has established a provision matrix that is based on its historical credit loss experience, adjusted for forward-looking factors specific to the debtors and the economic environment
j) Financial liabilities All financial liabilities are recognised initially at fair value plus, in the case of loans and borrowings, directly attributable transaction costs. The subsequent measurement of financial liabilities depends on their classification as follows:
Financial liabilities at fair value through profit or loss Financial liabilities at fair value through profit or loss include financial liabilities held for trading and financial liabilities designated upon initial recognition at fair value through profit or loss.
Financial liabilities are classified as held for trading if they are incurred for the purpose of repurchasing in the near term. This category also includes derivative financial instruments entered into by the Group that are not designated as hedging instruments in hedge relationships as defined by IFRS 9. Separated embedded derivatives are also classified as held for trading unless they are designated as effective hedging instruments.
Gains or losses on liabilities held for trading are recognised in the statement of profit or loss.
Financial liabilities designated upon initial recognition at fair value through profit or loss are designated at the initial date of recognition, and only if the criteria in IFRS 9 are satisfied.
Loans and borrowings This is the category most relevant to the Group. After initial recognition, interest-bearing loans and borrowings are subsequently measured at amortised cost using the EIR method. Gains and losses are recognised in profit or loss when the liabilities are derecognised as well as through the EIR amortisation process.
Amortised cost is calculated by taking into account any discount or premium on acquisition and fees or costs that are an integral part of the EIR. The EIR amortisation is included as finance costs in the statement of profit or loss. This category generally applies to interest-bearing loans and borrowings. For more information, refer to Note 23.
Derecognition A financial liability is derecognised when the obligation under the liability is discharged or cancelled or expires. When an existing financial liability is replaced by another from the same lender on substantially different terms, or the terms of an existing liability are substantially modified, such an exchange or modification is treated as the derecognition of the original liability and the recognition of a new liability. The difference in the respective carrying amounts is recognised in the statement of profit or loss.
k) Derivative financial instruments The Group utilises derivative financial instruments (shown separately in the consolidated statement of financial position under other financial assets and other financial liabilities) to economically hedge its primary market risk exposures, primarily risks related to commodity price movements, and to a lesser extent, related to exposure to foreign currency exchange and interest rate movements. For some of these derivative transactions, the Group will enter into positions through Trafigura Pte Ltd and Trafigura Derivatives Ltd. The Group has an agreement in place with Trafigura Pte Ltd and Trafigura Derivatives Ltd whereby those derivative transactions entered into on behalf of the Group by Trafigura Pte Ltd and Trafigura Derivatives Ltd are contractually binding to the Group and therefore any gains or losses arising from such transactions are strictly for the account of the Group.
Derivatives, including separated embedded derivatives, are classified as held for trading at fair values and related gains and losses are recorded in profit or loss unless they are designated as effective
1 2 9
PUMA ENERGY ANNUAL REPORT 2020
NOTES TO THE CONSOLIDATED FINANCIAL STATEMENTS
hedging instruments as defined by IFRS 9 The Group does not generally apply hedge accounting as defined by IFRS9.
Offsetting of financial instruments Financial assets and financial liabilities are offset and the net amount reported in the consolidated statement of financial position if, and only if, there is a currently enforceable legal right to offset the recognised amounts and there is an intention to settle on a net basis, or to realise the assets and settle the liabilities simultaneously.
Fair value of financial instruments The fair value of financial instruments that are traded in active markets at each reporting date is determined by reference to quoted market prices or dealer price quotations (bid price for long positions and ask price for short positions), without any deduction for transaction costs.
For financial instruments not traded in an active market, the fair value is determined using appropriate valuation techniques. Such techniques may include: using recent arm’s length market transactions; reference to the current fair value of another instrument that is substantially the same; a discounted cash flow analysis; or other valuation models.
Current versus non-current classification Derivative instruments that are not designated as effective hedging instruments are classified as current or non-current or separated into current and non-current portions based on an assessment of the facts and circumstances (e.g. the underlying contracted cash flows). • Where the Group will hold a derivative as an economic hedge (and does not apply hedge
accounting) for a period beyond 12 months after the reporting date, the derivative is classified as non-current (or separated into current and non-current portions) consistent with the classification of the underlying item.
• Embedded derivatives that are not closely related to the host contract are classified consistent with the cash flows of the host contract.
l) Inventory Inventories, other than inventories held for trading purposes, are stated at the lower of cost and net realisable value. Cost is determined by the weighted average method and comprises direct purchase costs, cost of production, transportation and manufacturing expenses. Borrowing costs are not included in the cost of inventory.
Net realisable value of petroleum products is based on the estimated selling price in the ordinary course of business less the estimated costs of completion and the estimated costs necessary to make the sale. Cost includes all costs incurred in the normal course of business in bringing each product to its present location and condition.
Any write-off is recognised when the probable realisable value is lower than the net book value.
With respect to inventories held for trading purposes, the Group accounts for them at fair value less costs to sell and any changes in value are recognised in profit or loss. Trading activities include optimisation of the Group’s supply cycle and the supply of petroleum products to business-to-business and wholesale clients. Further details are provided in Note 17.
m) Leases The Group as lessee The Group recognises a right-of-use asset and a lease liability at the lease commencement date. Both are presented as separated items in the statement of financial position under the note 15 and the note 24.
The right-of-use assets is measured at cost, which comprises the initial amount of the lease liability adjusted for any lease payments made at or before the commencement date, plus any initial direct costs incurred and an estimated of costs for dismantling less any lease incentive received.
The right-of-use asset is subsequently depreciated using the straight-line method from the commencement date to the end of the lease term. In addition, the right-of-use asset is periodically reduced by impairment losses, if any, and adjusted for certain remeasurements of the lease liability (ex: escalations). At implementation of the norm, we included any lease prepayment pending to amortise as of 31st December 2018 in the right-of-use.
The lease liability is initially measured at the present value of the lease payments that are not paid at the commencement date, discounted using the interest rate implicit in the lease or, if that rate cannot be readily determined, the Group’s incremental borrowing rate. Generally, the Group uses its incremental borrowing rate as the discount rate.
Lease payments included in the measurement of the lease liability comprise the following: • Fixed payments, including in-substance fixed payments; • Variable lease payments that depend on an index or a rate, initially measured using the index or rate
as at the commencement date;
1 3 0
PUMA ENERGY ANNUAL REPORT 2020

NOTES TO THE CONSOLIDATED FINANCIAL STATEMENTS
• Amounts expected to be payable under a residual value guarantee; and • The exercise price under a purchase option that the Group is reasonably certain to exercise, lease
payments in an optional renewal period if the Group is reasonably certain to exercise an extension option, and penalties for early termination of a lease unless the Group is reasonably certain not to terminate early.
The lease liability is measured at amortised cost using the effective interest method. It is remeasured when there is a change in future lease payments arising from a change in an index or rate, if there is a change in the Group’s estimate of the amount expected to be payable under a residual value guarantee, or if the Group changes its assessment of whether it will exercise a purchase, extension or termination option.
When the lease liability is remeasured in this way, a corresponding adjustment is made to the carrying amount of the right-of-use asset, or is recorded in profit or loss if the carrying amount of the right-of-use asset has been reduced to zero.
Short-term leases and leases of low-value assets The Group has elected not to recognise right-of-use assets and lease liabilities for short-term leases of machinery, vehicles, vessels and IT and office equipment that have a lease term of 12 months or less and any kind of leases nature when low-value assets are concerned. The Group recognises the lease payments associated with these leases as an expense on a straight-line basis over the lease term.
The Group as lessor When the Group acts as a lessor, it determines at lease inception whether each lease is a finance lease or an operating lease.
To classify each lease, the Group makes an overall assessment of whether the lease transfers substantially all of the risks and rewards incidental to ownership of the underlying asset. If this is the case, then the lease is a finance lease; if not, then it is an operating lease. As part of this assessment, the Group considers certain indicators such as whether the lease is for the major part of the economic life of the asset.
Amounts due from lessees under finance leases are recognised as receivables at the amount of the Group net investment in the leases. Finance lease income is allocated to accounting periods so as to reflect a constant periodic rate of return on the Group net investment outstanding in respect of the leases.
When the Group is an intermediate lessor, it accounts for its interests in the head lease and the sub-lease separately. It assesses the lease classification of a sub-lease with reference to the right-of-use asset arising from the head lease, not with reference to the underlying asset. If a head lease is a short-term lease to which the Group applies the exemption described above, then it classifies the sub-lease as an operating lease.
If an arrangement contains lease and non-lease components, the Group applies IFRS 15 to allocate the consideration in the contract.
Rental income from operating leases is recognised on a straight-line basis over the term of the relevant lease. Initial direct costs incurred in negotiating and arranging an operating lease are subtracted from lease on a straight-line basis over the lease term.
The accounting policies applicable to the Group as a lessor in the comparative period were not different from IFRS 16. However, when the Group was an intermediate lessor the sub-leases were classified with reference to the underlying asset.
n) Cash and short-term deposits Cash and short-term deposits in the consolidated statement of financial position comprise cash at banks and on hand and short-term deposits with a maturity of three months or less. For the purpose of the consolidated statement of cash flows, cash and cash equivalents consist of cash and short-term deposits as defined above.
o) Provisions Provisions are recognised when the Group has a present obligation as a result of a past event, it is probable that the Group will be required to settle the obligation, and a reliable estimate can be made of the amount of the obligation. The amount recognised as a provision is the best estimate of the consideration required to settle the present obligation at the end of the reporting period, taking into account the risks and uncertainties surrounding the obligation. When a provision is measured using the cash flows estimated to settle the present obligation, its carrying amount is the present value of those cash flows (when the effect of the time value of money is material).
When some or all of the economic benefits required to settle a provision are expected to be recovered from a third party, a receivable is recognised as an asset if it is virtually certain that reimbursement will be received and the amount of the receivable can be measured reliably.
1 3 1
PUMA ENERGY ANNUAL REPORT 2020
NOTES TO THE CONSOLIDATED FINANCIAL STATEMENTS
p) Revenue recognition Revenue is measured at the fair value of the consideration received or receivable, taking into account contractually defined terms of payment and excluding taxes or duty. Revenue is reduced for estimated customer returns, discounts and other similar allowances. The Group assesses its revenue arrangements against specific criteria in order to determine if it is acting as principal or agent. The Group has concluded that it is acting as a principal in all of its revenue arrangements. Revenue is recognised to the extent that it is probable that the economic benefits will flow to the Group and the revenue can be reliably measured, regardless of when the payment is being made. The following specific recognition criteria must also be met before revenue is recognised:
Sale of goods Revenue from the sale of goods is recognised when the significant risks and rewards of ownership of the goods have passed to the buyer, usually on delivery of the goods.
Rendering of services Revenue from a contract to provide services is recognised by reference to the stage of completion of the contract. The stage of completion of the contract is determined as follows: • Servicing fees included in the price of products sold are recognised by reference to the proportion of
the total cost of providing the servicing for the product sold. • Revenue from time and material contracts is recognised at the contractual rates as labour hours and
direct expenses are incurred.
Dividend and interest income Dividend income from investments is recognised when the shareholder’s right to receive payment has been established (provided that it is probable that the economic benefits will flow to the Group and the amount of income can be measured reliably).
Interest income from a financial asset is recognised when it is probable that the economic benefits will flow to the Group and the amount of income can be measured reliably. Interest income is accrued by reference to the principal outstanding and at the effective interest rate applicable, which is the rate that exactly discounts estimated future cash receipts through the expected life of the financial asset to that asset’s net carrying amount on initial recognition.
q) Taxes Current income tax Current income tax assets and liabilities are measured at the amounts expected to be recovered from or paid to the taxation authorities. The tax rates and tax laws used to compute the amounts are those that are enacted or substantively enacted, at the reporting date in the countries where the Group operates and generates taxable income. Current income tax relating to items recognised in other comprehensive income is also recognised in other comprehensive income and not in profit or loss.
Deferred tax Deferred tax assets and liabilities are recorded on temporary differences between the tax bases of assets and liabilities and their carrying amounts for financial reporting purposes at the reporting date and for operating loss and tax credit carry forwards. Deferred tax liabilities are generally recognised for all taxable temporary differences.
Deferred tax assets are generally recognised for all deductible temporary differences to the extent that it is probable that taxable profits will be available against which those deductible temporary differences, and the carry forward of unused tax credits and unused tax losses can be utilised. Such deferred tax assets and liabilities are not recognised if the temporary difference arises from goodwill or from the initial recognition (other than in a business combination) of other assets and liabilities in a transaction that affects neither the taxable profit nor the accounting profit.
Deferred tax liabilities are recognised for taxable temporary differences associated with investments in subsidiaries and associates, and interests in joint ventures, except where the Group is able to control the reversal of the temporary difference and it is probable that the temporary difference will not reverse in the foreseeable future. Deferred tax assets arising from deductible temporary differences associated with such investments and interests are only recognised to the extent that it is probable that there will be sufficient taxable profits against which to utilise the benefits of the temporary differences and they are expected to reverse in the foreseeable future.
The carrying amount of deferred tax assets is reviewed at each reporting date and reduced to the extent that it is no longer probable that sufficient taxable profit will be available to allow all or part of the deferred tax asset to be utilised. Unrecognised deferred tax assets are reassessed at each reporting date and are recognised to the extent that it has become probable that future taxable profits will allow the deferred tax asset to be recovered.
1 3 2
PUMA ENERGY ANNUAL REPORT 2020
NOTES TO THE CONSOLIDATED FINANCIAL STATEMENTS
Deferred tax assets and liabilities are measured at the tax rates that are expected to apply in the year when the asset is realised or the liability is settled, based on tax rates (and tax laws) that have been enacted or substantively enacted at the reporting date. The effect on deferred tax assets and liabilities of changes in tax rates is recognised in profit or loss in the period of the enactment of the change in tax rates.
Tax exposure In determining the amount of current and deferred tax, the Company takes into account the impact of uncertain tax positions and whether additional taxes and interest may be due. The Company believes that its accruals for tax liabilities are adequate for all open tax years based on its assessment of many factors, including interpretations of tax law and prior experience. This assessment relies on estimates and assumptions and may involve a series of judgements about future events. New information may become available that causes the Company to change its judgement regarding the adequacy of existing tax liabilities and such changes to tax liabilities will impact tax expense in the period that such a determination is made.
r) Share-based payments Employees of the Group receive remuneration in the form of share-based payments, whereby employees render services as consideration for cash (cash-settled transactions). Cash-settled share based payments result in recognition of a liability, which is an obligation to make a payment in cash or other assets, based on the price of the underlying equity instrument.
Employee services received in a cash-settled share based payment are measured indirectly at the fair value of the liability at the grant date. The initial measurement of the liability is based on the fair value of the underlying instrument. Market and non-vesting conditions are taken into account in determining the fair value of the liability.
At each reporting date, and ultimately at the settlement date, the fair value of the recognised liability is re-measured so that the ultimate liability equals the cash payment on settlement date. Re-measurements during the vesting period are recognised immediately to the extent that they relate to future services. Re-measurements after the vesting period are recognised immediately.
3. Significant accounting judgements, estimates and assumptions The preparation of the Group consolidated financial statements in conformity with IFRS requires management to make judgements, estimates and assumptions that affect the reported amounts of revenues, expenses, assets and liabilities, as well as the contingent liabilities at the date of the
consolidated financial statements. Estimates and assumptions are continuously evaluated and are based on management’s experience and other factors, including expectations of future events. Changes in these assumptions may materially affect the consolidated financial position or performance reported in future periods.
Impairment of assets In accordance with IAS 36 Impairment of Assets, the Group performs an assessment at each reporting date to determine whether there are any indications of impairment at each reporting date. If indications of impairment exist, an impairment test is performed to assess the recoverable amount of the assets.
Goodwill impairment Determining whether goodwill is impaired requires an estimation of the value in use of the CGUs to which goodwill has been allocated. The value in use calculation requires management to estimate the future cash flows expected to arise from the CGU, and a suitable discount rate, in order to calculate present value. Details of the Group goodwill impairment assessment at 31 December 2020 and 2019 are described in Note 16.
Useful lives of intangible assets and property and equipment Intangible assets and property and equipment are depreciated on a straight-line basis over the estimated useful lives of the assets. The useful lives are estimated by management at the time the assets are acquired and are reassessed annually, with the estimated useful lives being based on historical experience with similar assets, market conditions and future anticipated events.
Provision for expected credit losses For trade receivables and contract assets, the Group applies a simplified approach in calculating ECLs. Therefore, the Group does not track changes in credit risk, but instead recognises a loss allowance based on lifetime ECLs at each reporting. The Group has established a provision matrix that is based on its historical credit loss experience date (taking into account the ageing of trade receivables, and geographical risk as a proxy for counterparty risk), adjusted for forward-looking factors specific to the debtors and the economic environment.
The provision matrix is initially based on the Group’s historical observed default rates. The Group will calibrate the matrix to adjust the historical credit loss experience with forward-looking information. At every reporting date, the historical observed default rates are updated and changes in the forward-looking estimates are analysed.
1 3 3
PUMA ENERGY ANNUAL REPORT 2020

NOTES TO THE CONSOLIDATED FINANCIAL STATEMENTS
The assessment of the correlation between historical observed default rates, forecast economic conditions and ECLs is a significant estimate. The amount of ECLs is sensitive to changes in circumstances and of forecast economic conditions. The Group’s historical credit loss experience and forecast of economic conditions may also not be representative of customer’s actual default in the future.
Environmental costs Costs associated with environmental remediation obligations are provided for when the Group has a present obligation and the provision can be reasonably estimated. Such provisions are adjusted as further information develops or circumstances change.
Recovery of deferred tax assets Judgement is required in determining whether deferred tax assets should be recognised in the consolidated statement of financial position. Deferred tax assets, including those arising from unutilised tax losses, require management to assess the likelihood that the Group will generate sufficient taxable earnings in future periods, in order to utilise recognised deferred income tax assets. Assumptions about the generation of future taxable profits depend on management’s estimates of future cash flows. These estimates of future taxable income are based on forecast cash flows from operations (which are impacted by production and sales volumes, oil and natural gas prices, reserves, operating costs, decommissioning costs, capital expenditure, dividends and other capital management transactions) and judgement about the application of existing tax laws in each jurisdiction.
To the extent that future cash flows impacting the taxable income differ significantly from estimates, the ability of the Group to realise the net deferred tax assets recorded at the reporting date could be impacted. In addition, future changes in tax laws in the jurisdictions in which the Group operates could limit the ability of the Group to obtain tax deductions in future periods.
Contingencies By their nature, contingencies will only be resolved when one or more uncertain future events occur or fail to occur. The assessment of the existence, and potential quantum, of contingencies inherently involves the exercise of significant judgement and the use of estimates regarding the outcome of future events.
Determination of fair values in business combinations The Group has applied estimates and judgements to determine the fair value of assets acquired and liabilities and contingent liabilities assumed by way of a business combination. The value of assets,
liabilities and contingent liabilities recognised at the acquisition date are recognised at fair value. In determining fair value the Group has utilised valuation methodologies including discounted cash flow analysis market value assessments or replacement value by third parties for, in particular, acquired property and equipment. The market value of property and equipment is the estimated amount for which a property could be exchanged on the date of valuation between a willing buyer and a willing seller in an arm’s length. The assumptions made in performing these valuations include assumptions as to discount rates, foreign exchange rates, commodity prices, the timing of development, capital costs, and future operating costs. Any significant change in key assumptions may cause the acquisition accounting to be revised including the recognition of additional goodwill or a discount on acquisition.
4. Significant events Refinancing of and existing revolving credit facility In April 2019 the company successfully closed a 1-year US$310 million Revolving Credit Facility, with two 1 – year extension options, to refinance the Company’s existing 1-year US$350 million revolving credit facility dated April 2019.
Disposal of Australia fuels business In December 2019 the company announced the sale of its Australian commercial and retail fuels business to Chevron Australia Downstream Pty Ltd. The transaction completed on 30 June 2020. The operation under this disposal transaction was classified as discontinued operation and presented accordingly in the consolidated financial statements for years 2019 and 2020.
Change in shareholding structure On 10 June 2020, Cochan Holdings LLC transferred 11,834,721 ordinary shares to Trafigura PE Holding Limited for a consideration of US$390.0 million. Further, Trafigura PE Holding Limited transferred 5,300,000 ordinary shares to TPE Holdings 2 LLC for a consideration of US$102.2 million. Pursuant to a Director’s Resolution passed on 9 July 2020, additional 1,000,000 ordinary shares were transferred by Trafigura PE Holding Limited to TPE Holdings 2 LLC.
On 10 June 2020, the Company re-purchased 11,834,721 ordinary shares held by Trafigura PE Holding Limited for a consideration of US$390.0 million. The Company entered into a Subordinated Loan Agreement with Trafigura PE Holding Limited in order to fund the payment of purchase consideration pursuant to repurchase. All repurchased shares were immediately cancelled. The initial subordinated Loan Agreement between the Company and Trafigura PE Holding Limited of US$390.0 million was novated to Trafigura Pte Ltd (new lender).
1 3 4
PUMA ENERGY ANNUAL REPORT 2020
NOTES TO THE CONSOLIDATED FINANCIAL STATEMENTS
Business unit reorganization On 20 August 2020, the Company announced a reorganization of its business into three business units: the core ‘Downstream’ business, an ‘Infrastructure’ business and a ‘Future Energies’ business applicable from the 1st of October 2020: • The core ‘Downstream business unit’ consists of five customer-focused lines of business: retail,
commercial lubricants, bitumen, and aviation. • The ‘Infrastructure business unit’ is organized around 35 Marine & Inland terminals and storage
facilities. It focuses on safe storage and operation of assets. • The ‘Future Energies business unit’ focuses on delivering lower carbon alternatives for Downstream
customers in the context of the energy transition.
5. Changes in accounting standards New and amended standards and interpretations In 2020, the Group adopted the following new or amended standards and interpretations for the first time: • Amendments to References to the Conceptual Framework in IFRS Standards (effective for annual
periods on or after 1 January 2020) • Amendments to IAS 1 and IAS 8 – Definition of Material (effective for annual periods on or after 1
January 2020) • Amendments to IFRS 3 – Definition of a Business (effective for annual periods on or after 1 January
2020) • Amendments to IFRS 9, IAS 39 and IFRS 7 – Interest Rate Benchmark Reform (effective for annual
periods on or after 1 January 2020) • Amendment to IFRS 16 – COVID-19-Related Rent Concessions (effective for annual periods on or
after 1 June 2020)
Standards issued but not yet effective The standards and interpretations that have been issued or amended but not yet effective, up to the date of issuance of the Group’s consolidated financial statements are disclosed below. The Group intends to adopt the following standards, interpretations and amendments when they become effective, to the extent they are relevant to the Group. • Amendments to IAS 1 – Classification of Liabilities as Current or Non-current (including Amendment
to IAS 1 – Classification of Liabilities as Current or Non-current –) (effective for annual periods on or after 1 January 2023)
• Amendments to IAS 37 – Onerous Contracts: —Cost of Fulfilling a Contract (effective for annual periods on or after 1 January 2022)
• Amendments to IAS 16 – Property, Plant and Equipment: Proceeds before Intended Use (effective for annual periods on or after 1 January 2022)
• AIP (2018-2020 cycle): IFRS 1 First-time Adoption of International Financial Reporting Standards – Subsidiary as a First-time Adopter (effective for annual periods on or after 1 January 2022)
• AIP (2018-2020 cycle): IFRS 9 Financial Instruments – Fees in the ‘10 per cent’ Test for Derecognition of Financial Liabilities (effective for annual periods on or after 1 January 2022)
• AIP (2018-2020 cycle): IAS 41 Agriculture – Taxation in Fair Value Measurements (effective for annual periods on or after 1 January 2022)
• Amendments to IFRS 3 – Reference to the Conceptual Framework (effective for annual periods on or after 1 January 2022)
• Amendments to IFRS 9, IAS 39, IFRS 7, IFRS 4 and IFRS 16 – Interest Rate Benchmark Reform – Phase 2 (effective for annual periods on or after 1 January 2021)
The adoption of these issued or amended standards and interpretations is not expected to have a material impact on the consolidated financial position or performance of the Group.
1 3 5
PUMA ENERGY ANNUAL REPORT 2020
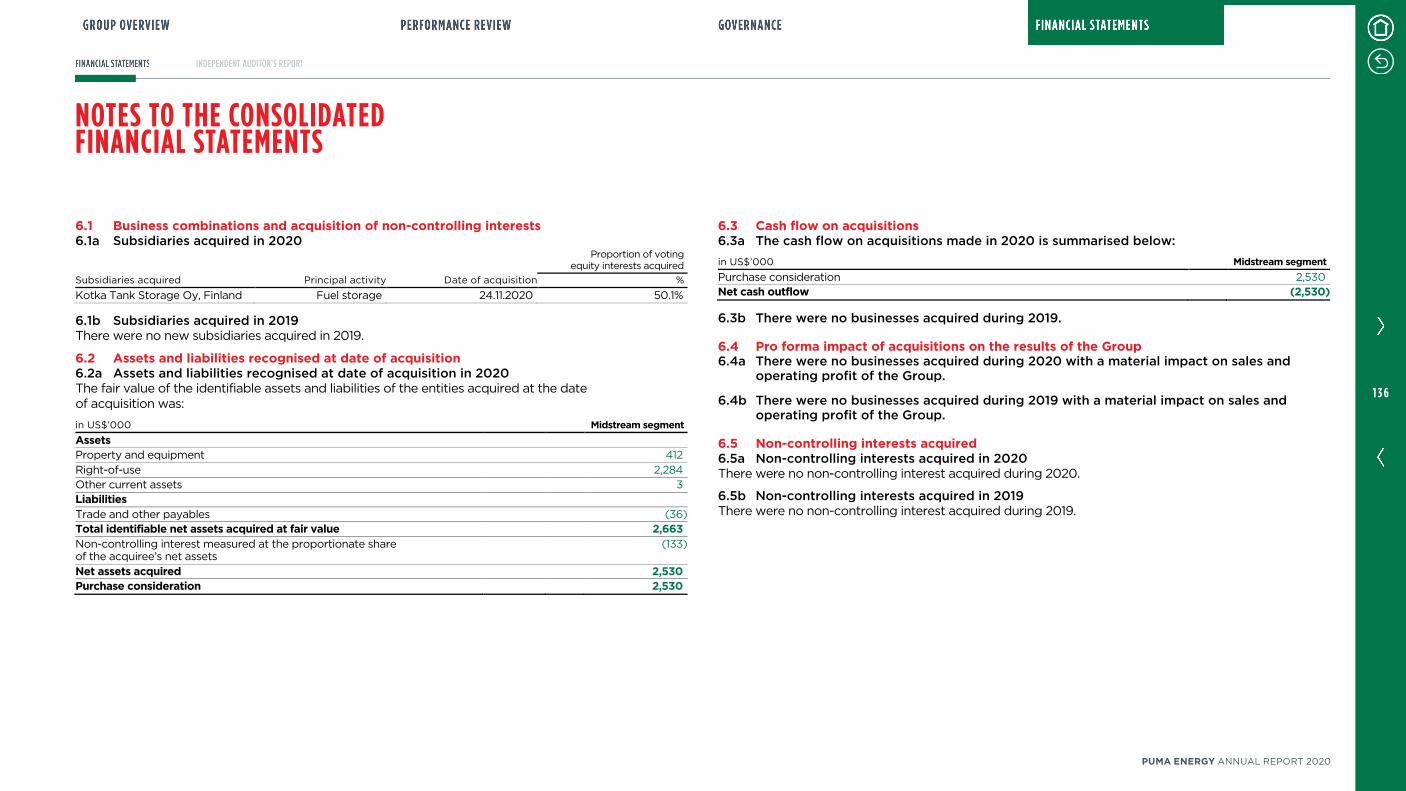
NOTES TO THE CONSOLIDATED FINANCIAL STATEMENTS
6.1 Business combinations and acquisition of non-controlling interests 6.1a Subsidiaries acquired in 2020 Proportion of voting
equity interests acquired
Subsidiaries acquired Principal activity Date of acquisition %
Kotka Tank Storage Oy, Finland Fuel storage 24.11.2020 50.1%
6.1b Subsidiaries acquired in 2019 There were no new subsidiaries acquired in 2019.
6.2 Assets and liabilities recognised at date of acquisition 6.2a Assets and liabilities recognised at date of acquisition in 2020 The fair value of the identifiable assets and liabilities of the entities acquired at the date of acquisition was:
in US$’000 Midstream segment Assets Property and equipment 412
Right-of-use 2,284 Other current assets 3 Liabilities
Trade and other payables (36) Total identifiable net assets acquired at fair value 2,663 Non-controlling interest measured at the proportionate share of the acquiree’s net assets
(133)
Net assets acquired 2,530 Purchase consideration 2,530
6.3 Cash flow on acquisitions 6.3a The cash flow on acquisitions made in 2020 is summarised below: in US$’000 Midstream segment Purchase consideration 2,530 Net cash outflow (2,530)
6.3b There were no businesses acquired during 2019.
6.4 Pro forma impact of acquisitions on the results of the Group 6.4a There were no businesses acquired during 2020 with a material impact on sales and
operating profit of the Group.
6.4b There were no businesses acquired during 2019 with a material impact on sales and operating profit of the Group.
6.5 Non-controlling interests acquired 6.5a Non-controlling interests acquired in 2020 There were no non-controlling interest acquired during 2020.
6.5b Non-controlling interests acquired in 2019 There were no non-controlling interest acquired during 2019.
1 3 6
PUMA ENERGY ANNUAL REPORT 2020

NOTES TO THE CONSOLIDATED FINANCIAL STATEMENTS
6.6 Sale of assets and investments 6.6a Sale of assets and investments in 2020 On the 30 June 2020 the Group disposed of its commercial and retail fuels business in Australia and on the 31 December 2020 of the aviation refuelling operations in Yuzhny Airport, Rostov-on-Don, Russia. On 29 December 2020 we have also received the outstanding amount related to our Paraguay activities divested in 2019. The impact of these transactions is presented in the table below.
in US$'000 Downstream segment
Assets
Cash and cash equivalents (15,671)
Inventories (74,062)
Receivables (88,841)
Property and equipment (207,319)
Goodwill and intangible assets (61,015)
Right-of-use (395,684)
Other long term assets (18,959)
Liabilities
Trade and other payables 154,579
Other current liabilities 42,526
Non-current liabilities 393,215
Total net assets disposed of (271,231) CTA reclassified to profit and loss (87,394) Gain on assets transferred 1,810
Transaction costs (16,101) Sales proceeds 315,693
Loss on investment disposal (57,223) Sales proceeds 315,693
Proceeds received on prior year transaction 45,378 Paid transaction costs (16,032)
Cash on deconsolidated perimeter (15,671) Net cash inflow 329,368
6.6b Sale of assets and investments in 2019 During 2019 the Group disposed activities in Indonesia on 1st July 2019 and Paraguay on 30th September 2019 as reflected by the figures below.
in US$’000 Downstream segment
Assets Cash and cash equivalents (2,545) Inventories (23,078) Receivables (17,954) Property and equipment (51,542) Goodwill and intangible assets (14,911) Other long term assets (434) Liabilities Trade and other payables 27,528 Other current liabilities 3,443 Non-current liabilities 2,003 Total net assets disposed of (77,490) Accumulated translation gains/(losses) (35,321) Sales proceeds 182,922 Gain on disposal 70,111
in US$'000
Downstream segment
Sales proceeds 183,121 Cash and cash equivalents exit (2,545) Receivables (44,077) Net cash inflow 136,499
1 3 7
PUMA ENERGY ANNUAL REPORT 2020

NOTES TO THE CONSOLIDATED FINANCIAL STATEMENTS
7. Leases As a lessee The Group as lessee has around 1,500 leases of different natures, mostly related to: • Lands: either for service stations, terminals or office buildings. • Services stations: the lease comprises a mix of land, building and equipment on the site. • Storage capacity for fuel and bitumen inventory. • Buildings, mainly office space and shops in service stations. • Vessels for bitumen transport.
In addition, the Group leases some equipment and machinery, mainly for our terminals, as well some cars and IT and office equipment.
in US$'000 2020 2019
Amortization expense of right-of-use assets (128,811) (143,780) Interest expense on lease liabilities (56,889) (68,633) Expense relating to short-term lease (9,221) (13,532) Expense relating to leases of low-value assets (899) (895) Variable lease expenses (recognised in cost of goods sold) (28,272) (25,248) Variable lease expenses (selling and operating expenses) (4,912) (4,569) Variable lease expenses (recognised in general and administrative exp.) (1,158) (722)
Variable payments It is frequent to have variable payments for terminal leases based in volume of the terminal used (throughput), as well as a variable lease payments for service stations leases based on volumes sold. These are considered as variable payments and recognised in the income statement under cost of goods sold.
Short-term leases and low-value assets The Group applies the short-term lease recognition exemption to leases of machinery, vehicles, vessels and IT and office equipment whenever they have a lease term of 12 months or less. It also applies the low-value recognition exemption to leases of any nature that are considered low-value: leased assets below $5,000. The Group recognises the lease payments associated with these leases as an expense on a straight-line basis over the lease term. The amount of lease expense recognised in the statement of profit or loss under short-term recognition exemption is US$8.6 million (2019: US$13.5 million), and the amount of lease expense under low-value recognition exemption is US$0.9 million (2019: US$0.9 million).
As a lessor The Group does not have any material financial lease. Concerning operational leases, the Group leases or subleases out to third and related parties some of its owned terminals’ capacity, jetty rights, services stations and office space. The Group has classified these leases as operating leases, because they do not transfer substantially all of the risks and rewards incidental to the ownership of the assets.
in US$'000 2020 2019
Operating Lease income 119,470 121,153 Thereof sublease income 12,641 18,286
8. Segment and geographic information 8.1 Segment information For management purposes, the Group is organised into business units based on products and services and has two reportable segments as follows: • Midstream business activities that include refining and storage of oil and gas products internationally. • Downstream business activities that include distribution, wholesale and retail sales of refined
products.
No operating segments have been aggregated to form the above reportable operating segments.
The Group Executive Committee monitors the operating results of its business units separately for the purpose of making decisions about resource allocation and performance assessment. Segment performance is evaluated based on operating profit or loss and is measured consistently with operating profit or loss in the consolidated financial statements. However, Group financing (including finance costs and finance income) and income taxes are managed on a Group basis and are not allocated to operating segments. Transfer prices between operating segments are on an arm’s length basis in a manner similar to transactions with third parties.
1 3 8
PUMA ENERGY ANNUAL REPORT 2020
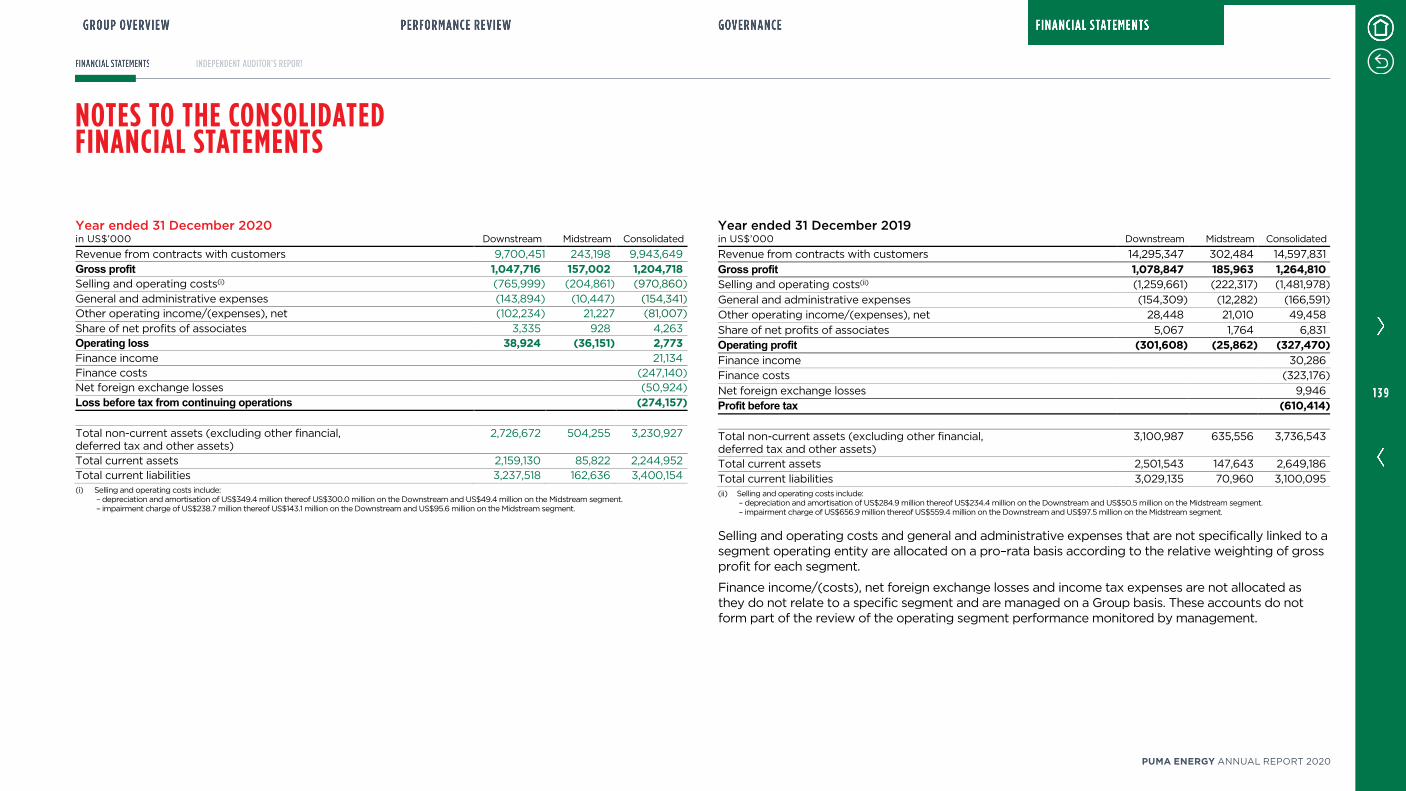
NOTES TO THE CONSOLIDATED FINANCIAL STATEMENTS
Year ended 31 December 2020 in US$’000 Downstream Midstream Consolidated
Revenue from contracts with customers 9,700,451 243,198 9,943,649
Gross profit 1,047,716 157,002 1,204,718 Selling and operating costs(i) (765,999) (204,861) (970,860)
General and administrative expenses (143,894) (10,447) (154,341) Other operating income/(expenses), net (102,234) 21,227 (81,007)
Share of net profits of associates 3,335 928 4,263 Operating loss 38,924 (36,151) 2,773 Finance income 21,134 Finance costs (247,140) Net foreign exchange losses (50,924)
Loss before tax from continuing operations (274,157) Total non-current assets (excluding other financial, deferred tax and other assets)
2,726,672 504,255 3,230,927
Total current assets 2,159,130 85,822 2,244,952 Total current liabilities 3,237,518 162,636 3,400,154 (i) Selling and operating costs include:
– depreciation and amortisation of US$349.4 million thereof US$300.0 million on the Downstream and US$49.4 million on the Midstream segment. – impairment charge of US$238.7 million thereof US$143.1 million on the Downstream and US$95.6 million on the Midstream segment.
Year ended 31 December 2019 in US$’000 Downstream Midstream Consolidated
Revenue from contracts with customers 14,295,347 302,484 14,597,831
Gross profit 1,078,847 185,963 1,264,810 Selling and operating costs(ii) (1,259,661) (222,317) (1,481,978)
General and administrative expenses (154,309) (12,282) (166,591)
Other operating income/(expenses), net 28,448 21,010 49,458
Share of net profits of associates 5,067 1,764 6,831
Operating profit (301,608) (25,862) (327,470) Finance income 30,286
Finance costs (323,176)
Net foreign exchange losses 9,946
Profit before tax (610,414) Total non-current assets (excluding other financial, deferred tax and other assets)
3,100,987 635,556 3,736,543
Total current assets 2,501,543 147,643 2,649,186
Total current liabilities 3,029,135 70,960 3,100,095 (ii) Selling and operating costs include:
– depreciation and amortisation of US$284.9 million thereof US$234.4 million on the Downstream and US$50.5 million on the Midstream segment. – impairment charge of US$656.9 million thereof US$559.4 million on the Downstream and US$97.5 million on the Midstream segment.
Selling and operating costs and general and administrative expenses that are not specifically linked to a segment operating entity are allocated on a pro–rata basis according to the relative weighting of gross profit for each segment.
Finance income/(costs), net foreign exchange losses and income tax expenses are not allocated as they do not relate to a specific segment and are managed on a Group basis. These accounts do not form part of the review of the operating segment performance monitored by management.
1 3 9
PUMA ENERGY ANNUAL REPORT 2020
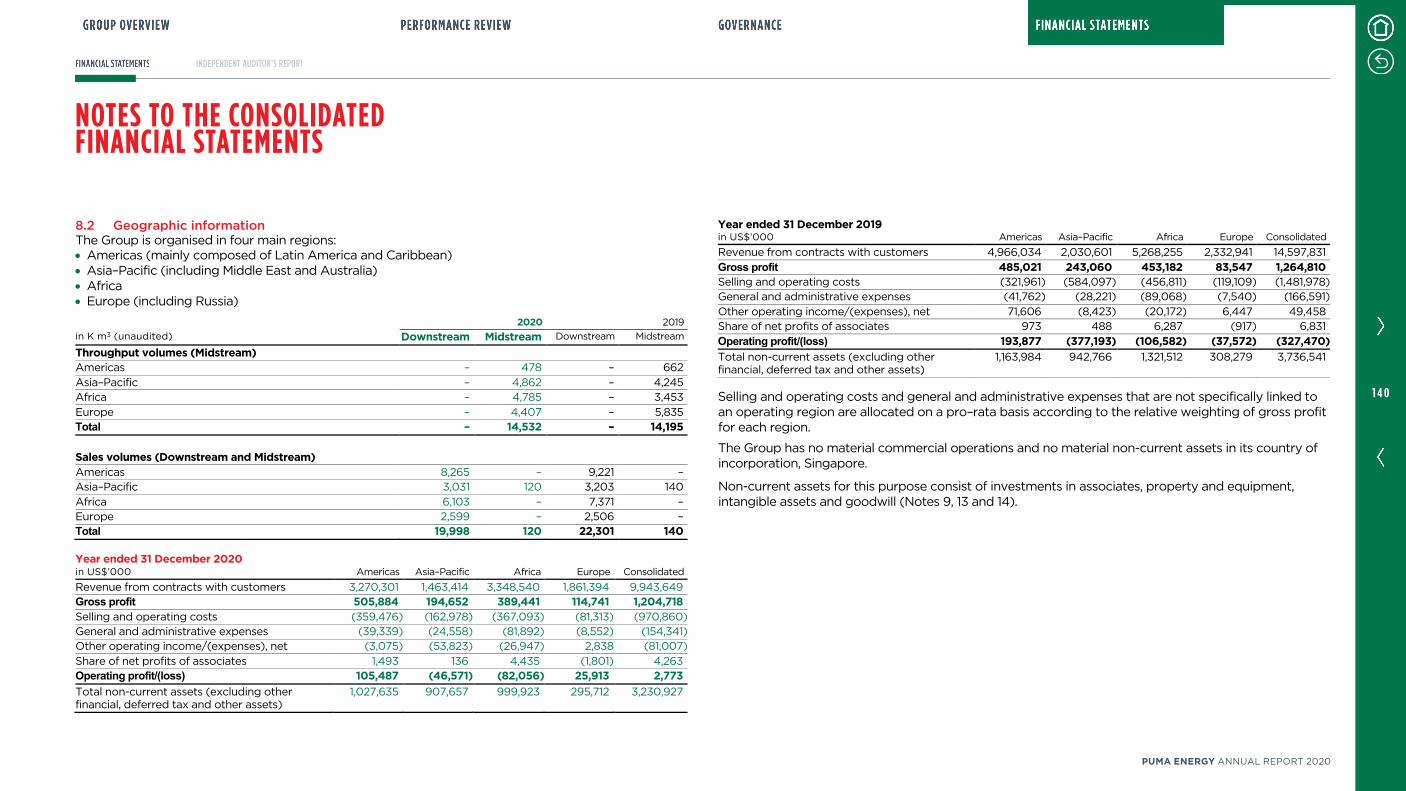
NOTES TO THE CONSOLIDATED FINANCIAL STATEMENTS
8.2 Geographic information The Group is organised in four main regions: • Americas (mainly composed of Latin America and Caribbean) • Asia–Pacific (including Middle East and Australia) • Africa • Europe (including Russia)
2020 2019
in K m3 (unaudited) Downstream Midstream Downstream Midstream
Throughput volumes (Midstream) Americas – 478 – 662
Asia–Pacific – 4,862 – 4,245 Africa – 4,785 – 3,453
Europe – 4,407 – 5,835 Total – 14,532 – 14,195 Sales volumes (Downstream and Midstream)
Americas 8,265 – 9,221 – Asia–Pacific 3,031 120 3,203 140
Africa 6,103 – 7,371 – Europe 2,599 – 2,506 – Total 19,998 120 22,301 140 Year ended 31 December 2020 in US$’000 Americas Asia–Pacific Africa Europe Consolidated
Revenue from contracts with customers 3,270,301 1,463,414 3,348,540 1,861,394 9,943,649 Gross profit 505,884 194,652 389,441 114,741 1,204,718 Selling and operating costs (359,476) (162,978) (367,093) (81,313) (970,860) General and administrative expenses (39,339) (24,558) (81,892) (8,552) (154,341) Other operating income/(expenses), net (3,075) (53,823) (26,947) 2,838 (81,007)
Share of net profits of associates 1,493 136 4,435 (1,801) 4,263 Operating profit/(loss) 105,487 (46,571) (82,056) 25,913 2,773 Total non-current assets (excluding other financial, deferred tax and other assets)
1,027,635 907,657 999,923 295,712 3,230,927
Year ended 31 December 2019 in US$’000 Americas Asia–Pacific Africa Europe Consolidated
Revenue from contracts with customers 4,966,034 2,030,601 5,268,255 2,332,941 14,597,831
Gross profit 485,021 243,060 453,182 83,547 1,264,810 Selling and operating costs (321,961) (584,097) (456,811) (119,109) (1,481,978) General and administrative expenses (41,762) (28,221) (89,068) (7,540) (166,591)
Other operating income/(expenses), net 71,606 (8,423) (20,172) 6,447 49,458 Share of net profits of associates 973 488 6,287 (917) 6,831
Operating profit/(loss) 193,877 (377,193) (106,582) (37,572) (327,470) Total non-current assets (excluding other financial, deferred tax and other assets)
1,163,984 942,766 1,321,512 308,279 3,736,541
Selling and operating costs and general and administrative expenses that are not specifically linked to an operating region are allocated on a pro–rata basis according to the relative weighting of gross profit for each region.
The Group has no material commercial operations and no material non-current assets in its country of incorporation, Singapore.
Non-current assets for this purpose consist of investments in associates, property and equipment, intangible assets and goodwill (Notes 9, 13 and 14).
1 4 0
PUMA ENERGY ANNUAL REPORT 2020
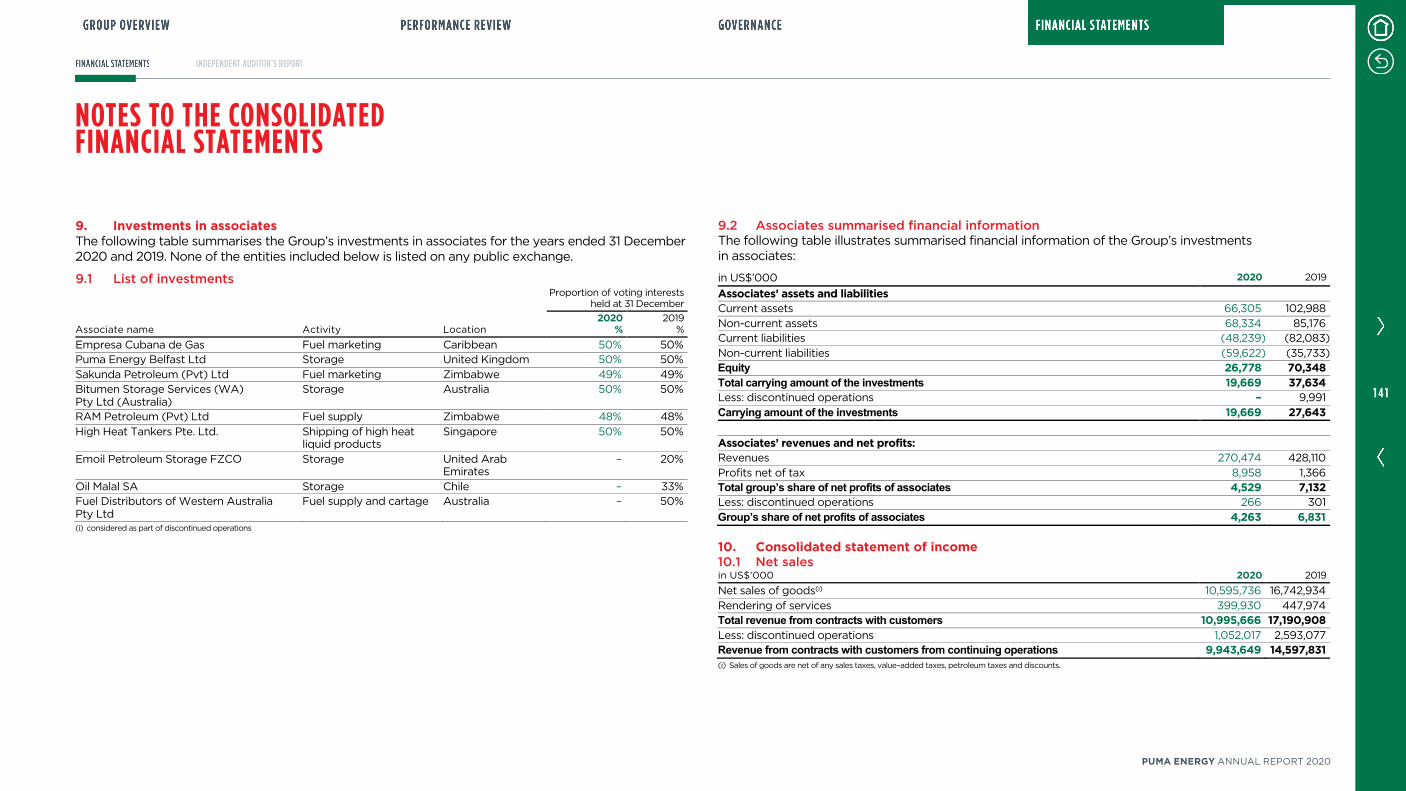
NOTES TO THE CONSOLIDATED FINANCIAL STATEMENTS
9. Investments in associates The following table summarises the Group’s investments in associates for the years ended 31 December 2020 and 2019. None of the entities included below is listed on any public exchange.
9.1 List of investments Proportion of voting interests
held at 31 December
Associate name Activity Location 2020
% 2019
%
Empresa Cubana de Gas Fuel marketing Caribbean 50% 50% Puma Energy Belfast Ltd Storage United Kingdom 50% 50%
Sakunda Petroleum (Pvt) Ltd Fuel marketing Zimbabwe 49% 49% Bitumen Storage Services (WA) Pty Ltd (Australia)
Storage Australia 50% 50%
RAM Petroleum (Pvt) Ltd Fuel supply Zimbabwe 48% 48%
High Heat Tankers Pte. Ltd. Shipping of high heat liquid products
Singapore 50% 50%
Emoil Petroleum Storage FZCO Storage United Arab Emirates
– 20%
Oil Malal SA Storage Chile – 33% Fuel Distributors of Western Australia Pty Ltd
Fuel supply and cartage Australia – 50%
(i) considered as part of discontinued operations
9.2 Associates summarised financial information The following table illustrates summarised financial information of the Group’s investments in associates:
in US$’000 2020 2019
Associates’ assets and liabilities Current assets 66,305 102,988
Non-current assets 68,334 85,176 Current liabilities (48,239) (82,083)
Non-current liabilities (59,622) (35,733) Equity 26,778 70,348 Total carrying amount of the investments 19,669 37,634 Less: discontinued operations – 9,991
Carrying amount of the investments 19,669 27,643
Associates’ revenues and net profits: Revenues 270,474 428,110
Profits net of tax 8,958 1,366 Total group’s share of net profits of associates 4,529 7,132 Less: discontinued operations 266 301
Group’s share of net profits of associates 4,263 6,831
10. Consolidated statement of income 10.1 Net sales in US$’000 2020 2019
Net sales of goods(i) 10,595,736 16,742,934
Rendering of services 399,930 447,974 Total revenue from contracts with customers 10,995,666 17,190,908 Less: discontinued operations 1,052,017 2,593,077 Revenue from contracts with customers from continuing operations 9,943,649 14,597,831 (i) Sales of goods are net of any sales taxes, value–added taxes, petroleum taxes and discounts.
1 4 1
PUMA ENERGY ANNUAL REPORT 2020
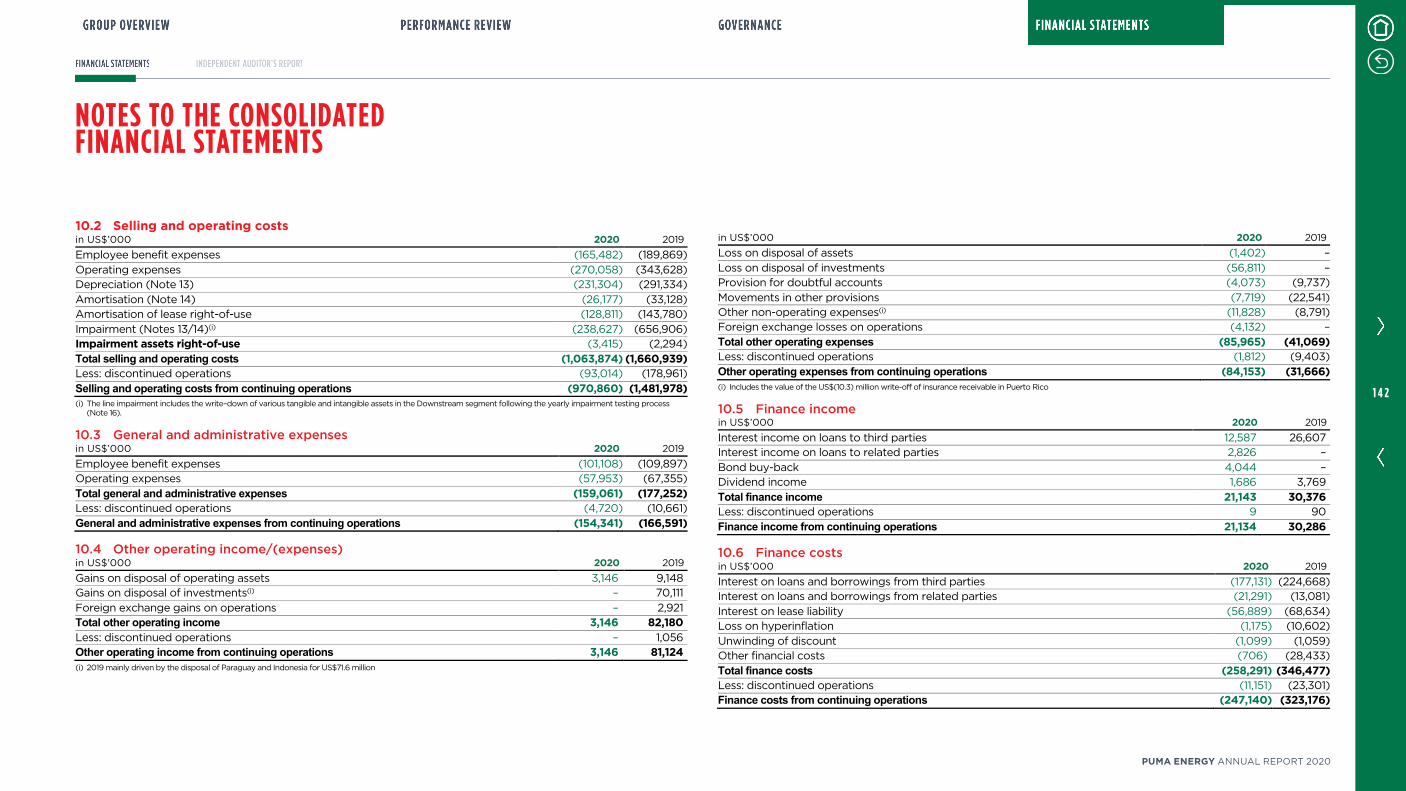
NOTES TO THE CONSOLIDATED FINANCIAL STATEMENTS
10.2 Selling and operating costs in US$’000 2020 2019
Employee benefit expenses (165,482) (189,869)
Operating expenses (270,058) (343,628) Depreciation (Note 13) (231,304) (291,334)
Amortisation (Note 14) (26,177) (33,128) Amortisation of lease right-of-use (128,811) (143,780)
Impairment (Notes 13/14)(i) (238,627) (656,906) Impairment assets right-of-use (3,415) (2,294)
Total selling and operating costs (1,063,874) (1,660,939) Less: discontinued operations (93,014) (178,961)
Selling and operating costs from continuing operations (970,860) (1,481,978) (i) The line impairment includes the write–down of various tangible and intangible assets in the Downstream segment following the yearly impairment testing process
(Note 16).
10.3 General and administrative expenses in US$’000 2020 2019
Employee benefit expenses (101,108) (109,897) Operating expenses (57,953) (67,355)
Total general and administrative expenses (159,061) (177,252) Less: discontinued operations (4,720) (10,661)
General and administrative expenses from continuing operations (154,341) (166,591)
10.4 Other operating income/(expenses) in US$’000 2020 2019
Gains on disposal of operating assets 3,146 9,148 Gains on disposal of investments(i) – 70,111
Foreign exchange gains on operations – 2,921 Total other operating income 3,146 82,180 Less: discontinued operations – 1,056 Other operating income from continuing operations 3,146 81,124 (i) 2019 mainly driven by the disposal of Paraguay and Indonesia for US$71.6 million
in US$’000 2020 2019
Loss on disposal of assets (1,402) –
Loss on disposal of investments (56,811) – Provision for doubtful accounts (4,073) (9,737)
Movements in other provisions (7,719) (22,541) Other non-operating expenses(i) (11,828) (8,791) Foreign exchange losses on operations (4,132) –
Total other operating expenses (85,965) (41,069) Less: discontinued operations (1,812) (9,403)
Other operating expenses from continuing operations (84,153) (31,666) (i) Includes the value of the US$(10.3) million write-off of insurance receivable in Puerto Rico
10.5 Finance income in US$’000 2020 2019
Interest income on loans to third parties 12,587 26,607 Interest income on loans to related parties 2,826 –
Bond buy-back 4,044 – Dividend income 1,686 3,769
Total finance income 21,143 30,376 Less: discontinued operations 9 90
Finance income from continuing operations 21,134 30,286
10.6 Finance costs in US$’000 2020 2019
Interest on loans and borrowings from third parties (177,131) (224,668) Interest on loans and borrowings from related parties (21,291) (13,081)
Interest on lease liability (56,889) (68,634) Loss on hyperinflation (1,175) (10,602)
Unwinding of discount (1,099) (1,059) Other financial costs (706) (28,433)
Total finance costs (258,291) (346,477) Less: discontinued operations (11,151) (23,301) Finance costs from continuing operations (247,140) (323,176)
1 4 2
PUMA ENERGY ANNUAL REPORT 2020
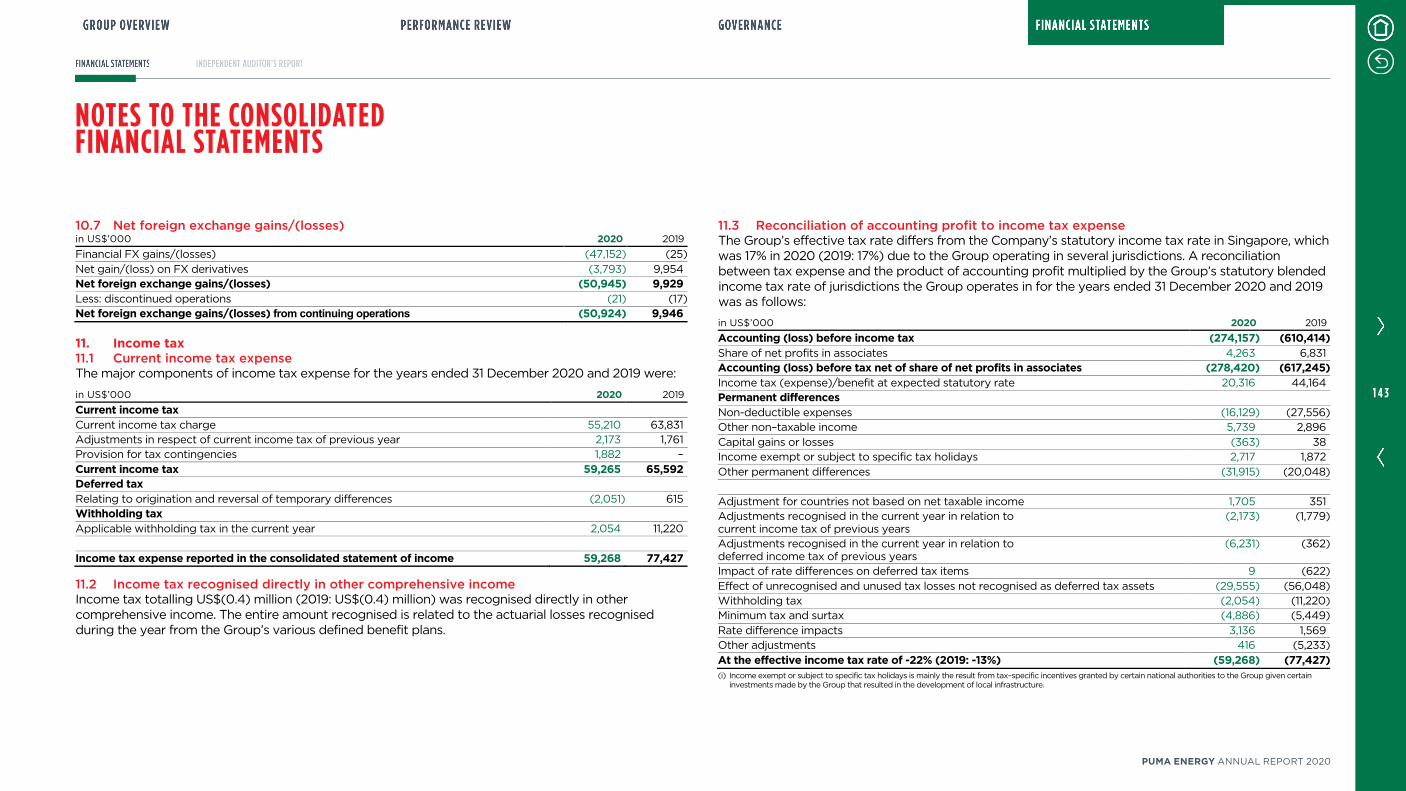
NOTES TO THE CONSOLIDATED FINANCIAL STATEMENTS
10.7 Net foreign exchange gains/(losses) in US$’000 2020 2019
Financial FX gains/(losses) (47,152) (25)
Net gain/(loss) on FX derivatives (3,793) 9,954 Net foreign exchange gains/(losses) (50,945) 9,929 Less: discontinued operations (21) (17) Net foreign exchange gains/(losses) from continuing operations (50,924) 9,946
11. Income tax 11.1 Current income tax expense The major components of income tax expense for the years ended 31 December 2020 and 2019 were:
in US$’000 2020 2019
Current income tax
Current income tax charge 55,210 63,831 Adjustments in respect of current income tax of previous year 2,173 1,761 Provision for tax contingencies 1,882 –
Current income tax 59,265 65,592 Deferred tax
Relating to origination and reversal of temporary differences (2,051) 615 Withholding tax
Applicable withholding tax in the current year 2,054 11,220
Income tax expense reported in the consolidated statement of income 59,268 77,427
11.2 Income tax recognised directly in other comprehensive income Income tax totalling US$(0.4) million (2019: US$(0.4) million) was recognised directly in other comprehensive income. The entire amount recognised is related to the actuarial losses recognised during the year from the Group’s various defined benefit plans.
11.3 Reconciliation of accounting profit to income tax expense The Group’s effective tax rate differs from the Company’s statutory income tax rate in Singapore, which was 17% in 2020 (2019: 17%) due to the Group operating in several jurisdictions. A reconciliation between tax expense and the product of accounting profit multiplied by the Group’s statutory blended income tax rate of jurisdictions the Group operates in for the years ended 31 December 2020 and 2019 was as follows:
in US$’000 2020 2019
Accounting (loss) before income tax (274,157) (610,414) Share of net profits in associates 4,263 6,831 Accounting (loss) before tax net of share of net profits in associates (278,420) (617,245) Income tax (expense)/benefit at expected statutory rate 20,316 44,164 Permanent differences
Non-deductible expenses (16,129) (27,556) Other non–taxable income 5,739 2,896
Capital gains or losses (363) 38 Income exempt or subject to specific tax holidays 2,717 1,872
Other permanent differences (31,915) (20,048)
Adjustment for countries not based on net taxable income 1,705 351 Adjustments recognised in the current year in relation to current income tax of previous years
(2,173) (1,779)
Adjustments recognised in the current year in relation to deferred income tax of previous years
(6,231) (362)
Impact of rate differences on deferred tax items 9 (622)
Effect of unrecognised and unused tax losses not recognised as deferred tax assets (29,555) (56,048) Withholding tax (2,054) (11,220) Minimum tax and surtax (4,886) (5,449)
Rate difference impacts 3,136 1,569 Other adjustments 416 (5,233)
At the effective income tax rate of -22% (2019: -13%) (59,268) (77,427) (i) Income exempt or subject to specific tax holidays is mainly the result from tax–specific incentives granted by certain national authorities to the Group given certain
investments made by the Group that resulted in the development of local infrastructure.
1 4 3
PUMA ENERGY ANNUAL REPORT 2020

NOTES TO THE CONSOLIDATED FINANCIAL STATEMENTS
The Group operates in a multitude of jurisdictions and adheres to applicable local and international tax law in the countries in which it operates, including legislation on transfer pricing. The Group’s tax policy is to pay appropriate tax according to work carried out in each jurisdiction, as determined by a functional analysis of operations using standard measures wherever possible, underpinned by reports prepared to fulfil local transfer pricing requirements. The Group’s effective tax rate – the average rate at which consolidated pre-tax profits are taxed – varies from year to year according to circumstances, but in 2020 it was -20% (2019: 19%), excluding Australia discontinued operations the ETR is -22% (2019: -13%). The difference in effective tax rate between the two years is explained, by non-recognition of deferred tax assets relating to tax loss carry forwards.
11.4 Current tax assets and liabilities Current income taxes are computed on the profit before tax presented in the consolidated statement of income adjusted to taxable profit in accordance with local tax legislation. Current income tax assets and liabilities for the current and prior periods are measured at the amount expected to be recovered from or paid to the tax authorities. Current tax assets mainly relate to overpaid tax. Current tax liabilities relate to income tax payable.
11.5 Deferred tax assets and liabilities
Consolidated statement
of financial position Consolidated statement
of income
in US$’000 2020 2019 2020 2019
Accelerated depreciation for tax purposes (19,148) (12,496) (2,936) (11,797)
Revaluations (16,296) (27,078) (4,294) (3,180) Losses 71,835 98,206 (24,018) (29,492) Other temporary differences (31,115) (57,245) 29,196 96,131
Deferred tax expense/(income) (2,052) 51,662 Deferred tax assets/(liabilities), net 5,276 1,387 Reflected in the consolidated statement of financial position as follows: Deferred tax assets 49,924 52,384 Deferred tax liabilities (44,648) (50,997)
Deferred tax assets/(liabilities), net 5,276 1,387
Reconciliation of net deferred tax assets/(liabilities) in US$’000 2020 2019
Opening balance at 1 January 1,387 3,414
Tax income recognised in profit or loss during the year 2,052 (616) Change in tax rate recognised in profit or loss during the year – –
Other movements during the year 1,837 (1,411) Closing balance at 31 December 5,276 1,387
At 31 December 2020, the Group had unrecognised tax loss carry forwards amounting to US$543.8 million excluding the impact of Australia discontinued operations (2019: US$516.7 million). These losses relate to subsidiaries that have had historical losses, which have an expiry date of more than four years. These losses may not be used to offset taxable income elsewhere in the Group and where the subsidiaries have no taxable temporary differences nor any tax planning opportunities available that could partly support the recognition of these losses as deferred tax assets.
At 31 December 2020, the Group had unrecognised other temporary differences amounting to US$1.7 million (2019: US$2.7 million). These temporary differences have no expiry date. If the Group was able to recognise all unrecognised deferred tax assets, profit would increase by US$113.6 million (2019: US$69.1 million).
11.6 IFRIC 23 – Uncertainty over income tax treatment The interpretation addresses the accounting for income taxes when tax treatments involve uncertainty that affects the application of IAS 12 Income Taxes. Due to its global reach, including operating in high-risk jurisdictions, the Group is subject to enhanced complexity and uncertainty, which may lead to uncertain tax treatments and the corresponding recognition and measurement of current and deferred taxes. The judgements and estimates made to separately recognise and measure the effect of each uncertain tax treatment are re-assessed whenever circumstances change or when there is new information that affects those judgments. The Group has re-assessed its global tax exposure and the key estimates taken in determining the positions recorded to adopt IFRIC 23. As of 1 January 2020, the global tax exposure has been determined by referencing to the uncertainty that the tax authority may not accept the Group’s proposed treatment of tax positions. The interpretation does not have a material impact on the Group.
1 4 4
PUMA ENERGY ANNUAL REPORT 2020
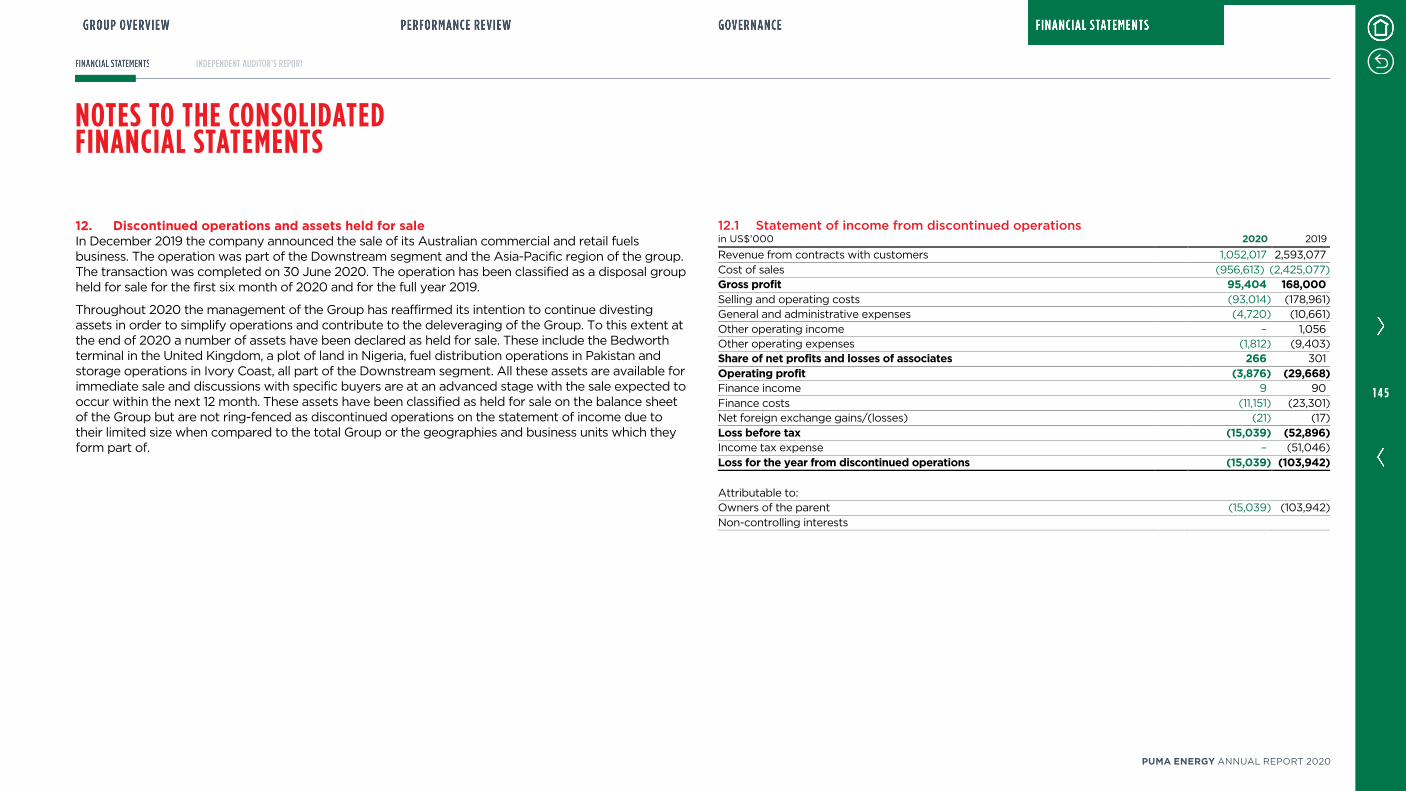
NOTES TO THE CONSOLIDATED FINANCIAL STATEMENTS
12. Discontinued operations and assets held for sale In December 2019 the company announced the sale of its Australian commercial and retail fuels business. The operation was part of the Downstream segment and the Asia-Pacific region of the group. The transaction was completed on 30 June 2020. The operation has been classified as a disposal group held for sale for the first six month of 2020 and for the full year 2019.
Throughout 2020 the management of the Group has reaffirmed its intention to continue divesting assets in order to simplify operations and contribute to the deleveraging of the Group. To this extent at the end of 2020 a number of assets have been declared as held for sale. These include the Bedworth terminal in the United Kingdom, a plot of land in Nigeria, fuel distribution operations in Pakistan and storage operations in Ivory Coast, all part of the Downstream segment. All these assets are available for immediate sale and discussions with specific buyers are at an advanced stage with the sale expected to occur within the next 12 month. These assets have been classified as held for sale on the balance sheet of the Group but are not ring-fenced as discontinued operations on the statement of income due to their limited size when compared to the total Group or the geographies and business units which they form part of.
12.1 Statement of income from discontinued operations in US$’000 2020 2019
Revenue from contracts with customers 1,052,017 2,593,077
Cost of sales (956,613) (2,425,077) Gross profit 95,404 168,000 Selling and operating costs (93,014) (178,961) General and administrative expenses (4,720) (10,661)
Other operating income – 1,056 Other operating expenses (1,812) (9,403) Share of net profits and losses of associates 266 301
Operating profit (3,876) (29,668) Finance income 9 90
Finance costs (11,151) (23,301) Net foreign exchange gains/(losses) (21) (17)
Loss before tax (15,039) (52,896) Income tax expense – (51,046)
Loss for the year from discontinued operations (15,039) (103,942) Attributable to: Owners of the parent (15,039) (103,942)
Non-controlling interests
1 4 5
PUMA ENERGY ANNUAL REPORT 2020
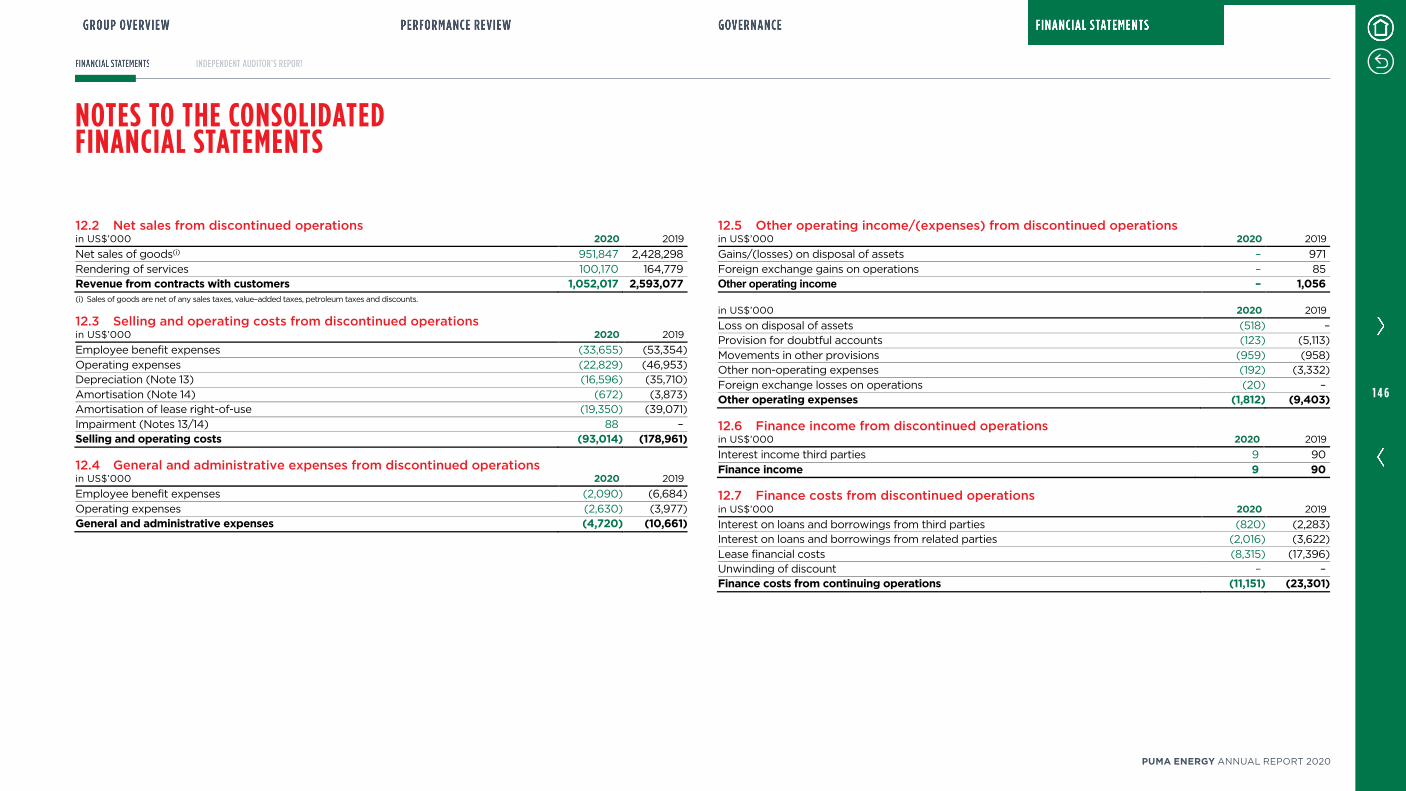
NOTES TO THE CONSOLIDATED FINANCIAL STATEMENTS
12.2 Net sales from discontinued operations in US$’000 2020 2019
Net sales of goods(i) 951,847 2,428,298
Rendering of services 100,170 164,779 Revenue from contracts with customers 1,052,017 2,593,077 (i) Sales of goods are net of any sales taxes, value–added taxes, petroleum taxes and discounts.
12.3 Selling and operating costs from discontinued operations in US$’000 2020 2019
Employee benefit expenses (33,655) (53,354)
Operating expenses (22,829) (46,953) Depreciation (Note 13) (16,596) (35,710)
Amortisation (Note 14) (672) (3,873) Amortisation of lease right-of-use (19,350) (39,071)
Impairment (Notes 13/14) 88 – Selling and operating costs (93,014) (178,961)
12.4 General and administrative expenses from discontinued operations in US$’000 2020 2019
Employee benefit expenses (2,090) (6,684)
Operating expenses (2,630) (3,977) General and administrative expenses (4,720) (10,661)
12.5 Other operating income/(expenses) from discontinued operations in US$’000 2020 2019
Gains/(losses) on disposal of assets – 971
Foreign exchange gains on operations – 85 Other operating income – 1,056 in US$’000
2020
2019
Loss on disposal of assets (518) – Provision for doubtful accounts (123) (5,113)
Movements in other provisions (959) (958) Other non-operating expenses (192) (3,332)
Foreign exchange losses on operations (20) – Other operating expenses (1,812) (9,403)
12.6 Finance income from discontinued operations in US$’000 2020 2019
Interest income third parties 9 90
Finance income 9 90
12.7 Finance costs from discontinued operations in US$’000 2020 2019
Interest on loans and borrowings from third parties (820) (2,283) Interest on loans and borrowings from related parties (2,016) (3,622)
Lease financial costs (8,315) (17,396) Unwinding of discount – – Finance costs from continuing operations (11,151) (23,301)
1 4 6
PUMA ENERGY ANNUAL REPORT 2020
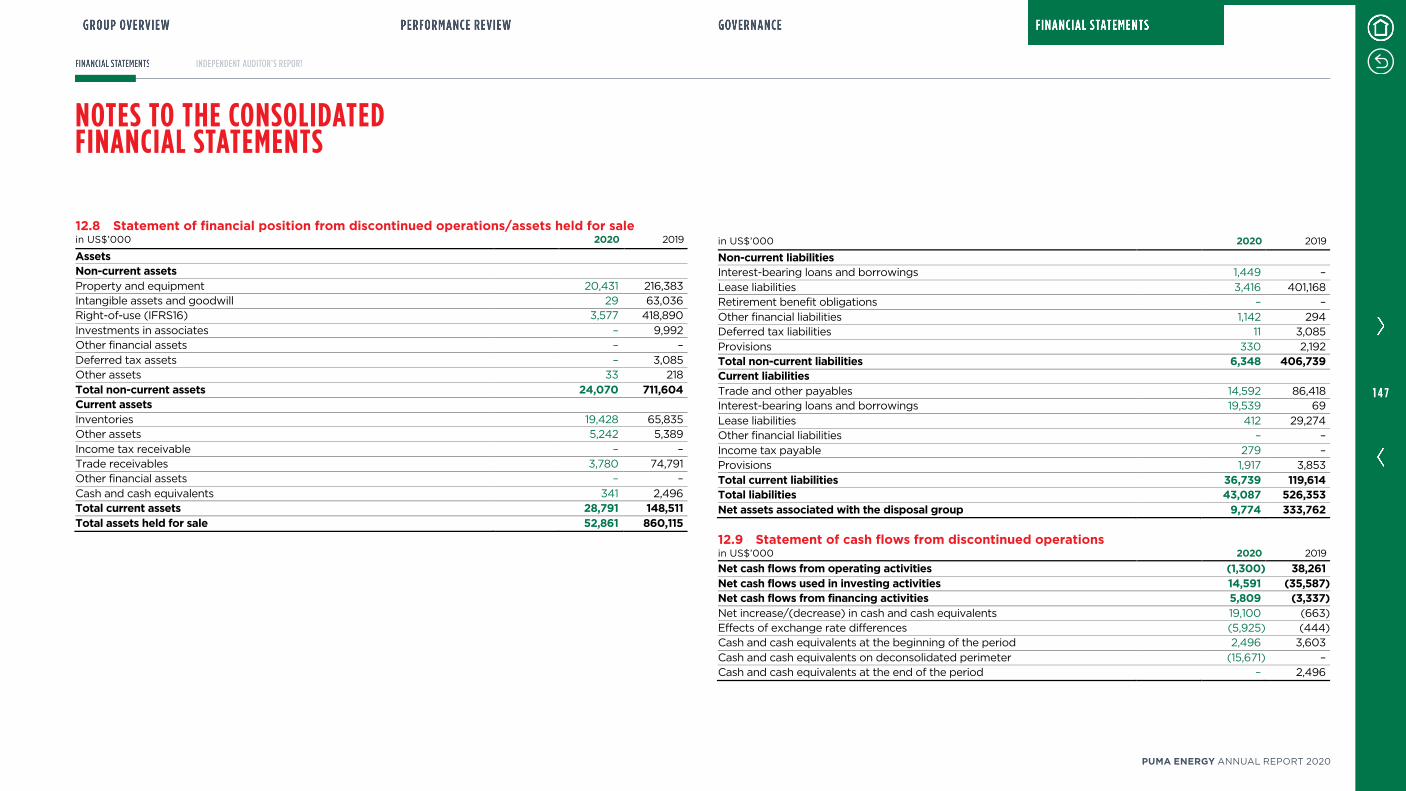
NOTES TO THE CONSOLIDATED FINANCIAL STATEMENTS
12.8 Statement of financial position from discontinued operations/assets held for sale in US$’000 2020 2019
Assets Non-current assets
Property and equipment 20,431 216,383 Intangible assets and goodwill 29 63,036 Right-of-use (IFRS16) 3,577 418,890
Investments in associates – 9,992 Other financial assets – –
Deferred tax assets – 3,085 Other assets 33 218
Total non-current assets 24,070 711,604 Current assets
Inventories 19,428 65,835 Other assets 5,242 5,389
Income tax receivable – – Trade receivables 3,780 74,791 Other financial assets – –
Cash and cash equivalents 341 2,496 Total current assets 28,791 148,511 Total assets held for sale 52,861 860,115
in US$’000 2020 2019
Non-current liabilities Interest-bearing loans and borrowings 1,449 –
Lease liabilities 3,416 401,168 Retirement benefit obligations – –
Other financial liabilities 1,142 294 Deferred tax liabilities 11 3,085
Provisions 330 2,192 Total non-current liabilities 6,348 406,739 Current liabilities
Trade and other payables 14,592 86,418 Interest-bearing loans and borrowings 19,539 69
Lease liabilities 412 29,274 Other financial liabilities – –
Income tax payable 279 – Provisions 1,917 3,853
Total current liabilities 36,739 119,614 Total liabilities 43,087 526,353 Net assets associated with the disposal group 9,774 333,762
12.9 Statement of cash flows from discontinued operations in US$’000 2020 2019
Net cash flows from operating activities (1,300) 38,261 Net cash flows used in investing activities 14,591 (35,587) Net cash flows from financing activities 5,809 (3,337) Net increase/(decrease) in cash and cash equivalents 19,100 (663) Effects of exchange rate differences (5,925) (444) Cash and cash equivalents at the beginning of the period 2,496 3,603
Cash and cash equivalents on deconsolidated perimeter (15,671) – Cash and cash equivalents at the end of the period – 2,496
1 4 7
PUMA ENERGY ANNUAL REPORT 2020
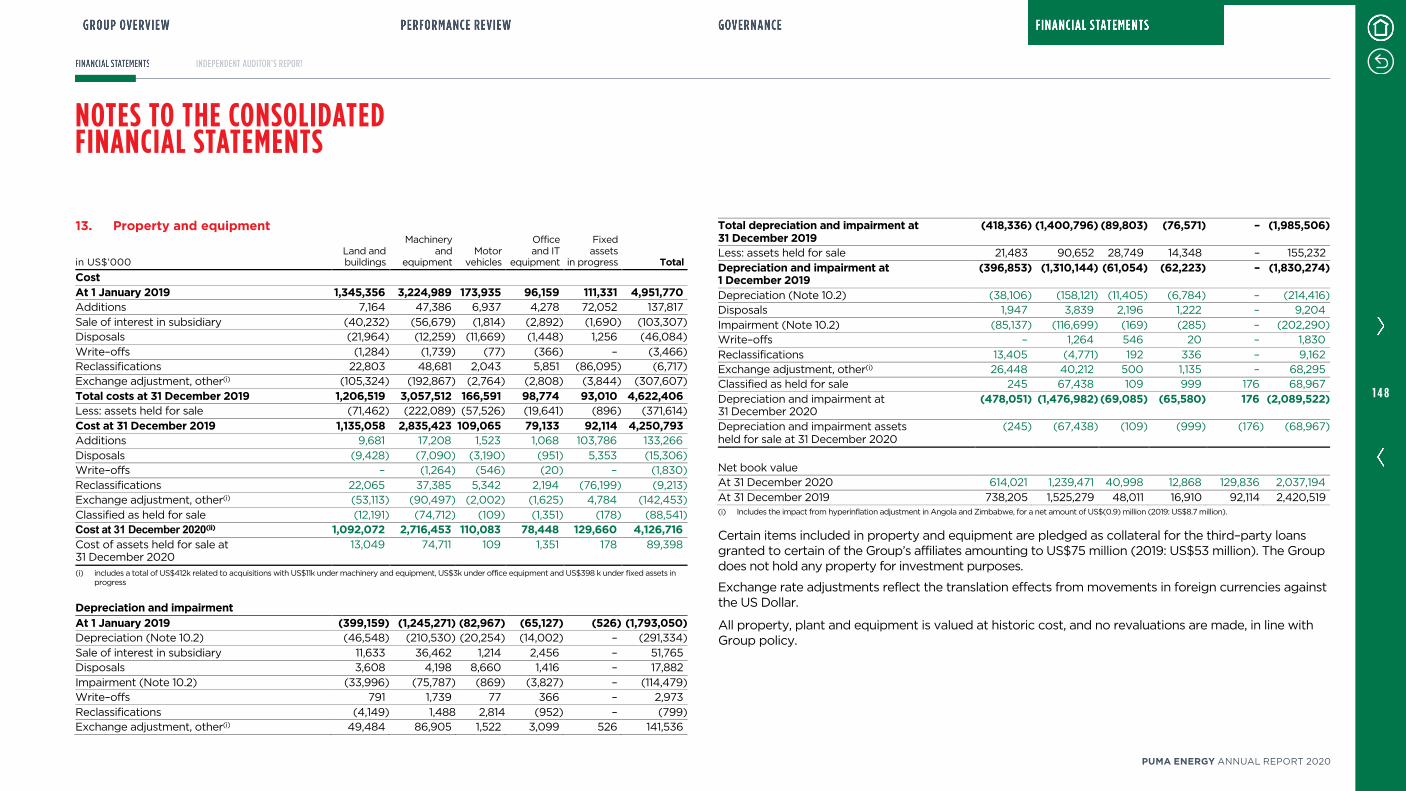
NOTES TO THE CONSOLIDATED FINANCIAL STATEMENTS
13. Property and equipment
in US$’000 Land and buildings
Machinery and
equipment Motor
vehicles
Office and IT
equipment
Fixed assets
in progress Total Cost
At 1 January 2019 1,345,356 3,224,989 173,935 96,159 111,331 4,951,770 Additions 7,164 47,386 6,937 4,278 72,052 137,817
Sale of interest in subsidiary (40,232) (56,679) (1,814) (2,892) (1,690) (103,307) Disposals (21,964) (12,259) (11,669) (1,448) 1,256 (46,084)
Write–offs (1,284) (1,739) (77) (366) – (3,466) Reclassifications 22,803 48,681 2,043 5,851 (86,095) (6,717) Exchange adjustment, other(i) (105,324) (192,867) (2,764) (2,808) (3,844) (307,607)
Total costs at 31 December 2019 1,206,519 3,057,512 166,591 98,774 93,010 4,622,406 Less: assets held for sale (71,462) (222,089) (57,526) (19,641) (896) (371,614)
Cost at 31 December 2019 1,135,058 2,835,423 109,065 79,133 92,114 4,250,793 Additions 9,681 17,208 1,523 1,068 103,786 133,266
Disposals (9,428) (7,090) (3,190) (951) 5,353 (15,306) Write–offs – (1,264) (546) (20) – (1,830)
Reclassifications 22,065 37,385 5,342 2,194 (76,199) (9,213) Exchange adjustment, other(i) (53,113) (90,497) (2,002) (1,625) 4,784 (142,453)
Classified as held for sale (12,191) (74,712) (109) (1,351) (178) (88,541) Cost at 31 December 2020(ii) 1,092,072 2,716,453 110,083 78,448 129,660 4,126,716 Cost of assets held for sale at 31 December 2020
13,049 74,711 109 1,351 178 89,398
(i) includes a total of US$412k related to acquisitions with US$11k under machinery and equipment, US$3k under office equipment and US$398 k under fixed assets in progress
Depreciation and impairment
At 1 January 2019 (399,159) (1,245,271) (82,967) (65,127) (526) (1,793,050) Depreciation (Note 10.2) (46,548) (210,530) (20,254) (14,002) – (291,334)
Sale of interest in subsidiary 11,633 36,462 1,214 2,456 – 51,765 Disposals 3,608 4,198 8,660 1,416 – 17,882
Impairment (Note 10.2) (33,996) (75,787) (869) (3,827) – (114,479) Write–offs 791 1,739 77 366 – 2,973
Reclassifications (4,149) 1,488 2,814 (952) – (799) Exchange adjustment, other(i) 49,484 86,905 1,522 3,099 526 141,536
Total depreciation and impairment at 31 December 2019
(418,336) (1,400,796) (89,803) (76,571) – (1,985,506)
Less: assets held for sale 21,483 90,652 28,749 14,348 – 155,232
Depreciation and impairment at 1 December 2019
(396,853) (1,310,144) (61,054) (62,223) – (1,830,274)
Depreciation (Note 10.2) (38,106) (158,121) (11,405) (6,784) – (214,416) Disposals 1,947 3,839 2,196 1,222 – 9,204
Impairment (Note 10.2) (85,137) (116,699) (169) (285) – (202,290) Write–offs – 1,264 546 20 – 1,830
Reclassifications 13,405 (4,771) 192 336 – 9,162 Exchange adjustment, other(i) 26,448 40,212 500 1,135 – 68,295 Classified as held for sale 245 67,438 109 999 176 68,967
Depreciation and impairment at 31 December 2020
(478,051) (1,476,982) (69,085) (65,580) 176 (2,089,522)
Depreciation and impairment assets held for sale at 31 December 2020
(245) (67,438) (109) (999) (176) (68,967)
Net book value
At 31 December 2020 614,021 1,239,471 40,998 12,868 129,836 2,037,194
At 31 December 2019 738,205 1,525,279 48,011 16,910 92,114 2,420,519 (i) Includes the impact from hyperinflation adjustment in Angola and Zimbabwe, for a net amount of US$(0.9) million (2019: US$8.7 million).
Certain items included in property and equipment are pledged as collateral for the third–party loans granted to certain of the Group’s affiliates amounting to US$75 million (2019: US$53 million). The Group does not hold any property for investment purposes.
Exchange rate adjustments reflect the translation effects from movements in foreign currencies against the US Dollar.
All property, plant and equipment is valued at historic cost, and no revaluations are made, in line with Group policy.
1 4 8
PUMA ENERGY ANNUAL REPORT 2020

NOTES TO THE CONSOLIDATED FINANCIAL STATEMENTS
14. Intangible assets and goodwill
in US$’000 Goodwill Licences Other
intangibles Total
Cost or valuation At 1 January 2019 997,354 99,931 420,067 1,517,352 Additions – 5,852 2,390 8,242 Sale of interest in subsidiary (Note 6.6) (9,229) (389) (33,341) (42,959)
Disposals – (387) (2,042) (2,429) Exchange adjustment, other(i) (3,108) (628) (24,393) (28,129)
Reclassifications – 431 2,950 3,381 Total cost or valuation at 31 December 2019 985,017 104,810 365,631 1,455,458 Less: assets held for sale (49,419) (14,181) (46,971) (110,571) Cost or valuation at 31 December 2019 935,598 90,629 318,660 1,344,887 Additions – 8,927 324 9,251
Sale of interest in subsidiary (409,570) – – (409,570) Disposals – – (34) (34)
Write-off – – (349) (349) Reclassifications 4,422 77 963 5,462
Exchange adjustment, other(i) (8,531) (591) (7,289) (16,411) Less: assets held for sale – (915) (187) (1,102)
Cost or valuation at 31 December 2020 521,919 98,127 312,088 932,134
in US$’000 Goodwill Licences Other
intangibles Total Amortisation and impairment At 1 January 2019 (67,102) (57,045) (120,197) (244,344) Amortisation charge for the year (Note 10.2) – (14,752) (18,376) (33,128) Impairment (Note 10.2) (542,336) (41) (50) (542,427)
Sale of interest in subsidiary (Note 6.6) 9,228 326 21,525 31,079 Disposals – 386 165 551 Exchange adjustment, other(i) (2,787) 650 4,108 1,971
Total amortisation and impairment at 31 December 2019 (602,997) (70,476) (112,825) (786,298) Less: assets held for sale – 13,740 33,795 47,535
Amortisation and impairment at 31 December 2019 (602,997) (56,736) (79,030) (738,763) Amortisation charge for the year (Note 10.2) – (12,888) (12,618) (25,506)
Impairment (Note 10.2) (5,967) (94) (30,363) (36,424) Sale of interest in subsidiary 409,570 – – 409,570
Disposals – 4 14 18 Write-off – – 349 349
Reclassifications (1,993) – 378 (1,615) Exchange adjustment, other(i) 6,690 677 (1,882) 5,485
Less: assets held for sale – 886 187 1,073 Amortisation and impairment at 31 December 2020 (194,697) (68,151) (122,965) (385,813) Net book value:
At 31 December 2020 327,222 29,976 189,123 546,321
At 31 December 2019 332,601 33,893 239,630 606,124 (i) Includes the impact from hyperinflation adjustment in Angola and Zimbabwe, for a net amount of US$0.3 million (2019: US$(0.4) million).
1 4 9
PUMA ENERGY ANNUAL REPORT 2020

NOTES TO THE CONSOLIDATED FINANCIAL STATEMENTS
15. Right-of-use
in US$’000 Land Buildings Service stations
Storage facilities
Equipment and
machinery Vehicles Vessels
Equipment and IT
material Total
Cost At 31 January 2019 – – – – – – – – – Additions 260,562 260,211 404,341 93,957 21,330 3,497 207,104 156 1,251,158 Decrease (5) (3) (18) – – – – – (26) Write-off (370) (611) (981) (9) – (195) – – (2,166) Reclassification 633 – – – – – – – 633 Sale of interest in subsidiaries
(3,104) – (68) (541) – – – – (3,713)
Exchange adjustment, other
(5,121) 1,255 450 1,788 117 26 – (1) (1,486)
Total cost at 31 December 2019
252,595 260,852 403,724 95,195 21,447 3,328 207,104 155 1,244,400
Less: assets held for sale
(26,467) (222,266)
(200,416) (8,949) (58) – – – (458,156)
Cost at 31 December 2019
226,128 38,586 203,308 86,246 21,389 3,328 207,104 155 786,244
Additions 35,850 14,636 21,886 4,859 2,939 2,069 248 7 82,494 Decrease (17,902) (1,871) (2,647) (601) (771) (138) – (30) (23,960) Reclassification from assets held for sale
– 371 – 8,052 – – – – 8,423
Write-off (2,755) (3,108) (641) (916) (216) (602) (169) (62) (8,469) Reclassification (165) 2,492 (2,326) – – – – – 1 Exchange adjustment, other
(141) 85 (4,609) 1,491 209 (20) – (2) (2,987)
Less: assets held for sale
(3,520) (358) (390) (242) – (28) – – (4,538)
Cost at 31 December 2020
237,495 50,833 214,581 98,889 23,550 4,609 207,183 68 837,208
in US$’000 Land Buildings Service stations
Storage facilities
Equipment and
machinery Vehicles Vessels
Equipment and IT
material Total
Amortisation and impairment
At 31 January 2019 –– –– –– –– –– –– –– –– –– Amortization (22,607) (25,095) (46,293) (11,071) (1,477) (1,202) (35,964) (71) (143,780) Impairment (1,499) (149) – (235) (411) – – – (2,294) Write-off 371 611 981 8 – 195 – – 2,166 Sale of interest in subsidiaries
349 – 7 324 – – – – 680
Exchange adjustment, other
282 (77) 4 (199) (28) (8) – – (26)
Total amortisation and impairment at 31 December 2019
(23,104) (24,710) (45,301) (11,173) (1,916) (1,015) (35,964) (71) (143,254)
Less: assets held for sale 1,712 17,086 20,122 340 7 – – – 39,267 Amortisation and impairment at 31 December 2019
(21,392) (7,624) (25,179) (10,833) (1,909) (1,015) (35,964) (71) (103,987)
Amortization (19,640) (9,706) (25,879) (12,796) (2,102) (1,179) (38,106) (42) (109,450) Reclassification from assets held for sale
– (21) – (435) – – – – (456)
Impairment 179 – (4,463) – 869 – – – (3,415) Write-off 2,756 3,108 641 916 216 601 169 63 8,470 Reclassification (60) (462) 515 – – – – – (7) Exchange adjustment, other
(515) (231) 228 (929) (121) (13) – – (1,581)
Less: assets held for sale 617 169 97 53 – 25 – – 961 Amortisation and impairment at 31 December 2020
(38,055) (14,767) (54,040) (24,024) (3,047) (1,581) (73,901) (50) (209,465)
At 31 December 2020 199,440 36,066 160,541 74,865 20,503 3,028 133,282 18 627,743 At 31 December 2019 204,736 30,962 178,129 75,413 19,480 2,313 171,140 84 682,257
1 5 0
PUMA ENERGY ANNUAL REPORT 2020
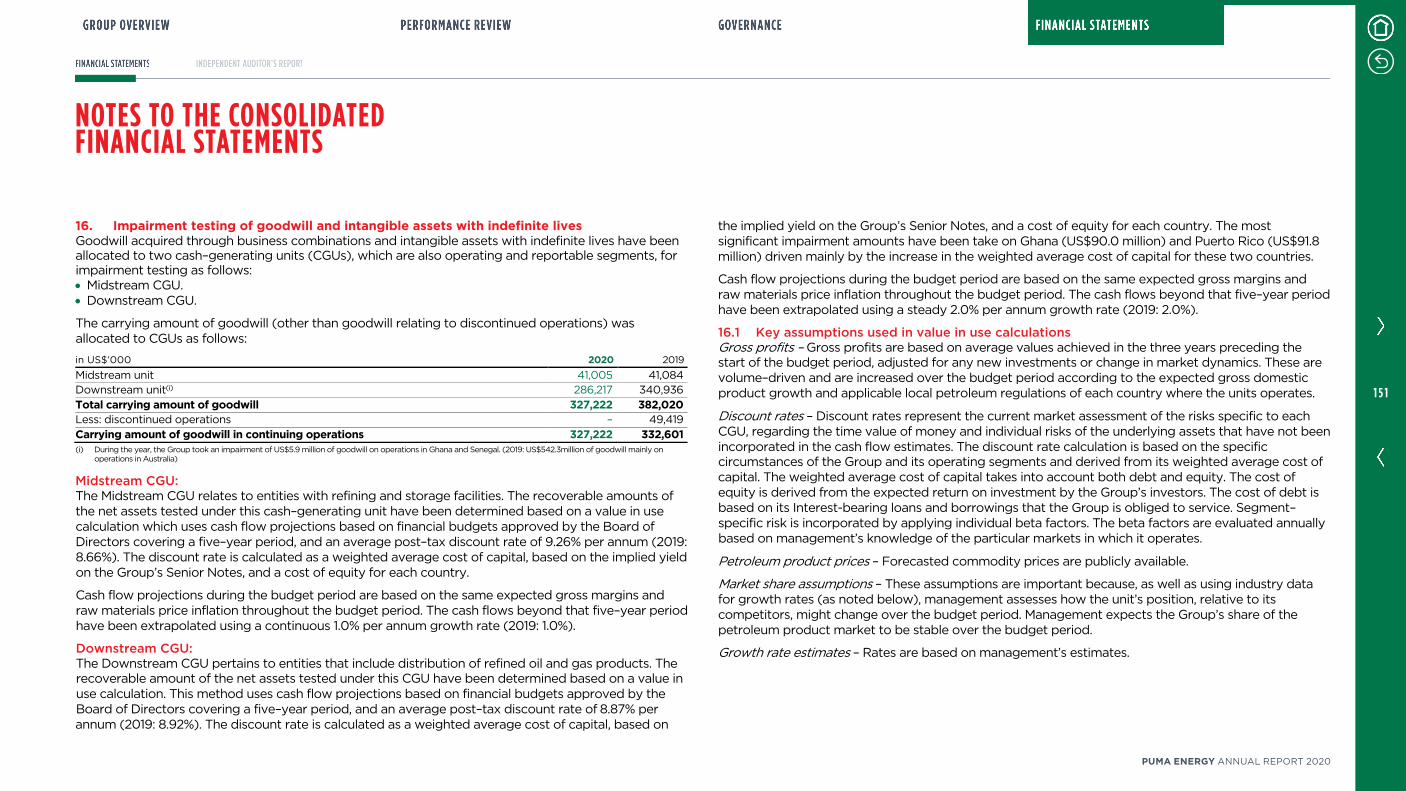
NOTES TO THE CONSOLIDATED FINANCIAL STATEMENTS
16. Impairment testing of goodwill and intangible assets with indefinite lives Goodwill acquired through business combinations and intangible assets with indefinite lives have been allocated to two cash–generating units (CGUs), which are also operating and reportable segments, for impairment testing as follows: • Midstream CGU. • Downstream CGU.
The carrying amount of goodwill (other than goodwill relating to discontinued operations) was allocated to CGUs as follows:
in US$’000 2020 2019
Midstream unit 41,005 41,084 Downstream unit(i) 286,217 340,936
Total carrying amount of goodwill 327,222 382,020 Less: discontinued operations – 49,419
Carrying amount of goodwill in continuing operations 327,222 332,601 (i) During the year, the Group took an impairment of US$5.9 million of goodwill on operations in Ghana and Senegal. (2019: US$542.3million of goodwill mainly on
operations in Australia)
Midstream CGU: The Midstream CGU relates to entities with refining and storage facilities. The recoverable amounts of the net assets tested under this cash–generating unit have been determined based on a value in use calculation which uses cash flow projections based on financial budgets approved by the Board of Directors covering a five–year period, and an average post–tax discount rate of 9.26% per annum (2019: 8.66%). The discount rate is calculated as a weighted average cost of capital, based on the implied yield on the Group’s Senior Notes, and a cost of equity for each country.
Cash flow projections during the budget period are based on the same expected gross margins and raw materials price inflation throughout the budget period. The cash flows beyond that five–year period have been extrapolated using a continuous 1.0% per annum growth rate (2019: 1.0%).
Downstream CGU: The Downstream CGU pertains to entities that include distribution of refined oil and gas products. The recoverable amount of the net assets tested under this CGU have been determined based on a value in use calculation. This method uses cash flow projections based on financial budgets approved by the Board of Directors covering a five–year period, and an average post–tax discount rate of 8.87% per annum (2019: 8.92%). The discount rate is calculated as a weighted average cost of capital, based on
the implied yield on the Group’s Senior Notes, and a cost of equity for each country. The most significant impairment amounts have been take on Ghana (US$90.0 million) and Puerto Rico (US$91.8 million) driven mainly by the increase in the weighted average cost of capital for these two countries.
Cash flow projections during the budget period are based on the same expected gross margins and raw materials price inflation throughout the budget period. The cash flows beyond that five–year period have been extrapolated using a steady 2.0% per annum growth rate (2019: 2.0%).
16.1 Key assumptions used in value in use calculations Gross profits – Gross profits are based on average values achieved in the three years preceding the start of the budget period, adjusted for any new investments or change in market dynamics. These are volume–driven and are increased over the budget period according to the expected gross domestic product growth and applicable local petroleum regulations of each country where the units operates.
Discount rates – Discount rates represent the current market assessment of the risks specific to each CGU, regarding the time value of money and individual risks of the underlying assets that have not been incorporated in the cash flow estimates. The discount rate calculation is based on the specific circumstances of the Group and its operating segments and derived from its weighted average cost of capital. The weighted average cost of capital takes into account both debt and equity. The cost of equity is derived from the expected return on investment by the Group’s investors. The cost of debt is based on its Interest-bearing loans and borrowings that the Group is obliged to service. Segment–specific risk is incorporated by applying individual beta factors. The beta factors are evaluated annually based on management’s knowledge of the particular markets in which it operates.
Petroleum product prices – Forecasted commodity prices are publicly available.
Market share assumptions – These assumptions are important because, as well as using industry data for growth rates (as noted below), management assesses how the unit’s position, relative to its competitors, might change over the budget period. Management expects the Group’s share of the petroleum product market to be stable over the budget period.
Growth rate estimates – Rates are based on management’s estimates.
1 5 1
PUMA ENERGY ANNUAL REPORT 2020
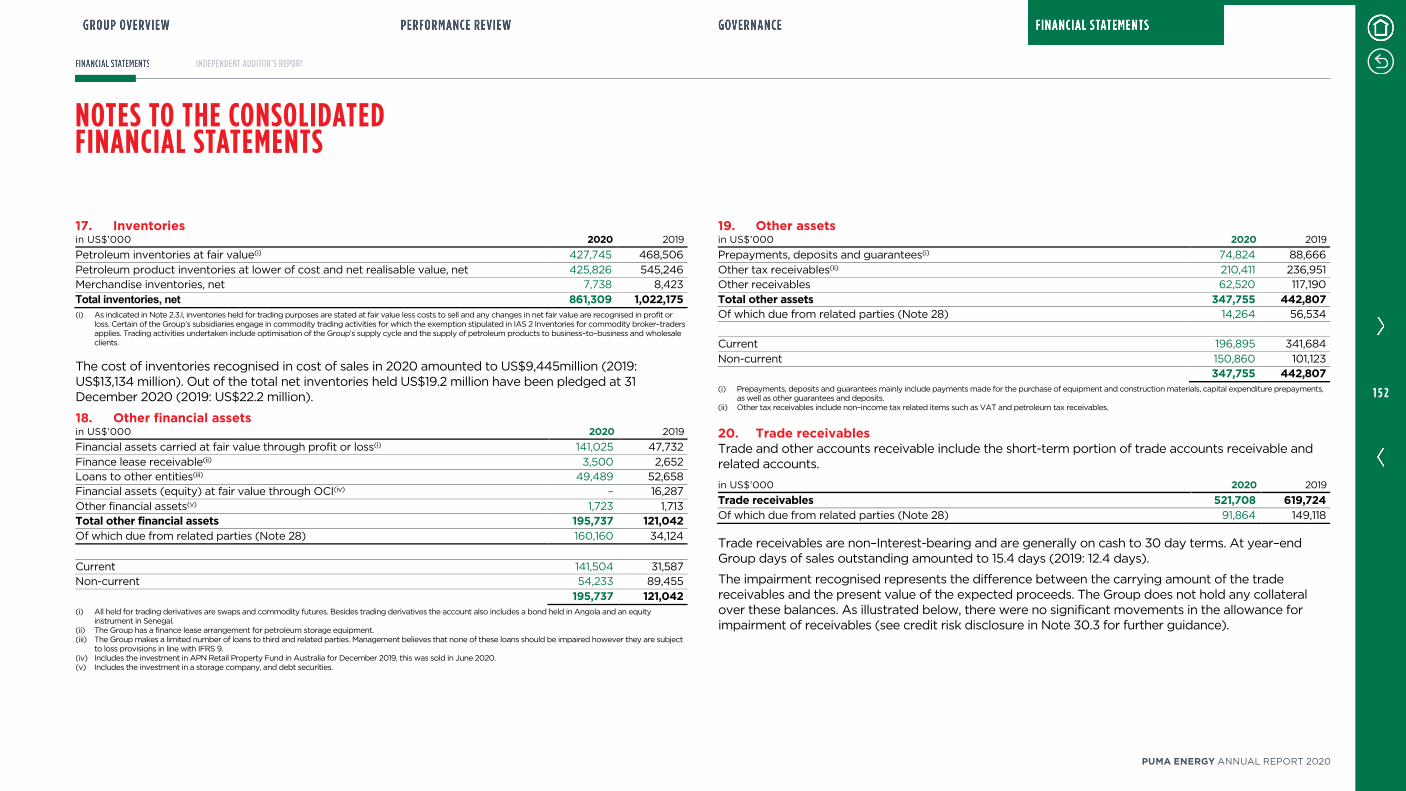
NOTES TO THE CONSOLIDATED FINANCIAL STATEMENTS
17. Inventories in US$’000 2020 2019
Petroleum inventories at fair value(i) 427,745 468,506
Petroleum product inventories at lower of cost and net realisable value, net 425,826 545,246 Merchandise inventories, net 7,738 8,423
Total inventories, net 861,309 1,022,175 (i) As indicated in Note 2.3.l, inventories held for trading purposes are stated at fair value less costs to sell and any changes in net fair value are recognised in profit or
loss. Certain of the Group’s subsidiaries engage in commodity trading activities for which the exemption stipulated in IAS 2 Inventories for commodity broker–traders applies. Trading activities undertaken include optimisation of the Group’s supply cycle and the supply of petroleum products to business–to–business and wholesale clients.
The cost of inventories recognised in cost of sales in 2020 amounted to US$9,445million (2019: US$13,134 million). Out of the total net inventories held US$19.2 million have been pledged at 31 December 2020 (2019: US$22.2 million).
18. Other financial assets in US$’000 2020 2019
Financial assets carried at fair value through profit or loss(i) 141,025 47,732
Finance lease receivable(ii) 3,500 2,652 Loans to other entities(iii) 49,489 52,658 Financial assets (equity) at fair value through OCI(iv) – 16,287
Other financial assets(v) 1,723 1,713 Total other financial assets 195,737 121,042 Of which due from related parties (Note 28) 160,160 34,124
Current 141,504 31,587 Non-current 54,233 89,455
195,737 121,042 (i) All held for trading derivatives are swaps and commodity futures. Besides trading derivatives the account also includes a bond held in Angola and an equity
instrument in Senegal. (ii) The Group has a finance lease arrangement for petroleum storage equipment. (iii) The Group makes a limited number of loans to third and related parties. Management believes that none of these loans should be impaired however they are subject
to loss provisions in line with IFRS 9. (iv) Includes the investment in APN Retail Property Fund in Australia for December 2019, this was sold in June 2020. (v) Includes the investment in a storage company, and debt securities.
19. Other assets in US$’000 2020 2019
Prepayments, deposits and guarantees(i) 74,824 88,666
Other tax receivables(ii) 210,411 236,951 Other receivables 62,520 117,190
Total other assets 347,755 442,807 Of which due from related parties (Note 28) 14,264 56,534
Current 196,895 341,684
Non-current 150,860 101,123 347,755 442,807 (i) Prepayments, deposits and guarantees mainly include payments made for the purchase of equipment and construction materials, capital expenditure prepayments,
as well as other guarantees and deposits. (ii) Other tax receivables include non–income tax related items such as VAT and petroleum tax receivables.
20. Trade receivables Trade and other accounts receivable include the short-term portion of trade accounts receivable and related accounts.
in US$’000 2020 2019
Trade receivables 521,708 619,724 Of which due from related parties (Note 28) 91,864 149,118
Trade receivables are non–Interest-bearing and are generally on cash to 30 day terms. At year–end Group days of sales outstanding amounted to 15.4 days (2019: 12.4 days).
The impairment recognised represents the difference between the carrying amount of the trade receivables and the present value of the expected proceeds. The Group does not hold any collateral over these balances. As illustrated below, there were no significant movements in the allowance for impairment of receivables (see credit risk disclosure in Note 30.3 for further guidance).
1 5 2
PUMA ENERGY ANNUAL REPORT 2020
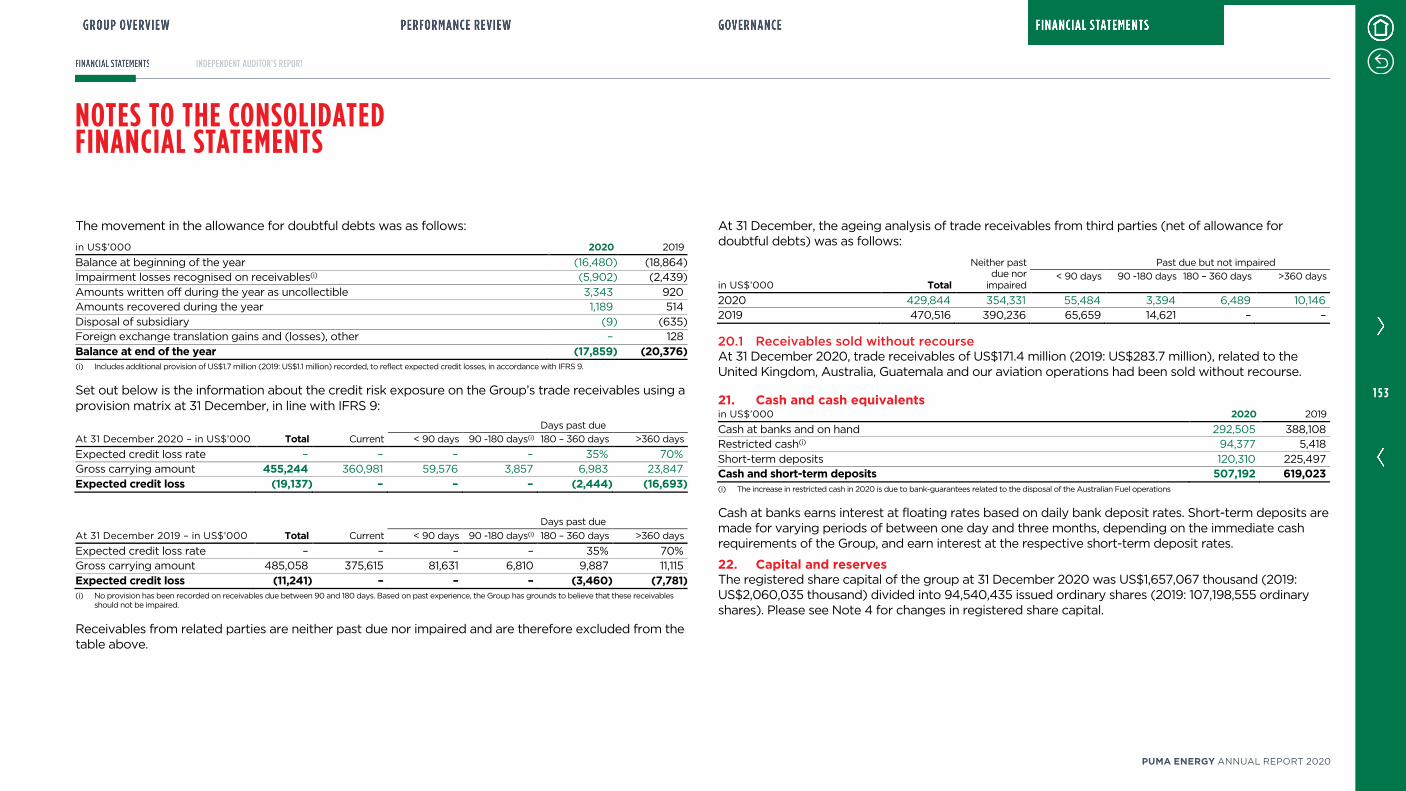
NOTES TO THE CONSOLIDATED FINANCIAL STATEMENTS
The movement in the allowance for doubtful debts was as follows:
in US$’000 2020 2019
Balance at beginning of the year (16,480) (18,864) Impairment losses recognised on receivables(i) (5,902) (2,439)
Amounts written off during the year as uncollectible 3,343 920 Amounts recovered during the year 1,189 514
Disposal of subsidiary (9) (635) Foreign exchange translation gains and (losses), other – 128
Balance at end of the year (17,859) (20,376) (i) Includes additional provision of US$1.7 million (2019: US$1.1 million) recorded, to reflect expected credit losses, in accordance with IFRS 9.
Set out below is the information about the credit risk exposure on the Group’s trade receivables using a provision matrix at 31 December, in line with IFRS 9:
At 31 December 2020 – in US$’000 Total Current
Days past due
< 90 days 90 -180 days(i) 180 – 360 days >360 days
Expected credit loss rate – – – – 35% 70% Gross carrying amount 455,244 360,981 59,576 3,857 6,983 23,847
Expected credit loss (19,137) – – – (2,444) (16,693)
At 31 December 2019 – in US$’000 Total Current
Days past due
< 90 days 90 -180 days(i) 180 – 360 days >360 days
Expected credit loss rate – – – – 35% 70% Gross carrying amount 485,058 375,615 81,631 6,810 9,887 11,115
Expected credit loss (11,241) – – – (3,460) (7,781) (i) No provision has been recorded on receivables due between 90 and 180 days. Based on past experience, the Group has grounds to believe that these receivables
should not be impaired.
Receivables from related parties are neither past due nor impaired and are therefore excluded from the table above.
At 31 December, the ageing analysis of trade receivables from third parties (net of allowance for doubtful debts) was as follows:
in US$’000 Total
Neither past due nor
impaired
Past due but not impaired
< 90 days 90 -180 days 180 – 360 days >360 days
2020 429,844 354,331 55,484 3,394 6,489 10,146 2019 470,516 390,236 65,659 14,621 – –
20.1 Receivables sold without recourse At 31 December 2020, trade receivables of US$171.4 million (2019: US$283.7 million), related to the United Kingdom, Australia, Guatemala and our aviation operations had been sold without recourse.
21. Cash and cash equivalents in US$’000 2020 2019
Cash at banks and on hand 292,505 388,108 Restricted cash(i) 94,377 5,418
Short-term deposits 120,310 225,497 Cash and short-term deposits 507,192 619,023 (i) The increase in restricted cash in 2020 is due to bank-guarantees related to the disposal of the Australian Fuel operations
Cash at banks earns interest at floating rates based on daily bank deposit rates. Short-term deposits are made for varying periods of between one day and three months, depending on the immediate cash requirements of the Group, and earn interest at the respective short-term deposit rates.
22. Capital and reserves The registered share capital of the group at 31 December 2020 was US$1,657,067 thousand (2019: US$2,060,035 thousand) divided into 94,540,435 issued ordinary shares (2019: 107,198,555 ordinary shares). Please see Note 4 for changes in registered share capital.
1 5 3
PUMA ENERGY ANNUAL REPORT 2020

NOTES TO THE CONSOLIDATED FINANCIAL STATEMENTS
23. Interest-bearing loans and borrowings in US$’000 2020 2019
Unsecured – at amortised cost
Senior notes(i) 1,556,467 1,576,168 Bank overdrafts 87,515 98,783
Obligations under finance leases 25 52 Accrued interest 29,962 37,324
Unsecured bank loans(ii) 964,135 1,272,949 Related parties(iv) 419,895 16,155
3,057,999 3,001,431 Secured – at amortised cost
Secured bank loans(ii)(iii) 57,653 8,236
57,653 8,236 Total Interest-bearing loans and borrowings 3,115,652 3,009,667 Of which due to related parties (Note 28) 419,895 16,630
Current 1,044,766 284,733
Non-current 2,070,886 2,724,934 3,115,652 3,009,667 (i) Includes US$600 million of 5.125% Senior Notes maturing in 2024, US$750 million of 5% Senior Notes maturing in 2026, a 2.65% private placement of EUR 200
million, repayable in instalments and maturing in 2024, and a 5.87% private placement of US$100 million, maturing in 2023. (ii) Secured and unsecured bank loans consist of fixed and floating rate loans, for which the weighted average effective interest rate (including arrangement fees) was
5.1% for the year ended 31 December 2020 and 6.7% for the year ended 31 December 2019. The Group economically hedges a portion of the loans for interest rate risk via an interest rate swap, exchanging variable rate interest for fixed rate interest. The fair value of Interest-bearing loans and borrowings for disclosure purposes is based on quoted prices in an active market for similar liabilities. These financial instruments are fair valued, based on Level 2 measurement.
(iii) Bank loans are secured by mortgages over certain of the Group’s assets (mainly inventories, qualifying receivables, shares of certain subsidiaries and other long-term assets). The total value of the pledged assets at 31 December 2020 was US$104.3 million (2019: US$156.3 million).
(iv) In June 2020 the Group entered into a US$390 million subordinated loan agreement maturing in January 2027 with Trafigura PE Holding Limited which was subsequently novated to Trafigura Pte Ltd. The loan bears an interest of 5.45% per annum and was used entirely to re-purchased ordinary shares held by Trafigura PE Holding Limited.
Loan maturity schedule in US$’000
2020 2019
Not later than one year 1,044,766 284,733
Later than one year and not later than five years 1,668,841 1,974,934 Later than five years 402,045 750,000 Total Interest-bearing loans and borrowings 3,115,652 3,009,667
In addition to the aforementioned debt facilities, the Group entered into a US$1.5 billion loan with Trafigura Pte Ltd. This loan was not drawn at 31 December 2020 and 2019, and consists of a US$500 million committed revolving credit facility and a US$1.0 billion uncommitted revolving credit facility. This loan is not secured and bears interest of 8.0% per annum (2019: 8.0% per annum). The loan will mature on September 2023.
24. Lease liabilities in US$’000 2020 2019
Lease liabilities – non-current (3rd parties) 451,542 452,532 Lease liabilities – non-current (related parties) 106,449 138,656 Lease liabilities – current (3rd parties) 57,675 50,578 Lease liabilities – current (related parties) 32,208 29,313 Total lease liabilities 647,874 671,079 Of which due to related parties (Note 28) 138,657 167,969
Current 89,883 79,890 Non-current 557,991 591,189 647,874 671,079 Lease liability maturity Within one year 89,883 79,890 After one year, but less than 5 years 285,000 311,366 More than 5 years 272,991 279,823 647,874 671,079
1 5 4
PUMA ENERGY ANNUAL REPORT 2020
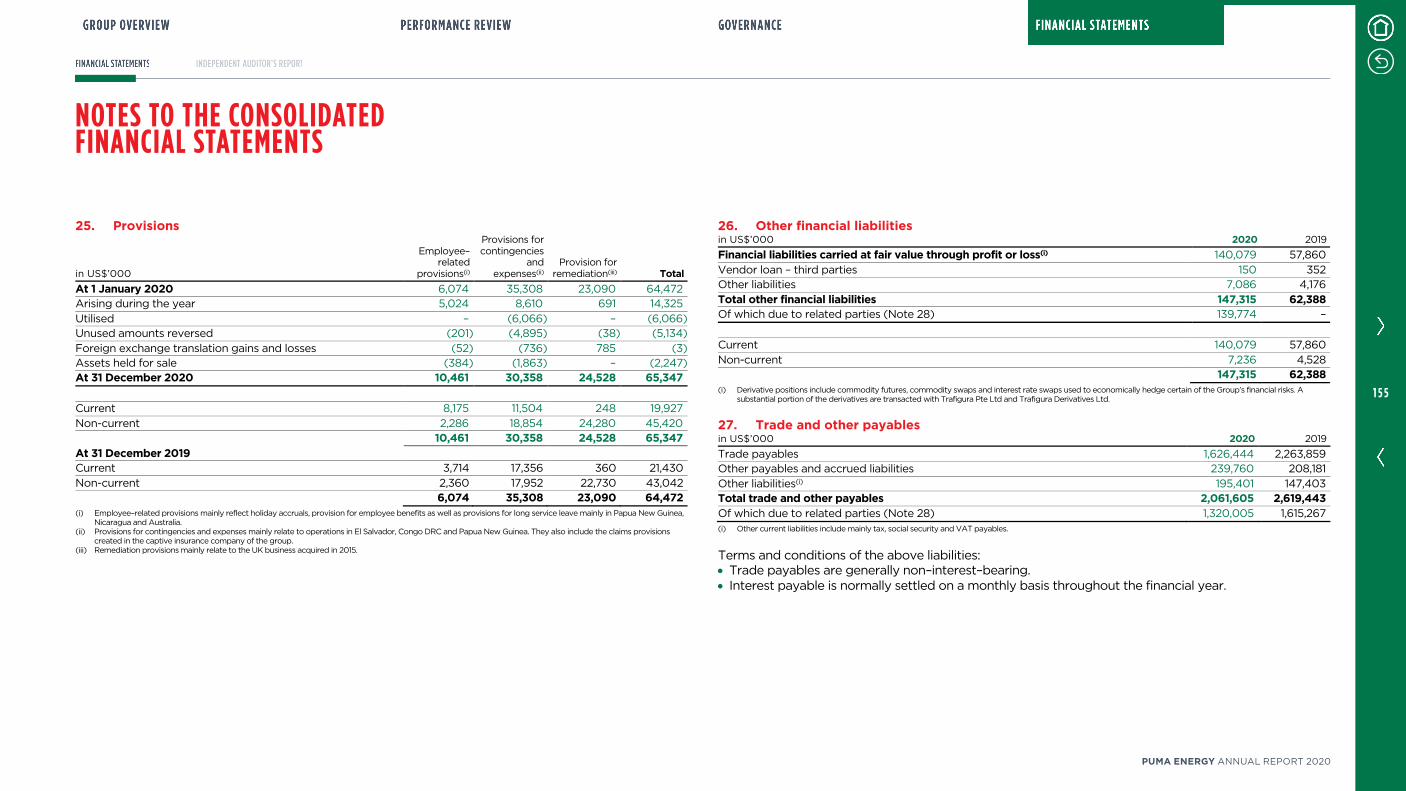
NOTES TO THE CONSOLIDATED FINANCIAL STATEMENTS
25. Provisions
in US$’000
Employee–related
provisions(i)
Provisions for contingencies
and expenses(ii)
Provision for remediation(iii) Total
At 1 January 2020 6,074 35,308 23,090 64,472 Arising during the year 5,024 8,610 691 14,325
Utilised – (6,066) – (6,066) Unused amounts reversed (201) (4,895) (38) (5,134)
Foreign exchange translation gains and losses (52) (736) 785 (3) Assets held for sale (384) (1,863) – (2,247) At 31 December 2020 10,461 30,358 24,528 65,347 Current 8,175 11,504 248 19,927
Non-current 2,286 18,854 24,280 45,420 10,461 30,358 24,528 65,347 At 31 December 2019 Current 3,714 17,356 360 21,430
Non-current 2,360 17,952 22,730 43,042 6,074 35,308 23,090 64,472 (i) Employee–related provisions mainly reflect holiday accruals, provision for employee benefits as well as provisions for long service leave mainly in Papua New Guinea,
Nicaragua and Australia. (ii) Provisions for contingencies and expenses mainly relate to operations in El Salvador, Congo DRC and Papua New Guinea. They also include the claims provisions
created in the captive insurance company of the group. (iii) Remediation provisions mainly relate to the UK business acquired in 2015.
26. Other financial liabilities in US$’000 2020 2019
Financial liabilities carried at fair value through profit or loss(i) 140,079 57,860
Vendor loan – third parties 150 352 Other liabilities 7,086 4,176
Total other financial liabilities 147,315 62,388 Of which due to related parties (Note 28) 139,774 –
Current 140,079 57,860
Non-current 7,236 4,528 147,315 62,388 (i) Derivative positions include commodity futures, commodity swaps and interest rate swaps used to economically hedge certain of the Group’s financial risks. A
substantial portion of the derivatives are transacted with Trafigura Pte Ltd and Trafigura Derivatives Ltd.
27. Trade and other payables in US$’000 2020 2019
Trade payables 1,626,444 2,263,859 Other payables and accrued liabilities 239,760 208,181
Other liabilities(i) 195,401 147,403 Total trade and other payables 2,061,605 2,619,443 Of which due to related parties (Note 28) 1,320,005 1,615,267 (i) Other current liabilities include mainly tax, social security and VAT payables.
Terms and conditions of the above liabilities: • Trade payables are generally non–interest–bearing. • Interest payable is normally settled on a monthly basis throughout the financial year.
1 5 5
PUMA ENERGY ANNUAL REPORT 2020
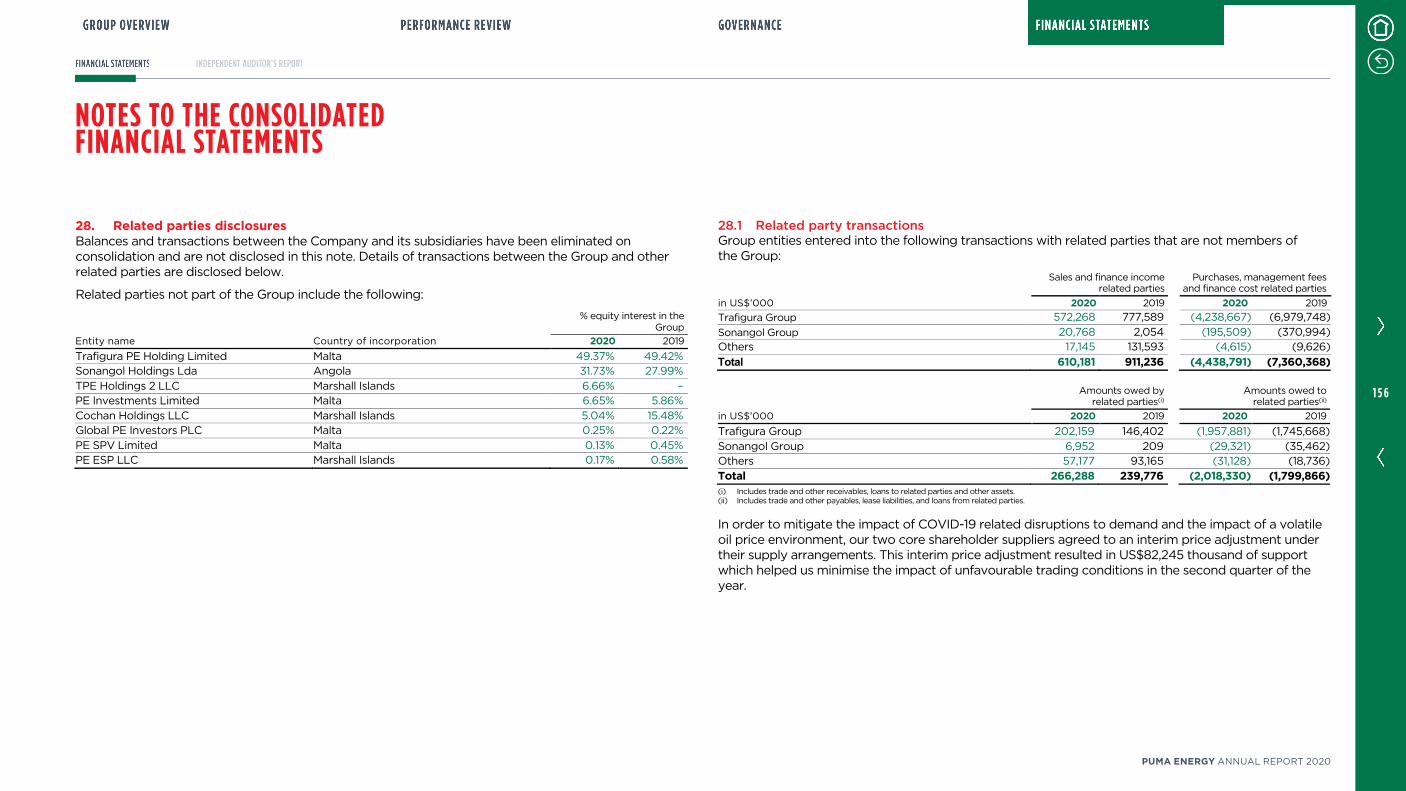
NOTES TO THE CONSOLIDATED FINANCIAL STATEMENTS
28. Related parties disclosures Balances and transactions between the Company and its subsidiaries have been eliminated on consolidation and are not disclosed in this note. Details of transactions between the Group and other related parties are disclosed below.
Related parties not part of the Group include the following:
% equity interest in the
Group
Entity name Country of incorporation 2020 2019
Trafigura PE Holding Limited Malta 49.37% 49.42% Sonangol Holdings Lda Angola 31.73% 27.99%
TPE Holdings 2 LLC Marshall Islands 6.66% – PE Investments Limited Malta 6.65% 5.86%
Cochan Holdings LLC Marshall Islands 5.04% 15.48% Global PE Investors PLC Malta 0.25% 0.22%
PE SPV Limited Malta 0.13% 0.45% PE ESP LLC Marshall Islands 0.17% 0.58%
28.1 Related party transactions Group entities entered into the following transactions with related parties that are not members of the Group:
Sales and finance income
related parties Purchases, management fees
and finance cost related parties
in US$’000 2020 2019 2020 2019
Trafigura Group 572,268 777,589 (4,238,667) (6,979,748)
Sonangol Group 20,768 2,054 (195,509) (370,994) Others 17,145 131,593 (4,615) (9,626)
Total 610,181 911,236 (4,438,791) (7,360,368)
Amounts owed by
related parties(i) Amounts owed to
related parties(ii)
in US$’000 2020 2019 2020 2019
Trafigura Group 202,159 146,402 (1,957,881) (1,745,668)
Sonangol Group 6,952 209 (29,321) (35,462) Others 57,177 93,165 (31,128) (18,736)
Total 266,288 239,776 (2,018,330) (1,799,866) (i) Includes trade and other receivables, loans to related parties and other assets. (ii) Includes trade and other payables, lease liabilities, and loans from related parties.
In order to mitigate the impact of COVID-19 related disruptions to demand and the impact of a volatile oil price environment, our two core shareholder suppliers agreed to an interim price adjustment under their supply arrangements. This interim price adjustment resulted in US$82,245 thousand of support which helped us minimise the impact of unfavourable trading conditions in the second quarter of the year.
1 5 6
PUMA ENERGY ANNUAL REPORT 2020
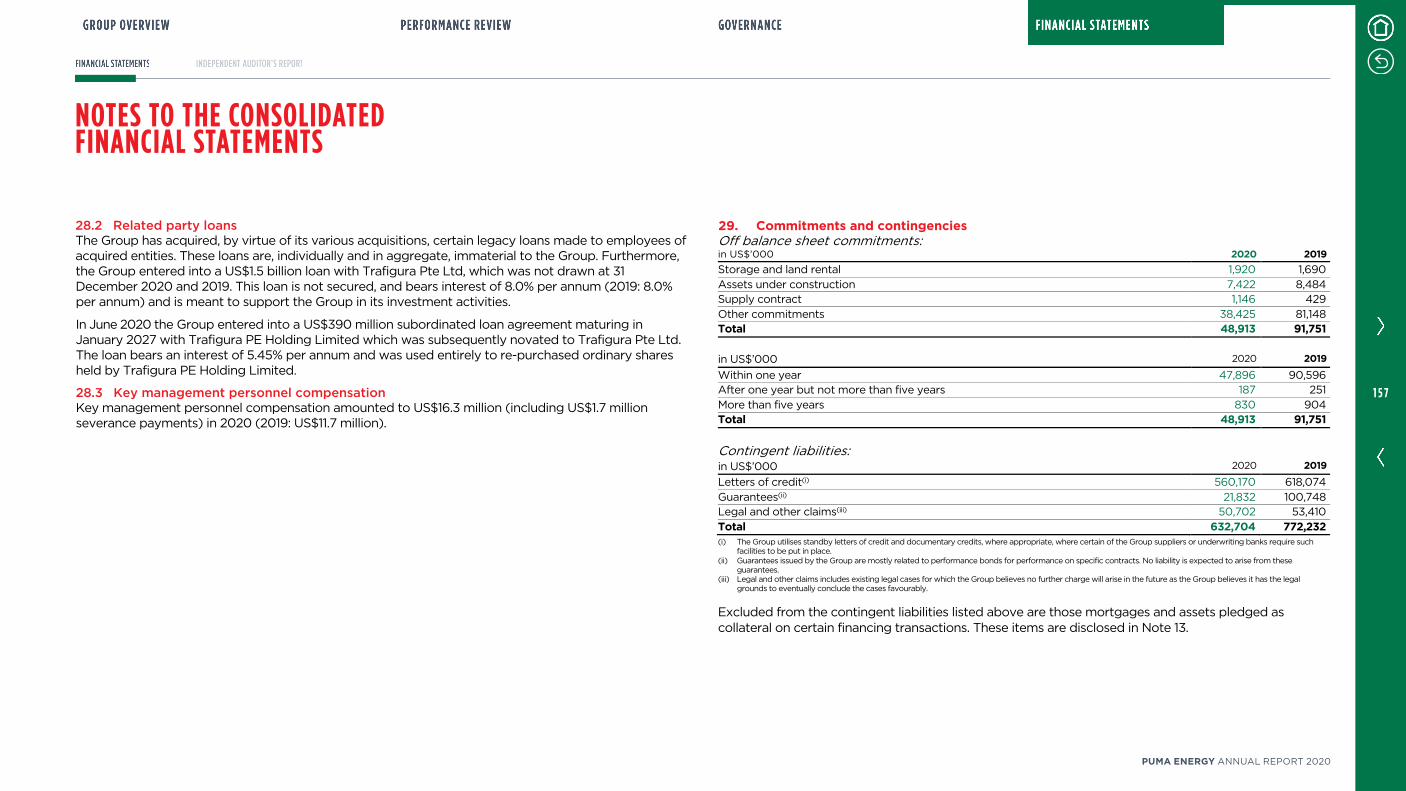
NOTES TO THE CONSOLIDATED FINANCIAL STATEMENTS
28.2 Related party loans The Group has acquired, by virtue of its various acquisitions, certain legacy loans made to employees of acquired entities. These loans are, individually and in aggregate, immaterial to the Group. Furthermore, the Group entered into a US$1.5 billion loan with Trafigura Pte Ltd, which was not drawn at 31 December 2020 and 2019. This loan is not secured, and bears interest of 8.0% per annum (2019: 8.0% per annum) and is meant to support the Group in its investment activities.
In June 2020 the Group entered into a US$390 million subordinated loan agreement maturing in January 2027 with Trafigura PE Holding Limited which was subsequently novated to Trafigura Pte Ltd. The loan bears an interest of 5.45% per annum and was used entirely to re-purchased ordinary shares held by Trafigura PE Holding Limited.
28.3 Key management personnel compensation Key management personnel compensation amounted to US$16.3 million (including US$1.7 million severance payments) in 2020 (2019: US$11.7 million).
29. Commitments and contingencies Off balance sheet commitments: in US$’000 2020 2019 Storage and land rental 1,920 1,690
Assets under construction 7,422 8,484 Supply contract 1,146 429
Other commitments 38,425 81,148 Total 48,913 91,751
in US$’000 2020 2019
Within one year 47,896 90,596 After one year but not more than five years 187 251
More than five years 830 904 Total 48,913 91,751
Contingent liabilities:
in US$’000 2020 2019
Letters of credit(i) 560,170 618,074
Guarantees(ii) 21,832 100,748 Legal and other claims(iii) 50,702 53,410
Total 632,704 772,232 (i) The Group utilises standby letters of credit and documentary credits, where appropriate, where certain of the Group suppliers or underwriting banks require such
facilities to be put in place. (ii) Guarantees issued by the Group are mostly related to performance bonds for performance on specific contracts. No liability is expected to arise from these
guarantees. (iii) Legal and other claims includes existing legal cases for which the Group believes no further charge will arise in the future as the Group believes it has the legal
grounds to eventually conclude the cases favourably.
Excluded from the contingent liabilities listed above are those mortgages and assets pledged as collateral on certain financing transactions. These items are disclosed in Note 13.
1 5 7
PUMA ENERGY ANNUAL REPORT 2020

NOTES TO THE CONSOLIDATED FINANCIAL STATEMENTS
30. Financial risk management objectives and policies The Group Executive Committee oversees the management of financial risks and reviews and agrees policies for managing these risks, which are defined in the Group Risk Management Framework. The Group Risk Management Framework is a comprehensive management tool utilised by the Group Executive Committee to assess potential risks facing the Group. With the support of the Group internal audit team, the Group Risk Management Framework provides a context through which the Group is able to continuously monitor external risks. The Group Risk Management Framework is reviewed on a quarterly basis by the Group Executive Committee.
The Group is primarily a Midstream and Downstream business with a strong risk management philosophy. The Group manages its exposure to key financial risks in accordance with the Group Risk Management Framework. The objective of the policy is to support the delivery of the Group’s financial targets while protecting future financial security. The main risks that could adversely affect the Group’s financial assets, liabilities or future cash flows are: market risks, comprising commodity price risk, cash flow interest rate risk and foreign currency risk; liquidity risk; and credit risk. As a rule, commodity price risk relating to the physical supply activities is systematically economically hedged, with the support of Trafigura Pte Ltd and Trafigura Derivatives Ltd. All derivative activities for risk management purposes are carried out by specialist teams that have the appropriate skills, experience and supervision.
It is the Group’s policy that no trading in derivatives for speculative purposes shall be undertaken as all derivative transactions are entered into for the purpose of managing the Group’s physical inventory exposure. At this stage, the Group does not currently apply any form of hedge accounting.
Furthermore, the Group, through the Group Risk Management Framework, has established conservative consolidated risk limits and closely monitors the Group’s risk positions to ensure that the Group’s risk exposure remains well within these limits.
30.1 Market risk The Group operates in various national markets where petroleum prices are predominantly regulated and, therefore, in many of its markets it has limited market risk in terms of price exposure. Furthermore, where the Group operates in unregulated markets, the Group is typically able to price its products so as to reflect increases or decreases in market prices on a timely basis and thereby substantially mitigate its price exposure. Despite the Group selling into markets where price exposure is largely mitigated, the Group does economically hedge its physical supply. The primary purpose of the economic hedging activities is to protect the Group against the risk of physical supply transactions being adversely affected by changes in commodity prices. The Group systematically enters into economic hedging contracts to cover price exposures in its physical supply activities. In particular, substantially all supply stock is at all times either pre–sold or the commodity index price risk is economically hedged. By virtue of the nature of the markets in which the Group operates and given the economic hedging conducted in the Group’s supply activities as per the Group Risk Management Framework, the Group faces limited market risk.
The following table provides an overview of the derivative contracts at the year–end. All commodity derivatives had maturities of less than one year at each year–end.
Fair value of derivatives
in US$’000 2020 2019
Commodity futures and swaps (682) (37,372) Currency swaps (8,102) (2,295)
Total (8,784) (39,667)
Currency risk The Group has exposures to foreign currency risk on its activities, and movements in currency exchange rates may have a material negative effect on our financial condition and result of operations. The Group reduces its exposure to changes in foreign currency exchange rates by borrowing in local currencies and entering into currency hedges.
The Group does not use financial instruments to hedge the translation risk related to equity and earnings of foreign subsidiaries and non–consolidated companies. Refer to the consolidated statement of changes in equity to see the impact of changes in foreign currencies on the Group’s equity.
1 5 8
PUMA ENERGY ANNUAL REPORT 2020
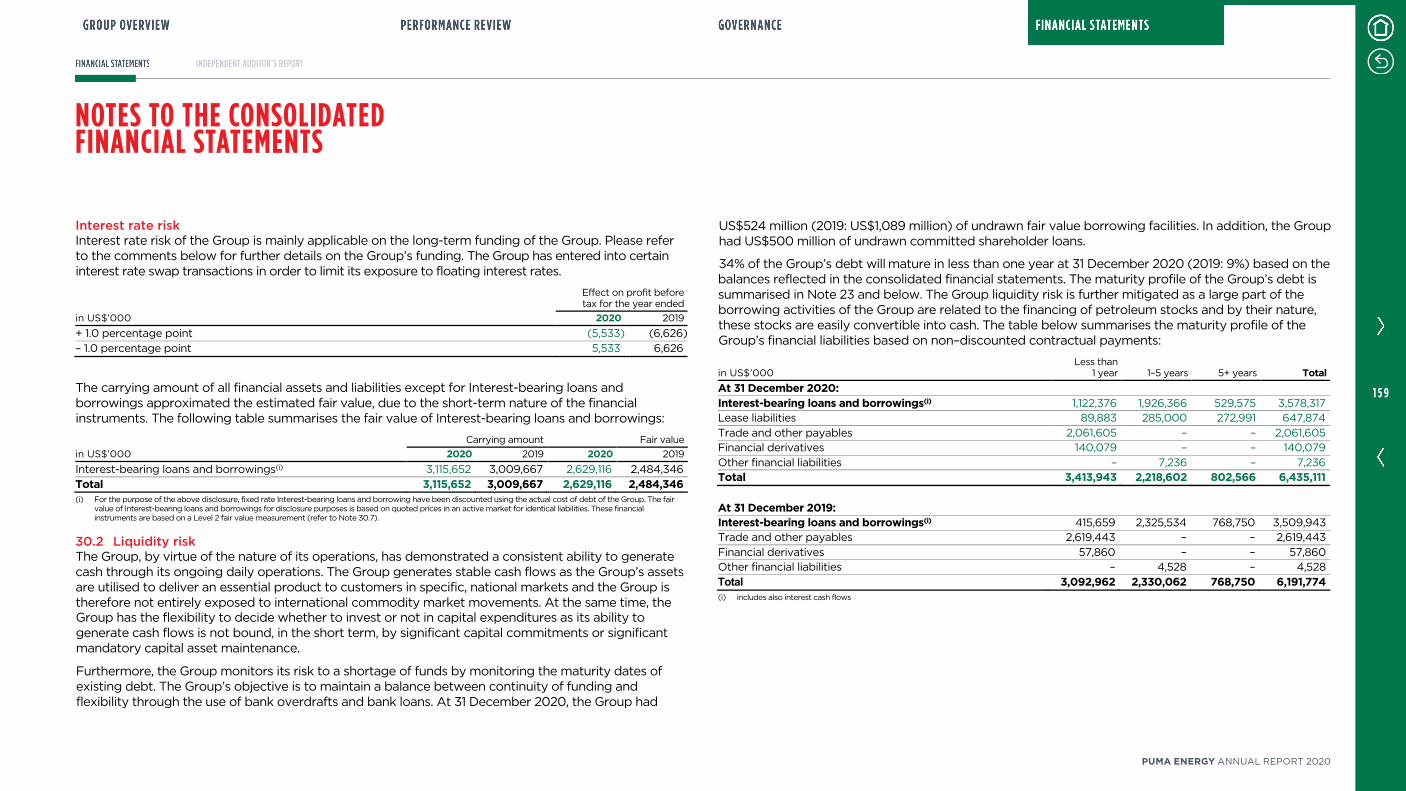
NOTES TO THE CONSOLIDATED FINANCIAL STATEMENTS
Interest rate risk Interest rate risk of the Group is mainly applicable on the long-term funding of the Group. Please refer to the comments below for further details on the Group’s funding. The Group has entered into certain interest rate swap transactions in order to limit its exposure to floating interest rates.
Effect on profit before tax for the year ended
in US$’000 2020 2019
+ 1.0 percentage point (5,533) (6,626)
– 1.0 percentage point 5,533 6,626
The carrying amount of all financial assets and liabilities except for Interest-bearing loans and borrowings approximated the estimated fair value, due to the short-term nature of the financial instruments. The following table summarises the fair value of Interest-bearing loans and borrowings:
Carrying amount Fair value
in US$’000 2020 2019 2020 2019
Interest-bearing loans and borrowings(i) 3,115,652 3,009,667 2,629,116 2,484,346
Total 3,115,652 3,009,667 2,629,116 2,484,346 (i) For the purpose of the above disclosure, fixed rate Interest-bearing loans and borrowing have been discounted using the actual cost of debt of the Group. The fair
value of Interest-bearing loans and borrowings for disclosure purposes is based on quoted prices in an active market for identical liabilities. These financial instruments are based on a Level 2 fair value measurement (refer to Note 30.7).
30.2 Liquidity risk The Group, by virtue of the nature of its operations, has demonstrated a consistent ability to generate cash through its ongoing daily operations. The Group generates stable cash flows as the Group’s assets are utilised to deliver an essential product to customers in specific, national markets and the Group is therefore not entirely exposed to international commodity market movements. At the same time, the Group has the flexibility to decide whether to invest or not in capital expenditures as its ability to generate cash flows is not bound, in the short term, by significant capital commitments or significant mandatory capital asset maintenance.
Furthermore, the Group monitors its risk to a shortage of funds by monitoring the maturity dates of existing debt. The Group’s objective is to maintain a balance between continuity of funding and flexibility through the use of bank overdrafts and bank loans. At 31 December 2020, the Group had
US$524 million (2019: US$1,089 million) of undrawn fair value borrowing facilities. In addition, the Group had US$500 million of undrawn committed shareholder loans.
34% of the Group’s debt will mature in less than one year at 31 December 2020 (2019: 9%) based on the balances reflected in the consolidated financial statements. The maturity profile of the Group’s debt is summarised in Note 23 and below. The Group liquidity risk is further mitigated as a large part of the borrowing activities of the Group are related to the financing of petroleum stocks and by their nature, these stocks are easily convertible into cash. The table below summarises the maturity profile of the Group’s financial liabilities based on non–discounted contractual payments:
in US$’000 Less than
1 year 1–5 years 5+ years Total At 31 December 2020:
Interest-bearing loans and borrowings(i) 1,122,376 1,926,366 529,575 3,578,317 Lease liabilities 89,883 285,000 272,991 647,874
Trade and other payables 2,061,605 – – 2,061,605 Financial derivatives 140,079 – – 140,079
Other financial liabilities – 7,236 – 7,236 Total 3,413,943 2,218,602 802,566 6,435,111 At 31 December 2019: Interest-bearing loans and borrowings(i) 415,659 2,325,534 768,750 3,509,943 Trade and other payables 2,619,443 – – 2,619,443
Financial derivatives 57,860 – – 57,860 Other financial liabilities – 4,528 – 4,528
Total 3,092,962 2,330,062 768,750 6,191,774 (i) includes also interest cash flows
1 5 9
PUMA ENERGY ANNUAL REPORT 2020
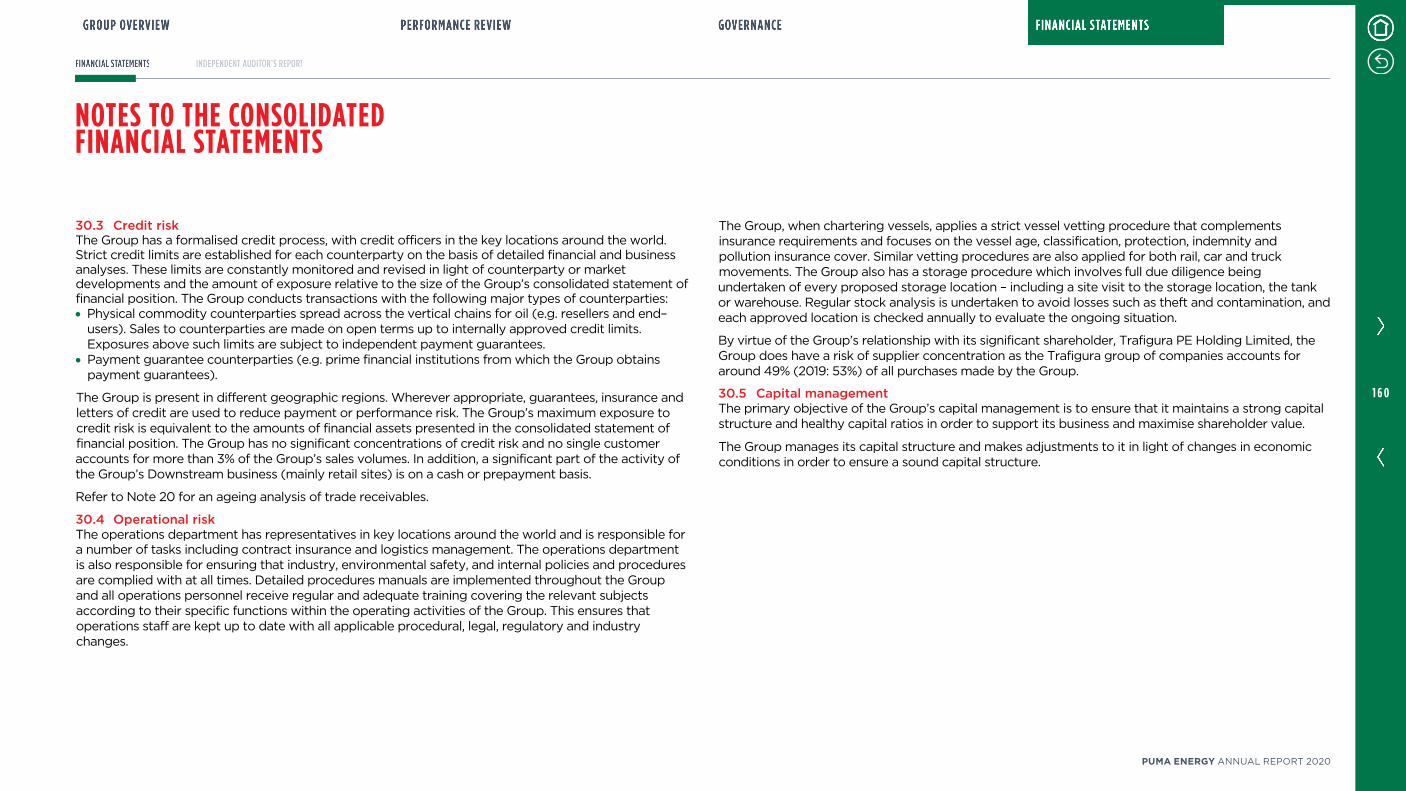
NOTES TO THE CONSOLIDATED FINANCIAL STATEMENTS
30.3 Credit risk The Group has a formalised credit process, with credit officers in the key locations around the world. Strict credit limits are established for each counterparty on the basis of detailed financial and business analyses. These limits are constantly monitored and revised in light of counterparty or market developments and the amount of exposure relative to the size of the Group’s consolidated statement of financial position. The Group conducts transactions with the following major types of counterparties: • Physical commodity counterparties spread across the vertical chains for oil (e.g. resellers and end–
users). Sales to counterparties are made on open terms up to internally approved credit limits. Exposures above such limits are subject to independent payment guarantees.
• Payment guarantee counterparties (e.g. prime financial institutions from which the Group obtains payment guarantees).
The Group is present in different geographic regions. Wherever appropriate, guarantees, insurance and letters of credit are used to reduce payment or performance risk. The Group’s maximum exposure to credit risk is equivalent to the amounts of financial assets presented in the consolidated statement of financial position. The Group has no significant concentrations of credit risk and no single customer accounts for more than 3% of the Group’s sales volumes. In addition, a significant part of the activity of the Group’s Downstream business (mainly retail sites) is on a cash or prepayment basis.
Refer to Note 20 for an ageing analysis of trade receivables.
30.4 Operational risk The operations department has representatives in key locations around the world and is responsible for a number of tasks including contract insurance and logistics management. The operations department is also responsible for ensuring that industry, environmental safety, and internal policies and procedures are complied with at all times. Detailed procedures manuals are implemented throughout the Group and all operations personnel receive regular and adequate training covering the relevant subjects according to their specific functions within the operating activities of the Group. This ensures that operations staff are kept up to date with all applicable procedural, legal, regulatory and industry changes.
The Group, when chartering vessels, applies a strict vessel vetting procedure that complements insurance requirements and focuses on the vessel age, classification, protection, indemnity and pollution insurance cover. Similar vetting procedures are also applied for both rail, car and truck movements. The Group also has a storage procedure which involves full due diligence being undertaken of every proposed storage location – including a site visit to the storage location, the tank or warehouse. Regular stock analysis is undertaken to avoid losses such as theft and contamination, and each approved location is checked annually to evaluate the ongoing situation.
By virtue of the Group’s relationship with its significant shareholder, Trafigura PE Holding Limited, the Group does have a risk of supplier concentration as the Trafigura group of companies accounts for around 49% (2019: 53%) of all purchases made by the Group.
30.5 Capital management The primary objective of the Group’s capital management is to ensure that it maintains a strong capital structure and healthy capital ratios in order to support its business and maximise shareholder value.
The Group manages its capital structure and makes adjustments to it in light of changes in economic conditions in order to ensure a sound capital structure.
1 6 0
PUMA ENERGY ANNUAL REPORT 2020

NOTES TO THE CONSOLIDATED FINANCIAL STATEMENTS
30.6 Changes in liabilities arising from financing activities
in US$’000 Financial
debt(i) Lease
liabilities Finance
leases Vendor
loans Dividends Total At 1 January 2019 3,284,857 478 30,469 – 3,315,804 Cash flows (500,726) (329) (29,281) (5,998) (536,334)
Non-cash movement (558) – – – (558) Acquisitions/Disposals (1,035) – – – (1,035)
Interest expense 237,749 – – – 237,749 Dividends declared during the year – – – 5,998 5,998
New leases – 3 – – 3 FX movements (10,551) (11) (836) – (11,398) Reclassification – (89) – (89)
Less: discontinued operations (69) – – – (69) At 31 December 2019 3,009,667 671,080 52 352 – 3,681,151 Cash flows (475,193) (132,234) (13) (202) (21,003) (628,645) Interest expense 198,422 198,422
Shareholder loan 390,000 390,000 Dividends declared during the year 21,003 21,003
New leases/increase 181,900 2 181,902 Lease reassament (70,851) – – – (70,851)
FX movements 13,744 1,806 (16) 15,534 Less: debt associated to assets held for sale (20,988) (3,827) (24,815) At 31 December 2020 3,115,652 647,874 25 150 – 3,763,701 (i) For the purpose of the above disclosure, current and non-current Interest-bearing loans and borrowings have been grouped together. At 31 December 2020 the balance sheet of the group discloses also US$647.9 million of lease liabilities (2019: US$671.1 million).
30.7 Fair value hierarchy The Group uses the following hierarchy for determining and disclosing the fair value of financial instruments, which are measured at fair value by valuation technique: • Level 1: Quoted (unadjusted) prices in active markets for identical assets or liabilities. • Level 2: Other techniques for which all inputs which have a significant effect on the recorded fair
value are observable, either directly or indirectly. • Level 3: Techniques that use inputs that have a significant effect on the recorded fair value that are
not based on observable market data.
All financial assets and liabilities, and inventories measured at fair value, at 31 December 2020 and 2019, fall under the Level 2 category described above, and include financial derivatives for a net amount of US$(8.8) million (2019: US$(39.7) million) and inventories for US$427.7 million (2019: US$468.5 million). There have been no transfers between fair value levels during any of the reporting periods.
31. Events after the reporting period PE ESP share repurchase On 14 January 2021, the Company repurchased 162,218 ordinary shares held by PE ESP LLC for a consideration of USD 4,682,165. All repurchased shares were immediately cancelled. PE ESP LLC no longer holds any shares of the Company.
Myanmar minority repurchase On 5 February 2021, Puma Energy Irrawaddy Pte Ltd purchased the 20% minority share in Puma Energy Asia Sun Co Ltd from Asia Sun Energy Co Ltd. There was now change of control and from the buyback Puma Energy Irrawaddy Pte Ltd owns 100% of the Puma Energy Asia Sun Co Ltd.
Myanmar operations On 1 February 2021, a military coup occurred in the Union of the Republic of Myanmar, due to the evolution of the situation, it was decided on 10 February 2021 to suspend operations to protect the safety and security of employees and partners with immediate effect until a time that it is safe for our staff to resume operations. Our shareholders and partners have been informed. We will continue to closely monitor and assess the situation. The financial impact of this event cannot be estimated at this point in time.
Rights issue The Company shareholders have been in active dialogue with the Puma Energy Board regarding various options to strengthen the Company’s capital structure. In that context, an Extraordinary General Meeting held on Thursday 18 February 2021 gave authority to the Company’s Directors to issue new shares in the Company, and the Company envisages a rights issue of up to US$1.1bn to conclude by mid-April 2021.
1 6 1
PUMA ENERGY ANNUAL REPORT 2020
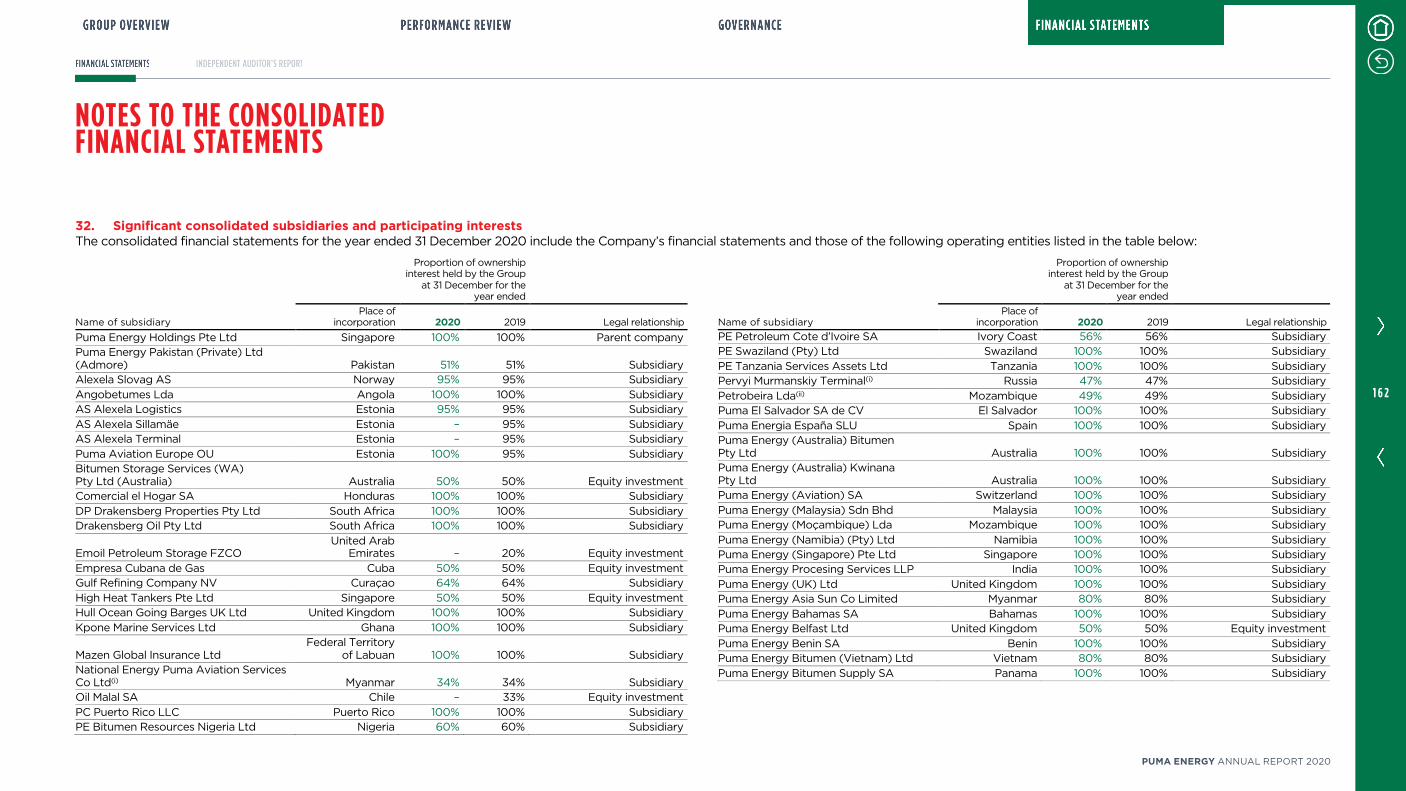
NOTES TO THE CONSOLIDATED FINANCIAL STATEMENTS
32. Significant consolidated subsidiaries and participating interests The consolidated financial statements for the year ended 31 December 2020 include the Company’s financial statements and those of the following operating entities listed in the table below:
Proportion of ownership interest held by the Group
at 31 December for the year ended
Name of subsidiary Place of
incorporation 2020 2019 Legal relationship
Puma Energy Holdings Pte Ltd Singapore 100% 100% Parent company Puma Energy Pakistan (Private) Ltd (Admore) Pakistan 51% 51% Subsidiary Alexela Slovag AS Norway 95% 95% Subsidiary
Angobetumes Lda Angola 100% 100% Subsidiary AS Alexela Logistics Estonia 95% 95% Subsidiary
AS Alexela Sillamäe Estonia – 95% Subsidiary AS Alexela Terminal Estonia – 95% Subsidiary
Puma Aviation Europe OU Estonia 100% 95% Subsidiary Bitumen Storage Services (WA) Pty Ltd (Australia) Australia 50% 50% Equity investment Comercial el Hogar SA Honduras 100% 100% Subsidiary
DP Drakensberg Properties Pty Ltd South Africa 100% 100% Subsidiary Drakensberg Oil Pty Ltd South Africa 100% 100% Subsidiary
Emoil Petroleum Storage FZCO United Arab
Emirates – 20% Equity investment
Empresa Cubana de Gas Cuba 50% 50% Equity investment Gulf Refining Company NV Curaçao 64% 64% Subsidiary
High Heat Tankers Pte Ltd Singapore 50% 50% Equity investment Hull Ocean Going Barges UK Ltd United Kingdom 100% 100% Subsidiary
Kpone Marine Services Ltd Ghana 100% 100% Subsidiary
Mazen Global Insurance Ltd Federal Territory
of Labuan 100% 100% Subsidiary National Energy Puma Aviation Services Co Ltd(i) Myanmar 34% 34% Subsidiary Oil Malal SA Chile – 33% Equity investment
PC Puerto Rico LLC Puerto Rico 100% 100% Subsidiary PE Bitumen Resources Nigeria Ltd Nigeria 60% 60% Subsidiary
Proportion of ownership interest held by the Group
at 31 December for the year ended
Name of subsidiary Place of
incorporation 2020 2019 Legal relationship
PE Petroleum Cote d’Ivoire SA Ivory Coast 56% 56% Subsidiary PE Swaziland (Pty) Ltd Swaziland 100% 100% Subsidiary
PE Tanzania Services Assets Ltd Tanzania 100% 100% Subsidiary Pervyi Murmanskiy Terminal(i) Russia 47% 47% Subsidiary
Petrobeira Lda(ii) Mozambique 49% 49% Subsidiary Puma El Salvador SA de CV El Salvador 100% 100% Subsidiary
Puma Energia España SLU Spain 100% 100% Subsidiary Puma Energy (Australia) Bitumen Pty Ltd Australia 100% 100% Subsidiary Puma Energy (Australia) Kwinana Pty Ltd Australia 100% 100% Subsidiary Puma Energy (Aviation) SA Switzerland 100% 100% Subsidiary
Puma Energy (Malaysia) Sdn Bhd Malaysia 100% 100% Subsidiary Puma Energy (Moçambique) Lda Mozambique 100% 100% Subsidiary
Puma Energy (Namibia) (Pty) Ltd Namibia 100% 100% Subsidiary Puma Energy (Singapore) Pte Ltd Singapore 100% 100% Subsidiary Puma Energy Procesing Services LLP India 100% 100% Subsidiary
Puma Energy (UK) Ltd United Kingdom 100% 100% Subsidiary Puma Energy Asia Sun Co Limited Myanmar 80% 80% Subsidiary
Puma Energy Bahamas SA Bahamas 100% 100% Subsidiary Puma Energy Belfast Ltd United Kingdom 50% 50% Equity investment
Puma Energy Benin SA Benin 100% 100% Subsidiary Puma Energy Bitumen (Vietnam) Ltd Vietnam 80% 80% Subsidiary
Puma Energy Bitumen Supply SA Panama 100% 100% Subsidiary
1 6 2
PUMA ENERGY ANNUAL REPORT 2020
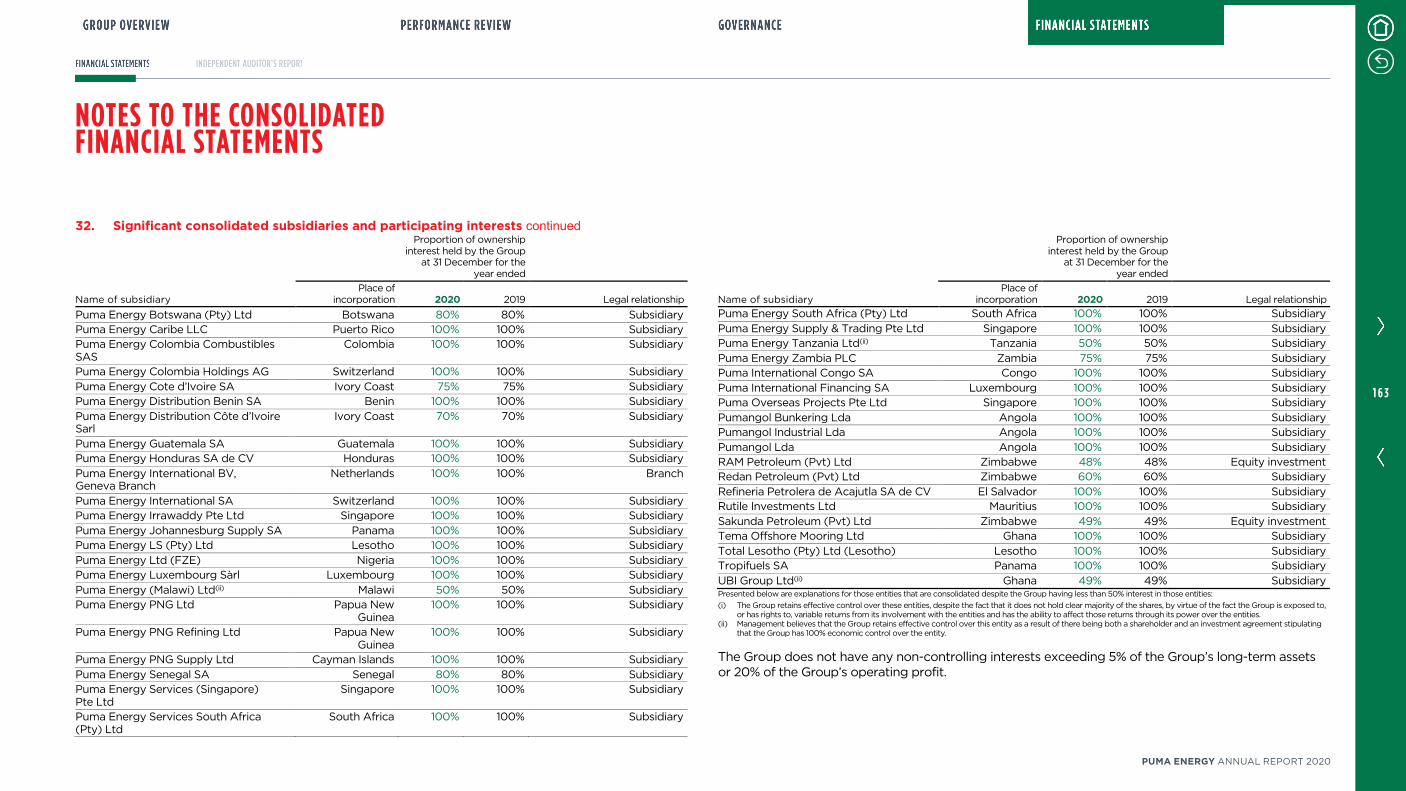
NOTES TO THE CONSOLIDATED FINANCIAL STATEMENTS
32. Significant consolidated subsidiaries and participating interests continued Proportion of ownership
interest held by the Group at 31 December for the
year ended
Name of subsidiary Place of
incorporation 2020 2019 Legal relationship
Puma Energy Botswana (Pty) Ltd Botswana 80% 80% Subsidiary Puma Energy Caribe LLC Puerto Rico 100% 100% Subsidiary Puma Energy Colombia Combustibles SAS
Colombia 100% 100% Subsidiary
Puma Energy Colombia Holdings AG Switzerland 100% 100% Subsidiary
Puma Energy Cote d’Ivoire SA Ivory Coast 75% 75% Subsidiary Puma Energy Distribution Benin SA Benin 100% 100% Subsidiary
Puma Energy Distribution Côte d’Ivoire Sarl
Ivory Coast 70% 70% Subsidiary
Puma Energy Guatemala SA Guatemala 100% 100% Subsidiary Puma Energy Honduras SA de CV Honduras 100% 100% Subsidiary
Puma Energy International BV, Geneva Branch
Netherlands 100% 100% Branch
Puma Energy International SA Switzerland 100% 100% Subsidiary Puma Energy Irrawaddy Pte Ltd Singapore 100% 100% Subsidiary
Puma Energy Johannesburg Supply SA Panama 100% 100% Subsidiary Puma Energy LS (Pty) Ltd Lesotho 100% 100% Subsidiary
Puma Energy Ltd (FZE) Nigeria 100% 100% Subsidiary Puma Energy Luxembourg Sàrl Luxembourg 100% 100% Subsidiary
Puma Energy (Malawi) Ltd(ii) Malawi 50% 50% Subsidiary Puma Energy PNG Ltd Papua New
Guinea 100% 100% Subsidiary
Puma Energy PNG Refining Ltd Papua New Guinea
100% 100% Subsidiary
Puma Energy PNG Supply Ltd Cayman Islands 100% 100% Subsidiary
Puma Energy Senegal SA Senegal 80% 80% Subsidiary Puma Energy Services (Singapore) Pte Ltd
Singapore 100% 100% Subsidiary
Puma Energy Services South Africa (Pty) Ltd
South Africa 100% 100% Subsidiary
Proportion of ownership interest held by the Group
at 31 December for the year ended
Name of subsidiary Place of
incorporation 2020 2019 Legal relationship
Puma Energy South Africa (Pty) Ltd South Africa 100% 100% Subsidiary
Puma Energy Supply & Trading Pte Ltd Singapore 100% 100% Subsidiary Puma Energy Tanzania Ltd(ii) Tanzania 50% 50% Subsidiary
Puma Energy Zambia PLC Zambia 75% 75% Subsidiary Puma International Congo SA Congo 100% 100% Subsidiary
Puma International Financing SA Luxembourg 100% 100% Subsidiary Puma Overseas Projects Pte Ltd Singapore 100% 100% Subsidiary
Pumangol Bunkering Lda Angola 100% 100% Subsidiary Pumangol Industrial Lda Angola 100% 100% Subsidiary
Pumangol Lda Angola 100% 100% Subsidiary RAM Petroleum (Pvt) Ltd Zimbabwe 48% 48% Equity investment Redan Petroleum (Pvt) Ltd Zimbabwe 60% 60% Subsidiary
Refineria Petrolera de Acajutla SA de CV El Salvador 100% 100% Subsidiary Rutile Investments Ltd Mauritius 100% 100% Subsidiary
Sakunda Petroleum (Pvt) Ltd Zimbabwe 49% 49% Equity investment Tema Offshore Mooring Ltd Ghana 100% 100% Subsidiary
Total Lesotho (Pty) Ltd (Lesotho) Lesotho 100% 100% Subsidiary Tropifuels SA Panama 100% 100% Subsidiary
UBI Group Ltd(ii) Ghana 49% 49% Subsidiary Presented below are explanations for those entities that are consolidated despite the Group having less than 50% interest in those entities:
(i) The Group retains effective control over these entities, despite the fact that it does not hold clear majority of the shares, by virtue of the fact the Group is exposed to, or has rights to, variable returns from its involvement with the entities and has the ability to affect those returns through its power over the entities.
(ii) Management believes that the Group retains effective control over this entity as a result of there being both a shareholder and an investment agreement stipulating that the Group has 100% economic control over the entity.
The Group does not have any non-controlling interests exceeding 5% of the Group’s long-term assets or 20% of the Group’s operating profit.
1 6 3
PUMA ENERGY ANNUAL REPORT 2020
INDEPENDENT AUDITOR’S REPORT
OpinionWe have audited the consolidated financial statements of Puma Energy Holdings Pte Ltd and its subsidiaries (the ‘Group’), which comprise the consolidated statement of financial position at 31 December 2020 and the consolidated statement of income, the consolidated statement of comprehensive income, the consolidated statement of changes in equity, and the consolidated statement of cash flows for the year then ended, and notes to the consolidated financial statements, including a summary of significant accounting policies
In our opinion the accompanying consolidated financial statements give a true and fair view of the consolidated financial position of the Group at 31 December 2020, and its consolidated financial performance and its cash flows for the year then ended in accordance with International Financial Reporting Standards (‘IFRS’)
Basis for opinionWe conducted our audit in accordance with International Standards on Auditing (‘ISA’) Our responsibilities under those provisions and standards are further described in the Auditor’s responsibilities for the audit of the consolidated financial statements section of our report
We are independent of the Group in accordance with the International Ethics Standards Board for Accountants’ Code of Ethics for Professional Accountants (‘IESBA Code’) and we have fulfilled our ethical responsibilities in accordance with the IESBA Code
We believe that the audit evidence we have obtained is sufficient and appropriate to provide a basis for our opinion
Key audit mattersKey audit matters are those matters that, in our professional judgment, were of most significance in our audit of the consolidated financial statements of the current period These matters were addressed in the context of our audit of the consolidated financial statements as a whole, and in forming our opinion thereon, and we do not provide a separate opinion on these matters For each matter below, our description of how our audit addressed the matter is provided in that context
We have fulfilled the responsibilities described in the Auditor’s responsibilities for the audit of the consolidated financial statements section of our report, including in relation to these matters Accordingly, our audit included the performance of procedures designed to respond to our assessment of the risks of material misstatement of the consolidated financial statements The results of our audit procedures, including the procedures performed to address the matters below, provide the basis for our audit opinion on the accompanying consolidated financial statements
Valuation of property and equipment, intangible assets and goodwillRiskAt 31 December 2020, the Group’s balance sheet includes property and equipment amounting to
US$2,037m, intangible assets amounting to US$219m and goodwill amounting to US$327m The assessment of the recoverable value of these assets for property and equipment and intangible assets, or of the relevant cash-generating unit for goodwill, incorporates significant judgement in respect of factors such as gross profits, discount rates, petroleum product prices, market shares and growth rates which are affected by expected future market or economic conditions in many different countries
The Group’s disclosures about property and equipment, intangible assets and goodwill, are included in Notes 13, 14 and 16 of the consolidated financial statements
Our audit responseWe performed the following procedures:• We reviewed the Group’s calculation of value in use or fair value less costs of disposal
• We involved our valuation specialists to evaluate methodologies and key assumptions, such as cash flow forecasts included in the impairment assessment for each cash generating unit or asset tested on a stand-alone basis, and discount rate assumptions
• We assessed whether the Group’s disclosures about the sensitivity of the outcome of the impairment assessment to changes in key assumptions reflected the risks inherent in the valuation
Our audit procedures did not lead to any material reservations regarding the impairment testing
Report of the independent auditor with consolidated financial statements at 31 December 2020 of Puma Energy Holdings Pte Ltd4 March 2021
1 6 4
PUMA ENERGY ANNUAL REPORT 2020
Recoverability of deferred tax assetsRiskAt 31 December 2020, the Group had deferred tax assets on deductible temporary differences of US$72 million (2019: US$98 million), which were recognized and relate to tax losses carried forward In addition, the Group had unrecognised tax loss carry forwards amounting to US$ 544 million excluding the impact of Australia discontinued operations (2019: US$517 million) The analysis of the recognition and recoverability of the deferred tax assets was significant to our audit because the amounts are material, the assessment process is complex and judgemental and is based on assumptions that are affected by expected future market or economic conditions
The Group’s disclosures about deferred tax assets are included in Note 11 of the consolidated financial statements
Our audit responseWe performed the following procedures:• We evaluated the Group’s process for the identification and evaluation of uncertain tax positions and other tax risks as well as for the assessment of the recoverability of deferred tax assets
• We also considered the Group’s process for the recording and continuous re-assessment of the related (contingent) liabilities and provisions as well as deferred taxes
• We reviewed tax exposures estimated by management and the risk analysis associated
with these exposures along with claims or assessments made by tax authorities to date
• We analysed the tax risk provision and the related business tax risks
• We reviewed documentation of tax audits and considered whether exposures raised by the tax authorities have been considered
• We analysed these with involvement of our internal tax experts, and assessed the tax risk provision
• We tested the calculation of deferred tax assets and liabilities and analysed the management estimates relating to the recoverability of deferred tax assets
• We analysed the offsetting and presentation of deferred tax positions
Our audit procedures did not lead to any material reservations regarding the recoverability of deferred tax assets
Cash Flow forecastRiskThe Group has prepared its cash flow forecasts considering various assumptions These assumptions were made taking into consideration the ongoing discussions with the Group’s shareholders to contribute towards the share capital increase to be paid in April 2021 as approved by the shareholders meeting of 18 February 2021; and the current negotiations with the Group’s major lending banks to extend the existing credit lines due to expire in May 2021 As disclosed in note 22 to these financial
statements, management expects that the shareholders will contribute up to US$ 1,100 million towards the share capital increase and that the revolving credit facility will be renewed
Our audit responseWe performed the following procedures:• We obtained evidence supporting the capital increase approved by the Shareholders on 18 February and due in April 2021, including documents indicating the willingness of the majority of the current shareholders to subscribe and/or underwrite this capital increase
• We enquired of management and obtained evidence and written representation as to the status of the renegotiations and likelihood of the extension of the revolving credit facility
• We reviewed the Group’s cash flow forecasts through to March 2022, including the above items
• We evaluated the assumption applied by management for preparing its liquidity forecast We did this evaluation with reference to budgets and the underlying substantiations
• We assessed the adequacy of the disclosures related to the going concern assumption in the notes to the financial statements
Our audit procedures did not lead to any material reservations regarding cash flow forecast and related disclosures
Other information in the annual reportManagement is responsible for the other information in the annual report The other information comprises all information included in the annual report, but does not include the consolidated financial statements and our auditor’s reports thereon Our opinion on the consolidated financial statements does not cover the other information in the annual report and we do not express any form of assurance conclusion thereon
In connection with our audit of the consolidated financial statements, our responsibility is to read the other information in the annual report and, in doing so, consider whether the other information is materially inconsistent with the consolidated financial statements or our knowledge obtained in the audit, or otherwise appears to be materially misstated If, based on the work we have performed, we conclude that there is a material misstatement of this other information, we are required to report that fact We have nothing to report in this regard
Responsibility of management for the consolidated financial statementsManagement is responsible for the preparation of the consolidated financial statements that give a true and fair view in accordance with IFRS, and for such internal control as management determines is necessary to enable the preparation of consolidated financial statements that are free from material misstatement, whether due to fraud or error
INDEPENDENT AUDITOR’S REPORT
1 6 5
PUMA ENERGY ANNUAL REPORT 2020
In preparing the consolidated financial statements, management is responsible for assessing the Group’s ability to continue as a going concern, disclosing, as applicable, matters related to going concern and using the going concern basis of accounting unless management either intends to liquidate the Group or to cease operations, or has no realistic alternative but to do so. Management is responsible for overseeing the Group’s financial reporting process.
Auditor’s responsibilities for the audit of the consolidated financial statementsOur objectives are to obtain reasonable assurance about whether the consolidated financial statements as a whole are free from material misstatement, whether due to fraud or error, and to issue an auditor’s report that includes our opinion. Reasonable assurance is a high level of assurance, but is not a guarantee that an audit conducted in accordance with ISA will always detect a material misstatement when it exists. Misstatements can arise from fraud or error and are considered material if, individually or in the aggregate, they could reasonably be expected to influence the economic decisions of users taken on the basis of these consolidated financial statements. As part of an audit in accordance with ISA, we exercise professional judgment and maintain professional scepticism throughout the audit. We also:• Identify and assess the risks of material misstatement of the consolidated financial statements, whether due to fraud or error,
design and perform audit procedures responsive to those risks, and obtain audit evidence that is sufficient and appropriate to provide a basis for our opinion. The risk of not detecting a material misstatement resulting from fraud is higher than for one resulting from error, as fraud may involve collusion, forgery, intentional omissions, misrepresentations, or the override of internal control.
• Obtain an understanding of internal control relevant to the audit in order to design audit procedures that are appropriate in the circumstances, but not for the purpose of expressing an opinion on the effectiveness of the Group’s internal control.
• Evaluate the appropriateness of accounting policies used and the reasonableness of accounting estimates and related disclosures made by management
• Conclude on the appropriateness of management’s use of the going concern basis of accounting and, based on the audit evidence obtained, whether a material uncertainty exists related to events or conditions that may cast significant doubt on the Group’s ability to continue as a going concern. If we conclude that a material uncertainty exists, we are required to draw attention in our auditor’s report to the related disclosures in the consolidated financial statements or, if such disclosures are inadequate, to modify our opinion. Our conclusions are based on the audit evidence obtained up to the date of our
auditor’s report. However, future events or conditions may cause the Group to cease to continue as a going concern.
• Evaluate the overall presentation, structure and content of the consolidated financial statements, including the disclosures, and whether the consolidated financial statements represent the underlying transactions and events in a manner that achieves fair presentation.
• Obtain sufficient appropriate audit evidence regarding the financial information of the entities or business activities within the Group to express an opinion on the consolidated financial statements. We are responsible for the direction, supervision and performance of the Group audit. We remain solely responsible for our audit opinion.
We communicate with management regarding, among other matters, the planned scope and timing of the audit and significant audit findings, including any significant deficiencies in internal control that we identify during our audit.
We also provide management with a statement that we have complied with relevant ethical requirements regarding independence, and to communicate with them all relationships and other matters that may reasonably be thought to bear on our independence, and where applicable, related safeguards.
From the matters communicated with management, we determine those matters that were of most significance in the audit of the financial statements of the current period and are therefore the key audit matters. We describe these matters in our auditor’s report unless law or regulation precludes public disclosure about the matter or when, in extremely rare circumstances, we determine that a matter should not be communicated in our report because the adverse consequences of doing so would reasonably be expected to outweigh the public interest benefits of such communication.
Ernst & Young Ltd
Mark Hawkins,Swiss licensed audit expert (Auditor in charge)
Didier Lequin,Swiss licensed audit expert
INDEPENDENT AUDITOR’S REPORT
1 6 6
PUMA ENERGY ANNUAL REPORT 2020

Puma EnergyCorporate AffairsRue de Jargonnant 11207 GenevaSwitzerland
Investors@pumaenergycomwwwpumaenergycom
Designed and produced by MerchantCantos merchantcantoscom
ANNUAL REPORT 2020
Copyright © 2022 FDOKUMEN