Estimating Puma Densities from Camera Trapping across Three Study Sites: Bolivia, Argentina, and...
11
ESTIMATING PUMA DENSITIES FROM CAMERA TRAPPING ACROSS THREE STUDY SITES: BOLIVIA, ARGENTINA, AND BELIZE MARCELLA J. KELLY,* ANDREW J. NOSS,MARIO S. DI BITETTI,LEONARDO MAFFEI,ROSARIO L. ARISPE, AGUSTIN PAVIOLO,CARLOS D. DE ANGELO, AND YAMIL E. DI BLANCO Department of Fisheries and Wildlife Sciences, Virginia Tech, 146 Cheatham Hall, Blacksburg, VA 24061-0321, USA (MJK) WCS–Bolivia, Casilla 6272, Santa Cruz, Bolivia (AJN, RAL) National Research Council of Argentina (CONICET) and Asociacio ´n Civil Centro de Investigaciones del Bosque Atla ´ntico (CeIBA), Yapeyu ´ 23, 3370 Puerto Iguazu ´, Misiones, Argentina (MSD, AP, CDD) Jaguar Conservation Program, WCS, Casilla 6272, Santa Cruz, Bolivia (LM) Asociacio ´n Civil Centro de Investigaciones del Bosque Atla ´ntico (CeIBA), Yapeyu ´ 23, 3370 Puerto Iguazu ´, Misiones, Argentina (YED) Estimates of abundance are extremely valuable for species conservation, yet determining abundance for elusive, wide-ranging, carnivores is difficult. We estimated density of pumas using remote cameras across study sites in Bolivia, Argentina, and Belize. We used obvious and subtle markings to identify individual pumas in pho- tographs and conducted double-blind identifications to examine the degree of agreement among investigators. Average agreement on identification between pairs of investigators was nearly 80.0% and 3-way agreement was 72.9%. Identification of pumas as different individuals was uncommon (7.8% pairwise, 0.69% 3-way dis- agreement) with the remainder described as unidentifiable. Densities of pumas varied consistently from site to site regardless of investigator. Bolivian pumas moved the shortest distances between camera stations and Argentinean pumas the longest, but distances among cameras and area covered by surveys varied among sites. We applied a correction factor to the Bolivian data to account for the small area surveyed and found that, averaged across investigator, Bolivia had significantly more pumas per 100 km 2 (mean 6 SD; 6.80 6 1.5) than Belize (3.42 6 1.3) or Argentina (0.67 6 0.2). Numbers of pumas in Argentina match those of low-density North American sites, and those for Belize are consistent with the Pantanal and high-density North American sites. Densities of pumas can be reliably estimated with remote cameras for these sites, and our work presents the 1st density estimates for Central America and for forested environments in South America. Key words: camera traps, density, individual identification, Neotropics, puma, Puma concolor Although it is likely that numbers of pumas (Puma concolor) have declined in recent years because of declines in prey and habitat loss and fragmentation, their status remains unknown over most of their range south of the United States border (Sunquist and Sunquist 2002). There are currently no reliable density estimates, particularly in dense forest habitat, for pumas in Central or South America and no standardized technique for estimating density of pumas. Those density estimates that do exist from its southern range result from radiotelemetry studies, and these methods have a number of limitations including small sample size, unknown number of animals not radio- tagged, and high cost and effort required (Karanth 1999; Karanth and Nichols 1998). Given that habitat loss is con- sidered the most critical threat to populations of pumas (Logan and Sweanor 2001; Medellı ´n et al. 2000), the lack of data on pumas in the Neotropics is particularly troubling because this area is currently experiencing some of the fastest habitat loss on earth. Density estimates are critical to the development of conservation and management plans for the species. Remotely triggered infrared cameras (camera traps) have been used successfully to estimate densities of elusive predator species such as tigers (Panthera tigris—Karanth 1995; Karanth and Nichols 1998; Kawanishi and Sunquist 2004; Linkie et al. 2006; O’Brien et al. 2003), jaguars (Panthera onca—Kelly * Correspondent: [email protected] Ó 2008 American Society of Mammalogists www.mammalogy.org Journal of Mammalogy, 89(2):408–418, 2008 408
Transcript of Estimating Puma Densities from Camera Trapping across Three Study Sites: Bolivia, Argentina, and...

ESTIMATING PUMA DENSITIES FROM CAMERATRAPPING ACROSS THREE STUDY SITES: BOLIVIA,ARGENTINA, AND BELIZE
MARCELLA J. KELLY,* ANDREW J. NOSS, MARIO S. DI BITETTI, LEONARDO MAFFEI, ROSARIO L. ARISPE,
AGUSTIN PAVIOLO, CARLOS D. DE ANGELO, AND YAMIL E. DI BLANCO
Department of Fisheries and Wildlife Sciences, Virginia Tech, 146 Cheatham Hall,Blacksburg, VA 24061-0321, USA (MJK)WCS–Bolivia, Casilla 6272, Santa Cruz, Bolivia (AJN, RAL)National Research Council of Argentina (CONICET) and Asociacion Civil Centro de Investigaciones delBosque Atlantico (CeIBA), Yapeyu 23, 3370 Puerto Iguazu, Misiones, Argentina (MSD, AP, CDD)Jaguar Conservation Program, WCS, Casilla 6272, Santa Cruz, Bolivia (LM)Asociacion Civil Centro de Investigaciones del Bosque Atlantico (CeIBA), Yapeyu 23,3370 Puerto Iguazu, Misiones, Argentina (YED)
Estimates of abundance are extremely valuable for species conservation, yet determining abundance for elusive,
wide-ranging, carnivores is difficult. We estimated density of pumas using remote cameras across study sites in
Bolivia, Argentina, and Belize. We used obvious and subtle markings to identify individual pumas in pho-
tographs and conducted double-blind identifications to examine the degree of agreement among investigators.
Average agreement on identification between pairs of investigators was nearly 80.0% and 3-way agreement was
72.9%. Identification of pumas as different individuals was uncommon (7.8% pairwise, 0.69% 3-way dis-
agreement) with the remainder described as unidentifiable. Densities of pumas varied consistently from site to
site regardless of investigator. Bolivian pumas moved the shortest distances between camera stations and
Argentinean pumas the longest, but distances among cameras and area covered by surveys varied among sites.
We applied a correction factor to the Bolivian data to account for the small area surveyed and found that,
averaged across investigator, Bolivia had significantly more pumas per 100 km2 (mean 6 SD; 6.80 6 1.5) than
Belize (3.42 6 1.3) or Argentina (0.67 6 0.2). Numbers of pumas in Argentina match those of low-density North
American sites, and those for Belize are consistent with the Pantanal and high-density North American sites.
Densities of pumas can be reliably estimated with remote cameras for these sites, and our work presents the 1st
density estimates for Central America and for forested environments in South America.
Key words: camera traps, density, individual identification, Neotropics, puma, Puma concolor
Although it is likely that numbers of pumas (Puma concolor)
have declined in recent years because of declines in prey and
habitat loss and fragmentation, their status remains unknown
over most of their range south of the United States border
(Sunquist and Sunquist 2002). There are currently no reliable
density estimates, particularly in dense forest habitat, for pumas
in Central or South America and no standardized technique for
estimating density of pumas. Those density estimates that do
exist from its southern range result from radiotelemetry studies,
and these methods have a number of limitations including
small sample size, unknown number of animals not radio-
tagged, and high cost and effort required (Karanth 1999;
Karanth and Nichols 1998). Given that habitat loss is con-
sidered the most critical threat to populations of pumas (Logan
and Sweanor 2001; Medellın et al. 2000), the lack of data on
pumas in the Neotropics is particularly troubling because this
area is currently experiencing some of the fastest habitat loss
on earth. Density estimates are critical to the development of
conservation and management plans for the species.
Remotely triggered infrared cameras (camera traps) have
been used successfully to estimate densities of elusive predator
species such as tigers (Panthera tigris—Karanth 1995; Karanth
and Nichols 1998; Kawanishi and Sunquist 2004; Linkie et al.
2006; O’Brien et al. 2003), jaguars (Panthera onca—Kelly
* Correspondent: [email protected]
� 2008 American Society of Mammalogistswww.mammalogy.org
Journal of Mammalogy, 89(2):408–418, 2008
408
2003; Maffei et al. 2004; Silver et al. 2004; Wallace et al.
2003), ocelots (Leopardus pardalis—Di Bitetti et al. 2006;
Dillon and Kelly 2007; Maffei et al. 2005; Trolle and Kery
2003), and Geoffroy’s cats (Leopardus geoffroyi—Cuellar
et al. 2006). This method requires that individual animals be
distinguishable in photographs by their natural markings (i.e.,
stripe and spot patterns). Individual identification is necessary
in order to create individual capture histories and perform
mark–recapture analysis to estimate abundance. Although this
method is relatively straightforward for well-marked species
such as tigers and jaguars, there has been considerable debate
about whether this technique could be applied to more subtly
marked animals such as the puma.
Pumas and jaguars are sympatric throughout most of Central
and South America. Therefore, if densities of pumas can be
estimated through camera trapping, the numerous studies con-
ducting camera trapping for jaguars likely already have the data
in hand to estimate densities of pumas. This makes possible an
examination of how densities of pumas vary across numerous
habitats in the Neotropics and how they covary with densities
of jaguars.
In this study, we assessed the reliability with which pumas
can be identified by their individual marks across 3 different
camera-trapping study sites in Bolivia, Argentina, and Belize.
We conducted double-blind observer identifications, created
capture histories based on each investigator’s identifications,
and used program CAPTURE (Rexstad and Burnham 1991) to
estimate abundance of pumas across study sites and by dif-
ferent investigators. We estimated densities of pumas following
Karanth and Nichols (1998; see also Silver et al. 2004). We
compared our estimates among investigators and sites and to
those estimates that existed from other methods and study sites.
We also supplied recommendations for applying this technique
in future studies.
MATERIALS AND METHODS
Study sites.—Surveys were conducted at study sites in
Bolivia, Argentina, and Belize (Fig. 1). Kaa-Iya del Gran
Chaco National Park (Taber et al. 1997) is a 34,400-km2
protected area covering the northern end of the Gran Chaco in
Bolivia. This area contains the world’s largest remaining area
of Chaco dry forest. At 300 m above sea level, the Estacion
Isoso (188259S, 618469W) field camp lies within the Chaco
plain transitional landscape system on the Bolivia–Brazil gas
pipeline, near the western border of Kaa-Iya National Park.
The canopy averages 10–15 m, and the thick underbrush is
dominated by terrestrial bromeliads and cacti. Annual pre-
cipitation averages from 700 to 800 mm and average annual
temperature is 258C. During the 6-month dry season, surface
water disappears for extended periods. The nearest human
settlement is the Isla Verde ranch and paddy rice farm, 22 km
to the west. Some poaching of wildlife took place until security
was improved in 2002.
The 2,742-km2 Yabotı Biosphere Reserve is located in the
southeastern portion of the Green Corridor of Misiones
Province (268559S, 548009W; 200–600 m above sea level) in
the Atlantic Forest of Argentina. The study site has a humid
subtropical climate with a mean annual precipitation that
usually ranges between 1,700 and 2,300 mm, with no marked
dry season (Crespo 1982). Although most of the Yabotı
Biosphere Reserve lies within private properties, the core area
of the Yabotı Biosphere Reserve is represented by the 316-km2
Esmeralda Provincial Park, which is relatively inaccessible in
relation to other areas within the Yabotı Biosphere Reserve.
Seasonality in temperature, day length, and primary pro-
ductivity is marked, with hot summers and ocassional frosts
during the winter months (Crespo 1982; Di Bitetti and Janson
2001). Most forests within the Yabotı Biosphere Reserve have
been logged or are currently under heavy logging. Logging
promotes the invasion of the forest by 2 species of bamboo
(Merostachys claussenii and Chusquea ramossisima) that
preclude forest regeneration (Campanello 2004). By provincial
law, the native forest within the Yabotı Biosphere Reserve
cannot be converted to other uses, including monoculture forest
plantations. Despite special regulations and efforts by the
provincial government, poaching and illegal timber harvesting
are common and widespread in the private properties of the
Yabotı Biosphere Reserve and affect forest structure, in par-
ticular by favoring the invasion of the forest by the 2 species
of bamboo.
In western Belize, the 1,744-km2 Chiquibul Forest Reserve
and National Park (168449N, 888599W; 500 m elevation) is the
largest managed forest reserve in Belize. With the adjacent
Peten region of Guatemala and Mexico, the Cockscomb Basin
Wildlife Sanctuary, and the Bladen Nature Reserve, this area
forms one of the last large naturally forested tropical areas
within Central America (Carr and de Stoll 1999; Penn et al.
2004). Rainfall averages about 1,500 mm/year with a rainy
season from June to January (Johnson and Chaffey 1973). The
life zone is classified as subtropical moist forest (Holdridge
et al. 1971) and vegetation occurs on steep limestone terrain
where water availability in the dry season is low. The veg-
etation is a mosaic of broadleaf tropical moist rain forest, decid-
uous semievergreen, deciduous seasonal forest, and stands of
pine in the north (Wright et al. 1959). The general canopy is at
FIG. 1.—Locations of study sites in Bolivia, Argentina, and Belize.
April 2008 409KELLY ET AL.—PUMA DENSITIES VIA CAMERA TRAPS
20–30 m. Some blocks of the Chiquibul Forest Reserve have
been, and are still being, selectively logged for commercially
important species such as mahogany (Swietenia macrophylla)
on a greater than 40-year rotational basis.
Camera-trapping surveys.—At all study sites we deployed
remote cameras arrayed at regular intervals (2–3 km) in a
gridlike formation across the landscape following previous pro-
tocol for jaguar surveys (Silver et al. 2004) originally pioneered
by Karanth (1995) for tigers. Surveys used between 17 and
42 camera stations operational for a 2- to 3-month time period
(Table 1). We collapsed daily data in blocks such that 1
encounter occasion consisted of a 4- to 7-day time period
depending on the study. We found abundance estimates to be
relatively insensitive to period of collapse after 3 days,
although capture and recapture rates, and probability of closure
did change. We also calculated a minimum convex polygon
surrounding camera traps to determine the extent of the area
over which cameras were deployed. Two cameras per station
were placed opposite each other on both sides of a trail or road.
This allowed us to obtain photographs of both flanks of the
puma. Studies used a suite of camera brands that included:
Camtrakker (CamTrakker, Watkinsville, Georgia), Deer Cam
100 and 200 (Non Typical Inc., Park Falls, Wisconsin); Leaf
River Trail Scan model C-1 (Leaf River Outdoor Products,
Taylorsville, Mississippi), TrailMAC (Trail Sense Engineering,
Middleton, Delaware), Trapacamera (Trapacamera, Cidade
Universitaria, Sao Paulo, Brazil), Tigrinus (Tigrinus Equipa-
mentos para Pesquisa Ltda., Timbo, Santa Catarina, Brazil),
and TrailMaster Active 1550 (Goodson and Associates Inc.,
Lenexa, Kansas). Cameras were operational 24 h/day with a
camera delay of 30 s to 5 min (i.e., the time that the cameras
would be ready to take another photograph should another
animal pass by). A capture ‘‘event’’ consisted of a record of a
puma at 1 or more of the cameras at a station within a 30-min to
1-h time period. We tallied the total number of events and the
total number of photographs for pumas and calculated trap
success as the number of puma events per 100 trap nights.
Identification of pumas and comparisons among sites andinvestigators.—To test the accuracy with which each in-
vestigator (or investigator team) identified individuals, we
duplicated our photographs, exchanged them, and conducted
a blind identification test in which the 3 investigators were
unaware of how the others had identified and categorized the
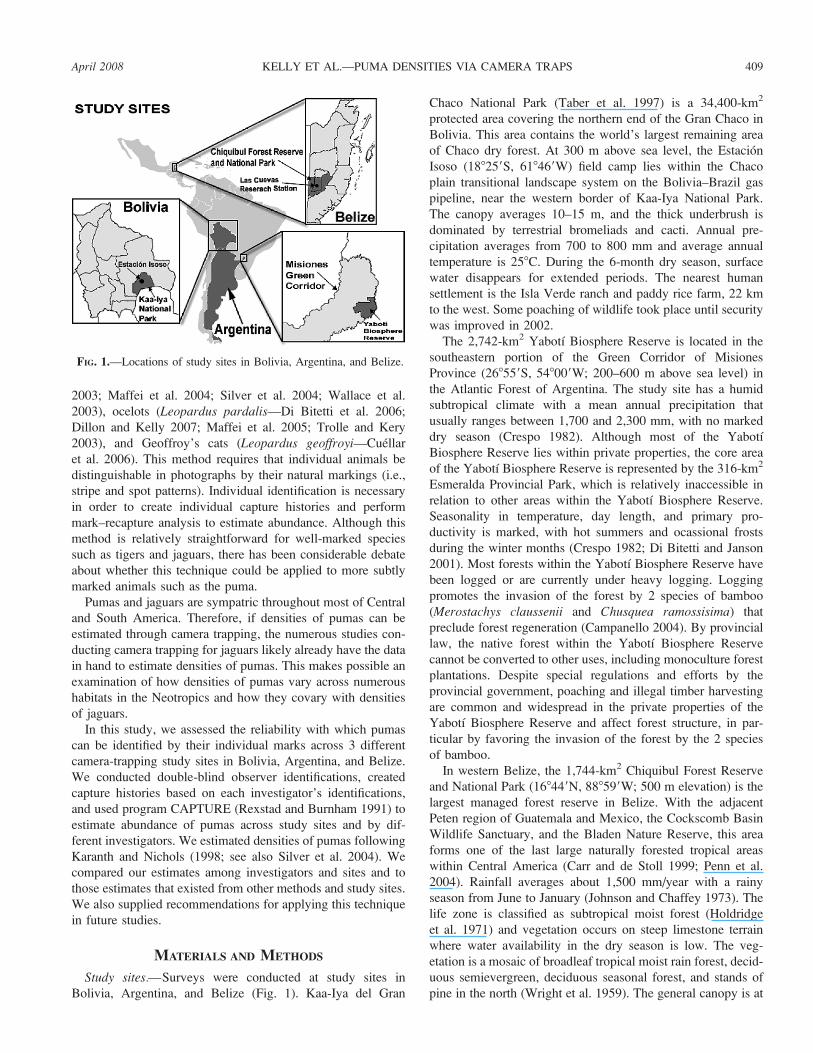
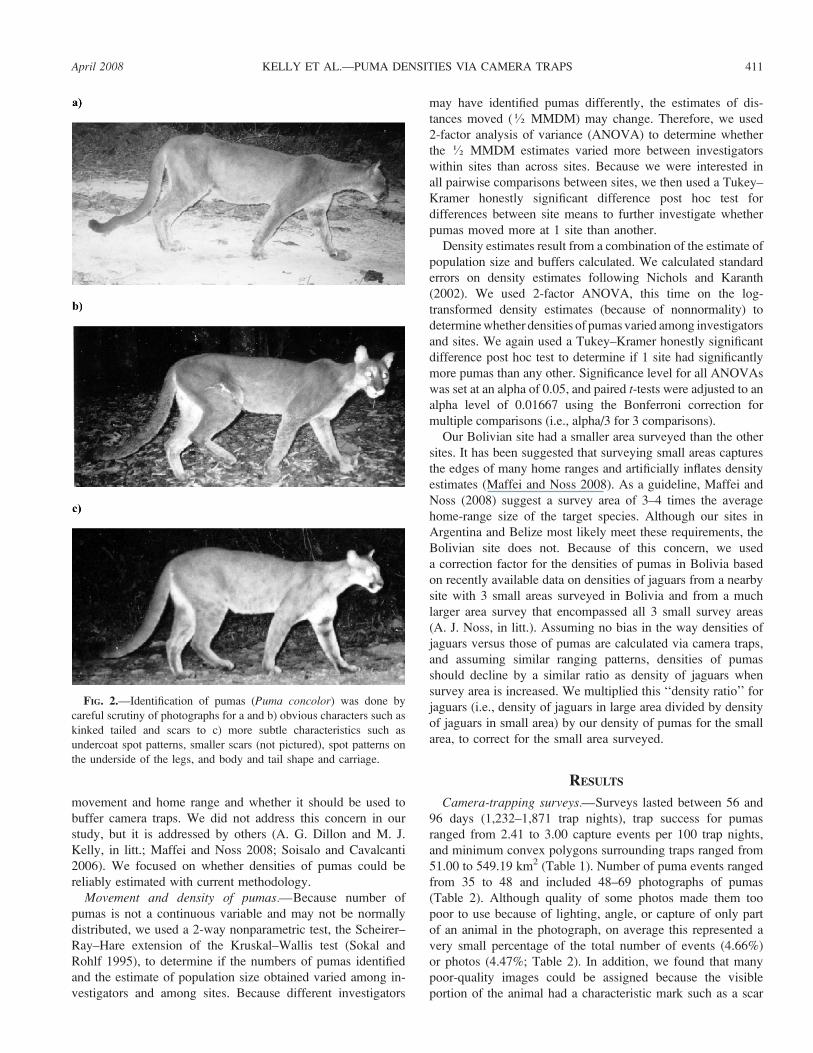
photographs. Pumas were identified by obvious marks (kinked
tails, scars, and ear nicks), by less obvious marks (scars that
healed over time [e.g., from botflies], tail-tip coloration, and
rings), and by subtle marks (undercoat spot patterns, coloration
on the underside of legs, tail carriage, and body shape and
carriage; Fig. 2). Each researcher sorted cats into positive
identifications, tentative identifications, and not possible to tell
(usually an unusable photo because of poor quality).
The 3 data sets were then compared to determine number of
exact matches between investigators across sites. Some inves-
tigators classified some photos as unusable whereas others did
not. Therefore we discarded events (unusable events) only when
all 3 investigators agreed they were unusable because of poor
quality. We then calculated percentage of exact matches by
dividing the number of events with exact and tentative matches
by the total number of usable events. In the same fashion, we
also calculated the number and percentage of events where all
3 investigators agreed on identifications. Finally, we examined
the number and percentage of complete disagreements between
pairwise investigators and among all 3 investigators.
Abundance of pumas.—Each investigator constructed 3
capture histories for the pumas at their own site based on their
own identification of pumas and those of the other 2 inves-
tigators based on the identifications provided by the others.
These capture–recapture histories were then analyzed using
program CAPTURE (Otis et al. 1978; Rexstad and Burnham
1991; White et al. 1982) to estimate sizes of populations of
pumas. To determine the size of the area surveyed, the mean of
the maximum distance moved between cameras was calculated
for each puma capture history and half this distance was used
(½ MMDM) as the buffer radius around each camera trap
location (Dice 1938; Wilson and Anderson 1985). Buffers were
dissolved and total area calculated in ArcView (ESRI 1999)
using X-tools or Spatial Analyst. The number of pumas from
each survey was then divided by the total survey area to obtain
density of pumas. This estimation method has been detailed
extensively in other camera-trapping publications and our study
follows those methods closely (Di Bitetti et al. 2006; Karanth
1995; Karanth and Nichols 1998; Kelly 2003; Maffei et al.
2004, 2005; Silver et al. 2004). There is considerable debate
concerning whether the ½ MMDM truly reflects animal
TABLE 1.—Summary of date of surveys, numbers of camera stations, trap nights, and trap success across study sites.
Study site
Dates of
survey
Approximate
spacing between
camera
stations (km)
No.
camera
stations
Survey
length
(days)
Total
trap
nightsa
Percent (%) puma
trap success
(capture events
per 100 trap nights)
Encounter
occasionsb
MCPs around
camera
traps (km2)c
Bolivia: Kaa-Iya del Gran
Chaco National Park
28 October�24
December 2005
2 22 56 1,232 2.84 15 51.00
Argentina: Yabotı
Biosphere Reserve
27 August�30
November 2005
2.5 42 96 1,871 2.41 16 549.19
Belize: Chiquibul Forest
Reserve and National Park
4 January�9
April 2003
3 17 95 1,601 3.00 19 109.85
a Calculated as number of stations times number of nights minus number of days when stations were nonfunctional because of camera malfunctions.b Number of trapping occasions used in program CAPTURE after collapsing data; for example, for Belize, 95 days were collapsed into nineteen 5-day capture periods.c MCP ¼ minimum convex polygon.
410 JOURNAL OF MAMMALOGY Vol. 89, No. 2
movement and home range and whether it should be used to
buffer camera traps. We did not address this concern in our
study, but it is addressed by others (A. G. Dillon and M. J.
Kelly, in litt.; Maffei and Noss 2008; Soisalo and Cavalcanti
2006). We focused on whether densities of pumas could be
reliably estimated with current methodology.
Movement and density of pumas.—Because number of
pumas is not a continuous variable and may not be normally
distributed, we used a 2-way nonparametric test, the Scheirer–
Ray–Hare extension of the Kruskal–Wallis test (Sokal and
Rohlf 1995), to determine if the numbers of pumas identified
and the estimate of population size obtained varied among in-
vestigators and among sites. Because different investigators
may have identified pumas differently, the estimates of dis-
tances moved (½ MMDM) may change. Therefore, we used
2-factor analysis of variance (ANOVA) to determine whether
the ½ MMDM estimates varied more between investigators
within sites than across sites. Because we were interested in
all pairwise comparisons between sites, we then used a Tukey–
Kramer honestly significant difference post hoc test for
differences between site means to further investigate whether
pumas moved more at 1 site than another.
Density estimates result from a combination of the estimate of
population size and buffers calculated. We calculated standard
errors on density estimates following Nichols and Karanth
(2002). We used 2-factor ANOVA, this time on the log-
transformed density estimates (because of nonnormality) to
determine whether densities of pumas varied among investigators
and sites. We again used a Tukey–Kramer honestly significant
difference post hoc test to determine if 1 site had significantly
more pumas than any other. Significance level for all ANOVAs
was set at an alpha of 0.05, and paired t-tests were adjusted to an
alpha level of 0.01667 using the Bonferroni correction for
multiple comparisons (i.e., alpha/3 for 3 comparisons).
Our Bolivian site had a smaller area surveyed than the other
sites. It has been suggested that surveying small areas captures
the edges of many home ranges and artificially inflates density
estimates (Maffei and Noss 2008). As a guideline, Maffei and
Noss (2008) suggest a survey area of 3–4 times the average
home-range size of the target species. Although our sites in
Argentina and Belize most likely meet these requirements, the
Bolivian site does not. Because of this concern, we used
a correction factor for the densities of pumas in Bolivia based
on recently available data on densities of jaguars from a nearby
site with 3 small areas surveyed in Bolivia and from a much
larger area survey that encompassed all 3 small survey areas
(A. J. Noss, in litt.). Assuming no bias in the way densities of
jaguars versus those of pumas are calculated via camera traps,
and assuming similar ranging patterns, densities of pumas
should decline by a similar ratio as density of jaguars when
survey area is increased. We multiplied this ‘‘density ratio’’ for
jaguars (i.e., density of jaguars in large area divided by density
of jaguars in small area) by our density of pumas for the small
area, to correct for the small area surveyed.
RESULTS
Camera-trapping surveys.—Surveys lasted between 56 and
96 days (1,232–1,871 trap nights), trap success for pumas
ranged from 2.41 to 3.00 capture events per 100 trap nights,
and minimum convex polygons surrounding traps ranged from
51.00 to 549.19 km2 (Table 1). Number of puma events ranged
from 35 to 48 and included 48–69 photographs of pumas
(Table 2). Although quality of some photos made them too
poor to use because of lighting, angle, or capture of only part
of an animal in the photograph, on average this represented a
very small percentage of the total number of events (4.66%)
or photos (4.47%; Table 2). In addition, we found that many
poor-quality images could be assigned because the visible
portion of the animal had a characteristic mark such as a scar
FIG. 2.—Identification of pumas (Puma concolor) was done by
careful scrutiny of photographs for a and b) obvious characters such as
kinked tailed and scars to c) more subtle characteristics such as
undercoat spot patterns, smaller scars (not pictured), spot patterns on
the underside of the legs, and body and tail shape and carriage.
April 2008 411KELLY ET AL.—PUMA DENSITIES VIA CAMERA TRAPS

or tail kink. We therefore found no real relationship between
quality of photos and ability to assign identifications to pumas.
Identification of pumas and comparisons among sites andinvestigators.—The average agreement on identifications of
pumas between pairs of investigators was high, at 79.3% across
all sites (Fig. 3a). Belizean pumas were more difficult to
identify and had the lowest average pairwise agreement at
68.1%, whereas Bolivian pumas were more easily identifiable
at 87.3% average agreement between pairs of investigators.
Average agreement between all 3 investigators across sites was
slightly lower at 72.9% than average pairwise agreement.
Disagreement on identification between investigators was
not simply the remainder of all cases other than agreement
because some investigators classified pumas as unidentifiable
whereas others did not and instances when pumas were con-
sidered unidentifiable were not included as agreements or dis-
agreements. Only if a puma event was classified by all 3
investigators as unidentifiable was it discarded. Disagreement
between investigators, when investigators identified pumas as
different individuals, was uncommon at only 7.8% between
investigators across sites (Fig. 3b) with the lowest disagreement
occurring for Argentinean pumas (4.7%) and the highest for
Belizean pumas (13.9%). Three-way disagreement (e.g., 3
unique pumas identified) was almost nonexistent at an average
of 0.69% (range 0–2.1%).
Abundance of pumas.—The number of pumas identified by
investigators ranged from 6 to 14 and varied significantly
among study sites (H ¼ 6.424, d.f. ¼ 2, P , 0.05) but not
among investigators (H ¼ 1.303, d.f. ¼ 2, P . 0.05; Table 3;
Fig. 4). Although differences among investigators were not
statistically significant, investigator 3 had a tendency to
identify more pumas (splitter) than investigator 1 (lumper)
across sites. We identified fewer pumas in Argentina (mean 6
SD; 6.67 6 1.16, n ¼ 3) than Bolivia (12.67 6 1.53, n ¼ 3) or
Belize (10.00 6 1.73, n ¼ 3).
Model selection in program CAPTURE always resulted in
either the null model M(o), or the heterogeneity model M(h) as
the most appropriate model (Table 3). We used M(h) for our
final estimates of population size because this seemed to reflect
puma behavior more appropriately than a constant probability
of capture, M(o). In 1 case, however, we used the more
conservative M(o) estimate of abundance because of large
inconsistencies in the M(h) estimate over several runs of the
model. Estimates of population size ranged from 6 to 18 animals
across study sites and for all model runs except 1, we could not
reject the null hypothesis of population closure (Table 3). It
should be noted that there are no truly suitable tests for the
assumption of closure (Rexstad and Burnham 1991), but the
length of our survey was short relative to the life span of the
animal, which is logically consistent with population closure.
Number of pumas estimated did not vary significantly among
investigators (H ¼ 1.6497, d.f. ¼ 2, P . 0.05), but did vary
significantly (marginally) among sites (H ¼ 5.8531, d.f. ¼ 2,
0.06 . P . 0.05).
Movement and densities of pumas.—Movement of pumas
among camera stations varied significantly among sites re-
gardless of investigator (2-way ANOVA; effect of site: F ¼43.5901, d.f. ¼ 2, 4, P ¼ 0.0019; effect of investigator: F ¼
FIG. 3.—a) Average agreement on identification of pumas (including
tentative agreements) between pairs of investigators (e.g., investigator 1
to 2, 1 to 3, and 2 to 3) within each study site, and b) average disagree-
ment, which included cases when investigators identified a puma as
2 different individuals but did not include cases when investigators
classified events as unusable and did not make an identification.
TABLE 2.—Summary of number of and percentage of unusable
capture events and photographs of pumas (Puma concolor).
Study site
No. puma
capture
events
No.
photos
in events
No. (%)
unusable
eventsa
No. (%)
unusable
photosa
Bolivia: Kaa-Iya del Gran
Chaco National Park 35 48 1 (2.86) 2 (4.17)
Argentina: Yabotı
Biosphere Reserve 65 97 5 (11.11) 6 (9.23)
Belize: Chiquibul Forest
Reserve and National Park 48 69 0 (0.00%) 0 (0.00%)
a Agreed upon as unusable by all 3 investigators or investigator teams.
412 JOURNAL OF MAMMALOGY Vol. 89, No. 2

0.5367, d.f. ¼ 2, 4, P ¼ 0.6216; Table 3; Fig. 5). Post hoc
comparisons for all pairs using the Tukey–Kramer honestly sig-
nificant difference method indicated that movement by pumas
(as measured by mean maximum distances among camera
captures) was significantly different among sites. Pumas in
Bolivia moved significantly shorter distances than pumas in
Argentina and those for Belize were intermediate (mean ½MMDM 6 SD, n ¼ 3; Bolivia: 1.827 6 0.186 km; Belize:
5.263 6 1.034 km; Argentina: 6.953 6 0.297 km).
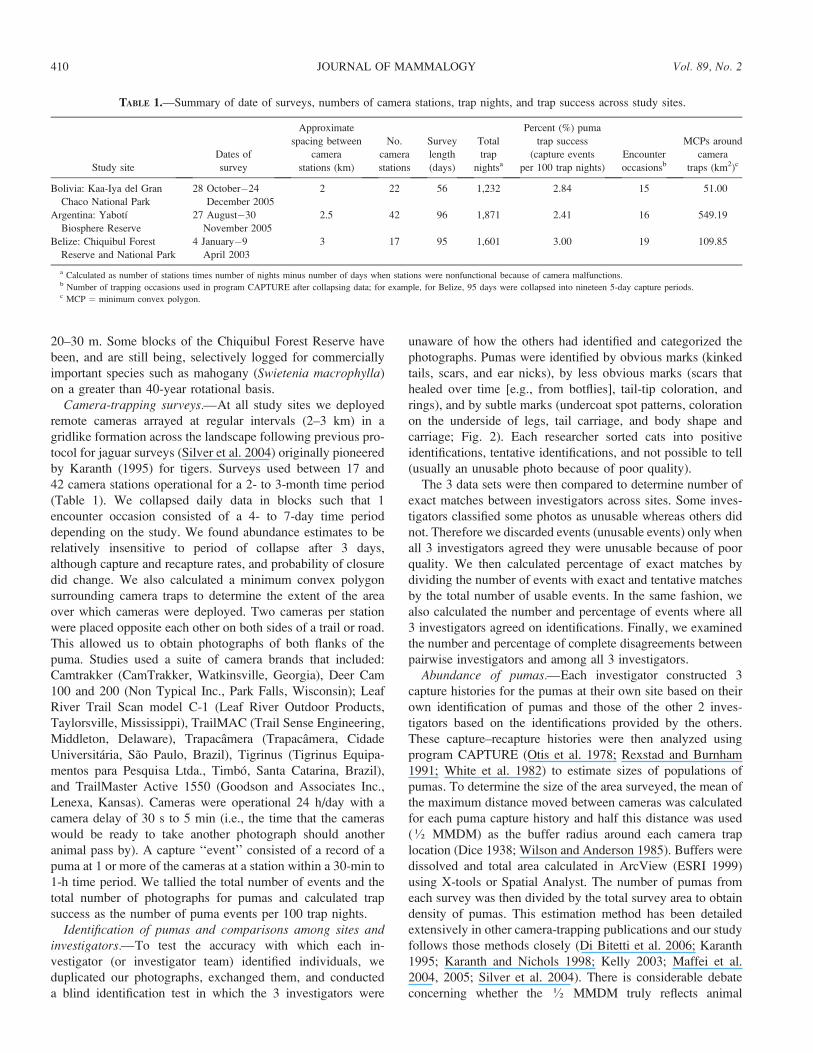
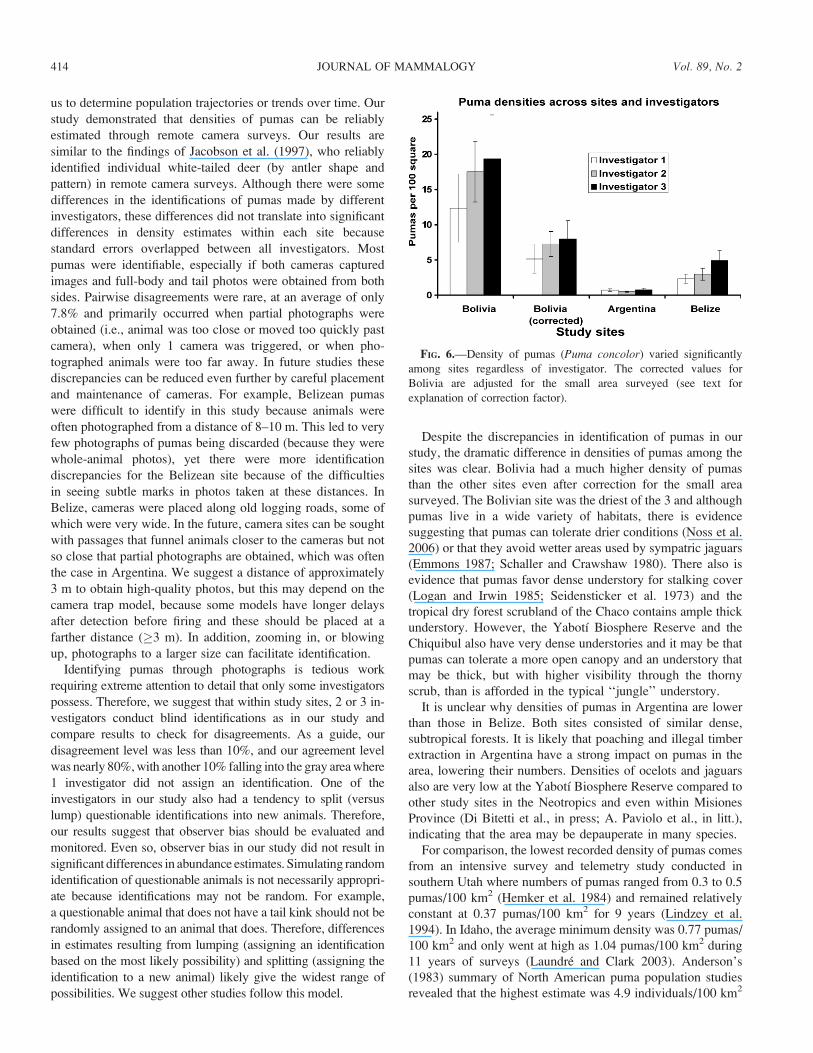
Densities of pumas per 100 km2 determined by different in-
vestigators were similar within each site and ranged from 0.50
to 0.81 for Argentina, 2.35 to 4.91 for Belize, and 5.13 to 8.01
for Bolivia (after applying the least conservative [i.e., strongest
impact of 3] correction factor of 0.414 to densities of pumas
in Bolivia; Fig. 6). Densities varied significantly across sites
but not among investigators (2-way ANOVA on log-trans-
formed density estimates; effect of site: F ¼ 94.232, d.f. ¼ 2, 4,
P ¼ 0.0004; effect of investigator: F ¼ 3.679, d.f. ¼ 2, 4, P ¼0.124). Post hoc comparisons for all pairs using the Tukey–
Kramer honestly significant difference method (using the log-
transformed density estimates in a 1-way ANOVA) indicated
that Bolivia had significantly higher densities of pumas, at an
average (6 SE) of 6.80 6 1.50 pumas/100 km2 than either
Argentina (0.67 6 0.16 pumas/100 km2) or Belize (3.42 6
1.33 pumas/100 km2) and the density estimates for Belize
where statistically higher than those of Argentina. No single
investigator had consistently higher or lower densities
estimates than another across sites.
DISCUSSION
Estimates of abundance for pumas are rare, and yet they are
extremely valuable for species conservation because they allow
TABLE 3.—Numbers of pumas (Puma concolor) identified by different investigators across sites and resulting estimates of population size,
effective survey area, and estimates of density.
Study site
No.
individuals
identified
No.
captures þrecaptures
Model selectiona Population
size
estimate M(h) SE
Capture
probability
Closure testEffective
survey
area (km2)
Density (SE)
per 100 km2bM(o) M(h) Z-score P-value ½ MMDM (km)
Bolivia
Investigator 1 11 25 0.97 1 13 3.16 0.113 �0.003 0.499 2.04 105 12.38 (4.85)
Investigator 2 13 27 0.93 1 16 3.48 0.104 �0.7 0.242 1.7 93 17.58 (4.29)
Investigator 3 14 27 0.92 1 18c 3.03 0.095 �0.675 0.25 1.74 91 19.35 (6.24)
Argentina
Investigator 1 6 22 1 0.88 8 2.01 0.172 �0.18 0.429 6.64 1,154 0.69 (0.33)
Investigator 2 6 26 1 0.82 6 0.88 0.271 �1.15 0.125 6.99 1,204 0.50 (0.33)
Investigator 3 8 28 1 0.89 10 2.01 0.175 �1.071 0.142 7.23 1,240 0.81 (0.45)
Belize
Investigator 1 8 33 0.95 1 10 2.05 0.144 �2.378 0.087 5.83 426 2.35 (0.67)
Investigator 2 11 34 0.9 1 13 3.24 0.114 �1.507 0.066 5.89 431 3.01 (0.85)
Investigator 3 11 27 1 0.95 14 3.48 0.102 �1.773 0.038 4.07 285 4.91 (1.48)
a M(o) ¼ the null model, constant capture probability; M(h) ¼ the heterogeneity model, heterogeneous capture probabilities for each individual.b For Bolivia, these densities estimates are before the correction factors for small area surveyed were applied.c For this estimate only we used the more conservative M(o) model because of inconsistencies in the M(h) model over several model runs.
FIG. 5.—Movements of pumas (measured as half the mean
maximum distance moved by individual pumas between camera
stations) varied among study sites.
FIG. 4.—Numbers of pumas (Puma concolor) identified by
investigators varied among study sites.
April 2008 413KELLY ET AL.—PUMA DENSITIES VIA CAMERA TRAPS
us to determine population trajectories or trends over time. Our
study demonstrated that densities of pumas can be reliably
estimated through remote camera surveys. Our results are
similar to the findings of Jacobson et al. (1997), who reliably
identified individual white-tailed deer (by antler shape and
pattern) in remote camera surveys. Although there were some
differences in the identifications of pumas made by different
investigators, these differences did not translate into significant
differences in density estimates within each site because
standard errors overlapped between all investigators. Most
pumas were identifiable, especially if both cameras captured
images and full-body and tail photos were obtained from both
sides. Pairwise disagreements were rare, at an average of only
7.8% and primarily occurred when partial photographs were
obtained (i.e., animal was too close or moved too quickly past
camera), when only 1 camera was triggered, or when pho-
tographed animals were too far away. In future studies these
discrepancies can be reduced even further by careful placement
and maintenance of cameras. For example, Belizean pumas
were difficult to identify in this study because animals were
often photographed from a distance of 8–10 m. This led to very
few photographs of pumas being discarded (because they were
whole-animal photos), yet there were more identification
discrepancies for the Belizean site because of the difficulties
in seeing subtle marks in photos taken at these distances. In
Belize, cameras were placed along old logging roads, some of
which were very wide. In the future, camera sites can be sought
with passages that funnel animals closer to the cameras but not
so close that partial photographs are obtained, which was often
the case in Argentina. We suggest a distance of approximately
3 m to obtain high-quality photos, but this may depend on the
camera trap model, because some models have longer delays
after detection before firing and these should be placed at a
farther distance (�3 m). In addition, zooming in, or blowing
up, photographs to a larger size can facilitate identification.
Identifying pumas through photographs is tedious work
requiring extreme attention to detail that only some investigators
possess. Therefore, we suggest that within study sites, 2 or 3 in-
vestigators conduct blind identifications as in our study and
compare results to check for disagreements. As a guide, our
disagreement level was less than 10%, and our agreement level
was nearly 80%, with another 10% falling into the gray area where
1 investigator did not assign an identification. One of the
investigators in our study also had a tendency to split (versus
lump) questionable identifications into new animals. Therefore,
our results suggest that observer bias should be evaluated and
monitored. Even so, observer bias in our study did not result in
significant differences in abundance estimates. Simulating random
identification of questionable animals is not necessarily appropri-
ate because identifications may not be random. For example,
a questionable animal that does not have a tail kink should not be
randomly assigned to an animal that does. Therefore, differences
in estimates resulting from lumping (assigning an identification
based on the most likely possibility) and splitting (assigning the
identification to a new animal) likely give the widest range of
possibilities. We suggest other studies follow this model.
Despite the discrepancies in identification of pumas in our
study, the dramatic difference in densities of pumas among the
sites was clear. Bolivia had a much higher density of pumas
than the other sites even after correction for the small area
surveyed. The Bolivian site was the driest of the 3 and although
pumas live in a wide variety of habitats, there is evidence
suggesting that pumas can tolerate drier conditions (Noss et al.
2006) or that they avoid wetter areas used by sympatric jaguars
(Emmons 1987; Schaller and Crawshaw 1980). There also is
evidence that pumas favor dense understory for stalking cover
(Logan and Irwin 1985; Seidensticker et al. 1973) and the
tropical dry forest scrubland of the Chaco contains ample thick
understory. However, the Yabotı Biosphere Reserve and the
Chiquibul also have very dense understories and it may be that
pumas can tolerate a more open canopy and an understory that
may be thick, but with higher visibility through the thorny
scrub, than is afforded in the typical ‘‘jungle’’ understory.
It is unclear why densities of pumas in Argentina are lower
than those in Belize. Both sites consisted of similar dense,
subtropical forests. It is likely that poaching and illegal timber
extraction in Argentina have a strong impact on pumas in the
area, lowering their numbers. Densities of ocelots and jaguars
also are very low at the Yabotı Biosphere Reserve compared to
other study sites in the Neotropics and even within Misiones
Province (Di Bitetti et al., in press; A. Paviolo et al., in litt.),
indicating that the area may be depauperate in many species.
For comparison, the lowest recorded density of pumas comes
from an intensive survey and telemetry study conducted in
southern Utah where numbers of pumas ranged from 0.3 to 0.5
pumas/100 km2 (Hemker et al. 1984) and remained relatively
constant at 0.37 pumas/100 km2 for 9 years (Lindzey et al.
1994). In Idaho, the average minimum density was 0.77 pumas/
100 km2 and only went at high as 1.04 pumas/100 km2 during
11 years of surveys (Laundre and Clark 2003). Anderson’s
(1983) summary of North American puma population studies
revealed that the highest estimate was 4.9 individuals/100 km2
FIG. 6.—Density of pumas (Puma concolor) varied significantly
among sites regardless of investigator. The corrected values for
Bolivia are adjusted for the small area surveyed (see text for
explanation of correction factor).
414 JOURNAL OF MAMMALOGY Vol. 89, No. 2
as of the time of their review. Smallwood (1997) claimed that
some studies have reported up to 13 pumas/100 km2, but
implied that these high densities may result from too small
a survey area and were potentially unreliable.
Aside from the Chaco, the only other density estimates for
pumas in South America are from Patagonia, Chile, and the
Brazilian Pantanal. However, these estimates are primarily
derived from radiotelemetry studies with small sample sizes
rather than mark–recapture studies. Patagonia was similar to
the Chaco with high densities of pumas at 7 pumas/100 km2
(Iriarte et al. 1991) and possibly much higher (;30 pumas/100
km2) in a peninsular area (Franklin et al. 1999). Crawshaw and
Quigley (in litt.; cited in Nowell and Jackson 1996) estimated
density at 4.4 pumas/100 km2 for the Pantanal, similar to
a preliminary estimate of 3 pumas/100 km2 from camera
trapping (Trolle et al. 2007). There are no estimates of density
of pumas from forested environments in South America and no
estimates from any habitat in Central America. Compared to
North America, the puma remains relatively unstudied in the
Neotropics, with only a handful of studies focusing primarily
on food habits and diet (Aranda and Sanchez-Cordero 1996;
Crawshaw and Quigley 2002; de Oliveira 2002; Emmons
1987; Iriarte et al. 1990; Novack et al. 2005; Taber et al. 1997;
Yanez et al. 1986), spatial distribution and home range
(Rabinowitz and Nottingham 1986; Schaller and Crawshaw
1980; Scognamillo et al. 2003), or both.
We provided the 1st density estimates of pumas for Central
America and from a forested environment in South America.
We advise that future studies follow Maffei and Noss (2008)
and standardize distance between cameras as well as cover an
area that encompasses at least 4 times the average home-range
size of the study animals. In addition, across the survey area,
spacing of cameras should seek to maximize capture prob-
ability, with 2 or more cameras per average home-range area.
We also provided a protocol and recommendations for esti-
mating puma densities reliably from remote cameras studies
(Appendix I). Our study revealed that Bolivia had the highest
densities of pumas, whereas Belize had intermediate densities
similar to those from the Pantanal and the highest North
American densities, and Argentina had low numbers of pumas
most similar to those of the long-term studies in Idaho and
Utah, the lowest densities recorded. Given that there are
currently numerous studies in the Neotropics conducting
camera trapping for jaguars, our technique could be used to
estimate densities of pumas in many other locations across the
geographic range of pumas. This would greatly expand our
knowledge of the population status of pumas in the Neotropics
and allow examination of how densities of pumas covary with
those of jaguars across their ranges. These data are valuable for
conservation, especially as habitat continues to shrink and
become more fragmented, potentially heightening competition
between these top predators.
RESUMEN
Las estimaciones de abundancia son muy valiosas para la
conservacion de especies, sin embargo, es difıcil determinar la
abundancia poblacional para carnıvoros elusivos y con areas de
accion extensas. Estimamos la densidad poblacional de pumas
utilizando camaras remotas en Bolivia, Argentina, y Belice.
Usamos marcas obvias y sutiles para identificar los individuos
en las fotografıas, y realizamos pruebas doble-ciegas de
identificacion para determinar la concordancia entre inves-
tigadores. El promedio de concordancia entre pares de in-
vestigadores fue de casi el 80%, y la concordancia entre 3
investigadores fue de 72.9%. La identificacion de pumas como
individuos diferentes fue poco comun (7.8% entre pares, 0.69%
desacuerdo entre 3), con los demas casos asignados a individ-
uos no-identificables. Las densidades poblaciones de pumas
variaron de manera consistente de un sitio a otro sin importar el
investigador. Los pumas en Bolivia tuvieron las menores
distancias de desplazamiento entre estaciones mientras que los
pumas en Argentina las mayores distancias, pero las distancias
entre estaciones y las areas cubiertas por los muestreos no
fueron consistentes entre sitios. Aplicamos un factor de cor-
reccion a los datos de Bolivia para tomar en cuenta la reducida
area de muestreo y encontramos que, usando el promedio de
los investigadores, Bolivia registro un numero significa-
tivamente mas alto de pumas cada 100 km2 (promedio 6
DE; 6.80 6 1.5) que Belice (3.42 6 1.3) o Argentina (0.67 6
0.2). La densidad de pumas en Argentina es similar a la de
sitios de Norteamerica con densidad baja, mientras que las
densidades en Belice son consistentes con las densidades del
Pantanal y de sitios de alta densidad en Norteamerica. Las
densidades poblacionales de pumas se pueden estimar de
manera confiable en estos sitios utilizando camaras remotas, y
nuestro trabajo presenta las primeras estimaciones de
densidad para Centroamerica y para ambientes de bosque en
Sudamerica.
ACKNOWLEDGMENTS
In Bolivia, we thank our partners (Capitanıa de Alto y Bajo Isoso,
Museo de Historia Natural Noel Kempff Mercado) and the Bolivian
authorities (Direccion General de Biodiversidad, Servicio Nacional de
Areas Protegidas) for assistance and for permission to work in Kaa-Iya
del Gran Chaco National Park. The Kaa-Iya Foundation and Gas
Transboliviano S.A. provided additional financial and logistical sup-
port. In Argentina we acknowledge the Ministry of Ecology Natural
Resources and Tourism of Misiones for permission to conduct
fieldwork at Yabotı Biosphere Reserve and for permission to use the
Marcio Ayres Field Station at Esmeralda Provincial Park. We are
thankful to V. Matuchaka, H. Heyer, C. Maders, E. Taron, G. Ibarra,
E. Arzamendia, O. Stempel, D. Terra, A. Garcıa, M. Benitez, M.
Matuchaka, and J. Prada for their invaluable help during the surveys.
We are grateful to E. Miot and other property owners for permission to
conduct fieldwork within their properties. Funding was provided by
the National Research Council of Argentina (CONICET), Lincoln
Park Zoo, Fundacion Vida Silvestre Argentina–World Wildlife Fund,
Idea Wild, Fundacion Antorchas, Rufford Foundation, Wildlife
Conservation Society, Eden Project–Darwin Initiative, and the
Ministry of Ecology Natural Resources and Tourism of Misiones. In
Belize, we would like to thank the Forestry Department of Belize for
permission to conduct research and for support of research in
Chiquibul Forest Reserve and National Park. We also thank the Las
Cuevas Research Station staff, C. Minty, N. (Chapal) Bol, C. Bol, I.
Bol, J. Bol, N. Coc, E. Saquil, and V. Quiroz for logistical support and
April 2008 415KELLY ET AL.—PUMA DENSITIES VIA CAMERA TRAPS

local knowledge of the area. Numerous students and technicians
deserve thanks for volunteering their time and effort in the field, or in
data entry or identifying pumas: N. Gour, H. Camblos, A. Dillon, D.
Kite, and T. McNamara. We also thank the Wildlife Conservation
Society, the Philadelphia Zoo, Virginia Tech, the Acorn Alcinda
Foundation, and Hidden Valley Inn for financial and logistical
support.
LITERATURE CITED
ANDERSON, A. E. 1983. A critical review of literature on puma (Felisconcolor). Colorado Division of Wildlife, Fort Collins, Colorado,
Special Report 54:1–91.
ARANDA, M., AND V. SANCHEZ-CORDERO. 1996. Prey spectra of jaguar
(Panthera onca) and puma (Puma concolor) in tropical forests of
Mexico. Studies on Neotropical Fauna and Environment 31:65–67.
CAMPANELLO, P. I. 2004. Diversidad, crecimiento y fisiologıa de
arboles en la Selva Misionera: efecto de los cambios en la estructura
y funcionamiento del ecosistema producidos por la invasion de
lianas y bambuceas. Ph.D. dissertation, Universidad de Buenos
Aires, Buenos Aires, Argentina.
CARR, A., AND A. C. DE STOLL (EDS.). 1999. Biological monitoring in
the Selva Maya. United States Man and the Biosphere Program/
Tropical Ecosystem Directorate, Wildlife Conservation Society,
New York.
CRAWSHAW, P. G., AND H. B. QUIGLEY. 2002. Jaguar and puma feeding
habits. Pp. 223–235 in El jaguar en el nuevos milenio. Una
evaluacion de suestado, deteccion de prioridades y recomenda-
ciones para la conservacion de los jaguars en America. (R. A.
Medellın, et al., eds.). Universidad Autonoma de Mexico and
Wildlife Conservation Society, Distrito Federal, Mexico.
CRESPO, J. A. 1982. Ecologıa de la comunidad de mamıferos del Parque
Nacional Iguazu, Misiones. Revista MACN, Ecologıa 3:45–162.
CUELLAR, E., L. MAFFEI, R. ARISPE, AND A. J. NOSS. 2006. Geoffroy’s
cats at the northern limit of their range: activity patterns and density
estimates from camera trapping in Bolivian dry forests. Studies on
Neotropical Fauna and Environment 41:169–178.
DE OLIVEIRA, T. 2002. Comparative feeding ecology of jaguar (Pantheraonca) and puma (Puma concolor) in the Neotropics. Pp. 265–288 in
El jaguar en el nuevos milenio. Una evaluacion de su estado,
deteccion de prioridades y recomendaciones para la conservacion
de los jaguars en America. (R. A. Medellın, et al., eds.). Universidad
Autonoma de Mexico and Wildlife Conservation Society, Distrito
Federal, Mexico.
DI BITETTI, M. S., AND C. H. JANSON. 2001. Reproductive socioecology
of tufted capuchins (Cebus apella nigritus), in northeastern
Argentina. International Journal of Primatology 22:127–142.
DI BITETTI, M. S., A. PAVIOLO, AND C. DE ANGELO. 2006. Density,
habitat use and activity patterns of ocelots (Leopardus pardalis) in
the Atlantic forest of Misiones, Argentina. Journal of Zoology
(London) 270:153–163.
DI BITETTI, M. S., A. PAVIOLO, C. DE ANGELO, AND Y. DI BLANCO.
In press. Local and continental correlates of the abundance of
a neotropical cat, the ocelot (Leopardus pardalis). Journal of
Tropical Ecology.
DICE, L. R. 1938. Some census methods for mammals. Journal of
Wildlife Management 2:119–180.
DILLON, A., AND M. J. KELLY. 2007. Ocelot Leopardus pardalis in
Belize: the impact of trap spacing and animal movement on density
estimates. Oryx 41:469–477.
EMMONS, L. H. 1987. Comparative feeding ecology of felids in a
neotropical rainforest. Behavioral Ecology and Sociobiology
20:271–283.
ESRI. 1999. Getting to know ArcView GIS: the geographic
information system (GIS) for everyone. Environmental Systems
Research Institute, Inc., Redlands, California.
FRANKLIN, W. L., W. E. JOHNSON, R. J. SARNO, AND J. A. IRIARTE. 1999.
Ecology of the Patagonia puma Felis concolor patagonica in
southern Chile. Biological Conservation 90:33–40.
HEMKER, T. P., F. G. LINDZEY, AND B. B. ACKERMAN. 1984. Population
characteristics and movement pattern of cougars in southern Utah.
Journal of Wildlife Management 48:1275–1284.
HOLDRIDGE, L. R., W. C. GRENKE, W. H. HATHEWAY, T. LIANG, AND
J. A. TOSI, JR. 1971. Forest environments in tropical life zones:
a pilot study. Oxford Pergamon Press, New York.
IRIARTE, J. A., W. L. FRANKLIN, W. E. JOHNSON, AND K. H. REDFORD.
1990. Biogeographic variation of food habits and body size of the
American puma. Oecologia 85:185–190.
IRIARTE, J. A., W. E. JOHNSON, AND W. L. FRANKLIN. 1991. Feeding
ecology of the Patagonia puma in southernmost Chile. Revista
Chilena de Historia Natural 64:145–156.
JACOBSON, H. A., J. C. KROLL, R. W. BROWNING, B. H. KOERTH, AND
M. H. CONWAY. 1997. Infrared-triggered cameras for censusing
white-tailed deer. Wildlife Society Bulletin 25:547–556.
JOHNSON, M. S., AND D. R. CHAFFEY. 1973. An inventory of the
Chiquibul Forest Reserve, Belize. Land resource study no. 14. Land
Resources Division, Overseas Development Administration, Surrey,
United Kingdom.
KARANTH, K. U. 1995. Estimating tiger (Panthera tigris) populations
from camera-trap data using capture–recapture models. Biological
Conservation 71:333–338.
KARANTH, K. U. 1999. Counting tigers with confidence. Pp. 350–353
in Riding the tiger: tiger conservation in human-dominated
landscapes (J. Seidensticker, S. Christie, and P. Jackson, eds.).
Cambridge University Press, Cambridge, United Kingdom.
KARANTH, K. U., AND J. D. NICHOLS. 1998. Estimation of tiger
densities in India using photographic captures and recaptures.
Ecology 79:2852–2862.
KAWANISHI, K., AND M. E. SUNQUIST. 2004. Conservation status of
tigers in a primary rainforest of Peninsular Malaysia. Biological
Conservation 120:329–344.
KELLY, M. J. 2003. Jaguar monitoring in western Belize. Caribbean
Geography 13:19–32.
LAUNDRE, J., AND T. W. CLARK. 2003. Managing puma hunting in the
western United States: through a metapopulation approach. Animal
Conservation 6:159–170.
LINDZEY, F. G., W. D. VAN SICKLE, B. B. ACKERMAN, D. BARNHURST,
T. P. HEMKER, AND S. P. LANG. 1994. Cougar population dynamics
in southern Utah. Journal of Wildlife Management 58:619–624.
LINKIE, M., G. CHAPRON, D. J. MARTYR, J. HOLDEN, AND N. LEADER-
WILLIAMS. 2006. Assessing the viability of tiger subpopulations in
a fragmented landscape. Journal of Applied Ecology 43:576–586.
LOGAN, K. A., AND L. L. IRWIN. 1985. Mountain lion habitats in the Big
Horn Mountains, Wyoming. Wildlife Society Bulletin 13:257–262.
LOGAN, K. A., AND L. L. SWEANOR. 2001. Desert puma: evolutionary
ecology and conservation of an enduring carnivore. Island Press,
Washington, D.C.
MAFFEI, L., E. CUELLAR, AND A. NOSS. 2004. One thousand jaguars
(Panthera onca) in Bolivia’s Chaco? Camera trapping in the Kaa-
Iya National Park. Journal of Zoology (London) 262:295–304.
MAFFEI, L., AND A. J. NOSS. 2008. How small is too small? Camera
trap survey areas and density estimates for ocelots in the Bolivian
Chaco. Biotropica 40:71–75.
MAFFEI, L., A. J. NOSS, E. CUELLAR, AND D. RUMIZ. 2005. Ocelot (Felispardalis) population densities, activity, and ranging behavior in the
416 JOURNAL OF MAMMALOGY Vol. 89, No. 2

dry forests of eastern Bolivia: data from camera trapping. Journal of
Tropical Ecology 21:349–353.
MEDELLIN, R. A., C. CHETKIEWICZ, A. RABINOWITZ, K. H. REDFORD, E.
SANDERSON, AND A. TABER. 2000. Jaguars in the new millennium. A
status assessment, priority detection and recommendation for the
conservation of jaguars in the Americas. Universidad Nacional
Autonoma de Mexico and Wildlife Conservation Society, Distrito
Federal, Mexico.
NICHOLS, J. D., AND K. U. KARANTH. 2002. Statistical concepts:
estimating absolute densities of tigers using capture–recapture
sampling. Pp. 121–137 in Monitoring tigers and their prey: a manual
for researchers, managers and conservationists in tropical Asia (K.
U. Karanth and J. D. Nichols, eds.). Centre for Wildlife Studies;
Bangalore, India.
NOSS, A. J., M. J. KELLY, H. B. CAMBLOS, AND D. I. RUMIZ. 2006.
Pumas y jaguares simpatricos: datos de trampas-camara en Bolivia
y Belize. Pp. 229–237 in Proceedings of the 5th Congress,
Manejo de Fauna Silvestre en Amazonia y Latinoamerica
(MEMORIAS) (E. Cabrera, C. Mercolli, and R. Resquin, eds.).
Convention on International Trade in Endangered Species (CITES)
Fund. Moises Bertoni, University of Florida.
NOVACK, A. J., M. B. MAIN, M. E. SUNQUIST, AND R. F. LABISKY. 2005.
Foraging ecology of jaguar (Panthera onca) and puma (Puma
concolor) in hunted and non-hunted sites within the Maya
Biosphere Reserve, Guatemala. Journal of Zoology (London)
267:167–178.
NOWELL, K., AND P. JACKSON (EDS.). 1996. Status, survey and
conservation action plan, wild cats. IUCN, Gland, Switzerland.
O’BRIEN, T. G., H. T. WIBISONO, AND M. F. KINNAIRD. 2003.
Crouching tigers, hidden prey: status of Sumatran tigers in the
Bukit Barisan Selatan National Park, Sumatra, Indonesia. Animal
Conservation 6:131–139.
OTIS, D. L., K. P. BURNHAM, G. C. WHITE, AND D. R. ANDERSON. 1978.
Statistical inference from capture data on closed animal populations.
Wildlife Monographs 62:1–135.
PENN, M. G., D. A. SUTTON, AND A. MONRO. 2004. Vegetation of the
Greater Maya Mountains, Belize. Systematics and Biodiversity
2:21–44.
RABINOWITZ, A. R., AND B. G. NOTTINGHAM. 1986. Ecology and
behaviour of the jaguar (Panthera onca) in Belize, Central America.
Journal of Zoology (London) 210:149–159.
REXSTAD, E., AND K. P. BURNHAM. 1991. User’s guide for interactive
program CAPTURE: abundance estimation of closed animal
populations. Colorado State University, Fort Collins.
SCHALLER, G. B., AND P. G. CRAWSHAW. 1980. Movement patterns of
jaguar. Biotropica 12:161–168.
SCOGNAMILLO, D., I. E. MAXIT, M. E. SUNQUIST, AND J. POLISAR. 2003.
Coexistence of jaguar (Panthera onca) and puma (Puma concolor)
in a mosaic landscape in the Venezuelan Llanos. Journal of Zoology
(London) 259:269–279.
SEIDENSTICKER, J. C., M. G. HORNOCKER, W. V. WILES, AND J. P.
MESSICK. 1973. Mountain lion social organization in the Idaho
Primitive Area. Wildlife Monographs 35:1–60.
SILVER, S. C., ET AL. 2004. The use of camera traps for estimating
jaguar Panthera onca abundance and density using capture/
recapture analysis. Oryx 38:148–154.
SMALLWOOD, K. S. 1997. Interpreting puma (Puma concolor)
population estimates for theory and management. Environmental
Conservation 24:283–289.
SOISALO, M. K., AND M. C. CAVALCANTI. 2006. Estimating the density
of a jaguar population in the Brazilian Pantanal using camera-traps
and capture–recapture sampling in combination with GPS radio-
telemetry. Biological Conservation 129:487–496.
SOKAL, R. R., AND F. J. ROHLF. 1995. Biometry: the principles and
practice of statistics in research. 3rd ed. W. H. Freeman and
Company, New York.
SUNQUIST, M., AND F. SUNQUIST. 2002. Wild cats of the world.
University of Chicago Press, Chicago, Illinois.
TABER, A. B., A. J. NOVARO, N. NERIS, AND F. H. COLEMAN. 1997. The
food habits of sympatric jaguar and puma in the Paraguayan Chaco.
Biotropica 29:204–213.
TROLLE, M., AND M. KERY. 2003. Estimation of ocelot density in the
Pantanal using capture–recapture analysis of camera-trapping data.
Journal of Mammalogy 84:607–614.
TROLLE, M., A. J. NOSS, E. DE S. LIMA, AND J. C. DALPONTE. 2007.
Camera-trap studies of maned wolf density in the Cerrado and the
Pantanal of Brazil. Biodiversity and Conservation 16:1197–1204.
WALLACE, R. B., H. GOMEZ, G. AYALA, AND F. ESPINOZA. 2003.
Camera trapping for jaguar (Panthera onca) in the Tuichi Valley,
Bolivia. Mastozoological Neotropical 10:5–11.
WHITE, G. C., D. R. ANDERSON, K. P. BURNHAM, AND D. L. OTIS. 1982.
Capture–recapture and removal methods for sampling closed
populations. Los Alamos National Laboratory, Los Alamos, New
Mexico.
WILSON, K. R., AND D. R. ANDERSON. 1985. Evaluation of a nested grid
approach for estimating density. Journal of Wildlife Management
49:675–678.
WRIGHT, A. C. S., D. H. ROMNEY, R. H. ARBUCKLE, AND V. E. VIAL.
1959. Land in British Honduras. Colonial Research Publication,
Her Majesty’s Service Office, London, United Kingdom.
YANEZ, J., J. C. CARDENAS, P. GEZELLE, AND F. M. JAKSIC. 1986. Food
habits of the southernmost mountain lions (Felis concolor) in South
America: natural versus livestocked range. Journal of Mammalogy
67:604–606.
Submitted 8 December 2006. Accepted 7 September 2007.
Associate Editor was Gerardo Ceballos.
APPENDIX IProtocol to identify individual pumas with camera-trap photography
for density estimation.
In the field.—Deploying the camera traps in the field can be done in
the same way as currently done to survey for jaguars, namely paired
camera traps by the side of roads, trails, or where the animal is
expected to walk through, installed 30–40 cm above the ground, and
programmed to be active 24 h/day. If you also are targeting smaller
animals such as ocelots, we suggest putting cameras at the lower
height. Cameras should be set at a distance of 2–3 m from the spot
where the animal is expected to pass. As with jaguars, camera traps
should be set 2–3 km apart and we recommend that the polygon
formed by all the cameras be at least 50 km2. If home ranges for
pumas in the study area are known, then the camera-trap survey should
seek to encompass a minimum area 4 times greater than the average
annual home range (Maffei and Noss 2008). If home-range data are
not available, researchers should conduct a preliminary survey and
adjust (usually increase) the sampled area if individual animals are
recaptured at stations located at the opposite extremes of the sampled
area or if the home range (minimum convex polygon) of an animal
covers .30% of the sampled area. Cameras should be deployed in the
field for no more than 3 months to fulfill the condition that the
population be closed during the survey period.
April 2008 417KELLY ET AL.—PUMA DENSITIES VIA CAMERA TRAPS

In the laboratory.—
1. Photographs of pumas must be as clear as possible, printed in
color on matte photographic paper at least 10 � 15 cm. In cases
where the animal is relatively far from the camera, the laboratory
should enlarge the animal itself rather than developing the entire
negative. The laboratory also can adjust the contrast and
brightness in order to clarify any markings that individual pumas
may have.
2. Every photograph should be labeled with the location, date, and
time information before starting to identify individuals. Multiple
photos of the same individual by the same pair of cameras should
be grouped 1st.
3. To identify individuals the animals that have clear and distinctive
marks (a large recent scar on the body, an injured eye, a torn ear,
a twisted or kinked tail, etc.) should be separated 1st. We have
found the most useful characteristics to be the following:
— Wounds or scars: in some cases fresh wounds are visible (on
shoulders, flanks, face, or legs) that, over time, heal but
often leave evident scars that serve to confirm the identity of
the individual. Injured eyes also are detectable in camera-
trap photographs. When using wounds or scars to identify
animals it is important to take into account the chronological
order of the photographs because the scars fade rapidly or
may be absent in the 1st pictures of the animal.
— Lingering juvenile spotting on the body: the sharp patterns
of spots or blotches on cubs linger into adulthood in some
cases, faded or more subtle, but constant within a 2- to 3-
month survey period.
— Tail kinks, end tuft, and white markings: pumas may present
recognizable kinks in their tails, with the tip bent or curled
markedly up or down; the size and coloration of the tail tuft
also varies; and finally, the underside of the tail may be
a uniform color or present white patches. When walking
calmly, the overall shape and form of the tail remains
consistent.
— Sex can often be determined from the photographs, with the
testicles of males especially apparent.
Additional subtle characteristics may help to sort the remaining
photos, but are generally more difficult to detect, are more variable in
camera-trap photographs, or both:
— Patterns of spotting: the inner forearms as well as hind limbs
present variable patterns of dark markings on lighter fur;
pumas also may present marks or color patterns on their
necks.
— Ear nicks, tears, and markings: some animals present tears
or notches in 1 or both ears, whereas the white markings on
the back of the ears also vary across individuals.
— Overall coat color, body structure, and head shape: coat
color may vary from light to dark (although color will be
affected by natural or artificial lighting and by any
adjustments made in the photo printing process), body
structure from relatively heavy to thin (independent of
whether the animal has recently eaten), and head shape and
size relative to ear size.
Because identifying characteristics can be somewhat subjective, we
recommend that at least 2 persons (with experience in camera trapping
and examining photographs) independently and without communica-
tion with the other observer, classify all the photos and compare
results. After this point it is useful to discuss any differences in order
to reach a consensus. Each observer may detect different character-
istics; therefore, working together helps to ensure that a larger number
of identifying characteristics are considered. Practice also is required
to train the eye to focus on the determining characteristics rather than
less reliable markers. Finally, identification of pumas involves an
ability to solve puzzles where the visibility of the marks may vary
according to body position, camera angle, lighting conditions, and so
on. The relatively small number of individuals present at each site also
aids identification, because fewer distinguishing characteristics are
required to distinguish few individuals. Multiple photos of the same
animal under different conditions and from different angles also assist
in confirming the identification of poor-quality photographs.
It is important to recognize that, in contrast to jaguars and ocelots, it
is unlikely that photographs of pumas from camera-trapping efforts
over long time periods or across different years can be classified.
Several characteristics are not permanent: scars can heal definitively
and disappear, spots in the inner part of the legs can fade with time, the
shape of the body can change with seasonal condition or reproductive
status, and so on. Within a survey, however, pumas are highly
identifiable.
Quality of photos can be improved in the field by situating the
cameras appropriately in relation to the location where the puma is
likely to pass: at a distance of 2–3 m. If cameras are too close only
partial body photos are acquired, the photos may be out of focus or
washed out by the flash, or both. If cameras are too far away the
animals are small relative to the negative frame, and the flash may not
illuminate the animal sufficiently. Position cameras perpendicular to
the point where the animal is expected to pass (identification is more
difficult in photos where the animal is angled toward or away from the
camera). Choose sites that provide a natural funnel or create a funnel
with downed vegetation or debris that directs the animal into a position
in front of the camera. Quality of photos also can be improved in the
laboratory during the printing process, as described above.
Identifications also can be improved if photos are acquired of both
sides of the animal as it passes, that is, if each of the paired cameras
functions properly. Thus, a larger set of characteristics visible on each
side of any new animal can be compared with those from previously
identified individuals. The tail is particularly useful as an identifying
characteristic because kinks and the size and shape of the end tuft look
similar from either side of the animal, thus it can help in cases when
only a single photo is acquired. This makes it especially important to
check cameras frequently for proper function in the field. We
recommend checking cameras every 10 days, if possible.
For conservation purposes, conservative estimates of abundance are
preferable, therefore we recommend ‘‘lumping’’ rather than ‘‘splitting’’
in cases when photos are difficult to assign. Poor-quality photos can be
discarded from the analysis outright, but if they are included then they
should be assigned tentatively to already-identified individuals as
possible recaptures rather than proposed as new individuals. Increasing
the number of individuals identified will increase the estimate of
population density, whereas increasing the number of recaptures of
a smaller set of individuals will often not significantly affect the
abundance estimated. Generally the majority of photos will be
relatively easy to assign to a small number of individuals, but a small
number of photos will be difficult to assign. Additional photos should
be checked 1 by 1 against all the previously identified individuals, and
only classified as a new individual if 2 or more key characteristics differ.
418 JOURNAL OF MAMMALOGY Vol. 89, No. 2