Annual Report 2019 - PUMA AR 2020
284
PREPARE Annual Report 2019 TO PERFORM EP PAR EPA PREPARE PA
-
Upload
khangminh22 -
Category
Documents
-
view
0 -
download
0
Transcript of Annual Report 2019 - PUMA AR 2020

1
PREPARE
Annual Report 2019
TO PERFORMPREPARE PREPARE PREPARE PREPARE PREPARE

ABOUT PERFORMANCE
04 TO OUR SHAREHOLDERS
05 CEO Letter
08 Report by the Supervisory Board
TABLE OF CONTENTS
ONE PLANET PERFORMANCE
47 SUSTAINABILITY
48 Introduction
49 “We want to embed sustainability into all of our products.” – Foreword Anne-Laure Descours, CSO
51 PUMA Sustainability Strategy 10FOR20
62 Social Aspects
68 Environment
84 Health and Safety
86 Governance
88 Summary and new Targets for 2025
91 GRI Index
107 Deloitte Assurance Statement
BRAND PERFORMANCE
12 OUR BRAND AND PRODUCTS
13 “We don’t make our brand – our consumers do.” – Interview Adam Petrick
15 Teamsport
18 Running and Training
21 Basketball
24 Golf
26 Motorsport
28 Sportstyle
31 Accessories
32 OUR STORES
ONE TEAM PERFORMANCE
35 OUR PEOPLE
36 Prepare for Growth
39 Culture
44 Personal Journey
2
Annual Report 2019 ↗ TABLE OF CONTENTS

PURE PERFORMANCE
109 COMBINED MANAGEMENT REPORT FOR THE FINANCIAL YEAR 2019
110 Overview 2019
113 PUMA Group Essential Information
113 Commercial Activities and Organizational Structure
114 Targets and Strategy
116 Product Development and Design
118 Sourcing
120 Employees
123 Management System
125 Information regarding the Non-financial Report
126 Economic Report
126 General Economic Conditions
127 Sales
130 Regional Development
132 Results of Operations
137 Dividends
138 Net Assets and Financial Position
142 Cash Flow
146 Statement regarding the Business Development and the
Overall Situation of the Group
147 Comments on the German GAAP Financial Statements of PUMA SE
151 Further Information
151 Information concerning Takeovers
154 Compensation Report
163 Corporate Governance Report including the Statement on
Corporate Governance in accordance with § 289f and § 315d HGB
172 Risk and Opportunity Report
179 Outlook
181 CONSOLIDATED FINANCIAL STATEMENTS
182 Consolidated Statement of Financial Position
184 Consolidated Income Statement
185 Consolidated Statement of Comprehensive Income
186 Consolidated Statement of Cash Flows
188 Statement of Changes in Equity
190 Notes to the Consolidated Financial Statements
268 Declaration by the Legal Representatives
269 Independent Auditor’s Report
276 ADDITIONAL INFORMATION
277 The PUMA Share
280 PUMA Year-on-Year Comparison
282 PUMA Group Development
284 Imprint
277 The PUMA Share
280 PUMA Year-on-Year Comparison
282 PUMA Group Development
284 Imprint
TABLE OF CONTENTS
3
Bjørn Gulden, Chief Executive Officer (CEO)
To our Shareholders
ABOUT PERFORMANCE
4
Annual Report 2019 ↗ TO OUR SHAREHOLDERS
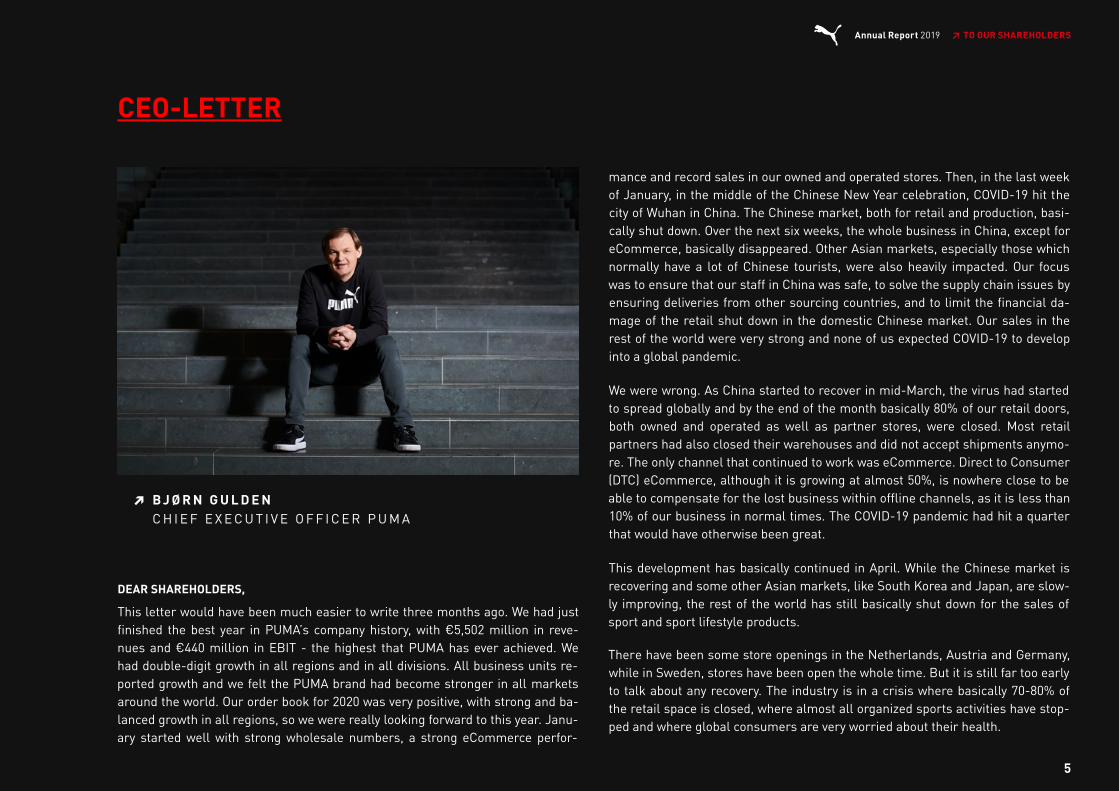
CEO-LETTER
DEAR SHAREHOLDERS,
This letter would have been much easier to write three months ago. We had justfinished the best year in PUMA’s company history, with €5,502 million in reve-nues and €440 million in EBIT - the highest that PUMA has ever achieved. Wehad double-digit growth in all regions and in all divisions. All business units re-ported growth and we felt the PUMA brand had become stronger in all marketsaround the world. Our order book for 2020 was very positive, with strong and ba-lanced growth in all regions, so we were really looking forward to this year. Janu-ary started well with strong wholesale numbers, a strong eCommerce perfor-
mance and record sales in our owned and operated stores. Then, in the last weekof January, in the middle of the Chinese New Year celebration, COVID-19 hit thecity of Wuhan in China. The Chinese market, both for retail and production, basi-cally shut down. Over the next six weeks, the whole business in China, except foreCommerce, basically disappeared. Other Asian markets, especially those whichnormally have a lot of Chinese tourists, were also heavily impacted. Our focuswas to ensure that our staff in China was safe, to solve the supply chain issues byensuring deliveries from other sourcing countries, and to limit the financial da-mage of the retail shut down in the domestic Chinese market. Our sales in therest of the world were very strong and none of us expected COVID-19 to developinto a global pandemic.
We were wrong. As China started to recover in mid-March, the virus had startedto spread globally and by the end of the month basically 80% of our retail doors,both owned and operated as well as partner stores, were closed. Most retailpartners had also closed their warehouses and did not accept shipments anymo-re. The only channel that continued to work was eCommerce. Direct to Consumer(DTC) eCommerce, although it is growing at almost 50%, is nowhere close to beable to compensate for the lost business within offline channels, as it is less than10% of our business in normal times. The COVID-19 pandemic had hit a quarterthat would have otherwise been great.
This development has basically continued in April. While the Chinese market isrecovering and some other Asian markets, like South Korea and Japan, are slow-ly improving, the rest of the world has still basically shut down for the sales ofsport and sport lifestyle products.
There have been some store openings in the Netherlands, Austria and Germany,while in Sweden, stores have been open the whole time. But it is still far too earlyto talk about any recovery. The industry is in a crisis where basically 70-80% ofthe retail space is closed, where almost all organized sports activities have stop-ped and where global consumers are very worried about their health.
B J Ø R N G U L D E N➔
C H I E F E X E C U T I V E O F F I C E R P U M A
5
Annual Report 2019 ↗ TO OUR SHAREHOLDERS
Our PUMA mantra to manage this difficult situation has been from the beginning“To manage the crisis in the short term without hindering the mid-termmomentum”.
This means to first survive this phase of little revenue, then recover and stabilizethe business in the markets and channels that are opening up again, and thenfinally utilize PUMA’s momentum to achieve growth again for 2021.
In order to get through this crisis, we are working closely with all our partnerssuch as retailers, suppliers, landlords, banks and authorities. We are reducingcosts and cash outflows wherever possible as well as securing additional finan-cing to ensure that we, together with our partners, can sustain the value chain inthis period. Suspending dividend payments and suspending the ManagementBoard’s salary by 100% for now as well as reducing salaries of our senior ma-nagement between 25% -35% are essential measures to achieve additional fi-nancing given the circumstances.
I am very impressed by how all of our employees and most of our partners havecooperated in these difficult weeks. Our goal is to survive this crisis together.
We are currently creating and distributing a lot of digital content to stay connec-ted with our customers. This also increases the traffic to our PUMA eCommerceplatforms. We are also in the process of finalizing the Spring/ Summer 2021 pro-duct range, where we will ensure that we can sell in the collections digitally to allour retail partners. We have not reduced investment in product development, andwe will present full new ranges in all categories and all divisions both for Spring/Summer 2021 and Autumn/ Winter 2021.
I am convinced that our industry will be very strong after the crisis. People willprobably do even more sports than before. Health and a healthy lifestyle will bemore important and the impact of global sports brands on global fashion will, inmy opinion, be even greater than before. The crisis will change the landscape,but those brands that survive will be in a relatively stronger position than before.
And PUMA will be strong. The fact that 2019 was the best year in PUMA‘s historyhas put us in a better position to manage this crisis. All regions and all productdivisions contributed with a double-digit sales growth, which underlines the on-going successful execution of our FOREVER FASTER strategy and demonstrates
PUMA’s enormous potential. On our way towards becoming the Fastest SportsBrand in the world, we have further refined our strategic priorities. In addition tobrand heat and desirability, a competitive product range, a leading offer for wo-men, improved quality of distribution, organizational speed and building oursports performance credibility in the US through our re-entry into Basketball, wehave now added communicating sustainability and a focus on local relevance astwo further strategic objectives.
Sustainability has been deeply embedded in our processes and is a big part ofhow we work every day. We have been acting in a sustainable way, but have notbeen vocal enough about it. For consumers worldwide, sustainability has becomemore important, so we will also make our actions more visible. In 2019, we alrea-dy reached nine out of our 10FOR20 sustainability targets and developed our nextset of targets for 2025, which we are announcing in this report.
In February, we launched a sportswear collection made from recycled plastic incollaboration with recycling company First Mile. The shoes and apparel are madefrom recycled yarn that is manufactured from collected plastic bottles.
Local relevance is key in our industry and is gaining importance every day. Diffe-rent countries have different sports that people follow and participate in. For us,it is key to be a part of that everywhere. One of the best examples of local rele-vance is our partnership with Virat Kohli, the captain of the Indian cricket team.Cricket is by far the most relevant sport in India and by partnering with Virat, wegain credibility as a sports brand in the Indian market. Netball and AustralianRules Football are relevant sports in Australia and New Zealand. Rugby plays amajor role in South Africa, whereas Handball is followed in vast parts of Europe.
In PUMA’s first full NBA Basketball season after our comeback in 2018, TorontoRaptors shooting guard Danny Green was the first PUMA athlete to win the NBAFinals since Isiah Thomas in 1990. With the support of JAY-Z, our Creative Direc-tor for basketball, we continued to launch additional performance basketballshoes and signed new highly talented NBA players such as RJ Barrett (New YorkKnicks), Kyle Kuzma (Los Angeles Lakers) and Marcus Smart (Boston Celtics).
In 2019, PUMA further improved its brand heat and desirability among consu-mers and accounts. We continued to work with relevant influencers on a globalas well as local basis and further expanded our sports endorsements, such as
6
Annual Report 2019 ↗ TO OUR SHAREHOLDERS
entering into partnerships with the football clubs Manchester City, and ValenciaCF.
In track and field, the World Athletics Championships in Doha were an importantevent for our 115 athletes and 12 national federations with Norwegian hurdlerKarsten Warholm successfully defending his title over 400 metres hurdles. InMotorsport, we signed a long-term agreement with Porsche as well as a separa-te collaboration with Porsche Design to create premium lifestyle products.
We added another bestseller to our Footwear offer, the RALPH SAMPSON, aclassic basketball silhouette. This underpins that we are generating credibility inbasketball, which we have leveraged into other categories. The RS-X-franchisecontinued to resonate well with our customers, as did the CALI franchise, pre-sented by PUMA’s ambassador Selena Gomez. Other key styles included thePUMA FUTURE football boot and running & training shoes based on our LQDCELL and HYBRID technology platforms. In the fourth quarter, we launched theRS-X3, CALI SPORT and the RIDER, which is inspired by one of the jogging shoeslaunched in the 1980s Creating a leading product offer for women remains apriority for PUMA and we have capitalized on this growing segment in the globalsportswear market. We continue to see more and more women taking up sportsworldwide. Athletic wear has long made its way into everyday outfits. “Where thegym meets the runway” continues to be the theme for our initiatives in the wo-men´s segment.
PUMA improved the quality of its distribution and expanded its presence in keysports performance and Sportstyle accounts around the world, in part by streng-thening our relationships with key retailers by being a flexible and service-orien-ted business partner. We also upgraded our owned-and-operated retail store
network with further refurbishments and in August, we opened our New Yorkflagship store on Fifth Avenue.
We continued to invest in our distribution and logistics network. Our new highlyautomated multichannel distribution center in Geiselwind, Germany is expectedto be operational in early 2021 as planned. A new, also highly automated distribu-tion hub just outside of Indianapolis will enter operations later this year.
There is no question that the issues and uncertainties associated with the COVID-19 pandemic present major challenges for PUMA and will have an impact on ourshort-term performance. However, there will be a time after COVID-19 and webelieve strongly that the future of the sporting goods industry and for PUMA, inparticular, is bright. Positive underlying trends such as increasing sports partici-pation and more casual wardrobe remain steady or will even accelerate as a re-sult of the crisis. I am extremely proud of our employees and for their spirit withwhich they are working through this crisis. I also recognize that for you as share-holders this is a tough time. Therefore, I want to thank you, our shareholders, foryour continuing support, your confidence and above all for your trust.
Bjørn GuldenChief Executive Officer PUMA
7
Annual Report 2019 ↗ TO OUR SHAREHOLDERS
.
REPORT BY THE SUPERVISORY BOARD
DEAR SHAREHOLDERS,
PUMA closes the year 2019 with record net sales and is growing faster in manyareas, beating both the markets and its competitors. The positive development ofall key performance indicators is a remarkable success – even without conside-ring the background of increasing global uncertainties. The 2019 financial yearhas begun with a change in the Management Board. Anne-Laure Descours wasappointed Chief Sourcing Officer. Especially in times when production sites are atthe centre of trade wars, it is of great advantage for PUMA to have in Anne-LaureDescours an experienced expert who is located in Hong Kong and who makes thenecessary decisions, if needed in coordination with our production partners. Onefocus of the Supervisory Board's work was the discussion and decision on theshare split, which intended to make PUMA shares more attractive for allinvestors.
In the financial year 2019, the Supervisory Board has exercised all its duties un-der the law, statutes and company rules. The Supervisory Board has dealt exten-sively with the status and the development of PUMA and has regularly advisedand supervised the Management Board in its management of the Company.
In this regard, the Supervisory Board has in its four regular meetings discussedand resolved on the Company’s business policies; all relevant aspects of corpo-rate development and corporation planning; the Company’s economic situation,including its net assets, financial position and results of operations; and all keydecisions for the Group. The Management Board has informed the SupervisoryBoard regularly, comprehensively, and in a timely manner in written and verbalform about the implementation of all decisions and about all major businesstransactions. Furthermore, in 2019 two extraordinary and a constitutive meetingof the Supervisory Board took place. Urgent matters were decided using electro-nic means of communication. All members participated in drawing up the reso-lutions. Where necessary, representatives of the shareholders and employeesheld separate preliminary discussions prior to the meetings.
Plenary SupervisoryBoard
Attendance at meetings(referring to regular and extraordinarymeetings)
Attendancein %
Jean-François Palus 7/7 100
Thore Ohlsson 7/7 100
Héloïse Temple-Boyer (since18.4.2019) 4/4 100
Fiona May (since 18.4.2019) 4/4 100
Jean-Marc Duplaix (until18.4.2019) 3/3 100
Béatrice Lazat (until 18.4.2019) 3/3 100
Martin Köppel 7/7 100
Bernd Illig 7/7 100
The Supervisory Board discussed in detail all of the Company’s key businesstransactions, based on the reports by the Management Board and the commit-tees, and presented its own ideas. The Management Board has provided the Su-
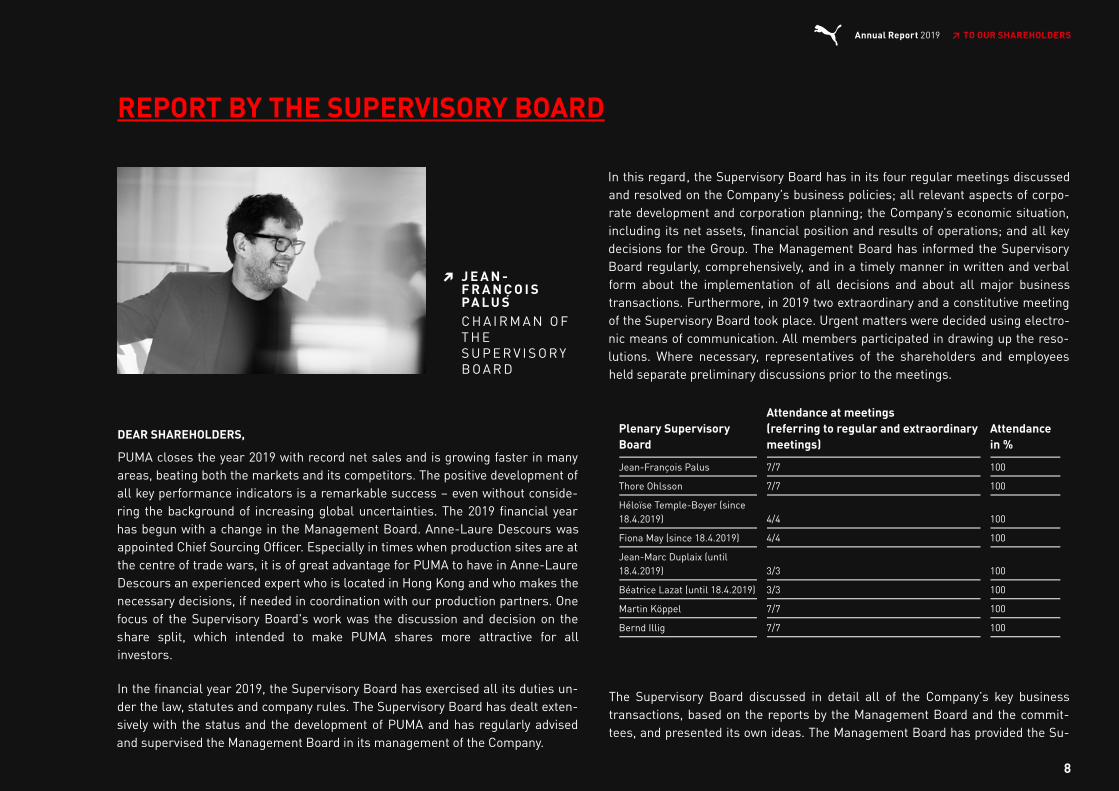
J E A N -F R A N Ç O I SPA L U S
➔
C H A I R M A N O FT H ES U P E R V I S O R YB O A R D
8
Annual Report 2019 ↗ TO OUR SHAREHOLDERS

pervisory Board with detailed information on any deviations of the business per-formance from the expected figures, both in writing and orally. The SupervisoryBoard verified all of these explanations using the supporting documents, whichwere always submitted in good time before the meetings. The Supervisory Boardwas involved in all key decisions at an early stage. In addition, the Chairman ofthe Supervisory Board maintained, and continues to maintain, regular verbal orwritten contact with the CEO and keeps himself informed of all major develop-ments. Overall, these discussions did not give rise to any doubts that the Ma-nagement Board were managing the Group in anything other than a lawful andproper manner.
MAIN ADVISORY FOCUS
In the financial year 2019, the focus was primarily on the following topics: changein the Management Board with the resignation of Lars Radoor Sørensen as ChiefOperating Officer and appointment of Anne-Laure Descours as Chief SourcingOfficer; audit and approval of the 2018 financial statements; setting the agendafor the Annual General Meeting of April 18, 2019; ongoing business and sales de-velopment; the Group’s financial position; business and budget planning for 2019and medium-term planning, including investments; further improvements of thecompliance management and the internal control systems as well as materiallitigation in the Group; and a proposal to the Annual General Meeting on the elec-tion of Héloïse Temple-Boyer and Fiona May to the Company's SupervisoryBoard.As every year, the Personnel Committee and the Supervisory Board set the targetachievements for the variable remuneration of the members of the ManagementBoard regarding 2018, and decided on the bonus for the members of the Ma-nagement Board and the targets for the remuneration of the members of theManagement Board in 2019.The share split was a central topic of discussion for the Supervisory Board in thefirst quarter of 2019, as the price of PUMA shares had risen considerably in re-cent years and PUMA shares were no longer affordable for the PUMA consumer.The share split was intended to bring the shares closer to other stocks in theMDAX and make the shares more attractive to a broader investing public.
CONFLICTS OF INTEREST
The members of the Supervisory Board are required to disclose any conflicts ofinterest immediately. In the past year, no such disclosures were made.
COMMITTEES
The Supervisory Board has established three committees to perform its duties:The Personnel Committee, the Audit Committee and the Nominating Committee.The Personnel Committee and the Nominating Committee each comprise twoshareholder representatives and one employee representative. The NominatingCommittee is composed only of shareholder representatives. The composition ofthe committees can be found in the notes to the consolidated financial state-ments. The Supervisory Board receives regular reports on their work.
PERSONNEL COMMITTEE
The Personnel Committee has the task of preparing the conclusion and amend-ment of employment contracts with the members of the Management Board andestablishing policies for Human Resources and personnel development. It metthree times in 2019. The discussions focused on proposals for determining thebonus payments for the members of the Management Board. In addition, thePersonnel Committee dealt with the definition of the targets for 2019 and discus-sed the personnel composition of the Management Board. The SupervisoryBoard was given corresponding recommendations for resolution.
9
Annual Report 2019 ↗ TO OUR SHAREHOLDERS
AUDIT COMMITTEE
The Audit Committee held four regular meetings in financial year 2019. In parti-cular, the Audit Committee is responsible for the annual and consolidated finan-cial statements, the quarterly reports and the half-yearly financial report, ac-counting issues and monitoring the accounting process, the effectiveness of theinternal control system, risk management and the risk management system, in-ternal audits, and compliance management; and the statutory audit of the finan-cial statements, with particular regard to the required independence of the statu-tory auditors, issuing the audit mandate to the statutory auditors, defining theaudit areas of focus, any additional services to be performed by the auditors, andthe fee agreement. In addition, heads of Group functions were available for re-ports and questions on individual agenda items at committee meetings.
NOMINATING COMMITTEE
The Nominating Committee has the task of proposing suitable candidates to theSupervisory Board for its election proposals to the Annual General Meeting. Itheld one meeting in the past fiscal year. The Nominating Committee recommen-ded that the Supervisory Board propose to the Annual General Meeting on April18, 2019 that Ms. Héloïse Temple-Boyer (Group Managing Director of ArtemisS.A.S., Paris/France) and Ms. Fiona May (Independent Management Consultant,Calenzano/Italy) be proposed for election to the Supervisory Board.
CORPORATE GOVERNANCE
As in previous years, the Supervisory Board addressed current developments inthe German Corporate Governance Code (GCGC) in the financial year 2019. TheGCGC contains essential statutory regulations and recommendations for the ma-nagement and supervision of listed companies and standards for responsiblecorporate governance. The corporate governance standards have long been apart of the corporate routine.
Pursuant to Paragraph 3.10 of the GCGC, the Supervisory Board reports on cor-porate governance in the Corporate Governance Report. With very few excepti-ons, the Company satisfies the requirements of the GCGC and explains thesesystem-related exceptions in the Statement of Compliance. The Statement ofCompliance of November 9, 2019 is available to our shareholders at any time onthe Company’s website under http://about.puma.com/de/investor-relations/cor-porate-governance/declaration-of-compliance/.
ANNUAL FINANCIAL STATEMENTS ADOPTED
The annual financial statements for PUMA SE prepared by the ManagementBoard in accordance with German Commercial Code (Handelsgesetzbuch/HGB),the consolidated financial statements and the combined management report forPUMA SE and the PUMA Group, each for the financial year 2019, prepared in ac-cordance with Section 315a HGB on the basis of the International Financial Re-porting Standards (IFRS) have been audited by the statutory auditors, DeloitteGmbH Wirtschaftsprüfungsgesellschaft, Munich, who were appointed at the An-nual General Meeting on April 18, 2019 and commissioned by the SupervisoryBoard to audit the annual financial statements and the consolidated financialstatements and have been given an unqualified auditor’s opinion.
In their report, the statutory auditors conclude that PUMA’s institutionalized riskmanagement system, in accordance with Section 91(2) of the German Stock Cor-poration Act (Aktiengesetz/AktG), is capable of detecting at an early stage andcountering any developments that might jeopardize the continuity of the Compa-ny as a going concern. The Supervisory Board has been updated by the Manage-ment Board regularly on all relevant risks in this regard, in particular their as-sessments of market and procurement risks, financial risks (including currencyrisks) and organizational risks.
The accounting records, the audit reports from the statutory auditors and theManagement Board’s and Supervisory Board’s recommendation on the appro-priation of net profit were made available to all members of the SupervisoryBoard in a timely manner. At the meeting of the Audit Committee on February 18,2020 and at the subsequent Supervisory Board meeting held on the same day,the statutory auditors reported on the key results of their audit and discussedthem in detail with the Management Board and the members of the SupervisoryBoard. No discrepancies were detected.
The Supervisory Board reviewed in detail the annual financial statements, thecombined management report for PUMA SE and the PUMA Group, the Manage-ment Board’s and the Supervisory Board’s recommendation on the appropriationof net profit and the consolidated financial statements and raised no objections.In accordance with the recommendation of the Audit Committee, the SupervisoryBoard agreed with the results of the audit of both statements and approved theannual financial statements of PUMA SE and the consolidated financial state-
10
Annual Report 2019 ↗ TO OUR SHAREHOLDERS

ments for the 2019 financial year. The 2019 annual financial statements havethus been adopted.
The Management Board and the Supervisory Board resolved to propose to theAnnual General Meeting a distribution of a dividend of € 0.50 per dividend entit-led share for the financial year 2019. In this context, the liquidity situation of theCompany, the financing and the effects on the capital market were discussed. Atotal amount of around € 74.8 million will be paid out in dividends from PUMASE’s retained earnings. The remaining retained earnings of around € 85.9 millionwill be carried forward.
Finally, in its meeting on February 18, 2020, the Supervisory Board was presen-ted the first draft of the non-financial report in accordance with §§ 315c in con-junction with §§ 289c to 289e of the German Commercial Code (HGB) and thestate of data collection was discussed. As soon as the non-financial report is fi-nalised, it will be submitted to the Supervisory Board for approval and will be pu-blished on the website of the Company by April 30, 2020.
PERSONNEL CHANGES IN THE SUPERVISORY BOARD
Mr. Jean-Marc Duplaix (Chief Financial Officer (CFO) of Kering S.A., Paris/France)and Ms. Béatrice Lazat (Human Resources Director, Kering S.A., Paris, France)each resigned from their positions as members of the Supervisory Board ofPUMA SE effective April 18, 2019. On April 18, 2019, the Annual General Meetingelected Ms. Héloïse Temple-Boyer (Group Managing Director of Artemis S.A.S.,Paris, France) and Ms. Fiona May (Independent Management Consultant, Calenz-ano/Italy) as members of the Supervisory Board of PUMA SE. Their term of officeends – as do those of the other members of the Supervisory Board – at the endof the Annual General Meeting which decides on the discharge for the fiscal year2022.
PERSONNEL CHANGES IN THE MANAGEMENT BOARD
Mr. Lars Radoor Sørensen resigned from his office as member of the Manage-ment Board of PUMA SE with effect from January 31, 2019. Mr. Radoor Søren-sen's successor for IT and Logistics was Mr. Michael Lämmermann, CFO ofPUMA SE, with effect from February 1, 2019. Ms. Anne-Laure Descours was ap-pointed as Mr. Radoor Sørensen's successor for the Sourcing division with effectfrom February 1, 2019.
We would like to express our sincere thanks to all departing members of the Su-pervisory Board and Management Board for their work.
THANKS
We would like to express our gratitude and recognition to the ManagementBoard, the management teams at the Group companies, the Works Council andall our employees for their hard work and their outstanding cooperation in 2019.
Herzogenaurach, February 18, 2020
On behalf of the Supervisory Board
Jean-François PalusChairman
11
Annual Report 2019 ↗ TO OUR SHAREHOLDERS

Our Brand and Products
BRAND PERFORMANCE
13 “We don’t make our brand – our consumers do.” – Interview Adam Petrick
15 Teamsport
18 Running and Training
21 Basketball
24 Golf
26 Motorsport
28 Sportstyle
31 Accessories
Adam Petrick, Global Director Brand Marketing
12
Annual Report 2019 ↗ OUR BRAND AND PRODUCTS

“WE DON’T MAKE OUR BRAND – OUR CONSUMERS DO.”
In 2019, Adam Petrick, PUMA’s Global Director Brand Marketing, talked about PUMA’s brand strategy in The CMO Podcast by Jim Stangle.
Stangle led transformations on brands like Hershey, Lexus, Nestle, SC Johnson and Shire. He began to see a common thread that truly significant transforma-tion is born from authentically activating a brand’s higher purpose. In The CMO Podcast, he takes a unique look at the thought process and motivation of Mar-keting leaders.
This is a condensed excerpt of the entire podcast, which you can find here.
JIM: Adam, you have done what few have done. You have kept a 71-year-old brand relevant. You´ve made it a real Sportstyle brand, attracted amazing tal-ent like Jay-Z, Rihanna and Cara Delevingne, while competing with Adidas and Nike. What can we learn from what you´ve done to give this brand the energy, relevance, magnetism and growth?
ADAM: Right now is an interesting moment. In 2013, we were in really bad shape and we had to reinvent this brand. We knew that we had a great logo, a great history and great people. We developed a brand concept that reflected all of that and put it into perspective for where we wanted to go next. That was a great opportunity to take what I had learned from the previous 14 years about fash-ion, style, culture and the connection with the consumers and blend that with the longer-term mark of the PUMA brand, which is going back 71 years. PUMA has always competed in providing athletes with the gear that they need to per-form at their very best - from Maradona and Pelé up to Usain Bolt.
In this latest 15-year cycle, we went from being a sports brand to a culture fashion brand - and then we tried to marry those two. We had the opportunity to bring something together that was a performance brand, based on innovation and servicing athletes. This is the heart and soul of what we do, but we do it in a way that’s different from our competition. We said let’s start from sports, let’s go through creativity, fashion and culture and let’s talk about activism.
JIM: When did you know you were starting to turn the corner after 2013?
ADAM: We had some luck and some influential people. Nobody hates PUMA, and the brand awareness is high. We have the best logo, everybody knows and rec-ognizes it. When you have that heritage, people will take a risk. Rihanna was the first to take a risk on us. Having the conversation of whether somebody like her would work with PUMA was the turning point.
JIM: For your size, you’re punching above your weight in the sort of people you’re attracting. Do you think it’s that spirit of collaboration, openness and listening?
ADAM: Our philosophy is: We don’t make our brand, our consumers make our brand and by extension our ambassadors. We choose ambassadors based on who they are and on their values. If we just sign someone based on their Social Media KPIs such as the number of followers, that´s probably not going to work. I think it matters that we truly care, truly listen and truly go out of our way to do whatever they find interesting in our brand.
JIM: You are ceding control to people who also care?
ADAM: We were doing research, trying to figure out who these people are and if they are aligned from a value standpoint. If we think we can do the right thing together, then why not give them the keys? That’s important to us. The same
Adam Petrick, Global Director Brand Marketing
13
Annual Report 2019 ↗ OUR BRAND AND PRODUCTS

thing applies for our consumers. If they want to shoot a campaign for PUMA, we’ll give them a camera and they can send us the pictures and we’ll post them. This allows our audience to say: “I’m a part of the creation of this brand, I’m invested in it.”
JIM: We talked about brand purpose. What does that mean at PUMA?
ADAM: Our purpose was to be in a place where everybody who wants to play can play. This means we are open and allowing for everybody who wants to take part to do so. It also extends to the areas of being supportive of universal equal-ity and extending our values into places that other companies might not be comfortable going, because you’ve got to pick a side. If I can feel good about extending that purpose into a territory that might be risky, I don’t care. We go back a long way as a brand in trying to do the right thing. Those are powerful shoulders to stand on.
JIM: Tell me about your job! Your title is Global Director of Brand and Market-ing? How do you spend your time?
ADAM: I spend almost all day talking to my colleagues. My job is to inspire, to get people to be thinking the right way, to prevent mistakes. My day is getting up and get on the phone: phone calls, meetings, video conferences with Germany, text messaging simultaneously. It’s a lot of communication.
JIM: What have been your lessons in building this lifestyle brand?
ADAM: This idea that the brand itself is a long-term project, it’s never finished. PUMA for me personally is like this giant enormous sculpture and every day I come in with my little hammer and try to constantly refine and improve it. That’s a long-term view. And it has to start with a really strong sense of values. You have to know what you stand for and why you choose to operate in the way you do.
JIM: Anything else that would help others to learn from?
ADAM: We did focus on product and product creation. At that point, we had to invest more in technology and innovation. We were a style company, almost a “casual company.” We had to go back and revisit what the design aesthetic was and the ideas behind the product. A lot came from the idea that sports has to be at the center of everything. If you ground the product in something that is true to the brand, then you will yield something more consistent and meaningful over time. Attention has to be paid on the why of the product, that’s my advice.
JIM: How do you stay in touch with sports, culture, business? What are your habits?
ADAM: Staying in touch is about listening to our ambassadors, we want them to inform us. There are hundreds of athletes. Listen to people who aren’t in the offices and seeing what they think is important. Taking clues from that is valu-able. That’s a competitive advantage. My advice: Who do you have outside of your organization that’s telling you the truth?
14
Annual Report 2019 ↗ OUR BRAND AND PRODUCTS
TEAMSPORT
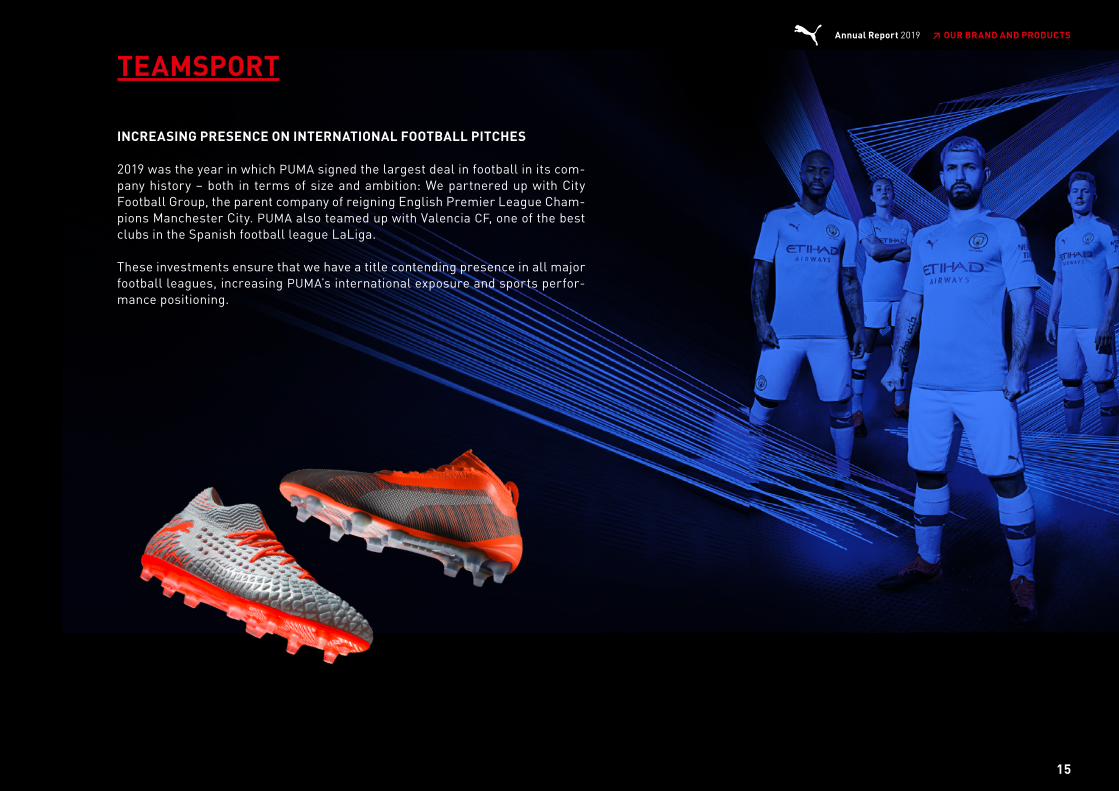
INCREASING PRESENCE ON INTERNATIONAL FOOTBALL PITCHES
2019 was the year in which PUMA signed the largest deal in football in its com-pany history – both in terms of size and ambition: We partnered up with City Football Group, the parent company of reigning English Premier League Cham-pions Manchester City. PUMA also teamed up with Valencia CF, one of the best clubs in the Spanish football league LaLiga.
These investments ensure that we have a title contending presence in all major football leagues, increasing PUMA’s international exposure and sports perfor-mance positioning.
15
Annual Report 2019 ↗ OUR BRAND AND PRODUCTS

We boosted our brand visibility in Spain even further by becoming the official match ball partner of LaLiga Santander and LaLiga 1|2|3. This means that all goals in one of the world’s strongest competitions are scored with PUMA’s LaLiga 1 football.
We also expanded our portfolio of national football teams, adding Egypt and Morocco to a total roster of twelve squads.
EXCELLENT BALL CONTROL IN ALL SITUATIONS
Our players performed well all year, showing off our key football boots, the FUTURE and the PUMA ONE. While the FUTURE provides an optimal feel for the boot through a unique lacing system that benefits an agile playing style, the PUMA ONE has a soft k-leather upper for excellent ball control in all situations. Romelu Lukaku continued as our main ambassador for the PUMA ONE, while Antoine Griezmann and Luis Suárez endorse the PUMA FUTURE. Also sporting the PUMA FUTURE is Jan Oblak, one of the world’s leading goalkeepers.
16
Annual Report 2019 ↗ OUR BRAND AND PRODUCTS
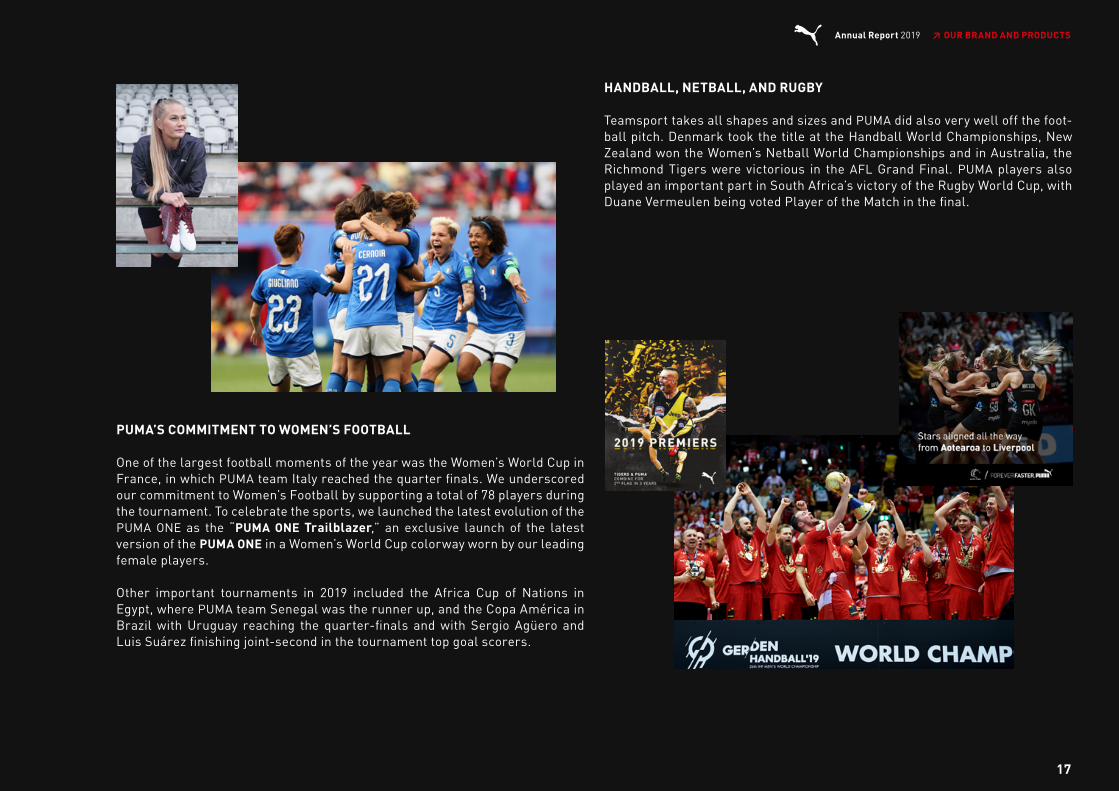
PUMA’S COMMITMENT TO WOMEN’S FOOTBALL
One of the largest football moments of the year was the Women’s World Cup in France, in which PUMA team Italy reached the quarter finals. We underscored our commitment to Women’s Football by supporting a total of 78 players during the tournament. To celebrate the sports, we launched the latest evolution of the PUMA ONE as the “PUMA ONE Trailblazer,” an exclusive launch of the latest version of the PUMA ONE in a Women’s World Cup colorway worn by our leading female players.
Other important tournaments in 2019 included the Africa Cup of Nations in Egypt, where PUMA team Senegal was the runner up, and the Copa América in Brazil with Uruguay reaching the quarter-finals and with Sergio Agüero and Luis Suárez finishing joint-second in the tournament top goal scorers.
HANDBALL, NETBALL, AND RUGBY
Teamsport takes all shapes and sizes and PUMA did also very well off the foot-ball pitch. Denmark took the title at the Handball World Championships, New Zealand won the Women’s Netball World Championships and in Australia, the Richmond Tigers were victorious in the AFL Grand Final. PUMA players also played an important part in South Africa’s victory of the Rugby World Cup, with Duane Vermeulen being voted Player of the Match in the final.
17
Annual Report 2019 ↗ OUR BRAND AND PRODUCTS
RUNNING & TRAINING
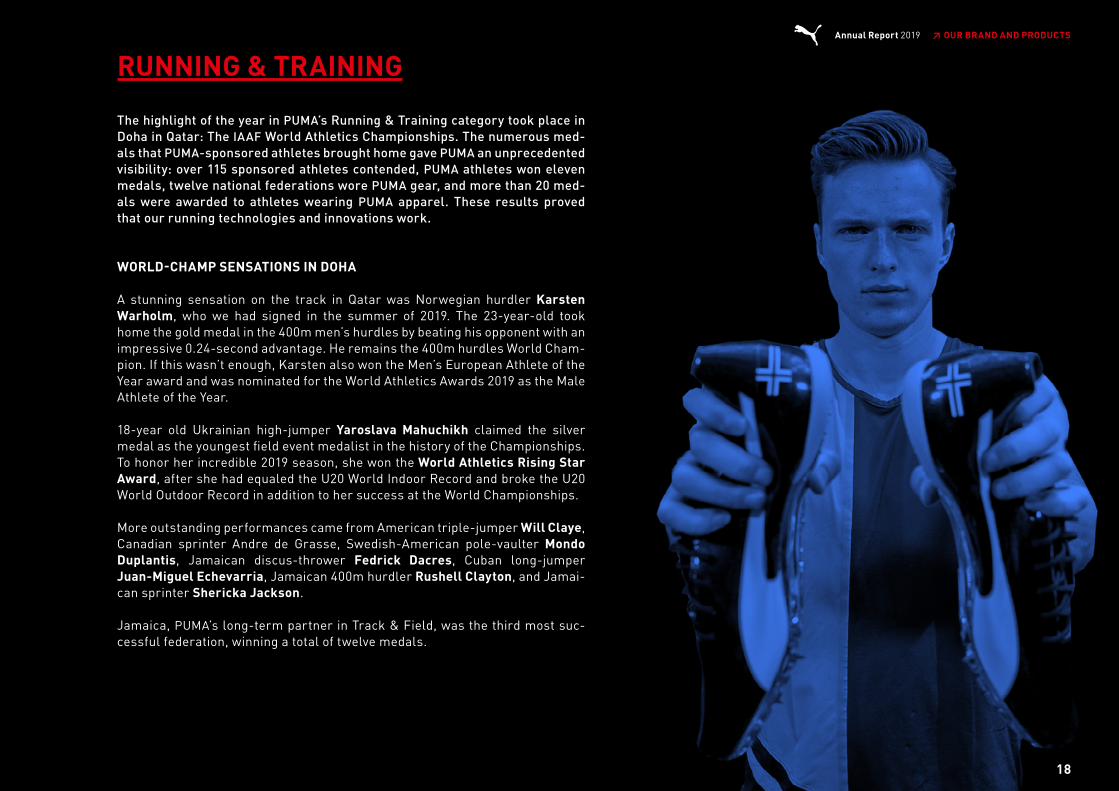
The highlight of the year in PUMA’s Running & Training category took place in Doha in Qatar: The IAAF World Athletics Championships. The numerous med-als that PUMA-sponsored athletes brought home gave PUMA an unprecedented visibility: over 115 sponsored athletes contended, PUMA athletes won eleven medals, twelve national federations wore PUMA gear, and more than 20 med-als were awarded to athletes wearing PUMA apparel. These results proved that our running technologies and innovations work.
WORLD-CHAMP SENSATIONS IN DOHA
A stunning sensation on the track in Qatar was Norwegian hurdler Karsten Warholm, who we had signed in the summer of 2019. The 23-year-old took home the gold medal in the 400m men’s hurdles by beating his opponent with an impressive 0.24-second advantage. He remains the 400m hurdles World Cham-pion. If this wasn’t enough, Karsten also won the Men’s European Athlete of the Year award and was nominated for the World Athletics Awards 2019 as the Male Athlete of the Year.
18-year old Ukrainian high-jumper Yaroslava Mahuchikh claimed the silver medal as the youngest field event medalist in the history of the Championships. To honor her incredible 2019 season, she won the World Athletics Rising Star Award, after she had equaled the U20 World Indoor Record and broke the U20 World Outdoor Record in addition to her success at the World Championships.
More outstanding performances came from American triple-jumper Will Claye, Canadian sprinter Andre de Grasse, Swedish-American pole-vaulter Mondo Duplantis, Jamaican discus-thrower Fedrick Dacres, Cuban long-jumper Juan-Miguel Echevarria, Jamaican 400m hurdler Rushell Clayton, and Jamai-can sprinter Shericka Jackson.
Jamaica, PUMA’s long-term partner in Track & Field, was the third most suc-cessful federation, winning a total of twelve medals.
18
Annual Report 2019 ↗ OUR BRAND AND PRODUCTS
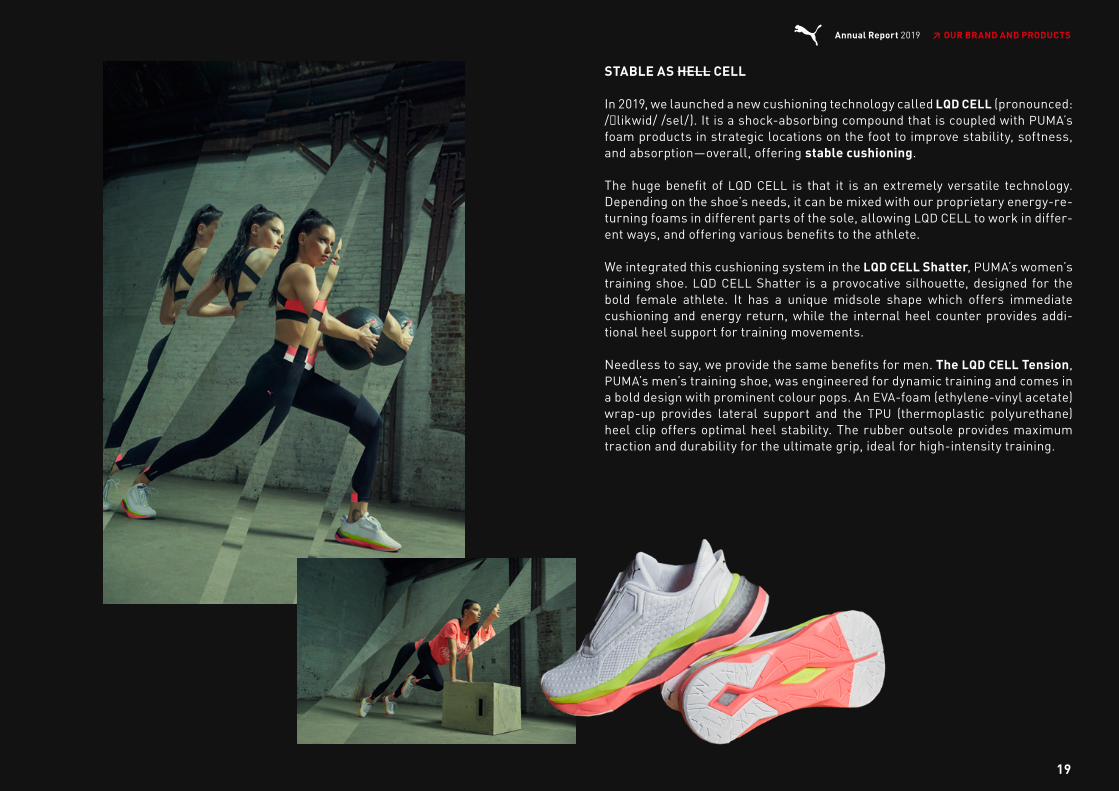
STABLE AS HELL CELL
In 2019, we launched a new cushioning technology called LQD CELL (pronounced: /ˈlikwid/ /sel/). It is a shock-absorbing compound that is coupled with PUMA’s foam products in strategic locations on the foot to improve stability, softness, and absorption—overall, offering stable cushioning.
The huge benefit of LQD CELL is that it is an extremely versatile technology. Depending on the shoe’s needs, it can be mixed with our proprietary energy-re-turning foams in different parts of the sole, allowing LQD CELL to work in differ-ent ways, and offering various benefits to the athlete.
We integrated this cushioning system in the LQD CELL Shatter, PUMA’s women’s training shoe. LQD CELL Shatter is a provocative silhouette, designed for the bold female athlete. It has a unique midsole shape which offers immediate cushioning and energy return, while the internal heel counter provides addi-tional heel support for training movements.
Needless to say, we provide the same benefits for men. The LQD CELL Tension, PUMA’s men’s training shoe, was engineered for dynamic training and comes in a bold design with prominent colour pops. An EVA-foam (ethylene-vinyl acetate) wrap-up provides lateral support and the TPU (thermoplastic polyurethane) heel clip offers optimal heel stability. The rubber outsole provides maximum traction and durability for the ultimate grip, ideal for high-intensity training.
19
Annual Report 2019 ↗ OUR BRAND AND PRODUCTS
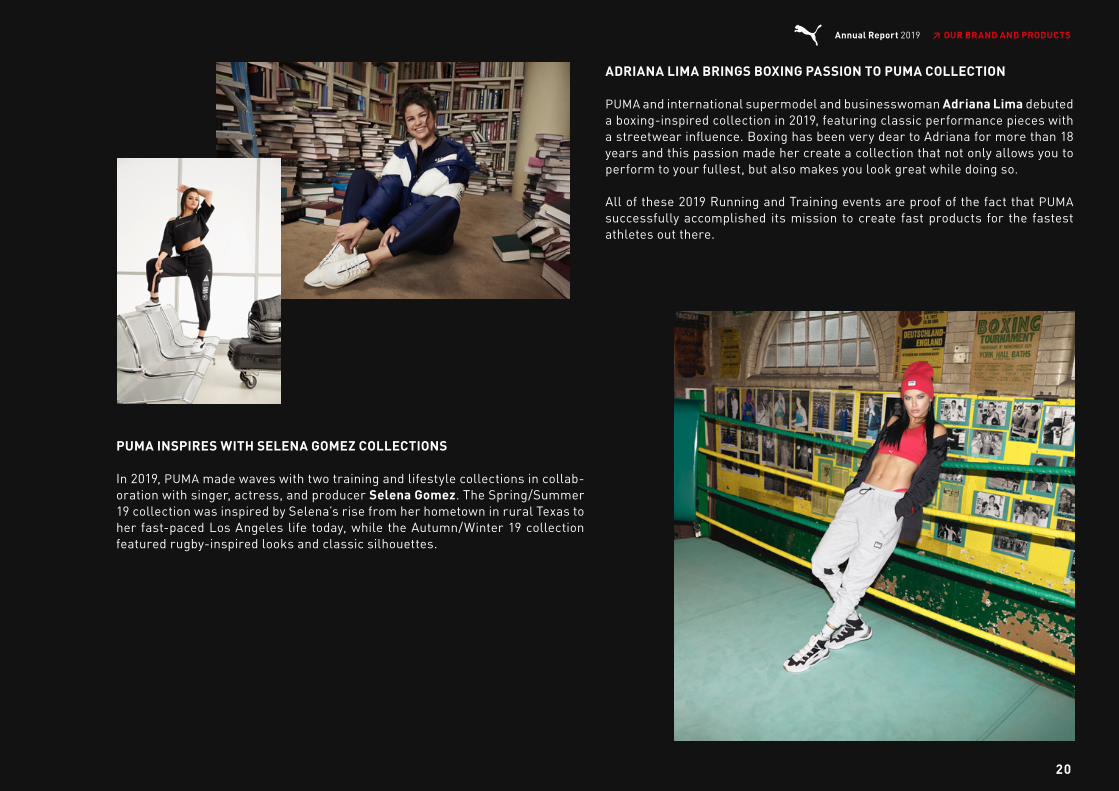
PUMA INSPIRES WITH SELENA GOMEZ COLLECTIONS
In 2019, PUMA made waves with two training and lifestyle collections in collab-oration with singer, actress, and producer Selena Gomez. The Spring/Summer 19 collection was inspired by Selena’s rise from her hometown in rural Texas to her fast-paced Los Angeles life today, while the Autumn/Winter 19 collection featured rugby-inspired looks and classic silhouettes.
ADRIANA LIMA BRINGS BOXING PASSION TO PUMA COLLECTION
PUMA and international supermodel and businesswoman Adriana Lima debuted a boxing-inspired collection in 2019, featuring classic performance pieces with a streetwear influence. Boxing has been very dear to Adriana for more than 18 years and this passion made her create a collection that not only allows you to perform to your fullest, but also makes you look great while doing so.
All of these 2019 Running and Training events are proof of the fact that PUMA successfully accomplished its mission to create fast products for the fastest athletes out there.
20
Annual Report 2019 ↗ OUR BRAND AND PRODUCTS
BASKETBALL
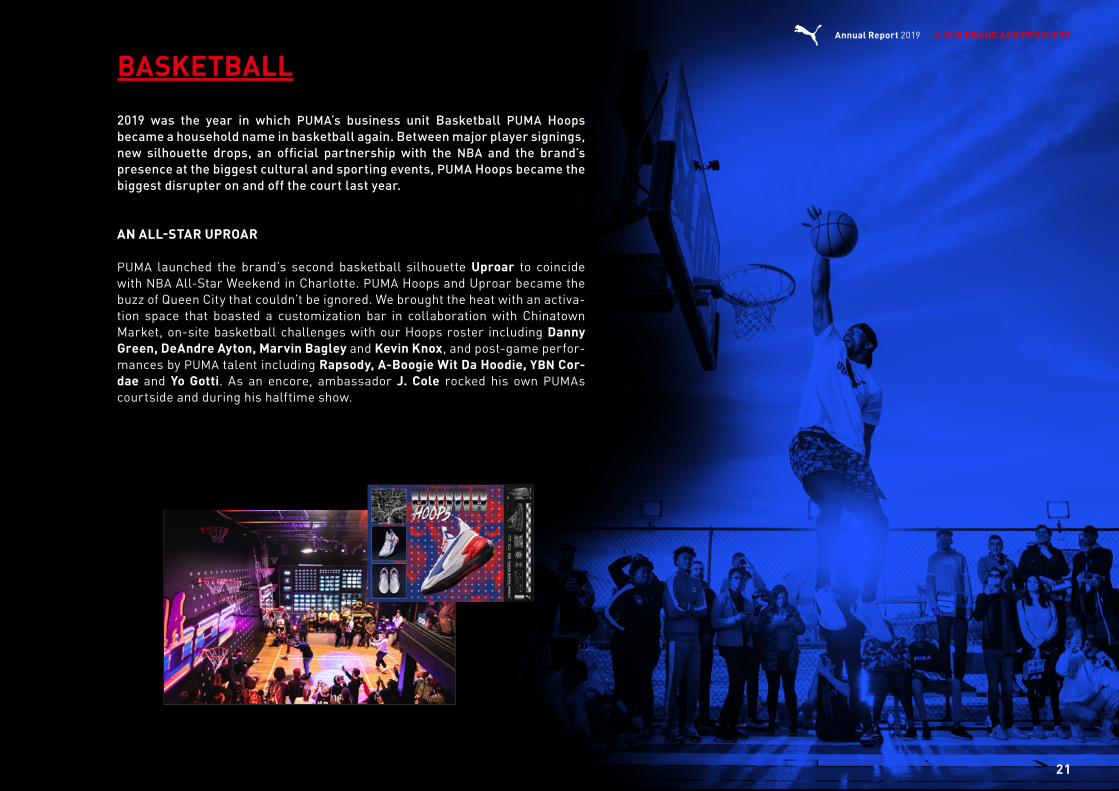
2019 was the year in which PUMA’s business unit Basketball PUMA Hoops became a household name in basketball again. Between major player signings, new silhouette drops, an official partnership with the NBA and the brand’s presence at the biggest cultural and sporting events, PUMA Hoops became the biggest disrupter on and off the court last year.
AN ALL-STAR UPROAR
PUMA launched the brand’s second basketball silhouette Uproar to coincide with NBA All-Star Weekend in Charlotte. PUMA Hoops and Uproar became the buzz of Queen City that couldn’t be ignored. We brought the heat with an activa-tion space that boasted a customization bar in collaboration with Chinatown Market, on-site basketball challenges with our Hoops roster including Danny Green, DeAndre Ayton, Marvin Bagley and Kevin Knox, and post-game perfor-mances by PUMA talent including Rapsody, A-Boogie Wit Da Hoodie, YBN Cor-dae and Yo Gotti. As an encore, ambassador J. Cole rocked his own PUMAs courtside and during his halftime show.
21
Annual Report 2019 ↗ OUR BRAND AND PRODUCTS
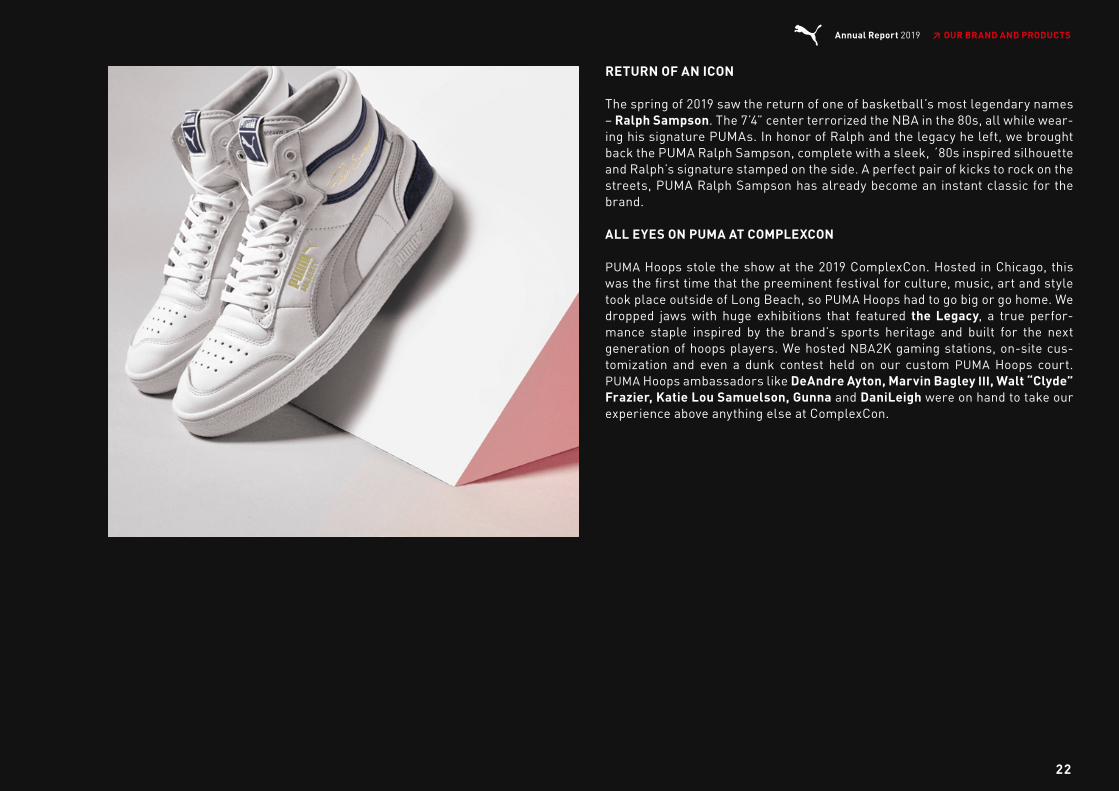
RETURN OF AN ICON
The spring of 2019 saw the return of one of basketball’s most legendary names – Ralph Sampson. The 7’4” center terrorized the NBA in the 80s, all while wear-ing his signature PUMAs. In honor of Ralph and the legacy he left, we brought back the PUMA Ralph Sampson, complete with a sleek, ´80s inspired silhouette and Ralph’s signature stamped on the side. A perfect pair of kicks to rock on the streets, PUMA Ralph Sampson has already become an instant classic for the brand.
ALL EYES ON PUMA AT COMPLEXCON
PUMA Hoops stole the show at the 2019 ComplexCon. Hosted in Chicago, this was the first time that the preeminent festival for culture, music, art and style took place outside of Long Beach, so PUMA Hoops had to go big or go home. We dropped jaws with huge exhibitions that featured the Legacy, a true perfor-mance staple inspired by the brand’s sports heritage and built for the next generation of hoops players. We hosted NBA2K gaming stations, on-site cus-tomization and even a dunk contest held on our custom PUMA Hoops court. PUMA Hoops ambassadors like DeAndre Ayton, Marvin Bagley III, Walt “Clyde” Frazier, Katie Lou Samuelson, Gunna and DaniLeigh were on hand to take our experience above anything else at ComplexCon.
22
Annual Report 2019 ↗ OUR BRAND AND PRODUCTS

THE PUMA HOOPS FAM GROWS
2019 was a big year for the PUMA Hoops family. We made waves with the addi-tion of six new ambassadors, including the #1 draft pick in the WNBA Jackie Young, as well as RJ Barrett, Kyle Kuzma, Kevin Porter Jr., Katie Lou Samuel-son, and Marcus Smart. We’re not known for doing things quietly, so we announced these signings in the most PUMA ways possible, with events on LA’s Fairfax Ave., pop-up food trucks outside of Madison Square Garden, humor-driv-en videos on social and everything in between.
CLYDE HARDWOOD TAKES ITS FIRST STEPS
In season two of PUMA Hoops, we introduced the Clyde Hardwood, a shoe that turns heads on and off the court. To officially unveil the newest addition to the Clyde franchise, PUMA Hoops hosted a Fireside Chat in NYC that featured cur-rent New York Knicks Stars RJ Barrett and Kevin Knox, and the legend himself, Walt “Clyde” Frazier, to talk basketball history, PUMA Hoops, and of course the Clyde Hardwood. On launch day, we organized a King of the Court basketball tournament and dunk contest at the Brooklyn Bridge Park on a pop-up floating basketball court overlooking the NYC skyline. All of our athletes debuted the Hardwood on court for the start of the season, RJ Barrett rocked them in the Jahnkoy Fashion Show during Fashion Week in NYC and J.Cole leaked the new silhouette during several training runs with Chris Brickley.
23
Annual Report 2019 ↗ OUR BRAND AND PRODUCTS
GOLF
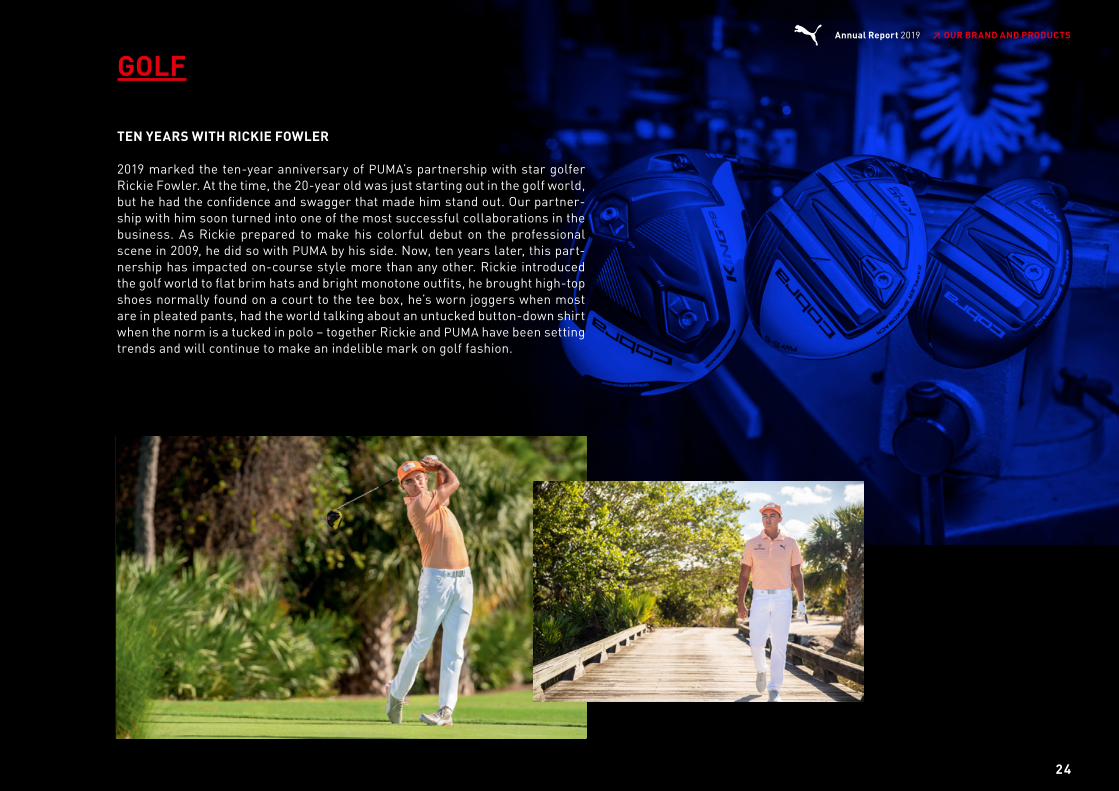
TEN YEARS WITH RICKIE FOWLER
2019 marked the ten-year anniversary of PUMA’s partnership with star golfer Rickie Fowler. At the time, the 20-year old was just starting out in the golf world, but he had the confidence and swagger that made him stand out. Our partner-ship with him soon turned into one of the most successful collaborations in the business. As Rickie prepared to make his colorful debut on the professional scene in 2009, he did so with PUMA by his side. Now, ten years later, this part-nership has impacted on-course style more than any other. Rickie introduced the golf world to flat brim hats and bright monotone outfits, he brought high-top shoes normally found on a court to the tee box, he’s worn joggers when most are in pleated pants, had the world talking about an untucked button-down shirt when the norm is a tucked in polo – together Rickie and PUMA have been setting trends and will continue to make an indelible mark on golf fashion.
24
Annual Report 2019 ↗ OUR BRAND AND PRODUCTS
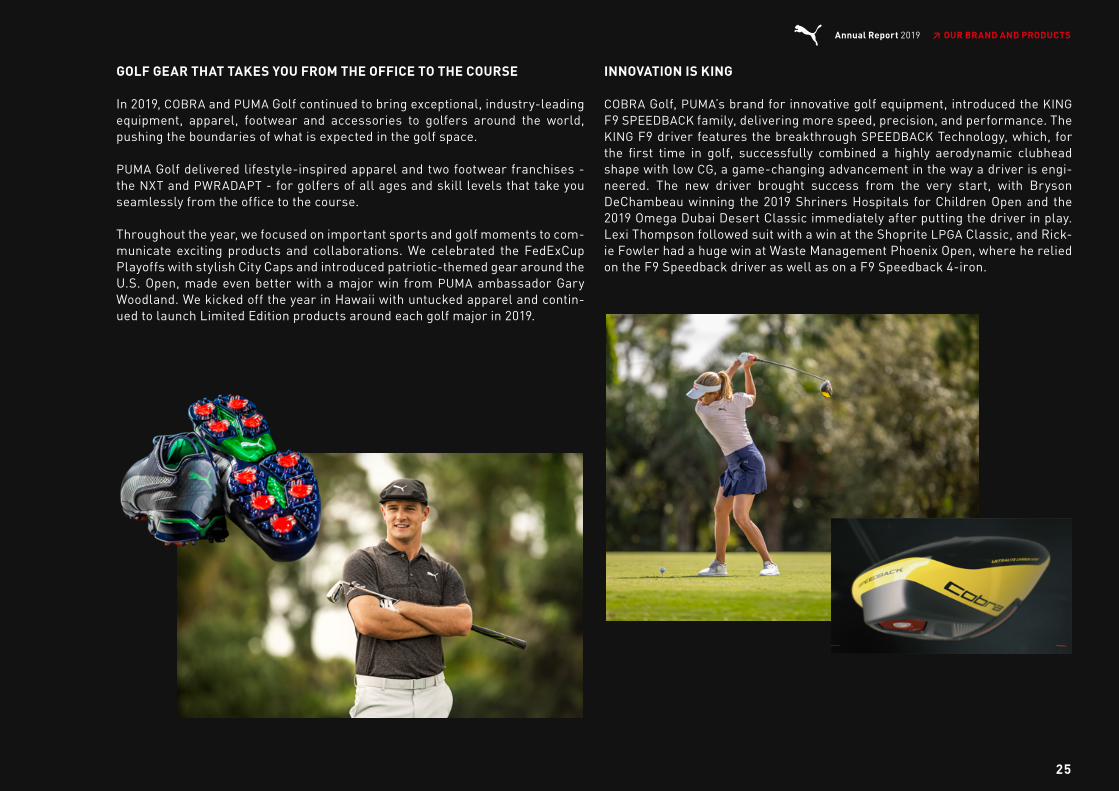
GOLF GEAR THAT TAKES YOU FROM THE OFFICE TO THE COURSE
In 2019, COBRA and PUMA Golf continued to bring exceptional, industry-leading equipment, apparel, footwear and accessories to golfers around the world, pushing the boundaries of what is expected in the golf space.
PUMA Golf delivered lifestyle-inspired apparel and two footwear franchises - the NXT and PWRADAPT - for golfers of all ages and skill levels that take you seamlessly from the office to the course.
Throughout the year, we focused on important sports and golf moments to com-municate exciting products and collaborations. We celebrated the FedExCup Playoffs with stylish City Caps and introduced patriotic-themed gear around the U.S. Open, made even better with a major win from PUMA ambassador Gary Woodland. We kicked off the year in Hawaii with untucked apparel and contin-ued to launch Limited Edition products around each golf major in 2019.
INNOVATION IS KING
COBRA Golf, PUMA’s brand for innovative golf equipment, introduced the KING F9 SPEEDBACK family, delivering more speed, precision, and performance. The KING F9 driver features the breakthrough SPEEDBACK Technology, which, for the first time in golf, successfully combined a highly aerodynamic clubhead shape with low CG, a game-changing advancement in the way a driver is engi-neered. The new driver brought success from the very start, with Bryson DeChambeau winning the 2019 Shriners Hospitals for Children Open and the 2019 Omega Dubai Desert Classic immediately after putting the driver in play. Lexi Thompson followed suit with a win at the Shoprite LPGA Classic, and Rick-ie Fowler had a huge win at Waste Management Phoenix Open, where he relied on the F9 Speedback driver as well as on a F9 Speedback 4-iron.
25
Annual Report 2019 ↗ OUR BRAND AND PRODUCTS

MOTORSPORT
In 2019, PUMA Motorsport continued successfully on its path to bring the race track to the street by introducing exclusive apparel and next-level perfor-mance footwear for drivers and fans alike. We also set out on a mission to widen our Motorsport audience and attract new consumer groups such as the gaming scene.
SIMPLY DELIVERING GRIP AND PERFORMANCE
We launched an entirely new shoe innovation, the Hi OCTN, which features an outsole and midsole inspired by rugged off-road tires to deliver grip and perfor-mance. We used this style to venture off to attract new consumer groups – in this case gamers. For the Hi OCTN x NFS, which came in an entirely new silhou-ette, we collaborated with Need for Speed, one of the most credible partners and iconic racing games on the planet. Gamers were able to customize their character to wear the Hi OCTN x NFS in the game, offering a perfect interaction between the product and the target group.
26
Annual Report 2019 ↗ OUR BRAND AND PRODUCTS

ATTRACTING THE YOUNG
Events, Social Media and exclusive product launches speed up the game to attract younger audiences by offering them something exclusive. The launch event of the Hi OCTN in Miami was the perfect platform to attract attention and spread the word via media, social media and influencer channels. Big names on stage like Hip Hop star French Montana rounded up an evening of success.
ONLY WORKING WITH THE BEST
We continued to cooperate with our partners from Mercedes-AMG Petronas Motorsport, Scuderia Ferrari, Aston Martin Red Bull Racing and BMW M Motor-sport, sponsoring the best drivers in the world. At the beginning of last year, we were able to add Porsche to our portfolio of the best motorsport partners in the world.
PUMA’s drivers delivered amazing results. Lewis Hamilton (Mercedes-AMG Petronas Motorsport) continued his legacy by claiming his 6th F1 World Cham-pion title. Together with Valtteri Bottas (2nd in F1 World Championships), Mer-cedes gained their 6th consecutive World Constructor Championship title in Formula 1 since 2014. The drivers completing the top 5 in the Formula 1 Cham-pionship – Max Verstappen (Aston Martin Red Bull Racing), Charles Leclerc (Scuderia Ferrari) and Sebastian Vettel (Scuderia Ferrari) – were also dressed in PUMA.
BMW M Motorsport celebrated a successful DTM season with Marco Wittmann racing in 3rd position overall in the World Championships. Team Penske secured three drivers in the top ten of the NASCAR Cup Series and Porsche will be offer-ing great opportunities for PUMA in their debut season in Formula E, which started in December 2019.
27
Annual Report 2019 ↗ OUR BRAND AND PRODUCTS

SPORTSTYLE
In 2019, PUMA’s Sportstyle category continued to disrupt the fashion and street scene with the successful RS series, an exaggerated footwear silhouette that was inspired by running shoes of the early 2000s.
The RS range perfectly underpinned PUMA’s mission in Sportstyle: to target everyone who is looking for an authentic style rooted in sports to serve the requirements of everyday modern life – be it for the street, the office or day-to-day leisure.
Celebrating extreme reinventions, the RS showcased bulky designs, bold col-orways and eye-catching material mixes combined with a revamped version of the RS technology that offers high rebound and comfort through its high-qual-ity cushioning.
28
Annual Report 2019 ↗ OUR BRAND AND PRODUCTS

BOXING GEAR MEETS PARISIAN CULTURE: PUMA X BALMAIN
For the first time ever, PUMA and French luxury fashion house BALMAIN creat-ed – together with PUMA ambassador Cara Delevingne – a unique collection that blends sport and luxury fashion. The line featured pieces inspired by tradi-tional boxing gear mixed up with Parisian couture and elevated with a stark color palette plus design elements straight out of BALMAIN’s atelier.
COMMEMORATING THE PAST AND EMBRACING THE FUTURE: WE CALL IT “FUTRO”
Towards the end of last year, PUMA’s legendary 80s running shoe, the FAST RID-ER, made a vibrant, playful splash on the streets. We launched the FAST RIDER OG to celebrate the iconic running shoe from the 1980s that kicked off a new era as Germany’s first “jogging” shoe 40 years ago when the sport of running moved from the track to the streets. While the PUMA FAST RIDER OG showcased the original shock-absorbing “Federbein” outsole with the RIDERFOAM midsole for high rebound in 80s inspired colors, we merged the best of the past and future in the FUTURE RIDER and STYLE RIDER. These styles featured futro silhouettes, newly developed RIDERFOAM for extra comfort, bold materials, playful color blocking and a subtle corrugated outsole inspired by the original “Federbein.”
Another bestseller that derived directly from our 80s archive and was worn by Selena Gomez was the PUMA Cali. This futro sneaker was inspired by the original PUMA California, a style born out of the courts in 1983 from Argentinean grand slam champ Guillermo Vilas. The PUMA Cali is a stylish ode to retro vibes. While it kept its sport-inspired leather upper true to the original and the characteristic rubber sole, the new version got a bold remake.
29
Annual Report 2019 ↗ OUR BRAND AND PRODUCTS

PUMA SELECT
Throughout 2019, PUMA SELECT continued to collaborate with renowned brands and fresh and upcoming designers across the world, such as Karl Lagerfeld, Helly Hansen, HAN KJØBENHAVN, Les Benjamins, Jahnkoy and others.
FOR OUR NEXT GENERATION: PUMA KIDS
In 2019, PUMA introduced various collections for kids in partnership with popu-lar brands like Sesame Street and Hello Kitty, featuring playful patterns, cute prints with popular cartoon characters, and bright colors. Understanding the kids’ need for freedom, PUMA elevates style with comfortable cuts and high-quality material.
30
Annual Report 2019 ↗ OUR BRAND AND PRODUCTS

ACCESSORIES
Accessories have always played a crucial role in our business, as they comple-ment our ranges with innovative and trendy products across Sportstyle, Running, Training, Motorsport and, for the first time in 2019, Basketball.
The fastest growing segment in 2019 was, in fact, our Women’s Accessories business. It was boosted by exciting campaigns such as the PUMA x Balmain debut collection, created with Cara Delevingne, which included bags, beanies, gloves, a headband and a choker. The Training capsule collection of Adriana Lima also included a full range of accessories.
A key growth driver across all categories was our headwear segment - be it in collaborations with up-and-coming fashion labels such as Rhude and Ader Error, or in Motorsport, where Formula 1 drivers such as Max Verstappen, Sebastian Vettel and Charles Leclerc wore their PUMA caps with pride all season.
31
Annual Report 2019 ↗ OUR BRAND AND PRODUCTS
Our Stores
BRAND PERFORMANCE
32
Annual Report 2019 ↗ OUR STORES
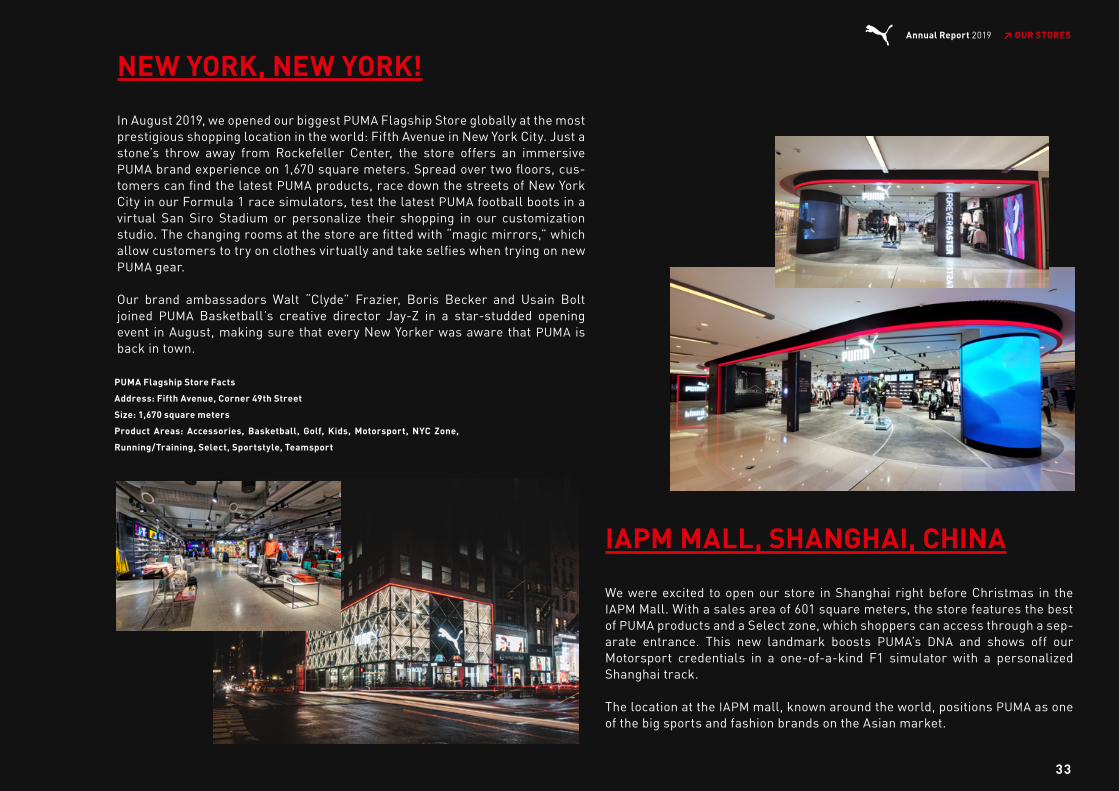
NEW YORK, NEW YORK!
In August 2019, we opened our biggest PUMA Flagship Store globally at the most prestigious shopping location in the world: Fifth Avenue in New York City. Just a stone’s throw away from Rockefeller Center, the store offers an immersive PUMA brand experience on 1,670 square meters. Spread over two floors, cus-tomers can find the latest PUMA products, race down the streets of New York City in our Formula 1 race simulators, test the latest PUMA football boots in a virtual San Siro Stadium or personalize their shopping in our customization studio. The changing rooms at the store are fitted with “magic mirrors,” which allow customers to try on clothes virtually and take selfies when trying on new PUMA gear.
Our brand ambassadors Walt “Clyde” Frazier, Boris Becker and Usain Bolt joined PUMA Basketball’s creative director Jay-Z in a star-studded opening event in August, making sure that every New Yorker was aware that PUMA is back in town.
IAPM MALL, SHANGHAI, CHINA
We were excited to open our store in Shanghai right before Christmas in the IAPM Mall. With a sales area of 601 square meters, the store features the best of PUMA products and a Select zone, which shoppers can access through a sep-arate entrance. This new landmark boosts PUMA’s DNA and shows off our Motorsport credentials in a one-of-a-kind F1 simulator with a personalized Shanghai track.
The location at the IAPM mall, known around the world, positions PUMA as one of the big sports and fashion brands on the Asian market.
PUMA Flagship Store Facts
Address: Fifth Avenue, Corner 49th Street
Size: 1,670 square meters
Product Areas: Accessories, Basketball, Golf, Kids, Motorsport, NYC Zone,
Running/Training, Select, Sportstyle, Teamsport
33
Annual Report 2019 ↗ OUR STORES

CHONGQING, CHINA
With a total sales area of 492 square meters, PUMA opened a full-price store in Chongqing in China in December. Located in one of the busiest streets of this populous city, the store is easily recognized by its impactful façade, which ele-gantly displays the extended catalog of product the brand can offer to consumers.
SCALO MILANO, ITALY
In June 2019, PUMA opened a 472-square-meter store in a premium outlet vil-lage located only a short drive away from the city center of Milan, Italy. As spon-sor of AC Milan, the brand has dedicated a permanent area to Teamsport, offer-ing a wide range of customization services to the customers.
34
Annual Report 2019 ↗ OUR STORES
Our People
ONE TEAM PERFORMANCE
36 Prepare for Growth
39 Culture
44 Personal Journey
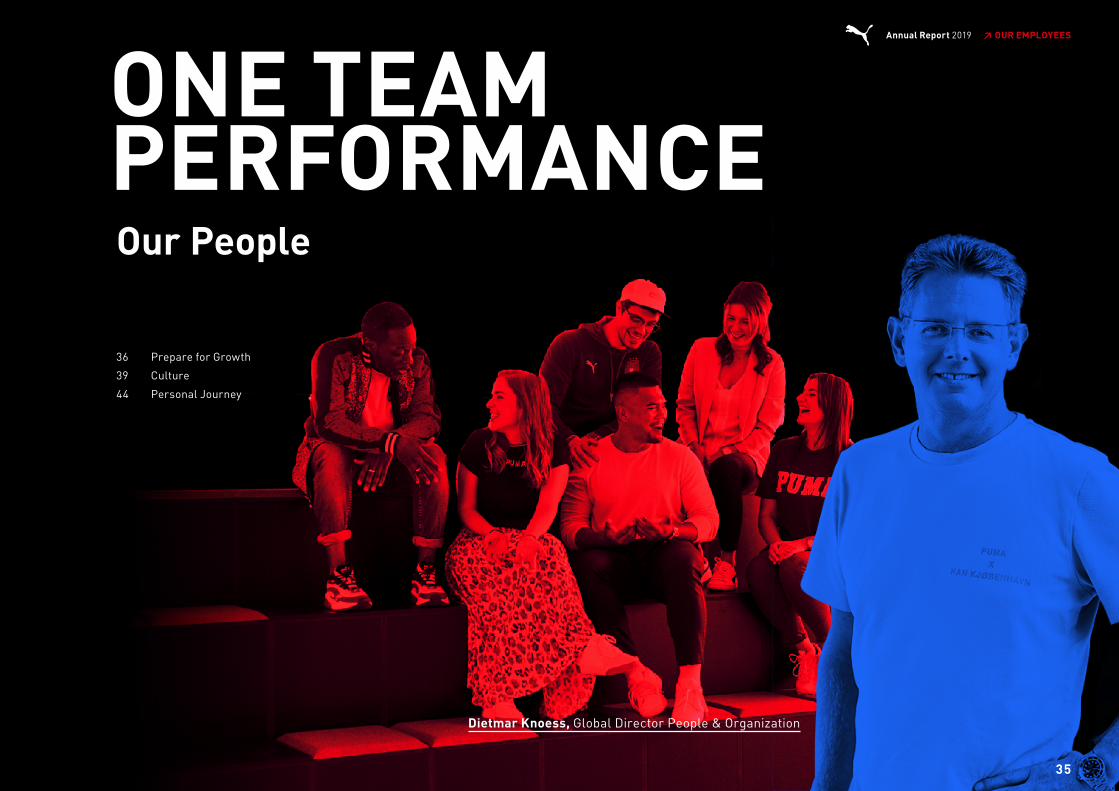
Dietmar Knoess, Global Director People & Organization
35
Annual Report 2019 ↗ OUR EMPLOYEES

PEOPLE & ORGANIZATION
We focus on our employees in everything we do. In order to send this strongmessage of people centricity both internally and externally we have renamed theHuman Resources department “People & Organization” in 2019. It is our em-ployees who allow us to push sports and culture forward and as an organization,we have to adapt quickly to new market situations and adjust to the fundamentalchanges of a modern working world. As we prepare our infrastructure for furthergrowth, we put a special focus on digitalization, and we provide a work environ-ment that fosters agile thinking, creativity and interaction. We ensure that ouremployees are familiar with agile working methods and encourage them to beversatile and adaptable while we support their wellbeing by creating the conditi-ons for a good work-life balance and encourage their personal development.
WORKDAY – CENTRAL SYSTEMS
To support PUMA’s growth, we continue to work on shaping our People & Orga-nization infrastructure through digitalization. Simplifying and aligning our pro-cesses worldwide enables us to quickly respond to changing needs.
In 2019, we reached the next level of digitalization. Our leading human capitalmanagement system “Workday,” which we introduced globally in 2017, is an im-portant part of our digital strategy. It includes the modules ”recruiting,” ”talentand performance,” ”time recording and absence management” and ”learning.”This means that only one software solution is used for major parts of importantpersonnel processes. In 2019, we continued to link Workday with other systemsand have steadily increased the number of employees and applicants who regu-larly and actively use the system. Our employees benefit from a single and easy-to-use system that is fully responsive. Furthermore, the system provides global
data in real time, which enables us to conduct large scale analyses and visualizethis data on dashboards. The insight we gain offers a solid basis for continuousprocess improvement and decisions.
NEW OFFICES
We are committed to provide modern places of work for our employees all overthe world. Preparing for further growth, we have rolled out an innovative globaloffice concept for our new offices and have refurbished already existing ones.These offices offer dynamic environments to promote creativity, focus, and colla-boration. Our employees can choose between the different areas and a variety ofoffice features, depending on the type of work they are doing.
At our headquarters in Herzogenaurach, we reopened the renovated and refur-bished canteen. To foster communication, the new design concept offers variousareas for our employees to not only have lunch or coffee but also have meetingsand conversations. Besides a new coffee bar, we set up different food stations,which provide a variety of healthy international food.
36
Annual Report 2019 ↗ OUR EMPLOYEES
PREPARE FOR GROWTH

COMMUNITY ENGAGEMENT
2019 was a very successful year for community engagement at PUMA. With thesupport of our employees, we continued to engage with local communitiesthrough a variety of different projects all around the world. One example was theproject “Mission to Seafarers,” where PUMA employees in the United Arab Emi-rates packed and distributed essential hygiene products for struggling fisher-men. The PUMA team in Vietnam built book shelves for kids who attend primaryschool in a province without a library. In Russia, a team of pupils from orphana-ges was provided with football equipment and PUMA employees hosted a footballtournament for them.
Our goal was to reach a total number of hours spent on community engagementequal to our average FTE (Full Time Equivalent) per year. We encouraged all ofour employees around the world to participate, and recorded projects and em-ployee engagement on an online platform. In total, initiatives led by our subsidia-ries on 5 continents contributed a total of 21,433 hours (1,783 for PUMA SE) ofcommunity engagement. Projects ranged from protecting the environment to
promoting health and fitness, fighting discrimination or supporting education forchildren in need. Often these projects were done in cooperation with local non-profit organizations. Considering that the number of FTEs in 2019 was 13,348(968 for PUMA SE), we far exceeded our target.
G.01 COMMUNITY ENGAGEMENT 2019➔
37
Annual Report 2019 ↗ OUR EMPLOYEES
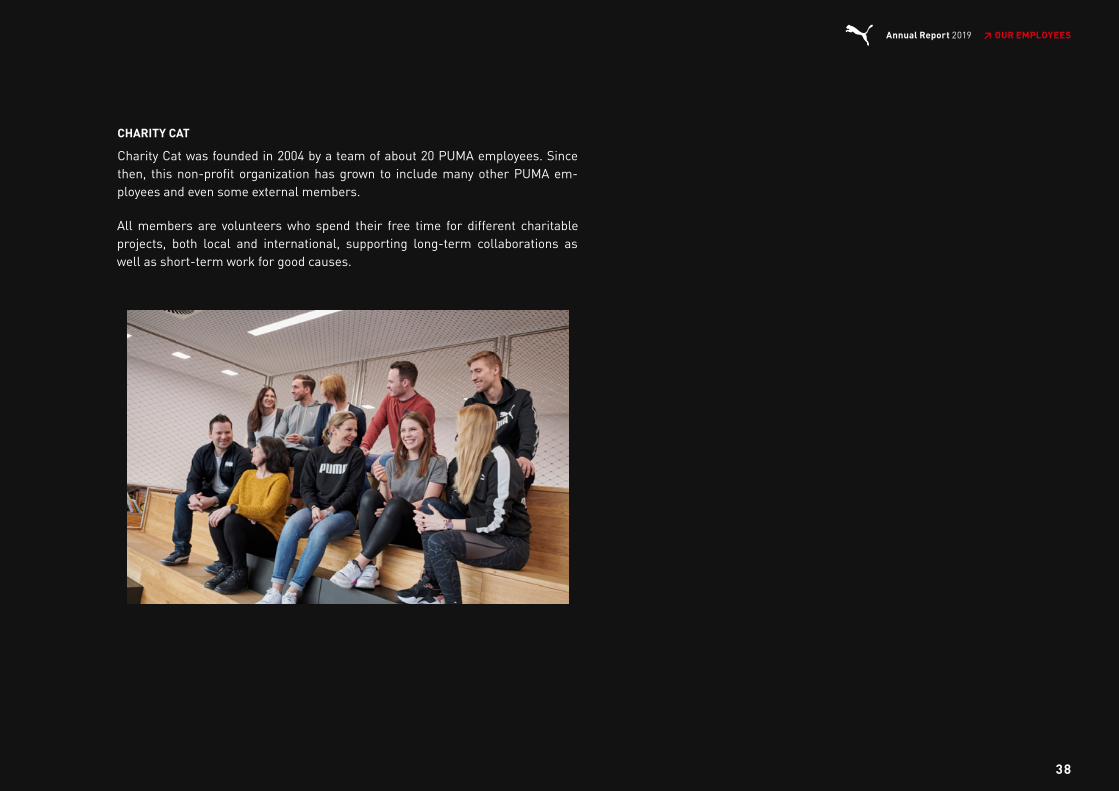
CHARITY CAT
Charity Cat was founded in 2004 by a team of about 20 PUMA employees. Sincethen, this non-profit organization has grown to include many other PUMA em-ployees and even some external members.
All members are volunteers who spend their free time for different charitableprojects, both local and international, supporting long-term collaborations aswell as short-term work for good causes.
38
Annual Report 2019 ↗ OUR EMPLOYEES
CULTURE
DIVERSITY & EQUALITY
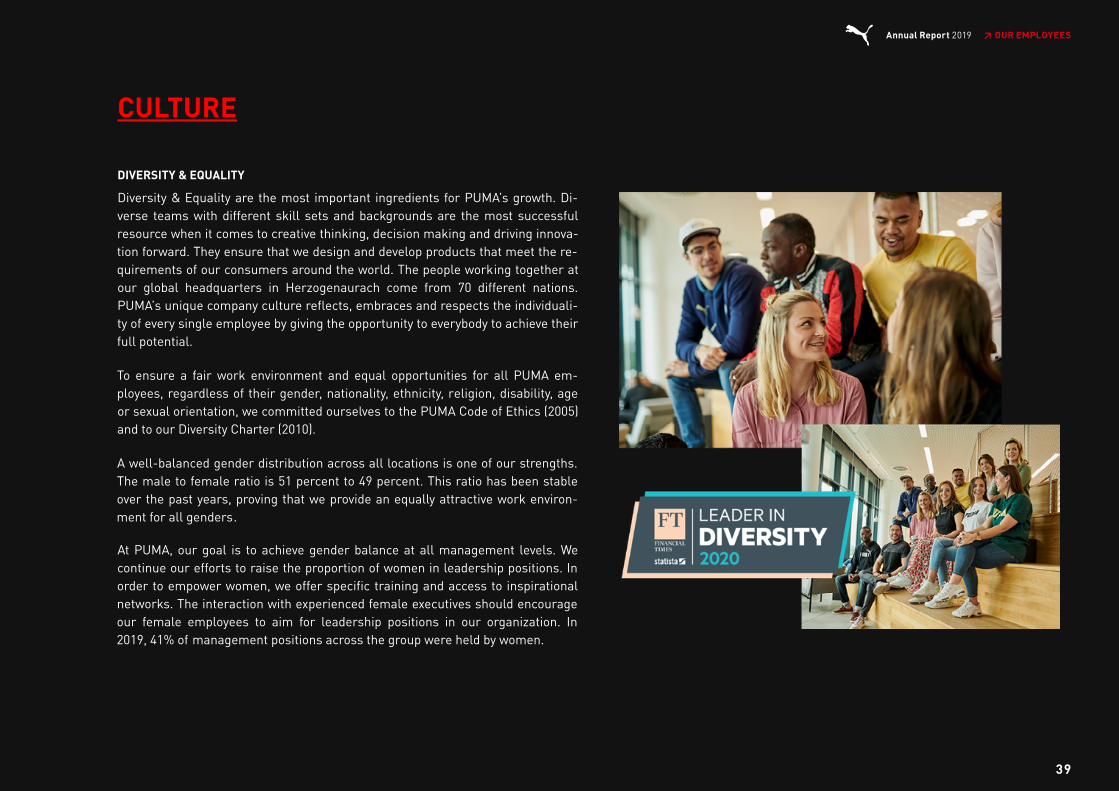
Diversity & Equality are the most important ingredients for PUMA’s growth. Di-verse teams with different skill sets and backgrounds are the most successfulresource when it comes to creative thinking, decision making and driving innova-tion forward. They ensure that we design and develop products that meet the re-quirements of our consumers around the world. The people working together atour global headquarters in Herzogenaurach come from 70 different nations.PUMA’s unique company culture reflects, embraces and respects the individuali-ty of every single employee by giving the opportunity to everybody to achieve theirfull potential.
To ensure a fair work environment and equal opportunities for all PUMA em-ployees, regardless of their gender, nationality, ethnicity, religion, disability, ageor sexual orientation, we committed ourselves to the PUMA Code of Ethics (2005)and to our Diversity Charter (2010).
A well-balanced gender distribution across all locations is one of our strengths.The male to female ratio is 51 percent to 49 percent. This ratio has been stableover the past years, proving that we provide an equally attractive work environ-ment for all genders.
At PUMA, our goal is to achieve gender balance at all management levels. Wecontinue our efforts to raise the proportion of women in leadership positions. Inorder to empower women, we offer specific training and access to inspirationalnetworks. The interaction with experienced female executives should encourageour female employees to aim for leadership positions in our organization. In2019, 41% of management positions across the group were held by women.
39
Annual Report 2019 ↗ OUR EMPLOYEES

Region 2015 2016 2017 2018 2019
EUROPE 30 30 31 31 35
EEMEA 39 40 38 43 42
North America 42 45 46 48 50
LATAM 33 34 35 38 38
APAC 42 43 41 44 43
Total 37 38 38 40 41
We have already reached our target to have at least 30% of women on the Super-visory Board and 20% on the Management Board. We are on track to reach ourambitious targets to have 30% of women at the first management level below theManagement Board and 40% of women at the second management levels belowthe Management Board, both until October 2021.
For 2020, PUMA’s ambitions regarding diversity and equality were recognized bythe Financial Times with the “Leader in Diversity” award for Europe.
WELLBEING
We invest in a range of services and benefits to improve the health and wellbeingof our employees. We believe that employees are more motivated and performbetter if they feel well and keep a healthy work-life balance. Our Wellbeing con-cept was started at our headquarters in Herzogenaurach and was adapted to lo-cal needs and regulations elsewhere. Today, it plays an important part at all ourPUMA subsidiaries globally.
Our wellbeing program includes four components: flex, athlete, finance andsocial.
As a sports company, we of course offer a wide range of sports and workout op-portunities, such as regular internal sports classes, sports events, free gym ac-cess and our different outdoor courts for football, volleyball and basketball. Ourcourses range from meditation and yoga, to TRX and HIIT. For employees at ourheadquarters, we offered 34 events and 23 weekly sports courses in 2019, with atotal of 1,478 registrations. Through regular “Be Well Weeks,” we promote ahealthy lifestyle, covering a variety of topics such as nutrition, health checks andinformation about the latest trends in exercise and sport.
T.01 PERCENTAGE OF WOMEN IN MANAGING POSITIONS (in %)➔
40
Annual Report 2019 ↗ OUR EMPLOYEES
Permanent Temporary
Total Female Male Diverse Total Female Male Diverse
EUROPE 3,130 1,571 1,559 0 535 291 244 0
LATAM 1,699 590 1,109 0 162 72 90 0
North America 2,445 1,313 1,131 1 688 353 335 0
EEMEA 3,408 1,311 2,097 0 217 120 97 0
Asia/Pacific 3,606 2,128 1,478 0 524 323 201 0
Total 14,288 6,913 7,374 1 2,126 1,159 967 0
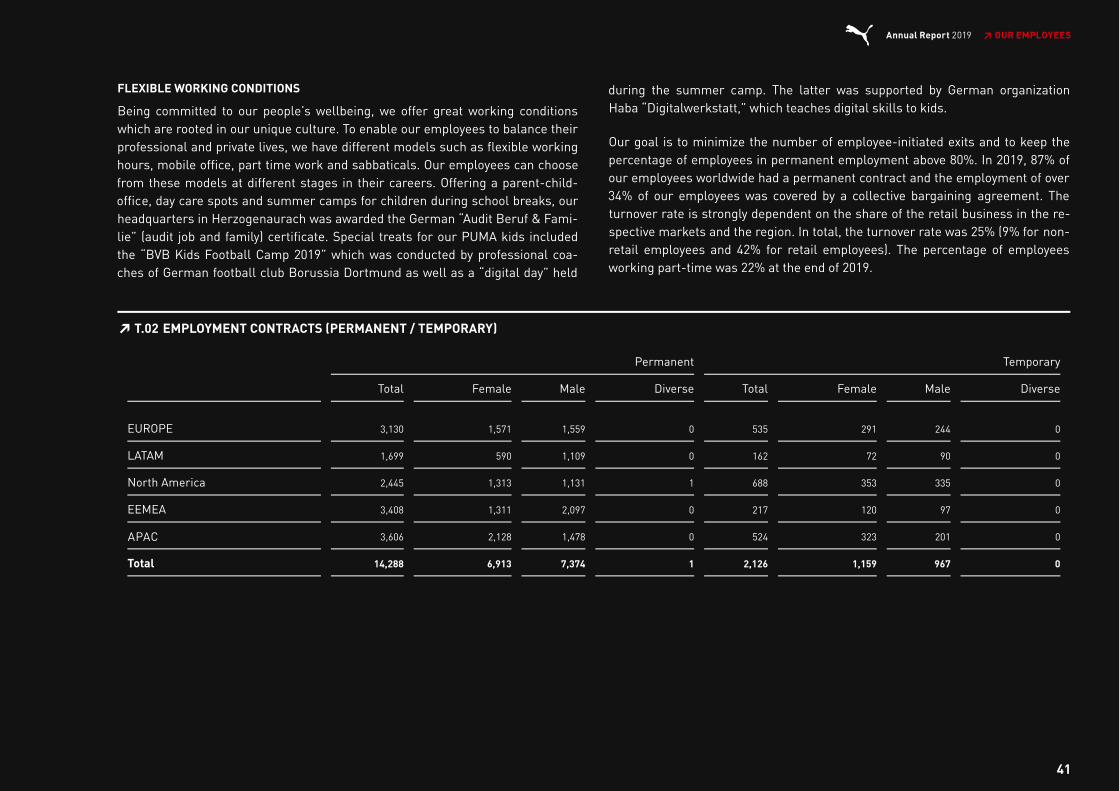
FLEXIBLE WORKING CONDITIONS
Being committed to our people’s wellbeing, we offer great working conditionswhich are rooted in our unique culture. To enable our employees to balance theirprofessional and private lives, we have different models such as flexible workinghours, mobile office, part time work and sabbaticals. Our employees can choosefrom these models at different stages in their careers. Offering a parent-child-office, day care spots and summer camps for children during school breaks, ourheadquarters in Herzogenaurach was awarded the German “Audit Beruf & Fami-lie” (audit job and family) certificate. Special treats for our PUMA kids includedthe “BVB Kids Football Camp 2019” which was conducted by professional coa-ches of German football club Borussia Dortmund as well as a “digital day” held
during the summer camp. The latter was supported by German organizationHaba “Digitalwerkstatt,” which teaches digital skills to kids.
Our goal is to minimize the number of employee-initiated exits and to keep thepercentage of employees in permanent employment above 80%. In 2019, 87% ofour employees worldwide had a permanent contract and the employment of over34% of our employees was covered by a collective bargaining agreement. Theturnover rate is strongly dependent on the share of the retail business in the re-spective markets and the region. In total, the turnover rate was 25% (9% for non-retail employees and 42% for retail employees). The percentage of employeesworking part-time was 22% at the end of 2019.
T.02 EMPLOYMENT CONTRACTS (PERMANENT / TEMPORARY)➔
41
Annual Report 2019 ↗ OUR EMPLOYEES
APAC
Employment contracts Female Male Diverse Total
Full-time 46 54 0 100
Part-time 59 41 0 100
OCCUPATIONAL HEALTH AND SAFETY
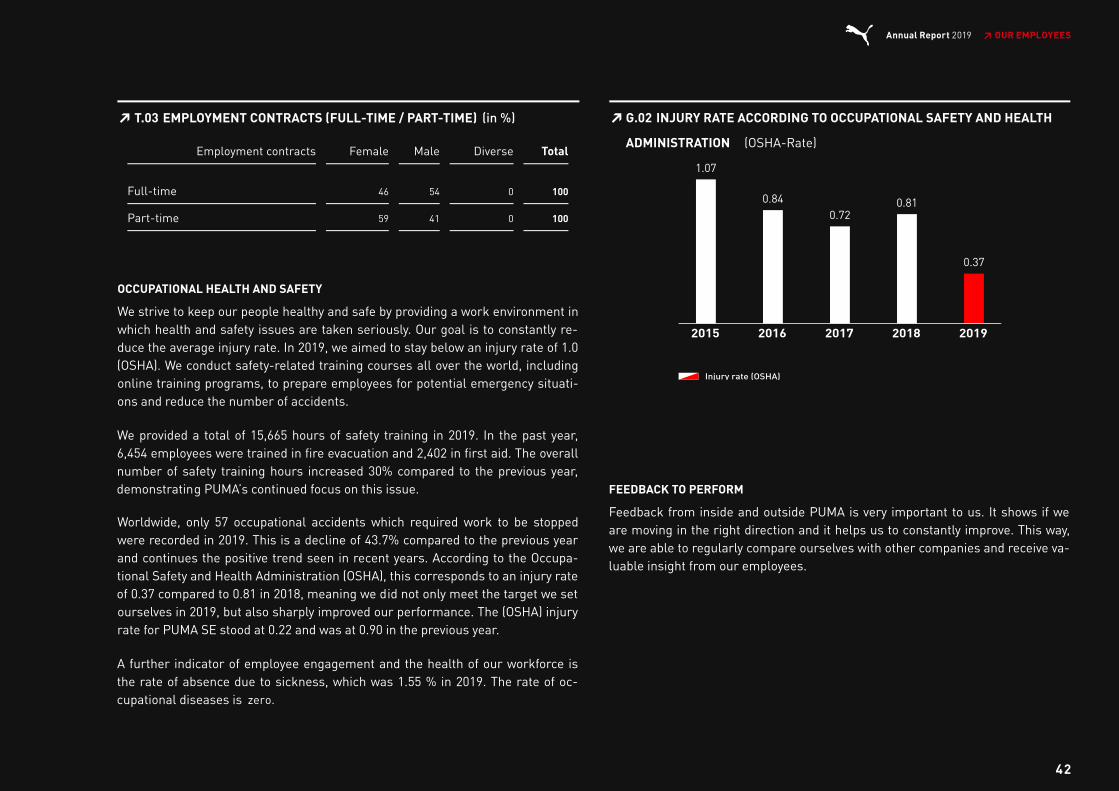
We strive to keep our people healthy and safe by providing a work environment inwhich health and safety issues are taken seriously. Our goal is to constantly re-duce the average injury rate. In 2019, we aimed to stay below an injury rate of 1.0(OSHA). We conduct safety-related training courses all over the world, includingonline training programs, to prepare employees for potential emergency situati-ons and reduce the number of accidents.
We provided a total of 15,665 hours of safety training in 2019. In the past year,6,454 employees were trained in fire evacuation and 2,402 in first aid. The overallnumber of safety training hours increased 30% compared to the previous year,demonstrating PUMA’s continued focus on this issue.
Worldwide, only 57 occupational accidents which required work to be stoppedwere recorded in 2019. This is a decline of 43.7% compared to the previous yearand continues the positive trend seen in recent years. According to the Occupa-tional Safety and Health Administration (OSHA), this corresponds to an injury rateof 0.37 compared to 0.81 in 2018, meaning we did not only meet the target we setourselves in 2019, but also sharply improved our performance. The (OSHA) injuryrate for PUMA SE stood at 0.22 and was at 0.90 in the previous year.
A further indicator of employee engagement and the health of our workforce isthe rate of absence due to sickness, which was 1.55 % in 2019. The rate of oc-cupational diseases is 0.
FEEDBACK TO PERFORM
Feedback from inside and outside PUMA is very important to us. It shows if weare moving in the right direction and it helps us to constantly improve. This way,we are able to regularly compare ourselves with other companies and receive va-luable insight from our employees.
T.03 EMPLOYMENT CONTRACTS (FULL-TIME / PART-TIME) (in %)➔
G.02 INJURY RATE ACCORDING TO OCCUPATIONAL SAFETY AND HEALTH
ADMINISTRATION (OSHA-Rate)
➔
1.07
0.84
0.72
0.81
0.37
2015 2016 2017 2018 2019
Injury rate (OSHA)
42
Annual Report 2019 ↗ OUR EMPLOYEES
Employment contracts Female Male Diverse Total
Full-time 46 54 0 100
Part-time 59 41 0 100
OCCUPATIONAL HEALTH AND SAFETY
We strive to keep our people healthy and safe by providing a work environment inwhich health and safety issues are taken seriously. Our goal is to constantly re-duce the average injury rate. In 2019, we aimed to stay below an injury rate of 1.0(OSHA). We conduct safety-related training courses all over the world, includingonline training programs, to prepare employees for potential emergency situati-ons and reduce the number of accidents.
We provided a total of 15,665 hours of safety training in 2019. In the past year,6,454 employees were trained in fire evacuation and 2,402 in first aid. The overallnumber of safety training hours increased 30% compared to the previous year,demonstrating PUMA’s continued focus on this issue.
Worldwide, only 57 occupational accidents which required work to be stoppedwere recorded in 2019. This is a decline of 43.7% compared to the previous yearand continues the positive trend seen in recent years. According to the Occupa-tional Safety and Health Administration (OSHA), this corresponds to an injury rateof 0.37 compared to 0.81 in 2018, meaning we did not only meet the target we setourselves in 2019, but also sharply improved our performance. The (OSHA) injuryrate for PUMA SE stood at 0.22 and was at 0.90 in the previous year.
A further indicator of employee engagement and the health of our workforce isthe rate of absence due to sickness, which was 1.55 % in 2019. The rate of oc-cupational diseases is 0.
FEEDBACK TO PERFORM
Feedback from inside and outside PUMA is very important to us. It shows if weare moving in the right direction and it helps us to constantly improve. This way,we are able to regularly compare ourselves with other companies and receive va-luable insight from our employees.
T.03 EMPLOYMENT CONTRACTS (FULL-TIME / PART-TIME) (in %)➔
G.02 INJURY RATE ACCORDING TO OCCUPATIONAL SAFETY AND HEALTH
ADMINISTRATION (OSHA-Rate)
➔
1.07
0.84
0.72
0.81
0.37
2015 2016 2017 2018 2019
Injury rate (OSHA)
zero.
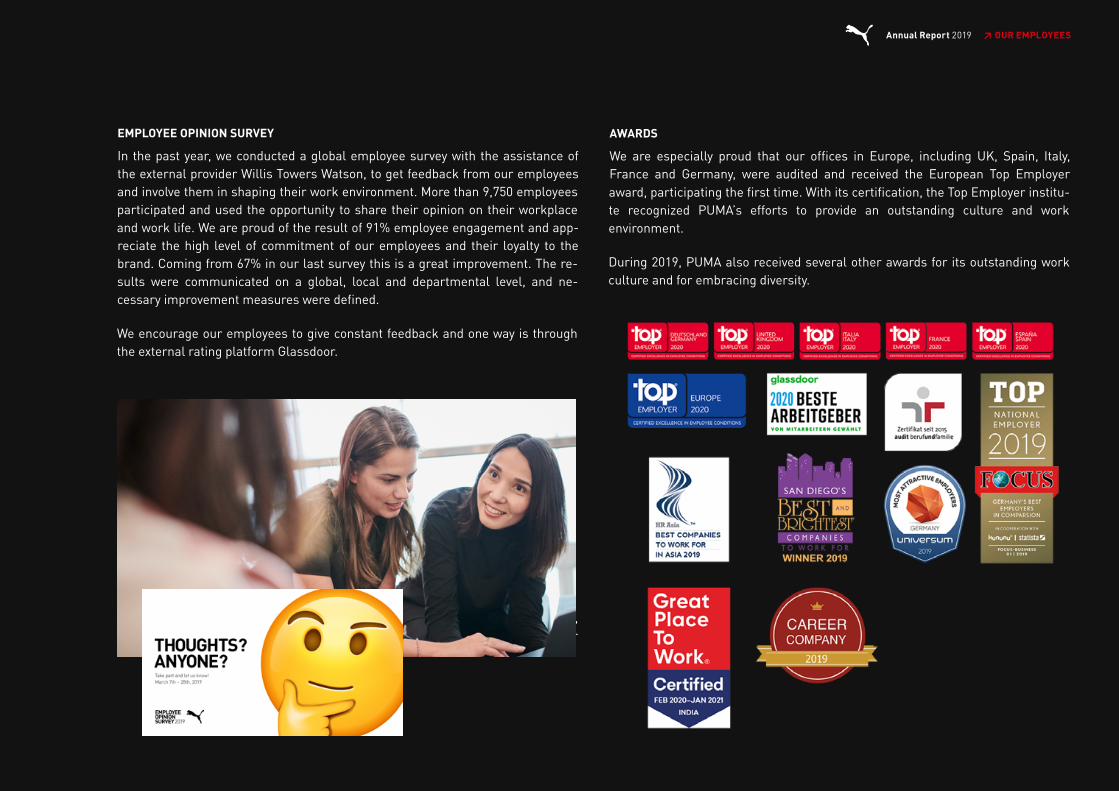
EMPLOYEE OPINION SURVEY
In the past year, we conducted a global employee survey with the assistance ofthe external provider Willis Towers Watson, to get feedback from our employeesand involve them in shaping their work environment. More than 9,750 employeesparticipated and used the opportunity to share their opinion on their workplaceand work life. We are proud of the result of 91% employee engagement and app-reciate the high level of commitment of our employees and their loyalty to thebrand. Coming from 67% in our last survey this is a great improvement. The re-sults were communicated on a global, local and departmental level, and ne-cessary improvement measures were defined.
We encourage our employees to give constant feedback and one way is throughthe external rating platform Glassdoor.
AWARDS
We are especially proud that our offices in Europe, including UK, Spain, Italy,France and Germany, were audited and received the European Top Employer
award, participating the first time. With its certification, the Top Employer institu-te recognized PUMA’s efforts to provide an outstanding culture and workenvironment.
During 2019, PUMA also received several other awards for its outstanding workculture and for embracing diversity.
43
Annual Report 2019 ↗ OUR EMPLOYEES
EMPLOYEE OPINION SURVEY
In the past year, we conducted a global employee survey with the assistance ofthe external provider Willis Towers Watson, to get feedback from our employeesand involve them in shaping their work environment. More than 9,750 employeesparticipated and used the opportunity to share their opinion on their workplaceand work life. We are proud of the result of 91% employee engagement and app-reciate the high level of commitment of our employees and their loyalty to thebrand. Coming from 67% in our last survey this is a great improvement. The re-sults were communicated on a global, local and departmental level, and ne-cessary improvement measures were defined.
We encourage our employees to give constant feedback and one way is throughthe external rating platform Glassdoor.
AWARDS
We are especially proud that our offices in Europe, including UK, Spain, Italy,France and Germany, were audited and received the European Top Employer
award, participating the first time. With its certification, the Top Employer institu-te recognized PUMA’s efforts to provide an outstanding culture and workenvironment.
During 2019, PUMA also received several other awards for its outstanding workculture and for embracing diversity.

PERSONALJOURNEY
PEOPLE CONNECTION & ATTRACTION
To support our company strategy and to ensure the success of our business, wefocus on connecting with potential candidates, attracting the right people and de-veloping our talents. With an integrated talent management approach, we fostera performance-learning and performance-driven culture at PUMA. We systema-tically evaluate all employees, develop them based on their needs, identify ta-lents and prepare them for driving the future success of PUMA.
We conduct talent conferences globally every year to assess the entire PUMAworkforce, including all levels of management. Employees are evaluated on cri-teria such as individual performance and competencies, potential, ambition, ca-reer progression and mobility. The targeted analysis of our employees’ profilesallows us to not only prepare individual development plans, but also to match in-ternal talent with vacancies. This helps us to find potential successors within thecompany and to foresee and to address the future competency needs of ourorganization.
We can only drive our mission to become the fastest sports brand in the worldand ensure PUMA’s long-term success with the right people. This becomes parti-cularly important in a constantly changing and increasingly complex environ-ment. Therefore, it is crucial that we are perceived as a top employer and attractexternal candidates who want to join the unique PUMA working culture. In orderto connect with these potential candidates, we use digital platforms and socialmedia for our target group-specific, individual recruiting measures, as well asour career website. Extensive networks of qualified applicants and up-to-datecandidate pools help us to quickly fill vacancies.
44
Annual Report 2019 ↗ OUR EMPLOYEES

DEVELOPMENT
We believe in nurturing talent within and therefore we are committed to promotethe professional and personal development of all our employees. By doing so, wealso ensure that our people have the necessary expertise to guarantee conti-nuous growth and market competence. Life-long learning is a necessity, particu-larly in times of a rapidly changing world. Considering the 70-20-10-rule,learning is optimized when it is done 70% on the job, 20% learning from othersand 10% training and self-study. We offer a large number of online and offlinetraining courses and workshops that are standardized or tailored to individualneeds. Fostering self-directed learning, we provide a state-of-the-art learninginfrastructure integrated in the Human Capital Management System Workday forinternal and external training courses. Furthermore, our employees have thepossibility to create their own content and share it with other PUMA employees.Ensuring that everyone has access everywhere and at all times, WorkdayLearning is available on all mobile devices. In 2019, 15,827 employees worldwideparticipated in training courses and workshops with a total of 199,496 hours.
To prepare and motivate our staff for digital change, we have started to train em-ployees to become ”agile coaches.” These coaches apply agile working methods,pass on their knowledge to other colleagues on site, have the right mindset, andare also available as experts on the subject. In addition to the management con-tent already available in the ILP (International Leadership Program), we send ourstaff on external and internal training courses to learn agile methods such asScrum, Design Thinking and KanBan. The high level of interest and steadily in-creasing numbers of staff attending these courses show that we are moving inthe right direction.
LEADERSHIP TRAINING ILP/ ILP²
Our PUMA leaders play an important role in fulfilling our mission to become fo-rever faster. We are only able to reach our goals through their commitment andpassion. They are responsible for driving and shaping our PUMA working cultureand our success depends on their skills and leadership expertise. That is why wedefined a set of leadership competencies, which is necessary to successfully leada team in an increasingly complex and volatile work environment. To equip ourstaff with such competencies and ensure a common understanding of leadershipthroughout the organization, we designed the International Leadership Program(ILP & ILP2). PUMA leaders receive intensive training and coaching, including in-teractive learning, roleplay simulations and best practice learning, as well asjoint projects. Areas of focus are in particular mindful leadership and agileworking methods. The program consists of different modules, providing leaderswith the opportunity to apply the newly acquired knowledge in between seminars.
45
Annual Report 2019 ↗ OUR EMPLOYEES
2

SPEED UP/SPEED UP²
Accelerating the progress of our employees is essential for organizational suc-cess. Driving that ambition, two selective development programs, Speed Up andSpeed Up , are designed to unlock the potential of our talents. To prepare themfor the next steps in their career, we provide an intense curriculum, includingcross-functional projects and tasks, coaching, mentoring, and job swaps as wellas targeted training courses. Participants also benefit from exposure to top ma-nagement and establish strong networks globally.
FUTURE CHAMPIONS
We are constantly looking for future talent we can develop successfully and passon the relevant skills to take over challenging roles within the PUMA Group. A va-ried range of initiatives at universities, both locally and internationally, gives usthe opportunity to approach potential employees and identify suitable candidates.Within a global work environment, we provide various options for graduates ta-king their first career step.
In 2019, 10 dual-program students and trainees joined the PUMA Headquartersin Herzogenaurach. In total, PUMA had 42 apprentices and dual-program stu-dents by the end of 2019, majoring in a range of subjects, from InternationalBusiness to IT. Another way of getting to know PUMA is an internship for stu-dents, in which they are given the opportunity to gain 6 months of workexperience.
2
46
Annual Report 2019 ↗ OUR EMPLOYEES
In 2019, ten dual-program students and trainees joined the PUMA Headquarters

ONE PLANET PERFORMANCE
48 Introduction
49 “We want to embed sustainability into all of
our products.”
– Foreword Anne-Laure Descours, CSO
51 PUMA Sustainability Strategy 10FOR20
62 Social Aspects
68 Environment
84 Health and Safety
86 Governance
88 Summary and new Targets for 2025
91 GRI Index
107 Deloitte Assurance Statement
Sustainability
Anne-Laure Descours, Chief Sourcing Officer (CSO)
47
Annual Report 2019 ↗ SUSTAINABILITY
ONE PLANET PERFORMANCE
In 2019, we completed our 10FOR20 sustainability strategy and reached our tar-gets one year ahead of schedule. At the same time, we finalized the new 10-FOR25 sustainability targets in collaboration with our major stakeholders.
Throughout the sustainability section of this Annual Report, we will list our mostmaterial sustainability topics and the approach we took to manage these. We willalso discuss the key performance indicators we set, and the results achieved foreach individual target area.
Overall, we made good progress and achieved the majority of key performanceindicators (KPIs) we had set in nine out of ten target areas. The performance inone target area (Water & Air) remained below expectations. Since we still firmlybelieve that we need close control over the emissions to air and water of oursuppliers, we will carry the targets for this area forward into our new targets for2025.
The concept of sustainability in itself is a long-term journey and much remains tobe done, both within our industry and our company, to achieve a truly sustainablebusiness model and conduct. In our support of the United Nations SustainableDevelopment Goals and tackling the climate crisis, we are happy to report thatwe have hit all four of our bonus-relevant sustainability targets related to Clima-te Action, Human Rights, and Health & Safety as well as Anti-Corruption.
Special highlights of the year 2019 were
the agreement and publication of a science based carbon emission tar-get paired with
a significant reduction of greenhouse gas emissions by purchasing re-newable energy and renewable energy attribute certificates;
the re-accreditation of our social compliance program by the Fair LaborAssociation;
achieving zero fatal accidents at PUMA and its finished goods suppliersfor the second year in a row;
surveying more than 20,000 workers at suppliers for working conditionsvia a mobile app;
an increase in the pass rate of our material tests for chemicals to 98.9%and wastewater tests at suppliers with wet-processing for chemical pa-rameters to 94% and above;
an increase in community hours donated by PUMA staff globally;
the elimination of recruitment fees for migrant workers within our Tier1 supplier base;
the launch of our Forever Better product sustainability platform;
increasing the usage of more sustainable cotton from Better Cotton In-itiative (BCI) to over 80%; and
increasing the usage of certified polyester (bluesign & OEKO-TEX) toover 90%.
®
48
Annual Report 2019 ↗ SUSTAINABILITY
INTRODUCTION
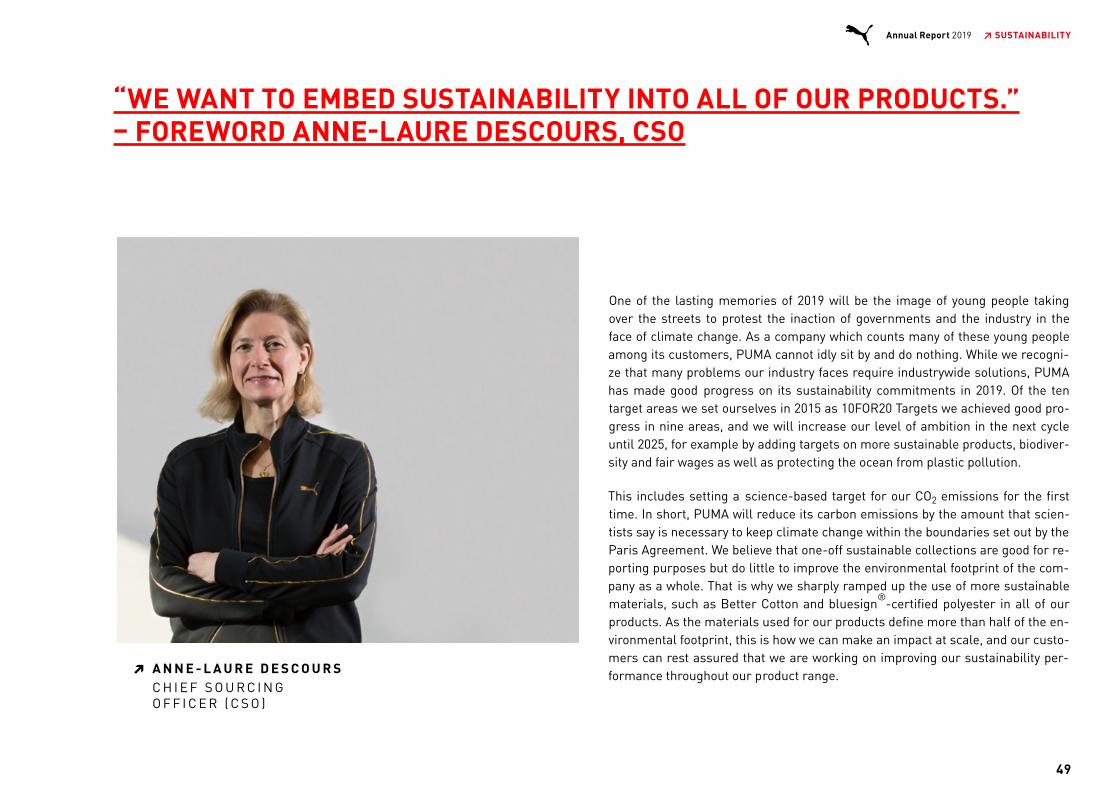
“WE WANT TO EMBED SUSTAINABILITY INTO ALL OF OURPRODUCTS.”- Foreword Anne-Laure Descours, CSO
One of the lasting memories of 2019 will be the image of young people takingover the streets to protest the inaction of governments and the industry in theface of climate change. As a company which counts many of these young peopleamong its customers, PUMA cannot idly sit by and do nothing. While we recogni-ze that many problems our industry faces require industrywide solutions, PUMAhas made good progress on its sustainability commitments in 2019. Of the tentarget areas we set ourselves in 2015 as 10FOR20 Targets we achieved good pro-gress in nine areas, and we will increase our level of ambition in the next cycleuntil 2025, for example by adding targets on more sustainable products, biodiver-sity and fair wages as well as protecting the ocean from plastic pollution.
This includes setting a science-based target for our CO emissions for the firsttime. In short, PUMA will reduce its carbon emissions by the amount that scien-tists say is necessary to keep climate change within the boundaries set out by theParis Agreement. We believe that one-off sustainable collections are good for re-porting purposes but do little to improve the environmental footprint of the com-pany as a whole. That is why we sharply ramped up the use of more sustainablematerials, such as Better Cotton and bluesign -certified polyester in all of ourproducts. As the materials used for our products define more than half of the en-vironmental footprint, this is how we can make an impact at scale, and our custo-mers can rest assured that we are working on improving our sustainability per-formance throughout our product range.A N N E - L A U R E D E S C O U R S▔
C H I E F S O U R C I N GO F F I C E R ( C S O )
2
®
“WE WANT TO EMBED SUSTAINABILITY INTO ALL OF OUR PRODUCTS.” – FOREWORD ANNE-LAURE DESCOURS, CSO
49
Annual Report 2019 ↗ SUSTAINABILITY
“WE WANT TO EMBED SUSTAINABILITY INTO ALL OF OURPRODUCTS.”- FOREWORD ANNE-LAURE DESCOURS, CSO
One of the lasting memories of 2019 will be the image of young people takingover the streets to protest the inaction of governments and the industry in theface of climate change. As a company which counts many of these young peopleamong its customers, PUMA cannot idly sit by and do nothing. While we recogni-ze that many problems our industry faces require industrywide solutions, PUMAhas made good progress on its sustainability commitments in 2019. Of the tentarget areas we set ourselves in 2015 as 10FOR20 Targets we achieved good pro-gress in nine areas, and we will increase our level of ambition in the next cycleuntil 2025, for example by adding targets on more sustainable products, biodiver-sity and fair wages as well as protecting the ocean from plastic pollution.
This includes setting a science-based target for our CO emissions for the firsttime. In short, PUMA will reduce its carbon emissions by the amount that scien-tists say is necessary to keep Climate Change within the boundaries set out bythe Paris Agreement. We believe that one-off sustainable collections are good forreporting purposes but do little to improve the environmental footprint of thecompany as a whole. That is why we sharply ramped up the use of moresustainable materials, such as Better Cotton and bluesign -certified polyester inall of our products. As the materials used for our products define more than halfof the environmental footprint, this is how we can make an impact at scale, andour customers can rest assured that we are working on improving our sustaina-bility performance throughout our product range.A N N E - L A U R E D E S C O U R S
➔
C H I E F S O U R C I N GO F F I C E R ( C S O )
2
®

Beyond the environmental aspects of our sustainability strategy, we have alsomade progress in improving the working conditions at our suppliers, for exampleby phasing out recruitment fees for migrant workers at our finished goods manu-facturers. In this context, we are encouraged that our social compliance programfor PUMA’s vendors and suppliers was once again approved by the Fair Labor As-sociation, of which we have been a member since 2004.
It is not enough to ask our suppliers to treat their workers well, we also have toset the right economic conditions. In 2019, we implemented new standards onhow we as a company should treat our manufacturing partners so they can makethe improvements of working conditions happen.
To share product-centric and consumer-facing information in a more accessibleway, we have partnered with sustainability communication experts Futerra andlaunched Forever Better, a consumer-oriented website which highlights oursustainability efforts (https://about.puma.com/en/forever-better).
There is still work to be done on our way towards becoming a more sustainablecompany, be it on climate action, a more circular business model or full supplychain transparency. For the challenges we cannot tackle on our own, we continueto work with our industry peers and suppliers. The latest example of such an in-dustry-wide approach is the “Fashion Pact” initiated by the French government,of which PUMA is a part.
Through such initiatives we can shape a more sustainable future and make surethat our products can also be enjoyed by the next generations of athletes.
50
Annual Report 2019 ↗ SUSTAINABILITY
Beyond the environmental aspects of our sustainability strategy, we have alsomade progress in improving the working conditions at our suppliers, for exampleby phasing out recruitment fees for migrant workers at our finished goods manu-facturers. In this context, we are encouraged that our social compliance programfor PUMA’s vendors and suppliers was once again approved by the Fair Labor As-sociation, of which we have been a member since 2004.
It is not enough to ask our suppliers to treat their workers well, we also have toset the right economic conditions. In 2019, we implemented new standards onhow we as a company should treat our manufacturing partners so they can makethe improvements of working conditions happen.
To share product-centric and consumer-facing information in a more accessibleway, we have partnered with sustainability communication experts Futerra andlaunched Forever Better, a consumer-oriented website which highlights oursustainability efforts (https://about.puma.com/en/forever-better).
There is still work to be done on our way towards becoming a more sustainablecompany, be it on climate action, a more circular business model or full supplychain transparency. For the challenges we cannot tackle on our own, we continueto work with our industry peers and suppliers. The latest example of such an in-dustry-wide approach is the “Fashion Pact” initiated by the French government,of which PUMA is a part.
Through such initiatives we can shape a more sustainable future and make surethat our products can also be enjoyed by the next generations of athletes.
climate action
PUMA SUSTAINABILITY STRATEGY 10FOR20
Our 10FOR20 sustainability strategy aims to create maximum positive impact.This holds true for our products, as well as for working conditions at PUMA andits supply chain, and the communities around us. We don’t want to grab quickheadlines with niche sustainability collections, although such collections canhelp to create consumer awareness. Rather, we want to deeply integratesustainability into all core business functions and all PUMA products. This wayour sustainability strategy is integrated with our overall company strategy andour sustainability efforts are much more authentic.
STAKEHOLDER DIALOGUE (10FOR20 TARGET AREA 1)
Target Description:Continue and expand PUMAs Stakeholder Dialogue and Public Non-Financial Re-porting in accordance with global standards; increase sustainability communica-tion towards consumers.
Relates to United Nations Sustainable Development Goal 17.
Example from the 10FOR20 Action Plan:
Conduct a global stakeholder meeting
Conduct regional stakeholder meetings in all key sourcing regions
KPIs:
Thematic and regional coverage of partnership initiatives
Percentage of suppliers reached via round table meetings
Publicly report on PUMA’s sustainability performance
Inform consumers on PUMA’s sustainability initiatives
Ever since our first global stakeholder meeting in 2003, we aim to align oursustainability program and actions with the expectations of our most relevantstakeholders. Therefore, we are constantly talking to our investors, suppliers,customers, consumers, athletes, industry peers, NGOs, scientists and of courseour biggest asset, our employees.
For us, a stakeholder dialogue means not shying away from inconvenient topicsand admitting that we cannot solve everything on our own. It means working onthese topics in close collaboration with experts and our industry peers and, ofcourse, always in line with anti-trust regulations.
For the first time in 2019, we invited more than 50 relevant stakeholders to ourPUMA headquarters in Herzogenaurach. This way we shared the PUMA spiritwith our guests, while at the same time allowing our top management (includingour CEO and CSO) to participate on both days.
51
Annual Report 2019 ↗ SUSTAINABILITY
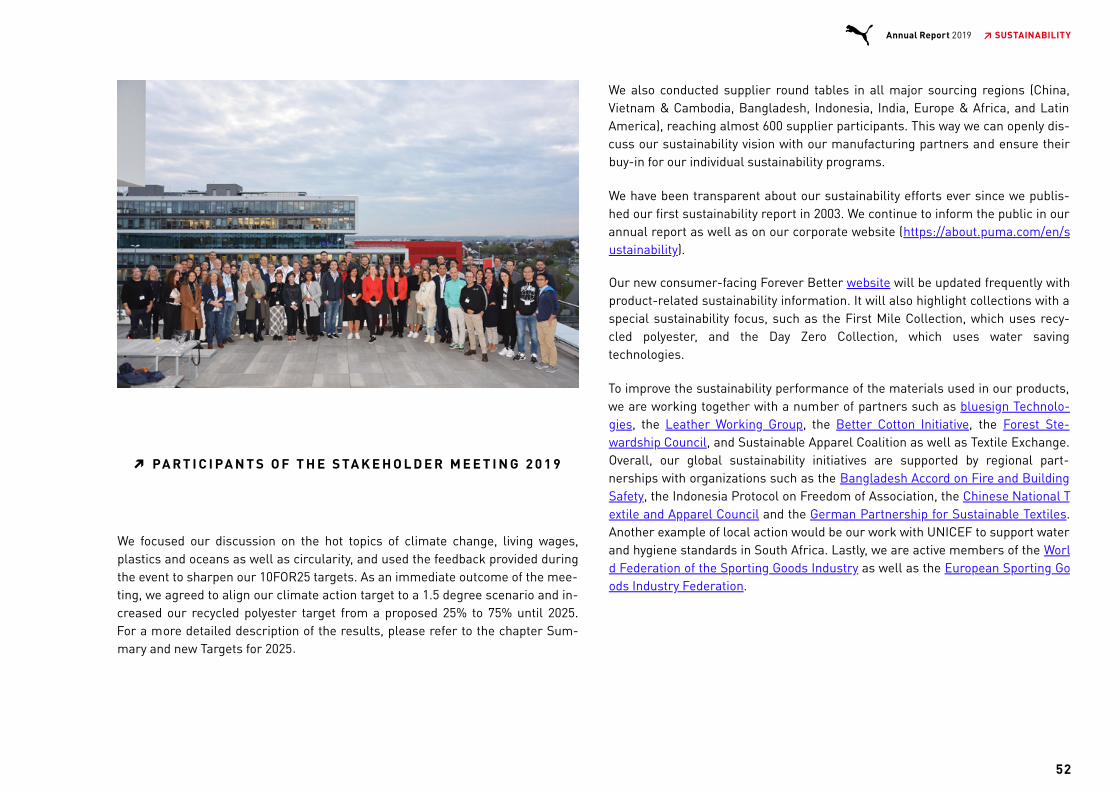
We focused our discussion on the hot topics of climate change, living wages,plastics and oceans as well as circularity, and used the feedback provided duringthe event to sharpen our 10FOR25 targets. As an immediate outcome of the mee-ting, we agreed to align our climate action target to a 1.5 degree scenario and in-creased our recycled polyester target from a proposed 25% to 75% until 2025.For a more detailed description of the results, please refer to the chapter Sum-mary and new Targets for 2025
We also conducted supplier round tables in all major sourcing regions (China,Vietnam & Cambodia, Bangladesh, Indonesia, India, Europe & Africa, and LatinAmerica), reaching almost 600 supplier participants. This way we can openly dis-cuss our sustainability vision with our manufacturing partners and ensure theirbuy-in for our individual sustainability programs.
We have been transparent about our sustainability efforts ever since we publis-hed our first sustainability report in 2003. We continue to inform the public in ourannual report as well as on our corporate website (https://about.puma.com/en/sustainability).
Our new consumer-facing Forever Better website will be updated frequently withproduct-related sustainability information. It will also highlight collections with aspecial sustainability focus, such as the First Mile Collection, which uses recy-cled polyester, and the Day Zero Collection, which uses water savingtechnologies.
To improve the sustainability performance of the materials used in our products,we are working together with a number of partners such as bluesign Technolo-gies, the Leather Working Group, the Better Cotton Initiative, the Forest Ste-wardship Council, and Sustainable Apparel Coalition as well as Textile Exchange.Overall, our global sustainability initiatives are supported by regional part-nerships with organizations such as the Bangladesh Accord on Fire and BuildingSafety, the Indonesia Protocol on Freedom of Association, the Chinese National Textile and Apparel Council and the German Partnership for Sustainable Textiles.Another example of local action would be our work with UNICEF to support waterand hygiene standards in South Africa. Lastly, we are active members of the World Federation of the Sporting Goods Industry as well as the European Sporting Goods Industry Federation.
PA R T I C I PA N T S O F T H E S TA K E H O L D E R M E E T I N G 2 0 1 9▔
52
Annual Report 2019 ↗ SUSTAINABILITY
.
“WE WANT TO EMBED SUSTAINABILITY INTO ALL OF OURPRODUCTS.”- FOREWORD ANNE-LAURE DESCOURS, CSO
One of the lasting memories of 2019 will be the image of young people takingover the streets to protest the inaction of governments and the industry in theface of climate change. As a company which counts many of these young peopleamong its customers, PUMA cannot idly sit by and do nothing. While we recogni-ze that many problems our industry faces require industrywide solutions, PUMAhas made good progress on its sustainability commitments in 2019. Of the tentarget areas we set ourselves in 2015 as 10FOR20 Targets we achieved good pro-gress in nine areas, and we will increase our level of ambition in the next cycleuntil 2025, for example by adding targets on more sustainable products, biodiver-sity and fair wages as well as protecting the ocean from plastic pollution.
This includes setting a science-based target for our CO emissions for the firsttime. In short, PUMA will reduce its carbon emissions by the amount that scien-tists say is necessary to keep Climate Change within the boundaries set out bythe Paris Agreement. We believe that one-off sustainable collections are good forreporting purposes but do little to improve the environmental footprint of thecompany as a whole. That is why we sharply ramped up the use of moresustainable materials, such as Better Cotton and bluesign -certified polyester inall of our products. As the materials used for our products define more than halfof the environmental footprint, this is how we can make an impact at scale, andour customers can rest assured that we are working on improving our sustaina-bility performance throughout our product range.A N N E - L A U R E D E S C O U R S
➔
C H I E F S O U R C I N GO F F I C E R ( C S O )
2
®

AFIRM: Apparel and Footwear International RSL Management, BCI: Better Cotton Initiative, CDP: Carbon Disclosure Project, FESI: Federation of the European Sporting Goods Industry, FLA: Fair Labor Association, IFC:International Finance Corporation, ILO: International Labor Organization, IPE: Institute of Public and Environmental Affairs, SLCP: Social and Labor Convergence Program, ZDHC: Zero Discharge of Hazardous Chemicals
G.01 MATRIX OF KEY PARTNERSHIP INITIATIVES▔
53
Annual Report 2019 ↗ SUSTAINABILITY
T.06 SCOPE 1 AND SCOPE 2 CO E EMISSIONS FROM PUMA➔
2
CO e-Emissions (absolute figues) 2019 2018 2017 2016 2015
% Change
2019/18
% Change
2019/2015
Scope 1 – Direkte CO e-Emissions Fossile Fuels (T) 6,326 6,918 7,678 6,854 7,296 -8.6 -13.3
Car Fleet 3,618 4,073 4,134 3,746 4,087 -11.2 -11.5
Heating 2,708 2,845 3,545 3,107 3,209 -4.8 -15.6
Scope 2 - Indirect CO e Emissions Electricity & Steam [T] 40,986 43,366 40,029 37,300 35,591 -5.5 15.2
Scope 2 - Indirect CO e Emissions Electricity & Steam [T] incl. RECs 11,533 22,128 40,029 37,300 35,591 -47.9 -67.6
Electricity (excl. RECs) 39,282 42,145 38,914 36,046 34,445 -6.8 14.0
Electricity (incl. RECs) 9,828 20,907 38,914 36,046 34,445 -53.0 -71.5
Steam 1,705 1,221 1,115 1,254 1,146 39.6 48.8
Subtotal Scope 1-2 47,312 50,284 47,707 44,153 42,887 -5.9 10.3
Subtotal Scope 1-2 incl. RECs 17,858 29,046 47,707 44,153 42,887 -38.5 -58.4
SCOPE 1-2 CO e EMISSIONS RELATIV TO SALES (in tons CO e per € million sales per year) 8.6 10.8 11.5 12.2 12.7 -20.5 -32.1
SCOPE 1-2 CO e EMISSIONS RELATIV TO SALES (in tons CO e per € million sales per year) (incl. RECs) 3.2 6.2 11.5 12.2 12.7 -48.1 -74.4
21 - 8
2
2
2
2 2
2 2

MOST MATERIAL ASPECTS
The most material aspects and targets for the 10FOR20 target period remainedunchanged and are displayed in figures 1 and 2 below.
G.02 MOST MATERIAL ASPECTS▔
54
Annual Report 2019 ↗ SUSTAINABILITY
T.06 SCOPE 1 AND SCOPE 2 CO E EMISSIONS FROM PUMA➔
2
CO e-Emissions (absolute figues) 2019 2018 2017 2016 2015
% Change
2019/18
% Change
2019/2015
Scope 1 – Direkte CO e-Emissions Fossile Fuels (T) 6,326 6,918 7,678 6,854 7,296 -8.6 -13.3
Car Fleet 3,618 4,073 4,134 3,746 4,087 -11.2 -11.5
Heating 2,708 2,845 3,545 3,107 3,209 -4.8 -15.6
Scope 2 - Indirect CO e Emissions Electricity & Steam [T] 40,986 43,366 40,029 37,300 35,591 -5.5 15.2
Scope 2 - Indirect CO e Emissions Electricity & Steam [T] incl. RECs 11,533 22,128 40,029 37,300 35,591 -47.9 -67.6
Electricity (excl. RECs) 39,282 42,145 38,914 36,046 34,445 -6.8 14.0
Electricity (incl. RECs) 9,828 20,907 38,914 36,046 34,445 -53.0 -71.5
Steam 1,705 1,221 1,115 1,254 1,146 39.6 48.8
Subtotal Scope 1-2 47,312 50,284 47,707 44,153 42,887 -5.9 10.3
Subtotal Scope 1-2 incl. RECs 17,858 29,046 47,707 44,153 42,887 -38.5 -58.4
SCOPE 1-2 CO e EMISSIONS RELATIV TO SALES (in tons CO e per € million sales per year) 8.6 10.8 11.5 12.2 12.7 -20.5 -32.1
SCOPE 1-2 CO e EMISSIONS RELATIV TO SALES (in tons CO e per € million sales per year) (incl. RECs) 3.2 6.2 11.5 12.2 12.7 -48.1 -74.4
21 - 8
2
2
2
2 2
2 2
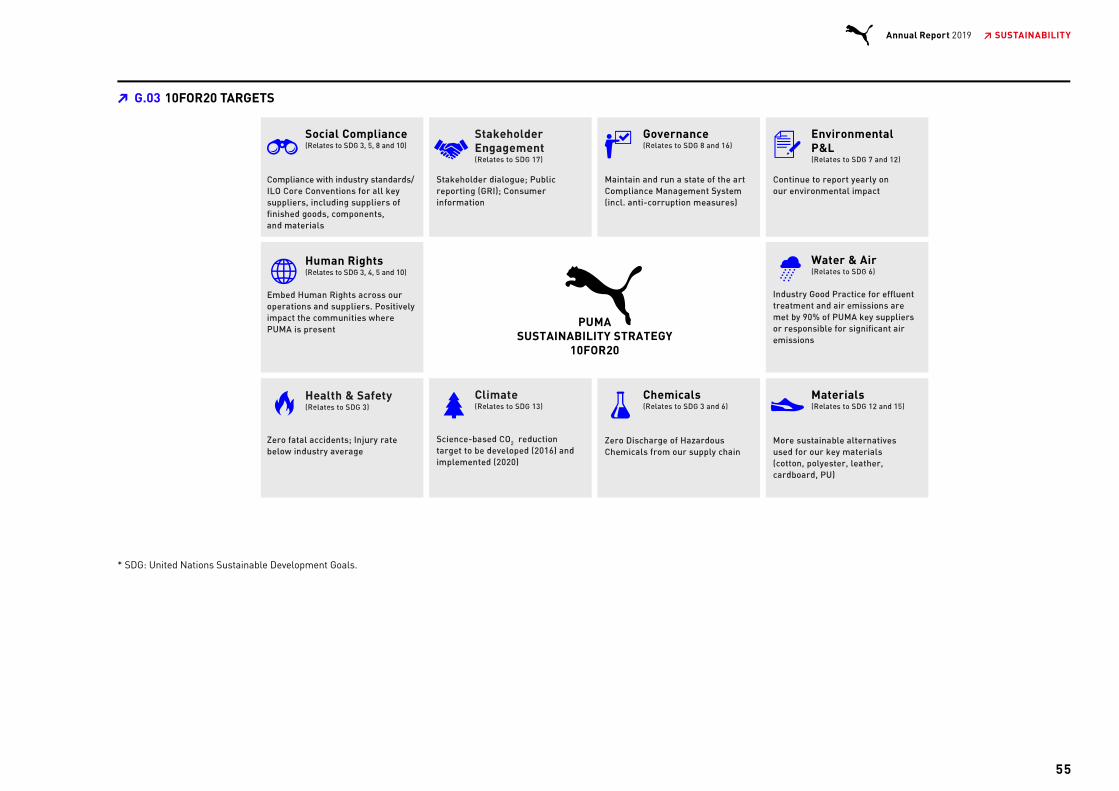
* SDG: United Nations Sustainable Development Goals.
G.03 10FOR20 TARGETS▔
55
Annual Report 2019 ↗ SUSTAINABILITY
T.06 SCOPE 1 AND SCOPE 2 CO E EMISSIONS FROM PUMA➔
2
CO e-Emissions (absolute figues) 2019 2018 2017 2016 2015
% Change
2019/18
% Change
2019/2015
Scope 1 – Direkte CO e-Emissions Fossile Fuels (T) 6,326 6,918 7,678 6,854 7,296 -8.6 -13.3
Car Fleet 3,618 4,073 4,134 3,746 4,087 -11.2 -11.5
Heating 2,708 2,845 3,545 3,107 3,209 -4.8 -15.6
Scope 2 - Indirect CO e Emissions Electricity & Steam [T] 40,986 43,366 40,029 37,300 35,591 -5.5 15.2
Scope 2 - Indirect CO e Emissions Electricity & Steam [T] incl. RECs 11,533 22,128 40,029 37,300 35,591 -47.9 -67.6
Electricity (excl. RECs) 39,282 42,145 38,914 36,046 34,445 -6.8 14.0
Electricity (incl. RECs) 9,828 20,907 38,914 36,046 34,445 -53.0 -71.5
Steam 1,705 1,221 1,115 1,254 1,146 39.6 48.8
Subtotal Scope 1-2 47,312 50,284 47,707 44,153 42,887 -5.9 10.3
Subtotal Scope 1-2 incl. RECs 17,858 29,046 47,707 44,153 42,887 -38.5 -58.4
SCOPE 1-2 CO e EMISSIONS RELATIV TO SALES (in tons CO e per € million sales per year) 8.6 10.8 11.5 12.2 12.7 -20.5 -32.1
SCOPE 1-2 CO e EMISSIONS RELATIV TO SALES (in tons CO e per € million sales per year) (incl. RECs) 3.2 6.2 11.5 12.2 12.7 -48.1 -74.4
21 - 8
2
2
2
2 2
2 2
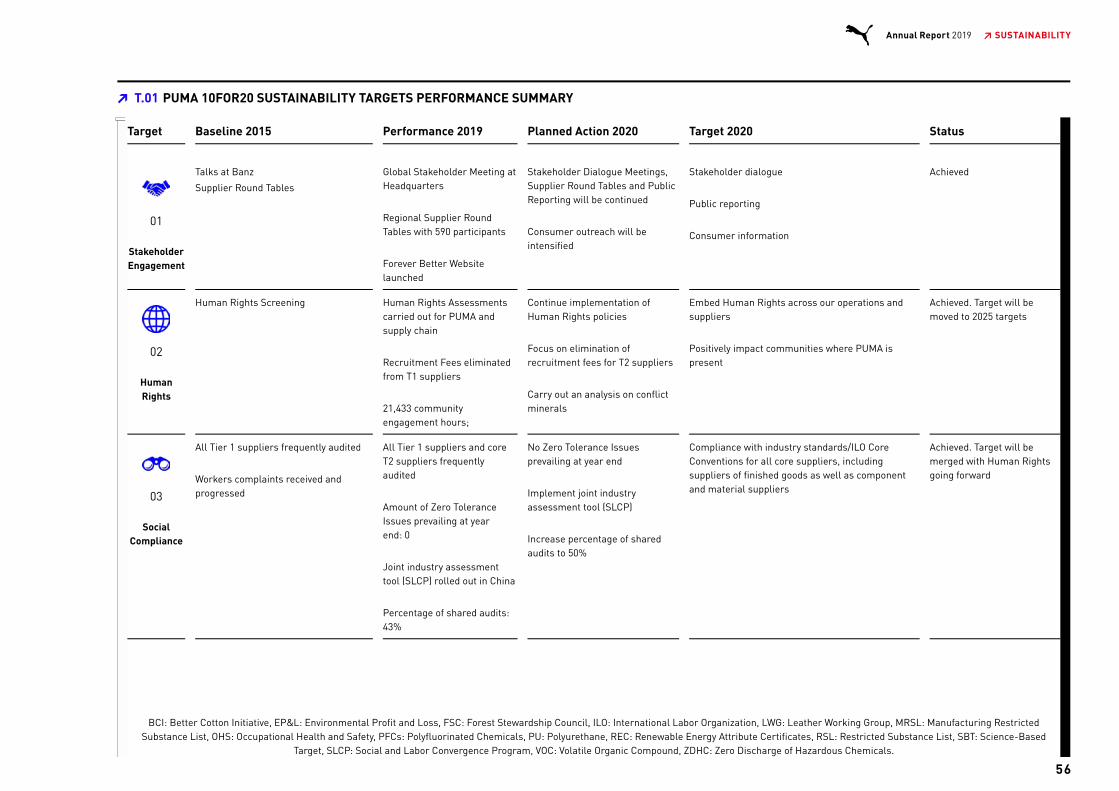
T.01 PUMA 10FOR20 SUSTAINABILITY TARGETS PERFORMANCE SUMMARY▔
Target Baseline 2015 Performance 2019 Planned Action 2020 Target 2020 Status
01
StakeholderEngagement
Talks at Banz
Supplier Round Tables
Global Stakeholder Meeting atHeadquarters
Regional Supplier RoundTables with 590 participants
Forever Better Websitelaunched
Stakeholder Dialogue Meetings,Supplier Round Tables and PublicReporting will be continued
Consumer outreach will beintensified
Stakeholder dialogue
Public reporting
Consumer information
Achieved
02
HumanRights
Human Rights Screening Human Rights Assessmentscarried out for PUMA andsupply chain
Recruitment Fees eliminatedfrom T1 suppliers
21,433 communityengagement hours;
Continue implementation ofHuman Rights policies
Focus on elimination ofrecruitment fees for T2 suppliers
Carry out an analysis on conflictminerals
Embed Human Rights across our operations andsuppliers
Positively impact communities where PUMA ispresent
Achieved. Target will bemoved to 2025 targets
03
SocialCompliance
All Tier 1 suppliers frequently audited;
Workers complaints received andprogressed
All Tier 1 suppliers and coreT2 suppliers frequentlyaudited
Amount of Zero ToleranceIssues prevailing at yearend: 0
Joint industry assessmenttool (SLCP) rolled out in China
Percentage of shared audits:43%
No Zero Tolerance Issuesprevailing at year end
Implement joint industryassessment tool (SLCP)
Increase percentage of sharedaudits to 50%
Compliance with industry standards/ILO CoreConventions for all core suppliers, includingsuppliers of finished goods as well as componentand material suppliers
Achieved. Target will bemerged with Human Rightsgoing forward
BCI: Better Cotton Initiative, EP&L: Environmental Profit and Loss, FSC: Forest Stewardship Council, ILO: International Labor Organization, LWG: Leather Working Group, MRSL: Manufacturing RestrictedSubstance List, OHS: Occupational Health and Safety, PFCs: Polyfluorinated Chemicals, PU: Polyurethane, REC: Renewable Energy Attribute Certificates, RSL: Restricted Substance List, SBT: Science-Based
Target, SLCP: Social and Labor Convergence Program, VOC: Volatile Organic Compound, ZDHC: Zero Discharge of Hazardous Chemicals.
56
Annual Report 2019 ↗ SUSTAINABILITY
T.06 SCOPE 1 AND SCOPE 2 CO E EMISSIONS FROM PUMA➔
2
CO e-Emissions (absolute figues) 2019 2018 2017 2016 2015
% Change
2019/18
% Change
2019/2015
Scope 1 – Direkte CO e-Emissions Fossile Fuels (T) 6,326 6,918 7,678 6,854 7,296 -8.6 -13.3
Car Fleet 3,618 4,073 4,134 3,746 4,087 -11.2 -11.5
Heating 2,708 2,845 3,545 3,107 3,209 -4.8 -15.6
Scope 2 - Indirect CO e Emissions Electricity & Steam [T] 40,986 43,366 40,029 37,300 35,591 -5.5 15.2
Scope 2 - Indirect CO e Emissions Electricity & Steam [T] incl. RECs 11,533 22,128 40,029 37,300 35,591 -47.9 -67.6
Electricity (excl. RECs) 39,282 42,145 38,914 36,046 34,445 -6.8 14.0
Electricity (incl. RECs) 9,828 20,907 38,914 36,046 34,445 -53.0 -71.5
Steam 1,705 1,221 1,115 1,254 1,146 39.6 48.8
Subtotal Scope 1-2 47,312 50,284 47,707 44,153 42,887 -5.9 10.3
Subtotal Scope 1-2 incl. RECs 17,858 29,046 47,707 44,153 42,887 -38.5 -58.4
SCOPE 1-2 CO e EMISSIONS RELATIV TO SALES (in tons CO e per € million sales per year) 8.6 10.8 11.5 12.2 12.7 -20.5 -32.1
SCOPE 1-2 CO e EMISSIONS RELATIV TO SALES (in tons CO e per € million sales per year) (incl. RECs) 3.2 6.2 11.5 12.2 12.7 -48.1 -74.4
21 - 8
2
2
2
2 2
2 2

Target Baseline 2015 Performance 2019 Planned Action 2020 Target 2020 Status
04
ClimateChange
Science-Based Target (SBT)development announced
Science based target acceptedand published:
Scope 1 and 2:
-35%
Scope 3:
-60% relative to sales
Coverage of 75% of allelectricity used by renewableenergy tariffs or certificates.
PUMA
(Scope 1&2)
Scope 1: -8.6%
Scope 2: -5.5%
Scope 2 (RECs)
-47.9%
Combined:
-38.5% (absolute)
Suppliers (Scope 3): -4.9%relative to sales
Coverage of 90% of all electricityused globally by renewable energytariffs or renewable energycertificates
Offset remaining Scope 1 and 2emissions
Focus on savings for Scope 3emissions (supply chain)
Science based reduction target to be developed andimplemented
Achieved for Scope 1&2.Scope 3 work in progress.Target will be moved to10FOR25 targets
05
Chemicals
Commitment to Zero Discharge ofHazardous Chemicals
RSL compliance rate of 98.9%
Wastewater tests from coresuppliers show 94%compliance on individualchemical parameters
PFCs eliminated from PUMAproducts
VOC Index below 16g/pair
Keep RSL compliance rate over98%
Improve wastewater compliancerate on individual chemicalparameters above 95%
Reduce VOC consumption per pairof shoes below 15g/pair
Zero discharge of hazardous chemicals from oursupply chain
Phase out of intentional useof hazardous chemicals(ZDHC MRSL and PFCs)achieved.
Target will be moved to10FOR25 Targets
BCI: Better Cotton Initiative, EP&L: Environmental Profit and Loss, FSC: Forest Stewardship Council, ILO: International Labor Organization, LWG: Leather Working Group, MRSL: Manufacturing RestrictedSubstance List, OHS: Occupational Health and Safety, PFCs: Polyfluorinated Chemicals, PU: Polyurethane, REC: Renewable Energy Attribute Certificates, RSL: Restricted Substance List, SBT: Science-Based
Target, SLCP: Social and Labor Convergence Program, VOC: Volatile Organic Compound, ZDHC: Zero Discharge of Hazardous Chemicals.
57
Annual Report 2019 ↗ SUSTAINABILITY

Target Baseline 2015 Performance 2019 Planned Action 2020 Target 2020 Status
06
Water & Air
Start of wastewater testing andpublication
Bi-Annual Wastewater Testsestablished at all coresuppliers with Wet-processing
Compliance rate ofconventional parametersabove 90% for 16 out of 17parameters
First draft of ZDHC AirEmissions Guideline available
Improve compliance rate ofconventional wastewaterparameters to above 90% for allparameters
Pilot Draft ZDHC Air EmissionsGuideline
Industry good practice on water treatment and airemissions are met by 90% of PUMA core suppliers
Target not yet achieved.
Will be carried to the new10FOR25 Targets
07
Materials
bluesign® (polyester), Leather WorkingGroup (leather), and FSC (paper &cardboard) certification used insignificant volumes
Apparel:
Cotton - BCI: 80%
Polyester -
bluesign® / OEKO-TEX: 98%
Down Feathers -
Responsible Down: 100%
Leather -
LWG: 98%
Cardboard & Paper:
FSC/Recycled: 100%
Accessories:
Polyester -
bluesign® / OEKO-TEX >99%
BCI >90%
FSC/Recycled >90%
LWG >90%
bluesign®&OEKO-TEX
> 90%
Responsible Down 100%
More sustainable materials used for our keymaterials: FSC 90%
LWG 90%
bluesign® 50%
BCI 50%
Original 2020 Targets alreadyachieved in 2018
2020 Target for cotton andpolyester upgraded to 90%
Targets will be merged into amore sustainable productstarget
08
EP&L
Kering Group EP&L published(including PUMA figures)
PUMA EP&L 2018 published
Reduction per unit of turnoverfrom 2013 to 2018 of 13.6%
Keep publishing EP&L values
Keep reducing the value per unitof turnover
Continue to report yearly on our impact
PUMA EP&L value significantly reduced
Target achieved. EP&Limpact will be reported onPUMA website
BCI: Better Cotton Initiative, EP&L: Environmental Profit and Loss, FSC: Forest Stewardship Council, ILO: International Labor Organization, LWG: Leather Working Group, MRSL: Manufacturing RestrictedSubstance List, OHS: Occupational Health and Safety, PFCs: Polyfluorinated Chemicals, PU: Polyurethane, REC: Renewable Energy Attribute Certificates, RSL: Restricted Substance List, SBT: Science-Based
Target, SLCP: Social and Labor Convergence Program, VOC: Volatile Organic Compound, ZDHC: Zero Discharge of Hazardous Chemicals.
58
Annual Report 2019 ↗ SUSTAINABILITY
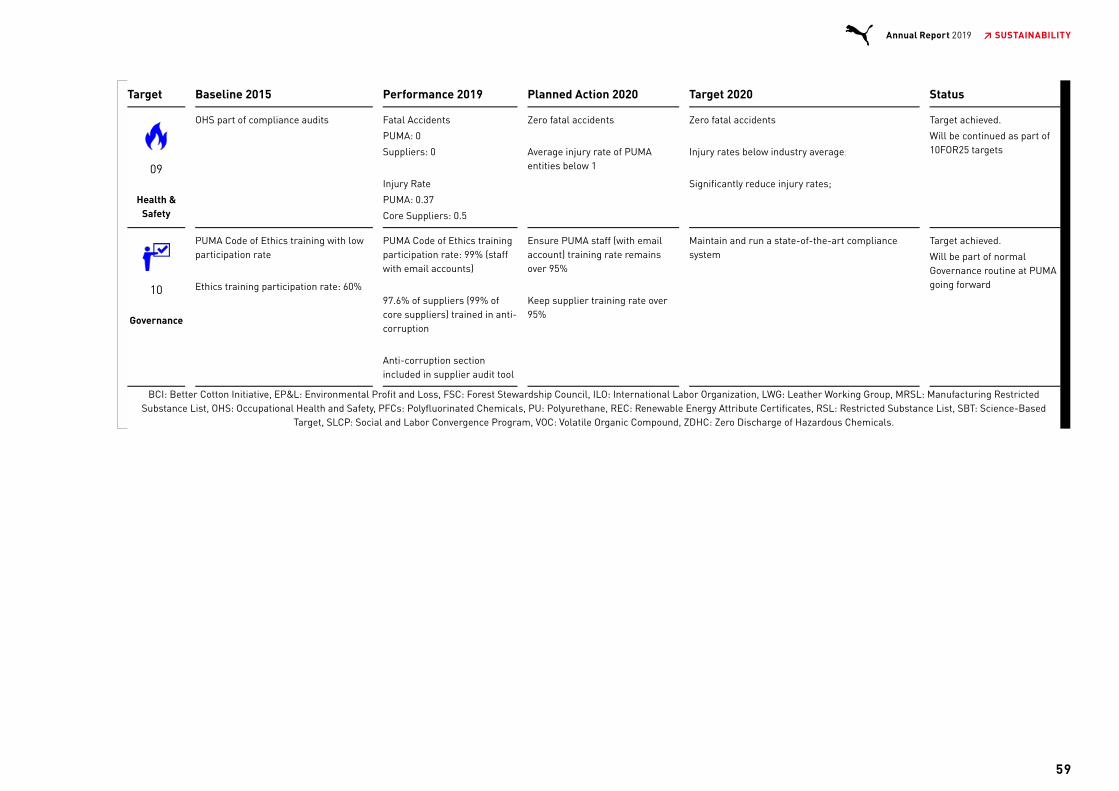
Target Baseline 2015 Performance 2019 Planned Action 2020 Target 2020 Status
09
Health &Safety
OHS part of compliance audits Fatal Accidents
PUMA: 0
Suppliers: 0
Injury Rate
PUMA: 0.37
Core Suppliers: 0.5
Zero fatal accidents
Average injury rate of PUMAentities below 1
Zero fatal accidents
Injury rates below industry average;
Significantly reduce injury rates;
Target achieved.
Will be continued as part of10FOR25 targets
10
Governance
PUMA Code of Ethics training with lowparticipation rate
Ethics training participation rate: 60%
PUMA Code of Ethics trainingparticipation rate: 99% (staffwith email accounts)
97.6% of suppliers (99% ofcore suppliers) trained in anti-corruption
Anti-corruption sectionincluded in supplier audit tool
Ensure PUMA staff (with emailaccount) training rate remainsover 95%
Keep supplier training rate over95%
Maintain and run a state-of-the-art compliancesystem
Target achieved.
Will be part of normalGovernance routine at PUMAgoing forward
BCI: Better Cotton Initiative, EP&L: Environmental Profit and Loss, FSC: Forest Stewardship Council, ILO: International Labor Organization, LWG: Leather Working Group, MRSL: Manufacturing RestrictedSubstance List, OHS: Occupational Health and Safety, PFCs: Polyfluorinated Chemicals, PU: Polyurethane, REC: Renewable Energy Attribute Certificates, RSL: Restricted Substance List, SBT: Science-Based
Target, SLCP: Social and Labor Convergence Program, VOC: Volatile Organic Compound, ZDHC: Zero Discharge of Hazardous Chemicals.
59
Annual Report 2019 ↗ SUSTAINABILITY
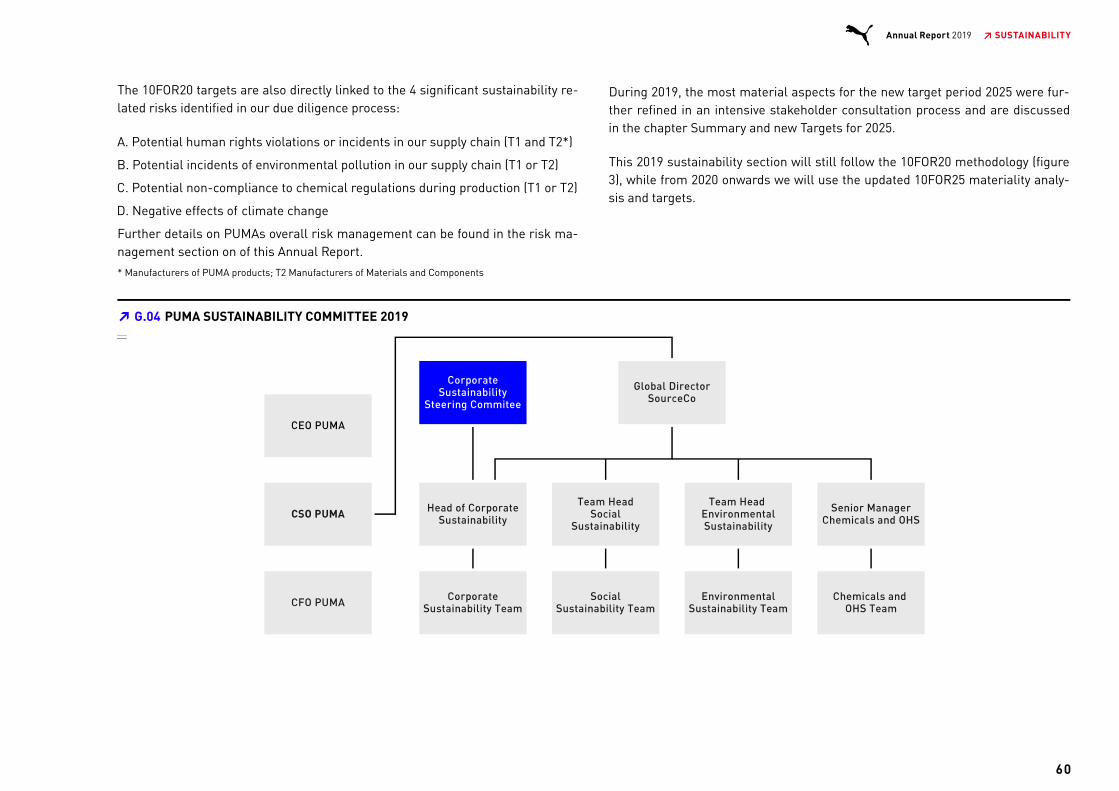
The 10FOR20 targets are also directly linked to the 4 significant sustainability re-lated risks identified in our due diligence process:
A. Potential human rights violations or incidents in our supply chain (T1 and T2*)
B. Potential incidents of environmental pollution in our supply chain (T1 or T2)
C. Potential non-compliance to chemical regulations during production (T1 or T2)
D. Negative effects of climate change
Further details on PUMAs overall risk management can be found in the risk ma-nagement section on of this Annual Report.
* Manufacturers of PUMA products; T2 Manufacturers of Materials and Components
During 2019, the most material aspects for the new target period 2025 were fur-ther refined in an intensive stakeholder consultation process and are discussedin the chapter Summary and new Targets for 2025.
This 2019 sustainability section will still follow the 10FOR20 methodology (figure3), while from 2020 onwards we will use the updated 10FOR25 materiality analy-sis and targets.
G.04 PUMA SUSTAINABILITY COMMITTEE 2019▔
60
Annual Report 2019 ↗ SUSTAINABILITY
T.06 SCOPE 1 AND SCOPE 2 CO E EMISSIONS FROM PUMA➔
2
CO e-Emissions (absolute figues) 2019 2018 2017 2016 2015
% Change
2019/18
% Change
2019/2015
Scope 1 – Direkte CO e-Emissions Fossile Fuels (T) 6,326 6,918 7,678 6,854 7,296 -8.6 -13.3
Car Fleet 3,618 4,073 4,134 3,746 4,087 -11.2 -11.5
Heating 2,708 2,845 3,545 3,107 3,209 -4.8 -15.6
Scope 2 - Indirect CO e Emissions Electricity & Steam [T] 40,986 43,366 40,029 37,300 35,591 -5.5 15.2
Scope 2 - Indirect CO e Emissions Electricity & Steam [T] incl. RECs 11,533 22,128 40,029 37,300 35,591 -47.9 -67.6
Electricity (excl. RECs) 39,282 42,145 38,914 36,046 34,445 -6.8 14.0
Electricity (incl. RECs) 9,828 20,907 38,914 36,046 34,445 -53.0 -71.5
Steam 1,705 1,221 1,115 1,254 1,146 39.6 48.8
Subtotal Scope 1-2 47,312 50,284 47,707 44,153 42,887 -5.9 10.3
Subtotal Scope 1-2 incl. RECs 17,858 29,046 47,707 44,153 42,887 -38.5 -58.4
SCOPE 1-2 CO e EMISSIONS RELATIV TO SALES (in tons CO e per € million sales per year) 8.6 10.8 11.5 12.2 12.7 -20.5 -32.1
SCOPE 1-2 CO e EMISSIONS RELATIV TO SALES (in tons CO e per € million sales per year) (incl. RECs) 3.2 6.2 11.5 12.2 12.7 -48.1 -74.4
21 - 8
2
2
2
2 2
2 2
SCOPE OF DATA COLLECTION
In this report we cover the PUMA Group. Our materiality analysis and EP&L cle-arly indicate that a major part of our impact originates in the manufacturing ofmaterials and components and not in the assembly of finished goods. We there-fore added our core suppliers of components and materials to the scope of ourdata collection.
DATA SOURCES
To ensure a high degree of transparency and to promote the sharing of environ-mental and social data with our industry peers, we have chosen to work with ex-ternal and often public databases:
The Fair Factories Clearinghouse to share compliance audit data withother brands.
The wastewater platform of the Zero Discharge of Hazardous ChemicalsFoundation(ZDHC) for sharing supplier data on wastewater testing.
The Chinese NGO IPE for the publication of supplier environmental data.
IPE’s Green Supply Chain Map, which enables the public to see the envi-ronmental performance of some of our core suppliers in China.
We also collect social and environmental performance data of our company’sown sites and from our core suppliers manufacturing our products.
61
Annual Report 2019 ↗ SUSTAINABILITY

SOCIAL ASPECTS
HUMAN RIGHTS (10FOR20 TARGET NO 2)
Target Description:Embed Human Rights across our operations and suppliers. Positively impact thecommunities where PUMA is present.
Relates to United Sustainable Development Goals 3,4,5,10
Examples from the 10FOR20 Action Plan:
Identify Human Rights hotspots in the supply chain
Mitigate the risk of Forced/Bonded Labor
Promote community engagement
KPIs:
Number of Zero Tolerance Issues prevailing at year end (shared KPIwith Social Compliance)
Number of employee hours spent on community engagement (sharedKPI with HR)
PUMA’s sustainability policies are aligned with the UN Declaration of Humanrights, the International Labor Organization’s Core Labor conventions and the tenprinciples of the United Nations Global Compact.
The observance of human rights has been a part of our first Code of Conduct in1993 and has guided our business ethics since then. In 2019 we established a Re-sponsible Purchasing Policy and a respective training program to ensure oursourcing practices are aligned with our Code of Conduct.
In previous years, we conducted human rights risk assessments at corporate andsupply chain respectively and communicated the results in our 2016 and 2017Annual Reports. The most critical risks to human rights are forced/bonded laborin our supply chain and, at the farm level, also the risk of child labor.
To mitigate the risk of forced and bonded labor we have advised our suppliers toeliminate any recruitment fees. Such fees were previously paid by migrantworkers to labor contractors for bringing them to apparel factories in Mauritiusand Malaysia. We also updated our Forever Better Handbook on Social Standardsaccordingly and, together with other brands, succeeded in eliminating recruit-ment fees from our suppliers in Mauritius. In Malaysia we had only one activesupplier, with whom we no longer work, so that there are no recruitment fees atour Tier 1 suppliers. There are still some challenges in the second tier of oursupply chain (fabric manufacturing in Taiwan), which we are currently workingon. We hope to resolve this issue by the end of 2020.
To ensure human rights are observed in cotton farming, we have joined the Bet-ter Cotton Initiative in 2015. We have since scaled up our use of BCI Cotton fromzero to 80% currently. At the end of 2020 we aim increase that figure to 90% andat the latest by 2025, our target is to purchase 100% of our cotton from certified,more sustainable sources (BCI and organic cotton, recycled cotton).
Additionally, we have identified community engagement as an important vehicleto create a positive impact locally, including on social and human rights causes.
Therefore, we have a community engagement program in place at PUMA. In2019, our PUMA colleagues around the globe spent 21,433 hours in community
62
Annual Report 2019 ↗ SUSTAINABILITY

engagement work. For more details on our community engagement program andHR programs please refer to the One Team Performance section of this report.
SOCIAL COMPLIANCE (10FOR20 TARGET NO 3)
Target Description:Compliance with industry standards / ILO Core Conventions for all core supp-liers, including suppliers of finished goods as well as component and materialsuppliers.
Relates to United Nations Sustainable Development Goals 3,5,8,10
Examples from the 10FOR20 Action Plan:
Align compliance assessments at the industry level
Measure and manage social KPIs (supply chain)
Disclose full core supplier list and audit tool
KPIs:
Number of Zero Tolerance Issues prevailing at year end
Percentage of worker complaints resolved
Our social compliance program dates back to 1999 and was accredited by theFair Labor Association in 2019 for the third time. In 2019, we continued our part-nerships with the Fair Labor Association, the Better Work Program of the Inter-national Labor Organization and International Finance Corporation and the Socialand Labor Convergence Program (SLCP), supporting the roll out of SLCP 2019operations in China. A total of 43 PUMA China and Taiwan core T1 and T2 supp-liers completed SLCP assessments.
Duplicate audits by numerous brands can create an administrative burden on asingle vendor and be an inefficient use of resources. That is why we heightenedour collaborative efforts in this area to increase the percentage of shared auditswith other companies from 39% to 43% of PUMA suppliers. This is how we aim toreduce costs and resources and maximize the efficiency of how we monitor ourcollective supply chain as an industry.
In total, we conducted 475 audits in 418 factories with 94% of our Tier 1 vendorsearning a passing grade. Six percent of T1 suppliers failed to meet our require-ments. If this happened to an active PUMA supplier, we worked with these part-ners to improve the situation. 62% of those receiving a second audit receivedpassing grades. Nine factories could not sufficiently improve their performanceand were consequently removed from our active supplier factory base. Thosethat applied to be suppliers but failed their first audits were not admitted.
We employ a team of compliance experts spread across all major sourcing regi-ons. They regularly visit and audit our core manufacturing partners. We also em-ploy external compliance auditors and work with the Better Work Program of theInternational Labor Organization. Each PUMA supplier factory has to undergo amandatory compliance audit on an annual basis and any issues identified need tobe remedied as part of a corrective action plan.
63
Annual Report 2019 ↗ SUSTAINABILITY

Beyond auditing, we track social key performance indicators such as averagepayments vs. minimum wage payments, overtime hours or coverage by collectivebargaining agreements.
Table 3 confirms that a majority of our core suppliers pay basic wages clearlyabove the minimum wage, on average 17.6%. Adding overtime and bonus pay-ments, this figure increases to 73.1%, a slight reduction from previous yearswhich can be attributed to increases in minimum wage figures. Social insurancecoverage remains above 90% and the percentage of permanent workers is get-ting close to 70%.
T.02 AUDIT RESULTS 2017-2019▔
Factory audits 2019 2018 2017
T1 T2 Warehouses T1 T2 T1 T2
A (Pass) 107 10 0 82 15 87 13
B+ (Pass) 126 17 1 148 29 122 27
B- (Pass) 121 10 0 128 42 118 34
C (Fail) 19 2 1 17 7 18 3
D (Fail) 4 0 0 5 0 9 1
Total 377 39 2 380 93 354 78
418 473 432
Pass/Fail % 94/6 95/5 50/50 94/6 91/9 92/8 95/5
64
Annual Report 2019 ↗ SUSTAINABILITY
T.06 SCOPE 1 AND SCOPE 2 CO E EMISSIONS FROM PUMA➔
2
CO e-Emissions (absolute figues) 2019 2018 2017 2016 2015
% Change
2019/18
% Change
2019/2015
Scope 1 – Direkte CO e-Emissions Fossile Fuels (T) 6,326 6,918 7,678 6,854 7,296 -8.6 -13.3
Car Fleet 3,618 4,073 4,134 3,746 4,087 -11.2 -11.5
Heating 2,708 2,845 3,545 3,107 3,209 -4.8 -15.6
Scope 2 - Indirect CO e Emissions Electricity & Steam [T] 40,986 43,366 40,029 37,300 35,591 -5.5 15.2
Scope 2 - Indirect CO e Emissions Electricity & Steam [T] incl. RECs 11,533 22,128 40,029 37,300 35,591 -47.9 -67.6
Electricity (excl. RECs) 39,282 42,145 38,914 36,046 34,445 -6.8 14.0
Electricity (incl. RECs) 9,828 20,907 38,914 36,046 34,445 -53.0 -71.5
Steam 1,705 1,221 1,115 1,254 1,146 39.6 48.8
Subtotal Scope 1-2 47,312 50,284 47,707 44,153 42,887 -5.9 10.3
Subtotal Scope 1-2 incl. RECs 17,858 29,046 47,707 44,153 42,887 -38.5 -58.4
SCOPE 1-2 CO e EMISSIONS RELATIV TO SALES (in tons CO e per € million sales per year) 8.6 10.8 11.5 12.2 12.7 -20.5 -32.1
SCOPE 1-2 CO e EMISSIONS RELATIV TO SALES (in tons CO e per € million sales per year) (incl. RECs) 3.2 6.2 11.5 12.2 12.7 -48.1 -74.4
21 - 8
2
2
2
2 2
2 2

T.03 SOCIAL KPIS PUMA CORE SUPPLIERS 2017-2019▔
2019LATINAMERICA SOUTH ASIA EAST AND SOUTHEAST ASIA EMEA 2019 2018 2017
KPI Mexico Bangladesh India Pakistan China Cambodia Indonesia Philippines Vietnam Turkey Average Average Average
Gross wage paid above minimumwage excluding overtime andbonuses (%) 59.1 22.9 18.5 22.1 7.6 8.6 1.6 0.0 33.6 2.4 17.6 20.9 26.1
Gross wage paid above minimumwage including overtime andbonuses (%) 158.3 70.5 28.7 31.0 170.2 66.8 39.7 35.1 108.1 22.4 73.1 83.7 86.7
Workers covered by socialinsurance (%) 86.0 100.0 97.7 99.0 64.3 100.0 100.0 95.5 93.9 100.0 93.6 95.3 95.7
Overtime work (hours per week) 2.5 10.2 0.0 0.2 18.9 7.8 7.0 10.3 8.7 5.2 7.1 6.1 6.8
Workers covered by a collectivebargaining agreement (%) 0.0 0.0 0.0 0.0 94.4 28.2 33.3 0.0 98.4 0.0 25.4 26.7 21.5
Female workers (%) 49.8 42.7 47.3 8.9 64.0 84.3 88.8 69.0 80.4 59.0 59.4 56.0 59.3
Permanent workers (%) 14.6 100.0 100.0 100.0 25.5 30.9 97.9 68.5 53.3 100.0 69.1 68.0 63.6
Annual Turnover Rate (%) 61.0 33.4 6.6 20.8 63.0 43.3 17.2 64.8 40.0 32.2 38.2 36.8 40.3
Injury Rate (%) 0.2 0.3 0.0 0.0 0.5 0.5 0.2 2.7 0.3 0.3 0.5 0.6 0.4
No. of suppliers 59 50 59
Data received from 59 PUMA core suppliers representing 82% of 2019 production volume; reporting period for data collection: November 2018 – October 2019*
65
Annual Report 2019 ↗ SUSTAINABILITY
T.06 SCOPE 1 AND SCOPE 2 CO E EMISSIONS FROM PUMA➔
2
CO e-Emissions (absolute figues) 2019 2018 2017 2016 2015
% Change
2019/18
% Change
2019/2015
Scope 1 – Direkte CO e-Emissions Fossile Fuels (T) 6,326 6,918 7,678 6,854 7,296 -8.6 -13.3
Car Fleet 3,618 4,073 4,134 3,746 4,087 -11.2 -11.5
Heating 2,708 2,845 3,545 3,107 3,209 -4.8 -15.6
Scope 2 - Indirect CO e Emissions Electricity & Steam [T] 40,986 43,366 40,029 37,300 35,591 -5.5 15.2
Scope 2 - Indirect CO e Emissions Electricity & Steam [T] incl. RECs 11,533 22,128 40,029 37,300 35,591 -47.9 -67.6
Electricity (excl. RECs) 39,282 42,145 38,914 36,046 34,445 -6.8 14.0
Electricity (incl. RECs) 9,828 20,907 38,914 36,046 34,445 -53.0 -71.5
Steam 1,705 1,221 1,115 1,254 1,146 39.6 48.8
Subtotal Scope 1-2 47,312 50,284 47,707 44,153 42,887 -5.9 10.3
Subtotal Scope 1-2 incl. RECs 17,858 29,046 47,707 44,153 42,887 -38.5 -58.4
SCOPE 1-2 CO e EMISSIONS RELATIV TO SALES (in tons CO e per € million sales per year) 8.6 10.8 11.5 12.2 12.7 -20.5 -32.1
SCOPE 1-2 CO e EMISSIONS RELATIV TO SALES (in tons CO e per € million sales per year) (incl. RECs) 3.2 6.2 11.5 12.2 12.7 -48.1 -74.4
21 - 8
2
2
2
2 2
2 2

We operate a PUMA worker compliance hotline. Phone numbers and email ad-dresses of this hotline are visible on our Code of Conduct posters, which are dis-played at every PUMA supplier globally. We also use social media such asWeChat to connect with workers and have established more formalized compli-ance and HR apps at selected core suppliers.
In total, 61 complaint issues across 7 countries were raised to PUMA’s feedbacksystem, 39% more than in the previous year. 100% were resolved by our team. InIndia we broke through the zero-complaints threshold, with one worker reachingout to PUMA about a compensation issue.
We also received 11 third-party complaints from external organizations related toPUMA manufacturing partners. The third-party complaints focused on freedomof association, fair compensation and discrimination. All 11 third-party com-plaints were resolved by year end.
Worker Complaints 2019 2018 2017
Total received 70 55 81
Total confirmed 61 44 74
Resolved 61 44 70
Not resolved 0 0 4
Resolution Rate (in %) 100 100 95
Any issues identified during our auditing and hotline activities are classified intozero tolerance issues (such as child labor or forced labor) critical issues andother issues.
As the name implies, zero tolerance issues lead to the immediate failure of anaudit. In case of a new factory, this factory will not be allowed to produce PUMA
goods. For an existing factory, zero tolerance issues must be remedied immedia-tely. This includes a root-cause analysis and preventive action must be taken toavoid the issue from reoccurring in the future. As a last resort, business relati-onships will be terminated if the factory is not cooperating. Other issues are alsofollowed up by our compliance team.
During 2019 we identified 3 zero tolerance issues and were able to remedy all ofthem.
Country 2019 2018 2017 Grand Total
Cambodia 1 1
China 1 1 2
Indonesia 1 1 1 3
Vietnam 1 2 2 5
Grand Total 3 5 3 11
T.04 WORKER COMPLAINTS 2017 - 2019▔
T.05 ZERO TOLERANCE ISSUES (ZTIS) FOR THE LAST 3 YEARS▔
66
Annual Report 2019 ↗ SUSTAINABILITY
T.06 SCOPE 1 AND SCOPE 2 CO E EMISSIONS FROM PUMA➔
2
CO e-Emissions (absolute figues) 2019 2018 2017 2016 2015
% Change
2019/18
% Change
2019/2015
Scope 1 – Direkte CO e-Emissions Fossile Fuels (T) 6,326 6,918 7,678 6,854 7,296 -8.6 -13.3
Car Fleet 3,618 4,073 4,134 3,746 4,087 -11.2 -11.5
Heating 2,708 2,845 3,545 3,107 3,209 -4.8 -15.6
Scope 2 - Indirect CO e Emissions Electricity & Steam [T] 40,986 43,366 40,029 37,300 35,591 -5.5 15.2
Scope 2 - Indirect CO e Emissions Electricity & Steam [T] incl. RECs 11,533 22,128 40,029 37,300 35,591 -47.9 -67.6
Electricity (excl. RECs) 39,282 42,145 38,914 36,046 34,445 -6.8 14.0
Electricity (incl. RECs) 9,828 20,907 38,914 36,046 34,445 -53.0 -71.5
Steam 1,705 1,221 1,115 1,254 1,146 39.6 48.8
Subtotal Scope 1-2 47,312 50,284 47,707 44,153 42,887 -5.9 10.3
Subtotal Scope 1-2 incl. RECs 17,858 29,046 47,707 44,153 42,887 -38.5 -58.4
SCOPE 1-2 CO e EMISSIONS RELATIV TO SALES (in tons CO e per € million sales per year) 8.6 10.8 11.5 12.2 12.7 -20.5 -32.1
SCOPE 1-2 CO e EMISSIONS RELATIV TO SALES (in tons CO e per € million sales per year) (incl. RECs) 3.2 6.2 11.5 12.2 12.7 -48.1 -74.4
21 - 8
2
2
2
2 2
2 2

In 2018 and 2019, PUMA moved to an operational phase on wage issues. With the support of the Fair Wage Network, it carriedout a series of fair wage assessments at its core suppliers in Bangladesh and Cambodia. Some of them were certified by theFair Wage scheme, based on their performance across 12 fair wage dimensions. A number of its other suppliers operating inthose two countries will implement a remediation phase to improve their pay practices.PUMA’s aim for 2025 is to expand this assessment and remediation exercise to suppliers from other countries. This shouldlead to fairer and also more efficient pay practices.
DANIEL VAUGHAN-WHITEHEADFair Wage NetworkCo-Founder and Chair
Moving from auditing to remediation and capacity building in our supply chain,we have set up capability-building initiatives to make suppliers more resilientand self-sufficient. To improve HR management skills and educate HR manage-rial team members, human resource management workshops were launched at10 PUMA footwear suppliers in China.
CAPACITY BUILDING ON FAIR WAGES▔
67
Annual Report 2019 ↗ SUSTAINABILITY
T.06 SCOPE 1 AND SCOPE 2 CO E EMISSIONS FROM PUMA➔
2
CO e-Emissions (absolute figues) 2019 2018 2017 2016 2015
% Change
2019/18
% Change
2019/2015
Scope 1 – Direkte CO e-Emissions Fossile Fuels (T) 6,326 6,918 7,678 6,854 7,296 -8.6 -13.3
Car Fleet 3,618 4,073 4,134 3,746 4,087 -11.2 -11.5
Heating 2,708 2,845 3,545 3,107 3,209 -4.8 -15.6
Scope 2 - Indirect CO e Emissions Electricity & Steam [T] 40,986 43,366 40,029 37,300 35,591 -5.5 15.2
Scope 2 - Indirect CO e Emissions Electricity & Steam [T] incl. RECs 11,533 22,128 40,029 37,300 35,591 -47.9 -67.6
Electricity (excl. RECs) 39,282 42,145 38,914 36,046 34,445 -6.8 14.0
Electricity (incl. RECs) 9,828 20,907 38,914 36,046 34,445 -53.0 -71.5
Steam 1,705 1,221 1,115 1,254 1,146 39.6 48.8
Subtotal Scope 1-2 47,312 50,284 47,707 44,153 42,887 -5.9 10.3
Subtotal Scope 1-2 incl. RECs 17,858 29,046 47,707 44,153 42,887 -38.5 -58.4
SCOPE 1-2 CO e EMISSIONS RELATIV TO SALES (in tons CO e per € million sales per year) 8.6 10.8 11.5 12.2 12.7 -20.5 -32.1
SCOPE 1-2 CO e EMISSIONS RELATIV TO SALES (in tons CO e per € million sales per year) (incl. RECs) 3.2 6.2 11.5 12.2 12.7 -48.1 -74.4
21 - 8
2
2
2
2 2
2 2
ENVIRONMENTThe basis of our environmental efforts is to ensure that PUMA and its suppliers arein full environmental compliance and any impact on the environment is optimized.
We conducted 19 energy efficiency audits last year at our own entities, following upon a first audit cycle in 2015. These audits, which are compulsory in the EuropeanUnion, help us identify energy saving opportunities at our offices, stores andwarehouses, which we can then roll out on a global basis.
As far as our suppliers are concerned, our PUMA compliance audits (as describedin the Social Compliance section of this report) contain a dedicated section on envi-ronmental and chemical compliance. During each audit, we check, for example,environmental permits, waste management and effluent treatment plants.
In addition, we continued to ask all of our core suppliers to complete the Environ-mental Facilities Module of the Sustainable Apparel Coalition. 127 of those assess-ments were externally verified in 2019, which equates to an onsite environmentalaudit. This figure is complemented by audits which our suppliers undergo frequent-ly to obtain environmental certifications such as from bluesign , OEKO-TEX, GOTS,GRS or the Leather Working Group.
CLIMATE CHANGE (10FOR20 TARGET NO. 4)
Target Description:Science based CO reduction target to be developed (2016) and implemented(2020).
Relates to United Nations Sustainable Development Goal 13
Interim Target:Relative reduction of Scope 1,2 and 3 CO emissions by 3% per year
Examples for the 10FOR20 Action Plan:
Work with industry peers on climate action
Extend large scale climate change projects in supply chain
KPIs:
Direct CO emissions from own entities (Scope 1)
Indirect CO emissions from own entities (Scope 2)
Indirect CO emissions from manufacturing, business travel and transportof goods (Scope 3)
During the UN Climate Conference in Paris 2015, PUMA agreed to set a science-based CO emissions target. After two attempts in 2017 and 2018, and the formati-on of the Fashion Industry Charter on Climate Action in 2018, we finally agreed ourscience based CO emissions target with the Science Based Target Coalition in2019 and published the target in June.
The year 2019 also saw the formation of 7 working groups as part of the FashionCharter on Climate Action. PUMA is active in 5 of those working group and chairsthe Steering Committee of the Charter. PUMA also co-chairs the working group onSector Decarbonization.
https://unfccc.int/climate-action/sectoral-engagement/global-climate-action-in-fashion/about-the-fashion-industry-charter-for-climate-action
®
2
2
2
2
2
2
2
68
Annual Report 2019 ↗ SUSTAINABILITY
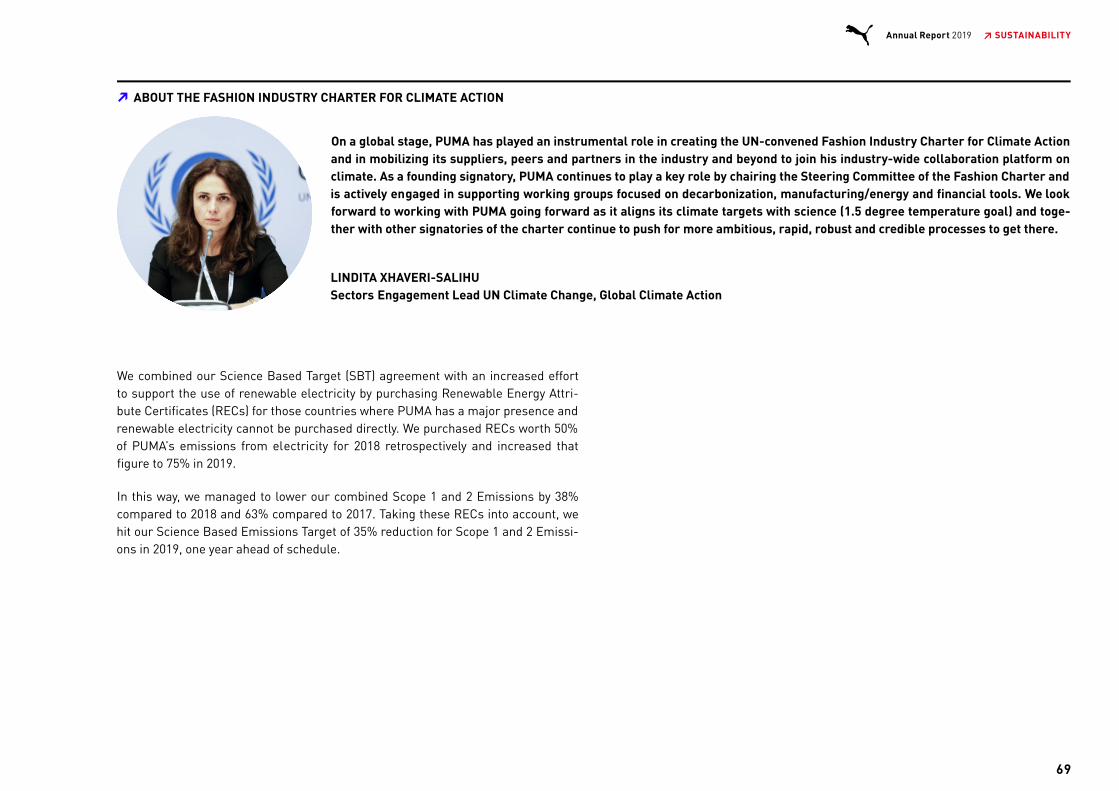
On a global stage, PUMA has played an instrumental role in creating the UN-convened Fashion Industry Charter for Climate Actionand in mobilizing its suppliers, peers and partners in the industry and beyond to join his industry-wide collaboration platform onclimate. As a founding signatory, PUMA continues to play a key role by chairing the Steering Committee of the Fashion Charter andis actively engaged in supporting working groups focused on decarbonization, manufacturing/energy and financial tools. We lookforward to working with PUMA going forward as it aligns its climate targets with science (1.5 degree temperature goal) and toge-ther with other signatories of the charter continue to push for more ambitious, rapid, robust and credible processes to get there.
LINDITA XHAVERI-SALIHUSectors Engagement Lead UN Climate Change, Global Climate Action
We combined our Science Based Target (SBT) agreement with an increased effortto support the use of renewable electricity by purchasing Renewable Energy Attri-bute Certificates (RECs) for those countries where PUMA has a major presence andrenewable electricity cannot be purchased directly. We purchased RECs worth 50%of PUMA’s emissions from electricity for 2018 retrospectively and increased thatfigure to 75% in 2019.
In this way, we managed to lower our combined Scope 1 and 2 Emissions by 38%compared to 2018 and 63% compared to 2017. Taking these RECs into account, wehit our Science Based Emissions Target of 35% reduction for Scope 1 and 2 Emissi-ons in 2019, one year ahead of schedule.
ABOUT THE FASHION INDUSTRY CHARTER FOR CLIMATE ACTION▔
69
Annual Report 2019 ↗ SUSTAINABILITY
T.06 SCOPE 1 AND SCOPE 2 CO E EMISSIONS FROM PUMA➔
2
CO e-Emissions (absolute figues) 2019 2018 2017 2016 2015
% Change
2019/18
% Change
2019/2015
Scope 1 – Direkte CO e-Emissions Fossile Fuels (T) 6,326 6,918 7,678 6,854 7,296 -8.6 -13.3
Car Fleet 3,618 4,073 4,134 3,746 4,087 -11.2 -11.5
Heating 2,708 2,845 3,545 3,107 3,209 -4.8 -15.6
Scope 2 - Indirect CO e Emissions Electricity & Steam [T] 40,986 43,366 40,029 37,300 35,591 -5.5 15.2
Scope 2 - Indirect CO e Emissions Electricity & Steam [T] incl. RECs 11,533 22,128 40,029 37,300 35,591 -47.9 -67.6
Electricity (excl. RECs) 39,282 42,145 38,914 36,046 34,445 -6.8 14.0
Electricity (incl. RECs) 9,828 20,907 38,914 36,046 34,445 -53.0 -71.5
Steam 1,705 1,221 1,115 1,254 1,146 39.6 48.8
Subtotal Scope 1-2 47,312 50,284 47,707 44,153 42,887 -5.9 10.3
Subtotal Scope 1-2 incl. RECs 17,858 29,046 47,707 44,153 42,887 -38.5 -58.4
SCOPE 1-2 CO e EMISSIONS RELATIV TO SALES (in tons CO e per € million sales per year) 8.6 10.8 11.5 12.2 12.7 -20.5 -32.1
SCOPE 1-2 CO e EMISSIONS RELATIV TO SALES (in tons CO e per € million sales per year) (incl. RECs) 3.2 6.2 11.5 12.2 12.7 -48.1 -74.4
21 - 8
2
2
2
2 2
2 2

* Science Based reduction Target (SBT)** Renewable Energy Attribute Certificates
In an attempt to balance our increasing Scope 3 emissions, we expanded the reachof our energy efficiency programs to China and Taiwan by joining the Clean by De-sign Program of the Apparel Impact Institute (https://apparelimpact.org/).
As part of our commitment to All, four of our fabric producers with wet-processingunits have been entered into the Clean by Design program in a first phase (twomore will be engaged in the first batch 2020), and we reserved the right to expandcoverage further, should the program prove successful.
Another effort to reduce our Tier 1 carbon footprint further was made by joiningWWF’s Low Carbon Manufacturing Program. We recruited our largest garment fac-tory to participate in the starter phase, identifying energy saving opportunities andproviding online carbon accounting training.
Our program in Vietnam, which is run in partnership with IFC, has shown positiveresults, with 5500 tons of CO saved from energy efficiency measures. Our vendors
also committed to install 2 megawatt hours of solar panels to create electricity.
The reduction of our Scope 3 emissions at factory level is complemented bypurchasing more sustainable – and therefore also less carbon-intensive – raw ma-terials. For example, after hitting our 50% bluesign certified polyester target in2018 already, we set new, more ambitious targets. In 2019 we achieved use of over90% bluesign or OEKO-TEX certified polyester and by 2025, we aim for 75% recy-cled polyester usage.
G.05 AGREED EMISSION TARGETS (SCOPE 1&2) (t CO e)▔ 2
2
S O L A R I N S TA L L AT I O N AT P U M A V E N D O R I N V I E T N A M▔
®
®
70
Annual Report 2019 ↗ SUSTAINABILITY
* Science Based reduction Target (SBT)** Renewable Energy Attribute Certificates
In an attempt to balance our increasing Scope 3 emissions, we expanded the reachof our energy efficiency programs to China and Taiwan by joining the Clean by De-sign Program of the Apparel Impact Institute (https://apparelimpact.org/).
As part of our commitment to All, four of our fabric producers with wet-processingunits have been entered into the Clean by Design program in a first phase (twomore will be engaged in the first batch 2020), and we reserved the right to expandcoverage further, should the program prove successful.
Another effort to reduce our Tier 1 carbon footprint further was made by joiningWWF’s Low Carbon Manufacturing Program. We recruited our largest garment fac-tory to participate in the starter phase, identifying energy saving opportunities andproviding online carbon accounting training.
Our program in Vietnam, which is run in partnership with IFC, has shown positiveresults, with 5500 tons of CO saved from energy efficiency measures. Our vendors
also committed to install 2 megawatt hours of solar panels to create electricity.
The reduction of our Scope 3 emissions at factory level is complemented bypurchasing more sustainable – and therefore also less carbon-intensive – raw ma-terials. For example, after hitting our 50% bluesign certified polyester target in2018 already, we set new, more ambitious targets. In 2019 we achieved use of over90% bluesign or OEKO-TEX certified polyester and by 2025, we aim for 75% recy-cled polyester usage.
G.05 AGREED EMISSION TARGETS (SCOPE 1&2) (t CO e)▔ 2
2
S O L A R I N S TA L L AT I O N AT P U M A V E N D O R I N V I E T N A M▔
®
®
T.06 SCOPE 1 AND SCOPE 2 CO E EMISSIONS FROM PUMA➔
2
CO e-Emissions (absolute figues) 2019 2018 2017 2016 2015
% Change
2019/18
% Change
2019/2015
Scope 1 – Direkte CO e-Emissions Fossile Fuels (T) 6,326 6,918 7,678 6,854 7,296 -8.6 -13.3
Car Fleet 3,618 4,073 4,134 3,746 4,087 -11.2 -11.5
Heating 2,708 2,845 3,545 3,107 3,209 -4.8 -15.6
Scope 2 - Indirect CO e Emissions Electricity & Steam [T] 40,986 43,366 40,029 37,300 35,591 -5.5 15.2
Scope 2 - Indirect CO e Emissions Electricity & Steam [T] incl. RECs 11,533 22,128 40,029 37,300 35,591 -47.9 -67.6
Electricity (excl. RECs) 39,282 42,145 38,914 36,046 34,445 -6.8 14.0
Electricity (incl. RECs) 9,828 20,907 38,914 36,046 34,445 -53.0 -71.5
Steam 1,705 1,221 1,115 1,254 1,146 39.6 48.8
Subtotal Scope 1-2 47,312 50,284 47,707 44,153 42,887 -5.9 10.3
Subtotal Scope 1-2 incl. RECs 17,858 29,046 47,707 44,153 42,887 -38.5 -58.4
SCOPE 1-2 CO e EMISSIONS RELATIV TO SALES (in tons CO e per € million sales per year) 8.6 10.8 11.5 12.2 12.7 -20.5 -32.1
SCOPE 1-2 CO e EMISSIONS RELATIV TO SALES (in tons CO e per € million sales per year) (incl. RECs) 3.2 6.2 11.5 12.2 12.7 -48.1 -74.4
21 - 8
2
2
2
2 2
2 2
* Science Based reduction Target (SBT)** Renewable Energy Attribute Certificates
In an attempt to balance our increasing Scope 3 emissions, we expanded the reachof our energy efficiency programs to China and Taiwan by joining the Clean by De-sign Program of the Apparel Impact Institute (https://apparelimpact.org/).
As part of our commitment to All, four of our fabric producers with wet-processingunits have been entered into the Clean by Design program in a first phase (twomore will be engaged in the first batch 2020), and we reserved the right to expandcoverage further, should the program prove successful.
Another effort to reduce our Tier 1 carbon footprint further was made by joiningWWF’s Low Carbon Manufacturing Program. We recruited our largest garment fac-tory to participate in the starter phase, identifying energy saving opportunities andproviding online carbon accounting training.
Our program in Vietnam, which is run in partnership with IFC, has shown positiveresults, with 5500 tons of CO saved from energy efficiency measures. Our vendors
also committed to install 2 megawatt hours of solar panels to create electricity.
The reduction of our Scope 3 emissions at factory level is complemented bypurchasing more sustainable – and therefore also less carbon-intensive – raw ma-terials. For example, after hitting our 50% bluesign certified polyester target in2018 already, we set new, more ambitious targets. In 2019 we achieved use of over90% bluesign or OEKO-TEX certified polyester and by 2025, we aim for 75% recy-cled polyester usage.
G.05 AGREED EMISSION TARGETS (SCOPE 1&2) (t CO e)▔ 2
2
S O L A R I N S TA L L AT I O N AT P U M A V E N D O R I N V I E T N A M▔
®
®
“WE WANT TO EMBED SUSTAINABILITY INTO ALL OF OURPRODUCTS.”- FOREWORD ANNE-LAURE DESCOURS, CSO
One of the lasting memories of 2019 will be the image of young people takingover the streets to protest the inaction of governments and the industry in theface of climate change. As a company which counts many of these young peopleamong its customers, PUMA cannot idly sit by and do nothing. While we recogni-ze that many problems our industry faces require industrywide solutions, PUMAhas made good progress on its sustainability commitments in 2019. Of the tentarget areas we set ourselves in 2015 as 10FOR20 Targets we achieved good pro-gress in nine areas, and we will increase our level of ambition in the next cycleuntil 2025, for example by adding targets on more sustainable products, biodiver-sity and fair wages as well as protecting the ocean from plastic pollution.
This includes setting a science-based target for our CO emissions for the firsttime. In short, PUMA will reduce its carbon emissions by the amount that scien-tists say is necessary to keep Climate Change within the boundaries set out bythe Paris Agreement. We believe that one-off sustainable collections are good forreporting purposes but do little to improve the environmental footprint of thecompany as a whole. That is why we sharply ramped up the use of moresustainable materials, such as Better Cotton and bluesign -certified polyester inall of our products. As the materials used for our products define more than halfof the environmental footprint, this is how we can make an impact at scale, andour customers can rest assured that we are working on improving our sustaina-bility performance throughout our product range.A N N E - L A U R E D E S C O U R S
➔
C H I E F S O U R C I N GO F F I C E R ( C S O )
2
®
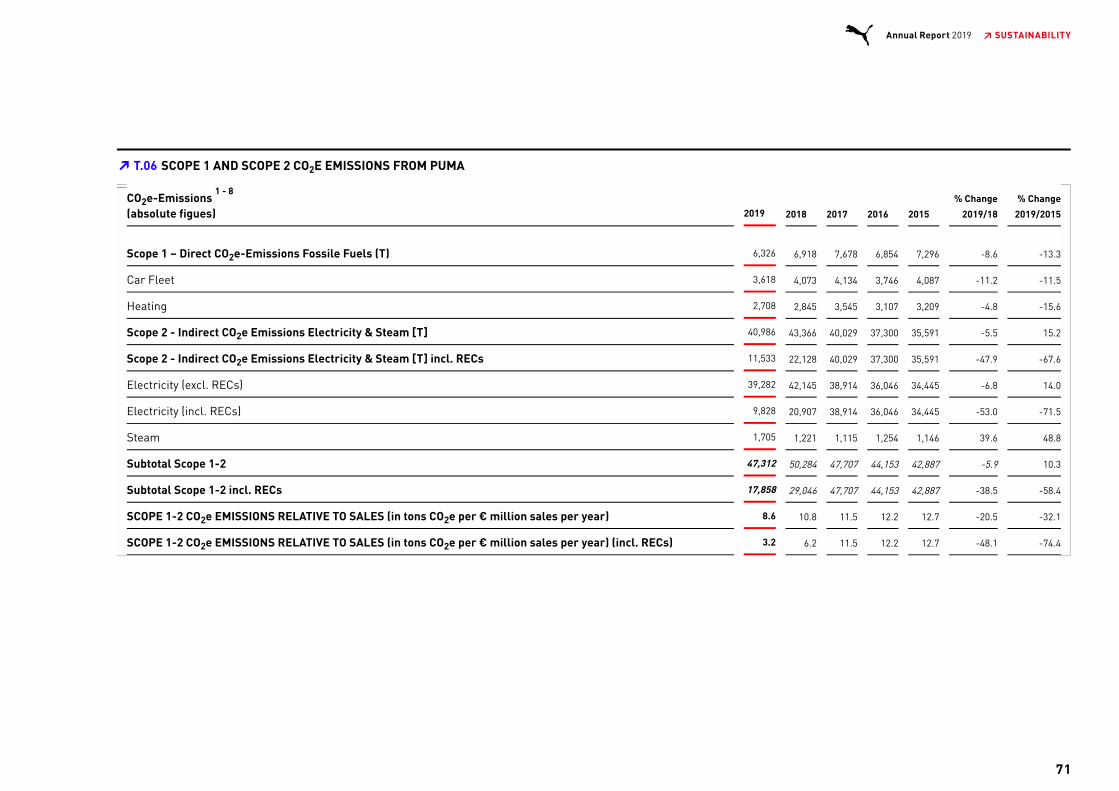
T.06 SCOPE 1 AND SCOPE 2 CO E EMISSIONS FROM PUMA▔ 2
CO e-Emissions (absolute figues) 2019 2018 2017 2016 2015
% Change
2019/18
% Change
2019/2015
Scope 1 – Direct CO e-Emissions Fossile Fuels (T) 6,326 6,918 7,678 6,854 7,296 -8.6 -13.3
Car Fleet 3,618 4,073 4,134 3,746 4,087 -11.2 -11.5
Heating 2,708 2,845 3,545 3,107 3,209 -4.8 -15.6
Scope 2 - Indirect CO e Emissions Electricity & Steam [T] 40,986 43,366 40,029 37,300 35,591 -5.5 15.2
Scope 2 - Indirect CO e Emissions Electricity & Steam [T] incl. RECs 11,533 22,128 40,029 37,300 35,591 -47.9 -67.6
Electricity (excl. RECs) 39,282 42,145 38,914 36,046 34,445 -6.8 14.0
Electricity (incl. RECs) 9,828 20,907 38,914 36,046 34,445 -53.0 -71.5
Steam 1,705 1,221 1,115 1,254 1,146 39.6 48.8
Subtotal Scope 1-2 47,312 50,284 47,707 44,153 42,887 -5.9 10.3
Subtotal Scope 1-2 incl. RECs 17,858 29,046 47,707 44,153 42,887 -38.5 -58.4
SCOPE 1-2 CO e EMISSIONS RELATIVE TO SALES (in tons CO e per € million sales per year) 8.6 10.8 11.5 12.2 12.7 -20.5 -32.1
SCOPE 1-2 CO e EMISSIONS RELATIVE TO SALES (in tons CO e per € million sales per year) (incl. RECs) 3.2 6.2 11.5 12.2 12.7 -48.1 -74.4
21 - 8
2
2
2
2 2
2 2
71
Annual Report 2019 ↗ SUSTAINABILITY
T.06 SCOPE 1 AND SCOPE 2 CO E EMISSIONS FROM PUMA➔
2
CO e-Emissions (absolute figues) 2019 2018 2017 2016 2015
% Change
2019/18
% Change
2019/2015
Scope 1 – Direkte CO e-Emissions Fossile Fuels (T) 6,326 6,918 7,678 6,854 7,296 -8.6 -13.3
Car Fleet 3,618 4,073 4,134 3,746 4,087 -11.2 -11.5
Heating 2,708 2,845 3,545 3,107 3,209 -4.8 -15.6
Scope 2 - Indirect CO e Emissions Electricity & Steam [T] 40,986 43,366 40,029 37,300 35,591 -5.5 15.2
Scope 2 - Indirect CO e Emissions Electricity & Steam [T] incl. RECs 11,533 22,128 40,029 37,300 35,591 -47.9 -67.6
Electricity (excl. RECs) 39,282 42,145 38,914 36,046 34,445 -6.8 14.0
Electricity (incl. RECs) 9,828 20,907 38,914 36,046 34,445 -53.0 -71.5
Steam 1,705 1,221 1,115 1,254 1,146 39.6 48.8
Subtotal Scope 1-2 47,312 50,284 47,707 44,153 42,887 -5.9 10.3
Subtotal Scope 1-2 incl. RECs 17,858 29,046 47,707 44,153 42,887 -38.5 -58.4
SCOPE 1-2 CO e EMISSIONS RELATIV TO SALES (in tons CO e per € million sales per year) 8.6 10.8 11.5 12.2 12.7 -20.5 -32.1
SCOPE 1-2 CO e EMISSIONS RELATIV TO SALES (in tons CO e per € million sales per year) (incl. RECs) 3.2 6.2 11.5 12.2 12.7 -48.1 -74.4
21 - 8
2
2
2
2 2
2 2

T.07 PUMA’S SCOPE 3 CO E EMISSIONS FROM SELECTED SUPPLY CHAIN ACTIVITIES▔ 2
CO e-Emissions (absolute figures) 2019 2018 2017 2016 2015
% Change2019/18
% Change2019/2015
Scope 3 - Other indirect emissions [T] 272,540 222,315 208,525 196,896 192,305 22.6 41.7
Scope 3 - Other indirect emissions [T] incl. RECs 250,240 222,315 208,525 196,896 192,305 12.6 30.1
CO e Emissions from business travel transportation [T] 18,727 15,582 14,394 12,167 10,191 20.2 83.8
CO e Emissions from B2B transport of goods [T] 98,386 74,182 64,076 48,484 57,085 32.6 72.3
CO e Emissions from B2C transport of goods [T] 9,358 5,961 6,994 16,223 6,321 57.0 48.0
CO e Emissions from Suppliers
CO e Emissions from production in Tier 1 supply chain [T] 146,069 126,590 123,061 120,023 118,708 15.4 23.0
CO e Emissions from production in Tier 1 supply chain [T] incl. RECs 123,769 126,590 123,061 120,023 118,708 -2.2 4.3
SCOPE 3 CO e EMISSIONS RELATIVE TO SALES (in tons CO e per € million sales per year) 49.5 47.8 50.4 54.3 56.8 3.6 -12.7
SCOPE 3 CO e EMISSIONS RELATIVE TO SALES (in tons CO e per € million sales per year) (incl. RECs) 45.5 47.8 50.4 54.3 56.8 -4.9 -19.9
Total Scope 1-3 [T] 319,852 272,599 256,232 241,049 235,192 17.3 36.0
Total Scope 1-3 [T] incl. RECs 268,098 251,361 256,232 241,049 235,192 6.7 14.0
Annual Sales PUMA (in € million) 5,502 4,648 4,136 3,627 3,387 18.4 62.4
TOTAL CO e EMISSIONS RELATIVE TO SALES (in tons CO e per € million sales per year) 58.1 58.6 62.0 66.5 69.4 -0.9 -16.3
TOTAL CO e EMISSIONS RELATIVE TO SALES (in tons CO e per € million sales per year) (incl. RECs) 48.7 54.1 62.0 66.5 69.4 -9.9 -29.8
1. PUMA uses its own methodology for CO accounting, with reference to the GHG protocol.
2. The consolidation scope follows the operational control approach, including PUMA-owned or operated offices, warehouses, stores and own industrial sites (Argentina).
3. Outsourced Tier 1 production is accounted in the scope 3 emissions, covering CO emissions from all three divisions (Accessories, Apparel, and Footwear).
4. We apply the “min. 90% rule” for data collection from PUMA entities, covering at least 90% of PUMA’s FTE employees worldwide. The residual will be extrapolated.
5. PUMA applies the location-based approach for scope 2, using emission factors by ADEME. In addition to the location-based approach, the market-based approach is used where renewable energy orenergy certificates are purchased. Scope 3 emissions factors are based on additional company and industry-specific emission factors.
6. Data includes extrapolations or estimations where no real data can be provided.
7. Methodological changes over the last three years influence results.
8. Tier 1 supplier emissions focus on energy related emissions
21 - 8
2
2
2
2
2
2
2 2
2 2
2 2
2 2
2
2
72
Annual Report 2019 ↗ SUSTAINABILITY
EMISSIONS RELATIVE TO SALES
EMISSIONS RELATIVE TO SALES
EMISSIONS RELATIVE TO SALES
EMISSIONS RELATIVE TO SALES
T.06 SCOPE 1 AND SCOPE 2 CO E EMISSIONS FROM PUMA➔
2
CO e-Emissions (absolute figues) 2019 2018 2017 2016 2015
% Change
2019/18
% Change
2019/2015
Scope 1 – Direkte CO e-Emissions Fossile Fuels (T) 6,326 6,918 7,678 6,854 7,296 -8.6 -13.3
Car Fleet 3,618 4,073 4,134 3,746 4,087 -11.2 -11.5
Heating 2,708 2,845 3,545 3,107 3,209 -4.8 -15.6
Scope 2 - Indirect CO e Emissions Electricity & Steam [T] 40,986 43,366 40,029 37,300 35,591 -5.5 15.2
Scope 2 - Indirect CO e Emissions Electricity & Steam [T] incl. RECs 11,533 22,128 40,029 37,300 35,591 -47.9 -67.6
Electricity (excl. RECs) 39,282 42,145 38,914 36,046 34,445 -6.8 14.0
Electricity (incl. RECs) 9,828 20,907 38,914 36,046 34,445 -53.0 -71.5
Steam 1,705 1,221 1,115 1,254 1,146 39.6 48.8
Subtotal Scope 1-2 47,312 50,284 47,707 44,153 42,887 -5.9 10.3
Subtotal Scope 1-2 incl. RECs 17,858 29,046 47,707 44,153 42,887 -38.5 -58.4
SCOPE 1-2 CO e EMISSIONS RELATIV TO SALES (in tons CO e per € million sales per year) 8.6 10.8 11.5 12.2 12.7 -20.5 -32.1
SCOPE 1-2 CO e EMISSIONS RELATIV TO SALES (in tons CO e per € million sales per year) (incl. RECs) 3.2 6.2 11.5 12.2 12.7 -48.1 -74.4
21 - 8
2
2
2
2 2
2 2
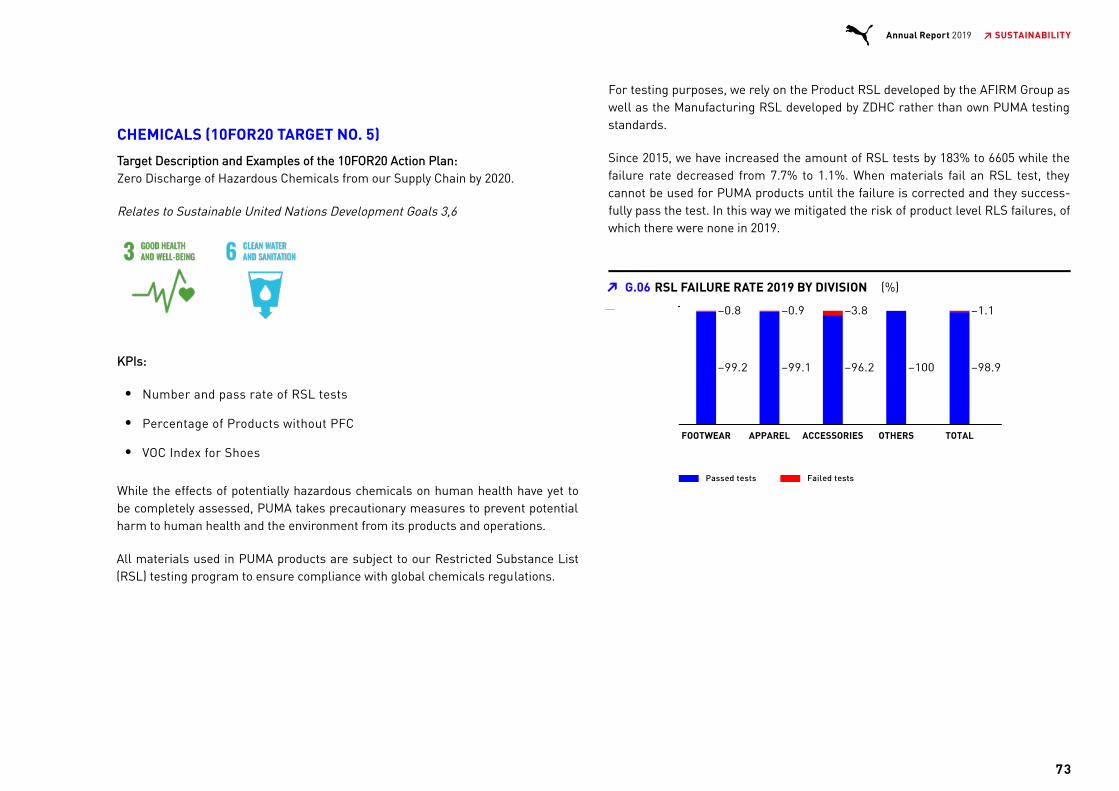
CHEMICALS (10FOR20 TARGET NO. 5)
Target Description and Examples of the 10FOR20 Action Plan:Zero Discharge of Hazardous Chemicals from our Supply Chain by 2020.
Relates to Sustainable United Nations Development Goals 3,6
KPIs:
Number and pass rate of RSL tests
Percentage of Products without PFC
VOC Index for Shoes
While the effects of potentially hazardous chemicals on human health have yet tobe completely assessed, PUMA takes precautionary measures to prevent potentialharm to human health and the environment from its products and operations.
All materials used in PUMA products are subject to our Restricted Substance List(RSL) testing program to ensure compliance with global chemicals regulations.
For testing purposes, we rely on the Product RSL developed by the AFIRM Group aswell as the Manufacturing RSL developed by ZDHC rather than own PUMA testingstandards.
Since 2015, we have increased the amount of RSL tests by 183% to 6605 while thefailure rate decreased from 7.7% to 1.1%. When materials fail an RSL test, theycannot be used for PUMA products until the failure is corrected and they success-fully pass the test. In this way we mitigated the risk of product level RLS failures, ofwhich there were none in 2019.
G.06 RSL FAILURE RATE 2019 BY DIVISION (%)▔
73
Annual Report 2019 ↗ SUSTAINABILITY
T.06 SCOPE 1 AND SCOPE 2 CO E EMISSIONS FROM PUMA➔
2
CO e-Emissions (absolute figues) 2019 2018 2017 2016 2015
% Change
2019/18
% Change
2019/2015
Scope 1 – Direkte CO e-Emissions Fossile Fuels (T) 6,326 6,918 7,678 6,854 7,296 -8.6 -13.3
Car Fleet 3,618 4,073 4,134 3,746 4,087 -11.2 -11.5
Heating 2,708 2,845 3,545 3,107 3,209 -4.8 -15.6
Scope 2 - Indirect CO e Emissions Electricity & Steam [T] 40,986 43,366 40,029 37,300 35,591 -5.5 15.2
Scope 2 - Indirect CO e Emissions Electricity & Steam [T] incl. RECs 11,533 22,128 40,029 37,300 35,591 -47.9 -67.6
Electricity (excl. RECs) 39,282 42,145 38,914 36,046 34,445 -6.8 14.0
Electricity (incl. RECs) 9,828 20,907 38,914 36,046 34,445 -53.0 -71.5
Steam 1,705 1,221 1,115 1,254 1,146 39.6 48.8
Subtotal Scope 1-2 47,312 50,284 47,707 44,153 42,887 -5.9 10.3
Subtotal Scope 1-2 incl. RECs 17,858 29,046 47,707 44,153 42,887 -38.5 -58.4
SCOPE 1-2 CO e EMISSIONS RELATIV TO SALES (in tons CO e per € million sales per year) 8.6 10.8 11.5 12.2 12.7 -20.5 -32.1
SCOPE 1-2 CO e EMISSIONS RELATIV TO SALES (in tons CO e per € million sales per year) (incl. RECs) 3.2 6.2 11.5 12.2 12.7 -48.1 -74.4
21 - 8
2
2
2
2 2
2 2
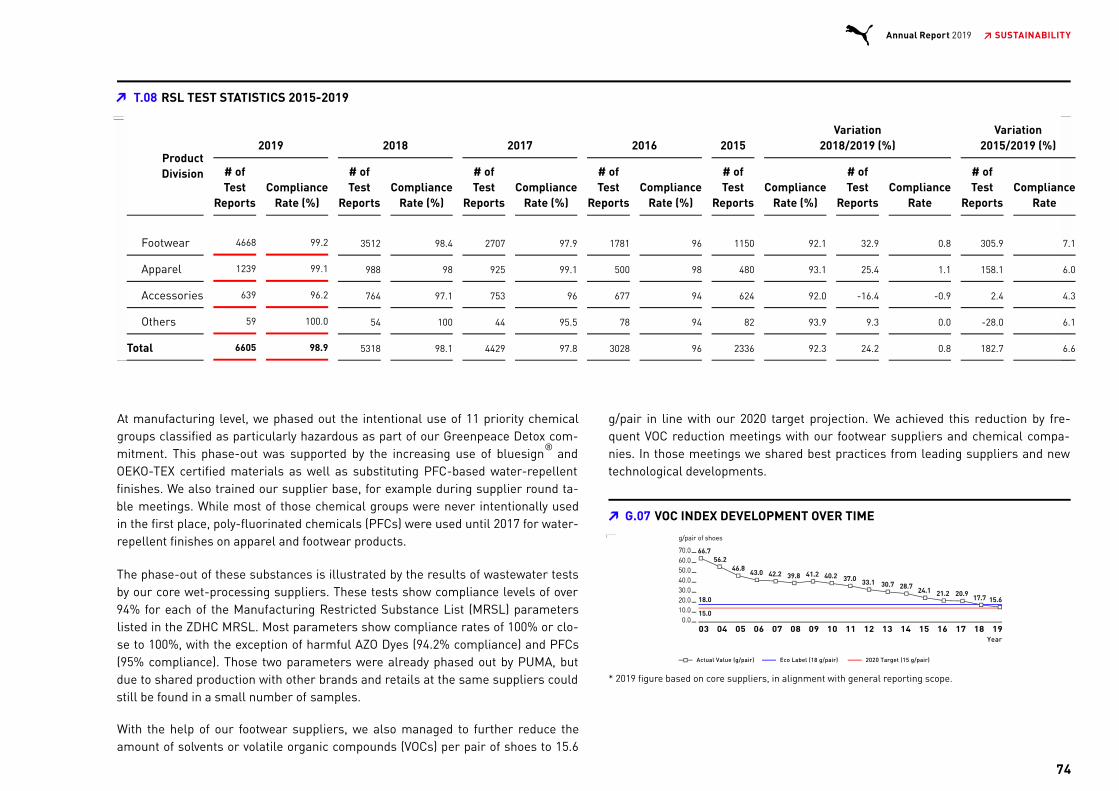
At manufacturing level, we phased out the intentional use of 11 priority chemicalgroups classified as particularly hazardous as part of our Greenpeace Detox com-mitment. This phase-out was supported by the increasing use of bluesign andOEKO-TEX certified materials as well as substituting PFC-based water-repellentfinishes. We also trained our supplier base, for example during supplier round ta-ble meetings. While most of those chemical groups were never intentionally usedin the first place, poly-fluorinated chemicals (PFCs) were used until 2017 for water-repellent finishes on apparel and footwear products.
The phase-out of these substances is illustrated by the results of wastewater testsby our core wet-processing suppliers. These tests show compliance levels of over94% for each of the Manufacturing Restricted Substance List (MRSL) parameterslisted in the ZDHC MRSL. Most parameters show compliance rates of 100% or clo-se to 100%, with the exception of harmful AZO Dyes (94.2% compliance) and PFCs(95% compliance). Those two parameters were already phased out by PUMA, butdue to shared production with other brands and retails at the same suppliers couldstill be found in a small number of samples.
With the help of our footwear suppliers, we also managed to further reduce theamount of solvents or volatile organic compounds (VOCs) per pair of shoes to 15.6
g/pair in line with our 2020 target projection. We achieved this reduction by fre-quent VOC reduction meetings with our footwear suppliers and chemical compa-nies. In those meetings we shared best practices from leading suppliers and newtechnological developments.
* 2019 figure based on core suppliers, in alignment with general reporting scope.
T.08 RSL TEST STATISTICS 2015-2019▔
ProductDivision
2019 2018 2017 2016 2015Variation
2018/2019 (%)Variation
2015/2019 (%)
# ofTest
ReportsCompliance
Rate (%)
# ofTest
ReportsCompliance
Rate (%)
# ofTest
ReportsCompliance
Rate (%)
# ofTest
ReportsCompliance
Rate (%)
# ofTest
ReportsCompliance
Rate (%)
# ofTest
ReportsCompliance
Rate
# ofTest
ReportsCompliance
Rate
Footwear 4668 99.2 3512 98.4 2707 97.9 1781 96 1150 92.1 32.9 0.8 305.9 7.1
Apparel 1239 99.1 988 98 925 99.1 500 98 480 93.1 25.4 1.1 158.1 6.0
Accessories 639 96.2 764 97.1 753 96 677 94 624 92.0 -16.4 -0.9 2.4 4.3
Others 59 100.0 54 100 44 95.5 78 94 82 93.9 9.3 0.0 -28.0 6.1
Total 6605 98.9 5318 98.1 4429 97.8 3028 96 2336 92.3 24.2 0.8 182.7 6.6
®
G.07 VOC INDEX DEVELOPMENT OVER TIME▔
74
Annual Report 2019 ↗ SUSTAINABILITY
T.06 SCOPE 1 AND SCOPE 2 CO E EMISSIONS FROM PUMA➔
2
CO e-Emissions (absolute figues) 2019 2018 2017 2016 2015
% Change
2019/18
% Change
2019/2015
Scope 1 – Direkte CO e-Emissions Fossile Fuels (T) 6,326 6,918 7,678 6,854 7,296 -8.6 -13.3
Car Fleet 3,618 4,073 4,134 3,746 4,087 -11.2 -11.5
Heating 2,708 2,845 3,545 3,107 3,209 -4.8 -15.6
Scope 2 - Indirect CO e Emissions Electricity & Steam [T] 40,986 43,366 40,029 37,300 35,591 -5.5 15.2
Scope 2 - Indirect CO e Emissions Electricity & Steam [T] incl. RECs 11,533 22,128 40,029 37,300 35,591 -47.9 -67.6
Electricity (excl. RECs) 39,282 42,145 38,914 36,046 34,445 -6.8 14.0
Electricity (incl. RECs) 9,828 20,907 38,914 36,046 34,445 -53.0 -71.5
Steam 1,705 1,221 1,115 1,254 1,146 39.6 48.8
Subtotal Scope 1-2 47,312 50,284 47,707 44,153 42,887 -5.9 10.3
Subtotal Scope 1-2 incl. RECs 17,858 29,046 47,707 44,153 42,887 -38.5 -58.4
SCOPE 1-2 CO e EMISSIONS RELATIV TO SALES (in tons CO e per € million sales per year) 8.6 10.8 11.5 12.2 12.7 -20.5 -32.1
SCOPE 1-2 CO e EMISSIONS RELATIV TO SALES (in tons CO e per € million sales per year) (incl. RECs) 3.2 6.2 11.5 12.2 12.7 -48.1 -74.4
21 - 8
2
2
2
2 2
2 2

WATER&AIR (10FOR20 TARGET NO 6)
Target Description:Industry good practice for effluent treatment is met by 90% of PUMA core supplierswith wet processing facilities. Industry good practice for air emissions is met by90% of PUMA core suppliers with significant air emissions.
Relates to United Nations Sustainable Development Goal 6
Examples for the 10FOR20 Action Plan:
Ensure regular wastewater testing at relevant suppliers
Support the development and adoption of an industry wastewaterstandard
Support the development of an industry air quality standard
KPIs:
Percentage of core suppliers with wet processing covered
Percentage of core suppliers meeting good practice standards for waste-water quality (good practice for air still not defined yet)
Since 2015, we increased the amount of wastewater testing from 33 suppliers to 70suppliers and 125 test reports, thereby covering 90% of all core suppliers with in-dustrial wet-processing facilities.
The test results imply that the phase-out of priority hazardous chemicals has beenlargely completed as planned. On the testing results of conventional wastewaterparameters, which are only applicable to suppliers which directly discharge their
wastewater into natural water bodies, 16 out of 17 measured parameters showequally high compliance levels of 90% or above.
One parameter, namely coliform bacteria* (70%) remained below our 90% compli-ance threshold against the ZDHC wastewater quality guidelines. We will work withthe 30% non-compliant suppliers on the installation of disinfection units to hit thecoliform bacteria target as well.
To further improve the wastewater quality performance, we initiated wastewatertreatment training, starting in Greater China. While waiting for more training beingoffered by the ZDHC, our plan is to provide training sessions in all of our majorsourcing regions.
Our air emissions target aims for an industry good practice standard for air emissi-ons. This standard is under development by the ZDHC and PUMA actively supportsthe standard development.
Therefore, we consider that we have not yet met both the water and air targets for2020. We will move these targets forward to our next target period for 2025.
* Coliform bacteria are universally present in large numbers in the feces of warm-blooded animals (or hu-mans). While coliforms themselves are not normally causes of serious illness, they are easy to culture, andtheir presence is used to indicate that other pathogenic organisms of fecal origin may be present https://en-.wikipedia.org/wiki/Coliform_bacteria
MATERIALS (10FOR20 TARGET NO 7)
Target Description:Use sustainable material alternatives for PUMA’s key materials: cotton, polyester,leather, polyurethane and cardboard.
Relates to United Nations Sustainable Development Goals 12,15
75
Annual Report 2019 ↗ SUSTAINABILITY
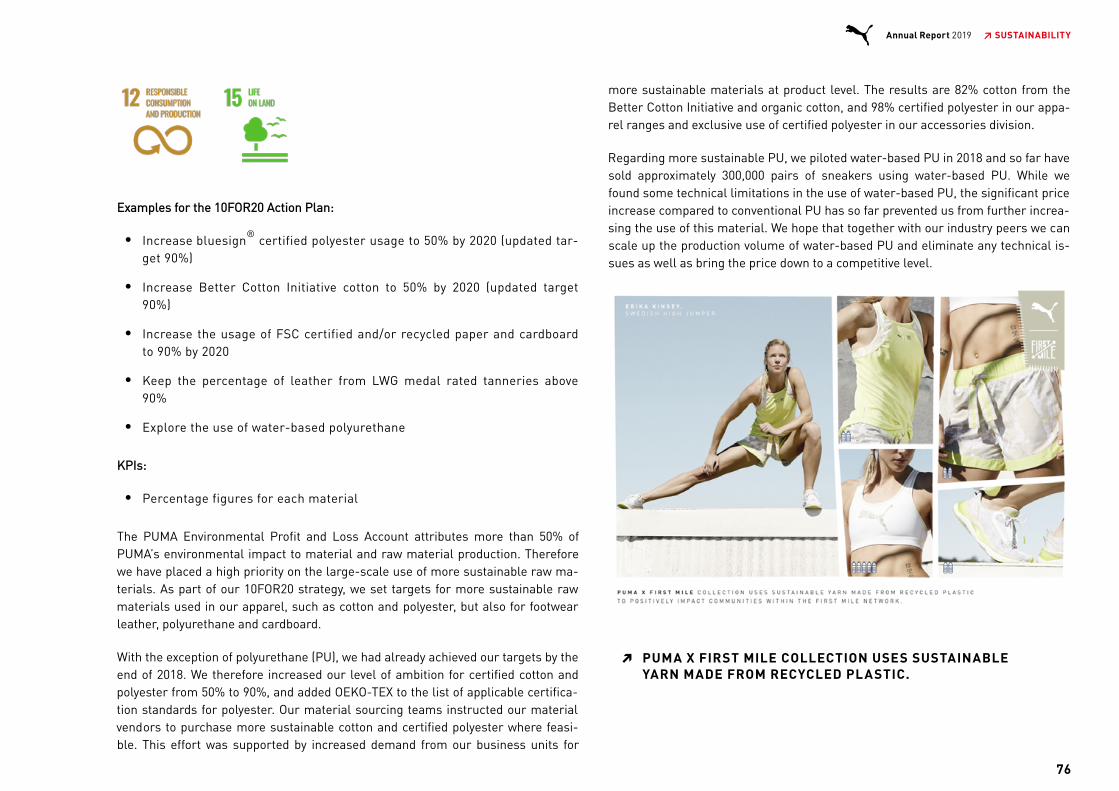
Examples for the 10FOR20 Action Plan:
Increase bluesign certified polyester usage to 50% by 2020 (updated tar-get 90%)
Increase Better Cotton Initiative cotton to 50% by 2020 (updated target90%)
Increase the usage of FSC certified and/or recycled paper and cardboardto 90% by 2020
Keep the percentage of leather from LWG medal rated tanneries above90%
Explore the use of water-based polyurethane
KPIs:
Percentage figures for each material
The PUMA Environmental Profit and Loss Account attributes more than 50% ofPUMA’s environmental impact to material and raw material production. Thereforewe have placed a high priority on the large-scale use of more sustainable raw ma-terials. As part of our 10FOR20 strategy, we set targets for more sustainable rawmaterials used in our apparel, such as cotton and polyester, but also for footwearleather, polyurethane and cardboard.
With the exception of polyurethane (PU), we had already achieved our targets by theend of 2018. We therefore increased our level of ambition for certified cotton andpolyester from 50% to 90%, and added OEKO-TEX to the list of applicable certifica-tion standards for polyester. Our material sourcing teams instructed our materialvendors to purchase more sustainable cotton and certified polyester where feasi-ble. This effort was supported by increased demand from our business units for
more sustainable materials at product level. The results are 82% cotton from theBetter Cotton Initiative and organic cotton, and 98% certified polyester in our appa-rel ranges and exclusive use of certified polyester in our accessories division.
Regarding more sustainable PU, we piloted water-based PU in 2018 and so far havesold approximately 300,000 pairs of sneakers using water-based PU. While wefound some technical limitations in the use of water-based PU, the significant priceincrease compared to conventional PU has so far prevented us from further increa-sing the use of this material. We hope that together with our industry peers we canscale up the production volume of water-based PU and eliminate any technical is-sues as well as bring the price down to a competitive level.
®
P U M A X F I R S T M I L E C O L L E C T I O N U S E S S U S TA I N A B L E YA R N M A D E F R O M R E C Y C L E D P L A S T I C .
▔
76
Annual Report 2019 ↗ SUSTAINABILITY
C O L L EC T IO NPUMA X FIRST MILE COLLECTION USES SUSTAINABLE YARN MADE FROM RECYCLED PLASTIC.
“WE WANT TO EMBED SUSTAINABILITY INTO ALL OF OURPRODUCTS.”- FOREWORD ANNE-LAURE DESCOURS, CSO
One of the lasting memories of 2019 will be the image of young people takingover the streets to protest the inaction of governments and the industry in theface of climate change. As a company which counts many of these young peopleamong its customers, PUMA cannot idly sit by and do nothing. While we recogni-ze that many problems our industry faces require industrywide solutions, PUMAhas made good progress on its sustainability commitments in 2019. Of the tentarget areas we set ourselves in 2015 as 10FOR20 Targets we achieved good pro-gress in nine areas, and we will increase our level of ambition in the next cycleuntil 2025, for example by adding targets on more sustainable products, biodiver-sity and fair wages as well as protecting the ocean from plastic pollution.
This includes setting a science-based target for our CO emissions for the firsttime. In short, PUMA will reduce its carbon emissions by the amount that scien-tists say is necessary to keep Climate Change within the boundaries set out bythe Paris Agreement. We believe that one-off sustainable collections are good forreporting purposes but do little to improve the environmental footprint of thecompany as a whole. That is why we sharply ramped up the use of moresustainable materials, such as Better Cotton and bluesign -certified polyester inall of our products. As the materials used for our products define more than halfof the environmental footprint, this is how we can make an impact at scale, andour customers can rest assured that we are working on improving our sustaina-bility performance throughout our product range.A N N E - L A U R E D E S C O U R S
➔
C H I E F S O U R C I N GO F F I C E R ( C S O )
2
®

Apart from our original targets on BCI cotton and certified polyester, we also star-ted using recycled polyester and organic cotton for some of our sustainability focu-sed collections.
EP&L IMPACT (10FOR20 TARGET NO 8)
Target Description:Continue to report on the EP&L every year.
Relates to United Nations Sustainable Development Goals 7,12
Examples for the 10FOR20 Action Plan:
Regularly publish updated PUMA EP&L data
Introduce industry aligned product sustainability tools for design anddevelopment
KPI:
Annual EP&L values PUMA
Following PUMA‘s spin-off from Kering, we re-integrated the calculation of thePUMA EP&L into our own sustainability efforts. The year 2019 was a transition yearto migrate the EP&L systems into our own IT landscape. At the end of the year, wewere able to calculate our 2018 EP&L results: (https://about.puma.com/en/sustainability/environment)
T.09 DEVELOPMENT OF MORE SUSTAINABLE MATERIAL USAGE SINCE 2015▔
Division Material Targets % of Total 2015 % of Total 2016 % of Total 2017 % of Total 2018 % of Total 2019 Target 2020
Apparel
Cotton from BCI 3% (organic) 19% 40% 50%
BCI+Organic: 82%
BCI cotton: 80%
Organic cotton: 2% 50% (90%)
bluesign certified Polyester 15% 24% 47% 66%
bluesign®-, OEKO-TEX-, Recycled: 98%
bluesign®: 55%
OEKO-TEX: 42%
Recycled: 1% 50% (90%)
Accessories bluesign certified Polyester 20% 21% 34% 46%
bluesign®-, OEKO-TEX: 100%
bluesign: 54%
Oeko-Tex: 46% 50% (90%)
Footwear FSC certified and/or recycled Paper&Cardboard 85% 78% 95% 92% Product Packaging 100% 90%
Footwear LWG Medal Rated Leather 99% 94% 99% 99% 98% 90%
®
®
®
77
Annual Report 2019 ↗ SUSTAINABILITY
T.06 SCOPE 1 AND SCOPE 2 CO E EMISSIONS FROM PUMA➔
2
CO e-Emissions (absolute figues) 2019 2018 2017 2016 2015
% Change
2019/18
% Change
2019/2015
Scope 1 – Direkte CO e-Emissions Fossile Fuels (T) 6,326 6,918 7,678 6,854 7,296 -8.6 -13.3
Car Fleet 3,618 4,073 4,134 3,746 4,087 -11.2 -11.5
Heating 2,708 2,845 3,545 3,107 3,209 -4.8 -15.6
Scope 2 - Indirect CO e Emissions Electricity & Steam [T] 40,986 43,366 40,029 37,300 35,591 -5.5 15.2
Scope 2 - Indirect CO e Emissions Electricity & Steam [T] incl. RECs 11,533 22,128 40,029 37,300 35,591 -47.9 -67.6
Electricity (excl. RECs) 39,282 42,145 38,914 36,046 34,445 -6.8 14.0
Electricity (incl. RECs) 9,828 20,907 38,914 36,046 34,445 -53.0 -71.5
Steam 1,705 1,221 1,115 1,254 1,146 39.6 48.8
Subtotal Scope 1-2 47,312 50,284 47,707 44,153 42,887 -5.9 10.3
Subtotal Scope 1-2 incl. RECs 17,858 29,046 47,707 44,153 42,887 -38.5 -58.4
SCOPE 1-2 CO e EMISSIONS RELATIV TO SALES (in tons CO e per € million sales per year) 8.6 10.8 11.5 12.2 12.7 -20.5 -32.1
SCOPE 1-2 CO e EMISSIONS RELATIV TO SALES (in tons CO e per € million sales per year) (incl. RECs) 3.2 6.2 11.5 12.2 12.7 -48.1 -74.4
21 - 8
2
2
2
2 2
2 2
Apart from our original targets on BCI cotton and certified polyester, we also star-ted using recycled polyester and organic cotton for some of our sustainability focu-sed collections.
EP&L IMPACT (10FOR20 TARGET NO 8)
Target Description:Continue to report on the EP&L every year.
Relates to United Nations Sustainable Development Goals 7,12
Examples for the 10FOR20 Action Plan:
Regularly publish updated PUMA EP&L data
Introduce industry aligned product sustainability tools for design anddevelopment
KPI:
Annual EP&L values PUMA
Following PUMA‘s spin-off from Kering, we re-integrated the calculation of thePUMA EP&L into our own sustainability efforts. The year 2019 was a transition yearto migrate the EP&L systems into our own IT landscape. At the end of the year, wewere able to calculate our 2018 EP&L results: (https://about.puma.com/en/sustainability/environment)
T.09 DEVELOPMENT OF MORE SUSTAINABLE MATERIAL USAGE SINCE 2015▔
Division Material Targets % of Total 2015 % of Total 2016 % of Total 2017 % of Total 2018 % of Total 2019 Target 2020
Apparel
Cotton from BCI 3% (organic) 19% 40% 50%
BCI+Organic: 82%
BCI cotton: 80%
Organic cotton: 2% 50% (90%)
bluesign certified Polyester 15% 24% 47% 66%
bluesign®-, OEKO-TEX-, Recycled: 98%
bluesign®: 55%
OEKO-TEX: 42%
Recycled: 1% 50% (90%)
Accessories bluesign certified Polyester 20% 21% 34% 46%
bluesign®-, OEKO-TEX: 100%
bluesign: 54%
Oeko-Tex: 46% 50% (90%)
Footwear FSC certified and/or recycled Paper&Cardboard 85% 78% 95% 92% Product Packaging 100% 90%
Footwear LWG Medal Rated Leather 99% 94% 99% 99% 98% 90%
®
®
®

* without value-channel footwear
G.08 PUMA EP&L 2018▔T.06 SCOPE 1 AND SCOPE 2 CO E EMISSIONS FROM PUMA➔
2
CO e-Emissions (absolute figues) 2019 2018 2017 2016 2015
% Change
2019/18
% Change
2019/2015
Scope 1 – Direkte CO e-Emissions Fossile Fuels (T) 6,326 6,918 7,678 6,854 7,296 -8.6 -13.3
Car Fleet 3,618 4,073 4,134 3,746 4,087 -11.2 -11.5
Heating 2,708 2,845 3,545 3,107 3,209 -4.8 -15.6
Scope 2 - Indirect CO e Emissions Electricity & Steam [T] 40,986 43,366 40,029 37,300 35,591 -5.5 15.2
Scope 2 - Indirect CO e Emissions Electricity & Steam [T] incl. RECs 11,533 22,128 40,029 37,300 35,591 -47.9 -67.6
Electricity (excl. RECs) 39,282 42,145 38,914 36,046 34,445 -6.8 14.0
Electricity (incl. RECs) 9,828 20,907 38,914 36,046 34,445 -53.0 -71.5
Steam 1,705 1,221 1,115 1,254 1,146 39.6 48.8
Subtotal Scope 1-2 47,312 50,284 47,707 44,153 42,887 -5.9 10.3
Subtotal Scope 1-2 incl. RECs 17,858 29,046 47,707 44,153 42,887 -38.5 -58.4
SCOPE 1-2 CO e EMISSIONS RELATIV TO SALES (in tons CO e per € million sales per year) 8.6 10.8 11.5 12.2 12.7 -20.5 -32.1
SCOPE 1-2 CO e EMISSIONS RELATIV TO SALES (in tons CO e per € million sales per year) (incl. RECs) 3.2 6.2 11.5 12.2 12.7 -48.1 -74.4
21 - 8
2
2
2
2 2
2 2
78
Annual Report 2019 ↗ SUSTAINABILITY
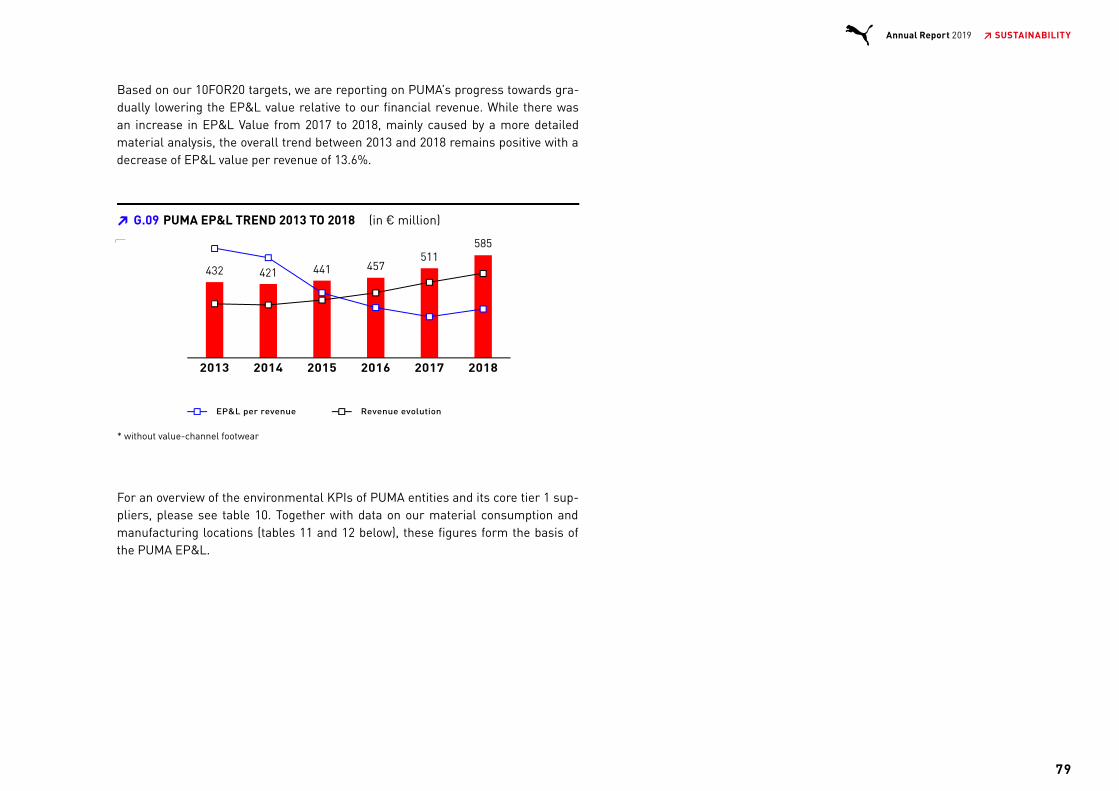
Based on our 10FOR20 targets, we are reporting on PUMA’s progress towards gra-dually lowering the EP&L value relative to our financial revenue. While there wasan increase in EP&L Value from 2017 to 2018, mainly caused by a more detailedmaterial analysis, the overall trend between 2013 and 2018 remains positive with adecrease of EP&L value per revenue of 13.6%.
* without value-channel footwear
For an overview of the environmental KPIs of PUMA entities and its core tier 1 sup-pliers, please see table 10. Together with data on our material consumption andmanufacturing locations (tables 11 and 12 below), these figures form the basis ofthe PUMA EP&L.
G.09 PUMA EP&L TREND 2013 TO 2018 (in € million)▔
79
Annual Report 2019 ↗ SUSTAINABILITY
T.06 SCOPE 1 AND SCOPE 2 CO E EMISSIONS FROM PUMA➔
2
CO e-Emissions (absolute figues) 2019 2018 2017 2016 2015
% Change
2019/18
% Change
2019/2015
Scope 1 – Direkte CO e-Emissions Fossile Fuels (T) 6,326 6,918 7,678 6,854 7,296 -8.6 -13.3
Car Fleet 3,618 4,073 4,134 3,746 4,087 -11.2 -11.5
Heating 2,708 2,845 3,545 3,107 3,209 -4.8 -15.6
Scope 2 - Indirect CO e Emissions Electricity & Steam [T] 40,986 43,366 40,029 37,300 35,591 -5.5 15.2
Scope 2 - Indirect CO e Emissions Electricity & Steam [T] incl. RECs 11,533 22,128 40,029 37,300 35,591 -47.9 -67.6
Electricity (excl. RECs) 39,282 42,145 38,914 36,046 34,445 -6.8 14.0
Electricity (incl. RECs) 9,828 20,907 38,914 36,046 34,445 -53.0 -71.5
Steam 1,705 1,221 1,115 1,254 1,146 39.6 48.8
Subtotal Scope 1-2 47,312 50,284 47,707 44,153 42,887 -5.9 10.3
Subtotal Scope 1-2 incl. RECs 17,858 29,046 47,707 44,153 42,887 -38.5 -58.4
SCOPE 1-2 CO e EMISSIONS RELATIV TO SALES (in tons CO e per € million sales per year) 8.6 10.8 11.5 12.2 12.7 -20.5 -32.1
SCOPE 1-2 CO e EMISSIONS RELATIV TO SALES (in tons CO e per € million sales per year) (incl. RECs) 3.2 6.2 11.5 12.2 12.7 -48.1 -74.4
21 - 8
2
2
2
2 2
2 2
Based on our 10FOR20 targets, we are reporting on PUMA’s progress towards gra-dually lowering the EP&L value relative to our financial revenue. While there wasan increase in EP&L Value from 2017 to 2018, mainly caused by a more detailedmaterial analysis, the overall trend between 2013 and 2018 remains positive with adecrease of EP&L value per revenue of 13.6%.
* without value-channel footwear
For an overview of the environmental KPIs of PUMA entities and its core tier 1 sup-pliers, please see table 10. Together with data on our material consumption andmanufacturing locations (tables 11 and 12 below), these figures form the basis ofthe PUMA EP&L.
G.09 PUMA EP&L TREND 2013 TO 2018 (in € million)▔
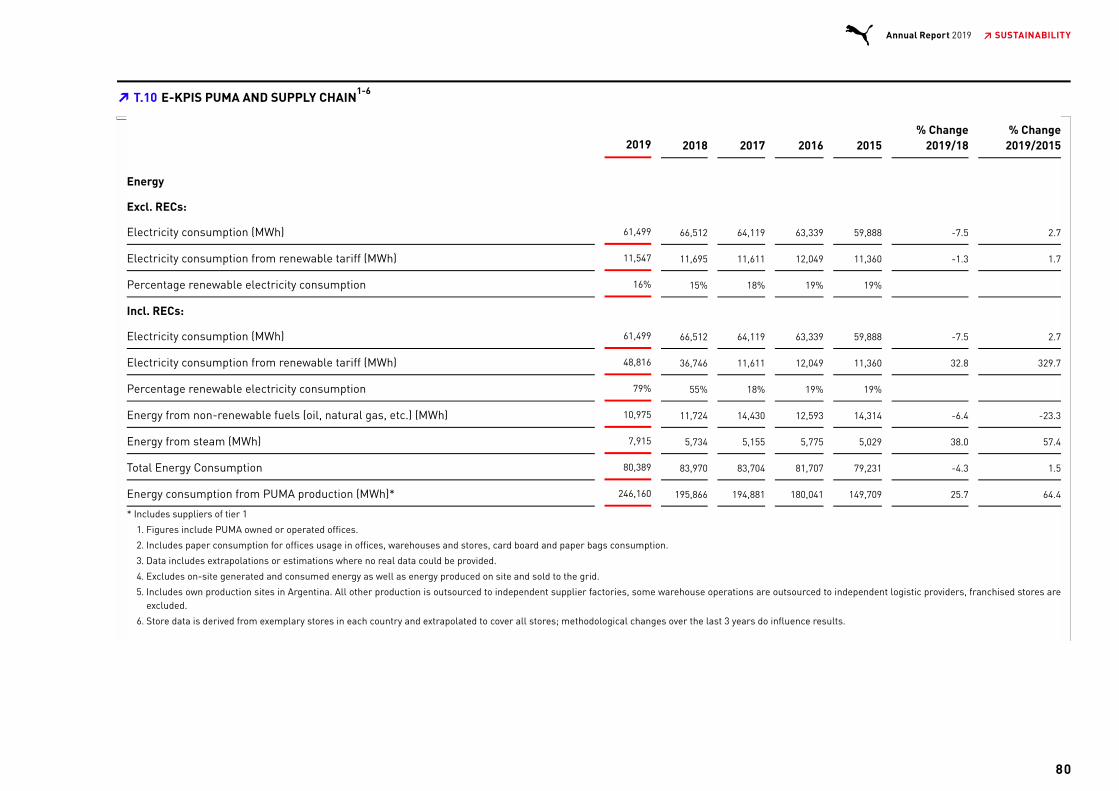
T.10 E-KPIS PUMA AND SUPPLY CHAIN▔1-6
2019 2018 2017 2016 2015% Change
2019/18% Change
2019/2015
Energy
Excl. RECs:
Electricity consumption (MWh) 61,499 66,512 64,119 63,339 59,888 -7.5 2.7
Electricity consumption from renewable tariff (MWh) 11,547 11,695 11,611 12,049 11,360 -1.3 1.7
Percentage renewable electricity consumption 16% 15% 18% 19% 19%
Incl. RECs:
Electricity consumption (MWh) 61,499 66,512 64,119 63,339 59,888 -7.5 2.7
Electricity consumption from renewable tariff (MWh) 48,816 36,746 11,611 12,049 11,360 32.8 329.7
Percentage renewable electricity consumption 79% 55% 18% 19% 19%
Energy from non-renewable fuels (oil, natural gas, etc.) (MWh) 10,975 11,724 14,430 12,593 14,314 -6.4 -23.3
Energy from steam (MWh) 7,915 5,734 5,155 5,775 5,029 38.0 57.4
Total Energy Consumption 80,389 83,970 83,704 81,707 79,231 -4.3 1.5
Energy consumption from PUMA production (MWh)* 246,160 195,866 194,881 180,041 149,709 25.7 64.4
* Includes suppliers of tier 1
1. Figures include PUMA owned or operated offices.
2. Includes paper consumption for offices usage in offices, warehouses and stores, card board and paper bags consumption.
3. Data includes extrapolations or estimations where no real data could be provided.
4. Excludes on-site generated and consumed energy as well as energy produced on site and sold to the grid.
5. Includes own production sites in Argentina. All other production is outsourced to independent supplier factories, some warehouse operations are outsourced to independent logistic providers, franchised stores areexcluded.
6. Store data is derived from exemplary stores in each country and extrapolated to cover all stores; methodological changes over the last 3 years do influence results.
80
Annual Report 2019 ↗ SUSTAINABILITY
T.06 SCOPE 1 AND SCOPE 2 CO E EMISSIONS FROM PUMA➔
2
CO e-Emissions (absolute figues) 2019 2018 2017 2016 2015
% Change
2019/18
% Change
2019/2015
Scope 1 – Direkte CO e-Emissions Fossile Fuels (T) 6,326 6,918 7,678 6,854 7,296 -8.6 -13.3
Car Fleet 3,618 4,073 4,134 3,746 4,087 -11.2 -11.5
Heating 2,708 2,845 3,545 3,107 3,209 -4.8 -15.6
Scope 2 - Indirect CO e Emissions Electricity & Steam [T] 40,986 43,366 40,029 37,300 35,591 -5.5 15.2
Scope 2 - Indirect CO e Emissions Electricity & Steam [T] incl. RECs 11,533 22,128 40,029 37,300 35,591 -47.9 -67.6
Electricity (excl. RECs) 39,282 42,145 38,914 36,046 34,445 -6.8 14.0
Electricity (incl. RECs) 9,828 20,907 38,914 36,046 34,445 -53.0 -71.5
Steam 1,705 1,221 1,115 1,254 1,146 39.6 48.8
Subtotal Scope 1-2 47,312 50,284 47,707 44,153 42,887 -5.9 10.3
Subtotal Scope 1-2 incl. RECs 17,858 29,046 47,707 44,153 42,887 -38.5 -58.4
SCOPE 1-2 CO e EMISSIONS RELATIV TO SALES (in tons CO e per € million sales per year) 8.6 10.8 11.5 12.2 12.7 -20.5 -32.1
SCOPE 1-2 CO e EMISSIONS RELATIV TO SALES (in tons CO e per € million sales per year) (incl. RECs) 3.2 6.2 11.5 12.2 12.7 -48.1 -74.4
21 - 8
2
2
2
2 2
2 2

We have worked with our core suppliers for almost 10 years on energy efficiency aswell as reducing water consumption and waste, for example as part of the VietnamImprovement Program (VIP) or the Partnership for Cleaner Textiles (PaCT) run bythe IFC.
The results of these efforts are visible in a positive overall trend of energy and wa-ter consumption per pair or piece of product since 2015, although we see a slightincrease in average footwear figures due to changes in our supplier base. New fac-
tories had been setup but were not running as efficiently as existing production li-nes, which caused this slight increase. Going forward, we will work with our supp-liers on increasing the efficiency of the new production lines and set new targets toreduce the amount of waste.
2019 2018 2017 2016 2015% Change
2019/18% Change
2019/2015
Waste, paper and water
Waste (tons) 3,154 4,877 5,293 5,302 5,007 -35.3 -37.0
Recycled waste (tons) 1,111 2,282 3,419 3,275 2,949 -51.3 -62.3
Percentage recycled waste 35% 47% 65% 62% 59%
Waste from PUMA produktion [T]* 24,205 16,682 14,686 12,257 11,433 45.1 111.7
Paper and cardboard consumption [T]** 2,281 2,292 2,756 3,337 3,465 -17.2 -34.2
Certified or recycled paper and cardboard consumption [T] 1,818 1,120 2,025 2,512 2,498 62.3 -27.2
Percentage certified or recycled paper consumption 80% 49% 74% 75% 72%
Paper and cardboard consumption from PUMA production [T]* 14,863 13,607 14,129 15,269 13,357 9.2 11.3
Water (m ) 95,291 89,676 106,397 107,025 104,221 6.3 -8.6
Water from PUMA production (thous. m )* 2,572 2,030 2,149 2,145 1,774 26.7 45.0
* Includes suppliers of tier 1
** Including paper bags, direct and indirect paper and cardboard consumption
1. Figures include PUMA owned or operated offices
2. Includes paper consumption for offices usage in offices, warehouses and stores, card board and paper bags consumption.
3. Data includes extrapolations or estimations where no real data could be provided.
4. Excludes on-site generated and consumed energy as well as energy produced on site and sold to the grid.
5. Includes own production sites in Argentina. All other production is outsourced to independent supplier factories, some warehouse operations are outsourced to independent logistic providers, franchised stores areexcluded.
6. Store data is derived from exemplary stores in each country and extrapolated to cover all stores; methodological changes over the last 3 years do influence results.
3
3
81
Annual Report 2019 ↗ SUSTAINABILITY
3
3
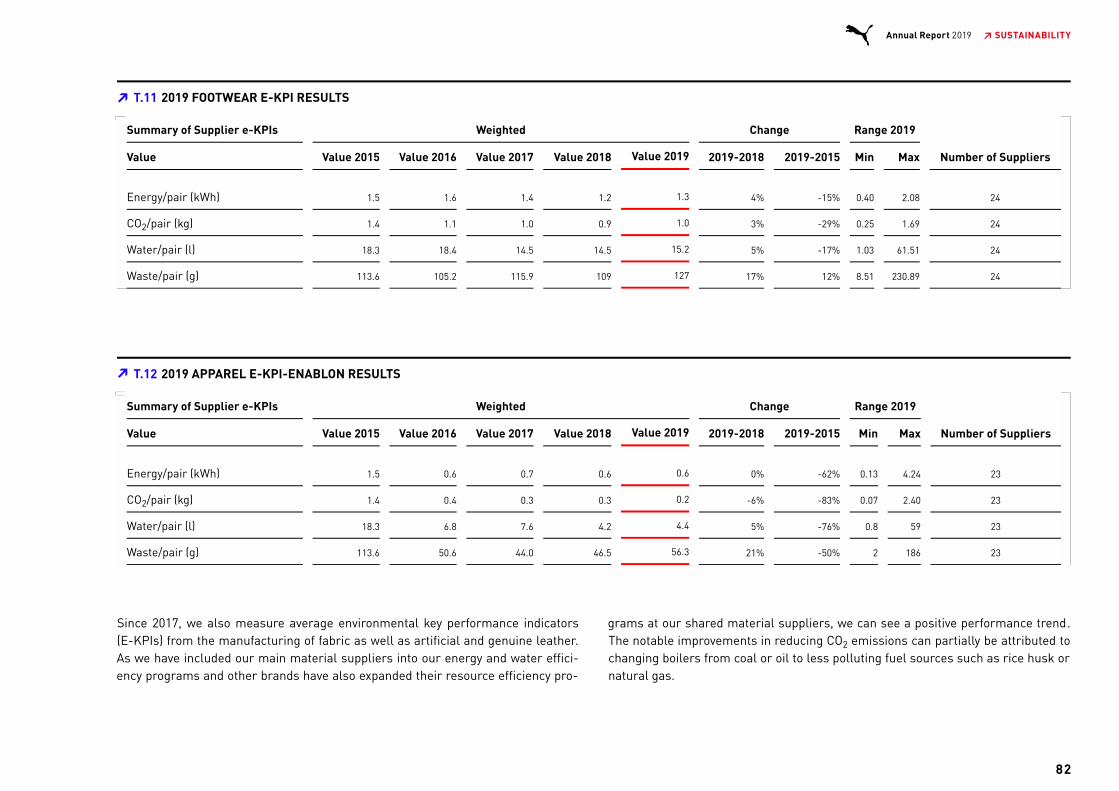
Since 2017, we also measure average environmental key performance indicators(E-KPIs) from the manufacturing of fabric as well as artificial and genuine leather.As we have included our main material suppliers into our energy and water effici-ency programs and other brands have also expanded their resource efficiency pro-
grams at our shared material suppliers, we can see a positive performance trend.The notable improvements in reducing CO emissions can partially be attributed tochanging boilers from coal or oil to less polluting fuel sources such as rice husk ornatural gas.
T.11 2019 FOOTWEAR E-KPI RESULTS▔
Summary of Supplier e-KPIs Weighted Change Range 2019
Value Value 2015 Value 2016 Value 2017 Value 2018 Value 2019 2019-2018 2019-2015 Min Max Number of Suppliers
Energy/pair (kWh) 1.5 1.6 1.4 1.2 1.3 4% -15% 0.40 2.08 24
CO /pair (kg) 1.4 1.1 1.0 0.9 1.0 3% -29% 0.25 1.69 24
Water/pair (l) 18.3 18.4 14.5 14.5 15.2 5% -17% 1.03 61.51 24
Waste/pair (g) 113.6 105.2 115.9 109 127 17% 12% 8.51 230.89 24
2
T.12 2019 APPAREL E-KPI-ENABLON RESULTS▔
Summary of Supplier e-KPIs Weighted Change Range 2019
Value Value 2015 Value 2016 Value 2017 Value 2018 Value 2019 2019-2018 2019-2015 Min Max Number of Suppliers
Energy/pair (kWh) 1.5 0.6 0.7 0.6 0.6 0% -62% 0.13 4.24 23
CO /pair (kg) 1.4 0.4 0.3 0.3 0.2 -6% -83% 0.07 2.40 23
Water/pair (l) 18.3 6.8 7.6 4.2 4.4 5% -76% 0.8 59 23
Waste/pair (g) 113.6 50.6 44.0 46.5 56.3 21% -50% 2 186 23
2
2
82
Annual Report 2019 ↗ SUSTAINABILITY
T.06 SCOPE 1 AND SCOPE 2 CO E EMISSIONS FROM PUMA➔
2
CO e-Emissions (absolute figues) 2019 2018 2017 2016 2015
% Change
2019/18
% Change
2019/2015
Scope 1 – Direkte CO e-Emissions Fossile Fuels (T) 6,326 6,918 7,678 6,854 7,296 -8.6 -13.3
Car Fleet 3,618 4,073 4,134 3,746 4,087 -11.2 -11.5
Heating 2,708 2,845 3,545 3,107 3,209 -4.8 -15.6
Scope 2 - Indirect CO e Emissions Electricity & Steam [T] 40,986 43,366 40,029 37,300 35,591 -5.5 15.2
Scope 2 - Indirect CO e Emissions Electricity & Steam [T] incl. RECs 11,533 22,128 40,029 37,300 35,591 -47.9 -67.6
Electricity (excl. RECs) 39,282 42,145 38,914 36,046 34,445 -6.8 14.0
Electricity (incl. RECs) 9,828 20,907 38,914 36,046 34,445 -53.0 -71.5
Steam 1,705 1,221 1,115 1,254 1,146 39.6 48.8
Subtotal Scope 1-2 47,312 50,284 47,707 44,153 42,887 -5.9 10.3
Subtotal Scope 1-2 incl. RECs 17,858 29,046 47,707 44,153 42,887 -38.5 -58.4
SCOPE 1-2 CO e EMISSIONS RELATIV TO SALES (in tons CO e per € million sales per year) 8.6 10.8 11.5 12.2 12.7 -20.5 -32.1
SCOPE 1-2 CO e EMISSIONS RELATIV TO SALES (in tons CO e per € million sales per year) (incl. RECs) 3.2 6.2 11.5 12.2 12.7 -48.1 -74.4
21 - 8
2
2
2
2 2
2 2
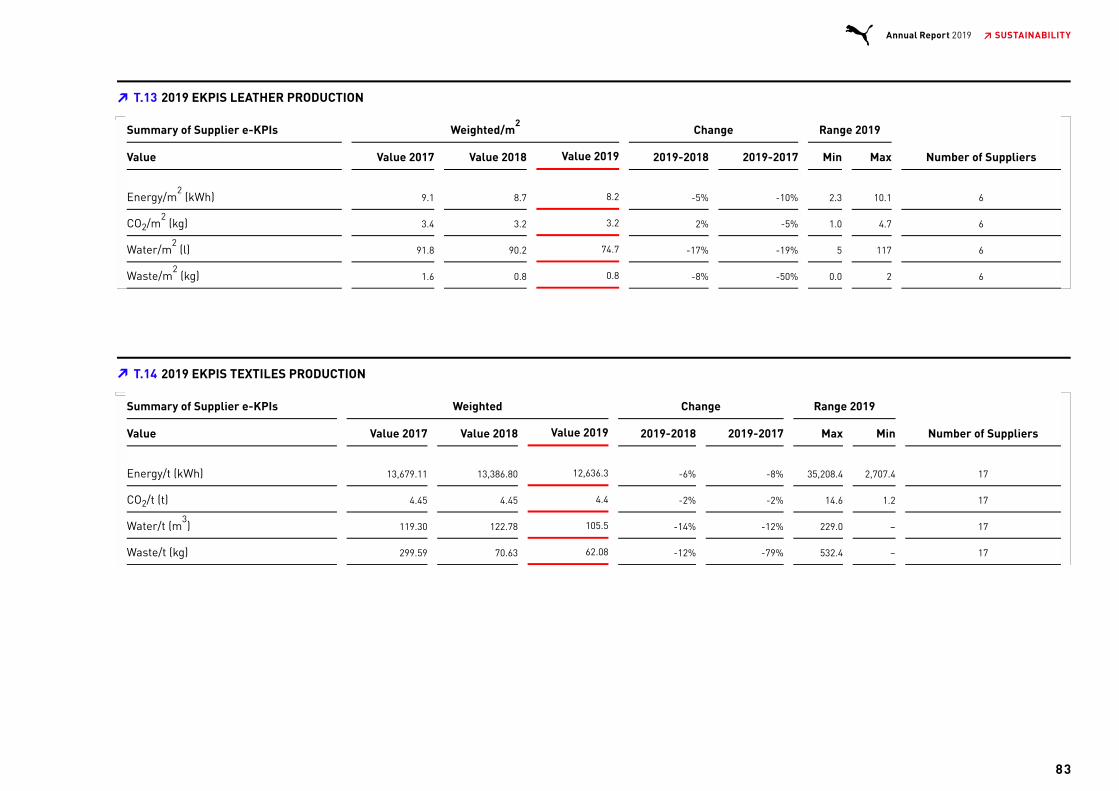
T.13 2019 EKPIS LEATHER PRODUCTION▔
Summary of Supplier e-KPIs Weighted/m Change Range 2019
Value Value 2017 Value 2018 Value 2019 2019-2018 2019-2017 Min Max Number of Suppliers
Energy/m (kWh) 9.1 8.7 8.2 -5% -10% 2.3 10.1 6
CO /m (kg) 3.4 3.2 3.2 2% -5% 1.0 4.7 6
Water/m (l) 91.8 90.2 74.7 -17% -19% 5 117 6
Waste/m (kg) 1.6 0.8 0.8 -8% -50% 0.0 2 6
2
2
22
2
2
T.14 2019 EKPIS TEXTILES PRODUCTION▔
Summary of Supplier e-KPIs Weighted Change Range 2019
Value Value 2017 Value 2018 Value 2019 2019-2018 2019-2017 Max Min Number of Suppliers
Energy/t (kWh) 13,679.11 13,386.80 12,636.3 -6% -8% 35,208.4 2,707.4 17
CO /t (t) 4.45 4.45 4.4 -2% -2% 14.6 1.2 17
Water/t (m ) 119.30 122.78 105.5 -14% -12% 229.0 – 17
Waste/t (kg) 299.59 70.63 62.08 -12% -79% 532.4 – 17
2
3
83
Annual Report 2019 ↗ SUSTAINABILITY
T.06 SCOPE 1 AND SCOPE 2 CO E EMISSIONS FROM PUMA➔
2
CO e-Emissions (absolute figues) 2019 2018 2017 2016 2015
% Change
2019/18
% Change
2019/2015
Scope 1 – Direkte CO e-Emissions Fossile Fuels (T) 6,326 6,918 7,678 6,854 7,296 -8.6 -13.3
Car Fleet 3,618 4,073 4,134 3,746 4,087 -11.2 -11.5
Heating 2,708 2,845 3,545 3,107 3,209 -4.8 -15.6
Scope 2 - Indirect CO e Emissions Electricity & Steam [T] 40,986 43,366 40,029 37,300 35,591 -5.5 15.2
Scope 2 - Indirect CO e Emissions Electricity & Steam [T] incl. RECs 11,533 22,128 40,029 37,300 35,591 -47.9 -67.6
Electricity (excl. RECs) 39,282 42,145 38,914 36,046 34,445 -6.8 14.0
Electricity (incl. RECs) 9,828 20,907 38,914 36,046 34,445 -53.0 -71.5
Steam 1,705 1,221 1,115 1,254 1,146 39.6 48.8
Subtotal Scope 1-2 47,312 50,284 47,707 44,153 42,887 -5.9 10.3
Subtotal Scope 1-2 incl. RECs 17,858 29,046 47,707 44,153 42,887 -38.5 -58.4
SCOPE 1-2 CO e EMISSIONS RELATIV TO SALES (in tons CO e per € million sales per year) 8.6 10.8 11.5 12.2 12.7 -20.5 -32.1
SCOPE 1-2 CO e EMISSIONS RELATIV TO SALES (in tons CO e per € million sales per year) (incl. RECs) 3.2 6.2 11.5 12.2 12.7 -48.1 -74.4
21 - 8
2
2
2
2 2
2 2
T.06 SCOPE 1 AND SCOPE 2 CO E EMISSIONS FROM PUMA➔
2
CO e-Emissions (absolute figues) 2019 2018 2017 2016 2015
% Change
2019/18
% Change
2019/2015
Scope 1 – Direkte CO e-Emissions Fossile Fuels (T) 6,326 6,918 7,678 6,854 7,296 -8.6 -13.3
Car Fleet 3,618 4,073 4,134 3,746 4,087 -11.2 -11.5
Heating 2,708 2,845 3,545 3,107 3,209 -4.8 -15.6
Scope 2 - Indirect CO e Emissions Electricity & Steam [T] 40,986 43,366 40,029 37,300 35,591 -5.5 15.2
Scope 2 - Indirect CO e Emissions Electricity & Steam [T] incl. RECs 11,533 22,128 40,029 37,300 35,591 -47.9 -67.6
Electricity (excl. RECs) 39,282 42,145 38,914 36,046 34,445 -6.8 14.0
Electricity (incl. RECs) 9,828 20,907 38,914 36,046 34,445 -53.0 -71.5
Steam 1,705 1,221 1,115 1,254 1,146 39.6 48.8
Subtotal Scope 1-2 47,312 50,284 47,707 44,153 42,887 -5.9 10.3
Subtotal Scope 1-2 incl. RECs 17,858 29,046 47,707 44,153 42,887 -38.5 -58.4
SCOPE 1-2 CO e EMISSIONS RELATIV TO SALES (in tons CO e per € million sales per year) 8.6 10.8 11.5 12.2 12.7 -20.5 -32.1
SCOPE 1-2 CO e EMISSIONS RELATIV TO SALES (in tons CO e per € million sales per year) (incl. RECs) 3.2 6.2 11.5 12.2 12.7 -48.1 -74.4
21 - 8
2
2
2
2 2
2 2
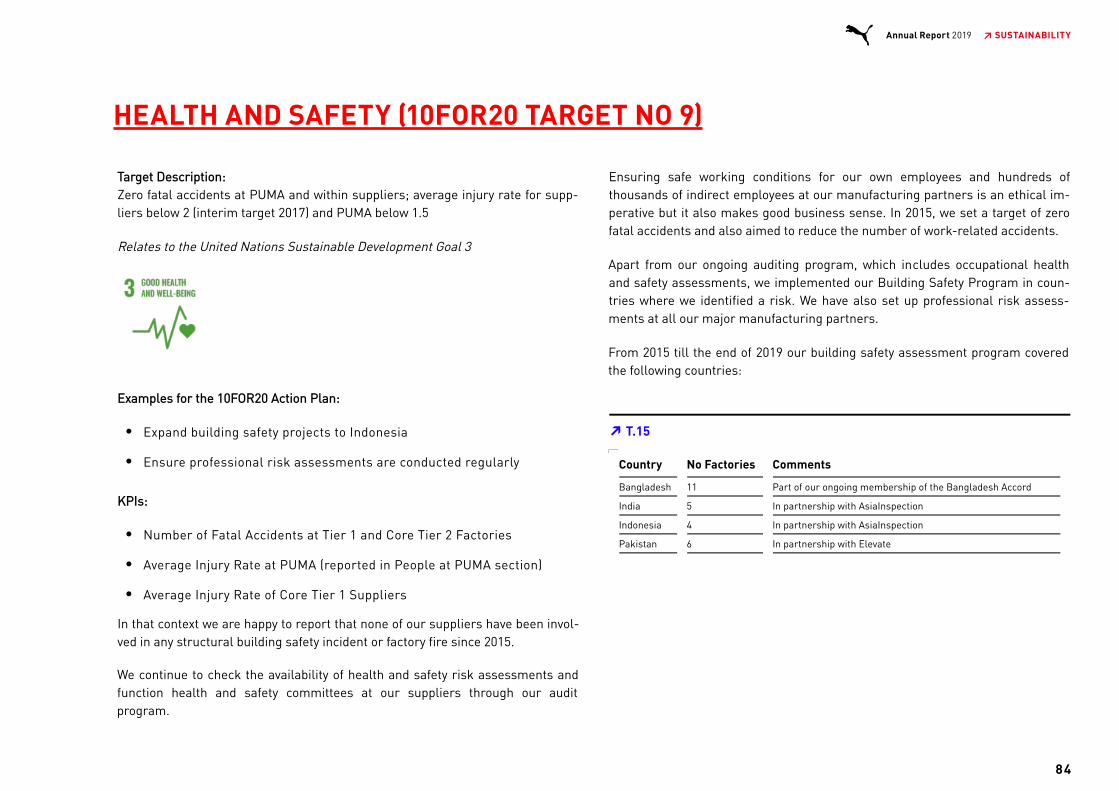
HEALTH AND SAFETY (10FOR20 TARGET NO 9)
In that context we are happy to report that none of our suppliers have been invol-ved in any structural building safety incident or factory fire since 2015.
We continue to check the availability of health and safety risk assessments andfunction health and safety committees at our suppliers through our auditprogram.
Target Description:Zero fatal accidents at PUMA and within suppliers; average injury rate for supp-liers below 2 (interim target 2017) and PUMA below 1.5
Relates to the United Nations Sustainable Development Goal 3
Examples for the 10FOR20 Action Plan:
Expand building safety projects to Indonesia
Ensure professional risk assessments are conducted regularly
KPIs:
Number of Fatal Accidents at Tier 1 and Core Tier 2 Factories
Average Injury Rate at PUMA (reported in People at PUMA section)
Average Injury Rate of Core Tier 1 Suppliers
Ensuring safe working conditions for our own employees and hundreds ofthousands of indirect employees at our manufacturing partners is an ethical im-perative but it also makes good business sense. In 2015, we set a target of zerofatal accidents and also aimed to reduce the number of work-related accidents.
Apart from our ongoing auditing program, which includes occupational healthand safety assessments, we implemented our Building Safety Program in coun-tries where we identified a risk. We have also set up professional risk assess-ments at all our major manufacturing partners.
From 2015 till the end of 2019 our building safety assessment program coveredthe following countries:
Country No Factories Comments
Bangladesh 11 Part of our ongoing membership of the Bangladesh Accord
India 5 In partnership with AsiaInspection
Indonesia 4 In partnership with AsiaInspection
Pakistan 6 In partnership with Elevate
T.15 ▔
84
Annual Report 2019 ↗ SUSTAINABILITY
HEALTH AND SAFETY (10FOR20 TARGET NO 9)
T.06 SCOPE 1 AND SCOPE 2 CO E EMISSIONS FROM PUMA➔
2
CO e-Emissions (absolute figues) 2019 2018 2017 2016 2015
% Change
2019/18
% Change
2019/2015
Scope 1 – Direkte CO e-Emissions Fossile Fuels (T) 6,326 6,918 7,678 6,854 7,296 -8.6 -13.3
Car Fleet 3,618 4,073 4,134 3,746 4,087 -11.2 -11.5
Heating 2,708 2,845 3,545 3,107 3,209 -4.8 -15.6
Scope 2 - Indirect CO e Emissions Electricity & Steam [T] 40,986 43,366 40,029 37,300 35,591 -5.5 15.2
Scope 2 - Indirect CO e Emissions Electricity & Steam [T] incl. RECs 11,533 22,128 40,029 37,300 35,591 -47.9 -67.6
Electricity (excl. RECs) 39,282 42,145 38,914 36,046 34,445 -6.8 14.0
Electricity (incl. RECs) 9,828 20,907 38,914 36,046 34,445 -53.0 -71.5
Steam 1,705 1,221 1,115 1,254 1,146 39.6 48.8
Subtotal Scope 1-2 47,312 50,284 47,707 44,153 42,887 -5.9 10.3
Subtotal Scope 1-2 incl. RECs 17,858 29,046 47,707 44,153 42,887 -38.5 -58.4
SCOPE 1-2 CO e EMISSIONS RELATIV TO SALES (in tons CO e per € million sales per year) 8.6 10.8 11.5 12.2 12.7 -20.5 -32.1
SCOPE 1-2 CO e EMISSIONS RELATIV TO SALES (in tons CO e per € million sales per year) (incl. RECs) 3.2 6.2 11.5 12.2 12.7 -48.1 -74.4
21 - 8
2
2
2
2 2
2 2
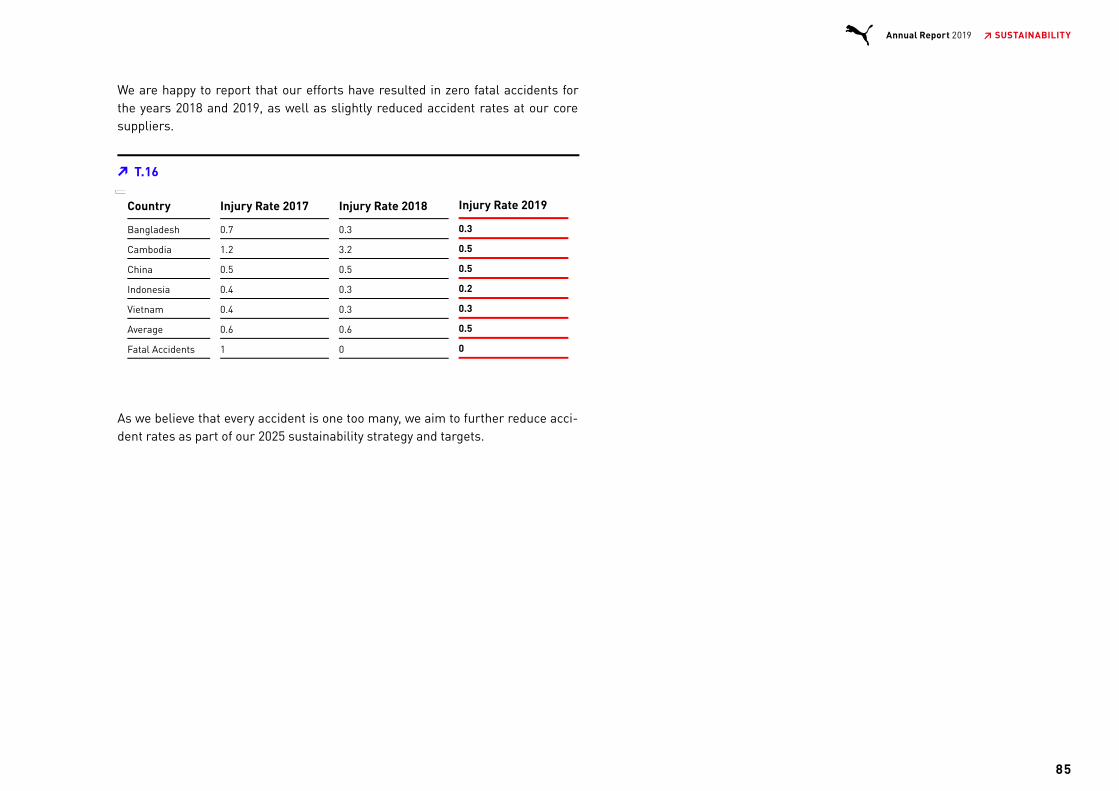
We are happy to report that our efforts have resulted in zero fatal accidents forthe years 2018 and 2019, as well as slightly reduced accident rates at our coresuppliers.
Country Injury Rate 2017 Injury Rate 2018 Injury Rate 2019
Bangladesh 0.7 0.3 0.3
Cambodia 1.2 3.2 0.5
China 0.5 0.5 0.5
Indonesia 0.4 0.3 0.2
Vietnam 0.4 0.3 0.3
Average 0.6 0.6 0.5
Fatal Accidents 1 0 0
As we believe that every accident is one too many, we aim to further reduce acci-dent rates as part of our 2025 sustainability strategy and targets.
T.16 ▔
85
Annual Report 2019 ↗ SUSTAINABILITY
T.06 SCOPE 1 AND SCOPE 2 CO E EMISSIONS FROM PUMA➔
2
CO e-Emissions (absolute figues) 2019 2018 2017 2016 2015
% Change
2019/18
% Change
2019/2015
Scope 1 – Direkte CO e-Emissions Fossile Fuels (T) 6,326 6,918 7,678 6,854 7,296 -8.6 -13.3
Car Fleet 3,618 4,073 4,134 3,746 4,087 -11.2 -11.5
Heating 2,708 2,845 3,545 3,107 3,209 -4.8 -15.6
Scope 2 - Indirect CO e Emissions Electricity & Steam [T] 40,986 43,366 40,029 37,300 35,591 -5.5 15.2
Scope 2 - Indirect CO e Emissions Electricity & Steam [T] incl. RECs 11,533 22,128 40,029 37,300 35,591 -47.9 -67.6
Electricity (excl. RECs) 39,282 42,145 38,914 36,046 34,445 -6.8 14.0
Electricity (incl. RECs) 9,828 20,907 38,914 36,046 34,445 -53.0 -71.5
Steam 1,705 1,221 1,115 1,254 1,146 39.6 48.8
Subtotal Scope 1-2 47,312 50,284 47,707 44,153 42,887 -5.9 10.3
Subtotal Scope 1-2 incl. RECs 17,858 29,046 47,707 44,153 42,887 -38.5 -58.4
SCOPE 1-2 CO e EMISSIONS RELATIV TO SALES (in tons CO e per € million sales per year) 8.6 10.8 11.5 12.2 12.7 -20.5 -32.1
SCOPE 1-2 CO e EMISSIONS RELATIV TO SALES (in tons CO e per € million sales per year) (incl. RECs) 3.2 6.2 11.5 12.2 12.7 -48.1 -74.4
21 - 8
2
2
2
2 2
2 2
GOVERNANCE (10FOR20 TARGET NO 10)
Target Description:Maintain and run a state-of-the-art Compliance Management System (includingAnti-Corruption measures).
Relates to United Nations Sustainable Development Goals 8,16
Examples for the 10FOR20 Action Plan:
Increase participation rate in Code of Ethics training
Introduce a PUMA Anti-Corruption Policy
KPIs:
Percentage of PUMA employees trained on anti-corruption
Percentage of PUMA Core suppliers trained in anti-corruption
COMPLIANCE MANAGEMENT SYSTEM AT PUMA
PUMA is a global sports company, aiming for sustainable growth and innovation.PUMA recognizes the legal and reputational risks inherent in running a globalbusiness in a fast-paced environment where laws and customs differ from coun-try to country. As outlined in the Corporate Governance Report, PUMA has set upa Compliance Management System (CMS) to systematically prevent, detect and
sanction violations in the areas of corruption, money laundering, conflicts of inte-rest, antitrust law, fraud and embezzlement.
PUMA’s Chief Compliance Officer is based at the headquarter in Herzogenaurachand reports to the CEO of PUMA SE. A network of Local Compliance Officers inoperating subsidiaries across the world supports the Chief Compliance Officer.They ensure that Compliance measures are rolled out globally and are in linewith local laws and customs. Local Compliance Officers also act as a first point ofcontact for employees and help with the investigation of incidents. PUMA promo-tes a “speak-up culture” where employees are encouraged to raise any compli-ance issues with their manager, Local Compliance Officer or People & Organizat-ion Partner. To give employees as many channels as possible to report incidentsthere is also a web-based whistleblowing platform. The platform allows em-ployees to report from anywhere, at any time, using their own language and an-onymously, if they choose. All incidents are investigated immediately and tho-roughly, and the required disciplinary steps or improvement measures are taken.There is regular and ad-hoc incident reporting to the top management. In 2019,the Compliance team received 33 reports about alleged violations. Three of theseconcerned alleged bribery/kickbacks. One case was closed after the investigationdid not confirm the allegation. In the other two cases the investigation is stillongoing.
86
Annual Report 2019 ↗ SUSTAINABILITY
GOVERNANCE (10FOR20 TARGET NO 10)

The PUMA Code of Ethics sets out the principles governing our actions and va-lues. It contains - among others - rules on the handling of conflicts of interest,personal data, and insider information, and prohibits anti-competitive behavioras well as corruption in any form. The Code of Ethics is an integral part of everyemployment contract. In order to further reduce the risk of misconduct, thePUMA Code of Ethics is complemented by comprehensive policies governingselected risk areas such as anti-corruption, violation of competition law and anti-money laundering in detail. The Code of Ethics as well as the PUMA compliancepolicies apply to all subsidiaries.
ANTI-CORRUPTION MEASURES
Prevention of bribery is one of the key aspects of the Compliance ManagementSystem. At PUMA, we have a zero-tolerance approach regarding bribery and cor-ruption in any form, and this is clearly communicated by top level management.
Employees are first introduced to the rules of the Code of Ethics and the PUMA-Group compliance policies when they start working for PUMA; reminders aresent out to them on a regular basis. The Code of Ethics and the rest of the comp-liance policies are available for everyone on the Compliance site on the Intranet.Every year PUMA rolls out a group-wide mandatory e-learning on the PUMACode of Ethics. To make sure that employees are familiar with all topics descri-bed in the Code of Ethics, the e-learning covers different topics every year. The
2019 e-learning course included the topics (i) prevention of bribery, (ii) inappro-priate behavior in the workplace and (iii) safeguarding data. Sponsor of the cam-paign was the Management Board of PUMA SE, above all the CEO Bjørn Gulden,who promoted the e-learning course to all PUMA employees . 99% of the em-ployees of the PUMA Group with a PUMA email account (PUMA SE appr. 97%)have completed the e-learning course. In addition, groups of employees selec-ted on the basis of risk exposure, are being provided with more in-depth know-ledge in regular face-to-face trainings. Last year the focus areas of these trai-nings were anti-corruption and competition law.
To implement our Anti-Corruption measures also at our PUMA suppliers, thePUMA Vendor Code of Conduct contains a paragraph on Ethical Business Prac-tices and the PUMA supplier compliance audit tool includes several questions onAnti-Corruption. Each year, we train our suppliers on Anti-Corruption measuresduring our Supplier Round Table Meetings. In the year 2019 we increased thetraining coverage among our Core Suppliers from 93% (in 2018) to 99%.
Highlights: 99% of all PUMA staff globally with email account completed ourCode of Ethics Training and 99% of our Core Suppliers were trained in Anti-Corruption.
Excluding employees on long-term leave, store staff, warehouse and factory employees.
1
1
1
87
Annual Report 2019 ↗ SUSTAINABILITY
SUMMARY AND NEW TARGETS FOR 2025
TARGET SUMMARY 2020
At the beginning of the new decade in 2020 we can summarize our 10FOR20 Tar-get achievement as follows:
Out of the 10 target areas set in 2015, we have achieved our desired progress in 9areas.
Particularly in the area of more sustainable Materials the progress has been fas-ter than anticipated and we clearly exceeded the targets for the materials we usethe most - cotton and polyester - with 82% and 98% target sourcing respectively.
We also see good progress in the area of Social Compliance and Chemicals Ma-nagement, where we constantly met our yearly targets during the target periodand achieved significant progress, for example with the elimination of recruit-ment fees for migrant workers at our contract factories and the phase-out ofPFCs.
In the area of Health and Safety, we struggled to meet our zero fatal accidentstarget in the first few years but hit the target from 2018 onwards.
Our Climate action program received a boost in 2018 with the creation of the Fa-shion Charter on Climate Action Initiative under the umbrella of UN Climate. Weused the positive momentum to finalize and publish our science-based COemission reduction target in 2019 and at the same time invested at a large scaleinto renewable energy – thus reducing our own emissions significantly.
The only target area where progress is falling significantly behind our expectati-ons is the target area of Water & Air.
When we set our targets for Water & Air in 2015, we did not anticipate that itwould take our industry more than four years to develop a standard for air emis-
sions and we also were more optimistic about achieving the standards set in theZDHC Wastewater Quality Guideline.
Therefore, we have decided to move those targets to our new target period for2025. However, we aim to complete these targets much earlier.
NEW TARGETS 2025
Following a formal materiality analysis process in 2018 and extensive internaland external stakeholder dialogue in 2019, our Board of Management has signedoff on our new 2025 target areas.
We decided to replace the activities which contribute to performance improve-ments more indirectly, such as Stakeholder Dialogue and the calculation of theEP&L, with new target areas which make a direct impact, such as Plastics andthe Oceans and Biodiversity. Both topics are also part of the Fashion Pact initia-ted by the French Government in 2019 and signed by PUMA.
In addition, we decided to merge the target areas for Social Compliance and Hu-man Rights because of the wide overlap between them, while giving the topic ofFair Income, which has been pointed out as very important by many stakehol-ders, more prominence by creating a separate target area.
Finally, we upgraded our existing Materials target area into a Products targetarea and added Circularity as a new target area, due to the growing interest andimportance of the topic.
Corporate Governance will no longer be reported under the umbrella of oursustainability program but instead as a separate and very important objective wi-thin the company.
2
88
Annual Report 2019 ↗ SUSTAINABILITY

*SDG: United Nations Sustainable Development Goals
G.10 PUMA SUSTAINABILITY TARGETS 2025▔T.06 SCOPE 1 AND SCOPE 2 CO E EMISSIONS FROM PUMA➔
2
CO e-Emissions (absolute figues) 2019 2018 2017 2016 2015
% Change
2019/18
% Change
2019/2015
Scope 1 – Direkte CO e-Emissions Fossile Fuels (T) 6,326 6,918 7,678 6,854 7,296 -8.6 -13.3
Car Fleet 3,618 4,073 4,134 3,746 4,087 -11.2 -11.5
Heating 2,708 2,845 3,545 3,107 3,209 -4.8 -15.6
Scope 2 - Indirect CO e Emissions Electricity & Steam [T] 40,986 43,366 40,029 37,300 35,591 -5.5 15.2
Scope 2 - Indirect CO e Emissions Electricity & Steam [T] incl. RECs 11,533 22,128 40,029 37,300 35,591 -47.9 -67.6
Electricity (excl. RECs) 39,282 42,145 38,914 36,046 34,445 -6.8 14.0
Electricity (incl. RECs) 9,828 20,907 38,914 36,046 34,445 -53.0 -71.5
Steam 1,705 1,221 1,115 1,254 1,146 39.6 48.8
Subtotal Scope 1-2 47,312 50,284 47,707 44,153 42,887 -5.9 10.3
Subtotal Scope 1-2 incl. RECs 17,858 29,046 47,707 44,153 42,887 -38.5 -58.4
SCOPE 1-2 CO e EMISSIONS RELATIV TO SALES (in tons CO e per € million sales per year) 8.6 10.8 11.5 12.2 12.7 -20.5 -32.1
SCOPE 1-2 CO e EMISSIONS RELATIV TO SALES (in tons CO e per € million sales per year) (incl. RECs) 3.2 6.2 11.5 12.2 12.7 -48.1 -74.4
21 - 8
2
2
2
2 2
2 2
89
Annual Report 2019 ↗ SUSTAINABILITY
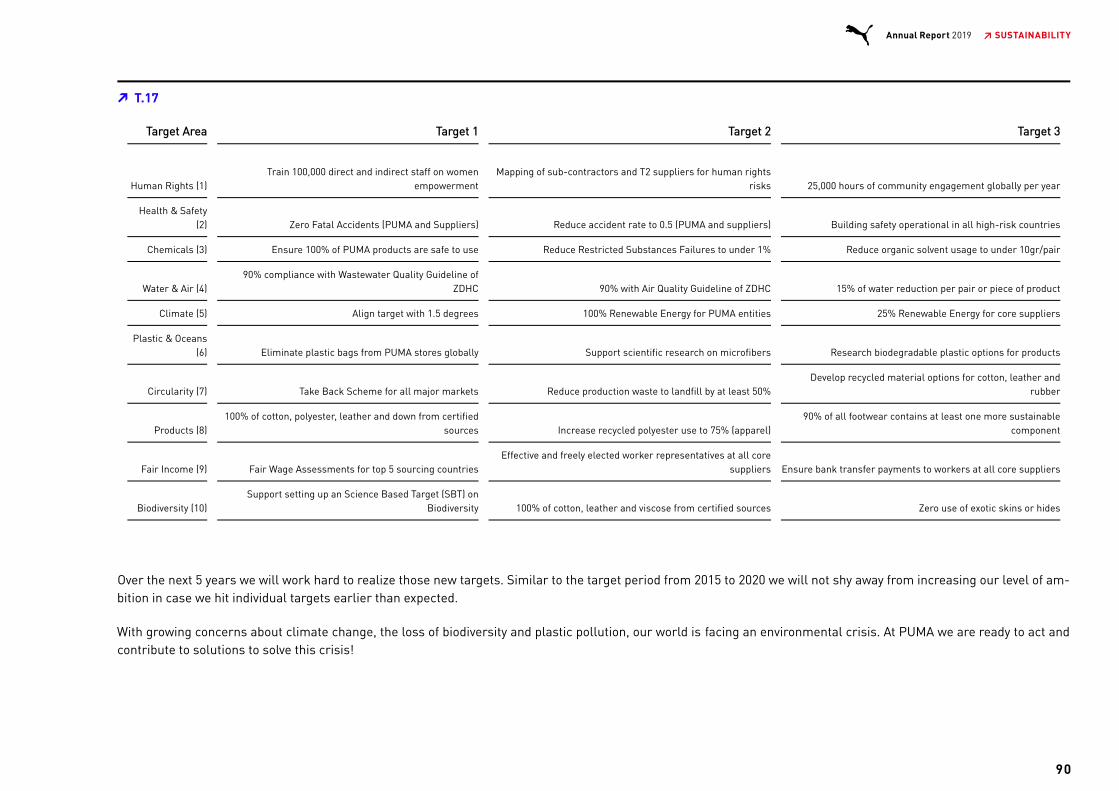
Target Area Target 1 Target 2 Target 3
Human Rights (1)Train 100,000 direct and indirect staff on women
empowermentMapping of sub-contractors and T2 suppliers for human rights
risks 25,000 hours of community engagement globally per year
Health & Safety(2) Zero Fatal Accidents (PUMA and Suppliers) Reduce accident rate to 0.5 (PUMA and suppliers) Building safety operational in all high-risk countries
Chemicals (3) Ensure 100% of PUMA products are safe to use Reduce Restricted Substances Failures to under 1% Reduce organic solvent usage to under 10gr/pair
Water & Air (4)90% compliance with Wastewater Quality Guideline of
ZDHC 90% with Air Quality Guideline of ZDHC 15% of water reduction per pair or piece of product
Climate (5) Align target with 1.5 degrees 100% Renewable Energy for PUMA entities 25% Renewable Energy for core suppliers
Plastic & Oceans(6) Eliminate plastic bags from PUMA stores globally Support scientific research on microfibers Research biodegradable plastic options for products
Circularity (7) Take Back Scheme for all major markets Reduce production waste to landfill by at least 50%Develop recycled material options for cotton, leather and
rubber
Products (8)100% of cotton, polyester, leather and down from certified
sources Increase recycled polyester use to 75% (apparel)90% of all footwear contains at least one more sustainable
component
Fair Income (9) Fair Wage Assessments for top 5 sourcing countriesEffective and freely elected worker representatives at all core
suppliers Ensure bank transfer payments to workers at all core suppliers
Biodiversity (10)Support setting up an Science Based Target (SBT) on
Biodiversity 100% of cotton, leather and viscose from certified sources Zero use of exotic skins or hides
Over the next 5 years we will work hard to realize those new targets. Similar to the target period from 2015 to 2020 we will not shy away from increasing our level of am-bition in case we hit individual targets earlier than expected.
With growing concerns about climate change, the loss of biodiversity and plastic pollution, our world is facing an environmental crisis. At PUMA we are ready to act andcontribute to solutions to solve this crisis!
T.17 ▔
90
Annual Report 2019 ↗ SUSTAINABILITY
T.06 SCOPE 1 AND SCOPE 2 CO E EMISSIONS FROM PUMA➔
2
CO e-Emissions (absolute figues) 2019 2018 2017 2016 2015
% Change
2019/18
% Change
2019/2015
Scope 1 – Direkte CO e-Emissions Fossile Fuels (T) 6,326 6,918 7,678 6,854 7,296 -8.6 -13.3
Car Fleet 3,618 4,073 4,134 3,746 4,087 -11.2 -11.5
Heating 2,708 2,845 3,545 3,107 3,209 -4.8 -15.6
Scope 2 - Indirect CO e Emissions Electricity & Steam [T] 40,986 43,366 40,029 37,300 35,591 -5.5 15.2
Scope 2 - Indirect CO e Emissions Electricity & Steam [T] incl. RECs 11,533 22,128 40,029 37,300 35,591 -47.9 -67.6
Electricity (excl. RECs) 39,282 42,145 38,914 36,046 34,445 -6.8 14.0
Electricity (incl. RECs) 9,828 20,907 38,914 36,046 34,445 -53.0 -71.5
Steam 1,705 1,221 1,115 1,254 1,146 39.6 48.8
Subtotal Scope 1-2 47,312 50,284 47,707 44,153 42,887 -5.9 10.3
Subtotal Scope 1-2 incl. RECs 17,858 29,046 47,707 44,153 42,887 -38.5 -58.4
SCOPE 1-2 CO e EMISSIONS RELATIV TO SALES (in tons CO e per € million sales per year) 8.6 10.8 11.5 12.2 12.7 -20.5 -32.1
SCOPE 1-2 CO e EMISSIONS RELATIV TO SALES (in tons CO e per € million sales per year) (incl. RECs) 3.2 6.2 11.5 12.2 12.7 -48.1 -74.4
21 - 8
2
2
2
2 2
2 2

GRI-INDEX
Index to Separate Combined Non-Financial Report and GRI content
This report constitutes a separate combined non-financial report in accordancewith sections 289b to 289e and 315b, 315c in conjunction with 289c to 289e of theGerman Commercial Code (HGB). This consolidated non-financial report consistsof the sections and disclosures referenced in the following overview in column“CSR Directive Implementation Act: Index to Non-financial Statement” as well asthe chapter "Sustainability" and the section "Culture" in the chapter "OurPeople".
The reporting period covered is January 1st, 2019 to December 31st, 2019. No re-statements of information have been made in this report. We have provided sepa-rate reports for PUMA SE and the PUMA Group within the “Governance andPeople at PUMA” section only. Separate reporting of other sustainability datawould not add any meaningful new information or value and would require signi-ficant additional resources, so we have omitted it here. Information about
PUMA’s business model is set out in the Financial section of this Annual Reporton page 113. This combined sustainability report has undergone a voluntary “li-mited assurance” with focus on accordance with German CSR ImplementationAct (CSR-RUG) by Deloitte.
Since 2003 PUMA’s sustainability reports are based on the guidelines of the Glo-bal Reporting Initiative (GRI), which developed detailed and widely recognizedstandards on sustainability reporting. This report has been prepared in accor-dance with the GRI Standards: Core option. This option enables us to report onthe impacts related to our economic, environmental, social, and governance per-formance. It includes topics that are material to PUMA’s business and our keystakeholders, and that constitute our sustainability targets. These targets havebeen systematically developed in accordance with the feedback from PUMA’sstakeholders.
91
Annual Report 2019 ↗ SUSTAINABILITY
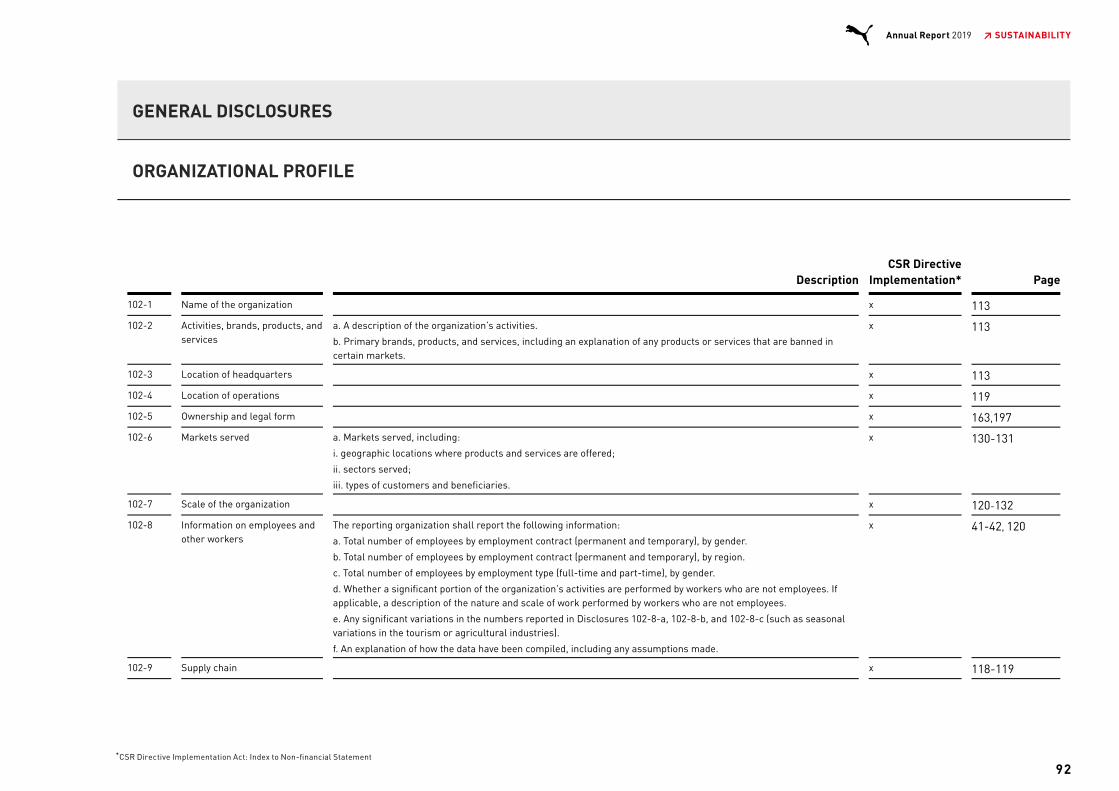
DescriptionCSR Directive
Implementation* Page
102-1 Name of the organization x 113
102-2 Activities, brands, products, andservices
a. A description of the organization’s activities.
b. Primary brands, products, and services, including an explanation of any products or services that are banned incertain markets.
x 113
102-3 Location of headquarters x 113
102-4 Location of operations x 119
102-5 Ownership and legal form x 163,197
102-6 Markets served a. Markets served, including:
i. geographic locations where products and services are offered;
ii. sectors served;
iii. types of customers and beneficiaries.
x 130-131
102-7 Scale of the organization x 120-132
102-8 Information on employees andother workers
The reporting organization shall report the following information:
a. Total number of employees by employment contract (permanent and temporary), by gender.
b. Total number of employees by employment contract (permanent and temporary), by region.
c. Total number of employees by employment type (full-time and part-time), by gender.
d. Whether a significant portion of the organization’s activities are performed by workers who are not employees. Ifapplicable, a description of the nature and scale of work performed by workers who are not employees.
e. Any significant variations in the numbers reported in Disclosures 102-8-a, 102-8-b, and 102-8-c (such as seasonalvariations in the tourism or agricultural industries).
f. An explanation of how the data have been compiled, including any assumptions made.
x 41-42, 120
102-9 Supply chain x 118-119
GENERAL DISCLOSURES
ORGANIZATIONAL PROFILE
92
Annual Report 2019 ↗ SUSTAINABILITY
*CSR Directive Implementation Act: Index to Non-financial Statement
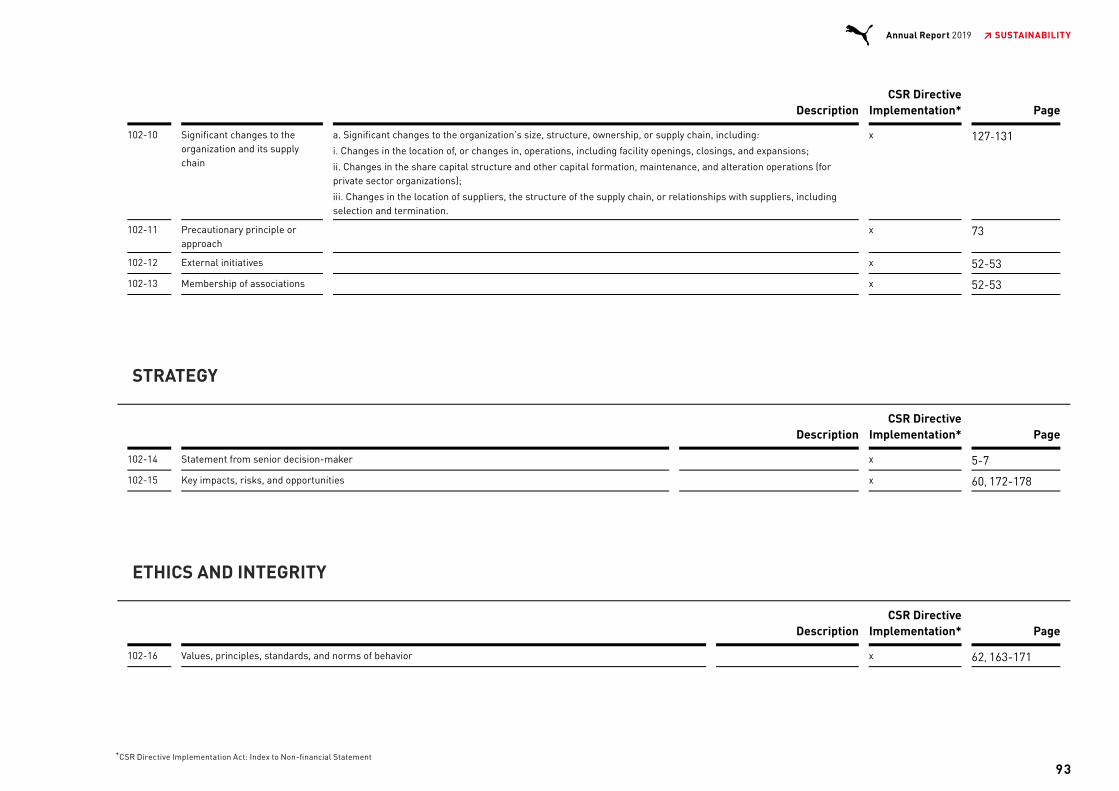
DescriptionCSR Directive
Implementation* Page
102-10 Significant changes to theorganization and its supplychain
a. Significant changes to the organization’s size, structure, ownership, or supply chain, including:
i. Changes in the location of, or changes in, operations, including facility openings, closings, and expansions;
ii. Changes in the share capital structure and other capital formation, maintenance, and alteration operations (forprivate sector organizations);
iii. Changes in the location of suppliers, the structure of the supply chain, or relationships with suppliers, includingselection and termination.
x 127-131
102-11 Precautionary principle orapproach
x 73
102-12 External initiatives x 52-53
102-13 Membership of associations x 52-53
DescriptionCSR Directive
Implementation* Page
102-14 Statement from senior decision-maker x 5-7
102-15 Key impacts, risks, and opportunities x 60, 172-178
DescriptionCSR Directive
Implementation* Page
102-16 Values, principles, standards, and norms of behavior x 62, 163-171
STRATEGY
ETHICS AND INTEGRITY
93
Annual Report 2019 ↗ SUSTAINABILITY
*CSR Directive Implementation Act: Index to Non-financial Statement

DescriptionCSR Directive
Implementation* Page
102-18 Governance structure The reporting organization shall report the following information:
a. Governance structure of the organization, including committees of the highestgovernance body.
b. Committees responsible for decision-making on economic, environmental, and socialtopics.
x 163-171
102-21 Consulting stakeholders on economic, environmental, andsocial topics
x 51-53
DescriptionCSR Directive
Implementation* Page
102-40 List of stakeholder groups x 51-53
102-41 Collective bargaining agreements x 41, 65
102-42 Identifying and selecting stakeholders x 51-53
102-43 Approach to stakeholder engagement x 51-53
102-44 Wichtige Themen und hervorgebrachteAnliegen
The reporting organization shall report the following information:
a. Key topics and concerns that have been raised through stakeholder engagement, including:
i. how the organization has responded to those key topics and concerns, including through itsreporting;
ii. the stakeholder groups that raised each of the key topics and concerns.
x 51-53
GOVERNANCE
STAKEHOLDER ENGAGEMENT
94
Annual Report 2019 ↗ SUSTAINABILITY
*CSR Directive Implementation Act: Index to Non-financial Statement
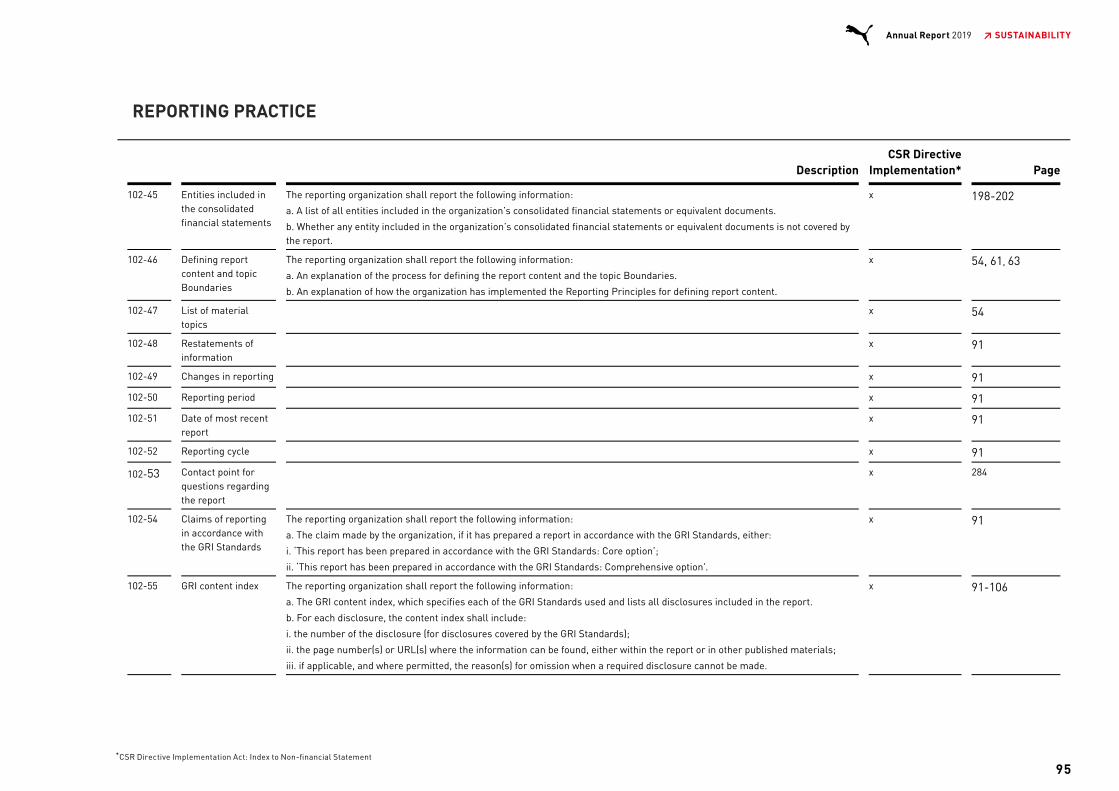
DescriptionCSR Directive
Implementation* Page
102-45 Entities included inthe consolidatedfinancial statements
The reporting organization shall report the following information:
a. A list of all entities included in the organization’s consolidated financial statements or equivalent documents.
b. Whether any entity included in the organization’s consolidated financial statements or equivalent documents is not covered bythe report.
x 198-202
102-46 Defining reportcontent and topicBoundaries
The reporting organization shall report the following information:
a. An explanation of the process for defining the report content and the topic Boundaries.
b. An explanation of how the organization has implemented the Reporting Principles for defining report content.
x 54, 61, 63
102-47 List of materialtopics
x 54
102-48 Restatements ofinformation
x 91
102-49 Changes in reporting x 91
102-50 Reporting period x 91
102-51 Date of most recentreport
x 91
102-52 Reporting cycle x 91
102-53 Contact point forquestions regardingthe report
x 284
102-54 Claims of reportingin accordance withthe GRI Standards
The reporting organization shall report the following information:
a. The claim made by the organization, if it has prepared a report in accordance with the GRI Standards, either:
i. ‘This report has been prepared in accordance with the GRI Standards: Core option’;
ii. ‘This report has been prepared in accordance with the GRI Standards: Comprehensive option’.
x 91
102-55 GRI content index The reporting organization shall report the following information:
a. The GRI content index, which specifies each of the GRI Standards used and lists all disclosures included in the report.
b. For each disclosure, the content index shall include:
i. the number of the disclosure (for disclosures covered by the GRI Standards);
ii. the page number(s) or URL(s) where the information can be found, either within the report or in other published materials;
iii. if applicable, and where permitted, the reason(s) for omission when a required disclosure cannot be made.
x 91-106
REPORTING PRACTICE
95
Annual Report 2019 ↗ SUSTAINABILITY
*CSR Directive Implementation Act: Index to Non-financial Statement

DescriptionCSR Directive
Implementation* Page
102-56 External assurance The reporting organization shall report the following information:
a. A description of the organization’s policy and current practice with regard to seeking external assurance for the report.
b. If the report has been externally assured:
i. A reference to the external assurance report, statements, or opinions. If not included in the assurance report accompanying thesustainability report, a description of what has and what has not been assured and on what basis, including the assurancestandards used, the level of assurance obtained, and any limitations of the assurance process;
ii. The relationship between the organization and the assurance provider;
iii. Whether and how the highest governance body or senior executives are involved in seeking external assurance for theorganization’s sustainability report.
x 107-108
96
Annual Report 2019 ↗ SUSTAINABILITY
*CSR Directive Implementation Act: Index to Non-financial Statement

Materials
DescriptionCSR Directive
Implementation* Page
103-1 Explanation of the material topic and its Boundary x 75-76
103-2 The management approach and its components x 75-76
103-3 Evaluation of the management approach x 75-76
DescriptionCSR Directive
Implementation* Page
301-1 Materials used by weight or volumeMaterialsused by weight or volume
Part Omitted: Materials used by weight or volume
Reason: Confidentiality constraints
Explanation: The total materials` weights are obtained to calculate the target progress. Forconfidentiality reasons only the percentages reached are disclosed.
x 77
SPECIFIC STANDARD DISCLOSURES
ENVIRONMENTAL TOPICS
GRI 103: MANAGEMENT APPROACH 2016
GRI 301: MATERIALS 2016
97
Annual Report 2019 ↗ SUSTAINABILITY
*CSR Directive Implementation Act: Index to Non-financial Statement

Energy
DescriptionCSR Directive
Implementation* Page
103-1 Explanation of the material topic and its Boundary x 68-70
103-2 The management approach and its components x 68-70
103-3 Evaluation of the management approach x 68-70
DescriptionCSR Directive
Implementation* Page
302-3 Energy intensity The reporting organization shall report the following information:
a. Energy intensity ratio for the organization.
b. Organization-specific metric (the denominator) chosen to calculate the ratio.
c. Types of energy included in the intensity ratio; whether fuel, electricity, heating, cooling, steam, or all.
d. Whether the ratio uses energy consumption within the organization, outside of it, or both.
x 80, 82-83
GRI 103: MANAGEMENT APPROACH 2016
GRI 302: ENERGY 2016
98
Annual Report 2019 ↗ SUSTAINABILITY
*CSR Directive Implementation Act: Index to Non-financial Statement
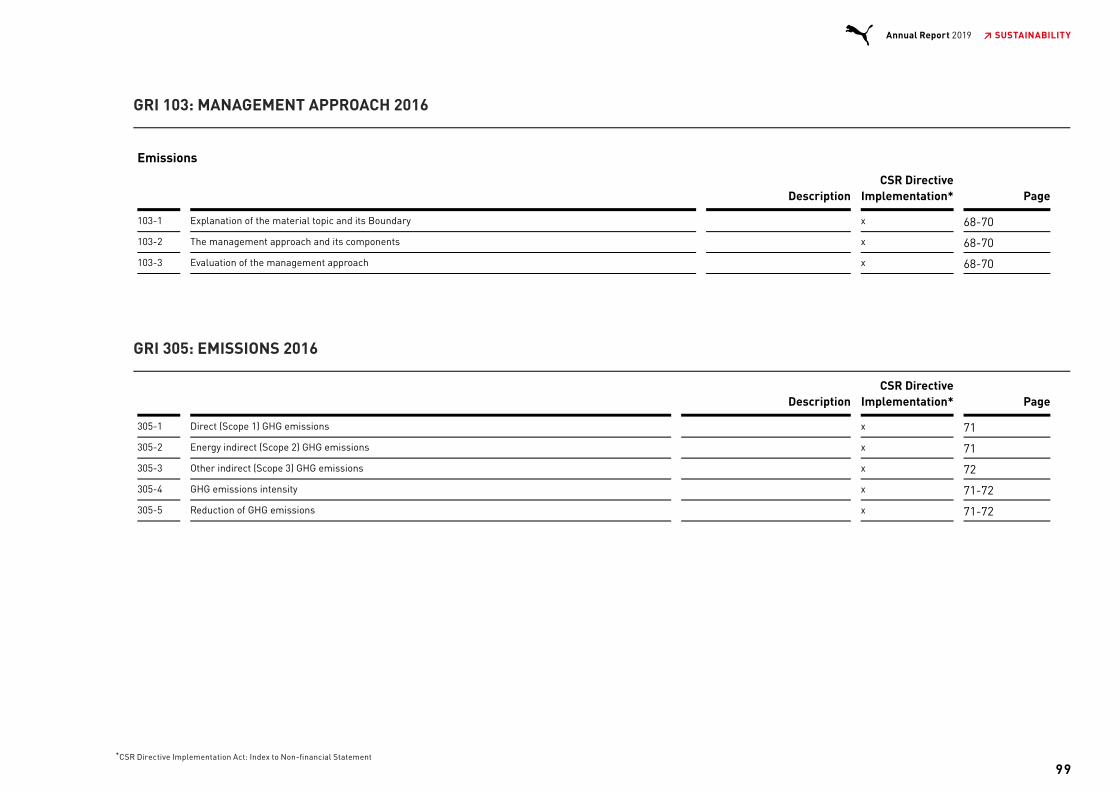
Emissions
DescriptionCSR Directive
Implementation* Page
103-1 Explanation of the material topic and its Boundary x 68-70
103-2 The management approach and its components x 68-70
103-3 Evaluation of the management approach x 68-70
DescriptionCSR Directive
Implementation* Page
305-1 Direct (Scope 1) GHG emissions x 71
305-2 Energy indirect (Scope 2) GHG emissions x 71
305-3 Other indirect (Scope 3) GHG emissions x 72
305-4 GHG emissions intensity x 71-72
305-5 Reduction of GHG emissions x 71-72
GRI 103: MANAGEMENT APPROACH 2016
GRI 305: EMISSIONS 2016
99
Annual Report 2019 ↗ SUSTAINABILITY
*CSR Directive Implementation Act: Index to Non-financial Statement

Supplier Social Assessment
DescriptionCSR Directive
Implementation* Page
103-1 Explanation of the material topic and its Boundary x 63
103-2 The management approach and its components x 63
103-3 Evaluation of the management approach x 63
DescriptionCSR Directive
Implementation* Page
414-1 New suppliers that were screenedusing social criteria
The reporting organization shall report the following information:
a. Percentage of new suppliers that were screened using social criteria.
x 63
414-2 Negative social impacts in the supplychain and actions taken
The reporting organization shall report the following information:
a. Number of suppliers assessed for social impacts.
b. Number of suppliers identified as having significant actual and potential negative social impacts.
c. Significant actual and potential negative social impacts identified in the supply chain.
d. Percentage of suppliers identified as having significant actual and potential negative social impacts withwhich improvements were agreed upon as a result of assessment.
e. Percentage of suppliers identified as having significant actual and potential negative social impacts withwhich relationships were terminated as a result of assessment, and why.
x 63-66
SOCIAL TOPICS
GRI 103: MANAGEMENT APPROACH 2016
GRI 414: SUPPLIER SOCIAL ASSESSMENT 2016
100
Annual Report 2019 ↗ SUSTAINABILITY
*CSR Directive Implementation Act: Index to Non-financial Statement
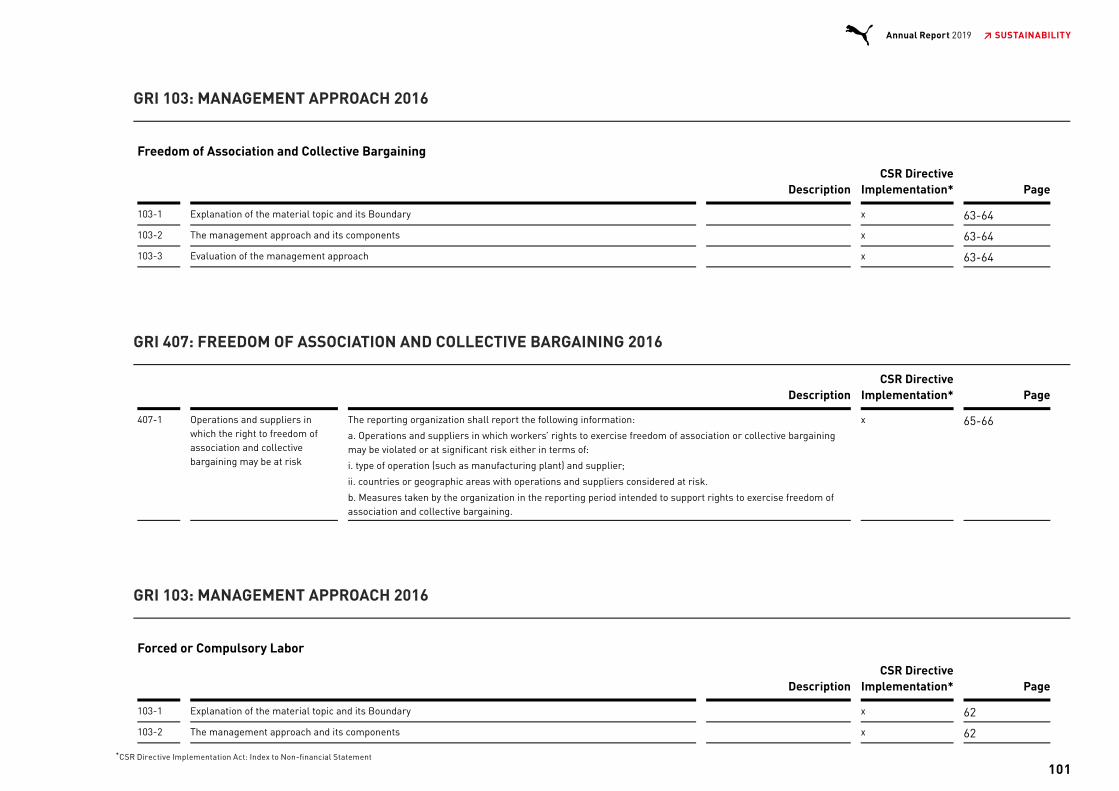
Freedom of Association and Collective Bargaining
DescriptionCSR Directive
Implementation* Page
103-1 Explanation of the material topic and its Boundary x 63-64
103-2 The management approach and its components x 63-64
103-3 Evaluation of the management approach x 63-64
DescriptionCSR Directive
Implementation* Page
407-1 Operations and suppliers inwhich the right to freedom ofassociation and collectivebargaining may be at risk
The reporting organization shall report the following information:
a. Operations and suppliers in which workers’ rights to exercise freedom of association or collective bargainingmay be violated or at significant risk either in terms of:
i. type of operation (such as manufacturing plant) and supplier;
ii. countries or geographic areas with operations and suppliers considered at risk.
b. Measures taken by the organization in the reporting period intended to support rights to exercise freedom ofassociation and collective bargaining.
x 65-66
Forced or Compulsory Labor
DescriptionCSR Directive
Implementation* Page
103-1 Explanation of the material topic and its Boundary x 62
103-2 The management approach and its components x 62
GRI 103: MANAGEMENT APPROACH 2016
GRI 407: FREEDOM OF ASSOCIATION AND COLLECTIVE BARGAINING 2016
GRI 103: MANAGEMENT APPROACH 2016
101
Annual Report 2019 ↗ SUSTAINABILITY
*CSR Directive Implementation Act: Index to Non-financial Statement

DescriptionCSR Directive
Implementation* Page
103-3 Evaluation of the management approach x 62
DescriptionCSR Directive
Implementation* Page
409-1 Operations and suppliers at significant risk forincidents of forced or compulsory labor
The reporting organization shall report the following information:
a. Operations and suppliers considered to have significant risk for incidents of forced orcompulsory labor either in terms of:
i. type of operation (such as manufacturing plant) and supplier;
ii. countries or geographic areas with operations and suppliers considered at risk.
b. Measures taken by the organization in the reporting period intended to contribute to theelimination of all forms of forced or compulsory labor.
x 62
Human Rights Assessment
DescriptionCSR Directive
Implementation* Page
103-1 Explanation of the material topic and its Boundary x 63
103-2 The management approach and its components x 63
103-3 Evaluation of the management approach x 63
GRI 409: FORCED OR COMPULSORY LABOR 2016
GRI 103: MANAGEMENT APPROACH 2016
102
Annual Report 2019 ↗ SUSTAINABILITY
*CSR Directive Implementation Act: Index to Non-financial Statement
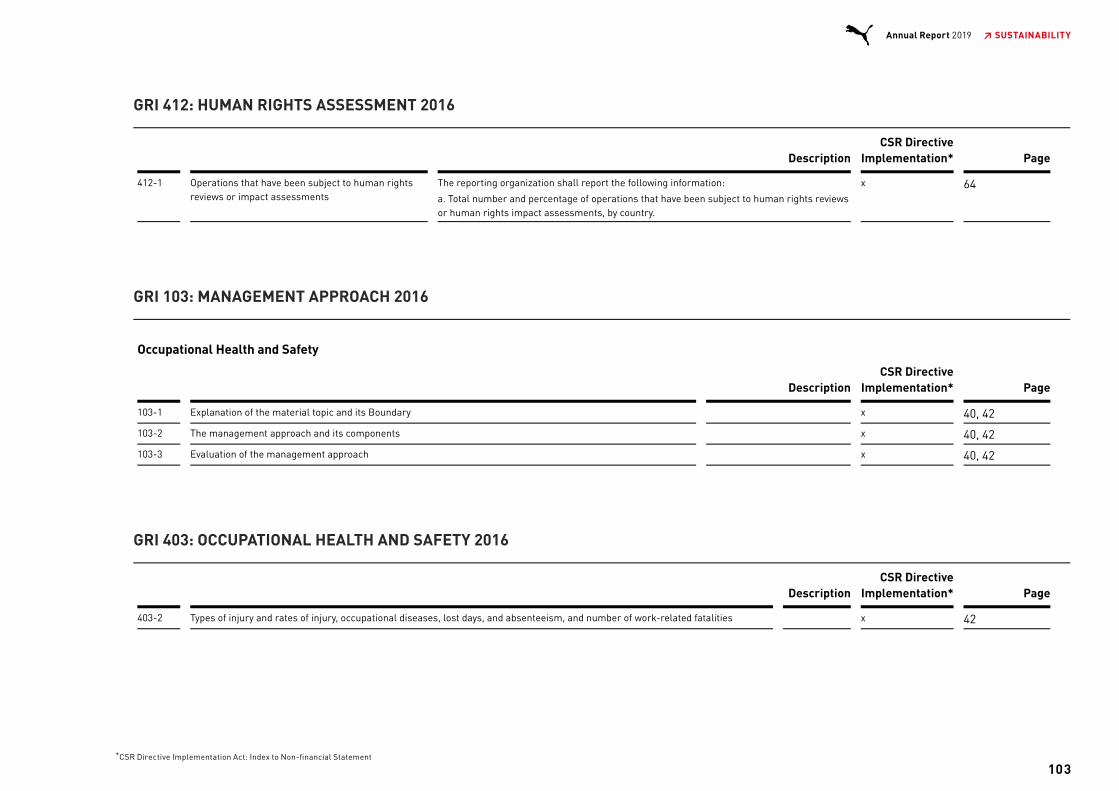
DescriptionCSR Directive
Implementation* Page
412-1 Operations that have been subject to human rightsreviews or impact assessments
The reporting organization shall report the following information:
a. Total number and percentage of operations that have been subject to human rights reviewsor human rights impact assessments, by country.
x 64
Occupational Health and Safety
DescriptionCSR Directive
Implementation* Page
103-1 Explanation of the material topic and its Boundary x 40, 42
103-2 The management approach and its components x 40, 42
103-3 Evaluation of the management approach x 40, 42
DescriptionCSR Directive
Implementation* Page
403-2 Types of injury and rates of injury, occupational diseases, lost days, and absenteeism, and number of work-related fatalities x 42
GRI 412: HUMAN RIGHTS ASSESSMENT 2016
GRI 103: MANAGEMENT APPROACH 2016
GRI 403: OCCUPATIONAL HEALTH AND SAFETY 2016
103
Annual Report 2019 ↗ SUSTAINABILITY
*CSR Directive Implementation Act: Index to Non-financial Statement
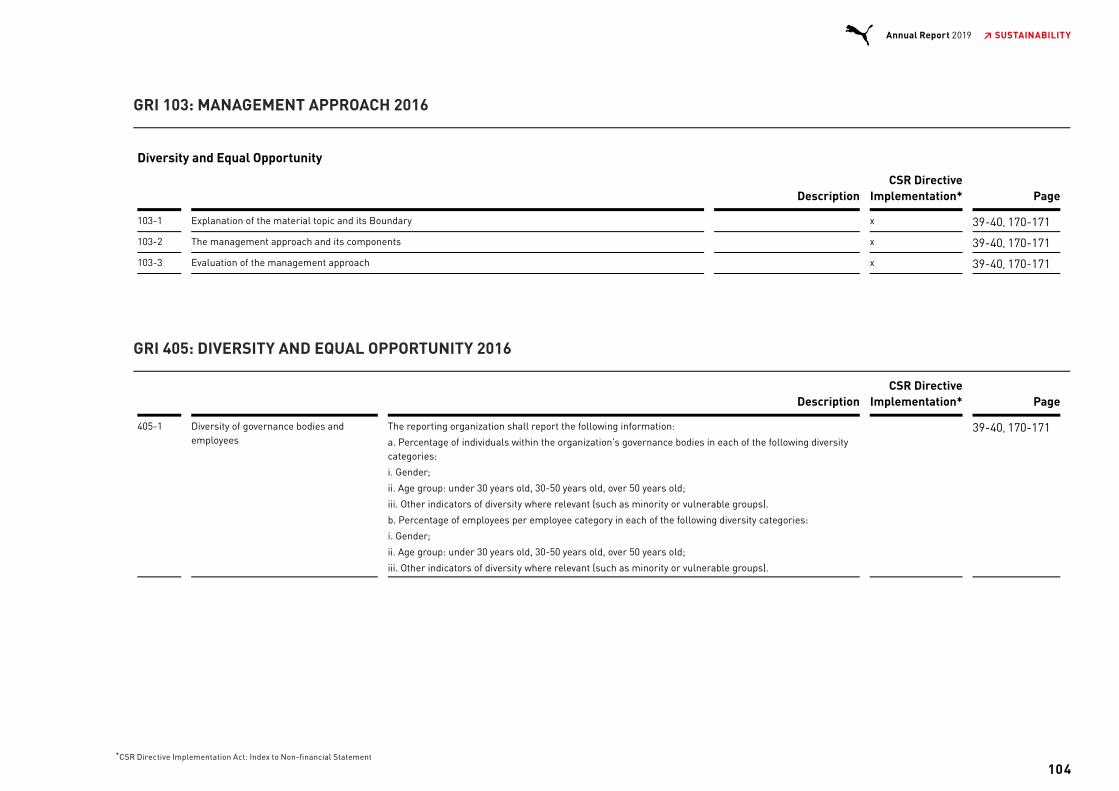
Diversity and Equal Opportunity
DescriptionCSR Directive
Implementation* Page
103-1 Explanation of the material topic and its Boundary x 39-40, 170-171
103-2 The management approach and its components x 39-40, 170-171
103-3 Evaluation of the management approach x 39-40, 170-171
DescriptionCSR Directive
Implementation* Page
405-1 Diversity of governance bodies andemployees
The reporting organization shall report the following information:
a. Percentage of individuals within the organization’s governance bodies in each of the following diversitycategories:
i. Gender;
ii. Age group: under 30 years old, 30-50 years old, over 50 years old;
iii. Other indicators of diversity where relevant (such as minority or vulnerable groups).
b. Percentage of employees per employee category in each of the following diversity categories:
i. Gender;
ii. Age group: under 30 years old, 30-50 years old, over 50 years old;
iii. Other indicators of diversity where relevant (such as minority or vulnerable groups).
39-40, 170-171
GRI 103: MANAGEMENT APPROACH 2016
GRI 405: DIVERSITY AND EQUAL OPPORTUNITY 2016
104
Annual Report 2019 ↗ SUSTAINABILITY
*CSR Directive Implementation Act: Index to Non-financial Statement

Anti-corruption
DescriptionCSR Directive
Implementation* Page
103-1 Explanation of the material topic and its Boundary x 86-87
103-2 The management approach and its components x 86-87
103-3 Evaluation of the management approach x 86-87
DescriptionCSR Directive
Implementation* Page
205-2 Communication and training about anti-corruption policies and procedures x 86-87
Economic Performance
DescriptionCSR Directive
Implementation* Page
103-1 Explanation of the material topic and its Boundary 172
103-2 The management approach and its components 172
103-3 Evaluation of the management approach 172
ECONOMIC TOPICS
GRI 103: MANAGEMENT APPROACH ANTI-CORRUPTION 2016
GRI 205: ANTI-CORRUPTION 2016
GRI 103: MANAGEMENT APPROACH 2016
105
Annual Report 2019 ↗ SUSTAINABILITY
*CSR Directive Implementation Act: Index to Non-financial Statement
DescriptionCSR Directive
Implementation* Page
201-2 Financial implications and other risks and opportunities due to climate change 174
CSR Directive Implementation Act: Index to Non-financial Statement
GRI 201: ECONOMIC PERFORMANCE 2016
*
106
Annual Report 2019 ↗ SUSTAINABILITY
*CSR Directive Implementation Act: Index to Non-financial Statement
DELOITTE ASSURANCE STATEMENT
INDEPENDENT AUDITOR’S REPORT ON A LIMITED ASSURANCEENGAGEMENT
To PUMA SE, Herzogenaurach
OUR ENGAGEMENT
We have performed a limited assurance engagement on the Separate Non-Fi-nancial Group Report of PUMA SE (hereinafter: “the Company”) in accordancewith Section 315b German Commercial Code (HGB), which was combined withthe Non-Financial Report of the parent company, PUMA SE, Herzogenaurach, inaccordance with Section 289b German Commercial Code (HGB) for the periodfrom January 1 to December 31, 2019 (hereinafter: “Combined Non-Financial Re-port”). This Combined Non-Financial Report consists of the chapter “Sustainabi-lity” and the section "Culture" in the chapter "Our People" of the Annual Reportof PUMA SE. The section “EP&L Impact” in the chapter “Sustainability” as wellas references to the Annual Report, the Company's website and external web-sites were not part of our engagement.
RESPONSIBILITY OF THE LEGAL REPRESENTATIVES
The legal representatives of PUMA SE are responsible for the preparation of theCombined Non-Financial Report in accordance with Sections 315b, 315c GermanCommercial Code (HGB) in connection with Sections 289c to 289e German Com-mercial Code (HGB).
In preparing the Combined Non-Financial Report, the legal representatives usedthe Sustainability Reporting Standards of the Global Reporting Initiative (GRI)with the option “Core” and have indicated these within the Combined Non-Finan-cial Report.
This responsibility of the Company’s legal representatives includes the selectionand application of appropriate methods for preparing the Combined Non-Finan-cial Report as well as making assumptions and estimates related to individualnon-financial disclosures, which are reasonable in the circumstances. In additi-
on, the legal representatives are responsible for such internal control they havedetermined necessary to enable the preparation of the Combined Non-FinancialReport that is free from material misstatements, whether intentional orunintentional.
The accuracy and completeness of the environmental data in the Combined Non-Financial Report are inherently subject to limits that result from the manner inwhich data is collected and calculated and assumptions made.
PRACTITIONER´S RESPONSIBILITY
Our responsibility is to express a limited assurance conclusion on the CombinedNon-Financial Report, based on the assurance engagement we have performed.
We are independent of the Company in accordance with the provisions underGerman commercial law and professional requirements, and we have fulfilledour other ethical responsibilities in accordance with these requirements.
Our audit company applies the German national legal requirements and the Ger-man profession’s pronouncements for quality control, in particular the by-lawsgoverning the rights and duties of public auditors and chartered accountants(Berufssatzung für Wirtschaftsprüfer und vereidigte Buchprüfer) as well as theIDW Standard on Quality Control 1: Requirements for Quality Control in AuditFirms [IDW Qualitätssicherungsstandard 1: Anforderungen an die Qualitätssiche-rung in der Wirtschaftsprüferpraxis (IDW QS 1)], which comply with the Interna-tional Standard on Quality Control 1 (ISQC 1) issued by the International Auditingand Assurance Standards Board (IAASB).
We conducted our assurance engagement in compliance with the InternationalStandard on Assurance Engagements (ISAE) 3000 (Revised): “Assurance Engage-ments other than Audits or Reviews of Historical Financial Information” issued bythe IAASB. This standard requires that we plan and perform the assurance enga-gement in a form that enables us to conclude with limited assurance that nothinghas come to our attention that causes us to believe that the information disclo-
1
107
Annual Report 2019 ↗ SUSTAINABILITY
1 We have performed a limited assurance engagement on the German version of the Combined Non-Financial
Report and issued an independent audit report in German language, which is authoritative. The following text
is a convenience translation of the independent auditor’s report.
DELOITTE ASSURANCE STATEMENT
INDEPENDENT AUDITOR’S REPORT ON A LIMITED ASSURANCEENGAGEMENT
To PUMA SE, Herzogenaurach
OUR ENGAGEMENT
We have performed a limited assurance engagement on the Separate Non-Fi-nancial Group Report of PUMA SE (hereinafter: “the Company”) in accordancewith Section 315b German Commercial Code (HGB), which was combined withthe Non-Financial Report of the parent company, PUMA SE, Herzogenaurach, inaccordance with Section 289b German Commercial Code (HGB) for the periodfrom January 1 to December 31, 2019 (hereinafter: “Combined Non-Financial Re-port”). This Combined Non-Financial Report consists of the chapter “Sustainabi-lity” and the section "Culture" in the chapter "Our People" of the Annual Reportof PUMA SE. The section “EP&L Impact” in the chapter “Sustainability” as wellas references to the Annual Report, the Company's website and external web-sites were not part of our engagement.
RESPONSIBILITY OF THE LEGAL REPRESENTATIVES
The legal representatives of PUMA SE are responsible for the preparation of theCombined Non-Financial Report in accordance with Sections 315b, 315c GermanCommercial Code (HGB) in connection with Sections 289c to 289e German Com-mercial Code (HGB).
In preparing the Combined Non-Financial Report, the legal representatives usedthe Sustainability Reporting Standards of the Global Reporting Initiative (GRI)with the option “Core” and have indicated these within the Combined Non-Finan-cial Report.
This responsibility of the Company’s legal representatives includes the selectionand application of appropriate methods for preparing the Combined Non-Finan-cial Report as well as making assumptions and estimates related to individualnon-financial disclosures, which are reasonable in the circumstances. In additi-
on, the legal representatives are responsible for such internal control they havedetermined necessary to enable the preparation of the Combined Non-FinancialReport that is free from material misstatements, whether intentional orunintentional.
The accuracy and completeness of the environmental data in the Combined Non-Financial Report are inherently subject to limits that result from the manner inwhich data is collected and calculated and assumptions made.
PRACTITIONER´S RESPONSIBILITY
Our responsibility is to express a limited assurance conclusion on the CombinedNon-Financial Report, based on the assurance engagement we have performed.
We are independent of the Company in accordance with the provisions underGerman commercial law and professional requirements, and we have fulfilledour other ethical responsibilities in accordance with these requirements.
Our audit company applies the German national legal requirements and the Ger-man profession’s pronouncements for quality control, in particular the by-lawsgoverning the rights and duties of public auditors and chartered accountants(Berufssatzung für Wirtschaftsprüfer und vereidigte Buchprüfer) as well as theIDW Standard on Quality Control 1: Requirements for Quality Control in AuditFirms [IDW Qualitätssicherungsstandard 1: Anforderungen an die Qualitätssiche-rung in der Wirtschaftsprüferpraxis (IDW QS 1)], which comply with the Interna-tional Standard on Quality Control 1 (ISQC 1) issued by the International Auditingand Assurance Standards Board (IAASB).
We conducted our assurance engagement in compliance with the InternationalStandard on Assurance Engagements (ISAE) 3000 (Revised): “Assurance Engage-ments other than Audits or Reviews of Historical Financial Information” issued bythe IAASB. This standard requires that we plan and perform the assurance enga-gement in a form that enables us to conclude with limited assurance that nothinghas come to our attention that causes us to believe that the information disclo-
1

sed in the Combined Non-Financial Report has not complied, in all material re-spects, with Sections 315b, 315c in connection with Sections 289c to 289e Ger-man Commercial Code (HGB). In a limited assurance engagement the assuranceprocedures are less in extent than for a reasonable assurance engagement and,therefore, a substantially lower level of assurance is obtained. The assuranceprocedures selected depend on the practitioner’s professional judgment.
Within the scope of our limited assurance engagement, which was performedfrom November 2019 to April 2020, we conducted, amongst others, the followingaudit procedures and other activities:
Obtaining an understanding of the structure of the sustainability orga-nization and of the stakeholder engagement
Interview of the legal representatives and relevant employees that par-ticipated in the preparation of the Combined Non-Financial Reportabout the process of preparation, the measures on hand and precautio-nary measures (system) for the preparation of the Combined Non-Fi-nancial Report as well as about the information within the CombinedNon-Financial Report
Identification of the risks of material misstatement within the CombinedNon-Financial Report
Analytical evaluation of selected disclosures within the Combined Non-Financial Report
Reconciliation of the disclosures within the Combined Non-FinancialReport with the respective data within the consolidated financial state-ments as well as the management report
Evaluation of the presentation of the disclosures
PRACTITIONER’S CONCLUSION
Based on the assurance work performed and evidence obtained, nothing hascome to our attention that causes us to believe that the information disclosed in
the Combined Non-Financial Report of the Company, for the period from January1 to December 31, 2019 has not complied, in all material aspects, with Sections315b, 315c German Commercial Code (HGB) in connection with Sections 289c to289e German Commercial Code (HGB).The audit opinion only refers to the chapter “Sustainability” and the section "Cul-ture" in the chapter "Our People" of the Annual Report of PUMA SE, Herzogenau-rach. Our opinion does not refer to section “EP&L Impact” in the chapter“Sustainability” as well as references to the Annual Report, the Company's web-site and external websites.
PURPOSE OF THE ASSURANCE STATEMENT
We issue this report on the basis of the engagement agreed with PUMA SE, Her-zogenaurach. The limited assurance engagement has been performed for purpo-ses of PUMA SE, Herzogenaurach, and the report is solely intended to informPUMA SE, Herzogenaurach, on the results of the assurance engagement.
LIABILITY
The report is not intended to provide third parties with support in making (finan-cial) decisions. Our responsibility exclusively refers to PUMA SE, Herzogenau-rach, and is also restricted under the engagement agreed with PUMA SE, Herzo-genaurach, on November 20, 2019 as well as in accordance with the “General en-gagement terms for Wirtschaftsprüfer and Wirtschaftsprüfungsgesellschaften(German public auditors and German public audit firms)” from January 1, 2017 ofthe Institut der Wirtschaftsprüfer in Deutschland e.V. We do not assume any res-ponsibility to third parties.
München/Germany, April 17, 2020
Deloitte GmbHWirtschaftsprüfungsgesellschaft
(Dr. Thomas Reitmayr)Wirtschaftsprüfer
(ppa. Thomas Krick)Director
We have performed a limited assurance engagement on the German version of the Combined Non-Fi-nancial Report and issued an independent audit report in German language, which is authoritative. Thefollowing text is a convenience translation of the independent auditor’s report.
1
108
Annual Report 2019 ↗ SUSTAINABILITY
sed in the Combined Non-Financial Report has not complied, in all material re-spects, with Sections 315b, 315c in connection with Sections 289c to 289e Ger-man Commercial Code (HGB). In a limited assurance engagement the assuranceprocedures are less in extent than for a reasonable assurance engagement and,therefore, a substantially lower level of assurance is obtained. The assuranceprocedures selected depend on the practitioner’s professional judgment.
Within the scope of our limited assurance engagement, which was performedfrom November 2019 to April 2020, we conducted, amongst others, the followingaudit procedures and other activities:
Obtaining an understanding of the structure of the sustainability orga-nization and of the stakeholder engagement
Interview of the legal representatives and relevant employees that par-ticipated in the preparation of the Combined Non-Financial Reportabout the process of preparation, the measures on hand and precautio-nary measures (system) for the preparation of the Combined Non-Fi-nancial Report as well as about the information within the CombinedNon-Financial Report
Identification of the risks of material misstatement within the CombinedNon-Financial Report
Analytical evaluation of selected disclosures within the Combined Non-Financial Report
Reconciliation of the disclosures within the Combined Non-FinancialReport with the respective data within the consolidated financial state-ments as well as the management report
Evaluation of the presentation of the disclosures
PRACTITIONER’S CONCLUSION
Based on the assurance work performed and evidence obtained, nothing hascome to our attention that causes us to believe that the information disclosed in
the Combined Non-Financial Report of the Company, for the period from January1 to December 31, 2019 has not complied, in all material aspects, with Sections315b, 315c German Commercial Code (HGB) in connection with Sections 289c to289e German Commercial Code (HGB).The audit opinion only refers to the chapter “Sustainability” and the section "Cul-ture" in the chapter "Our People" of the Annual Report of PUMA SE, Herzogenau-rach. Our opinion does not refer to section “EP&L Impact” in the chapter“Sustainability” as well as references to the Annual Report, the Company's web-site and external websites.
PURPOSE OF THE ASSURANCE STATEMENT
We issue this report on the basis of the engagement agreed with PUMA SE, Her-zogenaurach. The limited assurance engagement has been performed for purpo-ses of PUMA SE, Herzogenaurach, and the report is solely intended to informPUMA SE, Herzogenaurach, on the results of the assurance engagement.
LIABILITY
The report is not intended to provide third parties with support in making (finan-cial) decisions. Our responsibility exclusively refers to PUMA SE, Herzogenau-rach, and is also restricted under the engagement agreed with PUMA SE, Herzo-genaurach, on November 20, 2019 as well as in accordance with the “General en-gagement terms for Wirtschaftsprüfer and Wirtschaftsprüfungsgesellschaften(German public auditors and German public audit firms)” from January 1, 2017 ofthe Institut der Wirtschaftsprüfer in Deutschland e.V. We do not assume any res-ponsibility to third parties.
München/Germany, April 17, 2020
Deloitte GmbHWirtschaftsprüfungsgesellschaft
(Dr. Thomas Reitmayr)Wirtschaftsprüfer
(ppa. Thomas Krick)Director
We have performed a limited assurance engagement on the German version of the Combined Non-Fi-nancial Report and issued an independent audit report in German language, which is authoritative. Thefollowing text is a convenience translation of the independent auditor’s report.
1

Michael Lämmermann, Chief Financial Officer (CFO)
Combined Management Report*
110 Overview 2019
113 PUMA Group Essential Information
113 Commercial Activities and Organizational Structure
114 Targets and Strategy
116 Product Development and Design
118 Sourcing
120 Employees
123 Management System
125 Information regarding the Non-financial Report
126 Economic Report
126 General Economic Conditions
127 Sales
130 Regional Development
132 Results of Operations
137 Dividends
138 Net Assets and Financial Position
142 Cash Flow
146 Statement regarding the Business Development and the
Overall Situation of the Group
147 Comments on the German GAAP Financial Statements of
PUMA SE
151 Further Information
151 Information concerning Takeovers
154 Compensation Report
163 Corporate Governance Report including the
Statement on
Corporate Governance in accordance with §
289f and § 315d HGB
172 Risk and Opportunity Report
179 Outlook
* Combined Management Report: This report combines the Management Report of the PUMA Group and the Management Report of PUMA SE.
PURE PERFORMANCE
109
Annual Report 2019 ↗ COMBINED MANAGEMENT REPORT
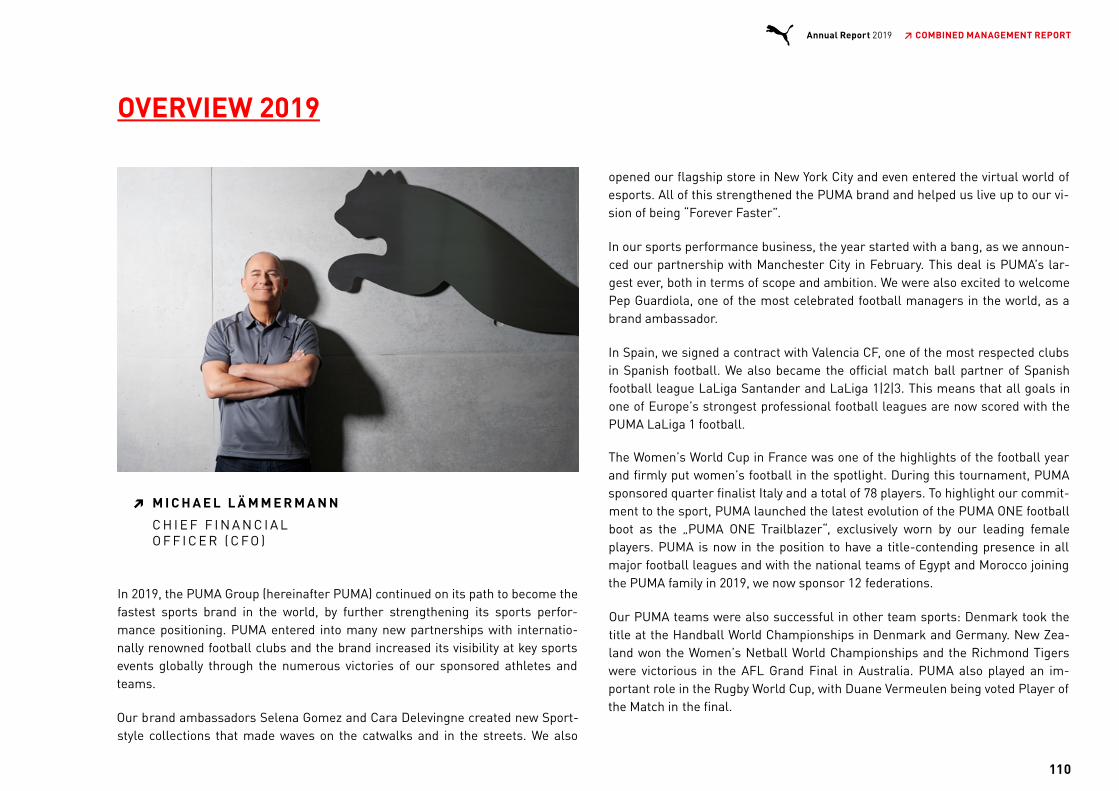
OVERVIEW 2019
In 2019, the PUMA Group (hereinafter PUMA) continued on its path to become thefastest sports brand in the world, by further strengthening its sports perfor-mance positioning. PUMA entered into many new partnerships with internatio-nally renowned football clubs and the brand increased its visibility at key sportsevents globally through the numerous victories of our sponsored athletes andteams.
Our brand ambassadors Selena Gomez and Cara Delevingne created new Sport-style collections that made waves on the catwalks and in the streets. We also
opened our flagship store in New York City and even entered the virtual world ofesports. All of this strengthened the PUMA brand and helped us live up to our vi-sion of being “Forever Faster”.
In our sports performance business, the year started with a bang, as we announ-ced our partnership with Manchester City in February. This deal is PUMA’s lar-gest ever, both in terms of scope and ambition. We were also excited to welcomePep Guardiola, one of the most celebrated football managers in the world, as abrand ambassador.
In Spain, we signed a contract with Valencia CF, one of the most respected clubsin Spanish football. We also became the official match ball partner of Spanishfootball league LaLiga Santander and LaLiga 1|2|3. This means that all goals inone of Europe’s strongest professional football leagues are now scored with thePUMA LaLiga 1 football.
The Women’s World Cup in France was one of the highlights of the football yearand firmly put women’s football in the spotlight. During this tournament, PUMAsponsored quarter finalist Italy and a total of 78 players. To highlight our commit-ment to the sport, PUMA launched the latest evolution of the PUMA ONE footballboot as the „PUMA ONE Trailblazer“, exclusively worn by our leading femaleplayers. PUMA is now in the position to have a title-contending presence in allmajor football leagues and with the national teams of Egypt and Morocco joiningthe PUMA family in 2019, we now sponsor 12 federations.
Our PUMA teams were also successful in other team sports: Denmark took thetitle at the Handball World Championships in Denmark and Germany. New Zea-land won the Women’s Netball World Championships and the Richmond Tigerswere victorious in the AFL Grand Final in Australia. PUMA also played an im-portant role in the Rugby World Cup, with Duane Vermeulen being voted Player ofthe Match in the final.
M I C H A E L L Ä M M E R M A N N➔
C H I E F F I N A N C I A L O F F I C E R ( C F O )
110
Annual Report 2019 ↗ COMBINED MANAGEMENT REPORT
The World Athletics Championships in Doha were an important event for ourtrack and field athletes. PUMA enjoyed a high level of visibility during the tourna-ment by supporting a total of 115 athletes and 12 national federations. Norwegi-an hurdler Karsten Warholm successfully defended his title over 400m hurdlesand was later voted European Male Athlete of the Year. During the tournament 22medals were won by athletes wearing PUMA.
PUMA also welcomed new partners in Motorsport, where we signed a long-termcontract with Porsche to become the exclusive technical partner for racing appa-rel and footwear. We launched a separate collaboration with Porsche Design tocreate premium lifestyle products inspired by motorsports, which aim at the hig-her end of the market.
Our Formula 1 teams Mercedes AMG Petronas, Scuderia Ferrari and Aston Mar-tin Red Bull Racing once again dominated the Formula 1 season, where PUMAfurther expanded its leading presence by becoming the official trackside retailpartner during F1 race weekends. Our brand ambassador Lewis Hamilton wascrowned Formula 1 Champion for the sixth time.
Making sure we also support the female champions of tomorrow, PUMA partne-red with W Series, the first racing competition for upcoming female talent inmotorsport.
In our Golf category, we celebrated the 10-year anniversary with golf ambassa-dor Rickie Fowler, one of the most vibrant ambassadors of the brand. Our latestaddition to our roster of golf players, Gary Woodland, won the US Open in June.
Also in North America, PUMA’s first full NBA Basketball season - after our re-turn to the sport in 2018 - saw Toronto Raptors shooting guard Danny Green be-come the first PUMA athlete to win the NBA Finals since Isiah Thomas in 1990.We launched our first basketball shoe, the CLYDE COURT, in several new colorsas well as two additional performance basketball shoes, the UPROAR and theCLYDE HARDWOOD. Both products were highly visible on court throughout theNBA Season, the All-Star Game, the Playoffs and the NBA Finals.
Deriving straight from the basketball court, the lifestyle shoe RALPH SAMPSONwas one of our most important footwear styles in 2019. In the “chunky”-shoe ca-tegory, several new colorways and collaborations within the RS-X-franchise con-
tinued to resonate well with our customers. Sneakers with a bulkier appearance,often referred to as “chunky” or “dad” shoes, have been an important trend overthe past two years. The CALI franchise, presented by PUMA’s ambassador SelenaGomez, was successful within the women’s lifestyle category.
Selena also launched her second collection with PUMA, but she was not the onlywomen’s brand ambassador to get creative with personal collections in 2019:Cara Delevingne teamed up with PUMA and French luxury fashion house Bal-main, while Adriana Lima presented a line of products reflecting her experiencein fitness and boxing.
As esports is becoming increasingly relevant for our consumers, PUMA announ-ced its first-ever partnership in virtual sports with esports team cloud9. We alsocreated our first products to meet the needs of esports athletes and gamers,such as an active gaming seat and active gaming socks. Through these part-nerships, we are positioning ourselves to benefit from the fast-growing gamingand esports markets. Keeping it high-tech, our first-ever smartwatch helps ath-letes train, stay motivated, track goals and connect with others while on the go.
On the operational side, we continued to invest in our distribution and logisticalnetwork as well as in organizational processes. We celebrated the topping outceremony for our new multichannel distribution center in Geiselwind, Germany,which is expected to be operational in early 2021. In addition, PUMA North Ame-rica announced the opening of a new distribution hub just outside of Indianapolisfor 2020. In August, we opened our New York flagship store on Fifth Avenue,which provides a deeply immersive brand experience and marks another miles-tone for our company.
PUMA’s net sales increased in the financial year 2019 by 16.7% currency-adjus-ted. In the reporting currency, the Euro, this corresponds to an increase in salesof 18.4% from € 4,648 million in the previous year to € 5,502 million in 2019. Theincrease of our brand heat and the continued focus on the improvement of ourproduct range significantly contributed to the sales growth. This was particularlya result of the consistent implementation of our "Forever Faster" corporate stra-tegy. Furthermore, we once again demonstrated our ability to react quickly andflexibly to changes and trends in our market environment. Despite the increase inuncertainty in the economic environment, as a result of the trade conflict bet-ween the United States of America and China, and in connection with Brexit,
111
Annual Report 2019 ↗ COMBINED MANAGEMENT REPORT

PUMA was able to achieve strong sales growth in the financial year 2019. There-fore, the currency-adjusted sales growth of around 10% prospected in the pre-vious Combined Management Report for 2019 and the forecast of a currency-ad-justed sales growth of around 15%, that was adjusted upwards during the year,were exceeded. As a consequence, PUMA was able to exceed the € 5 billion salesmark for the first time in the history of the company.
In addition to the strong sales growth, the increased gross profit margin contri-buted significantly to the increase in profitability in the financial year 2019.PUMA's gross profit margin improved by 40 basis points from 48.4% in the pre-vious year to 48.8% in 2019. The main drivers for the development of the grossprofit margin were the product mix and the regional mix and a higher proportionof our own retail sales. A slightly positive currency effect also contributed to theimproved gross profit margin.
Other operating income and expenses in total increased in 2019 by 17.8%. Theincrease was mainly driven by higher sales-related costs, including costs for lo-gistics, and higher expenses for marketing and investments in our own retailstores. The slightly lower increase compared to sales reflects the achieved ope-rating leverage and results in a decrease of our cost ratio from 41.5% in the pre-vious year to 41.3% in 2019. The continued focus on strict control of other opera-ting income and expenses also significantly contributed to our improved profita-bility in 2019.
The operating result (EBIT) increased in the past financial year by 30.5% from €337.4 million to € 440.2 million and was therefore above the guidance from thebeginning of 2019, which had originally forecast an operating result within a ran-ge of between € 395 million and € 415 million. We were also able to slightly ex-ceed the guidance, as adjusted during the year, for an operating result within arange of between € 420 million and € 430 million. The improvement in profitabi-
lity is overall the result of the strong sales growth in combination with an impro-ved gross profit margin and a slight operating leverage. This is also reflected inthe development of consolidated net earnings and earnings per share, which in-creased by 40.0% compared to the previous year. Consolidated net earnings in-creased from € 187.4 million in the previous year to € 262.4 million, and earningsper share increased accordingly from € 1.25 in the previous year to € 1.76. As aresult, PUMA was able to fully achieve or even slightly exceed the financial tar-gets of the previous financial year.
The strong business development enables the Management Board and the Su-pervisory Board to propose to the Annual General Meeting on May 7, 2020, a divi-dend payout of € 0.50 per share for the financial year 2019. This corresponds to apayout ratio of 28.5% of net earnings and means a dividend increase of 42.8%compared to the previous year. The dividend proposal is in accordance withPUMA's dividend policy, which foresees a payout ratio of 25% to 35% of consoli-dated net earnings. In the previous year, a dividend of € 0.35 per share was dis-tributed (payout ratio previous year: 27.9%).
To make PUMA more attractive for retail investors and in order to further diversi-fy its shareholder base, the Management Board decided in 2019 to exercise astock split with a 1:10 ratio. The stock split was subsequently approved by theAnnual General Meeting on April 18, 2019. The stock split was carried out onJune 10, 2019. The shareholders received nine additional shares for every shareheld on this date. The market price per share was accordingly adjusted at a ratioof 1:10. The PUMA share price developed very well in 2019. At the end of the year,the share price was at € 68.35. Taking the stock split into account, this repres-ents an increase of 60.1% compared to the previous year’s € 42.70. The marketcapitalization of the PUMA Group increased accordingly to around € 10.2 billionat year-end 2019 (previous year: € 6.4 billion).
112
Annual Report 2019 ↗ COMBINED MANAGEMENT REPORT
PUMA GROUP ESSENTIAL INFORMATION
COMMERCIAL ACTIVITIES AND ORGANIZATIONAL STRUCTURE
PUMA SE operates as a European stock corporation with Group headquarters inHerzogenaurach, Germany. In the internal reporting, our business activities aremapped according to three regions (EMEA, the Americas and Asia/Pacific) andthree product divisions (footwear, apparel and accessories). A detailed descripti-on can be found in the segment reporting in chapter 26 of the Notes to the Con-solidated Financial Statements.
Our revenues are derived from the sale of products from the PUMA and CobraGolf brands via the wholesale and retail trade, as well as from sales directly toconsumers in our own retail stores and online stores. We market and distributeour products worldwide primarily via our own subsidiaries. There are distributionagreements in place with independent distributors in a small number ofcountries.
As of December 31, 2019, 101 subsidiaries were controlled directly or indirectlyby PUMA SE. Our subsidiaries carry out various tasks at the local level, such asdistribution, marketing, product development, sourcing and administration. A fulllist of all subsidiaries can be found in chapter 2 of the Notes to the ConsolidatedFinancial Statements.
113
Annual Report 2019 ↗ COMBINED MANAGEMENT REPORT
TARGETS AND STRATEGY
PUMA has continued to focus on six strategic priorities to guide it on its way tobecome the fastest sports brand in the world. We focus on brand heat, a compe-titive product range, a leading offer for women, improving our distribution qualityand organizational speed as well as leveraging our re-entry into basketball tostrengthen our position on the North American market.
For more than 70 years, PUMA has created brand heat by partnering with thegreatest athletes: Usain Bolt, Lewis Hamilton, Pelé, Maradona, Tommie Smith,Boris Becker, Linford Christie, Serena Williams, Heike Drechsler and MartinaNavratilova, just to name a few. Today, PUMA continues to strengthen its positionas a sports brand through partnerships with some of the most elite ambassa-dors: the Italian national football team, star strikers Antoine Griezmann, RomeluLukaku, Sergio Agüero and Luis Suarez, top football manager Pep Guardiola, in-ternational top clubs Manchester City, Borussia Dortmund, Valencia CF and ACMilan, golf stars Lexi Thompson and Rickie Fowler, the six-time Formula 1 worldchampion Lewis Hamilton, Norwegian hurdler and world champion Karsten War-holm, Canadian sprinter André De Grasse and the Jamaican and Cuban OlympicFederations. Teaming up with the best athletes, teams and federations is key inkeeping PUMA’s brand credibility at high levels. To connect with young, trend-setting consumers, PUMA also drives brand heat byworking with icons of culture and fashion such as Selena Gomez, Cara Deleving-ne and Adriana Lima. This has made PUMA one of the hottest sports and fashionbrands for young consumers.
PUMA aims to design “cool stuff that works” and in 2019, we significantly impro-ved our product offering. Our most important performance footwear styles inclu-ded the PUMA FUTURE football boot and our running & training shoes based onour LQD CELL and HYBRID technology platforms. In Sportstyle, our bestsellingmodels were the RS-X, CALI and the RALPH SAMPSON. At the end of the year,we launched the RS-X3, CALI SPORT and the RIDER, which is inspired by one ofthe first jogging shoes launched in the 1980s. With these models, we see oursel-ves in a good starting position for 2020. In apparel, we saw strong growth acrossthe portfolio, especially from “Big Cat” logo applications and motorsport apparel.
Creating a leading product offer for women remains a priority for PUMA, to capi-talize on this growing segment in the global sportswear market. More and morewomen take up sports worldwide and athletic wear has long made its way intoeveryday outfits. “Where the gym meets the runway” continues to be the themefor our initiatives in the women´s segment. In 2019, our best-selling sneakersfor women were the CALI, DEFY and MUSE.
Returning to basketball, with an approach that resonated well beyond the court,was an important step towards increasing our credibility as a sports brand inNorth America. With the support of JAY-Z, our Creative Director for basketball,we added the UPROAR and the CLYDE HARDWOOD as new performance shoes tothis category in 2019. We added young and highly talented NBA players to ourroster such as RJ Barrett (New York Knicks), Kyle Kuzma (Los Angeles Lakers)and Marcus Smart (Boston Celtics). While revenues from basketball performanceproducts are still small, as expected, we are already seeing the benefits of beingback on court, as sales of Sportstyle products and other performance categoriesin the US have picked up. Bringing back the court-style sneaker RALPH SAMP-SON from our basketball archive, now one of our best-selling shoes in 2019,would not have been possible without re-entering basketball.
PUMA improved the quality of its distribution and expanded its presence in keysports performance and Sportstyle accounts around the world. We continued tostrengthen our relationships with key retailers by being a flexible and service-oriented business partner. By improving sell-through, we further expanded theshelf space given to us in our partners’ retail stores. As sell-through in wholesaleimproved, we expanded our retail store network and achieved like-for-like salesgrowth, while registering continued strong growth of our eCommerce business.Furthermore, PUMA upgraded its owned-and-operated retail store network withfurther refurbishments. On a regional basis, the Asia/Pacific, driven by China,and Americas regions contributed with double-digit increases, while EMEA conti-nued to grow, despite a difficult market environment.
114
Annual Report 2019 ↗ COMBINED MANAGEMENT REPORT

Operationally, we continued to improve infrastructure, processes and systemsthat are required to support our overall growth ambition. In 2019, a strong focuswas put on expanding our logistical network with the project launch of two newmulti-channel distribution center initiatives, one in Geiselwind, Germany and oneoutside of Indianapolis, USA – both are expected to be operational in 2020 andearly 2021. Beyond distribution center expansion, PUMA continued to focus onstandardization of ERP systems and enhancements of product developmenttools. This, combined with improvements of the overall IT infrastructure, enablesus a faster and better communication and information exchange. PUMA’s globaltrading entity (PUMA International Trading GmbH - PIT), which manages globalorder and invoice flows centrally, has extended its scope in order to supportstreamlining transactional processes and ensuring faster lead times for growingmarkets and allowing us to come one step closer to our mantra of being “ForeverFaster”. In sourcing, the long-term collaboration with suppliers remains the keycomponent of our sourcing strategy to ensure a stable sourcing base, consistentquality of our products and being well prepared for changes in the tradeenvironment.
In addition to our business priorities, social, economic and environmentalsustainability remains a core value for PUMA. In 2019, we delivered our 10FOR20sustainability targets and developed our next set of sustainability targets for2025, with a renewed focus on increasing the amount of sustainable products. Inaddition, we continued our leading role at the Fashion Charter for Climate Actionunder the umbrella of UN Climate and signed the Fashion Pact. The Fashion Pactis a global coalition of companies in the fashion and textile industry, along withsuppliers and distributors, all committed to a common core of environmentalgoals in three areas: stopping global warming, restoring biodiversity and protec-ting the oceans. The Pact was launched at the 2019 G7 summit in France. Ourlong-standing social compliance program has been supplemented by the aspectof a more responsible procurement policy and has been recognized by the rene-wed accreditation by the Fair Labor Association.
115
Annual Report 2019 ↗ COMBINED MANAGEMENT REPORT

PRODUCT DEVELOPMENT AND DESIGN
Building on more than 70 years of sports innovation and leading design, PUMA isin the very fortunate situation of having an inspiring archive of products. PUMA’sdesigners can take inspiration from iconic historic styles to mix the past and thepresent. In 2019, many of our most successful models derived from our history.
As the heir of RS Running System series, which was first introduced some 40 ye-ars ago, the RS-X continued to do well in the “Chunky Shoe” segment. In 2019,the RS-X made a bold entry into the market as the RS-X Trophy in black and goldand dropped in several other versions during the year.
In 2019, PUMA also built on its CELL technology platform, which uses hexagonalcells in the heel for superior cushioning and stability. We used CELL in the retroCELL Alien and CELL Endura models, which stayed true to their ancestors fromthe 80s. We also went one step further by creating new CELL shapes, using theupdated LQD CELL technology. LQD CELL is versatile enough to work across avariety of shoe designs and offers stable cushioning as a constant benefit. Thefirst product to use this new technology was the LQD CELL Origin AR sneaker,which came to life with an augmented reality app on mobile phones. LQD CELLtechnology was deployed throughout the year in several training products.
After returning to basketball last year, PUMA relaunched the “Ralph Sampson”sneaker, named after the legendary basketball star, which was first introduced inthe 1980s. This shoe is a new successful addition to our offering and was presen-ted in different colors and styles throughout 2019.
Towards the end of 2019, PUMA revived the RIDER, one of the first jogging shoes.Launched in October as the FAST RIDER OG, our designers reinterpreted the“Federbein” sole, which imitates the shock-absorbing qualities of a car suspen-
sion for additional comfort and high rebound. PUMA will continue to add newproducts to the RIDER franchise in 2020.
The CALI and the NOVA, presented by our brand ambassadors Selena Gomez andCara Delevingne respectively, continued to be our most successful Sportstylefranchises for women. Both ambassadors were deeply involved in the design pro-cess and created their own collections. Cara Delevingne teamed up with PUMAand French luxury brand Balmain for a boxing-inspired line of products. Super-model and women’s training ambassador Adriana Lima also presented a collec-tion aimed at women who want to look their best, even during the toughest work-outs. PUMA also teamed up with a selected number of brands and designers,such as Ader Error, Helly Hansen and Les Benjamins to create cool and stylishcollections.
Throughout its history, PUMA has catered to the needs of professional athletes.We launched new versions of our PUMA FUTURE football boot in 2019. Made foragile players, the FUTURE allows for sharp turns and complex movements on thefootball pitch.
Together with Swiss apparel technology group X-Bionic, PUMA launched acollection of thermoregulating running gear, which keeps athletes at an optimaltemperature at all times.
We also started a line of products for professional gamers and esports athletes.Together with Dutch gaming accessories maker PLAYSEAT, PUMA launched agaming seat, which takes gamers away from slouching on the sofa and towards amore active sitting position. The seat was accompanied by the launch of gamingsocks, a further example of how our Innovation department is looking for newways to provide products for this fast-growing market.
116
Annual Report 2019 ↗ COMBINED MANAGEMENT REPORT
Keeping it high-tech, PUMA also launched its first smartwatch in 2019, whichshould help athletes get the best out of their workouts with a built-in heart ratetracking, GPS and many of their favorite apps.
Research and product development at PUMA mainly comprise the areas of inno-vation (new technologies), product design and model and collection development.The research and product development activities range from the analysis of sci-entific studies and customer surveys through the generation of creative ideas tothe implementation of innovations in commercial products. The activities in rese-arch and product development are directly linked to sourcing activities.
As of December 31, 2019, a total of 999 people were employed in research anddevelopment/ product management (previous year: 946). In 2019, research anddevelopment/ product management expenses totaled € 114.3 million (previousyear: € 97.8 million), of which € 61.7 million (previous year: € 54.0 million) rela-ted to research and development.
117
Annual Report 2019 ↗ COMBINED MANAGEMENT REPORT
SOURCINGTHE SOURCING ORGANIZATION
PUMA Group’s sourcing functions, referred to as PUMA Group sourcing (PGS),manages all sourcing related activities for PUMA and Cobra, including vendorselection, product development, price negotiation and production control. Theseactivities are centrally managed by PUMA International Trading GmbH (PIT), thegroup’s global trading entity, with its head office in the Corporate headquarters inHerzogenaurach (Germany). In addition, PIT is responsible for procurement andsupply into the PUMA distribution channels worldwide. PIT receives volume fore-casts from PUMA subsidiaries and licensees worldwide, translates these fore-casts into production plans which are subsequently distributed to the referencedvendors. The PUMA subsidiaries confirm their forecasts into purchase orders toPIT, which in turn consolidates these requirements and purchases from the ven-dors. There is a clear buy/sell relationship between the sales-subsidiaries andPIT and between PIT and the vendors, for added transparency.
The centralization of both the sourcing and procurement functions, along withthe rollout of a cloud-based purchase order collaboration and payment platform,linking the sales-subsidiaries, PIT and the vendors, has enabled the digitalizationof the supply chain creating transparency, operational efficiency and reducingcomplexity. For example, container fill rates are optimized, foreign currency risksare managed by PIT directly via a centralized currency hedging policy, and allpayments to vendors are automated and paper free.
In order to meet our customers’ requirements concerning service, quality, socialand environmental compliance we focus on six core strategic pillars of collabora-tion, product, quality, growth management, margins and landed cost, andsustainability. The centralization of sourcing and procurement allows for conti-nuous improvements in all of these areas. Furthermore, the integration of thePUMA sustainability function (social, environment, chemical and occupationalhealth and safety) into operations, since 2016, has ensured these areas are partof our day to day business.
In 2019 further operating improvements were realized in sourcing, in particularwith regards to the centralization and standardization of processes and systems,capacity management and data analysis. To avoid production peaks and subse-quent delays on product availability, sourcing has proactively coordinated orde-ring windows for earlier production visibility and additionally, reduced productionlead time by prepositioning supply of materials. Short-lead time programs havebeen further increased to react on latest developments and trends in the mar-kets. In this regard sourcing has extended its local supply chain for the China sa-les-subsidiary to provide the right organizational setup with a focus on design,costing and lead time. To mitigate the negative impact of the international tradeenvironment, alternative sourcing locations have been allocated for the US mar-ket in the fourth quarter of 2019.
2019 saw the continued growth and expansion of the PUMA Vendor Finance Pro-gram for our suppliers. This innovative program launched in 2016 allows vendorsto be paid earlier and the rate of interest charged is dependent on their sustaina-bility performance. PUMA developed this program initially with the InternationalFinance Corporation (IFC), the trade finance arm of the World Bank. The programhas been expanded for the first time to include private international banks. Sincethe program is based on PUMA’s credit rating our vendors are able to benefitfrom the best possible interest rates and maintain their own lines of credit.
118
Annual Report 2019 ↗ COMBINED MANAGEMENT REPORT
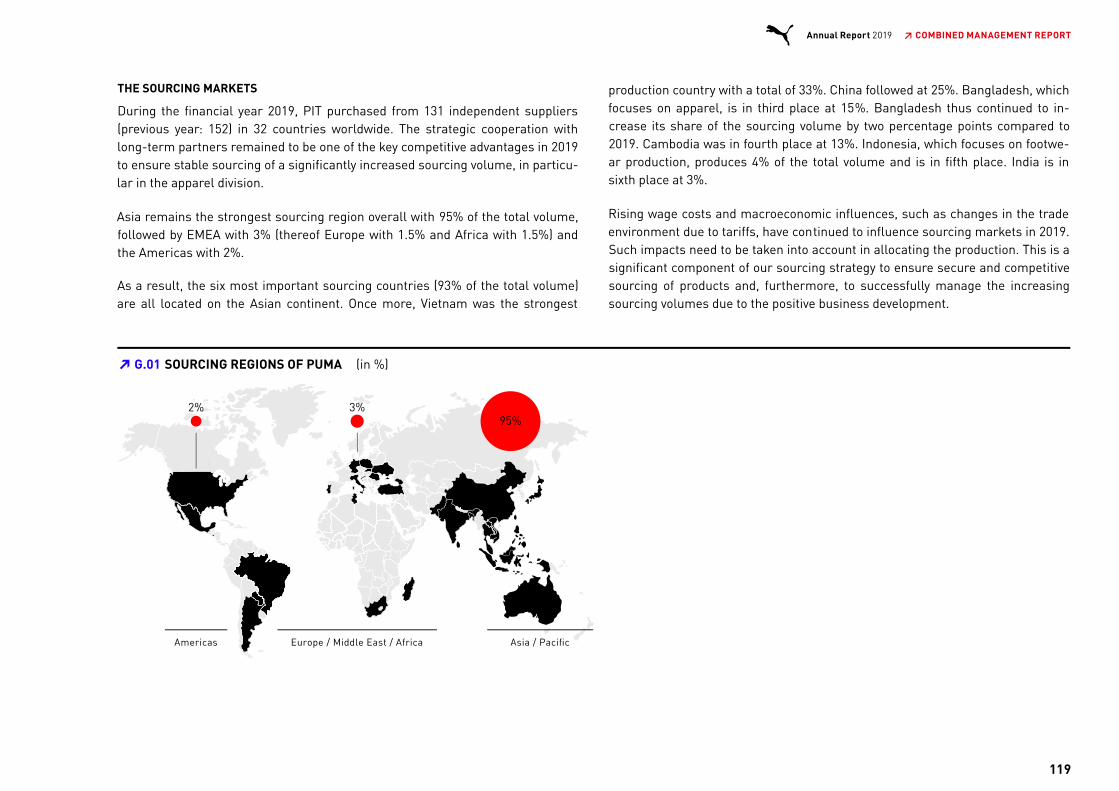
THE SOURCING MARKETS
During the financial year 2019, PIT purchased from 131 independent suppliers(previous year: 152) in 32 countries worldwide. The strategic cooperation withlong-term partners remained to be one of the key competitive advantages in 2019to ensure stable sourcing of a significantly increased sourcing volume, in particu-lar in the apparel division.
Asia remains the strongest sourcing region overall with 95% of the total volume,followed by EMEA with 3% (thereof Europe with 1.5% and Africa with 1.5%) andthe Americas with 2%.
As a result, the six most important sourcing countries (93% of the total volume)are all located on the Asian continent. Once more, Vietnam was the strongest
production country with a total of 33%. China followed at 25%. Bangladesh, whichfocuses on apparel, is in third place at 15%. Bangladesh thus continued to in-crease its share of the sourcing volume by two percentage points compared to2019. Cambodia was in fourth place at 13%. Indonesia, which focuses on footwe-ar production, produces 4% of the total volume and is in fifth place. India is insixth place at 3%.
Rising wage costs and macroeconomic influences, such as changes in the tradeenvironment due to tariffs, have continued to influence sourcing markets in 2019.Such impacts need to be taken into account in allocating the production. This is asignificant component of our sourcing strategy to ensure secure and competitivesourcing of products and, furthermore, to successfully manage the increasingsourcing volumes due to the positive business development.
G.01 SOURCING REGIONS OF PUMA (in %)➔
119
Annual Report 2019 ↗ COMBINED MANAGEMENT REPORT
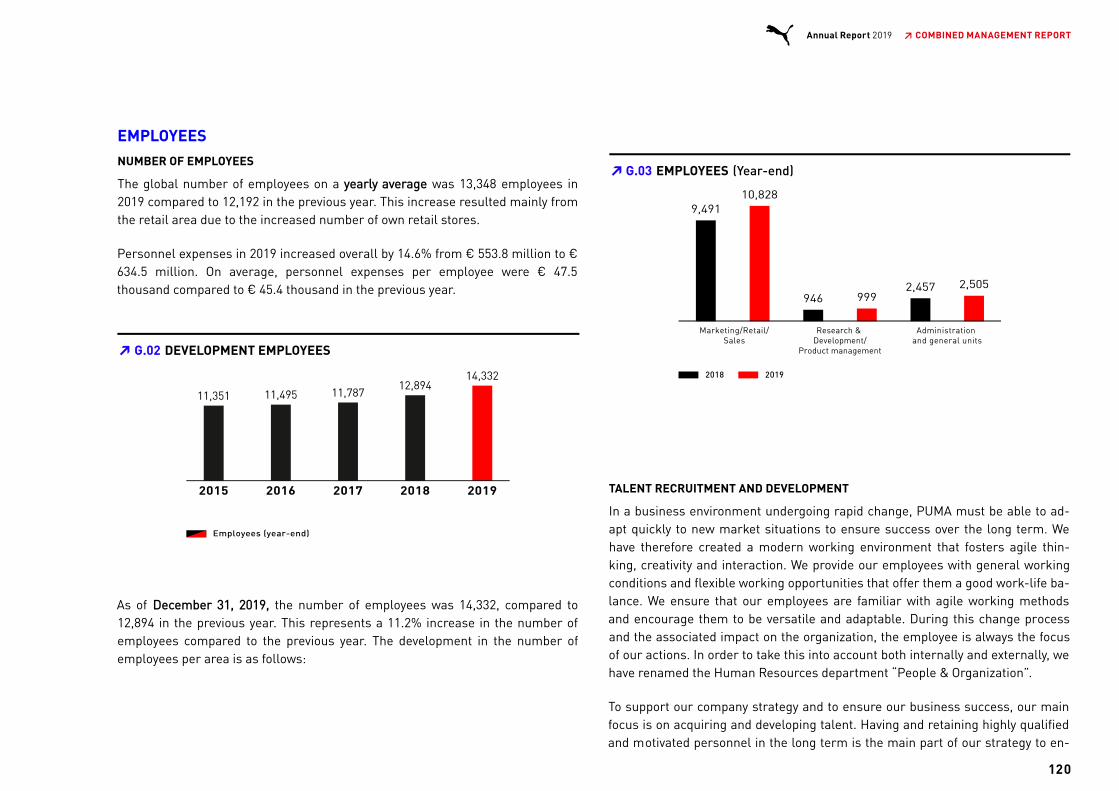
EMPLOYEESNUMBER OF EMPLOYEES
The global number of employees on a yearly average was 13,348 employees in2019 compared to 12,192 in the previous year. This increase resulted mainly fromthe retail area due to the increased number of own retail stores.
Personnel expenses in 2019 increased overall by 14.6% from € 553.8 million to €634.5 million. On average, personnel expenses per employee were € 47.5thousand compared to € 45.4 thousand in the previous year.
As of December 31, 2019, the number of employees was 14,332, compared to12,894 in the previous year. This represents a 11.2% increase in the number ofemployees compared to the previous year. The development in the number ofemployees per area is as follows:
TALENT RECRUITMENT AND DEVELOPMENT
In a business environment undergoing rapid change, PUMA must be able to ad-apt quickly to new market situations to ensure success over the long term. Wehave therefore created a modern working environment that fosters agile thin-king, creativity and interaction. We provide our employees with general workingconditions and flexible working opportunities that offer them a good work-life ba-lance. We ensure that our employees are familiar with agile working methodsand encourage them to be versatile and adaptable. During this change processand the associated impact on the organization, the employee is always the focusof our actions. In order to take this into account both internally and externally, wehave renamed the Human Resources department “People & Organization”.
To support our company strategy and to ensure our business success, our mainfocus is on acquiring and developing talent. Having and retaining highly qualifiedand motivated personnel in the long term is the main part of our strategy to en-
G.02 DEVELOPMENT EMPLOYEES➔
G.03 EMPLOYEES (Year-end)➔
120
Annual Report 2019 ↗ COMBINED MANAGEMENT REPORT

Using Speed Up and Speed Up , we conduct development programs for em-ployees on different levels. Various groups consisting of top talents are given in-
sure future competitiveness and growth. This becomes particularly important inan ever-changing, increasingly complex environment. We use digital platformsand social media for our target group-specific, individual recruiting measures, aswell as our career website, to attract external candidates. A range of initiatives atuniversities gives us the opportunity to approach potential employees and identi-fy suitable candidates. Extensive networks of qualified applicants and currentcandidate pools help us to quickly fill vacancies. In the competitive labor market,being an attractive employer, and being perceived as such by current and potenti-al employees are of critical importance. Top employer rankings and multipleawards evidence PUMA’s attractiveness.
The digitalization, the related simplification and acceleration of business proces-ses made further progress. "Workday", one of the leading human capital ma-nagement systems, which we introduced globally in 2017, contains the modules"recruiting", "talent and performance", "time recording and absence manage-ment" and "learning". As a result, only one software solution is used for majorparts of important personnel processes. In 2019, we continued to link Workdaywith other systems and have steadily increased the number of employees andapplicants who regularly and actively use the system. The evaluation of our cen-trally available global data enables us to conduct large-scale analyses. The re-sulting conclusions offer a solid basis for continuous process improvement anddecisions.
Our aim is to help each of our employees to develop in an international environ-ment and at the same time successfully and sustainably retain them in our com-pany. Based on the Workday software, a systematic succession plan is created aspart of talent management in addition to the performance assessment and tar-get-setting. We identify the talent available within the group as part of annualperformance reviews and foster talent development based on individual develop-ment plans. This type of talent management means that we can offer our em-ployees attractive career and development opportunities.
The ongoing professional and personal development of our employees also en-sures that our workforce has the necessary expertise to guarantee continuousgrowth and market competence particularly in times of digital change. The rangeof training we provide therefore includes a number of online and offline training
courses and workshops that are standardized or tailored to individual needs. Theconstant development of our PUMA training programs ensures that our em-ployees have innovative and diverse opportunities to expand their qualificationsand develop their existing skills or acquire new skills at any time. This approachhelps employees to achieve their personal goals and PUMA to reach its corporategoals.
In 2019, we have started to train employees to become "agile coaches" in order toprepare and motivate our workforce for the digital change. These coaches applyagile working methods, can pass on their knowledge to other colleagues on siteand are also available as experts on the subject. In addition to the managementcontent already available on the ILP (International Leadership Program), we sendour staff on external and internal training courses to qualify in agile methodssuch as Scrum, Design Thinking and KanBan. The high level of interest and stea-dily increasing numbers of staff attending these courses show that we are on theright path.
To provide adequate entry-level and development opportunities to talented indivi-duals at all levels, including the range of different apprenticeships and dual-stu-dy programs, we also promote the systematic training of our professionals andmanagers. To ensure a common understanding of leadership throughout the company, allmanagers complete our international leadership training program comprisingthe seminar series ILP and ILP . The program helps to develop participants overa longer period, provides them with the opportunities to apply the newly acquiredknowledge in practice between the individual modules and to share knowledgewith other seminar participants to learn from each other. Our goal is to provideour staff with the required skills and expertise to successfully lead their teams.They receive intensive training and coaching, including interactive learning, role-play simulations and best practice learning, as well as joint projects. The digita-lization and the changing work environment lead to new challenges for mana-gers in particular. The key topics are therefore coaching, mindful leadership andagile working methods. The training course “from employee to manager” prepa-res staff that are about to take on a management role for the first time. In additi-on to the training module, the program also offers individual coaching.
2
2
121
Annual Report 2019 ↗ COMBINED MANAGEMENT REPORT

tensive preparation for the next step in their careers by taking on interdisciplina-ry projects and tasks, targeted training courses, mentoring, and coaching as wellas job rotations. Increased visibility to upper management, the creation of cross-functional cooperation and establishing a strong network are also importantcomponents of this program.
In the past year, we conducted a global employee survey with the help of the ex-ternal provider Wills Towers Watson in order to get feedback from our employeesand involve them in the design of their work environment. More than 9,750 em-ployees participated and used the opportunity to share their opinion on theirworkplace and work life. We are proud of 91% employee engagement and appre-ciate the high level of commitment of our employees and their loyalty to thebrand. The category “change” received the lowest positive responses with 63%and was identified as an important future area of action. The results were com-municated on a global, local and departmental level and necessary improvementmeasures were defined.
WORKS COUNCIL
The trust-based collaboration with the Works’ Councils is an important part ofour corporate culture. In 2019, the European Works Council of PUMA SE repre-sented employees from 15 European countries and had 18 members. The Ger-man Works Council of PUMA SE has 15 members and represents the employeesof the PUMA Group in Germany. A designated member of the Works Councils re-presents the interests of employees with disabilities.
COMPENSATION
We at PUMA offer our employees a targeted and competitive compensation sys-tem, which consists of several components. In addition to a fixed base salary, thePUMA bonus system, profit-sharing programs and various social benefits andintangible benefits form part of a performance-based compensation system. Wealso offer long-term incentive programs for the senior management level thathonor the sustainable development and performance of the business. The bonussystem is transparent and globally standardized. Incentives are exclusively linkedto company goals.
122
Annual Report 2019 ↗ COMBINED MANAGEMENT REPORT
Using Speed Up and Speed Up , we conduct development programs for em-ployees on different levels. Various groups consisting of top talents are given in-
sure future competitiveness and growth. This becomes particularly important inan ever-changing, increasingly complex environment. We use digital platformsand social media for our target group-specific, individual recruiting measures, aswell as our career website, to attract external candidates. A range of initiatives atuniversities gives us the opportunity to approach potential employees and identi-fy suitable candidates. Extensive networks of qualified applicants and currentcandidate pools help us to quickly fill vacancies. In the competitive labor market,being an attractive employer, and being perceived as such by current and potenti-al employees are of critical importance. Top employer rankings and multipleawards evidence PUMA’s attractiveness.
The digitalization, the related simplification and acceleration of business proces-ses made further progress. "Workday", one of the leading human capital ma-nagement systems, which we introduced globally in 2017, contains the modules"recruiting", "talent and performance", "time recording and absence manage-ment" and "learning". As a result, only one software solution is used for majorparts of important personnel processes. In 2019, we continued to link Workdaywith other systems and have steadily increased the number of employees andapplicants who regularly and actively use the system. The evaluation of our cen-trally available global data enables us to conduct large-scale analyses. The re-sulting conclusions offer a solid basis for continuous process improvement anddecisions.
Our aim is to help each of our employees to develop in an international environ-ment and at the same time successfully and sustainably retain them in our com-pany. Based on the Workday software, a systematic succession plan is created aspart of talent management in addition to the performance assessment and tar-get-setting. We identify the talent available within the group as part of annualperformance reviews and foster talent development based on individual develop-ment plans. This type of talent management means that we can offer our em-ployees attractive career and development opportunities.
The ongoing professional and personal development of our employees also en-sures that our workforce has the necessary expertise to guarantee continuousgrowth and market competence particularly in times of digital change. The rangeof training we provide therefore includes a number of online and offline training
courses and workshops that are standardized or tailored to individual needs. Theconstant development of our PUMA training programs ensures that our em-ployees have innovative and diverse opportunities to expand their qualificationsand develop their existing skills or acquire new skills at any time. This approachhelps employees to achieve their personal goals and PUMA to reach its corporategoals.
In 2019, we have started to train employees to become "agile coaches" in order toprepare and motivate our workforce for the digital change. These coaches applyagile working methods, can pass on their knowledge to other colleagues on siteand are also available as experts on the subject. In addition to the managementcontent already available on the ILP (International Leadership Program), we sendour staff on external and internal training courses to qualify in agile methodssuch as Scrum, Design Thinking and KanBan. The high level of interest and stea-dily increasing numbers of staff attending these courses show that we are on theright path.
To provide adequate entry-level and development opportunities to talented indivi-duals at all levels, including the range of different apprenticeships and dual-stu-dy programs, we also promote the systematic training of our professionals andmanagers. To ensure a common understanding of leadership throughout the company, allmanagers complete our international leadership training program comprisingthe seminar series ILP and ILP . The program helps to develop participants overa longer period, provides them with the opportunities to apply the newly acquiredknowledge in practice between the individual modules and to share knowledgewith other seminar participants to learn from each other. Our goal is to provideour staff with the required skills and expertise to successfully lead their teams.They receive intensive training and coaching, including interactive learning, role-play simulations and best practice learning, as well as joint projects. The digita-lization and the changing work environment lead to new challenges for mana-gers in particular. The key topics are therefore coaching, mindful leadership andagile working methods. The training course “from employee to manager” prepa-res staff that are about to take on a management role for the first time. In additi-on to the training module, the program also offers individual coaching.
2
2

MANAGEMENT SYSTEM
PUMA's working capital is calculated based on the sum of current assets lessthe sum of current liabilities. In addition, cash and cash equivalents and positive
We use a variety of indicators to manage our performance in relation to our topcorporate goals. We have defined growth and profitability as key targets withinfinance-related areas. Our focus therefore is on improving sales, gross profitmargin, and operating result (EBIT). These are the financial control parametersthat are of particular significance. Moreover, we aim to minimize working capitaland improve free cash flow. Our Group's Planning and Management System hasbeen designed to provide a variety of instruments in order to assess currentbusiness developments and derive future strategy and investment decisions. Thisinvolves the continuous monitoring of key financial indicators within the PUMAGroup and a monthly comparison with budget targets. Any deviations from thetargets are analyzed in detail and appropriate countermeasures are taken in theevent such deviations have a negative impact.
Changes in net sales are also influenced by currency exchange effects. This iswhy we also state any changes in sales in Euro, the reporting currency, adjustedfor currency exchange effects in order to provide information that is relevant tothe decision-making process when assessing the revenue position. Currency-adjusted sales volumes are used for comparison purposes and are based on thevalues that would arise if the foreign currencies included in the consolidated fi-nancial statements were not translated at the average rates for the previous re-porting year, but were instead translated at the corresponding average rates forthe current year. As a result, currency-adjusted figures are not to be regarded asa substitute or as superior financial indicators, but should instead always be re-garded as additional information.
We use the indicator free cash flow in order to determine the change in cash andcash equivalents after deducting all expenses incurred to maintain or expand theorganic business of the PUMA Group. Free cash flow is calculated from the cashflow from operating activities and investment activities. We also use the indicatorfree cash flow before acquisitions, which goes beyond free cash flow and inclu-
des an adjustment for incoming and outgoing payments that are associated withinvestments in companies.
We use the indicator working capital in order to assess the financial position.Working capital is essentially the difference between current assets - includingin particular inventories and trade receivables - and current liabilities. Cash andcash equivalents, the positive and negative market values of derivative financialinstruments and current finance and lease liabilities are not included in workingcapital.
Non-financial performance indicators are of only minor importance as controlvariables at PUMA.
The calculation of key financial control parameters that PUMA uses are definedas follows:
The recognition of net sales is based on the provisions of IFRS 15 Revenue fromcontracts with customers.
PUMA's gross profit margin is calculated as cost of sales divided by net sales.Cost of sales mainly comprise the carrying amounts of inventory that were reco-gnized as expenses during the reporting period.
PUMA's operating result (EBIT) is the sum of net sales and royalty and commissi-on income, minus cost of sales and other operating income and expenses(OPEX). EBIT is defined as operating result, less depreciation and amortization,provisions and impairment loss, before interest (= financial result) and before ta-xes. The financial result contains interest income and interest expenses and cur-rency conversion differences and the income from associated companies in theprevious year. The EBIT margin is calculated as EBIT divided by net sales.
123
Annual Report 2019 ↗ COMBINED MANAGEMENT REPORT
and negative market values of derivative financial instruments are deducted. Themarket values of derivative financial instruments are recognized in the balancesheet in the items Other Current Assets and Other Current Liabilities not attribu-table to working capital. Current finance and lease liabilities are also not part ofworking capital.
In order to present the impact of the first-time application of IFRS 16 Leases onthe results of operations of the PUMA Group as transparently as possible, wealso present the impact of the new accounting standard on the operating resultbefore interest (= financial result), taxes and depreciation and amortization(EBITDA). EBITDA is calculated based on the operating result (EBIT) addingdepreciation and amortization, which may also contain any incurred impairmentexpenses relating to property, plant and equipment and financial assets. TheEBITDA margin is calculated as EBITDA divided by net sales.
124
Annual Report 2019 ↗ COMBINED MANAGEMENT REPORT
MANAGEMENT SYSTEM
PUMA's working capital is calculated based on the sum of current assets lessthe sum of current liabilities. In addition, cash and cash equivalents and positive
We use a variety of indicators to manage our performance in relation to our topcorporate goals. We have defined growth and profitability as key targets withinfinance-related areas. Our focus therefore is on improving sales, gross profitmargin, and operating result (EBIT). These are the financial control parametersthat are of particular significance. Moreover, we aim to minimize working capitaland improve free cash flow. Our Group's Planning and Management System hasbeen designed to provide a variety of instruments in order to assess currentbusiness developments and derive future strategy and investment decisions. Thisinvolves the continuous monitoring of key financial indicators within the PUMAGroup and a monthly comparison with budget targets. Any deviations from thetargets are analyzed in detail and appropriate countermeasures are taken in theevent such deviations have a negative impact.
Changes in net sales are also influenced by currency exchange effects. This iswhy we also state any changes in sales in Euro, the reporting currency, adjustedfor currency exchange effects in order to provide information that is relevant tothe decision-making process when assessing the revenue position. Currency-adjusted sales volumes are used for comparison purposes and are based on thevalues that would arise if the foreign currencies included in the consolidated fi-nancial statements were not translated at the average rates for the previous re-porting year, but were instead translated at the corresponding average rates forthe current year. As a result, currency-adjusted figures are not to be regarded asa substitute or as superior financial indicators, but should instead always be re-garded as additional information.
We use the indicator free cash flow in order to determine the change in cash andcash equivalents after deducting all expenses incurred to maintain or expand theorganic business of the PUMA Group. Free cash flow is calculated from the cashflow from operating activities and investment activities. We also use the indicatorfree cash flow before acquisitions, which goes beyond free cash flow and inclu-
des an adjustment for incoming and outgoing payments that are associated withinvestments in companies.
We use the indicator working capital in order to assess the financial position.Working capital is essentially the difference between current assets - includingin particular inventories and trade receivables - and current liabilities. Cash andcash equivalents, the positive and negative market values of derivative financialinstruments and current finance and lease liabilities are not included in workingcapital.
Non-financial performance indicators are of only minor importance as controlvariables at PUMA.
The calculation of key financial control parameters that PUMA uses are definedas follows:
The recognition of net sales is based on the provisions of IFRS 15 Revenue fromcontracts with customers.
PUMA's gross profit margin is calculated as cost of sales divided by net sales.Cost of sales mainly comprise the carrying amounts of inventory that were reco-gnized as expenses during the reporting period.
PUMA's operating result (EBIT) is the sum of net sales and royalty and commissi-on income, minus cost of sales and other operating income and expenses(OPEX). EBIT is defined as operating result, less depreciation and amortization,provisions and impairment loss, before interest (= financial result) and before ta-xes. The financial result contains interest income and interest expenses and cur-rency conversion differences and the income from associated companies in theprevious year. The EBIT margin is calculated as EBIT divided by net sales.
INFORMATION REGARDING THE NON-FINANCIAL REPORT
In accordance with Sections 289b and 315b of the German Commercial Code(HGB), we are required to make a non-financial declaration for PUMA SE and thePUMA Group within the Combined Management Report or present a non-financi-al report external to the Combined Management Report, in which we report onenvironmental, social and other non-financial aspects. PUMA has been publis-hing Sustainability Reports since 2003 under the provisions of the Global Re-porting Initiative (GRI) and since 2010 has published financial data and keysustainability indicators in one report. In this context, we report the informationrequired under Sections 289b and 315b of the HGB in the Sustainability chapterof our Annual Report. The Non-financial Report for the financial year 2019 will beavailable by April 30, 2020, at the latest on the following page of our website: https://about.puma.com/en/investor-relations/financial-reports
Furthermore, important sustainability information can be found on PUMA’s web-site in the section Sustainability at any time: http://about.puma.com/en/sustaina-bility
125
Annual Report 2019 ↗ COMBINED MANAGEMENT REPORT
ECONOMIC REPORT
GENERAL ECONOMIC CONDITIONSGLOBAL ECONOMY
According to the winter forecast of the Kiel Institute for the World Economy (ifwKiel) dated December 11, 2019, the momentum of the global economy has slo-wed down in 2019. The experts at ifw Kiel expect global gross domestic product(GDP) to rise by 3.0% in 2019. This represents a slight decline of 0.2% comparedto the summer forecast. The forecast for 2019 is also 0.7% below the growth inglobal GDP in 2018 (3.7%).
In 2019, the global economy was burdened by an intensification of the trade con-flict between the United States of America and China. The increase in customsduties and the extension of tariffs to additional product groups has greatly redu-ced trade between the two countries, leading to greater economic uncertainty inworld trade and weaker industrial production. In the advanced economies, theoverall economic situation continued to deteriorate. In the United States of Ame-rica, the strong fiscal stimuli, particularly in the form of the tax reform from2018, have expired. In contrast, the pace of expansion in the euro zone has notslowed further, primarily due to brisk private consumer demand. In Japan andthe United Kingdom, industrial production even picked up. Overall, the economicgap between the advanced economies, which had been observed in the previousyear, narrowed in the course of 2019.
In the emerging markets, on the other hand, economic momentum has stabilizedin 2019, as the financial environment in particular has improved. A more expansi-ve monetary policy and lower interest rates in the United States of America haveled to less devaluation pressure on the currencies in the emerging markets andenabled a noticeable reduction in key interest rates. However, the economic de-velopment in the individual emerging markets varies. While GDP growth ratesdeclined in China and India, Brazil, Russia and the other Asian emerging marketsrecorded an increase in the pace of expansion.
SPORTING GOODS INDUSTRY
Despite geopolitical tensions and trade conflicts, the sporting goods industrycontinued to grow strongly worldwide in 2019. More exercise and physical activity,as well as an increasingly healthy and sustainable lifestyle, continued to gain inimportance for an ever-increasing proportion of the world's population. In additi-on, the popularity of athletic footwear and apparel as an integral part of everydayfashion ("athleisure") increased. In addition, higher household incomes due to astable labor market led to an increase in consumer spending on sporting goods.
126
Annual Report 2019 ↗ COMBINED MANAGEMENT REPORT

SALESILLUSTRATION OF SALES DEVELOPMENT IN 2019 COMPARED TO THE OUTLOOK
PUMA’s 2018 Management Report had predicted a currency-adjusted growth innet sales of around 10% for the financial year 2019. This forecast was increasedseveral times throughout the year and PUMA ultimately expected a currency-ad-justed sales growth of around 15% for the financial year 2019. PUMA was able tosurpass the revised forecast for the financial year 2019, exceeding the originallyplanned sales target.
More details on sales development are provided below.
NET SALES
In the financial year 2019, PUMA's net sales grew in the reporting currency, theEuro, by 18.4% to € 5,502.2 million and, as a result, sales exceeded the € 5 billionmark for the first time. The currency-adjusted sales growth was 16.7%. All regi-ons and all product divisions contributed to this development with double-digitgrowth.
In the Footwear division, sales increased in the reporting currency, the Euro, by16.8% to € 2,552.5 million. Currency-adjusted sales increased by 15.6%. Thestrongest growth was therefore achieved in the Sportstyle, Running and Training,and Motorsport categories. The share of this division in total net sales fell slightlyfrom 47.0% in the previous year to 46.4% in 2019.
In the Apparel division, sales increased in the reporting currency, the Euro, by22.6% to € 2,068.7 million. Currency-adjusted sales increased by 20.5%. As a re-sult, sales in the Apparel division exceeded the € 2 billion mark for the first time.The Sportstyle category was the main driver of sales growth. The Running andTraining, and Motorsport categories also contributed to this growth. The share ofthe Apparel division increased to 37.6% of Group sales (previous year: 36.3%).
The Accessories division reported an increase in sales in the reporting currency,the Euro, by 13.5% to € 881.1 million. This corresponds to a currency-adjustedsales growth of 11.1%. Higher sales, particularly with socks and bodywear, aswell as Cobra golf clubs contributed to this increase in sales. The division's sharein Group sales decreased slightly from 16.7% in the previous year to 16.0% in2019.
G.07 SALES (€ million)➔
127
Annual Report 2019 ↗ COMBINED MANAGEMENT REPORT

RETAIL BUSINESSES
PUMA’s retail activities include direct sales to our consumers (“Direct to Consu-mer business”). This includes selling to our customers in PUMA’s own retailstores, the so-called “Full Price Stores”, “Factory Outlets”, and the e-commercebusiness on our own online platforms. Our own retail businesses ensure regionalavailability of PUMA products and the presentation of the PUMA brand in an envi-ronment suitable to our brand positioning.
PUMA’s retail sales increased by 22.0% currency-adjusted to € 1,395.3 million inthe financial year 2019. This corresponds to a share of 25.4% in total sales (pre-vious year: 24.3%). The increase in sales resulted from both the increase in like-
for-like sales and from the targeted expansion of our portfolio of own retailstores. In addition to the opening of additional retail stores at selected locationsworldwide, such as on Fifth Avenue in New York, we continued optimizing ourportfolio of own retail stores in the past financial year, which also included mo-dernizing existing retail stores in line with the "Forever Faster" store concept.This makes it possible to improve the shopping experience for our customerseven further and to present PUMA products and related technologies in an evenmore attractive environment. This strengthens PUMA’s position as a sportsbrand.
G.08 SALES BY PRODUCT DIVISIONS (€ million)➔
128
Annual Report 2019 ↗ COMBINED MANAGEMENT REPORT

Our e-commerce business continued to record far above-average growth in 2019.This was brought about by, for example, the expansion of the product range inonline stores worldwide and by our targeted sales promotions in the online busi-ness. In addition, our e-commerce activities on special days in the online busi-ness, such as Singles’ Day in China, the world’s biggest online shopping day, theso-called “Black Friday” and “Cyber Monday”, turned out to be particularlysuccessful.
LICENSING BUSINESS
For various products (such as watches, eyewear, and fragrances), PUMA issueslicenses authorizing independent partners to design, develop, manufacture, andsell these products. Sales revenue from license agreements also includes somedistribution licenses for different markets. PUMA's licensing and commission in-come increased in the financial year 2019 by 53.9% to € 25.1 million. The increa-se was the result of new collaborations.
G.09 RETAIL SALES➔
129
Annual Report 2019 ↗ COMBINED MANAGEMENT REPORT

REGIONAL DEVELOPMENT
In the following explanation of the regional distribution of sales, the sales are al-located to the customer’s actual region (“customer site”). It is divided into threegeographic regions (EMEA, America and Asia/Pacific). A more detailed regionalpresentation of the sales according to the registered office of the respectiveGroup company can be found in chapter 26 in the Notes to the Consolidated Fi-nancial Statements.
PUMA's net sales increased in the reporting currency, the Euro, by 18.4% in thefinancial year 2019. This corresponds to a currency-adjusted sales growth of16.7% compared to the previous year. All regions contributed to this developmentwith double-digit growth.
In the EMEA region, sales rose in the reporting currency, the Euro, by 11.2% to€ 2,001.4 million (currency-adjusted +11.2%). As a result, the EMEA region ex-ceeded the 2 billion Euro sales mark for the first time. Particularly strong growthcame from Germany, Italy and Spain, which recorded sales growth in the doubledigits. Russia, Ukraine and Turkey also developed very well with double-digitgrowth rates. The EMEA region accounted for 38.7% of Group sales compared to36.4% in the previous year.
With regards to product divisions, sales revenue from footwear recorded curren-cy-adjusted growth of 8.6%. Sales from apparel increased by 14.8% currency-ad-justed and sales from accessories grew by 10.6% currency-adjusted.
In the Americas region, sales increased in the reporting currency, the Euro, by20.6% to € 1,944.0 million. Currency-adjusted sales increased by 17.9%. BothNorth America and Latin America contributed with double-digit growth rates tothe increase in sales. While North America recorded positive currency exchangeeffects, the weakness of the Argentine Peso compared to the Euro, however, re-sulted in a noticeably negative currency exchange effect on the sales in the re-porting currency (Euro). The share of the Americas region in Group sales increa-sed slightly from 34.7% in the previous year to 35.3% in 2019.
With regards to product divisions, both footwear (currency-adjusted +19.2%) andapparel (currency-adjusted +21.5%) recorded excellent sales growth compared tothe previous year. Accessories sales were up by 8.8% currency-adjusted.
G.10 EMEA SALES (€ million)➔
130
Annual Report 2019 ↗ COMBINED MANAGEMENT REPORT

In the Asia/Pacific region, sales growth was particularly strong. Here, sales in-creased in the reporting currency, the Euro, by 26.0% to € 1,556.9 million. Thiscorresponds to a currency-adjusted increase in sales of 22.8%. The main driversof growth in the region were Greater China and India in particular, with bothcountries recording above-average double-digit growth rates. The share of theAsia/Pacific region in Group sales increased from 26.6% in the previous year to28.3% in 2019.
In terms of product divisions footwear (currency-adjusted +20.1%) and apparel(currency-adjusted +26.0%) as well as accessories (currency-adjusted +21.8%)developed very well with double-digit growth rates.
G.11 AMERICAS SALES (€ million)➔
G.12 ASIA/PACIFIC SALES (€ million)➔
131
Annual Report 2019 ↗ COMBINED MANAGEMENT REPORT
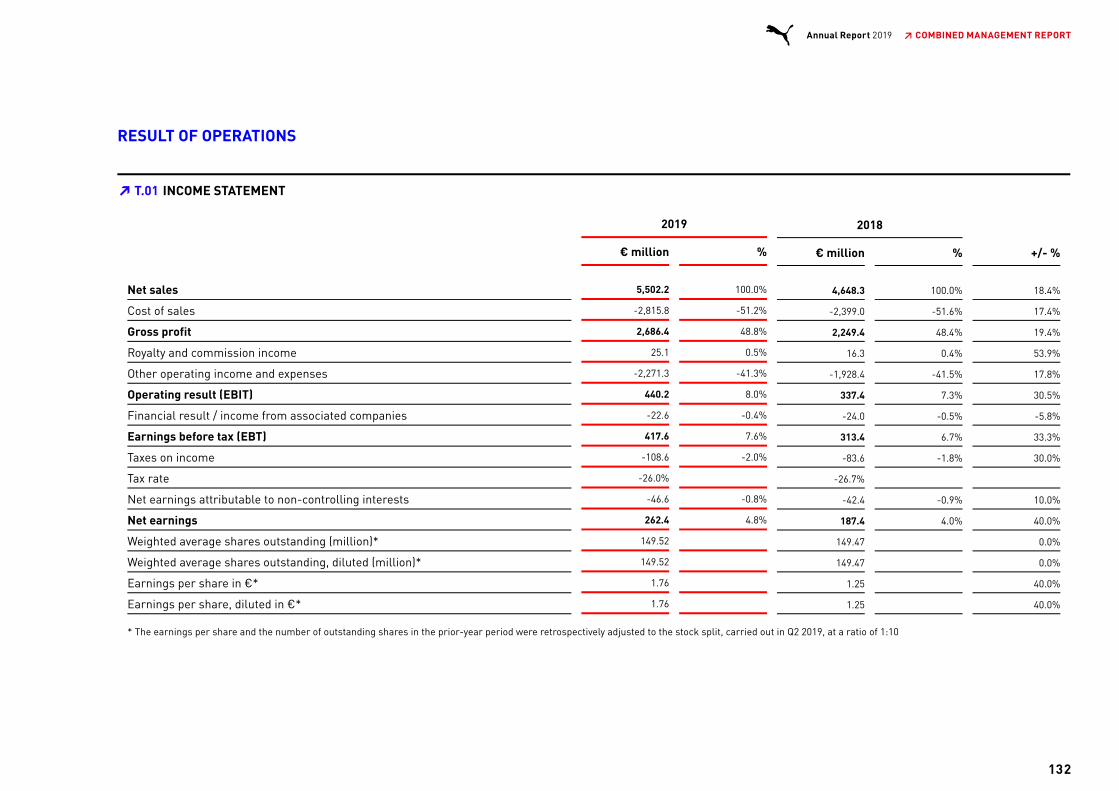
RESULT OF OPERATIONS
2019 2018
€ million % € million % +/- %
Net sales 5,502.2 100.0% 4,648.3 100.0% 18.4%
Cost of sales -2,815.8 -51.2% -2,399.0 -51.6% 17.4%
Gross profit 2,686.4 48.8% 2,249.4 48.4% 19.4%
Royalty and commission income 25.1 0.5% 16.3 0.4% 53.9%
Other operating income and expenses -2,271.3 -41.3% -1,928.4 -41.5% 17.8%
Operating result (EBIT) 440.2 8.0% 337.4 7.3% 30.5%
Financial result / income from associated companies -22.6 -0.4% -24.0 -0.5% -5.8%
Earnings before tax (EBT) 417.6 7.6% 313.4 6.7% 33.3%
Taxes on income -108.6 -2.0% -83.6 -1.8% 30.0%
Tax rate -26.0% -26.7%
Net earnings attributable to non-controlling interests -46.6 -0.8% -42.4 -0.9% 10.0%
Net earnings 262.4 4.8% 187.4 4.0% 40.0%
Weighted average shares outstanding (million)* 149.52 149.47 0.0%
Weighted average shares outstanding, diluted (million)* 149.52 149.47 0.0%
Earnings per share in €* 1.76 1.25 40.0%
Earnings per share, diluted in €* 1.76 1.25 40.0%
* The earnings per share and the number of outstanding shares in the prior-year period were retrospectively adjusted to the stock split, carried out in Q2 2019, at a ratio of 1:10
T.01 INCOME STATEMENT➔
132
Annual Report 2019 ↗ COMBINED MANAGEMENT REPORT
IMPACT OF THE FIRST-TIME APPLICATION OF IFRS 16 LEASES
The following explanations refer to the impact of the first-time application of thenew accounting standard IFRS 16 Leases as of 1 January 2019. As part of thetransition to the new accounting for leases, PUMA elected to use the partial ex-emption provision and has not performed a retrospective adjustment of previousyears' numbers. The comparative numbers presented in the IFRS Income State-ment above for the financial year 2018 remained unchanged and have been cal-culated based on the previous accounting standard for leases in accordance withIAS 17.We will therefore present below the impact of the first-time application of IFRS16 on the results of operations of the PUMA Group in the financial year 2019 toensure in this way a full comparability with the reported numbers in the previousyear.The first-time application of IFRS 16 in the financial year 2019 had a positive ef-fect on the operating result (EBIT) in the amount of € +19.2 million. This was cau-sed by a decrease in rental expenses by € 167.3 million and an increase in depre-ciation relating to the rights of use recognized in the balance sheet of€ 148.1 million. Taking the interest effects (€ -29.7 million) and deferred tax ef-fects (€ +2.8 million) into account, there was overall a slightly negative effect onthe consolidated net earnings in the amount of € -7.7 million in the financial year2019. In relation to the earnings per share and the diluted earnings per share,this corresponds to a decrease of € -0.05.Please refer to the Notes to the Consolidated Financial Statements, chapter 1General for a detailed description of the new accounting standards and the ef-fects of the first-time application of IFRS 16 Leases.
ILLUSTRATION OF EARNINGS DEVELOPMENT IN 2019 COMPARED TO THE OUTLOOK
In the outlook of the 2018 Annual Report, PUMA forecasted a slight improvementin the gross profit margin for the financial year 2019. PUMA expected a slightlyweaker increase of other operating income and expenses (OPEX) compared tonet sales. The forecast for the operating result (EBIT) was within a range of bet-ween € 395 million and € 415 million. This forecast already included the impactof the application of the new accounting rules for leases in accordance with IFRS16. In addition, a significant improvement in net earnings was expected for the
financial year 2019.The forecasts for the operating result were adjusted upward several timesthroughout the year, and PUMA now expected an operating result (EBIT) within arange of between € 420 million and € 430 million. In accordance with previousforecasts, the Management Board continued to expect a significant improvementin net earnings for the financial year 2019.
PUMA was able to fully achieve the increased forecasts in 2019, and even slightlyexceed them with regard to the operating result. This means that PUMA slightlyexceeded the originally targeted improvement in operating result for 2019. Moredetails on earnings development are provided below.
GROSS PROFIT MARGIN
PUMA's gross profit in the financial year 2019 increased by 19.4% from€ 2,249.4 million to € 2,686.4 million. The gross profit margin improved by 40 ba-sis points from 48.4% to 48.8%. The main drivers for the development of thegross profit margin were the product mix and the regional mix and a higher pro-portion of our own retail sales. A slightly positive currency effect also contributedto the improved gross profit margin.The gross profit margin in the Footwear division increased from 45.8% in the pre-vious year to 46.4% in 2019. The Apparel gross profit margin improved from50.9% to 51.1% and in Accessories, it also increased from 50.3% to 50.5%.
133
Annual Report 2019 ↗ COMBINED MANAGEMENT REPORT
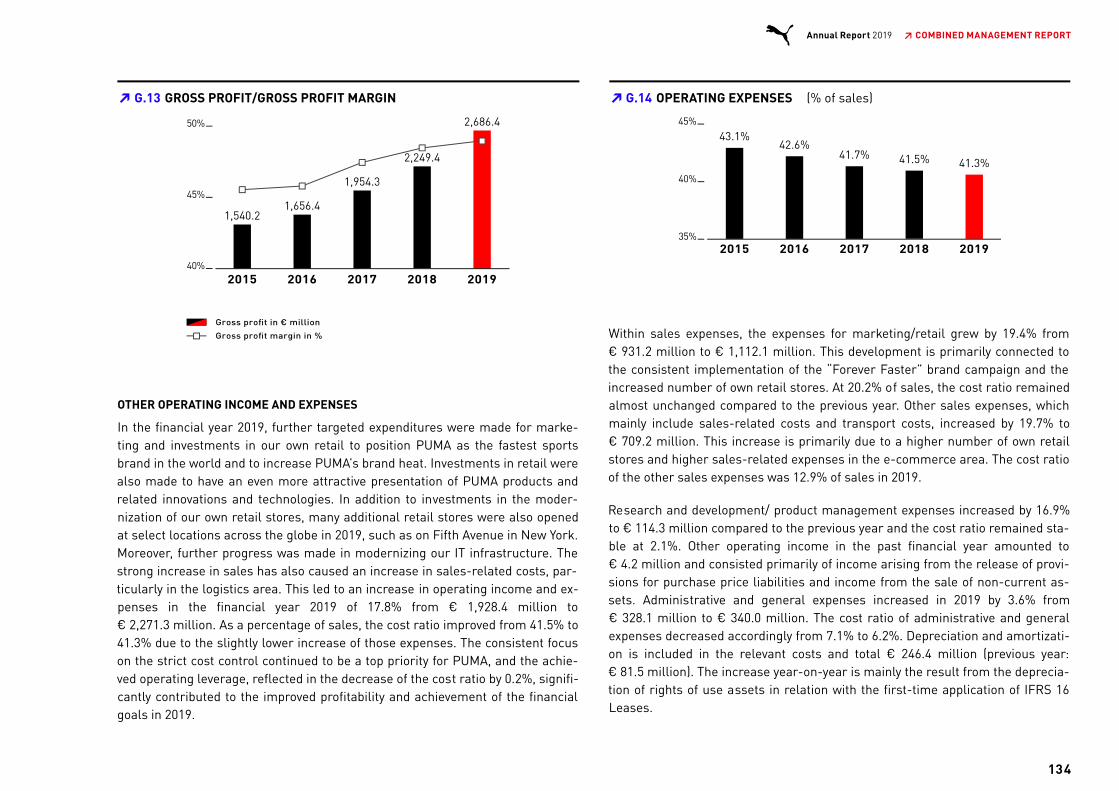
OTHER OPERATING INCOME AND EXPENSES
In the financial year 2019, further targeted expenditures were made for marke-ting and investments in our own retail to position PUMA as the fastest sportsbrand in the world and to increase PUMA’s brand heat. Investments in retail werealso made to have an even more attractive presentation of PUMA products andrelated innovations and technologies. In addition to investments in the moder-nization of our own retail stores, many additional retail stores were also openedat select locations across the globe in 2019, such as on Fifth Avenue in New York.Moreover, further progress was made in modernizing our IT infrastructure. Thestrong increase in sales has also caused an increase in sales-related costs, par-ticularly in the logistics area. This led to an increase in operating income and ex-penses in the financial year 2019 of 17.8% from € 1,928.4 million to€ 2,271.3 million. As a percentage of sales, the cost ratio improved from 41.5% to41.3% due to the slightly lower increase of those expenses. The consistent focuson the strict cost control continued to be a top priority for PUMA, and the achie-ved operating leverage, reflected in the decrease of the cost ratio by 0.2%, signifi-cantly contributed to the improved profitability and achievement of the financialgoals in 2019.
Within sales expenses, the expenses for marketing/retail grew by 19.4% from€ 931.2 million to € 1,112.1 million. This development is primarily connected tothe consistent implementation of the “Forever Faster” brand campaign and theincreased number of own retail stores. At 20.2% of sales, the cost ratio remainedalmost unchanged compared to the previous year. Other sales expenses, whichmainly include sales-related costs and transport costs, increased by 19.7% to€ 709.2 million. This increase is primarily due to a higher number of own retailstores and higher sales-related expenses in the e-commerce area. The cost ratioof the other sales expenses was 12.9% of sales in 2019.
Research and development/ product management expenses increased by 16.9%to € 114.3 million compared to the previous year and the cost ratio remained sta-ble at 2.1%. Other operating income in the past financial year amounted to€ 4.2 million and consisted primarily of income arising from the release of provi-sions for purchase price liabilities and income from the sale of non-current as-sets. Administrative and general expenses increased in 2019 by 3.6% from€ 328.1 million to € 340.0 million. The cost ratio of administrative and generalexpenses decreased accordingly from 7.1% to 6.2%. Depreciation and amortizati-on is included in the relevant costs and total € 246.4 million (previous year:€ 81.5 million). The increase year-on-year is mainly the result from the deprecia-tion of rights of use assets in relation with the first-time application of IFRS 16Leases.
G.13 GROSS PROFIT/GROSS PROFIT MARGIN➔
G.14 OPERATING EXPENSES (% of sales)➔
134
Annual Report 2019 ↗ COMBINED MANAGEMENT REPORT

RESULT BEFORE INTEREST, TAXES, DEPRECIATION AND AMORTIZATION (EBITDA)
The result before interest (= financial result), taxes, depreciation and amortizati-on increased by 63.7% in the financial year 2019 from € 419.5 million to€ 686.6 million. The increase was positively impacted in the amount of€ 167.2 million by the first-time application of the new accounting standard forleases (IFRS 16). Without this effect from the first-time application of IFRS 16,PUMA's EBITDA would have improved by around € 100 million or 23.8% to€ 519.4 million year-on-year.
OPERATING RESULT (EBIT)
In the financial year 2019, the operating result increased by 30.5% from€ 337.4 million in the previous year to € 440.2 million. This result is slightlyabove the adjusted EBIT forecast within a range of between € 420 million and€ 430 million. The significant improvement in profitability in 2019 resulted fromthe strong sales growth combined with the slight improvement in gross profitmargin and the slightly lower increase in other operating income and expensescompared to sales. The EBIT margin rose accordingly from 7.3% in the previousyear to 8.0%. FINANCIAL RESULT
The financial result improved from overall € -24.0 million in the previous year to€ -22.6 million in 2019, despite the additional interest expense of € 29.7 millionfrom the compounding of lease liabilities in connection with the new accountingstandard for leases (IFRS 16). This positive development is primarily the result ofgains from currency conversion differences of € 10.2 million in 2019, comparedto a loss from the currency conversion of € -14.4 million in the previous year. Inaddition, interest income of € 4.0 million in the previous year increased to€ 7.2 million in 2019, and interest expenses fell from € 14.6 million in the pre-vious year to € 13.9 million this year.
G.15 OPERATING RESULT - EBIT➔
135
Annual Report 2019 ↗ COMBINED MANAGEMENT REPORT
RESULT BEFORE INTEREST, TAXES, DEPRECIATION AND AMORTIZATION (EBITDA)
The result before interest (= financial result), taxes, depreciation and amortizati-on increased by 63.7% in the financial year 2019 from € 419.5 million to€ 686.6 million. The increase was positively impacted in the amount of€ 167.2 million by the first-time application of the new accounting standard forleases (IFRS 16). Without this effect from the first-time application of IFRS 16,PUMA's EBITDA would have improved by around € 100 million or 23.8% to€ 519.4 million year-on-year.
OPERATING RESULT (EBIT)
In the financial year 2019, the operating result increased by 30.5% from€ 337.4 million in the previous year to € 440.2 million. This result is slightlyabove the adjusted EBIT forecast within a range of between € 420 million and€ 430 million. The significant improvement in profitability in 2019 resulted fromthe strong sales growth combined with the slight improvement in gross profitmargin and the slightly lower increase in other operating income and expensescompared to sales. The EBIT margin rose accordingly from 7.3% in the previousyear to 8.0%. FINANCIAL RESULT
The financial result improved from overall € -24.0 million in the previous year to€ -22.6 million in 2019, despite the additional interest expense of € 29.7 millionfrom the compounding of lease liabilities in connection with the new accountingstandard for leases (IFRS 16). This positive development is primarily the result ofgains from currency conversion differences of € 10.2 million in 2019, comparedto a loss from the currency conversion of € -14.4 million in the previous year. Inaddition, interest income of € 4.0 million in the previous year increased to€ 7.2 million in 2019, and interest expenses fell from € 14.6 million in the pre-vious year to € 13.9 million this year.
G.15 OPERATING RESULT - EBIT➔
EARNINGS BEFORE TAX (EBT)
In the financial year 2019, PUMA generated earnings before taxes of € 417.6 mil-lion. This corresponds to an increase of 33.3% year-on-year (€ 313.4 million). Taxexpenses were € 108.6 million compared to € 83.6 million in the previous year,and the tax ratio decreased slightly from 26.7% to 26.0% in 2019.
NET EARNINGS ATTRIBUTABLE TO NON-CONTROLLING INTERESTS
Net earnings attributable to non-controlling interests relate to companies in theNorth American market, in each of which the same shareholder holds a minoritystake. The earnings attributable to this shareholder increased by 10.0% to€ 46.6 million in the financial year 2019 (previous year: € 42.4 million). Thesecompanies concern PUMA North America and PUMA United Canada, which werecreated in the past financial year from a merger and renaming of the companies,Janed, PUMA Accessories and PUMA Kids Apparel. The business purpose of the-se companies is the sale of socks, bodywear and children's apparel on the NorthAmerican market.
NET EARNINGS
Consolidated net earnings increased in the financial year 2019 by 40.0% from€ 187.4 million to € 262.4 million. The significant improvement in net earningsmainly resulted from the strong sales growth combined with the improvement inthe gross profit margin and operating leverage. The improved financial result anda slightly lower tax rate also had a positive effect on the net earnings in 2019. Ta-king the stock split at a ratio of 1:10 into account, the earnings per share and di-luted earnings per share increased accordingly by 40.0% from € 1.25 in the pre-vious year to € 1.76 in 2019.
136
Annual Report 2019 ↗ COMBINED MANAGEMENT REPORT

DIVIDENDS
The Management Board and the Supervisory Board will propose to the AnnualGeneral Meeting on May 7, 2020, to distribute a dividend of € 0.50 per share forthe financial year 2019 from PUMA SE’s net profit. This corresponds to an overallincrease in the dividend or dividend payout of 42.8% in 2019 compared to the pre-vious year. The payout ratio for financial year 2019 is 28.5% of consolidated netearnings. This is in accordance with PUMA SE’s dividend policy, which foresees apayout ratio of 25% to 35% of consolidated net earnings. The payment of the divi-dend is to take place in the days after the Annual General Meeting that decideson the distribution. A dividend of € 0.35 per share was distributed for the pre-vious year, taking into account the 1:10 stock split.
* Earnings per share and the number of outstanding shares for the prior periods were adjusted retroac-tively to the 1:10 stock split carried out in the second quarter of 2019** one/time special dividend
G.16 EARNINGS / DIVIDEND PER SHARE (in €)➔
137
Annual Report 2019 ↗ COMBINED MANAGEMENT REPORT
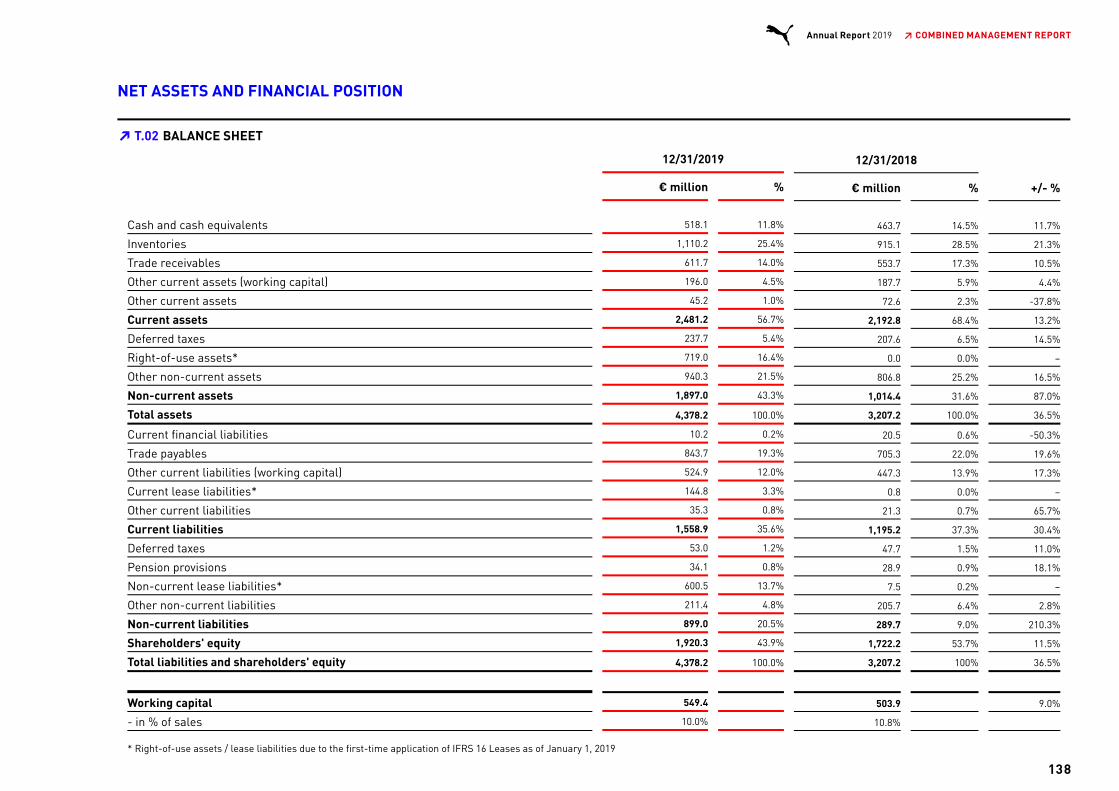
NET ASSETS AND FINANCIAL POSITION
12/31/2019 12/31/2018
€ million % € million % +/- %
Cash and cash equivalents 518.1 11.8% 463.7 14.5% 11.7%
Inventories 1,110.2 25.4% 915.1 28.5% 21.3%
Trade receivables 611.7 14.0% 553.7 17.3% 10.5%
Other current assets (working capital) 196.0 4.5% 187.7 5.9% 4.4%
Other current assets 45.2 1.0% 72.6 2.3% -37.8%
Current assets 2,481.2 56.7% 2,192.8 68.4% 13.2%
Deferred taxes 237.7 5.4% 207.6 6.5% 14.5%
Right-of-use assets* 719.0 16.4% 0.0 0.0% –
Other non-current assets 940.3 21.5% 806.8 25.2% 16.5%
Non-current assets 1,897.0 43.3% 1,014.4 31.6% 87.0%
Total assets 4,378.2 100.0% 3,207.2 100.0% 36.5%
Current financial liabilities 10.2 0.2% 20.5 0.6% -50.3%
Trade payables 843.7 19.3% 705.3 22.0% 19.6%
Other current liabilities (working capital) 524.9 12.0% 447.3 13.9% 17.3%
Current lease liabilities* 144.8 3.3% 0.8 0.0% –
Other current liabilities 35.3 0.8% 21.3 0.7% 65.7%
Current liabilities 1,558.9 35.6% 1,195.2 37.3% 30.4%
Deferred taxes 53.0 1.2% 47.7 1.5% 11.0%
Pension provisions 34.1 0.8% 28.9 0.9% 18.1%
Non-current lease liabilities* 600.5 13.7% 7.5 0.2% –
Other non-current liabilities 211.4 4.8% 205.7 6.4% 2.8%
Non-current liabilities 899.0 20.5% 289.7 9.0% 210.3%
Shareholders' equity 1,920.3 43.9% 1,722.2 53.7% 11.5%
Total liabilities and shareholders' equity 4,378.2 100.0% 3,207.2 100% 36.5%
Working capital 549.4 503.9 9.0%
- in % of sales 10.0% 10.8%
* Right-of-use assets / lease liabilities due to the first-time application of IFRS 16 Leases as of January 1, 2019
T.02 BALANCE SHEET➔
138
Annual Report 2019 ↗ COMBINED MANAGEMENT REPORT

IMPACT OF THE FIRST-TIME APPLICATION OF IFRS 16 LEASES
The following explanations refer to the impact of the first-time application of thenew accounting standard IFRS 16 Leases as of January 1, 2019. As a result of thenew standard all leases must be accounted for in the form of a right-of-use asseton the asset side of the balance sheet and a related current or non-current leaseliability on the liabilities side of the balance sheet. As part of the transition to thenew accounting for leases, PUMA elected to use the partial exemption provisionand has not performed a retrospective adjustment of the previous year’s figures.In the balance sheet above, the rights-of-use relating to assets and the lease lia-bilities were added as additional balance sheet items. The previous year's figuresremained unchanged. In order to ensure full comparability with the reported pre-vious year's figures, the impacts of the first-time application of IFRS 16 on PUMAGroup’s net assets in the financial year 2019 will be presented and explainedbelow.
The recognition in the balance sheet of the right-of-use assets in the amount of€ 719.0 million and the related current lease liabilities (€ 144.8 million) and non-current lease liabilities (€ 600.5 million) resulted in a significant increase of thebalance sheet total as of the balance sheet date on December 31, 2019. Theright-of-use assets refer to own retail stores totaling € 419.6 million, warehou-ses and distribution centers totaling € 175.7 million and other lease items, main-ly technical equipment and machines and motor vehicles totaling € 123.7 millionas of December 31, 2019.
The significantly increased balance sheet total specifically resulted in a decreaseof the equity ratio. The equity ratio, calculated as a quotient of equity and balancesheet total, decreased from 53.7% in the previous year to 43.9% as of December31, 2019. In absolute numbers, the equity of the PUMA Group, however, increasedby 11.5% from € 1,722.2 million to € 1,920.3 million. If the lease liabilities reco-gnized in the balanced sheet were disregarded for comparison purposes, theequity ratio as of December 31, 2019 would be almost unchanged at 52.9%.
The new leasing standard analogously caused a significant increase of the debtratio, calculated as the quotient of debt capital to equity. The ratio of debt to equi-ty was at 86% at the end of 2018. Due to the recognition of the lease liabilities on
the balance sheet, the debt ratio has now increased to 128% as of December 31,2019. If, for comparison purposes, the lease liabilities recognized on the balancesheet were disregarded, this would result in an almost unchanged debt ratio of89.2% as of December 31, 2019.
Please refer to the Notes to the Consolidated Financial Statements, chapter 1General for a detailed description of the new accounting standards and the ef-fects of the first-time application of IFRS 16 Leases.
139
Annual Report 2019 ↗ COMBINED MANAGEMENT REPORT
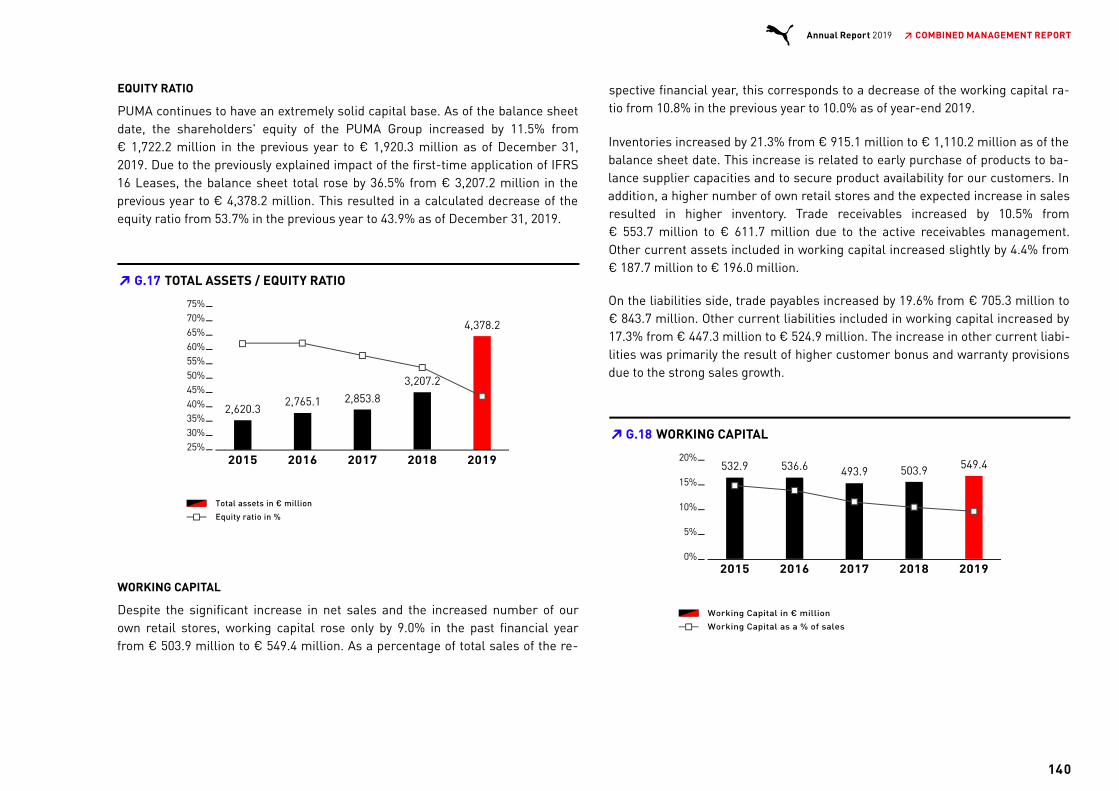
EQUITY RATIO
PUMA continues to have an extremely solid capital base. As of the balance sheetdate, the shareholders' equity of the PUMA Group increased by 11.5% from€ 1,722.2 million in the previous year to € 1,920.3 million as of December 31,2019. Due to the previously explained impact of the first-time application of IFRS16 Leases, the balance sheet total rose by 36.5% from € 3,207.2 million in theprevious year to € 4,378.2 million. This resulted in a calculated decrease of theequity ratio from 53.7% in the previous year to 43.9% as of December 31, 2019.
WORKING CAPITAL
Despite the significant increase in net sales and the increased number of ourown retail stores, working capital rose only by 9.0% in the past financial yearfrom € 503.9 million to € 549.4 million. As a percentage of total sales of the re-
spective financial year, this corresponds to a decrease of the working capital ra-tio from 10.8% in the previous year to 10.0% as of year-end 2019.
Inventories increased by 21.3% from € 915.1 million to € 1,110.2 million as of thebalance sheet date. This increase is related to early purchase of products to ba-lance supplier capacities and to secure product availability for our customers. Inaddition, a higher number of own retail stores and the expected increase in salesresulted in higher inventory. Trade receivables increased by 10.5% from€ 553.7 million to € 611.7 million due to the active receivables management.Other current assets included in working capital increased slightly by 4.4% from€ 187.7 million to € 196.0 million.
On the liabilities side, trade payables increased by 19.6% from € 705.3 million to€ 843.7 million. Other current liabilities included in working capital increased by17.3% from € 447.3 million to € 524.9 million. The increase in other current liabi-lities was primarily the result of higher customer bonus and warranty provisionsdue to the strong sales growth.
G.17 TOTAL ASSETS / EQUITY RATIO➔
G.18 WORKING CAPITAL➔
140
Annual Report 2019 ↗ COMBINED MANAGEMENT REPORT
OTHER ASSETS AND OTHER LIABILITIES
Other current assets, which only include the positive market value of derivativefinancial instruments, decreased compared to the previous year from € 72.6 mil-lion to € 45.2 million.
Right-of-use assets of € 719.0 million and related current and non-current leaseliabilities resulted from the first-time application of IFRS 16 Leases. The right-of-use assets referred to own retail stores totaling € 419.6 million, warehousesand distribution centers totaling € 175.7 million, and other leased items, mainlytechnical equipment, machines and motor vehicles totaling € 123.7 million as ofDecember 31, 2019.
Other non-current assets, which mainly comprise intangible assets and property,plant and equipment, rose as a consequence of the investment in non-currentassets by 16.5% from € 806.8 million to € 940.3 million.
Other current liabilities, which include the negative market value of derivative fi-nancial instruments, increased compared to the previous year from € 21.3 milli-on to € 35.3 million.
Pension provisions increased from € 28.9 million in the previous year to€ 34.1 million.
Other non-current liabilities, which mainly include the promissory note loans to-taling € 160.0 million, were € 211.4 million on the balance sheet date (previousyear: € 205.7 million).
141
Annual Report 2019 ↗ COMBINED MANAGEMENT REPORT

CASH FLOW
2019 2018
€ million € million +/- %
Earnings before tax (EBT) 417.6 313.4 33.3%
Financial result and non-cash affected expenses and income 287.2 84.7 –
Gross cash flow 704.8 398.0 77.1%
Change in current assets, net -44.5 -38.0 17.3%
Tax payments and dividends received -111.5 -81.9 36.1%
Net cash from operating activities 548.8 278.1 97.3%
Payments for acquisitions/ proceeds from the sale of shareholdings -1.2 23.5 –
Payments for investing in fixed assets -218.4 -130.2 67.7%
Other investing activities 0.8 1.4 -43.6%
Net cash used in investing activities -218.7 -105.3 107.8%
Free cash flow 330.0 172.9 90.9%
Free cash flow (before acquisitions) 331.2 149.4 121.7%
- in % of sales 6.0% 3.2%
Dividend payments to equity holders of the parent company -52.3 -186.8 -72.0%
Dividend payments to non-controlling interests -18.6 -55.7 -66.6%
Proceeds from borrowings 0.0 145.2 -100.0%
Repayments of borrowings -17.6 -16.6 5.8%
Repayments of lease liabilities -140.8 -1.8 –
Other proceeds/ payments -43.6 -12.6 –
Net cash used in financing activities -272.9 -128.3 112.7%
Exchange rate-related changes in cash and cash equivalents -2.8 4.2 –
Changes in cash and cash equivalents 54.3 48.7 11.5%
Cash and cash equivalents at the beginning of the financial year 463.7 415.0 11.7%
Cash and cash equivalents at the end of the financial year 518.1 463.7 11.7%
T.03 CASH FLOW STATEMENT➔
142
Annual Report 2019 ↗ COMBINED MANAGEMENT REPORT
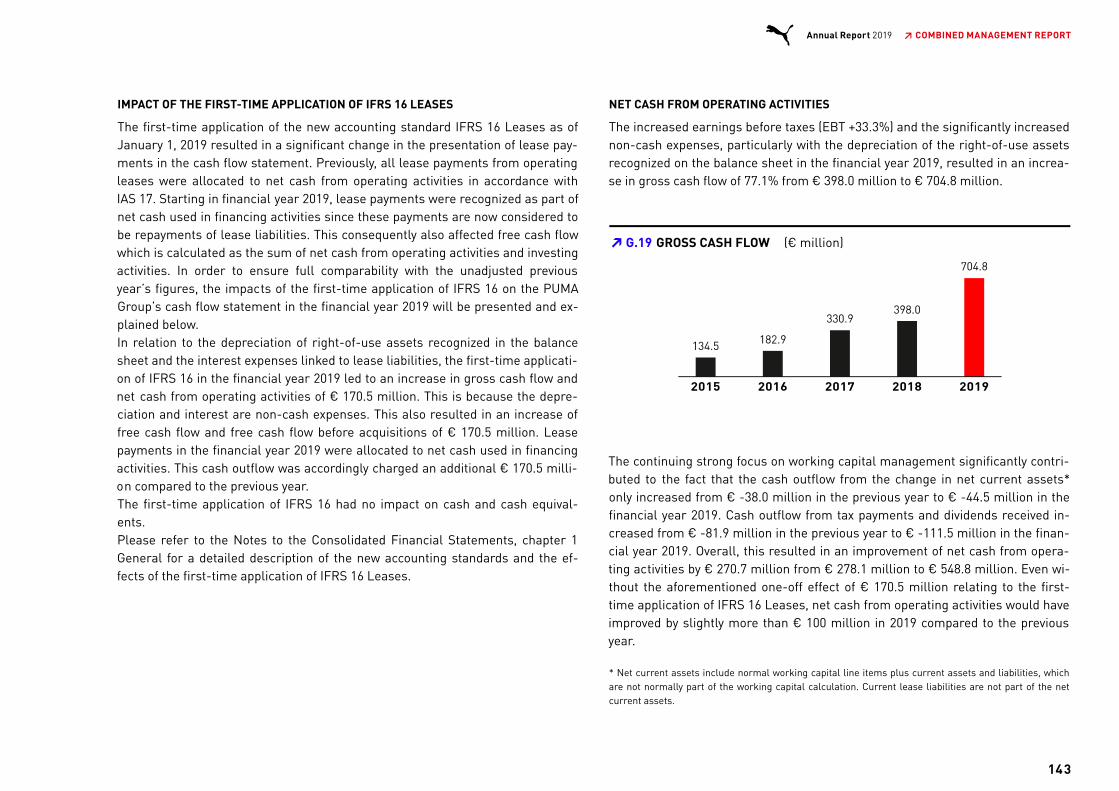
IMPACT OF THE FIRST-TIME APPLICATION OF IFRS 16 LEASES
The first-time application of the new accounting standard IFRS 16 Leases as ofJanuary 1, 2019 resulted in a significant change in the presentation of lease pay-ments in the cash flow statement. Previously, all lease payments from operatingleases were allocated to net cash from operating activities in accordance withIAS 17. Starting in financial year 2019, lease payments were recognized as part ofnet cash used in financing activities since these payments are now considered tobe repayments of lease liabilities. This consequently also affected free cash flowwhich is calculated as the sum of net cash from operating activities and investingactivities. In order to ensure full comparability with the unadjusted previousyear’s figures, the impacts of the first-time application of IFRS 16 on the PUMAGroup’s cash flow statement in the financial year 2019 will be presented and ex-plained below.In relation to the depreciation of right-of-use assets recognized in the balancesheet and the interest expenses linked to lease liabilities, the first-time applicati-on of IFRS 16 in the financial year 2019 led to an increase in gross cash flow andnet cash from operating activities of € 170.5 million. This is because the depre-ciation and interest are non-cash expenses. This also resulted in an increase offree cash flow and free cash flow before acquisitions of € 170.5 million. Leasepayments in the financial year 2019 were allocated to net cash used in financingactivities. This cash outflow was accordingly charged an additional € 170.5 milli-on compared to the previous year.The first-time application of IFRS 16 had no impact on cash and cash equival-ents.Please refer to the Notes to the Consolidated Financial Statements, chapter 1General for a detailed description of the new accounting standards and the ef-fects of the first-time application of IFRS 16 Leases.
NET CASH FROM OPERATING ACTIVITIES
The increased earnings before taxes (EBT +33.3%) and the significantly increasednon-cash expenses, particularly with the depreciation of the right-of-use assetsrecognized on the balance sheet in the financial year 2019, resulted in an increa-se in gross cash flow of 77.1% from € 398.0 million to € 704.8 million.
The continuing strong focus on working capital management significantly contri-buted to the fact that the cash outflow from the change in net current assets*only increased from € -38.0 million in the previous year to € -44.5 million in thefinancial year 2019. Cash outflow from tax payments and dividends received in-creased from € -81.9 million in the previous year to € -111.5 million in the finan-cial year 2019. Overall, this resulted in an improvement of net cash from opera-ting activities by € 270.7 million from € 278.1 million to € 548.8 million. Even wi-thout the aforementioned one-off effect of € 170.5 million relating to the first-time application of IFRS 16 Leases, net cash from operating activities would haveimproved by slightly more than € 100 million in 2019 compared to the previousyear.
* Net current assets include normal working capital line items plus current assets and liabilities, whichare not normally part of the working capital calculation. Current lease liabilities are not part of the netcurrent assets.
G.19 GROSS CASH FLOW (€ million)➔
143
Annual Report 2019 ↗ COMBINED MANAGEMENT REPORT

NET CASH USED IN INVESTING ACTIVITIES
Net cash used in investing activities rose from € 105.3 million to € 218.7 millionin the financial year 2019. The investments in fixed assets increased in accor-dance with our investment plan from € 130.2 million in the previous year to€ 218.4 million in 2019. The increase referred primarily to investments in own re-tail stores and into the new multi-channel distribution center in Germany. In ad-dition, investments into the improvement of the IT infrastructure continued.Payments for acquisitions in 2019 were related to the acquisition of the remai-ning shares of the Genesis Group International Ltd.
FREE CASH FLOW BEFORE ACQUISITIONS
The free cash flow before acquisitions is the balance of the cash inflows and out-flows from operating and investing activities. In addition, an adjustment is madefor incoming and outgoing payments that relate to shareholdings.Free cash flow before acquisitions increased from € 149.4 million in the previousyear to € 331.2 million in the financial year 2019. Free cash flow before acquisiti-
ons was 6.0% of sales compared to 3.2% in the previous year.Without the one-off positive effect of € 170.5 million as a result of the first-timeapplication of IFRS 16 Leases, the free cash flow before acquisitions would haveimproved by 7.6% or € 11.3 million in 2019 compared to the previous year.
G.20 FREE CASH FLOW (BEFORE ACQUISITIONS) (€ million)➔
144
Annual Report 2019 ↗ COMBINED MANAGEMENT REPORT

NET CASH USED IN FINANCING ACTIVITIES
Net cash used in financing activities mainly includes € 52.3 million in dividendpayments to shareholders of PUMA SE in the financial year 2019 (previous year:€ 186.8 million) and dividend payments to non-controlling interests of € 18.6 mil-lion (previous year: € 55.7 million). Furthermore, the net cash used in financingactivities for the first time contains the repayment of lease liabilities and relatedinterest expenses totaling € 170.5 million. Overall, the net cash used in financingactivities was € 272.9 million in 2019 (previous year: cash outflows of€ 128.3 million).Without the one-off negative effect of € 170.5 million as a result of the first-timeapplication of IFRS 16 Leases, net cash used in financing activities would havedecreased by € 25.9 million in 2019 compared to the previous year.
As of December 31, 2019, PUMA had cash and cash equivalents of € 518.1 milli-on, an increase of 11.7% compared to the previous year (€ 463.7 million). ThePUMA Group also had credit lines totaling € 687.6 million as of December 31,2019 (previous year: € 691.9 million). Unutilized credit lines totaled € 514.1 milli-on on the reporting date, compared to € 501.0 million in the previous year.
145
Annual Report 2019 ↗ COMBINED MANAGEMENT REPORT
STATEMENT REGARDING THE BUSINESS DEVELOPMENT AND THE OVERALL SITUATION OF THE GROUP
Overall, we are very satisfied with the business and economic development of thePUMA Group in the past financial year. In 2019, PUMA was able to fully achieve oreven slightly exceed its financial targets, which had already been raised duringthe year. We owe this in particular to the further consistent implementation ofour "Forever Faster" corporate strategy. We have therefore continued to maketargeted investments in marketing and concluded contracts with internationallyrenowned football clubs, such as Manchester City and Valencia CF, to strengthenour position as a sports brand and further increase our brand heat. Moreover, thestrategic focus on the further improvement of our product range for women andthe return to basketball have significantly contributed to the successful businessperformance in 2019. The opening of our new flagship store on Fifth Avenue inNew York and the project launch of our new multi-channel distribution centers inGermany and the U.S. represented additional milestones in PUMA's organizatio-nal development in the past financial year.
PUMA was again able to record a strong growth in sales with a currency-adjustedsales growth of 16.7% in 2019. All regions and all product divisions contributed tothis development with double-digit growth. In 2019, we were also once again ableto make significant improvements in terms of profitability. In 2019, the operatingresult (EBIT), net earnings and earnings per share increased by more than 30%compared to the previous year. In addition to the strong sales growth, this is pri-marily due to the improvement in the gross profit margin and also to the decrea-se in the cost ratio of other operating expenses. In the past financial year, theoperating result of € 440.2 million was even slightly above our forecast of € 420million to € 430 million, which had been raised during the year. Earnings per
share rose by 40% from € 1.25 to € 1.76 compared to the previous year. This me-ans we fully achieved and even slightly exceeded our profitability targets in thepast financial year.
With regards to the balance sheet, we believe that PUMA has continued to havean extremely solid capital base. On the balance sheet date, the equity of thePUMA Group was more than € 1.9 billion (previous year: € 1.7 billion) and theequity ratio was just under 44%. Furthermore, the consistent focus on workingcapital management contributed to the fact that working capital increased byonly 9% compared to the previous year despite the significant increase in sales.The increase in earnings before taxes (EBT) and the working capital managementin the past financial year also contributed to a significant improvement in cashflow. Free cash flow before acquisitions improved in 2019 by 7.6% or € 11.3 milli-on to € 331.2 million, even if the one-off positive effect of € 170.5 million fromthe first-time application of IFRS 16 is disregarded. Cash and cash equivalentsamounted to € 518.1 million on the balance sheet date (previous year: € 463.7million).
As a result, the asset, financial and income situation of the PUMA Group is over-all solid at the time the Combined Management Report was prepared. Thisenables the Management Board and the Supervisory Board to propose to the An-nual General Meeting on May 7, 2020, a dividend of € 0.50 per share for the fi-nancial year 2019. This corresponds to a payout ratio of 28.5% in relation to theconsolidated net earnings and is in line with our dividend policy.
146
Annual Report 2019 ↗ COMBINED MANAGEMENT REPORT

COMMENTS ON THE FINANCIAL STATEMENTS OF PUMA SEIN ACCORDANCE WITH THE GERMAN COMMERCIAL CODE(HGB)
RESULTS OF OPERATIONS
2019 2018
€ million % € million % +/- %
Net sales 722.3 100.0% 675.3 100.0% 7.0%
Other operating income 62.1 8.6% 50.8 7.5% 22.4%
Material Expenses -233.8 -32.4% -224.9 -33.3% 3.9%
Personnel Expenses -107.2 -14.8% -101.7 -15.1% 5.5%
Depreciation -24.8 -3.4% -20.1 -3.0% 23.5%
Other operating expenses -560.8 -77.6% -492.1 -72.9% 13.9%
Total expenses -926.6 -128.3% -838.8 -124.2% 10.5%
Financial Result 223.5 30.9% 212.9 31.5% 5.0%
Income before taxes 81.3 11.3% 100.1 14.8% -18.7%
Income Tax -12.8 -1.8% -16.8 -2.5% -23.5%
Net income 68.5 9.5% 83.3 12.3% -17.8%
PUMA SE’s financial statements have been prepared pursuant to the rules of theGerman Handelsgesetzbuch (HGB - German Commercial Code).
PUMA SE is the parent company of the PUMA Group. PUMA SE's results are si-gnificantly influenced by the directly and indirectly held subsidiaries and share-holdings. The business development of PUMA SE is essentially subject to thesame risks and opportunities as the PUMA Group.
PUMA SE is responsible for wholesale business in the DACH region, consisting ofthe home market of Germany, Austria, and Switzerland. Furthermore, PUMA SEis also responsible for the pan-European distribution for individual key accountsand sourcing products from European production countries as well as global li-censing management. In addition, PUMA SE acts as a holding company withinthe PUMA Group and is as such responsible for international product develop-ment, merchandising, international marketing, the global areas of finance, ope-rations and PUMA’s strategic direction.
T.04 PROFIT AND LOSS STATEMENT (GERMAN GAAP, HGB)➔
147
Annual Report 2019 ↗ COMBINED MANAGEMENT REPORT

Net sales rose in the financial year 2019 overall by 7.0% to € 722.3 million. Theincrease resulted from both increased product sales and commission incomefrom license management. Revenue from PUMA SE product sales increased by7.6% to € 354.6 million. The royalty and commission income included in net salesincreased by 10.7% to € 335.6 million. The other revenue, which mainly consistedof recharges of costs to affiliated companies was € 32.1 million in 2019 (previousyear: € 42.4 million).
Other operating income amounted to € 62.1 million in 2019 (previous year:€ 50.8 million) and includes in particular realized and unrealized gains from cur-rency conversion related to the measurement of receivables and payables in for-eign currencies on the balance sheet date.
The total expenditure from material expenses, personnel expenses, depreciationand other operating expenses increased by 10.5% to € 926.6 million compared tothe previous year (previous year: total € 838.8 million). The increase in materialexpenses was associated with the increase in sales. Depreciation increased pri-marily due to investments in IT and the expansion of the administration buildingin Herzogenaurach in the previous year. Other operating expenses increasedcompared to the previous year due to higher marketing expenditures as a resultof new sponsoring agreements with clubs and athletes. Furthermore, higherwarehousing and freight costs, in relation to the increase in sales and higher in-ventory, contributed to the increase in other operating expenses.
The financial result improved compared to the previous year by 5.0% to€ 223.5 million. The improvement was due to higher dividends from affiliatedcompanies, while the income from the transfer of profits from affiliated compa-nies decreased and expenses from loss transfers increased.
Income before taxes fell in 2019 by 18.7% from € 100.1 million to € 81.3 million.Taxes on income amounted to € 12.8 million (previous year: € 16.8 million). The-se include current income taxes for 2019 totaling € 2.1 million, taxes on incomefrom previous years of € 0.1 million, and expenditures for foreign withholding ta-xes on license and dividend payments in 2019 of € 15.8 million. In addition, inco-me tax reimbursements of € 5.2 million for previous years, after a mutual agree-ment procedure has been settled, are included. Net income in the financial year2019 was € 68.5 million compared to € 83.3 million in the previous year.
148
Annual Report 2019 ↗ COMBINED MANAGEMENT REPORT

NET ASSETS
12/31/2019 12/31/2018
€ million % € million % +/- %
Total non-current assets 1,053.7 63.0% 657.9 48.4% 60.2%
Inventories 59.8 3.6% 52.9 3.9% 13.2%
Receivables and other currentassets 504.8 30.2% 576.4 42.4% -12.4%
Cash and cash equivalents 47.2 2.8% 59.5 4.4% -20.6%
Total current assets 611.8 36.6% 688.8 50.6% -11.2%
Other 8.0 0.5% 13.9 1.0% -42.5%
Total assets 1,673.5 100.0% 1,360.6 100.0% 23.0%
Shareholders' equity 582.8 34.8% 564.3 41.5% 3.3%
Accruals / provisions 112.1 6.7% 101.5 7.5% 10.5%
Liabilities 978.6 58.5% 694.5 51.0% 40.9%
Other 0.0 0.0% 0.3 0.0% -100.0%
Total liabilities and shareholders'equity 1,673.5 100.0% 1,360.6 100.0% 23.0%
Non-current assets increased in 2019 by 60.2% to € 1,053.7 million. The increasewas mainly due to capital increases at the subsidiaries of PUMA SE, leading to anincrease in these investments in affiliated companies. The investments in a newbuilding with showrooms at the Herzogenaurach location and in IT also contribu-ted to the increase.
Within current assets, inventories increased by 13.2% to € 59.8 million. By con-trast, trade receivables and other assets fell by 12.4% to € 504.8 million compa-red to the previous year. This development is primarily due to the decrease in re-ceivables from affiliated companies. Cash and cash equivalents decreased by20.6% to € 47.2 million compared to the previous year.
On the liabilities side, equity increased by 3.3% to € 582.8 million due to the netincome for 2019, taking into account the dividend paid out in 2019. Provisions in-creased by 10.5% to € 112.1 million compared to the previous year due to higherprovisions for personnel and outstanding invoices. The increase in liabilities by40.9% to € 978.6 million was mainly the result of an increase in liabilities to affi-liated companies. Due to this development, the equity ratio fell from 41.5% to34.8% on the balance sheet date.
FINANCIAL POSITION
2019 2018
€ million € million +/- %
Net cash from operating activities 27.6 -12.9 > -100%
Net cash used in investingactivities -114.0 -72.7 56.8%
Free cash flow -86.4 -85.6 1.0%
Net cash from financing activities 74.2 25.7 >100%
Change in cash and cashequivalents -12.2 -59.9 -79.6%
Cash and cash equivalents atbeginning of the financial year 59.5 119.4 -50.2%
Cash and cash equivalents at theend of the financial year 47.2 59.5 -20.6%
T.05 BALANCE SHEET (GERMAN GAAP, HGB)➔
T.06 CASH FLOW STATEMENT (GERMAN GAAP, HGB)➔
149
Annual Report 2019 ↗ COMBINED MANAGEMENT REPORT
Net cash from operating activities improved to € 27.6 million. This is primarilythe result of a reduction in working capital as of the balance sheet date due tohigher liabilities to affiliated companies. Net cash used in investing activities in-creased from € -72.7 million to € -114.0 million due to investments in non-cur-rent assets and equity interests in affiliated companies. Free cash flow remainednearly unchanged at € -86.4 million compared to the previous year(€ -85.6 million).
Net cash from financing activities showed a cash inflow of € 74.2 million in 2019(previous year: € 25.7 million). The cash inflow was mainly due to an increase inliabilities to affiliated companies. This led to an overall reduction in cash andcash equivalents from € 59.5 million to € 47.2 million. In addition, PUMA SE hasaccess to a syndicated credit line of € 350.0 million, which at the balance sheetdate had not been utilized. The credit line is to be used for general corporate fi-nancing purposes, such as the financing of short-term, seasonal financing needsfrom goods purchases. In addition, medium- and long-term funding needs arecovered by a promissory note loan of € 160.0 million (previous year:€ 160.0 million).
OUTLOOKFor the financial year 2020 we expect an increase of sales at a mid-single-digitrate and a moderate increase of income before taxes.
150
Annual Report 2019 ↗ COMBINED MANAGEMENT REPORT
FURTHER INFORMATION
INFORMATION CONCERNING TAKEOVERS
The following information, valid December 31, 2019, is presented in accordancewith Art. 9 p. 1 c) (ii) of the SE Regulation in conjunction with Sections 289a, 315aGerman Commercial Code (HGB). Details under Sections 289a, 315a HGB whichdo not apply at PUMA SE are not mentioned.
Composition of the subscribed capital (Sections 289a [1][1][1], 315a [1][1][3] HGB)
On the balance sheet date, subscribed capital totaled € 150,824,640.00 and wasdivided into 150.824.640 no-par-value shares with a proportional amount in thestatutory capital of EUR 1.00 per share. As of the balance sheet date, the Compa-ny held 1,276,839 treasury shares.
Shareholdings exceeding 10% of the voting rights (Sections 289a [1][1][3], 315a[1][1][3] HGB)
As of December 31, 2019, there was one shareholding in PUMA SE that exceeded10% of the voting rights. It was held by the Pinault family via several companiescontrolled by them (ranked by size of stake held by the Pinault family: FinancièrePinault S.C.A., Artémis S.A.S. and Kering S.A.). The shareholding of Kering S.A. inPUMA SE amounted to 15.7% of the share capital according to Kering’s press re-lease from May 16, 2018. The shareholding of Artémis S.A.S. and Kering S.A.amounts to 44.22% of the share capital according to their voting rights notif-ication as of May 24, 2018.
Statutory provisions and regulations of the Articles of Association on the appoint-ment and dismissal of the members of the Management Board and on amend-ments to the Articles of Association (Sections 289a [1][1][6], 315a [1][1][6] HGB)
Regarding the appointment and dismissal of the members of the ManagementBoard, reference is made to the applicable statutory requirements of § 84 Ger-man Stock Corporation Act (AktG). Moreover, Section 7[1] of PUMA SE’s Articlesof Association stipulates that Management Board shall consist of two members
in the minimum; the Supervisory Board determines the number of members inthe Management Board. The Supervisory Board may appoint deputy members ofthe Management Board and appoint a member of the Management Board aschairperson of the Management Board. Members of the Management Board maybe dismissed only for good cause, within the meaning of Section 84[3] of the Ger-man Stock Corporation Act (AktG) or if the employment agreement is terminated,in which case a resolution must be adopted by the Supervisory Board with a sim-ple majority of the votes cast.
Amendments to the Articles of Association of the Company require a resolutionby the Annual General Meeting. Resolutions of the Annual General Meeting re-quire a majority according to Art. 59 SE Regulation and Sections 133[1], 179 [2][1] German Stock Corporation Act (AktG) (i.e. a simple majority of votes and amajority of at least three quarters of the share capital represented at the timethe resolution is adopted). The Company has not made use of Section 51 SEAG.
Authority of the Management Board to issue or repurchase shares (Sections 289a[1][1][7], 315a [1][1][7] HGB)
The authority of the Management Board to issue shares result from Section 4 ofthe Articles of Association and from the statutory provisions:
Authorized Capital
The Management Board shall be authorized with the approval of the SupervisoryBoard to increase the share capital of the Company by up to EUR 15,000,000.00by issuing, once or several times, new no par-value bearer shares against contri-butions in cash and/or kind until 11 April 2022 (Authorized Capital 2017). In caseof capital increases against contributions in cash, the new shares may be acqui-red by one or several banks, designated by the Management Board, subject tothe obligation to offer them to the shareholders for subscription (indirect pre-emption right).
151
Annual Report 2019 ↗ COMBINED MANAGEMENT REPORT

The shareholders shall generally be entitled to pre-emption rights. However, theManagement Board shall be authorized with the approval of the SupervisoryBoard to partially or completely exclude pre-emption rights
to avoid peak amounts;
in case of capital increases against contributions in cash if the pro-ra-ted amount of the share capital attributable to the new shares for whichpre-emption rights have been excluded does not exceed 10% of the sha-re capital and the issue price of the newly created shares is not signifi-cantly lower than the relevant exchange price for already listed sharesof the same class, Section 186 (3) sentence 4 AktG. The 10% limit of theshare capital shall apply at the time of the resolution on this authorizat-ion by the Annual General Meeting as well as at the time of exercise ofthe authorization. Shares of the Company (i) which are issued or soldduring the term of the Authorised Capital 2017 excluding shareholders’pre-emption rights directly or respectively applying Section 186 (3) sen-tence 4 AktG or (ii) which are or can be issued to service option and con-vertible bonds applying Section 186 (3) sentence 4 AktG while excludingshareholders’ pre-emption rights during the term of the Authorised Ca-pital 2017, shall be counted towards said limit of 10%.;
in case of capital increases against contributions in cash insofar as it isrequired to grant pre-emption rights regarding the Company’s shares toholders of option or convertible bonds which have been or will be issuedby the Company or its direct or indirect subsidiaries to such an extent towhich they would be entitled after exercising option or conversion rightsor fulfilling the conversion obligation as a shareholder;
in case of capital increases against contributions in kind for carrying outmergers or for the (also indirect) acquisition of companies, participationin companies or parts of companies or other assets including intellectu-
al property rights and receivables against the Company or any compa-nies controlled by it in the sense of Section 17 AktG.
The total amount of shares issued or to be issued based upon this authorizationwhile excluding shareholders’ pre-emption rights may neither exceed 20% of theshare capital at the time of the authorization becoming effective nor at the timeof exercising the authorization; this limit must include all shares which havebeen disposed of or issued or are to be issued during the term of this authorizati-on based on other authorizations while excluding pre-emption rights or whichare to be issued because of an issue of option or convertible bonds during theterm of this authorization while excluding pre-emption rights.
The Management Board shall be entitled with the approval of the SupervisoryBoard to determine the remaining terms of the rights associated with the newshares as well as the conditions of the issuance of shares.
The Management Board of PUMA SE did not make use of the existing AuthorizedCapital 2017 in the current reporting period.
Conditional Capital
The Annual General Meeting of 12 April 2018 has authorized the ManagementBoard until 11 April 2023 with the approval of the Supervisory Board to issueonce or several times, in whole or in part, and at the same time in different tran-ches bearer and/or registered convertible bonds and/or bonds with warrants,and participation rights and/or participating bonds or combinations thereof withor without maturity restrictions in the total nominal amount of up to EUR1,000,000,000.00 (Conditional Capital 2018).
152
Annual Report 2019 ↗ COMBINED MANAGEMENT REPORT
The share capital is conditionally increased by up to EUR 30,164,920.00 by issueof up to 30,164,920 new no-par bearer shares. The conditional capital increaseshall only be implemented to the extent that option/conversion rights are exer-cised or the option/conversion obligations are performed or tenders are carriedout and to the extent that other forms of performance are not applied.
No use has been made of this authorization to date.
Authorization to purchase treasury shares
The resolution adopted by the Annual General Meeting on May 6, 2015 authorizedthe company to purchase treasury shares up to a value of 10% of the share capi-tal until May 5, 2020.
Significant agreements of the Company which are subject to a change of controlas a result of a takeover bid and the resulting effects (Section 289a [1][1][8], 315a[1][1][8] HGB)
Material financing agreements of PUMA SE with its creditors contain the stan-dard change-of-control clauses. In the case of change of control the creditor isentitled to termination and early calling-in of any outstanding amounts.
For more details, please refer to the relevant disclosures in the Notes to the Con-solidated Financial Statements (chapter 18).
153
Annual Report 2019 ↗ COMBINED MANAGEMENT REPORT

COMPENSATION REPORTCOMPENSATION PHILOSOPHY
The Management Board compensation system is designed to create incentivesfor a sustainable and profit-oriented company performance. The objective of thecompensation system is to stimulate the implementation of long-term Groupstrategy by ensuring that the relevant success parameters that govern the per-formance-based compensation are aligned with the PUMA SE management sys-tem. Furthermore, the long-term interests of our shareholders are taken into ac-count by making the variable compensation strongly dependent on the perfor-mance of the PUMA SE share.With a greater share of performance-based and therefore variable compensati-on, the intention is to reward the contribution of our Management Board mem-bers towards a sustainable development of our Company, while negative deviati-ons from the set targets will result in a significant reduction of variablecompensation.
GOVERNANCE IN COMPENSATION MATTERS
It is the responsibility of the PUMA SE Supervisory Board to determine the com-pensation of the Management Board. The entire Supervisory Board decides onmatters relating to the compensation of the Management Board members basedon the respective recommendations of the Personnel Committee which is com-prised of members of the Supervisory Board. Criteria for calculating the totalcompensation are the responsibilities and performance of the individual Ma-nagement Board member, the economic situation, long-term strategic planningand related goals, the sustainability of targeted results and the company’s long-term prospects.
OVERVIEW OF COMPENSATION ELEMENTS
The compensation of the Management Board consists of non-performance-ba-sed and performance-based components. The non-performance-based compon-ents comprise the basic compensation, company pension contributions and otherfringe benefits, while the performance-based components are divided into twoparts, a bonus and a component with long-term incentive effect:
154
Annual Report 2019 ↗ COMBINED MANAGEMENT REPORT

* Figures in % of target compensation (total 100 %)CEO: Chief Executive Officer / OBM: Ordinary Board Member
G.21 TARGET COMPENSATION STRUCTURE➔
155
Annual Report 2019 ↗ COMBINED MANAGEMENT REPORT
NON-PERFORMANCE-BASED COMPENSATION AND FRINGE BENEFITS
BASIC COMPENSATION
The members of the Management Board receive a fixed basic salary which ispaid monthly. This salary is based on the duties and responsibilities of the mem-ber of the Management Board. For employment periods of less than twelvemonths in a calendar year, all compensation payments are paid on a proratedbasis.
FRINGE BENEFITS
In addition, the Management Board members receive in-kind compensation,such as use of company cars, accident insurance and D&O insurance. These arepart of the non-performance-based compensation.
COMPANY PENSION
Pension benefits are available for the members of the Management Board in theform of deferred compensation paid out of the performance-based and/or thenon-performance-based compensation, and for which the Company has takenout pension liability insurance. The proportion of the pension capital that is alre-ady financed through contributions to the pension liability insurance is deemed tobe vested.
PERFORMANCE-BASED COMPENSATION
In addition to the non-performance-based compensation, the members of theManagement Board receive performance-based and therefore variable compen-sation. The amount of this compensation is based on the attainment of previously
defined financial and non-financial targets. It consists of a bonus and a compo-nent with a long-term incentive effect. In the event of any outstanding perfor-mance, the Supervisory Board may, at its discretion, grant the members of theManagement Board a voluntary one-off payment.
SHORT-TERM VARIABLE COMPENSATION – BONUS
As part of the performance-based compensation, the bonus is primarily based onthe financial goals of the operating result (EBIT) and free cash flow (FCF) of thePUMA Group and the individual performance of the respective ManagementBoard member as well as the attainment of Group-wide sustainability targets.The Supervisory Board assesses the individual performance of the ManagementBoard member based on previously defined criteria, such as sustainable lea-dership, strategic vision and good corporate governance. The sustainability tar-gets include goals to reduce CO emissions, compliance targets and occupationalhealth and safety objectives, are applied throughout the PUMA Group and mea-sured quantitively on a standardized basis. The two financial success targets areweighted with 60% for EBIT and 20%, respectively, for FCF. The individual perfor-mance is included in the calculation with a weighting of 15%. The degree towhich the sustainability targets have been achieved is taken into account in thecalculation with a weighting of 5%. If 100% of the target is achieved ("target bo-nus"), the amount of the bonus, is 100% of the annual basic compensation for theChair of the Management Board and the Management Board members.
The aforementioned performance targets are combined. For EBIT, FCF and thesustainability targets, the bandwidth of possible target attainments ranges from0% to 150%. It is therefore possible that no short-term variable compensation atall is paid out if minimum targets are not attained.
2
156
Annual Report 2019 ↗ COMBINED MANAGEMENT REPORT

An identical target attainment curve has been created, respectively, for the twofinancial goals. If the budget target for EBIT or FCF is reached, the target attain-ment is 100% (target value). If EBIT/FCF are less than 95% of the target value,this results in a target attainment of 0%. If EBIT/FCF reach 95% of the target va-lue, the target attainment is 50%. If EBIT/FCF reach 120% or more above targetvalue, the target attainment is limited to 150% (maximum value). Target attain-ments between the determined target attainment points are interpolated on alinear basis. This results in the following target attainment curve for the EBITand FCF performance targets:
G.22 STI-PLAN➔
G.23 TARGET ATTAINMENT CURVE EBIT/FCF➔
157
Annual Report 2019 ↗ COMBINED MANAGEMENT REPORT

TARGET ATTAINMENT SUSTAINABILITY TARGETS
The Supervisory Board determines four target criteria for calculating thesustainability targets every year. At the end of the performance period, the Su-pervisory Board evaluates the degree of attainment of the target criteria. Forevery target criterion that has been met or exceeded, a target attainment percen-tage of 1.25% is credited.
LONG-TERM VARIABLE SHARE-BASED COMPENSATION – PUMA MONETARY UNITSPLAN 2019 (LTI)
The long-term variable compensation program of PUMA SE (PUMA MonetaryUnits Plan) is designed as a future-oriented, virtual shareholding with cash pay-ments. As part of this program, virtual shares of PUMA SE, the "Monetary Units",are allocated at the start of a three-year vesting period, at the end of which theholder is eligible to receive a cash payment. The amount of the allocation value is240% of the annual basic salary for the Chair of the Management Board and110% of the basic salary for the other Management Board members. The num-ber of the allocated Monetary Units is determined by dividing the allocation valueby the value of one PUMA Monetary Unit. The relevant value of a Monetary Unitfor the tranche of the following year is calculated once per year at the end of De-cember as the average value of the PUMA SE share over the past 30 trading days.The amount of the cash payment is therefore a result of the absolute develop-ment of the PUMA SE share. At the end of the three-year vesting period, the Ma-nagement Board members are able to exercise their Monetary Units within a pe-riod of two years. The payment of the amount can be requested on a quarterlybasis. The value of the Monetary Units is the average value of the PUMA SE shareover the last 30 trading days before the next quarterly report. The fundamentalexercise condition after the vesting period is the existence of an active employ-ment relationship with PUMA SE until the end of the vesting period.
158
Annual Report 2019 ↗ COMBINED MANAGEMENT REPORT
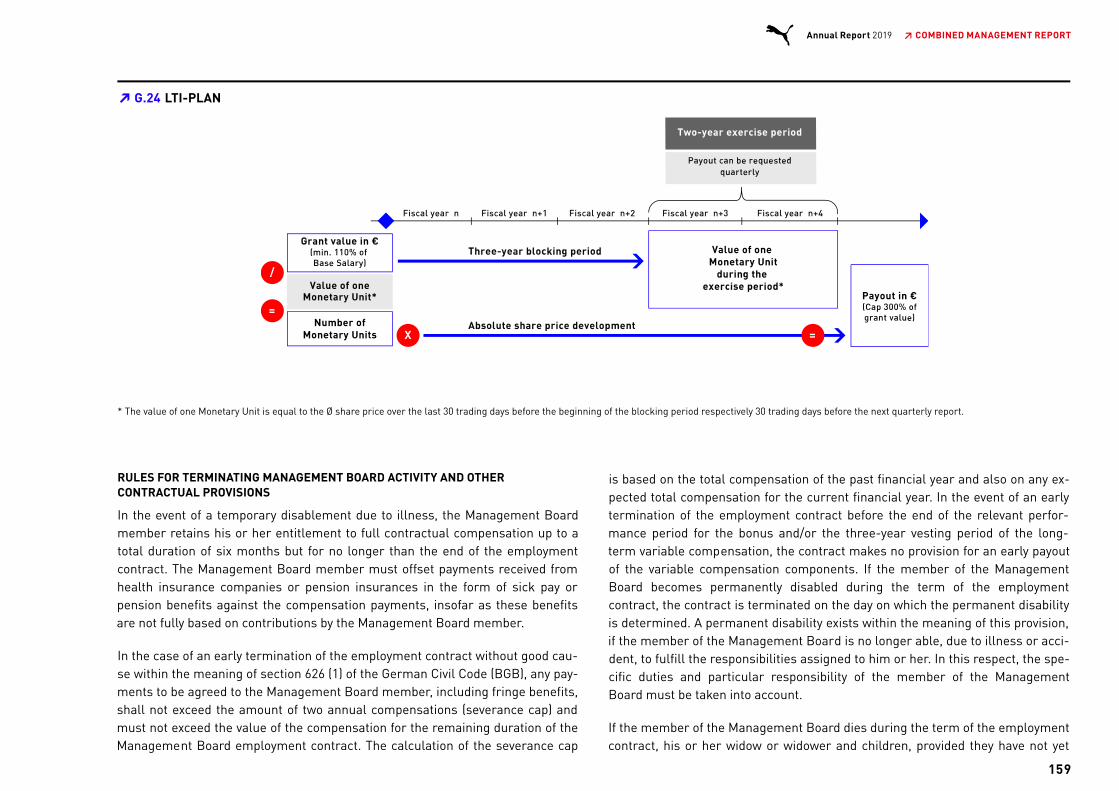
* The value of one Monetary Unit is equal to the Ø share price over the last 30 trading days before the beginning of the blocking period respectively 30 trading days before the next quarterly report.
RULES FOR TERMINATING MANAGEMENT BOARD ACTIVITY AND OTHERCONTRACTUAL PROVISIONS
In the event of a temporary disablement due to illness, the Management Boardmember retains his or her entitlement to full contractual compensation up to atotal duration of six months but for no longer than the end of the employmentcontract. The Management Board member must offset payments received fromhealth insurance companies or pension insurances in the form of sick pay orpension benefits against the compensation payments, insofar as these benefitsare not fully based on contributions by the Management Board member.
In the case of an early termination of the employment contract without good cau-se within the meaning of section 626 (1) of the German Civil Code (BGB), any pay-ments to be agreed to the Management Board member, including fringe benefits,shall not exceed the amount of two annual compensations (severance cap) andmust not exceed the value of the compensation for the remaining duration of theManagement Board employment contract. The calculation of the severance cap
is based on the total compensation of the past financial year and also on any ex-pected total compensation for the current financial year. In the event of an earlytermination of the employment contract before the end of the relevant perfor-mance period for the bonus and/or the three-year vesting period of the long-term variable compensation, the contract makes no provision for an early payoutof the variable compensation components. If the member of the ManagementBoard becomes permanently disabled during the term of the employmentcontract, the contract is terminated on the day on which the permanent disabilityis determined. A permanent disability exists within the meaning of this provision,if the member of the Management Board is no longer able, due to illness or acci-dent, to fulfill the responsibilities assigned to him or her. In this respect, the spe-cific duties and particular responsibility of the member of the ManagementBoard must be taken into account.
If the member of the Management Board dies during the term of the employmentcontract, his or her widow or widower and children, provided they have not yet
G.24 LTI-PLAN➔
159
Annual Report 2019 ↗ COMBINED MANAGEMENT REPORT

reached the age of 27, are entitled as joint creditors to receive the unreducedcontinued payment of the fixed compensation for the month in which the deathoccurred and for the six following months, but for no longer than up to the end ofthe regular term of the contract.
MANAGEMENT BOARD COMPENSATION
The following tables show the compensation paid during the financial year andinflows during or for the reporting year and the total related pension expensesfor all Management Board members.*
2018 20192019(min)
2019(max)
Fixed compensation 2.3 2.0 2.0 2.0
Fringe Benefits 0.1 0.1 0.1 0.1
Total 2.4 2.1 2.1 2.1
Short-term variable compensation 2.8 2.7 0.0 3.0
Long-term variable share-basedcompensation
LTI 2019 (2019 to 2021) 3.9 0.0 11.8
LTI 2018 (2018 to 2020) 4.3
Total variable compensation 7.0 6.6 0.0 14.8
Pension expenses 0.5 0.4 0.4 0.4
Total compensation 9.9 9.1 2.4 17.3
The grants and inflows shown below include the portion of the compensation of Ms. Anne-Laure Des-cours granted to Ms. Descours for her services as a member of the Management Board of PUMA SE. Inaddition, Ms. Descours receives compensation for her function as General Manager PUMA Group Sour-cing of World Cat Ltd, Hong Kong, a subsidiary of PUMA SE.
2018 2019
Fixed compensation 2.3 2.0
Fringe Benefits 0.1 0.1
Total 2.4 2.1
Short-term variable compensation 2.8 2.7
Long-term variable share-based compensation
LTI 2016 (2016 to 2018) 1.7
LTI 2015 (2015 to 2017) 8.8
Total variable compensation 11.6 4.3
Pension expenses 0.5 0.4
Total compensation 14.4 6.8
Pension benefits are available for the members of the Management Board in theform of deferred compensation paid out of the performance-based and/or thenon-performance-based compensation, for which the Company has taken outpension liability insurance. The proportion of the pension capital that is alreadyfinanced through contributions to the pension liability insurance is deemed to bevested. During the financial year, PUMA allocated € 0.4 million for members ofthe Management Board (previous year: € 0.5 million). The present value of thepension benefits granted to active Management Board members of € 10.8 millionas of December 31, 2019 (previous year: € 10.1 million) was netted against thepledged asset value of the pension liability insurance on the balance sheet.
T.07 COMPENSATION PAID (€ million)➔
*
T.08 INFLOW (€ million)➔
160
Annual Report 2019 ↗ COMBINED MANAGEMENT REPORT

COMPENSATION FOR FORMER MANAGEMENT BOARD MEMBERS
The appointment of Lars Radoor Sørensen as member of the Management Boardwas terminated by mutual agreement with effect from the end of January 31,2019. At this point, Mr. Sørensen's Management Board employment contract hada remaining term through December 31, 2020. Mr. Sørensen's ManagementBoard employment contract was terminated by mutual agreement with effectfrom the end of January 31, 2020. For the period from January 31, 2019 until Ja-nuary 31, 2020, the basic salary and short-term variable compensation was paidout assuming a target attainment of 100%. The tranche of the long-term variablecompensation was prorated for 2018-2020 and reduced by 11/36. No tranche wasgranted for 2019-2021. The compensation components for Mr. Sørensen basedon his work as a Management Board member are included in section “Manage-ment Board Compensation”.
There were pension obligations to former members of the Management Boardand their widows/widowers amounting to € 3.3 million (previous year: € 3.2 milli-on) as well as contribution-based pension commitments in connection with thedeferred compensation of former members of the Management Board and Ma-naging Directors amounting to € 11.6 million (previous year: € 10.6 million). Bothitems were recognized as liabilities within pension provisions to the extent theywere not offset against asset values of an equal amount. Pension obligations toformer members of the Management Board and their widows/widowers were in-curred amounting to € 0.2 million (previous year: € 0.2 million).
SUPERVISORY BOARD COMPENSATION SYSTEM
The Supervisory Board compensation system consists of two components. As forthe Management Board, the relevant criteria for calculating the compensationare the responsibilities and performance of the individual Supervisory Boardmember, the long-term strategic planning and related goals, the sustainability ofachieved results and the Company’s long-term prospects. For this reason, the
first component of the Supervisory Board compensation is a fixed, non-perfor-mance-based amount, while the second component is a performance-basedcompensation.
The non-performance-based component conforms to § 15 of the Articles of As-sociation, according to which each Supervisory Board member receives a fixedannual compensation of € 25,000.00. This amount is payable after the AnnualGeneral Meeting for the respective financial year. In addition to the fixed, annualcompensation, the members of the Supervisory Board are entitled to an increaseof their fixed compensation based on their position on the board and their partici-pation in committees. The Chair of the Supervisory Board and the Vice Chair re-ceive an additional fixed annual amount of € 25,000.00 respectively € 12,500.00.The chair of a committee additionally receives € 10,000.00, and the members of acommittee € 5,000.00, respectively. The respective committees are the PersonnelCommittee, the Audit Committee and the Sustainability Committee.
In addition to the fixed compensation, each Supervisory Board member receivesannual performance-based compensation equal to € 20.00 for each € 0.01 bywhich the earnings per share figure as disclosed in the consolidated financialstatements exceeds a minimum amount of € 16.00 per share. The performance-based compensation amounts to a maximum of € 10,000.00 per year. If earningsper share in the financial year are below the minimum amount, no performance-related compensation is payable. The Chair of the Supervisory Board receives€ 40.00 for every € 0.01 exceeding the minimum amount per share and a maxi-mum of € 20,000.00 per year. The Vice Chair receives € 30.00 for every € 0.01 ex-ceeding the minimum amount per share and a maximum of € 15,000.00 per year.
A member of the Supervisory Board who is only active for part of a financial yearreceives prorated remuneration calculated on the basis of the period of activitydetermined for full months.
161
Annual Report 2019 ↗ COMBINED MANAGEMENT REPORT

SUPERVISORY BOARD COMPENSATION
The compensation for the Supervisory Board for financial years 2018 and 2019are shown in the table below.
Fixedcompensation
Variablecompensation
Committeecompensation Total
2018 2019 2018 2019 2018 2019 2018 2019
Total 0.2 0.2 – – 0.0 0.0 0.2 0.2
T.09 SUPERVISORY BOARD COMPENSATION (€ million)➔
162
Annual Report 2019 ↗ COMBINED MANAGEMENT REPORT
CORPORATE GOVERNANCE REPORT INCLUDING THE STATEMENT ON CORPORATE GOVERNANCE IN ACCORDANCE WITH SECTION289F AND SECTION 315D HGB
Effective implementation of the principles of corporate governance is an im-portant aspect of PUMA's corporate policy. Transparent and responsible corpora-te governance is a key prerequisite for achieving corporate targets and for incre-asing the Company’s value in a sustainable manner. The Management and theSupervisory Board work closely with each other in the interests of the entireCompany to ensure that the Company is managed and monitored in an efficientway that will ensure sustainable added value through good corporate governan-ce. In the following the Management Board and the Supervisory Board report onthe corporate governance at PUMA SE in accordance with Section 3.10 of theGerman Corporate Governance Code. This section also includes the Statement ofCompliance in accordance with Art. 9(1) c(ii) of the SE Regulation (SE-VO) in con-junction with Section 289f and Section 315d HGB. Pursuant to Section 317 (2)Sentence 6 of the German Commercial Code (HGB), the purpose of the audit ofthe statements pursuant to Section 289f (2) and (5) and Section 315d of the HGBis limited to determining whether such statements have actually been provided.
PUMA SE has the legal form of a European company (Societas Europaea, or SE).Being an SE headquartered in Germany, PUMA SE is subject to European andGerman law for SEs while remaining subject to German stock corporation law.As a company listed in Germany, PUMA SE adheres to the German Corporate Go-vernance Code (DCGK).
PUMA SE has a dual management system featuring strict personal and functio-nal separation between the Management Board and the Supervisory Board (two-tier board). Accordingly, the Management Board manages the company while theSupervisory Board monitors and advises the Management Board.
STATEMENT OF COMPLIANCE PURSUANT TO SECTION 161 AKTG FOR 2019:
In their Statement of Compliance the Management Board and the SupervisoryBoard of PUMA SE declare at least once a year whether the DCGK has been andis being observed. On November 9, 2019, the Management Board and the Super-visory Board declared that PUMA SE has complied and will comply with the re-commendations of the DCGK (version dated February 7, 2017) since the lastStatement of Compliance dated November 9, 2018, with the following exceptionsand, if not, why not.
EXCEPTIONS TO THE CODE’S RECOMMENDATIONS
In derogation of No. 3.8 p. 3 of the Code, members of the SupervisoryBoard are provided with D&O insurance with no deductible. The Supervi-sory Board feels that it can dispense with a deductible for members ofthe Supervisory Board, because the D&O insurance is group insurancefor people in Germany and abroad, and a deductible is fairly unusualabroad.
According to No. 4.2.3 p. 2 s. 4 of the Code both positive and negativedevelopments shall be taken into account when determining variable re-muneration components. As regards negative developments this recom-mendation is deviated from, since the structure of the PUMA Monetary
163
Annual Report 2019 ↗ COMBINED MANAGEMENT REPORTCORPORATE GOVERNANCE REPORT INCLUDING THE STATEMENT ON CORPORATE GOVERNANCE IN ACCORDANCE WITH SECTION289F AND SECTION 315D HGB
Effective implementation of the principles of corporate governance is an im-portant aspect of PUMA's corporate policy. Transparent and responsible corpora-te governance is a key prerequisite for achieving corporate targets and for incre-asing the Company’s value in a sustainable manner. The Management and theSupervisory Board work closely with each other in the interests of the entireCompany to ensure that the Company is managed and monitored in an efficientway that will ensure sustainable added value through good corporate governan-ce. In the following the Management Board and the Supervisory Board report onthe corporate governance at PUMA SE in accordance with Section 3.10 of theGerman Corporate Governance Code. This section also includes the Statement ofCompliance in accordance with Art. 9(1) c(ii) of the SE Regulation (SE-VO) in con-junction with Section 289f and Section 315d HGB. Pursuant to Section 317 (2)Sentence 6 of the German Commercial Code (HGB), the purpose of the audit ofthe statements pursuant to Section 289f (2) and (5) and Section 315d of the HGBis limited to determining whether such statements have actually been provided.
PUMA SE has the legal form of a European company (Societas Europaea, or SE).Being an SE headquartered in Germany, PUMA SE is subject to European andGerman law for SEs while remaining subject to German stock corporation law.As a company listed in Germany, PUMA SE adheres to the German Corporate Go-vernance Code (DCGK).
PUMA SE has a dual management system featuring strict personal and functio-nal separation between the Management Board and the Supervisory Board (two-tier board). Accordingly, the Management Board manages the company while theSupervisory Board monitors and advises the Management Board.
STATEMENT OF COMPLIANCE PURSUANT TO SECTION 161 AKTG FOR 2019:
In their Statement of Compliance the Management Board and the SupervisoryBoard of PUMA SE declare at least once a year whether the DCGK has been andis being observed. On November 9, 2019, the Management Board and the Super-visory Board declared that PUMA SE has complied and will comply with the re-commendations of the DCGK (version dated February 7, 2017) since the lastStatement of Compliance dated November 9, 2018, with the following exceptionsand, if not, why not.
EXCEPTIONS TO THE CODE’S RECOMMENDATIONS
In derogation of No. 3.8 p. 3 of the Code, members of the SupervisoryBoard are provided with D&O insurance with no deductible. The Supervi-sory Board feels that it can dispense with a deductible for members ofthe Supervisory Board, because the D&O insurance is group insurancefor people in Germany and abroad, and a deductible is fairly unusualabroad.
According to No. 4.2.3 p. 2 s. 4 of the Code both positive and negativedevelopments shall be taken into account when determining variable re-muneration components. As regards negative developments this recom-mendation is deviated from, since the structure of the PUMA MonetaryUnit Plan may not fully comply with the purpose of the recommendation,but it comes fairly close.
In derogation of No. 4.2.3 p. 2 s. 6 of the Code the compensation of themembers of the Management Board does not show the maximumamount limits in total or their variable compensation components. Thisis due to the fact that neither the existing PUMA Monetary Units Plans2016/2017/2018 nor the PUMA Board Member Bonus Plan nor the dis-cretionary extra bonus clause provide for a maximum amount.
In derogation of No. 4.2.3 p. 2 s. 8 of the Code subsequent amendmentsto the performance targets or comparison parameters are not excluded.This provides the possibility to the supervisory board to react to extraor-dinary effects using its equitable discretion.
According to No. 4.2.3 p. 3 of the Code the target level of pension bene-fits for every pension commitment shall be established by the Supervi-sory Board. Due to the defined contribution plans, PUMA does not com-ply with this recommendation.
In accordance with the authorization by the Annual General Meeting onApril 12, 2018, pursuant to Section 286 p. 5 HGB, the Company shall notpublish the amounts of compensation for individual members of the Ma-nagement Board until the authorization expires (Nos. 4.2.4 and 4.2.5 ofthe Code). The members of the Management Board shall adhere to theauthorization when they prepare the annual financial statements. Basedon the authorization of the Annual General Meeting, and in derogation ofNo. 4.2.5 p. 3 of the Code the information stated in this Section regar-ding the compensation of the members of the Management Board is notincluded in the Compensation Report.
In derogation of No. 5.4.6 p. 2 s. 2 of the Code, members of the Supervi-sory Board receive performance-based compensation that is not linkedto the sustainable success of the Company. The compensation was aut-horized by the Annual General Meeting on April 12, 2018, it is stipulatedin the Articles of Association and is deemed to be proper and correct byPUMA SE.
In derogation of No. 5.4.6. p. 3 of the Code, the compensation of the Su-pervisory Board members is not shown individually. In the opinion ofPUMA SE, this is not additional information relevant to the capital mar-ket as the respective remuneration regulations included in the Articlesof Association are in the public domain.
Herzogenaurach, November 09, 2019PUMA SEFor the Management Board | For the Supervisory Board
Bjørn Gulden MichaelLämmermann
Jean-François Palus
RELEVANT DISCLOSURES OF CORPORATE GOVERNANCE PRACTICES THAT AREAPPLIED BEYOND THE REGULATORY REQUIREMENTS
CORPORATE SOCIAL RESPONSIBILITY
In order to fulfill our ecological and social responsibility as a global sportinggoods manufacturer, PUMA has developed groupwide guidelines on environmen-tal management and on compliance with workplace and social standards. PUMAis convinced that only on such a foundation can a lasting and sustainable corpo-rate success be achieved. That is why PUMA is committed to the principles of theUN Global Compact. The PUMA Code of Conduct prescribes ethical and environ-mental standards with which both employees and suppliers are required to com-ply. The PUMA Code of Conduct was revised in 2016 and explicitly addressesPUMA's obligation and commitment in respect of human rights and combatingcorruption. Detailed information on the company's corporate social responsibilitystrategy can be found in the Sustainability section of the Annual Report or on thecompany's homepage (http://about.PUMA.com under "SUSTAINABILITY").

Unit Plan may not fully comply with the purpose of the recommendation,but it comes fairly close.
In derogation of No. 4.2.3 p. 2 s. 6 of the Code the compensation of themembers of the Management Board does not show the maximumamount limits in total or their variable compensation components. Thisis due to the fact that neither the existing PUMA Monetary Units Plans2016/2017/2018 nor the PUMA Board Member Bonus Plan nor the dis-cretionary extra bonus clause provide for a maximum amount.
In derogation of No. 4.2.3 p. 2 s. 8 of the Code subsequent amendmentsto the performance targets or comparison parameters are not excluded.This provides the possibility to the supervisory board to react to extraor-dinary effects using its equitable discretion.
According to No. 4.2.3 p. 3 of the Code the target level of pension bene-fits for every pension commitment shall be established by the Supervi-sory Board. Due to the defined contribution plans, PUMA does not com-ply with this recommendation.
In accordance with the authorization by the Annual General Meeting onApril 12, 2018, pursuant to Section 286 p. 5 HGB, the Company shall notpublish the amounts of compensation for individual members of the Ma-nagement Board until the authorization expires (Nos. 4.2.4 and 4.2.5 ofthe Code). The members of the Management Board shall adhere to theauthorization when they prepare the annual financial statements. Basedon the authorization of the Annual General Meeting, and in derogation ofNo. 4.2.5 p. 3 of the Code the information stated in this Section regar-ding the compensation of the members of the Management Board is notincluded in the Compensation Report.
In derogation of No. 5.4.6 p. 2 s. 2 of the Code, members of the Supervi-sory Board receive performance-based compensation that is not linkedto the sustainable success of the Company. The compensation was aut-horized by the Annual General Meeting on April 12, 2018, it is stipulatedin the Articles of Association and is deemed to be proper and correct byPUMA SE.
In derogation of No. 5.4.6. p. 3 of the Code, the compensation of the Su-pervisory Board members is not shown individually. In the opinion ofPUMA SE, this is not additional information relevant to the capital mar-ket as the respective remuneration regulations included in the Articlesof Association are in the public domain.
Herzogenaurach, November 09, 2019PUMA SEFor the Management Board | For the Supervisory Board
Bjørn Gulden MichaelLämmermann
Jean-François Palus
RELEVANT DISCLOSURES OF CORPORATE GOVERNANCE PRACTICES THAT AREAPPLIED BEYOND THE REGULATORY REQUIREMENTS
CORPORATE SOCIAL RESPONSIBILITY
In order to fulfill our ecological and social responsibility as a global sportinggoods manufacturer, PUMA has developed groupwide guidelines on environmen-tal management and on compliance with workplace and social standards. PUMAis convinced that only on such a foundation can a lasting and sustainable corpo-rate success be achieved. That is why PUMA is committed to the principles of theUN Global Compact. The PUMA Code of Conduct prescribes ethical and environ-mental standards with which both employees and suppliers are required to com-ply. The PUMA Code of Conduct was revised in 2016 and explicitly addressesPUMA's obligation and commitment in respect of human rights and combatingcorruption. Detailed information on the company's corporate social responsibilitystrategy can be found in the Sustainability section of the Annual Report or on thecompany's homepage (http://about.PUMA.com under "SUSTAINABILITY").
164
Annual Report 2019 ↗ COMBINED MANAGEMENT REPORTUnit Plan may not fully comply with the purpose of the recommendation,but it comes fairly close.
In derogation of No. 4.2.3 p. 2 s. 6 of the Code the compensation of themembers of the Management Board does not show the maximumamount limits in total or their variable compensation components. Thisis due to the fact that neither the existing PUMA Monetary Units Plans2016/2017/2018 nor the PUMA Board Member Bonus Plan nor the dis-cretionary extra bonus clause provide for a maximum amount.
In derogation of No. 4.2.3 p. 2 s. 8 of the Code subsequent amendmentsto the performance targets or comparison parameters are not excluded.This provides the possibility to the supervisory board to react to extraor-dinary effects using its equitable discretion.
According to No. 4.2.3 p. 3 of the Code the target level of pension bene-fits for every pension commitment shall be established by the Supervi-sory Board. Due to the defined contribution plans, PUMA does not com-ply with this recommendation.
In accordance with the authorization by the Annual General Meeting onApril 12, 2018, pursuant to Section 286 p. 5 HGB, the Company shall notpublish the amounts of compensation for individual members of the Ma-nagement Board until the authorization expires (Nos. 4.2.4 and 4.2.5 ofthe Code). The members of the Management Board shall adhere to theauthorization when they prepare the annual financial statements. Basedon the authorization of the Annual General Meeting, and in derogation ofNo. 4.2.5 p. 3 of the Code the information stated in this Section regar-ding the compensation of the members of the Management Board is notincluded in the Compensation Report.
In derogation of No. 5.4.6 p. 2 s. 2 of the Code, members of the Supervi-sory Board receive performance-based compensation that is not linkedto the sustainable success of the Company. The compensation was aut-horized by the Annual General Meeting on April 12, 2018, it is stipulatedin the Articles of Association and is deemed to be proper and correct byPUMA SE.
In derogation of No. 5.4.6. p. 3 of the Code, the compensation of the Su-pervisory Board members is not shown individually. In the opinion ofPUMA SE, this is not additional information relevant to the capital mar-ket as the respective remuneration regulations included in the Articlesof Association are in the public domain.
Herzogenaurach, November 09, 2019PUMA SEFor the Management Board | For the Supervisory Board
Bjørn Gulden MichaelLämmermann
Jean-François Palus
RELEVANT DISCLOSURES OF CORPORATE GOVERNANCE PRACTICES THAT AREAPPLIED BEYOND THE REGULATORY REQUIREMENTS
CORPORATE SOCIAL RESPONSIBILITY
In order to fulfill our ecological and social responsibility as a global sportinggoods manufacturer, PUMA has developed groupwide guidelines on environmen-tal management and on compliance with workplace and social standards. PUMAis convinced that only on such a foundation can a lasting and sustainable corpo-rate success be achieved. That is why PUMA is committed to the principles of theUN Global Compact. The PUMA Code of Conduct prescribes ethical and environ-mental standards with which both employees and suppliers are required to com-ply. The PUMA Code of Conduct was revised in 2016 and explicitly addressesPUMA's obligation and commitment in respect of human rights and combatingcorruption. Detailed information on the company's corporate social responsibilitystrategy can be found in the Sustainability section of the Annual Report or on thecompany's homepage (http://about.PUMA.com under "SUSTAINABILITY").

COMPLIANCE MANAGEMENT SYSTEM
PUMA’s management acts in compliance with laws and self-imposed standardsof conduct. PUMA has set up a Compliance Management System (CMS) to syste-matically prevent, detect and sanction violations in the areas of corruption, mo-ney laundering, conflicts of interest, antitrust law, fraud and embezzlement. Vio-lations of the law or internal guidelines will not be tolerated.
The PUMA Code of Ethics is an important building block of the CMS and is bin-ding for employees of all subsidiaries worldwide. It defines the guidelines andvalues that shape PUMA's identity. PUMA expects all employees to be aware ofthese values and to act accordingly. The Code of Ethics contains rules, amongother things, on dealing with conflicts of interest and personal data and prohibitsinsider trading, anti-competitive behavior and corruption in any form. In order tofamiliarize employees with the rules of the Code of Ethics and to establish uni-form behavioral guidelines, the Code of Ethics is flanked by specific Group-wideguidelines.
All employees are familiarized with the regulatory areas of the Code of Ethicsthrough ongoing mandatory e-learning. In addition, employees selected on thebasis of risk-based principles are given in-depth knowledge in classroom trai-ning. In the past fiscal year, comprehensive face-to-face training courses wereheld in particular in the areas of anti-corruption and antitrust law. In 2019, allPUMA employees were encouraged by the CEO of PUMA SE to complete the e-learning on the Code of Ethics on the topics of anti-corruption, data protectionand inappropriate behavior in the workplace. The clear Tone from the Top resul-ted in 99% of PUMA employees successfully completing the e-learning on theCode of Ethics.
The Management Board is responsible for the proper functioning of the CMS. It issupported by a compliance organization consisting of the Chief Compliance Offi-cer and compliance officers in the main operating Group companies. The ChiefCompliance Officer of PUMA SE reports directly to the CEO of PUMA SE. The lo-cal Compliance Officers also serve as direct contact persons for employees andsupport them by appropriate communication measures as well as in dealing withand processing compliance incidents. The Audit Committee of the SupervisoryBoard of PUMA SE is regularly informed about the current status of the imple-mentation of compliance structures and serious compliance violations. The Chief
Compliance Officer works closely with the Legal Department and Internal Audit.In addition, regular meetings of the "PUMA SE Risk & Compliance Committee"take place. At the meetings of this committee, compliance risks are analyzed andevaluated and appropriate measures (guidelines, training, etc.) are defined andapproved. The review of the implementation of the requirements in the complian-ce guidelines is regularly part of the audit plan of the internal audit department.
PUMA has a Group-wide electronic whistleblower platform, which is operated byan external provider and to which employees and third parties can report protec-ted illegal or unethical conduct. Violations from all risk areas can be reported.Insofar as they do not fall within the competence of the compliance organization,the responsible specialist departments are responsible for identifying and takingmeasures. The introduction of the platform was communicated throughout theGroup by the CEO and the communication was flanked by appropriate informati-on material. Every year, the local compliance officers expressly draw attention tothe whistleblower system through appropriate communication measures or inface-to-face training sessions. Whistleblowers who report misconduct in goodfaith are protected from retaliation. All reports are followed up immediately and,if confirmed, appropriate measures are taken. In 2019, the Compliance Depart-ment at headquarters received 33 reports of alleged violations. In three of thesecases, allegations of corruption were made. In two of these cases, the investiga-tion is still ongoing; in the third case, the investigation has been completed andcould not confirm the allegation. In addition to the whistleblower platform, thereis a global hotline for whistleblowers from the supply chain.
165
Annual Report 2019 ↗ COMBINED MANAGEMENT REPORT
DESCRIPTION OF THE WORKING PRACTICES OF THE MANAGEMENT BOARD AND THESUPERVISORY BOARD
PUMA SE has three bodies – the Management Board, the Supervisory Board andthe Annual General Meeting.
MANAGEMENT BOARD
The Management Board of PUMA SE manages the company on its own responsi-bility with the goal of sustainable value creation. It develops PUMA's strategicorientation and coordinates it with the Supervisory Board. In addition, it ensuresgroup-wide compliance with legal requirements and an effective risk manage-ment and internal control system.
The members of the Management Board are appointed by the Supervisory Board.The Supervisory Board has set a general age limit of 70 years for the membersManagement Board. The Management Board currently consists of three mem-bers and has a CEO. Further information on the areas of responsibility of themembers of the Management Board can be found in the Notes to the Consolida-ted Financial Statements (last chapter).
The members of the Management Board are obliged to disclose conflicts of inte-rest to the Supervisory Board without delay and to inform the other members ofthe Management Board accordingly. They may only assume secondary activities,in particular supervisory board and comparable mandates outside the PUMAGroup, with the prior consent of the Supervisory Board. In the past fiscal year, themembers of the Management Board of PUMA SE did not report any conflicts ofinterest.
The principles of cooperation of the Management Board of PUMA SE are set outin the Rules of Procedure for the Management Board, which can be viewed at http://about.PUMA.com under "Corporate Governance".
SUPERVISORY BOARD
The German Codetermination Act does not apply to PUMA SE as a Europeancompany. Rather, the size and composition of the Supervisory Board are determi-ned by the Articles of Association of PUMA SE and the Agreement on the Involve-ment of Employees in PUMA SE dated 11 July 2011 and its amendment dated 7February 2018. The Supervisory Board of PUMA SE consists of six members, four
of whom are shareholder representatives and two of whom are employee repre-sentatives. CVs of the individual Supervisory Board members are available on theInternet and are updated regularly. The term of office of the current SupervisoryBoard members ends at the end of the Annual General Meeting which resolveson the discharge of the members of the Supervisory Board for the financial year2022. Further information on the members of the Supervisory Board can befound in the Notes to the Consolidated Financial Statements (last chapter).
The Supervisory Board appoints the members of the Management Board andmay dismiss them at any time for good cause. Initial appointments are generallyfor three years. The Supervisory Board determines the remuneration system forthe Management Board and reviews it regularly (most recently in 2018). It deter-mines the individual total compensation of each member of the Board of Ma-nagement, taking into account the ratio of the Management Board compensationto compensation in the MDAX (horizontal comparison) and to the average com-pensation of the first management level below the Management Board (n-1) aswell as to the average compensation of all employees (vertical comparison). Therelevant workforce is the workforce of PUMA SE. Variable compensation compo-nents have a multi-year, mainly future-related assessment basis. Variable remu-neration components that last several years are not paid out prematurely. Star-ting in the 2019 fiscal year, the Supervisory Board has set maximum limits for theindividual compensation of the Management Board both in total and with regardto its variable components.
The Supervisory Board monitors and advises the Management Board on the im-plementation of the strategy. The Management Board informs the SupervisoryBoard regularly, promptly and comprehensively about all issues of relevance tothe Company relating to strategy, planning, business development, the risk situa-tion, risk management and compliance management system. It deals with devia-tions in the course of business from the established plans and targets, statingthe reasons. The Supervisory Board is involved by the Management Board in de-cisions of paramount importance for the company or beyond the ordinary courseof business of PUMA SE and the PUMA Group to which it has rights of approval.The Supervisory Board receives regular reports on succession planning and thecriteria applied by the Management Board in this regard.
166
Annual Report 2019 ↗ COMBINED MANAGEMENT REPORT

Prior to Supervisory Board meetings, the Management Board regularly speaksseparately to the employee representatives and the shareholder representatives.At the end of the regular meetings, the Supervisory Board always has the oppor-tunity to discuss issues even in the absence of the Management Board. It alsomakes regular use of this opportunity. The members of the Supervisory Boardalso participate in the meetings by telephone or video conference.
The Supervisory Board regularly reviews the efficiency of its activities. The lasttime this review took place was at the beginning of 2019.
The members of the Supervisory Board attend on their own responsibility cour-ses of training and further training that might be necessary for the performanceof their tasks, and are supported by the Company in doing so. In an onboardingprogram, new members of the Supervisory Board not only receive training fromthe legal department on their rights and duties, but also have the opportunity inparticular to meet the members of the Management Board and other executivesfor a bilateral exchange on current management issues and thus gain an over-view of relevant topics of the Company.
SHAREHOLDERS AND ANNUAL GENERAL MEETING
The shareholders of PUMA SE exercise their rights, in particular their informati-on and voting rights, at the Annual General Meeting. Each share has one vote.Our shareholders can exercise their voting rights themselves or through a proxyappointed by the company and bound by instructions. All documents and infor-mation on the Annual General Meeting are available on the website of PUMA SE.
As part of our comprehensive investor relations and public relations work, we arein close contact with our shareholders. We inform shareholders, financial ana-lysts, shareholders' associations, the media and the interested public compre-hensively and regularly about the situation of the Company and inform them im-mediately about significant business changes. The Chairman of the SupervisoryBoard is also prepared to discuss Supervisory Board-specific issues with inves-tors within an appropriate framework.
In addition to other communication channels, we make intensive use of the Com-pany's website for our investor relations work. At about.puma.com/en/investor-relations, all material information published in the 2019 financial year, including
annual, quarterly and half-yearly financial reports, press releases, voting rightsannouncements by major shareholders, presentations and the financial calendar,can be accessed.
DESCRIPTION OF THE WORKING PRACTICES AND THE COMPOSITION OF THECOMMITTEES OF THE SUPERVISORY BOARD
The Supervisory Board meets at least every three months. Meetings must alsobe held if the best interests of the Company so require or if a member of the Su-pervisory Board requests that the meeting be convened. The Supervisory Boardhas established three committees to perform its duties and receives regular re-ports on their work. The principles of cooperation of the Supervisory Board ofPUMA SE and the duties of the committees are set out in the Rules of Procedurefor the Supervisory Board, which can be viewed at http://about.PUMA.com under"Corporate Governance".
The Personnel Committee consists of three members. The Personnel Committeeis responsible for entering into and making changes to the Management Boardmembers’ employment contracts and for establishing policies for Human Re-sources and personnel development. The entire Supervisory Board decides onissues involving the Management Board members’ compensation based on re-commendations from the Personnel Committee.
The Audit Committee consists of three members. The Chairman of the AuditCommittee must be an independent shareholder representative and must haveexpertise in the fields of accounting and auditing in accordance with Section100(5) AktG. In particular, the Audit Committee is responsible for accounting is-sues and monitoring the accounting process, the effectiveness of the internalcontrol system, the risk management system, internal audits, compliance andthe statutory audit of the financial statements, with particular regard to the re-quired independence of the statutory auditors, issuing the audit mandate to thestatutory auditors, defining the audit areas of focus, any additional services to beperformed by the auditors and the fee agreement. The recommendation of theSupervisory Board on the selection of the statutory auditors must be based on acorresponding recommendation by the Audit Committee. Once the Annual Gene-ral Meeting has appointed the statutory auditors, and the Supervisory Board has
167
Annual Report 2019 ↗ COMBINED MANAGEMENT REPORT
issued the audit assignment, the Audit Committee shall work with the statutoryauditors to specify the scope of the audit and the audit areas of focus. The statu-tory auditors shall attend a meeting to review the annual financial statementsand the consolidated financial statements and shall report on the key findings oftheir audit. They shall also inform the Committee about other services they haveprovided in addition to auditing services and shall confirm their independence.Each month, the Audit Committee shall receive financial data on the PUMAGroup, which will allow the tracking of developments in net assets, financial po-sition, results of operations and the order books on a continual basis. The AuditCommittee shall also deal with issues relating to the balance sheet and incomestatement and shall discuss these with the Management Board. In addition,when the internal audit projects are completed, the Audit Committee shall recei-ve the audit reports, which must also include any actions taken.
The Nominating Committee has three members, who may only be representati-ves of the shareholders on the Supervisory Board. The Nominating Committeeproposes suitable shareholder candidates to the Supervisory Board for its votingrecommendations to the Annual General Meeting.
The current composition of the committees can be found in the Notes to the Con-solidated Financial Statements (last chapter).
DIVERSITY CONCEPT FOR THE SUPERVISORY BOARD
A) OBJECTIVES FOR THE COMPOSITION OF THE SUPERVISORY BOARD
The Supervisory Board of PUMA SE is composed in such a way that its membersas a group possess the appropriate knowledge, skills and professional experi-ence necessary for the proper performance of their duties. The composition ofthe Supervisory Board is primarily determined by appropriate qualification, ta-king into account diversity and the appropriate involvement of women. Based onSection 5.4.1 of the Code, the Supervisory Board has set targets for his composi-tion that have been fulfilled. In detail:
The members of the Supervisory Board as a group have the experienceand knowledge in the field of management and/or monitoring market-
oriented companies as well as in the business segments and sales mar-kets of PUMA. Details of this are presented under lit. b) of this chapter.
A sufficient number of members have strong international backgrounds.This target has been clearly surpassed simply because of the internatio-nal origins of Jean-François Palus, Héloïse Temple-Boyer, Thore Ohls-son and Fiona May.
Including the employees' representative on the Supervisory Board, theSupervisory Board has an appropriate number of independent mem-bers. In the opinion of the Supervisory Board, there are currently noconcrete indications of relevant circumstances that speak against inde-pendence with regard to any of the shareholder representatives on theSupervisory Board. No member of the Supervisory Board exercises di-rectorships or advisory functions for major competitors. With regard toSupervisory Board members Jean-François Palus and Héloïse Temple-Boyer, the Supervisory Board is of the opinion that their functions as Di-recteur Général Délégué of Artémis S.A.S. do not impair their indepen-dence within the meaning of the German Corporate Governance Code.The Code does not contain an exhaustive definition of independence, butonly mentions examples of circumstances that speak against it. Accor-ding to the Code, a member of the Supervisory Board is not consideredindependent if he or she has a personal or business relationship withthe company, its executive bodies, a controlling shareholder or a com-pany affiliated with the latter, and this relationship may give rise to amaterial and not merely temporary conflict of interest. It is the task ofthe Supervisory Board to assess the independence of the individual Su-pervisory Board members on the basis of these indications. ArtémisS.A.S. is not a controlling shareholder, as Artémis S.A.S. is neither amajority shareholder nor does it have a de facto majority at the AnnualGeneral Meeting.
The Chairman of the Audit Committee has specialist knowledge and ex-perience in the application of accounting principles and internal controlprocedures and is independent. Thore Ohlsson has this knowledge andis independent. Jean-François Palus and Héloïse Temple-Boyer alsobring this knowledge with them.
168
Annual Report 2019 ↗ COMBINED MANAGEMENT REPORT
The members have sufficient time to perform his/her mandate in theSupervisory Board. Prior to each election proposal, the SupervisoryBoard examines whether the candidates concerned are able to completethe time required for the office.
The Supervisory Board prevents potential significant and not only tem-porary conflicts of interest of its members by regularly monitoring andcritically scrutinizing its members' other activities. There were no indi-cations of actual conflicts of interest in the 2019 financial year.
According to Section 1(4) of the Rules of Procedure for the SupervisoryBoard, Supervisory Board members may, in principle, not be over 70 ye-ars of age and their maximum term of office may not exceed threeterms. In setting this age limit, the Supervisory Board deliberately deci-ded against a rigid maximum age limit and in favor of a flexible rule li-mit that provides the necessary leeway for an appropriate assessmentof the circumstances of the individual case, sufficiently broadly definesthe circle of potential candidates and also allows re-election. Mr ThoreOhlsson has reached the statutory age limit. After careful consideration,he was nevertheless proposed by the Supervisory Board for re-electionin 2018 in order to ensure the necessary continuity after the spin-offfrom Kering S.A. in the best interests of the company. All other Supervi-sory Board members did not reach the standard age limit at the time oftheir election.
B) PROFILE OF SKILLS AND EXPERTISE
The Supervisory Board has determined a competence profile for the entireBoard. It stipulates that the members of the Supervisory Board as a whole mustcover the following professional competencies:
Managing of large or mid-sized international companies (Jean-FrançoisPalus, Héloïse Temple-Boyer, Thore Ohlsson)
Leadership experience in the sporting or luxury goods industry (Jean-François Palus, Héloïse Temple Boyer, Thore Ohlsson, Fiona May)
International corporate background (Jean-François Palus, HéloïseTemple-Boyer, Thore Ohlsson, Fiona May)
Leadership experience with various disribution channels, including e-commerce (Jean-François Palus, Thore Ohlsson)
Expertise in building strong international brands (Jean-François Palus,Héloïse Temple-Boyer, Thore Ohlsson, Fiona May)
Marketing, sales and digital know how (Jean-François Palus, HéloïseTemple-Boyer, Thore Ohlsson)
Financial expertise (accounting, treasury, risk management, corporategovernance) (Jean-François Palus, Thore Ohlsson, Héloïse Temple-Boyer)
Expertise in serving on the Administrative or Supervisory boards of pu-blicly listed companies (Jean-François Palus, Heloise Temple-Boyer)
Experience with mergers & acquisitions (Jean-François Palus, ThoreOhlsson)
Understanding of the industrial constitution law and advocating the in-terests of the employees (Martin Koeppel, Bernd Illig)
HR expertise (Jean-François Palus)
IT expertise (Bernd Illig).
The Supervisory Board of PUMA SE is currently composed in such a way that ithas the competence profile as an overall body.
169
Annual Report 2019 ↗ COMBINED MANAGEMENT REPORT

C) COMMITMENTS TO PROMOTE THE PARTICIPATION OF WOMEN IN MANAGEMENTPOSITIONS IN ACCORDANCE WITH ART. 9(1)C(II) OF THE SE REGULATION (SE-VO) INCONNECTION WITH SECTION 76(4), SECTION 111(5) AKTG
The Supervisory Board shall define a target figure for the proportion of womenon the Supervisory Board and the Management Board. The Management Board,for its part, shall set target figures for the proportion of women in the two ma-nagement levels below the Management Board.
For the Supervisory Board of PUMA SE, a target figure of 30% has been set forthe targeted proportion of women. As of December 31, 2019, the six-member Su-pervisory Board included two women, Fiona May and Héloïse Temple-Boyer, re-sulting in a female representation of 33%.
The Supervisory Board has set a target of 20% for the Management Board, provi-ded that PUMA SE has five or more members. The Management Board, whichconsisted of three members as of December 31, 2019 including Anne-Laure Des-cours, will be composed of 33% women and 66% men.
Together with the Supervisory Board, the Management Board has set a target of25% for the first management level below the Management Board and 30% forthe second management level below the Management Board. At Group level, theproportion of women is to increase to 30% for the first management level belowthe Management Board and to 40% for the second management level. The imple-mentation deadline here, too, is October 31, 2021.
The current composition of the Supervisory Board largely implements the diver-sity concept.
DIVERSITY CONCEPT FOR THE MANAGEMENT BOARD
The Supervisory Board and the Management Board promote an agile, open cor-porate culture in which the advantages of diversity are consciously utilized andeveryone can freely unfold their potential for the best of the company. PUMA stri-ves to fill Management Board positions and senior management positions prima-rily with people developed within the company.
The Supervisory Board's decision regarding a particular appointment to the Ma-nagement Board is always taken in consideration of the Company's best interestsbased on the professional and personal suitability of the candidate. It must beensured that the members of the Management Board as a whole have the know-ledge, skills and experience required for the best possible fulfillment of the tasksof a member of the Management Board of a sporting goods manufacturer suchas PUMA. It is not necessary for every member of the Management Board to re-flect the technical requirements laid out in the following. The diversity conceptfor the Management Board therefore stipulates that gender, internationality, age,educational background and experience must be taken into account in itscomposition:
- Gender
PUMA aims to have 20% women on the Management Board by October 31, 2021,provided that the Board has five or more Management Board members. In orderto achieve this goal, the Management Board ensures that an appropriate propor-tion of female candidates are included on the succession lists within the frame-work of the internal global management structure for the development of juniorstaff for the Management Board. In the future, the participation of women in theManagement Board is to be guaranteed in the event of a necessary replacement,in particular by giving special consideration to women in various equally qualifiedcandidates. Insofar as external candidates are to be appointed, suitably qualifiedfemale candidates shall be considered in particular. The same applies to the fil-ling of management functions. In order to involve women even more in manage-ment functions in the future, PUMA promotes the compatibility of family and ca-reer, for example through part-time and half-day models as well as flexibleworking hours and the provision of childcare places. With Anne-Laure Descoursa woman is represented on the Management Board. The proportion of women onthe Management Board is therefore currently 33%.
170
Annual Report 2019 ↗ COMBINED MANAGEMENT REPORT
- Internationality
PUMA is a globally operating company. An appropriate number of board mem-bers must therefore have international experience either due to their origin ordue to their many years of professional experience abroad. Notwithstanding theseveral years of international experience of all board members, this goal hasbeen exceeded simply because of the international origins of Bjørn Gulden andAnne-Laure Descours.
- Age
The Supervisory Board ensures a balanced age structure in the ManagementBoard. This is important to ensure the continuity of the Management Board'swork and to facilitate smooth succession planning. In principle, members of theManagement Board may not be older than 70 years. All members of the Manage-ment Board are below the standard age limit.
- Training and experience background
With regard to the educational and professional background, the selection of Ma-nagement Board members should be based on the competencies required in thePUMA Management Board in general as well as for the respective Management
Board with regard to corporate management, strategy development, finance andaccounting, supply chain, sales and HR. The same criteria apply here as were de-veloped for the competence profile of the Supervisory Board. These competen-cies do not have to be acquired as part of university studies or other educationaltraining, but may also have been acquired in other ways within or outside PUMA.The members of the board have all the above mentioned competences.
The current composition of the Management Board largely implements the diver-sity concept.
DIRECTORS’ DEALINGS
Transactions by management personnel in PUMA shares reported to the Compa-ny are published at https://about.puma.com/de-de/investor-relations/the-puma-share. Mr. Jean-François Palus reported in May 2019 that he received PUMA sha-res in 2018 as part of the distribution of a dividend in kind by Kering S.A. (Paris)to its shareholders. In October and November 2019, Mr. Palus also reported that,as part of a related transaction, he first sold his PUMA shares and shortly there-after repurchased the same number. Mr. Bjørn Gulden reported a purchase inPUMA shares on 3 January 2020.
171
Annual Report 2019 ↗ COMBINED MANAGEMENT REPORT
RISK AND OPPORTUNITY REPORT
Entrepreneurial activities are always associated with opportunities and risks.This is particularly true for the fast-moving sports and lifestyle industry in whichPUMA globally operates and is therefore continuously exposed to risks and op-portunities that must be identified and managed. We need effective risk and op-portunity management through which risks and opportunities can be systemati-cally recognized and monitored. A risk is defined as one or more future eventswith unplanned, adverse effects for the company up to any threat to the conti-nued existence of the company. Similarly, an opportunity is defined as one ormore events with unplanned, positive consequences for the company.
The Management Board of PUMA SE has overall responsibility for the risk andopportunity management system. The Risk Management Committee (RMC) is amanagement-level committee and responsible for the design and monitoring ofthe risk management system and therefore also the first point of contact for riskreporting. The task of operationally coordinating the group-wide risk manage-ment system has been transferred to Group Internal Audit & Governance, RiskManagement & Internal Control (GRC). Opportunity management is not part ofthe risk management. Individual risk interviews are conducted with selected exe-cutives as risk owners below the Management Board throughout the company atregular intervals of currently twice a year. The objective of these interviews is tosystematically identify, validate and categorize risks and record countermeasu-res. The Group Internal Audit & GRC department provides a uniform frameworkfor the assessment of risks. The assessment considers the probability of occur-rence, the potential effect and the control of the risk.The risks identified and assessed during the risk interviews are presented to theRMC in an aggregated form in a so-called risk heat map. The RMC consists of adefined group of executives from various corporate divisions, including the Ma-nagement Board. Chair of the RMC is the Chief Financial Officer as member ofthe Management Board. The results of the RMC meetings are reported to the Au-dit Committee as sub-committee of the Supervisory Board by the Chair of theRMC and the Head of the Group Internal Audit & GRC department. An integrated
GRC tool used to document the risk management processes is available to theGroup Internal Audit & GRC department and to the risk owners.
PUMA also has a comprehensive reporting and controlling system, which is anessential component of its risk management approach. PUMA’s reporting andcontrolling system is based on monthly financial reporting as well as the reviewand plausibility reports on reported information issued by the Controllingdepartment.
Managers analyze opportunities and risks in annual planning discussions aroundthe world, setting targets and defining courses of action based on the results.The comprehensive reporting system continuously monitors and generates re-ports on compliance with the set targets. This enables PUMA to promptly identifyany deviations or negative developments, and to initiate any necessary counter-measures in a timely manner.
RISK AND OPPORTUNITY CATEGORIES
The following explanations of opportunities and risks are shown in the order oftheir relative importance.
MACROECONOMIC DEVELOPMENTS
As an internationally operating group, PUMA is exposed to global macroecono-mic developments and the associated risks. For example, economic develop-ments in important sales markets may have an effect on consumer behavior.This can have positive or negative effects on the planned sales and results. Like-wise, political changes and social developments may result in changes in the le-gal framework conditions, such as in connection for example with Brexit and cur-
172
Annual Report 2019 ↗ COMBINED MANAGEMENT REPORT

rency exchange rate fluctuations.Overall, PUMA manages these challenges with geographic diversification and thedevelopment of alternative scenarios for the possible occurrence of seriousevents. This applies in particular to political developments and possible changesin legal framework conditions which are continuously monitored by PUMA.
BRAND IMAGE
Brand image and brand desirability are of key importance for PUMA, as consu-mer behavior can have a negative effect on the brand as well as a positive one.Accordingly, PUMA has formulated the guiding principle of “We want to becomethe fastest sports brand in the world” in order to underline the company’s long-term direction and strategy. The “Forever Faster” brand promise does not juststand for PUMA’s product range as a sports company, but also applies to all com-pany processes.PUMA manages brand image risks in particular through cooperation with brandambassadors who embody the core of the brand and PUMA’s brand values (“bra-ve”, “confident”, “determined” and “joyful”) and have a large potential for influen-cing PUMA’s target group. PUMA has therefore strengthened its position assports brand through partnerships with top athletes, such as star striker AntoineGriezmann, sprint legend Usain Bolt, multiple Formula 1 world champion LewisHamilton and pro golfer Rickie Fowler. In 2019, we were able to sign furtherbrand ambassadors, such as the goalkeeper Jan Oblak, the football managerPep Guardiola, and Karsten Warholm, the 400-meter hurdles world champion. Infootball, PUMA has long-term sponsorship agreements with top clubs, such asManchester City, Borussia Dortmund, AC Milan, Olympique Marseille and the Ita-lian national team. PUMA's return to basketball and its engagement in athleticsand other sports should also be viewed in this context. PUMA reaches youngtrendsetters via brand ambassadors and collaborations in the music, movie andfashion scene, such as with Jay-Z, Meek Mill, Adriana Lima, Cara Delevingne andSelena Gomez, and also increasingly through influencers in social networks.
INFORMATION TECHNOLOGY
The ongoing digitalization of PUMA's business environment exposes the compa-ny to risks, but it also increasingly provides opportunities. The failure of IT sys-tems may significantly disrupt important business procedures and processes.External attacks or wrong behavior, for example, may result in the loss of confi-dential and sensitive data, and lead to high costs, loss of revenue and reputatio-nal damage. Opportunities arise, for example, from improved, tailored communi-cation with customers via digital channels and new opportunities for productpresentation. In addition, new or more efficiently supported processes may addvalue or result in cost optimization.To mitigate these risks and use the existing opportunities inherent in digitalizati-on at the same time, PUMA continuously carries out technical and organizationalmeasures and invests in the renewal and security of its IT landscape. IT systemsare regularly checked, maintained and undergo security tests. In addition, allemployees are continuously sensitized using guidelines, training courses and in-formation campaigns.
SOURCING AND SUPPLY CHAIN
The majority of PUMA products is produced in selected Asian countries, in parti-cular in Vietnam, China, Bangladesh, Cambodia, Indonesia and India. Productionin these countries is associated with significant risks for PUMA, which result, forexample, from exchange rate fluctuations, changes in sourcing and wage costs,supply bottlenecks for raw materials or components, quality issues, but alsofrom natural disasters and political instability. Moreover, risks may result froman overdependence on individual manufacturers.The portfolio is regularly reviewed and adjusted to avoid creating a dependenceon individual suppliers and sourcing markets. Generally, long-term masterframework agreements are agreed upon to secure production capacities requi-red in the future. A quality assurance process and the direct collaboration withmanufacturers should permanently secure the quality of PUMA products.Sourcing and the supply chain must also respond to risks and opportunities, in-cluding changes in duties and tariffs as well as trade restrictions. PUMA accor-dingly continuously analyzes political and legal framework conditions in order to
173
Annual Report 2019 ↗ COMBINED MANAGEMENT REPORT

be able to react to changes at an early stage.The transport of products into the distribution countries is exposed to the risk ofdelays and disruptions among service providers. The collaboration with serviceproviders is accordingly secured by selection processes, uniform contractualterms and permanent monitoring of relevant indicators.
SUSTAINABILITY
Sustainability topics are highly important in sourcing, but also throughout theentire value chain. There is a risk that suppliers will violate core labor standardsof ILO (International Labour Organization), not comply with environmental stan-dards or use hazardous chemicals in production. This would violate PUMA's re-quirements to suppliers and also lead to negative reporting. Adherence to app-licable standards is ensured through regular audits of supplier companies.Climate change and increasing customer requirements with regard to sustaina-bility are leading to a stronger ecological focus both in our own locations andalong the production and supply chain. A more efficient use of resources and re-duction of greenhouse gas emissions and the increased use of sustainable pro-duction materials are expressions of PUMA's sustainability strategy.
PRODUCT AND MARKET ENVIRONMENT
The risk posed by market-specific product influences, in particular the risk ofsubstitutability in the highly competitive sport and lifestyle market, is decisivelycountered by the early recognition and taking advantage of relevant consumertrends. Only those companies that identify these trends at an early stage will beable to gain an edge over their competitors.Targeted investments in product design and product development are to ensurethat the characteristic PUMA design of the entire product range is consistentwith the overall brand strategy (“Forever Faster”), thereby creating a unique levelof brand recognition.
COUNTERFEIT PRODUCTS
Counterfeit products can cause damage to consumer confidence in the brandand can damage PUMA's brand image. For this reason, PUMA has made fightingbrand piracy a high priority. The PUMA team responsible for the protection of in-tellectual property not only ensures that we have a strong global portfolio of pro-perty rights, such as brands, designs and patents, but also works closely withcustoms and police forces and provides input regarding the implementation ofeffective legislation to protect intellectual property.
DISTRIBUTION STRUCTURE
PUMA utilizes various distribution channels, such as the traditional wholesalebusiness with our retail partners and the PUMA-owned retail and e-commercebusiness to reduce its dependency on individual distribution channels. The who-lesale business represents overall the largest revenue share. The focus on thecompany-own retail and e-commerce business is intended to ensure a highergross profit margin, better distribution control and exclusive presentation ofPUMA products in the desired brand environment.In the wholesale business, up-and-coming retailers, including those offeringtheir own brands, and competitors pose the risk of intensified competition forconsumers and market shares. Consumer purchase behavior is also changing,focusing more on e-commerce and a combination of stationary and digital trade.This requires continuous adjustment of the distribution structure. Distributionthrough the company's own retail stores and e-commerce channels is, however,also associated with various risks for PUMA. These include the necessary invest-ments in expansion and infrastructure, setting up and refurbishing stores, higherfixed costs and leases with long-term lease obligations. This can have an adverseimpact on profitability should business decline.In order to avoid risks and take advantage of opportunities, PUMA carries outpermanent monitoring of distribution channels and regular reporting by the Con-trolling and specialized departments. A detailed location and profitability analysisis carried out in our distribution channels before making any investment decisi-on. The company’s reporting and controlling system allows us to detect negativetrends early on, and to take the countermeasures required to manage individualstores. In e-commerce, global activities are harmonized and investments in the
174
Annual Report 2019 ↗ COMBINED MANAGEMENT REPORT
IT platform are made to further optimize purchase transaction settlement andfurther improve the shopping experience for consumers.
REPORTING IN THE MEDIA
A negative media report about PUMA, such as a product recall, infringement oflaws, or internal or external requirements, can also cause significant damage tothe brand and ultimately result in the loss of sales and profit, regardless of whe-ther these events actually happened or were just rumors. PUMA manages thisrisk by way of careful press, social media and public relations work which is ma-naged from its group headquarters in Herzogenaurach, Germany, and its subsi-diary in the U.S. In addition, PUMA continuously seeks an open dialog with keyexternal stakeholders, such as suppliers, NGOs and industry initiatives, and hasinstitutionalized this as part of regularly held "Sustainability StakeholderMeetings."
ORGANIZATIONAL CHALLENGES AND PROJECT RISKS
PUMA's organizational structure with its group headquarters in Herzogenaurach,a central sourcing organization and globally positioned distribution companiesgives the group a global orientation. This results in a risk for PUMA that the flowsof goods and information are not sufficiently supported by modern IT infrastruc-ture. For this reason, existing business processes must be continually optimizedand adapted. This is carried out systematically through targeted optimizationprojects, which are planned and managed centrally by a specialized department.
PERSONNEL DEPARTMENT
The creative potential, commitment and performance of PUMA employees areimportant factors for a successful business development and represent a signifi-cant opportunity for our business. PUMA encourages independent thinking andaction, which are key in an open corporate culture with flat hierarchies. PUMA’shuman resources strategy seeks to ensure this successful philosophy on a long-
term and sustainable basis. To achieve this goal, a control process is in place todetect and assess human-resource risks. Accordingly, special attention has beenpaid to managing talent, identifying key positions and high-potential individuals,and optimizing talent placement and succession planning. PUMA has institutedadditional national and global regulations and guidelines to ensure compliancewith legal provisions. PUMA will continue to make targeted investments in thehuman-resource needs of particular functions or regions in order to meet the fu-ture requirements of its corporate strategy.
LEGAL RISKS
As an internationally operating group, PUMA is exposed to various legal risks.These include contractual risks or risks that a third party could assert claimsand litigation for infringement of its trademark rights, patent rights or otherrights. The continuous monitoring of contractual obligations and the integrationof internal and external legal experts in contractual matters is to ensure that anylegal risks are avoided.
COMPLIANCE RISKS
PUMA is exposed to the risk that employees violate laws, directives and companystandards (compliance violations). These risks, such as theft, fraud, breach oftrust, embezzlement and corruption, as well as deliberate misrepresentations infinancial reporting, may lead to significant monetary and reputational damage.Therefore, PUMA uses various tools to manage these risks. This includes an in-tegrated compliance management system, the internal control system, groupcontrolling and the internal audit department. As part of the compliance ma-nagement system, awareness measures are carried out regarding critical comp-liance topics, such as corruption prevention and cartel law, and correspondingguidelines are introduced in the group. PUMA employees also have access to anintegrity system for reporting unethical behavior.
175
Annual Report 2019 ↗ COMBINED MANAGEMENT REPORT
CURRENCY RISKS
As an international company, PUMA is subject to currency risks resulting fromthe disparity between the respective amounts of currency used on the purcha-sing and sales sides and from exchange-rate fluctuations.PUMA’s biggest sourcing market is Asia, where most payments are settled in USdollars (USD), while sales of the PUMA Group are mostly invoiced in other cur-rencies. PUMA manages currency risk in accordance with internal guidelines.Currency forward contracts are used to hedge existing and future financial liabi-lities in foreign currencies.
To hedge signed or pending contracts against currency risk, PUMA only conclu-des currency forward contracts on customary market terms with reputable inter-national financial institutions. As of the end of 2019, the net requirements for the2020 planning period were adequately hedged against currency effects.
Foreign exchange risks may also arise from intra-group loans granted for finan-cing purposes. Currency swaps and currency forward transactions are used tohedge currency risks when converting intra-group loans denominated in foreigncurrencies into the functional currencies of the group companies (Euro).
In order to disclose market risks, IFRS 7 requires sensitivity analyses that showthe effects of hypothetical changes in relevant risk variables on earnings andequity. The periodic effects are determined by relating the hypothetical changescaused by the risk variables to the balance of the financial instruments held as ofthe balance sheet date. The underlying assumption is that the balance as of thebalance sheet date is representative for the entire year.
Currency risks as defined by IFRS 7 arise on account of financial instrumentsbeing denominated in a currency that is not the functional currency and is mone-tary in nature. Differences resulting from the conversion of the individual financi-al statements to the group currency are not taken into account. All non-functio-nal currencies in which PUMA employs financial instruments are generally con-sidered to be relevant risk variables.
Currency sensitivity analyses are based on the following assumptions:Material primary financial instruments (cash and cash equivalents, receivables,interest-bearing and non-interest-bearing liabilities) are either denominated in
the functional currency or are transferred into the functional currency using cur-rency forward transactions.
Currency forward contracts used to hedge against payment fluctuations causedby exchange rates are part of an effective cash flow hedging relationship pur-suant to IAS 39. Changes in the exchange rate of the currencies underlying thesecontracts have an effect on the hedge reserve in equity and the fair value of thesehedging contracts.
TAX RISKS
In an international business environment, applicable tax regulations must be ob-served. By means of appropriate internal rules of conduct, employees are requi-red to comply with and adhere to the relevant tax regulations. In addition to com-pliance with national tax regulations to which the individual group companies aresubject, there are increasing risks in the course of intra-group transfer pricing,which must be applied for various internal business transactions in accordancewith the arm's length principle between individual group companies. In all taxareas PUMA has taken adequate precautions with internal and external tax ex-perts in order to comply with the relevant tax regulations, but also to be able toreact to changes in the constantly changing tax environment.For the group-internal transfer prices a corresponding documentation exists,which was prepared according to international and national requirements andstandards. There are guidelines and specifications for determining transfer pri-ces for intra-group transactions that are customary for foreign companies, whichcomply with the applicable procedural rules and are binding on the employeesacting on behalf of the group. By means of internal tax reporting, external andinternal tax experts are able to control and monitor tax developments at PUMAon an ongoing basis. Both the Management Board and the Supervisory Board arecontinuously informed about tax developments at PUMA in order to identify andavoid tax risks as early as possible.
176
Annual Report 2019 ↗ COMBINED MANAGEMENT REPORT
DEFAULT RISKS
Because of its business activities, PUMA is exposed to default risk that is mana-ged by continuously monitoring outstanding receivables and recognizing impair-ment losses, where appropriate. The default risk is limited where possible bycredit insurance and the maximum default risk is reflected by the carryingamounts of the financial assets recognized on the balance sheet. Furthermore,default risks result to a lesser extent from the counterparty’s other contractualfinancial obligations such as bank deposits and derivative financial instruments.
LIQUIDITY RISK
PUMA continually analyzes short-term capital requirements through rolling cashflow planning at the level of the individual companies in coordination with thecentral Treasury department. PUMA maintains a liquidity reserve, for example, inthe form of cash and confirmed credit facilities in order to ensure the company’ssolvency, financial flexibility and a strategic liquidity buffer. In this respect, therewas a syndicated credit line amounting to € 350.0 million as of December 31,2019, which was not utilized as of the balance sheet date.Medium and long-term funding requirements that cannot be directly covered bynet cash from operating activities are financed by taking out medium and long-term loans. For this purpose, promissory note loans were issued in four tranchesin July 2018 (one tranche each with a fixed and a variable coupon with a residualterm of 2 years for a total of € 100.0 million and one tranche each with a residualterm of 4 years for a total of € 60.0 million). Furthermore, an additional promis-sory note loan totaling € 70.0 million was concluded in December 2019 with pay-out in January 2020. This promissory note loan comprises two tranches with afixed and a variable coupon and a term of 5 years.
INTEREST-RATE RISKS
At PUMA, changes in interest rates do not have a significant impact on interestrate sensitivity and therefore do not require the use of interest rate hedginginstruments.
SUMMARY
The assessment of the overall risk situation of the group and PUMA SE is the re-sult of a consolidated view of the individual risks described above. The Manage-ment Board is currently not aware of any significant risks that, either indepen-dently or in combination with other risks, could jeopardize the continued exis-tence of the group and PUMA SE. In 2019, there was no significant change in theoverall assessment of the risk situation compared to the previous year.However, we cannot exclude the possibility that in the future factors that are cur-rently unknown to us or that we currently assess as immaterial could influencethe continued existence of the group and PUMA SE and its consolidated compa-nies. Due to the extremely solid balance sheet structure and equity ratio, as wellas the positive business outlook, the Management Board does not see any risksthat could jeopardize the continued existence of the PUMA Group and PUMA SE.
177
Annual Report 2019 ↗ COMBINED MANAGEMENT REPORT

MAIN FEATURES OF THE INTERNAL CONTROL AND RISKMANAGEMENT SYSTEM AS IT RELATES TO THE GROUP’SACCOUNTING PROCESS
The Management Board of PUMA SE is responsible for the preparation and accu-racy of the annual financial statements, the consolidated financial statementsand the combined management report of PUMA SE. The consolidated financialstatements were prepared in accordance with the International Financial Re-porting Standards that apply in the EU, the requirements of the German Com-mercial Code (HGB), the German Stock Corporation Act (AktG) and the GermanSE Implementation Act (SEAG). Certain disclosures and amounts are based oncurrent estimates by the Management Board and the management.
The company’s Management Board is responsible for maintaining and regularlymonitoring a suitable internal control and risk management system covering theconsolidated financial statements and the disclosures in the combined manage-ment report. This control and risk management system is designed to ensure thecompliance and reliability of the internal and external accounting records, thepresentation and accuracy of the consolidated financial statements, and thecombined management report and the disclosures contained therein. It is basedon a series of process-integrated monitoring steps and encompasses the mea-sures necessary to accomplish these, internal instructions, organizational andauthorization guidelines, the PUMA Code of Ethics, a clear separation of func-tions within the Group and the dual-control principle. The adequacy and opera-ting effectiveness of these measures are regularly reviewed by the Group Inter-nal Audit & GRC department.
For monthly financial reporting and consolidation, PUMA has a group-wide re-porting and controlling system that allows it to regularly and promptly detect de-viations from projected figures and accounting irregularities and, where ne-cessary, to take countermeasures.
The risk management system can regularly, as well as on an ad-hoc basis, iden-tify events that could affect the company’s economic performance and its ac-counting process so that it can analyze and evaluate the resulting risks and takethe necessary actions to counter them.
In preparing the consolidated financial statements and the combined manage-ment report, it is also sometimes necessary to make assumptions and estimatesthat are based on the information available on the balance sheet date and whichwill affect the reported amounts and recognition of assets and liabilities, incomeand expenses, contingent liabilities, and other data that must be reported, aswell as how these are classified.
The Supervisory Board’s Audit Committee meets regularly with the independentstatutory auditors, the Management Board, and the Group Internal Audit & GRCdepartment to discuss the results of the statutory audits of the financial state-ments and of the audit review with regard to the internal control and risk ma-nagement system as it relates to the accounting process. At the annual meetingon the financial statements, the auditor reports to the Supervisory Board on theresults of the audit of the annual and consolidated financial statements.
In addition to the risk and opportunity management described, the Group Inter-nal Audit & GRC department carries out so-called Internal Control Self-Assess-ments (ICSA) at the process level for all essential business processes. In these,process owners evaluate the existing control framework based on internal andexternal guidelines and best-practice standards. The objective is to continuouslyimprove the internal control system and to identify specific risks at process levelto be able to introduce countermeasures. The results of the ICSA are reported tothe Audit Committee and are used specifically by the Group Internal Audit & GRCdepartment in risk-oriented audit planning.
178
Annual Report 2019 ↗ COMBINED MANAGEMENT REPORT
OUTLOOK
GLOBAL ECONOMY
After the dynamics of the global economy have slowed down in 2019, experts atthe Kiel Institute for the World Economy (ifw Kiel) expect global gross domesticproduct (GDP) to rise by 3.1% in 2020 (winter forecast dated December 11, 2019).This corresponds to a slight increase in the GDP growth rate of 0.1% compared to2019. Accordingly, the global economy is expected to stabilize overall in 2020.
Experts expect that the increase in production in the advanced economies willremain moderate in 2020. While economic momentum in the United States ofAmerica continues to slow down and the “Brexit” will continue to put a strain onthe UK economy in 2020, ifw Kiel expects the economy in the euro zone to remainat a similar level compared to 2019. The expansion of the Chinese economy is li-kely to lose further momentum in 2020. In the other emerging markets, however,the rise in production is likely to increase slightly. Trade policy uncertainties con-tinue to weigh on the outlook and remain a risk for the forecast.
SPORTING GOODS INDUSTRY
If there are no significant negative effects from the overall economic develop-ment, we expect the sporting goods industry to continue its stable growth in2020. It can be assumed that the trend towards sports activities and a healthylifestyle will continue and thus the demand for sporting goods will also continueto rise. In addition, major sporting events in 2020, especially the Tokyo Summer
Olympics and the European Football Championship, should help to supportgrowth in the sporting goods industry.
OUTLOOK 2020
Our business developed strongly in 2019, both in terms of sales and profitability.We are confident that the positive development will continue in 2020.
For the full year 2020, we therefore expect currency-adjusted sales growth ofaround 10%. We forecast the gross profit margin to show a slight improvementcompared to last year (2019: 48.8%) and operating expenses (OPEX) to increaseat a slightly lower rate than sales. Based on the current exchange rate levels weexpect an operating result (EBIT) for the financial year 2020 in a range between €500 million and € 520 million (2019: € 440.2 million). We also expect a significantimprovement of net earnings in 2020.
INVESTMENTS
Investments in fixed assets of around € 200 million are planned for 2020. Themajority of these investments will be in infrastructure in order to create the ope-rating requirements for the planned long-term growth. The investments mainlyconcern own distribution and logistics centers and further investments in the ex-pansion and modernization of the Group's own retail stores.
179
Annual Report 2019 ↗ COMBINED MANAGEMENT REPORT
FOUNDATION FOR LONG-TERM GROWTH
The Management Board and the Supervisory Board have set the long-term stra-tegic priorities. Action plans are being implemented in a targeted and value-ori-ented manner. We believe that the corporate strategy "Forever Faster" providesthe basis for medium- and long-term positive development. We therefore con-firm our medium-term target of an average annual growth rate of currency-ad-justed sales of around 10% (CAGR) and the achievement of a 10% EBIT margin by2021/ 2022.
Herzogenaurach, January 31, 2020
The Management Board
Gulden Lämmermann Descours
180
Annual Report 2019 ↗ COMBINED MANAGEMENT REPORT

Consolidated Financial Statements
182 Consolidated Statement of Financial Position
184 Consolidated Income Statement
185 Consolidated Statement of Comprehensive Income
186 Consolidated Statement of Cash Flows
188 Statement of Changes in Equity
190 Notes to the Consolidated Financial Statements
268 Declaration by the Legal Representatives
269 Independent Auditor’s Report
PURE PERFORMANCE
181
Annual Report 2019 ↗ CONSOLIDATED FINANCIAL STATEMENTS
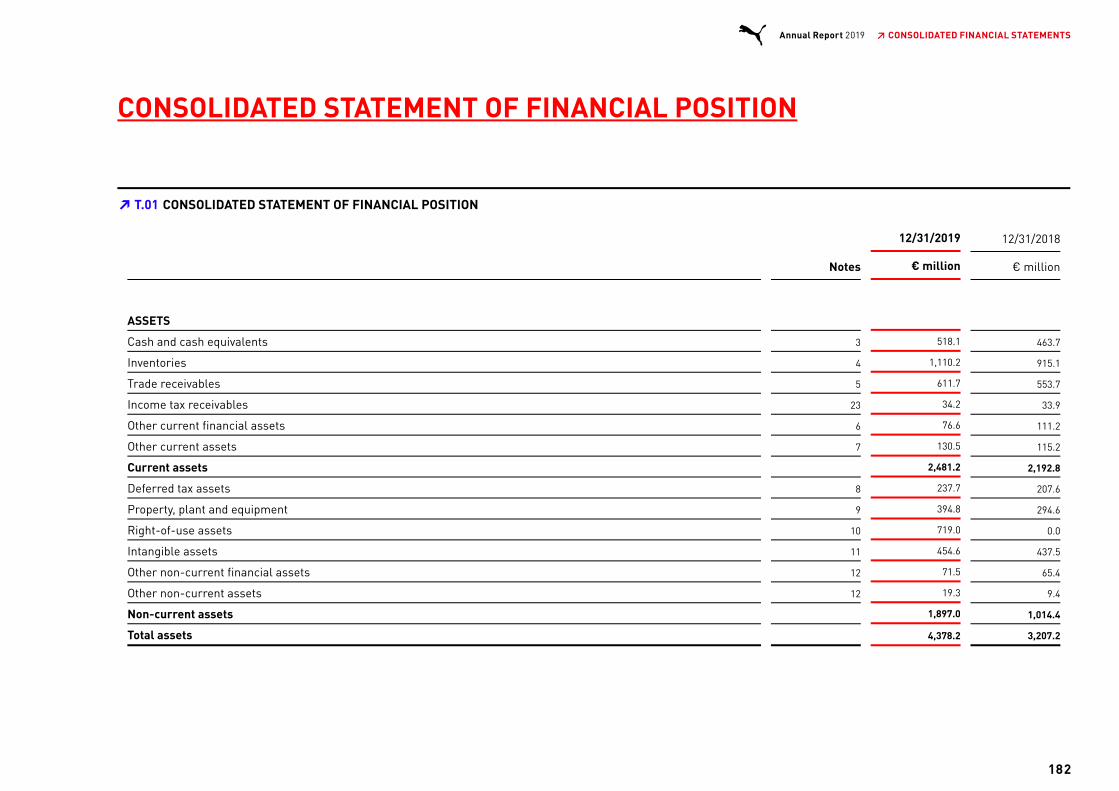
CONSOLIDATED STATEMENT OF FINANCIAL POSITION
12/31/2019 12/31/2018
Notes € million € million
ASSETS
Cash and cash equivalents 3 518.1 463.7
Inventories 4 1,110.2 915.1
Trade receivables 5 611.7 553.7
Income tax receivables 23 34.2 33.9
Other current financial assets 6 76.6 111.2
Other current assets 7 130.5 115.2
Current assets 2,481.2 2,192.8
Deferred tax assets 8 237.7 207.6
Property, plant and equipment 9 394.8 294.6
Right-of-use assets 10 719.0 0.0
Intangible assets 11 454.6 437.5
Other non-current financial assets 12 71.5 65.4
Other non-current assets 12 19.3 9.4
Non-current assets 1,897.0 1,014.4
Total assets 4,378.2 3,207.2
T.01 CONSOLIDATED STATEMENT OF FINANCIAL POSITION➔
182
Annual Report 2019 ↗ CONSOLIDATED FINANCIAL STATEMENTS
CONSOLIDATED STATEMENT OF FINANCIAL POSITION
12/31/2019 12/31/2018
Notes € million € million
ASSETS
Cash and cash equivalents 3 518.1 463.7
Inventories 4 1,110.2 915.1
Trade receivables 5 611.7 553.7
Income tax receivables 23 34.2 33.9
Other current financial assets 6 76.6 111.2
Other current assets 7 130.5 115.2
Current assets 2,481.2 2,192.8
Deferred tax assets 8 237.7 207.6
Property, plant and equipment 9 394.8 294.6
Right-of-use assets 10 719.0 0.0
Intangible assets 11 454.6 437.5
Other non-current financial assets 12 71.5 65.4
Other non-current assets 12 19.3 9.4
Non-current assets 1,897.0 1,014.4
Total assets 4,378.2 3,207.2
T.01 CONSOLIDATED STATEMENT OF FINANCIAL POSITION➔

12/31/2019 12/31/2018
Notes € million € million
LIABILITIES AND SHAREHOLDERS' EQUITY
Current financial liabilities 13 10.2 20.5
Trade payables 13 843.7 705.3
Income taxes 23 88.9 68.0
Current lease liabilities 10 144.8 0.8
Other current provisions 16 34.8 39.6
Other current financial liabilities 13 60.5 56.4
Other current liabilities 13 376.0 304.6
Current liabilities 1,558.9 1,195.2
Non-current lease liabilities 10 600.5 7.5
Deferred tax liabilities 8 53.0 47.7
Pension provisions 15 34.1 28.9
Other non-current provisions 16 43.2 26.3
Liabilities from acquisitions 17 0.0 3.3
Other non-current financial liabilities 13 163.8 173.2
Other non-current liabilities 13 4.4 2.9
Non-current liabilities 899.0 289.7
Subscribed capital 18 150.8 38.6
Capital reserve 18 83.0 193.6
Retained earnings 18 1,668.0 1,499.9
Treasury stock 18 -28.1 -28.9
Equity attributable to the shareholders of the parent 1,873.6 1,703.3
Non-controlling interest 18, 30 46.7 18.9
Shareholders' equity 1,920.3 1,722.2
Total liabilities and shareholders' equity 4,378.2 3,207.2
183
Annual Report 2019 ↗ CONSOLIDATED FINANCIAL STATEMENTS
12/31/2019 12/31/2018
Notes € million € million
LIABILITIES AND SHAREHOLDERS' EQUITY
Current financial liabilities 13 10.2 20.5
Trade payables 13 843.7 705.3
Income taxes 23 88.9 68.0
Current lease liabilities 10 144.8 0.8
Other current provisions 16 34.8 39.6
Other current financial liabilities 13 60.5 56.4
Other current liabilities 13 376.0 304.6
Current liabilities 1,558.9 1,195.2
Non-current lease liabilities 10 600.5 7.5
Deferred tax liabilities 8 53.0 47.7
Pension provisions 15 34.1 28.9
Other non-current provisions 16 43.2 26.3
Liabilities from acquisitions 17 0.0 3.3
Other non-current financial liabilities 13 163.8 173.2
Other non-current liabilities 13 4.4 2.9
Non-current liabilities 899.0 289.7
Subscribed capital 18 150.8 38.6
Capital reserve 18 83.0 193.6
Retained earnings 18 1,668.0 1,499.9
Treasury stock 18 -28.1 -28.9
Equity attributable to the shareholders of the parent 1,873.6 1,703.3
Non-controlling interest 18, 30 46.7 18.9
Shareholders' equity 1,920.3 1,722.2
Total liabilities and shareholders' equity 4,378.2 3,207.2

CONSOLIDATED INCOME STATEMENT
2019 2018
Notes € million € million
Sales 20, 26 5,502.2 4,648.3
Cost of sales 26 -2,815.8 -2,399.0
Gross profit 26 2,686.4 2,249.4
Royalty and commission income 25.1 16.3
Other operating income and expenses 21 -2,271.3 -1,928.4
thereof impairment losses of trade receivables and other financial assets 5 -3.4 -6.2
Operating result (EBIT) 440.2 337.4
Result from associated companies 22 0.0 -1.5
Financial income 22 25.8 11.6
Financial expenses 22 -48.4 -34.1
Financial result -22.6 -24.0
Earnings before taxes (EBT) 417.6 313.4
Taxes on income 23 -108.6 -83.6
Consolidated net earnings for the year 309.0 229.8
attributable to: Non-controlling interest 18, 30 -46.6 -42.4
Equity holders of the parent (net earnings) 262.4 187.4
Earnings per share (€)* 24 1.76 1.25
Earnings per share (€) - diluted* 24 1.76 1.25
Weighted average shares outstanding (million)* 24 149.52 149.47
Weighted average shares outstanding, diluted (million)* 24 149.52 149.47
*The average number and diluted number of shares as well as the earnings per share in the same period of pervious year were adjusted retrospectively to the 1:10 share split in the second quarter.
T.02 CONSOLIDATED INCOME STATEMENT➔
184
Annual Report 2019 ↗ CONSOLIDATED FINANCIAL STATEMENTS
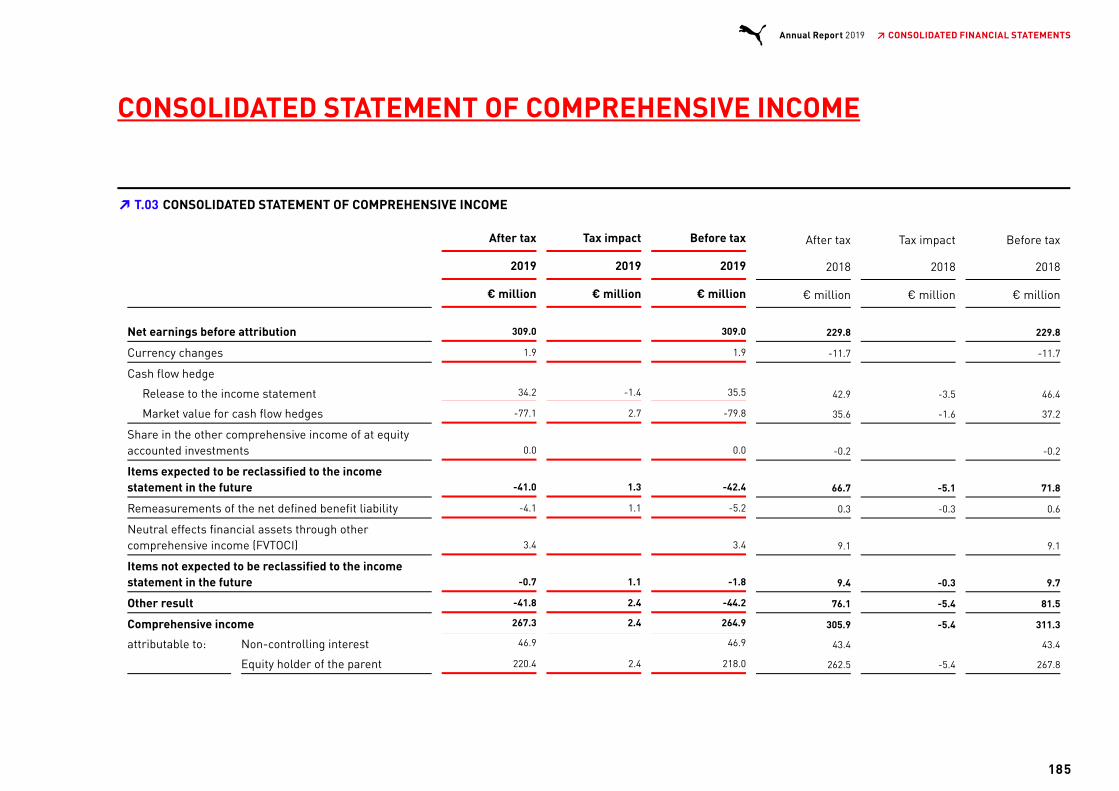
CONSOLIDATED STATEMENT OF COMPREHENSIVE INCOME
After tax Tax impact Before tax After tax Tax impact Before tax
2019 2019 2019 2018 2018 2018
€ million € million € million € million € million € million
Net earnings before attribution 309.0 309.0 229.8 229.8
Currency changes 1.9 1.9 -11.7 -11.7
Cash flow hedge
Release to the income statement 34.2 -1.4 35.5 42.9 -3.5 46.4
Market value for cash flow hedges -77.1 2.7 -79.8 35.6 -1.6 37.2
Share in the other comprehensive income of at equityaccounted investments 0.0 0.0 -0.2 -0.2
Items expected to be reclassified to the incomestatement in the future -41.0 1.3 -42.4 66.7 -5.1 71.8
Remeasurements of the net defined benefit liability -4.1 1.1 -5.2 0.3 -0.3 0.6
Neutral effects financial assets through othercomprehensive income (FVTOCI) 3.4 3.4 9.1 9.1
Items not expected to be reclassified to the incomestatement in the future -0.7 1.1 -1.8 9.4 -0.3 9.7
Other result -41.8 2.4 -44.2 76.1 -5.4 81.5
Comprehensive income 267.3 2.4 264.9 305.9 -5.4 311.3
attributable to: Non-controlling interest 46.9 46.9 43.4 43.4
Equity holder of the parent 220.4 2.4 218.0 262.5 -5.4 267.8
T.03 CONSOLIDATED STATEMENT OF COMPREHENSIVE INCOME➔
185
Annual Report 2019 ↗ CONSOLIDATED FINANCIAL STATEMENTS

CONSOLIDATED STATEMENT OF CASH FLOWS
2019 2018
Notes € million € million
Operating activities
Earnings before tax (EBT) 417.6 313.4
Adjustments for:
Depreciation 9, 10, 11 246.4 81.5
Non-realized currency gains/losses, net 1.9 -15.7
Result from associated companies 0.0 1.5
Financial income 22 -15.3 -11.3
Financial expenses 22 48.4 19.7
Changes from the sale of fixed assets 2.1 1.0
Changes to pension accruals 15 -1.2 -0.6
Other non-cash effected expenses/income 5.0 8.6
Gross cash flow 27 704.8 398.0
Changes in receivables and other current assets 5, 6, 7 -69.8 -61.2
Changes in inventories 4 -188.8 -122.8
Changes in trade payables and other current liabilities 13 214.1 146.0
Cash inflow from operating activities 660.3 360.1
Dividends received 12 0.3 0.9
Income taxes paid 23 -111.8 -82.9
Net cash from operating activities 27 548.8 278.1
T.04 CONSOLIDATED STATEMENT OF CASH FLOWS➔
186
Annual Report 2019 ↗ CONSOLIDATED FINANCIAL STATEMENTS

2019 2018
Notes € million € million
Investing activities
Payment for acquisitions 17 -1.2 0.0
Proceeds from sale of long-term shareholdings 0.0 23.5
Purchase of property and equipment 9, 11 -218.4 -130.2
Proceeds from sale of property and equipment 2.3 1.5
Payment for other assets 12 -6.0 -3.6
Interest received 22 4.5 3.5
Net cash used in investing activities -218.7 -105.3
Financing activities
Repayment of lease liabilities 10 -140.8 -1.8
Repayment of current financial liabilities 13 -10.4 -16.6
Repayment of non-current financial liabilities 13 -7.1 0.0
Raising of non-current financial liabilities 13 0.0 145.2
Dividend payments to equity holders of the parent 18 -52.3 -186.8
Dividend payments to non-controlling interests 18, 30 -18.6 -55.7
Interest paid 22 -43.6 -12.6
Net Cash used in financing activities 27 -272.9 -128.3
Exchange rate-related changes in cash flow -2.8 4.2
Change in cash and cash equivalents 54.3 48.7
Cash and cash equivalents at beginning of the financial year 463.7 415.0
Cash and cash equivalents at end of the financial year 3, 27 518.1 463.7
187
Annual Report 2019 ↗ CONSOLIDATED FINANCIAL STATEMENTS

STATEMENT OF CHANGES IN EQUITY
T.05 STATEMENT OF CHANGES IN EQUITY (in € million)➔
Subscribedcapital
Capitalreserve
Reserves
Treasurystock
Equitybefore
non-controlling
interests
Non-controlling
interestsTOTALequity
Revenuereserves
incl. retainedearnings
Differencefrom
currency conversion
Cash flow
hedges
At equityaccounted
investments
12/31/2017 38.6 192.6 1,681.5 -212.6 -44.8 0.2 -30.0 1,625.5 31.2 1,656.7
Net earnings 187.4 187.4 42.4 229.8
Net income directly recognized in equity 9.4 -13.0 78.8 -0.2 75.0 1.1 76.1
Total comprehensive income 196.8 -13.0 78.8 -0.2 262.5 43.4 305.9
Dividends paid to equity holders of the parent company /non-controlling interests -186.8 -186.8 -55.7 -242.5
Utilization / Issue of treasury stock 1.0 1.1 2.2 2.2
12/31/2018 38.6 193.6 1,691.5 -225.6 34.1 0.0 -28.9 1,703.3 18.9 1,722.2
188
Annual Report 2019 ↗ CONSOLIDATED FINANCIAL STATEMENTS
STATEMENT OF CHANGES IN EQUITY
T.05 STATEMENT OF CHANGES IN EQUITY (in € million)➔
Subscribedcapital
Capitalreserve
Reserves
Treasurystock
Equitybefore
non-controlling
interests
Non-controlling
interestsTOTALequity
Revenuereserves
incl. retainedearnings
Differencefrom
currency conversion
Cash flow
hedges
At equityaccounted
investments
12/31/2017 38.6 192.6 1,681.5 -212.6 -44.8 0.2 -30.0 1,625.5 31.2 1,656.7
Net earnings 187.4 187.4 42.4 229.8
Net income directly recognized in equity 9.4 -13.0 78.8 -0.2 75.0 1.1 76.1
Total comprehensive income 196.8 -13.0 78.8 -0.2 262.5 43.4 305.9
Dividends paid to equity holders of the parent company /non-controlling interests -186.8 -186.8 -55.7 -242.5
Utilization / Issue of treasury stock 1.0 1.1 2.2 2.2
12/31/2018 38.6 193.6 1,691.5 -225.6 34.1 0.0 -28.9 1,703.3 18.9 1,722.2
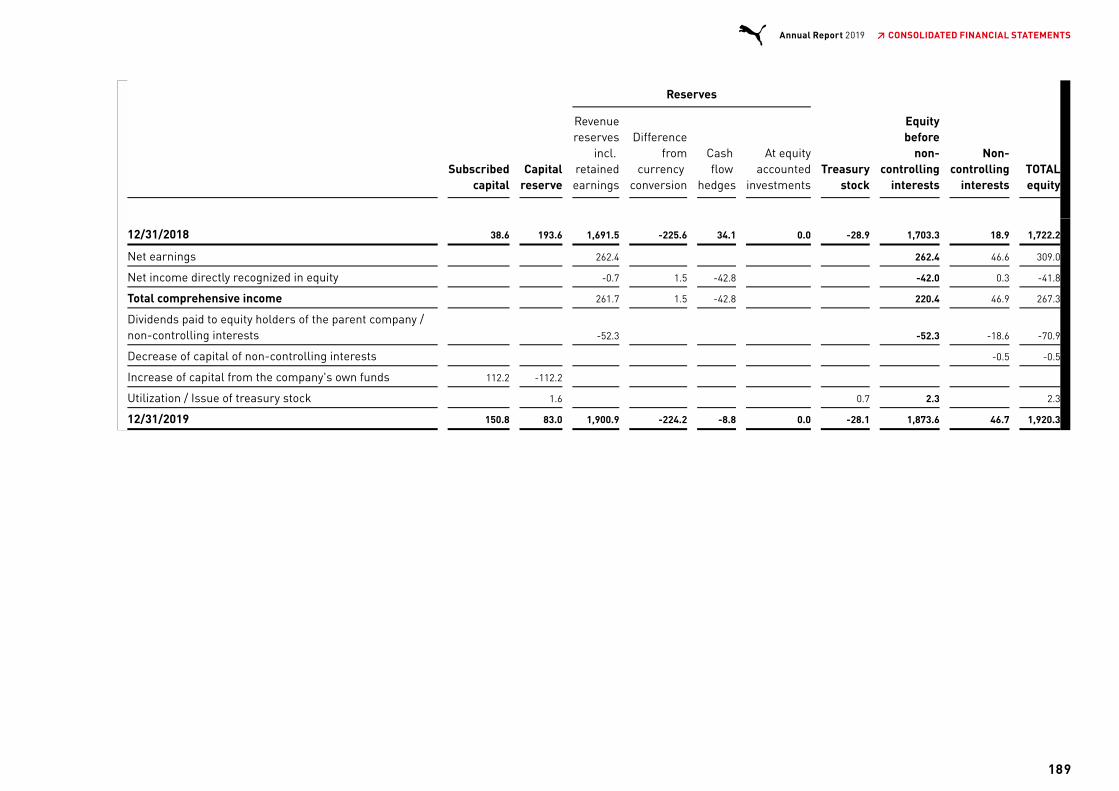
Subscribedcapital
Capitalreserve
Reserves
Treasurystock
Equitybefore
non-controlling
interests
Non-controlling
interestsTOTALequity
Revenuereserves
incl. retainedearnings
Differencefrom
currency conversion
Cash flow
hedges
At equityaccounted
investments
12/31/2018 38.6 193.6 1,691.5 -225.6 34.1 0.0 -28.9 1,703.3 18.9 1,722.2
Net earnings 262.4 262.4 46.6 309.0
Net income directly recognized in equity -0.7 1.5 -42.8 -42.0 0.3 -41.8
Total comprehensive income 261.7 1.5 -42.8 220.4 46.9 267.3
Dividends paid to equity holders of the parent company /non-controlling interests -52.3 -52.3 -18.6 -70.9
Decrease of capital of non-controlling interests -0.5 -0.5
Increase of capital from the company's own funds 112.2 -112.2
Utilization / Issue of treasury stock 1.6 0.7 2.3 2.3
12/31/2019 150.8 83.0 1,900.9 -224.2 -8.8 0.0 -28.1 1,873.6 46.7 1,920.3
189
Annual Report 2019 ↗ CONSOLIDATED FINANCIAL STATEMENTSSubscribed
capitalCapital
reserve
Reserves
Treasurystock
Equitybefore
non-controlling
interests
Non-controlling
interestsTOTALequity
Revenuereserves
incl. retainedearnings
Differencefrom
currency conversion
Cash flow
hedges
At equityaccounted
investments
12/31/2018 38.6 193.6 1,691.5 -225.6 34.1 0.0 -28.9 1,703.3 18.9 1,722.2
Net earnings 262.4 262.4 46.6 309.0
Net income directly recognized in equity -0.7 1.5 -42.8 -42.0 0.3 -41.8
Total comprehensive income 261.7 1.5 -42.8 220.4 46.9 267.3
Dividends paid to equity holders of the parent company /non-controlling interests -52.3 -52.3 -18.6 -70.9
Decrease of capital of non-controlling interests -0.5 -0.5
Increase of capital from the company's own funds 112.2 -112.2
Utilization / Issue of treasury stock 1.6 0.7 2.3 2.3
12/31/2019 150.8 83.0 1,900.9 -224.2 -8.8 0.0 -28.1 1,873.6 46.7 1,920.3
NOTES TO THE CONSOLIDATED FINANCIAL STATEMENTS
1. GENERAL
Under the “PUMA” brand name, PUMA SE and its subsidiaries are engaged in thedevelopment and sale of a broad range of sports and sports lifestyle products,including footwear, apparel and accessories. The company is a European stockcorporation (Societas Europaea/SE) and parent company of the PUMA Group; itsregistered office is on PUMA WAY 1, 91074 Herzogenaurach, Germany. The com-petent registry court is in Fürth (Bavaria), the register number is HRB 13085.
The consolidated financial statements of PUMA SE and its subsidiaries (hereinaf-ter shortly referred to as the “Group” or “PUMA”) were prepared in accordancewith the “International Financial Reporting Standards (IFRS)” accounting stan-dards issued by the International Accounting Standards Board (IASB), as they areto be applied in the EU, and the supplementary accounting principles to be app-lied in accordance with Section 315e (1) of the German Commercial Code. TheIASB standards and interpretations, as they are to be applied in the EU, which aremandatory for financial years as of January 1, 2019, have been applied.
The items contained in the financial statements of the individual Group compa-nies are measured based on the currency that corresponds to the currency of theprimary economic environment in which the Company operates. The consolida-ted financial statements are prepared in euros (EUR or €). The presentation ofamounts in millions of euros with one decimal place may lead to rounding diffe-rences since the calculation of individual items is based on figures presented inthousands.
The cost of sales method is used for the income statement.
The following new and amended standards and interpretations have been usedfor the first time in the current financial year:
Standard Title
First-time adoption in the currentfinancial year
IFRS 16 Leases
Amendments to IAS 19Plan Amendment, Curtailment orSettlement
Amendment IAS 28Long-term Interests in Associates andJoint Ventures
Amendment IFRS 9Prepayment Features with NegativeCompensation
IFRIC 23Uncertainty Transactions and AdvanceConsideration
AIP 2015 – 2017 Improvements to IFRS
The standards and interpretations used for the first time as of January 1, 2019had the following effects on the consolidated financial statements:
T.06 NEW AND AMENDED STANDARDS AND INTERPRETATIONS➔
190
Annual Report 2019 ↗ CONSOLIDATED FINANCIAL STATEMENTS
FIRST-TIME ADOPTION OF IFRS 16 – LEASES
In this financial year, PUMA has for the first time applied IFRS 16 leases as thenew standard became mandatory for financial years commencing on or after Ja-nuary 1, 2019.
The effect of the new leasing standard IFRS 16 was that all leases, except short-term and low-value leases, were recognized in the form of a right-of-use assetand a corresponding leasing liability. A differentiation between operating and fi-nance leases is no longer required. The impacts of the initial application of IFRS16 on the consolidated financial statements will be described in the following.
PUMA mainly concludes leasing contracts as an operating lessee. With the appli-cation of IFRS 16, the reporting of leases previously recognized as operating lea-ses and not recognized on the balance sheet has changed. In accordance with thenew standard, PUMA recognizes for all leases, except short-term leases with aduration of less than 12 months and low-value lease assets:
(a) in the consolidated balance sheet, a right-of-use asset and a correspon-ding lease liability which are initially valued at the present value of futurelease payments;
(b) depreciation of the right-of-use assets and interest expenses for the lea-se liabilities in the consolidated income statement;
(c) the lease installments in the cash flow statement; here, the repaymentand interest portions are separately recognized within the cash inflows/out-flows from financing activities.
The first-time application of IFRS 16 by PUMA is done based on the modified re-trospective method. This method did not require adjustment of the previousyear’s numbers. Instead, at the time of initial application (January 1, 2019), thecumulated effects of the initial application of IFRS 16 are recognized as a correc-tion item in the opening balance.
PUMA has made use of the exemption provision which does not require to newlyevaluate whether a contract contains a lease or not during the transition toIFRS 16. Accordingly, the definition of a lease in accordance with IAS 17 and IFRIC4 will continue to be applied to those contracts that were concluded or amended
before January 1, 2019. For all contracts that were concluded or amended on orafter January 1, 2019, PUMA already applies the definition of a lease based onthe guidelines stipulated by IFRS 16. As part of the implementation of the newleasing standard, PUMA has not determined any material changes as a result ofthe new definition of leases in accordance with IFRS 16.
PUMA has elected to fully use all recognition exemptions provided for by IFRS 16for the application of the standard. For the country portfolios of leases, PUMAhas applied a term-specific discount rate. The weighted average of the incre-mental borrowing rate was 4.6%. The incremental borrowing rate was determi-ned on a country- and currency-specific basis and with comparable terms basedon the risk-free market rate. Furthermore, a specific risk premium was addedfor every subsidiary.
As part of the initial application of IFRS 16, PUMA has decided not to perform animpairment test. As of December 31, 2018, no provisions existed for onerouscontracts from leases in accordance with IAS 37. Consequently, at the time of in-itial application on January 1, 2019, no adjustment of the right-of-use assets re-lating to provisions for onerous contracts from leases was necessary.In addition, PUMA has elected to use the exemption provisions for short-termleases with a term of less than 12 months and low-value lease assets and reco-gnized the underlying lease expense in operating expenses on a straight-line ba-sis in accordance with IFRS 16. Similarly, initial direct costs when measuring theright-of-use assets were disregarded at the time of initial application. In addition,PUMA retrospectively determined the term of the leases, for example with regardto extension and termination options ("use of hindsight").
191
Annual Report 2019 ↗ CONSOLIDATED FINANCIAL STATEMENTS

The measurement of the right-of-use assets occurred at the transition point inthe amount of the lease liabilities that were corrected by the amount of the pre-paid or deferred lease payments recognized on the balance sheet as of Decem-ber 31, 2018.
In addition, lease incentives of the lessee (e.g. rent-free periods and incentivepayments) were recognized during the measurement of the right-of-use assetand lease liability, whereas under IAS 17, these were recognized as deferred lia-bilities and reported as a reduction of rental expenses on a straight-line basis.
The right-of-use assets recognized on the balance sheet are subject to impair-ment of assets in accordance with IAS 36. In contrast, for operating leases underIAS 17, an assessment is made whether the contract is an onerous contract ac-cording to IAS 37 with regards to provisions.
With regards to the leases that were previously recognized as finance leases,PUMA assumed the carrying amount of the leased asset and the lease liabilityunder IAS 17 for the valuation of the right-of-use asset and the lease liability atthe time of initial adoption of IFRS 16. The carrying amount of the finance leaseswas € 8.3 million as of December 31, 2018 as shown in the reconciliation presen-ted below.
The following table represents the reconciliation of the obligations arising fromthe operating leases as of December 31, 2018 with the lease liabilities recognizedon the balance sheet as of January 1, 2019:
€ million
Obligations from operating leases as of Dec. 31, 2018 875.2
Discounting at the average weighted incremental borrowing rateof 4.6% at the date of first-time application of IFRS 16 -113.2
Liabilities from finance leases as of Dec. 31, 2018 8.3
(less) short-term leases and leases of low-value assets that arerecognized as an expense on a straight-line basis -8.2
Operating lease agreements with commencement date after Jan.1, 2019 -270.2
Differences from the exercise of extension options 132.0
Lease liability recognized on Jan. 1, 2019 623.9
T.07 ➔
192
Annual Report 2019 ↗ CONSOLIDATED FINANCIAL STATEMENTS

The change in accounting policies affected the balance sheet as of January 1,2019 as follows:
Jan. 1, 2019€ million
Decrease in property, plant and equipment -8.4
Increase in rights of use +615.8
Decrease in advance payments made -3.2
Increase in balance sheet total assets +604.2
Increase in lease liabilities +615.6
Decrease in trade payables -9.9
Decrease in other non-current liabilities -1.3
Decrease in other current liabilities -0.2
Increase in balance sheet total liabilities and shareholders’equity +604.2
There was no impact on retained earnings as of January 1, 2019.
The change in accounting policies had the following effects on the income state-ment in financial year 2019:
2019(without
applicationof IFRS 16)
Effectsfrom first-
timeapplicationof IFRS 16
2019 asreported
€ million € million € million
Other operating income and expenses -2,290.4 +19.2 -2,271.3
Operating result (EBIT) 421.1 +19.2 440.2
Financial result 7.1 -29.7 -22.6
Earnings before taxes (EBT) 428.2 -10.6 417.6
Taxes on income -111.4 +2.8 -108.6
Net earnings 270.2 -7.7 262.4
The initial application of IFRS 16 had the following effect on earnings per shareand diluted earnings per share:
Effect on earnings pershare
Effect on dilutedearnings per share
2019 € per share 2019 € per share
Effect of the first-timeapplication of IFRS 16 -0.05 -0.05
T.08 ➔
T.09 ➔
T.10 ➔
193
Annual Report 2019 ↗ CONSOLIDATED FINANCIAL STATEMENTS
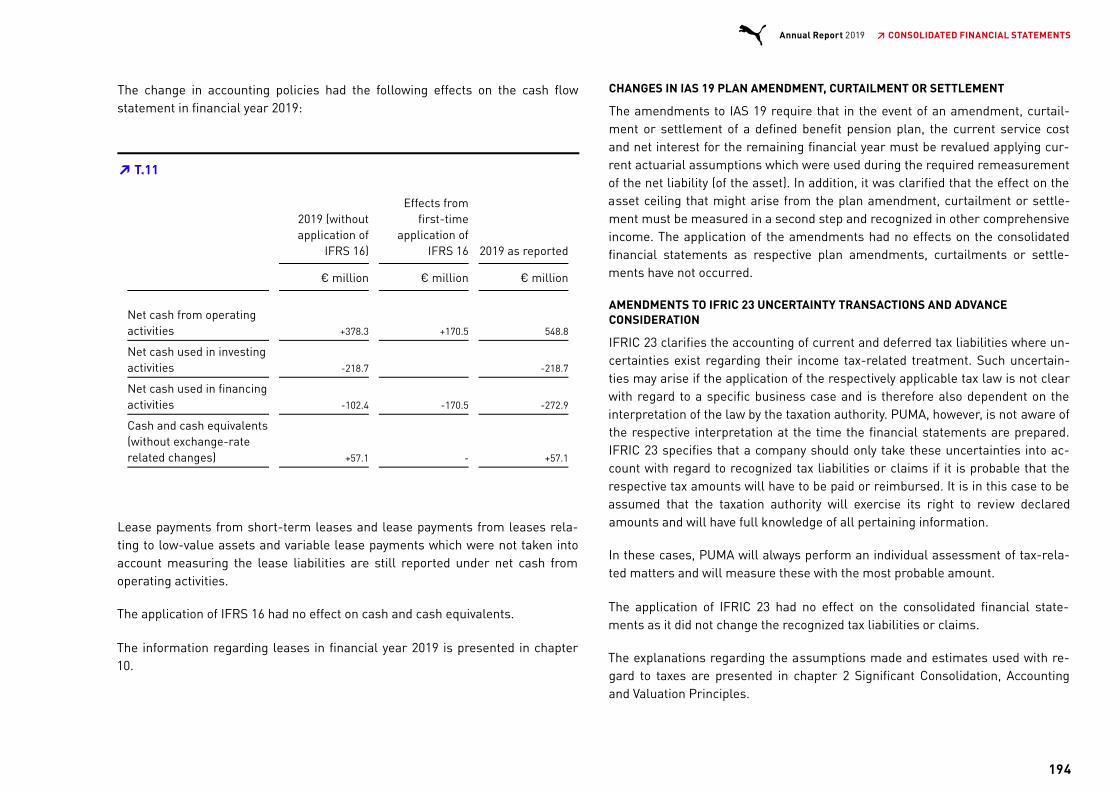
The change in accounting policies had the following effects on the cash flowstatement in financial year 2019:
2019 (withoutapplication of
IFRS 16)
Effects fromfirst-time
application ofIFRS 16 2019 as reported
€ million € million € million
Net cash from operatingactivities +378.3 +170.5 548.8
Net cash used in investingactivities -218.7 -218.7
Net cash used in financingactivities -102.4 -170.5 -272.9
Cash and cash equivalents(without exchange-raterelated changes) +57.1 - +57.1
Lease payments from short-term leases and lease payments from leases rela-ting to low-value assets and variable lease payments which were not taken intoaccount measuring the lease liabilities are still reported under net cash fromoperating activities.
The application of IFRS 16 had no effect on cash and cash equivalents.
The information regarding leases in financial year 2019 is presented in chapter10.
CHANGES IN IAS 19 PLAN AMENDMENT, CURTAILMENT OR SETTLEMENT
The amendments to IAS 19 require that in the event of an amendment, curtail-ment or settlement of a defined benefit pension plan, the current service costand net interest for the remaining financial year must be revalued applying cur-rent actuarial assumptions which were used during the required remeasurementof the net liability (of the asset). In addition, it was clarified that the effect on theasset ceiling that might arise from the plan amendment, curtailment or settle-ment must be measured in a second step and recognized in other comprehensiveincome. The application of the amendments had no effects on the consolidatedfinancial statements as respective plan amendments, curtailments or settle-ments have not occurred.
AMENDMENTS TO IFRIC 23 UNCERTAINTY TRANSACTIONS AND ADVANCECONSIDERATION
IFRIC 23 clarifies the accounting of current and deferred tax liabilities where un-certainties exist regarding their income tax-related treatment. Such uncertain-ties may arise if the application of the respectively applicable tax law is not clearwith regard to a specific business case and is therefore also dependent on theinterpretation of the law by the taxation authority. PUMA, however, is not aware ofthe respective interpretation at the time the financial statements are prepared.IFRIC 23 specifies that a company should only take these uncertainties into ac-count with regard to recognized tax liabilities or claims if it is probable that therespective tax amounts will have to be paid or reimbursed. It is in this case to beassumed that the taxation authority will exercise its right to review declaredamounts and will have full knowledge of all pertaining information.
In these cases, PUMA will always perform an individual assessment of tax-rela-ted matters and will measure these with the most probable amount.
The application of IFRIC 23 had no effect on the consolidated financial state-ments as it did not change the recognized tax liabilities or claims.
The explanations regarding the assumptions made and estimates used with re-gard to taxes are presented in chapter 2 Significant Consolidation, Accountingand Valuation Principles.
T.11 ➔
194
Annual Report 2019 ↗ CONSOLIDATED FINANCIAL STATEMENTS

CHANGES IN OTHER STANDARDS AND INTERPRETATIONS
The application of the amendment to IAS 28 (Long-term Interests in Associatesand Joint Ventures) had no effect on the consolidated financial statements asPUMA does not hold any such interests.
The application of the amendment to IFRS 9 (Prepayment features with negativecompensation) had no effect on the consolidated financial statements as PUMAhas not concluded any agreements regarding financial instruments with thesetypes of termination provisions.
The application of amendments as a result of the annual improvements to theIFRS (Annual Improvements 2015 – 2017) consecutively apply to step businesscombinations (IFRS 3), joint arrangements (IFRS 11), capitalization of borrowingcosts (IAS 23), and income tax consequences of dividend payments (IAS 12). Theapplication had no effect on the consolidated financial statements.
NEW, BUT NOT YET MANDATORY STANDARDS AND INTERPRETATIONS
The following standards and interpretations have been released but will only be-come effective in later reporting periods and are not applied earlier by the Group.
Standard TitleDate of adoption*
Plannedadoption
Endorsed
Amendments to IFRS 9,IAS 39, IFRS 7 Interest Rate Benchmark Reform 1/1/2020 1/1/2020
AmendmentsConceptual Framework
Amendments to References to theConceptual Framework 1/1/2020 1/1/2020
Amendment IAS 1 andIAS 8 Definition of Material 1/1/2020 1/1/2020
Endorsement pending
Amendments to IFRS 3 Definition of a Business 1/1/2020 1/1/2020
IFRS 17 Insurance Contracts 1/1/2021 1/1/2021
* Adjusted by EU endorsement, if applicable
PUMA does not expect any significant effects on the consolidated financial state-ments from these amendments.
T.12 ➔
195
Annual Report 2019 ↗ CONSOLIDATED FINANCIAL STATEMENTS
2. SIGNIFICANT CONSOLIDATION, ACCOUNTING AND VALUATION PRINCIPLESCONSOLIDATION PRINCIPLES
The consolidated financial statements were prepared as of December 31, 2019,the reporting date of the annual financial statements of the PUMA SE parentcompany, on the basis of uniform accounting and valuation principles accordingto IFRS, as applied in the EU.
Subsidiaries are companies in which the Group has existing rights that give it thecurrent ability to direct the relevant activities. The main activities are those thathave a significant influence on the profitability of the company. Control is therefo-re considered to exist if the Group is exposed to variable returns from its relati-onship with a company and has the power to govern those returns through itscontrol of the relevant activities. As a rule, control is based on PUMA’s direct orindirect majority of the voting rights. Consolidation begins at the point in timefrom which control is possible. It ends when this no longer exists.
The recognition of business combinations is based on the acquisition method.The assets, debts and contingent liabilities that can be identified as part of abusiness combination are generally stated at their fair value as of the acquisitiondate, regardless of the size of non-controlling interests. At the time of the acqui-sition, there is a separately exercisable right to vote on whether the interests ofthe non-controlling shareholders are valued at fair value or at proportional netasset value.
The surplus of the consideration transferred that exceeds the Group’s share inthe net assets stated at fair value is reported as goodwill. If the considerationtransferred is lower than the amount of the net assets stated at fair value, thedifference is reported directly in the income statement.
Based on the structure of agreements with shareholders holding non-controllinginterests in specific Group companies, PUMA is the economic owner when it hasa majority stake. The companies are fully included in the consolidated financialstatements and, therefore, non-controlling interests are not disclosed. The pre-sent value of the capital shares attributable to the non-controlling shareholders
and the present value of the residual purchase prices expected due to corporateperformance are included in the capital consolidation as acquisition costs for theholdings. The costs directly attributable to the purchase and later differences ofthe present values of the expected residual purchase prices are recognized in theincome statement in accordance with IFRS 3.
With respect to the remaining controlling interests, losses attributable to non-controlling interests are allocated to the latter even if this results in a negativebalance in non-controlling interests.
Receivables within the Group are offset against internal liabilities. As a generalrule, any set-off differences arising from exchange rate fluctuations are recogni-zed in the income statement to the extent that they accrued during the reportingperiod. If receivables and liabilities are long-term and capital-replacing in natu-re, the currency difference is recognized directly in equity and under Other Com-prehensive Income.
In the course of the expense and income consolidation, inter-company sales andintra-group income are offset against the expenses attributable to them. Interimprofits not yet realized within the Group as well as intra-group investment inco-me are eliminated by crediting them in the income statement.
196
Annual Report 2019 ↗ CONSOLIDATED FINANCIAL STATEMENTS

GROUP OF CONSOLIDATED COMPANIES
In addition to PUMA SE, the consolidated financial statements include all subsi-diaries in which PUMA SE directly or indirectly holds existing rights that give itthe current ability to direct the relevant activities. At present, control of all Groupcompanies is based on a direct or indirect majority of voting rights. Associated companies are generally accounted for in the Group using the equitymethod. As of December 31, 2019, the Group does not comprise any associatedcompanies.
The changes in the number of Group companies (including the parent companyPUMA SE) in the financial year 2019 were as follows:
As of 12/31/2018 104
Formation of companies 3
Disposal of companies 5
As of 12/31/2019 102
The additions to the group of consolidated companies relate to the formation of:
PUMA Logistik-Verwaltungs GmbH, Germany,
PUMA United Canada Holding, Inc., USA and
PUMA United Canada ULC, Canada
The disposals in the group of consolidated companies relate to the mergers ofthe following companies within the consolidation scope:
PUMA Kids Apparel North America, LLC, USA
PUMA Kids Apparel Canada, LLC, USA
PUMA Accessories North America, LLC, USA
PUMA North America Accessories Canada, LLC, USA
Furthermore, Sport Equipment TI Cyprus Ltd. u.Li., Cyprus was liquidated duringthe financial year.
During the financial year, Janed, LLC, USA was renamed to PUMA United NorthAmerica LLC, USA, and the Dobotex companies to "stichd".
The changes in the group of consolidated companies did not have a significanteffect on the net assets, financial position and results of operations.
T.13 ➔
197
Annual Report 2019 ↗ CONSOLIDATED FINANCIAL STATEMENTS

The Group companies are allocated to regions as follows:
DECEMBER 31, 2019
No. Companies/Legal Entities Country Region/City Shareholder Share in Capital
parent company
1. PUMA SE Germany Herzogenaurach
EMEA
2. Austria PUMA Dassler Ges. m.b.H. Austria Salzburg direct 100%
3. stichd austria gmbh Austria Salzburg indirect 100%
4. PUMA Czech Republic s.r.o. Czech Republic Prague indirect 100%
5. PUMA Denmark A/S Denmark Skanderborg indirect 100%
6. PUMA Estonia OÜ Estonia Tallinn indirect 100%
7. PUMA Finland Oy Finland Helsinki indirect 100%
8. PUMA FRANCE SAS France Illkirch-Graffenstaden indirect 100%
9. stichd france SAS France Boulogne Billancourt indirect 100%
10. PUMA International Trading GmbH Germany Herzogenaurach direct 100%
11. PUMA Europe GmbH Germany Herzogenaurach direct 100%
12. PUMA Sprint GmbH Germany Herzogenaurach direct 100%
13. PUMA Mostro GmbH Germany Herzogenaurach indirect 100%
14. stichd Deutschland gmbh Germany Düsseldorf indirect 100%
15. PUMA Logistik-Verwaltungs GmbH Germany Herzogenaurach indirect 100%
16. PUMA United Kingdom Ltd. Great Britain London indirect 100%
17. PUMA Premier Ltd. Great Britain London indirect 100%
18. STICHD UK LTD Great Britain Mansfield indirect 100%
19. STICHD SPORTMERCHANDISING UK LTD Great Britain London indirect 100%
20. Genesis Group International Ltd. Great Britain Manchester direct 100%
21. Sport Equipment Hellas S. A. of Footwear, Apparel and Sportswear u.Li. Greece Athens direct 100%*
T.14 ➔
* subsidiaries which are assigned to be economically 100% PUMA Group198
Annual Report 2019 ↗ CONSOLIDATED FINANCIAL STATEMENTS

DECEMBER 31, 2019
No. Companies/Legal Entities Country Region/City Shareholder Share in Capital
22. PUMA Italia S.r.l. Italy Assago indirect 100%
23. STICHD ITALY SRL Italy Assago indirect 100%
24. PUMA Sport Israel Ltd. Israel Hertzeliya indirect 100%
25. PUMA Malta Ltd. Malta St.Julians indirect 100%
26. PUMA Racing Ltd. Malta St.Julians indirect 100%
27. PUMA Benelux B.V. Netherlands Leusden direkt 100%
28. PUMA Teamwear Benelux B.V. Netherlands Leusden indirect 100%
29. PUMA International Sports Marketing B.V. Netherlands Leusden direct 100%
30. stichd group B.V. Netherlands 's-Hertogenbosch direct 100%
31. stichd international B.V. Netherlands 's-Hertogenbosch indirect 100%
32. stichd sportmerchandising B.V. Netherlands 's-Hertogenbosch indirect 100%
33. stichd B.V. Netherlands 's-Hertogenbosch indirect 100%
34. stichd logistics B.V. Netherlands 's-Hertogenbosch indirect 100%
35. stichd licensing B.V. Netherlands 's-Hertogenbosch indirect 100%
36. PUMA Norway AS Norway Oslo indirect 100%
37. PUMA Polska Sp. z o.o. Poland Warsaw indirect 100%
38. PUMA Sports Romania Srl Romania Bucharest indirect 100%
39. PUMA-RUS o.o.o. Russia Moscow indirect 100%
40. PUMA Slovakia s.r.o. v likvidácii Slovakia Bratislava indirect 100%
41. PUMA Sports Distributors (Pty) Ltd. South Africa Cape Town indirect 100%
42. PUMA Sports South Africa (Pty) Ltd. South Africa Cape Town indirect 100%
43. PUMA Iberia S.L.U Spain Madrid direct 100%
44. STICHDIBERIA S.L. Spain Barcelona indirect 100%
45. Nrotert AB Sweden Helsingborg direct 100%
46. PUMA Nordic AB Sweden Helsingborg indirect 100%
47. Nrotert Sweden AB Sweden Helsingborg indirect 100%
48. stichd nordic AB Sweden Helsingborg indirect 100%
49. Mount PUMA AG (Schweiz) Switzerland Oensingen direct 100%
50. PUMA Retail AG Switzerland Oensingen indirect 100%
199
Annual Report 2019 ↗ CONSOLIDATED FINANCIAL STATEMENTS

DECEMBER 31, 2019
No. Companies/Legal Entities Country Region/City Shareholder Share in Capital
51. stichd switzerland ag Switzerland Egerkingen indirect 100%
52. PUMA Spor Giyim Sanayi ve Ticaret A.S. Turkey Istanbul indirect 100%
53. PUMA Ukraine TOV Ukraine Kiev indirect 100%
54. PUMA Middle East FZ LLC United Arab Emirates Dubai indirect 100%
55. PUMA UAE LLC United Arab Emirates Dubai indirect 100%*
Americas
56. PUMA Sports Argentina S.A. Argentina Buenos Aires indirect 100%
57. PUMA Sports Ltda. Brazil Sao Paulo indirect 100%
58. PUMA Canada, Inc. Canada Toronto indirect 100%
59. PUMA United Canada ULC Canada Vancouver indirect 51%
60. PUMA CHILE SPA Chile Santiago direct 100%
61. PUMA SERVICIOS SPA Chile Santiago indirect 100%
62. PUMA México Sport, S.A. de C.V. Mexico Mexico City direct 100%
63. Servicios Profesionales RDS, S.A. de C.V. Mexico Mexico City indirect 100%
64. Importaciones RDS, S.A. de C.V. Mexico Mexico City direct 100%
65. GLOBAL LICENSE STICHD GROUP MEXICO S.A. de C.V. Mexico Mexico City indirect 100%
66. Importationes Brand Plus Licensing S.A. de C.V. Mexico Mexico City indirect 100%
67. Distribuidora Deportiva PUMA S.A.C. Peru Lima indirect 100%
68. Distribuidora Deportiva PUMA Tacna S.A.C. Peru Tacna indirect 100%
69. PUMA Retail Peru S.A.C. Peru Lima indirect 100%
70. PUMA Sports LA S.A. Uruguay Montevideo direct 100%
71. PUMA Suede Holding, Inc. USA Westford indirect 100%
72. PUMA North America, Inc. USA Westford indirect 100%
73. Cobra Golf Incorporated USA Carlsbad indirect 100%
74. PUMA United Canada Holding, Inc. USA Wilmington indirect 100%
75. PUMA United North America LLC USA Wilmington indirect 51%
76. Janed Canada, LLC USA New York indirect 51%
200
Annual Report 2019 ↗ CONSOLIDATED FINANCIAL STATEMENTS
* subsidiaries which are assigned to be economically 100% PUMA Group

DECEMBER 31, 2019
No. Companies/Legal Entities Country Region/City Shareholder Share in Capital
Asia/Pacific
77. PUMA Australia Pty. Ltd. Australia Melbourne indirect 100%
78. White Diamond Australia Pty. Ltd. Australia Melbourne indirect 100%
79. White Diamond Properties Pty. Ltd. Australia Melbourne indirect 100%
80. PUMA China Ltd. China Shanghai indirect 100%
81. stichd china ltd (斯梯起特贸易(上海)有限公司) China Shanghai indirect 100%
82. Guangzhou World Cat Information Consulting Services Company Ltd. China Guangzhou indirect 100%
83. World Cat Ltd. China Hongkong direct 100%
84. Development Services Ltd. China Hongkong direct 100%
85. PUMA International Trading Services Ltd. China Hongkong indirect 100%
86. PUMA Asia Pacific Ltd. China Hongkong direct 100%
87. PUMA Hong Kong Ltd. China Hongkong indirect 100%
88. stichd Limited China Hongkong indirect 100%
89. PUMA Sports India Private Ltd. India Bengaluru indirect 100%
90. PUMA India Corporate Services Private Ltd. India Bengaluru indirect 100%
91. World Cat Sourcing India Private Ltd. India Bengaluru indirect 100%
92. PT PUMA Cat Indonesia Ltd. Indonesia Jakarta indirect 100%
93. PUMA JAPAN K.K. Japan Tokyo indirect 100%
94. PUMA Korea Ltd. (푸마코리아 유한회사) Korea (South) Seoul direct 100%
95. Stichd Korea Ltd Korea (South) Incheon indirect 100%
96. PUMA Sports Goods Sdn. Bhd. Malaysia Kuala Lumpur indirect 100%
97. PUMA New Zealand Ltd. New Zealand Auckland indirect 100%
98. PUMANILA IT Services Inc. Philippines Manila indirect 100%
99. PUMA Sports SEA Trading Pte. Ltd. Singapore indirect 100%
100. PUMA SEA Holding Pte. Ltd. Singapore indirect 100%
101. PUMA Taiwan Sports Ltd. China Taiwan indirect 100%
102. World Cat Vietnam Sourcing & Development Services Co. Ltd. Vietnam Ho Chi Minh City indirect 100%
201
Annual Report 2019 ↗ CONSOLIDATED FINANCIAL STATEMENTS
DECEMBER 31, 2019
No. Companies/Legal Entities Country Region/City Shareholder Share in Capital
Asia/Pacific
77. PUMA Australia Pty. Ltd. Australia Melbourne indirect 100%
78. White Diamond Australia Pty. Ltd. Australia Melbourne indirect 100%
79. White Diamond Properties Pty. Ltd. Australia Melbourne indirect 100%
80. PUMA China Ltd. China Shanghai indirect 100%
81. stichd china ltd (斯梯起特贸易(上海)有限公司) China Shanghai indirect 100%
82. Guangzhou World Cat Information Consulting Services Company Ltd. China Guangzhou indirect 100%
83. World Cat Ltd. China Hongkong direct 100%
84. Development Services Ltd. China Hongkong direct 100%
85. PUMA International Trading Services Ltd. China Hongkong indirect 100%
86. PUMA Asia Pacific Ltd. China Hongkong direct 100%
87. PUMA Hong Kong Ltd. China Hongkong indirect 100%
88. stichd Limited China Hongkong indirect 100%
89. PUMA Sports India Private Ltd. India Bengaluru indirect 100%
90. PUMA India Corporate Services Private Ltd. India Bengaluru indirect 100%
91. World Cat Sourcing India Private Ltd. India Bengaluru indirect 100%
92. PT PUMA Cat Indonesia Ltd. Indonesia Jakarta indirect 100%
93. PUMA JAPAN K.K. Japan Tokyo indirect 100%
94. PUMA Korea Ltd. (푸마코리아 유한회사) Korea (South) Seoul direct 100%
95. Stichd Korea Ltd Korea (South) Incheon indirect 100%
96. PUMA Sports Goods Sdn. Bhd. Malaysia Kuala Lumpur indirect 100%
97. PUMA New Zealand Ltd. New Zealand Auckland indirect 100%
98. PUMANILA IT Services Inc. Philippines Manila indirect 100%
99. PUMA Sports SEA Trading Pte. Ltd. Singapore indirect 100%
100. PUMA SEA Holding Pte. Ltd. Singapore indirect 100%
101. PUMA Taiwan Sports Ltd. China Taiwan indirect 100%
102. World Cat Vietnam Sourcing & Development Services Co. Ltd. Vietnam Ho Chi Minh City indirect 100%

PUMA Mostro GmbH, PUMA Sprint GmbH, PUMA International Trading GmbH,PUMA Europe GmbH and PUMA Logistik-Verwaltungs GmbH have made use ofthe exemption provision under Section 264 (3) of the German Commercial Code(HGB).
CURRENCY CONVERSION
In general, monetary items in foreign currencies are converted in the individualfinancial statements of the Group companies at the exchange rate valid on thebalance sheet date. Any resulting currency gains and losses are immediately re-cognized in the income statement. Non-monetary items are converted at histori-cal acquisition and manufacturing costs.
The assets and liabilities of foreign subsidiaries, the functional currency of whichis not the euro, have been converted to euros at the average exchange rates validon the balance sheet date. Expenses and income have been converted at the an-nual average exchange rates. Any differences resulting from the currency con-version of net assets relative to exchange rates that had changed in comparisonwith the previous year were adjusted against equity.
The significant conversion rates per euro are as follows:
2019 2018
CurrencyReporting dateexchange rate
Averageexchange
rateReporting dateexchange rate
Averageexchange rate
USD 1.1234 1.1195 1.1450 1.1810
CNY 7.8205 7.7355 7.8751 7.8081
JPY 121.9400 122.0058 125.8500 130.3959
GBP 0.8508 0.8778 0.8945 0.8847
The currency area Argentina has been in a hyperinflationary environment since2018. The effects on the consolidated financial statements were analyzed in ac-cordance with IAS 29 and IAS 21.42. The application of the aforementioned stan-dards would have resulted in an increase in assets as of December 31, 2019 of €8.1 million (mainly property, plant and equipment, intangible assets and invento-ries) and an adjustment of equity of € 8.1 million. Furthermore, the operating re-sult (EBIT) would have decreased by € 2.9 million. The effects were consideredinsignificant and did not lead to an adjustment in the context of the groupaccounting.
T.15 ➔
202
Annual Report 2019 ↗ CONSOLIDATED FINANCIAL STATEMENTS

ACCOUNTING AND VALUATION PRINCIPLES
FINANCIAL INSTRUMENTS
Financial instruments are classified and recognized in accordance with IFRS 9.Under IFRS 9, the subsequent measurement of financial instruments is carriedout according to the classification at “amortised cost” (AC), at “fair value throughprofit or loss” (FVPL) or at “fair value through other comprehensive income”(FVOCI). The classification is based on two criteria: the Group’s business modelfor asset management and the question of whether the contractual cash flows ofthe financial instruments represent “exclusively payments of principal and inte-rest” toward the outstanding principal amount.
PUMA has no financial instruments to be assigned to the business model “Sell”and valued under IFRS 9 at “fair value through profit or loss” (FVPL).
For long-term interests (equity instruments), IFRS 9 under certain conditions al-lows a measurement at fair value through other comprehensive income (FVOCI).If these interests, however, are disposed of or written off due to impairment, thegains and losses from these interests which were not realized up to this point arereclassified to retained earnings in accordance with IFRS 9.
DERIVATIVE FINANCIAL INSTRUMENTS/HEDGE ACCOUNTING
In relation to the accounting of hedge relationships, PUMA made use of the elec-tive right to continue applying the rules of IAS 39 for hedge accounting.
Derivative financial instruments are recognized at fair value at the time acontract is entered into and thereafter. At the time a hedging instrument is con-cluded, PUMA classifies the derivatives either as hedges of a planned transaction(cash flow hedge) or as hedges of the fair value of a recognized asset or liability(fair value hedge).
At the time when the transaction is concluded, the hedging relationship betweenthe hedging instrument and the underlying transaction as well as the purpose ofrisk management and the underlying strategy are documented. In addition, as-sessments as to whether the derivatives used in the hedge accounting compen-sate effectively for a change in the fair value or the cash flow of the underlying
transaction are documented at the beginning of and continuously after the hedgeaccounting.
Changes in the market value of derivatives that are intended and suitable forcash flow hedges and that prove to be effective are adjusted against equity, takinginto account deferred taxes. If there is no complete effectiveness, the ineffectivepart is recognized in the income statement. The amounts recognized in equityare recognized in the income statement during the same period in which thehedged planned transaction affects the income statement. If, however, a hedgedfuture transaction results in the recognition of a non-financial asset or a liability,gains or losses previously recorded in equity are included in the initial measure-ment of the acquisition costs of the respective asset or liability.
Changes in the fair value of derivatives that qualify for and are designated as fairvalue hedges are recognized directly in the consolidated income statement, toge-ther with changes in the fair value of the underlying transaction attributable tothe hedged risk. The changes in the fair value of the derivatives and the changein the underlying transaction attributable to the hedged risk are reported in theconsolidated income statement under the item relating to the underlyingtransaction.
The fair values of the derivative instruments used to hedge planned transactionsand to hedge the fair value of a recognized asset or liability are shown underother current financial asserts or other current financial liabilities.
LEASES
PUMA has concluded leases exclusively as lessee.The leases are respectively identified on an individual contract level. PUMA reco-gnizes for all leases a right-of-use asset and a respective lease liability, with theexception of short-term leases (defined as leases with a term of no more than 12months) and low-value lease agreements (with a value of less than € 5,000 atcontract conclusion). In the case of a short-term lease or low-value lease agree-ment, the Group depreciates the lease payments on a straight-line basis over theterm of the lease agreement as other operating expense. In addition, right-of-use assets are not recognized for intangible assets. PUMA has made use of theelective right and decided not to apply IFRS 16 with regard to leases for intangib-le assets.
203
Annual Report 2019 ↗ CONSOLIDATED FINANCIAL STATEMENTS
The lease liability at initial recognition is measured at the present value of thenot yet paid lease payments at the beginning of the lease agreement. The pre-sent value is calculated using the incremental borrowing rate, as the interestrate underlying the lease contract is usually not known.
The following lease payments are included in the measurement of the leaseliability:
Fixed lease payments (including in-substance fixed payments), less anyincentive payments to be received;
Variable lease payments based on an index or rate, initially measuredbased on the index or rate at the start of the lease agreement; as a re-sult, future adjustments after changes in the index or rate remainunrecognized;
Exercise price of purchase options, if PUMA is sufficiently certain that itwill exercise them;
Expected payments from residual value guarantees; and
Penalties for the early termination of lease agreements, if PUMA is suf-ficiently certain that it will exercise this termination option and if thiswas taken respectively into account when determining the term of thelease agreement.
A number of lease agreements, particularly for real estate properties, containextension and termination options. When determining agreement terms, all factsand circumstances are taken into account that offer an economic incentive to ex-ercise the extension option or not exercise the termination option. The changesin the term of a lease due to the exercise or non-exercise of such options are onlytaken into account for the agreement term if they are sufficiently certain.
The lease liability is recognized as a separate line item on the consolidated ba-lance sheet.
The subsequent measurement of the lease liability is done by increasing the car-rying amount by adding the accrued interest of the lease liability (using the effec-
tive interest method) and by reducing the carrying amount of the lease liability bythe lease payments made.
If the term of a lease has changed or if a material event has led to a change inthe assessment relating to the exercise of a purchase option, PUMA will remea-sure the lease liability by discounting the adjusted lease payments using an up-dated interest rate and will adjust the corresponding right-of-use assetaccordingly.
If lease payments have changed due to index or interest rate changes or due to achange in the expected payments to be made due to a residual value guarantee,PUMA will remeasure the lease liability by discounting the adjusted lease pay-ments using an unchanged discount rate. The corresponding right-of-use assetis adjusted accordingly.
If a lease is changed and the change in the lease is not recognized as a separatelease, PUMA will remeasure the lease liability based on the lease term. As partof this, the changed lease payments are discounted using the updated interestrate at the time the change becomes effective.
The right-of-use assets comprise the respective lease liability as part of initialmeasurement. Lease installments that are paid before or at the beginning of thelease must be added. Lease incentives received from the lessor must be deduc-ted and initial direct costs must be included. If dismantling obligations exist withregard to the leased assets, they are included in the measurement of the right-of-use assets. The subsequent measurement of the right-of-use assets is at ac-quisition cost less accumulated depreciation and impairment losses.
The right-of-use assets are generally depreciated over the term of the lease. Ifthe useful life of the asset underlying the lease is shorter, this limits the depre-ciation period accordingly. Depreciation starts with the commencement of thelease.
204
Annual Report 2019 ↗ CONSOLIDATED FINANCIAL STATEMENTS

The right-of-use assets are recognized as a separate line item in the consolida-ted balance sheet.
The right-of-use assets are subject to impairment of assets in accordance withIAS 36. This approach is described in the following section "Impairment ofAssets".
Variable lease payments that are not dependent on an index or interest rate arenot included in the valuation of the lease liabilities. These payments are recogni-zed in the income statement as other expenses as soon as PUMA has receivedthe underlying benefit. This applies primarily to turnover-based rents for retailstores.
As part of the practical expedient, IFRS 16 permits omitting to separate betweennon-leasing components and leasing components. With regard to land and buil-dings, PUMA generally does not apply the practical expedient so that the right-of-use assets relating to land and buildings only contain leasing components.With regard to other right-of-use assets (comprising technical equipment & ma-chines and motor vehicles), the practical expedient is generally applied, as a re-sult of which the leasing components and non-leasing components are bothrecognized.
CASH AND CASH EQUIVALENTS
Cash and cash equivalents include cash and bank balances. To the extent thatbank deposits are not immediately required to finance current assets, they areinvested as risk-free fixed-term deposits, presently for a term of up to threemonths. The total amount of cash and cash equivalents is consistent with thecash and cash equivalents stated in the cash flow statement.
Cash and cash equivalents are measured at amortised cost. They are subject tothe impairment requirements in accordance with IFRS 9 "Financial Instruments".PUMA monitors the credit risk of these financial instruments taking into accountthe economic situation, external credit rating and/or premiums for credit defaultswaps (CDS) of other financial institutions. The credit risk from cash and cashequivalents is classified as immaterial, due to the relatively short terms and theinvestment-grade credit rating of the counterparty, which signals a relative lowprobability of default.
INVENTORIES
Inventories are measured at acquisition or manufacturing costs or at the lowernet realizable values derived from the selling price on the balance sheet date.The acquisition cost of merchandise is determined using an averaging method.Value adjustments are adequately recorded, depending on age, seasonality andrealizable market prices, in a manner that is standard throughout the Group.
TRADE RECEIVABLES
Trade Receivables are initially measured at the transaction price and subse-quently at amortised cost with deduction of value adjustments. The transactionprice according to IFRS 15 “Revenue from Contracts with Customers” is theamount of the consideration expected by the company for the delivery of goods orthe provision of services to customers, not taking into account the amountscollected on behalf of third parties.
For determining the value adjustments to trade receivables, PUMA uniformly ap-plies the simplified method in order to determine the expected credit losses overthe remaining lifetime of the trade receivables (called "lifetime expected creditlosses") in accordance with the provisions of IFRS 9 “Financial Instruments”. Forthis, trade receivables are classified by geographic region to suitable groups withshared credit risk characteristics. The expected credit losses are calculatedusing a matrix that presents the age structure of the receivables and depicts alikelihood of loss for the individual maturity bands of the receivables on the basisof historic credit loss events and future-based factors. The percentage rates forthe loss likelihoods are checked regularly to ensure they are up to date. If objec-tive indications of a credit impairment are found regarding the trade receivablesof a certain customer, a detailed analysis of this customer’s specific credit risk isconducted and an individual value adjustment is recognized for the trade receiva-bles with respect to this customer. If a credit insurance is in place, it is taken intoaccount in the amount of the value adjustment.
205
Annual Report 2019 ↗ CONSOLIDATED FINANCIAL STATEMENTS
OTHER ASSETS
Other assets are initially measured at fair value, taking into account transactioncosts, and subsequently measured at amortised costs after deduction of valueadjustments.
Other financial assets are classified based on the business model for control andthe cash flows of the financial assets. In the Group, financial assets are held ex-clusively under a business model that provides for “holding” the asset until ma-turity, in order to collect the contractual cash flows. The subsequent measure-ment of the Other financial assets is therefore always carried out at amortisedcost. The business model “trading” and the category “measured at fair valuethrough profit or loss” (FVPL) are not used.
The non-current assets contain loans and other assets. Non-interest-bearingnon-current assets are discounted to present value if the resulting effect issignificant.
NON-CURRENT INVESTMENTS
The investments recognized under non-current financial assets belong to the ca-tegory “measured at fair value through other comprehensive income” (FVOCI),since these investments are held over the long term for strategic reasons.
All purchases and disposals of non-current investments are recorded on the tra-de date. Non-current investments are initially recognized at fair value plus tran-saction costs. They are also recognized at fair value in subsequent periods if thiscan be reliably determined. Unrealized gains and losses are recognized in theOther Comprehensive Income, taking into account deferred taxes. The gain orloss on disposal of non-current investments is transferred to retained earnings.
The category “measured at fair value through profit or loss” (FVPL) is not used inthe Group.
PROPERTY, PLANT AND EQUIPMENT
Property, plant and equipment are measured at acquisition costs, net of accumu-lated depreciation. The depreciation period depends on the expected useful life ofthe respective item. The straight-line method of depreciation is applied. The use-ful life depends on the type of the assets involved. Buildings are subject to a use-ful life of between ten and fifty years, and a useful life of between three to ten ye-ars is assumed for movable assets. The acquisition costs of property, plant andequipment also include interest on borrowings in accordance with IAS 23, insofaras these accrue and the effect is significant.
Repair and maintenance costs are recorded as an expense as of the date onwhich they were incurred. Substantial improvements and upgrades are capitali-zed to the extent that the criteria for capitalization of an asset item apply.
GOODWILL
Goodwill resulting from a business combination is calculated based on the diffe-rence between the transferred consideration and the Group's share in the fair va-lue of the acquired assets and liabilities.
Goodwill amounts are allocated to the Group’s cash-generating units that are ex-pected to benefit from the synergy effects resulting from the businesscombination.
An impairment test of goodwill per group of cash-generating units (usually thesmallest company level at which goodwill is monitored) is performed once a yearand whenever there are indicators of impairment and can result in an impair-ment loss. There is no reversal of an impairment loss for goodwill. See chapter11 for further details, in particular regarding the assumptions used for thecalculation.
OTHER INTANGIBLE ASSETS
Acquired intangible assets largely consist of concessions, intellectual propertyrights and similar rights. These are measured at acquisition costs, net of accu-mulated amortization. The useful life of intangible assets is between three andten years. Depreciation is done on a straight-line basis.
206
Annual Report 2019 ↗ CONSOLIDATED FINANCIAL STATEMENTS

If the capitalization requirements of IAS 38.57 "Intangible Assets" are met cumu-latively, expenses in the development phase for internally generated intangibleassets are capitalized at the time they arise. In subsequent periods, internallygenerated intangible assets and acquired intangible assets are measured at costless accumulated amortization and impairment losses. In the Group, own workcapitalized is generally depreciated on a straight-line basis over a useful life of 3years.
The item also includes acquired trademark rights, which are assumed to have anindefinite useful life in light of the history of the brands and due to the fact thatthe brands are continued by PUMA.
IMPAIRMENT OF ASSETS
Intangible assets with an indefinite useful life are not amortised according toschedule but are subjected to an annual impairment test. Property, plant andequipment, right-of-use assets, and other intangible assets with finite useful li-ves are tested for impairment if there is any indication of impairment in the valueof the asset concerned. In order to determine whether there is a requirement torecord the impairment of an asset, the recoverable amount of the respective as-set (the higher amount of the fair value less costs to sell and value in use) iscompared with the carrying amount of the asset. If the recoverable amount is lo-wer than the carrying amount, the difference is recorded as an impairment loss.The test for impairment is performed, if possible, at the level of the respectiveindividual asset, otherwise at the level of the cash-generating unit. Goodwill, onthe other hand, is tested for impairment only at the level of a group of cash-ge-nerating units. If it is determined within the scope of the impairment test that anasset needs to be written down, then the goodwill, if any, of the group of cash-generating units is written down initially and, in a second step, the remainingamount is distributed proportionately over the remaining assets within the appli-cation scope of IAS 36. If the reason for the recorded impairment no longer app-lies, a reversal of impairment loss is recorded to the maximum amount of theamortised costs. There is no reversal of an impairment loss for goodwill.
Impairment tests are performed using the discounted cash flow method. For de-termining the fair value less costs to sell and value in use, the expected cashflows are based on corporate planning data. Expected cash flows are discountedusing an interest rate in line with market conditions. As part of the fair value de-
termination less cost to sell, no special synergies of cash-generating units aretaken into account, and corporate planning data is adjusted to the assumptions ofmarket participants, if required. Moreover, there is a difference between the fairvalue less costs to sell and the value in use because the costs to sell are also ta-ken into account.
Trademarks with an indefinite useful life are subjected to an impairment test ba-sed on the relief-from-royalty method during the financial year or when the oc-casion arises. Should indications of a value impairment of a self-used trademarkarise, the recoverability of the trademark is not only measured individually usingthe relief-from-royalty method, but the recoverable amount of the group of cash-generating units to which the trademark is to be allocated is also determined.
The inclusion of the right-of-use assets due to the initial application of IFRS 16resulted in an increase of the carrying amounts to be tested. This has an effecton the impairment tests in 2019. In contrast, the initial application of IFRS 16 alsoresulted in an increase of the recoverable amount because lease payments wereeliminated from Free cash flow. In addition, due to the recognition of the leaseliabilities of peer group companies on the balance sheet, their debt ratio has in-creased and consequently the weighted average capital costs (WACC) havedecreased.
Overall, the adjustments did not have any effect on the result of the impairmenttests.
See chapter 11 for further details, in particular regarding the assumptions usedfor the calculation.
FINANCIAL DEBT, OTHER FINANCIAL LIABILITIES AND OTHER LIABILITIES
In general, these items are recognized at their acquisition cost, taking into ac-count transaction costs and subsequently recognized at amortised cost. Non-in-terest or low-interest-bearing liabilities with a term of at least one year are reco-gnized at present value, taking into account an interest rate in line with marketconditions, and are compounded until their maturity at their repayment amount.Liabilities from finance lease agreements are recorded as of the beginning of thelease transaction at the amount of the present value of the minimum lease
207
Annual Report 2019 ↗ CONSOLIDATED FINANCIAL STATEMENTS

amount, or at the lower fair value, and are adjusted by the repayment amount ofthe lease installments.
The category “measured at fair value through profit or loss” (FVPL) is not used inthe Group with regard to financial liabilities.
As a general rule, current financial liabilities also include those long-term loansthat have a maximum residual term of up to one year.
PROVISIONS FOR PENSIONS AND SIMILAR OBLIGATIONS
In addition to defined benefit plans, some companies apply defined contributionplans, which do not result in any additional pension commitment other than thecurrent contributions. The pension provision under defined benefit plans is gene-rally calculated using the projected unit credit method. This method takes intoaccount not only known pension benefits and pension rights accrued as of the re-porting date, but also expected future salary and pension increases. The definedbenefit obligation (DBO) is calculated by discounting expected future cash out-flows at the rate of return on senior, fixed-rate corporate bonds. The currenciesand maturity periods of the underlying corporate bonds are consistent with thecurrencies and maturity periods of the obligations to be satisfied. In some of theplans, the obligation is accompanied by a plan asset. In that case, the pensionprovision shown is reduced by the plan asset.
Revaluations, consisting of actuarial profits and losses, changes resulting fromuse of the asset ceiling and return on plan assets (without interest on the netdebt) are immediately recorded under Other Comprehensive Income. The reva-luations recorded in Other Comprehensive Income are part of the retainedearnings and are no longer reclassified into the income statement. Past servicecosts are recorded as an expense if changes are made to the plan.
Details regarding the assumed life expectancy and the mortality tables used areshown in chapter 15.
OTHER PROVISIONS
Provisions are recognized if the Group, as a result of a past event, has a currentobligation and this obligation is likely to result in an outflow of resources witheconomic benefits, the amount of which can be reliably estimated. The provisionsare recognized at their settlement value as determined on the basis of the bestpossible estimate and are not offset by income. Non-current provisions arediscounted.
Provisions for the expected expenses from warranty obligations pursuant to therespective national sales contract laws are recognized at the time of sale of therelevant products, according to the best estimate in relation to the expenditureneeded in order to fulfill the Group’s obligation.
Provisions are also recognized to account for onerous contracts. An onerouscontract is assumed to exist where the unavoidable costs for fulfilling thecontract exceed the economic benefit arising from this contract.
Provisions for restructuring measures are also recorded if a detailed, formal re-structuring plan has been prepared, which has created a justified expectationthat the restructuring measures will be carried out by those concerned due to itsimplementation starting or its major components being announced.
TREASURY SHARES
Treasury stock is deducted from equity at its market price as of the date of acqui-sition, plus incidental acquisition costs. Pursuant to the authorization of the An-nual General Meeting, treasury stock can be repurchased for any authorized pur-pose, including the flexible management of the Company's capital requirements.
MANAGEMENT INCENTIVE PROGRAMS
PUMA uses cash-settled share-based payments and key performance indicator-based long-term incentive programs.
For share-based remunerations with cash compensation, a liability is recordedfor the services received and measured with its fair value upon recognition. Untilthe debt is cleared, its fair value is recalculated on every balance sheet date and
208
Annual Report 2019 ↗ CONSOLIDATED FINANCIAL STATEMENTS
on the settlement date and all changes to the fair value are recognized in the in-come statement.
During the three-year term of the respective programs, the medium-term tar-gets of the PUMA Group with regard to operating result (EBIT), cash flow andgross profit margin are determined for key figure-based compensation processesand recognized in the income statement as Other Provisions with their respectivedegree of target achievement.
RECOGNITION OF SALES REVENUES
The Group recognizes sales revenues from the sale of sporting goods. The salesrevenues are measured at fair value of the consideration to which the Group ex-pects to be entitled from the contract with the customer, taking into account re-turns, discounts and rebates. Amounts collected on behalf of third parties are notincluded in the sales revenues. The Group records sales revenues at the timewhen PUMA fulfills its performance obligation to the customer and has transfer-red the right of disposal over the product to the customer.
The Group sells footwear, apparel and accessories both to wholesalers and di-rectly to customers through its own retail stores. Meanwhile, the sales-relatedwarranty services cannot be purchased separately and do not lead to servicesthat go beyond the assurance of the specifications at the time of the transfer ofrisk. Accordingly, the Group records warranties in the balance sheet in conformi-ty with IAS 37 Provisions, Contingent Liabilities and Contingent Assets.
In the case of sales of products to wholesalers, the sales revenue is recorded atthe date on which the right of disposal over the products is transferred to thecustomer, in other words, when the products have been shipped to the specificlocation of the wholesaler (delivery). After delivery, the wholesaler bears the in-ventory risk and has full right of disposal over the manner and means of distri-bution and the selling price of the products. In the case of sales to end custom-ers in the Group’s own retail stores, the sales revenues are recorded at the datewhen the right of disposal over the products is transferred to the end customer,in other words, the date on which the end customer buys the products in the re-tail shop. The payment of the purchase price is due as soon as the customerpurchases the products.
Under certain conditions and according to the contractual stipulations, the custo-mer has the option to exchange products or return them for a credit. The amountof the expected returns is estimated on the basis of past experience and is de-ducted from sales revenues by a provision for returns. The asset value of theright arising from the product return claim is recorded under Inventories andleads to a corresponding reduction of Cost of Sales.
ROYALTY AND COMMISSION INCOME
The Group records royalty and commission income from the licensing of trade-mark rights to third parties. Income from royalties is recognized in the incomestatement in accordance with the invoices to be submitted by the licensees. Incertain cases, values must be estimated in order to permit accounting on an ac-crual basis. Commission income is invoiced if the underlying purchase transac-tion is classified as realized.
ADVERTISING AND PROMOTIONAL EXPENSES
Advertising expenses are recognized in the income statement as of the date oftheir accrual. In general, promotional expenses stretching over several years arerecognized as an expense over the contractual term on an accrual basis. Any ex-penditure surplus resulting from this allocation of expenses after the balancesheet date are recognized in the form of an impairment of assets or a provisionfor anticipated losses in the financial statements.
PRODUCT DEVELOPMENT
PUMA continuously develops new products in order to meet market require-ments and market changes. Research costs are expensed in full at the time theyare incurred. Development costs are also recognized as an expense when they donot meet the recognition criteria of IAS 38 "Intangible Assets".
FINANCIAL RESULT
The financial result includes the results from associated companies and interestincome from financial investments as well as interest expenses from loans andin connection with financial instruments. Financial results also include interestexpenses from lease liabilities, discounted, non-current liabilities and from pen-
209
Annual Report 2019 ↗ CONSOLIDATED FINANCIAL STATEMENTS

sion provisions that are associated with business combinations or arise from themeasurement of pension commitments.
Exchange rate effects that can be directly allocated to an underlying transactionare shown in the respective income statement item.
INCOME TAXES
Current income taxes are determined in accordance with the tax regulations ofthe respective countries where the Company conducts its operations.
DEFERRED TAXES
Deferred taxes resulting from temporary valuation differences between the IFRSand tax balance sheets of individual Group companies and from consolidationprocedures, which are levied by the same taxation authority and can be netted,are charged to each taxable entity and recognized either as deferred tax assetsor deferred tax liabilities.
With regard to the leases that were capitalized, tax deduction potential is alloca-ted to the respective right-of-use asset. If temporary differences arise duringsubsequent valuation from a netting perspective of right-of-use asset and leaseliability, deferred tax items will be created, provided the requirements under IAS12 are met.
Deferred tax assets may also include claims for tax reductions that result fromthe expected utilization of existing losses carried forward to subsequent yearsand which is sufficiently certain to materialize. Deferred tax assets or liabilitiesmay also result from accounting treatments that do not affect the income state-ment. Deferred taxes are calculated on the basis of the tax rates that apply to thereversal in the individual countries and that are in force or adopted as of the ba-lance sheet date.
Deferred tax assets are shown only to the extent that the respective tax advanta-ge is likely to materialize. Value adjustments are recognized on the basis of thepast earnings situation and the business expectations for the foreseeable future,if this criterion is not fulfilled.
ASSUMPTIONS AND ESTIMATES
The preparation of the consolidated financial statements requires some assump-tions and estimates that have an impact on the measurement and presentation ofthe recognized assets and liabilities, income and expenses, as well as contingentliabilities. The assumptions and estimates are based on premises, which in turnare based on currently available information. In individual cases, the actual va-lues may deviate from the assumptions and estimates made. Consequently, fu-ture periods involve a risk of adjustment to the carrying amount of the assets andliabilities concerned. If the actual development differs from the expectation, thepremises and, if necessary, the carrying amounts of the relevant assets anddebts are adjusted with an effect on profit or loss.
All assumptions and estimates are continuously reassessed. They are based onhistorical experiences and other factors, including expectations regarding futureglobal and industry-related trends that appear reasonable under the current cir-cumstances. Assumptions and estimates are made in particular with regard toevaluating the control of companies with non-controlling interests, the measure-ment of goodwill and brands, pension obligations, derivative financial instru-ments and taxes. The most significant forward-looking assumptions and sourcesof estimation and uncertainty as of the reporting date concerning the above-mentioned items are discussed below.
Goodwill and Brands
A review of the impairment of goodwill is based on the calculation of the value inuse as a leading valuation concept. In order to calculate the value in use, theGroup must estimate the future cash flows from those cash-generating units towhich the goodwill is allocated. To this end, the data used were from the three-year plan, which is based on forecasts of the overall economic development andthe resulting industry-specific consumer behavior. Another key assumption con-cerns the determination of an appropriate interest rate for discounting the cashflow to present value (discounted cash flow method). The “relief from royalty me-thod” is used to value brands. See chapter 11 for further details, in particular re-garding the assumptions used for the calculation.
210
Annual Report 2019 ↗ CONSOLIDATED FINANCIAL STATEMENTS
Pension Obligations
Pension obligations are determined using an actuarial calculation. This calculati-on is contingent on a large number of factors that are based on assumptions andestimates regarding the discount rate, the expected return on plan assets, futurewage and salary increases, mortality and future pension increases. Due to thelong-term nature of the commitments made, the assumptions are subject to si-gnificant uncertainties. Any change in these assumptions has an impact on thecarrying amount of the pension obligations. The Group determines at the end ofeach year the discount rate applied to determine the present value of future pay-ments. This discount rate is based on the interest rates of corporate bonds withthe highest credit rating that are denominated in the currency in which the bene-fits are paid and the maturity of which corresponds to that of the pension obliga-tions. See chapter 15 for further details, in particular regarding the parametersused for the calculation.
Taxes
Tax items are determined taking into account the various prevailing local tax lawsand the relevant administrative opinions and, due to their complexity, may besubject to different interpretations by persons subject to tax on the one hand andthe tax authorities on the other hand. Differing interpretations of tax laws mayresult in subsequent tax payments for past years; depending on the manage-ment’s assessment, these differing opinions may be taken into account using themost probable amount for the respective case.
The recognition of deferred taxes, in particular with respect to tax losses carriedforward, requires that estimates and assumptions be made concerning future taxplanning strategies as well as expected dates of occurrence and the amount offuture taxable income. The taxable income from the relevant corporate planning
is derived for this judgment. This takes into account the past financial positionand the business development expected in the future. Deferred tax assets on los-ses carried forward are recorded in the event of companies incurring a loss onlyif it is highly probable that future positive income will be achieved that can be off-set against these tax losses carried forward in the next 5 years. Please see chap-ter 8 for further information and detailed assumptions.
Derivative Financial Instruments
The assumptions used for estimating derivative financial instruments are basedon the prevailing market conditions as of the balance sheet date and thus reflectthe fair value. See chapter 25 for further information..
Leases
The measurement of the lease liabilities is based on assumptions for the dis-count rates used, the term of the lease agreements and the deferral of fixed lea-se payments. To determine the present value of future minimum lease payments,PUMA uses country- and currency-specific interest rates on borrowings withcompatible terms. In addition to the basic lease period, the Group includes ex-tension options in the determination of the agreement term if management issufficiently certain that such an option will be exercised after taking into accountall facts and circumstances. The fixed lease payments also include firmly agreedupon minimum amounts for agreements with a predominantly variable leaseamount.
211
Annual Report 2019 ↗ CONSOLIDATED FINANCIAL STATEMENTS
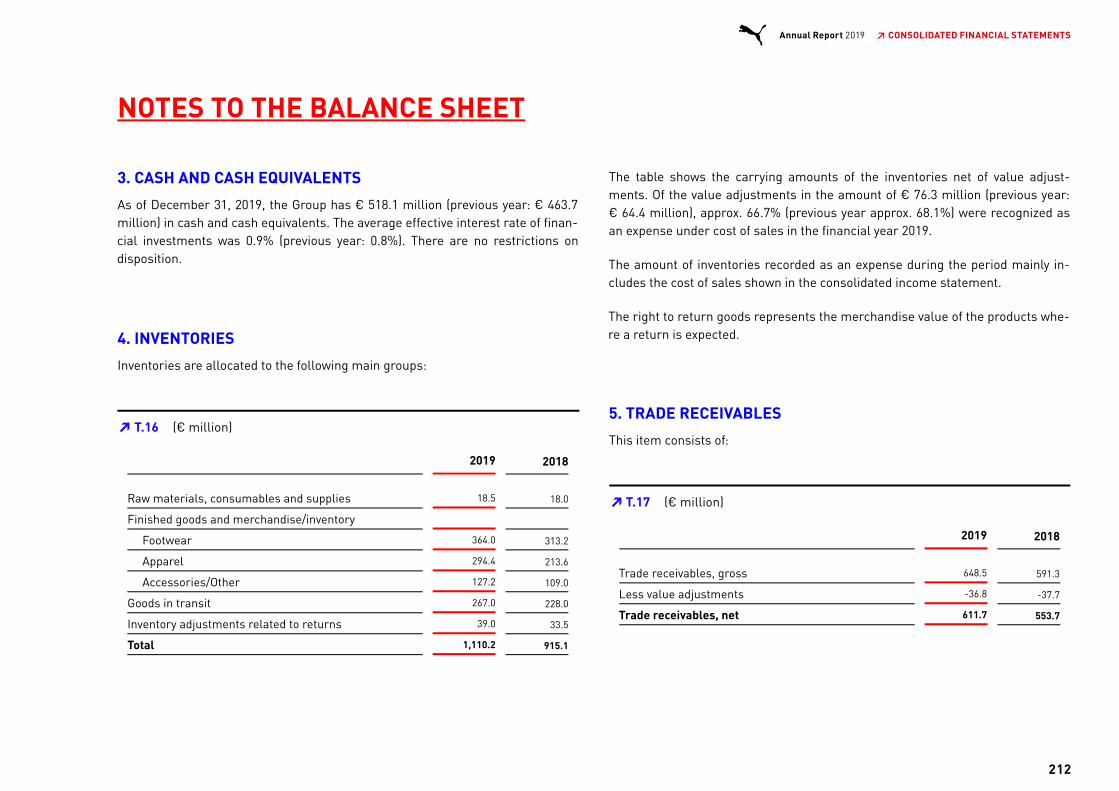
NOTES TO THE BALANCE SHEET
3. CASH AND CASH EQUIVALENTS
As of December 31, 2019, the Group has € 518.1 million (previous year: € 463.7million) in cash and cash equivalents. The average effective interest rate of finan-cial investments was 0.9% (previous year: 0.8%). There are no restrictions ondisposition.
4. INVENTORIES
Inventories are allocated to the following main groups:
2019 2018
Raw materials, consumables and supplies 18.5 18.0
Finished goods and merchandise/inventory
Footwear 364.0 313.2
Apparel 294.4 213.6
Accessories/Other 127.2 109.0
Goods in transit 267.0 228.0
Inventory adjustments related to returns 39.0 33.5
Total 1,110.2 915.1
The table shows the carrying amounts of the inventories net of value adjust-ments. Of the value adjustments in the amount of € 76.3 million (previous year:€ 64.4 million), approx. 66.7% (previous year approx. 68.1%) were recognized asan expense under cost of sales in the financial year 2019.
The amount of inventories recorded as an expense during the period mainly in-cludes the cost of sales shown in the consolidated income statement.
The right to return goods represents the merchandise value of the products whe-re a return is expected.
5. TRADE RECEIVABLES
This item consists of:
2019 2018
Trade receivables, gross 648.5 591.3
Less value adjustments -36.8 -37.7
Trade receivables, net 611.7 553.7
T.16 (€ million)➔
T.17 (€ million)➔
212
Annual Report 2019 ↗ CONSOLIDATED FINANCIAL STATEMENTS

The value adjustments to trade receivables relate to receivables in connectionwith sales revenues from contracts with customers and developed as follows:
2019 2018
Status of value adjustments as of January 1 37.7 37.8
Changes in scope 0.0 0.0
Exchange rate differences 0.1 -0.2
Additions 4.9 9.9
Utilization -2.3 -8.0
Reversals -3.6 -1.7
Status of value adjustments as of December 31 36.8 37.7
The age structure of the trade receivables is as follows:
2019 TotalNotdue
0–30days
31–90days
91–180days
Over180
days
Gross carrying amount -Trade receivables 648.5 533.0 54.9 23.4 9.4 27.8
Value adjustment 36.8 3.9 2.1 3.5 3.1 24.2
Net carrying amount -Trade receivables 611.7 529.1 52.8 19.9 6.3 3.6
Expected loss rate 0.7% 3.8% 14.9% 33.4% 86.9%
Receivables due for more than 90 days are allocated to Level 3 as "objectively im-paired", the remaining receivables are allocated to Level 2.
T.18 (€ million)➔
T.19 (€ million)➔
213
Annual Report 2019 ↗ CONSOLIDATED FINANCIAL STATEMENTS

2018 TotalNotdue
0–30days
31–90days
91–180days
Over180
days
Gross carrying amount-Trade receivables 591.3 478.9 53.8 22.2 8.1 28.3
Value adjustment 37.7 5.7 0.7 3.6 3.3 24.5
Net carrying amount -Trade receivables 553.7 473.3 53.0 18.6 4.9 3.8
Expected loss quote 1.2% 1.4% 16.1% 40.1% 86.4%
With respect to the net carrying amount of trade receivables, PUMA assumesthat the debtors will satisfy their payment obligations. There are no significantrisk concentrations as the customer base is very broad and there are nocorrelations.
6. OTHER CURRENT FINANCIAL ASSETS
This item consists of:
2019 2018
Fair value of derivative financial instruments 45.2 72.6
Other financial assets 31.4 38.6
Total 76.6 111.2
The amount shown is due within one year. The fair value corresponds to the car-rying amount.
The decrease in derivative financial instruments is mainly due to the lower USdollar exchange rate.
7. OTHER CURRENT ASSETS
This item consists of:
2019 2018
Prepaid expense relating to the subsequentperiod 63.1 49.7
Other receivables 67.4 65.5
Total 130.5 115.2
T.20 (€ million)➔
T.21 (€ million)➔
T.22 (€ million)➔
214
Annual Report 2019 ↗ CONSOLIDATED FINANCIAL STATEMENTS

The amount shown is due within one year. The fair value corresponds to the car-rying amount.
Other receivables mainly include VAT receivables amounting to € 30.1 million(previous year: € 41.9 million).
8. DEFERRED TAXES
Deferred taxes relate to the items shown below:
2019 2018
Tax loss carryforwards 89.5 76.2
Non-current assets 39.6 41.6
Current assets 48.7 46.8
Provisions and other liabilities 79.7 63.5
Deferred tax assets (before netting) 257.5 228.0
Non-current assets 61.2 53.5
Current assets 7.9 8.6
Provisions and other liabilities 3.7 6.1
Deferred tax liabilities (before netting) 72.7 68.2
Deferred tax assets, net 184.8 159.9
Of the deferred tax assets € 117.1 million (previous year: € 105.5 million) arecurrent, and of the deferred tax liabilities € 8.9 million (previous year: € 11.8 mil-lion) are current.
As of December 31, 2019, tax losses carried forward amounted to a total of€ 515.0 million (previous year: € 541.1 million). This results in a deferred tax as-set of € 141.4 million (previous year: € 147.6 million). Deferred tax liabilities wererecognized for these items in the amount at which the associated tax advantagesare likely to be realized in the form of future profits for income tax purposes. Ac-cordingly, deferred tax assets for tax loss carryforwards in the amount of€ 52.0 million (previous year: € 71.4 million) were not recognized; of these,€ 51.3 million (previous year: € 71.1 million) cannot expire, but € 13.6 million(previous year: € 13.3 million) will never be usable due to the absence of futureexpectations. The remaining unrecognized deferred tax receivables of € 0.7 milli-on (previous year: € 0.3 million) will expire within the next six years.
In addition, no deferred taxes were recognized for deductible temporary differen-ces amounting to € 4.4 million (previous year: € 4.8 million) because their rea-lization was not expected as of the balance sheet date.
Deferred tax liabilities for withholding taxes from possible dividends on retainedearnings of subsidiaries that serve to cover the financing needs of the respectivecompany were not accumulated, since it is most likely that such temporary diffe-rences will not be cleared in the near future.
Deferred tax assets and liabilities are netted if they relate to a taxable entity andcan in fact be netted. Accordingly, they are shown in the balance sheet as follows:
2019 2018
Deferred tax assets 237.7 207.6
Deferred tax liabilities 53.0 47.7
Deferred tax assets, net 184.8 159.9
T.23 (€ million)➔
T.24 (€ million)➔
215
Annual Report 2019 ↗ CONSOLIDATED FINANCIAL STATEMENTS

The changes in deferred tax assets were as follows:
2019 2018
Deferred tax assets, previous year 207.6 207.9
Recognition in the Income Statement 33.2 11.0
Adjustment against Other ComprehensiveIncome -3.0 -11.4
Deferred tax assets 237.7 207.6
The changes in deferred tax liabilities were as follows:
2019 2018
Deferred tax liabilities, previous year 47.7 37.6
Recognition in the Income Statement 4.4 8.1
Adjustment against Other ComprehensiveIncome 0.9 2.1
Deferred tax liabilities 53.0 47.7
9. PROPERTY, PLANT AND EQUIPMENT
Property, plant and equipment at their carrying amounts consist of:
2019 2018
Land and buildings, including buildings onthird-party land 118.0 121.4
Technical equipment and machinery 9.8 20.8
Other equipment, factory and office equipment 175.3 137.3
Assets under construction 91.7 15.2
Total 394.8 294.6
The carrying amount of property, plant and equipment is derived from the acqui-sition costs. Accumulated depreciation of property, plant and equipment amoun-ted to € 378.1 million (previous year: € 325.4 million).
In the previous year, the item Other equipment, factory and office equipment in-cluded leased objects (finance leasing) in the amount of € 0.2 million, and theitem Technical equipment and machines included € 8.3 million. With the adopti-on of IFRS 16, these will now be presented under right-of-use assets.
The changes in property, plant and equipment in the financial year 2019 areshown in “Changes in Fixed Assets” in Appendix 1 to the notes of the consolida-ted financial statements. During the reporting year, there are no impairment ex-penses that exceed current depreciation (previous year: € 0.6 million).
T.25 (€ million)➔
T.26 (€ million)➔
T.27 (€ million)➔
216
Annual Report 2019 ↗ CONSOLIDATED FINANCIAL STATEMENTS

10. LEASES
The Group rents and leases offices, warehouses, facilities and fleets of vehiclesand sales rooms for its own retail business. Rental agreements for the retailbusiness are concluded for terms of between five and fifteen years. The remai-ning rental and lease agreements typically have residual terms of between oneand five years. Some agreements include options to renew and price adjustmentclauses.
The carrying amounts for right-of-use assets recognized on the balance sheetrelate to the following asset classes:
2019 2018
Land and buildings - Retail stores 419.6 -
Land and buildings - Warehouses & Offices 281.7 -
Others (Technical equipment and machines andmotor vehicles) 17.7 -
Total 719.0 -
In the previous year, leased items from finance leases were recognized underProperty, Plant and Equipment (chapter 9).
The changes in right-of-use assets in the financial year 2019 are shown in“Changes in Fixed Assets” in Appendix 1 to the notes to the consolidated financialstatements. Impairment losses in accordance with IAS 36 were not incurred inthe financial year.
The following lease liabilities result:
2019 2018
Current lease liabilities 144.8 0.8
Non-current lease liabilities 600.5 7.5
Total 745.3 8.3
The amounts recognized in the income statement are as follows:
2019
Depreciation of right-of-use assets (included in operatingexpenses) 148,0
Profit (-)/loss (+) from disposal/revaluation of right-of-useassets/lease liabilities (included in operating expenses) -0.3
Interest expense (included in financial expenses) 29.7
Short-term leases (included in operating expenses) 6.9
Leases of low-value assets (included in operating expenses) 0.7
Variable lease payments (included in operating expenses) 28.3
Total 213.4
T.28 (€ million)➔
T.29 (€ million)➔
T.30 (€ million)➔
217
Annual Report 2019 ↗ CONSOLIDATED FINANCIAL STATEMENTS
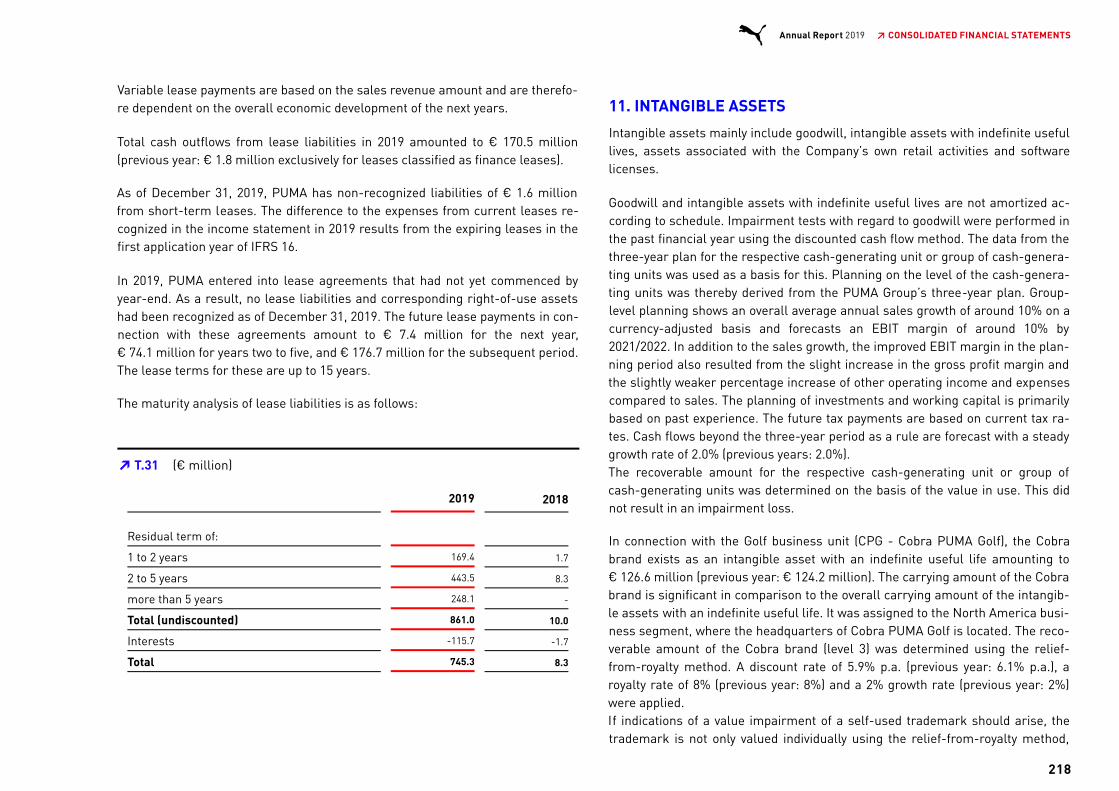
Variable lease payments are based on the sales revenue amount and are therefo-re dependent on the overall economic development of the next years.
Total cash outflows from lease liabilities in 2019 amounted to € 170.5 million(previous year: € 1.8 million exclusively for leases classified as finance leases).
As of December 31, 2019, PUMA has non-recognized liabilities of € 1.6 millionfrom short-term leases. The difference to the expenses from current leases re-cognized in the income statement in 2019 results from the expiring leases in thefirst application year of IFRS 16.
In 2019, PUMA entered into lease agreements that had not yet commenced byyear-end. As a result, no lease liabilities and corresponding right-of-use assetshad been recognized as of December 31, 2019. The future lease payments in con-nection with these agreements amount to € 7.4 million for the next year,€ 74.1 million for years two to five, and € 176.7 million for the subsequent period.The lease terms for these are up to 15 years.
The maturity analysis of lease liabilities is as follows:
2019 2018
Residual term of:
1 to 2 years 169.4 1.7
2 to 5 years 443.5 8.3
more than 5 years 248.1 -
Total (undiscounted) 861.0 10.0
Interests -115.7 -1.7
Total 745.3 8.3
11. INTANGIBLE ASSETS
Intangible assets mainly include goodwill, intangible assets with indefinite usefullives, assets associated with the Company’s own retail activities and softwarelicenses.
Goodwill and intangible assets with indefinite useful lives are not amortized ac-cording to schedule. Impairment tests with regard to goodwill were performed inthe past financial year using the discounted cash flow method. The data from thethree-year plan for the respective cash-generating unit or group of cash-genera-ting units was used as a basis for this. Planning on the level of the cash-genera-ting units was thereby derived from the PUMA Group’s three-year plan. Group-level planning shows an overall average annual sales growth of around 10% on acurrency-adjusted basis and forecasts an EBIT margin of around 10% by2021/2022. In addition to the sales growth, the improved EBIT margin in the plan-ning period also resulted from the slight increase in the gross profit margin andthe slightly weaker percentage increase of other operating income and expensescompared to sales. The planning of investments and working capital is primarilybased on past experience. The future tax payments are based on current tax ra-tes. Cash flows beyond the three-year period as a rule are forecast with a steadygrowth rate of 2.0% (previous years: 2.0%).The recoverable amount for the respective cash-generating unit or group ofcash-generating units was determined on the basis of the value in use. This didnot result in an impairment loss.
In connection with the Golf business unit (CPG - Cobra PUMA Golf), the Cobrabrand exists as an intangible asset with an indefinite useful life amounting to€ 126.6 million (previous year: € 124.2 million). The carrying amount of the Cobrabrand is significant in comparison to the overall carrying amount of the intangib-le assets with an indefinite useful life. It was assigned to the North America busi-ness segment, where the headquarters of Cobra PUMA Golf is located. The reco-verable amount of the Cobra brand (level 3) was determined using the relief-from-royalty method. A discount rate of 5.9% p.a. (previous year: 6.1% p.a.), aroyalty rate of 8% (previous year: 8%) and a 2% growth rate (previous year: 2%)were applied.If indications of a value impairment of a self-used trademark should arise, thetrademark is not only valued individually using the relief-from-royalty method,
T.31 (€ million)➔
218
Annual Report 2019 ↗ CONSOLIDATED FINANCIAL STATEMENTS

but the recoverable amount of the group of cash-generating units to which thetrademark is to be allocated is also determined. In 2019, there were no indicati-ons of an impairment.
In the financial year, development costs in connection with Cobra brand golfclubs amounting to € 1.8 million (previous year: € 1.7 million) were capitalized.Development costs are allocated to the item Other Intangible Assets in “Changesin Fixed Assets”. Current amortization of development costs amounted to€ 1.8 million in the financial year (previous year: € 1.1 million).
The changes in intangible assets in the financial year are shown in “Changes inFixed Assets” of Appendix 1 to the notes to the consolidated financial statements.The item Other intangible assets includes advance payments in the amount of€ 9.9 million (previous year: € 21.3 million).
The current amortization of intangible assets in the amount of € 23.5 million(previous year: € 17.2 million) is included in the other operating expenses. Ofthis, € 4.6 million relate to sales and distribution expenses (previous year:€ 3.5 million), € 0.1 million to expenses for product management/ merchandi-sing (previous year: € 1.2 million), € 1.8 million to development expenses (pre-vious year: € 0.0 million), and € 17.0 million to administrative and general expen-ses (previous year: € 12.5 million). As in the previous year, there were no impair-ment expenses that exceed current depreciation.
Goodwill is allocated to the Group’s identifiable group of cash-generating units(CGUs) according to the countries where the activities are carried out. Summari-zed by regions, goodwill is allocated as follows:
2019 2018
PUMA UK 1.7 1.6
Genesis 7.2 6.8
Subtotal Europe 8.8 8.4
PUMA South Africa 2.3 2.2
Subtotal EEMEA 2.3 2.2
PUMA Canada 9.8 9.1
PUMA United (former Janed) 2.0 1.9
Subtotal North America 11.7 11.1
PUMA Argentina 15.5 15.2
PUMA Chile 0.5 0.5
PUMA Mexico 10.7 10.1
Subtotal Latin America 26.8 25.9
PUMA China 2.5 2.5
PUMA Taiwan 13.3 12.8
Subtotal Greater China 15.8 15.3
PUMA Japan 44.9 43.5
Subtotal Asia/Pacific (without Greater China) 44.9 43.5
stichd 139.4 139.4
Total 249.7 245.7
T.32 (€ million)➔
219
Annual Report 2019 ↗ CONSOLIDATED FINANCIAL STATEMENTS
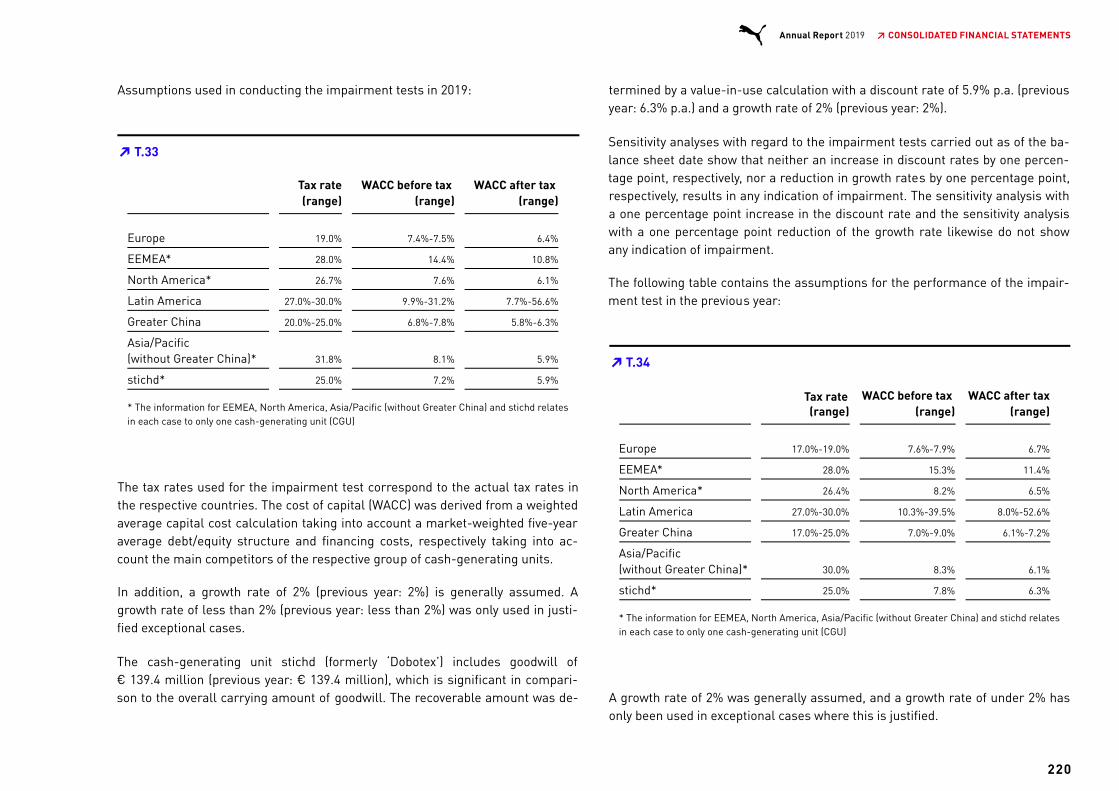
Assumptions used in conducting the impairment tests in 2019:
Tax rate(range)
WACC before tax (range)
WACC after tax (range)
Europe 19.0% 7.4%-7.5% 6.4%
EEMEA* 28.0% 14.4% 10.8%
North America* 26.7% 7.6% 6.1%
Latin America 27.0%-30.0% 9.9%-31.2% 7.7%-56.6%
Greater China 20.0%-25.0% 6.8%-7.8% 5.8%-6.3%
Asia/Pacific(without Greater China)* 31.8% 8.1% 5.9%
stichd* 25.0% 7.2% 5.9%
* The information for EEMEA, North America, Asia/Pacific (without Greater China) and stichd relatesin each case to only one cash-generating unit (CGU)
The tax rates used for the impairment test correspond to the actual tax rates inthe respective countries. The cost of capital (WACC) was derived from a weightedaverage capital cost calculation taking into account a market-weighted five-yearaverage debt/equity structure and financing costs, respectively taking into ac-count the main competitors of the respective group of cash-generating units.
In addition, a growth rate of 2% (previous year: 2%) is generally assumed. Agrowth rate of less than 2% (previous year: less than 2%) was only used in justi-fied exceptional cases.
The cash-generating unit stichd (formerly ‘Dobotex’) includes goodwill of€ 139.4 million (previous year: € 139.4 million), which is significant in compari-son to the overall carrying amount of goodwill. The recoverable amount was de-
termined by a value-in-use calculation with a discount rate of 5.9% p.a. (previousyear: 6.3% p.a.) and a growth rate of 2% (previous year: 2%).
Sensitivity analyses with regard to the impairment tests carried out as of the ba-lance sheet date show that neither an increase in discount rates by one percen-tage point, respectively, nor a reduction in growth rates by one percentage point,respectively, results in any indication of impairment. The sensitivity analysis witha one percentage point increase in the discount rate and the sensitivity analysiswith a one percentage point reduction of the growth rate likewise do not showany indication of impairment.
The following table contains the assumptions for the performance of the impair-ment test in the previous year:
Tax rate (range)WACC before tax
(range)WACC after tax
(range)
Europe 17.0%-19.0% 7.6%-7.9% 6.7%
EEMEA* 28.0% 15.3% 11.4%
North America* 26.4% 8.2% 6.5%
Latin America 27.0%-30.0% 10.3%-39.5% 8.0%-52.6%
Greater China 17.0%-25.0% 7.0%-9.0% 6.1%-7.2%
Asia/Pacific (without Greater China)* 30.0% 8.3% 6.1%
stichd* 25.0% 7.8% 6.3%
* The information for EEMEA, North America, Asia/Pacific (without Greater China) and stichd relatesin each case to only one cash-generating unit (CGU)
A growth rate of 2% was generally assumed, and a growth rate of under 2% hasonly been used in exceptional cases where this is justified.
T.33➔
T.34➔
220
Annual Report 2019 ↗ CONSOLIDATED FINANCIAL STATEMENTS
Assumptions used in conducting the impairment tests in 2019:
Tax rate(range)
WACC before tax (range)
WACC after tax (range)
Europe 19.0% 7.4%-7.5% 6.4%
EEMEA* 28.0% 14.4% 10.8%
North America* 26.7% 7.6% 6.1%
Latin America 27.0%-30.0% 9.9%-31.2% 7.7%-56.6%
Greater China 20.0%-25.0% 6.8%-7.8% 5.8%-6.3%
Asia/Pacific(without Greater China)* 31.8% 8.1% 5.9%
stichd* 25.0% 7.2% 5.9%
* The information for EEMEA, North America, Asia/Pacific (without Greater China) and stichd relatesin each case to only one cash-generating unit (CGU)
The tax rates used for the impairment test correspond to the actual tax rates inthe respective countries. The cost of capital (WACC) was derived from a weightedaverage capital cost calculation taking into account a market-weighted five-yearaverage debt/equity structure and financing costs, respectively taking into ac-count the main competitors of the respective group of cash-generating units.
In addition, a growth rate of 2% (previous year: 2%) is generally assumed. Agrowth rate of less than 2% (previous year: less than 2%) was only used in justi-fied exceptional cases.
The cash-generating unit stichd (formerly ‘Dobotex’) includes goodwill of€ 139.4 million (previous year: € 139.4 million), which is significant in compari-son to the overall carrying amount of goodwill. The recoverable amount was de-
termined by a value-in-use calculation with a discount rate of 5.9% p.a. (previousyear: 6.3% p.a.) and a growth rate of 2% (previous year: 2%).
Sensitivity analyses with regard to the impairment tests carried out as of the ba-lance sheet date show that neither an increase in discount rates by one percen-tage point, respectively, nor a reduction in growth rates by one percentage point,respectively, results in any indication of impairment. The sensitivity analysis witha one percentage point increase in the discount rate and the sensitivity analysiswith a one percentage point reduction of the growth rate likewise do not showany indication of impairment.
The following table contains the assumptions for the performance of the impair-ment test in the previous year:
Tax rate (range)WACC before tax
(range)WACC after tax
(range)
Europe 17.0%-19.0% 7.6%-7.9% 6.7%
EEMEA* 28.0% 15.3% 11.4%
North America* 26.4% 8.2% 6.5%
Latin America 27.0%-30.0% 10.3%-39.5% 8.0%-52.6%
Greater China 17.0%-25.0% 7.0%-9.0% 6.1%-7.2%
Asia/Pacific (without Greater China)* 30.0% 8.3% 6.1%
stichd* 25.0% 7.8% 6.3%
* The information for EEMEA, North America, Asia/Pacific (without Greater China) and stichd relatesin each case to only one cash-generating unit (CGU)
A growth rate of 2% was generally assumed, and a growth rate of under 2% hasonly been used in exceptional cases where this is justified.
T.33➔
T.34➔
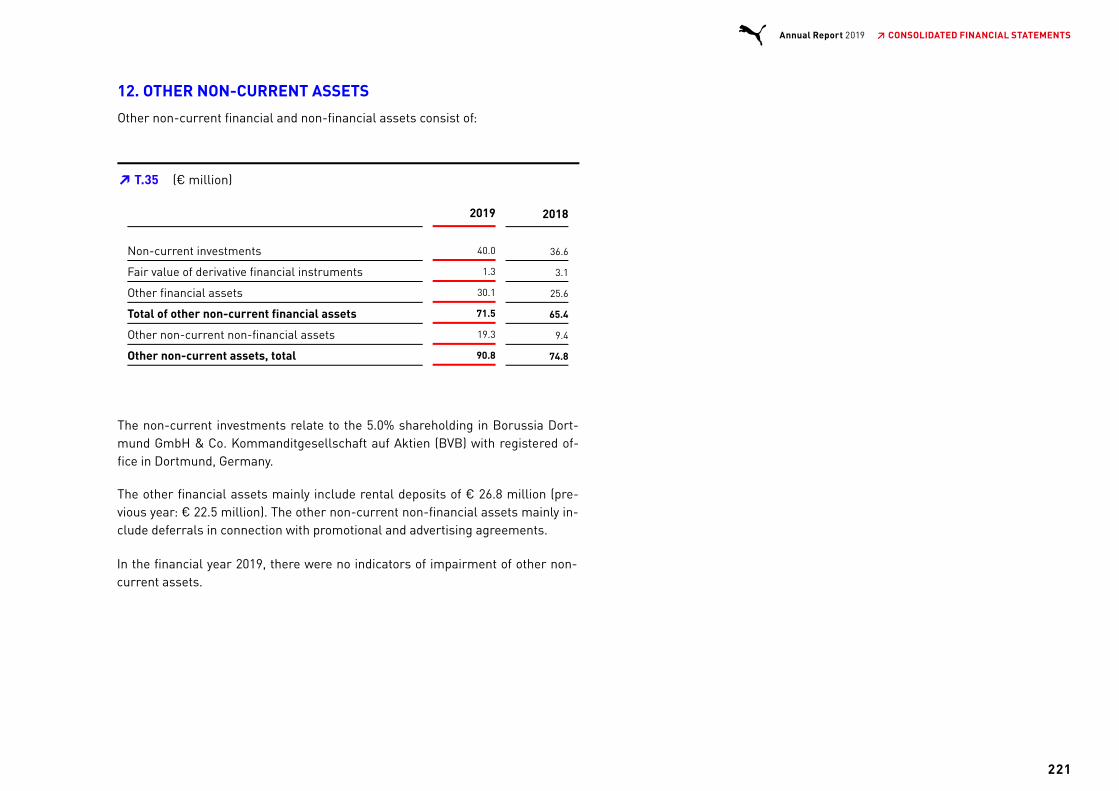
12. OTHER NON-CURRENT ASSETS
Other non-current financial and non-financial assets consist of:
2019 2018
Non-current investments 40.0 36.6
Fair value of derivative financial instruments 1.3 3.1
Other financial assets 30.1 25.6
Total of other non-current financial assets 71.5 65.4
Other non-current non-financial assets 19.3 9.4
Other non-current assets, total 90.8 74.8
The non-current investments relate to the 5.0% shareholding in Borussia Dort-mund GmbH & Co. Kommanditgesellschaft auf Aktien (BVB) with registered of-fice in Dortmund, Germany.
The other financial assets mainly include rental deposits of € 26.8 million (pre-vious year: € 22.5 million). The other non-current non-financial assets mainly in-clude deferrals in connection with promotional and advertising agreements.
In the financial year 2019, there were no indicators of impairment of other non-current assets.
T.35 (€ million)➔
221
Annual Report 2019 ↗ CONSOLIDATED FINANCIAL STATEMENTS

13. LIABILITIES
The residual terms of liabilities are as follows:
2019 2018
Total
Residual term of
Total
Residual term of
up to 1year
1 to 5years
over5 years
up to 1year
1 to 5years
over5 years
Financial liabilities 173.5 10.2 163.3 190.9 20.5 170.4
Trade payables 843.7 843.7 705.3 705.3
Liabilities from acquisitions 3.3 3.3
Other liabilities*
Liabilities from other taxes 39.5 39.5 41.8 41.8
Liabilities relating to social security 7.2 7.2 6.5 6.5
Payables to employees 114.0 114.0 94.9 94.9
Refund liabilities 208.3 208.3 154.9 154.9
Liabilities from market valuation of forward exchange transactions 38.2 34.1 4.0 22.8 20.7 2.1
Other liabilities 38.1 38.0 0.8 0.1 45.5 42.2 2.2 1.4
Total 1,462.5 1,295.1 168.2 0.1 1,265.9 1,086.9 178.0 1.4
* The maturity analysis for the lease liabilities is shown in chapter 10.
T.36 (€ million)➔
222
Annual Report 2019 ↗ CONSOLIDATED FINANCIAL STATEMENTS

Carrying amount2019
Cash flow
2020
Cash flow2021
Cash flow2022 et seq.
Interest Repayment Interest Repayment Interest Repayment
Non-derivative financial liabilities
Financial liabilities 173.5 0.7 10.2 0.6 103.3 0.7 60.0
Trade payables 843.7 843.7
Liabilities from acquisitions
Other liabilities 26.9 26.9 0.0
Derivative financial liabilities and assets
Cash-Inflow from forward exchange transactions 2,847.9 506.3
Cash-Outlow from forward exchange transactions 2,831.1 505.1
PUMA has confirmed credit facilities amounting to a total of € 687.6 million (pre-vious year: € 691.9 million). Under financial liabilities, € 0.0 million (previousyear: € 1.5 million) was utilized from credit lines granted only until further notice.Unutilized credit lines totaled € 514.1 million as of December 31, 2019, comparedto € 501.0 million the previous year.
The effective interest rate of the financial liabilities ranged between 0.1% and8.5% (previous year: 0.1% to 8.4%).
The liabilities from refund obligations result from contracts with customers andinclude obligations from customer return rights as well as obligations connectedwith customer bonuses.
The table below shows the cash flows of the non-derivative financial liabilitiesand of the derivative financial instruments with a positive and negative fair value:
The current financial liabilities can be repaid at any time.
T.37 CASH FLOWS FROM NON-DERIVATIVE AND DERIVATIVE FINANCIAL LIABILITIES (€ million)➔
223
Annual Report 2019 ↗ CONSOLIDATED FINANCIAL STATEMENTS
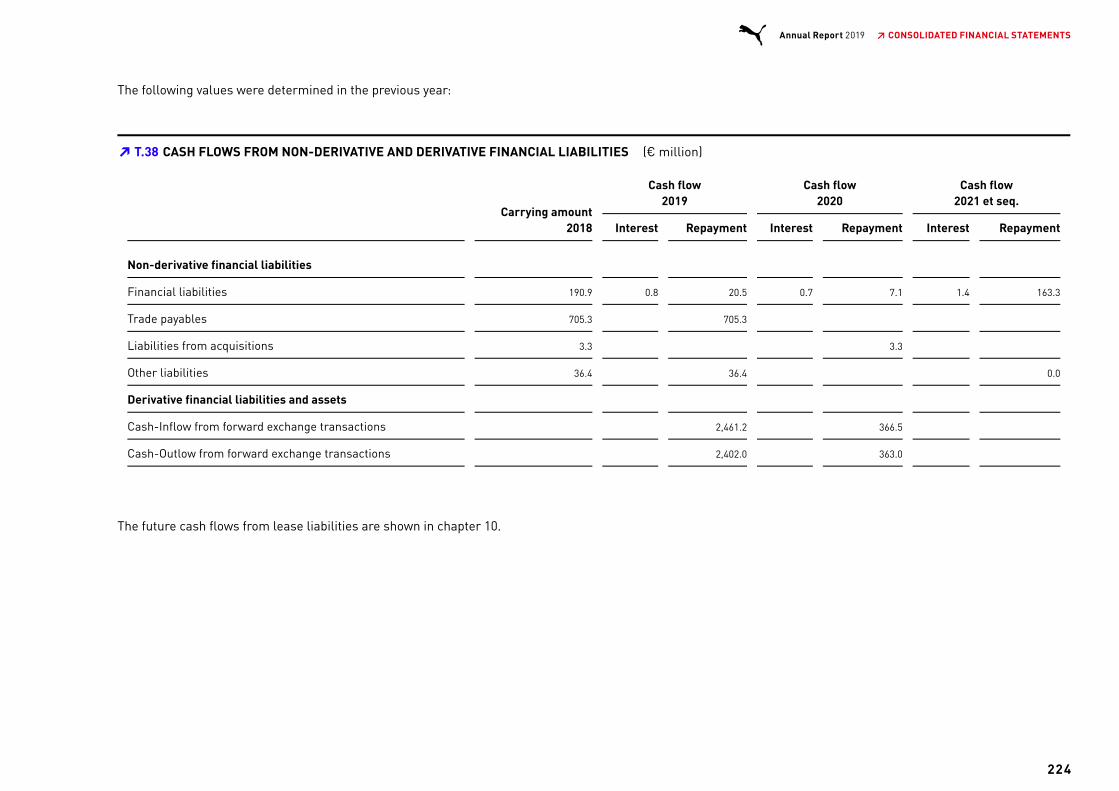
The following values were determined in the previous year:
Carrying amount2018
Cash flow2019
Cash flow2020
Cash flow2021 et seq.
Interest Repayment Interest Repayment Interest Repayment
Non-derivative financial liabilities
Financial liabilities 190.9 0.8 20.5 0.7 7.1 1.4 163.3
Trade payables 705.3 705.3
Liabilities from acquisitions 3.3 3.3
Other liabilities 36.4 36.4 0.0
Derivative financial liabilities and assets
Cash-Inflow from forward exchange transactions 2,461.2 366.5
Cash-Outlow from forward exchange transactions 2,402.0 363.0
The future cash flows from lease liabilities are shown in chapter 10.
T.38 CASH FLOWS FROM NON-DERIVATIVE AND DERIVATIVE FINANCIAL LIABILITIES (€ million)➔
224
Annual Report 2019 ↗ CONSOLIDATED FINANCIAL STATEMENTS
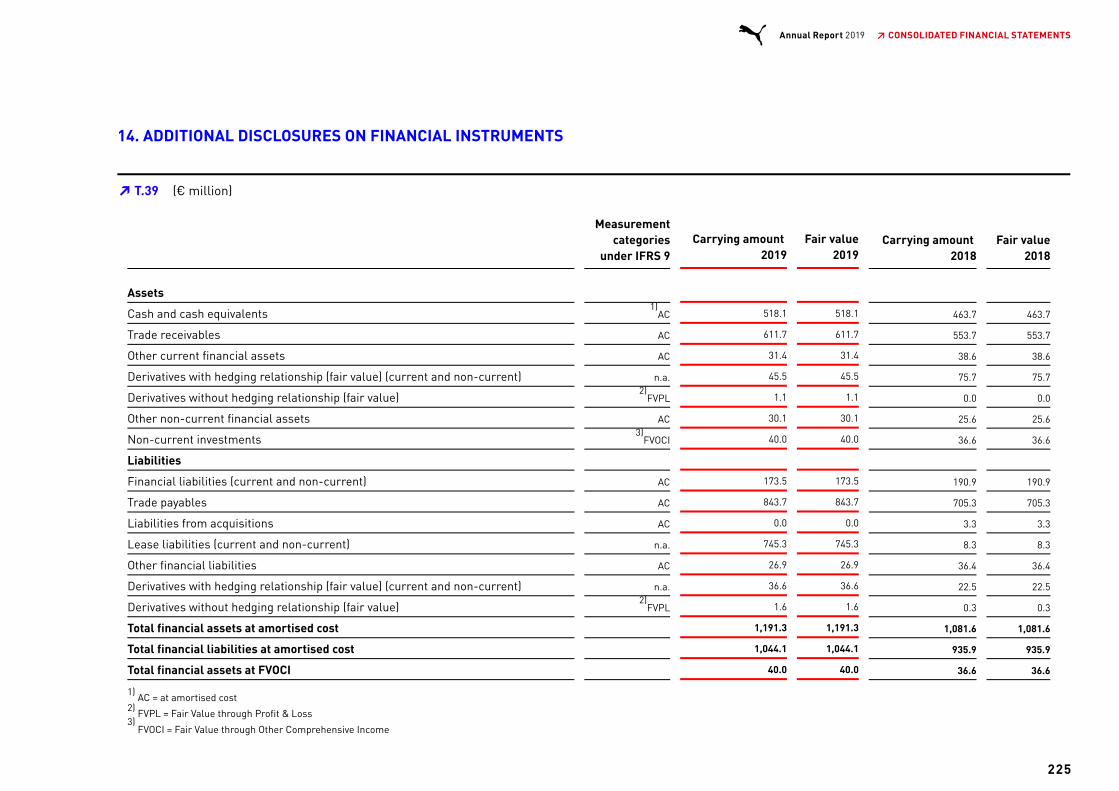
14. ADDITIONAL DISCLOSURES ON FINANCIAL INSTRUMENTS
Measurementcategories
under IFRS 9Carrying amount
2019Fair value
2019Carrying amount
2018Fair value
2018
Assets
Cash and cash equivalents AC 518.1 518.1 463.7 463.7
Trade receivables AC 611.7 611.7 553.7 553.7
Other current financial assets AC 31.4 31.4 38.6 38.6
Derivatives with hedging relationship (fair value) (current and non-current) n.a. 45.5 45.5 75.7 75.7
Derivatives without hedging relationship (fair value) FVPL 1.1 1.1 0.0 0.0
Other non-current financial assets AC 30.1 30.1 25.6 25.6
Non-current investments FVOCI 40.0 40.0 36.6 36.6
Liabilities
Financial liabilities (current and non-current) AC 173.5 173.5 190.9 190.9
Trade payables AC 843.7 843.7 705.3 705.3
Liabilities from acquisitions AC 0.0 0.0 3.3 3.3
Lease liabilities (current and non-current) n.a. 745.3 745.3 8.3 8.3
Other financial liabilities AC 26.9 26.9 36.4 36.4
Derivatives with hedging relationship (fair value) (current and non-current) n.a. 36.6 36.6 22.5 22.5
Derivatives without hedging relationship (fair value) FVPL 1.6 1.6 0.3 0.3
Total financial assets at amortised cost 1,191.3 1,191.3 1,081.6 1,081.6
Total financial liabilities at amortised cost 1,044.1 1,044.1 935.9 935.9
Total financial assets at FVOCI 40.0 40.0 36.6 36.6
AC = at amortised cost
FVPL = Fair Value through Profit & Loss
FVOCI = Fair Value through Other Comprehensive Income
T.39 (€ million)➔
1)
2)
3)
2)
1)
2)3)
225
Annual Report 2019 ↗ CONSOLIDATED FINANCIAL STATEMENTS
Financial instruments that are measured at fair value in the balance sheet weredetermined using the following hierarchy:
Level 1: Use of prices quoted on active markets for identical assets or liabilities.Level 2: Use of input factors that do not involve the quoted prices stated underLevel 1, but can be observed for the asset or liability either directly (i.e., as price)or indirectly (i.e., derivation of prices).Level 3: Use of factors for the valuation of the asset or liability that are based onnon-observable market data.
The fair value of the non-current investments held for strategic reasons only re-fers to equity instruments of the category “fair value through OCI” (FVOCI) and isdetermined on the basis of level 1. The market values of derivative assets or lia-bilities were determined on the basis of level 2.
Cash and cash equivalents, trade receivables and other receivables have shortmaturities. Accordingly, as of the reporting date, the carrying amount approxima-tes fair value. Receivables are stated at nominal value, taking into account de-ductions for default risk.
The fair values of other financial assets correspond to their carrying amount asthe interest calculation occurs at the prevailing market interest rates on the ba-lance sheet date. Other (current and non-current) financial assets include€ 34.6 million (previous year: € 30.4 million) that were pledged as rental depositsat usual market rates.
The current liabilities to banks can be repaid at any time. Accordingly, as of thereporting date, the carrying amount approximates fair value. The non-currentbank liabilities consist of fixed-interest loans. The carrying amount represents areasonable approximation of their fair value as the interest rate differential is notsignificant at the reporting date.
Trade payables have short residual maturities; their carrying amounts thereforeapproximate fair value.
Pursuant to the contracts entered into, purchase price liabilities associated withacquisitions of business enterprises lead to payments. The resulting nominalamounts were discounted at a reasonable market interest rate, depending on theexpected date of payment. There are no liabilities from acquisitions as of Decem-ber 31, 2019. As of December 31, 2018, there was one liability from acquisitionswhich only affected one company and was discounted with a market interest rateof 0.7%.
The remaining financial liabilities have short residual maturities; the recognizedamounts therefore approximate fair value.
The fair values of derivatives with a hedging relationship at the balance sheetdate are determined on the basis of current market parameters, i.e. referenceprices observable on the market, taking into account forward premiums and dis-counts. The discounted result of the comparison of the forward price on the re-porting date with the forward price on the valuation date is included in the mea-surement. The fair values are also checked for the counterparty’s non-perfor-mance risk. In doing this, PUMA calculates credit value adjustments (CVA) ordebt value adjustments (DVA) on the basis of an up/down method, taking currentmarket information into account. No material deviations were found, so that noadjustments were made to the fair value determined.
226
Annual Report 2019 ↗ CONSOLIDATED FINANCIAL STATEMENTS
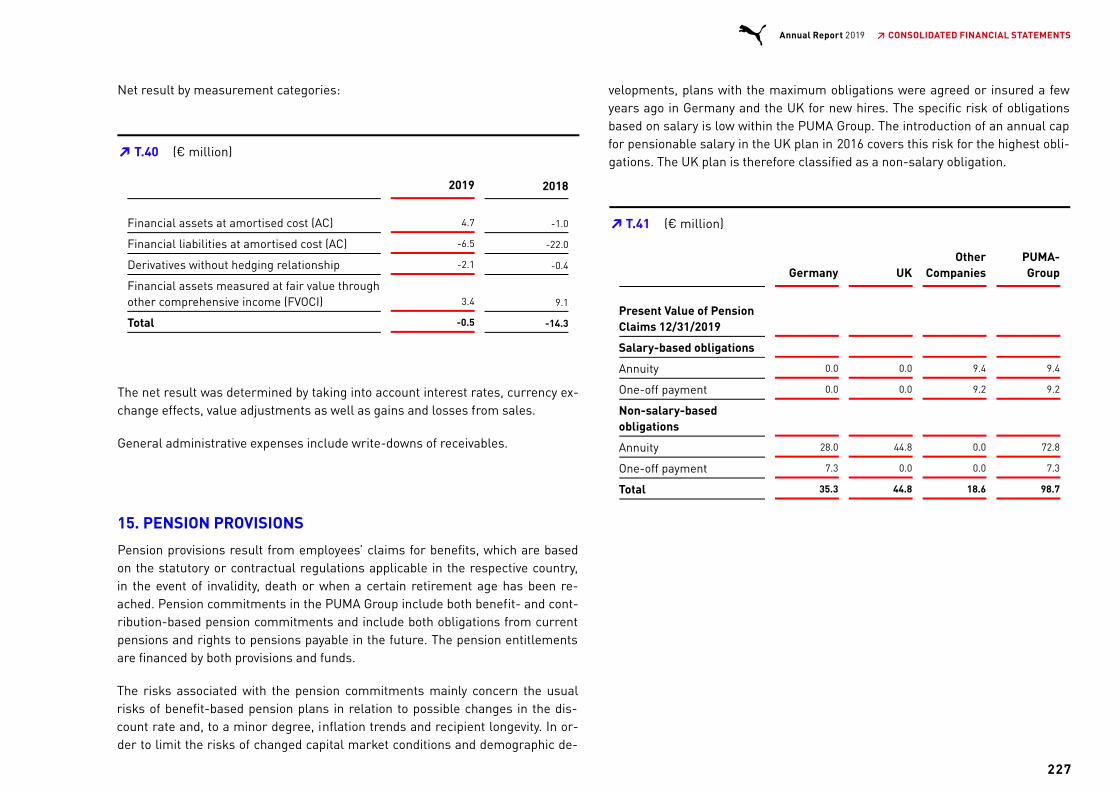
Net result by measurement categories:
2019 2018
Financial assets at amortised cost (AC) 4.7 -1.0
Financial liabilities at amortised cost (AC) -6.5 -22.0
Derivatives without hedging relationship -2.1 -0.4
Financial assets measured at fair value throughother comprehensive income (FVOCI) 3.4 9.1
Total -0.5 -14.3
The net result was determined by taking into account interest rates, currency ex-change effects, value adjustments as well as gains and losses from sales.
General administrative expenses include write-downs of receivables.
15. PENSION PROVISIONS
Pension provisions result from employees’ claims for benefits, which are basedon the statutory or contractual regulations applicable in the respective country,in the event of invalidity, death or when a certain retirement age has been re-ached. Pension commitments in the PUMA Group include both benefit- and cont-ribution-based pension commitments and include both obligations from currentpensions and rights to pensions payable in the future. The pension entitlementsare financed by both provisions and funds.
The risks associated with the pension commitments mainly concern the usualrisks of benefit-based pension plans in relation to possible changes in the dis-count rate and, to a minor degree, inflation trends and recipient longevity. In or-der to limit the risks of changed capital market conditions and demographic de-
velopments, plans with the maximum obligations were agreed or insured a fewyears ago in Germany and the UK for new hires. The specific risk of obligationsbased on salary is low within the PUMA Group. The introduction of an annual capfor pensionable salary in the UK plan in 2016 covers this risk for the highest obli-gations. The UK plan is therefore classified as a non-salary obligation.
Germany UKOther
CompaniesPUMA-Group
Present Value of PensionClaims 12/31/2019
Salary-based obligations
Annuity 0.0 0.0 9.4 9.4
One-off payment 0.0 0.0 9.2 9.2
Non-salary-basedobligations
Annuity 28.0 44.8 0.0 72.8
One-off payment 7.3 0.0 0.0 7.3
Total 35.3 44.8 18.6 98.7
T.40 (€ million)➔
T.41 (€ million)➔
227
Annual Report 2019 ↗ CONSOLIDATED FINANCIAL STATEMENTS

The following values were determined in the previous year:
Germany UKOther
CompaniesPUMA-Group
Present Value of PensionClaims 12/31/2018
Salary-based obligations
Annuity 0.0 0.0 7.3 7.3
One-off payment 0.0 0.0 8.1 8.1
Non-salary-basedobligations
Annuity 25.7 37.6 0.0 63.3
One-off payment 7.1 0.0 0.0 7.1
Total 32.8 37.6 15.4 85.8
The main pension arrangements are described below:
The general pension scheme of PUMA SE generally provides for pension pay-ments to a maximum amount of €127.82 per month and per eligible employee. Itwas closed for new members beginning in 1996. In addition, PUMA SE providesindividual commitments (fixed sums in different amounts) as well as contributi-on-based individual commitments (in part from salary conversion). The contribu-tion-based commitments are insured plans. There are no statutory minimumfunding requirements. The scope of obligation for domestic pension claimsamounts to € 35.3 million at the end of 2019 (previous year: € 32.7 million) andthus comprises 35.8% of the total obligation. The fair value of the plan assets re-lative to domestic obligations amounts to € 24.1 million. The corresponding pen-sion provision amounts to € 11.2 million.
The defined benefit plan in the United Kingdom has not been available to new hi-res since 2006. This defined benefit plan includes salary and length of service-based commitments to provide old age, invalidity and surviving dependents’ reti-rement benefits. In 2016, a growth cap of 1% p.a. was introduced on the pen-sionable salary. Partial capitalization of the old-age pension is permitted. Thereare statutory minimum funding requirements. The obligations regarding pensionclaims under the defined benefit plan in the UK amount to € 44.8 million at theend of 2019 (previous year: € 37.6 million) and thus accounts for 45.4% of the to-tal obligation. The obligation is covered by assets amounting to € 35.9 million.The provision amounts to € 8.9 million.
The changes in the present value of pension claims are as follows:
2019 2018
Present Value of Pension Claims January 1 85.8 81.3
Cost of the pension claims earned in thereporting year 2.3 7.2
Past service costs 0.0 -0.1
(Profits) and losses from settlements 0.0 0.0
Interest expense on pension claims 2.0 1.8
Employee contributions 1.0 0.2
Benefits paid -2.2 -1.7
Effects from transfers -0.4 -0.1
Actuarial gains (-) and losses 8.0 -2.4
Currency exchange effects 2.2 -0.4
Present Value of Pension Claims December 31 98.7 85.8
T.42 (€ million)➔
T.43 (€ million)➔
228
Annual Report 2019 ↗ CONSOLIDATED FINANCIAL STATEMENTS

The changes in the plan assets are as follows:
2019 2018
Plan Assets January 1 56.9 51.6
Interest income on plan assets 1.3 1.2
Actuarial gains and losses (-) 2.8 -1.8
Employer contributions 1.8 6.8
Employee contributions 1.0 0.2
Benefits paid -1.0 -0.9
Effects from transfers 0.0 0.0
Currency exchange effects 1.8 -0.2
Plan Assets December 31 64.6 56.9
The pension provision for the Group is derived as follows:
2019 2018
Present value of pension claims from benefitplans 98.7 85.8
Fair value of plan assets -64.6 -56.9
Financing Status 34.1 28.9
Amounts not recorded due to the maximumlimit applicable to assets 0.0 0.0
Pension Provision December 31 34.1 28.9
In 2019, benefits paid amounted to € 2.2 million (previous year: € 1.7 million).Contributions in 2020 are expected to amount to € 3.1 million. Of this, € 1.9 milli-on is expected to be paid directly by the employer. Contributions to external planassets amounted to € 1.8 million in 2019 (previous year: € 6.8 million). Contribu-tions in 2020 are expected to amount to € 2.1 million.
The changes in pension provisions are as follows:
2019 2018
Pension Provision January 1 28.9 29.7
Pension expense 3.0 7.7
Actuarial gains (-) and losses recorded in OtherComprehensive Income 5.2 -0.6
Employer contributions -1.8 -6.8
Direct pension payments made by the employer -1.2 -0.8
Transfer values -0.4 -0.1
Currency exchange differences 0.4 -0.2
Pension Provision December 31 34.1 28.9
of which assets 0.0 0.0
of which liabilities 34.1 28.9
T.44 (€ million)➔
T.45 (€ million)➔
T.46 (€ million)➔
229
Annual Report 2019 ↗ CONSOLIDATED FINANCIAL STATEMENTS

The expenses in the 2019 financial year are structured as follows:
2019 2018
Cost of the pension claims earned in thereporting year 2.3 7.2
Past service costs 0.0 -0.1
Income (-) and expenses from plan settlements 0.0 0.0
Interest expense on pension claims 2.0 1.8
Interest income on plan assets -1.3 -1.2
Administration costs 0.0 0.0
Expenses for Defined Benefit Plans 3.0 7.7
of which personnel costs 2.3 7.1
of which financial costs 0.7 0.6
In addition to the defined benefit pension plans, PUMA also makes contributionsto defined contribution plans. Payments for the financial year 2019 amounted to€ 14.0 million (previous year: € 12.5 million).
Actuarial gains and losses recorded in Other Comprehensive Income:
2019 2018
Revaluation of Pension Commitments 8.0 -2.4
Actuarial gains (-) and losses resulting fromchanges in demographic assumptions -0.8 0.8
Actuarial gains (-) and losses resulting fromchanges in financial assumptions 8.1 -2.5
Actuarial gains (-) and losses due toadjustments based on experience 0.7 -0.7
Revaluation of Plan Assets -2.8 1.8
Amounts not recorded due to the maximumlimit applicable to assets 0.0 0.0
Adjustment of administration costs 0.0 0.0
Total Revaluation Amounts recorded directlyin Other Comprehensive Income 5.2 -0.6
T.47 (€ million)➔
T.48 (€ million)➔
230
Annual Report 2019 ↗ CONSOLIDATED FINANCIAL STATEMENTS

Plan assets investment classes:
2019 2018
Cash and cash equivalents 2.6 1.4
Equity instruments 0.6 0.0
Bonds 0.9 0.0
Investment funds 20.1 17.3
Derivatives 6.1 5.6
Real estate 4.1 3.1
Insurance 24.1 24.6
Others 6.1 4.9
Total Plan Assets 64.6 56.9
Of which investment classes with a quoted market price:
2019 2018
Cash and cash equivalents 2.6 1.4
Equity instruments 0.6 0.0
Bonds 0.9 0.0
Investment funds 20.1 17.3
Derivatives 6.1 5.6
Real estate 3.5 3.1
Insurance 0.0 0.0
Others 5.8 4.9
Plan Assets with a quoted Market Price 39.6 32.3
Plan assets still do not include the Group’s own financial instruments or real es-tate used by Group companies.
The plan assets are used exclusively to fulfill defined pension commitments. Le-gal requirements exist in some countries for the type and amount of financial re-sources that can be chosen; in other countries (for example Germany) they canbe chosen freely. In the UK, a board of trustees made up of company representa-tives and employees is in charge of asset management. Its investment strategy isaimed at long-term profits and low volatility. It was revised in 2017 and 2018 andthe risk profile was reduced.
The following assumptions were used to determine pension obligations and pen-sion expenses:
2019 2018
Discount rate 1.64% 2.41%
Future pension increases 2.16% 2.31%
Future salary increases 1.66% 1.70%
The indicated values are weighted average values. A standard interest rate of1.00% was applied for the eurozone (previous year: 1.75%).
The 2018 G guideline tables were used as mortality tables for Germany. For theUK, the mortality was assumed based on basic table series S2 taking into ac-count life expectancy projections in accordance with CMI2018 with a long-termtrend of 1%.
The following overview shows how the present value of pension claims from be-nefit plans would have been affected by changes to significant actuarialassumptions.
T.49 (€ million)➔
T.50 (€ million)➔
T.51 ➔
231
Annual Report 2019 ↗ CONSOLIDATED FINANCIAL STATEMENTS

16. OTHER PROVISIONS
2018 2019
Currency
adjustments, retransfers Addition Utilization Reversal
Provisions for:
Warranties 1.9 0.0 1.3 -1.6 -0.2 1.4
Purchasing risks 9.8 0.0 8.3 -7.9 -0.7 9.4
Litigation risks 25.9 -0.3 6.8 -4.4 -4.3 23.7
Personnel 10.9 -0.2 13.3 -1.6 0.0 22.4
Other 17.5 0.5 8.1 -4.2 -0.8 21.0
Total 65.9 0.1 37.8 -19.7 -6.1 77.9
2019 2018
Effect on present value of pension claims if
the discount rate were 50 basis points higher -8.0 -6.7
the discount rate were 50 basis points lower 6.2 4.9
Salary and pension trends have only a negligible effect on the present value ofpension claims due to the structure of the benefit plans.
The weighted average duration of pension commitments is 18 years (previousyear: 17 years).
T.52 (€ million)➔
T.53 (€ million)➔
232
Annual Report 2019 ↗ CONSOLIDATED FINANCIAL STATEMENTS
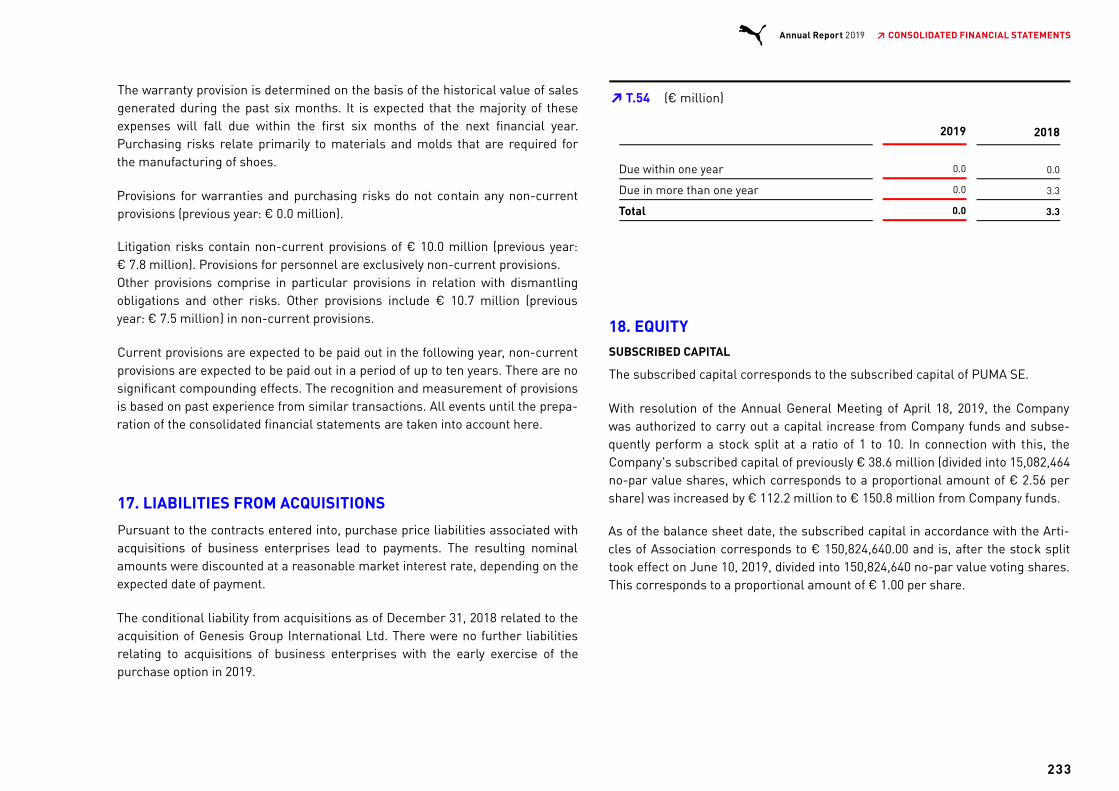
The warranty provision is determined on the basis of the historical value of salesgenerated during the past six months. It is expected that the majority of theseexpenses will fall due within the first six months of the next financial year.Purchasing risks relate primarily to materials and molds that are required forthe manufacturing of shoes.
Provisions for warranties and purchasing risks do not contain any non-currentprovisions (previous year: € 0.0 million).
Litigation risks contain non-current provisions of € 10.0 million (previous year:€ 7.8 million). Provisions for personnel are exclusively non-current provisions.Other provisions comprise in particular provisions in relation with dismantlingobligations and other risks. Other provisions include € 10.7 million (previousyear: € 7.5 million) in non-current provisions.
Current provisions are expected to be paid out in the following year, non-currentprovisions are expected to be paid out in a period of up to ten years. There are nosignificant compounding effects. The recognition and measurement of provisionsis based on past experience from similar transactions. All events until the prepa-ration of the consolidated financial statements are taken into account here.
17. LIABILITIES FROM ACQUISITIONS
Pursuant to the contracts entered into, purchase price liabilities associated withacquisitions of business enterprises lead to payments. The resulting nominalamounts were discounted at a reasonable market interest rate, depending on theexpected date of payment.
The conditional liability from acquisitions as of December 31, 2018 related to theacquisition of Genesis Group International Ltd. There were no further liabilitiesrelating to acquisitions of business enterprises with the early exercise of thepurchase option in 2019.
2019 2018
Due within one year 0.0 0.0
Due in more than one year 0.0 3.3
Total 0.0 3.3
18. EQUITYSUBSCRIBED CAPITAL
The subscribed capital corresponds to the subscribed capital of PUMA SE.
With resolution of the Annual General Meeting of April 18, 2019, the Companywas authorized to carry out a capital increase from Company funds and subse-quently perform a stock split at a ratio of 1 to 10. In connection with this, theCompany's subscribed capital of previously € 38.6 million (divided into 15,082,464no-par value shares, which corresponds to a proportional amount of € 2.56 pershare) was increased by € 112.2 million to € 150.8 million from Company funds.
As of the balance sheet date, the subscribed capital in accordance with the Arti-cles of Association corresponds to € 150,824,640.00 and is, after the stock splittook effect on June 10, 2019, divided into 150,824,640 no-par value voting shares.This corresponds to a proportional amount of € 1.00 per share.
T.54 (€ million)➔
233
Annual Report 2019 ↗ CONSOLIDATED FINANCIAL STATEMENTS
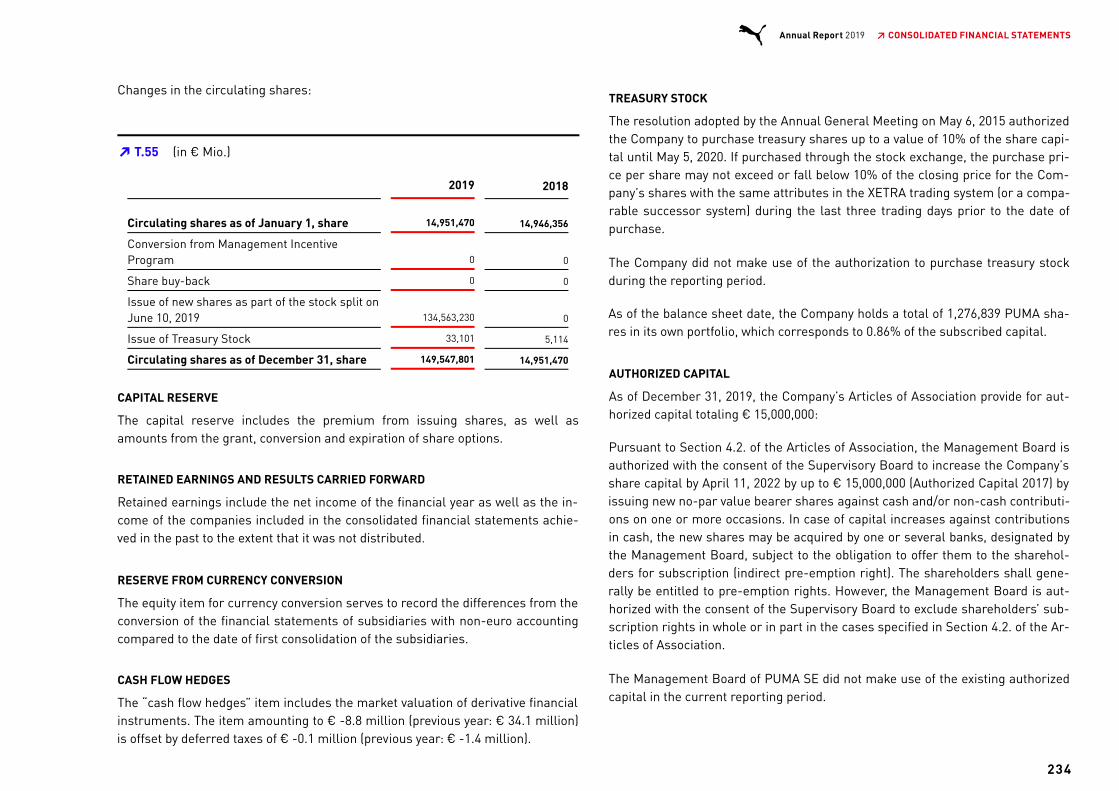
Changes in the circulating shares:
2019 2018
Circulating shares as of January 1, share 14,951,470 14,946,356
Conversion from Management IncentiveProgram 0 0
Share buy-back 0 0
Issue of new shares as part of the stock split onJune 10, 2019 134,563,230 0
Issue of Treasury Stock 33,101 5,114
Circulating shares as of December 31, share 149,547,801 14,951,470
CAPITAL RESERVE
The capital reserve includes the premium from issuing shares, as well asamounts from the grant, conversion and expiration of share options.
RETAINED EARNINGS AND RESULTS CARRIED FORWARD
Retained earnings include the net income of the financial year as well as the in-come of the companies included in the consolidated financial statements achie-ved in the past to the extent that it was not distributed.
RESERVE FROM CURRENCY CONVERSION
The equity item for currency conversion serves to record the differences from theconversion of the financial statements of subsidiaries with non-euro accountingcompared to the date of first consolidation of the subsidiaries.
CASH FLOW HEDGES
The “cash flow hedges” item includes the market valuation of derivative financialinstruments. The item amounting to € -8.8 million (previous year: € 34.1 million)is offset by deferred taxes of € -0.1 million (previous year: € -1.4 million).
TREASURY STOCK
The resolution adopted by the Annual General Meeting on May 6, 2015 authorizedthe Company to purchase treasury shares up to a value of 10% of the share capi-tal until May 5, 2020. If purchased through the stock exchange, the purchase pri-ce per share may not exceed or fall below 10% of the closing price for the Com-pany’s shares with the same attributes in the XETRA trading system (or a compa-rable successor system) during the last three trading days prior to the date ofpurchase.
The Company did not make use of the authorization to purchase treasury stockduring the reporting period.
As of the balance sheet date, the Company holds a total of 1,276,839 PUMA sha-res in its own portfolio, which corresponds to 0.86% of the subscribed capital.
AUTHORIZED CAPITAL
As of December 31, 2019, the Company’s Articles of Association provide for aut-horized capital totaling € 15,000,000:
Pursuant to Section 4.2. of the Articles of Association, the Management Board isauthorized with the consent of the Supervisory Board to increase the Company’sshare capital by April 11, 2022 by up to € 15,000,000 (Authorized Capital 2017) byissuing new no-par value bearer shares against cash and/or non-cash contributi-ons on one or more occasions. In case of capital increases against contributionsin cash, the new shares may be acquired by one or several banks, designated bythe Management Board, subject to the obligation to offer them to the sharehol-ders for subscription (indirect pre-emption right). The shareholders shall gene-rally be entitled to pre-emption rights. However, the Management Board is aut-horized with the consent of the Supervisory Board to exclude shareholders’ sub-scription rights in whole or in part in the cases specified in Section 4.2. of the Ar-ticles of Association.
The Management Board of PUMA SE did not make use of the existing authorizedcapital in the current reporting period.
T.55 (in € Mio.)➔
234
Annual Report 2019 ↗ CONSOLIDATED FINANCIAL STATEMENTS

CONDITIONAL CAPITAL
By resolution of the Annual General Meeting of April 12, 2018, the ManagementBoard was authorized until April 11, 2023, with the consent of the SupervisoryBoard, through one or more issues, altogether or in parts and in various tran-ches at the same time, to issue bearer or registered options and/or convertiblebonds, profit-sharing rights or participation bonds or a combination of these in-struments with or without a term limitation in a total nominal amount of up to€ 1,000,000,000.00 (Conditional Capital 2018).
In this connection, the share capital was increased conditionally by up to €30,164,920.00 by the issue of up to 30,164,920 new units of registered stock. Theconditional capital increase will be performed only insofar as use is made of opti-ons or conversion rights or a conversion or option obligation is fulfilled or insofaras deliveries are made and if other forms of fulfillment are not used forservicing.
No use has been made of the authorization to date.
DIVIDENDS
The amounts eligible for distribution relate to the retained earnings of PUMA SE,which is determined in accordance with German Commercial Law.
The Management Board and the Supervisory Board will propose to the AnnualGeneral Meeting that a dividend of € 0.50 per circulating share, or a total of€ 74.8 million (with respect to the circulating shares as of December 31, 2019),be distributed to the shareholders from the retained earnings of PUMA SE for thefinancial year 2019.
Proposed appropriation of the retained earnings of PUMA SE:
2019 2018
Retained earnings of PUMA SE as ofDecember 31, € million 160.7 144.5
Retained earnings available for distribution,€ million 160.7 144.5
Dividend per share, € 0.50 3.50
Number of circulating shares* 149,547,801 14,951,470
Total dividend*, € million 74.8 52.3
Carried forward to the new accountingperiod*, € million 85.9 92.2
* Previous year's values adjusted to the outcome of the Annual General Meeting
NON-CONTROLLING INTERESTS
This item comprises the remaining shares of non-controlling interests. The com-position is shown in chapter 30.
CAPITAL MANAGEMENT
The Group’s objective is to retain a strong equity base in order to maintain bothinvestor and market confidence and to strengthen future business performance.
Capital management relates to the consolidated equity of PUMA. This is shown inthe consolidated balance sheet as well as the reconciliation statement con-cerning “Changes in Equity.”
T.56 ➔
235
Annual Report 2019 ↗ CONSOLIDATED FINANCIAL STATEMENTS

Issue date 1/1/2014 1/1/2015 1/1/2016 1/1/2017 1/1/2018 1/1/2019
Term 5 5 5 5 5 5 Years
Vesting period 3 3 3 3 3 3 Years
Base price PUMA share at issue 23.20 17.40 20.00 24.00 37.10 44.40 EUR/share
Reference value PUMA-share at the end of the financial year N/A N/A N/A 67.69 45.13 22.56 EUR/share
Reference value PUMA-share at the conversion date N/A N/A 69.77 N/A N/A N/A EUR/share
Participants in year of issue 3 3 3 3 3 3 Persons
Participants at the end of the financial year 3 3 3 3 3 3 Persons
Number of monetary units as of 1/1/2019 0 0 113,930 107,360 117,440 97,320 Shares
Number of monetary units exercised in the FY 0 0 -25,310 0 0 0 Shares
Final number of monetary units as of 12/31/2019 0 0 88,620 107,360 117,440 97,320 Shares
Total monetary units 0 0 88,620 107,360 117,440 97,320 Shares
19. MANAGEMENT INCENTIVE PROGRAMS
In order to bind the management to the Company by a long-term incentive, virtu-al shares with cash settlement and other long-term incentive programs are usedat PUMA.
The current programs are described below:
EXPLANATION OF “VIRTUAL SHARES”, TERMED “MONETARY UNITS”
Monetary units were granted on an annual basis beginning in 2013 as part of amanagement incentive program. Monetary units are based on the PUMA shareperformance. Each of these monetary units entitles the holder to a cash paymentat the end of the term. The entitled cash payment compares the performance
using the average virtual appreciation rights of the last thirty trading days beforethe start of the year of issue with the virtual appreciation rights of the last thirtytrading days before the exercise date. Monetary units are subject to a vesting pe-riod of three years. After that, there is an exercise period of two years (startingwith each quarterly publication date for a period of 30 days) which can be freelyused by participants for the purposes of execution. The fundamental exercisecondition after the vesting period is the existence of an active employment relati-onship with PUMA until the end of the vesting period.
In the financial year 2019, an expense of € 12.6 million was recorded for this pur-pose on the basis of the employment contract commitments to the ManagementBoard members.
T.57 VIRTUAL SHARES (MONETARY UNITS)➔
236
Annual Report 2019 ↗ CONSOLIDATED FINANCIAL STATEMENTS
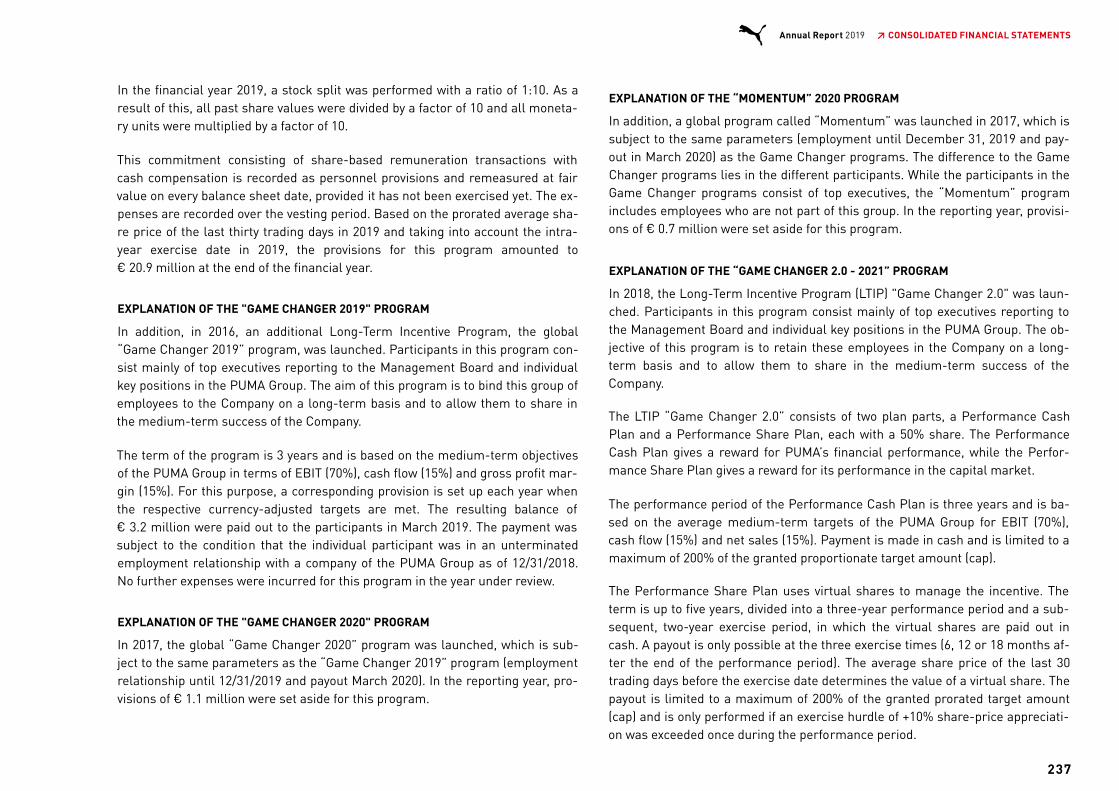
In the financial year 2019, a stock split was performed with a ratio of 1:10. As aresult of this, all past share values were divided by a factor of 10 and all moneta-ry units were multiplied by a factor of 10.
This commitment consisting of share-based remuneration transactions withcash compensation is recorded as personnel provisions and remeasured at fairvalue on every balance sheet date, provided it has not been exercised yet. The ex-penses are recorded over the vesting period. Based on the prorated average sha-re price of the last thirty trading days in 2019 and taking into account the intra-year exercise date in 2019, the provisions for this program amounted to€ 20.9 million at the end of the financial year.
EXPLANATION OF THE "GAME CHANGER 2019" PROGRAM
In addition, in 2016, an additional Long-Term Incentive Program, the global“Game Changer 2019” program, was launched. Participants in this program con-sist mainly of top executives reporting to the Management Board and individualkey positions in the PUMA Group. The aim of this program is to bind this group ofemployees to the Company on a long-term basis and to allow them to share inthe medium-term success of the Company.
The term of the program is 3 years and is based on the medium-term objectivesof the PUMA Group in terms of EBIT (70%), cash flow (15%) and gross profit mar-gin (15%). For this purpose, a corresponding provision is set up each year whenthe respective currency-adjusted targets are met. The resulting balance of€ 3.2 million were paid out to the participants in March 2019. The payment wassubject to the condition that the individual participant was in an unterminatedemployment relationship with a company of the PUMA Group as of 12/31/2018.No further expenses were incurred for this program in the year under review.
EXPLANATION OF THE "GAME CHANGER 2020" PROGRAM
In 2017, the global “Game Changer 2020” program was launched, which is sub-ject to the same parameters as the “Game Changer 2019” program (employmentrelationship until 12/31/2019 and payout March 2020). In the reporting year, pro-visions of € 1.1 million were set aside for this program.
EXPLANATION OF THE “MOMENTUM” 2020 PROGRAM
In addition, a global program called “Momentum” was launched in 2017, which issubject to the same parameters (employment until December 31, 2019 and pay-out in March 2020) as the Game Changer programs. The difference to the GameChanger programs lies in the different participants. While the participants in theGame Changer programs consist of top executives, the “Momentum” programincludes employees who are not part of this group. In the reporting year, provisi-ons of € 0.7 million were set aside for this program.
EXPLANATION OF THE “GAME CHANGER 2.0 - 2021” PROGRAM
In 2018, the Long-Term Incentive Program (LTIP) "Game Changer 2.0" was laun-ched. Participants in this program consist mainly of top executives reporting tothe Management Board and individual key positions in the PUMA Group. The ob-jective of this program is to retain these employees in the Company on a long-term basis and to allow them to share in the medium-term success of theCompany.
The LTIP “Game Changer 2.0” consists of two plan parts, a Performance CashPlan and a Performance Share Plan, each with a 50% share. The PerformanceCash Plan gives a reward for PUMA’s financial performance, while the Perfor-mance Share Plan gives a reward for its performance in the capital market.
The performance period of the Performance Cash Plan is three years and is ba-sed on the average medium-term targets of the PUMA Group for EBIT (70%),cash flow (15%) and net sales (15%). Payment is made in cash and is limited to amaximum of 200% of the granted proportionate target amount (cap).
The Performance Share Plan uses virtual shares to manage the incentive. Theterm is up to five years, divided into a three-year performance period and a sub-sequent, two-year exercise period, in which the virtual shares are paid out incash. A payout is only possible at the three exercise times (6, 12 or 18 months af-ter the end of the performance period). The average share price of the last 30trading days before the exercise date determines the value of a virtual share. Thepayout is limited to a maximum of 200% of the granted prorated target amount(cap) and is only performed if an exercise hurdle of +10% share-price appreciati-on was exceeded once during the performance period.
237
Annual Report 2019 ↗ CONSOLIDATED FINANCIAL STATEMENTS

The program is subject to the condition that the individual participant is in an un-terminated employment relationship with a company of the PUMA Group as of12/31/2020. A prorated share of € 1.9 million was set aside as a provision for the"Game Changer 2.0 – 2021" program during the reporting period.
EXPLANATION OF THE “GAME CHANGER 2.0 - 2022” PROGRAM
In 2019, the global “Game Changer 2.0 - 2022” program was launched, which issubject to the same parameters as the “Game Changer 2.0 - 2021” program (em-ployment relationship until 12/31/2021 and payout March 2022). In the reportingyear, a prorated amount of € 1.7 million was set aside as a provision for thisprogram.
Program addendum 2021 2022
Issue date 01/01/2018 01/01/2019
Term 5 5 Years
Vesting period 3 3 Years
Base price at program start 37.10 44.40 EUR/share
Reference value at the end of the financial year 45.36 22.68 EUR/share
Participants in year of issue 48 64 Persons
Participants at the end of the financial year 44 64 Persons
Number of “virtual shares” as of 1/1/2019 46,660 44,407 Shares
Number of “virtual shares” expired in the FY -3,660 0 Shares
Number of “virtual shares” exercised in the FY 0 0 Shares
Final number of “virtual shares” as of 12/31/2019 43,000 44,407 Shares
In the financial year 2019, a stock split was performed with a ratio of 1:10. As aresult of this, all past share values were divided by a factor of 10 and all virtualshares were multiplied by a factor of 10.
T.58 GAME CHANGER 2.0 (PERFORMANCE SHARE PLAN)➔
238
Annual Report 2019 ↗ CONSOLIDATED FINANCIAL STATEMENTS

NOTES TO THE INCOME STATEMENT
20. NET SALES
The net sales of the Group are broken down by product divisions and distributionchannels as follows:
2019 2018
Wholesale 4,106.9 3,520.8
Retail 1,395.3 1,127.5
Total 5,502.2 4,648.3
2019 2018
Footwear 2,552.5 2,184.7
Apparel 2,068.7 1,687.5
Accessories 881.1 776.1
Total 5,502.2 4,648.3
21. OTHER OPERATING INCOME AND EXPENSES
According to the respective functions, other operating income and expenses in-clude personnel, advertising, sales and distribution expenses as well as rentaland leasing expenditure, travel costs, legal and consulting expenses and othergeneral expenses. Typical operating income that is associated with operating ex-penses was offset. Rental and lease expenses associated with the Group’s ownretail stores include turnover-based rental components.
Other operating income and expenses are allocated based on functional areas asfollows:
2019 2018
Sales and distribution expenses 1,821.2 1,523.6
Product management/merchandising 52.6 43.8
Research and development 61.7 54.0
Administrative and general expenses 340.0 328.1
Other operating expenses 2,275.5 1,949.5
Other operating income 4.2 21.1
Total 2,271.3 1,928.4
Of which scheduled depreciation 246.4 81.5
Of which impairment expenses 0.0 0.6
T.59 BREAKDOWN BY DISTRIBUTION CHANNELS (€ million)➔
T.60 BREAKDOWN BY PRODUCT DIVISIONS (€ million)➔
T.61 (€ million)➔
239
Annual Report 2019 ↗ CONSOLIDATED FINANCIAL STATEMENTS
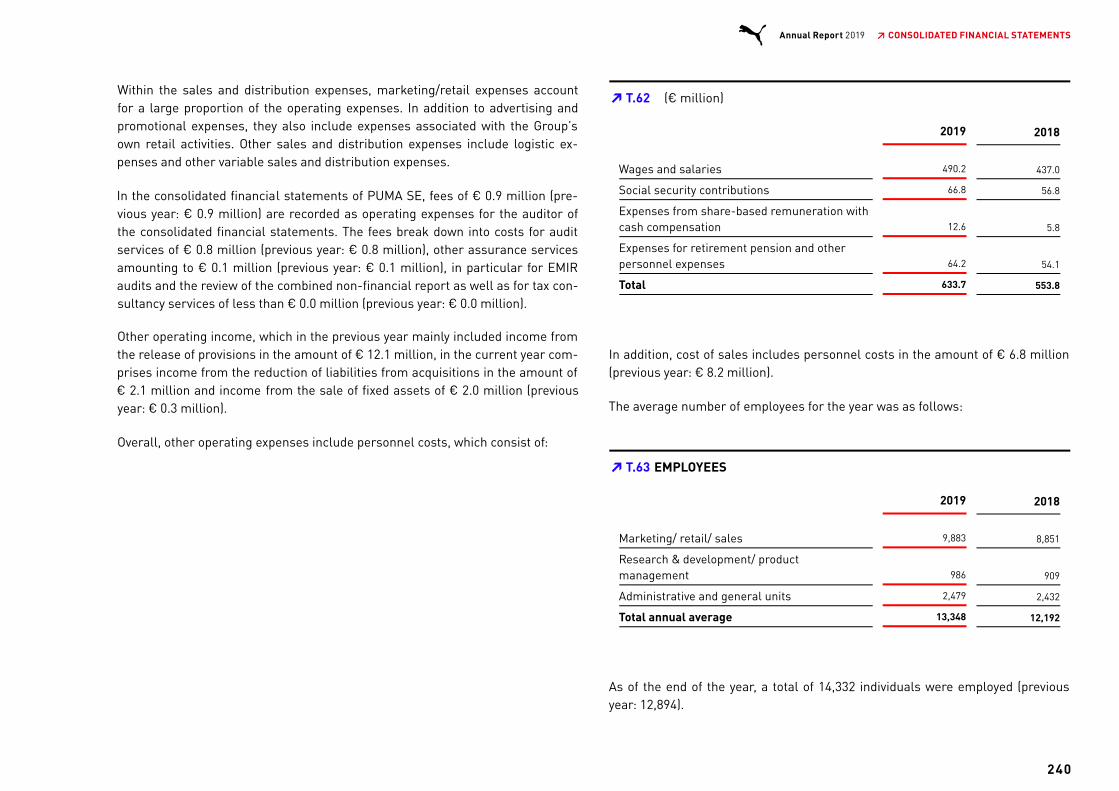
Within the sales and distribution expenses, marketing/retail expenses accountfor a large proportion of the operating expenses. In addition to advertising andpromotional expenses, they also include expenses associated with the Group’sown retail activities. Other sales and distribution expenses include logistic ex-penses and other variable sales and distribution expenses.
In the consolidated financial statements of PUMA SE, fees of € 0.9 million (pre-vious year: € 0.9 million) are recorded as operating expenses for the auditor ofthe consolidated financial statements. The fees break down into costs for auditservices of € 0.8 million (previous year: € 0.8 million), other assurance servicesamounting to € 0.1 million (previous year: € 0.1 million), in particular for EMIRaudits and the review of the combined non-financial report as well as for tax con-sultancy services of less than € 0.0 million (previous year: € 0.0 million).
Other operating income, which in the previous year mainly included income fromthe release of provisions in the amount of € 12.1 million, in the current year com-prises income from the reduction of liabilities from acquisitions in the amount of€ 2.1 million and income from the sale of fixed assets of € 2.0 million (previousyear: € 0.3 million).
Overall, other operating expenses include personnel costs, which consist of:
2019 2018
Wages and salaries 490.2 437.0
Social security contributions 66.8 56.8
Expenses from share-based remuneration withcash compensation 12.6 5.8
Expenses for retirement pension and otherpersonnel expenses 64.2 54.1
Total 633.7 553.8
In addition, cost of sales includes personnel costs in the amount of € 6.8 million(previous year: € 8.2 million).
The average number of employees for the year was as follows:
2019 2018
Marketing/ retail/ sales 9,883 8,851
Research & development/ productmanagement 986 909
Administrative and general units 2,479 2,432
Total annual average 13,348 12,192
As of the end of the year, a total of 14,332 individuals were employed (previousyear: 12,894).
T.62 (€ million)➔
T.63 EMPLOYEES➔
240
Annual Report 2019 ↗ CONSOLIDATED FINANCIAL STATEMENTS

22. FINANCIAL RESULT
The financial result consists of:
2019 2018
Result from associated companies – -1.5
Interest income 7.2 4.0
Income from currency-conversion differences,net 10.2 0.0
Others 8.5 7.6
Financial income 25.8 11.6
Interest expense -13.9 -14.6
Interest expense - Lease liability -29.7 -0.5
Interest accrued on liabilities from acquisitions -0.1 0.0
Valuation of pension plans -0.7 -0.6
Expenses from currency-conversiondifferences, net 0.0 -14.4
Others -4.1 -3.9
Financial expenses -48.4 -34.1
Financial result -22.6 -24.0
The result from associated companies comprises the result from the sharehol-ding in Wilderness Holdings Ltd. which was deconsolidated in 2018.
The item Others in financial income includes interest components (SWAP points)of € 8.2 million (previous year: € 7.3 million) from financial instruments in con-nection with currency derivatives, and dividend income of € 0.3 million (previousyear: € 0.3 million) from the investment in Borussia Dortmund GmbH & Co. KGaA(BVB).
Due to the first-time application of IFRS 16, a higher interest expense of € 29.7million is incurred with regard to lease liabilities (previous year: € 0.5 million)which were included in interest expenses in the previous year. The item Others infinancial expenses includes interest components (SWAP points) of € 4.1 million(previous year: € 3.9 million) from financial instruments in connection with cur-rency derivatives.
In addition, income from currency translation differences of € 10.2 million (pre-vious year: expenses of € -14.4 million) are included, which are to be assigned tothe financing area.
23. INCOME TAXES
2019 2018
Current income taxes
Germany 12.8 16.8
Other countries 124.6 69.7
Total current income taxes 137.5 86.5
Deferred taxes -28.8 -2.9
Total 108.6 83.6
In general, PUMA SE and its German subsidiaries are subject to corporate inco-me tax, plus a solidarity surcharge and trade tax. Thus, a weighted mixed tax rateof 27.22% continued to apply for the financial year.
T.64 (€ million)➔
T.65 (€ million)➔
241
Annual Report 2019 ↗ CONSOLIDATED FINANCIAL STATEMENTS
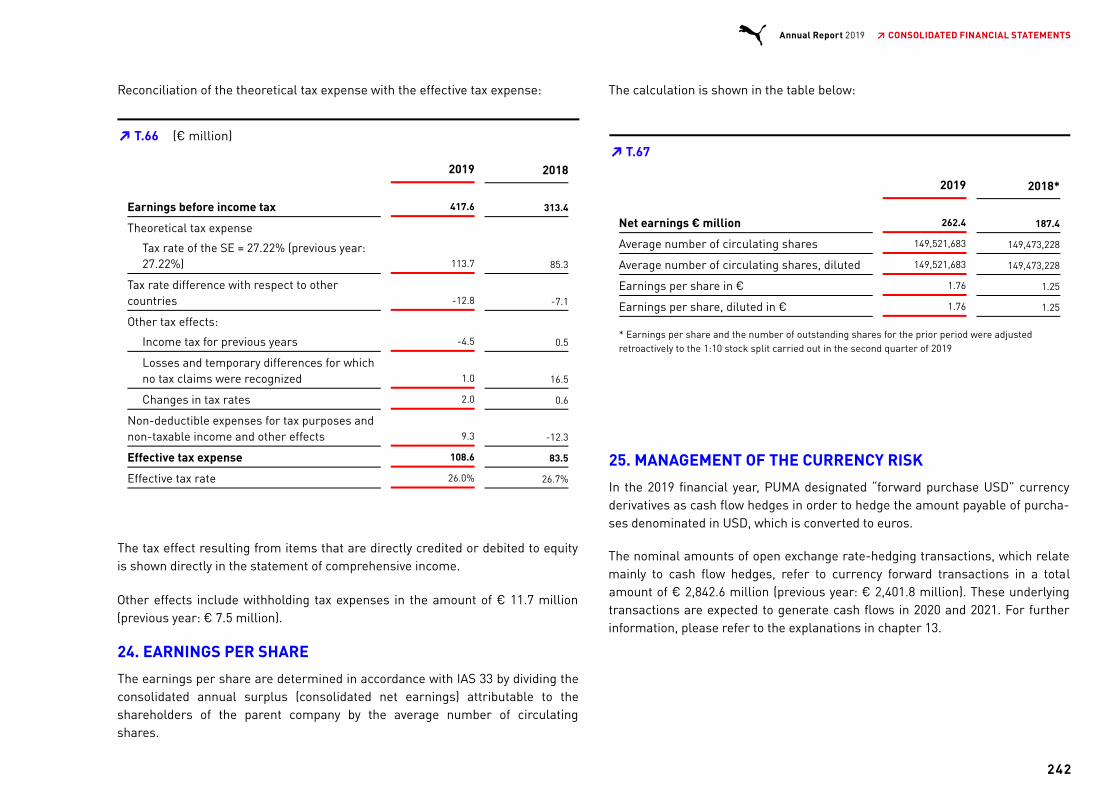
Reconciliation of the theoretical tax expense with the effective tax expense:
2019 2018
Earnings before income tax 417.6 313.4
Theoretical tax expense
Tax rate of the SE = 27.22% (previous year:27.22%) 113.7 85.3
Tax rate difference with respect to othercountries -12.8 -7.1
Other tax effects:
Income tax for previous years -4.5 0.5
Losses and temporary differences for whichno tax claims were recognized 1.0 16.5
Changes in tax rates 2.0 0.6
Non-deductible expenses for tax purposes andnon-taxable income and other effects 9.3 -12.3
Effective tax expense 108.6 83.5
Effective tax rate 26.0% 26.7%
The tax effect resulting from items that are directly credited or debited to equityis shown directly in the statement of comprehensive income.
Other effects include withholding tax expenses in the amount of € 11.7 million(previous year: € 7.5 million).
24. EARNINGS PER SHARE
The earnings per share are determined in accordance with IAS 33 by dividing theconsolidated annual surplus (consolidated net earnings) attributable to theshareholders of the parent company by the average number of circulatingshares.
The calculation is shown in the table below:
2019 2018*
Net earnings € million 262.4 187.4
Average number of circulating shares 149,521,683 149,473,228
Average number of circulating shares, diluted 149,521,683 149,473,228
Earnings per share in € 1.76 1.25
Earnings per share, diluted in € 1.76 1.25
* Earnings per share and the number of outstanding shares for the prior period were adjustedretroactively to the 1:10 stock split carried out in the second quarter of 2019
25. MANAGEMENT OF THE CURRENCY RISK
In the 2019 financial year, PUMA designated “forward purchase USD” currencyderivatives as cash flow hedges in order to hedge the amount payable of purcha-ses denominated in USD, which is converted to euros.
The nominal amounts of open exchange rate-hedging transactions, which relatemainly to cash flow hedges, refer to currency forward transactions in a totalamount of € 2,842.6 million (previous year: € 2,401.8 million). These underlyingtransactions are expected to generate cash flows in 2020 and 2021. For furtherinformation, please refer to the explanations in chapter 13.
T.66 (€ million)➔
T.67 ➔
242
Annual Report 2019 ↗ CONSOLIDATED FINANCIAL STATEMENTS
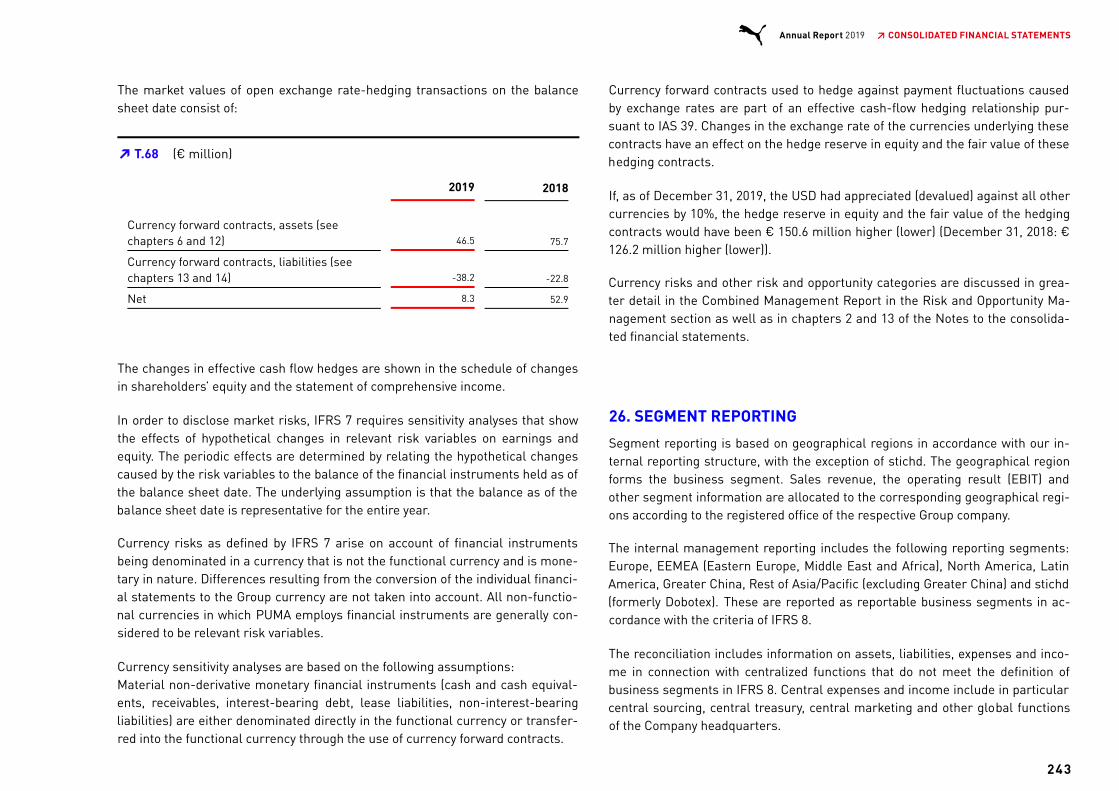
The market values of open exchange rate-hedging transactions on the balancesheet date consist of:
2019 2018
Currency forward contracts, assets (seechapters 6 and 12) 46.5 75.7
Currency forward contracts, liabilities (seechapters 13 and 14) -38.2 -22.8
Net 8.3 52.9
The changes in effective cash flow hedges are shown in the schedule of changesin shareholders’ equity and the statement of comprehensive income.
In order to disclose market risks, IFRS 7 requires sensitivity analyses that showthe effects of hypothetical changes in relevant risk variables on earnings andequity. The periodic effects are determined by relating the hypothetical changescaused by the risk variables to the balance of the financial instruments held as ofthe balance sheet date. The underlying assumption is that the balance as of thebalance sheet date is representative for the entire year.
Currency risks as defined by IFRS 7 arise on account of financial instrumentsbeing denominated in a currency that is not the functional currency and is mone-tary in nature. Differences resulting from the conversion of the individual financi-al statements to the Group currency are not taken into account. All non-functio-nal currencies in which PUMA employs financial instruments are generally con-sidered to be relevant risk variables.
Currency sensitivity analyses are based on the following assumptions:Material non-derivative monetary financial instruments (cash and cash equival-ents, receivables, interest-bearing debt, lease liabilities, non-interest-bearingliabilities) are either denominated directly in the functional currency or transfer-red into the functional currency through the use of currency forward contracts.
Currency forward contracts used to hedge against payment fluctuations causedby exchange rates are part of an effective cash-flow hedging relationship pur-suant to IAS 39. Changes in the exchange rate of the currencies underlying thesecontracts have an effect on the hedge reserve in equity and the fair value of thesehedging contracts.
If, as of December 31, 2019, the USD had appreciated (devalued) against all othercurrencies by 10%, the hedge reserve in equity and the fair value of the hedgingcontracts would have been € 150.6 million higher (lower) (December 31, 2018: €126.2 million higher (lower)).
Currency risks and other risk and opportunity categories are discussed in grea-ter detail in the Combined Management Report in the Risk and Opportunity Ma-nagement section as well as in chapters 2 and 13 of the Notes to the consolida-ted financial statements.
26. SEGMENT REPORTING
Segment reporting is based on geographical regions in accordance with our in-ternal reporting structure, with the exception of stichd. The geographical regionforms the business segment. Sales revenue, the operating result (EBIT) andother segment information are allocated to the corresponding geographical regi-ons according to the registered office of the respective Group company.
The internal management reporting includes the following reporting segments:Europe, EEMEA (Eastern Europe, Middle East and Africa), North America, LatinAmerica, Greater China, Rest of Asia/Pacific (excluding Greater China) and stichd(formerly Dobotex). These are reported as reportable business segments in ac-cordance with the criteria of IFRS 8.
The reconciliation includes information on assets, liabilities, expenses and inco-me in connection with centralized functions that do not meet the definition ofbusiness segments in IFRS 8. Central expenses and income include in particularcentral sourcing, central treasury, central marketing and other global functionsof the Company headquarters.
T.68 (€ million)➔
243
Annual Report 2019 ↗ CONSOLIDATED FINANCIAL STATEMENTS
The Company’s main decision-maker is defined as the entire Management Boardof PUMA SE.
With the exception of stichd's (formerly Dobotex) sales of products amounting to€ 32.7 million (previous year: € 26.9 million), there are no significant internal sa-les between the business segments, which are therefore not included in thepresentation.
The operating result (EBIT) of the business segments is defined as gross profitless the attributable other operating expenses plus royalty and commission inco-me and other operating income, but not taking into account the costs of the cen-tral departments and the central marketing expenses.
The external sales, operating result (EBIT), inventories and trade receivables ofthe business segments are regularly reported to the main decision-maker. In-vestments, depreciation and non-current assets at the level of the business seg-ments are not reported to the chief operating decision- maker. Intangible assets
are allocated to the business segments in the manner described under chapter11. Segment liabilities, the financial result and income taxes are not allocated tothe business segments and are therefore not reported to the chief operating de-cision-maker at the business segment level.
Non-current assets and depreciation comprise the carrying amounts and depre-ciation of property, plant and equipment, right-of-use assets and intangible as-sets during the past financial year. The investments comprise additions to pro-perty, plant and equipment and intangible assets. In addition, total impairmentexpenses in the amount of € 0.0 million (previous year: € 0.6 million, relating tothe Europe segment) were recognized.
Since PUMA is active in only one business area, the sports equipment industry,products are additionally allocated according to the footwear, apparel and ac-cessories product segments in accordance with the internal reporting structure.
244
Annual Report 2019 ↗ CONSOLIDATED FINANCIAL STATEMENTS

SEGMENT REPORTING 1-12/ 2019
External Sales EBIT Investments
1-12/2019 1-12/2018 1-12/2019 1-12/2018 1-12/2019 1-12/2018
Europe 1,267.6 1,171.2 177.0 164.1 76.2 15.0
EEMEA 657.1 523.2 109.2 81.5 20.4 12.2
North America 1,408.7 1,163.1 220.2 180.0 20.7 13.9
Latin America 516.6 431.7 94.7 61.1 8.4 11.1
Greater China 755.7 534.0 249.9 153.4 29.4 21.7
Asia/ Pacific (without Greater China) 600.2 553.0 70.4 83.5 12.8 9.2
stichd 296.3 272.0 102.4 91.4 4.1 3.4
Total business segments 5,502.2 4,648.3 1,023.9 814.9 172.0 86.5
Depreciation* Inventories Trade Receivables (3rd)
1-12/2019 1-12/2018 1-12/2019 1-12/2018 1-12/2019 1-12/2018
Europe 39.6 7.6 309.6 262.5 140.5 131.3
EEMEA 33.6 7.7 171.3 130.7 68.5 67.9
North America 49.8 11.6 323.6 258.9 130.7 109.0
Latin America 15.2 6.9 93.1 93.5 99.0 96.2
Greater China 33.8 15.4 118.3 87.0 50.1 36.0
Asia/ Pacific (without Greater China) 32.5 7.3 117.8 98.4 68.1 71.0
stichd 6.7 2.8 50.8 48.3 42.7 37.8
Total business segments 211.2 59.4 1,184.5 979.3 599.6 549.2
*2019 includes the depreciation and the carrying amount of the right-of-use assets from Leases (IFRS 16)
T.69 REGIONS (€ million)➔
245
Annual Report 2019 ↗ CONSOLIDATED FINANCIAL STATEMENTS

Long-term Assets*
1-12/2019 1-12/2018
Europe 284.8 44.7
EEMEA 130.6 29.5
North America 445.1 187.9
Latin America 80.9 47.4
Greater China 93.9 32.1
Asia/ Pacific (without Greater China) 163.0 73.0
stichd 162.2 143.9
Total business segments 1,360.5 558.5
*2019 includes the depreciation and the carrying amount of the right-of-use assets from Leases (IFRS 16)
External Sales Gross Profit Margin
1-12/2019 1-12/2018 1-12/2019 1-12/2018
Footwear 2,552.5 2,184.7 46.4% 45.8%
Apparel 2,068.7 1,687.5 51.1% 50.9%
Accessories 881.1 776.1 50.5% 50.3%
Total business segments 5,502.2 4,648.3 48.8% 48.4%
T.69 CONTINUATION T.69 REGIONS (€ million)➔
T.70 PRODUCT External Sales (€ million) Gross Profit Margin (in %)➔
246
Annual Report 2019 ↗ CONSOLIDATED FINANCIAL STATEMENTS

RECONCILITATIONS
EBIT
1-12/2019 1-12/2018
Total business segments 1,023.9 814.9
Central areas -251.1 -199.4
Central expenses marketing -332.5 -278.2
Consolidation 0.0 0.0
EBIT 440.2 337.4
Financial result -22.6 -24.0
EBT 417.6 313.4
Investments Depreciation*
1-12/2019 1-12/2018 1-12/2019 1-12/2018
Total business segments 172.0 86.5 211.2 59.4
Central areas 47.7 51.8 35.2 22.8
Consolidation 0.0 0.0 0.0 0.0
Total 219.6 138.2 246.4 82.1
*2019 includes the depreciation and the carrying amount of the right-of-use assets from Leases (IFRS 16)
T.71 RECONCILITATIONS (€ million)➔
247
Annual Report 2019 ↗ CONSOLIDATED FINANCIAL STATEMENTS

Inventories Trade Receivables (3rd) Long-term Assets*
1-12/2019 1-12/2018 1-12/2019 1-12/2018 1-12/2019 1-12/2018
Total business segments 1,184.5 979.3 599.6 549.2 1,360.5 558.5
Not allocated to the businesssegments -74.3 -64.2 12.1 4.5 208.0 173.6
Total 1,110.2 915.1 611.7 553.7 1,568.5 732.1
*2019 includes the depreciation and the carrying amount of the right-of-use assets from Leases (IFRS 16)
T.71 CONTINUATION T.71 RECONCILIATIONS (€ million)➔
248
Annual Report 2019 ↗ CONSOLIDATED FINANCIAL STATEMENTS

ADDITIONAL INFORMATION
27. NOTES TO THE CASH FLOW STATEMENT
Non-cash changes Cash changes
Notes As of Jan. 1, 2019Currencychanges Others As of Dec. 31, 2019
Financial liabilities
Lease liabilities* 10 623.9 12.2 250.0 -140.8 745.3
Current financial liabilities 13 20.5 0.1 0.0 -10.4 10.2
Non-current financial liabilities 13 170.4 0.0 0.0 -7.1 163.3
Total 814.8 12.3 250.0 -158.4 918.8
*adjusted opening values (please refer to chapter 1 first-time application IFRS 16)
The cash flow statement was prepared in accordance with IAS 7 and is structuredbased on cash flows from operating, investment and financing activities. The in-direct method is used to determine the cash outflow/inflow from ongoing opera-ting activities. The gross cash flow, derived from earnings before income tax andadjusted for non-cash income and expense items, is determined within the cashflow from ongoing operating activities. Cash outflow/inflow from operating activi-ties, reduced by investments in property, plant and equipment as well as intangi-ble assets is referred to as free cash flow.
The financial resource fund reported in the cash flow statement includes all pay-ment methods and equivalent payment methods shown under “Cash and cashequivalents”, i.e., cash in hand, checks and current bank balances.
The following table shows the cash and non-cash changes in financial liabilitiesin accordance with IAS 7.44A:
T.72 RECONCILIATION OF FINANCIAL LIABILITIES TO THE CASH INFLOW/OUTFLOW FROM FINANCING ACTIVITIES 2019 (€ million)➔
249
Annual Report 2019 ↗ CONSOLIDATED FINANCIAL STATEMENTS
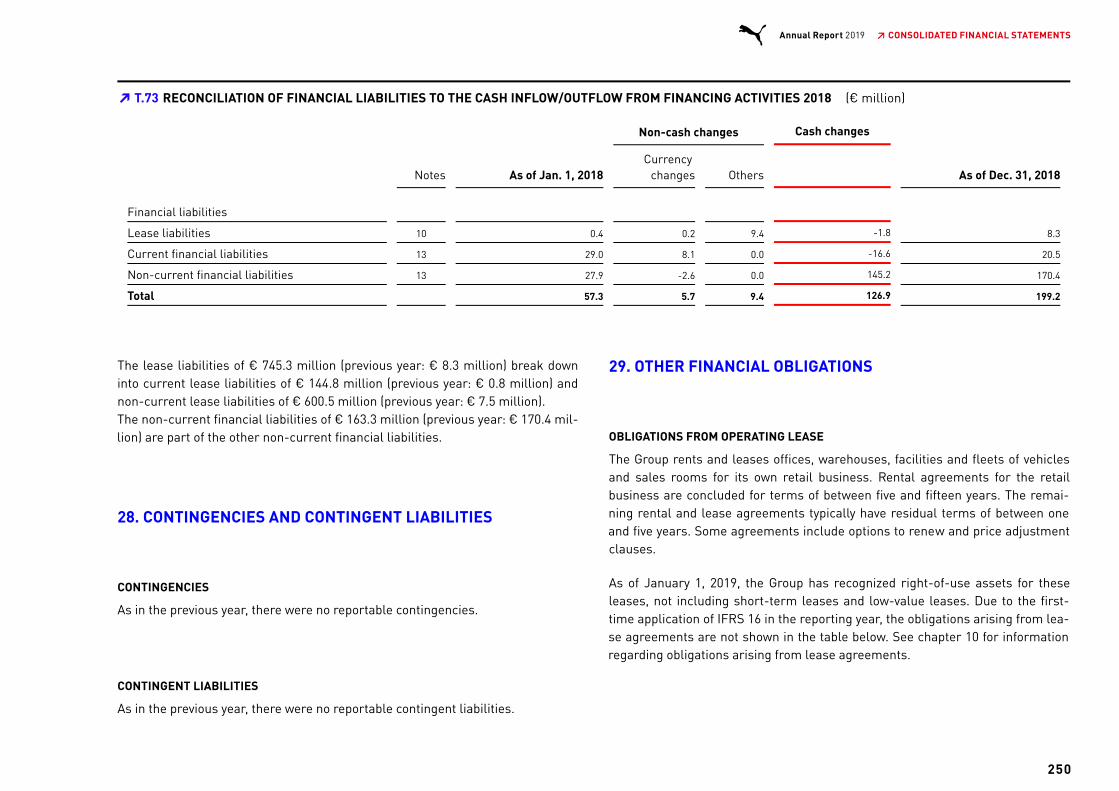
Non-cash changes Cash changes
Notes As of Jan. 1, 2018Currency
changes Others As of Dec. 31, 2018
Financial liabilities
Lease liabilities 10 0.4 0.2 9.4 -1.8 8.3
Current financial liabilities 13 29.0 8.1 0.0 -16.6 20.5
Non-current financial liabilities 13 27.9 -2.6 0.0 145.2 170.4
Total 57.3 5.7 9.4 126.9 199.2
The lease liabilities of € 745.3 million (previous year: € 8.3 million) break downinto current lease liabilities of € 144.8 million (previous year: € 0.8 million) andnon-current lease liabilities of € 600.5 million (previous year: € 7.5 million).The non-current financial liabilities of € 163.3 million (previous year: € 170.4 mil-lion) are part of the other non-current financial liabilities.
28. CONTINGENCIES AND CONTINGENT LIABILITIES
CONTINGENCIES
As in the previous year, there were no reportable contingencies.
CONTINGENT LIABILITIES
As in the previous year, there were no reportable contingent liabilities.
29. OTHER FINANCIAL OBLIGATIONS
OBLIGATIONS FROM OPERATING LEASE
The Group rents and leases offices, warehouses, facilities and fleets of vehiclesand sales rooms for its own retail business. Rental agreements for the retailbusiness are concluded for terms of between five and fifteen years. The remai-ning rental and lease agreements typically have residual terms of between oneand five years. Some agreements include options to renew and price adjustmentclauses.
As of January 1, 2019, the Group has recognized right-of-use assets for theseleases, not including short-term leases and low-value leases. Due to the first-time application of IFRS 16 in the reporting year, the obligations arising from lea-se agreements are not shown in the table below. See chapter 10 for informationregarding obligations arising from lease agreements.
T.73 RECONCILIATION OF FINANCIAL LIABILITIES TO THE CASH INFLOW/OUTFLOW FROM FINANCING ACTIVITIES 2018 (€ million)➔
250
Annual Report 2019 ↗ CONSOLIDATED FINANCIAL STATEMENTS
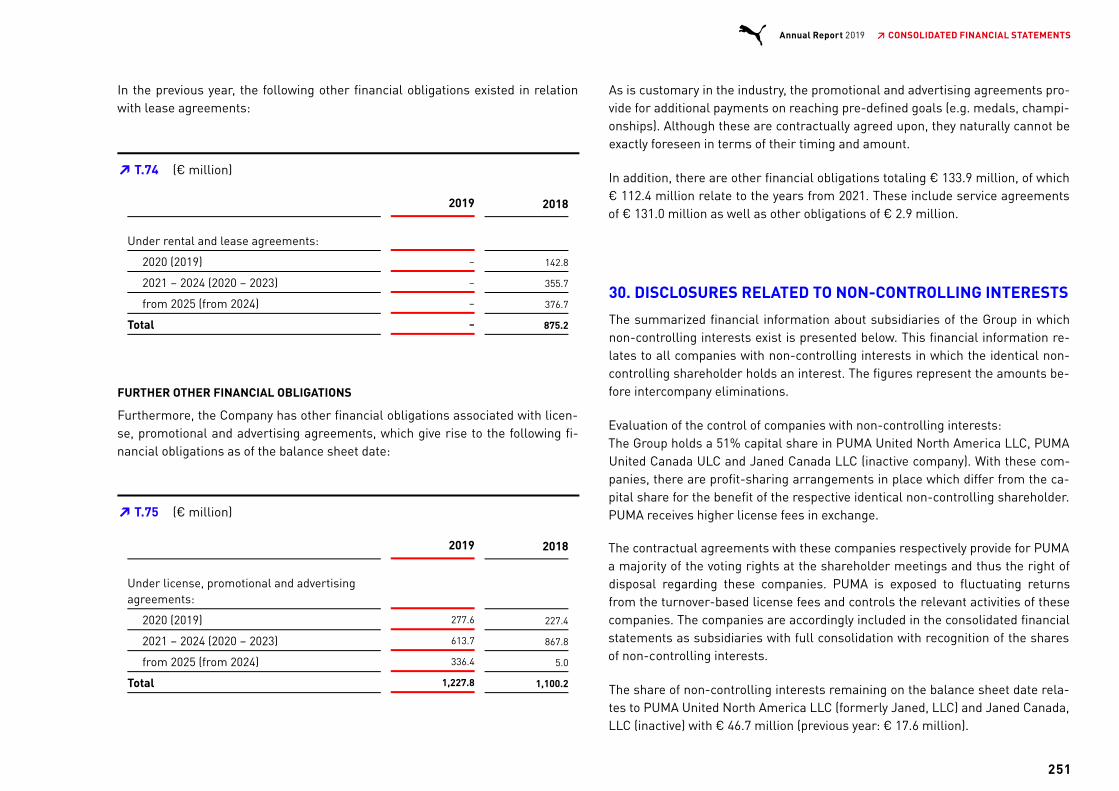
In the previous year, the following other financial obligations existed in relationwith lease agreements:
2019 2018
Under rental and lease agreements:
2020 (2019) – 142.8
2021 – 2024 (2020 – 2023) – 355.7
from 2025 (from 2024) – 376.7
Total – 875.2
FURTHER OTHER FINANCIAL OBLIGATIONS
Furthermore, the Company has other financial obligations associated with licen-se, promotional and advertising agreements, which give rise to the following fi-nancial obligations as of the balance sheet date:
2019 2018
Under license, promotional and advertisingagreements:
2020 (2019) 277.6 227.4
2021 – 2024 (2020 – 2023) 613.7 867.8
from 2025 (from 2024) 336.4 5.0
Total 1,227.8 1,100.2
As is customary in the industry, the promotional and advertising agreements pro-vide for additional payments on reaching pre-defined goals (e.g. medals, champi-onships). Although these are contractually agreed upon, they naturally cannot beexactly foreseen in terms of their timing and amount.
In addition, there are other financial obligations totaling € 133.9 million, of which€ 112.4 million relate to the years from 2021. These include service agreementsof € 131.0 million as well as other obligations of € 2.9 million.
30. DISCLOSURES RELATED TO NON-CONTROLLING INTERESTS
The summarized financial information about subsidiaries of the Group in whichnon-controlling interests exist is presented below. This financial information re-lates to all companies with non-controlling interests in which the identical non-controlling shareholder holds an interest. The figures represent the amounts be-fore intercompany eliminations.
Evaluation of the control of companies with non-controlling interests:The Group holds a 51% capital share in PUMA United North America LLC, PUMAUnited Canada ULC and Janed Canada LLC (inactive company). With these com-panies, there are profit-sharing arrangements in place which differ from the ca-pital share for the benefit of the respective identical non-controlling shareholder.PUMA receives higher license fees in exchange.
The contractual agreements with these companies respectively provide for PUMAa majority of the voting rights at the shareholder meetings and thus the right ofdisposal regarding these companies. PUMA is exposed to fluctuating returnsfrom the turnover-based license fees and controls the relevant activities of thesecompanies. The companies are accordingly included in the consolidated financialstatements as subsidiaries with full consolidation with recognition of the sharesof non-controlling interests.
The share of non-controlling interests remaining on the balance sheet date rela-tes to PUMA United North America LLC (formerly Janed, LLC) and Janed Canada,LLC (inactive) with € 46.7 million (previous year: € 17.6 million).
T.74 (€ million)➔
T.75 (€ million)➔
251
Annual Report 2019 ↗ CONSOLIDATED FINANCIAL STATEMENTS
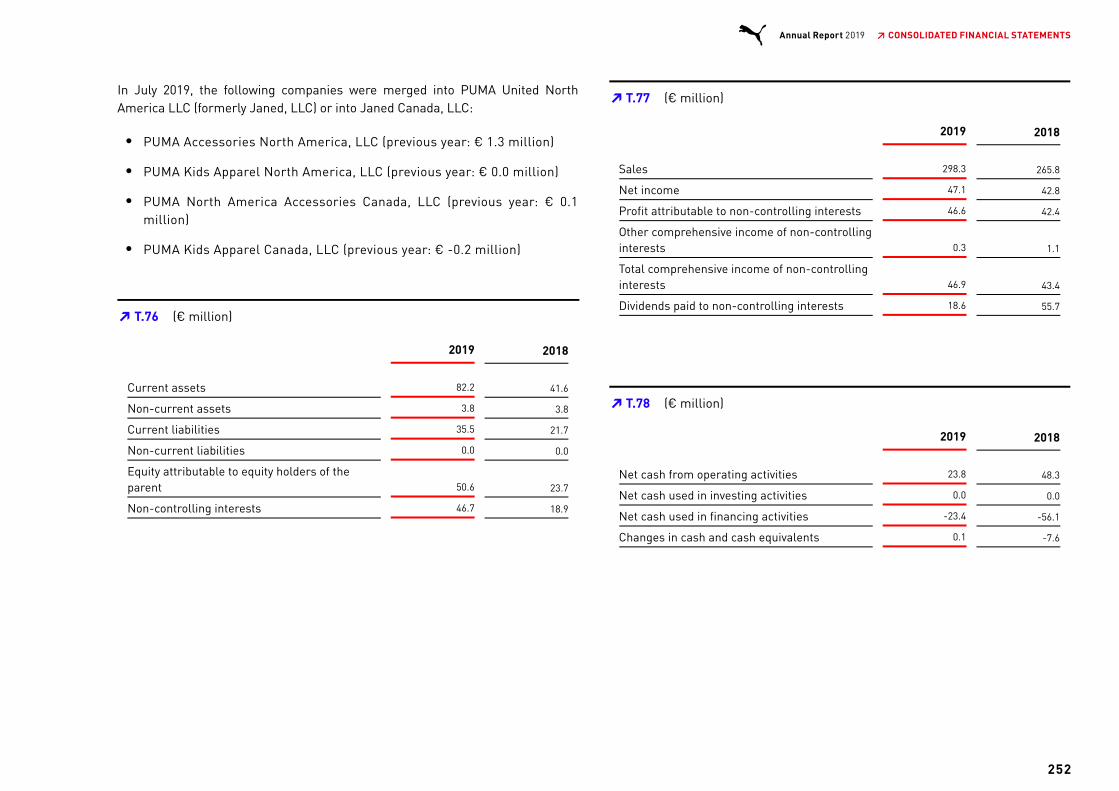
In July 2019, the following companies were merged into PUMA United NorthAmerica LLC (formerly Janed, LLC) or into Janed Canada, LLC:
PUMA Accessories North America, LLC (previous year: € 1.3 million)
PUMA Kids Apparel North America, LLC (previous year: € 0.0 million)
PUMA North America Accessories Canada, LLC (previous year: € 0.1million)
PUMA Kids Apparel Canada, LLC (previous year: € -0.2 million)
2019 2018
Current assets 82.2 41.6
Non-current assets 3.8 3.8
Current liabilities 35.5 21.7
Non-current liabilities 0.0 0.0
Equity attributable to equity holders of theparent 50.6 23.7
Non-controlling interests 46.7 18.9
2019 2018
Sales 298.3 265.8
Net income 47.1 42.8
Profit attributable to non-controlling interests 46.6 42.4
Other comprehensive income of non-controllinginterests 0.3 1.1
Total comprehensive income of non-controllinginterests 46.9 43.4
Dividends paid to non-controlling interests 18.6 55.7
2019 2018
Net cash from operating activities 23.8 48.3
Net cash used in investing activities 0.0 0.0
Net cash used in financing activities -23.4 -56.1
Changes in cash and cash equivalents 0.1 -7.6
T.76 (€ million)➔
T.77 (€ million)➔
T.78 (€ million)➔
252
Annual Report 2019 ↗ CONSOLIDATED FINANCIAL STATEMENTS

31. MANAGEMENT BOARD AND SUPERVISORY BOARD
Disclosures pursuant to Section 314 (1) No. 6 HGB
Pursuant to Sections 286 (5), 314 (3) Sentence 1 HGB, the publication of the indi-vidual remuneration of the members of the Management Board in accordancewith Section 285 No. 9 a) Sentences 5 to 8 and Section 314 (1) No. 6 a) Sentences5 to 8 HGB may be waived for five years if the Annual General Meeting soresolves.
By resolution of the Annual Shareholders' Meeting on April 12, 2018, the Compa-ny was authorized to waive the disclosure requirements pursuant to Section 285No. 9 a) Sentences 5 to 8 and Section 314 (1) No. 6 a) Sentences 5 to 9 of the Ger-man Commercial Code for the fiscal year beginning January 1, 2018 and for allsubsequent fiscal years ending December 31, 2022 at the latest.
The Supervisory Board is of the opinion that the shareholders' legitimate interestin information is sufficiently taken into account by disclosing the total remunera-tion of the members of the Management Board. In accordance with its statutoryobligations, the Supervisory Board will ensure the appropriateness of individualremuneration.
COMPENSATION PHILOSOPHY
The Management Board compensation system is designed to create incentivesfor a sustainable and profit-oriented company performance. The objective of thecompensation system is to stimulate the implementation of long-term Groupstrategy by ensuring that the relevant success parameters that govern the per-formance-based compensation are aligned with the PUMA SE management sys-tem. Furthermore, the long-term interests of our shareholders are taken into ac-
count by making the variable compensation strongly dependent on the perfor-mance of the PUMA SE share.With a greater share of performance-based and therefore variable compensati-on, the intention is to reward the contribution of our Management Board mem-bers towards a sustainable development of our Company, while negative deviati-ons from the set targets will result in a significant reduction of variablecompensation.
GOVERNANCE IN COMPENSATION MATTERS
It is the responsibility of the PUMA SE Supervisory Board to determine the com-pensation of the Management Board. The entire Supervisory Board decides onmatters relating to the compensation of the Management Board members basedon the respective recommendations of the Personnel Committee which is com-prised of members of the Supervisory Board. Criteria for calculating the totalcompensation are the responsibilities and performance of the individual Ma-nagement Board member, the economic situation, long-term strategic planningand related goals, the sustainability of targeted results and the company’s long-term prospects.
OVERVIEW OF COMPENSATION ELEMENTS
The compensation of the Management Board consists of non-performance-ba-sed and performance-based components. The non-performance-based compon-ents comprise the basic compensation, company pension contributions and otherfringe benefits, while the performance-based components are divided into twoparts, a bonus and a component with long-term incentive effect:
253
Annual Report 2019 ↗ CONSOLIDATED FINANCIAL STATEMENTS

* Figures in % of target compensation (total 100 %) CEO: Chief Executive Officer / OBM: Ordinary Board Member
NON-PERFORMANCE-BASED COMPENSATION AND FRINGE BENEFITS
BASIC COMPENSATION
The members of the Management Board receive a fixed basic salary which ispaid monthly. This salary is based on the duties and responsibilities of the mem-ber of the Management Board. For employment periods of less than twelvemonths in a calendar year, all compensation payments are paid on a proratedbasis.
FRINGE BENEFITS
In addition, the Management Board members receive in-kind compensation,such as use of company cars, accident insurance and D&O insurance. These arepart of the non-performance-based compensation.
COMPANY PENSION
Pension benefits are available for the members of the Management Board in theform of deferred compensation paid out of the performance-based and/or thenon-performance-based compensation, and for which the Company has takenout pension liability insurance. The proportion of the pension capital that is alre-ady financed through contributions to the pension liability insurance is deemed tobe vested.
PERFORMANCE-BASED COMPENSATION
In addition to the non-performance-based compensation, the members of theManagement Board receive performance-based and therefore variable compen-sation. The amount of this compensation is based on the attainment of previouslydefined financial and non-financial targets. It consists of a bonus and a compo-nent with a long-term incentive effect. In the event of any outstanding perfor-
G.01 TARGET COMPENSATION STRUCTURE➔
254
Annual Report 2019 ↗ CONSOLIDATED FINANCIAL STATEMENTS
SHORT-TERM VARIABLE COMPENSATION – BONUS
As part of the performance-based compensation, the bonus is primarily based onthe financial goals of the operating result (EBIT) and free cash flow (FCF) of thePUMA Group and the individual performance of the respective ManagementBoard member as well as the attainment of Group-wide sustainability targets.The Supervisory Board assesses the individual performance of the ManagementBoard member based on previously defined criteria, such as sustainable lea-dership, strategic vision and good corporate governance. The sustainability tar-gets include goals to reduce CO emissions, compliance targets and occupationalhealth and safety objectives, are applied throughout the PUMA Group and mea-sured quantitively on a standardized basis. The two financial success targets areweighted with 60% for EBIT and 20%, respectively, for FCF. The individual perfor-mance is included in the calculation with a weighting of 15%. The degree towhich the sustainability targets have been achieved is taken into account in thecalculation with a weighting of 5%. If 100% of the target is achieved ("target bo-nus"), the amount of the bonus, is 100% of the annual basic compensation for theChair of the Management Board and the Management Board members.
The aforementioned performance targets are combined. For EBIT, FCF and thesustainability targets, the bandwidth of possible target attainments ranges from0% to 150%. It is therefore possible that no short-term variable compensation atall is paid out if minimum targets are not attained.
mance, the Supervisory Board may, at its discretion, grant the members of theManagement Board a voluntary one-off payment.
2
255
Annual Report 2019 ↗ CONSOLIDATED FINANCIAL STATEMENTS
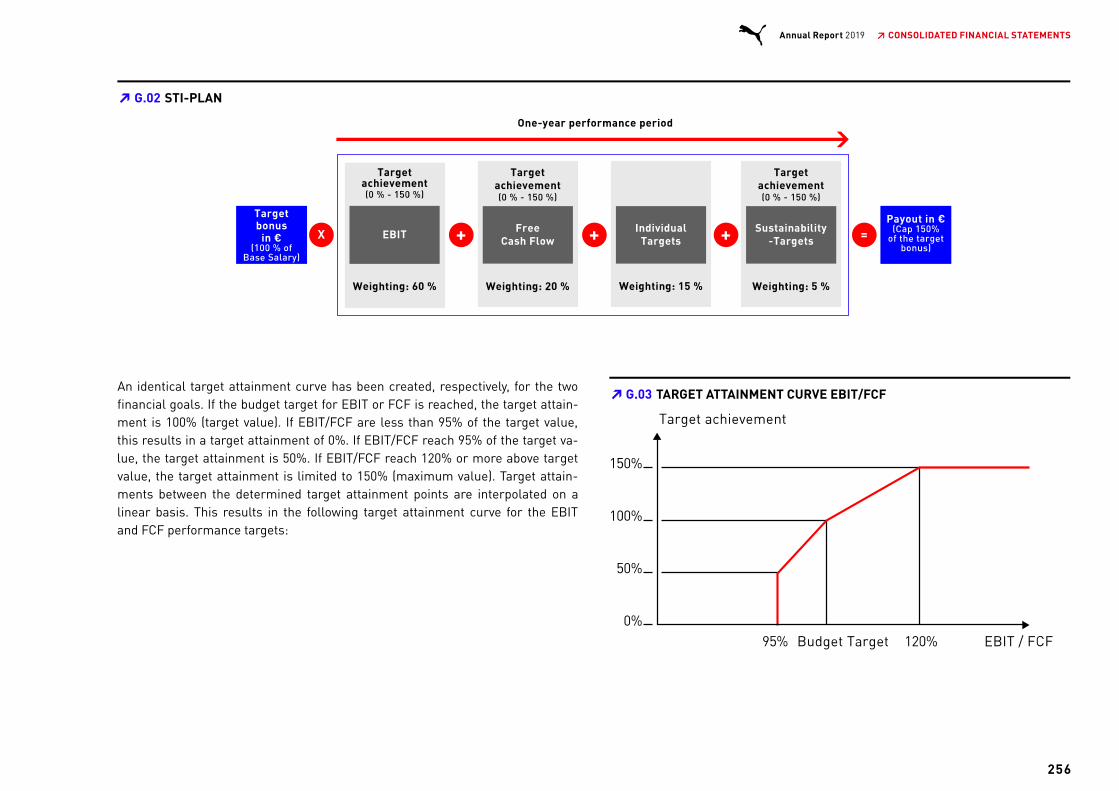
An identical target attainment curve has been created, respectively, for the twofinancial goals. If the budget target for EBIT or FCF is reached, the target attain-ment is 100% (target value). If EBIT/FCF are less than 95% of the target value,this results in a target attainment of 0%. If EBIT/FCF reach 95% of the target va-lue, the target attainment is 50%. If EBIT/FCF reach 120% or more above targetvalue, the target attainment is limited to 150% (maximum value). Target attain-ments between the determined target attainment points are interpolated on alinear basis. This results in the following target attainment curve for the EBITand FCF performance targets:
G.02 STI-PLAN➔
G.03 TARGET ATTAINMENT CURVE EBIT/FCF➔
256
Annual Report 2019 ↗ CONSOLIDATED FINANCIAL STATEMENTS

* The value of one Monetary Unit is equal to the Ø share price over the last 30 trading days before the beginning of the blocking period respectively 30 trading days before next quarterly report.
TARGET ATTAINMENT SUSTAINABILITY TARGETS
The Supervisory Board determines four target criteria for calculating thesustainability targets every year. At the end of the performance period, the Su-pervisory Board evaluates the degree of attainment of the target criteria. Forevery target criterion that has been met or exceeded, a target attainment percen-tage of 1.25% is credited.
LONG-TERM VARIABLE SHARE-BASED COMPENSATION – PUMA MONETARY UNITSPLAN 2019 (LTI)
The long-term variable compensation program of PUMA SE (PUMA MonetaryUnits Plan) is designed as a future-oriented, virtual shareholding with cash pay-ments. As part of this program, virtual shares of PUMA SE, the "Monetary Units",are allocated at the start of a three-year vesting period, at the end of which theholder is eligible to receive a cash payment. The amount of the allocation value is
240% of the annual basic salary for the Chair of the Management Board and110% of the basic salary for the other Management Board members. The num-ber of the allocated Monetary Units is determined by dividing the allocation valueby the value of one PUMA Monetary Unit. The relevant value of a Monetary Unitfor the tranche of the following year is calculated once per year at the end of De-cember as the average value of the PUMA SE share over the past 30 trading days.The amount of the cash payment is therefore a result of the absolute develop-ment of the PUMA SE share. At the end of the three-year vesting period, the Ma-nagement Board members are able to exercise their Monetary Units within a pe-riod of two years. The payment of the amount can be requested on a quarterlybasis. The value of the Monetary Units is the average value of the PUMA SE shareover the last 30 trading days before the next quarterly report. The fundamentalexercise condition after the vesting period is the existence of an active employ-ment relationship with PUMA SE until the end of the vesting period.
G.04 LTI-PLAN➔
257
Annual Report 2019 ↗ CONSOLIDATED FINANCIAL STATEMENTS
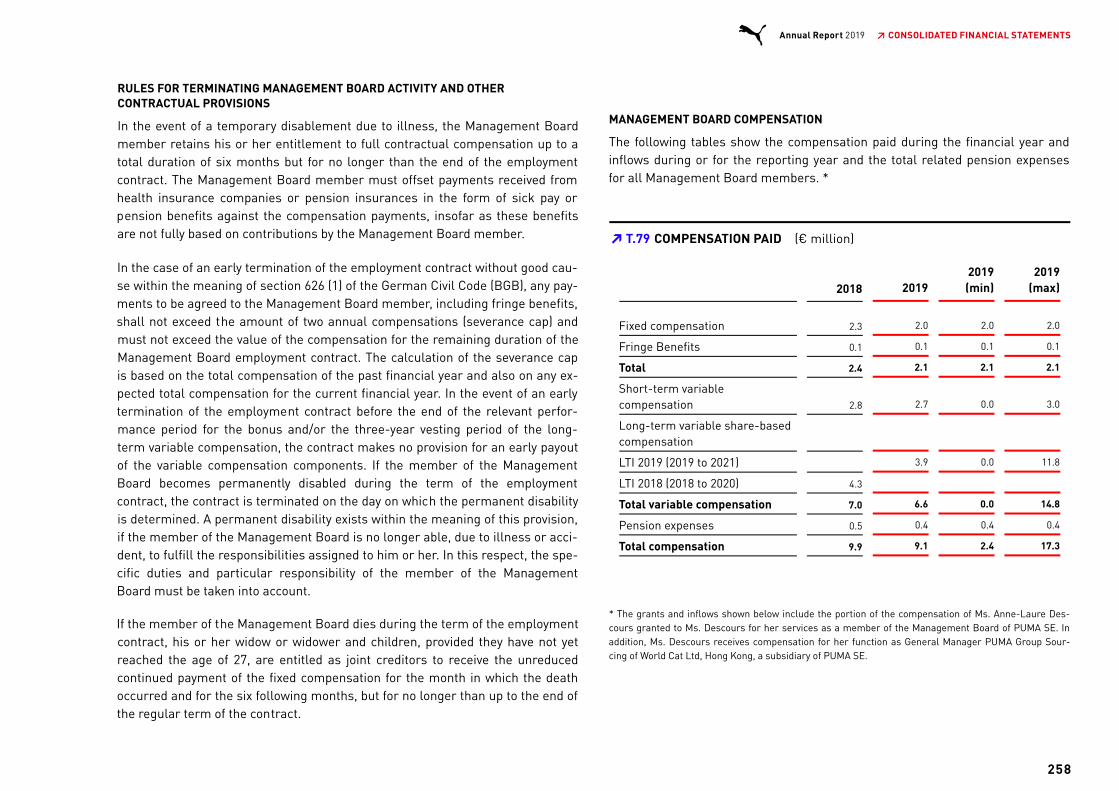
RULES FOR TERMINATING MANAGEMENT BOARD ACTIVITY AND OTHERCONTRACTUAL PROVISIONS
In the event of a temporary disablement due to illness, the Management Boardmember retains his or her entitlement to full contractual compensation up to atotal duration of six months but for no longer than the end of the employmentcontract. The Management Board member must offset payments received fromhealth insurance companies or pension insurances in the form of sick pay orpension benefits against the compensation payments, insofar as these benefitsare not fully based on contributions by the Management Board member.
In the case of an early termination of the employment contract without good cau-se within the meaning of section 626 (1) of the German Civil Code (BGB), any pay-ments to be agreed to the Management Board member, including fringe benefits,shall not exceed the amount of two annual compensations (severance cap) andmust not exceed the value of the compensation for the remaining duration of theManagement Board employment contract. The calculation of the severance capis based on the total compensation of the past financial year and also on any ex-pected total compensation for the current financial year. In the event of an earlytermination of the employment contract before the end of the relevant perfor-mance period for the bonus and/or the three-year vesting period of the long-term variable compensation, the contract makes no provision for an early payoutof the variable compensation components. If the member of the ManagementBoard becomes permanently disabled during the term of the employmentcontract, the contract is terminated on the day on which the permanent disabilityis determined. A permanent disability exists within the meaning of this provision,if the member of the Management Board is no longer able, due to illness or acci-dent, to fulfill the responsibilities assigned to him or her. In this respect, the spe-cific duties and particular responsibility of the member of the ManagementBoard must be taken into account.
If the member of the Management Board dies during the term of the employmentcontract, his or her widow or widower and children, provided they have not yetreached the age of 27, are entitled as joint creditors to receive the unreducedcontinued payment of the fixed compensation for the month in which the deathoccurred and for the six following months, but for no longer than up to the end ofthe regular term of the contract.
MANAGEMENT BOARD COMPENSATION
The following tables show the compensation paid during the financial year andinflows during or for the reporting year and the total related pension expensesfor all Management Board members. *
2018 20192019(min)
2019(max)
Fixed compensation 2.3 2.0 2.0 2.0
Fringe Benefits 0.1 0.1 0.1 0.1
Total 2.4 2.1 2.1 2.1
Short-term variablecompensation 2.8 2.7 0.0 3.0
Long-term variable share-basedcompensation
LTI 2019 (2019 to 2021) 3.9 0.0 11.8
LTI 2018 (2018 to 2020) 4.3
Total variable compensation 7.0 6.6 0.0 14.8
Pension expenses 0.5 0.4 0.4 0.4
Total compensation 9.9 9.1 2.4 17.3
* The grants and inflows shown below include the portion of the compensation of Ms. Anne-Laure Des-cours granted to Ms. Descours for her services as a member of the Management Board of PUMA SE. Inaddition, Ms. Descours receives compensation for her function as General Manager PUMA Group Sour-cing of World Cat Ltd, Hong Kong, a subsidiary of PUMA SE.
T.79 COMPENSATION PAID (€ million)➔
258
Annual Report 2019 ↗ CONSOLIDATED FINANCIAL STATEMENTS

2018 2019
Fixed compensation 2.3 2.0
Fringe Benefits 0.1 0.1
Total 2.4 2.1
Short-term variable compensation 2.8 2.7
Long-term variable share-based compensation
LTI 2016 (2016 bis 2018) 1.7
LTI 2015 (2015 bis 2017) 8.8
Total variable compensation 11.6 4.3
Pension expenses 0.5 0.4
Total compensation 14.4 6.8
Pension benefits are available for the members of the Management Board in theform of deferred compensation paid out of the performance-based and/or thenon-performance-based compensation, for which the Company has taken outpension liability insurance. The proportion of the pension capital that is alreadyfinanced through contributions to the pension liability insurance is deemed to bevested. During the financial year, PUMA allocated € 0.4 million for members ofthe Management Board (previous year: € 0.5 million). The present value of thepension benefits granted to active Management Board members of € 10.8 millionas of December 31, 2019 (previous year: € 10.1 million) was netted against thepledged asset value of the pension liability insurance on the balance sheet.
COMPENSATION FOR FORMER MANAGEMENT BOARD MEMBERS
The appointment of Lars Radoor Sørensen as member of the Management Boardwas terminated by mutual agreement with effect from the end of January 31,2019. At this point, Mr. Sørensen's Management Board employment contract hada remaining term through December 31, 2020. Mr. Sørensen's Management
Board employment contract was terminated by mutual agreement with effectfrom the end of January 31, 2020. For the period from January 31, 2019 until Ja-nuary 31, 2020, the basic salary and short-term variable compensation was paidout assuming a target attainment of 100%. The tranche of the long-term variablecompensation was prorated for 2018-2020 and reduced by 11/36. No tranche wasgranted for 2019-2021. The compensation components for Mr. Sørensen basedon his work as a Management Board member are included in section “Manage-ment Board Compensation”.
There were pension obligations to former members of the Management Boardand their widows/widowers amounting to € 3.3 million (previous year: € 3.2 milli-on) as well as contribution-based pension commitments in connection with thedeferred compensation of former members of the Management Board and Ma-naging Directors amounting to € 11.6 million (previous year: € 10.6 million). Bothitems were recognized as liabilities within pension provisions to the extent theywere not offset against asset values of an equal amount. Pension obligations toformer members of the Management Board and their widows/widowers were in-curred amounting to € 0.2 million (previous year: € 0.2 million).
SUPERVISORY BOARD COMPENSATION SYSTEM
The Supervisory Board compensation system consists of two components. As forthe Management Board, the relevant criteria for calculating the compensationare the responsibilities and performance of the individual Supervisory Boardmember, the long-term strategic planning and related goals, the sustainability ofachieved results and the Company’s long-term prospects. For this reason, thefirst component of the Supervisory Board compensation is a fixed, non-perfor-mance-based amount, while the second component is a performance-basedcompensation.
The non-performance-based component conforms to § 15 of the Articles of As-sociation, according to which each Supervisory Board member receives a fixedannual compensation of € 25,000.00. This amount is payable after the AnnualGeneral Meeting for the respective financial year. In addition to the fixed, annualcompensation, the members of the Supervisory Board are entitled to an increaseof their fixed compensation based on their position on the board and their partici-
T.80 INFLOW (€ million)➔
259
Annual Report 2019 ↗ CONSOLIDATED FINANCIAL STATEMENTS

pation in committees. The Chair of the Supervisory Board and the Vice Chair re-ceive an additional fixed annual amount of € 25,000.00 respectively € 12,500.00.The chair of a committee additionally receives € 10,000.00, and the members of acommittee € 5,000.00, respectively. The respective committees are the PersonnelCommittee, the Audit Committee and the Sustainability Committee.
In addition to the fixed compensation, each Supervisory Board member receivesannual performance-based compensation equal to € 20.00 for each € 0.01 bywhich the earnings per share figure as disclosed in the consolidated financialstatements exceeds a minimum amount of € 16.00 per share. The performance-based compensation amounts to a maximum of € 10,000.00 per year. If earningsper share in the financial year are below the minimum amount, no performance-related compensation is payable. The Chair of the Supervisory Board receives €40.00 for every € 0.01 exceeding the minimum amount per share and a maximumof € 20,000.00 per year. The Vice Chair receives € 30.00 for every € 0.01 excee-ding the minimum amount per share and a maximum of € 15,000.00 per year.
A member of the Supervisory Board who is only active for part of a financial yearreceives prorated remuneration calculated on the basis of the period of activitydetermined for full months.
SUPERVISORY BOARD COMPENSATION
The compensation for the Supervisory Board for financial years 2018 and 2019are shown in the table below.
Fixedcompensation
Variablecompensation
Committeecompensation Total
2018 2019 2018 2019 2018 2019 2018 2019
Total 0.2 0.2 – – 0.0 0.0 0.2 0.2
32. RELATED PARTY RELATIONSHIPS
In accordance with IAS 24, relationships to related parties and persons that con-trol or are controlled by the PUMA Group must be reported. All natural personsand companies that can be controlled by PUMA, that can exercise relevant con-trol over the PUMA Group or that are under the relevant control of another rela-ted party of the PUMA Group are considered related parties or persons within themeaning of IAS 24.
As of December 31, 2019, there was one shareholding in PUMA SE that exceeded10% of the voting rights. This is held by the Pinault family via several companiesthat the family controls (in order of proximity to the Pinault family: Financière Pi-nault S.C.A., Artémis S.A.S. and Kering S.A.). The shareholding of Kering S.A. inPUMA SE amounts to 15.7% of share capital according to Kering’s press releasefrom May 16, 2018. Together, Artémis S.A.S. and Kering S.A. hold 44.22% of theshare capital according to a voting rights announcement from May 24, 2018. Con-sequently, all companies that are directly or indirectly controlled by ArtémisS.A.S. and are not included in the consolidated financial statements of PUMA SEare considered related companies.
In addition, the disclosure obligation pursuant to IAS 24 extends to transactionswith associated companies as well as transactions with other related companies
T.81 SUPERVISORY BOARD COMPENSATION (€ million)➔
260
Annual Report 2019 ↗ CONSOLIDATED FINANCIAL STATEMENTS

and parties. These include non-controlling shareholders in particular.
Transactions with related companies and parties largely concern the sale ofgoods and services. These were concluded under normal market conditions thatare also customary with third parties.
The following overview illustrates the scope of the business relationships:
Deliveries and servicesrendered
Deliveries and servicesreceived
2019 2018 2019 2018
Companies included in theArtémis Group 0.0 0.0 0.0 0.0
Companies included in theKering Group 2.2 2.3 0.4 2.0
Other related parties andpersons 0.0 0.7 18.5 19.6
Total 2.2 2.9 18.9 21.6
Net receivables from Liabilities to
2019 2018 2019 2018
Companies included in theArtémis Group 0.0 0.0 0.0 0.0
Companies included in theKering Group 0.0 0.8 0.0 0.0
Other related parties andpersons 0.0 0.0 7.9 4.7
Total 0.0 0.8 7.9 4.8
In addition, dividend payments of € 18.6 million were made to non-controllingshareholders in the financial year 2019 (previous year: € 55.7 million).
Receivables from related companies and parties are, with one exception, notsubject to value adjustments. Only with respect to the receivables from a non-controlling shareholder and its group of companies were gross receivables in theamount of € 52.2 million adjusted in value for a subsidiary of PUMA SE in Greeceas of December 31, 2019 (previous year: € 52.2 million). As in the previous year,no expenses were recorded in this respect in the financial year 2019.
Classification of the remuneration of key management personnel in accordancewith IAS 24.17:
The members of key management personnel in accordance with IAS 24 are theManagement Board and the Supervisory Board. These are counted as relatedparties.
In the financial year 2019, the expenses for key management personnel of PUMASE for short-term benefits amounted to € 5.9 million (previous year: € 5.4 milli-on), for post-employment benefits € 0.5 million (previous year: € 0.4 million) andfor share-based compensation € 3.9 million (previous year: € 4.3 million). In ad-dition, no expenses for other long-term benefits or for termination benefits were
T.82 (€ million)➔
T.83 (€ million)➔
261
Annual Report 2019 ↗ CONSOLIDATED FINANCIAL STATEMENTS
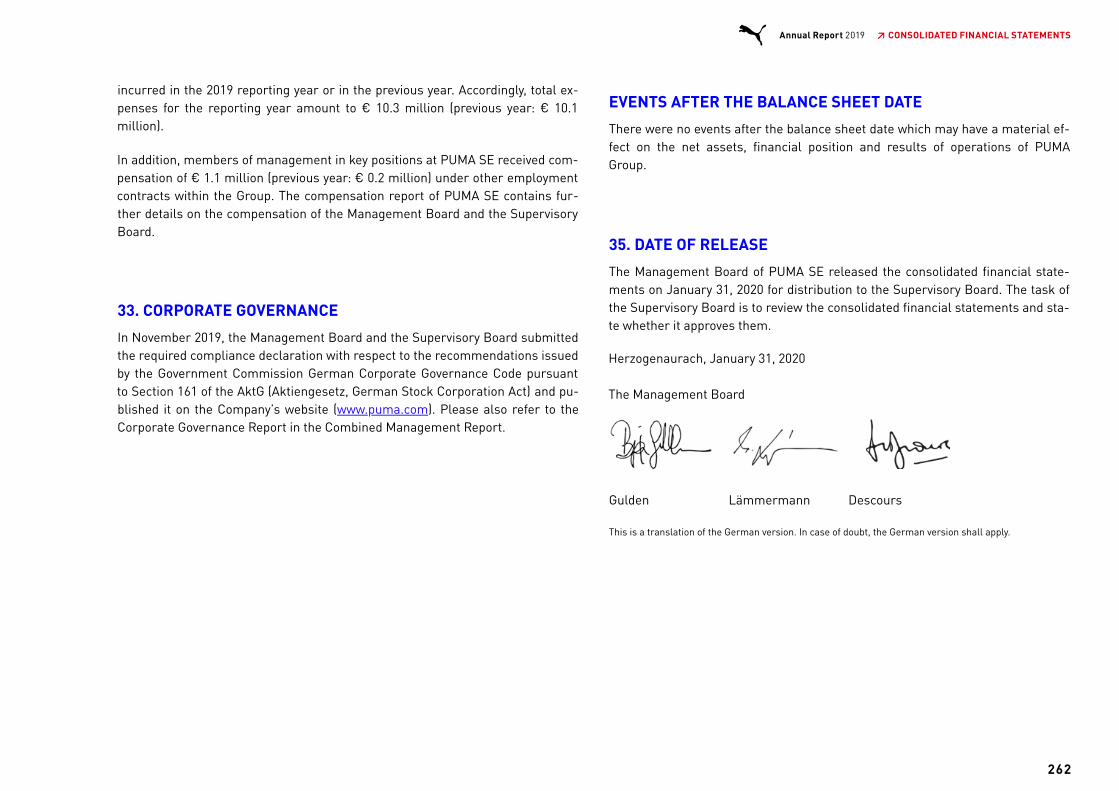
incurred in the 2019 reporting year or in the previous year. Accordingly, total ex-penses for the reporting year amount to € 10.3 million (previous year: € 10.1million).
In addition, members of management in key positions at PUMA SE received com-pensation of € 1.1 million (previous year: € 0.2 million) under other employmentcontracts within the Group. The compensation report of PUMA SE contains fur-ther details on the compensation of the Management Board and the SupervisoryBoard.
33. CORPORATE GOVERNANCE
In November 2019, the Management Board and the Supervisory Board submittedthe required compliance declaration with respect to the recommendations issuedby the Government Commission German Corporate Governance Code pursuantto Section 161 of the AktG (Aktiengesetz, German Stock Corporation Act) and pu-blished it on the Company’s website (www.puma.com). Please also refer to theCorporate Governance Report in the Combined Management Report.
EVENTS AFTER THE BALANCE SHEET DATE
There were no events after the balance sheet date which may have a material ef-fect on the net assets, financial position and results of operations of PUMAGroup.
35. DATE OF RELEASE
The Management Board of PUMA SE released the consolidated financial state-ments on January 31, 2020 for distribution to the Supervisory Board. The task ofthe Supervisory Board is to review the consolidated financial statements and sta-te whether it approves them.
Herzogenaurach, January 31, 2020
The Management Board
Gulden Lämmermann Descours
This is a translation of the German version. In case of doubt, the German version shall apply.
262
Annual Report 2019 ↗ CONSOLIDATED FINANCIAL STATEMENTS

APPENDIX 1 OF THE CONSOLIDATED FINANCIAL STATEMENTS
T.87 CHANGES IN FIXED ASSETS 2018 (€ million)➔
Purchase costs Accumulated depreciation Carrying amounts
Balance
1/1/2018
Currencychanges
andother
changes
Additions/
retransfers
Changes
in group of
consol- idated
companies Disposals
Balance
12/31/2018
Balance
1/1/2018
Currencychanges
andother
changes
Additions/
retransfers
Changes
in group of
consol- idated
companies Disposals
Balance
12/31/2018
Balance
12/31/2018
Balance
12/31/2017
PROPERTY, PLANT ANDEQUIPMENT
Land, land rights and buildingsincluding buildings on third partyland 131.8 34.7 3.7 -1.2 169.0 -42.1 -6.4 0.9 -47.7 121.4 89.7
Technical equipment andmachines 19.2 -1.4 14.4 -0.5 31.7 -9.1 0.7 -2.9 0.4 -10.9 20.8 10.1
Other equipment, factory andoffice equipment 360.2 4.7 67.6 -28.4 404.1 -238.2 -0.3 -55.6 27.3 -266.8 137.3 122.0
Payments on account and assetsunder construction 38.3 -42.5 20.3 -1.0 15.2 0.0 0.0 15.2 38.3
549.5 -4.5 106.0 -31.0 620.0 -289.5 0.4 -65.0 28.7 -325.4 294.6 260.1
INTANGIBLE ASSETS
Goodwill 288.2 3.9 -1.6 290.5 -46.3 -0.1 1.6 -44.8 245.7 241.9
Intangible assets with anindefinite useful life 136.2 5.6 141.8 -17.7 -17.7 124.1 118.5
Other intangible assets 156.0 0.6 32.2 -5.3 183.7 -103.7 -0.3 -17.2 5.1 -116.1 67.5 52.4
580.4 10.3 32.2 -6.9 616.0 -167.7 -0.5 -17.2 6.7 -178.6 437.4 412.7
1) There was an impairment for fixed assets in the amount of € 0.6 million in the financial year 2018 (see chapter 9). No impairment loss was recognized for intangible assets (see chapter 10).
1)
263
Annual Report 2019 ↗ CONSOLIDATED FINANCIAL STATEMENTS

T.88 CHANGES IN FIXED ASSETS 2019 (€ million)➔
Purchase costs Accumulated depreciation Carrying amounts
Balance*
1/1/2019
Currencychanges
and other
changes
Additions/
retransfers
Changes
in group of
consol idatedcompanies Disposals
Balance
12/31/2019
Balance*
1/1/2019
Currencychanges
andother
changes
Additions/
retransfers
Changes
in group of
consol- idated
companies Disposals
Balance
12/31/2019
Balance
12/31/2019
Balance
12/31/2018
PROPERTY, PLANT ANDEQUIPMENT
Land, land rights andbuildings includingbuildings on third party land 169.0 3.0 -0.7 171.3 -47.7 -0.1 -6.2 0.6 -53.4 117.9 121.4
Technical equipment andmachines 22.5 -1.6 0.5 -0.2 21.3 -10.2 0.8 -2.3 0.2 -11.5 9.8 20.8
Other equipment, factoryand office equipment 404.1 18.6 93.7 -27.6 488.7 -266.8 -4.7 -66.4 24.4 -313.4 175.3 137.3
Payments on account andassets under construction 15.2 -13.2 90.6 -0.9 91.7 91.7 15.2
610.8 3.8 187.8 -29.3 773.1 -324.7 -4.0 -74.9 25.2 -378.3 394.8 294.6
RIGHT-OF-USE ASSETS
Real Estate - Retail stores 409.6 8.2 97.7 -6.5 509.0 -90.3 1.0 -89.3 419.6
Real Estate - Warehouses &offices 188.9 4.0 143.6 -4.5 332.0 -0.1 -51.0 0.8 -50.3 281.7
Others (technical equipmentand machines and vehicles) 18.0 7.8 -1.0 24.8 -0.8 -6.7 0.4 -7.0 17.7
616.5 12.3 249.0 -12.1 865.7 -0.8 -0.1 -148.0 2.2 -146.7 719.0
INTANGIBLE ASSETS
Goodwill 290.5 4.1 294.6 -44.8 -0.1 -44.9 249.7 245.7
Intangible assets with anindefinite useful life 141.8 2.4 144.2 -17.7 -17.7 126.5 124.2
Other intangible assets 183.7 3.0 31.8 -2.4 216.1 -116.1 -0.3 -23.5 2.2 -137.8 78.3 67.5
616.0 9.5 31.8 -2.4 654.9 -178.6 -0.5 -23.5 2.2 -200.4 454.5 437.4
1) There was no impairment on fixed assets (in 2018: € 0,6 million, see chapter 9) or intangible assets (in 2018: € 0,0 million, see chapter 10) in the financial year. * Due to the first-time application of IFRS 16, there was a reclassification between property, plant and equipment and right-of-use assets, see in detail chapter 1.
1)
264
Annual Report 2019 ↗ CONSOLIDATED FINANCIAL STATEMENTS

APPENDIX 2 OF THE CONSOLIDATED FINANCIAL STATEMENTS
MEMBERS OF THE MANAGEMENT BOARD AND SUPERVISORY BOARD AND THEIRMANDATES
Status: 31 December 2019
MEMBERS OF THE MANAGEMENT BOARD AND THEIR MANDATES
Bjørn GuldenChief Executive Officer (CEO)
Membership of other supervisory boards and controlling bodies:
Tchibo GmbH, Hamburg
Borussia Dortmund GmbH & Co. KGaA, Dortmund
Salling Group A/S, Brabrand/Denmark (previously Dansk SupermarkedA/S)
Michael LämmermannChief Financial Officer (CFO)
Lars Radoor Sørensen (member until 31 January 2019)Chief Operating Officer (COO)
Membership of other supervisory boards and controlling bodies:
Scandinavian Brake Systems A/S, Svendborg/Dänemark
Hoyer Group A/S, Kopenhagen/Dänemark
Skiold A/S, Sæby/Dänemark
Anne-Laure Descours (member since 1 February 2019)Chief Sourcing Officer (CSO)
MEMBERS OF THE SUPERVISORY BOARD AND THEIR MANDATES
Jean-François Palus (Chairman)
London, United KingdomGroup Managing Director and member of the Board of Directors of Kering S.A.,Paris/France, responsible for Strategy, Operations and Organization
Membership of other supervisory boards and controlling bodies :
Kering Americas, Inc., New York/USA
Kering Tokyo Investment Ltd., Tokyo/Japan
Sowind Group S.A., La Chaux-de-Fonds/Switzerland
Guccio Gucci SpA., Florence/Italy
Gucci America, Inc., New York/USA
Kering Eyewear S.p.A., Padua/Italy
Yugen Kaisha Gucci LLC, Tokyo/Japan
Birdswan Solutions Ltd., Haywards Heath/West Sussex/United Kingdom
Paintgate Ltd., Haywards Heath/West Sussex/United Kingdom
Kering Asia Pacific Ltd., Hong-Kong/China
Kering South East Asia PTE Ltd., Singapore
Altuzarra LLC, New York/USA
Tomas Maier Holding LLC, New York/USA
Tomas Maier Distribution LLC, New York/USA
All mandates of Mr Palus are mandates within the Kering-Group. Kering S.A. is a listed company. Allother companies within the Kering-Group are not listed.
1
1
265
Annual Report 2019 ↗ CONSOLIDATED FINANCIAL STATEMENTS

Thore Ohlsson(Deputy Chairman)
Falsterbo, SwedenPresident of Elimexo AB, Falsterbo/Sweden
Membership of other supervisory boards and controlling bodies:
Docktricks AB, Uppsala/Sweden
Elite Hotels AB, Stockholm/Sweden
Tomas Frick AB, Vellinge/Sweden
Tjugonde AB, Malmö/Sweden
Dahlqvists Fastighetsförvaltning AB, Kristianstad/Sweden
Dofab AB, Malmö/Sweden
Orrefors Kosta Boda AB, Kosta/Sweden
Jean-Marc Duplaix (member until 18 April 2019)
Paris, France Chief Financial Officer (CFO) of Kering S.A., Paris/France
Membership of other supervisory boards and controlling bodies:
Redcats S.A., Paris/France
E_lite S.p.A., Milan/Italy
Pomellato S.p.A., Milan/Italy
Kering Japan Ltd., Tokyo/Japan
Kering Luxembourg S.A., Luxembourg/Luxembourg
Qeelin Holding Luxembourg S.A., Luxembourg/Luxembourg
E-Kering Lux S.A., Luxembourg/Luxembourg
Kering Spain S.L. (previously named Noga Luxe S.L.), Barcelona/Spain
Kering Eyewear S.p.A., Padua/Italy
GPo Holding S.A.S., Paris/France
Design Management Srl, Florence/Italy
Design Management 2 Srl, Florence/Italy
Kering Studio S.A.S., Paris/France
Balenciaga Asia Pacific Ltd., Hong Kong/China
Kering Eyewear Japan Ltd., Tokyo/Japan
Redcats Management Services S.A.S., Paris/France
Balenciaga S.A., Paris/France
Kering Investments Europe B.V., Amsterdam/Netherlands
Altuzarra LLC, New York/USA
Pomellato Japan Co. Ltd., Tokyo/Japan
Bottega Veneta Japan Ltd., Tokyo/Japan
Richard Ginori Asia Pacific Co. Ltd., Tokyo/Japan
Kering Korea Ltd., Seoul/Republic of Korea
KTK Netherlands BV, Amsterdam/Netherlands
Béatrice Lazat (member until 18 April 2019)
Paris, France Human Resources Director, Kering S.A., Paris/France
Membership of other supervisory boards and controlling bodies:
Castera S.A.R.L., Luxembourg/Luxembourg
Augustin S.A.R.L., Paris/France
Conseil et Assistance S.N.C., Paris/France
266
Annual Report 2019 ↗ CONSOLIDATED FINANCIAL STATEMENTS
Héloïse Temple-Boyer (member since 18 April 2019)
Paris, France Human Resources Director, Kering S.A., Paris/France
Membership of other supervisory boards and controlling bodies :
Kering S.A., Paris/France
Giambattista Valli S.A.S., Paris/ France
Société d’exploitation de l’hebdomadaire le Point S.A., Paris/France
Royalement Vôtre Editions S.A.S., Paris/France
ACHP Plc, London/United Kingdom
Christie’s International Plc, London/United Kingdom
Palazzo Grassi Spa, Venice/Italy
All mandates are mandates within the ARTÈMIS-Group. Kering S.A. is a listed company.
Fiona May (member since 18 April 2019)
Calenzano, Italy Independent Management Consultant
Membership of other supervisory boards and controlling bodies:
R.C.S. Media Group Active Team Srl, Milano/Italy
Martin Koeppel (Employees’ Representative)
Weisendorf, Germany Chairman of the Works Counsel of PUMA SE
Bernd Illig (Employees’ Representative)
Bechhofen, Germany Administrator IT Systems of PUMA SE
SUPERVISORY BOARD COMMITTEES
Personnel Committee
Jean-François Palus (Chairman)
Béatrice Lazat (until 18 April 2019)
Fiona May (since 18 April 2019)
Martin Köppel
Audit Committee
Thore Ohlsson (Chairman)
Jean-Marc Duplaix (until 18 April 2019)
Héloïse Temple-Boyer (since 18 April 2019)
Bernd Illig
Nominating Committee
Jean-François Palus (Chairman)
Jean-Marc Duplaix (until 18 April 2019)
Béatrice Lazat (until 18 April 2019)
Héloïse Temple-Boyer (since 18 April 2019)
Fiona May (since 18 April 2019)
2
2
267
Annual Report 2019 ↗ CONSOLIDATED FINANCIAL STATEMENTS

DECLARATION BY THE LEGAL REPRESENTATIVES
We state to the best of our knowledge that the consolidated financial state-ments give a true and fair view of the net assets, financial position and resultsof operations of the Group in accordance with the applicable accounting princi-ples, and that the Group management report, which is combined with the Ma-nagement report of PUMA SE for the financial year 2019, provides a true andfair view of the course of the development and performance of the business andthe position of the Group, together with a description of the principal risks andopportunities associated with the expected performance of the Group.
Herzogenaurach, January 31, 2020
The Management Board
Gulden Lämmermann Descours
268
Annual Report 2019 ↗ CONSOLIDATED FINANCIAL STATEMENTS

INDEPENDENT AUDITOR’S REPORT
To PUMA SE, Herzogenaurach
REPORT ON THE AUDIT OF THE CONSOLIDATED FINANCIALSTATEMENTS AND OF THE COMBINED MANAGEMENT REPORTAUDIT OPINIONS
We have audited the consolidated financial statements of PUMA SE, Herzogenau-rach, and its subsidiaries (the Group), which comprise the consolidated balancesheet as at 31 December 2019, the consolidated income statement, the consoli-dated statement of comprehensive income, the consolidated statement of chan-ges in equity and the consolidated cash flow statement for the financial year from1 January to 31 December 2019 as well as the notes to the consolidated financialstatements, including a summary of significant accounting policies. In addition,we have audited the combined management report of PUMA SE for the financialyear from 1 January to 31 December 2019. In accordance with the German legalrequirements, we have not audited the statement on corporate governance andthe corporate governance report specified in Chapter “Corporate Governance Re-port including the Statement on Corporate Governance pursuant to § 289f and §315d HGB” of the combined management report.with the German legal require-ments, we have not audited the content of those parts of the notes to the consoli-dated financial statements and of the combined management report as specifiedin the Chapter “Other information” of our independent auditor´s report.
In our opinion, on the basis of the knowledge obtained in the audit
the accompanying consolidated financial statements comply, in all ma-terial respects, with the International Financial Reporting Standards(IFRS) as adopted by the EU, and the additional requirements of Germancommercial law pursuant to Section 315e (1) German Commercial Code(HGB) and, in compliance with these requirements, give a true and fair
view of the assets, liabilities, and financial position of the Group as at 31December 2019, and of its financial performance for the financial yearfrom 1 January to 31 December 2019, and
the accompanying combined management report as a whole provides anappropriate view of the Group’s position. In all material respects, thiscombined management report is consistent with the consolidated finan-cial statements, complies with German legal requirements and appro-priately presents the opportunities and risks of future development. Ouraudit opinion on the combined management report does not cover thecontent of the statement on corporate governance and the corporate go-vernance report specified in Chapter “Corporate Governance Report in-cluding the Statement on Corporate Governance pursuant to § 289f and§ 315d HGB” of the combined management report.
Pursuant to Section 322 (3) Sentence 1 German Commercial Code (HGB), we de-clare that our audit has not led to any reservations relating to the legal complian-ce of the consolidated financial statements and of the combined managementreport.
269
Annual Report 2019 ↗ CONSOLIDATED FINANCIAL STATEMENTS

BASIS FOR THE AUDIT OPINIONS
We conducted our audit of the consolidated financial statements and of the com-bined management report in accordance with Section 317 German CommercialCode (HGB) and the EU Audit Regulation (No. 537/2014; referred to subsequentlyas “EU Audit Regulation”) and in compliance with German Generally AcceptedStandards for Financial Statement Audits promulgated by the Institut der Wirt-schaftsprüfer (IDW). Our responsibilities under those requirements and princi-ples are further described in the “Auditor’s Responsibilities for the Audit of theConsolidated Financial Statements and of the Combined Management Report”section of our auditor’s report. We are independent of the group entities in accor-dance with the requirements of European law and German commercial and pro-fessional law, and we have fulfilled our other German professional responsibili-ties in accordance with these requirements. In addition, in accordance with Arti-cle 10 (2) Point (f) of the EU Audit Regulation, we declare that we have not provi-ded non-audit services prohibited under Article 5 (1) of the EU Audit Regulation.We believe that the audit evidence we have obtained is sufficient and appropriateto provide a basis for our audit opinions on the consolidated financial statementsand on the combined management report.
KEY AUDIT MATTERS IN THE AUDIT OF THE CONSOLIDATED FINANCIALSTATEMENTS
Key audit matters are those matters that, in our professional judgment, were ofmost significance in our audit of the consolidated financial statements for the fi-nancial year from 1 January to 31 December 2019. These matters were addres-sed in the context of our audit of the consolidated financial statements as a who-le and in forming our audit opinion thereon; we do not provide a separate auditopinion on these matters.
In the following we present the key audit matters we have determined in thecourse of our audit:
1. Recoverability of goodwill
2. Recoverability of the Cobra brand
3. Impacts of first-time adoption of IFRS 16 on lease accounting
Our presentation of these key audit matters has been structured as follows:
(a) Description (including reference to corresponding information in theconsolidated financial statements)
(b) Auditor’s response
1. RECOVERY OF GOODWILL
a) The consolidated financial statements of PUMA SE show goodwill in theamount of mEUR 249.7 corresponding to approximately 5.7 % of the consolidatedbalance sheet total or 13.0 % of the group equity.
Each financial year or in case of respective signs of impairment, goodwill is sub-ject to impairment tests. The impairment tests are performed by PUMA SE by ap-plying the “discounted cash flow method”. The valuation is based on the presentvalues of the future cash flows. The company’s valuation model is based on fu-ture cash flows, which are in turn based on the effective three-year plan and va-lid at the date the impairment test. This detailed planning phase is extended withthe assumption of long-term growth rates. The discounting is performed usingthe weighted average cost of capital (WACC). Here, the realizable amount is de-termined on the basis of the value in use and a possible need for impairment isdetermined by comparing the value in use with the carrying amount.
The outcome of this valuation highly depends on the legal representatives’ as-sessment of future cash flows, the WACC rate applied and the long-term growthrate and therefore involves uncertainties and discretion. Thus, the assessment ofthe recoverability of the goodwill was classified as a key audit matter within thescope of our audit.
Information on the goodwill, provided by the legal representatives, is disclosed inChapter 2 “Significant Consolidation, Accounting and Valuation Principles” and inChapter 11 “Intangible Assets” of the notes to the consolidated financialstatements.
b) Within the scope of our risk-oriented audit, we gained an understanding of thesystematic approach applied when performing the impairment test. We satisfiedourselves, that the valuation model used adequately presents the requirements
270
Annual Report 2019 ↗ CONSOLIDATED FINANCIAL STATEMENTS
of the relevant standards, whether the necessary input data are completely andaccurately determined and whether the calculations within the model are perfor-med correctly. We satisfied ourselves of the appropriateness of the future cashflows used for the computation by reconciling these cash flows particularly withthe effective three-year plan as well as by interviewing the legal representativesor persons appointed by them with regard to the material assumptions underly-ing this plan. In addition, we performed a critical assessment of the plan underconsideration of general and industry-specific market expectations.
Since a material portion of the value in use results from the forecasted cashflows for the period after the three-year plan (phase of perpetuity), we in particu-lar critically assessed the sustainable growth rate used within the perpetuityphase by means of general and industry-specific market expectations. Since re-latively low changes of the discounting rate may materially affect the amount ofthe realizable value, we have also checked the parameters used when determi-ning the WACC rate involving internal valuation experts from the financial adviso-ry sector and reproduced the computation scheme.
Due to the material significance and taking into account the fact that the assess-ment of the goodwill also depends on the economic framework conditions thatcannot be influenced by the Group, we performed in addition a critical assess-ment of the sensitivity analyses performed by PUMA SE for the cash-generatingunits (so-called CGUs) with low headroom (present values compared to the car-rying amount) in order to be able to assess a possible impairment risk in case ofchange of a material valuation assumption.
2. RECOVERABILITY OF THE COBRA BRAND
a) The consolidated financial statements of PUMA SE disclose for the Cobrabrand a brand value in the amount of mEUR 126.6 with the indefinite useful lifecorresponding to approximately 2.9% of the consolidated balance sheet total or6.6 % of the group equity.
The Cobra brand is subject to an impairment test conducted annually or in caseof a triggering event. The impairment test is conducted by PUMA SE based on therelief from royalty method. According to this approach, the value of the brand re-sults from future royalty that a company would have to pay for the use of thebrand if they had to license it. The approach uses forecasted revenue generated
with the Cobra brand based on the effective three-year plan, valid at the time theimpairment test is conducted. Subsequently, the projection period is extendedassuming long-term growth rates. The discounting is performed by means of theweighted average cost of capital (WACC). The recoverable amount and the needfor impairment is determined by comparing the value in use with the carryingamount. If there are indications of impairment of the brand used by the Group,the recoverability of the brand is assessed by reference to the recoverableamount of the cash-generating unit to which the brand is allocated.
The outcome of this valuation highly depends on the legal representatives’ as-sumption of future revenue to be generated with the Cobra brand, the royalty rateand the long-term growth rate as well as the WACC rate applied and thereforeinvolves uncertainties and discretion. Thus, the assessment of the recoverabilityof the Cobra Brand was classified as key audit matter within the scope of ouraudit.
Information on the Cobra brand, provided by the legal representatives, is disclo-sed in Chapter 2 “Significant Consolidation, Accounting and Valuation Principles”and in Chapter 11 “Intangible Assets” of the notes to the consolidated financialstatements.
b) As part of our risk-oriented audit, we first examined on the basis of the infor-mation available to us and in discussions with the legal representatives and withpersons appointed by them, that there are no indications of impairment of thebrand and that the recoverability of the brand can be assessed by use of the reli-ef-from-royalty method as part of the impairment test. We have followed the me-thodological procedure for performing the impairment test using the relief-from-royalty method. In this regard we examined, whether the valuation model ade-quately reflects the conceptual requirements of the relevant standards, whetherthe necessary input data are completely and accurately determined and whetherthe calculations applied to the model are made correctly. We satisfied ourselvesof the appropriateness of the assumed future revenue underlying the computati-on (Cobra branded sales) by reconciling these sales particularly with the effectivethree-year plan as well as by interviewing the legal representatives and with per-sons appointed by them with regard to the material assumptions underlying thisplan. In addition, we performed a critical assessment of the plan taking into ac-count general and industry-specific market expectations.
271
Annual Report 2019 ↗ CONSOLIDATED FINANCIAL STATEMENTS
Since a material portion of the value in use results from the forecasted revenuefor the period following the three-year plan (phase of perpetuity), we particularlyreviewed the sustainable growth rate applied to the perpetuity phase by means ofgeneral and industry-specific market expectations. As even relatively smallchanges of the expected royalty rate and the used discount rate may have a ma-terial effect on the value in use, we also assessed the parameters involved in theassumed royalty rate and determination of the discount rate involving internalvaluation experts from the financial advisory sector and recalculated the compu-tation scheme. Additionally, we reviewed the applied royalty rate based on indus-try-specific average rates.
Due to the material significance and as the measurement of the brand also de-pends on general economic conditions that are beyond the Group’s control, weadditionally reviewed the sensitivity analyses concerning the Cobra brand origi-nally conducted by Puma SE in order to be able to determine a potential impair-ment risk in case a material assumption underlying the measurement changes.
3. IMPACTS OF FIRST-TIME ADOPTION OF IFRS 16 ON LEASE ACCOUNTING
a) In the consolidated financial statements of PUMA SE as at 31 December 2019,right-of-use assets of mEUR 719,0 and lease liabilities of mEUR 745,3 are ac-counted for, corresponding to approximately 16,4% or 17,0% of the consolidatedbalance sheet total and 37,4% or 38,8% of the group equity. In the financial year2019, the first-time adoption of the new lease accounting standard (IFRS 16) hassignificant effects on the opening balance values and their rollover as at the re-porting date, since operating leases in particular have become subject to the re-cognition requirement. The transition to IFRS 16 was performed applying the mo-dified retrospective approach; prior-period comparative figures were not resta-ted. It was not reassessed whether or not a contract is a lease within the mea-ning of IFRS 16. A central IT system has been implemented for the purpose oflease accounting. The new IFRS 16 standard requires the executive directors tomake estimates and judgements. This is particularly the case in view of the esti-mate as to exercising contractual renewal options, entailing implications on thelease term, as to, where applicable, the value of the interest rate, as to theamount of lease liability and the associated impact on the consolidated balancesheet, the consolidated statement of comprehensive income and the consolida-ted cash flow statement. In this light and due to the complexity of the new requi-rements, we classified the accounting of leases in accordance with IFRS 16 as a
key audit matter within the scope of our audit. The information provided by the executive directors on lease accounting and onthe impact of the first time adoption of IFRS 16 are included in the notes to theconsolidated financial statements in Chapter 1 “General” and in Chapter 10 “Lea-ses” of the notes to the consolidated financial statements.
b) During our audit, we assessed, among other matters, the appropriateness andimplementation of the processes and controls established by the Company forthe complete and correct identification and recognition of leases. This also app-lies to the implementation of the central IT system and the required adjustmentsto the existing IT systems in respect of lease accounting. Further, our audit comprised assessing the impact of the initial adoption of IFRS16. For this purpose, we reperformed the implementation steps taken by theCompany in response to the initial adoption of IFRS 16, and evaluated the designof the established processes and of the associated IT systems specific to leaseaccounting in accordance with IFRS 16. In this regard, we inspected selected lea-se contracts, obtained an understanding of the identification of performance obli-gations, and assessed whether the latter were completely and correctly reco-gnised and accounted for in the relevant IT systems. In this process, we inspec-ted selected contracts and other adequate evidence, and conducted interviewswith employees of the Company to assess, in particular, the appropriateness ofthe estimates made as to exercising contractual renewal options, entailing impli-cations on the lease term, as to the value of the interest rate, as to the amount oflease liability as well as the associated impact on the consolidated balancesheet, the consolidated statement of comprehensive income and the consolida-ted cash flow statements. Moreover, we examined whether the IT systems andprocesses that were established by the Company and adjusted to IFRS 16, inclu-ding the controls put in place, are appropriate. Furthermore, we reperformedwhether the estimates and judgements made by the executive directors are rea-sonably documented and substantiated.
The information provided by the executive directors in the notes to the consolida-ted financial statements concerning the impact on the consolidated financialstatements of the first time adoption of IFRS 16, and the information concerningexercising options and the related explanations in the notes to the consolidatedfinancial statements constituted further areas of audit focus.
272
Annual Report 2019 ↗ CONSOLIDATED FINANCIAL STATEMENTS

OTHER INFORMATION
The legal representatives are responsible for the other information. The otherinformation comprises:
the statement on corporate governance pursuant to Section 289f Ger-man Commercial Code (HGB) specified in Chapter “Corporate Gover-nance Report including the Statement on Corporate Governance pur-suant to § 289f and § 315d HGB” of the combined management report,
the corporate governance report pursuant to No. 3.10 of the GermanCorporate Governance Code specified in Chapter “Corporate Governan-ce Report including the Statement on Corporate Governance pursuant to§ 289f and § 315d HGB” of the combined management report,
the legal representatives‘ confirmation relating to the consolidated fi-nancial statements and to the combined management report pursuantto Section 297 (2) Sentence 4 and Section 315 (1) Sentence 5 GermanCommercial Code (HGB), respectively,
the combined non-financial report which will be published after the is-suance of this auditor´s report and
the remaining parts of the Annual Report which will be published afterthe issuance of this auditor´s report, with the exception of the auditedconsolidated financial statements and combined management reportand our auditor’s report.
Our audit opinions on the consolidated financial statements and on the combinedmanagement report do not cover the other information, and consequently we donot express an audit opinion or any other form of assurance conclusion thereon.
In connection with our audit, our responsibility is to read the other informationand, in so doing, to consider whether the other information
is materially inconsistent with the consolidated financial statements,with the combined management report or our knowledge obtained inthe audit, or
otherwise appears to be materially misstated.
RESPONSIBILITIES OF THE LEGAL REPRESENTATIVES AND THE SUPERVISORYBOARD FOR THE CONSOLIDATED FINANCIAL STATEMENTS AND THE COMBINEDMANAGEMENT REPORT
The legal representatives are responsible for the preparation of the consolidatedfinancial statements that comply, in all material respects, with IFRSs as adoptedby the EU and the additional requirements of German commercial law pursuantto Section 315e (1) German Commercial Code (HGB) and that the consolidatedfinancial statements, in compliance with these requirements, give a true and fairview of the assets, liabilities, financial position, and financial performance of theGroup. In addition, the legal representatives are responsible for such internalcontrol as they have determined necessary to enable the preparation of consoli-dated financial statements that are free from material misstatement, whetherdue to fraud or error.
In preparing the consolidated financial statements, the legal representatives areresponsible for assessing the Group’s ability to continue as a going concern. Theyalso have the responsibility for disclosing, as applicable, matters related to goingconcern. In addition, they are responsible for financial reporting based on the go-ing concern basis of accounting unless there is an intention to liquidate theGroup or to cease operations, or there is no realistic alternative but to do so.
Furthermore, the legal representatives are responsible for the preparation of thecombined management report that, as a whole, provides an appropriate view ofthe Group’s position and is, in all material respects, consistent with the consoli-dated financial statements, complies with German legal requirements, and ap-propriately presents the opportunities and risks of future development. In additi-on, the legal representatives are responsible for such arrangements and measu-res (systems) as they have considered necessary to enable the preparation of acombined management report that is in accordance with the applicable Germanlegal requirements, and to be able to provide sufficient appropriate evidence forthe assertions in the combined management report.
The Supervisory Board is responsible for overseeing the Group’s financial re-porting process for the preparation of the consolidated financial statements andof the combined management report.
273
Annual Report 2019 ↗ CONSOLIDATED FINANCIAL STATEMENTS
AUDITOR’S RESPONSIBILITIES FOR THE AUDIT OF THE CONSOLIDATED FINANCIALSTATEMENTS AND OF THE COMBINED MANAGEMENT REPORT
Our objectives are to obtain reasonable assurance about whether the consolida-ted financial statements as a whole are free from material misstatement, whe-ther due to fraud or error, and whether the combined management report as awhole provides an appropriate view of the Group’s position and, in all materialrespects, is consistent with the consolidated financial statements and the know-ledge obtained in the audit, complies with the German legal requirements andappropriately presents the opportunities and risks of future development, as wellas to issue an auditor’s report that includes our audit opinions on the consolida-ted financial statements and on the combined management report.
Reasonable assurance is a high level of assurance, but is not a guarantee that anaudit conducted in accordance with Section 317 German Commercial Code (HGB)and the EU Audit Regulation and in compliance with German Generally AcceptedStandards for Financial Statement Audits promulgated by the Institut der Wirt-schaftsprüfer (IDW) will always detect a material misstatement. Misstatementscan arise from fraud or error and are considered material if, individually or in theaggregate, they could reasonably be expected to influence the economic decisi-ons of users taken on the basis of these consolidated financial statements andthis combined management report.
We exercise professional judgment and maintain professional skepticismthroughout the audit. We also:
Identify and assess the risks of material misstatement of the consolida-ted financial statements and of the combined management report, whe-ther due to fraud or error, design and perform audit procedures respon-sive to those risks, and obtain audit evidence that is sufficient and ap-propriate to provide a basis for our audit opinions. The risk of not detec-ting a material misstatement resulting from fraud is higher than for oneresulting from error, as fraud may involve collusion, forgery, intentionalomissions, misrepresentations, or the override of internal control.
Obtain an understanding of internal control relevant to the audit of theconsolidated financial statements and of arrangements and measuresrelevant to the audit of the combined management report in order to de-sign audit procedures that are appropriate in the circumstances, but not
for the purpose of expressing an audit opinion on the effectiveness ofthese systems.
Evaluate the appropriateness of accounting policies used by the legalrepresentatives and the reasonableness of estimates made by the legalrepresentatives and related disclosures.
Conclude on the appropriateness of the legal representatives’ use of thegoing concern basis of accounting and, based on the audit evidence ob-tained, whether a material uncertainty exists related to events or condi-tions that may cast significant doubt on the Group’s ability to continueas a going concern. If we conclude that a material uncertainty exists, weare required to draw attention in the auditor’s report to the related dis-closures in the consolidated financial statements and in the combinedmanagement report or, if such disclosures are inadequate, to modifyour respective audit opinions. Our conclusions are based on the auditevidence obtained up to the date of our auditor’s report. However, futureevents or conditions may cause the Group to cease to be able to conti-nue as a going concern.
Evaluate the overall presentation, structure and content of the consoli-dated financial statements, including the disclosures, and whether theconsolidated financial statements present the underlying transactionsand events in a manner that the consolidated financial statements givea true and fair view of the assets, liabilities, financial position and finan-cial performance of the Group in compliance with IFRSs as adopted bythe EU and with the additional requirements of German commercial lawpursuant to Section 315e (1) German Commercial Code HGB).
Obtain sufficient appropriate audit evidence regarding the financial in-formation of the entities or business activities within the Group to ex-press audit opinions on the consolidated financial statements and onthe combined management report. We are responsible for the direction,supervision and performance of the group audit. We remain solely res-ponsible for our audit opinions.
Evaluate the consistency of the combined management report with theconsolidated financial statements, its conformity with German law, andthe view of the Group’s position it provides.
274
Annual Report 2019 ↗ CONSOLIDATED FINANCIAL STATEMENTS

Perform audit procedures on the prospective information presented bythe executive directors in the combined management report. On the ba-sis of sufficient appropriate audit evidence we evaluate, in particular,the significant assumptions used by the executive directors as a basisfor the prospective information, and evaluate the proper derivation ofthe prospective information from these assumptions. We do not expressa separate audit opinion on the prospective information and on the as-sumptions used as a basis. There is a substantial unavoidable risk thatfuture events will differ materially from the prospective information.
We communicate with those charged with governance regarding, among othermatters, the planned scope and timing of the audit and significant audit findings,including any significant deficiencies in internal control that we identify duringour audit.
We also provide those charged with governance with a statement that we havecomplied with the relevant independence requirements, and communicate withthem all relationships and other matters that may reasonably be thought to bearon our independence, and where applicable, the related safeguards.
From the matters communicated with those charged with governance, we deter-mine those matters that were of most significance in the audit of the consolida-ted financial statements of the current period and are therefore the key auditmatters. We describe these matters in our auditor’s report unless law or regula-tion precludes public disclosure about the matter.
OTHER LEGAL AND REGULATORY REQUIREMENTSFURTHER INFORMATION PURSUANT TO ARTICLE 10 OF THE EU AUDIT REGULATION
We were elected as group auditor by the annual general meeting on 18 April2019. We were engaged by the Supervisory Board on 30 Juli 2019. We have beenthe group auditor of PUMA SE, Herzogenaurach, without interruption since thefinancial year 2012.
We declare that the audit opinions expressed in this auditor’s report are consis-tent with the additional report to the audit committee pursuant to Article 11 ofthe EU Audit Regulation (long form audit report).
GERMAN PUBLIC AUDITOR RESPONSIBLE FOR THEENGAGEMENT
The German Public Auditor responsible for the engagement is Dr. ThomasReitmayr.
Munich, 31 January 2020
Deloitte GmbH Wirtschaftsprüfungsgesellschaft
Dr Thomas Reitmayr Wirtschaftsprüfer[German Public Auditor]
Stefan Otto Wirtschaftsprüfer[German Public Auditor]
275
Annual Report 2019 ↗ CONSOLIDATED FINANCIAL STATEMENTS

Additional Information
277 The PUMA Share
280 PUMA Year-on-Year Comparison
282 PUMA Group Development
284 Imprint
PURE PERFORMANCE
276
Annual Report 2019 ↗ ADDITIONAL INFORMATION

THE PUMA SHARE
2019 2018 2017 2016 2015 2014 2013
End of year price € 68.35 42.70 36.30 24.97 19.87 17.26 23.50
Highest price listed € 72.95 52.50 39.14 24.97 21.29 23.50 24.94
Lowest price listed € 43.00 31.70 24.35 16.82 14.19 15.71 20.54
Daily trading volume (Ø) amount in thousands 387 444 67 34 94 72 111
Earnings per share € 1.76 1.25 9.09 4.17 2.48 4.29 0.36
Gross cash flow per share € 47.15 2.66 2.21 1.22 0.90 1.15 1.54
Free cash flow (before acquisitions) per share € 2.22 1.00 0.86 0.38 -0.66 0.42 0.33
Shareholders' equity per share € 12.84 11.52 11.09 11.53 10.84 10.83 10.02
Dividend per share € 0.50 0.35 1.25** 0.08 0.05 0.05 0.05
* Disclosures for the prior periods were adjusted retroactively to the 1:10 stock split carried out in the second quarter of 2019
** one/time special dividend
The PUMA share had a very positive performance in the financial year 2019. Theclosing price of PUMA shares on the last trading day in the financial year 2019(December 30) was € 68.35, which was 60.1% higher than the closing price of theprevious year. The market capitalization of the PUMA Group rose accordinglyfrom € 6.4 billion at the end of the financial year 2018 to € 10.2 billion at the endof the financial year 2019. PUMA shares started into 2019 at a price of € 42.70. Inthe following twelve months, the price ranged between € 43.00 (January 3, 2019 /+0.7%) and € 72.95 (October 15, 2019 / +70.8%).
In order to make the PUMA share more attractive for retail investors and thus toexpand the shareholder base, a 1:10 stock split was carried out on June 10, 2019.On that day, shareholders received nine additional shares for each share held.The share price was adjusted accordingly at a ratio of 1:10. Taking the stock splitinto account, the daily trading volume of PUMA shares decreased from an avera-ge of 444 thousand shares in the previous year to an average of 387 thousandshares in the financial year 2019.Compared to the MDAX, which rose 30.5% in the financial year 2019, the PUMAshare performed significantly better with an increase of 60.1%.
T.90 KEY DATA PAR SHARE*➔
277
Annual Report 2019 ↗ ADDITIONAL INFORMATION
01

G.05 PUMA SHARE PERFORMANCE / TRADING VOLUME➔
278
Annual Report 2019 ↗ ADDITIONAL INFORMATION
01
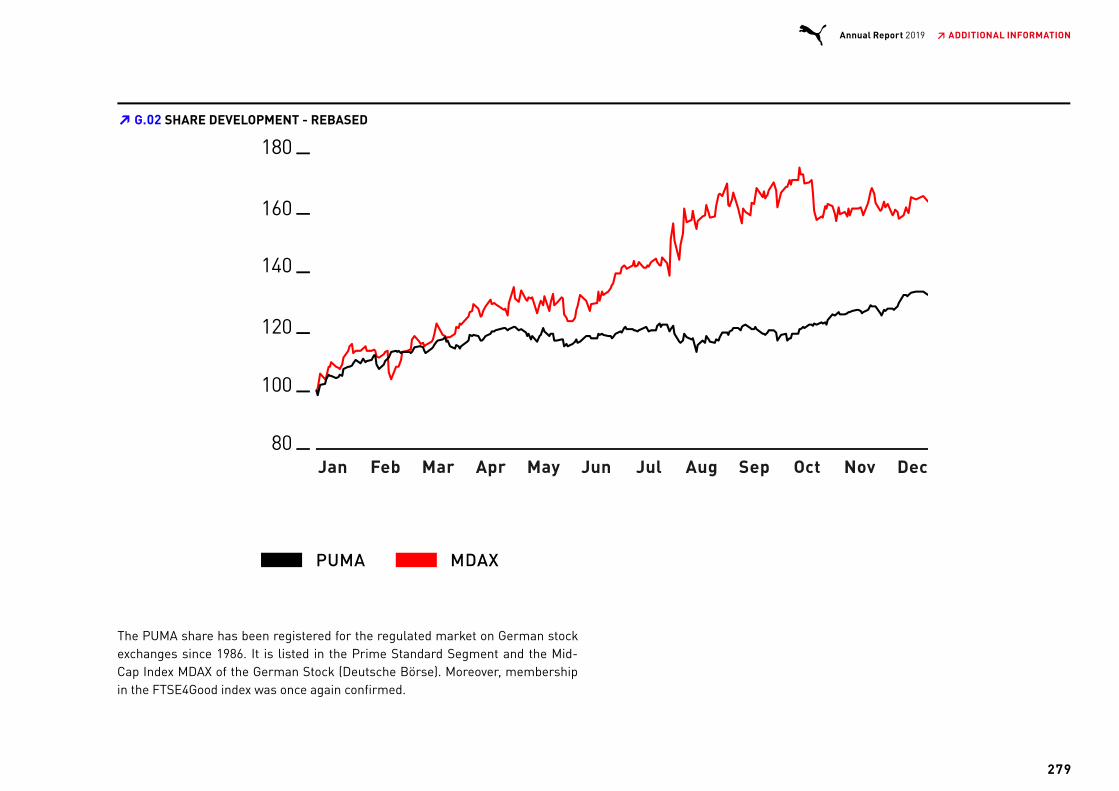
The PUMA share has been registered for the regulated market on German stockexchanges since 1986. It is listed in the Prime Standard Segment and the Mid-Cap Index MDAX of the German Stock (Deutsche Börse). Moreover, membershipin the FTSE4Good index was once again confirmed.
G.06 SHARE DEVELOPMENT - REBASED➔
279
Annual Report 2019 ↗ ADDITIONAL INFORMATION
02
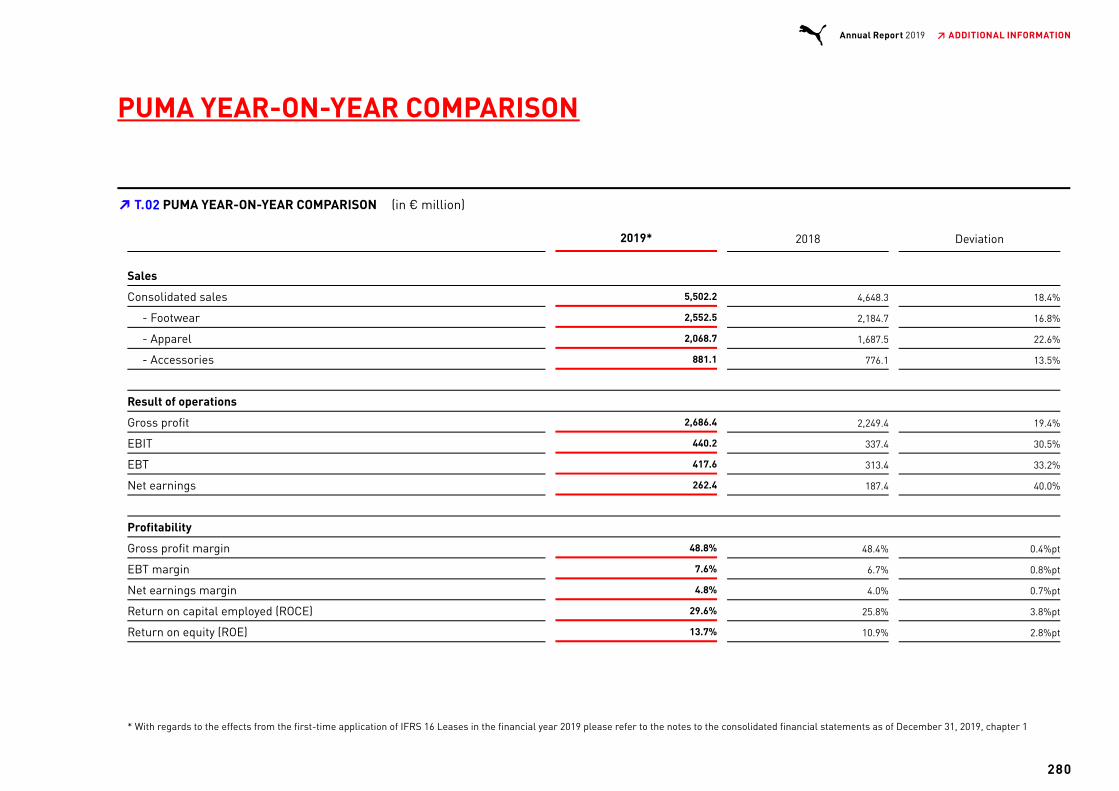
PUMA YEAR-ON-YEAR COMPARISON
2019* 2018 Deviation
Sales
Consolidated sales 5,502.2 4,648.3 18.4%
- Footwear 2,552.5 2,184.7 16.8%
- Apparel 2,068.7 1,687.5 22.6%
- Accessories 881.1 776.1 13.5%
Result of operations
Gross profit 2,686.4 2,249.4 19.4%
EBIT 440.2 337.4 30.5%
EBT 417.6 313.4 33.2%
Net earnings 262.4 187.4 40.0%
Profitability
Gross profit margin 48.8% 48.4% 0.4%pt
EBT margin 7.6% 6.7% 0.8%pt
Net earnings margin 4.8% 4.0% 0.7%pt
Return on capital employed (ROCE) 29.6% 25.8% 3.8%pt
Return on equity (ROE) 13.7% 10.9% 2.8%pt
* With regards to the effects from the first-time application of IFRS 16 Leases in the financial year 2019 please refer to the notes to the consolidated financial statements as of December 31, 2019, chapter 1
** Disclosures for the prior periods were adjusted retroactively to the 1:10 stock split carried out in the second quarter of 2019
T.91 PUMA YEAR-ON-YEAR COMPARISON (in € million)➔
280
Annual Report 2019 ↗ ADDITIONAL INFORMATION
**Die Angaben für die Vorjahre wurden rückwirkend an den Aktiensplit, der im 2. Quartal 2019 durchgeführt wurde, im Verhältnis 1:10 angepasst
02

2019* 2018 Deviation
Balance sheet information
Shareholders' equity 1,920.3 1,722.2 11.5%
- Equity ratio 43.9% 53.7% -9.8%pt
Working capital 549.4 503.9 9.0%
- in % of consolidated sales 10.0% 10.8% -0.9%pt
Cash flow and investments
Gross cash flow 704.8 398.0 77.1%
Free cash flow 330.0 172.9 90.9%
Investments (before acquisition) 218.4 130.2 67.7%
Acquisition investments 1.2 0.0 -
Employees
Number of employees (annual average) 13,348 12,192 9.5%
Sales per employee (k€) 412.2 381.3 8.1%
PUMA share**
Share price (in €) 68.35 42.70 60.1%
Average outstanding shares (in million) 149.52 149.47 0.0%
Number of shares outstanding as of Dec, 31 (in million) 149.55 149.51 0.0%
Earnings per share (in €) 1.76 1.25 40.4%
Market capitalization 10,222 6,384 60.1%
Average trading volume (amount/day) 386,863 443,855 -12.8%
* With regards to the effects from the first-time application of IFRS 16 Leases in the financial year 2019 please refer to the notes to the consolidated financial statements as of December 31, 2019, chapter 1
** Disclosures for the prior periods were adjusted retroactively to the 1:10 stock split carried out in the second quarter of 2019
281
Annual Report 2019 ↗ ADDITIONAL INFORMATION
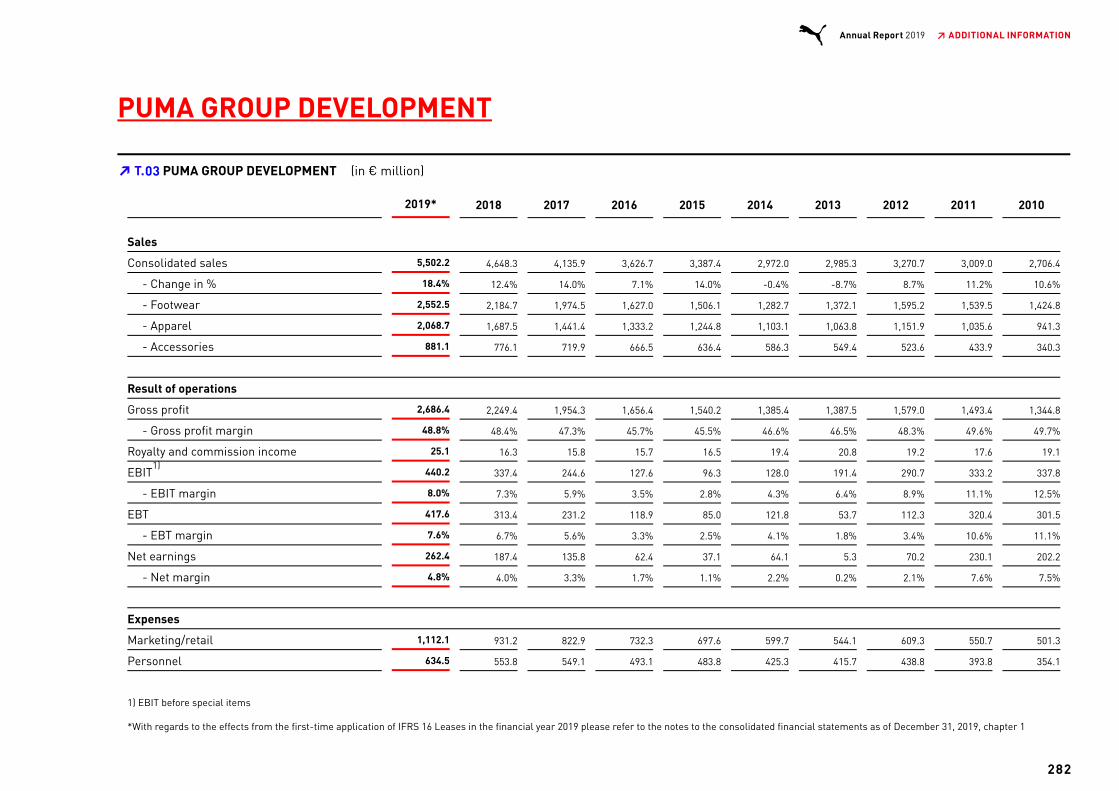
PUMA GROUP DEVELOPMENT
2019* 2018 2017 2016 2015 2014 2013 2012 2011 2010
Sales
Consolidated sales 5,502.2 4,648.3 4,135.9 3,626.7 3,387.4 2,972.0 2,985.3 3,270.7 3,009.0 2,706.4
- Change in % 18.4% 12.4% 14.0% 7.1% 14.0% -0.4% -8.7% 8.7% 11.2% 10.6%
- Footwear 2,552.5 2,184.7 1,974.5 1,627.0 1,506.1 1,282.7 1,372.1 1,595.2 1,539.5 1,424.8
- Apparel 2,068.7 1,687.5 1,441.4 1,333.2 1,244.8 1,103.1 1,063.8 1,151.9 1,035.6 941.3
- Accessories 881.1 776.1 719.9 666.5 636.4 586.3 549.4 523.6 433.9 340.3
Result of operations
Gross profit 2,686.4 2,249.4 1,954.3 1,656.4 1,540.2 1,385.4 1,387.5 1,579.0 1,493.4 1,344.8
- Gross profit margin 48.8% 48.4% 47.3% 45.7% 45.5% 46.6% 46.5% 48.3% 49.6% 49.7%
Royalty and commission income 25.1 16.3 15.8 15.7 16.5 19.4 20.8 19.2 17.6 19.1
EBIT 440.2 337.4 244.6 127.6 96.3 128.0 191.4 290.7 333.2 337.8
- EBIT margin 8.0% 7.3% 5.9% 3.5% 2.8% 4.3% 6.4% 8.9% 11.1% 12.5%
EBT 417.6 313.4 231.2 118.9 85.0 121.8 53.7 112.3 320.4 301.5
- EBT margin 7.6% 6.7% 5.6% 3.3% 2.5% 4.1% 1.8% 3.4% 10.6% 11.1%
Net earnings 262.4 187.4 135.8 62.4 37.1 64.1 5.3 70.2 230.1 202.2
- Net margin 4.8% 4.0% 3.3% 1.7% 1.1% 2.2% 0.2% 2.1% 7.6% 7.5%
Expenses
Marketing/retail 1,112.1 931.2 822.9 732.3 697.6 599.7 544.1 609.3 550.7 501.3
Personnel 634.5 553.8 549.1 493.1 483.8 425.3 415.7 438.8 393.8 354.1
1) EBIT before special items
*With regards to the effects from the first-time application of IFRS 16 Leases in the financial year 2019 please refer to the notes to the consolidated financial statements as of December 31, 2019, chapter 1
**Disclosures for the prior periods were adjusted retroactively to the 1:10 stock split carried out in the second quarter of 2019
T.92 PUMA GROUP DEVELOPMENT (in € million)➔
1)
282
Annual Report 2019 ↗ ADDITIONAL INFORMATION
03

2019* 2018 2017 2016 2015 2014 2013 2012 2011 2010
Balance sheet
Total assets 4,378.2 3,207.2 2,853.8 2,765.1 2,620.3 2,549.9 2,308.5 2,530.3 2,581.8 2,366.6
Shareholders' equity 1,902.3 1,722.2 1,656.7 1,722.2 1,619.3 1,618.3 1,497.3 1,597.4 1,605.2 1,386.4
- Equity ratio 43.4% 53.7% 58.1% 62.3% 61.8% 63.5% 64.9% 63.1% 62.2% 58.6%
Working capital 549.4 503.9 493.9 536.6 532.9 455.7 528.4 623.7 534.0 404.5
- thereof: inventories 1,110.2 915.1 778.5 718.9 657.0 571.5 521.3 552.5 536.8 439.7
Cash flow
Free cash flow 330.0 172.9 128.5 49.7 -98.9 39.3 29.2 -8.2 16.8 17.1
Investments (incl. acquisitions) 218.4 130.2 122.9 91.1 79.5 96.4 76.3 172.9 115.3 163.6
Profitability
Return on equity (ROE) 13.8% 10.9% 8.2% 3.6% 2.3% 4.0% 0.4% 4.4% 14.3% 14.6%
Return on capital employed (ROCE) 29.6% 25.8% 20.7% 10.3% 7.9% 11.5% 5.6% 8.6% 28.7% 31.7%
Additional information
Number of employees (year-end) 14,332 12,894 11,787 11,495 11,351 11,267 10,982 11,290 10,836 9,697
Number of employees (annual average) 13,348 12,192 11,389 11,128 10,988 10,830 10,750 10,935 10,043 9,313
PUMA share**
Share price (in €) 68.35 42.70 36.30 24.97 19.87 17.26 23.50 22.49 22.50 24.80
Earnings per share (in €) 1.76 1.25 0.91 0.42 0.25 0.43 0.04 0.47 1.54 1.35
Average outstanding shares (in million) 149.52 149.47 149.43 149.40 149.40 149.40 149.40 149.67 149.81 150.31
Number of shares outstanding as of Dec, 31 (inmillion) 149.55 149.51 149.46 149.40 149.40 149.40 149.40 149.39 149.35 149.81
Market capitalization 10,222 6,384 5,426 3,730 2,968 2,578 3,511 3,359 3,360 3,715
1) EBIT before special items
*With regards to the effects from the first-time application of IFRS 16 Leases in the financial year 2019 please refer to the notes to the consolidated financial statements as of December 31, 2019, chapter 1
**Disclosures for the prior periods were adjusted retroactively to the 1:10 stock split carried out in the second quarter of 2019
283
Annual Report 2019 ↗ ADDITIONAL INFORMATION

PUBLISHERPUMA SE
PUMA Way 1
91074 Herzogenaurach
Germany
+49 (0)9132 81-0
www.about.puma.com
CORPORATE COMMUNICATIONSKerstin Neuber
Senior Head of Communications
INVESTOR RELATIONSJohan-Philip Kuhlo
Head of Corporate Strategy &
Investor Relations
IMPRINT
PEOPLE & ORGANIZATIONDietmar Knoess
Global Director People & Organization
SUSTAINABILITYStefan Seidel
Head of Corporate Sustainability
BRAND DESIGNJan Hippchen
PHOTO CREDITSChristoph Maderer
Tom Ziora
Robert Ascroft
Benoît Peverelli
DESIGN AND REALISATION3st kommunikation GmbH
www.3st.de
284
Annual Report 2019 ↗ IMPRINT