SAIL AR Cover Final.cdr - BSE
196
-
Upload
khangminh22 -
Category
Documents
-
view
0 -
download
0
Transcript of SAIL AR Cover Final.cdr - BSE


Letter to Shareholders 02
Board of Directors 04
Ten years at a Glance 06
Directors’ Report 08
Management Discussion and Analysis Report 23
Standalone Financial Statements 29
Independent Auditors’ Report 80
Comments of C&AG 88
Secretarial Audit Report 89
Corporate Governance Report 91
Corporate Governance Certificate 97
Business Responsibility Report 98
Consolidated Financial Statements 104
Independent Auditors' Report on Consolidated 155
Financial Statements
Comments of C&AG on Consolidated 161Financial Statements
Statement containing salient features of the Financial 165Statement of Subsidiaries (Form AOC-1)
Extract of Annual Return (MGT-9) 167
Particulars of Loans, Guarantees or Investments under Section 186 176
SAIL Dividend Distribution Policy, 2017 177
Conservation of Energy, Technology Absorption, etc. 178
Report on Corporate Social Responsibility 184
Principal Executives 186
Notice 187
Proxy Form 192
Contents

2
Letter to Shareholders
Dear Shareholders,
I am privileged to address you once again and apprise you
about the achievements of your Company in the financial year
2016-17.
The World economic recovery is on track and a pickup in Global
growth presents a healthy sign for industrial and manufacturing
activities across globe. With Global output, as projected by
IMF, to grow by 3.5% in 2017 and 3.6% in 2018 on the back of
better performing emerging economies, we expect more
stability in the steel industry world-wide.
Meanwhile, India is projected to become the world's fifth largest
economy in 2017, surpassing UK and France and the world's
third largest economy by 2023, surpassing Japan and
Germany. India's GDP is projected to rise from USD 2.2 trillion
in 2016 to USD 3.6 trillion by 2020. This augurs well for
businesses that are focused on domestic growth in the future.
With suitable trade measures put in place by the Government
of India for providing a level playing field to the domestic steel
producers, the Indian steel industry could perform as per its
potential and India became a net expor ter of steel in FY
2016-17.
Given the current stage of development of the Indian economy
and the likely growth path for the Country's economy in the
next decade, the steel demand in India will witness significant
growth in future. India with its stable government, strong
reforms, rising infrastructure spend & robust consumption
demand will provide a platform to reach per capita steel
Dispatch of Parallel Flange Beams from SAIL's IISCO Steel Plant.

3
consumption of 160 kg & total steel capacity of 300 Million
tonnes by 2030-31 as envisaged by National Steel Policy 2017.
Your Company achieved a turnover of `49,180 crore during
2016-17, which is higher by 14% over previous year due to
increase in both sales volume (8%) as well as Net Sales
Realisation (NSR) of Saleable Steel of five Integrated Steel
Plants by about 6%. The increase in NSR was partly due to an
overall improvement in price levels and partly due to measures
in enriching Company's product mix. Your Company's intensive
focus on improving operational parameters resulted in positive
EBITDA in all four quarters of FY 2016-17 and your Company
trimmed losses by 30% by recording an overall improvement
in production, sales and efficiency.
As far as production performance is concerned, SAIL achieved
highest ever Hot Metal production at 15.73 Million Tonnes (MT),
Crude Steel production at 14.50 MT and Saleable Steel
production at 13.87 MT during FY 2016-17. There were all-
round improvements in the major techno-economic
parameters.
The unprecedented increase in coal prices during FY2016-17
however, adversely impacted the cost of production and overall
margins. During the year, there was an additional impact of
around ` 4,300 Crore as compared to FY 2015-16 on account
of increase in prices of both imported and domestic coal. This
increase in coal prices, neutralized the significant improvement
in Net Sales Realization (NSR). Notwithstanding the increase
in coal price, your Company could reduce its operational
expenditure per ton of saleable steel by 2% during the fiscal.
Your Company has almost completed its Modernization and
Expansion Programme (MEP). The state-of-the-ar t New
Universal Rail Mill at Bhilai Steel Plant (BSP) was inaugurated
by Hon'ble Steel Minister in January'17. This mill produces
World's longest single piece rail of 130 meters length and
supplies welded 260 mts rail panels to the Indian Railways.
With this capacity addition, BSP has the record of being the
single largest rail producing facility at one location in the World.
The already operational new facilities under the Modernization
and Expansion plan were ramped up during the year. New Blast
Furnace at Rourkela Steel Plant (RSP) achieved about 100%
of its capacity, whereas, other facilities like the New Plate Mill
also produced near to their rated capacities. The New 3 MTPA
Hot Strip Mill at RSP is also scheduled to be installed by 2018
and this will enlarge the basket of the value added products..
The new facilities at IISCO Steel Plant (ISP) have also been
ramped up significantly. The Wire Rod Mill of ISP will be soon
producing world class Wire rods in special grades to meet the
requirement of the Indian and Global Steel industries.
There has been significant value addition in the product mix of
the Company, with higher grades of steel like API X-70 from
RSP's New Plate Mill for the oil & gas sector, SAIL HT-600 for
the automotive sector and high strength LPG steel grade from
Bokaro Steel Plant, etc. Continuous product development
efforts are being made with intensive R&D efforts especially
from the new state of the art mills commissioned under the
Modernisation and Expansion Plan. Amongst the Indian steel
producers your company continues to be in the forefront in
R&D with the highest spending.
The products being manufactured by our new rolling mills have
been received well by the customers and it is our constant
endeavor to add more and more value added grades from these
mills. Products from the RSP NPM and BSL CRM-3 are being
well received in expor t markets too. In conjunction with
increased production, focus is being given to efficient and
strategic marketing for improving sales and realisations. More
emphasis is being given on last mile connectivity with the end
users, marketing in regions where we have natural freight
advantage, increasing retail & rural sales and leveraging the
brand image of SAIL.
We have launched a Companywide initiative with the help of
Boston Consulting Group (BCG) named 'SAIL Uday' for
improving our all-round performance. Cross functional teams
across plants, units and marketing have been formed and both
short and long term action plans have been formulated.
Implementation of various initiatives is already underway and
many benefits are expected to come in this fiscal itself.
Your Company continued its efforts of conducting operations
in an environmentally responsible manner. These have resulted
in reduction of emissions and discharge levels, increase in
utilization of solid wastes and green cover. Our efforts to plant
more trees continued during this year too.
Finally, I would like to take this opportunity to thank you as the
shareholders of the Company for your constant support and
trust. I would also like to thank our customers, suppliers, the
Central and the State Governments and our employees, who
have always stood by the Company and I look forward for
their continued support in the future.
(P.K Singh)
Chairman
Place: New Delhi
Dated: 11th August, 2017

4
Bankers
Axis Bank Limited
Bank of India
Bank of Baroda
Bank of Tokyo-Mitsubishi UFJ Limited
Barclays Bank PLC
Canara Bank
Corporation Bank
Deutsche Bank
HDFC Bank Limited
ICICI Bank Limited
IDBI Bank Limited
IndusInd Bank Limited
Jammu & Kashmir Bank Limited
Kotak Mahindra Bank Limited
Mizuho Bank
Punjab National Bank
State Bank of Hyderabad
State Bank of India
Sumitomo Mitsui Banking Corporation
United Overseas Bank
Vijaya Bank
Yes Bank Limited
Statutory Auditors
M/s. Singhi & Co.
Chartered Accountants
M/s. Chatterjee & Co.
Chartered Accountants
M/s. V.K. Dhingra & Co.
Chartered Accountants
M/s. A.K. Sabat & Co.
Chartered Accountants
Cost Auditors
M/s. R.J. Goel & Co.
Cost Accountants
M/s. Sanjay Gupta & Associates
Cost Accountants
M/s. Shome & Banerjee
Cost Accountants
Secretarial Auditor
M/s. Agarwal S. & Associates
Company Secretaries
Registered Office
Ispat Bhawan, Lodi Road, New Delhi-110003Phone: 24367481; Fax-24367015Internet: www.sail.co.inE.mail: [email protected]: L27109DL1973GOI006454
BOARD OF DIRECTORS (As on 11.08.2017)
Chairman and Managing DirectorShri P.K. Singh
Functional Directors
FinanceShri Anil Kumar Chaudhary
Raw Materials & LogisticsShri Kalyan Maity
Projects & Business Planning and Additional Charge of Director (Personnel)Dr. G. Vishwakarma
TechnicalShri Raman
CommercialMs. Soma Mondal
Government Directors
Shri Saraswati Prasad
Additional Secretary & Financial AdviserMinistry of Steel, Government of India
Shri Sunil Barthwal
Joint Secretary, Ministry of Steel,Government of India
Independent Directors
Shri P.K. Dash
Prof. Ashok Gupta
CA Parmod Bindal
Smt. Anshu Vaish
Dr. Samar Singh
Shri Nilanjan Sanyal
Chief Executive Officers (Permanent Invitees)
Rourkela Steel PlantShri Ashwini Kumar
Durgapur Steel PlantShri A.K. Rath
IISCO Steel PlantShri R.K. Rathi
Bhilai Steel PlantShri M. Ravi
Bokaro Steel PlantShri P.K. Singh
ED(F&A) and SecretaryShri M.C. Jain

5
6
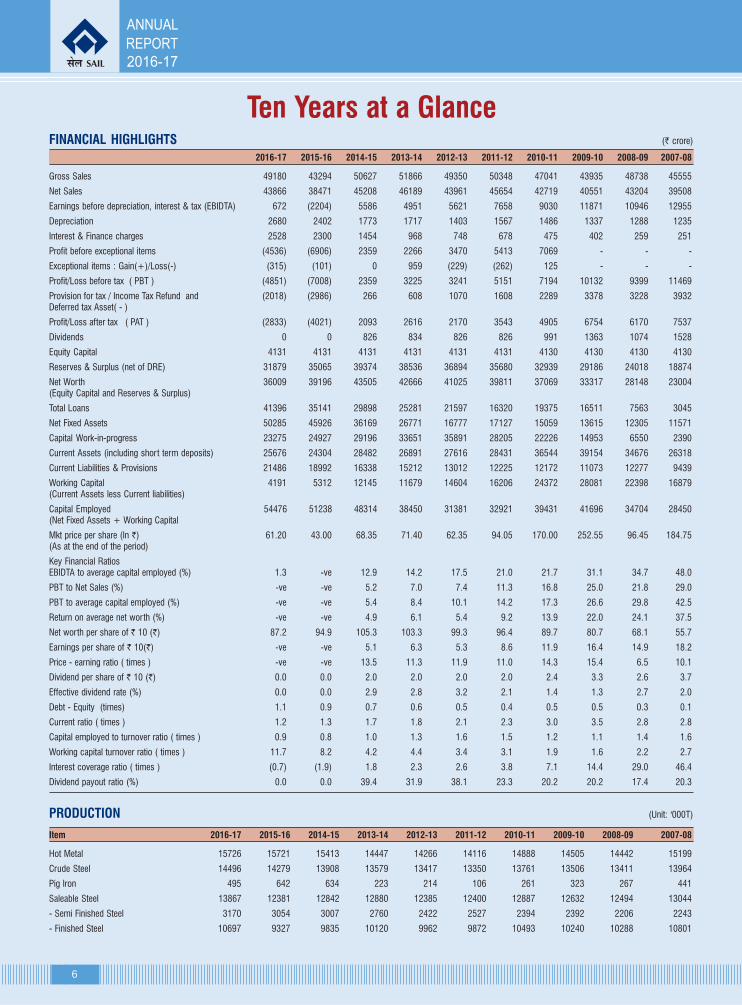
Ten Years at a GlanceFINANCIAL HIGHLIGHTS (` crore)
2016-17 2015-16 2014-15 2013-14 2012-13 2011-12 2010-11 2009-10 2008-09 2007-08
Gross Sales 49180 43294 50627 51866 49350 50348 47041 43935 48738 45555
Net Sales 43866 38471 45208 46189 43961 45654 42719 40551 43204 39508
Earnings before depreciation, interest & tax (EBIDTA) 672 (2204) 5586 4951 5621 7658 9030 11871 10946 12955
Depreciation 2680 2402 1773 1717 1403 1567 1486 1337 1288 1235
Interest & Finance charges 2528 2300 1454 968 748 678 475 402 259 251
Profit before exceptional items (4536) (6906) 2359 2266 3470 5413 7069 - - -
Exceptional items : Gain(+)/Loss(-) (315) (101) 0 959 (229) (262) 125 - - -
Profit/Loss before tax ( PBT ) (4851) (7008) 2359 3225 3241 5151 7194 10132 9399 11469
Provision for tax / Income Tax Refund and (2018) (2986) 266 608 1070 1608 2289 3378 3228 3932Deferred tax Asset( - )
Profit/Loss after tax ( PAT ) (2833) (4021) 2093 2616 2170 3543 4905 6754 6170 7537
Dividends 0 0 826 834 826 826 991 1363 1074 1528
Equity Capital 4131 4131 4131 4131 4131 4131 4130 4130 4130 4130
Reserves & Surplus (net of DRE) 31879 35065 39374 38536 36894 35680 32939 29186 24018 18874
Net Worth 36009 39196 43505 42666 41025 39811 37069 33317 28148 23004(Equity Capital and Reserves & Surplus)
Total Loans 41396 35141 29898 25281 21597 16320 19375 16511 7563 3045
Net Fixed Assets 50285 45926 36169 26771 16777 17127 15059 13615 12305 11571
Capital Work-in-progress 23275 24927 29196 33651 35891 28205 22226 14953 6550 2390
Current Assets (including short term deposits) 25676 24304 28482 26891 27616 28431 36544 39154 34676 26318
Current Liabilities & Provisions 21486 18992 16338 15212 13012 12225 12172 11073 12277 9439
Working Capital 4191 5312 12145 11679 14604 16206 24372 28081 22398 16879(Current Assets less Current liabilities)
Capital Employed 54476 51238 48314 38450 31381 32921 39431 41696 34704 28450(Net Fixed Assets + Working Capital
Mkt price per share (In `) 61.20 43.00 68.35 71.40 62.35 94.05 170.00 252.55 96.45 184.75(As at the end of the period)
Key Financial RatiosEBIDTA to average capital employed (%) 1.3 -ve 12.9 14.2 17.5 21.0 21.7 31.1 34.7 48.0
PBT to Net Sales (%) -ve -ve 5.2 7.0 7.4 11.3 16.8 25.0 21.8 29.0
PBT to average capital employed (%) -ve -ve 5.4 8.4 10.1 14.2 17.3 26.6 29.8 42.5
Return on average net worth (%) -ve -ve 4.9 6.1 5.4 9.2 13.9 22.0 24.1 37.5
Net worth per share of ` 10 (`) 87.2 94.9 105.3 103.3 99.3 96.4 89.7 80.7 68.1 55.7
Earnings per share of ` 10(`) -ve -ve 5.1 6.3 5.3 8.6 11.9 16.4 14.9 18.2
Price - earning ratio ( times ) -ve -ve 13.5 11.3 11.9 11.0 14.3 15.4 6.5 10.1
Dividend per share of ` 10 (`) 0.0 0.0 2.0 2.0 2.0 2.0 2.4 3.3 2.6 3.7
Effective dividend rate (%) 0.0 0.0 2.9 2.8 3.2 2.1 1.4 1.3 2.7 2.0
Debt - Equity (times) 1.1 0.9 0.7 0.6 0.5 0.4 0.5 0.5 0.3 0.1
Current ratio ( times ) 1.2 1.3 1.7 1.8 2.1 2.3 3.0 3.5 2.8 2.8
Capital employed to turnover ratio ( times ) 0.9 0.8 1.0 1.3 1.6 1.5 1.2 1.1 1.4 1.6
Working capital turnover ratio ( times ) 11.7 8.2 4.2 4.4 3.4 3.1 1.9 1.6 2.2 2.7
Interest coverage ratio ( times ) (0.7) (1.9) 1.8 2.3 2.6 3.8 7.1 14.4 29.0 46.4
Dividend payout ratio (%) 0.0 0.0 39.4 31.9 38.1 23.3 20.2 20.2 17.4 20.3
PRODUCTION (Unit: '000T)
Item 2016-17 2015-16 2014-15 2013-14 2012-13 2011-12 2010-11 2009-10 2008-09 2007-08
Hot Metal 15726 15721 15413 14447 14266 14116 14888 14505 14442 15199
Crude Steel 14496 14279 13908 13579 13417 13350 13761 13506 13411 13964
Pig Iron 495 642 634 223 214 106 261 323 267 441
Saleable Steel 13867 12381 12842 12880 12385 12400 12887 12632 12494 13044
- Semi Finished Steel 3170 3054 3007 2760 2422 2527 2394 2392 2206 2243
- Finished Steel 10697 9327 9835 10120 9962 9872 10493 10240 10288 10801

7
SHAREHOLDING PATTERN(AS ON 31.03.2017)
Category Number of Number of % of Equity
Holders Equity Shares
GOVERNMENT OF INDIA 1 3097767449 75.00
FINANCIAL INSTITUTIONS (INS. COS.) 11 471425760 11.41
BANKS 66 163196561 3.95
MUTUAL FUNDS 36 51402323 1.24
FOREIGN PORTFOLIO INVESTORS 120 175983209 4.26
GLOBAL DEPOSITORY RECEIPTS 2 117635 0.00
COMPANIES 2619 23860187 0.58(including Trusts & Clearing Members)
INDIVIDUALS 371194 146772165 3.56(including NRI & Employees)
TOTAL 374049 4130525289 100.00
VALUE ADDED STATEMENT
(` crore)
For the year 2016-17 2015-16
Value of own production 49598 43323
Other Revenues 1080 50678 1145 44468
Less: Cost of Raw Materials 21126 17155
Stores and Spares 2835 2889
Power and Fuel 5234 5334
Excise Duty 5314 4823
Freight Outward 1162 1131
Other Operating Cost 5702 41373 5726 37058
Total Value Added 9305 7410
Establishment Cost 8948 9715
Financing Cost 2528 2300
Corporate Income Tax -2018 -2986
Dividend Paid - 103
Dividend Tax - 21
Income Retained in Business
Depreciation 2680 2489
Retained in Business -2833 -153 -4232 -1743
Total Value Applied 9305 7410

8
DIRECTORS’ REPORT
To,
The Members,
The Board of Directors has the pleasure of presenting the 45th Annual Reportof Steel Authority of India Limited (SAIL, the Company) together with AuditedAccounts for the Financial Year ended 31st March, 2017.
A. FINANCIAL REVIEW
Your Company achieved a turnover of `49,180 crore during the Financial Year2016-17, which was higher by 14% over previous year due to increase inboth sales volume (8%) as well as Net Sales Realisation (NSR) of SaleableSteel of 5 Integrated Steel Plants by about 6%. The loss after tax of yourCompany for the Financial Year 2016-17 has reduced to `2,833 crore ascompared to loss after tax of `4,021 crore in the previous Financial Year.
The reduction in loss has been mainly on account of higher sales volume,higher Net Sales Realisation of 5 Integrated Steel Plants, higher production,increase in value added production, lower usage of imported coal in blend,higher usage of CDI in CDI furnaces, reduction in coke rate, improvement inBF productivity, reduction in salaries and wages, decrease in average purchasepower rate, foreign exchange gain, etc. However, the same has been partiallyoffset by increase in imported and indigenous coking coal prices, increase ininterest cost and depreciation.
SAIL continued its thrust on optimum utilisation of funds by better fundmanagement. This included replacement of high cost loans with low costdebts, timely repayment of loans including interest, action for future fund raising,etc. to meet our growth objectives. Further, the Company hedged the foreign
currency risk on Buyer's Credit and repayment of External CommercialBorrowings depending on market conditions. The Company had borrowingsof ̀ 41,396 crore as on 31st March, 2017. The debt equity ratio of the Companyincreased to 1.15:1 as on 31st March, 2017 from 0.90:1 as on 31st March,2016, due to increase in borrowings as well as reduction in net-worth duringthe year. The net-worth of Company declined substantially from ` 39,196crore as on 31st March, 2016 to `36,009 crore as on 31st March, 2017.
M/s CARE Ratings and M/s Brickwork Ratings, RBI approved credit ratingagencies, assigned 'CARE AA Outlook: Negative' and 'BWR AA+ Outlook:Stable' ratings respectively for SAIL's long term borrowing programme.
B. OPERATIONS REVIEW
Production Review
Financial Year 2016-17 has been a year full of challenges for your Company.The Company faced tough times amidst plunging steel prices, a flood of low-priced imports from China and other countries, unprecedented increase ininput prices and a subdued demand of steel.
The new facilities already operational were ramped up during the year. NewBlast Furnace at RSP achieved about 100% of its capacity, whereas, otherfacilities like New Caster and New Plate Mill were also in process of stabilizationand achieved 84% and 80% of their respective capacities during the year. Thenew facilities at IISCO Steel Plant have also been ramped up and the capacityutilization in Hot Metal, Crude Steel and Saleable Steel production was in therange of 50-70% of capacity during this year. At Bhilai Steel Plant, UniversalRail Mill (URM) (with capacity to produce World's longest single-piece 130-meter long rail) along with Rail Welding Line for production of 260 meter Long
The Prime Minister, Shri Narendra Modi at the Dhola-Sadiya Bridge, across River Brahmaputra, in Assam on May 26, 2017.

9
Rails, has been completed and the Mill has started regular production fromJan'17. Other facilities like Ore Handling Plant Part-A, 2nd Sinter Machine inSinter Plant-3 and Coke Oven Battery-11 are in regular operation. Further, Barline of Bar and Rod Mill (BRM) has been completed and hot trial of BRM hasstar ted in Mar'17. At IISCO, third converter(#1) in SMS was star ted inAugust'16.
Financial Year 2016-17 also witnessed several landmark achievements. YourCompany achieved highest ever Hot Metal production of 15.73 MillionTonnes(MT) surpassing its previous best of 15.72 MT achieved in 2015-16,highest ever Crude Steel production at 14.50 MT surpassing previous best of14.29 MT achieved in 2015-16 and highest ever Saleable Steel production at13.87 MT surpassing previous best of 13.04 MT achieved in 2007-08.
SAIL has achieved an all time best performance in case of Continuously-CastSteel and Sinter production, with production of 11.77 MT and 23.1 MTregistering a growth of 9% and 1% respectively over last year.
SAIL's various initiatives to reduce environmental footprint and enhanceoperational efficiency have led to significant improvement in environmentalparameters as well as techno-economic efficiency. This has enabled yourCompany to produce greener and more environmental friendly steel, than everbefore. The Plants recorded the best ever Coke Rate at 473 kg/thm and BFproductivity of 1.67 t/m3/day. This was achieved, as a result of higher volumeof Hot Metal produced through new state of art Blast Furnaces (29% of totalHot Metal) and increased Crude Steel production through energy efficientContinuous Casting route (81%, up by 5% over CPLY).
SAIL became true force in transforming the Nation by supplying steel to ISROfor the launch of a record 104 satellites in a single rocket by way of providinghigh quality stainless steel for the fuel and oxidizer tanks used in the launchvehicle. SSP had earlier supplied steel for the iconic Chandrayan and Mangalyanmissions too.
Power
Captive Power Generation during the Financial Year 2016-17 increased to820 MW from 785 MW in the previous year, with growth of 4.5%. About68.3% of the Company's total power requirement of 1200 MW was suppliedfrom Captive power generation, 30% by purchasing power from grid utilitiesand the balance 1.7% from Power Exchange through Open Access.
During the Financial Year 2016-17, with an objective to optimize power cost,SAIL Plants procured about 572 Million Units(MU) power through open accesswhich was highest ever in any year since open access regulations came intoeffect in the Country. Your Company was the first non-power entity to havestarted wheeling of power in the year 2004 after enactment of Electricity Act,2003. Out of the 572 MU, about 393 MU of captive power was wheeled fromNTPC SAIL Power Company Limited(NSPCL), Bhilai, a joint venture of SAILand NTPC Ltd. to RSP, SSP and CFP and the remaining 179 MU were purchasedfrom Power Exchange for RSP, VISP and SSP. Such power availed throughopen access helped in replacing costly grid power in the recipient Plants andresulted in substantial cost savings.
Grid power being the costliest source of power, there was continuous emphasison reduction in purchase of power from grid and Contract Demand with gridwas reduced by 48 MVA during the year, from the earlier level of 975 MW to927 MW, reduction by about 5% on year-on-year basis, though there wassubstantial increase in the production of saleable steel and commissioning ofnew facilities. Continuous efforts were made towards improvement in theperformance parameters of Captive Power Plants, both own as well as underjoint ventures. The performance of some of the Captive Power Plants underJoint Venture was better than the performance norms in the Country andimprovement in performance parameters helped in achieving considerablecost savings.
Your Company has always laid stress on reliability of power supply in itsPlants and strengthening of the power distribution system. Connectivity of
Union Minister for Steel, Shri Birender Singh, flagging-off the First rake of 260 metre rails, made from world’s longest 130 metre single rails at Universal Rail Mill, SAIL, Bhilai Steel Plant.

10
BSL with DVC grid at 220 KV level was commissioned during the year. Withthis, all the Integrated Steel Plants of SAIL are now connected with utility gridsat 220 KV level, which enhances the reliability of grid power supply and lowersthe tariff of grid power as well as open access charges for having gridconnectivity at such high voltages.
Captive power generation capacity is being augmented by capacity additionof 290 MW through NSPCL. Orders for supply and installation of Power Plantsof 1 x 250 MW at RSP and 2 x 20 MW at DSP were placed during the year.These Plants are expected to commence commercial operations during theFinancial Year 2019-20.
As a part of commitment towards development of renewable energy, yourCompany has already installed a capacity of 1070 KWp rooftop solar plants atvarious locations and 1 MWp grid interactive solar plant at RSP. Further actionsfor installation of 200 MWp capacity solar plants at various SAIL Plant locationshave also been initiated.
Raw Materials
During Financial Year 2016-17, total requirement of iron ore was met fromcaptive sources. The Company's captive iron ore mines produced about 26.44Million Tonnes(MT). However, in case of coking coal, about 19% requirement(2.91MT) was met from indigenous sources (Coal India Limited & captivesources) and for the balance requirement of coking coal (12.41 MT), theCompany has to depend on imports due to limitation in availability within theCountry. In the Financial Year 2016-17, production in captive collieries of theCompany was about 0.68 MT, out of which 0.54 MT was raw coking coal andbalance 0.14 MT of non coking coal. In case of fluxes, around 1.36 MT ofLimestone and 0.72 MT of Dolomite was produced giving a production of2.08 MT fluxes from captive sources. For thermal coal, your Company dependsentirely on purchases from Coal India Limited (CIL) except for small quantityproduced from captive mines.
In order to expedite capacity expansion projects of mines, following
environment and forest clearance have been obtained during the FinancialYear 2016-17:
• Environment Clearance(EC) for setting up of 3.5 million tonnes per annum(MTPA) capacity washery at Tasra was granted by MoEFCC on 30thMarch, 2017.
• Environment Clearance of the Dhobil Iron Ore mine has been amendedby MoEFCC on 19th April, 2017 for the limited purpose of continuation oftransportation of iron ore for further period of 5 years beyond 24th January,2017.
• MoEFCC vide letter dated 29th November, 2016 has revalidated the earlierEnvironment Clearance of Sitanala Coal block in favour of the Company.
• MoEFCC vide letter dated 06th December, 2016 transferred the EnvironmentClearance for Parbatpur Coal block to SAIL with a condition that "Nomining shall be carried out till the washery is operational".
However, the Stage-II forest clearances for the capacity expansions of Guaand Chiria mines and opening of South-Central Blocks in Kiriburu-Meghahatuburu mines in Saranda forest in Jharkhand are yet to be granted byMoEFCC. In view of its criticality to the capacity expansion projects, the matteris being actively pursued with the Government.
In view of promulgation of MMDR Amendment Act, 2015 and further issuanceof Mineral (Mining by Government Companies), Rules, 2015, lease period ofthe following leases have been extended:
• Lease period of ML-162 mining lease of Barsua Iron Ore Mine for an areaof 77.94 Ha. has been extended by Government of Odisha vide Orderdated 5th July, 2016. Under the said Rules, the first lease is deemed tobe granted for 50 years i.e. from 29th April, 1960 to 28th April, 2010 andfurther lease period is extended for another period of 20 years from 29th
April, 2010 to 28th April, 2030. Lease Amendment Agreement in this regardwas signed on 29th September, 2016.
Reclaimer in operation at SAIL’s Bolani Iron Ore Mine.

11
• Lease period of the Nandini Limestone Mine of BSP for the area of 526.34Ha. has been extended by Government of Chhattisgarh till 31st March,2028. Lease Amendment Agreement in this regard was signed on22nd March, 2017.
Government of Chhattisgarh vide Order dated 25th June, 2016 has extendedthe lease period of Hirri Dolomite Mine of BSP for an area of 128.77 Ha. underChhattisgarh Minor Minerals Rules, 2015 till 31st March, 2020. LeaseAmendment Agreement in this regard was signed on 22nd March, 2017.
Sales & Marketing
In-spite of the challenging market conditions, your Company achieved a totalsales volume of 13.1 million tonnes during the Financial Year 2016-17,registering a growth of about 13% over the previous financial year. With regardto Dealer Sales, record sales of around 0.82 million tonnes were achievedduring the Financial Year 2016-17, thereby registering a growth of 3% over2015-16. In respect of exports, 0.67 million tonnes were exported, whichwere higher by over 200% as compared to the previous year.
Your Company achieved highest ever despatches of Long Rails(260m panels)to Indian Railways with a growth of 11.1% over the previous year. Further,181 numbers of Narrow Guage Forged wheels were specially manufacturedand supplied for maintenance of the Kalka-Shimla Railway Line, a UNESCOdeclared World Heritage Site.
Your Company was the main supplier of steel in construction of the Country'slongest bridge "Dhola-Sadiya" built on river Lohit in Assam, connecting theStates of Assam and Arunachal Pradesh. SAIL has supplied around 30,000tonnes (90%) of steel comprising TMT, Structurals and Plates, for thisprestigious project built under public private partnership. The bridge being9.15 km in length, is 3.55 km longer than Mumbai's Bandra-Worli Sea Link.
Public Procurement Policy for Micro and Small Enterprises
As required by the Public Procurement Policy of the Government of India, theinformation on procurement from Micro & Small Enterprises during FinancialYears 2016-17 and 2015-16 is given below:
(` Crore)
Particulars 2016-17 2015-16
Total Amount of Procurement 3246.42 3211.93
Total Procurement from MSE 767.04 677.53
%age Procurement from MSE 23.63 21.09
Modernisation & Expansion Programme
Your Company is nearing towards the last leg of implementation of on-goingModernisation & Expansion Programme. During the Financial Year 2016-17,your Company has achieved many milestones. At Bhilai Steel Plant, NewUniversal Rail Mill for supply of 130 m rail, World's longest single piece rail,has been commissioned and welded 260 m rail panels are being dispatchedto Railways. Hot trial in Bar & Rod Mill has been carried out. Heating of stovesof Blast Furnace-8 has also been started. A capital expenditure of `4,939crore has been incurred during Financial Year 2016-17 and capex planned for2017-18 is `3,500 crore.
The details of Addition, Modification & Replacement (AMR) Schemes underimplementation are given in the Management Discussion & Analysis (MD&A)Report.
C. HUMAN RESOURCE MANAGEMENT REVIEW
Your Company recognizes contribution of its Human Resources in providing itthe competitive advantage. The Company has achieved its present level ofexcellence through investment in its human resource, where skill and knowledgeconstitute the basis of every initiative - be it technology or innovation.Developing skills and capabilities of employees to improve manpower utilizationand labour productivity is the key thrust area of Human Resource Management(HRM) in the Company.
Your Company provides an environment conducive for learning, encouragesadoption of best practices in every area and nurtures creativity and innovationamong employees. Human Resource initiatives in SAIL are focused ondeveloping team spirit, employee empowerment and their involvement invarious improvement activities. Strategic alignment of HRM to businesspriorities and objectives has facilitated smooth transition to state-of-the-arttechnology in the Modernization and Expansion Projects.
Enhanced Productivity with Rationalized Manpower
Your Company achieved the Labour Productivity (LP) of 320 TCS/Man/Year in2016-17. The manpower strength of the Company was 82,964 nos. as on31.3.2017 with manpower rationalization of 5,691 achieved during the year.The enhanced productivity with rationalized manpower could be achieved asa result of judicious recruitments, building competencies and infusing a senseof commitment and passion among employees to go beyond and excel. Togive further thrust for enhancing productivity and manpower rationalization,your Company has recently introduced Voluntary Retirement Scheme-2017w.e.f. 15th June, 2017. Trend of enhanced productivity and manpowerrationalization since 2007-08 onwards is depicted below:
Developing Employee Capabilities & Competencies
Your Company believes that people's development is the key for overall growthand training facilitates the development of employee's knowledge and skills,so that the resultant advancement of competence contributes towardsattainment of organisation's goals and objective. SAIL has been makingsustained efforts through various training and development activities with focuson preservation, transfer and improvement of skills, knowledge and technologyin collaboration with reputed organizations and development of effectivemanagerial competencies in association with premier institutes.
Preparing employees for tomorrow, for effectively taking up challenges anddischarging new roles and responsibilities was given a major thrust. Overall36,059 employees were trained against target of 34,822 employees duringthe year on various contemporary, technical and managerial modules.
Harmonious Employee Relations
SAIL has maintained its glorious tradition of building and maintaining aconducive and fulfilling employee-employer relations environment. The healthypractice of sorting out and settling issues through discussions with tradeunions/workers' representatives enabled the Company in ensuring workers'participation at different levels and establishing a peaceful IR climate. Someof the bi-partite forums are functioning since early seventies and are sufficientlyempowered to address different issues related to wage, safety, and welfare ofworkers, arising from time to time, thus helping in establishing a conducivework environment.
Bipartite forums like National Joint Committee for Steel Industry (NJCS), JointCommittee on Safety, Health & Environment in Steel Industry (JCSSI) etc.with representation from major central Trade Unions as well as representative

12
Unions of Plants/Units meet on periodic basis and jointly evolverecommendations/ action plans for ensuring a safe & harmonious work culturewhich gets substantiated from the harmonious Industrial Relations enjoyedover the years by SAIL Plant/Units, marked with diverse work culture at multi-locations.
In addition, Quality Circles, Suggestion Schemes, Shop Welfare Committees,Safety Committee, Canteen Management Committee, Productivity Committee,etc. also offer multiple avenues for enhanced workers' participation. Workersare also kept abreast of strategic business decisions and their views soughtthereon through structured /interactive workshops.
Communication with employees at various levels on a wide range of issuesimpacting the Company's performance as well as those related to employees'welfare is done in a structured manner across the Company. Masscommunication campaigns are undertaken at CEO / Senior Officers' levelinvolving structured discussion with large group of employees. Theseinteractive sessions help employees to align their working with the goals andobjective of the Company leading to not only higher production and productivitybut also enhance the sense of belongingness of the employees.
Grievance Redressal Mechanism
Effective internal grievances redressal machinery has been evolved andestablished in SAIL Plants and Units, separately for executives and non-executives. Joint grievance committees have been set up at Plant/Unit levelfor effective redressal of grievances.
SAIL Plants/Units are maintaining 3 stage grievance handling system andemployees are given an opportunity at every stage to raise grievances relatingto wage irregularities, working conditions, transfers, leave, work assignmentsand welfare amenities, etc. Majority of grievances are redressed informally inview of the participative nature of environment existing in the steel plants. Thesystem is comprehensive, simple and flexible and has proved effective inpromoting harmonious relationship between employees and management.
Against 402 staff grievances received during the Financial Year 2016-17 with1 grievance pending from previous year, 387 staff grievances have beendisposed off during the year, achieving 96.03% fulfilment.
Further, during Financial Year 2016-17, 1144 grievances have been receivedunder Centralised Public Grievance Redress and Monitoring System(CPGRAMS) while 17 grievances had been carried forward from the previousfinancial year. Total 1139 grievances have been disposed off during FinancialYear 2016-17, thereby achieving fulfilment rate of 98.10%. All the grievances
have been disposed off within 30 days of its receipt against the stipulatedtime of 60 days.
Remuneration Policy
In SAIL, pay and other benefits for executives is based on the PresidentialDirectives issued by Ministry of Steel, Government of India. The last pay revisioneffective from 01/01/2007 was done in accordance with Presidential Directivesdated 05/10/2009. In aforementioned pay revision, variable pay in the form ofPerformance Related Pay (PRP) has been introduced for executives. The PRPis based on the performance / profitability of the Company as well as individualperformance rating based on Key Performance Areas(KPAs) aligned to theorganization objectives. In case of Non-executive employees, the salaries andwages are finalized / revised in bipartite forum of National Joint Committee forSteel Industry (NJCS). The last NJCS agreement was finalized and signed on01.07.2014, effective from 01.01.2012. In terms of notification issued by theGovernment of India, the provisions of section 197 of the Companies Act,2013 are not applicable to Government Companies. As such, the disclosuresto be made in the Board's Report on the remuneration of Directors and otherprescribed details are not included in this Report.
Initiatives for Socio-economic Development of SCs /STs & Other Weaker
Sections of the Society
SAIL follows Presidential Directives on Reservation for Scheduled Castes (SCs)and Scheduled Tribes (STs) in the matter of recruitments and promotions. Ason 1.4.2017, out of total manpower of 82964, 13604 belong to SCs (16.40%)and 12018 belong to STs (14.49%).
SAIL Plants and Units including Mines are situated in economically backwardregions of the Country with predominant SC/ST population. Therefore, SAILhas contributed to the overall development of civic, medical, educational andother facilities in these regions. Some of the contributions are:
• Over the years, a large group of ancillary industries has also developed inthe vicinity of Steel Plants. This has created oppor tunities for localunemployed persons for jobs and development of entrepreneurship.
• For jobs of temporary & intermittent nature, generally contractors deployworkmen from the local areas, which again provide an opportunity foremployment of local candidates of economically weaker section.
• Establishment of SAIL Steel Plants in economically backward areas hasgiven a fillip to the economic activities thus benefiting the supportpopulation providing different types of services.
Employees at SAIL’s Bhilai Steel Plant

13
• Steel Townships developed by SAIL have the best of medical, educationand civic facilities and are like an oasis for the local Scheduled Castes,Scheduled Tribes and other population who share the fruits of prosperityalong with SAIL.
SAIL has undertaken several initiatives for the socio-economic developmentof SCs/STs and other weaker sections of the society which are mainly asunder:
• Special Schools have been started exclusively for poor, underprivilegedchildren at five integrated steel plant locations. The facilities providedinclude free education, mid-day meals, uniforms including shoes, textbooks, stationery items, school bags, water bottles and transportation insome cases.
• No tuition fee is charged from SC/ST students studying in the Companyrun schools, whether they are SAIL employees' wards or non-employees'wards.
• Free medical health centres for poor have been set up at Bhilai, Durgapur,Rourkela, Bokaro, Burnpur providing free medical consultation, medicines,etc. to the peripheral population mainly comprising of SC/ST and weakersections of society.
• SAIL Plants have adopted tribal children. They are being provided freeeducation, uniforms, textbooks, stationery, meals, boarding, lodging andmedical facilities for their overall growth at residential hostels, SarandaSuvan Chhatravas, Gyanodaya Hostel and an exclusive Gyan Jyoti Yojanafor nearly extinct Birhor Tribe.
• For Skill Development and better employability, tribal school passoutshave been sponsored for coaching in premier institutes for IIT/JEE entranceexaminations and for trainings along with monthly stipend,accommodation, transportation and fooding facility at various ITIs, Nursingand other vocational training institutes.
Implementation of Presidential Directives on Reservation for SC/ST
• Liaison Officers have been appointed as per Presidential Directives for
due compliance of the Orders and instructions pertaining to reservationfor SCs/STs/OBCs at Plants/Units of SAIL.
• SC/ST Cell is functioning in all of the main Plants/Units. A memberbelonging to SC/ST community is associated in all DPCs/SelectionCommittees. A sufficiently senior level officer of SC/ST category isnominated for the purpose as per the level of the Recruitment Board /Selection Committees/DPC.
• Internal workshops for Liaison Officers for SC/ST/OBC and other dealingofficers of SAIL Plants/Units are conducted at regular intervals throughan external expert to keep them updated on the reservation policy for SC/ST and other related matters.
• Plants/Units of SAIL have SC/ST Employees' Welfare Associations whichconduct regular meetings with Liaison Officers on implementation ofreservation policy & other issues. In addition, an Apex level umbrellabody namely SAIL SC/ST Employees Federation also exists in SAIL torepresent the issues of SC/ST Employees in a coordinated manner. Ameeting with the Federation at the level of Director (Personnel) is organisedon a regular basis.
Implementation of Right to Information Act, 2005
The provisions under the Right to Information Act, 2005 (RTI Act) are beingcomplied by all Plants and Units of SAIL. All statutory reports including AnnualReport are being sent to Ministry of Steel and also being uploaded on thewebsite of the Company. Your Company has appointed Public InformationOfficers(PIO)/Asstt. Public Information Officers and Appellate Authorities andTransparency Officer under Section 5 and Section 19(1) of the RTI Act in eachPlant and Unit for speedy redressal of the queries received under the Act.Under Sec.5(5), all the officers/ line managers responsible for providinginformation to the PIO are called Deemed PIO and are made equally responsibleas PIO, towards timely provision of information to the applicant.
An exclusive RTI Portal has been developed with link available on the websiteof the Company. All the Plants/Units have listed 17 manuals and details ofAuthorities under the Act are uploaded on the website of the Company. Quarterly
ITI Students undergoing tarining at SAIL’s ITI at Bokaro.

14
Returns and Annual Returns on implementation of RTI Act are being submittedonline through the CIC portal. Implementation of online request has alreadybeen introduced from 1st May 2015. A compilation of Record Retention Policyof various functions of Corporate Office has also been uploaded on the websiteof the Company. In addition to this, compilations of important decisions ofCIC, DOPT circulars and High Court cases are also available on the website ofthe Company.
Awareness Programs/Workshops on 'Obligation of Public Authorities underRTI' are being organised across Plants/Units and Information Commissionerhas been present in most of these programs. Further, Awareness Programmeson RTI Act are held at Plant, Units and Corporate Office regularly.
SAIL received a total of 3,564 applications and 612 appeals under RTI Act,2005 during the Financial Year 2016-17, all of which have been disposed offwithin the stipulated time frame under the Act. CIC has also taken up 82 casesand most of these cases were disposed off in favour of the Company.
Citizen Charter
Your Company is totally committed to excellence in public service deliverythrough good governance, by a laid down process of identifying citizens, ourcommitment to them in meeting their expectations and our communication tothem of our key policies, in order to make the service delivery process moreeffective.
SAIL's Citizen Char ter has outlined commitment of SAIL towards itsstakeholders, thereby empowering them to demand better products andservices. Objectives of the Citizen's Charter of SAIL may be summarized asbelow:
• Ensuring citizen-centric focus across all its processes by adopting TotalQuality Management principles for improvement of products and services.
• Ensuring effective citizen communication channels.
• Demonstrating transparency and openness of its business operations byhosting the Citizen's Charter on the Corporate website.
• Working towards delight of citizens, by fail-safe processes and in case ofexigencies leveraging its service recovery processes, like GrievanceRedressal, Handling Complaints, etc.
Disclosure under the Sexual Harassment of Women at Workplace
(Prevention, Prohibition and Redressal) Act, 2013:
The Company has in place a system of Complaints Committees (under SAILConduct, Discipline and Appeal (CDA Rules, 1977) in line with the requirementsof the Sexual Harassment of Women at the Workplace (Prevention, Prohibitionand Redressal) Act, 2013. These Committees have been set up to redresscomplaints received regarding sexual harassment. All employees of theCompany are covered under these Rules. The following is a summary of sexualharassment complaints received and disposed off during the year 2016-17:
Number of complaints received : 5
Number of complaints disposed off : 6(including 1 pending of previous year)
D. AWARDS & ACCOLADES WON DURING THE YEAR
Company Level
• Your Company has won 7 Prime Minister's Shram Awards (involving 26employees) for the year 2015.
• Your Company has won 10 Vishwakarma Rashtriya Puraskar Awards(involving 42 employees) for the performance year 2015.
• Your Company has won Gold Trophy of "SCOPE Meritorious Award forBest Practices in Human Resource Management" for the year 2014-15.
• Your Company has won Golden Peacock Award for Corporate Governance,by the Institute of Directors, India, for the year 2016.
• Your Company bagged the Governance Now PSU Award 2016 under theaward category 'Relative Growth & Adaptation'.
• Your Company was awarded the Ispat Rajbhasha Trophy for the year2014-15 for SAIL's best official language implementation.
Bhilai Steel Plant
• CII-Exim Bank Business Excellence Award 2016 organized by the CIIInstitute of Quality.
• Excellence Award in the category of Integrated Steel Plants under Iron &Steel Sector for the year 2015-16, in the State Level Sustainable EnergyAwards-2016 by Chhattisgarh State Renewable Energy DevelopmentAgency (CREDA).
• Vayoshreshtha Samman for the "Best Public Sector Organization inPromoting the Well Being and Welfare of Senior Citizens" on the occasionof International Day for Older Persons at Vigyan Bhawan, New Delhi on1st October, 2016.
• NARAKAS Bhilai-Durg bagged the "Madhya Kshetriya Pratham Puraskar"for the year 2015-16.
• Best Chapter Award for QCFI Bhilai Chapter in the event "NCQC-2016"held in Raipur for significant contribution towards Quality propagation.
• 17 Quality Circle Teams won awards (15 Par Excellence and 2 Excellence)from QCFI during their 30th National Convention on Quality Concepts.
Durgapur Steel Plant
• 10 Quality Circle Teams won awards (8 Par Excellence and 2 Excellence)from QCFI during their 30th National Convention on Quality Concepts.
Rourkela Steel Plant
• CII EXIM Bank Business Excellence Award for Strong Commitment toExcellence for the year 2015-16.
• Coal & Coke Zone and Steel and CCM Zone bagged 'Zero Fatality' awardsfor the years 2015 and 2016 respectively from the Joint Committee onSafety, Health & Environment in the Steel Industry (JCSSI).
• 8 Quality Circle Teams won awards (6 Par Excellence and 2 Excellence)from QCFI during their 30th National Convention on Quality Concepts.
Bokaro Steel Plant
• Golden Peacock HR Excellence Award for the year 2016
• Gold Award in Training Excellence Category at the 6th Annual GreentechHR Award for the year 2015-16.
• Energy Management Depar tment, First Prize in CII (ER) ProductivityAwards 2016.
• 6 Quality Circle Teams won awards (1 Par Excellence and 5 Excellence)from QCFI during their 30th National Convention on Quality Concepts.
Visvesvaraya Iron & Steel Plant
• Ispat Suraksha Puraskar for 'No fatal accident occurred during the CalendarYears 2015 & 2016 under Scheme-II, Group (B) (Special Steel Plant)' byJoint Committee on Safety, Health & Environment in the Steel Industry.
• Ispat Suraksha Puraskar for 'No fatal accident occurred involving ContractLabour during the Calendar Years 2015 & 2016 under Scheme-II, Group(B) (Special Steel Plant)'by Joint Committee on Safety, Health &Environment in the Steel Industry.
Salem Steel Plant
• Ispat Suraksha Puraskar for 'No fatal accident' during the Calendar Year2016 under Scheme-II, Group (B) (Special Steel Plant).
• Ispat Suraksha Puraskar for 'No fatal accident' involving Contract Labourduring the Calendar Year 2016 under Scheme-IV Group (B) (Special SteelPlant).
• National Award for the Empowerment of Persons with Disabilities-2016.(Best Employee with Disabilities under Hearing Impairment Category) fromHon'ble President of India on 03.12.2016 at Vigyan Bhawan, New Delhi.

15
Raw Materials Division
• 8 Quality Circle Teams won awards (5 Par Excellence and 3 Excellence)from QCFI during their 30th National Convention on Quality Concepts.
Research & Development Centre for Iron & Steel
• National G-cube (Good Green Governance) Award 2016 at Delhi on EarthDay, 22nd April, 2016.
E. ENVIRONMENT MANAGEMENT
Your Company is commited to conduct operations in an environmentallyresponsible manner to comply with applicable legal and other requirementsrelated to the environmental aspects. The environmental vision of the Companyis drawn from the tenets of the Policy which not only stresses on the need toremain in compliance but also to strive to go beyond, address stakeholderconcerns, and communicate Company's environmental philosophy to all thestake holders.
Improvement in Emissions and Discharges
Concerted efforts have been put over the last few years with a view to conductvarious operations in an environment friendly manner. These have resulted inreduction of emissions and discharge levels, increase in utilization of solidwastes and green cover. The Plants are effectively maintaining the air pollutioncontrol devices and regularly up-grading them in order to maintain the normswhich are becoming stringent day by day. Through continuous efforts, thespecific Particulate Matter (PM) emission load from the major stacks hasreduced by more than 12% in the last five years. Moreover, as a part of theon-going expansion cum modernisation projects, state of the art technologiesare being installed to further bring down the pollution level and CO
2 emission.
During the last five years, the specific CO2 emission has been reduced by
more than 5%.
Water pollution level at the Steel Plants are taken care by effective utilisation ofthe installed Effluent Treatment Plants (ETPs) at various shops, rejuvenationof the existing water re-circulation systems and recycling of used water forother operational purposes. The treated effluent from the ETPs, are then let outthrough the outfalls outside the Plant boundary only after meeting the stipulated
norms of effluent discharge. The specific effluent load of the discharges havereduced by more than 21% in the last five years. The quality of dischargesthrough the outfalls has remained well within the stipulated norms at all thePlants.
Major Pollution Control facilities installed during the year
• Secondary emission control facility, equipped with dog house and ESPsfor new converter (#3) at SMS-2 of RSP.
• Comprehensive Effluent Treatment Plant at the existing Hot Strip Mill ofRSP.
• Primary emission control facility with Converter#5 of SMS-1 at RSP.
New Initiatives
a. Use of Weathered LD Slag as Rail Track Ballast
The physical proper ties of Weathered LD Slag (WLD Slag) meet thespecification required for stone ballast for use as rail track ballast. In responseto a proposal by the Company, South Eastern Railway (SER) has agreed toconduct a field trial at the Bokaro Rail Yard with the WLD Slag from BSL. Fieldtrial in association with SER has started from June 2015, at Ispat Nagar RailwayYard, Bokaro. Inspections of the track parameters are being carried out jointlyby the representatives of the SER and SAIL, on monthly basis, which shallcontinue for a total period of about two years.
b. Bio-sequestration of CO2
Job assigned to M/s. Tropical Forest Research Institute, as the sequestrationpartner for the project which is being implemented at RSP. The followingactivities have been completed till the Financial Year 2016 -17:
• Vegetation survey, identification of high carbon sequestering species,training, development of nursery at site.
• Submission of repor ts for Biodiversity, Soil Organic Carbon, SoilCharacterisation and on quantification of existing total carbon stock invegetation, deadwood and litter.
Scheduled completion of the project is by March 2019.
Eco restoration with plantation at Purnapani mines.

16
Environmental Management System linked with ISO-14001:2004
Environmental Management System (EMS) linked to ISO-14001 is a set ofprocesses and practices that enable an organization to reduce its environmentalimpacts and increase its operating efficiency. Implementation of EMS hashelped the Plants and Mines to ensure that their performance remain withinthe regulatory requirements.
During the Financial Year 2016-17, implementation of EMS-ISO-14001:2004was completed at the CMO Warehouses at Bangalore and Bokaro.
Sustainable Development Projects
• Eco-restoration of mined out areas: As a part of the on-going SustainableDevelopment Project on long term maintenance of ecologically restored250 acre Limestone mined out area and 200 acre water body of minevoid at PLDQ, Purnapani, more than 10,000 saplings of different nativeplant species and more than 2000 saplings of medicinal plants wereplanted during the year.
• Training was provided to around 100 villagers (mostly from tribalcommunity) from Purnapani and neighbouring villages on practicing ofsilviculture, apiculture, pisciculture, etc.
Plantation
Your Company realizes the role of plantation in overall environmentalmanagement initiatives. It is a well-known fact that plants play an importantrole in the eco system and function as a carbon sink. Extensive afforestationprogramme has been religiously followed in all the Plants and Mines over thepast few decades. Around 2.10 lakhs saplings were planted in and aroundSAIL Plant and Mines during the year 2016-17.
Other Environmental Efforts
• Your Company observed January 2017 as Water Conservation Month,with the objective to reduce water consumption by 25%, through variousawareness programmes and workshops.
• Corporate Sustainability Report, 2015-16, in accordance with 'core option'of GRI's G4 Guidelines has been published through in-house resourcesand has been up-loaded on the website of the Company.
• For the first time a third par ty compliance audit for environmentalperformance was conducted at BSP. The consultant M/s. Bhagvati AnaLabs Pvt. Ltd. Hyderabad (a Bureau Veritas Group Company), a NABETaccredited agency, has submitted the report within the schedule time.
F. STRATEGIC INITIATIVES OF THE COMPANY
Your Company has adopted a multi-pronged approach that includes organicgrowth, brown-field projects, technology leadership through strategic alliances,
ensuring raw material security by developing new mines, diversifying in alliedareas, etc. In line with the above approach, SAIL has formed Joint VentureCompanies in different areas viz. power generation, rail wagon manufacturing,slag cement production, securing coking coal supplies from indigenous aswell as imported sources, etc. New initiatives are currently being explored inareas such as outsourcing of power distribution and educational facilities inSAIL townships, forged roll manufacturing, etc. The status of Strategic Initiativestaken by your Company in the recent past includes the following:
SAIL has undertaken a company-wide transformational and turnaroundprogramme, "SAIL Uday", supported by M/s. Boston Consulting Group (BCG),one of the top global consulting firm, covering improvements for all functionsin the Plants and Units, while reviewing and sharpening our business strategyand processes. BCG shall study the present health of the Company and suggestsuitable measures for its turnaround. The "SAIL Uday" initiative is expected todrive the Company towards profitability as well as build for sustained marketleadership.
Disinvestment of SAIL Plants: The Cabinet Committee on Economic Affairs(CCEA) in its meeting held on 27.10.2016 has 'in-principle' decided for strategicdisinvestment of Alloy Steels Plant (ASP), Durgapur; Visvesvaraya Iron andSteel Plant (VISP), Bhadrawati; and Salem Steel Plant (SSP), Salem. Theprocess is being carried out with the help of Advisors (Transaction Advisor,Legal Advisor and Asset Valuer).
Development of Rowghat - Jagdalpur Rail Corridor in the State of
Chhattisgarh: With the aim of bringing about greater socio-economicdevelopment of the backward areas of Bastar region in Chhattisgarh and tofurther the industrial progress and mining activities of the region, an MOUwas signed amongst SAIL, NMDC Ltd., IRCON International Ltd. andGovernment of Chhattisgarh, in May 2015 for development of a rail corridorfrom Rowghat to Jagdalpur. This rail corridor shall be used for both freightand passenger services in the Southern part of Chhattisgarh. A new JointVenture Company under the name "Bastar Railway Private Limited" has beenincorporated in May, 2016. The survey work & feasibility study for Railwayline is being undertaken by IRCON.
Rail Transportation: A Joint Venture Company(JVC) between SAIL and RITESviz. "M/s. SAIL RITES Bengal Wagon Industry Pvt. Ltd. (SRBWIPL)" has beenformed for manufacture and rehabilitation of railway wagons. The JVC hascommenced commercial operations at its factory at Kulti, West Bengal andOrders from Railways are being executed.
JV with ArcelorMittal for production of automotive steel: In line with Makein India programme of Govt. of India, SAIL and ArcelorMittal signed an MOU inMay, 2015 to explore the possibility of setting up an automotive steelmanufacturing facility under a Joint Venture (JV), in India. The proposed JVwill construct a state-of-the-art Cold Rolling Mill (CRM) and other downstream
Felicitation of proud recipients of Vishwakarma Rashtriya Puraskar Winners - 42 out of the total 117 awardees for the year 2014 (awarded in 2016) are from SAIL.
17
finishing facilities in India that will offer technologically advanced steel productsto India's rapidly growing automotive sector. Joint Task Force of SAIL andArcelorMittal is working on feasibility study, location of unit and businessmodel for the alliance. Based on the outcome of Joint Study, definitiveagreements for setting up the JV Company shall be entered into.
Ultra Mega Steel Project: With the aim to develop large capacity mega steelprojects in the Country, which would help India in achieving the capacity growthof 300 million tonnes of crude steel, Ministry of Steel has evolved a conceptof developing Ultra Mega Steel Plants. SAIL is participating for setting up of anUltra Mega Steel Plant of capacity (3+3) or (4+2) MTPA (million tonnes perannum) in Bastar, Chhattisgarh. An MoU to this effect was signed amongstSAIL, NMDC, Ministry of Steel and Government of Chhattisgarh in May, 2015,at Dantewada in the presence of Hon'ble Prime Minister. New Joint VentureCompanies for Steel SPV and Mining SPV have been formed. MECON hassubmitted a report for probable sites for the steel plant. Activities related toland acquisition, land development, etc. would be initiated after the iron oremine is leased to the Mining SPV by the State Government.
Business Excellence Initiatives
Excellence Model
SAIL has adopted European Foundation of Quality Management (EFQM) Modelwhich is implemented in India through CII-EXIM Bank Award for BusinessExcellence. BSP has been awarded the PRIZE (Score of 600+) consecutivelyfor the second year. Amongst PSUs, BSP is only the second PSU ever to beawarded the Prize. It is also the only PSU to receive the PRIZE twice. In steelarena, BSP has been the only steel maker ever to have achieved this coveteddistinction twice in a row.
Total Quality Management (TQM)
Most of SAIL Plants/Units of your Company are certified to ISO 9000, ISO14000, OHSAS 18000 and SA 8000 Management Systems. DSP & BSL havealso implemented ISO 50000 (Energy Management System). In addition toother Management Systems, DSP, BSL & RDCIS have also implemented ISO
270000 (Information Security System). Following Certifications were achievedduring 2016-17:
• BSL - ISO : 27000 ISMS certification.• RSP - New Plate Mill certified to ISO 9000 QMS.
The Certification Agencies for four Management Systems i.e. ISO 9000, ISO14000, OHSAS 18000 & SA 8000 were empanelled in 2013 for three yearsfor first time. The system resulted in reduction in cost, reduction in audit man-days, ease of operation in engaging Certification Agencies, improved qualityof audits and reduced administrative hassles. Second cycle of empanelmentfor three years has been completed with an extended scope which includesManagement System related to training, in addition to the Certification for theManagement Systems mentioned above. With a view to enhance awarenessof Business Excellence Initiatives, sharing of Knowledge and Best Practices3rd Annual e-BE Journal was prepared and uploaded on Portal. The otherongoing initiatives across organisation are Quality Circles, 5-S, Six Sigmaand TPM implementation.
IT Related Initiative
Your Company has embarked upon various Information Technology (IT)initiatives, duly aligned with its business goals and vision to maintain itscompetitive position in the marketplace.
Through Enterprise Resource Planning (ERP), the best global practices in allmajor functions like procurement, sales and distribution, production, finance,etc. have been implemented at 4 Integrated Steel Plants i.e. BSP, DSP, BSL &RSP and Central Marketing Organization. ERP implementation at IISCO SteelPlant and at Corporate Office for SAIL wide data consolidation throughintegration of all Plants/Units is in progress. Better market reach andtransparency has been achieved through Supplier Relation Management (SRM)/e-Procurement. SAIL has also been able to connect with customers throughCustomer Relationship Management. Seamless integration of IT drivenautomation applications has led to the evolution of an organisation-wideinformation backbone with better control and faster execution of variousprocesses.
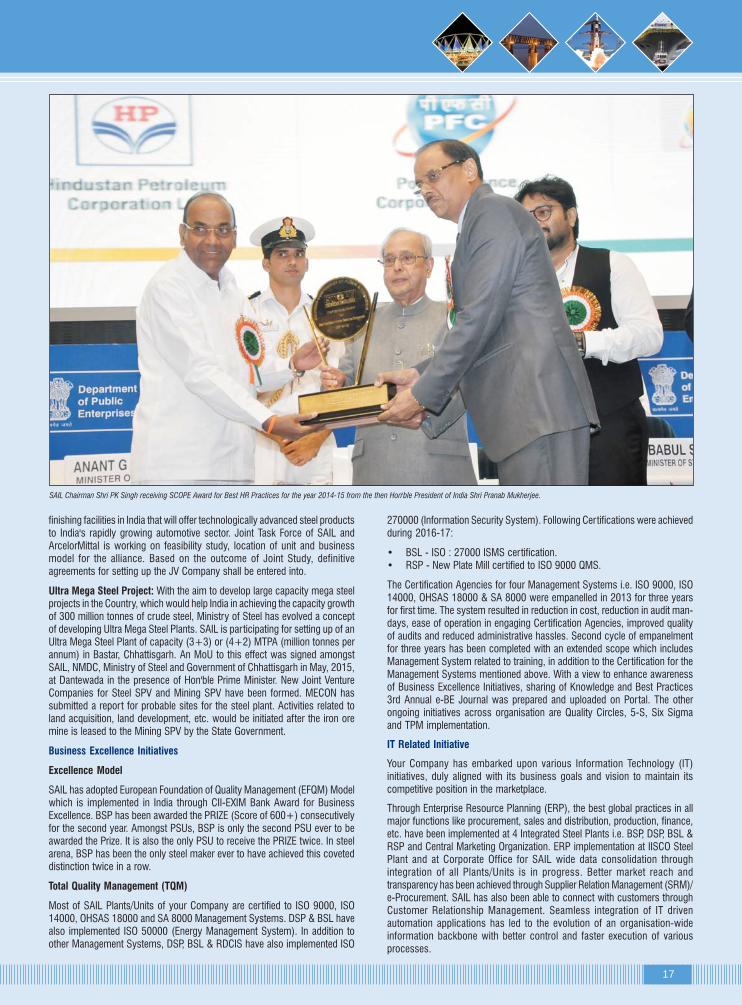
SAIL Chairman Shri PK Singh receiving SCOPE Award for Best HR Practices for the year 2014-15 from the then Hon'ble President of India Shri Pranab Mukherjee.

18
Production data has its roots in the strong foundation of 'ManufacturingExecution Systems' (MES) which has benefitted SAIL in achieving the marketexpectations by making the production and the associated processes cost,quality and delivery efficient.
Various steps have been taken up to promote 'Digital India Initiative' and systemsare being upgraded to maximize paperless/cashless transactions in business/employee welfare areas. As a step forward, various mobile applications arealso being developed.
Utmost care is being taken for internal financial control for protection andsecurity of data & information. To ensure data security, steps have been takenat all Plants/Units for Information Security Management System (ISMS):ISOcertification.
For better face to face discussions and reduction in tour & travel expenses,existing Video Conference system has been upgraded to High Definition Systemalong-with strengthening network bandwidth connecting all Plants & Units ofthe Company.
Corporate Communication
Your Company recognizing the need for continuous efforts required for brandbuilding and maintaining streamlined internal and external communications,undertook various new and innovative efforts during 2016-17.
Your Company actively participated in a number of exhibitions & fairs includingIndia Steel Expo, BRICS Summit, Vibrant Gujarat, India Maritime Summit, IndiaInternational Trade Fair, CSR Fair, etc. Also, 2017 marks “70 years of IndoRussia Friendship” and in this regard, SAIL took part in the India Sourcing Fairwhich was held in St. Petersburg. These events saw massive participation ofsenior dignitaries of the Government of India, public & private sector, andindustrial participants from around the globe. Brand building exercises alsoincluded a number of initiatives to connect with stakeholders through news,web, phone alerts, media features, daily news summaries, etc.
Advertising in different media formats including print, outdoor, television, mobileand internet has been a major focus of corporate communication activities atSAIL. In line with your Company's strategy, SAIL's advertising and visibilityefforts, across different formats, highlight use of SAIL steel in projects ofnational importance apar t from showcasing the core features of SAIL'sproducts, which stand for quality, durability, endurance, dependability andnation building.
G. VIGILANCE ACTIVITIES
The objective of SAIL Vigilance is to facilitate an environment enabling peopleto work with integrity, efficiency and in a transparent manner, upholding highestethical standards for the organization. To achieve this objective, the VigilanceDepartment carries out preventive, proactive and punitive actions with greateremphasis in the preventive and proactive functions. Following activities wereundertaken during the Financial Year 2016-17:
• To increase vigilance awareness amongst employees, vigilance awarenesssessions and workshops were regularly held at the various Plants andUnits. A total of 143 workshops involving 2938 participants were organizedfor enhancing Vigilance Awareness on Whistle Blower Policy, Purchase/Contract procedures, RTI Act, Conduct & Discipline Rules, System andProcedures followed in SAIL, etc.
• Periodic surprise checks including Joint Checks were conducted regularlyin vulnerable areas of the Company. A total of 2531 periodic checksincluding file scrutiny and Joint Checks were conducted at different Plants /Units. A saving of approx. `23.81 crores accrued from the preventivevigilance activities mainly on account of these surprise checks.
• Vigilance provides vital inputs to the operating authorities for improvingthe prevailing systems for bringing about more transparency. Accordingly,eight major System Improvement Projects (SIPs) were undertaken atdifferent Plants/Units of SAIL.
• 19 cases were taken up for Intensive Examination at different Plants /Units. During these Intensive Examinations, high value procurement /contracts are scrutinized comprehensively and necessaryrecommendations are forwarded to concerned depar tments forimplementing suggestions for improvement.
• As per the Guidelines of Central Vigilance Commission, VigilanceAwareness Week was observed in SAIL during 31st October to 5thNovember, 2016. On the opening day i.e. 31st October 2016, Pledgewas administered to the employees by Chairman, SAIL and CVO, SAIL atCorporate Office and by respective Chief Executives at Plants / Units.During the week, a booklet on "Preventive Vigilance- Do's & Don'ts" and16th edition of "Inspiration", the in-house journal of SAIL Vigilance werereleased. Various events including talk by eminent personalities, essay/debate/quiz competitions, etc. for employees/ families, interaction with
India’s longest road bridge, the 9.5 kilometre long Dhola Sadiya, built with SAIL Steel.

19
vendors/contractors were also organized across SAIL. In addition, as anoutreach measure, essay/debate/poster competitions were organisedamongst students of various schools / colleges located at varioustownships and the cities like Delhi, Kolkata, Chennai, etc. Events likeWalkathon / March against Corruption were organised at DSP, Durgapur& VISL, Bhadrawati, wherein general public, students, NGOs alsoparticipated. Detailed report on observance of Vigilance Awareness Week-2016 has been sent to CVC.
• The following three thrust areas were identified by SAIL Vigilance:
i) Implementation of e-procurement in Contract Cell (Works & Non-works) including Township Contracts.
ii) Installation of CCTV cameras at sensitive areas.
iii) Surveillance in the areas of receipt, sampling & testing of high valueraw materials.
• With a view to introduce analytics in the areas of procurement &contracting, in order to generate exception aler ts and red flags forcorrective action / system improvements, Business Intelligence (BI)Modules have been developed in the existing SAP/ERP system inIntegrated Steel Plants and Central Marketing Organisation.
• A Vendors' Meet was organized on "Success through Synergy" at NewDelhi on 16th July, 2016. The programme was chaired by Chairman,SAIL where IEMs of SAIL, CVO SAIL and Functional Directors of SAILwere present. Around 33 senior Management Executives from global /indigenous Vendors for Projects and Corporate Material ManagementGroup attended the programme.
• Certain vulnerable points were identified in the Plants/Units such as weighbridges, dispatch and unloading points, entry and exit points for goods,places of sampling and chemical analysis of received materials, etc., onthe advice of SAIL Vigilance. CCTV and allied data recording systemshave been installed at these places for monitoring and surveillance, whichwould help in preventing fraudulent activities at the above sensitive areas.
• It has been decided to introduce GPRS/GPS system for monitoring themovement of tippers /dumpers which are to be used by contractors for
transportation of Iron Ore to railway sidings which are at far-awaylocations. The fleet monitoring system has been introduced in Kalta IronOre Mines and is being extended to other mines.
• 'Inspiration- Prerna', an in-house publication of SAIL Vigilance is beingpublished regularly. The above publication contains case studies, articlesfrom eminent personalities, quiz on policy matters, etc. to enhanceawareness of the readers.
Vigil Mechanism
The Company has adopted Vigil Mechanism for conducting the affairs in a fairand transparent manner by adopting highest standards of professionalism,honesty, integrity and ethical behaviour. All employees of the Company andDirectors on the Board of the Company are covered under this Mechanism.This Mechanism has been established for employees to report concerns aboutunethical behaviour, actual or suspected fraud or violation of Code of Conduct.It also provides for adequate safeguards against the victimization of employeeswho avail the Mechanism and allows direct access to the Chairperson of theAudit Committee in exceptional cases.
MANAGEMENT DISCUSSION AND ANALYSIS REPORT
As per the SEBI(Listing Obligations and Disclosure Requirements) Regulations,2015, Management Discussion and Analysis Report covering the performanceand outlook of the Company is attached and forms part of the Annual Report.
AUDITORS' REPORT
The Statutory Auditors' Report on the Accounts of the Company for the FinancialYear ended 31st March, 2017 along with Management's replies thereon isplaced at Annexure-I. The Comments of Comptroller and Auditor General ofIndia (C&AG) on the accounts of the Company for the Financial Year ended31st March, 2017 under Section 143(6) of the Companies Act, 2013 and theManagements’ replies thereto are placed at Annexure-II.
COST AUDITORS
Pursuant to the direction of the Central Government for Audit of Cost Accounts,the Company has appointed M/s. Sanjay Gupta & Associates, New Delhi,M/s. Shome & Banerjee, Kolkata and M/s. R.J. Goel & Co., New Delhi as CostAuditor(s) for the Financial Year 2017-18.
Employees at New Plate Mill of SAIL's Rourkela Steel Plant.

20
SECRETARIAL AUDITOR'S REPORT
In terms of the provisions of Section 204 of the Companies Act, 2013, theBoard of Directors have appointed M/s. Agarwal S. & Associates, CompanySecretaries, as the Secretarial Auditor to conduct Secretarial Audit of theCompany for the Financial Year ended on 31st March, 2017. Secretarial AuditReport is placed at Annexure-III.
With regard to the observation of the Secretarial Auditor, that composition ofthe Board of Directors of the Company was not in compliance with Regulation17(1) of Securities and Exchange Board of India (Listing Obligations &Disclosure Requirements) Regulations, 2015 and Clause 3.1.4 of the DPEGuidelines on Corporate Governance for Central Public Enterprises, it is statedthat appointment of Independent Directors on the Board of the Company ismade by the Company based on nomination by Government of India. TheCompany has requested Ministry of Steel, Government of India for nominationof requisite number of Independent Directors on its Board.
In respect of observation regarding performance evaluation of the Directorsbeing not carried out as per the Regulation 17(10) & 25(4) of Securities andExchange Board of India (Listing Obligations and Disclosure Requirements)Regulations, 2015, it is mentioned that Ministry of Corporate Affairs has videits notification dated 5th June, 2015 has exempted Government Companiesfrom the provisions of the Companies Act, 2013 which, inter-alia, providesthat Sub Sections (2), (3) & (4) of Section 178 regarding appointment,performance evaluation and remuneration shall not apply to Directors of theGovernment Companies. Fur ther, the Ministry of Corporate Affairs videnotification dated 5th July, 2017 has notified certain amendments in ScheduleIV of the Companies Act, 2013 relating to Code for Independent Directors. Asper the notification, the clauses relating to evaluation of performance of Non-Independent Directors, Chairperson and Board in Schedule IV have beenexempted for Government Companies.
CORPORATE GOVERNANCE
In terms of SEBI (Listing Obligations and Disclosure Requirements) Regulations,2015, a Report on Corporate Governance and Auditors' Certificate thereonform part of the Annual Report. In terms of the SEBI Regulations, the Boardhas laid down a Code of Conduct for all Board Members and SeniorManagement of the Company. The Code of Conduct has been posted on thewebsite of the Company. All the Board Members and Senior ManagementPersonnel have affirmed compliance with the Code.
BUSINESS RESPONSIBILITY REPORT
As per Regulation 34(2)(f) of the SEBI(Listing Obligations and DisclosureRequirements) Regulations, 2015, the Business Responsibility Repor tdescribing the initiatives taken by the Company from Environmental, Socialand Governance perspective forms part of the Annual Report.
SUBSIDIARIES, JOINT VENTURES AND ASSOCIATES
IISCO-Ujjain Pipe and Foundry Company Limited, a wholly owned subsidiaryof the erstwhile Indian Iron and Steel Company Limited (IISCO), was orderedto be wound up by BIFR. The Official Liquidator is continuing its liquidationprocess.
Your Company has four other subsidiary Companies namely, SAIL RefractoryCompany Limited (SRCL), SAIL Jagdishpur Power Plant Limited, SAIL SindriProjects Limited and Chhattisgarh Mega Steel Limited. SRCL is operating theSalem Refractory Unit which was acquired by SAIL from Burn StandardCompany Limited on 16th December, 2011. SAIL Jagdishpur Power PlantLimited, incorporated for setting up of Gas based power Plant at Jagdishpurand SAIL Sindri Projects Limited, incorporated for revival of Sindri Unit ofFertilizer Corporation of India Limited have not taken off. Under present situation,the objectives with which these Companies were incorporated are difficult toachieve, hence the Board of Directors of your Company has decided to closeSAIL Jagadishpur Power Plant Limited and SAIL Sindri Projects Limited. Furtheractions for closure of these Companies are being taken. Chhattisgarh MegaSteel Limited which was incorporated as a Special Purpose Vehicle for settingup of an Ultra Mega Steel Plant of 6 Million Tonnes per annum as a green fieldsteel project under Joint Venture is yet to commence operation.
The Annual Accounts of the subsidiary Companies and related detailedinformation shall be made available to the Shareholders of the holding and
subsidiary companies, seeking such information at any point of time. Further,the Annual Accounts of the subsidiary companies are available for inspectionby any Shareholder in the Registered Office of the Company and of theSubsidiary Companies concerned between 11 AM to 1 PM on working days.A hard copy of the details of accounts of subsidiaries shall be furnished to theshareholders on receipt of written request.
CONSOLIDATED FINANCIAL STATEMENTS
Pursuant to provisions of Section 129 (3) of the Companies Act, 2013, theduly Audited Consolidated Financial Statements are placed at Annexure-IV.The Statutory Auditors' Report on the Consolidated Financial Statements alongwith the Management's replies thereon is placed at Annexure-V. The Commentsof Comptroller and Auditor General of India (C&AG) on the ConsolidatedFinancial Statements of the Company for the Financial Year ended 31st March,2017 and the Management's replies thereto are placed at Annexure-VI. Further,the statement containing salient features of the financial statements of thesubsidiary, joint venture and associate companies in the prescribed Form AOC-1 is placed at Annexure -VII.
EXTRACT OF ANNUAL RETURN
The Extract of Annual Return in Form MGT-9 as per the provisions of theCompanies Act, 2013 and Rules prescribed therein is placed at Annexure-VIII.
BOARD MEETINGS
During the year, 12 meetings of the Board of Directors of the Company wereheld, the details of which are given in the Corporate Governance Report formingpart of the Annual Report.
AUDIT COMMITTEE
The Audit Committee of the Board was initially formed by the Company in1998. The Audit Committee has been reconstituted from time to time in termsof the SEBI Regulations and Companies Act, 1956/2013. The minutes of theAudit Committee meetings are circulated to the Board, discussed, and takennote of. The composition and other details pertaining to the Audit Committeeare included in the Corporate Governance Report.
INTERNAL FINANCIAL CONTROLS (IFCs) AND ITS ADEQUACY
The Company has well established and documented policies and proceduresfor ensuring the orderly and efficient conduct of business, including adherenceto various policies and procedures for safeguarding its assets, prevention anddetection of frauds and errors, accuracy and completeness of the accountingrecords and timely preparation of reliable financial disclosures. Further, theCompany has adopted a corporate governance structure, various managementprocesses, controls, policies and guidelines that drive the organization towardsits business objective, while also satisfying various stakeholders' needs.
Some of your Company's robust protocols such as independent internal audit,well drafted and documented policies, guidelines, procedures, regular reviewby Audit Committee / Board, etc. helps in compliance of Internal FinancialControls under the Companies Act, 2013, SEBI (LODR) Regulations, 2015,etc. Your Company is commited to the highest standards of CorporateGovernance where the Board is accountable to all stakeholders for reportingeffectiveness of Internal Financial Controls (IFCs) and its adequacy. CorporateGovernance has been carried out in accordance with the Companies Act,2013 and SEBI (LODR) Regulations, 2015, etc.
DIRECTORS' RESPONSIBILITY STATEMENT
Pursuant to Section 134(3)(c) of the Companies Act, 2013, the Directorsstate that:
(i) in the preparation of the Annual Accounts, the applicable AccountingStandards have been followed along with proper explanation relating tomaterial departures;
(ii) the Directors have selected such Accounting Policies and applied themconsistently and made judgments and estimates that are reasonable andprudent so as to give a true and fair view of the state of affairs of theCompany at the end of the Financial Year and of the profit or loss of theCompany for that period;

21
(iii) the Directors have taken proper and sufficient care for the maintenanceof adequate Accounting Records in accordance with the provisions ofthe Act for safeguarding the assets of the Company and for preventingand detecting fraud and other irregularities;
(iv) the Directors have prepared the Annual Accounts on a Going-Concernbasis;
(v) the Directors have laid down internal financial controls to be followed bythe Company and that such internal financial controls are adequate andare operating effectively; and
(vi) the Directors have devised proper systems to ensure compliance withthe provisions of all applicable laws and that such systems are adequateand operating effectively.
INDEPENDENT DIRECTORS' DECLARATION
In terms of Section 149(7) of the Companies Act, 2013, necessary declarationhas been given by each Independent Director stating that he/she meets thecriteria of independence as provided in sub-section (6) of Section 149 of theCompanies Act, 2013.
PARTICULARS OF LOANS, GUARANTEES OR INVESTMENTS UNDER
SECTION 186
The details of Loans, Guarantees, Investments given during the Financial Yearended on 31st March, 2017 are given in Annexure-IX. in compliance with theprovisions of Section 186 of the Companies Act, 2013 read with Companies(Meetings of Board and its Powers) Rules, 2014.
PARTICULARS OF CONTRACTS OR ARRANGEMENTS WITH RELATED
PARTIES REFERRED TO IN SUB-SECTION (1) OF SECTION 188
All the contracts / arrangements / transactions entered by the Company duringthe Financial Year 2016-17, with the related parties were in the ordinary courseof business and on an arm's length basis. The transactions with the relatedparties have been disclosed in the financial statements. Therefore, particularsof contracts or arrangements with related parties referred to in Section 188(1)along with the justification for entering into such contract or arrangement inForm AOC-2 do not form part of the Report.
DIVIDEND DISTRIBUTION POLICY
In terms of the Regulation 43A of SEBI(Listing Obligations and DisclosureRequirements) Regulations, 2015, the Board of Directors of the Company hasadopted Dividend Distribution Policy and the same is given at Annexure-X tothis Report. The Policy has also been uploaded on the website of the Companywww.sail.co.in.
CONSERVATION OF ENERGY, TECHNOLOGY ABSORPTION AND FOREIGN
EXCHANGE EARNINGS AND OUTGO
In accordance with the provisions of Section 134(3)(m) of the CompaniesAct, 2013 read with Rule 8 of the Companies(Accounts) Rules, 2014, theparticulars relating to Conservation of Energy, Technology Absorption andForeign Exchange Earnings and Outgo are given in Annexure-XI to this Report.
RISK MANAGEMENT POLICY
Enterprise Risk Management (ERM) is a strategic business discipline thatsupports the organization's objectives by addressing full spectrum of its risksand managing the combined impact of those risks as an inter-related riskportfolio. The Risk Management Policy of your Company was approved bythe Board much before the same became a statutory requirement and sincethen, the risk management in SAIL has grown and developed in line with internaland external requirements. The Policy provides guidance for the managementof the business risks across the organisation. It focuses on ensuring that therisks are identified, evaluated and mitigated within a given time frame on aregular basis.
Currently, the architecture of Enterprise Risk Management in SAIL comprisesa well-designed multi-layered organization structure, with each Plant/Unithaving its own perceived Risks which are under the constant monitoring bythe Risk Owners / Risk Champions who frame and implement the mitigationstrategy and take it to its logical conclusion. Risk Management Committee of
the Plant/Unit Chaired by the Head of the Plant /Unit periodically reviews therisks and its mitigation status and reports the same to Chief Risk Officer (CRO)of SAIL. SAIL Risk Management Committee (SRMC) oversees the RiskManagement function in the Company by addressing issues pertaining to thepolicy formulation as well as evaluation of risk management function to assessits continuing effectiveness. Risks identified by the Risk Champion/Risk Officerare deliberated in the Risk Management Committee, escalated and draw themitigation strategy. Roles and responsibility of Board, Audit Committee, SAILRisk Management Committee, Risk Management Steering Committee, CRO,Risk Officer/Risk Champion related to risk management are defined under thePolicy and duly approved by the Board.
CORPORATE SOCIAL RESPONSIBILITY
SAIL's Social Objective is synonymous with Corporate Social Responsibility(CSR). Apart from the business of manufacturing steel, the objective of theCompany is to conduct business in ways that produce social, environmentaland economic benefits to the communities in which it operates. For anyorganization, CSR begins by being aware of the impact of its business onsociety. With the underlying philosophy and a credo to make a meaningfuldifference in people's lives, your Company has been structuring andimplementing CSR initiatives right from the inception. These efforts have seenthe obscure villages, where SAIL Plants are located, turn into large industrialhubs today.
The CSR initiatives of your Company have always been under taken inconformity to the Companies Act, 2013, Companies (Corporate SocialResponsibility Policy) Rules, 2014 and DPE Guidelines on CSR & Sustainability,2014. SAIL carries out CSR projects in and around periphery of steel townships,mines and far flung location across the Country in the thrust areas falling inline with the Schedule-VII of the Companies Act, 2013, namely, Education,providing Medical and Health Care facilities, village development, access towater facilities, infrastructural development in peripheral rural areas,environment conservation, women empowerment, assistance to people withdisabilities, sustainable income generation through self help groups, promotionof sports, art, culture & heritage conservation, etc.
The details of various CSR initiatives taken by the Company alongwith theReport on CSR in prescribed format are placed at Annexure-XII. The CSRPolicy of the Company is available on the website of the Company-www.sail.co.in.
Swachh Bharat Abhiyaan-Swachh Vidyalaya Abhiyaan: Your Company hasbeen actively participating in the "Swachh Bharat Abhiyan" initiated by theHon'ble Prime Minister of India. Under the campaign, construction of 672toilets in schools falling within the periphery of its Plants & Mines in the Statesof Chhattisgarh, West Bengal, Odisha, Jharkhand, Madhya Pradesh and TamilNadu; as allocated to SAIL by Ministry of HRD, had been undertaken andcompleted. Facilities like squatting units, urinals, washbasin and overheadwater storage have also been provided.
Healthcare: SAIL's extensive and specialised healthcare infrastructure providedspecialized and basic healthcare to 99 lakh people living in the vicinity of itsPlants and Units during the period 2011-16. In order to deliver quality healthcareat the doorsteps of the needy, regular health camps in various villages on fixeddays are being organized for the people living in the periphery of Plants/Units,mines and far-flung areas. During the Financial Year 2016-17, 6,240 HealthCamps have been organized benefitting over 1,25,000 villagers. 7 MobileMedical Units (MMUs) running in the Plant's peripheries have benefitted 28,000villagers at their doorsteps.
24 exclusive Health centres at Plants/Units provided free medical care andmedicines to 1,10,000 villagers during the Financial Year 2016-17.
Education: To develop the society through education, SAIL is supporting over145 schools which are providing modern education to more than 55,000children in the steel townships. 20 Special Schools (Kalyan & Mukul Vidyalayas)are benefitting over 3,100 BPL category students at integrated steel plantlocations with facilities of free education, mid-day meals, uniform includingshoes, text books, Stationary items, school bag, water bottles, etc. are runningunder CSR.

22
Your Company in association with Akshya Patra Foundation is providing mid-day meals to 68,000 students of over 500 Government schools in Bhilai andRourkela.
Women Empowerment & Sustainable Income Generation: Vocational andspecialised skill development training targeted towards sustainable incomegeneration has been provided to 2,070 youth and 2,461 women of peripheralvillages in areas such as Nursing, Physiotherapy, LMV Driving, Computers,Mobile repairing, Welder, Fitter & Electrician Training, Improved agriculture,Mushroom cultivation, Goatery, Poultry, Fishery, Piggery, Achar/Pappad/Agarbati/Candle making, Screen printing, Handicrafts, Sericulture, YarnWeaving, Tailoring, Sewing & embroidery, Gloves, Spices, Towels, Gunny-bags, Low-cost-Sanitary Napkins, Sweet Box, Soap, Smokeless chullahmaking, etc. 683 youths have been sponsored for ITI training at ITCs Bolani,Bargaon, Baliapur, Bokaro Pvt. ITI and Rourkela, etc. and 31 youths in PlasticEngineering through CIPET at Bokaro.
Connectivity & Water facilities in Rural Areas: Over 77.88 lakh people across435 villages have been connected to mainstream by SAIL since its inceptionby constructing and repairing of roads. Over 7,940 water sources have beeninstalled during last five years thereby enabling easy access to drinking waterto 46.46 lakh people living in far-flung areas.
Environment Conservation: Maintenance of parks, water bodies & botanicalgardens in its townships and plantation and maintenance of over 4 lakh treesat various locations has been undertaken.
Support to Differently Abled & Senior Citizens: Differently abled children/people are being supported through provision of equipments like- tricycle,motorized vehicles, calipers, hearing aids, artificial limbs, etc. Your Companysuppor ts various schemes and centres at Plants under CSR like "SnehSampada", "Prayas"and 'Muskaan" at Bhilai, "Schools for blind, deaf & mentallychallenged children" and Home and Hope" at Rourkela, "Ashalata ViklangKendra" at Bokaro, various programs like "Handicapped Oriented EducationProgram" and "Durgapur Handicapped Happy Home" at Durgapur, "CheshireHome" at Burnpur. Support has also been provided to NGOs working in thisfield like TAMANNA, Deepalaya, etc. Old age homes are being supported atdifferent Plant townships like "Siyan Sadan" at Bhilai, Acharya Dham andBadshah at Durgapur, etc.
Sports, Art & Culture and Heritage Conservation: SAIL is regularly organizinginter-village sports tournaments, extending support to major national sportsevents & tournaments. Also, supporting and coaching aspiring sportsmenand women through its residential sports academies at Bokaro (football),Rourkela (Hockey) - with world class astro-turf ground, Bhilai (Atheletics forboys), Durgapur (Athletics for girls) and Kiriburu, Jharkhand (Archery). Culturalevents like Chhattisgarh Lok Kala Mahotsav, Gramin Lokotsav are organisedevery year.
Disaster Relief: Your Company, as a responsible corporate citizen, supportedthe rehabilitation initiatives for the people affected by Natural Calamities, therecent being flood ravaged Jammu & Kashmir, Phylin cyclone in Odisha, FlashFloods in Uttarakhand, etc.
SARANDA Forest Development: In an effort to bring the marginalized massesof the remote forest areas to the mainstream of development, SAIL inassociation with Govt. of Jharkhand and Ministry of Rural Development, Govt.of India actively participated in the development process of Saranda forest,Jharkhand. SAIL provided ambulances, 7000 each of bicycles, transistors,solar lanterns and established an Integrated Development Centre (IDC) at Dighavillage in Saranda forest. IDC comprises of facilities like Bank, Panchayat Office,Ration shop, Telecom office, Anganwadi Centre, Meeting room, etc. for thelocal populace.
In an effor t to align the marginalized masses, a project to promotecomprehensive Water Supply and Sanitation has been initiated by RourkelaSteel Plant covering 897 households in 10 villages of Kuarmunda block. Eachhousehold is being provided potable water through a ground water source,storage tank and supply network of pipelines with 3 tap points and Sanitationunit with RCC roof on partnership model. The villagers have been mobilizedand empowered for their active participation in the project. Village level
committees have been formed for long-term sustenance of the project.
SAIL/Bolani Ore Mines has initiated a project to provide continuous drinkingwater supply and sanitation facility in the remote village of Barik Sahi (KuniSahi) under Bolani Panchayat connecting it with the water source: JhinkariaSpring, on south of Bolani through a network of G.I. pipelines. All the 300natives of Barik Sahi (Kuni Sahi), who had to travel upto 2 kms daily to fetchwater from the springs, have been benefitted with this facility.
SAIL Bio-Diversity Environment Theme Park 'VASUNDHARA' near JC BoseAvenue of DSP Township, Durgapur: The development of a 409 acres Bio-Diversity Environment Theme Park with a large water body and plantation of400 varieties of trees to attract migratory birds facilitating avian diversity,propagation of rare and medicinal plants, rainwater harvesting and soilconservation for maintaining ecological balance and environmentalsustainability has been carried out. The park site is enriching the environs for75,000 natives year on year.
GENERAL DISCLOSURES
i. During the year, the Company has not accepted any deposits under theCompanies Act, 2013.
ii. No significant or material orders were passed by the Regulators or Courtsor Tribunals impacting the going concern status and Company's operationsin future. However, attention of Members is drawn to the statement oncontingent liabilities in notes forming part of the Financial Statements.
DIRECTORS AND KEY MANAGERIAL PERSONNEL
• Shri S.S. Mohanty ceased to be Director on superannuation from servicesof the Company on 30th June, 2016(A/N).
• Shri Raman has been appointed as Director w.e.f. 1st July, 2016(F/N).
• Dr. Atmanand and Shri J.M. Mauskar, Independent Directors have ceasedto be Directors w.e.f. 18th July, 2016 on completion of their tenure.
• Smt. Bharathi S. Sihag ceased to be Director w.e.f. 30th November, 2016(A/N).
• Shri Nilanjan Sanyal and Dr. Samar Singh have been appointed asIndependent Directors w.e.f. 4th February, 2017.
• Shri Saraswati Prasad, Additional Secretary and Financial Adviser, Ministryof Steel has been appointed as Government Nominee Director on theBoard of the Company on 8th February, 2017.
• Shri Binod Kumar has ceased to be Director on superannuation fromservices of the Company on 28th February, 2017(A/N).
• Ms. Soma Mondal has been appointed as Director w.e.f. 1st March, 2017(F/N).
• Dr. N. Mohapatra has ceased to be Director on superannuation fromservices of the Company on 30th June, 2017(A/N).
ACKNOWLEDGEMENT
The Board of Directors wish to place on record their appreciation for the supportand value contributed by every member of the SAIL family. The Directors arethankful to the State Governments, Electricity Boards, Railways, Banks,Suppliers, Customers and Investors for their continued co-operation. TheDirectors also wish to acknowledge the continued support and guidancereceived from the different wings of the Government of India, particularly fromthe Ministry of Steel.
For and on behalf of the Board of Directors
(P.K. Singh)Chairman
Place: New DelhiDated: 11th August, 2017

23
MANAGEMENT DISCUSSION AND ANALYSIS REPORT
The Management of Steel Authority of India Limited (SAIL) presents its AnalysisReport covering the performance and outlook of the Company.
A. INDUSTRY STRUCTURE & DEVELOPMENTS
World Economic Environment
Global economic output grew by 3.1% in 2016, as per IMF in its April, 2017,World Economic Outlook update. Global economic activity is picking up witha long-awaited cyclical recovery in investment, manufacturing, and trade. Theeconomic activity is projected to pick up pace globally in 2017 (3.5%) and2018 (3.6%), especially due to the emerging markets and developingeconomies. These emerging economies now account for more than 75% ofglobal growth in output and consumption, almost double the share of twodecades ago.
Activity is projected to pick up markedly in emerging market and developingeconomies because conditions in commodity expor ters experiencingmacroeconomic strains are gradually expected to improve, supported by thepartial recovery in commodity prices, while growth is projected to remainstrong in China and many other commodity importers. In advanced economies,the pickup is primarily driven by higher projected growth in the United States,where activity was held back in 2016 by inventory adjustment and weakinvestment.
Growth in emerging market and developing economies is projected to increasemarginally to around 4.5% in 2017, with India expected to grow by 7.2%while growth in China is expected to grow at 6.6%. On the other hand, growthin advanced economies in 2017 is expected to remain at 2.0%.
World Steel Scenario
In 2016, Global Crude Steel production stood at 1,628.5 million tonnes(MT),a growth of 0.8% vis-à-vis 2015, as per World Steel Association. Crude Steelproduction decreased in Europe, the Americas and Africa. Crude Steelproduction increased in the CIS, the Middle East, Asia and Oceania.
Annual production in Asia was 1,125.1 MT of Crude Steel in 2016, an increaseof 1.6% compared to 2015. China's Crude Steel production in 2016 reached808.4 MT, up by 1.2% on 2015. China's share of World Crude Steel productionincreased from 49.4% in 2015 to 49.6% in 2016. Japan produced 104.8 MTin 2016, down by 0.3% compared to 2015. India's Crude Steel production in2016 was 95.6 MT, up by 7.4% on 2015. South Korea produced 68.6 MT ofCrude Steel in 2016, a decrease of 1.6% compared to 2015. The averagecapacity utilisation in 2016 was 69.3% compared to 69.7% in 2015.
World Steel Association has forecast that global steel demand will increaseby 1.3% to 1,535.2 MT in 2017, following growth of 1.0% in 2016. In 2018,it is forecast that global steel demand will grow by 0.9% and will reach 1,548.5MT. Steel demand in the emerging and developing economies excluding China,which accounts for 30% of world total, is expected to grow by 4.0% in 2017and then 4.9% in 2018.
Indian Economic Environment
The Indian economy registered a growth of 7.1% in 2016-17, according toProvisional Estimates published by the Central Statistics Office. The above5% growth trend has continued throughout the current fiscal with the economyregistering growth of 7.6%, 6.8%, 6.7% and 5.6% respectively during Q1,Q2, Q3 and Q4 of Financial Year 2016-17.
Growth in the Index of Industrial Production (IIP) is estimated at 5.0% for theperiod April-March 2016-17, over the same period last year. The cumulativegrowth in Mining, Manufacturing and Electricity during April-March 2016-17over the corresponding period of 2015-16 has been 5.4%, 4.9% and 5.8%respectively. Consumer Durables have grown by 5.5%, Capital Goods hasgrown by 3.1% alongwith a 3.8% growth in the Infrastructure/Constructiongoods during April-March 2016-17.
India's growth trajectory is expected to benefit from the Government'scommitment to reforms. IMF, in its latest outlook in Apr, 2017, has estimatedIndia's economic growth for the calendar year 2016 at 6.8%, and projects7.2% and 7.7% growth in 2017 & 2018 respectively. A growth rate of about6.5 - 7.0% has been projected overall for Financial Year 2016-17 in the currentEconomic Survey by the Govt. of India. For the Financial Year 2017-18, theGDP has been forecast in the range 6.75% - 7.5%.
Indian Steel Scenario
During April-March 2016-17, Crude Steel production was reported at 97.4million tonnes, growth of about 8.5% over last year. The finished steelproduction also registered a handsome growth of 11.3% during April-March2016-17. Import of total finished steel was at 7.5 million tonnes in the FinancialYear 2016-17 and saw a significant decline of 36.6 % compared to sameperiod of last year. India saw a growth of 102.1% in exports during 2016-17(8.244 million tonnes) over the last year and India emerged as a net exporterof total finished steel.
India's consumption of total finished steel saw a growth of 3% in April-March2016-17 (83.93 MT) over same period of last year.
Further, with the Government's focus on manufacturing and industry coupledwith spending on infrastructure (roads, rail and ports etc.), the demand forsteel is going to increase in the coming years.
B. OPPORTUNITIES & THREATS FOR SAIL
Opportunities:
• With an accelerated push from the policies proposed by the Governmentregarding steel intensive segments such as infrastructure, capital goodsand construction, India is all set to become the 2nd largest steel consumerin the World in the coming years.
• High export potential to markets of Middle East and South East Asia.
• Potential for improving product quality and reducing cost throughoperational efficiency and utilization of the modernized units.
Threats
• Dumping of steel from abroad and increased competition from domesticand international steel companies located in India.
• Cheap sourcing of steel from countries with whom India has Free TradeAgreement(FTA).
C. RISKS AND CONCERNS
• The Indian Metals and Mining Sector has been impacted by the ongoingcrisis and is facing a multitude of challenges like tightened liquidity position,leveraged balance sheets, surge in imports and declining sales realization.SAIL's profits have been impacted due to lower NSR of products anddepressed domestic demand.
• Internally, there have been deficiencies in the form of delays in rampingup of production from the new Units due to initial stabilization factors.Fur ther, higher capital related charges on account of incrementalDepreciation and Interest of new facilities have also increased expenses.
• Lease extension Orders for five sub-judice iron ore leases in Jharkhandand for two iron ore leases in Odisha are awaited. Capacity expansion ofGua iron ore mine and development of large mechanised mines at Chiriais dependent on extension of lease period of the sub-judice leases inJharkhand.
• Out of two iron ore leases in Odisha, in case of 6.9 Sq. Mile lease ofBolani Mine, Government of Odisha, vide letter dated 17.03.2017, hasissued a "Show Cause" Notice to the Company asking as to why the 6.90Sq. Miles lease should not be lapsed. Bolani mines produce about 6.5million tonnes of iron ore on yearly basis.
• In view of revised Guidelines dated 1.4.2015, issued by the Ministry ofEnvironment, Forest and Climate Change (MoEFCC), Government of India,there was a requirement of payment of NPV (about `1,100 Crore) forentire forest land within mining lease area by 30th March, 2017. SAIL,being a Government Company, the matter has been taken up with MoEFCCfor exemption of payment of NPV under the referred Guidelines. As theclarification in this regard was not provided by MoEFCC, therefore, toavoid closure of SAIL mines in Jharkhand on account of non payment ofNPV, the Company had approached Hon'ble Jharkhand High Court forrelief and Hon'ble Court in its interim Order directed not to take any coerciveaction against SAIL. The matter was taken up on 28.04.2017 and hasbeen referred to learned Division Bench for hearing at an early date.
• MoEFCC Guidelines dated 10.03.2015 stipulates fresh approval underForest Conservation(FC) Act to be obtained for areas which were or are

24
recorded as 'forest' in Government records on or after enactment of FCAct, but while processing, the proposals were treated as 'non forest'. Thetimeline provided in the Guidelines for obtaining approval under FC Actwas upto 31.12.2016. The proposals of Bolani Iron Ore mine in Odishaunder the Guideline are awaiting approval of MoEFCC. To avoid closureof Bolani mine beyond 31.12.2016, SAIL had approached Odisha HighCourt for relief. In respect of mining operations, Hon'ble Odisha HighCourt vide its Order dated 22.12.2016 has directed for status quo to bemaintained by the par ties till the next date of hearing. Fur ther, on16.01.2017, Court has directed to continue the interim Order till nextdate of listing. Listing of the matter is awaited.
• Calibrated Lump Ore defined by Ministry of Mines, GoI under MineralConservation and Development Rules, 2017 (MCDR) on 27.02.2017,may impact the Company financially in form of royalty on iron ore paid tothe State Governments.
• The developmental issues regarding overlap of Sitanala and Parbatpurcoal blocks, allocated to SAIL in recent times, with Coal Bed Methane(CBM) Block allottee i.e. ONGC has resulted in substantial reduction inthe available coal block area and extractable coal reserves available tothe Company. The techno-commercial viability of these blocks is beingre-assessed through MECON.
• Vide Gazette Notification dated 10.02.2015, Ministry of Mines, GoI hasnotified 31 major minerals to the category of minor minerals includingDolomite. The lease period of the mining leases for minor minerals isgoverned under Rules made by respective State Governments.Chhattisgarh Government has notified Minor Mineral Rules on 27.03.2015.Lease period for the mining lease has been amended on 23.03.2016 andis defined under Rule 38A. SAIL has two dolomite mines in Chhattisgarhviz. Hirri Dolomite Mine in Bilaspur district and Ispat Dolomite Quarry,Baraduar in Janjgir-Champa district. Under the provisions of these rules,lease period for Hirri and Baraduar mines may be extended maximum upto 31.03.2020 and 25.12.2020 respectively. The State Govt. has alreadyextended the lease period of Hirri dolomite lease till 31.03.2020. Withregard to Baraduar lease extension, State Govt. has asked for theenvironment and forest clearance for the lease. Subsequent to the expiryof these lease periods, if the mineral resource is still available in the area,the lease shall be put to auction or tendering, as the case may be, as perthe procedure specified in these Rules. Matter for further extension of thelease period is being taken up with Mineral Resources Department ofChhattisgarh Govt. for amendment of Chhattisgarh Minor Mineral Rules,2015 to have a provision of extension of lease period for the Governmentcompanies in line with Mineral (Mining by Government Company) Rules,2015, notified by Ministry of Mines, GoI for major minerals.
D. OUTLOOK
Analysts are upbeat over the expected above normal monsoon and higherGDP growth. The slow pace of public and private sector projects is expectedto improve with the Government of India's thrust on infrastructure projects.Further, 'Make in India' initiative has got a boost by a slew of measures aimedat improving the ease of doing business in the Country. Small and mediumindustry- a major employment generator for the economy- has been liberatedto participate in the Nation's development in accordance with its potential.Bold measures by the Government such as improved targeting of subsidy,broadening of the tax base and expected buoyancy in tax revenue are all aimedat achieving the fiscal consolidation which had been an area of concern in therecent past.
E. STRENGTHS & WEAKNESSES
Strengths
• SAIL continues to be among the leading steel producers of the Nation.
• Multi located production units give us an edge over other domestic steelplayers.
• Reasonably modernised units af ter completion of the on-goingmodernisation and expansion.
• Well established nationwide marketing and distribution network helps inenhancing the reach of SAIL products all across the Country.
• Most diverse product range offered by any domestic steel company.
• Availability of land bank at existing plant/unit locations for future brown-field expansion.
• Input security - 100 per cent integration in iron-ore.
• Highly qualified professionals with experience in steel making.
Weaknesses
• Dependence on external sources for key input - coking coal leads toexposure of the Company to the market risk.
• Newly commissioned large volume blast furnaces are more demandingwith respect to raw material quality and consistency. To address thisissue, higher percentage of prepared burden with increased proportionof pellets is planned.
• High manpower cost and relatively low manpower productivity.
• Currently, around 25% of the products are in the form of semi-finishedsteel, resulting in lower value addition to the product portfolio. The shareof semis is being targeted to be brought down by increasing the outputfrom new rolling mills.
F. REVIEW OF FINANCIAL PERFORMANCE
1. FINANCIAL OVERVIEW OF SAIL
The Ministry of Corporate Affairs(MCA) notified Companies(Indian AccountingStandard) Rules, 2015 enabling implementation of IND AS. Pursuant to thisnotification, SAIL and its subsidiaries, associates and joint ventures haveadopted IND AS with effect from 1st April, 2016. Accordingly, the Standaloneand Consolidated Financial Statements for the year ended 31st March, 2017,and 31st March, 2016 including transition date balance sheet as at 1st April,2015, have been prepared in accordance with IND AS.
SAIL achieved sales turnover of ̀ 49,180 crore during the Financial Year 2016-17, which was higher by 14% over last year's turnover of `43,294 crore.During the Financial Year 2016-17, there was Loss after Tax of `2,833 croreas compared to Loss after Tax of `4,021 crore during the last year, which is30% lower than corresponding period of last year. All the financial figureshave been reworked as per INDAS for 2015-16. The comparative performanceof major financial parameters during the Financial Years 2016-17 and 2015-16 is given below:
(` crore)
Particulars 2016-17 2015-16
Sales Turnover 49180.24 43294.06
Profit before interest, depreciation, 671.60 -2203.66exceptional/abnormal items and tax(EBIDTA)
Less: Interest and Finance Charges 2527.82 2300.45
Less: Depreciation 2679.95 2402.35
Profit before tax (PBT) before -4536.17 -6906.46exceptional / abnormal items
Exceptional items : Loss(-)/Gain(+) (VRS) -314.69 -101.04
Profit before tax/abnormal items (PBT) -4850.86 -7007.50after exceptional/ abnormal items
Less: Provision for taxation -2017.62 -2986.06
Profit(+)/Loss(-) after Tax -2833.24 -4021.44
Net Worth 36009 39196
EBIDTA to Net sales (%) 1.53 -5.73
Return (PAT) on Net worth (%) -7.87 -10.26
EBIDTA to average capital employed (%) 1.27 -4.28
Earning per share of Rupee 10/- each -6.86 -9.74
Debt Equity Ratio 1.15:1 0.90:1

25
As compared to last year, the Loss before Tax of your Company in the FinancialYear 2016-17 has reduced mainly due to higher Saleable Steelproduction(12%), concast production(9%), Saleable Steel sales (8.2%), NetSales Realisation of 5 Integrated Steel Plants(6.3%), lower usage of importedcoal in the blend, higher usage of CDI in CDI furnaces, reduction in coke rate,improvement in BF productivity, reduction in salaries & wages, decrease inaverage purchase power rate, foreign exchange gain, etc. However, theprofitability of your Company has been adversely affected due to increase inimported and indigenous coal prices, increase in security expenses, increasein repairs & maintenance, increase in interest cost and depreciation.
1.2 Initiatives Taken by the SAIL Management
1.2.1 Turnaround Plan
In order to meet the challenges of adverse business environment, it was decidedto create and implement a sustainable turnaround strategy. In line with thesame, a Company-wide turnaround initiative, named 'SAIL Uday' has beenundertaken covering improvements for all functions in the Plants and Units,while reviewing and sharpening our business strategy and processes. YourCompany has engaged M/s Boston Consulting Group (India) Private Limited(BCG), as Management Consultant to study the present health of the Companyand suggest suitable measures for its turnaround. The 'SAIL Uday' initiative isexpected to drive the Company towards profitability as well as build forsustained market leadership.
1.2.2 Cost Control Measures
• Emphasis on cost reduction with improvement in productivity continuedduring the year through process improvement and effor ts by R&D.Awareness was created at all levels to control cost in all areas of operation.
• Strategic actions such as optimizing coal blend, improvement in yields,reduction in coke rate, enhanced concast production, sale of idle assetsand maximizing use of in-house engineering shops resulted in enhancedcost reduction during the year.
• Further, with a view to rationalise manpower, Voluntary Retirement Schemehas been implemented w.e.f. 15th June, 2017.
1.2.3 Marketing
Your Company took various initiatives during the Financial Year 2016-17 tomaintain its leadership position in the market by improving customersatisfaction. Some of these initiatives include the following:
• Cross functional teams of Plant, Marketing and R&D engaged with specificsegments of customers to market products of new mills commissionedunder the on-going Modernization and Expansion Programme of theCompany. Regional seminars were also held to disseminate informationabout new products to designers, architects and structural engineers.
• Product development has been a continuous endeavour at SAIL for meetingspecific application requirement of our customers. 20 new products weredeveloped during the Financial Year 2016-17 for a wide variety ofapplications. Some of the products developed are given as under:
� Seismic Grade TMT rebars as per IS 1786 FE 500S.
� High Strength LPG sheets as per IS 15914 from BSL for domesticLPG cylinders.
� Cold Rolled Steel from the new Cold Rolling Mill 3 of BSL for newusages viz. Furniture, Drum & Barrel and Auto components.
� DMR 301 Steel for defence for under water applications.
� Narrow Parallel Flange Beam from ISP (NPB 400*189*75.66, NPB450*190*77.57, NPB 500*200*90.68/79.36) for constructionsector.
• 350 KVA Solar Power Plant has been installed at Kanpur for catering topower requirements of the entire warehouse, which is expected to resultin substantial monthly saving.
• In order to cater to the requirements of the consumers for processedmaterials, three service centres have been star ted at Jamshedpur,
Faridabad and Chennai for HR/CR products.
• Bokaro and Bangalore warehouses of CMO have been accredited withISO:14001:2015 during 2016-17 as per the norms of the EnvironmentManagement Systems (EMS) taking the total number of green SAILwarehouses to eleven.
• SAIL has the largest marketing network among all steel producers in theCountry. As on 1st April, 2017, SAIL's functional network of marketingoffices consists of 37 Branch Sales Offices, 10 active Customer ContactOffices, 24 Departmental Warehouses and 21 functional ConsignmentAgency yards. In addition, marketing efforts are supplemented by a strongdealer network of more than 2100 dealers spread across the Country,out of which over 630 are rural dealers. In order to further reach out tothe end customers in the Retail Segment through an efficient distributionchannel as also to provide value addition in product, delivery and servicesto customers, distributors for TMT bars & GC sheets are being appointedacross the Regions.
1.3 Funds Management
During the year, the Company continued its thrust on better funds management.The high cost loans were replaced with low cost debts, timely repayment ofloans including interest, actions for future fund raising, etc. to meet the growthobjectives. The Company had borrowings at `41,396 crore as on 31st March,2017. The Company hedged the foreign currency risk on Buyers' Credit andrepayment of External Commercial Borrowings depending on marketconditions. M/s CARE Ratings and M/s Brickwork Ratings, RBI approved creditrating agencies, assigned "CARE AA Outlook: Negative" and "BWR AA+Outlook: Stable" respectively, to SAIL's long-term borrowing programme. Thetrend of borrowings, net worth and term deposits is given as under:
1.4 Contribution to SAIL Gratuity Trust
The total contribution made by the Company to SAIL Gratuity Trust upto31.03.2017 was `3,349 crore. The fund size has grown to `5,836.33 croreas on 31.03.2017, net of settlement done towards payment of Gratuity.
2. ANALYSIS OF THE FINANCIAL PERFORMANCE OF THE COMPANY
2.1 Revenue from Operations
a) Sale of Products
(` crore)
Particulars 2016-17 2015-16 Change %
Sales of Saleable Steel 46653.91 40880.18 14.1Products
Sales of Other Products 2526.33 2413.88 4.6
Total Sales Turnover 49180.24 43294.06 13.6
Less: Excise Duty 5314.69 4823.29 10.1
Net Sales Turnover 43865.55 38470.77 14.0

26
b) Trend of Domestic Sales and Exports
The Company catered to almost the entire gamut of the mild steel businessnamely, Flat products in the form of Plates, HR coils/sheet, CR coils/sheets,Galvanised Plain/Corrugated Sheets and Long products comprising Rails,Structural, Wire-rods and Merchant Products. In addition, Electric ResistanceWelded Pipes, Spiral Welded Pipes and Silicon Steel Sheets formed part ofCompany's rich product-mix. The product category-wise sales turnover during2016-17 is given as under:
Products Category % of Sales value
Saleable Steel:
Flat Products 50(including Pipes & Electrical sheets) (a)
Long Products (b) 40
Integrated Steel Plants - 90Mild Steel (c = a + b)
Alloy & Special Steel Plants - 5Alloy & Special Steel (d)
Total Saleable Steel (e = c + d) 95
Secondary Products 5(Pig Iron, Scrap, Coal Chemicals etc.) (f)
Total (g = e + f) 100
c) Sale of Services - Service Charges
(` crore)
2016-17 2015-16 Change %
31.89 33.44 -4.63
Revenue from sale of services decreased by about `1.55 crore during thecurrent year.
d) Other Operating Revenues
(` crore)
2016-17 2015-16 Change %
554.97 547.67 1.33
Other operating revenues increased by about `7.3 crore over previous yearprimarily on account of higher realisation from social amenities and sale ofsundries.
2.2 Other Income
(` crore)
2016-17 2015-16 Change %
535.61 594.67 -9.93
Other income decreased by about `59.06 crore over previous year mainlydue to decrease in interest income from customers and term deposits anddecrease in dividend income.
2.3 Expenditure
(` crore)
Particulars 2016-17 2015-16 Change %
Raw Materials Consumed 21126 17155 23.1
Employee Remuneration & 8948 9715 -7.9Benefits
Finance Cost 2528 2300 9.8
Depreciation 2680 2402 11.5
Other Expenses 14220 14539 -2.1
During the year 2016-17, there was unprecedented increase in imported coalprices and this has affected the raw material prices hugely. Further, indigenouscoal prices also increased in line with imported coal prices due to invoking ofcoal price parity by domestic coal companies. During the year, the Employees'Remuneration & Benefits have decreased mainly due to reduction in manpowernumbers on account of natural separation and voluntary retirement scheme.Higher finance cost was due to increase in borrowings and increase indepreciation was due to capitalization of new facilities. The decrease in otherexpenses was on account of decrease in the cost of stores & spares, power &fuel, royalty and cess, etc.
2.4 Contribution to Exchequer
During the year, SAIL contributed `10,244 crore to the national exchequer byway of payment of taxes and duties to various government agencies.
2.5 Non-Current / Current Assets
(` crore)
Particulars 2016-17 2015-16 Change %
Non-Current Assets
(a) Property, Plant and Equipment 48762 44379 9.88
(b) Capital Work-in-Progress 23275 24927 -6.63
(c) Investment Property 1 1 -2.27
(d) Intangible Assets 1523 1546 -1.53
(e) Financial Assets
(i) Investments 1395 1292 8.01
(ii) Loans 454 450 0.89
(iii) Other Financial Assets 262 492 -46.75
(f) Deferred Tax Assets (Net) 4006 1800 122.57
(g) Non current tax assets (Net) 236 278 -15.11
(h) Other non-current assets 1063 977 8.80
TOTAL NON-CURRENT ASSETS 80977 76142 6.35

27
3. PLANT-WISE FINANCIAL PERFORMANCE (PROFIT BEFORE TAX)
(` crore)
Plant/Unit 2016-17 2015-16
Bhilai Steel Plant (BSP) 2.07 445.97
Durgapur Steel Plant (DSP) -951.16 -467.74
Rourkela Steel Plant (RSP) -1357.80 -2490.70
Bokaro Steel Plant (BSL) -203.07 -2060.95
IISCO Steel Plant (ISP) -1946.39 -1982.20
Alloy Steels Plant (ASP) -33.25 -81.01
Salem Steel Plant (SSP) -234.99 -461.29
Visvesvaraya Iron & Steel Plant (VISP) -116.89 -113.05
SAIL Refractory Unit (SRU) 19.79 23.56
Chandrapur Ferro Alloys Plant (CFP) -83.33 -80.85
Raw Materials Division/Central Units* 54.16 260.76
SAIL: Profit Before Tax (PBT) -4850.86 -7007.50
SAIL: Profit After Tax(PAT) -2833.24 -4021.44
*including interest earned on deposits and retained in the books of CorporateOffice.
G. MATERIALS MANAGEMENT
A number of initiatives were taken to reduce cost of inputs and improve theperformance of materials management, some of which are summarized asunder:• Inventory Reduction: Measures and initiatives like receipt/delivery control,
strict indent screening, de-proprietarisation, etc. lowered the holding periodof Stores & Spares to 6.54 months from earlier 7.09 months.
• Purchase Cost Reduction: By adopting multi-pronged strategy inpurchase of bulk items/Central Procurement Agency Items, cost-savingsof more than `200 crore were achieved in several areas like Low SilicaLimestone, Sea Water Magnesia, etc.
• E-Procurement: E-tendering using SRM/EPS platform increased to48.67% from 37.04% on Y-o-Y basis.
• Systems Improvement: All the major Policies and Procedures issuedmore than 5 years ago were taken up for review.
H. FOREIGN EXCHANGE CONSERVATION
The Company endeavors to procure equipment, raw materials and other inputsfrom indigenous sources to the extent they become available to the Company,at the commercially acceptable prices/costs and meet the requirements ofthe technologies being used in the Company. For incurrence of expenditure inforeign currency, besides exercising the requisite control, it is ensured that itis in the commercial interest of the Company. Further, the Company has alsotaken reasonable steps to ensure that all receivables in foreign exchange,which are due to the Company, are realized within contractual period.I. PROJECT MANAGEMENT
AMR SCHEMES
Besides Modernisation and Expansion Projects, the Addition, Modification &Replacement(AMR) Schemes have also been taken up which are required formanagement of existing operations and primarily focuses on improving thecurrent level of efficiency and output in incremental measures. AMR Schemesare undertaken for improving or revamping of existing facilities for sustainingthe existing operations, balancing / debottlenecking of production processes,improvement in energy & other resource consumption / services / safety andenvironment. Replacement includes mostly replacing the existing Plant &Equipment / facilities with better performance Plant & Equipment / facilities;Re-building of certain facilities like Coke Oven Batteries after its useful life isone of the types of replacement scheme. Accordingly, a number of AMRschemes costing around `7,451 crore are under implementation in differentPlants of the Company as under:• Upgradation of Stoves for Blast Furnace-4, Modification of Mid stack
Cooling System of Blast Furnace -7, Construction of Permanent Barrackat 21 locations for Rowghat Deposit, Revamping of Sinter Cooler of SinterPlant-3, Installation of Cast House Defuming System in Blast FurnaceNo.7, Setting up of Static facility for Environmentally Sound Managementof Polychlorinated Biphenyls and Installation of Electro Static Precipitators
(` crore)
Particulars 2016-17 2015-16 Change %
Current Assets
(a) Inventories 15711 14680 7.03
(b) Financial Assets
(i) Trade Receivables 2922 3143 -7.06
(ii) Cash & cash equivalents 121 132 -8.69
(iii) Bank balances other 168 166 1.59than (ii) above
(iv) Loans 61 64 -4.69
(v) Other Financial Assets 2268 1762 28.72
(c) Current Tax Assets (Net)
(d) Other Current Assets 4299 4230 1.63
(e) Assets classified as held 12 21 -42.01for sale
TOTAL CURRENT ASSETS 25562 24198 5.64
TOTAL ASSETS 106539 100340 6.18
• Property, Plant & Equipment increased by `4,383 crore mainly due tocapitalization of new facilities.
• The capital work-in-progress decreased by `1,652 crore on account ofcapitalization of various capital schemes in steel Plants.
• The non-current investments has increased by `104 crore primarily dueto investment in ICVL.
• Other Non-Current Assets increased by `87 crore.
• The inventories increased by `1,031 crore mainly on account of increasein raw materials inventory due to high prices of imported coking coal.
• Decrease in trade receivables was by `221 crore.
• Other Current Assets increased by ̀ 68 crore, mainly on account of higheramount of deposits required at Government Authorities.
2.6 Non-Current/ Current Liabilities(` crore)
Particulars 2016-17 2015-16 Change %
Non Current Liabilities
(a) Financial Liabilities
(i) Borrowings 19087 17496 9.1
(ii) Trade Payables 7 7 7.8
(iii) Other Financial Liabilities 1366 1572 -13.1
(b) Long Term Provisions 3594 3272 9.9
(c) Other Non-Current Liabilities 151 113 33.3
Total Non-Current Liabilities 24206 22459 7.8
Current Liabilities
(i) Borrowings 19813 15575 27.2
(ii) Trade Payables 5219 4003 30.4
(iii) Other Financial Liabilities 12766 10960 16.5
(b) Other Current Liabilities 5607 5493 2.1
(c) Provisions 2915 2643 10.3
(d) Current Tax Liabilities (Net) 5 12 -62.0
Total Current Liabilities 46324 38685 19.7
Total Current+Non-Current 70530 61144 15.4
Liabilities
• Increase in long term borrowings by 9% was due to fresh bond issue forcapital expenditure.
• The short term borrowings increased by ̀ 4,238 crore due to higher buyerscredit in form of foreign currency due to steep increase in imported coalprices.
28
as replacement of Multi Cyclones for all 4 nos. of Sinter Machine at SinterPlant -II at Bhilai Steel Plant.
• Installation of new Rotary Hearth Reheating Furnace at Wheel & Axleplant at Durgapur Steel Plant.
• Installation of New Hot Strip Mill at Rourkela Steel Plant.• Replacement of Battery cyclones with Electro Static Precipitators in Sinter
Plant, Replacement of Converter Shell Trunnion Ring of Steel MeltingShop-II, Rebuilding of Coke Oven Battery-7, Provision of Hydraulic Mudguncum Drill Machine for Blast Furnace -1, Alternate Gas Network, New SinterPlant, Modernization of Steel Melting Shop -I, Upgradation of Stoves ofBlast Furnace No. 1, Rebuilding of Coke Oven Battery-8 and Up-gradationof 6 nos. of Electro Static Precipitators of Lime Kiln at Bokaro Steel Plant.
• 4 MW Power Plant at Chandrapur Ferro Alloy Plant.
J. IN-HOUSE DESIGN & ENGINEERING
Centre for Engineering & Technology (CET), the in-house design, engineering& consultancy unit of SAIL provides the complete range of services fromconcept to successful commissioning of projects in the complete value chainof integrated steel plant and its mines. With a strength of about 250 qualified,trained and experienced engineers, CET is now taking leadership role in mineralbeneficiation, pellet plant, material handling, power plant, slag granulation plant,stoves, water management, automation and many other related areas. Thecurrent major projects in its basket include Re-building of Coke Oven BatteryNo.7&8 at BSL, new 3.0 MT Hot Strip Mill at RSP, Modernization of SMS-1 atBSL, etc.
K. CONSULTANCY SERVICES
Your Company has one of the largest pool of qualified and experiencedengineers, technologists, and professionally qualified HR & training experts.Based on its large and varied expertise and experience acquired over the lastfive decades, SAIL, through SAILCON, provides design, engineering, training,technical & management consultancy services in Iron & Steel and relatedareas and offers a wide range of services to clients globally. Technical andManagement Training services are its forte and these services have beenavailed of by several organizations in private and public sector within Indiaand abroad. To scale up the activities and to further reinforce the brand imageof SAIL as a consultant, SAILCON is continuously exploring the market, bothwithin and outside the Country for possible business opportunities as well asjoint ventures with Global consultants for commercialization of SAIL's expertise."SAILCON" has executed assignments within India and abroad coveringcountries like Egypt, Saudi Arabia, Iran, Qatar, Thailand, Nepal, Philippines, etc.During the Financial Year 2016-17, SAILCON laid enhanced focus on takingup training assignments and provided training services in steel making tonewly recruited executives of a green field integrated steel plant. Consultancyis also being extended for setting up of Power Plants, based on waste heatrecovery from the flue gases released out of Blast Furnace and non-recoverytype of Coke Oven batteries, as an environment friendly measure and as astep to combat global warming.
L. RESEARCH & DEVELOPMENT
Research and Development Centre for Iron & Steel (RDCIS) of the Companyis India's premier research organization in the field of ferrous metallurgy.Recognizing that development and assimilation of new technologies & processinnovations are basic tenets for sustainable growth, SAIL has given thrust forits R&D efforts through its well equipped R&D Centre located at Ranchi. It hasmore than three hundred diagnostic equipment and adequate pilot facilitiesunder fifteen major laboratories. The centre undertakes research projectsencompassing the entire spectrum of iron & steel starting from raw materialsto finished products. In the year 2016-17, 108 projects were pursued and 42projects completed with substantial benefits to the organization.RDCIS also pursues pioneering work in the area of development of nicheproducts as per market requirements aiming at superior performance basedon application. During the Financial Year 2016-17, twenty products have beendeveloped and some of the noteworthy products include resistant steels forIndian construction segment, Aircraft carrier ships, Submarines, DomesticLPG Cylinder, Tipper body, Earthmovers and Line pipes, etc.The Centre in its pursuit for excellence in various research fields enters intocollaboration mode of research in specific areas with renowned researchinstitutions and academia. During the Financial Year 2016-17, MOU/Collaboration agreements have been entered into with institutions such asNIFFT, Hatia, Ranchi; Kalyani Carpenter Special Steel Pvt. Ltd., Pune; PSGCollege of Technology, Coimbatore and IIT Kharagpur.
In order to maintain market leadership, improve operational efficiencies, nurtureprocess innovations and enhance quality of products to international levels,SAIL embarked upon an ambitious Master Plan for R&D during 2011-12 aimingat integrating R&D initiatives towards business & operational goals of theCompany. This called for creating Centre of Excellence (CoE) in all the Plantsand implementing High Impact Projects (HIP) and Technology Missions (TM)so as to achieve technological eminence. This initiative has taken roots and isunder different stages of implementation.The efforts of RDCIS engineers and scientists have culminated in filing of 35patents and 28 copyrights (in association with SAIL Plants) during 2016-17.As many as 95 technical papers (27 international) were published and 127papers (52 international) were presented. In addition, RDCIS undertook contractresearch work and provided consultancy services and know-how toorganisations outside SAIL.In recognition of the contributions made by the Centre, RDCIS has baggedseveral prestigious awards (11 in total) during 2016-17 like Metallurgist ofthe Year, IIM OP Jindal Gold Medal Award, Coal India (JG KumarmangalamMemorial) Award, Indranil Award for Metallurgy, etc.
M. INTERNAL CONTROL SYSTEMS & THEIR ADEQUACY
The Company has an efficient system of internal controls for achieving thefollowing business objectives of the company:• Efficiency of operations• Protection of resources• Accuracy and promptness of financial reporting• Compliance with the laid down policies and procedures• Compliance with various laws and regulations.In SAIL, Internal Audit is a multi-disciplinary function which reviews, evaluatesand appraises various systems, procedures/policies of the Company andsuggests meaningful and useful improvements. It helps Management toaccomplish its objectives by bringing a systematic and disciplined approachto improve the effectiveness of risk management towards good corporategovernance.The Company has taken a number of steps to make the audit function moreeffective. The Internal Audit is subject to overall control environment supervisedby Board Level Audit Committee, providing independence to the Internal Auditfunction, emphasizing transparency in the systems and internal controls withappropriate skill-mix of internal audit personnel etc. Audit Plan based onidentification of key-risk areas with thrust on system/process audits andbenchmarking of the best practices followed in the Plants/Units, is made andapproved by Audit Committee so as to achieve overall efficiency improvementincluding cost reduction in operation of Company. Development of InternalAudit Executives, bringing awareness amongst auditees, converging on thepro-active role of internal audit remained other focus areas during the year.The Audit Committee in its meetings with the Company's Statutory Auditorsalso ascertaines their views on the adequacy of internal control systems inthe Company and their observations on financial reports. The Audit Committee'sobservations are acted upon by the Management. The Audit Committee, inter-alia, has also monitored /reviewed the following areas:• Issues related to unauthorized occupation of Land and quarters in SAIL
Townships & Reconciliation of Title Deeds of land at different Plants/Units.
• Energy Audit.• Periodic review of Enterprise Risk Management (ERM).• Trade remedial measures.• Provisioning for restoration of closed Mines.• Performance vis-à-vis Turnaround Plan of SAIL.• Vigil Mechanism in SAIL.• ERP Implementation & its integration across SAIL.• Borrowings Management in SAIL.The Internal Audit system is supplemented by well-documented Policies,Guidelines and Procedures and regular reviews are being carried out by theInternal Audit Department. The reports containing significant audit findingsare periodically submitted to the Management and Audit Committee of the Board.
CAUTIONARY STATEMENT
Certain statements in the Management Discussion and Analysis, describingthe Company's objective, projections and estimates are forward lookingstatements and progressive within the meaning of applicable Laws andRegulations. Actual results may vary from those expressed or implied, dependingupon economic conditions, Government Policies and other incidental factors.

29
Note No. As at As at As at31st March, 2017 31st March, 2016 1st April, 2015
ASSETSNon-current assets(a) Property, Plant and Equipment 4 48,762.03 44,378.87 36,229.95(b) Capital work-in-progress 5 23,275.39 24,927.22 29,209.54(c) Investment property 6 0.86 0.88 0.90(d) Intangible assets 7 1,522.58 1,546.20 1,510.21(e) Financial assets
(i) Investments 8 1,395.48 1,291.75 967.35(ii) Trade receivables 9 - - 2.25(iii) Loans 10 453.52 449.95 426.98(iv) Other financial assets 11 262.42 492.38 698.08
(f) Deferred tax assets (net) 12 4,005.84 1,799.80 -(g) Current tax assets (net) 13 235.81 278.10 609.89(h) Other non-current assets 14 1,062.99 976.47 798.16
80,976.92 76,141.62 70,453.31Current assets(a) Inventories 15 15,711.35 14,679.53 17,250.70(b) Financial assets
(i) Trade receivables 9 2,921.69 3,143.49 3,585.97(ii) Cash and cash equivalents 16 120.93 132.44 148.17(iii) Other bank balances 17 168.16 165.52 2,163.76(iv) Loans 10 61.47 64.09 65.74(v) Other financial assets 11 2,267.85 1,762.14 2,338.43
(c) Other current assets 14 4,299.16 4,230.85 4,234.94 25,550.61 24,178.06 29,787.71
Assets classified as held for sale 18 11.94 20.59 20.46TOTAL ASSETS 1,06,539.47 1,00,340.27 1,00,261.48
EQUITY AND LIABILITIESEquity(a) Equity share capital 19 4,130.53 4,130.53 4,130.53(b) Other equity 20 31,878.53 35,065.37 39,392.79
36,009.06 39,195.90 43,523.32LiabilitiesNon-current liabilities(a) Financial liabilities
(i) Borrowings 21 19,087.48 17,495.71 15,620.20(ii) Trade payables 22 7.36 6.83 0.71(iii) Others financial liabilities 23 1,365.93 1,571.82 1,375.09
(b) Provisions 24 3,593.94 3,271.65 3,381.56(c) Deferred tax liabilities (net) 12 - - 1,268.95(d) Other non-current liabilities 25 151.29 113.48 117.90
24,206.00 22,459.49 21,764.41Current liabilities(a) Financial liabilities
(i) Borrowings 21 19,813.04 15,574.86 14,282.91(ii) Trade payables 22 5,219.20 4,002.71 3,606.38(iii) Other financial liabilities 23 12,765.62 10,959.80 10,411.63
(b) Other current liabilities 25 5,607.26 5,492.96 4,283.55(c) Provisions 24 2,914.77 2,642.65 2,377.38(d) Current tax liabilities (net) 13 4.52 11.90 11.90
46,324.41 38,684.88 34,973.75TOTAL EQUITY & LIABILITIES 1,06,539.47 1,00,340.27 1,00,261.48
Significant Accounting Policies 3The accompanying notes are an integral part of these standalone financial statements
Balance Sheet STANDALONE
As at 31st March, 2017 (` crore)
For and on behalf of Board of Directors
Sd/- Sd/- Sd/-(M.C.Jain) (Anil Kumar Chaudhary) (P. K. Singh)
Company Secretary Director (Finance) ChairmanDIN: 03256818 DIN: 06398868
In terms of our report of even date
For Singhi & Co. For Chatterjee & Co. For V K Dhingra & Co. For A K Sabat & Co.Chartered Accountants Chartered Accountants Chartered Accountants Chartered Accountants
Firm Registration No.302049E Firm Registration No.302114E Firm Registration No.000250N Firm Registration No.321012E
Sd/- Sd/- Sd/- Sd/-[ Shrenik Mehta ] [ R.N. Basu ] [ Lalit Ahuja ] [ A K Sabat ]
Partner Partner Partner PartnerM. No. 063769 M. No. 050430 M. No. 085842 M. No. 030310
Place : New DelhiDated : May 30, 2017

30
Note No. Year ended 31st March, 2017 Year ended 31st March, 2016
Income
Revenue from operations 26 49,767.10 43,875.17
Other income 27 535.61 594.67
Total Income 50,302.71 44,469.84
Expenses
Cost of materials consumed 28 21,125.70 17,155.23
Changes in inventories of finished goods and work in progress 29 120.63 540.61
Excise duty 5,314.69 4,823.29
Employee benefits expense 30 8,947.83 9,714.97
Finance costs 31 2,527.82 2,300.45
Depreciation and amortisation expense 2,679.95 2,402.35
Other expenses 32 14,220.21 14,540.44
Total Expenses 54,936.83 51,477.34
Profit/(Loss) before Exceptional item & tax (4,634.12) (7,007.50)
Add: Exceptional item
- Voluntary retirement compensation (216.74) -
Profit/(Loss) Before Tax (4,850.86) (7,007.50)
Tax expense 38
Current tax - -
Deferred tax (2,032.76) (2,909.55)
Earlier years 15.14 (76.51)
Total tax expense (2,017.62) (2,986.06)
Profit/(Loss) for the year (2,833.24) (4,021.44)
Other Comprehensive Income
A i) Items that will not be reclassified to profit and loss
Remeasurements of defined benefit plans (545.04) (145.08)
Gains and losses from investments in equity instruments 3.02 0.42designated at fair value through OCI
ii) Income tax relating to items that will not be 188.42 49.57reclassified to profit or loss
Other Comprehensive Loss for the year (353.60) (95.09)
Total Comprehensive Loss for the year (3,186.84) (4,116.53)
Earnings per equity share
Number of Equity Shares (face value of ` 10 each) 4,13,05,25,289 4,13,05,25,289
Basic and diluted earnings per share (`) (6.86) (9.74)
Significant Accounting Policies 3
The accompanying notes are an integral part of these standalone financial statements
Statement of Profit & LossFor the year ended 31st March, 2017
(` crore)
For and on behalf of Board of Directors
Sd/- Sd/- Sd/-(M.C.Jain) (Anil Kumar Chaudhary) (P. K. Singh)
Company Secretary Director (Finance) ChairmanDIN: 03256818 DIN: 06398868
In terms of our report of even date
For Singhi & Co. For Chatterjee & Co. For V K Dhingra & Co. For A K Sabat & Co.Chartered Accountants Chartered Accountants Chartered Accountants Chartered Accountants
Firm Registration No.302049E Firm Registration No.302114E Firm Registration No.000250N Firm Registration No.321012E
Sd/- Sd/- Sd/- Sd/-[ Shrenik Mehta ] [ R.N. Basu ] [ Lalit Ahuja ] [ A K Sabat ]
Partner Partner Partner PartnerM. No. 063769 M. No. 050430 M. No. 085842 M. No. 030310
Place : New DelhiDated : May 30, 2017

31
Statement of Changes in EquityFor the year ended 31st March, 2017
A. Equity Share Capital (` crore)
Particulars Balance as at Changes in equity Balance as at Changes in equity Balance as at1st April, 2015 share capital 31st March, 2016 share capital 31st March, 2017
Equity shares with voting rights 4,130.09 0.30 4,130.39 0.02 4,130.41
Equity shares without voting rights 0.44 (0.30) 0.14 (0.02) 0.12
For and on behalf of Board of Directors
Sd/- Sd/- Sd/-(M.C.Jain) (Anil Kumar Chaudhary) (P. K. Singh)
Company Secretary Director (Finance) ChairmanDIN: 03256818 DIN: 06398868
In terms of our report of even date
For Singhi & Co. For Chatterjee & Co. For V K Dhingra & Co. For A K Sabat & Co.Chartered Accountants Chartered Accountants Chartered Accountants Chartered Accountants
Firm Registration No.302049E Firm Registration No.302114E Firm Registration No.000250N Firm Registration No.321012E
Sd/- Sd/- Sd/- Sd/-[ Shrenik Mehta ] [ R.N. Basu ] [ Lalit Ahuja ] [ A K Sabat ]
Partner Partner Partner PartnerM. No. 063769 M. No. 050430 M. No. 085842 M. No. 030310
Place : New DelhiDated : May 30, 2017
B. Other Equity (` crore)
Othercomprehensive
income -Reserves and Surplus Reserve
Capital Securities General Bond Retained Equity TotalReserve Premium Reserve Redemption Earnings Instruments
Reserve Reserve through OtherComprehensive
Income
Balance as at 1st April, 2015 1.75 235.10 5,095.13 1,008.88 33,051.93 - 39,392.79
(Loss) for the year - - - - (4,021.44) (4,021.44)
Other comprehensive (loss) for the year - - - - (94.87) (0.22) (95.09)
Total comprehensive income/ (loss) for the year - - - - (4,116.31) (0.22) (4,116.53)
Impact of Depreciation on account of - - - - (86.61) - (86.61)Schedule II to Companies Act 2013 (net of tax)
Transfer from bond redemption reserve - - - (63.03) 63.03 - -
Transfer to bond redemption reserve - - - 504.11 (504.11) - -
Sub-total - - - 441.08 (527.69) - (86.61)
Transaction with owners in their capacity as owners:
Dividends - - - - (103.26) - (103.26)
Tax on dividends - - - - (21.02) - (21.02)
Sub-total - - - - (124.28) - (124.28)
Balance as at 31st March, 2016 1.75 235.10 5,095.13 1,449.96 28,283.65 (0.22) 35,065.37
Balance as at 1st April, 2016 1.75 235.10 5,095.13 1,449.96 28,283.65 (0.22) 35,065.37
(Loss) for the year - - - - (2,833.24) (2,833.24)
Other comprehensive income/ (loss) for the year - - - - (356.62) 3.02 (353.60)
Total comprehensive income/ (loss) for the year - - - - (3,189.86) 3.02 (3,186.84)
Transfer from bond redemption reserve - - - (84.09) 84.09 - -
Transfer to bond redemption reserve - - - 607.77 (607.77) - -
Balance as at 31st March, 2017 1.75 235.10 5,095.13 1,973.64 24,570.11 2.80 31,878.53

32
For the year ended For the year ended31st March, 2017 31st March, 2016
A. CASH FLOW FROM OPERATING ACTIVITIES
Profit/(Loss) before tax (4,850.86) (7,007.50)
Adjustments for:
Depreciation and amortisation expense 2,679.95 2,402.35
Gain on disposal of fixed assets (net) 48.17 68.05
Interest income (0.10) (182.24)
Dividend income (91.93) (70.85)
Finance costs 2,527.82 2,300.45
Loss on sale of non current investments (0.01) (7.31)
Bad debts and provision for doubtful advances/receivables 74.47 27.81
Other provisions 73.08 164.96
Unclaimed balances and excess provisions written back (97.62) (80.59)
Operating profit/(loss) before working capital changes 362.97 (2,384.87)
Change in assets and liabilities
Trade receivable 244.95 497.51
Loans, other financial assets and other assets (431.53) 586.45
Trade payable 1,217.02 402.45
Other financial liabilities, other liabilities and provisions 1,801.41 1,960.17
Inventories (1,104.70) 2,406.21
Cash flow from operating activities post working capital changes 2,090.12 3,467.92
Income tax paid (net) 34.91 331.79
Net cash flow from operating activities (A) 2,125.03 3,799.71
B. CASH FLOWS FROM INVESTING ACTIVITIES
Purchase of property, plant & equipment (including capital work-in-progress) and intangibles (5,452.18) (6,651.82)
Proceeds from sale/disposal of property, plant & equipment 25.02 158.99
Purchase of current and non-current investments (100.90) (316.67)
Movement in fixed deposits (net) (2.64) 1,998.24
Interest received 0.10 182.24
Dividend received 91.93 70.85
Net cash flows/(used) in investing activities (B) (5,438.67) (4,558.17)
C. CASH FLOWS FROM FINANCING ACTIVITIES
Proceeds from long-term borrowings (net) 1,591.77 1,875.51
Repayment of short-term borrowings (net) 4,238.18 1,291.95
Finance cost paid (2,527.82) (2,300.45)
Dividend paid (including tax) - (124.28)
Net cash flows/(used) in financing activities (C) 3,302.13 742.73
Increase in cash and cash equivalents (A+B+C) (11.51) (15.73)
Cash and cash equivalents at the beginning of the year 132.44 148.17
Cash and cash equivalents at the end of the year Note No. 16 120.93 132.44
The cash flow statement has been prepared under the indirect method as set out in Ind AS-7, Statement of Cash Flows.
The accompanying notes are an integral part of these standalone financial statements.
Cash Flow StatementFor the year ended 31st March, 2017 (` crore)
For and on behalf of Board of Directors
Sd/- Sd/- Sd/-(M.C.Jain) (Anil Kumar Chaudhary) (P. K. Singh)
Company Secretary Director (Finance) ChairmanDIN: 03256818 DIN: 06398868
In terms of our report of even date
For Singhi & Co. For Chatterjee & Co. For V K Dhingra & Co. For A K Sabat & Co.Chartered Accountants Chartered Accountants Chartered Accountants Chartered Accountants
Firm Registration No.302049E Firm Registration No.302114E Firm Registration No.000250N Firm Registration No.321012E
Sd/- Sd/- Sd/- Sd/-[ Shrenik Mehta ] [ R.N. Basu ] [ Lalit Ahuja ] [ A K Sabat ]
Partner Partner Partner PartnerM. No. 063769 M. No. 050430 M. No. 085842 M. No. 030310
Place : New DelhiDated : May 30, 2017

33
1. Corporate and General Information
Steel Authority of India Limited (referred to as "the Company") is domiciled andincorporated in India. The Company, a Public Sector Undertaking conferred withMaharatna status by Government of India, is one of the largest steel producersin the Country. The registered office of the Company is situated at Ispat Bhawan,Lodhi Road, New Delhi-110 003. The securities of the Company are listed onthe National, Bombay and London Stock Exchanges.
These financial statements have been approved by the Board of Directors of theCompany in their meeting held on 30th May, 2017.
2. Basis of Preparation
2.1 Statement of Compliance
The financial statements of the Company have been prepared on accrual basisof accounting in accordance with the Indian Accounting Standards (Ind AS) asprescribed under Section 133 of Companies Act, 2013, as notified under theCompanies (Indian Accounting Standards) Rules, 2015 (as amended), and otheraccounting principles generally accepted in India. The Company has uniformlyapplied the accounting policies during the periods presented. These are theCompany's first Ind AS financial statements and Ind AS 101, First-time Adoptionof Indian Accounting Standards has been applied.
For all the periods up to and including 31st March 2016, the Company hadprepared its financial statements in accordance with Generally AcceptedAccounting Principles (GAAP) in India, which includes, Accounting Standardsprescribed under Section 133 of the Companies Act 2013, read with Rule 7 ofthe Companies (Accounts) Rules, 2014 and the Companies Act, 2013(collectively referred to as 'Indian GAAP'). The Company followed the provisionsof IndAS 101 in preparing its opening Ind AS Balance Sheet as of the date oftransition, viz., 1st April, 2015. Certain of the Company's Ind AS AccountingPolicies used in the opening Balance Sheet differed from its Indian GAAPAccounting Policies applied as at 31st March, 2015 and accordingly theadjustments were made to restate the opening balances as per Ind AS. Theresulting adjustments, arising from events and transactions before the date oftransition to Ind AS, were recognised directly through retained earnings as at 1st
April, 2015 as required by Ind AS 101.
2.2 Basis of Measurement
The financial statements are prepared on a historical cost basis except for thefollowing assets and liabilities which have been measured at fair value:
• certain financial assets and liabilities which are classified as fair valuethrough profit and loss or fair value through other comprehensive income;
• assets held for sale, at the lower of the carrying amounts and fair valueless cost to sell;
• defined benefit plans and plan assets.
2.3 Functional and Presentation Currency
The Financial Statements have been presented in Indian Rupees (`), which isthe Company's functional currency. All financial information presented in ` havebeen rounded off to the nearest two decimals of Crore unless otherwise stated.
2.4 Use of Estimates and Management Judgement
In preparing the financial statements in conformity with Company's AccountingPolicies, management is required to make estimates and assumptions that affectreported amounts of assets and liabilities and the disclosure of contingentliabilities as at the date of the financial statements, the amounts of revenue andexpenses during the reported period and notes to the Financial Statements.Actual results could differ from those estimates. Any revision to such estimatesis recognised in the period in which the same is determined.
3. Significant Accounting Policies
A summary of the significant accounting policies applied in the preparation ofthe financial statements is given below. These accounting policies have beenapplied consistently to all the periods presented in the financial statements.
3.1 Property, Plant and Equipment
3.1.1 Recognition and Measurement
Tangible Assets
Property, plant and equipment held for use in the production or/and supply ofgoods or services, or for administrative purposes, are stated in the balancesheet at cost, less any subsequent accumulated depreciation and impairmentlosses. The initial cost at cash price equivalence of property, plant and equipmentacquired comprises its purchase price, including import duties and non-refundable purchase taxes, any directly attributable costs of bringing the assetsto its working condition and location and present value of any obligatorydecommissioning costs for its intended use. Plant and Machinery also includeassets held under finance lease.
In case of self-constructed assets, cost includes the costs of all materials usedin construction, direct labour, allocation of overheads, directly attributableborrowing costs including trial run expenses (net of revenue)
Spares having useful life of more than one year and having value of ` 10 lakhsor more in each case, are capitalised under the respective heads as and whenavailable for use.
Profit or loss arising on the disposal of property, plant and equipment isrecognised in the Statement of Profit and Loss.
3.1.2 Subsequent Cost
Subsequent expenditure is recognised as an increase in the carrying amount ofthe asset or recognised as a separate asset, as appropriate, only when it isprobable that future economic benefits derived from the cost incurred will flowto the Company and the cost of the item can be measured reliably. The carryingamount of replaced item (s) is derecognised. .
Any repairs of ̀ 50 lakhs or more of property, plant and equipment are recognisedin the carrying amount of the item if it is probable that the future economicbenefits of the costs incurred will flow to the Company. The carrying amount ofthe replaced item(s) is derecognised.
3.1.3 Depreciation
Depreciation on tangible assets and investment property is provided on straightline method, considering residual value of 5% of the cost of the asset, over theuseful lives of the assets, as specified in Schedule II of the Companies Act,2013 except in case of Factory Buildings, Plant and Machinery, Water Supply &Sewerage and Railway Lines & Sidings and components thereof, where usefullife is determined by technical experts. The useful life assumed by the technicalexperts is as under:
Asset category Estimated useful life (in years)
Factory Buildings 35 to 40
Plant and Machinery 10 to 40
Water Supply & Sewerage 25 to 40
Railway Lines & Sidings 35 to 40
For these classes of assets, based on technical evaluation carried out by externaltechnical experts, the Company believes that the useful lives as given abovebest represent the period over which Company expects to use these assets.Hence, the useful lives for these assets are different from the useful lives asprescribed under Part C of Schedule II of the Companies Act 2013.
The estimated useful lives and residual values of depreciable/ amortisable assetsare reviewed at each year end, with the effect of any changes in estimateaccounted for on a prospective basis.
Where the historical cost of a depreciable asset undergoes a change, thedepreciation on the revised unamortised depreciable amount is provided overthe residual useful life of the asset. Depreciation on addition/ deletion during theyear is provided on pro-rata basis with reference to the month of addition/ deletion.Assets costing up to ` 5000/- are fully depreciated in the year in which they areput to use.
Depreciation on capital spares is provided over the useful life of the spare orremaining useful life of the mother asset, as reassessed, whichever is lower.
3.2 Intangible Assets
3.2.1 Recognition and Measurement
Mining Rights
Mining Rights are treated as Intangible Assets and all related costs thereof areamortised on the basis of annual production to the total estimated mineablereserves. In case the mining rights are not renewed, the balance related costwill be charged to revenue in the year of decision of non- renewal.
Acquisition Cost i.e. cost associated with acquisition of licenses, and rights toexplore including related professional fees, payment towards statutory forestryclearances, as and when incurred, are treated as addition to the Mining Rights.
Other Intangible Assets
Software which is not an integral part of related hardware, is treated as intangibleasset and amortised over a period of five years or its licence period, whicheveris less.
Research and Development
Development expenditure is capitalised only if it can be measured reliably andthe related asset and process are identifiable and controlled by the Company.Research and other development expenditure is recognised as revenueexpenditure as and when incurred.
Notes to Standalone Financial Statements for the Year ended 31st March, 2017

34
3.2.2 Subsequent Cost
Subsequent expenditure is capitalised only when it increases the future economicbenefits embodied in the specific asset to which it relates. All other expenditureis recognised in the Statement of Profit and Loss.
3.3 Impairment of Non-Financial Assets
The Company reviews the carrying amount of its assets on each Balance Sheetdate for the purpose of ascertaining impairment indicators if any, by consideringassets of entire one Plant as Cash Generating Unit (CGU). If any such indicationexists, the assets' recoverable amount is estimated, as higher of the Net SellingPrice and the Value in Use. An impairment loss is recognised whenever thecarrying amount of an asset exceeds its recoverable amount.
Where an impairment loss subsequently reverses, the carrying amount of theasset (or cash-generating unit) is increased to the revised estimate of itsrecoverable amount, so that the increased carrying amount does not exceedthe carrying amount that would have been determined had no impairment lossbeen recognised for the asset (or cash-generating unit) in prior years. A reversalof an impairment loss is recognised immediately in the Statement of Profit andLoss.
3.4 Stripping Cost
The stripping cost incurred during the production phase of a surface mine isrecognised as an asset if such cost provides a benefit in terms of improvedaccess to ore in future periods and following criteria are met:
• It is probable that the future economic benefits (improved access to an orebody) associated with the stripping activity will flow to the entity,
• The entity can identify the component of an ore body for which access hasbeen improved, and
• The costs relating to the improved access to that component can bemeasured reliably.
The expenditure, which cannot be specifically identified to have been incurredto access ore is charged to revenue, based on stripping ratio as per 5 yearmining plan for mines, except collieries which is based on project report.
3.5 Borrowing Costs
Borrowing costs directly attributable to the acquisition or construction of aqualifying asset, which takes substantial period of time, are capitalised as a partof the cost of that asset, during the period of time that is necessary to completeand prepare the asset for its intended use.
The Company considers a period of twelve months or more as a substantialperiod of time.
Transaction costs in respect of long-term borrowings are amortised over thetenure of respective loans using effective interest method. Other borrowing costsare recognised in the Statement of Profit & Loss in the period in which these areincurred.
3.6 Inventories
Raw materials, Stores & Spares and Finished/Semi-finished products (includingprocess scrap) are valued at lower of cost and net realisable value of the itemsof the respective Plants/Units. In case of identified obsolete/ surplus/ non-movingitems, necessary provision is made and charged to revenue. The net realisablevalue of semi-finished special products, which have realisable value at finishedstage only, is estimated for the purpose of comparison with cost.
Residue products and other scrap are valued at estimated net realisable value.
The basis of determining cost is:
Raw materials - Periodical weighted average cost
Minor raw materials - Moving weighted average cost
Stores & Spares - Moving weighted average cost
Materials in-transit - at cost
Finished/Semi-finished products - material cost plus appropriate share of labour,related overheads and duties.
3.7 Government Grants
Government grants are recognised when there is reasonable assurance that theCompany will comply with the conditions attaching to them and that the grantswill be received.
Government grants are recognised in Statement of Profit and Loss on a systematicbasis over the periods in which the Company recognises as expenses the relatedcosts for which the grants are intended to compensate. Where the Grant relatesto an asset value, it is recognised as deferred income, and amortised over theexpected useful life of the asset. Other grants are recognised in the statement ofProfit & Loss concurrent to the expenses to which such grants relate/ are intendedto cover.
Where the Company receives non-monetary grants, the asset and the grant arerecorded gross at fair amounts and released to the income statement over theexpected useful life and pattern of consumption of the benefit of the underlyingasset.
3.8 Foreign Currency Transactions
Foreign currency transactions are translated into the functional currency of theCompany using the exchange rates prevailing at the date of the transactions.Foreign exchange gains and losses resulting from the settlement and re-measurement of monetary items denominated in foreign currency are recognisedin the Statement of Profit and Loss at period-end exchange rates.
The Company opted for accounting the exchange differences arising on reportingof long term foreign currency monetary items in line with Companies (AccountingStandards) Amendment Rules 2009 relating to Accounting Standard-11 notifiedby Government of India on 31st March, 2009 (as amended on 29th December2011), which will continue in accordance with Ind-AS 101 for all pre-existinglong term foreign currency monetary items as at 31st March 2016. Accordingly,exchange differences relating to long term monetary items, arising during theyear, in so far as they relate to the acquisition of fixed assets, are adjusted in thecarrying amount of such assets.
Non-monetary items are not retranslated at period-end and are measured athistorical cost (translated using the exchange rates at the transaction date),except for non-monetary items measured at fair value which are translated usingthe exchange rates at the date when fair value was determined.
3.9 Employee Benefits
Defined Contribution Plan
A defined contribution plan is a plan under which the Company pays fixedcontributions into a separate entity. Payments to defined contribution retirementbenefit plans are recognised as an expense when employees have renderedservice entitling them to the contributions. Contributions towards Provident Fundsare charged to the Statement of Profit and Loss of the period when thecontributions to the Funds are due.
Defined Benefit Plan
Defined benefit plans are the amount of the benefit that an employee will receiveon completion of services by reference to length of service, last drawn salary ordirect costs related to such benefits. The legal obligation for any benefits remainswith the Company.
The liability recognised for Defined Benefit Plans is the present value of theDefined Benefit Obligation (DBO) at the reporting date less the fair value of planassets, together with adjustments for unrecognised actuarial gains or lossesand past service costs. Management estimates the present value of the DBOannually through valuations by an independent actuary using the projected unitcredit method. Actuarial gains and losses are included in Statement of Profitand Loss or Other Comprehensive Income of the year.
Remeasurement, comprising of actuarial gains and losses, the effect of thechanges to the asset ceiling (if applicable) and the return on plan assets (excludinginterest), is reflected in the balance sheet with a charge or credit recognised inother comprehensive income in the period in which they occur. Remeasurementrecognised in other comprehensive income is reflected immediately in retainedearnings and will not be reclassified to the statement of profit and loss.
Short Term Employee Benefits
Short term employee benefits comprise of employee costs such as salaries,bonus, ex-gratia, annual leave and sick leave which are accrued in the year inwhich the associated services are rendered by employees of the Company.
Liabilities recognised in respect of short-term employee benefits are measuredat the undiscounted amount of the benefits expected to be paid in exchange forthe related services.
Expenditure incurred on Voluntary Retirement Scheme is charged to the Statementof Profit and Loss immediately.
3.10 Revenue Recognition
Revenue is measured at the fair value of consideration received or receivable.
Sale of goods
Sales include excise duty and are net of sales taxes, rebates and priceconcessions. Sales are recognised at the time of dispatch of materials to thebuyers including the cases where delivery documents are endorsed in favour ofthe buyers. Where the contract prices are not finalised with government agencies,sales are accounted for on provisional basis.
Marine export sales are recognised on:
i) the issue of bill of lading, or
ii) negotiation of export bills upon expiry of laycan period, in cases whererealisation of material value without shipment is provided in the letters ofcredit of respective contracts, whichever is earlier.
Export incentives under various schemes are recognised as income on certaintyof realisation.
The iron ore fines not readily useable/saleable are included in inventory andrevenue is recognised on disposal.

35
Interest and dividend income
Interest income is reported on an accrual basis using the effective interestmethod. Dividends are recognised at the time the right to receive is established.
3.11 Adjustment pertaining to Earlier Years
Income/Expenditure relating to a prior period, which do not exceed 0.5% ofTurnover in each case, are treated as income/expenditure of current year.
3.12 Claims for Liquidated Damages and Price Escalation
Claims for liquidated damages are accounted for as and when these areconsidered recoverable by the Company, on final settlement. These are adjustedto the capital cost or recognised in Statement of Profit and Loss, as the casemay be on final settlement of Liquidated damages.
Suppliers' and Contractors' claims for price escalation are accounted for to theextent such claims are accepted by the Company.
3.13 Leases
Company as a Lessee
Finance leases
Finance leases, which effectively transfer to the lessee substantially all the risksand benefits incidental to ownership of the leased item, are capitalised at thelower of the fair value and present value of the minimum lease payments at theinception of the lease term and disclosed as leased assets. Lease paymentsunder such leases are apportioned between the finance charges and reductionof the lease liability based on the implicit rate of return. Finance charges arecharged directly against income. Lease management fees, legal charges andother initial direct costs are capitalised.
If there is no reasonable certainty that the Company will obtain the ownershipby the end of lease term, capitalised leased assets are depreciated over theshorter of the estimated useful life of the asset or the lease term.
Operating leases
Assets acquired on leases where a significant portion of risk and rewards ofownership are retained by the lessor are classified as operating leases. Leaserental are charged to statement of profit and loss on straight-line basis exceptwhere scheduled increase in rent compensate the lessor for expected inflationarycosts.
Company as a Lessor
Finance leases
Leases which effectively transfer to the lessee substantially all the risks andbenefits incidental to ownership of the leased item are classified and accountedfor as finance lease. Lease rental receipts are apportioned between the financeincome and capital repayment based on the implicit rate of return. Contingentrents are recognised as revenue in the period in which they are earned.
Operating leases
Leases in which the Company does not transfer substantially all the risks andrewards of ownership of an asset are classified as operating leases. Therespective leased assets are included in the balance sheet based on their nature.Rental income is recognized on straight-line basis over the lease term exceptwhere scheduled increase in rent compensates the Company with expectedinflationary costs.
3.14 Investment Properties
Investment properties are properties held to earn rentals and/or for capitalappreciation. Investment properties are measured initially at cost includingtransaction costs. Subsequent to initial recognition, investment properties arestated at cost less accumulated depreciation and impairment losses. Any gainor loss on disposal of investment property is determined as the difference betweennet disposal proceeds and the carrying amount of the property and is recognisedin the Statement of Profit and Loss.
3.15 Non-current assets held for sale
Company classifies a non-current asset as held for sale if its carrying amountwill be recovered principally through a sale transaction. This condition is regardedas met only when the asset is available for immediate sale in its present conditionand its sale is highly probable.
Non-current assets including discontinued operations, classified as held for saleare measured at the lower of the carrying amounts and fair value less costs tosell and presented separately in the financial statements. Once classified asheld for sale, the assets are not subject to depreciation or amortisation.
Any profit or loss arising from the sale or re-measurement of discontinuedoperations is presented as part of a single line item in statement of profit andloss.
3.16 Mine Closure
Mine Closure Provision include the dismantling and demolition of infrastructure,the removal of residual materials and the remediation of disturbed areas formines. This provision is based on all regulatory requirements and relatedestimated cost based on best available information. Mine closure costs are
provided for in the accounting period when the obligation arises based on thenet present value of the estimated future costs of restoration to be incurredduring the life of the operation and post closure.
The initial close-down and restoration provision is capitalised within "Property,Plant and Equipment". Subsequent movements in the close-down and restorationprovisions for on-going operations, including those resulting from newdisturbance related to expansions or other activities qualifying for capitalisation,updated cost estimates, changes to the estimated lives of operations, changesto the timing of closure activities and revisions to discount rates are alsocapitalised within "Property, Plant and Equipment". These costs are depreciatedover the lives of the assets to which they relate. Any changes in closure provisionsrelating to closed operations are charged /credited to the Statement of Profit andLoss. The amortisation or "unwinding" of the discount applied in establishingthe provisions is charged as Finance Cost.
3.17 Provisions, Contingent Liabilities and Contingent Assets
Provisions and Contingent Liabilities
A Provision is recognised when the Company has present obligation as a resultof a past event and it is probable that an outflow of resources will be required tosettle the obligation in respect of which a reliable estimate can be made. Provisionsare discounted to their present value, where the time value of money is material.
When some or all of the economic benefits required to settle a provision areexpected to be recovered from a third party, the receivable is recognised as aseparate asset if it is virtually certain that reimbursement will be received andthe amount of the receivable can be measured reliably.
Contingent liability is a possible obligation arising from past events and theexistence of which will be confirmed only by the occurrence or non-occurrenceof one or more uncertain future events not wholly within the control of theCompany or a present obligation that arises from past events but is not recognisedbecause it is not possible that an outflow of resources embodying economicbenefit will be required to settle the obligations or reliable estimate of the amountof the obligations cannot be made. The Company discloses the existence ofcontingent liabilities in Other Notes to Financial Statements.
In cases where the possible outflow of economic resources as a result of presentobligation is considered improbable or remote, no Provision is recognised ordisclosure is made.
Contingent Assets
Contingent assets usually arise from unplanned or other unexpected events thatgive rise to the possibility of an inflow of economic benefits. Contingent Assetsare not recognised though are disclosed, where an inflow of economic benefitsis probable.
3.18 Income Taxes
Tax expense recognised in statement of profit and loss comprises the sum ofdeferred tax and current tax not recognised in Other Comprehensive Income(OCI) or directly in equity.
Current income tax is measured at the amount expected to be paid to the taxauthorities in accordance with the Indian Income-tax Act. Current income taxrelating to items recognised outside statement of profit and loss is recognisedeither in OCI or in equity.
Deferred income taxes are calculated using the liability method. Deferred taxliabilities are generally recognised in full for all taxable temporary differences.Deferred tax assets are recognised to the extent that it is probable that theunderlying tax loss, unused tax credits (MAT Credit entitlement) or deductibletemporary difference will be utilised against future taxable income. Unrecogniseddeferred tax assets are re-assessed at each reporting date and are recognisedto the extent that it has become probable that future taxable profits will allow thedeferred tax asset to be recovered.
Deferred tax assets and liabilities are measured at the tax rates that are expectedto apply in the year when the asset is realised or the liability is settled, based ontax rates (and tax laws) that have been enacted or substantively enacted at thereporting date. Deferred tax relating to items recognised outside statement ofprofit and loss is recognised either in OCI or in equity.
3.19 Cash and Cash Equivalents
Cash and cash equivalents comprise cash on hand and demand deposits,together with other short-term highly liquid investments (original maturity lessthan 3 months) that are readily convertible into known amount of cash and aresubject to an insignificant risk of changes in value.
3.20 Equity and Reserves
Share Capital represents the nominal value of shares that have been issued.Securities premium includes any premium received on issue of Share Capital.
Other components of equity include the following:
• Re-measurement of defined benefit liability comprises the actuarial gain orloss from changes in demographic and financial assumptions and returnon plan assets.
• Bond Redemption Reserve.

36
• Other transactions recorded directly in Other Comprehensive Income.
• Retained earnings include all current and prior period retained profits
3.21 Financial Instruments
Recognition, initial measurement and de-recognition
Financial assets and financial liabilities are recognised and are measured initiallyat fair value adjusted by transactions costs, except for those financial assetswhich are classified at Fair Value through Profit & Loss (FVTPL) at inception.
Financial assets are derecognised when the contractual rights to the cash flowsfrom the financial asset expire, or when the financial asset and all substantialrisks and rewards are transferred. A financial liability is derecognized when it isextinguished, discharged, cancelled or expires.
Classification and subsequent measurement of financial assets
For the purpose of subsequent measurement, financial assets are classified intothe following categories upon initial recognition:
• amortised cost
• financial assets at fair value through profit or loss (FVTPL)
• financial assets at fair value through other comprehensive income (FVOCI)
All financial assets except for those at FVTPL are subject to review for impairmentat least at each reporting date.
Amortised cost
A financial asset is measured at amortised cost using effective interest rates ifboth of the following conditions are met:
a) the financial asset is held within a business model whose objective is tohold financial assets in order to collect contractual cash flows; and
b) the contractual terms of the financial asset give rise on specified dates tocash flows that are solely payments of principal and interest on the principalamount outstanding.
The Company's cash and cash equivalents, trade and most other receivablesfall into this category of financial instruments.
Financial assets at FVTPL
Financial assets at FVTPL include financial assets that are either do not meet thecriteria for amortised cost classification or that are equity instruments held fortrading or that meet certain conditions and are designated at FVTPL upon initialrecognition. All derivative financial instruments also fall into this category. Assetsin this category are measured at fair value with gains or losses recognized inprofit or loss. The fair values of financial assets in this category are determinedby reference to active market transactions or using a valuation technique whereno active market exists.
Financial assets at FVOCI
FVOCI financial assets are either debt instruments that are managed under holdto collect and sell business model or are non-trading equity instruments that areirrevocable designated to this category at inception.
FVOCI financial assets are measured at fair value. Gains and losses are recognizedin other comprehensive income, except for interest and dividend income,impairment losses and foreign exchange differences on monetary assets, whichare recognized in statement of profit or loss.
Classification and subsequent measurement of financial liabilities
Financial liabilities are measured subsequently at amortized cost using theeffective interest method, except for financial liabilities held for trading ordesignated at FVTPL, that are carried subsequently at fair value with gains orlosses recognized in profit or loss. All derivative financial instruments areaccounted for at FVTPL.
Embedded Derivatives
Derivatives embedded in non-derivative host contracts are treated as separatederivatives when they meet the definition of a derivative, their risks andcharacteristics are not closely related to those of the host contracts and thecontracts are not measured at FVTPL.
Impairment of Financial Assets
In accordance with Ind AS 109, the Company applies Expected Credit Loss(ECL) model for measurement and recognition of impairment loss for financialassets.
ECL is the difference between all contractual cash flows that are due to theCompany in accordance with the contract and all the cash flows that the Companyexpects to receive.
Trade Receivables
The Company applies approach as specified in Indian Accounting Standards(Ind AS) 109 Financial Instruments, which requires expected lifetime losses tobe recognised from initial recognition of receivables.
Other Financial Assets
For recognition of impairment loss on other financial assets and risk exposure,
the Company determines whether there has been a significant increase in thecredit risk since initial recognition.
Offsetting financial instruments
Financial assets and liabilities are offset and the net amount reported in thebalance sheet when there is a legally enforceable right to offset the recognisedamounts and there is an intention to settle on a net basis or realise the asset andsettle the liability simultaneously. The legally enforceable right must not becontingent on future events and must be enforceable in the normal course ofbusiness and in the event of default, insolvency or bankruptcy of the counterparty.
3.22 Investments in subsidiaries, joint ventures and associates
The Company has accounted for its subsidiaries and associates, joint venturesat cost in its standalone financial statements in accordance with Ind AS- 27,Separate Financial Statements.
3.23 Significant Judgements, Assumptions and Estimations in applying AccountingPolicies
3.23.1 Classification of Leases
The Company enters into leasing arrangements for various assets. Theclassification of the leasing arrangement as a finance lease or operating lease isbased on an assessment of several factors, including, but not limited to, transferof ownership of leased asset at end of lease term, lessee's option to purchaseand estimated certainty of exercise of such option, proportion of lease term tothe asset's economic life, proportion of present value of minimum lease paymentsto fair value of leased asset and extent of specialized nature of the leased asset.
3.23.2 Close-down and Restoration Obligations
Close-down and restoration costs are normal consequence of mining orproduction, and majority of close-down and restoration expenditure are incurredin the years following the closure of mine, although the ultimate cost to beincurred is uncertain, the Company estimate their costs using current restorationtechniques.
3.23.3 Recognition of Deferred Tax Assets
The extent to which deferred tax assets can be recognized is based on anassessment of the probability of the Company's future taxable income againstwhich the deferred tax assets can be utilized. In addition, significant judgementis required in assessing the impact of any legal or economic limits.
3.23.4 Inventories
The Company estimates the cost of inventories taking into account the mostreliable evidence, such as cost of materials and overheads considered attributableto the production of such inventories including actual cost of production, etc.Management also estimates the net realisable values of inventories, taking intoaccount the most reliable evidence available at each reporting date. The futurerealisation of these inventories may be affected by future technology or othermarket-driven changes that may reduce future selling prices.
3.23.5 Defined Benefit Obligation (DBO)
Employee benefit obligations are measured on the basis of actuarial assumptionswhich include mortality and withdrawal rates as well as assumptions concerningfuture developments in discount rates, medical cost trends, anticipation of futuresalary increases and the inflation rate. The Company considers that theassumptions used to measure its obligations are appropriate. However, anychanges in these assumptions may have a material impact on the resultingcalculations.
3.23.6 Fair Value Measurements
The Company applies valuation techniques to determine the fair value of financialinstruments (where active market quotes are not available) and non-financialassets. This involves developing estimates and assumptions consistent withthe market participants to price the instrument. The Company's assumptionsare based on observable data as far as possible, otherwise on the best informationavailable. Estimated fair values may vary from the actual prices that would beachieved in an arm's length transaction at the reporting date.
3.23.7 Provisions and Contingencies
The assessments undertaken in recognising provisions and contingencies havebeen made in accordance with Indian Accounting Standards (Ind AS) 37,'Provisions, Contingent Liabilities and Contingent Assets'. The evaluation of thelikelihood of the contingent events is applied best judgement by managementregarding the probability of exposure to potential loss.
3.23.8 Mines Closure and Restoration Obligations
Environmental liabilities and Asset Retirement Obligation (ARO): Estimation ofenvironmental liabilities and ARO require interpretation of scientific and legaldata, in addition to assumptions about probability and future costs.
3.23.9 Useful lives of depreciable/ amortisable assets (tangible and intangible)
Management reviews its estimate of the useful lives of depreciable/ amortisableassets at each reporting date, based on the expected utility of the assets.Uncertainties in these estimates relate to actual normal wear and tear that maychange the utility of plant and equipment.

37
4.
PR
OP
ER
TY,
PLA
NT
AN
D E
QU
IPM
EN
T(F
or t
he y
ear
ende
d 31st
Mar
ch,
2016)
(` c
rore
)
Des
crip
tion
Gro
ss b
lock
Acc
umul
ated
dep
reci
atio
nN
et b
lock
Net
blo
ck *
As
atA
ddit
ions
Dis
posa
ls/
A
s at
As
atFo
rD
ispos
als
/A
s at
As
atA
s at
1st A
pril,
Adj
ustm
ents
31
st
Mar
ch,
1st A
pril,
the
Adj
ustm
ents
31st
Mar
ch,
31st
Mar
ch,
1st A
pril,
2015
2016
2015
Year
2016
2016
2015
A.
Pla
nt,
Min
es &
Oth
ers
Land
(In
clud
ing
cost
of
Dev
elop
men
t)
-Fre
ehol
d la
nd 2
61.1
5 1
.52
- 2
62.6
7 0
.87
- -
0.8
7 2
61.8
0 2
60.2
8
-Lea
seho
ld la
nd 9
59.0
1 2
1.81
1.5
4 9
79.2
8 1
13.8
6 5
8.99
1.3
3 1
71.5
2 8
07.7
6 8
45.1
5
Bui
ldin
gs a
nd r
elat
ed e
quip
men
ts 3
,939
.24
641
.94
(51
1.17
) 5
,092
.35
1,3
85.4
6 1
58.4
9 4
8.26
1,4
95.6
9 3
,596
.66
2,5
53.7
8
Pla
nt
and
mac
hine
ry
-Ste
el P
lant
51,
468.
58 9
,496
.05
821
.02
60,
143.
61 2
2,82
2.50
1,6
94.0
5 8
.62
24,
507.
93 3
5,63
5.68
28,
646.
08
-Oth
ers
- ow
ned
2,5
70.0
9 1
58.1
5 (
5.76
) 2
,734
.00
1,8
24.1
0 1
14.2
2 6
2.80
1,8
75.5
2 8
58.4
8 7
45.9
9
-Oth
ers
- le
aseh
old
(R
efer
not
e (ii
)) 1
,378
.01
77.
64 -
1,4
55.6
5 4
29.0
3 1
10.7
1 -
539
.74
915
.91
948
.98
Furn
iture
and
fix
ture
s 1
15.3
3 4
.58
1.5
1 1
18.4
0 8
0.96
5.0
5 0
.38
85.
63 3
2.77
34.
37
Vehi
cles
1,2
68.8
4 5
3.74
14.
02 1
,308
.56
643
.33
65.
66 1
0.01
698
.98
609
.58
625
.51
Offi
ce e
quip
men
ts 5
7.53
4.5
1 2
.07
59.
97 4
4.57
3.4
3 1
.91
46.
09 1
3.88
12.
96
Mis
cella
neou
s ar
ticle
s 3
02.3
6 2
7.65
20.
95 3
09.0
6 1
98.3
6 1
4.06
14.
44 1
97.9
8 1
11.0
8 1
04.0
0
Roa
ds,
Brid
ges
& C
ulve
rts
257
.55
54.
29 2
.46
309
.38
175
.53
33.
31 2
.06
206
.78
102
.60
82.
02
Wat
er S
uppl
y &
Sew
erag
e 6
36.4
3 3
1.20
115
.57
552
.06
314
.17
17.
90 2
6.05
306
.02
246
.04
322
.26
Rai
lway
Lin
es A
nd S
idin
gs 6
09.3
7 6
2.55
42.
09 6
29.8
3 2
39.5
8 1
2.97
19.
62 2
32.9
3 3
96.9
0 3
69.7
9
EDP
equ
ipm
ents
392
.46
10.
40 1
.55
401
.31
323
.26
22.
54 2
.38
343
.42
57.
89 6
9.20
Sub
tota
l 'A
' 6
4,2
15.9
5 1
0,6
46.0
3 5
05.8
5 7
4,3
56.1
3 2
8,5
95.5
8 2
,311.3
8 1
97.8
6 3
0,7
09.1
0 4
3,6
47.0
3 3
5,6
20.3
7
B.
Soc
ial
Faci
litie
s
Land
(In
clud
ing
cost
of
Dev
elop
men
t)
-Fre
ehol
d la
nd 1
0.88
- -
10.
88 -
10.
88 1
0.88
-Lea
seho
ld la
nd 6
.89
- -
6.8
9 5
.78
0.1
1 -
5.8
9 1
.00
1.1
1
Bui
ldin
gs a
nd r
elat
ed e
quip
men
ts 6
26.7
6 3
5.16
(1.
75)
663
.67
284
.70
17.
74 0
.68
301
.76
361
.91
342
.06
Pla
nt
and
mac
hine
ry
- O
ther
s 1
34.1
7 7
.27
0.4
8 1
40.9
6 8
9.13
5.7
2 0
.29
94.
56 4
6.40
45.
04
Furn
iture
and
fix
ture
s 2
5.32
2.0
3 0
.73
26.
62 1
7.94
1.4
1 0
.37
18.
98 7
.64
7.3
8
Vehi
cles
11.
19 -
0.2
1 1
0.98
9.2
3 0
.55
0.2
0 9
.58
1.4
0 1
.96
Offi
ce e
quip
men
ts 4
.20
0.5
2 0
.17
4.5
5 3
.41
0.3
3 0
.12
3.6
2 0
.93
0.7
9
Mis
cella
neou
s ar
ticle
s 2
05.2
8 9
.74
0.1
9 2
14.8
3 1
15.3
2 1
1.21
(0.
14)
126
.67
88.
16 8
9.96
Roa
ds,
Brid
ges
& C
ulve
rts
93.
36 2
9.85
(0.
63)
123
.84
55.
53 1
4.11
(0.
59)
70.
23 5
3.61
37.
83
Wat
er S
uppl
y &
Sew
erag
e 1
22.7
1 6
.18
(93
.68)
222
.57
107
.28
4.3
6 (
7.76
) 1
19.4
0 1
03.1
7 1
5.43
EDP
equ
ipm
ents
12.
72 0
.24
0.8
5 1
2.11
11.
11 0
.63
1.0
8 1
0.66
1.4
5 1
.61
Sub
tota
l 'B
' 1
,253.4
8 9
0.9
9 (
93.4
3)
1,4
37.9
0 6
99.4
3 5
6.1
7 (
5.7
5)
761.3
5 6
76.5
5 5
54.0
5
C.
Pro
pert
y, p
lant
and
equ
ipm
ent
reti
red
from
act
ive
use
Ass
ets
retir
ed f
rom
act
ive
use
55.
53 6
.49
6.7
3 5
5.29
- -
- -
55.
29 5
5.53
Sub
tota
l 'C
' 5
5.5
3 6
.49
6.7
3 5
5.2
9 -
- -
- 5
5.2
9 5
5.5
3
Tota
l 6
5,5
24.9
6 1
0,7
43.5
1 4
19.1
5 7
5,8
49.3
2 2
9,2
95.0
1 2
,367.5
5 1
92.1
1 3
1,4
70.4
5 4
4,3
78.8
7 3
6,2
29.9
5
* R
epre
sent
s de
emed
cos
t on
the
date
of
tran
sitio
n to
IndA
S.
Gro
ss b
lock
and
acc
umul
ated
dep
reci
atio
n fr
om th
e pr
evio
us G
AA
P h
ave
been
dis
clos
ed f
or th
e pu
rpos
e of
bet
ter
unde
rsta
ndin
g of
the
orig
inal
cos
t of
asse
ts.
Not
es t
o th
e S
tand
alon
e Fin
anci
al S
tate
men
ts f
or t
he y
ear
ende
d 31st M
arch
, 2017

38
4.
PR
OP
ER
TY,
PLA
NT
AN
D E
QU
IPM
EN
T(F
or t
he y
ear
ende
d 31
st M
arch
, 2017)
(` c
rore
)
Des
crip
tion
Gro
ss b
lock
Acc
umul
ated
dep
reci
atio
nN
et b
lock
Net
blo
ck
As
atA
ddit
ions
Dis
posa
ls/
A
s at
As
atFo
rD
ispos
als
/A
s at
As
atA
s at
1st A
pril,
Adj
ustm
ents
31
st
Mar
ch,
1st A
pril,
the
Adj
ustm
ents
31st
Mar
ch,
31st
Mar
ch,
1st A
pril,
2016
2017
2016
Year
2017
2017
2016
A.
Pla
nt,
Min
es &
Oth
ers
Land
(In
clud
ing
cost
of
Dev
elop
men
t)
-Fre
ehol
d la
nd 2
62.6
7 9
.69
(0.
02)
272
.38
0.8
7 -
- 0
.87
271
.51
261
.80
-Lea
seho
ld la
nd 9
79.2
8 0
.50
- 9
79.7
8 1
71.5
2 4
5.16
- 2
16.6
8 7
63.1
0 8
07.7
6
Bui
ldin
gs a
nd r
elat
ed e
quip
men
ts 5
,092
.35
75.
35 1
.41
5,1
66.2
9 1
,495
.69
146
.31
(0.
01)
1,6
42.0
1 3
,524
.28
3,5
96.6
6
Pla
nt
and
mac
hine
ry
-Ste
el P
lant
60,
143.
61 6
,298
.19
212
.54
66,
229.
26 2
4,50
7.93
2,0
01.4
8 1
61.4
3 2
6,34
7.98
39,
881.
28 3
5,63
5.68
-Oth
ers
- ow
ned
2,7
34.0
0 3
43.5
1 4
7.75
3,0
29.7
6 1
,875
.52
117
.96
39.
54 1
,953
.94
1,0
75.8
2 8
58.4
8
-Oth
ers
- le
aseh
old
(Ref
er n
ote
(ii))
1,4
55.6
5 1
01.5
8 -
1,5
57.2
3 5
39.7
4 1
17.6
2 (
0.01
) 6
57.3
7 8
99.8
6 9
15.9
1
Furn
iture
and
fix
ture
s 1
18.4
0 4
.99
(1.
83)
125
.22
85.
63 4
.86
(1.
42)
91.
91 3
3.31
32.
77
Vehi
cles
1,3
08.5
6 2
9.68
10.
80 1
,327
.44
698
.98
66.
45 9
.17
756
.26
571
.18
609
.58
Offi
ce e
quip
men
ts 5
9.97
2.0
5 1
.73
60.
29 4
6.09
3.2
3 1
.63
47.
69 1
2.60
13.
88
Mis
cella
neou
s ar
ticle
s 3
09.0
6 1
2.46
2.7
7 3
18.7
5 1
97.9
8 1
3.73
1.8
7 2
09.8
4 1
08.9
1 1
11.0
8
Roa
ds,
Brid
ges
& C
ulve
rts
309
.38
33.
97 0
.19
343
.16
206
.78
22.
43 0
.02
229
.19
113
.97
102
.60
Wat
er S
uppl
y &
Sew
erag
e 5
52.0
6 4
.76
0.0
3 5
56.7
9 3
06.0
2 1
8.67
0.0
3 3
24.6
6 2
32.1
3 2
46.0
4
Rai
lway
Lin
es A
nd S
idin
gs 6
29.8
3 9
3.47
13.
92 7
09.3
8 2
32.9
3 1
4.10
13.
17 2
33.8
6 4
75.5
2 3
96.9
0
EDP
equ
ipm
ents
401
.31
15.
60 2
.03
414
.88
343
.42
14.
47 1
.79
356
.10
58.
78 5
7.89
Sub
tota
l 'A
' 7
4,3
56.1
3 7
,025.8
0 2
91.3
2 8
1,0
90.6
1 3
0,7
09.1
0 2
,586.4
7 2
27.2
1 3
3,0
68.3
6 4
8,0
22.2
5 4
3,6
47.0
3
B.
Soc
ial
Faci
litie
s
Land
(In
clud
ing
cost
of
Dev
elop
men
t)
-Fre
ehol
d la
nd 1
0.88
- -
10.
88 -
- 1
0.88
10.
88
-Lea
seho
ld la
nd 6
.89
2.5
0 -
9.3
9 5
.89
0.0
6 -
5.9
5 3
.44
1.0
0
Bui
ldin
gs a
nd r
elat
ed e
quip
men
ts 6
63.6
7 2
0.80
0.7
0 6
83.7
7 3
01.7
6 1
5.65
0.3
8 3
17.0
3 3
66.7
4 3
61.9
1
Pla
nt
and
mac
hine
ry
- O
ther
s 1
40.9
6 9
.23
0.7
3 1
49.4
6 9
4.56
5.3
8 0
.44
99.
50 4
9.96
46.
40
Furn
iture
and
fix
ture
s 2
6.62
1.8
7 1
.61
26.
88 1
8.98
1.4
3 0
.90
19.
51 7
.37
7.6
4
Vehi
cles
10.
98 0
.38
0.1
3 1
1.23
9.5
8 0
.34
0.1
2 9
.80
1.4
3 1
.40
Offi
ce e
quip
men
ts 4
.55
0.1
4 0
.16
4.5
3 3
.62
0.2
8 0
.16
3.7
4 0
.79
0.9
3
Mis
cella
neou
s ar
ticle
s 2
14.8
3 1
5.49
3.5
2 2
26.8
0 1
26.6
7 1
1.59
2.9
7 1
35.2
9 9
1.51
88.
16
Roa
ds,
Brid
ges
& C
ulve
rts
123
.84
7.0
6 -
130
.90
70.
23 1
4.88
- 8
5.11
45.
79 5
3.61
Wat
er S
uppl
y &
Sew
erag
e 2
22.5
7 3
.99
0.0
2 2
26.5
4 1
19.4
0 4
.57
0.0
2 1
23.9
5 1
02.5
9 1
03.1
7
EDP
equ
ipm
ents
12.
11 1
.13
1.2
2 1
2.02
10.
66 0
.41
1.1
6 9
.91
2.1
1 1
.45
Sub
tota
l 'B
' 1
,437.9
0 6
2.5
9 8
.09
1,4
92.4
0 7
61.3
5 5
4.5
9 6
.15
809.7
9 6
82.6
1 6
76.5
5
C.
Pro
pert
y, p
lant
and
equ
ipm
ent
reti
red
from
act
ive
use
Ass
ets
retir
ed f
rom
act
ive
use
55.
29 9
.02
7.1
4 5
7.17
- -
- -
57.
17 5
5.29
Sub
tota
l 'C
' 5
5.2
9 9
.02
7.1
4 5
7.1
7 -
- -
- 5
7.1
7 5
5.2
9
Tota
l 7
5,8
49.3
2 7
,097.4
1 3
06.5
5 8
2,6
40.1
8 3
1,4
70.4
5 2
,641.0
6 2
33.3
6 3
3,8
78.1
5 4
8,7
62.0
3 4
4,3
78.8
7
Not
es t
o th
e S
tand
alon
e Fin
anci
al S
tate
men
ts f
or t
he y
ear
ende
d 31st M
arch
, 2017

39
4. PROPERTY, PLANT AND EQUIPMENT (CONTD.)
(` crore)
For the year For the yearended 31st ended 31st
March, 2017 March, 2016
Note: Allocation of depreciation
( a ) Charged to Statement of profit and loss 2,679.95 2,402.35
( b ) Charged to expenditure during construction 5.12 6.45
2,685.07 2,408.80
(i) Contractual obligations
Refer note 40.1 for disclosure of contractual commitments for the acquisition of property, plant and equipment.
(ii) Land:
a) Includes 67,718.76 acres ( 67,681.64 acres as on 31st March, 2016, 67,354.96 acres as on 1st April, 2015) owned / possessed / taken on lease by the Company, in respectof which title/lease deeds are pending for registration.
(b) Includes 34,061.08 acres (34,061.08 acres as on 31st March, 2016, 35,334.08 acres as on 1st April, 2015) in respect of which title is under dispute.
(c) 9,007.46 acres (8,856.73 acres as on 31st March, 2016, 8,851.69 acres as on 1st April, 2015) transferred/agreed to be transferred or made available for settlement to variousJoint Ventures / Central / State / Semi-Government authorities, in respect of which conveyance deeds remain to be executed/registered.
(d) 6,384.17 acres (7,181.43 acres as on 31st March, 2016, 6,345.43 acres as on 1st April, 2015) given on lease to various agencies/employees/ex-employees.
(e) Includes 4,436.70 acres (4,440.70 acres as on 31st March, 2016, 4,211.42 acres as on 1st April, 2015) under unauthorised occupation.
(f) 1,762.92 acres (1,762.92 acres as on 31st March, 2016, 1,762.92 acres as on 1st April, 2015) of Land which is not in the actual possession, shown as deemed possession.
(g) ` 68.71 crore is lying under deposits (in respect of land already acquired) with the District & Sessions Judge, Bokaro during the year 2007 towards compensation payable toland losers.
(h) Vide Notification of Acquisition in the Gazette of India (Extraordinary) bearing No S.O. 1309(E) dated 08.06.2012 and No. S.O. 2484E dated 13.10.2012, National HighwayAuthority of India Ltd.(NHAI) had notified its intention to acquire 9.553 acres
(i) Includes 21.13 acres freehold land notified for acquisition by Government of Jharkhand vide Gazette notification no. 42 & 43 dated 26th August, 2009, determining compensationof ` 13.91 crore only for 15.62 acres. Management proposes to contest the same with appropriate authorities. Pending further action in the matter, no effect of above has beengiven in the accounts.
(iii) Other Assets:
(a) Buildings include net block of ` 21.18 crore (` 21.73 crore as on 31st March, 2016, ` 22.15 crore as on 1st April, 2015) for which conveyance deed is yet to be registered inthe name of the Company.
(b) Includes 6,035 residential quarters/houses under unauthorised occupation.
Notes to the Standalone Financial Statements for the year ended 31st March, 2017
40
Notes to the Standalone Financial Statements for the year ended 31st March, 2017
(` crore)
As at As at As at31st March, 2017 31st March, 2016 1st April, 2015
5. CAPITAL WORK IN PROGRESS
Steel Plants & Units 22,922.89 24,616.37 28,885.79
Township 107.49 110.40 153.85
Ore Mines and Quarries 399.14 348.48 262.79
Provisions (199.32) (187.32) (131.77)
23,230.20 24,887.93 29,170.66
Construction Stores and Spares 37.49 34.67 36.07
Provision for non-moving items (3.39) (3.29) (2.77)
34.10 31.38 33.30
Expenditure during construction pending allocation 11.09 7.91 5.58
23,275.39 24,927.22 29,209.54
(i) Expenditure during construction pending allocation
For the year ended For the year ended For the year ended31st March, 2017 31st March, 2016 31st March, 2015
Opening balance 7.91 5.58 4.40
"Expenditure incurred during the year “Employees' Remuneration & Benefits"
Salaries & Wages 121.40 133.50 141.82
Company's contribution to Provident fund 10.86 12.51 13.73
Travel Concession 3.08 4.00 2.87
Welfare Expenses 0.11 0.13 (0.10)
Gratuity 0.71 3.20 1.22
136.16 153.34 159.54
Other expenses
Technical Consultants' fees & know-how 8.56 7.92 18.89
Power & Fuel 134.97 84.76 198.69
Other expenses 6.68 30.38 46.31
Interest & Finance charges 581.90 643.72 637.88
Depreciation 5.12 6.45 8.19
737.23 773.23 909.96
Recoveries
Interest Earned 0.47 0.66 1.68
Liquidated Damages 2.49 7.60 0.58
Hire Charges 0.35 0.42 0.71
Sundries 17.99 1.58 (1.46)
21.30 10.26 1.51
Net expenditure during the year 852.09 916.31 1,067.99
Less: Amount allocated to Property, plant & equipment /Capital Work-in-progress 848.91 913.98 1,066.81
Balance carried forward 11.09 7.91 5.58

41
6.
INV
ES
TMEN
T P
RO
PER
TY(F
or t
he y
ear
ende
d 31
st M
arch
, 2016)
(` c
rore
)
Des
crip
tion
Gro
ss b
lock
Acc
umul
ated
dep
reci
atio
nN
et b
lock
Net
blo
ck *
As
atA
ddit
ions
Dis
posa
ls/
A
s at
As
atFo
rD
ispos
als
/A
s at
As
atA
s at
1st A
pril,
Adj
ustm
ents
31
st
Mar
ch,
1st A
pril,
the
Adj
ustm
ents
31st
Mar
ch,
31st
Mar
ch,
1st A
pril,
2015
2016
2015
Year
2016
2016
2015
Bui
ldin
gs 1
.45
- -
1.4
5 0
.55
0.0
2 -
0.5
7 0
.88
0.9
0
Tota
l1.4
5 -
- 1
.45
0.5
5 0
.02
- 0
.57
0.8
8 0
.90
* R
epre
sent
s de
emed
cos
t on
the
date
of
tran
sitio
n to
IndA
S.
Gro
ss b
lock
and
acc
umul
ated
am
ortis
atio
n fr
om th
e pr
evio
us G
AA
P h
ave
been
dis
clos
ed f
or th
e pu
rpos
e of
bet
ter
unde
rsta
ndin
g of
the
orig
inal
cos
t of
asse
ts
Not
es t
o th
e S
tand
alon
e Fin
anci
al S
tate
men
ts f
or t
he y
ear
ende
d 31st M
arch
, 2017
(For
the
yea
r en
ded
31
st M
arch
, 2017)
(` c
rore
)
Des
crip
tion
Gro
ss b
lock
Acc
umul
ated
dep
reci
atio
nN
et b
lock
Net
blo
ck
As
atA
ddit
ions
Dis
posa
ls/
A
s at
As
atFo
rD
ispos
als
/A
s at
As
atA
s at
1st A
pril,
Adj
ustm
ents
31
st
Mar
ch,
1st A
pril,
the
Adj
ustm
ents
31st
Mar
ch,
31st
Mar
ch,
31st M
arch
,2016
2017
2016
Year
2017
2017
2016
Bui
ldin
gs 1
.45
- -
1.4
5 0
.57
0.0
2 -
0.5
9 0
.86
0.8
8
Tota
l1.4
5 -
- 1
.45
0.5
7 0
.02
- 0
.59
0.8
6 0
.88

42
6. INVESTMENT PROPERTY (CONTD.)
(i) Contractual obligations
There are no contractual obligation to purchase, construct or develop investment property or for its repair, maintenance or enhancement.
(ii) Amount recognised in profit and loss for investment properties
For the year For the yearended 31st ended 31st
March, 2017 March, 2016
Rental income 1.30 1.08
Direct operating expenses that generated rental income* - -
Direct operating expenses that did not generated rental income* - -
Profit from leasing of investment properties before depreciation 1.30 1.08
Depreciation 0.02 0.02
Profit from leasing of investment properties 1.28 1.06
*Direct expenses in relation to investment properties cannot be separately identified and are expected to be insignificant.
(iii) Leasing arrangements
Certain investment properties are leased to tenants under long-term operating leases with rentals payable monthly. Minimum lease payment receivable under non-cancellableleases of investment property are as follows:
As at 31st As at 31st As at 1st
March, 2017 March, 2016 April, 2015
Within one year 0.02 0.01 0.01
Later than one year but not later than 5 years 0.02 0.03 0.03
Later than 5 years 0.07 0.07 0.07
0.11 0.11 0.11
(iv) Fair value
Particulars As at 31st As at 31st As at 1st
March, 2017 March, 2016 April, 2015
Investment properties 21.66 21.66 21.66
(v) Estimation of fair value
The best evidence of fair value is current prices in an active market for similar properties. Where such information is not available, the Company considers information from avariety of sources including:
a) Current prices in an active market for properties of different nature or recent prices of similar properties in less active markets, adjusted to reflect those differences.
b) Discounted cash flow projections based on reliable estimates of future cash flows.
c) Circle rate of the property as provided by State Government.
Notes to the Standalone Financial Statements for the year ended 31st March, 2017

43
7.
INTA
NG
IBLE A
SS
ETS
(For
the
yea
r en
ded
31
st M
arch
, 2016)
(` c
rore
)
Des
crip
tion
Gro
ss b
lock
Acc
umul
ated
dep
reci
atio
nN
et b
lock
Net
blo
ck *
As
atA
ddit
ions
Dis
posa
ls/
A
s at
As
atFo
rD
ispos
als
/A
s at
As
atA
s at
1st A
pril,
Adj
ustm
ents
31
st
Mar
ch,
1st A
pril,
the
Adj
ustm
ents
31st
Mar
ch,
31st
Mar
ch,
1st A
pril,
2015
2016
2015
Year
2016
2016
2015
A.
Pla
nt,
Min
es &
Oth
ers
Com
pute
r S
oftw
are
99.
34 1
.18
0.0
2 1
00.5
0 9
0.80
3.7
5 0
.01
94.
54 5
.96
8.5
4
Min
ing
Rig
hts
1,7
27.2
7 7
5.99
- 1
,803
.26
225
.74
37.
40 -
263
.14
1,5
40.1
2 1
,501
.53
Sub
tota
l 'A
' 1
,826.6
1 7
7.1
7 0
.02
1,9
03.7
6 3
16.5
4 4
1.1
5 0
.01
357.6
8 1
,546.0
8 1
,510.0
7
B.
Soc
ial
Faci
litie
s
Com
pute
r S
oftw
are*
** 0
.75
0.0
7 0
.20
0.6
2 0
.61
0.0
8 0
.19
0.5
0 0
.12
0.1
4
Sub
tota
l 'B
' 0
.75
0.0
7 0
.20
0.6
2 0
.61
0.0
8 0
.19
0.5
0 0
.12
0.1
4
Tota
l 1
,827.3
6 7
7.2
4 0
.22
1,9
04.3
8 3
17.1
5 4
1.2
3 0
.20
358.1
8 1
,546.2
0 1
,510.2
1
* R
epre
sent
s de
emed
cos
t on
the
date
of
tran
sitio
n to
IndA
S.
Gro
ss b
lock
and
acc
umul
ated
dep
reci
atio
n fr
om th
e pr
evio
us G
AA
P h
ave
been
dis
clos
ed f
or th
e pu
rpos
e of
bet
ter
unde
rsta
ndin
g of
the
orig
inal
cos
t of
asse
ts.
Not
es t
o th
e S
tand
alon
e Fin
anci
al S
tate
men
ts f
or t
he y
ear
ende
d 31st M
arch
, 2017
(For
the
yea
r en
ded
31
st M
arch
, 2017)
(` c
rore
)
Des
crip
tion
Gro
ss b
lock
Acc
umul
ated
dep
reci
atio
nN
et b
lock
Net
blo
ck
As
atA
ddit
ions
Dis
posa
ls/
A
s at
As
atFo
rD
ispos
als
/A
s at
As
atA
s at
1st A
pril,
Adj
ustm
ents
31
st
Mar
ch,
1st A
pril,
the
Adj
ustm
ents
31st
Mar
ch,
31st
Mar
ch,
1st A
pril,
2016
2017
2016
Year
2017
2017
2016
A.
Pla
nt,
Min
es &
Oth
ers
Com
pute
r S
oftw
are
100
.50
1.2
8 (
0.58
) 1
01.2
0 9
4.54
3.2
4 0
.59
97.
19 4
.01
5.9
6
Min
ing
Rig
hts
1,8
03.2
6 1
9.07
- 1
,822
.33
263
.14
40.
69 -
303
.83
1,5
18.5
0 1
,540
.12
Sub
tota
l 'A
' 1
,903.7
6 2
0.3
5 (
0.5
8)
1,9
23.5
3 3
57.6
8 4
3.9
3 0
.59
401.0
2 1
,522.5
1 1
,546.0
8
B.
Soc
ial
Faci
litie
s
Com
pute
r S
oftw
are*
** 0
.62
0.0
1 -
0.6
3 0
.50
0.0
6 -
0.5
6 0
.07
0.1
2
Sub
tota
l 'B
' 0
.62
0.0
1 -
0.6
3 0
.50
0.0
6 -
0.5
6 0
.07
0.1
2
Tota
l 1
,904.3
8 2
0.3
6 (
0.5
8)
1,9
24.1
6 3
58.1
8 4
3.9
9 0
.59
401.5
8 1
,522.5
8 1
,546.2
0
**A
ll am
ortis
atio
n ch
arge
s ar
e in
clud
ed w
ithin
dep
reci
atio
n an
d am
ortis
atio
n ex
pens
e
***
Com
pute
r so
ftw
are
cons
ists
of
capi
taliz
ed d
evel
opm
ent
cost
s be
ing
an in
tern
ally
gen
erat
ed in
tang
ible
ass
ets.

44
Notes to the Standalone Financial Statements for the year ended 31st March, 2017
8. INVESTMENTS(` crore)
Number of shares Amount
As at 31st As at 31st As at 1st As at 31st As at 31st As at 1st
March, 2017 March, 2016 April, 2015 March, 2017 March, 2016 April, 2015
Investment carried at cost
In Subsidiaries
SAIL Refractory Company Limited 50,000 50,000 50,000 0.05 0.05 0.05
SAIL- Jagdishpur Power Plant Ltd 50,000 50,000 50,000 0.05 0.05 0.05
SAIL Sindri Projects Limited 50,000 50,000 50,000 0.05 0.05 0.05
0.15 0.15 0.15
In Associates (unquoted)
Almora Meganasite Limited (Face value- `100/share) 40,000 40,000 40,000 0.40 0.40 0.40
0.40 0.40 0.40
In Joint ventures (unquoted)
NTPC- SAIL Power Company Limited 49,02,50,050 49,02,50,050 49,02,50,050 490.25 490.25 490.25
Bokaro Power Supply Company Limited 12,40,25,000 12,40,25,000 12,40,25,000 124.03 124.03 124.03
Bhilai Jaypee Cement Limited 9,87,18,048 9,87,18,048 9,87,18,048 52.51 52.51 52.51
SAIL- Bansal Service Centre Limited 32,00,000 32,00,000 32,00,000 3.20 3.20 3.20
Mjunction Services Limited 40,00,000 40,00,000 40,00,000 4.00 4.00 4.00
S&T Mining Company Private Limited 1,29,41,400 1,29,41,400 1,29,41,400 12.94 12.94 12.94
SAIL MOIL Ferro Alloy Pvt. Ltd. 1,00,000 1,00,000 1,00,000 0.10 0.10 0.10
International Coal Ventures Pvt. Ltd. 59,37,59,279 49,50,34,286 18,20,00,000 593.76 495.03 182.00
SAIL-SCL Kerala Ltd. 1,30,17,801 1,30,17,801 1,27,79,850 18.75 18.75 18.10
SAIL-SCI Shipping Private Limited 1,00,000 1,00,000 1,00,000 0.10 0.10 0.10
SAIL RITES Bengal Wagon Industry Pvt. Ltd. 2,40,00,000 2,22,70,000 1,49,00,000 24.00 22.27 14.90
SAIL-KOBE Iron India Pvt. Ltd. 2,50,000 2,50,000 2,50,000 0.25 0.25 0.25
Prime Gold -SAIL JVC Ltd. 46,80,000 46,80,000 25,99,999 4.68 4.68 2.60
North Bengal Dolomite Ltd (Face value- `100/share) 97,900 97,900 97,900 0.98 0.98 0.98
Romelt SAIL (India) Limited 63,000 63,000 63,000 0.06 0.06 0.06
SAIL-Bengal Alloy Castings Pvt. Ltd. 10,000 10,000 10,000 0.01 0.01 0.01
VSL-SAIL JVC LIMITED 12,97,780 8,43,729 - 1.30 0.84 0.00
1,330.92 1,230.00 906.03
Total (A) 1,331.47 1,230.55 906.58
Investments carried at fair value through other comprehensive income
Quoted equity
HDFC Limited ( Face value - ` 2/share) 60,000 60,000 60,000 9.00 6.64 7.87
HDFC Bank Limited ( Face value - ` 2/share) 2,500 2,500 2,500 0.36 0.27 0.26
ICICI Bank Limited ( Face value - ` 2/share) 1,43,000 1,43,000 1,43,000 3.94 3.38 4.50
13.30 10.29 12.63
Unquoted equity
TRL Krozaki Refractories Limited 22,03,150 22,03,150 22,03,150 29.93 29.93 28.64
Indian Potash Limited 3,60,000 3,60,000 3,60,000 13.43 13.43 12.30
Haridaspur Paradeep Railway Co. Ltd. 50,00,000 50,00,000 50,00,000 5.00 5.00 5.00
Cement & Allied Products (Bihar) Limited 2 2 2 0.00 0.00 0.00
Chemical & Fertilizer Corporation (Bihar) Limited 1 1 1 0.00 0.00 0.00
Bhilai Power Supply Company Limited 5 5 5 0.00 0.00 0.00
MSTC Limited 80,000 80,000 80,000 6.66 6.66 6.31
IISCO Ujjain Pipe & Foundary Company Limited 30,00,000 30,00,000 30,00,000 3.00 3.00 3.00(under liquidation)#
UEC SAIL Information Technology Limited* 1,80,000 1,80,000 1,80,000 0.18 0.18 0.18
Bihar State Finance Corporation (Face value `100/share) 500 500 500 0.01 0.01 0.01
58.21 58.21 55.44
Contd.../

45
In Co-operative Society
Bokaro Steel Employees' Co-operative Credit Society 1,16,500 1,16,500 1,16,500 0.12 0.12 0.12
Bokaro Steel City Central Consumers' Co-operative society 250 250 250 0.00 0.00 0.00
NMDC Meghahatuburu Employees' Consumer 25 25 25 0.00 0.00 0.00Co-operative society (Face value ` 100/share)
DSP Employees' Co-operative society limited 1,377 1,377 1,377 0.01 0.01 0.01(Face value ` 100/share)
Bolani Ores Employees' Consumer 200 200 200 0.00 0.00 0.00Co-operative society limited (Face value ` 25/share)
IISCO Employees Primary Co-operative stores 23,000 23,000 23,000 0.05 0.05 0.05(Face value ` 20/share)
0.18 0.18 0.18
Total (B) 71.69 68.68 68.25
Grand total (A+B) 1,403.16 1,299.23 974.83
Provision for impairment in the value of investments 7.68 7.48 7.48
Net investment 1,395.48 1,291.75 967.35
Aggregate amount of quoted investments 13.30 10.29 12.63(market value thereof)
Aggregate amount of unquoted investments 1,389.86 1,288.94 962.20
Aggregate amount of impairment in value of investments 7.68 7.48 7.48
1,395.48 1,291.75 967.35
^All equity shares have face value ` 10 each unless otherwise stated.
*Entity is under liquidation, therefore, not considered as joint venture despite of joint agreement between shareholders.
#Entity is under liquidation therefore not in the control of the Company.
Notes to the Standalone Financial Statements for the year ended 31st March, 2017
8. INVESTMENTS (Contd.)
Number of shares (` crore)
As at 31st As at 31st As at 1st As at 31st As at 31st As at 1st
March, 2017 March, 2016 April, 2015 March, 2017 March, 2016 April, 2015
9. TRADE RECEIVABLES(` crore)
Non-current Current
As at 31st As at 31st As at 1st As at 31st As at 31st As at 1st
March, 2017 March, 2016 April, 2015 March, 2017 March, 2016 April, 2015
(Unsecured, considered good unless otherwise stated)
Unsecured*
Considered good - - 2.25 2,921.69 3,143.49 3,585.97
Considered doubtful 7.83 6.43 34.98 176.48 146.82 131.83
7.83 6.43 37.23 3,098.17 3,290.31 3,717.80
Provision for doubtful receivables (7.83) (6.43) (34.98) (176.48) (146.82) (131.83)
- - 2.25 2,921.69 3,143.49 3,585.97
* Receivables due by directors and its officers of the company is nil (previous year nil)
10. LOANS
(Unsecured, considered good unless otherwise stated)
Security deposits 110.65 140.54 108.83 10.49 13.40 10.97
Loan to employees 157.40 195.38 239.92 58.15 62.09 59.14
Loan to related parties 7.00 - 2.24
Loan to others 185.49 114.05 78.25 1.33 7.41 0.44
453.54 449.97 427.00 76.97 82.90 72.79
Provision for doubtful loans (0.02) (0.02) (0.02) (15.50) (18.81) (7.05)
453.52 449.95 426.98 61.47 64.09 65.74
* Receivables includes amounts due from Directors -Nil

46
Notes to the Standalone Financial Statements for the year ended 31st March, 2017
11. OTHER FINANCIAL ASSETS(` crore)
Non-current Current
As at 31st As at 31st As at 1st As at 31st As at 31st As at 1st
March, 2017 March, 2016 April, 2015 March, 2017 March, 2016 April, 2015
Derivative asset 46.59 265.30 351.25 180.95 208.65 119.19
Advances for purchase of shares 104.27 102.77 214.27 - - -
Claims recoverable - - 21.39 771.45 605.86 777.11
Receivables other than trade 103.46 115.45 102.07 245.38 175.05 142.50
Receivables from employees 0.12 0.88 0.35 6.88 7.77 20.04
Bills Receivable - - 0.77 1,072.99 773.55 1,181.12
Advances to related parties 10.53 10.53 10.53 23.66 47.92 151.95
264.97 494.93 700.63 2,301.31 1,818.80 2,391.91
Provision for doubtful assets (0.02) (0.02) (0.02) (32.07) (55.27) (52.09)
Provision for doubtful related parties advances (2.53) (2.53) (2.53) (1.39) (1.39) (1.39)
262.42 492.38 698.08 2,267.85 1,762.14 2,338.43
Deferred taxes arising from temporary differences and unused tax losses for year ended 31 March 2017 are summarized as follows: (` crore)
Deferred tax assets/(liabilities) As at Recognized Recognized As atApril 1, 2016 in profit or in other March 31,
loss comprehensive 2017income
Tax effect of items constituting deferred tax liabilities
Difference between book and tax depreciation 6,104.36 1,345.94 - 7,450.30
Amortisation of financial assets/liabilities 34.35 (2.96) - 31.39
Fair value adjustment through OCI 8.88 - - 8.88
6,147.59 1,342.98 - 7,490.57
Tax effect of items constituting deferred tax assets
Retirement benefits 66.45 (147.33) 188.42 107.54
Finance lease obligations 61.58 14.25 - 75.83
Derivative adjustments 9.07 75.28 - 84.35
Unpaid taxes and duties to be allowed on payment 1,487.41 (364.80) - 1,122.61
Losses available for offsetting against future taxable income 4,792.58 3,771.09 - 8,563.67
Tax credit (minimum alternative tax) 1,079.50 (28.50) - 1,051.00
Others 450.80 40.61 - 491.41
7,947.39 3,360.60 188.42 11,496.41
Deferred tax (assets) /liabilities (net) (1,799.80) (2,017.62) (188.42) (4,005.84)
12. DEFERRED TAX(` crore)
As at 31st As at 31st As at 1st
March, 2017 March, 2016 April, 2015
Tax effect of items constituting deferred tax liabilities
Difference between book and tax depreciation 7,450.30 6,104.36 4,526.61
Amortisation of financial assets/liabilities 31.39 34.35 62.23
Fair value adjustment through OCI 8.88 8.88 8.24
7,490.57 6,147.59 4,597.08
Tax effect of items constituting deferred tax assets
Retirement benefits 107.54 66.45 135.09
Finance lease obligations 75.83 61.58 58.55
Derivative adjustments 84.35 9.07 10.16
Unpaid taxes and duties to be allowed on payment 1,122.61 1,487.41 916.13
Losses available for offsetting against future taxable income 8,563.67 4,792.58 594.30
Others 491.41 450.80 525.66
10,445.41 6,867.89 2,239.89
Deferred tax (assets) /liabilities (net) (2,954.84) (720.30) 2,357.19
Tax credit (minimum alternative tax) (1,051.00) (1,079.50) (1,088.24)
(4,005.84) (1,799.80) 1,268.95

47
Notes to the Standalone Financial Statements for the year ended 31st March, 2017
Deferred taxes arising from temporary differences and unused tax losses for year ended 31 March, 2016 are summarized as follows: (` crore)
Deferred tax assets/(liabilities) As at Recognized Recognized As atApril 1, 2015 in profit or in other March 31,
loss comprehensive 2016income
Tax effect of items constituting deferred tax liabilities
Difference between book and tax depreciation 4,526.61 1,577.75 - 6,104.36
Amortisation of financial assets/liabilities 62.23 (27.88) - 34.35
Fair value adjustment through OCI 8.24 - 0.64 8.88
4,597.08 1,549.87 0.64 6,147.59
Tax effect of items constituting deferred tax assets
Retirement benefits 135.09 (118.85) 50.21 66.45
Finance lease obligations 58.55 3.03 - 61.58
Derivative adjustments 10.16 (1.09) - 9.07
Unpaid taxes and duties to be allowed on payment 916.13 571.28 - 1,487.41
Losses available for offsetting against future taxable income 594.30 4,198.28 - 4,792.58
Tax credit (minimum alternative tax) 1,088.24 (8.74) - 1,079.50
Others 525.66 (74.86) - 450.80
3,328.13 4,569.05 50.21 7,947.39
Recognised in retained earnings, pursuant to Schedule II application - (33.12) - -
Deferred tax (assets) /liabilities (net) 1,268.95 (2,986.06) (49.57) (1,799.80)
The Company is having accumulated business losses (Including Investment Allowance) of ` 24,744.77 crore (Previous year- ` 13,848.16 crore) [including accumulated unabsorbeddepreciation of ` 15,057.93 crore (Previous Year - ` 8,851.44 crore)] and MAT credit of ` 1,051.00 crore as on 31 March, 2017 as per the provisions of the Income Tax Act, 1961. Theunabsorbed business losses amounting to ` 9,686.84 crore (Previous Year - ` 4,996.72 crore) are available for offset for maximum period of eight years from the incurrence of loss andunused tax (MAT) credit will be available for offset within maximum period of fifteen years.
In view of the various measures being implemented by the Government for upliftment of the Steel Industry and to boost the demand coupled with steps being taken by the Company toreduce the cost, improvement in the efficiency/productivity, the Company is certain that it will be able to improve its physical and financial performance in future. Consequently, theCompany will be able to earn sufficient future taxable profits to adjust the accumulated business losses/unabsorbed depreciation and unused MAT credit.
Accordingly, deferre tax asset of ` 3,352.42 crores on acccumulated business losses (inlcuding ` 1,623.16 crores during the year ended 31st March, 2017) and MAT credit of` 1,051.00 crores, has been recognised as on 31st March, 2017.
12. DEFERRED TAX (CONTD.)
13. CURRENT TAX ASSETS/LIABILITIES (` crore)
Non-current Current
As at 31st As at 31st As at 1st As at 31st As at 31st As at 1st
March, 2017 March, 2016 April, 2015 March, 2017 March, 2016 April, 2015
Current tax assets
Advance income tax (net of provision) 235.81 278.10 609.89 - - -
235.81 278.10 609.89 - - -
Current tax liabilities
Opening Balance - - - 11.90 11.90 51.96
Add : Provision during the year - - - - - 499.15
Less: Amount paid during the year - - - (7.38) - (529.12)
Less: Provision written back during the year - - - - - (10.09)
- - - 4.52 11.90 11.90
235.81 278.10 609.89 (4.52) (11.90) (11.90)
14. OTHER ASSETS
Advances to contractors & suppliers 280.46 188.32 124.93 273.98 170.76 241.90
Advances Others 4.18 3.57 4.31 828.89 872.37 715.48
Deposits with Government authorities 624.82 587.76 537.84 2,519.05 2,209.64 1,996.34
Gold coins in hand - - - 0.23 0.23 0.23
Prepaid expenses 34.12 41.09 47.04 36.63 36.55 35.38
Claims receivable - - - 742.67 1,058.76 1,346.40
Export incentive receivables - - - 41.26 12.97 18.04
Capital advances 191.50 198.10 124.06 - - -
1,135.08 1,018.84 838.18 4,442.71 4,361.28 4,353.77
Less: provision for doubtful other assets (72.09) (42.37) (40.02) (143.55) (130.43) (118.83)
1,062.99 976.47 798.16 4,299.16 4,230.85 4,234.94

48
Notes to the Standalone Financial Statements for the year ended 31st March, 2017
(` crore)
As at 31st As at 31st As at 1st
March, 2017 March, 2016 April, 2015
15. INVENTORIES*
Stores & Spares
Production 1,843.43 1,957.51 2,181.20
Fuel Stores 91.72 77.31 119.38
Others 27.36 25.76 28.86
In-transit 114.48 140.76 169.74
Less: Provision for Non Moving/Obsolete items 212.36 204.05 196.04
1,864.63 1,997.29 2,303.14
Raw Material
Raw Material 2,584.23 2,086.81 3,126.56
Add: In transit 1,471.24 674.68 1,215.43
Less: Provision for unusable materials 15.80 20.17 9.81
4,039.67 2,741.32 4,332.18
Finished / Semi-finished products
Finished Goods 5,822.05 5,236.67 7,107.87
Work in Progress 3,985.00 4,704.25 3,507.51
9,807.05 9,940.92 10,615.38
15,711.35 14,679.53 17,250.70
*Valued as per accounting policy No. 3.6
16. CASH AND CASH EQUIVALENTS
Cash and stamps on hand 0.07 0.79 1.00
Cheques in hand 109.92 129.28 144.78
Balances with banks
Current accounts 10.76 2.21 1.87
Term Deposits with original maturity upto 3 months 0.18 0.16 0.14
Term Deposits as per court orders with original maturity upto 3 months - - 0.38
120.93 132.44 148.17
17. OTHER BANK BALANCES
Earmarked bank balances 159.31 155.84 145.18
Unpaid dividend accounts 8.53 9.23 11.73
Term Deposits Earmarked with original maturity upto 3 months - 0.14 0.14
Fixed Deposits with maturity for more than 3 months but less than 12 months 0.32 0.31 2,006.71
168.16 165.52 2,163.76
18. ASSETS CLASSIFIED AS HELD FOR SALE
Assets classified as held for sale 11.94 20.59 20.46
11.94 20.59 20.46
On floatation of tender for sale of items of Property, Plant and Equipment, it is considered highly likely that such assets will be sold within next 12 months and such assets are treated as‘Assets classified as held for sale’.
Plant & machinery classified as held for sale during the reporting period was measured at the lower of its carrying amount and fair value less costs to sell at the time of the reclassification.The fair value of the plant & machinery was determined using the comparable value approach. This is a level 3 measurement as per the fair value hierarchy set out in fair valuemeasurement disclosures. The key inputs under this approach is the metal price in the market.

49
Number of shares (` crore)
As at 31st As at 31st As at 1st As at 31st As at 31st As at 1st
March, 2017 March, 2016 April, 2015 March, 2017 March, 2016 April, 2015
19. EQUITY SHARE CAPITAL
Authorised capital
Equity shares of ` 10 each 500,00,00,000 5,00,00,00,000 5,00,00,00,000 5,000.00 5,000.00 5,000.00
5,000.00 5,000.00 5,000.00
Issued and subscribed capital & fully paid-up
Equity shares of ` 10 each 4,13,05,25,289 4,13,05,25,289 4,13,05,25,289 4,130.53 4,130.53 4,130.53
4,130.53 4,130.53 4,130.53
a) Reconciliation of equity shares outstanding at the beginning and at the end of the year.
Number of shares (` crore)
As at 31st As at 31st As at 31st As at 31st
March, 2017 March, 2016 March, 2017 March, 2016
Equity Shares with voting rights
Opening balance 4,13,03,92,654 4,13,00,92,154 4,130.39 4,130.09
Add : Shares converted into shares 15,000 3,00,500 0.02 0.30
with voting rights during the year
Closing balance 4,13,04,07,654 4,13,03,92,654 4,130.41 4,130.39
Equity Shares without voting rights *
Opening balance 1,32,635 4,33,135.00 0.14 0.44
Less : Shares converted into shares 15,000 3,00,500 0.12 0.14
with voting rights during the year
Closing balance 1,17,635 1,32,635 0.12 0.14
Total Equity shares outstanding 4,13,05,25,289 4,13,05,25,289 4,130.53 4,130.53
i) *Represented by one Global Depository Receipt (GDR) issued in 1996 @ US $ 29.55 each for an original aggregate amount of US $ 125 million.
ii) All shares rank equally with regard to the repayment of capital in the even of liquidation of the Company.
iii) The Company does not have a holding company.
iv) Details of shareholders holding more than 5% shares in the Company
% holding Number of shares
As at 31st As at 31st As at 31st As at 31st
March, 2017 March, 2016 March, 2017 March, 2016
Equity shares of `10 each fully paid up
President of India 75.00 75.00 3,09,77,67,449 3,09,77,67,449
LIC of India 10.70 10.70 44,18,74,667 44,18,74,667
v) The Company has neither issued bonus shares nor has bought back any shares during last 5 years.
Notes to the Standalone Financial Statements for the year ended 31st March, 2017

50
Notes to the Standalone Financial Statements for the year ended 31st March, 2017
(` crore)
As at 31st As at 31st
March, 2017 March, 2016
20. OTHER EQUITY
Reserves & Surplus
Capital reserve
Opening balance 1.75 1.75
Changes during the year - -
1.75 1.75
Securities premium reserve
Opening balance 235.10 235.10
Changes during the year - -
235.10 235.10
General reserve
Opening balance 5,095.13 5,095.13
Changes during the year - -
5,095.13 5,095.13
Bond redemption reserve
As per last balance sheet 1,449.96 1,008.88
Transfer from retained earnings 607.77 504.11
Transfer to retained earnings (84.09) (63.03)
1,973.64 1,449.96
Retained earnings
Opening balance 28,283.65 33,051.93
Net profit/(loss) for the year (2,833.24) (4,021.44)
Other comprehensive income/(loss) (356.62) (94.87)
Transfer from bond redemption reserve 84.09 63.03
Transfer to bond redemption reserve (607.77) (504.11)
Equity dividend - (103.26)
Tax on equity dividend - (21.02)
Depreciation adjustment - (86.61)
24,570.11 28,283.65
Other Comprehensive Income
Equity Instruments through Other Comprehensive Income
Opening balance (0.22) -
Change in fair value of FVOCI equity instruments 3.02 (0.22)
Deferred tax - -
2.80 (0.22)
Total other equity 31,878.53 35,065.37
Total other equity as at 1st April, 2015 39,392.79
Nature and purpose of other reserves
Capital reserve
Capital reserve which is created out of the capital profit , it is created out of the profit earned from some specific transactions of capital nature. Capital reserve is not available for thedistribution to the shareholders.
Securities premium reserve
Securities premium reserve represents premium received on issue of shares. The reserve is utilised in accordance with the provisions of the Companies Act.
Bond redemption reserve
The Company is required to create bond redemption reserve as per the provisions of Companies Act, 2013 out of the profits which are available for distribution of dividends. The reserveis maintained till the redemption of bonds.
Other Comprehensive Income(OCI) reserve
The Company has elected to recognise changes in the fair value of certain investments in equity securities in other comprehensive income. These changes are accumulated within theFVOCI equity investments reserve within equity. The Company transfers amounts from this reserve to retained earnings when the relevant equity securities are derecognised.

51
21. BORROWINGS(` crore)
Non-current
As at 31st As at 31st As at 1st
March, 2017 March, 2016 April, 2015
SECURED
Redeemable Non-Convertible Bonds
Rate of Interest Maturity Date Call/Put option (yr) SECURITYREF
9.35% 09-Sep-2026 12/nil ( a ) 455.00 455.00 455.00
9.00% 14-Oct-2024 ( a ) 1,000.00 1,000.00 1,000.00
8.70% 25-Aug-2024 ( a ) 300.00 300.00 300.00
8.30% 01-Aug-2023 ( a ) 1,200.00 - -
8.30% 03-Aug-2023 ( a ) 800.00 - -
8.35% 19-Nov-2022 ( a ) 1,185.00 1,185.00 -
9.30% 23-Aug-2021 ( a ) 400.00 400.00 400.00
8.55% 11-Aug-2021 ( a ) 700.00 700.00 700.00
8.27% 25-Aug-2020 ( a ) 265.00 265.00 -
8.72% 30-Apr-2020 ( a ) 660.00 660.00 660.00
8.75% 23-Apr-2020 ( a ) 545.00 545.00 545.00
8.65% 01-Feb-2020 5/nil ( a ) 242.00 242.00 242.00
8.30% 21-Jan-2020 ( a ) 500.00 500.00 500.00
8.65% 30-Dec-2019 ( a ) 450.00 450.00 450.00
8.50% 07-Dec-2019 ( a ) 120.00 120.00 120.00
8.60% 19-Nov-2019 ( a ) 335.00 335.00 335.00
8.75% 15-Sep-2019 ( b,d ) 100.00 100.00 100.00
8.80% 22-Jun-2019 ( a ) 825.00 825.00 825.00
7.70% 11-May-2019 5/5 ( a ) 25.00 25.00 25.00
8.90% 01-May-2019 5/nil ( b ) 950.00 950.00 950.00
8.80% 26-Oct-2018 ( b,c ) 112.00 126.00 140.00
8.18% 10-Aug-2018 ( a ) 1,000.00 1,000.00 -
8.25% 27-Jul-2018 ( a ) 500.00 500.00 -
8.35% 09-Jun-2018 ( a ) 420.00 420.00 -
9.30% 25-May-2018 ( a,k ) 360.00 360.00 360.00
8.25% 06-May-2018 3/3 ( a ) 245.00 800.00 800.00
7.95% 09-Apr-2018 ( a ) 670.00 670.00 -
8.38% 16-Dec-2017 ( a ) - 645.00 645.00
8.75% 08-Nov-2017 3/3 ( a ) - - 500.00
9.18% 27-Aug-2017 ( a ) - 300.00 300.00
Term Loans
From banks
Rupee loan ( m ) 2,500.00 - -
16,864.00 13,878.00 10,352.00
Unsecured
Foreign currency loan
1 KFW, Germany ( e ) 327.06 377.17 355.19
2 Bank of Tokyo Mitsubishi ( f ) - 414.63
3 Bank of Tokyo Mitsubishi ( g ) 438.24 824.32
4 Sumitomo Mitsubishi Banking Corp ( h ) 0.01 657.00 1,236.16
5 Natexis Banque ( i ) 14.75 18.56 17.97
6 Mizuho Coprorate Bank Ltd (j) 322.12 656.87 927.56
Steel development fund (l) 204.16 204.16 204.16
868.10 2,352.00 3,979.99
Long term maturities of finance lease obligations 1,355.38 1,265.71 1,288.21
19,087.48 17,495.71 15,620.20
No loans have been guaranteed by the directors and others.
There is no default as on the balance sheet date in the repayment of borrowings and interest thereon.
All bonds are repayable on the maturity date unless otherwise stated.
Bonds are secured, in respect of respective facilities by way of :
a) Secured by charges ranking pari-passu inter-se, on all the present and future immovable property at Mouje-Wadej of City taluka, District Ahmedabad, Gujarat and Company's Plant & Machinery, includingthe land on which it stands, pertaining to IISCO Steel Plant (ISP).
b) Secured by charges ranking pari-passu inter-se, on all the present and future immovable property at Mouje-Wadej of City taluka, District Ahmedabad, Gujarat and Company's Plant & Machinery, including theland on which it stands, pertaining to Durgapur Steel Plant.( DSP ).
c) Redeemable in 12 equal yearly instalments of ` 14 crore each starting w.e.f. 26th October, 2014. Instalment payable on 26th Oct, 2017 has been shown in Other Current Liabilities
Notes to the Standalone Financial Statements for the year ended 31st March, 2017

52
Notes to the Standalone Financial Statements for the year ended 31st March, 2017
d) Redeemable in 3 equal instalments of ` 50 crore each on 15th September of 2014, 2019 and 2024.
e) The soft basis of the loan was drawn in 3 tranches stated as 1(a), 1(b) and 1( c) at an interest rate of 8.75% p.a. The Interest on 1(a) is 0.75% p.a and balance 8% is towards meeting Exchange fluctuation (4%)and Pollution control schemes (4%). In case of 1 (b) the Interest is 0.75% p.a and balance 8.0% p.a is towards periphery development. The Interest on 1(c) is 3.66% p.a. and the balance 5.09% p.a. is towardsmeeting periphery development. The principal and interest is repayable half yearly. The loan is Guaranteed by Government of India.
f) The loan is repayable in 3 equal yearly instalments on 11th March starting from 2015 at an interest rate of 6 month London Inter Bank Offered Rate (LIBOR) +1%. Interest is paid half yearly.
g) The loan is repayable in 3 equal yearly instalments on 11th August starting from 2015 at an interest rate of 6 month LIBOR +1%. . Interest is paid half yearly.
h) The loan is repayable in 3 equal yearly instalments on 16th November starting from 2015 at an interest rate of 6 month LIBOR +1.06%. Interest is paid half yearly.
i) The loan is repayable by 2030. The principal and interest is paid half yearly, guaranteed by Government of India.
j) The loan is repayable in 3 equal yearly instalments on 21st December starting from 2016 at an interest rate of 6 month LIBOR +1.75%. Interest is paid half yearly.
k) Redeemable in 5 equal yearly instalments starting w.e.f 25th May, 2018.
l) Terms of Repayment is to be decided by SDF management Committee.
m) Secured by charges ranking pari-pasu on the present and future movable plant and machinery of BSL to the extent of loan.
Current
As at 31st As at 31st As at 1st
March, 2017 March, 2016 April, 2015
Secured
Repayable on demand :
From banks 1,302.09 2,256.04 5,552.55
Other loans and advances :
From banks 250.00 - 1,005.00
Unsecured
Other loan 600.00 - 800.00
Commercial paper 7,883.93 7,721.23 -
Foreign currency loans 9,777.02 5,597.59 6,925.36
19,813.04 15,574.86 14,282.91
1. Security disclosure for the outstanding short-term borrowings as on 31 March, 2017 :
Borrowings from banks are secured, in respect of respective facilities by way of :
(i) Hypothecation of all current assets
21. BORROWINGS (CONTD.)
(` crore)
Non-current Current
As at 31st As at 31st As at 1st As at 31st As at 31st As at 1st
March, 2017 March, 2016 April, 2015 March, 2017 March, 2016 April, 2015
22. TRADE PAYABLES
Due to micro, small and medium- - - - 38.12 29.46 27.27enterprises (refer note 40.2)
Amount payable to related parties - - - 11.58 12.91 7.38
Amount payable to contractors/suppliers/others 7.36 6.83 0.71 5,169.50 3,960.34 3,571.73
7.36 6.83 0.71 5,219.20 4,002.71 3,606.38
23. OTHERS FINANCIAL LIABILITIES
Employee related dues 458.39 517.79 416.07 161.73 144.06 146.26
Interest Accrued but not due on Borrowings 580.25 707.92 700.46 1,076.09 924.68 666.78
Other liabilities-debtors banking arrangement 228.16 295.00 379.00
Derivative liability - - - 603.57 153.68 144.96
Current maturities of long-term borrowings - - - 2,381.74 1,909.22 1,788.77
Current maturities of finance lease obligation - - - 113.39 161.61 145.03
Unclaimed Matured Deposits and Interest Accrued thereon - - - 1.03 1.03 1.03
Security deposits - - - 1,230.73 1,079.69 801.87
Unpaid dividends - - - 8.53 9.23 11.73
Payable for capital works - - - 2,530.70 2,046.81 2,246.92
Other Payables 327.29 346.11 258.56 4,429.95 4,234.79 4,079.28
1,365.93 1,571.82 1,375.09 12,765.62 10,959.80 10,411.63

53
Notes to the Standalone Financial Statements for the year ended 31st March, 2017
(` crore)
For the year ended For the year ended31st March, 2017 31st March, 2016
26. REVENUE FROM OPERATIONS
Sale of Products (including excise duty)
Domestic 47,376.04 42,727.27
Exports 1,737.83 557.25
Export Incentives 66.37 9.54
49,180.24 43,294.06
Sale of Services
Service charges 31.89 33.44
31.89 33.44
Other Operating Revenues
Social amenities-recoveries 334.01 317.74
Sale of empties etc. 70.74 61.89
Sundries 150.22 168.04
554.97 547.67
49,767.10 43,875.17
(` crore)
Non-current Current
As at 31st As at 31st As at 1st As at 31st As at 31st As at 1st
March, 2017 March, 2016 April, 2015 March, 2017 March, 2016 April, 2015
24. PROVISIONS
Provision for gratuity 80.75 0.02 238.94 236.10 198.11 157.51
Provision for accrued leave liability 2,436.37 2,293.62 2,190.68 303.68 242.31 221.16
Provision for post retirement medical & settlement benefits 931.02 867.04 856.32 108.95 100.05 95.76
Provision for long term service award 19.98 18.34 18.46 3.06 2.64 2.68
Provision for mines closure 53.94 43.14 35.22
Provision for pollution control - - - 39.43 53.65 83.93
Provision for foreign exchange fluctuation - - - 13.02 - 15.29
Provision for wage revision - - - 1,545.02 1,428.87 1,279.58
Provision for mine afforestation/ restoration etc. - - - 341.97 323.22 280.98
Other provisions 71.88 49.49 41.94 323.54 293.80 240.49
3,593.94 3,271.65 3,381.56 2,914.77 2,642.65 2,377.38
25. OTHER LIABILITIES
Income received in advance from customers - - - 1,760.93 1,837.84 801.06
Income received in advance- others - - - 82.53 50.18 53.67
Deferred income* 151.29 113.48 117.90 10.98 5.23 5.26
Other Payables - - - 3,752.82 3,599.71 3,423.56
151.29 113.48 117.90 5,607.26 5,492.96 4,283.55
Government grants*
Opening balance 26.95 26.63
Additions 2.12 4.51
Released to statement of profit and loss (1.28) (4.19)
27.79 26.95
*Deferred income inlcudes award conferred by the Prime Minister of India to the Bhilai Steel Plant as best integrated steel plant in India and the earnings from the fund are utilised forthe welfare of the employees in Bhilai.

54
Notes to the Standalone Financial Statements for the year ended 31st March, 2017
(` crore)
For the year ended For the year ended31st March, 2017 31st March, 2016
27. OTHER INCOME
Interest income :
Loans & advances to other companies 0.88 0.89
Customers 80.87 91.69
Employees 20.21 25.30
Bank deposits 0.10 182.24
Others 45.23 44.90
147.29 345.02
Dividend income
Dividend from Subsidiaries 4.64 4.80
Dividend from Investments* 87.29 66.05
* includes dividend from investments carried at fair value through OCI 91.93 70.85
Net gain on investments 0.01 7.31
0.01 7.31
Other Non-operating income
Subsidy, relief and concession 4.43 5.18
Grant-in-aid 0.10 0.01
Provisions no longer required written back 42.66 31.26
Write back of Other liabilities 54.96 49.33
Liquidated damages 75.53 47.81
Foreign exchange fluctuations (net) 76.60 -
Others 42.10 37.90
296.38 171.49
535.61 594.67
28. COST OF MATERIALS CONSUMED
Iron ore 3,614.87 4,160.07
Coal 16,198.51 12,083.07
Coke 70.64 81.64
Limestone 1,107.24 1,128.43
Dolomite 450.33 482.95
Ferro Manganese 340.96 357.29
Ferro Silicon 193.63 187.47
Silico Manganese 904.24 845.75
Intermediary Products 0.01 -
Zinc 122.03 104.99
Aluminium 226.91 229.16
Others 1,285.87 1,217.90
24,515.24 20,878.72
Less :Inter Account adjustments 3,389.54 3,723.49
21,125.70 17,155.23

55
Notes to the Standalone Financial Statements for the year ended 31st March, 2017
(` crore)
For the year ended For the year ended31st March, 2017 31st March, 2016
29. CHANGES IN INVENTORIES OF FINISHED GOODS AND WORK IN PROGRESS
Opening stock
Finished goods 5,545.82 7,107.87
Work in progress 4,395.10 3,507.51
9,940.92 10,615.38
Closing stock
Finished goods 5,822.07 5,236.67
Work in progress 3,984.98 4,704.25
9,807.05 9,940.92
Less : Excise duty on accretion(-) /Depletion to stock 13.24 133.85
120.63 540.61
30. EMPLOYEE BENEFIT EXPENSE*
Salaries & wages 6,876.89 6,877.26
Leave encashment 491.23 678.33
Company's contribution to Provident & other Funds 889.02 953.29
Travel concession 21.71 250.16
Welfare expenses 312.47 457.54
Gratuity 356.51 498.54
8,947.83 9,715.12
Less : Grants in aid received from Government of Karnataka - 0.15
8,947.83 9,714.97
Expenditure on Employees' Remuneration and Benefits not included above and charged to:
Expenditure during construction 136.16 153.34
136.16 153.34
** For descriptive notes on disclosure of defined benefit obligation refer note 42.
31. FINANCE COSTSInterest Cost
- Foreign Currency Loans* 552.45 658.75
- Non Convertible Bonds 794.54 608.10
- Bank Borrowings - working capital 63.12 47.89
- Steel Development Fund Loans 3.74 3.20
- Others 1,105.51 974.31
- Interest under Income Tax Act 0.01 -
Other Borrowing Costs 8.45 8.20
2,527.82 2,300.45
*Including foreign exchange fluctuations loss of `188.52 crore (Previous year `3.02 crore gain)
Expenditure on Interest & Finance charges not included above & charged to Expenditure During Construction:
Foreign currency loans 108.06 147.71
Non Convertible Bonds 468.48 491.05
Steel Development Fund loans - Interest 4.43 4.96
Others 0.93 -
581.90 643.72

56
Notes to the Standalone Financial Statements for the year ended 31st March, 2017
(` crore)
For the year ended For the year ended31st March, 2017 31st March, 2016
32. OTHER EXPENSES
Consumption of Stores & Spares
Consumption 3,694.99 3,848.30
Less: Departmentally manufactured stores 859.64 959.11
Less: Finished products internally consumed as stores and spares 532.15 567.05
2,303.20 2,322.14
Repairs & Maintenance
Buildings 201.73 197.22
Plant & Machinery 713.83 650.00
Others 223.64 221.16
1,139.20 1,068.38
Handling Expenses
Raw Materials 328.79 318.36
Scrap Recovery 297.33 314.33
626.12 632.69
Remuneration to Auditors
Audit Fees 1.91 1.49
Tax Audit Fees 0.47 0.41
For other Services 0.99 0.94
Out of Pocket Expenses 0.65 0.89
4.02 3.73
Provisions
Doubtful Debts, Loans and Advances 74.47 27.81
Investments 0.20 -
Stores, Spares and Sundries 72.88 164.96
147.55 192.77
Power and Fuel 5233.93 5,333.87
Freight Outward 1,161.99 1,130.92
Royalty and Cess 996.81 1,333.14
Conversion Charges 454.33 413.32
Excise Duty on Inter-Plant Transfer / Internal Consumption 292.12 305.40
Demurrage & Wharfage 53.41 48.64
Water Charges & Cess on Water Pollution 121.02 111.43
Insurance 32.47 29.25
Postage, Telegram & Telephone 20.42 18.59
Printing & Stationery 9.80 9.64
Rates & Taxes 69.64 48.90
Rent 60.72 69.97
Security Expenses 490.71 423.88
Travelling Expenses 156.30 148.49
Expenses on temporary suspended mines (Refer note- 41.11) 97.95 101.04
Training Expenses 30.36 40.88
Foreign Exchange Fluctuation ( Net ) - 75.73
Expenditure on Corporate Social Responsibility (Refer note-41.5) 29.05 73.99
Loss on sale/scrapping of Fixed Assets ( Net ) 48.17 68.05
Cost Audit Fees and Reimbursement of Expenses 0.32 0.20
Write-Offs - Miscellaneous 0.01 0.25
Handling Expenses - Finished goods 157.45 181.24
Commission to Selling Agents 7.34 7.06
Export Sales Expenses 22.97 8.85
Miscellaneous Expenses 452.83 338.00
14,220.21 14,540.44

57
Notes to the Standalone Financial Statements for the year ended 31st March, 2017
33. FINANCIAL INSTRUMENTS
i) Fair values hierarchy
Financial assets and financial liabilities measured at fair value in the statement of financial position are categorized into three Levels of a fair value hierarchy. The three Levels aredefined based on the observability of significant inputs to the measurement, as follows:
Level 1: Quoted prices (unadjusted) in active markets for financial instruments.
Level 2: The fair value of financial instruments that are not traded in an active market is determined using valuation techniques which maximise the use of observable marketdata rely as little as possible on entity specific estimates.
Level 3: If one or more of the significant inputs is not based on observable market data, the instrument is included in level 3.
ii) Financial assets and liabilities measured at fair value - recurring fair value measurements (` crore)
As at 31st March, 2017 Level 1 Level 2 Level 3 Total
Financial assets
Financial instruments at FVTPL
Derivative financial assets 227.54 227.54
Investments at FVOCI
Equity instruments*
Quoted 13.30 13.30
Unquoted 58.39 58.39
Total financial assets 13.30 227.54 58.39 299.23
Financial liabilities
Financial instruments at FVTPL
Derivative liability - 603.57 - 603.57
Total financial liabilities - 603.57 - 603.57
Financial assets and liabilities measured at fair value - recurring fair value measurements (` crore)
As at 31st March, 2016 Level 1 Level 2 Level 3 Total
Financial assets
Financial instruments at FVTPL
Derivative financial assets - 473.95 - 473.95
Investments at FVOCI
Equity instruments*
Quoted 10.29 - - 10.29
Unquoted 58.39 58.39
Total Financial assets 10.29 473.95 58.39 542.63
Financial liabilities
Financial instruments at FVTPL
Derivative liability 153.68 - 153.68
Total financial liabilities - 153.68 - 153.68
Financial assets and liabilities measured at fair value - recurring fair value measurements (` crore)
As at 1st April, 2015 Level 1 Level 2 Level 3 Total
Financial assets
Financial instruments at FVTPL
Derivative financial assets 470.44 470.44
Investments at FVOCI
Equity instruments*
Quoted 12.63 12.63
Unquoted 55.62 55.62
Total financial assets 12.63 470.44 55.62 538.69
Financial liabilities
Financial instruments at FVTPL
Derivative liability 144.96 144.96
Total financial liabilities - 144.96 - 144.96

58
Notes to the Standalone Financial Statements for the year ended 31st March, 2017
iii) Financial assets and liabilities - for which fair values are disclosed (` crore)
Level As at 31st March, 2017 As at 31st March, 2016 As at 1st April, 2015
Carrying value Fair Value Carrying value Fair Value Carrying value Fair Value
Financial assets
Loans Level-3 514.99 523.40 514.04 517.59 492.72 492.72
Derivative financial assets Level-2 227.54 227.54 473.95 473.95 470.44 470.44
Equity instruments*
Quoted Level-1 13.30 13.30 10.29 10.29 12.63 12.63
Unquoted Level-3 58.39 58.39 58.39 58.39 55.62 55.62
Total financial assets 814.22 822.63 1,056.67 1,060.22 1,031.41 1,031.41
Financial liabilities
Borrowings Level-3 43,280.15 43,628.65 37,069.00 37,225.74 33,583.15 33,838.95
Other payables Level-3 9,148.35 9,281.67 8,379.51 8,490.70 7,961.72 7,961.72
Derivative liability Level-2 603.57 603.57 153.68 153.68 144.96 144.96
Total financial liabilities 53,032.07 53,513.89 45,602.19 45,870.12 41,689.83 41,945.63
(iv) Valuation process and technique used to determine fair value
Specific valuation techniques used to value financial instruments include:
(a) Fair value of interest swap is determined based on dealer or counterparty quotes for similar instruments.
(b) Fair value of forward foreign exchange contract and principal swap is determined using forward rate at balance sheet date.
(c) The carrying value of borrowings bearing variable interest rate are considered to be representative of their fair value.
(d) The carrying value of financial assets and liabilities with maturities less than 12 months are considered to be representative of their fair value.
(e) Fair value of fixed interest rate financial assets and liabilities carried at amortised cost (including finance lease obligations) is determined by discounting the cash
flows using a discount rate equivalent to market interest rate applicable to similar assets and liabilities as at the balance sheet date.
(v) Unquoted investments
Fair value estimates of unquoted equity investments are included in level-3 and are based on information relating to value of investee company's net assets. For investments inco-operative societies the Company has determined that cost is approximate estimate of fair value, therefore there have been no changes on account of fair values.
vi) The following table presents the changes in value of financial instruments measured at fair value using level 3 inputs: (` crore)
Particulars Unlisted equity securities
As at 1st April, 2015 55.62
Gain/Loss recognised in other comprehensive income 2.77
As at 31 March, 2016 58.39
Gains/losses recognised in other comprehensive income -
As at 31st March, 2017 58.39
34 FINANCIAL RISK MANAGEMENT
i) Financial instruments by category (` crore)
As at 31st March, 2017 As at 31st March, 2016 As at 1st April, 2015
Particulars FVTPL FVOCI Amortised FVTPL FVOCI Amortised FVTPL FVOCI Amortisedcost cost cost
Financial assets
Investments
Equity instruments* 71.69 68.68 68.25
Trade receivables 2,921.69 3,143.49 3,588.22
Cash and cash equivalents 120.93 132.44 148.17
Other Bank Balances 168.16 165.52 2,163.76
Loans 514.99 514.04 492.72
Derivative financial assets 227.54 473.95 470.44
Other receivables 2,302.73 1,780.57 2,566.07
Total 227.54 71.69 6,028.50 473.95 68.68 5,736.06 470.44 68.25 8,958.94
Financial liabilities
Borrowings 43,280.15 37,069.00 33,583.15
Trade payable 5,226.56 4,009.54 3,607.09
Derivative Liability 603.57 153.68 144.96
Other payables 9,148.35 8,379.51 7,961.72
Total 603.57 - 57,655.06 153.68 - 49,458.05 144.96 - 45,151.96
* Investment in equity of joint ventures and associates have been carried at cost as per Ind AS 27 "Separate financial statements" and hence are not presented here.

59
ii) Risk Management
The Company is exposed to various risk in relation to financial instruments. The Company's financial asset and liabilities are by category are summarised in note 34(i). The maintypes of risks are market risk, credit risk and liquidity risk. The Company’s risk management is coordinated at its headquarters, in close cooperation with the board of directors, andfocuses on actively securing the Company’s short to medium-term cash flows by minimising the exposure to volatile financial markets. Long-term financial investments aremanaged to generate lasting returns. The Company does not actively engage in the trading of financial assets for speculative purposes nor does it write options. The most significantfinancial risks to which the Company is exposed are 'described below.
A) Credit risk
Credit risk is the risk that a counterparty fails to discharge an obligation to the Comapny. The Company is exposed to this risk for various financial instruments, for example bygranting loans and receivables to customers, placing deposits, etc. The Company’s maximum exposure to credit risk is limited to the carrying amount of following types financialassets.
-Cash and cash equivalents
-Derivative financial instruments
-Trade receivables
-Other financial assets measured at amortized cost
The Company continuously monitors defaults of customers and other counterparties, identified either individually or by the Company, and incorporates this information into its creditrisk controls. Where available at reasonable cost, external credit ratings and/or reports on customers and other counterparties are obtained and used. The Company's policy is todeal only with creditworthy counterparties.
a) Credit risk management
Cash and cash equivalent
Credit risk related to cash and cash equivalents is managed by only accepting highly rated banks and diversifying bank deposits and accounts in different banks across thecountry.
Derivative financial instruments
Credit risk related to derivative financial instruments is also managed by only entering into such arrangement with highly rated banks or financial institutions as counterparties.The company diversifies its holdings with multiple counterparties.
Trade receivables
Credit risk related to trade receivables are mitigated by taking bank guarantees from customers where credit risk is high. The Company closely monitors the credit-worthinessof the debtors and only sells goods to credit-worthy parties. The Company's internal systems are configured to define credit limits of customers, thereby limiting the credit riskto pre-calculated amounts.
Other financial assets measured at amortized cost
Other financial assets measured at amortized cost includes loans and advances to employees and others. Credit risk related to these other financial assets is managed bymonitoring the recoverability of such amounts continuously, while at the same time internal control system in place ensure the amounts are within defined limits.
b) Expected credit losses
Company provides expected credit losses based on the following:
Trade receivables
The Company recognizes lifetime expected credit losses on trade receivables using a simplified approach and uses historical information to arrive at loss percentage relevantto each category of trade receivables:
(` crore)
Ageing (As at 31st March, 2017) 0-3 months 3-12 months 12-24 months 24-36 months more than Total36 months
Gross carrying amount 2,289.06 414.86 133.89 37.83 222.53 3,098.17
Expected loss rate 0.03% 0.37% 1.57% 6.27% 76.33% 5.70%
Expected credit loss provision 0.61 1.54 2.10 2.37 169.86 176.48
Carrying amount of trade receivables (Net of impairment) 2,288.45 413.32 131.79 35.46 52.67 2,921.69
Ageing (As at 31st March, 2016) 0-3 months 3-12 months 12-24 months 24-36 months more than Total36 months
Gross carrying amount 2,457.10 520.08 33.45 101.69 177.99 3,290.31
Expected loss rate 0.02% 0.29% 7.10% 2.31% 78.66% 4.46%
Expected credit loss provision 0.58 1.51 2.38 2.35 140.01 146.83
Carrying amount of trade receivables (Net of impairment) 2,456.52 518.57 31.07 99.34 37.98 3,143.48
Ageing (As at 1st April, 2015) 0-3 months 3-12 months 12-24 months 24-36 months more than Total36 months
Gross carrying amount 2,437.67 782.65 305.21 13.04 179.23 3,717.80
Expected loss rate 0.03% 0.22% 0.77% 12.12% 70.04% 3.55%
Expected credit loss provision 0.62 1.75 2.35 1.58 125.53 131.83
Carrying amount of trade receivables (Net of impairment) 2,437.05 780.90 302.86 11.46 53.70 3,585.97
Notes to the Standalone Financial Statements for the year ended 31st March, 2017

60
Notes to the Standalone Financial Statements for the year ended 31st March, 2017
Reconciliation of Expected credit loss provision (` crore)
Particulars Unlisted equity securities
As at 1st April, 2015 131.83
Changes in provision (14.99)
As at 31st March, 2016 146.82
Changes in provision (29.65)
As at 31st March, 2017 176.48
Other financial assets measured at amortized cost
Company provides for expected credit losses on "loans advances and other than trade receivables" by assessing individual financial instruments for expectation of any credit losses.Since this category includes loans and receivables of varied natures and purpose, there is no trend that the company can draws to apply consistently to entire population. For suchfinancial assets, the Company's policy is to provides for 12 month expected credit losses upon initial recognition and provides for lifetime expected credit losses upon significantincrease in credit risk. The Company does not have any expected loss based impairment recognised on such assets considering their low credit risk nature, though incurred lossprovisions are disclosed under each sub-category of such financial assets.
B) Liquidity risk
Prudent liquidity risk management implies maintaining sufficient cash and marketable securities and the availability of funding through an adequate amount of committed creditfacilities to meet obligations when due. Due to the nature of the business, the Company maintains flexibility in funding by maintaining availability under committed facilities.
Management monitors rolling forecasts of the Company’s liquidity position and cash and cash equivalents on the basis of expected cash flows. The Company takes into account theliquidity of the market in which the entity operates. In addition, the Company’s liquidity management policy involves projecting cash flows in major currencies and considering thelevel of liquid assets necessary to meet these, monitoring balance sheet liquidity ratios against internal and external regulatory requirements and maintaining debt financing plans.
Maturities of financial liabilities
The tables below analyse the company’s financial liabilities into relevant maturity companying based on their contractual maturities for all non-derivative financial liabilities and theamounts disclosed in the table are the contractual undiscounted cash flows. Balances due within 12 months equal their carrying balances as the impact of discounting is notsignificant
(` crore)
Contractual maturities of financial liabilities as at 31st March, 2017 Less than 1-2 year 2-3 year More than Total1 year 3 years
Non-derivatives
Borrowings* 24,177.67 4,569.02 4,652.70 13,282.34 46,681.73
Trade payable 5,226.62 1.29 5.64 0.43 5,233.98
Other payables 10,428.43 125.11 105.03 1,445.94 12,104.51
Total 39,832.72 4,695.42 4,763.37 14,728.71 64,020.22
Derivatives
Derivative liability (Net Settled) 603.57 603.57
Total 603.57 - - - 603.57
Contractual maturities of financial liabilities as at 31st March, 2016 Less than 1-2 year 2-3 year More than Total1 year 3 years
Non-derivatives
Borrowings* 20,054.28 3,672.83 4,765.96 12,135.48 40,628.55
Trade payable 4,002.71 1.27 0.37 5.19 4,009.54
Other payables 9,032.64 132.46 110.45 1,627.81 10,903.36
Total 33,089.63 3,806.56 4,876.78 13,768.48 55,541.45
Derivatives
Derivative liability 153.68 153.68
Total 153.68 - - - 153.68
Contractual maturities of financial liabilities as at 1st April, 2015 Less than 1-2 year 2-3 year More than Total1 year 3 years
Non-derivatives
Borrowings* 18,233.78 2,692.93 3,526.40 10,008.35 34,461.46
Trade payable 3,606.38 - - 0.71 3,607.09
Other payables 8,621.25 109.82 105.36 1,503.00 10,339.43
Total 30,461.41 2,802.75 3,631.76 11,512.06 48,407.98
Derivatives
Derivative liability 144.96 144.96
Total 144.96 - - - 144.96
* borrowings excludes finance lease obligations, refer note 41.6(b) for disclosure of maturity profile of finance lease obligations.

61
Notes to the Standalone Financial Statements for the year ended 31st March, 2017
C) Market Risk
a) Foreign currency risk
Most of the Company’s transactions are carried out in INR. Exposures to currency exchange rates arise from the Company’s overseas borrowing arrangements, which are primarilydenominated in US dollars (USD).
To mitigate the Company’s exposure to foreign currency risk, non-INR cash flows are monitored and forward exchange contracts are entered into in accordance with the Company’srisk management policies. Generally, the Company’s risk management procedures distinguish short-term foreign currency cash flows (due within 6 months) from longer-term cashflows (due after 6 months). Where the amounts to be paid and received in a specific currency are expected to largely offset one another, no further hedging activity is undertaken.Forward exchange contracts are mainly entered into for significant long-term foreign currency exposures that are not expected to be offset by other same-currency transactions.
Foreign currency risk exposure:
The Company's significant exposures to foreign currency risk at the end of the reporting period expressed in ` crore are as follows:
Particulars As at 31st March, 2017 As at 31st March, 2016
USD Euro USD Euro
Financial assets
Trade receivables 38.25 5.95
Cash and cash equivalents
Other Bank Balances
Loans
Derivative financial assets (Gross amounts, to hedge borrowings) 10,099.90 6,924.71
Other receivables
Net exposure to foreign currency risk (assets) 10,138.15 - 6,930.66 -
Financial liabilities
Borrowings 13,039.83 327.06 9,791.53 377.17
Trade payable 57.25 307.02 58.73 294.50
Derivative Liability
Other payables
Net exposure to foreign currency risk (liabilities) 13,097.08 634.08 9,850.26 671.67
Sensitivity
The following table illustrates the sensitivity of profit and equity in regards to the Company’s financial assets and financial liabilities and the USD/INR exchange rate and EUR/INRexchange rate ‘all other things being equal’. It assumes a +/- 7.86% change of the INR/USD exchange rate for the year ended at 31 March, 2017 (2016: 11.83%). A +/- 4.09%change is considered for the INR/EUR exchange rate (2016: 4.92%). Both of these percentages have been determined based on the average market volatility in exchange rates in theprevious 12 months. The sensitivity analysis is based on the Company’s foreign currency financial instruments held at each reporting date and also takes into account forwardexchange contracts that offset effects from changes in currency exchange rates.
(` crore)
Particulars As at 31st March, 2017 As at 31st March, 2016
USD sensitivity
INR/USD- increase by 4.09% (31 March 2017) (121.02)
INR/USD- decrease by 4.09% (31 March 2017) 121.02
INR/USD- increase by 4.92% (31 March 2016) (143.64)
INR/USD- decrease by 4.92% (31 March 2016) 143.64
Euro sensitivity
INR/EUR- increase by 7.86% (31 March 2017) (49.84)
INR/EUR- decrease by 7.86% (31 March 2017) 49.84
INR/EUR- increase by 11.83% (31 March 2016) (79.46)
INR/EUR- decrease by 11.83% (31 March 2016) 79.46
b) Interest rate risk
The Company’s policy is to minimise interest rate cash flow risk exposures on long-term financing. Longer-term borrowings are therefore usually at fixed rates. At 31 March, 2017,the Company is exposed to changes in market interest rates through bank borrowings at variable interest rates. Other borrowings are at fixed interest rates. The Company’sinvestments in bonds all pay fixed interest rates. The exposure to interest rates for the Company’s money market funds is considered immaterial. The following table illustrates thesensitivity of profit and equity to a reasonably possible change in interest rates of +/- 1% (2016: +/- 1%). These changes are considered to be reasonably possible based onobservation of current market conditions. The calculations are based on a change in the average market interest rate for each period, and the financial instruments held at eachreporting date that are sensitive to changes in interest rates. All other variables are held constant.
i) Liabilities
The company’s policy is to minimise interest rate cash flow risk exposures on long-term financing. At 31st March, 2017, the company is exposed to changes in market interestrates through bank borrowings at variable interest rates.

62
Notes to the Standalone Financial Statements for the year ended 31st March, 2017
Interest rate risk exposure
Below is the overall exposure of the company to interest rate risk: (` crore)
Particulars As at 31st March, 2017 As at 31st March, 2016
Variable rate borrowing (excluding exposures offset by derivatives) 9,777.02 5,597.59
Fixed rate borrowing 33,503.13 31,471.41
Total borrowings 43,280.15 37,069.00
Sensitivity
Below is the sensitivity of profit or loss and equity changes in interest rates. (` crore)
Particulars As at 31st March, 2017 As at 31st March, 2016
Interest sensitivity
Interest rates – increase by 100 basis points 432.80 370.69
Interest rates – decrease by 100 basis points (432.80) (370.69)
ii) Assets
The company’s fixed deposits are carried at amortised cost and are fixed rate deposits. They are therefore not subject to interest rate risk as defined in Ind AS 107, since neitherthe carrying amount nor the future cash flows will fluctuate because of a change in market interest rates.
Interest rate risk exposure
Below is the overall exposure of the financial assets: (` crore)
Particulars As at 31st March, 2017 As at 31st March, 2016
Variable rate deposits/ loans - -
Fixed rate deposits/ loans 683.15 679.56
Total deposits 683.15 679.56
c) Price risk
Exposure
The Company is exposed to other price risk in respect of its investment shares of other companies (see Note 8). The Company does not consider changes in value of itsinvestments in shares as insignificant, therefore is not exposed to price risks on exposures outstanding on the balance sheet date.
35 CAPITAL MANAGEMENT
The company’ s capital management objectives are
- to ensure the company’s ability to continue as a going concern
- to provide an adequate return to shareholders
The company monitors capital on the basis of the carrying amount of equity less cash and cash equivalents as presented on the face of balance sheet.
Management assesses the company’s capital requirements in order to maintain an efficient overall financing structure while avoiding excessive leverage. This takes into accountthe subordination levels of the company’s various classes of debt. The company manages the capital structure and makes adjustments to it in the light of changes in economicconditions and the risk characteristics of the underlying assets. In order to maintain or adjust the capital structure, the company may adjust the amount of dividends paid toshareholders, return capital to shareholders, issue new shares, or sell assets to reduce debt.
(` crore)
Particulars As at 31st March, 2017 As at 31st March, 2016 As at 1st April, 2015
Net debts 42,991 36,771 31,271
Total equity 36,009 39,196 43,523
Net debt to equity ratio 119% 94% 72%
Dividends
(i) Equity shares
Final dividend for the year ended 31st March, 2015 of `. 0.25 Nil 103.26 -
(ii) Dividends not recognised at the end of the reporting period
The directors had recommended the payment of a final dividend of Nil Nil 103.26` 0.25 for the year ended 31st March, 2015 per fully paid equity share.This proposed dividend is subject to the approval of shareholders in theensuing annual general meeting.

63
Notes to the Standalone Financial Statements for the year ended 31st March, 2017
36 FIRST TIME ADOPTION OF IND AS
These are the Company's first financial statements prepared in accordance with Ind AS.
The accounting policies set out in note 3 have been applied in preparing the financial statements for the year ended 31st March, 2017, the comparative information presented in thesefinancial statements for the year ended 31 March, 2016 and in the preparation of an opening Ind AS balance sheet at 1st April, 2015 (the Company’s date of transition). An explanationof how the transition from previous GAAP to Ind AS has affected the Company’s financial position, financial performance and cash flows is set out in the following tables and notes.
A Ind AS optional exemptions
1 Deemed cost for property, plant and equipment, investment property and intangible assets
Ind AS 101 permits a first-time adopter to elect to continue with the carrying value for all of its property, plant and equipment as recognised in the financial statements as at the dateof transition to Ind AS, measured as per the previous GAAP and use that as its deemed cost as at the date of transition after making necessary adjustments for de-commissioningliabilities. This exemption can also be used for intangible assets covered by Ind AS 38 Intangible Assets and investment property covered by Ind AS 40 Investment Properties.Accordingly, the Company has elected to measure all of its property, plant and equipment, intangible assets and investment property at their previous GAAP carrying value.
2 Decommissioning liabilities included in cost of property, plant and equipment
Ind AS 101 permits a first-time adopter to not comply with the requirements of accounting for changes in decommissioning liabilities that occurred before the date of transition toInd ASs and only adjust the carrying value of property, plant and equipment by the amount of decommissioning liability that existed on the date of transition after considering theimpact of accumulated depreciation.
For the purpose of the determining the present value of liability, the rate of discount on government securities applicable for the relevant period when the such liability first arose wasapplied.
3 Designation of previously recognised financial instruments
Ind AS 101 allows an entity to designate investments in equity instruments at FVOCI on the basis of the facts and circumstances at the date of transition to Ind AS. The Companyhas elected to apply this exemption for its investment in equity investments.
4 Leases
Appendix C to Ind AS 17 requires an entity to assess whether a contract or arrangement contains a lease. In accordance with Ind AS 17, this assessment should be carried out atthe inception of the contract or arrangement. Ind AS 101 provides an option to make this assessment on the basis of facts and circumstances existing at the date of transition to IndAS, except where the effect is expected to be not material.
The Company has elected to apply this exemption for such contracts/arrangements.
5 Investment in Subsidiary/ Joint ventures and associates
Ind AS 101 permits a first-time adopter who elects to account for its investments in subsidiaries, joint ventures and associates at cost to continue with the carrying value of suchinvestments as recognised in the financial statements as at the date of transition to Ind AS, measured as per the previous GAAP and use that as its deemed cost as at the date oftransition.
B Ind AS mandatory exemptions
1 Estimates
An entity’s estimates in accordance with Ind ASs at the date of transition to Ind AS shall be consistent with estimates made for the same date in accordance with previous GAAP(after adjustments to reflect any difference in accounting policies), unless there is objective evidence that those estimates were in error.
Ind AS estimates as at 1st April, 2015 are consistent with the estimates as at the same date made in conformity with previous GAAP. The Company made estimates for following itemsin accordance with Ind AS at the date of transition as these were not required under previous GAAP:
a) Investment in equity instruments carried at FVTPL or FVOCI
b) Impairment of financial assets based on expected credit loss model.
2 Classification and measurement of financial assets and liabilities
The classification and measurement of financial assets will be made considering whether the conditions as per Ind AS 109 are met based on facts and circumstances existing at thedate of transition.
Financial assets can be measured using effective interest method by assessing its contractual cash flow characteristics only on the basis of facts and circumstances existing at thedate of transition and if it is impracticable to assess elements of modified time value of money i.e. the use of effective interest method, fair value of financial asset at the date oftransition shall be the new carrying amount of that asset. The measurement exemption applies for financial liabilities as well.
Applying a requirement is impracticable when the entity cannot apply it after making every reasonable effort to do so. It is impracticable to apply the changes retrospectively if:
a) The effects of the retrospective application or retrospective restatement are not determinable;
b) The retrospective application or restatement requires assumptions about what management’s intent would have been in that period;
The retrospective application or retrospective restatement requires significant estimates of amounts and it is impossible to distinguish objectively information about thoseestimates that existed at that time.
For the purpose of certain financial instruments carried at amortised cost for which fair value was determined on the date of transition to Ind AS, discount rates as at the dateof transition were determined on the following basis:
i) Loans given to employees: rates as per third party banks applicable to employees
ii) Finance lease obligations in relation to oxygen plant: rates as per Company's last available incremental borrowing rate
iii) Finance lease obligations in relation to power plants: implicit rate in the lease
iv) Other financial assets and financial labrialise: State Bank of India's base rate

64
C (i) Reconciliations between previous GAAP and Ind AS
Ind AS 101 requires an entity to reconcile equity, total comprehensive income and cash flows for prior periods. The following tables represent the reconciliations from previous GAAPto Ind AS.
1 Reconciliation of total equity as at 31 March, 2016 and 1st April, 2015 (` crore)
Notes to first As at 31st As at 1st
time adoption March, 2016 April, 2015
Total equity (shareholder's funds) as per previous GAAP 39,281.26 43,504.78
Adjustments:
Measurement of financial assets and liabilities at amortised cost 4 66.44 182.44
Recognition and measurement of certain arrangements and leases of land as finance leases 2 (210.35) (173.24)
Measurement of equity instruments at fair value through OCI 5 48.71 48.29
Measurement of derivatives and embedded derivatives at fair value through profit and loss 1 (26.22) (29.37)
Classification of certain leases of land as operating leases 6 (83.08) (87.21)
Recognition of grant from government as deferred income 7 (28.21) (27.89)
Capitalisation of major repairs and capital spares 3 58.76 (131.36)
Proposed dividend including dividend distribution tax 8 - 124.28
Deferred tax impact on Ind AS adjustments 11 12.46 38.00
Others 76.13 74.60
Total adjustments (85.36) 18.54
Total equity as per Ind AS 39,195.90 43,523.32
2 Reconciliation of total comprehensive income for the year ended 31st March, 2016 (` crore)
Notes to first As at 31st
time adoption March, 2016
Profit after tax as per previous GAAP (4,137.26)
Adjustments:
Measurement of derivatives and embedded derivatives at fair value through profit and loss 1 3.15
Recognition and measurement of certain arrangements and leases of land as finance leases 2 (37.10)
Capitalisation of major repairs and capital spares 3 190.12
Measurement of financial assets and liabilities at amortised cost 4 (115.99)
Deferred tax impact on Ind AS adjustments 11 (75.11)
Others 150.75
Total adjustments 115.82
Profit/(Loss) after tax as reported under Ind AS (4,021.44)
Other Comprehensive Income (OCI) (net of tax):
Remeasurement of defined benefit obligations 10 (94.87)
Measurement of equity instruments at fair value through OCI 5 (0.22)
Total Comprehensive Profit/(Loss) under IND-AS (4,116.53)
3 Impact of Ind AS adoption on statement of cashflows for the year ended 31st March, 2016 (` crore)
Previous GAAP Adjustments Ind AS
Profit after tax as per previous GAAP
Adjustments:
Net cash flows from operating activities 2,817.87 981.84 3,799.71
Net cash flows from investing activities (4,094.98) (463.19) (4,558.17)
Net cash flows from financing activities 1,258.88 (516.15) 742.73
Net increase/ (decrease) in cash and cash equivalents (18.23) 2.50 (15.73)
Cash and cash equivalent as at 1st April, 2015 160.04 (11.87) 148.17
Cash and cash equivalents as at 31st March, 2016* 141.81 (9.37) 132.44
*Cash and cash equivalents as at 31st March, 2016 and 1st April, 2015 under Ind-AS excludes restricted bank balances.
Note – 1
Measurement of derivatives
Under previous GAAP, forward contracts which are outstanding as at the reporting date were restated at the closing spot rate with corresponding amortization of forward premium. UnderInd AS, these derivative contracts are accounted for as FVTPL.
Further under Ind AS embedded derivatives not closely related to the host contract are separated and these derivative contracts have been also accounted for as FVTPL.
Notes to the Standalone Financial Statements for the year ended 31st March, 2017

65
Notes to the Standalone Financial Statements for the year ended 31st March, 2017
Note – 2
Recognition and measurement of certain arrangements and leases of land as finance leases
Under previous GAAP, leases of land were not classified between operating or finance leases as there was no specific accounting requirement. Accordingly, all such leases werecapitalized as fixed assets. Further, there was no guidance for recognising embedded leases under the previous GAAP.
Under Ind AS certain leases of land have been considered finance leases in accordance with Ind AS 17 also certain other arrangements have been treated as finance lease of property,plant and equipment (PP&E), resulting into increase in depreciation and finance cost, while reducing cost of goods/ services procured.
Note – 3
Capitalisation of major repairs and capital spares
Under previous GAAP spares were recognised as inventory and charged to P&L upon issuance and all expenditure on repairs was charged to P&L unless it increased the future benefitsfrom the existing asset beyond its previously assessed standard of performance.
Under Ind AS spares have been capitalised if they were held by the Company for use in business and that is expected to be used for more than one year. Similarly cost of major repairsand overhauls to continue to operate an item of PP&E has been capitalised as a cost of such PP&E.
Note – 4
Measurement of financial assets and liabilities at amortised cost
Under previous GAAP, all financial assets and financial liabilities were carried at cost.
Under Ind AS, certain financial assets and financial liabilities are subsequently measured at amortised cost which involves the application of effective interest method. The effectiveinterest rate is the rate that exactly discounts estimated future cash payments or receipts through the expected life of the financial asset or financial liability to the fair value amount on thedate of recognition of financial asset or financial liability.
Note – 5
Measurement of equity instruments at fair value through OCI
Under previous GAAP, investments in long-term equity instrument are shown at cost and tested for other than temporary diminution. Under Ind AS, such investments are accounted forunder Ind AS 109 which requires the company to measure such instruments at fair value through profit and loss (FVTPL) or fair value through other comprehensive income (FVOCI)(except for investment in subsidiaries, associates and joint venture).
Note – 6
Classification of certain leases of land as operating leases
Under previous GAAP, leases of land where Company was a lessor were not classified between operating or finance leases as there was no specific accounting requirement. Accordingly,all such leasehold lands were derecognized and lease premium was booked as sales consideration.“Under Ind AS certain leasehold land previously derecognized have been consideredoperating leases in accordance with Ind AS 17 therefore the premium on such leases has been recognized as deferred income.
Note – 7
Recognition of grant from government as deferred income
Under previous GAAP, grants received in nature of promoter's contribution were directly credited to equity. Under Ind AS, grants received where conditions for recognition were not methave been recognized as deferred income.
Note – 8
Proposed dividend
Under the previous GAAP, dividends proposed by the board of directors after the balance sheet date but before the approval of the financial statements were considered as adjustingevents. Accordingly, provision for proposed dividend was recognised as a liability. Under Ind AS, such dividends are recognised when the same is approved by the shareholders in thegeneral meeting.
Note –9
Retained earnings
Retained earnings as at 1st April, 2015 has been adjusted consequent to the above Ind AS transition adjustments.
Note – 10
Other comprehensive income
Under Ind AS, all items of income and expense recognised in a period should be included in profit or loss for the period, unless a standard requires or permits otherwise. Items of incomeand expense that are not recognised in profit or loss but are shown in the statement of profit and loss as ‘other comprehensive income’ includes re-measurements of defined benefit plans,foreign exchange differences arising on translation of foreign operations, effective portion of gains and losses on cash flow hedging instruments and fair value gains or (losses) on FVOCIequity instruments. The concept of other comprehensive income did not exist under previous GAAP.
Note – 11
Deferred tax
Under Ind AS, deferred tax is created using a balance sheet approach considering the taxable and deductible temporary differences, unlike previous GAAP where a concept of timingdifference was applied. Ind AS adjustments recorded by the Company also have a deferred tax impact which has been recognised in the financial statements.
Note - 12
Guaranteed receivables
Under Ind AS, financial assets and liabilities are not offset unless there is a legal right to setoff accordingly certain trade receivables and related liabilities have been reported on a grossbasis under Ind AS.

66
C(ii)- Reconciliation between previous GAAP and Ind AS for impact on balance sheet
(` crore)
Particulars Notes to first Previous GAAP Adjustments Ind AS as at Previous GAAP Adjustments Ind AS as attime as at 31st 31st March, as at 1st 1st April,
adoption March, 2016 2016 April, 2015 2015
ASSETS
Non-current assets
(a) Property, Plant and Equipment 2, 3 42,716.20 1,662.67 44,378.87 34,658.41 1,571.54 36,229.95
(b) Capital work-in-progress 3 24,884.26 42.96 24,927.22 29,195.82 13.72 29,209.54
(c) Investment property - 0.88 0.88 (-) 0.90 0.90
(d) Intangible assets 1,546.20 - 1,546.20 1,510.21 - 1,510.21
(e) Financial assets
(i) Investments 5 1,243.04 48.71 1,291.75 919.06 48.29 967.35
(ii) Trade receivable 3 37.34 (37.34) - 30.39 (28.14) 2.25
(iii) Loans 2, 4 487.53 (37.58) 449.95 481.08 (54.10) 426.98
(iv) Other financial assets 1, 4 222.60 269.78 492.38 342.25 355.83 698.08
(f) Deferred tax assets (net) 10 1,787.34 12.46 1,799.80 - - -
(g) Current tax assets (net) 278.10 - 278.10 609.89 - 609.89
(h) Other non current assets 1,007.08 (30.61) 976.47 802.68 (4.52) 798.16
74,209.69 1,931.93 76,141.62 68,549.79 1,903.52 70,453.31
Current assets
(a) Inventories 3 15,134.94 (455.41) 14,679.53 17,736.39 (485.69) 17,250.70
(b) Financial assets - -
(i) Trade receivable 12 2,900.68 242.81 3,143.49 3,215.21 370.76 3,585.97
(ii) Cash and cash equivalents 132.44 - 132.44 148.17 - 148.17
(iii) Other bank balances 165.52 - 165.52 2,163.76 - 2,163.76
(iv) Loans 4 0.00 64.09 64.09 - 65.74 65.74
(v) Other financial assets 1, 4 1,504.69 257.45 1,762.14 2,200.42 138.01 2,338.43
(c) Current tax assets (net) - - - - - -
(d) Other current assets 4,220.04 10.81 4,230.85 4,224.85 10.09 4,234.94
19 24,058.31 119.75 24,178.06 29,688.80 98.91 29,787.71
Assets classified as held for sale 0.00 20.59 20.59 0.00 20.46 20.46
TOTAL ASSETS 98,268.00 2,072.27 1,00,340.27 98,238.59 2,022.89 1,00,261.48
EQUITY AND LIABILITIES
Equity
(a) Equity share capital 4,130.53 4,130.53 4,130.53 4,130.53
(b) Other equity 35,150.73 (85.36) 35,065.37 39,374.25 18.54 39,392.79
39,281.26 (85.36) 39,195.90 43,504.78 18.54 43,523.32
Non-current liabilities
(a) Financial liabilities
(i) Borrowings 2, 4 15,936.16 1,559.55 17,495.71 13,937.79 1,682.41 15,620.20
(ii) Trade payables 6.83 - 6.83 0.71 - 0.71
(iii) Others 4 1,574.74 (2.92) 1,571.82 1,431.65 (56.56) 1,375.09
(b) Provisions 3,355.75 (84.10) 3,271.65 3,464.36 (82.80) 3,381.56
(c) Deferred tax liabilities (net) - - - 1,306.95 (38.00) 1,268.95
(d) Other non-current liabilities 6, 7 - 113.48 113.48 0.01 117.89 117.90
20,873.48 1,586.01 22,459.49 20,141.47 1,622.94 21,764.41
Current liabilities
(a) Financial Liabilities
(i) Borrowings 15,574.86 - 15,574.86 14,282.91 - 14,282.91
(ii) Trade payables 4,002.71 - 4,002.71 3,606.38 - 3,606.38
(iii) Other financial liabilities 1, 2, 12 10,396.93 562.87 10,959.80 9,911.19 500.44 10,411.63
(b) Other current liabilities 6 5,487.84 5.22 5,492.96 4,278.30 5.25 4,283.55
(c) Provisions 8 2,639.12 3.53 2,642.65 2,501.66 (124.28) 2,377.38
(d) Current tax liabilities (net) 11.90 - 11.90 11.90 - 11.90
38,113.26 571.62 38,684.88 34,592.34 381.41 34,973.75
TOTAL EQUITY & LIABILITIES 98,268.00 2,072.27 1,00,340.27 98,238.59 2,022.89 1,00,261.48
* Excluding reclassifications
Notes to the Standalone Financial Statements for the year ended 31st March, 2017

67
C (iii)- Reconciliation between previous GAAP and Ind AS for impact on statement of profit and loss (` crore)
Particulars Notes to first Previous GAAP Adjustments* Ind AS for thetime adoption For the year ended year ended 31st
31st March, 2016 March, 2016
Revenue
Revenue from operations 26 43,858.71 16.46 43,875.17
Other income 27 616.63 (21.96) 594.67
44,475.34 (5.50) 44,469.84
Expenses
Cost of materials consumed 28 17,155.23 - 17,155.23
Changes in inventories of finished goods and work in Progress 29 540.61 - 540.61
Excise duty 4,823.29 - 4,823.29
Employee benefits expense 30 9,845.41 (130.44) 9,714.97
Finance costs 31 2,046.71 253.74 2,300.45
Depreciation and amortisation expense 2,122.12 280.23 2,402.35
Other expenses 32 15,140.43 (599.97) 14,540.44
51,673.80 (196.46) 51,477.34
Profit/(Loss) Before Tax (7,198.46) 190.96 (7,007.50)
Tax expense
Deferred tax (2,984.66) 75.11 (2,909.55)
Earlier years (76.51) (76.51)
Total tax expense (3,061.17) 75.11 (2,986.06)
Profit/(Loss) for the year (4,137.29) 115.85 (4,021.44)
Other Comprehensive Income
A i) Items that will not be reclassified to profit and loss
Remeasurements of post employment benefit obligations - (145.08) (145.08)
Changes in fair value of FVOCI equity instruments 0.00 0.42 0.42
ii) Income tax relating to items that will not be reclassified to profit or loss (0.00) 49.57 49.57
Other Comprehensive Income for the year 0.00 (95.09) (95.09)
Total Comprehensive Income for the year (4,137.29) 20.76 (4,116.53)
* Excluding reclassifications
Notes to the Standalone Financial Statements for the year ended 31st March, 2017
37. DETAILS OF ASSETS PLEDGED
The carrying amounts of assets pledged as security for current and non-current borrowings are: (` crore)
Particulars As at 31st March, 2017 As at 31st March, 2016 As at 1st April, 2015
Current
Inventories and trade receivables (to the extent pledged) 1,552 2,256 6,558
Non Current
Plant & Machinery (movable assets) - Durgapur Steel Plant (to the extent pledged) 1,162 1,176 1,190
Plant & Machinery (movable assets) - Bokaro Steel Plant (to the extent pledged) 2,500 - -
Land (at Mouje-Wadej of city taluka, District Ahemadabad,Gujrat) - ISP 0.02 0.02 0.02
38. EFFECTIVE TAX RECONCILIATION(` crore)
Particulars For the year ended For the year ended31 March, 2017 31 March, 2016
Profit/(loss) before tax (4,850.86) (7,007.50)
Domestic tax rate for PFS 34.6080% 34.6080%
Expected tax expense [A] (1,678.79) (2,425.16)
Adjustment for tax-exempt income/ non-deductible expenses (9.51) 18.05
Adjustment for difference tax rate items 0.47 0.47
Deferred tax liability/ assets not recognised (9.01) 3.86
Tax incentive on specific expenditure (353.00) (524.84)
Tax related to earlier years 15.14 (76.51)
MAT credit reversal 28.50 12.71
Others (11.43) 5.36
Total adjustments [B] (338.83) (560.90)
Actual tax expense [C=A+B] (2,017.62) (2,986.06)
Tax expense comprises:
Current tax expense - -
Deferred tax credit (2,017.62) (2,986.06)
Tax expense recognized in Statement of profit and loss [D] (2,017.62) (2,986.06)

68
39.1 CONTINGENT LIABILITIES
(` crore)
As at As at As at31st March, 2017 31st March, 2016 1st April, 2015
(i) Claims against the Company pending appellate/judicial decisions :
a) Excise Duty 3751.71 2096.16 1667.91
b) Sales Tax on inter-state stock transfers from plants to stockyards*. 740.99 739.30 739.33
c) Other sales tax matters 628.34 717.65 230.26
d) Income Tax 1288.55 1224.85 1186.83
e) Other duties, cess and levies 6311.57 5248.51 2777.74
f) Civil matters ** 3178.30 3760.48 2776.79
g) Entry Tax 2173.75 2050.71 1647.65
h) Miscellaneous ** 15109.38 14655.47 11238.66
* No liability is expected to arise, as sales tax has been paid on eventual sales.** includes claims of ` 47.44crore (as at 31st March, 2016 ` 47.44crore) (as at 1st April, 2015` 47.43crore), against which there are counter-claims of ` 26.30crore(as at 31st March, 2016 ` 26.30crore) (as at 1st April, 2015 `28.06crore).
(ii) Other claims against the Company not acknowledged as debt:
a) Sales Tax 43.16 24.11 16.48
b) Duties, cess and levies 616.51 475.28 266.07
c) Civil Matters 89.94 82.67 55.23
d) Miscellaneous * 2494.37 1272.45 975.24
* includes claims of ` 100.94 crore (as at 31st March, 2016 `100.94 crore) (as at 1st April, 2015` 100.94 crore), against which there are counter-claims of ` 103.95 crore (as at 31st March, 2016` 103.95 crore)( as at 1st April, 2015 ` 103.95 crore).
(iii) Disputed income tax/service tax/other demand on joint venture company for which company may 32.89 33.79 31.59be contingently liable under the joint venture agreement
(iv) Bills drawn on customers and discounted with banks. 37.38 35.00 41.22
(v) Price escalation claims by contractors/suppliers and claims by employees. 408.62 166.58 250.71
39.2 a) (i) The Nine Judges Constitutional Bench of Hon'ble Supreme Court, vide its judgment dated 11.11.2016, has upheld the constitutional validity of levy of Entry Tax Acts
enacted by the States and has laid down principles/tests for consideration. The respective regular Benches of the Apex Court would hear the matters as per laid down
principles. Pending decisions by the regular Benches of the Apex Court on levy of Entry Tax in the States of Chhattisgarh, Odisha, Uttar Pradesh and Jharkhand, the Entry
Tax demands, under dispute, of `1092.28 crore, `352.16 crore, `92.23 crore and `5.15 crore respectively upto 31st March, 2017 aggregating to `1541.82 crore (including
a sum of `1091.02 crore, , `341.15 crore, `92.23 crore and `5.15 upto 31st March, 2016 and a sum `1084.32 crore, `333.95 crore, `92.23 crore and `5.15 as at 1st
April, 2015) have been treated as contingent liabilities.
The Company has deposited ` 1761.20 crore (upto 31st March, 2016 ` 1600.95 crore, as at 1st April, 2015 `1436.58 crore) against the said demand.
(ii) Pending final decision by the Hon'ble Calcutta High Court, in the case of levy of Entry Tax in West Bengal, the disputed Entry Tax demands of `254.21 crore upto 31st
March, 2017 (upto 31st March, 2016 `155.44 crore, as at 1st April, 2015 ` 79.90 crore) have been treated as contingent liabilities.
b) Hon'ble Supreme Court dismissed the SLP by the Company in respect of dispute with Damodar Valley Corporation(DVC) related to provisional tariff petition of electricity
charges for 2009-14 vide order dated 18th January, 2017, keeping the question of law open. The Order of Central Electricity Regulatory Commission (CERC) dt.7/8/2013
related to Tariff of 2009-14 against Petition No.275/GT/2012 has been challenged before Appellate Tribunal for Electricity (APTEL) (Appeal No.18 of 2014) in which the
Company has also intervened and the order of APTEL is pending. The appeal filed by DVC pertaining to tariff of 2004-09 is yet to be decided by the Hon'ble Supreme Court
of India. As per legal opinion received by the Company, the decision of Hon'ble Supreme Court of India on determination of the tariff of 2004-09 may have an effect on the
subsequent periods. Pending final decision in this regard, the claim of DVC of ` 587.72 crore upto 31st March, 2017 (upto 31.03.2016 `491.27 crore, as at 01.04.2015
`393.59 crore) has been considered as Contingent Liability and included in Note No. 39.1(i)(f) above. Against the said demands, the entire amount has been paid to DVC.
39.3 Under the Jharkhand Mineral Area Development Authority (Amendment) Act, 2015 the State Government of Jharkhand has made a demand of `3045.41 crore upto 31st
March, 2017 (upto 31.03.2016 `2375.95 crore, as at 01.04.2015 `63.31 crore) towards "Market Fee" on transaction value of coal, iron and steel items. As the matter is
sub-judice, the amount has been disclosed as a Contingent Liability in Note No. 39.1(i)(e) above.
39.4 The Company pays royalty on iron ore on the basis of quantity removed from the leased area at the rates based on notification by the Ministry of Mines, Government of India
and the price published by India Bureau of Mines on a monthly basis for both iron ore lumps and fines separately. A circular was issued by the State Government of Odisha
regarding payment of royalty on fines at the rate of lumps on 07.09.2010 retrospectively effective from August 2009. The Government of India, vide circular dated
23.07.2012, directed the State Government of Odisha to withdraw the circular dated 07.09.2010. Accordingly, excess royalty for fines at the rate applicable for lumps, paid
in two Iron Ore Mines of the Company amounting to `144.34 crore, has been shown as Claims Recoverable. As the Company has disputed the matter with the Appropriate
Authorities pending withdrawal of the circular of the State Government of Odisha, the amount of `144.34 crore ( As on 31.03.2016 `144.34 and 01.04.2015 `144.34
crore) has been included in the Contingent Liability, in Note No. 39.1(ii)(b) above.
39.5 In its judgement, the Central Administrative Tribunal (CAT), Kolkata has directed that Ministry of Steel shall consider the aspect of payment of arrears of revised perks and
allowances and take appropriate decision of payment of revised perks and allowances amounting to ` 325.13 crore to the executives for the period 26.11.2008 to
4.10.2009. Ministry of Steel intimated the matter to the Company on 7.12.2016. A stay petition in the matter has been filed on 22.12.2016 and is pending before the Hon'ble
Calcutta High Court. As the matter is sub-judice, the amount has been disclosed as a Contingent Liability in Note No. 39.1(v) above.

69
39.6 Indigenous washed coking coal supplies, have been claimed by Bharat Coaking Coal Limited (BCCL) and Central Coalfields Limited (CCL) at unilaterally notified price w.e.f.
13th January, 2017 and 14th January, 2017 respectively, which is in deviation from the mutually agreed price with the Company for the year 2016-17. The Company has
accounted for the supplies based on agreed prices as per jointly signed Memorandum of Understanding, valid for supplies w.e.f. 1st April, 2016 to 31st March, 2017, between
SAIL and BCCL & CCL. The differential claims of BCCL & CCL, amounting to `334.45 crore at unilaterally notified higher rates over and above MOU rates, have been
disclosed as contingent liability in the Note No. 39.1(ii)(d) above.
39.7 The Ministry of Environment & Forest and Climate Change (MoEF & CC) vide their letter No.- 11-599/ 2014-FC dated 1st April 2015 issued revised Guidelines for diversion
of Forest Land for non-forest purpose under the Forest (Conservation) Act, 1980 (FC Act). These revised Guidelines stipulated that in case of existing mining leases having
Forest Land (partially or fully), where approval for only a part of forest land has been obtained under the FC Act, the Central Government accorded general approval under
Section-2(iii) of the FC Act for the remaining area also to be Forest Land, subject to certain conditions, which includes realising Net Present Value (NPV) for the entire forest
land falling in the mining lease in case, NPV of such forest land has not already been realised.
In this matter, as per legal opinion obtained by the Company, Section 2 (iii) of FC Act, 1980 will not apply to Government Corporation and NPV is required to be paid only for
that limited area, which has been approved by MoEF & CC and in which mining activities are proposed to be done and not for the entire forest area. The matter of applicability
of NPV for total forest land has been challenged by the Company in Hon'ble High Court of Jharkhand. The Hon'ble Court, in its order, has directed to place the matter before
Division Bench of this Court.
40.1 Estimated amount of contracts remaining to be executed and not provided for (net of advances) are: (` crore)
Particulars As at 31st As at 31st As at 1st
March, 2017 March, 2016 April, 2015
Capital commitments 13580.65 15688.09 13013.17
Other commitments 1532.38 1444.26 1399.69
40.2 The amount due to Micro and Small Enterprises as defined in the The Micro, Small and Medium Enterprises Development Act, 2006 (as disclosed in Note No. 22 Trade
Payables) has been determined to the extent such parties have been identified on the basis of information available with the Company. The disclosures relating to Micro and
Small Enterprises as at 31st March, 2017are as under:
(` crore)
No. Description As at 31st As at 31st As at 1st
March, 2017 March, 2016 April, 2015
i. The principal amount remaining unpaid to supplier as at the end of the Year. 38.12 29.46 27.27
ii. The amount of interest accrued during the year and remaining unpaid at the end of the Year. - -
iii. The amount of further interest remaining due and payable even in the succeeding years, - -
until such date when the interest dues as above are actually paid to the small enterprises,
for the purpose of disallowance as a deductible expenditure under section 23.
iv. The interest due thereon remaining unpaid to supplier as at the end of the Year. - -
For the Year ended
31st March, 2017 31st March, 2016
v. The amount of interest paid in terms of section 16, along with the amount of the - -
payment made to the supplier beyond the appointed day during the Year.
vi. The amount of interest due and payable for the period of delay in making payment - -
(which have been paid but beyond the appointed day during the year) but without
adding the interest specified under this Act.
40.3 Balances of some of the Trade Receivables, Other Assets, Trade and Other Payables are subject to confirmation/reconciliation and consequential adjustment, if any.
Reconciliations are carried out on on-going basis. Provisions, wherever considered necessary, have been made. However, management does not expect to have any
material financial impact of such pending confirmation/reconciliation.
41.1 Sales include sale to Government Agencies recognised on provisional contract prices during the Year ended 31st March 2017: `3807.78 crore (Previous Year: `3779.85
crore) and cumulatively upto 31st March, 2017: `18342.41 crore (upto Previous Year: `14667.87 crore).
41.2 The long-term agreement for wage revision expired on 31st December, 2016. Pending finalisation of fresh agreement w.e.f. 1st January, 2017, an all-inclusive provision of
`107.15 crore towards salaries and wages revision, has been made on ad-hoc basis.
41.3 The research and development expenditure charged to Statement of Profit & Loss and allocated to Fixed Assets/Capital work-in-progress (Net), during the Year, amount to
`261.60 crore (`226.22 crore) and `77.83 crore (`50.78 crore) respectively. The aggregate amount of revenue expenditure incurred on research and development is
shown in the respective head of accounts. The break-up of the amount is as under:
(` crore)
Head of Account For the year ended
31st March 31st March
2017 2016
Raw Materials 26.93 66.25
Employees Benefits Expenses 88.87 95.18
Stores & Spares Consumed 9.44 5.39
Power & Fuel 4.80 14.79
Repairs & Maintenance 4.13 4.78
Depreciation and Amortisation Expenses 6.42 6.04
Other Expenses 119.01 33.61
Finance Cost 2.00 0.18
Total 261.60 226.22
70
41.4 The Company reviews the carrying amount of its fixed assets on each balance sheet date for the purpose of ascertaining impairment, if any, by considering assets of entire
one plant as Cash Generating Unit (CGU). If any such indication exists, the assets recoverable amount is estimated, as higher of the net selling price and the value in use.
An impairment loss is recognised whenever the carrying amount of an asset exceeds its recoverable amount. The net selling price of the CGU is determined once in every
three years.
On such review as on 31st March, 2017, no provision is required to be made during the year, as the value in use of assets of Bhilai Steel Plant, Durgapur Steel Plant, Rourkela
Steel Plant, Bokaro Steel Plant and IISCO Steel Plant, based on the present value of estimated future cash-flows expected to arise from the continuing use of an asset and
from its disposal at the end its useful life, is more than the carrying amount of the respective CGU.
No provision is required to be made during the year for Alloy Steels Plant, Salem Steel Plant and Visvesvaraya Iron and Steel Plant, as the net realisable value thereof,
assessed by an independent agency, as on 31st March, 2015 for Salem Steel Plant and as on 31st March, 2017 for Alloy Steels Plant and Visvesvaraya Iron & Steel Plant,
is more than the carrying amount of respective CGU.
41.5 As per Section 135 of the Companies Act, 2013 effective from 1st April, 2014, the Company is required to spend, in every financial year, at least 2% of the average net profits
of the Company made during the three immediately preceding financial years in accordance with its Corporate Social Responsibility (CSR) Policy. Since, the Company
reported average net loss made during the three immediately preceding financial years, no budget is required to be spent for the Financial Year 2016-17. Total amount to
be spent by the Company is `22.80 crore i.e. unspent amount of previous year. The Company has spent an amount of `29.05 crore on CSR activities during the year
2016-17 under the following heads :
Particulars ` crore
Education 8.96
Healthcare 3.39
Livelihood Generation 2.97
Women Empowerment 0.90
Drinking Water 0.95
Sanitation 1.50
Sports 0.97
Art & Culture 2.13
Rural Development 2.68
Social Security 0.26
Environment Sustainability 3.13
Project Identification and Monitoring 0.00
Capacity Building of Personnel 0.00
Total 29.05
41.6 Information on leases as per Indian Accounting Standards (Ind AS) 17 on `Leases':
a) The Company has granted lease of properties to the employees and third parties for varying periods. The lease premium received up-front, after adjusting against book
value, is booked to other revenues in the year of lease. Renewal premium, ground rent and service charges of properties, pending for renewal, given on lease are treated as
income in the year of receipt.
b) Finance lease liabilities (refer note 21 and 23) are secured by the related assets held under finance lease. Future minimum finance lease payments of the respective years
were as follows:
(` crore)
Minimum Lease Payment Due
Within 1 year 1-5 years After 5 years Total
31st March, 2017
Lease payment 251.21 913.69 2255.38 3420.28
Finance charge (158.59) (556.78) (1233.80) (1949.17)
Net present value 92.62 356.91 1021.58 1471.11
31st March, 2016
Lease payment 276.26 870.49 2222.86 3369.61
Finance charge (145.26) (478.65) (1281.99) (1905.90)
Net present value 131.00 391.84 940.87 1463.71
31st March, 2015
Lease payment 280.30 873.31 2365.11 3518.72
Finance charge (154.58) (497.43) (1387.45) (2039.46)
Net present value 125.72 375.88 977.66 1479.26
c) Description of major leasing arrangements
Power plant
The Company has accounted for a power plant as finance lease under Appendix C of Ind AS 17 by virtue of the power purchase agreement with the supplier. Under the terms
of the power purchase agreement, the Company shall continue to purchase power until the parties decide to terminate the agreement, which has been determined to be an
un-economic proposition considering the specialised nature and location of the asset.
Oxygen plant
The Company has accounted for an oxygen plant as finance lease (or operating lease) under Appendix C of Ind AS 17 by virtue of the oxygen purchase agreement with the
supplier. The agreement to purchase oxygen is a 15 year fixed term agreement.
Mining land
The Company has accounted for leasehold lands for mining as finance leases by virtue of its rights under the lease agreement after considering the right/ economic
compulsion for renewal.

71
d) (i) In respect of assets taken on lease/rent : The Company has various operating leases for, office facilities, guest houses and residential premises for employees that are
renewable on a periodic basis. Rental expenses for these leases recognised in the Statement of Profit and Loss during the Year is `14.16 crore (`13.96 crore).
(ii) As at the Balance Sheet date, the future Minimum lease payments under non-cancellable operating leases are:
(` crore)
As at 31st As at 31st As at 1st
March, 2017 March, 2016 April, 2015
Not later than one year 43.06 43.06 43.06
Later than 1 year and not later than 5 years 172.23 172.23 172.23
Later than 5 years 301.41 344.47 387.53
41.7 As per the Department of Public Enterprises (DPE) guidelines, the Company is required to contribute 30% of Salary (Basic Pay + Dearness Allowance) in respect of
executive employees as superannuation benefits, which may include Contributory Provident Fund (CPF), Gratuity, Pension and Post-Superannuation Benefits. Accordingly
the Company has made provision for pension benefit for executives @ 9% of Salary w.e.f. 1st January, 2007 and 3% of Salary w.e.f. 1st January, 2017. Further, pension
benefit for non-executives has been provided @ 6% of Salary w.e.f. 1st January, 2012 and 2% of Salary w.e.f. 1st January, 2017.
The cumulative provision/liability towards pension benefit for executive (w.e.f. 1st January, 2007) & non-executive (w.e.f. 1st January, 2012) employees, amounting to
`2367.93 crore (`324.81 crore during the Year) and `46.05 crore (`5.45 crore during the Year) have been charged to ‘Employee Benefits Expense’ and ‘Expenditure during
Construction’ respectively.
41.8 During the year, the Company had Specified Bank Notes (SBN) or other denomination notes as defined in the MCA notification G.S.R. 308E dated March 30, 2017 on the
details of SBN held and transacted during the period from November 8, 2016 to December 30, 2016, the denomination-wise SBNs and other notes as per the notification
is given below:
Amount in `
Particulars Specified Bank Notes Other Denomination Notes Total
(SBNs) (ODNs)
Closing Cash on Hand as on 08.11.2016 8203000 1266017 9469017
(+) Permitted Receipts 28605500 92848906 121454406
(-) Permitted Payments 303000 12115358 12418358
(-) Amounts Deposited in Bank 36505500 80982492 117487992
Closing cash on hand as on 30.12.2016 - 1017073 1017073
41.9 As per Government of India guidelines on payment of dividends, the Company is required to pay a minimum annual dividend of 30% of Profit After Tax or 5% of the Net-
worth, whichever is higher, subject to the maximum dividend permitted under the Companies Act, 2013 and other rules, unless lower dividend proposed to be paid is
justified after analysis of the various financial parameters of the Company. In case, the Company is not able to comply with the guidelines, specific exemption has to be
obtained from Department of Investment & Public Asset Management (DIPAM), Government of India. Keeping in view the adverse financial position of the Company due to
losses, the Company took up the matter with DIPAM for exemption from compliance of the guidelines for payment of dividends for the financial year 2015-16. DIPAM
intimated to the Company that efforts should be made to pay minimum dividend. The Company has again represented the matter to DIPAM for exemption and final decision
in this regard is awaited.
41.10 Contributions in cash and kind made for the period from the Financial Year 2006-07 to 2016-17 to Railway authorities for laying out railway line from Rajhara to Rowghat
would be recovered in cash at the rate of 7% per annum for 37 years on total contribution towards redemption of SAIL's contribution after commencement and fulfilment of
assured traffic from Rowghat mines. Management is of view that the criteria laid out in Memorandum of Understanding will be met and interest accrues from the date of
investment. The refund amount comprises principal and interest elements. Accordingly, the interest element has been computed and recognized as income during the year
amounting to `11.40 crore (till date `19.11 crore). As per the opinion of Expert Advisory Committee of The Institute of Chartered Accountants of India received during the
year such treatment of recognition on time proportion basis is in order as in view of Management, no significant uncertainty exist regarding collectability and measurability
of revenue.
41.11 Based on materiality and comparability, in respect of temporarily discontinuation of operation of mines namely Barsua (w.e.f 17.05.2014), Bhawnathpur (w.e.f. 29.04.2013)
and Punapani (w.e.f 01.03.2004.) due to environmental/forestry clearance issues, net expenditure during the year 2016-17, excluding depreciation, of ` 97.95 crore
(Previous Year ` 101.04 crore) has been included under Note No.32 'Other Expenses' in Statement of Profit and Loss (refer Note No 32). Head-wise bifurcation is as under:
(` crore)
Account Head For the year ended For the year ended
31st March, 2017 31st March, 2016
Salary and Wages 53.41 51.49
Stores and Spares 7.77 11.85
Power purchased 11.44 11.22
Repairs and Maintenance 6.84 7.63
Miscellaneous Expenses and Provisions 22.02 22.98
Total Expenditure 101.48 105.17
Less: Income 3.53 4.13
Net Expenditure 97.95 101.04

72
42.1 DEFINED BENEFIT SCHEMES
42.1.1 General Description of Defined Benefit Schemes:
Gratuity : Payable on separation @15 days pay for each completed year of service to eligible employees who render continuous service of 5 years or more. Maximum
amount of `10 lakhs for executives & non-executives joined on or after 1st July, 2014 and without any monetary limit for other non-executives, has been considered for
actuarial valuation.
Leave Encashment: Payable on superannuation to eligible employees who have accumulated earned and half pay leave, subject to maximum limit of 300 days combined
for earned leave and half pay leave. Encashment of accumulated earned leave is also allowed up to 30 days once in a financial year up to 18th November, 2015 and stopped
thereafter.
Provident Fund: 12% of Basic Pay Plus Dearness Allowance, contributed to the Provident Fund Trusts by the company.
Post Retirement Medical Benefits: Available to retired employees at company's hospitals and/or under the health insurance policy.
Post Retirement Settlement Benefits: Payable to retiring employees for settlement at their home town.
Long Term Service Award: Payable in kind on rendering minimum 25 years of service and also on superannuation.
42.1.2 Other disclosures, as required under Ind AS 19 on 'Employee Benefits', in respect of defined benefit obligations are :
(a) Reconciliation of Present Value of Defined Benefit Obligations*:
(` crore)
Sl. Particulars Gratuity Leave Post Post Long TermNo. Encashment Retirement Retirement Service
Medical Settlement AwardBenefits Benefit
i) Present Value of projected benefit obligations, 5692.84 2535.85 872.63 94.95 21.02as at the beginning of the year. (5457.44) (2411.82) (845.95) (106.10) (21.17)
ii) Service Cost 375.36 303.44 - - 1.60(472.63) (284.28) (-) (-) (1.47)
iii) Interest Cost 381.98 173.00 60.24 6.52 1.43(441.63) (189.49) (67.37) (8.59) (1.69)
iv) Actuarial Gains(-) / Losses(+) 550.79 28.06 86.89 11.68 1.82(123.60) (216.51) (50.28) (-11.38) (-1.02)
v) Past Service Cost - - - - -(-) (-) (-) (-) (-)
vi) Benefits Paid 847.91 300.34 83.55 8.92 2.73(802.48) (566.25) (90.97) (8.86) (2.29)
vii) Present Value of projected benefit obligations as at the 6153.06 2740.01 936.21 104.23 23.14end of the year. (i+ii+iii+iv-v-vi) (5692.82) (2535.85) (872.63) (94.45) (21.02)
(b) Reconciliation of Fair Value of Assets and Obligations
The Company has funded the gratuity liability through a separate Gratuity Fund. The fair value of the plan assets is mainly based on the information given by the insurancecompanies through whom the investments have been made by the Fund. The reconciliation of fair value of assets of the Gratuity Fund and defined benefit gratuity obligations isas under:
(` crore)
Sl. No. Particulars 2016-17 2015-16
i) Fair Value of plan assets as at the beginning of the year 5494.74 5061.05
ii) Expected return on plan assets 94.53 28.80
iii) Actual Company's contribution 696.38 802.38
iv) Interest Income/Actuarial Gain/Loss 398.35 404.89
v) Benefits payments 847.91 802.48
vi) Fair value of plan assets as at the end of the year 5836.21 5494.69
vii) Present value of defined benefit obligation [33.1.2)(a)(vii)] 6153.06 5692.82
viii) Net liability recognised in the Balance sheet (vii)-(vi) * 316.85 198.13
*The Company does not expect to contribute any amount towards the expenses of Gratuity Fund during the year 2017-18, after considering the return on the investments.
The defined benefit obligations, other than gratuity, are unfunded.

73
(c) Expenses recognised in the Statement of Profit & Loss for the Year:
(` crore)
Sl. Particulars Gratuity Leave Post Post Long TermNo. Encashment Retirement Retirement Service
Medical Settlement AwardBenefits Benefit
i) Service Cost 375.36 303.44 - - 1.60(472.63) (284.28) (-) (-) (1.47)
ii) Interest Cost -16.37 173.00 60.24 6.52 1.43(36.74) (189.49) (67.37) (8.59) (1.69)
iii) Actuarial Gains 550.79 28.06 86.89 11.68 1.82(-)/Losses (123.60) (216.51) (46.42) (-11.38) (-1.02)
iv) Past Service Cost - - - - -( - ) ( - ) ( - ) ( - ) ( - )
v) Expected Return on Plan Assets 93.25 - - - -(28.80) ( - ) ( - ) ( - ) ( - )
vi) Total (i+ii+iii+iv-v) 816.53 504.50 147.13 18.20 4.85(604.17) (690.28) (113.79) (-2.79) (2.14)
vii) Employees' Benefits Expenses :
a) Charged to Profit & Loss Account (Note 30) 356.51 491.23 58.34 - 4.85(498.54) (678.33) (66.77) ( - ) (2.14)
b) Charged to Expenditure During Construction -1.25 3.56 - 17.29 - (Note 5.1) (0.50) (1.60) (-) (-2.53) ( - )
c) Charged to OCI 456.26 - 88.79 - -( 94.80) ( - ) (50.28) ( - ) ( - )
d) Charged to Profit & Loss Account- Other Expenses 5.01 9.71 - 0.91 -( - ) ( - ) ( - ) (-0.26) ( - )
viii) Actual Return on Plan Assets 491.63 (433.71)
(d) Effect of half percentage point change in the Discount rate on Employees' Benefit Schemes(` crore)
Sl. Particulars 0.5 percentage point decrease 0.5 percentage point increaseNo. in discount rate in discount rate
i) Gratuity (256.33) 254.97
ii) Leave (122.34) 121.81
iii) Post Retirement Benefit (30.07) 30.55
iv) Long Term Service Award (1.13) 1.03
v) Retirement Travelling Allowance (4.83) 4.90
(e) Effect of one percentage point change in the salary escalation rate on Employees' Benefit Schemes(` crore)
Sl. Particulars 1 percentage point decrease 1 percentage point increaseNo. in discount rate in discount rate
i) Gratuity 254.97 (229.85)
ii) Leave 123.47 (120.17)
(f) Effect of one percentage point change in the assumed inflation rate in case of valuation of benefits under Post-retirement Medical Benefits Scheme(` crore)
Sl. Particulars One percentage point increase One percentage point decreaseNo. in medical inflation rate in medical inflation rate
i) Post-retirement Medical Benefits (17.96) 19.80

74
(g) Investments of Gratuity Trust
Particulars % of Investment
As at 31.03.2017 As at 31.03.2016
Insurance Investments 85.03 83.60
Central Government Securities 1.54 1.57
State Government Securities 4.77 4.90
PSU Bonds 8.63 9.91
Cash at Bank 0.03 0.02
Total 100.00 100.00
(h) Actuarial Assumptions
Sl. Description As at 31st March, 2017 As at 31st March, 2016No.
i) Discount Rate (per annum) 7.25% 8%
ii) Mortality Rate IALM (2006-08) Ultimate IALM (2006-08) Ultimate
iii) Withdrawal Rates (per annum) Executives & Non-executives- 0.10% to 0.50% Executives & Non-executives- 0.10% to 0.50%depending upon the age depending upon the age
iv) Medical Cost Trend Rates (per annum) 5% for hospital cost and Nil for Medi-claim premium. 5% for hospital cost and Nil for Medi-claim premium.
v) Estimated Rate of Return on Plan Assets 7.25% 8%
vi) Salary Escalation Executives : 6% p.a. Executives : 6% p.a.Non-Executives : 6% p.a. Non-Executives : 6% p.a.All employees- 6% step-up after every 10 years of All employees- 6% step-up after every 10 years ofservice starting 2017. service starting 2017.
The estimate of future salary increases considered in actuarial valuation, takes into account inflation rate,seniority, promotion and other relevant factors
(i) Maturity profile of Defined Benefit Obligations
(` crore)
Period As at 31st March, 2017
Upto 1 year 781.26
Between 1 to 2 years 804.35
Between 2 to 3 years 807.95
Between 3 to 4 years 815.25
Between 4 to 5 years 818.28
Between 5 to 10 years 4263.21
More than 10 years 24861.59
Total Undiscounted Payments related to Past Service 33151.90
Less: Discount for Interest 26998.83
Projected Benefit Obligation 6153.07
43. GENERAL
43.1 Segment Reporting
i) Business Segments: The five Integrated Steel Plants and three Alloy Steel Plants, being manufacturing units, have been considered as primary business segments for
reporting under Ind AS 108, Operating Segments' issued by Ministry of Corporate Affairs.
ii) In the opinion of the management, the captive mines are not a reportable business segment of the Company as per Para 27 of Ind AS 108, Operating Segments, issued
by Ministry of Corporate Affairs. As captive mines are supplying raw materials to various plants, the Mines have been treated as cost centre for accounting purpose.

75
43.2 Related Party
As per Ind AS 24 `Related Party Disclosures' issued by the Ministry of Corporate Affairs, the names of the related parties, are given below: -
A. Name of the related party and nature of relationship
Subsidiary Companies
SAIL-Jagdishpur Power Plant Limited
SAIL Refractory Company Limited
SAIL Sindri Projects Limited
Chhattisgarh Mega Steel Limited
Joint Venture Companies
NTPC-SAIL Power Company Limited
Bokaro Power Supply Company Private Limited
SAIL Bansal Service Centre Limited
Mjunction Services Limited
Bhilai Jaypee Cement Limited
S&T Mining Company Private Limited
SAIL & MOIL Ferro Alloys Private Limited
International Coal Ventures Private Limited
SAIL-SCI Shipping Private Limited
SAIL SCL Kerala Limited
SAIL-RITES Bengal Wagon Industry Private Limited
SAIL Kobe Iron India Private Limited
TMTSAL SAIL JV Limited
SAL SAIL JVC Limited
SAIL-Bengal Alloy Castings Private Limited
Prime Gold-SAIL JVC Limited
VSL SAIL JVC Limited
Abhinav-SAIL JVC Limited
N.E. Steel & Galvanising Private Limited
North Bengal Dolomite Limited
Romelt-SAIL (India) Limited
NMDC SAIL Limited
Bastar Railway Private Limited
Associate Company
Almora Magnesite Limited
Other Companies
ICVL Mauritius
Riverdale Mining (PTY) Limited (RML)
Minas De Banga (Mauritius) Limited Mozambique
ICVL Zambeze Mauritius Limited
ICVL Ventures Mauritius
Promark Services Limited RPU
Benga Power Plant (Mauritius) Limited
Minas De Benga LDA
ICVL Zambeze LDA
ICVL Ventures LDA
Minas De Changara LDA
Benga Energia SA
IISCO Ujjain Pipe & Foundry Co. Limited
UEC-SAIL Information Technology Limited
Post Employment Benefit Plans
HSL BSP Provident Fund, Bhilai
DSP Provident Fund, Durgapur
Hindustan Steel Ltd Contributory Provident Fund, Rourkela
Bokaro Steel Employees Provident Fund, Bokaro
IISCO Limited Provident Institution, Burnpur
IISCO Limited Provident Institution, Kolkata
IISCO Limited Works Provident Fund, Burnpur
SAIL ASP Provident Fund, Durgapur
Salem Steel Provident Fund, Salem
Visvesvaraya Iron and Steel Plant Employees Provident Fund Trust, Bhadravati
SAIL Provident Fund, New Delhi
Hindustan Steel Provident Fund, Ranchi
Hindustan Steel Limited, Central Purchase Organisation, Sales & Transport, CalcuttaProvident Fund
Bharat Refractories Provident Fund, Bokaro
IFICO Provident Fund, Ramgarh
CCSO Provident Fund, Dhanbad
SAIL RMD Establishment and Administrative Offices Employees Provident Fund, Kolkata
Bolani Ores Mines Provident Fund , Bolani
SAIL Employees' Superannuation Benefit Fund
SAIL Gratuity Fund
B. Key Management Personnel
Shri P.K. Singh
Shri Anil Kumar Chaudhary
Shri Raman
Shri S.S. Mohanty (upto 30th June 2016)
Shri Kalyan Maity
Shri Binod Kumar (upto 28th Feb 2017)
Dr. N. Mahapatra
Dr. G. Vishwakarma
Ms. Soma Mondal (w.e.f 1st March 2017)
Shri A. Maitra
Shri S. Chandrasekaran
Shri P Saidev
Shri R.K. Rathi
Shri A.K. Rath
Smt. K Raman
Shri C Srikanta
Shri S K Garai
Shri M. Ravi
Shri M.R. Panda
Shri B.K. Jha (upto 30th April 2016)
Shri Neeraj Mathur
Shri Somdev Das
Shri R Mitra
Shri S K Aggarwal
Shri H.P. Singh
Shri S.K. Jain
Shri U.K. De
Shri S. Kolay
Shri Sukumar Hedge
Shri A.Kumar
Shri Ashoke Kumar Paul (w.e.f. 2nd May, 2016)
Shri P.K. Mishra
Shri B.N. Thakur
Shri N Ramachandran

76
B. Details of transactions between the Company and the Related Parties during the Year(` crore)
Sl. Particulars Subsidiary/Associate/ Key Management Total Note No. and Account HeadNo. Joint Ventures Personnel
i) Purchase of Investment 100.92 - 100.92 8 : Investments(323.97) (323.97)
ii) Advance for purchase 100.68 - 100.68 11 : Other Financial Assetsof shares (99.22) (99.22)
iii) Services rendered 1.94 - 1.94 27: Other income(2.08) (2.08)
iv) Rental Income 0.12 - 0.12(13.02) (13.02)
v) Dividend Received 90.87 - 90.87(70.21) (70.21)
vi) Sale of Goods 2.26 - 2.26 26 : Revenue from Operations(30.17) (30.17)
vii) Purchase of Goods 105.08 105.08(97.24) (97.24)
viii) Purchase of Power 2047.53 2047.53(2151.86) (2151.86)
ix) Services received 44.35 - 44.35 32 : Other Expenses(41.04) (41.04)
3.19 - 3.19 5 : Capital WIP(2.68) (2.68)
x) Managerial remuneration - 7.42 7.42 30 : Employees' Benefits Expenses( - ) (6.20) (6.20)
xi) Interest Income 0.51 0.51(0.49) (0.49)
C. Balances with Related Parties as at the end of the Year(` crore)
Sl. Particulars Subsidiary/Associate/ Note No. and Account HeadNo. Joint Ventures
i) Investments 1331.65 8 : Investments(1230.73)
ii) Provision for Investments 4.63(4.43)
iii) Other Loans and Advances 39.60 10 : Loans(54.13)
iv) Provision for Loans and Advances 4.85(4.85)
v) Advance for Purchase of Shares 104.27 11 : Other Financial Assets(102.77)
vi) Trade Receivable 4.39 9 : Trade Receivables(2.65)
vii) Trade Payable 141.69 22 : Trade Payables(140.82)
viii) Security Deposit 0.33 23 : Other Financial Liabilities(0.33)

77
D. Disclosure of Material Transactions with Related Parties(` crore)
For the year ended For the year ended Note No. and31st March 2017 31st March 2016 Account Head
Purchase of InvestmentVSL SAIL JVC Limited 0.46 0.84 8 : InvestmentsPrime Gold SAIL JVC Limited - 2.08International Coal Ventures Pvt. Ltd. 98.73 313.03SAIL Rites Bengal Wagon Industries Pvt. Ltd. 1.73 7.37SAIL SCL Kerala Ltd - 0.65
Advance for Purchase of SharesVSL SAIL JVC 0.01 0.45 11 : Other Financial AssetsBastar Railway Pvt Ltd - -International Coal Ventures Pvt. Ltd. 100.00 98.72SAIL SCL Kerala Ltd 0.66 -NMDC SAIL Limited 0.01 -Chhattisgarh Mega Steel Limited - 0.05
Sale of GoodsBhilai Jaypee Cement Limited 2.26 30.17 26 : Revenue from Operations
Purchase of Goods105.08 97.24
Purchase of Power2047.53 2151.86
Dividend IncomeMjunction Services Limited 90.87 70.21 27 : Other Income
Services RenderedBhilai Jaypee Cement Limited 1.67 1.80Mjunction Services Limited 0.15 0.14SAIL-Bansal Services Centre Ltd. 0.03 0.04Bokaro Power Supply Co. Pvt. Ltd. 0.09 0.10
Auction ServicesMjunction Services Limited 44.35 41.04 32 : Other Expenses
3.19 2.68 5 : Capital WIP
Conversion ChargesSAIL-Bansal Services Centre Ltd. 1.84 1.66 32 : Other Expenses
E. During the year, Sales and Trade Receivables include `9009.19 crore (` 9912.77 crore) and ` 1493.07 crore (` 2506.50 crore) for transactions with the CentralGovernment (including Indian Railways) which constitute 19.07 % (23.62%) and 49.97% (69.72% ) of the Sales and Trade Receivables respectively.
43.3 Disclosures of provisions required by Indian Accounting Standards (Ind AS)37 'Provisions, Contingent Liabilities and Contingent Assets:
Brief Description of Provisions :
Mines afforestation costs - Payable on renewal (including deemed renewal)/forest clearance of mining leases to Government authorities, towards afforestation cost at mines foruse of forest land for mining purposes.
Mines closure costs - Estimated liability towards closure of mines, to be incurred at the time of cessation of mining activities.
Overburden backlog removal costs - To be incurred towards removal of overburden backlog at mines over the future years.(` crore)
Movement of provisions Mines afforestation Mines closure costs Over burden removal Totalcosts costs
Balance as at 1st April, 2016 238.72 109.90 84.50 433.12
Additions during the Year 0.00 17.11 19.70 36.81
Amounts utilised during the Year 0.00 67.29 0.51 67.80
Unused amount reversed during the Year 0.00 0.10 0.44 0.54
Balance as at 31st March, 2017 238.72 59.62 103.25 401.59
43.4 Particulars in respect of Loans and Advances as per the disclosure requirement of regulation 34(3) of Securities and Exchange Board of India (Listing Obligations and DisclosureRequirements) Regulations 2015:
(` crore)
Name of the subsidiary Company* Loans and advances in the nature of Maximum amount of loans andloans outstanding as at the end of advances in the nature of loans outstanding
the year during the year
IISCO Ujjain Pipe and Foundry Co. Limited 2.53* 2.53(under liquidation) (2.53)* (2.53)
* ` 2.53 crore (` 2.53 crore), being doubtful of recovery has been provided for in the books of accounts. ii) No loans have been given (other than loans to employees), wherein there is no repayment schedule or repayment is beyond seven years; andiii) There are no loans and advances in the nature of loans, to firms/companies, in which directors are interested.

78
Notes to the Standalone Financial Statements for the year ended 31st March, 201744. OPERATING SEGMENT INFORMATION
(` crore)
PARTICULARS BSP DSP RSP BSL ISP ASP SSP VISL OTHERS INTER TotalSEGMENT
SALES
REVENUE
- External Sales
Current Year ended 31st March 2017 14,135.97 6,209.54 9,683.32 11,796.81 4,709.85 383.07 2,015.72 169.15 76.81 49,180.24
PreviousYear ended 31st March 2016 14,661.52 6,094.97 7,693.32 9,073.55 3,317.08 393.40 1,772.39 219.36 68.47 43,294.06
- Inter Segment Sales
Current Year ended 31st March 2017 639.75 173.36 273.76 234.89 49.44 224.61 9.52 24.78 3,406.99 (5,037.10) -
PreviousYear ended 31st March 2016 684.85 178.49 100.86 122.67 46.33 200.14 11.25 32.42 3,822.65 (5,199.66) -
- Total revenue from sale of products
Current Year ended 31st March 2017 14,775.72 6,382.90 9,957.08 12,031.70 4,759.29 607.68 2,025.24 193.93 3,483.80 (5,037.10) 49,180.24
PreviousYear ended 31st March 2016 15,346.37 6,273.46 7,794.18 9,196.22 3,363.41 593.54 1,783.64 251.78 3,891.12 (5,199.66) 43,294.06
RESULT
- Operating Profit / (-) Loss beforeInterest and Exceptional items
Current Year ended 31st March 2017 546.87 (724.42) (703.22) 251.85 (1,326.32) (1.78) (112.45) (114.88) 78.05 (2,106.30)
PreviousYear ended 31st March 2016 803.09 (301.37) (1,895.58) (1,572.94) (1,493.36) (58.00) (334.05) (111.56) 256.72 (4,707.05)
- Finance cost
Current Year ended 31st March 2017 2,527.82
PreviousYear ended 31st March 2016 2,300.45
- Exceptional item (Voluntary RetirementCompensation)
Current Year ended 31st March 2017 216.74
PreviousYear ended 31st March 2016 -
- Tax expenses
Current Year ended 31st March 2017 (2,017.62)
PreviousYear ended 31st March 2016 (2,986.06)
- Profit/(Loss) for the year
Current Year ended 31st March 2017 (2,833.24)
PreviousYear ended 31st March 2016 (4,021.44)
OTHER INFORMATION
- Segment assets
Current Year ended 31st March 2017 27,079.13 6,006.72 18,906.12 14,437.15 18,836.19 600.26 2,554.16 678.16 17,441.58 1,06,539.47
PreviousYear ended 31st March 2016 24,452.24 5,700.74 18,729.80 14,665.33 18,776.06 580.22 2,858.02 640.80 13,937.06 1,00,340.27
- Segment Liabilities (including LongTerm Borrowing)
Current Year ended 31st March 2017 6,872.38 2,060.83 3,821.43 3,284.97 1,577.12 232.30 372.66 151.41 52,157.31 70,530.41
PreviousYear ended 31st March 2016 6,449.77 2,018.96 3,495.61 3,141.98 1,440.61 220.25 441.77 128.62 44,488.94 61,826.51
- Capital expenditure
Current Year ended 31st March 2017 1,683.88 403.56 1,212.44 1,259.91 635.67 3.71 11.91 2.43 252.43 5,465.94
PreviousYear ended 31st March 2016 1,779.70 602.48 1,258.08 1,237.02 1,137.22 (3.52) 62.57 19.74 445.14 6,538.43
- Depreciation
Current Year ended 31st March 2017 419.36 188.37 667.72 487.93 607.05 9.30 96.31 7.30 196.61 2,679.95
PreviousYear ended 31st March 2016 374.25 169.08 618.53 432.68 499.89 9.27 91.83 7.04 199.78 2,402.35
- Non Cash expenses other thanDepreciation
Current Year ended 31st March 2017 8.98 16.20 5.45 29.91 26.73 4.48 3.45 2.43 49.92 147.55
PreviousYear ended 31st March 2016 17.86 6.24 35.81 16.81 63.63 13.17 1.45 2.23 35.57 192.77

79
SOCIAL AMENITIES(` crore)
Expenses Township Education Medical Social & Co-operative Transport Total Previouscultural societies & Dairy Year
activities
Employees' Remuneration & Benefits
- Salaries & wages 191.21 86.79 283.12 7.19 6.05 8.35 582.71 612.72
- Company contribution 22.77 9.96 31.05 1.69 0.19 1.05 66.71 70.39to Provident Fund
- Travel concessions 6.87 2.10 6.86 0.17 0.00 1.44 17.44 28.70
- Welfare expenses 10.44 74.26 80.64 1.62 0.00 1.34 168.30 108.80
- Consumption of medicines 4.87 0.80 59.20 1.28 0.25 0.43 66.83 71.72
- Gratuity 23.93 13.49 21.25 0.67 0.02 1.40 60.76 61.26
Total 260.09 187.40 482.12 12.62 6.51 14.01 962.75 953.59
Stores & Spares 26.81 0.70 6.62 1.47 0.00 0.62 36.22 32.21
Repair & maintenance 129.01 1.59 23.17 0.38 0.21 0.32 154.68 161.49
Power & fuel 416.77 6.09 16.07 4.40 0.00 0.32 443.65 436.41
Miscellaneous expenses 37.53 5.48 24.36 1.63 0.00 5.29 74.29 76.42
Depreciation 37.45 2.93 12.70 0.54 0.35 0.72 54.69 56.15
Total 907.66 204.19 565.04 21.04 7.07 21.28 1726.28 1716.27
Less: Income 243.32 6.84 83.44 0.14 0.00 0.27 334.01 309.24
Net Deficit 664.34 197.35 481.60 20.90 7.07 21.01 1392.27 1407.03

80
Independent Auditors' ReportComments Management’s Replies
To the Members of Steel Authority of India Limited
Report on the Standalone Indian Accounting Standards (Ind AS) Financial Statements
We have audited the accompanying Standalone Ind AS Financial Statements of Steel Authority of IndiaLimited ("the Company"), which comprise the Balance Sheet as at 31st March, 2017, the Statement of Profitand Loss (including Other Comprehensive Income), the Cash Flow Statement, the Statement of Changes inEquity for the year then ended, and a summary of the significant accounting policies and other explanatoryinformation (herein after referred to as "Standalone Ind AS Financial Statements"), in which are incorporatedthe Returns of 8 branches for the year ended on that date audited by the branch auditors of the Company'sbranches.
Management's Responsibility for the Standalone Ind AS Financial Statements
The Company's Board of Directors is responsible for the matters stated in Section 134(5) of the CompaniesAct, 2013 ("the Act") with respect to the preparation and presentation of these Standalone Ind AS FinancialStatements that give a true and fair view of the financial position, financial performance (including othercomprehensive income), cash flows and changes in equity of the Company in accordance with the accountingprinciples generally accepted in India, including the Indian Accounting Standards (Ind AS) prescribed underSection 133 of the Act read with Companies(Indian Accounting Standards) Rules, 2015 (as amended).
This responsibility also includes maintenance of adequate accounting records in accordance with theprovisions of the Act for safeguarding the assets of the Company and for preventing and detecting fraudsand other irregularities; selection and application of appropriate accounting policies; making judgments andestimates that are reasonable and prudent; and design, implementation and maintenance of adequateinternal financial controls, that were operating effectively for ensuring the accuracy and completeness ofthe accounting records, relevant to the preparation and presentation of the Standalone Ind AS FinancialStatements that give a true and fair view and are free from material misstatement, whether due to fraud orerror.
Auditors' Responsibility
Our responsibility is to express an opinion on these Standalone Ind AS Financial Statements based on ouraudit.
In conducting our audit, we have taken into account the provisions of the Act, the accounting and auditingstandards and matters which are required to be included in the audit report under the provisions of the Actand the Rules made thereunder.
We conducted our audit in accordance with the Standards on Auditing specified under Section 143(10) ofthe Act. Those Standards require that we comply with ethical requirements and plan and perform the auditto obtain reasonable assurance about whether the Standalone Ind AS Financial Statements are free frommaterial misstatement.
An audit involves performing procedures to obtain audit evidence about the amounts and the disclosures inthe Standalone Ind AS Financial Statements. The procedures selected depend on the auditor's judgment,including the assessment of the risks of material misstatement of the Standalone Ind AS Financial Statements,whether due to fraud or error. In making those risk assessments, the auditor considers internal financialcontrol relevant to the Company's preparation of the Standalone Ind AS Financial Statements that give a trueand fair view in order to design audit procedures that are appropriate in the circumstances. An audit alsoincludes evaluating the appropriateness of the accounting policies used and the reasonableness of theaccounting estimates made by the Company's Directors, as well as evaluating the overall presentation ofthe Standalone Ind AS Financial Statements.
We believe that the audit evidence we have obtained is sufficient and appropriate to provide a basis for ouraudit opinion on the Standalone Ind AS Financial Statements.
Basis for Qualified Opinion
The Company has not provided for:
(i) Entry tax amounting to `1796.03 crore (Current year `111.04 crore and up to last year `1684.99crore) (Refer Note No.39.2(a)(i) & (ii)); and
(ii) amount paid to Damodar Valley Corporation (DVC) against bills raised for supply of power and retainedas advance to DVC by Bokaro Steel Plant amounting to `587.72 crore (current year `96.45 crore andup to last year `491.27 crore). (Refer Note No. 39.2 (b)).
The total impact of above para (i) & (ii) resulted in understatement of loss (net of tax) for the year ended 31st
March, 2017 by `1558.78 crore, overstatement of other equity as on 31st March, 2017 by ` 1558.78 crore,understatement of current liabilities by ` 2383.75 crore and understatement of assets by `824.97 crore.
In respect of item stated at (i), the Company's view is that the NineJudges Bench of Hon'ble Supreme Court, vide its judgment dated11th November, 2016, upheld the constitutional validity of levy of EntryTax by the States and has laid down principles/tests on levy of EntryTax Acts in various States. The respective regular benches of the ApexCourt would hear the matters as per laid down principles. Pendingdecision by the regular benches of the Apex Court on levy of entry taxin the States of Chhattisgarh, Odisha, Uttar Pradesh and in respect ofthe case pertaining to Calcutta High Court, the Entry Tax demandsunder dispute have been treated as contingent liabilities.
In respect of item stated at (ii), the Company's view is that the casesare sub-judice and pending for adjudication before the various judicialauthorities for a long time.
The above stated disputed demands, stated at (i) and (ii) above,contested on valid and bonafide grounds, have been treated ascontingent liabilities as it is not probable that present obligations existas on 31st March, 2017. Therefore, there is no adverse impact on lossfor the year.
Annexure-I to the Directors’ Report

81
Qualified Opinion
In our opinion and to the best of our information and according to the explanations given to us, and basedon the consideration of reports of the branch auditors on separate Financial Statements of the branchesreferred to in the Other Matters paragraph below, except for the possible effects of the matters described inthe Basis for Qualified Opinion paragraph above, the aforesaid Standalone Ind AS Financial Statements givethe information required by the Act in the manner so required and give a true and fair view in conformitywith the accounting principles generally accepted in India, of the state of affairs of the Company as at 31st
March, 2017, and its loss (including total comprehensive loss), its cash flows and the changes in equity forthe year ended on that date.
Emphasis of Matter
We draw attention to the following:
I. Sales include sale to the Government Agencies during the year ` 3807.78 crore and cumulative up to31st March, 2017 ` 18342.41 crore which is recognised on provisional contract prices. (Refer NoteNo. 41.1); and
II. Recognition of Deferred Tax Assets of `3352.42 crore (including `1623.16 crore for the year) on theaccumulated business losses as on 31st March, 2017 and unused tax credit (MAT Credit Entitlement)of `1051.00 crore as on 31st March, 2017. (Refer Note No.12).
Our opinion is not qualified in respect of this matter.
Other Matter
a) The comparative financial information of the Company for the year ended 31st March, 2016 and thetransition date opening balance sheet as at 1st April, 2015 included in these Standalone Ind AS FinancialStatements, are based on the previously issued statutory financial statements prepared in accordancewith the Companies (Accounting Standards) Rules, 2006 (as amended) audited by the auditors forthe respective years ended 31st March, 2016 and 31st March, 2015 whose reports dated 30th May,2016 and 29th May, 2015 respectively expressed modified opinion on those standalone financialstatements, as adjusted for the differences in the accounting principles adopted by the Company ontransition to Ind AS, which have been audited by us.
b) We did not audit the financial statements of 8 branches included in the Standalone Ind AS FinancialStatements of the Company whose financial statements reflect total assets of `45,416.36 crore as at31st March, 2017 and total revenues of `16,909.93 crore for the year ended on that date. The financialstatements of these branches have been audited by the branch auditors whose reports have beenfurnished to us, and our opinion in so far as it relates to the amounts and disclosures included inrespect of these branches, is based solely on the report of such branch auditors.
Our opinion is not modified in respect of these matters.
Report on Other Legal and Regulatory Requirements
1. As required by the Companies (Auditor's Report) Order, 2016 ("the Order") issued by the CentralGovernment of India in terms of Section 143(11) of the Act, we give in the "Annexure A" a statementon the matters specified in paragraphs 3 and 4 of the Order.
2. As required by Section 143(3) of the Act, based on our audit and on the consideration of the reportsof the branch auditors on the separate financial statements of the branches, referred to in the OtherMatters paragraph above,we report to the extent applicable that:
a) We have sought and obtained all the information and explanations which to the best of ourknowledge and belief were necessary for the purposes of our audit.
b) Except for the effects of the matters described in the Basis for Qualified Opinion paragraphabove, in our opinion proper books of account as required by law have been kept by the Companyso far as it appears from our examination of those books.
c) The reports on the accounts of the branch offices of the Company audited under Section 143(8)of the Act by the branch auditors have been sent to us and have been properly dealt with by usin preparing this report.
d) The Balance Sheet, the Statement of Profit and Loss including Other Comprehensive Income, theCash Flow Statement and Statement of Changes in Equity dealt with by this Report are in agreementwith the relevant books of account.
e) Except for the effects of the matters described in the Basis for Qualified Opinion paragraphabove, in our opinion, the aforesaid Standalone Ind AS Financial Statements comply with theIndian Accounting Standards prescribed under Section 133 of the Act read with relevant rulesissued there under.
f) The matters described in the Basis for Qualified Opinion paragraph above, in our opinion, maynot have an adverse effect on the functioning of the Company.
g) As per notification No. GSR 463(E) dated 5th June, 2015 issued by the Ministry of CorporateAffairs, Government of India, Section 164(2) of the Companies Act, 2013 is not applicable to theCompany.
h) With respect to the adequacy of the internal financial controls over financial reporting of theCompany and the operating effectiveness of such controls, refer to our separate Report in the"Annexure B".
Comments Management’s Replies

82
The Final Unclaimed Dividend for 2008-09 was due for transfer toIEPF account on 16th November, 2016. The Ministry of CorporateAffairs notified the Investor Education and Protection Fund (IEPF)Authority (Accounting, Audit, Transfer and Refund) Rules, 2016 ("theRules") along with detailed procedure effective from 7th September2016. The Rules required that all shares in respect of which dividendhas not been claimed or paid for seven consecutive years or moreshall be transferred to IEPF Suspense Account. The Rules furtherprovided that where 7 years are completed or being completed within3 months of coming into force of the Rules, the company shall initiatethe aforesaid procedure immediately and transfer the shares aftercompletion of 3 months. As per procedure prescribed in the Rules,the Company sent individual notices as well as through publication innewspapers, to 11346 shareholders, having unclaimed dividend of`64.85 lakh, providing them time up to 15.12.2016 to claim thedividend. Meanwhile, the implementation of Rules was deferred inDecember, 2016. However, the Company deposited the UnclaimedDividend on 3rd February, 2017 after processing the cases of claimantsfor the Final Unclaimed Dividend.
i) With respect to the other matters to be included in the Auditor's Report in accordance with Rule11 of the Companies (Audit and Auditors) Rules, 2014 (as amended), in our opinion and to thebest of our information and according to the explanations given to us:
i. The Company has disclosed the impact of pending litigations on its financial position in itsStandalone Ind AS Financial Statements; (Refer Note No.43.5)
ii. The Company did not have any long term contracts including derivative contracts for whichthere were any material foreseeable losses;
iii. There has been a case of delay in transferring ` 64,85,490/- being the amount of unpaiddividend for financial year 2008-09, required to be transferred to the Investor Educationand Protection Fund by the Company. However, the same has been transferred to the saidfund before 31st March, 2017; and
For Singhi & Co. For V.K. Dhingra & Co.Chartered Accountants Chartered Accountants
Firm Registration No.: 302049E Firm Registration No.: 000250N
Sd/- Sd/-[ Shrenik Mehta ] [ Lalit Ahuja ]
Partner Partner(M. No. 063769) (M. No. 085842)
For A.K. Sabat & Co. For Chatterjee & Co.Chartered Accountants Chartered Accountants
Firm Registration No.: 0321012E Firm Registration No.: 302114E
Sd/- Sd/-[ A.K. Sabat] [ R.N. Basu ]
Partner Partner(M. No. 30310) (M. No. 50430)
Place : New DelhiDated : 30th May, 2017
For and on behalf of Board of Directors
Sd/-(P.K. Singh)Chairman
Place : New DelhiDate : 30th June, 2017
iv. The Company has provided requisite disclosures in Note No. 41.8 to its Standalone Ind ASFinancial Statements as regards its holding and dealings in Specified Bank Notes as definedin the Notification S.O. 3407(E) dated the 8th November, 2016 of the Ministry of Finance,during the period from 8th November 2016 to 30th December, 2016. Based on auditprocedures and relying on the management representation, we report that the disclosuresare in accordance with books of account maintained by the Company and as produced tous by the Management.
3. As required by Section 143(5) of the Act, we give in the "Annexure C", a statement on the mattersspecified in the Directions issued by the Comptroller and Auditor General of India for the Company.

83
Independent Auditors' Report(Annexure-A to the Independent Auditors’ Report)
Comments Management’s Replies
Referred to in paragraph 1 under the heading "Report on other legal and regulatory requirements" of our report of even date to themembers of Steel Authority of India Limited on the Standalone Ind AS Financial Statements for the year ended 31st March 2017
i. In respect of its fixed assets:
a. The Company has maintained proper records showing in most cases, full particulars including quantitative details and situationof its fixed assets. However, the location and the extent of area in respect of few lands needs to be updated in the fixed assetsregisters and have to be reconciled with the revenue records as to the extent of holding and location of land. The delay isattributable to procedural matters involved in ascertaining and reconciling with revenue records maintained by the revenuedepartments of state governments involved.
b. The fixed assets of the Company have been physically verified by the Management at reasonable intervals in a phased mannerso as to generally cover all the assets once in three years. However, it is observed that certain land and buildings are underencroachment/unauthorised occupation. No material discrepancies have been noticed on such verification. In our opinion, thisperiodicity of physical verification is reasonable having regard to the size of the Company and the nature of its assets.
c. According to the information and explanations given to us and on basis of our examination of records of the Company, the titledeeds of immovable property are held in the name of Company except for items mentioned below:
Particulars Freehold Land Leasehold Land Building
Not in name of Company 48468.47 acres 17334.86 acres 571.24 sq. Mtr and1 case
Gross block of land not in 122.24 148.59 0.57name of Company (` crore)
Net block of land not in 122.24 131.02 0.33name of Company (` crore)
ii. In respect of physical verification of Inventory:
a. The inventories have been physically verified by the Management with reasonable frequency during the year. In certain cases,the stocks have been verified on the basis of visual survey/estimates.
b. In our opinion and according to the information and explanations given to us, discrepancies noticed on physical verification ofinventories were not material and have been properly dealt with in the books of account.
iii. In our opinion and according to the information and explanations given to us, the Company has not granted any loans, secured orunsecured, to companies, firms or other parties listed in the Register maintained under Section 189 of the Companies Act, 2013.Therefore, clauses (iii) (a) and (iii) (b) of Paragraph 3 of the Order are not applicable to the Company.
iv. The Company has not granted any loan or made any investments or given any guarantee and provided any security covered underSection 185 and 186 of the Companies Act, 2013. Accordingly, paragraph 3(iv) of the Order is not applicable to the Company.
v. The Company has not accepted any deposit from public within the meaning of Sections 73, 74, 75 and 76 of the Companies Act,2013 and rules framed there under, during the year. Accordingly, paragraph 3(v) of the Order is not applicable to the Company.
vi. Pursuant to the rules made by the Central Government of India, the Company is required to maintain cost records as specified underSection 148(1) of the Act in respect of its products.
We have broadly reviewed the same, and are of the opinion that, prima facie, the prescribed accounts and records have been madeand maintained. We have not, however, made a detailed examination of the records with a view to determine whether they areaccurate or complete.
vii. According to the information and explanations given to us in respect of statutory dues:
a. The Company has generally been regular in depositing undisputed statutory dues, including Provident Fund, Employees' StateInsurance, Income-tax, Sales Tax, Service Tax, Duty of Customs, Duty of Excise, Value Added Taxes, Cess and other applicableStatutory Dues to the appropriate authorities. According to the information and explanations given to us, there are no undisputedstatutory dues outstanding for a period of more than six months from the date they became payable, as per books of accountsas at 31st March, 2017.
b. According to the information and explanations given to us, there are disputed statutory dues, which have not been depositedas on 31st March, 2017 as given herein below:
Statute Nature of Dues Amount Forum where disputes(` crore) are pending
Sales Tax & VAT Sales Tax and VAT Demands 4.15 Supreme Court538.22 High Courts716.11 Sales Tax Tribunals105.84 Sales Tax Departments
Entry Tax Entry Tax 1097.43 Supreme Court739.03 High Courts483.71 Tribunal
19.02 Department
Necessary action is being taken toupdate the location and extent of areain respective plants in the fixed assetsregisters. This is a continuous process.
Necessary action is being taken to evictthe occupants from land and buildingsunder encroachment/ unauthorisedoccupation.

84
Central Excise Excise Duty 354.81 Supreme CourtAct, 1944 1993.19 High Courts
987.58 CESTAT559.78 Department
Service Tax Service Tax 0.79 High Court189.56 CESTAT
50.93 Department
Customs Duty Customs Duty 5.09 CESTAT
Income Tax TDS on Perks 33.10 High CourtsAct, 1961
Other TDS matters 46.71 High Courts1 .67 ITAT0.95 Department
Income Tax Disputes 194.52 High Courts213.16 ITAT289.03 Department
TOTAL 8624.38
viii. The Company has not defaulted in repayment of loans or borrowings to financial institutions, banks, Government or dues todebenture holders during the year. Accordingly, paragraph 3(viii) of the Order is not applicable to the Company.
ix. The Company did not raise any money by way of initial public offer or further public offer (including debt instruments). Termloans from banks and financial institutions have been applied for the purpose for which they were obtained.
x. According to the information and explanations given to us and based on the audit procedures performed, no material fraud bythe Company or on the Company by its officers or employees has been noticed or reported during the year.
xi. As per notification No. GSR 463(E) dated 5th June 2015 issued by the Ministry of Corporate Affairs, Government of India,Section 197 of the Companies Act, 2013 is not applicable to the Company. Accordingly, paragraph 3(xi) of the Order is notapplicable to the Company.
xii. In our opinion and according to the information and explanations given to us, the Company is not a Nidhi Company. Accordingly,paragraph 3(xii) of the Order is not applicable to the Company.
xiii. According to the information and explanations given to us and based on our examination of the records of the Company,transactions with the related parties are in compliance with Sections 177 and 188 of the Companies Act, 2013 whereapplicable and details of such transactions have been disclosed in the Standalone Ind AS Financial Statements as requiredunder Ind AS 24 - `Related Party Disclosures' specified under Section 133 of the Act read with relevant rules.
xiv. According to the information and explanations give to us and based on our examination of the records, the Company has notmade any preferential allotment or private placement of shares or fully or partly convertible debentures during the year.Accordingly, paragraph 3(xiv) of the Order is not applicable to the Company.
xv. According to the information and explanations given to us and based on our examination of the records of the Company, theCompany has not entered into non-cash transactions with directors or persons connected with him. Accordingly, paragraph3(xv) of the Order is not applicable to the Company.
xvi. The Company is not required to be registered under Section 45-IA of the Reserve Bank of India Act, 1934. Accordingly,paragraph 3(xvi) of the Order is not applicable to the Company.
Comments Management’s Replies
For Singhi & Co. For V.K. Dhingra & Co.Chartered Accountants Chartered Accountants
Firm Registration No.: 302049E Firm Registration No.: 000250N
Sd/- Sd/-[ Shrenik Mehta ] [ Lalit Ahuja ]
Partner Partner(M. No. 063769) (M. No. 085842)
For A.K. Sabat & Co. For Chatterjee & Co.Chartered Accountants Chartered Accountants
Firm Registration No.: 0321012E Firm Registration No.: 302114E
Sd/- Sd/-[ A.K. Sabat] [ R.N. Basu ]
Partner Partner(M. No. 30310) (M. No. 50430)
Place : New DelhiDated : 30th May, 2017
For and on behalf of Board of Directors
Sd/-(P.K. Singh)Chairman
Place : New DelhiDate : 30th June, 2017

85
Independent Auditors' Report(Annexure-B to the Independent Auditors’ Report)
Comments Management’s Replies
Referred to in paragraph 2 under the heading "Report on other legal and regulatory requirements" of our
report of even date to the members of Steel Authority of India Limited on the Standalone Ind AS Financial
Statements for the year ended 31st March 2017
Report on the Internal Financial Controls under Clause (i) of Sub-section 3 of Section 143 of the Companies
Act, 2013 ("the Act")
We have audited the internal financial controls over financial reporting of STEEL AUTHORITY OF INDIA LIMITED
("the Company") as of 31st March 2017 in conjunction with our audit of the Standalone Ind AS Financial Statements
of the Company for the year ended on that date.
Management's Responsibility For Internal Financial Controls
The Company's management is responsible for establishing and maintaining internal financial controls based on
the internal control over financial reporting criteria established by the Company considering the essential components
of internal control stated in the Guidance Note on Audit of Internal Financial Controls over Financial Reporting
issued by the Institute of Chartered Accountants of India ('ICAI'). These responsibilities include the design,
implementation and maintenance of adequate internal financial controls that were operating effectively for ensuring
the orderly and efficient conduct of its business, including adherence to Company's policies, the safeguarding of
its assets, the prevention and detection of frauds and errors, the accuracy and completeness of the accounting
records, and the timely preparation of reliable financial information, as required under the Companies Act, 2013.
Auditors' Responsibility
Our responsibility is to express an opinion on the Company's internal financial controls over financial reporting
based on our audit. We conducted our audit in accordance with the Guidance Note on Audit of Internal Financial
Controls Over Financial Reporting (the "Guidance Note") and the Standards on Auditing, issued by ICAI and deemed
to be prescribed under Section 143(10) of the Companies Act, 2013, to the extent applicable to an audit of internal
financial controls, both applicable to an audit of Internal Financial Controls and both issued by the Institute of
Chartered Accountants of India. Those Standards and the Guidance Note require that we comply with ethical
requirements and plan and perform the audit to obtain reasonable assurance about whether adequate internal
financial controls over financial reporting was established and maintained and if such controls operated effectively
in all material respects.
Our audit involves performing procedures to obtain audit evidence about the adequacy of the internal financial
controls system over financial reporting and their operating effectiveness. Our audit of internal financial controls
over financial reporting included obtaining an understanding of internal financial controls over financial reporting,
assessing the risk that a material weakness exists, and testing and evaluating the design and operating effectiveness
of internal control based on the assessed risk. The procedures selected depend on the auditor's judgment, including
the assessment of the risks of material misstatement of the financial statements, whether due to fraud or error.
We believe that the audit evidence we have obtained is sufficient and appropriate to provide a basis for our audit
opinion on the Company's internal financial controls system over financial reporting.
Meaning of Internal Financial Controls Over Financial Reporting
A Company's internal financial control over financial reporting is a process designed to provide reasonable assurance
regarding the reliability of financial reporting and the preparation of financial statements for external purposes in
accordance with generally accepted accounting principles. A Company's internal financial control over financial
reporting includes those policies and procedures that (1) Pertain to the maintenance of records that, in reasonable
detail, accurately and fairly reflect the transactions and dispositions of the assets of the Company; (2) provide
reasonable assurance that transactions are recorded as necessary to permit preparation of financial statements in
accordance with generally accepted accounting principles, and that receipts and expenditures of the Company are
being made only in accordance with authorizations of management and directors of the Company; and (3) provide
reasonable assurance regarding prevention or timely detection of unauthorized acquisition, use, or disposition of
the Company's assets that could have a material effect on the Standalone Ind AS Financial Statements.

86
Inherent Limitations of Internal Financial Controls Over Financial Reporting
Because of the inherent limitations of internal financial controls over financial reporting, including the possibility
of collusion or improper management override of controls, material misstatements due to error or fraud may
occur and not be detected. Also, projections of any evaluation of the internal financial controls over financial
reporting to future periods are subject to the risk that the internal financial control over financial reporting
may become inadequate because of changes in conditions, or that the degree of compliance with the
policies or procedures may deteriorate.
Opinion
In our opinion, the Company has, in all material respects, an adequate internal financial controls system
over financial reporting and such financial reporting were operating effectively as at 31 March 2017, based
on the internal control over financial reporting criteria established by the Company considering the essential
components of internal control stated in the Guidance Note on Audit of Internal Financial Controls Over
Financial Reporting issued by the Institute of Chartered Accountants of India.
Comments Management’s Replies
For Singhi & Co. For V.K. Dhingra & Co.Chartered Accountants Chartered Accountants
Firm Registration No.: 302049E Firm Registration No.: 000250N
Sd/- Sd/-[ Shrenik Mehta ] [ Lalit Ahuja ]
Partner Partner(M. No. 063769) (M. No. 085842)
For A.K. Sabat & Co. For Chatterjee & Co.Chartered Accountants Chartered Accountants
Firm Registration No.: 0321012E Firm Registration No.: 302114E
Sd/- Sd/-[ A.K. Sabat] [ R.N. Basu ]
Partner Partner(M. No. 30310) (M. No. 50430)
Place : New DelhiDated : 30th May, 2017

87
Independent Auditors' Report(Annexure-C to the Independent Auditors’ Report)
1. Whether the Company has clear title/lease deeds for freehold andleasehold land respectively? If notplease state the area of freehold andleasehold land for which title/leasedeeds are not available.
(Referred to in paragraph 3 under the heading "Report on other legal and regulatory requirements" of our report of even date to the members ofSteel Authority of India Limited on the Standalone Ind AS Financial Statements for the year ended 31st March 2017)
Directions issued by the Comptroller and Auditor General of India under sub section 5 of Section 143 of the Companies Act, 2013, based on theverification of records of the Company and according to information and explanations given to us, we report as under:
A. Directions under Section 143(5) of Companies Act, 2013
The Company has clear title/lease deeds for freehold and leasehold land respectively except for 65803.32acres of freehold/leasehold land.
2. Whether there are any cases ofwaiver/ write off of debts/loans/interest etc., if yes, the reasons therefor and the amount involved.
Necessary action is beingtaken for registration ofpending title deeds andeviction of unauthorisedoccupants of land.
Questions Auditors' Comments Management’s Replies
Waiver/ write offs are done on case to case basis with the approval of competent authorities. Details ofthe waiver/write off of debts/loans/interest are given below along with major reasons thereof:
Name of Plant/ Nature of dues Amount involved Major reasons ofUnit (` Crore) waiver or write off
Rourkela Steel Hospital Dues in respect of 0.08 Poor patientsplant non-entitled patients
CMO (Southern Credit sales to Bridge & Roof 0.32 Delay in supplyRegion) (India) Limited
CMO (T&S) Old Claims 0.01 No chances ofrecovery
The Company has maintained adequate records in respect of inventories lying with third parties.No assets were received as gifts from the Government or other authorities during the year.
3. Whether proper records aremaintained for inventories lying withthird parties & assets received as giftfrom Govt. or other authorities.
For Singhi & Co. For V.K. Dhingra & Co.Chartered Accountants Chartered Accountants
Firm Registration No.: 302049E Firm Registration No.: 000250N
Sd/- Sd/-[ Shrenik Mehta ] [ Lalit Ahuja ]
Partner Partner(M. No. 063769) (M. No. 085842)
For A.K. Sabat & Co. For Chatterjee & Co.Chartered Accountants Chartered Accountants
Firm Registration No.: 0321012E Firm Registration No.: 302114E
Sd/- Sd/-[ A.K. Sabat] [ R.N. Basu ]
Partner Partner(M. No. 30310) (M. No. 50430)
Place : New DelhiDated : 30th May, 2017
For and on behalf of Board of Directors
Sd/-(P.K. Singh)Chairman
Place : New DelhiDate : 30th June, 2017

88
Annexure-II to the Directors’ Report
Comments of C&AGMANAGEMENT'S REPLIES TO THE COMMENTS OF THE COMPTROLLER & AUDITOR GENERAL OF INDIA UNDER SECTION143(6)(b) OF THE COMPANIES ACT, 2013 ON THE STANDALONE FINANCIAL STATEMENT OF STEEL AUTHORITY OF INDIALIMITED FOR THE YEAR ENDED 31ST MARCH 2017
Comments Management’s Replies
The preparation of financial statements of Steel Authority of India Limited for theyear ended 31 March 2017 in accordance with the financial reporting frameworkprescribed under the Companies Act, 2013 (Act) is the responsibility of themanagement of the Company. The Statutory Auditors appointed by the Comptrollerand Auditor General of India under Section 139(5) of the Act are responsible forexpressing opinion on the financial statements under section 143 of the Act basedon independent audit in accordance with the standards on auditing prescribedunder Section 143(10) of the Act. This is stated to have been done by them videtheir Audit Report dated 30 May, 2017.I, on behalf of the Comptroller and Auditor General of India, have conducted asupplementary audit under Section 143(6) (a) of the Act, of the financial statementsof Steel Authority of India Limited for the year ended 31st March, 2017. Thissupplementary audit has been carried out independently without access to theworking papers of the statutory auditors and is limited primarily to inquiries of theStatutory Auditors and company personnel and a selective examination of someof the accounting records. Based on my supplementary audit, I would like tohighlight the following significant matters under section 143(6)(b) of the Act whichhave come to my attention and which in my view, are necessary for enabling abetter understanding of the financial statements and the related Audit Report:
A. COMMENTS ON PROFITABILITY
Balance Sheet
1. (i) Note 11 : Other Financial Asset: `2,267.85 crore
SAIL/ISP, Burnpur developed a new railway siding for handling of rawmaterials, Engine-on-load scheme was applicable for this new siding. Dueto failure of ISP to unload/load the wagons within permissible free time underEOL scheme, Indian Railways deducted `8.15 crore from ISP on account ofEngine Hire charges for the period between December 2015 and December2016 since the bills preferred by the Railways were not paid by ISP. Thisamount was however accounted for as Claims recoverable. Non-provisioningof above has resulted in overstatement of Other Financial Asset-Claimsrecoverable and understatement of Other expenses and Loss by `8.15 crore.
Statement of Profit and Loss
2. (i) Note-32 Other Expenses `14,220.21 crore
(a) SAIL and Ministry of Railways entered into a Memorandum ofUnderstanding (MoU) in February, 2003 for supply of long rails to IndianRailways (IR). SAIL supplied the rails to IR during 2008-2012 on provisionalprice. Excise duty was paid on the provisional price and invoices wereraised on the IR. The price of rails supplied during above period was finalizedin October 2013 and the final price was lower than the provisional price incase of rails supplied during the period between 2008 and 2010. Railwaysdeducted `31.51 crore for excess excise duty paid on differential price.Since there is no clause in the MoU for mutual adjustment of excise duty incase of escalation/de-escalation of final price, the possibility of refund of theamount by IR is remote. Therefore provision for doubtful recoveries shouldhave been made in the accounts. The company however made partialprovision for doubtful recoveries. This has resulted in understatement ofOther Expenses and Loss by `15.75 crore.
(b) NTPC-SAIL Power Supply Company Limited (NSPCL), a 50:50 JointVenture company between SAIL and NTPC claimed `22.87 crore towardsDeferred Tax Liability from SAIL in October 2016. The bill was not acceptedby SAIL and provision was not created even though the said demand hasmaterialized. Non-accountal of above by SAIL has resulted in understatementof Other expenses and Loss by `22.87 crore.
The IISCO Sidings-Damodar (llSD) mentioned in the comment, is not a new siding but onlyrelocation of existing siding and all rail rakes are moving through this relocated siding. Theproject report for this relocation has been approved by the Railways. A Joint Committee consistingof officials of Railways and Company has already recommended that "Engine-on-Load (EOL)System may not be introduced for unloading operations at llSD, as the train engine will getheavily detained and lead to inefficiency in train operations." The layout and logistics of llSDsiding restrict the placement of full rake, for unloading. Further, EOL System is not feasible forunloading of rakes with BOXN wagons having Tippler system. ISP has already lodged a claim onRailways for ` 8.15 crore deducted towards engine hire charges/ EOL and the same is beingpursued for recovery. Thus, there is no overstatement of Other Financial Asset - ClaimsRecoverable and understatement of Other Expenses and Loss.
For and on the behalf of theComptroller & Auditor General of India
Sd/-(Indu Agrawal)
Principal Director of Commercial Audit& Ex-Officio Member, Audit Board, Ranchi
Place : RanchiDate : 31st July, 2017
For and on behalf of Board of Directors
Sd/-(P.K. Singh)Chairman
Place: New DelhiDate: 11th August, 2017
The matter of unilateral notional deduction of Excise Duty and Sales Tax against de-escalationcredit notes issued to Railways has been taken up with Railways for refund.
Meanwhile in line with the Company's Accounting Policy for creation of provision based on ageof debtors, out of outstanding dues of `31.51 crore, the Company has provided `15.75 croreas doubtful debt. As the matter is being pursued with Railways for recovery of the entire amount,there is no understatement of Other Expenses and Loss.
As per Power Purchase Agreement between the Company and NSPCL, the income tax liabilityis accounted for and reimbursed to NSPCL at the time of actual payment to the Income TaxDepartment.NSPCL claimed re-imbursement of tax towards reversal of Deferred Tax Liability (DTL) for theyears 2009-10 to 2015-16. However, no tax has actually been paid to Income Tax Departmenton account of reversal during the period, as NSPCL has been paying income tax U/s 115JB ofthe Income Tax Act, 1961 i.e. under the provisions of Minimum Alternate Tax (MAT).Accordingly, there is no liability on SAIL to reimburse the tax payment due to reversal of DTL toNSPCL. Hence, there is no understatement of Other Expenses & Loss.

89
Secretarial Audit Report
Form No. MR-3{Pursuant to Section 204(1) of the Companies Act, 2013 and Rule 9 of the Companies
(Appointment and Remuneration of Managerial Personnel) Rules, 2014}
To,
The Members,
Steel Authority of India Limited.
We have conducted the Secretarial Audit of the compliance of applicable
statutory provisions and the adherence to good corporate practices by Steel
Authority of India Limited (hereinafter called SAIL/the Company). Secretarial
Audit was conducted in a manner that provided us a reasonable basis for
evaluating the corporate conducts/statutory compliances and expressing our
opinion thereon.
Based on our verification of the SAIL's books, papers, minute books, forms
and returns filed and other records maintained by the Company and also the
information provided by the Company, its officers, agents and authorized
representatives during the conduct of secretarial audit, we hereby report that,
in our opinion, the Company has, during the audit period covering the financial
period ended on 31st March, 2017 complied with the statutory provisions
listed hereunder and also that the Company has proper Board- processes and
Compliance-mechanism in place to the extent, in the manner and subject to
the reporting made hereinafter:
We have examined the books, papers, minute books, forms and returns filed
and other records maintained by SAIL for the financial year ended on 31st
March, 2017 according to the provisions of:
(i) The Companies Act, 2013 (the Act) and the rules made thereunder;
(ii) The Securities Contracts (Regulation) Act, 1956 ('SCRA') and the rules
made thereunder;
(iii) The Depositories Act, 1996 and the Regulations and Bye-laws framed
thereunder;
(iv) Foreign Exchange Management Act, 1999 and the rules and regulations
made thereunder to the extent of Foreign Direct Investment, Overseas
Direct Investment and External Commercial Borrowings;
(v) The following Regulations and Guidelines prescribed under the
Securities and Exchange Board of India Act, 1992 ('SEBI Act'):-
(a) The Securities and Exchange Board of India (Substantial
Acquisition of Shares and Takeovers) Regulation, 2011;
(b) The Securities and Exchange Board of India (Prohibition of
Insider Trading) Regulations, 2015;
(c) The Securities and Exchange Board of India (Issue and Listing
of Debt Securities) Regulations, 2008;
(d) The Securities and Exchange Board of India (Registrars to an
Issue and Share Transfer Agents) Regulations, 1993 regarding
the Companies Act and dealing with client;
(e) The Securities and Exchange Board of India (Issue of Capital
and Disclosure Requirements) Regulations, 2009;
(f) The Securities and Exchange Board of India (Employee Stock
Option Scheme and Employee Stock Purchase Scheme)
Guidelines, 1999;
(g) The Securities and Exchange Board of India (Delisting of Equity
Shares) Regulations, 2009; and
(h) The Securities and Exchange Board of India (Buyback of
Securities) Regulations, 1998;
(vi) Compliances/processes/systems under following specific applicable
Laws (as applicable to the industry) to the Company are being verified
on the basis of periodic certificate submitted to the Board of Directors
of the Company:
(a) Mines Act, 1952
(b) Mines and Mineral (Regulation and Development) Act, 1957
(c) The Factories Act, 1948
(d) Explosives Act, 1884
We have also examined compliance with the applicable clauses of the following:
(a) Secretarial Standards issued by the Institute of Company Secretaries of
India. Generally complied with.
(b) The Securities and Exchange Board of India (Listing Obligations &
Disclosure Requirements) Regulations, 2015 with National Stock
Exchange of India Limited & BSE Limited.
(c) DPE Guidelines on Corporate Governance for CPSE.
During the period under review the Company has complied with the provisions
of the Act, Rules, Regulations, Guidelines, Standards, etc. mentioned above,
subject to the following observations:
1. Compliance of Regulation 17 (1) of Securities Exchange Board of India
(Listing Obligations & Disclosure Requirements) Regulations, 2015 and
Clause 3.1.4 of the DPE Guidelines on Corporate Governance for Central
Public Sector Enterprises w.r.t. appointment of requisite no. of
Independent Directors on the Board of the Company.
2. Compliance of Regulation 17(10) & 25(4) of Securities Exchange Board
of India (Listing Obligations and Disclosure Requirements) Regulations,
2015, the Company has not carried out the performance evaluation of
Annexure-III to the Directors' Report
90
the Directors.
We further report that in the absence of requisite number of independent
Directors, the Company has not complied with the requirement pertaining to
the composition of the Board of Directors to be constituted as per the DPE
Guidelines and SEBI (Listing Obligations & Disclosure Requirements)
Regulations. The changes in the composition of the Board of Directors that
took place during the period under review were carried out in compliance with
the provisions of the Act.
Generally, adequate notice is given to all Directors to schedule the Board
Meetings, agenda and detailed notes on agenda were sent at least seven days
in advance, and a system exists for seeking and obtaining further information
and clarifications on the agenda items before the meeting and for meaningful
participation at the meeting from whole time directors.
All the decisions made in the Board/Committee meeting(s) were carried out
with unanimous consent of all the Directors/Members present during the
meeting and dissent, if any, have been duly incorporated in the Minutes.
We fur ther report that there are adequate systems and processes in the
Company commensurate with the size and operations of the Company to
monitor and ensure compliance with applicable laws, rules, regulations and
guidelines.
We further report that during the audit period, there were no specific events/
actions having a major bearing on the Company's affairs in pursuance of the
above referred laws.
For Agarwal S. & Associates,
Company Secretaries,
Sd/-
Sachin Agarwal
Partner
FCS No. : 5774
C.P No. : 5910
Place: New Delhi
Date: 18.05.2017
This report is to be read with our letter of even date which is annexed as
"Annexure A" and forms an integral part of this report.
Annexure 'A' to Secretarial Audit Report
To,
The Members,
Steel Authority of India Limited
Our report of even date is to be read along with this letter.
1. Maintenance of secretarial record is the responsibility of the
management of the Company. Our Responsibility is to express an
opinion on these secretarial records based on our audit.
2. We have followed the audit practices and processes as were appropriate
to obtain reasonable assurance about the correctness of the contents
of the secretarial records. The verification was done on test basis to
ensure that correct facts are reflected in secretarial records. We believe
that the processes and practices, we followed provide a reasonable
basis for our opinion.
3. We have not verified the correctness and appropriateness of financial
records and Books of Accounts of the Company.
4. Where ever required, we have obtained the Management representation
about the compliance of laws, rules and regulation and happening of
events etc.
5. The Compliance of the provisions of corporate and other applicable
laws, rules, regulations, standards is the responsibility of management.
Our examination was limited to the verification of procedures on test
basis.
6. The Secretarial Audit Report is neither an assurance as to future viability
of the Company nor of the efficacy or effectiveness with which the
management has conducted the affairs of the Company.
For Agarwal S. & Associates,
Company Secretaries,
Sd/-
Sachin Agarwal
Partner
FCS No. : 5774
C.P No. : 5910
Place: New Delhi
Date: 18.05.2017

91
CORPORATE GOVERNANCE REPORT 2016-17
(a) Company's Philosophy
The philosophy of the Company in relation to Corporate Governance is to ensure transparency, disclosures and reporting that conforms fully to laws,regulations and guidelines including DPE guidelines, and to promote ethical conduct throughout the Organization, with the primary objective of enhancingshareholders value, while being a responsible corporate citizen. The Company is committed to conforming to the highest standards of Corporate Governancein the Country. It recognizes that the Board is accountable to all shareholders and that each member of the Board owes his/her first duty for protecting andfurthering the interest of the Company.
(b) Board of Directors
As on 31st March, 2017, the Board of Directors comprised of a full time Chairman, 6 Whole Time Directors (i.e. Executive Directors) and 8 Non-ExecutiveDirectors (consisting of 2 Government Nominee Directors and 6 Independent Directors). During the year, 12 Board meetings were held on 26.04.2016,30.05.2016, 10.06.2016, 12.07.2016, 23.08.2016, 08.09.2016, 21.09.2016, 24.11.2016, 08.12.2016, 23.12.2016, 09.02.2017 and 24.03.2017.
The names of Directors, their attendance at the Board meetings held during 2016-17 as also at the last Annual General Meeting and number of otherdirectorships held by each of them, as disclosed, are as follows:
Name of the Director Category of Directorship No. of Board Attend- No. of other No. of Board
Meetings ance at Directorships Committee(s) asattended last AGM held as on Chairman/Member
during 2016-17 31.03.2017 * as on 31.03.2017**
1. Shri P. K. Singh Executive Chairman 12 Yes 1 -
2. Shri Anil Kumar Chaudhary Executive Director 12 Yes - 1-M
3. Shri S.S. Mohanty Executive Director 3 - 4 -(Upto 30.06.2016)
4. Shri Kalyan Maity Executive Director 12 Yes - -
5. Dr. Atmanand (Upto 17.07.2016) Independent Director 4 - - -
6. Shri J.M. Mauskar Independent Director 4 - - -(Upto 17.07.2016)
7. Shri Binod Kumar Executive Director 9 - - -(Upto 28.02.2017)
8. Shri Sunil Barthwal Non-Executive Director 10 - 4 -(Govt. Nominee)
9. Mrs. Bharathi S. Sihag Non-Executive Director 4 - 4 -(Upto 30.11.2016) (Govt. Nominee)
10. Shri P. K. Dash Independent Director 12 Yes 2 1-M
11. Prof. Ashok Gupta Independent Director 11 - - 1-M
12. CA Parmod Bindal Independent Director 12 Yes - 1-C1-M
13. Mrs. Anshu Vaish Independent Director 10 Yes - 1-M
14. Dr. N. Mohapatra Executive Director 12 Yes - 1-M
15. Shri G. Vishwakarma Executive Director 12 Yes 1 -
16. Shri Raman (From 01.07.2016) Executive Director 9 Yes 3 1-M
17. Shri Saraswati Prasad Non-Executive Director 2 - 4 -(From 08.02.2017) (Govt. Nominee)
18. Dr. Samar Singh Independent Director 2 - - 1-C(From 04.02.2017) 1-M
19. Shri Nilanjan Sanyal Independent Director 2 - - -(From 04.02.2017)
20. Ms. Soma Mondal Executive Director 1 - - -(From 01.03.2017)
* Includes Directorship in Private companies. ** Only Audit Committee and Stakeholders' Relationship Committee are considered for this purpose.M = Member, C = Chairman
(c) Audit Committee:
(i) Terms of reference:
The primary function of the Audit Committee is to assist the Board of Directors in fulfilling its oversight responsibilities by reviewing the Financial Reports; theCompany's systems of internal financial controls, accounting and legal compliance that Management and the Board have established; and the Company'sauditing, accounting and financial reporting process generally.
The Audit Committee reviews reports of the Internal Auditors, meets Statutory Auditors, discusses their findings, suggestions and other related matters andreviews major Accounting Policies followed by the Company. The Audit Committee reviews with management, the Quarterly and Annual Financial Statementsbefore their submission to the Board.
The minutes of the Audit Committee meetings are circulated to the Board, discussed, and taken note of.

92
(ii) Composition:
The Audit Committee of the Board was initially formed in 1998 and hasbeen reconstituted from time to time. As on 31.03.2017, the AuditCommittee consisted of CA. Parmod Bindal (Chairman), Shri P.K. Dash,Prof. Ashok Gupta, Mrs. Anshu Vaish, Dr. Samar Singh andDirector(Technical). During the last year, the Committee met 11 timesand attendance of the Members at the meetings is given below:
Name of the Director Status No. of meetings
attended
Dr. Atmanand, Chairman 5Independent Director(Upto 17.07.2016)
Shri J.M. Mauskar, Member 5Independent Director(Upto 17.07.2016)
Shri S.S. Mohanty, Member 4Director (Technical)(Upto 30.06.2016)
Shri P.K. Dash, Member 11Independent Director
CA Parmod Bindal, Member 11Independent Director
Prof. Ashok Gupta, Member 6Independent Director
Mrs. Anshu Vaish, Member 5Independent Director
Shri Raman, Director Member 7(Technical) (from 01.07.2016)
(d) Nomination & Remuneration Committee
(i) Being a Government Company, the nomination and fixation of termsand conditions for appointment as Director, is made by Government ofIndia. However, the Company has constituted a Committee onNomination & Remuneration to, inter-alia, look into various HR issues,matters prescribed under the Companies Act, 2013 and SEBIRegulations, finalization of Performance Related Pay (PRP) for theexecutives of the Company in terms of Department of Public EnterprisesGuidelines on Corporate Governance for Central Public SectorEnterprises, etc. As on 31st March, 2017, the Nomination &Remuneration Committee consisted of Mrs. Anshu Vaish (Chairperson),Shri P.K. Singh, Chairman, SAIL, Shri Sunil Barthwal, GovernmentNominee Director, Prof. Ashok Gupta, Independent Director andShri Nilanjan Sanyal, Independent Director, as Members.
As per Section 178(2) of the Companies Act, 2013, the Nominationand Remuneration Committee of the Board was required to carry outevaluation of every Director's performance. Further, Regulation 17(10)& 25(4) of SEBI (LODR) 2015 and the Code for Independent Directorspursuant to Section 149 (8) of the Companies Act, 2013 requires theperformance evaluation of Independent Directors to decide theircontinuance or otherwise. Further, the MCA has vide its notificationdate 5th June, 2015 notified exemptions to Government Companiesfrom the provisions of the Companies Act, 2013 which inter-alia providesthat Sub Sections (2), (3) & (4) of Section 178 regarding appointment,performance evaluation and remuneration shall not apply to Directorsof Government Companies. The appointment of Functional Directorsas well as Part Time Non-Official Directors (Independent Directors) onthe Board of SAIL is made based on nomination by Government ofIndia (GOI). Further, terms & conditions of appointment as well as tenureof all Directors are also decided by GOI and there is a well laid downprocedure for evaluation of Functional Directors and CMD byAdministrative Ministry.
(ii) The details of remuneration to Whole Time Directors are given below:(`)
Name of Salary Perquisites, Total
the Director etc.
Shri P.K. Singh 36,60,994 4,13,194 40,74,188
Shri Anil Kumar 37,32,939 4,00,510 41,33,449Chaudhary
Shri S.S. Mohanty 9,62,557 1,20,059 10,82,616(Upto 30.06.2016)
Shri Kalyan Maity 36,30,714 - 36,30,714
Shri Binod Kumar 31,89,528 - 31,89,528(Upto 28.02.2017)
Dr. N. Mohapatra 35,43,058 3,51,264 38,94,322
Shri G. Vishwakarma 29,90,438 3,80,045 33,70,483
Shri Raman 33,05,142 2,61,781 35,66,923(from 01.07.2016)
Ms. Soma Mondal 2,76,400 32,301 3,08,701(from 01.03.2017)
Total 2,52,91,770 19,59,154 2,72,50,924
(iii) The Non-Executive Directors (other than Government Nominee Directors)are paid only sitting fee of Rs.20,000/- for each Board/Board Sub-Committee/Independent Directors Meeting attended by them.
(iv) The salary of the Whole Time Directors is governed by pay scales andRules of the Government. No variable incentive is being paid to theDirectors except Performance Related Pay, paid to them on annual basisas per DPE guidelines.
(v) Terms & Conditions
The Whole Time Directors are nominated by Government of India forappointment as Director for a period of five years or till the age ofsuperannuation or until further orders, whichever is the earliest. Theyare initially appointed by the Board of Directors as Additional Directorsand, thereafter, by the Shareholders in the Annual General Meeting interms of the provisions of the Companies Act, 1956/2013.
The appointment may, however, be terminated by either side on threemonths' notice or on payment of three months' salary in lieu thereof.
(e) Stakeholders' Relationship Committee
(i) A Stakeholders' Relationship Committee under the Chairmanship Dr.Samar Singh with CA Parmod Bindal, Independent Director and twoWhole Time Directors, i.e. Director (Finance) and Director (Personnel),as Members, is functioning to consider and resolve the grievances ofthe security holders of the Company including complaints related totransfer of shares, non-receipt of balance sheet, non-receipt of declareddividend, etc.
(ii) Name of Compliance Officer: Shri M.C. Jain, ED(F&A) and CompanySecretary.
(iii) There were no complaints pending for redressal as on 31.03.2016.Number of shareholders' complaints received during the year from01.04.2016 to 31.03.2017 was 11. All the 11 complaints were resolvedand no complaint was pending for redressal as on 31.03.2017.
(f) Risk Management Committee: The Company has constituted SAILRisk Management Committee (SRMC) and the Chief Risk Officer of theCompany is acting as the Secretary of the Committee. The Companyhas formulated a Risk Management Policy for dealing with differentkinds of risks which it faces in the day to day operations. The RiskManagement Policy is comprehensive and processes faster risk updationin a dynamic business environment. The SRMC oversees the riskmanagement function in SAIL by addressing issues pertaining to policyformulation as well as evaluation of the risk management function toassess its continuing effectiveness.

93
Board Sub- Audit Projects Strategic Nomination & Corporate MOU, Vision Health, Safety StakeCommittee Committee Committee Alliance(s) & Remuneration Social & Strategic & Environment holders
Joint Ventures Committee Responsibility Planning Committee RelationshipCommittee Committee Committee Committee
1. 2. 3. 4. 5. 6. 7. 8. 9.
Meetings held 11 5 3 9 4 1 4 2
Directors Attendance
Shri P.K. Singh - - - 4 - - - -
Shri Anil Kumar Chaudhary - 5 3 - 4 1 - 2
Shri S.S. Mohanty 4 1 - - 2 - 1 -(upto 30.06.2016)
Shri Kalyan Maity - - - - - - 3 -
Dr. Atmanand 5 - - 2 2 - - -(upto 17.07.2016)
Shri J.M. Mauskar 5 1 1 2 - - 1 -(upto 17.07.2016)
Shri Sunil Barthwal - 3 3 6 - 1 - -
Shri P.K. Dash 11 5 3 - - 1 - -
Prof. Ashok Gupta 6 - - 9 2 1 4 -
CA Parmod Bindal 11 4 3 - - - - 2
Mrs. Anshu Vaish 5 - - 7 4 - 4 -
Dr. N. Mohapatra - - - - 4 - 3 2
Shri G. Vishwakarma - 5 3 - - 1 - -
Shri Raman 7 4 - - 2 - 3 -(from 01.07.2016)
Dr. Samar Singh - - - - - - - -(from 04.02.2017)
Shri Nilanjan Sanyal - - - - - - - -(from 04.02.2017)
Ms. Soma Mondal - - - - - - - -(from 01.03.2017)
(g) Corporate Social Responsibility (including Sustainability
Development) Committee: Corporate Social Responsibility is theCompany's commitment to its stakeholders to conduct business in aneconomically, socially and environmentally sustainable manner,whereby organisations serve the interests of the society, by takingresponsibility for the impact of their activities. The Board of Directorsof the Company has constituted Corporate Social ResponsibilityCommittee and has also approved Corporate Social ResponsibilityPolicy of the Company. The Policy is available on the website of theCompany-www.sail.co.in.
(h) In addition to the above, the following Board Sub-Committees havebeen constituted by the Company so that the issues are examined indetail before the same are considered by the Board of Directors:
• Strategic Alliance(s) & Joint Ventures - To examine and recommend tothe Board the issues relating to formation of Strategic Alliance(s) andJoint Ventures of the Company and review their performance.
• Projects Committee - To monitor and recommend to the Board thematters regarding taking up of new projects, monitoring ofimplementation of major capital projects viz-a-viz approved plan, etc.
• MOU, Vision & Strategic Planning Committee - To recommend to theBoard targets to be fixed in the annual MOU to be signed with theGovernment and to evaluate the performance of the Company againstthe targets finalized under the MOU. To give direction for formulation ofCompany's long term vision and strategic plan.
• Health, Safety & Environment - To review the Policy, Procedures,Systems, etc. on Health, Safety and Environmental matters and submitits recommendations to the Board.
• Raw Materials including Mining issues Committee - To review availabilityof the required quantity & quality of Raw Materials for Plants. To reviewthe operational performance of the Mines. However, no meeting washeld during the year.
(i) Details of Meetings of various Board Committees held during the year and Directors' attendance therein:
(j) In addition to above, 4 meetings of Independent Directors were held during the Financial Year 2016-17.

94
i) In the last 3 years, four Special Resolutions ( 2013-14-2; 2014-15-1 and 2015-16-1) were passed in the AGMs and none throughPostal Ballot.
ii) No Special Resolution is proposed to be conducted through PostalBallot upto the ensuing AGM.
(l) Disclosures:
(i) Pecuniary Relationship: There were no transactions by the Company ofmaterial nature with Promoters, Directors or the Management, theirSubsidiaries, relatives, etc. that may have potential conflict with theinterests of the Company at large. The Non-Executive Directors had nopecuniary relationships or transactions vis-à-vis the Company duringthe year except receipt of sitting fee paid to Independent Directors forattending the meetings of the Board/Board Sub-Committee. None ofthe Non-Executive Directors held any share/convertible instrument ofthe Company.
(ii) Maximum tenure of an Independent Director: SAIL being a GovernmentCompany, the nomination and fixation of terms and conditions forappointment of Independent Director is made by Government of India.
(iii) Letter of appointment to Independent Directors: SAIL being a GovernmentCompany, Directors on its Board are nominated/appointed by theGovernment of India. During the Financial Year 2016-17, 2 IndependentDirectors were nominated by the Government of India on the Board ofthe Company. The letters of appointment were issued to theseIndependent Directors based on the Terms and Conditions mentionedby the Government of India, while nominating/appointing the IndependentDirectors.
(iv) Familiarisation programme for Independent Directors: An induction cumfamiliarisation programme for Independent Directors is organized ontheir appointment, where an overall view of the Company is presentedto them which includes, inter-alia, details of Organization Structure,Company's Plants & Units, Product portfolio, Financial and OperationalPerformance, Modernization and Expansion Programme, etc., TheCompany also organizes visits of the Directors to various Plants/Unitsof the Company for first- hand knowledge of the operations of the Plants/Units. Further, the Directors are nominated to the training programmesby various institutions such as DPE, SCOPE, IOD, etc. on issues relatedto Corporate Governance, etc. The details of familarisation programmesimparted to Independent Directors are available on the website of theCompany - www.sail.co.in
(v) There were no instances of non-compliance by the Company, penalties,strictures imposed on the Company by Stock Exchanges or SEBI orany statutory authority, on any matter related to capital markets, duringthe last three years. However, there has been a case of delay intransferring Rs.64,85,490/- being the amount of unpaid dividend forfinancial year 2008-09, required to be transferred, to the InvestorEducation and Protection Fund by the Company.
(vi) The Company has adopted Whistle Blower Policy of Central VigilanceCommission (CVC) and it has not denied access to any personnel toapproach the Audit Committee/ Management on any issue. The WhistleBlower Policy is available on the website of the Company -www.sail.co.in. The Company has also formulated a Vigil Mechanismfor conducting the affairs in a fair and transparent manner by adoptinghighest standards of professionalism, honesty, integrity and ethical
behaviour. All employees of the Company and Directors on the Boardof the Company are covered under this Mechanism. This Mechanismhas been established for employees to report concerns about unethicalbehaviour, actual or suspected fraud or violation of Code of Conduct. Italso provides for adequate safeguards against the victimization ofemployees who avail of the Mechanism and allows direct access to theChairperson of the Audit Committee in exceptional cases. The VigilMechanism has been posted on the website of the Company -www.sail.co.in.
(vii) The Company has complied with the mandatory requirements of theSEBI (Listing Obligations and Disclosure Requirements) Regulations,2015 and the Guidelines on Corporate Governance for Central PublicSector Enterprises issued by the Department of Public Enterprises,Government of India during the Financial Year 2016-17. However, thereis shortfall of a few numbers of Independent Directors. SAIL being aGovernment Company, the Directors on its Board are appointed, basedon nomination by the Government of India. The matter of nominatingthe requisite number of Independent Directors on the Board of SAIL isunder consideration of the Government. Further, the Company has notfully adopted non-mandatory requirements of the SEBI (ListingObligations and Disclosure Requirements) Regulations, 2015.
(viii) There were two woman Directors on the Board of the Company as on31st March, 2017.
(ix) Presidential Directives for revision of pay scales of Board level andbelow Board level executives in SAIL were issued by the Ministry ofSteel vide file No.7(12)/2008-SAIL(PC) dated 5th October, 2009. TheCompany has complied with the same and also the PresidentialDirectives on reservation for SC/ST/OBC.
(x) The Independent Directors have submitted the declaration ofindependence, as required under Section 149(7) of the Companies Act,2013 stating that they meet the criteria of independence as provided insub-section (6) of Section 149 of the Companies Act, 2013.
(xi) Code of Conduct: The Board has laid down a Code of Conduct coveringthe requirements to be complied with by all the Board Members andSenior Management Personnel of the Company. An affirmation ofcompliance with the Code is received from them on annual basis. TheCode of Conduct has been placed on the website of the Company -www.sail.co.in.
(xii) Policy on Related Party Transactions: In terms of the Listing Agreement,the Board of Directors of the Company has adopted a Policy on RelatedParty Transactions. The Policy is placed on the website of the Company- www.sail.co.in.
(xiii) Policy on Material Subsidiaries: The Board of Directors of the Companyhas adopted a Policy for determination of Material Subsidiaries. ThePolicy is placed on the website of the Company - www.sail.co.in. TheCompany did not have any Material Subsidiary during 2016-17.
(xiv) In terms of the Regulation 43A of SEBI(Listing Obligations and DisclosureRequirements) Regulations, 2015, the Board of Directors of theCompany has adopted Dividend Distribution Policy and the same isuploaded on the website of the Company - www.sail.co.in.
(xv) The financial statements are signed by the Chairman and Director(Finance) of the Company, who are CEO and CFO respectively of theCompany.
(k) General Body Meetings:
Location and time where last three AGMs held:
Financial Year Date Time Location
2015-16 21.09.2016 10.30 a.m. NDMC Indoor Stadium, Talkatora Garden, New Delhi-110001.
2014-15 24.09.2015 10.30 a.m. NDMC Indoor Stadium, Talkatora Garden, New Delhi-110001.
2013-14 23.09.2014 10.30 a.m. NDMC Indoor Stadium, Talkatora Garden, New Delhi-110001.

95
(m) Means of Communication:
Quarterly results have been published in prominent daily newspapersas per the requirement, on the following dates:
Quarter 30.06.2016 30.09.2016 31.12.2016 31.03.2017Ending
Date of 09.09.2016 09.12.2016 10.02.2017 31.05.2017Publication
Name of the Mint (E) Business Mint (E) BusinessNewspapers Hindustan (H) Line (E) Hindustan(H) StandardE-English Amar Ujala (H&E)H-Hindi (H)
The Quarterly/Annual results are also made available at the website ofthe Company- www.sail.co.in. The Company displays official newsreleases also on its website.
(n) General Shareholders Information:
(i) Annual General Meeting is proposed to be held on 22nd September,2017 at NDMC Indoor Stadium, Talkatora Garden, New Delhi-110001.
(ii) Financial Year: 1st April, 2016 - 31st March, 2017.
(iii) Date of Book Closure: 23rd August, 2017 to 25th August, 2017(Bothdays inclusive).
(iv) The Shares of the Company are listed at the following stock exchanges:
Bombay Stock Exchange Ltd.,Phiroze Jeejeebhoy Towers,Dalal Street, Fort Mumbai-400001(Stock Code No.500113)
The National Stock Exchange of India Limited,Plot No. C/1, G Block, Bandra Kurla Complex, Bandra (E)Mumbai- 400051(Code: SAIL)
The GDRs issued by the Company in 1996 are listed at the LondonStock Exchange, 10 Paternoster Square, London EC4M 7LS, UK
The Annual Listing fee for 2016-17 has been paid to each of the StockExchange(s).
(v) The monthly high and low quotes of the Company's shares during eachmonth in the Financial Year 2016-17 at the Bombay Stock Exchange(BSE) and National Stock Exchange (NSE) are indicated below:
MONTH & YEARSENSEX SAIL at BSE (`) NIFTY SAIL at NSE (`)
HIGH LOW HIGH LOW HIGH LOW HIGH LOW
APRIL' 16 26100.54 24523.20 48.75 42.05 7992.00 7516.85 48.80 42.05
MAY'16 26837.20 25057.93 48.00 38.45 8213.60 7678.35 48.00 38.45
JUNE' 16 27105.41 25911.33 45.95 40.75 8308.15 7927.05 46.00 40.70
JULY' 16 28240.20 27034.14 51.10 45.75 8674.70 8287.55 51.15 45.60
AUGUST' 16 28532.25 27627.97 50.90 45.00 8819.20 8518.15 51.00 45.00
SEPTEMBER '16 29077.28 27716.78 54.80 44.25 8968.70 8555.20 54.70 44.15
OCTOBER' 16 28477.65 27488.30 52.45 46.55 8806.95 8506.15 52.40 46.55
NOVEMBER '16 28029.80 25717.93 53.60 44.75 8669.60 7916.40 53.70 44.10
DECEMBER' 16 26803.76 25753.74 56.15 47.20 8274.95 7893.80 56.10 47.10
JANUARY' 17 27980.39 26447.06 65.20 48.90 8672.70 8133.80 65.30 48.85
FEBRUARY'17 29065.31 27590.10 68.15 58.15 8982.15 8537.50 68.15 58.10
MARCH' 17 29824.62 28716.21 64.90 58.85 9218.40 8860.10 64.65 58.75
(vi) Registrar and Share Transfer Agent
M/s. MCS Share Transfer Agents Limited,F-65, 1st Floor, Okhla Industrial AreaPhase-I, New Delhi-110020Phone No.011-41406149
(vii) Share Transfer System:
The equity shares of the Company are mandatorily traded in thedematerialized form. The Share Transfer Committee of the Board meetsat regular intervals, to expedite the process of transfer of shares wellwithin the time limit prescribed in this respect under the ListingAgreement.
(viii) Distribution of Shareholdings as on 31st March, 2017:
Shareholding Shareholders Amount
Number % of Total In ` % of Total
(1) (2) (3) (4) (5)
Upto 500 331671 88.67 410990840 0.99
501 - 1000 22191 5.94 180444820 0.44
1001 - 2000 10672 2.85 163868840 0.40
2001 - 3000 3487 0.93 89639850 0.22
3001 - 4000 1508 0.40 54778530 0.13
4001 - 5000 1301 0.35 61896970 0.15
5001 - 10000 1749 0.47 130870590 0.32
10001 - 50000 1156 0.31 233807800 0.56
50001 - 100000 122 0.03 85233990 0.21
Above 100000 192 0.05 39893720660 96.58
Total 374049 100.00 41305252890 100.00

96
(ix) Shareholding pattern as on 31st March, 2017
Category No. of %age of
Shares held Shareholding
A. Promoters' holding
1 Promoters
- Indian Promoters v.i.z., 3097767449 75.00Govt of India
- Foreign Promoters - -
2 Persons acting in Concert - -
Sub-Total 3097767449 75.00
B Non-Promoters Holding
3 Institutional Investors
a Mutual Funds and UTI 51402323 1.24
b Banks & Financial Institutions 163196561 3.95
c Insurance Companies 471425760 11.41
d Foreign Institutional Investors 175983209 4.26(FIIs)
Sub-Total 862007853 20.86
4 Others
a Private Corporate Bodies 5617595 0.14
b Indian Public 128845103 3.12
c NRIs/OCBs 36169654 0.88
d Any other (Please specify) - 117635 0.00GDR
Sub-Total 170749987 4.14
GRAND TOTAL 4,13,05,25,289 100.00
(x) Status of dematerialization as on 31.03.2017
Particulars No. of Shares % of No. of
Capital Accounts
NSDL 4072217277 98.59 221373
CDSL 51780879 1.25 102505
Total Dematerialised 4123998156 99.84 323878
Physical 6527133 0.16 50171
Total 4130525289 100.00 374049
Government of India's shares are held in Demat form.
(xi) The Company’s Plants/Units/Subsidiaries are located at:
STEEL PLANTS
• Bhilai Steel Plant, Bhilai-490001, Chhattisgarh
• Durgapur Steel Plant, Durgapur-713203, West Bengal
• Rourkela Steel Plant, Rourkela-769011, Odisha
• Bokaro Steel Plant, Bokaro Steel City-827001, Jharkhand
• IISCO Steel Plant, Burnpur-713325, West Bengal
• Alloy Steels Plant, Durgapur-713208, West Bengal
• Salem Steel Plant, Salem-636013, Tamil Nadu
• Visvesvaraya Iron & Steel Plant, Bhadravati-577031, Karnataka
• Chandrapur Ferro Alloy Plant, Chandrapur, Maharashtra
UNITS
• Central Coal Supply Organisation, Dhanbad-828127, Jharkhand
• Central Marketing Organisation, Ispat Bhawan, 40, Jawahar Lal NehruRoad, Kolkata-700 071, West Bengal
• Centre for Engineering & Technology, Ranchi-834002, Jharkhand
• Environment Management Division, 6, Ganesh Chandra Avenue,(5th Floor), Kolkata-700013, West Bengal
• Growth Division, 97, Park Street, Kolkata-700016, West Bengal
• Management Training Institute, Ranchi-834002, Jharkhand
• Raw Materials Division, 10, Camac Street, Industry House, Kolkata-700017, West Bengal
• Research & Development Centre for Iron & Steel, Ranchi-834002,Jharkhand
• SAIL Consultancy Division, 16-20 Floor, SCOPE Minar, North Tower,Laxmi Nagar District Centre, Delhi-110092
• SAIL Safety Organisation, Ranchi-834002, Jharkhand
• SAIL Refractory Unit, Bokaro-827001, Jharkhand
SUBSIDIARIES
• IISCO-Ujjain Pipe & Foundry Company Limited, Kolkata (underliquidation)
• SAIL Jagdishpur Power Plant Limited, New Delhi-110003
• SAIL Refractory Company Limited, Salem-636013, Tamilnadu
• SAIL Sindri Projects Limited, Chasnala-828135, Jharkhand
• Chhattisgarh Mega Steel Limited, Bhilai-490001, Chhattisgarh
(xii) Address for correspondence from shareholders for queries/
complaints, if any:
M/s. MCS Share Transfer Agents Limited,F-65, 1st Floor, Okhla Industrial Area, Phase-I,New Delhi-110020Phone No.91-11-41406149,Fax No. 91-11-41709881E-mail:[email protected]

97
Auditors' Certificate on Compliance of Conditions of Corporate Governance
ToThe Members ofSteel Authority of India Limited
We have examined the compliance of the conditions of Corporate Governance by Steel Authority of India Limited (CIN:L27109DL1973GOI006454) ("the Company")for the year ended 31st March, 2017, as stipulated in regulations 17 to 27, clauses (b) to (i) of Sub-regulation (2) of Regulation 46 and paragraphs C, D and E ofSchedule V of Securities and Exchange Board of India (Listing Obligations and Disclosure Requirements) Regulations, 2015 ("the Regulation") and in the Guidelineson Corporate Governance for Central Public Sector Enterprises issued by the Department of Public Enterprises, Government of India, to the extent applicable duringthe year.
The compliance of the conditions of Corporate Governance is the responsibility of the Management. Our examination was carried out in accordance with theGuidance Note on Certification of Corporate Governance issued by the Institute of Chartered Accountants of India and was limited to a review of the procedures andimplementation thereof, adopted by the Company for ensuring the compliance of the conditions of the Corporate Governance. It is neither an audit nor an expressionof opinion on the financial statements of the Company.
In our opinion and to the best of our information and according to the explanations given to us, subject to the following:
The Company has not complied with the requirements of minimum number of independent directors in the composition of Board of Directors for the year ended31st March, 2017;
we certify that the Company has complied with the other conditions of Corporate Governance.
We further state that such compliance is neither an assurance as to the future viability of the Company nor the efficiency or effectiveness with which the Managementhas conducted the affairs of the Company.
For Singhi & Co. For Chatterjee & Co For V.K. Dhingra & Co. For A.K. Sabat & Co.
Chartered Accountants Chartered Accountants Chartered Accountants Chartered AccountantsFRN: 302049E FRN: 302114E FRN:000250N FRN:321012E
Sd/- Sd/- Sd/- Sd/-(Shrenik Mehta) (R.N. Basu) (Vipul Girotra) (A.K. Sabat)
Partner Partner Partner Partner(M. No. 063769) (M. No. 050430) (M.No.084312) (M.No.030310)
Place : New DelhiDate : 30th May, 2017

98
Business Responsibility Report
Section A: General Information about the Company
1. Corporate Identity Number (CIN): L27109 DL 1973 GOI 006454
2. Name of the Company: Steel Authority of India Limited
3. Registered Address: Ispat Bhawan, Lodhi Road, New Delhi - 110003
4. Website: www.sail.co.in
5. Email id : [email protected]
6. Financial Year reported: 2016-17
7. Sector(s) that the Company is engaged in (industrial activity code-wise):Manufacture of Steel and Steel products, National Industrial Classification (NIC)Code: 330
8. List three key products / services that the Company manufactures / provides (as inbalance sheet):
(i) Manufacture of Hot Rolled and Cold Rolled Steel Products
(ii) Manufacture of Rails
(iii) Manufacture of Wire Rods, Structurals, etc.
9. Total number of locations where business activity is undertaken by the Company:
(i) International locations: Nil
(ii) SAIL operates and owns five Integrated Steel Plants at Bhilai, Durgapur, Bokaro,Rourkela and Burnpur & three Special Steel Plants at Salem, Durgapur andBhadravati. Another Unit, Chandrapur Ferro-Alloy Plant (CFP) produces Ferro-alloys. It also has SAIL Refractory Unit (SRU) at Bokaro, with four refractorymanufacturing Units in Jharkhand and Chhattishgarh.
Apart from these, the other Units of SAIL are as follows:
• SAIL Growth Works at Kulti, West Bengal;
• Raw Materials Division (RMD)- Iron Ore Mines at Kiriburu,Meghahatuburu, Gua, Manoharpur (Chiria) in Jharkhand, Bolani, Kalta,Barsua(including Taldih), in Odisha;
• BSP Mines(Iron Ore) at Rajhara Group, Dalli Group, Rowghat inChhattisgarh;
• RMD flux mines at Kuteshwar in MP; Bhawanathpur, Tulsidamar inJharkhand;
• BSP Flux Mines at Nandini, Hirri, Baraduar in Chhattisgarh;
• VISP Flux Mines at Bhadigund, Kenchapuda in Karnataka;
• Collieries Division(Coal Mines) at Chasnalla, Jitpur, Tasra, Sitanala inJharkhand and Ramnagore in West Bengal;
• Central Marketing Organisation, HQ at Kolkata,
• Central Coal Supply Organisation, Dhanbad,
• SAIL Consultancy Division at Delhi,
• R & D Center for Iron & Steel, SAIL Safety Organisation, Centre forEngineering & Technology and Management Training Institute at Ranchi.
• Environment Management Division and Growth Division at Kolkata.
• Central Power Training Institute at Rourkela.
• Transport & Shipping at Kolkata.
SAIL has a pan India distribution network of 37 Branch Sales Offices(BSOs), 27 Customer Contact Offices (CCOs) and 67 Warehouses.
10. Markets served by the Company - Local / State / National / International: National& International
Section B: Financial Details of the Company
1. Paid up capital (INR) : ` 4,130.53 crore
2. Total turnover (INR) : ` 49,180 crore
3. Total loss after taxes (INR) : ` 2,833.24 crore
4. Total spending on Corporate Social Responsibility (CSR) as percentage of profitafter tax (%): Although the Company has incurred losses during the Financial Year2016-17, however, as a responsible Corporate Citizen, the Company has beenfulfilling its obligations towards CSR initiatives. Accordingly, the CSR spendingduring 2016-17 has been Rs.29.05 crore.
5. List of activities in which expenditure in 4 above has been incurred :
A) Promotion of Healthcare including Drinking Water Facilities and Sanitation:Swachh Vidyalay Abhiyan
B) Promotion of Education, Income Generation & Skill/Vocational Training
C) Empowerment of Women, Care for Senior Citizens and Differently-abledpersons
D) Environmental Sustainability
E) Promotion of Heritage, Art & Culture
F) Promotion of Sports
G) Rural Development: Infrastructure Development
Section C: Other Details
1. Does the Company have any Subsidiary Company / Companies?
Yes, the Company has four Subsidiary Companies, viz.:
A. SAIL Refractory Company Limited.
B. SAIL Jagdishpur Power Plant Limited.
C. SAIL Sindri Projects Limited.
D. Chhattisgarh Mega Steel Limited.
2 Do the Subsidiary Company / Companies participate in the BR initiative of theparent Company? If yes, then indicate the number of such subsidiarycompany(s):
Business Responsibility initiatives of the parent company are applicable on thesubsidiary companies.
3 Do any other entity / entities (e.g. suppliers, distributors etc.) that the companydoes business with; participate in the BR initiatives of the Company? If yes,then indicate the percentage of such entity / entities?[Less than 30%, 30-60%,More than 60%]
No
Section D: BR Information
1. Details of Director / Directors responsible for BR:
a) Details of the Director / Directors responsible for BR policy/policies:
• DIN Number 07352648
• Name: Dr. N. Mohapatra
• Designation: Director (Personnel)
• Details of the BR head
Sl.No Particulars Details
1 DIN Number (if applicable) 00101601
2 Name M.C. Jain
3 Designation Company Secretary
4 Telephone number 011-24368104
5 e-mail id [email protected]
2. Principal-wise (as per NVGs) BR Policy/Policies (Reply in Y/N)
The National Voluntary Guidelines on Social, Environmental and EconomicResponsibilities of Business (NVGs) released by the Ministry of Corporate Affairshas adopted nine areas of Business Responsibility. These briefly are as under:
P1 - Businesses should conduct and govern themselves with Ethics, Transparencyand Accountability.
P2 - Businesses should provide goods and services that are safe and contribute tosustainability throughout their life cycle.
P3 - Businesses should promote the well-being of all employees.
P4 - Businesses should respect the interests of, and be responsive towards allstakeholders, especially those who are disadvantaged, vulnerable and marginalized.
P5 - Businesses should respect and promote human rights.
P6 - Businesses should respect, protect, and make efforts to restore the environment.
P7 - Businesses, when engaged in influencing public and regulatory policy, should doso in a responsible manner.
P8 - Businesses should support inclusive growth and equitable development.
P9 - Businesses should engage with and provide value to their customers andconsumers in a responsible manner.
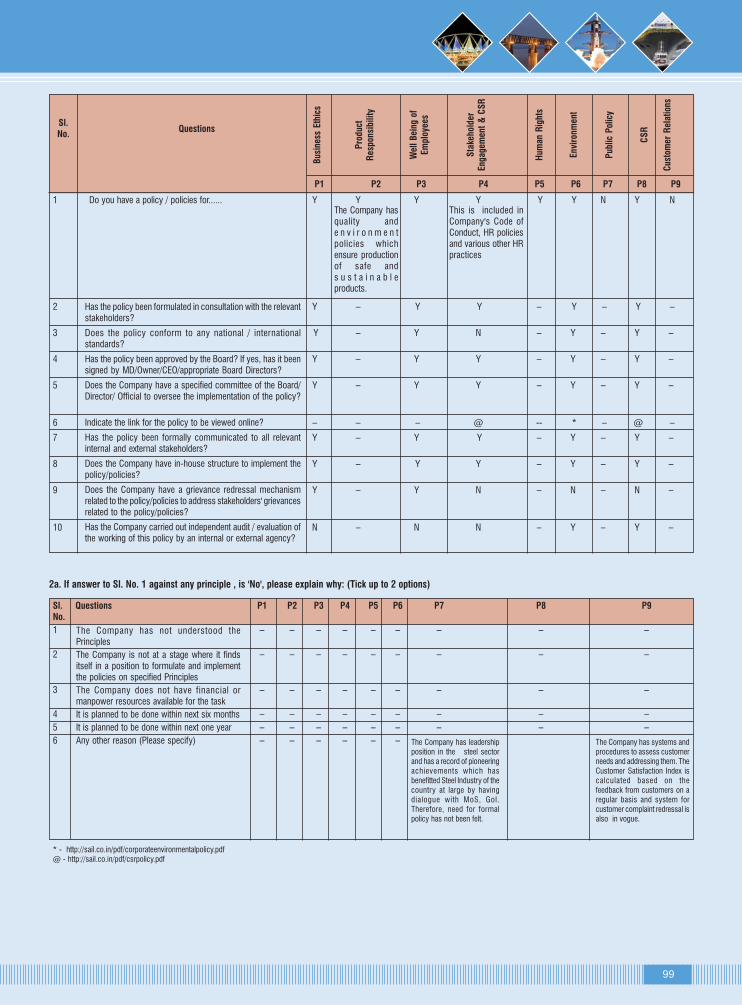
99
Sl.No.
Questions
Bus
ines
s Eth
ics
Pro
duct
Res
pons
ibili
ty
Wel
l B
eing
of
Em
ploy
ees
Sta
kehol
der
Eng
agem
ent
& C
SR
Hum
an R
ight
s
Env
iron
men
t
Pub
lic P
olic
y
CS
R
Cus
tom
er R
elat
ions
P1 P2 P3 P4 P5 P6 P7 P8 P9
1 Do you have a policy / policies for...... Y Y Y Y Y Y N Y N
2 Y – Y Y – Y – Y –
3 Y – Y N – Y – Y –
4 Y – Y Y – Y – Y –
5 Y – Y Y – Y – Y –
6 – – – @ -- * – @ –
7 Y – Y Y – Y – Y –
8 Y – Y Y – Y – Y –
9 Y – Y N – N – N –
10 N – N N – Y – Y –
2a. If answer to Sl. No. 1 against any principle , is 'No', please explain why: (Tick up to 2 options)
Sl. Questions P1 P2 P3 P4 P5 P6 P7 P8 P9No.
1 – – – – – – – – –
2 – – – – – – – – –
3 – – – – – – – – –
4 – – – – – – – – –
5 – – – – – – – – –
6 – – – – – –
The Company hasquality ande n v i r o n m e n tpolicies whichensure productionof safe ands u s t a i n a b l eproducts.
This is included inCompany's Code ofConduct, HR policiesand various other HRpractices
The Company has leadershipposition in the steel sectorand has a record of pioneeringachievements which hasbenefitted Steel Industry of thecountry at large by havingdialogue with MoS, GoI.Therefore, need for formalpolicy has not been felt.
The Company has systems andprocedures to assess customerneeds and addressing them. TheCustomer Satisfaction Index iscalculated based on thefeedback from customers on aregular basis and system forcustomer complaint redressal isalso in vogue.
* - http://sail.co.in/pdf/corporateenvironmentalpolicy.pdf@ - http://sail.co.in/pdf/csrpolicy.pdf
Has the policy been formulated in consultation with the relevantstakeholders?
Does the policy conform to any national / internationalstandards?
Has the policy been approved by the Board? If yes, has it beensigned by MD/Owner/CEO/appropriate Board Directors?
Does the Company have a specified committee of the Board/Director/ Official to oversee the implementation of the policy?
Indicate the link for the policy to be viewed online?
Has the policy been formally communicated to all relevantinternal and external stakeholders?
Does the Company have in-house structure to implement thepolicy/policies?
Does the Company have a grievance redressal mechanismrelated to the policy/policies to address stakeholders' grievancesrelated to the policy/policies?
Has the Company carried out independent audit / evaluation ofthe working of this policy by an internal or external agency?
The Company has not understood thePrinciples
The Company is not at a stage where it findsitself in a position to formulate and implementthe policies on specified Principles
The Company does not have financial ormanpower resources available for the task
It is planned to be done within next six months
It is planned to be done within next one year
Any other reason (Please specify)

100
3. Governance related to BR:
• Indicate the frequency with which the Board of Directors, Committeeof the Board or CEO assess the BR performance of the Company. Within3 months, 3-6 months, Annually, More than 1 year.
Annually.
• Does the Company publish a BR or a Sustainability Report? What isthe hyperlink for viewing this report? How frequently it is published?
Yes, the Company publishes printed versions of its Sustainability Report.An electronic version of the report is uploaded on the Company's websitein the intervening year as a web update. The hyperlink for viewing theSustainability Report of the Company is http://www.sail.co.in/
Section E : Principle-wise PerformancePrinciple 1: Business should conduct and govern themselves with Ethics, Transparencyand Accountability
1. Does the policy relating to ethics, bribery and corruption cover only the Company?Yes / No.
Does it extend to the Group / Joint Ventures / Suppliers / Contractors / NGOs /Others?
No, the policies implemented by SAIL, in these regards covers employees of theCompany as well as suppliers/ contractors/ bidders, etc. The Company has put inplace Conduct, Discipline and Appeal (CDA) Rules which prescribe the code ofconduct as applicable mostly to the executives of the Company whereas the non-executive workmen are covered under the code of conduct /misconduct asmentioned in the Standing Orders (tripar tite agreement between union andGovernment representatives) for respective Plants/Units of SAIL. In July 2007, theCompany implemented Integrity Pact for all contracts / procurements valuing `
100 crores and above. Subsequently, to cover more contracts/procurements.,threshold value has been reduced to ` 20 crores and all tenders related to handlingcontracts in CMO departmental warehouses, irrespective of threshold value arealso covered under Integrity Pact. Guidelines on banning of business dealing withbidders/contractors/ agencies dealing with SAIL have been implemented in theCompany and made part of the Integrity Pact, wherein it has been envisaged thatappropriate action shall be taken against the signatories of Integrity Pact, if they arefound involved in unethical practices including corruption and bribery.
2. How many stakeholder complaints have been received in the past financialyear and what percentage was satisfactorily resolved by the management? Ifso, provide details thereof, in about 50 words or so.
A total of 797 complaints from various sources including those referred by CentralVigilance Commission, Ministry of Steel were received in SAIL Vigilance during2016-17 and the same were examined vis-à-vis extant systems and procedures,policies, rules, etc. followed in the Company and actions as per rules, includingsystemic improvements were advised against the irregularities noticed in thesecomplaints and the same were agreed to by management for implementation. Hence,it may be construed that almost 100% complaints were satisfactorily resolved asper procedure in vogue.
Principle 2: Business should provide goods and services that are safe and contributeto sustainability throughout their life cycle
1. List up to 3 of your products or services whose design has incorporated socialor environmental concerns, risks and / or opportunities:
i) TMT EQR Rebars( Thermo-mechanically treated earthquake resistant) whichprovide improved ductility to concrete structures thereby improving safety ofbuildings.
ii) Seismic resistant grade TMT Rebars as per specification Fe 500S have beendeveloped with regard to safety concerns of buildings in seismic zones andhigh rise buildings.
iii) Parallel flange Structural, which can be used in place of conventional structuralreducing overall consumption of steel thereby, adding value to the customer.
2. For each such product, provide the following details in respect of resource use(energy, water, raw material etc) per unit of product (optional):
i) Reduction during sourcing / production / distribution achieved since theprevious year throughout the value chain
Consumption per unit of Current Previousproduction in SAIL Year year
Specific water consumption (m3/TCS) 3.75 3.83
Particulate matter (PM) emission load 0.77 0.81(kg/TCS)
ii) Reduction during usage by consumers (energy, water) has been achievedsince the previous year?
The information is not available.
3. Does the Company have procedures in place of sustainable sourcing (includingtransportation)? If yes, what percentage of your inputs was sourced sustainably?Also, provide details thereof, in about 50 words or so.
In addition to regular supplies from captive mines of SAIL, certain key input materialslike coal, fluxes (limestone, dolomite), etc. are sourced either through competitivebuying or long term arrangement with established suppliers. EnvironmentManagement System (EMS) is in place with ISO-14000 certification of Plants &Units. There are continuous effor ts to minimize impact of carbon footprint.Transportation of all raw materials from mines and ports to Plants is carried throughrail. Well laid out systems and procedures of competitive buying reinforce sustainablesourcing of Company's requirement.
4. Has the Company taken any steps to procure goods and services from local andsmall producers, including communities surrounding their place of work? Ifyes, what steps have been taken to improve the capacity and capability of localand small vendors?
In line with extant policy of Government of India, certain categories of goods &services are procured from Small & Medium Enterprises (SMEs). Major Plants alsohave local level Ancillary Policy which further enables procurement of goods &services from local and small producers including communities like Mahila Samiti /Samaj, Self Help Groups, etc. in the vicinity of Plant locations. Vendor DevelopmentPrograms are organized periodically by the Plants which help in capacity andcapability building of local and small vendors.
5. Does the Company have a mechanism to recycle products and waste? If yes,what is the percentage of recycling of products and waste? (Separately as <5%,5-10%, >10%). Also, provide details thereof, in about 50 words or so.
SAIL believes in the Policy of 4Rs (reduce, recover, recycle and reuse) across allour operations. A large quantity of wastes and by-products like slag, dust, sludge,used firebricks, etc. is generated during the iron and steel making process. Slag,which accounts for a majority of by-products, is utilized internally and also sold toexternal agencies. Blast Furnace slag is used for cement making while BOF slag isused internally for sinter making and also as material for road base, internal railtrack ballast, etc. During the year 2016-17, 89.47% of BF slag and 71.24% of BOFslag were utilised.
Other wastes like, BF flue dust, mill scale, lime/dolo fines and refractory wastes arealso used internally and sold to outside agencies. The belief of reuse and recycle isfirmly embedded in the organizational approach of SAIL and there have been severalinitiatives to maximise the utilisation of solid waste generated at various operations.
During 2016-17, 24.72% solid wastes were internally re-cycled out of total utilisationof 83.20% of solid wastes. Moreover, by-product gases like Coke Oven gas, BF gasand LD gas are used as fuels at the different shops of the Plants.
Principle 3: Business should promote the well-being of all employees
1. Please indicate the Total number of employees.
As on 1.4.2017 total number of employees in SAIL : 82964 (Executives-12840;Non-Executives - 70124)
2. Please indicate the Total number of employees hired on temporary/contractual/casual basis.
As on 1.4.2017, number of Contract labour engaged at SAIL Plants/Units : 59606
3. Please indicate the Number of permanent women employees
As on 1.4.2017, permanent women employees in SAIL : 4782 (Executives- 975;Non-Executives - 3807)
4. Please indicate the Number of permanent employees with disabilities.
As on 1.4.2017, total number of permanent employees with disabilities in SAILPlants/Units : 909 (Executives - 145; Non-Executives - 764)
5. Do you have an employee association that is recognized by management?
Recognition to trade unions having majority representation of non-executiveemployees is granted as per process, at the Plant/Unit level. At apex level, NationalJoint Committee for Steel Industry (NJCS), a bipar tite forum consistingrepresentatives from five Central Trade Union viz. INTUC, AITUC, CITU, HMS &BMS and representatives from recognized union of main Plants, providesrepresentation to all non-executive employees. Executives are represented by therespective Officer Associations (OA) of their Plants/Units which are affiliated toSteel Executives' Federation of India (SEFI)-the apex body representing executivesin SAIL.
6. What percentage of your permanent employees is members of this recognizedemployee association?
Almost all employees of SAIL are members of either Trade Unions or Officers'Associations.
7. Please indicate the Number of complaints relating to child labour, forced labour,involuntary labour, sexual harassment in the last financial year and pending, ason the end of the financial year
Information per taining to Child labour/Forced labour/Involuntary labour andDiscriminatory Employment is given in the table below:

101
Sl. Category No.of No. of complaintsNo. complaints filed pending as at end
during the of thefinancial year financial year
1. Child labour/ forced Nil Nillabour/involuntarylabour
2. Sexual harassment 5 Nil
3. Discriminatory Nil Nilemployment
8. Percentage of your under mentioned employees were given safety & skill up-gradation training in the last year?
• Permanent employees = 40.6
• Permanent women employees =40
• Casual / Temporary / Contractual employees = 100
• Employees with disabilities = 40
Training need of each individual in the organization is assessed. Under PMS, eachexecutive is asked to inform the Management as to what training needs to be givento him to help him perform his duties in a better way.
Also occupational training, safety and skill up-gradation training (technical /managerial / functional) are imparted to all permanent employees including femaleemployees and differently abled employees. During the year 2016-17, total 36,059(40.6% of total employees) regular employees were trained on various safety &skill up-gradation related programs.
SAIL is in the process of implementation of current Modernization & ExpansionProgramme wherein contractual workers are engaged in various activities. 100%of contractual workers are given safety awareness training which is mandatory forissuing gate pass to Plant premise. Skill up-gradation of contractual workers isalso taken care of while on job at their work place.
Principle 4 : Businesses should respect the interests of, and be responsive towardsall stakeholders, especially those who are disadvantaged, vulnerable andmarginalized.
1. Has the Company mapped its internal and external stakeholders? Yes / No
Yes
2. Out of the above, has the Company identified the disadvantaged, vulnerableand marginalized stakeholders?
There has never been any discrimination in the treatment and rights available tostakeholders.
3. Are there any special initiatives taken by the Company to engage with thedisadvantaged, vulnerable and marginalized stakeholders? If so, provide detailsthereof, in about 50 words or so.
Some of the special initiatives taken by the Company are as under:
(i) In an effor t to align the marginalized masses, a project to promotecomprehensive Water Supply and Sanitation has been initiated by RourkelaSteel Plant covering 897 households in 10 villages of Kuarmunda Block. Eachhousehold is being provided potable water through a ground water source,storage tank and supply network of pipelines with 3 tap points and Sanitationunit with RCC roof on partnership model. The villagers have been mobilizedand empowered for their active participation in the project. Village levelcommittees have been formed for long-term sustenance of the project.
(ii) In an attempt to bring the future generations of tribal to the mainstream, 331tribal children are being provided free education along with boarding, lodging,nourishing and wholesome food, clothing, free medical treatment, sports andcultural opportunities in a conducive atmosphere at Gyanodya Chatrawas,Bhilai & BSP School Rajhara; Birhors (a tribe near extinction) under GyanjyotiYojna at Bokaro; Saranda Suvan Chhatravas, Kiriburu; RTC Residential PublicSchool, Manoharpur Ore Mines; and at Kalinga Institute of Social Sciencessponsored by RSP.
(iii) Literate to Matriculate a mission program: 1400 school dropouts girls andwomen educated upto primary/middle class level, from peripheral villages ofBokaro have been identified and enrolled with the National Institute of OpenSchooling, Ranchi. The women are provided with free Training and LearningMaterials and Preparatory classes to enable them to appear for matriculationexams. The classes are being organised at Panchayat level through ZilaSaksharta Samiti (ZSS).
Principle 5: Business should respect and promote human rights
1. Does the policy of the Company on human rights cover only the Company orextend to the Group/Joint Ventures/Suppliers/Contractors/NGOs/Others?
The Company does not have a stated Human Rights Policy. However, most of theaspects are covered in the Company's Code of Business Conduct and Ethics as
well in various human resource practices.
2. How many stakeholder complaints have been received in the past financialyear and what percent was satisfactorily resolved by the management?
11 number of complaints were received from the stakeholders during 2016-17 andall the complaints were resolved during 2016-17.
Principle 6: Business should respect, protect, and make efforts to restore theenvironment
1. Does the policy of the related Principle 6 cover only the Company or extends tothe Group/Joint Ventures/Suppliers/Contractors/NGOs and others?
Policy and Strategy formulation at SAIL is a well-structured process guided byCompany's Vision and Credo. Elements of Sustainability are ingrained in SAIL'sVision, Strategies and Policies. The basket of Policies that includes Quality,Environmental, Safety Policies, etc. encompasses concepts of Sustainability. Plantlevel Policies on Human Resource, Occupational Health and Safety, Communication,Maintenance, Township, Energy Management and Social Accountability, etc. alsopromote concept of Sustainable Development.
Corporate Environmental Policy of the Company affirms to maintain a clean andsustainable environment in and around its Plants and Mines through soundenvironmental practices in all its activities, comply with legal and other requirementspertaining to the environment, forests and wildlife, contribute towards mitigation ofclimate change through the adoption of cleaner and energy efficient technologies,promote development of innovative environment-friendly processes and products,restore ecosystems in mined out landscapes and abandoned sites through ecologicalrestoration, integrate the principle of "reduce, recover, recycle and reuse" in itsoperations for conservation of natural resources to ensure a sustainable future,strive for continual improvement of environmental performance by setting andachieving challenging targets, ensure regular monitoring and review of environmentalperformance through a robust audit mechanism and a transparent reporting systemand continuously monitor emissions, discharges and ambient air quality and makedata available in the public domain.
The Policy also includes communication of environmental performance to allstakeholders, improve employee commitment and responsibility towardsenvironment protection through capacity building and promote environmentallyresponsible behaviour amongst contractual workforce and suppliers.
2. Does the Company have strategies/initiatives to address global environmentalissues such as climate change/global warming etc.? Y/N. If yes, please givehyper link for web page etc.
Yes, as a responsible corporate citizen, the Company has taken up various initiativesfor climate change mitigation through technology up-gradation, sourcing of goodquality of raw materials, retrofitting and revamping of old pollution control systems,etc. All these efforts, with particular emphasis on adoption of cleaner and energyefficient technologies, have ensured a reduction in specific emission of carbondioxide by more than 5% during the last five years.
The on-going project on "Carbon sequestration through afforestation at RSP", aTechnology Mission Project under R&D Master Plan, shall be contributing towardssequestration of CO
2 around the area.
The Company has also adopted Sustainable Development Policy and has beenpublishing its Corporate Sustainability Report, as per Global Reporting Initiative(GRI) Guidelines, for the last six years.
Corporate Sustainability Report, 2015-16, has been published as per GRI G4Guidelines (New Guidelines of GRI) after having been confirmed by GRI to havesuccessfully completed the GRI content index service and receiving the organisationalmark of GRI. This is available in the Corporate Governance section of the Company'swebsite (www.sail.co.in).
3. Does the Company identify and assess potential environmental risk? Y/N.
Yes, the Company has in place an Enterprise Risk Management(ERM) Policy andhas established mechanisms to identify and assess potential environmental risksand accordingly mitigation plan has been developed through Surveys, AdvanceWarning System (AWS) to foresee future risks, Risk Control Self Assessment (RCSA)Workshops, Discussions, Analysis of changing business scenarios, Scaling of risks,Compliance status, Reviews, etc. RCSA workshops are conducted for all theoperations and outcome of these workshops ensure location-wise, prioritized riskregisters. Risk owners have been identified for each of the identified risks andmitigation plans formulated, which are reviewed and updated on quarterly basis.ERM is a dynamic process to meet to objective of the Organisation.
4. Does the company have any project related to Clean Development Mechanism?If so, provide details thereof, in about 50 words or so. Also, if yes, whether anyenvironmental compliance report is filed.
The Company had identified several energy efficiency projects which were beingimplemented during the on-going Modernization and Expansion Programme foravailing the Clean Development Mechanism (CDM) benefits. Six projects have beenvalidated as Verified Emission Reduction (VER) projects as per VCS and ISOstandards. Around 1.37 Million Tonnes of CO
2 equivalent carbon credits have been
accrued.

102
Implementation of an Environment Management System linked to ISO 14001standard, which is essentially a voluntary initiative, has become an effective tool inSAIL towards protection of the environment. During the Financial Year 2016-17,warehouses of CMO at Bokaro and Bengaluru have been recommended forcertification to EMS linked to ISO 14001:2015.
5. Has the company undertaken any other initiatives on clean technology, energyefficiency, renewable energy etc.? Y/N. If yes, please give hyper link for webpage etc.
Yes, adoption of some notable cleaner technologies during the on-goingModernization and Expansion Programme of SAIL which have led towards energysavings are: Taller Coke Oven Batteries with Coke Dry Cooling Plant (CDCP); BiggerVolume Blast Furnaces with Top Gas Pressure Recovery Turbine (TRT); Heat recoveryfrom the sinter coolers; new Bloom cum Round casters; Gas fired boiler for powergeneration; etc.
Polices, Energy Security, Water, Food Security, Sustainable Business Principles,Others)
Yes, Sustainable Business Principles and Waste Management are the ones amongstthe stated broad areas.
Principle 8: Businesses should support inclusive growth and equitable development
1. Does the Company have specified programmes / initiatives / projects in pursuitof the policy related to Principle 8? If yes, details thereof.
Yes, SAIL's Social Objective is synonymous with Corporate Social Responsibility(CSR). Apart from the business of manufacturing steel, the objective of the Companyis to conduct business in ways that produce social, environmental and economicbenefits to the communities in which it operates. For any organization, CSR beginswith being aware of the impact of its business on society.
With the underlying philosophy and a credo to make a meaningful difference inpeople's lives, SAIL has been structuring and implementing CSR initiatives rightfrom the inception. These efforts have seen the obscure villages, where SAIL Plantsare located, turn into industrial hubs, today.
SAIL CSR initiatives are undertaken in conformity to the prevalent statutes like 'TheCompanies Act, 2013', CSR Rules, 2014 and DPE Guideline on CSR & Sustainability,2014. SAIL carries out CSR projects in and around steel townships, mines and farflung locations across the Country in the area of rural development includingDevelopment of Model Steel Villages, Providing Medical and Health Care,Immunization, Ante and Post Natal Care, Education, Access to water facilities,Construction of Roads, Road Side Drains & Street Lights, Environment andSustainability, Women Empowerment, Assistance to people with disabilities,Sustainable Income Generation through Self Help Groups, Promotion of Sports,Art, Culture & Recreational Activities, etc.
2. Are the programmes / projects undertaken through in-house team / ownfoundation / external NGO / government structures / any other organization?
Under the guidance of the Board level CSR Committee, the CSR activities/projectslisted in the approved Annual Plan of SAIL, are being implemented using internalresources or through an identified suitable agency or through providing financialassistance to NGOs/ specialized/ agencies/institutions/societies, as per theprovisions of Companies Act, 2013, CSR Rules and CSR Policy of the Company.
Since CSR projects are long term / continuous in nature like providing education,healthcare, mid day meals, sustainable livelihood generation through Self Help Groups(SHGs), etc., some of the projects are implemented through specialised agencies,depending on expertise available with them like, Mid-day meal project throughAkshaya Patra Foundation at Bhilai & Rourkela, Comprehensive Water & SanitationProject in the peripheral villages of Rourkela in association with Gram Vikas,Sustainable livelihood generation projects at Rourkela & Ranchi through BAIF &Society for Rural Infrastructure (SRI, Ranchi) and other social projects at variousPlant/Unit locations through Ramakrishna Mission, etc.
Except in cases, where financial assistance is provided for a specific CSR projectproposed by a specific agency, the external implementation partners having strongcredentials and track records, are identified for undertaking CSR projects, as definedin 'The Companies Act-2013'.
3. Have you done any impact assessment of your initiative?
In SAIL, every Plant / Unit is having a high level Committee headed by senior EDs/GMs, which recommends the CSR projects to be taken up by the respective Plant /Unit. The same Committee monitors the progress and execution of these projectsas well as under takes audit of social benefits achieved from CSR initiativesundertaken.
The impact assessment/social audit of the Company's CSR & Sustainability initiativeshas also been done through external professional agencies as detailed below:
• The impact assessments of Bhilai and Rourkela Steel Plants' CSR projects in2014-15 have been carried out by NABARD Consultancy Services (NABCONS).
• The impact assessment of Salem Steel Plant's CSR projects in 2014-15 hasbeen carried out by Madras School of Social Work, Chennai.
• The impact assessment of Raw Materials Division's CSR projects in 2014-15covering 129 villages of 7 mines in States of Odisha and Jharkhand has beencarried out by Institute of Social Sciences, Bhubaneswar (ISS).
In addition, SAIL has a strong internal mechanism to monitor the activities/ initiativesundertaken under CSR & Sustainability. The Board Sub Committee on CSR reviews/monitors CSR & Sustainability activities on regular basis.
4. What is the Company's direct contribution to community development projects- Amount in INR and the details of the projects undertaken?
Till the year 2013-14, DPE Guidelines provided for the linkage of Annual CSR budgetwith Net Profits/PAT of previous year. From April 1, 2014, the provisions of Company'sAct, 2013 have come into effect for the CSR activities which require the CSRexpenditure to be at least 2% of the average PBT of the immediately preceding 3fiscals. CSR budget allocation and expenditure w.e.f. 2014-15 are as follows:
The Company has already introduced various renewable energy initiatives like useof coal bed methane in re-heating furnaces, bio-diesel in locomotives, agro basedfuel in boilers and solar water heating & lighting systems at various locations. A 1MW grid connected Solar Power Plant has been commissioned at RSP.
To fulfil SAIL's Renewable Energy Commitment, a Solar Power Plant project is beingdeveloped through NTPC-SAIL Power Company Limited, a Joint Venture Companyof NTPC and SAIL. Further, the Company is also considering formation of a JointVenture Company with M/s Green Energy Development Corporation of Odisha Limitedfor installation of a Hydro Electric Power Plant at Rourkela.
6. Are the Emissions/Wastes generated by the Company within the permissiblelimits given by CPCB/SPCB for the financial year being reported?
The emissions are mostly within the permissible limits as prescribed by the CPCB/SPCB. Quality of effluent discharged from all the outfalls is also within the norms.The wastes generated are handled and managed as per the stipulated Guidelines/Rules. These are reported by the Company to the CPCB/SPCB on regular basis.
7. Number of show cause/legal notices received from CPCB/SPCB which arepending (i.e. not resolved to satisfaction) as on end of financial year.
One direction each from the SPCB and the MoEFCC was received during the FinancialYear 2016-17. Action plan for compliance of these directions has been prepared inconsultation with the statutory bodies and are under implementation.
Principle 7: Businesses, when engaged in influencing public and regulatory policy,should do so in a responsible manner
1. Is your Company a member of any trade and chambers or association? If yes,name only those major ones that your business deals with.
The Company is a Member of:
A. Confederation of Indian Industry (CII)
B. Federation of Indian Chambers of Commerce and Industry (FICCI)
C. The Associated Chambers of Commerce and Industry of India (ASSOCHAM)
D. World Steel Association (WSA)
E. Standing Conference of Public Enterprises (SCOPE)
F. Indian Steel Association
G. Institute for Steel Development & Growth
H. All India Organisation of Employees(AIOE)
I. Employee Federation of India (EFI)
2. Have you advocated / lobbied through above associations for the advancementor improvement of public good? Yes / No; if yes, specify the broad areas (dropbox: Governance and Administration, Economic Reforms, Inclusive Development

103
(` crore)
Year CSR Allocation CSR Expenditure
2014-15 78 35.04
2015-16 100.16 76.16(including unspent amount
of Rs.42.96 crores of 2014-15).
2016-17 29.34 29.05(including unspent amount of
Rs.24 crores of 2015-16)
Apart from the exclusive CSR budget, SAIL also spends to the tune of Rs.350crores annually for providing social facilities to Non-SAIL populace residing in theperipheral areas of SAIL Plants/Units either free or at a very nominal cost, such asHealthcare, Education, Sanitation, Drinking water availability, infrastructure like roads& street lights, promotion of Sports, Art and Culture, etc.
SAIL Plants/Units are located mostly in backward areas that inhabit majority ofdisadvantaged, vulnerable, marginalized, SC, ST and minorities. For the upliftmentof such populace, SAIL had developed 79 Model Steel Villages located in peripheralbackward areas and these are maintained regularly.
The details of CSR activities undertaken are as follows:
• SAIL has achieved 100% compliance by construction of 672 toilets in schoolswithout toilets/having dysfunctional toilets falling within the peripherals of SAILPlants & Units acknowledging the Prime Minister's ambitious drive forpromotion of sanitation and hygiene in remote areas, under "Swachch VidyalayaCampaign".
• SAIL is providing healthy & nutritious Mid-Day Meals to around 63,000 studentsin 500 Govt. schools daily, in and around Bhilai and Rourkela, in associationwith Akshya Patra Foundation.
• Education: To develop the society through education, SAIL is running over145 schools within and outside its steel townships to provide modern educationto more than 55,000 children and is assisting over 500 schools with about63,000 students by providing Mid-day meals. Special Schools (KalyanVidyalaya) for BPL category students are run at integrated steel Plant locationswith facilities of free education, mid-day meals, uniforms, shoes, text books,stationary items, school bag, water bottles, etc. are running under CSR.
• Healthcare: SAIL's extensive and specialised Healthcare Infrastructure providebasic and specialized healthcare to more than 1,10,000 villagers during 2016-17.
• 4700 health camps and Ambulances/MMUs provided medical facilities likefree health check-up, lab investigations, medicine, immunization, etc. at thedoorsteps of over 1,60,000 villagers during 2016-17.
• Over 78 Lakh people across 435 villages have been connected to mainstreamby SAIL since its inception, by constructing and repairing of roads. Over 8000water sources have been installed during last four years thereby enablingeasy access to drinking water to over 46 lakh people living in far-flung areas.
• To promote renewable sources of energy, Solar street lights have been installed,Solar Lanterns and Smokeless chullahs have been distributed among the ruralpeople. Maintaining parks, water bodies and botanical gardens in its townshipsand plantation & maintenance of over 3 Lakh trees at various locations havealso been carried out for environment conservation.
• Vocational and specialised skill development trainings have been impartedto 2176 village youths and 1878 women folks in 2016-17 in industrial andagriculture techniques, soft skills, handlooms, empowering them to bond with
mainstream. About 576 rural youths have been sponsored for ITI trainings atvarious ITIs.
• Sports, Art & Culture: Various sports coaching and events viz. SAIL KhelMela at Bhilai, Samvardhan; Rural Sports, Football and Kabbadi at Rourkela,Durgapur and Burnpur; Archery championships, Kho-Kho and Ladies CricketCoaching and matches at West Singhbhum, Jharkhand & Keonjhar, Odishawitnessed participation of about 2,000 rural youths. 4,000 folk artists, studentsand Viewers participated in the Lok Kala Mahotsava organised at Bhilai andGrameen Lokutsavas at Thanod and Aheri villages of Durg.
5. Have you taken steps to ensure that this community development initiative issuccessfully adopted by the community? Please explain in 50 words, or so.
SAIL Plants/Units have always conducted informal stakeholder engagements intheir respective areas. This exercise supports in identifying their needs, local issuesrequiring attention and intervention. Formal as well as informal mode has beenestablished with multi-stakeholders to resolve various issues affecting day to daylife from time to time as per the necessity. For peripheral villages, dialogues arenormally held with the Sarpanch/Panch of the village or the village representativesin an informal manner as and when required in connection with the peripheraldevelopmental activities. A well structured organizational mechanism is in place atPlants/Units for planning CSR activities in consultation with local authorities likePanchayats, District & State Authorities and various stakeholders.
Besides, at some of Plant locations the inputs from the Rehabilitation & PeripheralDevelopment Committee (RPDAC), in which MPs & MLAs are members, are alsotaken into consideration before finalizing the CSR projects.
Impact assessment of CSR activities is carried out to assess the effects of our CSRinitiatives. Also reforms/updates of the processes based on the feedback receivedfrom the beneficiaries are incorporated so that the sense of ownership is generatedamong the community and it adopts the social interventions in letter and spirit.
Principle 9: Businesses should engage with and provide value to their customers andconsumers in a responsible manner
1. What percentage of customer complaints / consumer cases is pending as onthe end of financial year?
A total of 1850 quality complaints including the complaints pending at the beginningof the year were received from customers in 2016-17, out of which 63 (around3%) were pending as of March 31, 2017, while the rest were settled satisfactorily.The pending complaints are in the process of settlement.
2. Does the Company display product information on the product label, over andabove what is mandated as per local laws? Yes / No / N.A. / Remarks (additionalinformation)
SAIL provides detailed Test Certificates to the customers with each supply. Packet/Coil /Heat number, size, quality of the item is displayed on the product label forsource authentication. In case of branded products, product brand is also displayed.Over and above, if there is an additional requirement from the customer, attempt ismade to incorporate the same on the label.
3. Is there any case filed by any stakeholder against the Company regarding unfairtrade practices, irresponsible advertising and / or anti-competitive behaviourduring the last five years and pending as of end of financial year? If so, providedetails thereof, in about 50 words or so.
There is no such case pending as of end of financial year.
4. Did your Company carry out any consumer survey / consumer satisfaction trends?
Yes, Customer satisfaction is measured in the form of Customer Satisfaction Index(CSI) for Key Accounts which is computed every month based on the feedbackcollected from identified Key Customers on parameters pertaining to Product Quality,Service and Price.

104
Note No. As at As at As at31st March, 2017 31st March, 2016 1st April, 2015
ASSETSNon-current assets(a) Property, Plant and Equipment 4 48,776.83 44,395.76 36,248.77(b) Capital work-in-progress 5 23,275.39 24,927.22 29,209.54(c) Investment property 6 0.86 0.88 0.90(d) Intangible assets 7 1,522.58 1,546.20 1,510.21(e) Investments accounted for using the equity method 2,410.41 2,216.80 2,054.48(f) Financial assets
(i) Investments 8 65.05 62.24 61.81(ii) Trade receivables 9 - - 2.25(iii) Loans 10 453.52 449.95 426.98(iv) Other financial assets 11 257.68 489.41 623.72
(g) Deferred tax assets (net) 12 3,848.75 1,669.81 -(h) Current tax assets (net) 13 235.81 278.10 609.89(i) Other non current assets 14 1,062.99 976.47 798.16
81,909.87 77,012.84 71,546.71Current assets(a) Inventories 15 15,736.09 14,708.24 17,274.12(b) Financial assets
(i) Trade receivables 9 2,934.69 3,151.42 3,585.89(ii) Cash and cash equivalents 16 140.64 145.18 165.04(iii) Other bank balances 17 238.19 200.37 2,211.72(iv) Loans 10 72.73 65.18 66.97(v) Other financial assets 11 2,268.18 1,762.84 2,338.81
(c) Current tax assets (net) 13 - 0.89 0.00(d) Other current assets 14 4,302.91 4,234.74 4,238.53
25,693.43 24,268.86 29,881.08Assets classified as held for sale 18 11.94 20.59 20.46
TOTAL ASSETS 1,07,615.24 1,01,302.29 1,01,448.25EQUITY AND LIABILITIESEquity(a) Equity share capital 19 4,130.53 4,130.53 4,130.53(b) Other equity 20 32,911.73 36,020.90 40,449.42(c) Non-controlling interest 0.01 - -
37,042.27 40,151.43 44,579.95LiabilitiesNon-current liabilities(a) Financial liabilities
(i) Borrowings 21 19,087.48 17,495.71 15,620.20(ii) Trade payables 22 7.36 6.83 0.71(iii) Others financial liabilities 23 1,365.93 1,571.82 1,375.09
(b) Provisions 24 3,596.40 3,273.72 3,387.15(c) Deferred tax liabilities (net) 12 - - 1,375.28(d) Other non-current liabilities 25 151.29 113.48 117.90
24,208.46 22,461.56 21,876.33Current liabilities(a) Financial liabilities
(i) Borrowings 21 19,813.04 15,574.86 14,282.91(ii) Trade payables 22 5,218.41 3,983.54 3,597.31(iii) Other financial liabilities 23 12,781.96 10,975.60 10,428.57
(b) Other current liabilities 25 5,609.56 5,494.99 4,287.46(c) Provisions 24 2,924.87 2,648.41 2,383.17(d) Current tax liabilities (net) 13 16.67 11.90 12.55
46,364.51 38,689.30 34,991.97TOTAL EQUITY & LIABILITIES 1,07,615.24 1,01,302.29 1,01,448.25
Significant Accounting PoliciesThe accompanying notes are an integral part of these consolidated financial statements
Consolidated Balance SheetAs at 31st March, 2017 (` crore)
For and on behalf of Board of Directors
Sd/- Sd/- Sd/-(M.C.Jain) (Anil Kumar Chaudhary) (P. K. Singh)
Company Secretary Director (Finance) ChairmanDIN: 03256818 DIN: 06398868
In terms of our report of even date
For Singhi & Co. For Chatterjee & Co. For V K Dhingra & Co. For A K Sabat & Co.Chartered Accountants Chartered Accountants Chartered Accountants Chartered Accountants
Firm Registration No.302049E Firm Registration No.302114E Firm Registration No.000250N Firm Registration No.321012E
Sd/- Sd/- Sd/- Sd/-[ Shrenik Mehta ] [ R.N. Basu ] [ Lalit Ahuja ] [ A K Sabat ]
Partner Partner Partner PartnerM. No. 063769 M. No. 050430 M. No. 085842 M. No. 030310
Place : New DelhiDated : May 30, 2017
Annexure-IV to the Directors' Report

105
Note No. Year ended 31st March, 2017 Year ended 31st March, 2016
IncomeRevenue from operations 26 49,828.95 43,932.73Other income 27 449.48 529.04Total Income 50,278.43 44,461.77ExpensesCost of materials consumed 28 21,161.45 17,183.00Changes in inventories of finished goods and work in progress 29 117.34 540.45Excise duty 5,327.18 4,834.29Employee benefits expense 30 8,963.78 9,728.57Finance costs 31 2,527.82 2,300.45Depreciation and amortisation expense 2,681.62 2,404.42Other expenses 32 14,192.11 14,548.94Total Expenses 54,971.30 51,540.12Profit before exceptional item, share of net profits of (4,692.87) (7,078.35)investment accounted for using equity method and taxShare of (loss) in investments accounted for using equity method 193.92 (35.86)Profit/(Loss) before Exceptional items & tax (4,498.95) (7,114.21)Add: Exceptional Items - Voluntary retirement compensation (216.74) -Profit/(Loss) Before Tax (4,715.69) (7,114.21)
Tax expenseCurrent tax 30.64 23.42Deferred tax (2,005.30) (2,886.11)Earlier years 15.14 (75.02)Total tax expense (1,959.52) (2,937.71)
Profit/(Loss) for the year (2,756.17) (4,176.50)Other Comprehensive IncomeA i) Items that will not be reclassified to profit and loss
Remeasurements of defined benefit plans (546.07) (144.45)Gains and losses from investments in equity instrumentsdesignated at fair value through OCI 3.02 0.42
ii) Income tax relating to items that will not be 188.78 49.35reclassified to profit or loss
B i) Items that will be reclassified to profit or lossShare of the OCI of associate and joint ventures 0.52 50.84accounted for using the equity method
ii) Income tax relating to items that will be reclassifiedto profit or loss
Other Comprehensive Loss for the year (353.75) (43.83)Total Comprehensive Loss for the year (3,109.92) (4,220.33)Profit attributable to ownersOwners of the parent (2,756.17) (4,176.50)Non-controlling interest - -
(2,756.17) (4,176.50)Total comprehensive Income for the yearOwners of the parent (3,109.92) (4,220.33)Non-controlling interest - -
(3,109.92) (4,220.33)Earnings per equity shareNumber of Equity Shares (face value of ` 10 each) 4130525289 4130525289Basic and diluted earnings per share (` ) (6.67) (10.11)
Significant Accounting Policies 3The accompanying notes are an integral part of these consolidated financial statements
Consolidated Statement of Profit & LossFor the year ended 31st March, 2017
(` crore)
For and on behalf of Board of Directors
Sd/- Sd/- Sd/-(M.C.Jain) (Anil Kumar Chaudhary) (P. K. Singh)
Company Secretary Director (Finance) ChairmanDIN: 03256818 DIN: 06398868
In terms of our report of even date
For Singhi & Co. For Chatterjee & Co. For V K Dhingra & Co. For A K Sabat & Co.Chartered Accountants Chartered Accountants Chartered Accountants Chartered Accountants
Firm Registration No.302049E Firm Registration No.302114E Firm Registration No.000250N Firm Registration No.321012E
Sd/- Sd/- Sd/- Sd/-[ Shrenik Mehta ] [ R.N. Basu ] [ Lalit Ahuja ] [ A K Sabat ]
Partner Partner Partner PartnerM. No. 063769 M. No. 050430 M. No. 085842 M. No. 030310
Place : New DelhiDated : May 30, 2017

106
Consolidated Statement of Changes in EquityFor the year ended 31st March, 2017
(` crore)
A Equity Share Capital
Particulars Balance as at Changes in equity Balance as at Changes in equity Balance as at1st April, 2015 share capital 31st March, 2016 share capital 31st March, 2017
Equity shares with voting rights 4,130.09 0.30 4,130.39 0.02 4,130.41Equity shares without voting rights 0.44 (0.30) 0.14 0.02 0.12
For and on behalf of Board of Directors
Sd/- Sd/- Sd/-(M.C.Jain) (Anil Kumar Chaudhary) (P. K. Singh)
Company Secretary Director (Finance) ChairmanDIN: 03256818 DIN: 06398868
In terms of our report of even date
For Singhi & Co. For Chatterjee & Co. For V K Dhingra & Co. For A K Sabat & Co.Chartered Accountants Chartered Accountants Chartered Accountants Chartered Accountants
Firm Registration No.302049E Firm Registration No.302114E Firm Registration No.000250N Firm Registration No.321012E
Sd/- Sd/- Sd/- Sd/-[ Shrenik Mehta ] [ R.N. Basu ] [ Lalit Ahuja ] [ A K Sabat ]
Partner Partner Partner PartnerM. No. 063769 M. No. 050430 M. No. 085842 M. No. 030310
Place : New DelhiDated : May 30, 2017
(` crore)B Other Equity
Reserves and Surplus Other comprehensiveincome - Reserve
Capital Securities General Bond Retained Equity Investment Total Non- TotalReserve Premium reserve redemption Earnings Instruments accounted other controlling
Reserve reserve through for as equity interestOther equity
Comprehensive methodIncome
Balance as at 1st April, 2015 500.88 235.10 5,099.17 1,008.88 33,605.39 - - 40,449.42 - 40,449.42Loss for the year - - - - (4,176.50) - - (4,176.50) - (4,176.50)Other comprehensive loss for the year - - - - (94.46) (0.22) 50.84 (43.84) - (43.84)Total comprehensive income/ (loss) - - - - (4,270.96) (0.22) 50.84 (4,220.34) - (4,220.34)for the yearImpact of Depreciation on account of - - - - (86.61) - - (86.61) - (86.61)SCH II of Companies Act 2013Transfer from bond redemption reserve - - - (63.03) 63.03 - - - - -Transfer to bond redemption reserve - - - 504.11 (504.11) - - - - -Transfer to general reserve - - 1.55 - (1.55) - - - - -Changes due to additional investment in 2.70 - - - - - - 2.70 - 2.70joint ventures
2.70 - 1.55 441.08 (529.24) - - (83.91) - (83.91)Transaction with owners in theircapacity as owners:Dividends - - - - (103.26) - - (103.26) - (103.26)Tax on dividends - - - - (21.02) - - (21.02) - (21.02)
- - - - (124.28) - - (124.28) - (124.28)Balance as at 31st March, 2016 503.58 235.10 5,100.72 1,449.96 28,680.91 (0.22) 50.84 36,020.89 - 36,020.89Balance as at 1st April, 2016 503.58 235.10 5,100.72 1,449.96 28,680.91 (0.22) 50.84 36,020.89 - 36,020.89Loss for the year - - - - (2,756.17) (2,756.17) (2,756.17)Other comprehensive income/(loss) - - - - (357.29) 3.02 0.52 (353.75) (353.75)for the yearTotal comprehensive income/ - - - - (3,113.46) 3.02 0.52 (3,109.92) - (3,109.92)(loss) for the yearTransfer from bond redemption reserve - - - (84.09) 84.09 - - - - -Transfer to bond redemption reserve - - - 607.77 (607.77) - - - - -Transfer to general reserve - - 2.04 - (2.04) - - - - -Changes due to additional investment 0.75 - - - - - - 0.75 - 0.75in joint ventures
0.75 - 2.04 523.68 (525.72) - - 0.75 - 0.75Transaction with owners in their capacity as owners:Dividends - - - - - - - - - -Tax on dividends - - - - - - - - - -Transaction with non-controlling interest - - - - (0.01) - - (0.01) 0.01 -
- - - - (0.01) - - (0.01) 0.01 -Balance as at 31st March, 2017 504.33 235.10 5,102.76 1,973.64 25,041.72 2.80 51.37 32,911.71 0.01 32,911.72

107
For the year ended For the year ended31st March, 2017 31st March, 2016
A. CASH FLOW FROM OPERATING ACTIVITIES
Profit/(Loss) before tax (4,715.69) (7,114.20)
Adjustments for:
Depreciation and amortisation expense 2,681.62 2,404.42
Gain on disposal of fixed assets (net) 48.17 68.05
Interest income 4.85 186.92
Dividend income (1.05) (0.54)
Finance costs 2,527.82 2,300.45
Loss on sale of non current investments (0.01) (7.31)
Bad debts and provision for doubtful advances/receivables 74.47 27.81
Other provisions 73.20 165.25
Share of profit from joint ventures (193.92) 35.86
Unclaimed balances and excess provisions written back (97.62) (80.59)
Operating profit/(loss) before working capital changes 401.84 (2,013.88)
Change in assets and liabilities
Trade receivable 239.88 489.49
Loans, other financial assets and other assets (439.41) 514.57
Trade payable 1,235.40 392.36
Other financial liabilities, other liabilities and provisions 1,810.70 1,953.58
Inventories (1,100.85) 2,400.64
Cash flow from operating activities post working capital changes 2,147.56 3,736.76
Income tax paid (net) 12.54 305.99
Net cash flow from operating activities (A) 2,160.10 4,042.75
B CASH FLOWS FROM INVESTING ACTIVITIES
Purchase of property, plant & equipment (including capital work-in-progress) and intangibles (5,454.27) (6,651.98)
Proceeds from sale/disposal of property, plant & equipment 27.53 158.99
Purchase of current and non-current investments 1.60 (137.34)
Movement in fixed deposits (net) (37.82) 2,011.35
Interest received (4.85) (186.92)
Dividend received 1.05 0.54
Net cash flows/ (used) in investing activities (B) (5,466.76) (4,805.36)
C CASH FLOWS FROM FINANCING ACTIVITIES
Proceeds from long-term borrowings (net) 1,591.77 1,875.51
Repayment of short-term borrowings (net) 4,238.18 1,291.95
Finance cost paid (2,527.82) (2,300.45)
Dividend paid (including tax) - (124.28)
Net cash flow /(used) in financing activities (C) 3,302.13 742.73
Decrease in cash and cash equivalents (A+B+C) (4.53) (19.88)
Cash and cash equivalents at the beginning of the year 145.18 165.04
Cash and cash equivalents at the end of the year Note no. 16 140.64 145.18
The cash flow statement has been prepared under the indirect method as set out in Ind AS-7, Statement of Cash Flows.
The accompanying notes are an integral part of these consolidated financial statements.
Cash Flow StatementFor the year ended 31st March, 2017 (` crore)
For and on behalf of Board of Directors
Sd/- Sd/- Sd/-(M.C.Jain) (Anil Kumar Chaudhary) (P. K. Singh)
Company Secretary Director (Finance) ChairmanDIN: 03256818 DIN: 06398868
In terms of our report of even date
For Singhi & Co. For Chatterjee & Co. For V K Dhingra & Co. For A K Sabat & Co.Chartered Accountants Chartered Accountants Chartered Accountants Chartered Accountants
Firm Registration No.302049E Firm Registration No.302114E Firm Registration No.000250N Firm Registration No.321012E
Sd/- Sd/- Sd/- Sd/-[ Shrenik Mehta ] [ R.N. Basu ] [ Lalit Ahuja ] [ A K Sabat ]
Partner Partner Partner PartnerM. No. 063769 M. No. 050430 M. No. 085842 M. No. 030310
Place : New DelhiDated : May 30, 2017

108
1. Corporate Information
Nature of Operations
Steel Authority of India Limited ('SAIL' or the 'Parent Company'), a publicsector undertaking conferred with Maharatna status by Government ofIndia, together with its subsidiaries, joint ventures and associate (collectivelyreferred to as the 'Group') is engaged primarily in steel manufacturingbusiness in the country.
General information and statement of compliance with Ind AS
The consolidated financial statements of the Group have been prepared onaccrual basis of Accounting in accordance with the Indian AccountingStandards as notified under section 133 of the Companies Act 2013 readwith the Companies (Indian Accounting Standards) Rules 2015 (by Ministryof Corporate Affairs ('MCA')). The Group has uniformly applied theaccounting policies during the periods presented.
For all periods up to and including the year ended 31 March 2016, theGroup has prepared its financial statements in accordance with IndianAccounting Standards (Ind AS) notified under the section 133 of theCompanies Act 2013, read together with paragraph 7 of the Companies(Accounts) Rules, 2014 (Previous GAAP). These are Group's firstconsolidated financial statements prepared in accordance with Ind AS (seenote 36 for explanation on transition to Ind AS). For the purpose ofcomparatives, consolidated financial statements for the year ended 31March 2016 are also prepared under Ind AS.
The consolidated financial statements for the year ended 31 March 2017were authorized and approved by the Board of Directors on 30th May,2017.
2. Summary of significant accounting policies
a) Overall consideration
The consolidated financial statements have been prepared using thesignificant accounting policies and measurement bases summarised below.These were used throughout all periods presented in the financialstatements, except where the Group has applied certain accounting policiesand exemptions upon transition to Ind AS.
Basis of preparation
The financial statements have been prepared on going concern basis underthe historical cost basis except for the following -
• certain financial assets and liabilities which are classified as fair valuethrough profit and loss or fair value through other comprehensiveincome;
• assets held for sale, at the lower of the carrying amounts and fairvalue less cost to sell; and
• defined benefit plans - plan assets measured at fair value.
Basis of consolidation
Subsidiaries
Subsidiaries are all entities (including structured entities) over which theGroup has control. The Group controls an entity when the Group is exposedto, or has rights to, variable returns from its involvement with the entity andhas the ability to affect those returns through its power to direct the relevantactivities of the entity. Subsidiaries are fully consolidated from the date onwhich control is transferred to the Group. They are deconsolidated fromthe date when control ceases. Profit/(loss) and Other ComprehensiveIncome ('OCI') of subsidiaries acquired or disposed of during the periodare recognised from the effective date of acquisition, or up to the effectivedate of disposal, as applicable. All the consolidated subsidiaries have aconsistent reporting date of 31 March 2017.
The Group consolidate the financial statements of the parent and itssubsidiaries on line by line basis adding together the items of assets,liabilities, equity, income and expenses. Intercompany transactions,balances and unrealised gains on transactions between group companiesare eliminated. Unrealised losses are also eliminated unless the transactionprovides evidence of an impairment of the transferred asset. Accountingpolicies of subsidiaries have been changed where necessary to ensureconsistency with the policies adopted by the Group.
Non-controlling interests, presented as part of equity, represent the portionof a subsidiary's statement of profit and loss and net assets that is not heldby the Group. Profit/(loss) and each component of OCI are attributed to theequity holders of the Parent Company and to the non-controlling interests,even if this results in the non-controlling interests having a deficit balance.The Group attributes total comprehensive income or loss of the subsidiariesbetween the owners of the parent and the non-controlling interests basedon their respective ownership interests.
The Group treats transactions with non-controlling interests that do notresult in a loss of control, as transactions with equity owners of the group.Such a change in ownership interest results in an adjustment between thecarrying amounts of the controlling and non-controlling interests to reflecttheir relative interests in the subsidiary. Any difference between the amountof the adjustment to non-controlling interests and any consideration paidor received is recognised within equity.
Associates and joint ventures
Associates
Investment in entities in which there exists significant influence but not acontrolling interest are accounted for under the equity method i.e. theinvestment is initially recorded at cost, identifying any goodwill/capitalreserve arising at the time of acquisition, as the case may be, which will beinherent in investment. The carrying amount of the investment is adjustedthereafter for the post acquisition change in the share of net assets of theinvestee, adjusted where necessary to ensure consistency with theaccounting policies of the Group. The consolidated statement of profit andloss includes the Group's share of the results of the operations of theinvestee. Dividends received or receivable from associate ventures arerecognised as a reduction in the carrying amount of the investment.Unrealised gains on transactions between the Group and associates areeliminated to the extent of the Group's interest in these entities.
Joint ventures
Investments in joint arrangements are classified as either Joint operationsor Joint ventures. The classification depends on the contractual rights andobligations of each investor, rather than the legal structure of the Jointarrangement.
• Joint ventures - Interest in joint venture are accounted for using theequity method, after initially being recognised at cost. The carryingamount of the investment is adjusted thereafter for the post acquisitionchange in the share of net assets of the investee, adjusted wherenecessary to ensure consistency with the accounting policies of theGroup. The consolidated statement of profit and loss includes theGroup's share of the results of the operations of the investee. Dividendsreceived or receivable from joint ventures are recognised as a reductionin the carrying amount of the investment. Unrealised gains ontransactions between the Group and joint ventures are eliminated tothe extent of the Group's interest in these entities.
• Joint operations - The Group recognises its direct right to the assets,liabilities, revenue and expenses of Joint operations and its share ofany jointly held or incurred assets, liabilities, revenue and expenses.These have been incorporated in the financial statement under theappropriate heading.
When the Group's share of losses in an equity-accounted investment equalsor exceeds its interest in the entity, including any other unsecured long-term receivables, the Group does not recognise further losses, unless ithas incurred obligations or made payments on behalf of the other entity.
b) Business combinations
The Group applies the acquisition method in accounting for businesscombinations. The consideration transferred by the Group to obtain controlof a subsidiary is calculated as the sum of the fair values of assetstransferred on acquisition-date, liabilities incurred and the equity interestsissued by the Group, which includes the fair value of any asset or liabilityarising from a contingent consideration arrangement. Acquisition costsare expensed as incurred.
Identifiable assets acquired and liabilities and contingent liabilities assumedin a business combination are measured initially at their fair values onacquisition-date.
Notes to Consolidated Financial Statements for the Year ended 31st March 2017

109
Goodwill is initially measured at cost, being the excess of the aggregate ofthe consideration transferred and the amount recognised for non-controllinginterests, and any previous interest held, over the net identifiable assetsacquired and liabilities assumed. If the fair value of the net assets acquiredis in excess of the aggregate consideration transferred, the resulting gainon bargain purchase is recognised in OCI and accumulated in equity ascapital reserve. However, if there is no clear evidence of bargain purchase,the entity recognise the gain directly in equity as capital reserve, withoutrouting the same through OCI
Where settlement of any part of cash consideration is deferred, the amountpayable in future is discounted to their present value as at the date ofexchange. The discount rate used is the Group's incremental borrowingrate, being the rate at which the similar borrowing could be obtained froman independent financier under comparable terms and condition.
Contingent consideration is classified either as equity or financial liability.Amount classified as financial liability are subsequently re-measured tofair value with changes in fair value recognised in statement of profit andloss.
Business combinations involving entities or businesses under commoncontrol have been accounted for using the pooling of interest method. Theassets and liabilities of the combining entities are reflected at their carryingamounts. No adjustments have been made to reflect fair values, or torecognise any new assets or liabilities except changes made to harmonisethe accounting policies.
On transition to Ind AS
Ind AS 103 'Business Combinations' has not been applied to acquisitionsof subsidiaries, or of interests in associates and joint ventures that occurredbefore the transition date. Previous GAAP carrying amount of goodwill hasbeen carried under Ind AS.
c) Current versus Non-current classification
The Group presents assets and liabilities in the balance sheet based oncurrent/ non-current classification. An asset is classified as current whenit is:
• Expected to be realised or intended to sold or consumed in normaloperating cycle
• Held primarily for the purpose of trading
• Expected to be realised within twelve months after the reporting period,or
• Cash or cash equivalent unless restricted from being exchanged orused to settle a liability for at least twelve months after the reportingperiod
All other assets are classified as non-current.
A liability is classified as current when:
• It is expected to be settled in normal operating cycle
• It is held primarily for the purpose of trading
• It is due to be settled within twelve months after the reporting period,or
• There is no unconditional right to defer the settlement of the liabilityfor at least twelve months after the reporting period
All other liabilities are classified as non-current.
The operating cycle is the time between the acquisition of assets forprocessing and their realisation in cash and cash equivalents. Deferred taxassets and liabilities are classified as non-current assets and liabilities.
2.1 Functional and Presentation Currency
The Financial Statements have been presented in Indian Rupees (`), whichis the Group's functional currency. All financial information presented in `have been rounded off to the nearest two decimals of Crore unless otherwisestated.
2.2 Use of Estimates and Management Judgement
In preparing the financial statements in conformity with Group's AccountingPolicies, management is required to make estimates and assumptions thataffect reported amounts of assets and liabilities and the disclosure ofcontingent liabilities as at the date of the financial statements, the amountsof revenue and expenses during the reported period and notes to the
Financial Statements. Actual results could differ from those estimates. Anyrevision to such estimates is recognised in the period in which the same isdetermined.
3. Significant Accounting Policies
A summary of the significant accounting policies applied in the preparationof the financial statements is given below. These accounting policies havebeen applied consistently to all the periods presented in the financialstatements.
3.1 Property, Plant and Equipment
3.1.1 Recognition and Measurement
Tangible Assets
Property, plant and equipment held for use in the production or/and supplyof goods or services, or for administrative purposes, are stated in thebalance sheet at cost, less any subsequent accumulated depreciation andimpairment losses. The initial cost at cash price equivalence of property,plant and equipment acquired comprises its purchase price, including importduties and non-refundable purchase taxes, any directly attributable costsof bringing the assets to its working condition and location and presentvalue of any obligatory decommissioning costs for its intended use. Plantand Machinery also include assets held under finance lease.
In case of self-constructed assets, cost includes the costs of all materialsused in construction, direct labour, allocation of overheads, directlyattributable borrowing costs including trial run expenses (net of revenue).
Spares having useful life of more than one year and having value of ` 10lakhs or more in each case, are capitalised under the respective heads asand when available for use.
Profit or loss arising on the disposal of property, plant and equipment isrecognised in the Statement of Profit and Loss.
3.1.2 Subsequent Cost
Subsequent expenditure is recognised as an increase in the carrying amountof the asset or recognised as a separate asset, as appropriate, only whenit is probable that future economic benefits derived from the cost incurredwill flow to the Group and the cost of the item can be measured reliably.The carrying amount of replaced item(s) is derecognised. .
Any repairs of ` 50 lakhs or more of property, plant and equipment arerecognised in the carrying amount of the item if it is probable that thefuture economic benefits of the costs incurred will flow to the Group. Thecarrying amount of the replaced item(s) is derecognised.
3.1.3 Depreciation
Depreciation on tangible assets and investment property is provided onstraight line method, considering residual value of 5% of the cost of theasset, over the useful lives of the assets, as specified in Schedule II of theCompanies Act, 2013 except in case of Factory Buildings, Plant andMachinery, Water Supply & Sewerage and Railway Lines & Sidings andcomponents thereof, where useful life is determined by technical experts.The useful life assumed by the technical experts is as under:
Asset category Estimated useful life (in years)
Factory Buildings 35 to 40
Plant and Machinery 10 to 40
Water Supply & Sewerage 25 to 40
Railway Lines & Sidings 35 to 40
For these classes of assets, based on technical evaluation carried out byexternal technical experts, the Group believes that the useful lives as givenabove best represent the period over which Group expects to use theseassets. Hence, the useful lives for these assets are different from the usefullives as prescribed under Part C of Schedule II of the Companies Act 2013.
The estimated useful lives and residual values of depreciable/ amortisableassets are reviewed at each year end, with the effect of any changes inestimate accounted for on a prospective basis.
Where the historical cost of a depreciable asset undergoes a change, thedepreciation on the revised unamortised depreciable amount is providedover the residual useful life of the asset. Depreciation on addition/ deletionduring the year is provided on pro-rata basis with reference to the month of

110
addition/ deletion. Assets costing up to ` 5000/- are fully depreciated inthe year in which they are put to use.
Depreciation on Bhilai Expansion Power Project (pp-II) located at Bhilai ischarged on straight line method following the rates and methodology notifiedby the CERC Tariff Regulations in accordance with Schedule II of the'Companies Act, 2013.
Depreciation on capital spares is provided over the useful life of the spareor remaining useful life of the mother asset, as reassessed, whichever islower.
3.2 Intangible assets
3.2.1 Recognition and measurement
Mining Rights
Mining Rights are treated as Intangible Assets and all related costs thereofare amortised on the basis of annual production to the total estimatedmineable reserves. In case the mining rights are not renewed, the balancerelated cost will be charged to revenue in the year of decision of non-renewal.
Acquisition Cost i.e. cost associated with acquisition of licenses, and rightsto explore including related professional fees, payment towards statutoryforestry clearances, as and when incurred, are treated as addition to theMining Rights.
Other Intangible Assets
Software which is not an integral part of related hardware, is treated asintangible asset and amortised over a period of five years or its licenceperiod, whichever is less.
Research and Development
Development expenditure is capitalised only if it can be measured reliablyand the related asset and process are identifiable and controlled by theGroup. Research and other development expenditure is recognised asrevenue expenditure as and when incurred.
3.2.2 Subsequent Cost
Subsequent expenditure is capitalised only when it increases the futureeconomic benefits embodied in the specific asset to which it relates. Allother expenditure is recognised in the Statement of Profit and Loss.
3.3 Impairment of Non-Financial Assets
The Group reviews the carrying amount of its assets on each BalanceSheet date for the purpose of ascertaining impairment indicators if any, byconsidering assets of entire one Plant as Cash Generating Unit (CGU). Ifany such indication exists, the assets' recoverable amount is estimated, ashigher of the Net Selling Price and the Value in Use. An impairment loss isrecognised whenever the carrying amount of an asset exceeds itsrecoverable amount.
Where an impairment loss subsequently reverses, the carrying amount ofthe asset (or cash-generating unit) is increased to the revised estimate ofits recoverable amount, so that the increased carrying amount does notexceed the carrying amount that would have been determined had noimpairment loss been recognised for the asset (or cash-generating unit) inprior years. A reversal of an impairment loss is recognised immediately inthe Statement of Profit and Loss.
3.4 Stripping Cost
The stripping cost incurred during the production phase of a surface mineis recognised as an asset if such cost provides a benefit in terms of improvedaccess to ore in future periods and following criteria are met:
• It is probable that the future economic benefits (improved access toan ore body) associated with the stripping activity will flow to theentity,
• The entity can identify the component of an ore body for which accesshas been improved, and
• The costs relating to the improved access to that component can bemeasured reliably.
The expenditure, which cannot be specifically identified to have beenincurred to access ore is charged to revenue, based on stripping ratio asper 5 year mining plan for mines, except collieries which is based on projectreport.
3.5 Borrowing Costs
Borrowing costs directly attributable to the acquisition or construction of aqualifying asset, which takes substantial period of time, are capitalised asa part of the cost of that asset, during the period of time that is necessaryto complete and prepare the asset for its intended use.
The Group considers a period of twelve months or more as a substantialperiod of time.
Transaction costs in respect of long-term borrowings are amortised overthe tenor of respective loans using effective interest method. Other borrowingcosts are recognised in the Statement of Profit & Loss in the period inwhich these are incurred.
3.6 Inventories
Raw materials, Stores & Spares and Finished/Semi-finished products(including process scrap) are valued at lower of cost and net realisablevalue of the items of the respective Plants/Units. In case of identifiedobsolete/ surplus/ non-moving items, necessary provision is made andcharged to revenue. The net realisable value of semi-finished specialproducts, which have realisable value at finished stage only, is estimatedfor the purpose of comparison with cost.
Residue products and other scrap are valued at estimated net realisablevalue.
The basis of determining cost is:
Raw materials - Periodical weighted average cost
Minor raw materials - Moving weighted average cost
Stores & Spares - Moving weighted average cost
Materials in-transit - at cost
Finished/Semi-finished products - material cost plus appropriate share oflabour, related overheads and duties.
3.7 Government Grants
Government grants are recognised when there is reasonable assurancethat the Company will comply with the conditions attaching to them andthat the grants will be received.
Government grants are recognised in Statement of Profit and Loss on asystematic basis over the periods in which the Company recognises asexpenses the related costs for which the grants are intended to compensate.Where the Grant relates to an asset value, it is recognised as deferredincome, and amortised over the expected useful life of the asset. Othergrants are recognised in the statement of Profit & Loss concurrent to theexpenses to which such grants relate/ are intended to cover.
Where the Company receives non-monetary grants, the asset and the grantare recorded gross at fair amounts and released to the income statementover the expected useful life and pattern of consumption of the benefit ofthe underlying asset.
3.8 Foreign Currency Transactions
Foreign currency transactions are translated into the functional currency ofthe Group using the exchange rates prevailing at the date of the transactions.Foreign exchange gains and losses resulting from the settlement and re-measurement of monetary items denominated in foreign currency arerecognised in the Statement of Profit and Loss at period-end exchangerates.
The Group opted for accounting the exchange differences arising onrepor ting of long term foreign currency monetary items in line withCompanies (Accounting Standards) Amendment Rules 2009 relating toAccounting Standard-11 notified by Government of India on 31st March,2009 (as amended on 29th December 2011), which will continue inaccordance with Ind-AS 101 for all pre-existing long term foreign currencymonetary items as at 31st March 2016. Accordingly, exchange differences(including arising out of forward exchange contracts) relating to long termmonetary items, arising during the year, in so far as they relate to theacquisition of fixed assets, are adjusted in the carrying amount of suchassets.
Non-monetary items are not retranslated at period-end and are measuredat historical cost (translated using the exchange rates at the transactiondate), except for non-monetary items measured at fair value which are

111
translated using the exchange rates at the date when fair value wasdetermined.
3.9 Employee Benefits
Defined Contribution Plan
A defined contribution plan is a plan under which the Group pays fixedcontributions into a separate entity. Payments to defined contributionretirement benefit plans are recognised as an expense when employeeshave rendered service entitling them to the contributions. Contributionstowards Provident Funds are charged to the Statement of Profit and Lossof the period when the contributions to the Funds are due.
Defined Benefit Plan
Defined benefit plans are the amount of the benefit that an employee willreceive on completion of services by reference to length of service, lastdrawn salary or direct costs related to such benefits. The legal obligationfor any benefits remains with the Group.
The liability recognised for Defined Benefit Plans is the present value of theDefined Benefit Obligation (DBO) at the reporting date less the fair value ofplan assets, together with adjustments for unrecognised actuarial gains orlosses and past service costs. Management estimates the present value ofthe DBO annually through valuations by an independent actuary using theprojected unit credit method. Actuarial gains and losses are included inStatement of Profit and Loss or Other Comprehensive Income of the year.
Remeasurement, comprising of actuarial gains and losses, the effect ofthe changes to the asset ceiling (if applicable) and the return on plan assets(excluding interest), is reflected in the balance sheet with a charge or creditrecognised in other comprehensive income in the period in which theyoccur. Remeasurement recognised in other comprehensive income isreflected immediately in retained earnings and will not be reclassified tothe statement of profit and loss.
Short Term Employee Benefits
Short term employee benefits comprise of employee costs such as salaries,bonus, ex-gratia, annual leave and sick leave which are accrued in the yearin which the associated services are rendered by employees of the Group.
Liabilities recognised in respect of shor t-term employee benefits aremeasured at the undiscounted amount of the benefits expected to be paidin exchange for the related services.
Expenditure incurred on Voluntary Retirement Scheme is charged to theStatement of Profit and Loss immediately.
3.10 Revenue Recognition
Revenue is measured at the fair value of consideration received or receivable.
Sale of goods
Sales include excise duty and are net of sales taxes, rebates and priceconcessions. Sales are recognised at the time of dispatch of materials tothe buyers including the cases where delivery documents are endorsed infavour of the buyers. Where the contract prices are not finalised withgovernment agencies, sales are accounted for on provisional basis.
Marine export sales are recognised on:
i) the issue of bill of lading, or
ii) negotiation of export bills upon expiry of laycan period, in cases whererealisation of material value without shipment is provided in the lettersof credit of respective contracts, whichever is earlier.
Export incentives under various schemes are recognised as income oncertainty of realisation.
The iron ore fines not readily useable/saleable are included in inventoryand revenue is recognised on disposal.
Interest and Dividend Income
Interest income is reported on an accrual basis using the effective interestmethod. Dividends are recognised at the time the right to receive isestablished.
3.11 Adjustment pertaining to Earlier Years
Income/Expenditure relating to a prior period, which do not exceed 0.5% ofTurnover in each case, are treated as income/expenditure of current year.
3.12 Claims for Liquidated Damages and Price Escalation
Claims for liquidated damages are accounted for as and when these areconsidered recoverable by the Parent Company. These are adjusted to thecapital cost or recognised in Statement of Profit and Loss, as the case maybe on final settlement of Liquidated damages.
Suppliers' and Contractors' claims for price escalation are accounted for tothe extent such claims are accepted by the Parent Company.
3.13 Leases
Group as a Lessee
Finance leases
Finance leases, which effectively transfer to the lessee substantially all therisks and benefits incidental to ownership of the leased item, are capitalisedat the lower of the fair value and present value of the minimum leasepayments at the inception of the lease term and disclosed as leased assets.Lease payments under such leases are apportioned between the financecharges and reduction of the lease liability based on the implicit rate ofreturn. Finance charges are charged directly against income. Leasemanagement fees, legal charges and other initial direct costs are capitalised.
If there is no reasonable certainty that the Group will obtain the ownershipby the end of lease term, capitalised leased assets are depreciated overthe shorter of the estimated useful life of the asset or the lease term.
Operating leases
Assets acquired on leases where a significant portion of risk and rewardsof ownership are retained by the lessor are classified as operating leases.Lease rental are charged to statement of profit and loss on straight-linebasis except where scheduled increase in rent compensate the lessor forexpected inflationary costs.
Group as a Lessor
Finance leases
Leases which effectively transfer to the lessee substantially all the risksand benefits incidental to ownership of the leased item are classified andaccounted for as finance lease. Lease rental receipts are apportionedbetween the finance income and capital repayment based on the implicitrate of return. Contingent rents are recognised as revenue in the period inwhich they are earned.
Operating leases
Leases in which the Group does not transfer substantially all the risks andrewards of ownership of an asset are classified as operating leases. Therespective leased assets are included in the balance sheet based on theirnature. Rental income is recognized on straight-line basis over the leaseterm except where scheduled increase in rent compensates the Group withexpected inflationary costs.
3.14 Investment Properties
Investment properties are properties held to earn rentals and/or for capitalappreciation. Investment properties are measured initially at cost includingtransaction costs. Subsequent to initial recognition, investment propertiesare stated at cost less accumulated depreciation and impairment losses.Any gain or loss on disposal of investment property is determined as thedifference between net disposal proceeds and the carrying amount of theproperty and is recognised in the Statement of Profit and Loss.
3.15 Non-current assets held for sale
Group classifies a non-current asset as held for sale if its carrying amountwill be recovered principally through a sale transaction. This condition isregarded as met only when the asset is available for immediate sale in itspresent condition and its sale is highly probable.
Non-current assets including discontinued operations, classified as heldfor sale are measured at the lower of the carrying amounts and fair valueless costs to sell and presented separately in the financial statements. Onceclassified as held for sale, the assets are not subject to depreciation oramortisation.
Any profit or loss arising from the sale or re-measurement of discontinuedoperations is presented as part of a single line item in Statement of Profitand Loss.
112
3.16 Mine Closure
Mine Closure Provision include the dismantling and demolition ofinfrastructure, the removal of residual materials and the remediation ofdisturbed areas for mines. This provision is based on all regulatoryrequirements and related estimated cost based on best available information.Mine closure costs are provided for in the accounting period when theobligation arises based on the net present value of the estimated futurecosts of restoration to be incurred during the life of the operation and postclosure.
The initial close-down and restoration provision is capitalised within"Property, Plant and Equipment". Subsequent movements in the close-downand restoration provisions for on-going operations, including those resultingfrom new disturbance related to expansions or other activities qualifyingfor capitalisation, updated cost estimates, changes to the estimated livesof operations, changes to the timing of closure activities and revisions todiscount rates are also capitalised within "Property, Plant and Equipment".These costs are depreciated over the lives of the assets to which theyrelate. Any changes in closure provisions relating to closed operations arecharged/ credited to the Statement of Profit and Loss. The amortisation or"unwinding" of the discount applied in establishing the provisions is chargedas Finance Cost.
3.17 Provisions, Contingent Liabilities and Contingent Assets
Provisions and Contingent Liabilities
A Provision is recognised when the Group has present obligation as a resultof a past event and it is probable that an outflow of resources will be requiredto settle the obligation in respect of which a reliable estimate can be made.Provisions are discounted to their present value, where the time value ofmoney is material.
When some or all of the economic benefits required to settle a provisionare expected to be recovered from a third party, the receivable is recognisedas a separate asset if it is virtually certain that reimbursement will be receivedand the amount of the receivable can be measured reliably.
Contingent liability is a possible obligation arising from past events and theexistence of which will be confirmed only by the occurrence or non-occurrence of one or more uncertain future events not wholly within thecontrol of the Group or a present obligation that arises from past eventsbut is not recognised because it is not possible that an outflow of resourcesembodying economic benefit will be required to settle the obligations orreliable estimate of the amount of the obligations cannot be made. TheGroup discloses the existence of contingent liabilities in Other Notes toFinancial Statements.
In cases where the possible outflow of economic resources as a result ofpresent obligation is considered improbable or remote, no Provision isrecognised or disclosure is made.
Contingent Assets
Contingent assets usually arise from unplanned or other unexpected eventsthat give rise to the possibility of an inflow of economic benefits. ContingentAssets are not recognised though are disclosed, where an inflow ofeconomic benefits is probable.
3.18 Income Taxes
Tax expense recognised in statement of profit and loss comprises the sumof deferred tax and current tax not recognised in Other ComprehensiveIncome (OCI) or directly in equity.
Current income tax is measured at the amount expected to be paid to thetax authorities in accordance with the Indian Income-tax Act. Current incometax relating to items recognised outside statement of profit and loss isrecognised either in OCI or in equity.
Deferred income taxes are calculated using the liability method. Deferredtax liabilities are generally recognised in full for all taxable temporarydifferences. Deferred tax assets are recognised to the extent that it isprobable that the underlying tax loss, unused tax credits (MAT Creditentitlement) or deductible temporary difference will be utilised against futuretaxable income. Unrecognised deferred tax assets are re-assessed at eachreporting date and are recognised to the extent that it has become probablethat future taxable profits will allow the deferred tax asset to be recovered.
Deferred tax assets and liabilities are measured at the tax rates that areexpected to apply in the year when the asset is realised or the liability is
settled, based on tax rates (and tax laws) that have been enacted orsubstantively enacted at the reporting date. Deferred tax relating to itemsrecognised outside statement of profit and loss is recognised either in OCIor in equity.
3.19 Cash and Cash Equivalents
Cash and cash equivalents comprise cash on hand and demand deposits,together with other short-term highly liquid investments (original maturityless than 3 months) that are readily convertible into known amount of cashand are subject to an insignificant risk of changes in value.
3.20 Segment Reporting
The Group has 8 operating/reportable segments: the five integrated steelplants and three alloy steel plants, being separate manufacturing units,have been considered reportable segments. In identifying these operatingsegments, management generally considers the Group's separatelyidentifiable manufacturing operations representing its main operations.
Each of these operating segments is managed separately as each requiresdifferent technologies, raw materials and other resources. All inter-segmenttransfers are carried out at arm's length prices based on prices charged tounrelated customers in standalone sales of identical goods or services.
For management purposes, the Group uses the same measurement policiesas those used in its consolidated financial statements.
In addition, corporate assets which are not directly attributable to thebusiness activities of any operating segment are not allocated to a segment.This primarily applies to the Group's administrative head office and miningoperations.
There have been no changes from prior periods in the measurementmethods used to determine repor ted segment profit or loss. Noasymmetrical allocations have been applied between segments.
3.21 Equity and Reserves
Share Capital represents the nominal value of shares that have been issued.Securities premium includes any premium received on issue of ShareCapital.
Other components of equity include the following:
• Re-measurement of defined benefit liability comprises the actuarialgain or loss from changes in demographic and financial assumptionsand return on plan assets.
• Bond Redemption Reserve.
• Other transactions recorded directly in Other Comprehensive Income.
• Retained earnings include all current and prior period retained profits.
3.22 Financial Instruments
Recognition, initial measurement and de-recognition
Financial assets and financial liabilities are recognised and are measuredinitially at fair value adjusted by transactions costs, except for those financialassets which are classified at Fair Value through Profit & Loss (FVTPL) atinception.
Financial assets are derecognised when the contractual rights to the cashflows from the financial asset expire, or when the financial asset and allsubstantial risks and rewards are transferred. A financial liability isderecognized when it is extinguished, discharged, cancelled or expires.
Classification and subsequent measurement of financial assets
For the purpose of subsequent measurement, financial assets are classifiedinto the following categories upon initial recognition:
• amortised cost
• financial assets at fair value through profit or loss (FVTPL)
• financial assets at fair value through other comprehensive income(FVOCI)
All financial assets except for those at FVTPL are subject to review forimpairment at least at each reporting date.
Amortised cost
A financial asset is measured at amortised cost using effective interestrates if both of the following conditions are met:

113
a) the financial asset is held within a business model whose objective isto hold financial assets in order to collect contractual cash flows; and
b) the contractual terms of the financial asset give rise on specified datesto cash flows that are solely payments of principal and interest on theprincipal amount outstanding.
The Group's cash and cash equivalents, trade and most other receivablesfall into this category of financial instruments.
Financial assets at FVTPL
Financial assets at FVTPL include financial assets that are either do notmeet the criteria for amortised cost classification or are equity instrumentsheld for trading or that meet certain conditions and are designated at FVTPLupon initial recognition. All derivative financial instruments also fall intothis category. Assets in this category are measured at fair value with gainsor losses recognized in profit or loss. The fair values of financial assets inthis category are determined by reference to active market transactions orusing a valuation technique where no active market exists.
Financial assets at FVOCI
FVOCI financial assets are either debt instruments that are managed underhold to collect and sell business model or are non-trading equity instrumentsthat are designated to this category.
FVOCI financial assets are measured at fair value. Gains and losses arerecognized in other comprehensive income, except for interest and dividendincome, impairment losses and foreign exchange differences on monetaryassets, which are recognized in statement of profit or loss.
Classification and subsequent measurement of financial liabilities
Financial liabilities are measured subsequently at amortized cost using theeffective interest method, except for financial liabilities held for trading ordesignated at FVTPL, that are carried subsequently at fair value with gainsor losses recognized in profit or loss. All derivative financial instrumentsare accounted for at FVTPL.
Embedded Derivatives
Derivatives embedded in non-derivative host contracts are treated asseparate derivatives when they meet the definition of a derivative, theirrisks and characteristics are not closely related to those of the host contractsand the contracts are not measured at FVTPL.
Impairment of Financial Assets
In accordance with Ind AS 109, the Group applies Expected Credit Loss(ECL) model for measurement and recognition of impairment loss forfinancial assets.
ECL is the difference between all contractual cash flows that are due to theGroup in accordance with the contract and all the cash flows that the Groupexpects to receive.
Trade Receivables
The Group applies approach as specified in Indian Accounting Standards(Ind AS) 109 Financial Instruments, which requires expected lifetime lossesto be recognised from initial recognition of receivables.
Other Financial Assets
For recognition of impairment loss on other financial assets and riskexposure, the Group determines whether there has been a significantincrease in the credit risk since initial recognition.
3.23 Significant Judgements, Assumptions and Estimations in applyingAccounting Policies
3.23.1 Classification of Leases
The Group enters into leasing arrangements for various assets. Theclassification of the leasing arrangement as a finance lease or operatinglease is based on an assessment of several factors, including, but not
limited to, transfer of ownership of leased asset at end of lease term, lessee'soption to purchase and estimated certainty of exercise of such option,proportion of lease term to the asset's economic life, proportion of presentvalue of minimum lease payments to fair value of leased asset and extentof specialized nature of the leased asset.
3.23.2 Close-down and Restoration Obligations
Close-down and restoration costs are normal consequence of mining orproduction, and majority of close-down and restoration expenditure areincurred in the years following the closure of mine, although the ultimatecost to be incurred is uncertain, the Group estimate their costs using currentrestoration techniques.
3.23.3 Recognition of Deferred Tax Assets
The extent to which deferred tax assets can be recognized is based on anassessment of the probability of the Group's future taxable income againstwhich the deferred tax assets can be utilized. In addition, significantjudgement is required in assessing the impact of any legal or economiclimits.
3.23.4 Inventories
The Group estimates the cost of inventories taking into account the mostreliable evidence, such as cost of materials and overheads consideredattributable to the production of such inventories including actual cost ofproduction, etc. Management also estimates the net realisable values ofinventories, taking into account the most reliable evidence available at eachreporting date. The future realisation of these inventories may be affectedby future technology or other market-driven changes that may reduce futureselling prices.
3.23.5 Defined Benefit Obligation (DBO)
Employee benefit obligations are measured on the basis of actuarialassumptions which include mortality and withdrawal rates as well asassumptions concerning future developments in discount rates, medicalcost trends, anticipation of future salary increases and the inflation rate.The Group considers that the assumptions used to measure its obligationsare appropriate. However, any changes in these assumptions may have amaterial impact on the resulting calculations.
3.23.6 Fair Value Measurements
The Group applies valuation techniques to determine the fair value of financialinstruments (where active market quotes are not available) and non-financialassets. This involves developing estimates and assumptions consistentwith the market par ticipants to price the instrument. The Group'sassumptions are based on observable data as far as possible, otherwiseon the best information available. Estimated fair values may vary from theactual prices that would be achieved in an arm's length transaction at thereporting date.
3.23.7 Provisions and Contingencies
The assessments undertaken in recognising provisions and contingencieshave been made in accordance with Indian Accounting Standards (Ind AS)37, 'Provisions, Contingent Liabilities and Contingent Assets'. The evaluationof the likelihood of the contingent events is applied best judgement bymanagement regarding the probability of exposure to potential loss.
3.23.8 Mines Closure and Restoration Obligations
Environmental liabilities and Asset Retirement Obligation (ARO): Estimationof environmental liabilities and ARO require interpretation of scientific andlegal data, in addition to assumptions about probability and future costs.
3.23.9 Useful lives of depreciable/ amortisable assets (tangible and intangible)
Management reviews its estimate of the useful lives of depreciable/amortisable assets at each reporting date, based on the expected utility ofthe assets. Uncertainties in these estimates relate to actual normal wearand tear that may change the utility of plant and equipment.

114
4.
PR
OP
ER
TY,
PLA
NT
AN
D E
QU
IPM
EN
T(F
or t
he y
ear
ende
d 31st
Mar
ch,
2016)
(` c
rore
)
Des
crip
tion
Gro
ss b
lock
Acc
umul
ated
dep
reci
atio
nN
et b
lock
Net
blo
ck *
As
atA
ddit
ions
Dis
posa
ls/
A
s at
As
atFo
rD
ispos
als
/A
s at
As
atA
s at
1st A
pril,
Adj
ustm
ents
31
st
Mar
ch,
1st A
pril,
the
Adj
ustm
ents
31st
Mar
ch,
31st
Mar
ch,
1st A
pril,
2015
2016
2015
Year
2016
2016
2015
A.
Pla
nt,
Min
es &
Oth
ers
Land
(In
clud
ing
cost
of
Dev
elop
men
t)
-Fre
ehol
d la
nd 2
66.2
6 1
.52
- 2
67.7
8 0
.87
- -
0.8
7 2
66.9
1 2
65.3
9
-Lea
seho
ld la
nd 9
59.0
1 2
1.81
1.5
4 9
79.2
8 1
13.8
6 5
8.99
1.3
3 1
71.5
2 8
07.7
6 8
45.1
5
Bui
ldin
gs a
nd r
elat
ed e
quip
men
ts 3
,941
.04
641
.94
(51
1.17
) 5
,094
.15
1,3
85.6
6 1
58.5
5 4
8.26
1,4
95.9
5 3
,598
.20
2,5
55.3
7
Dev
elop
ed m
ines
0.0
2-
- 0
.02
- -
- -
0.0
2 0
.02
Pla
nt
and
mac
hine
ry
-Ste
el P
lant
51,
468.
58 9
,496
.05
821
.02
60,
143.
61 2
2,82
2.50
1,6
94.0
5 8
.62
24,
507.
93 3
5,63
5.68
28,
646.
08
-Oth
ers
- ow
ned
2,5
86.8
5 1
58.1
5 (
5.76
) 2
,750
.76
1,8
29.7
4 1
16.1
4 6
2.80
1,8
83.0
8 8
67.6
8 7
57.1
1
-Oth
ers
- le
aseh
old
(R
efer
not
e (ii
)) 1
,378
.01
77.
64 -
1,4
55.6
5 4
29.0
3 1
10.7
1 -
539
.74
915
.91
948
.98
Furn
iture
and
fix
ture
s 1
15.4
4 4
.58
1.5
1 1
18.5
1 8
0.97
5.0
6 0
.38
85.
65 3
2.86
34.
46
Vehi
cles
1,2
69.0
4 5
3.80
14.
02 1
,308
.82
643
.33
65.
66 1
0.01
698
.98
609
.84
625
.71
Offi
ce e
quip
men
ts 5
7.53
4.5
1 2
.07
59.
97 4
4.57
3.4
3 1
.91
46.
09 1
3.88
12.
96
Mis
cella
neou
s ar
ticle
s 3
02.3
6 2
7.65
20.
95 3
09.0
6 1
98.3
6 1
4.06
14.
44 1
97.9
8 1
11.0
8 1
04.0
0
Roa
ds,
Brid
ges
& C
ulve
rts
257
.63
54.
29 2
.46
309
.46
175
.60
33.
31 2
.06
206
.85
102
.61
82.
03
Wat
er S
uppl
y &
Sew
erag
e 6
36.5
2 3
1.20
115
.57
552
.15
314
.24
17.
90 2
6.05
306
.09
246
.05
322
.28
Rai
lway
Lin
es A
nd S
idin
gs 6
09.3
7 6
2.55
42.
09 6
29.8
3 2
39.5
8 1
2.97
19.
62 2
32.9
3 3
96.9
0 3
69.7
9
EDP
equ
ipm
ents
392
.96
10.
47 1
.55
401
.87
323
.45
22.
61 2
.38
343
.69
58.
19 6
9.50
Sub
tota
l 'A
' 6
4,2
40.6
1 1
0,6
46.1
6 5
05.8
5 7
4,3
80.9
2 2
8,6
01.7
7 2
,313.4
4 1
97.8
6 3
0,7
17.3
5 4
3,6
63.5
7 3
5,6
38.8
3
B.
Soc
ial
Faci
litie
s
Land
(In
clud
ing
cost
of
Dev
elop
men
t)
-Fre
ehol
d la
nd 1
0.88
- -
10.
88 -
- -
- 1
0.88
10.
88
-Lea
seho
ld la
nd 6
.89
- -
6.8
9 5
.78
0.1
1 -
5.8
9 1
.00
1.1
1
Bui
ldin
gs a
nd r
elat
ed e
quip
men
ts 6
27.0
3 3
5.16
(1.
75)
663
.94
284
.73
17.
75 0
.68
301
.80
362
.15
342
.31
Pla
nt
and
mac
hine
ry
- O
ther
s 1
34.1
7 7
.27
0.4
8 1
40.9
6 8
9.13
5.7
2 0
.29
94.
56 4
6.40
45.
04
Furn
iture
and
fix
ture
s 2
5.32
2.0
3 0
.73
26.
62 1
7.94
1.4
1 0
.37
18.
98 7
.64
7.3
8
Vehi
cles
11.
19 -
0.2
1 1
0.98
9.2
3 0
.55
0.2
0 9
.58
1.4
0 1
.96
Offi
ce e
quip
men
ts 4
.20
0.5
2 0
.17
4.5
5 3
.41
0.3
3 0
.12
3.6
2 0
.93
0.7
9
Mis
cella
neou
s ar
ticle
s 2
05.2
8 9
.74
0.1
9 2
14.8
3 1
15.3
2 1
1.21
(0.
14)
126
.67
88.
16 8
9.96
Roa
ds,
Brid
ges
& C
ulve
rts
93.
36 2
9.85
(0.
63)
123
.84
55.
53 1
4.11
(0.
59)
70.
23 5
3.61
37.
83
Wat
er S
uppl
y &
Sew
erag
e 1
22.7
1 6
.18
(93
.68)
222
.57
107
.28
4.3
6 (
7.76
) 1
19.4
0 1
03.1
7 1
5.43
EDP
equ
ipm
ents
12.
72 0
.24
0.8
5 1
2.11
11.
11 0
.63
1.0
8 1
0.66
1.4
5 1
.61
Sub
tota
l 'B
' 1
,253.7
5 9
0.9
9 (
93.4
3)
1,4
38.1
7 6
99.4
6 5
6.1
8 (
5.7
5)
761.3
9 6
76.7
9 5
54.3
0
C.
Pro
pert
y, p
lant
and
equ
ipm
ent
reti
red
from
act
ive
use
Ass
ets
retir
ed f
rom
act
ive
use
55.
64 6
.49
6.7
3 5
5.40
- -
- -
55.
40 5
5.64
Sub
tota
l 'C
' 5
5.6
4 6
.49
6.7
3 5
5.4
0 -
- -
- 5
5.4
0 5
5.6
4
Tota
l 6
5,5
50.0
0 1
0,7
43.6
4 4
19.1
5 7
5,8
74.4
9 2
9,3
01.2
3 2
,369.6
2 1
92.1
1 3
1,4
78.7
3 4
4,3
95.7
6 3
6,2
48.7
7
* R
epre
sent
s de
emed
cos
t on
the
date
of
tran
sitio
n to
IndA
S.
Gro
ss b
lock
and
acc
umul
ated
dep
reci
atio
n fr
om th
e pr
evio
us G
AA
P h
ave
been
dis
clos
ed f
or th
e pu
rpos
e of
bet
ter
unde
rsta
ndin
g of
the
orig
inal
cos
t of
asse
ts.
Not
es t
o th
e C
onso
lidat
ed F
inan
cial
Sta
tem
ents
for
the
yea
r en
ded
31st M
arch
, 2017
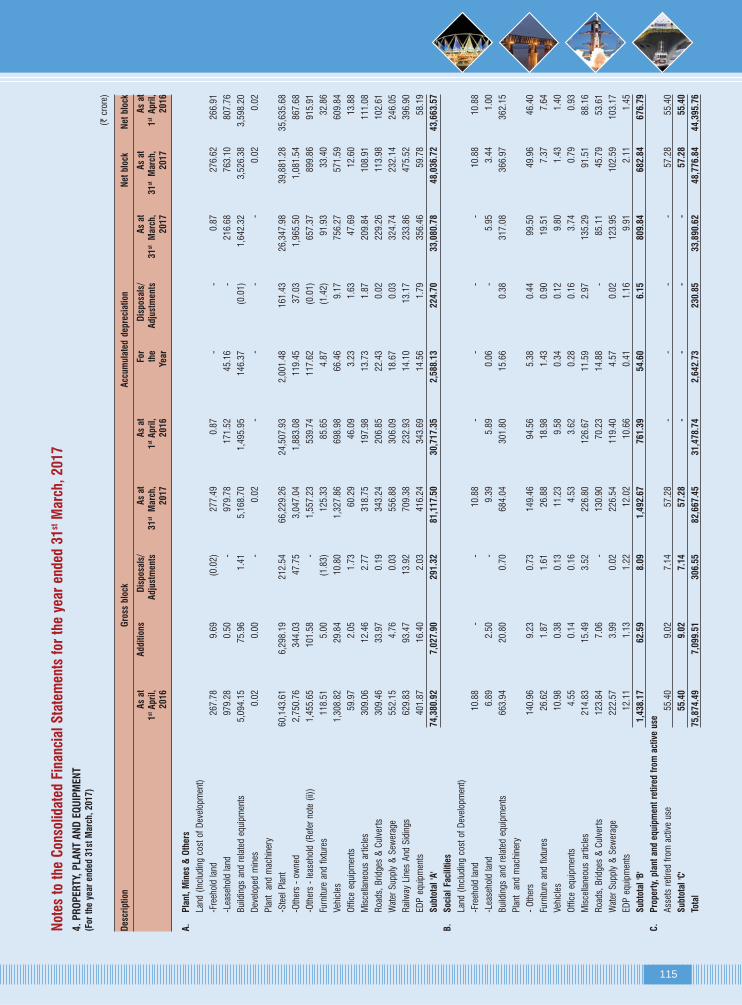
115
4.
PR
OP
ER
TY,
PLA
NT
AN
D E
QU
IPM
EN
T(F
or t
he y
ear
ende
d 31st
Mar
ch,
2017)
(` c
rore
)
Des
crip
tion
Gro
ss b
lock
Acc
umul
ated
dep
reci
atio
nN
et b
lock
Net
blo
ck
As
atA
ddit
ions
Dis
posa
ls/
A
s at
As
atFo
rD
ispos
als
/A
s at
As
atA
s at
1st A
pril,
Adj
ustm
ents
31
st
Mar
ch,
1st A
pril,
the
Adj
ustm
ents
31st
Mar
ch,
31st
Mar
ch,
1st A
pril,
2016
2017
2016
Year
2017
2017
2016
A.
Pla
nt,
Min
es &
Oth
ers
Land
(In
clud
ing
cost
of
Dev
elop
men
t)
-Fre
ehol
d la
nd 2
67.7
8 9
.69
(0.
02)
277
.49
0.8
7 -
- 0
.87
276
.62
266
.91
-Lea
seho
ld la
nd 9
79.2
8 0
.50
- 9
79.7
8 1
71.5
2 4
5.16
- 2
16.6
8 7
63.1
0 8
07.7
6
Bui
ldin
gs a
nd r
elat
ed e
quip
men
ts 5
,094
.15
75.
96 1
.41
5,1
68.7
0 1
,495
.95
146
.37
(0.
01)
1,6
42.3
2 3
,526
.38
3,5
98.2
0
Dev
elop
ed m
ines
0.0
2 0
.00
- 0
.02
--
--
0.0
2 0
.02
Pla
nt
and
mac
hine
ry
-Ste
el P
lant
60,
143.
61 6
,298
.19
212
.54
66,
229.
26 2
4,50
7.93
2,0
01.4
8 1
61.4
3 2
6,34
7.98
39,
881.
28 3
5,63
5.68
-Oth
ers
- ow
ned
2,7
50.7
6 3
44.0
3 4
7.75
3,0
47.0
4 1
,883
.08
119
.45
37.
03 1
,965
.50
1,0
81.5
4 8
67.6
8
-Oth
ers
- le
aseh
old
(Ref
er n
ote
(ii))
1,4
55.6
5 1
01.5
8 -
1,5
57.2
3 5
39.7
4 1
17.6
2 (
0.01
) 6
57.3
7 8
99.8
6 9
15.9
1
Furn
iture
and
fix
ture
s 1
18.5
1 5
.00
(1.
83)
125
.33
85.
65 4
.87
(1.
42)
91.
93 3
3.40
32.
86
Vehi
cles
1,3
08.8
2 2
9.84
10.
80 1
,327
.86
698
.98
66.
46 9
.17
756
.27
571
.59
609
.84
Offi
ce e
quip
men
ts 5
9.97
2.0
5 1
.73
60.
29 4
6.09
3.2
3 1
.63
47.
69 1
2.60
13.
88
Mis
cella
neou
s ar
ticle
s 3
09.0
6 1
2.46
2.7
7 3
18.7
5 1
97.9
8 1
3.73
1.8
7 2
09.8
4 1
08.9
1 1
11.0
8
Roa
ds,
Brid
ges
& C
ulve
rts
309
.46
33.
97 0
.19
343
.24
206
.85
22.
43 0
.02
229
.26
113
.98
102
.61
Wat
er S
uppl
y &
Sew
erag
e 5
52.1
5 4
.76
0.0
3 5
56.8
8 3
06.0
9 1
8.67
0.0
3 3
24.7
4 2
32.1
4 2
46.0
5
Rai
lway
Lin
es A
nd S
idin
gs 6
29.8
3 9
3.47
13.
92 7
09.3
8 2
32.9
3 1
4.10
13.
17 2
33.8
6 4
75.5
2 3
96.9
0
EDP
equ
ipm
ents
401
.87
16.
40 2
.03
416
.24
343
.69
14.
56 1
.79
356
.46
59.
78 5
8.19
Sub
tota
l 'A
' 7
4,3
80.9
2 7
,027.9
0 2
91.3
2 8
1,1
17.5
0 3
0,7
17.3
5 2
,588.1
3 2
24.7
0 3
3,0
80.7
8 4
8,0
36.7
2 4
3,6
63.5
7
B.
Soc
ial
Faci
litie
s
Land
(In
clud
ing
cost
of
Dev
elop
men
t)
-Fre
ehol
d la
nd 1
0.88
- -
10.
88 -
- -
- 1
0.88
10.
88
-Lea
seho
ld la
nd 6
.89
2.5
0 -
9.3
9 5
.89
0.0
6 -
5.9
5 3
.44
1.0
0
Bui
ldin
gs a
nd r
elat
ed e
quip
men
ts 6
63.9
4 2
0.80
0.7
0 6
84.0
4 3
01.8
0 1
5.66
0.3
8 3
17.0
8 3
66.9
7 3
62.1
5
Pla
nt
and
mac
hine
ry
- O
ther
s 1
40.9
6 9
.23
0.7
3 1
49.4
6 9
4.56
5.3
8 0
.44
99.
50 4
9.96
46.
40
Furn
iture
and
fix
ture
s 2
6.62
1.8
7 1
.61
26.
88 1
8.98
1.4
3 0
.90
19.
51 7
.37
7.6
4
Vehi
cles
10.
98 0
.38
0.1
3 1
1.23
9.5
8 0
.34
0.1
2 9
.80
1.4
3 1
.40
Offi
ce e
quip
men
ts 4
.55
0.1
4 0
.16
4.5
3 3
.62
0.2
8 0
.16
3.7
4 0
.79
0.9
3
Mis
cella
neou
s ar
ticle
s 2
14.8
3 1
5.49
3.5
2 2
26.8
0 1
26.6
7 1
1.59
2.9
7 1
35.2
9 9
1.51
88.
16
Roa
ds,
Brid
ges
& C
ulve
rts
123
.84
7.0
6 -
130
.90
70.
23 1
4.88
- 8
5.11
45.
79 5
3.61
Wat
er S
uppl
y &
Sew
erag
e 2
22.5
7 3
.99
0.0
2 2
26.5
4 1
19.4
0 4
.57
0.0
2 1
23.9
5 1
02.5
9 1
03.1
7
EDP
equ
ipm
ents
12.
11 1
.13
1.2
2 1
2.02
10.
66 0
.41
1.1
6 9
.91
2.1
1 1
.45
Sub
tota
l 'B
' 1
,438.1
7 6
2.5
9 8
.09
1,4
92.6
7 7
61.3
9 5
4.6
0 6
.15
809.8
4 6
82.8
4 6
76.7
9
C.
Pro
pert
y, p
lant
and
equ
ipm
ent
reti
red
from
act
ive
use
Ass
ets
retir
ed f
rom
act
ive
use
55.
40 9
.02
7.1
4 5
7.28
- -
- -
57.
28 5
5.40
Sub
tota
l 'C
' 5
5.4
0 9
.02
7.1
4 5
7.2
8 -
- -
- 5
7.2
8 5
5.4
0
Tota
l 7
5,8
74.4
9 7
,099.5
1 3
06.5
5 8
2,6
67.4
5 3
1,4
78.7
4 2
,642.7
3 2
30.8
5 3
3,8
90.6
2 4
8,7
76.8
4 4
4,3
95.7
6
Not
es t
o th
e C
onso
lidat
ed F
inan
cial
Sta
tem
ents
for
the
yea
r en
ded
31st M
arch
, 2017

116
4. PROPERTY, PLANT AND EQUIPMENT (CONTD.)
(` crore)
For the year For the yearended 31st ended 31st
March, 2017 March, 2016
Note: Allocation of Depreciation
( a ) Charged to profit and loss account 2,681.62 2,404.42
( b ) charged to expenditure during construction 5.12 6.45
2,686.74 2,410.87
(i) Contractual Obligations:
Refer note 39.1 for disclosure of contractual commitments for the acquisition of property, plant and equipment.
(ii) Land:
(a) Includes 67,718.76 acres ( 67,681.64 acres as on 31st March, 2016, 67354.96 acres as on 1st April, 2015) owned / possessed / taken on lease by the Group, in respect ofwhich title/lease deeds are pending for registration.
(b) Includes 34061.08 acres (34061.08 acres as on 31st March, 2016, 35334.08 acres as on 1st April 2015) in respect of which title is under dispute.
(c) 9007.46 acres (8856.73 acres as on 31st March, 2016, 8851.69 acres as on 1st April 2015) transferred/agreed to be transferred or made available for settlement to variousJoint Ventures / Central / State / Semi-Government authorities, in respect of which conveyance deeds remain to be executed/registered.
(d) 6384.17 acres (7181.43 acres as on 31st March, 2016, 6345.43 acres as on 1st April 2015) given on lease to various agencies/employees/ex-employees.
(e) Includes 4436.70 acres (4440.70 acres as on 31st March, 2016, 4211.42 acres as on 1st April 2015) under unauthorised occupation.
(f) 1762.92 acres (1762.92 acres as on 31st March, 2016, 1762.92 acres as on 1st April 2015) of Land which is not in the actual possession, shown as deemed possession.
(g) `68.71 crore is lying under deposits (in respect of land already acquired) with the District & Sessions Judge, Bokaro during the year 2007 towards compensation payable toland losers.
(h) Vide Notification of Acquisition in the Gazette of India (Extraordinary) bearing No S.O. 1309(E) dated 08.06.2012 and No. S.O. 2484E dated 13.10.2012, National HighwayAuthority of India Ltd.(NHAI) had notified its intention to acquire 9.553 acres.
(i) Includes 21.13 acres freehold land notified for acquisition by Government of Jharkhand vide Gazette notification no. 42 & 43 dated 26th August, 2009, determining compensationof `13.91 crore only for 15.62 acres. Management proposes to contest the same with appropriate authorities. Pending further action in the matter, no effect of above has beengiven in the accounts.
(iii) Other Assets:
(a) Buildings include net block of ` 21.18 crore (`21.73 crore as on 31st March, 2016, `22.15 crore as on 1st April, 2015) for which conveyance deed is yet to be registered inthe name of the Group.
(b) Includes 6035 residential quarters/houses under unauthorised occupation.
Notes to the Consolidated Financial Statements for the year ended 31st March, 2017

117
Notes to the Consolidated Financial Statements for the year ended 31st March, 2017
(` crore)
As at As at As at31st March, 2017 31st March, 2016 1st April, 2015
5. CAPITAL WORK IN PROGRESS
Steel Plants & Units 22,922.89 24,616.37 28,885.79
Township 107.49 110.40 153.85
Ore Mines and Quarries 399.14 348.48 262.79
Less: Provisions (199.32) (187.32) (131.77)
23,230.20 24,887.93 29,170.66
Construction Stores and Spares 37.49 34.67 36.07
Less: Provision for non-moving items (3.39) (3.29) (2.77)
34.10 31.38 33.30
Expenditure during construction pending allocation 11.09 7.91 5.58
23,275.39 24,927.22 29,209.54
(i) Expenditure during construction pending allocation
For the year ended For the year ended For the year ended31st March, 2017 31st March, 2016 31st March, 2015
Opening balance 7.91 5.58 4.40
"Expenditure incurred during the year “Employees' Remuneration & Benefits"
Salaries & Wages 121.40 133.50 141.82
Group's contribution to Provident Fund 10.86 12.51 13.73
Travel Concession 3.08 4.00 2.87
Welfare Expenses 0.11 0.13 (0.10)
Gratuity 0.71 3.20 1.22
136.16 153.34 159.54
Other expenses
Technical Consultants' fees & know-how 8.56 7.92 18.89
Power & Fuel 134.97 84.76 198.69
Other expenses 6.68 30.38 46.31
Interest & Finance charges 581.90 643.72 637.88
Depreciation 5.12 6.45 8.19
737.23 773.23 909.96
Recoveries
Interest Earned 0.47 0.66 1.68
Liquidated Damages 2.49 7.60 0.58
Hire Charges 0.35 0.42 0.71
Sundries 17.99 1.58 (1.46)
21.30 10.26 1.51
Net expenditure during the year 852.09 916.31 1,067.99
Less: Amount allocated to Property, plant & equipment /Capital Work-in-progress 848.91 913.98 1,066.81
Balance carried forward 11.09 7.91 5.58

118
6.
INV
ES
TMEN
T P
RO
PER
TY(F
or t
he y
ear
ende
d 31
st M
arch
, 2016)
(` c
rore
)
Des
crip
tion
Gro
ss b
lock
Acc
umul
ated
am
orti
sati
onN
et b
lock
Net
blo
ck *
1st A
pril,
Addit
ions/
Dis
posa
ls/
31
st
Mar
ch,
1st A
pril,
For
Dis
pos
als
/31
st
Mar
ch,
31st
Mar
ch,
1st A
pril,
2015
Adju
stm
ents
Adju
stm
ents
2016
2015
the
Adju
stm
ents
2016
2016
2015
Year
Bui
ldin
gs 1
.45
- -
1.4
5 0
.55
0.0
2 -
0.5
7 0
.88
0.9
0
Tota
l1.4
5 -
- 1
.45
0.5
5 0
.02
- 0
.57
0.8
8 0
.90
* R
epre
sent
s de
emed
cos
t on
the
date
of
tran
sitio
n to
IndA
S.
Gro
ss b
lock
and
acc
umul
ated
dep
reci
atio
n fr
om th
e pr
evio
us G
AA
P h
ave
been
dis
clos
ed f
or th
e pu
rpos
e of
bet
ter
unde
rsta
ndin
g of
the
orig
inal
cos
t of
asse
ts.
Not
es t
o th
e C
onso
lidat
ed F
inan
cial
Sta
tem
ents
for
the
yea
r en
ded
31st M
arch
, 2017
(For
the
yea
r en
ded
31
st M
arch
, 2017)
(` c
rore
)
Des
crip
tion
Gro
ss b
lock
Acc
umul
ated
dep
reci
atio
nN
et b
lock
Net
blo
ck
1st A
pril,
Addit
ions
Dis
posa
ls/
31
st
Mar
ch,
1st A
pril,
Addit
ions
Dis
pos
als
/31
st
Mar
ch,
31st
Mar
ch,
1st A
pril,
2016
Adju
stm
ents
2017
2016
Adju
stm
ents
2017
2017
2016
Bui
ldin
gs 1
.45
- -
1.4
5 0
.57
0.0
2 -
0.5
9 0
.86
0.8
8
Tota
l 1
.45
- -
1.4
5 0
.57
0.0
2 -
0.5
9 0
.86
0.8
8

119
6. INVESTMENT PROPERTY (CONTD.)
(i) Contractual obligations
There are no contractual obligation to purchase, construct or develop investment property or for its repair, maintenance or enhancement.
(ii) Amount recognised in profit and loss for investment properties
31st March, 31st March, 2017 2016
Rental income 1.30 1.08
Direct operating expenses that generated rental income* - -
Direct operating expenses that did not generate rental income* - -
Profit from leasing of investment properties before depreciation 1.30 1.08
Depreciation 0.02 0.02
Profit from leasing of investment properties 1.27 1.06
*Direct expenses in relation to investment properties cannot be separately identified and are expected to be insignificant.
(iii) Leasing arrangements
Certain investment properties are leased to tenants under long-term operating leases with rentals payable monthly. Minimum lease payment receivable under non-cancellable leasesof investment property are as follows:
31st March, 31st March, 1st April,2017 March, 2016 2015
Within one year 0.02 0.01 0.01
Later than one year but not later than 5 years 0.02 0.03 0.03
later than 5 years 0.07 0.07 0.07
0.11 0.11 0.11
(iv) Fair value
Particulars 31st March, 31st March, 1st April,2017 March, 2016 2015
Investment properties 21.66 21.66 21.66
(v) Estimation of fair value
The best evidence of fair value is current prices in an active market for similar properties. Where such information is not available, the Group consider information from a variety ofsources including:
a) Current prices in an active market for properties of different nature or recent prices of similar properties in less active markets, adjusted to reflect those differences.
b) Discounted cash flow projections based on reliable estimates of future cash flows.
c) Circle rate of the property as provided by state government.
Notes to the Consolidated Financial Statements for the year ended 31st March, 2017

120
7.
INTA
NG
IBLE A
SS
ETS
(For
the
yea
r en
ded
31
st M
arch
, 2016)
(` c
rore
)
Des
crip
tion
Gro
ss b
lock
Acc
umul
ated
am
orti
sati
onN
et b
lock
Net
blo
ck *
1st A
pril,
Addit
ions/
Dis
posa
ls/
31
st
Mar
ch,
1st A
pril,
For
Dis
pos
als
/31
st
Mar
ch,
As
at 3
1st
As
at 1
st
2015
Adju
stm
ents
Adju
stm
ents
2016
2015
the
Adju
stm
ents
2016
Mar
ch,
2016
Apr
il, 2
015
Year
A.
Pla
nt,
Min
es &
Oth
ers
Com
pute
r S
oftw
are
99.
34 1
.18
0.0
2 1
00.5
0 9
0.80
3.7
5 0
.01
94.
54 5
.96
8.5
4
Min
ing
Rig
hts
1,7
27.2
7 7
5.99
- 1
,803
.26
225
.74
37.
40 -
263
.14
1,5
40.1
2 1
,501
.53
Sub
tota
l 'A
' 1
,826.6
1 7
7.1
7 0
.02
1,9
03.7
6 3
16.5
4 4
1.1
5 0
.01
357.6
8 1
,546.0
8 1
,510.0
7
B.
Soc
ial
Faci
litie
s
Com
pute
r S
oftw
are
0.7
5 0
.07
0.2
0 0
.62
0.6
1 0
.08
0.1
9 0
.50
0.1
2 0
.14
Sub
tota
l 'B
' 0
.75
0.0
7 0
.20
0.6
2 0
.61
0.0
8 0
.19
0.5
0 0
.12
0.1
4
Tota
l 1
,827
.36
77.
24 0
.22
1,9
04.3
8 3
17.1
5 4
1.23
0.2
0 3
58.1
8 1
,546
.20
1,5
10.2
1
* R
epre
sent
s de
emed
cos
t on
the
date
of
tran
sitio
n to
IndA
S.
Gro
ss b
lock
and
acc
umul
ated
dep
reci
atio
n fr
om th
e pr
evio
us G
AA
P h
ave
been
dis
clos
ed f
or th
e pu
rpos
e of
bet
ter
unde
rsta
ndin
g of
the
orig
inal
cos
t of
asse
ts.
Not
es t
o th
e C
onso
lidat
ed F
inan
cial
Sta
tem
ents
for
the
yea
r en
ded
31st M
arch
, 2017
(For
the
yea
r en
ded
31
st M
arch
, 2017)
(` c
rore
)
Des
crip
tion
Gro
ss b
lock
Acc
umul
ated
dep
reci
atio
nN
et b
lock
Net
blo
ck
As
atA
ddit
ions
Dis
posa
ls/
A
s at
As
atFo
rD
ispos
als
/A
s at
As
atA
s at
1st A
pril,
Adj
ustm
ents
31
st
Mar
ch,
1st A
pril,
the
Adj
ustm
ents
31st
Mar
ch,
31st
Mar
ch,
31st M
arch
,2016
2017
2016
Year*
*2017
2017
2016
A.
Pla
nt,
Min
es &
Oth
ers
Com
pute
r S
oftw
are
100
.50
1.2
8 (
0.58
) 1
01.2
0 9
4.54
3.2
4 0
.59
97.
19 4
.01
5.9
6
Min
ing
Rig
hts
1,8
03.2
6 1
9.07
- 1
,822
.33
263
.14
40.
69 -
303
.83
1,5
18.5
0 1
,540
.12
Sub
tota
l 'A
' 1
,903.7
6 2
0.3
5 (
0.5
8)
1,9
23.5
3 3
57.6
8 4
3.9
3 0
.59
401.0
2 1
,522.5
1 1
,546.0
8
B.
Soc
ial
Faci
litie
s
Com
pute
r S
oftw
are*
** 0
.62
0.0
1 -
0.6
3 0
.50
0.0
6 -
0.5
6 0
.07
0.1
2
Sub
tota
l 'B
' 0
.62
0.0
1 -
0.6
3 0
.50
0.0
6 -
0.5
6 0
.07
0.1
2
Tota
l 1
,904.3
8 2
0.3
6 (
0.5
8)
1,9
24.1
6 3
58.1
8 4
3.9
9 0
.59
401.5
8 1
,522.5
8 1
,546.2
0
**A
ll am
ortis
atio
n ch
arge
s ar
e in
clud
ed w
ithin
dep
reci
atio
n an
d am
ortis
atio
n ex
pens
e
***
Com
pute
r so
ftw
are
cons
ists
of
capi
taliz
ed d
evel
opm
ent
cost
s be
ing
an in
tern
ally
gen
erat
ed in
tang
ible
ass
ets.

121
Notes to the Consolidated Financial Statements for the year ended 31st March, 2017
8. INVESTMENTS
Number of shares (` crore)
As at 31st As at 31st As at 1st As at 31st As at 31st As at 1st
March, 2017 March, 2016 April, 2015 March, 2017 March, 2016 April, 2015
Investment carried at cost
In Joint ventures (unquoted)-Defunct entities
North Bengal Dolomite Ltd (Face value-100/share) 97,900 97,900 97,900 0.98 0.98 0.98
Romelt SAIL ( India ) Limited 63,000 63,000 63,000 0.06 0.06 0.06
1.04 1.04 1.04
Investments carried at fair value through other comprehensive income
Quoted equity
HDFC Limited ( Face value - `2/share) 60,000 60,000 60,000 9.00 6.64 7.87
HDFC Bank Limited ( Face value - `2/share) 2,500 2,500 2,500 0.36 0.27 0.26
ICICI Bank Limited ( Face value - `2/share) 1,43,000 1,43,000 1,43,000 3.94 3.38 4.50
13.30 10.29 12.63
Unquoted equity
TRL Krozaki Refractories Limited 22,03,150 22,03,150 22,03,150 29.93 29.93 28.64
Indian Potash Limited 3,60,000 3,60,000 3,60,000 13.43 13.43 12.30
Haridaspur Paradeep Railway Co Ltd 50,00,000 50,00,000 50,00,000 5.00 5.00 5.00
Cement & Allied Products (Bihar) Limited 2 2 2 - - -
Chemical & Fertilizer Corporation (Bihar) Limited 1 1 1 - - -
Bhilai Power Supply Company Limited 5 5 5 - - -
MSTC Limited 80,000 80,000 80,000 6.66 6.66 6.31
IISCO Ujjain Pipe & Foundary Company Limited 30,00,000 30,00,000 30,00,000 3.00 3.00 3.00(under liquidation)#
UEC SAIL Information Technology Limited* 1,80,000 1,80,000 1,80,000 0.18 0.18 0.18
Bihar State Finance Corporation (Face value `100/share) 500 500 500 0.01 0.01 0.01
58.21 58.21 55.44
In Co-operative society
Bokaro Steel Employees' Co.-operative Credit Society 1,16,500 1,16,500 1,16,500 0.12 0.12 0.12
Bokaro Steel City Central Consumers' Co-operative Society 250 250 250 - - -
NMDC Meghahatuburu Employees' 25 25 25 - - -Co-operative Society (Face value `100/share)
DSP Employees' Co-operative Society Limited 1,377 1,377 1,377 0.01 0.01 0.01(Face value `100/share)
Bolani Ores Employees' Consumer 200 200 200 - - -co-operative Society Limited (Face value `25/share)
IISCO Employees Primary Co-operative 23,000 23,000 23,000 0.05 0.05 0.05Society ((Face value `20/share)
0.18 0.18 0.18
Total 72.73 69.72 69.29
Provision for impairment in the value of investments 7.68 7.48 7.48
Net investment 65.05 62.24 61.81
Aggregate amount of quoted investments 13.30 10.29 12.63(market value thereof)
Aggregate amount of unquoted investments 59.43 59.43 56.66
Aggregate amount of impairment in value of investments 7.68 7.48 7.48
65.05 62.24 61.81
^All equity shares have face value ` 10 each unless otherwise stated.*Entity is under liquidation therefore not considered as joint venture despite of joint agreement between shareholders.#Entity is under liquidation therefore not in the control of the Group.

122
Notes to the Consolidated Financial Statements for the year ended 31st March, 2017
(` crore)
Non-current Current
As at 31st As at 31st As at 1st As at 31st As at 31st As at 1st
March, 2017 March, 2016 April, 2015 March, 2017 March, 2016 April, 2015
9. TRADE RECEIVABLES
(Unsecured, considered good unless otherwise stated)
Unsecured*
Considered good - - 2.25 2,934.69 3,151.42 3,585.89
Considered doubtful 7.83 6.43 34.98 181.89 152.23 137.38
7.83 6.43 37.23 3,116.58 3,303.65 3,723.27
Provision for doubtful receivables (7.83) (6.43) (34.98) (181.89) (152.23) (137.38)
- - 2.25 2,934.69 3,151.42 3,585.89
* Receivables due by directors and its officers of the Parent Company is nil (previous year nil)
10. LOANS
(Unsecured, considered good unless otherwise stated)
Security deposits 110.65 140.54 108.83 21.33 14.01 11.59
Loan to employees 157.40 195.38 239.92 58.57 62.57 59.75
Loan to related parties - - - 7.00 - 2.24
Loan to others 185.49 114.05 78.25 1.33 7.41 0.44
453.54 449.97 427.00 88.23 83.99 74.02
Provision for doubtful receivables (0.02) (0.02) (0.02) (15.50) (18.81) (7.05)
453.52 449.95 426.98 72.73 65.18 66.97
* Receivables includes amounts due from directors
11. OTHER FINANCIAL ASSETS
Derivative asset 46.59 265.30 351.25 180.95 208.65 119.19
Advances for purchase of shares 99.53 99.80 139.91 - - -
Claims recoverable - - 21.39 773.29 608.07 778.98
Receivables other than trade 103.46 115.45 102.07 245.38 175.05 142.50
Receivables from employee 0.12 0.88 0.35 6.88 7.77 20.04
Bills Receivable - - 0.77 1,072.99 773.55 1,181.14
Advances to related parties 10.53 10.53 10.53 23.66 47.92 151.95
260.23 491.96 626.27 2,303.15 1,821.01 2,393.80
Provision for doubtful interest (0.02) (0.02) (0.02) (32.07) (55.27) (52.09)
Provision for doubtful related parties advances (2.53) (2.53) (2.53) (1.39) (1.39) (1.39)
257.68 489.41 623.72 2,269.69 1,764.35 2,340.32

123
Notes to the Consolidated Financial Statements for the year ended 31st March, 2017
(` crore)
As at 31st As at 31st As at 1st
March, 2017 March, 2016 April, 2015
12. DEFERRED TAX
Tax effect of items constituting deferred tax liabilities
Difference between book and tax depreciation 7,451.63 6,106.53 4,527.81
Amortisation of financial assets/liabilities 31.39 34.35 62.23
Undistributed profits of subsidiary and joint ventures 158.86 130.88 109.50
Fair value adjustment through OCI 8.88 8.88 8.24
7,650.76 6,280.64 4,707.78
Tax effect of items constituting deferred tax assets
Retirement benefits 108.77 67.65 137.54
Finance lease obligations 75.83 61.58 58.55
Derivative adjustments 84.35 9.07 10.16
Unpaid taxes and duties to be allowed on payment 1,122.61 1,487.41 916.13
Losses available for offsetting against future taxable income 8,563.67 4,792.57 594.30
Others 493.28 452.68 527.58
10,448.51 6,870.96 2,244.26
Deferred tax (assets) /liabilities (net) (2,797.75) (590.32) 2,463.52
Tax credit (minimum alternative tax) (1,051.00) (1,079.50) (1,088.24)
(3,848.75) (1,669.82) 1,375.28
Deferred taxes arising from temporary differences and unused tax losses for year ended 31 March, 2017 are summarized as follows:(` crore)
Deferred tax assets/(liabilities) As at Recognized Recognized As atApril 1, 2016 in profit or in other March 31,
loss comprehensive 2017income
Tax effect of items constituting deferred tax liabilities
Difference between book and tax depreciation 6,106.53 1,345.10 - 7,451.63
Amortisation of financial assets/liabilities 34.35 (2.95) - 31.39
Undistributed profits of subsidiary and joint ventures 130.88 27.97 - 158.86
Fair value adjustment through OCI 8.88 0.00 - 8.88
6,280.64 1,370.12 - 7,650.76
Tax effect of items constituting deferred tax assets
Retirement benefits 67.65 (147.65) 188.78 108.77
Finance lease obligations 61.58 14.25 - 75.83
Derivative adjustments 9.07 75.27 - 84.35
Unpaid taxes and duties to be allowed on payment 1,487.41 (364.80) - 1,122.61
Losses available for offsetting against future taxable income 4,792.57 3,771.10 - 8,563.67
Tax credit (minimum alternative tax) 1,079.50 (28.50) - 1,051.00
Others 452.68 40.61 - 493.28
7,950.46 3,360.28 188.78 11,499.51
Deferred tax (assets) /liabilities (net) (1,669.82) (1,990.16) (188.78) (3,848.75)

124
(` crore)
Non-current Current
As at 31st As at 31st As at 1st As at 31st As at 31st As at 1st
March, 2017 March, 2016 April, 2015 March, 2017 March, 2016 April, 2015
13. CURRENT TAX ASSETS/LIABILITIES
Current tax assets
Advance income tax (net of provision) 235.81 278.10 609.89 0.00 0.89 0.00
235.81 278.10 609.89 0.00 0.89 0.00
Current tax liabilities
Opening Balance - - - 11.90 11.90 51.96
Add : Provision during the year - - - - - 499.15
(less) Amount paid during the year - - - 4.77 - (528.47)
(less) Provision written back during the year - - - - - (10.09)
- - - 16.67 11.90 12.55
235.81 278.10 609.89 (16.67) (11.01) (12.55)
14. OTHER ASSETS
Advances to contractors & suppliers 280.46 188.32 124.93 277.94 174.83 245.26
Advances Others 4.18 3.57 4.31 828.89 872.37 715.48
Deposits with government authorities 624.82 587.76 537.84 2,519.05 2,209.68 1,996.34
Gold coins in hand - - - 0.23 0.23 0.23
Prepaid expenses 34.12 41.09 47.04 36.64 36.55 35.83
Claims receivable - - - 742.67 1,058.76 1,346.40
Export incentive receivables - - - 41.26 12.97 18.04
Capital advances 191.50 198.10 124.06 - - -
1,135.08 1,018.84 838.18 4,446.68 4,365.39 4,357.58
Less: Provision for doubtful other assets (72.09) (42.37) (40.02) (143.77) (130.65) (119.05)
1,062.99 976.47 798.16 4,302.91 4,234.74 4,238.53
12. DEFERRED TAX (CONTD.)
Deferred taxes arising from temporary differences and unused tax losses for year ended 31 March, 2016 are summarized as follows: (` crore)
Deferred tax assets/(liabilities) As at Recognized Recognized As atApril 1, 2015 in profit or in other March 31,
loss comprehensive 2016income
Tax effect of items constituting deferred tax liabilities
Difference between book and tax depreciation 4,527.81 1,578.72 - 6,106.53
Amortisation of financial assets/liabilities 62.23 (27.88) - 34.35
Undistributed profits of subsidiary and joint ventures 109.50 21.38 - 130.88
Fair value adjustment through OCI 8.24 - 0.64 8.88
4,707.78 1,572.22 0.64 6,280.64
Tax effect of items constituting deferred tax assets
Retirement benefits 137.54 (119.89) 49.99 67.65
Finance lease obligations 58.55 3.03 - 61.58
Derivative adjustments 10.16 (1.09) - 9.07
Unpaid taxes and duties to be allowed on payment 916.13 571.28 - 1,487.41
Losses available for offsetting against future taxable income 594.30 4,198.27 - 4,792.57
Tax credit (minimum alternative tax) 1,088.24 (8.74) - 1,079.50
Others 527.58 (74.90) - 452.68
3,332.51 4,567.96 49.99 7,950.46
Recognised in retained earnings, pursuant to Schedule II application - (33.12) - -
Deferred tax (assets) /liabilities (net) 1,375.27 (2,962.62) (49.35) (1,669.82)
The Group is having accumulated business losses (Including Investment Allowance) of `24,744.77 crore (Previous year `13,848.16 crore) [including accumulated unabsorbeddepreciation of `15,057.93 crore (Previous Year `8,851.44 crore)] and MAT credit of `1,051.00 crore as on 31 March 2017 as per the provisions of the Income Tax Act, 1961. Theunabsorbed business losses amounting to `9,686.84 crore (Previous Year `4,996.72 crore) are available for offset for maximum period of eight years from the incurrence of loss andunused tax (MAT) credit will be available for offset within maximum period of fifteen years.
In view of the various measures being implemented by the Government for upliftment of the Steel Industry and to boost the demand coupled with steps being taken by the Group to reducethe cost, improvement in the efficiency/productivity, the Group is certain that it will be able to improve its physical and financial performance in future. Consequently, the Group will be ableto earn sufficient future taxable profits to adjust the accumulated business losses/unabsorbed depreciation and unused MAT credit.
Accordingly, deferred tax asset of `3,352.42 crores on accumulated business losses (including `1623.16 crores during the year ended 31st March, 2017) and MAT credit of `1051.00crores, has been recognised as on 31st March, 2017.
Notes to the Consolidated Financial Statements for the year ended 31st March, 2017

125
Notes to the Consolidated Financial Statements for the year ended 31st March, 2017
(` crore)
As at 31st As at 31st As at 1st
March, 2017 March, 2016 April, 2015
15. INVENTORIES*
Stores & Spares
Production 1,848.85 1,964.42 2,187.46
Fuel Stores 91.72 77.31 119.38
Others 27.36 25.76 28.86
In-transit 114.48 140.76 169.74
(less) Provision for Non Moving/Obsolete items (212.36) (204.05) (196.04)
1,870.05 2,004.20 2,309.40
Raw Material
Raw Material 2,590.00 2,098.35 3,133.61
Add: In transit 1,471.24 674.68 1,215.43
(less) Provision for unusable materials (15.80) (20.17) (9.81)
4,045.44 2,752.86 4,339.23
Finished / Semi-finished products
Finished Goods 5,829.59 5,243.60 7,116.46
Work-in-Progress 3,991.01 4,707.58 3,509.02
9,820.60 9,951.18 10,625.48
15,736.09 14,708.24 17,274.12
*Valued as per accounting policy No. 3.6
16. CASH AND CASH EQUIVALENTS
Cash and stamps on hand 0.07 0.79 1.00
Cheques in hand 109.92 129.28 144.78
Balances with banks
Current accounts 14.56 2.95 7.32
Term Deposits with original maturity upto 3 months 16.09 12.16 11.56
Term Deposits as per court orders with original maturity upto 3 months - - 0.38
140.65 145.18 165.04
17. OTHER BANK BALANCES
Earmarked bank balances 159.31 155.84 145.18
Unpaid dividend accounts 8.53 9.23 11.73
Term Deposits Earmarked with original maturity upto 3 months - 0.14 0.14
Fixed deposits maturity for more than 3 months but less than 12 months 70.35 35.16 2,054.67
238.19 200.37 2,211.72
18. ASSETS CLASSIFIED AS HELD FOR SALE
Assets classified as held for sale11.94 20.59 20.46
11.94 20.59 20.46
On floatation of tender for sale of items of Property, Plant and Equipment, it is considered highly likely that such assets will be sold within next 12 months and such assets are treated as‘Assets classified as held for sale’.
Plant & machinery classified as held for sale during the reporting period was measured at the lower of its carrying amount and fair value less costs to sell at the time of the reclassification.The fair value of the plant & machinery was determined using the comparable value approach. This is a level 3 measurement as per the fair value hierarchy set out in fair valuemeasurement disclosures. The key inputs under this approach is the metal price in the market.

126
Number of shares (` crore)
As at 31st As at 31st As at 1st As at 31st As at 31st As at 1st
March, 2017 March, 2016 April, 2015 March, 2017 March, 2016 April, 2015
19. EQUITY SHARE CAPITAL
Authorised capital
Equity shares of ` 10 each 500,00,00,000 500,00,00,000 500,00,00,000 5,000.00 5,000.00 5,000.00
5,000.00 5,000.00 5,000.00
Issued and subscribed capital & fully paid-up
Equity shares of ` 10 each 4,13,05,25,289 4,13,05,25,289 4,13,05,25,289 4,130.53 4,130.53 4,130.53
4,130.53 4,130.53 4,130.53
a) Reconciliation of equity shares outstanding at the beginning and at the end of the year.
Number of shares (` crore)
As at 31st As at 31st As at 31st As at 31st
March, 2017 March, 2016 March, 2017 March, 2016
Equity Shares with voting rights
Opening balance 4,13,03,92,654 4,13,00,92,154 4,130.39 4,130.09
Add : Shares converted into shares 15,000 3,00,500 0.02 0.30
with voting rights during the year
Closing balance 4,13,04,07,654 4,13,03,92,654 4,130.41 4,130.39
Equity Shares without voting rights*
Opening balance 1,32,635 4,33,135.00 0.14 0.44
Less : Shares converted into shares 15,000 3,00,500 0.02 0.30with voting rights during the year
Closing balance 1,17,635 1,32,635 0.12 0.14
Total Equity shares outstanding 4,13,05,25,289 4,13,05,25,289 4,130.53 4,130.53
i) *Represented by one Global Depository Receipt (GDR) issued @ US $ 29.55 each for an aggregate amount of US $ 125 million.
ii) All shares rank equally with regard to the repayment of capital in the even of liquidation of the Parent Company.
iii) The Group does not have a holding company.
iv) Details of shareholders holding more than 5% shares in the Parent Company.
% holding Number of shares
As at 31st As at 31st As at 31st As at 31st
March, 2017 March, 2016 March, 2017 March, 2016
Equity shares of `10 each fully paid up
President of India 75 75 3,09,77,67,449 3,09,77,67,449
LIC of India 10.70 10.70 44,18,74,667 44,18,74,667
v) The Company has neither issued bonus shares nor has bought back any shares during last 5 years.
Notes to the Consolidated Financial Statements for the year ended 31st March, 2017
127
Notes to the Consolidated Financial Statements for the year ended 31st March, 2017
(` crore)
As at 31st As at 31st
March, 2017 March, 2016
20. OTHER EQUITY
Reserves & Surplus
Capital reserve
Opening balance 503.58 500.88
Changes due to additional investment in joint ventures 0.75 2.70
Changes during the year - -
504.33 503.58
Securities premium reserve
Opening balance 235.10 235.10
Changes during the year - -
235.10 235.10
General reserve
Opening balance 5,100.72 5,099.17
Changes during the year 2.04 1.55
5,102.76 5,100.72
Bond redemption reserve
As per last balance sheet 1,449.96 1,008.88
Transfer from retained earnings 607.77 504.11
Transfer to retained earnings (84.09) (63.03)
1,973.64 1,449.96
Retained earnings
Opening balance 28,680.91 33,605.39
Net profit for the year (2,756.17) (4,176.50)
Other comprehensive income (357.29) (94.46)
Transfer from bond redemption reserve 84.09 63.03
Transfer to bond redemption reserve (607.77) (504.11)
Equity dividend - (103.26)
Tax on equity dividend - (21.02)
Transfer to general reserve (2.04) (1.55)
Transaction with non-controlling interest (0.01) -
Depreciation adjustment - (86.61)
25,041.72 28,680.91
Other Comprehensive Income
Equity Instruments through Other Comprehensive Income
Opening balance (0.22) -
Change in fair value of FVOCI equity instruments 3.02 (0.22)
2.80 (0.22)
Share in Other Comprehensive Income of equity accounted investees
Opening balance 50.84 -
Changes during the year 0.52 50.84
Deferred tax
51.37 50.84
Total other equity 32,911.72 36,020.89
Total other equity as at 1st April, 2015 40,449.42
Nature and purpose of other reserves
Securities premium reserve
Securities premium reserve represents premium received on issue of shares. The reserve is utilised in accordance with the provisions of the Companies Act.
Other Comprehensive Income(OCI) reserve
(i) The Group has elected to recognise changes in the fair value of certain investments in equity securities in other comprehensive income. These changes are accumulated withinthe FVOCI equity investments reserve within equity. The Group transfers amounts from this reserve to retained earnings when the relevant equity securities are derecognised.
Bond redemption reserve
The Group is required to create bond redemption reserve as per the provisions of Companies Act, 2013 out of the profits which are available for distribution of dividends. The reserveis maintained till the redemption of bonds.
Capital reserve
Capital reserve which is created out of the capital profit, it is created out of the profit earned from some specific transactions of capital nature. Capital reserve is not available for thedistribution to the shareholders. Capital reserve also includes :
1) Group's share of capital reserve in its joint venture, which was recognised due to business combination accounted for under previous GAAP.
2) Group's bargain gain on acquiring additional state in joint ventures".

128
21. BORROWINGS(` crore)
Non-current
As at 31st As at 31st As at 1st
March, 2017 March, 2016 April, 2015
SECURED
Redeemable Non-Convertible Bonds
Rate of Interest Maturity Date Call/Put option (yr) SECURITYREF
9.35% 09-Sep-2026 12/nil ( a ) 455.00 455.00 455.00
9.00% 14-Oct-2024 ( a ) 1,000.00 1,000.00 1,000.00
8.70% 25-Aug-2024 ( a ) 300.00 300.00 300.00
8.30% 01-Aug-2023 ( a ) 1,200.00 - -
8.30% 03-Aug-2023 ( a ) 800.00 - -
8.35% 19-Nov-2022 ( a ) 1,185.00 1,185.00 -
9.30% 23-Aug-2021 ( a ) 400.00 400.00 400.00
8.55% 11-Aug-2021 ( a ) 700.00 700.00 700.00
8.27% 25-Aug-2020 ( a ) 265.00 265.00 -
8.72% 30-Apr-2020 ( a ) 660.00 660.00 660.00
8.75% 23-Apr-2020 ( a ) 545.00 545.00 545.00
8.65% 01-Feb-2020 5/nil ( a ) 242.00 242.00 242.00
8.30% 21-Jan-2020 ( a ) 500.00 500.00 500.00
8.65% 30-Dec-2019 ( a ) 450.00 450.00 450.00
8.50% 07-Dec-2019 ( a ) 120.00 120.00 120.00
8.60% 19-Nov-2019 ( a ) 335.00 335.00 335.00
8.75% 15-Sep-2019 ( b,d ) 100.00 100.00 100.00
8.80% 22-Jun-2019 ( a ) 825.00 825.00 825.00
7.70% 11-May-2019 5/5 ( a ) 25.00 25.00 25.00
8.90% 01-May-2019 5/nil ( b ) 950.00 950.00 950.00
8.80% 26-Oct-2018 ( b,c ) 112.00 126.00 140.00
8.18% 10-Aug-2018 ( a ) 1,000.00 1,000.00 -
8.25% 27-Jul-2018 ( a ) 500.00 500.00 -
8.35% 09-Jun-2018 ( a ) 420.00 420.00 -
9.30% 25-May-2018 ( a,k ) 360.00 360.00 360.00
8.25% 06-May-2018 3/3 ( a ) 245.00 800.00 800.00
7.95% 09-Apr-2018 ( a ) 670.00 670.00 -
8.38% 16-Dec-2017 ( a ) - 645.00 645.00
8.75% 08-Nov-2017 3/3 ( a ) - - 500.00
9.18% 27-Aug-2017 ( a ) - 300.00 300.00
Term Loans
From banks
Rupee loan ( m ) 2,500.00 - -
16,864.00 13,878.00 10,352.00
Unsecured
Foreign currency loan
1 KFW, Germany ( e ) 327.06 377.17 355.19
2 Bank of Tokyo Mitsubishi ( f ) - - 414.63
3 Bank of Tokyo Mitsubishi ( g ) - 438.24 824.32
4 Sumitomo Mitsubishi Banking Corp ( h ) 0.01 657.00 1,236.16
5 Natexis Banque ( i ) 14.75 18.56 17.97
6 Mizuho Corporate Bank Ltd (j) 322.12 656.87 927.56
Steel development fund (l) 204.16 204.16 204.16
868.10 2,352.00 3,979.99
Long term maturities of finance lease obligations 1,355.38 1,265.71 1,288.21
19,087.48 17,495.71 15,620.20
No loans have been guaranteed by the directors and others.
There is no default as on the balance sheet date in the repayment of borrowings and interest thereon.
All bonds are repayable on the maturity date unless otherwise stated.
Bonds are secured, in respect of respective facilities by way of :
a) Secured by charges ranking pari-passu inter-se, on all the present and future immovable property at Mouje-Wadej of City taluka, District Ahmedabad, Gujarat and Group's Plant & Machinery, including theland on which it stands, pertaining to IISCO Steel Plant (ISP).
b) Secured by charges ranking pari-passu inter-se, on all the present and future immovable property at Mouje-Wadej of City taluka, District Ahmedabad, Gujarat and Group's Plant & Machinery, including theland on which it stands, pertaining to Durgapur Steel Plant.( DSP ).
c) Redeemable in 12 equal yearly instalments of `14 crore each starting w.e.f 26th October 2014. Installment payable on 26th Oct, 2017 has been shown in Other Current Liabilitiesd) Redeemable in 3 equal instalments of `50 crore each on 15th September of 2014, 2019 and 2024.e) The soft basis of the loan was drawn in 3 tranches stated as 1(a), 1(b) and 1( c) at an interest rate of 8.75% p.a. The Interest on 1(a) is 0.75% p.a and balance 8% is towards meeting Exchange fluctuation
(4%) and Pollution control schemes (4%). In case of 1 (b) the Interest is 0.75% p.a. and balance 8.0% p.a is towards periphery development. The Interest on 1(c) is 3.66% p.a and the balance 5.09% p.a istowards meeting periphery development. The principal and interest is repayable half yearly. The loan is Guaranteed by Government of India.
f) The loan is repayable in 3 equal yearly instalments on 11th March starting from 2015 at an interest rate of 6 month London Inter Bank Offered Rate (LIBOR) +1%. Interest is paid half yearly .g) The loan is repayable in 3 equal yearly instalments on 11th August starting from 2015 at an interest rate of 6 month LIBOR +1%. . Interest is paid half yearly.h) The loan is repayable in 3 equal yearly instalments on 16th November starting from 2015 at an interest rate of 6 month LIBOR +1.06%. Interest is paid half yearly.i) The loan is repayable by 2030. The principal and interest is paid half yearly, guaranteed by Government of India.j) The loan is repayable in 3 equal yearly instalments on 21st December starting from 2016 at an interest rate of 6 month LIBOR +1.75%. Interest is paid half yearly.k) Redeemable in 5 equal yearly instalments starting w.e.f 25th May 2018.l) Terms of Repayment is to be decided by SDF management Committee.m) Secured by charges ranking pari-passu on the present and the future movable plant and machinery of BSL to the extent of loan.
Notes to the Consolidated Financial Statements for the year ended 31st March, 2017

129
Notes to the Consolidated Financial Statements for the year ended 31st March, 2017
21. BORROWINGS (CONTD.)(` crore)
Current
As at 31st As at 31st As at 1st
March, 2017 March, 2016 April, 2015
SecuredRepayable on demand :
From banks 1,302.09 2,256.04 5,552.55Other loans and advances:
From banks 250.00 - 1,005.00Unsecured - - -Other loan 600.00 - 800.00Commercial paper 7,883.93 7,721.23 -Foreign currency loans 9,777.02 5,597.59 6,925.36
19,813.04 15,574.86 14,282.91
1. Security disclosure for the outstanding short-term borrowings as on 31 March, 2017 :
Borrowings from banks are secured, in respect of respective facilities by way of :
(i) Hypothecation of all current assets
(` crore)
Non-current Current
As at 31st As at 31st As at 1st As at 31st As at 31st As at 1st
March, 2017 March, 2016 April, 2015 March, 2017 March, 2016 April, 2015
22. TRADE PAYABLES
Due to micro, small and medium- 38.12 29.46 27.27enterprises (refer note 43.1)
Amount payable to related parties 11.58 12.91 7.38
Amount payable to contractors/suppliers/others 7.36 6.83 0.71 5,168.71 3,941.17 3,562.66
7.36 6.83 0.71 5,218.41 3,983.54 3,597.31
23. OTHERS FINANCIAL LIABILITIESEmployee related dues 458.39 517.79 416.07 161.73 144.06 146.26
Interest Accrued but not due on borrowings 580.25 707.92 700.46 1,076.09 924.68 666.78
Other liabilities-debtors banking arrangement 228.16 295.00 379.00
Derivative liability - - - 603.57 153.68 144.96
Current maturities of long-term borrowings - - - 2,381.74 1,909.22 1,788.77
Current maturities of finance lease obligation - - - 113.39 161.61 145.03
Unclaimed Matured Deposits and Interest Accrued thereon - - 1.03 1.03 1.03
Security deposits - - - 1,233.06 1,081.25 803.21
Unpaid dividends - - - 8.53 9.23 11.73
Payable for capital works - - - 2,532.75 2,048.86 2,246.92
Other Payables 327.29 346.11 258.56 4,441.92 4,246.98 4,094.88
1,365.93 1,571.82 1,375.09 12,781.96 10,975.60 10,428.57
24. PROVISIONS
Provision for gratuity 81.90 1.22 243.83 237.22 199.43 158.87
Provision for accrued leave liability 2,437.58 2,294.39 2,191.36 303.75 242.47 221.32
Provision for post retirement medical & settlement benefits 931.02 867.04 856.32 108.95 100.05 95.76
Provision for long term service award 19.98 18.34 18.46 3.06 2.64 2.68
Provision for mines closure 53.97 43.17 35.24 - - -
Provision for pollution control - - - 39.43 53.65 83.93
Provision for foreign exchange fluctuation - - - 13.02 - 15.29
Provision for wage revision - - - 1,545.02 1,428.87 1,279.58
Provision for mine afforestation/ restoration etc. - - - 341.97 323.22 280.98
Other provisions 71.94 49.56 41.94 332.44 298.08 244.77
3,596.40 3,273.72 3,387.15 2,924.87 2,648.41 2,383.17
25. OTHER LIABILITIES
Income received in advance from customers 1,763.07 1,839.41 804.97
Income received in advance- others 82.53 50.18 53.67
Deferred income* 151.29 113.48 117.90 10.98 5.23 5.26
Other Payables 3,752.98 3,600.18 3,423.56
151.29 113.48 117.90 5,609.56 5,494.99 4,287.46
Government grants
Opening balance 26.95 26.63
Additions 2.12 4.51
Closing Balance (1.28) (4.19) - - - -
27.79 26.95 - 5,609.56 5,494.99 4,287.46
*Deferred income includes award conferred by the Prime Minister of India to the Bhilai Steel Plant as best integrated steel plant in India and the earnings from the fund are utilised forthe welfare of the employees in Bhilai.

130
Notes to the Consolidated Financial Statements for the year ended 31st March, 2017
(` crore)
Year ended Year ended31st March, 2017 31st March, 2016
26. REVENUE FROM OPERATIONS
Sale of Products
Domestic 47,437.74 42,784.68
Exports 1,737.83 557.25
Export Incentives 66.37 9.54
49,241.94 43,351.47
Sale of services
Service charges 31.89 33.44
31.89 33.44
Other operating revenues
Social amenities-recoveries 334.01 317.74
Sale of empties etc. 70.74 61.89
Sundries 150.37 168.19
555.12 547.82
49,828.95 43,932.73
27. OTHER INCOME
Interest income :
Loans & advances to other companies 0.88 0.89
Customers 80.87 91.69
Employees 20.21 25.30
Bank deposits 4.85 186.92
Others 45.23 44.90
152.04 349.70
Dividend income
Dividend from Investments* 1.05 0.54
1.05 0.54
Gain on sale of investments 0.01 7.31
0.01 7.31
Other Non-operating income
Subsidy, relief and concession 4.43 5.18
Grant-in-aid 0.10 0.01
Provisions no longer required written back 42.66 31.26
Write back of Other liabilities 54.96 49.33
Liquidated damages 75.53 47.81
Foreign exchange fluctuations (net) 76.60 -
Others 42.10 37.90
296.38 171.49
449.48 529.04
28. COST OF MATERIALS CONSUMED
Iron ore 3,614.87 4,160.07
Coal 16,198.51 12,083.07
Coke 70.64 81.64
Limestone 1,107.24 1,128.43
Dolomite 450.33 482.95
Ferro Manganese 340.96 357.29
Ferro Silicon 193.63 187.47
Silico Manganese 904.24 845.75
Intermediary Products 0.01 -
Zinc 122.03 104.99
Aluminium 226.91 229.16
Others 1,321.62 1,245.67
24,550.99 20,906.49
Less :Inter Account adjustments 3,389.54 3,723.49
21,161.45 17,183.00
(` crore)
Year ended Year ended31st March, 2017 31st March, 2016
29. CHANGES IN INVENTORIES OF FINISHED GOODS AND WORK INPROGRESS
Opening stock
Finished Goods 5,549.15 7,109.38
Work in Progress 4,402.03 3,516.10
9,951.18 10,625.48
Closing stock
Finished Goods 5,828.08 5,240.00
Work in Progress 3,992.52 4,711.18
9,820.60 9,951.18
Less : Excise Duty on accretion(-) / 13.24 133.85Depletion to stock
117.34 540.45
30. EMPLOYEE BENEFIT EXPENSE*
Salaries & wages 6,888.42 6,887.30
Leave encashment 491.23 678.33
Group's contribution to Provident & other Funds 889.91 954.22
Travel concession 22.21 250.28
Welfare expenses 314.27 459.16
Gratuity 357.74 499.43
8,963.78 9,728.72
Less : Grants in Aid received from - 0.15Government of Karnataka
8,963.78 9,728.57
Expenditure on Employees' Remunerationand Benefits not included above and charged to:
a) Expenditure During Construction 136.16 136.16
136.16 136.16
* For descriptive notes on disclosure of defined benefit obligation refer note 42.
31. FINANCE COSTS
Interest Cost
- Foreign Currency Loans* 552.45 658.75
- Non Convertible Bonds 794.54 608.10
- Bank Borrowings - working capital 63.12 47.89
- Steel Development Fund Loans 3.74 3.20
- Others 1,105.51 974.31
- Interest under Income Tax Act 0.01 -
Other Borrowing Costs 8.45 8.20
2,527.82 2,300.45
*Including foreign exchange fluctuations of`188.52 crore (`-3.02 crore on 31st March, 2016)
Expenditure on Interest & Finance charges notincluded above & charged toExpenditure During Construction:
Foreign currency loans 108.06 147.71
Non Convertible Bonds 468.48 491.05
Steel Development Fund loans - Interest 4.43 4.96
Others 0.93 -
581.90 643.72

131
(` crore)
Year ended Year ended31st March, 2017 31st March, 2016
32. OTHER EXPENSES
Consumption of Stores & Spares Parts
Consumption 3,621.28 3,780.97
Less: Departmentally manufactured stores 859.64 959.11
Less: Finished products internally 532.15 567.05consumed as stores and spares
2,229.49 2,254.81
Repairs & Maintenance
Buildings 202.17 197.27
Plant & Machinery 714.23 650.02
Others 223.86 221.29
1,140.27 1,068.58
Handling Expenses
Raw Material 333.34 325.51
Scrap Recovery 297.33 314.33
630.67 639.84
Remuneration to Auditors
Audit Fees 1.94 1.52
Tax Audit Fees 0.47 0.41
For other Services 0.99 0.94
Out of Pocket Expenses 0.65 0.89
4.05 3.76
Provisions
Doubtful Debts, Loans and Advances 74.47 27.81
Investments 0.20 0.00
Stores, Spares and Sundries 73.00 165.25
147.67 193.06
Power and Fuel 5,249.99 5,348.52
Notes to the Consolidated Financial Statements for the year ended 31st March, 2017
(` crore)
Year ended Year ended31st March, 2017 31st March, 2016
Freight Outward 1,166.58 1,135.37
Royalty and Cess 997.18 1,333.99
Conversion Charges 454.33 413.32
Excise Duty on Inter-Plant Transfer / 292.12 305.40
Demurrage & Wharfage 53.41 48.64
Water Charges & Cess on Water Pollution 121.02 111.43
Insurance 32.50 29.31
Law charges 0.04 0.11
Postage, Telegram & Telephone 20.53 18.69
Printing & Stationery 9.88 9.68
Rates & Taxes 69.82 48.99
Rent 60.77 70.02
Security Expenses 492.65 425.34
Travelling Expenses 156.48 148.69
Expenses on temporary suspended mines 97.95 101.04
Training Expenses 30.60 41.07
Foreign Exchange Fluctuation ( Net ) - 75.73
Expenditure on Corporate Social Responsibility 29.62 74.47(Refer note-41.5)
Loss on dilution of stake in joint ventures (net) 0.50 29.07
Loss on sale/scrapping of Fixed Assets ( Net ) 48.17 68.05
Cost Audit Fee and Reimbursement of Expenses 0.32 0.20
Write-Offs - Miscellaneous 0.01 0.25
Handling Expenses - Finished goods 160.75 186.59
Commission to Selling Agents 7.34 7.06
Export Sales Expenses 22.97 8.85
Miscellaneous 464.43 349.04
14,192.11 14,548.94
33. FINANCIAL INSTRUMENTS
i) Fair values hierarchy
Financial assets and financial liabilities measured at fair value in the statement of financial position are categorized into three Levels of a fair value hierarchy. The three Levels aredefined based on the observability of significant inputs to the measurement, as follows:
Level 1: Quoted prices (unadjusted) in active markets for financial instruments.
Level 2: The fair value of financial instruments that are not traded in an active market is determined using valuation techniques which maximise the use of observable marketdata rely as little as possible on entity specific estimates.
Level 3: If one or more of the significant inputs is not based on observable market data, the instrument is included in level 3.
ii) Financial assets and liabilities measured at fair value - recurring fair value measurements (` crore)
As at 31st March, 2017 Level 1 Level 2 Level 3 Total
Financial assets
Financial instruments at FVTPL
Derivative financial assets 227.54 227.54
Investments at FVOCI
Equity instruments*
Quoted 13.30 13.30
Unquoted 59.43 59.43
Total financial assets 13.30 227.54 59.43 300.27
Financial liabilities
Financial instruments at FVTPL
Derivative liability 603.57 603.57
Total financial liabilities - 603.57 - 603.57
32. OTHER EXPENSES (CONTD.)

132
Notes to the Consolidated Financial Statements for the year ended 31st March, 2017
Financial assets and liabilities measured at fair value - recurring fair value measurements (` crore)
As at 31st March, 2016 Level 1 Level 2 Level 3 Total
Financial assets
Financial instruments at FVTPL
Derivative financial assets 473.95 473.95
Investments at FVOCI
Equity instruments*
Quoted 10.29 10.29
Unquoted 59.43 59.43
Total financial assets 10.29 473.95 59.43 543.67
Financial liabilities
Financial instruments at FVTPL
Derivative liability 153.68 153.68
Total financial liabilities - 153.68 - 153.68
Financial assets and liabilities measured at fair value - recurring fair value measurements (` crore)
As at 1st April, 2015 Level 1 Level 2 Level 3 Total
Financial assets
Financial instruments at FVTPL
Derivative financial assets 470.44 470.44
Investments at FVOCI
Equity instruments*
Quoted 12.63 12.63
Unquoted 56.66 56.66
Total financial assets 12.63 470.44 56.66 539.73
Financial liabilities
Financial instruments at FVTPL
Derivative liability 144.96 144.96
Total financial liabilities - 144.96 - 144.96
iii) Financial assets and liabilities - for which fair values are disclosed (` crore)
Level As at 31st March, 2017 As at 31st March, 2016 As at 1st April, 2015
Carrying value Fair Value Carrying value Fair Value Carrying value Fair Value
Financial assets
Loans Level-3 526.25 534.66 515.13 518.68 493.95 493.95Derivative financial assets Level-2 227.54 227.54 473.95 473.95 470.44 470.44Equity instruments*
Quoted Level-1 13.30 13.30 10.29 10.29 12.63 12.63Unquoted Level-3 59.43 59.43 59.43 59.43 56.66 56.66
Total financial assets 826.52 834.93 1,058.80 1,062.35 1,033.68 1,033.68
Financial liabilities
Borrowings Level-3 43,280.15 43,628.65 37,069.00 37,225.74 33,583.15 33,838.95Other payables Level-3 9,164.69 9,298.01 8,395.31 8,506.50 7,978.66 7,978.66Derivative liability Level-2 603.57 603.57 153.68 153.68 144.96 144.96
Total financial liabilities 53,048.41 53,530.23 45,617.99 45,885.92 41,706.77 41,962.57
(iv) Valuation process and technique used to determine fair value
Specific valuation techniques used to value financial instruments include:
(a) Fair value of interest swap is determined based on dealer or counterparty quotes for similar instruments
(b) Fair value of forward foreign exchange contract and principal swap is determined using forward rate at balance sheet date.
(c) The carrying value of borrowings bearing variable interest rate are considered to be representative of their fair value.
(d) Fair value of fixed interest rate financial assets and liabilities carried at amortised cost (including finance lease obligations) is determined by discounting the cash flowsusing a discount rate equivalent to market interest rate applicable to similar assets and liabilities as at the balance sheet date.
(v) Unquoted investments
Fair value estimates of unquoted equity investments are included in level-3 and are based on information relating to value of investee company's net assets. For investments inco-operative societies the Company has determined that cost is approximate estimate of fair value, therefore, there have been no changes on account of fair values.
133
vi) The following table presents the changes in level 3 items for the periods ended 31st March, 2017 and 31st March, 2016: (` crore)
Particulars Unlisted equity securities
As at 1st April, 2015 56.66
Gain/Loss recognised in other comprehensive income 2.8
As at 31st March, 2016 59.43
Gains/losses recognised in other comprehensive income -
As at 31st March, 2017 59.43
34. FINANCIAL RISK MANAGEMENT
i) Financial instruments by category (` crore)
As at 31st March, 2017 As at 31st March, 2016 As at 1st April, 2015
Particulars FVTPL FVOCI Amortised FVTPL FVOCI Amortised FVTPL FVOCI Amortisedcost cost cost
Financial assets
Investments
Equity instruments* 72.73 69.72 69.29
Trade receivables 2,934.69 3,151.42 3,588.14
Cash and cash equivalents 140.64 145.18 165.04
Other Bank Balances 238.19 200.37 2,211.72
Loans 526.25 515.13 493.95
Derivative financial assets 227.54 473.95 470.44
Other receivables 2,299.82 1,779.81 2,493.60
Total 227.54 72.73 6,139.60 473.95 69.72 5,791.93 470.44 69.29 8,952.45
Financial liabilities
Borrowings 43,280.15 37,069.00 33,583.15
Trade payable 5,225.77 3,990.37 3,598.02
Derivative liability 603.57 153.68 144.96
Other payables 9,164.69 8,395.31 7,978.66
Total 603.57 - 57,670.62 153.68 - 49,454.68 144.96 - 45,159.83
* Investment in equity of joint ventures and associates have been carried at cost as per Ind AS 27 "Separate financial statements" and hence are not presented here.
ii) Risk Management
The group is exposed to various risk in relation to financial instruments. The group's financial asset and liabilities are by category are summarised in note 34(i). The main typesof risks are market risk, credit risk and liquidity risk. The Group’s risk management is coordinated at its headquarters, in close cooperation with the board of directors, and focuseson actively securing the Group’s short to medium-term cash flows by minimising the exposure to volatile financial markets. Long-term financial investments are managed togenerate lasting returns. The Group does not actively engage in the trading of financial assets for speculative purposes nor does it write options. The most significant financial risksto which the Group is exposed are 'described below:
A) Credit risk
Credit risk is the risk that a counterparty fails to discharge an obligation to the comapny.The Group is exposed to this risk for various financial instruments, for example by grantingloans and receivables to customers, placing deposits, etc. The Group’s maximum exposure to credit risk is limited to the carrying amount of following types financial assets.
-Cash and cash equivalents
-Derivative financial instruments
-Trade receivables
-Other financial assets measured at amortized cost
The Group continuously monitors defaults of customers and other counterparties, identified either individually or by the Group, and incorporates this information into its credit riskcontrols. Where available at reasonable cost, external credit ratings and/or reports on customers and other counterparties are obtained and used. The Group's policy is to deal onlywith creditworthy counterparties.
a) Credit risk management
Cash and cash equivalent
Credit risk related to cash and cash equivalents is managed by only accepting highly rated banks and diversifying bank deposits and accounts in different banks across thecountry.
Derivative financial instruments
Credit risk related to derivative financial instruments is also managed by only entering into such arrangement with highly rated banks or financial institutions as counterparties.The Group diversifies its holdings with multiple counterparties.
Trade receivables
Credit risk related to trade receivables are mitigated by taking bank guarantees from customers where credit risk is high. The Group closely monitors the credit-worthiness ofthe debtors and only sells goods to credit-worthy parties. The Group's internal systems are configured to define credit limits of customers, thereby limiting the credit risk to pre-calculated amounts.
Other financial assets measured at amortized cost
Other financial assets measured at amortized cost includes loans and advances to employees and others. Credit risk related to these other financial assets is managed bymonitoring the recoverability of such amounts continuously, while at the same time internal control system in place ensure the amounts are within defined limits.
Notes to the Consolidated Financial Statements for the year ended 31st March, 2017

134
Notes to the Consolidated Financial Statements for the year ended 31st March, 2017
b) Expected credit losses
Group provides expected credit losses based on the following
Trade receivables
The Group recognizes lifetime expected credit losses on trade receivables using a simplified approach and uses historical information to arrive at loss percentage relevant toeach category of trade receivables:
(` crore)
Ageing (As at 31st March, 2017) 0-3 months 3-12 months 12-24 months 24-36 months more than Totalold old old old 36 months old
Gross carrying amount 2295.26 420.10 135.85 37.96 227.41 3,116.58
Expected loss rate 0.03% 0.37% 1.84% 6.60% 76.84%
Expected credit loss provision 0.59 1.54 2.50 2.50 174.74 181.89
Carrying amount of trade receivables (Net of impairment) 2,294.65 418.56 133.35 35.46 52.67 2,934.69
Ageing (As at 31st March, 2016) 0-3 months 3-12 months 12-24 months 24-36 months more than Totalold old old old 36 months old
Gross carrying amount 2448.61 535.62 34.81 101.91 182.69 3,303.66
Expected loss rate 0.02% 0.33% 7.49% 2.53% 79.21%
Expected credit loss provision 0.58 1.76 2.61 2.57 144.72 152.24
Carrying amount of trade receivables (Net of impairment) 2,448.03 533.86 32.20 99.34 37.98 3,151.42
Ageing (As at 1st April, 2015) 0-3 months 3-12 months 12-24 months 24-36 months more than Totalold old old old 36 months old
Gross carrying amount 2432.93 787.79 305.52 13.40 185.89 3,725.52
Expected loss rate 0.03% 0.29% 0.84% 14.45% 70.76%
Expected credit loss provision 0.62 2.31 2.58 1.94 129.94 137.38
Carrying amount of trade receivables (Net of impairment) 2,432.31 785.48 302.94 11.46 55.95 3,588.14
Reconciliation of Expected credit loss provision (` crore)
Particulars Unlisted equity securities
As at 1st April, 2015 131.83Changes in provision 14.86As at 31st March, 2016 152.24Changes in provision 24.24As at 31st March, 2017 181.89
Other financial assets measured at amortized cost
Company provides for expected credit losses on "loans advances and other than trade receivables" by assessing individual financial instruments for expectation of any credit losses.Since this category includes loans and receivables of varied natures and purpose, there is no trend that the Company can draws to apply consistently to entire population. For suchfinancial assets, the Company's policy is to provides for 12 month expected credit losses upon initial recognition and provides for lifetime expected credit losses upon significantincrease in credit risk. The Company does not have any expected loss based impairment recognised on such assets considering their low credit risk nature, though incurred lossprovisions are disclosed under each sub-category of such financial assets.
B) Liquidity risk
Prudent liquidity risk management implies maintaining sufficient cash and marketable securities and the availability of funding through an adequate amount of committed creditfacilities to meet obligations when due. Due to the nature of the business, the Group maintains flexibility in funding by maintaining availability under committed facilities.Managementmonitors rolling forecasts of the Group’s liquidity position and cash and cash equivalents on the basis of expected cash flows. The Group takes into account the liquidity of themarket in which the entity operates. In addition, the Group’s liquidity management policy involves projecting cash flows in major currencies and considering the level of liquid assetsnecessary to meet these, monitoring balance sheet liquidity ratios against internal and external regulatory requirements and maintaining debt financing plans.
Maturities of financial liabilities
The tables below analyse the Group’s financial liabilities into relevant maturity Grouping based on their contractual maturities for all non-derivative financial liabilities and the amountsdisclosed in the table are the contractual undiscounted cash flows. Balances due within 12 months equal their carrying balances as the impact of discounting is not significant.
(` crore)
Contractual maturities of financial liabilities as at 31st March, 2017 Less than 1-2 years 2-3 years More than Total1 year 3 years
Non-derivatives
Borrowings* 24,177.67 4,569.02 4,652.70 13,282.34 46,681.73
Trade payable 5,218.41 1.29 5.64 0.43 5,225.77
Other payables 10,436.76 125.35 105.25 1,453.49 12,120.85
Total 39,832.84 4,695.66 4,763.59 14,736.26 64,028.35
Derivatives
Derivative liability (Net Settled) 603.57 603.57
Total 603.57 - - - 603.57

135
Notes to the Consolidated Financial Statements for the year ended 31st March, 2017
Contractual maturities of financial liabilities as at 31st March, 2016 Less than 1-2 year 2-3 year More than Total1 year 3 years
Non-derivativesBorrowings* 20,054.28 3,672.83 4,765.96 12,135.48 40,628.55Trade payable 3,983.54 1.27 0.37 5.19 3,990.37Other payables 9,039.50 132.74 110.59 1,635.33 10,918.15
Total 33,077.32 3,806.84 4,876.92 13,775.99 55,537.08
DerivativesDerivative liability 153.68 153.68
Total 153.68 - - - 153.68
Contractual maturities of financial liabilities as at 1st April, 2015 Less than 1-2 years 2-3 years More than Total1 year 3 years
Non-derivativesBorrowings* 18,233.78 2,692.93 3,526.40 10,008.35 34,461.46Trade payable 3,597.31 - - 0.71 3,598.02Other payables 8,630.40 110.01 105.48 1,510.47 10,356.36
Total 30,461.49 2,802.94 3,631.88 11,519.53 48,415.84
DerivativesDerivative liability 144.96 144.96
Total 144.96 - - - 144.96
* Borrowings excludes finance lease obligations, refer note 44.6(b) for disclosure of maturity profile of finance lease obligations.C) Market Risk
a) Foreign currency risk
The following table illustrates the sensitivity of profit and equity in regards to the Group’s financial assets and financial liabilities and the USD/INR exchange rate and EUR/INRexchange rate ‘all other things being equal’. It assumes a +/- 7.86% change of the INR/USD exchange rate for the year ended at 31 March 2017 (2016: 11.83%). A +/- 4.09%change is considered for the INR/EUR exchange rate (2016: 4.92%). Both of these percentages have been determined based on the average market volatility in exchange rates in theprevious 12 months. The sensitivity analysis is based on the Group’s foreign currency financial instruments held at each reporting date and also takes into account forwardexchange contracts that offset effects from changes in currency exchange rates.
Foreign currency risk exposure:
The Group's exposure to foreign currency risk at the end of the reporting period expressed in ` crore, are as follows:( ` crore)
Particulars As at 31st March, 2017 As at 31st March, 2016
USD Euro USD Euro
Financial assets
Trade receivables 38.25 5.95Cash and cash equivalentsOther Bank BalancesLoansGross derivative financial assets 10,099.90 6,924.71Other receivables
Net exposure to foreign currency risk (assets) 10,138.15 - 6,930.66 -
Financial liabilities
Borrowings 13,039.83 327.06 9,791.53 377.17Trade payable 57.25 307.02 58.73 294.50Derivative liabilityOther payables
Net exposure to foreign currency risk (liabilities) 13,097.08 634.08 9,850.26 671.67
Sensitivity
'The sensitivity of profit or loss and equity to changes in the exchange rates arises mainly from foreign currency denominated financial instruments.
(` crore)
Particulars As at 31st March, 2017 As at 31st March, 2016
USD sensitivity
INR/USD- increase by 4.09% (31 March 2017) (121.02)
INR/USD- decrease by 4.09% (31 March 2017) 121.02
INR/USD- increase by 4.92% (31 March 2016) (143.64)
INR/USD- decrease by 4.92% (31 March 2016) 143.64
Euro sensitivity
INR/EUR- increase by 7.86% (31 March 2017) (49.84)
INR/EUR- decrease by 7.86% (31 March 2017) 49.84
INR/EUR- increase by 11.83% (31 March 2016) (79.46)
INR/EUR- decrease by 11.83% (31 March 2016) 79.46

136
Notes to the Consolidated Financial Statements for the year ended 31st March, 2017
b) Interest rate riskThe Group’s policy is to minimise interest rate cash flow risk exposures on long-term financing. Longer-term borrowings are therefore usually at fixed rates. At 31 March 2017, theGroup is exposed to changes in market interest rates through bank borrowings at variable interest rates. Other borrowings are at fixed interest rates. The Group’s investments inbonds all pay fixed interest rates. The exposure to interest rates for the Group’s money market funds is considered immaterial. The following table illustrates the sensitivity of profitand equity to a reasonably possible change in interest rates of +/- 1% (2016: +/- 1%). These changes are considered to be reasonably possible based on observation of currentmarket conditions. The calculations are based on a change in the average market interest rate for each period, and the financial instruments held at each reporting date that aresensitive to changes in interest rates. All other variables are held constant.
i) LiabilitiesThe Group’s policy is to minimise interest rate cash flow risk exposures on long-term financing. At 31st March 2017, the Group is exposed to changes in market interest ratesthrough bank borrowings at variable interest rates.Interest rate risk exposure'Below is the overall exposure of the Group to interest rate risk: (` crore)
Particulars As at 31st March, 2017 As at 31st March, 2016
Variable rate borrowing 9,777.02 5,597.59Fixed rate borrowing 33,503.13 31,471.41
Total borrowings 43,280.15 37,069.00
Sensitivity
'Below is the sensitivity of profit or loss and equity changes in interest rates. (` crore)
Particulars As at 31st March, 2017 As at 31st March, 2016
Interest sensitivityInterest rates – increase by 100 basis points 432.80 370.69Interest rates – decrease by 100 basis points (432.80) (370.69)
ii) Assets
The Group’s fixed deposits are carried at amortised cost and are fixed rate deposits. They are therefore not subject to interest rate risk as defined in Ind AS 107, since neither thecarrying amount nor the future cash flows will fluctuate because of a change in market interest rates.
Interest rate risk exposure
'Below is the overall exposure of the Financial Assets: (` crore)
Particulars As at 31st March, 2017 As at 31st March, 2016
Variable rate deposits/Loans - -Fixed rate deposits/Loans 674.62 670.19
Total deposits 674.62 670.19
c) Price risk
Exposure
The Group is exposed to other price risk in respect of its investment shares of other companies (see Note 8). The Group does not consider changes in value of its investments inshares as insignificant, therefore is not exposed to price risks on exposures outstanding on the balance sheet date.
35 CAPITAL MANAGEMENT
The Group’ s capital management objectives are
- to ensure the Group’s ability to continue as a going concern
- to provide an adequate return to shareholders
The Group monitors capital on the basis of the carrying amount of equity less cash and cash equivalents as presented on the face of balance sheet.
Management assesses the Group’s capital requirements in order to maintain an efficient overall financing structure while avoiding excessive leverage. This takes into account thesubordination levels of the Group’s various classes of debt. The Group manages the capital structure and makes adjustments to it in the light of changes in economic conditionsand the risk characteristics of the underlying assets. In order to maintain or adjust the capital structure, the Group may adjust the amount of dividends paid to shareholders,return capital to shareholders, issue new shares, or sell assets to reduce debt.
(` crore)
Particulars As at 31st March, 2017 As at 31st March, 2016 As at 1st April, 2015
Net debts 42,901 36,723 31,206
Total equity 37,042 40,151 44,580
Net debt to equity ratio 116% 91% 70%
Dividends
(i) Equity shares
Final dividend for the year ended 31 March, 2015 of ` 0.25 Nil 103.26 -
(ii) Dividends not recognised at the end of the reporting period
The directors had recommended the payment of a final dividend of Nil Nil 103.26` 0.25 for the year ended 31 March, 2015 per fully paid equity share. Thisproposed dividend is subject to the approval of shareholders in the ensuingannual general meeting.

137
Notes to the Consolidated Financial Statements for the year ended 31st March, 2017
36 FIRST TIME ADOPTION OF IND AS
These are the Group's first financial statements prepared in accordance with Ind AS.
The accounting policies set out in note 1 have been applied in preparing the financial statements for the year ended 31st March, 2017 the comparative information presented in thesefinancial statements for the year ended 31 March, 2016 and in the preparation of an opening Ind AS balance sheet at 1st April, 2015 (the Group’s date of transition). An explanationof how the transition from previous GAAP to Ind AS has affected the Group’s financial position, financial performance and cash flows is set out in the following tables and notes.
A Ind AS optional exemptions
1 Deemed cost for property, plant and equipment, investment property and intangible assets
Ind AS 101 permits a first-time adopter to elect to continue with the carrying value for all of its property, plant and equipment as recognised in the financial statements as at the dateof transition to Ind AS, measured as per the previous GAAP and use that as its deemed cost as at the date of transition after making necessary adjustments for de-commissioningliabilities. This exemption can also be used for intangible assets covered by Ind AS 38 Intangible Assets and investment property covered by Ind AS 40 Investment Properties.Accordingly, the Group has elected to measure all of its property, plant and equipment, intangible assets and investment property at their previous GAAP carrying value.
2 Decommissioning liabilities included in cost of property, plant and equipment
Ind AS 101 permits a first-time adopter to not comply with the requirements of accounting for changes in decommissioning liabilities that occurred before the date of transition toInd ASs and only adjust the carrying value of property, plant and equipment by the amount of decommissioning liability that existed on the date of transition after considering theimpact of accumulated depreciation.
For the purpose of the determining the present value of liability, the rate of discount on government securities applicable for the relevant period when the such liability first arose wasapplied.
3 Designation of previously recognised financial instruments
Ind AS 101 allows an entity to designate investments in equity instruments at FVOCI on the basis of the facts and circumstances at the date of transition to Ind AS. The Group haselected to apply this exemption for its investment in equity investments.
4 Leases
Appendix C to Ind AS 17 requires an entity to assess whether a contract or arrangement contains a lease. In accordance with Ind AS 17, this assessment should be carried out atthe inception of the contract or arrangement. Ind AS 101 provides an option to make this assessment on the basis of facts and circumstances existing at the date of transition to IndAS, except where the effect is expected to be not material.
The Group has elected to apply this exemption for such contracts/arrangements.
5 Investment in Subsidiary/ Joint ventures and associates
Ind AS 101 permits a first-time adopter who to elects to account for its investments subsidiaries, joint ventures and associates at cost to continue with the carrying value of suchinvestments as recognised in the financial statements as at the date of transition to Ind AS, measured as per the previous GAAP and use that as its deemed cost as at the date oftransition.
B Ind AS mandatory exemptions
1 Estimates
An entity’s estimates in accordance with Ind ASs at the date of transition to Ind AS shall be consistent with estimates made for the same date in accordance with previous GAAP(after adjustments to reflect any difference in accounting policies), unless there is objective evidence that those estimates were in error.
Ind AS estimates as at 1st April, 2015 are consistent with the estimates as at the same date made in conformity with previous GAAP. The Group made estimates for following itemsin accordance with Ind AS at the date of transition as these were not required under previous GAAP:
a) Investment in equity instruments carried at FVTPL or FVOCI
b) Impairment of financial assets based on expected credit loss model.
2 Classification and measurement of financial assets and liabilities
The classification and measurement of financial assets will be made considering whether the conditions as per Ind AS 109 are met based on facts and circumstances existing at thedate of transition.
Financial assets can be measured using effective interest method by assessing its contractual cash flow characteristics only on the basis of facts and circumstances existing at thedate of transition and if it is impracticable to assess elements of modified time value of money i.e. the use of effective interest method, fair value of financial asset at the date oftransition shall be the new carrying amount of that asset. The measurement exemption applies for financial liabilities as well.
Applying a requirement is impracticable when the entity cannot apply it after making every reasonable effort to do so. It is impracticable to apply the changes retrospectively if:
a) The effects of the retrospective application or retrospective restatement are not determinable;
b) The retrospective application or restatement requires assumptions about what management’s intent would have been in that period;
The retrospective application or retrospective restatement requires significant estimates of amounts and it is impossible to distinguish objectively information about thoseestimates that existed at that time.
For the purpose of certain financial instruments carried at amortised cost for which fair value was determined on the date of transition to Ind AS, discount rates as at the date oftransition were determined on the following basis:
i) Loans given to employees: rates as per third party banks applicable to employees
ii) Finance lease obligations in relation to oxygen plant: rates as per Group's last available incremental borrowing rate
iii) Finance lease obligations in relation to power plants: implicit rate in the lease
iv) Other financial assets and financial liabilities: State Bank of India's base rate

138
C (i) Reconciliations between previous GAAP and Ind AS
Ind AS 101 requires an entity to reconcile equity, total comprehensive income and cash flows for prior periods. The following tables represent the reconciliations from previous GAAPto Ind AS.
1 Reconciliation of total equity as at 31st March, 2016 and 1st April, 2015 (` crore)
Notes to first As at 31st As at 1st
time adoption March, 2016 April, 2015
Total equity (shareholder's funds) as per previous GAAP 39,929.20 43,740.20
Adjustments:
Measurement of financial assets and liabilities at amortised cost 4 66.44 182.44
Recognition and measurement of certain arrangements and leases of land as finance leases 2 (210.35) (173.24)
Measurement of equity instruments at fair value through OCI 5 48.71 48.29
Measurement of derivatives and embedded derivatives at fair value through profit and loss 1 (26.22) (29.37)
Classification of certain leases of land as operating leases 6 (83.08) (87.21)
Recognition of grant from government as deferred income 7 (28.21) (27.89)
Capitalisation of major repairs and capital spares 3 58.76 (131.36)
Proposed dividend including dividend distribution tax 8 0.94 125.26
Change from proportionate consolidation of equity method of accounting 8.90 5.24
Effects of Ind AS transition on equity of joint ventures and associates 426.71 923.42
Deferred tax impact on Ind AS adjustments 11 (116.57) (69.60)
Others 76.20 73.77
Total adjustments 222.23 839.75
Total equity as per Ind AS 40,151.43 44,579.95
2 Reconciliation of total comprehensive income for the year ended 31st March, 2016 (` crore)
Notes to first As at 31st
time adoption March, 2016
Profit after tax as per previous GAAP (4,296.75)
Adjustments:
Measurement of derivatives and embedded derivatives at fair value through profit and loss 1 3.15
Recognition and measurement of certain arrangements and leases of land as finance leases 2 (37.10)
Capitalisation of major repairs and capital spares 3 190.12
Measurement of financial assets and liabilities at amortised cost 4 (115.99)
Deferred tax impact on Ind AS adjustments 11 (109.88)
Change from proportionate consolidation of equity method of accounting 4.33
Effects of Ind AS transition on profits of joint ventures and associates 33.97
Others 151.66
Total adjustments 120.25
Profit/(Loss) after tax as reported under Ind AS (4,176.50)
Other Comprehensive Income (OCI) (net of tax):
Remeasurement of defined benefit obligations 10 (94.46)
Measurement of equity instruments at fair value through OCI 5 (0.22)
Share of OCI of equity method investees 50.84
Total Comprehensive Profit/(Loss) under IND-AS (4,220.33)
3 Impact of Ind AS adoption on statement of cashflows for the year ended 31st March, 2016 (` crore)
Previous GAAP Adjustments Ind AS
Profit after tax as per previous GAAP
Adjustments:
Net cash flows from operating activities 3,498.29 544.46 4,042.75
Net cash flows from investing activities (3,549.86) (1,255.50) (4,805.36)
Net cash flows from financing activities 87.05 655.68 742.73
Net increase/ (decrease) in cash and cash equivalents 35.48 (55.37) (19.89)
Cash and cash equivalent as at 1st April, 2015 355.92 (190.88) 165.04
Cash and cash equivalents as at 31st March, 2016 391.40 (246.24) 145.15
Note – 1
Measurement of derivatives
Under previous GAAP, forward contracts which are outstanding as at the reporting date were restated at the closing spot rate with corresponding amortization of forward premium. UnderInd AS, these derivative contracts are accounted for as FVTPL. “Further under Ind AS embedded derivatives not closely related to the host contract are separated and these derivativecontracts have been also accounted for as FVTPL.
Notes to the Consolidated Financial Statements for the year ended 31st March, 2017

139
Notes to the Consolidated Financial Statements for the year ended 31st March, 2017
Note – 2
Recognition and measurement of certain arrangements and leases of land as finance leases
Under previous GAAP, leases of land were not classified between operating or finance leases as there was no specific accounting requirement. Accordingly, all such leases werecapitalized as fixed assets. Further, there was no guidance for recognising embedded leases under the previous GAAP.
Under Ind AS certain leases of land have been considered finance leases in accordance with Ind AS 17 also certain other arrangements have been treated as finance lease of property,plant and equipment (PP&E), resulting into increase in depreciation and finance cost, while reducing cost of goods/ services procured.
Note – 3
Capitalisation of major repairs and capital spares
Under previous GAAP spares were recognised as inventory and charged to P&L upon issuance and all expenditure on repairs was charged to P&L unless it increased the future benefitsfrom the existing asset beyond its previously assessed standard of performance.
Under Ind AS spares have been capitalised if they were held by the Group for use in business and that is expected to be used for more than one year. Similarly cost of major repairs andoverhauls to continue to operate an item of PP&E has been capitalised as a cost of such PP&E.
Note – 4
Measurement of financial assets and liabilities at amortised cost
Under previous GAAP, all financial assets and financial liabilities were carried at cost.
Under Ind AS, certain financial assets and financial liabilities are subsequently measured at amortised cost which involves the application of effective interest method. The effectiveinterest rate is the rate that exactly discounts estimated future cash payments or receipts through the expected life of the financial asset or financial liability to the fair value amount on thedate of recognition of financial asset or financial liability.
Note – 5
Measurement of equity instruments at fair value through OCI
Under previous GAAP, investments in long-term equity instrument are shown at cost and tested for other than temporary diminution. Under Ind AS, such investments are accounted forunder Ind AS 109 which requires the Group to measure such instruments at fair value through profit and loss (FVTPL) or fair value through other comprehensive income (FVOCI) (exceptfor investment in subsidiaries, associates and joint venture).
Note – 6
Classification of certain leases of land as operating leases
Under previous GAAP, leases of land where Group was a lessor were not classified between operating or finance leases as there was no specific accounting requirement. Accordingly, allsuch leasehold lands were derecognized and lease premium was booked as sales consideration.
Under Ind AS certain leasehold land previously derecognized have been considered operating leases in accordance with Ind AS 17 therefore the premium on such leases has beenrecognized as deferred income.
Note – 7
Recognition of grant from government as deferred income
Under previous GAAP, grants received in nature of promoter's contribution were directly credited to equity. Under Ind AS, grants received where conditions for recognition were not methave been recognized as deferred income.
Note – 8
Proposed dividend
Under the previous GAAP, dividends proposed by the board of directors after the balance sheet date but before the approval of the financial statements were considered as adjustingevents. Accordingly, provision for proposed dividend was recognised as a liability. Under Ind AS, such dividends are recognised when the same is approved by the shareholders in thegeneral meeting.
Note –9
Retained earnings
Retained earnings as at 1st April 2015 has been adjusted consequent to the above Ind AS transition adjustments.
Note – 10
Other comprehensive income
Under Ind AS, all items of income and expense recognised in a period should be included in profit or loss for the period, unless a standard requires or permits otherwise. Items ofincome and expense that are not recognised in profit or loss but are shown in the statement of profit and loss as ‘other comprehensive income’ includes re-measurements of definedbenefit plans, foreign exchange differences arising on translation of foreign operations, effective portion of gains and losses on cash flow hedging instruments and fair value gains or(losses) on FVOCI equity instruments. The concept of other comprehensive income did not exist under previous GAAP.
Note – 11
Deferred tax
Under Ind AS, deferred tax is created using a balance sheet approach considering the taxable and deductible temporary differences, unlike previous GAAP where a concept of timingdifference was applied. Ind AS adjustments recorded by the Group also have a deferred tax impact which has been recognised in the financial statements.
Note – 12
Guaranteed receivables
Under Ind AS, financial assets and liabilities are not offset unless there is a legal right to setoff accordingly certain trade receivables and related liabilities have been reported on agross basis under Ind AS.

140
C(ii)- Reconciliation between previous GAAP and Ind AS for impact on balance sheet
(` crore)
Particulars Notes to first Previous GAAP Adjustments Ind AS as at Previous GAAP Adjustments Ind AS as attime as at 31st 31st March, as at 1st 1st April,
adoption March, 2016 2016 April, 2015 2015
ASSETS
Non-current assets
(a) Property, Plant and Equipment 2, 3 42,733.08 1,662.67 44,395.76 34,677.23 1,571.54 36,248.77
(b) Capital work-in-progress 3 24,884.26 42.96 24,927.22 29,195.82 13.72 29,209.54
(c) Investment property 0.00 0.88 0.88 (0.00) 0.90 0.90
(d) Intangible assets 1,546.20 - 1,546.20 1,510.21 - 1,510.21
(e) Investments accounted for using the equity method 1,781.19 435.61 2,216.80 1,125.82 928.66 2,054.48
(e) Financial assets - - - -
(i) Investments 5 13.53 48.71 62.24 13.52 48.29 61.81
(ii) Trade receivable 3 37.34 (37.34) - 30.39 (28.14) 2.25
(iv) Loans 2, 4 487.53 (37.58) 449.95 481.08 (54.10) 426.98
(v) Other financial assets 1, 4 219.63 269.78 489.41 267.89 355.83 623.72
(f) Deferred tax assets (net) 10 1,786.39 (116.57) 1,669.81 0.00 (0.00) -
(g) Current tax assets (net) 278.10 - 278.10 609.89 - 609.89
(h) Other non current assets 1,007.08 (30.61) 976.47 802.68 (4.52) 798.16
74,774.33 2,238.51 77,012.84 68,714.53 2,832.18 71,546.71
Current assets
(a) Inventories 3 15,163.64 (455.41) 14,708.24 17,758.85 (484.73) 17,274.12
(b) Financial assets - -
(i) Trade receivable 12 2,908.61 242.81 3,151.42 3,215.13 370.76 3,585.89
(ii) Cash and cash equivalents 145.18 - 145.18 165.04 - 165.04
(iii) Other bank balances 200.37 - 200.37 2,211.72 - 2,211.72
(iv) Loans 4 (46.70) 111.89 65.18 (16.69) 83.66 66.97
(v) Other financial assets 1, 4 1,553.19 209.65 1,762.84 2,218.71 120.10 2,338.81
(c) Current tax assets (net) 0.89 - 0.89 0.00 - 0.00
(d) Other current assets 4,223.91 10.84 4,234.74 4,228.45 10.09 4,238.53
19 24,149.10 119.78 24,268.88 29,781.21 99.87 29,881.08
Assets classified as held for sale 0.03 20.56 20.59 0.00 20.46 20.46
TOTAL ASSETS 98,923.46 2,378.85 1,01,302.31 98,495.74 2,952.51 1,01,448.25
EQUITY AND LIABILITIES
Equity
(a) Equity share capital 4,130.53 - 4,130.53 4,130.53 - 4,130.53
(b) Other equity 35,798.67 222.23 36,020.90 39,609.67 839.75 40,449.42
39,929.20 222.23 40,151.43 43,740.20 839.75 44,579.95
Non-current liabilities
(a) Financial liabilities
(i) Borrowings 2, 4 15,936.16 1,559.55 17,495.71 13,937.79 1,682.41 15,620.20
(ii) Trade payables 6.83 - 6.83 0.71 - 0.71
(iii) Others 4 1,574.74 (2.92) 1,571.82 1,431.65 (56.56) 1,375.09
(b) Provisions 3,357.82 (84.10) 3,273.72 3,469.95 (82.80) 3,387.15
(c) Deferred tax liabilities (net) - - - 1,305.67 69.60 1,375.28
(d) Other non-current liabilities 6, 7 0.00 113.48 113.48 0.01 117.89 117.90
20,875.55 1,586.01 22,461.56 20,145.79 1,730.54 21,876.32
Current liabilities
(a) Financial liabilities
(i) Borrowings 15,574.86 - 15,574.86 14,282.91 - 14,282.91
(ii) Trade payables 3,983.54 - 3,983.54 3,597.31 - 3,597.31
(iii) Other financial liabilities 1, 2, 12 10,412.73 562.87 10,975.60 9,928.15 500.42 10,428.57
(b) Other current liabilities 6 5,489.76 5.23 5,494.99 4,282.21 5.25 4,287.46
(c) Provisions 8 2,645.89 2.52 2,648.41 2,506.62 (123.45) 2,383.17
(d) Current tax liabilities (net) 11.90 - 11.90 12.55 - 12.55
38,118.69 570.61 38,689.30 34,609.74 382.22 34,991.96
TOTAL EQUITY & LIABILITIES 98,923.44 2,378.85 1,01,302.29 98,495.73 2,952.51 1,01,448.23
* Excluding reclassifications and adjustments to individual line items upon application of equity method
Notes to the Consolidated Financial Statements for the year ended 31st March, 2017

141
C (iii)- Reconciliation between previous GAAP and Ind AS for impact on statement of profit and loss (` crore)
Particulars Notes to first Previous GAAP Adjustments* Ind AStime adoption for the year ended 31st March, 2016
1st April, 2015
RevenueRevenue from operations 26 43,916.27 16.46 43,932.73Other income 27 551.00 (21.96) 529.04
44,467.28 (5.50) 44,461.77ExpensesCost of materials consumed 28 17,183.00 - 17,183.00Purchase of Stock in Trade - - -Changes in inventories of finished goods and work in Progress 29 540.45 540.45Excise duty 4,834.29 4,834.29Employee benefits expense 30 9,859.01 (130.44) 9,728.57Finance costs 31 2,046.71 253.74 2,300.45Depreciation and amortisation expense 2,124.18 280.23 2,404.42Other expenses 32 15,149.82 (600.88) 14,548.94
51,737.45 (197.34) 51,540.11Profit before share of net profits of investment (7,270.18) 191.83 (7,078.34)accounted for using equity method and taxShare of (loss) in investments accounted for using equity method (40.19) 4.33 (35.86)Profit/(Loss) before tax (7,310.36) 196.16 (7,114.20)Profit/(Loss) before tax (7,310.36) 196.16 (7,114.20)Tax expense
Current tax 23.42 23.42Deferred tax (2,962.02) 75.91 (2,886.11)Earlier years (75.02) (75.02)
Total tax expense (3,013.62) 75.91 (2,937.71)Profit/(Loss) for the year (4,296.74) 120.25 (4,176.49)Other Comprehensive IncomeA i) Items that will not be reclassified to profit and loss
Remeasurements of post employment benefit obligations - (144.45) (144.45)Changes in fair value of FVOCI equity instruments - 0.42 0.42Others - - -
ii) Income tax relating to items that will not be reclassified to profit or loss - 49.35 49.35B i) Items that will be reclassified to profit or loss
Share of the OCI of associate and joint ventures accounted for using the equity method - 50.84 50.84ii) Income tax relating to items that will be reclassified to profit or loss
Other Comprehensive Income for the year - (43.83) (43.83)Total Comprehensive Income for the year (4,296.74) 76.42 (4,220.32)
* Excluding reclassifications
D. Due to application of equity method assets and liabilities of joint ventures which were proportionately consolidated in the previous GAAP have been aggregated into a singleline investment. The following table shows the break-down of assets and liabilities on the date of transition to Ind AS:
Particulars Proportionate share of assets and liabilities 1st April, 2015Non-Current Assets 973.92Financial 1,845.26Non-Financial 2,819.18TotalCurrent AssetsFinancial 543.17Non-Financial 266.45Total 809.62Total assets (A) 3,628.80Non-Current LiabilitiesFinancial 437.34Non-Financial 294.07Total 731.41Current LiabilitiesFinancial 504.13Non-Financial 176.76Total 680.89Total liabilities (B) 1,412.30Total Equity (A-B) 2,216.50ReconciliationTotal proportionate share in net assets 1st April, 2015 2,216.50Adjustment for share of share application money pending allotment: (167.86)Adjusted share in net assets 2,048.64Unrecognised losses due to application of equity method 5.24Amount of investment recognised using equity method 2,053.88Share in associate accounted for using equity method 0.60Amount of investment recognised using equity method on date of transition 2,054.48
Notes to the Consolidated Financial Statements for the year ended 31st March, 2017
142
Notes to the Consolidated Financial Statements for the year ended 31st March, 2017
A. Joint ventures individually significant to the Group
NTPC SAIL Power Company Limited(` crore)
Summarised balance sheet As at 31st As at 31st As at 1st
March, 2017 March, 2016 April, 2015
Current assets
Cash and cash equivalents 5.14 242.64 154.82
Other assets 920.51 538.63 678.43
925.65 781.27 833.25
Non-current assets 2,202.61 2,162.67 2,317.67
Current Liabilities
Financial liabilities (excluding trade 316.96 282.11 261.95payables and provisions)
Other Liabilities 103.23 107.97 229.96
420.19 390.08 491.91
Non-Current liabilities
Financial liabilities (excluding trade 570.13 555.21 742.28payables and provisions)
Other liabilities 164.43 243.42 268.96
734.56 798.63 1,011.24
Net assets 1,973.51 1,755.23 1,647.77
Ownership interest 50.00% 50.00% 50.00%
Carrying amount of interest 986.76 877.62 823.89
(` crore)
Summarised statement of For the year For the yearprofit and loss ended 31st March, ended 31st March,
2017 2016
Revenue 2,526.31 2,436.07
Depreciation and ammortisation 147.20 139.72
Interest income 94.46 69.48
Interest Expense 76.52 105.43
Income tax expense or income 46.73 18.52
Profit or loss from continuing operations. 388.87 251.96
Post-tax profit or loss from discontinued operations. - -
Other comprehensive income. (2.08) (0.01)
Total comprehensive income. 386.79 251.95
Ownership interest 50.00% 50.00%
Mjunction Services Limited(` crore)
Summarised balance sheet As at 31st As at 31st As at 1st
March, 2017 March, 2016 April, 2015
Current assets
Cash and cash equivalents 51.72 39.06 26.83
Other assets 210.95 187.38 155.10
262.67 226.44 181.93
Non-current assets 93.99 88.85 97.83
Current Liabilities
Financial liabilities (excluding trade 92.08 80.23 91.41payables and provisions)
Other Liabilities 24.90 19.86 17.53
116.98 100.09 108.94
Non-Current liabilities
Financial liabilities (excluding trade - - -payables and provisions)
Other liabilities 12.60 11.16 9.86
12.60 11.16 9.86
Net assets 227.08 204.04 160.96
Ownership interest 50.00% 50.00% 50.00%
Carrying amount of interest 113.54 102.02 80.48
(` crore)
Summarised statement of For the year For the yearprofit and loss ended 31st March, ended 31st March,
2017 2016
Revenue 176.15 175.54
Depreciation and ammortisation 8.07 7.87
Interest income 0.16 0.05
Interest Expense - -
Income tax expense or income 16.06 19.93
Profit or loss from continuing operations 37.75 43.04
Post-tax profit or loss from discontinued operations - -
Other comprehensive income 0.25 0.03
Total comprehensive income 38.00 43.07
Ownership interest 50.00% 50.00%
International Coal Ventures Limited(` crore)
Summarised balance sheet As at 31st As at 31st As at 1st
March, 2017 March, 2016 April, 2015
Current assets
Cash and cash equivalents 50.92 30.00 79.44
Other assets 37.21 30.76 11.90
88.13 60.76 91.34
Non-current assets 2,217.58 2,135.70 1,861.28
Current Liabilities
Financial liabilities (excluding trade 248.04 255.46 72.83payables and provisions)
Other Liabilities 0.51 9.04 19.43
248.55 264.50 92.26
Non-Current liabilities
Financial liabilities (excluding trade - - -payables and provisions)
Other liabilities 14.58 20.35 28.80
14.58 20.35 28.80
Net assets 2,042.58 1,911.61 1,831.56
less: share application money (180.01) (193.69) (335.20)pending allotment
Ownership interest 46.73% 46.62% 49.59%
Carrying amount of interest 870.38 800.89 742.04
(` crore)
Summarised statement of For the year For the yearprofit and loss ended 31st March, ended 31st March,
2017 2016
Revenue 13.91 27.11
Depreciation and ammortisation 0.13 0.08
Interest income 0.65 1.01
Interest Expense 89.91 6.15
Income tax expense or income 0.40 -
Profit or loss from continuing operations. (67.33) (433.56)
Post-tax profit or loss from discontinued operations. - -
Other comprehensive income. 3.26 108.80
Total comprehensive income. (64.07) (324.76)
Ownership interest 46.73% 46.62%
37. SUMMARISED FINANCIAL INFORMATION OF EQUITY METHOD INVESTEES

143
Notes to the Consolidated Financial Statements for the year ended 31st March, 2017
Bokaro Power Supply Co. Ltd.(` crore)
Summarised balance sheet As at 31st As at 31st As at 1st
March, 2017 March, 2016 April, 2015
Current assets
Cash and cash equivalents 134.91 165.37 78.90
Other assets 295.04 310.56 320.00
429.95 475.93 398.90
Non-current assets 834.01 779.11 775.39
Current Liabilities - - -
Financial liabilities (excluding trade 150.74 194.29 196.45payables and provisions)
Other Liabilities 70.72 91.33 71.93
221.46 285.62 268.38
Non-Current liabilities - - -
Financial liabilities (excluding trade 15.79 6.98 6.77payables and provisions)
Other liabilities 258.20 248.33 271.42
273.99 255.31 278.19
Net assets 768.51 714.11 627.72
Ownership interest 50.00% 50.00% 50.00%
Carrying amount of interest 384.26 357.06 313.86
(` crore)
Summarised statement of For the year For the yearprofit and loss ended 31st March, ended 31st March,
2017 2016
Revenue 900.72 951.04
Depreciation and ammortisation - -
Interest income 25.61 27.04
Interest Expense 15.66 19.29
Income tax expense or income 2.09 10.65
Profit or loss from continuing operations 78.54 99.21
Post-tax profit or loss from discontinued operations - -
Other comprehensive income (0.49) 0.21
Total comprehensive income 78.53 99.20
Ownership interest 50.00% 50.00%
Bhilai Jaypee Cement Limited(` crore)
Summarised balance sheet As at 31st As at 31st As at 1st
March, 2017 March, 2016 April, 2015
Current assets
Cash and cash equivalents 4.20 2.13 7.87
Other assets 31.43 64.34 130.86
35.63 66.47 138.73
Non-current assets 775.68 776.80 777.93
Current Liabilities
Financial liabilities (excluding trade 258.54 169.81 225.69payables and provisions)
Other Liabilities 435.83 471.71 402.12
694.37 641.52 627.81
Non-Current liabilities
Financial liabilities (excluding trade 13.94 30.53 38.64payables and provisions)
Other liabilities 5.62 4.81 2.84
19.56 35.34 41.48
Net assets 97.38 166.41 247.37
Ownership interest 26.00% 26.00% 26.00%
Calculated share of net assets 25.32 43.27 64.32
Goodwill 5.73 5.73 5.73
Carrying amount of interest 31.05 49.00 70.05
(` crore)
Summarised statement of For the year For the yearprofit and loss ended 31st March, ended 31st March,
2017 2016
Revenue 84.13 444.03
Depreciation and ammortisation 38.43 38.47
Interest income - -
Interest Expense 18.92 32.86
Income tax expense or income (30.80) (35.68)
Profit or loss from continuing operations (69.03) (80.54)
Post-tax profit or loss from discontinued operations - -
Other comprehensive income (0.31) -
Total comprehensive income (69.34) (80.54)
Ownership interest 26.00% 26.00%
B. Summarised financial information for Joint Ventures not individually significant(` crore)
Summarised statement of For the year For the yearprofit and loss ended 31st March, ended 31st March,
2017 2016
Profit or loss from continuing operations (24.89) (29.45)
Post-tax profit or loss from discontinued operations - -
Other comprehensive income 0.01 (0.05)
Total comprehensive income (24.88) (29.40)
C. Associates, not individually significant (` crore)
Summarised statement of For the year For the yearprofit and loss ended 31st March, ended 31st March,
2017 2016
Profit or loss from continuing operations 0.52 1.56
Post-tax profit or loss from discontinued operations - -
Other comprehensive income - -
Total comprehensive income 0.52 1.56
D. The unrecognised share of losses of joint ventures, both for the reporting period andcumulatively, where the Group has stopped recognising its share of losses of the joint venturewhen applying the equity method
(` crore)
Particulars As at 31st As at 31st As at 1st
March, 2017 March, 2016 April, 2015
SAL SAIL JVC Limited
reporting period - - -
cumulative 0.01 0.01 0.01
SAIL MOIL Ferro Alloys Private Limited
reporting period 0.19 0.21
cumulative 1.67 1.48 1.27
SAIL SCL Kerala Limited
reporting period 4.84 4.10
cumulative 12.25 7.41 3.96
Abhinav SAIL JVC Limited
reporting period - 0.01 -
cumulative 0.02 0.01 -
SAIL Bengal Alloy Castings Pvt. Limited
reporting period - 0.01 -
cumulative - 0.01 -
E. Dividends received from the joint ventures (` crore)
For the year For the yearended 31st March, ended 31st March,
2017 2016
NTPC SAIL Power Company Limited 84.25 72.21
Mjunction Services Limited 7.22 -
International Coal Ventures Limited - -
Bokaro Power Supply Co. Limited 12.32 6.52
Bhilai Jaypee Cement Limited - -

144
Proportionate Ownership in %
S. Name Relationship Nature of activity Principal Place As at 31st As at 31st As at 1st
No. of Business March, 2017 March, 2016 April, 2015
1 SAIL Jagdishpur Power Plant Limited Subsidiary Power Production India 100% 100% 100%
2 SAIL Refractory Company Limited Subsidiary Refactory Material production India 100% 100% 100%
3 SAIL Sindri Projects Limited Subsidiary Cement Production India 100% 100% 100%
4 Chhattisgarh Mega Steel Limited Subsidiary Steel Production India 74% 100% 100%
5 NTPC SAIL Power Company Ltd Joint-venture Power Production India 50% 50% 50%
6 Bokaro Power Supply Co. Pvt. Ltd. Joint-venture Power Production India 50% 50% 50%
7 Mjunction Services Limited Joint-venture Consultancy Services India 50% 50% 50%
8 SAIL Bansal Service Centre Ltd Joint-venture Consultancy Services India 40% 40% 40%
9 Bhilai Jaypee Cement Limited Joint-venture Cement Production India 26% 26% 26%
10 S& T Mining Co. Pvt. Limited Joint-venture Coal Mining India 50% 50% 50%
11 International Coal Ventures Private Ltd. Joint-venture Coal Mining India/ 47% 47% 50%Mozambique
12 SAIL-MOIL Ferro Alloys Private Ltd. Joint-venture Ferro Manganese Production India 50% 50% 50%
13 SAIL SCI Shipping Pvt. Limited Joint-venture Logistics India 50% 50% 50%
14 SAIL SCL Kerala Limited Joint-venture Steel Production India 49% 49% 48%
15 SAIL RITES Bengal Industry Pvt. Ltd. Joint-venture Railway Wagon Production India 50% 50% 50%
16 SAIL Kobe Iron India Pvt. Limited Joint-venture Steel Production India 50% 50% 50%
17 SAIL-BENGAL Alloy Castings Private Ltd. Joint-venture Alloy Casting India 50% 50% 50%
18 Prime Gold-SAIL JVC Limited Joint-venture Steel Production India 26% 26% 26%
19 VSL SAIL JVC Limited Joint-venture Alloy Casting India 21% 26% 26%
20 Abhinav SAIL JVC Limited Joint-venture Alloy Casting India 26% 26% 26%
21 NMDC SAIL Limited Joint-venture Railway Project India 49% - -
22 TMT SAL SAIL JV Limited Joint-venture Metal Products India 26% 26% 26%
23 SAL SAIL JVC Limited Joint-venture Metal Products India 26% 26% 26%
24 Bastar Railway Private Limited Joint-venture Railway Project India 21% - -
25 Almora Magnesite Limited Associate Megnesite Mining India 20% 20% 20%
37A. DETAILS OF SUBSIDIARIES, JOINT VENTURES AND ASSOCIATES
Notes to the Consolidated Financial Statements for the year ended 31st March, 2017
38. DETAILS OF ASSETS PLEDGED
The carrying amounts of assets pledged as security for current and non-current borrowings are:(` crore)
Particulars As at 31st March, 2017 As at 31st March, 2016 As at 1st April, 2015
Current
Inventories and trade receivables (to the extent pledged) 1,552 2,256 6,558
Non Current
Plant & Machinery (movable assets) - Durgapur Steel Plant (to the extent pledged) 1,162 1,176 1,190
Plant & Machinery (movable assets) - Bokaro Steel Plant (to the extent pledged) 2,500 - -
Land (at Mouje-Wadej of city taluka, District Ahemadabad, Gujrat) - ISP 0.02 0.02 0.02

145
Notes to the Consolidated Financial Statements for the year ended 31st March, 2017
39. EFFECTIVE TAX RECONCILIATION (` crore)
Particulars For the year ended For the year ended31 March, 2017 31 March, 2016
Profit/(Loss) before tax (4,715.69) (7,114.21)
Domestic tax rate for PFS 0.34608 0.34608
Expected tax expense [A] (1,632.01) (2,462.09)
Adjustment for tax-exempt income/ non-deductible expenses (10.71) 17.85
Adjustment for difference tax rate items 0.47 0.47
Deferred tax liability/ assets not recognised (9.01) 4.12
Tax incentive on specific expenditure (353.00) (524.84)
Tax related to earlier years 15.14 (75.02)
MAT credit reversal 28.50 12.71
Deferred tax on undistributed profit of subsidiary 2.61 1.71
Tax rate difference on undistributed profits and dividend income 8.37 80.80
Others (9.89) 6.58
Total adjustments [B] (327.52) (475.62)
Actual tax expense [C=A+B] (1,959.52) (2,937.71)
Tax expense comprises:
Current tax expense 30.64 24.91
Deferred tax credit (1,990.16) (2,962.62)
Tax expense recognized in profit and loss [D] (1,959.52) (2,937.71)
For the year ended 31 March, 2017 Net Worth Profit or (Loss) Other Comprehensive Total ComprehensiveIncome Income
Name of the entity in the group Ownership Proportionate As % of Share in As % of Share in As % of Share in As % ofin % Share Consolidated Profit/ (Loss) Consolidated Other Consolidated Total Consolidated
As at 31 Net Worth Profit/ (Loss) Comprehensive Other Comprehensive TotalMarch, 2017 Income Comprehensive Income Comprehensive
Income Income
Steel Authority of India 100 36,009.06 97.21% (2,833.24) 102.80% (353.60) 99.96% (3,186.84) 102.51%
Subsidiaries
SAIL Jagdishpur Power Plant Limited 100 0.02 0.00% (0.01) 0.00% - 0.00% (0.01) 0.00%
SAIL Refractory Company Limited 100 116.76 0.32% 21.01 -0.76% (0.67) 0.19% 20.34 -0.65%
SAIL Sindri Projects Limited 100 0.02 0.00% (0.01) 0.00% - 0.00% (0.01) 0.00%
Chhattisgarh mega steel limited 74 0.03 0.00% - 0.00% - 0.00% - 0.00%
Joint-ventures
NTPC SAIL Power Company Pvt. Ltd 50 986.76 2.66% 194.43 -7.05% (1.04) 0.29% 193.39 -6.22%
Bokaro Power Supply Co. Pvt. Ltd. 50 384.26 1.04% 39.27 -1.42% 0.25 -0.07% 39.52 -1.27%
Mjunction Services Limited 50 113.54 0.31% 18.87 -0.68% (0.12) 0.03% 18.75 -0.60%
SAIL Bansal Service Centre Ltd 40 0.50 0.00% (0.16) 0.01% 0.00 0.00% (0.16) 0.01%
Bhilai Jaypee Cement Limited 26 25.32 0.07% (17.87) 0.65% (0.08) 0.02% (17.95) 0.58%
S& T Mining Co. Pvt. Limited 50 (0.50) 0.00% (2.53) 0.09% - 0.00% (2.53) 0.08%
International Coal Ventures Private Ltd. 46.62 868.33 2.34% (31.39) 1.14% 1.52 -0.43% (29.87) 0.96%
SAIL-MOIL Ferro Alloys Private Ltd. 50 (1.67) 0.00% (0.19) 0.01% - 0.00% (0.19) 0.01%
SAIL SCI Shipping Pvt. Limited 50 0.07 0.00% 0.00 0.00% - 0.00% 0.00 0.00%
SAIL SCL Kerala Limited 49.26 (17.14) -0.05% (6.14) 0.22% - 0.00% (6.14) 0.20%
SAIL RITES Bengal Industry Pvt. Ltd. 50 14.83 0.04% (6.49) 0.24% - 0.00% (6.49) 0.21%
SAIL Kobe Iron India Pvt. Limited 50 0.26 0.00% - 0.00% - 0.00% - 0.00%
SAIL-BENGAL Alloy Castings Private Ltd. 50 (0.00) 0.00% (0.01) 0.00% - 0.00% (0.01) 0.00%
Prime Gold-SAIL JVC Limited 26 6.44 0.02% 1.07 -0.04% - 0.00% 1.07 -0.03%
VSL SAIL JVC Limited 26 1.58 0.00% - 0.00% - 0.00% - 0.00%
Abhinav SAIL JVC Limited 26 (0.03) 0.00% (0.02) 0.00% - 0.00% (0.02) 0.00%
NMDC SAIL Limited 49 0.02 0.00% (0.00) 0.00% - 0.00% (0.00) 0.00%
TMT SAL SAIL JV Limited 26 (0.00) 0.00% - 0.00% - 0.00% - 0.00%
SAL SAIL JVC Limited 26 (0.02) 0.00% (0.00) 0.00% - 0.00% (0.00) 0.00%
Bastar Railway Private Limited 21 0.49 0.00% (0.02) 0.00% - 0.00% (0.02) 0.00%
Associates
AlmoraMagnesite Limited 20 1.01 0.00% 0.10 0.00% - 0.00% 0.10 0.00%
Non-controlling interest 0.01 0.00% - 0.00% - 0.00% - 0.00%
Consolidation adjustments 1,467.65 -3.96% 132.87 4.82% - 0.00% 131.87 4.24%
Grand total 37,042.27 100.00% (2,756.17) 100.00% (353.75) 100.00% (3,108.92) 100.00%
40. INFORMATION REQUIRED BY SCHEDULE III OF THE COMPANIES ACT 2013, WITH RESPECT TO CONSOLIDATED FINANCIAL STATEMENTS
146
Notes to the Consolidated Financial Statements for the year ended 31st March, 2017
41. INFORMATION REQUIRED BY SCHEDULE III OF THE COMPANIES ACT 2013, WITH RESPECT TO CONSOLIDATED FINANCIAL STATEMENTS
For the year ended 31 March, 2016 Net Worth Profit or (Loss) Other Comprehensive Total ComprehensiveIncome Income
Name of the entity in the group Ownership Proportionate As % of Share in As % of Share in As % of Share in As % ofin % Share Consolidated Profit/ (Loss) Consolidated Other Consolidated Total Consolidated
As at 31 Net Worth Profit/ (Loss) Comprehensive Other Comprehensive TotalMarch, 2016 Income Comprehensive Income Comprehensive
Income Income
Steel Authority of India 100 39,195.90 97.62% (4,021.44) 96.29% (95.09) 216.93% (4,116.53) 97.56%
Subsidiaries
SAIL Jagdishpur Power Plant Limited 100 0.03 0.00% - 0.00% - 0.00% - 0.00%
SAIL Refractory Company Limited 100 102.00 0.25% 15.89 -0.38% 0.41 -0.94% 16.30 -0.39%
SAIL Sindri Projects Limited 100 0.03 0.00% (0.01) 0.00% - 0.00% (0.01) 0.00%
Chhattisgarh mega steel limited 100 0.04 0.00% (0.01) 0.00% - 0.00% (0.01) 0.00%
Joint-ventures
NTPC SAIL Power Company Pvt. Ltd 50 877.61 2.19% 125.98 -3.02% (0.00) 0.01% 125.97 -2.99%
Bokaro Power Supply Co. Pvt. Ltd. 50 357.06 0.89% 49.61 -1.19% 0.11 -0.24% 49.71 -1.18%
Mjunction Services Limited 50 102.02 0.25% 21.52 -0.52% 0.02 -0.03% 21.54 -0.51%
SAIL Bansal Service Centre Ltd 40 0.65 0.00% (0.33) 0.01% (0.01) 0.02% (0.34) 0.01%
Bhilai Jaypee Cement Limited 26 43.27 0.11% (20.94) 0.50% - 0.00% (20.94) 0.50%
S& T Mining Co. Pvt. Limited 50 2.03 0.01% (2.08) 0.05% 0.02 -0.03% (2.07) 0.05%
International Coal Ventures Private Ltd. 46.62 800.89 1.99% (202.13) 4.84% 50.72 -115.72% (151.40) 3.59%
SAIL-MOIL Ferro Alloys Private Ltd. 50 (1.48) 0.00% (0.21) 0.01% - 0.00% (0.21) 0.00%
SAIL SCI Shipping Pvt. Limited 50 0.07 0.00% 0.00 0.00% - 0.00% 0.00 0.00%
SAIL SCL Kerala Limited 49.26 (11.00) -0.03% (6.97) 0.17% - 0.00% (6.97) 0.17%
SAIL RITES Bengal Industry Pvt. Ltd. 50 19.59 0.05% (2.74) 0.07% - 0.00% (2.74) 0.06%
SAIL Kobe Iron India Pvt. Limited 50 0.26 0.00% - 0.00% - 0.00% - 0.00%
SAIL-BENGAL Alloy Castings Private Ltd. 50 (0.00) 0.00% (0.01) 0.00% - 0.00% (0.01) 0.00%
Prime Gold-SAIL JVC Limited 26 5.36 0.01% (1.53) 0.04% - 0.00% (1.53) 0.04%
VSL SAIL JVC Limited 26 1.34 0.00% - 0.00% - 0.00% - 0.00%
Abhinav SAIL JVC Limited 26 (0.01) 0.00% (0.01) 0.00% - 0.00% (0.01) 0.00%
TMT SAL SAIL JV Limited 26 (0.00) 0.00% (0.00) 0.00% - 0.00% (0.00) 0.00%
SAL SAIL JVC Limited 26 (0.02) 0.00% (0.00) 0.00% - 0.00% (0.00) 0.00%
Associates
AlmoraMagnesite Limited 20 0.91 0.00% 0.31 -0.01% - 0.00% 0.31 -0.01%
Consolidation adjustments 1,345.09 -3.35% 131.39 3.15% - 0.00% 130.39 3.09%
Grand total 40,151.43 100.00% (4,176.50) 100.00% (43.83) 100.00% (4,219.33) 100.00%
42.1 CONTINGENT LIABILITIES (` crore)
As at As at As at31st March, 2017 31st March, 2016 1st April, 2015
In Respect of SaIL:
(i) Claims against the Group pending appellate/judicial decisions against which the Group has counter 33182.59 30493.13 22265.17claims of `26.30crore (as at 31st March 2016 `26.30crore)( as at 1st April 2015 `28.06crore)
* includes sales tax on inter-state stock transfers from SAIL plants to stockyards -`740.99 crores(31st March 2016 `739.30 crores) (as at 1st April 2015 `739.33 crores) for which no liability isexpected to arise, as sales tax has been paid on eventual sales.
(ii) Other claims against the Group not acknowledged as debts against which the Group has 3243.98 1854.51 1313.02counter-claims of `103.95 crore (as at 31st March 2016 `103.95 crore)(as at 1st April 2015`103.95 crore).
(iii) Disputed income tax/service tax/other demand on joint venture company for which company 32.89 33.79 31.59may be contingently liable under the joint venture agreement
(iv) Bills drawn on customers and discounted with banks. 37.38 35.00 420.15
(v) Price escalation claims by contractors/suppliers and claims by certain employees, 408.62 166.58 250.71extent whereof is not ascertainable
Inclued above in respect of Joint Ventures:
(i) Claims against the Company pending appellate/judicial decisions 0.42 0.78 0.86
(ii) Other claims against the Company not acknowledged as debt 38.16 45.03 42.79

147
42.2 Estimated amount of contracts remaining to be executed and not provided for (net of advances) are: (` crore)
Particulars 31st March, 2017 31st March, 2016 1st April, 2015
Capital commitments 13582.21 15689.19 13014.50
Other commitments 1532.36 1444.26 1399.69
42.3 In respect of SAIL:a) The Nine Judges Constitutional Bench of Hon'ble Supreme Court, vide its judgment dated 11.11.2016, has upheld the constitutional validity of levy of Entry Tax Acts
enacted by the States and has laid down principles/tests for consideration. The respective regular Benches of the Court would hear the matters as per laid down principles.Pending decisions by the regular Benches of the Apex Court on levy of Entry Tax in the States of Chhattisgarh, Odisha, Uttar Pradesh, and Jharkhand, the Entry Tax demands,under dispute, of `1092.28 crore, `352.16 crore, `92.23 crore and `5.15 crore upto 31st March, 2017 aggregating to `1541.82 crore (including a sum of `1091.02 crore,`341.15 crore, `92.23 crore and `5.15 upto 31st March, 2016 and a sum of `1084.32 crore, , `333.95 crore, `92.23 crore and `5.15 upto 1st April, 2015) have beentreated as contingent liabilities.The Company has deposited ` 1761.20 crore (upto 31st March, 2016 ` 1600.95 crore) (upto 1st April, 2015 ` 1436.58 crore) against the said demand which has beentreated as Deposit and disclosed under Non-Current Financial Assets-Loans.Pending final decision by the Hon'ble Calcutta High Court, in the case of levy of Entry Tax in West Bengal, the disputed Entry Tax demands of `254.21 crore for the yearended 31st March, 2017 (for the year ended 31st March, 2016 `155.44 crore )( for the year ended 1st April, 2015 ` 79.90 crore) have been treated as contingent liabilities.
b) Hon'ble Supreme Court dismissed the SLP by the Company in respect of dispute with Damodar Valley Corporation(DVC) related to provisional tariff petition of electricitycharges for 2009-14 vide order dated 18th January, 2017, keeping the question of law open. The Order of Central Electricity Regulatory Commission (CERC) dt.7/8/2013related to Tariff of 2009-14 against Petition No.275/GT/2012 has been challenged before Appellate Tribunal for Electricity (APTEL) (Appeal No.18 of 2014) in which theCompany has also intervened and the order of APTEL is pending. The appeal filed by DVC pertaining to tariff of 2004-09 is yet to be decided by the Hon'ble Supreme Courtof India. As per legal opinion received by the Company, the decision of Hon'ble Supreme Court of India on determination of the tariff of 2004-09 may have an effect on thesubsequent periods. Pending final decision in this regard, the claim of DVC of ` 587.72 crore upto 31st March, 2017 (upto 31.03.2016 `491.27 crore, as at 01.04.2015`393.59 crore) has been considered as Contingent Liability and included in Note No. 42.1(i)(f) above. Against the said demands, the entire amount has been paid to DVC.
42.4 Under the Jharkhand Mineral Area Development Authority (Amendment) Act, 2015 the State Government of Jharkhand has made a demand of `3045.41 crore upto 31stMarch, 2017 (upto 31.03.2016 `2375.95 crore, as at 01.04.2015 `63.31 crore) towards "Market Fee" on transaction value of coal, iron and steel items. As the matter issub-judice, the amount has been disclosed as a Contingent Liability in Note No. 42.1(i) above.
42.5 The Company pays royalty on iron ore on the basis of quantity removed from the leased area at the rates based on notification by the Ministry of Mines, Government of Indiaand the price published by India Bureau of Mines on a monthly basis for both iron ore lumps and fines separately. A circular was issued by the State Government of Odisharegarding payment of royalty on fines at the rate of lumps on 07.09.2010 retrospectively effective from August 2009. The Government of India, vide circular dated23.07.2012, directed the State Government of Odisha to withdraw the circular dated 07.09.2010. Accordingly, excess royalty for fines at the rate applicable for lumps, paidin two Iron Ore Mines of the Company amounting to `144.34 crore, has been shown as Claims Recoverable. As the Company has disputed the matter with the AppropriateAuthorities pending withdrawal of the circular of the State Government of Odisha, the amount of `144.34 crore ( As on 31.03.2016 `144.34 and 01.04.2015 `144.34crore) has been included in the Contingent Liability, in Note No. 42.1(ii) above.
42.6 In its judgement, the Central Administrative Tribunal (CAT), Kolkata has directed that Ministry of Steel shall consider the aspect of payment of arrears of revised perks andallowances and take appropriate decision of payment of revised perks and allowances amounting to ` 325.13 crore to the executives for the period 26.11.2008 to4.10.2009. Ministry of Steel intimated the matter to the Company on 7.12.2016. A stay petition in the matter has been filed on 22.12.2016 and is pending before the Hon'bleCalcutta High Court. As the matter is sub-judice, the amount has been disclosed as a Contingent Liability in Note No. 42.1(v) above.
42.7 Indigenous washed coking coal supplies, have been claimed by Bharat Coaking Coal Limited (BCCL) and Central Coalfields Limited (CCL) at unilaterally notified price w.e.f.13th January, 2017 and 14th January, 2017 respectively, which is in deviation from the mutually agreed price with the Company for the year 2016-17. The Company hasaccounted for the supplies based on agreed prices as per jointly signed Memorandum of Understanding, valid for supplies w.e.f. 1st April, 2016 to 31st March, 2017,between SAIL and BCCL & CCL. The differential claims of BCCL & CCL, amounting to `334.45 crore at unilaterally notified higher rates over and above MOU rates, havebeen disclosed as contingent liability in the Note No. 42.1(ii) above.
42.8 The Ministry of Environment & Forest and Climate Change (MoEF & CC) vide their letter No.- 11-599/ 2014-FC dated 1st April 2015 issued revised Guidelines for diversionof Forest Land for non-forest purpose under the Forest (Conservation) Act, 1980 (FC Act). These revised Guidelines stipulated that in case of existing mining leases havingForest Land (partially or fully), where approval for only a part of forest land has been obtained under the FC Act, the Central Government accorded general approval underSection-2(iii) of the FC Act for the remaining area also to be Forest Land, subject to certain conditions, which includes realising Net Present Value (NPV) for the entire forestland falling in the mining lease in case, NPV of such forest land has not already been realised.In this matter, as per legal opinion obtained by the Company, Section 2 (iii) of FC Act, 1980 will not apply to Government Corporation and NPV is required to be paid only forthat limited area, which has been approved by MoEF & CC and in which mining activities are proposed to be done and not for the entire forest area. The matter of applicabilityof NPV for total forest land has been challenged by the Company in Hon'ble High Court of Jharkhand. The Hon'ble Court, in its order, has directed to place the matter beforeDivision Bench of this Court.
43.1 The amount due to Micro and Small Enterprises as defined in the `The Micro, Small and Medium Enterprises Development Act, 2006 (as disclosed in Note No. 22 TradePayables) has been determined to the extent such parties have been identified on the basis of information available with SAIL. The disclosures relating to Micro and SmallEnterprises as at 31st March, 2017 are as under: (` crore)
No. Description As at 31st As at 31st As at 1st
March, 2017 March, 2016 April, 2015
i. The principal amount remaining unpaid to supplier as at the end of the Year. 38.12 29.46 27.27ii. The amount of interest accrued during the year and remaining unpaid at the end of the Year. - -iii. The amount of further interest remaining due and payable even in the succeeding years, - -
until such date when the interest dues as above are actually paid to the small enterprises,for the purpose of disallowance as a deductible expenditure under section 23.
iv. The interest due thereon remaining unpaid to supplier as at the end of the Year. - -
For the Year ended
31st March, 2017 31st March, 2016
v. The amount of interest paid in terms of section 16, along with the amount of the payment - -made to the supplier beyond the appointed day during the Year.
vi. The amount of interest due and payable for the period of delay in making payment (which - -have been paid but beyond the appointed day during the year) but without adding theinterest specified under this Act.

148
43.2 Balances of some of the Trade Receivables, Other Assets, Trade and Other Payables are subject to confirmation/reconciliation and consequential adjustment, if any.Reconciliations are carried out on on-going basis. Provisions, wherever considered necessary, have been made. However, management does not expect to have anymaterial financial impact of such pending confirmation/reconciliation.
44.1 In respect of SAIL, Sales include sale to Government Agencies recognised on provisional contract prices during the Year ended 31st March 2017: `3807.78 crore (PreviousYear: `3779.85 crore) and cumulatively up to 31st March, 2017: `18342.41 crore (up to Previous Year: `14667.87 crore).
44.2 In respect of SAIL, the long-term agreement for wage revision expired on 31st December, 2016. Pending finalisation of fresh agreement w.e.f. 1st January 2017, an all-inclusive provision of Rs.107.15 crore towards salaries and wages revision, has been made on ad-hoc basis.
44.3 In respect of SAIL, The research and development expenditure charged to Statement of Profit & Loss and allocated to Fixed Assets/Capital work-in-progress (Net), duringthe Year, amount to `261.60 crore (`226.22 crore) and `77.83 crore (`50.78 crore) respectively. The aggregate amount of revenue expenditure incurred on research anddevelopment is shown in the respective head of accounts. The break-up of the amount is as under:
(` crore)
Head of Account For the year ended
31st March, 2017 31st March, 2016
Raw Materials 26.93 66.25
Employees Benefits Expenses 88.87 95.18
Stores & Spares Consumed 9.44 5.39
Power & Fuel 4.80 14.79
Repairs & Maintenance 4.13 4.78
Depreciation and Amortisation Expenses 6.42 6.04
Other Expenses 119.01 33.61
Finance Cost 2.00 0.18
Total 261.60 226.22
44.4 SAIL reviews the carrying amount of its fixed assets on each balance sheet date for the purpose of ascertaining impairment, if any, by considering assets of entire one plantas Cash Generating Unit (CGU). If any such indication exists, the assets recoverable amount is estimated, as higher of the net selling price and the value in use. Animpairment loss is recognised whenever the carrying amount of an asset exceeds its recoverable amount. The net selling price of the CGU is determined once in every threeyears.
On such review as on 31st March 2017, no provision is required to be made during the year, as the value in use of assets of Bhilai Steel Plant, Durgapur Steel Plant, RourkelaSteel Plant, Bokaro Steel Plant and IISCO Steel Plant, based on the present value of estimated future cash-flows expected to arise from the continuing use of an asset andfrom its disposal at the end its useful life, is more than the carrying amount of the respective CGU.
No provision is required to be made during the year for Alloy Steels Plant, Salem Steel Plant and Visvesvaraya Iron and Steel Plant, as the net realisable value thereof,assessed by an independent agency, as on 31st March, 2015 for Salem Steel Plant and as on 31st March, 2017 for Alloy Steels Plant and Visvesvaraya Iron & Steel Plant,is more than the carrying amount of respective CGU.
In the opinion of the management, there is no impairment of assets in the Rotary Polisher unit in Salem amounting to `7.29 crore as the net realisable value is higher thanthe book value. Similarly, the net realizable value of Pipe Coating Plant at RSP is higher than the book value at `34.63 crore.
44.5 As per Section 135 of the Companies Act, 2013 effective from 1st April, 2014, SAIL is required to spend, in every financial year, at least 2% of the average net profits of theCompany made during the three immediately preceding financial years in accordance with its Corporate Social Responsibility (CSR) Policy. Since, the Company reportedaverage net loss made during the three immediately preceding financial years, no budget is required to be spent for the Financial Year 2016-17. Total amount to be spentby the Company is `22.80 crore i.e. unspent amount of previous year. The Company has spent an amount of `29.05 crore on CSR activities during the year 2016-17 underthe following heads :
Particulars ` crore
Education 8.96
Healthcare 3.39
Livelihood Generation 2.97
Women Empowerment 0.90
Drinking Water 0.95
Sanitation 1.50
Sports 0.97
Art & Culture 2.13
Rural Development 2.68
Social Security 0.26
Environment Sustainability 3.13
Project Identification and Monitoring 0.00
Capacity Building of Personnel 0.00
Total 29.05
SRCL, has spent an amount of `0.57 crore, on CSR activities during the year 2016-17.
44.6 In respect of SAIL, Information on leases as per Indian Accounting Standards (Ind AS)17 on `Leases':
(a) The Company has granted lease of properties to the employees and third parties for varying periods. The lease premium received up-front, after adjusting against bookvalue, is booked to other revenues in the year of lease. Renewal premium, ground rent and service charges of properties, pending for renewal, given on lease are treated asincome in the year of receipt.

149
(b) Finance lease liabilities (refer note 21 and 23) are secured by the related assets held under finance lease. Future minimum finance lease payments of the respective yearswere as follows:
(` crore)
Minimum Lease Payment Due
Within 1 year 1-5 years After 5 years Total
31st March, 2017
Lease payment 251.21 913.69 2255.38 3420.28Finance charge -158.59 -556.78 -1233.80 -1949.17Net present value 92.62 356.91 1021.58 1471.11
31st March 2016
Lease payment 276.26 870.49 2222.86 3369.61Finance charge -145.26 -478.65 -1281.99 -1905.90Net present value 131.00 391.84 940.87 1463.71
31st March 2015
Lease payment 280.30 873.31 2365.11 3518.72Finance charge -154.58 -497.43 -1387.45 -2039.46Net present value 125.72 375.88 977.66 1479.26
c) Description of major leasing arrangements
Power plant
The Company has accounted for a power plant as finance lease under Appendix C of Ind AS 17 by virtue of the power purchase agreement with the supplier. Under the termsof the power purchase agreement, the Company shall continue to purchase power until the parties decide to terminate the agreement, which has been determined to be anun-economic proposition considering the specialised nature and location of the asset.
Oxygen plant
The Company has accounted for an oxygen plant as finance lease (or operating lease) under Appendix C of Ind AS 17 by virtue of the oxygen purchase agreement with thesupplier. The agreement to purchase oxygen is a 15 year fixed term agreement.
Mining land
The Company has accounted for leasehold lands for mining as finance leases by virtue of its rights under the lease agreement after considering the right/ economiccompulsion for renewal.
d) (i) In respect of assets taken on lease/rent : The Company has various operating leases for, office facilities, guest houses and residential premises for employees that arerenewable on a periodic basis. Rental expenses for these leases recognised in the Statement of Profit and Loss during the Year is `14.16 crore (`13.96 crore).
(ii) From the Balance Sheet date, the future Minimum lease payments under non-cancellable operating leases are :
(` crore)
2016-17 2015-16 2014-15
Not later than one year 43.06 43.06 43.06
Later than I year and not later than 5 years 172.23 172.23 172.23
Later than 5 years 301.41 344.47 387.53
44.7 As per the Department of Public Enterprises (DPE) guidelines, SAIL is required to contribute 30% of Salary (Basic Pay + Dearness Allowance) in respect of executiveemployees as superannuation benefits, which may include Contributory Provident Fund (CPF), Gratuity, Pension and Post-Superannuation Benefits. Accordingly theCompany has made provision for pension benefit for executives @ 9% of Salary w.e.f. 1st January, 2007 and 3% of Salary w.e.f. 1st January, 2017. Further, pension benefitfor non-executives has been provided @ 6% of Salary w.e.f. 1st January, 2012 and 2% of Salary w.e.f. 1st January, 2017.
The cumulative provision/liability towards pension benefit for executive (w.e.f. 1st January, 2007) & non-executive (w.e.f. 1st January, 2012) employees, amounting to`2367.93 crore (`324.81 crore during the Year) and `46.05 crore (`5.45 crore during the Year) have been charged to ‘Employee Benefits Expense’ and ‘Expenditure duringConstruction’ respectively.
44.8 During the year, SAIL had Specified Bank Notes (SBN) or other denomination notes as defined in the MCA notification G.S.R. 308E dated March 30, 2017 on the details ofSBN held and transacted during the period from November 8, 2016 to December 30, 2016, the denomination wise SBNs and other notes as per the notification is givenbelow:
Amount in `
Particulars Specified Bank Notes Other Denomination Notes Total
(SBNs) (ODNs)
Closing Cash on Hand as on 08.11.2016 8203000 1266017 9469017
(+) Permitted Receipts 28605500 92848906 121454406
(-) Permitted Payments 303000 12115358 12418358
(-) Amounts Deposited in Bank 36505500 80982492 117487992
Closing cash on hand as on 30.12.2016 - 1017073 1017073
44.9 As per Government of India guidelines on payment of dividends, SAIL is required to pay a minimum annual dividend of 30% of Profit After Tax or 5% of the Net-worth,whichever is higher, subject to the maximum dividend permitted under the Companies Act, 2013 and other rules, unless lower dividend proposed to be paid is justified afteranalysis of the various financial parameters of the Company. In case, the Company is not able to comply with the guidelines, specific exemption has to be obtained fromDepartment of Investment & Public Asset Management (DIPAM), Government of India. Keeping in view the adverse financial position of the Company due to losses, theCompany took up the matter with DIPAM for exemption from compliance of the guidelines for payment of dividends for the financial year 2015-16. DIPAM intimated to theCompany that efforts should be made to pay minimum dividend. The Company has again represented the matter to DIPAM for exemption and final decision in this regardis awaited.
44.10 Contributions in cash and kind made for the period from the Financial Year 2006-07 to 2016-17 to Railway authorities for laying out railway line from Rajhara to Rowghatwould be recovered in cash at the rate of 7% per annum for 37 years on total contribution towards redemption of SAIL's contribution after commencement and fulfilment ofassured traffic from Rowghat mines. Management is of view that the criteria laid out in Memorandum of Understanding will be met and interest accrues from the date of

150
investment. The refund amount comprises principal and interest elements. Accordingly, the interest element has been computed and recognized as income during the yearamounting to `11.40 crore (till date `19.11 crore). As per the opinion of Expert Advisory Committee of The Institute of Chartered Accountants of India received during theyear such treatment of recognition on time proportion basis is in order as in view of Management, no significant uncertainty exist regarding collectability and measurabilityof revenue.
44.11 In respect of SAIL, based on materiality and comparability, in respect of temporarily discontinuation of operation of mines namely Barsua (w.e.f 17.05.2014), Bhawnathpur(w.e.f 29.04.2013) and Punapani (w.e.f 01.03.2004.) due to environmental/forestry clearance issues, net expenditure during the year 2016-17, excluding depreciation, of` 97.95 crore (Previous Year ` 101.04 crore) has been included under Note No.32 'Other Expenses' in Statement of Profit and Loss (refer Note No 32). Head wise bifurcationis as under:
(` crore)
Account Head F.Y. 2016-17 F.Y. 2015-16
Salary and Wages 53.41 51.49
Stores and Spares 7.77 11.85
Power Purchased 11.44 11.22
Repairs and Maintenance 6.84 7.63
Miscellaneous Expenses and Provisions 22.02 22.98
Total Expenditure 101.48 105.17
Total Income -3.53 -4.13
Net Expenditure 97.95 101.04
45.1 DEFINED BENEFIT SCHEMES
45.1.1 General Description of Defined Benefit Schemes:
Gratuity : Payable on separation @15 days pay for each completed year of service to eligible employees who render continuous service of 5 years or more. Maximumamount of `10 lakhs for executives& non-executives joined on or after 1st July, 2014 and without any monetary limit for other non-executives, has been considered foractuarial valuation.
Leave Encashment: Payable on superannuation to eligible employees who have accumulated earned and half pay leave, subject to maximum limit of 300 days combinedfor earned leave and half pay leave. Encashment of accumulated earned leave is also allowed up to 30 days once in a financial year up to 18th November 2015 and stoppedthereafter.
Provident Fund: 12% of Basic Pay Plus Dearness Allowance, contributed to the Provident Fund Trusts by the company.
Post Retirement Medical Benefits: Available to retired employees at company's hospitals and/or under the health insurance policy.
Post Retirement Settlement Benefits: Payable to retiring employees for settlement at their home town.
Long Term Service Award: Payable in kind on rendering minimum 25 years of service and also on superannuation.
In respect of SAIL:
45.1.2 Other disclosures, as required under Indian Accounting Standards (Ind AS)-19 (revised) on 'Employees Benefits', in respect of defined benefit obligations are :
(a) Reconciliation of Present Value of Defined Benefit Obligations* :
(` crore)
Sl. Particulars Gratuity Leave Post Post Long TermNo. Encashment Retirement Retirement Service
Medical Settlement AwardBenefits Benefit
i) Present Value of projected benefit obligations, 5692.84 2535.85 872.63 94.95 21.02as at the beginning of the year. (5457.44) (2411.82) (845.95) (106.10) (21.17)
ii) Service Cost 375.36 303.44 - - 1.60(472.63) (284.28) (-) (-) (1.47)
iii) Interest Cost 381.98 173.00 60.24 6.52 1.43(441.63) (189.49) (67.37) (8.59) (1.69)
iv) Actuarial Gains(-) / Losses(+) 550.79 28.02 86.89 11.68 1.82(123.60) (216.51) (50.28) (-11.38) (-1.02)
v) Past Service Cost - - - - -(-) (-) (-) (-) (-)
vi) Benefits Paid 847.91 300.10 83.55 8.92 2.73(802.48) (566.25) (90.97) (8.86) (2.29)
vii) Present Value of projected benefit obligations as 6153.06 2740.21 936.21 104.23 23.14at the end of the year. (i+ii+iii+iv-v-vi) (5692.82) (2535.85) (872.63) (94.45) (21.02)
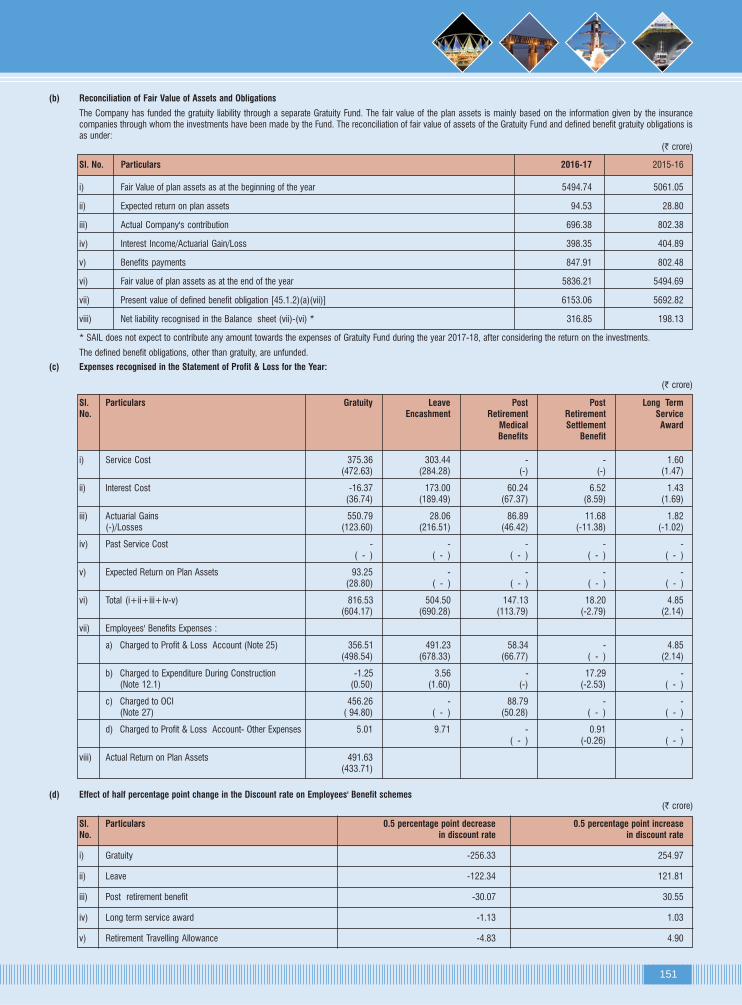
151
(b) Reconciliation of Fair Value of Assets and Obligations
The Company has funded the gratuity liability through a separate Gratuity Fund. The fair value of the plan assets is mainly based on the information given by the insurancecompanies through whom the investments have been made by the Fund. The reconciliation of fair value of assets of the Gratuity Fund and defined benefit gratuity obligations isas under:
(` crore)
Sl. No. Particulars 2016-17 2015-16
i) Fair Value of plan assets as at the beginning of the year 5494.74 5061.05
ii) Expected return on plan assets 94.53 28.80
iii) Actual Company's contribution 696.38 802.38
iv) Interest Income/Actuarial Gain/Loss 398.35 404.89
v) Benefits payments 847.91 802.48
vi) Fair value of plan assets as at the end of the year 5836.21 5494.69
vii) Present value of defined benefit obligation [45.1.2)(a)(vii)] 6153.06 5692.82
viii) Net liability recognised in the Balance sheet (vii)-(vi) * 316.85 198.13
* SAIL does not expect to contribute any amount towards the expenses of Gratuity Fund during the year 2017-18, after considering the return on the investments.
The defined benefit obligations, other than gratuity, are unfunded.
(c) Expenses recognised in the Statement of Profit & Loss for the Year:
(` crore)
Sl. Particulars Gratuity Leave Post Post Long TermNo. Encashment Retirement Retirement Service
Medical Settlement AwardBenefits Benefit
i) Service Cost 375.36 303.44 - - 1.60(472.63) (284.28) (-) (-) (1.47)
ii) Interest Cost -16.37 173.00 60.24 6.52 1.43(36.74) (189.49) (67.37) (8.59) (1.69)
iii) Actuarial Gains 550.79 28.06 86.89 11.68 1.82(-)/Losses (123.60) (216.51) (46.42) (-11.38) (-1.02)
iv) Past Service Cost - - - - -( - ) ( - ) ( - ) ( - ) ( - )
v) Expected Return on Plan Assets 93.25 - - - -(28.80) ( - ) ( - ) ( - ) ( - )
vi) Total (i+ii+iii+iv-v) 816.53 504.50 147.13 18.20 4.85(604.17) (690.28) (113.79) (-2.79) (2.14)
vii) Employees' Benefits Expenses :
a) Charged to Profit & Loss Account (Note 25) 356.51 491.23 58.34 - 4.85(498.54) (678.33) (66.77) ( - ) (2.14)
b) Charged to Expenditure During Construction -1.25 3.56 - 17.29 -(Note 12.1) (0.50) (1.60) (-) (-2.53) ( - )
c) Charged to OCI 456.26 - 88.79 - -(Note 27) ( 94.80) ( - ) (50.28) ( - ) ( - )
d) Charged to Profit & Loss Account- Other Expenses 5.01 9.71 - 0.91 -( - ) (-0.26) ( - )
viii) Actual Return on Plan Assets 491.63(433.71)
(d) Effect of half percentage point change in the Discount rate on Employees' Benefit schemes(` crore)
Sl. Particulars 0.5 percentage point decrease 0.5 percentage point increaseNo. in discount rate in discount rate
i) Gratuity -256.33 254.97
ii) Leave -122.34 121.81
iii) Post retirement benefit -30.07 30.55
iv) Long term service award -1.13 1.03
v) Retirement Travelling Allowance -4.83 4.90

152
(e) Effect of one percentage point change in the salary escalation rate on Employees' Benefit Schemes(` crore)
Sl. Particulars One percentage point decrease One percentage point increaseNo. in discount rate in discount rate
i) Gratuity 254.97 -229.85
ii) Leave 123.47 -120.17
(f) Effect of one percentage point change in the assumed inflation rate in case of valuation of benefits under post-retirement medical benefits scheme(` crore)
Sl. Particulars One percentage point increase One percentage point decreaseNo. in medical inflation rate in medical inflation rate
i) Post-retirement Medical Benefits -17.96 19.80
(g) Investments of Gratuity Trust
Particulars % of Investment
As at 31.03.2017 As at 31.03.2016
Insurance Investments 85.03 83.60
Central Government Securities 1.54 1.57
State Government Securities 4.77 4.90
PSU Bonds 8.63 9.91
Cash at Bank 0.03 0.02
Total 100.00 100.00
(h) Actuarial Assumptions
Sl. Description As at 31st March, 2017 As at 31st March, 2016No.
i) Discount Rate (per annum) 7.25% 8%
ii) Mortality Rate IALM (2006-08) Ultimate IALM (2006-08) Ultimate
iii) Withdrawal Rates (per annum) Executives & Non-executives- 0.10% to 0.50% Executives & Non-executives- 0.10% to 0.50%depending upon the age depending upon the age
iv) Medical Cost Trend Rates (per annum) 5% for hospital cost and Nil for Medi-claim premium. 5% for hospital cost and Nil for Medi-claim premium.
v) Estimated Rate of Return on Plan Assets 7.25% p.a. 8% p.a.
vi) Salary Escalation Executives : 6% p.a. Executives : 6% p.a.Non-Executives : 6% p.a. Non-Executives : 6% p.a.All employees- 6% step-up after every 10 years of All employees- 6% step-up after every 10 years ofservice starting 2017. service starting 2017.
The estimate of future salary increases considered in actuarial valuation, takes into account inflation rate,seniority, promotion and other relevant factors
(i) Maturity Profile of Defined Benefit Obligations
(` crore)
Period As at 31st March, 2017
Upto 1 year 781.26
Between 1 to 2 years 804.35
Between 2 to 3 years 807.95
Between 3 to 4 years 815.25
Between 4 to 5 years 818.28
Between 5 to 10 years 4263.21
More than 10 years 24861.59
Total Undiscounted Payments related to Past Service 33151.90
Less: Discount for Interest 26998.83
Projected Benefit Obligation 6153.07
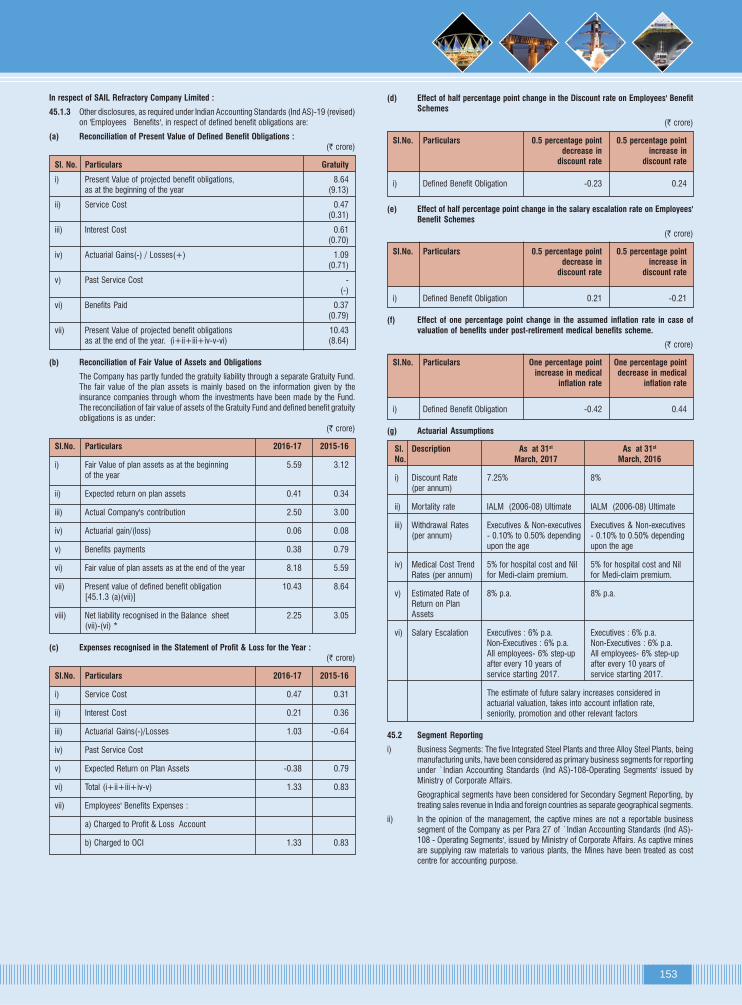
153
In respect of SAIL Refractory Company Limited :
45.1.3 Other disclosures, as required under Indian Accounting Standards (Ind AS)-19 (revised)on 'Employees Benefits', in respect of defined benefit obligations are:
(a) Reconciliation of Present Value of Defined Benefit Obligations :(` crore)
Sl. No. Particulars Gratuity
i) Present Value of projected benefit obligations, 8.64as at the beginning of the year (9.13)
ii) Service Cost 0.47(0.31)
iii) Interest Cost 0.61(0.70)
iv) Actuarial Gains(-) / Losses(+) 1.09(0.71)
v) Past Service Cost -(-)
vi) Benefits Paid 0.37(0.79)
vii) Present Value of projected benefit obligations 10.43as at the end of the year. (i+ii+iii+iv-v-vi) (8.64)
(b) Reconciliation of Fair Value of Assets and Obligations
The Company has partly funded the gratuity liability through a separate Gratuity Fund.The fair value of the plan assets is mainly based on the information given by theinsurance companies through whom the investments have been made by the Fund.The reconciliation of fair value of assets of the Gratuity Fund and defined benefit gratuityobligations is as under:
(` crore)
Sl.No. Particulars 2016-17 2015-16
i) Fair Value of plan assets as at the beginning 5.59 3.12of the year
ii) Expected return on plan assets 0.41 0.34
iii) Actual Company's contribution 2.50 3.00
iv) Actuarial gain/(loss) 0.06 0.08
v) Benefits payments 0.38 0.79
vi) Fair value of plan assets as at the end of the year 8.18 5.59
vii) Present value of defined benefit obligation 10.43 8.64[45.1.3 (a)(vii)]
viii) Net liability recognised in the Balance sheet 2.25 3.05(vii)-(vi) *
(c) Expenses recognised in the Statement of Profit & Loss for the Year :(` crore)
Sl.No. Particulars 2016-17 2015-16
i) Service Cost 0.47 0.31
ii) Interest Cost 0.21 0.36
iii) Actuarial Gains(-)/Losses 1.03 -0.64
iv) Past Service Cost
v) Expected Return on Plan Assets -0.38 0.79
vi) Total (i+ii+iii+iv-v) 1.33 0.83
vii) Employees' Benefits Expenses :
a) Charged to Profit & Loss Account
b) Charged to OCI 1.33 0.83
(d) Effect of half percentage point change in the Discount rate on Employees' BenefitSchemes
(` crore)
Sl.No. Particulars 0.5 percentage point 0.5 percentage pointdecrease in increase in
discount rate discount rate
i) Defined Benefit Obligation -0.23 0.24
(e) Effect of half percentage point change in the salary escalation rate on Employees'Benefit Schemes
(` crore)
Sl.No. Particulars 0.5 percentage point 0.5 percentage pointdecrease in increase in
discount rate discount rate
i) Defined Benefit Obligation 0.21 -0.21
(f) Effect of one percentage point change in the assumed inflation rate in case ofvaluation of benefits under post-retirement medical benefits scheme.
(` crore)
Sl.No. Particulars One percentage point One percentage pointincrease in medical decrease in medical
inflation rate inflation rate
i) Defined Benefit Obligation -0.42 0.44
(g) Actuarial Assumptions
Sl. Description As at 31st As at 31st
No. March, 2017 March, 2016
i) Discount Rate 7.25% 8%(per annum)
ii) Mortality rate IALM (2006-08) Ultimate IALM (2006-08) Ultimate
iii) Withdrawal Rates Executives & Non-executives Executives & Non-executives(per annum) - 0.10% to 0.50% depending - 0.10% to 0.50% depending
upon the age upon the age
iv) Medical Cost Trend 5% for hospital cost and Nil 5% for hospital cost and NilRates (per annum) for Medi-claim premium. for Medi-claim premium.
v) Estimated Rate of 8% p.a. 8% p.a.Return on PlanAssets
vi) Salary Escalation Executives : 6% p.a. Executives : 6% p.a.Non-Executives : 6% p.a. Non-Executives : 6% p.a.All employees- 6% step-up All employees- 6% step-upafter every 10 years of after every 10 years ofservice starting 2017. service starting 2017.
The estimate of future salary increases considered inactuarial valuation, takes into account inflation rate,seniority, promotion and other relevant factors
45.2 Segment Reporting
i) Business Segments: The five Integrated Steel Plants and three Alloy Steel Plants, beingmanufacturing units, have been considered as primary business segments for reportingunder `Indian Accounting Standards (Ind AS)-108-Operating Segments' issued byMinistry of Corporate Affairs.
Geographical segments have been considered for Secondary Segment Reporting, bytreating sales revenue in India and foreign countries as separate geographical segments.
ii) In the opinion of the management, the captive mines are not a reportable businesssegment of the Company as per Para 27 of `Indian Accounting Standards (Ind AS)-108 - Operating Segments', issued by Ministry of Corporate Affairs. As captive minesare supplying raw materials to various plants, the Mines have been treated as costcentre for accounting purpose.

154
45.3 Related Party
As per Indian Accounting Standards (Ind AS)-24 - `Related Party Disclosures' issuedby the Ministry of Corporate Affairs, the names of the related parties, excludingGovernment controlled enterprises, are given below:
Nature of Relationship Name of the related party
Key Management Shri P.K. Singh
Personnel Shri Anil Kumar Chaudhary
Shri Raman
Shri S.S. Mohanty (upto 30th June 2016)
Shri Kalyan Maity
Shri Binod Kumar (upto 28th Feb 2017)
Shri N. Mahapatra
Shri G. Vishwakarma
Smt Soma Mondal (w.e.f. 01st March 2017)
Shri A. Maitra
Shri S. Chandrasekaran
Shri P Saidev
Shri R.K. Rathi
Shri A.K. Rath
Smt. K Raman
Shri C Srikanta
Shri S K Garai
Shri M. Ravi
Shri M.R. Panda
Shri B.K. Jha (upto 30.04.2016)
Shri Neeraj Mathur
Shri Somdev Das
Shri R Mitra
Shri S K Aggarwal
Shri H.P. Singh
Shri S.K. Jain
Shri U.K. De
Shri S. Kolay
Shri Sukumar Hedge
Shri A.Kumar
Shri Ashoke Kumar Paul (w.e.f. 02.05.2016)
Shri P.K.Mishra
Shri B.N.Thakur
Shri N Ramachandran
45.4 Disclosures of provisions required by Indian Accounting Standards (Ind AS)37'Provisions, Contingent Liabilities and Contingent Assets:
Brief Description of Provisions :
Mines afforestation costs - Payable on renewal (including deemed renewal)/forestclearance of mining leases to Government authorities, towards afforestation cost atmines for use of forest land for mining purposes.
Mines closure costs - Estimated liability towards closure of mines, to be incurred atthe time of cessation of mining activities.
Overburden backlog removal costs - To be incurred towards removal of overburdenbacklog at mines over the future years.
(` crore)
Movement of provisions Mines Mines Over Totalaffore- closure burdenstation costs removalcosts costs
Balance as at 1st April, 2016 238.72 109.90 84.50 433.12
Additions during the Year 0.00 17.11 19.70 36.81
Amounts utilised during the Year 0.00 67.29 0.51 67.80
Unused amount reversed during 0.00 0.10 0.44 0.54the Year
Balance as at 31st March, 2017 238.72 59.62 103.25 401.59
45.5 In case of International Coal Ventures Limited, the consolidated financial statementshave been considered on the basis of actual shareholding percentage instead ofShare Capital ratio to be maintained as specified in Joint Venture Agreement betweenSAIL and other Joint Venture partners.

155
In respect of item stated at (i), the Company's view is that theNine Judges Bench of Hon'ble Supreme Court, vide its judgmentdated 11th November, 2016, upheld the constitutional validityof levy of Entry Tax by the States and has laid down principles/tests on levy of Entry Tax Acts in various States. The respectiveregular benches of the Apex Court would hear the matters asper laid down principles. Pending decision by the regular benches
Independent Auditors' Report on Consolidated Financial Statements
Comments Management’s Replies
TO THE MEMBERS OF STEEL AUTHORITY OF INDIA LIMITED
Report on the Consolidated Indian Accounting Standards (Ind AS) Financial Statements
We have audited the accompanying Consolidated Ind AS Financial Statements of Steel Authority ofIndia Limited (hereinafter referred to as "the Holding Company") and its subsidiaries (the HoldingCompany and its subsidiaries together referred to as "the Group"), its associates and its jointly controlledentities, comprising the Consolidated Balance Sheet as at 31st March, 2017, the Consolidated Statementof Profit and Loss (including other comprehensive income), the Consolidated Cash Flow Statement,the Consolidated Statement of Changes in Equity, for the year then ended, and a summary of thesignificant accounting policies and other explanatory information (hereinafter referred to as "theConsolidated Ind AS Financial Statements").
Management's Responsibility for the Consolidated Ind AS Financial Statements
The Holding Company's Board of Directors is responsible for the preparation of these ConsolidatedInd AS Financial Statements in terms of the requirements of the Companies Act, 2013 (hereinafterreferred to as "the Act") that give a true and fair view of the consolidated financial position, consolidatedfinancial performance including other comprehensive income, consolidated cash flows and consolidatedstatement of changes in equity of the Group including its Associates and Jointly controlled entities inaccordance with the accounting principles generally accepted in India, including the Indian AccountingStandards (Ind AS) prescribed under Section 133 of the Act read with Companies(Indian AccountingStandards) Rules, 2015 (as amended).
The respective Board of Directors of the companies included in the Group and of its associates andjointly controlled entities are responsible for maintenance of adequate accounting records in accordancewith the provisions of the Act for safeguarding the assets of the Group and its associates and its jointlycontrolled entities and for preventing and detecting frauds and other irregularities; the selection andapplication of appropriate accounting policies; making judgments and estimates that are reasonableand prudent; and the design, implementation and maintenance of adequate internal financial controls,that were operating effectively for ensuring the accuracy and completeness of the accounting records,relevant to the preparation and presentation of the Consolidated Ind AS Financial Statements that givea true and fair view and are free from material misstatement, whether due to fraud or error, which havebeen used for the purpose of preparation of the Consolidated Ind AS Financial Statements by theDirectors of the Holding Company, as aforesaid.
Auditors’ Responsibility
Our responsibility is to express an opinion on these Consolidated Ind AS Financial Statements basedon our audit. In conducting our audit, we have taken into account the provisions of the Act, theaccounting and auditing standards and matters which are required to be included in the audit reportunder the provisions of the Act and the Rules made thereunder.
We conducted our audit in accordance with the Standards on Auditing specified under Section 143(10)of the Act. Those Standards require that we comply with ethical requirements and plan and performthe audit to obtain reasonable assurance about whether the Consolidated Ind AS Financial Statementsare free from material misstatement.
An audit involves performing procedures to obtain audit evidence about the amounts and the disclosuresin the Consolidated Ind AS Financial Statements. The procedures selected depend on the auditor'sjudgment, including the assessment of the risks of material misstatement of the Consolidated Ind ASFinancial Statements, whether due to fraud or error. In making those risk assessments, the auditorconsiders internal financial control relevant to the Holding Company's preparation of the ConsolidatedInd AS Financial Statements that give a true and fair view in order to design audit procedures that areappropriate in the circumstances. An audit also includes evaluating the appropriateness of the accountingpolicies used and the reasonableness of the accounting estimates made by the Holding Company'sBoard of Directors, as well as evaluating the overall presentation of the Consolidated Ind AS FinancialStatements.
We believe that the audit evidence obtained by us and the audit evidence obtained by the other auditorsin terms of their reports referred to in the Other Matters paragraph below, is sufficient and appropriateto provide a basis for our qualified audit opinion on the Consolidated Ind AS Financial Statements.
Basis for Qualified Opinion
The Holding Company has not provided for :
(i) Entry tax amounting to ` 1796.03 crore (Current year ` 111.04 crore and up to last year `1684.99 crore) (Refer Note No.42.3(a)); and
(ii) amount paid to Damodar Valley Corporation (DVC) against bills raised for supply of power andretained as advance to DVC by Bokaro Steel Plant amounting to ` 587.72 crore (current year` 96.45 crore and up to last year ` 491.27 crores). (Refer Note No42.3 (b)).
Annexure-V to the Directors’ Report

156
The total impact of above paragraphs (i) & (ii) resulted in understatement of loss (net of tax) for theyear ended 31st March, 2017 by `1558.78 crore, overstatement of other equity as on 31st March,2017 by ̀ 1558.78 crore, understatement of current liabilities by ̀ 2383.75 crore and understatementof assets by ` 824.97 crore.
Comments Management’s Replies
Independent Auditors' Report on Consolidated Financial Statements
Qualified Opinion
In our opinion and to the best of our information and according to the explanations given to us, andbased on the consideration of repor ts of the auditors on separate Financial Statements of thesubsidiaries, associates and Jointly controlled entities referred to below in the Other Matters paragraph,except for the possible effects of the matters described in the Basis for Qualified Opinion paragraphabove, the aforesaid Consolidated Ind AS Financial Statements give the information required by theAct in the manner so required and, give a true and fair view in conformity with the accounting principlesgenerally accepted in India, of the consolidated state of affairs of the Group, its associates and Jointlycontrolled entities as at 31st March, 2017, and their consolidated loss, consolidated total comprehensiveloss, their consolidated cash flows and consolidated statement of changes in equity for the yearended on that date.
Emphasis of Matter
We draw attention to the following:
I. Sales include sales to Government agencies for ` 3807.78 crore and cumulative up to31st March, 2017: ` 18342.41 crore which is recognised on provisional contract prices. (ReferNote No. 44.1);
II. recognition of Deferred Tax Assets of ` 3352.42 crore (including ` 1623.16 crore for the year)on the accumulated business losses as on 31st March, 2017 and unused tax credit (MAT CreditEntitlement) of ` 1051.00 crore as on 31st March, 2017 (Refer Note No. 12); and
III. In International Coal Ventures Private Limited, a significant jointly controlled entity of HoldingCompany, there is non- adherence to the Share Capital ratio to be maintained between HoldingCompany and other joint venture partners as per requirements of Articles of Association of thejointly controlled entity and the Joint Venture agreement. The financial statement have beenconsidered on the basis of actual shareholding percentage of the Holding Company in the jointlycontrolled entity (Refer Note No. 45.5).
Our opinion is not modified in respect of these matters.
Other Matters
A. We did not audit the Financial Statements of subsidiaries specified in Annexure B included in theConsolidated Ind AS Financial Statements, whose Financial Statements reflect total assets of `168.36crore as at 31st March, 2017, total revenues of ` 146.52 crore, total net profit after tax of ` 20.99crore, total comprehensive profits of ` 20.32 crore and net cash flows of ` 6.94 crore for the yearended on that date, as considered in their respective Ind AS Financial Statements.
The Statement also includes the Group's share of net profit of ` 172.82 crore and total comprehensiveincome of ` 173.18 crore for the year ended 31st March, 2017, as considered in the Consolidated IndAS Financial Statements, in respect of Jointly controlled entities specified in Annexure C, whose FinancialStatements are not audited by us.
These Financial Statements have been audited by other auditors whose reports have been furnishedto us by the Management and our opinion on the Consolidated Ind AS Financial Statements, in so faras it relates to the amounts and disclosures included in respect of these subsidiary and jointly controlledentities, and our report in terms of sub-sections (3) and (11) of Section 143 of the Act, insofar as itrelates to the aforesaid subsidiaries and jointly controlled entities is based solely on the reports of theother auditors.
B. The Statement includes the Group's share of net profit of ` 21.10 crore and total comprehensiveincome of ` 21.26 crore for the year ended 31st March, 2017, as considered in the Consolidated IndAS Financial Statements, in respect of Joint Ventures and Associates specified in Annexure C, whoseFinancial Statements are not audited by us. These unaudited Financial Statements/ Financial Informationhave been furnished to us by the Management and our opinion on Statement is based solely on such
of the Apex Cour t on levy of Entry Tax in the States ofChhattisgarh, Odisha, Uttar Pradesh and in respect of the casepertaining to Calcutta High Court, the Entry Tax demands underdispute have been treated as contingent liabilities.
In respect of item stated at (ii), the Company's view is that thecases are sub-judice and pending for adjudication before thevarious judicial authorities for a long time.
The above stated disputed demands, stated at (i) and (ii) above,contested on valid and bonafide grounds, have been treated ascontingent liabilities as it is not probable that present obligationsexist as on 31st March, 2017. Therefore, there is no adverseimpact on loss for the year.

157
Independent Auditors' Report on Consolidated Financial Statements
Comments Management’s Replies
unaudited Financial Statements/ Financial Information. In our opinion and according to the informationgiven to us by the Management, these Financial Statements are not material to the Group.
C. In case of one subsidiary and four jointly controlled entities, the Financial Statements as at 31st
March, 2017 are not available. The investment in these companies has been fully provided for as at31st March, 2017. In the absence of their Financial Statements as at 31st March, 2017, the totalassets, total revenue and total profit/loss of these entities have not been included in the ConsolidatedInd AS Financial Results.
D. The Comparative Financial Information for the year ended 31st March, 2016 and the transition dateopening balance sheet as at 1st April, 2015 in respect of 4 subsidiaries and 6 jointly controlled entitiesincluded in this Consolidated Ind AS Financial Statements prepared in accordance with the Ind AShave been audited by other auditors and have been relied upon by us. The Comparative FinancialInformation for the year ended 31st March, 2016 and the transition date opening balance sheet as at1st April, 2015 in respect of 1 associate and 14 jointly controlled entities included in this ConsolidatedInd AS Financial Results prepared in accordance with the Ind AS have been certified by the Managementand not audited by us.
E. The Comparative Financial Information of the Holding Company for the year ended 31st March,2016 and the transition date opening balance sheet as at 1st April, 2015 included in these ConsolidatedInd AS Results, are based on the Statutory Financial Statements prepared in accordance with theCompanies (Accounting Standards) Rules, 2006 audited by the auditors for the respective yearsended 31st March, 2016 and 31st March, 2015 whose reports dated 10th June, 2016 and 29th May,2015 respectively expressed a modified opinion on those Consolidated Financial Statements, andhave been restated to comply with Ind AS. The adjustments made to the previously issued said FinancialStatements as adjusted for differences in accounting principles to comply with Ind AS have beenaudited by us.
Our report is not modified in respect of the matters specified in Other Matters.
Report on Other Legal and Regulatory Requirements
As required by Section 143(3) of the Act, based on our audit and on the consideration of the report ofthe other auditors on separate Financial Statements and the other financial information of joint operations,subsidiaries, associates and Jointly controlled entities companies incorporated in India, referred in theOther Matters paragraph above, we report, to the extent applicable, that:
(a) We have sought and obtained all the information and explanations which to the best of ourknowledge and belief were necessary for the purposes of our audit of the aforesaid ConsolidatedInd AS Financial Statements.
(b) In our opinion, except for the effect of the matters described in the Basis for Qualified Opinionparagraph above, proper books of account as required by law relating to preparation of theaforesaid Consolidated Ind AS Financial Statements have been kept so far as it appears from ourexamination of those books and the reports of the other auditors.
(c) The reports on the accounts of the Holding Company, Subsidiaries, Associate and Jointly ControlledCompanies incorporated in India, audited under Section 143 (8) of the Act by other auditors havebeen sent to us / the other auditors, as applicable, and have been properly dealt with in preparingthis report.
(d) The Consolidated Balance Sheet, the Consolidated Statement of Profit and Loss, and theConsolidated Cash Flow Statement and consolidated statement of changes in equity dealt withby this Report are in agreement with the relevant books of account maintained for the purpose ofpreparation of the Consolidated Ind AS Financial Statements.
(e) In our opinion, except for the effect of the matters described in the Basis for Qualified Opinionparagraph above, the aforesaid Consolidated Ind AS Financial Statementscomply with theAccounting Standards specified under Section 133 of the Act, read with Rule 7 of the Companies(Accounts) Rules, 2014.
(f) The matters described in the Basis for Qualified Opinion paragraph above, in our opinion, maynot have an adverse effect on the functioning of the Group.
(g) As per notification No. GSR 463(E) dated 5th June 2015 issued by the Ministry of CorporateAffairs, Government of India, Section 164(2) of the Act is not applicable to the Group.
(h) With respect to the adequacy of the internal financial controls over financial reporting and theoperating effectiveness of such controls, refer to our separate Report in "Annexure A", which isbased on the auditors' repor ts of the Holding company, subsidiary companies, associatecompanies and jointly controlled entities incorporated in India. Our report expresses an unmodifiedopinion on the adequacy and operating effectiveness of the Holding company's/ subsidiarycompanies / associate companies / jointly controlled companies incorporated in India, internalfinancial controls over financial reporting, and

158
Comments Management’s Replies
Independent Auditors' Report on Consolidated Financial Statements
(i) With respect to the other matters to be included in the Auditor's Report in accordance with Rule11 of the Companies (Audit and Auditor's) Rules, 2014, in our opinion and to the best of ourinformation and according to the explanations given to us:
i. Except for the possible effect of the matter described in paragraph on the Basis of QualifiedOpinion above, the Consolidated Ind AS Financial Statements disclose the impact of pendinglitigations on the consolidated financial position of the Group, its associate company andjointly controlled entities (Refer Note 42.1).
ii. The Group, its associates and jointly controlled entities did not have any material foreseeablelosses on long-term contracts including derivative contracts.
iii. There has been a case of delay in transferring `64,85,490/- being the amount of unpaiddividend for financial year 2008-09, required to be transferred to the Investor Education andProtection Fund by the Company. However, the same has been transferred to the said fundbefore 31st March, 2017;and
The Final Unclaimed Dividend for 2008-09 was due for transferto IEPF account on 16th November, 2016. The Ministry ofCorporate Affairs notified the Investor Education and ProtectionFund (IEPF) Authority (Accounting, Audit, Transfer and Refund)Rules, 2016 ("the Rules") along with detailed procedure effectivefrom 7th September 2016. The Rules required that all shares inrespect of which dividend has not been claimed or paid for sevenconsecutive years or more shall be transferred to IEPF SuspenseAccount. The Rules further provided that where 7 years arecompleted or being completed within 3 months of coming intoforce of the Rules, the company shall initiate the aforesaidprocedure immediately and transfer the shares after completionof 3 months. As per procedure prescribed in the Rules, theCompany sent individual notices as well as through publicationin newspapers, to 11346 shareholders, having unclaimeddividend of `64.85 lakh, providing them time up to 15.12.2016to claim the dividend. Meanwhile, the implementation of Ruleswas deferred in December, 2016. However, the Companydeposited the Unclaimed Dividend on 3rd February, 2017 afterprocessing the cases of claimants for the Final UnclaimedDividend.
For Singhi & Co. For V.K. Dhingra & Co.Chartered Accountants Chartered Accountants
Firm Registration No.: 302049E Firm Registration No.: 000250N
Sd/- Sd/-[ Shrenik Mehta ] [ Lalit Ahuja ]
Partner Partner(M. No. 063769) (M. No. 085842)
For A.K. Sabat & Co. For Chatterjee & Co.Chartered Accountants Chartered Accountants
Firm Registration No.: 0321012E Firm Registration No.: 302114E
Sd/- Sd/-[ A.K. Sabat] [ R.N. Basu ]
Partner Partner(M. No. 30310) (M. No. 50430)
Place : New DelhiDated : 30th May, 2017
For and on behalf of Board of Directors
Sd/-(P.K. Singh)Chairman
Place : New DelhiDate : 30th June, 2017
iv. The Company has provided requisite disclosures in Note 44.8 to its Consolidated Ind ASFinancial Statements as regards its holding and dealings in Specified Bank Notes as definedin the Notification S.O. 3407(E) dated the 8th November, 2016 of the Ministry of Finance,during the period from 8th November 2016 to 30th December 2016. Based on audit procedureand relying on the Management representation, we report that the disclosure are inaccordance with books of account maintained by the Company and as produced to us bythe Management.

159
Annexure-A to the Independent Auditor's Report on Consolidated Financial Statement
Comments Management’s Replies
(Referred under 'Report on Other Legal and Regulatory Requirements' of our report of even date)
Report on the Internal Financial Controls under Clause (i) of Sub-section 3 of Section 143 of the
Companies Act, 2013 ("the Act")
In conjunction with our audit of the consolidated financial statements of the Group, its associates and
jointly controlled entities as of and for the year ended March 31, 2017, we have audited the internal
financial controls over financial reporting of STEEL AUTHORITY OF INDIA LIMITED (hereinafter referred
to as "the Holding Company") and its subsidiary companies, its associate companies and jointly
controlled entities, which are companies incorporated in India, as of that date.
Management's Responsibility for Internal Financial Controls
The Respective Board of Directors of the Holding Company, its subsidiaries, its associate and jointly
controlled companies, which are companies incorporated in India, are responsible for establishing
and maintaining internal financial controls based on the internal control over financial reporting criteria
established by the respective companies considering the essential components of internal control
stated in the Guidance Note on Audit of Internal Financial Controls over Financial Reporting issued by
the Institute of Chartered Accountants of India ('ICAI'). These responsibilities include the design,
implementation and maintenance of adequate internal financial controls that were operating effectively
for ensuring the orderly and efficient conduct of its business, including adherence to company's policies,
the safeguarding of its assets, the prevention and detection of frauds and errors, the accuracy and
completeness of the accounting records, and the timely preparation of reliable financial information,
as required under the Act.
Auditor's Responsibility
Our responsibility is to express an opinion on the Company's internal financial controls over financial
reporting based on our audit. We conducted our audit in accordance with the Guidance Note on Audit
of Internal Financial Controls over Financial Reporting (the "Guidance Note") issued by the ICAI and
the Standards on Auditing, issued by ICAI and deemed to be prescribed under section 143(10) of the
Act, to the extent applicable to an audit of internal financial controls, both issued by the Institute of
Chartered Accountants of India. Those Standards and the Guidance Note require that we comply with
ethical requirements and plan and perform the audit to obtain reasonable assurance about whether
adequate internal financial controls over financial reporting was established and maintained and if
such controls operated effectively in all material respects.
Our audit involves performing procedures to obtain audit evidence about the adequacy of the internal
financial controls system over financial reporting and their operating effectiveness. Our audit of internal
financial controls over financial reporting included obtaining an understanding of internal financial
controls over financial reporting, assessing the risk that a material weakness exists, and testing and
evaluating the design and operating effectiveness of internal control based on the assessed risk. The
procedures selected depend on the auditor's judgment, including the assessment of the risks of material
misstatement of the financial statements, whether due to fraud or error.
We believe that the audit evidence we have obtained and the audit evidence obtained by the other
auditors in terms of their reports referred to in the Other Matters paragraph below, is sufficient and
appropriate to provide a basis for our audit opinion on the Company's internal financial controls system
over financial reporting.
Meaning of Internal Financial Controls over Financial Reporting
A company's internal financial control over financial reporting is a process designed to provide
reasonable assurance regarding the reliability of financial reporting and the preparation of financial
statements for external purposes in accordance with generally accepted accounting principles. A
company's internal financial control over financial reporting includes those policies and procedures
that
(1) pertain to the maintenance of records that, in reasonable detail, accurately and fairly reflect the
transactions and dispositions of the assets of the Company;
(2) provide reasonable assurance that transactions are recorded as necessary to permit preparation
of financial statements in accordance with generally accepted accounting principles, and that
receipts and expenditures of the Company are being made only in accordance with authorizations
of management and directors of the company; and
(3) provide reasonable assurance regarding prevention or timely detection of unauthorized acquisition,
use, or disposition of the Company's assets that could have a material effect on the financial
statements.
160
Annexure-A to the Independent Auditor's Report on Consolidated Financial Statement
Comments Management’s Replies
Inherent Limitations of Internal Financial Controls over Financial Reporting
Because of the inherent limitations of internal financial controls over financial
reporting, including the possibility of collusion or improper management override
of controls, material misstatements due to error or fraud may occur and not be
detected. Also, projections of any evaluation of the internal financial controls over
financial reporting to future periods are subject to the risk that the internal financial
control over financial reporting may become inadequate because of changes in
conditions, or that the degree of compliance with the policies or procedures may
deteriorate.
Opinion
In our opinion, the Holding Company, its subsidiary companies, its associate
companies and jointly controlled companies, which are companies incorporated in
India, have, in all material respects, an adequate internal financial controls system
over financial reporting and such internal financial controls over financial reporting
were operating effectively as at 31 March 2017, based on the internal control over
financial reporting criteria established by the Company considering the essential
components of internal control stated in the Guidance Note on Audit of Internal
Financial Controls Over Financial Reporting issued by the Institute of Chartered
Accountants of India.
Other Matters
Our aforesaid reports under Section 143(3)(i) of the Act on the adequacy and
operating effectiveness of the internal financial controls over financial reporting
insofar as it relates to 4 subsidiary companies, and 6 jointly controlled companies,
which are companies incorporated in India, is based on the corresponding reports
of the auditors of such companies incorporated in India.
For Singhi & Co. For V.K. Dhingra & Co.Chartered Accountants Chartered Accountants
Firm Registration No.: 302049E Firm Registration No.: 000250N
Sd/- Sd/-[ Shrenik Mehta ] [ Lalit Ahuja ]
Partner Partner(M. No. 063769) (M. No. 085842)
For A.K. Sabat & Co. For Chatterjee & Co.Chartered Accountants Chartered Accountants
Firm Registration No.: 0321012E Firm Registration No.: 302114E
Sd/- Sd/-[ A.K. Sabat] [ R.N. Basu ]
Partner Partner(M. No. 30310) (M. No. 50430)
Place : New DelhiDated : 30th May, 2017

161
Annexure-VI to the Directors’ Report
MANAGEMENT'S REPLIES TO THE COMMENTS OF THE COMPTROLLER & AUDITOR GENERAL OF INDIA UNDER SECTION143(6)(b) OF THE COMPANIES ACT, 2013 ON THE CONSOLIDATED FINANCIAL STATEMENTS OF STEEL AUTHORITY OF INDIALIMITED FOR THE YEAR ENDED 31ST MARCH 2017
Comments Management’s Replies
The preparation of consolidation financial statements of Steel Authority of India Limitedfor the year ended 31st March, 2016 in accordance with the financial reporting frameworkprescribed under the Companies Act, 2013 is the responsibility of the management ofthe Company. The Statutory Auditors appointed by the Comptroller and Auditor Generalof India under Section 139(5) read with section 129(4) of the Act are responsible forexpressing opinion on the financial statements under section 143 read with section129(4) of the Act based on independent audit in accordance with the standards onauditing prescribed under Section 143(10) of the Act. This is stated to have been doneby them vide their Audit Report dated 30 May, 2017.
I, on behalf of the Comptroller and Auditor General of India, have conducted asupplementary audit under section 143(6)(a) read with section 129(4) of the Act ofthe consolidated financial statements of Steel Authority of India Limited for the yearended 31 March 2017 which include the standalone financial statements of SteelAuthority of India Limited: its three1 subsidiaries, and three2 joint venture companies allcontrolled by the government and/or government companies. Supplementary auditunder section 143(6)(a) of the Act of one subsidiary company3, seven4 such jointventure companies and one5 associate company was not completed pending finalizationof their accounts and/or audit as on date. Under section 143(6)(a) of the Act, I am notrequired to conduct supplementary audit of the financial statements of the ten6
companies not controlled by the government but included in the consolidated financialstatement. Financial statement of one subsidiary7 and one8 joint venture companycontrolled by the government and two9 companies not controlled by the governmentwere not consolidated. (Details are enclosed as Annexure-1). Supplementary audit ofconsolidated financial statements has been carried out independently without accessto the working papers of the statutory auditors and is limited primarily to inquiries ofthe statutory auditors and company personnel and a selective examination of some ofthe accounting records.
Based on my supplementary audit, I would like to highlight the following significantmatters under section 143(6)(b) of the Act which have come to my attention andwhich in my view, are necessary for enabling a better understanding of the consolidatedfinancial statements and the related audit report:
A. COMMENTS ON CONSOLIDATED PROFITABILITY
Consolidated Balance Sheet
1 (i) Note 11 : Other Financial Asset: `2,268.18 crore
SAIL/ISP, Burnpur developed a new railway siding for handling of raw materials,Engine-on-load scheme was applicable for this new siding. Due to failure of ISPto unload/load the wagons within permissible free time under EOL scheme, IndianRailways deducted `8.15 crore from ISP on account of Engine Hire charges forthe period between December 2015 and December 2016 since the bills preferredby the Railways were not paid by ISP. This amount was however accounted foras Claims recoverable. Non-provisioning of above has resulted in overstatementof Other Financial Asset-Claims recoverable and understatement of Other expensesand Loss by `8.15 crore.
The IISCO Sidings-Damodar (llSD) mentioned in the comment, is not a new siding butonly relocation of existing siding and all rail rakes are moving through this relocatedsiding. The project report for this relocation has been approved by the Railways. AJoint Committee consisting of officials of Railways and Company has alreadyrecommended that "Engine-on-Load (EOL) System may not be introduced for unloadingoperations at llSD, as the train engine will get heavily detained and lead to inefficiencyin train operations." The layout and logistics of llSD siding restrict the placement of fullrake, for unloading. Further, EOL System is not feasible for unloading of rakes withBOXN wagons having Tippler system. ISP has already lodged a claim on Railways for` 8.15 crore, deducted towards engine hire charges/ EOL and the same is being pursuedfor recovery. Thus, there is no overstatement of Other Financial Asset - ClaimsRecoverable and understatement of Other Expenses and Loss.
1 SAIL Refractory Company Ltd., SAIL Jagdishpur Power Plant Ltd. and Chhattisgarh Mega Steel Ltd.2 NTPC-SAIL Power Company Ltd., SAIL-Bengal Alloy Casting Pvt. Ltd. and International Coal Ventures
Private Limited.3 SAIL Sindri Projects Ltd..4 Bokaro Power Supply Company Pvt. Ltd. SAIL & MOIL Ferro Alloys Pvt. Ltd., SAIL SCL Kerala
Limited SAIL RITES Bengal Wagons Industry Pvt. Ltd. NMDC SAIL Ltd., SAIL SCI Shipping Pvt. Ltd.and Bastar Railway Pvt. Ltd.
5 Almora Magnesite Limited6 Mjunction Services limited, Bhilai Jaypee Cement Limited, S & T Mining Co. Pvt. Limited, SAIL Kobe
Iron India Pvt. Limited, SAL SAIL JVC Limited, TMT SAL SAIL JVC Limited, Prime Gold-SAIL JVCLimited, SAIL Bansal Service Centre Limited, Abhinav SAIL JVC Limited, VSL SAIL JVC Limited
7 IISCO Ujjain Pipe & Foundry Company Ltd.8 North Bengal Dolomite Limited9 Romelt SAIl (India) Ltd and UEC SAIL Information Technology Limited

162
Comments Management’s Replies
Consolidated Statement of Profit and Loss
2. (i) Note-32 Other Expenses `14,192.111 crore
(a) SAIL and Ministry of Railways entered into a Memorandum of Understanding(MoU) in February, 2003 for supply of long rails to Indian Railways (IR). SAILsupplied the rails to IR during 2008-2012 on provisional price. Excise duty waspaid on the provisional price and invoices were raised on the IR. The price of railssupplied during above period was finalized in October 2013 and the final pricewas lower than the provisional price in case of rails supplied during the periodbetween 2008 and 2010. Railways deducted `31.51 crore for excess exciseduty paid on differential price. Since there is no clause in the MoU for mutualadjustment of excise duty in case of escalation/de-escalation of final price, thepossibility of refund of the amount by IR is remote. Therefore provision for doubtfulrecoveries should have been made in the accounts. The company however madepartial provision for doubtful recoveries. This has resulted in understatement ofOther Expenses and Loss by `15.75 crore.
(b) NTPC-SAIL Power Supply Company Limited (NSPCL), a 50:50 Joint Venturecompany between SAIL and NTPC claimed `22.87 crore towards Deferred TaxLiability from SAIL in October 2016. The bill was not accepted by SAIL andprovision was not created even though the said demand has materialized.Non-accountal of above by SAIL has resulted in understatement of Other expensesand Loss by `22.87 crore.
The matter of unilateral notional deduction of Excise Duty and Sales Tax against de-escalation credit notes issued to Railways has been taken up with Railways for refund.
Meanwhile in line with the Company's Accounting Policy for creation of provision basedon age of debtors, out of outstanding dues of `31.51 crore, the Company hasprovided `15.75 crore as doubtful debt. As the matter is being pursued with Railwaysfor recovery of the entire amount, there is no understatement of Other Expenses andLoss.
As per Power Purchase Agreement between the Company and NSPCL, the income taxliability is accounted for and reimbursed to NSPCL at the time of actual payment to theIncome Tax Department.
NSPCL claimed re-imbursement of tax towards reversal of Deferred Tax Liability (DTL)for the years 2009-10 to 2015-16. However, no tax has actually been paid to IncomeTax Department on account of reversal during the period, as NSPCL has been payingincome tax U/s 115JB of the Income Tax Act, 1961 i.e. under the provisions of MinimumAlternate Tax (MAT).
Accordingly, there is no liability on SAIL to reimburse the tax payment due to reversalof DTL to NSPCL. Hence, there is no understatement of Other Expenses & Loss.
For and on the behalf of theComptroller & Auditor General of India
Sd/-(Indu Agrawal)
Principal Director of Commercial Audit& Ex-Officio Member, Audit Board, Ranchi
Place : RanchiDate : 31st July, 2017
For and on behalf of Board of Directors
Sd/-(P.K. Singh)Chairman
Place: New DelhiDate: 11th August, 2017
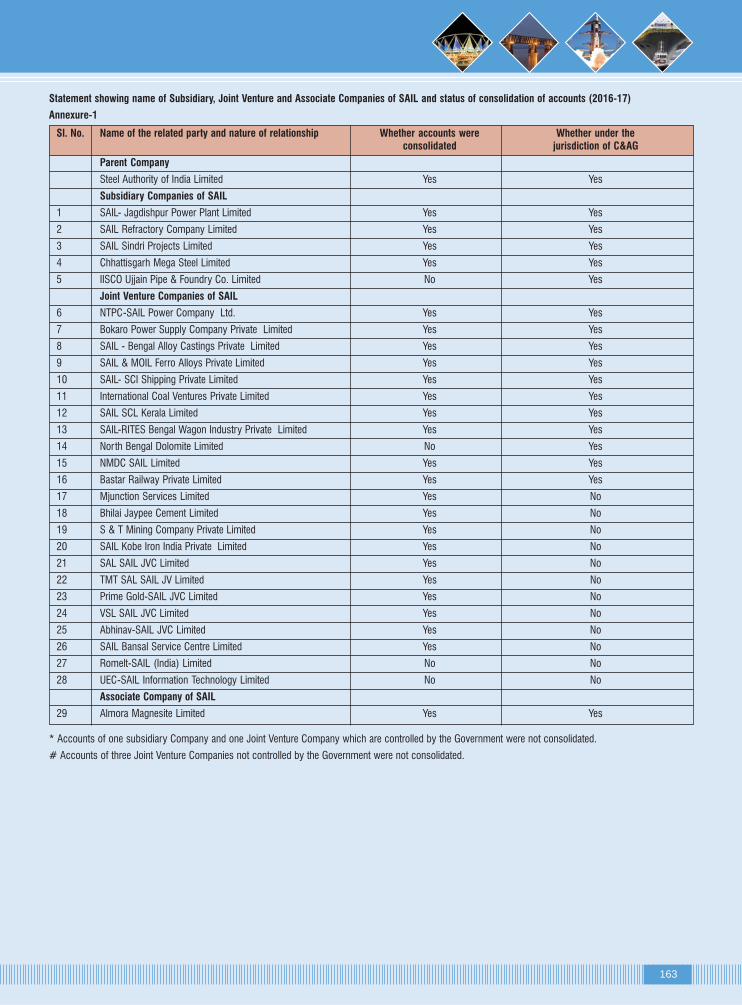
163
Statement showing name of Subsidiary, Joint Venture and Associate Companies of SAIL and status of consolidation of accounts (2016-17)
Annexure-1
Sl. No. Name of the related party and nature of relationship Whether accounts were Whether under the
consolidated jurisdiction of C&AG
Parent Company
Steel Authority of India Limited Yes Yes
Subsidiary Companies of SAIL
1 SAIL- Jagdishpur Power Plant Limited Yes Yes
2 SAIL Refractory Company Limited Yes Yes
3 SAIL Sindri Projects Limited Yes Yes
4 Chhattisgarh Mega Steel Limited Yes Yes
5 IISCO Ujjain Pipe & Foundry Co. Limited No Yes
Joint Venture Companies of SAIL
6 NTPC-SAIL Power Company Ltd. Yes Yes
7 Bokaro Power Supply Company Private Limited Yes Yes
8 SAIL - Bengal Alloy Castings Private Limited Yes Yes
9 SAIL & MOIL Ferro Alloys Private Limited Yes Yes
10 SAIL- SCI Shipping Private Limited Yes Yes
11 International Coal Ventures Private Limited Yes Yes
12 SAIL SCL Kerala Limited Yes Yes
13 SAIL-RITES Bengal Wagon Industry Private Limited Yes Yes
14 North Bengal Dolomite Limited No Yes
15 NMDC SAIL Limited Yes Yes
16 Bastar Railway Private Limited Yes Yes
17 Mjunction Services Limited Yes No
18 Bhilai Jaypee Cement Limited Yes No
19 S & T Mining Company Private Limited Yes No
20 SAIL Kobe Iron India Private Limited Yes No
21 SAL SAIL JVC Limited Yes No
22 TMT SAL SAIL JV Limited Yes No
23 Prime Gold-SAIL JVC Limited Yes No
24 VSL SAIL JVC Limited Yes No
25 Abhinav-SAIL JVC Limited Yes No
26 SAIL Bansal Service Centre Limited Yes No
27 Romelt-SAIL (India) Limited No No
28 UEC-SAIL Information Technology Limited No No
Associate Company of SAIL
29 Almora Magnesite Limited Yes Yes
* Accounts of one subsidiary Company and one Joint Venture Company which are controlled by the Government were not consolidated.
# Accounts of three Joint Venture Companies not controlled by the Government were not consolidated.

164
Operating segment information(` crore)
PARTICULARS BSP DSP RSP BSL ISP ASP SSP VISL OTHERS INTER TOTALSEGMENT
SALES
REVENUE
- External SalesCurrent Year ended 31st March 2017 14,135.97 6,209.54 9,683.32 11,796.81 4,709.85 383.07 2,015.72 169.15 138.51 49,241.94PreviousYear ended 31st March 2016 14,661.52 6,094.97 7,693.32 9,073.55 3,317.08 393.40 1,772.39 219.36 125.88 43,351.47
- Inter Segment SalesCurrent Year ended 31st March 2017 639.75 173.36 273.76 234.89 49.44 224.61 9.52 24.78 3,406.99 (5,037.10) -PreviousYear ended 31st March 2016 684.85 178.49 100.86 122.67 46.33 200.14 11.25 32.42 3,822.65 (5,199.66) -
- Total RevenueCurrent Year ended 31st March 2017 14,775.72 6,382.90 9,957.08 12,031.70 4,759.29 607.68 2,025.24 193.93 3,545.50 (5,037.10) 49,241.94PreviousYear ended 31st March 2016 17,726.54 8,012.53 9,583.05 13,175.37 1,914.96 780.03 2,216.05 279.33 3,714.91 (6,776.12) 43,351.47
RESULT
- Operating Profit / (-) Loss beforeInterest and Exceptional itemsCurrent Year ended 31st March 2017 546.87 (724.42) (703.22) 251.85 (1,326.32) (1.78) (112.45) (114.88) 213.22 (1,971.13)PreviousYear ended 31st March 2016 803.09 (301.37) (1,895.58) (1,572.94) (1,493.36) (58.00) (334.05) (111.56) 150.01 (4,813.76)
- Finance costCurrent Year ended 31st March 2017 2,527.82PreviousYear ended 31st March 2016 2,300.45
- Exceptional items (VolutaeyRetirement Compensation)Current Year ended 31st March 2017 216.74PreviousYear ended 31st March 2016 -
- Tax expensesCurrent Year ended 31st March 2017 (1,959.52)PreviousYear ended 31st March 2016 (2,937.71)
- Net Profit / Loss ( - )Current Year ended 31st March 2017 (2,756.17)PreviousYear ended 31st March 2016 (4,176.50)
OTHER INFORMATION
- Segment AssetsCurrent Year ended 31st March 2017 27,079.13 6,006.72 18,906.12 14,437.15 18,836.19 600.26 2,554.16 678.16 18,517.35 1,07,615.24PreviousYear ended 31st March 2016 24,452.24 5,700.74 18,729.80 14,665.33 18,776.06 580.22 2,858.02 640.80 14,899.08 1,01,302.29
- Segment Liabilities (including LongTerm Borrowing)Current Year ended 31st March 2017 6,872.38 2,060.83 3,821.43 3,284.97 1,577.12 232.30 372.66 151.41 52,199.87 70,572.97PreviousYear ended 31st March 2016 6,449.77 2,018.96 3,495.61 3,141.98 1,440.61 220.25 441.77 128.62 43,813.29 61,150.86
- Capital ExpenditureCurrent Year ended 31st March 2017 13,634.38 2,450.16 4,621.04 3,939.09 4,555.30 7.06 192.47 11.63 984.13 30,395.26PreviousYear ended 31st March 2016 1,779.70 602.48 1,258.08 1,237.02 1,137.22 (3.52) 62.57 19.74 3,445.27 9,538.56
- DepreciationCurrent Year ended 31st March 2017 419.36 188.37 667.72 487.93 607.05 9.30 96.31 7.30 198.28 2,681.62PreviousYear ended 31st March 2016 374.25 169.08 618.53 432.68 499.89 9.27 91.83 7.04 201.85 2,404.42
- Non Cash expenses other thanDepreciationCurrent Year ended 31st March 2017 8.98 16.20 5.45 29.91 26.73 4.48 3.45 2.43 50.04 147.67PreviousYear ended 31st March 2016 17.86 6.24 35.81 16.81 63.63 13.17 1.45 2.23 35.86 193.06
Notes to the Consolidated Financial Statements for the year ended 31st March, 2017

165
Form AOC-1
[Pursuant to first proviso to sub-section (3) of section 129 read with rule 5 of Companies (Accounts) Rules, 2014]
Statement containing salient features of the financial statementof Subsidiaries/Associate Company/Joint Ventures
for the year ended 31st March, 2017
Part "A": Subsidiaries
Sl. Particulars DetailsNo.
1. Name of the subsidiary SAIL Refractory SAIL Jagdishpur SAIL Sindri ChhattisgarhCompany Power Plant Projects Limited Mega SteelLimited Limited Limited
2 . Reporting period for the subsidiary concerned, Not applicable Not applicable Not applicable Not applicableif different from the holding company’sreporting period
3 . Reporting currency and Exchange rate as on the Not applicable Not applicable Not applicable Not applicablelast date of the relevant Financial year in the caseof foreign subsidiaries
` crore
4 . Share capital 0.05 0.05 0.05 0.05
5 . Reserves & Surplus 116.71 (-) 0.03 (-) 0.03 (-) 0.01
6 . Total Assets 168.27 0.03 0.02 0.04
7 . Total Liabilities 51.51 * * 0.04
8 . Investments - - - -
9 . Turnover 141.63 - - -
10. Profit/Loss(-) before Taxation 32.65 (-) 0.01 (-) 0.01 *
11. Provision for Taxation 11.64 - - -
12. Profit/Loss (-) after Taxation 21.01 (-) 0.01 (-) 0.01 *
13. Proposed Dividend - - -
14. % of shareholding 100 100 100 100
*Amount less than `50,000/-.
Note: The Company holds 30,00,000 equity shares of `10/- each in IISCO Ujjain Pipe & Foundry Co. Ltd. The Hon’ble High Court of Calcutta had directedwinding-up of the Company with effect from 10th July, 1997 and the official liquidator has taken over the possession of the assets of the Company. The liquidator,after disposing the assets of the Company, is in the process of settling the outstanding dues. The cumulative loss of IISCO Ujjain Pipe & Foundry Co. Ltd. upto 10th
July’97 was `17.05 crore.
For and on behalf of Board of Directors
Sd/- Sd/- Sd/-(M.C. Jain) (Anil Kumar Chaudhary) (P.K.Singh)
Company Secretary Director (Finance) Chairman
Place : New DelhiDate :30th May, 2017
Annexure-VII to the Directors' Report

166
Sl. Name of the Associate /Joint Ventures Latest Shares of Amount of Extend Description Reason Net worth Profit/ Consider- NotAudited Associate / Investment of of how why the attributable Loss for ed in Consider-Balance Joint in Holding there is associate / to the year Consoli- ed inSheet Ventures Associates / (%) significant Joint shareholding (` crore) dation Consoli-Date held by Joint influence venture as per (` crore) dation
the Venture is not latest (` crore)company (` crore) consoli- audited
on the dated Balanceyear end Sheet
(` crore)
Joint Ventures
1 NTPC SAIL Power Company Ltd. 31-03-2017 490250050 490.25 50.00% Note-1 986.76 388.87 194.43 194.44
2 International Coal Ventures Private Limited 31-03-2017 593759279 593.76 46.62% Note-1 868.33 (67.33) (31.39) (35.94)
3 Mjunction Services Limited 31-03-2017 4000000 4.00 50.00% Note-1 113.54 37.74 18.87 18.87
4 S& T Mining Co. Pvt. Limited 31-03-2017 12941400 12.94 50.00% Note-1 (0.50) (5.06) (2.53) (2.53)
5 SAIL SCI Shipping Pvt. Limited 31-03-2017 100000 0.10 50.00% Note-1 0.07 - - -
6 SAIL RITES Bengal Wagaon Industry Pvt. Limited 31-03-2017 24000000 24.00 50.00% Note-1 14.83 (12.97) (6.49) (6.48)
7 Bokaro Power Supply Co. Pvt. Ltd.* 31-03-2017 124025000 124.03 50.00% Note-1 384.26 78.54 39.27 39.27
8 SAIL Bansal Service Centre Ltd * 31-03-2017 3200000 3.20 40.00% Note-1 0.50 (0.40) (0.16) (0.24)
9 Bhilai Jaypee Cement Limited * 31-03-2017 98718048 52.51 26.00% Note-1 25.32 (68.72) (17.87) (50.85)
10 SAIL-MOIL Ferro Alloys Private Limited* 31-03-2017 100000 0.10 50.00% Note-1 (1.67) (0.37) (0.19) (0.18)
11 SAIL SCL Kerala Limited * 31-03-2017 13017801 18.75 49.26% Note-1 (17.14) (12.46) (6.14) (6.32)
12 SAIL Kobe Iron India Pvt. Limited* 31-03-2017 250000 0.25 50.00% Note-1 0.26 - - -
13 SAL SAIL JVC Limited * 31-03-2017 - - 26.00% Note-1 (0.02) (0.01) 0.00 (0.01)
14 TMT SAL SAIL JV Limited * 31-03-2017 - - 26.00% Note-1 - - -
15 SAIL-BENGAL Alloy Castings Private Limited* 31-03-2017 10000 0.01 50.00% Note-1 (0.01) (0.01) 0.00
16 Prime Gold-SAIL JVC Limited* 31-03-2017 4680000 4.68 26.00% Note-1 6.44 4.12 1.07 3.05
17 VSL SAIL JVC Limited * 31-03-2017 1297780 1.30 26.00% Note-1 - - -
18 Abhinav SAIL JVC Ltd* 31-03-2017 - - 26.00% Note-1 (0.03) (0.07) (0.02) (0.05)
19 NMDC SAIL Limited* 31-03-2017 - 0.02 49.00% Note-1 - (0.01) - (0.01)
20 Bastar Railway Pvt Limited* 31-03-2017 - - 21.00% Note-1 - (0.09) - (0.09)
21 Romelt SAIL (India) Ltd @ 63000 0.06 Note-1 Accountsnot available
22 North Bengal Dolomite Ltd @ 97900 0.98 Note-1 -do-
23 UEC SAIL Information Technology Limited # 180000 0.18 Note-1 -do-
24 N.E. Steel & Galvanising Pvt. Limited # - - 49.00% Note-1 -do-
Associate
1 Almora magnesite Limited* 31-03-2017 400000 0.40 20.00% Note-2 1.01 0.52 0.10 0.42
Part B: Associate Companies and Joint VenturesStatement pursuant to Section 129 (3) of the Companies Act, 2013 related to Associate Companies and Joint Ventures
For the Year ended 31st March, 2017
1. Voting power as per Joint Venture Agreement2. Holds 20% share capital* Based on the Unaudited Accounts for the Year 2016-17@ Operations under suspension# Companies under winding up/liquidation
For and on behalf of Board of Directors
Sd/- Sd/- Sd/-(M.C. Jain) (Anil Kumar Chaudhary) (P.K.Singh)
Company Secretary Director (Finance) Chairman
Place : New DelhiDate :30th May, 2017

167
Annexure-VIII to the Directors' Report
EXTRACT OF ANNUAL RETURN
as on the financial year ended on 31st March, 2017
FORM No. MGT-9[Pursuant to section 92(3) of the Companies Act, 2013 and Rule 12(1) of the
Companies (Management and Administration) Rules, 2014]
I. REGISTRATION AND OTHER DETAILS:
i) CIN : L27109DL1973GOI006454
ii) Registration Date : 24th January 1973
iii) Name of the Company : Steel Authority of India Limited
iv) Category / Sub-Category of the Company : Public company / Limited by Shares
v) Address of the Registered office and : Ispat Bhawan, Lodi Road, New Delhi-110003. Contact No. +91-11-24367481.contact details Fax No. +91-11-24367015. Email: [email protected]
vi) Whether listed company : Yes
vii) Name, Address and Contact details : MCS Share Transfer Agent Limited, F-65, Okhla Industrial Area, Phase- I,of Registrar and Transfer Agent New Delhi-110020. Phone No. +91-11-41406149. Fax No. +91-11-41709881.
Email: [email protected]
II. PRINCIPAL BUSINESS ACTIVITIES OF THE COMPANY
All the business activities contributing 10% or more of the total turnover of the company shall be stated:
Sl. No. Name and Description of main products / services NIC Code of the % to total turnoverProduct/ Service of the company
1 Flat Products (HR Coils, HR Plates, CR Coils, Pipes 52and Electric Sheets, etc.) 330
2 Long Products (TMT Bars, Wire Rods, etc.) 38
III. PARTICULARS OF HOLDING, SUBSIDIARY AND ASSOCIATE COMPANIES
Sl. No. Name and Address of the Company CIN/GLN Holding/ % of ApplicableSubsidiary/ shares SectionAssociate held
1. SAIL-Jagdisgpur Power Plant Limited, U40106DL2011GOI219901 SUBSIDIARY 100 2(87)Ispat Bhawan, Lodhi Road, New Delhi.
2. SAIL Refractory Company Limited, U14200TZ2011GOI017357 SUBSIDIARY 100 2(87)Salem Steel Plant, Salem
3. SAIL Sindri Projects Limited U27320JH2011GOI015168 SUBSIDIARY 100 2(87)Chasnala - 828135, Jharkhand
4. Chhattisgarh Mega Steel Limited U27100CT2015GOI001627 SUBSIDIARY 74 2(87)Bhilai Steel Plant, Ispat Bhawan, Bhilai, Chhattisgarh
5. IISCO Ujjain Pipe & Foundry Co. Limited U28113WB1964PLC026148 SUBSIDIARY 100 2(87)(Under Liquidation)50, Chowringhee Road, Kolkata-700071
6. Almora Magnesite Limited U26941UR1971PLC003453 ASSOCIATE 20 2(6)Magnesite House, Ranidhara Road, Almora-263601.
7. NTPC-SAIL Power Company Ltd. U74899DL1999PTC098274 JOINT VENTURE 50 2(6)Core-3, 5th Floor, SCOPE Complex,7, Institutional Area, Lodi Road, New Delhi-110003
8. Bokaro Power Supply Company Pvt. Ltd., U40300DL2001PTC112074 JOINT VENTURE 50 2(6)Ispat Bhawan, Lodi Road, New Delhi-110003.
9. North Bengal Dolomite Limited U14109WB1980PLC033031 JOINT VENTURE 50 2(6)28-B, Shakeshkpeare Sarani,Neelamber, Flat No.10A, 10th Floor, Kolkata-700017

168
10. UEC SAIL Information Technology Ltd. (under liquidation) U74899DL1995PLC064072 JOINT VENTURE 40 2(6)C/o I.M. Puri & Co., C-30. Chiragh Enclave,New Delhi-110048.
11. Romelt-SAIL (India) Limited U74899DL1997PLC090025 JOINT VENTURE 15 2(6)No.25/2, Madanpur, Khadar Near Sunder Public School,Opp. F Block, New Delhi-110 076
12. mjunction Services Limited U00000WB2001PLC115481 JOINT VENTURE 50 2(6)TATA Centre, 43, Jawaharlal Nehru Road,Kolkata-700071.
13. SAIL-Bansal Service Centre .Limited, 12/2, Park Mansion U27310WB2000PLC092486 JOINT VENTURE 40 2(6)57-A, Park Street, Kolkata-700 016.
14. Bhilai Jaypee Cement Ltd. U26940CT2007PLC020250 JOINT VENTURE 26 2(6)JA House, 63, Basant Lok, Vasant Vihar,New Delhi - 110057.
15. SAIL & MOIL Ferro Alloys Pvt. Ltd., U27101CT2008PTC020786 JOINT VENTURE 50 2(6)Sector-1, Bhilai - 490 001.
16. S&T Mining Co. Pvt. Ltd. U13100WB2008PTC129436 JOINT VENTURE 50 2(6)Tata Centre, 43, Jawaharlal Nehru Road,Kolkata - 700 071
17. International Coal Ventures Private Limited U10100DL2009PTC190448 JOINT VENTURE 46.62 2(6)20th Floor, Scope Minar, Laxmi Nagar District Centre,Delhi - 110 092
18. SAIL SCI Shipping Private Limited, U61100WB2010PTC148428 JOINT VENTURE 50 2(6)Shipping House, 13, Strand Road, Kolkata - 700 001
19. SAIL-SCL Kerala Limited U27104KL1969SGC002253 JOINT VENTURE 49.26 2(6)P.B. No. 42, Feroke - 673 631, Kozhikode, Kerala
20. SAIL-RITES Bengal Wagon Industry Pvt. Ltd. U35200DL2010PTC211955 JOINT VENTURE 50 2(6)Scope Minar, Laxmi Nagar, Delhi - 110092.
21. SAIL-Kobe Iron India Private Limited U27100DL2012PTC236499 JOINT VENTURE 50 2(6)Ispat Bhawan, Lodi Road, New Delhi
22. SAL-SAIL JVC Limited U28111DL2012PLC231225 JOINT VENTURE 26 2(6)B-7, WHS Kirti Nagar, New Delhi
23. TMTSAL-SAIL JVC Limited U28113DL2012PLC231234 JOINT VENTURE 26 2(6)B-7, WHS Kirti Nagar, New Delhi
24. SAIL- Bengal Alloy Castings Private Limited (SBACPL) U35122WB2013PTC190532 JOINT VENTURE 50 2(6)22B, Raja Santosh Road, Kolkata - 700 027
25. VSL-SAIL JVC Limited U27106AP2012PLC083896 JOINT VENTURE 26 2(6)Door No.2-51, Near Darga, Kardnur, PostpatiPatan Cheruvu Mandal, Hyderabad - 502 300.
26. Prime Gold-SAIL JVC Limited U28113DL2012PLC245537 JOINT VENTURE 26 2(6)5/2, Punjabi Bagh Extn., Club Road,New Delhi - 110026.
27. Abinav-SAIL JVC Limited U27100DL2012PLC245749 JOINT VENTURE 26 2(6)401, Mahaveer Ji Complex, LSC Rishab Vihar,Delhi - 110 092.
28. NMDC SAIL Limited U27320TG2016GOI109798 JOINT VENTURE 49 2(6)10-3-311/A, Khanij Bhavan Castle Hills, Masab Tank,Hyderabad, Hyderabad TG 500028 IN.
29. Bastar Railway Private Limited U74900CT2016PTC007251 JOINT VENTURE 21 2(6)Global Exploration Centre, NMDC Building Geens Villey City,Housing Board Colony Boriyakala Raipur,Raipur CT 492015 IN

169
IV. SHARE HOLDING PATTERN (Equity Share Capital Breakup as percentage of Total Equity)
i) Category-wise Share Holding
Category of No. of Shares held at the beginning of the year No. of Shares held at the end of the year % ChangeShareholders during the Year
Demat Physical Total % Total Demat Physical Total % TotalNo. of No. ofshares shares
A. Promoters
1. Indian - - - - - - - - -
a) Individual/ |HUF - - - - - - - - -
b) Central Govt 3097767449 - 3097767449 75.00 3097767449 - 3097767449 75.00 0.00
c) State Govt(s) - - - - - - - - -
d) Bodies Corp. - - - - - - - - -
e) Banks/FI - - - - - - - - -
f) Any other - - - - - - - - -
Sub Total (A)(1):- 3097767449 - 3097767449 75.00 3097767449 - 3097767449 75.00 0.00
2.Foreign
a) NRIs - Individuals - - - - - - - - -
b) Other - Individuals - - - - - - - - -
c) Bodies Corp. - - - - - - - - -
d) Banks / FI - - - - - - - - -
e) Any Other. - - - - - - - - -
Sub Total (A)(2):- - - - - - - - - -
Total Shareholding 3097767449 - 3097767449 75.00 3097767449 - 3097767449 75.00 0.00of Promoter (A) =(A)(1)+(A)(2)
B. Public Shareholding
1. Institutions
a) Mutual Funds 32407571 127300 32534871 0.79 51275023 127300 51402323 1.24 0.45
b) Banks/FI 144327257 61976 144389233 3.50 163134585 61976 163196561 3.95 045
c) Central Govt. - - - - - - - - -
d) State Govt.(s) - - - - - - - - -
e) Venture Capital Funds - - - - - - - - -
f) Insurance Companies 471432979 1900 471434879 11.41 471423860 1900 471425760 11.41 0.00
g) FIIs 206180711 48526 206229237 4.99 175934683 48526 175983209 4.26 (-)0.73
h) Foreign Venture - - - - - - - - -Capital Funds
i) Others (specify) - - - - - - - - -
Sub-Total(B)(1): 854348518 239702 854588220 20.69 861768151 239702 862007853 20.86 0.18
2. Non-Institutions
a) Bodies Corp. 21798673 70442 21869115 0.53 18172250 70342 18242592 0.44 (-)0.09
i) Indian - - - - - - - - -
ii) Overseas - - - - - - - - -
b) Individuals
i) Individual Shareholders 103201261 5682597 108883858 2.64 104957731 5636489 110594220 2.68 0.04holding nominal sharecapital upto Rs.1 lakhs
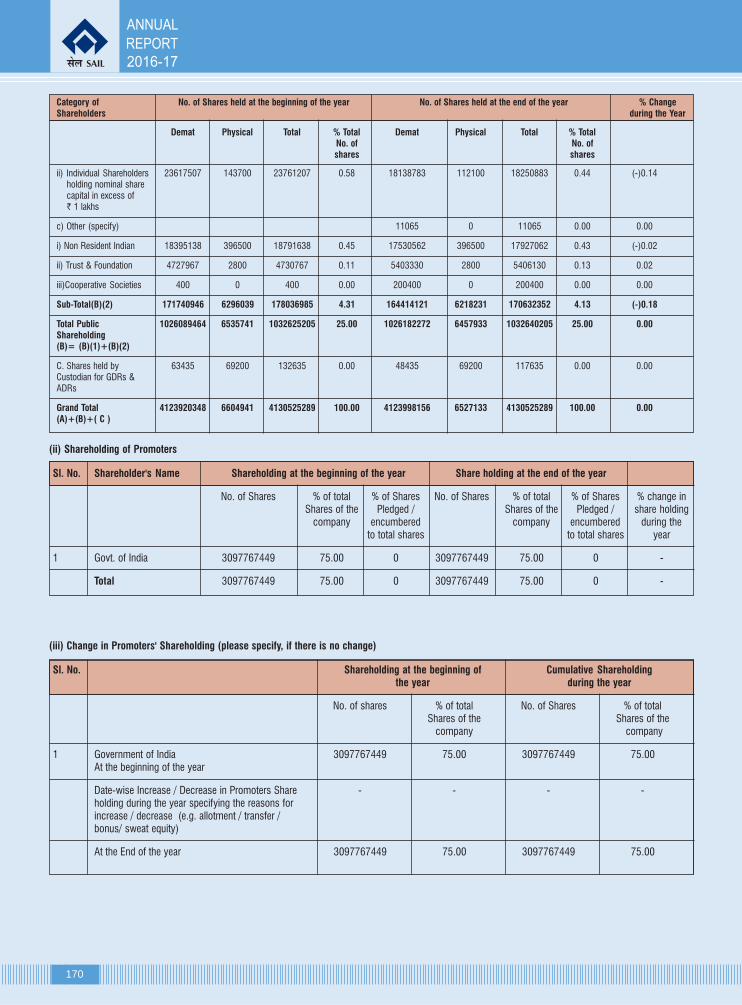
170
Category of No. of Shares held at the beginning of the year No. of Shares held at the end of the year % ChangeShareholders during the Year
Demat Physical Total % Total Demat Physical Total % TotalNo. of No. ofshares shares
ii) Individual Shareholders 23617507 143700 23761207 0.58 18138783 112100 18250883 0.44 (-)0.14holding nominal sharecapital in excess of` 1 lakhs
c) Other (specify) 11065 0 11065 0.00 0.00
i) Non Resident Indian 18395138 396500 18791638 0.45 17530562 396500 17927062 0.43 (-)0.02
ii) Trust & Foundation 4727967 2800 4730767 0.11 5403330 2800 5406130 0.13 0.02
iii)Cooperative Societies 400 0 400 0.00 200400 0 200400 0.00 0.00
Sub-Total(B)(2) 171740946 6296039 178036985 4.31 164414121 6218231 170632352 4.13 (-)0.18
Total Public 1026089464 6535741 1032625205 25.00 1026182272 6457933 1032640205 25.00 0.00Shareholding(B)= (B)(1)+(B)(2)
C. Shares held by 63435 69200 132635 0.00 48435 69200 117635 0.00 0.00Custodian for GDRs &ADRs
Grand Total 4123920348 6604941 4130525289 100.00 4123998156 6527133 4130525289 100.00 0.00(A)+(B)+( C )
(ii) Shareholding of Promoters
Sl. No. Shareholder's Name Shareholding at the beginning of the year Share holding at the end of the year
No. of Shares % of total % of Shares No. of Shares % of total % of Shares % change inShares of the Pledged / Shares of the Pledged / share holding
company encumbered company encumbered during theto total shares to total shares year
1 Govt. of India 3097767449 75.00 0 3097767449 75.00 0 -
Total 3097767449 75.00 0 3097767449 75.00 0 -
(iii) Change in Promoters' Shareholding (please specify, if there is no change)
Sl. No. Shareholding at the beginning of Cumulative Shareholdingthe year during the year
No. of shares % of total No. of Shares % of totalShares of the Shares of the
company company
1 Government of India 3097767449 75.00 3097767449 75.00At the beginning of the year
Date-wise Increase / Decrease in Promoters Share - - - -holding during the year specifying the reasons forincrease / decrease (e.g. allotment / transfer /bonus/ sweat equity)
At the End of the year 3097767449 75.00 3097767449 75.00

171
(iv)
Sha
reho
ldin
g P
atte
rn o
f To
p Te
n S
hare
hold
ers(
othe
r th
an D
irec
tors
, P
rom
oter
s an
d H
olde
rs o
f G
DR
s an
d A
DR
s):
Sha
reho
ldin
gC
umul
ativ
e S
hare
hold
ing
duri
ng t
he y
ear
2016
-17
Sl.
Folio
No.
Nam
eN
o. o
f S
hare
s at
% o
f to
tal
Dat
eIn
crea
se /
Rea
son
Sha
res
% o
f to
tal
No
the
Beg
inni
ngsh
ares
of
Dec
reas
eS
hare
s of
(31-
03-1
6) /
end
the
Com
pany
in S
hare
-th
e C
ompa
nyof
the
Yea
rho
ldin
g(3
1-03
-17)
1IN
3008
1210
0000
12LI
FE I
NSU
RA
NC
E C
OR
POR
ATIO
N O
F IN
DIA
4418
7466
710
.70
31/0
3/20
16
4418
7466
710
.70
31/0
3/20
17N
ILN
IL
2IN
3008
1210
4980
07LI
C O
F IN
DIA
MA
RKE
T PL
US
1 G
RO
WTH
FU
ND
5109
9546
1.24
31/0
3/20
16
5109
9546
1.24
31/0
3/20
17N
ILN
IL
3IN
3008
1210
5013
40LI
FE IN
SUR
AN
CE
CO
RPO
RAT
ION
OF
IND
IA P
& G
S FU
ND
2139
8731
0.52
31/0
3/20
16
04/1
1/20
1642
2753
4Pu
rcha
se25
6262
650.
62
11/1
1/20
1646
0769
2Pu
rcha
se30
2339
570.
73
18/1
1/20
1634
0000
0Pu
rcha
se33
6339
570.
81
25/1
1/20
1648
4778
7Pu
rcha
se38
4817
440.
93
02/1
2/20
1614
0487
3Pu
rcha
se39
8866
170.
97
3988
6617
0.97
31/0
3/20
17
4IN
3001
2611
2183
22IC
ICI
PRU
DEN
TIA
L BA
LAN
CED
AD
VAN
TAG
E FU
ND
1212
7645
0.29
31/0
3/20
16
17/0
6/20
1649
8182
3Pu
rcha
se17
1094
680.
41
01/0
7/20
1686
9346
Purc
hase
1797
8814
0.44
08/0
7/20
1617
413
Purc
hase
1799
6227
0.44
11/1
1/20
1620
2537
9Pu
rcha
se20
0216
060.
48
18/1
1/20
1620
5707
8Pu
rcha
se22
0786
840.
53
25/1
1/20
1611
3740
Purc
hase
2219
2424
0.54
2219
2424
0.54
31/0
3/20
17
5IN
3001
6710
0114
70VA
NG
UA
RD
EM
ERG
ING
MA
RKE
TS S
TOC
K IN
DEX
FU
ND
,16
1770
100.
3931
/03/
2016
ASE
RIE
S O
F VA
NG
U
08/0
4/20
1664
288
Purc
hase
1624
1298
0.39
22/0
4/20
1644
140
Purc
hase
1628
5438
0.39
10/0
6/20
1650
761
Purc
hase
1633
6199
0.40
24/0
6/20
1619
5976
Purc
hase
1653
2175
0.40
22/0
7/20
1640
086
Purc
hase
1657
2261
0.40
29/0
7/20
1611
9778
Purc
hase
1669
2039
0.40
05/0
8/20
1695
073
Purc
hase
1678
7112
0.41
12/0
8/20
1610
0980
Purc
hase
1688
8092
0.41
19/0
8/20
1614
3616
Purc
hase
1703
1708
0.41
09/0
9/20
1658
380
Purc
hase
1709
0088
0.41
07/1
0/20
1662
272
Purc
hase
1715
2360
0.42
14/1
0/20
1642
812
Purc
hase
1719
5172
0.42
21/1
0/20
1614
5950
Purc
hase
1734
1122
0.42
28/1
0/20
1658
380
Purc
hase
1739
9502
0.42
11/1
1/20
1612
6490
Purc
hase
1752
5992
0.42
25/1
1/20
1615
3734
Purc
hase
1767
9726
0.43

172
Sha
reho
ldin
gC
umul
ativ
e S
hare
hold
ing
duri
ng t
he y
ear
2016
-17
Sl.
Folio
No.
Nam
eN
o. o
f S
hare
s at
% o
f to
tal
Dat
eIn
crea
se /
Rea
son
Sha
res
% o
f to
tal
No
the
Beg
inni
ngsh
ares
of
Dec
reas
eS
hare
s of
(31-
03-1
6) /
end
the
Com
pany
in S
hare
-th
e C
ompa
nyof
the
Yea
rho
ldin
g(3
1-03
-17)
02/1
2/20
1687
570
Purc
hase
1776
7296
0.43
06/0
1/20
1746
992
Purc
hase
1781
4288
0.43
13/0
1/20
1799
858
Purc
hase
1791
4146
0.43
20/0
1/20
1746
992
Purc
hase
1796
1138
0.43
03/0
2/20
1714
0976
Purc
hase
1810
2114
0.44
17/0
2/20
1739
160
Purc
hase
1814
1274
0.44
24/0
3/20
1783
385
Purc
hase
1822
4659
0.44
1830
6191
0.44
31/0
3/20
1781
532
Purc
hase
6IN
3008
1210
4977
30LI
C O
F IN
DIA
MA
RKE
T PL
US
GR
OW
TH F
UN
D17
6775
830.
4331
/03/
2016
1767
7583
0.43
31/0
3/20
17N
ILN
IL
7IN
3034
3810
0039
72C
API
TAL
GR
OU
P EM
ERG
ING
MA
RKE
TS T
OTA
L94
4500
00.
2331
/03/
2016
OPP
OR
TUN
ITIE
S (L
UX)
16/0
9/20
1649
4798
1Pu
rcha
se14
3929
810.
35
10/0
2/20
1774
5886
Purc
hase
1513
8867
0.37
17/0
2/20
1749
3114
Purc
hase
1563
1981
0.38
1563
1981
0.38
31/0
3/20
17
8IN
3000
5410
0130
42A
CA
CIA
PAR
TNER
S, L
P15
1021
930.
3731
/03/
2016
1510
2193
0.37
31/0
3/20
17N
ILN
IL
9IN
3034
3810
0134
42ST
ICH
TIN
G D
EPO
SITA
RY
APG
EM
ERG
ING
MA
RKE
TS E
QU
ITY
1569
8000
0.38
31/0
3/20
16PO
OL
02/1
2/20
16-1
3000
00S
ale
1439
8000
0.35
1439
8000
0.35
31/0
3/20
17
10IN
3034
3810
0032
57VA
NG
UA
RD
TO
TAL
INTE
RN
ATIO
NA
L ST
OC
K IN
DEX
FU
ND
1060
4410
0.26
31/0
3/20
16
29/0
7/20
1647
7000
Purc
hase
1108
1410
0.27
25/1
1/20
1669
1929
Purc
hase
1177
3339
0.29
03/0
3/20
1754
2715
Purc
hase
1231
6054
0.30
1231
6054
0.30
31/0
3/20
170.
00
11IN
3001
2611
2193
56IC
ICI
PRU
DEN
TIA
L FO
CU
SED
BLU
ECH
IP E
QU
ITY
FUN
D13
2685
600.
3231
/03/
2016
08/0
7/20
1638
4300
0Pu
rcha
se17
1115
600.
41
28/1
0/20
1625
7966
7Pu
rcha
se19
6912
270.
48
17/0
2/20
17-4
3460
51S
ale
1534
5176
0.37
24/0
2/20
17-9
4420
2S
ale
1440
0974
0.35
03/0
3/20
17-2
2320
84S
ale
1216
8890
0.29
1216
8890
0.29
31/0
3/20
17
1212
0328
0000
3744
84YU
SUFF
ALI
MU
SALI
AM
VEE
TTIL
ABD
UL
KAD
ER .
1190
0000
0.29
31/0
3/20
16
1190
0000
0.29
31/0
3/20
17N
ILN
IL
13IN
3008
1210
4977
89LI
C O
F IN
DIA
MO
NEY
PLU
S G
RO
WTH
FU
ND
1175
4806
0.28
31/0
3/20
16
1175
4806
0.28
31/0
3/20
17N
ILN
IL
14IN
3001
2611
2419
22LI
C O
F IN
DIA
PR
OFI
T PL
US
GR
OW
TH F
UN
D11
6556
680.
2831
/03/
2016
1165
5668
0.28
31/0
3/20
17N
ILN
IL

173
Sha
reho
ldin
gC
umul
ativ
e S
hare
hold
ing
duri
ng t
he y
ear
2016
-17
Sl.
Folio
No.
Nam
eN
o. o
f S
hare
s at
% o
f to
tal
Dat
eIn
crea
se /
Rea
son
Sha
res
% o
f to
tal
No
the
Beg
inni
ngsh
ares
of
Dec
reas
eS
hare
s of
(31-
03-1
6) /
end
the
Com
pany
in S
hare
-th
e C
ompa
nyof
the
Yea
rho
ldin
g(3
1-03
-17)
15IN
3000
5410
0091
18H
DFC
TR
UST
EE C
OM
PAN
Y LI
MIT
ED -
HD
FC T
OP
200
FUN
D49
8841
50.
1231
/03/
2016
07/1
0/20
1638
5100
0Pu
rcha
se88
3941
50.
21
28/1
0/20
1618
0000
0Pu
rcha
se10
6394
150.
26
18/1
1/20
1616
9192
7Pu
rcha
se12
3313
420.
30
25/1
1/20
1680
73Pu
rcha
se12
3394
150.
30
10/0
3/20
17-1
3770
00S
ale
1096
2415
0.27
1096
2415
0.27
31/0
3/20
17
16IN
3008
1210
0000
29G
ENER
AL
INSU
RA
NC
E C
OR
POR
ATIO
N O
F IN
DIA
9940
574
0.24
31/0
3/20
16
9940
574
0.24
31/0
3/20
17N
ILN
IL
17IN
3000
5410
0130
34A
CA
CIA
IN
STIT
UTI
ON
AL
PAR
TNER
S, L
P95
9039
10.
2331
/03/
2016
9590
391
0.23
31/0
3/20
17N
ILN
IL
18IN
3008
1210
0017
28TH
E N
EW I
ND
IA A
SSU
RA
NC
E C
OM
PAN
Y LI
MIT
ED88
2506
00.
2131
/03/
2016
8825
060
0.21
31/0
3/20
17N
ILN
IL
19IN
3037
8610
0000
23ST
ATE
BAN
K O
F IN
DIA
8031
212
0.19
31/0
3/20
16
12/0
8/20
16-2
4000
Sal
e80
0721
20.
19
8007
212
0.19
31/0
3/20
17
20IN
3000
5410
0223
45A
CA
CIA
CO
NSE
RVA
TIO
N F
UN
D L
P74
7013
00.
1831
/03/
2016
7470
130
0.18
31/0
3/20
17N
ILN
IL
21IN
3034
3810
0039
81EM
ERG
ING
MA
RKE
TS G
RO
WTH
FU
ND
, IN
C.
2937
8374
0.71
31/0
3/20
16
17/0
6/20
16-3
3913
95S
ale
2598
6979
0.63
24/0
6/20
16-1
1527
83S
ale
2483
4196
0.60
22/0
7/20
16-1
0348
80S
ale
2379
9316
0.58
29/0
7/20
16-3
5563
82S
ale
2024
2934
0.49
05/0
8/20
16-1
4563
55S
ale
1878
6579
0.45
12/0
8/20
16-8
8638
8S
ale
1790
0191
0.43
19/0
8/20
16-2
4764
20S
ale
1542
3771
0.37
26/0
8/20
16-5
7841
67S
ale
9639
604
0.23
02/0
9/20
16-2
9191
4S
ale
9347
690
0.23
09/0
9/20
16-2
2315
21S
ale
7116
169
0.17
7116
169
0.17
31/0
3/20
17
22IN
3034
3810
0038
50C
API
TAL
INTE
RN
ATIO
NA
L EM
ERG
ING
MA
RKE
TS F
UN
D14
9271
510.
3631
/03/
2016
22/0
7/20
16-6
4730
8S
ale
1427
9843
0.35
29/0
7/20
16-2
2195
30S
ale
1206
0313
0.29
05/0
8/20
16-9
1547
0S
ale
1114
4843
0.27
12/0
8/20
16-5
5446
1S
ale
1059
0382
0.26
19/0
8/20
16-1
5457
59S
ale
9044
623
0.22
26/0
8/20
16-3
6183
04S
ale
5426
319
0.13
02/0
9/20
16-1
8141
1S
ale
5244
908
0.13
09/0
9/20
16-1
4002
39S
ale
3844
669
0.09
18/1
1/20
16-6
4497
6S
ale
3199
693
0.08
3199
693
0.08
31/0
3/20
17

174
(v) Shareholding of Directors and Key Managerial Personnel
Sl. Shareholding of each Directors and Shareholding at the beginning Cumulative ShareholdingNo. each Key Managerial Personnel of the year during the year
1. Anil Kumar Chaudhary No. of shares % of total No. of shares % of totalshares of the shares of the
company company
At the beginning of the year 200 0.00 200 0.00
Date wise Increase / Decrease in Promoters Nil Nil Nil NilShareholding during the year specifying the reasonsfor increase /decrease (e.g. allotment / transfer /bonus/ sweat equity etc.):
At the end of the year 200 0.00 200 0.00
Sl. Shareholding of Key Managerial Personnel Shareholding at the beginning Cumulative ShareholdingNo. of the year during the year
1. Shri M.C Jain No. of shares % of total No. of shares % of totalshares of the shares of the
Company Company
At the beginning of the year 68 0.00 68 0.00
Date wise Increase / Decrease in Promoters Nil Nil Nil NilShareholding during the year specifying the reasonsfor increase /decrease (e.g. allotment / transfer / bonus/sweat equity etc.):
At the end of the year 68 0.00 68 0.00
Note: All other Directors do not hold any shares of the Company at the beginning, during and at the end of the Financial Year 2016-17.
V. INDEBTEDNESS
Indebtedness of the Company including interest outstanding/accrued but not due for payment
(` crore)
Secured Loans Unsecured Deposits Totalexcluding deposits Loans Indebtedness
Indebtedness at the beginning of the Financial Year
i) Principal Amount 17575.36 17566.04 - 35141.40
ii) Interest due but not paid - - - -
iii) Interest accrued but not due 787.13 137.55 - 924.68
Total (i+ii+iii) 18362.49 17703.59 - 36066.08
Change in Indebtedness during the Financial Year
- Addition 15006.45 46466.40 - 61472.85
- Reduction 11737.95 43480.65 - 55218.60
Net Change 3268.50 2985.70 - 6254.25
Indebtedness at the end of the Financial Year
i) Principal Amount 20843.86 20551.79 - 41395.65
ii) Interest due but not paid - - - -
iii) Interest accrued but not due 832.85 243.24 - 1076.09
Total (i+ii+iii) 21676.71 20795.03 - 42471.74
Note: The opening balances has been regrouped in accordance with India Accounting Standard (INDAS)

175
VI. REMUNERATION OF DIRECTORS AND KEY MANAGERIAL PERSONNEL
A. Remuneration to Managing Director, Whole-time Directors and/or Manager:
Sl. Particulars of Name of MD/WTD/ Manager TotalNo. Remuneration Amount
(`)
Shri Shri Shri Shri Shri Shri Shri G. Shri Binod Ms. SomaP.K. Singh S. S Raman Anil Kumar Kalyan N. Vishwakarma Kumar Mondal
Mohanty (from Chaudhary Maity Mohapatra (upto (from(upto 01.07.16) 28.02.17) 01.03.17)
30.06.16)
Chairman Director Director Director Director Director Director Director Director(Technical) (Technical) (Finance) (RM&L) (Personnel) (P&BP) (Commercial) (Commercial)
1. Gross Salary 36,60,994 9,62,557 33,05,142 37,32,939 36,30,714 35,43,058 29,90,438 31,89,528 2,76,400 2,52,91,770
(a) Salary as per provisionscontained in section 17(1) of theIncome-tax Act, 1961
(b) Value of perquisites u/s 4,13,194 1,20,059 2,61,781 4,00,510 - 3,51,264 3,80,045 - 32,301 19,59,15417(2) Income-tax Act, 1961
(c) Profits in lieu of salary undersection 17(3) Income- tax Act, 1961
2. Stock Option - - - - - - - - - -
3. Sweat Equity - - - - - - - - - -
4. Commission- as % of profit- others, specify - - - - - - - - - -
5. Others, please specify - - - - - - - - - -
Total (A) 40,74,188 10,82,616 35,66,923 41,33,449 36,30,714 38,94,322 33,70,483 31,89,528 3,08,701 2,72,50,924
Ceiling as per the Act N.A. N.A. N.A. N.A. N.A. N.A. N.A. N.A. N.A. N.A.
B. Remuneration to Other Directors:
Sl. Particulars of Remuneration Fee For attending Board/ Commission Others, Please Total AmountNo. Committee Meetings Specify
1. Independent Directors*
Dr. Atmanand (upto 18.07.16) 3,80,000 - - 3,80,000
Sh. J.M Mauskar (upto 18.07.16) 3,80,000 - - 3,80,000
Sh. P.K. Dash 7,60,000 - - 7,60,000
Mrs. Anshu Vaish 7,20,000 - - 7,20,000
CA Parmod Bindal 8,00,000 - - 8,00,000
Prof. Ashok Gupta 8,20,000 - - 8,20,000
Dr. Samar Singh(from 04.02.17) 40,000 - - 40,000
Sh. Nilanjan Sanyal (from 04.02.17) 40,000 - - 40,000
Total(1) 39,40,000 - - 39,40,000
2. Other Non- Executive Directors**
Total (2) - - - -
Total (B)=(1+2) 39,40,000 - - 39,40,000
Total Managerial Remuneration
Ceiling as per the act ((@1% of profits N.A. N.A. N.A. N.A.calculated under section 198 of theCompanies Act, 2013)
*Only sitting fee is paid to Independent Directors.
**No sitting fee is paid to other Non-Executive Directors.

176
C. Remuneration to Key Managerial Personnel Other Than MD/Manager/WTD
Sl. No. Particulars of Remuneration Shri. M. C Jain TotalCompany Secretary
1. Gross Salary(a) Salary as per provisions contained in section 17(1) of the Income-tax Act, 1961 25,30,370 25,30,370(b) Value of perquisites u/s 17(2) Income-tax Act, 1961 3,55,316 3,55,316(c) Profits in lieu of salary under section 17(3) Income-tax Act, 1961 - -
2. Stock Option - -
3. Sweat Equity - -
4. Commission- as % of profit - -- others, specify…
5. Others, please specify - -
Total (A) 28,85,686 28,85,686
VII. PENALTIES / PUNISHMENT/ COMPOUNDING OF OFFENCES:
TYPE Section of Brief Description Details of Penalty/ Authority Appeal Made,Companies Act Punishment / (RD/NCLT/Court) if any
Compounding ofFees imposed
A. COMPANY
Penalty
Punishment
Compounding
B. DIRECTORS
Penalty
Punishment
Compounding
C. DEFAULT
Penalty
Punishment
Compounding
NIL
Particulars of Loans, Guarantees or Investments in accordance with Section 186 of the Companies Act, 2013
i) Amount outstanding as at 31st March, 201
Particulars Amount (` crore)
Loans given * 193.82
Investments made 1395.48
* `1.00 crore provided for.
ii) Investments made during the year ended 31st March, 2017
Name of the Entity Relation Amount Purpose for which the(` crore) Investments are proposed
to be utilised
International Coal Ventures Pvt. Limited Joint Venture 98.73 Business Purpose
SAIL RITES Bengal Wagon Industry Pvt. Limited Joint Venture 1.73 Business Purpose
VSL SAIL JVC Limited Joint Venture 0.46 Business Purpose
Annexure-IX to the Directors' Report

177
SAIL DIVIDEND DISTRIBUTION POLICY, 20171. INTRODUCTION
Securities Exchange Board of India (SEBI) vide its notification dated 8th July, 2016has inser ted Regulation 43A in the SEBI (Listing Obligations and DisclosureRequirements) Regulations, 2015, (second amendment) which requires top fivehundred listed entities based on market capitalisation (calculated as on March 31of every year) to formulate a dividend distribution policy to be disclosed in itsAnnual Report and on its website. The Regulation further provides that the dividenddistribution policy shall include the following parameters:
(a) the circumstances under which the shareholders of the listed entities may ormay not expect dividend;
(b) the financial parameters that shall be considered while declaring dividend;
(c) internal and external factors that shall be considered for declaration of dividend;
(d) policy as to how the retained earnings shall be utilized; and
(e) parameters that shall be adopted with regard to various classes of shares.
The Regulation also provides that if the listed entity proposes to declare dividendon the basis of parameters in addition to clauses (a) to (e) above or proposesto change such additional parameters or the dividend distribution policycontained in any of the parameters, it shall disclose such changes along withthe rationale for the same in its Annual Report and on its website. The equityshares of Steel Authority of India Limited(SAIL) are listed on National StockExchange of India Limited(NSE) and Bombay Stock Exchange Limited. As,SAIL is ranked 101st as per NSE, based on market capitalisation, on 31st
March, 2016, the regulation is applicable to the Company.
2. OBJECTIVE
The objective of this Policy is to enhance the value of the Company and itsshareholders through regular dividend payout after balancing the requirement ofimmediate payout from profits, future growth plans and sustenance.
3. EFFECTIVE DATE
The SAIL Dividend Distribution Policy, 2017 shall be effective from the date of itsapproval by the Board of Directors i.e. 24th March, 2017.
4. POLICY FRAMEWORK
The Policy has been formulated in line with the provisions of the Companies Act,2013, Regulations issued by SEBI, Guidelines on Capital Restructuring of CentralPublic Sector Enterprises issued by Department of Investment and Public AssetManagement (DIPAM), Guidelines issued by Ministry of Finance/Ministry ofCorporate Affairs and other guidelines, to the extent applicable on the Company.Any subsequent amendments in these provisions would ipso-facto apply to thisPolicy. The Policy is not an alternative to the decision taken by the Board regardingdeclaration/recommendation of dividend after considering the various relevantfactors.
5. DIVIDEND
Dividend is the amount paid by the Company out of profits, to its Shareholders inproportion to the amount paid up on the shares held by the shareholders. As perthe provisions of the Companies Act, 2013, the dividend can be paid as interim orfinal.
5.1 Interim Dividend
(a) The Board of Directors of the Company shall declare the interim dividendduring the financial year, as and when they consider it fit to declare.
(b) The interim dividend can be declared by the Board of Directors one or moretimes in a financial year and normally, the Board may consider the declarationof interim dividend after the finalization of the quarterly/half yearly financialstatements of the Company.
(c) The interim dividend, if declared, shall be paid to the eligible shareholders, asper provisions of the Companies Act, 2013, SEBI Regulations and other laws,to the extent applicable. First interim dividend, if any, may be declared in theBoard Meeting convened for approving financial statements for the 2nd quarter/half-year, and 2nd interim dividend, if any, may be declared at the time ofapproving financial statements for the 3rd quarter of the financial year.
(d) In case no final dividend is declared by the Company, interim dividend paidduring the financial year, if any, shall be considered as final dividend in theAnnual General Meeting of the Company.
5.2 Final Dividend
(a) The final dividend, if any, is paid once in a financial year after the preparation of theannual financial statements.
(b) The Board of Directors shall recommend the final dividend to the Shareholders fortheir approval in the Annual General Meeting of the Company. The declaration offinal dividend, if any, shall be included in the ordinary business items to be transactedat the Annual General Meeting of the Company.
(c) The final dividend shall be paid to the eligible shareholders as per provisions of theCompanies Act, 2013, SEBI Regulations and other laws, to the extent applicable.
6. CIRCUMSTANCES UNDER WHICH THE SHAREHOLDERS OF THE COMPANY MAYOR MAY NOT EXPECT DIVIDEND
6.1 The decision regarding dividend payout is a vital decision, as it determines theamount of the profit to be distributed among its shareholders and the amount of theprofit to be retained in business for the future growth and modernization & expansionplan of the Company. The Company would continue to adopt a progressive anddynamic dividend distribution policy to ensure its immediate and long termrequirements along with rewarding the Shareholders of the Company. Dividend forthe financial year shall be decided/recommended by the Board, considering,statutory, economic, market, industry, external and internal factors.
6.2 The Company may not declare dividend or declare dividend at a lower rate underthe following circumstances:
(a) in the event of the Company making losses or the profits are inadequate;
(b) where the Company is having requirement of funds for Capex requiring highcapital allocation, working capital, repayment of loans taken in the past;
(c) inadequate availability of cash; and
(d) higher cost of raising funds from alternate sources.
6.3 It may be noted that declaration of dividend shall be subject to the provisions ofCompanies Act, 2013, SEBI Regulations, Guidelines issued by Ministry of CorporateAffairs/Ministry of Finance/Department of Investment and Public Asset Managementor any other authority.
7. FINANCIAL PARAMETERS THAT SHALL BE CONSIDERED FOR DECLARINGDIVIDEND
The Board of Directors of the Company while declaring/recommending the dividendmay, inter-alia, consider the following parameters:
(a) net profit earned and cash generated by the Company during the financialyear;
(b) present and future Capital requirements for Capex plan and other investmentopportunities;
(c) retention of sufficient profits for further leveraging in line with CAPEX needsi.e. maintenance of debt:equity ratio;
(d) availability of cash and bank balance and liquidity position of the Company;
(e) Existing borrowings, capacity to further borrow and cost of borrowings;
(f) tax on profits including dividend tax rate and outgo;
(g) financial covenants agreed in the loan and other commercial agreements;
(h) limits prescribed w.r.t. various statutes, notifications and guidelines; and
(i) any other parameter which the Board may consider fit.
8. INTERNAL AND EXTERNAL FACTORS THAT SHALL BE CONSIDERED FORDECLARING DIVIDEND
Internal Factors
In addition to the financial parameters mentioned at Sl.No.7 above, the internalfactors that shall be considered by the Board for declaring/recommending dividendwould include past payout of dividend, statutory provisions applicable to theCompany for payment of dividend, etc.
External Factors
The external factors that shall be considered by the Board for declaring/recommending dividend would include macroeconomic factors affecting the industryand Company, commodity prices, applicable statutory provisions and guidelines,practice followed by industry and industry segment, expectations of the shareholders,any other factor which the Board may consider fit based on the general marketconditions.
9. UTILISATION OF RETAINED EARNINGS
The retained earnings shall be utilized in line with the objects of the Company asmentioned in the Memorandum of Association of the Company. However, the Boardof Directors may consider the following factors for utilization of the retained earningswhile declaring/recommending payment of dividend:
(a) financing plan of the projects under Capex plan of the Company
(b) statutory provisions and Government guidelines with respect to issue of bonusshares, buy-back of shares, creation of reserves, etc.
(c) any other factor which the Board of Directors may deem fit.
10. PARAMETERS TO BE ADOPTED WITH REGARD TO VARIOUS CLASSES OFSHARES
As the Company has issued only one class of equity shares with equal votingrights, all the members of the Company are entitled to receive the same amount ofdividend per share.
11. AMENDMENTS
The Policy will be reviewed as and when the Board of Directors may deem appropriatefrom time to time.
Annexure-X to the Directors' Report

178
Annexure-XI to the Directors' Report
Particulars of Energy Conservation, Technology Absorption and Foreign Exchange Earnings & Outgo[Pursuant to Section 134(3)(m) of the Companies Act, 2013 read with Rule 8 of the Companies(Accounts) Rules, 2014]
(A) Conservation of energy
i) Steps taken or impact on conservation of energy
Bhilai Steel Plant (BSP)
a. Air-gas ratio control of Hot Blast Stoves in BF #6 through HT drives forCombustion Air fan motors for energy optimization.
b. Improvement in specific heat consumption of
• Sinter Plant-II to 38.65 Mcal/t sinter, as against 39.12 Mcal/t sinter in2015-16.
• Rail & Structural Mill to 638 Mcal/ t input, as against 655 Mcal/t input in2015-16
c. Improvement in specific power consumption of
• Rail & Structural Mill to 60.4 kWh/t, as against 60.5 kWh/t in 2015-16.
• Merchant Mill to 48.4 kWh/t, as against 49.0 kWh/t in 2015-16.
d. Installation of timers for outdoor lighting circuits of CCD-3 in COB#11 forconsiderable energy saving and cost control.
e. Installation & Commissioning of VVVF drives in
• All the 4 sections of Charging Side Roller Tables of Wire Rod Mill resultingin energy saving of 580 MWh / year (approx.): Each AC drive is running10 -11 Roller table motors.
• Swivelling drive of Turn table-40 of Rod Finishing #2 area of Wire RodMill, resulting in energy saving of 9 MWh / year due to reduction inmotor current for pallet movement for B, C & D strands.
• Ladle Drier #5, #6, #7 & #8 in Ladle preparation bay of SMS-2.
f. Old inefficient pumps # 2 & #3 of Pump House #61 & #64, respectively,replaced with energy efficient pumps, with in-house resources.
g. Plant specific overall energy consumption - 6.58 Gcal/tcs.
h. Plant specific overall power consumption - 497 kwh/t of saleable steel.
Durgapur Steel Plant (DSP)
a. Commission of revamped Coke Oven Battery #5.
b. Hot repair of Coke Oven Battery #6B.
c. Cold repair of Coke Oven Battery #6A.
d. Installation of VVVF panel in Coke Oven Battery #1.
e. Photo sensors introduced in Coke Oven & Coal Chemicals area lighting.
f. All 15 silos at Coal Handling Plant put into operation.
g. Highest ever Coke Oven Gas yield @ 311.9 Nm3/tdc.
h. Complete replacement of sinter cars in Sinter Plant -1 for suction improvement.
i. Commissioning of Coal Bed Methane injection in Blast Furnace #4 to increaseHot Blast Temperature.
j. Lowest ever Blast Furnace Coke rate of 483 kg/thm.
k. Highest ever Blast Furnace Coal Dust Injection rate of 56 kg/thm .
l. Installation of additional Coke Oven Gas burners in boilers #5 & #6, therebydrastically reducing coal consumption.
m. Closure of energy intensive Soaking Pit route. Production through ContinuousCasting route increased from 88% to 95%.
n. 2 x 200 T Propane storage and handling system commissioned.
o. Top segment of Wheel Plant A-furnace recuperator replaced to increase wasteheat recovery.
p. Plant specific overall energy consumption - 6.50 Gcal/tcs.
Rourkela Steel Plant (RSP)
a. Increased power generation from Top-pressure Recovery Turbine Generator(TRTG) & Back Pressure Turbine Generator (BPTG) to 14.98 MW consistently,resulting in reduced import of power from Grid.
b. Reduction in coke consumption at BF from 464 kg/thm in 2015-16 to 418 kg/thm.
c. Consistent LD Gas recovery of 67 Nm3/tcs as in 2015-16.
d. Replacement of skid pipes with insulation in RH Furnace #5 of Hot Strip Millto reduce heat loss.
e. Erection and commissioning of an alternate NB 800 mixed gas line to CP-II forits smooth operation.
f. Plant specific overall energy consumption - 6.43 Gcal/tcs.
g. Plant specific overall power consumption - 464 kwh/t of saleable steel.
Bokaro Steel Plant (BSL)
a. Capital Repair of
• Sinter machine #1
• Soaking Pit Ceramic Recuperators - 3 nos. fully & 02 nos partially.
b. Cleaning of 3 nos. Soaking Pit Metallic Recuperators.
c. Improvement of power factor by reviving capacitor bank of LF-1 sub-stationof CCS.
d. Commissioning of new ID fan no-2 with VFD in SMS-II.
e. Change of heating mode in pickling from direct heating to indirect heatingthrough steam.
f. Reduction in avg. cycle time in Annealing #1 by using base fan in 50 bases.
g. Rectification of about 110 steam leakage points & replacement of 25 steamtraps.
h. Plant specific overall energy consumption - 6.69 Gcal/tcs.
i. Plant specific overall power consumption - 404 kwh/t of saleable steel.
IISCO Steel Plant (ISP)
a. Increase in
• Coke Oven gas yield to 323 Nm3/tdc as against 313 Nm3/tdc in 2015-16.
• BF gas yield to 1,807 Nm3/thm as against 1,740 Nm3/thm in 2015-16.
• Power generation from Top-pressure Recovery Turbine (TRT) to 7.5 MW,as against 0.7 MW in 2015-16.
• Coal Dust Injection (CDI) rate at BF #5 to 62 kg/thm, as against 21 kg/thm in 2015-16.
b. Decrease in Coke rate at BF#5 to 479 kg/thm, as against 511 kg/thm in2015-16.
c. Installation of energy efficient lights
• 78 nos. of 27 W LED Well Glass Fixtures.
• 25 nos. of 42W LED lamps in Well Glass Fittings.
• 40 nos. of 10W LED lamps in Bulkhead Light Fittings.
• 90 nos. of >700 Lm LED lamps with B22 caps.
• 3,477 nos. of 18 / 20 W LED tube lights.
• 40 nos. of 90W L.E.D. Luminaire Street Lighting.
• 815 nos,. of retrofitted LED Tube light for T5 Tube Luminaries.
• 2,000 nos. of retrofitted Led Lamp for conventional E27 Cap 70w HPSV /HPMV Lamps.
• 19 nos. of 120W Led Street Light Fixture.
d. Intra Plant Energy Audit of 160 KWP off Grid Roof Top Solar Power Plantconducted.
e. 3 x 50 t Propane storage and handling system ordered.
f. Plant specific overall energy consumption - 7.30 Gcal/tcs.
ii) Steps taken by the Company for utilizing alternate sources of energy
a. Generation of 1.43 GWh of solar power at RSP.
iii) Capital Investment on energy conservation equipments
A Capital expenditure of Rs.66.98 crore, as detailed below, has been incurred duringthe Financial Year 2016-17:
Particulars ` Crore
Recovery of sensible heat of Coke by Installation of Coke 12.78Dry Quenching System in Coke Oven Battery #11 at ISP, # 6at RSP, #11 at BSP
Bell Less Top Charging System in Blast Furnace # 3 of DSP 0.32
Top Pressure Recovery Turbine System at Blast Furnace # 5 1.89of ISP
Coal Dust Injection System in Blast Furnace #5 at ISP, #4 0.42at RSP (usage of auxiliary fuel to reduce Coke charging)
Installation of energy efficient Walking Beam Type Furnace 26.44at BSP, DSP, RSP, BSL & ISP
Torpedo Ladle for Hot Metal handling at BSP, RSP & ISP 15.21
Cast House Slag Granulation System at BSL 9.92
Total 66.98

179
(B) Technology absorption
i) Efforts made towards technology absorption
Research and Development Centre for Iron & Steel(RDCIS) is the Corporate R&DUnit of SAIL. Over the years, RDCIS has earned credentials of being an R&D Centreof international repute in the field of ferrous metallurgy. The major thrust of RDCISis to plan, demonstrate and implement multi-disciplinary R&D programmes in SAILPlants to improve their key performance indices related to quality, productivity andyield. RDCIS works with steel Plants and Central Marketing Organisation of theCompany to reduce product cost, develop value added market centric productsand demonstrate the application of SAIL products amongst the customers. Specificareas in which R&D activities were carried out by the Company in 2016-17 are asunder:
a) Process Developments
Raw Materials
• Optimization of classifier operation to reduce gangue content in ore fines atwashing Plant, MIOM, RMD.
• PLC based instrumentation and control system for performance improvementat Chasnala Washery, Collieries.
Coke Making
• Enhancing the crude Benzol yield at BSP.
• Improvement in coke quality through process optimization of coke oven atDSP.
• Coke oven battery health monitoring through cross-leakage determination atRSP.
Agglomeration
• Optimisation of sintering air flow and process parameters at Sinter Plant atBSL.
• Improvement in performance of Sinter Plant through optimisation of processparameters at ISP.
Blast Furnaces
• Introduction of hot metal temperature measurement system in Cast House ofBF# 3 at DSP.
• Characterization of high temperature properties of ferrous burden being usedin blast furnaces at BSP.
• Extending campaign life of BF # 4 at DSP.
• Improvement in HBT of BF #3 at DSP.
Steel Making
• Improvement in ladle heating system at SMS-II at RSP.
• Development of low cost flux practice and reduction in pipe defect at SMS-I atBSP.
• Sequence casting & quality improvement of wheel steel through Bloom cumRound caster at DSP.
• Improvement in refractory lining performance of EAF roof at ASP.
Rolling Mills
• Automation of slab extractor mechanism of RHFs and slab thickness measuringsystem before Roughing stand of Plate Mill at BSP.
• Design and development of a system for monitoring of critical processparameters and protection of the welding machines at R&S Mill at BSP.
• Design of an improved system for synchronisation of arms of slab kick offmechanism at HSM at BSL.
• Study the feasibility for tempering of steel plates in the existing NormalisingFurnace #2, Plate Mill at BSP.
• Consistency in achieving/maintaining section in rails and modification in rollpass design at BSP.
• Qualifying criteria test of rails as per IRS-T-12-2009/EN-13674-2011specification at BSP.
• Centralized monitoring and Control for wheel handling system at Wheel & AxlePlant at DSP.
Energy Conservation and Environment
• Energy optimization for air-gas control at stoves by HT VVVF drives forcombustion air fan motors at BF #6 at BSP.
• Investigative study of cyanide and ammonia in effluent of BF # 5 GCP at ISP.
b) Laboratory based work
• Development of procedure for Pilot Oven carbonisation test for producing cokehaving properties similar to that of commercial ovens.
• Evaluation of new imported coking coals through Pilot Carbonization tests.
• Characterization of raw feed linkages and washed coals produced from all MCCwasheries under Central Coalfields Ltd..
• Characterization of new indigenous coal and creation of a coal testing laboratory atCCSO, Dhanbad.
• Combustion simulation of existing side burner of sinter machine of IISCO SteelPlant and work out improved burner design.
• Development of model for steel superheat control.
• Development of mathematical model for study of fluid flow characteristics in BeamBlank Mould.
• Creation of databank on melting behavior of various steelmaking slags of SAILPlants.
• Study of microstructure and texture evolution in low carbon formable steels.
• Evaluation of bond strength properties of SAIL TMT rebars.
• Upgradation of Instron 8801 servo-hydraulic universal testing machine.
• Study on the corrosion fatigue behaviour of rail steels.
• Computerisation of contract activities, cylinder rent management, registration ofvendors, risk purchase tracking and MIS generation for MMD.
c) Product Development & Application
RDCIS, through continuous technological inputs, has been helping the Company inproducing value added steel products at a competitive price. Several new products,particularly special steels, having superior product quality attributes have beendeveloped and commercialized for meeting stringent application requirement ofvarious market segments. Principle of cost effective alloy design and optimizationof process parameters were the prime consideration for development of the newmarket oriented products. During the year 2016-17, the following 20 nos. of productshave been developed:
• IS 1786 Fe 500S Gr. 25 mm TMT rebars at BSP for Construction.
• Normalized DMR 249 Gr A plates of 24mm thickness at BSP for Defense(Aircraft Carrier Ships).
• Non-microalloyed IS 2062 E 350 BR & B0 grade 15-30 mm thick plates atBSP for Structural.
• AB3 Grade Steel Plates at RSP for Defense (submarines).
• Hardox 400 Q&T Plates (20 mm) at RSP for Earthmovers.
• Non-microalloyed IS 2062 E350 BR plates at RSP for Structural.
• SAIL Forming 250 grade HR coil at BSL for Auto Segment (Dummy axle).
• Thinner Guage (2.3 mm) High Strength LPG (IS 15914 HS 345) at BSL forDomestic LPG Cylinder.
• API 5L X65 PSL1 HR Coils at BSL for Linepipe.
• Nano-Precipitation Strengthened Advanced High Strength steels (SAIL HT 600)at BSL for Tipper body.
• SAE 1008 (SWR 10) Wire Rod 6 & 7 mm at ISP for Construction.
• IS 1786 Fe500S TMT rebars (12 mm) at ISP for Construction.
• IS 1786 Fe500S TMT rebars (16 mm) at ISP for Construction.
• IS 1786 Fe500S TMT rebars (20 mm) at ISP for Construction.
• IS 1786 Fe500D TMT rebars (25 mm) at ISP for Construction.
• IS 1786 Fe500D TMT rebars (40 mm) at ISP for Construction.
• Non-alloyed IS 2062 E350 BR grade IPE 400 (NPB 400x189x75.66) at ISPfor Construction.
• Non-alloyed IS 2062 E350 BR grade IPE 450 (NPB 450x190x77.57) at ISPfor Construction.
• Non-alloyed IS 2062 E350 BR grade IPE 500 (NPB 500x200x90.68/79.36) atISP for Construction.
• Non-alloyed IS 2062 E350 BR grade Angle 200x200x20 at ISP for Construction.
d) R&D Master Plan
RDCIS was entrusted the responsibility to revisit R&D Master Plan and introducesuitable changes in identification, selection, implementation and monitoring of R&Dprograms to make it more user friendly, effective and sustainable. RDCIS inconsultation with the Plants/Units Champions of COE projects, other stake holdersinvolved, identified the major roadblocks through a series of workshops/brainstorming sessions, and designed a modified process which has been successfullyimplemented in all the Plants/Units of SAIL leading to larger participation of Plants'personnel in R&D activities across the Company. The major changes incorporatedincludes a process to identify projects of large technological impact under differentcategories, simplified purchase procedure, concept of Co-Champion, availability offunds after approval of projects and an innovative process to capture R&Dexpenditure across the Company. The process developed shall help to meet thefollowing goals:
• Achieve operational goals of business plan.
• Develop global competitiveness.
• Develop in-house process development and design capabilities
• Develop/adapt radically new technologies strategically important to SAIL.
• Disseminate R&D culture in the steel Plants through "Centre ofExcellence"(COE) Projects.
• Increase R&D expenditure to international benchmark of 1% of turnover.
The above called for creating Centre of Excellence(CoE) in all the Plants andimplementing High Impact Projects (HIP) and Technology Missions (TM) in orderto achieve technological eminence. This initiative has taken roots and is underdifferent stages of implementation.

180
(ii) Benefits derived from key projects in 2016-17:
• Process Area
Project Title Benefits Derived
Enhancing the crude Benzol yield, BSP • Benzol yield increased from 7.3 kg/tdc to 7.4 kg/tdc.
Energy optimization for air-gas control at stoves by HT VVVF drives for • Significant electrical energy saving in the tune of 70-75% has been recorded due to VFDcombustion air fan motors at BF #6, BSP. drives.
• Thermal life of motors will be enhanced due to reduction of harmonics.• Due to smooth variation of speed, thrust on impeller and bearings will be reduced.
Development of low cost flux practice and reduction in pipe defect at SMS-I, • Lower rejection ~ 2.51% (avg.) level in trial heats has been achieved as compared toBSP. 3.06% (avg.) annual rejection in 2015-16.
Design and development of a system for monitoring of critical process • The system has a feature to generate alarm at certain level and it can provide trippingparameters and protection of the welding machines at Rail & Structural Mill, BSP. command to the machine if the level exceeds the threshold limit.
Improvement in coke quality through process optimization of coke oven, DSP. • Tar moisture has improved to < 10% and coke quality in terms of M10 has also improved to<8.0%.
Introduction of Hot Metal temperature measurement system in Cast House of • With improved thermal control of the furnace, corrected coke rate of the furnace, afterBF# 3, DSP. neutralizing other parameters, has come down by 2- 3kg/thm in Oct-Nov'16.
Improvement in HBT of BF #3, DSP. • Monthly average of 10000C HBT was achieved on regular basis during Sept - Oct'16.
Extending campaign life of BF # 4, DSP. • This campaign life is the highest in DSP history (BF#4 has produced 7.51 MT in its previouscampaign during 1996-2006).
Sequence casting & quality improvement of wheel steel through Bloom cum • Sequence length up-to 4 heats have been successfully made by finishing the heat withinRound caster, DSP. 50 minutes in VAD excluding delays.
Centralized monitoring and Control for wheel handling system at Wheel & • Centralized monitoring facility at Shift control room as well as monitoring facility at anyAxle Plant , DSP. authenticated PC on DSP Intranet.
Coke oven battery health monitoring through cross-leakage determination, RSP. • COB#6 has already exceeded the target pushing level envisaged (84); current pushing levelis 92 pushing/day.
Improvement in ladle heating system at SMS-II, RSP. • The ladle preheat temperature of 11000C has been achieved in 8 hrs. in the modifiedstands against 850-9500C with the old ladle dryer stands.
• Improvements in refractory lining life of the ladle and reduction in skull formation areexpected due to ladle heating at about 11000C.
Optimisation of sintering air flow and process parameters at Sinter Plant, BSL. • The specific sinter machine productivity improved by 5.18%, 3.64% & 3% in sintermachines#1, 2 & 3 respectively.
• Machine speed improved by 3.82% (in m/c-1), by 7.95% (in m/c -2) and by 5.78%(in m/c-3).
• The RDI & RI of BSL sinter was respectively found to be 36% & 64%, which is consideredbetter.
Improvement in performance of Sinter Plant through optimisation of process • Increase in specific productivity of the Plant from 0.93 to 1.15 t/m2/hr.parameters, ISP.
Improvement in refractory lining performance of EAF roof, ASP. • With these developed bricks, average EAF roof lining life of approx. 160 heats with anall-time record life of 200 heats have been achieved against earlier average lining life of100 heats.
Optimization of classifier operation to reduce gangue content in ore fines at • Decrease in slime loss of about 1.5 times when the ore is processed through the modifiedwashing plant, MIOM, RMD. classifier.
• Apart from recovery of valuable minerals, the classifier product also showed with higheriron (62.8%Fe) content in comparison to existing classifier (without modification) product(62.4%Fe).
• Silica reduction also noticed to certain extent in case of modified classifier operation.
PLC based instrumentation and control system for performance • Reduction in annual electrical delay by~ 75% in raw coal charging area.improvement at Chasnala Washery.
Characterization of new indigenous coal and creation of a coal testing • Widening of coal supply base.laboratory at CCSO, Dhanbad.
Development of procedure for Pilot Oven carbonisation test for producing coke • Better prediction of commercial coke quality.having properties similar to that of commercial ovens .
Evaluation of new imported coking coals through Pilot Carbonization tests. • Widening of imported coal base.
Characterization of raw feed linkages and washed coals produced from • Widening of indigenous coal supply base.all MCC washeries under Central Coalfields Ltd.
Combustion simulation of existing side burner of sinter machine of IISCO • Based on CFD (Computational Fluid Dynamics), a modified burner design has beenSteel Plant and work out improved burner design. worked out to improve combustion characteristics of side mounted burners of Sinter
Plant, ISP.• The modified burner design shall be installed and commissioned in one Sinter Machine of
ISP in the year 2017-18 to improve sinter productivity.
Development of model for steel superheat control. • Mathematical model has been developed for predicting steel temperature at different stagesof refining with respect to time using empirical co-relations and CFD modeling.

181
Product Benefits Derived
IS 1786 Fe 500S Gr. 25 mm TMT rebars, BSP. Developed Fe-500S grade TMT rebars with UTS/YS ratio of 1.25 min as per IS 1786, 2008 forconstruction of seismic resistant RCC structure. Process technology established for the productionof 25 mm diameter TMT rebars in Fe 500S grade.
Normalized DMR 249 Gr. A plates of 24mm Thickness, BSP. DMR 249 Gr. A plates of thickness 20-24 mm are supplied in Q&T condition whereas upto 20mm thickness as-rolled normalized plates are accepted. Processing of as-rolled-normalised DMR249 Gr. A plates of 24 mm thickness has been developed for naval application (Aircraft CarrierShips).
Non-micro alloyed IS 2062 E 350 BR & B0 grade 15-30 mm thick plates, BSP. Through modified chemistry and fine-tuned rolling practice, properties of IS 2062 E 350 BR /B0grade structural steel are met without addition of microalloying. Product has been used successfullyin fabricating road rollers.
Thinner Guage (2.3 mm) High Strength LPG (IS 15914 HS 345), BSL. This product was developed for manufacturing light weight (18% less weight) domestic LPGcylinders as per requirement of HPCL. Process technology was established for production of 2.3mm thick high strength (YS 500MPa) HR coils. Fabricated cylinders after normalising couldachieve all the requisite properties as per specification.
Nano-Precipitation Strengthened Advanced High Strength steels (SAIL HT 600), A new generation high-strength advanced ferritic steel developed for the first time in SAIL rolledBSL. condition through HSM. Thinner gauge(5, 6 & 8 mm) high strength HT 600 having UTS >600
MPa has been used for tipper bodies to reduce the weight .
SAIL forming 250 grade HR coil, BSL. This product was developed for use in auto segment for manufacturing of dummy axle. Processtechnology was established and the properties were achieved as per specification.
API 5L X65 PSL1 HR Coils, BSL. Product is used for making line pipes.
Hardox 400 Plates (20 mm), RSP. Process technology was established for production of HARDOX Plates (with tensile strength1400MPa and 380BHN hardness) in 20mm thickness for wear resistant application in Earthmovingequipment.
AB3 Grade Steel Plates, RSP. Process technology for processing of AB3 grade plates has been developed at RSP. This steelfinds application in making of submarines.
Non-microalloyed IS 2062 E350 BR plates, RSP. Similar to development at BSP, process technology for meeting properties of IS 2062 E 350 BR/B0 grade structural steel without addition of microalloying have been developed at RSP.
IS 1786 Fe500S TMT rebars (12 mm), ISP. Developed Fe-500S grade TMT rebars with UTS/YS ratio of 1.25 min as per IS 1786, 2008 forconstruction of seismic resistant RCC structure. Process technology established for the productionof 12 mm diameter TMT rebars in Fe 500S grade.
IS 1786 Fe500S TMT rebars (20 mm), ISP. Developed Fe-500S grade TMT rebars with UTS/YS ratio of 1.25 min as per IS 1786, 2008 forconstruction of seismic resistant RCC structure. Process technology established for the productionof 20 mm diameter TMT rebars in Fe 500S grade.
IS 1786 Fe500D TMT rebars (25 mm), ISP. Process technology established for the production of 25 mm diameter TMT rebars in Fe 500Dgrade with UTS/YS ratio of 1.18 min for construction segment as per IS 1786, 2008 throughnewly installed bar mill of ISP.
IS 1786 Fe500D TMT rebars (40 mm), ISP. Process technology established for the production of 40mm diameter TMT rebars in Fe 500Dgrade with UTS/YS ratio of 1.18 min for construction segment as per IS 1786, 2008 throughnewly installed Bar Mill of ISP.
Non-alloyed IS 2062 E350 BR/B0 grade IPE 400 (NPB 400x189x 75.66), ISP. Process technology established for the production of high strength E350 BR/B0 grade narrowparallel flange beam IPE 400 (NPB 400x189x75.66) as per IS 2062 through Universal SectionMill of ISP. The process is a cost effective method for production of steel without using costlymicro-alloying elements. This product finds application in steel structures in construction sector.
Non-alloyed IS 2062 E350 BR/B0 grade IPE 450 (NPB 450 x190x 77.57), ISP. Process technology established for the production of high strength E350 BR/B0 grade narrowparallel flange beam IPE 450 (NPB 450x190x77.57) as per IS 2062 through Universal SectionMill of ISP. The process is a cost effective method for production of steel without using costlymicro-alloying elements. This product is extensively used in steel structures in constructionsector.
Non-alloyed IS 2062 E350 BR/B0 grade IPE 500 (NPB 500x 200x 90.68/ 79.36), Process technology established for the production of high strength E350 BR/B0 grade narrowISP. parallel flange beam IPE 500 (NPB 500x200x90.68/ 79.36) as per IS 2062 through Universal
Section Mill of ISP. The process is a cost effective method for production of steel without usingcostly micro-alloying elements. This product finds application in steel structures in constructionsector.
Non-alloyed IS 2062 E350 BR/B0 grade Angle 200x200x20, ISP. Process technology established for the production of high strength E350 BR/B0 grade Angle200x200x20 as per IS 2062 through Universal Section Mill of ISP. The process is a cost effectivemethod for production of steel without using costly micro-alloying elements. This product isextensively used in steel structures in construction sector.
IS 1786 Fe500S TMT rebars (16 mm), ISP. Developed Fe-500S grade TMT rebars with UTS/YS ratio of 1.25 min as per IS 1786, 2008 forconstruction of seismic resistant RCC structure. Process technology established for the productionof 16mm diameter TMT rebars in Fe 500S grade.
SAE 1008 (SWR 10) Wire Rod 6 & 7 mm, ISP. Process technology developed for production of SAE 1008 Grades. This grade is used for makingwire mesh and ordinary grade fasteners.
• Product Area

182
Other Technology Absorption, Adaption & Innovation Measures
Technology development, absorption, adaption and further improvement are continuously taking place in the Company in different areas of Steel Plant operationthrough a definitive technology strategy. A number of new technologies are installed / being installed as a part of modernization/continuous improvement. Thesearea-wise include:
Sl. No. Description Year Status
COKE MAKING
1. Rebuilding of environment friendly Coke Oven Battery No. 5 at DSP 2016 Commissioned
2. New 7m tall environment friendly Coke Oven Battery No. 9 at BSP. 2016 Commissioned
3. Rebuilding of environment friendly Coke Oven Battery No. 3 at RSP 2016 Commissioned
4. Rebuilding of environment friendly Coke Oven Battery No.7 at BSL 2017 Likely to be commissioned
SINTER MAKING/AGGLOMERATION
IRON MAKING
1. Blast Furnace (BF) with modern facilities such as :• Conveyor charging system.• Closed Loop Cooling System with soft water as an efficient cooling system.• Modern refractory design.• Flat Cast House design with ramp for use of mobile equipment for maintenance, etc.
i) 4060m3 BF at BSP. 2017 Likely to be commissioned
2. Gas Cleaning Plant (GCP) for improvement in quality of BF gas
i) GCP in BF#8, BSP. 2017 Likely to be commissioned
3. INBA Cast House Slag Granulation Technology at BSL
i) BF#2, Cast House 4. 2017 Likely to be commissioned
ii) BF#3, Cast House 5. 2017 Likely to be commissioned
4. High Hot Blast technology in stoves with waste heat recovery system for achieving HBT of>1200oC
i) Stoves System in BF#8 BSP. 2017 Likely to be commissioned
ii) Stoves System in BF#1 RSP. 2017 Likely to be commissioned
5. Top Recovery Turbine in Blast Furnaces for generation of power
i) Installation in BF#8 BSP. 2017 Likely to be commissioned
STEEL MAKING
1. Introduction of RH degassing unit at SMS-II, RSP. 2016 Commissioned
2. Introduction of RH degassing unit at SMS, ISP. 2016 Commissioned
3. Installation of 45 MVA SAF at CFP. 2017 Under Commissioning
4. Introduction of Slide gate system in Tundish in CCM of SMS-II of BSL. 2016 Commissioned
ROLLING & FINISHING
IISCO STEEL PLANT
Bar Mill
Universal Section Mill
1. Hot charging of blooms to reduce specific fuel consumption. 2016 Commissioned
2. Walking-beam (WB) type re-heating furnaces.
3. Universal stands with quick roll cassette changing facility for easy switch-over of campaigns andproduction of universal sections which have inherent advantages of simplicity in fabrication,higher section modulus to weight ratio, higher buckling strength, etc.
4. On-line profile gauges for stock to stock monitoring of important geometric values for minimizingrejections and taking timely corrective actions.

183
Sl. No. Description Year Status
BHILAI STEEL PLANT
Universal Rail Mill
1. Walking-beam (WB) type re-heating furnaces. 2017 Under commissioning
2. Universal stands with quick roll cassette changing facility for easy switch-over of campaignsand production of universal sections which have inherent advantages of simplicity in fabrication,higher section modulus to weight ratio, higher buckling strength, etc..
Bar & Rod Mill
1. Hot charging of billets to reduce specific fuel consumption. 2017 Under commissioning
2. Walking-beam (WB) type re-heating furnaces.
3. High speed slit rolling with commensurate bar receiving, speed braking & delivery facility in coolingbeds to achieve high production rate, close/ negative tolerance and better surface finish of lowerdiameter TMT rods/ bars.
4. Reducing & sizing mills to facilitate size-free rolling (faster changeover of sections to any diameterin increment of 0.5 mm) of wire rods.
5. On-line profile gauges for stock to stock monitoring of important geometric values forminimizing rejections and taking timely corrective actions.
DURGAPUR STEEL PLANT
Medium Structural Mill
1. Walking-beam (WB) type re-heating furnaces. 2017 Likely to be commissioned
2. Universal stands with quick roll cassette changing facility for easy switch-over of campaigns andproduction of universal sections which have inherent advantages of simplicity in fabrication, highersection modulus to weight ratio, higher buckling strength, etc..
3. On-line profile gauges for stock to stock monitoring of important geometric values for minimizingrejections and taking timely corrective actions.
BOKARO STEEL PLANT
Hot Strip Mill
Crop-ends optimization, automatic width control, hydraulic automatic gauge control (HAGC), 2016 Commissionedwedge/camber control in roughing stand.
Cold Rolling Mill-III
Coupled Picking Line & Tandem Mill, shaped roll crown control, roll shifting, work-roll thermal 2016 Commissionedcrown control, hydrogen batch annealing with capability for dual phase steel, galv-annealingfacilities, future provision of colour coating line, etc.
Expenditure on Research & Development (` Crore)
(a) Capital : 77.83
(b) Recurring : 261.60
Total : 339.43
Total R&D Expenditure as a % of Total Turnover : 0.69
Foreign Exchange Earnings and Outgo (` Crore)
i) Foreign Exchange earned from exports and other activities : 1,729.73
ii) Foreign Exchange used:
a) CIF Value of imports : 14,679.06
b) Other expenditure in foreign currency : 185.69
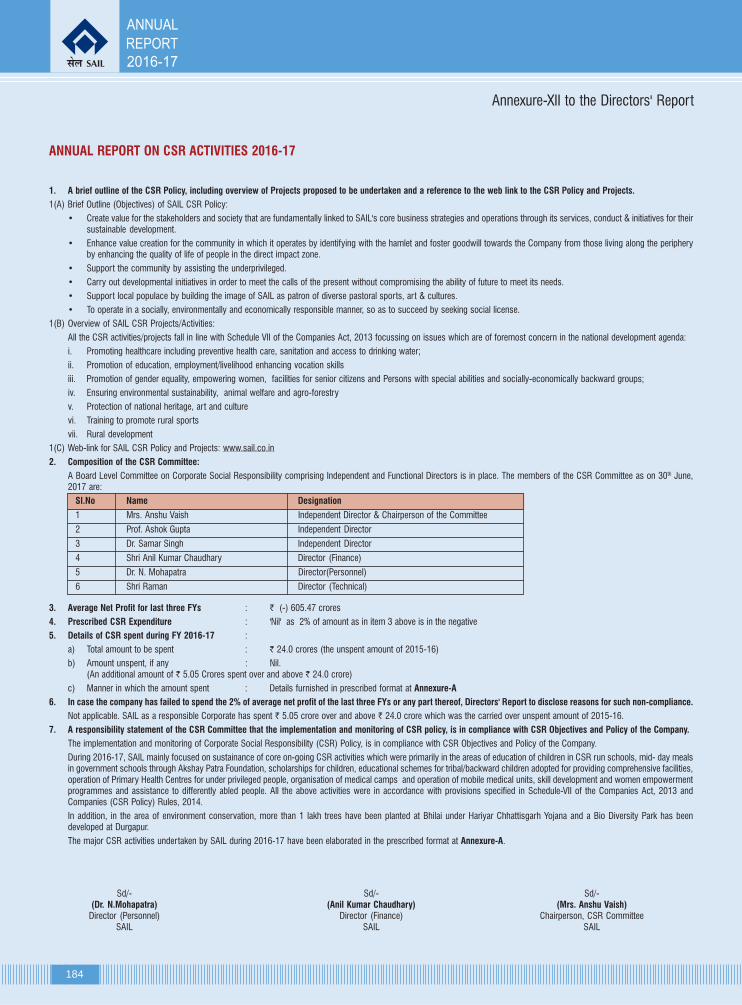
184
ANNUAL REPORT ON CSR ACTIVITIES 2016-17
1. A brief outline of the CSR Policy, including overview of Projects proposed to be undertaken and a reference to the web link to the CSR Policy and Projects.
1(A) Brief Outline (Objectives) of SAIL CSR Policy:
• Create value for the stakeholders and society that are fundamentally linked to SAIL's core business strategies and operations through its services, conduct & initiatives for theirsustainable development.
• Enhance value creation for the community in which it operates by identifying with the hamlet and foster goodwill towards the Company from those living along the peripheryby enhancing the quality of life of people in the direct impact zone.
• Support the community by assisting the underprivileged.
• Carry out developmental initiatives in order to meet the calls of the present without compromising the ability of future to meet its needs.
• Support local populace by building the image of SAIL as patron of diverse pastoral sports, art & cultures.
• To operate in a socially, environmentally and economically responsible manner, so as to succeed by seeking social license.
1(B) Overview of SAIL CSR Projects/Activities:
All the CSR activities/projects fall in line with Schedule VII of the Companies Act, 2013 focussing on issues which are of foremost concern in the national development agenda:
i. Promoting healthcare including preventive health care, sanitation and access to drinking water;
ii. Promotion of education, employment/livelihood enhancing vocation skills
iii. Promotion of gender equality, empowering women, facilities for senior citizens and Persons with special abilities and socially-economically backward groups;
iv. Ensuring environmental sustainability, animal welfare and agro-forestry
v. Protection of national heritage, art and culture
vi. Training to promote rural sports
vii. Rural development
1(C) Web-link for SAIL CSR Policy and Projects: www.sail.co.in
2. Composition of the CSR Committee:
A Board Level Committee on Corporate Social Responsibility comprising Independent and Functional Directors is in place. The members of the CSR Committee as on 30th June,2017 are:
Sl.No Name Designation
1 Mrs. Anshu Vaish Independent Director & Chairperson of the Committee
2 Prof. Ashok Gupta Independent Director
3 Dr. Samar Singh Independent Director
4 Shri Anil Kumar Chaudhary Director (Finance)
5 Dr. N. Mohapatra Director(Personnel)
6 Shri Raman Director (Technical)
3. Average Net Profit for last three FYs : ` (-) 605.47 crores
4. Prescribed CSR Expenditure : 'Nil' as 2% of amount as in item 3 above is in the negative
5. Details of CSR spent during FY 2016-17 :
a) Total amount to be spent : ` 24.0 crores (the unspent amount of 2015-16)
b) Amount unspent, if any : Nil.(An additional amount of ` 5.05 Crores spent over and above ` 24.0 crore)
c) Manner in which the amount spent : Details furnished in prescribed format at Annexure-A
6. In case the company has failed to spend the 2% of average net profit of the last three FYs or any part thereof, Directors' Report to disclose reasons for such non-compliance.
Not applicable. SAIL as a responsible Corporate has spent ` 5.05 crore over and above ` 24.0 crore which was the carried over unspent amount of 2015-16.
7. A responsibility statement of the CSR Committee that the implementation and monitoring of CSR policy, is in compliance with CSR Objectives and Policy of the Company.
The implementation and monitoring of Corporate Social Responsibility (CSR) Policy, is in compliance with CSR Objectives and Policy of the Company.
During 2016-17, SAIL mainly focused on sustainance of core on-going CSR activities which were primarily in the areas of education of children in CSR run schools, mid- day mealsin government schools through Akshay Patra Foundation, scholarships for children, educational schemes for tribal/backward children adopted for providing comprehensive facilities,operation of Primary Health Centres for under privileged people, organisation of medical camps and operation of mobile medical units, skill development and women empowermentprogrammes and assistance to differently abled people. All the above activities were in accordance with provisions specified in Schedule-VII of the Companies Act, 2013 andCompanies (CSR Policy) Rules, 2014.
In addition, in the area of environment conservation, more than 1 lakh trees have been planted at Bhilai under Hariyar Chhattisgarh Yojana and a Bio Diversity Park has beendeveloped at Durgapur.
The major CSR activities undertaken by SAIL during 2016-17 have been elaborated in the prescribed format at Annexure-A.
Sd/- Sd/- Sd/-(Dr. N.Mohapatra) (Anil Kumar Chaudhary) (Mrs. Anshu Vaish)
Director (Personnel) Director (Finance) Chairperson, CSR CommitteeSAIL SAIL SAIL
Annexure-XII to the Directors' Report

185
Annexure-A
SAIL CSR PROJECTS/ACTIVITIES UNDERTAKEN DURING 2016-17
(` crore)
Sl. CSR Project or activity identified Sector in which the Projects (State & Amount Amount spent Cumulative Amount spent :No. project is covered District where projects outlay on the projects: expenditure Direct or through
were undertaken) (budget) Direct up to the implementingprojects expenditure reporting agency
wise or Overheads period (2014-15to 2016-17)
1 2 3 4 5 6 7 8
1 Eradicating hunger, poverty and malnutrition, promoting Cl.(i) Healthcare, 7.07 5.79 42.05healthcare including preventive health care and sanitation, Drinking Water & Sanitationconstruction of toilets under SVA and making availablesafe drinking water;
2 Promotion of education including special education and Cl.(ii) Education & 13.28 11.60 40.08employment enhancing vocation skills especially among Livelihood Generationchildren, women, elderly and differently abled andlivelihood enhancement projects;
3 Promotion of gender equality and empowering women, Cl.(iii) Women 0.75 1.16 8.52setting up homes and hostel for women and orphans; Empowerment & Care forsetting up old age homes, day care centers and such Sr. Citizens & PwDsother facilities for senior citizens and measures forreducing inequalities faced by socially and economicallybackward groups;
4 Protection of heritage, art, culture & Training to promote Cl.(v) & (vii) Promotion of 1.21 2.93 12.93rural sports,Nationally recognised sports, paralympic Sports, Art & Culturesports and Olympic sports;
5 Ensuring environmental sustainability, flora and fauna, Cl.(iv) Environment 2.18 3.68 19.86animal welfare, agroforestry, conservation of natural sustainabilityresources and maintaining quality of soil, air and water;
6 Rural development projects Cl.(x) Infrastructure & 1.88 2.68 13.70Rural Dev
7 Capacity Building CSR Rules, 2014 Cl.4(6) 0.57 1.21 3.11
8 Provisions for Disaster Relief & Additional allocation for General Circular No. 2.40 - -CSR projects as per Schedule-VII 21/2014 dt.18/8/14
Annexure Pt.7 of Para (i)
Total 29.34* 29.05 140.25
* This includes unspent amount of ` 24.0 Crore of 2015-16 Budget.
Direct and throughImplementingAgencies, viz. AkshayaPatra Fdn; PG Collegeof Nursing, Bhilai;NIOS; Zila SakshartaSamiti, RamKrishnaMission,YogodaSatsanga Society, IspatMahila Samaj,SRREOSHI, Jharkraft,Aroh Fdn, Indian RedCross Society,Durgapur Sub-Div.Branch, SamayitaMath, Gopalmath SisuKalyan Kendra, SVVPSamity, Apex BodyVVK Durgapur InfoCentre, Art of Living,DSP Mahila Samaj,Blind Relief Society,Burnpur AmbaganVolunteers S.W. Org,Cure Intl, BaidyanathSewa Trust, PiramalSwasthya,Bokaro, DMIAbasik Mahila Samaj,Asha Kiran ShelterHome, Peace House W.Trust, BIKK, Society forRural Industria-lisation,Chh'garh Rajya VanVikas Nigam, VanvasiKalyan Kendra,Bokaro,ASP/DSP SC & STEmployees W.Association, etc.
In the peripheral areas ofSAIL Plants and Units. Thedistricts covered are Durg,Bilaspur, Balod, Kanker,Narayanpur, Dhamtari,Rajnandgaon, Champa inChhattisgarh, Burdwan,Bankura, South 24parganas, Nadia andKolkata in W.Bengal,Sudergarh & Keojhar inOdisha, Bokaro, Deoghar,W.Singhbhum, Garhwa,Dhanbad, Ranch & Khuntiin Jharkhand, Salem &Cuddalore in Tamilnadu,Chikamagaluru inKarnataka, Chandrapur inMaharashtra, Gwalior inMP, Guntur in AndhraPradesh etc.

186
PRINCIPAL EXECUTIVES AS ON 18.07.2017
CORPORATE OFFICE
NEW DELHI
ChairmanP. K. Singh
Directors
FinanceAnil Kumar Chaudhary
Raw Materials & LogisticsKalyan Maity
Projects & Business Planning with addl. charge ofDirector (Personnel)Dr. Ganesh VishwakarmaTechnicalRamanCommercialMs. Soma Mondal
Executive Directors
Power, Elec. & SAILCONTejveer Singh
VigilanceD. Bartaria
Business PlanningS. K. Garg
Logistic & Infra.D. K. Sama
Chairman's Sectt.P. K. Jha
Personnel & AdministrationS. P. S. Jaggi
Law & PLOH. R. Choudhury
ED(F&A) & Secretary
M. C. JainICVLUmesh Kumar
Chief of Corporate Affairs
R. K. Singhal
SafetyR. K. Tripathi
Hridaya Mohan
Growth DivisionT. S. Prakash
Management Training InstituteMrs. Kamakshi Raman
STEEL PLANTS / UNITS
Bhilai Steel PlantChief Executive OfficerM. RaviExecutive DirectorsPersonnel & AdministrationM. K. Barman
ProjectsA. K. Mathur
WorksT. B. Singh
Durgapur Steel PlantChief Executive OfficerA. K. RathExecutive DirectorsPersonnel & AdministrationAtul SrivastavaM&HSDr. N. Kulshreshtha - Dir I/cWorksHarinand Rai
Rourkela Steel Plant
Chief Executive OfficerAshwini Kumar
Executive DirectorsPersonnel & AdministrationP. K. PradhanWorksS. DasMaterials ManagementParamananda SahooProjectsR. Agarwal
Bokaro Steel Plant
Chief Executive OfficerP. K. Singh
Executive DirectorsM&HSDr. A. K. Singh - Dir. I/cMaterials ManagementH. P. SinghWorksS. K. SinghFinance & AccountsR. Krishnaswamy
IISCO Steel Plant
Chief Executive OfficerR. K. Rathi
Executive DirectorsProjectsWakil SinghMaterials ManagementC. SrikantaWorksR. P. Mandal
Alloy Steels Plant
General Manager I/cG. Bhattacharya
Salem Steel Plant
Executive DirectorP. K. Mishra
Visvesvaraya Iron & Steel PlantGeneral Manager I/cV. S. Hegde
UNITS
Research & Development Centre for Iron & SteelExecutive DirectorB. N. Thakur
Raw Materials Division
Executive Director I/c with addnl. Charge of ED(T&S)Alok ShrivastavaProjectsS. SitapatiPersonnel & AdministrationAmitabha Bhattacharya
Centre for Engineering & TechnologyExecutive DirectorP. Saidev
Central Marketing OrganisationExecutive DirectorsMarketing - Special InitiativesP. K. Mishra
Marketing - CommercialAlok SahayMarketing - LP & FPBiswajit ChongdarMarketing - SPUSanjeev SaurabhMarketing - ITDDeb Kalyan Mohanty
Transport & ShippingGeneral ManagerL. N. Mallick
SAIL Refractory UnitExecutive DirectorSwapan Kumar Garai
Chandrapur Ferro Alloy Plant
Executive DirectorS. K. Saha
Collieries
Executive DirectorS. K. Basak
Environment Mgmt. Division
Executive DirectorR. Mitra

187
STEEL AUTHORITY OF INDIA LIMITEDREGISTERED OFFICE: ISPAT BHAWAN, LODI ROAD, NEW DELHI-110003
CIN: L27109DL1973GOI006454
NOTICE
NOTICE IS HEREBY GIVEN THAT the 45th Annual General Meeting of the Members ofSteel Authority of India Limited will be held at 1030 hours on Friday, the 22nd September,2017, at NDMC Indoor Stadium, Talkatora Garden, New Delhi-110001 to transact thefollowing business:
ORDINARY BUSINESS
1. To receive, consider and adopt:
(i) the Audited Standalone Financial Statements of the Company for the FinancialYear ended 31st March, 2017, together with Reports of the Board of Directorsand Auditors' thereon.
(ii) the Audited Consolidated Financial Statements of the Company for the FinancialYear ended 31st March, 2017 and the Report of the Auditors thereon.
2. To appoint a director in place of Shri Anil Kumar Chaudhary (DIN:03256818), whoretires by rotation at this Annual General Meeting and is eligible for re-appointment.
3. To appoint a director in place of Shri Kalyan Maity (DIN:06530613), who retires byrotation at this Annual General Meeting and is eligible for re-appointment.
4. To fix the remuneration of the Auditors of the Company appointed by the Comptroller& Auditor General of India for the Financial Year 2017-18.
SPECIAL BUSINESS
5. To appoint Dr. Samar Singh (DIN:07725642) as an Independent Director and in thisregard to consider and if thought fit, to pass, with or without modification(s), thefollowing resolution as an Ordinary Resolution:
"RESOLVED THAT pursuant to the provisions of sections 149 and 152 read withSchedule IV and all other applicable provisions of the Companies Act, 2013, Dr.Samar Singh (DIN:07725642), who was appointed as an Additional Director pursuantto the provisions of Section 161 of the Companies Act, 2013 and the Articles ofAssociation of the Company and who holds office upto the date of this AnnualGeneral Meeting and in respect of whom the Company has received a notice inwriting under Section 160 of the Companies Act, 2013, proposing his candidaturefor the office of Director, be and is hereby appointed as an Independent Director ofthe Company to hold office for 3 (three) consecutive years for a term upto 3rdFebruary, 2020."
6. To appoint Shri Nilanjan Sanyal (DIN: 03026624) as an Independent Director and inthis regard to consider and if thought fit, to pass, with or without modification(s),the following resolution as an Ordinary Resolution:
"RESOLVED THAT pursuant to the provisions of sections 149 and 152 read withSchedule IV and all other applicable provisions of the Companies Act, 2013, ShriNilanjan Sanyal (DIN:03026624), who was appointed as an Additional Directorpursuant to the provisions of Section 161 of the Companies Act, 2013 and theArticles of Association of the Company and who holds office upto the date of thisAnnual General Meeting and in respect of whom the Company has received a noticein writing under Section 160 of the Companies Act, 2013, proposing his candidaturefor the office of Director, be and is hereby appointed as an Independent Director ofthe Company to hold office for 3 (three) consecutive years for a term upto 3rdFebruary, 2020."
7. To appoint Ms. Soma Mondal (DIN:06845389) as a Whole Time Director and in thisregard to consider and if thought fit, to pass, with or without modification(s), thefollowing resolution as an Ordinary Resolution:
"RESOLVED THAT Ms. Soma Mondal (DIN:06845389) who was appointed as anAdditional Director of the Company by the Board of Directors under Section 161 ofthe Companies Act, 2013 and the Articles of Association of the Company and whoholds office upto the date of this Annual General Meeting and in respect of whomthe Company has received a notice in writing, proposing her candidature for theoffice of Director, under Section 160 of the Companies Act, 2013, be and is herebyappointed as a Director of the Company, liable to retire by rotation."
8. To obtain consent for Borrowings and in this regard to consider and if thought fit, topass with or without modification(s), the following resolutions as SpecialResolutions:
"RESOLVED THAT in supersession of the Resolution passed by the Shareholders ofthe Company at the Annual General Meeting held on 22nd September, 1999, andpursuant to the provisions of Section 180(1)(c) and other applicable provisions, ifany, of the Companies Act, 2013, as amended from time to time, and the Articles ofAssociation of the Company, consent of the Company be and is hereby accordedto the Board of Directors of the Company, including any Committee thereof, for
borrowing from time to time any sum or sums of monies, which together with themonies already borrowed by the Company (apart from temporary loans obtainedor to be obtained from the Bankers of the Company in the ordinary course of thebusiness) shall not at any time exceed Rs.40,000 crores or the aggregate of thepaid up capital and free reserves of the Company, whichever is higher."
FURTHER RESOLVED THAT the Board be and is hereby authorised to do all suchacts, deeds and things, to execute all such documents, instruments and writingsas may be required to give effect to this Resolution."
9. To obtain consent for Borrowings and creation of charge on the assets of theCompany and in this regard to consider and if thought fit, to pass with or withoutmodification(s), the following resolutions as Special Resolutions:
"RESOLVED THAT pursuant to the provisions of Section 42 of the Companies Act,2013 read with Rule 14 of the Companies (Prospectus and Allotment of Securities)Rules, 2014 and any other applicable provisions of the Companies Act, 2013, theBoard of Directors of the Company be and is hereby authorized to make Offer(s) orInvitation(s) to raise funds through Private Placement of Secured Non-convertibleDebentures/Bonds of up to Rs.5,000 crore, during a period of one year from thedate of this Annual General Meeting, in one or more tranches to such person orpersons, including eligible investors (whether residents and/or non-residents and/or institutions/corporate bodies and/or individuals and/or trustees and/or banks orotherwise, in domestic and/or one or more international markets), Non-residentIndians, Foreign Institutional Investors (FIIs), Venture Capital Funds, Foreign VentureCapital Investors, State Industrial Developments Corporations, Insurance Companies,Provident Funds, Pension Funds, Development Financial Institutions, BodiesCorporate, companies, private or public, or other entities, authorities and suchother persons, who may or may not be the bond/debenture holders of the Company,in one or more combinations thereof, including the green-shoe option (within overalllimit of Rs.5,000 crore, as stated above), as the Board may, at its sole discretiondecide on such terms and conditions as may be finalized by the Board or anyCommittee thereof as may be approved and authorized by the Board or such otherfunctionary of the Company as may be approved by the Board/ or such Committee."
"RESOLVED FURTHER THAT consent of the Company be and is hereby accordedin terms of Section 180 (1)(a) and other applicable provisions, if any, of theCompanies Act, 2013 read with the Companies (Management and Administration)Rules, 2014 (including any statutory modification(s) or re-enactment thereof, forthe time being in force) and any other applicable laws and provisions of Articles ofAssociation of the Company, to the Board of Directors of the Company (the "Board")or any Committee thereof, to create charge, hypothecate, mortgage, pledge inaddition to existing charges, mortgages and hypothecations created by the Companyon any movable and/or immovable properties of the Company wheresoever situated,both present and future and on the whole or substantially the whole of the undertakingor undertakings of the Company in favour of any banks, financial institutions, hirepurchase/lease companies, body corporates, trustees for the holders of Debentures/Bonds/Other Instruments/Securities or any other persons on such terms andconditions and covenants as the Board or any Committee thereof may think fit forsecuring borrowings of funds, availed or to be availed, from time to time, by way ofTerm Loans, External Commercial Borrowings, issue of Debentures/Bonds, etc.not exceeding the limit approved by the Shareholders in terms of Section 180(1)(c)of the Companies Act, 2013.
"RESOLVED FURTHER THAT the Board of Directors of the Company, be and ishereby authorized to authorize the Committee of the Board to determine the termsof the Issue, including the class of investors to whom the bonds/debentures are tobe allotted, the number of bonds/debentures to be allotted in each tranche, issueprice, tenor, interest rate, premium/discount to the then prevailing market price,amount of issue, discount to issue price to a class of bond/debenture holders,listing, issuing any declaration/undertaking, etc. required to be included in the PrivatePlacement Offer Letter and any other regulatory requirement for the time being inforce."
"RESOLVED FURTHER THAT the Board of Directors of the Company and /or aCommittee thereof as may be approved and authorized by the Board, if any, be andare hereby authorized to do all necessary acts, deeds, actions, and other thingsand to take all such steps as may be required or considered necessary or incidentalthereto for giving effect to this resolution."
"RESOLVED FURTHER THAT the Board of Directors of the Company be and ishereby authorized to delegate all or any of the powers herein conferred to anyCommittee of Directors or any one or more Directors of the Company."

188
10. To ratify the remuneration of the Cost Auditors of the Company and in this regard toconsider, and if thought fit, to pass, with or without modification(s), the followingresolution as an Ordinary Resolution.
"RESOLVED THAT pursuant to the provisions of Section 148 and other applicableprovisions, if any, of the Companies Act, 2013 and the Companies (Audit andAuditors) Rules, 2014 (including any statutory modification(s) or re-enactmentthereof, for the time being in force), the remuneration of Rs.9,75,000/- plus taxesas applicable and reimbursement of Daily Allowance, travelling expenses and outof pocket expenses to be paid to the Cost Auditors viz. M/s. R.J. Goel & Co., NewDelhi (for Bhilai Steel Plant, Durgapur Steel Plant and IISCO Steel Plant), M/s. Shome& Banerjee, Kolkata (for Bokaro Steel Plant and Rourkela Steel Plant), M/s. SanjayGupta & Associates, New Delhi (for Alloy Steels Plant, Salem Steel Plant andVisvesvaraya Iron and Steel Plant) for the Financial Year 2017-18, as approved bythe Board of Directors, be and is hereby ratified."
"RESOLVED FURTHER THAT the Board of Directors of the Company be and ishereby authorized to do all acts and take all such steps as may be necessary,proper or expedient to give effect to this resolution."
By order of the Board of Directors
(M.C. Jain)ED (F&A) and Secretary
Place: New DelhiDated: 11th August, 2017Registered Office:Ispat Bhawan, Lodi Road, New Delhi-110003.CIN: L27109DL1973GOI006454
Notes:
1. The relevant Explanatory Statement, pursuant to Section 102(1) of the CompaniesAct, 2013, in respect of the business Item Nos. 5 to 10 above is annexed hereto.The relevant details under Item No.2 and 3 of the Notice of the person(s) seekingre-appointment as Director required vide Regulation 36(3) of SEBI (Listing Obligationsand Disclosure Requirements) Regulations, 2015 are also annexed.
2. A MEMBER ENTITLED TO ATTEND AND VOTE AT THE MEETING IS ENTITLED TOAPPOINT A PROXY TO ATTEND AND VOTE INSTEAD OF HIMSELF. SUCH PROXYNEED NOT BE A MEMBER OF THE COMPANY. PROXIES IN ORDER TO BE EFFECTIVEMUST BE RECEIVED BY THE COMPANY NOT LESS THAN 48 HOURS BEFORE THECOMMENCEMENT OF THE MEETING. THE PROXY FORM IS ENCLOSED.
A PERSON CAN ACT AS A PROXY ON BEHALF OF MEMBERS NOT EXCEEDINGFIFTY AND HOLDING IN THE AGGREGATE NOT MORE THAN TEN PERCENT OFTHE TOTAL SHARE CAPITAL OF THE COMPANY CARRYING VOTING RIGHTS. AMEMBER HOLDING MORE THAN TEN PERCENT OF THE TOTAL SHARE CAPITALOF THE COMPANY CARRYING VOTING RIGHTS MAY APPOINT A SINGLE PERSONAS PROXY AND SUCH PERSON SHALL NOT ACT AS A PROXY FOR ANY OTHERPERSON OR SHAREHOLDER.
3. Only Members carrying the attendance slips or holders of valid proxies registeredwith the Company will be permitted to attend the meeting. In case of shares held injoint names or shares held under different registered folios wherein the name of thesole holder/first joint-holder is same, only the first joint-holder/sole holder or anyproxy appointed by such holder, as the case may be, will be permitted to attend themeeting.
4. Corporate Members intending to send their authorised representative(s) to attendthe meeting are requested to submit to the Company a certified true copy of therelevant Board Resolution alongwith the specimen signature(s) of therepresentative(s) authorised to attend and vote on their behalf at the meeting.
5. Members attending the meeting are requested to bring their copy of the AnnualReport as extra copies will not be supplied.
6. The Register of Members of the Company will remain closed from 23rd August,2017 to 25th August, 2017 (both days inclusive).
7. M/s. MCS Share Transfer Agents Limited are acting as the Registrar and TransferAgent (R&TA) for carrying out the Company's entire share related activities viz.Transfer/ transmission/ transposition/ dematerialisation/ rematerialisation/ split/consolidation of shares, change of address, bank mandate, filing of nomination,dividend payment and allied activities. Shareholders are requested to make all futurecorrespondence related to share transfer and allied activities with this agency onlyat the following address:
M/s. MCS Share Transfer Agents Limited,F-65, 1st Floor, Okhla Industrial Area, Phase-I,New Delhi-110020Phone No.011-41406149, E-mail: [email protected]
8. Dematerialisation
i) Securities and Exchange Board of India (SEBI) Regulations provide that equity sharesof SAIL are to be compulsorily delivered in the dematerialized form, for the purposeof trading. Though most of the shareholders have converted their holdings intodemat form, it is seen that some shareholders still hold their shares in paper form(Physical). In this connection, shareholders are advised in their own interest, toopen a demat account with any depository participant authorized by either NationalSecurities Depository Ltd. or Central Depository Services Ltd. and dematerializetheir shares.
ii) Members holding shares in the physical form should notify change in their addresses,if any, to the R&TA specifying full address in block letters with PIN CODE of theirpost offices, which is mandatory. Members holding shares in the Electronic Form(Demat), should inform the change of address to their Depository Participant.
iii) For making nomination, Members holding shares in physical form are advised tocollect the Nomination Form from the Company's Share & Transfer Agents and
Members holding shares in Electronic Form, may obtain the Nomination Form fromtheir respective Depository Participant(s).
iv) EFT MANDATE
Shareholders holding shares, whether in Physical or Demat form are advised to optfor Electronic Fund Transfer (EFT), for any future payouts from the Company. Underthe EFT, the payment instruction is issued by the banker (Payer's banker)electronically to the clearing authority (RBI or SBI). The clearing authority providescredit reports to the payee's Bank, who credits the amount to their respectiveaccounts. It becomes inevitable that the shareholders opting for EFT should providedetails of their Bank Name, IFSC Code, A/c No., A/c Type, Branch Name, 9 digitMICR No. along with their Name and Folio Number (DP-ID/Client ID) to the Companyif their holding is in Physical Form and to the Depository participant, if their holdingis in Demat Form.
9. Members holding shares in identical order of names in more than one folio arerequested to write to the Company's Shares Department/R&TA enclosing their ShareCertificates to enable the Company to consolidate their holdings in one folio.
10. The Company has transferred to Investor Education and Protection Fund, unclaimeddividends till Financial Year 2009-10(Interim). The Company has, thereafter, paid/declared the following dividends:
Year Interim Dividend (%) Final Dividend (%)
2009-2010 - 17.00
2010-2011 12.00 12.00
2011-2012 12.00 8.00
2012-2013 16.00 4.00
2013-2014 20.20 -
2014-2015 17.50 2.50
2015-2016 - -
2016-2017 - -
Shareholders who have not encashed their dividend warrants as above are requestedto make their claims to the Company.
Section 124 (5) of the Companies Act, 2013 read with Investor Education andProtection Fund Authority (Accounting, Audit, Transfer and Refund) Rules, 2016,("Rules") provide that, any money transferred to the Unpaid Dividend Account of acompany in pursuance of this section which remains unpaid or unclaimed for aperiod of seven years from the date of such transfer, shall be transferred by thecompany along with interest accrued, if any, thereon to the Investor Education andProtection Fund (IEPF). Pursuant to the above provisions, the Company has transferredall upaid/unclaimed dividend declared by it upto Financial year 2009-10 (interimdividend). Upon completion of a period of seven years, the Company would transferthe unclaimed /unpaid dividend (final) of Financial year 2009-10 in December 2017.
Section 124(6) of the Companies Act, 2013 read with Rules provide that all sharesin respect of which dividend has not been paid or claimed for seven consecutiveyears or more shall be transferred by the company in the name of IEPF. Accordingly,the Company would initiate the process for transfer of the shares to IEPF. TheCompany, has sent individual communication(s) to the concerned shareholderswhose dividend has remained unpaid or unclaimed for seven consecutive years,providing complete details of the shares due for transfer to IEPF. The Company hasalso published Notice in the newspapers advising such shareholders to encashtheir unclaimed dividend to avoid transfer of the shares. Details of such Shareholdersand Shares due for transfer to IEPF has been uploaded on the Company's website.
Claimants of the dividend /shares transferred to IEPF are entitled to claim refund byapplying to IEPF.

189
11. Members seeking further information on the Accounts or any other matter containedin the Notice, are requested to write to the Company at least 7 days before themeeting so that relevant information can be kept ready at the meeting.
12. Green Initiative in Corporate Governance of Ministry of Corporate Affairs
The Ministry of Corporate Affairs ("Ministry") has taken a "Green Initiative in CorporateGovernance" by allowing paperless compliances by companies through electronicmode. In accordance with the circulars issued by the Ministry of Corporate Affairs,companies can now send various notices /documents (including notice(s) callingGeneral Meeting(s), Audited Financial Statements, Directors' Report, Auditors’Report, etc.) to their shareholders through electronic mode, to the registered emailaddresses of the shareholders.
Members are requested to opt for receipt of the above notices/documents throughelectronic mode. They are requested to register their e-mail ID for this purpose withtheir respective depository participant or with the Company's Registrar and TransferAgent i.e. M/s. MCS Share Transfer Agents Limited at the address given above ore-mail at [email protected]
Please note that these documents will also be available on the Company's websitewww.sail.co.in and physical copies of the same will also be available at the registeredoffice as mentioned herein above for inspection during office hours.
13. Entry to the Auditorium will be strictly against Entry Slip available at the countersat the venue and against exchange of Attendance Slip.
14. No Brief case or Bag or mobile phone will be allowed to be taken inside theauditorium.
15. General Information and Instructions for E-voting:
I. In compliance with provisions of Section 108 of the Companies Act, 2013,and the Companies (Management and Administration) Rules, 2014 asamended, and other applicable provisions, if any, of the Companies Act, 2013and Regulation 44 of SEBI (Listing Obligations and Disclosure Requirements),Regulations, 2015, the Company is pleased to provide its Members the facilityto exercise their right to vote on resolutions proposed to be considered at theAnnual General Meeting (AGM) by electronic means. The Members may casttheir votes using an electric voting system from a place other than the venueof the AGM (remote e-voting).
II. The facility for voting through ballot paper shall be made available at the venueof the AGM and the Members attending the AGM who have not cast their voteby remote e-voting shall be able to vote at the AGM through ballot papervoting system.
III. The Members who have cast their vote by remote e-voting prior to the AGMmay also attend the AGM but shall not be entitled to cast their vote again.
IV. The Company has engaged the services of M/s. National Securities DepositoryLimited(NSDL) as the Agency to provide the remote e-voting facility.
V. The Board of Directors of the Company has appointed Shri Sachin Agarwal, aCompany Secretary in Practice of the Company Secretary Firm-M/s. AgarwalS. & Associates and in his absence Ms. Karishma Singh of M/s. Agarwal S. &Associates as Scrutiniser to scrutinize the remote e-voting and voting at thevenue of the AGM through ballot paper in a fair and transparent manner andhe has communicated his willingness to be appointed and available for samepurpose.
VI. A person whose name is recorded in the Register of Members or in the Registerof Beneficial Owners maintained by the depositories as on the cut-off date i.e.16th September, 2017 only shall be entitled to avail the facility of remote e-voting or voting at the venue of the AGM through ballot paper.
VII. A person who becomes a Member of the Company after dispatch of the Noticeof the AGM and holding shares as on cut-off date i.e.16th September, 2017,can follow the process for generating the Login ID and Password as providedin the Notice of the AGM.
VIII. The remote e-voting period commences on 19th September, 2017 (9:00 am)and ends on 21st September, 2017 (5:00 pm). During this period Members ofthe Company, holding shares either in physical form or in dematerialized form,as on the cut-off date of 16th September, 2017, may cast their vote by remotee-voting. The remote e-voting module will be disabled by NSDL for votingupon the expiry of the above period. Once the vote on a resolution is cast bya Member, the Member shall not be allowed to change it subsequently orcast the vote again.
IX. The Scrutinizer, after scrutinizing the votes cast at the venue of the AGM(ballotpaper) and through remote e-voting, will, not later than 48 Hours from theconclusion of the AGM, make a consolidated scrutiniser's report and submitthe same to the Chairman or a person authorized by him in writing. The resultsdeclared alongwith with the consolidated scrutiniser's report shall be placedon the website of the Company-www.sail.co.in and on the website of NSDL.The results shall be simultaneously communicated to the Stock Exchanges.
X. Subject to receipt of requisite number of votes, the Resolutions shall be deemedto be passed on the date of the AGM i.e.22nd September, 2017.
XI. The process and manner for remote e-voting are as under:
A. In case of Members who receive the Notice in electronic mode i.e.email from NSDL:
(i) Open email and open PDF file viz. "SAIL e-voting.pdf" with yourClient ID No. or Registered Folio No. as password. The said PDFfile contains your 'User ID' and 'Password/PIN' for remote e-voting.Please note that the password is an initial password.
(ii) Launch internet browser by typing the following URL: https://www.evoting.nsdl.com/
(iii) Click on Shareholder - Login
(iv) Insert your User ID and Password as Initial Password/PIN as statedat (i) above and Click Login. If you are already registered with NSDLfor E-voting, then you can use your existing 'User ID' and 'Password'.
(v) Password change menu appears. Change the password/PIN withnew password of your choice with minimum 8 digits/characters orcombination thereof. Note new password. Please do not share yourpassword with any other person and take utmost care to keep yourpassword confidential.
(vi) Home page of remote e-voting opens. Click on remote e-voting:Active Voting Cycles.
(vii) Select the Electronic Voting Event Number(EVEN) of "SAIL".
(viii) Now you are ready for remote e-voting as 'Cast Vote' page opens.
(ix) Cast your vote by selecting your option and click on "Submit" andthen click on "Confirm" when prompted.
(x) Upon confirmation, the message "Vote cast successfully" will bedisplayed.
(xi) Once you have voted on the resolution, you will not be allowed tomodify your vote.
(xii) Corporate / Institutional shareholders (i.e. other than individuals,HUF, NRI, etc.) are required to send scanned copy (PDF/JPG Format)of the relevant Board Resolution/ appropriate authorization togetherwith attested specimen signature of the duly authorizedsignatory(ies) who are authorized to vote, to the Scrutinizer throughe-mail to [email protected] with a copy marked to NSDL'se-mail ID [email protected].
B. In case of Members who receive the Notice by post i.e. physical copy:
(i) The members whose email ID is not registered with the Company/Depository Participant(s) may obtain a login ID and password forcasting his /her vote by remote e-voting by sending a request [email protected] or by contacting NSDL at the toll free No.:1800-222-990, by mentioning their Demat Account No./Folio No.
(ii) Please follow all steps from Sl. No. (ii) to Sl. No. (xii) in A above, tocast vote.
C. Members already registered with NSDL for remote e-voting can usetheir existing user ID and password for Login. Thereafter, please followthe steps from Sl.Nos. (vi) to (xii) mentioned in A above, to cast yourvote. Note: Shareholders already registered with NSDL for e-votingwill not receive the PDF file "SAIL e-voting.pdf".
D. Those who became Members of the Company after dispatch of the Noticebut on or before 16th September, 2017(cut-off date) may mail to NSDLat [email protected], requesting for user ID and password. On receiptof user ID and password, the steps from Sl.Nos. (ii) to (xii) in A aboveshould be followed for casting of vote.
XII. In case of any query/grievance, you may refer to the Frequently Asked Questions(FAQs) for Shareholders and e-voting User Manual for Shareholders availableunder the Downloads section of NSDL's e-voting websitewww.evoting.nsdl.com or contact:
Mr. Rajiv Ranjan, Assistant Manager, National Securities Depository Limited,Trade World, 'A' Wing, 4th & 5th Floors, Kamala Mills Compound, SenapatiBapat Marg, Lower Parel, Mumbai-400013 at telephone no. 022-24994738or toll free No. 1800 222 990 or at email ID: [email protected]
NOTE: Shareholders who forgot the User Details/Password can use "ForgotUser Details/Password?" or "Physical User Reset Password?" optionavailable on www.evoting.nsdl.com In case shareholders are holding sharesin Demat Mode, USER-ID is the combination of (DPID+Client ID).
In case Shareholders are holding shares in Physical Mode, USER-ID is thecombination of (Even No. + Folio No.)

190
Item No. 5
On nomination by the President of India vide Government's Order F.No. 1(10)/2015-BLA(Vol-II) dated 31st January, 2017, Dr. Samar Singh (DIN:07725642) was appointedas an Additional Director of the Company with effect from 4th February, 2017. Histenure as Non-Official Independent Director is for a period of three years with effect from4th February, 2017 or until further orders, whichever is earlier. In terms of the provisionsof Section 161(1) of the Companies Act, 2013, Dr. Samar Singh would hold office uptothe date of the ensuing Annual General Meeting. The Company has received a notice inwriting under Section 160 of the Act proposing the candidature of Dr. Samar Singh forthe office of Director of the Company.
Dr. Samar Singh is a distinguished academician and presently working as a SeniorAssistant Professor in Ranchi University. His area of specialization is Research and SocialServices. He is Chairman of the Stakeholders Relationship Committee and Member ofthe Audit Committee of the Company.
Dr. Samar Singh is not disqualified from being appointed as a Director in terms of Section164 of the Act and has given his consent to act as a Director. The Company has receiveda declaration from Dr. Samar Singh that he meets with the criteria of independence asprescribed under sub- section 6 of Section 149 of the Act.
Save and except Dr. Samar Singh and his relatives, to the extent of their shareholdinginterest, if any, in the Company, none of the other Directors/ Key Managerial Personnel ofthe Company/their relatives are, in any way, concerned or interested financially orotherwise, in the Resolution set out at Item No.5 of the Notice.
Keeping in view the vast expertise and knowledge of Dr. Samar Singh, the Board considersit desirable that the Company should continue to avail itself of his services as a Directorand recommends this Resolution for approval of the shareholders.
Item No. 6
On nomination by the President of India vide Government's Order F.No. 1(10)/2015-BLA(Vol-II) dated 31st January, 2017, Shri Nilanjan Sanyal (DIN:03026624) was appointedas an Additional Director of the Company with effect from 4th February, 2017. His tenureas Non-Official Independent Director is for a period of three years with effect from 4th
February, 2017 or until further orders, whichever is earlier. In terms of the provisions ofSection 161(1) of the Companies Act, 2013, Shri Nilanjan Sanyal would hold office uptothe date of the ensuing Annual General Meeting. The Company has received a notice inwriting under Section 160 of the Act proposing the candidature of Shri Nilanjan Sanyalfor the office of Director of the Company.
Shri Nilanjan Sanyal, IAS (Retd.-Odisha, 1979) was in the civil services for over 36years. He retired as Secretary to the Government of India, Ministry of Ayurveda, Yoga &Naturopathy, Unani, Siddha and Homoeopathy (AYUSH) on 31st August, 2015. Earlier, hehad held several assignments in the State of Odisha and the Central Government since1981.
Shri Nilanjan Sanyal is not disqualified from being appointed as a Director in terms ofSection 164 of the Act and has given his consent to act as a Director. The Company hasreceived a declaration from Shri Nilanjan Sanyal that he meets with the criteria ofindependence as prescribed under sub-section 6 of Section 149 of the Act. He is aMember of the Nomination & Remuneration Committee of the Company.
Save and except Shri Nilanjan Sanyal and his relatives, to the extent of their shareholdinginterest, if any, in the Company, none of the other Directors/ Key Managerial Personnel ofthe Company/their relatives are, in any way, concerned or interested financially orotherwise, in the Resolution set out at Item No.6 of the Notice.
Keeping in view the vast expertise and knowledge of Shri Nilanjan Sanyal, the Boardconsiders it desirable that the Company should continue to avail itself of his services asa Director and recommends this Resolution for approval of the shareholders.
Item No. 7
On nomination by the President of India vide Government's Order No.6/2/2016-BLAdated 25th January, 2017, Ms. Soma Mondal (DIN:06845389) was appointed as anAdditional Director of the Company with effect from 1st March, 2017 subject to her re-appointment by the shareholders in the Annual General Meeting. Her tenure as Directoris for a period of five years from 1st March, 2017 or till the date of her superannuation oruntil further orders, whichever is earliest. She is liable to retire by rotation in terms ofprovision of the Companies Act, 2013. In terms of Section 161 of the Companies Act,2013 and Articles of Association of the Company, she would hold office upto the date ofthe ensuing Annual General Meeting. The notice under Section 160 of the said Act hasbeen received proposing the name of Ms. Soma Mondal as a candidate for the office ofDirector of the Company.
Ms. Soma Mondal, aged 54 years, has graduated in Electrical Engineering from NationalInstitute of Technology, Rourkela in 1984. Prior to joining SAIL, she was Director
(Commercial) in National Aluminium Company Limited (NALCO). She had beeninstrumental in devising marketing strategies of different products for NALCO in theDomestic & Overseas markets and had also been actively involved in launch of variousnew products by the Company.
Ms. Soma Mondal is not disqualified from being appointed as a Director in terms ofSection 164 of the Act and has given her consent to act as a Director.
Save and except Ms. Soma Mondal and her relatives, to the extent of their shareholdinginterest, if any, in the Company, none of the other Directors/ Key Managerial Personnel ofthe Company/their relatives are, in any way, concerned or interested financially orotherwise, in the Resolution set out at Item No.7 of the Notice.
The Board considers it desirable that the Company should continue to avail itself of herservices as a Director and recommends this Resolution for approval of the shareholders.
Item No. 8
Section 180(1)(c) of the Companies Act, 2013 provides that a Company shall not borrowfunds in excess of its paid-up share capital and free reserves, except with the approval ofthe Shareholders by a Special Resolution passed in a General Meeting. Earlier, in termsof provision of Section 293(1)(d) of the Companies Act, 1956, consent of the Membershad been obtained for the Directors to borrow upto the maximum amount of ` 20,000crores exceeding paid-up share capital and free reserves of the Company. The Companywould need substantial amount of funds for financing capital expenditure, meetingoperational requirements, debt servicing obligations and has plans to convert short termloans to long/medium term loans during Financial Year 2017-18 and onwards. In view ofthe above, the borrowing limit may exceed the permissible limits under Section 180(1)(c)of the Companies Act, 2013. It is, therefore, proposed to increase the borrowing limit to` 40,000/- crore or Paid-up Capital and Free reserves of the Company, whichever ishigher.
The Board recommends the Resolution for your approval as Special Resolution.
None of the Directors and /or Key Managerial Personnel of the Company or their relative(s)is / are concerned or interested in the Resolution set out at Item No. 8 of the Notice.
Item No. 9
As informed in the previous years, your Company has taken up a massive Modernisation& Expansion programme of its Plants and also for augmentation of Raw Material suppliesfrom its own mines. The expansion programme has been decided to be funded througha mix of debt and equity. The Company has already spent about ` 65,822 crore on itsexpansion programme till 30th June, 2017. In order to par t finance the expansionprogramme as well as to convert short loans into medium and long term loans, yourCompany plans to borrow about ` 5,000 crore during the period of one year from thedate of this Annual General Meeting or such other period as may be permitted under theCompanies Act, 2013 and other applicable laws.
On analysis of the various options of raising funds through borrowing in Domestic andInternational Market, it has been decided by the Board of Directors to raise the fundsthrough private placement of Secured Non-convertible Debentures / Bonds to the extentof `5,000 crore during the year.
The provisions of Section 42 of the Companies Act, 2013, read with Rule 14 of theCompanies (Prospectus and Allotment of Securities) Rules, 2014, mandate the Companyto seek approval of shareholders by means of a Special Resolution for raising fundsthrough private placement of non-convertible debentures/bonds. Accordingly, approvalof Shareholders for the resolution as set out in Item No.9 of the Notice is being sought toborrow funds by offer or invitation to subscribe to Secured Non-convertible Debentures/ Bonds for an amount upto ` 5,000 crore. This resolution would be valid for the periodof one year from the date of this AGM. The terms and conditions of Secured Non-convertible Debentures / Bonds shall be decided by the Board of Directors / Committeethereof or any one or more Directors, as may be required.
The borrowings of the Company are in general required to be secured by mortgages /charges / hypothecation or encumbrances on all or any of the movable or immovableproperties of the Company. Consent of the members is being sought in terms of Section180(1)(a) of the Companies Act, 2013 to enable the Company to create charge,hypothecate, mortgage, pledge on any movable, immovable properties of the Companyboth present and future and on the whole or substantially the whole of the undertaking orundertakings of the Company and wherever situated and to authorize the Board to takenecessary action in this regard.
The Board recommends the Resolution for your approval as Special Resolution.
None of the Directors and /or Key Managerial Personnel of the Company or their relative(s)is / are concerned or interested in the Resolution set out at Item No. 9 of the Notice.
ANNEXURE TO THE NOTICEEXPLANATORY STATEMENT PURSUANT TO SECTION
102(1) OF THE COMPANIES ACT, 2013

191
Item No.10
The Board of Directors of the Company, on the recommendation of the Audit Committee,at its meeting held on 27th April, 2017 has considered and approved the appointment ofM/s. R.J. Goel & Co., New Delhi (for Bhilai Steel Plant, Durgapur Steel Plant and IISCOSteel Plant), M/s. Shome & Banerjee, Kolkata (for Bokaro Steel Plant and Rourkela SteelPlant), M/s. Sanjay Gupta & Associates, New Delhi (for Alloy Steels Plant, Salem SteelPlant and Visvesvaraya Iron and Steel Plant) as the Cost Auditors of the Company for theFinancial Year 2017-18 at a remuneration of `9,75,000/- plus taxes as applicable andreimbursement of Daily Allowance, travelling expenses and out of pocket expenses. Inaddition, M/s Sanjay Gupta & Associates have been designated as Lead Cost Auditor forXBRL conversion and filing of Consolidated Cost Audit Report of the Company at anadditional fee of `35,000/- plus taxes as applicable.
Pursuant to Section 148(3) of the Companies Act, 2013 read with Rule 14 of theCompanies (Audit and Auditors) Rules, 2014, the remuneration, as approved by theBoard of Directors of the Company on the recommendation of the Audit Committee, isrequired to be subsequently ratified by the Members of the Company. Accordingly, theResolution for ratification of the fee of the Cost Auditors as set out at item No.10 of theNotice is submitted for approval of the Shareholders.
The Board recommends the resolution for your approval.
None of the Directors and/or Key Managerial Personnel of the Company and / or theirrelatives is concerned or interested in the resolution.
By order of the Board of Directors
(M.C. Jain)ED (F&A) and Secretary
Place: New DelhiDated: 11th August, 2017Registered Office:Ispat Bhawan, Lodi Road, New Delhi-110003.CIN: L27109DL1973GOI006454
Details of Directors seeking re-appointment in forthcoming Annual General Meeting furnished in terms of SEBI Regulations:
Name of the Director Shri Anil Kumar Chaudhary Shri Kalyan Maity
Date of Birth 11.12.1960 13.02.1960
Date of Appointment 01.09.2011 01.03.2013
Expertise in Specific functional areas Finance Mining
Qualifications B.COM(H), CMA, CS, LLB., PG Diploma in BE (Hons.) in MiningPersonnel/Business Management.
List of Companies in which outside Directorship is held. NIL NIL
Chairman/Member of the Committees of the Board of the SAIL NILCompanies on which he is a Director. • Stakeholders Relationship Committee - Member
• CSR Committee - Member• SAIL Risk Management Committee - Member

○ ○ ○ ○ ○ ○ ○ ○ ○ ○ ○ ○ ○ ○ ○ ○ ○ ○ ○ ○ ○ ○ ○ ○ ○ ○ ○ ○ ○ ○ ○ ○ ○ ○ ○ ○ ○ ○ ○ ○ ○ ○ ○ ○ ○ ○ ○ ○ ○ ○ ○ ○ ○ ○ ○ ○ ○ ○ ○ ○ ○
STEEL AUTHORITY OF INDIA LIMITEDCIN: L27109DL1973GOI006454
Registered Office: Ispat Bhawan, Lodi Road, New Delhi - 110 003
Tel: +91 11 24367481, Fax: +91 11 24367015, E-mail: [email protected], Website: www.sail.co.in
PROXY FORM
[Pursuant to Section 105(6) of the Companies Act, 2013 and Rule 19(3) of the Companies (Management and Administration) Rules, 2014]
Name of the Member(s)
Registered address
Folio No./DP ID-Client ID
Email ID
I/We, being the member(s) of ……..........................................................................................................................….. shares, hereby appoint:
1.Name: ........................................................................................................ Address: ..............................................................................................................................................E-mail Id: .................................................................................................................................................................. Signature: .............................................................. , or failing him2.Name: .......................................................................................................... Address: .................................................................................................................................................E-mail Id: ................................................................................................................................................................. Signature: ............................................................. , or failing him3.Name: .............................................................................................................. Address: ........................................................................................................................................................E-mail Id: ...................................................................................................................................................................Signature: ...................................................................................
as my/our proxy to attend and vote (on a poll) for me/us and on my/our behalf at the 45th Annual General Meeting of the Company to be held on 22nd September, 2017 at 1030 hours atNDMC Indoor Stadium, Talkatora Garden, New Delhi-110001 and at any adjournment thereof in respect of such resolutions as are indicated below:
S.No. Resolutions
Ordinary Business
1. To receive, consider and adopt the (i) the Audited Standalone Financial Statements of the Company for the Financial Year ended 31st March, 2017 together with Reports of theBoard of Directors and Auditors thereon.
(ii) the Audited Consolidated Financial Statements of the Company for the Financial Year ended 31st March, 2017 and the Report of the Auditors thereon.
2. To appoint a director in place of Shri Anil Kumar Chaudhary (DIN:03256818), who retires by rotation at this Annual General Meeting and is eligible for re-appointment.
3. To appoint a director in place of Shri Kalyan Maity (DIN:06530613), who retires by rotation at this Annual General Meeting and is eligible for re-appointment.
4. To fix the remuneration of the Auditors of the Company appointed by the Comptroller & Auditor General of India for the Financial Year 2017-18.
Special Business
5. To appoint Dr. Samar Singh (DIN:07725642) as an Independent Director of the Company.
6. To appoint Shri Nilanjan Sanyal (DIN:03026624) as an Independent Director of the Company.
7. To appoint Ms. Soma Mondal (DIN:06845389) as a Whole-time Director of the Company.
8. To Authorise Board to borrow money beyond the Share Capital and Free Reserve of the Company upto Rs.40,000 crore.
9. To obtain consent for Borrowings upto Rs.5,000 crore through private placement and creation of charge on the assets of the Company.
10. To ratify Remuneration of Cost Auditors of the Company.
Signed this ………...............................................day of ………...................................................……........2017Signature of Member(s).........................................................................................................................................Signature of proxy holder(s) ....................................................................................................................................
NOTE:This Proxy Form in order to be effective should be duly completed and deposited at the Registered Office of the Company at Ispat Bhawan, Lodi Road, New Delhi-110003 not less than48 hours before the commencement of the Annual General Meeting.
STEEL AUTHORITY OF INDIA LIMITEDCIN: L27109DL1973GOI006454
Registered Office: Ispat Bhawan, Lodi Road, New Delhi - 110 003Tel: +91 11 24367481, Fax: +91 11 24367015, E-mail: [email protected], Website: www.sail.co.in
ATTENDANCE SLIP
45th Annual General Meeting to be held on Friday, 22nd September, 2017 at 10.30 hours
NAME OF THE ATTENDING MEMBER (IN BLOCK LETTERS)
*Folio No.
DP ID No. / Client ID No.
No. of Shares Held
NAME OF PROXY (IN BLOCK LETTERS, TO BE FILLED INIF THE PROXY ATTENDS INSTEAD OF THE MEMBER)
I, hereby record my presence at the 45th Annual General Meeting of the Company to be held on Friday, 22nd September, 2017 at NDMC Indoor Stadium, Talkatora Garden,New Delhi-110001.
*Applicable in case of Shares held in Physical Form
Member's/Proxy's Signature ____________________________________________
NOTE:1. The attendance slip should be signed as per the specimen signature registered with the R&TA/Depository Participant (DP). Such duly completed and signed Attendance Slip
should be handed over at the registration counter(s) at the venue against which R&TA will issue admission card.2. Entry to the hall will be strictly on the basis of admission card as provided by R&TA.3. Members in person/Proxy holders may please carry photo-ID card for identification/verification purposes.4. Shareholder(s) present in person or through registered proxy shall only be entertained.5. Briefcase, mobile phone, bag, eatables, helmets and other belongings will not be allowed to be taken inside the venue of the meeting for security purposes and shareholder(s)/
proxy holder(s) will be required to take care of their belonging(s).6. No gifts will be distributed at the Annual General Meeting.
Please
affix` 1
Revenue
Stamp