
Atmos Energy
784
JOHN N. HUGHES Attorney at Law Professional service Corporation 124 West Todd Street Frankfort, Kentucky 40601 Telephone: (502) 227-7270 [email protected]t September 28, 2018 Gwen Pinson Executive Director Public Service Commission 211 Sower Blvd. Frankfort, KY 40601 Re: Atmos Energy Corporation Case No. 2018-00281 Dear Ms. Pinson: Atmos Energy Corporation submits its petition for adjustment of rates. I certify that the electronic documents are true and correct copies of the original documents. If you have any questions about this filing, please contact me. Submitted By: Mark R. Hutchinson Wilson, Hutchinson and Littlepage 611 Frederica St. Owensboro, KY 42301 270 926 5011 [email protected] And John N. Hughes 124 West Todd St. Frankfort, KY 40601 502 227 7270 jnhughes@[email protected] Attorneys for Atmos Energy Corporation
-
Upload
khangminh22 -
Category
Documents
-
view
1 -
download
0
Transcript of Atmos Energy

JOHN N. HUGHES Attorney at Law
Professional service Corporation 124 West Todd Street
Frankfort, Kentucky 40601
Telephone: (502) 227-7270 [email protected]
September 28, 2018
Gwen Pinson Executive Director Public Service Commission 211 Sower Blvd. Frankfort, KY 40601 Re: Atmos Energy Corporation Case No. 2018-00281 Dear Ms. Pinson: Atmos Energy Corporation submits its petition for adjustment of rates. I certify that the electronic documents are true and correct copies of the original documents. If you have any questions about this filing, please contact me.
Submitted By:
Mark R. Hutchinson Wilson, Hutchinson and Littlepage 611 Frederica St. Owensboro, KY 42301 270 926 5011
And
John N. Hughes 124 West Todd St. Frankfort, KY 40601 502 227 7270 jnhughes@[email protected]
Attorneys for Atmos Energy Corporation

1
COMMONWEALTH OF KENTUCKY
BEFORE THE PUBLIC SERVICE COMMISSION
IN THE MATTER OF:
Application of Atmos Energy Corporation ) for an Adjustment of Rates ) Case No. 2018-00281 and Tariff Modifications )
APPLICATION FOR ADJUSTMENT OF RATES
AND TARIFF MODIFICATIONS
1. Atmos Energy Corporation (“Atmos Energy”), by counsel, pursuant to
KRS 278.180, KRS 278.190, 807 KAR 5:001(14) and (16) and 807 KAR 5:011
submits the attached revised tariffs and proposes that certain gas rates and
revised tariff provisions for its Kentucky Division become effective on October
28, 2018. This Application and the attached supporting exhibits contain the facts
on which the relief being requested is based, a request for the relief sought and
references to the particular provisions of law requiring or providing for the relief
sought as specified in 807 KAR 5:001. Correspondence and communications
with respect to this Application should be directed to:
Mark A. Martin, Atmos Energy Corporation, 3275 Highland Pointe Drive, Owensboro, Kentucky (270) 685-8095 Ph (270) 689-2076 fax ([email protected]) Mark R. Hutchinson, Wilson, Hutchinson & Littlepage 611 Frederica Street, Owensboro, Kentucky 42301

2
270 926 5011 Ph (270) 926-9394 fax ([email protected]) And John N. Hughes 124 W. Todd St. Frankfort, KY 40601 (502) 227 7270 Ph No fax ([email protected])
2. Atmos Energy is a utility as defined by KRS 278.010 (3)(b) and
is subject to the jurisdiction of the Public Service Commission
("Commission"), pursuant to KRS 278.040. Atmos Energy delivers natural gas
to approximately three million residential, commercial, industrial and public-
authority customers in eight states. It has six gas utility operating divisions.
They are located in Denver, Colorado (Colorado/Kansas Division); Baton
Rouge, Louisiana (Louisiana division); Flowood, Mississippi (Mississippi
Division); Lubbock, Texas (West Texas Division); Dallas, Texas (Mid-Tex
Division); and Franklin, Tennessee (Kentucky/Mid-States Division).
3. The President of the Atmos Energy Kentucky/Mid-States Division
is J. Kevin Dobbs. The Vice President – Rates and Regulatory Affairs for the
Kentucky/Mid-States Division is Mark Martin. Atmos Energy’s corporate office
address is:
Atmos Energy Corporation 5430 LBJ Freeway 1800 Three Lincoln Centre Dallas, TX 75240 P.O. Box 650205 Dallas, Texas 75265-0205 www.atmosenergy.com

3
Atmos Energy' s Kentucky/Mid-States Division office location is:
3275 Highland Pointe Dr. Owensboro, KY 42303 270 685 8000 Ph. (270) 689-2076 fax ([email protected])
4. Atmos Energy was initially incorporated in Texas on February 6,
1981 and in Virginia on July 21, 1997. Its articles of incorporation were filed in
Case No. 2017-00349. Applicant attests that it is a foreign corporation in good
standing to operate in Kentucky. Atmos Energy does not operate under an
assumed name in Kentucky.
5. Atmos Energy serves approximately 176,800 customers in central
and western Kentucky. The customer base includes residential, commercial
and industrial customers. Residential class customers account for the majority
of meters of approximately 157,100. Atmos Energy’s natural gas deliveries
totaled approximately 47.6 Bcf during the 12-month period ending June, 2018.
6. Atmos Energy’s Annual Reports including the 2017 report are on file
with the Commission as required by 807 KAR 5:006§4(1 and 2).
7. Notice of Intent to file a rate application was delivered to the Executive
Director and the Attorney General on August 21, 2018. A copy of that notice is filed
as FR 16(2)(c) in Volume 3.
8. In this Application, Atmos Energy proposes rates that will result in
an overall approximate increase in the amount of $14,455,538 annually or 15.8%
with increases of approximately $8,349,681 or 16.5% for residential consumers,

4
and $3,224,373 or 16.1% for commercial and public authority consumers, and
approximately $2,777,316 or 17.2% for industrial and transportation consumers.
Charges from other gas revenue will increase $104,167 or 4.9%. The average
monthly bill for residential consumers will increase approximately $4.41 or 8.6%.
The average monthly bill for commercial and public authority consumers will
increase approximately $14.45 or 6.6%. The average monthly bill for industrial and
transportation customers will increase approximately $909.82 or 15.8%. The actual
increases by amount and percentage for each customer class are listed in the
schedule attached as FR 17(4)(a)(b) and (c) in Volume 7.
9. Pursuant to KRS 278.192(1), this filing is based upon a fully
forecasted test year using a base period January 1, 2018 through December 31,
2018 (“Base Period”) and the forecasted test period is April 1, 2019 through March
31, 2020 (“Test Period”). As required by KRS 278.192(2), within 45 days after the
end of base period, the actual results for the estimated months will be filed.
10. The reasons for the proposed rate adjustment are declining return on
equity and inadequate revenue to continue to provide the quality of service required
by the Commission and demanded by our customers. Revised rates are necessary
to allow Atmos Energy the opportunity to recover its reasonable operating costs
and to earn a reasonable return on its investment. The rate increase is needed to
provide sufficient revenue for Atmos Energy to maintain its facilities and provide
the level of service mandated by the Commission and the public. This revenue is
also necessary for the attraction of additional capital. The existing rates are
inadequate for these purposes and thus fail to meet the fair, just and reasonable
standard. A more detailed explanation of the need for the rate adjustment is

5
provided in the testimony filed as FR 16(7)(a), Volumes 1 and 2.
11. In addition to the adjustment of distribution rates, Atmos Energy is
proposing certain tariff proposals are as follows:
1) Delete the current Pipeline Replacement Program (PRP) tariff to
align the Company’s commitment to replace bare steel pipe with the
provisions of the order in Case No. 2017-00349.
2) Minor text changes to the DSM tariff
12. Atmos Energy is providing notice of this filing to its customers and
interested parties by publication in newspapers of general circulation and
posting in each of Atmos Energy local offices for public inspection as well as
posting on its website. A copy of the notice is in contained in FR 17 (1)(a-c)
Volume 7.
13. Atmos Energy requests that the Commission allow the proposed
rate changes to take effect without delay.
14. Atmos Energy also requests a deviation pursuant to 807 KAR
5:006(28) and 807 KAR 5:001(22) from any rule, regulation or other
requirement that might otherwise delay or impede the review and approval of
this Application.
15. All filing requirements (FR) of 807 KAR 5:001 are listed in the table
attached to this application.
16. Based on the information provided and in compliance with all filing
requirements of KRS Chapter 278 and 807 KAR 5:001, Atmos Energy requests
that the Commission issue an order approving the proposed rates and the

6
proposed tariff revisions and granting all other appropriate relief.
Submitted by: Mark R. Hutchinson Wilson, Hutchinson & Littlepage 611 Frederica St. Owensboro, KY 42303 270 926 5011 Ph. (270) 926-9394 fax [email protected]
John N. Hughes 124 West Todd Street Frankfort, KY 40601 (502) 227 7270 Ph. No fax [email protected] Attorneys for Atmos Energy Corporation
CERTIFICATE In accordance with the requirements of 807 KAR 5:001(8), I certify that this electronic filing is a true and accurate copy of the documents to be filed in paper medium; that the electronic filing has been transmitted to the Commission on September 28, 2018; that an original of the filing will be delivered to the Commission within two days of September 28, 2018; and that no party has been excused from participation by electronic means.

7
Law/Regulation Filing Requirement Witness Volume No. Section 16(7)(a) Prepared testimony of each witness supporting its
application including testimony from chief officer in charge of Kentucky operations on the existing programs to achieve improvements in efficiency and productivity, including an explanation of the purpose of the program;
Christian, Densman, Gillham, Martin, Raab, Smith, Story, Vander Weide, Waller, Watson
1, 2
Section 14(2)
If a corporation, identify the state that applicant is incorporated, attest that it is currently in good standing in the state it is organized and if not a Kentucky corporation attest that it is authorized to do business in Kentucky.
Martin 3
Section 16(1)(b)1 A statement of the reason the adjustment is required. Martin 3Section 16(1)(b)2 A certified copy of a certificate of assumed name as
required by KRS 365.015 or a statement that such a certificate is not necessary.
Martin 2
Section 16(1)(b)3 The proposed tariff in form complying with 807 KAR 5:011 with an effective date not less than thirty (30) days from the date the application is filed.
Martin 3
Section 16(1)(b)4 Proposed tariff changes shown either by providing present and proposed tariffs in comparative form or indicating additions by italicized inserts or underscoring and striking over deletions in a copy of the current tariff.
Martin
3
Section 16(1)(b)5 A statement that customer notice has been given in compliance with Section 17 with a copy of the notice.
Martin 3
Section 16(2)(a)-(c) Notice of intent. A utility with gross annual revenues greater than $5,000,000 shall notify the commission in writing of intent to file a rate application at least thirty (30) days, but not more than sixty (60) days, prior to filing its application. (a) The notice of intent shall state if the rate application
will be supported by a historical test period or a fully forecasted test period.
(b) Upon filing the notice of intent, an application may be made to the commission for permission to use an abbreviated form of newspaper notice of proposed rate increases provided the notice includes a coupon that may be used to obtain a copy from the applicant of the full schedule of increases or rate changes.
(c) The applicant shall also transmit by electronic mail a copy of the notice in a portable document format to the Attorney General’s Office of Rate Intervention at [email protected].
Martin 3
Section 16(6)(a) Financial data for forecasted period presented as pro forma adjustments to base period.
Densman, Waller 3
Section 16(6)(b) Forecasted adjustments shall be limited to the 12 months immediately following the suspension period.
Densman, Waller 3
Section 16(6)(c) Capitalization and net investment rate base shall be based on a 13 month average for the forecasted period.
Christian, Waller 3
Section 16(6)(f) The utility shall provide a reconciliation of the rate base and capital used to determine its revenue requirements.
Waller 3
Section 16(7)(b) Most recent capital construction budget containing at minimum 3 year forecast of construction expenditures
Waller 3
Section 16(7)(c) Complete description, which may be in pre-filed testimony form, of all factors used to prepare forecast period. All econometric models, variables, assumptions, escalation
Christian, Densman, Waller
3

8
Law/Regulation Filing Requirement Witness Volume No. factors, contingency provisions, and changes in activity levels shall be quantified, explained, and properly supported;
Section 10(7)(d) Annual and monthly budget for the 12 months preceding filing date, base period and forecasted period;
Waller 3
Section 16(7)(e) Attestation signed by utility's chief officer in charge of Kentucky operations providing: 1. That forecast is reasonable, reliable, made in good
faith and that all basic assumptions used have been identified and justified; and
2. That forecast contains same assumptions and methodologies used in forecast prepared for use by management, or an identification and explanation for any differences; and
3. That productivity and efficiency gains are included in the forecast;
Martin 3
Section 16(7)(f) For each major construction project constituting 5% or more of annual construction budget within 3 year forecast, following information shall be filed: 1. Date project began or estimated starting date; 2. Estimated completion date; 3. Total estimated cost of construction by year exclusive
and inclusive of Allowance for Funds Used During Construction (“AFUDC”) or Interest During Construction Credit; and
4. Most recent available total costs incurred exclusive and inclusive of AFUDC or Interest During Construction Credit;
Waller 3
Section 16(7)(g) For all construction projects constituting less than 5% of annual construction budget within 3 year forecast, file aggregate of information requested in paragraph (f) 3 and 4 of this subsection;
Smith, Waller 3
Section 16(7)(h) Financial forecast for each of 3 forecasted years included in capital construction budget supported by underlying assumptions made in projecting results of operations and including the following information:
1. Operating income statement (exclusive of dividends per share or earnings per share);
Densman, Waller 3
2. Balance sheet; Waller 3 3. Statement of cash flows; Waller 3 4. Revenue requirements necessary to support the
forecasted rate of return; Waller 3
5. Load forecast including energy and demand (electric);
N/A 3
6. Access line forecast (telephone); N/A 3 7. Mix of generation (electric); N/A 3 8. Mix of gas supply (gas); Densman 3 9. Employee level; Waller 3 10. Labor cost changes; Waller 3 11. Capital structure requirements; Christian 3 12. Rate base; Waller 3 13. Gallons of water projected to be sold (water); N/A 3 14. Customer forecast (gas, water); Densman 3 15. MCF sales forecasts (gas); Densman 3 16. Toll and access forecast of number of calls and
number of minutes (telephone); and N/A 3

9
Law/Regulation Filing Requirement Witness Volume No. 17. A detailed explanation of other information
provided, if applicable; N/A 3
Section 16(7)(i) Most recent FERC or FCC audit reports; Martin 3 Section 16(7)(j) Prospectuses of most recent stock or bond offerings; Christian 3 Section 16(7)(k) Most recent FERC Form 1 (electric), FERC Form 2 (gas),
or the Automated Reporting Management Information System Report (telephone) and PSC Form T (telephone);
Gillham 3
Section 16(7)(l) The annual report to shareholders or members and the statistical supplements covering the most recent two (2) years from the application filing date;
Gillham 3, 4
Section 16(7)(m) Current chart of accounts if more detailed than Uniform System of Accounts chart;
Gillham 4
Section 16(7)(n) Latest 12 months of the monthly managerial reports providing financial results of operations in comparison to forecast;
Waller 4
Section 16(7)(o) Complete monthly budget variance reports, with narrative explanations, for the 12 months prior to base period, each month of base period, and subsequent months, as available;
Gillham, Waller 4
Section 16(7)(p) SEC's annual report for most recent 2 years, Form 10-Ks and any Form 8-Ks issued during prior 2 years and any Form 10-Qs issued during past 6 quarters;
Gillham 5, 6, 7
Section 16(7)(q) Independent auditor's annual opinion report, with any written communication which indicates the existence of a material weakness in internal controls;
Gillham 7
Section 16(7)(r) Quarterly reports to the stockholders for the most recent 5 quarters;
Gillham 7
Section 16(7)(s) Summary of latest depreciation study with schedules itemized by major plant accounts, except that telecommunications utilities adopting PSC's average depreciation rates shall identify current and base period depreciation rates used by major plant accounts. If information has been filed in another PSC case, refer to that case's number and style;
Watson 7
Section 16(7)(t) List all commercial or in-house computer software, programs, and models used to develop schedules and work papers associated with application. Include each software, program, or model; its use; identify the supplier of each; briefly describe software, program, or model; specifications for computer hardware and operating system required to run program
Waller 7
Section 16(7)(u) If the utility had any amounts charged or allocated to it by an affiliate or general or home office or paid any monies to an affiliate or general or home office during the base period or during the previous three (3) calendar years, the utility shall file: 1. Detailed description of method of calculation and
amounts allocated or charged to utility by affiliate or general or home office for each allocation or payment;
2. Method and amounts allocated during base period and method and estimated amounts to be allocated during forecasted test period;
3. Explain how allocator for both base and forecasted test period was determined; and
Gillham, Waller 7

10
Law/Regulation Filing Requirement Witness Volume No. 4. All facts relied upon, including other regulatory
approval, to demonstrate that each amount charged, allocated or paid during base period is reasonable.
Section 16(7)(v) If gas, electric or water utility with annual gross revenues greater than $5,000,000, cost of service study based on methodology generally accepted in industry and based on current and reliable data from single time period;
Raab 7
Section 16(7)(w) Incumbent local exchange carriers with fewer than 50,000 access lines shall not be required to file cost of service studies, except as specifically directed by the commission. Local exchange carriers with more than 50,000 access lines shall file: 1. A jurisdictional separations study consistent with 47
C.F.R. Part 36; and 2. Service specific cost studies to support the pricing of all
services that generate annual revenue greater than $1,000,000 except local exchange access:
a. Based on current and reliable data from a single time period; and
b. Using generally recognized fully allocated, embedded, or incremental cost principles.
N/A 7
Section 16(8)(a) Jurisdictional financial summary for both base and forecasted periods detailing how utility derived amount of requested revenue increase;
Waller 7
Section 16(8)(b) Jurisdictional rate base summary for both base and forecasted periods with supporting schedules which include detailed analyses of each component of the rate base;
Christian, Story, Waller
7
Section 16(8)(c) Jurisdictional operating income summary for both base and forecasted periods with supporting schedules which provide breakdowns by major account group and by individual account;
Densman, Waller 7
Section 16(8)(d)
Summary of jurisdictional adjustments to operating income by major account with supporting schedules for individual adjustments and jurisdictional factors;
Densman, Waller 7
Section 16(8)(e)
Jurisdictional federal and state income tax summary for both base and forecasted periods with all supporting schedules of the various components of jurisdictional income taxes;
Story, Waller 7
Section 16(8)(f) Summary schedules for both base and forecasted periods (utility may also provide summary segregating items it proposes to recover in rates) of organization membership dues; initiation fees; expenditures for country club; charitable contributions; marketing, sales, and advertising; professional services; civic and political activities; employee parties and outings; employee gifts; and rate cases;
Waller 7
Section 16(8)(g) Analyses of payroll costs including schedules for wages and salaries, employees benefits, payroll taxes straight time and overtime hours, and executive compensation by title;
Waller 7
Section 16(8)(h) Computation of gross revenue conversion factor for forecasted period;
Waller 7
Section 16(8)(i) Comparative income statements (exclusive of dividends per share or earnings per share), revenue statistics and sales statistics for 5 calendar years prior to application
Densman, Gillham, Waller
7

11
Law/Regulation Filing Requirement Witness Volume No. filing date, base period, forecasted period, and 2 calendar years beyond forecast period;
Section 16(8)(j) Cost of capital summary for both base and forecasted periods with supporting schedules providing details on each component of the capital structure
Christian 7
Section 16(8)(k) Comparative financial data and earnings measures for the 10 most recent calendar years, base period, and forecast period;
Densman, Gillham, Waller
7
Section 16(8)(l) Narrative description and explanation of all proposed tariff changes;
Martin 7
Section 16(8)(m) Revenue summary for both base and forecasted periods with supporting schedules which provide detailed billing analyses for all customer classes; and
Densman 7
Section 16(8)(n) Typical bill comparison under present and proposed rates for all customer classes.
Martin 7
Section 16(10) A request for waiver of provisions of these filing requirements shall establish the specific reasons for the request. The commission shall grant the request for waiver upon good cause shown by the utility. In determining if good cause has been shown, the commission shall consider: (a) If other information that the utility would provide if the
waiver is granted is sufficient to allow the commission to effectively and efficiently review the rate application;
(b) If the information that is the subject of the waiver request is normally maintained by the utility or reasonably available to it from the information that it maintains; and
(c) The expense to the utility in providing the information that is the subject of the waiver request.
Martin 7
Section 17(1)(a)-(c) Notice of General Rate Adjustment. Upon filing an application for a general rate adjustment, a utility shall provide notice as established in this section. (1) Public postings. (a) A utility shall post a sample copy of the required
notification at its place of business no later than the date on which the application is filed.
(b) A utility that maintains a public web site shall, within five (5) business days of filing an application, post a copy of the public notice as well as a hyperlink to its filed application on the commission's Web site.
(c) The information required in paragraphs (a) and (b) of this subsection shall not be removed until the commission issues a final decision on the application.
Martin 7
Section 17(2)(b)(3) Publish notice once a week for three (3) consecutive weeks in a prominent manner in a newspaper of general circulation in the utility's service area, the first publication to be made by the date the application is filed.
Martin 7
Section 17(3)(b) If the notice is published, an affidavit from the publisher verifying the notice was published, including the dates of the publication with an attached copy of the published notice, shall be filed with the commission no later than forty-five (45) days of the filed date of the application.
Martin 7
Section 17(4)(a)-(j) Notice Requirements. Each notice shall contain the following information:
Martin 7

12
Law/Regulation Filing Requirement Witness Volume No. (a) The proposed effective date and the date the proposed
rates are expected to be filed with the Commission; (b) The present rates and proposed rates for each
customer class to which the proposed rates will apply; (c) The amount of the change requested in both dollar
amounts and percentage change for customer classification to which the proposed rate change will apply;
(d) The amount of the average usage and the effect upon the average bill for each customer class to which the proposed rate change will apply, except for local exchange companies, which shall include the effect upon the average bill for each customer class for the proposed rate change in basic local service;
(e) A statement that a person may examine this application at the office of (utility name) located at (utility address);
(f) A statement that a person may examine this application at the commission’s offices located at 211 Sower Boulevard, Frankfort, Kentucky, Monday through Friday, 8:00 a.m. to 4:30 p.m., or through the commission’s Web site at http://psc.ky.gov;
(g) A statement that comments regarding this application may be submitted to the Public Service Commission through its Web site or my mail to Public Service Commission, Post Office Box 615, Frankfort, Kentucky 40602;
(h) A statement that the rates contained in this notice are the rates proposed by (name of utility) but that the Public Service Commission may order rates to be charged that differ from the proposed rates contained in this notice;
(i) A statement that a person may submit a timely written request for intervention to the Public Service Commission, Post Office Box 615, Frankfort, Kentucky 40602, establishing the grounds for the request including the status and interest of the party; and
(j) A statement that if the commission does not receive a written request for intervention within thirty (30) days of the initial publication or mailing of the notice, the commission may take final action on the application.

State of Tennessee
County of Williamson
VERIFICATION
I, J. Kevin Dobbs, after being duly sworn, state that I am President of Kentucky/Mid-States, a division of Atmos Energy Corporation and that I am authorized to submit this application on behalf of the Company and that the information and statements contained in the Application are true of my own knowledge except as to those matters stated on information and belief, and as to those matters I believe them to be true.
SUBSCRIBED, ACKNOWLEDGED AND SWORN to before me by
_._)...::.- ...... A_,_'\.7(_/:(e..._.....'-"'V....!...:I ,J~J)-........:::.""""O"""k? .... k:....:::.S~- on this the ;).5-IL day of September, 2018. I
Notary Public
My Commission expires: (Y)A.q_e.Jv 3 .;fo),o

Direct Testimony of Mark A. Martin Page 1 Kentucky / Martin
BEFORE THE PUBLIC SERVICE COMMISSION
COMMONWEALTH OF KENTUCKY
APPLICATION OF ATMOS ENERGY ) ) CORPORATION FOR AN ADJUSTMENT ) Case No. 2018-00281 ) OF RATES AND TARIFF MODIFICATIONS )
TESTIMONY OF MARK A. MARTIN
I. INTRODUCTION 1
Q. PLEASE STATE YOUR NAME, POSITION AND BUSINESS ADDRESS. 2
A. My name is Mark A. Martin. I am Vice President - Rates and Regulatory Affairs for 3
the Kentucky/Mid-States Division of Atmos Energy Corporation (“Atmos Energy” or 4
the “Company”). My business address is 3275 Highland Pointe Drive, Owensboro, 5
Kentucky, 42303. 6
Q. PLEASE BRIEFLY DESCRIBE YOUR CURRENT RESPONSIBILITIES, 7
AND PROFESSIONAL AND EDUCATIONAL BACKGROUND. 8
A. I am responsible for all rate and regulatory matters in Kentucky, Tennessee and 9
Virginia. I graduated from Eastern Illinois University in 1995 with a degree in 10
Accounting. I have been with United Cities Gas Company and subsequently its 11
successor, Atmos Energy Corporation, since September 1995. I have served in a 12
variety of positions of increasing responsibility in both Gas Supply and Rates prior to 13
assuming my current responsibilities in 2007. 14

Direct Testimony of Mark A. Martin Page 2 Kentucky / Martin
Q. HAVE YOU SUBMITTED TESTIMONY BEFORE THE KENTUCKY 1
PUBLIC SERVICE COMMISSION (“COMMISSION”)? 2
A. Yes. I filed testimony in Case No. 2010-00146, Case No. 2013-00148, Case No. 3
2015-00343, and Case No. 2017-00349. 4
Q. HAVE YOU PREVIOUSLY SUBMITTED TESTIMONY ON MATTERS 5
BEFORE OTHER STATE REGULATORY COMMISSIONS? 6
A. Yes, I have filed testimony before the Georgia Public Service Commission, the 7
Illinois Commerce Commission, the Missouri Public Service Commission, the South 8
Carolina Public Service Commission, and the Virginia State Corporation 9
Commission. 10
Q. ARE YOU SPONSORING ANY OF THE FILING REQUIREMENTS IN THIS 11
CASE, AND, IF SO, WHICH REQUIREMENTS? 12
A. Yes. I am sponsoring the following filing requirements: 13
FR 16(1)(a)(2) Application Supported by a Fully Forecasted Test Period 14
FR 14(2) Certified Copy of Articles of Incorporation 15
FR 16(1)(b)(1) Statement of Reasons 16
FR 16(1)(b)(2) Compliance with KRS 365.015 17
FR 16(1)(b)(3) Proposed Tariffs 18
FR 16(1)(b)(4) Proposed Tariff Changes 19
FR 16(1)(b)(5) Statement on Customer Notice 20
FR 16(2)(a)-(c) Notice of Intent 21
FR 16(7)(a) Statement of Officer in Charge of Kentucky Operations 22
FR 16(7)(e) Statement of Attestation 23

Direct Testimony of Mark A. Martin Page 3 Kentucky / Martin
FR 16(8)(l) Narrative of Proposed Tariff Changes 1
FR 16(8)(n) Bill Comparison 2
FR 16(10) Request for Waiver of Certain Filing Requirements 3
FR 17(1)(a)-(c) Notice of General Rate Adjustment 4
FR 17(2)(b)3 Manner of Notification 5
FR 17(3)(b) Publisher Affidavits 6
FR 17(4)(a)-(j) Notice Requirements 7
Q. DO YOU ADOPT THESE FILING REQUIREMENTS AND MAKE THEM 8
PART OF YOUR TESTIMONY? 9
A. Yes. 10
II. PURPOSE AND SUMMARY OF TESTIMONY 11
Q. WHAT IS THE PURPOSE OF YOUR TESTIMONY? 12
A. My direct testimony will address several areas. First, I will briefly describe the 13
Company’s operations in Kentucky and the recent history of its rate proceedings 14
before this Commission. Second, I will provide an overview of the Company’s 15
customer base and market trends since 2017. Third, I will describe the principal 16
factors leading the Company to file this rate application and address the Company’s 17
efforts to achieve improvements to its efficiency and productivity. Fourth, I will 18
introduce the other witnesses who will be providing support for the requested rate 19
increase. Finally, I will present the rates and various tariff changes proposed by the 20
Company. 21

Direct Testimony of Mark A. Martin Page 4 Kentucky / Martin
III. ATMOS ENERGY’S OPERATIONS IN KENTUCKY 1
Q. CAN YOU PROVIDE THE COMMISSION WITH A GENERAL 2
DESCRIPTION AND BACKGROUND OF THE COMPANY’S OPERATIONS 3
IN KENTUCKY? 4
A. Yes. We have a Kentucky-based work force of approximately 202 employees 5
providing safe and reliable service to a customer base of approximately 176,800 6
residential, commercial and industrial consumers. Our utility plant in Kentucky 7
includes over 4,200 miles of transmission and distribution lines. 8
Q. PLEASE PROVIDE A BRIEF DESCRIPTION OF ATMOS ENERGY’S 9
CORPORATE STRUCTURE AND HOW IT ENABLES THE COMPANY TO 10
BE AN EFFICIENT, LOW COST PROVIDER OF NATURAL GAS. 11
A. Atmos Energy is the largest pure natural gas distribution company in the United 12
States, delivering natural gas to over 3 million residential, commercial, industrial and 13
public-authority customers in 8 states. Atmos Energy has six gas utility operating 14
divisions. They are located in Denver, Colorado (Kansas and Colorado division); 15
Baton Rouge, Louisiana (Louisiana division); Flowood, Mississippi (Mississippi 16
division); Lubbock, Texas (West Texas division); Dallas, Texas (Mid-Tex division); 17
and Owensboro, Kentucky and Franklin, Tennessee (Kentucky/Mid-States division). 18
In addition, Atmos Energy has an operating division consisting of a regulated 19
intrastate pipeline that functions only within the state of Texas. 20
Atmos Energy’s corporate offices are located in Dallas, Texas and provide 21
services such as accounting, legal, human resources, rate administration, 22
procurement, information technology and customer service organizations. The 23

Direct Testimony of Mark A. Martin Page 5 Kentucky / Martin
Company also has two customer contact centers located in Amarillo and Waco, 1
Texas. These centralized services are shared with the other Atmos Energy operating 2
divisions in order to avoid having to staff and maintain these functions at each 3
division level. These centralized services are the technical and administrative 4
services that would be required by each division if it were a stand-alone company. 5
Atmos Energy believes that this structure provides it with an economic advantage 6
and enables it to be a low-cost, high-quality provider of natural gas. 7
IV. OVERVIEW OF SERVICE AREA AND CUSTOMER BASE 8
Q. WHAT ARE THE COMPANY’S PRIMARY OBJECTIVES IN ITS 9
KENTUCKY OPERATIONS? 10
A. We strive to be the safest provider of natural gas service in the United States. The 11
Company is very proud of its tradition as a low-cost, efficient provider of natural gas 12
service. Our distribution charges, particularly for residential customers, are the 13
lowest among the major utilities in Kentucky and our pass-through gas costs are also 14
among the lowest in the state. 15
Q. PLEASE DESCRIBE THE MAKEUP OF ATMOS ENERGY’S CURRENT 16
CUSTOMER BASE IN KENTUCKY. 17
A. Atmos Energy currently serves approximately 176,800 customers throughout its 18
service area extending from western to central Kentucky. Residential class 19
customers account for the vast majority of meters, at approximately 157,100. Atmos 20
Energy’s natural gas deliveries totaled approximately 47.6 Bcf during the 12-month 21
period ending June 2018. 22

Direct Testimony of Mark A. Martin Page 6 Kentucky / Martin
The Company is somewhat unique in its level of throughput to industrial class 1
customers, with industrial sales and transportation volumes accounting for 2
approximately 67% of Atmos Energy’s annual throughput in Kentucky during that 3
12-month period. The region served by Atmos Energy is economically dependent on 4
the well-being of these industries, as is Atmos Energy through its requirements for 5
operating margin under current rate designs. 6
Q. HAS THE COMPANY EXPERIENCED GROWTH IN KENTUCKY IN 7
RECENT YEARS? 8
A. Yes, but only for residential sales, which have seen only modest growth. 9
V. PRINCIPAL FACTORS FOR THIS RATE APPLICATION 10
Q. WHY DID THE COMPANY FILE THIS CASE SO SOON AFTER THE 11
CONCLUSION OF THE PREVIOUS CASE? 12
A. As the Commission is aware, the actual costs of the natural gas consumed by our 13
customers are collected through a gas cost adjustment mechanism. The purpose of 14
this case is to establish new distribution rates which exclude those pass-through gas 15
costs and which allow the Company to recover its cost of service, including a fair and 16
reasonable return on investment. For the past eight years the Company has filed 17
annual PRP filings to recover investments in infrastructure replacement and this has 18
allowed the Company to extend the period between base rate cases. The Company 19
now seeks to recover all of its capital investment, including PRP, through annual rate 20
cases because, as discussed more fully in the testimony of Mr. Waller, the changes to 21
PRP required by the Commission in Case No. 2017-00349 affect the recovery of 22

Direct Testimony of Mark A. Martin Page 7 Kentucky / Martin
capital investment, which has a direct impact on the financial condition of the 1
Company. 2
Q. WHEN DID THE COMPANY’S CURRENT RATES BECOME EFFECTIVE? 3
A. The Company’s current base distribution rates were established by the Commission 4
in Case No. 2017-00349 and became effective on May 3, 2018.1 5
Q. ARE THE DISTRIBUTION RATES CURRENTLY IN EFFECT PROVIDING 6
SUFFICIENT REVENUES? 7
A. No. Although Atmos Energy continues to operate very efficiently and is proud to 8
have the lowest distribution charges for residential customers of the major natural gas 9
providers in Kentucky, our current rates are not providing a fair return on the 10
Company’s investments. 11
At current rates, the Company’s calculated rate of return on rate base for the 12
test year is only 5.58%. The decline in return is primarily due to capital investment 13
that is not recovered through the Company’s current rates and to the increased costs 14
of doing business. Examples of capital investment that are not covered through the 15
Company’s current rates are capital investment related to system integrity, system 16
improvements, structures, public improvements, information technology, growth, and 17
equipment. An example of a system integrity investment would be a capital 18
investment made to replace aging infrastructure. Examples of system improvements 19
would be capital investment related to reinforcing our existing system either through 20
updated odorizers and regulators to any type of capacity enhancement. Examples of 21
1 Case No. 2017-00349, Electronic Application of Atmos Energy Corporation for an Adjustment of Rates and Tariff Modifications (Ky. PSC May 3, 2018).

Direct Testimony of Mark A. Martin Page 8 Kentucky / Martin
public improvements would be capital investment related to the relocation of our 1
existing system to accommodate a public project. 2
Q. WHAT RATE OF RETURN ON RATE BASE IS ATMOS ENERGY 3
REQUESTING IN THIS RATE APPLICATION? 4
A. Atmos Energy is asking the Commission to approve new rate schedules that would 5
increase revenues to provide an overall rate of return on rate base of 7.95% on the 6
test year rate base of $496,111,427. 7
Q. WHAT IS THE AMOUNT OF THE RATE INCREASE THAT ATMOS 8
ENERGY IS SEEKING IN THIS RATE APPLICATION? 9
A. Atmos Energy is seeking approval to increase its rates to recover approximately 10
$14,455,538 in additional revenues. The difference between this amount and the 11
amount cited in Mr. Waller’s testimony and on Schedule A.1 of FR 16(8)(a) is due to 12
the rounding differences inherent in striking rates. For an average residential 13
customer, the total bill increase would be $4.41 per month. 14
Q. PURSUANT TO 807 KAR 5:001(16)(12)(e)(3), PLEASE EXPLAIN HOW THE 15
COMPANY WORKS TO ACHIEVE IMPROVEMENTS IN ITS EFFICIENCY 16
AND PRODUCTIVIY. 17
A. The Company continuously make investments in customer-focused programs to 18
improve service and to ensure reliability and safety. Since our most recent rate filing 19
in 2017, Atmos Energy continues to make substantial investments in technology and 20
process improvements to ensure that it provides the best and most efficient customer 21
service possible. Examples of these improvements include an Interactive Voice 22
Recognition (IVR) system for Spanish speaking customers, changes to the customer 23

Direct Testimony of Mark A. Martin Page 9 Kentucky / Martin
information system to ensure that we are capturing email addresses to facilitate 1
communication with our customers, increasing use of advanced data analytics, and 2
meter reading system upgrades. Each of these investments will enable the Company 3
to be more productive and provide the best possible service. 4
Q. HOW HAVE IMPROVEMENTS TO EFFICIENCY AND PRODUCTIVITY 5
IMPACTED CUSTOMER BILLS? 6
A. On average, residential bills have remained steady since 2007. The Company 7
estimates that the average monthly residential bill for 2018 to be $55 which is well 8
below the average residential bills in 2007, 2008 or 2009; basically a decade ago. 9
The Company estimates that average residential bills will be at or lower than those a 10
decade ago for the next few years. While the cost of gas is a large percentage of a 11
residential bill, the Company has been extremely efficient in order to minimize the 12
impact to customers. When compared to other utility bills, the value proposition for 13
natural gas is excellent. 14
Q. PLEASE EXPLAIN WHETHER THE COMPANY INCORPORATED THE 15
COMMISSION’S ORDER IN CASE NO. 2017-00349 IN ITS RATEMAKING 16
ADJUSTMENTS REFLECTED IN THIS FILING. 17
A. Yes, the Company did consider the Commission’s decision in Case No. 2017-00349 18
in the preparation of this case. Company witness Mr. Greg Waller discusses the 19
various adjustments made to align this filing with the Commission’s findings and 20
Order in Case No. 2017-00349 in his testimony. While reserving the right to propose 21
alternative approaches in future proceedings, the Company has made those changes 22
to simplify the regulatory review process in this Case. 23

Direct Testimony of Mark A. Martin Page 10 Kentucky / Martin
VI. INTRODUCTION OF WITNESSES 1
Q. PLEASE IDENTIFY THE OTHER WITNESSES SPONSORING 2
TESTIMONY IN THIS PROCEEDING? 3
A. In addition to my testimony, Atmos Energy will present the direct testimony and 4
exhibits of 9 witnesses. 5
Gregory K. Waller, Manager of Rates and Regulatory Affairs for Atmos 6
Energy Corporation, is presenting testimony concerning the Operating and 7
Maintenance (O&M) expense budgeting process used by the Company; the control 8
and the monitoring of O&M variances by the Company; the forecasted test year 9
budget for O&M, the Company’s capital investments, depreciation expense, and 10
taxes other than income taxes incurred directly by the Company’s Kentucky 11
operations as well as allocated to Kentucky from the Kentucky / Mid-States General 12
Office and Shared Services Unit. Mr. Waller is also responsible for the calculation of 13
Company’s revenue deficiency and rate base. 14
Laura Gillham, Director of Accounting Services for Atmos Energy 15
Corporation, is filing testimony regarding the historic books and records of the 16
Company and the integrity of the financial information in this case. She also 17
provides testimony concerning the Company’s Cost Allocation Manual (CAM), 18
which describes the methodology for shared services cost allocations. 19
Josh Densman, Vice President of Finance for the Kentucky/Mid-States 20
Division of Atmos Energy Corporation, is filing testimony regarding the methods 21
used to forecast the Company’s revenues and volumes as they relate to the base 22

Direct Testimony of Mark A. Martin Page 11 Kentucky / Martin
period and test period in this case as well as present the test period forecast of 1
revenues and volumes. 2
Greg Smith, Vice President of Technical Services for the Kentucky/MidStates 3
Division of Atmos Energy Corporation, is filing testimony regarding the Company’s 4
capital investments related to system integrity, specifically, safety. 5
Joe Christian, Director of Rates and Regulatory Affairs for Atmos Energy 6
Corporation, is filing testimony regarding the Company’s Cash Working Capital 7
study as well as the Company’s capital structure and cost of debt. 8
Jennifer Story, Director of Income Tax for Atmos Energy Corporation, is 9
filing testimony regarding the current status of reflecting the changes of the Tax Cuts 10
and Jobs Act (“TCJA”) in Atmos Energy’s Kentucky rates and describing how the 11
current rate case will further reflect TCJA changes. 12
Dr. James Vander Weide testifies regarding the Company’s cost of capital and 13
recommends a rate of return on equity that is appropriate to be used in setting rates 14
for Atmos Energy in this proceeding. 15
Paul Raab, of Paul H. Raab Economic Consulting, presents the Company’s 16
class cost of service study. 17
Dane Watson, of the Alliance Consulting Group, presents the Company’s 18
depreciation study and corresponding depreciation rates. 19

Direct Testimony of Mark A. Martin Page 12 Kentucky / Martin
VII. PROPOSED RATES, RATE STRUCTURES AND TARIFF CHANGES 1
Q. WHAT ARE THE PRIMARY RATE DESIGN OBJECTIVES OF ATMOS 2
ENERGY IN THIS CASE? 3
A. As stated earlier in my testimony, Atmos Energy’s primary objective is to strive to be 4
the safest provider of natural gas service. The Company is very proud of its tradition 5
as a low-cost, efficient provider of natural gas service. 6
Atmos Energy’s tariff and rate design proposals are as follows: 7
1) Maintain the general balance of fixed and variable elements in our distribution 8
rates to reflect the underlying cost characteristics of our service. 9
2) Remove the Company’s Tariff to reflect the impact on the recovery of investment 10
associated with Pipe Replacement Program (PRP) resulting from the 11
Commission’s Order in Case No. 2017-00349. 12
3) Update the time period used to weather normalize revenues and with the 13
Company’s Weather Normalization Adjustment (WNA) Rider. 14
4) Minor text changes to its Demand Side Management (DSM) tariff related to the 15
timing of the adjustment for the distribution charge for residential and 16
commercial G-1 sales 17
Q. HOW DID YOU DETERMINE THE MANNER IN WHICH THE REVENUE 18
DEFICIENCY WOULD BE SPREAD TO CUSTOMER CLASSES AND TO 19
FIXED AND VARIABLE BILLING COMPONENTS? 20
A. Company witness Raab sponsors a Class Cost of Service study which is required 21
pursuant to the Minimum Filing Requirements in this Case. In his study, he 22
determines that all classes contribute adequate amounts to the Company’s cost of 23

Direct Testimony of Mark A. Martin Page 13 Kentucky / Martin
service with the lone exception being residential sales. While Mr. Raab’s analysis is 1
utilized as one point of reference, the Company believes that each class (commercial, 2
public authority, industrial sales and transportation), in addition to the residential 3
class, should bear some portion of the requested increase. 4
With respect to the balance of the increase to be borne between the fixed or 5
variable components, the Company has chosen to propose an increase in the fixed 6
monthly charges and an increase in the variable components when compared to the 7
currents rates. 8
Q. WHAT IS THE RESULTING EFFECT OF ATMOS ENERGY’S PROPOSED 9
RATES COMPARED TO CURRENT RATES FOR THE AVERAGE 10
RESIDENTIAL, COMMERCIAL AND INDUSTRIAL CUSTOMERS 11
RESPECTIVELY? 12
A. Using the test year volumes and gas costs as the basis for comparison, the annual 13
impact of Atmos Energy’s proposed rates is as follows. The average monthly 14
charges for a residential customer under G-1 service increases $4.41, a 8.6% increase 15
over current rates. Commercial and public authority class customers’ average 16
monthly charges increase $14.45, a 6.6% increase over current rates, and the 17
industrial sales and transportation class average monthly charges increase $909.82, a 18
15.8% increase over current rates. The test year revenues at proposed rates are 19
summarized earlier in the testimony of Company witness Josh Densman. Please 20
refer to Exhibit MAM-1 (in a format comparable to Exhibit JCD-2) as well as 21
Exhibit MAM-2 which provides the proposed monthly revenues (in a format 22
comparable to Exhibit JCD-5). 23

Direct Testimony of Mark A. Martin Page 14 Kentucky / Martin
Q. IS THE COMPANY PROPOSING AN ANNUAL FORMULA RATE 1
MECHANISM AS IT DID IN CASE NO. 2017-00349? 2
A. No. However, in light of the fact that the Company will now seek recovery of all 3
investment through the traditional ratemaking process due to changes in the PRP in 4
the last case we would like for the Commission to continue to consider the potential 5
benefits of an annual rate review mechanism similar to the one that the Company has 6
in Tennessee. 7
Q. DO YOU BELIEVE A FORMULA RATE MECHANISM WOULD BE 8
APPROPRIATE FOR THE COMPANY’S KENTUCKY OPERATIONS? 9
A. Yes. A process similar to the one utilized in Tennessee would provide for a regularly 10
scheduled rate review that will cost less and adjust the rates each year in a more 11
timely manner to actually achieve the result contemplated by the Commission’s rate 12
orders. The Company envisions an annual mechanism saving all parties time, 13
money and resources as well as being in the spirit of the Governor’s Red Tape 14
Initiative. 15
Q. WHY HAS THE COMPANY PROPOSED TO ELIMINATE ITS EXISTING 16
PIPE REPLACEMENT PROGRAM (PRP) TARIFF? 17
A. The Company has proposed removal of the PRP tariff in light of the Commission’s 18
Order in Case No. 2017-00349 and anticipates transferring the ratemaking for this 19
program to annual forward-looking rate case filings going forward. 20
Q. PLEASE EXPLAIN. 21
A. The Commission limited the PRP tariff to apply to bare steel pipe replacements and 22
capped these replacements at $28 million per year through 2027. The Company is 23

Direct Testimony of Mark A. Martin Page 15 Kentucky / Martin
agreeable and committed to achieving the investment target for PRP. However, the 1
Commission also limited recovery through the PRP to historical, lagged recovery as 2
opposed to the prospective treatment previously afforded the PRP. As discussed in 3
the testimony of Mr. Waller, when engaging in pipe replacements of the magnitude 4
that the Commission and the Company are contemplating, historical test year 5
recovery is financially detrimental to the Company. The Company proposes to file 6
annual plans for bare steel replacement which describe the capital projects that the 7
Company plans to undertake in its next fiscal year. 8
Q. IS THE COMPANY PROPOSING A DIFFERENT PERIOD TO WEATHER 9
NORMALIZE REVENUES IN THIS CASE? 10
A. Yes. As approved in Case No. 2015-00343, the Company is proposing to use a more 11
current period of time to weather normalize revenues. 12
Q. WHAT IS THE PERIOD THAT THE COMPANY IS PROPOSING TO USE 13
TO NORMALIZE REVENUES IN THIS CASE? 14
A. The Company is proposing to use the twenty year period ending June 2018, or stated 15
another way, the period of July 1998 through June 2018. 16
VIII. CONCLUSION 17
Q. DOES THIS CONCLUDE YOUR TESTIMONY? 18
A. Yes. 19

COMMONWEALTH OF KENTUCKY
BEFORE THE PUBLIC SERVICE COMMISSION
IN THE MATTER OF RATE APPLICATION OF A TMOS ENERGY CORPORATION
) ) )
Case No. 20 18-00281
CERTIFICATE AND AFFIDAVIT
The Affiant, Mark A. Martin, being duly sworn, deposes and states that the prepared testimony attached hereto and made a part hereof, constitutes the prepared direct testimony of this affiant in Case No. 2018-00281, in the Matter of the Rate Application of Atmos Energy Corporation, and that if asked the questions propounded therein, this affiant would make the answers set forth in the attached prepared direct pre-filed testimony.
STATE 0 F ____,\'----< _____,'f_N"---'--'-1-\....._,1A'-=L""--"J\(...___.L(<t-
COUNTY oF _D~rA~u"'--·.L-'-1 e~.£.6o<'S,___ __
fMark A. Martin
1 -'1-~h SUBSCRIBED AND SWORN to before me by Mark A. Matiin on this the _ I_ day of September, 2018.
~~~APOh Not ry Public
My Commiss ion Expires: - - -:14JOIYrtn1ne--M;-Heoderson
NOTARY PUIUC State at lar'~;!t1 Kentucky
10, 590005 My Commission Expires 3/22/2022
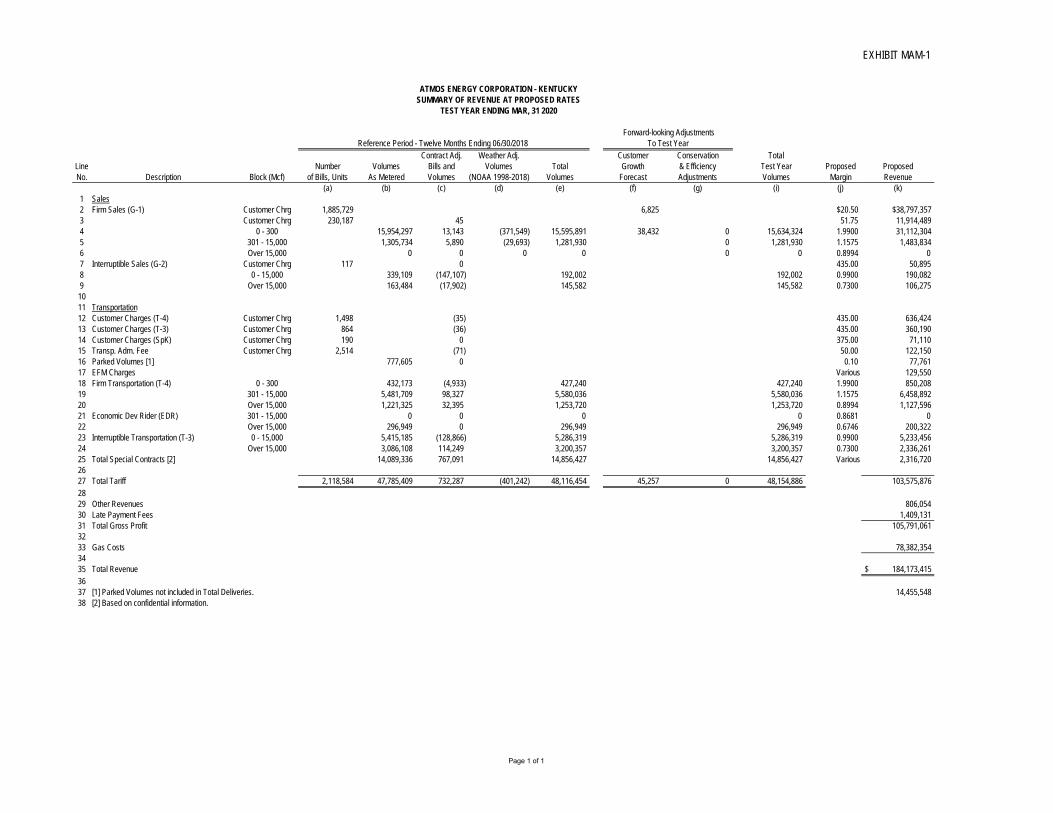
EXHIBIT MAM-1
ATMOS ENERGY CORPORATION - KENTUCKYSUMMARY OF REVENUE AT PROPOSED RATES
TEST YEAR ENDING MAR, 31 2020
Reference Period - Twelve Months Ending 06/30/2018Contract Adj. Weather Adj. Customer Conservation Total
Line Number Volumes Bills and Volumes Total Growth & Efficiency Test Year Proposed ProposedNo. Description Block (Mcf) of Bills, Units As Metered Volumes (NOAA 1998-2018) Volumes Forecast Adjustments Volumes Margin Revenue
(a) (b) (c) (d) (e) (f) (g) (i) (j) (k)1 Sales2 Firm Sales (G-1) Customer Chrg 1,885,729 6,825 $20.50 $38,797,3573 Customer Chrg 230,187 45 51.75 11,914,489 4 0 - 300 15,954,297 13,143 (371,549) 15,595,891 38,432 0 15,634,324 1.9900 31,112,3045 301 - 15,000 1,305,734 5,890 (29,693) 1,281,930 0 1,281,930 1.1575 1,483,8346 Over 15,000 0 0 0 0 0 0 0.8994 07 Interruptible Sales (G-2) Customer Chrg 117 0 435.00 50,895 8 0 - 15,000 339,109 (147,107) 192,002 192,002 0.9900 190,0829 Over 15,000 163,484 (17,902) 145,582 145,582 0.7300 106,2751011 Transportation12 Customer Charges (T-4) Customer Chrg 1,498 (35) 435.00 636,42413 Customer Charges (T-3) Customer Chrg 864 (36) 435.00 360,19014 Customer Charges (SpK) Customer Chrg 190 0 375.00 71,11015 Transp. Adm. Fee Customer Chrg 2,514 (71) 50.00 122,15016 Parked Volumes [1] 777,605 0 0.10 77,76117 EFM Charges Various 129,55018 Firm Transportation (T-4) 0 - 300 432,173 (4,933) 427,240 427,240 1.9900 850,20819 301 - 15,000 5,481,709 98,327 5,580,036 5,580,036 1.1575 6,458,89220 Over 15,000 1,221,325 32,395 1,253,720 1,253,720 0.8994 1,127,59621 Economic Dev Rider (EDR) 301 - 15,000 0 0 0 0 0.8681 022 Over 15,000 296,949 0 296,949 296,949 0.6746 200,32223 Interruptible Transportation (T-3) 0 - 15,000 5,415,185 (128,866) 5,286,319 5,286,319 0.9900 5,233,45624 Over 15,000 3,086,108 114,249 3,200,357 3,200,357 0.7300 2,336,26125 Total Special Contracts [2] 14,089,336 767,091 14,856,427 14,856,427 Various 2,316,7202627 Total Tariff 2,118,584 47,785,409 732,287 (401,242) 48,116,454 45,257 0 48,154,886 103,575,876 2829 Other Revenues 806,054 30 Late Payment Fees 1,409,13131 Total Gross Profit 105,791,061 3233 Gas Costs 78,382,354 3435 Total Revenue 184,173,415$ 3637 [1] Parked Volumes not included in Total Deliveries. 14,455,548 38 [2] Based on confidential information.
Forward-looking AdjustmentsTo Test Year
Page 1 of 1

EXHIBIT MAM-2
ATMOS ENERGY CORPORATION - KENTUCKYBILL FREQUENCY WITH KNOWN & MEASURABLE ADJUSTMENTS
TEST YEAR ENDING MAR, 31 2020PROPOSED RATES
Line TotalNo. Class of Customers Rate Apr-19 May-19 Jun-19 Jul-19 Aug-19 Sep-19 Oct-19 Nov-19 Dec-19 Jan-20 Feb-20 Mar-20 Billing Units
(a) (b) (c) (d) (e) (f) (g) (h) (i) (j) (k) (l) (m)
1 RESIDENTIAL (Rate G-1) $5,119,101 $4,083,233 $3,614,273 $3,479,158 $3,485,976 $3,449,324 $3,824,303 $4,929,956 $6,264,613 $7,230,710 $7,279,553 $6,102,513 $58,862,7122 FIRM BILLS $20.50 160,467 159,811 157,145 155,132 155,436 153,445 154,720 156,840 158,382 160,519 160,031 160,626 1,892,5543 Sales: 1-300 1.9900 919,361 405,582 197,387 150,227 150,522 152,614 327,911 861,676 1,516,473 1,979,935 2,009,506 1,411,900 10,083,0934 Sales: 301-15000 1.1575 0 0 0 0 0 0 0 0 0 0 0 0 05 Sales: Over 15000 0.8994 0 0 0 0 0 0 0 0 0 0 0 0 06 CLASS TOTAL (Mcf/month) 919,361 405,582 197,387 150,227 150,522 152,614 327,911 861,676 1,516,473 1,979,935 2,009,506 1,411,900 10,083,0937 Gas Charge per Mcf $4.59 $4.73 $4.73 $4.73 $4.70 $4.70 $4.70 $4.56 $4.56 $4.56 $4.49 $4.498 Gas Costs $4,216,600 $1,919,446 $934,150 $710,962 $707,030 $716,858 $1,540,264 $3,932,955 $6,921,650 $9,037,031 $9,027,031 $6,342,484 $46,006,4609
10 FIRM COMMERCIAL (Rate G-1) $1,825,381 $1,410,087 $1,208,917 $1,155,972 $1,149,639 $1,131,166 $1,258,715 $1,717,608 $2,243,104 $2,631,074 $2,635,010 $2,212,980 $20,579,65311 FIRM BILLS 51.75 17,943 17,779 17,193 16,952 17,018 16,770 16,867 17,362 17,609 18,032 17,837 17,954 209,31612 Sales: 1-300 1.9900 423,372 233,238 153,360 133,117 120,622 114,537 162,731 372,283 608,952 768,305 778,453 604,553 4,473,52413 Sales: 301-15000 1.1575 46,929 22,359 12,088 11,925 24,985 30,575 53,575 67,631 103,692 145,996 140,668 69,805 730,22714 Sales: Over 15000 0.8994 0 0 0 0 0 0 0 0 0 0 0 0 015 CLASS TOTAL (Mcf/month) 470,301 255,597 165,449 145,042 145,607 145,112 216,306 439,913 712,644 914,301 919,121 674,358 5,203,75116 Gas Charge per Mcf $4.59 $4.73 $4.73 $4.73 $4.70 $4.70 $4.70 $4.56 $4.56 $4.56 $4.49 $4.4917 Gas Costs $2,157,012 $1,209,631 $782,998 $686,421 $683,945 $681,620 $1,016,033 $2,007,900 $3,252,727 $4,173,151 $4,128,843 $3,029,326 $23,809,6081819 FIRM INDUSTRIAL (Rate G-1) $124,426 $59,732 $33,503 $42,415 $47,703 $46,586 $52,948 $88,380 $118,834 $219,167 $173,188 $131,410 $1,138,29220 FIRM BILLS $51.75 231 211 201 207 205 204 195 211 195 225 206 211 2,50221 Sales: 1-300 1.9900 38,933 17,474 7,228 8,996 9,700 9,082 10,605 23,195 32,755 47,455 41,295 37,768 284,48622 Sales: 301-15000 1.1575 31,080 14,946 3,876 11,923 15,372 15,513 18,794 27,044 37,633 97,700 69,417 39,166 382,46523 Sales: Over 15000 0.8994 (1,081) (3,624) 4,705 0 0 0 0 0 0 0 0 0 024 CLASS TOTAL (Mcf/month) 68,931 28,796 15,809 20,920 25,072 24,595 29,399 50,239 70,388 145,156 110,712 76,935 666,95125 Gas Charge per Mcf $4.59 $4.73 $4.73 $4.73 $4.70 $4.70 $4.70 $4.56 $4.56 $4.56 $4.49 $4.4926 Gas Costs $316,151 $136,281 $74,818 $99,004 $117,766 $115,528 $138,091 $229,306 $321,273 $662,534 $497,338 $345,602 $3,053,6922728 FIRM PUBLIC AUTHORITY (Rate G-1) $245,309 $162,477 $128,608 $122,943 $122,722 $117,409 $151,159 $236,906 $335,304 $391,716 $394,739 $318,036 $2,727,32729 FIRM BILLS $51.75 1,548 1,541 1,519 1,527 1,543 1,456 1,539 1,549 1,542 1,558 1,547 1,545 18,41430 Sales: 1-300 1.9900 78,270 38,548 23,379 21,135 19,543 19,916 32,856 72,398 116,321 129,707 131,632 109,517 793,22131 Sales: 301-15000 1.1575 8,157 5,201 3,004 1,608 3,439 2,098 5,298 10,949 20,757 45,765 45,559 17,402 169,23732 Sales: Over 15000 0.8994 0 0 0 0 0 0 0 0 0 0 0 0 033 CLASS TOTAL (Mcf/month) 86,428 43,749 26,382 22,743 22,982 22,013 38,154 83,347 137,078 175,472 177,191 126,919 962,45934 Gas Charge per Mcf $4.59 $4.73 $4.73 $4.73 $4.70 $4.70 $4.70 $4.56 $4.56 $4.56 $4.49 $4.4935 Gas Costs $396,396 $207,044 $124,856 $107,635 $107,952 $103,401 $179,217 $380,421 $625,667 $800,907 $795,971 $570,142 $4,399,6093637 INTERRUPTIBLE COMMERCIAL (G-2) $3,270 $2,774 $917 $967 $902 $967 $1,444 $2,086 $3,079 $3,797 $3,888 $3,088 $27,17638 INT BILLS 435.00 3 4 2 2 2 2 3 3 3 3 3 3 3339 Sales: 1-15000 0.9900 1,985 1,044 47 98 32 98 140 789 1,791 2,517 2,609 1,801 12,95140 Sales: Over 15000 0.7300 0 0 0 0 0 0 0 0 0 0 0 0 141 CLASS TOTAL (Mcf/month) 1,985 1,044 47 98 32 98 140 789 1,791 2,517 2,609 1,801 12,95242 Gas Charge per Mcf $3.31 $3.46 $3.46 $3.46 $3.42 $3.42 $3.42 $3.29 $3.29 $3.29 $3.22 $3.2243 Gas Costs $6,569 $3,608 $163 $337 $111 $334 $479 $2,595 $5,893 $8,279 $8,394 $5,794 $42,55644
Page 1 of 2

EXHIBIT MAM-2
ATMOS ENERGY CORPORATION - KENTUCKYBILL FREQUENCY WITH KNOWN & MEASURABLE ADJUSTMENTS
TEST YEAR ENDING MAR, 31 2020PROPOSED RATES
Line TotalNo. Class of Customers Rate Apr-19 May-19 Jun-19 Jul-19 Aug-19 Sep-19 Oct-19 Nov-19 Dec-19 Jan-20 Feb-20 Mar-20 Billing Units
(a) (b) (c) (d) (e) (f) (g) (h) (i) (j) (k) (l) (m)
45 INTERRUPTIBLE INDUSTRIAL (G-2) $15,122 $15,754 $10,157 $7,858 $12,878 $9,978 $19,758 $14,145 $28,003 $105,336 $63,901 $17,188 $320,07646 INT BILLS 435.00 7 7 7 6 8 6 8 7 7 7 7 7 8447 Sales: 1-15000 0.9900 12,199 12,837 7,184 5,301 9,493 7,442 16,443 11,212 25,210 28,893 28,553 14,285 179,05348 Sales: Over 15000 0.7300 0 0 0 0 0 0 0 0 0 100,941 44,641 0 145,58349 CLASS TOTAL (Mcf/month) 12,199 12,837 7,184 5,301 9,493 7,442 16,443 11,212 25,210 129,834 73,194 14,285 324,63550 Gas Charge per Mcf $3.31 $3.46 $3.46 $3.46 $3.42 $3.42 $3.42 $3.29 $3.29 $3.29 $3.22 $3.2251 Gas Costs $40,376 $44,366 $24,828 $18,320 $32,473 $25,457 $56,244 $36,882 $82,929 $427,096 $235,497 $45,962 $1,070,4305253 TRANSPORTATION (T-4) $794,318 $660,966 $639,778 $591,532 $648,084 $641,449 $723,823 $806,928 $921,908 $1,073,076 $833,185 $888,874 $9,223,91854 TRANSPORTATION BILLS 435.00 122 121 122 122 122 122 122 122 122 122 122 122 1,46355 Trans Admin Fee 6,050 6,050 6,100 6,050 6,050 6,050 6,050 6,050 6,050 6,050 6,050 6,050 $72,65056 EFM Fee 6,500 6,500 6,600 6,175 6,375 6,300 6,250 6,250 6,350 6,350 6,450 6,500 $76,60057 Parking Fee 186 218 20 117 18 15 3 5 49 311 136 474 $1,55058 Firm Transport: 1-300 1.9900 36,521 34,227 34,098 33,445 34,070 34,695 36,140 36,591 36,900 36,900 36,797 36,856 427,24059 Firm Transport: 301-15000 1.1575 489,153 398,913 377,568 340,009 388,131 375,657 439,078 494,373 566,834 650,182 516,718 543,420 5,580,03660 Firm Transport: Over 1500 0.8994 99,656 73,060 76,827 73,386 72,838 80,218 87,057 107,294 141,036 201,555 106,906 133,887 1,253,72061 CLASS TOTAL (Mcf/month) 625,330 506,200 488,493 446,840 495,039 490,570 562,275 638,258 744,770 888,637 660,421 714,163 7,260,9966263 ECONOMIC DEV RIDER (EDR) 19,438 19,754 17,806 10,971 13,842 12,901 17,355 18,793 13,950 18,737 16,876 19,885 200,307 64 Firm Transport: 1-300 1.4925 0 0 0 0 0 0 0 0 0 0 0 0 065 Firm Transport: 301-15000 0.8681 0 0 0 0 0 0 0 0 0 0 0 0 066 Firm Transport: Over 15000 0.6746 28,816 29,285 26,397 16,264 20,520 19,125 25,728 27,860 20,680 27,777 25,018 29,479 296,94967 CLASS TOTAL (Mcf/month) 28,816 29,285 26,397 16,264 20,520 19,125 25,728 27,860 20,680 27,777 25,018 29,479 296,9496869 TRANSPORTATION (T-3) $690,519 $640,402 $563,990 $560,640 $612,299 $609,678 $676,840 $704,038 $733,834 $802,653 $697,817 $725,924 $8,018,63470 TRANSPORTATION BILLS 435.00 69 69 69 69 69 69 69 69 69 69 69 69 82871 Trans Admin Fee 3,450 3,450 3,450 3,450 3,450 3,450 3,450 3,450 3,450 3,450 3,450 3,450 $41,40072 EFM Fee 3,675 3,675 3,675 3,575 3,575 3,600 3,600 3,600 3,575 3,575 3,575 3,675 $43,37573 Parking Fee 375 489 379 347 293 119 341 206 370 155 538 341 $3,95274 Interrupt Transport: 1-15000 0.9900 457,135 421,909 386,801 388,309 408,123 401,591 434,332 462,526 485,980 508,312 459,763 471,538 5,286,32075 Interrupt Transport: Over 15000 0.7300 274,568 253,539 196,628 190,175 234,143 239,615 286,911 286,118 294,936 359,219 280,923 303,582 3,200,35876 CLASS TOTAL (Mcf/month) 731,703 675,448 583,429 578,484 642,266 641,206 721,243 748,644 780,916 867,531 740,686 775,120 8,486,6787778 SPECIAL CONTRACTS $209,397 $195,682 $179,746 $157,141 $159,212 $171,560 $201,623 $213,081 $245,950 $268,663 $230,460 $245,247 $2,477,76379 TRANSPORTATION BILLS 375.00 16 16 16 15 16 16 16 16 16 16 16 16 19080 Trans Admin Fee 650 650 650 650 700 700 700 700 700 700 650 650 $8,10081 EFM Fee 775 775 775 900 725 725 725 875 875 875 775 775 $9,57582 Parking Fee 8,223 4,727 4,258 4,804 2,635 2,262 4,989 4,624 15,795 6,226 6,312 7,403 $72,25983 Transported Volumes Various 1,214,231 1,204,865 1,066,868 873,738 906,591 1,017,007 1,177,897 1,238,832 1,390,754 1,727,414 1,475,749 1,562,481 14,856,42784 Charges for Transport Volumes 193,757 183,580 168,113 145,212 149,201 161,923 189,260 200,932 222,630 254,912 216,774 230,426 $2,316,72085 CLASS TOTAL (Mcf/month) 1,214,231 1,204,865 1,066,868 873,738 906,591 1,017,007 1,177,897 1,238,832 1,390,754 1,727,414 1,475,749 1,562,481 14,856,4278687 OTHER REVENUE88 Service Charges $49,919 $53,628 $55,397 $45,327 $57,173 $55,395 $88,176 $126,545 $87,101 $58,133 $54,439 $74,821 $806,05489 Late Payment Fees $167,099 $123,787 $80,070 $60,906 $56,375 $56,239 $56,455 $73,720 $121,221 $178,511 $218,444 $216,305 $1,409,1319091 TOTAL GROSS PROFIT $9,263,299 $7,428,276 $6,533,162 $6,235,829 $6,366,805 $6,302,650 $7,072,598 $8,932,184 $11,116,899 $12,981,572 $12,601,500 $10,956,270 $105,791,04492 Gas Costs $7,133,103 $3,520,378 $1,941,813 $1,622,678 $1,649,276 $1,643,198 $2,930,328 $6,590,058 $11,210,139 $15,108,999 $14,693,074 $10,339,311 $78,382,35493 TOTAL REVENUE $16,396,402 $10,948,653 $8,474,975 $7,858,508 $8,016,081 $7,945,847 $10,002,926 $15,522,242 $22,327,038 $28,090,571 $27,294,574 $21,295,581 $184,173,399
Page 2 of 2

Direct Testimony of Gregory K. Waller Page 1 Kentucky / Waller
BEFORE THE PUBLIC SERVICE COMMISSION
COMMONWEALTH OF KENTUCKY
APPLICATION OF ATMOS ENERGY ) ) CORPORATION FOR AN ADJUSTMENT ) Case No. 2018-00281 ) OF RATES AND TARIFF MODIFICATIONS )
TESTIMONY OF GREGORY K. WALLER
I. INTRODUCTION 1
Q. PLEASE STATE YOUR NAME, JOB TITLE AND BUSINESS ADDRESS. 2
A. My name is Gregory K. Waller. I am Manager, Rates and Regulatory Affairs with 3
Atmos Energy Corporation (“Atmos Energy” or “Company”). My business address 4
is 5420 LBJ Freeway, Ste. 1600, Dallas, Texas 75240. 5
Q. WHAT IS YOUR EDUCATIONAL BACKGROUND AND PROFESSIONAL 6
EXPERIENCE? 7
A. I received a Bachelor of Arts degree in economics from Dartmouth College in 1994 8
and an MBA degree from the University of Texas in 2000. I worked as a 9
management consultant from 1994 to 2003 at Harbor Research in Boston, MA (1994-10
1996) and Towers Perrin in Dallas, TX (1997-2003). I joined Atmos Energy in 2003 11
in the Planning and Budgeting Department in Dallas. In November of 2005 I became 12
Vice President of Finance for the Kentucky/Mid-States Division, which includes the 13
Company’s regulated Kentucky operations. I assumed my current role in Dallas, TX 14
in July 2012. 15

Direct Testimony of Gregory K. Waller Page 2 Kentucky / Waller
Q. HAVE YOU TESTIFIED BEFORE THIS OR ANY OTHER REGULATORY 1
COMMISSION? 2
A. Yes. I testified before this Commission in Case No. 2013-00148 and 2017-00349. I 3
have also testified before the Tennessee Public Utility Commission in 2006, 2016 and 4
2017, and the Georgia Public Service Commission in 2008, 2009 and 2011. I also 5
submitted direct testimony in the Company’s rate proceedings in Kentucky (2006, 6
2009, 2013 and 2015), Tennessee (2007, 2008, 2012, 2014, 2016, 2017 and 2018), 7
and Virginia (2008, 2009, 2014, 2016 and 2017). 8
Q. WHAT IS THE SCOPE OF YOUR TESTIMONY IN THIS PROCEEDING? 9
A. I am responsible for supporting the calculation of the Company’s revenue deficiency, 10
rate base and operating expenses in this rate proceeding. In that regard I am 11
sponsoring the following Filing Requirements (FR): 12
FR 16(6)(a) Forecasted financial data presented as pro forma adjustments 13
to the base period; 14
FR 16(6)(b) Forecasted adjustments limited to twelve (12) months 15
immediately following the suspension period; 16
FR 16(6)(c) Capitalization and net investment rate base; 17
FR 16(6)(f) Reconciliation of the rate base and capitalization; 18
FR 16(7)(b) The utility’s most recent capital construction budget 19
containing at a minimum a three (3) year forecast of 20
construction expenditures; 21
FR 16(7)(c) Description of all factors used in preparation of the forecast 22
test period - income statement, operation and maintenance 23

Direct Testimony of Gregory K. Waller Page 3 Kentucky / Waller
expenses, employee and labor expenses, capital construction 1
budget; 2
FR 16(7)(d) Annual and monthly budget for the 12 month period 3
preceding filing date, the base period and the forecast period; 4
FR 16(7)(f) Detailed information for each major construction project 5
constituting more than five percent (5%) of the annual 6
construction budget within the three (3) year forecast; 7
FR 16(7)(g) Detailed information for the aggregate of construction 8
projects constituting less than five percent (5%) of the annual 9
construction budget within the three (3) year forecast; 10
FR 16(7)(h) (1) Operating Income Statement; (2) Balance Sheet; (3) 11
Statement of Cash Flows; (4) Revenue Requirements; (9) 12
Employee Level; (10) Labor cost changes; and (12) Rate 13
Base; 14
FR 16(7)(i) Most Recent FERC or FCC Audit Reports; 15
FR 16(7)(n) Latest 12 months of the monthly managerial reports providing 16
financial results of operations in comparison to forecast; 17
FR 16(7)(o) Complete monthly budget variance reports, with narrative 18
explanations, for the twelve (12) months immediately prior to 19
the base period, each month of the base period, and any 20
subsequent months, as they become available; 21

Direct Testimony of Gregory K. Waller Page 4 Kentucky / Waller
FR 16(7)(t) List all commercial or in-house computer software, programs, 1
and models used to develop schedules and work papers 2
associated with this application; 3
FR 16(8)(a) A jurisdictional financial summary for both the base period 4
and the forecasted period that details how the utility derived 5
the amount of the requested revenue increase; 6
FR 16(8)(b) A jurisdictional rate base summary for both the base period 7
and the forecasted period with supporting schedules, which 8
include detailed analyses of each component of the rate base; 9
FR 16(8)(c) Jurisdictional operating income summary for both base and 10
forecasted periods with supporting schedules which provide 11
breakdowns by major account group and individual account; 12
FR 16(8)(d) Summary of jurisdictional adjustments to operating income; 13
FR 16(8)(e) Jurisdictional federal and state income tax summaries; 14
FR 16(8)(f) Summary schedules for the base and forecast periods of 15
various expenses; 16
FR 16(8)(g) Analysis of payroll costs; 17
FR 16(8)(h) Computation of gross revenue conversion factor; 18
FR 16(8)(i) Comparative income statements, revenue and sales statistics, 19
base period, forecast period and two (2) years beyond; 20
FR 16 (8)(k) Comparative financial data. 21

Direct Testimony of Gregory K. Waller Page 5 Kentucky / Waller
Q. WHAT ARE THE BASE PERIOD AND TEST PERIOD FOR THIS CASE? 1
A. The base period is January 1, 2018 through December 31, 2018 (“Base Period”) and 2
the forecasted test period is April 1, 2019 through March 31, 2020 (“Test Period”) 3
Q. ARE YOU SPONSORING ANY EXHIBITS IN CONNECTION WITH YOUR 4
TESTIMONY? 5
A. Yes, I am sponsoring Exhibits GKW-1 and GKW-2, both of which are attached to my 6
testimony. Exhibit GKW-1 provides the composite factors used to allocate common 7
costs for the purpose of the Test Period in this rate proceeding. Exhibit GKW-2 is a 8
Base Period to Test Period O&M comparison by cost element. 9
Q. DO YOU ADOPT THESE FILING REQUIREMENTS AND EXHIBITS, AND 10
THEIR ASSOCIATED SCHEDULES, AND MAKE THEM PART OF YOUR 11
TESTIMONY? 12
A. Yes. 13
Q. WHAT IS THE SOURCE OF THE DATA USED TO COMPLETE THE 14
FILING REQUIREMENTS THAT YOU ARE SPONSORING? 15
A. The source of the data includes the accounting books and records of the Company 16
which are being sponsored by Company witness Ms. Laura Gillham along with 17
information provided by the following witnesses to this proceeding: Mr. Josh 18
Densman (revenues, gas cost and margin forecast; sales statistics); Mr. Joe Christian 19
(capital structure and cost of debt; cash working capital); Mr. Dane Watson 20
(depreciation rates); and Dr. James Vander Weide (rate of return on equity). 21
The detail concerning how this information was derived is found in the 22
testimony of these witnesses. The data and information provided by these witnesses 23

Direct Testimony of Gregory K. Waller Page 6 Kentucky / Waller
is the best available information and was developed consistent with sound 1
ratemaking practices. Further, the methods that I used to determine the Company’s 2
revenue requirement in this Case are consistent with the Company’s approach in 3
prior cases before this Commission while recognizing and honoring the 4
Commission’s findings in the Final Order of Case No. 2017-00349. 5
II. REVENUE DEFICIENCY 6
Q. WHAT IS THE AMOUNT OF ATMOS ENERGY’S REVENUE 7
DEFICIENCY? 8
A. The amount of revenue deficiency Atmos Energy seeks to recover in its proposed 9
rates is $14,455,544 as shown on line 10 of Schedule A. This deficiency is based on 10
the forecasted Test Period twelve months ended March 31, 2020, an average rate base 11
of $496,111,427 and a required rate of return on rate base of 7.95%. The amount 12
includes the annual amortization of the Company’s excess deferred income tax 13
liability of $1,463,766 which was approved in Case No. 2017-00349 subject to the 14
outcome of Case No. 2017-00481 and discussed in the testimony of Ms. Jennifer 15
Story. 16
Q. WHAT IS THE SOURCE OF FORECASTED TEST PERIOD ADJUSTED 17
OPERATING INCOME OF $27,701,923 SHOWN ON SCHEDULE A, LINE 2? 18
A. The forecasted Test Period adjusted operating income is determined in Schedule C 19
using inputs discussed in my testimony and the testimony of Company witnesses 20
Josh Densman and Dane Watson. 21

Direct Testimony of Gregory K. Waller Page 7 Kentucky / Waller
III. RATE BASE 1
Q. HOW DID YOU DETERMINE THE LEVEL OF RATE BASE FOR THE 2
TEST PERIOD? 3
A. The Test Period rate base of $496,111,427 is summarized in Schedule B-1, and 4
detailed in Schedules B-2 through B-6. Each component of the Test Period rate base 5
is a thirteen month average forecasted amount, unless noted otherwise. The 6
components of rate base are: net plant in service, construction work in progress, cash 7
working capital, regulatory assets and liabilities, and an allowance for other working 8
capital items consisting of materials and supplies and gas stored underground, less 9
customer advances for construction and deferred income taxes. 10
Q. HOW WAS THE TEST PERIOD GROSS PLANT IN SERVICE PROJECTED? 11
A. I began with actual per books gross plant as of June 30, 2018 including allocations of 12
shared plant as discussed by Ms. Gillham in her testimony. I used the capital 13
spending projection for July - September 2018 and the recently approved fiscal year 14
2019 budget for the months in fiscal year 2019 (October 2018 through September 15
2019). For the months of October 2019 - March 2020, I added plant additions in 16
monthly amounts equal to the previous year’s budget for Kentucky direct as well as 17
Shared Services and Division office investment. The absence of growth in direct 18
investment forecasted beyond the FY2019 budget is consistent with the 19
Commission’s findings and Final Order in Case No. 2017-00349. Projected plant 20
retirements were based on the level of retirements recorded in the six months of 21
actuals included in the Base Period (January 2018 through June 2018). Routine 22

Direct Testimony of Gregory K. Waller Page 8 Kentucky / Waller
retirements in each forecasted month were projected to continue at the same level in 1
the same month in future years. 2
Q. WHAT IS THE FORECASTED TEST PERIOD CAPITAL PROJECTION? 3
A. The forecasted Test Period capital investment projection is $87.76 million which is 4
comprised of three components - the direct capital spending for Kentucky for the 5
forecasted test period, the amount allocated to Kentucky resulting from capital 6
spending by the Kentucky/Mid-States Division’s general office and the amount 7
allocated to Kentucky resulting from capital spending by the SSU during the 8
forecasted test period. 9
Q. WHAT KEY PRIORITIES ARE ADDRESSED THROUGH THE KENTUCKY 10
DIRECT CAPITAL BUDGET? 11
A. Investments that focus on customer safety and system reliability are our highest 12
priorities for capital budgeting. The next priority is public improvements and state 13
and local public works projects such as highway relocations. The next priority is 14
customer growth. Atmos Energy continues to build good working relationships with 15
developers, economic development boards, and growing communities to meet the 16
needs of the customer and to accommodate customer growth on its system. Next in 17
order of priority, a modern fleet of vehicles and equipment (backhoes, safety 18
equipment, ditchers, first responder equipment, air compressors, welding machines, 19
etc.) allows us to maintain our system and continue to provide a reliable and efficient 20
level of service to our customers. To enhance the level of customer service provided 21
in the field, we also continue to make investments in new technology. Technology is 22
a strategic investment that will enable us to continue improving our business 23

Direct Testimony of Gregory K. Waller Page 9 Kentucky / Waller
processes, hold down operating costs, and meet the changing expectations of our 1
customers. 2
Q. WHAT IS KENTUCKY’S FY2019 DIRECT CAPITAL BUDGET? 3
A. The FY2019 direct capital budget for Kentucky is $86,655,268. 4
Q. HOW DID YOU ADJUST KENTUCKY’S FY2019 CAPITAL BUDGET IN 5
ORDER TO PREPARE THE FORECASTED TEST PERIOD CAPITAL 6
BUDGET? 7
A. For the months of the forecasted Test Period that extend beyond the Company’s 8
FY2019 budget, I added plant additions in monthly amounts equal to the previous 9
year’s budget. The absence of growth in direct investment forecasted beyond the 10
FY2019 budget is consistent with the Commission’s findings and Final Order in Case 11
No. 2017-00349. 12
Q. IS THE PIPE REPLACEMENT PROGRAM (“PRP”) ESTABLISHED IN 13
DOCKET NO. 2009-00354 COMPLETE? 14
A. No, it is not complete. While the Company’s effort to replace bare steel pipe is not 15
complete, it remains on track. Please see the testimony of Mr. Mark Martin and Mr. 16
Greg Smith for further discussion. Consistent with the discussion in Mr. Martin’s 17
testimony regarding PRP, I have forecasted all capital investment, inclusive of 18
planned bare steel replacement projects, into the plant forecast for this case. 19
Furthermore, the impact of the Company’s cumulative PRP investment is included 20
throughout the filing and reflected in the total revenue requirement proposed by the 21
Company. 22

Direct Testimony of Gregory K. Waller Page 10 Kentucky / Waller
Q. WHY HAS THE COMPANY CHOSEN TO FILE THIS CASE IN THIS 1
MANNER - WITH ALL CAPITAL INVESTMENT INCLUDED IN THE 2
FORWARD LOOKING TEST YEAR? 3
A. The Company has chosen to file this comprehensive general rate case in the manner 4
described above in order to preserve forward looking treatment on its capital 5
investment and related operating expenses. 6
Q. WHAT IS THE SIGNIFICANCE OF FORWARD LOOKING TREATMENT 7
IN RATEMAKING? 8
A. Forward looking treatment, as generally described in the context of rate of return 9
regulation, entails forecasting cost of service components and implementing rates 10
such that the timing of the Company’s revenues collected from customers aligns with 11
the timing of its cost of service. In allowing such treatment, regulators ensure that 12
the rates customers are paying reflect the utility’s cost of service and the value of 13
investment provided during the same time period. 14
Q. DOES EXISITNG KENTUCKY STATUTE ALLOW FORWARD LOOKING 15
TREATMENT? 16
A. Yes. KRS 278.192 allows for forward looking treatment in rate proceedings for the 17
utilities regulated by the Public Service Commission ("PSC" or "Commission"). 18
Atmos Energy’s Kentucky rates have been set on a forward looking basis going back 19
many years (at least since 1999) and were set on a forward looking basis in the 20
Company’s most recent rate case, Case No. 2017-00349. As a result, the Company 21
has chosen to file this case by exercising its option under the statute. 22

Direct Testimony of Gregory K. Waller Page 11 Kentucky / Waller
Q. DID THE COMPANY CONSIDER THE PROVISIONS OF KRS 278.192 1
WHEN PROPOSING THE PRP IN 2009? 2
A. Yes. Given that Kentucky statute allows the Commission to utilize forward looking 3
treatment, which it has applied without exception for many years to the Company’s 4
Kentucky rates, the Company proposed a pipe replacement mechanism that 5
maintained forward looking treatment and made it a cornerstone of its proposal. The 6
Company viewed that proposal as consistent with the statute. 7
Q. WHAT WOULD BE THE DISADVANTAGE OF ELIMINATING FORWARD 8
LOOKING TREATMENT ON THE COMPANY’S INVESTMENT? 9
A. Eliminating forward looking treatment would result in a regulatory construct that 10
systematically prevents the Company from earning its authorized return on equity 11
("ROE"). 12
Q. WHAT CAUSES A FILING BASED ON HISTORIC COST OF SERVICE TO 13
SYSTEMATICALLY PRODUCE REVENUES LOWER THAN THOSE 14
REQUIRED TO ALLOW A UTILITY TO EARN ITS AUTHORIZED 15
RETURN ON EQUITY? 16
A. Regulatory lag. If a Company must invest capital, experience depreciation on its 17
investment, and support a given level of operating expenses in one time period but 18
wait until a future time period to recover those costs, it cannot mathematically cover 19
its total cost of service (including return) in a timely fashion. This is the definition of 20
regulatory lag and it is especially harmful when a utility is in an era of increasing 21
capital investment requirements (as is the case for virtually every public gas utility in 22
America today). Atmos Energy’s 2019 capital investment plan for Kentucky calls for 23

Direct Testimony of Gregory K. Waller Page 12 Kentucky / Waller
investment that is almost four times its forecasted level of depreciation. The 1
additional depreciation expense alone forecasted in this case for the forward looking 2
test year given that level of investment is $2.1 million. At that rate, regulatory lag 3
would systematically cause the Company to fail to earn its authorized return, should 4
rates be set on a time period that does not include forward looking treatment. 5
Q. HOW WAS THE KENTUCKY/MID-STATES GENERAL OFFICE CAPITAL 6
BUDGET DEVELOPED? 7
A. The capital budget for the Kentucky/Mid-States Division general office was 8
developed in conjunction with Kentucky’s capital budget as well as the capital 9
budgets for all other rate divisions within the Division as part of the Division’s total 10
capital budget. The Division general office budget for the forecasted Test Period is 11
$59,333, $29,536 of which is allocated to Kentucky for ratemaking purposes. 12
Q. WHAT IS THE SHARED SERVICES FORECASTED TEST PERIOD 13
CAPITAL INVESTMENT PROJECTION FOR THIS PROCEEDING? 14
A. The Shared Services projection for the forecasted Test Period is $22.50 million, 15
$1.07 million of which is allocated to Kentucky for ratemaking purposes. 16
Q. HOW WAS THE TEST PERIOD ACCUMULATED DEPRECIATION 17
PROJECTED? 18
A. I began with actual per books accumulated depreciation as of June 2018 including 19
allocations as discussed by Ms. Gillham in her testimony. For the months of July 20
2018 through the end of the test year, I added projected depreciation expenses 21
(described later in my testimony) and deducted the same retirements that were 22
projected for gross plant. 23

Direct Testimony of Gregory K. Waller Page 13 Kentucky / Waller
Q. HOW DID YOU DETERMINE THE AMOUNT OF TEST PERIOD 1
CONSTRUCTION WORK IN PROGRESS (“CWIP”) TO INCLUDE IN RATE 2
BASE? 3
A. I began with actual per books CWIP as of June 2018 including allocations. I reduced 4
that amount to exclude the allowance for funds used during construction on projects 5
on which it was recorded. I concluded that the June 2018 CWIP balances were 6
reasonable estimates of future CWIP balances through the forecasted Test Period. By 7
leaving the amount of CWIP level through the end of the test year I in effect assumed 8
that projected capital projects would be closed to gross plant at the same rate at 9
which capital costs were incurred and booked to construction work in progress. My 10
methodology also ensures that the Company recovers these investments and 11
associated return once and only once as the amount of forecasted capital expenditures 12
will equal the amount of new gross plant additions by holding the level of CWIP 13
constant throughout the forecasted Test Period. 14
Q. HOW DID YOU DETERMINE THE AMOUNT OF TEST PERIOD CASH 15
WORKING CAPITAL ALLOWANCE TO INCLUDE IN RATE BASE? 16
A. Recognizing the Commission’s findings and Final Order in Case No. 2017-00349, 17
the Company prepared a lead-lag study to calculate its Cash Working Capital 18
requirement. The lead-lag study is sponsored by Company Witness Mr. Joe Christian 19
and is discussed in his testimony. 20

Direct Testimony of Gregory K. Waller Page 14 Kentucky / Waller
Q. HOW WAS THE TEST PERIOD AMOUNT OF MATERIAL AND SUPPLIES 1
DETERMINED? 2
A. I calculated the 13 month average amount of materials and supplies in the forecasted 3
Test Period using average actual balances recorded in the six months of actuals 4
included in the Base Period (January 2018 - June 2018). The Company does not 5
anticipate a significant change in the amount of materials and supplies in the test 6
year. The calculation method maintains the historic level of materials and supplies 7
while smoothing out any historic month to month fluctuations. 8
Q. HOW WAS THE AMOUNT OF GAS IN STORAGE DETERMINED? 9
A. The projected amount of gas in storage is discussed in Mr. Josh Densman’s 10
testimony. 11
Q. HOW DID YOU PROJECT THE AMOUNT OF TEST PERIOD CUSTOMER 12
ADVANCES FOR CONSTRUCTION? 13
A. I calculated the amount of customer advances in the forecasted Test Period based on 14
the average of actual amounts booked in the base period from January 2018 to June 15
2018. The Company does not anticipate a significant change in the amount of 16
customer advances in the test year. The calculation method maintains the historic 17
level of customer advances while smoothing out any historic month to month 18
fluctuations. 19
Q. DID YOU PROPOSE ANY ADJUSTMENTS FOR ANY REGULATORY 20
ASSETS AND LIABILITIES? 21
A. Yes. I included the 13 month average of the projected unamortized balance of two 22
regulatory assets and one regulatory liability. I have included a regulatory asset for 23

Direct Testimony of Gregory K. Waller Page 15 Kentucky / Waller
the unamortized balance of the rate case expenses deferred by the Company in Case 1
No. 2017-00349 per the Final Order. I am also proposing a regulatory asset for the 2
unamortized balance of projected rate case expenses that the Company projects to 3
incur in the context of this proceeding. The Company projects rate case expenses 4
totaling $337,304. I am proposing a three year amortization of these costs in 5
recognition of the Commission’s findings and Final Order in Case No. 2017-00349. 6
The amortization expense is included in O&M and the details concerning the 7
regulatory assets are documented on Schedule F.6 in FR 16(8)(f). I also included the 8
13 month average of the projected unamortized balance of the excess deferred 9
income tax liability that is discussed in the testimony of Company witness Ms. 10
Jennifer Story. 11
Q. DOES THE COMPANY’S RATE FILING REFLECT A PROJECTION OF 12
ACCUMULATED DEFERRED INCOME TAX (“ADIT”)? 13
A. Yes. ADIT balances are projected in a manner consistent with the Commission’s 14
findings and Final Order in Case No. 2017-00349. The projection excludes ADIT 15
items consistent with the Commission’s findings and Final Order in Case No. 2017-16
00349. In addition to the ADIT items specifically discussed in that Order, I have also 17
removed the ADIT items corresponding to Director’s stock expense and prepayments 18
consistent with their removal from O&M and rate base respectively as discussed 19
elsewhere in my testimony. 20

Direct Testimony of Gregory K. Waller Page 16 Kentucky / Waller
Q. DID YOU PREPARE A RECONCILIATION OF TEST PERIOD RATE BASE 1
AND CAPITALIZATION? 2
A. Yes. To comply with section 16(6)(f) of 807 KAR 5:001, I prepared the 3
reconciliation in Schedule FR 16(6)(f). It shows the differences between the Test 4
Period average rate base and Test Period end capital that result from using 13-month 5
averages in rate base, certain balance sheet items not being included in rate base as 6
well as amounts included in rate base for particular categories that differ from the 7
amount included on the balance sheet. 8
IV. O&M BUDGETING PROCESS 9
Q. WHAT ARE THE OBJECTIVES OF THE COMPANY’S O&M BUDGETING 10
PROCESS? 11
A. The objectives of the Company’s O&M budgeting process are to: (1) formalize the 12
process of identifying the anticipated costs of operating and maintaining Atmos 13
Energy’s systems each year; (2) ensure that all policies and procedures associated 14
with the annual budgeting process are consistently adhered to by the functional 15
managers and officers; (3) assess the appropriateness of routine maintenance 16
requirements and non-capital expenditures proposed by the functional managers and 17
officers to ensure that the amounts are adequate to deliver safe, reliable and efficient 18
natural gas service to the Company’s customers; and (4) ensure that the O&M budget 19
properly reflects our strategic operational and financial plans. These objectives are 20
applicable to the Company as a whole as well as to its various division, state and 21
local level operations. 22

Direct Testimony of Gregory K. Waller Page 17 Kentucky / Waller
Q. CAN YOU DESCRIBE THE COMPANY’S O&M BUDGETING PROCESS? 1
A. Yes. O&M costs are budgeted on a fiscal year basis, which begins on October 1 of 2
each year (consistent with the seasonal operations of our business) and runs through 3
September 30 of the following year. Preparation of operating and construction 4
budgets for a fiscal year formally begins in late May of each year and culminates 5
with completion of final budgets in late August, just prior to the beginning of the 6
fiscal year. Budget preparation is based on meeting the four objectives described 7
above. Budgets are approved at multiple levels beginning with supervisors/managers 8
up through division leadership. Additional reviews are performed by corporate 9
executive operations management and their staff. High level reviews of the division 10
budgets are also performed by the Company’s senior executives who are presiding 11
members of the Company’s Management Committee. The Board of Directors must 12
review and approve the total Company budget before finalization and 13
implementation. This approval typically occurs in September of each year. 14
Q. WHAT ROLE DOES THE O&M BUDGETING PROCESS PLAY IN THE 15
COMPANY’S FINANCIAL PLANNING? 16
A. Atmos Energy’s Planning and Budgeting Department is responsible for financial 17
planning at the enterprise level. That department receives direction from the Board 18
of Directors concerning forward-looking financial objectives for the Company. 19
Planning and Budgeting is responsible, with significant input and collaboration from 20
division leadership, for translating those enterprise targets into a financial plan for 21
each division and rate jurisdiction. It is the collaboration between Planning and 22
Budgeting and division leadership that ensures that all four of the objectives 23

Direct Testimony of Gregory K. Waller Page 18 Kentucky / Waller
described above are met each year. Spending targets are established as a result of 1
this collaboration. 2
Q. SO FAR YOU HAVE DESCRIBED THE O&M BUDGETING PROCESS. 3
CAN YOU EXPLAIN HOW THE BUDGET IS PREPARED WITHIN THE 4
PARAMETERS OF THIS PROCESS? 5
A. Yes. The O&M budget is prepared by type of cost element, such as labor, benefits, 6
transportation, rents, office supplies, etc. Within each cost element we budget 7
expenses at the sub-account level. The prior year’s actual costs, year-to-date actual 8
costs and budgeted costs for the remainder of the fiscal year are used as guidelines 9
for budgeting by functional managers and officers. The budgets are prepared using a 10
web-based software tool called PlanIt. This tool allows cost center owners to enter 11
their budgets and for management to review budgets using a number of standard and 12
ad hoc reports. 13
Q. ARE THESE BUDGETS PREPARED BY FERC ACCOUNT? 14
A. No. In our experience, FERC accounts do not provide a sufficient level of detail to 15
enable us to understand the costs within each account. For budgeting purposes (and 16
subsequent managing of expenses), we need more individualized expense types that 17
relate to the operation of each cost center. FERC accounts do not provide that level 18
of detail. However, we do identify our expenditures by FERC account as well as 19
expense type. This provides a timely analysis of the type of charges being expensed 20
by FERC account. 21

Direct Testimony of Gregory K. Waller Page 19 Kentucky / Waller
Q. HOW DOES ATMOS ENERGY CONVERT ITS O&M BUDGET BY COST 1
ELEMENT INTO FERC ACCOUNTS? 2
A. To convert our budget and forecast to FERC accounts, prior year actual expenditures 3
are downloaded from the general ledger by FERC account and cost element. A 4
calculation is then made to determine within each cost element type the percentage of 5
spending attributable to each FERC account. Each percentage factor was then 6
applied to the fiscal year 2019 budget and test period forecast by cost type to develop 7
a budget and Test Period forecast by FERC account. 8
V. CONTROL AND MONITORING PROCESSES 9
Q. DOES THE COMPANY EMPLOY ANY METHODOLOGY TO MONITOR 10
AND CONTROL O&M ACCORDING TO BUDGETED LEVELS? 11
A. Yes. Atmos Energy utilizes variance monitoring to ensure financial quality control of 12
O&M expenses by formalizing the analysis of variances by cost type and cost center. 13
On a quarterly basis, the Division presents actual to budget variances with 14
explanation to the Company’s Management Committee, SSU department heads, 15
select Board of Directors members and external auditors at a formal Quarterly 16
Performance Review. The goal is to keep all levels of management informed of our 17
O&M spending in comparison to budgeted amounts, in order to allow management 18
to react to unanticipated events on a timely basis. 19
Q. ARE O&M VARIANCES EVALUATED MORE FREQUENTLY THAN ON A 20
QUARTERLY BASIS? 21
A. Yes. The Kentucky Mid-States Division Finance Department conducts a thorough 22
review of O&M actual to budget variances each month. 23

Direct Testimony of Gregory K. Waller Page 20 Kentucky / Waller
Q. PLEASE DESCRIBE YOUR MONTHLY VARIANCE REVIEW PROCESS. 1
A. The process begins by examining, at the Division level, significant variances by cost 2
type (labor, benefits, materials, rents, etc.). Significant variances are researched until 3
an explanation is found. Reasonable explanations could include events that affected 4
the entire Division or a particular cost center or region. In some cases, clarifying 5
information is sought from cost center owners to explain unusual variances or 6
transactions. For some cost types, clarifying analysis is provided by SSU 7
departments. If errors are found, they are most often corrected in the current month’s 8
business. Occasionally, however, errors are discovered after the books are closed, 9
and, depending on materiality, they are corrected in the following month’s business. 10
Q. DOES ANYONE ELSE WITHIN THE DIVISION HAVE THE ABILITY TO 11
MONITOR OR REVIEW O&M VARIANCES? 12
A. In addition to the research conducted by the Division Finance Department, each cost 13
center owner has the ability to run variance reports throughout the monthly closing 14
process. Because cost center owners are held accountable for significant variances to 15
budget, they conduct their own research and often contact the Division Finance 16
Department when they find errors or have questions about the expenses that were 17
charged to their cost centers. 18
Q. WHAT CONTROLS AND REPORTING ARE INVOLVED IN THE 19
MONTHLY CLOSE PROCESS REGARDING O&M VARIANCES? 20
A. Once the monthly books are closed, the SSU Financial Reporting department in 21
Dallas publishes (electronically) the monthly Atmos Energy Financial Package. This 22
package details the financial performance for Atmos Energy at the corporate and 23

Direct Testimony of Gregory K. Waller Page 21 Kentucky / Waller
division level. For each division, the report includes a comparative income 1
statement, operating statistics (volumes, total spending), and other financial details. 2
At the end of each quarter, narrative comments are provided by Division officers to 3
describe quarterly and YTD variances. Once complete, this Financial Package is 4
available to all Atmos Energy officers and Board members for review and is an 5
official Sarbanes-Oxley control document of the Company. On a quarterly basis, 6
once the package is complete, an online questionnaire generated by our Sarbanes-7
Oxley Compliance Tool is completed certifying that the Division Finance 8
Department has conducted a thorough review of the Division’s financial performance 9
and the Financial Package and all matters addressed therein. The Company’s 10
external auditors look for this certification as evidence of Sarbanes-Oxley 11
compliance. 12
After meeting the Financial Package control requirement, the Division 13
Finance Department publishes (electronically) detailed O&M reports that include 14
monthly and YTD variances for each cost center and these reports are then made 15
available to each cost center owner and their respective managers (managers, 16
Division Vice Presidents, and the Division President). This activity ensures that each 17
cost center owner receives the same information in the same format each month in a 18
timely fashion in order to make operational decisions and manage our operations 19
effectively and efficiently. 20

Direct Testimony of Gregory K. Waller Page 22 Kentucky / Waller
Q. HAS THE O&M VARIANCE MONITORING AND CONTROL PROCESS 1
YOU HAVE DESCRIBED ENABLED KENTUCKY TO OPERATE 2
REASONABLY WITHIN ITS BUDGET EACH YEAR? 3
A. Yes. As the table below demonstrates, the Company’s actual O&M expenditures 4
over the past five years in Kentucky have tracked closely to overall budgeted 5
amounts. 6
Fiscal Year
Actual $
Budget $
Over/(Under) $
Variance %
2017 $27,511 $27,657 $(146) (0.5)% 2016 $27,496 $26,191 $1,305 5.0% 2015 $27,922 $26,762 $1,160 4.3% 2014 $26,515 $26,804 ($289) (1.1)% 2013 $25,509 24,913 $596 2.4%
Dollars in thousands 7
Q. DO YOU HAVE AN OPINION REGARDING THE SIGNIFICANCE OF THE 8
HISTORICAL DATA REFLECTED IN THE TABLE ABOVE? 9
A. Overall, I believe that these results indicate that we have been successful in our 10
annual budgets in projecting and managing our O&M expense to the extent those 11
expenses are within our control. 12
Q. WHY IS THAT IMPORTANT? 13
A. This data demonstrates that the Company’s budgeting and control processes I have 14
described form a reasonable basis for purposes of the Company’s forecasted Test 15
Period O&M budget in this rate proceeding. 16

Direct Testimony of Gregory K. Waller Page 23 Kentucky / Waller
Q. WHAT ARE THE GOALS OF THE COMPANY’S PROCESS OF 1
CONTROLLING AND MONITORING CAPITAL EXPENDITURE 2
VARIANCES? 3
A. Variances from budgeted amounts are inherent in the process of making capital 4
expenditures. Our variance monitoring process exists to institute financial quality 5
control by formalizing the analysis of variances by budget category and 6
responsibility center in a process that identifies year-to-date spending variances. 7
The goal is to keep all levels of management informed of spending by category and 8
responsibility center relative to budgeted levels and to ensure that corrective action is 9
initiated on a timely basis. This supports decision-making related to the cost and 10
appropriate management of current and future capital projects. 11
Q. PLEASE DESCRIBE THE COMPANY’S PROCESS FOR CONTROLLING 12
AND MONITORING CAPITAL EXPENDITURE VARIANCES. 13
A. The Company’s process for controlling and monitoring capital expenditure variances 14
is utilized by each operating division as well as by Shared Services. At the division 15
level the Company’s capital budgeting system maintains projects in two broad 16
categories - Blanket Functionals and Specific Projects. The Blanket Functionals 17
include total capital authorizations of a similar type such as new services, leak repair, 18
short main replacements, small integrity/reliability projects, etc. Specific projects are 19
uniquely identified such as a specific highway relocation project, replacement of 20
work equipment, or some larger significant integrity/reliability project. 21
Once a project has been entered in the capital budget system a request for 22
authorization is submitted. If during the course of a project, field management 23

Direct Testimony of Gregory K. Waller Page 24 Kentucky / Waller
identifies that the costs of the project will exceed approved amounts, a request for 1
supplemental funding may be submitted. All expenditures above authorized 2
appropriation, as well as expenditures for unbudgeted projects or variances on 3
budgeted and approved projects, must be approved at the appropriate levels within 4
the Company. 5
In FY2015 the Company began utilizing a monthly capital forecast module 6
through its accounting system PowerPlan. The forecast module is updated 7
throughout the month by Project Specialists, Operation Supervisors and Operation 8
Managers as known and measurable changes occur. At the end of each month, the 9
forecast for that specific month is updated with actuals and closed to future charges 10
as part of the monthly closing process. Once current month actuals have posted, the 11
Project Specialists, Operations Supervisors and Operations Managers are given two 12
to three days to make final updates to their respective projects. Once complete, the 13
forecasts are reviewed by the Operations Supervisors, Operations Managers and the 14
VP Operations. A final review of the forecast is performed by the division Finance 15
Department. The VP of Finance communicates to the corporate Plant Accounting 16
Department that the forecast is approved. A snapshot of the forecast is then taken by 17
Plant Accounting for archiving. Upon completion of the snapshot the forecast 18
module is reopened for changes as they become known and measurable during the 19
course of the new month. 20

Direct Testimony of Gregory K. Waller Page 25 Kentucky / Waller
VI. FORECASTED TEST PERIOD O&M BUDGET 1
Q. WHAT IS THE FORECASTED TEST PERIOD USED IN THIS RATE 2
APPLICATION? 3
A. The forecasted Test Period is April 1, 2019 through March 31, 2020. 4
Q. HOW WAS THE FORECASTED TEST PERIOD BUDGET DEVELOPED? 5
A. The basis for the forecasted Test Period is our FY2019 budget. Consistent with our 6
normal annual budgeting timelines, this budget was prepared during the summer of 7
2018 and approved by the Board of Directors in September of 2018. This budget 8
was prepared in the manner I described earlier. The forecasted Test Period includes 9
the last six months of FY2019 and the first six months of FY2020. I will describe the 10
methodology used for the projection period in detail below. The FY2019 O&M 11
budget and forecasted Test Period projection were converted into FERC account 12
detail using the method described above. 13
Q. WHAT ARE THE COMPONENTS OF O&M FOR THE FORECASTED TEST 14
PERIOD? 15
A. The forecasted Test Period O&M is comprised of three parts: expenses incurred and 16
booked directly in Kentucky (rate division 009), allocated expenses from the 17
Division General Office (rate division 091), and allocated expenses from SSU 18
(comprised of rate divisions 002 and 012). I will describe the methodology used for 19
the projection for each of the three components. 20

Direct Testimony of Gregory K. Waller Page 26 Kentucky / Waller
Q. WHAT COMPRISES THE BASE PERIOD LEVEL OF COST FILED IN THIS 1
RATE APPLICATION? 2
A. The Base Period level of cost is January 1, 2018 through December 31, 2018. It is 3
composed of six months of actual results through June 2018 and six months of our 4
FY2018 and FY2019 budgets. 5
Q. WHAT IS THE DIRECT O&M FOR THE BASE PERIOD? 6
A. $15,500,391. 7
Q. WHAT IS THE DIRECT O&M BUDGET FOR THE FORECASTED TEST 8
PERIOD? 9
A. $14,458,592. 10
Q. WHAT IS THE DIFFERENCE BETWEEN THE BASE PERIOD O&M AND 11
TEST PERIOD O&M? 12
A. The difference is a decrease of $1,041,799 and reflects adjustments I have made for 13
labor and benefits, rent, other O&M and bad debt. 14
Q. PLEASE EXPLAIN YOUR ADJUSTMENT FOR LABOR AND BENEFITS. 15
A. The labor forecast for the forecasted Test Period is based on the Company’s approved 16
FY2019 budget. As part of the normal budgeting process, each employee’s total 17
salary, expected capital / expense ratio and expected standby and overtime amounts 18
are included. While there is always a normal level of position vacancy at any given 19
point in time, we strive to fill open positions in a timely manner when and if filling 20
the position is justified by current workload. The Base Period level of total labor 21
expenditures represents a fully staffed level minus the normal level of vacancies and 22
employee levels are projected to remain relatively constant from the base period to 23

Direct Testimony of Gregory K. Waller Page 27 Kentucky / Waller
the test period. Base pay increases go into effect each October 1 and averaged 3.0% 1
for the increases that are effective October 1, 2018. These increases are captured as 2
part of the FY2019 budget. An adjustment was made as part of the forecast to 3
account for an average wage increase of 3.0% to become effective October 1, 2019. 4
The 3.0% is consistent with the average level of increases from the past several 5
years. Overall, direct labor expense is projected to decrease $179,909 from the base 6
period to the test period. 7
Benefits are projected as a fixed benefit load percentage of labor expense plus 8
an amount for workers’ comp insurance. The Test Period benefits expense of 9
$1,696,574 is $16,969 lower than the base period. 10
Q. PLEASE EXPLAIN YOUR ADJUSTMENT RELATING TO RENT. 11
A. Unlike other O&M categories that are likely to increase with normal inflation, our 12
building rents are driven by leases already in place and can therefore be projected 13
with a high level of accuracy. Overall, direct Rent, Utilities and Maintenance is 14
projected to decrease $102,990 from the base period. 15
Q. PLEASE EXPLAIN YOUR ADJUSTMENT RELATING TO OTHER O&M. 16
A. Other O&M consists of all expenses except labor, benefits, rent and bad debt. In 17
filings involving forward looking test periods, the Company normally includes in 18
O&M its most recent budget without adjustments for the months where the budget 19
and test year overlap and applies an inflation factor to these O&M categories for 20
months when the forward looking test period extends beyond the Company’s budget. 21

Direct Testimony of Gregory K. Waller Page 28 Kentucky / Waller
However, recognizing the Commission’s findings in Case No. 2013-00148,1 I have 1
not inflated these O&M categories above budgeted levels in this proceeding. 2
Q. PLEASE EXPLAIN YOUR ADJUSTMENT RELATING TO BAD DEBT. 3
A. Our goal is to keep bad debt no higher than 0.50% of residential, commercial and 4
public authority margin during any given year. We work vigorously to collect bad 5
debts and reduce the impact of bad debt expense on customers. To arrive at the bad 6
debt projection of $341,050, I calculated 0.50% of residential, commercial and public 7
authority margin from the revenue projection in the direct testimony of Company 8
witness Mr. Josh Densman. This projection is $208,293 lower than the Base Period. 9
Q. WHAT IS THE AMOUNT OF THE DIVISION’S GENERAL OFFICE O&M 10
ALLOCATED TO KENTUCKY FOR THE BASE PERIOD? 11
A. $4,835,070. 12
Q. WHAT IS THE AMOUNT OF THE DIVISION’S GENERAL OFFICE O&M 13
BUDGET ALLOCATED TO KENTUCKY FOR THE FORECASTED TEST 14
PERIOD? 15
A. $5,442,099. 16
Q. PLEASE DISCUSS THE DIFFERENCES BETWEEN THE GENERAL 17
OFFICE BASE PERIOD AND FORECASTED TEST PERIOD AMOUNTS. 18
A. The difference is $607,029 and reflects adjustments I have made for labor and 19
benefits, rent and other O&M. The budgeting process and forecast methodologies 20
are identical for both direct O&M and General Office O&M. Therefore, the 21
1 Case No. 2013-00148, Application of Atmos Energy Corporation for an Adjustment of Rates and Tariff Modifications (Ky. PSC Apr. 22, 2014) at 16-17.

Direct Testimony of Gregory K. Waller Page 29 Kentucky / Waller
categories of adjustments made to forecast General Office O&M are also the same as 1
direct. 2
Q. WHAT IS THE AMOUNT OF SHARED SERVICES O&M ALLOCATED TO 3
KENTUCKY FOR THE BASE PERIOD? 4
A. $8,195,676. 5
Q. WHAT IS THE AMOUNT OF THE SHARED SERVICES O&M BUDGET 6
ALLOCATED TO KENTUCKY FOR THE FORECASTED TEST PERIOD? 7
A. $7,324,291. 8
Q. PLEASE DISCUSS THE DIFFERENCES BETWEEN THE SHARED 9
SERVICES BASE PERIOD AND FORECASTED TEST PERIOD AMOUNTS. 10
A. The difference is a decrease of $871,385. The SSU budget is prepared in a fashion 11
consistent with that of the Division. Once the SSU department heads complete, 12
submit and get approval for their budgets, the appropriate level of expenses are 13
allocated to the Kentucky rate jurisdiction per the methodologies described in Ms. 14
Laura Gillham’s testimony. 15
Q. WHO MONITORS SHARED SERVICES BILLINGS TO THE DIVISION? 16
A. Shared Services expense billings are reviewed as part of our monthly close process 17
described earlier. The Division Finance Department is then responsible to contact 18
Accounting in Dallas and obtain an explanation for any significant variances. 19
Q. WHAT IS THE TOTAL FORECASTED TEST PERIOD O&M THAT 20
RESULTS FROM THE SUM OF THE DIRECT, GENERAL OFFICE AND 21
SSU COMPONENTS? 22
A. $27,224,981. 23

Direct Testimony of Gregory K. Waller Page 30 Kentucky / Waller
Q. DO THE FORECASTED O&M AMOUNTS DISCUSSED IN YOUR 1
TESTIMONY INCLUDE THE RATEMAKING ADJUSTMENTS 2
QUANTIFIED ON SCHEDULE C-2? 3
A. Yes. Schedule C-2 contains six ratemaking adjustments. 4
• Adjustment for Sales and Promotional Advertising Expenses 5
The first adjustment removes $196,297 of sales and promotional advertising 6
from test year sales expense. It is quantified on Schedule F.4. 7
• Adjustment for Regulatory Asset Amortization Expenses 8
The second adjustment adds $180,927 to test year administrative and general 9
expense to account for the three year amortization of the expected costs 10
pertaining to this case and Case No. 2017-00349. The amounts are quantified 11
on Schedule F.6. 12
• Adjustment for Expense Report Exclusion 13
The third adjustment removes $84,083 of certain expense report items from 14
test year administrative and general expense. The Company’s goal is to 15
ensure that its Kentucky rates rest upon a sound foundation of unquestionable 16
costs. The Company is committed to achieving that goal even if it means 17
foregoing recovery of a certain amount of legitimate business expense in an 18
effort to ensure that there can be no question about what remains. The 19
expense report exclusion adjustment is made to exclude certain cost items of 20
which the Company does not intend to seek recovery from its customers in 21
this case. The excluded amounts are quantified on Schedule F.8 and occur in 22
Kentucky as well as the Division General Office and SSU. 23

Direct Testimony of Gregory K. Waller Page 31 Kentucky / Waller
• Adjustment for Incentive Compensation 1
The fourth adjustment removes incentive compensation expenses associated 2
with all of its employees. This adjustment is $962,983. The Company 3
believes incentive compensation is a critical part of the ability to attract and 4
retain employees at competitive market rates, and should be included as a 5
recoverable O&M expense. Atmos Energy is not unique in making incentive 6
compensation part of the overall compensation package that it provides to its 7
employees. The Company designs its total compensation package to be in 8
the middle of the job market in which we compete for talent. This means that 9
there are as many companies offering total compensation above Atmos 10
Energy’s package as there are below it for comparable jobs. It is important to 11
understand that “total compensation” does not represent only base salary, but 12
also includes bonuses, benefits, retirement, etc. Because Atmos Energy falls 13
in the middle of the job market in terms of the overall compensation 14
packages, the Company believes the incentive compensation costs that are a 15
component of this overall compensation package are reasonable and should 16
be recovered as part of revenue requirement. In order to meet the Company’s 17
incentive pay criteria, Company employees must work together to ensure that 18
the Company operates efficiently and effectively. Efficient and effective 19
operations translate into lower costs and therefore into lower rates for 20
customers. Strong financial performance for the Company and lower rates 21
for customers are, therefore, not mutually exclusive. However, in recognition 22

Direct Testimony of Gregory K. Waller Page 32 Kentucky / Waller
of the Commission’s findings in Case No. 2013-001482, I have removed this 1
expense in this proceeding for the sole purpose of simplifying the regulatory 2
review process. This adjustment is quantified on Schedule F.10. 3
• Adjustment for Certain Retirement Plan Expenses 4
The fifth adjustment removes costs associated with the 401(k) match for 5
employees that also participate in the Company’s pension plan. This 6
adjustment is $518,619. While the Company supports the prudency of these 7
costs as part of its comprehensive rewards program for employees, I have 8
removed these costs in the same manner in which they were removed from 9
revenue requirement in Case No. 2017-00349 consistent with the 10
Commission’s findings and Final Order for the sole purpose of simplifying 11
the regulatory review process in the current rate case proceeding. This 12
adjustment is quantified on Schedule F.11. 13
• Adjustment for Directors’ Stock Expenses 14
The sixth adjustment removes costs associated with stock awarded to 15
members of the Board of Directors as part of their compensation. This 16
adjustment is $189,721. While the Company supports the prudency of these 17
costs as part of its market competitive compensation package for Directors, I 18
have removed these costs in the same manner in which they were removed 19
from revenue requirement in Case No. 2017-00349 consistent with the 20
Commission’s findings and Final Order for the sole purpose of simplifying 21
2 See id. at 19-20.

Direct Testimony of Gregory K. Waller Page 33 Kentucky / Waller
the regulatory review process in the current rate case proceeding. This 1
adjustment is quantified on Schedule F.11. 2
Q. DO YOU BELIEVE THAT THE FORECASTED TEST PERIOD O&M 3
BUDGET YOU HAVE PRESENTED IS THE MOST REASONABLE 4
ESTIMATE OF COSTS FOR THE TEST PERIOD USED IN THIS 5
PROCEEDING? 6
A. Yes. It is the best estimate we have of the Kentucky jurisdiction’s future operating 7
and maintenance expenses. 8
VII. DEPRECIATION EXPENSE AND TAXES OTHER THAN 9 INCOME TAXES 10
Q. WHAT IS THE DEPRECIATION EXPENSE FOR THE BASE PERIOD? 11
A. The amount of depreciation expense for the Base Period is $20,483,034. 12
Q. WHAT IS THE DEPRECIATION EXPENSE FOR THE FORECASTED TEST 13
PERIOD? 14
A. The amount of depreciation expense for the forecasted Test Period is $22,541,774. 15
Q. PLEASE DISCUSS THE DIFFERENCES BETWEEN THE BASE PERIOD 16
AND FORECASTED TEST PERIOD DEPRECIATION AMOUNTS. 17
A. Proposed depreciation rates for the forecasted Test Period are discussed in the 18
testimony of and supported by Company witness Mr. Dane Watson. The depreciation 19
rates are applied to the applicable categories of plant for the Kentucky jurisdiction as 20
well as the General Office and Shared Services division, resulting in total 21
depreciation expense. The amounts allocated from the General Office and SSU to 22

Direct Testimony of Gregory K. Waller Page 34 Kentucky / Waller
Kentucky are based upon the cost allocation methodology more fully described in 1
Ms. Laura Gillham’s testimony. 2
Q. WHAT IS THE EXPENSE LEVEL FOR TAXES, OTHER THAN INCOME 3
TAXES FOR THE BASE PERIOD? 4
A. $6,491,574. 5
Q. WHAT IS THE LEVEL OF TAXES, OTHER THAN INCOME TAXES FOR 6
THE FORECASTED TEST PERIOD? 7
A. $7,511,837. 8
Q. PLEASE DISCUSS THE DIFFERENCES BETWEEN THE BASE PERIOD 9
AND FORECASTED TEST PERIOD. 10
A. The difference is an increase of $1,020,263. The components are itemized by type of 11
tax on Schedule C.2.3 F. For all months of the forecasted Test Period (April 1, 2019 12
- March 31, 2020), payroll taxes have been escalated from the FY2019 budget to 13
account for base pay increases consistent with my labor forecast. The monthly 14
accrual for the Public Service Commission Assessment is based on the assessment 15
rate and projected Test Period revenues. The DOT transmission user tax has been 16
held constant from the Base Period. The Commission’s findings and Final Order in 17
Case No. 2017-00349 rejected the Company’s traditional methodology for 18
forecasting ad valorem expense. Therefore, I developed the ad valorem forecast for 19
the current proceeding by adopting the methodology most recently used and 20
approved in the Company’s PRP filings. That methodology develops an historical 21
ratio of ad valorem expense to plant and applies the ratio to projected levels of plant 22
for the Forecasted Test Period. The amount of taxes allocated from the Division 23
Direct Testimony of Gregory K. Waller Page 35 Kentucky / Waller
General Office and SSU is based on the allocation methodologies discussed in the 1
Cost Allocation Manual. 2
VIII. CONCLUSION 3
Q. DO YOU BELIEVE THAT THE FORECASTED TEST PERIOD COST OF 4
SERVICE COMPONENTS YOU HAVE PRESENTED REPRESENT THE 5
MOST REASONABLE ESTIMATE OF COSTS FOR THE TEST PERIOD 6
USED IN THIS PROCEEDING? 7
A. Yes. The cost of service forecast is the best projection of the Company’s future cost 8
of service. The expenses and investments for which the Company seeks recovery 9
have been prudently budgeted and will be prudently incurred. 10
Q. DOES THIS CONCLUDE YOUR TESTIMONY? 11
A. Yes. 12

COMMONWEALTH OF KENTUCKY
BEFORE THE PUBLIC SERVICE COMMISSION
IN THE MATTER OF RATE APPLICATION OF ATMOS ENERGY CORPORATION
) ) )
Case No. 2018-00281
CERTIFICATE AND AFFIDAVIT
The Affiant, Gregory K. Waller, being duly sworn, deposes and states that the prepared testimony attached hereto and made a part hereof, constitutes the prepared direct testimony of this affiant in Case No. 2018-00281, in the Matter of the Rate Application of Atmos Energy Corporation, and that if asked the questions propounded therein, this affiant would make the answers set forth in the attached prepared direct pre-filed testimony.
STATE OF k;co..s COUNTY OF Dct l \ ct..s
1h SUBSCRIBED AND SWORN to before me by Gregory K. Waller on this the 212_ day of September, 2018.
My Commission Expires:
1111111 .:-~~~~{~ GISELLE R HEROY ~~(:*'':<;'~NotaryPublic, State of Texas -;,.''{;, ...... !../fJ Comm. Expires 09-01-2020
,...., ~OF~~,,
'''''u''''' Notary ID 13080484-2

Exhibit GKW‐1Case No. 2018‐00281
ATMOS ENERGY CORPORATION
Allocation of Atmos Corporate (Co. # 10) Cost Based on 12 Month Period Ended 9/30/17
30 60 20 20 50 70 80 180
ALL COMPANIES
A. Composite Allocation Factor: Total West Tex Div CO/KS Div LA Div 007 LA Div 077Kentucky/
MidStates Div Mississippi Div Mid-Tex Div Atmos P/L
Gross Direct PP&E $ 11,351,084,851 775,535,809 627,897,312 271,823,262 684,712,282 1,207,787,075 644,175,624 4,336,467,256 2,741,038,028
Average Number of Customers # 3,119,142 301,348 252,821 74,063 275,380 341,608 247,554 1,625,785 314
Total O&M Expense * $ 405,258,008 31,424,110 26,709,190 8,446,043 23,663,510 38,899,593 35,132,692 122,663,005 113,799,113
(* w/o Allocation )
Total Composite Factor
Gross Direct PP&E % 100.00% 6.84% 5.53% 2.39% 6.03% 10.64% 5.68% 38.20% 24.15%
Average Number of Customers % 100.00% 9.66% 8.11% 2.37% 8.83% 10.95% 7.94% 52.12% 0.01%
Total O&M Expense % 100.00% 7.75% 6.59% 2.08% 5.84% 9.60% 8.67% 30.27% 28.08%
Total Composite Factor for FY 2018 % 100.00% 8.08% 6.74% 2.28% 6.90% 10.40% 7.43% 40.20% 17.41%
212 232 234 303 Remainder
FY18=Co 233
AEM UCG Storage TLGS TLGP Remaining non reg
Gross Direct PP&E $ - 9,686,100 8,392,479 23,322,888 20,246,735
Average Number of Customers # - 6 264
Total O&M Expense * $ - 360,291 280,012 1,684,235 2,196,215
(* w/o Allocation ) -
Total Composite Factor 0Gross Direct PP&E % 0.00% 0.09% 0.07% 0.21% 0.17%
Average Number of Customers % 0.00% 0.00% 0.00% 0.00% 0.01%
Total O&M Expense % 0.00% 0.09% 0.07% 0.42% 0.54%
Total Composite Factor for FY 2018 % 0.00% 0.06% 0.05% 0.21% 0.24%

Exhibit GKW‐1Case No. 2018‐00281
Div # Division Name
Sept ' 17 Direct Property Plant &
Equipment
Percent of MidStates Property
YE Sept '17 Total O &M w/o
922
Percent of MidStates O
& M
YE Sept '17 Avg Number of
Customers
Percent of MidStates Customers
STAT Sub account for customers
MidStates Allocation
Percent
(1) (2) (3) (4) (5) (6) (7)
09 KENTUCKY 575,632,189 47.80451 15,546,019 50.02596 175,989 51.51797 91C09 49.78281
93 TENNESSEE 528,207,480 43.86603 12,471,004 40.13078 142,529 41.72309 91C93 41.90663
96 VIRGINIA 100,298,271 8.32947 3,058,883 9.84326 23,089 6.75894 91C96 8.31055
Total 1,204,137,941.10 100.00 31,075,905.39 100.00 341,607 100.00 100.00
Atmos Energy CorporationAtmos Energy Mid States Div
Development of Allocation Factors Effective October 1, 2017

Exhibit GKW‐2Case No. 2018‐00281
O&M by Cost Element
Base Test Difference Base Test Difference Base Test Difference Base Test Difference
Labor 5,297,266$ 5,117,357$ (179,909)$ 4,069,172$ 4,430,163$ 360,991$ 1,265,876$ 1,255,099$ (10,777)$ 10,632,314$ 10,802,619$ 170,305$
Benefits 1,713,543 1,696,574 (16,969) 1,319,018 1,447,463 128,445 441,831 525,466 83,635 3,474,391 3,669,503 195,112
Employee Welfare 125,322 108,482 (16,840) 2,011,243 1,685,635 (325,608) 701,347 590,242 (111,105) 2,837,912 2,384,359 (453,553)
Insurance 95,549 4,021 (91,528) 1,079,768 1,048,098 (31,669) 120,158 209,984 89,826 1,295,475 1,262,103 (33,372)
Rent, Maint., & Utilities 630,787 527,796 (102,990) 429,539 458,766 29,227 157,083 153,436 (3,647) 1,217,408 1,139,998 (77,410)
Vehicles & Equip 1,054,585 1,040,217 (14,368) 3,950 5,065 1,115 29,518 48,263 18,745 1,088,053 1,093,545 5,492
Materials & Supplies 901,818 673,337 (228,481) 55,693 58,056 2,363 102,522 95,563 (6,959) 1,060,032 826,956 (233,077)
Information Technologies 2,316 - (2,316) 1,154,671 1,310,217 155,546 41,606 90,560 48,954 1,198,593 1,400,776 202,184
Telecom 342,158 358,236 16,078 146,168 133,630 (12,538) 198,374 262,977 64,603 686,700 754,844 68,143
Marketing 189,590 153,182 (36,408) 13,666 14,312 645 163,938 194,334 30,396 367,194 361,827 (5,367)
Directors & Shareholders &PR - 242 242 356,562 362,946 6,385 - - - 356,562 363,188 6,627
Dues & Donations 113,262 71,067 (42,195) 30,076 36,500 6,424 41,273 81,176 39,903 184,611 188,743 4,132
Print & Postages 10,775 13,885 3,110 12,495 13,880 1,385 7,379 7,861 483 30,649 35,626 4,978
Travel & Entertainment 508,461 559,664 51,202 179,367 213,049 33,682 273,631 330,116 56,485 961,460 1,102,828 141,369
Training 21,115 20,109 (1,007) 67,268 72,013 4,745 37,112 49,616 12,504 125,496 141,738 16,243
Outside Services 3,926,150 3,705,636 (220,513) 881,310 851,986 (29,324) 1,291,835 2,063,447 771,612 6,099,295 6,621,069 521,774
Provision for Bad Debt 549,343 341,050 (208,293) - - - - - - 549,343 341,050 (208,293)
Miscellaneous 18,349 125,513 107,164 (3,614,289) (3,609,965) 4,323 (38,412) 8,811 47,223 (3,634,352) (3,475,641) 158,710
Total O&M Expenses 15,500,391$ 14,516,369$ (984,022)$ 8,195,676$ 8,531,813$ 336,137$ 4,835,070$ 5,966,951$ 1,131,881$ 28,531,137$ 29,015,133$ 483,996$
RateMaking Adjustments:Advertising Adjustments (184,693) (184,693) (10,926) (10,926) (679) (679) (196,297) (196,297)
Club Expenses - - - -
Expense Report Exclusions (34,636) (34,636) (27,018) (27,018) (22,429) (22,429) (84,083) (84,083)
Leases (19,375) (19,375) (19,375) (19,375)
Regulatory Asset Amortizations 180,927 180,927 - - 180,927 180,927
Incentive Compensation - - (461,238) (461,238) (501,744) (501,744) (962,983) (962,983)
Retirement Expense and Director's Stock (708,340) (708,340) (708,340) (708,340)
Grand Total 15,500,391$ 14,458,592$ (1,041,799)$ 8,195,676$ 7,324,291$ (871,385)$ 4,835,070$ 5,442,099$ 607,029$ 28,531,137$ 27,224,981$ (1,306,156)$
Kentucky SSU Division General Office Total

Direct Testimony of Josh C. Densman Page 1 Kentucky / Densman
BEFORE THE PUBLIC SERVICE COMMISSION
COMMONWEALTH OF KENTUCKY
APPLICATION OF ATMOS ENERGY ) ) CORPORATION FOR AN ADJUSTMENT ) Case No. 2018-00281 ) OF RATES AND TARIFF MODIFICATIONS )
TESTIMONY OF JOSH C. DENSMAN
I. INTRODUCTION 1
Q. PLEASE STATE YOUR NAME, POSITION AND BUSINESS ADDRESS. 2
A. My name is Josh C. Densman. I am Vice President of Finance for the 3
Kentucky/Mid-States Division (“Division”) of Atmos Energy Corporation (“Atmos 4
Energy” or the “Company”). My business address is 810 Crescent Centre Drive, 5
Suite 600, Franklin, Tennessee 37067. 6
Q. PLEASE BRIEFLY DESCRIBE YOUR CURRENT RESPONSIBILITIES, 7
AND PROFESSIONAL AND EDUCATIONAL BACKGROUND. 8
A. I am responsible for monitoring and analyzing the financial performance of the 9
Division, and implementing necessary actions based on those results. I also direct 10
the development of the Division’s annual budget. I have a Bachelor of Business 11
Administration from Baylor University. I have worked for Atmos Energy since 12
2005. I have served in a variety of positions of increasing responsibility prior to 13
assuming my current responsibility in 2012. 14

Direct Testimony of Josh C. Densman Page 2 Kentucky / Densman
Q. HAVE YOU SUBMITTED TESTIMONY BEFORE THE KENTUCKY 1
PUBLIC SERVICE COMMISSION (“COMMISSION”)? 2
A. Yes. I filed testimony in Case No. 2013-00148. 3
Q. HAVE YOU PREVIOUSLY SUBMITTED TESTIMONY ON MATTERS 4
BEFORE OTHER STATE REGULATORY COMMISSIONS? 5
A. Yes, I have filed testimony before the Tennessee Public Utility Commission in 6
Docket No. 12-00064. 7
Q. ARE YOU SPONSORING ANY OF THE FILING REQUIREMENTS IN THIS 8
CASE, AND, IF SO, WHICH REQUIREMENTS? 9
A. Yes. I am sponsoring the following filing requirements: 10
FR 16(7)(c) Description of all factors used in preparation of the forecast 11
test period - income statement, operation and maintenance 12
expenses, employee and labor expenses, capital construction 13
budget; 14
FR 16(7)(h) Financial Forecast (Revenues) 15
FR 16(7)(h)1 Operating Income Statement (Revenues) 16
FR16(7)(h)8 Mix of Gas Supply 17
FR 16(7)(h)14 Customer Forecast 18
FR 16(7)(h)15 Mcf Sales Volume Forecast 19
FR 16(8)(c) Jurisdictional operating income summary for both base and 20
forecast period with supporting schedules which provide 21
breakdowns by major account group and individual account 22
FR 16(8)(d) Summary of jurisdictional adjustments to operating income 23

Direct Testimony of Josh C. Densman Page 3 Kentucky / Densman
FR 16(8)(i) Comparative income statements, revenue and sales statistics, 1
base period, forecast period and two (2) years beyond 2
FR 16(8)(k) Comparative Financial Data 3
FR 16(8)(m) Revenue Summary for Both the Period and Forecasted Period 4
Q. ARE YOU SPONSORING ANY EXHIBITS? 5
A. Yes. I am sponsoring Exhibits JCD-1 - JCD-5. 6
Q. DO YOU ADOPT THESE FILING REQUIREMENTS AND EXHIBITS, 7
AND THEIR ASSOCIATED SCHEDULES, AND MAKE THEM PART OF 8
YOUR TESTIMONY? 9
A. Yes. 10
II. PURPOSE AND SUMMARY OF TESTIMONY 11
Q. WHAT IS THE PURPOSE OF YOUR TESTIMONY? 12
A. First, I will describe the methods used to forecast Company’s revenues and volumes 13
as they relate to the base period and test period in this case. Second, I will present 14
the test period forecast of revenues and volumes. 15
III. PROCESS OF FORECASTING OF REVENUES AND VOLUMES 16
Q. PLEASE DESCRIBE THE GOALS OF FORECASTING REVENUE AND 17
VOLUMES. 18
A. The goal of revenue forecasting, fundamentally, is to determine expected revenues 19
for business planning purposes. The primary emphasis of the “revenue” forecasting 20
process is the estimate of the Company’s gross margin, which is that portion of 21
revenues excluding purchased gas costs. Purchased gas costs, which are recovered 22

Direct Testimony of Josh C. Densman Page 4 Kentucky / Densman
through the Company’s Gas Cost Adjustment (“GCA”) mechanism, are calculated 1
only as a final step in the process, to forecast gross revenues. 2
Revenue forecasting is an essential element of Atmos Energy’s financial 3
planning and affects our level of operating and maintenance expenses, capital 4
investment, and cash flow requirements. 5
Q. WHAT TYPES OF FACTORS ARE CONSIDERED IN ATMOS ENERGY’S 6
REVENUE AND GROWTH FORECASTING PROCESS? 7
A. The forecast process can be segregated into two primary steps. The first step is an 8
analysis of revenue trends over recent years to determine a baseline reference. The 9
second step is the consideration of factors and issues expected to affect the budget 10
period. 11
First, the analysis of historical revenue trends quantifies the net customer 12
additions and Mcf requirements, by customer class. Using heating degree day 13
(“HDD”) data for the respective periods, the Mcf requirements are “weather-14
normalized” for residential, commercial and public authority sales customer classes. 15
The HDD is a measure of the difference between average daily temperature and a 65 16
degree Fahrenheit base. Upon completing the analysis of historic data, customer 17
growth and class usage trends may be identified. 18
Second, consideration is given to any factors that could either continue or 19
alter historical trends. These factors include, but are not limited to: gas supply price 20
outlook and consideration of its impact on the market, changing local economic 21
conditions that could influence customer growth and major industrial additions or 22
plant closings. 23

Direct Testimony of Josh C. Densman Page 5 Kentucky / Densman
Considered individually, these factors may have either a positive or negative 1
effect upon forecasted revenue streams. 2
Q. WHAT TIME PERIOD TYPICALLY FORMS THE BASIS FOR REVENUE 3
AND VOLUME FORECASTS? 4
A. Forecasts are typically prepared for Atmos Energy’s fiscal year, which runs from 5
October 1 to the following September 30. 6
Q. WHAT IS THE BASE PERIOD FOR THIS CASE? 7
A. The base period is January 1, 2018 through December 31, 2018. 8
Q. WHAT IS THE FORECASTED TEST PERIOD FOR THIS CASE? 9
A. The forecasted test period for this case is April 1, 2019 to March 31, 2020. 10
Q. DID THE COMPANY UTILIZE ITS TYPICAL REVENUE BUDGETING 11
PROCESS TO DEVELOP THE BASE PERIOD AND FORECASTED TEST 12
PERIOD REVENUES? 13
A. No. Although the simple two-step process of historical review and consideration of 14
forward-looking factors is the same, the annual budget process is not developed at 15
the level necessary for determining rate design billing determinants. For example, 16
the typical annual revenue budget is based upon financial statistics reported to the 17
customer class level; not to the rate classification / billing block level of detail. In 18
order to build rate case quality billing data, Atmos Energy produced bill frequency 19
reports to isolate correct determinants of bills rendered and volumes delivered by 20
customer class as well as by rate classification for the 12-month period ending June 21
30, 2018. This 12-month period serves as the “reference period” to be normalized 22
and upon which forward-looking adjustments may be applied, ultimately resulting in 23

Direct Testimony of Josh C. Densman Page 6 Kentucky / Densman
a forecast of billing determinants for the test year period of April 1, 2019 to March 1
31, 2020. 2
Q. IS THE PROCESS FOR DEVELOPING THE BASE PERIOD AND 3
FORECASTED TEST PERIOD REVENUES THE SAME AS PRIOR RATE 4
CASE FILINGS? 5
A. Yes. And it is notable that the Commission found the Company’s revenue forecast in 6
Case No. 2013-00148, Case No. 2015-00343, and Case No. 2017-00349 to be 7
reasonable and accepted the normalized base-rate revenues without adjustment. 8
Q. HOW WAS THE DATA FOR THE REFERENCE PERIOD GATHERED? 9
A. The unadjusted data for the reference period reflects the actual billing units and 10
margins for all services during the twelve months ending June 30, 2018. This data 11
was gathered from billing system reports for that period. Exhibit JCD-1 attached 12
hereto provides the actual monthly billing units and volumes by class of service for 13
the reference period ending June 30, 2018. 14
Q. WHAT STEPS WERE TAKEN TO FORECAST THE FUTURE TEST YEAR 15
FROM THE BASELINE REFERENCE PERIOD? 16
A. First, the Company assessed appropriate pro-forma adjustments to the reference 17
period to: 1) reflect known and measurable service contract changes, load changes, 18
new industries and industry closings, and 2) adjust firm residential, commercial and 19
public authority volumes to correlate to normal HDD’s. 20
Then, forward-looking adjustments were considered to account for net 21
customer growth or losses. 22

Direct Testimony of Josh C. Densman Page 7 Kentucky / Densman
A summary of annualized adjustments for each of these steps is shown on 1
Exhibit JCD-2 attached hereto. 2
Q. PLEASE DESCRIBE THE ADJUSTMENTS TO THE REFERENCE PERIOD, 3
INCLUDING KEY ASSUMPTIONS, FOR INDUSTRIAL SALES AND 4
TRANSPORTATION SERVICES. 5
A. Historical volume requirements for each transportation customer were reviewed, with 6
adjustments made to account for expected changes by service type for future periods. 7
For example, usage for a new industrial customer added midway through the 8
reference period would not be representative of its forecast test period requirements. 9
In this case, the customer’s volumes would need to be “annualized” to reflect usage 10
throughout the full twelve months. Adjustments were also made for industry 11
closings, expansions or reductions, and contract changes altering a customer’s 12
service type or rate schedule. These adjustments ensured that known and measurable 13
changes in industrial sales and transportation were reflected in our test period 14
forecast. Exhibit JCD-3 attached hereto summarizes the annualized impact of 15
industrial contract and volume changes, by service type. 16
Q. PLEASE DESCRIBE THE PROCESS EMPLOYED TO DETERMINE THE 17
ADJUSTMENT FOR WEATHER VARIANCES DURING THE REFERENCE 18
PERIOD. 19
A. Adjusting for variances from normal weather is a common practice. The 20
methodology for determining composite degree days was based on a process 21
instituted originally in Case No. 1999-070, which utilized the composite calculated 22
weighting weather data from Paducah, Lexington and Louisville, KY, Evansville, IN 23

Direct Testimony of Josh C. Densman Page 8 Kentucky / Densman
and Nashville, TN. The composite normal heating degree days were based upon the 1
same weighting of the five weather stations, applying the National Oceanic and 2
Atmospheric Administration (“NOAA”) HDD data averages for the twenty-year 3
period ending June 30, 2018. The Company has chosen a 20-year average HDD 4
basis based on analysis required in the Commission Order in Case No. 2013-00148 5
and approved in Commission Orders in both Case No. 2015-00343 and Case No. 6
2017-00349. Later, my testimony will describe this analysis. Exhibit JCD-4 7
attached hereto summarizes the monthly weather adjustment to the reference period 8
resulting from the 3.11% colder than normal period. Exhibit JCD-4 also provides 9
details of the calculations of the respective weather adjustment for the weather 10
sensitive residential, commercial and public authority classes. 11
Q. HOW ARE WEATHER NORMALIZATION ADJUSTMENT (“WNA”) 12
TARIFF REVENUES FACTORED INTO THE WEATHER ADJUSTMENT? 13
A. For the purpose of the weather adjustment, WNA revenues are ignored. The weather 14
adjustment calculates the normalized volumes associated with normal weather, which 15
will be priced out to demonstrate weather normalized revenues. Actual WNA 16
revenues compensate for only a portion of those variances; those occurring during 17
the WNA billing months of November 1 through April 30 each winter. The weather 18
adjustment in this Case is intended to normalize the entire 12 month period. 19
Q. PLEASE DESCRIBE IN DETAIL THE HISTORICAL DATA CONSIDERED 20
IN THE REVENUE AND VOLUME FORECASTING PROCESS. 21
A. To assess key historical trends necessary for the forecast, financial statistics for ten 22
years were analyzed, noting the numbers of active customers served during that time 23

Direct Testimony of Josh C. Densman Page 9 Kentucky / Densman
and the total volumetric requirements by customer class. Actual sales volumes each 1
year were adjusted for variances from normal weather, based on the current HDD 2
composite and normal basis. 3
Based on the historical data, trends were noted for the customer count, net 4
annual growth and weather normalized adjusted volumes per customer for 5
residential, commercial and public authority classes. 6
Q. PLEASE DISCUSS THE HISTORICAL TRENDS OBSERVED AND THE 7
ASSUMPTIONS USED IN THE DEVELOPMENT OF THE FORECAST 8
TEST PERIOD BUDGET STARTING WITH NET CUSTOMER GROWTH. 9
A. Based on the net average annual customer growth over the past three years, I 10
forecasted residential customer growth of 325 customers per year. Based on the 11
same analysis of commercial and public authority classes, I forecasted zero net 12
commercial and public authority customer changes from the reference period to the 13
test year. 14
Q. WHAT IS THE ASSUMPTION FOR FUTURE DECLINING USE TRENDS AS 15
IT RELATES TO THE TEST YEAR? 16
A. In Case No. 1999-070 and in subsequent cases, Atmos Energy noted the long-17
standing trend of declining customer usage. The trend-line for the past ten years, 18
however, shows no apparent further decline in average customer usage. Therefore, I 19
have not forecasted a decline in residential, commercial or public authority sales 20
usage in this Case. 21

Direct Testimony of Josh C. Densman Page 10 Kentucky / Densman
Q. WHAT WERE THE ASSUMPTIONS FOR SERVICE CHARGES AND THE 1
LATE PAYMENT FEES? 2
A. I forecasted the transaction-based service charges to remain flat, equal to the 3
experience in the twelve month reference period ending June 2018. 4
Late payment fees were first adopted in Case No. 1999-070, beginning in 5
mid-2000. Since that time, we have observed that late payment fee revenue is 6
proportionate to the total revenues billed for residential, commercial and public 7
authority classes. Based upon the correlation for the past few years, I estimated late 8
payment fees at a ratio equal to 0.90% of the total projected residential, commercial 9
and public authority class revenues. 10
Q. HOW WERE GAS COSTS PROJECTED FOR THE TEST YEAR? 11
A. Based upon the sales volumes projected, projected gas supply prices as stated in 12
current NYMEX futures, and applying the Company’s seasonal plans for storage 13
injections and withdrawals, I modeled the forward periods to estimate the gas costs to 14
be recovered through future GCAs. This method was first created in conjunction 15
with Case No. 1999-070, and has been refined over time to simulate interstate 16
pipeline demand and commodity costs, retention and other items recoverable through 17
the GCA. This model was also utilized in the determination of storage cost balances 18
for forward periods. 19

Direct Testimony of Josh C. Densman Page 11 Kentucky / Densman
Q. IS THE FORECASTING PROCESS YOU HAVE DESCRIBED THE BEST 1
METHOD TO USE FOR THE DEVELOPMENT OF THE TEST YEAR 2
VOLUME AND REVENUE FORECAST IN THIS CASE? 3
A. Yes. The method of developing the forecast ensures a solid bridge of logical and 4
measurable adjustments, building upon the actual performance of a recent, reference 5
period. This forecasting process has been employed in prior Kentucky cases and, in 6
Case No. 2013-00148, Case No. 2015-00343, and Case No. 2017-00349 was found 7
by the Commission to be reasonable and accepted the normalized base-rate revenues 8
without adjustment. 9
Exhibit JCD-2 attached hereto summarizes each step of the process and 10
applies current rates to the derived billing determinants. Exhibit JCD-5 summarizes 11
the billing determinants for each month of the test year. 12
Q. PLEASE DESCRIBE HOW YOUR EXHIBITS ARE UTILIZED IN 13
DETERMING SUMMARIZING THE REVENUE AT CURRENT RATES AS 14
WELL AS RATES PROPOSED BY ATMOS ENERGY. 15
A. Mark Martin takes the summarized billing determinants from Exhibit JCD-5 and 16
recalculates revenue at present rates, as shown in his Exhibit MAM-1 and MAM-2. 17
Exhibit MAM-1 replicates my Exhibit JCD-2 walking forward each set of 18
adjustments from the reference billing determinants to those forecast for the test 19
period and adds in the revenue at proposed rates. Exhibit MAM-2 replicates my 20
Exhibit JDC-5 and applies the proposed rates to calculate the revenue at present 21
rates. Mr. Martin discusses how he developed the proposed rates in his testimony. 22

Direct Testimony of Josh C. Densman Page 12 Kentucky / Densman
IV. CONCLUSION 1
Q. DOES THIS CONCLUDE YOUR TESTIMONY? 2
A. Yes. 3

COMMONWEALTH OF KENTUCKY
BEFORE THE PUBLIC SERVICE COMMISSION
IN THE MATTER OF RATE APPLICATION OF ATMOS ENERGY CORPORATION
) ) )
Case No. 2018-00281
CERTIFICATE AND AFFIDAVIT
The Affiant, Josh C. Densman, being duly sworn, deposes and states that the prepared testimony attached hereto and made a part hereof, constitutes the prepared direct testimony ofthis affiant in Case No. 2018-00281, in the Matter of the Rate Application of Atmos Energy Corporation, and that if asked the questions propounded therein, this affiant would make the answers set forth in the attached par d direct pre-filed testimony.
STATEOF -Je"N'flle.55ee COUNTY OF wf /lit4m.So,/
.SUBSCRIBED AND SWORN to before me by Josh C. Densman on this the VI~ day of September, 2018.

EXHIBIT JCD-1
ATMOS ENERGY CORPORATION - KENTUCKYBILL FREQUENCY DATA
Reference Period - Twelve Months Ending 06/30/2018
Line Number Of TotalNo. Class of Customers Jul-17 Aug-17 Sep-17 Oct-17 Nov-17 Dec-17 Jan-18 Feb-18 Mar-18 Apr-18 May-18 Jun-18 Bills Mcf Rate Revenue
(a) (b) (c) (d) (e) (f) (g) (h) (i) (j) (k) (l) (m) (n) (o) (p)
1 RESIDENTIAL (Rate G-1)2 FIRM BILLS 154,482 154,786 152,795 154,070 156,190 157,732 159,869 159,381 159,976 160,142 159,486 156,820 1,885,729 $17.50 $33,000,2583 Sales: 1-300 149,792 149,698 176,235 172,040 705,319 1,336,227 2,491,569 2,022,345 1,258,346 1,223,271 472,415 152,584 10,309,840 1.7250 17,784,4734 Sales: 301-15000 0 0 439 219 248 315 431 967 759 -654 207 708 3,639 0.9600 3,4945 Sales: Over 15000 0 0 0 0 0 0 0 0 0 0 0 0 0 0.7700 06 CLASS TOTAL (Mcf/month) 149,792 149,698 176,674 172,259 705,567 1,336,542 2,492,000 2,023,312 1,259,105 1,222,618 472,622 153,291 1,885,729 10,313,479 $50,788,22478 FIRM COMMERCIAL (Rate G-1)9 FIRM BILLS 16,952 17,018 16,770 16,867 17,362 17,609 18,032 17,837 17,954 17,943 17,779 17,193 209,316 44.50 $9,314,56210 Sales: 1-300 123,616 129,198 159,983 144,692 312,448 532,192 966,729 800,867 525,768 501,585 238,637 125,810 4,561,526 1.7250 7,868,63311 Sales: 301-15000 11,073 26,761 42,707 47,636 56,761 90,622 183,701 144,719 60,708 55,599 22,876 9,917 753,079 0.9600 722,95612 Sales: Over 15000 0 0.7700 013 CLASS TOTAL (Mcf/month) 134,690 155,959 202,690 192,328 369,209 622,813 1,150,430 945,585 586,476 557,184 261,514 135,727 209,316 5,314,605 $17,906,1501415 FIRM INDUSTRIAL (Rate G-1)16 FIRM BILLS 203 201 200 191 207 191 221 202 207 228 208 198 2,457 $44.50 $109,32217 Sales: 1-300 8,714 9,357 8,525 9,811 21,995 31,555 46,255 40,095 36,568 38,066 17,146 6,895 274,982 1.7250 474,34418 Sales: 301-15000 11,923 15,372 15,313 18,594 26,745 36,358 94,813 66,588 37,374 31,033 14,946 3,876 372,936 0.9600 358,01919 Sales: Over 15000 0 0 0 0 0 0 0 0 0 -1,081 -3,624 4,705 0 0.7700 020 CLASS TOTAL (Mcf/month) 20,638 24,729 23,838 28,405 48,740 67,913 141,069 106,683 73,943 68,017 28,468 15,476 2,457 647,918 $941,6852122 FIRM PUBLIC AUTHORITY (Rate G-1)23 FIRM BILLS 1,527 1,543 1,456 1,539 1,549 1,542 1,558 1,547 1,545 1,548 1,541 1,519 18,414 $44.50 $819,42324 Sales: 1-300 19,725 20,833 22,055 26,169 60,046 100,132 153,823 138,967 96,039 98,322 48,273 23,566 807,950 1.7250 1,393,71325 Sales: 301-15000 1,501 3,666 2,323 4,220 9,081 17,868 54,274 48,098 15,260 10,247 6,513 3,028 176,079 0.9600 169,03626 Sales: Over 15000 0 0 0 0 0 0 0 0 0 0 0 0 0 0.7700 027 CLASS TOTAL (Mcf/month) 21,226 24,499 24,377 30,389 69,127 118,000 208,097 187,065 111,299 108,569 54,787 26,593 18,414 984,029 $2,382,1722829 INTERRUPTIBLE COMMERCIAL (G-2)30 INT BILLS 2 2 2 3 3 3 3 3 3 3 4 2 33 375.00 $12,37531 Sales: 1-15000 98 32 98 140 789 1,791 2,517 2,609 1,801 1,985 1,044 47 12,950 0.8550 11,07232 Sales: Over 15000 0 0 0 0 0 0 0 0 0 0 0 0 0 0.6350 033 CLASS TOTAL (Mcf/month) 98 32 98 140 789 1,791 2,517 2,609 1,801 1,985 1,044 47 33 12,950 $23,4473435 INTERRUPTIBLE INDUSTRIAL (G-2)36 INT BILLS 6 8 6 8 7 7 7 7 7 7 7 7 84 375.00 $31,50037 Sales: 1-15000 11,211 15,981 14,631 19,796 19,863 42,882 49,424 50,993 35,454 28,019 24,369 13,536 326,159 0.8550 278,86638 Sales: Over 15000 0 0 0 0 0 1,458 105,450 47,254 9,322 0 0 0 163,484 0.6350 103,81239 CLASS TOTAL (Mcf/month) 11,211 15,981 14,631 19,796 19,863 44,340 154,874 98,247 44,776 28,019 24,369 13,536 84 489,643 $414,1784041 TRANSPORTATION (T-4)42 TRANSPORTATION BILLS 124 124 124 125 125 125 125 125 126 126 124 125 1,498 375.00 $561,76643 Trans Admin Fee $6,150 $6,150 $6,150 $6,200 $6,200 $6,200 $6,200 $6,200 $6,250 $6,250 $6,200 $6,250 74,40044 EFM Fee $6,325 $6,525 $6,450 $6,475 $6,475 $6,575 $6,575 $6,675 $6,800 $6,800 $6,725 $6,825 79,22545 Parking Fee $117 $18 $15 $3 $5 $49 $311 $136 $474 $186 $218 $20 1,55046 Firm Transport: 1-300 33,377 33,734 34,554 36,036 37,197 37,696 37,653 37,458 37,786 37,405 34,846 34,431 432,173 1.7250 745,49847 Firm Transport: 301-15000 326,444 374,900 361,231 425,586 482,589 556,329 640,980 506,141 545,366 488,392 397,796 375,955 5,481,709 0.9600 5,262,44148 Firm Transport: Over 15000 71,515 70,237 78,210 84,411 105,273 138,019 197,406 104,141 130,007 97,019 70,364 74,723 1,221,325 0.7700 940,42049 CLASS TOTAL (Mcf/month) 431,336 478,871 473,995 546,033 625,059 732,044 876,039 647,740 713,159 622,816 503,006 485,109 1,498 7,135,207 $7,665,3005051 ECONOMIC DEV RIDER (EDR)52 Firm Transport: 1-300 0 0 0 0 0 0 0 0 0 0 0 0 0 1.2938 $053 Firm Transport: 301-15000 0 0 0 0 0 0 0 0 0 0 0 0 0 0.7200 054 Firm Transport: Over 15000 16,264 20,520 19,125 25,728 27,860 20,680 27,777 25,018 29,479 28,816 29,285 26,397 296,949 0.5775 171,48855 CLASS TOTAL (Mcf/month) 16,264 20,520 19,125 25,728 27,860 20,680 27,777 25,018 29,479 28,816 29,285 26,397 296,949 $171,48856
Page 1 of 2

EXHIBIT JCD-1
ATMOS ENERGY CORPORATION - KENTUCKYBILL FREQUENCY DATA
Reference Period - Twelve Months Ending 06/30/2018
Line Number Of TotalNo. Class of Customers Jul-17 Aug-17 Sep-17 Oct-17 Nov-17 Dec-17 Jan-18 Feb-18 Mar-18 Apr-18 May-18 Jun-18 Bills Mcf Rate Revenue
(a) (b) (c) (d) (e) (f) (g) (h) (i) (j) (k) (l) (m) (n) (o) (p)57 TRANSPORTATION (T-3)58 TRANSPORTATION BILLS 73 73 73 73 73 72 72 71 71 71 71 71 864 375.00 $324,00959 Trans Admin Fee $3,650 $3,650 $3,650 $3,650 $3,650 $3,600 $3,600 $3,550 $3,550 $3,550 $3,550 $3,550 43,20060 EFM Fee $3,875 $3,875 $3,900 $3,900 $3,900 $3,800 $3,800 $3,725 $3,825 $3,825 $3,825 $3,825 46,07561 Parking Fee $347 $293 $119 $341 $206 $370 $155 $538 $341 $375 $489 $379 3,95262 Interrupt Transport: 1-15000 399,682 422,349 416,809 452,464 485,649 498,054 517,185 464,701 478,200 465,423 425,171 389,498 5,415,185 0.8550 4,629,98363 Interrupt Transport: Over 15000 183,396 225,891 231,100 277,549 278,907 286,761 346,985 270,203 291,807 261,462 241,800 190,247 3,086,108 0.6350 1,959,67964 CLASS TOTAL (Mcf/month) 583,078 648,240 647,909 730,013 764,556 784,815 864,170 734,904 770,007 726,885 666,971 579,745 864 8,501,293 $7,006,8976566 SPECIAL CONTRACTS67 TRANSPORTATION BILLS 15 16 16 16 16 16 16 16 16 16 16 16 190 375.00 $71,11068 Trans Admin Fee $650 $700 $700 $700 $700 $700 $700 $650 $650 $650 $650 $650 8,10069 EFM Fee $900 $725 $725 $725 $875 $875 $875 $775 $775 $775 $775 $775 9,57570 Parking / Pooling Fees $4,804 $2,635 $2,262 $4,989 $4,624 $15,795 $6,226 $6,312 $7,403 $8,223 $4,727 $4,258 72,25971 Transported Volumes 866,719 899,344 1,006,697 1,165,482 1,225,178 1,375,009 1,471,150 1,268,510 1,360,696 1,201,912 1,192,830 1,055,809 14,089,336 Various72 Charges for Transport Volumes $144,033 $148,001 $160,334 $187,264 $198,676 $220,022 $239,642 $204,388 $218,307 $191,841 $181,703 $166,414 2,260,62373 CLASS TOTAL (Mcf/month) 866,719 899,344 1,006,697 1,165,482 1,225,178 1,375,009 1,471,150 1,268,510 1,360,696 1,201,912 1,192,830 1,055,809 190 14,089,336 $2,421,667
Page 2 of 2

EXHIBIT JCD-2
ATMOS ENERGY CORPORATION - KENTUCKYSUMMARY OF REVENUE AT PRESENT RATES
TEST YEAR ENDING MAR, 31 2020
Reference Period - Twelve Months Ending 06/30/2018Contract Adj. Weather Adj. Customer Conservation Total
Line Number Volumes Bills and Volumes Total Growth & Efficiency Test Year Present PresentNo. Description Block (Mcf) of Bills, Units As Metered Volumes (NOAA 1998-2018) Volumes Forecast Adjustments Volumes Margin Revenue
(a) (b) (c) (d) (e) (f) (g) (i) (j) (k)1 Sales2 Firm Sales (G-1) Customer Chrg 1,885,729 6,825 $17.50 $33,119,6953 Customer Chrg 230,187 45 44.50 10,245,310 4 0 - 300 15,954,297 13,143 (371,549) 15,595,891 38,432 0 15,634,324 1.7250 26,969,2085 301 - 15,000 1,305,734 5,890 (29,693) 1,281,930 0 0 1,281,930 0.9600 1,230,6536 Over 15,000 0 0 0 0 0 0 - 0.7700 07 Interruptible Sales (G-2) Customer Chrg 117 0 375.00 43,875 8 0 - 15,000 339,109 (147,107) 192,002 192,002 0.8550 164,1629 Over 15,000 163,484 (17,902) 145,582 145,582 0.6350 92,4451011 Transportation12 Customer Charges (T-4) Customer Chrg 1,498 (35) 375.00 548,64113 Customer Charges (T-3) Customer Chrg 864 (36) 375.00 310,50914 Customer Charges (SpK) Customer Chrg 190 0 375.00 71,11015 Transp. Adm. Fee Customer Chrg 2,514 (71) 50.00 122,15016 Parked Volumes [1] 777,605 0 0.10 77,76117 EFM Charges Various 129,55018 Firm Transportation (T-4) 0 - 300 432,173 (4,933) 427,240 427,240 1.7250 736,98919 301 - 15,000 5,481,709 98,327 5,580,036 5,580,036 0.9600 5,356,83520 Over 15,000 1,221,325 32,395 1,253,720 1,253,720 0.7700 965,36421 Economic Dev Rider (EDR) 301 - 15,000 0 0 0 0 0.7200 022 Over 15,000 296,949 0 296,949 296,949 0.5775 171,48823 Interruptible Transportation (T-3) 0 - 15,000 5,415,185 (128,866) 5,286,319 5,286,319 0.8550 4,519,80324 Over 15,000 3,086,108 114,249 3,200,357 3,200,357 0.6350 2,032,22725 Total Special Contracts [2] 14,089,336 767,091 14,856,427 14,856,427 Various 2,316,7202627 Total Tariff 2,118,584 47,785,409 732,287 (401,242) 48,116,454 45,257 0 48,154,886 89,224,495 2829 Other Revenues 806,054 30 Late Payment Fees 1,304,96531 Total Gross Profit 91,335,513 3233 Gas Costs 78,382,354 3435 Total Revenue 169,717,867$ 3637 [1] Parked Volumes not included in Total Deliveries.38 [2] Based on confidential information.
Forward-looking AdjustmentsTo Test Year
Page 1 of 1

EXHIBIT JCD-3
ATMOS ENERGY CORPORATION - KENTUCKYVOLUME AND CONTRACT ADJUSTMENTS
Reference Period - Twelve Months Ending 06/30/2018
Line Number Of TotalNo. Class of Customers Jul-17 Aug-17 Sep-17 Oct-17 Nov-17 Dec-17 Jan-18 Feb-18 Mar-18 Apr-18 May-18 Jun-18 Bills Mcf Rate Revenue
(a) (b) (c) (d) (e) (f) (g) (h) (i) (j) (k) (l) (m) (n) (o) (p)
1 RESIDENTIAL (Rate G-1)2 FIRM BILLS 0 $17.50 $03 Sales: 1-300 0 0 439 219 248 315 431 967 759 (654) 207 708 3,639 1.7250 6,2784 Sales: 301-15000 0 0 (439) (219) (248) (315) (431) (967) (759) 654 (207) (708) (3,639) 0.9600 (3,494)5 Sales: Over 15000 0 0 0.7700 06 CLASS TOTAL (Mcf/month) 0 0 0 0 0 0 0 0 0 0 0 0 0 0 $2,78478 FIRM COMMERCIAL (Rate G-1)9 FIRM BILLS 44.50 $010 Sales: 1-300 1.7250 011 Sales: 301-15000 0 0 0 0 0 0 0 0 0 0 0 0 0.9600 012 Sales: Over 15000 0 0 0 0 0 0 0 0 0 0 0 0 0.7700 013 CLASS TOTAL (Mcf/month) 0 0 0 0 0 0 0 0 0 0 0 0 0 0 $01415 FIRM INDUSTRIAL (Rate G-1)16 FIRM BILLS 4 4 4 4 4 4 4 4 4 3 3 3 45 44.50 $2,00317 Sales: 1-300 282 343 557 794 1,200 1,200 1,200 1,200 1,200 867 328 333 9,504 1.7250 16,39418 Sales: 301-15000 0 0 200 200 299 1,275 2,887 2,829 1,792 47 0 0 9,529 0.9600 9,14819 Sales: Over 15000 0 0 0 0 0 0 0 0 0 0 0 0 0 0.7700 020 CLASS TOTAL (Mcf/month) 282 343 757 994 1,499 2,475 4,087 4,029 2,992 914 328 333 45 19,033 $27,5452122 FIRM PUBLIC AUTHORITY (Rate G-1)23 FIRM BILLS 0 44.50 $024 Sales: 1-300 0 1.7250 025 Sales: 301-15000 0 0.9600 026 Sales: Over 15000 0 0.7700 027 CLASS TOTAL (Mcf/month) 0 0 0 0 0 0 0 0 0 0 0 0 0 0 $02829 INTERRUPTIBLE COMMERCIAL (G-2)30 INT BILLS 0 375.00 $031 Sales: 1-15000 0 0.8550 032 Sales: Over 15000 0 0.6350 033 CLASS TOTAL (Mcf/month) 0 0 0 0 0 0 0 0 0 0 0 0 0 0 $03435 INTERRUPTIBLE INDUSTRIAL (G-2)36 INT BILLS 0 0 0 0 0 0 0 0 0 0 0 0 0 375.00 $037 Sales: 1-15000 (5,910) (6,488) (7,189) (3,353) (8,651) (17,672) (20,531) (22,440) (21,169) (15,820) (11,532) (6,352) (147,107) 0.8550 (125,776)38 Sales: Over 15000 0 0 0 0 0 (1,458) (4,509) (2,613) (9,322) 0 0 0 (17,902) 0.6350 (11,368)39 CLASS TOTAL (Mcf/month) (5,910) (6,488) (7,189) (3,353) (8,651) (19,130) (25,040) (25,053) (30,491) (15,820) (11,532) (6,352) 0 (165,009) ($137,144)
Page 1 of 2

EXHIBIT JCD-3
ATMOS ENERGY CORPORATION - KENTUCKYVOLUME AND CONTRACT ADJUSTMENTS
Reference Period - Twelve Months Ending 06/30/2018
Line Number Of TotalNo. Class of Customers Jul-17 Aug-17 Sep-17 Oct-17 Nov-17 Dec-17 Jan-18 Feb-18 Mar-18 Apr-18 May-18 Jun-18 Bills Mcf Rate Revenue
(a) (b) (c) (d) (e) (f) (g) (h) (i) (j) (k) (l) (m) (n) (o) (p)
4041 TRANSPORTATION (T-4)42 TRANSPORTATION BILLS (2) (2) (2) (3) (3) (3) (3) (3) (4) (4) (3) (3) (35) 375.00 ($13,125)43 Trans Admin Fee ($100) ($100) ($100) ($150) ($150) ($150) ($150) ($150) ($200) ($200) ($150) ($150) (1,750)44 EFM Fee ($150) ($150) ($150) ($225) ($225) ($225) ($225) ($225) ($300) ($300) ($225) ($225) (2,625)45 Parking Fee $0 $0 $0 $0 $0 $0 $0 $0 $0 $0 $0 $0 046 Firm Transport: 1-300 68 336 141 104 (606) (796) (753) (661) (930) (884) (619) (333) (4,933) 1.7250 (8,509)47 Firm Transport: 301-15000 13,565 13,231 14,426 13,492 11,784 10,505 9,202 10,577 (1,946) 761 1,117 1,613 98,327 0.9600 94,39448 Firm Transport: Over 15000 1,871 2,601 2,008 2,646 2,021 3,017 4,149 2,765 3,880 2,637 2,696 2,104 32,395 0.7700 24,94449 CLASS TOTAL (Mcf/month) 15,504 16,168 16,575 16,242 13,199 12,726 12,598 12,681 1,004 2,514 3,194 3,384 (35) 125,789 $93,3295051 ECONOMIC DEV RIDER (EDR)52 Firm Transport: 1-300 0 0 0 0 0 0 0 0 0 0 0 0 0 1.2938 $053 Firm Transport: 301-15000 0 0 0 0 0 0 0 0 0 0 0 0 0 0.7200 054 Firm Transport: Over 15000 0 0 0 0 0 0 0 0 0 0 0 0 0 0.5775 055 CLASS TOTAL (Mcf/month) 0 0 0 0 0 0 0 0 0 0 0 0 0 $05657 TRANSPORTATION (T-3)58 TRANSPORTATION BILLS (4) (4) (4) (4) (4) (3) (3) (2) (2) (2) (2) (2) (36) 375.00 ($13,500)59 Trans Admin Fee ($200) ($200) ($200) ($200) ($200) ($150) ($150) ($100) ($100) ($100) ($100) ($100) (1,800)60 EFM Fee ($300) ($300) ($300) ($300) ($300) ($225) ($225) ($150) ($150) ($150) ($150) ($150) (2,700)61 Parking Fee $0 $0 $0 $0 $0 $0 $0 $0 $0 $0 $0 $0 062 Interrupt Transport: 1-15000 (11,373) (14,226) (15,218) (18,132) (23,123) (12,074) (8,873) (4,938) (6,662) (8,288) (3,262) (2,697) (128,866) 0.8550 (110,180)63 Interrupt Transport: Over 15000 6,779 8,252 8,515 9,362 7,211 8,175 12,234 10,720 11,775 13,106 11,739 6,381 114,249 0.6350 72,54864 CLASS TOTAL (Mcf/month) (4,594) (5,974) (6,703) (8,770) (15,912) (3,899) 3,361 5,782 5,113 4,818 8,477 3,684 (36) (14,617) ($55,632)6566 SPECIAL CONTRACTS67 TRANSPORTATION BILLS 0 0 0 0 0 0 0 0 0 0 0 0 0 375.00 $068 Trans Admin Fee $0 $0 $0 $0 $0 $0 $0 $0 $0 $0 $0 $0 069 EFM Fee $0 $0 $0 $0 $0 $0 $0 $0 $0 $0 $0 $0 070 Parking Fee $0 $0 $0 $0 $0 $0 $0 $0 $0 $0 $0 $0 071 Transported Volumes 7,019 7,247 10,310 12,415 13,654 15,745 256,264 207,239 201,785 12,319 12,035 11,059 767,091 Various72 Charges for Transport Volumes 1,179 1,200 1,589 1,996 2,257 2,608 15,270 12,386 12,119 1,916 1,877 1,699 56,09673 CLASS TOTAL (Mcf/month) 7,019 7,247 10,310 12,415 13,654 15,745 256,264 207,239 201,785 12,319 12,035 11,059 0 767,091 $56,096
Page 2 of 2

EXHIBIT JCD-4 (A)
ATMOS ENERGY CORPORATION - KENTUCKYWEATHER ADJUSTMENT - BASE NOAA 1998-2018Reference Period - Twelve Months Ending 06/30/2018
Line Number Of TotalNo. Class of Customers Jul-17 Aug-17 Sep-17 Oct-17 Nov-17 Dec-17 Jan-18 Feb-18 Mar-18 Apr-18 May-18 Jun-18 Bills Mcf Rate Revenue
(a) (b) (c) (d) (e) (f) (g) (h) (i) (j) (k) (l) (m) (n) (o) (p)
1 RESIDENTIAL (Rate G-1)2 FIRM BILLS 0 $17.50 $03 Sales: 1-300 (194) 194 (24,707) 154,274 152,491 173,645 (520,162) (22,064) 147,017 (305,135) (67,865) 43,688 (268,818) 1.7250 (463,711)4 Sales: 301-15000 0 0.9600 05 Sales: Over 15000 0 0.7700 06 CLASS TOTAL (Mcf/month) (194) 194 (24,707) 154,274 152,491 173,645 (520,162) (22,064) 147,017 (305,135) (67,865) 43,688 0 (268,818) ($463,711)78 FIRM COMMERCIAL (Rate G-1)9 FIRM BILLS 0 44.50 $010 Sales: 1-300 9,501 (8,576) (45,446) 18,039 59,834 76,760 (198,424) (22,414) 78,785 (78,213) (5,399) 27,550 (88,003) 1.7250 (151,804)11 Sales: 301-15000 851 (1,776) (12,132) 5,939 10,870 13,071 (37,705) (4,050) 9,097 (8,670) (518) 2,172 (22,851) 0.9600 (21,937)12 Sales: Over 15000 0 0.7700 013 CLASS TOTAL (Mcf/month) 10,352 (10,352) (57,578) 23,978 70,704 89,831 (236,129) (26,464) 87,882 (86,883) (5,917) 29,722 0 (110,854) ($173,742)1415 FIRM PUBLIC AUTHORITY (Rate G-1)16 FIRM BILLS 0 - $017 Sales: 1-300 1,410 (1,290) (2,139) 6,687 12,352 16,189 (24,116) (7,335) 13,478 (20,051) (9,726) (187) (14,728) 0.0000 018 Sales: 301-15000 107 (227) (225) 1,078 1,868 2,889 (8,509) (2,539) 2,142 (2,090) (1,312) (24) (6,842) 0.0000 019 Sales: Over 15000 0 0.0000 020 CLASS TOTAL (Mcf/month) 1,517 (1,517) (2,364) 7,765 14,220 19,078 (32,625) (9,874) 15,620 (22,141) (11,038) (211) 0 (21,570) $0
Page 1 of 4

Atmos Energy - KentuckyNormalization Of Volumes For Weather
Reference Period - Twelve Months Ending 06/30/2018(Weather Basis: 20-years ending 2018)
Line Month Jul-17 Aug-17 Sep-17 Oct-17 Nov-17 Dec-17 Jan-18 Feb-18 Mar-18 Apr-18 May-18 Jun-18(a) (b) (c) (d) (e) (f) (g) (h) (i) (j) (k) (l)
1 Lagged Actual HDDs 0 0 13 14 376 667 1,053 854 471 477 151 02 Lagged Normal HDDs 0 0 2 88 346 658 869 886 598 364 120 223 Calendar Normal HDDs 0 0 23 210 490 804 907 724 517 218 58 245 RESIDENTIAL (Rate G-1)67 Annual Customer Growth8 Annual Base Load Decline9 Annual Total Load Decline1011 Actual Constand Load 149,598 149,892 147,964 149,199 151,252 152,745 154,814 154,342 154,918 155,079 154,443 151,862 12 Actual Heat Load 194 (194) 28,710 23,060 554,315 1,183,797 2,337,185 1,868,971 1,104,187 1,067,539 318,178 1,429 13 Heat Load / Customer 0.001 (0.001) 0.188 0.150 3.549 7.505 14.619 11.726 6.902 6.666 1.995 0.009 14 Actual X Coefficient 0.0131 0.0131 0.0131 0.0131 0.0131 0.0131 0.0131 0.0131 0.0131 0.0131 0.0131 0.0131 15 Product 0 0 0.0262 1.151 4.5253 8.606 11.3657 11.588 7.8212 4.7608 1.5695 0.287716 Base Load 0.9684 0.9684 0.9684 0.9684 0.9684 0.9684 0.9684 0.9684 0.9684 0.9684 0.9684 0.968417 Normal Usage / Customer 0.9684 0.9684 0.9946 2.1194 5.4937 9.5744 12.3341 12.5564 8.7896 5.7292 2.5379 1.256118 No. of Customers 154,482 154,786 152,795 154,070 156,190 157,732 159,869 159,381 159,976 160,142 159,486 156,82019 Normalized Volumes 149,598 149,892 151,967 326,533 858,058 1,510,187 1,971,837 2,001,249 1,406,122 917,483 404,757 196,979 20 Actual Volumes 149,792 149,698 176,674 172,259 705,567 1,336,542 2,492,000 2,023,312 1,259,105 1,222,618 472,622 153,291 21 Normalized Volume Including Unbilled 149,598 149,892 193,927 572,366 1,152,228 1,811,379 2,051,286 1,663,552 1,236,651 611,679 275,427 155,964 22 Normalized Calendar Volumes 149,907 150,202 194,328 573,549 1,154,609 1,815,122 2,055,524 1,666,990 1,239,206 612,943 275,996 156,286 2324 Weather Adjustment (194) 194 (24,707) 154,274 152,491 173,645 (520,162) (22,064) 147,017 (305,135) (67,865) 43,688 2526 Tier 1 (194) 194 (24,707) 154,274 152,491 173,645 (520,162) (22,064) 147,017 (305,135) (67,865) 43,688 27 Tier 228 Tier 329 Total (194) 194 (24,707) 154,274 152,491 173,645 (520,162) (22,064) 147,017 (305,135) (67,865) 43,688 3031
EXHIBIT JCD-4 (B)
Page 2 of 4

Atmos Energy - KentuckyNormalization Of Volumes For Weather
Reference Period - Twelve Months Ending 06/30/2018(Weather Basis: 20-years ending 2018)
Line Month Jul-17 Aug-17 Sep-17 Oct-17 Nov-17 Dec-17 Jan-18 Feb-18 Mar-18 Apr-18 May-18 Jun-18(a) (b) (c) (d) (e) (f) (g) (h) (i) (j) (k) (l)
1 Lagged Actual HDDs 0 0 13 14 376 667 1,053 854 471 477 151 02 Lagged Normal HDDs 0 0 2 88 346 658 869 886 598 364 120 223 Calendar Normal HDDs 0 0 23 210 490 804 907 724 517 218 58 24
EXHIBIT JCD-4 (B)
32 FIRM COMMERCIAL (Rate G-1)3334 Annual Customer Growth35 Annual Base Load Decline36 Annual Total Load Decline3738 Actual Constand Load 145,042 145,607 143,485 144,315 148,550 150,663 154,283 152,614 153,615 153,521 152,118 147,104 39 Actual Heat Load (10,352) 10,352 59,205 48,013 220,659 472,150 996,147 792,971 432,861 403,663 109,396 (11,377) 40 Heat Load / Customer (0.611) 0.608 3.530 2.847 12.709 26.813 55.243 44.457 24.109 22.497 6.153 (0.662) 41 Actual X Coefficient 0.0485 0.0485 0.0485 0.0485 0.0485 0.0485 0.0485 0.0485 0.0485 0.0485 0.0485 0.0485 42 Product 0 0 0.097 4.2682 16.7817 31.9144 42.1483 42.9729 29.0043 17.6548 5.8203 1.06743 Base Load 8.5560 8.5560 8.5560 8.5560 8.5560 8.5560 8.5560 8.5560 8.5560 8.5560 8.5560 8.556044 Normal Usage / Customer 8.5560 8.5560 8.6530 12.8242 25.3377 40.4704 50.7043 51.5289 37.5603 26.2108 14.3763 9.623045 No. of Customers 16,952 17,018 16,770 16,867 17,362 17,609 18,032 17,837 17,954 17,943 17,779 17,19346 Normalized Volumes 145,042 145,607 145,111 216,306 439,914 712,644 914,301 919,122 674,358 470,301 255,597 165,449 47 Actual Volumes 134,690 155,959 202,690 192,328 369,209 622,813 1,150,430 945,585 586,476 557,184 261,514 135,727 48 Normalized Volume Including Unbilled 145,042 145,607 162,193 316,113 561,176 837,338 947,536 778,970 603,822 343,241 202,132 148,772 49 Normalized Calendar Volumes 145,372 145,938 162,562 316,832 562,452 839,243 949,691 780,742 605,196 344,021 202,592 149,110 5051 Weather Adjustment 10,352 (10,352) (57,578) 23,978 70,704 89,831 (236,129) (26,464) 87,882 (86,883) (5,917) 29,722 5253 Tier 1 9,501 (8,576) (45,446) 18,039 59,834 76,760 (198,424) (22,414) 78,785 (78,213) (5,399) 27,550 54 Tier 2 851 (1,776) (12,132) 5,939 10,870 13,071 (37,705) (4,050) 9,097 (8,670) (518) 2,172 55 Tier 3 - - - - - - - - - - - - 56 Total 10,352 (10,352) (57,578) 23,978 70,704 89,831 (236,129) (26,464) 87,882 (86,883) (5,917) 29,722 5758
Page 3 of 4

Atmos Energy - KentuckyNormalization Of Volumes For Weather
Reference Period - Twelve Months Ending 06/30/2018(Weather Basis: 20-years ending 2018)
Line Month Jul-17 Aug-17 Sep-17 Oct-17 Nov-17 Dec-17 Jan-18 Feb-18 Mar-18 Apr-18 May-18 Jun-18(a) (b) (c) (d) (e) (f) (g) (h) (i) (j) (k) (l)
1 Lagged Actual HDDs 0 0 13 14 376 667 1,053 854 471 477 151 02 Lagged Normal HDDs 0 0 2 88 346 658 869 886 598 364 120 223 Calendar Normal HDDs 0 0 23 210 490 804 907 724 517 218 58 24
EXHIBIT JCD-4 (B)
59 FIRM PUBLIC AUTHORITY (Rate G-1)6061 Annual Customer Growth62 Annual Base Load Decline63 Annual Total Load Decline6465 Actual Constand Load 22,744 22,982 21,686 22,922 23,071 22,967 23,205 23,041 23,012 23,056 22,952 22,624 66 Actual Heat Load (1,517) 1,517 2,691 7,467 46,056 95,033 184,891 164,024 88,288 85,512 31,835 3,969 67 Heat Load / Customer (0.994) 0.983 1.848 4.852 29.732 61.630 118.672 106.027 57.144 55.240 20.658 2.613 68 Actual X Coefficient 0.1125 0.1125 0.1125 0.1125 0.1125 0.1125 0.1125 0.1125 0.1125 0.1125 0.1125 0.1125 69 Product 0 0 0.2249 9.8969 38.9129 74.0019 97.732 99.6439 67.254 40.9372 13.4958 2.474270 Base Load 14.8943 14.8943 14.8943 14.8943 14.8943 14.8943 14.8943 14.8943 14.8943 14.8943 14.8943 14.894371 Normal Usage / Customer 14.8943 14.8943 15.1192 24.7912 53.8072 88.8962 112.6263 114.5382 82.1483 55.8315 28.3901 17.368572 No. of Customers 1,527 1,543 1,456 1,539 1,549 1,542 1,558 1,547 1,545 1,548 1,541 1,51973 Normalized Volumes 22,744 22,982 22,014 38,154 83,347 137,078 175,472 177,191 126,919 86,427 43,749 26,383 74 Actual Volumes 21,226 24,499 24,377 30,389 69,127 118,000 208,097 187,065 111,299 108,569 54,787 26,593 75 Normalized Volume Including Unbilled 22,744 22,982 25,452 59,270 108,433 162,397 182,130 149,005 112,845 61,009 33,004 22,966 76 Normalized Calendar Volumes 22,749 22,987 25,458 59,283 108,458 162,435 182,172 149,039 112,871 61,023 33,012 22,971 7778 Weather Adjustment 1,517 (1,517) (2,364) 7,765 14,220 19,078 (32,625) (9,874) 15,620 (22,141) (11,038) (211) 7980 Tier 1 1,410 (1,290) (2,139) 6,687 12,352 16,189 (24,116) (7,335) 13,478 (20,051) (9,726) (187) 81 Tier 2 107 (227) (225) 1,078 1,868 2,889 (8,509) (2,539) 2,142 (2,090) (1,312) (24) 82 Tier 3 - - - - - - - - - - - - 83 Total 1,517 (1,517) (2,364) 7,765 14,220 19,078 (32,625) (9,874) 15,620 (22,141) (11,038) (211)
Page 4 of 4

EXHIBIT JCD-5
ATMOS ENERGY CORPORATION - KENTUCKYBILL FREQUENCY WITH KNOWN & MEASURABLE ADJUSTMENTS
TEST YEAR ENDING MAR, 31 2020CURRENT RATES
Line TotalNo. Class of Customers Rate Apr-19 May-19 Jun-19 Jul-19 Aug-19 Sep-19 Oct-19 Nov-19 Dec-19 Jan-20 Feb-20 Mar-20 Billing Units
(a) (b) (c) (d) (e) (f) (g) (h) (i) (j) (k) (l) (m)
1 RESIDENTIAL (Rate G-1) $4,394,070 $3,496,321 $3,090,530 $2,973,952 $2,979,780 $2,948,546 $3,273,246 $4,231,091 $5,387,601 $6,224,470 $6,266,941 $5,246,482 $50,513,0312 FIRM BILLS $17.50 160,467 159,811 157,145 155,132 155,436 153,445 154,720 156,840 158,382 160,519 160,031 160,626 1,892,5543 Sales: 1-300 1.7250 919,361 405,582 197,387 150,227 150,522 152,614 327,911 861,676 1,516,473 1,979,935 2,009,506 1,411,900 10,083,0934 Sales: 301-15000 0.9600 0 0 0 0 0 0 0 0 0 0 0 0 05 Sales: Over 15000 0.7700 0 0 0 0 0 0 0 0 0 0 0 0 06 CLASS TOTAL (Mcf/month) 919,361 405,582 197,387 150,227 150,522 152,614 327,911 861,676 1,516,473 1,979,935 2,009,506 1,411,900 10,083,0937 Gas Charge per Mcf $4.59 $4.73 $4.73 $4.73 $4.70 $4.70 $4.70 $4.56 $4.56 $4.56 $4.49 $4.498 Gas Costs $4,216,600 $1,919,446 $934,150 $710,962 $707,030 $716,858 $1,540,264 $3,932,955 $6,921,650 $9,037,031 $9,027,031 $6,342,484 $46,006,460910 FIRM COMMERCIAL (Rate G-1) $1,573,832 $1,214,965 $1,041,240 $995,439 $989,359 $973,193 $1,082,725 $1,479,722 $1,933,587 $2,267,907 $2,271,620 $1,908,820 $17,732,40911 FIRM BILLS 44.50 17,943 17,779 17,193 16,952 17,018 16,770 16,867 17,362 17,609 18,032 17,837 17,954 209,31612 Sales: 1-300 1.7250 423,372 233,238 153,360 133,117 120,622 114,537 162,731 372,283 608,952 768,305 778,453 604,553 4,473,52413 Sales: 301-15000 0.9600 46,929 22,359 12,088 11,925 24,985 30,575 53,575 67,631 103,692 145,996 140,668 69,805 730,22714 Sales: Over 15000 0.7700 0 0 0 0 0 0 0 0 0 0 0 0 015 CLASS TOTAL (Mcf/month) 470,301 255,597 165,449 145,042 145,607 145,112 216,306 439,913 712,644 914,301 919,121 674,358 5,203,75116 Gas Charge per Mcf $4.59 $4.73 $4.73 $4.73 $4.70 $4.70 $4.70 $4.56 $4.56 $4.56 $4.49 $4.4917 Gas Costs $2,157,012 $1,209,631 $782,998 $686,421 $683,945 $681,620 $1,016,033 $2,007,900 $3,252,727 $4,173,151 $4,128,843 $3,029,326 $23,809,6081819 FIRM INDUSTRIAL (Rate G-1) $106,437 $51,089 $28,756 $36,176 $40,611 $39,636 $45,012 $75,362 $101,307 $185,665 $147,041 $112,136 $969,22920 FIRM BILLS $44.50 231 211 201 207 205 204 195 211 195 225 206 211 2,50221 Sales: 1-300 1.7250 38,933 17,474 7,228 8,996 9,700 9,082 10,605 23,195 32,755 47,455 41,295 37,768 284,48622 Sales: 301-15000 0.9600 31,080 14,946 3,876 11,923 15,372 15,513 18,794 27,044 37,633 97,700 69,417 39,166 382,46523 Sales: Over 15000 0.7700 (1,081) (3,624) 4,705 0 0 0 0 0 0 0 0 0 024 CLASS TOTAL (Mcf/month) 68,931 28,796 15,809 20,920 25,072 24,595 29,399 50,239 70,388 145,156 110,712 76,935 666,95125 Gas Charge per Mcf $4.59 $4.73 $4.73 $4.73 $4.70 $4.70 $4.70 $4.56 $4.56 $4.56 $4.49 $4.4926 Gas Costs $316,151 $136,281 $74,818 $99,004 $117,766 $115,528 $138,091 $229,306 $321,273 $662,534 $497,338 $345,602 $3,053,6922728 FIRM PUBLIC AUTHORITY (Rate G-1) $211,733 $140,062 $110,807 $105,954 $105,677 $101,161 $130,248 $204,328 $289,200 $337,010 $339,643 $274,376 $2,350,19829 FIRM BILLS $44.50 1,548 1,541 1,519 1,527 1,543 1,456 1,539 1,549 1,542 1,558 1,547 1,545 18,41430 Sales: 1-300 1.7250 78,270 38,548 23,379 21,135 19,543 19,916 32,856 72,398 116,321 129,707 131,632 109,517 793,22131 Sales: 301-15000 0.9600 8,157 5,201 3,004 1,608 3,439 2,098 5,298 10,949 20,757 45,765 45,559 17,402 169,23732 Sales: Over 15000 0.7700 0 0 0 0 0 0 0 0 0 0 0 0 033 CLASS TOTAL (Mcf/month) 86,428 43,749 26,382 22,743 22,982 22,013 38,154 83,347 137,078 175,472 177,191 126,919 962,45934 Gas Charge per Mcf $4.59 $4.73 $4.73 $4.73 $4.70 $4.70 $4.70 $4.56 $4.56 $4.56 $4.49 $4.4935 Gas Costs $396,396 $207,044 $124,856 $107,635 $107,952 $103,401 $179,217 $380,421 $625,667 $800,907 $795,971 $570,142 $4,399,6093637 INTERRUPTIBLE COMMERCIAL (G-2) $2,822 $2,393 $790 $833 $778 $834 $1,245 $1,799 $2,657 $3,277 $3,356 $2,665 $23,44738 INT BILLS 375.00 3 4 2 2 2 2 3 3 3 3 3 3 3339 Sales: 1-15000 0.8550 1,985 1,044 47 98 32 98 140 789 1,791 2,517 2,609 1,801 12,95140 Sales: Over 15000 0.6350 0 0 0 0 0 0 0 0 0 0 0 0 141 CLASS TOTAL (Mcf/month) 1,985 1,044 47 98 32 98 140 789 1,791 2,517 2,609 1,801 12,95242 Gas Charge per Mcf $3.31 $3.46 $3.46 $3.46 $3.42 $3.42 $3.42 $3.29 $3.29 $3.29 $3.22 $3.2243 Gas Costs $6,569 $3,608 $163 $337 $111 $334 $479 $2,595 $5,893 $8,279 $8,394 $5,794 $42,55644
Page 1 of 2

EXHIBIT JCD-5
ATMOS ENERGY CORPORATION - KENTUCKYBILL FREQUENCY WITH KNOWN & MEASURABLE ADJUSTMENTS
TEST YEAR ENDING MAR, 31 2020CURRENT RATES
Line TotalNo. Class of Customers Rate Apr-19 May-19 Jun-19 Jul-19 Aug-19 Sep-19 Oct-19 Nov-19 Dec-19 Jan-20 Feb-20 Mar-20 Billing Units
(a) (b) (c) (d) (e) (f) (g) (h) (i) (j) (k) (l) (m)
45 INTERRUPTIBLE INDUSTRIAL (G-2) $13,055 $13,601 $8,767 $6,782 $11,117 $8,613 $17,058 $12,211 $24,179 $91,426 $55,385 $14,839 $277,03446 INT BILLS 375.00 7 7 7 6 8 6 8 7 7 7 7 7 8447 Sales: 1-15000 0.8550 12,199 12,837 7,184 5,301 9,493 7,442 16,443 11,212 25,210 28,893 28,553 14,285 179,05348 Sales: Over 15000 0.6350 0 0 0 0 0 0 0 0 0 100,941 44,641 0 145,58349 CLASS TOTAL (Mcf/month) 12,199 12,837 7,184 5,301 9,493 7,442 16,443 11,212 25,210 129,834 73,194 14,285 324,63550 Gas Charge per Mcf $3.31 $3.46 $3.46 $3.46 $3.42 $3.42 $3.42 $3.29 $3.29 $3.29 $3.22 $3.2251 Gas Costs $40,376 $44,366 $24,828 $18,320 $32,473 $25,457 $56,244 $36,882 $82,929 $427,096 $235,497 $45,962 $1,070,4305253 TRANSPORTATION (T-4) $667,815 $556,397 $538,911 $498,701 $545,654 $540,362 $608,943 $678,388 $774,609 $901,485 $700,228 $747,135 $7,758,62954 TRANSPORTATION BILLS $375.00 122 121 122 122 122 122 122 122 122 122 122 122 1,46355 Trans Admin Fee 6,050 6,050 6,100 6,050 6,050 6,050 6,050 6,050 6,050 6,050 6,050 6,050 $72,65056 EFM Fee 6,500 6,500 6,600 6,175 6,375 6,300 6,250 6,250 6,350 6,350 6,450 6,500 $76,60057 Parking Fee 186 218 20 117 18 15 3 5 49 311 136 474 $1,55058 Firm Transport: 1-300 1.7250 36,521 34,227 34,098 33,445 34,070 34,695 36,140 36,591 36,900 36,900 36,797 36,856 427,24059 Firm Transport: 301-15000 0.9600 489,153 398,913 377,568 340,009 388,131 375,657 439,078 494,373 566,834 650,182 516,718 543,420 5,580,03660 Firm Transport: Over 1500 0.7700 99,656 73,060 76,827 73,386 72,838 80,218 87,057 107,294 141,036 201,555 106,906 133,887 1,253,72061 CLASS TOTAL (Mcf/month) 625,330 506,200 488,493 446,840 495,039 490,570 562,275 638,258 744,770 888,637 660,421 714,163 7,260,9966263 ECONOMIC DEV RIDER (EDR) 16,641 16,912 15,244 9,392 11,850 11,045 14,858 16,089 11,943 16,041 14,448 17,024 171,488 64 Firm Transport: 1-300 1.29375 0 0 0 0 0 0 0 0 0 0 0 0 065 Firm Transport: 301-15000 0.7200 0 0 0 0 0 0 0 0 0 0 0 0 066 Firm Transport: Over 15000 0.5775 28,816 29,285 26,397 16,264 20,520 19,125 25,728 27,860 20,680 27,777 25,018 29,479 296,94967 CLASS TOTAL (Mcf/month) 28,816 29,285 26,397 16,264 20,520 19,125 25,728 27,860 20,680 27,777 25,018 29,479 296,9496869 TRANSPORTATION (T-3) $598,581 $555,218 $488,953 $486,012 $530,819 $528,559 $586,808 $610,275 $636,068 $695,766 $604,921 $629,285 $6,951,26570 TRANSPORTATION BILLS 375.00 69 69 69 69 69 69 69 69 69 69 69 69 82871 Trans Admin Fee 3,450 3,450 3,450 3,450 3,450 3,450 3,450 3,450 3,450 3,450 3,450 3,450 $41,40072 EFM Fee 3,675 3,675 3,675 3,575 3,575 3,600 3,600 3,600 3,575 3,575 3,575 3,675 $43,37573 Parking Fee 375 489 379 347 293 119 341 206 370 155 538 341 $3,95274 Interrupt Transport: 1-15000 0.8550 457,135 421,909 386,801 388,309 408,123 401,591 434,332 462,526 485,980 508,312 459,763 471,538 5,286,32075 Interrupt Transport: Over 15000 0.6350 274,568 253,539 196,628 190,175 234,143 239,615 286,911 286,118 294,936 359,219 280,923 303,582 3,200,35876 CLASS TOTAL (Mcf/month) 731,703 675,448 583,429 578,484 642,266 641,206 721,243 748,644 780,916 867,531 740,686 775,120 8,486,6777778 SPECIAL CONTRACTS $209,397 $195,682 $179,746 $157,141 $159,212 $171,560 $201,623 $213,081 $245,950 $268,663 $230,460 $245,247 $2,477,76379 TRANSPORTATION BILLS 375.00 16 16 16 15 16 16 16 16 16 16 16 16 19080 Trans Admin Fee 650 650 650 650 700 700 700 700 700 700 650 650 $8,10081 EFM Fee 775 775 775 900 725 725 725 875 875 875 775 775 $9,57582 Parking Fee 8,223 4,727 4,258 4,804 2,635 2,262 4,989 4,624 15,795 6,226 6,312 7,403 $72,25983 Transported Volumes Various 1,214,231 1,204,865 1,066,868 873,738 906,591 1,017,007 1,177,897 1,238,832 1,390,754 1,727,414 1,475,749 1,562,481 14,856,42784 Charges for Transport Volumes 193,757 183,580 168,113 145,212 149,201 161,923 189,260 200,932 222,630 254,912 216,774 230,426 $2,316,72085 CLASS TOTAL (Mcf/month) 1,214,231 1,204,865 1,066,868 873,738 906,591 1,017,007 1,177,897 1,238,832 1,390,754 1,727,414 1,475,749 1,562,481 14,856,4278687 OTHER REVENUE88 Service Charges $49,919 $53,628 $55,397 $45,327 $57,173 $55,395 $88,176 $126,545 $87,101 $58,133 $54,439 $74,821 $806,05489 Late Payment Fees $158,007 $116,547 $73,687 $54,761 $50,223 $50,164 $49,723 $64,996 $110,128 $165,694 $205,564 $205,470 $1,304,9659091 TOTAL GROSS PROFIT $8,002,310 $6,412,815 $5,632,829 $5,370,470 $5,482,252 $5,429,068 $6,099,666 $7,713,889 $9,604,330 $11,215,535 $10,894,047 $9,478,301 $91,335,51292 Gas Costs $7,133,103 $3,520,378 $1,941,813 $1,622,678 $1,649,276 $1,643,198 $2,930,328 $6,590,058 $11,210,139 $15,108,999 $14,693,074 $10,339,311 $78,382,35493 TOTAL REVENUE $15,135,413 $9,933,192 $7,574,641 $6,993,149 $7,131,529 $7,072,265 $9,029,994 $14,303,947 $20,814,470 $26,324,534 $25,587,121 $19,817,612 $169,717,866
Page 2 of 2

Direct Testimony of Joe T. Christian Page 1 Kentucky / Christian
BEFORE THE PUBLIC SERVICE COMMISSION
COMMONWEALTH OF KENTUCKY APPLICATION OF ATMOS ENERGY ) ) CORPORATION FOR AN ADJUSTMENT ) Case No. 2018-00281 ) OF RATES AND TARIFF MODIFICATIONS )
TESTIMONY OF JOE T. CHRISTIAN
I. INTRODUCTION 1
Q. PLEASE STATE YOUR NAME AND BUSINESS ADDRESS. 2
A. My name is Joe T. Christian. My business address is 5420 LBJ Freeway, 1600 3
Lincoln Centre, Dallas, TX 75240. 4
Q. BY WHOM ARE YOU EMPLOYED AND IN WHAT CAPACITY? 5
A. I am employed by Atmos Energy Corporation (“Atmos Energy” or “the Company”) 6
as Director of Rates & Regulatory Affairs (Shared Services). 7
Q. WHAT ARE YOUR JOB RESPONSIBILITIES? 8
A. I am responsible for leading and directing the rates and regulatory activity in Atmos 9
Energy’s eight-state service area. This responsibility includes developing the 10
strategy, preparing the revenue deficiency filings, and managing the overall 11
ratemaking process for the Company. For the past seventeen years, I have managed 12
Company-specific dockets and other commission proceedings in Colorado, Kansas, 13
Kentucky, Louisiana, Mississippi, Tennessee, and Texas. I also managed Company-14

Direct Testimony of Joe T. Christian Page 2 Kentucky / Christian
specific dockets in Georgia, Illinois, Iowa, and Missouri relating to regulated assets 1
that the Company has since sold. 2
Q. PLEASE DESCRIBE YOUR EDUCATIONAL BACKGROUND AND 3
PROFESSIONAL EXPERIENCE. 4
A. I graduated from East Texas State University in 1985 with a Bachelor of Business 5
Administration Degree, majoring in Accounting. In 1987, I received a Masters of 6
Business Administration from East Texas State University. I am a Certified Public 7
Accountant in the State of Texas and a member of the American Institute of Certified 8
Public Accountants. I have made presentations before industry groups and the 9
NARUC Staff Subcommittee on Accounting and Finance. 10
My professional experience includes approximately two years of public 11
accounting experience with a large local accounting firm based in Dallas, Texas. In 12
1989, I accepted a position in the internal audit group with Atmos Energy. I was 13
promoted to positions of increasing responsibility within the Atmos Energy finance 14
team during my first nine years with the Company. I joined Atmos Energy’s 15
Colorado-Kansas operations as Vice President & Controller in June of 1998 and, 16
effective December 1, 2001, was named Vice President of Rates & Regulatory 17
Affairs. I assumed my current position on August 1, 2007. 18
Q. ARE YOU A MEMBER OF ANY PROFESSIONAL ORGANIZATIONS? 19
A. Yes. I am licensed by the State of Texas as a Certified Public Accountant (“CPA”).20

Direct Testimony of Joe T. Christian Page 3 Kentucky / Christian
Q. HAVE YOU PREVIOUSLY TESTIFIED BEFORE THE KENTUCKY PUBLIC 1
SERVICE COMMISSION OR OTHER REGULATORY ENTITIES? 2
A. Yes. I have testified in the Company’s last rate proceeding1 as well as supported the 3
Company’s position in the Commission’s Investigation of the Tax Cut and Job’s Act 4
on the Rates of Investor Owned Utilities.2 I have submitted testimony before the 5
Kansas Corporation Commission (“KCC”) in five general rate case proceedings3 and 6
provided oral comments to the KCC in a rules investigation.4 I have also submitted 7
testimony before the Mississippi Public Service Commission to amend our tariffs to 8
add a supplemental growth rider,5 to amend our formula rate tariff to establish a 9
system integrity plan and establish a rural development pilot program,6 and to request 10
a system integrity rider and support our capital budget for 2015 through 2024.7 I 11
have also submitted testimony before the Louisiana Public Service Commission to 12
amend our formula rate making tariffs to reduce lag related to system integrity 13
investment.8 Finally, I filed testimony before the Colorado Public Utilities 14
Commission numerous times, including the Company’s prior general rate case 15
proceedings;9 gas prudence reviews;10 a Phase II class cost of service/rate design 16
1 Case No. 2017-00349.
2 Case No. 2017-00481.
3 Docket Nos. 03-ATMG-1036-RTS, 08-ATMG-280-RTS, 10-ATMG-495-RTS, 12-ATMG-564-RTS, 14-
ATMG-320-RTS. 4 Docket No. 02-GIMX-211-GIV, General Investigation of the Cold Weather Rule. 5 Docket No. 2013-UN-023.
6 Docket No. 2014-UN-117.
7 Docket No. 2015-UN-049. 8 Docket No. U-32987.
9 Proceeding Nos. 00S-668G, 09AL-507G, 13AL-0496G, 14AL-0300G, 15AL-0299G, 17AL-0429G.
10 Proceeding Nos. 00P-296G and 03P-229G.

Direct Testimony of Joe T. Christian Page 4 Kentucky / Christian
proceeding;11 a transportation terms & conditions proceeding;12 an upstream gas 1
transportation matter;13 a complaint proceeding regarding upstream gas 2
transportation;14 an Advanced Metering Infrastructure surcharge matter;15 a proposal 3
to extend the pilot related to recovering uncollectible gas costs through the Gas Cost 4
Adjustment (“GCA”) mechanism;16 the Company’s proposal to put into effect a 5
System Safety and Integrity Plan;17 and the Company’s application for a Certificate 6
of Public Convenience and Necessity to implement the Greeley Building Project.18 7
II. PURPOSE OF TESTIMONY 8
Q. WHAT IS THE SCOPE OF YOUR TESTIMONY IN THIS PROCEEDING? 9
A. I am responsible for the proposed capital structure and embedded cost of debt in this 10
rate proceeding. The Company’s proposed capital structure will include an 11
adjustment to reflect financing activity that is anticipated to occur in March 2019. I 12
will discuss the impact of the refinancing later in my testimony. In regards to capital 13
structure and cost of capital, I am sponsoring the following Filing Requirements 14
(FR): 15
FR 16(7)(c) Description of all factors used in preparation of the forecast 16
test period - income statement, operation and maintenance 17
11 Proceeding No. 02S-411G.
12 Proceeding No. 02S-442G.
13 Proceeding No. 04A-275G.
14 Proceeding No. 08F-033G.
15 Proceeding No. 10AL-822G.
16 Proceeding No. 12AL-1003G.
17 Proceeding No. 12AL-1139G.
18 Proceeding No. 13A-0153G.

Direct Testimony of Joe T. Christian Page 5 Kentucky / Christian
expenses, employee and labor expenses, capital construction 1
budget; 2
FR 16(7)(h) (11) Capital Structure Requirements 3
FR 16(8)(b) A jurisdictional rate base summary for both the base period 4
and the forecasted period with supporting schedules, which 5
include detailed analysis of each component of the rate base 6
FR 16(8)(j) Cost of Capital summary 7
I also support the calculation of cash working capital requirements in the 8
attached lead-lag study. The Company filed and supported a cash working capital 9
requirements in Atmos Energy’s most recent case and has followed the same 10
methodologies which the Commission found more accurately reflects the working 11
capital needs of the Company.19 12
Q. DO YOU HAVE ANY EXHIBITS ATTACHED TO YOUR TESTIMONY? 13
A. Yes. I have one Exhibit, ATO-1 Lead Lag Study. 14
III. CAPITAL STRUCTURE AND COST OF DEBT 15
Q. HOW IS ATMOS ENERGY ORGANIZED? 16
A. Atmos Energy conducts its utility operations in eight states through unincorporated 17
operating divisions. The Company division for which rates are sought to be adjusted 18
in this proceeding is commonly referred to as the Kentucky/Mid-States Division.19
19 Page 16/17 of the final order stated, “While the one eighth O&M methodology is a reasonable estimate of cash working capital absent a lead/lag study, Atmos's lead/lag study is part of the record of this proceeding and more accurately reflects the working capital needs of Atmos.”

Direct Testimony of Joe T. Christian Page 6 Kentucky / Christian
Q. DO THE COMPANY’S UNINCORPORATED DIVISIONS ISSUE THEIR 1
OWN DEBT OR EQUITY? 2
A. No. These divisions, including the Kentucky/Mid-States Division, are not separate 3
legal entities. Instead, these unincorporated divisions collectively comprise the legal 4
entity that is Atmos Energy Corporation. Therefore, all debt or equity funding of the 5
operations performed by the utility divisions must be (and is) issued by Atmos 6
Energy Corporation as a whole, on a consolidated basis. 7
Q. SHOULD ATMOS ENERGY’S CONSOLIDATED CAPITAL STRUCTURE 8
BE USED AS THE BASIS FOR A CAPITAL STRUCTURE IN THIS 9
PROCEEDING? 10
A. Yes. Although this proceeding only affects the rates which may be charged by the 11
Company for its regulated utility operations in Kentucky, the appropriate capital 12
structure for each of the Atmos Energy utility operating divisions, including its 13
Kentucky/Mid-States Division, is equivalent to the consolidated capital structure for 14
Atmos Energy as a whole. Atmos Energy’s consolidated capital structure is 15
appropriate for use in setting rates for the Company’s Kentucky customers because 16
Atmos Energy provides the debt and equity capital that supports the assets serving 17
those customers. 18
Q. HOW HAS THE COMPANY RELIED ON THE CONSOLIDATED CAPITAL 19
STRUCTURE OF ATMOS ENERGY IN THIS PROCEEDING? 20
A. The capital structure that is appropriate for the Company’s Kentucky operations in 21
this proceeding is set forth in FR 16(8)(j). As shown on FR 16(8)(j), the capital 22
structure is the Company’s period end actual capital structure as June 30, 2018, with 23

Direct Testimony of Joe T. Christian Page 7 Kentucky / Christian
an adjustment to the outstanding long-term debt which I describe below. The actual 1
capital structure for the period ended June 30, 2018 is representative of the capital 2
structure that will be in effect during the forecast period. As shown in that FR, 3
column (G), short term debt comprises 3.44%, long-term debt comprises 38.39% and 4
equity is 58.17% of the Company’s 13-month average rate base for the forward 5
looking test period. 6
Q. WHAT RATE DO YOU PROPOSE FOR THE EMBEDDED COST OF LONG-7
TERM DEBT CAPITAL IN SETTING RATES IN THIS CASE? 8
A. As shown in the calculation on Schedule J-3 F, column (e), a 4.72% weighted 9
average cost of long-term debt is supported. 10
Q. IS THIS THE WEIGHTED AVERAGE COST OF LONG-TERM DEBT AS OF 11
JUNE 30, 2018? 12
A. No. The weighted average cost of long-term debt has been adjusted to reflect the 13
Company’s anticipated issuance of $450 million in long-term debt in March 2019. 14
The long-term debt issuance reflects only a refinancing of $450 million plus the 15
incremental long-term debt associated with hedge instruments used to lock in the 16
rate. I have also updated J-3 F, Line 10 to reflect the balance outstanding at the end 17
of the period. 18
Q. WHAT RATE DO YOU PROPOSE FOR THE COST OF SHORT-TERM 19
DEBT CAPITAL IN SETTING RATES IN THIS CASE? 20
A. As shown in the calculation on Schedule J-2 F, column (e), a 2.40% weighted 21
average cost of short-term debt is supported. 22

Direct Testimony of Joe T. Christian Page 8 Kentucky / Christian
Q. IS THIS THE WEIGHTED AVERAGE COST OF SHORT-TERM DEBT AS 1
OF JUNE 30, 2018? 2
A. Yes. 3
Q. HAS THE JUNE 30, 2018 SHAREHOLDER EQUITY BALANCE BEEN 4
ADJUSTED IN TO REFLECT THE ISSUANCE OF EQUITY DURING THE 5
BASE OR FORECAST PERIOD? 6
A. No. I believe that the Company's incremental external financing along with cash 7
flow reinvested in the business will result in an overall capital structure that is in line 8
with the June 30, 2018 capital structure therefore no adjustment is warranted at this 9
time. 10
Q. SHOULD THE CAPITAL STRUCTURE BE UPDATED BEYOND THE JUNE 11
30, 2018 QUARTER INFORMATION? 12
A. Perhaps. I would note that two more quarters of actual information will be available 13
(September and December 2018) when rebuttal is filed in this case and therefore 14
could be utilized in establishing a cost of capital in this case. This would pick up 15
incremental long-term debt financing along with additional equity issuances and 16
changes in average short-term debt balances/rates and thus be more reflective of the 17
costs that will be incurred when new base rates go in effect. 18

Direct Testimony of Joe T. Christian Page 9 Kentucky / Christian
Q. ARE YOU FAMILIAR WITH THE COMMISSION’S USE OF REGULATORY 1
RESEARCH ASSOCIATES (“RRA”) INFORMATION IN OTHER 2
COMMISSION DOCKETS? 3
A. Yes. In preparation for Atmos Energy’s Case No. 2017-00349 I reviewed portions of 4
the Commission's Final Orders in Case Nos. 2016-0002620, 2016-0016221 and 2016-5
0037122 that relate to the Commission’s usage of RRA in forming their decisions 6
regarding rate of return outcomes. In preparation for this case I have also reviewed 7
portions of the Commission’s Final Orders in Case Nos. 2017-0017923 and 2017-8
0032124. 9
Q. HAS THE COMMISSION’S USE OF RRA DATA EVOLVED OVER THIS 10
PERIOD OF TIME? 11
A. I believe that the Commission has changed is characterization of how SNL Energy’s 12
RRA reports are utilized as a reference and now draw a better line of sight between 13
the evidence in the record and the final decision. However the Commission’s orders 14
20 In the Matter of: Application of Kentucky Utilities Company for Certificates of Public Convenience and Necessity and Approval of its 2016 Compliance Plan For Recovery by Environmental Surcharge, Case No. 2016-00026, August 8, 2016. 21 In the Matter of: Application of Columbia Gas of Kentucky, Inc. for an increase in base rates, Case No. 2016-00162, December 22, 2016. 22 In the Matter of: Electronic Application of Louisville Gas and Electric Company for an Adjustment of its electric and gas rates and for certificates of public convenience and necessity, Case No. 2016-00371, June 22, 2017. 23 In the Matter of: Electronic Application of Kentucky Power Company for (1) A general adjustment of its rates for electric service ; (2) An order approving its 2017 environmental compliance plan; (3) An order approving its tariffs and riders; (4) An order approving accounting practices to establish regulatory assets and liabilities; and (5) An order granting all other required approvals and relief, Case No. 2017-00179, January 18, 2018. 24 In the Matter of: Electronic Application of Duke Energy Kentucky, Inc. for: 1) An adjustment of the electric rates ; 2) Approval of an environmental compliance plan and surcharge mechanism; 3) Approval of new tariffs; 4) Approval of accounting practices to establish regulatory assets and liabilities; and 5) All other required approvals and relief, Case No. 2017-00321, April 13, 2018.

Direct Testimony of Joe T. Christian Page 10 Kentucky / Christian
continue to compare its recommended outcome to the latest available RRA 1
information. 2
Q. DOES RRA TRACK ALL RATE CHANGES DURING A QUARTER/YEAR? 3
A. No. As I mentioned in Atmos Energy’s rate case, none of our formula rate 4
mechanisms are included in the average ROE outcomes reported by RRA but the 5
majority of our capital investment deployed each year is recovered through formula 6
rate mechanisms. Thus, I believe that the reported RRA average return on equity has 7
a significant omission in that it does not accurately reflect capital investment 8
deployed through formula rate plans, and the ROE allowed on that investment, by 9
only considering outcomes tracked by RRA. While RRA’ tracked case trends may be 10
reflecting a trend either up or down, this trend applies only to a minority of capital 11
deployed by investor-owned utilities. 12
Q. HAVE CAPITAL COSTS TRENDED UPWARDS SINCE THE COMPANY 13
FILED ITS RATE CASE IN SEPTEMBER OF 2017? IN OTHER WORDS, 14
SHOULD ROE RESULTS BEGIN TRENDING UP WITH THE ECONOMY 15
GAINING STRENGTH? 16
A. Yes. As shown in Table JTC-1, 10 Year, 20 Year, and 30 Year Treasury rates have all 17
trended upwards since the Company filed Case No. 2017-00349. 18

Direct Testimony of Joe T. Christian Page 11 Kentucky / Christian
1
Q. HAVE BORROWING COSTS SHOWED THIS SAME TREND? 2
A. The change hasn’t been as pronounced year-over-year, but since early 2018 when the 3
Company was pulling together information for rebuttal the trend has been upward for 4
debt costs. This is demonstrated in Table JTC-2: 5
6

Direct Testimony of Joe T. Christian Page 12 Kentucky / Christian
IV. CASH WORKING CAPITAL 1
Q. WHY HAS THE COMPANY INCLUDED A LEAD-LAG ANALYSIS WITH 2
THIS CASE? 3
A. Although the Company was reluctant to file a lead-lag study in prior cases25 the study 4
filed by the Company in Case No. 2017-00349 was accepted “as filed” in the 5
calculation of the rate base in the final order. In light of the Commission’s order in 6
that case the inclusion of a lead-lag study following the same methodology accepted 7
in calculating lead-lag in Case No. 2017-00349 is appropriate in this case. 8
Q. WHAT IS THE PURPOSE OF THE LEAD-LAG ANALYSIS? 9
A. Rate base is the value of invested capital, including all items used to provide utility 10
service. Cash working capital is the capital investment in addition to other rate base 11
items that is required to bridge the gap between when cash is paid for expenses 12
necessary to provide service and when cash is received from customers for that 13
service. As stated above, this amount is included in rate base. A lead-lag analysis is 14
a method of measuring the amount of cash working capital used to provide utility 15
service. This analysis compares two different lags. The lag between (1) the 16
provision of service to customers and the collection of cash from customers is 17
compared to the lag between (2) the recording of expenses and the payment of cash 18
by the company for those expenses. 19
25 The Company had utilized the formula approach of 1/8 of operations and maintenance expenses since its purchase of Western Kentucky Gas Company in 1987.

Direct Testimony of Joe T. Christian Page 13 Kentucky / Christian
Q. DO YOU HAVE ANY PAST EXPERIENCE PERFORMING LEAD-LAG 1
STUDIES? 2
A. Yes. In addition to our most recent Kentucky rate case I have prepared several lead 3
lag studies for the Company, including studies filed in Atmos Energy’s last rate cases 4
in Tennessee, Colorado, and Virginia. 5
Q. PLEASE DESCRIBE SCHEDULE ATO-CWC1. 6
A. This Schedule actually consists of two parts - Schedule ATO-CWC1 A and ATO-7
CWC1 B. Schedule ATO-CWC1 A summarizes the results of the lead-lag analysis 8
for the test period that ends March 31, 2020. It shows the calculation of the cash 9
working capital requirement based on revenue and expense lag days and projected 10
expense amounts in the proposed revenue requirement. 11
Q. PLEASE DESCRIBE SCHEDULE ATO-CWC1B 12
A. Schedule ATO-CWC1B summarizes the results of the lead-lag analysis for the base 13
period ended December 31, 2018. It shows the calculation of the cash working 14
capital requirement based on revenue and expense lag days and actual expenses for 15
the base period. 16
Q. PLEASE DESCRIBE HOW SCHEDULES ATO-CWC 1A AND 1B ARE 17
ARRANGED? 18
A. Column (a) lists the type of expenses analyzed in the lead lag study including gas 19
costs, O&M labor, other O&M, taxes other than income, federal income tax, state 20
income tax, depreciation, long term and short term debt interest expense and return 21
on equity. Schedule ATO-CWC1A Column (b) contains the projected expenses for 22
the forecasted test period and Schedule ATO-CWC1B Column (b) contains the 23

Direct Testimony of Joe T. Christian Page 14 Kentucky / Christian
expenses for the base period test year. Schedule ATO-CWC1A and ATO-CWC1B 1
Column (c) divides the expenses in Column (b) by 365 to arrive at the average daily 2
expense. Column (d) contains the revenue lag which is calculated on Schedule ATO-3
CWC2. Column (e) contains the expense lags which are calculated on Schedule 4
ATO-CWC3 through Schedule ATO-CWC9 and their related Workpapers. Column 5
(f) calculates the net lag by subtracting the expense lag from the revenue lag. 6
Column (g) contains the calculation of the cash working capital requirement which is 7
calculated by multiplying Column (c) times Column (f). The cash working capital 8
requirement to be added to rate base for the forecasted test period is $2.7 million. 9
Q. PLEASE DESCRIBE SCHEDULE ATO-CWC2. 10
A. The average revenue lag is calculated on Schedule ATO-CWC2. The revenue lag is 11
the average number of days from the time service is provided by the company until 12
revenue related to that service is available to pay bills. It consists of four subparts: 13
the service lag, the billing lag, the collection lag and the bank lag. 14
Q. WHAT IS THE SERVICE LAG? 15
A. The service lag is the average number of days from the time service is provided until 16
the meter is read. Since service is provided daily and meters are read monthly, the 17
service lag is one-half of a month or 15.21 days. 18
Q. WHAT IS THE BILLING LAG? 19
A. The billing lag is the time lag from meter reading to bill issuance. The average 20
billing lag based on all bills issued in a heating season month (January) and a non-21
heating season month (September), was 1.41 days. 22

Direct Testimony of Joe T. Christian Page 15 Kentucky / Christian
Q. WHAT IS THE COLLECTION LAG? 1
A. The collection lag is the average number of days between issuing a bill and receiving 2
payment. This was calculated by dividing the average daily accounts receivable 3
balance by the average daily revenue plus billed taxes. The total revenue plus billed 4
taxes may be found on WP 2-2. It resulted in a lag period of 23.20 days. 5
Q. WHAT IS THE BANK LAG? 6
A. The bank lag is the one-day lag between receiving payment through one of the 7
Company’s ten pay channels and having funds available to draw at the bank. 8
Customer accounts receivable balances are credited when payment is received. 9
Q. WHAT IS THE TOTAL AVERAGE REVENUE LAG? 10
A. The resulting total average revenue lag is 40.82 days, as shown on the last line of 11
Schedule ATO-CWC2. 12
Q. PLEASE DESCRIBE SCHEDULE ATO-CWC3. 13
A. Schedule ATO-CWC3 shows the calculation of the average purchased gas cost 14
payment lag of 39.48 days from the delivery of the gas to the payment for the gas. 15
The schedule shows the service dates, the invoice date, and the payment date for all 16
gas invoices in the base period. 17
Q. PLEASE DESCRIBE SCHEDULE ATO-CWC4. 18
A. Schedule ATO-CWC4 shows the calculation of the average payroll lag, which is the 19
average number of days from the time service is provided until payroll related to that 20
service is paid. The payroll lag days consists of: the service lag, the payment lag, and 21
the check-clearing lag. The service lag is the average number of days from the time 22
labor is provided until the end of the pay period. The Company uses a two-week pay 23

Direct Testimony of Joe T. Christian Page 16 Kentucky / Christian
period, so the service lag is seven days. The payment lag is the average number of 1
days between the end of the pay period and payment date. With the Company’s 2
practice of paying on Friday for a pay period that ended the previous Friday, the 3
payment lag is seven days. Most employees receive their pay via direct deposit, and 4
therefore have no check-clearing lag. However, the few employees that are paid by 5
check result in an average check-clearing lag of 0.08 days. The total average payroll 6
lag is 14.08 days. 7
Q. PLEASE DESCRIBE SCHEDULE ATO-CWC5. 8
A. Schedule ATO-CWC5 shows the calculation of the average number of lag days for 9
other O&M expenses. The calculation is based on an analysis of payments for the 10
twelve months ended June 30, 2018. I analyzed a random sample of 385 invoices out 11
of the 8,566 total Kentucky O&M invoices to determine the lag between the date 12
services were provided to the Company and the date the Company paid the bill for 13
those services. In most cases, the service period could be determined from the 14
invoice. If no information was available regarding the date service was provided, 15
then the date of the invoice was used in most cases other than utilities, telecom and 16
rent. Please see WP 5-1 for the analysis. 17
Q. DID THE SAMPLE CONTAIN ANY INVOICES THAT WOULD HAVE 18
SKEWED THE OVERALL REASONABLENESS OF THE RESULTS? 19
A. Yes. One invoice pulled was incorrectly charged to O&M as service was for a future 20
period therefore it was removed from the results. 21

Direct Testimony of Joe T. Christian Page 17 Kentucky / Christian
Q. PLEASE DESCRIBE SCHEDULE ATO-CWC6. 1
A. Schedule ATO-CWC6 shows the calculation of the average payment lag days for 2
taxes other than income tax. As each tax has its unique payment due date, the 3
calculation of the lag is shown separately for each type of tax (payroll taxes - FICA 4
and unemployment, ad valorem taxes, taxes property and other, DOT fees, Public 5
Service Commission taxes and franchise and other pass through taxes). 6
Q. PLEASE DISCUSS THE LAG RELATING TO PAYROLL TAXES. 7
A. Payroll taxes consist of FICA taxes and unemployment taxes. FICA taxes are paid 8
by wire on the first banking day before each payday. Since paydays are normally on 9
Fridays, FICA lag days are equal to the payroll lag days for direct deposit employees 10
of 14 days less 1 day, for a total lag of 13 days. Unemployment taxes are paid 11
quarterly at the end of the month following each quarter. Therefore, for 12
unemployment taxes, the lag, as calculated from the mid-point of the quarter to the 13
payment date at the end of the following month plus the payroll service lag, is 83.6 14
days. 15
Q. PLEASE DISCUSS THE LAG RELATING TO AD VALOREM TAXES. 16
A. Kentucky Ad Valorem taxes for a calendar year are paid as billed throughout the year 17
following the year of assessment. Therefore, the Kentucky ad valorem tax lag, as 18
calculated from the mid-point of the calendar year to the payment date, is 305.64 19
days. Ad Valorem taxes allocated from Shared Services are paid by January 31 for 20
the year following the assessment. Therefore, the SSU ad valorem tax lag as 21
calculated from the mid-point of the calendar year to the payment date is 213.50 22
days. 23

Direct Testimony of Joe T. Christian Page 18 Kentucky / Christian
Q. PLEASE DISCUSS THE LAG RELATING TO TAXES PROPERTY AND 1
OTHER. 2
A. Taxes Property and Other consist of various franchise agreements that are paid on a 3
per meter basis rather than on a revenue basis and Kentucky Highway Use Tax. The 4
expense lag on the franchise taxes are determined by the franchise with each 5
individual city and may be a prepayment or paid in arrears. The Kentucky Highway 6
Use Tax is paid at the end of the month in the month following the end of each 7
quarter. The weighted average lag of all taxes paid is a prepayment of 60.37 days. 8
Q. PLEASE DISCUSS THE LAG RELATING TO THE DOT FEE. 9
A. The annual DOT fee lag of 59 days is calculated from the midpoint of the fiscal year 10
to the payment date on May 28th of the following calendar year. 11
Q. PLEASE DISCUSS THE LAG RELATING TO THE FRANCHISE AND 12
OTHER PASS THROUGH TAXES. 13
A. Franchise and other pass through taxes consist of franchise taxes that are paid on a 14
revenue basis, Kentucky sales use tax and Kentucky school tax. The franchise taxes 15
are paid at the end of the month following the end of the quarter. The Kentucky sales 16
use tax and school tax are paid at the end of the month for the prior month. The 17
weighted lag for Franchise and other pass through taxes is 38.52 days. 18
Q. PLEASE DESCRIBE SCHEDULE ATO-CWC7. 19
A. Schedule ATO-CWC7 shows the calculation of the federal income tax lag. Income 20
taxes for the base period are paid in four quarterly payments during the year. The 21
average lag from the midpoint of the base period to the payment dates is 29.75 days. 22

Direct Testimony of Joe T. Christian Page 19 Kentucky / Christian
This is the lag for paying current taxes. Taxes that are deferred are recorded as a rate 1
base credit and thus have an expense lag of zero days. 2
Q. PLEASE DESCRIBE SCHEDULE ATO-CWC8. 3
A. Schedule ATO-CWC8 shows the calculation of the state income tax lag. State 4
income taxes for a fiscal year are paid on the same schedule as federal income taxes. 5
Therefore, the average lag from the midpoint of the tax year to the payment dates is 6
also 29.75 days for paying current taxes, and zero days for deferred taxes. 7
Q. PLEASE DESCRIBE SCHEDULE ATO-CWC9. 8
A. Schedule ATO-CWC9 shows the calculation of the long-term debt lag. Long-term 9
debt interest expense includes monthly payments, and semi-annual payments. 10
Interest is recorded on an accrual basis and paid in the period it is due. The long-11
term debt lag, as calculated from the mid-point of the accrual period to the payment 12
date, averages 90.02 days. 13
Q. PLEASE DESCRIBE SHORT-TERM DEBT LAG ON ATO-CWC1. 14
A. In the base period short-term debt interest expense was for commercial paper. Most 15
commercial paper issued by the company is very short-term. Commitment fees are 16
generally paid at the end of the quarter. Other base period short-term debt costs were 17
prepaid. The weighted average short-term debt cost payment lag in the base period 18
was 35.20 days. 19
Q. HOW DID YOU TREAT PREPAID ITEMS IN THE CALCULATION OF 20
CASH WORKING CAPITAL? 21
A. Expenses that are paid by the Company before they are recorded as an expense are 22
included with a negative lag to reflect the difference between the payment of the 23

Direct Testimony of Joe T. Christian Page 20 Kentucky / Christian
expense and the recording of the expense. With this method both the lag from the 1
payment to the recording of the expense and the subsequent revenue lag from the 2
provision of service to the receipt of cash are recognized in rate base. 3
Q. IS DEPRECIATION EXPENSE PROPERLY INCLUDED IN THE LEAD-LAG 4
STUDY. 5
A. Yes, because the payment for the asset precedes the receipt of service from the asset 6
and the recording of depreciation expense. The lag between payment for the asset 7
and the recording of depreciation expense is recognized by the including net plant in 8
service in rate base. 9
Q. DOES INCLUSION OF PLANT IN SERVICE IN RATE BASE SUFFICE TO 10
PROPERLY ACCOUNT FOR THE ENTIRE LAG RELATING TO 11
DEPRECIATION? 12
A. No. The inclusion in rate base of plant in service does not recognize the subsequent 13
lag from the provision of service to the receipt of cash for that service. By including 14
depreciation expense in the lead-lag study with a zero expense lag, the lead-lag study 15
properly recognizes the subsequent revenue lag on recovering cash related to 16
investment in plant assets. In other words, the investment in an asset is included in 17
rate base as net plant in service until depreciation is recorded on that asset. 18
Recording depreciation removes the asset from rate base, even though cash has not 19
been received to pay for the service provided by the asset, unless the revenue lag on 20
depreciation expense is included in cash working capital through the lead-lag study.21

Direct Testimony of Joe T. Christian Page 21 Kentucky / Christian
Q. DISCUSS THE TREATMENT OF RETURN ON EQUITY IN THE LEAD-1
LAG STUDY. 2
A. Similar to depreciation, operating income is earned at the provision of utility service. 3
There is again a revenue lag between the provision of service and the receipt of cash 4
for that service. By including return on equity in the lead-lag study with a zero 5
expense lag, the lead-lag study properly recognizes the subsequent revenue lag on 6
recovering cash related return. 7
Q. DOES THIS CONCLUDE YOUR TESTIMONY? 8
A. Yes. 9

COMMONWEALTH OF KENTUCKY
BEFORE THE PUBLIC SERVICE COMMISSION
IN THE MATTER OF RATE APPLICATION OF ATMOS ENERGY CORPORATION
) ) )
Case No. 2018-00281
CERTIFICATE AND AFFIDAVIT
The Affiant, Joe T. Christian, being duly sworn, deposes and states that the prepared testimony attached hereto and made a pati hereof, constitutes the prepared direct testimony ofthis affiant in Case No. 2018-00281, in the Matter ofthe Rate Application of Atmos Energy Corporation, and that if asked the questions propounded therein, this affiant would make the answers set forth in the attached prepared direct pre-filed testimony.
STATE OF tcx;.as COUNTY OF DC{ I [ c:t 5
SUBSCRIBED AND SWORN to before me by Joe T. Christian on this the __ day of September, 2018.
,,,,''V~ff,,, GISELL-E R HEROY ..!"'~~ •••• ~~ ff( .. .£6'{<:'~ Notary Public, State of Texas ~"{··.·p.r.··',>,.~S Comm. Expires 09-01-2020 "'',:f,Rf;~,,.:- Notary ID 13080484-2
I I J
I '/
' ' I ' '
' ;
' I

EXHIBIT ATO-1 Lead Lag Study
ATO-CWC1 AAtmos Energy Corporation-Kentucky
Cash Working Capital Lead/Lag AnalysisFor Forecast Test Year Ended March 31, 2020
Average CWCLine Test Year Daily Expense Revenue Expense Net Lag RequirementNo. Description Expenses (b) / 365 days Lag Lag ( d) - (e) (c) x (f)
(a) (b) ( c) (d) (e) (f) (g)
1 Gas Supply Expense2 Purchased Gas 78,382,354 214,746 CWC2 40.82 CWC3 39.48 1.34 287,76034 Operation and Maintenance Expense5 O&M, Labor 10,802,619 29,596 CWC2 40.82 CWC4 14.08 26.74 791,3976 O&M, Non-Labor 16,422,362 44,993 CWC2 40.82 CWC5 28.33 12.49 561,9637 Total O&M Expense 27,224,981 1,353,36089 Taxes Other Than Income
10 Ad Valorem 5,910,122 16,192 CWC2 40.82 CWC6 305.64 (264.82) (4,287,956)11 Taxes Property and Other 99,099 272 CWC2 40.82 CWC6 60.37 (19.55) (5,318)12 Payroll Taxes 355,960 975 CWC2 40.82 CWC6 83.63 (42.81) (41,735)13 Franchise and other pass through 9,703,180 26,584 CWC2 40.82 CWC6 38.52 2.30 61,14414 Public Service Commission 339,436 930 N/A 0.00 CWC6 0.00 0.00 015 DOT 137,062 376 CWC2 40.82 CWC6 59.00 (18.18) (6,836)1617 Allocated Taxes-Shared Services18 Ad Valorem 20% 93,633 257 CWC2 40.82 CWC6 213.50 (172.68) (44,379)19 Payroll Taxes 80% 375,720 1,029 CWC2 40.82 CWC6 83.63 (42.81) (44,046)2021 Allocated Taxes-Business Unit22 Ad Valorem 4,779 13 CWC2 40.82 CWC6 305.64 (264.82) (3,443)23 Payroll Taxes 196,026 537 CWC2 40.82 CWC6 83.63 (42.81) (22,986)24 Total Taxes Other Than Income 17,215,017 (4,395,554)2526 Federal Income Tax 5,973,69627 Current Taxes 0 0 CWC2 40.82 CWC7 29.75 11.07 028 Deferred Taxes 5,973,696 16,366 CWC2 40.82 CWC7 0.00 40.82 668,0602930 State Income Tax 381,30031 Current Taxes 0 0 CWC2 40.82 CWC8 29.75 11.07 032 Deferred Taxes 381,300 1,045 CWC2 40.82 CWC8 0.00 40.82 42,6573334 Depreciation 22,541,774 61,758 CWC2 40.82 0 40.82 2,520,9623536 Interest Expense - STD 772,788 2,117 CWC2 40.82 (1) 35.20 5.62 11,8983738 Interest Expense - LTD 8,594,947 23,548 CWC2 40.82 CWC9 90.02 (49.20) (1,158,645)3940 Return on Equity 30,064,352 82,368 CWC2 40.82 0 40.82 3,362,2624142 TOTAL 191,151,210 2,692,759
4344 (1) Please see relied file labeled "CWC1 STD Days Outstanding.pdf (Page 9)" for calculation of average days held Page 1 of 1

EXHIBIT ATO-1 Lead Lag Study
ATO-CWC1 BAtmos Energy Corporation-Kentucky
Cash Working Capital Lead/Lag AnalysisFor Base Period Ended December 30, 2018
Average CWCLine Test Year Daily Expense Revenue Expense Net Lag RequirementNo. Description Expenses (b) / 365 days Lag Lag ( d) - (e) (c) x (f)
(a) (b) ( c) (d) (e) (f) (g)
1 Gas Supply Expense2 Purchased Gas 83,882,422 229,815 CWC2 40.82 CWC3 39.48 1.34 307,95234 Operation and Maintenance Expense 5 O&M, Labor 10,632,314 29,130 CWC2 40.82 CWC4 14.08 26.74 778,9266 O&M, Non-Labor 17,898,824 49,038 CWC2 40.82 CWC5 28.33 12.49 612,4837 Total O&M Expense 28,531,137 1,391,40989 Taxes Other Than Income 10 Ad Valorem 5,199,059 14,244 CWC2 40.82 CWC6 305.64 (264.82) (3,772,087)11 Taxes Property and Other 144,877 397 CWC2 40.82 CWC6 60.37 (19.55) (7,760)12 Payroll Taxes 358,215 981 CWC2 40.82 CWC6 83.63 (42.81) (42,009)13 Franchise and other pass through 9,703,180 26,584 CWC2 40.82 CWC6 38.52 2.30 61,14514 Public Service Commission 307,288 842 N/A 0.00 CWC6 0.00 0.00 015 DOT 137,062 376 CWC2 40.82 CWC6 59.00 (18.18) (6,827)1617 Allocated Taxes-Shared Services (1)18 Ad Valorem 86,842 238 CWC2 40.82 CWC6 213.50 (172.68) (41,085)19 Payroll Taxes 326,526 895 CWC2 40.82 CWC6 83.63 (42.81) (38,293)2021 Allocated Taxes-Business Unit (2)22 Ad Valorem 3,534 10 CWC2 40.82 CWC6 305.64 (264.82) (2,564)23 Payroll Taxes 182,474 500 CWC2 40.82 CWC6 83.63 (42.81) (21,400)24 Total Taxes Other Than Income 16,449,059 (3,870,880)2526 Federal Income Tax 5,973,69627 Current Taxes 0 0 CWC2 40.82 CWC7 29.75 11.07 028 Deferred Taxes 5,973,696 16,366 CWC2 40.82 CWC7 0.00 40.82 668,0722930 State Income Tax 381,30031 Current Taxes 0 0 CWC2 40.82 CWC8 29.75 11.07 032 Deferred Taxes 381,300 1,045 CWC2 40.82 CWC8 0.00 40.82 42,6433334 Depreciation 20,483,034 56,118 CWC2 40.82 0 40.82 2,290,7333536 Interest Expense - STD 646,110 1,770 CWC2 40.82 (3) 35.20 5.62 9,9483738 Interest Expense - LTD 7,186,035 19,688 CWC2 40.82 CWC9 90.02 (49.20) (968,707)3940 Return on Equity 25,099,761 68,766 CWC2 40.82 0 40.82 2,807,0474142 TOTAL 188,632,554 2,678,2174344 (1) Excludes a Texas sales tax refund of $15,846 and a reversal of a previous accrual of $1,095,601 related to a Kansas sales tax audit
(2) Excludes reversal of a previous accrual of ad valorem taxes of $396,774 related to AEM(3) Please see relied file labeled "CWC1 STD Days Outstanding.pdf" for calculation of average days held
Page 1 of 1

EXHIBIT ATO-1 Lead Lag Study
ATO-CWC2Atmos Energy Corporation-Kentucky
Revenue Lag StudyFor the CWC Study Test Year Ended June 30, 2018
Line Weighted No. Description Average Lag
(a) (b)
1 Average Billing Lag (1) = 1.4123 Service Lag = 15.2145 Collection Lag: 23.206 (Test Yr Average Daily Accounts Receivable / Test Yr Average Daily Revenue)78 Bank Lag (2) = 1.009
10 Total Revenue Lag = 40.82
1112 Notes:13 (1) Please see the relied upon labeled "CWC2 Read to Billing Lag" for the billing lag14 for the months of September, 2017 and January, 201815 (2) Please see the relied upon labeled "CWC2 Bank Lag" for the lag by payment channel
Page 1 of 1

EXHIBIT ATO-1 Lead Lag Study
Atmos Energy Corporation-Kentucky CWC WP 2-1Revenue Lag Study - Daily Accts Receivable Balances for Mid-StatesFor the CWC Study Test Year Ended June 30, 2018
Line No. Date Total
1 Saturday, July 1, 2017 8,131,027.522 Sunday, July 2, 2017 7,440,010.543 Monday, July 3, 2017 7,440,010.544 Tuesday, July 4, 2017 6,894,119.675 Wednesday, July 5, 2017 6,966,523.796 Thursday, July 6, 2017 6,691,749.967 Friday, July 7, 2017 6,691,749.968 Saturday, July 8, 2017 6,638,793.659 Sunday, July 9, 2017 6,122,765.2010 Monday, July 10, 2017 5,966,898.7211 Tuesday, July 11, 2017 5,460,003.2012 Wednesday, July 12, 2017 5,460,003.2013 Thursday, July 13, 2017 5,902,605.8514 Friday, July 14, 2017 5,902,605.8515 Saturday, July 15, 2017 5,789,009.4516 Sunday, July 16, 2017 5,783,094.7517 Monday, July 17, 2017 7,357,748.3818 Tuesday, July 18, 2017 7,606,040.7419 Wednesday, July 19, 2017 7,941,667.9120 Thursday, July 20, 2017 8,056,601.5421 Friday, July 21, 2017 8,056,601.5422 Saturday, July 22, 2017 7,988,861.4423 Sunday, July 23, 2017 7,908,961.7324 Monday, July 24, 2017 8,102,721.7425 Tuesday, July 25, 2017 8,158,353.4826 Wednesday, July 26, 2017 8,213,758.3827 Thursday, July 27, 2017 8,202,544.8828 Friday, July 28, 2017 8,202,544.8829 Saturday, July 29, 2017 8,138,906.8330 Sunday, July 30, 2017 7,672,132.8531 Monday, July 31, 2017 7,485,580.2232 Tuesday, August 1, 2017 7,311,980.8833 Wednesday, August 2, 2017 7,405,817.8334 Thursday, August 3, 2017 7,318,869.9835 Friday, August 4, 2017 7,318,869.9836 Saturday, August 5, 2017 7,265,215.7037 Sunday, August 6, 2017 6,494,366.9438 Monday, August 7, 2017 6,347,928.9139 Tuesday, August 8, 2017 6,466,159.6240 Wednesday, August 9, 2017 6,332,708.6941 Thursday, August 10, 2017 6,333,802.3842 Friday, August 11, 2017 6,333,802.3843 Saturday, August 12, 2017 6,277,543.2744 Sunday, August 13, 2017 7,169,853.4345 Monday, August 14, 2017 6,796,208.3546 Tuesday, August 15, 2017 6,884,293.4147 Wednesday, August 16, 2017 7,099,212.3448 Thursday, August 17, 2017 7,179,832.1349 Friday, August 18, 2017 7,179,832.1350 Saturday, August 19, 2017 7,122,720.2251 Sunday, August 20, 2017 6,821,844.1152 Monday, August 21, 2017 6,762,874.9053 Tuesday, August 22, 2017 6,928,726.4354 Wednesday, August 23, 2017 7,124,523.2955 Thursday, August 24, 2017 7,184,288.3556 Friday, August 25, 2017 7,184,288.3557 Saturday, August 26, 2017 7,113,807.5958 Sunday, August 27, 2017 6,831,667.85
Page 1 of 7

EXHIBIT ATO-1 Lead Lag Study
Atmos Energy Corporation-Kentucky CWC WP 2-1Revenue Lag Study - Daily Accts Receivable Balances for Mid-StatesFor the CWC Study Test Year Ended June 30, 2018
Line No. Date Total59 Monday, August 28, 2017 6,227,744.4960 Tuesday, August 29, 2017 5,872,567.2961 Wednesday, August 30, 2017 5,661,375.9562 Thursday, August 31, 2017 5,392,206.4763 Friday, September 1, 2017 5,392,206.4764 Saturday, September 2, 2017 5,392,206.4765 Sunday, September 3, 2017 5,202,097.7066 Monday, September 4, 2017 3,872,453.6167 Tuesday, September 5, 2017 3,704,937.4968 Wednesday, September 6, 2017 3,694,065.6169 Thursday, September 7, 2017 5,411,696.3770 Friday, September 8, 2017 7,129,327.1371 Saturday, September 9, 2017 3,414,507.4872 Sunday, September 10, 2017 3,463,996.6473 Monday, September 11, 2017 3,164,988.5174 Tuesday, September 12, 2017 3,522,288.7775 Wednesday, September 13, 2017 3,824,895.1576 Thursday, September 14, 2017 3,938,260.6177 Friday, September 15, 2017 4,051,626.0778 Saturday, September 16, 2017 4,001,611.8479 Sunday, September 17, 2017 4,150,018.0880 Monday, September 18, 2017 4,445,926.9281 Tuesday, September 19, 2017 6,057,915.3182 Wednesday, September 20, 2017 6,181,556.6083 Thursday, September 21, 2017 6,236,300.5584 Friday, September 22, 2017 6,236,300.5585 Saturday, September 23, 2017 6,179,222.0286 Sunday, September 24, 2017 6,264,331.0487 Monday, September 25, 2017 6,227,865.9488 Tuesday, September 26, 2017 6,272,201.4489 Wednesday, September 27, 2017 6,265,955.7590 Thursday, September 28, 2017 6,137,035.3591 Friday, September 29, 2017 6,093,867.1292 Saturday, September 30, 2017 6,053,341.4693 Sunday, October 1, 2017 5,680,397.0094 Monday, October 2, 2017 5,564,713.5995 Tuesday, October 3, 2017 5,353,879.8796 Wednesday, October 4, 2017 5,294,780.9397 Thursday, October 5, 2017 5,406,817.7498 Friday, October 6, 2017 5,406,817.7499 Saturday, October 7, 2017 5,253,833.14
100 Sunday, October 8, 2017 5,296,470.32101 Monday, October 9, 2017 5,009,408.30102 Tuesday, October 10, 2017 4,796,034.40103 Wednesday, October 11, 2017 4,822,754.88104 Thursday, October 12, 2017 4,667,615.73105 Friday, October 13, 2017 4,667,615.73106 Saturday, October 14, 2017 4,607,296.14107 Sunday, October 15, 2017 4,426,327.95108 Monday, October 16, 2017 6,024,278.99109 Tuesday, October 17, 2017 5,744,996.00110 Wednesday, October 18, 2017 5,564,126.21111 Thursday, October 19, 2017 5,624,428.40112 Friday, October 20, 2017 5,624,428.40113 Saturday, October 21, 2017 5,529,052.82114 Sunday, October 22, 2017 5,304,079.48115 Monday, October 23, 2017 5,274,265.28116 Tuesday, October 24, 2017 5,160,967.59117 Wednesday, October 25, 2017 5,295,369.17
Page 2 of 7

EXHIBIT ATO-1 Lead Lag Study
Atmos Energy Corporation-Kentucky CWC WP 2-1Revenue Lag Study - Daily Accts Receivable Balances for Mid-StatesFor the CWC Study Test Year Ended June 30, 2018
Line No. Date Total118 Thursday, October 26, 2017 5,376,143.97119 Friday, October 27, 2017 5,376,143.97120 Saturday, October 28, 2017 5,246,013.67121 Sunday, October 29, 2017 4,911,871.48122 Monday, October 30, 2017 4,436,034.81123 Tuesday, October 31, 2017 4,293,619.11124 Wednesday, November 1, 2017 4,422,953.83125 Thursday, November 2, 2017 4,420,129.85126 Friday, November 3, 2017 4,420,129.85127 Saturday, November 4, 2017 4,325,243.02128 Sunday, November 5, 2017 4,318,287.19129 Monday, November 6, 2017 3,888,308.37130 Tuesday, November 7, 2017 3,990,197.92131 Wednesday, November 8, 2017 4,452,921.12132 Thursday, November 9, 2017 4,441,502.07133 Friday, November 10, 2017 4,441,502.07134 Saturday, November 11, 2017 4,360,222.58135 Sunday, November 12, 2017 4,616,949.05136 Monday, November 13, 2017 5,180,403.55137 Tuesday, November 14, 2017 5,134,681.59138 Wednesday, November 15, 2017 5,650,139.88139 Thursday, November 16, 2017 7,814,973.69140 Friday, November 17, 2017 7,814,973.69141 Saturday, November 18, 2017 7,675,119.54142 Sunday, November 19, 2017 7,916,600.55143 Monday, November 20, 2017 8,189,457.39144 Tuesday, November 21, 2017 8,668,582.00145 Wednesday, November 22, 2017 8,668,582.00146 Thursday, November 23, 2017 8,668,582.00147 Friday, November 24, 2017 8,668,582.00148 Saturday, November 25, 2017 8,207,786.47149 Sunday, November 26, 2017 8,101,687.03150 Monday, November 27, 2017 8,431,327.32151 Tuesday, November 28, 2017 8,668,629.75152 Wednesday, November 29, 2017 8,429,034.01153 Thursday, November 30, 2017 8,552,218.17154 Friday, December 1, 2017 8,552,218.17155 Saturday, December 2, 2017 8,402,677.04156 Sunday, December 3, 2017 7,634,464.81157 Monday, December 4, 2017 7,742,033.23158 Tuesday, December 5, 2017 7,852,404.17159 Wednesday, December 6, 2017 8,476,392.95160 Thursday, December 7, 2017 8,807,648.83161 Friday, December 8, 2017 8,807,648.83162 Saturday, December 9, 2017 8,628,066.46163 Sunday, December 10, 2017 8,650,093.72164 Monday, December 11, 2017 9,564,178.54165 Tuesday, December 12, 2017 12,010,372.55166 Wednesday, December 13, 2017 13,467,761.76167 Thursday, December 14, 2017 13,679,789.59168 Friday, December 15, 2017 13,679,789.59169 Saturday, December 16, 2017 13,525,675.08170 Sunday, December 17, 2017 13,668,747.20171 Monday, December 18, 2017 14,225,197.07172 Tuesday, December 19, 2017 14,899,316.67173 Wednesday, December 20, 2017 15,649,916.31174 Thursday, December 21, 2017 16,328,579.86175 Friday, December 22, 2017 16,328,579.86176 Saturday, December 23, 2017 16,328,579.86
Page 3 of 7

EXHIBIT ATO-1 Lead Lag Study
Atmos Energy Corporation-Kentucky CWC WP 2-1Revenue Lag Study - Daily Accts Receivable Balances for Mid-StatesFor the CWC Study Test Year Ended June 30, 2018
Line No. Date Total177 Sunday, December 24, 2017 16,328,579.86178 Monday, December 25, 2017 15,435,832.44179 Tuesday, December 26, 2017 14,775,093.37180 Wednesday, December 27, 2017 14,835,876.43181 Thursday, December 28, 2017 13,636,875.23182 Friday, December 29, 2017 13,636,875.23183 Saturday, December 30, 2017 13,437,637.39184 Sunday, December 31, 2017 13,342,344.21185 Monday, January 1, 2018 12,487,642.12186 Tuesday, January 2, 2018 12,461,903.32187 Wednesday, January 3, 2018 12,530,783.09188 Thursday, January 4, 2018 13,045,359.69189 Friday, January 5, 2018 13,045,359.69190 Saturday, January 6, 2018 12,666,663.43191 Sunday, January 7, 2018 11,956,908.24192 Monday, January 8, 2018 12,362,240.81193 Tuesday, January 9, 2018 12,945,982.37194 Wednesday, January 10, 2018 13,614,678.00195 Thursday, January 11, 2018 14,012,254.35196 Friday, January 12, 2018 14,012,254.35197 Saturday, January 13, 2018 13,825,540.96198 Sunday, January 14, 2018 15,188,811.09199 Monday, January 15, 2018 15,028,037.02200 Tuesday, January 16, 2018 18,761,375.15201 Wednesday, January 17, 2018 20,366,571.26202 Thursday, January 18, 2018 21,158,490.85203 Friday, January 19, 2018 21,158,490.85204 Saturday, January 20, 2018 20,939,156.52205 Sunday, January 21, 2018 21,302,859.55206 Monday, January 22, 2018 21,952,204.85207 Tuesday, January 23, 2018 23,148,379.49208 Wednesday, January 24, 2018 24,260,090.82209 Thursday, January 25, 2018 24,976,732.47210 Friday, January 26, 2018 24,976,732.47211 Saturday, January 27, 2018 24,738,787.42212 Sunday, January 28, 2018 23,852,790.73213 Monday, January 29, 2018 22,435,258.78214 Tuesday, January 30, 2018 21,701,755.90215 Wednesday, January 31, 2018 22,346,356.26216 Thursday, February 1, 2018 22,569,043.44217 Friday, February 2, 2018 22,569,043.44218 Saturday, February 3, 2018 22,285,778.12219 Sunday, February 4, 2018 21,995,699.47220 Monday, February 5, 2018 20,689,586.94221 Tuesday, February 6, 2018 20,359,239.24222 Wednesday, February 7, 2018 21,336,023.37223 Thursday, February 8, 2018 21,953,320.16224 Friday, February 9, 2018 21,953,320.16225 Saturday, February 10, 2018 21,700,152.90226 Sunday, February 11, 2018 21,424,459.71227 Monday, February 12, 2018 21,227,003.07228 Tuesday, February 13, 2018 21,501,882.55229 Wednesday, February 14, 2018 22,516,022.66230 Thursday, February 15, 2018 22,979,716.86231 Friday, February 16, 2018 23,443,411.05232 Saturday, February 17, 2018 23,269,075.98233 Sunday, February 18, 2018 26,602,004.85234 Monday, February 19, 2018 26,387,060.71235 Tuesday, February 20, 2018 26,673,337.49
Page 4 of 7

EXHIBIT ATO-1 Lead Lag Study
Atmos Energy Corporation-Kentucky CWC WP 2-1Revenue Lag Study - Daily Accts Receivable Balances for Mid-StatesFor the CWC Study Test Year Ended June 30, 2018
Line No. Date Total236 Wednesday, February 21, 2018 27,144,866.39237 Thursday, February 22, 2018 27,110,925.81238 Friday, February 23, 2018 27,110,925.81239 Saturday, February 24, 2018 26,690,415.97240 Sunday, February 25, 2018 26,307,711.19241 Monday, February 26, 2018 26,330,640.89242 Tuesday, February 27, 2018 25,106,887.89243 Wednesday, February 28, 2018 24,867,778.63244 Thursday, March 1, 2018 24,147,273.56245 Friday, March 2, 2018 24,147,273.56246 Saturday, March 3, 2018 23,756,296.57247 Sunday, March 4, 2018 22,363,136.85248 Monday, March 5, 2018 21,559,116.67249 Tuesday, March 6, 2018 21,327,549.82250 Wednesday, March 7, 2018 21,509,548.75251 Thursday, March 8, 2018 21,854,540.38252 Friday, March 9, 2018 21,854,540.38253 Saturday, March 10, 2018 21,589,189.32254 Sunday, March 11, 2018 20,916,747.41255 Monday, March 12, 2018 21,155,650.33256 Tuesday, March 13, 2018 20,841,774.15257 Wednesday, March 14, 2018 20,178,849.94258 Thursday, March 15, 2018 20,458,010.32259 Friday, March 16, 2018 20,458,010.32260 Saturday, March 17, 2018 20,120,407.07261 Sunday, March 18, 2018 20,060,670.21262 Monday, March 19, 2018 20,908,299.79263 Tuesday, March 20, 2018 19,844,835.13264 Wednesday, March 21, 2018 20,935,032.42265 Thursday, March 22, 2018 21,832,493.43266 Friday, March 23, 2018 21,832,493.43267 Saturday, March 24, 2018 21,359,830.61268 Sunday, March 25, 2018 21,409,815.64269 Monday, March 26, 2018 21,515,138.65270 Tuesday, March 27, 2018 21,234,497.33271 Wednesday, March 28, 2018 20,540,477.41272 Thursday, March 29, 2018 20,540,477.41273 Friday, March 30, 2018 19,819,479.53274 Saturday, March 31, 2018 19,647,407.43275 Sunday, April 1, 2018 18,995,058.52276 Monday, April 2, 2018 18,831,093.40277 Tuesday, April 3, 2018 18,317,371.52278 Wednesday, April 4, 2018 18,469,156.87279 Thursday, April 5, 2018 18,441,499.26280 Friday, April 6, 2018 18,441,499.26281 Saturday, April 7, 2018 18,203,755.86282 Sunday, April 8, 2018 17,603,320.17283 Monday, April 9, 2018 16,999,882.46284 Tuesday, April 10, 2018 17,360,183.47285 Wednesday, April 11, 2018 17,397,378.88286 Thursday, April 12, 2018 17,261,221.23287 Friday, April 13, 2018 17,261,221.23288 Saturday, April 14, 2018 16,901,713.86289 Sunday, April 15, 2018 18,352,687.66290 Monday, April 16, 2018 18,701,711.56291 Tuesday, April 17, 2018 19,102,663.94292 Wednesday, April 18, 2018 19,230,057.27293 Thursday, April 19, 2018 19,363,557.94294 Friday, April 20, 2018 19,363,557.94
Page 5 of 7

EXHIBIT ATO-1 Lead Lag Study
Atmos Energy Corporation-Kentucky CWC WP 2-1Revenue Lag Study - Daily Accts Receivable Balances for Mid-StatesFor the CWC Study Test Year Ended June 30, 2018
Line No. Date Total295 Saturday, April 21, 2018 19,183,437.12296 Sunday, April 22, 2018 18,866,425.92297 Monday, April 23, 2018 19,449,622.64298 Tuesday, April 24, 2018 19,288,767.71299 Wednesday, April 25, 2018 19,598,037.24300 Thursday, April 26, 2018 19,359,601.86301 Friday, April 27, 2018 19,359,601.86302 Saturday, April 28, 2018 19,043,851.63303 Sunday, April 29, 2018 17,720,189.84304 Monday, April 30, 2018 17,392,559.72305 Tuesday, May 1, 2018 16,692,744.53306 Wednesday, May 2, 2018 16,115,468.95307 Thursday, May 3, 2018 16,631,971.36308 Friday, May 4, 2018 16,631,971.36309 Saturday, May 5, 2018 16,332,626.33310 Sunday, May 6, 2018 15,281,054.31311 Monday, May 7, 2018 14,859,275.52312 Tuesday, May 8, 2018 14,444,888.25313 Wednesday, May 9, 2018 14,534,610.25314 Thursday, May 10, 2018 15,945,828.54315 Friday, May 11, 2018 15,945,828.54316 Saturday, May 12, 2018 15,781,174.91317 Sunday, May 13, 2018 15,339,709.57318 Monday, May 14, 2018 15,100,277.88319 Tuesday, May 15, 2018 14,483,741.68320 Wednesday, May 16, 2018 14,764,480.49321 Thursday, May 17, 2018 14,765,909.58322 Friday, May 18, 2018 14,765,909.58323 Saturday, May 19, 2018 14,611,415.54324 Sunday, May 20, 2018 14,253,635.88325 Monday, May 21, 2018 13,876,684.29326 Tuesday, May 22, 2018 13,953,165.46327 Wednesday, May 23, 2018 14,221,361.03328 Thursday, May 24, 2018 14,221,361.03329 Friday, May 25, 2018 14,221,361.03330 Saturday, May 26, 2018 14,221,361.03331 Sunday, May 27, 2018 14,145,198.69332 Monday, May 28, 2018 13,127,993.96333 Tuesday, May 29, 2018 13,056,652.82334 Wednesday, May 30, 2018 12,624,721.07335 Thursday, May 31, 2018 12,112,349.24336 Friday, June 1, 2018 12,112,349.24337 Saturday, June 2, 2018 12,007,012.79338 Sunday, June 3, 2018 11,176,980.12339 Monday, June 4, 2018 10,879,275.93340 Tuesday, June 5, 2018 10,407,542.12341 Wednesday, June 6, 2018 10,120,601.79342 Thursday, June 7, 2018 9,738,741.64343 Friday, June 8, 2018 9,738,741.64344 Saturday, June 9, 2018 9,663,481.18345 Sunday, June 10, 2018 9,216,800.07346 Monday, June 11, 2018 9,085,881.69347 Tuesday, June 12, 2018 9,012,772.48348 Wednesday, June 13, 2018 9,125,515.42349 Thursday, June 14, 2018 9,160,766.36350 Friday, June 15, 2018 9,160,766.36351 Saturday, June 16, 2018 9,049,816.66352 Sunday, June 17, 2018 10,374,927.87353 Monday, June 18, 2018 10,631,148.51
Page 6 of 7

EXHIBIT ATO-1 Lead Lag Study
Atmos Energy Corporation-Kentucky CWC WP 2-1Revenue Lag Study - Daily Accts Receivable Balances for Mid-StatesFor the CWC Study Test Year Ended June 30, 2018
Line No. Date Total354 Tuesday, June 19, 2018 10,841,831.26355 Wednesday, June 20, 2018 10,994,763.73356 Thursday, June 21, 2018 10,745,108.79357 Friday, June 22, 2018 10,745,108.79358 Saturday, June 23, 2018 10,669,842.70359 Sunday, June 24, 2018 10,507,297.17360 Monday, June 25, 2018 10,496,350.92361 Tuesday, June 26, 2018 10,543,901.49362 Wednesday, June 27, 2018 10,540,038.42363 Thursday, June 28, 2018 10,364,272.55364 Friday, June 29, 2018 10,315,703.01365 Saturday, June 30, 2018 10,272,333.94366367 AVERAGE DAILY TOTALS 12,382,825.26368369 KENTUCKY ANNUAL BILLED REVENUE 194,798,643.00 From WP 2-2370 KENTUCKY AVERAGE DAILY REVENUE 533,694.91371372 REVENUE LAG 23.20
Page 7 of 7

EXHIBIT ATO-1 Lead Lag Study
Atmos Energy Corporation-Kentucky CWC WP 2-2Revenue Lag Study - Division 009 Kentucky Monthly RevenuesFor the CWC Study Test Year Ended June 30, 2018
Account Description Jul-17 Aug-17 Sep-17 Oct-17 Nov-17 Dec-17 Jan-18 Feb-18 Mar-18 Apr-18 May-18 Jun-18 Total4800 Residential sales (3,912,522) (3,911,150) (4,056,095) (4,053,406) (7,728,795) (11,997,506) (18,914,908) (17,207,260) (12,369,456) (11,018,918) (6,154,176) (3,781,327) (105,105,517) 4811 Commercial Revenue (1,734,376) (1,857,062) (2,143,315) (2,077,847) (3,292,933) (4,990,853) (8,086,208) (7,415,175) (5,130,722) (4,548,595) (2,633,468) (1,707,134) (45,617,688) 4812 Industrial Revenue (212,760) (235,590) (231,267) (292,940) (367,965) (486,521) (973,707) (1,334,354) (899,111) (594,159) (355,283) (174,114) (6,157,771) 4820 Other Sales to Public Authority (216,697) (235,766) (231,292) (274,326) (526,757) (844,603) (1,354,830) (1,331,272) (872,594) (783,701) (441,272) (251,739) (7,364,850) 4870 Forfeited discounts (49,238) (67,376) (42,564) (57,504) (63,837) (107,575) (192,879) (230,566) (230,342) (151,215) (139,653) (59,471) (1,392,220) 4880 Miscellaneous service revenues (45,000) (56,467) (56,890) (113,182) (111,321) (70,489) (59,320) (48,866) (64,491) (54,927) (49,757) (54,928) (785,638) 4893 Revenue-Transportation Distrib (1,182,277) (1,275,238) (1,291,705) (1,481,954) (1,653,314) (1,852,334) (2,135,655) (1,772,398) (1,770,851) (1,589,668) (1,412,283) (1,232,115) (18,649,791) 4895 Revenue-Transportation Commerc - - - - - - - - - - - - - 4896 Revenue-Transportation Industr - - - - - - - - - - - - - 4930 Rent from Gas Property - - - - - - - - - - - - - 4950 Other gas revenues - - - - - - - - - - - - -
Billed Revenue (185,073,476)
Billed Taxes (395,782) (398,815) (412,447) (436,522) (714,990) (1,058,025) (1,651,587) (1,576,526) (1,119,702) (974,710) (595,675) (390,386) (9,725,167)
Billed Revenue plus Taxes (194,798,643)
4805 Unbilled Residential Revenue 85,112 (22,429) 37,437 (1,732,245) (2,209,701) (3,104,257) 405,968 3,377,820 (677,729) 1,794,375 1,963,448 45,375 (36,827) 4815 Unbilled Comm Revenue (4,161) (91,082) (23,863) (346,071) (931,188) (1,370,307) 87,595 1,449,166 (170,766) 667,416 568,707 44,232 (120,322) 4816 Unbilled Indus Revenue 27,342 (8,621) 276 8,285 (40,835) (124,351) (505,592) 248,260 260,988 70,107 48,981 80,944 65,784 4825 Unbilled Public Authority Reve 7,033 (13,856) 15,695 (185,528) (165,179) (271,690) 20,773 303,344 (75,991) 96,466 221,124 6,068 (41,741) 4960 Cost of Service Reserve - - - - - - 651,059 688,493 452,336 - - - 1,791,888
Total Revenue (183,414,693)
Page 1 of 1

EXHIBIT ATO-1 Lead Lag Study
ATO-CWC3
Line Production Month Production Month Service Date of Invoice Date Payment Total $ DaysNo. Supplier Start Service Finish Service Lag Invoice Lag Paid Lag Lag Amount (h) x (i)
(a) (b) (c) (d) (e) (f) (g) (h) (i) (j) (k)
1 Antle Operating Company Inc. 06/01/17 06/30/17 15.00 07/19/17 19.00 07/24/17 5.00 39.00 3,905.64 152,319.96 2 Centerpoint Energy Services Inc 06/01/17 06/30/17 15.00 07/20/17 20.00 07/25/17 5.00 40.00 4,515,901.61 180,636,064.40 3 Centerpoint Energy Services Inc 06/01/17 06/30/17 15.00 07/19/17 19.00 07/25/17 6.00 40.00 91,592.88 3,663,715.20 4 Har Ken Agent OK 06/01/17 06/30/17 15.00 07/19/17 19.00 07/24/17 5.00 39.00 392.00 15,288.00 5 Midwestern Gas Transmission 06/01/17 06/30/17 15.00 07/11/17 11.00 07/20/17 9.00 35.00 612.46 21,436.10 6 Orbit Gas Transmission Inc 06/01/17 06/30/17 15.00 07/19/17 19.00 07/24/17 5.00 39.00 1,839.61 71,744.79 7 Tennessee Gas Pipeline Co 06/01/17 06/30/17 15.00 07/13/17 13.00 07/24/17 11.00 39.00 182,614.74 7,121,974.86 8 Texas Gas Transmission Corporatio 06/01/17 06/30/17 15.00 07/12/17 12.00 07/24/17 12.00 39.00 1,190,663.70 46,435,884.30 9 Trunkline Gas Company, LLC 06/01/17 06/30/17 15.00 07/11/17 11.00 07/20/17 9.00 35.00 6,661.04 233,136.40 10 United Energy Trading, LLC 06/01/17 06/30/17 15.00 07/19/17 19.00 07/25/17 6.00 40.00 862,162.67 34,486,506.80 11 Antle Operating Company Inc. 07/01/17 07/31/17 15.50 08/14/17 14.00 08/21/17 7.00 36.50 3,862.18 140,969.57 12 Centerpoint Energy Services Inc 07/01/17 07/31/17 15.50 08/14/17 14.00 08/25/17 11.00 40.50 201.77 8,171.69 13 Centerpoint Energy Services Inc 07/01/17 07/31/17 15.50 08/14/17 14.00 08/25/17 11.00 40.50 404.94 16,400.07 14 Centerpoint Energy Services Inc 07/01/17 07/31/17 15.50 08/14/17 14.00 08/25/17 11.00 40.50 656.56 26,590.68 15 Centerpoint Energy Services Inc 07/01/17 07/31/17 15.50 08/24/17 24.00 08/25/17 1.00 40.50 3,426,603.08 138,777,424.74 16 Centerpoint Energy Services Inc 07/01/17 07/31/17 15.50 08/16/17 16.00 08/25/17 9.00 40.50 89,302.15 3,616,737.08 17 Har Ken Agent OK 07/01/17 07/31/17 15.50 08/14/17 14.00 08/21/17 7.00 36.50 284.85 10,397.03 18 Midwestern Gas Transmission 07/01/17 07/31/17 15.50 08/14/17 14.00 08/17/17 3.00 32.50 600.15 19,504.88 19 Orbit Gas Transmission Inc 07/01/17 07/31/17 15.50 08/14/17 14.00 08/21/17 7.00 36.50 2,099.58 76,634.67 20 Tennessee Gas Pipeline Co 07/01/17 07/31/17 15.50 08/10/17 10.00 08/21/17 11.00 36.50 182,614.74 6,665,438.01 21 Texas Gas Transmission Corporatio 07/01/17 07/31/17 15.50 08/09/17 9.00 08/21/17 12.00 36.50 1,230,352.49 44,907,865.89 22 Trunkline Gas Company, LLC 07/01/17 07/31/17 15.50 08/10/17 10.00 08/21/17 11.00 36.50 6,985.14 254,957.61 23 United Energy Trading, LLC 07/01/17 07/31/17 15.50 08/23/17 23.00 08/25/17 2.00 40.50 669,330.65 27,107,891.33 24 Antle Operating Company Inc. 08/01/17 08/31/17 15.50 09/18/17 18.00 09/22/17 4.00 37.50 4,539.58 170,234.25 25 Centerpoint Energy Services Inc 08/01/17 08/31/17 15.50 09/22/17 22.00 09/25/17 3.00 40.50 3,607,778.87 146,115,044.24 26 Centerpoint Energy Services Inc 08/01/17 08/31/17 15.50 09/19/17 19.00 09/25/17 6.00 40.50 86,023.34 3,483,945.27 27 Har Ken Agent OK 08/01/17 08/31/17 15.50 09/18/17 18.00 09/22/17 4.00 37.50 356.10 13,353.75 28 Orbit Gas Transmission Inc 08/01/17 08/31/17 15.50 09/18/17 18.00 09/22/17 4.00 37.50 2,510.52 94,144.50 29 Tennessee Gas Pipeline Co 08/01/17 08/31/17 15.50 09/13/17 13.00 09/25/17 12.00 40.50 182,614.74 7,395,896.97 30 Texas Gas Transmission Corporatio 08/01/17 08/31/17 15.50 09/13/17 13.00 09/22/17 9.00 37.50 1,230,352.49 46,138,218.38 31 Trunkline Gas Company, LLC 08/01/17 08/31/17 15.50 09/13/17 13.00 09/20/17 7.00 35.50 6,942.08 246,443.84 32 United Energy Trading, LLC 08/01/17 08/31/17 15.50 09/21/17 21.00 09/25/17 4.00 40.50 625,449.82 25,330,717.71 33 Antle Operating Company Inc. 09/01/17 09/30/17 15.00 10/16/17 16.00 10/20/17 4.00 35.00 3,762.00 131,670.00 34 Centerpoint Energy Services Inc 09/01/17 09/30/17 15.00 10/24/17 24.00 10/25/17 1.00 40.00 3,771,122.56 150,844,902.40 35 Centerpoint Energy Services Inc 09/01/17 09/30/17 15.00 10/23/17 23.00 10/25/17 2.00 40.00 82,668.71 3,306,748.40 36 Har Ken Agent OK 09/01/17 09/30/17 15.00 10/16/17 16.00 10/20/17 4.00 35.00 342.50 11,987.50 37 Orbit Gas Transmission Inc 09/01/17 09/30/17 15.00 10/16/17 16.00 10/20/17 4.00 35.00 3,864.68 135,263.80 38 Tennessee Gas Pipeline Co 09/01/17 09/30/17 15.00 10/12/17 12.00 10/23/17 11.00 38.00 182,614.74 6,939,360.12 39 Texas Gas Transmission Corporatio 09/01/17 09/30/17 15.00 10/10/17 10.00 10/20/17 10.00 35.00 1,190,663.70 41,673,229.50 40 Trunkline Gas Company, LLC 09/01/17 09/30/17 15.00 10/10/17 10.00 10/20/17 10.00 35.00 6,759.42 236,579.70 41 United Energy Trading, LLC 09/01/17 09/30/17 15.00 10/23/17 23.00 10/25/17 2.00 40.00 659,194.10 26,367,764.00 42 Antle Operating Company Inc. 10/01/17 10/31/17 15.50 11/14/17 14.00 11/22/17 8.00 37.50 3,887.38 145,776.75 43 Centerpoint Energy Services Inc 10/01/17 10/31/17 15.50 11/21/17 21.00 11/27/17 6.00 42.50 5,384,616.67 228,846,208.48 44 Centerpoint Energy Services Inc 10/01/17 10/31/17 15.50 11/20/17 20.00 11/27/17 7.00 42.50 85,471.62 3,632,543.85 45 Har Ken Agent OK 10/01/17 10/31/17 15.50 11/14/17 14.00 11/22/17 8.00 37.50 375.76 14,091.00 46 Midwestern Gas Transmission 10/01/17 10/31/17 15.50 11/14/17 14.00 12/18/17 34.00 63.50 (374.78) (23,798.53) 47 Orbit Gas Transmission Inc 10/01/17 10/31/17 15.50 11/14/17 14.00 11/21/17 7.00 36.50 685.03 25,003.60 48 Tennessee Gas Pipeline Co 10/01/17 10/31/17 15.50 11/14/17 14.00 11/20/17 6.00 35.50 203,939.34 7,239,846.57 49 Texas Gas Transmission Corporatio 10/01/17 10/31/17 15.50 11/14/17 14.00 11/20/17 6.00 35.50 1,621,371.92 57,558,703.16 50 Trunkline Gas Company, LLC 10/01/17 10/31/17 15.50 11/15/17 15.00 11/20/17 5.00 35.50 6,752.89 239,727.60 51 United Energy Trading, LLC 10/01/17 10/31/17 15.50 11/21/17 21.00 11/27/17 6.00 42.50 880,245.91 37,410,451.18
Atmos Energy Corporation-Kentucky
For the CWC Study Test Year Ended June 30, 2018Per Books Purchase Gas Cost
Page 1 of 3

EXHIBIT ATO-1 Lead Lag Study
ATO-CWC3
Line Production Month Production Month Service Date of Invoice Date Payment Total $ DaysNo. Supplier Start Service Finish Service Lag Invoice Lag Paid Lag Lag Amount (h) x (i)
(a) (b) (c) (d) (e) (f) (g) (h) (i) (j) (k)
Atmos Energy Corporation-Kentucky
For the CWC Study Test Year Ended June 30, 2018Per Books Purchase Gas Cost
52 Antle Operating Company Inc. 11/01/17 11/30/17 15.00 12/14/17 14.00 12/18/17 4.00 33.00 3,822.00 126,126.00 53 Centerpoint Energy Services Inc 11/01/17 11/30/17 15.00 12/21/17 21.00 12/26/17 5.00 41.00 2,785,341.33 114,198,994.53 54 Centerpoint Energy Services Inc 11/01/17 11/30/17 15.00 12/18/17 18.00 12/26/17 8.00 41.00 150,815.46 6,183,433.86 55 Har Ken Agent OK 11/01/17 11/30/17 15.00 12/14/17 14.00 12/18/17 4.00 33.00 299.71 9,890.43 56 Midwestern Gas Transmission 11/01/17 11/30/17 15.00 12/13/17 13.00 12/18/17 5.00 33.00 1,179.15 38,911.95 57 Orbit Gas Transmission Inc 11/01/17 11/30/17 15.00 12/14/17 14.00 12/18/17 4.00 33.00 744.32 24,562.56 58 Tennessee Gas Pipeline Co 11/01/17 11/30/17 15.00 12/14/17 14.00 12/22/17 8.00 37.00 406,544.04 15,042,129.48 59 Texas Gas Transmission Corporatio 11/01/17 11/30/17 15.00 12/13/17 13.00 12/21/17 8.00 36.00 1,717,703.80 61,837,336.80 60 Trunkline Gas Company, LLC 11/01/17 11/30/17 15.00 12/15/17 15.00 12/20/17 5.00 35.00 29,594.87 1,035,820.45 61 United Energy Trading, LLC 11/01/17 11/30/17 15.00 12/21/17 21.00 12/26/17 5.00 41.00 147,435.57 6,044,858.37 62 Antle Operating Company Inc. 12/01/17 12/31/17 15.50 01/17/18 17.00 01/26/18 9.00 41.50 2,351.26 97,577.29 63 Centerpoint Energy Services Inc 12/01/17 12/31/17 15.50 01/24/18 24.00 01/25/18 1.00 40.50 5,748,155.18 232,800,284.79 64 Centerpoint Energy Services Inc 12/01/17 12/31/17 15.50 01/24/18 24.00 01/25/18 1.00 40.50 222,787.64 9,022,899.42 65 Har Ken Agent OK 12/01/17 12/31/17 15.50 01/18/18 18.00 01/26/18 8.00 41.50 617.04 25,607.16 66 Midwestern Gas Transmission 12/01/17 12/31/17 15.50 01/12/18 12.00 02/20/18 39.00 66.50 (1,281.59) (85,225.74) 67 Orbit Gas Transmission Inc 12/01/17 12/31/17 15.50 01/17/18 17.00 01/25/18 8.00 40.50 700.19 28,357.70 68 Tennessee Gas Pipeline Co 12/01/17 12/31/17 15.50 01/11/18 11.00 01/22/18 11.00 37.50 417,206.94 15,645,260.25 69 Texas Gas Transmission Corporatio 12/01/17 12/31/17 15.50 01/11/18 11.00 01/22/18 11.00 37.50 1,774,373.66 66,539,012.25 70 Trunkline Gas Company, LLC 12/01/17 12/31/17 15.50 01/12/18 12.00 01/22/18 10.00 37.50 41,391.60 1,552,185.00 71 United Energy Trading, LLC 12/01/17 12/31/17 15.50 01/24/18 24.00 01/25/18 1.00 40.50 660,840.34 26,764,033.77 72 Antle Operating Company Inc. 01/01/18 01/31/18 15.50 02/13/18 13.00 02/16/18 3.00 31.50 3,433.71 108,161.87 73 Centerpoint Energy Services Inc 01/01/18 01/31/18 15.50 02/23/18 23.00 02/26/18 3.00 41.50 6,427,617.12 266,746,110.48 74 Centerpoint Energy Services Inc 01/01/18 01/31/18 15.50 02/21/18 21.00 02/26/18 5.00 41.50 362,150.76 15,029,256.54 75 Har Ken Agent OK 01/01/18 01/31/18 15.50 02/13/18 13.00 02/16/18 3.00 31.50 44.55 1,403.33 76 Midwestern Gas Transmission 01/01/18 01/31/18 15.50 02/16/18 16.00 02/20/18 4.00 35.50 2,083.63 73,968.87 77 Orbit Gas Transmission Inc 01/01/18 01/31/18 15.50 02/13/18 13.00 02/15/18 2.00 30.50 584.74 17,834.57 78 Tennessee Gas Pipeline Co 01/01/18 01/31/18 15.50 02/13/18 13.00 02/22/18 9.00 37.50 417,206.94 15,645,260.25 79 Texas Gas Transmission Corporatio 01/01/18 01/31/18 15.50 02/13/18 13.00 02/20/18 7.00 35.50 1,774,373.66 62,990,264.93 80 Trunkline Gas Company, LLC 01/01/18 01/31/18 15.50 02/16/18 16.00 02/20/18 4.00 35.50 25,736.56 913,647.88 81 United Energy Trading, LLC 01/01/18 01/31/18 15.50 02/21/18 21.00 02/26/18 5.00 41.50 762,803.65 31,656,351.48 82 Antle Operating Company Inc. 02/01/18 02/28/18 14.00 03/12/18 12.00 03/16/18 4.00 30.00 3,512.03 105,360.90 83 Centerpoint Energy Services Inc 02/01/18 02/28/18 14.00 03/23/18 23.00 03/26/18 3.00 40.00 1,729,288.45 69,171,538.00 84 Centerpoint Energy Services Inc 02/01/18 02/28/18 14.00 03/15/18 15.00 03/26/18 11.00 40.00 242,273.28 9,690,931.20 85 Har Ken Agent OK 02/01/18 02/28/18 14.00 03/12/18 12.00 03/16/18 4.00 30.00 314.73 9,441.90 86 Midwestern Gas Transmission 02/01/18 02/28/18 14.00 03/15/18 15.00 03/19/18 4.00 33.00 522.53 17,243.49 87 Orbit Gas Transmission Inc 02/01/18 02/28/18 14.00 03/12/18 12.00 03/15/18 3.00 29.00 865.48 25,098.92 88 Tennessee Gas Pipeline Co 02/01/18 02/28/18 14.00 03/13/18 13.00 03/22/18 9.00 36.00 417,206.94 15,019,449.84 89 Texas Gas Transmission Corporatio 02/01/18 02/28/18 14.00 03/09/18 9.00 03/19/18 10.00 33.00 1,602,660.08 52,887,782.64 90 Trunkline Gas Company, LLC 02/01/18 02/28/18 14.00 03/15/18 15.00 03/20/18 5.00 34.00 29,713.96 1,010,274.64 91 United Energy Trading, LLC 02/01/18 02/28/18 14.00 03/19/18 19.00 03/26/18 7.00 40.00 417,111.79 16,684,471.60 92 Antle Operating Company Inc. 03/01/18 03/31/18 15.50 04/10/18 10.00 04/18/18 8.00 33.50 3,019.52 101,153.92 93 Centerpoint Energy Services Inc 03/01/18 03/31/18 15.50 04/24/18 24.00 04/25/18 1.00 40.50 641,576.77 25,983,859.19 94 Centerpoint Energy Services Inc 03/01/18 03/31/18 15.50 04/24/18 24.00 04/25/18 1.00 40.50 215,436.33 8,725,171.37 95 Centerpoint Energy Services Inc 03/01/18 03/31/18 15.50 04/11/18 11.00 04/25/18 14.00 40.50 (609.66) (24,691.23) 96 Centerpoint Energy Services Inc 03/01/18 03/31/18 15.50 04/11/18 11.00 04/25/18 14.00 40.50 (2,410.12) (97,609.86) 97 Har Ken Agent OK 03/01/18 03/31/18 15.50 04/10/18 10.00 04/18/18 8.00 33.50 185.21 6,204.54 98 Orbit Gas Transmission Inc 03/01/18 03/31/18 15.50 04/10/18 10.00 04/17/18 7.00 32.50 704.32 22,890.40 99 Tennessee Gas Pipeline Co 03/01/18 03/31/18 15.50 04/11/18 11.00 04/23/18 12.00 38.50 406,544.04 15,651,945.54 100 Texas Gas Transmission Corporatio 03/01/18 03/31/18 15.50 04/10/18 10.00 04/20/18 10.00 35.50 1,768,590.61 62,784,966.66 101 Trunkline Gas Company, LLC 03/01/18 03/31/18 15.50 04/16/18 16.00 04/20/18 4.00 35.50 33,068.39 1,173,927.85 102 United Energy Trading, LLC 03/01/18 03/31/18 15.50 04/16/18 16.00 04/25/18 9.00 40.50 227,583.76 9,217,142.28 103 Antle Operating Company Inc. 04/01/18 04/30/18 15.00 05/14/18 14.00 05/18/18 4.00 33.00 3,115.71 102,818.43 Page 2 of 3

EXHIBIT ATO-1 Lead Lag Study
ATO-CWC3
Line Production Month Production Month Service Date of Invoice Date Payment Total $ DaysNo. Supplier Start Service Finish Service Lag Invoice Lag Paid Lag Lag Amount (h) x (i)
(a) (b) (c) (d) (e) (f) (g) (h) (i) (j) (k)
Atmos Energy Corporation-Kentucky
For the CWC Study Test Year Ended June 30, 2018Per Books Purchase Gas Cost
104 Centerpoint Energy Services Inc 04/01/18 04/30/18 15.00 05/17/18 17.00 05/25/18 8.00 40.00 74,146.07 2,965,842.80 105 Centerpoint Energy Services Inc 04/01/18 04/30/18 15.00 05/31/18 31.00 06/25/18 25.00 71.00 70.12 4,978.52 106 Centerpoint Energy Services Inc 04/01/18 04/30/18 15.00 05/24/18 24.00 05/25/18 1.00 40.00 5,136,036.93 205,441,477.20 107 Centerpoint Energy Services Inc 04/01/18 04/30/18 15.00 05/31/18 31.00 06/25/18 25.00 71.00 (458.03) (32,520.13) 108 Centerpoint Energy Services Inc 04/01/18 04/30/18 15.00 05/31/18 31.00 06/25/18 25.00 71.00 59.61 4,232.31 109 Har Ken Agent OK 04/01/18 04/30/18 15.00 05/14/18 14.00 05/18/18 4.00 33.00 489.32 16,147.56 110 Orbit Gas Transmission Inc 04/01/18 04/30/18 15.00 05/14/18 14.00 05/17/18 3.00 32.00 585.58 18,738.56 111 Tennessee Gas Pipeline Co 04/01/18 04/30/18 15.00 05/14/18 14.00 05/21/18 7.00 36.00 289,252.14 10,413,077.04 112 Texas Gas Transmission Corporatio 04/01/18 04/30/18 15.00 05/14/18 14.00 05/21/18 7.00 36.00 1,520,202.90 54,727,304.40 113 Trunkline Gas Company, LLC 04/01/18 04/30/18 15.00 05/17/18 17.00 05/21/18 4.00 36.00 6,756.67 243,240.12 114 United Energy Trading, LLC 04/01/18 04/30/18 15.00 05/23/18 23.00 05/25/18 2.00 40.00 966,809.08 38,672,363.20 115 Antle Operating Company Inc. 05/01/18 05/31/18 15.50 06/15/18 15.00 06/22/18 7.00 37.50 3,848.85 144,331.88 116 Centerpoint Energy Services Inc 05/01/18 05/31/18 15.50 06/22/18 22.00 06/25/18 3.00 40.50 4,185,565.45 169,515,400.73 117 Centerpoint Energy Services Inc 05/01/18 05/31/18 15.50 06/20/18 20.00 06/25/18 5.00 40.50 80,691.93 3,268,023.17 118 Har Ken Agent OK 05/01/18 05/31/18 15.50 06/15/18 15.00 06/22/18 7.00 37.50 280.81 10,530.38 119 Orbit Gas Transmission Inc 05/01/18 05/31/18 15.50 06/15/18 15.00 06/21/18 6.00 36.50 803.88 29,341.62 120 Tennessee Gas Pipeline Co 05/01/18 05/31/18 15.50 06/11/18 11.00 06/21/18 10.00 36.50 193,286.04 7,054,940.46 121 Texas Gas Transmission Corporatio 05/01/18 05/31/18 15.50 06/11/18 11.00 06/21/18 10.00 36.50 1,231,333.33 44,943,666.55 122 Trunkline Gas Company, LLC 05/01/18 05/31/18 15.50 06/15/18 15.00 06/20/18 5.00 35.50 6,896.76 244,834.98 123 United Energy Trading, LLC 05/01/18 05/31/18 15.50 06/21/18 21.00 06/25/18 4.00 40.50 685,926.52 27,780,024.06 124125 78,313,692 3,092,040,776126127 39.48
To Schedule 1, Line 3
Page 3 of 3

EXHIBIT ATO-1 Lead Lag Study
ATO-CWC4
Start End
Morning Evening Total
Line of 1st day of Last Day No. of Service Date Payment Direct Payroll
No. of Pay Period of Pay Period Days Lag Paid Lag Lag
(a) (b) (c) (d) (e) (f) (g)
1 07/01/17 07/14/17 14.00 7.00 07/21/17 7.00 14.00
2 07/15/17 07/28/17 14.00 7.00 08/04/17 7.00 14.00
3 07/29/17 08/11/17 14.00 7.00 08/18/17 7.00 14.00
4 08/12/17 08/25/17 14.00 7.00 09/01/17 7.00 14.00
5 08/26/17 09/08/17 14.00 7.00 09/15/17 7.00 14.00
6 09/09/17 09/22/17 14.00 7.00 09/29/17 7.00 14.007 09/23/17 10/06/17 14.00 7.00 10/13/17 7.00 14.00
8 10/07/17 10/20/17 14.00 7.00 10/27/17 7.00 14.00
9 10/21/17 11/03/17 14.00 7.00 11/10/17 7.00 14.00
10 11/04/17 11/17/17 14.00 7.00 11/24/17 7.00 14.00
11 11/18/17 12/01/17 14.00 7.00 12/08/17 7.00 14.00
12 12/02/17 12/15/17 14.00 7.00 12/22/17 7.00 14.00
13 12/16/17 12/29/17 14.00 7.00 01/05/18 7.00 14.00
14 12/30/17 01/12/18 14.00 7.00 01/19/18 7.00 14.00
15 01/13/18 01/26/18 14.00 7.00 02/02/18 7.00 14.00
16 01/27/18 02/09/18 14.00 7.00 02/16/18 7.00 14.00
17 02/10/18 02/23/18 14.00 7.00 03/02/18 7.00 14.00
18 02/24/18 03/09/18 14.00 7.00 03/16/18 7.00 14.00
19 03/10/18 03/23/18 14.00 7.00 03/30/18 7.00 14.00
20 03/24/18 04/06/18 14.00 7.00 04/13/18 7.00 14.00
21 04/07/18 04/20/18 14.00 7.00 04/27/18 7.00 14.00
22 04/21/18 05/04/18 14.00 7.00 05/11/18 7.00 14.00
23 05/05/18 05/18/18 14.00 7.00 05/25/18 7.00 14.00
24 05/19/18 06/01/18 14.00 7.00 06/08/18 7.00 14.00
25 06/02/18 06/15/18 14.00 7.00 06/22/18 7.00 14.00
26 06/16/18 06/29/18 14.00 7.00 07/06/18 7.00 14.00
27 06/30/18 07/13/18 14.00 7.00 07/20/18 7.00 14.00
28
29 TOTAL PAYROLL DIRECT DEPOSIT WEIGHTED AVG EXPENSE LAG 14.00
30
31 ACTUAL CHECKS WRITTEN:
32 Date Clearing Payroll Checks
33 Paid # of Days from Pd Dt Weighted Avg
34 (e) (h) (i)35 Same day 06/08/18 0 0.00% 0.0036 Next day 06/11/18 3 2.00% 0.0637 2 days 06/12/18 4 34.00% 1.3638 3-7 days 6/13/18-6/17/18 9 40.00% 3.6039 8-14 days 6/18/2018-6/24/18 16 16.00% 2.5640 > 2 weeks 06/25/18 23 8.00% 1.844142 Total Payroll Check Lag 9.424344 % of Payroll Checks 0.82%4546 WEIGHTED AVERAGE OF ACTUAL PAYROLL CHECKS 0.084748 TOTAL PAYROLL LAG 14.08
49
50 Period: 05/18/18 to 06/01/18 Paydate 06/08/18
Atmos Energy Corporation-Kentucky
Payroll Lead Days
For the CWC Study Test Year Ended June 30, 2018
Page 1 of 1

EXHIBIT ATO-1 Lead Lag Study
ATO-CWC5Atmos Energy Corporation-Kentucky
Other O&M Payment Lag
Line WeightedNo. Description $ Days
a b
1 Other O&M Payment Lag Days: 25.5523 Check Clearing Lag Days: 2.7845 Total O&M Payment Lag Days: 28.33
For the CWC Study Test Year Ended June 30, 2018
Page 1 of 1

EXHIBIT ATO-1 Lead Lag Study
Atmos Energy Corporation-Kentucky CWC WP 5-1Other O&M Payment and Check Clearing Lag For the CWC Study Test Year Ended June 30, 2018
Midpoint Weighted Weighted Line Invoice Invoice Division 009 Payment Service Period Service Date Payment Payment Date Clearing ClearingNo. Vendor Date Amount Amount Type From To Service Paid lag Lag Cleared Lag Lag
a b c d e f g h i = i -(h or b k = (j * d) l m = (l - i) n = (m * d)1 AIRGAS USA LLC 2-Jun-17 60 60 CHECK 2-Jun-17 2-Jun-17 2-Jun-17 13-Dec-17 194 11,659 20-Dec-17 7 421 2 AIRGAS USA LLC 15-Jun-17 63 63 CHECK 15-Jun-17 15-Jun-17 15-Jun-17 10-Jul-17 25 1,585 18-Jul-17 8 507 3 AIRGAS USA LLC 4-Jun-18 98 98 CHECK 4-Jun-18 4-Jun-18 4-Jun-18 29-Jun-18 25 2,438 9-Jul-18 10 975 4 AIRGAS USA LLC 30-Jun-17 598 598 CHECK 1-Jun-17 30-Jun-17 15-Jun-17 26-Jul-17 41 24,530 1-Aug-17 6 3,590 5 AIRGAS USA LLC 31-Jul-17 24 24 CHECK 1-Jul-17 31-Jul-17 16-Jul-17 25-Aug-17 40 969 1-Sep-17 7 170 6 AIRGAS USA LLC 31-Aug-17 617 617 CHECK 1-Aug-17 31-Aug-17 16-Aug-17 25-Sep-17 40 24,670 3-Oct-17 8 4,934 7 AIRGAS USA LLC 31-Dec-17 679 679 CHECK 1-Dec-17 31-Dec-17 16-Dec-17 26-Jan-18 41 27,837 2-Feb-18 7 4,753 8 AIRGAS USA LLC 31-Jan-18 34 34 CHECK 1-Jan-18 31-Jan-18 16-Jan-18 26-Feb-18 41 1,412 6-Mar-18 8 276 9 ALEPRA KEN 7-Aug-17 3,680 3,680 CHECK 21-Dec-16 21-Dec-16 21-Dec-16 9-Aug-17 231 850,080 28-Aug-17 19 69,920
10 AMBERS CLEANING LLC 26-Jun-17 65 65 CHECK 25-Jun-17 25-Jun-17 25-Jun-17 21-Jul-17 26 1,690 1-Aug-17 11 715 11 AMBERS CLEANING LLC 3-Jul-17 65 65 CHECK 2-Jul-17 2-Jul-17 2-Jul-17 28-Jul-17 26 1,690 4-Aug-17 7 455 12 AMBERS CLEANING LLC 19-Sep-17 239 239 CHECK 19-Sep-17 19-Sep-17 19-Sep-17 16-Oct-17 27 6,457 24-Oct-17 8 1,913 13 AMBERS CLEANING LLC 12-Mar-18 985 985 CHECK 8-Mar-18 8-Mar-18 8-Mar-18 6-Apr-18 29 28,565 17-Apr-18 11 10,835 14 Anderson, Bernie G Jr 24-Jul-17 1,489 1,425 Direct Depo 19-Jun-17 10-Jul-17 29-Jun-17 26-Jul-17 27 38,480 26-Jul-17 0 - 15 Anderson, Bernie G Jr 28-Sep-17 2,224 2,224 Direct Depo 11-Aug-17 9-Oct-17 9-Sep-17 2-Oct-17 23 51,144 2-Oct-17 0 - 16 Arnold, Robert H Jr 17-May-18 2,083 1,934 Direct Depo 12-Feb-18 31-Mar-19 6-Sep-18 18-May-18 (111) (214,671) 18-May-18 0 - 17 AT&T 1-Jul-17 133 133 CHECK 23-Jul-17 22-Aug-17 7-Aug-17 9-Aug-17 2 267 17-Aug-17 8 1,068 18 AT&T 26-Nov-17 186 186 CHECK 26-Nov-17 25-Dec-17 10-Dec-17 10-Jan-18 31 5,762 22-Jan-18 12 2,230 19 AT&T 26-Aug-17 154 154 CHECK 26-Aug-17 25-Sep-17 10-Sep-17 13-Sep-17 3 463 25-Sep-17 12 1,852 20 AT&T 26-Mar-18 589 589 CHECK 26-Mar-18 25-Apr-18 10-Apr-18 11-Apr-18 1 589 25-Apr-18 14 8,243 21 AT&T 26-Feb-18 263 263 CHECK 26-Feb-18 25-Mar-18 11-Mar-18 9-Mar-18 (3) (788) 30-Mar-18 21 5,518 22 AT&T 26-May-18 1,202 1,202 CHECK 26-May-18 25-Jun-18 10-Jun-18 18-Jun-18 8 9,616 29-Jun-18 11 13,222 23 AT&T 26-Oct-17 1,103 1,103 CHECK 26-Oct-17 25-Nov-17 10-Nov-17 15-Nov-17 5 5,516 24-Nov-17 9 9,930 24 AT&T 26-Jul-17 154 154 CHECK 26-Jul-17 25-Aug-17 10-Aug-17 16-Aug-17 6 924 22-Aug-17 6 924 25 AT&T 26-Jun-17 411 411 CHECK 26-Jun-17 25-Jul-17 10-Jul-17 26-Jul-17 16 6,568 2-Aug-17 7 2,874 26 AT&T 26-Jul-17 378 378 CHECK 26-Jul-17 25-Aug-17 10-Aug-17 26-Jul-17 (15) (5,668) 2-Aug-17 7 2,645 27 AT&T 20-May-18 112 112 CHECK 20-May-18 19-Jun-18 4-Jun-18 6-Jun-18 2 224 13-Jun-18 7 784 28 AT&T MOBILITY 27-May-18 19,793 11,359 CHECK 27-May-18 26-Jun-18 11-Jun-18 1-Jun-18 (10) (113,592) 11-Jun-18 10 113,592 29 ATMOS ENERGY CORPORATION 16-May-18 77 77 CHECK 18-Apr-18 16-May-18 2-May-18 25-May-18 23 1,765 1-Jun-18 7 537 30 ATMOS ENERGY CORPORATION 21-Mar-18 186 186 CHECK 21-Feb-18 21-Mar-18 7-Mar-18 2-Apr-18 26 4,839 5-Apr-18 3 558 31 ATMOS ENERGY CORPORATION 3-Nov-17 24 24 CHECK 5-Oct-17 3-Nov-17 19-Oct-17 17-Nov-17 29 700 21-Nov-17 4 97 32 Austin, Timothy R (Ryan) 28-Mar-18 613 477 Direct Depo 11-Mar-18 23-Mar-18 17-Mar-18 4-Apr-18 18 8,594 4-Apr-18 0 - 33 Austin, Timothy R (Ryan) 23-Apr-18 388 331 Direct Depo 16-Apr-18 20-Apr-18 18-Apr-18 25-Apr-18 7 2,320 25-Apr-18 0 - 34 AUTOMOTIVE RESOURCES INTERNAT 5-Dec-17 458,617 34,759 Direct Depo 1-Nov-17 30-Nov-17 15-Nov-17 6-Dec-17 21 729,936 6-Dec-17 0 - 35 BANK OF AMERICA 16-Jan-18 819 45 EFT 7-Dec-17 9-Jan-18 23-Dec-17 30-Jan-18 38 1,698 30-Jan-18 0 - 36 BANK OF AMERICA 16-Oct-17 901 50 EFT 6-Sep-17 6-Sep-17 6-Sep-17 30-Oct-17 54 2,708 30-Oct-17 0 - 37 BANK OF AMERICA 16-Dec-17 2,888 1,552 EFT 21-Nov-17 14-Dec-17 2-Dec-17 29-Dec-17 27 41,894 29-Dec-17 0 - 38 BANK OF AMERICA 16-Apr-18 12 12 EFT 6-Apr-18 6-Apr-18 6-Apr-18 30-Apr-18 24 294 30-Apr-18 0 - 39 BANK OF AMERICA 16-May-18 13 13 EFT 27-Apr-18 3-May-18 30-Apr-18 30-May-18 30 379 30-May-18 0 - 40 BANK OF AMERICA 16-Apr-18 181 181 EFT 21-Mar-18 11-Apr-18 31-Mar-18 30-Apr-18 30 5,441 30-Apr-18 0 - 41 BANK OF AMERICA 16-Jun-18 152 44 EFT 22-May-18 7-Jun-18 30-May-18 29-Jun-18 30 1,321 29-Jun-18 0 - 42 BANK OF AMERICA 16-Mar-18 32 26 EFT 16-Feb-18 14-Mar-18 1-Mar-18 16-Mar-18 15 397 16-Mar-18 0 - 43 BANK OF AMERICA 16-Nov-17 169 47 EFT 17-Oct-17 7-Nov-17 27-Oct-17 30-Nov-17 34 1,585 30-Nov-17 0 - 44 BANK OF AMERICA 16-Dec-17 373 373 EFT 15-Nov-17 13-Dec-17 29-Nov-17 29-Dec-17 30 11,189 29-Dec-17 0 - 45 BANK OF AMERICA 16-Feb-18 1,649 1,649 EFT 15-Jan-18 15-Feb-18 30-Jan-18 28-Feb-18 29 47,830 28-Feb-18 0 - 46 BANK OF AMERICA 16-Oct-17 1,611 1,611 EFT 14-Sep-17 13-Oct-17 28-Sep-17 30-Oct-17 32 51,561 30-Oct-17 0 - 47 BANK OF AMERICA 16-Mar-18 197 197 EFT 7-Mar-18 7-Mar-18 7-Mar-18 16-Mar-18 9 1,774 16-Mar-18 0 - 48 BANK OF AMERICA 16-Apr-18 315 315 EFT 7-Mar-18 12-Apr-18 25-Mar-18 30-Apr-18 36 11,338 30-Apr-18 0 - 49 BANK OF AMERICA 16-Feb-18 37 37 EFT 16-Jan-18 16-Jan-18 16-Jan-18 28-Feb-18 43 1,595 28-Feb-18 0 - 50 BANK OF AMERICA 16-Mar-18 29 29 EFT 1-Mar-18 11-Mar-18 6-Mar-18 16-Mar-18 10 289 16-Mar-18 0 - 51 BANK OF AMERICA 16-Nov-17 12 12 EFT 26-Oct-17 26-Oct-17 26-Oct-17 30-Nov-17 35 421 30-Nov-17 0 - 52 BANK OF AMERICA 16-May-18 113 113 EFT 27-Apr-18 30-Apr-18 28-Apr-18 30-May-18 32 3,607 30-May-18 0 - 53 BANK OF AMERICA 16-Nov-17 284 130 EFT 25-Oct-17 15-Nov-17 4-Nov-17 30-Nov-17 26 3,387 30-Nov-17 0 -
Page 1 of 8

EXHIBIT ATO-1 Lead Lag Study
Atmos Energy Corporation-Kentucky CWC WP 5-1Other O&M Payment and Check Clearing Lag For the CWC Study Test Year Ended June 30, 2018
Midpoint Weighted Weighted Line Invoice Invoice Division 009 Payment Service Period Service Date Payment Payment Date Clearing ClearingNo. Vendor Date Amount Amount Type From To Service Paid lag Lag Cleared Lag Lag
54 BANK OF AMERICA 16-Dec-17 95 95 EFT 22-Nov-17 11-Dec-17 1-Dec-17 29-Dec-17 28 2,668 29-Dec-17 0 - 55 BANK OF AMERICA 16-Nov-17 682 682 EFT 24-Oct-17 8-Nov-17 31-Oct-17 30-Nov-17 30 20,470 30-Nov-17 0 - 56 BANK OF AMERICA 16-May-18 14 14 EFT 1-May-18 1-May-18 1-May-18 30-May-18 29 399 30-May-18 0 - 57 BANK OF AMERICA 16-Jan-18 203 203 EFT 4-Jan-18 4-Jan-18 4-Jan-18 30-Jan-18 26 5,267 30-Jan-18 0 - 58 BANK OF AMERICA 16-Aug-17 173 173 EFT 15-Jul-17 1-Aug-17 23-Jul-17 28-Aug-17 36 6,226 28-Aug-17 0 - 59 BANK OF AMERICA 16-Jan-18 114 114 EFT 18-Dec-17 20-Dec-17 19-Dec-17 30-Jan-18 42 4,780 30-Jan-18 0 - 60 BANK OF AMERICA 16-Jun-18 74 22 EFT 25-May-18 6-Jun-18 31-May-18 29-Jun-18 29 630 29-Jun-18 0 - 61 BANK OF AMERICA 16-Mar-18 28 28 EFT 22-Feb-18 22-Feb-18 22-Feb-18 16-Mar-18 22 627 16-Mar-18 0 - 62 BANK OF AMERICA 16-Jul-17 11 11 EFT 10-Jul-17 10-Jul-17 10-Jul-17 28-Jul-17 18 191 28-Jul-17 0 - 63 BANK OF AMERICA 16-Oct-17 286 180 EFT 20-Sep-17 27-Sep-17 23-Sep-17 30-Oct-17 37 6,647 30-Oct-17 0 - 64 BANK OF AMERICA 16-Nov-17 1,004 127 EFT 18-Oct-17 24-Oct-17 21-Oct-17 30-Nov-17 40 5,088 30-Nov-17 0 - 65 BANK OF AMERICA 16-Apr-18 201 201 EFT 22-Mar-18 10-Apr-18 31-Mar-18 30-Apr-18 30 6,039 30-Apr-18 0 - 66 BANK OF AMERICA 16-Mar-18 104 36 EFT 27-Feb-18 8-Mar-18 3-Mar-18 16-Mar-18 13 464 16-Mar-18 0 - 67 BANK OF AMERICA 16-May-18 750 750 EFT 11-Apr-18 10-May-18 25-Apr-18 30-May-18 35 26,254 30-May-18 0 - 68 BANK OF AMERICA 16-Jan-18 123 123 EFT 19-Dec-17 8-Jan-18 29-Dec-17 30-Jan-18 32 3,930 30-Jan-18 0 - 69 BANK OF AMERICA 16-Mar-18 188 188 EFT 21-Feb-18 8-Mar-18 28-Feb-18 16-Mar-18 16 3,004 16-Mar-18 0 - 70 BANK OF AMERICA 16-Jan-18 26 26 EFT 22-Dec-17 22-Dec-17 22-Dec-17 30-Jan-18 39 1,028 30-Jan-18 0 - 71 BANK OF AMERICA 16-Mar-18 231 231 EFT 16-Feb-18 1-Mar-18 22-Feb-18 16-Mar-18 22 5,089 16-Mar-18 0 - 72 BANK OF AMERICA 16-Jun-18 191 191 EFT 21-May-18 22-May-18 21-May-18 29-Jun-18 39 7,448 29-Jun-18 0 - 73 BANK OF AMERICA 16-Jan-18 78 78 EFT 20-Dec-17 12-Jan-18 31-Dec-17 30-Jan-18 30 2,346 30-Jan-18 0 - 74 BANK OF AMERICA 16-Sep-17 24 24 EFT 21-Aug-17 21-Aug-17 21-Aug-17 28-Sep-17 38 925 28-Sep-17 0 - 75 BANK OF AMERICA 16-Jan-18 20 20 EFT 3-Jan-18 3-Jan-18 3-Jan-18 30-Jan-18 27 540 30-Jan-18 0 - 76 BANK OF AMERICA 16-Jan-18 142 142 EFT 18-Dec-17 13-Jan-18 31-Dec-17 30-Jan-18 30 4,263 30-Jan-18 0 - 77 BANK OF AMERICA 16-Jul-17 109 19 EFT 6-Jul-17 12-Jul-17 9-Jul-17 28-Jul-17 19 362 28-Jul-17 0 - 78 BANK OF AMERICA 16-Mar-18 241 241 EFT 16-Feb-18 7-Mar-18 25-Feb-18 16-Mar-18 19 4,576 16-Mar-18 0 - 79 BANK OF AMERICA 16-Mar-18 1,532 1,532 EFT 14-Feb-18 6-Apr-18 11-Mar-18 16-Mar-18 5 7,658 16-Mar-18 0 - 80 BANK OF AMERICA 16-Mar-18 53 53 EFT 20-Feb-18 1-Mar-18 24-Feb-18 16-Mar-18 20 1,066 16-Mar-18 0 - 81 BANK OF AMERICA 16-Apr-18 889 529 EFT 15-Mar-18 5-Apr-18 25-Mar-18 30-Apr-18 36 19,032 30-Apr-18 0 - 82 BANK OF AMERICA 16-Feb-18 627 311 EFT 15-Jan-18 9-Feb-18 27-Jan-18 28-Feb-18 32 9,946 28-Feb-18 0 - 83 BANK OF AMERICA 16-Feb-18 1,650 1,383 EFT 24-Jan-18 15-Feb-18 4-Feb-18 28-Feb-18 24 33,198 28-Feb-18 0 - 84 BANK OF AMERICA 16-Jun-18 1,663 1,308 EFT 22-May-18 14-Jun-18 2-Jun-18 29-Jun-18 27 35,307 29-Jun-18 0 - 85 BANK OF AMERICA 16-Sep-17 1,064 1,064 EFT 15-Aug-17 14-Sep-17 30-Aug-17 28-Sep-17 29 30,861 28-Sep-17 0 - 86 BANK OF AMERICA 16-Dec-17 535 307 EFT 17-Nov-17 7-Dec-17 27-Nov-17 29-Dec-17 32 9,836 29-Dec-17 0 - 87 BANK OF AMERICA 16-Jun-18 258 258 EFT 23-May-18 8-Jun-18 31-May-18 29-Jun-18 29 7,494 29-Jun-18 0 - 88 BANK OF AMERICA 16-Mar-18 320 190 EFT 19-Feb-18 14-Mar-18 2-Mar-18 16-Mar-18 14 2,665 16-Mar-18 0 - 89 BANK OF AMERICA 16-May-18 27 27 EFT 20-Apr-18 20-Apr-18 20-Apr-18 30-May-18 40 1,068 30-May-18 0 - 90 BANK OF AMERICA 16-Oct-17 24 24 EFT 15-Sep-17 15-Sep-17 15-Sep-17 30-Oct-17 45 1,073 30-Oct-17 0 - 91 BANK OF AMERICA 16-Jan-18 218 218 EFT 4-Jan-18 15-Jan-18 9-Jan-18 30-Jan-18 21 4,570 30-Jan-18 0 - 92 BANK OF AMERICA 16-Sep-17 428 265 EFT 30-Aug-17 22-Sep-17 10-Sep-17 28-Sep-17 18 4,764 28-Sep-17 0 - 93 BANK OF AMERICA 16-Dec-17 256 256 EFT 1-Dec-17 13-Dec-17 7-Dec-17 29-Dec-17 22 5,634 29-Dec-17 0 - 94 BANK OF AMERICA 16-Dec-17 25 25 EFT 26-Nov-17 26-Nov-17 26-Nov-17 29-Dec-17 33 825 29-Dec-17 0 - 95 BANK OF AMERICA 16-May-18 118 118 EFT 24-Apr-18 3-May-18 28-Apr-18 30-May-18 32 3,766 30-May-18 0 - 96 BANK OF AMERICA 16-Feb-18 74 74 EFT 17-Jan-18 5-Feb-18 26-Jan-18 28-Feb-18 33 2,457 28-Feb-18 0 - 97 BANK OF AMERICA 16-Feb-18 29 29 EFT 5-Feb-18 6-Feb-18 5-Feb-18 28-Feb-18 23 675 28-Feb-18 0 - 98 BANK OF AMERICA 16-Feb-18 2,493 51 EFT 18-Jan-18 1-Feb-18 25-Jan-18 28-Feb-18 34 1,729 28-Feb-18 0 - 99 BANK OF AMERICA 16-Mar-18 227 144 EFT 15-Feb-18 27-Feb-18 21-Feb-18 16-Mar-18 23 3,315 16-Mar-18 0 -
100 BANK OF AMERICA 16-Feb-18 108 35 EFT 17-Jan-18 6-Feb-18 27-Jan-18 28-Feb-18 32 1,107 28-Feb-18 0 - 101 BANK OF AMERICA 16-Aug-17 183 130 EFT 13-Jul-17 25-Jul-17 19-Jul-17 28-Aug-17 40 5,188 28-Aug-17 0 - 102 BANK OF AMERICA 16-Mar-18 356 356 EFT 26-Feb-18 12-Mar-18 5-Mar-18 16-Mar-18 11 3,914 16-Mar-18 0 - 103 BANK OF AMERICA 16-Mar-18 168 168 EFT 20-Feb-18 28-Feb-18 24-Feb-18 16-Mar-18 20 3,364 16-Mar-18 0 - 104 BANK OF AMERICA 16-Nov-17 51 51 EFT 1-Nov-17 1-Nov-17 1-Nov-17 30-Nov-17 29 1,477 30-Nov-17 0 - 105 BANK OF AMERICA 16-Sep-17 75 75 EFT 16-Aug-17 31-Aug-17 23-Aug-17 28-Sep-17 36 2,694 28-Sep-17 0 - 106 BANK OF AMERICA 16-Jan-18 62 62 EFT 2-Jan-18 4-Jan-18 3-Jan-18 30-Jan-18 27 1,661 30-Jan-18 0 - 107 BANK OF AMERICA 16-Mar-18 167 167 EFT 28-Feb-18 31-Mar-18 15-Mar-18 16-Mar-18 1 167 16-Mar-18 0 -
Page 2 of 8

EXHIBIT ATO-1 Lead Lag Study
Atmos Energy Corporation-Kentucky CWC WP 5-1Other O&M Payment and Check Clearing Lag For the CWC Study Test Year Ended June 30, 2018
Midpoint Weighted Weighted Line Invoice Invoice Division 009 Payment Service Period Service Date Payment Payment Date Clearing ClearingNo. Vendor Date Amount Amount Type From To Service Paid lag Lag Cleared Lag Lag108 BANK OF AMERICA 16-Oct-17 27 27 EFT 1-Oct-17 31-Oct-17 16-Oct-17 30-Oct-17 14 377 30-Oct-17 0 - 109 BANK OF AMERICA 16-Aug-17 79 79 EFT 9-Aug-17 10-Aug-17 9-Aug-17 28-Aug-17 19 1,495 28-Aug-17 0 - 110 BANK OF AMERICA 16-Sep-17 199 199 EFT 22-Aug-17 5-Sep-17 29-Aug-17 28-Sep-17 30 5,955 28-Sep-17 0 - 111 Beeny, Robert A (Alan) 16-Jun-18 75 75 Direct Depo 10-Jun-18 10-Jun-18 10-Jun-18 19-Jun-18 9 675 19-Jun-18 0 - 112 Benningfield, Katherine B (Kathy) 29-Nov-17 78 78 Direct Depo 27-Nov-17 27-Nov-17 27-Nov-17 1-Dec-17 4 312 1-Dec-17 0 - 113 Benningfield, Katherine B (Kathy) 11-May-18 537 486 Direct Depo 25-Apr-18 9-May-18 2-May-18 15-May-18 13 6,322 15-May-18 0 - 114 Benningfield, Katherine B (Kathy) 15-Jun-18 495 495 Direct Depo 12-Jun-18 12-Jun-18 12-Jun-18 19-Jun-18 7 3,468 19-Jun-18 0 - 115 Bittel, Stephen J (Steve) 21-May-18 715 681 Direct Depo 2-May-18 17-May-18 9-May-18 22-May-18 13 8,848 22-May-18 0 - 116 Blackburn, Jack B (Jack) 13-Nov-17 243 243 Direct Depo 27-Sep-17 3-Nov-17 15-Oct-17 16-Nov-17 32 7,776 16-Nov-17 0 - 117 BLUE GRASS ENERGY 7-Dec-17 52 52 CHECK 31-Oct-17 1-Dec-17 15-Nov-17 2-Jan-18 48 2,508 9-Jan-18 7 366 118 BOLES DWIGHT AND CARRIE 19-Mar-18 200 200 CHECK 19-Mar-18 17-Apr-18 2-Apr-18 27-Mar-18 (7) (1,400) 6-Apr-18 10 2,000 119 Bonner, Donald W 6-Mar-18 122 122 Direct Depo 13-Feb-18 5-Mar-18 23-Feb-18 8-Mar-18 13 1,584 8-Mar-18 0 - 120 Bonner, Donald W 28-Mar-18 769 769 Direct Depo 19-Mar-18 27-Mar-18 23-Mar-18 2-Apr-18 10 7,692 2-Apr-18 0 - 121 BOWLING GREEN MUNICIPAL UTILITIE 8-Nov-17 39 39 CHECK 11-Oct-17 8-Nov-17 25-Oct-17 1-Dec-17 37 1,446 12-Dec-17 11 430 122 Brittain, Chad A 7-Nov-17 193 193 Direct Depo 2-Nov-17 2-Nov-17 2-Nov-17 10-Nov-17 8 1,541 10-Nov-17 0 - 123 Brown, Sean R 5-Feb-18 797 791 Direct Depo 29-Jan-18 2-Feb-18 31-Jan-18 8-Feb-18 8 6,328 8-Feb-18 0 - 124 Brown, Sean R 16-Mar-18 266 230 Direct Depo 4-Mar-18 15-Mar-18 9-Mar-18 20-Mar-18 11 2,533 20-Mar-18 0 - 125 Buchanan, Rebecca M 10-Apr-18 2,150 228 Direct Depo 9-Nov-17 20-Dec-17 29-Nov-17 18-Apr-18 140 31,899 18-Apr-18 0 - 126 BUSHELS AND BLOOMS LLC 23-May-18 1,000 1,000 CHECK 21-Feb-18 21-Feb-18 21-Feb-18 18-Jun-18 117 117,000 2-Jul-18 14 14,000 127 CANTEEN REFRESHMENT SERVICES 2-Feb-18 48 48 Direct Depo 2-Feb-18 2-Feb-18 2-Feb-18 27-Feb-18 25 1,200 27-Feb-18 0 - 128 CANTEEN REFRESHMENT SERVICES C 28-Mar-18 35 35 CHECK 28-Mar-18 28-Mar-18 28-Mar-18 14-May-18 47 1,645 21-May-18 7 245 129 CARDINAL TRACKING INC 21-Nov-17 135 144 Direct Depo 21-Nov-17 21-Nov-17 21-Nov-17 28-Dec-17 37 5,314 28-Dec-17 0 - 130 CCATT LLC 1-Jul-17 586 586 Direct Depo 1-Jul-17 31-Jul-17 16-Jul-17 25-Jul-17 9 5,278 25-Jul-17 0 - 131 CCATT LLC 1-Mar-18 589 589 Direct Depo 1-Mar-18 31-Mar-18 16-Mar-18 26-Mar-18 10 5,894 26-Mar-18 0 - 132 CENTURYLINK 13-Nov-17 19 19 CHECK 13-Nov-17 12-Dec-17 27-Nov-17 4-Dec-17 7 133 12-Dec-17 8 152 133 CHAMBER OF COMMERCE 1-Aug-17 300 300 CHECK 1-Aug-17 31-Jul-18 30-Jan-18 7-Aug-17 (176) (52,800) 17-Aug-17 10 3,000 134 CHAMBER OF COMMERCE 24-May-18 1,284 1,284 CHECK 24-May-18 24-May-18 24-May-18 11-Jun-18 18 23,113 19-Jun-18 8 10,273 135 CHAMBER OF COMMERCE 1-Dec-17 305 305 CHECK 1-Dec-17 30-Nov-18 1-Jun-18 18-Dec-17 (165) (50,325) 2-Jan-18 15 4,575 136 Christian, Joe T 16-Apr-18 2,918 1,397 Direct Depo 20-Mar-18 24-Apr-18 6-Apr-18 17-Apr-18 11 15,363 17-Apr-18 0 - 137 CITY OF DANVILLE 24-Aug-17 7 7 CHECK 13-Jun-17 24-Aug-17 19-Jul-17 8-Sep-17 51 343 18-Sep-17 10 67 138 CITY OF DANVILLE 24-Aug-17 101 50 CHECK 13-Jun-17 24-Aug-17 19-Jul-17 5-Sep-17 48 2,419 14-Sep-17 9 454 139 CITY OF OWENSBORO 15-Sep-17 929 929 CHECK 16-Aug-17 15-Sep-17 31-Aug-17 2-Oct-17 32 29,730 11-Oct-17 9 8,362 140 CLEAN GREEN PORTA POTTIES LLC 7-Aug-17 117 117 CHECK 11-Jun-17 8-Jul-17 24-Jun-17 5-Sep-17 73 8,512 21-Sep-17 16 1,866 141 Coleman, McKinley W 30-Jan-18 22 22 CHECK 29-Jan-18 29-Jan-18 29-Jan-18 2-Feb-18 4 88 13-Feb-18 11 243 142 Coleman, Michael D (Mike) 23-Mar-18 357 105 Direct Depo 23-Feb-18 15-Mar-18 5-Mar-18 27-Mar-18 22 2,303 27-Mar-18 0 - 143 Cook, Robert R 2-Aug-17 256 256 Direct Depo 25-Jul-17 27-Jul-17 26-Jul-17 4-Aug-17 9 2,304 4-Aug-17 0 - 144 CORPORATE COMMUNICATIONS CENT 31-Jan-18 395 395 Direct Depo 1-Jan-18 31-Jan-18 16-Jan-18 26-Feb-18 41 16,195 26-Feb-18 0 - 145 CROWN CASTLE SOUTH LLC 1-Sep-17 589 589 CHECK 1-Sep-17 30-Sep-17 15-Sep-17 25-Sep-17 10 5,894 2-Oct-17 7 4,126 146 CROWN CASTLE SOUTH LLC 1-Apr-18 775 775 Direct Depo 1-Apr-18 30-Apr-18 15-Apr-18 25-Apr-18 10 7,750 25-Apr-18 0 - 147 CSX TRANSPORTATION INC 22-Mar-18 87 87 Direct Depo 11-May-18 10-May-19 9-Nov-18 16-Apr-18 (207) (18,009) 16-Apr-18 0 - 148 D AND S CONCRETE SERVICE LLC 22-Jul-17 5,000 5,000 CHECK 22-Jul-17 22-Jul-17 22-Jul-17 16-Aug-17 25 125,000 23-Aug-17 7 35,000 149 Densman, Josh C 16-Jan-18 2,447 381 Direct Depo 3-Jan-18 25-Jan-18 14-Jan-18 17-Jan-18 3 1,144 17-Jan-18 0 - 150 DITCH WITCH OF OHIO W PA AND W NY 24-Jul-17 144 144 CHECK 24-Jul-17 24-Jul-17 24-Jul-17 18-Oct-17 86 12,355 31-Oct-17 13 1,868 151 DRISKILLS QUALITY CLEANING 4-Sep-17 150 150 CHECK 4-Aug-17 25-Aug-17 14-Aug-17 29-Sep-17 46 6,900 10-Oct-17 11 1,650 152 DUFF AND PHELPS LLC 12-Sep-17 80,000 80,000 CHECK 24-Aug-17 24-Sep-18 10-Mar-18 9-Oct-17 (152) (12,160,000) 16-Oct-17 7 560,000 153 EF TECHNOLOGIES INC 19-Oct-17 1,224 1,297 CHECK 18-Oct-17 18-Oct-17 18-Oct-17 2-Jan-18 76 98,570 10-Jan-18 8 10,376 154 EF TECHNOLOGIES INC 19-Apr-18 635 673 CHECK 18-Apr-18 18-Apr-18 18-Apr-18 14-May-18 26 17,501 23-May-18 9 6,058 155 EGW UTILITIES INC 24-Oct-17 836 836 Direct Depo 24-Oct-17 24-Oct-17 24-Oct-17 20-Nov-17 27 22,567 20-Nov-17 0 - 156 EGW UTILITIES INC 11-Apr-18 303 303 Direct Depo 11-Apr-18 11-Apr-18 11-Apr-18 7-May-18 26 7,882 7-May-18 0 - 157 EGW UTILITIES INC 13-Apr-18 1,491 1,491 Direct Depo 13-Apr-18 13-Apr-18 13-Apr-18 21-May-18 38 56,660 21-May-18 0 - 158 ELEMENT FLEET 13-Oct-17 2,380,583 70,494 Direct Depo 1-Sep-17 30-Sep-17 15-Sep-17 16-Oct-17 28 1,941,407 16-Oct-17 0 - 159 FARMERS RURAL ELECTRIC COOPERA 20-Apr-18 26 26 CHECK 20-Mar-18 17-Apr-18 3-Apr-18 27-Apr-18 24 622 7-May-18 10 259 160 FARMERS RURAL ELECTRIC COOPERA 20-Jun-18 27 27 CHECK 18-May-18 19-Jun-18 3-Jun-18 29-Jun-18 26 705 6-Jul-18 7 190 161 FIERS HEATING AND COOLING 19-Feb-18 398 398 CHECK 2-Feb-18 2-Feb-18 2-Feb-18 28-Feb-18 26 10,360 19-Mar-18 19 7,571
Page 3 of 8

EXHIBIT ATO-1 Lead Lag Study
Atmos Energy Corporation-Kentucky CWC WP 5-1Other O&M Payment and Check Clearing Lag For the CWC Study Test Year Ended June 30, 2018
Midpoint Weighted Weighted Line Invoice Invoice Division 009 Payment Service Period Service Date Payment Payment Date Clearing ClearingNo. Vendor Date Amount Amount Type From To Service Paid lag Lag Cleared Lag Lag162 Flick, Robert K 25-Oct-17 69 69 Direct Depo 20-Oct-17 24-Oct-17 22-Oct-17 30-Oct-17 8 552 30-Oct-17 0 - 163 FRANKLIN ELECTRIC PLANT BOARD 19-Jun-17 33 33 CHECK 15-May-17 19-Jun-17 1-Jun-17 7-Jul-17 36 1,204 14-Jul-17 7 234 164 FRANKLIN ELECTRIC PLANT BOARD 27-Sep-17 74 74 CHECK 22-Aug-17 27-Sep-17 9-Sep-17 16-Oct-17 37 2,737 24-Oct-17 8 592 165 Gillham, Laura K 28-Mar-18 96 96 Direct Depo 20-Mar-18 23-Mar-18 21-Mar-18 4-Apr-18 14 1,344 4-Apr-18 0 - 166 GLASGOW ELECTRIC PLANT BOARD 1-Mar-18 51 51 CHECK 1-Feb-18 1-Mar-18 15-Feb-18 16-Mar-18 29 1,477 26-Mar-18 10 509 167 GLASGOW WATER COMPANY 26-Apr-18 9 9 CHECK 30-Mar-18 26-Apr-18 12-Apr-18 23-May-18 41 377 31-May-18 8 74 168 GO RECYCLING 1-Jan-18 360 360 CHECK 1-Jan-18 31-Mar-18 14-Feb-18 3-Jan-18 (43) (15,480) 11-Jan-18 8 2,880 169 GREEN RIVER RENTALS INC 5-Mar-18 205 205 CHECK 11-Jan-18 11-Jan-18 11-Jan-18 29-Mar-18 77 15,813 5-Apr-18 7 1,438 170 Hamilton, Gary L 1-Sep-17 478 427 Direct Depo 11-Aug-17 24-Aug-17 17-Aug-17 5-Sep-17 19 8,122 5-Sep-17 0 - 171 HARRIS MCBURNEY COMPANY INC 1-Jul-17 307 307 Direct Depo 25-Jun-17 1-Jul-17 28-Jun-17 26-Jul-17 28 8,599 26-Jul-17 0 - 172 HARRIS MCBURNEY COMPANY INC 8-Jul-17 855 855 Direct Depo 2-Jul-17 8-Jul-17 5-Jul-17 2-Aug-17 28 23,950 2-Aug-17 0 - 173 HARRIS MCBURNEY COMPANY INC 5-Aug-17 853 853 Direct Depo 30-Jul-17 5-Aug-17 2-Aug-17 30-Aug-17 28 23,876 30-Aug-17 0 - 174 HARRIS MCBURNEY COMPANY INC 18-Aug-17 1,521 1,521 Direct Depo 13-Aug-17 19-Aug-17 16-Aug-17 12-Sep-17 27 41,057 12-Sep-17 0 - 175 HARRIS MCBURNEY COMPANY INC 2-Sep-17 415 415 Direct Depo 27-Aug-17 2-Sep-17 30-Aug-17 27-Sep-17 28 11,630 27-Sep-17 0 - 176 HARRIS MCBURNEY COMPANY INC 16-Sep-17 8,185 8,185 Direct Depo 10-Sep-17 16-Sep-17 13-Sep-17 11-Oct-17 28 229,177 11-Oct-17 0 - 177 HARRIS MCBURNEY COMPANY INC 23-Sep-17 8,488 8,488 Direct Depo 17-Sep-17 23-Sep-17 20-Sep-17 18-Oct-17 28 237,653 18-Oct-17 0 - 178 HARRIS MCBURNEY COMPANY INC 7-Oct-17 1,190 1,190 Direct Depo 1-Oct-17 7-Oct-17 4-Oct-17 1-Nov-17 28 33,313 1-Nov-17 0 - 179 HARRIS MCBURNEY COMPANY INC 4-Nov-17 3,986 3,986 Direct Depo 29-Oct-17 4-Nov-17 1-Nov-17 29-Nov-17 28 111,619 29-Nov-17 0 - 180 HARRIS MCBURNEY COMPANY INC 11-Nov-17 1,325 1,325 Direct Depo 5-Nov-17 11-Nov-17 8-Nov-17 6-Dec-17 28 37,108 6-Dec-17 0 - 181 HARRIS MCBURNEY COMPANY INC 16-Dec-17 3,051 3,051 Direct Depo 10-Dec-17 16-Dec-17 13-Dec-17 10-Jan-18 28 85,427 10-Jan-18 0 - 182 HARRIS MCBURNEY COMPANY INC 5-May-18 7,085 7,085 Direct Depo 29-Apr-18 5-May-18 2-May-18 30-May-18 28 198,374 30-May-18 0 - 183 HARRIS MCBURNEY COMPANY INC 20-May-18 2,258 2,258 Direct Depo 20-May-18 26-May-18 23-May-18 25-Jun-18 33 74,510 25-Jun-18 0 - 184 HEATH CONSULTANTS INC 2-Sep-17 3,211 3,211 Direct Depo 27-Aug-17 2-Sep-17 30-Aug-17 20-Sep-17 21 67,431 20-Sep-17 0 - 185 HEATH CONSULTANTS INC 2-Sep-17 828 828 Direct Depo 27-Aug-17 2-Sep-17 30-Aug-17 20-Sep-17 21 17,390 20-Sep-17 0 - 186 HEATH CONSULTANTS INC 16-Sep-17 1,200 1,200 Direct Depo 10-Sep-17 16-Sep-17 13-Sep-17 29-Sep-17 16 19,198 29-Sep-17 0 - 187 HEATH CONSULTANTS INC 2-Jun-18 135,977 132,513 Direct Depo 1-May-18 31-May-18 16-May-18 13-Jun-18 28 3,710,361 13-Jun-18 0 - 188 HEATH CONSULTANTS INC 27-May-17 3,498 3,498 Direct Depo 1-May-17 9-May-17 5-May-17 18-Jul-17 74 258,874 18-Jul-17 0 - 189 HEATH CONSULTANTS INC 1-Jul-17 2,383 2,383 Direct Depo 25-Jun-17 1-Jul-17 28-Jun-17 19-Jul-17 21 50,041 19-Jul-17 0 - 190 HEATH CONSULTANTS INC 12-Aug-17 3,448 3,448 Direct Depo 6-Aug-17 12-Aug-17 9-Aug-17 30-Aug-17 21 72,400 30-Aug-17 0 - 191 HEATH CONSULTANTS INC 12-Aug-17 2,180 2,180 Direct Depo 6-Aug-17 12-Aug-17 9-Aug-17 25-Aug-17 16 34,882 25-Aug-17 0 - 192 Henderson, Joanne M 15-Nov-17 799 19 Direct Depo 26-Oct-17 9-Nov-17 2-Nov-17 17-Nov-17 15 281 17-Nov-17 0 - 193 HENDRICKSON USA 9-Jan-18 2,363 24 CHECK 1-Jan-15 31-Dec-16 1-Jan-16 10-Jan-18 740 17,494 5-Feb-18 26 615 194 HOME BUILDERS ASSOCIATION OF OW 1-Nov-17 1,000 1,060 CHECK 1-Nov-17 1-Nov-17 1-Nov-17 6-Nov-17 5 5,300 1-Dec-17 25 26,500 195 HOPKINSVILLE ELECTRIC SYSTEM 19-Mar-18 422 422 CHECK 18-Feb-18 19-Mar-18 4-Mar-18 13-Apr-18 40 16,891 26-Apr-18 13 5,490 196 HOPKINSVILLE ELECTRIC SYSTEM 18-Oct-17 485 485 CHECK 19-Sep-17 18-Oct-17 3-Oct-17 17-Nov-17 45 21,812 30-Nov-17 13 6,301 197 HOPKINSVILLE WATER ENVIROMENT A 31-Mar-18 6 6 CHECK 1-Mar-18 31-Mar-18 16-Mar-18 2-Apr-18 17 102 10-Apr-18 8 48 198 HOPKINSVILLE WATER ENVIROMENT A 30-May-18 6 6 CHECK 1-May-18 31-May-18 16-May-18 1-Jun-18 16 96 11-Jun-18 10 60 199 Hudson, Sidney W (Sid) 31-Jan-18 3,819 157 Direct Depo 14-Dec-17 30-Jan-18 6-Jan-18 2-Feb-18 27 4,252 2-Feb-18 0 - 200 INDUSTRIAL PARK DISTRIBUTORS 2-Jan-18 67 71 CHECK 2-Jan-18 2-Jan-18 2-Jan-18 29-Jan-18 27 1,917 9-Feb-18 11 781 201 INFOSOURCE 1-Jul-17 75 75 CHECK 1-Jul-17 1-Jul-17 1-Jul-17 7-Jul-17 6 450 1-Aug-17 25 1,875 202 INSTRUMENT AND VALVE SERVICES C 22-Nov-17 444 471 Direct Depo 22-Nov-17 22-Nov-17 22-Nov-17 18-Dec-17 26 12,243 18-Dec-17 0 - 203 INTER COUNTY ENERGY 27-Apr-18 19 19 CHECK 10-Mar-18 10-Apr-18 25-Mar-18 4-May-18 40 768 11-May-18 7 134 204 INTER COUNTY ENERGY 19-Oct-17 13 13 CHECK 1-Sep-17 1-Oct-17 16-Sep-17 27-Oct-17 41 534 7-Nov-17 11 143 205 INTER COUNTY ENERGY 19-Nov-17 24 24 CHECK 1-Oct-17 1-Nov-17 16-Oct-17 1-Dec-17 46 1,112 13-Dec-17 12 290 206 INTER COUNTY ENERGY 19-Dec-17 24 24 CHECK 1-Nov-17 1-Dec-17 16-Nov-17 2-Jan-18 47 1,116 10-Jan-18 8 190 207 INTER COUNTY ENERGY 27-Sep-17 12 12 CHECK 10-Aug-17 10-Sep-17 25-Aug-17 16-Oct-17 52 603 25-Oct-17 9 104 208 JACKSON PURCHASE ENERGY CORPO 28-Feb-18 29 29 CHECK 23-Jan-18 19-Feb-18 5-Feb-18 12-Mar-18 35 1,021 20-Mar-18 8 233 209 JACKSON PURCHASE ENERGY CORPO 28-Jul-17 28 28 CHECK 21-Jun-17 24-Jul-17 7-Jul-17 14-Aug-17 38 1,068 23-Aug-17 9 253 210 JACKSON PURCHASE ENERGY CORPO 28-Jul-17 25 25 CHECK 21-Jun-17 24-Jul-17 7-Jul-17 14-Aug-17 38 960 23-Aug-17 9 227 211 JEFF MALONEYS LAWN SERVICE 18-Sep-17 60 60 CHECK 9-Aug-17 23-Aug-17 16-Aug-17 29-Sep-17 44 2,640 6-Oct-17 7 420 212 JENNINGS AND LITTLE EXCAVATING 7-Aug-17 1,600 1,600 CHECK 3-Aug-17 3-Aug-17 3-Aug-17 5-Sep-17 33 52,800 14-Sep-17 9 14,400 213 JEWELL LAWN AND LANDSCAPE 1-Dec-17 800 800 CHECK 1-Dec-17 1-Dec-17 1-Dec-17 8-Jan-18 38 30,400 18-Jan-18 10 8,000 214 JOHN CONTI COFFEE AND TEA INC 2-May-18 24 25 CHECK 2-May-18 2-May-18 2-May-18 9-May-18 7 178 15-May-18 6 152 215 Johns, Steven D (Derrick) 23-Mar-18 722 722 Direct Depo 19-Mar-18 22-Mar-18 20-Mar-18 26-Mar-18 6 4,331 26-Mar-18 0 -
Page 4 of 8

EXHIBIT ATO-1 Lead Lag Study
Atmos Energy Corporation-Kentucky CWC WP 5-1Other O&M Payment and Check Clearing Lag For the CWC Study Test Year Ended June 30, 2018
Midpoint Weighted Weighted Line Invoice Invoice Division 009 Payment Service Period Service Date Payment Payment Date Clearing ClearingNo. Vendor Date Amount Amount Type From To Service Paid lag Lag Cleared Lag Lag216 Jones, Sean D 21-May-18 914 886 Direct Depo 13-May-18 18-May-18 15-May-18 23-May-18 8 7,086 23-May-18 0 - 217 KENERGY CORP 13-Nov-17 41 41 CHECK 12-Oct-17 13-Nov-17 28-Oct-17 1-Dec-17 34 1,395 13-Dec-17 12 492 218 KENERGY CORP 13-Apr-18 33 33 CHECK 13-Mar-18 13-Apr-18 28-Mar-18 27-Apr-18 30 976 4-May-18 7 228 219 KENERGY CORP 12-Oct-17 36 36 CHECK 10-Sep-17 12-Oct-17 26-Sep-17 1-Nov-17 36 1,283 8-Nov-17 7 249 220 KENERGY CORP 13-Nov-17 35 35 CHECK 12-Oct-17 13-Nov-17 28-Oct-17 1-Dec-17 34 1,207 13-Dec-17 12 426 221 KENERGY CORP 6-Nov-17 28 28 CHECK 5-Oct-17 6-Nov-17 21-Oct-17 29-Nov-17 39 1,073 7-Dec-17 8 220 222 KENERGY CORP 30-Nov-17 48 48 CHECK 30-Oct-17 30-Nov-17 14-Nov-17 18-Dec-17 34 1,624 28-Dec-17 10 478 223 KENERGY CORP 2-Nov-17 47 47 CHECK 1-Oct-17 2-Nov-17 17-Oct-17 17-Nov-17 31 1,450 29-Nov-17 12 561 224 KENERGY CORP 2-Feb-18 45 45 CHECK 2-Jan-18 2-Feb-18 17-Jan-18 19-Feb-18 33 1,487 27-Feb-18 8 361 225 KENERGY CORP 2-Apr-18 39 39 CHECK 2-Mar-18 2-Apr-18 17-Mar-18 20-Apr-18 34 1,332 30-Apr-18 10 392 226 KENERGY CORP 2-Mar-18 27 27 CHECK 2-Feb-18 2-Mar-18 16-Feb-18 16-Mar-18 28 760 26-Mar-18 10 271 227 KENERGY CORP 17-Dec-17 26 26 CHECK 17-Nov-17 17-Dec-17 2-Dec-17 2-Jan-18 31 794 9-Jan-18 7 179 228 KENERGY CORP 6-Nov-17 38 38 CHECK 5-Oct-17 6-Nov-17 21-Oct-17 29-Nov-17 39 1,489 7-Dec-17 8 306 229 KENERGY CORP 20-Nov-17 40 40 CHECK 19-Oct-17 20-Nov-17 4-Nov-17 6-Dec-17 32 1,294 13-Dec-17 7 283 230 KENERGY CORP 16-Jun-18 104 104 CHECK 16-May-18 16-Jun-18 31-May-18 29-Jun-18 29 3,002 6-Jul-18 7 725 231 KENERGY CORP 15-Oct-17 105 105 CHECK 13-Sep-17 15-Oct-17 29-Sep-17 1-Nov-17 33 3,468 8-Nov-17 7 736 232 KENERGY CORP 24-Jul-17 29 29 CHECK 21-Jun-17 24-Jul-17 7-Jul-17 14-Aug-17 38 1,089 22-Aug-17 8 229 233 KENTUCKY 811 17-May-18 7,877 7,877 Direct Depo 1-Apr-18 30-Apr-18 15-Apr-18 11-Jun-18 57 448,961 11-Jun-18 0 - 234 KENTUCKY ASSOCIATION FOR ECONO 3-Aug-17 2,500 2,500 CHECK 3-Aug-17 3-Aug-17 3-Aug-17 7-Aug-17 4 10,000 17-Aug-17 10 25,000 235 KING MECHANICAL SPECIALTY INC 19-Dec-17 781 828 Direct Depo 19-Dec-17 19-Dec-17 19-Dec-17 16-Jan-18 28 23,180 16-Jan-18 0 - 236 KOORSEN FIRE AND SECURITY INC 2-Nov-17 30 30 Direct Depo 1-Dec-17 31-Dec-17 16-Dec-17 7-Dec-17 (9) (270) 7-Dec-17 0 - 237 KU ENERGY CORPORATION 2-Apr-18 34 34 CHECK 3-Mar-18 2-Apr-18 18-Mar-18 9-Apr-18 22 753 17-Apr-18 8 274 238 KU ENERGY CORPORATION 1-Nov-17 35 35 CHECK 2-Oct-17 1-Nov-17 17-Oct-17 10-Nov-17 24 843 20-Nov-17 10 351 239 KU ENERGY CORPORATION 23-Feb-18 90 90 CHECK 24-Jan-18 23-Feb-18 8-Feb-18 2-Mar-18 22 1,979 14-Mar-18 12 1,079 240 KU ENERGY CORPORATION 25-Aug-17 52 52 CHECK 26-Jul-17 25-Aug-17 10-Aug-17 30-Aug-17 20 1,050 11-Sep-17 12 630 241 KU ENERGY CORPORATION 29-Nov-17 50 50 CHECK 30-Oct-17 29-Nov-17 14-Nov-17 18-Dec-17 34 1,705 29-Dec-17 11 552 242 KU ENERGY CORPORATION 17-Nov-17 226 226 CHECK 18-Oct-17 15-Nov-17 1-Nov-17 1-Dec-17 30 6,778 13-Dec-17 12 2,711 243 KU ENERGY CORPORATION 13-Mar-18 37 37 CHECK 12-Feb-18 12-Mar-18 26-Feb-18 26-Mar-18 28 1,037 3-Apr-18 8 296 244 KU ENERGY CORPORATION 14-Aug-17 38 38 CHECK 13-Jul-17 11-Aug-17 27-Jul-17 25-Aug-17 29 1,115 5-Sep-17 11 423 245 KU ENERGY CORPORATION 10-Nov-17 39 39 CHECK 13-Oct-17 9-Nov-17 26-Oct-17 20-Nov-17 25 963 30-Nov-17 10 385 246 KU ENERGY CORPORATION 7-Nov-17 38 38 CHECK 6-Oct-17 6-Nov-17 21-Oct-17 17-Nov-17 27 1,019 30-Nov-17 13 490 247 LARRYS CLEANING SERVICE 1-Feb-18 700 700 CHECK 1-Jan-18 31-Jan-18 16-Jan-18 26-Feb-18 41 28,700 3-Apr-18 36 25,200 248 LEBANON WATER WORKS INC 15-May-18 22 22 CHECK 16-Apr-18 15-May-18 30-Apr-18 8-Jun-18 39 859 18-Jun-18 10 220 249 LEE JIMMY D 2-Oct-17 600 600 CHECK 1-Jul-17 30-Sep-17 15-Aug-17 11-Oct-17 57 34,200 18-Oct-17 7 4,200 250 LG AND E NATURAL PLAINS ENERGY S 15-Aug-17 38 38 CHECK 14-Jul-17 14-Aug-17 29-Jul-17 30-Aug-17 32 1,213 8-Sep-17 9 341 251 LIBERTY PRINTING 18-Sep-17 248 248 CHECK 18-Sep-17 18-Sep-17 18-Sep-17 13-Oct-17 25 6,208 27-Oct-17 14 3,476 252 LINDON REALTY LLC 1-Aug-17 10,164 1,321 CHECK 1-Aug-17 31-Aug-17 16-Aug-17 2-Aug-17 (14) (18,498) 9-Aug-17 7 9,249 253 LINDON REALTY LLC 1-Dec-17 10,164 1,321 CHECK 1-Dec-17 31-Dec-17 16-Dec-17 1-Dec-17 (15) (19,820) 11-Dec-17 10 13,213 254 LINDON REALTY LLC 1-Jul-17 10,164 1,321 CHECK 1-Jul-17 31-Jul-17 16-Jul-17 3-Jul-17 (13) (17,177) 12-Jul-17 9 11,892 255 LOGANS INC 6-Nov-17 76 76 CHECK 6-Nov-17 6-Nov-17 6-Nov-17 1-Dec-17 25 1,894 12-Dec-17 11 833 256 LOGANS INC 1-Jan-18 76 76 CHECK 1-Jan-18 1-Jan-18 1-Jan-18 9-Apr-18 98 7,423 16-Apr-18 7 530 257 MADISONVILLE MESSENGER 6-May-18 620 620 CHECK 19-Apr-18 19-Apr-18 19-Apr-18 14-May-18 25 15,500 21-May-18 7 4,340 258 MADISONVILLE MUNICIPAL UTILITIES 2-Aug-17 34 34 CHECK 5-Jul-17 2-Aug-17 19-Jul-17 18-Aug-17 30 1,013 29-Aug-17 11 372 259 MADISONVILLE MUNICIPAL UTILITIES 21-Jun-17 93 93 CHECK 19-May-17 21-Jun-17 4-Jun-17 14-Jul-17 40 3,725 19-Jul-17 5 466 260 MAGNOLIA RIVER SERVICES INC 11-Apr-18 1,360 1,360 Direct Depo 2-Apr-18 6-Apr-18 4-Apr-18 7-May-18 33 44,872 7-May-18 0 - 261 MAGNOLIA RIVER SERVICES INC 2-May-18 7,739 7,739 Direct Depo 22-Mar-18 27-Apr-18 9-Apr-18 29-May-18 50 386,953 29-May-18 0 - 262 MAGNOLIA RIVER SERVICES INC 23-May-18 1,238 1,238 Direct Depo 14-May-18 18-May-18 16-May-18 18-Jun-18 33 40,862 18-Jun-18 0 - 263 MARIAHS 6-Dec-17 821 821 CHECK 6-Dec-17 6-Dec-17 6-Dec-17 2-Jan-18 27 22,179 9-Jan-18 7 5,750 264 MARTIN CONTRACTING INC 21-Mar-18 875 875 Direct Depo 13-Mar-18 15-Mar-18 14-Mar-18 27-Mar-18 13 11,375 27-Mar-18 0 - 265 MARTIN CONTRACTING INC 19-Apr-18 1,435 1,435 Direct Depo 9-Apr-18 13-Apr-18 11-Apr-18 1-May-18 20 28,700 1-May-18 0 - 266 MASTER CONTROLS INC 15-Jan-18 2,619 2,776 CHECK 11-Jan-18 11-Jan-18 11-Jan-18 9-Feb-18 29 80,507 21-Feb-18 12 33,313 267 MASTERCRAFT PRINTED PRODUCTS A 19-Jun-17 149 149 Direct Depo 16-Jun-17 16-Jun-17 16-Jun-17 14-Jul-17 28 4,159 14-Jul-17 0 - 268 MASTERCRAFT PRINTED PRODUCTS A 15-Feb-18 50 53 Direct Depo 14-Feb-18 14-Feb-18 14-Feb-18 16-Mar-18 30 1,594 16-Mar-18 0 - 269 Mattingly, Patrick T (Pat) 28-Jul-17 189 87 Direct Depo 5-Jul-17 25-Jul-17 15-Jul-17 31-Jul-17 16 1,399 31-Jul-17 0 -
Page 5 of 8

EXHIBIT ATO-1 Lead Lag Study
Atmos Energy Corporation-Kentucky CWC WP 5-1Other O&M Payment and Check Clearing Lag For the CWC Study Test Year Ended June 30, 2018
Midpoint Weighted Weighted Line Invoice Invoice Division 009 Payment Service Period Service Date Payment Payment Date Clearing ClearingNo. Vendor Date Amount Amount Type From To Service Paid lag Lag Cleared Lag Lag270 Mattingly, Patrick T (Pat) 7-Sep-17 308 148 Direct Depo 21-Aug-17 6-Sep-17 29-Aug-17 12-Sep-17 14 2,069 12-Sep-17 0 - 271 MAX ARNOLD AND SONS INC 23-Jan-18 2,809 2,809 CHECK 23-Jan-18 23-Jan-18 23-Jan-18 26-Jan-18 3 8,427 5-Feb-18 10 28,090 272 MAYFIELD ELECTRIC AND WATER SYS 15-Dec-17 40 40 CHECK 15-Nov-17 15-Dec-17 30-Nov-17 5-Jan-18 36 1,433 16-Jan-18 11 438 273 MAYFIELD ELECTRIC AND WATER SYS 16-Jan-18 813 813 CHECK 15-Dec-17 16-Jan-18 31-Dec-17 31-Jan-18 31 25,190 7-Feb-18 7 5,688 274 MAYFIELD ELECTRIC AND WATER SYS 15-Mar-18 10 10 CHECK 15-Feb-18 15-Mar-18 1-Mar-18 11-Apr-18 41 422 18-Apr-18 7 72 275 MAYFIELD ELECTRIC AND WATER SYS 15-Mar-18 50 50 CHECK 15-Feb-18 15-Mar-18 1-Mar-18 11-Apr-18 41 2,045 18-Apr-18 7 349 276 MEADE COUNTY RURAL ELECTRIC 10-Jul-17 51 51 CHECK 3-Jun-17 3-Jul-17 18-Jun-17 14-Jul-17 26 1,335 18-Jul-17 4 205 277 Medley, Chris Lee 26-Feb-18 597 597 CHECK 18-Feb-18 23-Feb-18 20-Feb-18 2-Mar-18 10 5,974 12-Mar-18 10 5,974 278 MILLER PEST CONTROL INC 27-Nov-17 25 25 CHECK 27-Nov-17 27-Nov-17 27-Nov-17 22-Dec-17 25 625 3-Jan-18 12 300 279 Miller, Teddy W 12-Feb-18 285 285 Direct Depo 28-Dec-17 31-Jan-18 14-Jan-18 14-Feb-18 31 8,848 14-Feb-18 0 - 280 MODERN SUPPLY COMPANY INC 30-Jun-17 40 42 CHECK 21-Jun-17 30-Jun-17 25-Jun-17 14-Jul-17 19 802 18-Jul-17 4 169 281 MRC GLOBAL 16-Oct-17 283,371 2,029 Direct Depo 9-Aug-17 13-Oct-17 10-Sep-17 6-Nov-17 57 115,640 6-Nov-17 0 - 282 MRC GLOBAL 27-Nov-17 99,732 2,640 Direct Depo 17-Aug-17 21-Nov-17 4-Oct-17 18-Dec-17 75 197,985 18-Dec-17 0 - 283 MRC GLOBAL 22-Jan-18 175,206 2,604 Direct Depo 7-Dec-17 18-Jan-18 28-Dec-17 12-Feb-18 46 119,800 12-Feb-18 0 - 284 OFFICE COFFEE SYSTEMS INC 22-Jun-17 14 14 CHECK 22-Jun-17 22-Jun-17 22-Jun-17 17-Jul-17 25 350 25-Jul-17 8 112 285 Owen, Timothy D (Tim) 13-Oct-17 3,122 3,089 Direct Depo 19-Sep-17 20-Oct-17 4-Oct-17 17-Oct-17 13 40,151 17-Oct-17 0 - 286 OWENSBORO COMMUNITY AND TECH 7-Aug-17 2,998 2,998 CHECK 7-Aug-17 7-Aug-17 7-Aug-17 11-Aug-17 4 11,992 23-Aug-17 12 35,976 287 OWENSBORO MUNICIPAL UTILITIES 16-May-18 20 20 CHECK 13-Apr-18 10-May-18 26-Apr-18 1-Jun-18 36 723 8-Jun-18 7 140 288 OWENSBORO MUNICIPAL UTILITIES 16-Apr-18 31 31 CHECK 10-Mar-18 10-Apr-18 25-Mar-18 27-Apr-18 33 1,031 4-May-18 7 219 289 PADUCAH POWER SYSTEM 17-Apr-18 24 24 CHECK 13-Mar-18 14-Apr-18 29-Mar-18 2-May-18 34 817 9-May-18 7 168 290 PADUCAH POWER SYSTEM 23-Mar-18 37 37 CHECK 20-Feb-18 20-Mar-18 6-Mar-18 4-Apr-18 29 1,086 11-Apr-18 7 262 291 PADUCAH POWER SYSTEM 22-Jun-17 39 39 CHECK 20-May-17 20-Jun-17 4-Jun-17 7-Jul-17 33 1,298 17-Jul-17 10 393 292 PADUCAH WATER WORKS 6-Nov-17 111 111 CHECK 1-Sep-17 6-Nov-17 4-Oct-17 29-Nov-17 56 6,188 6-Dec-17 7 774 293 Payne, James M 29-Jan-18 827 827 Direct Depo 19-Dec-17 25-Jan-18 6-Jan-18 1-Feb-18 26 21,505 1-Feb-18 0 - 294 Payne, James M 8-May-18 1,375 1,345 Direct Depo 28-Mar-18 8-May-18 17-Apr-18 11-May-18 24 32,282 11-May-18 0 - 295 PENNYRILE RURAL ELECTRIC COOP C 16-Jun-17 258 258 CHECK 16-May-17 16-Jun-17 31-May-17 7-Jul-17 37 9,545 14-Jul-17 7 1,806 296 PENNYRILE RURAL ELECTRIC COOP C 26-Apr-18 34 34 CHECK 26-Mar-18 26-Apr-18 10-Apr-18 9-May-18 29 991 15-May-18 6 205 297 PENNYRILE RURAL ELECTRIC COOP C 26-Apr-18 29 29 CHECK 26-Mar-18 26-Apr-18 10-Apr-18 9-May-18 29 850 15-May-18 6 176 298 PENNYRILE RURAL ELECTRIC COOP C 14-May-18 73 73 CHECK 14-Apr-18 14-May-18 29-Apr-18 25-May-18 26 1,885 30-May-18 5 363 299 PENNYRILE RURAL ELECTRIC COOP C 1-Jul-17 35 35 CHECK 31-May-17 1-Jul-17 15-Jun-17 17-Jul-17 32 1,105 24-Jul-17 7 242 300 PENNYRILE RURAL ELECTRIC COOP C 16-Oct-17 39 39 CHECK 16-Sep-17 16-Oct-17 1-Oct-17 3-Nov-17 33 1,294 10-Nov-17 7 275 301 PEOPLE PLUS INC 1-Sep-17 833 833 Direct Depo 21-Aug-17 27-Aug-17 24-Aug-17 26-Sep-17 33 27,490 26-Sep-17 0 - 302 PEOPLE PLUS INC 8-Sep-17 768 768 Direct Depo 28-Aug-17 3-Sep-17 31-Aug-17 3-Oct-17 33 25,340 3-Oct-17 0 - 303 Persson, Matthew M (Matt) 8-Mar-18 11 11 Direct Depo 7-Mar-18 7-Mar-18 7-Mar-18 13-Mar-18 6 64 13-Mar-18 0 - 304 PLUMBERS SUPPLY COMPANY 26-Mar-18 40 40 Direct Depo 26-Mar-18 26-Mar-18 26-Mar-18 5-Apr-18 10 401 5-Apr-18 0 - 305 POLLUX BUSINESS SERVICES 18-Aug-17 4,705 4,705 CHECK 19-Jul-17 18-Aug-17 3-Aug-17 30-Aug-17 27 127,027 6-Sep-17 7 32,933 306 Porter, Gary R 15-May-18 304 304 Direct Depo 9-Mar-18 15-May-18 11-Apr-18 18-May-18 37 11,260 18-May-18 0 - 307 PRECISION PRODUCTS LLC 13-Apr-18 2,170 2,170 CHECK 13-Apr-18 12-Apr-19 12-Oct-18 30-Apr-18 (165) (358,065) 7-May-18 7 15,191 308 Price, Daniel K (Dan) 31-Aug-17 867 281 Direct Depo 20-Jun-17 31-Aug-17 26-Jul-17 6-Sep-17 42 11,799 6-Sep-17 0 - 309 Price, Daniel K (Dan) 30-Apr-18 403 397 Direct Depo 24-Apr-18 25-Apr-18 24-Apr-18 2-May-18 8 3,173 2-May-18 0 - 310 PRINCETON EPB 20-Dec-17 148 148 CHECK 22-Nov-17 20-Dec-17 6-Dec-17 24-Jan-18 49 7,241 31-Jan-18 7 1,034 311 PRINCETON WATER AND SEWER 12-Jul-17 40 40 CHECK 12-Jun-17 12-Jul-17 27-Jun-17 26-Jul-17 29 1,166 1-Aug-17 6 241 312 Redd, William D (Doug) 12-Jan-18 99 99 Direct Depo 9-Jan-18 12-Jan-18 10-Jan-18 16-Jan-18 6 593 16-Jan-18 0 - 313 REPUBLIC SERVICES 15-Oct-17 668 668 Direct Depo 1-Nov-17 30-Nov-17 15-Nov-17 6-Nov-17 (10) (6,677) 6-Nov-17 0 - 314 REPUBLIC SERVICES 15-Jan-18 346 346 Direct Depo 1-Feb-18 28-Feb-18 14-Feb-18 29-Jan-18 (17) (5,888) 29-Jan-18 0 - 315 REPUBLIC SERVICES 20-Jun-17 428 428 Direct Depo 1-Jul-17 31-Jul-17 16-Jul-17 5-Jul-17 (11) (4,706) 5-Jul-17 0 - 316 REPUBLIC SERVICES 20-Jul-17 446 446 Direct Depo 12-Jul-17 31-Aug-17 6-Aug-17 7-Aug-17 1 446 7-Aug-17 0 - 317 REPUBLIC SERVICES 25-Aug-17 535 535 Direct Depo 1-Sep-17 30-Sep-17 15-Sep-17 11-Sep-17 (5) (2,677) 11-Sep-17 0 - 318 REPUBLIC SERVICES 25-May-18 640 640 Direct Depo 1-Jun-18 30-Jun-18 15-Jun-18 19-Jun-18 4 2,559 19-Jun-18 0 - 319 Rice, Thomas C (Craig) 26-Apr-18 798 668 Direct Depo 22-Mar-18 25-Apr-18 8-Apr-18 30-Apr-18 22 14,705 30-Apr-18 0 - 320 RICKS ELECTRIC INC 31-Jan-18 151 151 Direct Depo 31-Jan-18 31-Jan-18 31-Jan-18 5-Mar-18 33 4,990 5-Mar-18 0 - 321 RICOH USA INC 15-May-17 3,042 3,042 CHECK 1-Apr-18 30-Apr-18 15-Apr-18 14-Jul-17 (276) (839,504) 19-Jul-17 5 15,208 322 RICOH USA INC 7-Mar-18 6,132 1,618 CHECK 1-Feb-18 31-Mar-18 2-Mar-18 2-Apr-18 31 50,156 12-Apr-18 10 16,180 323 SALT RIVER ELECTRIC COOP CORP 8-Jun-18 47 47 CHECK 4-May-18 5-Jun-18 20-May-18 15-Jun-18 26 1,211 25-Jun-18 10 466
Page 6 of 8

EXHIBIT ATO-1 Lead Lag Study
Atmos Energy Corporation-Kentucky CWC WP 5-1Other O&M Payment and Check Clearing Lag For the CWC Study Test Year Ended June 30, 2018
Midpoint Weighted Weighted Line Invoice Invoice Division 009 Payment Service Period Service Date Payment Payment Date Clearing ClearingNo. Vendor Date Amount Amount Type From To Service Paid lag Lag Cleared Lag Lag324 SCOTT GROSS COMPANY INC 31-Mar-17 1 1 Direct Depo 31-Mar-17 31-Mar-17 31-Mar-17 3-Nov-17 217 245 3-Nov-17 0 - 325 SCOTT WASTE SERVICES INC 27-Jul-17 191 191 CHECK 1-Jul-17 31-Jul-17 16-Jul-17 21-Aug-17 36 6,869 29-Aug-17 8 1,526 326 SCOTT WASTE SERVICES INC 1-May-18 179 179 CHECK 1-Apr-18 30-Apr-18 15-Apr-18 29-May-18 44 7,868 15-Jun-18 17 3,040 327 SENSIT TECHNOLOGIES 15-Aug-17 82 82 Direct Depo 15-Aug-17 15-Aug-17 15-Aug-17 25-Aug-17 10 824 25-Aug-17 0 - 328 SENSIT TECHNOLOGIES 21-Dec-17 156 156 Direct Depo 21-Dec-17 21-Dec-17 21-Dec-17 10-Jan-18 20 3,121 10-Jan-18 0 - 329 SENSIT TECHNOLOGIES 30-Apr-18 889 889 Direct Depo 30-Apr-18 30-Apr-18 30-Apr-18 10-May-18 10 8,893 10-May-18 0 - 330 SENSIT TECHNOLOGIES 21-May-18 571 571 Direct Depo 21-May-18 21-May-18 21-May-18 1-Jun-18 11 6,277 1-Jun-18 0 - 331 SHELBYVILLE MUNICIPAL WATER 27-Apr-18 90 96 CHECK 14-Mar-18 12-Apr-18 28-Mar-18 9-May-18 42 4,014 16-May-18 7 669 332 Sherfey, Chris L 23-Apr-18 696 696 Direct Depo 16-Apr-18 19-Apr-18 17-Apr-18 27-Apr-18 10 6,963 27-Apr-18 0 - 333 SMYTH COUNTY SHERRIFF CALENDAR 20-Dec-17 550 550 CHECK 20-Dec-17 20-Dec-17 20-Dec-17 26-Jan-18 37 20,350 13-Feb-18 18 9,900 334 SOUTHEAST DAVIESS CO WATER DIST 29-Dec-17 4 2 CHECK 6-Nov-17 6-Dec-17 21-Nov-17 5-Jan-18 45 87 17-Jan-18 12 23 335 SOUTHEAST DAVIESS CO WATER DIST 31-Jan-18 128 64 CHECK 6-Dec-17 6-Jan-18 21-Dec-17 9-Feb-18 50 3,208 21-Feb-18 12 770 336 SPRINT INC 25-Jun-17 4,694 26 Direct Depo 3-Apr-18 24-Jun-18 14-May-18 5-Jul-17 (313) (8,025) 5-Jul-17 0 - 337 STYLES BY JOE - JOES CLEANING SER 1-May-17 590 590 Direct Depo 1-Apr-17 30-Apr-17 15-Apr-17 25-Sep-17 163 96,170 25-Sep-17 0 - 338 STYLES BY JOE - JOES CLEANING SER 1-Jun-17 590 590 Direct Depo 1-May-17 31-May-17 16-May-17 25-Sep-17 132 77,880 25-Sep-17 0 - 339 STYLES BY JOE - JOES CLEANING SER 1-Dec-17 590 590 CHECK 1-Nov-17 30-Nov-17 15-Nov-17 27-Dec-17 42 24,780 3-Jan-18 7 4,130 340 SUBLETT-BUNTON MYRA 16-Apr-18 800 800 CHECK 16-Mar-18 15-Apr-18 31-Mar-18 23-Apr-18 23 18,400 30-Apr-18 7 5,600 341 SWAGELOK INDIANA 20-Nov-17 268 268 CHECK 17-Nov-17 17-Nov-17 17-Nov-17 15-Dec-17 28 7,516 4-Jan-18 20 5,369 342 Taylor, Brannon C 16-Feb-18 802 802 Direct Depo 7-Mar-18 8-Mar-18 7-Mar-18 20-Feb-18 (16) (12,840) 20-Feb-18 0 - 343 TERRYS APPLIANCE REPAIR 19-Jan-18 79 79 CHECK 19-Jan-18 19-Jan-18 19-Jan-18 21-Mar-18 61 4,819 9-Apr-18 19 1,501 344 TIME WARNER CABLE 1-Feb-18 14,660 260 CHECK 1-Feb-18 28-Feb-18 14-Feb-18 28-Feb-18 14 3,640 8-Mar-18 8 2,080 345 TIME WARNER CABLE 6-Oct-17 277 277 CHECK 6-Oct-17 5-Nov-17 21-Oct-17 10-Nov-17 20 5,540 21-Nov-17 11 3,047 346 Tolbert, Ryan K 28-Sep-17 38 38 Direct Depo 28-Sep-17 28-Sep-17 28-Sep-17 2-Oct-17 4 152 2-Oct-17 0 - 347 Tolbert, Ryan K 1-May-18 16 16 Direct Depo 1-May-18 1-May-18 1-May-18 4-May-18 3 49 4-May-18 0 - 348 TRIPLE T FARMS 4-Jun-18 616 653 CHECK 4-Jun-18 4-Jun-18 4-Jun-18 11-Jun-18 7 4,571 21-Jun-18 10 6,530 349 Upton, Dalton C 1-Sep-17 462 462 Direct Depo 21-Aug-17 24-Aug-17 22-Aug-17 11-Sep-17 20 9,240 11-Sep-17 0 - 350 Upton, Dalton C 1-Sep-17 25 25 Direct Depo 21-Aug-17 21-Aug-17 21-Aug-17 11-Sep-17 21 525 11-Sep-17 0 - 351 Upton, Dalton C 16-Dec-17 1,290 1,224 Direct Depo 30-Oct-17 15-Dec-17 22-Nov-17 3-Jan-18 42 51,393 3-Jan-18 0 - 352 Upton, Dalton C 27-Jan-18 379 356 Direct Depo 19-Jan-18 26-Jan-18 22-Jan-18 30-Jan-18 8 2,846 30-Jan-18 0 - 353 VERIZON WIRELESS 22-Feb-18 239 178 CHECK 23-Feb-18 22-Mar-18 8-Mar-18 9-Mar-18 1 178 15-Mar-18 6 1,065 354 VERIZON WIRELESS 9-Jan-18 12,218 591 CHECK 10-Dec-17 9-Jan-18 25-Dec-17 2-Feb-18 39 23,061 8-Feb-18 6 3,548 355 VERIZON WIRELESS 9-Sep-17 12,783 623 CHECK 10-Aug-17 9-Sep-17 25-Aug-17 2-Oct-17 38 23,691 6-Oct-17 4 2,494 356 VERMEER OF INDIANA INC 30-Nov-17 2,636 2,636 CHECK 8-Nov-17 30-Nov-17 19-Nov-17 24-Jan-18 66 174,004 30-Jan-18 6 15,819 357 VF IMAGEWEAR INC 16-Oct-17 234 234 Direct Depo 16-Oct-17 16-Oct-17 16-Oct-17 10-Nov-17 25 5,850 10-Nov-17 0 - 358 VF IMAGEWEAR INC 24-Oct-17 362 362 Direct Depo 24-Oct-17 24-Oct-17 24-Oct-17 29-Nov-17 36 13,033 29-Nov-17 0 - 359 VF IMAGEWEAR INC 24-Oct-17 374 374 Direct Depo 24-Oct-17 24-Oct-17 24-Oct-17 30-Nov-17 37 13,856 30-Nov-17 0 - 360 VF IMAGEWEAR INC 26-Oct-17 449 449 Direct Depo 26-Oct-17 26-Oct-17 26-Oct-17 30-Nov-17 35 15,730 30-Nov-17 0 - 361 VF IMAGEWEAR INC 11-Nov-17 379 379 Direct Depo 11-Nov-17 11-Nov-17 11-Nov-17 12-Dec-17 31 11,740 12-Dec-17 0 - 362 VF IMAGEWEAR INC 13-Mar-18 128 128 Direct Depo 13-Mar-18 13-Mar-18 13-Mar-18 10-Apr-18 28 3,578 10-Apr-18 0 - 363 VF IMAGEWEAR INC 9-Apr-18 225 225 Direct Depo 9-Apr-18 9-Apr-18 9-Apr-18 4-May-18 25 5,626 4-May-18 0 - 364 Waller, Gregory K (Greg) 26-Mar-18 1,403 1,403 Direct Depo 7-Mar-18 23-Mar-18 15-Mar-18 2-Apr-18 18 25,253 2-Apr-18 0 - 365 WARREN COUNTY WATER DISTRICT 21-Mar-18 67 67 CHECK 12-Feb-18 13-Mar-18 26-Feb-18 4-Apr-18 37 2,466 11-Apr-18 7 467 366 WARREN COUNTY WATER DISTRICT 23-Apr-18 67 71 CHECK 13-Mar-18 10-Apr-18 27-Mar-18 7-May-18 41 2,897 15-May-18 8 565 367 WARREN RURAL ELECTRIC COOP 22-Nov-17 22 22 CHECK 17-Oct-17 15-Nov-17 31-Oct-17 1-Dec-17 31 690 11-Dec-17 10 223 368 WARREN RURAL ELECTRIC COOP 6-Jun-18 28 28 CHECK 27-Apr-18 29-May-18 13-May-18 13-Jun-18 31 872 19-Jun-18 6 169 369 WARREN RURAL ELECTRIC COOP 6-Jun-18 26 26 CHECK 27-Apr-18 29-May-18 13-May-18 13-Jun-18 31 792 19-Jun-18 6 153 370 WARREN RURAL ELECTRIC COOP 6-Nov-17 24 24 CHECK 28-Sep-17 27-Oct-17 12-Oct-17 17-Nov-17 36 868 28-Nov-17 11 265 371 WARREN RURAL ELECTRIC COOP 5-Dec-17 26 26 CHECK 27-Oct-17 28-Nov-17 12-Nov-17 18-Dec-17 36 921 28-Dec-17 10 256 372 WARREN RURAL ELECTRIC COOP 21-Jun-17 23 23 CHECK 22-May-17 21-Jun-17 6-Jun-17 10-Jul-17 34 792 17-Jul-17 7 163 373 WARREN RURAL ELECTRIC COOP 8-Mar-18 23 23 CHECK 30-Jan-18 28-Feb-18 13-Feb-18 23-Mar-18 38 885 30-Mar-18 7 163 374 WELDQUIP INC 28-Feb-18 152 152 Direct Depo 1-Feb-18 28-Feb-18 14-Feb-18 24-May-18 99 15,089 24-May-18 0 - 375 Wessinger, Marcie L 17-Nov-17 1,753 594 Direct Depo 13-Oct-17 17-Nov-17 30-Oct-17 21-Nov-17 22 13,066 21-Nov-17 0 - 376 WEST KENTUCKY RURAL ELECTRIC 12-Apr-18 41 41 CHECK 11-Apr-18 12-May-18 26-Apr-18 2-May-18 6 245 9-May-18 7 286 377 WESTERFIELD ELECTRIC LLC 7-Feb-18 145 145 CHECK 2-Feb-18 2-Feb-18 2-Feb-18 26-Feb-18 24 3,480 7-Mar-18 9 1,305
Page 7 of 8

EXHIBIT ATO-1 Lead Lag Study
Atmos Energy Corporation-Kentucky CWC WP 5-1Other O&M Payment and Check Clearing Lag For the CWC Study Test Year Ended June 30, 2018
Midpoint Weighted Weighted Line Invoice Invoice Division 009 Payment Service Period Service Date Payment Payment Date Clearing ClearingNo. Vendor Date Amount Amount Type From To Service Paid lag Lag Cleared Lag Lag378 WHITE GLOVE INSPECTION INC 22-Dec-17 3,124 3,124 CHECK 1-Dec-17 22-Dec-17 11-Dec-17 29-Dec-17 18 56,232 5-Jan-18 7 21,868 379 WHITE GLOVE INSPECTION INC 23-May-18 2,674 2,674 CHECK 1-May-18 23-May-18 12-May-18 25-May-18 13 34,762 4-Jun-18 10 26,740 380 White, Dalton B Jr (Buddy) 28-Mar-18 1,729 129 Direct Depo 2-Mar-18 26-Mar-18 14-Mar-18 2-Apr-18 19 2,451 2-Apr-18 0 - 381 White, Eric M 6-Nov-17 45 45 Direct Depo 4-Nov-17 4-Nov-17 4-Nov-17 8-Nov-17 4 180 8-Nov-17 0 - 382 Williams, Gavin J 27-Sep-17 64 64 Direct Depo 26-Sep-17 26-Sep-17 26-Sep-17 2-Oct-17 6 384 2-Oct-17 0 - 383 WILSON ALLEN F 8-Jun-18 1,000 1,098 CHECK 8-Jun-18 8-Jun-18 8-Jun-18 15-Jun-18 7 7,683 25-Jun-18 10 10,975 384 WILSON HUTCHINSON POTEAT & LITTL 1-Oct-17 5,040 5,040 CHECK 1-Sep-17 30-Sep-17 15-Sep-17 27-Oct-17 42 211,676 10-Nov-17 14 70,559 385 WORLD TESTING INC 19-Jan-18 860 860 CHECK 18-Jan-18 18-Jan-18 18-Jan-18 12-Feb-18 25 21,500 21-Feb-18 9 7,740 386387 Totals Full Sample 550,968 (124,729) 1,532,991 388389 Totals with Line 152 removed 470,968 12,035,271 972,991 390391 Other O&M Payment Lag Days: (0.23) 2.78
Page 8 of 8

EXHIBIT ATO-1 Lead Lag Study
Atmos Energy Corporation-Kentucky CWC WP 5-2Other O&M Payment and Check Clearing Lag For the CWC Study Test Year Ended June 30, 2018
Midpoint Weighted Weighted Line Invoice Invoice Division 009 Payment Service Period Service Date Payment Payment Date Clearing ClearingNo. Vendor Date Amount Amount Type From To Service Paid lag Lag Cleared Lag Lag
a b c d e f g h i = i -(h or b k = (j * d) l m = (l - i) n = (m * d)1 ELEMENT FLEET 20-Jul-17 2,678,616 207,165 Direct Depo 1-Jun-17 30-Jun-17 15-Jun-17 25-Jul-17 40 8,286,596 25-Jul-17 0 - 2 ELEMENT FLEET 29-Aug-17 2,231,689 187,353 Direct Depo 1-Jul-17 31-Jul-17 16-Jul-17 31-Aug-17 46 8,618,255 31-Aug-17 0 - 3 ELEMENT FLEET 12-Sep-17 2,720,073 193,030 Direct Depo 1-Aug-17 31-Aug-17 16-Aug-17 13-Sep-17 28 5,404,832 13-Sep-17 0 - 4 ELEMENT FLEET 13-Oct-17 2,380,583 165,859 Direct Depo 1-Sep-17 30-Sep-17 15-Sep-17 16-Oct-17 31 5,141,627 16-Oct-17 0 - 5 ELEMENT FLEET 5-Nov-17 2,485,115 159,550 Direct Depo 1-Oct-17 31-Oct-17 16-Oct-17 8-Nov-17 23 3,669,651 8-Nov-17 0 - 6 ELEMENT FLEET 5-Dec-17 2,401,501 185,579 Direct Depo 1-Nov-17 30-Nov-17 15-Nov-17 7-Dec-17 22 4,082,729 7-Dec-17 0 - 7 ELEMENT FLEET 8-Jan-18 2,727,135 185,882 Direct Depo 1-Dec-17 31-Dec-17 16-Dec-17 9-Jan-18 24 4,461,178 9-Jan-18 0 - 8 ELEMENT FLEET 5-Feb-18 2,311,843 169,427 Direct Depo 1-Jan-18 31-Jan-18 16-Jan-18 6-Feb-18 21 3,557,976 6-Feb-18 0 - 9 ELEMENT FLEET 5-Mar-18 3,003,111 198,664 Direct Depo 1-Feb-18 28-Feb-18 14-Feb-18 7-Mar-18 21 4,171,953 7-Mar-18 0 -
10 ELEMENT FLEET 6-Apr-18 2,711,495 201,477 Direct Depo 1-Mar-18 31-Mar-18 16-Mar-18 10-Apr-18 25 5,036,919 10-Apr-18 0 - 11 ELEMENT FLEET 7-May-18 2,771,695 235,340 Direct Depo 1-Apr-18 30-Apr-18 15-Apr-18 8-May-18 23 5,412,829 8-May-18 0 - 12 ELEMENT FLEET 8-Jun-18 2,800,102 200,752 Direct Depo 1-May-18 31-May-18 16-May-18 11-Jun-18 26 5,219,557 11-Jun-18 0 - 1314 2,290,079 63,064,102 - 1516 Total Normalized Other O&M 17,898,824 Other O&M Payment Lag Days: 27.54 0.001718 Element Fleet Percent of Total 12.79%1920 O&M Sample Excluding Element Fleet 480,4742122 O&M Sample with Element Fleet at percent of total from above 550,9682324 Adjusted Element Fleet amount in sample 70,494
Page 1 of 1

EXHIBIT ATO-1 Lead Lag Study
ATO-CWC6
Taxes Other Than Income Taxes
WeightedLine As Adjusted Lag LagNo. Description $ Amount Days Days
(a) (b) ( c) (d)
1 Payroll Taxes:2 FICA - Paid on the day before each payday: 0 13.0 - 34 Federal Unemployment - Paid quarterly in arrears at the5 end of the month following each quarter plus payroll service lag: 0 83.6 - 67 State Unemployment - Paid quarterly in arrears at the end8 end of the month following each quarter plus payroll service lag: 355,960 83.6 83.63 9
10 Total Payroll Taxes 355,960 83.631112 Division Ad Valorem - Previous calendar year taxes are paid13 45 days after billed for state agencies and 30 days after14 billed for local agencies 305.641516 Shared Services Ad Valorem - Previous calendar year17 taxes are paid by January 31 of the current calendar year 213.501819 Taxes property and other 60.372021 Franchise and Other Pass Through Taxes 38.522223 Public Service Commission Assessment24 Assessment are prepaid to the Commission annually and25 are included in prepayments in rate base 0.002627 DOT - Payment for the pipeline safety user fee for the28 current fiscal year is due by May 30th 59.00
Atmos Energy Corporation-Kentucky
For the CWC Study Test Year Ended June 30, 2018
Page 1 of 1

EXHIBIT ATO-1 Lead Lag Study
Atmos Energy Corporation-Kentucky ATO-CWC7Federal Income Taxes
Line Due Begin End Lead/Lag WeightedNo. Date Test Period Test Period Midpoint Weight Days Lead/Lag Days
(a) ( c) (d) (e) (f) (g)
1 Federal Income Tax Payments:2 September 15, 2017 7/1/2017 6/30/2018 182.50 25.00% (106.50) (26.63)3 December 15, 2017 7/1/2017 6/30/2018 182.50 25.00% (15.50) (3.88)4 March 15, 2018 7/1/2017 6/30/2018 182.50 25.00% 74.50 18.635 June 15, 2018 7/1/2017 6/30/2018 182.50 25.00% 166.50 41.6367 100.00% 29.75
For the CWC Study Test Year Ended June 30, 2018
Page 1 of 1

EXHIBIT ATO-1 Lead Lag Study
Atmos Energy Corporation-Kentucky ATO-CWC8 State Income Taxes
Line Begin End Lead/Lag WeightedNo. Due Date Test PeriodTest Period Midpoint Weight Days Lead/Lag Days
(a) (b) ( c) (d) (e) (f) (g)
1 State Income Tax Payments:2 September 15, 2017 7/1/2017 6/30/2018 182.50 25.00% (106.50) (26.63)3 December 15, 2017 7/1/2017 6/30/2018 182.50 25.00% (15.50) (3.88)4 March 15, 2018 7/1/2017 6/30/2018 182.50 25.00% 74.50 18.635 June 15, 2018 7/1/2017 6/30/2018 182.50 25.00% 166.50 41.6367 100.00% 29.75
For the CWC Study Test Year Ended June 30, 2018
Page 1 of 1

EXHIBIT ATO-1 Lead Lag Study
ATO-CWC9 Atmos Energy Corporation-Kentucky
Long Term Debt
Atmos Consolidated Balances
Line Lead/Lag Annual % of Weighted
No. Lender Maturity Type of Payment Pymt 1 Pymt 2 Pymt 3 Pymt 4 Pymt 5 Pymt 6 Pymt 7 Pymt 8 Pymt 9 Pymt 10 Pymt 11 Pymt 12 Days Interest Total Interest $
(a) (b)
1 MTN 1995-1 12/31/2025 SEMI ANNUAL 12/15/2017 6/15/2018 91.25 667,000$ 0.44% 0.40
2 Debentures 07/15/28 SEMI ANNUAL 7/16/2017 1/16/2018 91.25 10,125,000$ 6.62% 6.04
3 SrNote 5.95% 10/15/34 SEMI ANNUAL 10/16/2017 4/16/2018 91.25 11,900,000$ 7.78% 7.10
4 SrNote 3.00% 06/15/2027 SEMI ANNUAL 12/15/2017 6/15/2018 91.25 15,291,667$ 9.99% 9.12
5 SrNote 8.50% 3/15/2019 SEMI ANNUAL 9/15/2017 3/15/2018 91.25 38,250,000$ 25.00% 22.81
6 Sr Note 5.50% 06/15/2041 SEMI ANNUAL 12/15/2017 6/15/2018 91.25 22,000,000$ 14.38% 13.12
7 SrNote 4.15% 1/15/2043 SEMI ANNUAL 7/17/2017 1/16/2018 91.25 20,750,000$ 13.56% 12.37
8 SrNote 4.125% 10/15/2044 SEMI ANNUAL 10/16/2017 4/16/2018 91.25 30,937,500$ 20.22% 18.45
9 LTD Term Loan Varied 09/22/2019 MONTHLY 7/31/2017 8/31/2017 9/29/2017 10/31/2017 11/30/2017 12/29/2017 1/31/2018 2/28/2018 3/29/2018 4/30/2018 5/31/2018 6/29/2018 30.42 3,084,792$ 2.02% 0.61
10
11 WEIGHTED AVERAGE LEAD DAYS OF LONG TERM DEBT EXPENSE 153,005,958$ 100.00% 90.02
For the CWC Study Test Year Ended June 30, 2018
Page 1 of 1

Direct Testimony of Laura K. Gillham Page 1 Kentucky / Gillham
BEFORE THE PUBLIC SERVICE COMMISSION
COMMONWEALTH OF KENTUCKY
APPLICATION OF ATMOS ENERGY ) ) CORPORATION FOR AN ADJUSTMENT ) Case No. 2018-00281 ) OF RATES AND TARIFF MODIFICATIONS )
TESTIMONY OF LAURA K. GILLHAM
I. POSITION AND QUALIFICATIONS 1
Q. PLEASE STATE YOUR NAME AND BUSINESS ADDRESS. 2
A. My name is Laura K. Gillham. My business address is 5430 LBJ Freeway, Suite 3
600, Dallas, Texas 75240. 4
Q. BY WHOM ARE YOU EMPLOYED AND IN WHAT CAPACITY? 5
A. I am the Director of Accounting Services for Atmos Energy Corporation (hereinafter 6
“Atmos Energy” or the “Company”). 7
Q. WHAT ARE YOUR JOB RESPONSIBILITIES? 8
A. I am primarily responsible for directing various accounting activities and policies 9
within the Company. My main duties include the oversight of general accounting, 10
fixed assets accounting, payroll, and cost allocations. I also serve on an internal 11
committee which is responsible for the oversight and monitoring of Sarbanes-Oxley 12
(SOX) compliance. In addition, I work with both our internal and external auditors 13
on implementing, testing, maintaining and modifying the Company’s accounting 14
controls, as well as interfacing between the auditors and the Company. 15

Direct Testimony of Laura K. Gillham Page 2 Kentucky / Gillham
I am also responsible for ensuring effective financial and internal controls for 1
the Company’s accounting processes, system and procedures. I have knowledge of 2
the Company’s accounting activities, which include compiling, processing, reporting 3
and analyzing financial information to satisfy the requirements of internal 4
management, internal independent auditors, external independent auditors and 5
regulatory agencies. 6
Q. PLEASE DESCRIBE YOUR EDUCATIONAL BACKGROUND AND 7
PROFESSIONAL EXPERIENCE. 8
A. I earned a Bachelor of Business Administration degree in Accounting and Finance 9
from Texas Christian University in 2007. I also earned a Master of Accounting 10
degree from Texas Christian University in 2008. 11
Before joining Atmos Energy, I worked in public accounting at 12
PricewaterhouseCoopers, LLP for approximately nine years, serving clients across 13
multiple industries. I joined Atmos Energy in May 2017 as the Manager of Financial 14
Reporting and assumed the role of Director of Accounting Services in August 2017. 15
Since assuming the role of the Director of Accounting Services, I have worked to 16
maintain the Company’s Cost Allocation Manual (“CAM”) to ensure it was aligned 17
with Atmos Energy’s recordkeeping practices. 18
Q. ARE YOU A MEMBER OF ANY PROFESSIONAL ORGANIZATIONS? 19
A. Yes. I am licensed by the State of Texas as a Certified Public Accountant (“CPA”).20

Direct Testimony of Laura K. Gillham Page 3 Kentucky / Gillham
Q. HAVE YOU PREVIOUSLY TESTIFIED BEFORE THE KENTUCKY PUBLIC 1
SERVICE COMMISSION OR OTHER REGULATORY ENTITIES? 2
A. Yes, I have testified before the Kentucky Public Service Commission in Case No. 3
2017-00349. I have also submitted testimony to the Virginia State Corporation 4
Commission in Case No. PUR-2018-00014. 5
II. PURPOSE OF TESTIMONY 6
Q. WHAT IS THE PURPOSE OF YOUR TESTIMONY? 7
A. The purpose of my testimony is to authenticate the historical books and records of 8
the Company and demonstrate the integrity of the financial information that has been 9
filed in this case. I am also providing testimony concerning the CAM which 10
describes the methodology for shared services cost allocations. 11
Q. ARE YOU SPONSORING ANY OF THE FILING REQUIREMENT IN 12
THIS CASE, AND, IF SO WHICH REQUIREMENTS? 13
A. Yes, I am sponsoring the following specific filing requirements of Section 16 of 807 14
K.A.R. 5:001: 15
FR 16(7)(k) Most recent FERC Form 1 (electric), FERC Form 2, or the 16
Automated Reporting Management Information System 17
Report (telephone) and PSC Form T (telephone); 18
FR 16(7)(l) The annual report to shareholders or members and the 19
statistical supplements covering the most recent two (2) years 20
from the application filing date; 21
FR 16(7)(m) Current chart of accounts if more detailed than Uniform 22
System of Accounts chart; 23

Direct Testimony of Laura K. Gillham Page 4 Kentucky / Gillham
FR 16(7)(p) SEC’s annual report for most recent 2 years, Form 10-Ks 1
and any Form 8-Ks issued during prior 2 years and any 2
Form 10-Qs issued during past 6 quarters; 3
FR 16(7)(q) Independent auditors annual opinion report, with any written 4
communication which indicates the existence of a material 5
weakness in internal controls; and 6
FR 16(7)(r) Quarterly reports to stockholders for the most recent five 7
quarters. 8
FR 16(7)(u) Detailed description of method of calculation and amounts 9
allocated or charged to utility by affiliate or general or 10
home office for each allocation or payment; 11
Method and amounts allocated during base period and 12
method and estimated amounts to be allocated during 13
forecasted test period; 14
Explain how allocator for both base and forecasted test 15
period was determined; and 16
All facts relied upon, including other regulatory approval, 17
to demonstrate that each amount charged, allocated or paid 18
during base period is reasonable; 19
FR 16(8)(i) Comparative income statements, revenue and sales statistics 20
most recent five years, base period, forecast period and two 21
(2) years beyond 22
FR 16(8)(k) Comparative financial data and earnings 23

Direct Testimony of Laura K. Gillham Page 5 Kentucky / Gillham
Q. DO YOU ADOPT THESE FILING REQUIREMENTS AND MAKE THEM 1
PART OF YOUR TESTIMONY? 2
A. Yes. 3
III. AUTHENTICATION OF BOOKS AND RECORDS 4
Q. ARE THE BOOKS AND RECORDS OF THE COMPANY PREPARED 5
UNDER YOUR DIRECTION? 6
A. Yes, for the areas under my direction (which do not include gas accounting or 7
taxation). 8
Q. HOW DOES ATMOS ENERGY MAINTAIN AND UTILIZE ITS BOOKS AND 9
RECORDS IN THE REGULAR COURSE OF BUSINESS? 10
A. Atmos Energy maintains its books and records in accordance with the Federal Energy 11
Regulatory Commission’s (FERC) Uniform System of Accounts (USOA) and 12
Generally Accepted Accounting Principles (GAAP). The USOA is the prescribed 13
methodology for maintaining utility records in all of the state jurisdictions which 14
regulate the Company’s natural gas utility operations, which currently include 15
Colorado, Kansas, Kentucky, Louisiana, Mississippi, Tennessee, Texas and Virginia. 16
Atmos Energy’s accounting organization utilizes integrated computerized business 17
systems to efficiently process, record and maintain transactions generated in the 18
regular course of business. Financial transactions are created and entered into the 19
system at or near the time of the transaction by the responsible personnel in various 20
divisions having personal knowledge, or acting in reliance on information 21
transmitted by persons having personal knowledge of the transactions, as well as of 22
the applicable accounting procedures and requirements. Reports are generated by the 23

Direct Testimony of Laura K. Gillham Page 6 Kentucky / Gillham
system in the regular course of business to assist in management’s review of the 1
results of operations and to assist in the analysis of the cost data of gas operations. 2
Q. AS THE DIRECTOR OF ACCOUNTING SERVICES, HOW DO YOU 3
ASSURE YOURSELF THAT TRANSACTIONS ARE RECORDED 4
PROPERLY? 5
A. As the Director of Accounting Services, I have personal knowledge of the 6
organizational business processes and staffing in the Controllership function. The 7
Controller’s organization is staffed with highly qualified accounting managers and 8
staff, with many accounting positions filled by CPAs. The managers in the 9
organization are charged with the responsibility to inspect, review and revise, if 10
appropriate, the work of the accountants they supervise. To fill certain management 11
positions, an individual is required to have an accounting degree as well as 12
significant accounting experience. We have established and maintained controls that 13
ensure the accuracy of our books and records. These controls help identify any 14
necessary adjustments to accounting entries which are then recorded to the original 15
books and records in a timely manner. Additionally, Atmos Energy contracts with 16
KPMG LLP (“KPMG”) for internal audit services. This group periodically performs 17
reviews of those controls. 18
Q. WHAT TYPES OF REGULAR AUDITS ARE CONDUCTED TO 19
AUTHENTICATE ATMOS ENERGY’S BOOKS AND RECORDS? 20
A. Atmos Energy’s books and records are audited annually by the independent public 21
accounting firm of Ernst & Young LLP (“EY”). In addition, EY also performs 22
reviews of Atmos Energy’s quarterly financial statements. These audits and reviews 23

Direct Testimony of Laura K. Gillham Page 7 Kentucky / Gillham
are conducted in accordance with the standards of the Public Company Accounting 1
Oversight Board (United States). 2
Q. ARE THE COSTS RECORDED ON THE COMPANY’S BOOKS AND 3
RECORDS SUPPORTED BY UNDERLYING INVOICES OR OTHER 4
RECORDS? 5
A. Yes. In order for an item to be recorded in the Company’s general ledger, there must 6
be an invoice or other underlying supporting documentation. The former, for 7
example, may be in the form of a billing invoice received from a vendor. The latter, 8
for example, may be in the form of an employee’s timesheet. The manager of a 9
specific cost center or project is responsible for reviewing, coding and approving 10
invoices or other underlying supporting documentation that are charged to that 11
particular manager’s cost center or project. 12
Q. WHAT DO YOU MEAN BY COST CENTERS? 13
A. As described in the Company’s CAM, a cost center is a designation generally utilized 14
for the assignment of departmental cost responsibility and internal management 15
reporting. Employees with responsibility for these functional areas are delegated a 16
certain level of authority to conduct the business of the Company. 17
Q. HOW ARE THESE AUTHORITY LEVELS DETERMINED OR DELEGATED 18
WITHIN THE COMPANY? 19
A. The Board of Directors initially delegates authority to the chief executive officer of 20
the Company who then authorizes the controller to further delegate authority to 21
others throughout the Company as necessary. The Controller’s approval of authority 22
limits is generally based on a review of the needs and recommendations from those 23

Direct Testimony of Laura K. Gillham Page 8 Kentucky / Gillham
requesting authority limit changes. Approved authority limits are maintained in a 1
secure table within the Company’s accounting system. 2
Q. DOES THE COMPANY HAVE IN PLACE ANY PROCESS OR SYSTEM FOR 3
THE REVIEW AND VALIDATION OF INVOICES? 4
A. Yes. Most invoices are scanned into an accounts payable processing system called 5
“Markview” when they are received by the Company. Once scanned, an image of 6
the invoice is routed electronically to the appropriate cost center owner. The cost 7
center owner reviews and electronically codes and approves the invoice within the 8
established approval hierarchy. As a part of this process, the cost center owner is 9
responsible for ensuring the cost is valid, just, and reasonable. If the amount of the 10
invoice exceeds the authority limit of the initial approver, it is automatically 11
escalated through the approval hierarchy to a person with the appropriate level of 12
authority. A similar review process is performed at each level within the approval 13
hierarchy. Once final approval has been obtained, the invoice is submitted to the 14
accounts payable department for final payment. 15
Q. DOES THE COMPANY HAVE IN PLACE ANY PROCESS OR SYSTEM FOR 16
THE REVIEW AND VALIDATION OF COSTS THAT ARE NOT 17
PROCESSED THOUGH MARKVIEW? 18
A. Yes. Certain invoices and other requests for payment that are not presented as an 19
invoice are processed outside of Markview. Examples of these types of documents 20
include, but are not limited to, tax returns, contracts for certain outside services, or 21
certain wire transfer requests. The process for the review, coding and approval of 22
these costs is the same, except that the process may be manual in nature rather than 23

Direct Testimony of Laura K. Gillham Page 9 Kentucky / Gillham
electronic. The Company employee in charge of this documentation is responsible 1
for ensuring the cost is valid, just, and reasonable. Coding and approvals are 2
performed within the approval hierarchy. Once final approval has been obtained, the 3
documentation is submitted to the accounts payable department for final payment. 4
Q. ARE THERE ANY OTHER ACCOUNTING CONTROLS OR PROCESSES IN 5
PLACE TO ENSURE THE ACCURACY OF THE COMPANY’S BOOKS AND 6
RECORDS? 7
A. Yes. The Company executes a series of detective monitoring controls designed to 8
identify and explain material and/or unusual costs that have been recorded in the 9
general ledger. Occasionally, errors are found and they are typically corrected in the 10
following month’s reporting period, unless they are material. If material, these errors 11
are corrected in the current month. 12
Additionally, the Chief Executive Officer and Chief Financial Officer must 13
certify the Company’s annual and quarterly financial statements and must attest to 14
and report on the Company’s system of internal control. To facilitate this effort, the 15
Company outsources its internal audit function to KPMG to conduct tests of the 16
Company’s system of internal control. These tests are developed to ensure the 17
system of internal control has been designed effectively and that the controls are 18
functioning as designed as of the end of the Company’s fiscal year. 19
Q. PLEASE DESCRIBE THE PROCESS USED TO TEST INTERNAL 20
CONTROLS. 21
A. The Company maintains a SOX steering committee, which is responsible for the 22
oversight and monitoring of Sarbanes-Oxley compliance. This committee is 23

Direct Testimony of Laura K. Gillham Page 10 Kentucky / Gillham
comprised of myself, the Vice President and Controller, the Director of Financial 1
Reporting, the Director of Gas Accounting and Rate Administration and the Director 2
of Information Security. 3
During the first quarter of the fiscal year, the company meets with the internal 4
auditors to review our listing of key controls to assess whether changes to that list 5
should be made based upon changes in the risk profile or organization of the 6
company. A key control is defined as a control necessary to mitigate the risks and 7
ensure financial reporting is reasonable and materially correct. 8
The internal audit group will develop a testing plan based upon these key controls 9
that is reviewed and approved by the SOX steering committee. The key controls are 10
tested throughout the year. If issues arise, they are individually addressed by a 11
steering committee member who has knowledge of the affected areas. The SOX 12
steering committee meets regularly to assess the progress and review the results of 13
the testing. During this process, all findings are discussed and the steering 14
committee will determine whether the finding should be considered a control 15
deficiency, a significant deficiency or a material weakness. A control deficiency 16
exists when the design or operation of a control does not allow management or 17
employees, in the normal course of performing their assigned functions, to prevent or 18
detect misstatements on a timely basis. A significant deficiency is a deficiency, or a 19
combination of deficiencies, in internal control over financial reporting that is less 20
severe than a material weakness, yet important enough to merit attention by those 21
responsible for oversight of the company's financial reporting. A material weakness 22
is a deficiency, or a combination of deficiencies, in internal control over financial 23

Direct Testimony of Laura K. Gillham Page 11 Kentucky / Gillham
reporting, such that there is a reasonable possibility that a material misstatement of 1
the company's annual or interim financial statements will not be prevented or 2
detected on a timely basis. 3
At the end of the fiscal year, the steering committee makes recommendations 4
regarding the effectiveness of the Company’s internal control structure to be included 5
in the internal auditor’s final report to the audit committee. 6
Q. PLEASE SUMMARIZE THE RESULTS OF TESTING FOR THE MOST 7
RECENTLY COMPLETED FISCAL YEAR. 8
A. The most recent fiscal year for which results are available is fiscal 2017. A total of 9
209 key controls related to the Company’s natural gas distribution operations were 10
tested. Five control deficiencies were identified. No significant deficiencies or 11
material weaknesses were identified. Subject to the closing of the fiscal year, the five 12
deficiencies were remediated in fiscal 2018. 13
Q. ARE THESE CONTROL DEFICIENCIES THE SAME DEFICIENCIES 14
THAT WERE IDENTIFIED BEFORE THE KENTUCKY PUBLIC SERVICE 15
COMMISSION IN CASE NO. 2017-00349? 16
A. No. The deficiencies identified in fiscal 2017 are not the same deficiencies identified 17
before the Kentucky Public Service Commission in Case No. 2017-00349. 18
Q. ARE THE COMPANY’S TESTS OF INTERNAL CONTROL SUBJECT TO 19
EXAMINATION BY AN INDEPENDENT REGISTERED PUBLIC 20
ACCOUNTING FIRM? 21
A. Yes. As a publicly traded company, Atmos Energy is required to have an 22
independent registered public accounting firm audit management’s public assertions 23

Direct Testimony of Laura K. Gillham Page 12 Kentucky / Gillham
regarding the Company’s system of internal control. EY serves as the Company’s 1
independent registered public accounting firm. 2
Q. CAN YOU SUMMARIZE THE PROCESS USED BY EY TO PERFORM ITS 3
ATTEST FUNCTION? 4
A. Yes. EY will perform independent tests regarding the design of the Company’s 5
internal control function and the effectiveness of the controls as of the end of the 6
fiscal year. They will rely, in part, on the work performed by the internal auditors in 7
completing their audit procedures. Upon completion of their work, EY will issue an 8
audit report summarizing their findings, which is included in the Company’s annual 9
report on Form 10-K. 10
Q. DID EY’S MOST RECENT REPORT DIFFER FROM THE FINDINGS OF 11
MANAGEMENT? 12
A. No. EY issued an unqualified audit report for fiscal 2017 which means that they 13
agreed with management’s assertions. 14
Q. ARE THERE OTHER TYPES OF REGULAR AUDITS AND REVIEWS 15
THAT ARE CONDUCTED OF ATMOS ENERGY’S BOOKS AND 16
RECORDS? 17
A. Yes. In addition to the audit of internal control, EY also conducts an annual audit of 18
Atmos Energy’s books and records. In addition, EY performs reviews of Atmos 19
Energy’s quarterly financial statements. These audits and reviews are conducted in 20
accordance with the standards of the Public Company Accounting Oversight Board 21
(United States). 22

Direct Testimony of Laura K. Gillham Page 13 Kentucky / Gillham
Q. HOW DOES THE ACCOUNTING SYSTEM ALLOW FOR THE SEPARATE 1
RECORDING AND TRACKING OF COSTS FOR ATMOS ENERGY’S 2
UTILITY DIVISIONS? 3
A. Direct costs are charged directly to the natural gas distribution division which has 4
incurred the costs. In addition, technical and support services are provided to the 5
distribution divisions by centralized shared services departments primarily located at 6
the Atmos Energy headquarters in Dallas. These centralized functions include, but 7
are not limited to, accounting, human resources, legal, treasury, risk management, 8
etc. The costs for these shared services are allocated to the operating divisions. 9
Q. WERE THE BOOKS AND RECORDS OF THE COMPANY PROVIDED TO 10
COMPANY WITNESSES FOR UTILIZATION IN THEIR ANALYSIS FOR 11
RATEMAKING PURPOSES? 12
A. Yes. 13
IV. COST ALLOCATION MANUAL 14
Q. WHAT IS THE COST ALLOCATION MANUAL? 15
A. The Cost Allocation Manual (CAM), contained in Exhibit LKG-1, describes and 16
documents the process whereby allocations are made within the books and records of 17
the Company. These include allocations of various common expenses which are 18
incurred for the benefit of two or more of the Company’s rate divisions and are 19
therefore allocable to those rate divisions. Additionally, the CAM also describes and 20
documents the processes whereby allocations are made between Atmos Energy and 21
its affiliates and between affiliates. 22

Direct Testimony of Laura K. Gillham Page 14 Kentucky / Gillham
Q. PLEASE DESCRIBE THE HISTORY OF THE CAM. 1
A. Although the Company had been utilizing the allocation methodology described in 2
the CAM for many years prior, the CAM was formally documented in response to 3
807 K.A.R. 5:080, and was first filed with the Commission in April of 2001. Atmos 4
Energy is required to update the CAM each year. The Company has used the CAM 5
to document its allocation processes in the regular course of business since it was 6
first filed. 7
Q. ARE THE ALLOCATIONS DESCRIBED IN THE CAM USED IN EVERY 8
JURISDICTION IN WHICH ATMOS ENERGY OPERATES? 9
A. Yes. The CAM is uniformly applied in all eight states in which Atmos Energy has 10
regulated utility operations for the allocation of common costs among Atmos 11
Energy’s various operating divisions, including Kentucky. 12
Q. DOES THE CAM DESCRIBE HOW TO ALLOCATE BALANCE SHEET 13
AMOUNTS? 14
A. No. The CAM describes how to allocate expense items from Atmos Energy’s 15
income statement. Investment or balance sheet items are not allocated within Atmos 16
Energy’s books and records. Investment amounts are allocated only for ratemaking 17
purposes in the context of a rate filing or certain regulatory reports. 18
Q. IN YOUR OPINION, DOES THE COMPANY’S ALLOCATION PROCESS 19
UNIFORMLY AND CONSISTENTLY ALLOCATE COMMON OR SHARED 20
SERVICES COSTS? 21
A. Yes, the allocation process described in the CAM operates fairly and reasonably in 22
allocating those costs on a uniform basis, both as between Atmos Energy’s various 23

Direct Testimony of Laura K. Gillham Page 15 Kentucky / Gillham
operating divisions and affiliates and between the various regulatory jurisdictions in 1
which the Company operates. 2
Q. DOES THIS CONCLUDE YOUR TESTIMONY? 3
A. Yes. 4

COMMONWEALTH OF KENTUCKY
BEFORE THE PUBLIC SERVICE COMMISSION
IN THE MATTER OF RATE APPLICATION OF ATMOS ENERGY CORPORATION
) ) )
Case No. 2018-00281
CERTIFICATE AND AFFIDAVIT
The Affiant, Laura K. Gillham, being duly sworn, deposes and states that the prepared testimony attached hereto and made a pari hereof, constitutes the prepared direct testimony ofthis affiant in Case No. 2018-00281, in the Matter of the Rate Application of Atmos Energy Corporation, and that if asked the questions propounded therein, this affiant would make the answers set fmih in the attached prepared direct pre-filed testimony.
Laura K. Gillham
STATE OF -, E)(A ~
COUNTYOF_D~~~~=L~~~) ________ _
SUBSCRIBED AND SWORN to before me by Laura K. Gillham on this the~ day of September, 2018.
'"'''' A~~~f,J~~~~ MARIAS. WILSON ~f(:.A ... >~~ Notary Public, State of Texas ~~· .. ~.:"c~§ Comm . Expires 05·26-2022 ~""t""''fc:,'"' ,,,,,m,~''' Notary ID 131582768
Notary Public
My Commission Expires: s\a..s\3=06 d-.

ATMOS ENERGY CORPORATION COST ALLOCATION MANUAL
April 1, 2018
EXHIBIT LKG-1

1
TABLE OF CONTENTS Description
Page No.
2 Introduction 2 a. Corporate Structure
2-3 b. Accounting 3-7 c. Glossary of Terms 8 Capitalized overhead (general) 9 Stores overhead 10 Expenses in Shared Services – Customer Support cost centers
11-12 O&M Expenses in Shared Services – General Office cost centers 13 SSU – Customer Support taxes other than income taxes 14
15 16
SSU – General Office taxes other than income taxes SSU – Customer Support depreciation SSU – General Office depreciation
17-18 West Texas Division operating division general office O&M, depreciation and taxes other than income taxes, to rate division level
19 Colorado-Kansas Division operating division general office expenses to state regional office division level
20 Colorado-Kansas Division state regional office division level expenses to rate division levels
21-22 Kentucky/Mid-States Division operating division general office O&M, depreciation and taxes other than income taxes, to rate division level
23-24 Louisiana Division operating division general office O&M, depreciation and taxes other than income taxes, to rate division level
25-26 Mid-Tex/Atmos Pipeline – Texas Division - Intracompany Labor 27 Mid-Tex/Atmos Pipeline – Texas Division - Non Labor Expenses 28 Intercompany labor 29 Adjustments to Uncollectible Accounts Expense 30 Intra-company labor allocation – other than operating division general office labor
31-32 Other income and interest expense(All below the line accounts) 33 Gas cost between state jurisdictions for contiguous systems 34 Gas storage services between an operating division and an affiliate 35 Working capital funds management 36 Gas storage services provided between affiliates 37 Property Insurance 38 Intercompany Interest on Notes Payable 39 Appendix A 40 Corporate Organization Chart
EXHIBIT LKG-1

2
1. Introduction:
a. Corporate Structure Atmos Energy Corporation (Atmos or the Company) operates its Regulated Operations through seven operating divisions in 8 states. The seven operating divisions and their service areas are:
Division Service Area Atmos Energy Colorado-Kansas Division Colorado, Kansas Atmos Energy Kentucky/Mid-States Division Kentucky, Tennessee, Virginia Atmos Energy Louisiana Division Louisiana Atmos Energy Mid-Tex Division Texas, including the Dallas/Fort
Worth metropolitan area Atmos Energy Mississippi Division Mississippi Atmos Energy West Texas Division West Texas Atmos Pipeline – Texas Division Intrastate pipeline business in Texas
These operating divisions are not subsidiaries or separate legal entities. Therefore, by definition, they cannot be considered affiliates of Atmos. Technical and support services are provided to the operating divisions by centralized shared services departments primarily located at the Atmos headquarters in Dallas. These centralized functions currently include, but are not limited to, accounting, gas supply, human resources, information technology, legal, rates and customer support. The costs for these shared services are allocated to the operating divisions. In addition, for operating divisions that operate in more than one rate jurisdiction, costs from an operating division’s general office are allocated to separate rate divisions within the operating division. Atmos Energy Holdings, Inc. is a wholly owned subsidiary of Atmos. Atmos Energy Holdings and its various wholly owned subsidiaries are separate legal entities and are considered affiliates of Atmos. The Company’s current legal entity organization chart is contained in Appendix A. Note that the descriptions contained herein do not address tariffed services.
b. Accounting: Atmos' account coding structure enables it to capture the costs for allocable activities. Expenses, assets, and liabilities for Atmos' shared services and other operating division general office divisions are coded to applicable location codes and cost centers as necessary, and are then allocated to the appropriate rate divisions based upon the methodologies described herein. Allocations recorded in the books and records of the Company are primarily for management control purposes and may not reflect the allocation methodology used for rate making purposes. Atmos’ account coding structure is as follows:
XXX. XXXX. XXXX. XXXXX. XXXXXX. XXXX
EXHIBIT LKG-1

3
Company Cost FERC Sub- Service Future Center Account Account Area Use 3 digit 4 digit 4 digits 5 digits 6 digits 4 digits
Within the above coding structure, "Company" and "Cost Center" are primarily utilized for internal management responsibility reporting purposes for Atmos’ operating divisions. The terms "Company" and “Cost Center” are defined in the glossary beginning below. Utilization of the "Company" or "Cost Center" fields is not suitable for meaningful financial or regulatory reporting purposes. The FERC account field contains the three-digit FERC USOA account plus one extension digit which in some cases is utilized by the FERC USOA. The first three digits of the Service Area field are the primary coding utilized for cost allocations within Atmos and is generally referred to as "rate division number". This portion of the field denotes Atmos' various rate divisions as well as the Company's various shared services and operating division general office divisions. These codes are the primary source of information for regulatory reporting and rate activity. The remaining three digits represent "town" location which is utilized only for some accounts. Atmos Pipeline-Texas uses the final three digits of the service area to represent the actual storage or compressor facility; however, this is used for O&M expenses only.
c. Glossary of Terms: The following terms are defined for purposes of this document only:
Affiliate - One or more of Atmos' subsidiaries.
Below the Line - Amounts which are generally not included in an analysis of costs from which gas service rates are derived.
Company - In general terms, it refers to Atmos Energy Corporation. Within the context of the account coding string, this term represents an operating division, wholly-owned subsidiary or other legal entity controlled by Atmos.
Composite Factor - The Company's general allocation factor which is derived for each applicable area based upon the simple average of gross plant in service, average number of customers and direct operation and maintenance expenses for each applicable area.
Corporate Headquarters - The headquarters of Atmos Energy Corporation located in Dallas, Texas. Cost Centers - Account coding which denotes an area of cost responsibility. This coding is used primarily for management purposes. Customer Factor - The Company's general allocation factor which is derived based on the average number of customers of the Operating Divisions that receive allocable costs for the services provided.
EXHIBIT LKG-1

4
Direct Charges - Those charges which may originate in a shared services department or operating division general office division or a rate division which are booked directly to the applicable rate division. FERC USOA - The Uniform System of Accounts as prescribed by the Federal Energy Regulatory Commission. Municipal Jurisdiction - For Atmos' utility operations in Texas, each municipality which it serves has original jurisdiction over rates. Operating Division - An unincorporated division of Atmos Energy Corporation that contains at least one rate division that is responsible for the management of the Company's Regulated Operations. Operating divisions are not subsidiaries or separate legal entities. As such, they do not have separate equity or debt structures. Additionally, the divisions do not keep separate books and records. Operating divisions with multiple rate divisions have one operating division general office rate division in addition to rate divisions corresponding to regulatory jurisdictional areas. Operating Division General Office - Administrative offices that are located outside of shared service offices which serve as the base of operations and central office for each "operating division." Rate Division – Often referred to as an operating rate division, it denotes Atmos' regulatory jurisdictions that are defined by state and geographic boundaries. The term also denotes Atmos' various shared services and operating division general office divisions. These divisions are the primary source for regulatory reporting and rate activity for an area in which rates have been set by a regulatory authority such as the Colorado Public Utilities Commission. Rate divisions are identifiable in the Company’s account coding string. As such, costs are accumulated within the general ledger and represent the sum of direct costs plus costs allocated to the rate division. Regulated Operations – Represents the Company’s six regulated natural gas distribution operating divisions operating in 8 states and the Company’s regulated intrastate pipeline operations in the State of Texas. Service Area - The portion of the Company's account coding structure of which the first three digits denote rate division. The last three digits of this code denote "town" which is used only in certain instances. Atmos Pipeline-Texas uses the final three digits of the service area to represent the actual storage or compressor facility; however, this is used for O&M expenses only. Shared Services - The Company's functions that serve multiple rate divisions. These services include departments such as legal, billing, call center, accounting, information technology, human resources, gas supply, rates administration among others. Shared Services is comprised of Shared Services – General Office and Shared Services – Customer Support Shared Services – Customer Support – Shared Services functions that include billing, customer call center functions and customer support related services.
EXHIBIT LKG-1

5
Shared Services – General Office – Shared Services functions that include all other functions not encompassed by Shared Services – Customer Support.
The following are divisions of Atmos Energy Corporation:
Atmos Energy Colorado-Kansas Division is a regulated operating division that serves approximately 170 communities throughout Colorado and Kansas, including the cities of Olathe, Kansas, a suburb of Kansas City and Greeley, Colorado, located near Denver.
Atmos Energy Kentucky/Mid-States Division is a regulated operating division that operates Kentucky, Tennessee and Virginia. The service areas in these states are primarily rural; however, this division serves Franklin, Tennessee, and other suburban areas of Nashville.
Atmos Energy Louisiana Division is a regulated operating division that serves nearly 300 communities, including the suburban areas of New Orleans, the metropolitan area of Monroe and western Louisiana. Direct sales of natural gas to industrial customers in Louisiana, who use gas for fuel or in manufacturing processes, and sales of natural gas for vehicle fuel are exempt from regulation and are recognized in our Atmos Energy Louisiana Industrial Gas segment.
Atmos Energy Mid-Tex Division is a regulated operating division that serves approximately 550 incorporated and unincorporated communities in the north-central, eastern and western parts of Texas, including the Dallas/Fort Worth Metroplex. The governing body of each municipality we serve has original jurisdiction over all gas distribution rates, operations and services within its city limits, except with respect to sales of natural gas for vehicle fuel and agricultural use. The Railroad Commission of Texas (RRC) has exclusive appellate jurisdiction over all rate and regulatory orders and ordinances of the municipalities and exclusive original jurisdiction over rates and services to customers not located within the limits of a municipality. Atmos Energy Mississippi Division is a regulated operating division that serves about 110 communities throughout the northern half of the state, including the Jackson metropolitan area.
Atmos Energy West Texas Division is a regulated operating division that serves approximately 80 communities in West Texas, including the Amarillo, Lubbock and Midland areas. Like our Mid-Tex Division, each municipality we serve has original jurisdiction over all gas distribution rates, operations and services within its city limits, with the RRC having exclusive appellate jurisdiction over the municipalities and exclusive original jurisdiction over rates and services provided to customers not located within the limits of a municipality.
Atmos Pipeline – Texas Division is one of the largest intrastate pipeline operations in Texas with a heavy concentration in the established natural gas producing areas of central, northern and eastern Texas, extending into or near the major producing areas of the Barnett Shale, the Texas Gulf Coast and the Delaware and Val Verde Basins of West Texas. APT provides transportation and storage services to our Mid-Tex Division, other third party local distribution companies, industrial and electric generation
EXHIBIT LKG-1

6
customers, as well as marketers and producers. As part of its pipeline operations, APT manages five underground storage reservoirs in Texas.
The following are affiliates of Atmos Energy Corporation:
Blueflame Insurance Services, LTD is a wholly-owned subsidiary of Atmos Energy Corporation that was created to provide cost-effective property insurance coverage for Atmos Energy and its subsidiaries. It was chartered in Bermuda effective December 16, 2003, and became operational as of January 1, 2004. It is incorporated under Bermuda’s insurance law and regulations and is fully capitalized under the requirements of applicable Bermuda law. Atmos Energy Services, LLC was established on April 1, 2004 to provide natural gas management services to Atmos Energy’s natural gas distribution operations, other than the Mid-Tex Division. These services include aggregating and purchasing gas supply, arranging transportation and storage logistics and ultimately delivering the gas to Atmos Energy’s natural gas distribution service areas at competitive prices. AES provided these services through December 31, 2006. Effective January 1, 2007, the gas supply department within shared services began providing these services. However, AES continues to provide limited services to the natural gas distribution operations of Atmos Energy. Phoenix Gas Gathering Company is a wholly owned subsidiary of Atmos Gathering Company, LLC, and was created to develop, own and operate a non-regulated natural gas gathering system located in Kentucky. Atmos Gathering Company, LLC is a wholly owned subsidiary of Atmos Pipeline and Storage, LLC and was created to conduct our non-regulated natural gas gathering operations. Atmos Energy Holdings, Inc. is the parent company of Atmos Energy Corporation’s non-utility operations. Atmos Energy Louisiana Industrial Gas, LLC serves industrial customers in Louisiana who use gas for fuel, manufacturing and other processes. Atmos Exploration and Production, Inc. holds some insignificant Kentucky production interests which the Company succeeded to when it acquired Western Kentucky Gas Company in 1989. This subsidiary is functionally inactive as the Company does not actively engage in the exploration and production business.
Atmos Pipeline and Storage, LLC owns or has an interest in underground storage fields in Kentucky and Louisiana. The utility divisions of Atmos Energy also use these storage facilities to reduce the need to contract for additional pipeline capacity to meet customer demand during peak periods.
Atmos Power Systems, Inc. constructs gas-fired electric peaking power generating plant and associated facilities and may enter into agreements to either lease or sell these plants. Since 2001, 2 sales-type lease transactions have been executed.
EXHIBIT LKG-1

7
Egasco, LLC was, several years ago, engaged in the marketing and sale of natural gas to large-volume commercial and agricultural customers in West Texas. Egasco no longer serves any customers.
Fort Necessity Gas Storage, LLC is a wholly owned subsidiary of Atmos Pipeline and Storage, LLC, and was created in 2009 to construct and operate a non-regulated salt-cavern gas storage project in Louisiana. In March 2011, we recorded a $19.3 million charge to substantially write off our investment in Fort Necessity.
Trans Louisiana Gas Storage, Inc. owns a minority interest in a salt dome storage facility in Louisiana. This facility is used to serve utility and non-utility customers. Trans Louisiana Gas Pipeline, Inc. owns and operates an intrastate pipeline system in Louisiana. This facility is used to serve utility and non-utility customers. UCG Storage, Inc. owns certain storage field interests in Kentucky which are used to serve utility customers. WKG Storage, Inc. owns certain storage field interests in Kentucky which are used to serve utility customers.
EXHIBIT LKG-1

8
Service: Capitalized overhead (general) Description: Overhead related to capital expenditures Current Provider of Service
Shared Services Atmos Pipeline – Texas Division Louisiana Division operating division general office Kentucky/Mid-States Division operating division general office Colorado-Kansas Division operating division general office Mid-Tex Division Mississippi Division West Texas Division operating division general office
Current Use of Service
Rate divisions
Basis for allocation
Capitalized overhead costs are accumulated by operating division (and state level for multiple state divisions). Each operating division (and state) sets an application rate at the beginning of the year based on projected expenditures. As expenditures for CWIP and RWIP are recorded overhead is applied at the application rate. Periodically, the application rate is reviewed. Shared services overhead is allocated to operating divisions based on operating division capital expenditures. At the end of each quarter, the amount that has accumulated in the OH project is cleared to all eligible projects that incurred charges during that quarter, on a pro rata basis
Note: Please see the allocation of expenses from General Office to State Regional Office to Rate Division on the following pages: West Texas - 17, Colorado/Kansas - 19, Louisiana - 23
General Ledger Entries: Example Only
$1,000 (1) (1) $1,000 $1,000 (1) (1) $1,000 $600 (3)$400 (3a)
(3b) $20 $200 (2) (2) $200 (3) $600 $150 (4)(3b) $180 $450 (4a)
(5) $10 $20 (3b)
(3a) $400 $180 (3b) (4) $150 $10 (5) (4a) $450
* Cap rate = 20%** Many rate division offices exist within Mid-States in addition to Div 009.
Flow of Activity(1) Purchase Office Supplies(2) Capitalize Overhead is calculated based on cost center capitalization percentage(3) Allocating Shared Services Expenses to General Offices - 60% Allocation rate for illustration purposes only
(3a) Allocation to remaining general offices(3b) Allocate capitalization credits to business units(4) Allocating Shared Services Expenses to Rate Division Office - 25% Allocation rate for illustration purposes only
(4a) Allocation to remaining division offices(5) Allocating Shared Services Capitalization Credit to Rate Division Office - 50% Allocation rate for illustration purposes only
Acct. 922 Acct. 922 Acct. 922
General Office
Expenses Expenses Expenses Transferred Transferred Transferred
Rate Div Office Rate Div OfficeRemaining Mid States Div 009 ** Mid States Div -Remaining
Administrative Administrative Administrative
Acct. 922 Acct. 920 in Progress TransferredCost Center 1910 * Cost Center 1910 Acct. 107 Acct. 922
Expenses Administrative SSU BU 010 Administrative Transferred & General Construction Work Expenses
SSU BU 010Administrative SSU BU 010 General Office - Div 091
Accounts Payable Acct. 921 Acct. 922Acct. 131 Acct. 232 Cost Center XXXX * Cost Center XXXX
Cash
SSU BU 010SSU BU 010 Administrative
Office Supply Expenses SSU BU 010 SSU BU 010 and Expenses Transferred
EXHIBIT LKG-1

9
Service: Stores overhead Description: Overhead related to inventory warehousing is allocated to materials as
issued. Current Provider of Service
Shared Services Operating division general office
Current Use of Service
Atmos Pipeline – Texas Division West Texas Division rate divisions Louisiana Division rate divisions Kentucky/Mid-States Division rate divisions Mid-Tex Division rate division Colorado-Kansas Division rate divisions Mississippi Division rate division
Basis for allocation
Overhead costs associated with inventory items, including rent, labor and supervision are accumulated by operating division. Each operating division sets an application rate at the beginning of the year based on projected overhead and materials activity. As materials are issued from the warehouse, the overhead assigned is also allocated to the same account. Periodically, the balance in the undistributed stores overhead account is compared to the materials on hand balance and a new rate is determined. Shared Services stores overhead is allocated monthly to the operating divisions based on number of meters.
General Ledger Entries: Example Only
$100 (1) (1) $100 $100 (2) (2) $100$2 (3a) (3b) $2
(3a) $2 $2 (3b) (3a) $2 $2 (3a)
** Many rate division offices exist within Mid-States in addition to Div 009.
Flow of Activity1 Purchase Inventory - Material2 Issue Inventory to Capital Project
3a Incurring Inventory Expense3b Apply Inventory Storage Rate
Assume 2%
Undistributed PayableAcct. 163 Acct. 232
Acct. 131 Acct. 107
SSU BU 010 SSU BU 010Stores Expense Accounts
Rate Div OfficeMid States Div 009 **
SSU BU 010 SSU BU 010 Construction Work Cash Inventory in Progress
EXHIBIT LKG-1

10
Service: O&M Expenses in Shared Services – Customer Support cost centers Description: Includes all expenses for Customer Support. (Division 012)
Current Provider Of Service Current Use of Service
Shared Services West Texas Rate Divisions Mid-Tex Division Louisiana Rate Divisions Kentucky/Mid-States Rate Divisions Colorado-Kansas Rate Divisions Mississippi Division
Basis for allocation
Costs are allocated to the applicable operating division general office in total based on the average number of customers in each operating division as a percentage of the total number of customers in all of the operating divisions. From the operating division general office Divisions Customer Support charges are allocated to rate divisions using the average number of customers in each rate division.
Note: Please see the allocation of expenses from General Office to State Regional Office to Rate Division on the following pages: West Texas - 17, Colorado/Kansas - 19, Louisiana - 23
General Ledger Entries: Example Only
$1,000 (1) (1) $1,000 $1,000 (1) (1) $1,000400$ (2)600$ (2a)
(2a) 600$ (2) $400 $100 (3) (3) $100 (3a) $300$300 (3a)
* Many O&M expense accounts exist in addition to 921 that get cleared out of account 922.** Many rate division offices exist within Mid-States in addition to Div 009.
Flow of Activity(1) Purchase Office Supplies - Shared Services(2) Allocating Shared Services Expenses to General Offices - 40% Allocation rate for illustration purposes only
(2a) Allocation to remaining general offices(3) Allocating Shared Services Expenses to Rate Division Office - 25% Allocation rate for illustration purposes only
(3a) Allocation to remaining division offices
Mid States -RemainingAdministrative
Expenses Transferred
Acct. 922
SSU BU 010Administrative
Expenses Transferred
Acct. 922
General Office Rate Div Office
Transferred Transferred TransferredAcct. 922 Acct. 922 Acct. 922
Administrative Administrative Administrative Expenses Expenses Expenses
Acct. 131 Acct. 232 Cost Center XXXX
General Office Rate Div OfficeRemaining Mid States - Div 091 Mid States Div 009 **
SSU BU 010Office Supply
SSU BU 010 SSU BU 010 and Expenses *Cash Accounts Payable Acct. 921
EXHIBIT LKG-1

11
Service: O&M Expenses in Shared Services – General Office cost centers Description: Includes O&M expenses in Shared Services – General Office. (Division 002)
Current Provider Of Service Current Use of Service
Shared Services Atmos Energy Louisiana Industrial Gas, LLC Trans Louisiana Gas Pipeline WKG Storage, Inc. West Texas Division Mid-Tex Division Atmos Pipeline – Texas Division Louisiana Division Kentucky/Mid-States Division Colorado-Kansas Division Mississippi Division Trans Louisiana Gas Storage Atmos Power Systems, Inc UCG Storage, Inc. Atmos Energy Holdings, Inc.
Basis for allocation
Costs are allocated to affiliates and operating divisions based on a composite factor applied to the Shared Services departments. Shared Services departments which provide services to the Company’s affiliates utilize a composite factor which includes the affiliates. Shared Service departments that do not provide services to the Company’s affiliates utilize a composite factor which does not include the Company’s affiliates. Other allocation methods used as appropriate include, but are not limited to, composite not including affiliates or Atmos Pipeline –Texas and an Overhead rate. From each operating division general office charges are allocated to rate divisions using the composite rate for each rate division.
See page 12 for General Ledger Entries: Example Only.
EXHIBIT LKG-1

12
Note: Operating Divisions Mississippi, Mid-Tex and Atmos Pipeline – Texas have 1 rate division. There is no allocation to remaining division offices (3a). Note: Please see the allocation of expenses from General Office to State Regional Office to Rate Division on the following pages: West Texas - 17, Colorado/Kansas - 19, Louisiana - 23
General Ledger Entries: Example Only
$1,000 (1) (1) $1,000 $1,000 (1) (1) $1,000 300$ (2)700$ (2a)
(2a) 700$ (2) $300 $150 (3) (3) $150 (3a) $150$150 (3a)
* Many O&M expense accounts exist in addition to 921 that get cleared out of account 922.** Many rate division offices exist within Mid-States in addition to Div 009.
Flow of Activity(1) Purchase Office Supplies - Shared Services(2) Allocating Shared Services Expenses to General Offices - 30% Allocation rate for illustration purposes only
(2a) Allocation to remaining general offices(3) Allocating Shared Services Expenses to Rate Division Office - 50% Allocation rate for illustration purposes only
(3a) Allocation to remaining division offices
Mid States -RemainingAdministrative
Expenses Transferred
Acct. 922
SSU BU 010Administrative
Expenses Transferred
Acct. 922
General Office Rate Div Office
Transferred Transferred TransferredAcct. 922 Acct. 922 Acct. 922
Administrative Administrative Administrative Expenses Expenses Expenses
Acct. 131 Acct. 232 Cost Center XXXX
General Office Rate Div OfficeRemaining Mid States - Div 091 Mid States Div 009 **
SSU BU 010Office Supply
SSU BU 010 SSU BU 010 and Expenses *Cash Accounts Payable Acct. 921
EXHIBIT LKG-1

13
Service: SSU – Customer Support taxes other than income taxes Description: Includes all taxes other than income tax charged in Shared Services – Customer Support. Current Provider Of Services Current Use of Service
Shared Services West Texas Rate Divisions Louisiana Rate Divisions Kentucky/Mid-States Rate Divisions Mid-Tex Division Colorado-Kansas Rate Divisions Mississippi Division
Basis for allocation Costs are allocated to the applicable rate division level in total based on the average number of
customers in each operating division as a percentage of the total number of customers in all of the operating divisions. If needed number of customers in the rate divisions is used to allocate from the operating division general office to the rate divisions.
Note: Please see the allocation of expenses from General Office to State Regional Office to Rate Division on the following pages: West Texas - 17, Colorado/Kansas - 19, Louisiana - 23
General Ledger Entries: Example Only
$1,000 (1) (1) $1,000 $1,000 (1) (1) $1,000 $400 (2) (2a) $600$600 (2a)
(2) $400 $100 (3) (3) $100 (3a) $300$300 (3a)
** Many rate division offices exist in addtion to Div 009.
Flow of Activity(1) Taxes Other than Income Taxes incurred(2) Allocating Shared Services Expenses to General Offices - 40% to Mid States BU - for illustration purposes
(2a) Allocating to remaining division offices(3) Allocating Shared Services Expenses to Rate Division Office - 25% for Kentucky Rate Division Office - for illustration purposes only
(3a) Allocating Shared Services Expenses to remaining Rate Division Offices
General Office
Mid States - Remaining
Acct. 408.1 Acct. 408.1 Acct. 408.1
RemainingTaxes Other than
Income TaxesAcct. 408.1
Mid States -Div 091 Mid States -Div 009**Taxes Other than Taxes Other than Taxes Other than
Income Taxes Income Taxes Income Taxes
Acct. 131 Acct. 232 Acct. 408.1
General Office Rate Div Office Rate Div Office
SSU BU 010SSU BU 010 SSU BU 010 Taxes Other than
Cash Accounts Payable Income Taxes
EXHIBIT LKG-1

14
Service: SSU – General Office taxes other than income taxes Description: Includes all taxes other than income tax charged in Shared Services –
General Office. Current Provider Of Services Current Use of Service
Shared Services Atmos Energy Louisiana Industrial Gas, LLC Atmos Power Systems, Inc. WKG Storage, Inc. Trans Louisiana Gas Pipeline, Inc. West Texas Division Mid-Tex Division Atmos Pipeline – Texas Division Louisiana Division Kentucky/Mid-States Division Colorado-Kansas Division Mississippi Division UCG Storage, Inc. Atmos Energy Holdings, Inc.
Basis for allocation
Costs are allocated to the applicable operating divisions in total based on the Composite Factor. The Composite Factor is the simple average of three percentages: The percentage of Gross Direct Property Plant and Equipment in each operating division unit as a percentage of the total Direct Property Plant and Equipment in all of the operating divisions. The number of customers in each operating division as a percentage of the total number of customers in all of the operating divisions. The total direct O&M expense in each operating division as a percentage of the total direct O&M expense in all operating divisions. If needed, allocation from operating division general offices to rate division uses the composite rate.
See page 13 for General Ledger Entry – Example Only.
EXHIBIT LKG-1

15
Service: SSU – Customer Support depreciation Description: Includes all depreciation charged in Shared Services – Customer Support. Current Provider Of Services Current Use of Service
Shared Services West Texas Rate Divisions Louisiana Rate Divisions Kentucky/Mid-States Rate Divisions Mid-Tex Division Colorado-Kansas Rate Divisions Mississippi Division
Basis for allocation Costs are generally allocated to the applicable rate division level in total based on the average
number of customers in each operating division as a percentage of the total number of customers in all of the operating divisions. If needed number of customers in the rate divisions is used to allocated from the operating division general office to the rate divisions. Depreciation associated with the Charles K. Vaughan Center is allocated based upon square footage, number of customers and employee training usage.
Note: Please see the allocation of expenses from General Office to State Regional Office to Rate Division on the following pages: West Texas - 17, Colorado/Kansas - 19, Louisiana - 23
General Ledger Entries: Example Only
(1) $5,000 $200 (2) $5,000 (1) (2) $200$4,800 (2a) (2a) $4,800
** Many rate division offices exist in addtion to Div 009.
Flow of Activity(1) Monthly Depreciation Expense is booked through Powerplant and interfaces with the Oracle general ledger.(2) Current Month Depreciation Expense is allocated to the various utility rate divisions using the following allocation factors:
i. For SSU division 002 - General - Allocated using the composite factorii. For SSU division 012 - Call Center - Allocated using the customer factor.
(2a) Allocation to remaining Rate Divisions
Acct. 403 Acct. 108 Acct. 403
Rate Div OfficeSSU BU 010 SSU BU 010 Mid States -Div 009**
Depreciation Exp Depreciation Exp Depreciation Exp
EXHIBIT LKG-1

16
Service: SSU – General Office depreciation Description: Includes all depreciation charged in Shared Services – General Office. Current Provider Of Services Current Use of Service
Shared Services Atmos Energy Louisiana Industrial Gas, LLC WKG Storage, Inc. Trans Louisiana Gas Pipeline, Inc. West Texas Division Mid-Tex Division Atmos Pipeline – Texas Division Louisiana Division Kentucky/Mid-States Division Colorado-Kansas Division Mississippi Division UCG Storage, Inc. Atmos Energy Holdings, Inc.
Basis for allocation
Costs are generally allocated to the applicable operating divisions in total based on the Composite Factor. The Composite Factor is the simple average of three percentages:
(1) The percentage of Gross Direct Property Plant and Equipment in each operating division unit as a percentage of the total Direct Property Plant and Equipment in all of the operating divisions.
(2) The number of customers in each operating division as a percentage
of the total number of customers in all of the operating divisions.
(3) The total direct O&M expense in each operating division as a percentage of the total direct O&M expense in all operating divisions.
If needed, allocation from operating division general offices to rate division uses the composite rate. The depreciation allocation for the Greenville Data Center is based upon the Composite Factor and square footage percent by business unit. The depreciation allocation for SSU General Office (Div 002) assets that support the enterprise excluding our Atmos Pipeline – Texas (APT) Division are based on a composite factor that excludes APT. This rate is referred to as AEAM. The depreciation allocation for our Aligne billing system assets are based upon invoiced volumes per business unit as a percentage of total volumes. Currently, only the Mid-Tex, APT and AELIG business units use this rate.
See page 15 for General Ledger Entry – Example Only.
EXHIBIT LKG-1

17
Service:
West Texas Division operating division general office O&M, depreciation and taxes other than income taxes, to rate division level
Description: Allocation of operating division general office expenses to rate division levels
Current Provider of Service
West Texas Division operating division general office
Current Use of Service
West Texas Division rate divisions
Basis for allocation
Costs are allocated to the applicable operating divisions in total based on the Composite Factor. The Composite Factor is the simple average of three percentages:
(1) The percentage of Gross Direct Property Plant and Equipment in each division as a percentage of the total Direct Property Plant and Equipment in the West Texas Division rate divisions.
(2) The number of customers in each rate division as a percentage of the total number of customers in the West Texas Division rate divisions.
(3) The total direct O&M expense in each municipal rate division as a percentage of the total direct O&M expense in the West Texas Division rate divisions.
See Page 18 for General Ledger Entries: Example Only.
EXHIBIT LKG-1

18
General Ledger Entries: Example Only
$500 (1) (1) $500 $500 (1) (1) $500 $400 (5) (5) $400 $400 (5)
$200 (2) (2) $200 (2a) $300 $300 (2a)
(3) $100 $15 (4) $100 (3) (4) $15 $85 (4a)
(5) $400 $100 (6) (6) 100$ (4a) $85 $300 (6a) (6a) $300
* Many O&M expense accounts exist in addition to 921 that get cleared out of account 922.** Many rate division offices exist in addition to Div 020.
Flow of Activity (1) Purchase Office Supplies - West Texas Division General Office(2) Allocating General Office Expenses to Rate Division Office - 40% Allocation rate for illustration purposes only
(2a) Allocation to remaining division offices(3) Monthly Depreciation Expense is booked through Powerplant and interfaces with the Oracle general ledger.(4) Allocation from Division 010 - West Texas General Office to West Texas Rate Divisions
(4a) Allocation to remaining division offices(5) Taxes Other than Income Taxes incurred(6) Allocating General Office Expenses to Rate Division Office - 25% to West Texas Rate Division Office - for illustration purposes only
(6a) Allocation to remaining division offices
Acct. 408.1 and 403
Transferred Acct. 922
Rate Div Office West Texas -Remaining
Taxes Other and Depreciation
Rate Div Office West Texas -Remaining
Administrative Expenses
Taxes Other than Taxes Other thanIncome Taxes Income Taxes
Acct. 408.1 Acct. 408.1
Acct. 403 Acct. 108 Acct. 403
General Office Rate Div OfficeWest Texas - Div 010 West Texas Div 020**
General Office Rate Div Office West Texas - Div 010 West Texas - Div 010 West Texas Div 020**
Depreciation Exp Accumulated Depreciation Depreciation Exp
Expenses Expenses Transferred Transferred
Acct. 922 Acct. 922
General Office Rate Div OfficeWest Texas - Div 010 West Texas Div 020**
Administrative Administrative
Cash Accounts Payable and Expenses *Acct. 131 Acct. 232 Acct. 921
General Office General Office General Office West Texas - Div 010
SSU – Div 002 SSU – Div 002 Office Supply
EXHIBIT LKG-1

19
Service: Colorado-Kansas Division operating division general office expenses to state regional office division level.
Description: Allocation of division general office expenses to state regional office division levels.
Current Provider of Service Current Use of Service
Colorado-Kansas Division operating division general office Colorado-Kansas Operating Division state office divisions.
Basis for allocation Costs are allocated to the applicable state regional office divisions in total based on
the Composite Factor. The Composite Factor is the simple average of three percentages:
(1) The percentage of Gross Direct Property Plant and Equipment in each state as a percentage of the total Direct Property Plant and Equipment in Colorado-Kansas Division.
(2) The number of customers in each state as a percentage of the total number of customers in Colorado-Kansas Division.
(3) The total direct O&M expense in each state as a percentage of the total direct O&M expense in Colorado-Kansas Division.
General Ledger Entries: Example Only
$500(1) (1) $500 $500(1) (1) $500
$250(2) (2) $250 (2a) $250$250(2a)
* Many O&M expense accounts exist in addition to 921 that get cleared out of account 922.
Flow of Activity(1) Purchase Office Supplies - Colorado/Kansas Division General Office(2) Allocating General Office Expenses to State Division Office - 50% Allocation rate for illustration purposes only
(2a) Allocation to remaining state office
Transferred Transferred TransferredAcct. 922 Acct. 922 Acct. 922
Administrative Administrative Administrative Expenses Expenses Expenses
General Office State Div Office Rate Div OfficeCO/KS BU 060 CO/KS Div 031 CO/KS Div 080
Cash Accounts Payable and Expenses *Acct. 131 Acct. 232 Acct. 921
General OfficeGeneral Office General Office CO/KS BU 060
SSU – Div 002 SSU – Div 002 Office Supply
EXHIBIT LKG-1

20
Service: Colorado-Kansas Division state regional office division level expenses to rate division level
Description: Allocation of state regional office division level expenses to rate division levels.
Current Provider of Service Current Use of Service
Colorado-Kansas Division regional division office Colorado-Kansas Division rate divisions
Basis for allocation Costs are allocated to the applicable rate divisions in total based on the Composite
Factor. The Composite Factor is the simple average of three percentages:
(1) The percentage of Gross Direct Property Plant and Equipment in each state rate division as a percentage of the total Direct Property Plant and Equipment in each state.
(2) The number of customers in each state rate division as a percentage of the total number of customers in each state.
(3) The total direct O&M expense in each state rate division as a percentage of the total direct O&M expense in each state.
General Ledger Entries: Example Only
$500 (1) (1) $500 $500 (1) (1) $500
$200 (2) (2) $200 (2a) $300 $300 (2a)
* Many O&M expense accounts exist in addition to 921 that get cleared out of account 922.** Many rate division offices exist within the state in addition to Div 033.
Flow of Activity (1) Purchase Office Supplies - Colorado/Kansas State Division Office(2) Allocating State Divisoin Office Expenses to Rate Division Office - 40% Allocation rate for illustration purposes only
(2a) Allocation to remaining division offices
Transferred Acct. 922
Rate Div OfficeCO/KS - Remaining
Administrative Expenses Expenses Expenses
Transferred TransferredAcct. 922 Acct. 922
State Div Office Rate Div OfficeCO/KS BU 060 CO/KS Div 033 **
Administrative Administrative
Cash Accounts Payable and Expenses *Acct. 131 Acct. 232 Acct. 921
State Div Office General Office General Office CO/KS BU 060
SSU – Div 002 SSU – Div 002 Office Supply
EXHIBIT LKG-1

21
Service: Kentucky/Mid-States Division operating division general office O&M, depreciation and taxes other than income taxes, to rate division level
Description: Allocation of operating division general office expenses to rate division levels Current Provider Of Service Current Use of Service
Kentucky/Mid-States Division operating division general office Kentucky/Mid-States Division rate divisions
Basis for allocation
Costs are allocated to the applicable rate divisions in total based on the Composite Factor. The Composite Factor is the simple average of three percentages:
(1) The percentage of Gross Direct Property Plant and Equipment in each rate division as a percentage of the total Direct Property Plant and Equipment in Kentucky/Mid-States Division.
(2) The number of customers in each rate division as a percentage of the total number of customers in Kentucky/Mid-States Division.
(3) The total direct O&M expense in each rate division as a percentage of the total direct O&M expense in Kentucky/Mid-States Division.
See Page 22 for General Ledger Entries: Example Only.
EXHIBIT LKG-1

22
General Ledger Entries: Example Only
$500 (1) (1) $500 $500 (1) (1) $500 $400 (5) (5) $400 $400 (5)
$200 (2) (2) $200 (2a) $300 $300 (2a)
(3) $100 $15 (4) $100 (3) (4) $15 $85 (4a)
(5) $400 $100 (6) (6) 100$ (4a) $85 $300 (6a) (6a) $300
* Many O&M expense accounts exist in addition to 921 that get cleared out of account 922.** Many rate division offices exist in addition to Div 009.
Flow of Activity(1) Purchase Office Supplies - Mid States Division General Office(2) Allocating General Office Expenses to Rate Division Office - 40% Allocation rate for illustration purposes only
(2a) Allocation to remaining division offices(3) Monthly Depreciation Expense is booked through Powerplant and interfaces with the Oracle general ledger.(4) Allocation from Division 091 - Mid States General Office to Mid States Rate Divisions - Allocated using the composite factor.
(4a) Allocation to remaining division offices(5) Taxes Other than Income Taxes incurred(6) Allocating General Office Expenses to Rate Division Office - 25% to Mid States Rate Division Office - for illustration purposes only
(6a) Allocation to remaining division offices
Taxes Other and Depreciation
Acct. 408.1 and 403
Rate Div Office Mid States -Remaining
Administrative Expenses
Transferred Acct. 922
Taxes Other than Taxes Other thanIncome Taxes Income Taxes
Acct. 408.1 Acct. 408.1
Acct. 403 Acct. 108 Acct. 403
General Office Rate Div OfficeMid States - Div 091 Mid States Div 009 **
Rate Div Office Mid States -Remaining
General Office Rate Div Office Mid States - Div 091 Mid States - Div 091 Mid States Div 009 **
Depreciation Exp Accumulated Depreciation Depreciation Exp
Expenses Expenses Transferred Transferred
Acct. 922 Acct. 922
General Office Rate Div OfficeMid States - Div 091 Mid States Div 009 **
Administrative Administrative
Cash Accounts Payable and Expenses *Acct. 131 Acct. 232 Acct. 921
General Office General Office General Office Mid States - Div 091
SSU – Div 002 SSU – Div 002 Office Supply
EXHIBIT LKG-1

23
Service: Louisiana Division operating division general office O&M, depreciation and taxes other than income taxes, to rate division level
Description: Allocation of operating division general office expenses to rate division levels
Current Provider of Service
Louisiana Division operating division general office
Current Use of Service
Louisiana Division rate divisions
Basis for allocation
Costs are allocated to the applicable rate divisions in total based on the Composite Factor. The Composite Factor is the simple average of three percentages:
(1) The percentage of Gross Direct Property Plant and Equipment in each rate division as a percentage of the total Direct Property Plant and Equipment in Louisiana Division.
(2) The number of customers in each rate division as a percentage of the total number of customers in Louisiana Division.
(3) The total direct O&M expense in each rate division as a percentage of the total direct O&M expense in Louisiana Division.
See Page 24 for General Ledger Entries: Example Only.
EXHIBIT LKG-1

24
General Ledger Entries: Example Only
$500 (1) (1) $500 $500 (1) (1) $500 $400 (5) (5) $400 $400 (5)
$200 (2) (2) $200 (2a) $300 $300 (2a)
(3) $100 $15 (4) $100 (3) (4) $15 $85 (4a) (4a) $85
(5) $400.00 $100 (6) (6) 100$ (4a) $85 $300 (6a) (6a) $300
* Many O&M expense accounts exist in addition to 921 that get cleared out of account 922.
Flow of Activity (1) Purchase Office Supplies - LA Division General Office(2) Allocating General Office Expenses to Rate Division Office - 40% Allocation rate for illustration purposes only
(2a) Allocation to remaining division offices (3) Monthly Depreciation Expense is booked through Powerplant and interfaces with the Oracle general ledger. (4) Allocation from Division 107 - LA General Office to LA Rate Divisions - Allocated using the composite factor.
(4a) Allocation to remaining division offices (5) Taxes Other than Income Taxes incurred (6) Allocating General Office Expenses to Rate Division Office - 25% to LA Rate Division Office - for illustration purposes only
(6a) Allocation to remaining division offices
Taxes Other and Depreciation
Acct. 408.1 and 403
Rate Div Office LA Div 007
Administrative Expenses
Transferred Acct. 922
Taxes Other than Taxes Other thanIncome Taxes Income Taxes
Acct. 408.1 Acct. 408.1
Acct. 403 Acct. 108 Acct. 403
General Office Rate Div OfficeLA - Div 107 LA Div 007
Rate Div Office LA Div 007
General Office Rate Div Office LA - Div 107 LA - Div 107 LA Div 007
Depreciation Exp Accumulated Depreciation Depreciation Exp
Expenses Expenses Transferred Transferred
Acct. 922 Acct. 922
General Office Rate Div OfficeLA - Div 107 LA Div 007
Administrative Administrative
Cash Accounts Payable and Expenses *Acct. 131 Acct. 232 Acct. 921
General Office General Office General Office LA - Div 107
SSU – Div 002 SSU – Div 002 Office Supply
EXHIBIT LKG-1

25
Description of Relationship between Mid-Tex and Atmos Pipeline – Texas: Mid-Tex performs operations and maintenance and capital services for the Atmos Pipeline – Texas (“APT”) Division. Services are provided on an ongoing basis throughout the Mid-Tex and APT service areas. The field operations include, but are not limited to, services related to pipeline integrity, measurement, compliance work, painting, right of way mowing and reclamation, leak surveys, patrolling, regulator maintenance, fence replacements, line repairs and line replacements. Additionally, Technical and Support Services are provided to APT by centralized departments primarily located at the Mid-Tex headquarters in Dallas. These centralized functions include, but are not limited to, compliance monitoring and reporting, gas measurement, finance and human resources. APT employs outside contractor labor services and purchases materials and supplies for field operations and construction in addition to the services provided by Mid-Tex. These services and materials are direct charged to APT and are not allocated from Mid-Tex. APT employs some pipeline only personnel. This labor and the related benefit cost is primarily charged directly to APT and not allocated from Mid-Tex. Service: Mid-Tex/Atmos Pipeline – Texas Division - Intracompany Labor Description: Mid-Tex employees’ labor supporting APT operations
Current Provider Of Service Current Use of Service
Mid-Tex Atmos Pipeline – Texas
Basis for allocation
The Operational Split is calculated each fiscal year based upon budgeted non-supervisory employee labor and contract labor for the Mid-Tex and APT divisions. Mid-Tex supervisory and support employees (finance, human resources, etc) who charge time to APT generally use the operational split. Mid-Tex non-supervisory employees who charge time to APT generally record their time through the time reporting system.
EXHIBIT LKG-1

26
$1,000 (1) (1) $1,000 $1,000 (2) (2) $200
(2) $ 400
Mid-Tex BU 080
Accounts PayableAcct. 232
Mid-Tex BU 080 Construction work
In Progress Acct. 107
Cost Center 4XXX
SSU – Div 002 SSU – Div 002
Acct. 131Cash
O&M Labor Acct. 853
Cost Center 4XXX
(2) $ 250
APT BU 180
(2) $150
APT BU 180 O&M Labor Acct. 853
Cost Center 9XXX
Construction work In Progress Acct. 107
Cost Center 9XXX
General Ledger Entry: Supervisory employee (Example Only)
Flow of Activity: (1) Pay Mid-Tex Supervisory employee (2) Allocate labor to Mid-Tex and APT – for illustration purposes, this employee’s time is charged 60% to Mid-Tex and 40% to APT. The APT portion is 63% capital.
$800 (1) (1) $800 $800 (2) (2) $400
Mid-Tex BU 080
Accounts PayableAcct. 232
SSU – Div 002 SSU – Div 002
Acct. 131Cash
O&M Labor Acct. 853
Cost Center 4XXX
(2) $ 100
APT BU 180
(2) $300
APT BU 180 O&M Labor Acct. 853
Cost Center 9XXX
Construction work In Progress Acct. 107
Cost Center 9XXX
General Ledger Entry: Non Supervisory employee (Example Only)
Flow of Activity: (1) Pay Mid-Tex employee labor (2) Direct charge labor to Mid-Tex and APT – for illustration purposes, this employee’s time for this payroll cycle was 50% Mid-Tex and 50% APT. The APT portion was 25% capital and 75% expense.
EXHIBIT LKG-1

27
Service: Mid-Tex/Atmos Pipeline – Texas Division - Non Labor Expenses Description: Allocation includes but is not limited to rents, heavy equipment, utilities, telecom,
transportation (vehicles), uniforms, insurance, printing and postage. Current Provider Of Service Current Use of Service
Mid-Tex Atmos Pipeline – Texas Division
Basis for allocation
Factors are primarily based on direct employee labor and contractor labor. The vehicle allocation is based on Company labor only. Allocations vary based on the cost center and sub account.
General Ledger Entries: Transportation Expense (Example Only)
$1,000 (1) (1) $1,000 $1,000 (1) (1) $1,000 $780 (2)
(3) $220 (2) $780 $220 (3)
Flow of Activity (1) $1000 in transportation expense (2) $780 is allocated from Mid-Tex O&M to APT O&M(3) A portion of the cost is capitalized, for illustration purposes only (22%)
Cost Center 9XXX Acct. 107 Acct. 853
Cost Center 4XXX
Cost Center 4XXX
Acct. 131 Acct. 232
APT BU 180 APT BU 180CWIP O&M Transportation
Mid Tex BU 080 SSU – Div 002 SSU – Div 002 O&M Transportation
Cash Accounts Payable Acct. 853
EXHIBIT LKG-1

28
Service: Intercompany labor Description: To the extent operating division employees provide labor services to an
affiliate, the labor costs for the services will be charged to the appropriate affiliate.
Current Provider of Service
Louisiana Division Colorado-Kansas Division Kentucky/Mid-States Division Mississippi Division West Texas Division
Current Use of Service
UCG Storage, Inc. Atmos Energy Louisiana Industrial Gas, LLC WKG Storage, Inc. Trans Louisiana Gas Pipeline, Inc. Trans Louisiana Gas Storage, Inc.
Basis for allocation
Labor charges are captured through direct time sheet entries and transferred to the appropriate subsidiary receiving the labor services.
General Ledger Entries: Example Only
$500 (2a) (2b) $500 (2a) $500 $500 (2b)
(1) $500 $500 (2b) (2b) $500 $500 (1)
Flow of Activity(1) Employee X is a Kentucky Employee. He worked on a special project in March for Atmos subsidiary,
AES (Atmos Energy Services). Time is captured through a direct time sheet entry.(2a) Salary is paid to employee x(2b) JE is made to relieve payable in operating division.
Intercompany Entry generated by Oracle to keep Operating Divisions in sync.
Acct. 8740
SSU BU 010Cash
Acct. 131
AES BU 301Mains & Services Exp
SSU BU 010 SSU BU 010Accounts Payable
Atmos Energy Services
Acct. 232Acct. 146Accounts Payable
A/R from Assoc Co.Acct. 146
A/R from Assoc Co.
Acct. 232
Mid States BU 050-Div 091Mid States BU 050-Div 002
EXHIBIT LKG-1

29
Service: Adjustments to Uncollectible Accounts Expense Description: Allocation of additional expense amounts booked to adjust the Provision for
Uncollectibles (Account 144) Current Provider of Service
West Texas Division rate divisions Louisiana Division rate divisions Kentucky/Mid-States Division rate divisions Colorado-Kansas Division rate divisions Mid-Tex Division rate division Mississippi Division rate division
Current Use of Service
West Texas Division rate divisions Louisiana Division rate divisions Kentucky/Mid-States Division rate divisions Colorado-Kansas Division rate divisions Mid-Tex Division rate division Mississippi Division rate division
Basis of Intra-company Allocations
Costs are allocated to the rate divisions in total based on Sales Revenue or Margin.
General Ledger Entries: Example Only
(2) 250 $ 1,000 $ (1) (1) 1,000$ 250 $ (2)
* Each rate division has a different allocation rate.
Flow of Activity (1)Monthly allocated costs. (2)Write off of uncollectible accounts as needed.
Receivable Customer Accounts -
Acct. 904
Rate DivisionCustomer Accounts
Acct. 142 sub xxxxx Uncollectible Accounts
Rate Division * Rate Division
Acct. 144 sub xxxxx
Accumulated Provision for Uncollectible Accounts
EXHIBIT LKG-1

30
Service: Intra-company labor allocation – other than operating division general office labor
Description: Certain employee activities cross multiple rate divisions within an operating
division. The costs associated with such activities include labor, benefits and associated taxes.
Current Provider of Service
Atmos Pipeline – Texas Division West Texas Division Louisiana Division Kentucky/Mid-States Division Mid-Tex Division Colorado-Kansas Division Mississippi Division
Current Use of Service
Atmos Pipeline – Texas Division West Texas Division Louisiana Division Kentucky/Mid-States Division Mid-Tex Division Colorado-Kansas Division Mississippi Division
Basis of Intra-company Allocations
Labor associated with cross-jurisdictional activities is charged to each jurisdiction based on the level of employee activity. The costs are captured either through direct time sheet entries or fixed labor distribution percentages.
General Ledger Entries: Example Only
$500 (2a) (2b) $500 (2a) $500 $500 (2b)
(1) $250 (1) $250 $500 (2b) (2b) $500 $500 (1)
Flow of Activity(1) Employee x lives in Kentucky and works 50% in Kentucky and 50% in Tennessee every month.
Time is captured through fixed labor distribution(2a) Salary is paid to employee x(2b) JE is made to relieve payable in operating division.
Intercompany Entry generated by Oracle to keep Operating Divisions in sync
Mid-States BU 050-Div 091Mains & Services Exp Mains & Services Exp A/R from Assoc Co. Accounts Payable
Acct. 8740 Acct. 8740 Acct. 146 Acct. 232
Acct. 131 Acct. 146 Acct. 232
Kentucky Division Tennessee DivisionMid-States BU 050-Div 009 Mid-States BU 050-Div 093 Mid-States BU 050-Div 002
SSU BU 010 SSU BU 010 SSU BU 010Cash A/R from Assoc Co. Accounts Payable
EXHIBIT LKG-1

31
Service: Other income and interest expense (All below the line accounts) Description: Allocation of Shared Services’ other income and interest expense (All below
the line accounts) Current Provider of Service
Shared Services
Current Use of Service
West Texas Division Louisiana Division Kentucky/Mid-States Division Mid-Tex Division Colorado-Kansas Division Mississippi Division Atmos Pipeline – Texas Division
Basis for allocation
Interest Expense, Interest Income and Other Non-Operating Income in shared services are allocated to each utility division based on the budget allocation percentages. The budget allocation is based on projected average net investment by rate division for the budget year. For this purpose, ‘net investment’ is defined as regulatory rate base + goodwill. These allocation factors are the same throughout the fiscal year. The allocation stays in the account the charge was originally booked in. Headquarter allocation of below the line accounts to rate divisions follows the same process as described above.
See page 33 for General Ledger Entries: Example Only.
EXHIBIT LKG-1

32
General Ledger Entries: Example Only
$1,000 (1) $1,000 $1,000 (1) (2) $20 $1,000 (1) $20
$2,000 (3) (3) $2,000 $2,000 (3) (3) $2,000 $40 (4) (4) $40
$3,000 (5) (5) $3,000 $3,000 (5) (5) $600 $12 (6) (6) 12$
(5) $2,400 $48 (6) (6) 48$
* Includes various accounts but cleared out of account 426.5
Flow of Activity(1) Interest and Dividend Income generated(2) Allocating Shared Services Income and Dividend Income to Div 33 only - Assume 2% allocation rate(3) Other Income and Expenses generated(4) Allocating Shared Services Other Deductions to Div 33 only - Assume 2% allocation rate(5) Interest Expense generated(6) Allocating Shared Services Interest Expense to Div 33 only - Assume 2% allocation rate
Interest Expense Interest ExpenseAcct. 431 Acct. 431
(Long Term) (Long Term)
Acct. 131 Acct. 143 (Short Term) (Short Term)
SSU BU 010 Div 033
Cash Accounts Receivable Interest Expense Interest ExpenseAcct. 431 Acct. 431
Acct. 131 Acct. 143 Acct. 426.5 Acct. 426.5
SSU BU 010 SSU BU 010 SSU BU 010 Div 033
SSU BU 010 SSU BU 010 SSU BU 010 Div 033Cash Accounts Receivable Other Deductions * Other Deductions
Cash Accounts Receivable Dividend Income Dividend IncomeAcct. 131 Acct. 143 Acct. 419 Acct. 419
SSU BU 010 Div 033SSU BU 010 SSU BU 010 Interest and Interest and
EXHIBIT LKG-1

33
Service: Gas cost between state jurisdictions for contiguous systems Description: Gas costs that apply to contiguous systems that cross state jurisdictional
boundaries are allocated between those rate jurisdictions. Current Provider of Service
West Texas Division Colorado-Kansas Division Kentucky/Mid-States Division
Current Use of Service
West Texas Division Colorado-Kansas Division Kentucky/Mid-States Division
Basis of Allocations
Allocations are based upon throughput for the West Texas Division and the Colorado-Kansas Division’s Southeast Colorado/Southwest Kansas operations. For the Colorado-Kansas Division’s Kansas system and for the Kentucky/Mid-States Division, demand costs are allocated based on peak-day requirements. Commodity costs are allocated based upon throughput.
Atmos Energy CorporationGeneral Ledger Entries: Gas Costs between state jurisdictions for contiguous systems (Example Only)
$1,000 (1) (1) $1,000 $1,000 (2)
(2) $1,000
(1) Gas cost incurred(2) Gas cost paid
Acct. 232
SSU BU 010 SSU BU 010
Acct. 804
Acct. 131 Cash
Various BU's & Svc Areas
Accounts Payable
Natural Gas City Gate Purchase
EXHIBIT LKG-1

34
Service: Gas storage services between an operating division and an affiliate Description: To the extent an operating division stores gas in a storage field owned by an
affiliate, a rental fee for the use of the storage field shall be charged by the affiliate.
Current Provider of Service
UCG Storage, Inc. WKG Storage, Inc.
Current Use of Service
Kentucky/Mid-States Division
Basis for allocation
The annual demand charge between UCG Storage, Inc. and Atmos Energy Corporation (Tennessee operations only) is calculated based on fiscal year plant in service, gas inventory, actual operational costs incurred, and application of revenue and cost of capital conversion factors based on prior regulatory approval. In the calculation of the demand charge, costs not specifically related to a designated area are allocated to each affiliate based on the percentage of total plant servicing that affiliate. The annual demand charge between WKG Storage, Inc. and Atmos Energy Corporation (Kentucky operation only) is based on services provided at actual cost, market rate or as otherwise provided under tariff or contract.
General Ledger Entries: Example Only WKG Storage BU 233 KY/Mid-State BU 050, Div 009 Other Gas Revenues Transportation to City Gate Acct. 495 Acct. 8580 $100 (1) (1) $100 WKG Storage BU 233, Div 002 KY/Mid-State BU 050, Div 002 A/R from Assoc Co. A/R from Assoc Co. Acct. 146 Acct. 146
(2) $100 $100 (2)
Flow of Activity - East Diamond Storage Facility
1 Monthly demand charge for the East Diamond Storage Facility 2 Intercompany Entry generated by Oracle to keep Operating Divisions in sync
UCG Storage BU 232 KY/Mid-State BU 050, Div 009 Other Gas Revenues Other gas supply expenses Acct. 495 Acct. 813 $100 (1) (1) $100 WKG Storage BU 232, Div 002 KY/Mid-State BU 050, Div 002 A/R from Assoc Co. A/R from Assoc Co. Acct. 146 Acct. 146
(2) $100 $100 (2)
Flow of Activity - Barnsley Storage Facility
1 Monthly demand charge for the Barnsley Storage Facility 2 Intercompany Entry generated by Oracle to keep Operating Divisions in sync
Service: Working capital funds management (Intercompany account)
EXHIBIT LKG-1

35
Description: Funds are invested on behalf of or provided to affiliates based on operations.
Current Provider of Service:
Atmos Energy Corporation
Atmos Energy Holdings, Inc.
Current Use of Service: Atmos Energy Holdings, Inc.
Atmos Energy Corporation
Interest Income/Expense Calculation (See Below) A B
Basis for allocation
Interest income or expense is recognized each month at the subsidiaries’ level based on the total average outstanding balance of all intercompany receivable/payable balances using the following rates: A (AEH is the borrower) Expense – One month LIBOR (last day of the month) plus 300 basis points Income – One month LIBOR (last day of the month) B (AEC is the borrower) Expense – The lowest outstanding CP rate or the Eurodollar rate under the AEC Credit Facility (Credit Ag), which is LIBOR plus 100 Income – One month LIBOR (last day of the month)
Atmos Energy CorporationGeneral Ledger Entries: Working Capital Funds Management (Example Only)
$1,000 (1)
$1,000 (1)
(1) Interest Income and/or expense is recognized each month at the subsidiaries' level
SSU BU 010
Acct. 431
Acct. 419 Interest and Dividend Income
AEH BU 312 Other Interest Expense
EXHIBIT LKG-1

36
Service: Gas storage services provided between affiliates Description: To the extent an affiliate stores gas in a storage field owned by another
affiliate, a fee for the use of the storage field shall be charged. Current Provider of Service
Trans Louisiana Gas Storage, Inc.
Current Use of Service
Trans Louisiana Gas Pipeline, Inc.
Basis for allocation
The fee to the affiliate utilizing the storage service is based on services provided at actual cost, market rate or as otherwise provided under tariff.
Service: Property Insurance
$100 $100
$100 $100
BU 303 BU 303
Accounts Receivable fromAssociated Company Other Gas Supply Expense
Acct. 146 Acct. 813
BU 234 BU 234
Accounts Receivable fromAssociated Company
Revenue Transportation -Industrial
Acct. 146 Acct. 4896
General Ledger Entries: Example Only
EXHIBIT LKG-1

37
Description: Blueflame Insurance Services, LTD provides a direct property insurance policy. The policy covers the property against all risks of direct physical loss or damage.
Current Provider of Service
Blueflame Insurance Services, LTD
Current Use of Service
Kentucky/Mid-States Division Colorado-Kansas Division Shared Services Louisiana Division Mississippi Division Mid-Tex Division West Texas Division Atmos Pipeline – Texas Division Atmos Energy Louisiana Industrial Gas, LLC Atmos Exploration & Production, Inc. Atmos Energy Services, LLC Atmos Power Systems, Inc. Trans Louisiana Gas Pipeline, Inc. Trans Louisiana Gas Storage, Inc. UCG Storage, Inc. WKG Storage, Inc. Atmos Gathering Company, LLC
Basis for allocation
Atmos Energy Corporation is invoiced by Blueflame Insurance Services. Costs are allocated based on the gross property, plant and equipment and gas stored underground balances of each affiliate at a rate division level.
Service:
Intercompany Interest on Notes Payable
General Ledger Entries: Example Only
$1,200 (1) (1) $1,200 $1,200 (1) (1) $1,200 $100 (2)
(2) (3) $100
Flow of Activity (1) Purchase of property insurance (2) Monthly amortization to rate divisions
Acct. 165Accounts Payable
Acct. 232 SSU BU 010 SSU BU 010
Acct. 131 Cash SSU BU 010Prepayments
Acct. 924
General Office Property Insurance CO/KS BU 060
(3) Amounts remaining in SSU cost centers are allocated to the divisions using the method described on pages 11 and 12.
EXHIBIT LKG-1

38
Description: Intercompany Interest on Notes Payable Current Provider Of Services Current Use of Service
Shared Services Atmos Energy Holdings, Inc.
Current Provider of Service:
Atmos Energy Corporation
Atmos Energy Holdings, Inc.
Current Use of Service: Atmos Energy Holdings, Inc.
Atmos Energy Corporation
Interest Income/Expense Calculation (See Below) A B
Basis for allocation
Interest income and expense is recognized each month at the subsidiaries’ level using the following rates: A (AEH is the borrower) Expense – One month LIBOR (last day of the month) plus 300 basis points Income – One month LIBOR (last day of the month) B (AEC is the borrower) Expense – The lowest outstanding CP rate or the Eurodollar rate under the AEC Credit Facility (Credit Ag), which is LIBOR plus 100 Income – One month LIBOR (last day of the month)
General Ledger Entries: Example Only Shared Services Shared Services
Accounts Receivable from
Associated Company Interest on Debt to Associated
Companies Acct. 146 Acct. 431
$1,000 (1) (1) $1,000 Atmos Energy Holdings, Inc. Atmos Energy Holdings, Inc.
Accounts Receivable from
Associated Company Interest and Dividend Income Acct. 146 Acct. 419
(1) $1,000 $1,000 (1)
Flow of Activity
(1) Intercompany Interest on Notes Payable is recognized each month at the subsidiary level.
EXHIBIT LKG-1

39
Appendix A
EXHIBIT LKG-1
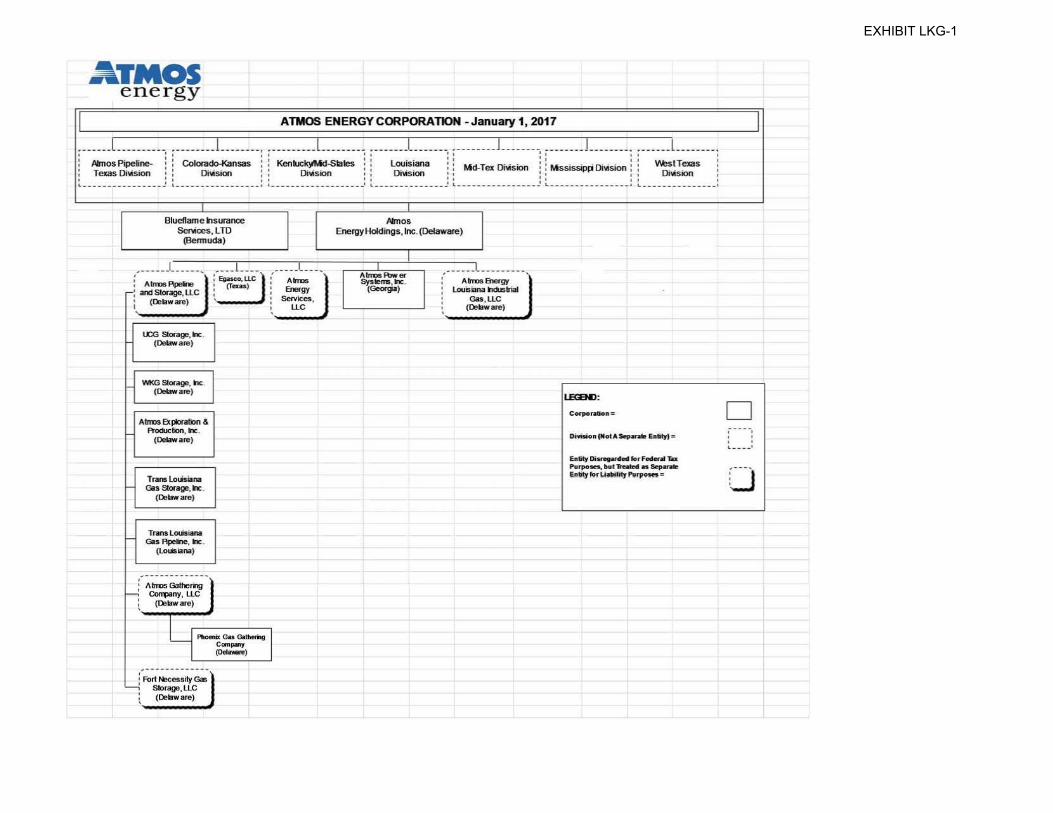
EXHIBIT LKG-1
ATMOS energy
ATMOS ENERGY CORPORATION - January 1, 2017
_______ [_ _________________ _I ________ , __________ [_ _______________ _[ ________________ ]_ ______________ _1 ________ , ______ j ________ , I I I 1 I I : • • :: :: :: :
: Aamos Pipeline- : : Colorado-Kansas : : Kentucf(yMd-states : ! L~~s~ana ! : Md-Tex DMsion : : M ssissipp OMsion : : ~~T~s : : Texas Di\lision : : Di\tision : : DMsion : , Dt\1Ston • , : , , , Di~s100 ,
~----------------J ~-----------------: :------------------ .. : i---- ----------; ~-----------------' ~----------______ : ~--------------_:
Blueftame hsurance Sef'o;ices, l TO
(Bermuda)
__ __ __ j ___ ____ _ ___ ( ___ _ . : AlrmsApeh>
. . Eguco,LLC (Texas I
- : Z111Siorage, llC . . (Delaware) I
UCG storage, Inc. (Delaware)
H IM<G storage, Inc. (Delaware)
Atrms El< pk>ratiOn a Production, Inc.
(Delaw are)
Translo.OSiana Gas storage, Inc.
(Oelilw are)
Trans lO.OSiana 1- Gas ApeD>, Inc.
(LO.OSiana)
r--(~~~~"1 \ (Delilw are)
Y~ Gas Galhemg om pony ~ ... )
, ....................................... ! Fort Neeessily Gas
Slorage, llC (Delaware)
Almos EnergyHoldings, lnc.(Oelaware)
: Alrms EMtgy : louisiana toclatrial • Gas,llC
(Delaware)
Corpor~~tioa=
o;Mion{lloiASep.,.... EnliiJI=
EaliiJ o;..._-.. , Fed..-.1 Tu POI'pOieS, bol-as Sepat* Elllily !9rLiHilily l'll11>otn=
D -----, . . . l ......... _ ,
CJ

Direct Testimony of Gregory W. Smith Page 1 Kentucky / Smith
BEFORE THE PUBLIC SERVICE COMMISSION
COMMONWEALTH OF KENTUCKY APPLICATION OF ATMOS ENERGY ) ) CORPORATION FOR AN ADJUSTMENT ) Case No. 2018-00281 ) OF RATES AND TARIFF MODIFICATIONS )
TESTIMONY OF GREGORY W. SMITH
I. POSITION AND QUALIFICATIONS 1
Q. PLEASE STATE YOUR NAME AND BUSINESS ADDRESS. 2
A. My name is Gregory W. Smith, P.E. My business address is 810 Crescent Centre Dr 3
# 600, Franklin, Tennessee, 37067. 4
Q. BY WHOM ARE YOU EMPLOYED AND IN WHAT CAPACITY? 5
A. I am the Vice President of Technical Services for Atmos Energy Corporation’s 6
Kentucky/Mid-States Division (hereinafter “Atmos Energy” or the “Company”). 7
Q. WHAT ARE YOUR JOB RESPONSIBILITIES? 8
A. My current responsibilities for the Company include oversight of engineering, 9
geographic information systems, measurement, compliance, safety, related 10
information technology, and procurement. My department is responsible for 11
execution of Projects within our Pipeline Integrity Plan, Annual DOT filings, 12
Contracting, and Project Management for planned system growth, improvement, and 13
replacement projects. I previously served as the Program Manager for the Kentucky 14
Pipeline Replacement Program ("PRP") from 2011 through 2015. 15

Direct Testimony of Gregory W. Smith Page 2 Kentucky / Smith
Q. PLEASE DESCRIBE YOUR EDUCATIONAL BACKGROUND AND 1
PROFESSIONAL EXPERIENCE. 2
A. I earned a Bachelor of Science degree in Mechanical Engineering from Texas Tech 3
University in 1996. I am a Registered Professional Engineer in the states of Texas 4
and Kentucky. I have been employed by Atmos Energy for 22 years. During my 5
time at Atmos Energy I have held several different engineering positions (1996-2002) 6
in the West Texas and Colorado-Kansas Divisions, as an Operations Supervisor 7
(2002-2006) in the Kentucky/Mid-States Division, Manager of Strategic Sourcing 8
and Small Business Liaison Officer (2006-2011) in the Dallas Corporate Office, and 9
Operations/Engineering Manager over Kentucky PRP (2011-2015) in the 10
Kentucky/Mid-States Division - before moving to my current role in June of 2018. 11
Q. ARE YOU A MEMBER OF ANY PROFESSIONAL ORGANIZATIONS? 12
A. Yes, I have had previous membership with several different industry associations 13
including American Gas Association, Southern Gas Association and the Kentucky 14
Gas Association. Currently I serve as a member of the Board of Directors of the 15
Tennessee Gas Association. 16
Q. HAVE YOU PREVIOUSLY TESTIFIED BEFORE THE KENTUCKY PUBLIC 17
SERVICE COMMISSION OR OTHER REGULATORY ENTITIES? 18
A. Yes, I submitted rebuttal testimony before this Commission in Case No. 2017-00349. 19
II. INTRODUCTION 20
Q. WHAT IS THE PURPOSE OF YOUR TESTIMONY? 21
A. The purpose of my testimony is to provide an overview of the Company's pipeline 22
replacement progress in Kentucky. As the Commission is aware, the Company has 23
been expediting the replacement of aging infrastructure in Kentucky pursuant to its 24
PRP. While the Company is proposing certain tariff changes related to the PRP in this 25
proceeding, the Company's risk-reduction efforts in Kentucky remains unchanged.26

Direct Testimony of Gregory W. Smith Page 3 Kentucky / Smith
Q. PLEASE SUMMARIZE YOUR TESTIMONY. 1
A. My testimony (1) discusses the history of the PRP; (2) explains from an engineering 2
perspective how the Company determines what projects to undertake each year; and 3
(3) affirms the Company's commitment to ensuring safe and reliable gas service. 4
III. HISTORY OF PRP 5
Q. HAS THE COMPANY'S PRP FUNCTIONED WELL? 6
A. Yes. As I testified in Case No. 2017-00349, the Company’s most fundamental 7
objective is to provide safe and reliable gas service to all customers. The PRP 8
enabled the Company to expedite the replacement of older and no longer industry-9
standard materials with safer, modern piping materials installed to current industry 10
specifications. 11
Q. IS THE PRP ESTABLISHED IN CASE NO. 2009-00354 COMPLETE? 12
A. The Company’s replacement of bare steel pipe is not complete, however it is on 13
schedule as specified in Case No. 2017-00349. As the Commission stated, "the 14
original 15-year PRP time period should be extended and that annual ratepayer-15
funded PRP investment should be limited to $28 million, barring the identification of 16
a PRP eligible pipeline-related hazard that could not have been reasonably foreseen. 17
$28 million in annual investment should cause the remaining PRP for bare steel 18
replacement to be complete in 8 - 9 years beginning in 2019 with estimated 19
completion in 2027, adding two years to the originally approved 15-year 20
timeframe."1 21
1 In the Matter of Electronic Application of Atmos Energy Corporation for An Adjustment of Rates and Tariff Modifications, Case No. 2017-00349, May 3, 2018.

Direct Testimony of Gregory W. Smith Page 4 Kentucky / Smith
Q. HOW MUCH PROGRESS HAS BEEN MADE ON THE REPLACEMENT OF 1
BARE STEEL PURSUANT TO THE PRP? 2
A. The Company had proposed to accelerate the replacement of bare steel in a manner 3
that would have resulted in the replacement of all bare steel by 2022 as proposed in 4
Case No. 2017-00349. However, in light of the Commission's final order in that 5
proceeding, the Company is now following the judgment of the Commission to slow 6
down replacement of bare steel at an annual rate targeting completion of bare steel 7
replacement by 2027. By the end of CY2018, the Company will have approximately 8
188 miles of the original 345 miles of bare steel remaining in Kentucky. 9
Q. IS THE PRP ONLY MEANT TO ADDRESS THE REPLACEMENT OF BARE 10
STEEL? 11
A. It is my understanding that, in light of the Commission's decision in Case No. 2017-12
00349, with the exception of certain specific projects that were included in the past, 13
the PRP was only intended to address the accelerated replacement of natural gas 14
systems containing bare steel and related infrastructure. 15
Q. DO YOU ADVOCATE THE ACCELERATED REPLACEMENT OF MORE 16
THAN JUST BARE STEEL? 17
A. Yes. As I testified in Case No. 2017-00349, there are other types of pipeline materials 18
that I believe warrant accelerated replacement. Completion of our bare steel 19
replacement will also eliminate approximately 60% of the remaining low pressure 20
distribution systems. Utilities need to have appropriate replacement cycles for all of 21
their pipeline infrastructure. However, the industry recognizes bare steel as one of the 22
leading risk types. 23
Q. WHAT DO YOU MEAN BY "REPLACEMENT CYCLES?" 24
A. In the state of Kentucky, Atmos Energy has approximately 4200 miles of natural gas 25
distribution and transmission pipeline (plus associated service lines). If we were to 26
replace 42 miles of pipe per year (1%), it would take 100 years to renew the entire 27

Direct Testimony of Gregory W. Smith Page 5 Kentucky / Smith
system…and in the future we would be left with a pipeline system with 100 years old 1
segments. The reality is that a majority of our bare steel systems were installed in the 2
1930’s-1950’s, already making them 65-85 years old. A prudent pipeline operator 3
must consider the overall replacement cycle of its system. 4
Q. IN CASE NO. 2017-00349, YOU TESTIFIED THAT THE ATMOS ENERGY 5
PIPLINE SYSTEM IN KENTUCKY WAS SAFE. IS IT STILL SAFE? 6
A. Yes. The Company has been able to continue to replace aged and antiquated pipeline 7
materials since I testified in Case No. 2017-00349. Also, as noted in a recent article 8
in S&P Global, gas distribution pipeline incidents have fallen since 2009 when 9
PHMSA enacted rules for gas distribution systems that required pipeline operators to 10
"continually assess, evaluate, repair, and validate" the integrity of gas distribution 11
systems and take steps to fix threats and concerns.2 Reducing bare steel reduces the 12
occurrence of leaks. Reducing leaks reduces risks to the public and enhances safety. 13
As the following chart demonstrates, pipeline leaks in Kentucky have fallen 14
dramatically since the PRP began. 15
Date # LeaksJan, 2011 1,127
Jan, 2012 1,308
Jan, 2013 1,354
Jan, 2014 1,169
Jan, 2015 1,076
Jan, 2016 677
Jan, 2017 600
Jan, 2018 489
16
2 Smith, Sarah. Gas Distribution Pipe Incidents Down After 2009 Safety Rule, Study Shows. S&P Global, August 27, 2018.

Direct Testimony of Gregory W. Smith Page 6 Kentucky / Smith
IV. DETERMINATION OF PROJECTS 1
Q. DID YOU RESPOND TO POST-HEARING DATA REQUESTS RELATING 2
TO THE PRP IN CASE NO. 2017-00349? 3
A. Yes. There were multiple rounds of post-hearing data requests, necessitated by some 4
confusion regarding the detail of information Commission Staff was seeking. 5
Q. CAN YOU EXPLAIN WHAT YOU MEAN BY "CONFUSION?" 6
A. I believe that there was some misunderstanding relating to whether certain estimates 7
related strictly to bare steel or also included other materials when distribution 8
systems are replaced. I also believe there was some confusion regarding the 9
Company's pipeline project forecasts. As previously described in Case No. 2017-10
00349, Company has detailed estimates for a pool of projects 12-18 months in 11
advance and then an identified list of projects within its five year plan that may 12
require longer term engineering design, permitting, or easement acquisition. Within 13
that five year plan, the Company has an idea of a list of projects that it would like to 14
undertake, but unable to provide budget-level detail beyond the first 12-18 months. 15
Beyond five years, the Company only identifies total system mileage of target 16
replacement materials and the location of where those materials are located. 17
Q. COULD THE COMPANY PROVIDE BUDGET LEVEL DETAIL MORE 18
THAN 12-18 MONTHS IN ADVANCE? 19
A. In my opinion, not efficiently. Cost estimates performed ahead of the budget cycle 20
for that year would be very speculative without having final designs and taking into 21
consideration materials pricing, easement acquisition, contractor availability, and 22
permitting. 23

Direct Testimony of Gregory W. Smith Page 7 Kentucky / Smith
Q. WHY ELSE IS THE COMPANY UNABLE TO PROVIDE BUDGET-LEVEL 1
DETAIL BEYOND APPROXIMATELY 12-18 MONTHS IN ADVANCE? 2
A. In addition to the forecasting difficulties I just identified, providing budget-level 3
detail further out would be difficult given the Company's budget process. Mr. Waller 4
describes the Company's capital budgeting process in his Direct Testimony. 5
Q. SO DOES THE BUDGET PROCESS DETERMINE WHICH PROJECTS ARE 6
PERFORMED EACH YEAR? 7
A. Only indirectly. Ultimately, it is up to the Kentucky/Mid-States Division to determine 8
what portfolio of projects to undertake. The capital budgeting process determines the 9
capital available to be spent. The Kentucky/Mid-States Division decides how to 10
deploy that capital for the upcoming fiscal year. I would add that the Kentucky/Mid-11
States Division often has projects that exceed any one year's capital budget - those 12
projects have to be completed in phases or in sequence over multiple years based on 13
the system type. 14
V. AFFIRM COMMITMENT 15
Q. IN LIGHT OF THE ELIMINATION OF THE PRP FROM THE COMPANY'S 16
TARIFF, HAS THE IMPORTANCE OF PROACTIVELY REPLACING BARE 17
STEEL CHANGED? 18
A. No. As I said earlier, replacing bare steel lines is a high priority and the Company 19
will still be replacing bare steel at the accelerated rate in accordance within the 20
timeframe set forth in the Commission's order in Case No. 2017-00349. 21
Q. FROM YOUR PERSPECTIVE, DOES THE REMOVAL OF THE PRP 22
FROM THE COMPANY'S TARIFF CHANGE ANYTHING? 23
A. Although I have been told that the timing of regulatory review may differ or that the 24
regulatory lag might be different than if the PRP was continued, those aren't really 25
my concerns. From an engineering and risk perspective, nothing has changed. The 26

Direct Testimony of Gregory W. Smith Page 8 Kentucky / Smith
exact same bare steel materials that were previously targeted for replacement will be 1
still replaced within the timeframe set forth by the Commission. 2
Q. WILL THE COMPANY STILL PREPARE AND FILE THE SAME 3
INFORMATION AS IT DID UNDER THE PRP? 4
A. Yes. Please see Mr. Martin's testimony the Company's commitment to prepare an 5
annual informational report showing bare steel replacement capital spending. 6
Additional information relating to pipeline replacement projects can be filed in 7
conjunction with the Company's general rate cases. However, the Kentucky/Mid-8
States Division would still perform the same analysis and prepare and store all of the 9
same information it does now related to PRP projects. 10
VI. CONCLUSION 11
Q. PLEASE SUMMARIZE YOUR TESTIMONY? 12
A. The removal of the PRP from the Company's Tariff in no way changes the 13
Company's commitment to replacing bare steel materials. The replacement of bare 14
steel and aging infrastructure materials is still the highest priority for the Company's 15
accelerated system replacement planning purposes and will be accomplished within 16
the timeframe set forth in Case No. 2017-00349. While it is my understanding that 17
recognition of capital investment associated with bare steel replacement will now be 18
sought through rate case proceedings rather than through a PRP mechanism, from an 19
engineering standpoint, nothing has changed. 20
Q. DOES THIS CONCLUDE YOUR DIRECT TESTIMONY? 21
A. Yes. 22

COMMONWEALTH OF KENTUCKY
BEFORE THE PUBLIC SERVICE COMMISSION
IN THE MATTER OF RATE APPLICATION OF ATMOS ENERGY CORPORATION
) ) )
Case No. 2018-00281
CERTIFICATE AND AFFIDAVIT
The Affiant, Gregory W. Smith, being duly swam, deposes and states that the prepared testimony attached hereto and made a part hereof, constitutes the prepared direct testimony of this affiant in Case No. 2018-00281, in the Matter of the Rate Application of Atmos Energy Corporation, and that if asked the questions propounded therein, this affiant would make the answers set forth in the attached prepa dir e-file testimony.
STATE OF -Je.wNt!SS~ COUNTY OF (,.J· J I :Arrh5otV
SUBSCRIBED AND SWORN to before me by Gregory W. Smith on this the J't#v day of September, 2018.
Notary Public
My Commission Expires: (YIA~ 3 ;;Jo~o ,,, ...... ,~ 7
,,''\A PL~ ~,._ .............. ~ •••••• &'.::""' ~"'~··· l'f1ttl ·;-r~" 14:. .' OP •. ;A';
• • • • ~ : TeNNESSEB : i ; •. NOTARY : · ! \ ~./• PUBUO ,• ~~ ',,'0··· •• ·~l ,, ;s-o • • • ~''"' , ,, '•,,, N CO\l'' ,,,•'
''''"""'''

Direct Testimony of Jennifer K. Story Page 1 Kentucky / Story
BEFORE THE PUBLIC SERVICE COMMISSION
COMMONWEALTH OF KENTUCKY
APPLICATION OF ATMOS ENERGY ) ) CORPORATION FOR AN ADJUSTMENT ) Case No. 2018-00281 ) OF RATES AND TARIFF MODIFICATIONS )
TESTIMONY OF JENNIFER K. STORY
I. INTRODUCTION 1
Q. PLEASE STATE YOUR NAME, POSITION, AND BUSINESS ADDRESS. 2
A. My name is Jennifer K. Story. My business address is 5430 LBJ Freeway, Suite 700, 3
Dallas, TX 75240. I am employed by Atmos Energy Corporation (“Atmos Energy” or 4
the “Company”) as Director of Income Tax. 5
Q. PLEASE STATE YOUR EDUCATION AND PROFESSIONAL 6
BACKGROUND. 7
A. I received my education at the University of Texas at Dallas. In 2002, I received a 8
Bachelor of Science degree with a major in accounting. I am a licensed certified 9
public accountant in the State of Texas. 10
I worked in both a large corporate tax department and in public accounting 11
prior to joining Atmos Energy in December 2006. Since joining Atmos Energy, I 12
have assumed the oversight and management of all income tax matters for the 13
Company. I also serve as a representative for the Company on the American Gas 14
Association’s Tax Committee. 15

Direct Testimony of Jennifer K. Story Page 2 Kentucky / Story
Q. WHAT ARE YOUR RESPONSIBILITIES AT ATMOS ENERGY? 1
A. As Director of Income Tax for Atmos Energy, I am responsible for oversight and 2
management of all income tax matters for the Company. This oversight includes 3
ensuring that the income tax accounts recorded on the books and records accurately 4
reflect the Company’s tax filings and positions. I am also responsible for ensuring 5
that deferred taxes are recorded on the financial statements in accordance with 6
Generally Accepted Accounting Principles (“GAAP”). I oversee a group of six tax 7
professionals, who undertake tax planning to minimize taxes, prepare the Company’s 8
tax filings, and defend those filings under audit. I am also responsible for the 9
establishment of and compliance with the Company’s income tax policies and 10
controls. 11
Q. HAVE YOU TESTIFIED BEFORE THIS OR ANY OTHER REGULATORY 12
COMMISSION? 13
A. Yes. I have submitted direct and rebuttal testimony regarding income taxes in the 14
following proceedings: 15
Regulatory Authority Proceeding Testimony Submitted
Kentucky Public Service Commission Case No. 2017-00481 Direct Kentucky Public Service Commission Case No. 2017-00349 Rebuttal Colorado Public Utilities Commission Proceeding No. 15AL-0299G Rebuttal Mississippi Public Service Commission Docket No. 2015-UN-049 Rebuttal Texas Railroad Commission GUD No. 10580 Rebuttal Texas Railroad Commission GUD No. 10640 Rebuttal Texas Railroad Commission GUD No. 10742 Direct Texas Railroad Commission GUD No. 10743 Direct
Tennessee Public Utility Commission Docket No. 17-00012 Direct and Rebuttal
Tennessee Public Utility Commission Docket No. 18-00067 Direct
Virginia State Corporation Commission Case No. PUR-2018-00014 Direct

Direct Testimony of Jennifer K. Story Page 3 Kentucky / Story
II. PURPOSE OF TESTIMONY 1
Q. WHAT IS THE PURPOSE OF YOUR TESTIMONY? 2
A. The purpose of my testimony is to (1) summarize the history of the Tax Cuts and 3
Jobs Act (“TCJA”); (2) provide an update of the current status of reflecting the 4
changes from the TCJA in Atmos Energy’s Kentucky rates and describe how the 5
current rate case will reflect TCJA changes; and (3) briefly discuss related TCJA 6
concepts. 7
The TCJA resulted in a reduction in the federal corporate tax rate from 35% 8
to 21%. That tax reduction resulted in the Company having to revalue its 9
Accumulated Deferred Income Taxes (“ADIT”), including Net Operating Loss 10
Carryforward (“NOLC”), to reflect the lower tax rate. Additionally, the Company had 11
to lower its rates to reflect the new ongoing tax expense1. 12
Through settlement in Electronic Investigation of the Impact of the Tax Cuts 13
and Jobs Act on the Rates of Atmos Energy Corporation (KPSC Case No. 2018-14
00039) and resolution of the Company’s last rate case, the Company has lowered its 15
rates to reflect the 21% federal statutory tax rate in tax expense, and to reflect the 16
return of the estimated excess deferred income tax liability ("EDITL"). 17
In the current rate case, the Company has proposed to refine the EDITL 18
estimate and continues to amortize this estimated liability over a period of 24 years, 19
as was approved in the last rate case. 20
In regards to the tax components discussed above, I am sponsoring the following 21
Filing Requirements (FR): 22
1 Case No. 2017-00481

Direct Testimony of Jennifer K. Story Page 4 Kentucky / Story
FR 16(8)(b) A jurisdictional rate base summary for both the base period 1
and the forecasted period with supporting schedules, which 2
include detailed analyses of each component of the rate base; 3
FR 16(8)(e) Jurisdictional federal and state income tax summaries; 4
Q. ARE YOU SPONSORING ANY EXHIBITS? 5
A. No. I am not sponsoring any exhibits. 6
Q. DO YOU ADOPT THESE FILING REQUIREMENTS AND THEIR 7
ASSOCIATED SCHEDULES, AND MAKE THEM PART OF YOUR 8
TESTIMONY? 9
A. Yes. 10
III. IMPACT OF TCJA 11
Q. HOW DID THE TCJA AFFECT ATMOS ENERGY? 12
A. As I have previously testified in Electronic Investigation of the Impact of the Tax 13
Cuts and Jobs Act on the Rates of Atmos Energy Corporation, et al., Case No. 14
2017-00481, the TCJA resulted in a lowering of the maximum federal corporate tax 15
rate. As a result of that tax rate reduction, the Company was required to revalue its 16
ADIT, including NOLC, based upon the new statutory tax rate. The revaluation of 17
ADIT resulting from the reduction in the tax rate resulted both in the establishment 18
of a regulatory liability and an impact to the Company’s fiscal year ended September 19
30, 2018 earnings. As stated in my Direct Testimony in Case No. 2017-00481, 20
additional complexity exists because Atmos Energy is a fiscal year taxpayer with a 21
fiscal year ended September 30. It is for this reason that the estimate of the EDITL 22

Direct Testimony of Jennifer K. Story Page 5 Kentucky / Story
has changed slightly since the last rate case. This amount will be final once the 1
Company’s fiscal year has ended and the corresponding tax return has been filed. 2
Q. SO THE COMPANY HAS NOT HAD A FISCAL YEAR END SINCE THE 3
PASSAGE OF THE TCJA? 4
A. That is correct. Also, even though the fiscal year end will occur shortly after the 5
filing of this direct testimony, the Company will not close its books on this fiscal year 6
until November 2018, nor file its tax return for this fiscal year until July 2019. 7
Q. WHAT ADJUSTMENTS TO ADIT DID THE COMPANY HAVE TO MAKE 8
AS A RESULT OF THE REDUCTION IN FEDERAL CORPORATE TAX 9
RATES? 10
A. As a result of the reduction in federal corporate tax rates, the Company revalued the 11
ADIT on its books at the new statutory rate. The reduction in the federal statutory 12
rate reduced the future tax liabilities for which the Company has deferred tax 13
liabilities recorded. In other words, the amount recorded on the Company’s books 14
prior to the tax law change was in excess of what the Company now will have to pay 15
the federal government in the future. The Company established a regulatory liability 16
for the excess deferred taxes associated with items in rate base for each of the eight 17
jurisdictions in which it operates. 18
IV. REFLECTING THE TCJA IN RATES 19
Q. WHAT ARE THE RATE IMPACTS OF THE TCJA? 20
A. There were two main types of rate impacts (1) lower ongoing tax expense and (2) a 21
return of the liability for excess deferred income taxes. 22

Direct Testimony of Jennifer K. Story Page 6 Kentucky / Story
Q. HOW WAS THE LOWER ONGOING TAX EXPENSE REFLECTED IN THE 1
COMPANY’S KENTUCKY RATES? 2
A. As a result of the Company’s rate case in Electronic Application of Atmos Energy 3
Corporation for An Adjustment of Rates and Tariff Modifications, Case No. 2017-4
00349, which was pending at the time of the passage of the TCJA2, the Company’s 5
rates were adjusted to reflect the lower tax expense. The federal income tax rate in 6
this filing also reflects the 21% federal statutory rate resulting from the TCJA. 7
Q. HOW IS TAX EXPENSE CALCULATED IN THE CURRENT FILING? 8
A. Tax expense is calculated by applying statutory tax rates to the forecasted return to 9
arrive at required operating income, as shown on Schedule C.1. 10
Q. IS THIS CALCULATION CONSISTENT WITH THAT IN CASE NO. 2017-11
00349? 12
A. Yes. I would note that the Company excludes the impact of the $1.4 million 13
amortization of EDITL in calculating the current income taxes but then provides the 14
benefit to customers on Schedule A.1. The Company’s method for flowing through 15
the benefit of EDITL to customers in this manner was affirmed by the Commission’s 16
Final Rehearing Order for Case No. 2017-00349 issued on September 17, 2018. 17
Q. WHY IS CALCULATING THE CURRENT INCOME TAX, EXCLUSIVE OF 18
EDITL AMORTIZATION NECESSARY? 19
A. If the reduction in present rates for amortization of EDITL was taken into account 20
when calculating the proposed increase, income tax expense calculated on Schedule 21
C.1, would be artificially lowered for the tax benefit related to the amortization of the 22
2 The Company updated its proposed rate increase in rebuttal to reflect the impacts of TCJA

Direct Testimony of Jennifer K. Story Page 7 Kentucky / Story
EDITL. This tax benefit has already been accounted for when the EDITL was 1
established on the Company's books. 2
Q. HOW HAS THE TAX EFFECT OF THE AMORTIZATION OF THE EDITL 3
BEEN REFLECTED ON THE COMPANY’S BOOKS AND IN THIS FILING? 4
A. Upon enactment of the TCJA, in accordance with Generally Accepted Accounting 5
Principles (“GAAP”), the Company recorded on its books and records the regulatory 6
liability for excess deferred income taxes, grossed up for taxes, as well as a deferred 7
tax asset for the tax gross up. Since the flow back of EDITL to customers represents 8
a return of tax expense collected in rates that is in excess of what the Company now 9
expects to pay the federal government, this flow back should not result in additional 10
tax expense or benefit for the customers or the Company. GAAP requirements state 11
that the EDITL must be grossed up for income taxes at the enacted income tax rates 12
to reflect the revenue requirements to be received from or refunded to customers in 13
the future. This grossed up liability is reflected on WP B.5F1 of the model and is the 14
amount the Company has proposed to amortize. The corresponding deferred tax asset 15
for the tax gross up is included in ADIT on Schedule B.5F 16
Q. WHY WOULD IT BE INAPPROPRIATE TO INCLUDE THE 17
AMORTIZATION OF EDITL CURRENTLY IN RATES IN THE 18
CALCULATION OF THE PROPOSED INCREASE? 19
A. To do so would duplicate the impact to the revenue requirement of taxes related to 20
the amortization. As I have described, the accounting requirements that the Company 21
complied with and reflected in this filing properly accounted for all impacts to the 22
revenue requirement. 23

Direct Testimony of Jennifer K. Story Page 8 Kentucky / Story
Q. FOCUSING NOW ON EDITL, HOW IS THE RETURN OF EDITL 1
REFLECTED IN THE COMPANY’S KENTUCKY RATES? 2
A. The Company's rate case in Case No. 2017-00349 was updated in rebuttal and 3
adopted in the final order to reflect the Company's estimate of the amortization for 4
EDITL. Case No. 2017-00481 remains open to allow for finalization of both the 5
regulatory liability for EDITL and the amortization period over which it will be 6
flowed to customers. 7
Q. IS THE COMPANY PROPOSING A FURTHER ADJUSTMENT TO THE 8
AMOUNT OF EDITL IN THIS PROCEEDING? 9
A. Yes. Since the rate case in Case No. 2017-00349 concluded, the Company has 10
completed the third quarter of the 2018 fiscal year. Accordingly, the Company 11
proposes to update its estimate for the amount of the EDITL based on its financial 12
data through June 30, 2018. 13
Q. IS THE COMPANY PROPOSING ANY ADJUSTMENT TO THE 14
AMORTIZATION PERIOD IN THIS PROCEEDING? 15
A. No. At this time the Company continues to believe that 24 years is the appropriate 16
amortization period. As described in my rebuttal testimony in Case No. 2017-00349, 17
the amortization period will be finalized once necessary modifications to the 18
Company’s tax systems are complete. 19
Q. HAS THE COMPANY DETERMINED THE TIME REQUIRED TO 20
COMPLETE THESE MODIFICATIONS? 21
A. Yes. The Company began working with consultants to make these changes to its tax 22
systems during the last rate case. These modifications are expected to be completed 23

Direct Testimony of Jennifer K. Story Page 9 Kentucky / Story
by the end of the calendar year. If the calculation of the amortization period is 1
completed prior to the Company submitting rebuttal testimony in this docket, the 2
Company will include updated amounts at that time. 3
V. RELATED TCJA CONCEPTS 4
Q. HAS THE COMPANY DETERMINED HOW TO AMORTIZE THE 5
REGULATORY LIABILTY BACK TO CUSTOMERS IN A MANNER THAT 6
CONFORMS WITH THE INTERNAL REVENUE CODE AND THE 7
REGULATORS IN ITS OTHER JURISDICTIONS? 8
A. Yes. As I discussed in my rebuttal testimony in Case No. 2017-00349, the TCJA 9
requires that the amortization of EDITL happen no more rapidly than it would using 10
the Average Rate Assumption Method (“ARAM”). The TCJA also provides an 11
alternative method for return of EDITL for companies whose records do not contain 12
the data required to implement ARAM. The alternative method is known as the 13
Reverse South Georgia Method (“RSGM”). The Company is proposing to use the 14
RSGM method in all jurisdictions in which it operates. 15
Q. IS THIS COMPANY’S PROPOSED METHOD OF AMORTIZATION OF 16
EDITL IN THIS FILING CONSISTENT WITH THE METHODOLOGY 17
PROPOSED AND ACCEPTED IN THE OTHER JURISDICTIONS THE 18
COMPOANY OPERATES IN? 19
A. Yes. The Company's use of RSGM has been accepted in all states where rates reflect 20
the return of EDITL3. Furthermore, due to the Company's need to complete its fiscal 21
3 As of October 1, 2018 this includes Colorado, Louisiana, and Texas

Direct Testimony of Jennifer K. Story Page 10 Kentucky / Story
year end and file its tax return, estimates of the excess deferred income tax regulatory 1
liability and related amortization period have been provided in all jurisdictions. 2
Q. HOW WOULD YOU SUMMARIZE THE CURRENT STATUS OF THE 3
COMPANY’S EFFORTS TO REFLECT THE TCJA? 4
A. The rates that the Company charges its ratepayers already reflect the new federal 5
income tax rate and will continue to do so. The Company has already taken the 6
necessary steps to ensure that its customers receive the full current tax benefit of the 7
new lower federal income tax rate. The Company is currently returning EDIT to 8
customers according to its best estimates of the amortization schedule required by the 9
RSGM in compliance with the Internal Revenue Code. In this proceeding, the 10
Company is proposing to adjust the EDIT liability amount to reflect additional 11
information determined after the conclusion of the Company’s last general rate case. 12
As the Company is further able to refine the amortization schedule for the EDIT 13
liability, it will make further adjustments in future filings. 14
Q. DOES THIS CONCLUDE YOUR TESTIMONY? 15
A. Yes. 16

COMMONWEALTH OF KENTUCKY
BEFORE THE PUBLIC SERVICE COMMISSION
IN THE MATTER OF RATE APPLICATION OF ATMOS ENERGY CORPORATION
) ) )
Case No. 2018-00281
CERTIFICATE AND AFFIDAVIT
The Mfiant, Jennifer K. Story, being duly sworn, deposes and states that the prepared testimony attached hereto and made a pati hereof, constitutes the prepared direct testimony ofthis affiant in Case No. 2018-00281, in the Matter ofthe Rate Application of Atmos Energy Corporation, and that if asked the questions propounded therein, this affiant would make the answers set fmih in the attached prepm·ed direct pre-filed testimony.
STATEOF ___ --_{ ~~~--_5 ______ __
COUNTYOF~l)~e~I I~Q~S~------
-+h SUBSCRIBED AND SWORN to before me by Jennifer K. Story on this the 20 day of September, 2018.
\ \ I I • l I 1 ,
'\ \ .:, ,' ,, '
. \/ ; .. ' I
...
,,~~ 1t'''' GISELLE R HEROY ~1>(~~~ Notary Publi~, State of Texas ;~· .. ~.:~= Comm. Exp1res 09-01-2020
~;t,:~t;~'~ Notary ID 13080484-2

BEFORE THE PUBLIC SERVICE COMMISSION
COMMONWEALTH OF KENTUCKY
APPLICATION OF ATMOS ENERGY ) ) CORPORATION FOR AN ADJUSTMENT ) Case No. 2018-00281 ) OF RATES AND TARIFF MODIFICATIONS )
DIRECT TESTIMONY OF JAMES H. VANDER WEIDE, PH.D.
RATE OF RETURN

Direct Testimony of James H. Vander Weide PH.D. Page i Kentucky / Vander Weide
TABLE OF CONTENTS
I. INTRODUCTION AND PURPOSE .......................................................................1
II. SUMMARY OF TESTIMONY ...............................................................................2
III. ECONOMIC AND LEGAL PRINCIPLES .............................................................5
IV. BUSINESS AND FINANCIAL RISKS ................................................................10
V. COST OF EQUITY ESTIMATION METHODS..................................................17
A. DISCOUNTED CASH FLOW METHOD ......................................................18
B. RISK PREMIUM METHOD ...........................................................................28
1. Ex Ante Risk Premium Method ………………………………………… 30
2. Ex Post Risk Premium Method………………………………………….. 33
C. CAPITAL ASSET PRICING MODEL ...........................................................36
1. Historical CAPM………………………………………………………... 38
2. DCF-Based CAPM……………………………………………………… 44
VI. FAIR RATE OF RETURN ON EQUITY .............................................................45
EXHIBIT:
Exhibit JVW-1 – Schedules and Appendices

Direct Testimony of James H. Vander Weide PH.D. Page 1 Kentucky / Vander Weide
I. INTRODUCTION AND PURPOSE 1
Q. PLEASE STATE YOUR NAME, TITLE, AND BUSINESS ADDRESS. 2
A. My name is James H. Vander Weide. I am President of Financial Strategy 3
Associates, a firm that provides strategic and financial consulting services to 4
business clients. My business address is 3606 Stoneybrook Drive, Durham, North 5
Carolina 27705. 6
Q. PLEASE DESCRIBE YOUR EDUCATIONAL BACKGROUND AND 7
PRIOR ACADEMIC EXPERIENCE. 8
A. I graduated from Cornell University with a Bachelor’s Degree in Economics and 9
from Northwestern University with a Ph.D. in Finance. After joining the faculty of 10
the School of Business at Duke University, I was named Assistant Professor, 11
Associate Professor, Professor, and then Research Professor. I have published 12
research in the areas of finance and economics and taught courses in these fields at 13
Duke for more than thirty-five years. I am now retired from my teaching duties at 14
Duke. A summary of my research, teaching, and other professional experience is 15
presented in Exhibit JVW-1, Appendix 1. 16
Q. HAVE YOU PREVIOUSLY TESTIFIED ON FINANCIAL OR ECONOMIC 17
ISSUES? 18
A. Yes. As an expert on financial and economic theory and practice, I have participated 19
in more than five hundred regulatory and legal proceedings before the public 20
service commissions of forty-five states and four Canadian provinces, the Federal 21
Energy Regulatory Commission, the National Energy Board (Canada), the Federal 22
Communications Commission, the Canadian Radio-Television and 23

Direct Testimony of James H. Vander Weide PH.D. Page 2 Kentucky / Vander Weide
Telecommunications Commission, the United States Congress, the National 1
Telecommunications and Information Administration, the insurance commissions 2
of five states, the Iowa State Board of Tax Review, the National Association of 3
Securities Dealers, and the North Carolina Property Tax Commission. In addition, 4
I have prepared expert testimony in proceedings before the United States District 5
Court for the District of Nebraska; the United States District Court for the District 6
of New Hampshire; the United States District Court for the District of Northern 7
Illinois; the United States District Court for the Eastern District of North Carolina; 8
the Montana Second Judicial District Court, Silver Bow County; the United States 9
District Court for the Northern District of California; the Superior Court, North 10
Carolina; the United States Bankruptcy Court for the Southern District of West 11
Virginia; the United States District Court for the Eastern District of Michigan; and 12
the Supreme Court of the State of New York. 13
Q. WHAT IS THE PURPOSE OF YOUR TESTIMONY? 14
A. I have been asked by Atmos Energy Corporation (“Atmos Energy” or “the 15
Company”) to prepare an independent appraisal of its cost of equity capital and to 16
recommend a rate of return on equity that is fair, that allows Atmos Energy to attract 17
capital on reasonable terms, and that allows Atmos Energy to maintain its financial 18
integrity. 19
II. SUMMARY OF TESTIMONY 20
Q. HOW DO YOU ESTIMATE ATMOS ENERGY’S COST OF EQUITY? 21
A. I estimate Atmos Energy’s cost of equity by applying several standard cost of equity 22
methods to market data for a proxy group of utility companies of comparable risk. 23

Direct Testimony of James H. Vander Weide PH.D. Page 3 Kentucky / Vander Weide
Q. WHY DO YOU APPLY YOUR COST OF EQUITY METHODS TO A 1
PROXY GROUP OF COMPARABLE RISK UTILITIES RATHER THAN 2
SOLELY TO ATMOS ENERGY? 3
A. I apply my cost of equity methods to a proxy group of comparable risk companies 4
because standard cost of equity methods, such as the discounted cash flow (DCF), 5
risk premium, and capital asset pricing model (CAPM) require inputs of quantities 6
that are not easily measured. Because these inputs can only be estimated, there is 7
naturally some degree of uncertainty surrounding the estimate of the cost of equity 8
for each company. However, the uncertainty in the estimate of the cost of equity 9
for an individual company can be greatly reduced by applying cost of equity 10
methods to a sample of comparable companies. 11
Intuitively, unusually high estimates for some individual companies are 12
offset by unusually low estimates for other individual companies. Thus, financial 13
economists invariably apply cost of equity methods to a group of comparable 14
companies. In utility regulation, the practice of using a group of comparable 15
companies, called the comparable company approach, is further supported by the 16
United States Supreme Court standard that the utility should be allowed to earn a 17
return on its investment that is commensurate with returns being earned on other 18
investments of similar risk. See Bluefield Water Works and Improvement Co. v. 19
Public Service Comm’n. 262 U.S. 679, 692 (1923) and Federal Power Comm’n v. 20
Hope Natural Gas Co., 320 U.S. 561, 603 (1944). 21

Direct Testimony of James H. Vander Weide PH.D. Page 4 Kentucky / Vander Weide
Q. WHAT COST OF EQUITY DO YOU FIND FOR YOUR COMPARABLE 1
COMPANIES IN THIS PROCEEDING? 2
A. On the basis of my studies, I find that the cost of equity for my comparable 3
companies is 10.4 percent. This conclusion is based on my application of standard 4
cost of equity estimation techniques, including the DCF model, the ex ante risk 5
premium approach, the ex post risk premium approach, and the CAPM, to a broad 6
group of utilities of comparable business risk. 7
Q. WHAT IS YOUR RECOMMENDATION REGARDING ATMOS 8
ENERGY’S FAIR RATE OF RETURN ON COMMON EQUITY? 9
A. I conservatively recommend that Atmos Energy be allowed a fair rate of return on 10
common equity equal to 10.4 percent. 11
Q. WHY IS YOUR RECOMMENDED RETURN ON EQUITY 12
CONSERVATIVE? 13
A. My recommended return on equity is conservative because the financial risk of my 14
comparable companies, which is based on the equity ratio resulting from the market 15
values of their equity and debt, is less than the financial risk of the lower equity 16
ratio in Atmos Energy’s ratemaking capital structure, which is based on its book 17
values of equity and debt. 18
Q. DO YOU HAVE EXHIBITS ACCOMPANYING YOUR TESTIMONY? 19
A. Yes. I have prepared or supervised the preparation of Exhibit JVW-1 consisting of 20
nine schedules and five appendices that were prepared by me or under my direction 21
and supervision. 22

Direct Testimony of James H. Vander Weide PH.D. Page 5 Kentucky / Vander Weide
III. ECONOMIC AND LEGAL PRINCIPLES 1
Q. HOW DO ECONOMISTS DEFINE THE REQUIRED RATE OF RETURN, 2
OR COST OF CAPITAL, ASSOCIATED WITH PARTICULAR 3
INVESTMENT DECISIONS SUCH AS THE DECISION TO INVEST IN 4
NATURAL GAS UTILITY PLANT AND EQUIPMENT? 5
A. Economists define the cost of capital as the return investors expect to receive on 6
alternative investments of comparable risk. 7
Q. HOW DOES THE COST OF CAPITAL AFFECT A FIRM’S INVESTMENT 8
DECISIONS? 9
A. The goal of a firm is to maximize the value of the firm. This goal can be 10
accomplished by investing only in that plant and equipment with an expected rate 11
of return that is equal to or greater than the cost of capital. Thus, a firm should 12
continue to invest in plant and equipment only so long as the return on its 13
investment is greater than or equal to its cost of capital. 14
Q. HOW DOES THE COST OF CAPITAL AFFECT INVESTORS’ 15
WILLINGNESS TO INVEST IN A COMPANY? 16
A. The cost of capital measures the return investors can expect on investments of 17
comparable risk. The cost of capital also measures the required rate of return on 18
investment because rational investors will not invest if they expect a return that is 19
less than the cost of capital. Thus, the cost of capital is a hurdle rate for both 20
investors and the firm. 21
Q. DO ALL INVESTORS HAVE THE SAME POSITION IN THE FIRM? 22
A. No. Debt investors have a fixed claim on a firm’s assets and income that must be 23
paid prior to any payment to the firm’s equity investors. Since the firm’s equity 24

Direct Testimony of James H. Vander Weide PH.D. Page 6 Kentucky / Vander Weide
investors have a residual claim on the firm’s assets and income, equity investments 1
are riskier than debt investments. Thus, the cost of equity exceeds the cost of debt. 2
Q. WHAT IS THE OVERALL OR AVERAGE COST OF CAPITAL? 3
A. The overall or average cost of capital is a weighted average of the cost of debt and 4
cost of equity, where the weights are the percentages of debt and equity in a firm’s 5
capital structure. 6
Q. CAN YOU ILLUSTRATE THE CALCULATION OF THE OVERALL OR 7
WEIGHTED AVERAGE COST OF CAPITAL? 8
A. Yes. Assume that the cost of debt is 7 percent, the cost of equity is 13 percent, and 9
the percentages of debt and equity in the firm’s capital structure are 50 percent and 10
50 percent, respectively. Then the weighted average cost of capital is expressed by 11
0.50 times 7 percent plus 0.50 times 13 percent, or 10.0 percent. 12
Q. HOW DO ECONOMISTS DEFINE THE COST OF EQUITY? 13
A. Economists define the cost of equity as the return investors expect to receive on 14
alternative equity investments of comparable risk. Since the return on an equity 15
investment of comparable risk is not a contractual return, the cost of equity is more 16
difficult to measure than the cost of debt. However, as I have already noted, there 17
is agreement among economists that the cost of equity is greater than the cost of 18
debt. There is also agreement among economists that the cost of equity, like the 19
cost of debt, is both forward looking and market based. 20

Direct Testimony of James H. Vander Weide PH.D. Page 7 Kentucky / Vander Weide
Q. HOW DO ECONOMISTS MEASURE THE PERCENTAGES OF DEBT 1
AND EQUITY IN A FIRM’S CAPITAL STRUCTURE? 2
A. Economists measure the percentages of debt and equity in a firm’s capital structure 3
by first calculating the market value of the firm’s debt and the market value of its 4
equity. Economists then calculate the percentage of debt by the ratio of the market 5
value of debt to the combined market value of debt and equity, and the percentage 6
of equity by the ratio of the market value of equity to the combined market value 7
of debt and equity. For example, if a firm’s debt has a market value of $25 million 8
and its equity has a market value of $75 million, then its total market capitalization 9
is $100 million, and its capital structure contains twenty-five percent debt and 10
seventy-five percent equity. 11
Q. WHY DO ECONOMISTS MEASURE A FIRM’S CAPITAL STRUCTURE 12
IN TERMS OF THE MARKET VALUES OF ITS DEBT AND EQUITY? 13
A. Economists measure a firm’s capital structure in terms of the market values of its 14
debt and equity because: (1) the weighted average cost of capital is defined as the 15
return investors expect to earn on a portfolio of the company’s debt and equity 16
securities; (2) investors measure the expected return and risk on their portfolios 17
using market value weights, not book value weights; and (3) market values are the 18
best measures of the amounts of debt and equity investors have invested in the 19
company on a going forward basis. 20

Direct Testimony of James H. Vander Weide PH.D. Page 8 Kentucky / Vander Weide
Q. WHY DO INVESTORS MEASURE THE EXPECTED RETURN AND RISK 1
ON THEIR INVESTMENT PORTFOLIOS USING MARKET VALUE 2
WEIGHTS RATHER THAN BOOK VALUE WEIGHTS? 3
A. Investors measure the expected return and risk on their investment portfolios using 4
market value weights because: (1) the expected return on a portfolio is calculated 5
by comparing the expected value of the portfolio at the end of the investment period 6
to its current value; (2) the risk of a portfolio is calculated by examining the 7
variability of the end-of-period return on the portfolio about the expected value; 8
and (3) market values are the best measure of the current value of the portfolio. 9
From the investor’s point of view, the historical cost, or book value of the 10
investment, is irrelevant for the purpose of assessing the required return and risk on 11
their portfolios because if they were to sell their investments, they would receive 12
market value, not historical cost. Thus, the return can only be measured in terms of 13
market values. 14
Q. IS THE ECONOMIC DEFINITION OF THE WEIGHTED AVERAGE 15
COST OF CAPITAL CONSISTENT WITH REGULATORS’ 16
TRADITIONAL DEFINITION OF THE AVERAGE COST OF CAPITAL? 17
A. No. The economic definition of the weighted average cost of capital is based on the 18
market costs of debt and equity, the market value percentages of debt and equity in 19
a company’s capital structure, and the future expected risk of investing in the 20
company. In contrast, regulators have traditionally defined the weighted average 21
cost of capital using the embedded cost of debt and the book values of debt and 22
equity in a company’s capital structure. 23

Direct Testimony of James H. Vander Weide PH.D. Page 9 Kentucky / Vander Weide
Q. ARE THE ECONOMIC PRINCIPLES REGARDING THE FAIR RETURN 1
FOR CAPITAL RECOGNIZED IN ANY UNITED STATES SUPREME 2
COURT CASES? 3
A. Yes. These economic principles, relating to the supply of and demand for capital, 4
are recognized in two United States Supreme Court cases: (1) Bluefield Water 5
Works and Improvement Co. v. Public Service Comm’n. of W. Va.; and (2) Federal 6
Power Comm’n v. Hope Natural Gas Co. In Bluefield Water Works, the Court 7
stated: 8
A public utility is entitled to such rates as will permit it to earn a 9 return upon the value of the property which it employs for the 10 convenience of the public equal to that generally being made at the 11 same time and in the same general part of the country on investments 12 in other business undertakings which are attended by corresponding 13 risks and uncertainties; but it has no constitutional right to profits 14 such as are realized or anticipated in highly profitable enterprises or 15 speculative ventures. The return should be reasonably sufficient to 16 assure confidence in the financial soundness of the utility, and 17 should be adequate, under efficient and economical management, to 18 maintain and support its credit, and enable it to raise the money 19 necessary for the proper discharge of its public duties. [Bluefield 20 Water Works and Improvement Co. v. Public Service Comm’n. 262 21 U.S. 679, 692 (1923).] 22
The Court clearly recognizes here that: (1) a regulated firm cannot remain 23
financially sound unless the return it is allowed to earn on the value of its property 24
is at least equal to the cost of capital (the principle relating to the demand for 25
capital); and (2) a regulated firm will not be able to attract capital if it does not offer 26
investors an opportunity to earn a return on their investment equal to the return they 27
expect to earn on other investments of the same risk (the principle relating to the 28
supply of capital). 29
In the Hope Natural Gas case, the Court reiterates the financial soundness 30

Direct Testimony of James H. Vander Weide PH.D. Page 10 Kentucky / Vander Weide
and capital attraction principles of Bluefield Water Works: 1
From the investor or company point of view it is important that there 2 be enough revenue not only for operating expenses but also for the 3 capital costs of the business. These include service on the debt and 4 dividends on the stock... By that standard the return to the equity 5 owner should be commensurate with returns on investments in other 6 enterprises having corresponding risks. That return, moreover, 7 should be sufficient to assure confidence in the financial integrity of 8 the enterprise, so as to maintain its credit and to attract capital. 9 [Federal Power Comm’n v. Hope Natural Gas Co., 320 U.S. 591, 10 603 (1944).] 11
The Court clearly recognizes that the fair rate of return on equity should be: 12
(1) comparable to returns investors expect to earn on other investments of similar 13
risk; (2) sufficient to assure confidence in the company’s financial integrity; and 14
(3) adequate to maintain and support the company’s credit and to attract capital. 15
IV. BUSINESS AND FINANCIAL RISKS 16
Q. HOW DO INVESTORS ESTIMATE THE EXPECTED RATE OF RETURN 17
ON SPECIFIC INVESTMENTS, SUCH AS AN INVESTMENT IN ATMOS 18
ENERGY? 19
A. Investors estimate the expected rate of return in several steps. First, they estimate 20
the amount of their investment in the company. Second, they estimate the timing 21
and amounts of the cash flows they expect to receive from their investment over 22
the life of the investment. Third, they determine the return, or discount rate, that 23
equates the present value of the expected cash receipts from their investment in the 24
company to the current value of their investment in the company. 25

Direct Testimony of James H. Vander Weide PH.D. Page 11 Kentucky / Vander Weide
Q. ARE THE RETURNS ON INVESTMENT OPPORTUNITIES, SUCH AS AN 1
INVESTMENT IN ATMOS ENERGY, KNOWN WITH CERTAINTY AT 2
THE TIME THE INVESTMENT IS MADE? 3
A. No. The return on an investment in Atmos Energy depends on the Company’s 4
expected future cash flows over the life of the investment, as discussed above. Since 5
the Company’s expected future cash flows are uncertain at the time the investment 6
is made, the return on the investment is also uncertain. 7
Q. YOU NOTE THAT INVESTORS REQUIRE A RETURN ON 8
INVESTMENT THAT IS EQUAL TO THE RETURN THEY EXPECT TO 9
RECEIVE ON OTHER INVESTMENTS OF SIMILAR RISK. DOES THE 10
REQUIRED RETURN ON AN INVESTMENT DEPEND ON THE RISK OF 11
THAT INVESTMENT? 12
A. Yes. Since investors are averse to risk, they require a higher rate of return on 13
investments with greater risk. 14
Q. WHAT FUNDAMENTAL RISK DO INVESTORS FACE WHEN THEY 15
INVEST IN A COMPANY SUCH AS ATMOS ENERGY? 16
A. Investors face the fundamental risk that their realized, or actual, return on 17
investment will be less than their required return on investment. 18
Q. HOW DO INVESTORS MEASURE INVESTMENT RISK? 19
A. Investors generally measure investment risk by estimating the probability, or 20
likelihood, of earning less than the required return on investment. For investments 21
with potential returns distributed symmetrically about the expected, or mean, 22

Direct Testimony of James H. Vander Weide PH.D. Page 12 Kentucky / Vander Weide
return, investors can also measure investment risk by estimating the variance, or 1
volatility, of the potential return on investment. 2
Q. DO INVESTORS DISTINGUISH BETWEEN BUSINESS AND FINANCIAL 3
RISK? 4
A. Yes. Business risk is the underlying risk that investors will earn less than their 5
required return on investment when the investment is financed entirely with equity. 6
Financial risk is the additional risk of earning less than the required return when the 7
investment is financed with both fixed-cost debt and equity. 8
Q. WHAT ARE THE PRIMARY DETERMINANTS OF A NATURAL GAS 9
UTILITY’S BUSINESS RISK? 10
A. The business risk of investing in natural gas utilities such as Atmos Energy is 11
caused by: (1) demand uncertainty; (2) operating expense uncertainty; 12
(3) investment cost uncertainty; (4) high operating leverage; and (5) regulatory 13
uncertainty. 14
Q. HOW DOES DEMAND UNCERTAINTY AFFECT A NATURAL GAS 15
UTILITY’S BUSINESS RISK? 16
A. Demand uncertainty affects a natural gas utility’s business risk through its impact 17
on the variability of the company’s revenues and its return on investment. The 18
greater the uncertainty in demand, the greater is the uncertainty in the company’s 19
revenues and its return on investment. 20

Direct Testimony of James H. Vander Weide PH.D. Page 13 Kentucky / Vander Weide
Q. WHAT CAUSES THE DEMAND FOR NATURAL GAS DISTRIBUTION 1
SERVICES TO BE UNCERTAIN? 2
A. Demand uncertainty is caused by the sensitivity of demand to: (1) the state of the 3
economy and population growth; (2) fluctuations in temperatures during the peak 4
heating season; (3) changes in rates; (4) customer efforts to conserve energy; 5
(5) the ability of customers to switch to alternative sources of energy such as 6
electricity or propane; (6) customer use of more efficient appliances; and 7
(7) potential service interruptions due to accidents or natural disasters. 8
Q. WHY ARE A NATURAL GAS UTILITY’S OPERATING EXPENSES 9
UNCERTAIN? 10
A. Operating expense uncertainty arises as a result of variability in (1) purchased gas 11
costs; (2) pipeline capacity costs; (3) employee-related costs such as salaries and 12
wages, pensions, and insurance; (4) maintenance and materials costs; (5) customer 13
billing and accounting expenses; and (6) bad debt expenses. 14
Q. WHY ARE A NATURAL GAS UTILITY’S INVESTMENT COSTS 15
UNCERTAIN? 16
A. The natural gas utility business requires large investments in the storage and 17
distribution facilities required to deliver natural gas to customers. The future 18
amounts of required investment in storage and distribution facilities are uncertain 19
due to uncertainty regarding: (1) long-run demand; (2) costs of complying with 20
environmental, health, and safety laws and regulations; (3) costs to maintain and 21
replace aging plant and equipment; and (4) costs required to assure adequate natural 22
gas supply to meet forecasted demand. 23

Direct Testimony of James H. Vander Weide PH.D. Page 14 Kentucky / Vander Weide
Q. YOU NOTE ABOVE THAT HIGH OPERATING LEVERAGE 1
CONTRIBUTES TO THE BUSINESS RISK OF NATURAL GAS 2
UTILITIES. WHAT IS OPERATING LEVERAGE? 3
A. Operating leverage is the increased sensitivity of a company’s earnings to sales 4
variability that arises when some of the company’s costs are fixed. 5
Q. HOW DO ECONOMISTS MEASURE OPERATING LEVERAGE? 6
A. Economists typically measure operating leverage by the ratio of a company’s fixed 7
expenses to its operating margin (revenues minus variable expenses). 8
Q. WHAT IS THE DIFFERENCE BETWEEN FIXED AND VARIABLE 9
EXPENSES? 10
A. Fixed expenses are expenses that do not vary with output, and variable expenses 11
are expenses that vary directly with output. For natural gas utilities, fixed expenses 12
include the fixed component of operating and maintenance costs, depreciation and 13
amortization, and taxes. Variable expenses include fuel costs and the variable 14
component of operations and maintenance costs. 15
Q. DO NATURAL GAS UTILITIES EXPERIENCE HIGH OPERATING 16
LEVERAGE? 17
A. Yes. As noted above, operating leverage increases when a firm’s commitment to 18
fixed costs rises in relation to its operating margin on sales. The relatively high 19
degree of fixed costs in the natural gas utility business arises primarily from: (1) 20
the average natural gas utility’s large investment in fixed, long-lived plant and 21
equipment; and (2) the relative “fixity” of a natural gas utility’s operating and 22

Direct Testimony of James H. Vander Weide PH.D. Page 15 Kentucky / Vander Weide
maintenance costs. High operating leverage causes the average natural gas utility’s 1
operating income to be highly sensitive to demand and revenue fluctuations. 2
Q. HOW DOES OPERATING LEVERAGE AFFECT A COMPANY’S 3
BUSINESS RISK? 4
A. Operating leverage affects a company’s business risk through its impact on the 5
variability of the company’s profits or income. Generally speaking, the higher a 6
company’s operating leverage, the higher is the variability of the company’s 7
operating profits. 8
Q. DOES REGULATION CREATE UNCERTAINTY FOR NATURAL GAS 9
UTILITIES? 10
A. Yes. Rates for natural gas distribution services are generally set by state regulatory 11
authorities in a manner that provides natural gas distribution companies an 12
opportunity to recover prudently incurred operating expenses and earn a fair rate of 13
return on their prudently incurred investment in property, plant, and equipment. 14
Investors’ perceptions of the business and financial risks of natural gas utilities are 15
strongly influenced by their views of the quality of regulation. Investors are aware 16
that regulators in some jurisdictions may be unwilling at times to set rates that allow 17
companies an opportunity to recover their cost of service in a timely manner and 18
earn a fair and reasonable return on investment. Investors are also aware that, even 19
if a company presently has an opportunity to earn a fair return on its investment in 20
property, plant, and equipment, there is no assurance that they will continue to have 21
such an opportunity in the future. If investors perceive that regulators may not 22
provide an opportunity to earn a fair rate of return on investment, investors may 23

Direct Testimony of James H. Vander Weide PH.D. Page 16 Kentucky / Vander Weide
demand a higher rate of return for natural gas utilities operating in such 1
jurisdictions. If investors perceive that regulators are likely to continue to provide 2
an opportunity for a company to earn a fair rate of return on investment, investors 3
will view the risk of earning a less than fair return as minimal. 4
Q. YOU NOTE THAT FINANCIAL LEVERAGE INCREASES THE RISK OF 5
INVESTING IN NATURAL GAS UTILITIES SUCH AS ATMOS ENERGY. 6
HOW DO ECONOMISTS MEASURE FINANCIAL LEVERAGE? 7
A. Economists generally measure financial leverage by the percentages of debt and 8
equity in a company’s market value capital structure. Companies with a high 9
percentage of debt compared to equity are considered to have high financial 10
leverage. 11
Q. WHY DOES FINANCIAL LEVERAGE AFFECT THE RISK OF 12
INVESTING IN A NATURAL GAS UTILITY’S STOCK? 13
A. High financial leverage is a source of additional risk to utility stock investors 14
because it increases the percentage of the firm’s costs that are fixed, and the 15
presence of higher fixed costs increases the variability of the equity investors’ 16
return on investment. 17
Q. CAN THE RISKS OF INVESTING IN NATURAL GAS UTILITIES SUCH 18
AS ATMOS ENERGY BE DISTINGUISHED FROM THE RISKS OF 19
INVESTING IN COMPANIES IN OTHER INDUSTRIES? 20
A. Yes. The risks of investing in natural gas utilities such as Atmos Energy can be 21
distinguished from the risks of investing in companies in many other industries in 22
several ways. First, the risks of investing in natural gas utilities are increased 23

Direct Testimony of James H. Vander Weide PH.D. Page 17 Kentucky / Vander Weide
because of the greater capital intensity of the natural gas utility business and the 1
fact that most investments in natural gas facilities are largely irreversible once they 2
are made. Second, unlike returns in competitive industries, the returns from 3
investment in natural gas utilities are largely asymmetric. That is, there is little 4
opportunity for natural gas utilities to earn more than the required return, and a 5
significant chance that the utilities will earn less than the required return. 6
V. COST OF EQUITY ESTIMATION METHODS 7
Q. WHAT METHODS DO YOU USE TO ESTIMATE ATMOS ENERGY’S 8
COST OF EQUITY? 9
A. I use several generally accepted methods for estimating the cost of equity for Atmos 10
Energy. These are the DCF, the ex ante risk premium, the ex post risk premium, 11
and the CAPM. The DCF method assumes that the current market price of a firm’s 12
stock is equal to the discounted value of all expected future cash flows. The ex ante 13
risk premium method assumes that an investor’s expectations regarding the equity 14
risk premium can be estimated from data on the DCF expected rate of return on 15
equity compared to the interest rate on long-term bonds. The ex post risk premium 16
method assumes that an investor’s expectations regarding the equity-debt return 17
differential are influenced by the historical record of comparable returns on stock 18
and bond investments. The cost of equity under both risk premium methods is then 19
equal to the expected interest rate on bond investments plus the expected risk 20
premium. The CAPM assumes that the investor’s required rate of return on equity 21
is equal to an expected risk-free rate of interest plus the product of a company-22
specific risk factor, beta, and the expected risk premium on the market portfolio. 23

Direct Testimony of James H. Vander Weide PH.D. Page 18 Kentucky / Vander Weide
A. DISCOUNTED CASH FLOW METHOD 1
Q. PLEASE DESCRIBE THE DCF MODEL. 2
A. The DCF model is based on the assumption that investors value an asset because 3
they expect to receive a sequence of cash flows from owning the asset. Thus, 4
investors value an investment in a bond because they expect to receive a sequence 5
of semi-annual coupon payments over the life of the bond and a terminal payment 6
equal to the bond’s face value at the time the bond matures. Likewise, investors 7
value an investment in a firm’s stock because they expect to receive a sequence of 8
dividend payments and, perhaps, expect to sell the stock at a higher price sometime 9
in the future. 10
A second fundamental principle of the DCF method is that investors value 11
a dollar received in the future less than a dollar received today. A future dollar is 12
valued less than a current dollar because investors could invest a current dollar in 13
an interest earning account and increase their wealth. This principle is called the 14
time value of money. 15
Applying the two fundamental DCF principles noted above to an investment 16
in a bond leads to the conclusion that investors value their investment in the bond 17
on the basis of the present value of the bond’s future cash flows. Thus, the price of 18
the bond should be equal to: 19
EQUATION 1 20
21
where: 22
PB = Bond price; 23
nB iFC
iC
iCP
)1()1()1( 2

Direct Testimony of James H. Vander Weide PH.D. Page 19 Kentucky / Vander Weide
C = Cash value of the coupon payment (assumed for notational 1
convenience to occur annually rather than semi-annually); 2
F = Face value of the bond; 3
i = The rate of interest the investor could earn by investing her 4
money in an alternative bond of equal risk; and 5
n = The number of periods before the bond matures. 6
Applying these same principles to an investment in a firm’s stock suggests that 7
the price of the stock should be equal to: 8
EQUATION 2 9
10
where: 11
PS = Current price of the firm’s stock; 12
D1, D2...Dn = Expected annual dividend per share on the firm’s stock; 13
Pn = Price per share of stock at the time the investor expects to sell 14
the stock; and 15
k = Return the investor expects to earn on alternative investments 16
of the same risk, i.e., the investor’s required rate of return. 17
Equation 2 is frequently called the annual discounted cash flow model of stock 18
valuation. Assuming that dividends grow at a constant annual rate, g, this equation 19
can be solved for k, the cost of equity. The resulting cost of equity equation is k = 20
D1/Ps + g, where k is the cost of equity, D1 is the expected next period annual 21
dividend, Ps is the current price of the stock, and g is the constant annual growth 22
rate in earnings, dividends, and book value per share. The term D1/Ps is called the 23
nnn
s kPD
kD
kDP
)1()1()1( 221

Direct Testimony of James H. Vander Weide PH.D. Page 20 Kentucky / Vander Weide
expected dividend yield component of the annual DCF model, and the term g is 1
called the expected growth component of the annual DCF model. As in the case of 2
the price of a bond, the price of a stock is related to the timing, magnitude, and 3
relative risk of the expected cash flows. 4
Q. ARE YOU RECOMMENDING THAT THE ANNUAL DCF MODEL BE 5
USED TO ESTIMATE ATMOS ENERGY’S COST OF EQUITY? 6
A. No. The DCF model assumes that a company’s stock price is equal to the present 7
discounted value of all expected future dividends. The annual DCF model is only a 8
correct expression for the present value of future dividends if dividends are paid 9
annually at the end of each year. Because the companies in my comparable group 10
all pay dividends quarterly, the current market price that investors are willing to 11
pay reflects the expected quarterly receipt of dividends. Therefore, a quarterly DCF 12
model should be used to estimate the cost of equity for these firms. The quarterly 13
DCF model differs from the annual DCF model in that it expresses a company’s 14
price as the present value of a quarterly stream of dividend payments. A complete 15
analysis of the implications of the quarterly payment of dividends on the DCF 16
model is provided in Exhibit JVW-1, Appendix 2. For the reasons cited there, I 17
employed the quarterly DCF model throughout my calculations, even though the 18
results of the quarterly DCF model for my companies are approximately equal to 19
the results of a properly applied annual DCF model (in which the end-of-year 20
dividend is estimated by multiplying the current annual dividend by the factor one 21
plus the growth rate). 22

Direct Testimony of James H. Vander Weide PH.D. Page 21 Kentucky / Vander Weide
Q. PLEASE DESCRIBE THE QUARTERLY DCF MODEL YOU USE. 1
A. The quarterly DCF model I use is described on Exhibit JVW-1, Schedule 1 and in 2
Appendix 2. The quarterly DCF equation shows that the cost of equity is: the sum 3
of the future expected dividend yield and the growth rate, where the dividend in the 4
dividend yield is the equivalent future value of the four quarterly dividends at the 5
end of the year, and the growth rate is the expected growth in dividends or earnings 6
per share. 7
Q. HOW DO YOU ESTIMATE THE QUARTERLY DIVIDEND PAYMENTS 8
IN YOUR QUARTERLY DCF MODEL? 9
A. The quarterly DCF model requires an estimate of the dividends, d1, d2, d3, and d4, 10
investors expect to receive over the next four quarters. I estimate the next four 11
quarterly dividends by multiplying the previous four quarterly dividends by the 12
factor, (1 + the growth rate, g). 13
Q. CAN YOU ILLUSTRATE HOW YOU ESTIMATE THE NEXT FOUR 14
QUARTERLY DIVIDENDS WITH DATA FOR A SPECIFIC COMPANY? 15
A. Yes. In the case of Atmos Energy, the first company shown in Exhibit JVW-1, 16
Schedule 1, the last four quarterly dividends are equal to 0.45, 0.485, 0.485, and 17
0.485. Thus, dividend d1 is equal to 0.48 [.45 x (1 + .067) = 0.48] and dividends d2, 18
d3, and d4 are equal to 0.517 [0.485 x (1 + .067) = 0.517]. (As noted previously, the 19
logic underlying this procedure is described in Appendix 2.) 20

Direct Testimony of James H. Vander Weide PH.D. Page 22 Kentucky / Vander Weide
Q. HOW DO YOU ESTIMATE THE GROWTH COMPONENT OF THE 1
QUARTERLY DCF MODEL? 2
A. I use the analysts’ estimates of future earnings per share (EPS) growth reported by 3
I/B/E/S Thomson Reuters. 4
Q. WHAT ARE THE ANALYSTS’ ESTIMATES OF FUTURE EPS GROWTH? 5
A. As part of their research, financial analysts working at Wall Street firms 6
periodically estimate EPS growth for each firm they follow. The EPS forecasts for 7
each firm are then published. Investors who are contemplating purchasing or selling 8
shares in individual companies review the forecasts. These estimates represent 9
three- to five-year forecasts of EPS growth. 10
Q. WHAT IS I/B/E/S? 11
A. I/B/E/S is a division of Thomson Reuters that reports analysts’ EPS growth 12
forecasts for a broad group of companies. The forecasts are expressed in terms of a 13
mean forecast and a standard deviation of forecast for each firm. Investors use the 14
mean forecast as an estimate of future firm performance. 15
Q. WHY DO YOU USE THE I/B/E/S GROWTH ESTIMATES? 16
A. I use the I/B/E/S growth rates because they: (1) are widely circulated in the 17
financial community, (2) include the projections of reputable financial analysts 18
who develop estimates of future EPS growth, (3) are reported on a timely basis to 19
investors, and (4) are widely used by institutional and other investors. 20

Direct Testimony of James H. Vander Weide PH.D. Page 23 Kentucky / Vander Weide
Q. WHY DO YOU RELY ON ANALYSTS’ PROJECTIONS OF FUTURE EPS 1
GROWTH IN ESTIMATING THE INVESTORS’ EXPECTED GROWTH 2
RATE RATHER THAN LOOKING AT HISTORICAL GROWTH RATES? 3
A. I rely on analysts’ projections of future EPS growth because there is considerable 4
empirical evidence that investors use analysts’ forecasts to estimate future earnings 5
growth. 6
Q. HAVE YOU PERFORMED ANY STUDIES CONCERNING THE USE OF 7
ANALYSTS’ FORECASTS AS AN ESTIMATE OF INVESTORS’ 8
EXPECTED GROWTH RATE, G? 9
A. Yes. I prepared a study with Willard T. Carleton, Professor Emeritus of Finance at 10
the University of Arizona, which is described in a paper entitled “Investor Growth 11
Expectations and Stock Prices: Analysts vs. History,” published in the Spring 1988 12
edition of The Journal of Portfolio Management. 13
Q. PLEASE SUMMARIZE THE RESULTS OF YOUR STUDY. 14
A. We performed a correlation analysis to identify the historically oriented growth 15
rates which best described a firm’s stock price. We then performed a regression 16
study comparing the historical growth rates and retention growth rates with the 17
average I/B/E/S analysts’ forecasts. In every case, the regression equations 18
containing the average of analysts’ forecasts statistically outperformed the 19
regression equations containing the historical growth and retention growth 20
estimates. These results are consistent with those found by Cragg and Malkiel, the 21
early major research in this area (John G. Cragg and Burton G. Malkiel, 22
Expectations and the Structure of Share Prices, University of Chicago Press, 1982). 23

Direct Testimony of James H. Vander Weide PH.D. Page 24 Kentucky / Vander Weide
These results are also consistent with the hypothesis that investors use analysts’ 1
forecasts, rather than historically oriented growth calculations, in making decisions 2
to buy and sell stock. The results provide overwhelming evidence that the analysts’ 3
forecasts of future growth are superior to historically-oriented growth measures in 4
predicting a firm’s stock price. I note that researchers at State Street Financial 5
Advisors updated my study in 2004, and their results continue to confirm that 6
analysts’ growth forecasts are superior to historically-oriented growth measures in 7
predicting a company’s stock price. 8
Q. WHAT PRICE DO YOU USE IN YOUR DCF MODEL? 9
A. I use a simple average of the monthly high and low stock prices for each firm for 10
the three-month period ending July 2018. These high and low stock prices were 11
obtained from Thomson Reuters. 12
Q. WHY DO YOU USE THE THREE-MONTH AVERAGE STOCK PRICE IN 13
APPLYING THE DCF METHOD? 14
A. I use the three-month average stock price in applying the DCF method because 15
stock prices fluctuate daily, while financial analysts’ forecasts for a given company 16
are generally changed less frequently, often on a quarterly basis. Thus, to match the 17
stock price with an earnings forecast, it is appropriate to average stock prices over 18
a three-month period. 19

Direct Testimony of James H. Vander Weide PH.D. Page 25 Kentucky / Vander Weide
Q. DO YOU INCLUDE AN ALLOWANCE FOR FLOTATION COSTS IN 1
YOUR DCF ANALYSIS? 2
A. Yes. I include a five percent allowance for flotation costs in my DCF calculations. 3
A complete explanation of the need for a flotation cost allowance is contained in 4
Appendix 3. 5
Q. ARE YOU AWARE THAT THE COMMISSION CONCLUDED THAT 6
FLOTATION COSTS SHOULD BE EXCLUDED FROM COST OF 7
EQUITY ANALYSES BECAUSE, ACCORDING TO THE COMMISSION, 8
FLOTATION COSTS ARE ALREADY ACCOUNTED FOR IN CURRENT 9
STOCK PRICES? (SEE COMMISSION ORDER, CASE NO. 2017-00349, 10
MAY 3, 2018, AT P. 28.) 11
A. Yes. However, I disagree with the Commission’s assertion that flotation costs are 12
already accounted for in current stock prices. Rather, flotation costs are an expense 13
that is deducted from the proceeds associated with a stock issuance before the 14
proceeds are distributed to the issuing company. Because a company’s stock price 15
reflects the return on the amount of cash actually invested by the company, and 16
flotation costs are deducted from the proceeds of a stock issuance prior to the 17
distribution of the net proceeds to the company, flotation costs are not included in 18
a company’s stock price. 19
Q. PLEASE EXPLAIN YOUR INCLUSION OF A FLOTATION COST 20
ALLOWANCE. 21
A. All firms that have sold securities in the capital markets have incurred some level 22
of flotation costs, including the costs of underwriters’ commissions, legal fees, and 23

Direct Testimony of James H. Vander Weide PH.D. Page 26 Kentucky / Vander Weide
printing expense, for example. These costs are withheld from the proceeds of the 1
stock sale or are paid separately and must be recovered over the life of the equity 2
issue. Costs vary depending upon the size of the issue, the type of registration 3
method used and other factors, but in general these costs range between three and 4
five percent of the proceeds from the issue [see Inmoo Lee, Scott Lochhead, 5
Jay Ritter, and Quanshui Zhao, “The Costs of Raising Capital,” The Journal of 6
Financial Research, Vol. XIX No 1 (Spring 1996), 59-74, and Clifford W. Smith, 7
“Alternative Methods for Raising Capital,” Journal of Financial Economics 5 8
(1977) 273-307]. In addition to these costs, for large equity issues (in relation to 9
outstanding equity shares), there is likely to be a decline in price associated with 10
the sale of shares to the public. On average, the decline in price associated with new 11
stock issuances has been estimated at two to three percent (see Richard H. Pettway, 12
“The Effects of New Equity Sales upon Utility Share Prices,” Public Utilities 13
Fortnightly, May 10, 1984, 35—39). Thus, the total flotation cost, including both 14
issuance expense and stock price decline, generally ranges from five to 15
eight percent of the proceeds of an equity issue. I believe a combined five percent 16
allowance for flotation costs is a conservative estimate that should be used in 17
applying the DCF model in this proceeding (see Exhibit JVW-1, Schedule 1). 18
Q. IS A FLOTATION COST ADJUSTMENT ONLY APPROPRIATE IF A 19
COMPANY ISSUES STOCK DURING THE TEST YEAR? 20
A. No. As described in Exhibit JVW-1, Appendix 3, a flotation cost adjustment is 21
required whether or not a company issued new stock during the test year. Previously 22
incurred flotation costs have not been recovered in previous rate cases; rather, they 23

Direct Testimony of James H. Vander Weide PH.D. Page 27 Kentucky / Vander Weide
are a permanent cost associated with past issues of common stock. Just as an 1
adjustment is made to the embedded cost of debt to reflect previously incurred debt 2
issuance costs (regardless of whether additional bond issuances were made in the 3
test year), so should an adjustment be made to the cost of equity regardless of 4
whether additional stock was issued during the test year. 5
Q. HOW DO YOU APPLY THE DCF APPROACH TO ESTIMATE THE 6
REQUIRED RETURN ON EQUITY FOR ATMOS ENERGY? 7
A. I apply the DCF approach to the Value Line natural gas utilities shown in Exhibit 8
JVW-1, Schedule 1. 9
Q. HOW DO YOU SELECT YOUR PROXY GROUP OF NATURAL GAS 10
DISTRIBUTION COMPANIES? 11
A. I select all the natural gas utilities followed by Value Line that: (1) paid dividends 12
during every quarter of the last two years; (2) did not decrease dividends during 13
any quarter of the past two years; (3) have an available positive I/B/E/S long-term 14
growth forecast; (4) have an investment grade bond rating and a Value Line Safety 15
Rank of 1, 2, or 3; and (5) are not the subject of a merger offer that has not been 16
completed. 17
Q. WHY DO YOU ELIMINATE COMPANIES THAT HAVE EITHER 18
DECREASED OR ELIMINATED THEIR DIVIDEND IN THE PAST TWO 19
YEARS? 20
A. The DCF model requires the assumption that dividends will grow at a constant rate 21
into the indefinite future. If a company has either decreased or eliminated its 22

Direct Testimony of James H. Vander Weide PH.D. Page 28 Kentucky / Vander Weide
dividend in recent years, an assumption that the company’s dividend will grow at 1
the same rate into the indefinite future is questionable. 2
Q. WHY DO YOU ELIMINATE COMPANIES THAT ARE THE SUBJECT OF 3
A MERGER OFFER THAT HAS NOT BEEN COMPLETED? 4
A. A merger announcement can sometimes have a significant impact on a company’s 5
stock price because of anticipated merger-related cost savings and new market 6
opportunities. Analysts’ growth forecasts, on the other hand, are necessarily related 7
to companies as they currently exist, and do not reflect investors’ views of the 8
potential cost savings and new market opportunities associated with mergers. The 9
use of a stock price that includes the value of potential mergers in conjunction with 10
growth forecasts that do not include the growth-enhancing prospects of potential 11
mergers produces DCF results that tend to distort a company’s cost of equity. 12
Q. PLEASE SUMMARIZE THE RESULTS OF YOUR APPLICATION OF 13
THE DCF MODEL TO YOUR PROXY GROUP. 14
A. As shown on JVW-1, Schedule 1, I obtain an average DCF result of 9.2 percent. 15
B. RISK PREMIUM METHOD 16
Q. PLEASE DESCRIBE THE RISK PREMIUM METHOD OF ESTIMATING 17
THE COST OF EQUITY. 18
A. The risk premium method is based on the principle that investors expect to earn a 19
return on an equity investment that reflects a “premium” above the interest rate they 20
expect to earn on an investment in bonds. This equity risk premium compensates 21
equity investors for the additional risk they bear in making equity investments 22
versus bond investments. 23

Direct Testimony of James H. Vander Weide PH.D. Page 29 Kentucky / Vander Weide
Q. DOES THE RISK PREMIUM APPROACH SPECIFY WHAT DEBT 1
INSTRUMENT SHOULD BE USED TO ESTIMATE THE INTEREST 2
RATE COMPONENT IN THE METHODOLOGY? 3
A. No. The risk premium approach can be implemented using virtually any debt 4
instrument. However, the risk premium approach does require that the debt 5
instrument used to estimate the risk premium be the same as the debt instrument 6
used to calculate the interest rate component of the risk premium approach. For 7
example, if the risk premium on equity is calculated by comparing the returns on 8
stocks to the interest rate on A-rated utility bonds, then the interest rate on A-rated 9
utility bonds must be used to estimate the interest rate component of the risk 10
premium approach. 11
Q. DOES THE RISK PREMIUM APPROACH REQUIRE THAT THE SAME 12
COMPANIES BE USED TO ESTIMATE THE STOCK RETURN AS ARE 13
USED TO ESTIMATE THE BOND RETURN? 14
A. No. For example, many analysts apply the risk premium approach by comparing 15
the return on a portfolio of stocks to the income return on Treasury securities such 16
as long-term Treasury bonds. Clearly, in this widely accepted application of the risk 17
premium approach, the same companies are not used to estimate the stock return as 18
are used to estimate the bond return, since the United States government is not a 19
company. 20

Direct Testimony of James H. Vander Weide PH.D. Page 30 Kentucky / Vander Weide
Q. HOW DO YOU MEASURE THE REQUIRED RISK PREMIUM ON AN 1
EQUITY INVESTMENT IN YOUR GROUP OF PUBLICLY-TRADED 2
NATURAL GAS UTILITIES? 3
A. I use two methods to estimate the required risk premium on an equity investment 4
in publicly-traded natural gas utilities. The first is called the ex ante risk premium 5
method and the second is called the ex post risk premium method. 6
1. Ex Ante Risk Premium Method 7
Q. PLEASE DESCRIBE YOUR EX ANTE RISK PREMIUM APPROACH FOR 8
MEASURING THE REQUIRED RISK PREMIUM ON AN EQUITY 9
INVESTMENT IN NATURAL GAS UTILITIES. 10
A. My ex ante risk premium method is based on studies of the DCF expected return 11
on a group of natural gas utilities compared to the interest rate on Moody’s A-rated 12
utility bonds. Specifically, for each month in my study period, I calculate the risk 13
premium using the equation, 14
RPPROXY = DCFPROXY – IA 15
where: 16
RPPROXY = the required risk premium on an equity investment in the 17
proxy group of companies; 18
DCFPROXY = average DCF estimated cost of equity on a portfolio of 19
proxy companies; and 20
IA = the yield to maturity on an investment in A-rated utility 21
bonds. 22
I then perform regression analyses to determine if there is a relationship between 23

Direct Testimony of James H. Vander Weide PH.D. Page 31 Kentucky / Vander Weide
the calculated risk premium and interest rates. A detailed description of my ex ante 1
risk premium studies is contained in Appendix 4, and the underlying DCF results 2
and interest rates are displayed in Exhibit JVW-1, Schedule 2. 3
Q. FROM YOUR REGRESSION ANALYSES, DO YOU FIND THAT THERE 4
IS A RELATIONSHIP BETWEEN THE CALCULATED EQUITY RISK 5
PREMIUM AND INTEREST RATES? 6
A. Yes. My regression analyses confirm that there is an inverse relationship between 7
the calculated equity risk premium and interest rates. Specifically, my analyses 8
indicate that when the yield to maturity on A-rated utility bonds declines by 100 9
basis points, the required equity risk premium increases by approximately 60 basis 10
points; and when the yield on A-rated utility bonds increases by 100 basis points, 11
the required equity risk premium declines by 60 basis points (see Appendix 4, p. 12
3). 13
Q. HOW DO YOU USE THE REGRESSION ANALYSES TO ESTIMATE THE 14
COST OF EQUITY IN YOUR EX ANTE RISK PREMIUM METHOD? 15
A. To estimate the cost of equity, I add the estimated 5.2 percent required equity risk 16
premium obtained from my regression analyses to the forecasted interest rate on A-17
rated utility bonds. 18
Q. WHAT COST OF EQUITY ESTIMATE DO YOU OBTAIN USING YOUR 19
EX ANTE RISK PREMIUM METHOD? 20
A. I obtain a cost of equity estimate of 10.9 percent using my ex ante risk premium 21
method. This cost of equity estimate is the sum of the estimated 5.2 percent equity 22

Direct Testimony of James H. Vander Weide PH.D. Page 32 Kentucky / Vander Weide
risk premium from my regression analyses and the 5.7 percent forecasted yield to 1
maturity on A-rated utility bonds. 2
Q. HOW DO YOU OBTAIN THE EXPECTED YIELD ON A-RATED UTILITY 3
BONDS? 4
A. I obtain the expected yield to maturity on A-rated utility bonds, 5.7 percent, by 5
averaging forecast data from Value Line and the U.S. Energy Information 6
Administration (EIA). Value Line Selection & Opinion ( June1, 2018) projects a 7
AAA-rated Corporate bond yield equal to 4.8 percent. The average spread between 8
A-rated utility bonds and Aaa-rated Corporate bonds is 40 basis points (A-rated 9
utility, 4.27 percent, less Aaa-rated Corporate, 3.87 percent, equals 40 basis points). 10
Adding 40 basis points to the 4.8 percent Value Line Aaa Corporate bond forecast 11
equals a forecast yield of 5.2 percent for the A-rated utility bonds. The EIA 12
forecasts an AA-rated utility bond yield equal to 6.11 percent. The spread between 13
AA-rated utility and A-rated utility bonds is 17 basis points (4.27 percent less 14
4.10 percent). Adding 17 basis points to EIA’s 6.11 percent AA-utility bond yield 15
forecast equals a forecast yield for A-rated utility bonds equal to 6.3 percent. The 16
average of the forecasts (5.2 percent using Value Line data and 6.3 percent using 17
EIA data) is 5.7 percent. 18
Q. WHY DO YOU USE A FORECASTED YIELD TO MATURITY ON A-19
RATED UTILITY BONDS RATHER THAN A CURRENT YIELD TO 20
MATURITY? 21
A. I use a forecasted yield to maturity on A-rated utility bonds rather than a current 22
yield to maturity because the fair rate of return standard requires that a company 23

Direct Testimony of James H. Vander Weide PH.D. Page 33 Kentucky / Vander Weide
have an opportunity to earn its required return on its investment during the forward-1
looking period during which rates will be in effect. Economists project that future 2
interest rates will be higher than current interest rates as the Federal Reserve raises 3
interest rates in order to prevent inflation. Thus, the use of forecasted interest rates 4
is consistent with the fair rate of return standard, whereas the use of current interest 5
rates at this time is not. 6
2. Ex Post Risk Premium Method 7
Q. PLEASE DESCRIBE YOUR EX POST RISK PREMIUM METHOD FOR 8
MEASURING THE REQUIRED RISK PREMIUM ON AN EQUITY 9
INVESTMENT IN NATURAL GAS UTILITIES. 10
A. I first perform a study of the comparable returns received by stock and bond 11
investors over the 81 years of my study. I estimate the returns on stock and bond 12
portfolios, using stock price and dividend yield data on the S&P 500 and bond yield 13
data on Moody’s A-rated Utility Bonds. My study consists of making an investment 14
of one dollar in the S&P 500 and Moody’s A-rated utility bonds at the beginning 15
of 1937, and reinvesting the principal plus return each year to 2018. The return 16
associated with each stock portfolio is the sum of the annual dividend yield and 17
capital gain (or loss) which accrued to this portfolio during the year(s) in which it 18
was held. The return associated with the bond portfolio, on the other hand, is the 19
sum of the annual coupon yield and capital gain (or loss) which accrued to the bond 20
portfolio during the year(s) in which it was held. The resulting annual returns on 21
the stock and bond portfolios purchased in each year from 1937 to 2018 are shown 22
on Exhibit JVW-1, Schedule 3. The average annual return on an investment in the 23

Direct Testimony of James H. Vander Weide PH.D. Page 34 Kentucky / Vander Weide
S&P 500 stock portfolio is 11.4 percent, while the average annual return on an 1
investment in the Moody’s A-rated utility bond portfolio is 6.7 percent. The risk 2
premium on the S&P 500 stock portfolio is, therefore, 4.7 percent (11.4 – 6.7 = 3
4.7). 4
I also conduct a second study using stock data on the S&P Utilities rather 5
than the S&P 500. As shown on Exhibit JVW-1, Schedule 4, the average annual 6
return on an investment in the S&P Utility stock portfolio is 10.64 percent per year. 7
Thus, the return on the S&P Utility stock portfolio exceeded the return on the 8
Moody’s A-rated utility bond portfolio by 4.0 percent (10.64 – 6.67 = 3.97, rounded 9
to 4.0 percent). 10
Q. WHY IS IT APPROPRIATE TO PERFORM YOUR EX POST RISK 11
PREMIUM ANALYSIS USING BOTH THE S&P 500 AND THE S&P 12
UTILITIES STOCK INDICES? 13
A. I perform my ex post risk premium analysis on both the S&P 500 and the S&P 14
Utilities because I believe natural gas utilities today face risks that are somewhere 15
in between the average risk of the S&P Utilities and the S&P 500 over the years 16
1937 to 2018. Thus, I use the average of the two historically-based risk premiums 17
as my estimate of the required risk premium in my ex post risk premium method. 18
Q. WOULD YOUR STUDY PROVIDE A DIFFERENT RISK PREMIUM IF 19
YOU STARTED WITH A DIFFERENT TIME PERIOD? 20
A. Yes. The risk premium results vary somewhat depending on the historical time 21
period chosen. My policy is to go back as far in history as I can get reliable data. I 22
thought it would be most meaningful to begin after the passage and implementation 23
Direct Testimony of James H. Vander Weide PH.D. Page 35 Kentucky / Vander Weide
of the Public Utility Holding Company Act of 1935 (the 1935 Act). This Act 1
significantly changed the structure of the public utility industry. Because the 1935 2
Act was not implemented until the beginning of 1937, I concluded that data prior 3
to 1937 should not be used in my study. (The repeal of the 1935 Act has not 4
materially impacted the structure of the public utility industry; thus, the Act’s repeal 5
does not have any impact on my choice of time period.) 6
Q. WHY IS IT NECESSARY TO EXAMINE THE YIELD FROM DEBT 7
INVESTMENTS IN ORDER TO DETERMINE THE INVESTORS’ 8
REQUIRED RATE OF RETURN ON EQUITY CAPITAL? 9
A. As previously explained, investors expect to earn a return on their equity investment 10
that exceeds currently available bond yields because the return on equity, as a 11
residual return, is less certain than the yield on bonds; and investors must be 12
compensated for this uncertainty. Investors’ expectations concerning the amount 13
by which the return on equity will exceed the bond yield may be influenced by 14
historical differences in returns to bond and stock investors. Thus, we can estimate 15
investors’ expected returns from an equity investment based on information about 16
past differences between returns on stocks and bonds. In interpreting this 17
information, investors would also recognize that risk premiums increase when 18
interest rates are low. 19

Direct Testimony of James H. Vander Weide PH.D. Page 36 Kentucky / Vander Weide
Q. WHAT CONCLUSIONS DO YOU DRAW FROM YOUR EX POST RISK 1
PREMIUM ANALYSES ABOUT THE REQUIRED RETURN ON AN 2
EQUITY INVESTMENT IN NATURAL GAS UTILITIES? 3
A. My studies provide strong evidence that investors today require an equity return of 4
at least 4.0 to 4.7 percentage points above the expected yield on A-rated utility 5
bonds. As discussed above, the forecast yield on A-rated utility bonds is 6
5.7 percent. Adding a 4.0 to 4.7 percentage point risk premium to a yield of 7
5.7 percent on A-rated utility bonds, I obtain an expected return on equity in the 8
range 9.7 percent to 10.4 percent, with a midpoint of 10.1 percent. Adding a 15 9
basis-point allowance for flotation costs, I obtain an estimate of 10.2 percent as the 10
ex post risk premium cost of equity. (I determine the flotation cost allowance by 11
calculating the difference in my DCF results with and without a flotation cost 12
allowance.) 13
C. CAPITAL ASSET PRICING MODEL 14
Q. WHAT IS THE CAPM? 15
A. The CAPM is an equilibrium model of the security markets in which the expected 16
or required return on a given security is equal to the risk-free rate of interest, plus 17
the company equity “beta,” times the market risk premium: 18
Cost of equity = Risk-free rate + (Equity beta x Market risk premium) 19
The risk-free rate in this equation is the expected rate of return on a risk-free 20
government security, the equity beta is a measure of the company’s risk relative to 21
the market as a whole, and the market risk premium is the premium investors 22
require to invest in the market basket of all securities compared to the risk-free 23

Direct Testimony of James H. Vander Weide PH.D. Page 37 Kentucky / Vander Weide
security. 1
Q. HOW DO YOU USE THE CAPM TO ESTIMATE THE COST OF EQUITY 2
FOR YOUR PROXY COMPANIES? 3
A. The CAPM requires an estimate of the risk-free rate, the company-specific risk 4
factor or beta, and the expected return on the market portfolio. For my estimate of 5
the risk-free rate, I use a forecasted yield to maturity on 20-year Treasury bonds of 6
3.9 percent, obtained using data from Value Line and EIA. For my estimate of the 7
company-specific risk, or beta, I use both the current average 0.69 Value Line beta 8
for my group of natural gas utilities and the 0.88 beta estimated from the 9
relationship between the historical risk premium on utilities and the historical risk 10
premium on the market portfolio. For my estimate of the expected risk premium on 11
the market portfolio, I use two approaches. First, I estimate the risk premium on the 12
market portfolio using historical risk premium data reported in the 2018 Valuation 13
Handbook for the years 1926 through 2017, data which are consistent with the data 14
previously reported by Ibbotson® SBBI®. Second, I estimate the risk premium on 15
the market portfolio from the difference between the DCF cost of equity for the 16
S&P 500 and the forecasted yield to maturity on 20-year Treasury bonds. 17
Q. HOW DO YOU OBTAIN THE FORECASTED YIELD TO MATURITY ON 18
20-YEAR TREASURY BONDS? 19
A. As noted above, I use data from Value Line and EIA to obtain a forecasted yield to 20
maturity on 20-year Treasury bonds. Value Line forecasts a yield on 10-year 21
Treasury notes equal to 3.6 percent. The spread between the average yield on 10-22
year Treasury notes (2.89 percent) and 20-year Treasury bonds (2.94 percent) is 5 23

Direct Testimony of James H. Vander Weide PH.D. Page 38 Kentucky / Vander Weide
basis points. Adding 5 basis points to Value Line’s 3.6 percent forecasted yield on 1
10-year Treasury notes produces a forecasted yield of 3.65 percent for 20-year 2
Treasury bonds (see Value Line Investment Survey, Selection & Opinion, June 1, 3
2018). EIA forecasts a yield of 4.07 percent on 10-year Treasury notes. Adding the 4
5-basis point spread between 10-year Treasury notes and 20-year Treasury bonds 5
to the EIA forecast of 4.07 percent for 10-year Treasury notes produces an EIA 6
forecast for 20-year Treasury bonds equal to 4.12 percent. The average of the 7
forecasts is 3.9 percent (3.7 percent using Value Line data and 4.1 percent using 8
EIA data). 9
1. Historical CAPM 10
Q. HOW DO YOU ESTIMATE THE EXPECTED RISK PREMIUM ON THE 11
MARKET PORTFOLIO USING HISTORICAL RISK PREMIUM DATA 12
DEVELOPED BY IBBOTSON® SBBI®? 13
A. I estimate the expected risk premium on the market portfolio by calculating the 14
difference between the arithmetic mean total return on the S&P 500 from 1926 to 15
2018 (12.06 percent) and the average income return on 20-year U.S. Treasury 16
bonds over the same period (4.99 percent). Thus, my historical risk premium 17
method produces a risk premium of 7.07 percent (12.06 – 4.99 = 7.07). 18
Q. WHY DO YOU RECOMMEND THAT THE RISK PREMIUM ON THE 19
MARKET PORTFOLIO BE ESTIMATED USING THE ARITHMETIC 20
MEAN RETURN ON THE S&P 500? 21
A. I recommend that the risk premium on the market portfolio be estimated using the 22
arithmetic mean return on the S&P 500 because, in my opinion, the arithmetic mean 23

Direct Testimony of James H. Vander Weide PH.D. Page 39 Kentucky / Vander Weide
return is the best approach for calculating the return investors expect to receive in 1
the future. For an investment which has an uncertain outcome, the arithmetic mean 2
is the best historically-based measure of the return investors expect to receive in the 3
future. A discussion of the importance of using arithmetic mean returns in the 4
context of CAPM or risk premium studies is contained in Exhibit JVW-1, Schedule 5
5. 6
Q. WHY DO YOU RECOMMEND THAT THE RISK PREMIUM ON THE 7
MARKET PORTFOLIO BE MEASURED USING THE INCOME RETURN 8
ON 20-YEAR TREASURY BONDS RATHER THAN THE TOTAL 9
RETURN ON THESE BONDS? 10
A. As discussed above, the CAPM requires an estimate of the risk-free rate of interest. 11
When Treasury bonds are issued, the income return on the bond is risk free, but the 12
total return, which includes both income and capital gains or losses, is not. Thus, 13
the income return should be used in the CAPM because it is only the income return 14
that is risk free. 15
Q. WHAT CAPM RESULT DO YOU OBTAIN WHEN YOU ESTIMATE THE 16
EXPECTED RISK PREMIUM ON THE MARKET PORTFOLIO FROM 17
THE ARITHMETIC MEAN DIFFERENCE BETWEEN THE RETURN ON 18
THE MARKET AND THE YIELD ON 20-YEAR TREASURY BONDS? 19
A. Using a risk-free rate equal to 3.9 percent, a natural gas utility beta equal to 0.69, a 20
risk premium on the market portfolio equal to 7.1 percent, and a flotation cost 21
allowance equal to 15 basis points, I obtain an historical CAPM estimate of the cost 22

Direct Testimony of James H. Vander Weide PH.D. Page 40 Kentucky / Vander Weide
of equity equal to 8.9 percent for my natural gas utility group (3.9 + 0.69 x 7.1 + 1
0.15= 8.9) (see Exhibit JVW-1, Schedule 6). 2
Q. CAN A REASONABLE APPLICATION OF THE CAPM PRODUCE 3
HIGHER COST OF EQUITY RESULTS THAN YOU HAVE JUST 4
REPORTED? 5
A. Yes. There is evidence that the CAPM tends to underestimate the cost of equity for 6
small market capitalization companies, such as many of the natural gas utilities, 7
and for companies whose betas are less than 1.0. 8
Q. DOES THE FINANCE LITERATURE SUPPORT AN ADJUSTMENT TO 9
THE CAPM EQUATION TO ACCOUNT FOR A COMPANY’S SIZE AS 10
MEASURED BY MARKET CAPITALIZATION? 11
A. Yes. For example, the 2017 Valuation Yearbook supports such an adjustment. The 12
estimates of the size premium required to be added to the basic CAPM cost of 13
equity are shown below in TABLE 1. 14
TABLE 1 15
ESTIMATES OF PREMIUMS FOR COMPANY SIZE 16 (2017 VALUATION YEARBOOK) 17
Decile Smallest Mkt. Cap. ($Millions)
Largest Mkt. Cap. ($Millions)
Premium
Large-Cap (No Adjustment) 10,712.000 0 Mid-Cap (3-5) 2,392.689 10,711.194 1.02% Low-Cap (6-8) 569.279 2,390.899 1.75% Micro-Cap (9-10) 2.516 567.843 3.67%
18
Q. DO YOU MAKE AN ADJUSTMENT TO REFLECT THE SMALL 19
MARKET CAPITALIZATION OF THE NATURAL GAS UTILITIES? 20
A. Yes. The size-adjusted CAPM result is 10.1 percent (see Exhibit JVW-1, 21
Schedule 6). 22

Direct Testimony of James H. Vander Weide PH.D. Page 41 Kentucky / Vander Weide
Q. WHAT IS THE EVIDENCE THAT THE CAPM TENDS TO 1
UNDERESTIMATE THE COST OF EQUITY FOR COMPANIES WITH 2
BETAS LESS THAN 1.0 AND IS LESS RELIABLE THE FURTHER THE 3
ESTIMATED BETA IS FROM 1.0? 4
A. The original evidence that the unadjusted CAPM tends to underestimate the cost of 5
equity for companies whose equity beta is less than 1.0 and is less reliable the 6
further the estimated beta is from 1.0 was presented in a paper by Black, Jensen, 7
and Scholes, “The Capital Asset Pricing Model: Some Empirical Tests.” Numerous 8
subsequent papers have validated the Black, Jensen, and Scholes findings, 9
including those by Litzenberger and Ramaswamy (1979), Banz (1981), Fama and 10
French (1992), Fama and French (2004), Fama and MacBeth (1973), and Jegadeesh 11
and Titman (1993). 12
Q. CAN YOU BRIEFLY SUMMARIZE THESE ARTICLES? 13
A. Yes. The CAPM conjectures that security returns increase with increases in security 14
betas in line with the equation 15
fmifi RERRER , 16
where ERi is the expected return on security or portfolio i, Rf is the risk-free rate, 17
ERm – Rf is the expected risk premium on the market portfolio, and βi is a 18
measure of the risk of investing in security or portfolio i. If the CAPM correctly 19
predicts the relationship between risk and return in the marketplace, then the 20
realized returns on portfolios of securities and the corresponding portfolio betas 21
should lie on the solid straight line with intercept Rf and slope [Rm – Rf] shown 22
below in FIGURE 1. 23

Direct Testimony of James H. Vander Weide PH.D. Page 42 Kentucky / Vander Weide
FIGURE 1 1 AVERAGE RETURNS COMPARED TO BETA 2
FOR PORTFOLIOS FORMED ON PRIOR BETA 3
4
5
6
7
8
9
10
11
12
Financial 13 scholars have studied the relationship between estimated
portfolio betas and the achieved returns on the underlying portfolio of securities to 14
test whether the CAPM correctly predicts achieved returns in the marketplace. They 15
find that the relationship between returns and betas is inconsistent with the 16
relationship posited by the CAPM. As described in Fama and French (1992) and 17
Fama and French (2004), the actual relationship between portfolio betas and returns 18
is shown by the dotted line in FIGURE 1 above. Although financial scholars disagree 19
on the reasons why the return/beta relationship looks more like the dotted line in 20
Figure 1 than the solid line, they generally agree that the dotted line lies above the 21
solid line for portfolios with betas less than 1.0 and below the solid line for 22
portfolios with betas greater than 1.0. Thus, in practice, scholars generally agree 23
that the CAPM underestimates portfolio returns for companies with betas less than 24
1.0, and overestimates portfolio returns for portfolios with betas greater than 1.0. 25
1.0 0.75 0
Return predicted by CAPM
Actual Portfolio Return
Beta
Return
Rf

Direct Testimony of James H. Vander Weide PH.D. Page 43 Kentucky / Vander Weide
Q. DO YOU HAVE ADDITIONAL EVIDENCE THAT THE CAPM TENDS TO 1
UNDERESTIMATE THE COST OF EQUITY FOR UTILITIES WITH 2
AVERAGE BETAS LESS THAN 1.0? 3
A. Yes. As shown in Exhibit JVW-1, Schedule 7, over the period 1937 to 2018, 4
investors in the S&P Utilities Stock Index have earned a risk premium over the 5
yield on long-term Treasury bonds equal to 5.58 percent, while investors in the S&P 6
500 have earned a risk premium over the yield on long-term Treasury bonds equal 7
to 6.28 percent. According to the CAPM, investors in utility stocks should expect 8
to earn a risk premium over the yield on long-term Treasury securities equal to the 9
average utility beta times the expected risk premium on the S&P 500. Thus, the 10
ratio of the risk premium on the utility portfolio to the risk premium on the S&P 11
500 should equal the utility beta. However, the average natural gas utility beta at 12
the time of my studies is approximately 0.69, whereas the historical ratio of the 13
utility risk premium to the S&P 500 risk premium is 0.88 (5.58 ÷ 6.28 = 0.88). In 14
short, the current 0.69 measured beta for natural gas utilities underestimates the cost 15
of equity for natural gas utilities, providing further support for the conclusion that 16
the CAPM underestimates the cost of equity for natural gas utilities at this time. 17
Q. CAN YOU ADJUST FOR THE TENDENCY OF THE CAPM TO 18
UNDERESTIMATE THE COST OF EQUITY FOR COMPANIES WITH 19
BETAS LESS THAN 1.0? 20
A. Yes. I can implement the CAPM using the 0.88 beta I discuss above, which I obtain 21
by comparing the historical returns on utilities to historical returns on the S&P 500. 22

Direct Testimony of James H. Vander Weide PH.D. Page 44 Kentucky / Vander Weide
Q. WHAT CAPM RESULT DO YOU OBTAIN WHEN YOU USE A BETA 1
EQUAL TO 0.88 RATHER THAN A NATURAL GAS UTILITY BETA 2
EQUAL TO 0.69? 3
A. I obtain a CAPM result equal to 10.3 percent using a risk-free rate equal to 3.9 4
percent, a beta equal to 0.88, the historical market risk premium equal to 7.1 5
percent, and a flotation cost allowance of 15 basis points (3.9 + 0.88 x 7.1+ 0.15= 6
10.3). (See Exhibit JVW-1, Schedule 8.) 7
Q. WHAT IS THE AVERAGE OF YOUR THREE HISTORICAL CAPM 8
RESULTS? 9
A. The average of my three historical CAPM results is 9.7 percent (8.9 percent + 10.1 10
percent + 10.3 percent) ÷ 3 = 9.7 percent). I use 9.7 percent as my estimate of the 11
historical CAPM cost of equity. 12
2. DCF-Based CAPM 13
Q. HOW DOES YOUR DCF-BASED CAPM DIFFER FROM YOUR 14
HISTORICAL CAPM? 15
A. As noted above, my DCF-based CAPM differs from my historical CAPM only in 16
the method I use to estimate the risk premium on the market portfolio. In the 17
historical CAPM, I use historical risk premium data to estimate the risk premium 18
on the market portfolio. In the DCF-based CAPM, I estimate the risk premium on 19
the market portfolio from the difference between the DCF cost of equity for the 20
S&P 500 and the forecasted yield to maturity on 20-year Treasury bonds. 21

Direct Testimony of James H. Vander Weide PH.D. Page 45 Kentucky / Vander Weide
Q. WHAT RISK PREMIUM DO YOU OBTAIN WHEN YOU CALCULATE 1
THE DIFFERENCE BETWEEN THE DCF-RETURN ON THE S&P 500 2
AND THE RISK-FREE RATE? 3
A. Using this method, I obtain a risk premium on the market portfolio equal to 4
9.8 percent (This value is obtained by subtracting the forecasted risk-free rate, 3.9 5
percent, from the DCF estimate of the market return, 13.7 percent (13.7 – 3.9 = 6
9.8). (See Exhibit JVW-1, Schedule 9.) 7
Q. WHAT CAPM RESULT DO YOU OBTAIN WHEN YOU ESTIMATE THE 8
EXPECTED RETURN ON THE MARKET PORTFOLIO BY APPLYING 9
THE DCF MODEL TO THE S&P 500? 10
A. Using a risk-free rate of 3.9 percent, a natural gas utility beta of 0.69, a risk 11
premium on the market portfolio of 9.8 percent, and a flotation cost allowance equal 12
to 15 basis points, I obtain a CAPM result of 10.8 percent for my natural gas utility 13
group. Using a risk-free rate of 3.9 percent, a natural gas utility beta of 0.88, a risk 14
premium on the market portfolio of 9.8 percent, and a flotation cost allowance of 15
15 basis points, I obtain a CAPM result of 12.7 percent for my natural gas utility 16
group. The average of these two results is 11.7 percent [(10.8 percent + 17
12.7 percent) ÷ 2 = 11.7 percent]. I use 11.7 percent as my estimate of the DCF-18
based CAPM cost of equity. 19
VI. FAIR RATE OF RETURN ON EQUITY 20
Q. WHAT IS THE FAIR RATE OF RETURN ON EQUITY? 21
A. The fair rate of return on equity is a forward-looking return on equity that provides 22
the regulated company with an opportunity to earn a return on its investment over 23

Direct Testimony of James H. Vander Weide PH.D. Page 46 Kentucky / Vander Weide
the period in which rates are in effect that is commensurate with returns that 1
investors expect to earn on other investments of similar risk. Because the fair rate 2
of return is a forward-looking return, the estimate of the fair return requires 3
consideration of investors’ expectations for a reasonably long period into the future. 4
Q. BASED ON YOUR APPLICATION OF SEVERAL COST OF EQUITY 5
METHODS TO YOUR PROXY COMPANY GROUPS, WHAT IS YOUR 6
CONCLUSION REGARDING THE FAIR RATE OF RETURN ON EQUITY 7
FOR YOUR COMPARABLE COMPANIES? 8
A. Based on my application of several cost of equity methods, I conclude that the fair 9
rate of return on equity for my comparable companies is in the range 9.2 percent to 10
11.7 percent, with an average equal to 10.4 percent (see Table 2, apparent 11
discrepancy due to rounding). I conclude that the fair rate of return on equity for 12
my comparable companies is 10.4 percent. 13
TABLE 2 COST OF EQUITY MODEL RESULTS
METHOD MODEL RESULT DCF 9.2% Ex Ante Risk Premium 10.9% Ex Post Risk Premium 10.2% CAPM-Historical 9.7% CAPM-DCF Based 11.7% Average 10.4%
14
Q. IS THERE EVIDENCE THAT YOUR 10.4 PERCENT COST OF EQUITY 15
RECOMMENDATION IS CONSERVATIVE? 16
A. Yes. My cost of equity analyses reflect the financial risk of my proxy companies as 17
measured by their average market value capital structure, which has more than 18

Direct Testimony of James H. Vander Weide PH.D. Page 47 Kentucky / Vander Weide
67 percent equity. If Atmos Energy’s ratemaking, or book value capital structure, 1
is used to set rates, the cost of equity for Atmos Energy will necessarily be higher 2
than the cost of equity for the proxy group because the financial risk associated 3
with Atmos Energy’s book value capital structure is significantly higher than the 4
financial risk reflected in the cost of equity estimate for my proxy companies. 5
Q. WHAT IS ATMOS ENERGY’S RECOMMENDED RATEMAKING 6
CAPITAL STRUCTURE IN THIS PROCEEDING? 7
A. Atmos Energy is recommending a ratemaking capital structure containing 8
3.4 percent short-term debt, 38.4 percent long-term debt, and 58.2 percent common 9
equity. 10
Q. DOES THIS CONCLUDE YOUR TESTIMONY? 11
A. Yes, it does. 12

COMMONWEALTH OF KENTUCKY
BEFORE THE PUBLIC SERVICE COMMISSION
IN THE MATTER OF RATE APPLICATION OF A TMOS ENERGY CORPORATION
) ) )
Case No. 2018-00281
CERTIFICATE AND AFFIDAVIT
The Affiant, James H. Vander Weide, being duly sworn, deposes and states that the prepared testimony attached hereto and made a part hereof, constitutes the prepared direct testimony of this affiant in Case No. 2018-00281, in the Matter of the Rate Application of Atmos Energy Corporation, and that if asked the questions propounded therein, this affiant would make the answers set forth in the attached prepared direct prefiled testimony.
STATE OF _ /'V_ :.Y_' "--'-f_l_lw--><.. =-...:.v_f ~-'"'-COUNTY 0 F _ ____LQ--=LN":...:__l_"..:..._li,__ __ _
SUBSCRIBED AND SWORN to before me by James H. Vander Weide on this the \ 0t;-_ day of September, 2018.
JUSTIN COUCH Notary Public
Orange Co .• North carolina My Commission Expires New. 7, 2al2
u Notalf'Public
My Commission Expires:

LIST OF SCHEDULES AND APPENDICES
Exhibit JVW-1 Schedule-1 Summary of Discounted Cash Flow Analysis for Natural Gas Utilities
Exhibit JVW-1 Schedule-2 Comparison of the DCF Expected Return on an Investment in Natural Gas Utilities to the Interest Rate on Moody’s A-Rated Utility Bonds
Exhibit JVW-1 Schedule-3 Comparative Returns on S&P 500 Stock Index and Moody’s A-Rated Bonds 1937—2018
Exhibit JVW-1 Schedule-4 Comparative Returns on S&P Utility Stock Index and Moody’s A-Rated Bonds 1937—2018
Exhibit JVW-1 Schedule-5 Using the Arithmetic Mean to Estimate the Cost of Equity Capital
Exhibit JVW-1 Schedule-6 Calculation of Capital Asset Pricing Model Cost of Equity Using an Historical Risk Premium
Exhibit JVW-1 Schedule-7 Comparison of Risk Premiums on S&P500 and S&P Utilities 1937 – 2018
Exhibit JVW-1 Schedule-8 Calculation of Capital Asset Pricing Model Cost of Equity Using an Historical Risk Premium and a 0.88 Utility Beta
Exhibit JVW-1 Schedule-9 Calculation of Capital Asset Pricing Model Cost of Equity Using DCF Estimate of the Expected Rate of Return on the Market Portfolio
Exhibit JVW-1 Appendix 1 Qualifications of James H. Vander Weide
Exhibit JVW-1 Appendix 2 Derivation of the Quarterly DCF Model
Exhibit JVW-1 Appendix 3 Adjusting for Flotation Costs in Determining a Public Utility’s Allowed Rate of Return on Equity
Exhibit JVW-1 Appendix 4 Ex Ante Risk Premium Method
Exhibit JVW-1 Appendix 5 Ex Post Risk Premium Method
EXHIBIT JVW-1

Schedule 1 Page 1 of 2
ATMOS ENERGY EXHIBIT__(JVW-1)
SCHEDULE 1 SUMMARY OF DISCOUNTED CASH FLOW ANALYSIS
FOR NATURAL GAS UTILITIES
COMPANY
MOST RECENT
QUARTERLY DIVIDEND
(d0)
STOCK PRICE
(P0)
I/B/E/S FORECAST
OF FUTURE
EARNINGS GROWTH
MARKET CAP $ (MIL)
DCF MODEL RESULT
1 Atmos Energy 0.485 88.832 6.7% 10,188 9.1%2 Chesapeake Utilities 0.370 79.267 6.0% 1,383 7.9%3 New Jersey Resources 0.273 43.967 6.4% 4,023 9.3%4 NiSource Inc. 0.195 25.298 5.7% 9,486 9.2%5 Northwest Nat. Gas 0.473 61.863 4.5% 1,848 8.0%6 ONE Gas Inc. 0.460 73.848 5.5% 4,023 8.2%7 South Jersey Inds. 0.280 32.717 12.0% 2,896 16.2%8 Southwest Gas 0.520 75.607 4.0% 3,824 7.0%9 Spire Inc. 0.563 70.675 3.5% 3,653 7.0%10 UGI Corp. 0.260 50.957 7.9% 9,201 10.2%11 Average 9.2%12 Market-weighted Average 9.3%13 Average Line 11, Line 12 9.2%
EXHIBIT JVW-1

Schedule 1 Page 2 of 2
Notes:
d0 = Most recent quarterly dividend d1,d2,d3,d4 = Next four quarterly dividends, calculated by multiplying the last four quarterly
dividends by the factor (1 + g) P0 = Average of the monthly high and low stock prices during the three months ending
July 2018 per Thomson Reuters FC = Flotation cost allowance (five percent) as a percent of stock price g = I/B/E/S forecast of future earnings growth July 2018 from Thomson Reuters k = Cost of equity using the quarterly version of the DCF model
gFCP
dkdkdkdk
)1(
)1()1()1(
0
425.
350.
275.
1
EXHIBIT JVW-1

Schedule 2 Page 1 of 6
ATMOS ENERGY EXHIBIT__(JVW-1)
SCHEDULE 2 COMPARISON OF DCF EXPECTED RETURN ON AN INVESTMENT IN NATURAL GAS UTILITY STOCKS TO THE INTEREST RATE ON MOODY’S A-RATED UTILITY BONDS
In this analysis, I compute a natural gas utility equity risk premium by comparing the DCF estimated cost of equity for an electric utility proxy group to the interest rate on A-rated utility bonds. For each month in my June 1998 through July 2018 study period:
DCF = Average DCF-estimated cost of equity on a portfolio of proxy companies; Bond Yield = Yield to maturity on an investment in A-rated utility bonds; and Risk Premium = DCF – Bond yield.
A more detailed description of my ex ante risk premium method is contained in Appendix 4.
DATE DCF BOND YIELD
RISK PREMIUM
Jun-98 0.1154 0.0703 0.0451
Jul-98 0.1186 0.0703 0.0483
Aug-98 0.1234 0.0700 0.0534
Sep-98 0.1273 0.0693 0.0580
Oct-98 0.1260 0.0696 0.0564
Nov-98 0.1211 0.0703 0.0508
Dec-98 0.1185 0.0691 0.0494
Jan-99 0.1195 0.0697 0.0498
Feb-99 0.1243 0.0709 0.0534
Mar-99 0.1257 0.0726 0.0531
Apr-99 0.1260 0.0722 0.0538
May-99 0.1221 0.0747 0.0474
Jun-99 0.1208 0.0774 0.0434
Jul-99 0.1222 0.0771 0.0451
Aug-99 0.1220 0.0791 0.0429
Sep-99 0.1226 0.0793 0.0433
Oct-99 0.1233 0.0806 0.0427
Nov-99 0.1240 0.0794 0.0446
Dec-99 0.1280 0.0814 0.0466
Jan-00 0.1301 0.0835 0.0466
Feb-00 0.1344 0.0825 0.0519
Mar-00 0.1344 0.0828 0.0516
Apr-00 0.1316 0.0829 0.0487
May-00 0.1292 0.0870 0.0422
Jun-00 0.1295 0.0836 0.0459
Jul-00 0.1317 0.0825 0.0492
Aug-00 0.1290 0.0813 0.0477
Sep-00 0.1257 0.0823 0.0434
Oct-00 0.1260 0.0814 0.0446
Nov-00 0.1251 0.0811 0.0440
Dec-00 0.1239 0.0784 0.0455
Jan-01 0.1261 0.0780 0.0481
Feb-01 0.1261 0.0774 0.0487
Mar-01 0.1275 0.0768 0.0507
Apr-01 0.1227 0.0794 0.0433
May-01 0.1302 0.0799 0.0503
Jun-01 0.1304 0.0785 0.0519
Jul-01 0.1338 0.0778 0.0560
Aug-01 0.1327 0.0759 0.0568
EXHIBIT JVW-1

Schedule 2 Page 2 of 6
DATE DCF BOND YIELD
RISK PREMIUM
Sep-01 0.1268 0.0775 0.0493
Oct-01 0.1268 0.0763 0.0505
Nov-01 0.1268 0.0757 0.0511
Dec-01 0.1254 0.0783 0.0471
Jan-02 0.1236 0.0766 0.0470
Feb-02 0.1241 0.0754 0.0487
Mar-02 0.1189 0.0776 0.0413
Apr-02 0.1159 0.0757 0.0402
May-02 0.1162 0.0752 0.0410
Jun-02 0.1170 0.0741 0.0429
Jul-02 0.1242 0.0731 0.0511
Aug-02 0.1234 0.0717 0.0517
Sep-02 0.1260 0.0708 0.0552
Oct-02 0.1250 0.0723 0.0527
Nov-02 0.1221 0.0714 0.0507
Dec-02 0.1216 0.0707 0.0509
Jan-03 0.1219 0.0706 0.0513
Feb-03 0.1232 0.0693 0.0539
Mar-03 0.1195 0.0679 0.0516
Apr-03 0.1162 0.0664 0.0498
May-03 0.1126 0.0636 0.0490
Jun-03 0.1114 0.0621 0.0493
Jul-03 0.1127 0.0657 0.0470
Aug-03 0.1139 0.0678 0.0461
Sep-03 0.1127 0.0656 0.0471
Oct-03 0.1123 0.0643 0.0480
Nov-03 0.1089 0.0637 0.0452
Dec-03 0.1071 0.0627 0.0444
Jan-04 0.1059 0.0615 0.0444
Feb-04 0.1039 0.0615 0.0424
Mar-04 0.1037 0.0597 0.0440
Apr-04 0.1041 0.0635 0.0406
May-04 0.1045 0.0662 0.0383
Jun-04 0.1036 0.0646 0.0390
Jul-04 0.1011 0.0627 0.0384
Aug-04 0.1008 0.0614 0.0394
Sep-04 0.0976 0.0598 0.0378
Oct-04 0.0974 0.0594 0.0380
Nov-04 0.0962 0.0597 0.0365
Dec-04 0.0970 0.0592 0.0378
Jan-05 0.0990 0.0578 0.0412
Feb-05 0.0979 0.0561 0.0418
Mar-05 0.0979 0.0583 0.0396
Apr-05 0.0988 0.0564 0.0424
May-05 0.0981 0.0553 0.0427
Jun-05 0.0976 0.0540 0.0436
Jul-05 0.0966 0.0551 0.0415
Aug-05 0.0969 0.0550 0.0419
Sep-05 0.0980 0.0552 0.0428
Oct-05 0.0990 0.0579 0.0411
Nov-05 0.1049 0.0588 0.0461
Dec-05 0.1045 0.0580 0.0465
Jan-06 0.0982 0.0575 0.0407
Feb-06 0.1124 0.0582 0.0542
Mar-06 0.1127 0.0598 0.0529
EXHIBIT JVW-1

Schedule 2 Page 3 of 6
DATE DCF BOND YIELD
RISK PREMIUM
Apr-06 0.1100 0.0629 0.0471
May-06 0.1056 0.0642 0.0414
Jun-06 0.1049 0.0640 0.0409
Jul-06 0.1087 0.0637 0.0450
Aug-06 0.1041 0.0620 0.0421
Sep-06 0.1053 0.0600 0.0453
Oct-06 0.1030 0.0598 0.0432
Nov-06 0.1033 0.0580 0.0453
Dec-06 0.1035 0.0581 0.0454
Jan-07 0.1013 0.0596 0.0417
Feb-07 0.1018 0.0590 0.0428
Mar-07 0.1018 0.0585 0.0433
Apr-07 0.1007 0.0597 0.0410
May-07 0.0967 0.0599 0.0368
Jun-07 0.0970 0.0630 0.0340
Jul-07 0.1006 0.0625 0.0381
Aug-07 0.1021 0.0624 0.0397
Sep-07 0.1014 0.0618 0.0396
Oct-07 0.1080 0.0611 0.0469
Nov-07 0.1083 0.0597 0.0486
Dec-07 0.1084 0.0616 0.0468
Jan-08 0.1113 0.0602 0.0511
Feb-08 0.1139 0.0621 0.0518
Mar-08 0.1147 0.0621 0.0526
Apr-08 0.1167 0.0629 0.0538
May-08 0.1069 0.0627 0.0442
Jun-08 0.1062 0.0638 0.0424
Jul-08 0.1086 0.0640 0.0446
Aug-08 0.1123 0.0637 0.0486
Sep-08 0.1130 0.0649 0.0481
Oct-08 0.1213 0.0756 0.0457
Nov-08 0.1221 0.0760 0.0461
Dec-08 0.1162 0.0654 0.0508
Jan-09 0.1131 0.0639 0.0492
Feb-09 0.1155 0.0630 0.0524
Mar-09 0.1198 0.0642 0.0556
Apr-09 0.1146 0.0648 0.0498
May-09 0.1225 0.0649 0.0576
Jun-09 0.1208 0.0620 0.0588
Jul-09 0.1145 0.0597 0.0548
Aug-09 0.1109 0.0571 0.0538
Sep-09 0.1109 0.0553 0.0556
Oct-09 0.1146 0.0555 0.0592
Nov-09 0.1148 0.0564 0.0584
Dec-09 0.1123 0.0579 0.0544
Jan-10 0.1198 0.0577 0.0621
Feb-10 0.1167 0.0587 0.0580
Mar-10 0.1074 0.0584 0.0490
Apr-10 0.0934 0.0582 0.0352
May-10 0.0970 0.0552 0.0418
Jun-10 0.0953 0.0546 0.0407
Jul-10 0.1050 0.0526 0.0524
Aug-10 0.1038 0.0501 0.0537
Sep-10 0.1034 0.0501 0.0533
Oct-10 0.1050 0.0510 0.0540
EXHIBIT JVW-1

Schedule 2 Page 4 of 6
DATE DCF BOND YIELD
RISK PREMIUM
Nov-10 0.1041 0.0536 0.0505
Dec-10 0.1029 0.0557 0.0472
Jan-11 0.1019 0.0557 0.0462
Feb-11 0.1004 0.0568 0.0436
Mar-11 0.1014 0.0556 0.0458
Apr-11 0.1031 0.0555 0.0476
May-11 0.1018 0.0532 0.0486
Jun-11 0.1020 0.0526 0.0494
Jul-11 0.1035 0.0527 0.0508
Aug-11 0.1179 0.0469 0.0710
Sep-11 0.1155 0.0448 0.0707
Oct-11 0.1150 0.0452 0.0698
Nov-11 0.1120 0.0425 0.0695
Dec-11 0.1092 0.0435 0.0657
Jan-12 0.1078 0.0434 0.0644
Feb-12 0.1081 0.0436 0.0645
Mar-12 0.1081 0.0448 0.0633
Apr-12 0.1133 0.0440 0.0693
May-12 0.1203 0.0420 0.0783
Jun-12 0.1013 0.0408 0.0605
Jul-12 0.0978 0.0393 0.0585
Aug-12 0.1025 0.0400 0.0625
Sep-12 0.1040 0.0402 0.0638
Oct-12 0.1011 0.0391 0.0620
Nov-12 0.1032 0.0384 0.0648
Dec-12 0.1023 0.0400 0.0623
Jan-13 0.1013 0.0415 0.0598
Feb-13 0.0982 0.0418 0.0564
Mar-13 0.1018 0.0420 0.0598
Apr-13 0.1001 0.0400 0.0601
May-13 0.1000 0.0417 0.0583
Jun-13 0.1000 0.0453 0.0547
Jul-13 0.0983 0.0468 0.0515
Aug-13 0.0982 0.0473 0.0509
Sep-13 0.0991 0.0480 0.0511
Oct-13 0.0998 0.0470 0.0528
Nov-13 0.0964 0.0477 0.0487
Dec-13 0.0966 0.0481 0.0485
Jan-14 0.0948 0.0463 0.0485
Feb-14 0.1019 0.0453 0.0566
Mar-14 0.1027 0.0451 0.0576
Apr-14 0.1081 0.0441 0.0640
May-14 0.1069 0.0426 0.0643
Jun-14 0.1059 0.0429 0.0630
Jul-14 0.1075 0.0423 0.0652
Aug-14 0.1069 0.0413 0.0656
Sep-14 0.1058 0.0424 0.0634
Oct-14 0.1131 0.0406 0.0725
Nov-14 0.1113 0.0409 0.0704
Dec-14 0.1105 0.0395 0.0710
Jan-15 0.1043 0.0358 0.0685
Feb-15 0.1043 0.0367 0.0676
Mar-15 0.1062 0.0374 0.0688
Apr-15 0.1072 0.0375 0.0697
May-15 0.1067 0.0417 0.0650
EXHIBIT JVW-1

Schedule 2 Page 5 of 6
DATE DCF BOND YIELD
RISK PREMIUM
Jun-15 0.1020 0.0439 0.0581
Jul-15 0.0974 0.0440 0.0534
Aug-15 0.0949 0.0425 0.0524
Sep-15 0.0975 0.0439 0.0536
Oct-15 0.0961 0.0429 0.0532
Nov-15 0.1007 0.0440 0.0567
Dec-15 0.1027 0.0435 0.0592
Jan-16 0.1017 0.0427 0.0590
Feb-16 0.1002 0.0411 0.0591
Mar-16 0.0973 0.0416 0.0557
Apr-16 0.0974 0.0400 0.0574
May-16 0.0944 0.0393 0.0551
Jun-16 0.0963 0.0378 0.0585
Jul-16 0.0952 0.0357 0.0595
Aug-16 0.0971 0.0359 0.0612
Sep-16 0.0978 0.0366 0.0612
Oct-16 0.0990 0.0377 0.0613
Nov-16 0.1041 0.0408 0.0633
Dec-16 0.1032 0.0427 0.0605
Jan-17 0.1021 0.0414 0.0607
Feb-17 0.0991 0.0418 0.0573
Mar-17 0.0983 0.0423 0.0560
Apr-17 0.0975 0.0412 0.0563
May-17 0.0984 0.0412 0.0572
Jun-17 0.0968 0.0394 0.0574
Jul-17 0.0975 0.0399 0.0576
Aug-17 0.0955 0.0386 0.0569
Sep-17 0.0957 0.0387 0.0570
Oct-17 0.0975 0.0391 0.0584
Nov-17 0.0975 0.0383 0.0592
Dec-17 0.0915 0.0379 0.0536
Jan-18 0.0938 0.0386 0.0552
Feb-18 0.0994 0.0409 0.0585
Mar-18 0.0936 0.0413 0.0523
Apr-18 0.0920 0.0417 0.0503
May-18 0.0917 0.0428 0.0489
Jun-18 0.0920 0.0427 0.0493
Jul-18 0.0927 0.0427 0.0500
Notes: Utility bond yield information from Mergent Bond Record (formerly Moody’s). See Appendix 4 for a description of my ex ante risk premium approach. DCF results are calculated using a quarterly DCF model as follows:
d0 = Latest quarterly dividend P0 = Average of the monthly high and low stock prices for each month per Thomson
Reuters FC = Flotation cost allowance (five percent) as a percentage of stock price g = I/B/E/S forecast of future earnings growth for each month k = Cost of equity using the quarterly version of the DCF model
EXHIBIT JVW-1

Schedule 2 Page 6 of 6
1 - )1()1(P
)g+(1d = k 41
0
4
1
0
4
g
FC
EXHIBIT JVW-1

Schedule 3 Page 1 of 2
ATMOS ENERGY EXHIBIT__(JVW-1)
SCHEDULE 3 COMPARATIVE RETURNS ON S&P 500 STOCK INDEX AND MOODY’S A-RATED UTILITY BONDS 1937 – 2018
LINE YEAR S&P 500 STOCK PRICE
STOCK DIVIDEND
YIELD
STOCK RETURN
A-RATED BOND PRICE
BOND RETURN
RISK PREMIUM
1 2017 2,275.12 0.0209 24.71% $96.13 10.75% 13.97%
2 2016 1,918.60 0.0222 20.80% $95.48 4.87% 15.93%
3 2015 2,028.18 0.0208 -3.32% $107.65 -7.59% 4.26%
4 2014 1,822.36 0.0210 13.39% $89.89 24.20% -10.81%
5 2013 1,481.11 0.0220 25.24% $97.45 -3.65% 28.89%
6 2012 1,300.58 0.0214 16.02% $94.36 7.52% 8.50%
7 2011 1,282.62 0.0185 3.25% $77.36 27.14% -23.89%
8 2010 1,123.58 0.0203 16.18% $75.02 8.44% 7.74%
9 2009 865.58 0.0310 32.91% $68.43 15.48% 17.43%
10 2008 1,378.76 0.0206 -35.16% $72.25 0.24% -35.40%
11 2007 1,424.16 0.0181 -1.38% $72.91 4.59% -5.97%
12 2006 1,278.72 0.0183 13.20% $75.25 2.20% 11.01%
13 2005 1,181.41 0.0177 10.01% $74.91 5.80% 4.21%
14 2004 1,132.52 0.0162 5.94% $70.87 11.34% -5.40%
15 2003 895.84 0.0180 28.22% $62.26 20.27% 7.95%
16 2002 1,140.21 0.0138 -20.05% $57.44 15.35% -35.40%
17 2001 1,335.63 0.0116 -13.47% $56.40 8.93% -22.40%
18 2000 1,425.59 0.0118 -5.13% $52.60 14.82% -19.95%
19 1999 1,248.77 0.0130 15.46% $63.03 -10.20% 25.66%
20 1998 963.35 0.0162 31.25% $62.43 7.38% 23.87%
21 1997 766.22 0.0195 27.68% $56.62 17.32% 10.36%
22 1996 614.42 0.0231 27.02% $60.91 -0.48% 27.49%
23 1995 465.25 0.0287 34.93% $50.22 29.26% 5.68%
24 1994 472.99 0.0269 1.05% $60.01 -9.65% 10.71%
25 1993 435.23 0.0288 11.56% $53.13 20.48% -8.93%
26 1992 416.08 0.0290 7.50% $49.56 15.27% -7.77%
27 1991 325.49 0.0382 31.65% $44.84 19.44% 12.21%
28 1990 339.97 0.0341 -0.85% $45.60 7.11% -7.96%
29 1989 285.41 0.0364 22.76% $43.06 15.18% 7.58%
30 1988 250.48 0.0366 17.61% $40.10 17.36% 0.25%
31 1987 264.51 0.0317 -2.13% $48.92 -9.84% 7.71%
32 1986 208.19 0.0390 30.95% $39.98 32.36% -1.41%
33 1985 171.61 0.0451 25.83% $32.57 35.05% -9.22%
34 1984 166.39 0.0427 7.41% $31.49 16.12% -8.72%
35 1983 144.27 0.0479 20.12% $29.41 20.65% -0.53%
36 1982 117.28 0.0595 28.96% $24.48 36.48% -7.51%
37 1981 132.97 0.0480 -7.00% $29.37 -3.01% -3.99%
38 1980 110.87 0.0541 25.34% $34.69 -3.81% 29.16%
39 1979 99.71 0.0533 16.52% $43.91 -11.89% 28.41%
40 1978 90.25 0.0532 15.80% $49.09 -2.40% 18.20%
41 1977 103.80 0.0399 -9.06% $50.95 4.20% -13.27%
EXHIBIT JVW-1

Schedule 3 Page 2 of 2
LINE YEAR S&P 500 STOCK PRICE
STOCK DIVIDEND
YIELD
STOCK RETURN
A-RATED BOND PRICE
BOND RETURN
RISK PREMIUM
42 1976 96.86 0.0380 10.96% $43.91 25.13% -14.17%
43 1975 72.56 0.0507 38.56% $41.76 14.75% 23.81%
44 1974 96.11 0.0364 -20.86% $52.54 -12.91% -7.96%
45 1973 118.40 0.0269 -16.14% $58.51 -3.37% -12.77%
46 1972 103.30 0.0296 17.58% $56.47 10.69% 6.89%
47 1971 93.49 0.0332 13.81% $53.93 12.13% 1.69%
48 1970 90.31 0.0356 7.08% $50.46 14.81% -7.73%
49 1969 102.00 0.0306 -8.40% $62.43 -12.76% 4.36%
50 1968 95.04 0.0313 10.45% $66.97 -0.81% 11.26%
51 1967 84.45 0.0351 16.05% $78.69 -9.81% 25.86%
52 1966 93.32 0.0302 -6.48% $86.57 -4.48% -2.00%
53 1965 86.12 0.0299 11.35% $91.40 -0.91% 12.26%
54 1964 76.45 0.0305 15.70% $92.01 3.68% 12.02%
55 1963 65.06 0.0331 20.82% $93.56 2.61% 18.20%
56 1962 69.07 0.0297 -2.84% $89.60 8.89% -11.73%
57 1961 59.72 0.0328 18.94% $89.74 4.29% 14.64%
58 1960 58.03 0.0327 6.18% $84.36 11.13% -4.95%
59 1959 55.62 0.0324 7.57% $91.55 -3.49% 11.06%
60 1958 41.12 0.0448 39.74% $101.22 -5.60% 45.35%
61 1957 45.43 0.0431 -5.18% $100.70 4.49% -9.67%
62 1956 44.15 0.0424 7.14% $113.00 -7.35% 14.49%
63 1955 35.60 0.0438 28.40% $116.77 0.20% 28.20%
64 1954 25.46 0.0569 45.52% $112.79 7.07% 38.45%
65 1953 26.18 0.0545 2.70% $114.24 2.24% 0.46%
66 1952 24.19 0.0582 14.05% $113.41 4.26% 9.79%
67 1951 21.21 0.0634 20.39% $123.44 -4.89% 25.28%
68 1950 16.88 0.0665 32.30% $125.08 1.89% 30.41%
69 1949 15.36 0.0620 16.10% $119.82 7.72% 8.37%
70 1948 14.83 0.0571 9.28% $118.50 4.49% 4.79%
71 1947 15.21 0.0449 1.99% $126.02 -2.79% 4.79%
72 1946 18.02 0.0356 -12.03% $126.74 2.59% -14.63%
73 1945 13.49 0.0460 38.18% $119.82 9.11% 29.07%
74 1944 11.85 0.0495 18.79% $119.82 3.34% 15.45%
75 1943 10.09 0.0554 22.98% $118.50 4.49% 18.49%
76 1942 8.93 0.0788 20.87% $117.63 4.14% 16.73%
77 1941 10.55 0.0638 -8.98% $116.34 4.55% -13.52%
78 1940 12.30 0.0458 -9.65% $112.39 7.08% -16.73%
79 1939 12.50 0.0349 1.89% $105.75 10.05% -8.16%
80 1938 11.31 0.0784 18.36% $99.83 9.94% 8.42%
81 1937 17.59 0.0434 -31.36% $103.18 0.63% -31.99%
82 Average 11.4% 6.7% 4.7%
Note: See Appendix 5 for an explanation of how stock and bond returns are derived and the source of the data presented.
EXHIBIT JVW-1

Schedule 4 Page 1 of 3
ATMOS ENERGY EXHIBIT__(JVW-1)
SCHEDULE 4 COMPARATIVE RETURNS ON S&P UTILITY STOCK INDEX
AND MOODY’S A-RATED UTILITY BONDS 1937 – 2018
LINE YEAR
S&P UTILITY STOCK PRICE
STOCK DIVIDEND
YIELD
STOCK RETURN
A-RATED BOND PRICE
BOND RETURN
RISK PREMIUM
1 2017 11.72% $96.13 10.75% 0.97%
2 2016 17.44% $95.48 4.87% 12.57%
3 2015 -3.90% $107.65 -7.59% 3.69%
4 2014 28.91% $89.89 24.20% 4.71%
5 2013 13.01% $97.45 -3.65% 16.66%
6 2012 2.09% $94.36 7.52% -5.43%
7 2011 19.99% $77.36 27.14% -7.15%
8 2010 7.04% $75.02 8.44% -1.40%
9 2009 10.71% $68.43 15.48% -4.77%
10 2008 -25.90% $72.25 0.24% -26.14%
11 2007 16.56% $72.91 4.59% 11.96%
12 2006 20.76% $75.25 2.20% 18.56%
13 2005 16.05% $74.91 5.80% 10.25%
14 2003 23.48% $62.26 20.27% 3.21%
16 2002 -14.73% $57.44 15.35% -30.08%
17 2001 307.70 0.0287 -17.90% $56.40 8.93% -26.83%
18 2000 239.17 0.0413 32.78% $52.60 14.82% 17.96%
19 1999 253.52 0.0394 -1.72% $63.03 -10.20% 8.48%
20 1998 228.61 0.0457 15.47% $62.43 7.38% 8.09%
21 1997 201.14 0.0492 18.58% $56.62 17.32% 1.26%
22 1996 202.57 0.0454 3.83% $60.91 -0.48% 4.31%
23 1995 153.87 0.0584 37.49% $50.22 29.26% 8.23%
24 1994 168.70 0.0496 -3.83% $60.01 -9.65% 5.82%
25 1993 159.79 0.0537 10.95% $53.13 20.48% -9.54%
26 1992 149.70 0.0572 12.46% $49.56 15.27% -2.81%
27 1991 138.38 0.0607 14.25% $44.84 19.44% -5.19%
28 1990 146.04 0.0558 0.33% $45.60 7.11% -6.78%
29 1989 114.37 0.0699 34.68% $43.06 15.18% 19.51%
30 1988 106.13 0.0704 14.80% $40.10 17.36% -2.55%
31 1987 120.09 0.0588 -5.74% $48.92 -9.84% 4.10%
32 1986 92.06 0.0742 37.87% $39.98 32.36% 5.51%
33 1985 75.83 0.0860 30.00% $32.57 35.05% -5.04%
34 1984 68.50 0.0925 19.95% $31.49 16.12% 3.83%
35 1983 61.89 0.0948 20.16% $29.41 20.65% -0.49%
36 1982 51.81 0.1074 30.20% $24.48 36.48% -6.28%
37 1981 52.01 0.0978 9.40% $29.37 -3.01% 12.41%
38 1980 50.26 0.0953 13.01% $34.69 -3.81% 16.83%
39 1979 50.33 0.0893 8.79% $43.91 -11.89% 20.68%
40 1978 52.40 0.0791 3.96% $49.09 -2.40% 6.36%
41 1977 54.01 0.0714 4.16% $50.95 4.20% -0.04%
42 1976 46.99 0.0776 22.70% $43.91 25.13% -2.43%
EXHIBIT JVW-1

Schedule 4 Page 2 of 3
LINE YEAR
S&P UTILITY STOCK PRICE
STOCK DIVIDEND
YIELD
STOCK RETURN
A-RATED BOND PRICE
BOND RETURN
RISK PREMIUM
43 1975 38.19 0.0920 32.24% $41.76 14.75% 17.49%
44 1974 48.60 0.0713 -14.29% $52.54 -12.91% -1.38%
45 1973 60.01 0.0556 -13.45% $58.51 -3.37% -10.08%
46 1972 60.19 0.0542 5.12% $56.47 10.69% -5.57%
47 1971 63.43 0.0504 -0.07% $53.93 12.13% -12.19%
48 1970 55.72 0.0561 19.45% $50.46 14.81% 4.64%
49 1969 68.65 0.0445 -14.38% $62.43 -12.76% -1.62%
50 1968 68.02 0.0435 5.28% $66.97 -0.81% 6.08%
51 1967 70.63 0.0392 0.22% $78.69 -9.81% 10.03%
52 1966 74.50 0.0347 -1.72% $86.57 -4.48% 2.76%
53 1965 75.87 0.0315 1.34% $91.40 -0.91% 2.25%
54 1964 67.26 0.0331 16.11% $92.01 3.68% 12.43%
55 1963 63.35 0.0330 9.47% $93.56 2.61% 6.86%
56 1962 62.69 0.0320 4.25% $89.60 8.89% -4.64%
57 1961 52.73 0.0358 22.47% $89.74 4.29% 18.18%
58 1960 44.50 0.0403 22.52% $84.36 11.13% 11.39%
59 1959 43.96 0.0377 5.00% $91.55 -3.49% 8.49%
60 1958 33.30 0.0487 36.88% $101.22 -5.60% 42.48%
61 1957 32.32 0.0487 7.90% $100.70 4.49% 3.41%
62 1956 31.55 0.0472 7.16% $113.00 -7.35% 14.51%
63 1955 29.89 0.0461 10.16% $116.77 0.20% 9.97%
64 1954 25.51 0.0520 22.37% $112.79 7.07% 15.30%
65 1953 24.41 0.0511 9.62% $114.24 2.24% 7.38%
66 1952 22.22 0.0550 15.36% $113.41 4.26% 11.10%
67 1951 20.01 0.0606 17.10% $123.44 -4.89% 21.99%
68 1950 20.20 0.0554 4.60% $125.08 1.89% 2.71%
69 1949 16.54 0.0570 27.83% $119.82 7.72% 20.10%
70 1948 16.53 0.0535 5.41% $118.50 4.49% 0.92%
71 1947 19.21 0.0354 -10.41% $126.02 -2.79% -7.62%
72 1946 21.34 0.0298 -7.00% $126.74 2.59% -9.59%
73 1945 13.91 0.0448 57.89% $119.82 9.11% 48.79%
74 1944 12.10 0.0569 20.65% $119.82 3.34% 17.31%
75 1943 9.22 0.0621 37.45% $118.50 4.49% 32.96%
76 1942 8.54 0.0940 17.36% $117.63 4.14% 13.22%
77 1941 13.25 0.0717 -28.38% $116.34 4.55% -32.92%
78 1940 16.97 0.0540 -16.52% $112.39 7.08% -23.60%
79 1939 16.05 0.0553 11.26% $105.75 10.05% 1.21%
80 1938 14.30 0.0730 19.54% $99.83 9.94% 9.59%
81 1937 24.34 0.0432 -36.93% $103.18 0.63% -37.55%
82 Average 10.64% 6.67% 3.97%
EXHIBIT JVW-1

Schedule 4 Page 3 of 3
Note: See Appendix 5 for an explanation of how stock and bond returns are derived and the source of the data presented. Because Standard & Poor’s discontinued its historical S&P Utilities Index in December 2001, stock returns beginning in 2002 are based on the total returns for the EEI Index of United States shareholder-owned electric utilities, as reported by EEI on its website. http://www.eei.org/whatwedo/DataAnalysis/IndusFinanAnalysis/Pages/QtrlyFinancialUpdates.aspx
EXHIBIT JVW-1

Schedule 5 Page 1 of 1
ATMOS ENERGY EXHIBIT__(JVW-1)
SCHEDULE 5 USING THE ARITHMETIC MEAN TO ESTIMATE
THE COST OF EQUITY CAPITAL
Consider an investment that in a given year generates a return of 30 percent with probability equal to 0.5 and a return of -10 percent with a probability equal to 0.5. For each one dollar invested, the possible outcomes of this investment at the end of year one are:
END OF YEAR 1 WEALTH AFTER
ONE YEAR PROBABILITY
$1.30 0.5 $0.90 0.5
At the end of year two, the possible outcomes are:
END OF YEAR 2 WEALTH AFTER TWO YEARS
VALUE PROBABILITY WEALTH X PROBABILITY
(1.30) (1.30) = $ 1.69 0.25 $ 0.4225 (1.30) (.9) = $ 1.17 0.25 $ 0.2925 (.9) (1.30) = $ 1.17 0.25 $ 0.2925 (.9) (.9) = $ 0.81 0.25 $ 0.2025
Expected Wealth = $ 1.21
The expected value of this investment at the end of year two is $1.21. In a competitive capital market, the cost of equity is equal to the expected rate of return on an investment. In the above example, the cost of equity is that rate of return which will make the initial investment of one dollar grow to the expected value of $1.21 at the end of two years. Thus, the cost of equity is the solution to the equation:
1(1+k)2 = 1.21 or
k = (1.21/1).5 – 1 = 10%. The arithmetic mean of this investment is:
(30%) (.5) + (-10%) (.5) = 10%. Thus, the arithmetic mean is equal to the cost of equity capital. The geometric mean of this investment is:
[(1.3) (.9)].5 – 1 = .082 = 8.2%. Thus, the geometric mean is not equal to the cost of equity capital. The lesson is obvious: for an investment with an uncertain outcome, the arithmetic mean is the best measure of the cost of equity capital.
EXHIBIT JVW-1

Schedule 6 Page 1 of 1
ATMOS ENERGY EXHIBIT__(JVW-1)
SCHEDULE-6 CALCULATION OF CAPITAL ASSET PRICING MODEL COST OF EQUITY
USING AN HISTORICAL 7.1 PERCENT RISK PREMIUM
LINE COMPANY VALUE
LINE BETA
RISK-FREE RATE
MARKET RISK
PREMIUM
BETA X RISK
PREMIUM
CAPM RESULT
MARKET CAP $ (MIL)
SIZE PREMIUM
SIZE-ADJUSTED
CAPM
1 Atmos Energy 0.60 3.9% 7.1% 4.24% 8.3% 10,188 1.02% 9.3%
2 Chesapeake Utilities 0.70 3.9% 7.1% 4.95% 9.0% 1,383 1.75% 10.7%
3 New Jersey Resources 0.70 3.9% 7.1% 4.95% 9.0% 4,023 1.02% 10.0%
4 NiSource Inc. 0.55 3.9% 7.1% 3.89% 7.9% 9,486 1.02% 9.0%
5 Northwest Nat. Gas 0.65 3.9% 7.1% 4.60% 8.6% 1,848 1.75% 10.4%
6 ONE Gas Inc. 0.65 3.9% 7.1% 4.60% 8.6% 4,023 1.02% 9.7%
7 South Jersey Inds. 0.75 3.9% 7.1% 5.30% 9.4% 2,896 1.02% 10.4%
8 Southwest Gas 0.75 3.9% 7.1% 5.30% 9.4% 3,824 1.02% 10.4%
9 Spire Inc. 0.65 3.9% 7.1% 4.60% 8.6% 3,653 1.02% 9.7%
10 UGI Corp. 0.85 3.9% 7.1% 6.01% 10.1% 9,201 1.02% 11.1%
11 Historical CAPM Model Results 0.69 3.9% 7.1% 4.84% 8.9% 10.1%
Notes
Estimates of Premiums for Company Size
Decile Smallest Mkt.
Cap. ($Millions)
Largest Mkt. Cap. ($Millions) Premium
Large-Cap (No Adjustment) 10,712.000 0
Mid-Cap (3-5) 2,392.689 10,711.194 1.02%
Low-Cap (6-8) 569.279 2,390.899 1.75%
Micro-Cap (9-10) 2.516 567.843 3.67%
Risk-free Rate 3.9% Forecast Yield on Long-term Treasury Bonds
Market Risk Premium 7.1% Ibbotson
Flotation - Natural Gas Utilities 0.15%
Historical Ibbotson® SBBI® risk premium including years 1926 through year end 2017 from 2018 SBBI®. Value Line beta for comparable companies from Value Line Investment Analyzer. Treasury bond yield forecast from data in Value Line Selection & Opinion, June 1, 2018, and Energy Information Administration, 2018, determined as follows. Value Line forecasts a yield on 10-year Treasury notes equal to 3.6 percent. The spread between the average yield on 10-year Treasury notes (2.89 percent) and 20-year Treasury bonds (2.94 percent) is 5 basis points. Adding 5 basis points to Value Line’s 3.6 percent forecasted yield on 10-year Treasury notes produces a forecasted yield of 3.65 percent for 20-year Treasury bonds (see Value Line Investment Survey, Selection & Opinion, June 1, 2018). EIA forecasts a yield of 4.07 percent on 10-year Treasury notes. Adding the 5-basis point spread between 10-year Treasury notes and 20-year Treasury bonds to the EIA forecast of 4.07 percent for 10-year Treasury notes produces an EIA forecast for 20-year Treasury bonds equal to 4.12 percent. The average of the forecasts is 3.9 percent (3.7 percent using Value Line data and 4.1 percent using EIA data).
.
EXHIBIT JVW-1

Schedule 7 Page 1 of 2
ATMOS ENERGY EXHIBIT__(JVW-1)
SCHEDULE-7 COMPARISON OF RISK PREMIUMS ON S&P500 AND S&P UTILITIES 1937 – 2018
YEAR
S&P UTILITIES
STOCK RETURN
SP500 STOCK
RETURN
10-YR. TREASURY
BOND YIELD
UTILITIES RISK
PREMIUM
MARKET RISK
PREMIUM
2017 0.1172 0.2471 0.0233 0.0939 0.2238
2016 0.1744 0.2080 0.0184 0.1560 0.1896
2015 -0.0390 -0.0332 0.0214 -0.0604 -0.0546
2014 0.2891 0.1339 0.0254 0.2637 0.1085
2013 0.1301 0.2524 0.0235 0.1066 0.2289
2012 0.0209 0.1602 0.0180 0.0029 0.1422
2011 0.1999 0.0325 0.0278 0.1721 0.0047
2010 0.0704 0.1618 0.0322 0.0382 0.1296
2009 0.1071 0.3291 0.0326 0.0745 0.2965
2008 -0.2590 -0.3516 0.0367 -0.2957 -0.3883
2007 0.1656 -0.0138 0.0463 0.1193 -0.0601
2006 0.2076 0.1320 0.0479 0.1597 0.0841
2005 0.1605 0.1001 0.0429 0.1176 0.0572
2004 0.2284 0.0594 0.0427 0.1857 0.0167
2003 0.2348 0.2822 0.0401 0.1947 0.2421
2002 -0.1473 -0.2005 0.0461 -0.1934 -0.2466
2001 -0.1790 -0.1347 0.0502 -0.2292 -0.1849
2000 0.3278 -0.0513 0.0603 0.2675 -0.1116
1999 -0.0172 0.1546 0.0564 -0.0736 0.0982
1998 0.1547 0.3125 0.0526 0.1021 0.2599
1997 0.1858 0.2768 0.0635 0.1223 0.2133
1996 0.0383 0.2702 0.0644 -0.0261 0.2058
1995 0.3749 0.3493 0.0658 0.3091 0.2835
1994 -0.0383 0.0105 0.0708 -0.1091 -0.0603
1993 0.1095 0.1156 0.0587 0.0508 0.0569
1992 0.1246 0.0750 0.0701 0.0545 0.0049
1991 0.1425 0.3165 0.0786 0.0639 0.2379
1990 0.0033 -0.0085 0.0855 -0.0822 -0.0940
1989 0.3468 0.2276 0.0850 0.2618 0.1426
1988 0.1480 0.1761 0.0884 0.0596 0.0877
1987 -0.0574 -0.0213 0.0838 -0.1412 -0.1051
1986 0.3787 0.3095 0.0768 0.3019 0.2327
1985 0.3000 0.2583 0.1062 0.1938 0.1521
1984 0.1995 0.0741 0.1244 0.0751 -0.0503
1983 0.2016 0.2012 0.1110 0.0906 0.0902
1982 0.3020 0.2896 0.1300 0.1720 0.1596
1981 0.0940 -0.0700 0.1391 -0.0451 -0.2091
1980 0.1301 0.2534 0.1146 0.0155 0.1388
1979 0.0879 0.1652 0.0944 -0.0065 0.0708
EXHIBIT JVW-1

Schedule 7 Page 2 of 2
YEAR
S&P UTILITIES
STOCK RETURN
SP500 STOCK
RETURN
10-YR. TREASURY
BOND YIELD
UTILITIES RISK
PREMIUM
MARKET RISK
PREMIUM
1978 0.0396 0.1580 0.0841 -0.0445 0.0739
1977 0.0416 -0.0906 0.0742 -0.0326 -0.1648
1976 0.2270 0.1096 0.0761 0.1509 0.0335
1975 0.3224 0.3856 0.0799 0.2425 0.3057
1974 -0.1429 -0.2086 0.0756 -0.2185 -0.2842
1973 -0.1345 -0.1614 0.0684 -0.2029 -0.2298
1972 0.0512 0.1758 0.0621 -0.0109 0.1137
1971 -0.0007 0.1381 0.0616 -0.0623 0.0765
1970 0.1945 0.0708 0.0735 0.1210 -0.0027
1969 -0.1438 -0.0840 0.0667 -0.2105 -0.1507
1968 0.0528 0.1045 0.0565 -0.0037 0.0480
1967 0.0022 0.1605 0.0507 -0.0485 0.1098
1966 -0.0172 -0.0648 0.0492 -0.0664 -0.1140
1965 0.0134 0.1135 0.0428 -0.0294 0.0707
1964 0.1611 0.1570 0.0419 0.1192 0.1151
1963 0.0947 0.2082 0.0400 0.0547 0.1682
1962 0.0425 -0.0284 0.0395 0.0030 -0.0679
1961 0.2247 0.1894 0.0388 0.1859 0.1506
1960 0.2252 0.0618 0.0412 0.1840 0.0206
1959 0.0500 0.0757 0.0433 0.0067 0.0324
1958 0.3688 0.3974 0.0332 0.3356 0.3642
1957 0.0790 -0.0518 0.0365 0.0425 -0.0883
1956 0.0716 0.0714 0.0318 0.0398 0.0396
1955 0.1016 0.2840 0.0282 0.0734 0.2558
1954 0.2237 0.4552 0.0240 0.1997 0.4312
1953 0.0962 0.0270 0.0281 0.0681 -0.0011
1952 0.1536 0.1405 0.0248 0.1288 0.1157
1951 0.1710 0.2039 0.0241 0.1469 0.1798
1950 0.0460 0.3230 0.0205 0.0255 0.3025
1949 0.2783 0.1610 0.0193 0.2590 0.1417
1948 0.0541 0.0928 0.0215 0.0326 0.0713
1947 -0.1041 0.0199 0.0185 -0.1226 0.0014
1946 -0.0700 -0.1203 0.0174 -0.0874 -0.1377
1945 0.5789 0.3818 0.0173 0.5616 0.3645
1944 0.2065 0.1879 0.0209 0.1856 0.1670
1943 0.3745 0.2298 0.0207 0.3538 0.2091
1942 0.1736 0.2087 0.0211 0.1525 0.1876
1941 -0.2838 -0.0898 0.0199 -0.3037 -0.1097
1940 -0.1652 -0.0965 0.0220 -0.1872 -0.1185
1939 0.1126 0.0189 0.0235 0.0891 -0.0046
1938 0.1954 0.1836 0.0255 0.1699 0.1581
1937 -0.3693 -0.3136 0.0269 -0.3962 -0.3405
Risk Premium 1937 to 2018 0.0552 0.0628
RP Utilities/RP SP500 0.88
EXHIBIT JVW-1

Schedule 8 Page 1 of 1
ATMOS ENERGY EXHIBIT__(JVW-1)
SCHEDULE-8 CALCULATION OF CAPITAL ASSET PRICING MODEL COST OF EQUITY
USING AN HISTORICAL 7.1 PERCENT RISK PREMIUM AND A 0.88 UTILITY BETA
BETA RISK-FREE RATE
MARKET RISK
PREMIUM
BETA X MRP
MODEL RESULT
1 Historical Utility Beta 0.88 3.9% 7.1% 6.22% 10.3%
Historical utility beta per Schedule 7. Flotation cost of 15 basis points. Treasury bond yield forecast from data in Value Line Selection & Opinion, June 1, 2018, and Energy Information Administration, 2018, determined as follows. Value Line forecasts a yield on 10-year Treasury notes equal to 3.6 percent. The spread between the average yield on 10-year Treasury notes (2.89 percent) and 20-year Treasury bonds (2.94 percent) is 5 basis points. Adding 5 basis points to Value Line’s 3.6 percent forecasted yield on 10-year Treasury notes produces a forecasted yield of 3.65 percent for 20-year Treasury bonds (see Value Line Investment Survey, Selection & Opinion, June 1, 2018). EIA forecasts a yield of 4.07 percent on 10-year Treasury notes. Adding the 5-basis point spread between 10-year Treasury notes and 20-year Treasury bonds to the EIA forecast of 4.07 percent for 10-year Treasury notes produces an EIA forecast for 20-year Treasury bonds equal to 4.12 percent. The average of the forecasts is 3.9 percent (3.7 percent using Value Line data and 4.1 percent using EIA data). .
EXHIBIT JVW-1

Schedule 9 Page 1 of 4
ATMOS ENERGY EXHIBIT__(JVW-1)
SCHEDULE 9 CALCULATION OF CAPITAL ASSET PRICING MODEL COST OF EQUITY
USING DCF ESTIMATE OF THE EXPECTED RATE OF RETURN ON THE MARKET PORTFOLIO
LINE COMPANY VALUE
LINE BETA
RISK-FREE RATE
DCF S&P 500
MARKET RISK
PREMIUM
BETA X RISK
PREMIUM
CAPM COST
OF EQUITY
1 Atmos Energy 0.60 3.9% 13.7% 9.8% 5.89% 9.9%
2 Chesapeake Utilities 0.70 3.9% 13.7% 9.8% 6.87% 10.9%
3 New Jersey Resources 0.70 3.9% 13.7% 9.8% 6.87% 10.9%
4 NiSource Inc. 0.55 3.9% 13.7% 9.8% 5.40% 9.5%
5 Northwest Nat. Gas 0.65 3.9% 13.7% 9.8% 6.38% 10.4%
6 ONE Gas Inc. 0.65 3.9% 13.7% 9.8% 6.38% 10.4%
7 South Jersey Inds. 0.75 3.9% 13.7% 9.8% 7.37% 11.4%
8 Southwest Gas 0.75 3.9% 13.7% 9.8% 7.37% 11.4%
9 Spire Inc. 0.65 3.9% 13.7% 9.8% 6.38% 10.4%
10 UGI Corp. 0.85 3.9% 13.7% 9.8% 8.35% 12.4%
11 DCF CAPM Result 0.69 3.9% 13.7% 9.8% 6.73% 10.8%
Beta Equal to 0.88
1 DCF CAPM Result 0.88 3.9% 13.7% 9.8% 8.64% 12.7%
Risk-free Rate 3.9% Forecast Yield on Long-term Treasury Bonds Flotation 0.15%
DCF S&P 500 July 2018 13.7%
Beta per Value Line for proxy utilities and per Schedule 7. Treasury bond yield forecast from data in Value Line Selection & Opinion, June 1, 2018, and Energy Information Administration, 2018, determined as follows. Value Line forecasts a yield on 10-year Treasury notes equal to 3.6 percent. The spread between the average yield on 10-year Treasury notes (2.89 percent) and 20-year Treasury bonds (2.94 percent) is 5 basis points. Adding 5 basis points to Value Line’s 3.6 percent forecasted yield on 10-year Treasury notes produces a forecasted yield of 3.65 percent for 20-year Treasury bonds (see Value Line Investment Survey, Selection & Opinion, June 1, 2018). EIA forecasts a yield of 4.07 percent on 10-year Treasury notes. Adding the 5-basis point spread between 10-year Treasury notes and 20-year Treasury bonds to the EIA forecast of 4.07 percent for 10-year Treasury notes produces an EIA forecast for 20-year Treasury bonds equal to 4.12 percent. The average of the forecasts is 3.9 percent (3.7 percent using Value Line data and 4.1 percent using EIA data).
EXHIBIT JVW-1

Schedule 9 Page 2 of 4
ATMOS ENERGY EXHIBIT__(JVW-1)
SCHEDULE 9 (CONTINUED) SUMMARY OF DISCOUNTED CASH FLOW ANALYSIS
FOR S&P 500 COMPANIES
COMPANY STOCK
PRICE (P0) D0
FORECAST OF FUTURE
EARNINGS GROWTH
MODEL RESULT
MARKET CAP $ (MILS)
1 3M 200.21 5.44 8.44% 11.4% 118,261
2 ABBOTT LABORATORIES 61.65 1.12 11.90% 13.9% 111,890
3 ADV.AUTO PARTS 131.76 0.24 14.00% 14.2% 10,614
4 AETNA 182.28 2.00 10.06% 11.3% 62,219
5 AGILENT TECHS. 64.32 0.60 10.20% 11.2% 20,525
6 ALBEMARLE 95.81 1.34 11.78% 13.4% 10,657
7 AMERICAN AIRLINES GROUP 40.98 0.40 10.84% 11.9% 17,851
8 AMERICAN EXPRESS 99.70 1.40 11.80% 13.4% 86,252
9 AMERISOURCEBERGEN 87.55 1.52 10.00% 11.9% 18,806
10 APPLE 184.99 2.92 12.78% 14.6% 943,117
11 APTIV 93.96 0.88 13.37% 14.4% 25,145
12 AT&T 32.16 2.00 5.29% 12.0% 229,084
13 AVERY DENNISON 106.39 2.08 13.46% 15.7% 9,153
14 BALL 37.29 0.40 10.11% 11.3% 13,365
15 BAXTER INTL. 72.66 0.76 13.48% 14.7% 40,022
16 BECTON DICKINSON 234.41 3.00 14.14% 15.6% 66,083
17 BEST BUY 74.16 1.80 12.75% 15.5% 21,787
18 BLACKROCK 517.63 12.52 13.80% 16.6% 80,868
19 BRISTOL MYERS SQUIBB 54.12 1.60 10.85% 14.2% 92,266
20 BROADCOM 240.10 7.00 13.23% 16.6% 90,813
21 CENTERPOINT EN. 26.71 1.11 8.51% 13.1% 12,090
22 CH ROBINSON WWD. 87.21 1.84 12.07% 14.5% 12,474
23 CHURCH & DWIGHT CO. 50.46 0.87 10.44% 12.4% 13,248
24 CIGNA 173.48 0.04 13.57% 13.6% 42,791
25 CISCO SYSTEMS 43.38 1.32 9.29% 12.7% 199,402
26 CLOROX 126.92 3.84 8.00% 11.3% 16,880
27 COGNIZANT TECH.SLTN.'A' 79.13 0.80 13.45% 14.6% 48,266
28 CONSTELLATION BRANDS 'A' 220.80 2.08 12.56% 13.6% 36,228
29 COSTCO WHOLESALE 205.01 2.28 11.86% 13.1% 95,400
30 CUMMINS 141.09 4.56 10.73% 14.4% 22,508
31 CVS HEALTH 66.62 2.00 11.40% 14.8% 67,241
32 DARDEN RESTAURANTS 98.80 3.00 11.88% 15.3% 13,813
33 DISCOVER FINANCIAL SVS. 72.83 1.60 13.07% 15.6% 24,955
34 DOMINION ENERGY 66.50 3.34 6.38% 11.8% 47,071
35 ECOLAB 142.07 1.64 12.69% 14.0% 40,995
36 ELI LILLY 86.29 2.25 11.61% 14.5% 97,070
37 EXPEDITOR INTL.OF WASH. 72.43 0.90 11.23% 12.6% 12,762
38 FEDEX 242.65 2.60 13.44% 14.7% 62,904
39 FIDELITY NAT.INFO.SVS. 104.06 1.28 13.89% 15.3% 35,988
40 GAP 30.76 0.97 10.31% 13.8% 11,899
41 GENERAL DYNAMICS 196.24 3.72 12.31% 14.5% 57,582
42 GENERAL MOTORS 39.86 1.52 11.07% 15.4% 55,462
43 HCA HEALTHCARE 106.13 1.40 13.50% 15.0% 37,620
44 HERSHEY 93.32 2.69 9.60% 12.8% 13,710
45 HONEYWELL INTL. 148.21 2.98 10.67% 12.9% 109,565
46 HP 22.78 0.56 9.46% 12.2% 37,348
EXHIBIT JVW-1

Schedule 9 Page 3 of 4
COMPANY STOCK
PRICE (P0) D0
FORECAST OF FUTURE
EARNINGS GROWTH
MODEL RESULT
MARKET CAP $ (MILS)
47 HUMANA 296.38 2.00 14.65% 15.4% 43,864
48 ILLINOIS TOOL WORKS 143.41 4.00 12.81% 16.0% 48,780
49 INTEL 52.17 1.20 10.09% 12.6% 239,680
50 INVESCO 27.24 1.20 8.44% 13.3% 10,555
51 JACOBS ENGR. 63.40 0.60 15.36% 16.5% 9,477
52 JP MORGAN CHASE & CO. 109.09 2.48 9.32% 11.8% 369,327
53 L BRANDS 34.57 2.40 7.38% 15.0% 9,084
54 M&T BANK 174.67 3.20 14.23% 16.3% 25,092
55 MCCORMICK & COMPANY NV. 110.12 2.08 10.61% 12.7% 14,326
56 MCDONALDS 161.46 4.04 9.03% 11.8% 122,119
57 MICROSOFT 100.26 1.68 12.50% 14.4% 802,125
58 MONDELEZ INTERNATIONAL CL.A 40.36 1.04 9.91% 12.8% 62,307
59 MOTOROLA SOLUTIONS 113.82 2.08 13.03% 15.1% 19,826
60 NIKE 'B' 74.47 0.80 12.21% 13.4% 98,703
61 NVIDIA 246.13 0.60 14.06% 14.3% 152,982
62 PACKAGING CORP.OF AM. 116.05 3.16 11.35% 14.4% 10,972
63 PAYCHEX 67.09 2.24 8.33% 12.0% 25,306
64 PEPSICO 105.31 3.71 7.54% 11.4% 163,736
65 PERKINELMER 75.06 0.28 14.22% 14.6% 8,674
66 PHILIP MORRIS INTL. 80.58 4.56 7.15% 13.3% 125,757
67 PVH 155.32 0.15 12.27% 12.4% 11,837
68 QUEST DIAGNOSTICS 108.44 2.00 9.90% 11.9% 15,715
69 RALPH LAUREN CL.A 131.04 2.50 9.23% 11.3% 7,543
70 ROCKWELL AUTOMATION 174.06 3.68 12.20% 14.6% 21,193
71 ROCKWELL COLLINS 135.72 1.32 12.51% 13.6% 22,524
72 ROSS STORES 83.28 0.90 10.89% 12.1% 32,925
73 S&P GLOBAL 202.06 2.00 14.97% 16.1% 53,092
74 SHERWIN-WILLIAMS 400.30 3.44 15.33% 16.3% 40,068
75 SKYWORKS SOLUTIONS 97.37 1.52 12.32% 14.1% 18,342
76 STANLEY BLACK & DECKER 140.98 2.64 10.90% 13.0% 21,549
77 STRYKER 170.56 1.88 9.97% 11.2% 64,648
78 SYMANTEC 21.94 0.30 10.56% 12.1% 13,233
79 T ROWE PRICE GROUP 118.76 2.80 13.46% 16.2% 29,238
80 TAPESTRY 46.23 1.35 11.51% 14.8% 13,821
81 TEXAS INSTRUMENTS 110.75 2.48 13.70% 16.3% 112,174
82 THERMO FISHER SCIENTIFIC 214.25 0.68 11.88% 12.2% 87,036
83 TIFFANY & CO 128.69 2.20 10.16% 12.1% 16,910
84 TJX 92.06 1.56 10.63% 12.5% 61,076
85 TOTAL SYSTEM SERVICES 87.54 0.52 14.92% 15.6% 16,296
86 TRACTOR SUPPLY 74.90 1.24 13.73% 15.6% 9,693
87 TWENTY-FIRST CENTURY FOX CL.A 43.08 0.36 11.50% 12.4% 49,171
88 TWENTY-FIRST CENTURY FOX CL.B 43.08 0.36 11.50% 12.4% 49,171
89 UNITED PARCEL SER.'B' 112.92 3.64 11.01% 14.6% 77,810
90 V F 82.94 1.84 11.59% 14.1% 35,201
91 WALGREENS BOOTS ALLIANCE 64.13 1.76 11.64% 14.7% 64,437
92 WALT DISNEY 105.01 1.68 11.52% 13.3% 166,709
93 WASTE MANAGEMENT 83.41 1.86 12.73% 15.3% 35,736
94 WHIRLPOOL 148.23 4.60 9.73% 13.2% 10,786
95 WILLIS TOWERS WATSON 153.66 2.40 11.72% 13.5% 20,941
96 XILINX 68.87 1.44 12.17% 14.5% 17,363
97 ZOETIS 84.37 0.50 15.19% 15.9% 41,332
98 Market-weighted Average 13.7%
EXHIBIT JVW-1

Schedule 9 Page 4 of 4
Notes: In applying the DCF model to the S&P 500, I included in the DCF analysis only those companies in the S&P 500 group which pay a dividend, have a positive growth rate, and have at least three analysts’ long-term growth estimates. I also eliminated those 25 percent of companies with the highest and lowest DCF results, a decision which had no impact on my CAPM estimate of the cost of equity.
D0 = Current dividend per Thomson Reuters P0 = Average of the monthly high and low stock prices during the three months ending July 2018 per Thomson
Reuters g = I/B/E/S forecast of future earnings growth July 2018 k = Cost of equity using the quarterly version of the DCF model shown below:
1 - P
)g+(1d = k0
4
1
0
4
4
1
)1( g
EXHIBIT JVW-1

Exhibit No. _____(JVW-1) Appendix 1 Page 1 of 6
APPENDIX 1 QUALIFICATIONS OF JAMES H. VANDER WEIDE, PH.D.
3606 STONEYBROOK DRIVE DURHAM, NC 27705
James H. Vander Weide is President of Financial Strategy Associates, a consulting firm that
provides financial and economic consulting services, including cost of capital and valuation studies, to
corporate clients. Dr. Vander Weide holds a Ph.D. in Finance from Northwestern University and a Bachelor
of Arts in Economics from Cornell University. After receiving his Ph.D. in Finance, Dr. Vander Weide joined
the faculty at Duke University, the Fuqua School of Business, and was named Assistant Professor, Associate
Professor, Professor, and then Research Professor of Finance and Economics.
As a Professor at Duke University and the Fuqua School of Business, Dr. Vander Weide has
published research in the areas of finance and economics and taught courses in corporate finance, investment
management, management of financial institutions, statistics, economics, operations research, and the theory
of public utility pricing. Dr. Vander Weide has been active in executive education at Duke and Duke
Corporate Education, leading executive development seminars on topics including financial analysis, cost of
capital, creating shareholder value, mergers and acquisitions, capital budgeting, measuring corporate
performance, and valuation. In addition, Dr. Vander Weide designed and served as Program Director for
several executive education programs, including the Advanced Management Program, Competitive
Strategies in Telecommunications, and the Duke Program for Manager Development for managers from the
former Soviet Union. He is now retired from his teaching responsibilities at Duke.
As an expert financial economist and industry expert, Dr. Vander Weide has participated in
approximately five hundred regulatory and legal proceedings, appearing in United States courts and federal
and state or provincial proceedings in the United States and Canada. He has testified as an expert witness on
the cost of capital, competition, risk, incentive regulation, forward-looking economic cost, economic pricing
guidelines, valuation, and other financial and economic issues. His clients include investor-owned electric,
gas, and water utilities, natural gas pipelines, oil pipelines, telecommunications companies, and insurance
companies.
Publications
Dr. Vander Weide has written research papers on such topics as portfolio management, capital
budgeting, investments, the effect of regulation on the performance of public utilities, and cash management.
His articles have been published in American Economic Review, Journal of Finance, Journal of Financial
and Quantitative Analysis, Management Science, Financial Management, Journal of Portfolio Management,
International Journal of Industrial Organization, Journal of Bank Research, Journal of Accounting
Research, Journal of Cash Management, Atlantic Economic Journal, Journal of Economics and Business,
and Computers and Operations Research. He has written a book entitled Managing Corporate Liquidity: An
Introduction to Working Capital Management published by John Wiley and Sons, Inc.; and he has written a
chapter titled “Financial Management in the Short Run” for The Handbook of Modern Finance, and a chapter
EXHIBIT JVW-1

Exhibit No. _____(JVW-1) Appendix 1 Page 2 of 6
titled “Principles for Lifetime Portfolio Selection: Lessons from Portfolio Theory” for The Handbook of
Portfolio Construction: Contemporary Applications of Markowitz Techniques. The Handbook of Portfolio
Construction is a peer-reviewed collection of research papers by notable scholars on portfolio optimization,
published in 2010 in honor of Nobel Prize winner Harry Markowitz.
Professional Consulting Experience
Dr. Vander Weide has provided financial and economic consulting services to firms in the electric,
gas, insurance, oil and gas pipeline, telecommunications, and water industries for more than thirty years. He
has testified on the cost of capital, competition, risk, incentive regulation, forward-looking economic cost,
economic pricing guidelines, valuation, and other financial and economic issues in more than five hundred
cases before the Federal Energy Regulatory Commission, the National Energy Board (Canada), the Federal
Communications Commission, the Canadian Radio-Television and Telecommunications Commission, the
National Telecommunications and Information Administration, the United States Tax Court, the public
service commissions of forty-five states and the District of Columbia, four Canadian provinces, the insurance
commissions of five states, the Iowa State Board of Tax Review, and the North Carolina Property Tax
Commission. In addition, he has testified as an expert witness in proceedings before numerous federal district
courts, including the United States District Court for the District of Nebraska; the United States District Court
for the District of New Hampshire; the United States District Court for the District of Northern Illinois; the
United States District Court for the Eastern District of North Carolina; the Montana Second Judicial District
Court, Silver Bow County; the United States District Court for the Northern District of California; the
Superior Court, North Carolina; the United States Bankruptcy Court for the Southern District of West
Virginia; the United States District Court for the Eastern District of Michigan; and the Supreme Court of the
State of New York. Dr. Vander Weide testified in thirty states on issues relating to the pricing of unbundled
network elements and universal service cost studies and consulted with Bell Canada, Deutsche Telekom, and
Telefónica on similar issues. Dr. Vander Weide has provided consulting and expert witness testimony to the
following companies:
EXHIBIT JVW-1

Exhibit No. _____(JVW-1) Appendix 1 Page 3 of 6
ELECTRIC, GAS, PIPELINE, WATER COMPANIES Alcoa Power Generating, Inc. MidAmerican Energy and subsidiaries Alliant Energy and subsidiaries National Fuel Gas AltaLink, L.P. Nevada Power Company Ameren Newfoundland Power Inc. American Water Works and subsidiaries NICOR Atmos Energy and subsidiaries North Carolina Natural Gas BP p.l.c. North Shore Gas Buckeye Partners, L.P. Northern Natural Gas Company Central Illinois Public Service NOVA Gas Transmission Ltd. Citizens Utilities PacifiCorp Consolidated Edison and subsidiaries Peoples Energy and its subsidiaries Consolidated Natural Gas and subsidiaries PG&E Dominion Resources and subsidiaries Plains All American Pipeline, L.P. Duke Energy and subsidiaries Progress Energy and subsidiaries Empire District Electric and subsidiaries PSE&G EPCOR Distribution & Transmission Inc. Public Service Company of North Carolina EPCOR Energy Alberta Inc. Sempra Energy/San Diego Gas and Electric FortisAlberta Inc. South Carolina Electric and Gas FortisBC Utilities Southern Company and subsidiaries Hope Natural Gas Spectra Energy Iberdrola Renewables Tennessee-American Water Company Interstate Power Company The Peoples Gas, Light and Coke Co. Iowa Southern Trans Québec & Maritimes Pipeline Inc. Iowa-American Water Company TransCanada Iowa-Illinois Gas and Electric Union Gas Kentucky Power Company United Cities Gas Company Kentucky-American Water Company Virginia-American Water Company Kinder Morgan Energy Partners West Virginia-American Water Company Maritimes & Northeast Pipeline Westcoast Energy Inc. Wisconsin Energy Corporation Xcel Energy
TELECOMMUNICATIONS COMPANIES
ALLTEL and subsidiaries Phillips County Cooperative Tel. Co.
Ameritech (now AT&T new) Pine Drive Cooperative Telephone Co.
AT&T (old) Roseville Telephone Company (SureWest)
Bell Canada/Nortel SBC Communications (now AT&T new)
BellSouth and subsidiaries Sherburne Telephone Company
Centel and subsidiaries Siemens
Cincinnati Bell (Broadwing) Southern New England Telephone
Cisco Systems Sprint/United and subsidiaries
Citizens Telephone Company Telefónica
Concord Telephone Company Tellabs, Inc.
Contel and subsidiaries The Stentor Companies
EXHIBIT JVW-1

Exhibit No. _____(JVW-1) Appendix 1 Page 4 of 6
TELECOMMUNICATIONS COMPANIES
Deutsche Telekom U S West (Qwest)
GTE and subsidiaries (now Verizon) Union Telephone Company
Heins Telephone Company United States Telephone Association
JDS Uniphase Valor Telecommunications (Windstream)
Lucent Technologies Verizon (Bell Atlantic) and subsidiaries
Minnesota Independent Equal Access Corp. Woodbury Telephone Company
NYNEX and subsidiaries (Verizon)
Pacific Telesis and subsidiaries
INSURANCE COMPANIES
Allstate
North Carolina Rate Bureau
United Services Automobile Association (USAA)
The Travelers Indemnity Company
Gulf Insurance Company
Other Professional Experience
Dr. Vander Weide has conducted in-house seminars and training sessions on topics such as creating
shareholder value, financial analysis, competitive strategy, cost of capital, real options, financial strategy,
managing growth, mergers and acquisitions, valuation, measuring corporate performance, capital budgeting,
cash management, and financial planning. Among the firms for whom he has designed and taught tailored
programs and training sessions are ABB Asea Brown Boveri, Accenture, Allstate, Ameritech, AT&T, Bell
Atlantic/Verizon, BellSouth, Progress Energy/Carolina Power & Light, Contel, Fisons, GlaxoSmithKline,
GTE, Lafarge, MidAmerican Energy, New Century Energies, Norfolk Southern, Pacific Bell Telephone, The
Rank Group, Siemens, Southern New England Telephone, TRW, and Wolseley Plc. Dr. Vander Weide has
also hosted a nationally prominent conference/workshop on estimating the cost of capital. In 1989, at the
request of Mr. Fuqua, Dr. Vander Weide designed the Duke Program for Manager Development for
managers from the former Soviet Union, the first in the United States designed exclusively for managers
from Russia and the former Soviet republics.
Early in his career, Dr. Vander Weide helped found University Analytics, Inc., one of the fastest
growing small firms in the country at that time. As an officer at University Analytics, he designed cash
management models, databases, and software used by most major United States banks in consulting with
their corporate clients. Having sold his interest in University Analytics, Dr. Vander Weide now concentrates
on strategic and financial consulting, academic research, and executive education.
EXHIBIT JVW-1

Exhibit No. _____(JVW-1) Appendix 1 Page 5 of 6
PUBLICATIONS JAMES H. VANDER WEIDE
The Lock-Box Location Problem: a Practical Reformulation, Journal of Bank Research, Summer, 1974, pp. 92-96 (with S. Maier). Reprinted in Management Science in Banking, edited by K. J. Cohen and S. E. Gibson, Warren, Gorham and Lamont, 1978.
A Finite Horizon Dynamic Programming Approach to the Telephone Cable Layout Problem, Conference Record, 1976 International Conference on Communications (with S. Maier and C. Lam).
A Note on the Optimal Investment Policy of the Regulated Firm, Atlantic Economic Journal, Fall, 1976 (with D. Peterson).
A Unified Location Model for Cash Disbursements and Lock-Box Collections, Journal of Bank Research, Summer, 1976 (with S. Maier). Reprinted in Management Science in Banking, edited by K. J. Cohen and S. E. Gibson, Warren Gorham and Lamont, 1978. Also reprinted in Readings on the Management of Working Capital, edited by K. V. Smith, West Publishing Company, 1979.
Capital Budgeting in the Decentralized Firm,’ Management Science, Vol. 23, No. 4, December 1976, pp. 433-443 (with S. Maier).
A Monte Carlo Investigation of Characteristics of Optimal Geometric Mean Portfolios, Journal of Financial and Quantitative Analysis, June, 1977, pp. 215-233 (with S. Maier and D. Peterson).
A Strategy which Maximizes the Geometric Mean Return on Portfolio Investments, Management Science, June, 1977, Vol. 23, No. 10, pp. 1117-1123 (with S. Maier and D. Peterson).
A Decision Analysis Approach to the Computer Lease-Purchase Decision, Computers and Operations Research, Vol. 4, No. 3, September, 1977, pp. 167-172 (with S. Maier).
A Practical Approach to Short-run Financial Planning, Financial Management, Winter, 1978 (with S. Maier). Reprinted in Readings on the Management of Working Capital, edited by K. V. Smith, West Publishing Company, 1979.
Effectiveness of Regulation in the Electric Utility Industry,’ Journal of Economics and Business, May, 1979 (with F. Tapon).
On the Decentralized Capital Budgeting Problem Under Uncertainty, Management Science, September 1979 (with B. Obel).
Expectations Data and the Predictive Value of Interim Reporting: A Comment, Journal of Accounting Research, Spring 1980 (with L. D. Brown, J. S. Hughes, and M. S. Rozeff).
General Telephone’s Experience with a Short-run Financial Planning Model, Cash Management Forum, June 1980, Vol. 6, No. 1 (with J. Austin and S. Maier).
Deregulation and Oligopolistic Price-Quality Rivalry, American Economic Review, March 1981 (with J. Zalkind).
Forecasting Disbursement Float, Financial Management, Spring 1981 (with S. Maier and D. Robinson).
Recent Developments in Management Science in Banking, Management Science, October 1981 (with K. Cohen and S. Maier).
EXHIBIT JVW-1

Exhibit No. _____(JVW-1) Appendix 1 Page 6 of 6
Incentive Considerations in the Reporting of Leveraged Leases, Journal of Bank Research, April 1982 (with J. S. Hughes).
A Decision-Support System for Managing a Short-term Financial Instrument Portfolio, Journal of Cash Management, March 1982 (with S. Maier).
An Empirical Bayes Estimate of Market Risk, Management Science, July 1982 (with S. Maier and D. Peterson).
The Bond Scheduling Problem of the Multi-subsidiary Holding Company, Management Science, July 1982 (with K. Baker).
Deregulation and Locational Rents in Banking: a Comment, Journal of Bank Research, Summer 1983.
What Lockbox and Disbursement Models Really Do, Journal of Finance, May 1983 (with S. Maier).
Financial Management in the Short Run, Handbook of Modern Finance, edited by Dennis Logue, published by Warren, Gorham, & Lamont, Inc., New York, 1984.
Managing Corporate Liquidity: an Introduction to Working Capital Management, John Wiley and Sons, 1984 (with S. Maier)
Measuring Investors’ Growth Expectations: Analysts vs. History, The Journal of Portfolio Management, Spring 1988 (with W. Carleton).
Entry Auctions and Strategic Behavior under Cross-Market Price Constraints, International Journal of Industrial Organization, 20 (2002) 611-629 (with J. Anton and N. Vettas).
Principles for Lifetime Portfolio Selection: Lessons from Portfolio Theory, Handbook of Portfolio Construction: Contemporary Applications of Markowitz Techniques, John B. Guerard, (Ed.), Springer, 2009.
EXHIBIT JVW-1

Exhibit No. _____(JVW-1) Appendix 2 Page 1 of 10
APPENDIX 2 DERIVATION OF THE QUARTERLY DCF MODEL
The simple DCF Model assumes that a firm pays dividends only at the end of each
year. Since firms in fact pay dividends quarterly and investors appreciate the time value of
money, the annual version of the DCF Model generally underestimates the value investors
are willing to place on the firm’s expected future dividend stream. In these workpapers, we
review two alternative formulations of the DCF Model that allow for the quarterly payment
of dividends.
When dividends are assumed to be paid annually, the DCF Model suggests that the
current price of the firm’s stock is given by the expression:
where
P0 = current price per share of the firm’s stock, D1, D2,...,Dn = expected annual dividends per share on the firm’s stock, Pn = price per share of stock at the time investors expect to sell the
stock, and k = return investors expect to earn on alternative investments of the
same risk, i.e., the investors’ required rate of return.
Unfortunately, expression (1) is rather difficult to analyze, especially for the purpose of
estimating k. Thus, most analysts make a number of simplifying assumptions. First, they
assume that dividends are expected to grow at the constant rate g into the indefinite
future. Second, they assume that the stock price at time n is simply the present value of
all dividends expected in periods subsequent to n. Third, they assume that the investors’
required rate of return, k, exceeds the expected dividend growth rate g. Under the above
simplifying assumptions, a firm’s stock price may be written as the following sum:
EXHIBIT JVW-1

Exhibit No. _____(JVW-1) Appendix 2 Page 2 of 10
where the three dots indicate that the sum continues indefinitely.
As we shall demonstrate shortly, this sum may be simplified to:
g)-(kg)+(1D = P 0
0
First, however, we need to review the very useful concept of a geometric progression.
Geometric Progression
Consider the sequence of numbers 3, 6, 12, 24,…, where each number after the first is
obtained by multiplying the preceding number by the factor 2. Obviously, this sequence of
numbers may also be expressed as the sequence 3, 3 x 2, 3 x 22, 3 x 23, etc. This sequence is
an example of a geometric progression.
Definition: A geometric progression is a sequence in which each term after the first is
obtained by multiplying some fixed number, called the common ratio, by the preceding term.
A general notation for geometric progressions is: a, the first term, r, the common ratio,
and n, the number of terms. Using this notation, any geometric progression may be
represented by the sequence:
a, ar, ar2, ar3,…, arn-1.
In studying the DCF Model, we will find it useful to have an expression for the sum of n terms
of a geometric progression. Call this sum Sn. Then
However, this expression can be simplified by multiplying both sides of equation (3) by r and
then subtracting the new equation from the old. Thus,
EXHIBIT JVW-1

Exhibit No. _____(JVW-1) Appendix 2 Page 3 of 10
rSn = ar + ar2 + ar3 +… + arn
and
Sn - rSn = a - arn ,
or
(1 - r) Sn = a (1 - rn) .
Solving for Sn, we obtain:
r)-(1)r-a(1 = S
n
n (4)
as a simple expression for the sum of n terms of a geometric progression. Furthermore, if |r|
< 1, then Sn is finite, and as n approaches infinity, Sn approaches a ÷ (1-r). Thus, for a
geometric progression with an infinite number of terms and |r| < 1, equation (4) becomes:
r- 1a =S (5)
Application to DCF Model
Comparing equation (2) with equation (3), we see that the firm’s stock price (under
the DCF assumption) is the sum of an infinite geometric progression with the first term
k)+(1g)+(1D = a 0
and common factor
k)+(1g)+(1 = r
Applying equation (5) for the sum of such a geometric progression, we obtain
EXHIBIT JVW-1

Exhibit No. _____(JVW-1) Appendix 2 Page 4 of 10
g-kg)+(1D =
g-kk+1
k)+(1g)+(1D =
k+1g+1-1
1 k)+(1
g)+(1D = r)-(1
1 a =S 000
as we suggested earlier.
EXHIBIT JVW-1

Exhibit No. _____(JVW-1) Appendix 2 Page 5 of 10
Quarterly DCF Model
The Annual DCF Model assumes that dividends grow at an annual rate of g% per
year (see Figure 1).
Figure 1
Annual DCF Model
D0 D1
0 1
Year
D0 = 4d0 D1 = D0(1 + g)
Figure 2
Quarterly DCF Model (Constant Growth Version)
d0 d1 d2 d3 D1
0 1 Year
d1 = d0(1+g).25 d2 = d0(1+g).50
d3 = d0(1+g).75 d4 = d0(1+g)
In the Quarterly DCF Model, it is natural to assume that quarterly dividend payments differ from the preceding quarterly dividend by the factor (1 + g).25, where g is expressed in terms of percent per year and the decimal .25 indicates that the growth has only occurred for one quarter of the year. (See Figure 2.) Using this assumption, along with the assumption of
EXHIBIT JVW-1

Exhibit No. _____(JVW-1) Appendix 2 Page 6 of 10
constant growth and k > g, we obtain a new expression for the firm’s stock price, which takes account of the quarterly payment of dividends. This expression is:
where d0 is the last quarterly dividend payment, rather than the last annual dividend payment.
(We use a lower case d to remind the reader that this is not the annual dividend.)
Although equation (6) looks formidable at first glance, it too can be greatly simplified
using the formula [equation (4)] for the sum of an infinite geometric progression. As the reader
can easily verify, equation (6) can be simplified to:
)g+(1- )k+(1
)g+(1d = P41
41
41
00 (7)
Solving equation (7) for k, we obtain a DCF formula for estimating the cost of equity
under the quarterly dividend assumption:
1 - )g+(1 + P
)g+(1d = k 4
1
0
4
1
0
4
(8)
EXHIBIT JVW-1

Exhibit No. _____(JVW-1) Appendix 2 Page 7 of 10
An Alternative Quarterly DCF Model
Although the constant growth Quarterly DCF Model [equation (8)] allows for the
quarterly timing of dividend payments, it does require the assumption that the firm increases
its dividend payments each quarter. Since this assumption is difficult for some analysts to
accept, we now discuss a second Quarterly DCF Model that allows for constant quarterly
dividend payments within each dividend year.
Assume then that the firm pays dividends quarterly and that each dividend payment is
constant for four consecutive quarters. There are four cases to consider, with each case
distinguished by varying assumptions about where we are evaluating the firm in relation to
the time of its next dividend increase. (See Figure 3.)
EXHIBIT JVW-1

Exhibit No. _____(JVW-1) Appendix 2 Page 8 of 10
Figure 3
Quarterly DCF Model (Constant Dividend Version)
Case 1
d0 d1 d2 d3 d4
0 1
Year
d1 = d2 = d3 = d4 = d0(1+g)
Case 2
d0 d1 d2 d3 d4
0 1
Year
d1 = d0
d2 = d3 = d4 = d0(1+g)
EXHIBIT JVW-1

Exhibit No. _____(JVW-1) Appendix 2 Page 9 of 10
Figure 3 (continued)
Case 3
d0 d1 d2 d3 d4
0 1 Year
d1 = d2 = d0
d3 = d4 = d0(1+g)
Case 4
d0 d1 d2 d3 d4
0 1
Year
d1 = d2 = d3 = d0
d4 = d0(1+g)
EXHIBIT JVW-1

Exhibit No. _____(JVW-1) Appendix 2 Page 10 of 10
If we assume that the investor invests the quarterly dividend in an alternative investment
of the same risk, then the amount accumulated by the end of the year will in all cases be
given by:
D1* = d1 (1+k)3/4 + d2 (1+k)1/2 + d3 (1+k)1/4 + d4
where d1, d2, d3 and d4 are the four quarterly dividends. Under these new assumptions, the
firm’s stock price may be expressed by an Annual DCF Model of the form (2), with the
exception that:
D1* = d1 (1 + k)3/4 + d2 (1 + k)1/2 + d3 (1 + k)1/4 + d4 (9)
is used in place of D0(1+g). But, we already know that the Annual DCF Model may be reduced
to:
g-kg)+(1D = P 0
0
Thus, under the assumptions of the second Quarterly DCF Model, the firm’s cost of equity is
given by:
g + PD = k
0
*1
(10)
with D1* given by (9).
Although equation (10) looks like the Annual DCF Model, there are at least two very
important practical differences. First, since D1* is always greater than D0(1+g), the estimates
of the cost of equity are always larger (and more accurate) in the Quarterly Model (10) than
in the Annual Model. Second, since D1* depends on k through equation (9), the unknown “k”
appears on both sides of (10), and an iterative procedure is required to solve for k.
EXHIBIT JVW-1

Exhibit No. _____(JVW-1) Appendix 3 Page 1 of 17
APPENDIX 3 ADJUSTING FOR FLOTATION COSTS IN DETERMINING
A PUBLIC UTILITY’S ALLOWED RATE OF RETURN ON EQUITY
I. Introduction
Regulation of public utilities is guided by the principle that utility revenues should be sufficient to allow recovery of all prudently incurred expenses, including the cost of capital. As set forth in the 1944 Hope Natural Gas Case [Federal Power Comm’n v. Hope Natural Gas Co. 320 U. S. 591 (1944) at 603], the U. S. Supreme Court states:
From the investor or company point of view it is important that there be enough revenue not only for operating expenses but also for the capital costs of the business. These include service on the debt and dividends on the stock.…By that standard the return to the equity owner should be commensurate with returns on investments in other enterprises having corresponding risks.
Since the flotation costs arising from the issuance of debt and equity securities are an integral component of capital costs, this standard requires that the company’s revenues be sufficient to fully recover flotation costs.
Despite the widespread agreement that flotation costs should be recovered in the regulatory process, several issues still need to be resolved. These include:
1. How is the term “flotation costs” defined? Does it include only the out-of-pocket costs associated with issuing securities (e. g., legal fees, printing costs, selling and underwriting expenses), or does it also include the reduction in a security’s price that frequently accompanies flotation?
2. What should be the time pattern of cost recovery? Should a company be allowed to recover flotation costs immediately, or should flotation costs be recovered over the life of the issue?
3. For the purposes of regulatory accounting, should flotation costs be included as an expense? As an addition to rate base? Or as an additional element of a firm’s allowed rate of return?
4. Do existing regulatory methods for flotation cost recovery allow a firm full recovery of flotation costs?
In this paper, I review the literature pertaining to the above issues and discuss my own views regarding how this literature applies to the cost of equity for a regulated firm.
II. Definition of Flotation Cost
The value of a firm is related to the future stream of net cash flows (revenues minus expenses measured on a cash basis) that can be derived from its assets. In the process of
EXHIBIT JVW-1

Exhibit No. _____(JVW-1) Appendix 3 Page 2 of 17
acquiring assets, a firm incurs certain expenses which reduce its value. Some of these expenses or costs are directly associated with revenue production in one period (e. g., wages, cost of goods sold), others are more properly associated with revenue production in many periods (e. g., the acquisition cost of plant and equipment). In either case, the word “cost” refers to any item that reduces the value of a firm.
If this concept is applied to the act of issuing new securities to finance asset purchases, many items are properly included in issuance or flotation costs. These include: (1) compensation received by investment bankers for underwriting services, (2) legal fees, (3) accounting fees, (4) engineering fees, (5) trustee’s fees, (6) listing fees, (7) printing and engraving expenses, (8) SEC registration fees, (9) Federal Revenue Stamps, (10) state taxes, (11) warrants granted to underwriters as extra compensation, (12) postage expenses, (13) employees’ time, (14) market pressure, and (15) the offer discount. The finance literature generally divides these flotation cost items into three categories, namely, underwriting expenses, issuer expenses, and price effects.
III. Magnitude of Flotation Costs
The finance literature contains several studies of the magnitude of the flotation costs associated with new debt and equity issues. These studies differ primarily with regard to the time period studied, the sample of companies included, and the source of data. The flotation cost studies generally agree, however, that for large issues, underwriting expenses represent approximately one and one-half percent of the proceeds of debt issues and three to five percent of the proceeds of seasoned equity issues. They also agree that issuer expenses represent approximately 0.5 percent of both debt and equity issues, and that the difference between the offering price and the last reported sales price is at least two to three percent of the proceeds from the stock issue. (Underwriters set the public offering price at a value less than the most recent market price in order to reduce the risk that they would have to sell the equity at a loss.) Thus, total flotation costs represent
approximately two percent1 of the proceeds from debt issues, and five and one-half to
eight and one-half percent of the proceeds of equity issues.
Lee et. al. [14] is an excellent example of the type of flotation cost studies found in the finance literature. The Lee study is a comprehensive study of the underwriting and issuer costs associated with debt and equity issues for both utilities and non-utilities. The results of the Lee et. al. study are reproduced in Tables 1 and 2. Table 1 demonstrates that the total underwriting and issuer expenses for the 1,092 debt issues in their study averaged 2.24 percent of the proceeds of the issues, while the total underwriting and issuer costs for the 1,593 seasoned equity issues in their study averaged 7.11 percent of the proceeds of the new issue. Table 1 also demonstrates that the total underwriting and issuer costs of seasoned equity offerings, as a percent of proceeds, decline with the size of the issue. For
[1] The two percent flotation cost on debt only recognizes the cost of newly-issued debt. When interest
rates decline, many companies exercise the call provisions on higher cost debt and reissue debt at lower rates. This process involves reacquisition costs that are not included in the academic studies. If reacquisition costs were included in the academic studies, debt flotation costs could increase significantly.
EXHIBIT JVW-1

Exhibit No. _____(JVW-1) Appendix 3 Page 3 of 17
issues above $60 million, total underwriting and issuer costs amount to from three to five percent of the amount of the proceeds.
Table 2 reports the total underwriting and issuer expenses for 135 utility debt issues and 136 seasoned utility equity issues. Total underwriting and issuer expenses for utility bond offerings averaged 1.47 percent of the amount of the proceeds and for seasoned utility equity offerings averaged 4.92 percent of the amount of the proceeds. Again, there are some economies of scale associated with larger equity offerings. Total underwriting and issuer expenses for equity offerings in excess of 40 million dollars generally range from three to four percent of the proceeds.
The results of the Lee study for large equity issues are consistent with results of earlier studies by Bhagat and Frost [4], Mikkelson and Partch [17], and Smith [24]. Bhagat and Frost found that total underwriting and issuer expenses average approximately four and one-half percent of the amount of proceeds from negotiated utility offerings during the period 1973 to 1980, and approximately three and one-half percent of the amount of the proceeds from competitive utility offerings over the same period. Mikkelson and Partch found that total underwriting and issuer expenses average five and one-half percent of the proceeds from seasoned equity offerings over the 1972 to 1982 period. Smith found that total underwriting and issuer expenses for larger equity issues generally amount to four to five percent of the proceeds of the new issue.
The finance literature also contains numerous studies of the decline in price associated with sales of large blocks of stock to the public. These articles relate to the price impact of: (1) initial public offerings; (2) the sale of large blocks of stock from one investor to another; and (3) the issuance of seasoned equity issues to the general public. All of these studies generally support the notion that the announcement of the sale of large blocks of stock produces a decline in a company’s share price. The decline in share price for initial public offerings is significantly larger than the decline in share price for seasoned equity offerings; and the decline in share price for public utilities is less than the decline in share price for non-public utilities. A comprehensive study of the magnitude of the decline in share price associated specifically with the sale of new equity by public utilities is reported in Pettway [19], who found the market pressure effect for a sample of 368 public utility equity sales to be in the range of two to three percent. This decline in price is a real cost to the utility, because the proceeds to the utility depend on the stock price on the day of issue.
In addition to the price decline associated with the announcement of a new equity issue, the finance literature recognizes that there is also a price decline associated with the actual issuance of equity securities. In particular, underwriters typically sell seasoned new equity securities to investors at a price lower than the closing market price on the day preceding the issue. The Rules of Fair Practice of the National Association of Securities Dealers require that underwriters not sell shares at a price above the offer price. Because the offer price represents a binding constraint to the underwriter, the underwriter tends to set the offer price slightly below the last reported market price to compensate for the risk that the price received by the underwriter may go down, but cannot increase.
EXHIBIT JVW-1

Exhibit No. _____(JVW-1) Appendix 3 Page 4 of 17
In summary, the finance literature provides strong support for the conclusion that total underwriting and issuer expenses for public utility debt offerings represent approximately two percent of the amount of the proceeds, while total underwriting and issuer expenses for public utility equity offerings represent at least four to five percent of the amount of the proceeds. In addition, the finance literature supports the conclusion that the cost associated with the decline in stock price at the announcement date represents approximately two to three percent as a result of a large public utility equity issue.
IV. Time Pattern Of Flotation Cost Recovery
Although flotation costs are incurred only at the time a firm issues new securities, there is no reason why an issuing firm ought to recognize the expense only in the current period. In fact, if assets purchased with the proceeds of a security issue produce revenues over many years, a sound argument can be made in favor of recognizing flotation expenses over a reasonably lengthy period of time. Such recognition is certainly consistent with the generally accepted accounting principle that the time pattern of expenses match the time pattern of revenues, and it is also consistent with the normal treatment of debt flotation expenses in both regulated and unregulated industries.
In the context of a regulated firm, it should be noted that there are many possible time patterns for the recovery of flotation expenses. However, if it is felt that flotation expenses are most appropriately recovered over a period of years, then it should be recognized that investors must also be compensated for the passage of time. That is to say, the value of an investor’s capital will be reduced if the expenses are merely distributed over time, without any allowance for the time value of money.
V. Accounting For Flotation Cost In A Regulatory Setting
In a regulatory setting, a firm’s revenue requirements are determined by the equation:
Revenue Requirement = Total Expenses + Allowed Rate of Return x Rate Base
Thus, there are three ways in which an issuing firm can account for and recover its flotation expenses: (1) treat flotation expenses as a current expense and recover them immediately; (2) include flotation expenses in rate base and recover them over time; and (3) adjust the allowed rate of return upward and again recover flotation expenses over time. Before considering methods currently being used to recover flotation expenses in a regulatory setting, I shall briefly consider the advantages and disadvantages of these three basic recovery methods. Expenses. Treating flotation costs as a current expense has several advantages. Because it allows for recovery at the time the expense occurs, it is not necessary to compute amortized balances over time and to debate which interest rate should be applied to these balances. A firm’s stockholders are treated fairly, and so are the firm’s customers, because they pay neither more nor less than the actual flotation expense. Since flotation costs are relatively small compared to the total revenue requirement, treatment as a current expense does not cause unusual rate hikes in the year of flotation, as would the
EXHIBIT JVW-1

Exhibit No. _____(JVW-1) Appendix 3 Page 5 of 17
introduction of a large generating plant in a state that does not allow Construction Work in Progress in rate base.
On the other hand, there are two major disadvantages of treating flotation costs as a current expense. First, since the asset purchased with the acquired funds will likely generate revenues for many years into the future, it seems unfair that current ratepayers should bear the full cost of issuing new securities, when future ratepayers share in the benefits. Second, this method requires an estimate of the underpricing effect on each security issue. Given the difficulties involved in measuring the extent of underpricing, it may be more accurate to estimate the average underpricing allowance for many securities than to estimate the exact figure for one security.
Rate Base. In an article in Public Utilities Fortnightly, Bierman and Hass [5] recommend that flotation costs be treated as an intangible asset that is included in a firm’s rate base along with the assets acquired with the stock proceeds. This approach has many advantages. For ratepayers, it provides a better match between benefits and expenses: the future ratepayers who benefit from the financing costs contribute the revenues to recover these costs. For investors, if the allowed rate of return is equal to the investors’ required rate of return, it is also theoretically fair since they are compensated for the opportunity cost of their investment (including both the time value of money and the investment risk).
Despite the compelling advantages of this method of cost recovery, there are several disadvantages that probably explain why it has not been used in practice. First, a firm will only recover the proper amount for flotation expenses if the rate base is multiplied by the appropriate cost of capital. To the extent that a commission under or over estimates the cost of capital, a firm will under or over recover its flotation expenses. Second, it is may be both legally and psychologically difficult for commissioners to include an intangible asset in a firm’s rate base. According to established legal doctrine, assets are to be included in rate base only if they are “used and useful” in the public service. It is unclear whether intangible assets such as flotation expenses meet this criterion.
Rate of Return. The prevailing practice among state regulators is to treat flotation expenses as an additional element of a firm’s cost of capital or allowed rate of return. This method is similar to the second method above (treatment in rate base) in that some part of the initial flotation cost is amortized over time. However, it has a disadvantage not shared by the rate base method. If flotation cost is included in rate base, it is fairly easy to keep track of the flotation cost on each new equity issue and see how it is recovered over time. Using the rate of return method, it is not possible to track the flotation cost for specific issues because the flotation cost for a specific issue is never recorded. Thus, it is not clear to participants whether a current allowance is meant to recover (1) flotation costs actually incurred in a test period, (2) expected future flotation costs, or (3) past flotation costs. This confusion never arises in the treatment of debt flotation costs. Because the exact costs are recorded and explicitly amortized over time, participants recognize that current allowances for debt flotation costs are meant to recover some fraction of the flotation costs on all past debt issues.
VI. Existing Regulatory Methods
EXHIBIT JVW-1

Exhibit No. _____(JVW-1) Appendix 3 Page 6 of 17
Although most state commissions prefer to let a regulated firm recover flotation expenses through an adjustment to the allowed rate of return, there is considerable controversy about the magnitude of the required adjustment. The following are some of the most frequently asked questions: (1) Should an adjustment to the allowed return be made every year, or should the adjustment be made only in those years in which new equity is raised? (2) Should an adjusted rate of return be applied to the entire rate base, or should it be applied only to that portion of the rate base financed with paid-in capital (as opposed to retained earnings)? (3) What is the appropriate formula for adjusting the rate of return?
This section reviews several methods of allowing for flotation cost recovery. Since the regulatory methods of allowing for recovery of debt flotation costs is well known and widely accepted, I will begin my discussion of flotation cost recovery procedures by describing the widely accepted procedure of allowing for debt flotation cost recovery.
Debt Flotation Costs
Regulators uniformly recognize that companies incur flotation costs when they issue debt securities. They typically allow recovery of debt flotation costs by making an adjustment to both the cost of debt and the rate base (see Brigham [6]). Assume that: (1) a regulated company issues $100 million in bonds that mature in 10 years; (2) the interest rate on these bonds is seven percent; and (3) flotation costs represent four percent of the amount of the proceeds. Then the cost of debt for regulatory purposes will generally be calculated as follows:
%71.7
000,000,4$000,000,100$
000,400$000,000,7$
costsflotation ed Unamortiz- valuePrincipal
costsflotation ofon Amortizati expenseInterest Debt ofCost
Thus, current regulatory practice requires that the cost of debt be adjusted upward by approximately 71 basis points, in this example, to allow for the recovery of debt flotation costs. This example does not include losses on reacquisition of debt. The flotation cost allowance would increase if losses on reacquisition of debt were included.
The logic behind the traditional method of allowing for recovery of debt flotation costs is simple. Although the company has issued $100 million in bonds, it can only invest $96 million in rate base because flotation costs have reduced the amount of funds received by $4 million. If the company is not allowed to earn a 71 basis point higher rate of return on the $96 million invested in rate base, it will not generate sufficient cash flow to pay the seven percent interest on the $100 million in bonds it has issued. Thus, proper regulatory treatment is to increase the required rate of return on debt by 71 basis points.
EXHIBIT JVW-1

Exhibit No. _____(JVW-1) Appendix 3 Page 7 of 17
Equity Flotation Costs
The finance literature discusses several methods of recovering equity flotation costs. Since each method stems from a specific model, (i. e., set of assumptions) of a firm and its cash flows, I will highlight the assumptions that distinguish one method from another.
Arzac and Marcus. Arzac and Marcus [2] study the proper flotation cost adjustment formula for a firm that makes continuous use of retained earnings and external equity financing and maintains a constant capital structure (debt/equity ratio). They assume at the outset that underwriting expenses and underpricing apply only to new equity obtained from external sources. They also assume that a firm has previously recovered all underwriting expenses, issuer expenses, and underpricing associated with previous issues of new equity.
To discuss and compare various equity flotation cost adjustment formulas, Arzac and Marcus make use of the following notation:
k = an investors’ required return on equity
r = a utility’s allowed return on equity base
S = value of equity in the absence of flotation costs
Sf = value of equity net of flotation costs
Kt = equity base at time t
Et = total earnings in year t
Dt = total cash dividends at time t
b = (Et-Dt) ÷ Et = retention rate, expressed as a fraction of
earnings
h = new equity issues, expressed as a fraction of earnings
m = equity investment rate, expressed as a fraction of
earnings,
m = b + h < 1 f = flotation costs, expressed as a fraction of the value of an
issue.
Because of flotation costs, Arzac and Marcus assume that a firm must issue a greater amount of external equity each year than it actually needs. In terms of the above notation, a firm issues hEt ÷ (1-f) to obtain hEt in external equity funding. Thus, each year a firm loses:
Equation 1
ttt hE
ffhE
fhE
L
11
EXHIBIT JVW-1

Exhibit No. _____(JVW-1) Appendix 3 Page 8 of 17
due to flotation expenses. The present value, V, of all future flotation expenses is:
Equation 2
mrkrK
ffh
kffhEV
tt
t
0
1 1)1)(1(
To avoid diluting the value of the initial stockholder’s equity, a regulatory authority needs to find the value of r, a firm’s allowed return on equity base, that equates the value of equity net of flotation costs to the initial equity base (Sf = K0). Since the value of equity net of flotation costs equals the value of equity in the absence of flotation costs minus the present value of flotation costs, a regulatory authority needs to find that value of r that solves the following equation:
.LSS f This value is:
Equation 3
ffh
kr
11
To illustrate the Arzac-Marcus approach to adjusting the allowed return on equity for the effect of flotation costs, suppose that the cost of equity in the absence of flotation costs is 12 percent. Furthermore, assume that a firm obtains external equity financing each year equal to 10 percent of its earnings and that flotation expenses equal 5 percent of the value of each issue. Then, according to Arzac and Marcus, the allowed return on equity should be:
%06.121206.
95.
)1).(.05(.1
12.
r
Summary. With respect to the three questions raised at the beginning of this section, it is evident that Arzac and Marcus believe the flotation cost adjustment should be applied each year, since continuous external equity financing is a fundamental assumption of their model. They also believe that the adjusted rate of return should be applied to the entire equity-financed portion of the rate base because their model is based on the assumption that the flotation cost adjustment mechanism will be applied to the entire equity financed portion of the rate base. Finally, Arzac and Marcus recommend a flotation cost adjustment formula, Equation (3), that implicitly excludes recovery of financing costs associated with financing in previous periods and includes only an allowance for the fraction of equity financing obtained from external sources.
Patterson. The Arzac-Marcus flotation cost adjustment formula is significantly different from the conventional approach (found in many introductory textbooks) which recommends the adjustment equation:
EXHIBIT JVW-1

Exhibit No. _____(JVW-1) Appendix 3 Page 9 of 17
Equation 4
gfP
Drt
t
)1(1
where Pt-1 is the stock price in the previous period and g is the expected dividend growth rate. Patterson [18] compares the Arzac-Marcus adjustment formula to the conventional approach and reaches the conclusion that the Arzac-Marcus formula effectively expenses issuance costs as they are incurred, while the conventional approach effectively amortizes them over an assumed infinite life of the equity issue. Thus, the conventional formula is similar to the formula for the recovery of debt flotation costs: it is not meant to compensate investors for the flotation costs of future issues, but instead is meant to compensate investors for the flotation costs of previous issues. Patterson argues that the conventional approach is more appropriate for rate making purposes because the plant purchased with external equity funds will yield benefits over many future periods.
Illustration. To illustrate the Patterson approach to flotation cost recovery, assume that a newly organized utility sells an initial issue of stock for $100 per share, and that the utility plans to finance all new investments with retained earnings. Assume also that: (1) the initial dividend per share is six dollars; (2) the expected long-run dividend growth rate is six percent; (3) the flotation cost is five percent of the amount of the proceeds; and (4) the payout ratio is 51.28 percent. Then, the investor’s required rate of return on equity is [k = (D/P) + g = 6 percent + 6 percent = 12 percent]; and the flotation-cost-adjusted cost of equity is [6 percent (1/.95) + 6 percent = 12.316 percent].
The effects of the Patterson adjustment formula on the utility’s rate base, dividends, earnings, and stock price are shown in Table 3. We see that the Patterson formula allows earnings and dividends to grow at the expected six percent rate. We also see that the present value of expected future dividends, $100, is just sufficient to induce investors to part with their money. If the present value of expected future dividends were less than $100, investors would not have been willing to invest $100 in the firm. Furthermore, the present value of future dividends will only equal $100 if the firm is allowed to earn the 12.316 percent flotation-cost-adjusted cost of equity on its entire rate base.
Summary. Patterson’s opinions on the three issues raised in this section are in stark contrast to those of Arzac and Marcus. He believes that: (1) a flotation cost adjustment should be applied in every year, regardless of whether a firm issues any new equity in each year; (2) a flotation cost adjustment should be applied to the entire equity-financed portion of the rate base, including that portion financed by retained earnings; and (3) the rate of return adjustment formula should allow a firm to recover an appropriate fraction of all previous flotation expenses.
VII. Conclusion
Having reviewed the literature and analyzed flotation cost issues, I conclude that:
EXHIBIT JVW-1

Exhibit No. _____(JVW-1) Appendix 3 Page 10 of 17
Definition of Flotation Cost: A regulated firm should be allowed to recover both the total underwriting and issuance expenses associated with issuing securities and the cost of market pressure.
Time Pattern of Flotation Cost Recovery. Shareholders are indifferent between the alternatives of immediate recovery of flotation costs and recovery over time, as long as they are fairly compensated for the opportunity cost of their money. This opportunity cost must include both the time value of money and a risk premium for equity investments of this nature.
Regulatory Recovery of Flotation Costs. The Patterson approach to recovering flotation costs is the only rate-of-return-adjustment approach that meets the Hope case criterion that a regulated company’s revenues must be sufficient to allow the company an opportunity to recover all prudently incurred expenses, including the cost of capital. The Patterson approach is also the only rate-of-return-adjustment approach that provides an incentive for investors to invest in the regulated company.
Implementation of a Flotation Cost Adjustment. As noted earlier, prevailing regulatory practice seems to be to allow the recovery of flotation costs through an adjustment to the required rate of return. My review of the literature on this subject indicates that there are at least two recommended methods of making this adjustment: the Patterson approach and the Arzac-Marcus approach. The Patterson approach assumes that a firm’s flotation expenses on new equity issues are treated in the same manner as flotation expenses on new bond issues, i. e., they are amortized over future time periods. If this assumption is true (and I believe it is), then the flotation cost adjustment should be applied to a firm’s entire equity base, including retained earnings. In practical terms, the Patterson approach produces an increase in a firm’s cost of equity of approximately twenty to thirty basis points. The Arzac-Marcus approach assumes that flotation costs on new equity issues are recovered entirely in the year in which the securities are sold. Under the Arzac-Marcus assumption, a firm should not be allowed any adjustments for flotation costs associated with previous flotations. Instead, a firm should be allowed only an adjustment on future security sales as they occur. Under reasonable assumptions about the rate of new equity sales, this method produces an increase in the cost of equity of approximately six basis points. Since the Arzac-Marcus approach does not allow the company to recover the entire amount of its flotation cost, I recommend that this approach be rejected and the Patterson approach be accepted.
EXHIBIT JVW-1

Exhibit No. _____(JVW-1) Appendix 3 Page 11 of 17
BIBLIOGRAPHY
1. Armknecht, Raymond, Fred Grygiel and Patrick Hess, “Market Pressure: The Sales of New Common Equity and Rate of Return Regulation, “Proceedings of the Business and Economic Statistics Section of the American Statistical Association, 1974, pp. 80—91.
2. Arzac, E. R., and M. Marcus, “Flotation Cost Allowance in Rate of Return Regulation: A Note,” Journal of Finance, December 1981, pp. 1199—1202.
3. Barclay, M. J. and R. H. Litzenberger, 1988, “Announcement Effects of New Equity Issues and the Use of Intraday Price Data,” Journal of Financial Economics 21, 71—99.
4. Bhagat, S. and P. A. Frost, 1986, “Issuing Costs to Existing Shareholders in Competitive and Negotiated Underwritten Public Utility Equity Offerings,” Journal of Financial Economics 15, 233—59.
5. Bierman, H., and J. E. Hass, “Equity Flotation Cost Adjustments in Utilities’ Cost of Service,” Public Utilities Fortnightly, March 1, 1983, pp.46—49 .
6. Bowyer, Jr., John W., and Jess B. Yawitz, “The Effect of New Equity Issues on Utility Stock Prices,” Pubic Utilities Fortnightly, May 22, 1980.
7. Brigham, Eugene F., Dana Aberwald, and Louis C. Gapenski, “Common Equity Flotation Costs and Rate Making,” Public Utilities Fortnightly, May 2, 1985, pp. 28—26.
8. Calomiris, C. W. and D. M. G Raff, 1995, “The Evolution of Market Structure, Information, and Spreads in American Investment Banking,” in M. B. Bordo and R. Sylla, eds., Anglo-American Finance: Financial Markets and Institutions in 20th Century North America and the U. K. (Business One-Irwin Homewood, IL), 103—60.
9. Dunbar, C. G., 1995, “The Use of Warrants as Underwriter Compensation in Initial Public Offerings,” Journal of Financial Economics 38, 59—78.
10. Evans, Robert E., “On the Existence, Measurement, and Economic Significance of Market Pressure in the Pricing of New Equity Shares,” unpublished dissertation, University of Wisconsin, 1978.
11. Howe, K. M., “Flotation Cost Allowance in Rate of Return Regulation: Comment,” Journal of Finance, March 1984, pp. 289—290.
12. Howe, K. M., “Flotation Cost Allowance for the Regulated Firm: A Comparison of Alternatives,” unpublished working paper, School of Business, Iowa State University.
13. Ibbotson, R. C., “Price Performance of Common Stock New Issues,” Journal of Financial Economics, 1975, pp. 235—272.
14. Lee, Inmoo, Scott Lochhead, Jay Ritter, and Quanshui Zhao, “The Costs of Raising Capital,” The Journal of Financial Research, Vol XIX No 1 (Spring 1996), 59—74
15. Logue, D. E., “On the Pricing of Unseasoned Equity Offerings: 1965—1969,” Journal of Financial and Quantitative Analysis, January 1973, pp. 91—103.
16. McDonald, J. G. and A. K. Fisher, “New Issue Stock Price Behavior,” Journal of Finance, March 1972, pp. 97—102.
17. Mikkelson, Wayne H. and M. Megan Partch, “Valuation Effects of Security Offerings and the Issuance Process,” Journal of Financial Economics 15 (1986), pp. 31-60.
18. Patterson, C. S., “Flotation Cost Allowance in Rate of Return Regulation: Comment,” Journal of Finance, September 1983, pp. 1335—1338.
19. Pettway, R. H., “The Effects of New Equity Sales Upon Utility Share Prices,” Public Utilities Fortnightly, May 10, 1984, pp. 35—39.
20. Reilly, F. K. and K. Hatfield, “Investor Experience with New Stock Issues,” Financial Analysts’ Journal, September--October 1969, pp. 73—80.
EXHIBIT JVW-1

Exhibit No. _____(JVW-1) Appendix 3 Page 12 of 17
21. Richter, P. H., “The Ever Present Need for an Underpricing Allowance,” Public Utilities Fortnightly, February 18, 1982, pp. 58—61.
22. Scholes, M., “The Market for New Securities: Substitution versus Price Pressure and the Effects of Information on Share Prices,” Journal of Business, April 1972, pp. 179—211.
23. Securities and Exchange Commission, Report of Special Study on Securities Markets, U. S. Government Printing Office, Washington, D. C. 1963.
24. Smith, Clifford W. Jr., “Alternative Methods for Raising Capital,” Journal of Financial Economics 5 (1977) 273-307.
EXHIBIT JVW-1

Exhibit No. _____(JVW-1) Appendix 3 Page 13 of 17
Table 1 Direct Costs as a Percentage of Gross Proceeds
for Equity (IPOs and SEOs) and Straight and Convertible Bonds Offered by Domestic Operating Companies 1990—19942
Equities
IPOs SEOs
Line No.
Proceeds
($ in millions)
No. of
Issues
Gross
Spreads
Other Direct
Expenses
Total Direct Costs
No. of
Issues
Gross
Spreads
Other Direct
Expenses
Total Direct Costs
1 2-9.99 337 9.05% 7.91% 16.96% 167 7.72% 5.56% 13.28%2 10-19.99 389 7.24% 4.39% 11.63% 310 6.23% 2.49% 8.72%3 20-39.99 533 7.01% 2.69% 9.70% 425 5.60% 1.33% 6.93%4 40-59.99 215 6.96% 1.76% 8.72% 261 5.05% 0.82% 5.87%5 60-79.99 79 6.74% 1.46% 8.20% 143 4.57% 0.61% 5.18%6 80-99.99 51 6.47% 1.44% 7.91% 71 4.25% 0.48% 4.73%7 100-199.99 106 6.03% 1.03% 7.06% 152 3.85% 0.37% 4.22%8 200-499.99 47 5.67% 0.86% 6.53% 55 3.26% 0.21% 3.47%9 500 and up 10 5.21% 0.51% 5.72% 9 3.03% 0.12% 3.15%10 Total/Average 1,767 7.31% 3.69% 11.00% 1,593 5.44% 1.67% 7.11%
Bonds
Convertible Bonds Straight Bonds
Line No.
Proceeds
($ in millions)
No. of
Issues
Gross
Spreads
Other Direct
Expenses
Total Direct Costs
No. of
Issues
Gross
Spreads
Other Direct
Expenses
Total Direct Costs
1 2-9.99 4 6.07% 2.68% 8.75% 32 2.07% 2.32% 4.39%2 10-19.99 14 5.48% 3.18% 8.66% 78 1.36% 1.40% 2.76%3 20-39.99 18 4.16% 1.95% 6.11% 89 1.54% 0.88% 2.42%4 40-59.99 28 3.26% 1.04% 4.30% 90 0.72% 0.60% 1.32%5 60-79.99 47 2.64% 0.59% 3.23% 92 1.76% 0.58% 2.34%6 80-99.99 13 2.43% 0.61% 3.04% 112 1.55% 0.61% 2.16%7 100-199.99 57 2.34% 0.42% 2.76% 409 1.77% 0.54% 2.31%8 200-499.99 27 1.99% 0.19% 2.18% 170 1.79% 0.40% 2.19%9 500 and up 3 2.00% 0.09% 2.09% 20 1.39% 0.25% 1.64%10 Total/Average 211 2.92% 0.87% 3.79% 1,092 1.62% 0.62% 2.24%
[2] Inmoo Lee, Scott Lochhead, Jay Ritter, and Quanshui Zhao, “The Costs of Raising Capital,” Journal
of Financial Research Vol 19 No 1 (Spring 1996) pp. 59-74.
EXHIBIT JVW-1

Exhibit No. _____(JVW-1) Appendix 3 Page 14 of 17
Notes:
Closed-end funds and unit offerings are excluded from the sample. Rights offerings for SEOs are also excluded. Bond offerings do not include securities backed by mortgages and issues by Federal agencies. Only firm commitment offerings and non-shelf-registered offerings are included. Gross Spreads as a percentage of total proceeds, including management fee, underwriting fee, and selling concession. Other Direct Expenses as a percentage of total proceeds, including management fee, underwriting fee, and selling concession. Total Direct Costs as a percentage of total proceeds (total direct costs are the sum of gross spreads and other direct expenses).
EXHIBIT JVW-1

Exhibit No. _____(JVW-1) Appendix 3 Page 15 of 17
Table 2
Direct Costs of Raising Capital 1990—1994 Utility versus Non-Utility Companies3
Equities
Non-Utilities IPOs SEOs
Line No.
Proceeds
($ in millions) No.
of Issues
Gross Spreads Total Direct Costs No.
Of Issues
Gross Spreads Total Direct
Costs 1 2-9.99 332 9.04% 16.97% 154 7.91% 13.76%2 10-19.99 388 7.24% 11.64% 278 6.42% 9.01%3 20-39.99 528 7.01% 9.70% 399 5.70% 7.07%4 40-59.99 214 6.96% 8.71% 240 5.17% 6.02%5 60-79.99 78 6.74% 8.21% 131 4.68% 5.31%6 80-99.99 47 6.46% 7.88% 60 4.35% 4.84%7 100-199.99 101 6.01% 7.01% 137 3.97% 4.36%8 200-499.99 44 5.65% 6.49% 50 3.27% 3.48%9 500 and up 10 5.21% 5.72% 8 3.12% 3.25%10 Total/Average 1,742 7.31% 11.01% 1,457 5.57% 7.32%
11 Utilities Only 12 2-9.99 5 9.40% 16.54% 13 5.41% 7.68%13 10-19.99 1 7.00% 8.77% 32 4.59% 6.21%14 20-39.99 5 7.00% 9.86% 26 4.17% 4.96%15 40-59.99 1 6.98% 11.55% 21 3.69% 4.12%16 60-79.99 1 6.50% 7.55% 12 3.39% 3.72%17 80-99.99 4 6.57% 8.24% 11 3.68% 4.11%18 100-199.99 5 6.45% 7.96% 15 2.83% 2.98%19 200-499.99 3 5.88% 7.00% 5 3.19% 3.48%20 500 and up 0 1 2.25% 2.31%21 Total/Average 25 7.15% 10.14% 136 4.01% 4.92%
[3] Lee et al, op. cit.
EXHIBIT JVW-1

Exhibit No. _____(JVW-1) Appendix 3 Page 16 of 17
Table 2 (continued) Direct Costs of Raising Capital 1990—1994
Utility versus Non-Utility Companies4
Bonds Non- Utilities Convertible Bonds Straight Bonds
Line No.
Proceeds ($ in millions)
No. of Issues Gross Spreads
Total Direct Costs
No. of Issues Gross Spreads
Total Direct Costs
1 2-9.99 4 6.07% 8.75% 29 2.07% 4.53%2 10-19.99 12 5.54% 8.65% 47 1.70% 3.28%3 20-39.99 16 4.20% 6.23% 63 1.59% 2.52%4 40-59.99 28 3.26% 4.30% 76 0.73% 1.37%5 60-79.99 47 2.64% 3.23% 84 1.84% 2.44%6 80-99.99 12 2.54% 3.19% 104 1.61% 2.25%7 100-199.99 55 2.34% 2.77% 381 1.83% 2.38%8 200-499.99 26 1.97% 2.16% 154 1.87% 2.27%9 500 and up 3 2.00% 2.09% 19 1.28% 1.53%
10 Total/Average 203 2.90% 3.75% 957 1.70% 2.34%
11 Utilities Only 12 2-9.99 0 3 2.00% 3.28%13 10-19.99 2 5.13% 8.72% 31 0.86% 1.35%14 20-39.99 2 3.88% 5.18% 26 1.40% 2.06%15 40-59.99 0 14 0.63% 1.10%16 60-79.99 0 8 0.87% 1.13%17 80-99.99 1 1.13% 1.34% 8 0.71% 0.98%18 100-199.99 2 2.50% 2.74% 28 1.06% 1.42%19 200-499.99 1 2.50% 2.65% 16 1.00% 1.40%
20 500 and up 0 1 3.50% na5
21 Total/Average 8 3.33% 4.66% 135 1.04% 1.47%
Notes: Total proceeds raised in the United States, excluding proceeds from the exercise of over allotment options. Gross spreads as a percentage of total proceeds (including management fee, underwriting fee, and selling concession). Other direct expenses as a percentage of total proceeds (including registration fee and printing, legal, and auditing costs).
[4] Lee et al, op. cit. [5] Not available because of missing data on other direct expenses.
EXHIBIT JVW-1

Exhibit No. _____(JVW-1) Appendix 3 Page 17 of 17
Table 3 Illustration of Patterson Approach to Flotation Cost Recovery
LINE NO.
TIME PERIOD
RATE BASE
EARNINGS @
12.32%
EARNINGS @
12.00%
DIVIDENDS
AMORTIZATION INITIAL FC
1 0 95.00 2 1 100.70 11.70 11.40 6.00 0.30003 2 106.74 12.40 12.08 6.36 0.31804 3 113.15 13.15 12.81 6.74 0.33715 4 119.94 13.93 13.58 7.15 0.35736 5 127.13 14.77 14.39 7.57 0.37877 6 134.76 15.66 15.26 8.03 0.40158 7 142.84 16.60 16.17 8.51 0.42569 8 151.42 17.59 17.14 9.02 0.451110 9 160.50 18.65 18.17 9.56 0.478211 10 170.13 19.77 19.26 10.14 0.506812 11 180.34 20.95 20.42 10.75 0.537313 12 191.16 22.21 21.64 11.39 0.569514 13 202.63 23.54 22.94 12.07 0.603715 14 214.79 24.96 24.32 12.80 0.639916 15 227.67 26.45 25.77 13.57 0.678317 16 241.33 28.04 27.32 14.38 0.719018 17 255.81 29.72 28.96 15.24 0.762119 18 271.16 31.51 30.70 16.16 0.807820 19 287.43 33.40 32.54 17.13 0.856321 20 304.68 35.40 34.49 18.15 0.907722 21 322.96 37.52 36.56 19.24 0.962123 22 342.34 39.77 38.76 20.40 1.019924 23 362.88 42.16 41.08 21.62 1.081125 24 384.65 44.69 43.55 22.92 1.145926 25 407.73 47.37 46.16 24.29 1.214727 26 432.19 50.21 48.93 25.75 1.287628 27 458.12 53.23 51.86 27.30 1.364829 28 485.61 56.42 54.97 28.93 1.446730 29 514.75 59.81 58.27 30.67 1.533531 30 545.63 63.40 61.77 32.51 1.625532 Present Value@12% 195.00 190.00 100.00 5.00
EXHIBIT JVW-1

Exhibit No. _____(JVW-1) Appendix 4 Page 1 of 3
APPENDIX 4 EX ANTE RISK PREMIUM APPROACH
My ex ante risk premium method is based on studies of the DCF expected return
on proxy companies compared to the interest rate on Moody’s A-rated utility bonds.
Specifically, for each month in my study period, I calculate the risk premium using the
equation,
RPPROXY = DCFPROXY – IA
where:
RPPROXY = the required risk premium on an equity investment in the
proxy group of companies,
DCFPROXY = average DCF estimated cost of equity on a portfolio of
proxy companies; and
IA = the yield to maturity on an investment in A-rated utility
bonds.
For my ex ante risk premium analysis, I begin with my comparable group of
natural gas companies. Previous studies have shown that the ex ante risk premium tends
to vary inversely with the level of interest rates, that is, the risk premium tends to increase
when interest rates decline, and decrease when interest rates go up. To test whether my
studies also indicate that the ex ante risk premium varies inversely with the level of
interest rates, I perform a regression analysis of the relationship between the ex ante risk
premium and the yield to maturity on A-rated utility bonds, using the equation,
RPPROXY = a + (b x IA) + e
EXHIBIT JVW-1

Exhibit No. _____(JVW-1) Appendix 4 Page 2 of 3
where:
RPPROXY = risk premium on proxy company group;
IA = yield to maturity on A-rated utility bonds;
e = a random residual; and
a, b = coefficients estimated by the regression procedure.
Regression analysis assumes that the statistical residuals from the regression equation are
random. My examination of the residuals reveals that there is a significant probability
that the residuals are serially correlated (non-zero serial correlation indicates that the
residual in one time period tends to be correlated with the residual in the previous time
period). Therefore, I make adjustments to my data to correct for the possibility of serial
correlation in the residuals.
The common procedure for dealing with serial correlation in the residuals is to
estimate the regression coefficients in two steps. First, a multiple regression analysis is
used to estimate the serial correlation coefficient, r. Second, the estimated serial
correlation coefficient is used to transform the original variables into new variables
whose serial correlation is approximately zero. The regression coefficients are then re-
estimated using the transformed variables as inputs in the regression equation. Based on
my knowledge of the statistical relationship between the yield to maturity on A-rated
utility bonds and the required risk premium, my estimate of the ex ante risk premium on
an investment in my proxy natural gas company group as compared to an investment in
A-rated utility bonds is given by the equation:
EXHIBIT JVW-1

Exhibit No. _____(JVW-1) Appendix 4 Page 3 of 3
RPPROXY = 8.50 -0.587 x IA.
(14.82) (-6.20) [6]
Using a 5.74 percent forecasted yield to maturity on A-rated utility bonds at July
2018, 7 the regression equation produces an ex ante risk premium based on the natural gas
proxy group equal to 5.14 percent (8.50 – .587 x 5.74= 5.14).
To estimate the cost of equity using the ex ante risk premium method, one may
add the estimated risk premium over the yield on A-rated utility bonds to the forecasted
yield to maturity on A-rated utility bonds. As described above, my analyses produce an
estimated risk premium over the yield on A-rated utility bonds equal to 5.14 percent.
Adding an estimated risk premium of 5.14 percent to the 5.74 percent forecasted yield to
maturity on A-rated utility bonds produces a cost of equity estimate of 10.9 percent using
the ex ante risk premium method.
[6] The t-statistics are shown in parentheses. [7] As described in my testimony, I obtain the expected yield to maturity on A-rated utility bonds,
5.74 percent, by averaging forecast data from Value Line Selection & Opinion (June 1, 2018) and the United States Energy Information Administration (EIA). Value Line Selection & Opinion ( June1, 2018) projects a AAA-rated Corporate bond yield equal to 4.8 percent. The average spread between A-rated utility bonds and Aaa-rated Corporate bonds is 40 basis points (A-rated utility, 4.27 percent, less Aaa-rated Corporate, 3.87 percent, equals 40 basis points). Adding 40 basis points to the 4.8 percent Value Line Aaa Corporate bond forecast equals a forecast yield of 5.2 percent for the A-rated utility bonds. The EIA forecasts an AA-rated utility bond yield equal to 6.11 percent. The spread between AA-rated utility and A-rated utility bonds is 17 basis points (4.27 percent less 4.10 percent). Adding 17 basis points to EIA’s 6.11 percent AA-utility bond yield forecast equals a forecast yield for A-rated utility bonds equal to 6.3 percent. The average of the forecasts (5.2 percent using Value Line data and 6.3 percent using EIA data) is 5.7 percent.
EXHIBIT JVW-1

Exhibit No. _____(JVW-1) Appendix 5 Page 1 of 1
APPENDIX 5 EX POST RISK PREMIUM APPROACH
Source
Stock price and yield information is obtained from Standard & Poor’s Security Price publication. Standard & Poor’s derives the stock dividend yield by dividing the aggregate cash dividends (based on the latest known annual rate) by the aggregate market value of the stocks in the group. The bond price information is obtained by calculating the present value of a bond due in thirty years with a $4.00 coupon and a yield to maturity of a particular year’s indicated Moody’s A-rated utility bond yield. The values shown in the schedules are the January values of the respective indices.
Calculation of Stock and Bond Returns
Sample calculation of “Stock Return” column:
where Dividend (2017) = Stock Price (2017) x Stock Div. Yield (2017)
Sample calculation of “Bond Return” column:
where Interest = $4.00.
(2017) PriceStock
(2017) Dividend + (2017) PriceStock - (2018) PriceStock (2017)Return Stock
(2017) PriceBond
(2017) Interest + (2017) PriceBond - (2018) PriceBond (2017)Return Bond
EXHIBIT JVW-1

BEFORE THE PUBLIC SERVICE COMMISSION
COMMONWEALTH OF KENTUCKY
APPLICATION OF ATMOS ENERGY ) ) CORPORATION FOR AN ADJUSTMENT ) Case No. 2018-00281 ) OF RATES AND TARIFF MODIFICATIONS )
TESTIMONY OF DANE A. WATSON, PE CDP

Direct Testimony of Dane A. Watson Page i Kentucky / Watson
TABLE OF CONTENTS
I. POSITION AND QUALIFICATIONS ...................................................................... 1
II. PURPOSE OF DIRECT TESTIMONY .................................................................... 3
III. KENTUCKY DIRECT GAS DEPRECIATION STUDY ......................................... 5
IV. KENTUCKY MID-STATES GENERAL OFFICE DEPRECIATION STUDY ..... 13
V. CONCLUSION ........................................................................................................ 16
EXHIBITS:
Exhibit DAW-1 – Experience of Dane A. Watson
Exhibit DAW-2 – Atmos Energy Corporation - Kentucky Depreciation Rate Study at September 30, 2017
Exhibit DAW-3 – Atmos Energy Corporation - Kentucky Mid-States General Office Depreciation Rate Study at September 30, 2017

Direct Testimony of Dane A. Watson Page 1 Kentucky / Watson
I. POSITION AND QUALIFICATIONS 1
Q. PLEASE STATE YOUR NAME AND ADDRESS. 2
A. My name is Dane A. Watson, and my business address is 101 E. Park Blvd., Suite 3
220, Plano, Texas 75074. I am Managing Partner of Alliance Consulting Group. 4
Alliance Consulting Group provides consulting and expert services to the utility 5
industry. 6
Q. WHAT IS YOUR EDUCATIONAL BACKGROUND? 7
A. I hold a Bachelor of Science degree in Electrical Engineering from the University of 8
Arkansas at Fayetteville and a Master's Degree in Business Administration from 9
Amberton University. 10
Q. DO YOU HOLD ANY SPECIAL CERTIFICATION AS A DEPRECIATION 11
EXPERT? 12
A. Yes. The Society of Depreciation Professionals (“the Society”) has established 13
national standards for depreciation professionals. The Society administers an 14
examination and has certain required qualifications to become certified in this field. 15
I met all requirements and have become a Certified Depreciation Professional 16
(“CDP”). 17
Q. PLEASE OUTLINE YOUR EXPERIENCE IN THE FIELD OF 18
DEPRECIATION. 19
A. Since graduation from college in 1985, I have worked in the area of depreciation and 20
valuation. I founded Alliance Consulting Group in 2004 and am responsible for 21
conducting depreciation, valuation and certain accounting-related studies for utilities 22
in various industries. My duties relate to preparing depreciation studies and include 23

Direct Testimony of Dane A. Watson Page 2 Kentucky / Watson
(1) assembling and analyzing historical and simulated data, (2) conducting field 1
reviews, (3) determining service life and net salvage estimates, (4) calculating annual 2
depreciation, (5) presenting recommended depreciation rates to utility management 3
for its consideration, and (6) supporting such rates before regulatory bodies. 4
My prior employment from 1985 to 2004 was with Texas Utilities (“TXU”). 5
During my tenure with TXU, I was responsible for, among other things, conducting 6
valuation and depreciation studies for the domestic TXU companies. During that 7
time, I served as Manager of Property Accounting Services and Records 8
Management in addition to my depreciation responsibilities. 9
I have twice been Chair of the Edison Electric Institute (“EEI”) Property 10
Accounting and Valuation Committee and have been Chairman of EEI’s 11
Depreciation and Economic Issues Subcommittee. I am a Registered Professional 12
Engineer (“PE”) in the State of Texas and a Certified Depreciation Professional. I 13
am a Senior Member of the Institute of Electrical and Electronics Engineers ("IEEE") 14
and have held numerous offices on the Executive Board of the Dallas Section, 15
Region and worldwide offices of IEEE. I am also twice Past President of the Society 16
of Depreciation Professionals. 17
Q. HAVE YOU PREVIOUSLY TESTIFIED BEFORE ANY REGULATORY 18
COMMISSIONS? 19
A. Yes. In my 33-year career, I have testified in more than 165 proceedings before 20
approximately 35 regulatory commissions across the United States. I have also 21
presented expert testimony before the Federal Energy Regulatory Commission 22

Direct Testimony of Dane A. Watson Page 3 Kentucky / Watson
(“FERC”). A complete listing of my filed written testimony is provided in Exhibit 1
DAW-1. 2
Q. HAVE YOU PREVIOUSLY FILED TESTIMONY BEFORE THE KENTUCKY 3
PUBLIC SERVICE COMMISSION? 4
A. Yes. I provided written testimony on behalf of Atmos Energy in Case Nos. 2013-5
00148, 2015-00343, and 2017-00349 Rebuttal. 6
II. PURPOSE OF DIRECT TESTIMONY 7
Q. WHAT IS THE PURPOSE OF YOUR DIRECT TESTIMONY IN THIS 8
PROCEEDING? 9
A. I sponsor and support the depreciation studies performed for Atmos Energy 10
Corporation - Kentucky (“Kentucky” or “Atmos Energy” or “Company”), and its 11
Kentucky Mid-States General Office (“KY Mid-States”). In that regard, I am 12
sponsoring the following Filing Requirements (“FR”): 13
FR 16(7)(s) Summary of latest depreciation study with schedules itemized 14
by major plant accounts. 15
Q. ARE YOU SPONSORING ANY EXHIBITS IN THIS PROCEEDING? 16
A. Yes. I am sponsoring the following exhibits: 17
• DAW-1 - List of Experience (Studies Performed, Filed Testimony and/or 18
Regulatory Appearances); 19
• DAW-2 - Atmos Energy Corporation - Kentucky Depreciation Rate Study at 20
September 30, 2017; and 21
• DAW-3 - Atmos Energy Corporation - Kentucky Mid-States General Office 22
Depreciation Rate Study at September 30, 20174. 23

Direct Testimony of Dane A. Watson Page 4 Kentucky / Watson
Q. WERE THESE EXHIBITS PREPARED BY YOU OR UNDER YOUR 1
SUPERVISION AND CONTROL? 2
A. Yes. 3
Q. PLEASE SUMMARIZE YOUR CONCLUSIONS. 4
A. The Atmos Energy Kentucky and KY Mid-States depreciation studies and analyses 5
that I have performed support establishing depreciation rates at the level 6
recommended in my testimony. The Kentucky depreciation rate study is attached to 7
my testimony as Exhibit DAW-2. The Kentucky study shows that a decrease in the 8
annual depreciation expense for Atmos Energy’s assets of approximately $38 9
thousand per year is needed to ensure that the appropriate amount of depreciation 10
expense is collected by the Company. This amount was determined by comparing 11
the depreciation expense between the current rates and the proposed rates as shown 12
in Appendix B of Exhibit DAW-2. Changes in various accounts in the Distribution 13
Plant function are the drivers for the decrease. The KY Mid-States depreciation rate 14
study is attached as Exhibit DAW-3. Before allocation to the KY Mid-States rate 15
divisions, the KY Mid-States depreciation study results in an approximate $2,600 16
annual increase in depreciation expense. The allocated impact of this increase to 17
Kentucky customers can be provided by Company Witness Greg Waller. 18
Q. DO THE DEPRECIATION STUDIES YOU SPONSOR IN THIS CASE 19
REFLECT THE MOST CURRENT DATA AVAILABLE? 20
A. Yes. The data used reflects the most recent experience and future expectations for 21
life and net salvage characteristics for assets in Atmos’ Kentucky and KY Mid-States 22
depreciation studies as of September 30, 2017. 23

Direct Testimony of Dane A. Watson Page 5 Kentucky / Watson
III. KENTUCKY DIRECT GAS DEPRECIATION STUDY 1
Q. DID YOU PREPARE THE KENTUCKY DIRECT DEPRECIATION STUDY? 2
A. Yes. The Atmos Kentucky Depreciation Study is attached to my testimony as Exhibit 3
DAW-2. The study in Exhibit DAW-2 analyzes the life and net salvage percentage 4
for Atmos Energy’s gas assets at September 30, 2017. 5
Q. WHAT PROPERTY IS INCLUDED IN THE DEPRECIATION STUDY? 6
A. There are four general classes, or functional groups, of depreciable property: Storage 7
Plant, Transmission Plant, Distribution Plant and General Plant property. The 8
Storage Plant functional group primarily consists of facilities that store natural gas 9
for use as needed. The Transmission Plant functional group primarily consists of 10
high and intermediate pressure transmission assets that deliver gas to various receipt 11
points or city gates. The Distribution Plant functional group primarily consists of 12
lines and associated facilities used to distribute and meter gas within the areas served 13
by Atmos Energy. General Plant property, both depreciated and amortized, is not 14
location specific but is used to support the overall distribution of gas to its customers. 15
Q. WHAT DEFINITION OF DEPRECIATION HAVE YOU USED FOR THE 16
PURPOSES OF CONDUCTING A DEPRECIATION STUDY AND 17
PREPARING YOUR TESTIMONY? 18
A. The term "depreciation," as used herein, is considered in the accounting sense; that 19
is, a system of accounting that distributes the cost of assets, less net salvage (if any), 20
over the estimated useful life of the assets in a systematic and rational manner. 21
Depreciation is a process of allocation, not valuation. Depreciation expense is 22
systematically allocated to accounting periods over the life of the properties. The 23

Direct Testimony of Dane A. Watson Page 6 Kentucky / Watson
amount allocated to any one accounting period does not necessarily represent the loss 1
or decrease in value that will occur during that particular period. Thus, depreciation 2
is considered an expense or cost, rather than a loss or decrease in value. The 3
Company accrues depreciation based on the original cost of all property included in 4
each depreciable plant account. On retirement, the full cost of depreciable property, 5
less the net salvage amount, if any, is charged to the depreciation reserve. 6
Q. PLEASE DESCRIBE YOUR DEPRECIATION STUDY APPROACH. 7
A. I conducted the depreciation studies in four phases as shown in my Exhibits DAW-2 8
and DAW-3. The four phases are: Data Collection, Analysis, Evaluation, and 9
Calculation. During the initial phase of the study, I collected historical data to be 10
used in the analysis. After the data was assembled, I performed analyses to 11
determine the life and net salvage percentage for the different property groups being 12
studied. As part of this process, I conferred with field personnel, engineers, and 13
managers responsible for the installation, operation, and removal of the assets to gain 14
their input into the operation, maintenance, and salvage of the assets. The 15
information obtained from field personnel, engineers, and managerial personnel, 16
combined with the study results, was then evaluated to determine how the results of 17
the historical asset activity analysis, in conjunction with the Company’s expected 18
future plans should be applied. Using all of these resources, I then calculated the 19
depreciation rate for each function. 20
Q. WHAT DEPRECIATION METHODOLOGY DID YOU USE? 21
A. The straight-line (method), Equal Life Group (“ELG”) (procedure), and remaining-22
life (technique) depreciation system were employed to calculate annual and accrued 23

Direct Testimony of Dane A. Watson Page 7 Kentucky / Watson
depreciation in this study. This methodology is consistent with the existing approved 1
rates. 2
Q. HOW ARE THE DEPRECIATION RATES DETERMINED USING THE ELG 3
PROCEDURE? 4
A. In this system, the annual depreciation expense for each group is computed by 5
dividing the original cost of the asset less allocated depreciation reserve less 6
estimated net salvage by its respective equal life group remaining life. The resulting 7
annual accrual amounts of all depreciable property within a function were 8
accumulated, and the total was divided by the original cost of all functional 9
depreciable property to determine the depreciation rate. The calculated remaining 10
lives and annual depreciation accrual rates were based on attained ages of plant in 11
service and the estimated service life and salvage characteristics of each depreciable 12
group. The computations of the annual depreciation rates are shown in Appendix A 13
of my Exhibit DAW-2. 14
Q. HAVE INDUSTRY AND DEPRECIATION EXPERTS DESCRIBED THE ELG 15
PROCEDURE AS A MORE THEORETICALLY CORRECT DEPRECIATION 16
PROCEDURE? 17
A. Yes. The ELG procedure has been recognized as the more theoretically correct 18
depreciation procedure. This conclusion was first reached by Mr. Robley Winfrey 19
(who helped design the current depreciation system we use today) approximately 60 20
years ago. Specifically, Mr. Winfrey, the founding father of modern depreciation 21
systems, has stated that the ELG procedure is the “only mathematically correct 22
[depreciation] procedure.” Similarly, Dr. W. Chester Fitch and Dr. Frank K. Wolf 23

Direct Testimony of Dane A. Watson Page 8 Kentucky / Watson
(who literally wrote the book on depreciation and trained many of the depreciation 1
professional working today, including myself), are also in agreement with Mr. 2
Winfrey on the validity of the ELG method. I would note again that a number of 3
regulatory commissions have approved the use of the ELG procedure, and this 4
Commission has consistently approved the use of ELG rates for Atmos Energy. 5
Q. WHAT TIME PERIOD DID YOU USE TO DEVELOP THE PROPOSED 6
DEPRECIATION RATES? 7
A. The account level depreciation rates were developed based on the depreciable 8
property recorded on the Company’s books at September 30, 2017. 9
Q. PLEASE SUMMARIZE THE DEPRECIATION STUDY RESULTS WITH 10
RESPECT TO DEPRECIATION RATES. 11
A. Exhibit DAW-2, Appendix A shows the approved and proposed annual depreciation 12
rates and accrual for each account. Based on this comparison there is an overall 13
decrease in annual depreciation expense of $38 thousand. This is comprised of a 14
decrease of approximately $3 thousand for Storage Plant; a decrease of $154 15
thousand for Transmission Plant; an increase of $255 thousand for Distribution Plant; 16
and a decrease of $136 thousand for General Plant (depreciated and amortized). 17
Q. WHAT FACTORS INFLUENCE THE DEPRECIATION RATES FOR AN 18
ACCOUNT? 19
A. The primary factors that influence the depreciation rate for an account are: (1) the 20
remaining investment to be recovered in the account, (2) the depreciable life of the 21
account, and (3) the net salvage for the account. 22

Direct Testimony of Dane A. Watson Page 9 Kentucky / Watson
Q. WHAT ARE THE PRIMARY FACTORS DRIVING THE DECREASE IN THE 1
KY DIRECT DEPRECIATION STUDY? 2
A. Adjustments in life and net salvage factors for various accounts were recommended 3
as discussed later and in Exhibit DAW-2. The largest decrease in annual depreciation 4
expense is due to the changes in life for Transmission and Distribution Mains and 5
Distribution Services accounts. For Mains and Services, the Company has been in a 6
major pipe and service replacement program. While it is not yet complete, the life is 7
expected to increase over existing and is recognized in this study. The adjustments in 8
life impact the reserve position, which is also contributing to the change in each 9
function as described above. 10
Q. WHAT METHOD DID YOU USE TO ANALYZE HISTORICAL DATA TO 11
DETERMINE LIFE CHARACTERISTICS? 12
A. Accounts were analyzed using both the retirement rate method (actuarial method) 13
and simulated plant record balances analysis (SPR method) to estimate the life of 14
property. However, as the Company’s aged database continues to be developed over 15
time, we are trying to move to using the actuarial method exclusively and confirming 16
results with the SPR analysis, when needed. In much the same manner as human 17
mortality is analyzed by actuaries, depreciation analysts use models of property 18
mortality characteristics that have been validated in research and empirical 19
applications. Further detail is found in the life analysis section of Exhibit DAW-2.20

Direct Testimony of Dane A. Watson Page 10 Kentucky / Watson
Q. HOW DID YOU DETERMINE THE AVERAGE SERVICE LIVES FOR 1
EACH ASSET GROUP? 2
A. The establishment of appropriate average service lives for each account was 3
determined by using the Actuarial and/or SPR analysis methods. Graphs illustrating 4
the chosen Iowa Curves used to determine the average service lives for analyzed 5
accounts are found in the Life Analysis section of my Exhibit DAW-2. A summary 6
of the depreciable life for each account is shown in Exhibit DAW-2, Appendix C. 7
Q. PLEASE DESCRIBE SOME OF THE CHANGES IN THE AVERAGE 8
SERVICE LIVES FOR THE VARIOUS ACCOUNTS? 9
A. The detailed analysis of each account is described fully in Exhibit DAW-2. 10
Examples of some of the changes in average service lives are: 11
• There were only three decreases in life and were in the General Plant 12
Function. Two of these accounts are technology based accounts, which had 13
lives that were too long for the assets and/or Atmos’ current policy and 14
practices. 15
• The largest increases in life were 17, 15, and 13 years for Cushion Gas in 16
Storage; Mains in Distribution; and Mains in Transmission functions, 17
respectively. Also in the Storage Function, Accounts 35301 and 35302 - 18
Field Lines and Tributary Lines, each increased by 10 years to match the life 19
of Transmission Mains. 20
• There are 62 accounts of which 23 had no change, three had a decrease, and 21
36 had an increase in life. 22
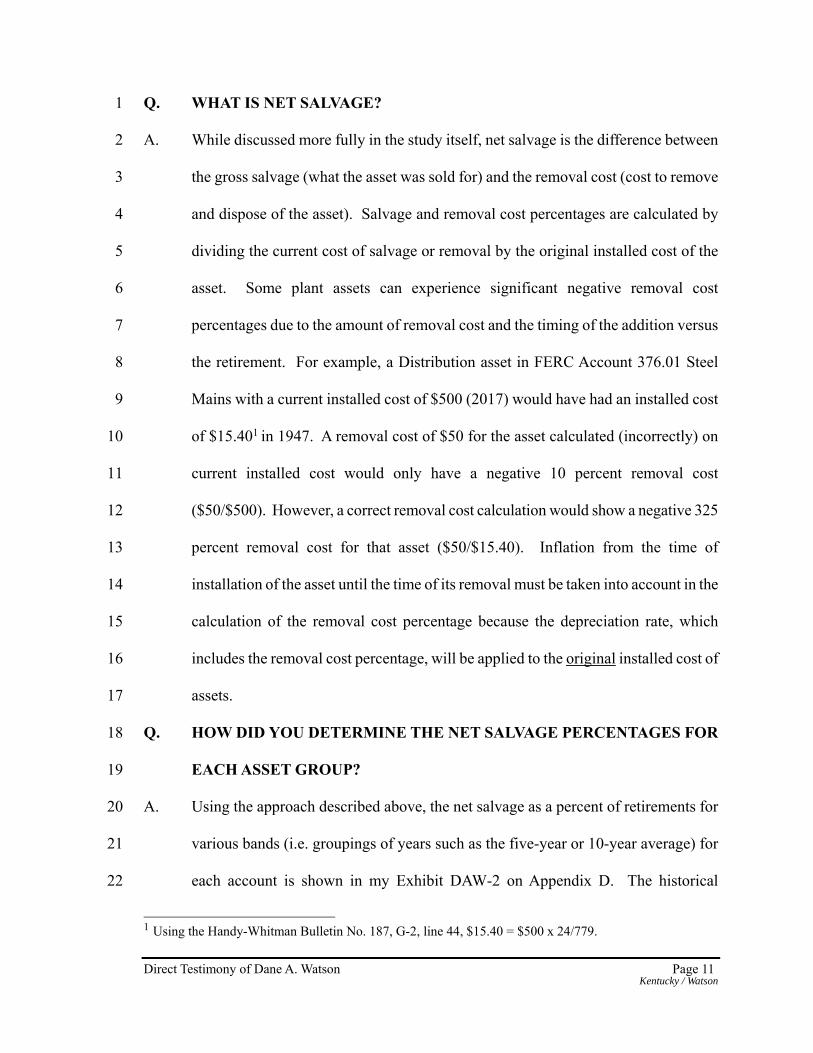
Direct Testimony of Dane A. Watson Page 11 Kentucky / Watson
Q. WHAT IS NET SALVAGE? 1
A. While discussed more fully in the study itself, net salvage is the difference between 2
the gross salvage (what the asset was sold for) and the removal cost (cost to remove 3
and dispose of the asset). Salvage and removal cost percentages are calculated by 4
dividing the current cost of salvage or removal by the original installed cost of the 5
asset. Some plant assets can experience significant negative removal cost 6
percentages due to the amount of removal cost and the timing of the addition versus 7
the retirement. For example, a Distribution asset in FERC Account 376.01 Steel 8
Mains with a current installed cost of $500 (2017) would have had an installed cost 9
of $15.401 in 1947. A removal cost of $50 for the asset calculated (incorrectly) on 10
current installed cost would only have a negative 10 percent removal cost 11
($50/$500). However, a correct removal cost calculation would show a negative 325 12
percent removal cost for that asset ($50/$15.40). Inflation from the time of 13
installation of the asset until the time of its removal must be taken into account in the 14
calculation of the removal cost percentage because the depreciation rate, which 15
includes the removal cost percentage, will be applied to the original installed cost of 16
assets. 17
Q. HOW DID YOU DETERMINE THE NET SALVAGE PERCENTAGES FOR 18
EACH ASSET GROUP? 19
A. Using the approach described above, the net salvage as a percent of retirements for 20
various bands (i.e. groupings of years such as the five-year or 10-year average) for 21
each account is shown in my Exhibit DAW-2 on Appendix D. The historical 22
1 Using the Handy-Whitman Bulletin No. 187, G-2, line 44, $15.40 = $500 x 24/779.

Direct Testimony of Dane A. Watson Page 12 Kentucky / Watson
experience, input from company experts and judgment were used to select a net 1
salvage percentage that represents the future expectations for each account. Atmos 2
has implemented the results of the Time and Motion Study across all its jurisdictions, 3
the results of which would not yet be fully identifiable. However, when evaluating 4
net salvage for the accounts in the Time and Motion Studies, a conservative approach 5
was taken for net salvage recommendations. 6
Q. CAN YOU EXPLAIN WHAT YOU MEAN BY A CONSERVATIVE 7
APPROACH? 8
A. Yes. In some accounts, net salvage was trending towards a more negative indication. 9
Knowing there can be timing differences that occur in net salvage when there are 10
large replacement programs, as well as understanding the implementation of the 11
Time and Motion Studies would not yet be fully shown in the analysis, I chose to 12
retain the approved net salvage parameters for some accounts rather than follow the 13
trend seen in the last couple years. 14
Q. PLEASE DESCRIBE SOME OF THE CHANGES IN THE NET SALVAGE 15
PERCENTAGES FOR THE VARIOUS ACCOUNTS? 16
A. The detailed analysis of each account is described fully in Exhibit DAW-2. 17
Examples of some of the changes in net salvage are: 18
• The largest increase (i.e. less negative) was a 39 percent change for Account 19
38100 - Distribution Meters, which moved from a negative 50 percent to a 20
negative 11 percent. Account 38200 - Distribution Meter Installations moved 21
from a negative 50 percent to a negative 35 percent. There was a 4 percent 22
change (less negative) for all M&R accounts across Storage, Transmission, 23

Direct Testimony of Dane A. Watson Page 13 Kentucky / Watson
and Distribution functions. There was a slight increase (less negative) in net 1
salvage for Services, a change from a negative 20 percent to negative 18 2
percent. Finally, the General Plant function also saw an increase in net 3
salvage for Account 396 Power Operated Equipment from 8 percent to 16 4
percent. 5
• The largest decrease (i.e. more negative or less positive) is in Account 383.00 6
and 384.00 - Distribution House Regulators and House Regulator Installation 7
moved from 0 percent to negative 35 percent, which is due to the combined 8
meter loop analysis. Account 354 Compressor Station Equipment also 9
changed from 0 percent to a negative 5 percent, based on historical 10
experience. 11
• Overall, 13 accounts experienced some level of increase (less negative) in net 12
salvage while 4 accounts experienced a decrease (more negative or less 13
positive) in net salvage, and 45 accounts remained unchanged. 14
IV. KENTUCKY MID-STATES GENERAL OFFICE DEPRECIATION STUDY 15
Q. DID ALLIANCE PREPARE A 2017 DEPRECIATION STUDY FOR ATMOS 16
KENTUCKY MID-STATES GENERAL OFFICE? 17
A. Yes. We have conducted a study as of September 30, 2017. The study 18
recommendations and results are attached to my direct testimony as Exhibit DAW-3. 19
Q. ARE THE STEPS DESCRIBED ABOVE FOR THE KENTUCKY 20
DEPRECIATION STUDY THE SAME FOR THE KY MID-STATES 21
GENERAL OFFICE ASSETS? 22
A. Yes. The same approach and methods were used. 23

Direct Testimony of Dane A. Watson Page 14 Kentucky / Watson
Q. WHAT PROPERTY IS INCLUDED IN THE KY MID-STATES GENERAL 1
OFFICE DEPRECIATION STUDY? 2
A. For KY Mid-States General Office, there is one general class of depreciable property 3
which is related to general office activities. These assets include office buildings and 4
leasehold improvements, office furniture, communications equipment, transportation 5
equipment, computer software and hardware and other miscellaneous general office 6
assets. 7
Q. WHAT TIME PERIOD WAS USED TO DEVELOP THE PROPOSED 8
DEPRECIATION RATES? 9
A. The depreciation rates were developed based on the depreciable property recorded on 10
KY Mid-States General Office books at September 30, 2017. 11
Q. WHAT ARE THE RESULTS OF THE KY MID-STATES GENERAL OFFICE 12
DEPRECIATION STUDY? 13
A. The 2017 KY Mid-States General Office Depreciation Study is found in Exhibit 14
DAW-3. The proposed annual depreciation expense, before allocation, is 15
approximately $51 thousand per year compared to the existing annual depreciation 16
expense of $48 thousand per year or a slight increase of approximately $3 thousand 17
per year. More details related to the study and results are found in Exhibit DAW-3. 18
Q. WHAT ARE THE PRIMARY FORCES AFFECTING THE DEPRECIATION 19
RATES RECOMMENDED IN THIS STUDY? 20
A. Generally, depreciation rates are affected by three separate factors - changes in 21
average service life, changes in net salvage, and the effect of reserve position. The 22
KY Mid-States General Office depreciation rates have all three of these affecting the 23

Direct Testimony of Dane A. Watson Page 15 Kentucky / Watson
rates. Also, due to the age and/or reserve position of the assets, numerous accounts 1
are considered fully depreciated at this time. 2
Q. DO YOU HAVE ANY GENERAL OBSERVATIONS REGARDING THE 3
RECOMMENDATIONS IN THE STUDY YOU WOULD LIKE TO EXPLAIN? 4
A. Yes. The change in expense is related to technology-based assets, which generally 5
have shorter life expectations than gas operational assets. There are accounts that 6
are fully depreciated. For those accounts we provide a whole life rate, which can be 7
applied in the future. The proposed rates for all accounts are shown on Exhibit 8
DAW-3 Appendix A and Appendix B. A comparison of the mortality characteristics 9
(average service life, curve, salvage and cost of removal) for each account is shown 10
on Exhibit DAW-3 Appendix C. Accounts 390, 392 and 396 are the only accounts 11
experiencing or expected to incur any level of net salvage. Detailed discussions for 12
each account can be found in Exhibit DAW-3. 13
Q. WHAT ASSETS WERE ANALYZED FOR THE 2017 KY MID-STATES 14
GENERAL OFFICE DEPRECIATION STUDY? 15
A. The KY Mid-States General Office assets perform a common service to all of Atmos’ 16
KY Mid-States Division, which includes its regulated utility operations across 17
multiple states, Kentucky being one of the states. The assets used to perform these 18
common services were analyzed during the depreciation study. As previously stated 19
these assets include, but are not limited to, office buildings, furniture and equipment, 20
communication equipment, and any computer hardware or software utilized to serve 21
general utility operations. The top largest investments in KY Mid-States General 22

Direct Testimony of Dane A. Watson Page 16 Kentucky / Watson
Office are Application Software, Miscellaneous Equipment, and Structures & 1
Improvements. 2
Q. WHAT DEPRECIATION RATES DOES THE COMPANY PROPOSE TO USE 3
FOR KY MID-STATES GENERAL OFFICE ASSETS? 4
A. The Company proposes to utilize the depreciation rates recommended in my 5
depreciation study, which can be found in Exhibit DAW-3 on Appendix A and 6
Appendix B. 7
Q. HAS ALLIANCE QUANTIFIED THE DEPRECIATION EXPENSE FOR KY 8
MID-STATES GENERAL OFFICE AS A RESULT OF THE DEPRECIATION 9
STUDY IT PERFORMED? 10
A. Yes. Based on September 30, 2017 plant balances and before allocation, the 11
proposed annual depreciation expense related to KY Mid-States General Office is 12
approximately $51 thousand. The individual account depreciation rates and resulting 13
annual depreciation expense can be found on Appendix A and Appendix B in Exhibit 14
DAW-3. 15
V. CONCLUSION 16
Q. WHAT ACCOUNT DEPRECIATION RATES ARE YOU PROPOSING, AND 17
HOW DO THEY COMPARE WITH THE CURRENT RATES? 18
A. The current depreciation rates and the rates I am now proposing related to Kentucky 19
are found in Appendix B of my Exhibit DAW-2. The proposed rates for KY Mid-20
States General Office are in Appendix B of my Exhibit DAW-3. Detailed 21
calculations and comparisons of these rates are found in my studies, Exhibit DAW-2 22
and DAW-3. 23

Direct Testimony of Dane A. Watson Page 17 Kentucky / Watson
Q. MR. WATSON, DO YOU HAVE ANY CONCLUDING REMARKS? 1
A. Yes. The depreciation studies and analysis performed under my supervision fully 2
support setting depreciation rates at the level I have indicated in my testimony. The 3
Company should continue to periodically review the annual depreciation rates for its 4
property. In this way, all customers are charged for their appropriate share of the 5
capital expended for their benefit. The depreciation studies for Atmos Energy’s 6
Kentucky, and Kentucky Mid-States General Office property as of September 30, 7
2017 describes the extensive analysis performed and the resulting rates that are now 8
appropriate for Company property. The Company’s depreciation rates should be set 9
at my recommended amounts in order to recover the Company’s total investment in 10
property over the estimated remaining life of the assets. 11
Q. DOES THIS CONCLUDE YOUR DIRECT TESTIMONY? 12
A. Yes, it does. 13

CO~ONWEALTHOFKENTUCKY
BEFORE THE PUBLIC SERVICE CO~SSION
IN THE MATTER OF RATE APPLICATION OF ATMOSENERGYCORPORATION
) ) )
Case No. 2018-00281
CERTIFICATE AND AFFIDAVIT
The Affiant, Dane A. Watson, being duly sworn, deposes and states that the prepared testimony attached hereto and made a part hereof, constitutes the prepared direct testimony of this affiant in Case No. 2018-00281 , in the Matter of the Rate Application of Atmos Energy Corporation, and that if asked the questions propounded therein, this affiant would make the answers set forth in the attached prepared direct pre-filed testimony.
STATE OF TEXAS
COUNTY OF COLLIN
ctt-~ a~~ Dane A. Watson
SUBSCRIBED AND SWORN to before me by Dane A. Watson on this the 24th day of September, 2018.

Dane Watson Testimony Appearances Exhibit DAW-1Page 1 of 8
Asset Location Commission Docket (If Applicable Company Year Description
Alaska Regulatory Commission of Alaska U-18-054 Matanuska Electric Coop 2018 Electric Generation
Depreciation Study
California California Public Utilities Commission A17-10-007 San Diego Gas and Electric 2018 Electric and Gas
Depreciation Study
Texas Public Utility Commission of Texas 48401 Texas New Mexico Power 2018 Electric Depreciation
Study
Nevada Public Utility Commission of Nevada 18-05031 Southwest Gas 2018 Gas Depreciation
Study
Texas Public Utility Commission of Texas 48231 Oncor Electric Delivery 2018 Depreciation Rates
Texas Public Utility Commission of Texas 48371 Entergy Texas 2018 Electric Depreciation
Study
Kansas Kansas Corporation Commission 18-KCPE-480-RTS Kansas City Power and
Light 2018 Electric Depreciation Study
Arkansas Arkansas Public Service Commission 18-027-U Liberty Pine Bluff Water 2018 Water Depreciation
Study
Kentucky Kentucky Public Service Commission 2017-00349 Atmos KY 2018 Gas Depreciation
Rates
Tennessee Tennesee Public Utility Commission 18-00017 Chattanooga Gas 2018 Gas Depreciation
Study
Texas Railroad Commission of Texas 10679 Si Energy 2018 Gas Depreciation
Study
Alaska Regulatory Commission of Alaska U-17-104 Anchorage Water and
Wastewater 2017Water and Waste
Water Depreciation Study
Michigan Michigan Public Service Commission U-18488 Michigan Gas Utilities
Corporation 2017 Gas Depreciation Study
Texas Railroad Commission of Texas 10669 CemterPoint South Texas 2017 Gas Depreciation
Study
Arkansas Arkansas Public Service Commission 17-061-U Empire District Electric
Company 2017 Depreciation Rates for New Wind Generation
Kansas Kansas Corporation Commission 18-EPDE-184-PRE Empire District Electric
Company 2017 Depreciation Rates for New Wind Generation
Oklahoma Oklahoma Corporation Commission PUD 201700471 Empire District Electric
Company 2017 Depreciation Rates for New Wind Generation
Missouri Missouri Public Service Commission EO-2018-0092 Empire District Electric
Company 2017 Depreciation Rates for New Wind Generation
Michigan Michigan Public Service Commission U-18457 Upper Peninsula Power
Company 2017 Electric Depreciation Study
Florida Florida Public Service Commission 20170179-GU Florida City Gas 2017 Gas Depreciation
Study
Michigan FERC ER18-56-000 Consumers Energy 2017 Electric Depreciation Study
Missouri Missouri Public Service Commission GR-2018-0013 Liberty Utilites 2017 Gas Depreciation
Study

Dane Watson Testimony Appearances Exhibit DAW-1Page 2 of 8
Asset Location Commission Docket (If Applicable Company Year Description
Michigan Michigan Public Service Commission U-18452 SEMCO 2017 Gas Depreciation
Study
Texas Public Utility Commission of Texas 47527 SPS 2017 Electric Production
Depreciation Study
MultiState FERC ER17-1664 American Transmission Company 2017 Electric Depreciation
Study
Alaska Regulatory Commission of Alaska U-17-008 Municipal Power and Light
City of Anchorage 2017 Generating Unit Depreciation Study
Mississippi Mississippi Public Service Commission 2017-UN-041 Atmos Energy 2017 Gas Depreciation
Study
Texas Public Utility Commission of Texas 46957 Oncor Electric Delivery 2017 Electric Depreciation
Study
Oklahoma Oklahoma Corporation Commission PUD 201700078 CenterPoint Oklahoma 2017 Gas Depreciation
Study
New York FERC ER17-1010-000 New York Power Authority 2017 Electric Depreciation Study
Texas Railroad Commission of Texas GUD 10580 Atmos Pipeline Texas 2017 Gas Depreciation
Study
Texas Railroad Commission of Texas GUD 10567 CenterPoint Texas 2016 Gas Depreciation
Study
MultiState FERC ER17-191-000 American Transmission Company 2016 Electric Depreciation
Study
New Jersey New Jersey Public Utilities Board GR16090826 Elizabethtown Natural Gas 2016 Gas Depreciation
Study
North Carolina North Carolina Utilities Commission Docket G-9 Sub 77H Piedmont Natural Gas 2016 Gas Depreciation
Study
Michigan Michigan Public Service Commission U-18195 Consumers Energy/DTE
Electric 2016Ludington Pumped
Storage Depreciation Study
Alabama FERC ER16-2313-000 SEGCO 2016 Electric Depreciation Study
Alabama FERC ER16-2312-000 Alabama Power Company 2016 Electric Depreciation Study
Michigan Michigan Public Service Commission U-18127 Consumers Energy 2016 Natural Gas
Depreciation Study
Mississippi Mississippi Public Service Commission 2016 UN 267 Willmut Natural Gas 2016 Natural Gas
Depreciation Study
Iowa Iowa Utilities Board RPU-2016-0003 Liberty-Iowa 2016 Natural Gas Depreciation Study
Illinois Illinois Commerce Commission GRM #16-208 Liberty-Illinois 2016 Natural Gas
Depreciation Study
Kentucky FERC RP16-097-000 KOT 2016 Natural Gas Depreciation Study
Alaska Regulatory Commission of Alaska U-16-067 Alaska Electric Light and
Power 2016 Generating Unit Depreciation Study
Florida Florida Public Service Commission 160170-EI Gulf Power 2016 Electric Depreciation
Study

Dane Watson Testimony Appearances Exhibit DAW-1Page 3 of 8
Asset Location Commission Docket (If Applicable Company Year Description
California California Public Utilities Commission A 16-07-002 California American Water 2016
Water and Waste Water Depreciation
Study
Arizona Arizona Corporation Commission G-01551A-16-0107 Southwest Gas 2016 Gas Depreciation
Study
Texas Public Utility Commission of Texas 45414 Sharyland 2016 Electric Depreciation
Study
Colorado Colorado Public Utilities Commission 16A-0231E Public Service of Colorado 2016 Electric Depreciation
Study
Multi-State NE US FERC 16-453-000 Northeast Transmission Development, LLC 2015 Electric Depreciaiton
Study
Arkansas Arkansas Public Service Commission 15-098-U CenterPoint Arkansas 2015
Gas Depreciation Study and Cost of
Removal Study
New MexicoNew Mexico Public
Regulation Commission
15-00296-UT SPS NM 2015 Electric Depreciation Study
Atmos Energy Corporation
Tennessee Regulatory Authority 14-00146 Atmos Tennessee 2015 Natural Gas
Depreciation Study
New MexicoNew Mexico Public
Regulation Commission
15-00261-UT Public Service Company of New Mexico 2015 Electric Depreciation
Study
Hawaii NA NA Hawaii American Water 2015 Water/Wastewater Depreciation Study
Kansas Kansas Corporation Commission 16-ATMG-079-RTS Atmos Kansas 2015 Gas Depreciation
Study
Texas Public Utility Commission of Texas 44704 Entergy Texas 2015 Electric Depreciation
Study
Alaska Regulatory Commission of Alaska U-15-089 Fairbanks Water and
Wastewater 2015Water and Waste
Water Depreciation Study
Arkansas Arkansas Public Service Commission 15-031-U Source Gas Arkansas 2015
Underground Storage Gas Depreciation
Study
New MexicoNew Mexico Public
Regulation Commission
15-00139-UT SPS NM 2015 Electric Depreciation Study
Texas Public Utility Commission of Texas 44746 Wind Energy Transmission
Texas 2015 Electric Depreciation Study
Colorado Colorado Public Utilities Commission 15-AL-0299G Atmos Colorado 2015 Gas Depreciation
Study
Arkansas Arkansas Public Service Commission 15-011-U Source Gas Arkansas 2015 Gas Depreciation
Study
Texas Railroad Commission of Texas GUD 10432 CenterPoint- Texas Coast
Division 2015 Gas Depreciation Study
Kansas Kansas Corporation Commission 15-KCPE-116-RTS Kansas City Power and
Light 2015 Electric Depreciation Study
Alaska Regulatory Commission of Alaska U-14-120 Alaska Electric Light and
Power2014-2015
Electric Depreciation Study

Dane Watson Testimony Appearances Exhibit DAW-1Page 4 of 8
Asset Location Commission Docket (If Applicable Company Year Description
Texas Public Utility Commission of Texas 43950 Cross Texas Transmission 2014 Electric Depreciation
Study
New MexicoNew Mexico Public
Regulation Commission
14-00332-UT Public Service of New Mexico 2014 Electric Depreciation
Study
Texas Public Utility Commission of Texas 43695 Xcel Energy 2014 Electric Depreciation
Study
Multi State – SE US FERC RP15-101 Florida Gas Transmission 2014 Gas Transmission Depreciation Study
California California Public Utilities Commission A.14-07-006 Golden State Water 2014
Water and Waste Water Depreciation
Study
Michigan Michigan Public Service Commission U-17653 Consumers Energy
Company 2014 Electric and Common Depreciation Study
ColoradoPublic Utilities Commission of
Colorado14AL-0660E Public Service of Colorado 2014 Electric Depreciation
Study
Wisconsin Wisconsin 05-DU-102 WE Energies 2014Electric, Gas, Steam
and Common Depreciation Studies
Texas Public Utility Commission of Texas 42469 Lone Star Transmission 2014 Electric Depreciation
Study
Nebraska Nebraska Public Service Commission NG-0079 Source Gas Nebraska 2014 Gas Depreciation
Study
Alaska Regulatory Commission of Alaska U-14-055 TDX North Slope
Generating 2014 Electric Depreciation Study
Alaska Regulatory Commission of Alaska U-14-054 Sand Point Generating LLC 2014 Electric Depreciation
Study
Alaska Regulatory Commission of Alaska U-14-045 Matanuska Electric Coop 2014 Electric Generation
Depreciation Study
Texas, New Mexico Public Utility Commission of Texas 42004 Xcel Energy 2013-
2014
Electric Production, Transmission,
Distribution and General Plant
Depreciation Study
New Jersey Board of Public Utilities GR13111137 South Jersey Gas 2013 Gas Depreciation
Study
Various FERC RP14-247-000 Sea Robin 2013 Gas Depreciation Study
Arkansas Arkansas Public Service Commission 13-078-U Arkansas Oklahoma Gas 2013 Gas Depreciation
Study
Arkansas Arkansas Public Service Commission 13-079-U Source Gas Arkansas 2013 Gas Depreciation
Study
California California Public Utilities Commission
Proceeding No.: A.13-11-003 Southern California Edison 2013 Electric Depreciation
Study

Dane Watson Testimony Appearances Exhibit DAW-1Page 5 of 8
Asset Location Commission Docket (If Applicable Company Year Description
North Carolina/South Carolina FERC ER13-1313 Progress Energy Carolina 2013 Electric Depreciation
Study
WisconsinPublic Service Commission of
Wisconsin4220-DU-108 Northern States Power-
Wisconsin 2013
Electric, Gas and Common
Transmission, Distribution and
General
Texas Public Utility Commission of Texas 41474 Sharyland 2013 Electric Depreciation
Study
Kentucky Kentucky Public Service Commission 2013-00148 Atmos Energy Corporation 2013 Gas Depreciation
Study
Minnesota Minnesota Public Utilities Commission 13-252 Allete Minnesota Power 2013 Electric Depreciation
Study
New Hampshire New Hampshire Public Service Commission DE 13-063 Liberty Utilities 2013 Electric Distribution
and General
Texas Railroad Commission of Texas 10235 West Texas Gas 2013 Gas Depreciation
Study
Alaska Regulatory Commission of Alaska U-12-154 Alaska Telephone Company 2012 Telecommunications
Utility
New MexicoNew Mexico Public
Regulation Commission
12-00350-UT SPS 2012 Electric Depreciation Study
Colorado Colorado Public Utilities Commission 12AL-1269ST Public Service of Colorado 2012 Gas and Steam
Depreciation Study
Colorado Colorado Public Utilities Commission 12AL-1268G Public Service of Colorado 2012 Gas and Steam
Depreciation Study
Alaska Regulatory Commission of Alaska U-12-149 Municipal Power and Light
City of Anchorage 2012 Electric Depreciation Study
Texas Texas Public Utility Commission 40824 Xcel Energy 2012 Electric Depreciation
Study
South CarolinaPublic Service
Commission of South Carolina
Docket 2012-384-E Progress Energy Carolina 2012 Electric Depreciation Study
Alaska Regulatory Commission of Alaska U-12-141 Interior Telephone
Company 2012 Telecommunications Utility
Michigan Michigan Public Service Commission U-17104 Michigan Gas Utilities
Corporation 2012 Gas Depreciation Study
North Carolina North Carolina Utilities Commission E-2 Sub 1025 Progress Energy Carolina 2012 Electric Depreciation
Study
Texas Texas Public Utility Commission 40606 Wind Energy Transmission
Texas 2012 Electric Depreciation Study
Texas Texas Public Utility Commission 40604 Cross Texas Transmission 2012 Electric Depreciation
Study
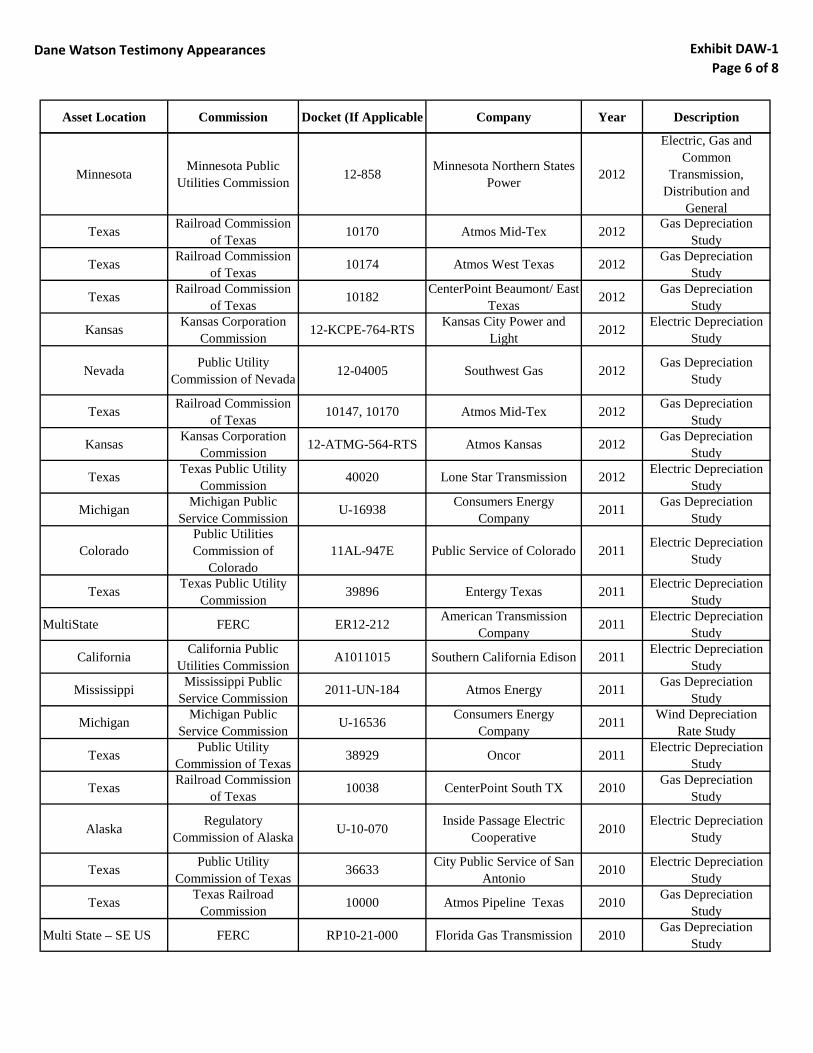
Dane Watson Testimony Appearances Exhibit DAW-1Page 6 of 8
Asset Location Commission Docket (If Applicable Company Year Description
Minnesota Minnesota Public Utilities Commission 12-858 Minnesota Northern States
Power 2012
Electric, Gas and Common
Transmission, Distribution and
General
Texas Railroad Commission of Texas 10170 Atmos Mid-Tex 2012 Gas Depreciation
Study
Texas Railroad Commission of Texas 10174 Atmos West Texas 2012 Gas Depreciation
Study
Texas Railroad Commission of Texas 10182 CenterPoint Beaumont/ East
Texas 2012 Gas Depreciation Study
Kansas Kansas Corporation Commission 12-KCPE-764-RTS Kansas City Power and
Light 2012 Electric Depreciation Study
Nevada Public Utility Commission of Nevada 12-04005 Southwest Gas 2012 Gas Depreciation
Study
Texas Railroad Commission of Texas 10147, 10170 Atmos Mid-Tex 2012 Gas Depreciation
Study
Kansas Kansas Corporation Commission 12-ATMG-564-RTS Atmos Kansas 2012 Gas Depreciation
Study
Texas Texas Public Utility Commission 40020 Lone Star Transmission 2012 Electric Depreciation
Study
Michigan Michigan Public Service Commission U-16938 Consumers Energy
Company 2011 Gas Depreciation Study
ColoradoPublic Utilities Commission of
Colorado11AL-947E Public Service of Colorado 2011 Electric Depreciation
Study
Texas Texas Public Utility Commission 39896 Entergy Texas 2011 Electric Depreciation
Study
MultiState FERC ER12-212 American Transmission Company 2011 Electric Depreciation
Study
California California Public Utilities Commission A1011015 Southern California Edison 2011 Electric Depreciation
Study
Mississippi Mississippi Public Service Commission 2011-UN-184 Atmos Energy 2011 Gas Depreciation
Study
Michigan Michigan Public Service Commission U-16536 Consumers Energy
Company 2011 Wind Depreciation Rate Study
Texas Public Utility Commission of Texas 38929 Oncor 2011 Electric Depreciation
Study
Texas Railroad Commission of Texas 10038 CenterPoint South TX 2010 Gas Depreciation
Study
Alaska Regulatory Commission of Alaska U-10-070 Inside Passage Electric
Cooperative 2010 Electric Depreciation Study
Texas Public Utility Commission of Texas 36633 City Public Service of San
Antonio 2010 Electric Depreciation Study
Texas Texas Railroad Commission 10000 Atmos Pipeline Texas 2010 Gas Depreciation
Study
Multi State – SE US FERC RP10-21-000 Florida Gas Transmission 2010 Gas Depreciation Study

Dane Watson Testimony Appearances Exhibit DAW-1Page 7 of 8
Asset Location Commission Docket (If Applicable Company Year Description
Maine/ New Hampshire FERC 10-896 Granite State Gas
Transmission 2010 Gas Depreciation Study
Texas Public Utility Commission of Texas 38480 Texas New Mexico Power 2010 Electric Depreciation
Study
Texas Public Utility Commission of Texas 38339 CenterPoint Electric 2010 Electric Depreciation
Study
Texas Texas Railroad Commission 10041 Atmos Amarillo 2010 Gas Depreciation
Study
Georgia Georgia Public Service Commission 31647 Atlanta Gas Light 2010 Gas Depreciation
Study
Texas Public Utility Commission of Texas 38147 Southwestern Public
Service 2010 Electric Technical Update
Alaska Regulatory Commission of Alaska U-09-015 Alaska Electric Light and
Power2009-2010
Electric Depreciation Study
Alaska Regulatory Commission of Alaska U-10-043 Utility Services of Alaska 2009-
2010Water Depreciation
Study
Michigan Michigan Public Service Commission U-16055 Consumers Energy/DTE
Energy2009-2010
Ludington Pumped Storage Depreciation
Study
Michigan Michigan Public Service Commission U-16054 Consumers Energy 2009-
2010Electric Depreciation
Study
Michigan Michigan Public Service Commission U-15963 Michigan Gas Utilities
Corporation 2009 Gas Depreciation Study
Michigan Michigan Public Service Commission U-15989 Upper Peninsula Power
Company 2009 Electric Depreciation Study
Texas Railroad Commission of Texas 9869 Atmos Energy 2009 Shared Services
Depreciation Study
Mississippi Mississippi Public Service Commission 09-UN-334 CenterPoint Energy
Mississippi 2009 Gas Depreciation Study
Texas Railroad Commission of Texas 9902 CenterPoint Energy
Houston 2009 Gas Depreciation Study
Colorado Colorado Public Utilities Commission 09AL-299E Public Service of Colorado 2009 Electric Depreciation
Study
Tennessee Tennessee Regulatory Authority 11-00144 Piedmont Natural Gas 2009 Gas Depreciation
Study
Louisiana Louisiana Public Service Commission U-30689 Cleco 2008 Electric Depreciation
Study
Texas Public Utility Commission of Texas 35763 SPS 2008
Electric Production, Transmission,
Distribution and General Plant
Depreciation Study
Wisconsin Wisconsin 05-DU-101 WE Energies 2008Electric, Gas, Steam
and Common Depreciation Studies
North Dakota North Dakota Public Service Commission PU-07-776 Northern States Power 2008 Net Salvage

Dane Watson Testimony Appearances Exhibit DAW-1Page 8 of 8
Asset Location Commission Docket (If Applicable Company Year Description
New MexicoNew Mexico Public
Regulation Commission
07-00319-UT SPS 2008 Testimony – Depreciation
Multiple States Railroad Commission of Texas 9762 Atmos Energy 2007-
2008Shared Services
Depreciation Study
Minnesota Minnesota Public Utilities Commission E015/D-08-422 Minnesota Power 2007-
2008Electric Depreciation
Study
Texas Public Utility Commission of Texas 35717 Oncor 2008 Electric Depreciation
Study
Texas Public Utility Commission of Texas 34040 Oncor 2007 Electric Depreciation
Study
Michigan Michigan Public Service Commission U-15629 Consumers Energy 2006-
2009Gas Depreciation
Study
Colorado Colorado Public Utilities Commission 06-234-EG Public Service of Colorado 2006 Electric Depreciation
Study
Arkansas Arkansas Public Service Commission 06-161-U CenterPoint Energy – Arkla
Gas 2006
Gas Distribution Depreciation Study and Removal Cost
Study
Texas, New Mexico Public Utility Commission of Texas 32766 Xcel Energy 2005-
2006
Electric Production, Transmission,
Distribution and General Plant
Depreciation Study
Texas Railroad Commission of Texas 9670/9676 Atmos Energy Corp 2005-
2006Gas Distribution
Depreciation Study

ATMOS ENERGY CORPORATION KENTUCKY PROPERTIES
DEPRECIATION RATE STUDY As of September 30, 2017
http://www.utilityalliance.com
Exhibit DAW-2 Page 1 of 111

ATMOS ENERGY CORPORATION KENTUCKY PROPERTIES
DEPRECIATION RATE STUDY EXECUTIVE SUMMARY
Atmos Energy Corporation (“Atmos” or “Company”) engaged Alliance
Consulting Group to conduct a depreciation study of the Company’s Kentucky
Properties (“Kentucky”) natural gas operations depreciable assets as of fiscal
year end September 30, 2017.
The existing depreciation rates were based on the straight-line method,
equal life group (“ELG”) procedure, and remaining-life technique and the same
method, procedure and technique are retained in this study. This study
recommends a decrease of approximately $38 thousand in annual depreciation
expense when compared to the depreciation rates currently in effect. Life
estimates showed the following changes: 35 accounts have an increase in life;
three accounts have a decrease in life, and 23 accounts remain unchanged. Net
salvage showed the following changes: 13 accounts have a decrease in net
salvage (more negative or less positive), four accounts have an increase in net
salvage (more positive or less negative), and 45 accounts remain unchanged.
The depreciation study we conducted analyzed and developed
depreciation recommendations at an account level resulting in annual
depreciation accrual amounts and depreciation rates at that level. The
depreciation study also reflects the continuation of Vintage Group Amortization
for certain General Plant accounts. Appendix B demonstrates the change in
depreciation expense.
Exhibit DAW-2 Page 2 of 111

ATMOS ENERGY CORPORATION KENTUCKY PROPERTIES
DEPRECIATION RATE STUDY As of September 30, 2017
Table of Contents
PURPOSE ...................................................................................................................................................... 4
STUDY RESULTS ........................................................................................................................................ 5
GENERAL DISCUSSION ............................................................................................................................ 6 DEFINITION .................................................................................................................................... 6 BASIS OF DEPRECIATION ESTIMATES .............................................................................................. 6 SURVIVOR CURVES ........................................................................................................................ 7 ACTUARIAL ANALYSIS .................................................................................................................. 10 SIMULATED PLANT RECORD PROCEDURE (“SPR”) ....................................................................... 11 JUDGMENT .................................................................................................................................. 13 EQUAL LIFE GROUP DEPRECIATION .............................................................................................. 14 THEORETICAL DEPRECIATION RESERVE ........................................................................................ 15
DETAILED DISCUSSION ......................................................................................................................... 16 DEPRECIATION STUDY PROCESS .................................................................................................. 16 DEPRECIATION RATE CALCULATION ............................................................................................. 19 REMAINING LIFE CALCULATION .................................................................................................... 19 CALCULATION PROCESS .............................................................................................................. 19 LIFE ANALYSIS ............................................................................................................................ 21 SALVAGE ANALYSIS ..................................................................................................................... 59 SALVAGE CHARACTERISTICS........................................................................................................ 60
APPENDIX A - CALCULATION OF EQUAL LIFE GROUP DEPRECIATION RATES ................ 73
APPENDIX B - COMPARISON OF DEPRECIATION RATES ........................................................... 77
APPENDIX C – COMPARISON OF MORTALITY CHARACTERISTICS ....................................... 81
APPENDIX D - NET SALVAGE ............................................................................................................... 85
Exhibit DAW-2 Page 3 of 111

4
PURPOSE
The purpose of this study is to develop depreciation rates for the
depreciable property as recorded on Atmos Kentucky books at September 30,
2017. The account based depreciation rates were designed to recover the total
remaining undepreciated investment, adjusted for net salvage, over the
remaining life of Atmos’ property on a straight-line basis. Non-depreciable
property and property which is amortized such as intangible assets were
excluded from this study.
Atmos Energy provides local gas distribution service to over 180,000
customers in Kentucky. Its assets currently consists of various storage,
transmission, and distribution plant, including approximately 2,400 miles of steel
and 1,600 miles of plastic gas distribution mains, located across the service area.
It has a number of receipt points or city gates, throughout the system where gas
enters the distribution system and is then delivered to customers for burner tip
consumption.
Exhibit DAW-2 Page 4 of 111

5
STUDY RESULTS The existing and current study of annual depreciation expense results from
the use of Iowa Curve dispersion patterns with the straight-line method, equal life
group (“ELG”) procedure and remaining-life technique, and consideration of net
salvage in the development of the study recommended depreciation rates.
Detailed information for each of these factors will follow in this report.
Overall depreciation rates for Kentucky depreciable property are shown in
Appendix A and B. The recommended rates translate into an annual
depreciation accrual of approximately $18.358 million based on Kentucky’s
depreciable investment at September 30, 2017. The annual equivalent
depreciation expense calculated by the same method using the currently
approved rates was $18.396 million. An increase in depreciation expense for the
Distribution function was offset by decreases in the Storage, Transmission, and
General plant functions, resulting in a slight decrease in overall depreciation
expense of $38 thousand.
Consistent with the prior study and FERC Rule AR-15, this depreciation
study continues the use of Vintage Group Amortization in Accounts 391 through
399, excluding 392 and 396 accounts. This approach provides for the timely
retirement of assets, at the end of the amortized life property will be retired from
the books and simplifies accounting for general property.
Appendix A presents development of the depreciation rates and annual
accruals. Appendix B presents a comparison of the composite existing rates
versus the recommended study rates. Appendix C presents the mortality and net
salvage parameters by account. Appendix D shows the net salvage analysis by
plant account.
Exhibit DAW-2 Page 5 of 111

6
GENERAL DISCUSSION
Definition
The term "depreciation" as used in this study is considered in the
accounting sense, that is, a system of accounting that distributes the cost of
assets, less net salvage (if any), over the estimated useful life of the assets in a
systematic and rational manner. It is a process of allocation, not valuation. This
expense is systematically allocated to accounting periods over the life of the
properties. The amount allocated to any one accounting period does not
necessarily represent the loss or decrease in value that will occur during that
particular period. The Company accrues depreciation on the basis of the original
cost of all depreciable property included in each functional property group. On
retirement the full cost of depreciable property, less the net salvage value, is
charged to the depreciation reserve.
Basis of Depreciation Estimates
The straight-line, equal life group, remaining-life depreciation system was
employed to calculate annual and accrued depreciation in this study. In this
system, the annual depreciation expense for each group is computed by dividing
the original cost of the asset, less allocated depreciation reserve, less estimated
net salvage, by its respective equal life group remaining lives. The resulting
annual accrual amounts of all depreciable property within an account were
accumulated, and the total was divided by the original cost of assets in the
account to determine the depreciation rate. The calculated remaining lives and
annual depreciation accrual rates were based on attained ages of plant in service
and the estimated service life and salvage characteristics of each depreciable
group. The computations of the annual depreciation rates are shown in
Appendix B and in the study workpapers.
Two life estimation approaches were incorporated into the life analyses.
Both Simulated Plant Record (SPR) analysis and Actuarial Analysis are
commonly used mortality analysis techniques for gas utility property. Historically,
Atmos has used the SPR analysis, but has been developing its actuarial
Exhibit DAW-2 Page 6 of 111

7
database so the actuarial analysis was performed and relied upon. However, the
SPR analysis was also run to benchmark life indications. For the accounts the
experience bands varied depending on the amount of data. Judgment was used
to a greater or lesser degree on all accounts. Each approach is more fully
described in a later section.
Survivor Curves
To fully understand depreciation projections in a regulated utility setting,
there must be a basic understanding of survivor curves. Individual property units
within a group do not normally have identical lives or investment amounts. The
average life of a group can be determined by first constructing a survivor curve
which is plotted as a percentage of the units surviving at each age. A survivor
curve represents the percentage of property remaining in service at various age
intervals. The Iowa Curves are the result of an extensive investigation of life
characteristics of physical property made at Iowa State College Engineering
Experiment Station in the first half of the prior century. Through common usage,
revalidation and regulatory acceptance, these curves have become a descriptive
standard for the life characteristics of industrial property. An example of an Iowa
Curve is shown below.
Exhibit DAW-2 Page 7 of 111

8
There are four families in the Iowa Curves that are distinguished by the
relation of the age at the retirement mode (largest annual retirement frequency)
and the average life. For distributions with the mode age greater than the
average life, an "R" designation (i.e., Right modal) is used. The family of “R”
moded curves is shown below.
Exhibit DAW-2 Page 8 of 111

9
Similarly, an "S" designation (i.e., Symmetric modal) is used for the family
whose mode age is symmetric about the average life. An "L" designation (i.e.,
Left modal) is used for the family whose mode age is less than the average life.
A special case of left modal dispersion is the "O" or origin modal curve family.
Within each curve family, numerical designations are used to describe the
relative magnitude of the retirement frequencies at the mode. A "6" indicates that
the retirements are not greatly dispersed from the mode (i.e., high mode
frequency) while a "1" indicates a large dispersion about the mode (i.e., low
mode frequency). For example, a curve with an average life of 30 years and an
"L3" dispersion is a moderately dispersed, left modal curve that can be
designated as a 30 L3 Curve. An SQ, or square, survivor curve occurs where no
dispersion is present (i.e., units of common age retire simultaneously).
Most property groups can be closely fitted to one Iowa Curve with a unique
average service life. The blending of judgment concerning current conditions
and future trends along with the matching of historical data permits the
Exhibit DAW-2 Page 9 of 111
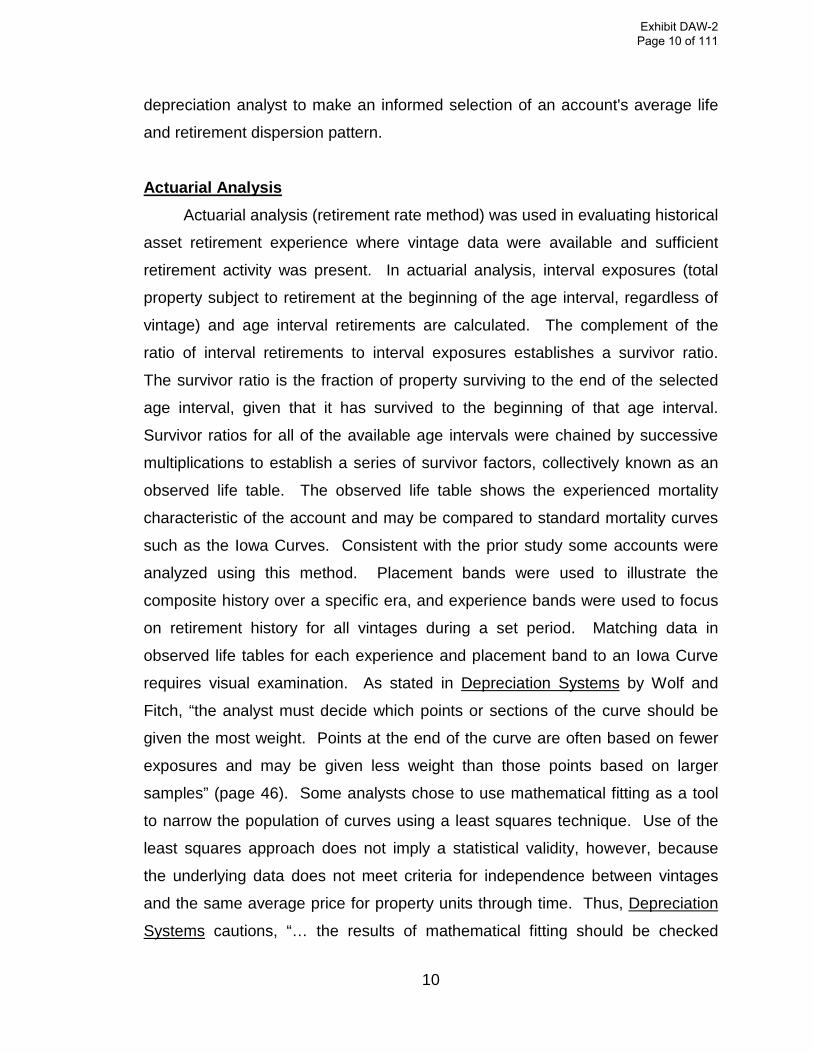
10
depreciation analyst to make an informed selection of an account's average life
and retirement dispersion pattern.
Actuarial Analysis
Actuarial analysis (retirement rate method) was used in evaluating historical
asset retirement experience where vintage data were available and sufficient
retirement activity was present. In actuarial analysis, interval exposures (total
property subject to retirement at the beginning of the age interval, regardless of
vintage) and age interval retirements are calculated. The complement of the
ratio of interval retirements to interval exposures establishes a survivor ratio.
The survivor ratio is the fraction of property surviving to the end of the selected
age interval, given that it has survived to the beginning of that age interval.
Survivor ratios for all of the available age intervals were chained by successive
multiplications to establish a series of survivor factors, collectively known as an
observed life table. The observed life table shows the experienced mortality
characteristic of the account and may be compared to standard mortality curves
such as the Iowa Curves. Consistent with the prior study some accounts were
analyzed using this method. Placement bands were used to illustrate the
composite history over a specific era, and experience bands were used to focus
on retirement history for all vintages during a set period. Matching data in
observed life tables for each experience and placement band to an Iowa Curve
requires visual examination. As stated in Depreciation Systems by Wolf and
Fitch, “the analyst must decide which points or sections of the curve should be
given the most weight. Points at the end of the curve are often based on fewer
exposures and may be given less weight than those points based on larger
samples” (page 46). Some analysts chose to use mathematical fitting as a tool
to narrow the population of curves using a least squares technique. Use of the
least squares approach does not imply a statistical validity, however, because
the underlying data does not meet criteria for independence between vintages
and the same average price for property units through time. Thus, Depreciation
Systems cautions, “… the results of mathematical fitting should be checked
Exhibit DAW-2 Page 10 of 111

11
visually and the final determination of best fit made by the analyst” (page 48).
This study uses the visual matching approach to match Iowa Curves, since
mathematical fitting produces theoretically possible curve matches. Visual
examination and experienced judgment allow the depreciation professional to
make the final determination as to the best curve type. Detailed information for
each account is shown later in this study and in workpapers.
Simulated Plant Record Procedure (“SPR”)
The SPR - Balances approach is one of the commonly accepted
approaches to analyze mortality characteristics of utility property. SPR was also
run on the accounts, where feasible, to confirm the actuarial results. In this
method, an Iowa Curve and average service life are selected as a starting point
of the analysis and its survivor factors are applied to the actual annual additions
to give a sequence of annual balance totals. These simulated balances are
compared with the actual balances by using both graphical and statistical
analysis. Through multiple comparisons, the mortality characteristics (as defined
by an average life and Iowa Curve) that are the best match to the property in the
account can be found.
The Conformance Index (CI) is one measure used to evaluate SPR
analyses. CIs are also used to evaluate the "goodness of fit" between the actual
data and the Iowa Curve being referenced. The sum of squares difference
(SSD) is a summation of the difference between the calculated balances and the
actual balances for the band or test year being analyzed. This difference is
squared and then summed to arrive at the SSD, where n is the number of years
in the test band.
)Balance Observed-Balance d(Calculate=SSD 2ii
n1S
This calculation can then be used to develop other calculations, which the
analyst feels might give a better indication for the “goodness of fit” for the
representative curve under consideration. The residual measure (RM) is the
Exhibit DAW-2 Page 11 of 111

12
square root of the average squared differences as developed above. The
residual measure is calculated as follows:
)n
SSD(=RM
The conformance index (CI) is developed from the residual measure and
the average observed plant balances for the band or test year being analyzed.
The calculation of conformance index is shown below:
RM
n / Balances=CI in1∑
The retirement experience index (REI) gives an indication of the maturity of
the account and is the percent of the property retired from the oldest vintage in
the band at the end of the test year. Retirement indices range from 0 percent to
100 percent and a REI of 100 percent indicates that a complete curve was used.
A retirement index less than 100 percent indicates that the survivor curve was
truncated at that point. The originator of the SPR method, Alex Bauhan,
suggests ranges of value for the CI and REI. The relationship for CI proposed by
Bauhan is shown below1:
CI Value Over 75 Excellent 50 to 75 Good 25 to 50 Fair Under 25 Poor
The relationship for REI proposed by Bauhan2 is shown below:
REI Value Over 75 Excellent 50 to 75 Good 33 to 50 Fair 17 to 33 Poor 17 and below Valueless
1 Public Utility Depreciation Practices, p. 96. 2 Public Utility Depreciation Practices, p. 97.
Exhibit DAW-2 Page 12 of 111

13
Depreciation analysts have used these measures in analyzing SPR results
for nearly 60 years, since the SPR method was developed. Both the CI and REI
statistics provide the analyst with important information with which to make a
comparison between a band of simulated or calculated balances and the
observed or actual balances in the account being studied. It is important to
understand that observing the pattern of best-fitting curves over various bands,
as well as considering other company and asset-specific information, is important
in the ultimate decision for the most appropriate live and curve combination that
will reflect future retirements of each account.
Statistics are useful in analyzing mortality characteristics of accounts, as
well as determining a range of service lives to be analyzed using the detailed
graphical method. However, these statistics boil all the information down to one,
or at most, a few numbers for comparison. Visual matching through comparison
between actual and calculated balances expands the analysis by permitting the
analyst to view many points of data at a time. The goodness of fit should be
visually compared to plots of other Iowa Curve dispersions and average lives for
the selection of the appropriate curve and life. Detailed information for each
account is shown later in this study and in workpapers.
Judgment
Any depreciation study requires informed judgment by the analyst
conducting the study. A knowledge of the property being studied, company
policies and procedures, general trends in technology and industry practice, and
a sound basis of understanding depreciation theory are needed to apply this
informed judgment. Judgment was used in areas such as survivor curve
modeling and selection, depreciation method selection, simulated plant record
method analysis, and actuarial analysis.
Judgment is not defined as being used in cases where there are specific,
significant pieces of information that influence the choice of a life or curve.
Those cases would simply be a reflection of specific facts into the analysis.
Where there are multiple factors, activities, actions, property characteristics,
Exhibit DAW-2 Page 13 of 111

14
statistical inconsistencies, implications of applying certain curves, property mix in
accounts or a multitude of other considerations that impact the analysis
(potentially in various directions), judgment is used to take all of these factors
and synthesize them into a general direction or understanding of the
characteristics of the property. In these cases, it is rare for one factor to
individually have a, substantial impact on the analysis. However, individual
factors may shed light on the utilization and characteristics of assets. Judgment
may also be defined as deduction, inference, wisdom, common sense, or the
ability to make sensible decisions. There is no single correct result from
statistical analysis; hence, there is no answer absent judgment. At the very least
for example, any analysis requires choosing upon which bands to place more
emphasis.
The establishment of appropriate average service lives and retirement
dispersions for the Storage, Transmission, Distribution and General accounts
requires judgment to incorporate the understanding of the operation of the
system with the available accounting information analyzed using the SPR
balance and actuarial methods. The appropriateness of lives and curves
depends not only on statistical analyses, but also on how well future retirement
patterns will match past retirements.
Current applications and trends in use of the equipment also need to be
factored into life and survivor curve choices in order for appropriate mortality
characteristics to be chosen.
Equal Life Group Depreciation
Atmos continues to support the use of the ELG depreciation procedure for
its Kentucky property. In addition to being approved by this Commission for the
Company’s currently authorized rates, the Kentucky Public Service Commission
has repeatedly approved the use of ELG for Atmos. This study uses the ELG
depreciation procedure to group the assets within each account. After an
average service life and dispersion were selected for each account, those
parameters were used to estimate what portion of the surviving investment of
Exhibit DAW-2 Page 14 of 111

15
each vintage was expected to retire. The depreciation of the group continues
until all investment in the vintage group is retired. ELG groups are defined by
their respective account dispersion, life, and net salvage estimates. A straight-
line rate for each ELG group is computed and accumulated across each vintage.
The resulting rate for each ELG group is designed to recover all retirements less
net salvage as each vintage retires. The ELG procedure recovers net book cost
over the life of each ELG group rather than averaging many components. It also
closely matches the concept of component or item accounting found in all
accounting textbooks.
Theoretical Depreciation Reserve
The Company’s book depreciation reserves were reallocated within each
function by plant account based on the theoretical reserves for each account.
This study used a reserve model that relied on a prospective concept relating
future retirement and accrual patterns for property, given current life and salvage
estimates. The theoretical reserve of a group is developed from the estimated
remaining life, total life of the property group, and estimated net salvage. The
theoretical reserve represents the portion of the group cost that would have been
accrued if current forecasts were used throughout the life of the group for future
depreciation accruals. The computation involves multiplying the vintage
balances within the group by the theoretical reserve ratio for each vintage. The
equal life group method requires an estimate of dispersion and service life to
establish how much of each vintage is expected to be retired in each year until all
property within the vintage is retired. Estimated average service lives and
dispersion determine the amount within each equal life group. The equal life
group-remaining-life theoretical reserve ratio (RRELG) is calculated as:
Ratio) SalvageNet-(1* Life(ELG
Life) Remaining(ELG -1=RRELG)
Exhibit DAW-2 Page 15 of 111

16
DETAILED DISCUSSION
Depreciation Study Process This depreciation study encompassed four distinct phases. The first
phase involved data collection and field interviews. The second phase was
where the initial data analysis occurred. The third phase was where the
information and analysis was evaluated. Once the first three stages were
complete, the fourth phase began. This phase involved the calculation of
deprecation rates and documenting the corresponding recommendations.
During the Phase I data collection process, historical data was compiled
from continuing property records and general ledger systems. Data was
validated for accuracy by extracting and comparing to multiple financial system
sources. Audit of this data was validated against historical data from prior
periods, historical general ledger sources, and field personnel discussions. This
data was reviewed extensively to put in the proper format for a depreciation
study. Further discussion on data review and adjustment is found in the Salvage
Considerations Section of this study. Also as part of the Phase I data collection
process, numerous discussions were conducted with engineers and field
operations personnel to obtain information that would assist in formulating life
and salvage recommendations in this study. One of the most important elements
of performing a proper depreciation study is to understand how the Company
utilizes assets and the environment of those assets. Interviews with engineering
and operations personnel are important ways to allow the analyst to obtain
information that is beneficial when evaluating the output from the life and net
salvage programs in relation to the Company’s actual asset utilization and
environment. Information that was gleaned in these discussions is found both in
the Detailed Discussion of this study in the life analysis section, the salvage
analysis section, and also in workpapers.
Exhibit DAW-2 Page 16 of 111

17
Phase 2 was where the actuarial and SPR analysis was performed.
Phase 2 and 3 overlap to a significant degree. The detailed property records
information is used in phase 2 to develop observed life tables for life analysis.
These tables were visually compared to industry standard tables to determine
historical life characteristics. It is possible that the analyst would cycle back to
this phase based on the evaluation process performed in phase 3. Net salvage
analysis consists of compiling historical salvage and removal data by functional
group to determine values and trends in gross salvage and removal cost. This
information was then carried forward into phase 3 for the evaluation process.
Phase 3 was the evaluation process which synthesized analysis,
interviews, and operational characteristics into a final selection of asset lives and
net salvage parameters. The historical analysis from phase 2 was further
enhanced by the incorporation of recent or future changes in the characteristics
or operations of assets that were revealed in phase 1. Phases 2 and 3 allowed
the depreciation analyst to validate the asset characteristics as seen in the
accounting transactions with actual Company operational experience.
Finally, Phase 4 involved the calculation of accrual rates, making
recommendations and documenting the conclusions in the final report. The
calculation of accrual rates is found in Appendix A. Recommendations for the
various accounts are contained within the Detailed Discussion of this report. The
depreciation study flow diagram shown as Figure 13 documents the steps used in
conducting this study. Depreciation Systems, page 289 documents the same
basic processes in performing a depreciation study which are: Statistical
analysis, evaluation of statistical analysis, discussions with management,
forecast assumptions, write logic supporting forecasts and estimation, and write
final report.
3 Public Utility Finance & Accounting, A Reader
Exhibit DAW-2 Page 17 of 111

18
Figure 1
KENTUCKY DEPRECIATION STUDY PROCESS
Exhibit DAW-2 Page 18 of 111

19
Depreciation Rate Calculation
Annual depreciation expense amounts for the depreciable accounts of the
Company were calculated by the straight line, equal life group, remaining life
depreciation system. With this approach, remaining lives were calculated
according to standard ELG group expectancy techniques, using the Iowa
Survivor Curves noted in the calculation. For each plant account, the difference
between the surviving investment, adjusted for estimated net salvage, and the
allocated book depreciation reserve, was divided by the average remaining life to
yield the annual depreciation expense. These calculations are shown in
Appendix A.
Remaining Life Calculation
The establishment of appropriate average service lives and retirement
dispersions for each account within a functional group was based on engineering
judgment that incorporated available accounting information analyzed using the
retirement rate actuarial and the SPR methods. After establishment of
appropriate average service lives and retirement dispersion, remaining life was
computed for each account. Theoretical depreciation reserve with zero net
salvage was calculated using theoretical reserve ratios as defined in the
theoretical reserve portion of the General Discussion section. The difference
between plant balance and theoretical reserve was then spread over the ELG
depreciation accruals. Remaining life is shown for each account in Appendix A.
Calculation Process
Annual depreciation expense amounts for all accounts were calculated by
the straight line method, remaining life technique.
Exhibit DAW-2 Page 19 of 111

20
In a whole life representation, the annual accrual rate is computed by the
following equation,
Life Service AveragePercent) SalvageNet (100%Rate Accrual Annual −
=
Use of the remaining life depreciation technique adds a self-correcting
mechanism, which accounts for any differences between theoretical and book
depreciation reserve over the remaining life of the group. With the straight line,
remaining life, equal life group system using Iowa Curves, composite remaining
lives were calculated according to standard broad group expectancy techniques,
noted in the formula below:
∑
∑ −=
Accrual Annual Life WholeReserve lTheoreticaCost Original
Life Remaining Composite
For each plant account, the difference between the surviving investment,
adjusted for estimated net salvage, and the allocated book depreciation reserve,
was divided by the composite remaining life to yield the annual depreciation
expense as noted in this equation.
Life Remaining Composite%) SalvageNet (1*Cost) (OriginalReserveBook Cost OriginalExpenseon Depreciati Annual −−−
=
Where the net salvage percent represents future net salvage.
Within a group, the sum of the group annual depreciation expense
amounts, as a percentage of the depreciable original cost investment summed,
gives the annual depreciation rate as shown below:
∑
∑=
Cost Original
Expenseon Depreciati AnnualRateon Depreciati Annual
These calculations are shown in Appendix B. The calculations of the
theoretical depreciation reserve values and the corresponding remaining life
calculations are shown in workpapers. Book depreciation reserves were
Exhibit DAW-2 Page 20 of 111

21
allocated from a functional level to individual accounts and the theoretical reserve
computation was used to compute a composite remaining life for each account.
Life Analysis
The actuarial and SPR semi-actuarial analysis method was applied to most
accounts for Kentucky. For SPR the analysis was performed at intervals for the
overall band and at various (usually 10-year) intervals within the overall balance
period.
The retirement rate actuarial analysis method was applied to those
accounts where sufficient vintage retirement detail is available. For each
account, an actuarial retirement rate analysis was made with placement and
experience bands of varying width. The historical observed life table was plotted
and compared with various Iowa Survivor Curves to obtain the most appropriate
match. A graph of the observed life table, for a selected placement and
experience band, is shown in the life analysis section below, where possible.
The remainder of placement and experience band analyses performed is
contained in the workpapers.
For each account on the overall band (i.e. placement from earliest vintage
year through 2017 and experience band from earliest available experience year
through 2017, most recently approved survivor curves were used as a starting
point. Then using the same life, various dispersion curves were plotted.
Frequently, visual matching would confirm one specific dispersion pattern (i.e. L,
S. or R) as an obviously better match than others. The next step would be to
determine the most appropriate life using that dispersion pattern. Then, after
looking at the overall experience band, different experience bands were plotted
and analyzed. Repeated matching usually pointed to a focus on one dispersion
family and small range of service lives. Generally, the goal of visual matching
was to minimize the differential between the observed life table and Iowa curve in
top and mid-range of the plots. When adequate activity is present a graph of the
observed life table versus the proposed life and curve is provided for each
Exhibit DAW-2 Page 21 of 111

22
account where the actuarial life analysis was used.
The historical analysis is used to help predict the life of the assets currently
in service, in conjunction with other factors, such as asset mix, Subject Matter
Expert input (“SME”), programs, etc. that may influence asset lives.
Storage Plant – FERC Accounts 350.20 – 356.00 There are five storage fields using wells previously used to as gas wells.
There are approximately 55 wells between the five fields. One well, Bon Harbor,
was retired (around 2009-2010). In 2017, 3 more wells were plugged based on
risk due to surrounding neighborhoods encroaching on wells. Another well was
plugged at Grand View in 2017 and the Company abandoned 2 others in
Kirkwood Springs in 2016 due to integrity issues. There are 4 compressors,
which are all reciprocating engines.
Account 350.20 Rights-of-Way (75 R5)
This account includes the cost of rights of way used in connection with
storage plant operations. There is approximately $5 thousand in this account.
The existing life is 70 R5. There has been no activity so no analysis was
performed. Based on the type of assets, this study recommends moving to a 75
year life and R5 dispersion. No graph is provided.
Account 351.00-351.04 Structures & Improvements, Compressor Structures, M&R Structures, and Other Structures (60 R5)
These accounts include the cost of structures and improvements,
buildings, fencing and other structures used in connection with storage plant
operations. There is approximately $332 thousand in total for these accounts.
No change has taken place since the last study. The assets in these accounts
are similar in form and function, have the same life expectations, and are
combined in this study for analysis purposes.
Discussions with Company personnel indicated these are like “pole
Exhibit DAW-2 Page 22 of 111

23
barns”. Most buildings are fairly old. A few fences have been replaced in recent
years (e.g. Bon Harbor and maybe Hickory). Company personnel indicated the
existing 60 years is a reasonable life for structures in general. The current
average age of the investment is approximately 34 years.
The Company is maintaining aged retirement data, but there is not enough
aged retirement activity for a meaningful life analysis to be performed. There has
been no additional activity since the prior study. Based upon lack of activity
since the last study, discussions with Company personnel, and judgment, this
study recommends retaining the 60 R5 at this time. A comparison of actual
versus simulated balances is shown below for the 60 R5.
0
100,000
200,000
300,000
400,000
500,000
1988 1993 1998 2003 2008 2013
Bal
ance
Am
ount
$
Transaction Year
Atmos Energy Kentucky Division Account 351 Combined
Actual vs Simulated Balance 60 R5
Actual Simulated
Exhibit DAW-2 Page 23 of 111

24
Accounts 352.00, 352.01, 352.02 Wells, Well Construction, and Well Equipment (67 S5)
These accounts include the cost of wells, well construction, and well
equipment used in connection with storage plant operations. There is
approximately $10.5 million total for the combined accounts. The existing life is
67 S5.
Discussions with Company personnel indicated Bon Harbor was retired
around 2009-2010. In 2017, three more wells were plugged based on risk to
surrounding neighborhoods that were encroaching on the wells. One well at
Grand View was plugged in 2017 and two wells in Kirkwood Springs were
abandoned in 2016 due to integrity issues. They have 55 wells - most of which
are fairly old. Most wells have had the well heads replaced (starting in 2009) and
they expect to finish well head replacement by fall of 2018. Company personnel
indicated the existing 67 year average life for this account is reasonable. The
casing and original drilling is 50 years old or older on average. The Company
has been building an aged (actuarial) database, but there is not sufficient activity
for a meaningful actuarial life analysis. However, there has been no additional
activity since the prior study. Based upon lack of activity, discussions with
Company personnel, and future expectations, this study recommends retaining
the 67 S5 at this time. A comparison of actual versus simulated balances is
shown below for the 67 S5.
Exhibit DAW-2 Page 24 of 111

25
Account 352.03 Cushion Gas (67 S5)
This account includes the cost of cushion gas used in connection with
storage plant operations. There is approximately $1.7 million in this account.
The existing life is 50 SQ. Based on discussions with Company personnel and
the specific facts related to the capitalization of the cushion gas, the life for the
cushion gas was set to the same 67 S5 life as the wells. This study recommends
moving from 50 SQ to 67 S5. No graph is provided.
Account 352.10 Storage Leaseholds (67 S5)
This account includes the cost of storage leaseholds used in connection
with storage plant operations. There is approximately $178 thousand in this
account. The existing life is 67 S5. Consistent with the life of the underlying
assets (Wells), this study recommends retaining the 67 year life and S5
dispersion. No graph is provided.
Account 352.11 Storage Rights (67 S5)
This account includes the cost of storage rights used in connection with
storage plant operations. There is approximately $55 thousand in this account.
0
3,000,000
6,000,000
9,000,000
12,000,000
15,000,000
1988 1993 1998 2003 2008 2013
Bal
ance
Am
ount
$
Transaction Year
Atmos Energy Kentucky Division Account 352 Combined
Actual vs Simulated Balance 67 S5
Actual Simulated
Exhibit DAW-2 Page 25 of 111

26
The existing life is 67 S5. Consistent with the life of the underlying assets
(Wells), this study recommends retaining the 67 year life and S5 dispersion. No
graph is provided.
Accounts 353.01 & 353.02 Storage Field and Tributary Lines (70 R1.5) These accounts include the cost of field and tributary lines used in
connection with storage plant operations. There is approximately $385 thousand
between these two accounts. The existing life is 60 S1. The current average
age of the combined investment is nearly 49 years.
Discussions with Company personnel indicated there has been little
capital activity on these lines that run from wells to the dehydration plant.
Company personnel believe these assets have similar characteristics and will
exhibit the same life as transmission steel mains.
There has been approximately $3 thousand in retirements recorded for
these two accounts, which is not sufficient activity for a meaningful analysis
under SPR or actuarial analysis. Based on the activity, discussions with
Company personnel and the study recommendation to increase the life of
Transmission Account 367.01 Steel Mains, this study recommends increasing
the life to 70 years to match the life of steel mains and moving to the R1.5
dispersion. No graph is provided.
Account 354.00 Compressor Station Equipment (54 R3) This account includes the cost of compressor station equipment used in
connection with storage plant operations. There is approximately $923 thousand
in this account. The existing life is 51 R3. The current average age of
investment is 21 years.
Discussions with Company personnel indicated the cost of overhauls on
compressors is considered capital. They will be retiring one compressor in 2019,
which will be around 54 years old at retirement. Company personnel indicated
that a life around 55 years is reasonable with appropriate overhauls and
Exhibit DAW-2 Page 26 of 111

27
maintenance. They did note that one driver of compressor retirements is when
parts are no longer available.
The full placement and experience band are the only bands where the
percent surviving curve drops to near 60 percent. As can be seen in the graph
below, there is a drop in the percent surviving when the investment is around 47
years old. The majority of the other visual curve fits in the fuller bands indicate a
life near the existing life of 51 years. The more recent bands indicate a much
lower life and steeper dispersion pattern than what would be expected for these
assets. There have been no retirements recorded since 2012. Considering the
analysis and activity, discussions with Company personnel, type of assets, and
judgment this study recommends retaining the existing 54 R3. A graph of the
observed life table and recommendation is shown below for the 54 R3.
Exhibit DAW-2 Page 27 of 111

28
Account 355.00 Measuring and Regulating (50 R1.5) This account includes the cost of measuring and regulating (M&R)
equipment used in connection with storage plant operations. There is
approximately $273 thousand in this account. The existing life is 46 R5.
Discussions with Company personnel indicated the life of these assets
should be the same as M&R assets recorded in other functions. In a combined
analysis of Accounts 369, 378, and 379, the full band has an excellent fit with 50
R1.5. Other bands had a mix of different best fitting lives and dispersions. The
full band fit is at the top end of Company expectations of 40-50 years. Based on
the analysis, discussions with Company, and judgment, this study recommends
increasing the life to 50 years and also changing to the R1.5 dispersion. A graph
of the combined observed life table and recommendation is shown below for the
50 R1.5.
Exhibit DAW-2 Page 28 of 111

29
Account 356.00 Purification Equipment (46 R5) This account includes the cost of purification equipment including
dehydration units, tanks, and piping. There is approximately $415 thousand in
this account. The existing life is 46 R5.
Discussions with Company personnel confirmed there are currently five
dehydration plants in operation. In 2013, the Company replaced two dehydration
units and has plans to replace two more in 2019 all of which will be around 50
years old at retirement. The corrosive environment within the units is the primary
cause for replacement.
Most of the retirement activity has come over the past five years. The
average age of retirements is 41 years and the average age of the surviving
investment is nearly 17 years. The visual fits performed for this account are
indicating a life less than existing life. Based on the analysis, Company plans
and expectations as well as the recent replacements, this study recommends
retaining the existing 46 R5. A graph of the observed life table and
recommendation is shown below for the 46 R5.
Exhibit DAW-2 Page 29 of 111

30
Transmission Plant – FERC Accounts 365.20 – 369.01
Account 365.20 Rights-of-Way (75 R5) This account includes the cost of rights of way used in connection with
transmission operations. There is approximately $868 thousand in this account.
The existing life is 70 R5.
Discussions with Company personnel indicated few rights have been
released in recent years. Land rights are generally owned as long as assets are
on the rights of way.
There has been only one retirement recorded, and that was in 1974.
There is not sufficient historical retirement activity for SPR or actuarial life
analysis. Based on the proposed life increase for the underlying assets in the
Transmission function, this study recommends moving to a 75 year life and R5
dispersion. No graph is provided.
Exhibit DAW-2 Page 30 of 111

31
Account 366.02 & 366.03 Meas. & Reg. Station Structures & Other Structures (58 R4)
These accounts include the cost of measuring and regulating station
structures and other structures used in connection with transmission operations.
There is approximately a combined investment of $110 thousand. The existing
life is 53 R4. The current average age of investment is 28 years.
Discussions with Company personnel indicated buildings are generally
small metal buildings and a 50 year life would be reasonable life. Fencing will
not last that long, maybe 25-30 years.
Based on the combined actuarial analysis, the most complete curve drops
to nearly 40 percent surviving and was observed in the full placement band. The
other bands only dropped to 80 percent surviving. The full band fit was excellent
at 58 R4, which is reaching the high end of the range of expectations for these
types of assets. Based on the analysis indications and Company input, this
study recommends moving from the existing 53 year life to 58 but retaining the
R4 dispersion. A graph of the observed life table and the proposed is shown
below.
Exhibit DAW-2 Page 31 of 111

32
Account 367.00 Mains – Cathodic Protection (25 R4) This account includes the cost of cathodic protection for mains such as
rectifiers, groundbeds, and other related equipment used in connection with
transmission operations. There is approximately $47 thousand in this account.
The existing life is 20 SQ.
Discussions with Company personnel indicated the assets have a life
range of 18 to 25 years. In this study, anodes have been segregated to a
separate account to be amortized. The remaining assets will stay in this account
and are expected to have a slightly longer life than anodes. This study
recommends moving the life to 25 years and changing to the R4 dispersion. No
graph is provided.
Account 367.01 Mains Steel (70 R1.5) This account includes the cost of steel mains used in connection with
transmission operations. There is approximately $27.68 million in this account.
The existing life is 57 R4. The current average age of the investment is 29 years.
Discussions with Company personnel indicated that any steel mains put in
the ground now will be classified as high pressure distribution. Less than 25% of
the transmission pipe will be replaced and moved to distribution under the PRP
program. The earliest transmission pipe still in the ground is from the late 1950s
or 1960s. No bare steel is left on the transmission system. The current 57 year
life is shorter than expected for steel mains. Company SMEs would expect at
least a 65 year life for transmission mains. There have been only a couple of
times where transmission pipe had to be pulled out of right of way in order to do
the replacement in the last few years (2013-2014).
The visual fits performed under actuarial analysis indicate a life shorter
than expectations, which is a reflection of the ongoing PRP program. Eventually,
we expect the analysis to begin reflecting a longer life. The R1.5 dispersion is in
the top three ranked curves, but the CI and REIs are not in an excellent range
and the life is not reasonable. When the CI and REIs do move in the excellent
Exhibit DAW-2 Page 32 of 111

33
range the life is shorter than expected. Based upon discussions with Company
personnel and the indications in both the SPR and actuarial analysis, this study
recommends increasing the life from the existing 57 R4 and moving to the 70
R1.5. This is consistent with Company expectations and Distribution Mains
Accounts 376.01 and 376.02. A graph of the observed life table and the
proposed is shown below.
Account 367.03 Mains – Anodes (20 SQ)
This account includes the cost of anodes used in cathodic protection in
connection with transmission mains and operations. There is approximately $92
thousand in this account. The existing life is 20 SQ.
Discussions with Company personnel indicated these assets should be
segregated from other cathodic protection equipment because they have a
shorter life expectancy and no current mechanism to properly record retirements.
Additionally, Atmos is working to obtain consistency among its jurisdictions with
Exhibit DAW-2 Page 33 of 111

34
the segregation of anodes. This study recommends retaining the existing 20 SQ.
No graph is provided.
Account 369.00 & 369.01 Measuring & Regulating Station Equipment (50 R1.5)
These accounts include the cost of measuring and regulating station
equipment used in connection with transmission operations. There is
approximately $3.0 million for the combined accounts. The existing life is 49
R1.5. The current average age of the investment is 29 years.
Discussions with Company personnel indicated the earliest generation
regulators were replaced at 60-70 years old (Jet stream), the next generation
(Axial flow) was 40-50 year old at retirement. Mooney is the more current
generation with 30-40 year expectation at retirement based on its technology.
Technology has significantly changed in the last 15 years. Axial flow regulators
had some operational concerns and are actively being replaced. The technology
changes going on now would drive future lives to be shorter. Some electronic
control equipment is expected to have a shorter life. Heaters/boilers would have
a 50+ year life expectation. The old odorizers are bypass and the new are
injection. The electronics used in injection odorizers are Flow Computers. The
Company expects to see a shorter life for this account based on technology
change, more electronics and the shorter life realized for regulators. Account
369, 378 and 379 all have similar assets with few differences. Due to the
similarity in the assets between these accounts, there can be confusion in
retirements between the three accounts and also movement due to shifting
definitions between transmission and distribution.
The combined actuarial analysis of Measuring & Regulating Equipment for
Transmission and Distribution functions indicated the 50 R1.5 to be a good visual
fit on the full placement band. The full placement band provides the most
complete curve illustration. The SPR analysis was performed on individual
accounts and had a range of top ranked curves and life depending on the
Exhibit DAW-2 Page 34 of 111

35
account. This confirms Company information of possible cross recording of
assets and/or an indication of changing lives over the years from 60-70 years to
40-50 years. Newer generations are more technology driven and we could see a
decrease in life, but this is not evident yet in the combined actuarial analysis.
Giving consideration to the various generations still in service and the combined
actuarial analysis, this study recommends continuing a life around the currently
approved life and moving to 50 R1.5 until more evidence for a decreasing life is
present. A graph of the combined accounts observed life table and
recommendation is shown below for the 50 R1.5.
Exhibit DAW-2 Page 35 of 111

36
Distribution Plant – FERC Accounts 374.02-385 Account 374.02 Land Rights (75 R5)
This account includes the cost of land rights used in connection with
distribution operations. There is approximately $2.4 million in this account. The
existing life is 75 R5. The average age of the surviving investment is 4 years.
The balance in this account has increased significantly between the prior
study and this study as evidenced in the average age. There have been few
retirements and few are expected in the near future. Generally, the life of land
rights and right of ways are tied to the underlying assets. Based on the increase
in life for Transmission and Distribution mains, this study recommends increasing
the life to 75 years, while retaining the R5 dispersion. A graph of the account
observed life table and recommendation is shown below for the R5 75.
Exhibit DAW-2 Page 36 of 111

37
Account 375.00, 375.01, 375.02, & 375.03 Structures & Improvements (66 R3)
These accounts include the cost of border and regulating station
structures, fences, and other related assets used in distribution operations.
There is approximately $486 thousand total for the combined accounts. The
existing life is 57 R2.5. The current average age of the surviving investment is
approximately 23 years.
Discussions with Company personnel indicated there is little difference
between these assets in the transmission and distribution function but there are
more stations on the distribution system.
The actuarial analysis in the full band had a good visual fit with a 66 R3
and drops to near 60 percent surviving. The SPR analysis showed the 59 R3 as
the first pattern with a near 100 REI, but a CI in the poor range. However, no CI
was above the fair range. No retirements have been recorded since 2015.
Based on input from Company personnel, considering the type assets and both
life analyses, this study recommends moving to 66 R3. A graph of the accounts
observed life table and recommendation is shown below for the R3 66.
Exhibit DAW-2 Page 37 of 111

38
Account 376.00 Mains - Cathodic Protected (25 R4) This account includes the cost of rectifiers, groundbeds, weldovers and
other miscellaneous cathodic protection equipment used for distribution mains.
There is approximately $2.3 million in this account. The existing life is the 20 SQ.
Based on discussions with Company personnel, they expect the ground
bed and rectifiers to last a little longer than anodes - maybe 20 - 25 years. This
study reflects the further segregation of cathodic protection assets by creating
separate anode and leak clamp accounts. This is consistent with Atmos’ other
jurisdictions and more reflective of the accounting and operational practices.
This study recommends reflecting a longer life, 25 years, for the remaining
assets used for cathodic protection of distribution mains as well as changing the
dispersion pattern to the R4. No graph is provided.
Account 376.01 & 376.02 Mains - Steel and Plastic (70 L0) These accounts include the cost of steel and plastic mains. There is
approximately $247.1 million for the combined accounts. This nearly doubles the
investment since the prior study. The existing life is the 55 R3 dispersion pattern.
The current average age of the surviving investment is nearly 10 years old.
Discussions with Company personnel indicated there is approximately
2,234 miles of coated steel, 121.3 miles of bare steel, and 1,616.2 of plastic.
Plastic mains are approximately 49% of the total mile of mains. The Commission
approved a Pipe Replacement Program (PRP) in 2010, which is a 15 year
program. Most pipe is installed in public easements. Road moves trigger a
number of retirements and the Company expects it to stay at the increased levels
of the last few years. Plastic pipe was not installed in large measure until the
early 1980s. Except for the high pressure (HP) distribution moving from
transmission in conjunction with the PRP project, all new installations of pipe
(with few exceptions) will be plastic. Protected steel will last longer than 55 years
(maybe 65 to 70 years). Everything installed after 1957 has cathodic protection
on the pipe. There is an expectation for a longer life than the current 55 years.
Exhibit DAW-2 Page 38 of 111

39
Our actuarial life analysis indications suggested the visual best fits in the
full band continue to show the existing life as the best fits with some indications
of longer life in the more recent bands. However, we expect these life indications
to be temporary and likely the result of the PRP. While there is at least another 5
or more years of the PRP, our expectation is that the assets currently in this
account will demonstrate a longer life. This should become more evident once
the PRP is complete. In the actuarial analysis we see a fairly good fit with the L0
65 in the 1963-2017 placement band 2006-2017 experience band. We typically
do not fit the L dispersion pattern with mains but factoring in the effects of the
PRP, the 65 year life is a better reflection of the account and expectations at this
time. The SPR analysis in the full band had the top rank curve R4 with a 46 year
life. The CIs were fair and REIs were at 100 or an excellent value.
Consideration should be given now that the PRP has 5-10 years to complete,
and the account’s life will likely increase as that program ends. In fact, the
shorter bands of actuarial analysis reflect this reality already. Company
personnel also believe mains will definitely have a life longer than the existing.
Based on all these factors, this study recommends making a significant move to
increase the life from 55 R3 to 70 L0 at this time. A graph of the accounts
observed life table and recommendation is shown below for the L0 70.
Exhibit DAW-2 Page 39 of 111

40
Exhibit DAW-2 Page 40 of 111
100
80
"" c
·~ 60 ::::J Ul -c 40 Q)
'-' ~ Q)
0.. 20
0 0
Account 3760102-Mains Steel-Plastic Scenario Atmos KY Direct 2017 Actuarial
.a. Actual Data
' ....
16
• LO 70.00
----.....: ~"""'IIIIIJ -~
32
Age (Years) Vintages: 1948-2017
Activity Years: 2006-2017
~ ...
48
.. -.......
64 80

41
Account 376.03 Mains - Anodes (20 SQ) This account includes the cost of anodes used in cathodic protection in
connection with distribution mains and operations. There is approximately $4.4
million in this account. The existing life is 20 SQ.
Discussions with Company personnel indicated anodes should last 15-18
years. They believe these assets should be segregated from other cathodic
protection equipment because they have a shorter life expectancy and no current
mechanism to properly record retirements. Additionally, Atmos is working to
obtain consistency among its jurisdictions with the segregation of anodes.
This study recommends retaining the existing 20 SQ when these assets
were recorded to 376.00 Cathodic Protection. No graph is provided.
Account 376.04 Mains – Leak Clamps (20 SQ) This account includes the cost of leak clamps used in connection with
distribution mains and operations. There is approximately $14.3 million in this
account. The existing life is 20 SQ.
Discussions with Company personnel indicated these assets should be
segregated from other cathodic protection equipment because they have a
shorter life expectancy and no current mechanism to properly record retirements.
Additionally, Atmos is working to obtain consistency among its jurisdictions with
the segregation of leak clamps.
This study recommends retaining the existing 20 SQ when these assets
were recorded to 376.00 Cathodic Protection. No graph is provided.
Exhibit DAW-2 Page 41 of 111

42
Account 378.00 M&R Station Equipment (50 R1.5) This account consists of various measuring equipment, regulator station
and valves used in distribution operations. There is approximately $9.7 million of
investment in this account. The existing life is 49 years with the R1.5 dispersion.
Due to similarities in assets between the different M&R accounts, a
combined analysis was performed for all measuring and regulating equipment in
Transmission and Distribution functions. See a more detail about discussions
with Company personnel in Account 369 above. In summary, the indicated lives
of the assets have changed over the years from 60-70 year life expectancy,
recent past generation to be 40-50 year life expectancy, to the most current
generation, more technology driven, to be 30-40 year life expectancy.
The combined actuarial analysis full placement band yielded an excellent
visual fit with the 50 R1.5. This study recommends moving to the 50 year life
while retaining the R1.5 dispersion pattern at this time. Giving consideration to
the various generations still in service and the combined actuarial analysis, this
study recommends moving to 50 R1.5. A graph of the accounts observed life
table and recommendation is shown below for the 50 R1.5.
Exhibit DAW-2 Page 42 of 111

43
Account 379.00 & 379.05 M&R – City Gate Equipment (50 R1.5) These accounts include the cost of measuring and regulating stations and
other related equipment for city gate. There is approximately $5.6 million for
combined accounts. The existing life is 49 R1.5.
Due to similarities in assets between M&R accounts, a combined analysis
was performed for all measuring and regulating equipment in Transmission and
Distribution functions. See a more detail about discussions with Company
personnel in Account 369 above. In summary indicated lives of the assets have
changed over the years from 60-70 year life expectancy to recent past
generation of 40-50 year life expectancy to the most current generation, which is
more technology driven, to be 30-40 year life expectancy.
The combined actuarial analysis full placement band yielded an excellent
visual fit with the 50 R1.5. This study recommends moving to the 50 year life
while retaining the R1.5 dispersion pattern at this time. Giving consideration to
the various generations still in service and the combined actuarial analysis, this
study recommends moving to 50 R1.5. A graph of the accounts observed life
table and recommendation is shown below for the 50 R1.5.
Exhibit DAW-2 Page 43 of 111

44
Account 380.00 Services (45 R1.5) This account consists of all types of services used in distribution
operations. There is approximately $117.6 million of investment in this account.
The existing life is 40 years with the R1.5 dispersion. The current average age of
investment is approximately 13 years.
Discussions with Company personnel indicated the PRP is causing an
increased replacement of services and they would expect the life to decrease
until the program is over. They are replacing around 2,000 services per year for
a total of 180,240 services. There are approximately 3,231 in unprotected steel
services, protected steel services of 76,717 and 100,282 of plastic services
currently installed on the system. Previously, meter to property line was owned
by customer and from main to property line was owned by Atmos. Recent
changes now have Atmos owning all of the service line (main to meter). If the
main is part of the PRP and the service is not owned to the house, their policy is
to replace the service. The Company indicated the life of services is less than
that of mains. Thinner pipe walls, more exposure to third party damage,
relocations and bringing older services up to code are all cause of retirement.
Company expects a 40 or 45 year life for services would be reasonable.
The actuarial analysis visual fit was difficult to match and had a tendency
to flat L and R dispersion patterns. This is likely due to the effects of the PRP.
The SPR analysis indicated the top ranked fit to be the S1 with a 30 year life.
This had excellent REI but poor CI. This is too low of a life based on
expectations and is even lower than existing. The R1.5 had a 33 year life and
was ranked in the top 10. Giving consideration to the analysis, discussions with
Company personnel, and the temporary impact on life from the PRP, this study
recommends moving out to 45 years and retaining the R1.5 dispersion. A graph
of the account observed life table and recommendation is shown below for the 45
R1.5.
Exhibit DAW-2 Page 44 of 111

45
Exhibit DAW-2 Page 45 of 111
100 .. ... .. 80
"" c
·~ 60 ::::J Ul -c 40 Q)
'-' ~ Q)
0.. 20
0 0
Account 38000-Services Scenario Atmos KY Direct 2017 Actuarial .. Actual Data • R1.5 45.00
••••• ~-········ ...
...... ...... ~ ...
10
• ••• ···-· -- •••• •• ••••• •••• ..... ......................
& A&£&&.&..&&. .. ......
20 30 40
Age (Years) Vintages: 1976-2017
Activity Years: 2006-2017
• • • • • •
50

46
Account 381.00 Meters (20 R0.5) This account includes the cost of all type of meters. The balance is $31.4
million and the existing life is 20 R0.5. The current average age of investment is
9 years.
Discussions with Company personnel indicated that approximately 67,547
out of 183,224 (at 6-2018) are WMR, with a life of 20 years for those assets.
Non-compatible meters have been replaced over the last 6-7 years, if they are
over 25 years old. There are 1,600-2,000 meters that are obsolete and have
been pulled out each year. The Company is using Sensus WMR meters, but
there are some meters without WMR. Newer meters cost less, but are not as
durable as old ones. When a meter is brought in, it is retired and sent to a third
party to refurbish. Company personnel believe 20 years is a reasonable life for
meters. The Company has been doing military sampling since 1999. In
Kentucky, if no military sampling is performed, the Company would have to
change out meters every 10 years. Military sampling groups meters into groups,
performing random sample test of all groups and then react if a particular group
fails the test. Non-WMR meters would have a maximum life of 25 years based
on the military sampling. When a WMR device fails, they will generally replace
the meter as well. The life of the WMR battery is 20 years at most.
The actuarial analysis produced visual fits that were generally longer than
the existing 20 years. More recent bands were indicating lives at existing, maybe
a little less. The SPR analysis has the R0.5 dispersion with a 20 year life in the
top ranked curves, but the CIs are poor with excellent REIs. The historical
retirement experience is based on the longer-lived old meters. Consideration
was given to input of Company SMEs, the analysis, changes in the assets with
plans to continue implementing technology based equipment, manufacturers and
Company expectations which all point to a life around 20 years. This is also
consistent with the expected battery life. This study recommends retaining the
20 R0.5. A graph of the account observed life table and recommendation is
shown below for the 20 R0.5.
Exhibit DAW-2 Page 46 of 111

47
Exhibit DAW-2 Page 47 of 111

48
Account 382.00 Meter Installations (43 L1) This account includes the cost of meter installations. This account has a
balance of $55.2 million. The existing life is 42 R1.5. The current average age of
investment is approximately 12 years.
Discussions with Company personnel indicated they will evaluate the
meter loop when a meter is pulled and replace as necessary. The installation
would not be replaced as often as the meter. However, with PRP replacements,
they will replace the meter bar a well. The Company started buying
premanufactured loops in early 2000s (perhaps 2002). With the meter loops, the
life of the meter installation, house regulator, and house regulator installations
are treated as one.
The combined (382-384) actuarial analysis produces a great fit for the
combined in the placement (1963-2017) band and experience (1997-2017) band
of 43 L1, which is close to existing. Based on the implementation of the
premanufactured meter loop, PRP, and both life analysis indications, this study
recommends moving to 43 L1. A graph of the account observed life table and
recommendation is shown below for the 43 L1.
Exhibit DAW-2 Page 48 of 111

49
Account 383.00 House Regulators (43 L1) This account includes the cost of house regulators. There is
approximately $10.7 million in this account. The existing life is a 31 S6.
Discussions with Company personnel indicated when a meter is replaced,
they will check the regulator for lock up and only change if it fails locked up. The
life is expected to be longer than the meter but less than or equal to the life of the
meter installation. Company personnel indicated the existing 31 years seems
short for regulators.
Due to the premanufactured meter loop, running a combined analysis is
reasonable. See Account 382 for more discussion. Based on the combined
analysis and Company input, this study recommends using the 43 L1. A graph of
the combined accounts observed life table and recommendation is shown below
for the 43 L1.
Exhibit DAW-2 Page 49 of 111

50
Account 384.00 House Regulator Installations (43 L1) This account includes the cost of house regulators installations. There is
approximately $200 thousand in this account. The existing life is a 42 R1.5.
Discussions with Company personnel indicated the current retirement
practice for house regulator installation is not as robust. Company would expect
the life of the meter installation, regulator and regulator installation to be the
same since the loops are now prefabricated (in the last 15 years) and if a
regulator is replaced, the “stick” loop is rebuilt. This account has limited
retirement activity being recorded and with the premanufactured meter loop, a
combined analysis makes sense. See Account 382 detailed discussion. Based
on the combined analysis and Company input, this study recommends using the
43 L1. A graph of the combined accounts observed life table and
recommendation is shown below for the 43 L1.
Exhibit DAW-2 Page 50 of 111

51
Account 385.00 Industrial Measuring (53 R4) This account includes the cost of regulator installations, regulator stations,
valves and pressure recorders for industrial customers. There is approximately
$5.2 million in this account. The existing life is a 42 L5.
Discussions with Company personnel indicated this equipment is more
expensive and heavy duty due for use with industrial customers. This equipment
is tested on site more frequently and only replaced if it fails. Company personnel
expect a life around 40 years or more.
The actuarial analysis indicated the life was increasing with a good visual
fit of 53 R4 across the bands analyzed. This study recommends moving to 53
R4 at this time. A graph of the combined accounts observed life table and
recommendation is shown below for the 53 R4.
Exhibit DAW-2 Page 51 of 111

52
General Plant – FERC Accounts 390-399.08
Account 390.00, 390.02, & 390.03 Structures and Improvements (45 R2) These accounts include the cost of buildings, roof, carpet, and other
miscellaneous assets. Consistent with the prior study, all Account 390’s, except
390.04 and390.09, will be combined to calculate a depreciation rate to be applied
to each account. There is approximately $8 million for the combined accounts.
The current life is 40 R2.
The life analysis for this account was performed using the actuarial
analysis. There are retirements occurring earlier than would be expected. A
reasonable visual fit was the 45 R2. Considering the Company now owns some
buildings (not all being leased) and judgment, this study recommends moving the
life to 45 years and retaining the R2 dispersion for this account. A graph of the
combined accounts observed life table and recommendation is shown below for
the 45 R2.
Exhibit DAW-2 Page 52 of 111

53
Account 390.04 Heating and Air Conditioning Equipment (25 R2) These accounts include the cost of heating and cooling equipment. This
account was segregated from the other accounts. There is approximately $13
thousand in this account. The current life is a 40 R2.
There was only one retirement in the actuarial database. The prior SPR
analysis had combined all 390 accounts, so there is not enough historical
retirement activity for the segregated account for a meaningful life analysis.
Based on type of assets in the account and judgment, this study recommends
moving to a 25 R2 for this account. No graph is provided.
Account 390.09 Improvements - Leased (20 R3)
This account includes the cost of improvements to leased buildings.
There is approximately $1.2 million in this account. The current life is a 20 R3.
Based on the current plans to own buildings and the lease term being 20 years
with 2-5 year extensions, this study recommends retaining the existing 20 R3 for
this account. No graph is provided.
Account 391.00 & 391.03 Office Furniture, Equipment and Machines (15 SQ) These accounts consist of miscellaneous office furniture such as desks,
chairs, filing cabinets, tables, copiers, and other office equipment used for
general utility service. There is approximately $1.7 million in this account. The
existing life is 15 SQ and uses vintage group amortization and is retained. No
graph is provided.
Exhibit DAW-2 Page 53 of 111

54
Account 392.00 Transportation Equipment (20 L4) This account consists of various types of transportation equipment such
as cars, trucks, tractor, and trailers. There is approximately $221 thousand in
this account. The current parameter is 8 L5.
Discussions with Company personnel indicated nearly half of the
investment is a Mueller truck (to stop/plug lines), some tractors, and trailers. Life
of this type of equipment should last 20 years on average
The actuarial analysis indicated a life less than Company personnel
expectations. This is most likely due to the prior history of a mix of autos and
light duty trucks, which are now leased. Based on input from the Company, type
of assets, and judgment, this study recommends moving to 20 L4 which is
reflective of the current surviving assets, policy and expectations. A graph of the
account observed life table and recommendation is shown below for the 20 L4.
Exhibit DAW-2 Page 54 of 111

55
Account 392.02 Trailers (20 L4) This account consists of working trailers used in general plant. There is
currently a zero balance in this account. The current parameter is 20 L3. See
account 392.00 above. This study recommends using the same 20 L4 from
Account 392.00. The assets, policy and expectations are the same. No graph is
provided.
Account 394.00 Tools, Shop, and Garage Equipment (16 SQ) This account consists of various tools used in the shop and garages such
as boring equipment, leak detectors, pipe locators, fusion, tapping, and plugging
equipment. There is approximately $3.2 million in this account. The existing life
is 16 SQ, uses vintage group amortization and is retained. No graph is provided.
Exhibit DAW-2 Page 55 of 111

56
Account 396.03, 396.04, & 396.05 Ditchers, Backhoes and Welders (20 S4) These accounts consist of power operated equipment including ditchers,
backhoes, and welders. There is approximately $122 thousand for the combined
accounts. The current life is 14 years with the S4 dispersion.
Discussions with Company personnel indicated 20 years would be a more
reasonably expected life for this type of equipment than the current 14 years.
The analysis indicates a life much shorter than Company expectations and
the mix of surviving assets. Considering the analysis, type of equipment, and
Company input, this study recommends increasing the life to 20 years while
retaining the S4 dispersion pattern. A graph of the account observed life table
and recommendation is shown below for the 20 S4.
Exhibit DAW-2 Page 56 of 111

57
Accounts 397.00 Communication Equipment (15 SQ) This account consists of all communication equipment including mobile
and fixed radio systems along with telephone, telemetering and other
miscellaneous communication equipment. There is $439 thousand in this
account. The existing life is 15 SQ, uses vintage group amortization and is
retained. No graph is provided.
Account 398.00 Miscellaneous Equipment (20 SQ) This account consists of kitchen, audio/video equipment, television, and
other miscellaneous equipment used in general utility service. There is
approximately $3.9 million in this account. The existing life is a 20 SQ, uses
vintage group amortization and is retained. No graph is provided.
Account 399.01 Server Hardware (7 SQ) This account consists of server hardware computer equipment. There is
$14 thousand in this account. The existing life is 10 SQ and uses vintage group
amortization. Discussions with Company personnel indicated the existing 10
year is a maximum life and not likely. The Company recently retired a server at 7
years. Based on Company input, policy, type of assets, and judgment, this study
recommends moving to a 7 SQ and vintage group amortization is retained.
Account 399.02 Server Software (7 SQ) This account consists of server software. There is no balance in this
account. The existing life is 7 SQ and uses vintage group amortization and is
retained. No graph is provided.
Exhibit DAW-2 Page 57 of 111

58
Account 399.03 – Network Hardware (10 SQ) This account consists of network hardware computer equipment. There is
approximately $134 thousand in this account. The existing life is 10 SQ, uses
vintage group amortization and is retained. No graph is provided.
Account 399.06 – PC Hardware (5 SQ)
This account consists of personal computer hardware, laptops, mobile
data terminals (MDT), printers, monitors, and projectors. There is approximately
$1.1 million in this account. The existing life is 5 SQ, uses vintage group
amortization and is retained. No graph is provided.
Account 399.07 PC Software (7 SQ)
This account consists of software for personal computers. There is no
balance in this account. The existing life is 7 SQ, uses vintage group
amortization and is retained. No graph is provided.
Account 399.08 Application Software (12 SQ)
This account consists of smaller software applications such as GIS
software. The balance in this account is $123 thousand. The existing life is 15
SQ and uses vintage group amortization. Discussions with Company personnel
indicated that the large application software is no longer recorded at utility level
so this account contains software that has a slight shorter life. This study moves
the life to 12 years with the SQ. Vintage group amortization is retained. No
graph is provided.
Exhibit DAW-2 Page 58 of 111

59
Salvage Analysis When a capital asset is retired, physically removed from service and finally
disposed of, terminal retirement is said to have occurred. The residual value of a
terminal retirement is called gross salvage. Net salvage is the difference
between the gross salvage (what the asset was sold for) and the removal cost
(cost to remove and dispose of the asset). Salvage and removal cost
percentages are calculated by dividing the current cost of salvage or removal by
the original installed cost of the asset. Some plant assets can experience
significant negative removal cost percentages due to the timing of the original
addition versus the retirement. For example, a Distribution asset in FERC
Account 376.01 Steel Mains with a current installed cost of $500 (2017) would
have had an installed cost of $15.404 in 1947. A removal cost of $50 for the
asset calculated (incorrectly) on current installed cost would only have a negative
10 percent removal cost ($50/$500). However, a correct removal cost calculation
would show a negative 325 percent removal cost for that asset ($50/$15.40).
Inflation from the time of installation of the asset until the time of its removal must
be taken into account in the calculation of the removal cost percentage because
the depreciation rate, which includes the removal cost percentage, will be applied
to the original installed cost of assets.
The net salvage analysis uses the history of the individual accounts to
estimate the future net salvage that Kentucky can expect in its operations. As a
result, the analysis not only looks at the historical experience but also takes into
account recent and expected changes in operations that could reasonably lead to
different future expectations for net salvage than were experienced in the past.
Generally, recent experience is more heavily weighted in making net salvage
recommendations than experience older than 10 years.
4 Using the Handy-Whitman Bulletin No. 187, G-2, line 44, $15.40 = $500 x 24/779.
Exhibit DAW-2 Page 59 of 111

60
Salvage Characteristics For each account, data for retirements, gross salvage, and cost of removal
were derived from 1996-2017. Moving averages, which remove timing
differences between retirement and salvage and removal cost, were analyzed
over periods varying from one to 19 years, which were evaluated in making the
net salvage recommendations for the study. However, for purposes of printing in
this report, we have limited it to a period of 10 years in Appendix D. A discussion
for each account provides the recommended net salvage factor, the existing net
salvage factor if known, and any specific considerations given to support the
recommendations.
Storage Plant – FERC Accounts 350.20 – 356.00 Account 350.20 Rights-of-Way (0%)
This account includes any salvage and removal cost related to rights of
way used in connection with storage plant operations. The existing net salvage
is zero percent. No net salvage is expected and, a zero percent net salvage is
retained.
Account 351.00-351.04 Structures & Improvements, Compressor Structures, M&R Station Structures, and Other Structures (-5%)
These accounts include any salvage and removal cost related to
structures and improvements, buildings, and fences used in connection with
storage plant operations. The existing net salvage is negative 5 percent. Similar
to the combined life analysis for these accounts, a combined net salvage
analysis was performed. Some salvage was recorded due to retirement of a
building and the sale of a garage door. This is not expected to reoccur. Overall
cost of removal is expected to exceed any salvage in the future. This study
recommends retention of the existing negative 5 percent net salvage.
Exhibit DAW-2 Page 60 of 111

61
Account 352.00, 352.01, 352.02 Wells, Well Construction and Well Equipment (-30%)
These accounts include any salvage and removal cost related to wells,
well construction, and well equipment used in connection with storage plant
operations. The existing net salvage is negative 30 percent. The Company has
approximately 55 wells across 5 storage fields. There have been several wells
retired or abandoned. Based on discussions with Company the average cost to
plug and abandon a well is around $50,000. The recent experience suggests a
negative net salvage of 100 percent of more. Since timing differences are known
to occur, this study recommends retention of the negative 30 percent for all three
accounts at this time.
Account 352.03 Cushion Gas (0%)
This account includes any salvage and removal cost related to cushion
gas used in connection with storage plant operations. There has been no activity
and is not expected to have any removal cost. This study retains the existing
zero percent net salvage.
Account 352.10 Storage Leaseholds (0%)
This account includes any salvage and removal cost related to storage
leaseholds used in connection with storage plant operations. There is no
salvage or cost of removal recorded or expected. This study recommends
retaining the approved zero percent net salvage for this account.
Account 352.11 Storage Rights (0%) This account includes any salvage and removal cost related to storage
rights used in connection with storage plant operations. The existing net salvage
is zero percent and is retained.
Exhibit DAW-2 Page 61 of 111

62
Account 353.01, 353.02 Storage Field and Tributary Lines (-5%) These accounts include any salvage and removal cost related to field and
tributary lines used in connection with storage plant operations. Currently, the
net salvage for these accounts is negative 5 percent and is retained.
Account 354.00 Compressor Station Equipment (-5%)
This account includes any salvage and removal cost related to
compressor station equipment used in connection with storage plant operations.
Currently, the net salvage is zero percent. Some salvage and cost of removal
was recorded. The 10 year moving average is a negative 11 percent. No
salvage has been received but cost of removal has been recorded. Based on the
experience, some negative net salvage is expected, this study recommends
moving from zero to a negative 5 percent net salvage.
Account 355.00 Measuring and Regulating (-4%) This account includes any salvage and removal cost related to measuring
and regulating equipment used in connection with storage plant operations. The
existing net salvage is negative 4 percent. There has been some activity with no
salvage and some cost of removal. Based on the overall analysis indications,
this study recommends retaining a negative 4 percent net salvage for this
account.
Account 356.00 Purification Equipment (-3%)
This account includes any salvage and removal cost related to purification
equipment used in connection with storage plant operations. The existing net
salvage is negative 3 percent. Although sparse, some cost of removal has been
recorded. The most recent 5 year moving average is a negative 8 percent. This
study recommends retention of the existing negative 3 percent.
Exhibit DAW-2 Page 62 of 111

63
Transmission Plant – FERC Accounts 365.20 – 369.01 Account 365.20 Rights-of-Way (0%)
This account includes any salvage and removal cost related to rights of
way used in connection with transmission operations. The existing net salvage is
zero percent and is retained.
Account 366.02 & 366.03 M&R Station Structures & Other Structures (-3%) These accounts include any salvage and removal cost related to
measuring and regulating station structures and other structures used in
connection with transmission operations. The existing net salvage is negative 6
percent. The combined account analysis indicates some salvage and cost of
removal recorded for these two accounts. Salvage in 2008 was for a fence and
is not likely to reoccur. The most recent moving average with net salvage is the
7 year and is a negative 3 percent. While the fuller experience moves more
negative there is not enough consistency in the movement. Based on the overall
analysis indications and expectations that cost of removal will exceed any
salvage, this study recommends moving to a negative 3 percent net salvage for
these accounts.
Account 367.00 Mains – Cathodic Protection (0%) This account includes any salvage and removal cost related to cathodic
protection mains used in connection with transmission operations. There has
been some cost of removal recorded but is minimal. Little removal cost is
expected. Currently the net salvage for this account is zero percent and is
retained.
Account 367.01 Mains – Steel (-20%)
This account includes any salvage and removal cost related to steel mains
used in connection with transmission operations. Currently, the net salvage for
this account is negative 20 percent. The Company recently completed a
Exhibit DAW-2 Page 63 of 111

64
separate Time and Motion Study to evaluate the costs related to retirement
activities for its Mains and Services. There has not been sufficient time from
implementation of the Time and Motion Study to see the impact, so the current
analysis indicates a continued pattern of negative net salvage. However, this
study recommends retention of the existing negative 20 percent net salvage at
this time.
Account 369.00 & 369.01 M&R Stations (-15%) These accounts include any salvage and removal cost related to
measuring and regulating station equipment used in connection with
transmission operations. The existing net salvage for these accounts is negative
19 percent. Using the combined analysis, overall indications suggest there is no
salvage and some cost of removal will be incurred. Considering the Time and
Motion Study and the overall indications in the combined analysis, this study
recommends moving to negative 15 percent net salvage for this account.
Distribution Plant – FERC Accounts 374.02-387 Account 374.02 Land Rights (0%) This account includes any salvage and removal cost related to land rights
used in connection with distribution operations. Existing net salvage is zero
percent. Very small salvage was recorded, and is not expected to occur in the
future. This study recommends retaining the zero percent net salvage for this
account.
Account 375.00, 375.01, 375.02, & 375.03 Structures & Improvements (-10%)
These accounts consist of any salvage and removal cost related to
buildings, border station and regulating station structures, fences, and other
miscellaneous related assets used in connection with distribution operations.
The existing net salvage is negative 10 percent. The combined analysis
indicates no salvage and some cost of removal being incurred. The overall
Exhibit DAW-2 Page 64 of 111

65
indications are sparse but suggest a negative 47 percent. This indication is not
reasonable to expect for all assets in the future. This study recommends
retaining the existing negative 10 percent net salvage for this account.
Account 376.00 Mains - Cathodic Protected (0%)
This account consists of any salvage and removal cost related to cathodic
protected mains. The existing net salvage is zero percent. This study has
segregated anodes and leak clamps from this account. Very little salvage but
some cost of removal has been incurred. This study recommends retention of
zero percent net salvage for this account.
Account 376.01 Mains - Steel (-5%) This account consists of any salvage and removal cost related to steel
mains. The existing net salvage is negative 5 percent based on a combined
analysis of Account 376.01 and 376.02. The Company completed and
implemented a Time and Motion Study for its Mains and Services. The impact is
not fully evident in the analysis as it indicates a continued pattern of negative net
salvage with a 3 year moving average negative 55 percent. The most recent 5
year average is negative 40 percent and a negative 34 percent for the 10 year.
Based on the combined analysis for both steel and plastic and considering the
Time and Motion, this study recommends not making any changes and retains
the existing negative 5 percent net salvage for both steel and plastic mains at this
time.
Account 376.02 Mains - Plastic (-5%) This account consists of any salvage and removal cost related to plastic
mains. The existing net salvage is negative 5 percent. The existing net salvage
is negative 5 percent based on a combined analysis of Account 376.01 and
376.02. The Company completed and implemented a Time and Motion Study for
its Mains and Services. The impact is not fully evident in the analysis as it
Exhibit DAW-2 Page 65 of 111

66
indicates a continued pattern of negative net salvage with a 3 year moving
average negative 55 percent. The most recent 5 year average is negative 40
percent and a negative 34 percent for the 10 year. Based on the combined
analysis for both steel and plastic and considering the Time and Motion, this
study recommends not making any changes and retains the existing negative 5
percent net salvage for both steel and plastic mains at this time.
Account 378.00 M&R Station Equipment (-15%) This account includes any salvage and removal cost related to measuring
equipment, regulator station and valves used in distribution operations. The
existing net salvage is negative 19 percent. Consistent with the life analysis, a
combined analysis was run for all measuring and regulating equipment in the
transmission and distribution functions. The Company also performed a Time
and Motion Study on its metering type assets. Similar to Mains and Services
there has not been enough time to see the results. However, looking at the
combined analysis, the 10 year moving average is a negative 15 percent. Giving
consideration to all these factors, this study recommends moving to a negative
15 percent, which is the recommendation of this study.
Account 379.00 & 379.05 M&R – City Gate Equipment (-15%) These accounts include any salvage and removal cost related to station
equipment used in measuring and regulating gas at the city gate. The existing
net salvage is negative 19 percent. Consistent with the life analysis, a combined
analysis was run for all measuring and regulating equipment in the transmission
and distribution functions. The Company also performed a Time and Motion
Study on its metering type assets. Similar to Mains and Services there has not
been enough time to see the results. However, looking at the combined analysis,
the 10 year moving average is a negative 15 percent. Giving consideration to all
these factors, this study recommends moving to a negative 15 percent, which is
the recommendation of this study.
Exhibit DAW-2 Page 66 of 111

67
Account 380.00 Services (-18%) This account includes any salvage and removal cost related to all types of
services related to distribution operations. The existing net salvage is negative
20 percent. The Company completed and implemented the Time and Motion
Study results but not enough time has passed to be fully reflective in the
analysis. However, the most recent 3 year moving average is a negative 18
percent. The fuller moving average, 10 year, is a negative 32 percent.
Considering the Time and Motion Study, the recent (3 year) indications, and the
existing, this study recommends moving to a negative 18 percent net salvage for
this account.
Account 381.00 Meters (-11%) This account includes any salvage and removal cost related to meters.
The existing net salvage is negative 50 percent. Discussions with Company
personnel indicated meters is separate from the meter loop in life and net
salvage, so it has been analyzed separately. The current analysis indicates the
most recent 5 year moving average is negative 11 percent and the 10 year
average is a negative 18 percent. Giving consideration to the Time and Motion
study impact, the current analysis indications in the 5 year average, and future
expectations for this account, this study recommends moving to a negative 11
percent net salvage at this time.
Account 382.00 Meter Installations (-35%)
This account includes any salvage and removal cost related to meter
installations. The existing net salvage is negative 50 percent. Individually, this
account has very high negative net salvage, but based on discussions with
Company personnel this account is more appropriately grouped with house
regulators and house regulator installations due to how the meter loop is treated.
The combined analysis most recent 5 year moving average is a negative 186
percent and the 10 year is a negative 154 percent, both of which are beyond
Exhibit DAW-2 Page 67 of 111

68
expectations. The cost of removal recorded in 2016 appears to be due to timing
differences and is skewing the results. Giving consideration to the handling of
the meter loop, the Time and Motion Study, and the analysis, this study
recommends moving to a negative 35 percent net salvage at this time and it be
applied to Accounts 382, 383, and 384.
Account 383.00 House Regulators (-35%)
This account includes any salvage and removal cost related to house
regulators. The existing net salvage is zero percent. A combined analysis was
performed and used for Accounts 382, 383, and 384. The combined analysis
most recent 5 year moving average is a negative 186 percent and the 10 year is
a negative 154 percent, both of which are beyond expectations. The cost of
removal recorded in 2016 appears to be due to timing differences and is skewing
the results. Giving consideration to the handling of the meter loop, the Time and
Motion Study, and the analysis, this study recommends moving to a negative 35
percent net salvage at this time and it be applied to Accounts 382, 383, and 384.
Account 384.00 House Regulator Installations (-35%)
This account includes any salvage and removal cost related to house
regulator installations. The existing net salvage is zero percent. See discussions
for Accounts 381, 382, and 383. The combined analysis most recent 5 year
moving average is a negative 186 percent and the 10 year is a negative 154
percent, both of which are beyond expectations. The cost of removal recorded in
2016 appears to be due to timing differences and is skewing the results. Giving
consideration to the handling of the meter loop, the Time and Motion Study, and
the analysis, this study recommends moving to a negative 35 percent net
salvage at this time and it be applied to Accounts 382, 383, and 384.This study
recommends retaining the zero percent net salvage for this account.
Exhibit DAW-2 Page 68 of 111

69
Account 385.00 Industrial M&R (-8%) This account includes any salvage and removal cost related to meters,
regulator installations, regulator stations, valves and pressure recorders for
industrial customers. The existing net salvage is negative 12 percent. 2012 is
much more negative and 2014 was positive but may be the result of timing
differences. This account is included in scope of the Time and Motion Study, but
the impact is not fully known. However, the most recent 10 year net salvage
indication is a negative 8 percent, which is the recommendation in this study.
General Plant – FERC Accounts 390-399.08 Account 390.00, 390.02, 390.03, 390.04 Structures and Improvements (-10%)
These accounts include the gross salvage and cost or removal for costs of
structures and improvements used for utility service. The existing net salvage is
negative 10 percent. The combined analysis indicates a negative 2 percent for
the most recent 10 year moving average. There are known timing differences
that occur, so this study recommends retaining a negative 10 percent net salvage
for these accounts at this time.
Account 390.09 Improvements – Leased (0%) This account includes the gross salvage and cost or removal for costs of
improvements to leased structures used for utility service. The existing net
salvage is zero percent. Some salvage was recorded in 2008 but is not likely to
reoccur and now cost of removal has exceeded any salvage for an overall
negative net salvage. This study recommends retaining zero percent net salvage
for this account at this time.
Account 391.00 & 391.03 Office Furniture & Equipment (0%)
These accounts include the gross salvage and cost or removal for office
furniture, equipment and office machines used for utility service. The existing net
Exhibit DAW-2 Page 69 of 111

70
salvage is zero percent. No significant salvage or cost of removal is expected.
This study recommends retaining zero percent net salvage at this time.
Account 392.00 Transportation Equipment (10%)
This account consists of gross salvage and cost of removal for cars,
trucks, and other transportation equipment that can be licensed on roadways.
The existing net salvage is 10 percent. No cost of removal is expected nor
recorded. Overall analysis indicates a move downward, but this study
recommends retention of the existing positive 10 percent.
Account 392.02 Working Trailers (10%) This account consists of gross salvage and cost of removal for working
trailers. The existing net salvage is 14 percent. There is no longer any
investment in this account and will be recorded to Account 392.00. This study
recommends a 10 percent net salvage, which is consistent with Account 392.
Account 394.00 Tools, Shop, and Garage Equipment (0%) This account includes the gross salvage and cost or removal for tools,
shop, and garage equipment used for utility service. The existing net salvage is
zero percent. The most recent moving averages are both positive and negative.
Overall a zero percent net salvage for these assets at end of life is expected.
This study recommends retaining a zero percent net salvage for this account at
this time.
Account 396.03, 396.04, and 396.05 Ditchers, Backhoes, and Welders (16%)
These accounts include the gross salvage and cost or removal for
ditchers, backhoes, welders, and other power operated equipment that cannot be
licensed on roadways. The existing net salvage is 8 percent. A combined
analysis was performed, which indicated some positive net salvage is being
recorded. Due to timing differences some of the more recent positive salvage
indications are not reasonable to expect in the future. However, the most recent
Exhibit DAW-2 Page 70 of 111

71
10 year average is positive 16 percent and is reasonable for these assets.
Based on the 10 year indications and more recent activity, this study
recommends increasing the net salvage from the existing 8 percent to 16 percent
net salvage at this time.
Accounts 397.00 Communication Equipment (0%)
This account includes the gross salvage and cost or removal for
telephone, telemetry, and other communication type equipment. The existing net
salvage is zero percent. Typically, these assets do not produce any gross
salvage or removal cost at retirement. This study recommends retaining zero
percent net salvage for this account.
Account 398.00 Miscellaneous Equipment (0%) This account includes the gross salvage and cost or removal for
miscellaneous equipment. The existing net salvage is zero percent. Small
negative net salvage is indicated, but these assets typically will not produce any
gross salvage or removal cost at end of life. This study recommends retaining
zero percent net salvage for this account.
Account 399.01 Server Hardware (0%)
This account consists of gross salvage and cost of removal for server
hardware computer equipment. The existing net salvage is zero percent.
Typically, these assets do not produce any gross salvage or removal cost. This
study recommends retaining zero percent net salvage for this account.
Account 399.02 Server Software (0%) This account consists of gross salvage and cost of removal for server
software. The existing net salvage is zero percent. Typically, these assets do not
produce any gross salvage or removal cost. This study recommends retaining
zero percent net salvage for this account.
Exhibit DAW-2 Page 71 of 111

72
Account 399.03 Network Hardware (0%) This account consists of gross salvage and cost of removal for network
hardware computer equipment. The existing net salvage is zero percent.
Typically, these assets do not produce any gross salvage or removal cost. This
study recommends retaining zero percent net salvage for this account.
Account 399.06 PC Hardware (0%)
This account consists of gross salvage and cost of removal for personal
computer hardware, laptop, printers, monitors, and projectors. The existing net
salvage is zero percent. A small negative net salvage is indicated in the
analysis. However, typically these assets do not produce any gross salvage or
removal cost. This study recommends retaining a zero percent net salvage for
this account.
Account 399.07 PC Software (0%)
This account consists of gross salvage and cost of removal for software
for personal computers. The existing net salvage is zero percent. Typically,
these assets do not produce any gross salvage or removal cost. This study
recommends retaining zero percent net salvage for this account.
Account 399.08 Application Software (0%)
This account consists of gross salvage and cost of removal for large
application software. The existing net salvage is zero percent. Typically, these
assets do not produce any gross salvage or removal cost. This study
recommends retaining zero percent net salvage for this account.
Exhibit DAW-2 Page 72 of 111

73
APPENDIX A - Calculation of Equal Life Group Depreciation Rates
Exhibit DAW-2 Page 73 of 111

Using Equal Life Group Annual AnnualPlant In Allocated Net Net Salvage Unaccrued Remaining Accrual Accrual
Account Description Service Book Reserve Salvage % Amount Balance Life Amount Accrual Rate(a) (b) (c) (d) (e) [f] [g] [h] [i] [j]
35020 Rights-Of-Way 4,681.58$ 4,285.92$ 0% -$ 395.66$ 18.14 21.81$ 0.47%35100 Structures & Improvements 17,916.19 5,798.78 -5% (895.81) 13,013.22 43.76 297.39 1.66%35102 Structures - Compressor Station 153,261.30 111,882.25 -5% (7,663.07) 49,042.11 25.51 1,922.12 1.25%35103 Structures - M&R Stations 23,138.38 20,480.76 -5% (1,156.92) 3,814.54 18.27 208.84 0.90%35104 Other Structures 137,442.53 98,479.17 -5% (6,872.13) 45,835.48 25.82 1,775.22 1.29%35200 Wells 8,353,042.61 1,017,144.77 -30% (2,505,912.78) 9,841,810.62 60.92 161,541.53 1.93%35201 Well Construction 1,699,998.54 1,393,570.60 -30% (509,999.56) 816,427.50 31.70 25,758.87 1.52%35202 Well Equipment 449,309.06 454,795.24 -30% (134,792.72) 129,306.54 23.69 5,457.88 1.21%35203 Cushion Gas 1,694,832.96 533,786.19 0% 0.00 1,161,046.77 49.50 23,456.81 1.38%35210 Storage Leaseholds 178,530.09 171,013.62 0% 0.00 7,516.47 13.79 545.08 0.31%35211 Storage Rights 54,614.27 43,850.53 0% 0.00 10,763.74 22.39 480.77 0.88%353 C Storage Field & Tributary Lines 384,669.27 299,213.33 -5% (19,233.46) 104,689.41 30.01 3,488.82 0.91%35400 Compressor Station Equipment 923,446.05 493,156.35 -5% (46,172.30) 476,462.00 30.40 15,672.76 1.70%35500 M&R Equipment 273,084.38 175,223.57 -4% (10,923.38) 108,784.18 23.87 4,556.67 1.67%35600 Purification Equipment 414,663.45 177,084.26 -3% (12,439.90) 250,019.10 30.43 8,216.24 1.98%
Total Storage 14,762,630.66$ 4,999,765.33$ (3,256,062.03)$ 13,018,927.36$ 253,400.82$ 1.72%
36520 Rights-Of-Way 867,772.00$ 455,379.60$ 0% -$ 412,392.40$ 45.06 9,151.49$ 1.05%366 C Structures - M&R Station 109,828.01 72,369.18 -3% (3,294.84) 40,753.67 30.02 1,357.69 1.24%36700 Mains - Cathodic Protection 47,232.93 13,394.47 0% 0.00 33,838.46 18.66 1,813.87 3.84%36701 Mains - Steel 27,638,493.47 17,806,185.27 -20% (5,527,698.69) 15,360,006.90 39.30 390,807.52 1.41%36703 Mains - Anodes 92,404.75 72,038.75 0% 0.00 20,366.00 4.41 4,620.24 5.00%369 C M&R Stations 3,001,022.55 2,269,262.74 -15% (450,153.38) 1,181,913.20 25.61 46,145.00 1.54%
Total Transmission 31,756,753.71$ 20,688,630.00$ (5,981,146.92)$ 17,049,270.63$ 453,895.81$ 1.43%
37402 Land Rights 2,371,406.31$ 139,565.41$ 0% -$ 2,231,840.90$ 69.07 32,313.87$ 1.36%375 C Structures & Improvements 486,254.94 188,791.98 -10% (48,625.49) 346,088.46 39.79 8,697.84 1.79%37600 Mains - Cathodic Protection 2,326,532.18 526,823.99 0% 0.00 1,799,708.19 18.26 98,564.89 4.24%
37601-02 Mains - Steel & Plastic 247,129,715.72 44,226,488.56 -5% (12,356,485.79) 215,259,712.94 34.60 6,221,857.95 2.52%37603 Mains - Anodes 4,392,139.28 2,635,974.04 0% 0.00 1,756,165.24 8.00 219,589.47 5.00%37604 Mains - Leak Clamps 14,313,691.11 8,834,833.14 0% 0.00 5,478,857.97 7.66 715,557.47 5.00%37800 M&R Equipment - General 9,659,648.27 2,189,008.88 -15% (1,448,947.24) 8,919,586.63 30.25 294,842.14 3.05%379 C M&R Equipment - City Gate 5,593,717.47 1,738,573.24 -15% (839,057.62) 4,694,201.85 29.62 158,492.28 2.83%38000 Services 117,564,972.19 39,335,068.75 -18% (21,161,694.99) 99,391,598.43 26.54 3,745,141.38 3.19%38100 Meters 31,440,206.71 12,349,983.03 -11% (3,458,422.74) 22,548,646.41 10.17 2,216,824.34 7.05%38200 Meter Installations 55,250,692.16 23,366,541.68 -35% (19,337,742.26) 51,221,892.73 23.71 2,160,265.34 3.91%38300 House Regulators 10,759,407.20 3,920,827.20 -35% (3,765,792.52) 10,604,372.52 24.55 431,896.65 4.01%38400 House Regulator Installations 200,274.50 114,849.93 -35% (70,096.08) 155,520.65 22.40 6,943.51 3.47%38500 Industrial M&R 5,165,445.65 2,206,876.84 -8% (413,235.65) 3,371,804.46 30.46 110,681.27 2.14%
Total Distribution 506,654,103.69$ 141,774,206.68$ (62,900,100.38)$ 427,779,997.39$ 16,421,668.39$ 3.24%
Appendix AATMOS ENERGY - KENTUCKY PROPERTIES
COMPUTATION OF DEPRECIATION ACCRUAL RATEAT SEPTEMBER 30, 2017
STORAGE PLANT
TRANSMISSION PLANT
DISTRIBUTION PLANT
Exhibit DAW-2 Page 74 of 111

Using Equal Life Group Annual AnnualPlant In Allocated Net Net Salvage Unaccrued Remaining Accrual Accrual
Account Description Service Book Reserve Salvage % Amount Balance Life Amount Accrual Rate(a) (b) (c) (d) (e) [f] [g] [h] [i] [j]
Appendix AATMOS ENERGY - KENTUCKY PROPERTIES
COMPUTATION OF DEPRECIATION ACCRUAL RATEAT SEPTEMBER 30, 2017
390 C Structures & Improvements 8,023,991.50$ 858,183.93$ -10% (802,399.15)$ 7,968,206.72$ 30.88 258,055.30$ 3.22%39004 Air Conditioning 12,954.74 5,237.93 -10% (1,295.47) 9,012.29 12.33 731.05 5.64%39009 Improvements - Leased 1,246,194.18 834,749.60 0% 0.00 411,444.58 2.06 199,857.84 16.04%39200 Transportation Equipment * 220,986.90 32,252.16 10% 22,098.69 166,636.05 14.64 11,385.62 5.15%396 C Power Operated Equipment 121,784.60 65,827.07 16% 19,485.54 36,471.99 2.64 13,816.95 11.35%
Total General Depreciated 9,625,911.92$ 1,796,250.69$ (762,110.40)$ 8,591,771.63$ 483,846.74$ 5.03%Total Study Depreciated 562,799,399.98$ 169,258,852.70$ (72,899,419.72)$ 466,439,967.00$ 17,612,811.75$ 3.13%
*This account includes 39202.
GENERAL PLANT DEPRECIATED
Exhibit DAW-2 Page 75 of 111

Appendix A
AssetsPlant Allocated Theoretical Reserve Greater
Account Description Balance Reserve Reserve (Deficit)/Surplus than ASL(a) (b) (c) (d) (e) [f] [g]
3910C Office Furniture & Equipment - All 1,749,085.61$ 760,016.12$ 760,016.12$ 0.00 -$ 39400 Tools, Shop,&Garage Equipment 3,207,557.31 969,997.70 969,997.70 0.00 32,152.80 39700 Communication Equipment 438,830.96 220,507.03 220,507.03 0.00 - 39800 Miscellaneous Equipment 3,897,155.54 1,873,554.01 1,873,554.01 0.00 - 39901 Servers Hardware 14,389.76 5,139.20 5,139.20 0.00 - 39903 Network Hardware 134,598.86 39,115.33 39,115.33 0.00 - 39906 PC Hardware 1,068,402.71 550,294.80 550,294.80 0.00 - 39907 PC Software - - - 0.00 - 39908 Application Software 123,514.83 93,445.51 93,445.51 0.00 57,909.03
Total General Amortized 10,633,535.58$ 4,512,069.70$ 4,512,069.70$ - 90,061.83$
After Retirements of Assets With Age > Average Service LifeAnnual Annual
Plant Allocated Amortization AmortizationAccount Description Balance Reserve Amount %
3910C Office Furniture & Equipment - All 1,749,085.61$ 760,016.12$ 87,454.28$ 5.00%39400 Tools, Shop,&Garage Equipment 3,175,404.51 937,844.90 198,462.78 6.25%39700 Communication Equipment 438,830.96 220,507.03 29,255.40 6.67%39800 Miscellaneous Equipment 3,897,155.54 1,873,554.01 194,857.78 5.00%39901 Servers Hardware 14,389.76 5,139.20 2,055.68 14.29%39903 Network Hardware 134,598.86 39,115.33 13,459.89 10.00%39906 PC Hardware 1,068,402.71 550,294.80 213,680.54 20.00%39907 PC Software - - - 14.29%39908 Application Software 65,605.80 35,536.48 5,467.15 8.33%
Total General Amortized After Ret 10,543,473.75$ 4,422,007.87$ 744,693.49$ 7.06%90,061.83$ 90,061.83$
GENERAL PLANT - AMORTIZED
AR 15 Retirements > ASL
ATMOS ENERGY - KENTUCKY PROPERTIESCOMPUTATION OF DEPRECIATION ACCRUAL RATE
AT SEPTEMBER 30, 2017
Exhibit DAW-2 Page 76 of 111

77
APPENDIX B - Comparison of Depreciation Rates
Exhibit DAW-2 Page 77 of 111

Appendix B
Change inAnnual Annual Annual Annual Depreciation
Account Description Plant Balance Accrual Rate Accrual Accrual Rate Accrual Expense(a) (b) (c) (d) (e) [f] [g] [h]
35020 Rights-Of-Way 4,681.58$ 0.25% 11.78$ 0.47% 21.81$ 10.03$ 35100 Structures & Improvements 17,916.19 1.67% 299.64 1.66% 297.39 (2.25) 35102 Structures - Compressor Station 153,261.30 1.26% 1,931.44 1.25% 1,922.12 (9.32) 35103 Structures - M&R Stations 23,138.38 0.92% 212.60 0.90% 208.84 (3.76) 35104 Other Structures 137,442.53 1.30% 1,787.00 1.29% 1,775.22 (11.78) 35200 Wells 8,353,042.61 1.93% 161,063.46 1.93% 161,541.53 478.07 35201 Well Construction 1,699,998.54 1.51% 25,740.01 1.52% 25,758.87 18.86 35202 Well Equipment 449,309.06 0.93% 4,164.67 1.21% 5,457.88 1,293.20 35203 Cushion Gas 1,694,832.96 1.80% 30,472.58 1.38% 23,456.81 (7,015.77) 35210 Storage Leaseholds 178,530.09 0.35% 630.45 0.31% 545.08 (85.37) 35211 Storage Rights 54,614.27 0.88% 480.44 0.88% 480.77 0.33 35301 Storage Field Lines 175,350.37 0.81% 1,413.12 0.91% 1,590.37 177.24 35302 Storage Tributary Lines 209,318.90 0.81% 1,686.87 0.91% 1,898.45 211.58 35400 Compressor Station Equipment 923,446.05 1.80% 16,654.90 1.70% 15,672.76 (982.14) 35500 M&R Equipment 273,084.38 0.51% 1,386.73 1.67% 4,556.67 3,169.95 35600 Purification Equipment 414,663.45 2.05% 8,481.41 1.98% 8,216.24 (265.16)
Total Storage 14,762,630.66$ 1.74% 256,417.09$ 1.72% 253,400.82$ (3,016.28)$
36520 Rights-Of-Way 867,772.00$ 1.33% 11,525.96$ 1.05% 9,151.49$ (2,374.48)$ 36602 Structures - M&R Station 49,001.72 1.78% 874.32 1.24% 605.76 (268.57) 36603 Other Structures 60,826.29 1.78% 1,085.30 1.24% 751.93 (333.37) 36700 Mains - Cathodic Protection 47,232.93 5.00% 2,361.65 3.84% 1,813.87 (547.77) 36701 Mains - Steel 27,638,493.47 1.89% 523,135.94 1.41% 390,807.52 (132,328.42) 36703 Mains - Anodes 92,404.75 5.00% 4,620.24 5.00% 4,620.24 - 36900 M&R Stations 731,466.64 2.14% 15,648.84 1.54% 11,247.34 (4,401.50) 36901 M&R Stations 2,269,555.91 2.14% 48,554.39 1.54% 34,897.66 (13,656.73)
Total Transmission 31,756,753.71$ 1.91% 607,806.64$ 1.43% 453,895.81$ (153,910.84)$
Atmos Energy Corporation - Kentucky PropertiesComparison of Depreciation Expense
Existing vs Proposed Depreciation Accrual RatesAs of September 30, 2017
Existing Proposed
STORAGE PLANT
TRANSMISSION PLANT
Exhibit DAW-2 Page 78 of 111

Appendix B
Change inAnnual Annual Annual Annual Depreciation
Account Description Plant Balance Accrual Rate Accrual Accrual Rate Accrual Expense(a) (b) (c) (d) (e) [f] [g] [h]
Atmos Energy Corporation - Kentucky PropertiesComparison of Depreciation Expense
Existing vs Proposed Depreciation Accrual RatesAs of September 30, 2017
Existing Proposed
37402 Land Rights 2,371,406.31$ 1.46% 34,511.69$ 1.36% 32,313.87$ (2,197.83)$ 37500 Structures & Improvements 336,167.54 2.06% 6,930.64 1.79% 6,013.16 (917.48) 37501 Structures & Improvements 99,818.13 2.06% 2,057.91 1.79% 1,785.49 (272.43) 37502 Structures - Land Rights 46,264.19 2.06% 953.81 1.79% 827.55 (126.27) 37503 Improvements 4,005.08 2.06% 82.57 1.79% 71.64 (10.93) 37600 Mains - Cathodic Protection 2,326,532.18 5.00% 116,326.61 4.24% 98,564.89 (17,761.72) 37601 Mains - Steel 146,469,840.87 2.09% 3,068,428.47 2.52% 3,687,595.97 619,167.50 37602 Mains - Plastic 100,659,874.85 2.09% 2,108,745.56 2.52% 2,534,261.98 425,516.42 37603 Mains - Anodes 4,392,139.28 5.00% 219,606.96 5.00% 219,606.96 - 37604 Mains - Leak Clamps 14,313,691.11 5.00% 715,684.56 5.00% 715,684.56 - 37800 M&R Equipment - General 9,659,648.27 2.89% 279,118.23 3.05% 294,842.14 15,723.91 37900 M&R Equipment - City Gate 3,941,078.12 2.86% 112,905.83 2.83% 111,666.43 (1,239.40) 37905 M&R Equipment - City Gate 1,652,639.35 2.86% 47,345.58 2.83% 46,825.85 (519.73) 38000 Services 117,564,972.19 3.47% 4,079,289.71 3.19% 3,745,141.38 (334,148.34) 38100 Meters 31,440,206.71 8.30% 2,609,256.74 7.05% 2,216,824.34 (392,432.40) 38200 Meter Installations 55,250,692.16 4.13% 2,283,386.98 3.91% 2,160,265.34 (123,121.64) 38300 House Regulators 10,759,407.20 3.14% 337,924.59 4.01% 431,896.65 93,972.06 38400 House Regulator Installations 200,274.50 2.35% 4,708.91 3.47% 6,943.51 2,234.60 38500 Industrial M&R 5,165,445.65 2.71% 139,762.88 2.14% 110,681.27 (29,081.61)
Total Distribution 506,654,103.69$ 3.19% 16,167,028.25$ 3.24% 16,421,812.97$ 254,784.72$
39000 Structures & Improvements 7,141,677.47$ 3.76% 268,599.77$ 3.22% 229,679.67$ (38,920.10)$ 39002 Structures - Brick 173,114.85 3.76% 6,510.88 3.22% 5,567.45 (943.43) 39003 Improvements 709,199.18 3.76% 26,673.11 3.22% 22,808.18 (3,864.93) 39004 Air Conditioning Equipment 12,954.74 3.76% 487.23 5.64% 731.05 243.82 39009 Improvements - Leased 1,246,194.18 18.71% 233,102.79 16.04% 199,857.84 (33,244.95) 39200 Transportation Equipment 220,986.90 15.14% 33,465.94 5.15% 11,385.62 (22,080.32) 39202 Transportation - Trailers - 9.95% - 5.15% - -
DISTRIBUTION PLANT
GENERAL PLANT - DEPRECIATED
Exhibit DAW-2 Page 79 of 111

Appendix B
Change inAnnual Annual Annual Annual Depreciation
Account Description Plant Balance Accrual Rate Accrual Accrual Rate Accrual Expense(a) (b) (c) (d) (e) [f] [g] [h]
Atmos Energy Corporation - Kentucky PropertiesComparison of Depreciation Expense
Existing vs Proposed Depreciation Accrual RatesAs of September 30, 2017
Existing Proposed
39603 Power Operated -Ditchers 39,610.08 19.47% 7,713.99 11.35% 4,493.92 (3,220.07) 39604 Power Operated - Backhoes 62,747.29 19.47% 12,219.92 11.35% 7,118.93 (5,100.99) 39605 Power Operated - Welders 19,427.23 19.47% 3,783.42 11.35% 2,204.10 (1,579.32)
Total General Depreciated 9,625,911.92$ 6.16% 592,557.04$ 5.03% 483,846.74$ (108,710.30)$ Total Depreciated Plant 562,799,399.98$ 3.13% 17,623,809.03$ 3.13% 17,612,956.33$ (10,852.70)$
39100 Office Furniture & Equipment 1,749,085.61$ 6.67% 116,605.71$ 5.00% 87,454.28$ (29,151.43)$ 39400 Tools, Shop, & Garage Equipment 3,175,404.51 6.25% 198,462.78 6.25% 198,462.78 - 39700 Communication Equipment 438,830.96 6.67% 29,255.40 6.67% 29,255.40 - 39800 Miscellaneous Equipment 3,897,155.54 5.00% 194,857.78 5.00% 194,857.78 - 39901 Servers Hardware 14,389.76 10.00% 1,438.98 14.29% 2,055.68 616.70 39903 Network Hardware 134,598.86 10.00% 13,459.89 10.00% 13,459.89 - 39906 PC Hardware 1,068,402.71 20.00% 213,680.54 20.00% 213,680.54 - 39907 PC Software - 14.29% - 14.29% - - 39908 Application Software 65,605.80 6.67% 4,373.72 8.33% 5,467.15 1,093.43
Total General Amortized 10,543,473.75$ 7.32% 772,134.79$ 7.06% 744,693.49$ (27,441.29)$ Total General 20,169,385.67$ 6.77% 1,364,691.83$ 6.09% 1,228,540.23$ (136,151.59)$
TOTAL PLANT IN STUDY 573,342,873.73$ 3.21% 18,395,943.82$ 3.20% 18,357,649.83$ (38,293.99)$
GENERAL PLANT - AMORTIZED
Exhibit DAW-2 Page 80 of 111

81
APPENDIX C – Comparison of Mortality Characteristics
Exhibit DAW-2 Page 81 of 111

Iowa Gross Cost of Net Iowa Gross Cost of NetAccount Description ASL Curve Salvage Removal Salvage ASL Curve Salvage Removal Salvage
(a) (b) (c) (d) [e] [f] [g] [h] [i] [j] [k] [l]
STORAGE PLANT35020 Rights-Of-Way 70 R5 0% 0% 0% 75 R5 0% 0% 0%35100 Structures & Improvements 60 R5 0% 5% -5% 60 R5 0% 5% -5%35102 Structures - Compressor Station 60 R5 0% 5% -5% 60 R5 0% 5% -5%35103 Structures - M&R Stations 60 R5 0% 5% -5% 60 R5 0% 5% -5%35104 Other Structures 60 R5 0% 5% -5% 60 R5 0% 5% -5%35200 Wells 67 S5 0% 30% -30% 67 S5 0% 30% -30%35201 Well Construction 67 S5 0% 30% -30% 67 S5 0% 30% -30%35202 Well Equipment 67 S5 0% 30% -30% 67 S5 0% 30% -30%35203 Cushion Gas 50 SQ 0% 0% 0% 67 S5 0% 0% 0%35210 Storage Leaseholds 67 S5 0% 0% 0% 67 S5 0% 0% 0%35211 Storage Rights 67 S5 0% 0% 0% 67 S5 0% 0% 0%35301 Storage Field Lines 60 S1 0% 5% -5% 70 R1.5 0% 5% -5%35302 Storage Tributary Lines 60 S1 0% 5% -5% 70 R1.5 0% 5% -5%35400 Compressor Station Equipment 54 R3 0% 0% 0% 54 R3 0% 5% -5%35500 M&R Equipment 46 R5 0% 4% -4% 50 R1.5 0% 4% -4%35600 Purification Equipment 46 R5 0% 3% -3% 46 R5 0% 3% -3%
TRANSMISSION PLANT36520 Rights-Of-Way 70 R5 0% 0% 0% 75 R5 0% 0% 0%36602 Structures - M&R Station 53 R4 0% 6% -6% 58 R4 0% 3% -3%36603 Other Structures 53 R4 0% 6% -6% 58 R4 0% 3% -3%36700 Mains - Cathodic Protection 20 SQ 0% 0% 0% 25 R4 0% 0% 0%36701 Mains - Steel 57 R4 0% 20% -20% 70 R1.5 0% 20% -20%36703 Mains - Anodes 20 SQ 0% 0% 0% 20 SQ 0% 0% 0%36900 M&R Stations 49 R1.5 0% 19% -19% 50 R1.5 0% 15% -15%36901 M&R Stations 49 R1.5 0% 19% -19% 50 R1.5 0% 15% -15%
EXISTING PROPOSED
Appendix CAtmos Energy Corporation - Kentucky Properties
Existing and Proposed ParametersDepreciation Study as of September 30, 2017
Exhibit DAW-2 Page 82 of 111

Iowa Gross Cost of Net Iowa Gross Cost of NetAccount Description ASL Curve Salvage Removal Salvage ASL Curve Salvage Removal Salvage
(a) (b) (c) (d) [e] [f] [g] [h] [i] [j] [k] [l]
EXISTING PROPOSED
Appendix CAtmos Energy Corporation - Kentucky Properties
Existing and Proposed ParametersDepreciation Study as of September 30, 2017
DISTRIBUTION PLANT37402 Land Rights 70 R5 0% 0% 0% 75 R5 0% 0% 0%37500 Structures & Improvements 57 R2.5 0% 10% -10% 66 R3 0% 10% -10%37501 Structures & Improvements 57 R2.5 0% 10% -10% 66 R3 0% 10% -10%37502 Structures - Land Rights 57 R2.5 0% 10% -10% 66 R3 0% 10% -10%37503 Improvements 57 R2.5 0% 10% -10% 66 R3 0% 10% -10%37600 Mains - Cathodic Protection 20 SQ 0% 0% 0% 25 R4 0% 0% 0%37601 Mains - Steel 55 R3 0% 5% -5% 70 L0 0% 5% -5%37602 Mains - Plastic 55 R3 0% 5% -5% 70 L0 0% 5% -5%37603 Mains - Anodes 20 SQ 0% 0% 0% 20 SQ 0% 0% 0%37604 Mains - Leak Clamps 20 SQ 0% 0% 0% 20 SQ 0% 0% 0%37800 M&R Equipment - General 49 R1.5 0% 19% -19% 50 R1.5 0% 15% -15%37900 M&R Equipment - City Gate 49 R1.5 0% 19% -19% 50 R1.5 0% 15% -15%37905 M&R Equipment - City Gate 49 R1.5 0% 19% -19% 50 R1.5 0% 15% -15%38000 Services 40 R1.5 0% 20% -20% 45 R1.5 0% 18% -18%38100 Meters 20 R0.5 0% 50% -50% 20 R0.5 0% 11% -11%38200 Meter Installations 42 R1.5 0% 50% -50% 43 L1 0% 35% -35%38300 House Regulators 31 S6 0% 0% 0% 43 L1 0% 35% -35%38400 House Regulator Installations 42 R1.5 0% 0% 0% 43 L1 0% 35% -35%38500 Industrial M&R 42 L5 0% 12% -12% 53 R4 0% 8% -8%
GENERAL PLANT39000 Structures & Improvements 40 R2 0% 10% -10% 45 R2 0% 10% -10%39002 Structures - Brick 40 R2 0% 10% -10% 45 R2 0% 10% -10%39003 Improvements 40 R2 0% 10% -10% 45 R2 0% 10% -10%39004 Air Conditioning Equipment 40 R2 0% 10% -10% 25 R2 0% 10% -10%
Exhibit DAW-2 Page 83 of 111

Iowa Gross Cost of Net Iowa Gross Cost of NetAccount Description ASL Curve Salvage Removal Salvage ASL Curve Salvage Removal Salvage
(a) (b) (c) (d) [e] [f] [g] [h] [i] [j] [k] [l]
EXISTING PROPOSED
Appendix CAtmos Energy Corporation - Kentucky Properties
Existing and Proposed ParametersDepreciation Study as of September 30, 2017
39009 Improvements - Leased 20 R3 0% 0% 0% 20 R3 0% 0% 0%39100 Office Furniture & Equipment 15 SQ 0% 0% 0% 20 SQ 0% 0% 0%39200 Transportation Equipment 8 L5 10% 0% 10% 20 L4 10% 0% 10%39202 Transportation - Trailers 20 L3 14% 0% 14% 20 L4 10% 0% 10%39400 Tools, Shop, & Garage Equipment 16 SQ 0% 0% 0% 16 SQ 0% 0% 0%39603 Power Operated -Ditchers 14 S4 8% 0% 8% 20 S4 16% 0% 16%39604 Power Operated - Backhoes 14 S4 8% 0% 8% 20 S4 16% 0% 16%39605 Power Operated - Welders 14 S4 8% 0% 8% 20 S4 16% 0% 16%39700 Communication Equipment 15 SQ 0% 0% 0% 15 SQ 0% 0% 0%39800 Miscellaneous Equipment 20 SQ 0% 0% 0% 20 SQ 0% 0% 0%39901 Servers Hardware 10 SQ 0% 0% 0% 7 SQ 0% 0% 0%39903 Network Hardware 10 SQ 0% 0% 0% 10 SQ 0% 0% 0%39906 PC Hardware 5 SQ 0% 0% 0% 5 SQ 0% 0% 0%39907 PC Software 7 SQ 0% 0% 0% 7 SQ 0% 0% 0%39908 Application Software 15 SQ 0% 0% 0% 12 SQ 0% 0% 0%
Exhibit DAW-2 Page 84 of 111

85
APPENDIX D - Net Salvage
Exhibit DAW-2 Page 85 of 111

Appendix D
2- yr 3- yr 4- yr 5- yr 6- yr 7- yr 8- yr 9- yr 10- yrNet Net Net Net Net Net Net Net Net Net Net
Account TY Retirements Salvage COR Salvage Salv. % Salv. % Salv. % Salv. % Salv. % Salv. % Salv. % Salv. % Salv. % Salv. %
33400 1996 0 0 0 0 NA33400 1997 0 0 0 0 NA NA33400 1998 0 0 0 0 NA NA NA33400 1999 0 0 0 0 NA NA NA NA33400 2000 0 0 0 0 NA NA NA NA NA33400 2001 0 0 0 0 NA NA NA NA NA NA33400 2002 0 0 0 0 NA NA NA NA NA NA NA33400 2003 0 0 0 0 NA NA NA NA NA NA NA NA33400 2004 0 0 0 0 NA NA NA NA NA NA NA NA NA33400 2005 0 0 0 0 NA NA NA NA NA NA NA NA NA NA33400 2006 0 0 0 0 NA NA NA NA NA NA NA NA NA NA33400 2007 6,084 0 207 (207) -3.40% -3.40% -3.40% -3.40% -3.40% -3.40% -3.40% -3.40% -3.40% -3.40%33400 2008 0 0 2,552 (2,552) NA -45.34% -45.34% -45.34% -45.34% -45.34% -45.34% -45.34% -45.34% -45.34%33400 2009 0 0 0 0 NA NA -45.34% -45.34% -45.34% -45.34% -45.34% -45.34% -45.34% -45.34%33400 2010 0 0 0 0 NA NA NA -45.34% -45.34% -45.34% -45.34% -45.34% -45.34% -45.34%33400 2011 0 0 0 0 NA NA NA NA -45.34% -45.34% -45.34% -45.34% -45.34% -45.34%33400 2012 0 0 0 0 NA NA NA NA NA -45.34% -45.34% -45.34% -45.34% -45.34%33400 2013 0 0 0 0 NA NA NA NA NA NA -45.34% -45.34% -45.34% -45.34%33400 2014 183,204 0 0 0 0.00% 0.00% 0.00% 0.00% 0.00% 0.00% -1.39% -1.46% -1.46% -1.46%33400 2015 9,180 0 0 0 0.00% 0.00% 0.00% 0.00% 0.00% 0.00% 0.00% -1.33% -1.39% -1.39%33400 2016 0 0 0 0 NA 0.00% 0.00% 0.00% 0.00% 0.00% 0.00% 0.00% -1.33% -1.39%33400 2017 0 0 0 0 NA NA 0.00% 0.00% 0.00% 0.00% 0.00% 0.00% 0.00% -1.33%
33600 1996 0 0 0 0 NA33600 1997 0 0 0 0 NA NA33600 1998 0 0 0 0 NA NA NA33600 1999 0 0 0 0 NA NA NA NA33600 2000 0 0 0 0 NA NA NA NA NA33600 2001 0 0 0 0 NA NA NA NA NA NA33600 2002 0 0 0 0 NA NA NA NA NA NA NA33600 2003 0 0 0 0 NA NA NA NA NA NA NA NA33600 2004 0 0 0 0 NA NA NA NA NA NA NA NA NA33600 2005 0 0 0 0 NA NA NA NA NA NA NA NA NA NA33600 2006 0 0 0 0 NA NA NA NA NA NA NA NA NA NA33600 2007 0 0 0 0 NA NA NA NA NA NA NA NA NA NA33600 2008 0 0 0 0 NA NA NA NA NA NA NA NA NA NA33600 2009 0 0 0 0 NA NA NA NA NA NA NA NA NA NA33600 2010 0 0 0 0 NA NA NA NA NA NA NA NA NA NA33600 2011 0 0 0 0 NA NA NA NA NA NA NA NA NA NA33600 2012 0 0 0 0 NA NA NA NA NA NA NA NA NA NA33600 2013 0 0 0 0 NA NA NA NA NA NA NA NA NA NA33600 2014 44,219 0 0 0 0.00% 0.00% 0.00% 0.00% 0.00% 0.00% 0.00% 0.00% 0.00% 0.00%33600 2015 150 0 0 0 0.00% 0.00% 0.00% 0.00% 0.00% 0.00% 0.00% 0.00% 0.00% 0.00%33600 2016 0 0 0 0 NA 0.00% 0.00% 0.00% 0.00% 0.00% 0.00% 0.00% 0.00% 0.00%33600 2017 0 0 0 0 NA NA 0.00% 0.00% 0.00% 0.00% 0.00% 0.00% 0.00% 0.00%
35100 1996 0 0 0 0 NA35100 1997 0 0 0 0 NA NA35100 1998 589 619 0 619 105.09% 105.09% 105.09%35100 1999 0 0 0 0 NA 105.09% 105.09% 105.09%35100 2000 0 0 0 0 NA NA 105.09% 105.09% 105.09%35100 2001 0 0 0 0 NA NA NA 105.09% 105.09% 105.09%35100 2002 0 0 0 0 NA NA NA NA 105.09% 105.09% 105.09%35100 2003 0 0 0 0 NA NA NA NA NA 105.09% 105.09% 105.09%35100 2004 0 0 0 0 NA NA NA NA NA NA 105.09% 105.09% 105.09%35100 2005 0 0 0 0 NA NA NA NA NA NA NA 105.09% 105.09% 105.09%35100 2006 0 0 0 0 NA NA NA NA NA NA NA NA 105.09% 105.09%35100 2007 0 0 0 0 NA NA NA NA NA NA NA NA NA 105.09%35100 2008 0 0 0 0 NA NA NA NA NA NA NA NA NA NA35100 2009 0 0 0 0 NA NA NA NA NA NA NA NA NA NA35100 2010 0 0 0 0 NA NA NA NA NA NA NA NA NA NA35100 2011 0 0 0 0 NA NA NA NA NA NA NA NA NA NA
ATMOS ENERGY - KENTUCKY DIVISIONDepreciation Study as of September 30, 2017
NET SALVAGE HISTORY
Exhibit DAW-2 Page 86 of 111

Appendix D
2- yr 3- yr 4- yr 5- yr 6- yr 7- yr 8- yr 9- yr 10- yrNet Net Net Net Net Net Net Net Net Net Net
Account TY Retirements Salvage COR Salvage Salv. % Salv. % Salv. % Salv. % Salv. % Salv. % Salv. % Salv. % Salv. % Salv. %
ATMOS ENERGY - KENTUCKY DIVISIONDepreciation Study as of September 30, 2017
NET SALVAGE HISTORY
35100 2012 0 0 0 0 NA NA NA NA NA NA NA NA NA NA35100 2013 0 0 0 0 NA NA NA NA NA NA NA NA NA NA35100 2014 0 0 0 0 NA NA NA NA NA NA NA NA NA NA35100 2015 0 0 0 0 NA NA NA NA NA NA NA NA NA NA35100 2016 0 0 0 0 NA NA NA NA NA NA NA NA NA NA35100 2017 0 0 0 0 NA NA NA NA NA NA NA NA NA NA
35104 1996 0 0 0 0 NA35104 1997 0 0 0 0 NA NA35104 1998 0 0 0 0 NA NA NA35104 1999 0 0 0 0 NA NA NA NA35104 2000 0 0 0 0 NA NA NA NA NA35104 2001 0 0 0 0 NA NA NA NA NA NA35104 2002 0 0 0 0 NA NA NA NA NA NA NA35104 2003 0 0 0 0 NA NA NA NA NA NA NA NA35104 2004 0 0 0 0 NA NA NA NA NA NA NA NA NA35104 2005 0 0 0 0 NA NA NA NA NA NA NA NA NA NA35104 2006 0 0 0 0 NA NA NA NA NA NA NA NA NA NA35104 2007 0 0 0 0 NA NA NA NA NA NA NA NA NA NA35104 2008 7,112 0 0 0 0.00% 0.00% 0.00% 0.00% 0.00% 0.00% 0.00% 0.00% 0.00% 0.00%35104 2009 0 0 0 0 NA 0.00% 0.00% 0.00% 0.00% 0.00% 0.00% 0.00% 0.00% 0.00%35104 2010 0 0 0 0 NA NA 0.00% 0.00% 0.00% 0.00% 0.00% 0.00% 0.00% 0.00%35104 2011 0 0 0 0 NA NA NA 0.00% 0.00% 0.00% 0.00% 0.00% 0.00% 0.00%35104 2012 0 0 0 0 NA NA NA NA 0.00% 0.00% 0.00% 0.00% 0.00% 0.00%35104 2013 0 0 0 0 NA NA NA NA NA 0.00% 0.00% 0.00% 0.00% 0.00%35104 2014 0 0 0 0 NA NA NA NA NA NA 0.00% 0.00% 0.00% 0.00%35104 2015 0 0 0 0 NA NA NA NA NA NA NA 0.00% 0.00% 0.00%35104 2016 0 0 0 0 NA NA NA NA NA NA NA NA 0.00% 0.00%35104 2017 0 0 0 0 NA NA NA NA NA NA NA NA NA 0.00%
35200 1996 0 0 0 0 NA35200 1997 0 0 0 0 NA NA35200 1998 1,565 0 0 0 0.00% 0.00% 0.00%35200 1999 15,727 0 30 (30) -0.19% -0.17% -0.17% -0.17%35200 2000 59,273 0 29,992 (29,992) -50.60% -40.03% -39.21% -39.21% -39.21%35200 2001 0 0 0 0 NA -50.60% -40.03% -39.21% -39.21% -39.21%35200 2002 0 0 0 0 NA NA -50.60% -40.03% -39.21% -39.21% -39.21%35200 2003 0 0 0 0 NA NA NA -50.60% -40.03% -39.21% -39.21% -39.21%35200 2004 0 0 0 0 NA NA NA NA -50.60% -40.03% -39.21% -39.21% -39.21%35200 2005 0 0 0 0 NA NA NA NA NA -50.60% -40.03% -39.21% -39.21% -39.21%35200 2006 0 0 0 0 NA NA NA NA NA NA -50.60% -40.03% -39.21% -39.21%35200 2007 0 0 0 0 NA NA NA NA NA NA NA -50.60% -40.03% -39.21%35200 2008 0 0 0 0 NA NA NA NA NA NA NA NA -50.60% -40.03%35200 2009 0 0 0 0 NA NA NA NA NA NA NA NA NA -50.60%35200 2010 0 0 0 0 NA NA NA NA NA NA NA NA NA NA35200 2011 0 0 0 0 NA NA NA NA NA NA NA NA NA NA35200 2012 0 0 0 0 NA NA NA NA NA NA NA NA NA NA35200 2013 0 0 0 0 NA NA NA NA NA NA NA NA NA NA35200 2014 0 0 0 0 NA NA NA NA NA NA NA NA NA NA35200 2015 0 0 0 0 NA NA NA NA NA NA NA NA NA NA35200 2016 0 0 0 0 NA NA NA NA NA NA NA NA NA NA35200 2017 110,306 0 164,497 (164,497) -149.13% -149.13% -149.13% -149.13% -149.13% -149.13% -149.13% -149.13% -149.13% -149.13%
35201 1996 0 0 0 0 NA35201 1997 0 0 0 0 NA NA35201 1998 0 0 0 0 NA NA NA35201 1999 0 0 0 0 NA NA NA NA35201 2000 0 0 0 0 NA NA NA NA NA35201 2001 0 0 0 0 NA NA NA NA NA NA35201 2002 0 0 0 0 NA NA NA NA NA NA NA35201 2003 0 0 0 0 NA NA NA NA NA NA NA NA35201 2004 0 0 0 0 NA NA NA NA NA NA NA NA NA35201 2005 0 0 0 0 NA NA NA NA NA NA NA NA NA NA35201 2006 0 0 0 0 NA NA NA NA NA NA NA NA NA NA
Exhibit DAW-2 Page 87 of 111

Appendix D
2- yr 3- yr 4- yr 5- yr 6- yr 7- yr 8- yr 9- yr 10- yrNet Net Net Net Net Net Net Net Net Net Net
Account TY Retirements Salvage COR Salvage Salv. % Salv. % Salv. % Salv. % Salv. % Salv. % Salv. % Salv. % Salv. % Salv. %
ATMOS ENERGY - KENTUCKY DIVISIONDepreciation Study as of September 30, 2017
NET SALVAGE HISTORY
35201 2007 0 0 0 0 NA NA NA NA NA NA NA NA NA NA35201 2008 0 0 0 0 NA NA NA NA NA NA NA NA NA NA35201 2009 0 0 0 0 NA NA NA NA NA NA NA NA NA NA35201 2010 0 0 0 0 NA NA NA NA NA NA NA NA NA NA35201 2011 9,187 0 0 0 0.00% 0.00% 0.00% 0.00% 0.00% 0.00% 0.00% 0.00% 0.00% 0.00%35201 2012 0 0 0 0 NA 0.00% 0.00% 0.00% 0.00% 0.00% 0.00% 0.00% 0.00% 0.00%35201 2013 167,597 0 79,710 (79,710) -47.56% -47.56% -45.09% -45.09% -45.09% -45.09% -45.09% -45.09% -45.09% -45.09%35201 2014 0 0 0 0 NA -47.56% -47.56% -45.09% -45.09% -45.09% -45.09% -45.09% -45.09% -45.09%35201 2015 0 0 0 0 NA NA -47.56% -47.56% -45.09% -45.09% -45.09% -45.09% -45.09% -45.09%35201 2016 0 0 0 0 NA NA NA -47.56% -47.56% -45.09% -45.09% -45.09% -45.09% -45.09%35201 2017 0 0 0 0 NA NA NA NA -47.56% -47.56% -45.09% -45.09% -45.09% -45.09%
35202 1996 0 0 NA35202 1997 0 0 NA NA35202 1998 0 0 NA NA NA35202 1999 0 0 NA NA NA NA35202 2000 0 0 NA NA NA NA NA35202 2001 0 0 NA NA NA NA NA NA35202 2002 0 0 NA NA NA NA NA NA NA35202 2003 0 0 NA NA NA NA NA NA NA NA35202 2004 0 0 NA NA NA NA NA NA NA NA NA35202 2005 0 0 NA NA NA NA NA NA NA NA NA NA35202 2006 0 0 NA NA NA NA NA NA NA NA NA NA35202 2007 0 0 NA NA NA NA NA NA NA NA NA NA35202 2008 0 0 NA NA NA NA NA NA NA NA NA NA35202 2009 0 0 NA NA NA NA NA NA NA NA NA NA35202 2010 0 0 NA NA NA NA NA NA NA NA NA NA35202 2011 22,030 0 0 0.00% 0.00% 0.00% 0.00% 0.00% 0.00% 0.00% 0.00% 0.00% 0.00%35202 2012 0 2,250 5,061 (2,811) NA -12.76% -12.76% -12.76% -12.76% -12.76% -12.76% -12.76% -12.76% -12.76%35202 2013 17,870 28,555 (28,555) -159.79% -175.52% -78.61% -78.61% -78.61% -78.61% -78.61% -78.61% -78.61% -78.61%35202 2014 12,688 54,929 (54,929) -432.91% -273.19% -282.39% -164.09% -164.09% -164.09% -164.09% -164.09% -164.09% -164.09%35202 2015 8,931 0 19,269 (19,269) -215.75% -343.20% -260.20% -267.32% -171.59% -171.59% -171.59% -171.59% -171.59% -171.59%35202 2016 0 0 (633) 633 NA -208.66% -340.27% -258.60% -265.71% -170.56% -170.56% -170.56% -170.56% -170.56%35202 2017 11,046 0 0 0 0.00% 5.73% -93.29% -225.21% -202.07% -207.64% -144.60% -144.60% -144.60% -144.60%
352 Combine 1996 0 0 0 0 NA352 Combine 1997 0 0 0 0 NA NA352 Combine 1998 1,565 0 0 0 0.00% 0.00% 0.00%352 Combine 1999 15,727 0 30 (30) -0.19% -0.17% -0.17% -0.17%352 Combine 2000 59,273 0 29,992 (29,992) -50.60% -40.03% -39.21% -39.21% -39.21%352 Combine 2001 0 0 0 0 NA -50.60% -40.03% -39.21% -39.21% -39.21%352 Combine 2002 0 0 0 0 NA NA -50.60% -40.03% -39.21% -39.21% -39.21%352 Combine 2003 0 0 0 0 NA NA NA -50.60% -40.03% -39.21% -39.21% -39.21%352 Combine 2004 0 0 0 0 NA NA NA NA -50.60% -40.03% -39.21% -39.21% -39.21%352 Combine 2005 0 0 0 0 NA NA NA NA NA -50.60% -40.03% -39.21% -39.21% -39.21%352 Combine 2006 0 0 0 0 NA NA NA NA NA NA -50.60% -40.03% -39.21% -39.21%352 Combine 2007 0 0 0 0 NA NA NA NA NA NA NA -50.60% -40.03% -39.21%352 Combine 2008 0 0 0 0 NA NA NA NA NA NA NA NA -50.60% -40.03%352 Combine 2009 0 0 0 0 NA NA NA NA NA NA NA NA NA -50.60%352 Combine 2010 0 0 0 0 NA NA NA NA NA NA NA NA NA NA352 Combine 2011 31,217 0 0 0 0.00% 0.00% 0.00% 0.00% 0.00% 0.00% 0.00% 0.00% 0.00% 0.00%352 Combine 2012 0 2,250 5,061 (2,811) NA -9.00% -9.00% -9.00% -9.00% -9.00% -9.00% -9.00% -9.00% -9.00%352 Combine 2013 185,467 0 108,264 (108,264) -58.37% -59.89% -51.26% -51.26% -51.26% -51.26% -51.26% -51.26% -51.26% -51.26%352 Combine 2014 12,688 0 54,929 (54,929) -432.91% -82.36% -83.77% -72.37% -72.37% -72.37% -72.37% -72.37% -72.37% -72.37%352 Combine 2015 8,931 0 19,269 (19,269) -215.75% -343.20% -88.11% -89.47% -77.75% -77.75% -77.75% -77.75% -77.75% -77.75%352 Combine 2016 0 0 (633) 633 NA -208.66% -340.27% -87.80% -89.16% -77.48% -77.48% -77.48% -77.48% -77.48%352 Combine 2017 121,352 0 164,497 (164,497) -135.55% -135.03% -140.57% -166.51% -105.45% -106.30% -97.08% -97.08% -97.08% -97.08%
35301 1996 0 0 0 0 NA35301 1997 0 0 0 0 NA NA35301 1998 0 0 0 0 NA NA NA35301 1999 0 0 0 0 NA NA NA NA35301 2000 0 0 0 0 NA NA NA NA NA35301 2001 0 0 0 0 NA NA NA NA NA NA
Exhibit DAW-2 Page 88 of 111

Appendix D
2- yr 3- yr 4- yr 5- yr 6- yr 7- yr 8- yr 9- yr 10- yrNet Net Net Net Net Net Net Net Net Net Net
Account TY Retirements Salvage COR Salvage Salv. % Salv. % Salv. % Salv. % Salv. % Salv. % Salv. % Salv. % Salv. % Salv. %
ATMOS ENERGY - KENTUCKY DIVISIONDepreciation Study as of September 30, 2017
NET SALVAGE HISTORY
35301 2002 0 0 0 0 NA NA NA NA NA NA NA35301 2003 0 0 0 0 NA NA NA NA NA NA NA NA35301 2004 0 0 0 0 NA NA NA NA NA NA NA NA NA35301 2005 0 0 0 0 NA NA NA NA NA NA NA NA NA NA35301 2006 0 0 0 0 NA NA NA NA NA NA NA NA NA NA35301 2007 0 0 0 0 NA NA NA NA NA NA NA NA NA NA35301 2008 0 0 0 0 NA NA NA NA NA NA NA NA NA NA35301 2009 0 0 0 0 NA NA NA NA NA NA NA NA NA NA35301 2010 0 0 0 0 NA NA NA NA NA NA NA NA NA NA35301 2011 4 0 0 0 0.00% 0.00% 0.00% 0.00% 0.00% 0.00% 0.00% 0.00% 0.00% 0.00%35301 2012 0 0 0 0 NA 0.00% 0.00% 0.00% 0.00% 0.00% 0.00% 0.00% 0.00% 0.00%35301 2013 0 0 15,227 (15,227) NA NA -422972.22% -422972.22% -422972.22% -422972.22% -422972.22% -422972.22% -422972.22% -422972.22%35301 2014 0 0 0 0 NA NA NA -422972.22% -422972.22% -422972.22% -422972.22% -422972.22% -422972.22% -422972.22%35301 2015 0 0 0 0 NA NA NA NA -422972.22% -422972.22% -422972.22% -422972.22% -422972.22% -422972.22%35301 2016 0 0 0 0 NA NA NA NA NA -422972.22% -422972.22% -422972.22% -422972.22% -422972.22%35301 2017 3,147 0 0 0 0.00% 0.00% 0.00% 0.00% -483.93% -483.93% -483.38% -483.38% -483.38% -483.38%
35302 1996 0 0 0 0 NA35302 1997 0 0 0 0 NA NA35302 1998 0 0 0 0 NA NA NA35302 1999 0 0 0 0 NA NA NA NA35302 2000 0 0 0 0 NA NA NA NA NA35302 2001 0 0 0 0 NA NA NA NA NA NA35302 2002 0 0 0 0 NA NA NA NA NA NA NA35302 2003 0 0 0 0 NA NA NA NA NA NA NA NA35302 2004 0 0 0 0 NA NA NA NA NA NA NA NA NA35302 2005 0 0 0 0 NA NA NA NA NA NA NA NA NA NA35302 2006 0 0 0 0 NA NA NA NA NA NA NA NA NA NA35302 2007 0 0 0 0 NA NA NA NA NA NA NA NA NA NA35302 2008 0 0 0 0 NA NA NA NA NA NA NA NA NA NA35302 2009 0 0 0 0 NA NA NA NA NA NA NA NA NA NA35302 2010 0 0 0 0 NA NA NA NA NA NA NA NA NA NA35302 2011 0 0 0 0 NA NA NA NA NA NA NA NA NA NA35302 2012 0 0 0 0 NA NA NA NA NA NA NA NA NA NA35302 2013 0 0 0 0 NA NA NA NA NA NA NA NA NA NA35302 2014 0 0 0 0 NA NA NA NA NA NA NA NA NA NA35302 2015 0 0 0 0 NA NA NA NA NA NA NA NA NA NA35302 2016 0 0 0 0 NA NA NA NA NA NA NA NA NA NA35302 2017 139 0 0 0 0.00% 0.00% 0.00% 0.00% 0.00% 0.00% 0.00% 0.00% 0.00% 0.00%
35400 1996 0 0 0 0 NA35400 1997 0 0 0 0 NA NA35400 1998 0 0 0 0 NA NA NA35400 1999 0 0 0 0 NA NA NA NA35400 2000 0 0 0 0 NA NA NA NA NA35400 2001 0 0 0 0 NA NA NA NA NA NA35400 2002 0 0 0 0 NA NA NA NA NA NA NA35400 2003 0 0 0 0 NA NA NA NA NA NA NA NA35400 2004 0 0 0 0 NA NA NA NA NA NA NA NA NA35400 2005 0 0 0 0 NA NA NA NA NA NA NA NA NA NA35400 2006 0 0 0 0 NA NA NA NA NA NA NA NA NA NA35400 2007 0 0 0 0 NA NA NA NA NA NA NA NA NA NA35400 2008 29,359 0 6,317 (6,317) -21.51% -21.51% -21.51% -21.51% -21.51% -21.51% -21.51% -21.51% -21.51% -21.51%35400 2009 18,288 0 3,264 (3,264) -17.85% -20.11% -20.11% -20.11% -20.11% -20.11% -20.11% -20.11% -20.11% -20.11%35400 2010 0 0 0 0 NA -17.85% -20.11% -20.11% -20.11% -20.11% -20.11% -20.11% -20.11% -20.11%35400 2011 0 0 0 0 NA NA -17.85% -20.11% -20.11% -20.11% -20.11% -20.11% -20.11% -20.11%35400 2012 98,737 0 6,772 (6,772) -6.86% -6.86% -6.86% -8.58% -11.17% -11.17% -11.17% -11.17% -11.17% -11.17%35400 2013 0 0 0 0 NA -6.86% -6.86% -6.86% -8.58% -11.17% -11.17% -11.17% -11.17% -11.17%35400 2014 0 0 0 0 NA NA -6.86% -6.86% -6.86% -8.58% -11.17% -11.17% -11.17% -11.17%35400 2015 0 0 0 0 NA NA NA -6.86% -6.86% -6.86% -8.58% -11.17% -11.17% -11.17%35400 2016 0 0 0 0 NA NA NA NA -6.86% -6.86% -6.86% -8.58% -11.17% -11.17%35400 2017 0 0 0 0 NA NA NA NA NA -6.86% -6.86% -6.86% -8.58% -11.17%
Exhibit DAW-2 Page 89 of 111
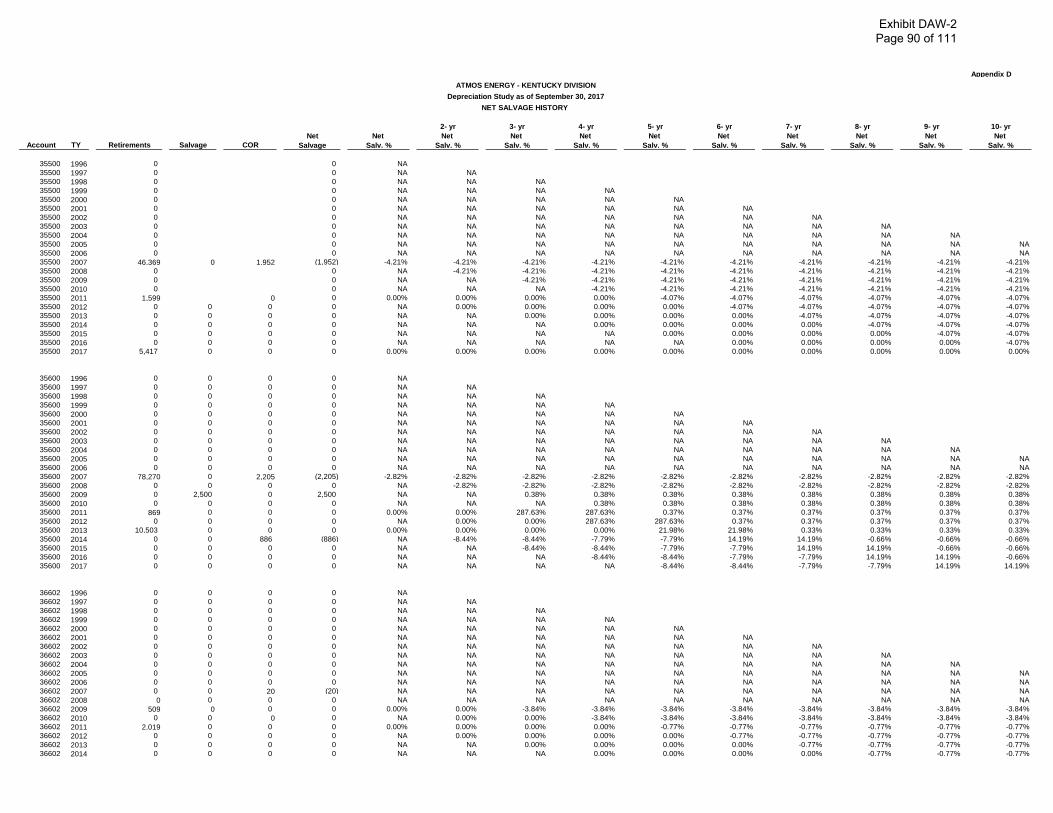
Appendix D
2- yr 3- yr 4- yr 5- yr 6- yr 7- yr 8- yr 9- yr 10- yrNet Net Net Net Net Net Net Net Net Net Net
Account TY Retirements Salvage COR Salvage Salv. % Salv. % Salv. % Salv. % Salv. % Salv. % Salv. % Salv. % Salv. % Salv. %
ATMOS ENERGY - KENTUCKY DIVISIONDepreciation Study as of September 30, 2017
NET SALVAGE HISTORY
35500 1996 0 0 NA35500 1997 0 0 NA NA35500 1998 0 0 NA NA NA35500 1999 0 0 NA NA NA NA35500 2000 0 0 NA NA NA NA NA35500 2001 0 0 NA NA NA NA NA NA35500 2002 0 0 NA NA NA NA NA NA NA35500 2003 0 0 NA NA NA NA NA NA NA NA35500 2004 0 0 NA NA NA NA NA NA NA NA NA35500 2005 0 0 NA NA NA NA NA NA NA NA NA NA35500 2006 0 0 NA NA NA NA NA NA NA NA NA NA35500 2007 46,369 0 1,952 (1,952) -4.21% -4.21% -4.21% -4.21% -4.21% -4.21% -4.21% -4.21% -4.21% -4.21%35500 2008 0 0 NA -4.21% -4.21% -4.21% -4.21% -4.21% -4.21% -4.21% -4.21% -4.21%35500 2009 0 0 NA NA -4.21% -4.21% -4.21% -4.21% -4.21% -4.21% -4.21% -4.21%35500 2010 0 0 NA NA NA -4.21% -4.21% -4.21% -4.21% -4.21% -4.21% -4.21%35500 2011 1,599 0 0 0.00% 0.00% 0.00% 0.00% -4.07% -4.07% -4.07% -4.07% -4.07% -4.07%35500 2012 0 0 0 0 NA 0.00% 0.00% 0.00% 0.00% -4.07% -4.07% -4.07% -4.07% -4.07%35500 2013 0 0 0 0 NA NA 0.00% 0.00% 0.00% 0.00% -4.07% -4.07% -4.07% -4.07%35500 2014 0 0 0 0 NA NA NA 0.00% 0.00% 0.00% 0.00% -4.07% -4.07% -4.07%35500 2015 0 0 0 0 NA NA NA NA 0.00% 0.00% 0.00% 0.00% -4.07% -4.07%35500 2016 0 0 0 0 NA NA NA NA NA 0.00% 0.00% 0.00% 0.00% -4.07%35500 2017 5,417 0 0 0 0.00% 0.00% 0.00% 0.00% 0.00% 0.00% 0.00% 0.00% 0.00% 0.00%
35600 1996 0 0 0 0 NA35600 1997 0 0 0 0 NA NA35600 1998 0 0 0 0 NA NA NA35600 1999 0 0 0 0 NA NA NA NA35600 2000 0 0 0 0 NA NA NA NA NA35600 2001 0 0 0 0 NA NA NA NA NA NA35600 2002 0 0 0 0 NA NA NA NA NA NA NA35600 2003 0 0 0 0 NA NA NA NA NA NA NA NA35600 2004 0 0 0 0 NA NA NA NA NA NA NA NA NA35600 2005 0 0 0 0 NA NA NA NA NA NA NA NA NA NA35600 2006 0 0 0 0 NA NA NA NA NA NA NA NA NA NA35600 2007 78,270 0 2,205 (2,205) -2.82% -2.82% -2.82% -2.82% -2.82% -2.82% -2.82% -2.82% -2.82% -2.82%35600 2008 0 0 0 0 NA -2.82% -2.82% -2.82% -2.82% -2.82% -2.82% -2.82% -2.82% -2.82%35600 2009 0 2,500 0 2,500 NA NA 0.38% 0.38% 0.38% 0.38% 0.38% 0.38% 0.38% 0.38%35600 2010 0 0 0 0 NA NA NA 0.38% 0.38% 0.38% 0.38% 0.38% 0.38% 0.38%35600 2011 869 0 0 0 0.00% 0.00% 287.63% 287.63% 0.37% 0.37% 0.37% 0.37% 0.37% 0.37%35600 2012 0 0 0 0 NA 0.00% 0.00% 287.63% 287.63% 0.37% 0.37% 0.37% 0.37% 0.37%35600 2013 10,503 0 0 0 0.00% 0.00% 0.00% 0.00% 21.98% 21.98% 0.33% 0.33% 0.33% 0.33%35600 2014 0 0 886 (886) NA -8.44% -8.44% -7.79% -7.79% 14.19% 14.19% -0.66% -0.66% -0.66%35600 2015 0 0 0 0 NA NA -8.44% -8.44% -7.79% -7.79% 14.19% 14.19% -0.66% -0.66%35600 2016 0 0 0 0 NA NA NA -8.44% -8.44% -7.79% -7.79% 14.19% 14.19% -0.66%35600 2017 0 0 0 0 NA NA NA NA -8.44% -8.44% -7.79% -7.79% 14.19% 14.19%
36602 1996 0 0 0 0 NA36602 1997 0 0 0 0 NA NA36602 1998 0 0 0 0 NA NA NA36602 1999 0 0 0 0 NA NA NA NA36602 2000 0 0 0 0 NA NA NA NA NA36602 2001 0 0 0 0 NA NA NA NA NA NA36602 2002 0 0 0 0 NA NA NA NA NA NA NA36602 2003 0 0 0 0 NA NA NA NA NA NA NA NA36602 2004 0 0 0 0 NA NA NA NA NA NA NA NA NA36602 2005 0 0 0 0 NA NA NA NA NA NA NA NA NA NA36602 2006 0 0 0 0 NA NA NA NA NA NA NA NA NA NA36602 2007 0 0 20 (20) NA NA NA NA NA NA NA NA NA NA36602 2008 0 0 0 0 NA NA NA NA NA NA NA NA NA NA36602 2009 509 0 0 0 0.00% 0.00% -3.84% -3.84% -3.84% -3.84% -3.84% -3.84% -3.84% -3.84%36602 2010 0 0 0 0 NA 0.00% 0.00% -3.84% -3.84% -3.84% -3.84% -3.84% -3.84% -3.84%36602 2011 2,019 0 0 0 0.00% 0.00% 0.00% 0.00% -0.77% -0.77% -0.77% -0.77% -0.77% -0.77%36602 2012 0 0 0 0 NA 0.00% 0.00% 0.00% 0.00% -0.77% -0.77% -0.77% -0.77% -0.77%36602 2013 0 0 0 0 NA NA 0.00% 0.00% 0.00% 0.00% -0.77% -0.77% -0.77% -0.77%36602 2014 0 0 0 0 NA NA NA 0.00% 0.00% 0.00% 0.00% -0.77% -0.77% -0.77%
Exhibit DAW-2 Page 90 of 111

Appendix D
2- yr 3- yr 4- yr 5- yr 6- yr 7- yr 8- yr 9- yr 10- yrNet Net Net Net Net Net Net Net Net Net Net
Account TY Retirements Salvage COR Salvage Salv. % Salv. % Salv. % Salv. % Salv. % Salv. % Salv. % Salv. % Salv. % Salv. %
ATMOS ENERGY - KENTUCKY DIVISIONDepreciation Study as of September 30, 2017
NET SALVAGE HISTORY
36602 2015 0 0 0 0 NA NA NA NA 0.00% 0.00% 0.00% 0.00% -0.77% -0.77%36602 2016 0 0 0 0 NA NA NA NA NA 0.00% 0.00% 0.00% 0.00% -0.77%36602 2017 0 0 0 0 NA NA NA NA NA NA 0.00% 0.00% 0.00% 0.00%
36603 1996 0 0 0 0 NA36603 1997 0 0 0 0 NA NA36603 1998 0 0 0 0 NA NA NA36603 1999 0 0 0 0 NA NA NA NA36603 2000 0 0 0 0 NA NA NA NA NA36603 2001 0 0 0 0 NA NA NA NA NA NA36603 2002 0 0 0 0 NA NA NA NA NA NA NA36603 2003 0 0 0 0 NA NA NA NA NA NA NA NA36603 2004 0 0 0 0 NA NA NA NA NA NA NA NA NA36603 2005 0 0 0 0 NA NA NA NA NA NA NA NA NA NA36603 2006 0 0 0 0 NA NA NA NA NA NA NA NA NA NA36603 2007 0 0 0 0 NA NA NA NA NA NA NA NA NA NA36603 2008 3,200 0 842 (842) -26.33% -26.33% -26.33% -26.33% -26.33% -26.33% -26.33% -26.33% -26.33% -26.33%36603 2009 0 0 0 0 NA -26.33% -26.33% -26.33% -26.33% -26.33% -26.33% -26.33% -26.33% -26.33%36603 2010 0 0 0 0 NA NA -26.33% -26.33% -26.33% -26.33% -26.33% -26.33% -26.33% -26.33%36603 2011 114 0 0 0 0.00% 0.00% 0.00% -25.42% -25.42% -25.42% -25.42% -25.42% -25.42% -25.42%36603 2012 0 0 0 0 NA 0.00% 0.00% 0.00% -25.42% -25.42% -25.42% -25.42% -25.42% -25.42%36603 2013 0 0 70 (70) NA NA -60.99% -60.99% -60.99% -27.52% -27.52% -27.52% -27.52% -27.52%36603 2014 0 0 0 0 NA NA NA -60.99% -60.99% -60.99% -27.52% -27.52% -27.52% -27.52%36603 2015 0 0 0 0 NA NA NA NA -60.99% -60.99% -60.99% -27.52% -27.52% -27.52%36603 2016 0 0 0 0 NA NA NA NA NA -60.99% -60.99% -60.99% -27.52% -27.52%36603 2017 0 0 0 0 NA NA NA NA NA NA -60.99% -60.99% -60.99% -27.52%
366 Combine 1996 0 0 0 0 NA366 Combine 1997 0 0 0 0 NA NA366 Combine 1998 0 0 0 0 NA NA NA366 Combine 1999 0 0 0 0 NA NA NA NA366 Combine 2000 0 0 0 0 NA NA NA NA NA366 Combine 2001 0 0 0 0 NA NA NA NA NA NA366 Combine 2002 0 0 0 0 NA NA NA NA NA NA NA366 Combine 2003 0 0 0 0 NA NA NA NA NA NA NA NA366 Combine 2004 0 0 0 0 NA NA NA NA NA NA NA NA NA366 Combine 2005 0 0 0 0 NA NA NA NA NA NA NA NA NA NA366 Combine 2006 0 0 0 0 NA NA NA NA NA NA NA NA NA NA366 Combine 2007 0 0 20 (20) NA NA NA NA NA NA NA NA NA NA366 Combine 2008 3,200 0 842 (842) -26.33% -26.94% -26.94% -26.94% -26.94% -26.94% -26.94% -26.94% -26.94% -26.94%366 Combine 2009 509 0 0 0 0.00% -22.71% -23.24% -23.24% -23.24% -23.24% -23.24% -23.24% -23.24% -23.24%366 Combine 2010 0 0 0 0 NA 0.00% -22.71% -23.24% -23.24% -23.24% -23.24% -23.24% -23.24% -23.24%366 Combine 2011 2,133 0 0 0 0.00% 0.00% 0.00% -14.42% -14.75% -14.75% -14.75% -14.75% -14.75% -14.75%366 Combine 2012 0 0 0 0 NA 0.00% 0.00% 0.00% -14.42% -14.75% -14.75% -14.75% -14.75% -14.75%366 Combine 2013 0 0 70 (70) NA NA -3.26% -3.26% -2.63% -15.61% -15.95% -15.95% -15.95% -15.95%366 Combine 2014 0 0 0 0 NA NA NA -3.26% -3.26% -2.63% -15.61% -15.95% -15.95% -15.95%366 Combine 2015 0 0 0 0 NA NA NA NA -3.26% -3.26% -2.63% -15.61% -15.95% -15.95%366 Combine 2016 0 0 0 0 NA NA NA NA NA -3.26% -3.26% -2.63% -15.61% -15.95%366 Combine 2017 0 0 0 0 NA NA NA NA NA NA -3.26% -3.26% -2.63% -15.61%
36700 1996 8,002 0 12 (12) -0.15%36700 1997 0 0 333 (333) NA -4.31%36700 1998 2,611 0 0 0 0.00% -12.75% -3.25%36700 1999 883 0 0 0 0.00% 0.00% -9.53% -3.00%36700 2000 7,957 0 0 0 0.00% 0.00% 0.00% -2.91% -1.77%36700 2001 6,910 0 0 0 0.00% 0.00% 0.00% 0.00% -1.81% -1.31%36700 2002 2,750 0 0 0 0.00% 0.00% 0.00% 0.00% 0.00% -1.58% -1.19%36700 2003 0 0 0 0 NA 0.00% 0.00% 0.00% 0.00% 0.00% -1.58% -1.19%36700 2004 0 0 0 0 NA NA 0.00% 0.00% 0.00% 0.00% 0.00% -1.58% -1.19%36700 2005 22,519 0 28,499 (28,499) -126.56% -126.56% -126.56% -112.78% -88.56% -71.01% -69.48% -65.32% -66.08% -55.86%36700 2006 0 0 0 0 NA -126.56% -126.56% -126.56% -112.78% -88.56% -71.01% -69.48% -65.32% -66.08%36700 2007 11,634 0 625 (625) -5.37% -5.37% -85.28% -85.28% -85.28% -78.92% -66.47% -56.26% -55.31% -52.70%36700 2008 0 0 0 0 NA -5.37% -5.37% -85.28% -85.28% -85.28% -78.92% -66.47% -56.26% -55.31%36700 2009 0 0 0 0 NA NA -5.37% -5.37% -85.28% -85.28% -85.28% -78.92% -66.47% -56.26%
Exhibit DAW-2 Page 91 of 111

Appendix D
2- yr 3- yr 4- yr 5- yr 6- yr 7- yr 8- yr 9- yr 10- yrNet Net Net Net Net Net Net Net Net Net Net
Account TY Retirements Salvage COR Salvage Salv. % Salv. % Salv. % Salv. % Salv. % Salv. % Salv. % Salv. % Salv. % Salv. %
ATMOS ENERGY - KENTUCKY DIVISIONDepreciation Study as of September 30, 2017
NET SALVAGE HISTORY
36700 2010 0 0 0 0 NA NA NA -5.37% -5.37% -85.28% -85.28% -85.28% -78.92% -66.47%36700 2011 2,632 0 314 (314) -11.92% -11.92% -11.92% -11.92% -6.58% -6.58% -80.03% -80.03% -80.03% -74.46%36700 2012 0 0 0 0 NA -11.92% -11.92% -11.92% -11.92% -6.58% -6.58% -80.03% -80.03% -80.03%36700 2013 14,934 0 0 0 0.00% 0.00% -1.79% -1.79% -1.79% -1.79% -3.22% -3.22% -56.92% -56.92%36700 2014 252,544 0 1,189 (1,189) -0.47% -0.44% -0.44% -0.56% -0.56% -0.56% -0.56% -0.76% -0.76% -10.07%36700 2015 18,844 0 0 0 0.00% -0.44% -0.42% -0.42% -0.52% -0.52% -0.52% -0.52% -0.71% -0.71%36700 2016 7,740 0 0 0 0.00% 0.00% -0.43% -0.40% -0.40% -0.51% -0.51% -0.51% -0.51% -0.69%36700 2017 19,288 0 0 0 0.00% 0.00% 0.00% -0.40% -0.38% -0.38% -0.48% -0.48% -0.48% -0.48%
36701 1996 0 0 0 0 NA36701 1997 0 0 0 0 NA NA36701 1998 0 0 0 0 NA NA NA36701 1999 0 0 0 0 NA NA NA NA36701 2000 0 0 0 0 NA NA NA NA NA36701 2001 0 0 0 0 NA NA NA NA NA NA36701 2002 0 0 0 0 NA NA NA NA NA NA NA36701 2003 0 0 0 0 NA NA NA NA NA NA NA NA36701 2004 0 0 0 0 NA NA NA NA NA NA NA NA NA36701 2005 0 0 0 0 NA NA NA NA NA NA NA NA NA NA36701 2006 2,765 0 5,224 (5,224) -188.92% -188.92% -188.92% -188.92% -188.92% -188.92% -188.92% -188.92% -188.92% -188.92%36701 2007 32,747 0 7,086 (7,086) -21.64% -34.66% -34.66% -34.66% -34.66% -34.66% -34.66% -34.66% -34.66% -34.66%36701 2008 5,151 0 19,867 (19,867) -385.72% -71.12% -79.13% -79.13% -79.13% -79.13% -79.13% -79.13% -79.13% -79.13%36701 2009 193,189 0 4,538 (4,538) -2.35% -12.30% -13.63% -15.70% -15.70% -15.70% -15.70% -15.70% -15.70% -15.70%36701 2010 13,353 0 547 (547) -4.10% -2.46% -11.79% -13.11% -15.07% -15.07% -15.07% -15.07% -15.07% -15.07%36701 2011 205,129 0 80,449 (80,449) -39.22% -37.07% -20.78% -25.29% -25.02% -26.02% -26.02% -26.02% -26.02% -26.02%36701 2012 9,558 0 71,136 (71,136) -744.23% -70.61% -66.71% -37.19% -41.40% -39.99% -40.89% -40.89% -40.89% -40.89%36701 2013 328,938 0 142,895 (142,895) -43.44% -63.23% -54.17% -52.97% -39.93% -42.29% -41.43% -41.95% -41.95% -41.95%36701 2014 803,047 0 146,711 (146,711) -18.27% -25.58% -31.60% -32.76% -32.48% -28.73% -29.91% -29.74% -30.02% -30.02%36701 2015 93,597 0 55,213 (55,213) -58.99% -22.52% -28.14% -33.68% -34.47% -34.19% -30.45% -31.56% -31.37% -31.63%36701 2016 209,943 0 148,525 (148,525) -70.75% -67.12% -31.67% -34.37% -39.06% -39.08% -38.80% -35.01% -35.98% -35.73%36701 2017 30,726 0 27,966 (27,966) -91.02% -73.33% -69.32% -33.27% -35.55% -40.14% -40.03% -39.75% -35.92% -36.87%
367 Comb 1996 8,002 0 12 (12) -0.15%367 Comb 1997 0 0 333 (333) NA -4.31%367 Comb 1998 2,611 0 0 0 0.00% -12.75% -3.25%367 Comb 1999 883 0 0 0 0.00% 0.00% -9.53% -3.00%367 Comb 2000 7,957 0 0 0 0.00% 0.00% 0.00% -2.91% -1.77%367 Comb 2001 6,910 0 0 0 0.00% 0.00% 0.00% 0.00% -1.81% -1.31%367 Comb 2002 2,750 0 0 0 0.00% 0.00% 0.00% 0.00% 0.00% -1.58% -1.19%367 Comb 2003 0 0 0 0 NA 0.00% 0.00% 0.00% 0.00% 0.00% -1.58% -1.19%367 Comb 2004 0 0 0 0 NA NA 0.00% 0.00% 0.00% 0.00% 0.00% -1.58% -1.19%367 Comb 2005 22,519 0 28,499 (28,499) -126.56% -126.56% -126.56% -112.78% -88.56% -71.01% -69.48% -65.32% -66.08% -55.86%367 Comb 2006 2,765 0 5,224 (5,224) -188.92% -133.38% -133.38% -133.38% -120.29% -96.51% -78.61% -77.02% -72.69% -73.40%367 Comb 2007 44,380 0 7,711 (7,711) -17.37% -27.44% -59.48% -59.48% -59.48% -57.22% -52.23% -47.47% -47.00% -45.64%367 Comb 2008 5,151 0 19,867 (19,867) -385.72% -55.68% -62.72% -81.94% -81.94% -81.94% -79.03% -72.57% -66.32% -65.69%367 Comb 2009 193,189 0 4,538 (4,538) -2.35% -12.30% -13.23% -15.21% -24.57% -24.57% -24.57% -24.32% -23.71% -23.05%367 Comb 2010 13,353 0 547 (547) -4.10% -2.46% -11.79% -12.76% -14.64% -23.60% -23.60% -23.60% -23.37% -22.81%367 Comb 2011 207,761 0 80,763 (80,763) -38.87% -36.77% -20.72% -25.20% -24.45% -25.43% -30.08% -30.08% -30.08% -29.92%367 Comb 2012 9,558 0 71,136 (71,136) -744.23% -69.90% -66.09% -37.04% -41.22% -38.99% -39.86% -43.77% -43.77% -43.77%367 Comb 2013 343,872 0 142,895 (142,895) -41.55% -60.56% -52.53% -51.40% -39.06% -41.37% -40.07% -40.57% -42.87% -42.87%367 Comb 2014 1,055,591 0 147,900 (147,900) -14.01% -20.78% -25.69% -27.38% -27.19% -24.56% -25.58% -25.38% -25.62% -26.82%367 Comb 2015 112,440 0 55,213 (55,213) -49.10% -17.39% -22.89% -27.42% -28.79% -28.60% -25.98% -26.94% -26.73% -26.95%367 Comb 2016 217,683 0 148,525 (148,525) -68.23% -61.72% -25.38% -28.59% -32.53% -33.20% -33.00% -30.25% -31.10% -30.83%367 Comb 2017 50,014 0 27,966 (27,966) -55.92% -65.93% -60.95% -26.44% -29.36% -33.18% -33.77% -33.57% -30.84% -31.66%
36900 1996 0 0 191 (191) NA36900 1997 0 0 0 0 NA NA36900 1998 13,523 0 77 (77) -0.57% -0.57% -1.98%36900 1999 0 0 0 0 NA -0.57% -0.57% -1.98%36900 2000 0 0 0 0 NA NA -0.57% -0.57% -1.98%36900 2001 2,183 0 0 0 0.00% 0.00% 0.00% -0.49% -0.49% -1.71%36900 2002 0 0 0 0 NA 0.00% 0.00% 0.00% -0.49% -0.49% -1.71%36900 2003 0 0 0 0 NA NA 0.00% 0.00% 0.00% -0.49% -0.49% -1.71%36900 2004 0 0 0 0 NA NA NA 0.00% 0.00% 0.00% -0.49% -0.49% -1.71%
Exhibit DAW-2 Page 92 of 111

Appendix D
2- yr 3- yr 4- yr 5- yr 6- yr 7- yr 8- yr 9- yr 10- yrNet Net Net Net Net Net Net Net Net Net Net
Account TY Retirements Salvage COR Salvage Salv. % Salv. % Salv. % Salv. % Salv. % Salv. % Salv. % Salv. % Salv. % Salv. %
ATMOS ENERGY - KENTUCKY DIVISIONDepreciation Study as of September 30, 2017
NET SALVAGE HISTORY
36900 2005 0 0 0 0 NA NA NA NA 0.00% 0.00% 0.00% -0.49% -0.49% -1.71%36900 2006 0 0 0 0 NA NA NA NA NA 0.00% 0.00% 0.00% -0.49% -0.49%36900 2007 0 0 1,251 (1,251) NA NA NA NA NA NA -57.32% -57.32% -57.32% -8.46%36900 2008 0 0 0 0 NA NA NA NA NA NA NA -57.32% -57.32% -57.32%36900 2009 0 0 0 0 NA NA NA NA NA NA NA NA -57.32% -57.32%36900 2010 0 0 0 0 NA NA NA NA NA NA NA NA NA -57.32%36900 2011 62,140 0 0 0.00% 0.00% 0.00% 0.00% -2.01% -2.01% -2.01% -2.01% -2.01% -2.01%36900 2012 0 0 0 0 NA 0.00% 0.00% 0.00% 0.00% -2.01% -2.01% -2.01% -2.01% -2.01%36900 2013 0 0 0 0 NA NA 0.00% 0.00% 0.00% 0.00% -2.01% -2.01% -2.01% -2.01%36900 2014 0 0 0 0 NA NA NA 0.00% 0.00% 0.00% 0.00% -2.01% -2.01% -2.01%36900 2015 0 0 0 0 NA NA NA NA 0.00% 0.00% 0.00% 0.00% -2.01% -2.01%36900 2016 0 0 0 0 NA NA NA NA NA 0.00% 0.00% 0.00% 0.00% -2.01%36900 2017 0 0 0 0 NA NA NA NA NA NA 0.00% 0.00% 0.00% 0.00%
36901 1996 0 0 0 0 NA36901 1997 0 0 0 0 NA NA36901 1998 0 0 0 0 NA NA NA36901 1999 0 0 0 0 NA NA NA NA36901 2000 0 0 0 0 NA NA NA NA NA36901 2001 0 0 0 0 NA NA NA NA NA NA36901 2002 0 0 0 0 NA NA NA NA NA NA NA36901 2003 0 0 0 0 NA NA NA NA NA NA NA NA36901 2004 0 0 0 0 NA NA NA NA NA NA NA NA NA36901 2005 0 0 0 0 NA NA NA NA NA NA NA NA NA NA36901 2006 0 0 0 0 NA NA NA NA NA NA NA NA NA NA36901 2007 0 0 0 0 NA NA NA NA NA NA NA NA NA NA36901 2008 34,337 0 16,587 (16,587) -48.31% -48.31% -48.31% -48.31% -48.31% -48.31% -48.31% -48.31% -48.31% -48.31%36901 2009 135,216 0 3,139 (3,139) -2.32% -11.63% -11.63% -11.63% -11.63% -11.63% -11.63% -11.63% -11.63% -11.63%36901 2010 0 0 0 0 NA -2.32% -11.63% -11.63% -11.63% -11.63% -11.63% -11.63% -11.63% -11.63%36901 2011 0 0 0 0 NA NA -2.32% -11.63% -11.63% -11.63% -11.63% -11.63% -11.63% -11.63%36901 2012 132 0 0 0.00% 0.00% 0.00% -2.32% -11.63% -11.63% -11.63% -11.63% -11.63% -11.63%36901 2013 805 0 1,613 (1,613) -200.45% -172.18% -172.18% -172.18% -3.49% -12.52% -12.52% -12.52% -12.52% -12.52%36901 2014 2,502 0 0 0 0.00% -48.78% -46.90% -46.90% -46.90% -3.43% -12.34% -12.34% -12.34% -12.34%36901 2015 3,650 0 2,302 (2,302) -63.08% -37.42% -56.28% -55.23% -55.23% -55.23% -4.96% -13.38% -13.38% -13.38%36901 2016 316 0 582 (582) -184.48% -72.74% -44.60% -61.84% -60.74% -60.74% -60.74% -5.35% -13.69% -13.69%36901 2017 0 0 0 0 NA -184.48% -72.74% -44.60% -61.84% -60.74% -60.74% -60.74% -5.35% -13.69%
369 Combine 1996 0 0 191 (191) NA369 Combine 1997 0 0 0 0 NA NA369 Combine 1998 13,523 0 77 (77) -0.57% -0.57% -1.98%369 Combine 1999 0 0 0 0 NA -0.57% -0.57% -1.98%369 Combine 2000 0 0 0 0 NA NA -0.57% -0.57% -1.98%369 Combine 2001 2,183 0 0 0 0.00% 0.00% 0.00% -0.49% -0.49% -1.71%369 Combine 2002 0 0 0 0 NA 0.00% 0.00% 0.00% -0.49% -0.49% -1.71%369 Combine 2003 0 0 0 0 NA NA 0.00% 0.00% 0.00% -0.49% -0.49% -1.71%369 Combine 2004 0 0 0 0 NA NA NA 0.00% 0.00% 0.00% -0.49% -0.49% -1.71%369 Combine 2005 0 0 0 0 NA NA NA NA 0.00% 0.00% 0.00% -0.49% -0.49% -1.71%369 Combine 2006 0 0 0 0 NA NA NA NA NA 0.00% 0.00% 0.00% -0.49% -0.49%369 Combine 2007 0 0 1,251 (1,251) NA NA NA NA NA NA -57.32% -57.32% -57.32% -8.46%369 Combine 2008 34,337 0 16,587 (16,587) -48.31% -51.95% -51.95% -51.95% -51.95% -51.95% -51.95% -48.84% -48.84% -48.84%369 Combine 2009 135,216 0 3,139 (3,139) -2.32% -11.63% -12.37% -12.37% -12.37% -12.37% -12.37% -12.37% -12.21% -12.21%369 Combine 2010 0 0 0 0 NA -2.32% -11.63% -12.37% -12.37% -12.37% -12.37% -12.37% -12.37% -12.21%369 Combine 2011 62,140 0 0 0 0.00% 0.00% -1.59% -8.51% -9.05% -9.05% -9.05% -9.05% -9.05% -9.05%369 Combine 2012 132 0 0 0 0.00% 0.00% 0.00% -1.59% -8.51% -9.05% -9.05% -9.05% -9.05% -9.05%369 Combine 2013 805 0 1,613 (1,613) -200.45% -172.18% -2.56% -2.56% -2.40% -9.17% -9.71% -9.71% -9.71% -9.71%369 Combine 2014 2,502 0 0 0 0.00% -48.78% -46.90% -2.46% -2.46% -2.37% -9.08% -9.61% -9.61% -9.61%369 Combine 2015 3,650 0 2,302 (2,302) -63.08% -37.42% -56.28% -55.23% -5.65% -5.65% -3.45% -9.90% -10.42% -10.42%369 Combine 2016 316 0 582 (582) -184.48% -72.74% -44.60% -61.84% -60.74% -6.47% -6.47% -3.73% -10.13% -10.65%369 Combine 2017 0 0 0 0 NA -184.48% -72.74% -44.60% -61.84% -60.74% -6.47% -6.47% -3.73% -10.13%
37402 1996 0 0 0 0 NA37402 1997 0 0 0 0 NA NA37402 1998 0 0 0 0 NA NA NA37402 1999 0 0 0 0 NA NA NA NA
Exhibit DAW-2 Page 93 of 111

Appendix D
2- yr 3- yr 4- yr 5- yr 6- yr 7- yr 8- yr 9- yr 10- yrNet Net Net Net Net Net Net Net Net Net Net
Account TY Retirements Salvage COR Salvage Salv. % Salv. % Salv. % Salv. % Salv. % Salv. % Salv. % Salv. % Salv. % Salv. %
ATMOS ENERGY - KENTUCKY DIVISIONDepreciation Study as of September 30, 2017
NET SALVAGE HISTORY
37402 2000 0 0 0 0 NA NA NA NA NA37402 2001 0 0 0 0 NA NA NA NA NA NA37402 2002 0 0 0 0 NA NA NA NA NA NA NA37402 2003 0 0 0 0 NA NA NA NA NA NA NA NA37402 2004 0 0 0 0 NA NA NA NA NA NA NA NA NA37402 2005 0 0 0 0 NA NA NA NA NA NA NA NA NA NA37402 2006 0 0 0 0 NA NA NA NA NA NA NA NA NA NA37402 2007 0 0 0 0 NA NA NA NA NA NA NA NA NA NA37402 2008 17 8 0 8 49.11% 49.11% 49.11% 49.11% 49.11% 49.11% 49.11% 49.11% 49.11% 49.11%37402 2009 0 0 0 0 NA 49.11% 49.11% 49.11% 49.11% 49.11% 49.11% 49.11% 49.11% 49.11%37402 2010 0 0 0 0 NA NA 49.11% 49.11% 49.11% 49.11% 49.11% 49.11% 49.11% 49.11%37402 2011 0 0 0 0 NA NA NA 49.11% 49.11% 49.11% 49.11% 49.11% 49.11% 49.11%37402 2012 0 0 0 0 NA NA NA NA 49.11% 49.11% 49.11% 49.11% 49.11% 49.11%37402 2013 0 0 0 0 NA NA NA NA NA 49.11% 49.11% 49.11% 49.11% 49.11%37402 2014 0 0 0 0 NA NA NA NA NA NA 49.11% 49.11% 49.11% 49.11%37402 2015 0 0 0 0 NA NA NA NA NA NA NA 49.11% 49.11% 49.11%37402 2016 0 0 0 0 NA NA NA NA NA NA NA NA 49.11% 49.11%37402 2017 0 0 0 0 NA NA NA NA NA NA NA NA NA 49.11%
37500 1996 0 0 0 0 NA37500 1997 0 0 0 0 NA NA37500 1998 0 0 0 0 NA NA NA37500 1999 0 0 0 0 NA NA NA NA37500 2000 4,190 0 3,054 (3,054) -72.89% -72.89% -72.89% -72.89% -72.89%37500 2001 0 0 0 0 NA -72.89% -72.89% -72.89% -72.89% -72.89%37500 2002 0 0 0 0 NA NA -72.89% -72.89% -72.89% -72.89% -72.89%37500 2003 0 0 0 0 NA NA NA -72.89% -72.89% -72.89% -72.89% -72.89%37500 2004 0 0 0 0 NA NA NA NA -72.89% -72.89% -72.89% -72.89% -72.89%37500 2005 0 0 0 0 NA NA NA NA NA -72.89% -72.89% -72.89% -72.89% -72.89%37500 2006 0 0 0 0 NA NA NA NA NA NA -72.89% -72.89% -72.89% -72.89%37500 2007 0 0 42 (42) NA NA NA NA NA NA NA -73.88% -73.88% -73.88%37500 2008 0 0 0 0 NA NA NA NA NA NA NA NA -73.88% -73.88%37500 2009 0 0 0 0 NA NA NA NA NA NA NA NA NA -73.88%37500 2010 0 0 0 0 NA NA NA NA NA NA NA NA NA NA37500 2011 0 0 0 0 NA NA NA NA NA NA NA NA NA NA37500 2012 0 0 0 0 NA NA NA NA NA NA NA NA NA NA37500 2013 0 0 0 0 NA NA NA NA NA NA NA NA NA NA37500 2014 0 0 0 0 NA NA NA NA NA NA NA NA NA NA37500 2015 0 0 0 0 NA NA NA NA NA NA NA NA NA NA37500 2016 0 0 0 0 NA NA NA NA NA NA NA NA NA NA37500 2017 0 0 0 0 NA NA NA NA NA NA NA NA NA NA
37501 1996 0 0 0 0 NA37501 1997 0 0 0 0 NA NA37501 1998 0 0 0 0 NA NA NA37501 1999 0 0 0 0 NA NA NA NA37501 2000 0 0 0 0 NA NA NA NA NA37501 2001 0 0 0 0 NA NA NA NA NA NA37501 2002 0 0 0 0 NA NA NA NA NA NA NA37501 2003 0 0 0 0 NA NA NA NA NA NA NA NA37501 2004 0 0 0 0 NA NA NA NA NA NA NA NA NA37501 2005 0 0 0 0 NA NA NA NA NA NA NA NA NA NA37501 2006 0 0 0 0 NA NA NA NA NA NA NA NA NA NA37501 2007 0 0 0 0 NA NA NA NA NA NA NA NA NA NA37501 2008 0 0 0 0 NA NA NA NA NA NA NA NA NA NA37501 2009 2,803 0 369 (369) -13.16% -13.16% -13.16% -13.16% -13.16% -13.16% -13.16% -13.16% -13.16% -13.16%37501 2010 0 0 0 0 NA -13.16% -13.16% -13.16% -13.16% -13.16% -13.16% -13.16% -13.16% -13.16%37501 2011 0 0 0 0 NA NA -13.16% -13.16% -13.16% -13.16% -13.16% -13.16% -13.16% -13.16%37501 2012 0 0 0 0 NA NA NA -13.16% -13.16% -13.16% -13.16% -13.16% -13.16% -13.16%37501 2013 1,006 0 1,099 (1,099) -109.24% -109.24% -109.24% -109.24% -38.53% -38.53% -38.53% -38.53% -38.53% -38.53%37501 2014 683 0 774 (774) -113.41% -110.93% -110.93% -110.93% -110.93% -49.91% -49.91% -49.91% -49.91% -49.91%37502 2015 327 0 0 0 0.00% -76.70% -92.94% -92.94% -92.94% -92.94% -46.52% -46.52% -46.52% -46.52%37501 2016 0 0 0 0 NA 0.00% -76.70% -92.94% -92.94% -92.94% -92.94% -46.52% -46.52% -46.52%37501 2017 0 0 0 0 NA NA 0.00% -76.70% -92.94% -92.94% -92.94% -92.94% -46.52% -46.52%
Exhibit DAW-2 Page 94 of 111

Appendix D
2- yr 3- yr 4- yr 5- yr 6- yr 7- yr 8- yr 9- yr 10- yrNet Net Net Net Net Net Net Net Net Net Net
Account TY Retirements Salvage COR Salvage Salv. % Salv. % Salv. % Salv. % Salv. % Salv. % Salv. % Salv. % Salv. % Salv. %
ATMOS ENERGY - KENTUCKY DIVISIONDepreciation Study as of September 30, 2017
NET SALVAGE HISTORY
375 Combine 1996 0 0 0 0 NA375 Combine 1997 0 0 0 0 NA NA375 Combine 1998 0 0 0 0 NA NA NA375 Combine 1999 0 0 0 0 NA NA NA NA375 Combine 2000 4,190 0 3,054 (3,054) -72.89% -72.89% -72.89% -72.89% -72.89%375 Combine 2001 0 0 0 0 NA -72.89% -72.89% -72.89% -72.89% -72.89%375 Combine 2002 0 0 0 0 NA NA -72.89% -72.89% -72.89% -72.89% -72.89%375 Combine 2003 0 0 0 0 NA NA NA -72.89% -72.89% -72.89% -72.89% -72.89%375 Combine 2004 0 0 0 0 NA NA NA NA -72.89% -72.89% -72.89% -72.89% -72.89%375 Combine 2005 0 0 0 0 NA NA NA NA NA -72.89% -72.89% -72.89% -72.89% -72.89%375 Combine 2006 0 0 0 0 NA NA NA NA NA NA -72.89% -72.89% -72.89% -72.89%375 Combine 2007 0 0 42 (42) NA NA NA NA NA NA NA -73.88% -73.88% -73.88%375 Combine 2008 0 0 0 0 NA NA NA NA NA NA NA NA -73.88% -73.88%375 Combine 2009 2,803 0 369 (369) -13.16% -13.16% -14.64% -14.64% -14.64% -14.64% -14.64% -14.64% -14.64% -49.54%375 Combine 2010 0 0 0 0 NA -13.16% -13.16% -14.64% -14.64% -14.64% -14.64% -14.64% -14.64% -14.64%375 Combine 2011 0 0 0 0 NA NA -13.16% -13.16% -14.64% -14.64% -14.64% -14.64% -14.64% -14.64%375 Combine 2012 0 0 0 0 NA NA NA -13.16% -13.16% -14.64% -14.64% -14.64% -14.64% -14.64%375 Combine 2013 1,006 0 1,099 (1,099) -109.24% -109.24% -109.24% -109.24% -38.53% -38.53% -39.62% -39.62% -39.62% -39.62%375 Combine 2014 683 0 774 (774) -113.41% -110.93% -110.93% -110.93% -110.93% -49.91% -49.91% -50.83% -50.83% -50.83%375 Combine 2015 327 0 0 0 0.00% -76.70% -92.94% -92.94% -92.94% -92.94% -46.52% -46.52% -47.39% -47.39%375 Combine 2016 0 0 0 0 NA 0.00% -76.70% -92.94% -92.94% -92.94% -92.94% -46.52% -46.52% -47.39%375 Combine 2017 0 0 0 0 NA NA 0.00% -76.70% -92.94% -92.94% -92.94% -92.94% -46.52% -46.52%
37600 1996 55,351 67,855 4,609 63,246 114.26%37600 1997 197,090 0 251,775 (251,775) -127.75% -74.68%37600 1998 121,727 6,321 2,709 3,612 2.97% -77.84% -49.42%37600 1999 143,666 0 25,600 (25,600) -17.82% -8.29% -59.19% -40.65%37600 2000 67,723 0 80,330 (80,330) -118.62% -50.11% -30.72% -66.78% -49.67%37600 2001 180,309 0 100,246 (100,246) -55.60% -72.80% -52.64% -39.45% -63.95% -51.07%37600 2002 112,370 0 20,416 (20,416) -18.17% -41.23% -55.77% -44.95% -35.63% -57.69% -46.86%37600 2003 112,104 0 42,202 (42,202) -37.65% -27.90% -40.23% -51.47% -43.62% -35.94% -55.29% -45.81%37600 2004 63,595 0 50,731 (50,731) -79.77% -52.89% -39.35% -45.60% -54.83% -47.01% -39.42% -56.85% -47.86%37600 2005 305,582 0 32,095 (32,095) -10.50% -22.44% -25.98% -24.50% -31.74% -38.73% -35.68% -31.43% -45.99% -39.47%37600 2006 (40,283) 0 8,347 (8,347) 20.72% -15.24% -27.72% -30.24% -27.79% -34.63% -41.72% -38.09% -33.40% -48.12%37600 2007 290,163 0 149,699 (149,699) -51.59% -63.25% -34.23% -38.91% -38.72% -35.98% -39.43% -44.35% -41.26% -37.29%37600 2008 1,893 0 1,110 (1,110) -58.66% -51.64% -63.21% -34.31% -38.97% -38.77% -36.03% -39.47% -44.37% -41.29%37600 2009 101,014 0 4,299 (4,299) -4.26% -5.26% -39.46% -46.33% -29.70% -34.11% -34.59% -32.64% -36.31% -40.98%37600 2010 20,732 0 309 (309) -1.49% -3.79% -4.63% -37.56% -43.84% -28.84% -33.20% -33.78% -31.97% -35.68%37600 2011 18,609 0 65 (65) -0.35% -0.95% -3.33% -4.07% -35.96% -41.78% -28.08% -32.40% -33.07% -31.37%37600 2012 697,633 0 24,625 (24,625) -3.53% -3.45% -3.39% -3.50% -3.62% -15.94% -17.29% -15.81% -18.59% -19.95%37600 2013 8,566 0 6,506 (6,506) -75.94% -4.41% -4.30% -4.23% -4.23% -4.35% -16.39% -17.75% -16.17% -18.93%37600 2014 1,192,398 0 35,179 (35,179) -2.95% -3.47% -3.49% -3.46% -3.44% -3.48% -3.53% -9.51% -10.05% -10.10%37600 2015 569,322 0 16,535 (16,535) -2.90% -2.94% -3.29% -3.36% -3.33% -3.32% -3.36% -3.40% -8.22% -8.62%37600 2016 487,689 0 0 0 0.00% -1.56% -2.30% -2.58% -2.80% -2.79% -2.78% -2.83% -2.86% -7.03%37600 2017 152,242 0 27 (27) -0.02% 0.00% -1.37% -2.15% -2.42% -2.67% -2.65% -2.65% -2.70% -2.73%
37601 1996 0 0 NA37601 1997 0 0 NA NA37601 1998 0 0 NA NA NA37601 1999 0 0 NA NA NA NA37601 2000 0 0 NA NA NA NA NA37601 2001 0 0 NA NA NA NA NA NA37601 2002 0 0 NA NA NA NA NA NA NA37601 2003 0 0 NA NA NA NA NA NA NA NA37601 2004 0 0 NA NA NA NA NA NA NA NA NA37601 2005 0 0 NA NA NA NA NA NA NA NA NA NA37601 2006 244,942 0 351,639 (351,639) -143.56% -143.56% -143.56% -143.56% -143.56% -143.56% -143.56% -143.56% -143.56% -143.56%37601 2007 1,361,933 0 95,990 (95,990) -7.05% -27.86% -27.86% -27.86% -27.86% -27.86% -27.86% -27.86% -27.86% -27.86%37601 2008 963,544 0 128,492 (128,492) -13.34% -9.65% -22.41% -22.41% -22.41% -22.41% -22.41% -22.41% -22.41% -22.41%37601 2009 180,458 0 15,880 (15,880) -8.80% -12.62% -9.59% -21.52% -21.52% -21.52% -21.52% -21.52% -21.52% -21.52%37601 2010 1,118,382 18,213 267,327 (249,114) -22.27% -20.40% -17.39% -13.51% -21.74% -21.74% -21.74% -21.74% -21.74% -21.74%37601 2011 402,027 0 131,714 (131,714) -32.76% -25.05% -23.32% -19.71% -15.43% -22.78% -22.78% -22.78% -22.78% -22.78%37601 2012 1,204,856 0 186,642 (186,642) -15.49% -19.81% -20.82% -20.08% -18.40% -15.44% -21.17% -21.17% -21.17% -21.17%
Exhibit DAW-2 Page 95 of 111

Appendix D
2- yr 3- yr 4- yr 5- yr 6- yr 7- yr 8- yr 9- yr 10- yrNet Net Net Net Net Net Net Net Net Net Net
Account TY Retirements Salvage COR Salvage Salv. % Salv. % Salv. % Salv. % Salv. % Salv. % Salv. % Salv. % Salv. % Salv. %
ATMOS ENERGY - KENTUCKY DIVISIONDepreciation Study as of September 30, 2017
NET SALVAGE HISTORY
37601 2013 1,859,842 0 378,030 (378,030) -20.33% -18.43% -20.09% -20.62% -20.17% -19.02% -16.72% -20.96% -20.96% -20.96%37601 2014 1,714,980 0 403,146 (403,146) -23.51% -21.85% -20.25% -21.22% -21.41% -21.06% -20.06% -18.04% -21.44% -21.44%37601 2015 1,309,164 0 452,935 (452,935) -34.60% -28.31% -25.27% -23.33% -23.92% -23.68% -23.33% -22.23% -20.19% -23.10%37601 2016 915,650 0 695,891 (695,891) -76.00% -51.64% -39.39% -33.28% -30.22% -30.36% -29.30% -28.87% -27.32% -24.82%37601 2017 1,090,919 0 654,326 (654,326) -59.98% -67.29% -54.38% -43.86% -37.51% -34.23% -34.16% -32.78% -32.34% -30.63%
37602 1996 0 0 NA37602 1997 0 0 NA NA37602 1998 0 0 NA NA NA37602 1999 0 0 NA NA NA NA37602 2000 0 0 NA NA NA NA NA37602 2001 0 0 NA NA NA NA NA NA37602 2002 0 0 NA NA NA NA NA NA NA37602 2003 0 0 NA NA NA NA NA NA NA NA37602 2004 0 0 NA NA NA NA NA NA NA NA NA37602 2005 0 0 NA NA NA NA NA NA NA NA NA NA37602 2006 49,624 0 120,053 (120,053) -241.93% -241.93% -241.93% -241.93% -241.93% -241.93% -241.93% -241.93% -241.93% -241.93%37602 2007 33,520 0 6,878 (6,878) -20.52% -152.67% -152.67% -152.67% -152.67% -152.67% -152.67% -152.67% -152.67% -152.67%37602 2008 40,051 0 8,219 (8,219) -20.52% -20.52% -109.71% -109.71% -109.71% -109.71% -109.71% -109.71% -109.71% -109.71%37602 2009 17,783 0 2,167 (2,167) -12.19% -17.96% -18.90% -97.40% -97.40% -97.40% -97.40% -97.40% -97.40% -97.40%37602 2010 44,183 0 20,406 (20,406) -46.19% -36.43% -30.18% -27.79% -85.18% -85.18% -85.18% -85.18% -85.18% -85.18%37602 2011 58,128 0 35,843 (35,843) -61.66% -54.98% -48.64% -41.61% -37.96% -79.56% -79.56% -79.56% -79.56% -79.56%37602 2012 152,151 0 119,496 (119,496) -78.54% -73.87% -69.07% -65.35% -59.60% -55.81% -79.17% -79.17% -79.17% -79.17%37602 2013 155,927 0 137,956 (137,956) -88.47% -83.57% -80.09% -76.44% -73.77% -69.22% -65.96% -81.80% -81.80% -81.80%37602 2014 223,390 0 102,076 (102,076) -45.69% -63.28% -67.65% -67.06% -65.60% -64.14% -61.62% -59.72% -71.39% -71.39%37602 2015 68,253 0 111,039 (111,039) -162.69% -73.07% -78.44% -78.46% -76.98% -75.04% -73.49% -70.70% -68.58% -78.78%37602 2016 323,645 0 73,755 (73,755) -22.79% -47.15% -46.62% -55.09% -58.95% -59.11% -58.55% -57.76% -56.39% -55.31%37602 2017 105,528 0 95,233 (95,233) -90.24% -39.38% -56.30% -53.01% -59.32% -62.16% -62.13% -61.51% -60.75% -59.39%
37601&02 1996 0 0 0 0 NA37601&02 1997 0 0 0 0 NA NA37601&02 1998 0 0 0 0 NA NA NA37601&02 1999 0 0 0 0 NA NA NA NA37601&02 2000 0 0 0 0 NA NA NA NA NA37601&02 2001 0 0 0 0 NA NA NA NA NA NA37601&02 2002 0 0 0 0 NA NA NA NA NA NA NA37601&02 2003 0 0 0 0 NA NA NA NA NA NA NA NA37601&02 2004 0 0 0 0 NA NA NA NA NA NA NA NA NA37601&02 2005 0 0 0 0 NA NA NA NA NA NA NA NA NA NA37601&02 2006 294,566 0 471,692 (471,692) -160.13% -160.13% -160.13% -160.13% -160.13% -160.13% -160.13% -160.13% -160.13% -160.13%37601&02 2007 1,395,453 0 102,868 (102,868) -7.37% -34.00% -34.00% -34.00% -34.00% -34.00% -34.00% -34.00% -34.00% -34.00%37601&02 2008 1,003,595 0 136,711 (136,711) -13.62% -9.99% -26.41% -26.41% -26.41% -26.41% -26.41% -26.41% -26.41% -26.41%37601&02 2009 198,241 0 18,047 (18,047) -9.10% -12.88% -9.92% -25.22% -25.22% -25.22% -25.22% -25.22% -25.22% -25.22%37601&02 2010 1,162,565 18,213 287,733 (269,520) -23.18% -21.13% -17.94% -14.02% -24.64% -24.64% -24.64% -24.64% -24.64% -24.64%37601&02 2011 460,155 0 167,557 (167,557) -36.41% -26.93% -24.99% -20.95% -16.46% -25.84% -25.84% -25.84% -25.84% -25.84%37601&02 2012 1,357,007 0 306,138 (306,138) -22.56% -26.07% -24.94% -23.95% -21.47% -17.95% -25.08% -25.08% -25.08% -25.08%37601&02 2013 2,015,769 0 515,986 (515,986) -25.60% -24.38% -25.82% -25.21% -24.59% -22.82% -19.98% -25.21% -25.21% -25.21%37601&02 2014 1,938,370 0 505,222 (505,222) -26.06% -25.83% -24.99% -25.90% -25.45% -24.99% -23.59% -21.22% -25.38% -25.38%37601&02 2015 1,377,417 0 563,974 (563,974) -40.94% -32.25% -29.73% -28.28% -28.80% -28.01% -27.57% -26.10% -23.71% -27.29%37601&02 2016 1,239,296 0 769,645 (769,645) -62.10% -50.97% -40.37% -35.84% -33.56% -33.72% -32.44% -31.96% -30.25% -27.62%37601&02 2017 1,196,447 0 749,559 (749,559) -62.65% -62.37% -54.63% -45.00% -39.97% -37.38% -37.33% -35.80% -35.32% -33.50%
376 Combine 1996 55,351 67,855 4,609 63,246 114.26%376 Combine 1997 197,090 0 251,775 (251,775) -127.75% -74.68%376 Combine 1998 121,727 6,321 2,709 3,612 2.97% -77.84% -49.42%376 Combine 1999 143,666 0 25,600 (25,600) -17.82% -8.29% -59.19% -40.65%376 Combine 2000 67,723 0 80,330 (80,330) -118.62% -50.11% -30.72% -66.78% -49.67%376 Combine 2001 180,309 0 100,246 (100,246) -55.60% -72.80% -52.64% -39.45% -63.95% -51.07%376 Combine 2002 112,370 0 20,416 (20,416) -18.17% -41.23% -55.77% -44.95% -35.63% -57.69% -46.86%376 Combine 2003 112,104 0 42,202 (42,202) -37.65% -27.90% -40.23% -51.47% -43.62% -35.94% -55.29% -45.81%376 Combine 2004 63,595 0 50,731 (50,731) -79.77% -52.89% -39.35% -45.60% -54.83% -47.01% -39.42% -56.85% -47.86%376 Combine 2005 305,582 0 32,095 (32,095) -10.50% -22.44% -25.98% -24.50% -31.74% -38.73% -35.68% -31.43% -45.99% -39.47%376 Combine 2006 254,283 0 480,040 (480,040) -188.78% -91.47% -90.28% -82.26% -73.77% -70.58% -73.55% -67.09% -60.83% -69.29%376 Combine 2007 1,685,616 0 252,567 (252,567) -14.98% -37.77% -34.06% -35.31% -35.42% -34.66% -36.05% -38.06% -37.06% -35.47%
Exhibit DAW-2 Page 96 of 111

Appendix D
2- yr 3- yr 4- yr 5- yr 6- yr 7- yr 8- yr 9- yr 10- yrNet Net Net Net Net Net Net Net Net Net Net
Account TY Retirements Salvage COR Salvage Salv. % Salv. % Salv. % Salv. % Salv. % Salv. % Salv. % Salv. % Salv. % Salv. %
ATMOS ENERGY - KENTUCKY DIVISIONDepreciation Study as of September 30, 2017
NET SALVAGE HISTORY
376 Combine 2008 1,005,488 0 137,822 (137,822) -13.71% -14.51% -29.55% -27.76% -28.76% -29.05% -28.70% -30.01% -31.59% -31.09%376 Combine 2009 299,255 0 22,347 (22,347) -7.47% -12.28% -13.80% -27.52% -26.05% -27.00% -27.32% -27.05% -28.33% -29.83%376 Combine 2010 1,183,296 18,213 288,042 (269,829) -22.80% -19.71% -17.28% -16.35% -26.26% -25.24% -25.96% -26.23% -26.05% -27.07%376 Combine 2011 478,764 0 167,622 (167,622) -35.01% -26.32% -23.44% -20.14% -18.27% -27.11% -26.14% -26.78% -27.01% -26.83%376 Combine 2012 2,054,640 0 330,762 (330,762) -16.10% -19.67% -20.67% -19.69% -18.49% -17.61% -23.86% -23.30% -23.79% -24.00%376 Combine 2013 2,024,335 0 522,492 (522,492) -25.81% -20.92% -22.40% -22.48% -21.74% -20.59% -19.51% -24.30% -23.85% -24.23%376 Combine 2014 3,130,769 0 540,401 (540,401) -17.26% -20.62% -19.33% -20.31% -20.64% -20.21% -19.57% -18.92% -22.48% -22.19%376 Combine 2015 1,946,739 0 580,509 (580,509) -29.82% -22.08% -23.14% -21.56% -22.23% -22.29% -21.89% -21.21% -20.45% -23.50%376 Combine 2016 1,726,985 0 769,645 (769,645) -44.57% -36.75% -27.78% -27.33% -25.21% -25.62% -25.36% -24.94% -24.13% -23.13%376 Combine 2017 1,348,688 0 749,587 (749,587) -55.58% -49.40% -41.81% -32.38% -31.07% -28.56% -28.80% -28.29% -27.85% -26.92%
37800 1996 0 0 39 (39) NA37800 1997 0 0 NA NA37800 1998 375 0 23 (23) -6.13% -6.13% -16.53%37800 1999 917 0 0 0 0.00% -1.78% -1.78% -4.80%37800 2000 0 0 NA 0.00% -1.78% -1.78% -4.80%37800 2001 0 0 NA NA 0.00% -1.78% -1.78% -4.80%37800 2002 0 0 NA NA NA 0.00% -1.78% -1.78% -4.80%37800 2003 0 0 NA NA NA NA 0.00% -1.78% -1.78% -4.80%37800 2004 0 0 NA NA NA NA NA 0.00% -1.78% -1.78% -4.80%37800 2005 0 0 NA NA NA NA NA NA 0.00% -1.78% -1.78% -4.80%37800 2006 12,627 0 7,595 (7,595) -60.15% -60.15% -60.15% -60.15% -60.15% -60.15% -60.15% -56.08% -54.73% -54.73%37800 2007 24,754 0 53,949 (53,949) -217.94% -164.64% -164.64% -164.64% -164.64% -164.64% -164.64% -164.64% -160.70% -159.20%37800 2008 42,841 0 8,927 (8,927) -20.84% -93.02% -87.85% -87.85% -87.85% -87.85% -87.85% -87.85% -87.85% -86.85%37800 2009 77,930 0 12,616 (12,616) -16.19% -17.84% -51.88% -52.54% -52.54% -52.54% -52.54% -52.54% -52.54% -52.54%37800 2010 40,104 (5,556) (51,951) 46,395 115.69% 28.62% 15.45% -15.67% -18.51% -18.51% -18.51% -18.51% -18.51% -18.51%37800 2011 6,999 0 16,668 (16,668) -238.13% 63.11% 13.69% 4.88% -23.76% -26.00% -26.00% -26.00% -26.00% -26.00%37800 2012 18,828 0 2,731 (2,731) -14.50% -75.11% 40.95% 10.00% 2.92% -22.93% -25.03% -25.03% -25.03% -25.03%37800 2013 8,476 0 12,586 (12,586) -148.48% -56.10% -93.24% 19.37% 1.18% -3.65% -27.77% -29.53% -29.53% -29.53%37800 2014 57,926 0 4,841 (4,841) -8.36% -26.24% -23.65% -39.93% 7.23% -1.45% -4.73% -23.72% -25.31% -25.31%37800 2015 16,891 0 3,082 (3,082) -18.25% -10.59% -24.62% -22.76% -36.57% 4.35% -2.70% -5.58% -23.41% -24.92%37800 2016 41,403 0 15,577 (15,577) -37.62% -32.01% -20.22% -28.94% -27.05% -36.86% -4.77% -8.08% -9.84% -25.16%37800 2017 155,918 0 29,529 (29,529) -18.94% -22.86% -22.50% -19.49% -23.38% -22.82% -27.74% -11.14% -12.07% -12.87%
37900 1996 0 0 NA37900 1997 0 0 NA NA37900 1998 0 0 NA NA NA37900 1999 1,547 0 0 0 0.00% 0.00% 0.00% 0.00%37900 2000 12,823 0 2,112 (2,112) -16.47% -14.70% -14.70% -14.70% -14.70%37900 2001 0 0 NA -16.47% -14.70% -14.70% -14.70% -14.70%37900 2002 0 0 NA NA -16.47% -14.70% -14.70% -14.70% -14.70%37900 2003 0 0 NA NA NA -16.47% -14.70% -14.70% -14.70% -14.70%37900 2004 302 0 0 0 0.00% 0.00% 0.00% 0.00% -16.09% -14.39% -14.39% -14.39% -14.39%37900 2005 0 0 NA 0.00% 0.00% 0.00% 0.00% -16.09% -14.39% -14.39% -14.39% -14.39%37900 2006 0 0 NA NA 0.00% 0.00% 0.00% 0.00% -16.09% -14.39% -14.39% -14.39%37900 2007 0 0 502 (502) NA NA NA -166.36% -166.36% -166.36% -166.36% -19.92% -17.82% -17.82%37900 2008 738 0 867 (867) -117.56% -185.65% -185.65% -185.65% -131.73% -131.73% -131.73% -131.73% -25.12% -22.59%37900 2009 17,655 0 9 (9) -0.05% -4.77% -7.50% -7.50% -7.50% -7.38% -7.38% -7.38% -7.38% -11.08%37900 2010 12,989 0 145 (145) -1.11% -0.50% -3.26% -4.86% -4.86% -4.86% -4.81% -4.81% -4.81% -4.81%37900 2011 58,536 0 683 (683) -1.17% -1.16% -0.94% -1.90% -2.45% -2.45% -2.45% -2.45% -2.45% -2.45%37900 2012 0 0 (7) 7 NA -1.15% -1.15% -0.93% -1.89% -2.45% -2.45% -2.45% -2.44% -2.44%37900 2013 0 0 11,475 (11,475) NA NA -20.76% -17.19% -13.80% -14.65% -15.21% -15.21% -15.21% -15.16%37900 2014 9,769 0 1,891 (1,891) -19.36% -136.82% -136.74% -20.56% -17.45% -14.35% -15.11% -15.61% -15.61% -15.61%37900 2015 43,901 0 4,487 (4,487) -10.22% -11.88% -33.26% -33.25% -16.51% -14.92% -13.08% -13.62% -13.97% -13.97%37900 2016 61,494 0 4,637 (4,637) -7.54% -8.66% -9.56% -19.53% -19.52% -13.34% -12.49% -11.41% -11.79% -12.04%37900 2017 0 0 0 0 NA -7.54% -8.66% -9.56% -19.53% -19.52% -13.34% -12.49% -11.41% -11.79%
37905 1996 0 0 NA37905 1997 0 0 NA NA37905 1998 0 0 NA NA NA37905 1999 0 0 NA NA NA NA37905 2000 0 0 NA NA NA NA NA37905 2001 0 0 NA NA NA NA NA NA37905 2002 0 0 NA NA NA NA NA NA NA
Exhibit DAW-2 Page 97 of 111

Appendix D
2- yr 3- yr 4- yr 5- yr 6- yr 7- yr 8- yr 9- yr 10- yrNet Net Net Net Net Net Net Net Net Net Net
Account TY Retirements Salvage COR Salvage Salv. % Salv. % Salv. % Salv. % Salv. % Salv. % Salv. % Salv. % Salv. % Salv. %
ATMOS ENERGY - KENTUCKY DIVISIONDepreciation Study as of September 30, 2017
NET SALVAGE HISTORY
37905 2003 0 0 NA NA NA NA NA NA NA NA37905 2004 0 0 NA NA NA NA NA NA NA NA NA37905 2005 0 0 NA NA NA NA NA NA NA NA NA NA37905 2006 0 0 NA NA NA NA NA NA NA NA NA NA37905 2007 0 0 1,427 (1,427) NA NA NA NA NA NA NA NA NA NA37905 2008 24,696 0 946 (946) -3.83% -9.61% -9.61% -9.61% -9.61% -9.61% -9.61% -9.61% -9.61% -9.61%37905 2009 123,048 0 6,103 (6,103) -4.96% -4.77% -5.74% -5.74% -5.74% -5.74% -5.74% -5.74% -5.74% -5.74%37905 2010 5,468 0 7,061 (7,061) -129.13% -10.24% -9.21% -10.14% -10.14% -10.14% -10.14% -10.14% -10.14% -10.14%37905 2011 24,566 0 16,849 (16,849) -68.59% -79.61% -19.61% -17.41% -18.22% -18.22% -18.22% -18.22% -18.22% -18.22%37905 2012 9,710 0 2,479 (2,479) -25.53% -56.39% -66.40% -19.96% -17.83% -18.60% -18.60% -18.60% -18.60% -18.60%37905 2013 10,272 0 18,042 (18,042) -175.64% -102.70% -83.89% -88.83% -29.20% -26.03% -26.75% -26.75% -26.75% -26.75%37905 2014 9,158 0 1,288 (1,288) -14.06% -99.48% -74.84% -71.98% -77.26% -28.44% -25.50% -26.19% -26.19% -26.19%37905 2015 2,122 0 4,417 (4,417) -208.18% -50.57% -110.18% -83.89% -77.16% -81.79% -30.51% -27.36% -28.04% -28.04%37905 2016 4,421 0 3 (3) -0.08% -67.56% -36.35% -91.44% -73.51% -71.50% -76.30% -29.79% -26.79% -27.46%37905 2017 913 0 1,861 (1,861) -203.93% -34.96% -84.25% -45.56% -95.26% -76.76% -73.48% -78.04% -30.63% -27.54%
379 Combine 1996 0 0 0 0 NA379 Combine 1997 0 0 0 0 NA NA379 Combine 1998 0 0 0 0 NA NA NA379 Combine 1999 1,547 0 0 0 0.00% 0.00% 0.00% 0.00%379 Combine 2000 12,823 0 2,112 (2,112) -16.47% -14.70% -14.70% -14.70% -14.70%379 Combine 2001 0 0 0 0 NA -16.47% -14.70% -14.70% -14.70% -14.70%379 Combine 2002 0 0 0 0 NA NA -16.47% -14.70% -14.70% -14.70% -14.70%379 Combine 2003 0 0 0 0 NA NA NA -16.47% -14.70% -14.70% -14.70% -14.70%379 Combine 2004 302 0 0 0 0.00% 0.00% 0.00% 0.00% -16.09% -14.39% -14.39% -14.39% -14.39%379 Combine 2005 0 0 0 0 NA 0.00% 0.00% 0.00% 0.00% -16.09% -14.39% -14.39% -14.39% -14.39%379 Combine 2006 0 0 0 0 NA NA 0.00% 0.00% 0.00% 0.00% -16.09% -14.39% -14.39% -14.39%379 Combine 2007 0 0 1,930 (1,930) NA NA NA -638.94% -638.94% -638.94% -638.94% -30.79% -27.55% -27.55%379 Combine 2008 25,434 0 1,813 (1,813) -7.13% -14.72% -14.72% -14.72% -14.54% -14.54% -14.54% -14.54% -15.18% -14.60%379 Combine 2009 140,703 0 6,112 (6,112) -4.34% -4.77% -5.93% -5.93% -5.93% -5.92% -5.92% -5.92% -5.92% -6.68%379 Combine 2010 18,456 0 7,206 (7,206) -39.04% -8.37% -8.20% -9.24% -9.24% -9.24% -9.23% -9.23% -9.23% -9.23%379 Combine 2011 83,102 0 17,532 (17,532) -21.10% -24.36% -12.73% -12.20% -12.92% -12.92% -12.92% -12.91% -12.91% -12.91%379 Combine 2012 9,710 0 2,471 (2,471) -25.45% -21.55% -24.45% -13.22% -12.67% -13.36% -13.36% -13.36% -13.35% -13.35%379 Combine 2013 10,272 0 29,517 (29,517) -287.34% -160.08% -48.04% -46.67% -23.96% -22.47% -23.14% -23.14% -23.14% -23.12%379 Combine 2014 18,927 0 3,179 (3,179) -16.79% -111.97% -90.38% -43.19% -42.65% -23.48% -22.12% -22.75% -22.75% -22.75%379 Combine 2015 46,022 0 8,904 (8,904) -19.35% -18.60% -55.30% -51.89% -36.66% -36.90% -22.90% -21.76% -22.31% -22.31%379 Combine 2016 65,914 0 4,640 (4,640) -7.04% -12.10% -12.78% -32.76% -32.29% -28.32% -29.10% -20.24% -19.44% -19.90%379 Combine 2017 913 0 1,861 (1,861) -203.93% -9.73% -13.65% -14.10% -33.86% -33.32% -29.00% -29.73% -20.66% -19.84%
369378379 1996 0 0 230 (230) NA369378379 1997 0 0 0 0 NA NA369378379 1998 13,898 0 100 (100) -0.72% -0.72% -2.37%369378379 1999 2,464 0 0 0 0.00% -0.61% -0.61% -2.02%369378379 2000 12,823 0 2,112 (2,112) -16.47% -13.82% -7.58% -7.58% -8.37%369378379 2001 2,183 0 0 0 0.00% -14.07% -12.09% -7.05% -7.05% -7.79%369378379 2002 0 0 0 0 NA 0.00% -14.07% -12.09% -7.05% -7.05% -7.79%369378379 2003 0 0 0 0 NA NA 0.00% -14.07% -12.09% -7.05% -7.05% -7.79%369378379 2004 302 0 0 0 0.00% 0.00% 0.00% 0.00% -13.80% -11.88% -6.98% -6.98% -7.71%369378379 2005 0 0 0 0 NA 0.00% 0.00% 0.00% 0.00% -13.80% -11.88% -6.98% -6.98% -7.71%369378379 2006 12,627 0 7,595 (7,595) -60.15% -60.15% -58.75% -58.75% -58.75% -50.26% -34.75% -31.93% -22.14% -22.14%369378379 2007 24,754 0 57,130 (57,130) -230.79% -173.15% -173.15% -171.76% -171.76% -171.76% -162.36% -126.85% -121.19% -96.94%369378379 2008 102,611 0 27,327 (27,327) -26.63% -66.31% -65.76% -65.76% -65.61% -65.61% -65.61% -64.61% -60.63% -59.69%369378379 2009 353,849 0 21,868 (21,868) -6.18% -10.78% -22.10% -23.07% -23.07% -23.05% -23.05% -23.05% -22.95% -22.79%369378379 2010 58,561 (5,556) (44,745) 39,190 66.92% 4.20% -1.94% -12.44% -13.53% -13.53% -13.52% -13.52% -13.52% -13.47%369378379 2011 152,240 0 34,200 (34,200) -22.46% 2.37% -2.99% -6.62% -14.64% -15.46% -15.46% -15.45% -15.45% -15.45%369378379 2012 28,670 0 5,202 (5,202) -18.14% -21.78% -0.09% -3.72% -7.10% -14.78% -15.56% -15.56% -15.56% -15.56%369378379 2013 19,553 0 43,716 (43,716) -223.57% -101.44% -41.46% -16.96% -10.74% -13.02% -20.30% -20.97% -20.97% -20.96%369378379 2014 79,356 0 8,019 (8,019) -10.11% -52.31% -44.63% -32.57% -15.35% -10.66% -12.72% -19.31% -19.93% -19.93%369378379 2015 66,562 0 14,288 (14,288) -21.47% -15.29% -39.90% -36.69% -30.44% -16.36% -11.61% -13.40% -19.47% -20.04%369378379 2016 107,633 0 20,800 (20,800) -19.32% -20.14% -17.00% -31.79% -30.49% -27.80% -16.98% -12.57% -14.06% -19.46%369378379 2017 156,830 0 31,390 (31,390) -20.02% -19.73% -20.08% -18.15% -27.50% -26.91% -25.80% -17.69% -13.71% -14.89%
Exhibit DAW-2 Page 98 of 111

Appendix D
2- yr 3- yr 4- yr 5- yr 6- yr 7- yr 8- yr 9- yr 10- yrNet Net Net Net Net Net Net Net Net Net Net
Account TY Retirements Salvage COR Salvage Salv. % Salv. % Salv. % Salv. % Salv. % Salv. % Salv. % Salv. % Salv. % Salv. %
ATMOS ENERGY - KENTUCKY DIVISIONDepreciation Study as of September 30, 2017
NET SALVAGE HISTORY
38000 1996 176,565 0 27,636 (27,636) -15.65%38000 1997 215,379 154 29,621 (29,467) -13.68% -14.57%38000 1998 0 0 16,139 (16,139) NA -21.17% -18.69%38000 1999 340,026 0 253,715 (253,715) -74.62% -79.36% -53.89% -44.67%38000 2000 436,424 0 559,854 (559,854) -128.28% -104.78% -106.86% -86.63% -75.90%38000 2001 1,081,065 0 450,538 (450,538) -41.68% -66.58% -68.05% -68.92% -63.18% -59.45%38000 2002 353,920 0 282,498 (282,498) -79.82% -51.08% -69.09% -69.94% -70.67% -65.61% -62.22%38000 2003 573,781 0 600,977 (600,977) -104.74% -95.23% -66.41% -77.45% -77.11% -77.69% -73.09% -69.90%38000 2004 127,032 0 479,035 (479,035) -377.10% -154.11% -129.18% -84.89% -92.25% -90.19% -90.75% -85.44% -81.71%38000 2005 540,726 0 257,366 (257,366) -47.60% -110.28% -107.72% -101.53% -77.35% -84.49% -83.52% -83.99% -79.86% -76.91%38000 2006 1,319,886 0 760,812 (760,812) -57.64% -54.72% -75.33% -81.91% -81.66% -70.84% -76.50% -76.37% -76.70% -73.98%38000 2007 163,702 0 351,968 (351,968) -215.01% -75.01% -67.68% -85.95% -89.91% -88.75% -76.52% -81.43% -80.96% -81.29%38000 2008 70,173 0 23,861 (23,861) -34.00% -160.70% -73.15% -66.56% -84.31% -88.51% -87.53% -75.81% -80.72% -80.30%38000 2009 2,051,976 0 7 (7) 0.00% -1.12% -16.44% -31.52% -33.62% -43.83% -51.04% -53.00% -51.05% -56.07%38000 2010 1,905,040 0 2,062,319 (2,062,319) -108.26% -52.12% -51.80% -58.18% -58.05% -57.12% -63.69% -67.18% -67.81% -64.36%38000 2011 3,127,619 0 957,931 (957,931) -30.63% -60.01% -42.63% -42.55% -46.40% -48.12% -48.09% -52.58% -55.61% -56.45%38000 2012 2,788,517 0 1,345,462 (1,345,462) -48.25% -38.93% -55.82% -44.22% -44.15% -46.91% -48.15% -48.13% -51.58% -53.99%38000 2013 1,104,233 0 1,326,142 (1,326,142) -120.10% -68.63% -51.70% -63.77% -51.85% -51.74% -54.12% -54.49% -54.21% -57.31%38000 2014 1,010,606 0 900,316 (900,316) -89.09% -105.28% -72.85% -56.40% -66.35% -54.99% -54.87% -57.01% -57.07% -56.71%38000 2015 6,004,705 0 1,550,528 (1,550,528) -25.82% -34.94% -46.52% -46.96% -43.32% -51.08% -45.26% -45.21% -46.74% -47.47%38000 2016 8,454,192 0 1,322,582 (1,322,582) -15.64% -19.87% -24.39% -30.77% -33.29% -32.92% -38.80% -35.79% -35.79% -36.88%38000 2017 4,632,739 0 568,633 (568,633) -12.27% -14.45% -18.03% -21.60% -26.73% -29.23% -29.39% -34.57% -32.28% -32.29%
38100 1996 796,549 359,733 3,981 355,752 44.66%38100 1997 165,892 20,205 109 20,096 12.11% 39.05%38100 1998 5,818 38,534 0 38,534 662.32% 34.14% 42.80%38100 1999 292,116 0 26,537 (26,537) -9.08% 4.03% 6.92% 30.77%38100 2000 0 0 NA -9.08% 4.03% 6.92% 30.77%38100 2001 0 0 NA NA -9.08% 4.03% 6.92% 30.77%38100 2002 0 0 NA NA NA -9.08% 4.03% 6.92% 30.77%38100 2003 9,244,466 0 0 0 0.00% 0.00% 0.00% 0.00% -0.28% 0.13% 0.33% 3.69%38100 2004 0 0 NA 0.00% 0.00% 0.00% 0.00% -0.28% 0.13% 0.33% 3.69%38100 2005 0 0 NA NA 0.00% 0.00% 0.00% 0.00% -0.28% 0.13% 0.33% 3.69%38100 2006 0 0 NA NA NA 0.00% 0.00% 0.00% 0.00% -0.28% 0.13% 0.33%38100 2007 588,405 0 52,884 (52,884) -8.99% -8.99% -8.99% -8.99% -0.54% -0.54% -0.54% -0.54% -0.78% -0.40%38100 2008 257,366 0 5,632 (5,632) -2.19% -6.92% -6.92% -6.92% -6.92% -0.58% -0.58% -0.58% -0.58% -0.82%38100 2009 25,931 0 61,850 (61,850) -238.52% -23.82% -13.81% -13.81% -13.81% -13.81% -1.19% -1.19% -1.19% -1.19%38100 2010 0 0 NA -238.52% -23.82% -13.81% -13.81% -13.81% -13.81% -1.19% -1.19% -1.19%38100 2011 28,203 0 0 0.00% 0.00% -114.26% -21.66% -13.38% -13.38% -13.38% -13.38% -1.19% -1.19%38100 2012 303,636 0 186,923 (186,923) -61.56% -56.33% -56.33% -69.53% -41.36% -25.53% -25.53% -25.53% -25.53% -2.94%38100 2013 24,130 0 31,850 (31,850) -132.00% -66.75% -61.46% -61.46% -73.48% -44.78% -27.62% -27.62% -27.62% -27.62%38100 2014 723,289 0 31,183 (31,183) -4.31% -8.43% -23.78% -23.16% -23.16% -28.21% -23.30% -18.98% -18.98% -18.98%38100 2015 555,219 0 13,229 (13,229) -2.38% -3.47% -5.85% -16.38% -16.10% -16.10% -19.58% -17.24% -15.30% -15.30%38100 2016 325,177 1 136,383 (136,382) -41.94% -16.99% -11.27% -13.06% -20.69% -20.39% -20.39% -23.24% -20.82% -18.36%38100 2017 355,426 0 7,412 (7,412) -2.09% -21.13% -12.71% -9.61% -11.10% -17.80% -17.58% -17.58% -20.03% -18.26%
38200 1996 50,071 0 61,106 (61,106) -122.04%38200 1997 61,875 0 106,958 (106,958) -172.86% -150.13%38200 1998 0 0 9,625 (9,625) NA -188.42% -158.73%38200 1999 10,925 0 7,540 (7,540) -69.02% -157.12% -170.50% -150.75%38200 2000 79,200 0 414,823 (414,823) -523.77% -468.64% -479.32% -354.57% -296.95%38200 2001 57,297 0 161,169 (161,169) -281.29% -421.98% -395.82% -402.35% -334.51% -293.49%38200 2002 250,858 0 1,139,462 (1,139,462) -454.23% -422.07% -442.86% -432.61% -435.03% -399.77% -372.52%38200 2003 312,393 0 536,125 (536,125) -171.62% -297.48% -295.99% -321.77% -317.88% -319.24% -307.52% -296.23%38200 2004 203,956 0 521,798 (521,798) -255.84% -204.89% -286.41% -286.06% -306.89% -304.05% -305.10% -296.72% -288.20%38200 2005 110,560 0 157,057 (157,057) -142.06% -215.84% -193.80% -268.23% -269.03% -288.92% -286.58% -287.52% -280.99% -273.99%38200 2006 527,453 0 943,844 (943,844) -178.94% -172.55% -192.73% -187.01% -234.72% -236.54% -251.30% -250.01% -250.63% -247.65%38200 2007 57,689 0 118,099 (118,099) -204.72% -181.48% -175.22% -193.50% -187.86% -233.53% -235.33% -249.62% -248.39% -248.99%38200 2008 0 0 10,248 (10,248) NA -222.48% -183.24% -176.69% -194.63% -188.70% -234.23% -236.01% -250.26% -249.03%38200 2009 1,027,944 0 7 (7) 0.00% -1.00% -11.82% -66.47% -71.32% -90.84% -102.11% -137.57% -140.80% -152.34%38200 2010 475,357 0 4,428,393 (4,428,393) -931.59% -294.58% -295.26% -291.91% -263.38% -257.28% -257.16% -247.32% -264.82% -265.13%38200 2011 1,816,947 0 964,265 (964,265) -53.07% -235.25% -162.42% -162.73% -163.44% -165.54% -164.89% -169.29% -169.45% -184.38%38200 2012 583,220 0 314,535 (314,535) -53.93% -53.28% -198.47% -146.21% -146.47% -147.32% -151.04% -150.82% -155.28% -156.28%
Exhibit DAW-2 Page 99 of 111

Appendix D
2- yr 3- yr 4- yr 5- yr 6- yr 7- yr 8- yr 9- yr 10- yrNet Net Net Net Net Net Net Net Net Net Net
Account TY Retirements Salvage COR Salvage Salv. % Salv. % Salv. % Salv. % Salv. % Salv. % Salv. % Salv. % Salv. % Salv. %
ATMOS ENERGY - KENTUCKY DIVISIONDepreciation Study as of September 30, 2017
NET SALVAGE HISTORY
38200 2013 164,053 0 0 0 0.00% -42.09% -49.87% -187.76% -140.31% -140.56% -141.46% -145.71% -145.63% -150.15%38200 2014 0 0 8,717 (8,717) NA -5.31% -43.26% -50.21% -188.05% -140.53% -140.78% -141.67% -145.90% -145.81%38200 2015 779,567 0 124,672 (124,672) -15.99% -17.11% -14.14% -29.34% -42.23% -152.93% -120.50% -120.71% -121.70% -127.25%38200 2016 565,583 1,289 2,490,298 (2,489,010) -440.08% -194.30% -194.95% -173.76% -140.36% -99.79% -189.97% -153.89% -154.08% -154.61%38200 2017 716,766 0 182,031 (182,031) -25.40% -208.29% -135.59% -136.01% -125.99% -111.03% -88.26% -166.85% -138.86% -139.03%
381-382 C 1996 846,620 359,733 65,087 294,646 34.80%381-382 C 1997 227,767 20,205 107,067 (86,862) -38.14% 19.34%381-382 C 1998 5,818 38,534 9,625 28,909 496.89% -24.81% 21.91%381-382 C 1999 303,041 0 34,077 (34,077) -11.25% -1.67% -17.15% 14.65%381-382 C 2000 79,200 0 414,823 (414,823) -523.77% -117.44% -108.23% -82.30% -14.51%381-382 C 2001 57,297 0 161,169 (161,169) -281.29% -421.98% -138.80% -130.49% -99.24% -24.57%381-382 C 2002 250,858 0 1,139,462 (1,139,462) -454.23% -422.07% -442.86% -253.41% -247.14% -195.62% -85.44%381-382 C 2003 9,556,859 0 536,125 (536,125) -5.61% -17.08% -18.62% -22.64% -22.31% -22.01% -22.36% -18.09%381-382 C 2004 203,956 0 521,798 (521,798) -255.84% -10.84% -21.95% -23.42% -27.33% -26.86% -26.57% -26.82% -22.29%381-382 C 2005 110,560 0 157,057 (157,057) -142.06% -215.84% -12.31% -23.26% -24.71% -28.57% -28.07% -27.78% -28.00% -23.43%381-382 C 2006 527,453 0 943,844 (943,844) -178.94% -172.55% -192.73% -20.76% -30.97% -32.31% -35.92% -35.24% -34.97% -35.03%381-382 C 2007 646,095 0 170,983 (170,983) -26.46% -95.00% -99.05% -120.54% -21.09% -30.71% -31.98% -35.38% -34.76% -34.50%381-382 C 2008 257,366 0 15,880 (15,880) -6.17% -20.68% -79.02% -83.54% -103.67% -20.75% -30.17% -31.41% -34.74% -34.15%381-382 C 2009 1,053,875 0 61,857 (61,857) -5.87% -5.93% -12.71% -47.99% -52.00% -66.85% -19.48% -28.14% -29.28% -32.35%381-382 C 2010 475,357 0 4,428,393 (4,428,393) -931.59% -293.63% -252.22% -192.26% -189.89% -188.17% -192.38% -53.27% -60.96% -61.92%381-382 C 2011 1,845,150 0 964,265 (964,265) -52.26% -232.39% -161.64% -150.63% -131.87% -137.04% -137.15% -141.88% -53.15% -59.89%381-382 C 2012 886,856 0 501,458 (501,458) -56.54% -53.65% -183.77% -139.77% -132.16% -118.94% -124.50% -124.83% -129.28% -53.34%381-382 C 2013 188,183 0 31,850 (31,850) -16.93% -49.61% -51.28% -174.52% -134.58% -127.55% -115.35% -121.06% -121.44% -125.87%381-382 C 2014 723,289 0 39,900 (39,900) -5.52% -7.87% -31.87% -42.20% -144.84% -116.53% -111.30% -102.28% -108.40% -108.96%381-382 C 2015 1,334,786 0 137,900 (137,900) -10.33% -8.64% -9.33% -22.70% -33.65% -111.92% -94.75% -91.38% -85.72% -91.91%381-382 C 2016 890,760 1,289 2,626,681 (2,625,392) -294.74% -124.16% -95.06% -90.37% -82.92% -73.28% -137.59% -118.83% -115.04% -108.14%381-382 C 2017 1,072,192 0 189,443 (189,443) -17.67% -143.40% -89.54% -74.42% -71.85% -69.19% -64.69% -120.25% -106.02% -103.08%
38300 1996 143,491 0 0 0 0.00%38300 1997 0 NA 0.00%38300 1998 264,277 0 0 0 0.00% 0.00% 0.00%38300 1999 0 NA 0.00% 0.00% 0.00%38300 2000 0 NA NA 0.00% 0.00% 0.00%38300 2001 0 NA NA NA 0.00% 0.00% 0.00%38300 2002 0 NA NA NA NA 0.00% 0.00% 0.00%38300 2003 68 0 0 0 0.00% 0.00% 0.00% 0.00% 0.00% 0.00% 0.00% 0.00%38300 2004 0 NA 0.00% 0.00% 0.00% 0.00% 0.00% 0.00% 0.00% 0.00%38300 2005 4,054 0 0 0 0.00% 0.00% 0.00% 0.00% 0.00% 0.00% 0.00% 0.00% 0.00% 0.00%38300 2006 0 NA 0.00% 0.00% 0.00% 0.00% 0.00% 0.00% 0.00% 0.00% 0.00%38300 2007 1,772 0 1,453 (1,453) -81.97% -81.97% -24.94% -24.94% -24.65% -24.65% -24.65% -24.65% -24.65% -0.54%38300 2008 12,153 0 4,450 (4,450) -36.62% -42.39% -42.39% -32.83% -32.83% -32.71% -32.71% -32.71% -32.71% -32.71%38300 2009 0 0 3,141 (3,141) NA -62.46% -64.94% -64.94% -50.30% -50.30% -50.11% -50.11% -50.11% -50.11%38300 2010 0 0 793 (793) NA NA -68.99% -70.64% -70.64% -54.71% -54.71% -54.51% -54.51% -54.51%38300 2011 420,633 0 34,099 (34,099) -8.11% -8.30% -9.04% -9.82% -10.11% -10.11% -10.02% -10.02% -10.02% -10.02%38300 2012 7,278 0 153,966 (153,966) -2115.57% -43.95% -44.13% -44.87% -44.64% -44.79% -44.79% -44.38% -44.38% -44.38%38300 2013 0 0 0 0 NA -2115.57% -43.95% -44.13% -44.87% -44.64% -44.79% -44.79% -44.38% -44.38%38300 2014 51 0 79,296 (79,296) -156681.25% -156681.25% -3183.01% -62.47% -62.66% -63.39% -62.65% -62.73% -62.73% -62.16%38300 2015 152,578 0 6,999 (6,999) -4.59% -56.54% -56.54% -150.25% -47.26% -47.40% -47.94% -47.71% -47.81% -47.81%38300 2016 65,200 1,301 1,777,797 (1,776,497) -2724.71% -818.95% -855.17% -855.17% -895.92% -317.60% -317.72% -318.21% -313.01% -312.39%38300 2017 76,902 0 11,253 (11,253) -14.63% -1258.08% -609.05% -635.85% -635.85% -671.51% -285.36% -285.47% -285.90% -281.78%
38400 1996 0 0 0 0 NA38400 1997 2,664 0 0 0 0.00% 0.00%38400 1998 0 0 0 0 NA 0.00% 0.00%38400 1999 0 0 0 0 NA NA 0.00% 0.00%38400 2000 0 0 0 0 NA NA NA 0.00% 0.00%38400 2001 0 0 0 0 NA NA NA NA 0.00% 0.00%38400 2002 0 0 0 0 NA NA NA NA NA 0.00% 0.00%38400 2003 0 0 0 0 NA NA NA NA NA NA 0.00% 0.00%38400 2004 0 0 0 0 NA NA NA NA NA NA NA 0.00% 0.00%38400 2005 0 0 0 0 NA NA NA NA NA NA NA NA 0.00% 0.00%38400 2006 0 0 0 0 NA NA NA NA NA NA NA NA NA 0.00%38400 2007 0 0 0 0 NA NA NA NA NA NA NA NA NA NA
Exhibit DAW-2 Page 100 of 111

Appendix D
2- yr 3- yr 4- yr 5- yr 6- yr 7- yr 8- yr 9- yr 10- yrNet Net Net Net Net Net Net Net Net Net Net
Account TY Retirements Salvage COR Salvage Salv. % Salv. % Salv. % Salv. % Salv. % Salv. % Salv. % Salv. % Salv. % Salv. %
ATMOS ENERGY - KENTUCKY DIVISIONDepreciation Study as of September 30, 2017
NET SALVAGE HISTORY
38400 2008 0 0 0 0 NA NA NA NA NA NA NA NA NA NA38400 2009 0 0 0 0 NA NA NA NA NA NA NA NA NA NA38400 2010 0 0 0 0 NA NA NA NA NA NA NA NA NA NA38400 2011 0 0 0 0 NA NA NA NA NA NA NA NA NA NA38400 2012 0 0 0 0 NA NA NA NA NA NA NA NA NA NA38400 2013 0 0 0 0 NA NA NA NA NA NA NA NA NA NA38400 2014 0 0 0 0 NA NA NA NA NA NA NA NA NA NA38400 2015 0 0 0 0 NA NA NA NA NA NA NA NA NA NA38400 2016 0 0 0 0 NA NA NA NA NA NA NA NA NA NA38400 2017 0 0 0 0 NA NA NA NA NA NA NA NA NA NA
381-384 1996 990,111 359,733 65,087 294,646 29.76%381-384 1997 230,431 20,205 107,067 (86,862) -37.70% 17.02%381-384 1998 270,095 38,534 9,625 28,909 10.70% -11.58% 15.88%381-384 1999 303,041 0 34,077 (34,077) -11.25% -0.90% -11.45% 11.30%381-384 2000 79,200 0 414,823 (414,823) -523.77% -117.44% -64.38% -57.42% -11.33%381-384 2001 57,297 0 161,169 (161,169) -281.29% -421.98% -138.80% -81.90% -71.06% -19.34%381-384 2002 250,858 0 1,139,462 (1,139,462) -454.23% -422.07% -442.86% -253.41% -179.14% -151.77% -69.36%381-384 2003 9,556,927 0 536,125 (536,125) -5.61% -17.08% -18.62% -22.64% -22.30% -21.46% -21.81% -17.46%381-384 2004 203,956 0 521,798 (521,798) -255.84% -10.84% -21.95% -23.42% -27.33% -26.86% -25.92% -26.16% -21.53%381-384 2005 114,614 0 157,057 (157,057) -137.03% -213.09% -12.30% -23.25% -24.70% -28.55% -28.06% -27.09% -27.31% -22.63%381-384 2006 527,453 0 943,844 (943,844) -178.94% -171.46% -191.80% -20.75% -30.96% -32.30% -35.91% -35.23% -34.14% -34.21%381-384 2007 647,867 0 172,436 (172,436) -26.62% -94.98% -98.71% -120.17% -21.10% -30.71% -31.97% -35.38% -34.76% -33.73%381-384 2008 269,519 0 20,330 (20,330) -7.54% -21.01% -78.67% -82.96% -102.95% -20.77% -30.17% -31.41% -34.74% -34.15%381-384 2009 1,053,875 0 64,998 (64,998) -6.17% -6.45% -13.08% -48.09% -51.99% -66.75% -19.53% -28.17% -29.31% -32.38%381-384 2010 475,357 0 4,429,186 (4,429,186) -931.76% -293.89% -250.98% -191.57% -189.33% -187.39% -191.63% -53.28% -60.95% -61.91%381-384 2011 2,265,783 0 998,363 (998,363) -44.06% -198.00% -144.73% -135.63% -120.65% -126.51% -126.74% -131.48% -51.90% -58.46%381-384 2012 894,134 0 655,424 (655,424) -73.30% -52.34% -167.33% -131.11% -124.39% -113.10% -118.76% -119.09% -123.42% -53.09%381-384 2013 188,183 0 31,850 (31,850) -16.93% -63.50% -50.35% -159.93% -126.70% -120.46% -109.97% -115.73% -116.11% -120.40%381-384 2014 723,339 0 119,196 (119,196) -16.48% -16.57% -44.66% -44.33% -137.11% -112.47% -107.65% -99.60% -105.54% -106.04%381-384 2015 1,487,364 0 144,899 (144,899) -9.74% -11.95% -12.34% -28.89% -35.07% -105.71% -90.91% -87.86% -82.90% -88.84%381-384 2016 955,960 2,590 4,404,478 (4,401,889) -460.47% -186.09% -147.35% -140.03% -125.99% -97.50% -154.23% -134.83% -130.70% -123.18%381-384 2017 1,149,093 0 200,696 (200,696) -17.47% -218.64% -132.15% -112.77% -108.76% -102.89% -85.50% -134.92% -120.16% -116.95%
382-384 1996 193,562 0 61,106 (61,106) -31.57%382-384 1997 64,539 0 106,958 (106,958) -165.73% -65.12%382-384 1998 264,277 0 9,625 (9,625) -3.64% -35.46% -34.02%382-384 1999 10,925 0 7,540 (7,540) -69.02% -6.24% -36.53% -34.73%382-384 2000 79,200 0 414,823 (414,823) -523.77% -468.64% -121.89% -128.64% -97.97%382-384 2001 57,297 0 161,169 (161,169) -281.29% -421.98% -395.82% -144.08% -147.01% -113.65%382-384 2002 250,858 0 1,139,462 (1,139,462) -454.23% -422.07% -442.86% -432.61% -261.50% -253.00% -206.45%382-384 2003 312,461 0 536,125 (536,125) -171.58% -297.45% -295.96% -321.74% -317.85% -232.69% -228.53% -197.61%382-384 2004 203,956 0 521,798 (521,798) -255.84% -204.86% -286.39% -286.03% -306.87% -304.03% -236.69% -233.01% -205.88%382-384 2005 114,614 0 157,057 (157,057) -137.03% -213.09% -192.54% -266.98% -267.85% -287.75% -285.43% -227.86% -224.91% -200.79%382-384 2006 527,453 0 943,844 (943,844) -178.94% -171.46% -191.80% -186.35% -234.03% -235.88% -250.63% -249.35% -213.69% -212.05%382-384 2007 59,462 0 119,552 (119,552) -201.06% -181.18% -173.97% -192.41% -187.07% -232.70% -234.52% -248.79% -247.58% -213.29%382-384 2008 12,153 0 14,698 (14,698) -120.94% -187.46% -179.96% -173.07% -191.46% -186.41% -231.78% -233.62% -247.83% -246.63%382-384 2009 1,027,944 0 3,148 (3,148) -0.31% -1.72% -12.50% -66.46% -71.10% -90.47% -101.69% -136.94% -140.16% -151.65%382-384 2010 475,357 0 4,429,186 (4,429,186) -931.76% -294.84% -293.45% -289.96% -262.11% -255.64% -255.66% -246.05% -263.55% -263.88%382-384 2011 2,237,580 0 998,363 (998,363) -44.62% -200.06% -145.17% -145.09% -145.97% -149.97% -149.64% -154.29% -155.38% -169.73%382-384 2012 590,498 0 468,501 (468,501) -79.34% -51.87% -178.48% -136.20% -136.15% -137.03% -141.51% -141.41% -145.86% -147.30%382-384 2013 164,053 0 0 0 0.00% -62.09% -49.02% -170.04% -131.23% -131.20% -132.11% -136.96% -136.96% -141.44%382-384 2014 51 0 88,014 (88,014) -173905.51% -53.63% -73.75% -51.96% -172.57% -133.18% -133.15% -134.03% -138.68% -138.65%382-384 2015 932,145 0 131,670 (131,670) -14.13% -23.57% -20.04% -40.80% -42.98% -139.00% -112.74% -112.75% -113.71% -119.42%382-384 2016 630,783 2,589 4,268,095 (4,265,506) -676.22% -281.34% -286.96% -259.71% -213.75% -130.67% -206.37% -171.40% -171.30% -171.59%382-384 2017 793,667 0 193,284 (193,284) -24.35% -313.02% -194.79% -198.52% -185.60% -165.43% -114.89% -181.56% -154.37% -154.31%
38500 1996 16,570 1,028 3 1,025 6.19%38500 1997 2,204 0 18 (18) -0.82% 5.36%38500 1998 14,263 0 10 (10) -0.07% -0.17% 3.02%38500 1999 6,054 0 0 0 0.00% -0.05% -0.12% 2.55%38500 2000 681 0 1,698 (1,698) -249.34% -25.21% -8.13% -7.44% -1.76%38500 2001 16,167 0 7,896 (7,896) -48.84% -56.94% -41.89% -25.84% -24.44% -15.37%38500 2002 0 0 0 0 NA -48.84% -56.94% -41.89% -25.84% -24.44% -15.37%
Exhibit DAW-2 Page 101 of 111

Appendix D
2- yr 3- yr 4- yr 5- yr 6- yr 7- yr 8- yr 9- yr 10- yrNet Net Net Net Net Net Net Net Net Net Net
Account TY Retirements Salvage COR Salvage Salv. % Salv. % Salv. % Salv. % Salv. % Salv. % Salv. % Salv. % Salv. % Salv. %
ATMOS ENERGY - KENTUCKY DIVISIONDepreciation Study as of September 30, 2017
NET SALVAGE HISTORY
38500 2003 0 0 0 0 NA NA -48.84% -56.94% -41.89% -25.84% -24.44% -15.37%38500 2004 0 0 0 0 NA NA NA -48.84% -56.94% -41.89% -25.84% -24.44% -15.37%38500 2005 0 0 0 0 NA NA NA NA -48.84% -56.94% -41.89% -25.84% -24.44% -15.37%38500 2006 0 0 0 0 NA NA NA NA NA -48.84% -56.94% -41.89% -25.84% -24.44%38500 2007 11,826 0 3,573 (3,573) -30.21% -30.21% -30.21% -30.21% -30.21% -30.21% -40.97% -45.92% -37.92% -26.90%38500 2008 30,185 0 0 0.00% -8.51% -8.51% -8.51% -8.51% -8.51% -8.51% -19.71% -22.37% -20.28%38500 2009 3,375 0 9,909 (9,909) -293.54% -29.52% -29.70% -29.70% -29.70% -29.70% -29.70% -29.70% -34.73% -37.08%38500 2010 10,244 0 1,623 (1,623) -15.85% -84.67% -26.33% -27.15% -27.15% -27.15% -27.15% -27.15% -27.15% -32.04%38500 2011 8,966 0 3,423 (3,423) -38.18% -26.27% -66.21% -28.34% -28.68% -28.68% -28.68% -28.68% -28.68% -28.68%38500 2012 6,251 0 6,611 (6,611) -105.76% -65.94% -45.79% -74.79% -36.54% -35.48% -35.48% -35.48% -35.48% -35.48%38500 2013 14,689 0 4,226 (4,226) -28.77% -51.75% -47.68% -39.56% -59.26% -34.99% -34.33% -34.33% -34.33% -34.33%38500 2014 7,819 0 (20,568) 20,568 263.05% 72.61% 33.84% 16.72% 9.77% -10.17% -6.41% -9.42% -9.42% -9.42%38500 2015 8,886 0 1,971 (1,971) -22.18% 111.33% 45.78% 20.61% 9.31% 4.77% -11.95% -7.96% -10.53% -10.53%38500 2016 0 0 0 0 NA -22.18% 111.33% 45.78% 20.61% 9.31% 4.77% -11.95% -7.96% -10.53%38500 2017 0 0 0 0 NA NA -22.18% 111.33% 45.78% 20.61% 9.31% 4.77% -11.95% -7.96%
39000 1996 0 0 0 0 NA39000 1997 0 0 0 0 NA NA39000 1998 1,718 0 0 0 0.00% 0.00% 0.00%39000 1999 0 0 0 0 NA 0.00% 0.00% 0.00%39000 2000 0 0 0 0 NA NA 0.00% 0.00% 0.00%39000 2001 0 0 0 0 NA NA NA 0.00% 0.00% 0.00%39000 2002 0 0 0 0 NA NA NA NA 0.00% 0.00% 0.00%39000 2003 0 0 0 0 NA NA NA NA NA 0.00% 0.00% 0.00%39000 2004 0 0 0 0 NA NA NA NA NA NA 0.00% 0.00% 0.00%39000 2005 0 0 0 0 NA NA NA NA NA NA NA 0.00% 0.00% 0.00%39000 2006 0 0 0 0 NA NA NA NA NA NA NA NA 0.00% 0.00%39000 2007 0 0 0 0 NA NA NA NA NA NA NA NA NA 0.00%39000 2008 0 0 274 (274) NA NA NA NA NA NA NA NA NA NA39000 2009 0 0 442 (442) NA NA NA NA NA NA NA NA NA NA39000 2010 0 0 0 0 NA NA NA NA NA NA NA NA NA NA39000 2011 201 0 0 0 0.00% 0.00% -219.92% -356.25% -356.25% -356.25% -356.25% -356.25% -356.25% -356.25%39000 2012 0 0 0 0 NA 0.00% 0.00% -219.92% -356.25% -356.25% -356.25% -356.25% -356.25% -356.25%39000 2013 5,256 0 830 (830) -15.78% -15.78% -15.20% -15.20% -23.29% -28.31% -28.31% -28.31% -28.31% -28.31%39000 2014 0 0 0 0 NA -15.78% -15.78% -15.20% -15.20% -23.29% -28.31% -28.31% -28.31% -28.31%39000 2015 298,352 0 0 0 0.00% 0.00% -0.27% -0.27% -0.27% -0.27% -0.42% -0.51% -0.51% -0.51%39000 2016 0 0 0 0 NA 0.00% 0.00% -0.27% -0.27% -0.27% -0.27% -0.42% -0.51% -0.51%39000 2017 0 0 0 0 NA NA 0.00% 0.00% -0.27% -0.27% -0.27% -0.27% -0.42% -0.51%
39002 1996 0 0 0 0 NA39002 1997 0 0 0 0 NA NA39002 1998 0 0 0 0 NA NA NA39002 1999 0 0 0 0 NA NA NA NA39002 2000 0 0 0 0 NA NA NA NA NA39002 2001 0 0 0 0 NA NA NA NA NA NA39002 2002 0 0 0 0 NA NA NA NA NA NA NA39002 2003 0 0 0 0 NA NA NA NA NA NA NA NA39002 2004 0 0 0 0 NA NA NA NA NA NA NA NA NA39002 2005 0 0 0 0 NA NA NA NA NA NA NA NA NA NA39002 2006 0 0 0 0 NA NA NA NA NA NA NA NA NA NA39002 2007 6,777 0 32 (32) -0.48% -0.48% -0.48% -0.48% -0.48% -0.48% -0.48% -0.48% -0.48% -0.48%39002 2008 5,677 1,994 7,674 (5,680) -100.05% -45.87% -45.87% -45.87% -45.87% -45.87% -45.87% -45.87% -45.87% -45.87%39002 2009 0 0 0 0 NA -100.05% -45.87% -45.87% -45.87% -45.87% -45.87% -45.87% -45.87% -45.87%39002 2010 2,388 0 1,210 (1,210) -50.65% -50.65% -85.42% -46.64% -46.64% -46.64% -46.64% -46.64% -46.64% -46.64%39002 2011 0 0 0 0 NA -50.65% -50.65% -85.42% -46.64% -46.64% -46.64% -46.64% -46.64% -46.64%39002 2012 0 0 0 0 NA NA -50.65% -50.65% -85.42% -46.64% -46.64% -46.64% -46.64% -46.64%39002 2013 0 0 0 0 NA NA NA -50.65% -50.65% -85.42% -46.64% -46.64% -46.64% -46.64%39002 2014 5,641 0 0 0 0.00% 0.00% 0.00% 0.00% -15.07% -15.07% -50.27% -33.79% -33.79% -33.79%39002 2015 0 0 0 0 NA 0.00% 0.00% 0.00% 0.00% -15.07% -15.07% -50.27% -33.79% -33.79%39002 2016 0 0 0 0 NA NA 0.00% 0.00% 0.00% 0.00% -15.07% -15.07% -50.27% -33.79%39002 2017 0 0 0 0 NA NA NA 0.00% 0.00% 0.00% 0.00% -15.07% -15.07% -50.27%
Exhibit DAW-2 Page 102 of 111

Appendix D
2- yr 3- yr 4- yr 5- yr 6- yr 7- yr 8- yr 9- yr 10- yrNet Net Net Net Net Net Net Net Net Net Net
Account TY Retirements Salvage COR Salvage Salv. % Salv. % Salv. % Salv. % Salv. % Salv. % Salv. % Salv. % Salv. % Salv. %
ATMOS ENERGY - KENTUCKY DIVISIONDepreciation Study as of September 30, 2017
NET SALVAGE HISTORY
39003 1996 0 0 0 0 NA39003 1997 0 0 0 0 NA NA39003 1998 0 0 0 0 NA NA NA39003 1999 0 0 0 0 NA NA NA NA39003 2000 0 0 0 0 NA NA NA NA NA39003 2001 0 0 0 0 NA NA NA NA NA NA39003 2002 0 0 0 0 NA NA NA NA NA NA NA39003 2003 0 0 0 0 NA NA NA NA NA NA NA NA39003 2004 0 0 0 0 NA NA NA NA NA NA NA NA NA39003 2005 0 0 0 0 NA NA NA NA NA NA NA NA NA NA39003 2006 0 0 0 0 NA NA NA NA NA NA NA NA NA NA39003 2007 23,305 0 111 (111) -0.48% -0.48% -0.48% -0.48% -0.48% -0.48% -0.48% -0.48% -0.48% -0.48%39003 2008 3,449 1,694 1 1,693 49.10% 5.91% 5.91% 5.91% 5.91% 5.91% 5.91% 5.91% 5.91% 5.91%39003 2009 0 0 0 0 NA 49.10% 5.91% 5.91% 5.91% 5.91% 5.91% 5.91% 5.91% 5.91%39003 2010 2,511 0 110 (110) -4.39% -4.39% 26.56% 5.03% 5.03% 5.03% 5.03% 5.03% 5.03% 5.03%39003 2011 0 0 0 0 NA -4.39% -4.39% 26.56% 5.03% 5.03% 5.03% 5.03% 5.03% 5.03%39003 2012 0 0 0 0 NA NA -4.39% -4.39% 26.56% 5.03% 5.03% 5.03% 5.03% 5.03%39003 2013 0 0 0 0 NA NA NA -4.39% -4.39% 26.56% 5.03% 5.03% 5.03% 5.03%39003 2014 0 0 0 0 NA NA NA NA -4.39% -4.39% 26.56% 5.03% 5.03% 5.03%39003 2015 15,823 0 0 0 0.00% 0.00% 0.00% 0.00% 0.00% -0.60% -0.60% 7.27% 3.26% 3.26%39003 2016 0 0 0 0 NA 0.00% 0.00% 0.00% 0.00% 0.00% -0.60% -0.60% 7.27% 3.26%39003 2017 0 0 0 0 NA NA 0.00% 0.00% 0.00% 0.00% 0.00% -0.60% -0.60% 7.27%
39004 1996 0 0 0 0 NA39004 1997 0 0 0 0 NA NA39004 1998 0 0 0 0 NA NA NA39004 1999 0 0 0 0 NA NA NA NA39004 2000 0 0 0 0 NA NA NA NA NA39004 2001 0 0 0 0 NA NA NA NA NA NA39004 2002 0 0 0 0 NA NA NA NA NA NA NA39004 2003 0 0 0 0 NA NA NA NA NA NA NA NA39004 2004 0 0 0 0 NA NA NA NA NA NA NA NA NA39004 2005 0 0 0 0 NA NA NA NA NA NA NA NA NA NA39004 2006 0 0 0 0 NA NA NA NA NA NA NA NA NA NA39004 2007 0 0 0 0 NA NA NA NA NA NA NA NA NA NA39004 2008 2,310 1,135 1 1,134 49.10% 49.10% 49.10% 49.10% 49.10% 49.10% 49.10% 49.10% 49.10% 49.10%39004 2009 0 0 0 0 NA 49.10% 49.10% 49.10% 49.10% 49.10% 49.10% 49.10% 49.10% 49.10%39004 2010 0 0 0 0 NA NA 49.10% 49.10% 49.10% 49.10% 49.10% 49.10% 49.10% 49.10%39004 2011 0 0 0 0 NA NA NA 49.10% 49.10% 49.10% 49.10% 49.10% 49.10% 49.10%39004 2012 0 0 0 0 NA NA NA NA 49.10% 49.10% 49.10% 49.10% 49.10% 49.10%39004 2013 0 0 0 0 NA NA NA NA NA 49.10% 49.10% 49.10% 49.10% 49.10%39004 2014 0 0 0 0 NA NA NA NA NA NA 49.10% 49.10% 49.10% 49.10%39004 2015 0 0 0 0 NA NA NA NA NA NA NA 49.10% 49.10% 49.10%39004 2016 0 0 0 0 NA NA NA NA NA NA NA NA 49.10% 49.10%39004 2017 0 0 0 0 NA NA NA NA NA NA NA NA NA 49.10%
390 Combine 1996 0 0 0 0 NA390 Combine 1997 0 0 0 0 NA NA390 Combine 1998 1,718 0 0 0 0.00% 0.00% 0.00%390 Combine 1999 0 0 0 0 NA 0.00% 0.00% 0.00%390 Combine 2000 0 0 0 0 NA NA 0.00% 0.00% 0.00%390 Combine 2001 0 0 0 0 NA NA NA 0.00% 0.00% 0.00%390 Combine 2002 0 0 0 0 NA NA NA NA 0.00% 0.00% 0.00%390 Combine 2003 0 0 0 0 NA NA NA NA NA 0.00% 0.00% 0.00%390 Combine 2004 0 0 0 0 NA NA NA NA NA NA 0.00% 0.00% 0.00%390 Combine 2005 0 0 0 0 NA NA NA NA NA NA NA 0.00% 0.00% 0.00%390 Combine 2006 0 0 0 0 NA NA NA NA NA NA NA NA 0.00% 0.00%390 Combine 2007 30,082 0 144 (144) -0.48% -0.48% -0.48% -0.48% -0.48% -0.48% -0.48% -0.48% -0.48% -0.45%390 Combine 2008 11,436 4,822 7,949 (3,126) -27.34% -7.88% -7.88% -7.88% -7.88% -7.88% -7.88% -7.88% -7.88% -7.88%390 Combine 2009 0 0 442 (442) NA -31.20% -8.94% -8.94% -8.94% -8.94% -8.94% -8.94% -8.94% -8.94%390 Combine 2010 4,900 0 1,320 (1,320) -26.94% -35.95% -29.92% -10.84% -10.84% -10.84% -10.84% -10.84% -10.84% -10.84%390 Combine 2011 201 0 0 0 0.00% -25.88% -34.54% -29.56% -10.79% -10.79% -10.79% -10.79% -10.79% -10.79%
Exhibit DAW-2 Page 103 of 111

Appendix D
2- yr 3- yr 4- yr 5- yr 6- yr 7- yr 8- yr 9- yr 10- yrNet Net Net Net Net Net Net Net Net Net Net
Account TY Retirements Salvage COR Salvage Salv. % Salv. % Salv. % Salv. % Salv. % Salv. % Salv. % Salv. % Salv. % Salv. %
ATMOS ENERGY - KENTUCKY DIVISIONDepreciation Study as of September 30, 2017
NET SALVAGE HISTORY
390 Combine 2012 0 0 0 0 NA 0.00% -25.88% -34.54% -29.56% -10.79% -10.79% -10.79% -10.79% -10.79%390 Combine 2013 5,256 0 830 (830) -15.78% -15.78% -15.20% -20.76% -25.02% -26.23% -11.30% -11.30% -11.30% -11.30%390 Combine 2014 5,641 0 0 0 0.00% -7.61% -7.61% -7.47% -13.44% -16.20% -20.84% -10.19% -10.19% -10.19%390 Combine 2015 314,175 0 0 0 0.00% 0.00% -0.26% -0.26% -0.26% -0.65% -0.78% -1.67% -1.58% -1.58%390 Combine 2016 0 0 0 0 NA 0.00% 0.00% -0.26% -0.26% -0.26% -0.65% -0.78% -1.67% -1.58%390 Combine 2017 0 0 0 0 NA NA 0.00% 0.00% -0.26% -0.26% -0.26% -0.65% -0.78% -1.67%
39009 1996 0 0 0 0 NA39009 1997 0 0 0 0 NA NA39009 1998 0 0 0 0 NA NA NA39009 1999 0 0 0 0 NA NA NA NA39009 2000 0 0 0 0 NA NA NA NA NA39009 2001 0 0 0 0 NA NA NA NA NA NA39009 2002 0 0 0 0 NA NA NA NA NA NA NA39009 2003 0 0 0 0 NA NA NA NA NA NA NA NA39009 2004 0 0 0 0 NA NA NA NA NA NA NA NA NA39009 2005 0 0 0 0 NA NA NA NA NA NA NA NA NA NA39009 2006 0 0 0 0 NA NA NA NA NA NA NA NA NA NA39009 2007 7,867 0 38 (38) -0.48% -0.48% -0.48% -0.48% -0.48% -0.48% -0.48% -0.48% -0.48% -0.48%39009 2008 59,962 13,844 137 13,707 22.86% 20.15% 20.15% 20.15% 20.15% 20.15% 20.15% 20.15% 20.15% 20.15%39009 2009 455 0 222 (222) -48.74% 22.32% 19.69% 19.69% 19.69% 19.69% 19.69% 19.69% 19.69% 19.69%39009 2010 33,229 0 10,387 (10,387) -31.26% -31.49% 3.31% 3.02% 3.02% 3.02% 3.02% 3.02% 3.02% 3.02%39009 2011 0 0 0 0 NA -31.26% -31.49% 3.31% 3.02% 3.02% 3.02% 3.02% 3.02% 3.02%39009 2012 0 0 0 0 NA NA -31.26% -31.49% 3.31% 3.02% 3.02% 3.02% 3.02% 3.02%39009 2013 0 0 0 0 NA NA NA -31.26% -31.49% 3.31% 3.02% 3.02% 3.02% 3.02%39009 2014 0 0 0 0 NA NA NA NA -31.26% -31.49% 3.31% 3.02% 3.02% 3.02%39009 2015 33,182 0 0 0 0.00% 0.00% 0.00% 0.00% 0.00% -15.64% -15.87% 2.44% 2.27% 2.27%39009 2016 0 0 0 0 NA 0.00% 0.00% 0.00% 0.00% 0.00% -15.64% -15.87% 2.44% 2.27%39009 2017 0 0 0 0 NA NA 0.00% 0.00% 0.00% 0.00% 0.00% -15.64% -15.87% 2.44%
39100 1996 14,396 0 0 0 0.00%39100 1997 0 2,809 0 2,809 NA 19.51%39100 1998 6,356 1,342 0 1,342 21.11% 65.31% 20.00%39100 1999 1,465 0 0 0 0.00% 17.16% 53.08% 18.68%39100 2000 13,341 0 0 0 0.00% 0.00% 6.34% 19.62% 11.67%39100 2001 72,169 0 28 (28) -0.04% -0.03% -0.03% 1.41% 4.42% 3.83%39100 2002 94,992 0 0 0 0.00% -0.02% -0.02% -0.02% 0.70% 2.19% 2.03%39100 2003 15,380 0 0 0 0.00% 0.00% -0.02% -0.01% -0.01% 0.65% 2.02% 1.89%39100 2004 38,289 0 0 0 0.00% 0.00% 0.00% -0.01% -0.01% -0.01% 0.54% 1.70% 1.61%39100 2005 548,104 0 0 0 0.00% 0.00% 0.00% 0.00% 0.00% 0.00% 0.00% 0.17% 0.52% 0.51%39100 2006 66,373 0 0 0 0.00% 0.00% 0.00% 0.00% 0.00% 0.00% 0.00% 0.00% 0.15% 0.48%39100 2007 18,622 672 7 665 3.57% 0.78% 0.10% 0.10% 0.10% 0.09% 0.07% 0.07% 0.07% 0.23%39100 2008 905,386 0 4,119 (4,119) -0.45% -0.37% -0.35% -0.22% -0.22% -0.22% -0.20% -0.20% -0.20% -0.20%39100 2009 7,149 0 3,382 (3,382) -47.30% -0.82% -0.73% -0.69% -0.44% -0.43% -0.43% -0.40% -0.39% -0.39%39100 2010 240 0 0 0 0.00% -45.77% -0.82% -0.73% -0.69% -0.44% -0.43% -0.43% -0.40% -0.39%39100 2011 22,502 0 0 0 0.00% 0.00% -11.31% -0.80% -0.72% -0.67% -0.44% -0.43% -0.42% -0.40%39100 2012 0 0 0 0 NA 0.00% 0.00% -11.31% -0.80% -0.72% -0.67% -0.44% -0.43% -0.42%39100 2013 3,836 0 134 (134) -3.50% -3.50% -0.51% -0.51% -10.42% -0.81% -0.73% -0.68% -0.44% -0.43%39100 2014 55,784 0 0 0 0.00% -0.23% -0.23% -0.16% -0.16% -3.93% -0.77% -0.69% -0.65% -0.43%39100 2015 0 0 0 0 NA 0.00% -0.23% -0.23% -0.16% -0.16% -3.93% -0.77% -0.69% -0.65%39100 2016 0 0 0 0 NA NA 0.00% -0.23% -0.23% -0.16% -0.16% -3.93% -0.77% -0.69%39100 2017 45,533 0 0 0 0.00% 0.00% 0.00% 0.00% -0.13% -0.13% -0.11% -0.10% -2.60% -0.73%
39103 1996 0 0 0 0 NA39103 1997 0 0 0 0 NA NA39103 1998 0 0 0 0 NA NA NA39103 1999 0 0 0 0 NA NA NA NA39103 2000 0 0 0 0 NA NA NA NA NA39103 2001 0 0 0 0 NA NA NA NA NA NA39103 2002 0 0 0 0 NA NA NA NA NA NA NA39103 2003 0 0 0 0 NA NA NA NA NA NA NA NA39103 2004 0 0 0 0 NA NA NA NA NA NA NA NA NA39103 2005 0 0 0 0 NA NA NA NA NA NA NA NA NA NA39103 2006 806 0 0 0 0.00% 0.00% 0.00% 0.00% 0.00% 0.00% 0.00% 0.00% 0.00% 0.00%
Exhibit DAW-2 Page 104 of 111

Appendix D
2- yr 3- yr 4- yr 5- yr 6- yr 7- yr 8- yr 9- yr 10- yrNet Net Net Net Net Net Net Net Net Net Net
Account TY Retirements Salvage COR Salvage Salv. % Salv. % Salv. % Salv. % Salv. % Salv. % Salv. % Salv. % Salv. % Salv. %
ATMOS ENERGY - KENTUCKY DIVISIONDepreciation Study as of September 30, 2017
NET SALVAGE HISTORY
39103 2007 482 0 0 0 0.00% 0.00% 0.00% 0.00% 0.00% 0.00% 0.00% 0.00% 0.00% 0.00%39103 2008 426 209 0 209 49.10% 23.04% 12.20% 12.20% 12.20% 12.20% 12.20% 12.20% 12.20% 12.20%39103 2009 92,410 0 0 0 0.00% 0.23% 0.22% 0.22% 0.22% 0.22% 0.22% 0.22% 0.22% 0.22%39103 2010 408 0 0 0 0.00% 0.00% 0.22% 0.22% 0.22% 0.22% 0.22% 0.22% 0.22% 0.22%39103 2011 1,389 0 0 0 0.00% 0.00% 0.00% 0.22% 0.22% 0.22% 0.22% 0.22% 0.22% 0.22%39103 2012 0 0 0 0 NA 0.00% 0.00% 0.00% 0.22% 0.22% 0.22% 0.22% 0.22% 0.22%39103 2013 0 0 0 0 NA NA 0.00% 0.00% 0.00% 0.22% 0.22% 0.22% 0.22% 0.22%39103 2014 0 0 0 0 NA NA NA 0.00% 0.00% 0.00% 0.22% 0.22% 0.22% 0.22%39103 2015 0 0 0 0 NA NA NA NA 0.00% 0.00% 0.00% 0.22% 0.22% 0.22%39103 2016 0 0 0 0 NA NA NA NA NA 0.00% 0.00% 0.00% 0.22% 0.22%39103 2017 0 0 0 0 NA NA NA NA NA NA 0.00% 0.00% 0.00% 0.22%
39200 1996 623,819 189,433 1,191 188,242 30.18%39200 1997 131,611 40,503 615 39,888 30.31% 30.20%39200 1998 550,378 127,968 8 127,960 23.25% 24.61% 27.27%39200 1999 291,792 77,749 275 77,474 26.55% 24.39% 25.19% 27.14%39200 2000 810,884 101,794 0 101,794 12.55% 16.26% 18.59% 19.45% 22.23%39200 2001 549,771 7,561 0 7,561 1.38% 8.04% 11.31% 14.29% 15.19% 18.35%39200 2002 216,646 35,292 0 35,292 16.29% 5.59% 9.17% 11.88% 14.47% 15.29% 18.21%39200 2003 2,732,280 79,320 0 79,320 2.90% 3.89% 3.49% 5.20% 6.55% 8.34% 8.88% 11.13%39200 2004 559,510 0 0 0 0.00% 2.41% 3.27% 3.01% 4.60% 5.84% 7.52% 8.03% 10.17%39200 2005 394,260 67,019 4,646 62,373 15.82% 6.54% 3.84% 4.53% 4.14% 5.44% 6.55% 8.05% 8.52% 10.49%39200 2006 82,381 0 0 0 0.00% 13.09% 6.02% 3.76% 4.44% 4.07% 5.36% 6.45% 7.95% 8.41%39200 2007 0 0 0 0 NA 0.00% 13.09% 6.02% 3.76% 4.44% 4.07% 5.36% 6.45% 7.95%39200 2008 151,446 3,885 0 3,885 2.57% 2.57% 1.66% 10.55% 5.58% 3.71% 4.37% 4.02% 5.28% 6.35%39200 2009 117,142 0 0 0 0.00% 1.45% 1.45% 1.11% 8.89% 5.08% 3.61% 4.25% 3.92% 5.17%39200 2010 63,504 13,432 (131) 13,563 21.36% 7.51% 5.25% 5.25% 4.21% 9.87% 5.83% 3.88% 4.50% 4.15%39200 2011 2,672 0 0 0 0.00% 20.50% 7.40% 5.21% 5.21% 4.18% 9.84% 5.82% 3.88% 4.50%39200 2012 0 0 0 0 NA 0.00% 20.50% 7.40% 5.21% 5.21% 4.18% 9.84% 5.82% 3.88%39200 2013 37,101 0 171 (171) -0.46% -0.46% -0.43% 12.97% 6.08% 4.65% 4.65% 3.80% 9.39% 5.66%39200 2014 97,648 7,291 198 7,093 7.26% 5.14% 5.14% 5.04% 10.20% 6.44% 5.19% 5.19% 4.42% 9.17%39200 2015 56,098 0 0 0 0.00% 4.61% 3.63% 3.63% 3.58% 7.97% 5.47% 4.64% 4.64% 4.01%39200 2016 54,635 0 0 0 0.00% 0.00% 3.40% 2.82% 2.82% 2.79% 6.57% 4.78% 4.20% 4.20%39200 2017 105,083 0 0 0 0.00% 0.00% 0.00% 2.26% 1.97% 1.97% 1.96% 4.92% 3.84% 3.56%
39201 1996 0 0 0 0 NA39201 1997 0 0 0 0 NA NA39201 1998 0 0 0 0 NA NA NA39201 1999 0 0 0 0 NA NA NA NA39201 2000 0 0 0 0 NA NA NA NA NA39201 2001 0 0 0 0 NA NA NA NA NA NA39201 2002 0 0 0 0 NA NA NA NA NA NA NA39201 2003 0 0 0 0 NA NA NA NA NA NA NA NA39201 2004 0 0 0 0 NA NA NA NA NA NA NA NA NA39201 2005 0 0 0 0 NA NA NA NA NA NA NA NA NA NA39201 2006 21,372 0 0 0 0.00% 0.00% 0.00% 0.00% 0.00% 0.00% 0.00% 0.00% 0.00% 0.00%39201 2007 0 0 0 0 NA 0.00% 0.00% 0.00% 0.00% 0.00% 0.00% 0.00% 0.00% 0.00%39201 2008 0 0 0 0 NA NA 0.00% 0.00% 0.00% 0.00% 0.00% 0.00% 0.00% 0.00%39201 2009 0 0 0 0 NA NA NA 0.00% 0.00% 0.00% 0.00% 0.00% 0.00% 0.00%39201 2010 21,941 0 0 0 0.00% 0.00% 0.00% 0.00% 0.00% 0.00% 0.00% 0.00% 0.00% 0.00%39201 2011 0 0 0 0 NA 0.00% 0.00% 0.00% 0.00% 0.00% 0.00% 0.00% 0.00% 0.00%39201 2012 0 0 0 0 NA NA 0.00% 0.00% 0.00% 0.00% 0.00% 0.00% 0.00% 0.00%39201 2013 0 0 0 0 NA NA NA 0.00% 0.00% 0.00% 0.00% 0.00% 0.00% 0.00%39201 2014 0 0 0 0 NA NA NA NA 0.00% 0.00% 0.00% 0.00% 0.00% 0.00%39201 2015 0 0 0 0 NA NA NA NA NA 0.00% 0.00% 0.00% 0.00% 0.00%39201 2016 0 0 0 0 NA NA NA NA NA NA 0.00% 0.00% 0.00% 0.00%39201 2017 0 0 0 0 NA NA NA NA NA NA NA 0.00% 0.00% 0.00%
39202 1996 0 NA39202 1997 0 NA NA39202 1998 0 NA NA NA39202 1999 0 NA NA NA NA39202 2000 0 NA NA NA NA NA39202 2001 0 NA NA NA NA NA NA
Exhibit DAW-2 Page 105 of 111

Appendix D
2- yr 3- yr 4- yr 5- yr 6- yr 7- yr 8- yr 9- yr 10- yrNet Net Net Net Net Net Net Net Net Net Net
Account TY Retirements Salvage COR Salvage Salv. % Salv. % Salv. % Salv. % Salv. % Salv. % Salv. % Salv. % Salv. % Salv. %
ATMOS ENERGY - KENTUCKY DIVISIONDepreciation Study as of September 30, 2017
NET SALVAGE HISTORY
39202 2002 0 NA NA NA NA NA NA NA39202 2003 0 NA NA NA NA NA NA NA NA39202 2004 0 NA NA NA NA NA NA NA NA NA39202 2005 0 NA NA NA NA NA NA NA NA NA NA39202 2006 27,842 0 0 0.00% 0.00% 0.00% 0.00% 0.00% 0.00% 0.00% 0.00% 0.00% 0.00%39202 2007 9,991 3,500 0 3,500 35.03% 9.25% 9.25% 9.25% 9.25% 9.25% 9.25% 9.25% 9.25% 9.25%39202 2008 9,529 1,546 (10,475) 12,020 126.14% 79.51% 32.77% 32.77% 32.77% 32.77% 32.77% 32.77% 32.77% 32.77%39202 2009 39,260 0 0 0.00% 24.64% 26.40% 17.92% 17.92% 17.92% 17.92% 17.92% 17.92% 17.92%39202 2010 25,154 0 0 0.00% 0.00% 16.26% 18.49% 13.89% 13.89% 13.89% 13.89% 13.89% 13.89%39202 2011 0 NA 0.00% 0.00% 16.26% 18.49% 13.89% 13.89% 13.89% 13.89% 13.89%39202 2012 1,505 0 105 (105) -6.97% -6.97% -0.39% -0.16% 15.79% 18.04% 13.61% 13.61% 13.61% 13.61%39202 2013 0 0 0 0 NA -6.97% -6.97% -0.39% -0.16% 15.79% 18.04% 13.61% 13.61% 13.61%39202 2014 0 0 0 0 NA NA -6.97% -6.97% -0.39% -0.16% 15.79% 18.04% 13.61% 13.61%39202 2015 8,734 4,493 652 3,841 43.97% 43.97% 43.97% 36.49% 36.49% 10.56% 5.00% 18.72% 20.45% 15.78%39202 2016 18,726 11,378 0 11,378 60.76% 55.42% 55.42% 55.42% 52.18% 52.18% 27.93% 16.19% 26.37% 27.13%39202 2017 5,732 0 0 0 0.00% 46.52% 45.85% 45.85% 45.85% 43.56% 43.56% 25.25% 15.25% 24.98%
39400 1996 35,537 4,400 0 4,400 12.38%39400 1997 12,767 0 0 0 0.00% 9.11%39400 1998 0 NA 0.00% 9.11%39400 1999 4,300 0 0 0 0.00% 0.00% 0.00% 8.36%39400 2000 25,384 10,742 0 10,742 42.32% 36.19% 36.19% 25.30% 19.42%39400 2001 18,601 0 0 0 0.00% 24.42% 22.25% 22.25% 17.59% 15.68%39400 2002 764,651 0 0 0 0.00% 0.00% 1.33% 1.32% 1.32% 1.30% 1.76%39400 2003 61,408 0 0 0 0.00% 0.00% 0.00% 1.23% 1.23% 1.23% 1.21% 1.64%39400 2004 517,271 0 0 0 0.00% 0.00% 0.00% 0.00% 0.77% 0.77% 0.77% 0.76% 1.05%39400 2005 43,563 200 6 194 0.45% 0.03% 0.03% 0.01% 0.01% 0.76% 0.76% 0.76% 0.76% 1.03%39400 2006 578,946 0 0 0.00% 0.03% 0.02% 0.02% 0.01% 0.01% 0.54% 0.54% 0.54% 0.54%39400 2007 96,025 155 (367) 522 0.54% 0.08% 0.10% 0.06% 0.06% 0.03% 0.03% 0.54% 0.54% 0.54%39400 2008 42,541 170 (79) 249 0.59% 0.56% 0.11% 0.13% 0.08% 0.07% 0.05% 0.05% 0.54% 0.54%39400 2009 169,281 7,500 3,805 3,695 2.18% 1.86% 1.45% 0.50% 0.50% 0.32% 0.31% 0.20% 0.20% 0.66%39400 2010 91,719 0 2,129 (2,129) -2.32% 0.60% 0.60% 0.58% 0.24% 0.25% 0.16% 0.16% 0.11% 0.11%39400 2011 76,934 0 123 (123) -0.16% -1.34% 0.43% 0.44% 0.46% 0.21% 0.22% 0.15% 0.14% 0.10%39400 2012 106,304 21,458 1,222 20,236 19.04% 10.98% 6.54% 4.88% 4.50% 3.85% 1.93% 1.88% 1.31% 1.27%39400 2013 95,484 0 202 (202) -0.21% 9.93% 7.14% 4.80% 3.98% 3.73% 3.28% 1.77% 1.73% 1.23%39400 2014 590,143 132 722 (590) -0.10% -0.12% 2.46% 2.22% 1.79% 1.85% 1.80% 1.71% 1.17% 1.16%39400 2015 13,823 0 1,303 (1,303) -9.43% -0.31% -0.30% 2.25% 2.04% 1.63% 1.71% 1.67% 1.59% 1.09%39400 2016 9,172 0 0 0 0.00% -5.67% -0.31% -0.30% 2.23% 2.02% 1.62% 1.70% 1.66% 1.58%39400 2017 84,238 0 0 0 0.00% 0.00% -1.22% -0.27% -0.26% 2.02% 1.85% 1.49% 1.58% 1.55%
39600 1996 1,106 7,500 0 7,500 678.12%39600 1997 0 1,900 356 1,544 NA 817.72%39600 1998 1,515 520 0 520 34.32% 136.24% 364.90%39600 1999 22,556 0 0 0 0.00% 2.16% 8.57% 37.99%39600 2000 153,880 54,000 0 54,000 35.09% 30.61% 30.64% 31.51% 35.50%39600 2001 1,617 0 0 0 0.00% 34.73% 30.33% 30.36% 31.22% 35.18%39600 2002 278,879 22,479 0 22,479 8.06% 8.01% 17.61% 16.74% 16.80% 17.13% 18.72%39600 2003 357,777 0 0 0 0.00% 3.53% 3.52% 9.65% 9.39% 9.43% 9.62% 10.53%39600 2004 204,050 0 0 0 0.00% 0.00% 2.67% 2.67% 7.68% 7.51% 7.55% 7.70% 8.42%39600 2005 42,281 12,486 0 12,486 29.53% 5.07% 2.07% 3.96% 3.95% 8.57% 8.38% 8.42% 8.57% 9.26%39600 2006 0 0 0 0 NA 29.53% 5.07% 2.07% 3.96% 3.95% 8.57% 8.38% 8.42% 8.57%39600 2007 0 0 0 0 NA NA 29.53% 5.07% 2.07% 3.96% 3.95% 8.57% 8.38% 8.42%39600 2008 0 0 0 0 NA NA NA 29.53% 5.07% 2.07% 3.96% 3.95% 8.57% 8.38%39600 2009 0 0 0 0 NA NA NA NA 29.53% 5.07% 2.07% 3.96% 3.95% 8.57%39600 2010 0 0 0 0 NA NA NA NA NA 29.53% 5.07% 2.07% 3.96% 3.95%39600 2011 0 0 0 0 NA NA NA NA NA NA 29.53% 5.07% 2.07% 3.96%39600 2012 0 0 0 0 NA NA NA NA NA NA NA 29.53% 5.07% 2.07%39600 2013 0 0 0 0 NA NA NA NA NA NA NA NA 29.53% 5.07%39600 2014 0 0 0 0 NA NA NA NA NA NA NA NA NA 29.53%39600 2015 0 0 0 0 NA NA NA NA NA NA NA NA NA NA39600 2016 0 0 0 0 NA NA NA NA NA NA NA NA NA NA39600 2017 0 0 0 0 NA NA NA NA NA NA NA NA NA NA
Exhibit DAW-2 Page 106 of 111

Appendix D
2- yr 3- yr 4- yr 5- yr 6- yr 7- yr 8- yr 9- yr 10- yrNet Net Net Net Net Net Net Net Net Net Net
Account TY Retirements Salvage COR Salvage Salv. % Salv. % Salv. % Salv. % Salv. % Salv. % Salv. % Salv. % Salv. % Salv. %
ATMOS ENERGY - KENTUCKY DIVISIONDepreciation Study as of September 30, 2017
NET SALVAGE HISTORY
39603 1996 0 0 0 0 NA39603 1997 0 0 0 0 NA NA39603 1998 0 0 0 0 NA NA NA39603 1999 0 0 0 0 NA NA NA NA39603 2000 0 0 0 0 NA NA NA NA NA39603 2001 0 0 0 0 NA NA NA NA NA NA39603 2002 0 0 0 0 NA NA NA NA NA NA NA39603 2003 0 0 0 0 NA NA NA NA NA NA NA NA39603 2004 0 0 0 0 NA NA NA NA NA NA NA NA NA39603 2005 0 0 0 0 NA NA NA NA NA NA NA NA NA NA39603 2006 62,479 0 0 0 0.00% 0.00% 0.00% 0.00% 0.00% 0.00% 0.00% 0.00% 0.00% 0.00%39603 2007 51,616 0 0 0 0.00% 0.00% 0.00% 0.00% 0.00% 0.00% 0.00% 0.00% 0.00% 0.00%39603 2008 0 0 0 0 NA 0.00% 0.00% 0.00% 0.00% 0.00% 0.00% 0.00% 0.00% 0.00%39603 2009 327 0 0 0 0.00% 0.00% 0.00% 0.00% 0.00% 0.00% 0.00% 0.00% 0.00% 0.00%39603 2010 89,252 0 0 0 0.00% 0.00% 0.00% 0.00% 0.00% 0.00% 0.00% 0.00% 0.00% 0.00%39603 2011 0 0 0 0 NA 0.00% 0.00% 0.00% 0.00% 0.00% 0.00% 0.00% 0.00% 0.00%39603 2012 50,878 0 0 0 0.00% 0.00% 0.00% 0.00% 0.00% 0.00% 0.00% 0.00% 0.00% 0.00%39603 2013 0 0 0 0 NA 0.00% 0.00% 0.00% 0.00% 0.00% 0.00% 0.00% 0.00% 0.00%39603 2014 0 0 0 0 NA NA 0.00% 0.00% 0.00% 0.00% 0.00% 0.00% 0.00% 0.00%39603 2015 6,401 0 0 0 0.00% 0.00% 0.00% 0.00% 0.00% 0.00% 0.00% 0.00% 0.00% 0.00%39603 2016 7,693 27,849 0 27,849 362.01% 197.60% 197.60% 197.60% 42.86% 42.86% 18.06% 18.02% 18.02% 13.51%39603 2017 0 0 0 0 NA 362.01% 197.60% 197.60% 197.60% 42.86% 42.86% 18.06% 18.02% 18.02%
39604 1996 0 0 0 0 NA39604 1997 0 0 0 0 NA NA39604 1998 0 0 0 0 NA NA NA39604 1999 0 0 0 0 NA NA NA NA39604 2000 0 0 0 0 NA NA NA NA NA39604 2001 0 0 0 0 NA NA NA NA NA NA39604 2002 0 0 0 0 NA NA NA NA NA NA NA39604 2003 0 0 0 0 NA NA NA NA NA NA NA NA39604 2004 0 0 0 0 NA NA NA NA NA NA NA NA NA39604 2005 0 0 0 0 NA NA NA NA NA NA NA NA NA NA39604 2006 28,350 0 0 0.00% 0.00% 0.00% 0.00% 0.00% 0.00% 0.00% 0.00% 0.00% 0.00%39604 2007 4,184 173 (409) 582 13.90% 1.79% 1.79% 1.79% 1.79% 1.79% 1.79% 1.79% 1.79% 1.79%39604 2008 78,140 14,945 461 14,483 18.54% 18.30% 13.61% 13.61% 13.61% 13.61% 13.61% 13.61% 13.61% 13.61%39604 2009 120,660 0 0 0.00% 7.29% 7.42% 6.51% 6.51% 6.51% 6.51% 6.51% 6.51% 6.51%39604 2010 8,958 18,719 0 18,719 208.95% 14.44% 15.98% 15.94% 14.06% 14.06% 14.06% 14.06% 14.06% 14.06%39604 2011 0 0 0 0 NA 208.95% 14.44% 15.98% 15.94% 14.06% 14.06% 14.06% 14.06% 14.06%39604 2012 0 0 0 0 NA NA 208.95% 14.44% 15.98% 15.94% 14.06% 14.06% 14.06% 14.06%39604 2013 0 0 0 0 NA NA NA 208.95% 14.44% 15.98% 15.94% 14.06% 14.06% 14.06%39604 2014 0 0 0 0 NA NA NA NA 208.95% 14.44% 15.98% 15.94% 14.06% 14.06%39604 2015 0 0 0 0 NA NA NA NA NA 208.95% 14.44% 15.98% 15.94% 14.06%39604 2016 0 0 0 0 NA NA NA NA NA NA 208.95% 14.44% 15.98% 15.94%39604 2017 0 0 0 0 NA NA NA NA NA NA NA 208.95% 14.44% 15.98%
39605 1996 0 0 0 0 NA39605 1997 0 0 0 0 NA NA39605 1998 0 0 0 0 NA NA NA39605 1999 0 0 0 0 NA NA NA NA39605 2000 0 0 0 0 NA NA NA NA NA39605 2001 0 0 0 0 NA NA NA NA NA NA39605 2002 0 0 0 0 NA NA NA NA NA NA NA39605 2003 0 0 0 0 NA NA NA NA NA NA NA NA39605 2004 0 0 0 0 NA NA NA NA NA NA NA NA NA39605 2005 0 0 0 0 NA NA NA NA NA NA NA NA NA NA39605 2006 25,467 0 0 0 0.00% 0.00% 0.00% 0.00% 0.00% 0.00% 0.00% 0.00% 0.00% 0.00%39605 2007 3,362 0 0 0 0.00% 0.00% 0.00% 0.00% 0.00% 0.00% 0.00% 0.00% 0.00% 0.00%39605 2008 3,600 1,027 0 1,027 28.53% 14.75% 3.17% 3.17% 3.17% 3.17% 3.17% 3.17% 3.17% 3.17%39605 2009 4,088 0 0 0 0.00% 13.36% 9.29% 2.81% 2.81% 2.81% 2.81% 2.81% 2.81% 2.81%39605 2010 6,738 300 0 300 4.45% 2.77% 9.20% 7.46% 3.07% 3.07% 3.07% 3.07% 3.07% 3.07%39605 2011 3,112 0 0 0 0.00% 3.05% 2.15% 7.57% 6.35% 2.86% 2.86% 2.86% 2.86% 2.86%
Exhibit DAW-2 Page 107 of 111

Appendix D
2- yr 3- yr 4- yr 5- yr 6- yr 7- yr 8- yr 9- yr 10- yrNet Net Net Net Net Net Net Net Net Net Net
Account TY Retirements Salvage COR Salvage Salv. % Salv. % Salv. % Salv. % Salv. % Salv. % Salv. % Salv. % Salv. % Salv. %
ATMOS ENERGY - KENTUCKY DIVISIONDepreciation Study as of September 30, 2017
NET SALVAGE HISTORY
39605 2012 4,978 0 0 0 0.00% 0.00% 2.02% 1.59% 5.89% 5.13% 2.58% 2.58% 2.58% 2.58%39605 2013 0 0 0 0 NA 0.00% 0.00% 2.02% 1.59% 5.89% 5.13% 2.58% 2.58% 2.58%39605 2014 0 0 0 0 NA NA 0.00% 0.00% 2.02% 1.59% 5.89% 5.13% 2.58% 2.58%39605 2015 0 1,762 0 1,762 NA NA NA 35.40% 21.78% 13.91% 10.90% 13.72% 11.94% 6.02%39605 2016 13,809 0 0 0 0.00% 12.76% 12.76% 12.76% 9.38% 8.05% 7.20% 6.30% 8.50% 7.78%39605 2017 0 0 0 0 NA 0.00% 12.76% 12.76% 12.76% 9.38% 8.05% 7.20% 6.30% 8.50%
396 Combine 1996 1,106 7,500 0 7,500 678.12%396 Combine 1997 0 1,900 356 1,544 NA 817.72%396 Combine 1998 1,515 520 0 520 34.32% 136.24% 364.90%396 Combine 1999 22,556 0 0 0 0.00% 2.16% 8.57% 37.99%396 Combine 2000 153,880 54,000 0 54,000 35.09% 30.61% 30.64% 31.51% 35.50%396 Combine 2001 1,617 0 0 0 0.00% 34.73% 30.33% 30.36% 31.22% 35.18%396 Combine 2002 278,879 22,479 0 22,479 8.06% 8.01% 17.61% 16.74% 16.80% 17.13% 18.72%396 Combine 2003 357,777 0 0 0 0.00% 3.53% 3.52% 9.65% 9.39% 9.43% 9.62% 10.53%396 Combine 2004 204,050 0 0 0 0.00% 0.00% 2.67% 2.67% 7.68% 7.51% 7.55% 7.70% 8.42%396 Combine 2005 42,281 12,486 0 12,486 29.53% 5.07% 2.07% 3.96% 3.95% 8.57% 8.38% 8.42% 8.57% 9.26%396 Combine 2006 116,296 0 0 0 0.00% 7.87% 3.44% 1.73% 3.50% 3.49% 7.70% 7.56% 7.59% 7.72%396 Combine 2007 59,162 173 (409) 582 0.98% 0.33% 6.00% 3.10% 1.68% 3.36% 3.35% 7.38% 7.24% 7.28%396 Combine 2008 81,739 15,972 461 15,510 18.98% 11.42% 6.26% 9.54% 5.68% 3.32% 4.48% 4.47% 8.11% 7.97%396 Combine 2009 125,074 0 0 0 0.00% 7.50% 6.05% 4.21% 6.73% 4.55% 2.90% 4.04% 4.03% 7.39%396 Combine 2010 104,948 19,019 0 19,019 18.12% 8.27% 11.08% 9.47% 7.21% 8.99% 6.49% 4.36% 5.11% 5.11%396 Combine 2011 3,112 0 0 0 0.00% 17.60% 8.16% 10.97% 9.39% 7.16% 8.94% 6.46% 4.35% 5.10%396 Combine 2012 55,856 0 0 0 0.00% 0.00% 11.60% 6.58% 9.31% 8.17% 6.43% 8.09% 6.01% 4.14%396 Combine 2013 0 0 0 0 NA 0.00% 0.00% 11.60% 6.58% 9.31% 8.17% 6.43% 8.09% 6.01%396 Combine 2014 0 0 0 0 NA NA 0.00% 0.00% 11.60% 6.58% 9.31% 8.17% 6.43% 8.09%396 Combine 2015 6,401 1,762 0 1,762 27.53% 27.53% 27.53% 2.83% 2.70% 12.20% 7.04% 9.62% 8.45% 6.67%396 Combine 2016 21,502 27,849 0 27,849 129.52% 106.12% 106.12% 106.12% 35.35% 34.09% 25.35% 15.35% 16.09% 14.14%396 Combine 2017 0 0 0 0 NA 129.52% 106.12% 106.12% 106.12% 35.35% 34.09% 25.35% 15.35% 16.09%
39700 1996 2,141 0 0 0 0.00%39700 1997 1,536 0 0 0 0.00% 0.00%39700 1998 0 0 0 0 NA 0.00% 0.00%39700 1999 2,345 0 0 0 0.00% 0.00% 0.00% 0.00%39700 2000 0 0 0 0 NA 0.00% 0.00% 0.00% 0.00%39700 2001 0 0 0 0 NA NA 0.00% 0.00% 0.00% 0.00%39700 2002 38,139 0 0 0 0.00% 0.00% 0.00% 0.00% 0.00% 0.00% 0.00%39700 2003 4,941 0 0 0 0.00% 0.00% 0.00% 0.00% 0.00% 0.00% 0.00% 0.00%39700 2004 0 0 0 0 NA 0.00% 0.00% 0.00% 0.00% 0.00% 0.00% 0.00% 0.00%39700 2005 32,436 0 0 0 0.00% 0.00% 0.00% 0.00% 0.00% 0.00% 0.00% 0.00% 0.00% 0.00%39700 2006 0 0 0 0 NA 0.00% 0.00% 0.00% 0.00% 0.00% 0.00% 0.00% 0.00% 0.00%39700 2007 919,964 0 0 0 0.00% 0.00% 0.00% 0.00% 0.00% 0.00% 0.00% 0.00% 0.00% 0.00%39700 2008 48,953 0 (2,228) 2,228 4.55% 0.23% 0.23% 0.22% 0.22% 0.22% 0.21% 0.21% 0.21% 0.21%39700 2009 7,200 0 0 0 0.00% 3.97% 0.23% 0.23% 0.22% 0.22% 0.22% 0.21% 0.21% 0.21%39700 2010 12,519 0 0 0 0.00% 0.00% 3.24% 0.23% 0.23% 0.22% 0.22% 0.22% 0.21% 0.21%39700 2011 0 0 0 0 NA 0.00% 0.00% 3.24% 0.23% 0.23% 0.22% 0.22% 0.22% 0.21%39700 2012 0 0 0 0 NA NA 0.00% 0.00% 3.24% 0.23% 0.23% 0.22% 0.22% 0.22%39700 2013 441 0 0 0 0.00% 0.00% 0.00% 0.00% 0.00% 3.22% 0.23% 0.23% 0.22% 0.22%39700 2014 44,500 0 0 0 0.00% 0.00% 0.00% 0.00% 0.00% 0.00% 1.96% 0.22% 0.22% 0.21%39700 2015 0 0 0 0 NA 0.00% 0.00% 0.00% 0.00% 0.00% 0.00% 1.96% 0.22% 0.22%39700 2016 0 0 0 0 NA NA 0.00% 0.00% 0.00% 0.00% 0.00% 0.00% 1.96% 0.22%39700 2017 0 0 0 0 NA NA NA 0.00% 0.00% 0.00% 0.00% 0.00% 0.00% 1.96%
39701 1996 0 0 0 0 NA39701 1997 0 0 0 0 NA NA39701 1998 0 0 0 0 NA NA NA39701 1999 0 0 0 0 NA NA NA NA39701 2000 0 0 0 0 NA NA NA NA NA39701 2001 0 0 0 0 NA NA NA NA NA NA39701 2002 0 0 0 0 NA NA NA NA NA NA NA39701 2003 0 0 0 0 NA NA NA NA NA NA NA NA39701 2004 0 0 0 0 NA NA NA NA NA NA NA NA NA39701 2005 0 0 0 0 NA NA NA NA NA NA NA NA NA NA39701 2006 0 0 0 0 NA NA NA NA NA NA NA NA NA NA
Exhibit DAW-2 Page 108 of 111

Appendix D
2- yr 3- yr 4- yr 5- yr 6- yr 7- yr 8- yr 9- yr 10- yrNet Net Net Net Net Net Net Net Net Net Net
Account TY Retirements Salvage COR Salvage Salv. % Salv. % Salv. % Salv. % Salv. % Salv. % Salv. % Salv. % Salv. % Salv. %
ATMOS ENERGY - KENTUCKY DIVISIONDepreciation Study as of September 30, 2017
NET SALVAGE HISTORY
39701 2007 1,198 0 0 0.00% 0.00% 0.00% 0.00% 0.00% 0.00% 0.00% 0.00% 0.00% 0.00%39701 2008 2,140 0 20 (20) -0.94% -0.60% -0.60% -0.60% -0.60% -0.60% -0.60% -0.60% -0.60% -0.60%39701 2009 0 0 0 0 NA -0.94% -0.60% -0.60% -0.60% -0.60% -0.60% -0.60% -0.60% -0.60%39701 2010 0 0 0 0 NA NA -0.94% -0.60% -0.60% -0.60% -0.60% -0.60% -0.60% -0.60%39701 2011 0 0 0 0 NA NA NA -0.94% -0.60% -0.60% -0.60% -0.60% -0.60% -0.60%39701 2012 0 0 0 0 NA NA NA NA -0.94% -0.60% -0.60% -0.60% -0.60% -0.60%39701 2013 0 0 0 0 NA NA NA NA NA -0.94% -0.60% -0.60% -0.60% -0.60%39701 2014 0 0 0 0 NA NA NA NA NA NA -0.94% -0.60% -0.60% -0.60%39701 2015 0 0 0 0 NA NA NA NA NA NA NA -0.94% -0.60% -0.60%39701 2016 0 0 0 0 NA NA NA NA NA NA NA NA -0.94% -0.60%39701 2017 0 0 0 0 NA NA NA NA NA NA NA NA NA -0.94%
39702 1996 0 NA39702 1997 0 NA NA39702 1998 0 NA NA NA39702 1999 0 NA NA NA NA39702 2000 0 NA NA NA NA NA39702 2001 0 NA NA NA NA NA NA39702 2002 0 NA NA NA NA NA NA NA39702 2003 0 NA NA NA NA NA NA NA NA39702 2004 0 NA NA NA NA NA NA NA NA NA39702 2005 0 NA NA NA NA NA NA NA NA NA NA39702 2006 0 NA NA NA NA NA NA NA NA NA NA39702 2007 38,600 0 0 0.00% NA NA NA NA NA NA NA NA NA39702 2008 2,832 0 24 (24) -0.84% -0.06% -0.06% -0.06% -0.06% -0.06% -0.06% -0.06% -0.06% -0.06%39702 2009 0 NA NA -0.06% -0.06% -0.06% -0.06% -0.06% -0.06% -0.06% -0.06%39702 2010 0 NA NA NA -0.06% -0.06% -0.06% -0.06% -0.06% -0.06% -0.06%39702 2011 0 NA NA NA NA -0.06% -0.06% -0.06% -0.06% -0.06% -0.06%39702 2012 0 NA NA NA NA NA -0.06% -0.06% -0.06% -0.06% -0.06%39702 2013 0 0 0 0 NA NA NA NA NA -0.84% -0.06% -0.06% -0.06% -0.06%39702 2014 0 0 0 0 NA NA NA NA NA NA -0.84% -0.06% -0.06% -0.06%39702 2015 0 0 0 0 NA NA NA NA NA NA NA -0.84% -0.06% -0.06%39702 2016 0 0 0 0 NA NA NA NA NA NA NA NA -0.84% -0.06%39702 2017 0 0 0 0 NA NA NA NA NA NA NA NA NA -0.84%
39705 1996 0 0 0 0 NA39705 1997 0 0 0 0 NA NA39705 1998 0 0 0 0 NA NA NA39705 1999 0 0 0 0 NA NA NA NA39705 2000 0 0 0 0 NA NA NA NA NA39705 2001 0 0 0 0 NA NA NA NA NA NA39705 2002 0 0 0 0 NA NA NA NA NA NA NA39705 2003 0 0 0 0 NA NA NA NA NA NA NA NA39705 2004 0 0 0 0 NA NA NA NA NA NA NA NA NA39705 2005 0 0 0 0 NA NA NA NA NA NA NA NA NA NA39705 2006 0 0 0 0 NA NA NA NA NA NA NA NA NA NA39705 2007 230,512 0 0 0.00% 0.00% 0.00% 0.00% 0.00% 0.00% 0.00% 0.00% 0.00% 0.00%39705 2008 15,408 0 0 0.00% 0.00% 0.00% 0.00% 0.00% 0.00% 0.00% 0.00% 0.00% 0.00%39705 2009 0 0 0 0 NA 0.00% 0.00% 0.00% 0.00% 0.00% 0.00% 0.00% 0.00% 0.00%39705 2010 0 0 0 0 NA NA 0.00% 0.00% 0.00% 0.00% 0.00% 0.00% 0.00% 0.00%39705 2011 0 0 0 0 NA NA NA 0.00% 0.00% 0.00% 0.00% 0.00% 0.00% 0.00%39705 2012 0 0 0 0 NA NA NA NA 0.00% 0.00% 0.00% 0.00% 0.00% 0.00%39705 2013 0 0 0 0 NA NA NA NA NA 0.00% 0.00% 0.00% 0.00% 0.00%39705 2014 66,316 0 0 0 0.00% 0.00% 0.00% 0.00% 0.00% 0.00% 0.00% 0.00% 0.00% 0.00%39705 2015 0 0 0 0 NA 0.00% 0.00% 0.00% 0.00% 0.00% 0.00% 0.00% 0.00% 0.00%39705 2016 0 0 0 0 NA NA 0.00% 0.00% 0.00% 0.00% 0.00% 0.00% 0.00% 0.00%39705 2017 0 0 0 0 NA NA NA 0.00% 0.00% 0.00% 0.00% 0.00% 0.00% 0.00%
397 Combine 1996 2,141 0 0 0 0.00%397 Combine 1997 1,536 0 0 0 0.00% 0.00%397 Combine 1998 0 0 0 0 NA 0.00% 0.00%397 Combine 1999 2,345 0 0 0 0.00% 0.00% 0.00% 0.00%397 Combine 2000 0 0 0 0 NA 0.00% 0.00% 0.00% 0.00%397 Combine 2001 0 0 0 0 NA NA 0.00% 0.00% 0.00% 0.00%
Exhibit DAW-2 Page 109 of 111

Appendix D
2- yr 3- yr 4- yr 5- yr 6- yr 7- yr 8- yr 9- yr 10- yrNet Net Net Net Net Net Net Net Net Net Net
Account TY Retirements Salvage COR Salvage Salv. % Salv. % Salv. % Salv. % Salv. % Salv. % Salv. % Salv. % Salv. % Salv. %
ATMOS ENERGY - KENTUCKY DIVISIONDepreciation Study as of September 30, 2017
NET SALVAGE HISTORY
397 Combine 2002 38,139 0 0 0 0.00% 0.00% 0.00% 0.00% 0.00% 0.00% 0.00%397 Combine 2003 4,941 0 0 0 0.00% 0.00% 0.00% 0.00% 0.00% 0.00% 0.00% 0.00%397 Combine 2004 0 0 0 0 NA 0.00% 0.00% 0.00% 0.00% 0.00% 0.00% 0.00% 0.00%397 Combine 2005 32,436 0 0 0 0.00% 0.00% 0.00% 0.00% 0.00% 0.00% 0.00% 0.00% 0.00% 0.00%397 Combine 2006 0 0 0 0 NA 0.00% 0.00% 0.00% 0.00% 0.00% 0.00% 0.00% 0.00% 0.00%397 Combine 2007 1,190,274 0 0 0 0.00% 0.00% 0.00% 0.00% 0.00% 0.00% 0.00% 0.00% 0.00% 0.00%397 Combine 2008 69,334 0 (2,184) 2,184 3.15% 0.17% 0.17% 0.17% 0.17% 0.17% 0.16% 0.16% 0.16% 0.16%397 Combine 2009 7,200 0 0 0 0.00% 2.85% 0.17% 0.17% 0.17% 0.17% 0.17% 0.16% 0.16% 0.16%397 Combine 2010 12,519 0 0 0 0.00% 0.00% 2.45% 0.17% 0.17% 0.17% 0.17% 0.17% 0.16% 0.16%397 Combine 2011 0 0 0 0 NA 0.00% 0.00% 2.45% 0.17% 0.17% 0.17% 0.17% 0.17% 0.16%397 Combine 2012 0 0 0 0 NA NA 0.00% 0.00% 2.45% 0.17% 0.17% 0.17% 0.17% 0.17%397 Combine 2013 441 0 0 0 0.00% 0.00% 0.00% 0.00% 0.00% 2.44% 0.17% 0.17% 0.17% 0.17%397 Combine 2014 110,816 0 0 0 0.00% 0.00% 0.00% 0.00% 0.00% 0.00% 1.09% 0.16% 0.16% 0.15%397 Combine 2015 0 0 0 0 NA 0.00% 0.00% 0.00% 0.00% 0.00% 0.00% 1.09% 0.16% 0.16%397 Combine 2016 0 0 0 0 NA NA 0.00% 0.00% 0.00% 0.00% 0.00% 0.00% 1.09% 0.16%397 Combine 2017 0 0 0 0 NA NA NA 0.00% 0.00% 0.00% 0.00% 0.00% 0.00% 1.09%
39800 1996 0 0 0 0 NA39800 1997 0 0 0 0 NA NA39800 1998 0 0 0 0 NA NA NA39800 1999 0 0 0 0 NA NA NA NA39800 2000 0 0 0 0 NA NA NA NA NA39800 2001 0 0 0 0 NA NA NA NA NA NA39800 2002 0 0 0 0 NA NA NA NA NA NA NA39800 2003 0 0 0 0 NA NA NA NA NA NA NA NA39800 2004 0 0 0 0 NA NA NA NA NA NA NA NA NA39800 2005 0 0 0 0 NA NA NA NA NA NA NA NA NA NA39800 2006 0 0 0 0 NA NA NA NA NA NA NA NA NA NA39800 2007 0 0 0 0 NA NA NA NA NA NA NA NA NA NA39800 2008 125,948 2,665 157 2,508 1.99% 1.99% 1.99% 1.99% 1.99% 1.99% 1.99% 1.99% 1.99% 1.99%39800 2009 27,605 0 1,113 (1,113) -4.03% 0.91% 0.91% 0.91% 0.91% 0.91% 0.91% 0.91% 0.91% 0.91%39800 2010 154,967 2,236 3,718 (1,482) -0.96% -1.42% -0.03% -0.03% -0.03% -0.03% -0.03% -0.03% -0.03% -0.03%39800 2011 45,141 0 192 (192) -0.42% -0.84% -1.22% -0.08% -0.08% -0.08% -0.08% -0.08% -0.08% -0.08%39800 2012 131,828 0 563 (563) -0.43% -0.43% -0.67% -0.93% -0.17% -0.17% -0.17% -0.17% -0.17% -0.17%39800 2013 213,314 0 235 (235) -0.11% -0.23% -0.25% -0.45% -0.63% -0.15% -0.15% -0.15% -0.15% -0.15%39800 2014 211,669 0 328 (328) -0.15% -0.13% -0.20% -0.22% -0.37% -0.50% -0.15% -0.15% -0.15% -0.15%39800 2015 1,236 0 652 (652) -52.73% -0.46% -0.28% -0.32% -0.33% -0.46% -0.58% -0.23% -0.23% -0.23%39800 2016 420 0 0 0 0.00% -39.35% -0.46% -0.28% -0.32% -0.33% -0.45% -0.58% -0.23% -0.23%39800 2017 0 0 0 0 NA 0.00% -39.35% -0.46% -0.28% -0.32% -0.33% -0.45% -0.58% -0.23%
39906 1996 0 0 0 0 NA39906 1997 0 0 0 0 NA NA39906 1998 0 0 0 0 NA NA NA39906 1999 0 0 0 0 NA NA NA NA39906 2000 0 0 0 0 NA NA NA NA NA39906 2001 0 0 0 0 NA NA NA NA NA NA39906 2002 190,623 0 0 0 0.00% 0.00% 0.00% 0.00% 0.00% 0.00% 0.00%39906 2003 158,354 2,788 0 2,788 1.76% 0.80% 0.80% 0.80% 0.80% 0.80% 0.80% 0.80%39906 2004 176,848 0 0 0 0.00% 0.83% 0.53% 0.53% 0.53% 0.53% 0.53% 0.53% 0.53%39906 2005 0 0 0 0 NA 0.00% 0.83% 0.53% 0.53% 0.53% 0.53% 0.53% 0.53% 0.53%39906 2006 0 0 0 0 NA NA 0.00% 0.83% 0.53% 0.53% 0.53% 0.53% 0.53% 0.53%39906 2007 0 0 0 0 NA NA NA 0.00% 0.83% 0.53% 0.53% 0.53% 0.53% 0.53%39906 2008 0 0 0 0 NA NA NA NA 0.00% 0.83% 0.53% 0.53% 0.53% 0.53%39906 2009 130,184 0 0 0.00% 0.00% 0.00% 0.00% 0.00% 0.00% 0.60% 0.42% 0.42% 0.42%39906 2010 764,871 0 2,696 (2,696) -0.35% -0.30% -0.30% -0.30% -0.30% -0.30% -0.25% 0.01% 0.01% 0.01%39906 2011 0 0 0 0 NA -0.35% -0.30% -0.30% -0.30% -0.30% -0.30% -0.25% 0.01% 0.01%39906 2012 399,769 0 0 0.00% 0.00% -0.23% -0.21% -0.21% -0.21% -0.21% -0.21% -0.18% 0.01%39906 2013 1,182,003 0 2,934 (2,934) -0.25% -0.19% -0.19% -0.24% -0.23% -0.23% -0.23% -0.23% -0.23% -0.21%39906 2014 1,680,400 0 3,755 (3,755) -0.22% -0.23% -0.21% -0.21% -0.23% -0.23% -0.23% -0.23% -0.23% -0.23%39906 2015 125,151 0 0 0 0.00% -0.21% -0.22% -0.20% -0.20% -0.23% -0.22% -0.22% -0.22% -0.22%39906 2016 84,538 0 0 0 0.00% 0.00% -0.20% -0.22% -0.19% -0.19% -0.22% -0.21% -0.21% -0.21%39906 2017 383,332 0 0 0 0.00% 0.00% 0.00% -0.17% -0.19% -0.17% -0.17% -0.20% -0.20% -0.20%
Exhibit DAW-2 Page 110 of 111

Appendix D
2- yr 3- yr 4- yr 5- yr 6- yr 7- yr 8- yr 9- yr 10- yrNet Net Net Net Net Net Net Net Net Net Net
Account TY Retirements Salvage COR Salvage Salv. % Salv. % Salv. % Salv. % Salv. % Salv. % Salv. % Salv. % Salv. % Salv. %
ATMOS ENERGY - KENTUCKY DIVISIONDepreciation Study as of September 30, 2017
NET SALVAGE HISTORY
39907 1996 0 0 0 0 NA39907 1997 0 0 0 0 NA NA39907 1998 0 0 0 0 NA NA NA39907 1999 185,509 0 0 0 0.00% 0.00% 0.00% 0.00%39907 2000 0 0 0 0 NA 0.00% 0.00% 0.00% 0.00%39907 2001 0 0 0 0 NA NA 0.00% 0.00% 0.00% 0.00%39907 2002 0 0 0 0 NA NA NA 0.00% 0.00% 0.00% 0.00%39907 2003 54,807 0 0 0 0.00% 0.00% 0.00% 0.00% 0.00% 0.00% 0.00% 0.00%39907 2004 0 0 0 0 NA 0.00% 0.00% 0.00% 0.00% 0.00% 0.00% 0.00% 0.00%39907 2005 0 0 0 0 NA NA 0.00% 0.00% 0.00% 0.00% 0.00% 0.00% 0.00% 0.00%39907 2006 0 0 0 0 NA NA NA 0.00% 0.00% 0.00% 0.00% 0.00% 0.00% 0.00%39907 2007 9,399 0 0 0.00% 0.00% 0.00% 0.00% 0.00% 0.00% 0.00% 0.00% 0.00% 0.00%39907 2008 0 0 0 0 NA 0.00% 0.00% 0.00% 0.00% 0.00% 0.00% 0.00% 0.00% 0.00%39907 2009 0 0 0 0 NA NA 0.00% 0.00% 0.00% 0.00% 0.00% 0.00% 0.00% 0.00%39907 2010 0 0 0 0 NA NA NA 0.00% 0.00% 0.00% 0.00% 0.00% 0.00% 0.00%39907 2011 0 0 0 0 NA NA NA NA 0.00% 0.00% 0.00% 0.00% 0.00% 0.00%39907 2012 0 0 0 0 NA NA NA NA NA 0.00% 0.00% 0.00% 0.00% 0.00%39907 2013 233,448 0 0 0 0.00% 0.00% 0.00% 0.00% 0.00% 0.00% 0.00% 0.00% 0.00% 0.00%39907 2014 131 0 0 0 0.00% 0.00% 0.00% 0.00% 0.00% 0.00% 0.00% 0.00% 0.00% 0.00%39907 2015 0 0 0 0 NA 0.00% 0.00% 0.00% 0.00% 0.00% 0.00% 0.00% 0.00% 0.00%39907 2016 0 0 0 0 NA NA 0.00% 0.00% 0.00% 0.00% 0.00% 0.00% 0.00% 0.00%39907 2017 13,752 0 0 0 0.00% 0.00% 0.00% 0.00% 0.00% 0.00% 0.00% 0.00% 0.00% 0.00%
39908 1996 0 0 0 0 NA39908 1997 0 0 0 0 NA NA39908 1998 0 0 0 0 NA NA NA39908 1999 55,783 0 0 0 0.00% 0.00% 0.00% 0.00%39908 2000 0 0 0 0 NA 0.00% 0.00% 0.00% 0.00%39908 2001 0 0 0 0 NA NA 0.00% 0.00% 0.00% 0.00%39908 2002 0 0 0 0 NA NA NA 0.00% 0.00% 0.00% 0.00%39908 2003 0 0 0 0 NA NA NA NA 0.00% 0.00% 0.00% 0.00%39908 2004 0 0 0 0 NA NA NA NA NA 0.00% 0.00% 0.00% 0.00%39908 2005 0 0 0 0 NA NA NA NA NA NA 0.00% 0.00% 0.00% 0.00%39908 2006 0 0 0 0 NA NA NA NA NA NA NA 0.00% 0.00% 0.00%39908 2007 (176,150) 0 0 0.00% 0.00% 0.00% 0.00% 0.00% 0.00% 0.00% 0.00% 0.00% 0.00%39908 2008 0 0 0 0 NA 0.00% 0.00% 0.00% 0.00% 0.00% 0.00% 0.00% 0.00% 0.00%39908 2009 0 0 0 0 NA NA 0.00% 0.00% 0.00% 0.00% 0.00% 0.00% 0.00% 0.00%39908 2010 0 0 0 0 NA NA NA 0.00% 0.00% 0.00% 0.00% 0.00% 0.00% 0.00%39908 2011 0 0 0 0 NA NA NA NA 0.00% 0.00% 0.00% 0.00% 0.00% 0.00%39908 2012 0 0 0 0 NA NA NA NA NA 0.00% 0.00% 0.00% 0.00% 0.00%39908 2013 272,696 0 0 0 0.00% 0.00% 0.00% 0.00% 0.00% 0.00% 0.00% 0.00% 0.00% 0.00%39908 2014 15,499 0 0 0 0.00% 0.00% 0.00% 0.00% 0.00% 0.00% 0.00% 0.00% 0.00% 0.00%39908 2015 0 0 0 0 NA 0.00% 0.00% 0.00% 0.00% 0.00% 0.00% 0.00% 0.00% 0.00%39908 2016 0 0 0 0 NA NA 0.00% 0.00% 0.00% 0.00% 0.00% 0.00% 0.00% 0.00%39908 2017 0 0 0 0 NA NA NA 0.00% 0.00% 0.00% 0.00% 0.00% 0.00% 0.00%
Exhibit DAW-2 Page 111 of 111

ATMOS ENERGY CORPORATION KENTUCKY MID-STATES GENERAL OFFICE
PROPERTY DEPRECIATION RATE STUDY
As of September 30, 2017
http://www.utilityalliance.com
Exhibit DAW-3 Page 1 of 49

ATMOS ENERGY CORPORATION KENTUCKY MID-STATES GENERAL OFFICE PROPERTY
DEPRECIATION RATE STUDY EXECUTIVE SUMMARY
Atmos Energy Corporation (“Atmos” or “Company”) engaged Alliance
Consulting Group to conduct a depreciation study of the Company’s Kentucky
Mid-States General Office (“KMD”) depreciable assets as of fiscal year end
September 30, 2017. KMD provides support to Atmos Energy Corporation’s
regulated utility divisions which at year end September 30, 2017 were:
• Kentucky; • Tennessee; and • Virginia
The depreciation rates are based on the straight-line method, equal life
group (“ELG”) procedure, and remaining-life technique. This study results in an
annual depreciation expense accrual of approximately $51 thousand when
applied to depreciable plant balances as of September 30, 2017.
The depreciation study conducted analyzed and developed depreciation
recommendations at an account level. The resulting annual depreciation accrual
amounts and depreciation rates contained in this study are at the account level.
The Company will accrue depreciation expense based on the account level
depreciation rates developed in this study. Appendix A demonstrates the annual
depreciation expense.
Exhibit DAW-3 Page 2 of 49

ATMOS ENERGY CORPORATION KENTUCKY MID-STATES GENERAL OFFICE PROPERTY
DEPRECIATION RATE STUDY As of September 30, 2017
Table of Contents
PURPOSE ...................................................................................................................................................... 1
STUDY RESULTS ........................................................................................................................................ 2
GENERAL DISCUSSION ............................................................................................................................ 3 DEFINITION .................................................................................................................................... 3 BASIS OF DEPRECIATION ESTIMATES .............................................................................................. 3 SURVIVOR CURVES ........................................................................................................................ 4 ACTUARIAL ANALYSIS ..................................................................................................................... 7 JUDGMENT ..................................................................................................................................... 8 EQUAL LIFE GROUP DEPRECIATION ................................................................................................ 9 THEORETICAL DEPRECIATION RESERVE .......................................................................................... 9
DETAILED DISCUSSION ......................................................................................................................... 11
DEPRECIATION STUDY PROCESS .................................................................................................. 11 DEPRECIATION RATE CALCULATION .............................................................................................. 14 REMAINING LIFE CALCULATION ..................................................................................................... 14 CALCULATION PROCESS ............................................................................................................... 14
LIFE AND NET SALVAGE ...................................................................................................................... 16
NET SALVAGE CONSIDERATIONS ..................................................................................................... 17
APPENDIX A - ANNUAL ACCRUAL RATE CALCULATIONS ........................................................ 30
APPENDIX B - COMPARISON OF ANNUAL RATE AND ACCRUAL ............................................. 32
APPENDIX C - COMPARISON OF MORTALITY CHARACTERISTICS ....................................... 34 APPENDIX D - NET SALVAGE ANALYSIS .......................................................................................... 36
Exhibit DAW-3 Page 3 of 49

1
PURPOSE
The purpose of this study is to develop depreciation rates for the
depreciable property as recorded on KMD’s books at September 30, 2017. The
account based depreciation rates were designed to recover the total remaining
undepreciated investment, adjusted for net salvage, over the remaining life of
KMD’ property on a straight-line basis. Non-depreciable property and property
which is amortized, such as intangibles were excluded from this study.
KMD is a division of Atmos Corporation dedicated to providing various
support services to its operating companies in the Mid States Region. As of the
study date, KMD supported regulated gas utility divisions operating in three
different states, Kentucky, Tennessee, and Virginia. KMD serves over 300,000
customers across these states, with approximately 180,000 in the Kentucky
jurisdiction.
Exhibit DAW-3 Page 4 of 49

2
STUDY RESULTS
The existing and current study annual depreciation expense results from
the use of Iowa Curve dispersion patterns with average service life, the equal life
group (“ELG”) procedure and remaining-life technique, and consideration of net
salvage in the development of the study recommended depreciation rates.
Detailed information for each of these factors will follow in this report.
Overall depreciation rates for KMD depreciable property are shown in
Appendix A. These rates translate into an annual depreciation accrual of $51
thousand based on KMD' depreciable investment at September 30, 2017.
Appendix A presents the development of the depreciation rates and annual
accruals. Appendix B presents the recommended study annual accrual rates
and amounts. Appendix C presents the recommended study mortality and net
salvage parameters by account. Appendix D shows net salvage history by plant
account.
Exhibit DAW-3 Page 5 of 49

3
GENERAL DISCUSSION
Definition
The term "depreciation" as used in this study is considered in the
accounting sense, that is, a system of accounting that distributes the cost of
assets, less net salvage (if any), over the estimated useful life of the assets in a
systematic and rational manner. It is a process of allocation, not valuation. This
expense is systematically allocated to accounting periods over the life of the
properties. The amount allocated to any one accounting period does not
necessarily represent the loss or decrease in value that will occur during that
particular period. The Company accrues depreciation on the basis of the original
cost of all depreciable property included in each functional property group. On
retirement the full cost of depreciable property, less the net salvage value, is
charged to the depreciation reserve.
Basis of Depreciation Estimates
The straight-line, equal life group (“ELG”), remaining-life depreciation
system was employed to calculate annual and accrued depreciation in this study.
In this system, the annual depreciation expense for each group is computed by
dividing the original cost of the asset less allocated depreciation reserve less
estimated net salvage by its respective equal life group remaining life. The
resulting annual accrual amounts of all depreciable property within a function
were accumulated, and the total was divided by the original cost of all functional
depreciable property to determine the depreciation rate. The calculated
remaining lives and annual depreciation accrual rates were based on attained
ages of plant in service and the estimated service life and salvage characteristics
of each depreciable group. The computations of the annual depreciation rates
are shown in Appendix A and remaining life calculations are provided in the
workpapers.
Actuarial analysis was used with each account within a function where
Exhibit DAW-3 Page 6 of 49

4
sufficient data was available, and judgment was used to some degree on all
accounts.
Survivor Curves
To fully understand depreciation projections in a regulated utility setting,
there must be a basic understanding of survivor curves. Individual property units
within a group do not normally have identical lives or investment amounts. The
average life of a group can be determined by first constructing a survivor curve
which is plotted as a percentage of the units surviving at each age. A survivor
curve represents the percentage of property remaining in service at various age
intervals. The Iowa Curves are the result of an extensive investigation of life
characteristics of physical property made at Iowa State College Engineering
Experiment Station in the first half of the prior century. Through common usage,
revalidation and regulatory acceptance, these curves have become a descriptive
standard for the life characteristics of industrial property. An example of an Iowa
Curve is shown below.
Exhibit DAW-3 Page 7 of 49

5
There are four families in the Iowa Curves that are distinguished by the
relation of the age at the retirement mode (largest annual retirement frequency)
and the average life. For distributions with the mode age greater than the
average life, an "R" designation (i.e., Right modal) is used. The family of “R”
moded curves is shown below.
Exhibit DAW-3 Page 8 of 49

6
Similarly, an "S" designation (i.e., Symmetric modal) is used for the family
whose mode age is symmetric about the average life. An "L" designation (i.e.,
Left modal) is used for the family whose mode age is less than the average life.
A special case of left modal dispersion is the "O" or origin modal curve family.
Within each curve family, numerical designations are used to describe the
relative magnitude of the retirement frequencies at the mode. A "6" indicates that
the retirements are not greatly dispersed from the mode (i.e., high mode
frequency) while a "1" indicates a large dispersion about the mode (i.e., low
mode frequency). For example, a curve with an average life of 30 years and an
"L3" dispersion is a moderately dispersed, left modal curve that can be
designated as a 30 L3 Curve. An SQ, or square, survivor curve occurs where no
dispersion is present (i.e., units of common age retire simultaneously).
Most property groups can be closely fitted to one Iowa Curve with a unique
Exhibit DAW-3 Page 9 of 49

7
average service life. The blending of judgment concerning current conditions
and future trends along with the matching of historical data permits the
depreciation analyst to make an informed selection of an account's average life
and retirement dispersion pattern.
Actuarial Analysis
Actuarial analysis (retirement rate method) was used in evaluating historical
asset retirement experience where vintage data were available and sufficient
retirement activity was present. In actuarial analysis, interval exposures (total
property subject to retirement at the beginning of the age interval, regardless of
vintage) and age interval retirements are calculated. The complement of the
ratio of interval retirements to interval exposures establishes a survivor ratio.
The survivor ratio is the fraction of property surviving to the end of the selected
age interval, given that it has survived to the beginning of that age interval.
Survivor ratios for all of the available age intervals were chained by successive
multiplications to establish a series of survivor factors, collectively known as an
observed life table. The observed life table shows the experienced mortality
characteristic of the account and may be compared to standard mortality curves
such as the Iowa Curves. Where data was available, accounts were analyzed
using this method. Placement bands were used to illustrate the composite
history over a specific era, and experience bands were used to focus on
retirement history for all vintages during a set period. The results from these
analyses for those accounts which had data sufficient to be analyzed using this
method are shown in the Life Analysis section of this report.
Exhibit DAW-3 Page 10 of 49

8
Judgment Any depreciation study requires informed judgment by the analyst
conducting the study. A knowledge of the property being studied, company
policies and procedures, general trends in technology and industry practice, and
a sound basis of understanding depreciation theory are needed to apply this
informed judgment. Judgment was used in areas such as survivor curve
modeling and selection, depreciation method selection, simulated plant record
method analysis, and actuarial analysis.
Judgment is not defined as being used in cases where there are specific,
significant pieces of information that influence the choice of a life or curve.
Those cases would simply be a reflection of specific facts into the analysis.
Where there are multiple factors, activities, actions, property characteristics,
statistical inconsistencies, implications of applying certain curves, property mix in
accounts or a multitude of other considerations that impact the analysis
(potentially in various directions), judgment is used to take all of these factors
and synthesize them into a general direction or understanding of the
characteristics of the property. Individually, no one factor in these cases may
have a substantial impact on the analysis, but overall, may shed light on the
utilization and characteristics of assets. Judgment may also be defined as
deduction, inference, wisdom, common sense, or the ability to make sensible
decisions. There is no single correct result from statistical analysis; hence, there
is no answer absent judgment. At the very least for example, any analysis
requires choosing which bands to place more emphasis.
The establishment of appropriate average service lives and retirement
dispersions for KMD’ accounts requires judgment to incorporate the
understanding of the operation of the system with the available accounting
information analyzed using the Retirement Rate actuarial methods. The
appropriateness of lives and curves depends not only on statistical analyses, but
also on how well future retirement patterns will match past retirements.
Exhibit DAW-3 Page 11 of 49

9
Current applications and trends in use of the equipment also need to be
factored into life and survivor curve choices in order for appropriate mortality
characteristics to be chosen.
Equal Life Group Depreciation
Atmos agreed that the continued use of the ELG depreciation procedure
was appropriate. This study uses the ELG depreciation procedure to group the
assets within each account. After an average service life and dispersion were
selected for each account, those parameters were used to estimate what portion
of the surviving investment of each vintage was expected to retire. The
depreciation of the group continues until all investment in the vintage group is
retired. ELG groups are defined by their respective account dispersion, life, and
net salvage estimates. A straight-line rate for each ELG group is computed and
accumulated across each vintage. The resulting rate for each ELG group is
designed to recover all retirements less net salvage as each vintage retires. The
ELG procedure recovers net book cost over the life of each ELG group rather
than averaging many components. It also closely matches the concept of
component or item accounting found in all accounting textbooks.
Theoretical Depreciation Reserve
The Company’s book depreciation reserves were used for each account.
This study used a reserve model that relied on a prospective concept relating
future retirement and accrual patterns for property, given current life and salvage
estimates. The theoretical reserve of a group is developed from the estimated
remaining life, total life of the property group, and estimated net salvage. The
theoretical reserve represents the portion of the group cost that would have been
accrued if current forecasts were used throughout the life of the group for future
depreciation accruals. The computation involves multiplying the vintage
balances within the group by the theoretical reserve ratio for each vintage. The
Exhibit DAW-3 Page 12 of 49

10
equal life group method requires an estimate of dispersion and service life to
establish how much of each vintage is expected to be retired in each year until all
property within the vintage is retired. Estimated average service lives and
dispersion determine the amount within each equal life group. The equal life
group-remaining-life theoretical reserve ratio (RRELG) is calculated as:
Ratio) SalvageNet-(1* Life(ELG
Life) Remaining(ELG -1=RRELG)
Exhibit DAW-3 Page 13 of 49

11
DETAILED DISCUSSION
Depreciation Study Process This depreciation study encompassed four distinct phases. The first
phase involved data collection and field interviews. The second phase was
where the initial data analysis occurred. The third phase was where the
information and analysis was evaluated. Once the first three stages were
complete, the fourth phase began. This phase involved the calculation of
deprecation rates and documenting the corresponding recommendations.
During the Phase I data collection process, historical data was compiled
from continuing property records and general ledger systems. Data was
validated for accuracy by extracting and comparing to multiple financial system
sources. Audit of this data was validated against historical data from prior
periods, historical general ledger sources, and field personnel discussions. This
data was reviewed extensively to put in the proper format for a depreciation
study. Further discussion on data review and adjustment is found in the Salvage
Considerations Section of this study. Also as part of the Phase I data collection
process, numerous discussions were conducted with engineers and field
operations personnel to obtain information that would assist in formulating life
and salvage recommendations in this study. One of the most important elements
of performing a proper depreciation study is to understand how the Company
utilizes assets and the environment of those assets. Interviews with engineering
and operations personnel are important ways to allow the analyst to obtain
information that is beneficial when evaluating the output from the life and net
salvage programs in relation to the Company’s actual asset utilization and
environment. Information that was gleaned in these discussions is found both in
the Detailed Discussion of this study in the life analysis and salvage analysis
sections and also in workpapers.
Exhibit DAW-3 Page 14 of 49

12
Phase 2 is where the actuarial analysis is performed. Phase 2 and 3
overlap to a significant degree. The detailed property records information is used
in phase 2 to develop observed life tables for life analysis. These tables are
visually compared to industry standard tables to determine historical life
characteristics. It is possible that the analyst would cycle back to this phase
based on the evaluation process performed in phase 3. Net salvage analysis
consists of compiling historical salvage and removal data by functional group to
determine values and trends in gross salvage and removal cost. This information
was then carried forward into phase 3 for the evaluation process.
Phase 3 is the evaluation process which synthesizes analysis, interviews,
and operational characteristics into a final selection of asset lives and net
salvage parameters. The historical analysis from phase 2 is further enhanced by
the incorporation of recent or future changes in the characteristics or operations
of assets that were revealed in phase 1. Phases 2 and 3 allow the depreciation
analyst to validate the asset characteristics as seen in the accounting
transactions with actual Company operational experience.
Finally, Phase 4 involved the calculation of accrual rates, making
recommendations and documenting the conclusions in a final report. The
calculation of accrual rates is found in Appendix B. Recommendations for the
various accounts are contained within the Detailed Discussion of this report. The
depreciation study flow diagram shown as Figure 11 documents the steps used in
conducting this study. Depreciation Systems, page 289 documents the same
basic processes in performing a depreciation study which are: Statistical
analyses, evaluation of statistical analysis, discussions with management,
forecast assumptions, write logic supporting forecasts and estimation, and write
final report.
1 Public Utility Finance & Accounting, A Reader
Exhibit DAW-3 Page 15 of 49
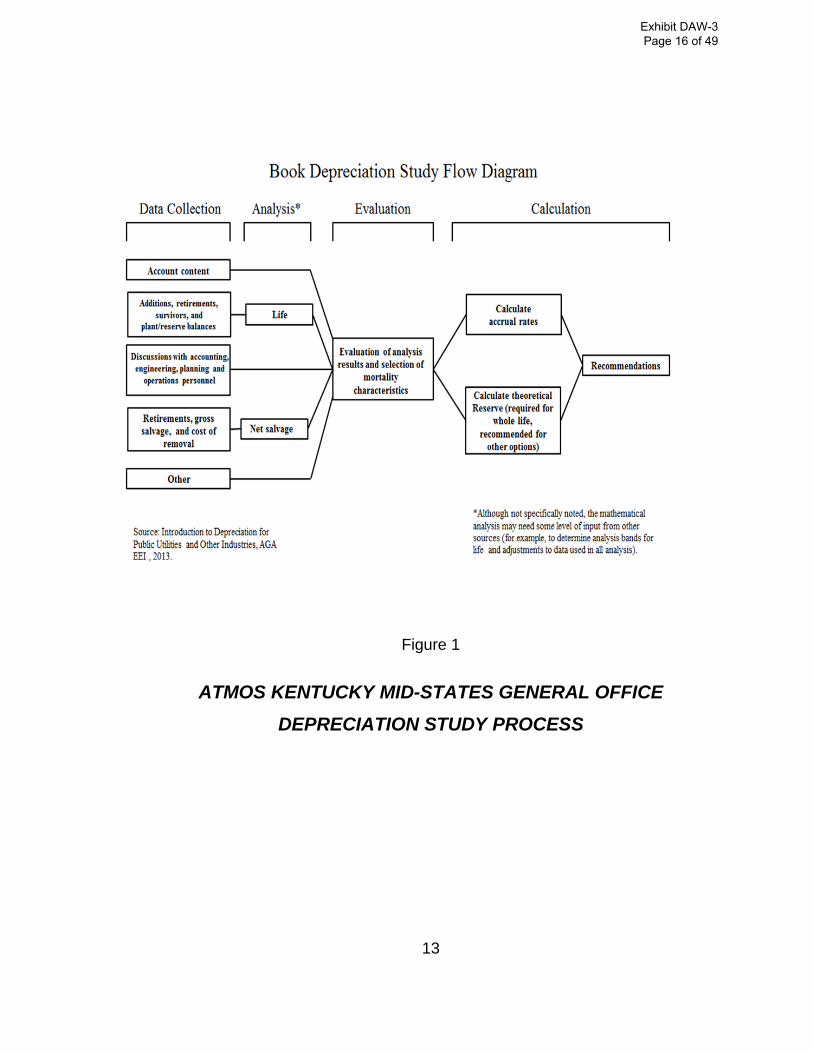
13
Figure 1
ATMOS KENTUCKY MID-STATES GENERAL OFFICE DEPRECIATION STUDY PROCESS
Exhibit DAW-3 Page 16 of 49

14
Depreciation Rate Calculation Annual depreciation expense amounts for the depreciable property
accounts of KMD were calculated by the straight line, equal life group, and
remaining-life system. With this approach, remaining lives were calculated
according to standard ELG group expectancy techniques, using the Iowa
Survivor Curves noted in the calculation. For each plant account, the difference
between the surviving investment, adjusted for estimated net salvage and the
allocated book depreciation reserve, was divided by the average remaining life to
yield the annual depreciation expense. These calculations are shown in
Appendix A.
Remaining Life Calculation
The establishment of appropriate average service lives and retirement
dispersions for each account within a functional group was based on engineering
judgment that incorporated available accounting information analyzed using the
actuarial methods. After establishment of appropriate average service lives and
retirement dispersions, remaining lives were computed for each account. The
theoretical depreciation reserve with zero net salvage (used in calculating
remaining life) was calculated using theoretical reserve ratios as defined in the
theoretical reserve portion of the general discussion section. The difference
between plant balance and theoretical reserve was then spread over the ELG
depreciation accruals. After accumulating the ELG accruals across each vintage,
the annual accrual was divided into the net balance to compute remaining life.
Details of the theoretical reserve computations, ELG accruals, and remaining life
are found by account within each division in the study workpapers.
Calculation Process
Annual depreciation expense amounts for all accounts were calculated by
the straight line, remaining life procedure.
In a whole life representation, the annual accrual rate is computed by the
Exhibit DAW-3 Page 17 of 49

15
following equation,
Life Service AveragePercent) SalvageNet (100%Rate Accrual Annual −
=
Use of the remaining life depreciation system adds a self-correcting
mechanism, which accounts for any differences between theoretical and book
depreciation reserve over the remaining life of the group. With the straight line,
remaining life, average life group system using Iowa Curves, composite
remaining lives were calculated according to standard broad group expectancy
techniques, noted in the formula below:
∑
∑ −=
Accrual Annual Life WholeReserve lTheoreticaCost Original
Life Remaining Composite
For each plant account, the difference between the surviving investment,
adjusted for estimated net salvage, and the book depreciation reserve, was
divided by the composite remaining life to yield the annual depreciation expense
as noted in this equation where the net salvage percent represents future net
salvage.
Life Remaining Composite%) SalvageNet (1*Cost) (OriginalReserveBook Cost OriginalExpenseon Depreciati Annual −−−
=
Within a group, the sum of the group annual depreciation expense
amounts, as a percentage of the depreciable original cost investment summed,
gives the annual depreciation rate as shown below:
∑
∑=
Cost Original
Expenseon Depreciati AnnualRateon Depreciati Annual
These calculations are shown in Appendix A. The calculations of the
theoretical depreciation reserve values and the corresponding remaining life
calculations are shown in workpapers. Book depreciation reserves of individual
accounts and the theoretical reserve computation was used to compute a
composite remaining life for each account.
Exhibit DAW-3 Page 18 of 49

16
LIFE AND NET SALVAGE
The retirement rate actuarial analysis method was applied to all accounts
for KMD. For each account, an actuarial retirement rate analysis was made with
placement and experience bands of varying width. The historical observed life
table was plotted and compared with various Iowa Survivor Curves to obtain the
most appropriate match. A selected curve for each account is shown in the Life
Analysis Section of this report. The observed life tables for all analyzed
placement and experience bands are provided in workpapers.
For the overall band (i.e. placement from earliest vintage year which
varied for each account through 2017) for each account, various dispersion
curves were plotted. Frequently, visual matching would confirm one specific
dispersion pattern (i.e. L, S. or R) as a better match than others. The next step
would be to determine the most appropriate life using that dispersion pattern.
Then, after looking at the overall experience band, different experience bands
were plotted and analyzed, for instance 1998-2017, 2003-2017, etc. Next
placement bands of varying width were plotted with each experience band
discussed above. Repeated matching usually pointed to a focus on one
dispersion family and small range of service lives. The goal of visual matching
was to minimize the differential between the observed life table and Iowa curve in
top and mid-range of the plots. These results are used in conjunction with all
other factors that may influence asset lives.
Exhibit DAW-3 Page 19 of 49

17
NET SALVAGE CONSIDERATIONS
When a capital asset is retired, physically removed from service and finally
disposed of, terminal retirement is said to have occurred. The residual value of a
terminal retirement is called gross salvage. Net salvage is the difference
between the gross salvage (what the asset was sold for) and the removal cost
(cost to remove and dispose of the asset).
The net salvage analysis, for each account, is shown in Appendix D.
Moving averages for intervals are also included in Appendix D. The assets of
KMD generally do not incur cost of removal and salvage has declined in over the
years. In this study a zero percent net salvage is recommended for each
account, with the exception of Accounts 390, 392, and 396.
Account Life and Net Salvage Analysis Account 390.01 – Structures - Frame This account includes the cost of buildings and improvements. The
account balance is $179 thousand. The existing life is 40 years with a R2 curve.
The average age of the investment is approximately 15 years. Discussions with
Company personnel indicated some building will be owned going forward. There
have been no retirements, which did not allow for any meaningful life analysis to
be performed. Based on discussions with Company personnel, judgment and
type of assets this study recommends retaining the 40 year life with the R2
dispersion pattern. No graph is provided.
There has been no salvage or cost of removal recorded. However, when
retirements do occur, cost of removal is expected to exceed any salvage based
on the type of assets. The approved negative 10 percent net salvage is retained
at this time.
Exhibit DAW-3 Page 20 of 49

18
Account 390.04 – Air Conditioning Equipment This account includes the cost of air conditioning equipment. The account
balance is $15 thousand. The existing life is 15 years with an R2 curve. The
current average age of investment is 8 years.
There have been no retirements, so no meaningful life analysis could be
performed. Based on the type of assets, current age, discussions with Company
personnel and judgment, this study recommends retention of the 15 R2. No
graph is provided.
The existing net salvage is negative 10 percent. Cost of removal is
expected to exceed any salvage at time of retirement. This study recommends
retention of negative 10 percent.
Account 390.09 – Improvements to Leased Premises
This account includes the cost of improvements to leased premises. The
balance is $39 thousand. The current life and curve is 20 R3. The current
average age of investment is nearing 19 years.
Discussions with Company personnel indicated the assets in this account
are tied to the lease term, which is 20 years, but has 2-5 year renewal options.
There have been no retirements, which did not allow for any meaningful life
analysis to be performed. Based on discussion with Company personnel, the
type of assets, and lease term, this study recommends retention of the existing
20 R3. No graph is provided.
The existing net salvage is zero percent. No salvage or removal cost is
currently expected at retirement. This study recommends retention of the
existing zero percent net salvage.
This account is fully accrued at this time and only when a depreciable
balance exists will the calculated rate be applied.
Exhibit DAW-3 Page 21 of 49

19
Account 391.00 – Office Furniture and Equipment This account consists of modular furniture, desks, chairs, bookcases,
credenzas, file cabinets, office machines and other miscellaneous equipment.
The balance is $42 thousand. The current life and curve is 20 R3. An expected
life range for the assets in this account is 20 to 25 years. The life analysis
indicates a shorter life than would be expected for this account. This study
recommends retention of the 20 R3 dispersion pattern. A graph of the observed
life table and the recommended life and curve are shown below.
The existing net salvage is zero percent. There is no cost of removal and
salvage has declined to a negligible level. A zero percent net salvage rate is
recommended for this account.
This account is fully accrued at this time and only when a depreciable
balance exists will the calculated rate be applied.
Exhibit DAW-3 Page 22 of 49

20
Account 392.00 – Transportation Equipment This account consists of trailers. The balance is $27 thousand. The
current life and curve is 15 L3. The average age of the surviving investment is
around 5 years.
Discussions with Company personnel indicated the life of some trailers
could reach 20 years. There have been no retirements, which did not allow for
any meaningful life analysis to be performed. Based on input from Company
personnel, the young age of the assets and type of assets, this study
recommends retention of the 15 L3. No graph is provided.
The current net salvage in this account is positive five percent. No cost of
removal is anticipated but salvage is expected at time of retirement. This study
recommends moving to a positive 10 percent net salvage for this account.
Account 393.00 – Stores Equipment This account typically consists of shelving, bins, forklift, and other
miscellaneous equipment. There is currently no account balance in this account.
The current life and curve is 9 S2. We recommend retention of the 9 S2 for this
account. No graph of the observed life table is provided.
This existing net salvage is zero percent. No salvage or cost of removal is
expected at retirement. This study recommends retention of the existing zero
percent net salvage for this account.
This account has no investment balance at this time and only when a
depreciable balance exists would the existing rate be applied until a new study
can be conducted.
Exhibit DAW-3 Page 23 of 49

21
Account 394.00 – Tools, Shop & Garage Equipment This account consists of various small tools and equipment used in an
office. The balance is $176 thousand in this account. The existing dispersion is
15 R3. The average age of investment is nearly 11 years.
Discussion with Company personnel indicated the existing 15 years might
be a little long for these assets. However, the life analysis indicates the existing
life to be a pretty good fit based on historical experience. This study
recommends retention of the 15 year life while moving to a slightly higher
dispersion pattern of R5. A graph of the observed life table and the
recommended life and curve are shown below.
There is generally little or no salvage and no cost of removal related to the
equipment in the account at retirement. This study recommends retention of
zero percent net salvage for this account.
Exhibit DAW-3 Page 24 of 49

22
Account 396.00 – Power Operated Equipment This account consists of various power operated equipment, such as
forklifts. The balance is $20 thousand in this account. The current life and curve
is 15 L3. The average age of investment is 5 years.
Discussions with Company personnel indicated the life of the assets could
be up to 20 years depending on how heavy the use of the assets. There has
been only one retirement, so no meaningful life analysis was possible. Giving
consideration to the current average age, type of assets, and judgment, this
study recommends retention of the 15 L3 at this time. No graph is provided.
The current net salvage is positive 5 percent. This study recommends
increasing the net salvage from positive 5 percent to a positive 16 percent at this
time.
Account 397.00 – Communications Equipment
The communications equipment account includes telephone, satellite dish,
and radio equipment. The balance is $37 thousand in this account. The existing
parameters are 15 R4. The current average age of investment is 0.5 year.
Discussions with Company personnel indicated new systems have been
installed over the last several years and are IP digital phone systems. Some of
the earlier systems installed in the last 10 years are still in service and it may be
possible to get up to 15 years of life from them. Newer digital IP systems are
expected to have a shorter life.
The actuarial best fits were all below the existing 15 years. Based on the
analysis, discussions with Company personnel, the new digital equipment being
installed, this study recommends decreasing the life slightly to 12 years while
retaining the R4 dispersion. A graph of the observed life table and the
recommended life and curve are shown below.
Exhibit DAW-3 Page 25 of 49

23
The existing net salvage is zero percent. There has been no recent
salvage and removal cost experience and none is expected at the end of life.
This study recommends retention of zero percent net salvage for this account.
Exhibit DAW-3 Page 26 of 49

24
Account 398.00 - Miscellaneous Equipment This account consists of various small office equipment items, such as
kitchen appliances, televisions and audio/video equipment that are not
homogeneous with other plant accounts. The balance is $814 thousand.
Currently the life is 20 years with the R2.5 dispersion. The current average age
of investment is 15 years.
There is a mix of assets with various life expectations. The small level of
retirements makes the analysis less useful for determining life expectations. The
average age of retirements for this account is around 5 years. Based upon the
type and mix of assets, along with judgment, this study proposes to retain the 20
R2.5. A graph of the observed life table and the recommended life and curve
are shown below.
The existing net salvage is zero percent. Little or no salvage is expected
at retirement with no cost of removal. The existing zero percent net salvage is
retained.
Exhibit DAW-3 Page 27 of 49

25
Account 399.00 – Other Tangible Property This account normally holds some computer hardware and communication
equipment. There is currently no account balance in this account. The current
life and curve is 10 SQ. Since there is no retirement activity, we are
recommending retention of the 10 SQ for this account. No graph is provided.
This existing net salvage is zero percent. No salvage or cost of removal is
expected at retirement. This study recommends retention of the existing zero
percent net salvage for this account.
This account has no investment balance at this time and only when a
depreciable balance exists will the calculated rate be applied.
Account 399.01 – Servers Hardware
This account normally consists of assets various server hardware and
equipment. There is currently no balance in this account. The current life and
curve is 10 SQ. Based on discussions with Company personnel, the current 10
year life would be a maximum life but the normal life expectation would be less.
In Kentucky direct property, a server was replaced recently at 7 years. This
study recommends moving to the 7 SQ consistent with lives in Kentucky direct
and Company plans and expectations. No graph is provided.
This existing net salvage is zero percent. No salvage or cost of removal is
expected at the time of retirement for these assets. A zero net salvage is
retained.
This account has no investment balance at this time and only when a
depreciable balance exists will the calculated rate be applied.
Exhibit DAW-3 Page 28 of 49

26
Account 399.02 – Servers Software This account normally consists of server software and licenses. There is
currently no balance in this account. There have been no retirements. The
current life and curve is 7 SQ.
Discussions with Company personnel indicated the software for servers
would be installed on a server for the life of the software but not beyond 7 years.
Upgrades would replace software faster than the underlying server.
There is no life analysis. Based on information from Company personnel,
type of assets, and judgment, this study recommends retention of the 7 SQ for
this account. No graph is provided.
This existing net salvage is zero percent. No salvage or cost of removal is
expected at the time of retirement for these assets. A zero net salvage is
retained.
This account has no investment balance at this time and only when a
depreciable balance exists will the calculated rate be applied.
Account 399.03 – Network Hardware
This account normally consists of routers, switches, mostly Cisco
equipment related to networking activities. There is no balance in this account.
The existing life is 10 SQ.
Discussions with Company personnel indicated a 10 year life for network
hardware is reasonable in most cases. Based on input from Company
personnel, type of equipment and judgment, this study recommends retention of
the 10 SQ. No graph is provided.
This existing net salvage is zero percent. No salvage or cost of removal is
expected at the time of retirement for these assets. A zero net salvage is
retained.
This account has no investment balance at this time and only when a
depreciable balance exists will the calculated rate be applied.
Exhibit DAW-3 Page 29 of 49

27
Account 399.06 – PC Hardware This account consists of laptops, CPU, monitors, and various other PC
related equipment. The balance is $74 thousand in this account. The existing
life is 7 R2. Discussions with Company personnel indicated they are on 4 year
rotation for PCs and have tried to consistently follow this rotation. However, in
some instances it could be delayed to five years, which is considered to be the
life of the PCs. The proposed life in this study is 5 R5. A graph of the observed
life table and the proposed life and curve is provided below.
This existing net salvage is zero percent. No salvage or cost of removal is
expected at the time of retirement for these assets. A zero net salvage is
retained.
This account is fully accrued at this time and only when a depreciable
balance exists will the calculated rate be applied.
Exhibit DAW-3 Page 30 of 49

28
Account 399.07 – PC Software This account holds software assets including operating system software
such as Windows, Microsoft Office, and other related application software. The
balance is $35 thousand. The existing life is 9 years with the R1.5 dispersion.
Discussions with Company personnel indicated the assets are 2013 MS
Office licenses and a 7 year life is more representative of expectations. There
has only been one retirement, which is not sufficient for a meaningful life
analysis. Based on the type of assets, discussions with Company personnel and
judgment, this study recommends moving to 7 year average service life while
retaining the R1.5 dispersion. No graph is provided.
This existing net salvage is zero percent. No salvage or cost of removal is
expected at the time of retirement for these assets. A zero net salvage is
retained.
Account 399.08 – Application Software
The account contains software assets including small application software,
electronic mapping (GIS) and training software applications. The balance is
$828 thousand. The existing life is 12 years with the R2.5 dispersion.
Discussions with Company personnel indicated most of the surviving
invest is in Ubisense (GIS) license ($570K) and also $181K for Core Logic Flood
(GIS). The Company believes a 12 year life is reasonable for GIS software.
Anything beyond a 12 year life would not be reasonable for smaller software
assets from a technology and obsolescence standpoint. Past history had larger
application software assets with longer life expectations, those are all retired.
Generally, smaller application software used in a more local environment will be
recorded here.
Exhibit DAW-3 Page 31 of 49

29
There is limited retirement activity to perform visual fits. Based on the
type of assets, input from Company personnel, and judgment, this study retains
the existing 12 R2.5 at this time. A graph of the observed life table and the
proposed life and curve is provided below.
This existing net salvage is zero percent. No salvage or cost of removal is
expected at the time of retirement for these assets. A zero net salvage is
retained.
This account is fully accrued at this time and only when a depreciable
balance exists will the calculated rate be applied.
.
Exhibit DAW-3 Page 32 of 49

30
APPENDIX A - Annual Accrual Rate Calculations
Exhibit DAW-3 Page 33 of 49

Appendix A
Using Equal Life Group Net Net Annual AnnualPlant in Allocated Salvage Salvage Unaccrued Remaining Accrual Accrual
Account Description Service Reserve % Amount Balance Life Amount Accrual Rate(a) (b) (c) (d) (e) [f] [g] [h] [i] [j]
39001 Structures & Improvements 179,338.52$ 83,715.83$ -10% (17,933.85)$ 113,556.54$ 22.59 5,027.84$ 2.80%39004 Air Conditioning 15,383.91 7,358.07 -10% (1,538.39) 9,564.23 8.48 1,127.51 7.33%39200 Transportation Equipment 27,284.69 9,399.43 10% 2,728.47 15,156.79 8.61 1,759.80 6.45%39400 Tools Shop And Garage 175,867.44 129,488.56 0% 0.00 46,378.88 5.20 8,918.94 5.07%39600 Power Operated Equipment 20,515.69 6,765.15 16% 3,282.51 10,468.03 8.58 1,220.21 5.95%39700 Communication Equipment 37,541.00 1,748.68 0% 0.00 35,792.32 10.78 3,320.30 8.84%39800 Miscellaneous Equipment 814,166.88 640,324.65 0% 0.00 173,842.23 7.07 24,573.95 3.02%39907 Pc Software 35,063.77 18,116.49 0% 0.00 16,947.28 3.62 4,683.50 13.36%
Total Depreciated Plant 1,305,161.90$ 896,916.86$ (13,461.26)$ 421,706.30$ 50,632.05$ 3.88%
ACCOUNTS FULLY ACCRUED39009 Improvements - Leased * 38,834.00$ 38,834.00$ 5.00%39100 Office Furniture And Equipment * 41,397.21 41,397.21 5.00%39906 Pc Hardware * 74,189.62 74,189.62 20.00%39908 Application Software * 828,509.36 828,509.36 8.33%
Total Plant Fully Depreciated 982,930.19$ 982,930.19$
Total Study Balances 2,288,092.09$ 1,879,847.05$
ATMOS ENERGY - KENTUCKY MID-STATES GENERAL OFFICE COMPUTATION OF DEPRECIATION ACCRUAL RATE
AT SEPTEMBER 30, 2017
GENERAL PLANT DEPRECIATED
*Fully accrued accounts we recommend the following whole life (1-NS%/ASL) rates until a new study is performed.
Exhibit DAW-3 Page 34 of 49

32
APPENDIX B - Comparison of Annual Rate and Accrual
Exhibit DAW-3 Page 35 of 49

Appendix B
Change inAnnual Annual Annual Annual Depreciation
Account Description Plant Balance Accrual Rate Accrual Accrual Rate Accrual Expense(a) (b) (c) (d) (e) [f] [g] [h]
GENERAL PLANT DEPRECIABLE39001 Structures & Improvements 179,338.52$ 2.68% 4,806.27$ 2.80% 5,021.48$ 215.21$ 39004 Air Conditioning 15,383.91 7.33% 1,127.64 7.33% 1,127.64 - 39200 Transportation Equipment 27,284.69 6.67% 1,819.89 6.45% 1,759.86 (60.03) 39400 Tools Shop And Garage 175,867.44 3.40% 5,979.49 5.07% 8,916.48 2,936.99 39600 Power Operated Equipment 20,515.69 4.36% 894.48 5.95% 1,220.68 326.20 39700 Communication Equipment 37,541.00 3.13% 1,175.03 8.84% 3,318.62 2,143.59 39800 Miscellaneous Equipment 814,166.88 3.47% 28,251.59 3.02% 24,587.84 (3,663.75) 39907 Pc Software 35,063.77 11.11% 3,895.58 13.36% 4,684.52 788.93
Total Depreciable Plant 1,305,161.90$ 3.67% 47,949.99$ 3.88% 50,637.13$ 2,687.14$
ACCOUNTS FULLY ACCRUED39009 Improvements - Leased * 38,834.00 5.00%39100 Office Furniture And Equipment * 41,397.21 5.00%39906 PC Hardware * 74,189.62 20.00%39908 Application Software * 828,509.36 8.33%
Total Fully Accrued 982,930.19
Total Depreciable Plant In Service 2,288,092.09$
*Fully accrued accounts we recommend the following whole life (1-NS%/ASL) rates until a new study is performed.
Atmos Energy CorporationKentucky Mid-States General Office Property
Comparison of Depreciation Expense Existing vs Proposed Depreciation Accrual Rates
As of September 30, 2017
Existing Proposed
Exhibit DAW-3 Page 36 of 49

34
APPENDIX C - Comparison of Mortality Characteristics
Exhibit DAW-3 Page 37 of 49

Iowa Gross Cost of Net Iowa Gross Cost of NetAccount Description ASL Curve Salvage Removal Salvage ASL Curve Salvage Removal Salvage
(a) (b) (c) (d) (e) (f) (g) (h) (i) (j) (k) (l)
39001 Structures - Frame 40 R2 0% 10% -10% 40 R2 0% 10% -10%39004 Air Conditioning Equipment 15 R2 0% 10% -10% 15 R2 0% 10% -10%39009 Improvements - Leased 20 R3 0% 0% 0% 20 R3 0% 0% 0%39100 Office Furniture & Equipment 20 R3 0% 0% 0% 20 R3 0% 0% 0%39200 Transportation Equipment 15 L3 5% 0% 5% 15 L3 10% 0% 10%39300 Stores Equipment 9 S2 0% 0% 0% 9 S2 0% 0% 0%39400 Tools Shop & Garage Equipment 15 R3 0% 0% 0% 15 R5 0% 0% 0%39600 Power Operated Equipment 15 L3 5% 0% 5% 15 L3 16% 0% 16%39700 Communication Equipment 15 R4 0% 0% 0% 12 R4 0% 0% 0%39800 Miscellaneous Equipment 20 R2.5 0% 0% 0% 20 R2.5 0% 0% 0%39900 Other Tangible Equipment 10 SQ 0% 0% 0% 10 SQ 0% 0% 0%39901 Servers Hardware 10 SQ 0% 0% 0% 7 SQ 0% 0% 0%39902 Servers Software 7 SQ 0% 0% 0% 7 SQ 0% 0% 0%39903 Network Hardware 10 SQ 0% 0% 0% 10 SQ 0% 0% 0%39906 Pc Hardware 7 R2. 0% 0% 0% 5 R5 0% 0% 0%39907 Pc Software 9 R1.5 0% 0% 0% 7 R1.5 0% 0% 0%39908 Application Software 12 R2.5 0% 0% 0% 12 R2.5 0% 0% 0%
EXISTING PROPOSED
Appendix CAtmos Energy Corporation
Kentucky Mid-States General OfficeDepreciation Study as of September 30, 2017
Existing and Proposed Parameters
Exhibit DAW-3 Page 38 of 49

36
APPENDIX D - Net Salvage Analysis
Exhibit DAW-3 Page 39 of 49

2- yr 3- yr 4- yr 5- yr 6- yr 7- yr 8- yr 9- yr 10- yrNet Net Net Net Net Net Net Net Net Net Net
Account TY Retirements Salvage COR Salvage Salv. % Salv. % Salv. % Salv. % Salv. % Salv. % Salv. % Salv. % Salv. % Salv. %
39001 1998 0.00 0.00 0.00 0.00 NA39001 1999 0.00 0.00 0.00 0.00 NA NA39001 2000 0.00 0.00 0.00 0.00 NA NA NA39001 2001 0.00 0.00 0.00 0.00 NA NA NA NA39001 2002 0.00 0.00 0.00 0.00 NA NA NA NA NA39001 2003 0.00 0.00 0.00 0.00 NA NA NA NA NA NA39001 2004 0.00 0.00 0.00 0.00 NA NA NA NA NA NA NA39001 2005 0.00 0.00 0.00 0.00 NA NA NA NA NA NA NA NA39001 2006 0.00 0.00 0.00 0.00 NA NA NA NA NA NA NA NA NA39001 2007 0.00 0.00 0.00 0.00 NA NA NA NA NA NA NA NA NA NA39001 2008 0.00 0.00 0.00 0.00 NA NA NA NA NA NA NA NA NA NA39001 2009 0.00 0.00 0.00 0.00 NA NA NA NA NA NA NA NA NA NA39001 2010 0.00 0.00 0.00 0.00 NA NA NA NA NA NA NA NA NA NA39001 2011 0.00 0.00 0.00 0.00 NA NA NA NA NA NA NA NA NA NA39001 2012 0.00 0.00 0.00 0.00 NA NA NA NA NA NA NA NA NA NA39001 2013 0.00 0.00 0.00 0.00 NA NA NA NA NA NA NA NA NA NA39001 2014 0.00 0.00 0.00 0.00 NA NA NA NA NA NA NA NA NA NA39001 2015 0.00 0.00 0.00 0.00 NA NA NA NA NA NA NA NA NA NA39001 2016 0.00 0.00 0.00 0.00 NA NA NA NA NA NA NA NA NA NA39001 2017 0.00 0.00 0.00 0.00 NA NA NA NA NA NA NA NA NA NA
39004 1998 0.00 0.00 0.00 0.00 NA39004 1999 0.00 0.00 0.00 0.00 NA NA39004 2000 0.00 0.00 0.00 0.00 NA NA NA39004 2001 0.00 0.00 0.00 0.00 NA NA NA NA39004 2002 0.00 0.00 0.00 0.00 NA NA NA NA NA39004 2003 0.00 0.00 0.00 0.00 NA NA NA NA NA NA39004 2004 0.00 0.00 0.00 0.00 NA NA NA NA NA NA NA39004 2005 0.00 0.00 0.00 0.00 NA NA NA NA NA NA NA NA39004 2006 0.00 0.00 0.00 0.00 NA NA NA NA NA NA NA NA NA39004 2007 0.00 0.00 0.00 0.00 NA NA NA NA NA NA NA NA NA NA39004 2008 0.00 0.00 0.00 0.00 NA NA NA NA NA NA NA NA NA NA39004 2009 0.00 0.00 0.00 0.00 NA NA NA NA NA NA NA NA NA NA39004 2010 0.00 0.00 0.00 0.00 NA NA NA NA NA NA NA NA NA NA39004 2011 0.00 0.00 0.00 0.00 NA NA NA NA NA NA NA NA NA NA39004 2012 0.00 0.00 0.00 0.00 NA NA NA NA NA NA NA NA NA NA39004 2013 0.00 0.00 0.00 0.00 NA NA NA NA NA NA NA NA NA NA39004 2014 0.00 0.00 0.00 0.00 NA NA NA NA NA NA NA NA NA NA39004 2015 0.00 0.00 0.00 0.00 NA NA NA NA NA NA NA NA NA NA39004 2016 0.00 0.00 0.00 0.00 NA NA NA NA NA NA NA NA NA NA39004 2017 0.00 0.00 0.00 0.00 NA NA NA NA NA NA NA NA NA NA
ATMOS ENERGY - KENTUCKY MID-STATES GENERAL OFFICE DIVISIONDepreciation Study as of September 30, 2017
NET SALVAGE ANALYSIS
Appendix D
Exhibit DAW-3 Page 40 of 49

2- yr 3- yr 4- yr 5- yr 6- yr 7- yr 8- yr 9- yr 10- yrNet Net Net Net Net Net Net Net Net Net Net
Account TY Retirements Salvage COR Salvage Salv. % Salv. % Salv. % Salv. % Salv. % Salv. % Salv. % Salv. % Salv. % Salv. %
ATMOS ENERGY - KENTUCKY MID-STATES GENERAL OFFICE DIVISIONDepreciation Study as of September 30, 2017
NET SALVAGE ANALYSIS
Appendix D
39009 1998 0.00 0.00 0.00 0.00 NA39009 1999 0.00 0.00 0.00 0.00 NA NA39009 2000 0.00 0.00 0.00 0.00 NA NA NA39009 2001 0.00 0.00 0.00 0.00 NA NA NA NA39009 2002 0.00 0.00 0.00 0.00 NA NA NA NA NA39009 2003 0.00 0.00 0.00 0.00 NA NA NA NA NA NA39009 2004 0.00 0.00 0.00 0.00 NA NA NA NA NA NA NA39009 2005 0.00 0.00 0.00 0.00 NA NA NA NA NA NA NA NA39009 2006 0.00 0.00 0.00 0.00 NA NA NA NA NA NA NA NA NA39009 2007 0.00 0.00 0.00 0.00 NA NA NA NA NA NA NA NA NA NA39009 2008 0.00 0.00 0.00 0.00 NA NA NA NA NA NA NA NA NA NA39009 2009 0.00 0.00 0.00 0.00 NA NA NA NA NA NA NA NA NA NA39009 2010 0.00 0.00 0.00 0.00 NA NA NA NA NA NA NA NA NA NA39009 2011 0.00 0.00 0.00 0.00 NA NA NA NA NA NA NA NA NA NA39009 2012 0.00 0.00 0.00 0.00 NA NA NA NA NA NA NA NA NA NA39009 2013 0.00 0.00 0.00 0.00 NA NA NA NA NA NA NA NA NA NA39009 2014 0.00 0.00 0.00 0.00 NA NA NA NA NA NA NA NA NA NA39009 2015 0.00 0.00 0.00 0.00 NA NA NA NA NA NA NA NA NA NA39009 2016 0.00 0.00 0.00 0.00 NA NA NA NA NA NA NA NA NA NA39009 2017 0.00 0.00 0.00 0.00 NA NA NA NA NA NA NA NA NA NA
39100 1998 0.00 0.00 0.00 0.00 NA39100 1999 0.00 0.00 0.00 0.00 NA NA39100 2000 0.00 0.00 0.00 0.00 NA NA NA39100 2001 0.00 0.00 0.00 0.00 NA NA NA NA39100 2002 0.00 0.00 0.00 0.00 NA NA NA NA NA39100 2003 0.00 0.00 0.00 0.00 NA NA NA NA NA NA39100 2004 0.00 0.00 0.00 0.00 NA NA NA NA NA NA NA39100 2005 0.00 0.00 0.00 0.00 NA NA NA NA NA NA NA NA39100 2006 0.00 0.00 0.00 0.00 NA NA NA NA NA NA NA NA NA39100 2007 0.00 0.00 0.00 0.00 NA NA NA NA NA NA NA NA NA NA39100 2008 1,287,606.41 0.00 0.00 0.00 0.0% 0.0% 0.0% 0.0% 0.0% 0.00% 0.00% 0.00% 0.00% 0.00%39100 2009 0.00 0.00 0.00 0.00 NA 0.0% 0.0% 0.0% 0.0% 0.00% 0.00% 0.00% 0.00% 0.00%39100 2010 7,888.88 0.00 0.00 0.00 0.0% 0.0% 0.0% 0.0% 0.0% 0.00% 0.00% 0.00% 0.00% 0.00%39100 2011 0.00 0.00 0.00 0.00 NA 0.0% 0.0% 0.0% 0.0% 0.00% 0.00% 0.00% 0.00% 0.00%39100 2012 0.00 0.00 0.00 0.00 NA NA 0.0% 0.0% 0.0% 0.00% 0.00% 0.00% 0.00% 0.00%39100 2013 0.00 0.00 0.00 0.00 NA NA NA 0.0% 0.0% 0.00% 0.00% 0.00% 0.00% 0.00%39100 2014 22,133.16 0.00 0.00 0.00 0.0% 0.0% 0.0% 0.0% 0.0% 0.00% 0.00% 0.00% 0.00% 0.00%39100 2015 2,230.02 0.00 0.00 0.00 0.0% 0.0% 0.0% 0.0% 0.0% 0.00% 0.00% 0.00% 0.00% 0.00%39100 2016 1,106.25 0.00 0.00 0.00 0.0% 0.0% 0.0% 0.0% 0.0% 0.00% 0.00% 0.00% 0.00% 0.00%39100 2017 0.00 0.00 0.00 0.00 NA 0.0% 0.0% 0.0% 0.0% 0.00% 0.00% 0.00% 0.00% 0.00%
Exhibit DAW-3 Page 41 of 49

2- yr 3- yr 4- yr 5- yr 6- yr 7- yr 8- yr 9- yr 10- yrNet Net Net Net Net Net Net Net Net Net Net
Account TY Retirements Salvage COR Salvage Salv. % Salv. % Salv. % Salv. % Salv. % Salv. % Salv. % Salv. % Salv. % Salv. %
ATMOS ENERGY - KENTUCKY MID-STATES GENERAL OFFICE DIVISIONDepreciation Study as of September 30, 2017
NET SALVAGE ANALYSIS
Appendix D
39200 1998 0.00 0.00 0.00 0.00 NA39200 1999 0.00 0.00 0.00 0.00 NA NA39200 2000 0.00 0.00 0.00 0.00 NA NA NA39200 2001 0.00 0.00 0.00 0.00 NA NA NA NA39200 2002 0.00 0.00 0.00 0.00 NA NA NA NA NA39200 2003 0.00 0.00 0.00 0.00 NA NA NA NA NA NA39200 2004 0.00 0.00 0.00 0.00 NA NA NA NA NA NA NA39200 2005 0.00 0.00 0.00 0.00 NA NA NA NA NA NA NA NA39200 2006 0.00 0.00 0.00 0.00 NA NA NA NA NA NA NA NA NA39200 2007 0.00 0.00 0.00 0.00 NA NA NA NA NA NA NA NA NA NA39200 2008 0.00 0.00 0.00 0.00 NA NA NA NA NA NA NA NA NA NA39200 2009 0.00 0.00 0.00 0.00 NA NA NA NA NA NA NA NA NA NA39200 2010 0.00 0.00 0.00 0.00 NA NA NA NA NA NA NA NA NA NA39200 2011 0.00 0.00 0.00 0.00 NA NA NA NA NA NA NA NA NA NA39200 2012 0.00 0.00 0.00 0.00 NA NA NA NA NA NA NA NA NA NA39200 2013 0.00 0.00 0.00 0.00 NA NA NA NA NA NA NA NA NA NA39200 2014 0.00 0.00 0.00 0.00 NA NA NA NA NA NA NA NA NA NA39200 2015 0.00 0.00 0.00 0.00 NA NA NA NA NA NA NA NA NA NA39200 2016 0.00 5,024.00 0.00 5,024.00 NA NA NA NA NA NA NA NA NA NA39200 2017 0.00 0.00 0.00 0.00 NA NA NA NA NA NA NA NA NA NA
39300 1998 29,077.00 0.00 0.00 0.00 0.0%39300 1999 0.00 0.00 0.00 0.00 NA 0.0%39300 2000 0.00 0.00 0.00 0.00 NA NA 0.0%39300 2001 0.00 0.00 0.00 0.00 NA NA NA 0.0%39300 2002 0.00 0.00 0.00 0.00 NA NA NA NA 0.0%39300 2003 0.00 0.00 0.00 0.00 NA NA NA NA NA 0.00%39300 2004 0.00 0.00 0.00 0.00 NA NA NA NA NA NA 0.00%39300 2005 0.00 0.00 0.00 0.00 NA NA NA NA NA NA NA 0.00%39300 2006 0.00 0.00 0.00 0.00 NA NA NA NA NA NA NA NA 0.00%39300 2007 6,537.00 0.00 0.00 0.00 0.0% 0.0% 0.0% 0.0% 0.0% 0.00% 0.00% 0.00% 0.00% 0.00%39300 2008 0.00 0.00 0.00 0.00 NA 0.0% 0.0% 0.0% 0.0% 0.00% 0.00% 0.00% 0.00% 0.00%39300 2009 0.00 0.00 0.00 0.00 NA NA 0.0% 0.0% 0.0% 0.00% 0.00% 0.00% 0.00% 0.00%39300 2010 0.00 0.00 0.00 0.00 NA NA NA 0.0% 0.0% 0.00% 0.00% 0.00% 0.00% 0.00%39300 2011 0.00 0.00 0.00 0.00 NA NA NA NA 0.0% 0.00% 0.00% 0.00% 0.00% 0.00%39300 2012 0.00 0.00 0.00 0.00 NA NA NA NA NA 0.00% 0.00% 0.00% 0.00% 0.00%39300 2013 4,161.06 0.00 0.00 0.00 0.0% 0.0% 0.0% 0.0% 0.0% 0.00% 0.00% 0.00% 0.00% 0.00%39300 2014 0.00 0.00 0.00 0.00 NA 0.0% 0.0% 0.0% 0.0% 0.00% 0.00% 0.00% 0.00% 0.00%39300 2015 0.00 0.00 0.00 0.00 NA NA 0.0% 0.0% 0.0% 0.00% 0.00% 0.00% 0.00% 0.00%39300 2016 0.00 0.00 0.00 0.00 NA NA NA 0.0% 0.0% 0.00% 0.00% 0.00% 0.00% 0.00%39300 2017 0.00 0.00 0.00 0.00 NA NA NA NA 0.0% 0.00% 0.00% 0.00% 0.00% 0.00%
Exhibit DAW-3 Page 42 of 49

2- yr 3- yr 4- yr 5- yr 6- yr 7- yr 8- yr 9- yr 10- yrNet Net Net Net Net Net Net Net Net Net Net
Account TY Retirements Salvage COR Salvage Salv. % Salv. % Salv. % Salv. % Salv. % Salv. % Salv. % Salv. % Salv. % Salv. %
ATMOS ENERGY - KENTUCKY MID-STATES GENERAL OFFICE DIVISIONDepreciation Study as of September 30, 2017
NET SALVAGE ANALYSIS
Appendix D
39400 1998 0.00 0.00 0.00 0.00 NA39400 1999 0.00 0.00 0.00 0.00 NA NA39400 2000 0.00 0.00 0.00 0.00 NA NA NA39400 2001 0.00 0.00 0.00 0.00 NA NA NA NA39400 2002 0.00 0.00 0.00 0.00 NA NA NA NA NA39400 2003 0.00 0.00 0.00 0.00 NA NA NA NA NA NA39400 2004 0.00 0.00 0.00 0.00 NA NA NA NA NA NA NA39400 2005 0.00 0.00 0.00 0.00 NA NA NA NA NA NA NA NA39400 2006 15,243.00 0.00 0.00 0.00 0.0% 0.0% 0.0% 0.0% 0.0% 0.00% 0.00% 0.00% 0.00%39400 2007 1,249.00 48.41 0.00 48.41 3.9% 0.3% 0.3% 0.3% 0.3% 0.29% 0.29% 0.29% 0.29% 0.29%39400 2008 0.00 0.00 0.00 0.00 NA 3.9% 0.3% 0.3% 0.3% 0.29% 0.29% 0.29% 0.29% 0.29%39400 2009 1,641.15 0.00 0.00 0.00 0.0% 0.0% 1.7% 0.3% 0.3% 0.27% 0.27% 0.27% 0.27% 0.27%39400 2010 0.00 0.00 0.00 0.00 NA 0.0% 0.0% 1.7% 0.3% 0.27% 0.27% 0.27% 0.27% 0.27%39400 2011 0.00 0.00 0.00 0.00 NA NA 0.0% 0.0% 1.7% 0.27% 0.27% 0.27% 0.27% 0.27%39400 2012 0.00 0.00 0.00 0.00 NA NA NA 0.0% 0.0% 1.67% 0.27% 0.27% 0.27% 0.27%39400 2013 (419.03) 0.00 0.00 0.00 0.0% 0.0% 0.0% 0.0% 0.0% 0.00% 1.96% 0.27% 0.27% 0.27%39400 2014 0.00 0.00 0.00 0.00 NA 0.0% 0.0% 0.0% 0.0% 0.00% 0.00% 1.96% 0.27% 0.27%39400 2015 0.00 0.00 0.00 0.00 NA NA 0.0% 0.0% 0.0% 0.00% 0.00% 0.00% 1.96% 0.27%39400 2016 16,246.08 0.00 0.00 0.00 0.0% 0.0% 0.0% 0.0% 0.0% 0.00% 0.00% 0.00% 0.00% 0.26%39400 2017 0.00 0.00 0.00 0.00 NA 0.0% 0.0% 0.0% 0.0% 0.00% 0.00% 0.00% 0.00% 0.00%
39500 1998 0.00 0.00 0.00 0.00 NA39500 1999 0.00 0.00 0.00 0.00 NA NA39500 2000 0.00 0.00 0.00 0.00 NA NA NA39500 2001 0.00 0.00 0.00 0.00 NA NA NA NA39500 2002 0.00 0.00 0.00 0.00 NA NA NA NA NA39500 2003 0.00 0.00 0.00 0.00 NA NA NA NA NA NA39500 2004 0.00 0.00 0.00 0.00 NA NA NA NA NA NA NA39500 2005 0.00 0.00 0.00 0.00 NA NA NA NA NA NA NA NA39500 2006 0.00 0.00 0.00 0.00 NA NA NA NA NA NA NA NA NA39500 2007 0.00 0.00 0.00 0.00 NA NA NA NA NA NA NA NA NA NA39500 2008 0.00 0.00 0.00 0.00 NA NA NA NA NA NA NA NA NA NA39500 2009 0.00 0.00 0.00 0.00 NA NA NA NA NA NA NA NA NA NA39500 2010 0.00 0.00 0.00 0.00 NA NA NA NA NA NA NA NA NA NA39500 2011 0.00 0.00 0.00 0.00 NA NA NA NA NA NA NA NA NA NA39500 2012 0.00 0.00 0.00 0.00 NA NA NA NA NA NA NA NA NA NA39500 2013 0.00 0.00 0.00 0.00 NA NA NA NA NA NA NA NA NA NA39500 2014 0.00 0.00 0.00 0.00 NA NA NA NA NA NA NA NA NA NA39500 2015 0.00 0.00 0.00 0.00 NA NA NA NA NA NA NA NA NA NA39500 2016 0.00 0.00 0.00 0.00 NA NA NA NA NA NA NA NA NA NA39500 2017 0.00 0.00 0.00 0.00 NA NA NA NA NA NA NA NA NA NA
Exhibit DAW-3 Page 43 of 49

2- yr 3- yr 4- yr 5- yr 6- yr 7- yr 8- yr 9- yr 10- yrNet Net Net Net Net Net Net Net Net Net Net
Account TY Retirements Salvage COR Salvage Salv. % Salv. % Salv. % Salv. % Salv. % Salv. % Salv. % Salv. % Salv. % Salv. %
ATMOS ENERGY - KENTUCKY MID-STATES GENERAL OFFICE DIVISIONDepreciation Study as of September 30, 2017
NET SALVAGE ANALYSIS
Appendix D
39600 1998 0.00 0.00 0.00 0.00 NA39600 1999 0.00 0.00 0.00 0.00 NA NA39600 2000 0.00 0.00 0.00 0.00 NA NA NA39600 2001 0.00 0.00 0.00 0.00 NA NA NA NA39600 2002 0.00 0.00 0.00 0.00 NA NA NA NA NA39600 2003 0.00 0.00 0.00 0.00 NA NA NA NA NA NA39600 2004 0.00 0.00 0.00 0.00 NA NA NA NA NA NA NA39600 2005 0.00 0.00 0.00 0.00 NA NA NA NA NA NA NA NA39600 2006 0.00 0.00 0.00 0.00 NA NA NA NA NA NA NA NA NA39600 2007 0.00 0.00 0.00 0.00 NA NA NA NA NA NA NA NA NA NA39600 2008 0.00 0.00 0.00 0.00 NA NA NA NA NA NA NA NA NA NA39600 2009 0.00 0.00 0.00 0.00 NA NA NA NA NA NA NA NA NA NA39600 2010 0.00 0.00 0.00 0.00 NA NA NA NA NA NA NA NA NA NA39600 2011 0.00 0.00 0.00 0.00 NA NA NA NA NA NA NA NA NA NA39600 2012 0.00 0.00 0.00 0.00 NA NA NA NA NA NA NA NA NA NA39600 2013 0.00 0.00 0.00 0.00 NA NA NA NA NA NA NA NA NA NA39600 2014 0.00 0.00 0.00 0.00 NA NA NA NA NA NA NA NA NA NA39600 2015 8,497.07 0.00 0.00 0.00 0.0% 0.0% 0.0% 0.0% 0.0% 0.00% 0.00% 0.00% 0.00% 0.00%39600 2016 0.00 0.00 0.00 0.00 NA 0.0% 0.0% 0.0% 0.0% 0.00% 0.00% 0.00% 0.00% 0.00%39600 2017 0.00 0.00 0.00 0.00 NA NA 0.0% 0.0% 0.0% 0.00% 0.00% 0.00% 0.00% 0.00%
39700 1998 0.00 0.00 0.00 0.00 NA39700 1999 0.00 0.00 0.00 0.00 NA NA39700 2000 3,194.00 0.00 0.00 0.00 0.0% 0.0% 0.0%39700 2001 0.00 0.00 0.00 0.00 NA 0.0% 0.0% 0.0%39700 2002 0.00 0.00 0.00 0.00 NA NA 0.0% 0.0% 0.0%39700 2003 0.00 0.00 0.00 0.00 NA NA NA 0.0% 0.0% 0.00%39700 2004 0.00 0.00 0.00 0.00 NA NA NA NA 0.0% 0.00% 0.00%39700 2005 0.00 0.00 0.00 0.00 NA NA NA NA NA 0.00% 0.00% 0.00%39700 2006 0.00 0.00 0.00 0.00 NA NA NA NA NA NA 0.00% 0.00% 0.00%39700 2007 3,184.00 0.00 0.00 0.00 0.0% 0.0% 0.0% 0.0% 0.0% 0.00% 0.00% 0.00% 0.00% 0.00%39700 2008 0.00 0.00 0.00 0.00 NA 0.0% 0.0% 0.0% 0.0% 0.00% 0.00% 0.00% 0.00% 0.00%39700 2009 2,751.76 0.00 0.00 0.00 0.0% 0.0% 0.0% 0.0% 0.0% 0.00% 0.00% 0.00% 0.00% 0.00%39700 2010 0.00 0.00 0.00 0.00 NA 0.0% 0.0% 0.0% 0.0% 0.00% 0.00% 0.00% 0.00% 0.00%39700 2011 0.00 0.00 0.00 0.00 NA NA 0.0% 0.0% 0.0% 0.00% 0.00% 0.00% 0.00% 0.00%39700 2012 3,241.01 0.00 0.00 0.00 0.0% 0.0% 0.0% 0.0% 0.0% 0.00% 0.00% 0.00% 0.00% 0.00%39700 2013 91,931.23 0.00 0.00 0.00 0.0% 0.0% 0.0% 0.0% 0.0% 0.00% 0.00% 0.00% 0.00% 0.00%39700 2014 0.00 0.00 0.00 0.00 NA 0.0% 0.0% 0.0% 0.0% 0.00% 0.00% 0.00% 0.00% 0.00%39700 2015 0.00 0.00 0.00 0.00 NA NA 0.0% 0.0% 0.0% 0.00% 0.00% 0.00% 0.00% 0.00%39700 2016 225,613.58 0.00 0.00 0.00 0.0% 0.0% 0.0% 0.0% 0.0% 0.00% 0.00% 0.00% 0.00% 0.00%39700 2017 0.00 0.00 0.00 0.00 NA 0.0% 0.0% 0.0% 0.0% 0.00% 0.00% 0.00% 0.00% 0.00%
Exhibit DAW-3 Page 44 of 49

2- yr 3- yr 4- yr 5- yr 6- yr 7- yr 8- yr 9- yr 10- yrNet Net Net Net Net Net Net Net Net Net Net
Account TY Retirements Salvage COR Salvage Salv. % Salv. % Salv. % Salv. % Salv. % Salv. % Salv. % Salv. % Salv. % Salv. %
ATMOS ENERGY - KENTUCKY MID-STATES GENERAL OFFICE DIVISIONDepreciation Study as of September 30, 2017
NET SALVAGE ANALYSIS
Appendix D
39701 1998 0.00 0.00 0.00 0.00 NA39701 1999 0.00 0.00 0.00 0.00 NA NA39701 2000 0.00 0.00 0.00 0.00 NA NA NA39701 2001 0.00 0.00 0.00 0.00 NA NA NA NA39701 2002 0.00 0.00 0.00 0.00 NA NA NA NA NA39701 2003 0.00 0.00 0.00 0.00 NA NA NA NA NA NA39701 2004 0.00 0.00 0.00 0.00 NA NA NA NA NA NA NA39701 2005 0.00 0.00 0.00 0.00 NA NA NA NA NA NA NA NA39701 2006 0.00 0.00 0.00 0.00 NA NA NA NA NA NA NA NA NA39701 2007 0.00 0.00 0.00 0.00 NA NA NA NA NA NA NA NA NA NA39701 2008 0.00 0.00 0.00 0.00 NA NA NA NA NA NA NA NA NA NA39701 2009 0.00 0.00 0.00 0.00 NA NA NA NA NA NA NA NA NA NA39701 2010 0.00 0.00 0.00 0.00 NA NA NA NA NA NA NA NA NA NA39701 2011 0.00 0.00 0.00 0.00 NA NA NA NA NA NA NA NA NA NA39701 2012 0.00 0.00 0.00 0.00 NA NA NA NA NA NA NA NA NA NA39701 2013 0.00 0.00 0.00 0.00 NA NA NA NA NA NA NA NA NA NA39701 2014 0.00 0.00 0.00 0.00 NA NA NA NA NA NA NA NA NA NA39701 2015 0.00 0.00 0.00 0.00 NA NA NA NA NA NA NA NA NA NA39701 2016 0.00 0.00 0.00 0.00 NA NA NA NA NA NA NA NA NA NA39701 2017 0.00 0.00 0.00 0.00 NA NA NA NA NA NA NA NA NA NA
39702 1998 0.00 0.00 0.00 0.00 NA39702 1999 0.00 0.00 0.00 0.00 NA NA39702 2000 0.00 0.00 0.00 0.00 NA NA NA39702 2001 0.00 0.00 0.00 0.00 NA NA NA NA39702 2002 0.00 0.00 0.00 0.00 NA NA NA NA NA39702 2003 0.00 0.00 0.00 0.00 NA NA NA NA NA NA39702 2004 0.00 0.00 0.00 0.00 NA NA NA NA NA NA NA39702 2005 0.00 0.00 0.00 0.00 NA NA NA NA NA NA NA NA39702 2006 0.00 0.00 0.00 0.00 NA NA NA NA NA NA NA NA NA39702 2007 0.00 0.00 0.00 0.00 NA NA NA NA NA NA NA NA NA NA39702 2008 0.00 0.00 0.00 0.00 NA NA NA NA NA NA NA NA NA NA39702 2009 0.00 0.00 0.00 0.00 NA NA NA NA NA NA NA NA NA NA39702 2010 0.00 0.00 0.00 0.00 NA NA NA NA NA NA NA NA NA NA39702 2011 0.00 0.00 0.00 0.00 NA NA NA NA NA NA NA NA NA NA39702 2012 0.00 0.00 0.00 0.00 NA NA NA NA NA NA NA NA NA NA39702 2013 0.00 0.00 0.00 0.00 NA NA NA NA NA NA NA NA NA NA39702 2014 0.00 0.00 0.00 0.00 NA NA NA NA NA NA NA NA NA NA39702 2015 0.00 0.00 0.00 0.00 NA NA NA NA NA NA NA NA NA NA39702 2016 0.00 0.00 0.00 0.00 NA NA NA NA NA NA NA NA NA NA39702 2017 0.00 0.00 0.00 0.00 NA NA NA NA NA NA NA NA NA NA
Exhibit DAW-3 Page 45 of 49

2- yr 3- yr 4- yr 5- yr 6- yr 7- yr 8- yr 9- yr 10- yrNet Net Net Net Net Net Net Net Net Net Net
Account TY Retirements Salvage COR Salvage Salv. % Salv. % Salv. % Salv. % Salv. % Salv. % Salv. % Salv. % Salv. % Salv. %
ATMOS ENERGY - KENTUCKY MID-STATES GENERAL OFFICE DIVISIONDepreciation Study as of September 30, 2017
NET SALVAGE ANALYSIS
Appendix D
39800 1998 0.00 0.00 0.00 0.00 NA39800 1999 13,889.00 0.00 0.00 0.00 0.0% 0.0%39800 2000 0.00 0.00 0.00 0.00 NA 0.0% 0.0%39800 2001 0.00 0.00 0.00 0.00 NA NA 0.0% 0.0%39800 2002 0.00 0.00 0.00 0.00 NA NA NA 0.0% 0.0%39800 2003 0.00 0.00 0.00 0.00 NA NA NA NA 0.0% 0.00%39800 2004 0.00 0.00 0.00 0.00 NA NA NA NA NA 0.00% 0.00%39800 2005 0.00 0.00 0.00 0.00 NA NA NA NA NA NA 0.00% 0.00%39800 2006 0.00 0.00 0.00 0.00 NA NA NA NA NA NA NA 0.00% 0.00%39800 2007 0.00 0.00 0.00 0.00 NA NA NA NA NA NA NA NA 0.00% 0.00%39800 2008 10,559.64 0.00 (1,405.61) 1,405.61 13.3% 13.3% 13.3% 13.3% 13.3% 13.31% 13.31% 13.31% 13.31% 5.75%39800 2009 0.00 0.00 0.00 0.00 NA 13.3% 13.3% 13.3% 13.3% 13.31% 13.31% 13.31% 13.31% 13.31%39800 2010 0.00 0.00 0.00 0.00 NA NA 13.3% 13.3% 13.3% 13.31% 13.31% 13.31% 13.31% 13.31%39800 2011 10,791.35 0.00 0.00 0.00 0.0% 0.0% 0.0% 6.6% 6.6% 6.58% 6.58% 6.58% 6.58% 6.58%39800 2012 0.00 0.00 0.00 0.00 NA 0.0% 0.0% 0.0% 6.6% 6.58% 6.58% 6.58% 6.58% 6.58%39800 2013 7,898.84 0.00 0.00 0.00 0.0% 0.0% 0.0% 0.0% 0.0% 4.81% 4.81% 4.81% 4.81% 4.81%39800 2014 0.00 0.00 2,080.58 (2,080.58) NA -26.3% -26.3% -11.1% -11.1% -11.13% -2.31% -2.31% -2.31% -2.31%39800 2015 6,587.92 0.00 0.00 0.00 0.0% -31.6% -14.4% -14.4% -8.2% -8.23% -8.23% -1.88% -1.88% -1.88%39800 2016 0.00 0.00 0.00 0.00 NA 0.0% -31.6% -14.4% -14.4% -8.23% -8.23% -8.23% -1.88% -1.88%39800 2017 0.00 0.00 0.00 0.00 NA NA 0.0% -31.6% -14.4% -14.36% -8.23% -8.23% -8.23% -1.88%
39900 1998 0.00 0.00 0.00 0.00 NA39900 1999 0.00 0.00 0.00 0.00 NA NA39900 2000 0.00 0.00 0.00 0.00 NA NA NA39900 2001 0.00 0.00 0.00 0.00 NA NA NA NA39900 2002 0.00 0.00 0.00 0.00 NA NA NA NA NA39900 2003 0.00 0.00 0.00 0.00 NA NA NA NA NA NA39900 2004 0.00 0.00 0.00 0.00 NA NA NA NA NA NA NA39900 2005 0.00 0.00 0.00 0.00 NA NA NA NA NA NA NA NA39900 2006 0.00 0.00 0.00 0.00 NA NA NA NA NA NA NA NA NA39900 2007 0.00 0.00 0.00 0.00 NA NA NA NA NA NA NA NA NA NA39900 2008 0.00 0.00 0.00 0.00 NA NA NA NA NA NA NA NA NA NA39900 2009 0.00 0.00 0.00 0.00 NA NA NA NA NA NA NA NA NA NA39900 2010 0.00 0.00 0.00 0.00 NA NA NA NA NA NA NA NA NA NA39900 2011 0.00 0.00 0.00 0.00 NA NA NA NA NA NA NA NA NA NA39900 2012 0.00 0.00 0.00 0.00 NA NA NA NA NA NA NA NA NA NA39900 2013 0.00 0.00 0.00 0.00 NA NA NA NA NA NA NA NA NA NA39900 2014 0.00 0.00 0.00 0.00 NA NA NA NA NA NA NA NA NA NA39900 2015 0.00 0.00 0.00 0.00 NA NA NA NA NA NA NA NA NA NA39900 2016 76,993.22 0.00 0.00 0.00 0.0% 0.0% 0.0% 0.0% 0.0% 0.00% 0.00% 0.00% 0.00% 0.00%39900 2017 0.00 0.00 0.00 0.00 NA 0.0% 0.0% 0.0% 0.0% 0.00% 0.00% 0.00% 0.00% 0.00%
Exhibit DAW-3 Page 46 of 49

2- yr 3- yr 4- yr 5- yr 6- yr 7- yr 8- yr 9- yr 10- yrNet Net Net Net Net Net Net Net Net Net Net
Account TY Retirements Salvage COR Salvage Salv. % Salv. % Salv. % Salv. % Salv. % Salv. % Salv. % Salv. % Salv. % Salv. %
ATMOS ENERGY - KENTUCKY MID-STATES GENERAL OFFICE DIVISIONDepreciation Study as of September 30, 2017
NET SALVAGE ANALYSIS
Appendix D
39901 1998 0.00 0.00 0.00 0.00 NA39901 1999 0.00 0.00 0.00 0.00 NA NA39901 2000 0.00 0.00 0.00 0.00 NA NA NA39901 2001 0.00 0.00 0.00 0.00 NA NA NA NA39901 2002 0.00 0.00 0.00 0.00 NA NA NA NA NA39901 2003 0.00 0.00 0.00 0.00 NA NA NA NA NA NA39901 2004 0.00 0.00 0.00 0.00 NA NA NA NA NA NA NA39901 2005 0.00 0.00 0.00 0.00 NA NA NA NA NA NA NA NA39901 2006 0.00 0.00 0.00 0.00 NA NA NA NA NA NA NA NA NA39901 2007 0.00 0.00 0.00 0.00 NA NA NA NA NA NA NA NA NA NA39901 2008 0.00 0.00 0.00 0.00 NA NA NA NA NA NA NA NA NA NA39901 2009 0.00 0.00 0.00 0.00 NA NA NA NA NA NA NA NA NA NA39901 2010 0.00 0.00 0.00 0.00 NA NA NA NA NA NA NA NA NA NA39901 2011 0.00 0.00 0.00 0.00 NA NA NA NA NA NA NA NA NA NA39901 2012 0.00 0.00 0.00 0.00 NA NA NA NA NA NA NA NA NA NA39901 2013 0.00 0.00 0.00 0.00 NA NA NA NA NA NA NA NA NA NA39901 2014 0.00 0.00 0.00 0.00 NA NA NA NA NA NA NA NA NA NA39901 2015 0.00 0.00 0.00 0.00 NA NA NA NA NA NA NA NA NA NA39901 2016 338,069.37 0.00 0.00 0.00 0.0% 0.0% 0.0% 0.0% 0.0% 0.00% 0.00% 0.00% 0.00% 0.00%39901 2017 6,124.17 0.00 0.00 0.00 0.0% 0.0% 0.0% 0.0% 0.0% 0.00% 0.00% 0.00% 0.00% 0.00%
39902 1998 0.00 0.00 0.00 0.00 NA39902 1999 0.00 0.00 0.00 0.00 NA NA39902 2000 0.00 0.00 0.00 0.00 NA NA NA39902 2001 0.00 0.00 0.00 0.00 NA NA NA NA39902 2002 0.00 0.00 0.00 0.00 NA NA NA NA NA39902 2003 0.00 0.00 0.00 0.00 NA NA NA NA NA NA39902 2004 0.00 0.00 0.00 0.00 NA NA NA NA NA NA NA39902 2005 0.00 0.00 0.00 0.00 NA NA NA NA NA NA NA NA39902 2006 0.00 0.00 0.00 0.00 NA NA NA NA NA NA NA NA NA39902 2007 0.00 0.00 0.00 0.00 NA NA NA NA NA NA NA NA NA NA39902 2008 0.00 0.00 0.00 0.00 NA NA NA NA NA NA NA NA NA NA39902 2009 0.00 0.00 0.00 0.00 NA NA NA NA NA NA NA NA NA NA39902 2010 0.00 0.00 0.00 0.00 NA NA NA NA NA NA NA NA NA NA39902 2011 0.00 0.00 0.00 0.00 NA NA NA NA NA NA NA NA NA NA39902 2012 0.00 0.00 0.00 0.00 NA NA NA NA NA NA NA NA NA NA39902 2013 0.00 0.00 0.00 0.00 NA NA NA NA NA NA NA NA NA NA39902 2014 0.00 0.00 0.00 0.00 NA NA NA NA NA NA NA NA NA NA39902 2015 0.00 0.00 0.00 0.00 NA NA NA NA NA NA NA NA NA NA39902 2016 8,273.14 0.00 0.00 0.00 0.0% 0.0% 0.0% 0.0% 0.0% 0.00% 0.00% 0.00% 0.00% 0.00%39902 2017 0.00 0.00 0.00 0.00 NA 0.0% 0.0% 0.0% 0.0% 0.00% 0.00% 0.00% 0.00% 0.00%
Exhibit DAW-3 Page 47 of 49

2- yr 3- yr 4- yr 5- yr 6- yr 7- yr 8- yr 9- yr 10- yrNet Net Net Net Net Net Net Net Net Net Net
Account TY Retirements Salvage COR Salvage Salv. % Salv. % Salv. % Salv. % Salv. % Salv. % Salv. % Salv. % Salv. % Salv. %
ATMOS ENERGY - KENTUCKY MID-STATES GENERAL OFFICE DIVISIONDepreciation Study as of September 30, 2017
NET SALVAGE ANALYSIS
Appendix D
39903 1998 0.00 0.00 0.00 0.00 NA39903 1999 0.00 0.00 0.00 0.00 NA NA39903 2000 0.00 0.00 0.00 0.00 NA NA NA39903 2001 0.00 0.00 0.00 0.00 NA NA NA NA39903 2002 0.00 0.00 0.00 0.00 NA NA NA NA NA39903 2003 0.00 0.00 0.00 0.00 NA NA NA NA NA NA39903 2004 0.00 0.00 0.00 0.00 NA NA NA NA NA NA NA39903 2005 0.00 0.00 0.00 0.00 NA NA NA NA NA NA NA NA39903 2006 0.00 0.00 0.00 0.00 NA NA NA NA NA NA NA NA NA39903 2007 0.00 0.00 0.00 0.00 NA NA NA NA NA NA NA NA NA NA39903 2008 0.00 0.00 0.00 0.00 NA NA NA NA NA NA NA NA NA NA39903 2009 0.00 0.00 0.00 0.00 NA NA NA NA NA NA NA NA NA NA39903 2010 0.00 0.00 0.00 0.00 NA NA NA NA NA NA NA NA NA NA39903 2011 0.00 0.00 0.00 0.00 NA NA NA NA NA NA NA NA NA NA39903 2012 0.00 0.00 0.00 0.00 NA NA NA NA NA NA NA NA NA NA39903 2013 42,340.49 0.00 0.00 0.00 0.0% 0.0% 0.0% 0.0% 0.0% 0.00% 0.00% 0.00% 0.00% 0.00%39903 2014 0.00 0.00 0.00 0.00 NA 0.0% 0.0% 0.0% 0.0% 0.00% 0.00% 0.00% 0.00% 0.00%39903 2015 0.00 0.00 0.00 0.00 NA NA 0.0% 0.0% 0.0% 0.00% 0.00% 0.00% 0.00% 0.00%39903 2016 209,357.66 0.00 0.00 0.00 0.0% 0.0% 0.0% 0.0% 0.0% 0.00% 0.00% 0.00% 0.00% 0.00%39903 2017 0.00 0.00 0.00 0.00 NA 0.0% 0.0% 0.0% 0.0% 0.00% 0.00% 0.00% 0.00% 0.00%
39906 1998 0.00 0.00 0.00 0.00 NA39906 1999 0.00 0.00 0.00 0.00 NA NA39906 2000 0.00 0.00 0.00 0.00 NA NA NA39906 2001 0.00 0.00 0.00 0.00 NA NA NA NA39906 2002 1,693,996.00 0.00 0.00 0.00 0.0% 0.0% 0.0% 0.0% 0.0%39906 2003 3,923.00 0.00 0.00 0.00 0.0% 0.0% 0.0% 0.0% 0.0% 0.00%39906 2004 0.00 0.00 0.00 0.00 NA 0.0% 0.0% 0.0% 0.0% 0.00% 0.00%39906 2005 0.00 0.00 0.00 0.00 NA NA 0.0% 0.0% 0.0% 0.00% 0.00% 0.00%39906 2006 0.00 0.00 0.00 0.00 NA NA NA 0.0% 0.0% 0.00% 0.00% 0.00% 0.00%39906 2007 41,174.00 0.00 147.66 (147.66) -0.4% -0.4% -0.4% -0.4% -0.3% -0.01% -0.01% -0.01% -0.01% -0.01%39906 2008 0.00 0.00 0.00 NA -0.4% -0.4% -0.4% -0.4% -0.33% -0.01% -0.01% -0.01% -0.01%39906 2009 24,631.70 0.00 0.00 0.00 0.0% 0.0% -0.2% -0.2% -0.2% -0.22% -0.21% -0.01% -0.01% -0.01%39906 2010 48,092.94 0.00 0.00 0.00 0.0% 0.0% 0.0% -0.1% -0.1% -0.13% -0.13% -0.13% -0.01% -0.01%39906 2011 1,431.13 0.00 0.00 0.00 0.0% 0.0% 0.0% 0.0% -0.1% -0.13% -0.13% -0.13% -0.12% -0.01%39906 2012 3,062.70 0.00 90.89 (90.89) -3.0% -2.0% -0.2% -0.1% -0.1% -0.20% -0.20% -0.20% -0.20% -0.20%39906 2013 643,291.29 0.00 0.00 0.00 0.0% 0.0% 0.0% 0.0% 0.0% -0.01% -0.03% -0.03% -0.03% -0.03%39906 2014 1,326.41 0.00 0.00 0.00 0.0% 0.0% 0.0% 0.0% 0.0% -0.01% -0.01% -0.03% -0.03% -0.03%39906 2015 397,422.65 0.00 0.00 0.00 0.0% 0.0% 0.0% 0.0% 0.0% -0.01% -0.01% -0.01% -0.02% -0.02%39906 2016 542.57 0.00 0.00 0.00 0.0% 0.0% 0.0% 0.0% 0.0% -0.01% -0.01% -0.01% -0.01% -0.02%39906 2017 261,491.54 0.00 0.00 0.00 0.0% 0.0% 0.0% 0.0% 0.0% -0.01% -0.01% -0.01% -0.01% -0.01%
Exhibit DAW-3 Page 48 of 49

2- yr 3- yr 4- yr 5- yr 6- yr 7- yr 8- yr 9- yr 10- yrNet Net Net Net Net Net Net Net Net Net Net
Account TY Retirements Salvage COR Salvage Salv. % Salv. % Salv. % Salv. % Salv. % Salv. % Salv. % Salv. % Salv. % Salv. %
ATMOS ENERGY - KENTUCKY MID-STATES GENERAL OFFICE DIVISIONDepreciation Study as of September 30, 2017
NET SALVAGE ANALYSIS
Appendix D
39907 1998 0.00 0.00 0.00 0.00 NA39907 1999 0.00 0.00 0.00 0.00 NA NA39907 2000 0.00 0.00 0.00 0.00 NA NA NA39907 2001 0.00 0.00 0.00 0.00 NA NA NA NA39907 2002 0.00 0.00 0.00 0.00 NA NA NA NA NA39907 2003 0.00 0.00 0.00 0.00 NA NA NA NA NA NA39907 2004 0.00 0.00 0.00 0.00 NA NA NA NA NA NA NA39907 2005 0.00 0.00 0.00 0.00 NA NA NA NA NA NA NA NA39907 2006 0.00 0.00 0.00 0.00 NA NA NA NA NA NA NA NA NA39907 2007 0.00 0.00 0.00 0.00 NA NA NA NA NA NA NA NA NA NA39907 2008 0.00 0.00 0.00 0.00 NA NA NA NA NA NA NA NA NA NA39907 2009 0.00 0.00 0.00 0.00 NA NA NA NA NA NA NA NA NA NA39907 2010 0.00 0.00 0.00 0.00 NA NA NA NA NA NA NA NA NA NA39907 2011 0.00 0.00 0.00 0.00 NA NA NA NA NA NA NA NA NA NA39907 2012 0.00 0.00 0.00 0.00 NA NA NA NA NA NA NA NA NA NA39907 2013 88,815.18 0.00 0.00 0.00 0.0% 0.0% 0.0% 0.0% 0.0% 0.00% 0.00% 0.00% 0.00% 0.00%39907 2014 0.00 0.00 0.00 0.00 NA 0.0% 0.0% 0.0% 0.0% 0.00% 0.00% 0.00% 0.00% 0.00%39907 2015 0.00 0.00 0.00 0.00 NA NA 0.0% 0.0% 0.0% 0.00% 0.00% 0.00% 0.00% 0.00%39907 2016 39,816.30 0.00 0.00 0.00 0.0% 0.0% 0.0% 0.0% 0.0% 0.00% 0.00% 0.00% 0.00% 0.00%39907 2017 0.00 0.00 0.00 0.00 NA 0.0% 0.0% 0.0% 0.0% 0.00% 0.00% 0.00% 0.00% 0.00%
39908 1998 0.00 0.00 0.00 0.00 NA39908 1999 0.00 0.00 0.00 0.00 NA NA39908 2000 0.00 0.00 0.00 0.00 NA NA NA39908 2001 0.00 0.00 0.00 0.00 NA NA NA NA39908 2002 0.00 0.00 0.00 0.00 NA NA NA NA NA39908 2003 0.00 0.00 0.00 0.00 NA NA NA NA NA NA39908 2004 0.00 0.00 0.00 0.00 NA NA NA NA NA NA NA39908 2005 0.00 0.00 0.00 0.00 NA NA NA NA NA NA NA NA39908 2006 0.00 0.00 0.00 0.00 NA NA NA NA NA NA NA NA NA39908 2007 0.00 0.00 0.00 0.00 NA NA NA NA NA NA NA NA NA NA39908 2008 0.00 0.00 0.00 0.00 NA NA NA NA NA NA NA NA NA NA39908 2009 0.00 0.00 0.00 0.00 NA NA NA NA NA NA NA NA NA NA39908 2010 0.00 0.00 0.00 0.00 NA NA NA NA NA NA NA NA NA NA39908 2011 0.00 0.00 0.00 0.00 NA NA NA NA NA NA NA NA NA NA39908 2012 0.00 0.00 0.00 0.00 NA NA NA NA NA NA NA NA NA NA39908 2013 707,722.30 0.00 0.00 0.00 0.0% 0.0% 0.0% 0.0% 0.0% 0.00% 0.00% 0.00% 0.00% 0.00%39908 2014 0.00 0.00 0.00 0.00 NA 0.0% 0.0% 0.0% 0.0% 0.00% 0.00% 0.00% 0.00% 0.00%39908 2015 0.00 0.00 0.00 0.00 NA NA 0.0% 0.0% 0.0% 0.00% 0.00% 0.00% 0.00% 0.00%39908 2016 31,388.38 0.00 0.00 0.00 0.0% 0.0% 0.0% 0.0% 0.0% 0.00% 0.00% 0.00% 0.00% 0.00%39908 2017 38,575.39 0.00 0.00 0.00 0.0% 0.0% 0.0% 0.0% 0.0% 0.00% 0.00% 0.00% 0.00% 0.00%
Exhibit DAW-3 Page 49 of 49

Direct Testimony of Paul H. Raab Page 1 Kentucky / Raab
BEFORE THE PUBLIC SERVICE COMMISSION
COMMONWEALTH OF KENTUCKY
APPLICATION OF ATMOS ENERGY ) ) CORPORATION FOR AN ADJUSTMENT ) Case No. 2018-00281 ) OF RATES AND TARIFF MODIFICATIONS )
DIRECT TESTIMONY OF PAUL H. RAAB
Q. PLEASE STATE YOUR NAME, OCCUPATION AND BUSINESS 1
ADDRESS. 2
A. My name is Paul H. Raab and my business address is 5313 Portsmouth Road, 3
Bethesda, MD 20816. I am an independent economic consultant. 4
Q. ON WHOSE BEHALF ARE YOU APPEARING TODAY? 5
A. I am appearing on behalf of Atmos Energy Corporation, Kentucky/Mid-States 6
Division (“Atmos Energy” or “Company”). 7
I. QUALIFICATIONS 8
Q. WHAT IS YOUR EDUCATIONAL BACKGROUND? 9
A. I have a B.A. in Economics from Rutgers University and an M.A. from the State 10
University of New York at Binghamton with a concentration in Econometrics. 11
While attending Rutgers, I studied as a Henry Rutgers Scholar. 12
Q. PLEASE DESCRIBE YOUR BUSINESS EXPERIENCE. 13
A. I have been providing consulting services to the utility industry for over forty years, 14
having assisted electric, gas, telephone, and water utilities; Commissions; and 15

Direct Testimony of Paul H. Raab Page 2 Kentucky / Raab
intervenor clients in a variety of areas. I am trained as a quantitative economist so 1
that most of this assistance has been in the form of mathematical and economic 2
analysis and information systems development. My particular areas of focus are 3
planning issues, costing and rate design analysis, and depreciation and life analysis. 4
I began my career with the professional services firm that is now known as Ernst & 5
Young, where I was employed for ten years. 6
Q. HAVE YOU TESTIFIED PREVIOUSLY BEFORE COMMISSIONS IN 7
REGULATORY PROCEEDINGS? 8
A. Yes. I have previously provided expert testimony before this Commission in a 9
number of dockets as enumerated in Exhibit PHR-1, as well as the state regulatory 10
authorities of Alaska, Colorado, the District of Columbia, Georgia, Indiana, Iowa, 11
Kansas, Louisiana, Maryland, Michigan, Missouri, Montana, Nebraska, Nevada, 12
New Jersey, New Mexico, New York, Ohio, Oklahoma, Pennsylvania, Tennessee, 13
Texas, Virginia, West Virginia, and Wisconsin. In addition, I have presented expert 14
testimony before the Federal Energy Regulatory Commission, the Pennsylvania 15
House Consumer Affairs Committee, the Michigan House Economic Development 16
and Energy Committee, the Province of Saskatchewan, and the United States Tax 17
Court. Details on the subject matter of the testimony presented are provided in 18
Exhibit PHR-1. 19
II. PURPOSE OF TESTIMONY 20
Q. WHAT IS THE PURPOSE OF YOUR TESTIMONY? 21
A. The purpose of my testimony is to present the Company’s class cost of service 22
studies (COSS). These studies are used to guide the Company in assigning the 23

Direct Testimony of Paul H. Raab Page 3 Kentucky / Raab
required revenue increase to the various customer classes and in designing rates. 1
Q. WHY HAVE YOU PREPARED MULTIPLE CLASS COST OF SERVICE 2
STUDIES IN THIS CASE? 3
A. In its order in Case No. 2013-00148 the Commission stated that, “the Commission 4
strongly encourages Atmos-Ky. to file multiple-methodology COSSes in future rate 5
cases in order to give the Commission a range of reasonable results for use in 6
determining revenue allocation and rate design.” Order at 34. This directive has 7
guided the Company’s COSS presentation in its base rate filings from that point 8
forward and I continue it in this case. 9
Consistent with the Company’s practice since Case No. 2013-00148, I have 10
developed three COSS for this case that differ based on the treatment of distribution 11
mains, which is generally recognized as having a significant impact on the class 12
results. As the Commission noted in its order in Case No. 2013-00148: “Although 13
certain minor differences exist between the two COSSes, Atmos-Ky. and the AG 14
agree that the primary difference lies in the treatment of distribution mains.” Order 15
at 32. 16
Q. PLEASE DESCRIBE THESE STUDIES. 17
A. The first study, termed the “customer/demand” study, classifies investments in 18
distribution mains as both customer- and demand-related using the “minimum 19
system” approach. Such a classification reflects the fact that the Company’s level 20
of investment in distribution mains is driven by the maximum demand that 21
customers place on the system, but that there is also a minimum level of investments 22
in distribution mains that would be necessary regardless of the level of such 23

Direct Testimony of Paul H. Raab Page 4 Kentucky / Raab
demands. As indicated in the National Association of Regulatory Utility 1
Commissioners (NARUC) publication entitled Gas Rate Design, “[t]he argument 2
for inclusion of [customer] cost[s] relating to a service line and/or a ‘minimum size 3
or zero inch’ distribution main is that these facilities are necessary to connect the 4
customer to the system and thus afford him the opportunity to take service if he so 5
desires.” Gas Rate Design at 29, 30. I find this rationale compelling, and generally 6
favor a customer/demand classification of distribution mains in my work in other 7
jurisdictions. 8
However, Gas Rate Design also notes that “[t]he contra argument is that 9
mains and services are installed to serve demands of the customers and should be 10
allocated [exclusively] to that function.” Accordingly, I have prepared a second 11
COSS, termed the “demand-only” study, which classifies investments in 12
distribution mains as only demand-related, consistent with this discussion from Gas 13
Rate Design. 14
Finally, I have prepared a third study, entitled the “demand/commodity” 15
study, which reflects the Commission’s 1987 guidance that, “cost-of-service 16
methodologies should give some consideration to volume of use.” Administrative 17
Case No. 297, An Investigation of the Impact of Federal Policy on Natural Gas to 18
Kentucky Consumers and Suppliers ("Admin. 297") (Ky. PSC May 29, 1987), 19
Order at 47. While I do not believe that such an approach reflects distribution mains 20
investment cost incurrence, and therefore is a results-driven choice of classification 21
methodologies, I have nevertheless provided such a study for the Commission’s 22
consideration. 23

Direct Testimony of Paul H. Raab Page 5 Kentucky / Raab
III. IDENTIFICATION OF EXHIBITS 1
Q. DO YOU SPONSOR ANY EXHIBITS IN SUPPORT OF YOUR 2
TESTIMONY? 3
A. Yes, I sponsor five exhibits. Exhibit PHR-1 is a summary of my qualifications and 4
experience. Exhibits PHR-2, PHR-3 and PHR-4 are the results of the Company’s 5
class cost of service studies based on a customer/demand allocation of distribution 6
mains, a demand-only allocation of distribution mains and a demand/commodity 7
allocation of distribution mains, respectively. Finally, Exhibit PHR-5 is a summary 8
exhibit that highlights the two most important differences among the three studies: 9
(1) the suggested allocation of the proposed revenue increase and (2) the level of 10
fixed costs indicated for each study. 11
The above-designated exhibits were prepared by me or under my direction 12
and supervision. 13
IV. ORGANIZATION OF TESTIMONY 14
Q. HOW IS YOUR TESTIMONY ORGANIZED? 15
A. My testimony is organized into one additional section, Section V, which describes 16
the class cost of service studies. 17
V. CLASS COST OF SERVICE 18
a. Background 19
Q. WHAT IS A CLASS COST OF SERVICE ANALYSIS? 20
A. A class cost of service analysis is the process by which the costs that a utility incurs 21
to serve particular classes of customers are linked to the classes of customers that 22
caused those costs to be incurred. 23

Direct Testimony of Paul H. Raab Page 6 Kentucky / Raab
Q. WHY IS IT NECESSARY TO ALLOCATE COSTS TO THE DIFFERENT 1
CUSTOMER CLASSES? 2
A. It is a generally accepted utility ratemaking principle that rates should be based on 3
costs. This statement applies not only to the overall level of costs incurred by the 4
utility, but also to the costs that the utility incurs to serve individual services, classes 5
of customers, and segments of the utility’s business. Adherence to this principle is 6
complicated by the fact that many of the costs incurred to provide different types 7
of service are “joint” costs and many are “common” costs, neither of which has a 8
theoretically precise method by which they can be assigned to the different products 9
produced as a result of the incurrence of these costs. 10
Joint costs occur when the provision of one service is an automatic by-11
product of another (e.g., the delivery of natural gas at different times of the year). 12
Common costs are incurred when several outputs are produced using the same 13
facilities or inputs (e.g., administrative and general expenses). 14
Thus, cost of service studies are the primary method used to allocate the 15
common and joint costs incurred by the utility in serving different customer classes. 16
They are used for five purposes: 17
1. To attribute costs to different categories of customers based on how those 18
customers cause costs to be incurred; 19
2. To determine how costs will be recovered from customers within each 20
customer class; 21
3. To calculate the costs of individual types of service based on the costs each 22
service requires the utility to expend; 23

Direct Testimony of Paul H. Raab Page 7 Kentucky / Raab
4. To determine the revenue requirement for the monopoly services offered by 1
a utility operating in both monopoly and competitive markets; and 2
5. To separate costs between different regulatory jurisdictions. 3
Q. HOW ARE THE COSTS INCURRED BY THE UTILITY ALLOCATED TO 4
THE DIFFERENT CUSTOMER CLASSES? 5
A. These costs are allocated to the different customer classes in three steps: 6
functionalization, classification, and allocation. 7
Q. PLEASE DESCRIBE THE FUNCTIONALIZATION PROCESS. 8
A. Functionalization is the process whereby the capital and operating costs incurred 9
by the utility to provide service are categorized by function. The typical functions 10
of a natural gas utility are transmission, distribution, customer service and facilities, 11
and administrative and general. The transmission function includes those assets 12
and expenses associated with the delivery of natural gas from the field to the 13
distribution system. The assets and expenses involved in the delivery of natural gas 14
to ultimate customers, except those that can be directly assigned to a particular 15
customer, are included in the distribution function. Those distribution costs that 16
can be directly assigned to a particular customer (e.g., service drops and meters) 17
plus the meter reading and other customer service functions such as billing and 18
collections are included in the customer service and facilities function. The 19
administrative and general function includes management costs that cannot be 20
directly assigned to the other major cost functions. 21
Q. WHY DOES ONE FUNCTIONALIZE COSTS? 22
A. Costs are functionalized so that they can be more easily classified, which is the next 23

Direct Testimony of Paul H. Raab Page 8 Kentucky / Raab
step in the cost of service analysis. 1
Q. HOW WAS THE FUNCTIONALIZATION PROCESS PERFORMED FOR 2
ATMOS ENERGY? 3
A. The Company’s accounting processes follow the FERC Uniform System of 4
Accounts. In large measure, this system of accounts records costs by the function 5
for which they were incurred. Thus, the costs that I work with in the cost of service 6
analysis are already grouped by function. 7
Q. PLEASE DESCRIBE THE CLASSIFICATION PROCESS. 8
A. The classification process recognizes that the utility’s costs are incurred for a 9
number of purposes: to meet customers’ peak demands (demand-related costs), to 10
provide energy (energy- or commodity-related costs), and because there are 11
customers on the system (customer-related costs). The classification process 12
groups the utility’s costs by the purpose for which they were incurred. The cost of 13
odorant is the best example of a cost that is incurred in direct proportion to the 14
amount of natural gas that flows through the system and is therefore classified as 15
an energy-related cost. On the other hand, metering costs are primarily driven by 16
the number of customers on the system and would be classified as customer-related 17
costs. 18
Q. HOW WERE THE COMPANY’S COSTS CLASSIFIED IN THIS STUDY? 19
A. All of the studies discussed above rely on the same classification scheme for all 20
costs and investments other than investments in distribution mains. The 21
classification of distribution mains investment costs differs among the three studies 22
as follows. For the customer/demand study, distribution mains investment costs 23

Direct Testimony of Paul H. Raab Page 9 Kentucky / Raab
are classified as both customer-related and demand-related based on the results of 1
a minimum system study, consistent with Company studies in prior cases. The 2
demand-only study classifies distribution mains investment costs as only demand-3
related. The demand/commodity study classifies distribution mains investment 4
costs as both demand-related and commodity-related, based on the average and 5
excess demand approach, consistent with the methodology endorsed by the 6
Attorney General in Docket No. 2013-00148. The first two approaches are 7
consistent with the suggested classification of the NARUC. The third approach is 8
consistent with prior Commission guidance related to cost-of-service 9
methodologies. My testimony below explains the specific classification factors 10
employed. 11
Q. PLEASE DESCRIBE THE ALLOCATION PROCESS. 12
A. The allocation process is one in which the functionalized and classified costs from 13
above are assigned to specific customer classes. It is assumed that the load 14
characteristics of the customers within each of the major customer classes are 15
relatively homogeneous with respect to their usage characteristics. Thus, costs can 16
be allocated to customer classes based on these characteristics. Those costs that 17
have been classified as demand-related costs in the classification process above are 18
allocated among the customer classes on the basis of demands imposed on the 19
system during the peak day. Commodity- or energy-related costs are allocated on 20
the basis of the energy that the system must supply to meet the needs of these 21
customers. Customer-related costs are allocated to the different customer classes 22
based on the number of customers. 23

Direct Testimony of Paul H. Raab Page 10 Kentucky / Raab
Q. HOW ARE THESE COSTS ALLOCATED TO THE COMPANY’S 1
DIFFERENT CUSTOMER CLASSES? 2
A. First, customers are divided into groups or classes. These classes are populated with 3
customers having similar natural gas demand characteristics. The customers within 4
each class can therefore be billed pursuant to a single rate schedule containing a 5
customer charge and an energy charge since their load profiles are sufficiently 6
similar. Next, costs are examined to determine why the utility incurred them and 7
how customers' usage characteristics impact the utility's cost incurrence decisions. 8
Finally, a demand characteristic is associated with each cost incurred; each 9
customer class' contribution to that cost provides the basis for the allocation of the 10
associated cost. 11
Q. WHAT ARE THESE "USAGE CHARACTERISTICS" THAT 12
CUSTOMERS PLACE ON THE SYSTEM? 13
A. The customer's request for service is a cost causative demand characteristic that 14
necessarily results in an immediate investment in a regulator, a service line and 15
metering facilities and establishes a commitment on the part of the company to 16
provide, among other things, answers to questions and a monthly billing. Hence, 17
the very existence of this customer-utility relationship causes the incurrence of cost. 18
The amount of natural gas taken from the utility system, usually expressed 19
volumetrically (Mcf) or in terms of the energy content of the natural gas itself 20
(therms or Dth) and referred to as the customer's energy use or usage, is an 21
important cost causative characteristic as well. Additionally, as my testimony will 22
describe in more detail, the magnitude of costs incurred to serve a customer is also 23

Direct Testimony of Paul H. Raab Page 11 Kentucky / Raab
driven by the customer's potential rate of energy use, usually expressed in design 1
day usage and referred to as the customer's demand. 2
Q. HOW DO SUCH DEMANDS AFFECT COST INCURRENCE? 3
A. Cost incurrence is strongly driven by two primary factors, the physical connection 4
to the system and the rate at which energy is used. As described above, the physical 5
connection to the system involves investments (a regulator, a service line and 6
metering facilities) and establishes a commitment on the part of the company to 7
provide monthly billing, even if no customer usage occurs. Likewise, the rate at 8
which energy is used serves as the link to the incurrence and magnitude of demand 9
related utility costs. 10
Q. WHY HAVE YOU EMPHASIZED THE PHYSICAL CONNECTION TO 11
THE SYSTEM AND THE RATE AT WHICH ENERGY IS USED WHEN 12
DESCRIBING COST CAUSATIVE CUSTOMER UTILIZATION 13
FACTORS? 14
A. There are two very important factors that drive a natural gas utility's cost 15
incurrence. First, it is a capital-intensive enterprise. Second, the system must be 16
sized so that it has the capability to deliver natural gas to customers during 17
extremely cold conditions (the “design day”), even though this intensity of usage 18
only occurs a few days out of the year, if at all. This combination of capital intensity 19
and sizing to meet peak day demands dictates the prominence of the physical 20
connection and the "rate of use" customer demand characteristic when discussing 21
the cause of cost incurrence. 22

Direct Testimony of Paul H. Raab Page 12 Kentucky / Raab
Q. WHAT IS THE SIGNIFICANCE OF THE DESIGN DAY DEMAND? 1
A. It is necessary first and foremost to safely and reliably meet the simultaneous loads 2
of all customers. Furthermore, transmission plant is built to meet the highest 3
simultaneous peak established by customers. Therefore, the class contribution to 4
the coincident design day demand is the appropriate cost causative factor to be used 5
in the allocation of capital cost carrying charges of facilities to customer classes. 6
Q. WHAT ARE THE GENERAL PRINCIPLES THAT SHOULD GUIDE AN 7
ANALYST IN PREPARING A CLASS COST OF SERVICE STUDY? 8
A. Allocation of costs among customer classes establishes the basis to measure 9
existing revenue levels from such classes against the costs incurred by the Company 10
to serve them. It also provides a basis for establishing actual tariff prices that will 11
equitably recover the costs associated with providing service while minimizing 12
inter-class subsidies that may otherwise occur. In brief, using the class cost of 13
service analysis, the analyst allocates costs to cost causers. The costs that a utility 14
incurs to serve customers are the transmission facilities to transmit the natural gas 15
to town border stations, distribution facilities to distribute the natural gas to homes 16
and businesses, general facilities that provide support to the first two functional 17
groups and the related costs of operation. 18
Some analysts utilize energy use in a class cost of service to distribute 19
capital costs to classes. These analysts rationalize this allocation methodology by 20
pointing out that these facilities serve year-round load. This methodology gives no 21
weight to the critical point that these facilities were sized and built to meet the 22
highest demand that occurs during the winter period for Atmos Energy. 23

Direct Testimony of Paul H. Raab Page 13 Kentucky / Raab
During the five winter months of November through March (the winter 1
heating season), Atmos Energy can be expected to distribute about 75 percent of its 2
total firm sales volumes. This vividly illustrates that the use of a design day 3
allocation methodology links cost incurrence and the cost causer for demand-4
related fixed costs. 5
Energy-related costs such as odorant vary with the actual throughput and 6
should be spread to the various classes based on test year throughput. Costs such as 7
services, regulators, meters, operation and maintenance of these facilities, customer 8
accounting and other similar costs can he directly linked to given customer classes 9
and should be allocated to and collected from those classes. 10
b. The Classification Study 11
Q. PLEASE DESCRIBE THE CLASSIFICATION STUDIES. 12
A. The classification studies I prepared for the Company follow the general guidelines 13
established above. It is easiest to present the details associated with this process by 14
introducing the specific studies I have conducted. Exhibit PHR-2 contains the 15
complete customer/demand cost of service study (including the classifications 16
developed) for Atmos Energy. The first five pages of the study contain summaries 17
of the completed cost of service for total and customer-, demand-, and commodity-18
related costs. Pages 6 through 19 of the study contain summaries of the cost 19
classifications employed. Pages 6 through 18 contain classification schedules for 20
Gross Plant in Service, Reserve for Depreciation and Amortization, Other Rate 21
Base, O&M Expense, Depreciation Expense, and Taxes Other Than Income and 22
Net Deductions for Income Tax, respectively. Page 19 summarizes the 23

Direct Testimony of Paul H. Raab Page 14 Kentucky / Raab
classifications developed. Exhibit PHR-3 (the demand-only study) and Exhibit 1
PHR-4 (the demand/commodity study) are organized in the same way. 2
Q. PLEASE DESCRIBE YOUR CLASSIFICATION OF GROSS PLANT IN 3
SERVICE. 4
A. As shown on pages 6-8 of Exhibit PHR-2, a majority of gross plant in service 5
accounts (general plant) are classified through the use of an internally-generated 6
composite factor, developed from the classification of all production, storage, 7
transmission and distribution plant. Investments in transmission plant are classified 8
as 100% demand-related and investments in storage facilities are classified as 50% 9
demand and 50% commodity. Both classifications are consistent with those used 10
in the Company’s last base rate proceeding. In this study, investments in 11
distribution mains and related facilities are classified as approximately 33% 12
customer and 67% demand, in accordance with the results of a minimum system 13
study. 14
The demand-only study (Exhibit PHR-3) changes the distribution mains and 15
related facilities classification to 100% demand and the demand/commodity study 16
(Exhibit PHR-4) changes the classification of investments in distribution mains as 17
approximately 65% demand and 35% commodity, based on the calculated load 18
factor of the system. Of course, as these alternative classification schemes are 19
applied, the internally-generated composite factors also change to reflect more 20
heavily the classification chosen for distribution mains and related facilities. 21

Direct Testimony of Paul H. Raab Page 15 Kentucky / Raab
Q. PLEASE DESCRIBE YOUR CLASSIFICATION OF RESERVE FOR 1
DEPRECIATION AND AMORTIZATION. 2
A. As shown on pages 9-11 of the class cost of service study, the classifications of the 3
Reserves for Depreciation and Amortization follow the same classifications as 4
employed for Gross Plant in Service, by study, since the same factors that influence 5
Gross Plant in Service also affect the Reserves for Depreciation of those plant 6
categories. 7
Q. PLEASE DESCRIBE YOUR CLASSIFICATION OF OTHER RATE BASE 8
ITEMS. 9
A. Other Rate Base items include materials and supplies, gas storage inventory, 10
prepayments, cash working capital, customer advances and accumulated deferred 11
income taxes and these amounts are classified in the same way across all studies. 12
Materials and supplies, prepayments and cash working capital are classified in the 13
same way as operations and maintenance expenditures. Gas storage inventories are 14
classified as 100% commodity-related. Customer advances are classified as a 15
customer-related cost and accumulated deferred income taxes are classified 16
according to net plant, since they would appear to be largely driven by these 17
investments. 18
Q. PLEASE DESCRIBE YOUR CLASSIFICATION OF OPERATIONS AND 19
MAINTENANCE (O&M) EXPENSES. 20
A. As can be seen on pages 13-14 of the studies, I have generally classified O&M 21
expenses in accordance with the NARUC classification models and the same across 22
all three studies. For example, other gas supply expenses have been classified as 23

Direct Testimony of Paul H. Raab Page 16 Kentucky / Raab
100% commodity-related. Underground storage O&M expenses are classified in 1
the same way as investments in storage plant, i.e., 50% demand-related and 50% 2
commodity-related. 3
Transmission O&M expense is classified as entirely demand-related. 4
Distribution O&M expense classifications rely on customers for those expenses 5
related to services, regulators and meters and composite classification factors for 6
many of the other accounts that make up distribution O&M expenses. These 7
composite factors are generated within the class cost of service model. A&G 8
expenses are also classified based on composite classification factors. Customer 9
accounts expenses, customer service and information expenses and sales expenses 10
are all classified as customer-related. 11
Q. PLEASE DESCRIBE YOUR CLASSIFICATION OF DEPRECIATION 12
AND AMORTIZATION EXPENSE. 13
A. Functionalized depreciation and amortization expense is shown on pages 15-17 of 14
the class cost of service study. Functionalized depreciation expense is classified 15
the same as gross plant. Of course, this changes the classification of distribution 16
mains and related facilities depreciation expense across the studies to be consistent 17
with the way that each study classifies investments in these facilities. 18
Q. PLEASE DESCRIBE YOUR CLASSIFICATION OF TAXES, OTHER 19
THAN INCOME TAXES. 20
A. Taxes other than income taxes fall into two categories, ad valorem and payroll-21
related. Ad valorem taxes are classified on the basis of plant while the various 22
payroll-related taxes, most notably FICA taxes, are classified on the basis of total 23

Direct Testimony of Paul H. Raab Page 17 Kentucky / Raab
O&M expenses. Total O&M expenses are also used to classify the DOT 1
transmission user tax and other taxes. The Public Service Commission Assessment 2
is classified as commodity-related. Finally, while not a tax, the taxes other than 3
income taxes schedule includes a classification of interest expense, a deduction to 4
income taxes. Income taxes are computed elsewhere in the program. These 5
classifications are shown on Page 18 of the class cost of service studies, and utilize 6
the same classification factors across all studies. 7
c. The Allocation Study 8
Q. PLEASE DESCRIBE THE ALLOCATION STUDY. 9
A. The allocation schedules of the cost of service study begin on page 20 of the class 10
cost of service studies. Each allocation section consists of 4 subsections. The first 11
subsection shows the allocation of the functionalized cost item’s customer 12
component, the second subsection shows the allocation of the item’s demand 13
component, the third the commodity component, and the fourth the total allocated 14
costs. Thus, for example, pages 20-22 contain the allocation of gross plant 15
customer-related costs, pages 23-25 gross plant demand-related costs, pages 26-28 16
gross plant commodity-related costs and pages 29-31 total allocated gross plant. 17
Each line lists the functionalized cost item, the allocation factor used, the 18
total company classified costs for that item, and the amount allocated of that cost 19
item to each of the rate classes. These pages continue through page 71 of the 20
exhibit. The allocation of revenue follows on page 72. Page 73 shows the 21
classification factors used in the study, while pages 74 and 75 show the allocation 22
factors used. 23

Direct Testimony of Paul H. Raab Page 18 Kentucky / Raab
Q. PLEASE DESCRIBE THE PRIMARY ALLOCATION FACTORS THAT 1
YOU HAVE USED IN YOUR STUDY. 2
A. There are three types of allocation factors used in this study. As is the case with 3
the classification studies discussed above, these allocation factors are related to 4
customers on the system, demands placed on the system, and energy demanded 5
from the system. 6
Q. PLEASE DESCRIBE THE ALLOCATORS OF CUSTOMER-RELATED 7
COSTS THAT YOU USE. 8
A. Three primary allocators are used to assign customer-related costs to customer 9
classes: the number of bills, customer-weighted meter investments, and direct 10
assignment to the five individual customer classes. I used these different allocators 11
because different customer-related costs are more appropriately allocated with 12
each. 13
Q. CAN YOU PROVIDE AN EXAMPLE? 14
A. Certainly. The number of customers by class is used to allocate such expense items 15
as sales and customer service and information costs. Meter investments are the best 16
allocator for investment in meters. Industrial measuring and regulating station 17
expenses are most appropriately assigned directly to non-residential sales and 18
transport customers. 19
Q. PLEASE DESCRIBE THE ALLOCATORS OF DEMAND-RELATED 20
COSTS THAT YOU USE. 21
A. The two demand allocators used are a class’ design day peak, since design day 22
forms the basis for planning decisions made by the Company and winter volumes, 23

Direct Testimony of Paul H. Raab Page 19 Kentucky / Raab
used to allocate storage expenses. 1
Q. PLEASE DESCRIBE THE ALLOCATORS OF COMMODITY-RELATED 2
COSTS THAT YOU USE. 3
A. The primary allocator for commodity-related costs is total throughput. 4
Q. PLEASE SUMMARIZE YOUR ALLOCATION STUDIES. 5
A. The results are provided on lines 34 and 35 of the first page of each class cost of 6
service study and summarized on Exhibit PHR-5. Page 1 of Exhibit PHR-5 shows 7
actual and relative returns at present rates, the increases needed for an equalized 8
proposed return by class and the estimated customer-related costs for the Company 9
and for each of the cost of service classes for each of the studies developed. This 10
information is provided for the customer/demand study on lines 1-6, for the 11
demand-only study on lines 7-12, and the demand/commodity study on lines 13-12
18. Page 2 of the exhibit summarizes these results to show the minimum, maximum 13
and average revenue increases required by class to produce an equalized rate of 14
return from the three studies on lines 1-6. Similar information related to the 15
customer component of costs identified in each of the studies is provided on lines 16
7-12. 17
Q. WHY ARE THESE AMOUNTS OF INTEREST TO THE COMMISSION? 18
A. One of the primary purposes of a class cost of service analysis is to identify 19
interclass subsidies that may exist between the different classes of a natural gas 20
distribution system so that steps can be taken to eliminate them. This exhibit 21
identifies for the Commission the extent to which rates need to be adjusted so that 22
all identified subsidies can be eliminated under a range of reasonable allocation 23

Direct Testimony of Paul H. Raab Page 20 Kentucky / Raab
assumptions. 1
Q. DOES THE REVENUE INCREASE ALLOCATION ADVOCATED BY 2
COMPANY WITNESS MARK MARTIN MOVE THE CLASSES CLOSER 3
TO AN EQUALIZED RATE OF RETURN? 4
A. Yes. This can be seen by comparing the class relative rates of return at proposed 5
rates (line 56 of page 1 of Exhibits PHR-2, PHR-3 and PHR-4) to the class relative 6
rates of return at existing rates (line 35 of page 1 of those same exhibits). If the 7
class relative rates of return at proposed rates move closer to 1.0, the proposed 8
revenue increase is a movement toward parity of class returns and a reduction of 9
interclass subsidies. As this condition generally prevails across all classes and 10
studies, I would conclude that the Company’s proposed revenue distribution is a 11
reasonable movement toward reducing interclass subsidies. 12
In addition, the Company’s proposed revenue increases by class are 13
generally within the range of increases suggested by all of the studies, as shown on 14
lines 1-6 in the last column of page 2 of Exhibit PHR-5. While alterative revenue 15
distributions could also be supported, the Company’s proposals appear to be 16
reasonable and reflect gradualism in the assignment of the revenue increase. 17
Q. DOES THE EXHIBIT PROVIDE ANY OTHER SUPPORT FOR MR. 18
MARTIN’S RATE DESIGNS? 19
A. Yes. Mr. Martin proposes customer charges for Residential Sales Customers of 20
$20.50/month and $51.75/month for Non-Residential Sales Customers. The levels 21
of these charges are generally within the bounds established by the different studies, 22
as shown on lines 8 and 9 of Page 2 of Exhibit PHR-5. 23

Direct Testimony of Paul H. Raab Page 21 Kentucky / Raab
Q. DOES THAT COMPLETE YOUR DIRECT TESTIMONY AT THIS TIME? 1
A. Yes, it does. 2

COMMONWEALTH OF KENTUCKY
BEFORE THE PUBLIC SERVICE COMMISSION
IN THE MATTER OF RATE APPLICATION OF
) ) )
Case No. 2018-00281 ATMOS ENERGY CORPORATION
CERTIFICATE AND AFFIDAVIT
The Affiant, Paul H. Raab, being duly sworn, deposes and states that the prepared testimony attached hereto and made a part hereof, constitutes the prepared direct testimony of this affiant in Case No. 2018-00281, in the Matter of the Rate Application of Atmos Energy Corporation, and that if asked the questions propounded therein, this affiant would make the answers set forth in the attached prepared direct pre-filed testimony.
STATE OF W\w;y \CUI\ cY coUNTY OF Mcn+~o YY\'-\'.Af ;1
SUBSCRIBED AND SWORN to before me by Paul H. Raab on this the F7t~ay of September, 2018.
JOAN ABUCEJO NOTARY PUBUC
r.i~.ntgomery County i'itat~ of Maryland
~V Gtlmmlssion Expires )Hiy 9~1 ~o~~

Exhibit PHR-1 Page 1 of 12
PAUL H. RAAB Mr. Raab's consulting focus is on the regulated public utility industry. His experience includes mathematical and economic analyses and system development and his areas of expertise include regulatory change management, load forecasting, supply-side and demand-side planning, management audits, mergers and acquisitions, costing and rate design, and depreciation and life analysis. PROFESSIONAL EXPERIENCE Mr. Raab has directed or has had a key role in numerous engagements in the areas listed above. Representative clients are provided for each of these areas in the subsections below.
Regulatory Change Management. Mr. Raab has recently been assisting both electric and natural gas utilities as they prepare to operate in an environment that is significantly different from the one they operate in today. This work has involved the development of unbundled cost of service studies; the development of strategies that will allow companies to prosper in a restructured industry; retail access program development, implementation, and evaluation; and the development of innovative ratemaking approaches to accompany changes in the regulatory structure. Representative clients for whom he has performed such work include:
o Texas Gas Service o Virginia Natural Gas o UGI Utilities, Inc. – Gas Division, UGI Penn Natural Gas, Inc., and UGI
Central Penn Gas, Inc. o The Peoples Natural Gas Company d/b/a Dominion Peoples o National Fuel Gas Distribution Corporation o Columbia Gas of Pennsylvania, Inc. o Aquila o Kansas Corporation Commission o Atmos Energy Corporation o Electric Cooperatives’ Association o Cleco o Washington Gas o Western Resources o Kansas Gas Service o Mid Continent Market Center.
Load Forecasting. Mr. Raab has broad experience in the review and
development of forecasts of sales forecasts for electric and natural gas utilities. This work has also included the development of elasticity of demand measures that have been used for attrition adjustments and revenue requirement reconciliations. Representative clients for whom he has performed such work include:

Exhibit PHR-1 Page 2 of 12
o Washington Gas Energy Services o Central Louisiana Electric Company o Washington Gas o Saskatchewan Public Utilities Review Commission o Union Gas Limited o Nova Scotia Power Corporation o Cajun Electric Power Cooperative o Cincinnati Gas & Electric o Commonwealth Edison Company o Cleveland Electric Illuminating o Public Service of Indiana o Atlantic City Electric Company o Detroit Edison Company o Sierra Pacific Power o Connecticut Natural Gas Corporation o Appalachian Power Company o Missouri Public Service Company o Empire District Electric Company o Public Service Company of Oklahoma o Wisconsin Electric Power Company o Northern States Power Company o Iowa State Commerce Commission o Missouri Public Service Commission.
Supply Side Planning. Mr. Raab has assisted clients to determine the most
appropriate supply-side resources to meet future demands. This assistance has included the determination of optimal sizes and types of capacity to install, determination of production costs including and excluding the resource, and an assessment of system reliability changes as a result of different resource additions. Much of this work for the following clients has been done in conjunction with litigation:
o Enstar Natural Gas o AGL Resources o Washington Gas o Soyland Electric Cooperative o Houston Lighting and Power o City of Farmington, New Mexico o Big Rivers Electric Cooperative o City of Redding, California o Brown & Root o Kentucky Joint Committee on Electric Power Planning Coordination o Sierra Pacific Power.
Demand Side Planning. Demand Side Planning involves the forecasting of future
demands; the design, development, implementation, and evaluation of demand side management programs; the determination of future supply side costs; and the integration

Exhibit PHR-1 Page 3 of 12
of cost effective demand side management programs into an Integrated Least Cost Resource Plan. Mr. Raab has performed such work for the following clients:
o UGI Utilities o Dominion Peoples Gas o National Fuel Gas Distribution Corporation o Columbia Gas of Pennsylvania o Kansas Gas Service o Atmos Energy Corporation o Black Hills Gas Company o Oklahoma Natural Gas Company o Washington Gas Light Company o Piedmont Natural Gas Company o Chesapeake Utilities o Pennsylvania & Southern Gas o Montana-Dakota Utilities.
Management Audits. Mr. Raab has been involved in a number of management
audits. Consistent with his other experience, the focus of his efforts has been in the areas of load forecasting, demand- and supply-side planning, integrated resource planning, sales and marketing, and rates. Representative commission/utility clients are as follows:
o Public Utilities Commission of Ohio/East Ohio Gas o Kentucky Public Service Commission/Louisville Gas & Electric o New Hampshire Public Service Commission/Public Service Company of
New Hampshire o New Mexico Public Service Commission/Public Service of New Mexico o New York Public Service Commission/New York State Electric & Gas o Missouri Public Service Commission/Laclede Gas Company o New Jersey Board of Public Utilities/Jersey Central Power & Light o New Jersey Board of Public Utilities/New Jersey Natural Gas o Pennsylvania Public Utilities Commission/ Pennsylvania Power & Light o California Public Utilities Commission/San Diego Gas & Electric Company.
Mergers and Acquisitions. Mr. Raab has been involved in a number of merger
and acquisition studies throughout his career. Many of these were conducted as confidential studies and cannot be listed. Those in which his involvement was publicly known are:
o ONEOK, Inc./Southwest Gas Corporation o Western Resources o Constellation.
Costing and Rate Design Analysis. Mr. Raab has prepared generic rate design
studies for the National Governor's Conference, the Electricity Consumer's Resource Council, the Tennessee Valley Industrial Committee, the State Electricity Commission of

Exhibit PHR-1 Page 4 of 12
Western Australia, and the State Electricity Commission of Victoria. These generic studies addressed advantages and disadvantages of alternative costing approaches in the electric utility industry; the strengths and weaknesses of commonly encountered costing methodologies; future tariff policies to promote equity, efficiency, and fairness criteria; and the advisability of changing tariff policies. Mr. Raab has performed specific costing and rate design studies for the following companies:
o New Mexico Gas o SEMCO Gas o Enstar Natural Gas o Atmos Energy Corporation o Southern Maryland Electric Cooperative, Inc. o Comcast Cable Communications, Inc. o Cable Television Association of Georgia o Devon Energy o Aquila o Oklahoma Natural Gas o Semco Energy Gas Company o Laclede Gas o Western Resources o Kansas Gas Service Company o Central Louisiana Electric Company o Washington Gas Light Company o Piedmont Natural Gas Company o Chesapeake Utilities o Pennsylvania & Southern Gas o KPL Gas Service Company o Allegheny Power Systems o Northern States Power o Interstate Power Company o Iowa-Illinois Gas & Electric Company o Arkansas Power and Light o Iowa Power & Light o Iowa Public Service Company o Southern California Edison o Pacific Gas & Electric o New York State Electric & Gas o Middle South Utilities o Missouri Public Service Company o Empire District Electric Company o Sierra Pacific Power o Commonwealth Edison Company o South Carolina Electric & Gas o State Electricity Commission of Western Australia o State Electricity Commission of Victoria, Australia o Public Service Company of New Mexico

Exhibit PHR-1 Page 5 of 12
o Tennessee Valley Authority. Depreciation and Life Analysis. Mr. Raab has extensive experience in
depreciation and life analysis studies for the electric, gas, rail, and telephone industries and has taught a course on depreciation at George Washington University, Washington, DC. Representative clients in this area include:
o Champaign Telephone Company o Plains Generation & Transmission Cooperative o CSX Corporation (Includes work for Seaboard Coast Line, Louisville &
Nashville, Baltimore & Ohio, Chesapeake & Ohio, and Western Maryland Railroads)
o Lea County Electric Cooperative, Inc. o North Carolina Electric Membership Cooperative o Alberta Gas Trunk Lines (NOVA) o Federal Communications Commission.
TESTIMONY The following table summarizes Mr. Raab's testimony experience.
Jurisdiction Docket Number Subject Alaska U-09-069, U-09-070 Rate Design U-14-010 Rate Design Colorado 14AL-0300G Costing/Rate Design 17AL-0363G Costing/Rate Design District of Columbia 834 Demand Side Planning 905 Costing/Rate Design 917 Costing/Rate Design 921 Demand Side Planning 922 Rate Design 934 Rate Design 989 Rate Design 1016 Rate Design 1053 Costing/Rate Design 1079 Rate Design 1093 Costing/Rate Design 1137 Costing/Rate Design Georgia 18300-U Costing/Rate Design Indiana 36818 Capacity Planning

Exhibit PHR-1 Page 6 of 12
Jurisdiction Docket Number Subject
Iowa RPU-05-2 Costing/Rate Design Kansas 174,155-U Retail Competition 176,716-U Costing/Rate Design 98-KGSG-822-TAR Rate Design 99-KGSG-705-GIG Restructuring 01-KGSG-229-TAR Rate Design 02-KGSG-018-TAR Rate Design 02-WSRE-301-RTS Cost of Service 03-KGSG-602-RTS Cost of Service/Rate Design 03-AQLG-1076-TAR Rate Design 05-AQLG-367-RTS Cost of Service/Rate Design 06-KGSG-1209-RTS Cost of Service/Rate Design 07-AQLG-431-RTS Rate Design 08-WSEE-1041-RTS Cost of Service 10-KCPE-415-RTS Cost of Service/Rate Design 10-KGSG-421-TAR Demand Side Planning 10-KCPE-795-TAR Demand Side Planning 12-WSEE-112-RTS Cost of Service/Rate Design 12-KGSG-835-RTS Cost of Service/Rate Design 12-GIMX-337-GIV Demand Side Planning 12-KG&E-718-CON Cost of Service 13-KG&E-451-CON Cost of Service 13-WSEE-629-RTS Cost of Service/Rate Design 14-ATMG-320-RTS Cost of Service/Rate Design 15-WSEE-181-TAR Demand Side Planning 15-KCPE-116-RTS Cost of Service/Rate Design 16-ATMG-079-RTS Cost of Service/Rate Design 16-KGSG-491-RTS Cost of Service/Rate Design 16-KCPE-446-TAR Demand Side Planning 18-KCPE-480-RTS Cost of Service/Rate Design 18-KGSG-560-RTS Cost of Service/Rate Design Kentucky 9613 Capacity Planning 97-083 Management Audit 2009-00354 Cost of Service 2013-00148 Cost of Service 2015-00343 Cost of Service 2017-00349 Cost of Service Louisiana U-21453 Restructuring/Market Power

Exhibit PHR-1 Page 7 of 12
Jurisdiction Docket Number Subject Maryland 8251 Costing/Rate Design 8259 Demand Side Planning
8315 Costing/Rate Design 8720 Demand Side Planning 8791 Costing/Rate Design 8920 Costing/Rate Design 8959 Costing/Rate Design 9092 Costing/Rate Design 9104 Costing/Rate Design 9106 Costing/Rate Design 9180 Capacity Planning 9267 Costing/Rate Design 9433 Capacity Planning 9481 Costing Michigan U-6949 Load Forecasting U-13575 Costing/Rate Design U-16169 Costing/Rate Design Missouri GR-2002-356 Rate Design Montana D2005.4.48 Costing/Rate Design Nebraska NG-0001, NG-0002, NG-
0003 Rate Design
NG-0041 Rate Design Nevada 81-660 Load Forecasting New Jersey OAL# PUC 1876-82 Load Forecasting BPU# 822-0116 New Mexico 2087 Capacity Planning 11-00042-UT Rate Design New York 27546 Costing/Rate Design Ohio 81-1378-EL-AIR Load Forecasting

Exhibit PHR-1 Page 8 of 12
Jurisdiction Docket Number Subject Oklahoma 27068 Load Forecasting PUD 200400610 Costing/Rate Design PUD 200700449 Demand Side Planning PUD 200800348 Costing/Rate Design PUD 200900110 Costing/Rate Design PUD 201000143 Demand Side Planning PUD 201100170 Demand Side Planning
PUD 201200029 Demand Side Planning PUD 201300007 Demand Side Planning PUD 201300032 Demand Side Planning PUD 201400069 Demand Side Planning PUD 201500138 Demand Side Planning PUD 201500213 Costing/Rate Design PUD 201600132 Demand Side Planning PUD 201700079 Demand Side Planning PUD 201800028 Demand Side Planning Pennsylvania R-0061346 Costing/Rate Design M-2009-2092222, M-2009-
2112952, M-2009-2112956 Demand Side Planning
M-2009-2093216 Demand Side Planning M-2009-2093217 Demand Side Planning M-2009-2093218 Demand Side Planning M-2010-2210316 Demand Side Planning R-2010-2214415 Demand Side Planning
M-2012-2334387, M-2012-2334392, M-2012-2334398
Demand Side Planning
M-2012-2334388 Demand Side Planning M-2015-2177174 Demand Side Planning Tennessee PURPA Hearings Costing/Rate Design Texas GUD No. 9762 Costing/Rate Design GUD No. 10170 Costing/Rate Design GUD No. 10174 Costing/Rate Design GUD No. 10506 Demand Side Planning GUD No. 10526 Demand Side Planning US Tax Court 4870 Life Analysis 4875 Life Analysis

Exhibit PHR-1 Page 9 of 12
Jurisdiction Docket Number Subject Virginia PUE900013 Demand Side Planning PUE920041 Costing/Rate Design PUE940030 Costing/Rate Design PUE940031 Costing/Rate Design PUE950131 Capacity Planning PUE980813 Costing/Rate Design PUE-2002-00364 Costing/Rate Design PUE-2003-00603 Costing/Rate Design PUE-2006-00059 Costing/Rate Design PUE-2008-00060 Demand Side Planning
PUE-2009-00064 Demand Side Planning Virginia PUE-2012-00118 Demand Side Planning PUE-2015-00132 Demand Side Planning PUE-2015-00138 Demand Side Planning PUE-2016-00001 Capacity Planning PUR-2018-00080 Demand Side Planning West Virginia 79-140-E-42T Capacity Planning 90-046-E-PC Demand Side Planning Wisconsin 05-EP-2 Capacity Planning
In addition, Mr. Raab has presented expert testimony before the Federal Energy Regulatory Commission, the Pennsylvania House Consumer Affairs Committee, the Michigan House Economic Development and Energy Committee and the Province of Saskatchewan. He is a member of the Advisory Board of the Expert Evidence Report, published by The Bureau of National Affairs, Inc. EDUCATION Mr. Raab holds a B.A. (with high distinction) in Economics from Rutgers University and an M.A. from SUNY at Binghamton with a concentration in Econometrics. While attending Rutgers, he studied as a Henry Rutgers Scholar.
PUBLICATIONS AND PRESENTATIONS Mr. Raab has published in a number of professional journals and spoken at a number of industry conferences. His publications/ presentations include:

Exhibit PHR-1 Page 10 of 12
o "Natural Gas as an Electric DSM Tool," American Gas Association
Membership Services Committee Meeting, Williamsburg, VA, September 15, 2009.
o "Electric-to-Gas Fuel Switching," NARUC Summer Meeting, Seattle, WA, July 20, 2009.
o "The Future of Fuel in Virginia: Natural Gas," The Twenty-Seventh National
Regulatory Conference, Williamsburg, VA, May 19, 2009.
o "Revenue Decoupling for Natural Gas Utilities," Energy Bar Association Midwest Energy Conference, Chicago, IL, March 6, 2008.
o "Responses to Arrearage Problems from High Natural Gas Bills," American Gas Association Rate and Regulatory Issues Seminar, Phoenix, AZ, April 8, 2004.
o "Factors Influencing Cooperative Power Supply," National Rural Utilities
Cooperative Finance Corporation Independent Borrower's Conference, Boston, MA, July 3, 1997.
o "Current Status of LDC Unbundling," American Gas Association Unbundling
Conference: Regulatory and Competitive Issues, Arlington, VA, June 19, 1997.
o "Balancing, Capacity Assignment, and Stranded Costs," American Gas
Association Rate and Strategic Planning Committee Spring Meeting, Phoenix, AZ, March 26, 1997.
o "Gas Industry Restructuring and Changes: The Relationship of Economics
and Marketing" (with Jed Smith), National Association of Business Economists, 38th Annual Meeting, Boston, MA September 10, 1996.
o "Improving Corporate Performance By Better Forecasting," 1996 Peak Day
Demand and Supply Planning Seminar, San Francisco, CA, April 11, 1996.
o "Natural Gas Price Elasticity Estimation," AGA Forecasting Review, Vol. 6, No. 1, November 1995.
o "Assessing Price Competitiveness," Competitive Analysis & Benchmarking
for Power Companies, Washington, DC, November 13, 1995.
o "Avoided Cost Concepts and Management Considerations," Workshop on Avoided Costs in a Post 636 Gas Industry: Is It Time to Unbundle Avoided Cost? Sponsored by the Gas Research Institute and Wisconsin Center for Demand-Side Research, Milwaukee, WI, June 29, 1994.

Exhibit PHR-1 Page 11 of 12
o "Estimating Implied Long- and Short-Run Price Elasticities of Natural Gas Consumption," Atlantic Economic Conference, Philadelphia, PA, October 10, 1993.
o "Program Evaluation and Marginal Cost," The Natural Gas Least Cost
Planning Conference, Washington, DC, April 7, 1992.
o "The New Environmentalism & Least Cost Planning," Institute for Environmental Negotiation, University of Virginia, May 15, 1991.
o "Development of Conditional Demand Estimates of Gas Appliances," AGA
Forecasting Review, Vol. 1, No. 1, October 1988.
o "The Feasibility Study: Forecasting and Sensitivities," Municipal Wastewater Treatment Facilities, The Energy Bureau, Inc., November 18, 1985.
o "The Development of a Gas Sales End-Use Forecasting Model," Third
International Forecasting Symposium, The International Institute of Forecasting, July 1984.
o "New Forecasting Guidelines for REC's - A Seminar," (Chairman), Kansas
City, Missouri, June 1984.
o "A Method and Application of Estimating Long Run Marginal Cost for an Electric Utility," Advances in Microeconomics, Volume II, 1983.
o "Forecasting Under Public Scrutiny," Forecasting Energy and Demand
Requirements, University of Wisconsin - Extension, October 25, 1982.
o "Forecasting Public Utilities," The Journal of Business Forecasting, Vol. 1, No. 4, Summer, 1982.
o "Are Utilities Underforecasting," Electric Ratemaking, Vol. 1. No. 1,
February, 1982.
o "A Polynomial Spline Function Technique for Defining and Forecasting Electric Utility Load Duration Curves," First International Forecasting Symposium, Montreal, Canada, May, 1981.
o "Time-of-Use Rates and Marginal Costs," ELCON Legal Seminar, March
20, l980.
o "The Ernst & Whinney Forecasting Model," Forecasting Energy & Demand Requirements, University of Wisconsin - Extension, October 8, l979.

Exhibit PHR-1 Page 12 of 12
o "Marginal Cost in Electric Utilities - A Multi-Technology Multi-Period
Analysis" (with Frederick McCoy), ORSA/Tims Joint National Meeting, Los Angeles, California, November 13-15, 1978.

Exhibit PHR-2Page 1 of 75
Atmos Energy Corporation, Kentucky/Mid-States DivisionClass Cost of Service - Customer/Demand StudyForecasted Test Period: Twelve Months Ended March 31, 2020
SUMMARY OF RESULTS1234 Total Residential Non-Res Sales Non-Res Sales Transport Transport5 Company Sales Firm Interruptible Firm Interruptible6 $78 Operating Revenues 169,717,866 99,196,203 53,584,857 1,440,122 8,258,004 7,238,6819
10 Operating Expenses:1112 Operating & Maintenance 105,607,336 64,103,985 36,939,829 1,276,457 1,730,542 1,556,52113 Depreciation & Amortization 22,541,774 15,067,027 5,017,488 114,972 1,244,687 1,097,60014 Taxes Other Than Income 7,511,837 4,745,538 1,768,479 53,881 489,011 454,9271516 Total Operating Expenses 135,660,946 83,916,550 43,725,797 1,445,310 3,464,240 3,109,0491718 Income Before Taxes 34,056,920 15,279,653 9,859,060 (5,189) 4,793,763 4,129,6321920 Interest Expense 9,367,735 6,177,901 1,839,408 55,082 678,360 616,9842122 Income Taxes:2324 State Income Taxes 6.00% 1,481,351 546,105 481,179 (3,616) 246,924 210,75925 Federal Income Taxes 21.00% 4,873,645 1,796,686 1,583,079 (11,897) 812,381 693,39725 Total Deferred Income Taxes 0 0 0 0 0 026 Amortization of ITC 0 0 0 0 0 02728 Total Income Taxes 6,354,996 2,342,791 2,064,258 (15,514) 1,059,305 904,1562930 Net Income 27,701,923 12,936,862 7,794,802 10,325 3,734,459 3,225,4763132 Total Rate Base 496,111,427 327,179,122 97,414,310 2,917,111 35,925,681 32,675,2033334 Rate of Return 5.5838% 3.9541% 8.0017% 0.3539% 10.3950% 9.8713%35 Relative Rate of Return 1.00 0.71 1.43 0.06 1.86 1.77 3637 Equalized ROR:3839 Net Income Increase 11,738,935 13,073,878 (50,364) 221,585 (878,367) (627,798)40 Uncollectibles/PSC Fees Increase 0.7000% 111,435 124,108 (478) 2,103 (8,338) (5,960)41 Income Taxes 4,068,949 4,531,667 (17,457) 76,806 (304,460) (217,607)42 Gross Revenue After Increase 185,637,186 116,925,856 53,516,558 1,740,617 7,066,839 6,387,31643 Revenue Deficiency 15,919,320 17,729,653 (68,299) 300,495 (1,191,165) (851,364)44 Rate of Return 7.9500% 7.9500% 7.9500% 7.9500% 7.9500% 7.9500%45 Relative Rate of Return 1.00 1.00 1.00 1.00 1.00 1.00 46 Percent Increase 9.3799% 17.8733% -0.1275% 20.8659% -14.4244% -11.7613%4748 Proposed Rate Levels:4950 Net Income Increase 11,738,923 6,881,836 2,837,833 45,268 1,146,537 827,45051 Uncollectibles/PSC Fees Increase 111,435 65,328 26,939 430 10,884 7,85552 Income Taxes 4,068,945 2,385,382 983,650 15,691 397,412 286,81153 Gross Revenue After Increase 185,637,170 108,528,749 57,433,278 1,501,510 9,812,836 8,360,79754 Revenue Deficiency 15,919,304 9,332,546 3,848,421 61,388 1,554,833 1,122,11655 Rate of Return 7.9500% 6.0574% 10.9149% 1.9057% 13.5864% 12.4037%56 Relative Rate of Return 1.00 0.76 1.37 0.24 1.71 1.56 57 Percent Increase 9.3799% 9.4082% 7.1819% 4.2627% 18.8282% 15.5017%

Exhibit PHR-2Page 2 of 75
Atmos Energy Corporation, Kentucky/Mid-States DivisionClass Cost of Service - Customer/Demand StudyForecasted Test Period: Twelve Months Ended March 31, 2020
SUMMARY OF CUSTOMER COSTS
Total Residential Non-Res Sales Non-Res Sales Transport TransportCompany Sales Firm Interruptible Firm Interruptible
$
1 Rate Base 284,136,858 236,060,248 46,353,387 82,776 1,047,568 592,87923 Return @ Realized ROR 15,865,664 10,127,257 3,937,272 (82,754) 1,048,418 835,4714 O&M Expenses 15,715,974 12,921,579 2,710,782 7,383 48,674 27,5565 Depreciation Expense 14,611,144 11,491,663 2,970,522 7,237 90,501 51,2206 Taxes, Other 3,596,845 2,914,817 654,888 1,355 16,466 9,31978 Interest Expense 5,365,163 4,457,365 875,259 1,563 19,781 11,1959
10 Income Taxes:1112 State Income Taxes # 848,411 458,111 247,402 (6,813) 83,111 66,59913 Federal Income Taxes # 2,791,273 1,507,186 813,953 (22,413) 273,435 219,11114 Deferred Income Taxes 0 0 0 0 0 015 Amortization of ITC 0 0 0 0 0 01617 Total Income Taxes 3,639,684 1,965,298 1,061,355 (29,226) 356,546 285,7111819 Total Customer-Related Costs @ Realized ROR 53,429,311 39,420,614 11,334,819 (96,004) 1,560,605 1,209,27720 Total Customers 177,100 157,713 19,186 10 122 6921 Customer Costs ($/customer/month) 20.83$ 49.23$ (820.55)$ 1,066.68$ 1,460.44$ 222324 Incremental Return @ Equalized ROR 6,723,216 8,639,533 (252,178) 89,335 (965,136) (788,337)25 Incremental Income Taxes 2,330,401 2,994,635 (87,410) 30,965 (334,536) (273,253)26 Incremental Uncollectibles/PSC Fees Increase # 63,822 82,013 (2,394) 848 (9,162) (7,484)2728 Total Customer-Related Costs @ Equalized ROR 62,546,750 51,136,795 10,992,837 25,144 251,771 140,20329 Customers 177,100 157,713 19,186 10 122 6930 Dollars/Customer/Month 29.43$ 27.02$ 47.75$ 214.90$ 172.09$ 169.32$ 313233 Incremental Return @ Proposed Rates 6,723,209 5,093,176 1,401,973 (11,647) 194,583 45,12434 Incremental Income Taxes 2,330,399 1,765,397 485,952 (4,037) 67,446 15,64135 Incremental Uncollectibles/PSC Fees Increase 63,822 48,348 13,309 (111) 1,847 4283637 Total Customer-Related Costs @ Proposed Rates 62,546,741 46,327,535 13,236,053 (111,799) 1,824,481 1,270,47138 Customers 177,100 157,713 19,186 10 122 6939 Dollars/Customer/Month 29.43$ 24.48$ 57.49$ (955.55)$ 1,247.05$ 1,534.34$

Exhibit PHR-2Page 3 of 75
Atmos Energy Corporation, Kentucky/Mid-States DivisionClass Cost of Service - Customer/Demand StudyForecasted Test Period: Twelve Months Ended March 31, 2020
SUMMARY OF DEMAND COSTS
Total Residential Non-Res Sales Non-Res Sales Transport TransportCompany Sales Firm Interruptible Firm Interruptible
$
1 Rate Base 220,445,634 99,671,071 56,993,879 2,997,739 31,930,045 28,852,90023 Return @ Realized ROR 12,309,267 3,196,096 4,229,032 99,598 2,550,939 2,233,6014 O&M Expenses 11,199,521 5,063,690 2,895,517 152,297 1,622,174 1,465,8435 Depreciation Expense 7,789,863 3,522,066 2,013,986 105,931 1,128,309 1,019,5726 Taxes, Other 2,642,021 1,194,549 683,067 35,928 382,679 345,79978 Interest Expense 4,162,525 1,882,021 1,076,177 56,604 602,913 544,8109
10 Income Taxes:1112 State Income Taxes # 658,234 106,174 254,742 3,474 157,395 136,45013 Federal Income Taxes # 2,165,590 349,311 838,101 11,429 517,830 448,91914 Deferred Income Taxes 0 0 0 0 0 015 Amortization of ITC 0 0 0 0 0 01617 Total Income Taxes 2,823,824 455,485 1,092,843 14,902 675,225 585,3691819 Total Demand-Related Costs @ Realized ROR 36,764,497 13,431,885 10,914,446 408,656 6,359,325 5,650,184202122 Incremental Return @ Equalized ROR 5,216,161 4,727,754 301,981 138,722 (12,500) 60,20423 Incremental Income Taxes 1,808,026 1,638,734 104,673 48,084 (4,333) 20,86824 Incremental Uncollectibles/PSC Fees Increase # 49,516 44,880 2,867 1,317 (119) 5722526 Total Demand-Related Costs @ Equalized ROR 43,838,199 19,843,253 11,323,966 596,779 6,342,373 5,731,828272829 Incremental Return @ Proposed Rates 5,216,156 1,976,339 1,585,342 60,376 887,259 706,83930 Incremental Income Taxes 1,808,024 685,039 549,511 20,928 307,542 245,00531 Incremental Uncollectibles/PSC Fees Increase # 49,516 18,761 15,049 573 8,423 6,7103233 Total Demand-Related Costs @ Proposed Rates 43,838,192 16,112,024 13,064,349 490,533 7,562,548 6,608,738

Exhibit PHR-2Page 4 of 75
Atmos Energy Corporation, Kentucky/Mid-States DivisionClass Cost of Service - Customer/Demand StudyForecasted Test Period: Twelve Months Ended March 31, 2020
SUMMARY OF COMMODITY COSTS
Total Residential Non-Res Sales Non-Res Sales Transport TransportCompany Sales Firm Interruptible Firm Interruptible
$
1 Rate Base (8,471,064) (8,552,198) (5,932,956) (163,404) 2,948,068 3,229,42423 Return @ Realized ROR (473,008) (477,539) (331,285) (9,124) 164,615 180,3254 O&M Expenses 78,691,840 46,118,716 31,333,529 1,116,777 59,694 63,1225 Depreciation Expense 140,767 53,298 32,980 1,804 25,877 26,8086 Taxes, Other 1,272,971 636,172 430,525 16,598 89,866 99,80978 Interest Expense (159,953) (161,485) (112,028) (3,085) 55,666 60,9799
10 Income Taxes:1112 State Income Taxes # (25,294) (25,536) (17,715) (488) 8,803 9,64313 Federal Income Taxes # (83,217) (84,014) (58,284) (1,605) 28,961 31,72514 Deferred Income Taxes 0 0 0 0 0 015 Amortization of ITC 0 0 0 0 0 01617 Total Income Taxes (108,511) (109,550) (75,999) (2,093) 37,764 41,3681819 Total Commodity-Related Costs 79,524,058 46,221,098 31,389,750 1,123,962 377,816 411,43220 Total Throughput 33,298,463 10,083,093 6,833,161 337,587 7,557,945 8,486,67721 Commodity Costs ($/Mcf) 4.58402$ 4.59374$ 3.32940$ 0.04999$ 0.05$ 222324 Incremental Return @ Equalized ROR (200,441) (202,361) (140,385) (3,866) 69,757 76,41425 Incremental Income Taxes (69,477) (70,142) (48,660) (1,340) 24,179 26,48726 Incremental Uncollectibles/PSC Fees Increase # (1,903) (1,921) (1,333) (37) 662 7252728 Total Commodity-Related Costs @ Equalized ROR 79,252,237 45,946,673 31,199,373 1,118,719 472,414 515,05829 Total Throughput 33,298,463 10,083,093 6,833,161 337,587 7,557,945 8,486,67730 Commodity Costs ($/Mcf) 2.38$ 4.56$ 4.57$ 3.31$ 0.06$ 0.06$ 313233 Incremental Return @ Proposed Rates (200,441) (96,632) (189,701) (856) 35,182 51,56634 Incremental Income Taxes (69,477) (33,495) (65,754) (297) 12,195 17,87435 Incremental Uncollectibles/PSC Fees Increase (1,903) (917) (1,801) (8) 334 4903637 Total Commodity-Related Costs @ Proposed Rates 79,252,237 46,090,053 31,132,495 1,122,801 425,527 481,36138 Total Throughput 33,298,463 10,083,093 6,833,161 337,587 7,557,945 8,486,67739 Commodity Costs ($/Mcf) 2.38$ 4.57$ 4.56$ 3.33$ 0.06$ 0.06$

Exhibit PHR-2Page 5 of 75
Atmos Energy Corporation, Kentucky/Mid-States DivisionClass Cost of Service - Customer/Demand StudyForecasted Test Period: Twelve Months Ended March 31, 2020
TOTAL COST OF SERVICE
Total Residential Non-Res Sales Non-Res Sales Transport TransportCompany Sales Firm Interruptible Firm Interruptible
$
1 Rate Base 496,111,427 327,179,122 97,414,310 2,917,111 35,925,681 32,675,20323 Return @ Realized ROR 27,701,923 12,845,815 7,835,020 7,720 3,763,971 3,249,3974 O&M Expenses 105,607,336 64,103,985 36,939,829 1,276,457 1,730,542 1,556,5215 Depreciation Expense 22,541,774 15,067,027 5,017,488 114,972 1,244,687 1,097,6006 Taxes, Other 7,511,837 4,745,538 1,768,479 53,881 489,011 454,92778 Interest Expense 9,367,735 6,177,901 1,839,408 55,082 678,360 616,9849
10 Income Taxes:1112 State Income Taxes 1,481,351 538,749 484,429 (3,827) 249,309 212,69213 Federal Income Taxes 4,873,645 1,772,483 1,593,770 (12,590) 820,226 699,75614 Deferred Income Taxes 0 0 0 0 0 015 Amortization of ITC 0 0 0 0 0 01617 Total Income Taxes 6,354,996 2,311,232 2,078,199 (16,417) 1,069,535 912,4471819 Total Cost of Service @ Realized ROR 169,717,866 99,073,597 53,639,015 1,436,614 8,297,746 7,270,893202122 Incremental Return @ Equalized ROR 11,738,935 13,164,925 (90,582) 224,190 (907,880) (651,719)23 Incremental Income Taxes 4,068,949 4,563,226 (31,397) 77,709 (314,689) (225,899)24 Incremental Uncollectibles/PSC Fees Increase 111,435 124,972 (860) 2,128 (8,618) (6,187)2526 Total Cost of Service @ Equalized ROR 185,637,186 116,926,721 53,516,176 1,740,641 7,066,559 6,387,089272829 Incremental Return @ Proposed Rates 11,738,923 6,972,883 2,797,615 47,873 1,117,024 803,52930 Incremental Income Taxes 4,068,945 2,416,941 969,709 16,594 387,183 278,51931 Incremental Uncollectibles/PSC Fees Increase 111,435 66,192 26,557 454 10,604 7,6283233 Total Cost of Service @ Proposed Rates 185,637,170 108,529,613 57,432,896 1,501,535 9,812,556 8,360,570

Exhibit PHR-2Page 6 of 75
Atmos Energy Corporation, Kentucky/Mid-States DivisionClass Cost of Service - Customer/Demand StudyForecasted Test Period: Twelve Months Ended March 31, 2020
CLASSIFICATION OF GROSS PLANT IN SERVICE
Test Year Classif. Classif. Customer Demand CommodityLine Acct. $ Factor Basis $ $ $No. No.
1 Intangible Plant:23 30100 Organization 8,330 5.4 P, S, T & D Plant 4,746 3,492 92 4 30200 Franchises & Consents 119,853 5.4 P, S, T & D Plant 68,293 50,240 1,320 5 30300 Misc Intangible Plant - 99.0 - - - - 67 Total Intangible Plant: 128,182 73,039 53,731 1,41289 Production Plant:
1011 32520 Producing Leaseholds - 99.0 - - - - 12 32540 Rights of Ways - 99.0 - - - - 13 33100 Production Gas Wells Equipment - 99.0 - - - - 14 33201 Field Lines - 99.0 - - - - 15 33202 Tributary Lines - 99.0 - - - - 16 33400 Field Meas. & Reg. Sta. Equip - 99.0 - - - - 17 33600 Purification Equipment - 99.0 - - - - 1819 Total Production Plant 0 0 0 02021 Storage Plant:2223 35010 Land 261,127 3.5 Storage (50/50) - 130,563 130,563 24 35020 Rights of Way 4,682 3.5 Storage (50/50) - 2,341 2,341 25 35100 Structures and Improvements 17,916 3.5 Storage (50/50) - 8,958 8,958 26 35102 Compression Station Equipment 153,261 3.5 Storage (50/50) - 76,631 76,631 27 35103 Meas. & Reg. Sta. Structues 23,138 3.5 Storage (50/50) - 11,569 11,569 28 35104 Other Structures 137,443 3.5 Storage (50/50) - 68,721 68,721 29 35200 Wells \ Rights of Way 8,348,396 3.5 Storage (50/50) - 4,174,198 4,174,198 30 35201 Well Construction 1,699,999 3.5 Storage (50/50) - 849,999 849,999 31 35202 Well Equipment 449,309 3.5 Storage (50/50) - 224,655 224,655 32 35203 Cushion Gas 1,694,833 3.5 Storage (50/50) - 847,416 847,416 33 35210 Leaseholds 178,530 3.5 Storage (50/50) - 89,265 89,265 34 35211 Storage Rights 54,614 3.5 Storage (50/50) - 27,307 27,307 35 35301 Field Lines 175,350 3.5 Storage (50/50) - 87,675 87,675 36 35302 Tributary Lines 209,319 3.5 Storage (50/50) - 104,659 104,659 37 35400 Compressor Station Equipment 923,446 3.5 Storage (50/50) - 461,723 461,723 38 35500 Meas & Reg. Equipment 273,084 3.5 Storage (50/50) - 136,542 136,542 39 35600 Purification Equipment 414,663 3.5 Storage (50/50) - 207,332 207,332 4041 Total Storage Plant 15,019,110 0 7,509,555 7,509,5554243 Transmission:4445 36510 Land & Land Rights 26,970 2.0 Demand - 26,970 - 46 36520 Rights of Way 867,772 2.0 Demand - 867,772 - 47 36602 Structures & Improvements 49,002 2.0 Demand - 49,002 - 48 36603 Other Structues 60,826 2.0 Demand - 60,826 - 49 36700 Mains Cathodic Protection 139,638 2.0 Demand - 139,638 - 50 36701 Mains - Steel 27,047,831 2.0 Demand - 27,047,831 - 51 36900 Meas. & Reg. Equipment 731,467 2.0 Demand - 731,467 - 52 36901 Meas. & Reg. Equipment 2,269,556 2.0 Demand - 2,269,556 - 5354 Total Transmission Plant 31,193,061 0 31,193,061 05556 Distribution:5758 37400 Land & Land Rights 531,167 4.0 Mains (Minimum System) 177,653 353,514 - 59 37401 Land 37,326 4.0 Mains (Minimum System) 12,484 24,842 - 60 37402 Land Rights 3,645,749 4.0 Mains (Minimum System) 1,219,352 2,426,397 - 61 37403 Land Other 2,784 4.0 Mains (Minimum System) 931 1,853 - 62 37500 Structures & Improvements 336,168 4.0 Mains (Minimum System) 112,434 223,733 - 63 37501 Structures & Improvements T.B. 99,818 4.0 Mains (Minimum System) 33,385 66,433 - 64 37502 Land Rights 46,264 4.0 Mains (Minimum System) 15,473 30,791 - 65 37503 Improvements 4,005 4.0 Mains (Minimum System) 1,340 2,666 - 66 37600 Mains Cathodic Protection 20,611,541 4.0 Mains (Minimum System) 6,893,706 13,717,835 - 67 37601 Mains - Steel 176,025,498 4.0 Mains (Minimum System) 58,873,231 117,152,267 - 68 37602 Mains - Plastic 133,261,910 4.0 Mains (Minimum System) 44,570,584 88,691,326 - 69 37800 Meas & Reg. Sta. Equip - General 29,911,913 4.0 Mains (Minimum System) 10,004,295 19,907,618 - 70 37900 Meas & Reg. Sta. Equip - City Gate 5,126,032 4.0 Mains (Minimum System) 1,714,445 3,411,587 - 71 37905 Meas & Reg. Sta. Equipment T.b. 1,652,259 4.0 Mains (Minimum System) 552,612 1,099,647 - 72 38000 Services 150,274,437 1.0 Customer 150,274,437 - - 73 38100 Meters 38,722,015 1.0 Customer 38,722,015 - - 74 38200 Meter Installations 57,067,155 1.0 Customer 57,067,155 - - 75 38300 House Regulators 12,779,948 1.0 Customer 12,779,948 - - 76 38400 House Reg. Installations 252,587 1.0 Customer 252,587 - - 77 38500 Ind. Meas. & Reg. Sta. Equipment 5,241,043 1.0 Customer 5,241,043 - - 78 38600 Other Prop. On Cust. Prem - 99.0 - - - - 7980 Total Distribution Plant 635,629,619 388,519,111 247,110,508 081

Exhibit PHR-2Page 7 of 75
Atmos Energy Corporation, Kentucky/Mid-States DivisionClass Cost of Service - Customer/Demand StudyForecasted Test Period: Twelve Months Ended March 31, 2020
CLASSIFICATION OF GROSS PLANT IN SERVICE
Test Year Classif. Classif. Customer Demand CommodityLine Acct. $ Factor Basis $ $ $No. No.
82 General:8384 38900 Land & Land Rights 1,211,697 5.4 P, S, T & D Plant 690,435 507,917 13,345 85 39000 Structures & Improvements 7,595,600 5.4 P, S, T & D Plant 4,328,036 3,183,909 83,655 86 39001 Structures Frame - 5.4 P, S, T & D Plant - - - 87 39002 Structures-Brick 173,115 5.4 P, S, T & D Plant 98,642 72,566 1,907 88 39003 Improvements 709,199 5.4 P, S, T & D Plant 404,108 297,281 7,811 89 39004 Air Conditioning Equipment 12,955 5.4 P, S, T & D Plant 7,382 5,430 143 90 39009 Improvement to leased Premises 1,246,194 5.4 P, S, T & D Plant 710,092 522,377 13,725 91 39100 Office Furniture & Equipment 1,866,038 5.4 P, S, T & D Plant 1,063,284 782,202 20,552 92 39102 Remittance Processing Equip - 5.4 P, S, T & D Plant - - - 93 39103 Office Machines - 5.4 P, S, T & D Plant - - - 94 39200 Transportation Equipment 220,987 5.4 P, S, T & D Plant 125,920 92,633 2,434 95 39201 Trucks - 5.4 P, S, T & D Plant - - - 96 39202 Trailers - 5.4 P, S, T & D Plant - - - 97 39300 Stores Equipment - 5.4 P, S, T & D Plant - - - 98 39400 Tools, Shop & Garage Equipment 4,078,361 5.4 P, S, T & D Plant 2,323,884 1,709,559 44,918 99 39600 Power Operated Equipment - 5.4 P, S, T & D Plant - - -
100 39603 Ditchers 39,610 5.4 P, S, T & D Plant 22,570 16,604 436 101 39604 Backhoes 62,747 5.4 P, S, T & D Plant 35,754 26,302 691 102 39605 Welders 19,427 5.4 P, S, T & D Plant 11,070 8,143 214 103 39700 Communication Equipment 524,257 5.4 P, S, T & D Plant 298,726 219,757 5,774 104 39701 Communication Equipment - Mobile Radios - 5.4 P, S, T & D Plant - - - 105 39702 Communication Equipment - Fixed Radios - 5.4 P, S, T & D Plant - - - 106 39705 Communication Equip. - Telemetering - 5.4 P, S, T & D Plant - - - 107 39800 Miscellaneous Equipment 3,891,771 5.4 P, S, T & D Plant 2,217,563 1,631,345 42,863 108 39900 Other Tangible Property - 5.4 P, S, T & D Plant - - - 109 39901 Other Tangible Property - Servers - H/W 14,390 5.4 P, S, T & D Plant 8,199 6,032 158 110 39902 Other Tangible Property - Servers - S/W - 5.4 P, S, T & D Plant - - - 111 39903 Other Tangible Property - Network - H/W 134,599 5.4 P, S, T & D Plant 76,696 56,421 1,482 112 39904 Other Tang. Property - CPU - 5.4 P, S, T & D Plant - - - 113 39905 Other Tangible Property - MF - Hardware - 5.4 P, S, T & D Plant - - - 114 39906 Other Tang. Property - PC Hardware 461,888 5.4 P, S, T & D Plant 263,188 193,613 5,087 115 39907 Other Tang. Property - PC Software - 5.4 P, S, T & D Plant - - - 116 39908 Other Tang. Property - Mainframe S/W 123,515 5.4 P, S, T & D Plant 70,380 51,775 1,360 117 39909 Other Tang. Property - Application Software - 5.4 P, S, T & D Plant - - - 118 39924 Other Tang. Property - General Startup Costs - 5.4 P, S, T & D Plant - - - 119120 Total General Plant 22,386,350 12,755,928 9,383,867 246,555121122 TOTAL DIRECT PLANT 704,356,323 401,348,078 295,250,723 7,757,522123124 CWIP w/o AFUDC 38,154,809 5.4 P, S, T & D Plant 21,740,927 15,993,659 420,223 125126 Kentucky Mid-States General Office:127128 Intangible Plant:129130 30100 Organization 92,247 5.4 P, S, T & D Plant 52,563 38,668 1,016 131 30200 Franchises & Consents - 5.4 P, S, T & D Plant - - - 132 30300 Misc Intangible Plant 552,335 5.4 P, S, T & D Plant 314,725 231,527 6,083 133134 Total Intangible Plant: 644,582 367,288 270,195 7,099135136 General:137138 37400 Land & Land Rights - 5.4 P, S, T & D Plant - - - 139 39001 Structures Frame 89,275 5.4 P, S, T & D Plant 50,869 37,422 983 140 36602 Structures & Improvements - 5.4 P, S, T & D Plant - - - 141 38900 Land & Land Rights - 5.4 P, S, T & D Plant - - - 142 39004 Air Conditioning Equipment 7,658 5.4 P, S, T & D Plant 4,364 3,210 84 143 39009 Improvement to leased Premises 19,332 5.4 P, S, T & D Plant 11,015 8,103 213 144 39100 Office Furniture & Equipment 19,220 5.4 P, S, T & D Plant 10,952 8,056 212 145 39102 Remittance Processing Equip - 5.4 P, S, T & D Plant - - - 146 39103 Office Machines - 5.4 P, S, T & D Plant - - - 147 39200 Transportation Equipment 13,582 5.4 P, S, T & D Plant 7,739 5,693 150 148 39201 Trucks - 5.4 P, S, T & D Plant - - - 149 39202 Trailers - 5.4 P, S, T & D Plant - - - 150 39300 Stores Equipment - 5.4 P, S, T & D Plant - - - 151 39400 Tools, Shop & Garage Equipment 87,547 5.4 P, S, T & D Plant 49,885 36,698 964 152 39600 Power Operated Equipment 10,213 5.4 P, S, T & D Plant 5,819 4,281 112 153 39603 Ditchers - 5.4 P, S, T & D Plant - - - 154 39604 Backhoes - 5.4 P, S, T & D Plant - - - 155 39605 Welders - 5.4 P, S, T & D Plant - - - 156 39700 Communication Equipment 18,688 5.4 P, S, T & D Plant 10,649 7,834 206 157 39701 Communication Equipment - Mobile Radios - 5.4 P, S, T & D Plant - - - 158 39702 Communication Equipment - Fixed Radios - 5.4 P, S, T & D Plant - - - 159 39705 Communication Equip. - Telemetering - 5.4 P, S, T & D Plant - - - 160 39800 Miscellaneous Equipment 405,292 5.4 P, S, T & D Plant 230,939 169,890 4,464 161 39900 Other Tangible Property - 5.4 P, S, T & D Plant - - - 162 39901 Other Tangible Property - Servers - H/W - 5.4 P, S, T & D Plant - - - 163 39902 Other Tangible Property - Servers - S/W - 5.4 P, S, T & D Plant - - - 164 39903 Other Tangible Property - Network - H/W - 5.4 P, S, T & D Plant - - - 165 39904 Other Tang. Property - CPU - 5.4 P, S, T & D Plant - - - 166 39905 Other Tangible Property - MF - Hardware - 5.4 P, S, T & D Plant - - - 167 39906 Other Tang. Property - PC Hardware 34,934 5.4 P, S, T & D Plant 19,906 14,644 385 168 39907 Other Tang. Property - PC Software 82,288 5.4 P, S, T & D Plant 46,889 34,493 906 169 39908 Other Tang. Property - Mainframe S/W 412,432 5.4 P, S, T & D Plant 235,007 172,882 4,542 170 39909 Other Tang. Property - Application Software - 5.4 P, S, T & D Plant - - - 171 39924 Other Tang. Property - General Startup Costs - 5.4 P, S, T & D Plant - - - 172173 Total General Plant 1,200,461 684,033 503,207 13,221174175 CWIP w/o AFUDC 2,311 5.4 P, S, T & D Plant 1,317 969 25 176

Exhibit PHR-2Page 8 of 75
Atmos Energy Corporation, Kentucky/Mid-States DivisionClass Cost of Service - Customer/Demand StudyForecasted Test Period: Twelve Months Ended March 31, 2020
CLASSIFICATION OF GROSS PLANT IN SERVICE
Test Year Classif. Classif. Customer Demand CommodityLine Acct. $ Factor Basis $ $ $No. No.177 Shared Services General Office:178179 General:180181 37400 Land & Land Rights - 5.4 P, S, T & D Plant - - - 182 39001 Structures Frame - 5.4 P, S, T & D Plant - - - 183 36602 Structures & Improvements 236,424 5.4 P, S, T & D Plant 134,716 99,104 2,604 184 37503 Improvements - 5.4 P, S, T & D Plant - - - 185 39004 Air Conditioning Equipment - 5.4 P, S, T & D Plant - - - 186 39009 Improvement to leased Premises 483,357 5.4 P, S, T & D Plant 275,421 202,613 5,324 187 39100 Office Furniture & Equipment 286,918 5.4 P, S, T & D Plant 163,488 120,270 3,160 188 39102 Remittance Processing Equip - 5.4 P, S, T & D Plant - - - 189 39103 Office Machines - 5.4 P, S, T & D Plant - - - 190 39200 Transportation Equipment 369 5.4 P, S, T & D Plant 210 155 4 191 39201 Trucks - 5.4 P, S, T & D Plant - - - 192 39202 Trailers - 5.4 P, S, T & D Plant - - - 193 39300 Stores Equipment - 5.4 P, S, T & D Plant - - - 194 39400 Tools, Shop & Garage Equipment 3,938 5.4 P, S, T & D Plant 2,244 1,651 43 195 39500 Tools, Shop & Garage Equipment - 5.4 P, S, T & D Plant - - - 196 39603 Ditchers - 5.4 P, S, T & D Plant - - - 197 39604 Backhoes - 5.4 P, S, T & D Plant - - - 198 39605 Welders - 5.4 P, S, T & D Plant - - - 199 39700 Communication Equipment 54,370 5.4 P, S, T & D Plant 30,980 22,791 599 200 39701 Communication Equipment - Mobile Radios - 5.4 P, S, T & D Plant - - - 201 39702 Communication Equipment - Fixed Radios - 5.4 P, S, T & D Plant - - - 202 39705 Communication Equip. - Telemetering - 5.4 P, S, T & D Plant - - - 203 39800 Miscellaneous Equipment 7,537 5.4 P, S, T & D Plant 4,295 3,159 83 204 39900 Other Tangible Property 8,377 5.4 P, S, T & D Plant 4,773 3,512 92 205 39901 Other Tangible Property - Servers - H/W 2,321,928 5.4 P, S, T & D Plant 1,323,054 973,301 25,573 206 39902 Other Tangible Property - Servers - S/W 1,402,428 5.4 P, S, T & D Plant 799,115 587,867 15,446 207 39903 Other Tangible Property - Network - H/W 442,303 5.4 P, S, T & D Plant 252,028 185,404 4,871 208 39904 Other Tang. Property - CPU - 5.4 P, S, T & D Plant - - - 209 39905 Other Tangible Property - MF - Hardware - 5.4 P, S, T & D Plant - - - 210 39906 Other Tang. Property - PC Hardware 155,862 5.4 P, S, T & D Plant 88,811 65,334 1,717 211 39907 Other Tang. Property - PC Software 86,214 5.4 P, S, T & D Plant 49,126 36,139 950 212 39908 Other Tang. Property - Mainframe S/W 3,879,643 5.4 P, S, T & D Plant 2,210,653 1,626,261 42,729 213 39909 Other Tang. Property - Application Software 1,322,956 5.4 P, S, T & D Plant 753,831 554,554 14,571 214 39931 Other Tang. Property - ALGN - 5.4 P, S, T & D Plant - - - 215216 Total General Plant 10,692,624 6,092,746 4,482,113 117,765217218 CWIP w/o AFUDC 748,344 5.4 P, S, T & D Plant 426,413 313,690 8,242 219220 Shared Services Customer Support:221222 General:223224 37400 Land & Land Rights 205,882 5.4 P, S, T & D Plant 117,313 86,301 2,268 225 39001 Structures Frame - 5.4 P, S, T & D Plant - - - 226 36602 Structures & Improvements 1,000,011 5.4 P, S, T & D Plant 569,815 419,183 11,014 227 37503 Improvements - 5.4 P, S, T & D Plant - - - 228 39004 Air Conditioning Equipment - 5.4 P, S, T & D Plant - - - 229 39009 Improvement to leased Premises 159,117 5.4 P, S, T & D Plant 90,666 66,698 1,752 230 39100 Office Furniture & Equipment 154,692 5.4 P, S, T & D Plant 88,145 64,843 1,704 231 39102 Remittance Processing Equip - 5.4 P, S, T & D Plant - - - 232 39103 Office Machines - 5.4 P, S, T & D Plant - - - 233 39200 Transportation Equipment 2,233 5.4 P, S, T & D Plant 1,272 936 25 234 39201 Trucks - 5.4 P, S, T & D Plant - - - 235 39202 Trailers - 5.4 P, S, T & D Plant - - - 236 39300 Stores Equipment - 5.4 P, S, T & D Plant - - - 237 39400 Tools, Shop & Garage Equipment 14,093 5.4 P, S, T & D Plant 8,030 5,907 155 238 39510 Laboratory Equip 548 5.4 P, S, T & D Plant 312 230 6 239 39603 Ditchers - 5.4 P, S, T & D Plant - - - 240 39604 Backhoes - 5.4 P, S, T & D Plant - - - 241 39605 Welders - 5.4 P, S, T & D Plant - - - 242 39700 Communication Equipment 114,682 5.4 P, S, T & D Plant 65,347 48,072 1,263 243 39701 Communication Equipment - Mobile Radios - 5.4 P, S, T & D Plant - - - 244 39702 Communication Equipment - Fixed Radios - 5.4 P, S, T & D Plant - - - 245 39705 Communication Equip. - Telemetering - 5.4 P, S, T & D Plant - - - 246 39800 Miscellaneous Equipment 15,758 5.4 P, S, T & D Plant 8,979 6,605 174 247 39900 Other Tangible Property 43,368 5.4 P, S, T & D Plant 24,711 18,179 478 248 39901 Other Tangible Property - Servers - H/W 583,485 5.4 P, S, T & D Plant 332,475 244,584 6,426 249 39902 Other Tangible Property - Servers - S/W 114,175 5.4 P, S, T & D Plant 65,058 47,860 1,257 250 39903 Other Tangible Property - Network - H/W 35,496 5.4 P, S, T & D Plant 20,226 14,879 391 251 39904 Other Tang. Property - CPU - 5.4 P, S, T & D Plant - - - 252 39905 Other Tangible Property - MF - Hardware - 5.4 P, S, T & D Plant - - - 253 39906 Other Tang. Property - PC Hardware 69,473 5.4 P, S, T & D Plant 39,586 29,121 765 254 39907 Other Tang. Property - PC Software 13,141 5.4 P, S, T & D Plant 7,488 5,508 145 255 39908 Other Tang. Property - Mainframe S/W 5,248,748 5.4 P, S, T & D Plant 2,990,780 2,200,160 57,808 256 39909 Other Tang. Property - Application Software 477 5.4 P, S, T & D Plant 272 200 5 257 39924 Other Tang. Property - General Startup Costs - 5.4 P, S, T & D Plant - - - 258259 Total General Plant 7,775,377 4,430,475 3,259,268 85,635260261 CWIP w/o AFUDC 224,734 5.4 P, S, T & D Plant 128,056 94,204 2,475 262263 TOTAL PLANT IN SERVICE 724,669,367 412,922,619 303,765,506 7,981,242264265 TOTAL CWIP W/O AFUDC 39,130,198 22,296,712 16,402,521 430,966

Exhibit PHR-2Page 9 of 75
Atmos Energy Corporation, Kentucky/Mid-States DivisionClass Cost of Service - Customer/Demand StudyForecasted Test Period: Twelve Months Ended March 31, 2020
CLASSIFICATION OF RESERVE FOR DEPRECIATION AND AMORTIZATION
Test Year Classif. Classif. Customer Demand CommodityLine Acct. $ Factor Basis $ $ $No. No.
1 Intangible Plant:23 30100 Organization 8,330 5.4 P, S, T & D Plant 4,746 3,492 92 4 30200 Franchises & Consents 119,853 5.4 P, S, T & D Plant 68,293 50,240 1,320 5 30300 Misc Intangible Plant - 99.0 - - - - 67 Total Intangible Plant: 128,182 73,039 53,731 1,41289 Production Plant:
1011 32520 Producing Leaseholds - 99.0 - - - - 12 32540 Rights of Ways - 99.0 - - - - 13 33100 Production Gas Wells Equipment - 99.0 - - - - 14 33201 Field Lines - 99.0 - - - - 15 33202 Tributary Lines - 99.0 - - - - 16 33400 Field Meas. & Reg. Sta. Equip - 99.0 - - - - 17 33600 Purification Equipment - 99.0 - - - - 1819 Total Production Plant - 0 0 02021 Storage Plant:2223 35010 Land - 3.5 Storage (50/50) - - - 24 35020 Rights of Way 4,453 3.5 Storage (50/50) - 2,227 2,227 25 35100 Structures and Improvements 6,289 3.5 Storage (50/50) - 3,144 3,144 26 35102 Compression Station Equipment 113,744 3.5 Storage (50/50) - 56,872 56,872 27 35103 Meas. & Reg. Sta. Structues 20,483 3.5 Storage (50/50) - 10,242 10,242 28 35104 Other Structures 100,144 3.5 Storage (50/50) - 50,072 50,072 29 35200 Wells \ Rights of Way 1,190,830 3.5 Storage (50/50) - 595,415 595,415 30 35201 Well Construction 1,419,511 3.5 Storage (50/50) - 709,755 709,755 31 35202 Well Equipment 450,595 3.5 Storage (50/50) - 225,298 225,298 32 35203 Cushion Gas 758,594 3.5 Storage (50/50) - 379,297 379,297 33 35210 Leaseholds 168,062 3.5 Storage (50/50) - 84,031 84,031 34 35211 Storage Rights 43,956 3.5 Storage (50/50) - 21,978 21,978 35 35301 Field Lines (88,396) 3.5 Storage (50/50) - (44,198) (44,198) 36 35302 Tributary Lines 189,177 3.5 Storage (50/50) - 94,588 94,588 37 35400 Compressor Station Equipment 497,853 3.5 Storage (50/50) - 248,926 248,926 38 35500 Meas & Reg. Equipment 202,544 3.5 Storage (50/50) - 101,272 101,272 39 35600 Purification Equipment 191,797 3.5 Storage (50/50) - 95,899 95,899 4041 Total Storage Plant 5,269,635 0 2,634,817 2,634,8174243 Transmission:4445 36510 Land & Land Rights - 2.0 Demand - - - 46 36520 Rights of Way 428,096 2.0 Demand - 428,096 - 47 36602 Structures & Improvements 16,837 2.0 Demand - 16,837 - 48 36603 Other Structues 53,066 2.0 Demand - 53,066 - 49 36700 Mains Cathodic Protection 98,316 2.0 Demand - 98,316 - 50 36701 Mains - Steel 16,387,961 2.0 Demand - 16,387,961 - 51 36900 Meas. & Reg. Equipment 353,469 2.0 Demand - 353,469 - 52 36901 Meas. & Reg. Equipment 1,774,251 2.0 Demand - 1,774,251 - 5354 Total Transmission Plant 19,111,996 0 19,111,996 05556 Distribution:5758 37400 Land & Land Rights - 4.0 Mains (Minimum System) - - - 59 37401 Land - 4.0 Mains (Minimum System) - - - 60 37402 Land Rights 235,363 4.0 Mains (Minimum System) 78,719 156,644 - 61 37403 Land Other - 4.0 Mains (Minimum System) - - - 62 37500 Structures & Improvements 113,695 4.0 Mains (Minimum System) 38,026 75,669 - 63 37501 Structures & Improvements T.B. 71,449 4.0 Mains (Minimum System) 23,897 47,552 - 64 37502 Land Rights 35,399 4.0 Mains (Minimum System) 11,840 23,560 - 65 37503 Improvements 1,920 4.0 Mains (Minimum System) 642 1,278 - 66 37600 Mains Cathodic Protection 13,210,658 4.0 Mains (Minimum System) 4,418,417 8,792,241 - 67 37601 Mains - Steel 33,671,112 4.0 Mains (Minimum System) 11,261,591 22,409,521 - 68 37602 Mains - Plastic 19,028,671 4.0 Mains (Minimum System) 6,364,302 12,664,370 - 69 37800 Meas & Reg. Sta. Equip - General 2,894,799 4.0 Mains (Minimum System) 968,190 1,926,609 - 70 37900 Meas & Reg. Sta. Equip - City Gate 984,409 4.0 Mains (Minimum System) 329,244 655,165 - 71 37905 Meas & Reg. Sta. Equipment T.b. 1,038,111 4.0 Mains (Minimum System) 347,205 690,906 - 72 38000 Services 30,562,139 1.0 Customer 30,562,139 - - 73 38100 Meters 21,386,354 1.0 Customer 21,386,354 - - 74 38200 Meter Installaitons 26,987,899 1.0 Customer 26,987,899 - - 75 38300 House Regulators 4,321,265 1.0 Customer 4,321,265 - - 76 38400 House Reg. Installations 94,403 1.0 Customer 94,403 - - 77 38500 Ind. Meas. & Reg. Sta. Equipment 2,958,741 1.0 Customer 2,958,741 - - 78 38600 Other Prop. On Cust. Prem - 99.0 - - - - 7980 Total Distribution Plant 157,596,387 110,152,874 47,443,513 081

Exhibit PHR-2Page 10 of 75
Atmos Energy Corporation, Kentucky/Mid-States DivisionClass Cost of Service - Customer/Demand StudyForecasted Test Period: Twelve Months Ended March 31, 2020
CLASSIFICATION OF RESERVE FOR DEPRECIATION AND AMORTIZATION
Test Year Classif. Classif. Customer Demand CommodityLine Acct. $ Factor Basis $ $ $No. No.
82 General:8384 38900 Land & Land Rights - 5.4 P, S, T & D Plant - - - 85 39000 Structures & Improvements 1,253,482 5.4 P, S, T & D Plant 714,244 525,432 13,805 86 39002 Structures - Brick 107,583 5.4 P, S, T & D Plant 61,302 45,096 1,185 87 39003 Improvements 292,730 5.4 P, S, T & D Plant 166,800 122,706 3,224 88 39003 Air Conditioning Equipment 5,049 5.4 P, S, T & D Plant 2,877 2,117 56 89 39004 Improvement to Leased Premises 1,248,110 5.4 P, S, T & D Plant 711,183 523,180 13,746 90 39009 Office Furniture & Equipment 1,144,609 5.4 P, S, T & D Plant 652,208 479,795 12,606 91 39100 Remittance Processing Equip - 5.4 P, S, T & D Plant - - - 92 39102 Office Machines - 5.4 P, S, T & D Plant - - - 93 39103 Transportation Equipment 113,788 5.4 P, S, T & D Plant 64,837 47,697 1,253 94 39200 Trucks - 5.4 P, S, T & D Plant - - - 95 39201 Trailers (2,529) 5.4 P, S, T & D Plant (1,441) (1,060) (28) 96 39202 Stores Equipment - 5.4 P, S, T & D Plant - - - 97 39400 Tools, Shop & Garage Equipment 1,300,851 5.4 P, S, T & D Plant 741,236 545,288 14,327 98 39600 Power Operated Equipment - 5.4 P, S, T & D Plant - - - 99 39603 Ditchers 39,655 5.4 P, S, T & D Plant 22,596 16,622 437
100 39604 Backhoes 62,818 5.4 P, S, T & D Plant 35,794 26,332 692 101 39605 Welders 19,456 5.4 P, S, T & D Plant 11,086 8,156 214 102 39700 Communication Equipment 269,010 5.4 P, S, T & D Plant 153,284 112,763 2,963 103 39701 Communication Equipment - Mobile Radios - 5.4 P, S, T & D Plant - - - 104 39702 Communication Equipment - Fixed Radios - 5.4 P, S, T & D Plant - - - 105 39705 Communication Equip. - Telemetering - 5.4 P, S, T & D Plant - - - 106 39800 Miscellaneous Equipment 2,072,883 5.4 P, S, T & D Plant 1,181,146 868,907 22,830 107 39900 Other Tangible Property - 5.4 P, S, T & D Plant - - - 108 39901 Other Tangible Property - Servers - H/W 6,670 5.4 P, S, T & D Plant 3,801 2,796 73 109 39902 Other Tangible Property - Servers - S/W - 5.4 P, S, T & D Plant - - - 110 39903 Other Tangible Property - Network - H/W 64,644 5.4 P, S, T & D Plant 36,835 27,098 712 111 39904 Other Tang. Property - CPU - 5.4 P, S, T & D Plant - - - 112 39905 Other Tangible Property - MF - Hardware - 5.4 P, S, T & D Plant - - - 113 39906 Other Tang. Property - PC Hardware 112,226 5.4 P, S, T & D Plant 63,947 47,043 1,236 114 39907 Other Tang. Property - PC Software - 5.4 P, S, T & D Plant - - - 115 39908 Other Tang. Property - Mainframe S/W - 5.4 P, S, T & D Plant - - - 116 39909 Other Tang. Property - Application Software 117,916 5.4 P, S, T & D Plant 67,190 49,428 1,299 117 Other Tang. Property - General Startup Costs - 5.4 P, S, T & D Plant - - - 118 Retirement Work in Progress (6,374,709) 5.4 P, S, T & D Plant (3,632,362) (2,672,138) (70,209) 119 AR 15 general plant amortization - 5.4 P, S, T & D Plant - - - 120121 Total General Plant 1,854,243 1,056,563 777,258 20,422122123 TOTAL DIRECT RESERVE FOR DEPRECIATION 183,960,444 111,282,476 70,021,316 2,656,651124125 Kentucky Mid-States General Office:126127 Intangible Plant:128129 30100 Organization - 5.4 P, S, T & D Plant - - - 130 30200 Franchises & Consents - 5.4 P, S, T & D Plant - - - 131 30300 Misc Intangible Plant - 5.4 P, S, T & D Plant - - - 132133 Total Intangible Plant: - 0 0 0134135 General:136137 37400 Land & Land Rights - 5.4 P, S, T & D Plant - - - 138 39001 Structures Frame 52,708 5.4 P, S, T & D Plant 30,033 22,094 581 139 36602 Structures & Improvements - 5.4 P, S, T & D Plant - - - 140 38900 Land & Land Rights - 5.4 P, S, T & D Plant - - - 141 39004 Air Conditioning Equipment 5,090 5.4 P, S, T & D Plant 2,900 2,133 56 142 39009 Improvement to leased Premises 19,332 5.4 P, S, T & D Plant 11,015 8,103 213 143 39100 Office Furniture & Equipment 19,220 5.4 P, S, T & D Plant 10,952 8,056 212 144 39102 Remittance Processing Equip - 5.4 P, S, T & D Plant - - - 145 39103 Office Machines - 5.4 P, S, T & D Plant - - - 146 39200 Transportation Equipment 8,895 5.4 P, S, T & D Plant 5,069 3,729 98 147 39201 Trucks - 5.4 P, S, T & D Plant - - - 148 39202 Trailers - 5.4 P, S, T & D Plant - - - 149 39300 Stores Equipment - 5.4 P, S, T & D Plant - - - 150 39400 Tools, Shop & Garage Equipment 71,611 5.4 P, S, T & D Plant 40,804 30,018 789 151 39600 Power Operated Equipment 4,375 5.4 P, S, T & D Plant 2,493 1,834 48 152 39603 Ditchers - 5.4 P, S, T & D Plant - - - 153 39604 Backhoes - 5.4 P, S, T & D Plant - - - 154 39605 Welders - 5.4 P, S, T & D Plant - - - 155 39700 Communication Equipment (2,991) 5.4 P, S, T & D Plant (1,705) (1,254) (33) 156 39701 Communication Equipment - Mobile Radios - 5.4 P, S, T & D Plant - - - 157 39702 Communication Equipment - Fixed Radios - 5.4 P, S, T & D Plant - - - 158 39705 Communication Equip. - Telemetering - 5.4 P, S, T & D Plant - - - 159 39800 Miscellaneous Equipment 359,341 5.4 P, S, T & D Plant 204,755 150,628 3,958 160 39900 Other Tangible Property - 5.4 P, S, T & D Plant - - - 161 39901 Other Tangible Property - Servers - H/W (17,306) 5.4 P, S, T & D Plant (9,861) (7,254) (191) 162 39902 Other Tangible Property - Servers - S/W - 5.4 P, S, T & D Plant - - - 163 39903 Other Tangible Property - Network - H/W - 5.4 P, S, T & D Plant - - - 164 39904 Other Tang. Property - CPU - 5.4 P, S, T & D Plant - - - 165 39905 Other Tangible Property - MF - Hardware - 5.4 P, S, T & D Plant - - - 166 39906 Other Tang. Property - PC Hardware 34,944 5.4 P, S, T & D Plant 19,911 14,648 385 167 39907 Other Tang. Property - PC Software 21,086 5.4 P, S, T & D Plant 12,015 8,839 232 168 39908 Other Tang. Property - Mainframe S/W 412,432 5.4 P, S, T & D Plant 235,007 172,882 4,542 169 39909 Other Tang. Property - Application Software - 5.4 P, S, T & D Plant - - - 170 39924 Other Tang. Property - General Startup Costs - 5.4 P, S, T & D Plant - - - 171 Retirement Work in Progress 26,143 5.4 P, S, T & D Plant 14,897 10,959 288 172173 Total General Plant 1,014,877 578,286 425,414 11,177174

Exhibit PHR-2Page 11 of 75
Atmos Energy Corporation, Kentucky/Mid-States DivisionClass Cost of Service - Customer/Demand StudyForecasted Test Period: Twelve Months Ended March 31, 2020
CLASSIFICATION OF RESERVE FOR DEPRECIATION AND AMORTIZATION
Test Year Classif. Classif. Customer Demand CommodityLine Acct. $ Factor Basis $ $ $No. No.175 Shared Services General Office:176177 General:178179 37400 Land & Land Rights - 5.4 P, S, T & D Plant - - - 180 39000 Structures & Improvements 90,855 5.4 P, S, T & D Plant 51,770 38,084 1,001 181 36602 Structures & Improvements - 5.4 P, S, T & D Plant - - - 182 37503 Improvements - 5.4 P, S, T & D Plant - - - 183 39004 Air Conditioning Equipment - 5.4 P, S, T & D Plant - - - 184 39009 Improvement to leased Premises 482,368 5.4 P, S, T & D Plant 274,857 202,198 5,313 185 39100 Office Furniture & Equipment 116,207 5.4 P, S, T & D Plant 66,216 48,712 1,280 186 39102 Remittance Processing Equip 0 5.4 P, S, T & D Plant 0 0 0 187 39103 Office Machines 0 5.4 P, S, T & D Plant 0 0 0 188 39200 Transportation Equipment 284 5.4 P, S, T & D Plant 162 119 3 189 39201 Trucks - 5.4 P, S, T & D Plant - - - 190 39202 Trailers - 5.4 P, S, T & D Plant - - - 191 39300 Stores Equipment - 5.4 P, S, T & D Plant - - - 192 39400 Tools, Shop & Garage Equipment 1,722 5.4 P, S, T & D Plant 981 722 19 193 39500 39500-Laboratory Equipment - 5.4 P, S, T & D Plant - - - 194 39603 Ditchers - 5.4 P, S, T & D Plant - - - 195 39604 Backhoes - 5.4 P, S, T & D Plant - - - 196 39605 Welders - 5.4 P, S, T & D Plant - - - 197 39700 Communication Equipment 28,314 5.4 P, S, T & D Plant 16,134 11,869 312 198 39701 Communication Equipment - Mobile Radios - 5.4 P, S, T & D Plant - - - 199 39702 Communication Equipment - Fixed Radios - 5.4 P, S, T & D Plant - - - 200 39705 Communication Equip. - Telemetering - 5.4 P, S, T & D Plant - - - 201 39800 Miscellaneous Equipment 2,855 5.4 P, S, T & D Plant 1,627 1,197 31 202 39900 Other Tangible Property 8,438 5.4 P, S, T & D Plant 4,808 3,537 93 203 39901 Other Tangible Property - Servers - H/W 1,335,526 5.4 P, S, T & D Plant 760,994 559,823 14,709 204 39902 Other Tangible Property - Servers - S/W 969,778 5.4 P, S, T & D Plant 552,588 406,510 10,681 205 39903 Other Tangible Property - Network - H/W 134,188 5.4 P, S, T & D Plant 76,461 56,248 1,478 206 39904 Other Tang. Property - CPU - 5.4 P, S, T & D Plant - - - 207 39905 Other Tangible Property - MF - Hardware - 5.4 P, S, T & D Plant - - - 208 39906 Other Tang. Property - PC Hardware 94,055 5.4 P, S, T & D Plant 53,593 39,426 1,036 209 39907 Other Tang. Property - PC Software 91,932 5.4 P, S, T & D Plant 52,384 38,536 1,013 210 39908 Other Tang. Property - Mainframe S/W 2,311 5.4 P, S, T & D Plant 1,317 969 25 211 39909 Other Tang. Property - Application Software 2,526,463 5.4 P, S, T & D Plant 1,439,600 1,059,038 27,826 212 39924 Other Tang. Property - General Startup Costs - 5.4 P, S, T & D Plant - - - 213 Retirement Work in Progress - 5.4 P, S, T & D Plant - - - 214215 Total General Plant 5,885,295 3,353,490 2,466,987 64,818216217 Shared Services Customer Support:218219 General:220221 37400 Land & Land Rights - 5.4 P, S, T & D Plant - - - 222 39001 Structures Frame - 5.4 P, S, T & D Plant - - - 223 36602 Structures & Improvements 204,679 5.4 P, S, T & D Plant 116,628 85,797 2,254 224 37503 Improvements - 5.4 P, S, T & D Plant - - - 225 39004 Air Conditioning Equipment - 5.4 P, S, T & D Plant - - - 226 39009 Improvement to leased Premises 99,706 5.4 P, S, T & D Plant 56,813 41,794 1,098 227 39100 Office Furniture & Equipment 54,761 5.4 P, S, T & D Plant 31,203 22,954 603 228 39102 Remittance Processing Equip - 5.4 P, S, T & D Plant - - - 229 39103 Office Machines - 5.4 P, S, T & D Plant - - - 230 39200 Transportation Equipment 2,235 5.4 P, S, T & D Plant 1,273 937 25 231 39201 Trucks - 5.4 P, S, T & D Plant - - - 232 39202 Trailers - 5.4 P, S, T & D Plant - - - 233 39300 Stores Equipment - 5.4 P, S, T & D Plant - - - 234 39400 Tools, Shop & Garage Equipment 3,654 5.4 P, S, T & D Plant 2,082 1,532 40 235 39500 Laboratory Equipment 426 5.4 P, S, T & D Plant 243 178 5 236 39603 Ditchers - 5.4 P, S, T & D Plant - - - 237 39604 Backhoes - 5.4 P, S, T & D Plant - - - 238 39605 Welders - 5.4 P, S, T & D Plant - - - 239 39700 Communication Equipment 70,180 5.4 P, S, T & D Plant 39,989 29,418 773 240 39701 Communication Equipment - Mobile Radios - 5.4 P, S, T & D Plant - - - 241 39702 Communication Equipment - Fixed Radios - 5.4 P, S, T & D Plant - - - 242 39705 Communication Equip. - Telemetering - 5.4 P, S, T & D Plant - - - 243 39800 Miscellaneous Equipment 4,862 5.4 P, S, T & D Plant 2,770 2,038 54 244 39900 Other Tangible Property 31,781 5.4 P, S, T & D Plant 18,109 13,322 350 245 39901 Other Tangible Property - Servers - H/W 338,151 5.4 P, S, T & D Plant 192,681 141,745 3,724 246 39902 Other Tangible Property - Servers - S/W 77,363 5.4 P, S, T & D Plant 44,082 32,429 852 247 39903 Other Tangible Property - Network - H/W 22,965 5.4 P, S, T & D Plant 13,086 9,626 253 248 39904 Other Tang. Property - CPU - 5.4 P, S, T & D Plant - - - 249 39905 Other Tangible Property - MF - Hardware - 5.4 P, S, T & D Plant - - - 250 39906 Other Tang. Property - PC Hardware 43,877 5.4 P, S, T & D Plant 25,002 18,392 483 251 39907 Other Tang. Property - PC Software 10,171 5.4 P, S, T & D Plant 5,795 4,263 112 252 39908 Other Tang. Property - Mainframe S/W 2,050,478 5.4 P, S, T & D Plant 1,168,380 859,516 22,583 253 39909 Other Tang. Property - Application Software 4,865 5.4 P, S, T & D Plant 2,772 2,039 54 254 39924 Other Tang. Property - General Startup Costs - 5.4 P, S, T & D Plant - - - 255 Retirement Work in Progress - 5.4 P, S, T & D Plant - - - 256257 Total General Plant 3,020,151 1,720,907 1,265,981 33,263258259 TOTAL RESERVE FOR DEPRECIATION 193,880,768 116,935,159 74,179,698 2,765,910

Exhibit PHR-2Page 12 of 75
Atmos Energy Corporation, Kentucky/Mid-States DivisionClass Cost of Service - Customer/Demand StudyForecasted Test Period: Twelve Months Ended March 31, 2020
CLASSIFICATION OF OTHER RATE BASE
Test Year Classif. Classif. Customer Demand Commodity$ Factor Basis $ $ $
1 Rate Base Additions:23 Materials and Supplies - KY Direct (402,124) 9.1 Allocated O&M Expenses (59,842) (42,645) (299,637) 4 Materials and Supplies - KY Mid-States GO 519,990 9.1 Allocated O&M Expenses 77,382 55,144 387,463 5 Materials and Supplies - Shared Services GO (0) 9.1 Allocated O&M Expenses (0) (0) (0) 6 Materials and Supplies - Shared Services CS 0 9.1 Allocated O&M Expenses - - - 7 Gas Storage Inventory 8,905,991 3.0 Commodity - - 8,905,991 8 Prepayments - KY Direct 0 9.1 Allocated O&M Expenses - - - 9 Prepayments - KY Mid-States GO 0 9.1 Allocated O&M Expenses - - -
10 Prepayments - Shared Services GO 0 9.1 Allocated O&M Expenses - - - 11 Prepayments - Shared Services CS 0 9.1 Allocated O&M Expenses - - - 12 Cash Working Capital 2,692,759 9.1 Allocated O&M Expenses 400,723 285,564 2,006,472 13 Regulatory Assets (33,020,670) 9.1 Allocated O&M Expenses (4,913,977) (3,501,799) (24,604,894) 1415 Total Rate Base Additions (21,304,054) (4,495,713) (3,203,736) (13,604,604)161718 Rate Base Deductions:1920 Customer Advances - KY Direct (747,234) 1.0 Customer (747,234) - - 21 Customer Advances - KY Mid-States GO 0 1.0 Customer - - - 22 Customer Advances - Shared Services GO 0 1.0 Customer - - - 23 Customer Advances - Shared Services CS 0 1.0 Customer - - - 24 ADIT - KY Direct (75,117,257) 5.7 Net Plant (41,950,948) (32,422,107) (744,201) 25 ADIT - KY Mid-States GO 22,846,265 5.7 Net Plant 12,759,018 9,860,904 226,342 26 ADIT - Shared Services GO (848,471) 5.7 Net Plant (473,848) (366,217) (8,406) 27 ADIT - Shared Services CS 67,614 5.7 Net Plant 37,760 29,183 670 28 Change in Net Operating Loss Carryforward 1,295,767 5.7 Net Plant 723,651 559,279 12,837 2930 Total Rate Base Deductions (52,503,316) (29,651,601) (22,338,958) (512,758)313233 TOTAL OTHER RB (73,807,370) (34,147,314) (25,542,694) (14,117,362)3435 Interest on Customer Deposits 0 1.0 Customer - - -

Exhibit PHR-2Page 13 of 75
Atmos Energy Corporation, Kentucky/Mid-States DivisionClass Cost of Service - Customer/Demand StudyForecasted Test Period: Twelve Months Ended March 31, 2020
CLASSIFICATION OF O&M EXPENSE
Test Year Classif. Classif. Customer Demand CommodityLine Acct. $ Factor Basis $ $ $No. No.
1 Production & Gathering:2 Operation3 7500 Op., Sup., & Eng. 0 99.0 - - - - 4 7510 Production Maps & Records 0 99.0 - - - - 5 7530 Field Lines Expenses 0 99.0 - - - - 6 7540 Field Compressor Station Expense 0 99.0 - - - - 7 7550 Field Compressor Sta. Fuel & Pwr. 0 99.0 - - - - 8 7560 Field Meas. & Regul. Station Exp 0 99.0 - - - - 9 7570 Purification Expense 0 99.0 - - - -
10 7590 Other Expenses 0 99.0 - - - - 11 Maintenance12 7610 Maint. Sup., & Eng. 0 99.0 - - - - 13 7620 Structures and Improvements 0 99.0 - - - - 14 7640 Field Line Maintenance 0 99.0 - - - - 15 7650 Compressor Station Equip. Maint. 0 99.0 - - - - 16 7660 Meas. & Regul. Station Equip Maint 0 99.0 - - - - 17 7670 Purification Equipment Maintenance 0 99.0 - - - - 18 7680 Other Equipment Maintenance 0 99.0 - - - - 19 7690 Gas Processed By Others 0 99.0 - - - - 20 Total Production & Gathering 0 0 0 02122 Other Gas Supply Expenses:23 Operation24 8001 Intercompany Gas Well-head Purchases 0 3.0 Commodity - - - 25 8010 Natural gas field line purchases 61,240 3.0 Commodity - - 61,240 26 8040 Natural gas city gate purchases 51,401,318 3.0 Commodity - - 51,401,318 27 8050 Other purchases (7,602) 3.0 Commodity - - (7,602) 28 8051 PGA for Residential 47,517,427 3.0 Commodity - - 47,517,427 29 8052 PGA for Commercial 24,564,311 3.0 Commodity - - 24,564,311 30 8053 PGA for Industrial 4,854,142 3.0 Commodity - - 4,854,142 31 8054 PGA for Public Authorities 4,585,482 3.0 Commodity - - 4,585,482 32 8058 Unbilled PGA Cost (3,124,678) 3.0 Commodity - - (3,124,678) 33 8059 PGA Offset to Unrecovered Gas Cost (71,826,171) 3.0 Commodity - - (71,826,171) 34 8060 Exchange gas (2,147,338) 3.0 Commodity - - (2,147,338) 35 8081 Gas withdrawn from storage-Debit 12,436,037 3.0 Commodity - - 12,436,037 36 8082 Gas delivered to storage-Credit (12,626,734) 3.0 Commodity - - (12,626,734) 37 8120 Gas used for other utility operations-Credit (14,329) 3.0 Commodity - - (14,329) 38 8580 Transmission and compression of gas by others 22,709,250 3.0 Commodity - - 22,709,250 39 Maintenance40 8350 Maint. Of Purch. Gas Meas. Sta. 0 3.0 Commodity - - - 41 Total Other Gas Supply Expenses 78,382,354 0 0 78,382,3544243 Underground Storage:44 Operation45 8140 Storage-Operation supervision and engineering 0 3.5 Storage (50/50) - - - 46 8160 Wells expenses 291,917 3.5 Storage (50/50) - 145,959 145,959 47 8170 Lines expenses 21,251 3.5 Storage (50/50) - 10,626 10,626 48 8180 Compressor station expenses 25,060 3.5 Storage (50/50) - 12,530 12,530 49 8190 Compressor station fuel and power 735 3.5 Storage (50/50) - 368 368 50 8200 Storage-Measuring and regulating station expenses 6,181 3.5 Storage (50/50) - 3,090 3,090 51 8210 Storage-Purification expenses 49,856 3.5 Storage (50/50) - 24,928 24,928 52 8240 Storage-Other expenses 0 3.5 Storage (50/50) - - - 53 8250 Storage well royalties 8,763 3.5 Storage (50/50) - 4,382 4,382 54 8260 Rents 0 3.5 Storage (50/50) - - - 55 Maintenance56 8300 Maint. Sup., & Eng. 0 3.5 Storage (50/50) - - - 57 8310 Structures and Improvements 12,736 3.5 Storage (50/50) - 6,368 6,368 58 8320 Reservoirs & Wells Maintenance 0 3.5 Storage (50/50) - - - 59 8330 Line Maintenance 0 3.5 Storage (50/50) - - - 60 8340 Compressor Station Equip Maint 3,331 3.5 Storage (50/50) - 1,665 1,665 61 8350 Meas. & Regul. Station Equip Maint 0 3.5 Storage (50/50) - - - 62 8360 Purification Equipment Maintenance 0 3.5 Storage (50/50) - - - 63 8410 Other storage expenses-Operation labor and expenses 69,083 3.5 Storage (50/50) - 34,542 34,542 64 Total Underground Storage Expense 488,914 0 244,457 244,4576566 Transmission:67 Operation68 8500 Op., Sup., & Eng. 35 2.0 Demand - 35 - 69 8510 System Control & Load Dispatching 0 2.0 Demand - - - 70 8520 Communication Systems Expense 0 2.0 Demand - - - 71 8530 Compressor Station Labor Expense 0 2.0 Demand - - - 72 8540 Compressor Station Fuel Gas 0 2.0 Demand - - - 73 8550 Compressor Station Fuel & Power 308 2.0 Demand - 308 - 74 8560 Mains Expense 366,202 2.0 Demand - 366,202 - 75 8570 Meas. & Regul. Station Expenses 27,278 2.0 Demand - 27,278 - 76 8580 LDC Payment 0 2.0 Demand - - - 77 8580 LDC Payment - A&G 0 2.0 Demand - - - 78 8590 Other Expenses 0 2.0 Demand - - - 79 8600 Rents 0 2.0 Demand - - - 80 Maintenance81 8610 Maint. Sup., & Eng. 0 2.0 Demand - - - 82 8620 Structures and Improvements 0 2.0 Demand - - - 83 8630 Mains 16,280 2.0 Demand - 16,280 - 84 8640 Compressor Station Equip Maint 0 2.0 Demand - - - 85 8650 Meas. & Regul. Station Equip Maint 0 2.0 Demand - - - 86 8660 Communication Equipment Maintenance 0 2.0 Demand - - - 87 8670 Other Equipment Maintenance 0 2.0 Demand - - - 88 Total Transmission Expense 410,103 0 410,103 089

Exhibit PHR-2Page 14 of 75
Atmos Energy Corporation, Kentucky/Mid-States DivisionClass Cost of Service - Customer/Demand StudyForecasted Test Period: Twelve Months Ended March 31, 2020
CLASSIFICATION OF O&M EXPENSE
Test Year Classif. Classif. Customer Demand CommodityLine Acct. $ Factor Basis $ $ $No. No.
90 Distribution:91 Operation92 8700 Supervision and Engineering 963,411 10.0 Composite of Accts. 871-879 & 886-893 422,826 537,275 3,310 93 8710 Distribution Load Dispatching 663 3.0 Commodity - - 663 94 8711 Odorization 19,956 3.0 Commodity - - 19,956 94 8720 Compressor Station Labor & Expenses 0 3.0 Commodity - - - 95 8740 Mains & Services 4,320,719 12.0 Composite of Accts. 374-379 1,445,101 2,875,617 - 96 8750 Measuring and Regulating Station Exp. - Gen 574,714 12.0 Composite of Accts. 374-379 192,218 382,496 - 97 8760 Measuring and Regulating Station Exp. - Ind. 120,928 1.0 Customer 120,928 - - 98 8770 Measuring and Regulating Sta. Exp. - City Gate 38,286 12.0 Composite of Accts. 374-379 12,805 25,481 - 99 8780 Meters and House Regulator Expense 820,621 1.0 Customer 820,621 - -
100 8790 Customer Installations Expense 2,246 1.0 Customer 2,246 - - 101 8800 Other Expense 3,204 10.0 Composite of Accts. 871-879 & 886-893 1,406 1,787 11 102 8810 Rents 369,768 10.0 Composite of Accts. 871-879 & 886-893 162,285 206,212 1,270 103 Maintenance104 8850 Maintenance Supervision and Engineering 1,588 10.0 Composite of Accts. 871-879 & 886-893 697 886 5 105 8860 Maintenance of Structures and Improvements 98 12.0 Composite of Accts. 374-379 33 65 - 106 8870 Maintenance of Mains 28,852 12.0 Composite of Accts. 374-379 9,650 19,202 - 107 8890 Maintenance of compressor station equipment 0 3.0 Commodity - - - 108 8900 Maint. of Measuring and Regulating Station Equip. - General 65,572 12.0 Composite of Accts. 374-379 21,931 43,641 - 109 8910 Maint. of Measuring and Regulating Station Equip. - Industrial 1,723 1.0 Customer 1,723 - - 110 8920 Maint. of Measuring and Regulating Station Equip. - City Gate 795 12.0 Composite of Accts. 374-379 266 529 - 111 8930 Maintenance of Services 6,533 1.0 Customer 6,533 - - 112 8940 Maintenance of Meters and House Regulators 0 1.0 Customer - - - 113 8950 Maintenance of Other Equipment 5,866 10.0 Composite of Accts. 871-879 & 886-893 2,575 3,271 20 114 Total Distribution 7,345,541 3,223,843 4,096,462 25,235115116 Customer Accounts:117 9010 Supervision 0 1.0 Customer - - - 118 9020 Meter Reading Expense 1,085,047 1.0 Customer 1,085,047 - - 119 9030 Customer Records and Collection Expenses 1,220,802 1.0 Customer 1,220,802 - - 120 9040 Uncollectible Accounts 341,050 1.0 Customer 341,050 - - 121 9050 Miscellaneous Customer Accounts Expenses 0 1.0 Customer - - - 122 Total Customer Accounts 2,646,900 2,646,900 0 0123124 Customer Service and Information:125 9070 Supervision 0 1.0 Customer - - - 126 9080 Customer Assistance Expenses 0 1.0 Customer - - - 127 9090 Informational and Instructional Advertising Expenses 128,272 1.0 Customer 128,272 - - 128 9100 Miscellaneous Customer Service and Informational Expenses 0 1.0 Customer - - - 129 Total Customer Service and Information 128,272 128,272 0 0130131 Sales:132 9110 Supervision 253,468 1.0 Customer 253,468 - - 133 9120 Demonstrating and Selling Expenses 115,937 1.0 Customer 115,937 - - 134 9130 Advertising Expenses 35,170 1.0 Customer 35,170 - - 135 9160 Miscellaneous Sales Expenses (196,297) 1.0 Customer (196,297) - - 136 Total Sales 208,278 208,278 0 0137138 Administrative & General:139 Operation140 9200 Administrative and General Salaries (834,543) 17.0 Composite of Accts. 870-902, 905-916, 924 & 928-930.1 (476,980) (355,371) (2,191) 141 9210 Office Supplies and Expenses 17,616 17.0 Composite of Accts. 870-902, 905-916, 924 & 928-930.1 10,068 7,501 46 142 9220 Administrative Expenses Transferred - Customer Support - 1.0 Customer - - - 143 9220 Administrative Expenses Transferred - General 14,498,764 17.0 Composite of Accts. 870-902, 905-916, 924 & 928-930.1 8,286,720 6,173,971 38,074 144 9230 Outside Services Employed 339,697 17.0 Composite of Accts. 870-902, 905-916, 924 & 928-930.1 194,153 144,652 892 145 9240 Property Insurance 3,718 5.7 Net Plant 2,077 1,605 37 146 9250 Injuries and Damages 74,010 17.0 Composite of Accts. 870-902, 905-916, 924 & 928-930.1 42,300 31,516 194 147 9260 Employee Pensions and Benefits 1,082,941 17.0 Composite of Accts. 870-902, 905-916, 924 & 928-930.1 618,951 461,146 2,844 148 9270 Franchise Requirements 646 1.0 Customer 646 - - 149 9280 Regulatory Commission Expenses 852,920 1.0 Customer 852,920 - - 150 930.1 General Advertising Expenses - 1.0 Customer - - - 151 930.2 Miscellaneous General Expense (42,325) 17.0 Composite of Accts. 870-902, 905-916, 924 & 928-930.1 (24,191) (18,023) (111) 152 9310 Rents (8,275) 17.0 Composite of Accts. 870-902, 905-916, 924 & 928-930.1 (4,730) (3,524) (22) 153 Maintenance154 9320 Maintenance of General Plant 11,804 17.0 Composite of Accts. 870-902, 905-916, 924 & 928-930.1 6,746 5,026 31 155 Total A&G 15,996,974 9,508,682 6,448,499 39,793156157 TOTAL O&M EXPENSE 105,607,336 15,715,974 11,199,521 78,691,840

Exhibit PHR-2Page 15 of 75
Atmos Energy Corporation, Kentucky/Mid-States DivisionClass Cost of Service - Customer/Demand StudyForecasted Test Period: Twelve Months Ended March 31, 2020
CLASSIFICATION OF DEPRECIATION EXPENSE
Test Year Classif. Classif. Customer Demand CommodityLine Acct. $ Factor Basis $ $ $No. No.
1 Intangible Plant:23 30100 Organization - 99.0 - - - - 4 30200 Franchises & Consents - 99.0 - - - - 5 30300 Misc Intangible Plant - 99.0 - - - - 67 Total Intangible Plant: 0 0 0 089 Production Plant:
1011 32520 Producing Leaseholds - 99.0 - - - - 12 32540 Rights of Ways - 99.0 - - - - 13 33100 Production Gas Wells Equipment - 99.0 - - - - 14 33201 Field Lines - 99.0 - - - - 15 33202 Tributary Lines - 99.0 - - - - 16 33400 Field Meas. & Reg. Sta. Equip - 99.0 - - - - 17 33600 Purification Equipment - 99.0 - - - - 1819 Total Production Plant 0 0 0 02021 Storage Plant:2223 35010 Land - 3.5 Storage (50/50) - - - 24 35020 Rights of Way 22 3.5 Storage (50/50) - 11 11 25 35100 Structures and Improvements 297 3.5 Storage (50/50) - 149 149 26 35102 Compression Station Equipment 1,916 3.5 Storage (50/50) - 958 958 27 35103 Meas. & Reg. Sta. Structues 208 3.5 Storage (50/50) - 104 104 28 35104 Other Structures 1,773 3.5 Storage (50/50) - 887 887 29 35200 Wells \ Rights of Way 161,122 3.5 Storage (50/50) - 80,561 80,561 30 35201 Well Construction 25,840 3.5 Storage (50/50) - 12,920 12,920 31 35202 Well Equipment - 3.5 Storage (50/50) - - - 32 35203 Cushion Gas 23,389 3.5 Storage (50/50) - 11,694 11,694 33 35210 Leaseholds 553 3.5 Storage (50/50) - 277 277 34 35211 Storage Rights 481 3.5 Storage (50/50) - 240 240 35 35301 Field Lines 1,596 3.5 Storage (50/50) - 798 798 36 35302 Tributary Lines 1,905 3.5 Storage (50/50) - 952 952 37 35400 Compressor Station Equipment 15,699 3.5 Storage (50/50) - 7,849 7,849 38 35500 Meas & Reg. Equipment 4,561 3.5 Storage (50/50) - 2,280 2,280 39 35600 Purification Equipment 8,210 3.5 Storage (50/50) - 4,105 4,105 4041 Total Storage Plant 247,571 0 123,785 123,7854243 Transmission:4445 36510 Land & Land Rights - 2.0 Demand - - - 46 36520 Rights of Way 9,112 2.0 Demand - 9,112 - 47 36602 Structures & Improvements 608 2.0 Demand - 608 - 48 36603 Other Structues 754 2.0 Demand - 754 - 49 36700 Mains Cathodic Protection 5,362 2.0 Demand - 5,362 - 50 36701 Mains - Steel 381,167 2.0 Demand - 381,167 - 51 36900 Meas. & Reg. Equipment 11,265 2.0 Demand - 11,265 - 52 36901 Meas. & Reg. Equipment 34,951 2.0 Demand - 34,951 - 5354 Total Transmission Plant 443,218 0 443,218 05556 Distribution:5758 37400 Land & Land Rights - 4.0 Mains (Minimum System) - - - 59 37401 Land - 4.0 Mains (Minimum System) - - - 60 37402 Land Rights 49,908 4.0 Mains (Minimum System) 16,692 33,216 - 61 37403 Land Other - 4.0 Mains (Minimum System) - - - 62 37500 Structures & Improvements 6,017 4.0 Mains (Minimum System) 2,013 4,005 - 63 37501 Structures & Improvements T.B. 1,787 4.0 Mains (Minimum System) 598 1,189 - 64 37502 Land Rights 828 4.0 Mains (Minimum System) 277 551 - 65 37503 Improvements 72 4.0 Mains (Minimum System) 24 48 - 66 37600 Mains Cathodic Protection 873,542 4.0 Mains (Minimum System) 292,164 581,379 - 67 37601 Mains - Steel 4,454,842 4.0 Mains (Minimum System) 1,489,960 2,964,882 - 68 37602 Mains - Plastic 3,376,201 4.0 Mains (Minimum System) 1,129,199 2,247,002 - 69 37800 Meas & Reg. Sta. Equip - General 925,640 4.0 Mains (Minimum System) 309,588 616,052 - 70 37900 Meas & Reg. Sta. Equip - City Gate 145,903 4.0 Mains (Minimum System) 48,799 97,105 - 71 37905 Meas & Reg. Sta. Equipment T.b. 46,759 4.0 Mains (Minimum System) 15,639 31,120 - 72 38000 Services 4,817,588 1.0 Customer 4,817,588 - - 73 38100 Meters 2,741,749 1.0 Customer 2,741,749 - - 74 38200 Meter Installaitons 2,232,937 1.0 Customer 2,232,937 - - 75 38300 House Regulators 514,355 1.0 Customer 514,355 - - 76 38400 House Reg. Installations 8,807 1.0 Customer 8,807 - - 77 38500 Ind. Meas. & Reg. Sta. Equipment 112,194 1.0 Customer 112,194 - - 78 38600 Other Prop. On Cust. Prem - 99.0 - - - - 7980 Total Distribution Plant 20,309,129 13,732,582 6,576,548 081

Exhibit PHR-2Page 16 of 75
Atmos Energy Corporation, Kentucky/Mid-States DivisionClass Cost of Service - Customer/Demand StudyForecasted Test Period: Twelve Months Ended March 31, 2020
CLASSIFICATION OF DEPRECIATION EXPENSE
Test Year Classif. Classif. Customer Demand CommodityLine Acct. $ Factor Basis $ $ $No. No.
82 General:8384 38900 Land & Land Rights - 5.4 P, S, T & D Plant - - - 85 39000 Structures & Improvements 244,888 5.4 P, S, T & D Plant 139,539 102,652 2,697 86 39001 Structures - Brick 5,574 5.4 P, S, T & D Plant 3,176 2,337 61 87 39002 Improvements 22,836 5.4 P, S, T & D Plant 13,012 9,572 252 88 39003 Air Conditioning Equipment 731 5.4 P, S, T & D Plant 416 306 8 89 39004 Improvement to leased Premises - 5.4 P, S, T & D Plant - - - 90 39009 Office Furniture & Equipment 93,448 5.4 P, S, T & D Plant 53,247 39,171 1,029 91 39100 Remittance Processing Equip - 5.4 P, S, T & D Plant - - - 92 39102 Office Machines - 5.4 P, S, T & D Plant - - - 93 39200 Transportation Equipment 5,191 5.4 P, S, T & D Plant 2,958 2,176 57 94 39201 Trucks - 5.4 P, S, T & D Plant - - - 95 39202 Trailers - 5.4 P, S, T & D Plant - - - 96 39300 Stores Equipment - 5.4 P, S, T & D Plant - - - 97 39400 Tools, Shop & Garage Equipment 116,855 5.4 P, S, T & D Plant 66,585 48,983 1,287 98 39600 Power Operated Equipment - 5.4 P, S, T & D Plant - - - 99 39603 Ditchers - 5.4 P, S, T & D Plant - - -
100 39604 Backhoes - 5.4 P, S, T & D Plant - - - 101 39605 Welders - 5.4 P, S, T & D Plant - - - 102 39700 Communication Equipment 34,968 5.4 P, S, T & D Plant 19,925 14,658 385 103 39701 Communication Equipment - Mobile Radios - 5.4 P, S, T & D Plant - - - 104 39702 Communication Equipment - Fixed Radios - 5.4 P, S, T & D Plant - - - 105 39705 Communication Equip. - Telemetering - 5.4 P, S, T & D Plant - - - 106 39800 Miscellaneous Equipment 194,589 5.4 P, S, T & D Plant 110,878 81,567 2,143 107 39900 Other Tangible Property - 5.4 P, S, T & D Plant - - - 108 39901 Other Tangible Property - Servers - H/W 2,056 5.4 P, S, T & D Plant 1,172 862 23 109 39902 Other Tangible Property - Servers - S/W - 5.4 P, S, T & D Plant - - - 110 39903 Other Tangible Property - Network - H/W 13,460 5.4 P, S, T & D Plant 7,670 5,642 148 111 39904 Other Tang. Property - CPU - 5.4 P, S, T & D Plant - - - 112 39905 Other Tangible Property - MF - Hardware - 5.4 P, S, T & D Plant - - - 113 39906 Other Tang. Property - PC Hardware 89,351 5.4 P, S, T & D Plant 50,913 37,454 984 114 39907 Other Tang. Property - PC Software - 5.4 P, S, T & D Plant - - - 115 39908 Other Tang. Property - Mainframe S/W - 5.4 P, S, T & D Plant - - - 116 39908 Other Tang. Property - Application Software 10,289 5.4 P, S, T & D Plant 5,863 4,313 113 117 40600 Amortization of gas plant acquisition adjustments - 5.4 P, S, T & D Plant - - - 118119120 Total General Plant 834,236 475,354 349,693 9,188121122 TOTAL DIRECT DEPRECIATION EXPENSE 21,834,154 14,207,936 7,493,244 132,973123124 Kentucky Mid-States General Office:125126 Intangible Plant:127128 30100 Organization - 5.4 P, S, T & D Plant - - - 129 30200 Franchises & Consents - 5.4 P, S, T & D Plant - - - 130 30300 Misc Intangible Plant - 5.4 P, S, T & D Plant - - - 131132 Total Intangible Plant: 0 0 0 0133134 General:135136 37400 Land & Land Rights - 5.4 P, S, T & D Plant - - - 137 39001 Structures Frame 2,500 5.4 P, S, T & D Plant 1,424 1,048 28 138 36602 Structures & Improvements - 5.4 P, S, T & D Plant - - - 139 38900 Land & Land Rights - 5.4 P, S, T & D Plant - - - 140 39004 Air Conditioning Equipment 561 5.4 P, S, T & D Plant 320 235 6 141 39009 Improvement to leased Premises - 5.4 P, S, T & D Plant - - - 142 39100 Office Furniture & Equipment - 5.4 P, S, T & D Plant - - - 143 39102 Remittance Processing Equip - 5.4 P, S, T & D Plant - - - 144 39103 Office Machines - 5.4 P, S, T & D Plant - - - 145 39200 Transportation Equipment 400 5.4 P, S, T & D Plant 228 168 4 146 39201 Trucks - 5.4 P, S, T & D Plant - - - 147 39202 Trailers - 5.4 P, S, T & D Plant - - - 148 39300 Stores Equipment - 5.4 P, S, T & D Plant - - - 149 39400 Tools, Shop & Garage Equipment 2,025 5.4 P, S, T & D Plant 1,154 849 22 150 39600 Power Operated Equipment 12 5.4 P, S, T & D Plant 7 5 0 151 39603 Ditchers - 5.4 P, S, T & D Plant - - - 152 39604 Backhoes - 5.4 P, S, T & D Plant - - - 153 39605 Welders - 5.4 P, S, T & D Plant - - - 154 39700 Communication Equipment 1,652 5.4 P, S, T & D Plant 941 692 18 155 39701 Communication Equipment - Mobile Radios - 5.4 P, S, T & D Plant - - - 156 39702 Communication Equipment - Fixed Radios - 5.4 P, S, T & D Plant - - - 157 39705 Communication Equip. - Telemetering - 5.4 P, S, T & D Plant - - - 158 39800 Miscellaneous Equipment 12,240 5.4 P, S, T & D Plant 6,974 5,131 135 159 39900 Other Tangible Property - 5.4 P, S, T & D Plant - - - 160 39901 Other Tangible Property - Servers - H/W - 5.4 P, S, T & D Plant - - - 161 39902 Other Tangible Property - Servers - S/W - 5.4 P, S, T & D Plant - - - 162 39903 Other Tangible Property - Network - H/W - 5.4 P, S, T & D Plant - - - 163 39904 Other Tang. Property - CPU - 5.4 P, S, T & D Plant - - - 164 39905 Other Tangible Property - MF - Hardware - 5.4 P, S, T & D Plant - - - 165 39906 Other Tang. Property - PC Hardware - 5.4 P, S, T & D Plant - - - 166 39907 Other Tang. Property - PC Software 11,145 5.4 P, S, T & D Plant 6,351 4,672 123 167 39908 Other Tang. Property - Mainframe S/W - 5.4 P, S, T & D Plant - - - 168 39909 Other Tang. Property - Application Software - 5.4 P, S, T & D Plant - - - 169 39924 Other Tang. Property - General Startup Costs - 5.4 P, S, T & D Plant - - - 170171172 Total General Plant 30,535 17,399 12,800 336

Exhibit PHR-2Page 17 of 75
Atmos Energy Corporation, Kentucky/Mid-States DivisionClass Cost of Service - Customer/Demand StudyForecasted Test Period: Twelve Months Ended March 31, 2020
CLASSIFICATION OF DEPRECIATION EXPENSE
Test Year Classif. Classif. Customer Demand CommodityLine Acct. $ Factor Basis $ $ $No. No.173174 Shared Services General Office:175176 General:177178 37400 Land & Land Rights - 5.4 P, S, T & D Plant - - - 179 39000 Structures & Improvements 7,132 5.4 P, S, T & D Plant 4,064 2,990 79 180 36602 Structures & Improvements - 5.4 P, S, T & D Plant - - - 181 37503 Improvements - 5.4 P, S, T & D Plant - - - 182 39004 Air Conditioning Equipment - 5.4 P, S, T & D Plant - - - 183 39009 Improvement to leased Premises 35 5.4 P, S, T & D Plant 20 15 0 184 39100 Office Furniture & Equipment 10,791 5.4 P, S, T & D Plant 6,149 4,523 119 185 39102 Remittance Processing Equip - 5.4 P, S, T & D Plant - - - 186 39103 Office Machines - 5.4 P, S, T & D Plant - - - 187 39200 Transportation Equipment - 5.4 P, S, T & D Plant - - - 188 39201 Trucks - 5.4 P, S, T & D Plant - - - 189 39202 Trailers - 5.4 P, S, T & D Plant - - - 190 39300 Stores Equipment - 5.4 P, S, T & D Plant - - - 191 39400 Tools, Shop & Garage Equipment - 5.4 P, S, T & D Plant - - - 192 39500 Laboratory Equipment - 5.4 P, S, T & D Plant - - - 193 39603 Ditchers - 5.4 P, S, T & D Plant - - - 194 39604 Backhoes - 5.4 P, S, T & D Plant - - - 195 39605 Welders - 5.4 P, S, T & D Plant - - - 196 39700 Communication Equipment 27 5.4 P, S, T & D Plant 15 11 0 197 39701 Communication Equipment - Mobile Radios - 5.4 P, S, T & D Plant - - - 198 39702 Communication Equipment - Fixed Radios - 5.4 P, S, T & D Plant - - - 199 39705 Communication Equip. - Telemetering - 5.4 P, S, T & D Plant - - - 200 39800 Miscellaneous Equipment 66 5.4 P, S, T & D Plant 37 28 1 201 39900 Other Tangible Property - 5.4 P, S, T & D Plant - - - 202 39901 Other Tangible Property - Servers - H/W 133,882 5.4 P, S, T & D Plant 76,287 56,121 1,475 203 39902 Other Tangible Property - Servers - S/W 40,124 5.4 P, S, T & D Plant 22,863 16,819 442 204 39903 Other Tangible Property - Network - H/W - 5.4 P, S, T & D Plant - - - 205 39904 Other Tang. Property - CPU - 5.4 P, S, T & D Plant - - - 206 39905 Other Tangible Property - MF - Hardware - 5.4 P, S, T & D Plant - - - 207 39906 Other Tang. Property - PC Hardware 9,073 5.4 P, S, T & D Plant 5,170 3,803 100 208 39907 Other Tang. Property - PC Software - 5.4 P, S, T & D Plant - - - 209 39908 Other Tang. Property - Mainframe S/W - 5.4 P, S, T & D Plant - - - 210 39909 Other Tang. Property - Application Software 1,366 5.4 P, S, T & D Plant 778 572 15 211 39924 Other Tang. Property - General Startup Costs - 5.4 P, S, T & D Plant - - - 212213214 Total General Plant 202,494 115,383 84,881 2,230215216 Shared Services Customer Support:217218 General:219220 37400 Land & Land Rights - 5.4 P, S, T & D Plant - - - 221 39001 Structures Frame - 5.4 P, S, T & D Plant - - - 222 36602 Structures & Improvements 30,100 5.4 P, S, T & D Plant 17,151 12,617 332 223 37503 Improvements - 5.4 P, S, T & D Plant - - - 224 39004 Air Conditioning Equipment - 5.4 P, S, T & D Plant - - - 225 39009 Improvement to leased Premises 5,171 5.4 P, S, T & D Plant 2,947 2,168 57 226 39100 Office Furniture & Equipment 6,139 5.4 P, S, T & D Plant 3,498 2,573 68 227 39102 Remittance Processing Equip - 5.4 P, S, T & D Plant - - - 228 39103 Office Machines - 5.4 P, S, T & D Plant - - - 229 39200 Transportation Equipment - 5.4 P, S, T & D Plant - - - 230 39201 Trucks - 5.4 P, S, T & D Plant - - - 231 39202 Trailers - 5.4 P, S, T & D Plant - - - 232 39300 Stores Equipment - 5.4 P, S, T & D Plant - - - 233 39500 Laboratory Equipment 1,191 5.4 P, S, T & D Plant 679 499 13 234 39600 Power Operated Equipment 55 5.4 P, S, T & D Plant 31 23 1 235 39603 Ditchers - 5.4 P, S, T & D Plant - - - 236 39604 Backhoes - 5.4 P, S, T & D Plant - - - 237 39605 Welders - 5.4 P, S, T & D Plant - - - 238 39700 Communication Equipment 6,709 5.4 P, S, T & D Plant 3,823 2,812 74 239 39701 Communication Equipment - Mobile Radios - 5.4 P, S, T & D Plant - - - 240 39702 Communication Equipment - Fixed Radios - 5.4 P, S, T & D Plant - - - 241 39705 Communication Equip. - Telemetering - 5.4 P, S, T & D Plant - - - 242 39800 Miscellaneous Equipment 834 5.4 P, S, T & D Plant 475 349 9 243 39900 Other Tangible Property 5,664 5.4 P, S, T & D Plant 3,227 2,374 62 244 39901 Other Tangible Property - Servers - H/W 55,314 5.4 P, S, T & D Plant 31,519 23,187 609 245 39902 Other Tangible Property - Servers - S/W 10,196 5.4 P, S, T & D Plant 5,810 4,274 112 246 39903 Other Tangible Property - Network - H/W 2,481 5.4 P, S, T & D Plant 1,414 1,040 27 247 39904 Other Tang. Property - CPU - 5.4 P, S, T & D Plant - - - 248 39905 Other Tangible Property - MF - Hardware - 5.4 P, S, T & D Plant - - - 249 39906 Other Tang. Property - PC Hardware 7,309 5.4 P, S, T & D Plant 4,165 3,064 80 250 39907 Other Tang. Property - PC Software 871 5.4 P, S, T & D Plant 496 365 10 251 39908 Other Tang. Property - Mainframe S/W - 5.4 P, S, T & D Plant - - - 252 39909 Other Tang. Property - Application Software 342,525 5.4 P, S, T & D Plant 195,174 143,579 3,772 253 39924 Other Tang. Property - General Startup Costs 31 5.4 P, S, T & D Plant 18 13 0 254255256 Total General Plant 474,591 270,426 198,938 5,227257258 TOTAL DEPRECIATION EXPENSE 22,541,774 14,611,144 7,789,863 140,767

Exhibit PHR-2Page 18 of 75
Atmos Energy Corporation, Kentucky/Mid-States DivisionClass Cost of Service - Customer/Demand StudyForecasted Test Period: Twelve Months Ended March 31, 2020
CLASSIFICATION OF TAXES, OTHER THAN INCOME & NET DEDUCTIONS FOR INCOME TAX
Test Year Classif. Classif. Customer Demand Commodity$ Factor Basis $ $ $
1 Taxes Other Than Income23 Non Revenue Related:4 Payroll Related 927,870 9.1 Allocated O&M Expenses 138,081 98,399 691,389 5 Property Related 6,008,371 5.4 P, S, T & D Plant 3,423,620 2,518,577 66,174 6 DOT Transmission User Tax 137,062 9.1 Allocated O&M Expenses 20,397 14,535 102,130 7 Other 99,099 9.1 Allocated O&M Expenses 14,747 10,509 73,842 8 Total Non Revenue Related: 7,172,401 3,596,845 2,642,021 933,5359
10 Revenue Related:11 State Gross Receipts - Tax 0 99.0 - - - - 12 Local Gross Receipts - Tax 0 99.0 - - - - 13 Public Service Commission Assessment 339,436 3.0 Commodity - - 339,436 14 Total Revenue Related: 339,436 0 0 339,4361516 Total Taxes, Other Than Income 7,511,837 3,596,845 2,642,021 1,272,971171819 Interest Expense 9,367,735 13.0 Rate Base 5,365,163 4,162,525 (159,953) 2021 Amortization of Excess ADIT (1,463,766) 18.0 Total Cost of Service at Equalized ROR (493,187) (345,668) (624,911)

Exhibit PHR-2Page 19 of 75
Atmos Energy Corporation, Kentucky/Mid-States DivisionClass Cost of Service - Customer/Demand StudyForecasted Test Period: Twelve Months Ended March 31, 2020
SUMMARY OF CLASSIFICATION1234 Test Year Classif. Classif. Customer Demand Commodity5 $ Factor Basis $ $ $67 Operating Revenues 169,717,866 53,429,311 36,764,497 79,524,05889 Operating Expenses:
1011 Operating & Maintenance 105,607,336 15,715,974 11,199,521 78,691,84012 Depreciation & Amortization 22,541,774 14,611,144 7,789,863 140,76713 Taxes Other Than Income 7,511,837 3,596,845 2,642,021 1,272,9711415 Total Operating Expenses 135,660,946 33,923,963 21,631,406 80,105,5771617 Income Before Taxes 34,056,920 19,505,348 15,133,091 (581,519)1819 Interest Expense 9,367,735 5,365,163 4,162,525 (159,953)2021 Income Taxes:2223 State Income Taxes 1,481,351 6.00% 848,411 658,234 (25,294)24 Federal Income Taxes 4,873,645 21.00% 2,791,273 2,165,590 (83,217)25 Total Deferred Income Taxes 0 0 0 026 Amortization of ITC 0 0 0 02728 Total Income Taxes 6,354,996 3,639,684 2,823,824 (108,511)2930 Net Income 27,701,923 15,865,664 12,309,267 (473,008) 3132 Total Rate Base 496,111,427 284,136,858 220,445,634 (8,471,064)3334 Rate of Return 5.5838% 5.5838% 5.5838% 5.5838%

Exhibit PHR-2Page 20 of 75
Atmos Energy Corporation, Kentucky/Mid-States DivisionClass Cost of Service - Customer/Demand StudyForecasted Test Period: Twelve Months Ended March 31, 2020
ALLOCATION OF PLANT IN SERVICE
Customer
Allocation Allocation Total Residential Non-Res Sales Non-Res Sales Transport TransportLine Acct. Factor Basis Company Sales Firm Interruptible Firm InterruptibleNo. No.
1 Intangible Plant:23 30100 Organization 6.2 P, S, T & D Plant - Customer 4,746 3,844 866 2 22 12 4 30200 Franchises & Consents 6.2 P, S, T & D Plant - Customer 68,293 55,303 12,467 25 318 180 5 30300 Misc Intangible Plant 99.0 - 0 - - - - - 67 Total Intangible Plant: 73,039 59,146 13,334 27 340 19289 Production Plant:
1011 32520 Producing Leaseholds 99.0 - 0 - - - - - 12 32540 Rights of Ways 99.0 - 0 - - - - - 13 33100 Production Gas Wells Equipment 99.0 - 0 - - - - - 14 33201 Field Lines 99.0 - 0 - - - - - 15 33202 Tributary Lines 99.0 - 0 - - - - - 16 33400 Field Meas. & Reg. Sta. Equip 99.0 - 0 - - - - - 17 33600 Purification Equipment 99.0 - 0 - - - - - 1819 Total Production Plant 0 0 0 0 0 02021 Storage Plant:2223 35010 Land 99.0 - 0 - - - - - 24 35020 Rights of Way 99.0 - 0 - - - - - 25 35100 Structures and Improvements 99.0 - 0 - - - - - 26 35102 Compression Station Equipment 99.0 - 0 - - - - - 27 35103 Meas. & Reg. Sta. Structues 99.0 - 0 - - - - - 28 35104 Other Structures 99.0 - 0 - - - - - 29 35200 Wells \ Rights of Way 99.0 - 0 - - - - - 30 35201 Well Construction 99.0 - 0 - - - - - 31 35202 Well Equipment 99.0 - 0 - - - - - 32 35203 Cushion Gas 99.0 - 0 - - - - - 33 35210 Leaseholds 99.0 - 0 - - - - - 34 35211 Storage Rights 99.0 - 0 - - - - - 35 35301 Field Lines 99.0 - 0 - - - - - 36 35302 Tributary Lines 99.0 - 0 - - - - - 37 35400 Compressor Station Equipment 99.0 - 0 - - - - - 38 35500 Meas & Reg. Equipment 99.0 - 0 - - - - - 39 35600 Purification Equipment 99.0 - 0 - - - - - 4041 Total Storage Plant 0 0 0 0 0 04243 Transmission:4445 36510 Land & Land Rights 99.0 - 0 - - - - - 46 36520 Rights of Way 99.0 - 0 - - - - - 47 36602 Structures & Improvements 99.0 - 0 - - - - - 48 36603 Other Structues 99.0 - 0 - - - - - 49 36700 Mains Cathodic Protection 99.0 - 0 - - - - - 50 36701 Mains - Steel 99.0 - 0 - - - - - 51 36900 Meas. & Reg. Equipment 99.0 - 0 - - - - - 52 36901 Meas. & Reg. Equipment 99.0 - 0 - - - - - 5354 Total Transmission Plant 0 0 0 0 0 05556 Distribution:5758 37400 Land & Land Rights 2.0 Bills 177,653 158,206 19,246 10 122 69 59 37401 Land 2.0 Bills 12,484 11,118 1,352 1 9 5 60 37402 Land Rights 2.0 Bills 1,219,352 1,085,872 132,098 67 839 475 61 37403 Land Other 2.0 Bills 931 829 101 0 1 0 62 37500 Structures & Improvements 2.0 Bills 112,434 100,126 12,181 6 77 44 63 37501 Structures & Improvements T.B. 2.0 Bills 33,385 29,730 3,617 2 23 13 64 37502 Land Rights 2.0 Bills 15,473 13,780 1,676 1 11 6 65 37503 Improvements 2.0 Bills 1,340 1,193 145 0 1 1 66 37600 Mains Cathodic Protection 2.0 Bills 6,893,706 6,139,068 746,827 380 4,746 2,686 67 37601 Mains - Steel 2.0 Bills 58,873,231 52,428,515 6,378,007 3,241 40,530 22,938 68 37602 Mains - Plastic 2.0 Bills 44,570,584 39,691,545 4,828,535 2,454 30,684 17,366 69 37800 Meas & Reg. Sta. Equip - General 2.0 Bills 10,004,295 8,909,148 1,083,811 551 6,887 3,898 70 37900 Meas & Reg. Sta. Equip - City Gate 2.0 Bills 1,714,445 1,526,769 185,734 94 1,180 668 71 37905 Meas & Reg. Sta. Equipment T.b. 2.0 Bills 552,612 492,119 59,867 30 380 215 72 38000 Services 2.0 Bills 150,274,437 133,824,243 16,279,918 8,273 103,453 58,550 73 38100 Meters 4.0 Meter Investment 38,722,015 24,980,781 12,812,487 45,125 564,268 319,353 74 38200 Meter Installaitons 4.0 Meter Investment 57,067,155 36,815,804 18,882,597 66,503 831,599 470,652 75 38300 House Regulators 4.0 Meter Investment 12,779,948 8,244,744 4,228,678 14,893 186,233 105,401 76 38400 House Reg. Installations 4.0 Meter Investment 252,587 162,952 83,577 294 3,681 2,083 77 38500 Ind. Meas. & Reg. Sta. Equipment 2.2 Non-Residential Bills 5,241,043 - 5,186,793 2,636 32,960 18,654 78 38600 Other Prop. On Cust. Prem 99.0 - 0 - - - - - 7980 Total Distribution Plant 388,519,111 314,616,542 70,927,245 144,561 1,807,685 1,023,078

Exhibit PHR-2Page 21 of 75
Atmos Energy Corporation, Kentucky/Mid-States DivisionClass Cost of Service - Customer/Demand StudyForecasted Test Period: Twelve Months Ended March 31, 2020
ALLOCATION OF PLANT IN SERVICE8182 General:8384 38900 Land & Land Rights 6.2 P, S, T & D Plant - Customer 690,435 559,103 126,044 257 3,212 1,818 85 39000 Structures & Improvements 6.2 P, S, T & D Plant - Customer 4,328,036 3,504,774 790,117 1,610 20,137 11,397 86 39001 Structures Frame 6.2 P, S, T & D Plant - Customer 0 - - - - - 87 39002 Structures-Brick 6.2 P, S, T & D Plant - Customer 98,642 79,879 18,008 37 459 260 88 39003 Improvements 6.2 P, S, T & D Plant - Customer 404,108 327,240 73,773 150 1,880 1,064 89 39004 Air Conditioning Equipment 6.2 P, S, T & D Plant - Customer 7,382 5,978 1,348 3 34 19 90 39009 Improvement to leased Premises 6.2 P, S, T & D Plant - Customer 710,092 575,021 129,633 264 3,304 1,870 91 39100 Office Furniture & Equipment 6.2 P, S, T & D Plant - Customer 1,063,284 861,030 194,111 396 4,947 2,800 92 39102 Remittance Processing Equip 6.2 P, S, T & D Plant - Customer 0 - - - - - 93 39103 Office Machines 6.2 P, S, T & D Plant - Customer 0 - - - - - 94 39200 Transportation Equipment 6.2 P, S, T & D Plant - Customer 125,920 101,968 22,988 47 586 332 95 39201 Trucks 6.2 P, S, T & D Plant - Customer 0 - - - - - 96 39202 Trailers 6.2 P, S, T & D Plant - Customer 0 - - - - - 97 39300 Stores Equipment 6.2 P, S, T & D Plant - Customer 0 - - - - - 98 39400 Tools, Shop & Garage Equipment 6.2 P, S, T & D Plant - Customer 2,323,884 1,881,844 424,243 865 10,812 6,119 99 39600 Power Operated Equipment 6.2 P, S, T & D Plant - Customer 0 - - - - -
100 39603 Ditchers 6.2 P, S, T & D Plant - Customer 22,570 18,277 4,120 8 105 59 101 39604 Backhoes 6.2 P, S, T & D Plant - Customer 35,754 28,953 6,527 13 166 94 102 39605 Welders 6.2 P, S, T & D Plant - Customer 11,070 8,964 2,021 4 52 29 103 39700 Communication Equipment 6.2 P, S, T & D Plant - Customer 298,726 241,904 54,535 111 1,390 787 104 39701 Communication Equipment - Mobile Radios 6.2 P, S, T & D Plant - Customer 0 - - - - - 105 39702 Communication Equipment - Fixed Radios 6.2 P, S, T & D Plant - Customer 0 - - - - - 106 39705 Communication Equip. - Telemetering 6.2 P, S, T & D Plant - Customer 0 - - - - - 107 39800 Miscellaneous Equipment 6.2 P, S, T & D Plant - Customer 2,217,563 1,795,747 404,834 825 10,318 5,839 108 39900 Other Tangible Property 6.2 P, S, T & D Plant - Customer 0 - - - - - 109 39901 Other Tangible Property - Servers - H/W 6.2 P, S, T & D Plant - Customer 8,199 6,640 1,497 3 38 22 110 39902 Other Tangible Property - Servers - S/W 6.2 P, S, T & D Plant - Customer 0 - - - - - 111 39903 Other Tangible Property - Network - H/W 6.2 P, S, T & D Plant - Customer 76,696 62,107 14,001 29 357 202 112 39904 Other Tang. Property - CPU 6.2 P, S, T & D Plant - Customer 0 - - - - - 113 39905 Other Tangible Property - MF - Hardware 6.2 P, S, T & D Plant - Customer 0 - - - - - 114 39906 Other Tang. Property - PC Hardware 6.2 P, S, T & D Plant - Customer 263,188 213,125 48,047 98 1,225 693 115 39907 Other Tang. Property - PC Software 6.2 P, S, T & D Plant - Customer 0 - - - - - 116 39908 Other Tang. Property - Mainframe S/W 6.2 P, S, T & D Plant - Customer 70,380 56,992 12,848 26 327 185 117 39909 Other Tang. Property - Application Software 6.2 P, S, T & D Plant - Customer 0 - - - - - 118 39924 Other Tang. Property - General Startup Costs 6.2 P, S, T & D Plant - Customer 0 - - - - - 119120 Total General Plant 12,755,928 10,329,546 2,328,696 4,746 59,350 33,590121122 TOTAL DIRECT PLANT 401,348,078 325,005,234 73,269,274 149,335 1,867,375 1,056,860123124 CWIP w/o AFUDC 6.2 P, S, T & D Plant - Customer 21,740,927 17,605,453 3,968,979 8,089 101,155 57,250 125126 Kentucky Mid-States General Office:127128 Intangible Plant:129130 30100 Organization 6.2 P, S, T & D Plant - Customer 52,563 42,565 9,596 20 245 138 131 30200 Franchises & Consents 6.2 P, S, T & D Plant - Customer 0 - - - - - 132 30300 Misc Intangible Plant 6.2 P, S, T & D Plant - Customer 314,725 254,859 57,456 117 1,464 829 133134 Total Intangible Plant 367,288 297,424 67,051 137 1,709 967135136 General:137138 37400 Land & Land Rights 6.2 P, S, T & D Plant - Customer 0 - - - - - 139 39001 Structures Frame 6.2 P, S, T & D Plant - Customer 50,869 41,193 9,287 19 237 134 140 36602 Structures & Improvements 6.2 P, S, T & D Plant - Customer 0 - - - - - 141 38900 Land & Land Rights 6.2 P, S, T & D Plant - Customer 0 - - - - - 142 39004 Air Conditioning Equipment 6.2 P, S, T & D Plant - Customer 4,364 3,534 797 2 20 11 143 39009 Improvement to leased Premises 6.2 P, S, T & D Plant - Customer 11,015 8,920 2,011 4 51 29 144 39100 Office Furniture & Equipment 6.2 P, S, T & D Plant - Customer 10,952 8,868 1,999 4 51 29 145 39102 Remittance Processing Equip 6.2 P, S, T & D Plant - Customer 0 - - - - - 146 39103 Office Machines 6.2 P, S, T & D Plant - Customer 0 - - - - - 147 39200 Transportation Equipment 6.2 P, S, T & D Plant - Customer 7,739 6,267 1,413 3 36 20 148 39201 Trucks 6.2 P, S, T & D Plant - Customer 0 - - - - - 149 39202 Trailers 6.2 P, S, T & D Plant - Customer 0 - - - - - 150 39300 Stores Equipment 6.2 P, S, T & D Plant - Customer 0 - - - - - 151 39400 Tools, Shop & Garage Equipment 6.2 P, S, T & D Plant - Customer 49,885 40,396 9,107 19 232 131 152 39600 Power Operated Equipment 6.2 P, S, T & D Plant - Customer 5,819 4,712 1,062 2 27 15 153 39603 Ditchers 6.2 P, S, T & D Plant - Customer 0 - - - - - 154 39604 Backhoes 6.2 P, S, T & D Plant - Customer 0 - - - - - 155 39605 Welders 6.2 P, S, T & D Plant - Customer 0 - - - - - 156 39700 Communication Equipment 6.2 P, S, T & D Plant - Customer 10,649 8,623 1,944 4 50 28 157 39701 Communication Equipment - Mobile Radios 6.2 P, S, T & D Plant - Customer 0 - - - - - 158 39702 Communication Equipment - Fixed Radios 6.2 P, S, T & D Plant - Customer 0 - - - - - 159 39705 Communication Equip. - Telemetering 6.2 P, S, T & D Plant - Customer 0 - - - - - 160 39800 Miscellaneous Equipment 6.2 P, S, T & D Plant - Customer 230,939 187,011 42,160 86 1,075 608 161 39900 Other Tangible Property 6.2 P, S, T & D Plant - Customer 0 - - - - - 162 39901 Other Tangible Property - Servers - H/W 6.2 P, S, T & D Plant - Customer 0 - - - - - 163 39902 Other Tangible Property - Servers - S/W 6.2 P, S, T & D Plant - Customer 0 - - - - - 164 39903 Other Tangible Property - Network - H/W 6.2 P, S, T & D Plant - Customer 0 - - - - - 165 39904 Other Tang. Property - CPU 6.2 P, S, T & D Plant - Customer 0 - - - - - 166 39905 Other Tangible Property - MF - Hardware 6.2 P, S, T & D Plant - Customer 0 - - - - - 167 39906 Other Tang. Property - PC Hardware 6.2 P, S, T & D Plant - Customer 19,906 16,120 3,634 7 93 52 168 39907 Other Tang. Property - PC Software 6.2 P, S, T & D Plant - Customer 46,889 37,970 8,560 17 218 123 169 39908 Other Tang. Property - Mainframe S/W 6.2 P, S, T & D Plant - Customer 235,007 190,305 42,902 87 1,093 619 170 39909 Other Tang. Property - Application Software 6.2 P, S, T & D Plant - Customer 0 - - - - - 171 39924 Other Tang. Property - General Startup Costs 6.2 P, S, T & D Plant - Customer 0 - - - - - 172173 Total General Plant 684,033 553,919 124,876 255 3,183 1,801174175 CWIP w/o AFUDC 6.2 P, S, T & D Plant - Customer 1,317 1,066 240 0 6 3

Exhibit PHR-2Page 22 of 75
Atmos Energy Corporation, Kentucky/Mid-States DivisionClass Cost of Service - Customer/Demand StudyForecasted Test Period: Twelve Months Ended March 31, 2020
ALLOCATION OF PLANT IN SERVICE176177 Shared Services General Office:178179 General:180181 37400 Land & Land Rights 6.2 P, S, T & D Plant - Customer 0 - - - - - 182 39001 Structures Frame 6.2 P, S, T & D Plant - Customer 0 - - - - - 183 36602 Structures & Improvements 6.2 P, S, T & D Plant - Customer 134,716 109,091 24,594 50 627 355 184 37503 Improvements 6.2 P, S, T & D Plant - Customer 0 - - - - - 185 39004 Air Conditioning Equipment 6.2 P, S, T & D Plant - Customer 0 - - - - - 186 39009 Improvement to leased Premises 6.2 P, S, T & D Plant - Customer 275,421 223,032 50,280 102 1,281 725 187 39100 Office Furniture & Equipment 6.2 P, S, T & D Plant - Customer 163,488 132,390 29,846 61 761 431 188 39102 Remittance Processing Equip 6.2 P, S, T & D Plant - Customer 0 - - - - - 189 39103 Office Machines 6.2 P, S, T & D Plant - Customer 0 - - - - - 190 39200 Transportation Equipment 6.2 P, S, T & D Plant - Customer 210 170 38 0 1 1 191 39201 Trucks 6.2 P, S, T & D Plant - Customer 0 - - - - - 192 39202 Trailers 6.2 P, S, T & D Plant - Customer 0 - - - - - 193 39300 Stores Equipment 6.2 P, S, T & D Plant - Customer 0 - - - - - 194 39400 Tools, Shop & Garage Equipment 6.2 P, S, T & D Plant - Customer 2,244 1,817 410 1 10 6 195 39600 Power Operated Equipment 6.2 P, S, T & D Plant - Customer 0 - - - - - 196 39603 Ditchers 6.2 P, S, T & D Plant - Customer 0 - - - - - 197 39604 Backhoes 6.2 P, S, T & D Plant - Customer 0 - - - - - 198 39605 Welders 6.2 P, S, T & D Plant - Customer 0 - - - - - 199 39700 Communication Equipment 6.2 P, S, T & D Plant - Customer 30,980 25,087 5,656 12 144 82 200 39701 Communication Equipment - Mobile Radios 6.2 P, S, T & D Plant - Customer 0 - - - - - 201 39702 Communication Equipment - Fixed Radios 6.2 P, S, T & D Plant - Customer 0 - - - - - 202 39705 Communication Equip. - Telemetering 6.2 P, S, T & D Plant - Customer 0 - - - - - 203 39800 Miscellaneous Equipment 6.2 P, S, T & D Plant - Customer 4,295 3,478 784 2 20 11 204 39900 Other Tangible Property 6.2 P, S, T & D Plant - Customer 4,773 3,865 871 2 22 13 205 39901 Other Tangible Property - Servers - H/W 6.2 P, S, T & D Plant - Customer 1,323,054 1,071,388 241,534 492 6,156 3,484 206 39902 Other Tangible Property - Servers - S/W 6.2 P, S, T & D Plant - Customer 799,115 647,111 145,885 297 3,718 2,104 207 39903 Other Tangible Property - Network - H/W 6.2 P, S, T & D Plant - Customer 252,028 204,088 46,010 94 1,173 664 208 39904 Other Tang. Property - CPU 6.2 P, S, T & D Plant - Customer 0 - - - - - 209 39905 Other Tangible Property - MF - Hardware 6.2 P, S, T & D Plant - Customer 0 - - - - - 210 39906 Other Tang. Property - PC Hardware 6.2 P, S, T & D Plant - Customer 88,811 71,918 16,213 33 413 234 211 39907 Other Tang. Property - PC Software 6.2 P, S, T & D Plant - Customer 49,126 39,781 8,968 18 229 129 212 39908 Other Tang. Property - Mainframe S/W 6.2 P, S, T & D Plant - Customer 2,210,653 1,790,151 403,572 823 10,286 5,821 213 39909 Other Tang. Property - Application Software 6.2 P, S, T & D Plant - Customer 753,831 610,441 137,618 280 3,507 1,985 214 39931 Other Tang. Property - ALGN 6.2 P, S, T & D Plant - Customer 0 - - - - - 215216 Total General Plant 6,092,746 4,933,808 1,112,279 2,267 28,348 16,044217218 CWIP w/o AFUDC 6.2 P, S, T & D Plant - Customer 426,413 345,302 77,845 159 1,984 1,123 219220 Shared Services Customer Support:221222 General:223224 37400 Land & Land Rights 6.2 P, S, T & D Plant - Customer 117,313 94,998 21,416 44 546 309 225 39001 Structures Frame 6.2 P, S, T & D Plant - Customer 0 - - - - - 226 36602 Structures & Improvements 6.2 P, S, T & D Plant - Customer 569,815 461,427 104,024 212 2,651 1,500 227 37503 Improvements 6.2 P, S, T & D Plant - Customer 0 - - - - - 228 39004 Air Conditioning Equipment 6.2 P, S, T & D Plant - Customer 0 - - - - - 229 39009 Improvement to leased Premises 6.2 P, S, T & D Plant - Customer 90,666 73,420 16,552 34 422 239 230 39100 Office Furniture & Equipment 6.2 P, S, T & D Plant - Customer 88,145 71,378 16,092 33 410 232 231 39102 Remittance Processing Equip 6.2 P, S, T & D Plant - Customer 0 - - - - - 232 39103 Office Machines 6.2 P, S, T & D Plant - Customer 0 - - - - - 233 39200 Transportation Equipment 6.2 P, S, T & D Plant - Customer 1,272 1,030 232 0 6 3 234 39201 Trucks 6.2 P, S, T & D Plant - Customer 0 - - - - - 235 39202 Trailers 6.2 P, S, T & D Plant - Customer 0 - - - - - 236 39300 Stores Equipment 6.2 P, S, T & D Plant - Customer 0 - - - - - 237 39400 Tools, Shop & Garage Equipment 6.2 P, S, T & D Plant - Customer 8,030 6,503 1,466 3 37 21 238 39600 Power Operated Equipment 6.2 P, S, T & D Plant - Customer 312 253 57 0 1 1 239 39603 Ditchers 6.2 P, S, T & D Plant - Customer 0 - - - - - 240 39604 Backhoes 6.2 P, S, T & D Plant - Customer 0 - - - - - 241 39605 Welders 6.2 P, S, T & D Plant - Customer 0 - - - - - 242 39700 Communication Equipment 6.2 P, S, T & D Plant - Customer 65,347 52,917 11,930 24 304 172 243 39701 Communication Equipment - Mobile Radios 6.2 P, S, T & D Plant - Customer 0 - - - - - 244 39702 Communication Equipment - Fixed Radios 6.2 P, S, T & D Plant - Customer 0 - - - - - 245 39705 Communication Equip. - Telemetering 6.2 P, S, T & D Plant - Customer 0 - - - - - 246 39800 Miscellaneous Equipment 6.2 P, S, T & D Plant - Customer 8,979 7,271 1,639 3 42 24 247 39900 Other Tangible Property 6.2 P, S, T & D Plant - Customer 24,711 20,011 4,511 9 115 65 248 39901 Other Tangible Property - Servers - H/W 6.2 P, S, T & D Plant - Customer 332,475 269,233 60,696 124 1,547 875 249 39902 Other Tangible Property - Servers - S/W 6.2 P, S, T & D Plant - Customer 65,058 52,683 11,877 24 303 171 250 39903 Other Tangible Property - Network - H/W 6.2 P, S, T & D Plant - Customer 20,226 16,379 3,692 8 94 53 251 39904 Other Tang. Property - CPU 6.2 P, S, T & D Plant - Customer 0 - - - - - 252 39905 Other Tangible Property - MF - Hardware 6.2 P, S, T & D Plant - Customer 0 - - - - - 253 39906 Other Tang. Property - PC Hardware 6.2 P, S, T & D Plant - Customer 39,586 32,056 7,227 15 184 104 254 39907 Other Tang. Property - PC Software 6.2 P, S, T & D Plant - Customer 7,488 6,064 1,367 3 35 20 255 39908 Other Tang. Property - Mainframe S/W 6.2 P, S, T & D Plant - Customer 2,990,780 2,421,886 545,991 1,113 13,915 7,876 256 39909 Other Tang. Property - Application Software 6.2 P, S, T & D Plant - Customer 272 220 50 0 1 1 257 39924 Other Tang. Property - General Startup Costs 6.2 P, S, T & D Plant - Customer 0 - - - - - 258259 Total General Plant 4,430,475 3,587,727 808,818 1,649 20,614 11,667260261 CWIP w/o AFUDC 6.2 P, S, T & D Plant - Customer 128,056 103,697 23,378 48 596 337 262263 TOTAL PLANT IN SERVICE - CUSTOMER 412,922,619 334,378,112 75,382,299 153,641 1,921,229 1,087,339264265 TOTAL CWIP W/O AFUDC - CUSTOMER 22,296,712 18,055,519 4,070,442 8,296 103,741 58,713

Exhibit PHR-2Page 23 of 75
Atmos Energy Corporation, Kentucky/Mid-States DivisionClass Cost of Service - Customer/Demand StudyForecasted Test Period: Twelve Months Ended March 31, 2020
ALLOCATION OF PLANT IN SERVICE
Demand
Allocation Allocation Total Residential Non-Res Sales Non-Res Sales Transport TransportLine Acct. Factor Basis Company Sales Firm Interruptible Firm InterruptibleNo. No.
266 Intangible Plant:267268 30100 Organization 6.4 P, S, T & D Plant - Demand 3,492 1,579 903 47 506 457 269 30200 Franchises & Consents 6.4 P, S, T & D Plant - Demand 50,240 22,715 12,989 683 7,277 6,576 270 30300 Misc Intangible Plant 99.0 - 0 - - - - - 271272 Total Intangible Plant: 53,731 24,294 13,892 731 7,783 7,033273274 Production Plant:275276 32520 Producing Leaseholds 3.0 Peak Day 0 - - - - - 277 32540 Rights of Ways 3.0 Peak Day 0 - - - - - 278 33100 Production Gas Wells Equipment 3.0 Peak Day 0 - - - - - 279 33201 Field Lines 3.0 Peak Day 0 - - - - - 280 33202 Tributary Lines 3.0 Peak Day 0 - - - - - 281 33400 Field Meas. & Reg. Sta. Equip 3.0 Peak Day 0 - - - - - 282 33600 Purification Equipment 3.0 Peak Day 0 - - - - - 283284 Total Production Plant 0 0 0 0 0 0285286 Storage Plant:287288 35010 Land 3.0 Peak Day 130,563 59,032 33,756 1,775 18,911 17,089 289 35020 Rights of Way 3.0 Peak Day 2,341 1,058 605 32 339 306 290 35100 Structures and Improvements 3.0 Peak Day 8,958 4,050 2,316 122 1,298 1,172 291 35102 Compression Station Equipment 3.0 Peak Day 76,631 34,647 19,812 1,042 11,099 10,030 292 35103 Meas. & Reg. Sta. Structues 3.0 Peak Day 11,569 5,231 2,991 157 1,676 1,514 293 35104 Other Structures 3.0 Peak Day 68,721 31,071 17,767 935 9,954 8,995 294 35200 Wells \ Rights of Way 3.0 Peak Day 4,174,198 1,887,299 1,079,195 56,763 604,604 546,337 295 35201 Well Construction 3.0 Peak Day 849,999 384,314 219,758 11,559 123,117 111,252 296 35202 Well Equipment 3.0 Peak Day 224,655 101,574 58,082 3,055 32,540 29,404 297 35203 Cushion Gas 3.0 Peak Day 847,416 383,146 219,091 11,524 122,742 110,914 298 35210 Leaseholds 3.0 Peak Day 89,265 40,360 23,079 1,214 12,929 11,683 299 35211 Storage Rights 3.0 Peak Day 27,307 12,346 7,060 371 3,955 3,574 300 35301 Field Lines 3.0 Peak Day 87,675 39,641 22,667 1,192 12,699 11,475 301 35302 Tributary Lines 3.0 Peak Day 104,659 47,320 27,059 1,423 15,159 13,698 302 35400 Compressor Station Equipment 3.0 Peak Day 461,723 208,761 119,374 6,279 66,877 60,432 303 35500 Meas & Reg. Equipment 3.0 Peak Day 136,542 61,735 35,302 1,857 19,777 17,871 304 35600 Purification Equipment 3.0 Peak Day 207,332 93,742 53,603 2,819 30,031 27,136 305306 Total Storage Plant 7,509,555 3,395,329 1,941,516 102,119 1,087,708 982,884307308 Transmission:309310 36510 Land & Land Rights 3.0 Peak Day 26,970 12,194 6,973 367 3,906 3,530 311 36520 Rights of Way 3.0 Peak Day 867,772 392,350 224,353 11,800 125,691 113,578 312 36602 Structures & Improvements 3.0 Peak Day 49,002 22,155 12,669 666 7,098 6,414 313 36603 Other Structues 3.0 Peak Day 60,826 27,502 15,726 827 8,810 7,961 314 36700 Mains Cathodic Protection 3.0 Peak Day 139,638 63,135 36,102 1,899 20,226 18,276 315 36701 Mains - Steel 3.0 Peak Day 27,047,831 12,229,257 6,992,930 367,811 3,917,694 3,540,140 316 36900 Meas. & Reg. Equipment 3.0 Peak Day 731,467 330,721 189,113 9,947 105,948 95,738 317 36901 Meas. & Reg. Equipment 3.0 Peak Day 2,269,556 1,026,144 586,770 30,863 328,730 297,050 318319 Total Transmission Plant 31,193,061 14,103,458 8,064,635 424,180 4,518,102 4,082,686320321 Distribution:322323 37400 Land & Land Rights 3.0 Peak Day 353,514 159,836 91,397 4,807 51,204 46,269 324 37401 Land 3.0 Peak Day 24,842 11,232 6,423 338 3,598 3,251 325 37402 Land Rights 3.0 Peak Day 2,426,397 1,097,058 627,319 32,995 351,447 317,578 326 37403 Land Other 3.0 Peak Day 1,853 838 479 25 268 243 327 37500 Structures & Improvements 3.0 Peak Day 223,733 101,158 57,844 3,042 32,406 29,283 328 37501 Structures & Improvements T.B. 3.0 Peak Day 66,433 30,037 17,176 903 9,622 8,695 329 37502 Land Rights 3.0 Peak Day 30,791 13,922 7,961 419 4,460 4,030 330 37503 Improvements 3.0 Peak Day 2,666 1,205 689 36 386 349 331 37600 Mains Cathodic Protection 3.0 Peak Day 13,717,835 6,202,306 3,546,601 186,543 1,986,935 1,795,451 332 37601 Mains - Steel 3.0 Peak Day 117,152,267 52,968,579 30,288,475 1,593,100 16,968,706 15,333,407 333 37602 Mains - Plastic 3.0 Peak Day 88,691,326 40,100,406 22,930,201 1,206,073 12,846,333 11,608,313 334 37800 Meas & Reg. Sta. Equip - General 3.0 Peak Day 19,907,618 9,000,921 5,146,903 270,715 2,883,483 2,605,597 335 37900 Meas & Reg. Sta. Equip - City Gate 3.0 Peak Day 3,411,587 1,542,496 882,030 46,393 494,145 446,524 336 37905 Meas & Reg. Sta. Equipment T.b. 3.0 Peak Day 1,099,647 497,188 284,302 14,954 159,276 143,927 337 38000 Services 99.0 - 0 - - - - - 338 38100 Meters 99.0 - 0 - - - - - 339 38200 Meter Installaitons 99.0 - 0 - - - - - 340 38300 House Regulators 99.0 - 0 - - - - - 341 38400 House Reg. Installations 99.0 - 0 - - - - - 342 38500 Ind. Meas. & Reg. Sta. Equipment 99.0 - 0 - - - - - 343 38600 Other Prop. On Cust. Prem 99.0 - 0 - - - - - 344345 Total Distribution Plant 247,110,508 111,727,180 63,887,800 3,360,342 35,792,270 32,342,916

Exhibit PHR-2Page 24 of 75
Atmos Energy Corporation, Kentucky/Mid-States DivisionClass Cost of Service - Customer/Demand StudyForecasted Test Period: Twelve Months Ended March 31, 2020
ALLOCATION OF PLANT IN SERVICE346347 General:348349 38900 Land & Land Rights 6.4 P, S, T & D Plant - Demand 507,917 229,647 131,317 6,907 73,568 66,478 350 39000 Structures & Improvements 6.4 P, S, T & D Plant - Demand 3,183,909 1,439,555 823,166 43,297 461,167 416,724 351 39001 Structures Frame 6.4 P, S, T & D Plant - Demand 0 - - - - - 352 39002 Structures-Brick 6.4 P, S, T & D Plant - Demand 72,566 32,810 18,761 987 10,511 9,498 353 39003 Improvements 6.4 P, S, T & D Plant - Demand 297,281 134,411 76,859 4,043 43,059 38,909 354 39004 Air Conditioning Equipment 6.4 P, S, T & D Plant - Demand 5,430 2,455 1,404 74 787 711 355 39009 Improvement to leased Premises 6.4 P, S, T & D Plant - Demand 522,377 236,185 135,055 7,104 75,663 68,371 356 39100 Office Furniture & Equipment 6.4 P, S, T & D Plant - Demand 782,202 353,661 202,230 10,637 113,297 102,378 357 39102 Remittance Processing Equip 6.4 P, S, T & D Plant - Demand 0 - - - - - 358 39103 Office Machines 6.4 P, S, T & D Plant - Demand 0 - - - - - 359 39200 Transportation Equipment 6.4 P, S, T & D Plant - Demand 92,633 41,883 23,949 1,260 13,417 12,124 360 39201 Trucks 6.4 P, S, T & D Plant - Demand 0 - - - - - 361 39202 Trailers 6.4 P, S, T & D Plant - Demand 0 - - - - - 362 39300 Stores Equipment 6.4 P, S, T & D Plant - Demand 0 - - - - - 363 39400 Tools, Shop & Garage Equipment 6.4 P, S, T & D Plant - Demand 1,709,559 772,951 441,988 23,248 247,618 223,755 364 39600 Power Operated Equipment 6.4 P, S, T & D Plant - Demand 0 - - - - - 365 39603 Ditchers 6.4 P, S, T & D Plant - Demand 16,604 7,507 4,293 226 2,405 2,173 366 39604 Backhoes 6.4 P, S, T & D Plant - Demand 26,302 11,892 6,800 358 3,810 3,443 367 39605 Welders 6.4 P, S, T & D Plant - Demand 8,143 3,682 2,105 111 1,180 1,066 368 39700 Communication Equipment 6.4 P, S, T & D Plant - Demand 219,757 99,360 56,816 2,988 31,830 28,763 369 39701 Communication Equipment - Mobile Radios 6.4 P, S, T & D Plant - Demand 0 - - - - - 370 39702 Communication Equipment - Fixed Radios 6.4 P, S, T & D Plant - Demand 0 - - - - - 371 39705 Communication Equip. - Telemetering 6.4 P, S, T & D Plant - Demand 0 - - - - - 372 39800 Miscellaneous Equipment 6.4 P, S, T & D Plant - Demand 1,631,345 737,587 421,767 22,184 236,289 213,518 373 39900 Other Tangible Property 6.4 P, S, T & D Plant - Demand 0 - - - - - 374 39901 Other Tangible Property - Servers - H/W 6.4 P, S, T & D Plant - Demand 6,032 2,727 1,559 82 874 789 375 39902 Other Tangible Property - Servers - S/W 6.4 P, S, T & D Plant - Demand 0 - - - - - 376 39903 Other Tangible Property - Network - H/W 6.4 P, S, T & D Plant - Demand 56,421 25,510 14,587 767 8,172 7,385 377 39904 Other Tang. Property - CPU 6.4 P, S, T & D Plant - Demand 0 - - - - - 378 39905 Other Tangible Property - MF - Hardware 6.4 P, S, T & D Plant - Demand 0 - - - - - 379 39906 Other Tang. Property - PC Hardware 6.4 P, S, T & D Plant - Demand 193,613 87,539 50,057 2,633 28,044 25,341 380 39907 Other Tang. Property - PC Software 6.4 P, S, T & D Plant - Demand 0 - - - - - 381 39908 Other Tang. Property - Mainframe S/W 6.4 P, S, T & D Plant - Demand 51,775 23,409 13,386 704 7,499 6,777 382 39909 Other Tang. Property - Application Software 6.4 P, S, T & D Plant - Demand 0 - - - - - 383 39924 Other Tang. Property - General Startup Costs 6.4 P, S, T & D Plant - Demand 0 - - - - - 384385 Total General Plant 9,383,867 4,242,770 2,426,099 127,607 1,359,189 1,228,202386387 TOTAL DIRECT PLANT 295,250,723 133,493,031 76,333,941 4,014,979 42,765,051 38,643,721388389 CWIP w/o AFUDC 6.4 P, S, T & D Plant - Demand 15,993,659 7,231,285 4,134,991 217,490 2,316,572 2,093,321 390391 Kentucky Mid-States General Office:392393 Intangible Plant:394395 30100 Organization 6.4 P, S, T & D Plant - Demand 38,668 17,483 9,997 526 5,601 5,061 396 30200 Franchises & Consents 6.4 P, S, T & D Plant - Demand 0 - - - - - 397 30300 Misc Intangible Plant 6.4 P, S, T & D Plant - Demand 231,527 104,681 59,859 3,148 33,535 30,303 398399 Total Intangible Plant: 270,195 122,164 69,856 3,674 39,136 35,364400401 General:402403 37400 Land & Land Rights 6.4 P, S, T & D Plant - Demand 0 - - - - - 404 39001 Structures Frame 6.4 P, S, T & D Plant - Demand 37,422 16,920 9,675 509 5,420 4,898 405 36602 Structures & Improvements 6.4 P, S, T & D Plant - Demand 0 - - - - - 406 38900 Land & Land Rights 6.4 P, S, T & D Plant - Demand 0 - - - - - 407 39004 Air Conditioning Equipment 6.4 P, S, T & D Plant - Demand 3,210 1,451 830 44 465 420 408 39009 Improvement to leased Premises 6.4 P, S, T & D Plant - Demand 8,103 3,664 2,095 110 1,174 1,061 409 39100 Office Furniture & Equipment 6.4 P, S, T & D Plant - Demand 8,056 3,643 2,083 110 1,167 1,054 410 39102 Remittance Processing Equip 6.4 P, S, T & D Plant - Demand 0 - - - - - 411 39103 Office Machines 6.4 P, S, T & D Plant - Demand 0 - - - - - 412 39200 Transportation Equipment 6.4 P, S, T & D Plant - Demand 5,693 2,574 1,472 77 825 745 413 39201 Trucks 6.4 P, S, T & D Plant - Demand 0 - - - - - 414 39202 Trailers 6.4 P, S, T & D Plant - Demand 0 - - - - - 415 39300 Stores Equipment 6.4 P, S, T & D Plant - Demand 0 - - - - - 416 39400 Tools, Shop & Garage Equipment 6.4 P, S, T & D Plant - Demand 36,698 16,592 9,488 499 5,315 4,803 417 39600 Power Operated Equipment 6.4 P, S, T & D Plant - Demand 4,281 1,936 1,107 58 620 560 418 39603 Ditchers 6.4 P, S, T & D Plant - Demand 0 - - - - - 419 39604 Backhoes 6.4 P, S, T & D Plant - Demand 0 - - - - - 420 39605 Welders 6.4 P, S, T & D Plant - Demand 0 - - - - - 421 39700 Communication Equipment 6.4 P, S, T & D Plant - Demand 7,834 3,542 2,025 107 1,135 1,025 422 39701 Communication Equipment - Mobile Radios 6.4 P, S, T & D Plant - Demand 0 - - - - - 423 39702 Communication Equipment - Fixed Radios 6.4 P, S, T & D Plant - Demand 0 - - - - - 424 39705 Communication Equip. - Telemetering 6.4 P, S, T & D Plant - Demand 0 - - - - - 425 39800 Miscellaneous Equipment 6.4 P, S, T & D Plant - Demand 169,890 76,813 43,923 2,310 24,607 22,236 426 39900 Other Tangible Property 6.4 P, S, T & D Plant - Demand 0 - - - - - 427 39901 Other Tangible Property - Servers - H/W 6.4 P, S, T & D Plant - Demand 0 - - - - - 428 39902 Other Tangible Property - Servers - S/W 6.4 P, S, T & D Plant - Demand 0 - - - - - 429 39903 Other Tangible Property - Network - H/W 6.4 P, S, T & D Plant - Demand 0 - - - - - 430 39904 Other Tang. Property - CPU 6.4 P, S, T & D Plant - Demand 0 - - - - - 431 39905 Other Tangible Property - MF - Hardware 6.4 P, S, T & D Plant - Demand 0 - - - - - 432 39906 Other Tang. Property - PC Hardware 6.4 P, S, T & D Plant - Demand 14,644 6,621 3,786 199 2,121 1,917 433 39907 Other Tang. Property - PC Software 6.4 P, S, T & D Plant - Demand 34,493 15,596 8,918 469 4,996 4,515 434 39908 Other Tang. Property - Mainframe S/W 6.4 P, S, T & D Plant - Demand 172,882 78,166 44,697 2,351 25,041 22,628 435 39909 Other Tang. Property - Application Software 6.4 P, S, T & D Plant - Demand 0 - - - - - 436 39924 Other Tang. Property - General Startup Costs 6.4 P, S, T & D Plant - Demand 0 - - - - - 437438 Total General Plant 503,207 227,517 130,099 6,843 72,886 65,862439440 CWIP w/o AFUDC 6.4 P, S, T & D Plant - Demand 969 438 250 13 140 127

Exhibit PHR-2Page 25 of 75
Atmos Energy Corporation, Kentucky/Mid-States DivisionClass Cost of Service - Customer/Demand StudyForecasted Test Period: Twelve Months Ended March 31, 2020
ALLOCATION OF PLANT IN SERVICE441442 Shared Services General Office:443444 General:445446 37400 Land & Land Rights 6.4 P, S, T & D Plant - Demand 0 - - - - - 447 39001 Structures Frame 6.4 P, S, T & D Plant - Demand 0 - - - - - 448 36602 Structures & Improvements 6.4 P, S, T & D Plant - Demand 99,104 44,808 25,622 1,348 14,354 12,971 449 37503 Improvements 6.4 P, S, T & D Plant - Demand 0 - - - - - 450 39004 Air Conditioning Equipment 6.4 P, S, T & D Plant - Demand 0 - - - - - 451 39009 Improvement to leased Premises 6.4 P, S, T & D Plant - Demand 202,613 91,608 52,383 2,755 29,347 26,519 452 39100 Office Furniture & Equipment 6.4 P, S, T & D Plant - Demand 120,270 54,378 31,094 1,635 17,420 15,741 453 39102 Remittance Processing Equip 6.4 P, S, T & D Plant - Demand 0 - - - - - 454 39103 Office Machines 6.4 P, S, T & D Plant - Demand 0 - - - - - 455 39200 Transportation Equipment 6.4 P, S, T & D Plant - Demand 155 70 40 2 22 20 456 39201 Trucks 6.4 P, S, T & D Plant - Demand 0 - - - - - 457 39202 Trailers 6.4 P, S, T & D Plant - Demand 0 - - - - - 458 39300 Stores Equipment 6.4 P, S, T & D Plant - Demand 0 - - - - - 459 39400 Tools, Shop & Garage Equipment 6.4 P, S, T & D Plant - Demand 1,651 746 427 22 239 216 460 39600 Power Operated Equipment 6.4 P, S, T & D Plant - Demand 0 - - - - - 461 39603 Ditchers 6.4 P, S, T & D Plant - Demand 0 - - - - - 462 39604 Backhoes 6.4 P, S, T & D Plant - Demand 0 - - - - - 463 39605 Welders 6.4 P, S, T & D Plant - Demand 0 - - - - - 464 39700 Communication Equipment 6.4 P, S, T & D Plant - Demand 22,791 10,304 5,892 310 3,301 2,983 465 39701 Communication Equipment - Mobile Radios 6.4 P, S, T & D Plant - Demand 0 - - - - - 466 39702 Communication Equipment - Fixed Radios 6.4 P, S, T & D Plant - Demand 0 - - - - - 467 39705 Communication Equip. - Telemetering 6.4 P, S, T & D Plant - Demand 0 - - - - - 468 39800 Miscellaneous Equipment 6.4 P, S, T & D Plant - Demand 3,159 1,429 817 43 458 414 469 39900 Other Tangible Property 6.4 P, S, T & D Plant - Demand 3,512 1,588 908 48 509 460 470 39901 Other Tangible Property - Servers - H/W 6.4 P, S, T & D Plant - Demand 973,301 440,063 251,637 13,235 140,976 127,390 471 39902 Other Tangible Property - Servers - S/W 6.4 P, S, T & D Plant - Demand 587,867 265,795 151,987 7,994 85,149 76,943 472 39903 Other Tangible Property - Network - H/W 6.4 P, S, T & D Plant - Demand 185,404 83,827 47,934 2,521 26,854 24,266 473 39904 Other Tang. Property - CPU 6.4 P, S, T & D Plant - Demand 0 - - - - - 474 39905 Other Tangible Property - MF - Hardware 6.4 P, S, T & D Plant - Demand 0 - - - - - 475 39906 Other Tang. Property - PC Hardware 6.4 P, S, T & D Plant - Demand 65,334 29,540 16,891 888 9,463 8,551 476 39907 Other Tang. Property - PC Software 6.4 P, S, T & D Plant - Demand 36,139 16,340 9,343 491 5,234 4,730 477 39908 Other Tang. Property - Mainframe S/W 6.4 P, S, T & D Plant - Demand 1,626,261 735,289 420,453 22,115 235,553 212,852 478 39909 Other Tang. Property - Application Software 6.4 P, S, T & D Plant - Demand 554,554 250,733 143,374 7,541 80,323 72,583 479 39931 Other Tang. Property - ALGN 6.4 P, S, T & D Plant - Demand 0 - - - - - 480481 Total General Plant 4,482,113 2,026,518 1,158,803 60,950 649,204 586,639482483 CWIP w/o AFUDC 6.4 P, S, T & D Plant - Demand 313,690 141,830 81,101 4,266 45,436 41,057 484485 Shared Services Customer Support:486487 General:488489 37400 Land & Land Rights 6.4 P, S, T & D Plant - Demand 86,301 39,020 22,312 1,174 12,500 11,295 490 39001 Structures Frame 6.4 P, S, T & D Plant - Demand 0 - - - - - 491 36602 Structures & Improvements 6.4 P, S, T & D Plant - Demand 419,183 189,527 108,375 5,700 60,716 54,864 492 37503 Improvements 6.4 P, S, T & D Plant - Demand 0 - - - - - 493 39004 Air Conditioning Equipment 6.4 P, S, T & D Plant - Demand 0 - - - - - 494 39009 Improvement to leased Premises 6.4 P, S, T & D Plant - Demand 66,698 30,157 17,244 907 9,661 8,730 495 39100 Office Furniture & Equipment 6.4 P, S, T & D Plant - Demand 64,843 29,318 16,765 882 9,392 8,487 496 39102 Remittance Processing Equip 6.4 P, S, T & D Plant - Demand 0 - - - - - 497 39103 Office Machines 6.4 P, S, T & D Plant - Demand 0 - - - - - 498 39200 Transportation Equipment 6.4 P, S, T & D Plant - Demand 936 423 242 13 136 122 499 39201 Trucks 6.4 P, S, T & D Plant - Demand 0 - - - - - 500 39202 Trailers 6.4 P, S, T & D Plant - Demand 0 - - - - - 501 39300 Stores Equipment 6.4 P, S, T & D Plant - Demand 0 - - - - - 502 39400 Tools, Shop & Garage Equipment 6.4 P, S, T & D Plant - Demand 5,907 2,671 1,527 80 856 773 503 39600 Power Operated Equipment 6.4 P, S, T & D Plant - Demand 230 104 59 3 33 30 504 39603 Ditchers 6.4 P, S, T & D Plant - Demand 0 - - - - - 505 39604 Backhoes 6.4 P, S, T & D Plant - Demand 0 - - - - - 506 39605 Welders 6.4 P, S, T & D Plant - Demand 0 - - - - - 507 39700 Communication Equipment 6.4 P, S, T & D Plant - Demand 48,072 21,735 12,429 654 6,963 6,292 508 39701 Communication Equipment - Mobile Radios 6.4 P, S, T & D Plant - Demand 0 - - - - - 509 39702 Communication Equipment - Fixed Radios 6.4 P, S, T & D Plant - Demand 0 - - - - - 510 39705 Communication Equip. - Telemetering 6.4 P, S, T & D Plant - Demand 0 - - - - - 511 39800 Miscellaneous Equipment 6.4 P, S, T & D Plant - Demand 6,605 2,987 1,708 90 957 865 512 39900 Other Tangible Property 6.4 P, S, T & D Plant - Demand 18,179 8,219 4,700 247 2,633 2,379 513 39901 Other Tangible Property - Servers - H/W 6.4 P, S, T & D Plant - Demand 244,584 110,585 63,235 3,326 35,426 32,012 514 39902 Other Tangible Property - Servers - S/W 6.4 P, S, T & D Plant - Demand 47,860 21,639 12,374 651 6,932 6,264 515 39903 Other Tangible Property - Network - H/W 6.4 P, S, T & D Plant - Demand 14,879 6,727 3,847 202 2,155 1,947 516 39904 Other Tang. Property - CPU 6.4 P, S, T & D Plant - Demand 0 - - - - - 517 39905 Other Tangible Property - MF - Hardware 6.4 P, S, T & D Plant - Demand 0 - - - - - 518 39906 Other Tang. Property - PC Hardware 6.4 P, S, T & D Plant - Demand 29,121 13,167 7,529 396 4,218 3,812 519 39907 Other Tang. Property - PC Software 6.4 P, S, T & D Plant - Demand 5,508 2,491 1,424 75 798 721 520 39908 Other Tang. Property - Mainframe S/W 6.4 P, S, T & D Plant - Demand 2,200,160 994,768 568,828 29,919 318,678 287,967 521 39909 Other Tang. Property - Application Software 6.4 P, S, T & D Plant - Demand 200 90 52 3 29 26 522 39924 Other Tang. Property - General Startup Costs 6.4 P, S, T & D Plant - Demand 0 - - - - - 523524 Total General Plant 3,259,268 1,473,627 842,649 44,321 472,083 426,587525526 CWIP w/o AFUDC 6.4 P, S, T & D Plant - Demand 94,204 42,593 24,355 1,281 13,645 12,330 527528 TOTAL PLANT IN SERVICE - DEMAND 303,765,506 137,342,857 78,535,348 4,130,768 43,998,359 39,758,173529530 TOTAL CWIP W/O AFUDC - DEMAND 16,402,521 7,416,145 4,240,698 223,050 2,375,793 2,146,834

Exhibit PHR-2Page 26 of 75
Atmos Energy Corporation, Kentucky/Mid-States DivisionClass Cost of Service - Customer/Demand StudyForecasted Test Period: Twelve Months Ended March 31, 2020
ALLOCATION OF PLANT IN SERVICE
Commodity
Allocation Allocation Total Residential Non-Res Sales Non-Res Sales Transport TransportLine Acct. Factor Basis Company Sales Firm Interruptible Firm InterruptibleNo. No.
531 Intangible Plant:532533 30100 Organization 6.6 P, S, T & D Plant - Commodity 92 35 21 1 17 17 534 30200 Franchises & Consents 6.6 P, S, T & D Plant - Commodity 1,320 500 309 17 243 251 535 30300 Misc Intangible Plant 99.0 - 0 - - - - - 536537 Total Intangible Plant: 1,412 535 331 18 260 269538539 Production Plant:540541 32520 Producing Leaseholds 99.0 - 0 - - - - - 542 32540 Rights of Ways 99.0 - 0 - - - - - 543 33100 Production Gas Wells Equipment 99.0 - 0 - - - - - 544 33201 Field Lines 99.0 - 0 - - - - - 545 33202 Tributary Lines 99.0 - 0 - - - - - 546 33400 Field Meas. & Reg. Sta. Equip 99.0 - 0 - - - - - 547 33600 Purification Equipment 99.0 - 0 - - - - - 548549 Total Production Plant 0 0 0 0 0 0550551 Storage Plant:552553 35010 Land 1.5 Winter Volumes 130,563 49,435 30,589 1,673 24,001 24,865 554 35020 Rights of Way 1.5 Winter Volumes 2,341 886 548 30 430 446 555 35100 Structures and Improvements 1.5 Winter Volumes 8,958 3,392 2,099 115 1,647 1,706 556 35102 Compression Station Equipment 1.5 Winter Volumes 76,631 29,015 17,954 982 14,087 14,594 557 35103 Meas. & Reg. Sta. Structues 1.5 Winter Volumes 11,569 4,380 2,711 148 2,127 2,203 558 35104 Other Structures 1.5 Winter Volumes 68,721 26,020 16,101 880 12,633 13,087 559 35200 Wells \ Rights of Way 1.5 Winter Volumes 4,174,198 1,580,473 977,961 53,480 767,344 794,940 560 35201 Well Construction 1.5 Winter Volumes 849,999 321,834 199,144 10,890 156,256 161,875 561 35202 Well Equipment 1.5 Winter Volumes 224,655 85,061 52,634 2,878 41,298 42,784 562 35203 Cushion Gas 1.5 Winter Volumes 847,416 320,857 198,539 10,857 155,781 161,383 563 35210 Leaseholds 1.5 Winter Volumes 89,265 33,798 20,914 1,144 16,410 17,000 564 35211 Storage Rights 1.5 Winter Volumes 27,307 10,339 6,398 350 5,020 5,200 565 35301 Field Lines 1.5 Winter Volumes 87,675 33,196 20,541 1,123 16,117 16,697 566 35302 Tributary Lines 1.5 Winter Volumes 104,659 39,627 24,520 1,341 19,240 19,931 567 35400 Compressor Station Equipment 1.5 Winter Volumes 461,723 174,822 108,176 5,916 84,879 87,931 568 35500 Meas & Reg. Equipment 1.5 Winter Volumes 136,542 51,699 31,990 1,749 25,101 26,003 569 35600 Purification Equipment 1.5 Winter Volumes 207,332 78,502 48,575 2,656 38,114 39,485 570571 Total Storage Plant 7,509,555 2,843,336 1,759,393 96,213 1,380,484 1,430,130572573 Transmission:574575 36510 Land & Land Rights 99.0 - 0 - - - - - 576 36520 Rights of Way 99.0 - 0 - - - - - 577 36602 Structures & Improvements 99.0 - 0 - - - - - 578 36603 Other Structues 99.0 - 0 - - - - - 579 36700 Mains Cathodic Protection 99.0 - 0 - - - - - 580 36701 Mains - Steel 99.0 - 0 - - - - - 581 36900 Meas. & Reg. Equipment 99.0 - 0 - - - - - 582 36901 Meas. & Reg. Equipment 99.0 - 0 - - - - - 583584 Total Transmission Plant 0 0 0 0 0 0585586 Distribution:587588 37400 Land & Land Rights 1.0 Mcf 0 - - - - - 589 37401 Land 1.0 Mcf 0 - - - - - 590 37402 Land Rights 1.0 Mcf 0 - - - - - 591 37403 Land Other 1.0 Mcf 0 - - - - - 592 37500 Structures & Improvements 1.0 Mcf 0 - - - - - 593 37501 Structures & Improvements T.B. 1.0 Mcf 0 - - - - - 594 37502 Land Rights 1.0 Mcf 0 - - - - - 595 37503 Improvements 1.0 Mcf 0 - - - - - 596 37600 Mains Cathodic Protection 1.0 Mcf 0 - - - - - 597 37601 Mains - Steel 1.0 Mcf 0 - - - - - 598 37602 Mains - Plastic 1.0 Mcf 0 - - - - - 599 37800 Meas & Reg. Sta. Equip - General 1.0 Mcf 0 - - - - - 600 37900 Meas & Reg. Sta. Equip - City Gate 1.0 Mcf 0 - - - - - 601 37905 Meas & Reg. Sta. Equipment T.b. 1.0 Mcf 0 - - - - - 602 38000 Services 99.0 - 0 - - - - - 603 38100 Meters 99.0 - 0 - - - - - 604 38200 Meter Installaitons 99.0 - 0 - - - - - 605 38300 House Regulators 99.0 - 0 - - - - - 606 38400 House Reg. Installations 99.0 - 0 - - - - - 607 38500 Ind. Meas. & Reg. Sta. Equipment 99.0 - 0 - - - - - 608 38600 Other Prop. On Cust. Prem 99.0 - 0 - - - - - 609610 Total Distribution Plant 0 0 0 0 0 0

Exhibit PHR-2Page 27 of 75
Atmos Energy Corporation, Kentucky/Mid-States DivisionClass Cost of Service - Customer/Demand StudyForecasted Test Period: Twelve Months Ended March 31, 2020
ALLOCATION OF PLANT IN SERVICE611612 General:613614 38900 Land & Land Rights 6.6 P, S, T & D Plant - Commodity 13,345 5,053 3,127 171 2,453 2,541 615 39000 Structures & Improvements 6.6 P, S, T & D Plant - Commodity 83,655 31,674 19,599 1,072 15,378 15,931 616 39001 Structures Frame 6.6 P, S, T & D Plant - Commodity 0 - - - - - 617 39002 Structures-Brick 6.6 P, S, T & D Plant - Commodity 1,907 722 447 24 350 363 618 39003 Improvements 6.6 P, S, T & D Plant - Commodity 7,811 2,957 1,830 100 1,436 1,488 619 39004 Air Conditioning Equipment 6.6 P, S, T & D Plant - Commodity 143 54 33 2 26 27 620 39009 Improvement to leased Premises 6.6 P, S, T & D Plant - Commodity 13,725 5,197 3,216 176 2,523 2,614 621 39100 Office Furniture & Equipment 6.6 P, S, T & D Plant - Commodity 20,552 7,782 4,815 263 3,778 3,914 622 39102 Remittance Processing Equip 6.6 P, S, T & D Plant - Commodity 0 - - - - - 623 39103 Office Machines 6.6 P, S, T & D Plant - Commodity 0 - - - - - 624 39200 Transportation Equipment 6.6 P, S, T & D Plant - Commodity 2,434 922 570 31 447 464 625 39201 Trucks 6.6 P, S, T & D Plant - Commodity 0 - - - - - 626 39202 Trailers 6.6 P, S, T & D Plant - Commodity 0 - - - - - 627 39300 Stores Equipment 6.6 P, S, T & D Plant - Commodity 0 - - - - - 628 39400 Tools, Shop & Garage Equipment 6.6 P, S, T & D Plant - Commodity 44,918 17,007 10,524 575 8,257 8,554 629 39600 Power Operated Equipment 6.6 P, S, T & D Plant - Commodity 0 - - - - - 630 39603 Ditchers 6.6 P, S, T & D Plant - Commodity 436 165 102 6 80 83 631 39604 Backhoes 6.6 P, S, T & D Plant - Commodity 691 262 162 9 127 132 632 39605 Welders 6.6 P, S, T & D Plant - Commodity 214 81 50 3 39 41 633 39700 Communication Equipment 6.6 P, S, T & D Plant - Commodity 5,774 2,186 1,353 74 1,061 1,100 634 39701 Communication Equipment - Mobile Radios 6.6 P, S, T & D Plant - Commodity 0 - - - - - 635 39702 Communication Equipment - Fixed Radios 6.6 P, S, T & D Plant - Commodity 0 - - - - - 636 39705 Communication Equip. - Telemetering 6.6 P, S, T & D Plant - Commodity 0 - - - - - 637 39800 Miscellaneous Equipment 6.6 P, S, T & D Plant - Commodity 42,863 16,229 10,042 549 7,879 8,163 638 39900 Other Tangible Property 6.6 P, S, T & D Plant - Commodity 0 - - - - - 639 39901 Other Tangible Property - Servers - H/W 6.6 P, S, T & D Plant - Commodity 158 60 37 2 29 30 640 39902 Other Tangible Property - Servers - S/W 6.6 P, S, T & D Plant - Commodity 0 - - - - - 641 39903 Other Tangible Property - Network - H/W 6.6 P, S, T & D Plant - Commodity 1,482 561 347 19 273 282 642 39904 Other Tang. Property - CPU 6.6 P, S, T & D Plant - Commodity 0 - - - - - 643 39905 Other Tangible Property - MF - Hardware 6.6 P, S, T & D Plant - Commodity 0 - - - - - 644 39906 Other Tang. Property - PC Hardware 6.6 P, S, T & D Plant - Commodity 5,087 1,926 1,192 65 935 969 645 39907 Other Tang. Property - PC Software 6.6 P, S, T & D Plant - Commodity 0 - - - - - 646 39908 Other Tang. Property - Mainframe S/W 6.6 P, S, T & D Plant - Commodity 1,360 515 319 17 250 259 647 39909 Other Tang. Property - Application Software 6.6 P, S, T & D Plant - Commodity 0 - - - - - 648 39924 Other Tang. Property - General Startup Costs 6.6 P, S, T & D Plant - Commodity 0 - - - - - 649650 Total General Plant 246,555 93,353 57,765 3,159 45,324 46,954651652 TOTAL DIRECT PLANT 7,757,522 2,937,224 1,817,488 99,389 1,426,068 1,477,353653654 CWIP w/o AFUDC 6.6 P, S, T & D Plant - Commodity 420,223 159,109 98,453 5,384 77,250 80,028 655656 Kentucky Mid-States General Office:657658 Intangible Plant:659660 30100 Organization 6.6 P, S, T & D Plant - Commodity 1,016 385 238 13 187 193 661 30200 Franchises & Consents 6.6 P, S, T & D Plant - Commodity 0 - - - - - 662 30300 Misc Intangible Plant 6.6 P, S, T & D Plant - Commodity 6,083 2,303 1,425 78 1,118 1,158 663664 Total Intangible Plant: 7,099 2,688 1,663 91 1,305 1,352665666 General:667668 37400 Land & Land Rights 6.6 P, S, T & D Plant - Commodity 0 - - - - - 669 39001 Structures Frame 6.6 P, S, T & D Plant - Commodity 983 372 230 13 181 187 670 36602 Structures & Improvements 6.6 P, S, T & D Plant - Commodity 0 - - - - - 671 38900 Land & Land Rights 6.6 P, S, T & D Plant - Commodity 0 - - - - - 672 39004 Air Conditioning Equipment 6.6 P, S, T & D Plant - Commodity 84 32 20 1 16 16 673 39009 Improvement to leased Premises 6.6 P, S, T & D Plant - Commodity 213 81 50 3 39 41 674 39100 Office Furniture & Equipment 6.6 P, S, T & D Plant - Commodity 212 80 50 3 39 40 675 39102 Remittance Processing Equip 6.6 P, S, T & D Plant - Commodity 0 - - - - - 676 39103 Office Machines 6.6 P, S, T & D Plant - Commodity 0 - - - - - 677 39200 Transportation Equipment 6.6 P, S, T & D Plant - Commodity 150 57 35 2 27 28 678 39201 Trucks 6.6 P, S, T & D Plant - Commodity 0 - - - - - 679 39202 Trailers 6.6 P, S, T & D Plant - Commodity 0 - - - - - 680 39300 Stores Equipment 6.6 P, S, T & D Plant - Commodity 0 - - - - - 681 39400 Tools, Shop & Garage Equipment 6.6 P, S, T & D Plant - Commodity 964 365 226 12 177 184 682 39600 Power Operated Equipment 6.6 P, S, T & D Plant - Commodity 112 43 26 1 21 21 683 39603 Ditchers 6.6 P, S, T & D Plant - Commodity 0 - - - - - 684 39604 Backhoes 6.6 P, S, T & D Plant - Commodity 0 - - - - - 685 39605 Welders 6.6 P, S, T & D Plant - Commodity 0 - - - - - 686 39700 Communication Equipment 6.6 P, S, T & D Plant - Commodity 206 78 48 3 38 39 687 39701 Communication Equipment - Mobile Radios 6.6 P, S, T & D Plant - Commodity 0 - - - - - 688 39702 Communication Equipment - Fixed Radios 6.6 P, S, T & D Plant - Commodity 0 - - - - - 689 39705 Communication Equip. - Telemetering 6.6 P, S, T & D Plant - Commodity 0 - - - - - 690 39800 Miscellaneous Equipment 6.6 P, S, T & D Plant - Commodity 4,464 1,690 1,046 57 821 850 691 39900 Other Tangible Property 6.6 P, S, T & D Plant - Commodity 0 - - - - - 692 39901 Other Tangible Property - Servers - H/W 6.6 P, S, T & D Plant - Commodity 0 - - - - - 693 39902 Other Tangible Property - Servers - S/W 6.6 P, S, T & D Plant - Commodity 0 - - - - - 694 39903 Other Tangible Property - Network - H/W 6.6 P, S, T & D Plant - Commodity 0 - - - - - 695 39904 Other Tang. Property - CPU 6.6 P, S, T & D Plant - Commodity 0 - - - - - 696 39905 Other Tangible Property - MF - Hardware 6.6 P, S, T & D Plant - Commodity 0 - - - - - 697 39906 Other Tang. Property - PC Hardware 6.6 P, S, T & D Plant - Commodity 385 146 90 5 71 73 698 39907 Other Tang. Property - PC Software 6.6 P, S, T & D Plant - Commodity 906 343 212 12 167 173 699 39908 Other Tang. Property - Mainframe S/W 6.6 P, S, T & D Plant - Commodity 4,542 1,720 1,064 58 835 865 700 39909 Other Tang. Property - Application Software 6.6 P, S, T & D Plant - Commodity 0 - - - - - 701 39924 Other Tang. Property - General Startup Costs 6.6 P, S, T & D Plant - Commodity 0 - - - - - 702703 Total General Plant 13,221 5,006 3,098 169 2,431 2,518704705 CWIP w/o AFUDC 6.6 P, S, T & D Plant - Commodity 25 10 6 0 5 5

Exhibit PHR-2Page 28 of 75
Atmos Energy Corporation, Kentucky/Mid-States DivisionClass Cost of Service - Customer/Demand StudyForecasted Test Period: Twelve Months Ended March 31, 2020
ALLOCATION OF PLANT IN SERVICE706707 Shared Services General Office:708709 General:710711 37400 Land & Land Rights 6.6 P, S, T & D Plant - Commodity 0 - - - - - 712 39001 Structures Frame 6.6 P, S, T & D Plant - Commodity 0 - - - - - 713 36602 Structures & Improvements 6.6 P, S, T & D Plant - Commodity 2,604 986 610 33 479 496 714 37503 Improvements 6.6 P, S, T & D Plant - Commodity 0 - - - - - 715 39004 Air Conditioning Equipment 6.6 P, S, T & D Plant - Commodity 0 - - - - - 716 39009 Improvement to leased Premises 6.6 P, S, T & D Plant - Commodity 5,324 2,016 1,247 68 979 1,014 717 39100 Office Furniture & Equipment 6.6 P, S, T & D Plant - Commodity 3,160 1,196 740 40 581 602 718 39102 Remittance Processing Equip 6.6 P, S, T & D Plant - Commodity 0 - - - - - 719 39103 Office Machines 6.6 P, S, T & D Plant - Commodity 0 - - - - - 720 39200 Transportation Equipment 6.6 P, S, T & D Plant - Commodity 4 2 1 0 1 1 721 39201 Trucks 6.6 P, S, T & D Plant - Commodity 0 - - - - - 722 39202 Trailers 6.6 P, S, T & D Plant - Commodity 0 - - - - - 723 39300 Stores Equipment 6.6 P, S, T & D Plant - Commodity 0 - - - - - 724 39400 Tools, Shop & Garage Equipment 6.6 P, S, T & D Plant - Commodity 43 16 10 1 8 8 725 39600 Power Operated Equipment 6.6 P, S, T & D Plant - Commodity 0 - - - - - 726 39603 Ditchers 6.6 P, S, T & D Plant - Commodity 0 - - - - - 727 39604 Backhoes 6.6 P, S, T & D Plant - Commodity 0 - - - - - 728 39605 Welders 6.6 P, S, T & D Plant - Commodity 0 - - - - - 729 39700 Communication Equipment 6.6 P, S, T & D Plant - Commodity 599 227 140 8 110 114 730 39701 Communication Equipment - Mobile Radios 6.6 P, S, T & D Plant - Commodity 0 - - - - - 731 39702 Communication Equipment - Fixed Radios 6.6 P, S, T & D Plant - Commodity 0 - - - - - 732 39705 Communication Equip. - Telemetering 6.6 P, S, T & D Plant - Commodity 0 - - - - - 733 39800 Miscellaneous Equipment 6.6 P, S, T & D Plant - Commodity 83 31 19 1 15 16 734 39900 Other Tangible Property 6.6 P, S, T & D Plant - Commodity 92 35 22 1 17 18 735 39901 Other Tangible Property - Servers - H/W 6.6 P, S, T & D Plant - Commodity 25,573 9,683 5,991 328 4,701 4,870 736 39902 Other Tangible Property - Servers - S/W 6.6 P, S, T & D Plant - Commodity 15,446 5,848 3,619 198 2,839 2,942 737 39903 Other Tangible Property - Network - H/W 6.6 P, S, T & D Plant - Commodity 4,871 1,844 1,141 62 896 928 738 39904 Other Tang. Property - CPU 6.6 P, S, T & D Plant - Commodity 0 - - - - - 739 39905 Other Tangible Property - MF - Hardware 6.6 P, S, T & D Plant - Commodity 0 - - - - - 740 39906 Other Tang. Property - PC Hardware 6.6 P, S, T & D Plant - Commodity 1,717 650 402 22 316 327 741 39907 Other Tang. Property - PC Software 6.6 P, S, T & D Plant - Commodity 950 360 222 12 175 181 742 39908 Other Tang. Property - Mainframe S/W 6.6 P, S, T & D Plant - Commodity 42,729 16,178 10,011 547 7,855 8,137 743 39909 Other Tang. Property - Application Software 6.6 P, S, T & D Plant - Commodity 14,571 5,517 3,414 187 2,679 2,775 744 39931 Other Tang. Property - ALGN 6.6 P, S, T & D Plant - Commodity 0 - - - - - 745746 Total General Plant 117,765 44,589 27,591 1,509 21,649 22,427747748 CWIP w/o AFUDC 6.6 P, S, T & D Plant - Commodity 8,242 3,121 1,931 106 1,515 1,570 749750 Shared Services Customer Support:751752 General:753754 37400 Land & Land Rights 6.6 P, S, T & D Plant - Commodity 2,268 859 531 29 417 432 755 39001 Structures Frame 6.6 P, S, T & D Plant - Commodity 0 - - - - - 756 36602 Structures & Improvements 6.6 P, S, T & D Plant - Commodity 11,014 4,170 2,580 141 2,025 2,097 757 37503 Improvements 6.6 P, S, T & D Plant - Commodity 0 - - - - - 758 39004 Air Conditioning Equipment 6.6 P, S, T & D Plant - Commodity 0 - - - - - 759 39009 Improvement to leased Premises 6.6 P, S, T & D Plant - Commodity 1,752 664 411 22 322 334 760 39100 Office Furniture & Equipment 6.6 P, S, T & D Plant - Commodity 1,704 645 399 22 313 324 761 39102 Remittance Processing Equip 6.6 P, S, T & D Plant - Commodity 0 - - - - - 762 39103 Office Machines 6.6 P, S, T & D Plant - Commodity 0 - - - - - 763 39200 Transportation Equipment 6.6 P, S, T & D Plant - Commodity 25 9 6 0 5 5 764 39201 Trucks 6.6 P, S, T & D Plant - Commodity 0 - - - - - 765 39202 Trailers 6.6 P, S, T & D Plant - Commodity 0 - - - - - 766 39300 Stores Equipment 6.6 P, S, T & D Plant - Commodity 0 - - - - - 767 39400 Tools, Shop & Garage Equipment 6.6 P, S, T & D Plant - Commodity 155 59 36 2 29 30 768 39600 Power Operated Equipment 6.6 P, S, T & D Plant - Commodity 6 2 1 0 1 1 769 39603 Ditchers 6.6 P, S, T & D Plant - Commodity 0 - - - - - 770 39604 Backhoes 6.6 P, S, T & D Plant - Commodity 0 - - - - - 771 39605 Welders 6.6 P, S, T & D Plant - Commodity 0 - - - - - 772 39700 Communication Equipment 6.6 P, S, T & D Plant - Commodity 1,263 478 296 16 232 241 773 39701 Communication Equipment - Mobile Radios 6.6 P, S, T & D Plant - Commodity 0 - - - - - 774 39702 Communication Equipment - Fixed Radios 6.6 P, S, T & D Plant - Commodity 0 - - - - - 775 39705 Communication Equip. - Telemetering 6.6 P, S, T & D Plant - Commodity 0 - - - - - 776 39800 Miscellaneous Equipment 6.6 P, S, T & D Plant - Commodity 174 66 41 2 32 33 777 39900 Other Tangible Property 6.6 P, S, T & D Plant - Commodity 478 181 112 6 88 91 778 39901 Other Tangible Property - Servers - H/W 6.6 P, S, T & D Plant - Commodity 6,426 2,433 1,506 82 1,181 1,224 779 39902 Other Tangible Property - Servers - S/W 6.6 P, S, T & D Plant - Commodity 1,257 476 295 16 231 239 780 39903 Other Tangible Property - Network - H/W 6.6 P, S, T & D Plant - Commodity 391 148 92 5 72 74 781 39904 Other Tang. Property - CPU 6.6 P, S, T & D Plant - Commodity 0 - - - - - 782 39905 Other Tangible Property - MF - Hardware 6.6 P, S, T & D Plant - Commodity 0 - - - - - 783 39906 Other Tang. Property - PC Hardware 6.6 P, S, T & D Plant - Commodity 765 290 179 10 141 146 784 39907 Other Tang. Property - PC Software 6.6 P, S, T & D Plant - Commodity 145 55 34 2 27 28 785 39908 Other Tang. Property - Mainframe S/W 6.6 P, S, T & D Plant - Commodity 57,808 21,888 13,544 741 10,627 11,009 786 39909 Other Tang. Property - Application Software 6.6 P, S, T & D Plant - Commodity 5 2 1 0 1 1 787 39924 Other Tang. Property - General Startup Costs 6.6 P, S, T & D Plant - Commodity 0 - - - - - 788789 Total General Plant 85,635 32,424 20,063 1,097 15,742 16,308790791 CWIP w/o AFUDC 6.6 P, S, T & D Plant - Commodity 2,475 937 580 32 455 471 792793 TOTAL PLANT IN SERVICE - COMMODITY 7,981,242 3,021,931 1,869,903 102,256 1,467,194 1,519,959794795 TOTAL CWIP W/O AFUDC - COMMODITY 430,966 163,176 100,970 5,522 79,225 82,074

Exhibit PHR-2Page 29 of 75
Atmos Energy Corporation, Kentucky/Mid-States DivisionClass Cost of Service - Customer/Demand StudyForecasted Test Period: Twelve Months Ended March 31, 2020
ALLOCATION OF PLANT IN SERVICE
Total Plant in Service
Allocation Allocation Total Residential Non-Res Sales Non-Res Sales Transport TransportLine Acct. Factor Basis Company Sales Firm Interruptible Firm InterruptibleNo. No.
796 Intangible Plant:797798 30100 Organization 8,330 5,457 1,791 50 545 487 799 30200 Franchises & Consents 119,853 78,517 25,766 726 7,837 7,007 800 30300 Misc Intangible Plant 0 - - - - - 801802 Total Intangible Plant: 128,182 83,974 27,556 776 8,382 7,494803804 Production Plant:805806 32520 Producing Leaseholds 0 - - - - - 807 32540 Rights of Ways 0 - - - - - 808 33100 Production Gas Wells Equipment 0 - - - - - 809 33201 Field Lines 0 - - - - - 810 33202 Tributary Lines 0 - - - - - 811 33400 Field Meas. & Reg. Sta. Equip 0 - - - - - 812 33600 Purification Equipment 0 - - - - - 813814 Total Production Plant 0 0 0 0 0 0815816 Storage Plant:817818 35010 Land 261,127 108,467 64,345 3,448 42,913 41,953 819 35020 Rights of Way 4,682 1,945 1,154 62 769 752 820 35100 Structures and Improvements 17,916 7,442 4,415 237 2,944 2,878 821 35102 Compression Station Equipment 153,261 63,662 37,766 2,024 25,186 24,623 822 35103 Meas. & Reg. Sta. Structues 23,138 9,611 5,702 306 3,802 3,717 823 35104 Other Structures 137,443 57,091 33,868 1,815 22,587 22,082 824 35200 Wells \ Rights of Way 8,348,396 3,467,772 2,057,156 110,243 1,371,948 1,341,277 825 35201 Well Construction 1,699,999 706,148 418,902 22,449 279,372 273,127 826 35202 Well Equipment 449,309 186,635 110,716 5,933 73,838 72,187 827 35203 Cushion Gas 1,694,833 704,003 417,629 22,381 278,523 272,297 828 35210 Leaseholds 178,530 74,158 43,992 2,358 29,339 28,683 829 35211 Storage Rights 54,614 22,686 13,458 721 8,975 8,774 830 35301 Field Lines 175,350 72,837 43,209 2,316 28,817 28,172 831 35302 Tributary Lines 209,319 86,947 51,579 2,764 34,399 33,630 832 35400 Compressor Station Equipment 923,446 383,583 227,549 12,194 151,756 148,364 833 35500 Meas & Reg. Equipment 273,084 113,434 67,292 3,606 44,878 43,875 834 35600 Purification Equipment 414,663 172,244 102,179 5,476 68,144 66,621 835836 Total Storage Plant 15,019,110 6,238,665 3,700,909 198,331 2,468,192 2,413,014837838 Transmission:839840 36510 Land & Land Rights 26,970 12,194 6,973 367 3,906 3,530 841 36520 Rights of Way 867,772 392,350 224,353 11,800 125,691 113,578 842 36602 Structures & Improvements 49,002 22,155 12,669 666 7,098 6,414 843 36603 Other Structues 60,826 27,502 15,726 827 8,810 7,961 844 36700 Mains Cathodic Protection 139,638 63,135 36,102 1,899 20,226 18,276 845 36701 Mains - Steel 27,047,831 12,229,257 6,992,930 367,811 3,917,694 3,540,140 846 36900 Meas. & Reg. Equipment 731,467 330,721 189,113 9,947 105,948 95,738 847 36901 Meas. & Reg. Equipment 2,269,556 1,026,144 586,770 30,863 328,730 297,050 848849 Total Transmission Plant 31,193,061 14,103,458 8,064,635 424,180 4,518,102 4,082,686850851 Distribution:852853 37400 Land & Land Rights 531,167 318,042 110,643 4,817 51,326 46,339 854 37401 Land 37,326 22,350 7,775 339 3,607 3,256 855 37402 Land Rights 3,645,749 2,182,930 759,417 33,063 352,286 318,053 856 37403 Land Other 2,784 1,667 580 25 269 243 857 37500 Structures & Improvements 336,168 201,284 70,024 3,049 32,484 29,327 858 37501 Structures & Improvements T.B. 99,818 59,767 20,792 905 9,645 8,708 859 37502 Land Rights 46,264 27,701 9,637 420 4,470 4,036 860 37503 Improvements 4,005 2,398 834 36 387 349 861 37600 Mains Cathodic Protection 20,611,541 12,341,374 4,293,427 186,922 1,991,681 1,798,137 862 37601 Mains - Steel 176,025,498 105,397,094 36,666,482 1,596,341 17,009,236 15,356,345 863 37602 Mains - Plastic 133,261,910 79,791,952 27,758,737 1,208,526 12,877,017 11,625,679 864 37800 Meas & Reg. Sta. Equip - General 29,911,913 17,910,068 6,230,714 271,265 2,890,370 2,609,495 865 37900 Meas & Reg. Sta. Equip - City Gate 5,126,032 3,069,265 1,067,763 46,487 495,325 447,192 866 37905 Meas & Reg. Sta. Equipment T.b. 1,652,259 989,307 344,169 14,984 159,657 144,142 867 38000 Services 150,274,437 133,824,243 16,279,918 8,273 103,453 58,550 868 38100 Meters 38,722,015 24,980,781 12,812,487 45,125 564,268 319,353 869 38200 Meter Installaitons 57,067,155 36,815,804 18,882,597 66,503 831,599 470,652 870 38300 House Regulators 12,779,948 8,244,744 4,228,678 14,893 186,233 105,401 871 38400 House Reg. Installations 252,587 162,952 83,577 294 3,681 2,083 872 38500 Ind. Meas. & Reg. Sta. Equipment 5,241,043 - 5,186,793 2,636 32,960 18,654 873 38600 Other Prop. On Cust. Prem 0 - - - - - 874875 Total Distribution Plant 635,629,619 426,343,722 134,815,044 3,504,904 37,599,955 33,365,994

Exhibit PHR-2Page 30 of 75
Atmos Energy Corporation, Kentucky/Mid-States DivisionClass Cost of Service - Customer/Demand StudyForecasted Test Period: Twelve Months Ended March 31, 2020
ALLOCATION OF PLANT IN SERVICE876877 General:878879 38900 Land & Land Rights 1,211,697 793,803 260,488 7,335 79,234 70,838 880 39000 Structures & Improvements 7,595,600 4,976,003 1,632,882 45,979 496,683 444,052 881 39001 Structures Frame 0 - - - - - 882 39002 Structures-Brick 173,115 113,410 37,216 1,048 11,320 10,121 883 39003 Improvements 709,199 464,608 152,462 4,293 46,375 41,461 884 39004 Air Conditioning Equipment 12,955 8,487 2,785 78 847 757 885 39009 Improvement to leased Premises 1,246,194 816,402 267,904 7,544 81,490 72,855 886 39100 Office Furniture & Equipment 1,866,038 1,222,472 401,156 11,296 122,022 109,092 887 39102 Remittance Processing Equip 0 - - - - - 888 39103 Office Machines 0 - - - - - 889 39200 Transportation Equipment 220,987 144,772 47,507 1,338 14,451 12,919 890 39201 Trucks 0 - - - - - 891 39202 Trailers 0 - - - - - 892 39300 Stores Equipment 0 - - - - - 893 39400 Tools, Shop & Garage Equipment 4,078,361 2,671,802 876,755 24,688 266,688 238,428 894 39600 Power Operated Equipment 0 - - - - - 895 39603 Ditchers 39,610 25,949 8,515 240 2,590 2,316 896 39604 Backhoes 62,747 41,107 13,489 380 4,103 3,668 897 39605 Welders 19,427 12,727 4,176 118 1,270 1,136 898 39700 Communication Equipment 524,257 343,450 112,703 3,174 34,282 30,649 899 39701 Communication Equipment - Mobile Radios 0 - - - - - 900 39702 Communication Equipment - Fixed Radios 0 - - - - - 901 39705 Communication Equip. - Telemetering 0 - - - - - 902 39800 Miscellaneous Equipment 3,891,771 2,549,564 836,643 23,558 254,486 227,520 903 39900 Other Tangible Property 0 - - - - - 904 39901 Other Tangible Property - Servers - H/W 14,390 9,427 3,093 87 941 841 905 39902 Other Tangible Property - Servers - S/W 0 - - - - - 906 39903 Other Tangible Property - Network - H/W 134,599 88,178 28,936 815 8,802 7,869 907 39904 Other Tang. Property - CPU 0 - - - - - 908 39905 Other Tangible Property - MF - Hardware 0 - - - - - 909 39906 Other Tang. Property - PC Hardware 461,888 302,590 99,295 2,796 30,203 27,003 910 39907 Other Tang. Property - PC Software 0 - - - - - 911 39908 Other Tang. Property - Mainframe S/W 123,515 80,917 26,553 748 8,077 7,221 912 39909 Other Tang. Property - Application Software 0 - - - - - 913 39924 Other Tang. Property - General Startup Costs 0 - - - - - 914915 Total General Plant 22,386,350 14,665,669 4,812,560 135,512 1,463,864 1,308,746 916917 TOTAL DIRECT PLANT 704,356,323 461,435,488 151,420,704 4,263,703 46,058,494 41,177,934918919 CWIP w/o AFUDC 38,154,809 24,995,847 8,202,422 230,964 2,494,977 2,230,599 920921 Kentucky Mid-States General Office:922923 Intangible Plant:924925 30100 Organization 92,247 60,433 19,831 558 6,032 5,393 926 30200 Franchises & Consents 0 - - - - - 927 30300 Misc Intangible Plant 552,335 361,844 118,740 3,343 36,118 32,290 928929 Total Intangible Plant: 644,582 422,276 138,571 3,902 42,150 37,683930931 General:932933 37400 Land & Land Rights 0 - - - - - 934 39001 Structures Frame 89,275 58,485 19,192 540 5,838 5,219 935 36602 Structures & Improvements 0 - - - - - 936 38900 Land & Land Rights 0 - - - - - 937 39004 Air Conditioning Equipment 7,658 5,017 1,646 46 501 448 938 39009 Improvement to leased Premises 19,332 12,664 4,156 117 1,264 1,130 939 39100 Office Furniture & Equipment 19,220 12,591 4,132 116 1,257 1,124 940 39102 Remittance Processing Equip 0 - - - - - 941 39103 Office Machines 0 - - - - - 942 39200 Transportation Equipment 13,582 8,898 2,920 82 888 794 943 39201 Trucks 0 - - - - - 944 39202 Trailers 0 - - - - - 945 39300 Stores Equipment 0 - - - - - 946 39400 Tools, Shop & Garage Equipment 87,547 57,353 18,821 530 5,725 5,118 947 39600 Power Operated Equipment 10,213 6,691 2,196 62 668 597 948 39603 Ditchers 0 - - - - - 949 39604 Backhoes 0 - - - - - 950 39605 Welders 0 - - - - - 951 39700 Communication Equipment 18,688 12,243 4,017 113 1,222 1,093 952 39701 Communication Equipment - Mobile Radios 0 - - - - - 953 39702 Communication Equipment - Fixed Radios 0 - - - - - 954 39705 Communication Equip. - Telemetering 0 - - - - - 955 39800 Miscellaneous Equipment 405,292 265,514 87,129 2,453 26,502 23,694 956 39900 Other Tangible Property 0 - - - - - 957 39901 Other Tangible Property - Servers - H/W 0 - - - - - 958 39902 Other Tangible Property - Servers - S/W 0 - - - - - 959 39903 Other Tangible Property - Network - H/W 0 - - - - - 960 39904 Other Tang. Property - CPU 0 - - - - - 961 39905 Other Tangible Property - MF - Hardware 0 - - - - - 962 39906 Other Tang. Property - PC Hardware 34,934 22,886 7,510 211 2,284 2,042 963 39907 Other Tang. Property - PC Software 82,288 53,908 17,690 498 5,381 4,811 964 39908 Other Tang. Property - Mainframe S/W 412,432 270,191 88,664 2,497 26,969 24,112 965 39909 Other Tang. Property - Application Software 0 - - - - - 966 39924 Other Tang. Property - General Startup Costs 0 - - - - - 967968 Total General Plant 1,200,461 786,442 258,072 7,267 78,499 70,181969970 CWIP w/o AFUDC 2,311 1,514 497 14 151 135

Exhibit PHR-2Page 31 of 75
Atmos Energy Corporation, Kentucky/Mid-States DivisionClass Cost of Service - Customer/Demand StudyForecasted Test Period: Twelve Months Ended March 31, 2020
ALLOCATION OF PLANT IN SERVICE971972 Shared Services General Office:973974 General:975976 37400 Land & Land Rights 0 - - - - - 977 39001 Structures Frame 0 - - - - - 978 36602 Structures & Improvements 236,424 154,885 50,826 1,431 15,460 13,822 979 37503 Improvements 0 - - - - - 980 39004 Air Conditioning Equipment 0 - - - - - 981 39009 Improvement to leased Premises 483,357 316,655 103,911 2,926 31,607 28,258 982 39100 Office Furniture & Equipment 286,918 187,965 61,681 1,737 18,762 16,774 983 39102 Remittance Processing Equip 0 - - - - - 984 39103 Office Machines 0 - - - - - 985 39200 Transportation Equipment 369 242 79 2 24 22 986 39201 Trucks 0 - - - - - 987 39202 Trailers 0 - - - - - 988 39300 Stores Equipment 0 - - - - - 989 39400 Tools, Shop & Garage Equipment 3,938 2,580 847 24 258 230 990 39600 Power Operated Equipment 0 - - - - - 991 39603 Ditchers 0 - - - - - 992 39604 Backhoes 0 - - - - - 993 39605 Welders 0 - - - - - 994 39700 Communication Equipment 54,370 35,618 11,688 329 3,555 3,179 995 39701 Communication Equipment - Mobile Radios 0 - - - - - 996 39702 Communication Equipment - Fixed Radios 0 - - - - - 997 39705 Communication Equip. - Telemetering 0 - - - - - 998 39800 Miscellaneous Equipment 7,537 4,938 1,620 46 493 441 999 39900 Other Tangible Property 8,377 5,488 1,801 51 548 490
1000 39901 Other Tangible Property - Servers - H/W 2,321,928 1,521,134 499,162 14,055 151,833 135,744 1001 39902 Other Tangible Property - Servers - S/W 1,402,428 918,754 301,490 8,489 91,706 81,988 1002 39903 Other Tangible Property - Network - H/W 442,303 289,760 95,085 2,677 28,923 25,858 1003 39904 Other Tang. Property - CPU 0 - - - - - 1004 39905 Other Tangible Property - MF - Hardware 0 - - - - - 1005 39906 Other Tang. Property - PC Hardware 155,862 102,108 33,507 943 10,192 9,112 1006 39907 Other Tang. Property - PC Software 86,214 56,480 18,534 522 5,638 5,040 1007 39908 Other Tang. Property - Mainframe S/W 3,879,643 2,541,618 834,036 23,485 253,693 226,811 1008 39909 Other Tang. Property - Application Software 1,322,956 866,691 284,406 8,008 86,509 77,342 1009 39931 Other Tang. Property - ALGN 0 - - - - - 10101011 Total General Plant 10,692,624 7,004,915 2,298,673 64,726 699,200 625,11010121013 CWIP w/o AFUDC 748,344 490,253 160,877 4,530 48,935 43,750 10141015 Shared Services Customer Support:10161017 General:10181019 37400 Land & Land Rights 205,882 134,876 44,260 1,246 13,463 12,036 1020 39001 Structures Frame 0 - - - - - 1021 36602 Structures & Improvements 1,000,011 655,124 214,980 6,053 65,392 58,462 1022 37503 Improvements 0 - - - - - 1023 39004 Air Conditioning Equipment 0 - - - - - 1024 39009 Improvement to leased Premises 159,117 104,240 34,207 963 10,405 9,302 1025 39100 Office Furniture & Equipment 154,692 101,341 33,255 936 10,115 9,044 1026 39102 Remittance Processing Equip 0 - - - - - 1027 39103 Office Machines 0 - - - - - 1028 39200 Transportation Equipment 2,233 1,463 480 14 146 131 1029 39201 Trucks 0 - - - - - 1030 39202 Trailers 0 - - - - - 1031 39300 Stores Equipment 0 - - - - - 1032 39400 Tools, Shop & Garage Equipment 14,093 9,232 3,030 85 922 824 1033 39600 Power Operated Equipment 548 359 118 3 36 32 1034 39603 Ditchers 0 - - - - - 1035 39604 Backhoes 0 - - - - - 1036 39605 Welders 0 - - - - - 1037 39700 Communication Equipment 114,682 75,130 24,654 694 7,499 6,705 1038 39701 Communication Equipment - Mobile Radios 0 - - - - - 1039 39702 Communication Equipment - Fixed Radios 0 - - - - - 1040 39705 Communication Equip. - Telemetering 0 - - - - - 1041 39800 Miscellaneous Equipment 15,758 10,323 3,388 95 1,030 921 1042 39900 Other Tangible Property 43,368 28,411 9,323 263 2,836 2,535 1043 39901 Other Tangible Property - Servers - H/W 583,485 382,251 125,436 3,532 38,155 34,112 1044 39902 Other Tangible Property - Servers - S/W 114,175 74,798 24,545 691 7,466 6,675 1045 39903 Other Tangible Property - Network - H/W 35,496 23,254 7,631 215 2,321 2,075 1046 39904 Other Tang. Property - CPU 0 - - - - - 1047 39905 Other Tangible Property - MF - Hardware 0 - - - - - 1048 39906 Other Tang. Property - PC Hardware 69,473 45,513 14,935 421 4,543 4,061 1049 39907 Other Tang. Property - PC Software 13,141 8,609 2,825 80 859 768 1050 39908 Other Tang. Property - Mainframe S/W 5,248,748 3,438,542 1,128,362 31,772 343,220 306,851 1051 39909 Other Tang. Property - Application Software 477 312 102 3 31 28 1052 39924 Other Tang. Property - General Startup Costs 0 - - - - - 10531054 Total General Plant 7,775,377 5,093,778 1,671,531 47,067 508,439 454,56310551056 CWIP w/o AFUDC 224,734 147,227 48,313 1,360 14,696 13,138 10571058 TOTAL PLANT IN SERVICE 724,669,367 474,742,900 155,787,550 4,386,665 47,386,782 42,365,47110591060 TOTAL CWIP W/O AFUDC 39,130,198 25,634,841 8,412,109 236,868 2,558,759 2,287,622

Exhibit PHR-2Page 32 of 75
Atmos Energy Corporation, Kentucky/Mid-States DivisionClass Cost of Service - Customer/Demand StudyForecasted Test Period: Twelve Months Ended March 31, 2020
ALLOCATION OF RESERVE FOR DEPRECIATION
Customer
Line Acct. Allocation Allocation Total Residential Non-Res Sales Non-Res Sales Transport TransportNo. No. Factor Basis Company Sales Firm Interruptible Firm Interruptible
1 Intangible Plant:23 30100 Organization 6.2 P, S, T & D Plant - Customer 4,746 3,844 866 2 22 12 4 30200 Franchises & Consents 6.2 P, S, T & D Plant - Customer 68,293 55,303 12,467 25 318 180 5 30300 Misc Intangible Plant 99.0 - 0 - - - - - 67 Total Intangible Plant: 73,039 59,146 13,334 27 340 19289 Production Plant:
1011 32520 Producing Leaseholds 99.0 - 0 - - - - - 12 32540 Rights of Ways 99.0 - 0 - - - - - 13 33100 Production Gas Wells Equipment 99.0 - 0 - - - - - 14 33201 Field Lines 99.0 - 0 - - - - - 15 33202 Tributary Lines 99.0 - 0 - - - - - 16 33400 Field Meas. & Reg. Sta. Equip 99.0 - 0 - - - - - 17 33600 Purification Equipment 99.0 - 0 - - - - - 1819 Total Production Plant 0 0 0 0 0 02021 Storage Plant:2223 35010 Land 99.0 - 0 - - - - - 24 35020 Rights of Way 99.0 - 0 - - - - - 25 35100 Structures and Improvements 99.0 - 0 - - - - - 26 35102 Compression Station Equipment 99.0 - 0 - - - - - 27 35103 Meas. & Reg. Sta. Structues 99.0 - 0 - - - - - 28 35104 Other Structures 99.0 - 0 - - - - - 29 35200 Wells \ Rights of Way 99.0 - 0 - - - - - 30 35201 Well Construction 99.0 - 0 - - - - - 31 35202 Well Equipment 99.0 - 0 - - - - - 32 35203 Cushion Gas 99.0 - 0 - - - - - 33 35210 Leaseholds 99.0 - 0 - - - - - 34 35211 Storage Rights 99.0 - 0 - - - - - 35 35301 Field Lines 99.0 - 0 - - - - - 36 35302 Tributary Lines 99.0 - 0 - - - - - 37 35400 Compressor Station Equipment 99.0 - 0 - - - - - 38 35500 Meas & Reg. Equipment 99.0 - 0 - - - - - 39 35600 Purification Equipment 99.0 - 0 - - - - - 4041 Total Storage Plant 0 - - - - - 4243 Transmission:4445 36510 Land & Land Rights 99.0 - 0 - - - - - 46 36520 Rights of Way 99.0 - 0 - - - - - 47 36602 Structures & Improvements 99.0 - 0 - - - - - 48 36603 Other Structues 99.0 - 0 - - - - - 49 36700 Mains Cathodic Protection 99.0 - 0 - - - - - 50 36701 Mains - Steel 99.0 - 0 - - - - - 51 36900 Meas. & Reg. Equipment 99.0 - 0 - - - - - 52 36901 Meas. & Reg. Equipment 99.0 - 0 - - - - - 5354 Total Transmission Plant 0 - - - - - 5556 Distribution:5758 37400 Land & Land Rights 2.0 Bills 0 - - - - - 59 37401 Land 2.0 Bills 0 - - - - - 60 37402 Land Rights 2.0 Bills 78,719 70,102 8,528 4 54 31 61 37403 Land Other 2.0 Bills 0 - - - - - 62 37500 Structures & Improvements 2.0 Bills 38,026 33,864 4,120 2 26 15 63 37501 Structures & Improvements T.B. 2.0 Bills 23,897 21,281 2,589 1 16 9 64 37502 Land Rights 2.0 Bills 11,840 10,544 1,283 1 8 5 65 37503 Improvements 2.0 Bills 642 572 70 0 0 0 66 37600 Mains Cathodic Protection 2.0 Bills 4,418,417 3,934,744 478,667 243 3,042 1,722 67 37601 Mains - Steel 2.0 Bills 11,261,591 10,028,811 1,220,020 620 7,753 4,388 68 37602 Mains - Plastic 2.0 Bills 6,364,302 5,667,616 689,474 350 4,381 2,480 69 37800 Meas & Reg. Sta. Equip - General 2.0 Bills 968,190 862,205 104,888 53 667 377 70 37900 Meas & Reg. Sta. Equip - City Gate 2.0 Bills 329,244 293,202 35,669 18 227 128 71 37905 Meas & Reg. Sta. Equipment T.b. 2.0 Bills 347,205 309,197 37,614 19 239 135 72 38000 Services 2.0 Bills 30,562,139 27,216,572 3,310,936 1,683 21,040 11,908 73 38100 Meters 4.0 Meter Investment 21,386,354 13,797,005 7,076,398 24,923 311,648 176,380 74 38200 Meter Installaitons 4.0 Meter Investment 26,987,899 17,410,737 8,929,858 31,450 393,275 222,578 75 38300 House Regulators 4.0 Meter Investment 4,321,265 2,787,783 1,429,836 5,036 62,971 35,639 76 38400 House Reg. Installations 4.0 Meter Investment 94,403 60,903 31,237 110 1,376 779 77 38500 Ind. Meas. & Reg. Sta. Equipment 2.2 Non-Residential Bills 2,958,741 - 2,928,115 1,488 18,607 10,531 78 38600 Other Prop. On Cust. Prem 99.0 - 0 - - - - - 7980 Total Distribution Plant 110,152,874 82,505,136 26,289,301 66,002 825,330 467,104

Exhibit PHR-2Page 33 of 75
Atmos Energy Corporation, Kentucky/Mid-States DivisionClass Cost of Service - Customer/Demand StudyForecasted Test Period: Twelve Months Ended March 31, 2020
ALLOCATION OF RESERVE FOR DEPRECIATION8182 General:8384 38900 Land & Land Rights 6.2 P, S, T & D Plant - Customer 0 - - - - - 85 39000 Structures & Improvements 6.2 P, S, T & D Plant - Customer 714,244 578,384 130,391 266 3,323 1,881 86 39002 Structures - Brick 6.2 P, S, T & D Plant - Customer 61,302 49,641 11,191 23 285 161 87 39003 Improvements 6.2 P, S, T & D Plant - Customer 166,800 135,072 30,451 62 776 439 88 39003 Air Conditioning Equipment 6.2 P, S, T & D Plant - Customer 2,877 2,330 525 1 13 8 89 39004 Improvement to Leased Premises 6.2 P, S, T & D Plant - Customer 711,183 575,905 129,832 265 3,309 1,873 90 39009 Office Furniture & Equipment 6.2 P, S, T & D Plant - Customer 652,208 528,148 119,066 243 3,035 1,717 91 39100 Remittance Processing Equip 6.2 P, S, T & D Plant - Customer 0 - - - - - 92 39102 Office Machines 6.2 P, S, T & D Plant - Customer 0 - - - - - 93 39103 Transportation Equipment 6.2 P, S, T & D Plant - Customer 64,837 52,504 11,837 24 302 171 94 39200 Trucks 6.2 P, S, T & D Plant - Customer 0 - - - - - 95 39201 Trailers 6.2 P, S, T & D Plant - Customer (1,441) (1,167) (263) (1) (7) (4) 96 39202 Stores Equipment 6.2 P, S, T & D Plant - Customer 0 - - - - - 97 39400 Tools, Shop & Garage Equipment 6.2 P, S, T & D Plant - Customer 741,236 600,241 135,319 276 3,449 1,952 98 39600 Power Operated Equipment 6.2 P, S, T & D Plant - Customer 0 - - - - - 99 39603 Ditchers 6.2 P, S, T & D Plant - Customer 22,596 18,298 4,125 8 105 60
100 39604 Backhoes 6.2 P, S, T & D Plant - Customer 35,794 28,986 6,535 13 167 94 101 39605 Welders 6.2 P, S, T & D Plant - Customer 11,086 8,978 2,024 4 52 29 102 39700 Communication Equipment 6.2 P, S, T & D Plant - Customer 153,284 124,127 27,983 57 713 404 103 39701 Communication Equipment - Mobile Radios 6.2 P, S, T & D Plant - Customer 0 - - - - - 104 39702 Communication Equipment - Fixed Radios 6.2 P, S, T & D Plant - Customer 0 - - - - - 105 39705 Communication Equip. - Telemetering 6.2 P, S, T & D Plant - Customer 0 - - - - - 106 39800 Miscellaneous Equipment 6.2 P, S, T & D Plant - Customer 1,181,146 956,473 215,628 439 5,496 3,110 107 39900 Other Tangible Property 6.2 P, S, T & D Plant - Customer 0 - - - - - 108 39901 Other Tangible Property - Servers - H/W 6.2 P, S, T & D Plant - Customer 3,801 3,078 694 1 18 10 109 39902 Other Tangible Property - Servers - S/W 6.2 P, S, T & D Plant - Customer 0 - - - - - 110 39903 Other Tangible Property - Network - H/W 6.2 P, S, T & D Plant - Customer 36,835 29,828 6,725 14 171 97 111 39904 Other Tang. Property - CPU 6.2 P, S, T & D Plant - Customer 0 - - - - - 112 39905 Other Tangible Property - MF - Hardware 6.2 P, S, T & D Plant - Customer 0 - - - - - 113 39906 Other Tang. Property - PC Hardware 6.2 P, S, T & D Plant - Customer 63,947 51,783 11,674 24 298 168 114 39907 Other Tang. Property - PC Software 6.2 P, S, T & D Plant - Customer 0 - - - - - 115 39908 Other Tang. Property - Mainframe S/W 6.2 P, S, T & D Plant - Customer 0 - - - - - 116 39909 Other Tang. Property - Application Software 6.2 P, S, T & D Plant - Customer 67,190 54,409 12,266 25 313 177 117 Other Tang. Property - General Startup Costs 6.2 P, S, T & D Plant - Customer 0 - - - - - 118 Retirement Work in Progress 6.2 P, S, T & D Plant - Customer (3,632,362) (2,941,429) (663,117) (1,352) (16,900) (9,565) 119 AR 15 general plant amortization 6.2 P, S, T & D Plant - Customer 0 - - - - - 120121 Total General Plant 1,056,563 855,588 192,884 393 4,916 2,782 122123 TOTAL DIRECT RESERVE FOR DEPRECIATION 111,282,476 83,419,870 26,495,519 66,422 830,586 470,079124125 Kentucky Mid-States General Office:126127 Intangible Plant:128129 30100 Organization 99.0 - 0 - - - - - 130 30200 Franchises & Consents 99.0 - 0 - - - - - 131 30300 Misc Intangible Plant 99.0 - 0 - - - - - 132133 Total Intangible Plant:134135 General:136137 37400 Land & Land Rights 6.2 P, S, T & D Plant - Customer 0 - - - - - 138 39001 Structures Frame 6.2 P, S, T & D Plant - Customer 30,033 24,320 5,483 11 140 79 139 36602 Structures & Improvements 6.2 P, S, T & D Plant - Customer 0 - - - - - 140 38900 Land & Land Rights 6.2 P, S, T & D Plant - Customer 0 - - - - - 141 39004 Air Conditioning Equipment 6.2 P, S, T & D Plant - Customer 2,900 2,348 529 1 13 8 142 39009 Improvement to leased Premises 6.2 P, S, T & D Plant - Customer 11,015 8,920 2,011 4 51 29 143 39100 Office Furniture & Equipment 6.2 P, S, T & D Plant - Customer 10,952 8,868 1,999 4 51 29 144 39102 Remittance Processing Equip 6.2 P, S, T & D Plant - Customer 0 - - - - - 145 39103 Office Machines 6.2 P, S, T & D Plant - Customer 0 - - - - - 146 39200 Transportation Equipment 6.2 P, S, T & D Plant - Customer 5,069 4,104 925 2 24 13 147 39201 Trucks 6.2 P, S, T & D Plant - Customer 0 - - - - - 148 39202 Trailers 6.2 P, S, T & D Plant - Customer 0 - - - - - 149 39300 Stores Equipment 6.2 P, S, T & D Plant - Customer 0 - - - - - 150 39400 Tools, Shop & Garage Equipment 6.2 P, S, T & D Plant - Customer 40,804 33,043 7,449 15 190 107 151 39600 Power Operated Equipment 6.2 P, S, T & D Plant - Customer 2,493 2,019 455 1 12 7 152 39603 Ditchers 6.2 P, S, T & D Plant - Customer 0 - - - - - 153 39604 Backhoes 6.2 P, S, T & D Plant - Customer 0 - - - - - 154 39605 Welders 6.2 P, S, T & D Plant - Customer 0 - - - - - 155 39700 Communication Equipment 6.2 P, S, T & D Plant - Customer (1,705) (1,380) (311) (1) (8) (4) 156 39701 Communication Equipment - Mobile Radios 6.2 P, S, T & D Plant - Customer 0 - - - - - 157 39702 Communication Equipment - Fixed Radios 6.2 P, S, T & D Plant - Customer 0 - - - - - 158 39705 Communication Equip. - Telemetering 6.2 P, S, T & D Plant - Customer 0 - - - - - 159 39800 Miscellaneous Equipment 6.2 P, S, T & D Plant - Customer 204,755 165,808 37,380 76 953 539 160 39900 Other Tangible Property 6.2 P, S, T & D Plant - Customer 0 - - - - - 161 39901 Other Tangible Property - Servers - H/W 6.2 P, S, T & D Plant - Customer (9,861) (7,986) (1,800) (4) (46) (26) 162 39902 Other Tangible Property - Servers - S/W 6.2 P, S, T & D Plant - Customer 0 - - - - - 163 39903 Other Tangible Property - Network - H/W 6.2 P, S, T & D Plant - Customer 0 - - - - - 164 39904 Other Tang. Property - CPU 6.2 P, S, T & D Plant - Customer 0 - - - - - 165 39905 Other Tangible Property - MF - Hardware 6.2 P, S, T & D Plant - Customer 0 - - - - - 166 39906 Other Tang. Property - PC Hardware 6.2 P, S, T & D Plant - Customer 19,911 16,124 3,635 7 93 52 167 39907 Other Tang. Property - PC Software 6.2 P, S, T & D Plant - Customer 12,015 9,730 2,193 4 56 32 168 39908 Other Tang. Property - Mainframe S/W 6.2 P, S, T & D Plant - Customer 235,007 190,305 42,902 87 1,093 619 169 39909 Other Tang. Property - Application Software 6.2 P, S, T & D Plant - Customer 0 - - - - - 170 39924 Other Tang. Property - General Startup Costs 6.2 P, S, T & D Plant - Customer 0 - - - - - 171 Retirement Work in Progress 6.2 P, S, T & D Plant - Customer 14,897 12,063 2,719 6 69 39 172173 Total General Plant 578,286 468,286 105,571 215 2,691 1,523

Exhibit PHR-2Page 34 of 75
Atmos Energy Corporation, Kentucky/Mid-States DivisionClass Cost of Service - Customer/Demand StudyForecasted Test Period: Twelve Months Ended March 31, 2020
ALLOCATION OF RESERVE FOR DEPRECIATION174175 Shared Services General Office:176177 General:178179 37400 Land & Land Rights 6.2 P, S, T & D Plant - Customer 0 - - - - - 180 39000 Structures & Improvements 6.2 P, S, T & D Plant - Customer 51,770 41,922 9,451 19 241 136 181 36602 Structures & Improvements 6.2 P, S, T & D Plant - Customer 0 - - - - - 182 37503 Improvements 6.2 P, S, T & D Plant - Customer 0 - - - - - 183 39004 Air Conditioning Equipment 6.2 P, S, T & D Plant - Customer 0 - - - - - 184 39009 Improvement to leased Premises 6.2 P, S, T & D Plant - Customer 274,857 222,575 50,177 102 1,279 724 185 39100 Office Furniture & Equipment 6.2 P, S, T & D Plant - Customer 66,216 53,621 12,088 25 308 174 186 39102 Remittance Processing Equip 6.2 P, S, T & D Plant - Customer 0 0 0 0 0 0 187 39103 Office Machines 6.2 P, S, T & D Plant - Customer 0 0 0 0 0 0 188 39200 Transportation Equipment 6.2 P, S, T & D Plant - Customer 162 131 30 0 1 0 189 39201 Trucks 6.2 P, S, T & D Plant - Customer 0 - - - - - 190 39202 Trailers 6.2 P, S, T & D Plant - Customer 0 - - - - - 191 39300 Stores Equipment 6.2 P, S, T & D Plant - Customer 0 - - - - - 192 39400 Tools, Shop & Garage Equipment 6.2 P, S, T & D Plant - Customer 981 795 179 0 5 3 193 39600 Power Operated Equipment 6.2 P, S, T & D Plant - Customer 0 - - - - - 194 39603 Ditchers 6.2 P, S, T & D Plant - Customer 0 - - - - - 195 39604 Backhoes 6.2 P, S, T & D Plant - Customer 0 - - - - - 196 39605 Welders 6.2 P, S, T & D Plant - Customer 0 - - - - - 197 39700 Communication Equipment 6.2 P, S, T & D Plant - Customer 16,134 13,065 2,945 6 75 42 198 39701 Communication Equipment - Mobile Radios 6.2 P, S, T & D Plant - Customer 0 - - - - - 199 39702 Communication Equipment - Fixed Radios 6.2 P, S, T & D Plant - Customer 0 - - - - - 200 39705 Communication Equip. - Telemetering 6.2 P, S, T & D Plant - Customer 0 - - - - - 201 39800 Miscellaneous Equipment 6.2 P, S, T & D Plant - Customer 1,627 1,317 297 1 8 4 202 39900 Other Tangible Property 6.2 P, S, T & D Plant - Customer 4,808 3,893 878 2 22 13 203 39901 Other Tangible Property - Servers - H/W 6.2 P, S, T & D Plant - Customer 760,994 616,240 138,925 283 3,541 2,004 204 39902 Other Tangible Property - Servers - S/W 6.2 P, S, T & D Plant - Customer 552,588 447,477 100,879 206 2,571 1,455 205 39903 Other Tangible Property - Network - H/W 6.2 P, S, T & D Plant - Customer 76,461 61,917 13,959 28 356 201 206 39904 Other Tang. Property - CPU 6.2 P, S, T & D Plant - Customer 0 - - - - - 207 39905 Other Tangible Property - MF - Hardware 6.2 P, S, T & D Plant - Customer 0 - - - - - 208 39906 Other Tang. Property - PC Hardware 6.2 P, S, T & D Plant - Customer 53,593 43,399 9,784 20 249 141 209 39907 Other Tang. Property - PC Software 6.2 P, S, T & D Plant - Customer 52,384 42,419 9,563 19 244 138 210 39908 Other Tang. Property - Mainframe S/W 6.2 P, S, T & D Plant - Customer 1,317 1,066 240 0 6 3 211 39909 Other Tang. Property - Application Software 6.2 P, S, T & D Plant - Customer 1,439,600 1,165,765 262,810 536 6,698 3,791 212 39924 Other Tang. Property - General Startup Costs 6.2 P, S, T & D Plant - Customer 0 - - - - - 213 Retirement Work in Progress 6.2 P, S, T & D Plant - Customer 0 - - - - - 214215 Total General Plant 3,353,490 2,715,602 612,206 1,248 15,603 8,831 216 945,223 765,427 172,558 352 4,398 2,489217 Shared Services Customer Support:218219 General:220221 37400 Land & Land Rights 6.2 P, S, T & D Plant - Customer 0 - - - - - 222 39001 Structures Frame 6.2 P, S, T & D Plant - Customer 0 - - - - - 223 36602 Structures & Improvements 6.2 P, S, T & D Plant - Customer 116,628 94,443 21,291 43 543 307 224 37503 Improvements 6.2 P, S, T & D Plant - Customer 0 - - - - - 225 39004 Air Conditioning Equipment 6.2 P, S, T & D Plant - Customer 0 - - - - - 226 39009 Improvement to leased Premises 6.2 P, S, T & D Plant - Customer 56,813 46,006 10,372 21 264 150 227 39100 Office Furniture & Equipment 6.2 P, S, T & D Plant - Customer 31,203 25,268 5,696 12 145 82 228 39102 Remittance Processing Equip 6.2 P, S, T & D Plant - Customer 0 - - - - - 229 39103 Office Machines 6.2 P, S, T & D Plant - Customer 0 - - - - - 230 39200 Transportation Equipment 6.2 P, S, T & D Plant - Customer 1,273 1,031 232 0 6 3 231 39201 Trucks 6.2 P, S, T & D Plant - Customer 0 - - - - - 232 39202 Trailers 6.2 P, S, T & D Plant - Customer 0 - - - - - 233 39300 Stores Equipment 6.2 P, S, T & D Plant - Customer 0 - - - - - 234 39400 Tools, Shop & Garage Equipment 6.2 P, S, T & D Plant - Customer 2,082 1,686 380 1 10 5 235 39500 Laboratory Equipment 6.2 P, S, T & D Plant - Customer 243 196 44 0 1 1 236 39603 Ditchers 6.2 P, S, T & D Plant - Customer 0 - - - - - 237 39604 Backhoes 6.2 P, S, T & D Plant - Customer 0 - - - - - 238 39605 Welders 6.2 P, S, T & D Plant - Customer 0 - - - - - 239 39700 Communication Equipment 6.2 P, S, T & D Plant - Customer 39,989 32,383 7,300 15 186 105 240 39701 Communication Equipment - Mobile Radios 6.2 P, S, T & D Plant - Customer 0 - - - - - 241 39702 Communication Equipment - Fixed Radios 6.2 P, S, T & D Plant - Customer 0 - - - - - 242 39705 Communication Equip. - Telemetering 6.2 P, S, T & D Plant - Customer 0 - - - - - 243 39800 Miscellaneous Equipment 6.2 P, S, T & D Plant - Customer 2,770 2,243 506 1 13 7 244 39900 Other Tangible Property 6.2 P, S, T & D Plant - Customer 18,109 14,664 3,306 7 84 48 245 39901 Other Tangible Property - Servers - H/W 6.2 P, S, T & D Plant - Customer 192,681 156,030 35,175 72 896 507 246 39902 Other Tangible Property - Servers - S/W 6.2 P, S, T & D Plant - Customer 44,082 35,697 8,048 16 205 116 247 39903 Other Tangible Property - Network - H/W 6.2 P, S, T & D Plant - Customer 13,086 10,596 2,389 5 61 34 248 39904 Other Tang. Property - CPU 6.2 P, S, T & D Plant - Customer 0 - - - - - 249 39905 Other Tangible Property - MF - Hardware 6.2 P, S, T & D Plant - Customer 0 - - - - - 250 39906 Other Tang. Property - PC Hardware 6.2 P, S, T & D Plant - Customer 25,002 20,246 4,564 9 116 66 251 39907 Other Tang. Property - PC Software 6.2 P, S, T & D Plant - Customer 5,795 4,693 1,058 2 27 15 252 39908 Other Tang. Property - Mainframe S/W 6.2 P, S, T & D Plant - Customer 1,168,380 946,135 213,297 435 5,436 3,077 253 39909 Other Tang. Property - Application Software 6.2 P, S, T & D Plant - Customer 2,772 2,245 506 1 13 7 254 39924 Other Tang. Property - General Startup Costs 6.2 P, S, T & D Plant - Customer 0 - - - - - 255 Retirement Work in Progress 6.2 P, S, T & D Plant - Customer 0 - - - - - 256257 Total General Plant 1,720,907 1,393,563 314,165 640 8,007 4,532 258259 TOTAL RESERVE FOR DEPRECIATION - CUSTOMER 116,935,159 87,997,322 27,527,461 68,526 856,887 484,964

Exhibit PHR-2Page 35 of 75
Atmos Energy Corporation, Kentucky/Mid-States DivisionClass Cost of Service - Customer/Demand StudyForecasted Test Period: Twelve Months Ended March 31, 2020
ALLOCATION OF RESERVE FOR DEPRECIATION
Demand
Line Acct. Allocation Allocation Total Residential Non-Res Sales Non-Res Sales Transport TransportNo. No. Factor Basis Company Sales Firm Interruptible Firm Interruptible
260 Intangible Plant:261262 30100 Organization 6.4 P, S, T & D Plant - Demand 3,492 1,579 903 47 506 457 263 30200 Franchises & Consents 6.4 P, S, T & D Plant - Demand 50,240 22,715 12,989 683 7,277 6,576 264 30300 Misc Intangible Plant 99.0 - 0 - - - - - 265266 Total Intangible Plant: 53,731 24,294 13,892 731 7,783 7,033267268 Production Plant:269270 32520 Producing Leaseholds 3.0 Peak Day 0 - - - - - 271 32540 Rights of Ways 3.0 Peak Day 0 - - - - - 272 33100 Production Gas Wells Equipment 3.0 Peak Day 0 - - - - - 273 33201 Field Lines 3.0 Peak Day 0 - - - - - 274 33202 Tributary Lines 3.0 Peak Day 0 - - - - - 275 33400 Field Meas. & Reg. Sta. Equip 3.0 Peak Day 0 - - - - - 276 33600 Purification Equipment 3.0 Peak Day 0 - - - - - 277278 Total Production Plant 0 0 0 0 0 0279280 Storage Plant:281282 35010 Land 3.0 Peak Day 0 - - - - - 283 35020 Rights of Way 3.0 Peak Day 2,227 1,007 576 30 323 291 284 35100 Structures and Improvements 3.0 Peak Day 3,144 1,422 813 43 455 412 285 35102 Compression Station Equipment 3.0 Peak Day 56,872 25,714 14,704 773 8,238 7,444 286 35103 Meas. & Reg. Sta. Structues 3.0 Peak Day 10,242 4,631 2,648 139 1,483 1,340 287 35104 Other Structures 3.0 Peak Day 50,072 22,639 12,946 681 7,253 6,554 288 35200 Wells \ Rights of Way 3.0 Peak Day 595,415 269,208 153,938 8,097 86,242 77,931 289 35201 Well Construction 3.0 Peak Day 709,755 320,905 183,500 9,652 102,803 92,896 290 35202 Well Equipment 3.0 Peak Day 225,298 101,865 58,248 3,064 32,633 29,488 291 35203 Cushion Gas 3.0 Peak Day 379,297 171,493 98,063 5,158 54,939 49,644 292 35210 Leaseholds 3.0 Peak Day 84,031 37,993 21,725 1,143 12,171 10,998 293 35211 Storage Rights 3.0 Peak Day 21,978 9,937 5,682 299 3,183 2,877 294 35301 Field Lines 3.0 Peak Day (44,198) (19,983) (11,427) (601) (6,402) (5,785) 295 35302 Tributary Lines 3.0 Peak Day 94,588 42,767 24,455 1,286 13,700 12,380 296 35400 Compressor Station Equipment 3.0 Peak Day 248,926 112,548 64,357 3,385 36,055 32,581 297 35500 Meas & Reg. Equipment 3.0 Peak Day 101,272 45,788 26,183 1,377 14,669 13,255 298 35600 Purification Equipment 3.0 Peak Day 95,899 43,359 24,794 1,304 13,890 12,552 299300 Total Storage Plant 2,634,817 1,191,292 681,204 35,830 381,635 344,857 301302 Transmission:303304 36510 Land & Land Rights 3.0 Peak Day 0 - - - - - 305 36520 Rights of Way 3.0 Peak Day 428,096 193,557 110,680 5,821 62,007 56,031 306 36602 Structures & Improvements 3.0 Peak Day 16,837 7,613 4,353 229 2,439 2,204 307 36603 Other Structues 3.0 Peak Day 53,066 23,993 13,720 722 7,686 6,946 308 36700 Mains Cathodic Protection 3.0 Peak Day 98,316 44,452 25,419 1,337 14,240 12,868 309 36701 Mains - Steel 3.0 Peak Day 16,387,961 7,409,562 4,236,933 222,852 2,373,684 2,144,929 310 36900 Meas. & Reg. Equipment 3.0 Peak Day 353,469 159,816 91,386 4,807 51,198 46,264 311 36901 Meas. & Reg. Equipment 3.0 Peak Day 1,774,251 802,200 458,714 24,127 256,988 232,222 312313 Total Transmission Plant 19,111,996 8,641,192 4,941,204 259,895 2,768,242 2,501,463 314315 Distribution:316317 37400 Land & Land Rights 3.0 Peak Day 0 - - - - - 318 37401 Land 3.0 Peak Day 0 - - - - - 319 37402 Land Rights 3.0 Peak Day 156,644 70,824 40,499 2,130 22,689 20,502 320 37403 Land Other 3.0 Peak Day 0 - - - - - 321 37500 Structures & Improvements 3.0 Peak Day 75,669 34,212 19,563 1,029 10,960 9,904 322 37501 Structures & Improvements T.B. 3.0 Peak Day 47,552 21,500 12,294 647 6,888 6,224 323 37502 Land Rights 3.0 Peak Day 23,560 10,652 6,091 320 3,412 3,084 324 37503 Improvements 3.0 Peak Day 1,278 578 330 17 185 167 325 37600 Mains Cathodic Protection 3.0 Peak Day 8,792,241 3,975,275 2,273,141 119,562 1,273,496 1,150,767 326 37601 Mains - Steel 3.0 Peak Day 22,409,521 10,132,117 5,793,744 304,737 3,245,866 2,933,057 327 37602 Mains - Plastic 3.0 Peak Day 12,664,370 5,725,998 3,274,238 172,217 1,834,347 1,657,569 328 37800 Meas & Reg. Sta. Equip - General 3.0 Peak Day 1,926,609 871,086 498,104 26,199 279,056 252,163 329 37900 Meas & Reg. Sta. Equip - City Gate 3.0 Peak Day 655,165 296,223 169,386 8,909 94,896 85,751 330 37905 Meas & Reg. Sta. Equipment T.b. 3.0 Peak Day 690,906 312,382 178,626 9,395 100,073 90,429 331 38000 Services 99.0 - 0 - - - - - 332 38100 Meters 99.0 - 0 - - - - - 333 38200 Meter Installaitons 99.0 - 0 - - - - - 334 38300 House Regulators 99.0 - 0 - - - - - 335 38400 House Reg. Installations 99.0 - 0 - - - - - 336 38500 Ind. Meas. & Reg. Sta. Equipment 99.0 - 0 - - - - - 337 38600 Other Prop. On Cust. Prem 99.0 - 0 - - - - - 338339 Total Distribution Plant 47,443,513 21,450,848 12,266,017 645,163 6,871,869 6,209,617

Exhibit PHR-2Page 36 of 75
Atmos Energy Corporation, Kentucky/Mid-States DivisionClass Cost of Service - Customer/Demand StudyForecasted Test Period: Twelve Months Ended March 31, 2020
ALLOCATION OF RESERVE FOR DEPRECIATION340341 General:342343 38900 Land & Land Rights 6.4 P, S, T & D Plant - Demand 0 - - - - - 344 39000 Structures & Improvements 6.4 P, S, T & D Plant - Demand 525,432 237,566 135,845 7,145 76,105 68,771 345 39002 Structures - Brick 6.4 P, S, T & D Plant - Demand 45,096 20,390 11,659 613 6,532 5,902 346 39003 Improvements 6.4 P, S, T & D Plant - Demand 122,706 55,480 31,724 1,669 17,773 16,060 347 39003 Air Conditioning Equipment 6.4 P, S, T & D Plant - Demand 2,117 957 547 29 307 277 348 39004 Improvement to Leased Premises 6.4 P, S, T & D Plant - Demand 523,180 236,548 135,263 7,114 75,779 68,476 349 39009 Office Furniture & Equipment 6.4 P, S, T & D Plant - Demand 479,795 216,932 124,046 6,525 69,495 62,798 350 39100 Remittance Processing Equip 6.4 P, S, T & D Plant - Demand 0 - - - - - 351 39102 Office Machines 6.4 P, S, T & D Plant - Demand 0 - - - - - 352 39103 Transportation Equipment 6.4 P, S, T & D Plant - Demand 47,697 21,566 12,332 649 6,909 6,243 353 39200 Trucks 6.4 P, S, T & D Plant - Demand 0 - - - - - 354 39201 Trailers 6.4 P, S, T & D Plant - Demand (1,060) (479) (274) (14) (154) (139) 355 39202 Stores Equipment 6.4 P, S, T & D Plant - Demand 0 - - - - - 356 39400 Tools, Shop & Garage Equipment 6.4 P, S, T & D Plant - Demand 545,288 246,544 140,979 7,415 78,981 71,370 357 39600 Power Operated Equipment 6.4 P, S, T & D Plant - Demand 0 - - - - - 358 39603 Ditchers 6.4 P, S, T & D Plant - Demand 16,622 7,516 4,298 226 2,408 2,176 359 39604 Backhoes 6.4 P, S, T & D Plant - Demand 26,332 11,906 6,808 358 3,814 3,446 360 39605 Welders 6.4 P, S, T & D Plant - Demand 8,156 3,687 2,109 111 1,181 1,067 361 39700 Communication Equipment 6.4 P, S, T & D Plant - Demand 112,763 50,984 29,154 1,533 16,333 14,759 362 39701 Communication Equipment - Mobile Radios 6.4 P, S, T & D Plant - Demand 0 - - - - - 363 39702 Communication Equipment - Fixed Radios 6.4 P, S, T & D Plant - Demand 0 - - - - - 364 39705 Communication Equip. - Telemetering 6.4 P, S, T & D Plant - Demand 0 - - - - - 365 39800 Miscellaneous Equipment 6.4 P, S, T & D Plant - Demand 868,907 392,863 224,647 11,816 125,855 113,726 366 39900 Other Tangible Property 6.4 P, S, T & D Plant - Demand 0 - - - - - 367 39901 Other Tangible Property - Servers - H/W 6.4 P, S, T & D Plant - Demand 2,796 1,264 723 38 405 366 368 39902 Other Tangible Property - Servers - S/W 6.4 P, S, T & D Plant - Demand 0 - - - - - 369 39903 Other Tangible Property - Network - H/W 6.4 P, S, T & D Plant - Demand 27,098 12,252 7,006 368 3,925 3,547 370 39904 Other Tang. Property - CPU 6.4 P, S, T & D Plant - Demand 0 - - - - - 371 39905 Other Tangible Property - MF - Hardware 6.4 P, S, T & D Plant - Demand 0 - - - - - 372 39906 Other Tang. Property - PC Hardware 6.4 P, S, T & D Plant - Demand 47,043 21,270 12,162 640 6,814 6,157 373 39907 Other Tang. Property - PC Software 6.4 P, S, T & D Plant - Demand 0 - - - - - 374 39908 Other Tang. Property - Mainframe S/W 6.4 P, S, T & D Plant - Demand 0 - - - - - 375 39909 Other Tang. Property - Application Software 6.4 P, S, T & D Plant - Demand 49,428 22,348 12,779 672 7,159 6,469 376 Other Tang. Property - General Startup Costs 6.4 P, S, T & D Plant - Demand 0 - - - - - 377 Retirement Work in Progress 6.4 P, S, T & D Plant - Demand (2,672,138) (1,208,166) (690,853) (36,337) (387,041) (349,741) 378 AR 15 general plant amortization 6.4 P, S, T & D Plant - Demand 0 - - - - - 379380 Total General Plant 777,258 351,425 200,952 10,570 112,581 101,731 381382 TOTAL DIRECT RESERVE FOR DEPRECIATION 70,021,316 31,659,051 18,103,268 952,188 10,142,110 9,164,700383384 Kentucky Mid-States General Office:385386 Intangible Plant:387388 30100 Organization 99.0 - 0 - - - - - 389 30200 Franchises & Consents 99.0 - 0 - - - - - 390 30300 Misc Intangible Plant 99.0 - 0 - - - - - 391392 Total Intangible Plant:393394 General:395396 37400 Land & Land Rights 6.4 P, S, T & D Plant - Demand 0 - - - - - 397 39001 Structures Frame 6.4 P, S, T & D Plant - Demand 22,094 9,989 5,712 300 3,200 2,892 398 36602 Structures & Improvements 6.4 P, S, T & D Plant - Demand 0 - - - - - 399 38900 Land & Land Rights 6.4 P, S, T & D Plant - Demand 0 - - - - - 400 39004 Air Conditioning Equipment 6.4 P, S, T & D Plant - Demand 2,133 965 552 29 309 279 401 39009 Improvement to leased Premises 6.4 P, S, T & D Plant - Demand 8,103 3,664 2,095 110 1,174 1,061 402 39100 Office Furniture & Equipment 6.4 P, S, T & D Plant - Demand 8,056 3,643 2,083 110 1,167 1,054 403 39102 Remittance Processing Equip 6.4 P, S, T & D Plant - Demand 0 - - - - - 404 39103 Office Machines 6.4 P, S, T & D Plant - Demand 0 - - - - - 405 39200 Transportation Equipment 6.4 P, S, T & D Plant - Demand 3,729 1,686 964 51 540 488 406 39201 Trucks 6.4 P, S, T & D Plant - Demand 0 - - - - - 407 39202 Trailers 6.4 P, S, T & D Plant - Demand 0 - - - - - 408 39300 Stores Equipment 6.4 P, S, T & D Plant - Demand 0 - - - - - 409 39400 Tools, Shop & Garage Equipment 6.4 P, S, T & D Plant - Demand 30,018 13,572 7,761 408 4,348 3,929 410 39600 Power Operated Equipment 6.4 P, S, T & D Plant - Demand 1,834 829 474 25 266 240 411 39603 Ditchers 6.4 P, S, T & D Plant - Demand 0 - - - - - 412 39604 Backhoes 6.4 P, S, T & D Plant - Demand 0 - - - - - 413 39605 Welders 6.4 P, S, T & D Plant - Demand 0 - - - - - 414 39700 Communication Equipment 6.4 P, S, T & D Plant - Demand (1,254) (567) (324) (17) (182) (164) 415 39701 Communication Equipment - Mobile Radios 6.4 P, S, T & D Plant - Demand 0 - - - - - 416 39702 Communication Equipment - Fixed Radios 6.4 P, S, T & D Plant - Demand 0 - - - - - 417 39705 Communication Equip. - Telemetering 6.4 P, S, T & D Plant - Demand 0 - - - - - 418 39800 Miscellaneous Equipment 6.4 P, S, T & D Plant - Demand 150,628 68,104 38,943 2,048 21,817 19,715 419 39900 Other Tangible Property 6.4 P, S, T & D Plant - Demand 0 - - - - - 420 39901 Other Tangible Property - Servers - H/W 6.4 P, S, T & D Plant - Demand (7,254) (3,280) (1,876) (99) (1,051) (949) 421 39902 Other Tangible Property - Servers - S/W 6.4 P, S, T & D Plant - Demand 0 - - - - - 422 39903 Other Tangible Property - Network - H/W 6.4 P, S, T & D Plant - Demand 0 - - - - - 423 39904 Other Tang. Property - CPU 6.4 P, S, T & D Plant - Demand 0 - - - - - 424 39905 Other Tangible Property - MF - Hardware 6.4 P, S, T & D Plant - Demand 0 - - - - - 425 39906 Other Tang. Property - PC Hardware 6.4 P, S, T & D Plant - Demand 14,648 6,623 3,787 199 2,122 1,917 426 39907 Other Tang. Property - PC Software 6.4 P, S, T & D Plant - Demand 8,839 3,996 2,285 120 1,280 1,157 427 39908 Other Tang. Property - Mainframe S/W 6.4 P, S, T & D Plant - Demand 172,882 78,166 44,697 2,351 25,041 22,628 428 39909 Other Tang. Property - Application Software 6.4 P, S, T & D Plant - Demand 0 - - - - - 429 39924 Other Tang. Property - General Startup Costs 6.4 P, S, T & D Plant - Demand 0 - - - - - 430 Retirement Work in Progress 6.4 P, S, T & D Plant - Demand 10,959 4,955 2,833 149 1,587 1,434 431432 Total General Plant 425,414 192,344 109,986 5,785 61,618 55,680

Exhibit PHR-2Page 37 of 75
Atmos Energy Corporation, Kentucky/Mid-States DivisionClass Cost of Service - Customer/Demand StudyForecasted Test Period: Twelve Months Ended March 31, 2020
ALLOCATION OF RESERVE FOR DEPRECIATION433434 Shared Services General Office:435436 General:437438 37400 Land & Land Rights 6.4 P, S, T & D Plant - Demand 0 - - - - - 439 39000 Structures & Improvements 6.4 P, S, T & D Plant - Demand 38,084 17,219 9,846 518 5,516 4,985 440 36602 Structures & Improvements 6.4 P, S, T & D Plant - Demand 0 - - - - - 441 37503 Improvements 6.4 P, S, T & D Plant - Demand 0 - - - - - 442 39004 Air Conditioning Equipment 6.4 P, S, T & D Plant - Demand 0 - - - - - 443 39009 Improvement to leased Premises 6.4 P, S, T & D Plant - Demand 202,198 91,421 52,276 2,750 29,287 26,465 444 39100 Office Furniture & Equipment 6.4 P, S, T & D Plant - Demand 48,712 22,024 12,594 662 7,056 6,376 445 39102 Remittance Processing Equip 6.4 P, S, T & D Plant - Demand 0 0 0 0 0 0 446 39103 Office Machines 6.4 P, S, T & D Plant - Demand 0 0 0 0 0 0 447 39200 Transportation Equipment 6.4 P, S, T & D Plant - Demand 119 54 31 2 17 16 448 39201 Trucks 6.4 P, S, T & D Plant - Demand 0 - - - - - 449 39202 Trailers 6.4 P, S, T & D Plant - Demand 0 - - - - - 450 39300 Stores Equipment 6.4 P, S, T & D Plant - Demand 0 - - - - - 451 39400 Tools, Shop & Garage Equipment 6.4 P, S, T & D Plant - Demand 722 326 187 10 105 94 452 39600 Power Operated Equipment 6.4 P, S, T & D Plant - Demand 0 - - - - - 453 39603 Ditchers 6.4 P, S, T & D Plant - Demand 0 - - - - - 454 39604 Backhoes 6.4 P, S, T & D Plant - Demand 0 - - - - - 455 39605 Welders 6.4 P, S, T & D Plant - Demand 0 - - - - - 456 39700 Communication Equipment 6.4 P, S, T & D Plant - Demand 11,869 5,366 3,069 161 1,719 1,553 457 39701 Communication Equipment - Mobile Radios 6.4 P, S, T & D Plant - Demand 0 - - - - - 458 39702 Communication Equipment - Fixed Radios 6.4 P, S, T & D Plant - Demand 0 - - - - - 459 39705 Communication Equip. - Telemetering 6.4 P, S, T & D Plant - Demand 0 - - - - - 460 39800 Miscellaneous Equipment 6.4 P, S, T & D Plant - Demand 1,197 541 309 16 173 157 461 39900 Other Tangible Property 6.4 P, S, T & D Plant - Demand 3,537 1,599 914 48 512 463 462 39901 Other Tangible Property - Servers - H/W 6.4 P, S, T & D Plant - Demand 559,823 253,115 144,736 7,613 81,087 73,272 463 39902 Other Tangible Property - Servers - S/W 6.4 P, S, T & D Plant - Demand 406,510 183,797 105,099 5,528 58,880 53,206 464 39903 Other Tangible Property - Network - H/W 6.4 P, S, T & D Plant - Demand 56,248 25,432 14,542 765 8,147 7,362 465 39904 Other Tang. Property - CPU 6.4 P, S, T & D Plant - Demand 0 - - - - - 466 39905 Other Tangible Property - MF - Hardware 6.4 P, S, T & D Plant - Demand 0 - - - - - 467 39906 Other Tang. Property - PC Hardware 6.4 P, S, T & D Plant - Demand 39,426 17,826 10,193 536 5,711 5,160 468 39907 Other Tang. Property - PC Software 6.4 P, S, T & D Plant - Demand 38,536 17,423 9,963 524 5,582 5,044 469 39908 Other Tang. Property - Mainframe S/W 6.4 P, S, T & D Plant - Demand 969 438 250 13 140 127 470 39909 Other Tang. Property - Application Software 6.4 P, S, T & D Plant - Demand 1,059,038 478,828 273,803 14,401 153,394 138,612 471 39924 Other Tang. Property - General Startup Costs 6.4 P, S, T & D Plant - Demand 0 - - - - - 472 Retirement Work in Progress 6.4 P, S, T & D Plant - Demand 0 - - - - - 473474 Total General Plant 2,466,987 1,115,410 637,813 33,547 357,326 322,890 475476 Shared Services Customer Support:477478 General:479480 37400 Land & Land Rights 6.4 P, S, T & D Plant - Demand 0 - - - - - 481 39001 Structures Frame 6.4 P, S, T & D Plant - Demand 0 - - - - - 482 36602 Structures & Improvements 6.4 P, S, T & D Plant - Demand 85,797 38,792 22,182 1,167 12,427 11,229 483 37503 Improvements 6.4 P, S, T & D Plant - Demand 0 - - - - - 484 39004 Air Conditioning Equipment 6.4 P, S, T & D Plant - Demand 0 - - - - - 485 39009 Improvement to leased Premises 6.4 P, S, T & D Plant - Demand 41,794 18,897 10,806 568 6,054 5,470 486 39100 Office Furniture & Equipment 6.4 P, S, T & D Plant - Demand 22,954 10,379 5,935 312 3,325 3,004 487 39102 Remittance Processing Equip 6.4 P, S, T & D Plant - Demand 0 - - - - - 488 39103 Office Machines 6.4 P, S, T & D Plant - Demand 0 - - - - - 489 39200 Transportation Equipment 6.4 P, S, T & D Plant - Demand 937 424 242 13 136 123 490 39201 Trucks 6.4 P, S, T & D Plant - Demand 0 - - - - - 491 39202 Trailers 6.4 P, S, T & D Plant - Demand 0 - - - - - 492 39300 Stores Equipment 6.4 P, S, T & D Plant - Demand 0 - - - - - 493 39400 Tools, Shop & Garage Equipment 6.4 P, S, T & D Plant - Demand 1,532 692 396 21 222 200 494 39500 Laboratory Equipment 6.4 P, S, T & D Plant - Demand 178 81 46 2 26 23 495 39603 Ditchers 6.4 P, S, T & D Plant - Demand 0 - - - - - 496 39604 Backhoes 6.4 P, S, T & D Plant - Demand 0 - - - - - 497 39605 Welders 6.4 P, S, T & D Plant - Demand 0 - - - - - 498 39700 Communication Equipment 6.4 P, S, T & D Plant - Demand 29,418 13,301 7,606 400 4,261 3,850 499 39701 Communication Equipment - Mobile Radios 6.4 P, S, T & D Plant - Demand 0 - - - - - 500 39702 Communication Equipment - Fixed Radios 6.4 P, S, T & D Plant - Demand 0 - - - - - 501 39705 Communication Equip. - Telemetering 6.4 P, S, T & D Plant - Demand 0 - - - - - 502 39800 Miscellaneous Equipment 6.4 P, S, T & D Plant - Demand 2,038 921 527 28 295 267 503 39900 Other Tangible Property 6.4 P, S, T & D Plant - Demand 13,322 6,023 3,444 181 1,930 1,744 504 39901 Other Tangible Property - Servers - H/W 6.4 P, S, T & D Plant - Demand 141,745 64,088 36,647 1,928 20,531 18,552 505 39902 Other Tangible Property - Servers - S/W 6.4 P, S, T & D Plant - Demand 32,429 14,662 8,384 441 4,697 4,244 506 39903 Other Tangible Property - Network - H/W 6.4 P, S, T & D Plant - Demand 9,626 4,352 2,489 131 1,394 1,260 507 39904 Other Tang. Property - CPU 6.4 P, S, T & D Plant - Demand 0 - - - - - 508 39905 Other Tangible Property - MF - Hardware 6.4 P, S, T & D Plant - Demand 0 - - - - - 509 39906 Other Tang. Property - PC Hardware 6.4 P, S, T & D Plant - Demand 18,392 8,316 4,755 250 2,664 2,407 510 39907 Other Tang. Property - PC Software 6.4 P, S, T & D Plant - Demand 4,263 1,928 1,102 58 618 558 511 39908 Other Tang. Property - Mainframe S/W 6.4 P, S, T & D Plant - Demand 859,516 388,617 222,219 11,688 124,495 112,497 512 39909 Other Tang. Property - Application Software 6.4 P, S, T & D Plant - Demand 2,039 922 527 28 295 267 513 39924 Other Tang. Property - General Startup Costs 6.4 P, S, T & D Plant - Demand 0 - - - - - 514 Retirement Work in Progress 6.4 P, S, T & D Plant - Demand 0 - - - - - 515516 Total General Plant 1,265,981 572,394 327,306 17,215 183,369 165,697 517518 TOTAL RESERVE FOR DEPRECIATION - DEMAND 74,179,698 33,539,199 19,178,374 1,008,736 10,744,423 9,708,967

Exhibit PHR-2Page 38 of 75
Atmos Energy Corporation, Kentucky/Mid-States DivisionClass Cost of Service - Customer/Demand StudyForecasted Test Period: Twelve Months Ended March 31, 2020
ALLOCATION OF RESERVE FOR DEPRECIATION
Commodity
Line Acct. Allocation Allocation Total Residential Non-Res Sales Non-Res Sales Transport TransportNo. No. Factor Basis Company Sales Firm Interruptible Firm Interruptible
519 Intangible Plant:520521 30100 Organization 6.6 P, S, T & D Plant - Commodity 92 35 21 1 17 17 522 30200 Franchises & Consents 6.6 P, S, T & D Plant - Commodity 1,320 500 309 17 243 251 523 30300 Misc Intangible Plant 99.0 - 0 - - - - - 524525 Total Intangible Plant: 1,412 535 331 18 260 269526527 Production Plant:528529 32520 Producing Leaseholds 99.0 - 0 - - - - - 530 32540 Rights of Ways 99.0 - 0 - - - - - 531 33100 Production Gas Wells Equipment 99.0 - 0 - - - - - 532 33201 Field Lines 99.0 - 0 - - - - - 533 33202 Tributary Lines 1.2 Sales Mcf 0 - - - - - 534 33400 Field Meas. & Reg. Sta. Equip 1.2 Sales Mcf 0 - - - - - 535 33600 Purification Equipment 99.0 - 0 - - - - - 536537 Total Production Plant 0 0 0 0 0 0538539 Storage Plant:540541 35010 Land 1.5 Winter Volumes 0 - - - - - 542 35020 Rights of Way 1.5 Winter Volumes 2,227 843 522 29 409 424 543 35100 Structures and Improvements 1.5 Winter Volumes 3,144 1,191 737 40 578 599 544 35102 Compression Station Equipment 1.5 Winter Volumes 56,872 21,533 13,324 729 10,455 10,831 545 35103 Meas. & Reg. Sta. Structues 1.5 Winter Volumes 10,242 3,878 2,399 131 1,883 1,950 546 35104 Other Structures 1.5 Winter Volumes 50,072 18,959 11,731 642 9,205 9,536 547 35200 Wells \ Rights of Way 1.5 Winter Volumes 595,415 225,442 139,498 7,628 109,455 113,392 548 35201 Well Construction 1.5 Winter Volumes 709,755 268,734 166,287 9,093 130,475 135,167 549 35202 Well Equipment 1.5 Winter Volumes 225,298 85,304 52,784 2,887 41,417 42,906 550 35203 Cushion Gas 1.5 Winter Volumes 379,297 143,613 88,864 4,860 69,726 72,234 551 35210 Leaseholds 1.5 Winter Volumes 84,031 31,817 19,687 1,077 15,447 16,003 552 35211 Storage Rights 1.5 Winter Volumes 21,978 8,321 5,149 282 4,040 4,185 553 35301 Field Lines 1.5 Winter Volumes (44,198) (16,735) (10,355) (566) (8,125) (8,417) 554 35302 Tributary Lines 1.5 Winter Volumes 94,588 35,814 22,161 1,212 17,388 18,014 555 35400 Compressor Station Equipment 1.5 Winter Volumes 248,926 94,251 58,320 3,189 45,760 47,406 556 35500 Meas & Reg. Equipment 1.5 Winter Volumes 101,272 38,344 23,727 1,297 18,617 19,286 557 35600 Purification Equipment 1.5 Winter Volumes 95,899 36,310 22,468 1,229 17,629 18,263 558559 Total Storage Plant 2,634,817 997,619 617,304 33,757 484,359 501,778 560561 Transmission:562563 36510 Land & Land Rights 99.0 - 0 - - - - - 564 36520 Rights of Way 99.0 - 0 - - - - - 565 36602 Structures & Improvements 99.0 - 0 - - - - - 566 36603 Other Structues 99.0 - 0 - - - - - 567 36700 Mains Cathodic Protection 99.0 - 0 - - - - - 568 36701 Mains - Steel 99.0 - 0 - - - - - 569 36900 Meas. & Reg. Equipment 99.0 - 0 - - - - - 570 36901 Meas. & Reg. Equipment 99.0 - 0 - - - - - 571572 Total Transmission Plant 0 - - - - - 573574 Distribution:575576 37400 Land & Land Rights 99.0 - 0 - - - - - 577 37401 Land 99.0 - 0 - - - - - 578 37402 Land Rights 1.0 Mcf 0 - - - - - 579 37403 Land Other 99.0 - 0 - - - - - 580 37500 Structures & Improvements 1.0 Mcf 0 - - - - - 581 37501 Structures & Improvements T.B. 1.0 Mcf 0 - - - - - 582 37502 Land Rights 1.0 Mcf 0 - - - - - 583 37503 Improvements 1.0 Mcf 0 - - - - - 584 37600 Mains Cathodic Protection 1.0 Mcf 0 - - - - - 585 37601 Mains - Steel 1.0 Mcf 0 - - - - - 586 37602 Mains - Plastic 1.0 Mcf 0 - - - - - 587 37800 Meas & Reg. Sta. Equip - General 1.0 Mcf 0 - - - - - 588 37900 Meas & Reg. Sta. Equip - City Gate 1.0 Mcf 0 - - - - - 589 37905 Meas & Reg. Sta. Equipment T.b. 1.0 Mcf 0 - - - - - 590 38000 Services 99.0 - 0 - - - - - 591 38100 Meters 99.0 - 0 - - - - - 592 38200 Meter Installaitons 99.0 - 0 - - - - - 593 38300 House Regulators 99.0 - 0 - - - - - 594 38400 House Reg. Installations 99.0 - 0 - - - - - 595 38500 Ind. Meas. & Reg. Sta. Equipment 99.0 - 0 - - - - - 596 38600 Other Prop. On Cust. Prem 99.0 - 0 - - - - - 597598 Total Distribution Plant 0 - - - - -

Exhibit PHR-2Page 39 of 75
Atmos Energy Corporation, Kentucky/Mid-States DivisionClass Cost of Service - Customer/Demand StudyForecasted Test Period: Twelve Months Ended March 31, 2020
ALLOCATION OF RESERVE FOR DEPRECIATION599600 General:601602 38900 Land & Land Rights 6.6 P, S, T & D Plant - Commodity 0 - - - - - 603 39000 Structures & Improvements 6.6 P, S, T & D Plant - Commodity 13,805 5,227 3,234 177 2,538 2,629 604 39002 Structures - Brick 6.6 P, S, T & D Plant - Commodity 1,185 449 278 15 218 226 605 39003 Improvements 6.6 P, S, T & D Plant - Commodity 3,224 1,221 755 41 593 614 606 39003 Air Conditioning Equipment 6.6 P, S, T & D Plant - Commodity 56 21 13 1 10 11 607 39004 Improvement to Leased Premises 6.6 P, S, T & D Plant - Commodity 13,746 5,205 3,221 176 2,527 2,618 608 39009 Office Furniture & Equipment 6.6 P, S, T & D Plant - Commodity 12,606 4,773 2,953 162 2,317 2,401 609 39100 Remittance Processing Equip 6.6 P, S, T & D Plant - Commodity 0 - - - - - 610 39102 Office Machines 6.6 P, S, T & D Plant - Commodity 0 - - - - - 611 39103 Transportation Equipment 6.6 P, S, T & D Plant - Commodity 1,253 475 294 16 230 239 612 39200 Trucks 6.6 P, S, T & D Plant - Commodity 0 - - - - - 613 39201 Trailers 6.6 P, S, T & D Plant - Commodity (28) (11) (7) (0) (5) (5) 614 39202 Stores Equipment 6.6 P, S, T & D Plant - Commodity 0 - - - - - 615 39400 Tools, Shop & Garage Equipment 6.6 P, S, T & D Plant - Commodity 14,327 5,425 3,357 184 2,634 2,728 616 39600 Power Operated Equipment 6.6 P, S, T & D Plant - Commodity 0 - - - - - 617 39603 Ditchers 6.6 P, S, T & D Plant - Commodity 437 165 102 6 80 83 618 39604 Backhoes 6.6 P, S, T & D Plant - Commodity 692 262 162 9 127 132 619 39605 Welders 6.6 P, S, T & D Plant - Commodity 214 81 50 3 39 41 620 39700 Communication Equipment 6.6 P, S, T & D Plant - Commodity 2,963 1,122 694 38 545 564 621 39701 Communication Equipment - Mobile Radios 6.6 P, S, T & D Plant - Commodity 0 - - - - - 622 39702 Communication Equipment - Fixed Radios 6.6 P, S, T & D Plant - Commodity 0 - - - - - 623 39705 Communication Equip. - Telemetering 6.6 P, S, T & D Plant - Commodity 0 - - - - - 624 39800 Miscellaneous Equipment 6.6 P, S, T & D Plant - Commodity 22,830 8,644 5,349 292 4,197 4,348 625 39900 Other Tangible Property 6.6 P, S, T & D Plant - Commodity 0 - - - - - 626 39901 Other Tangible Property - Servers - H/W 6.6 P, S, T & D Plant - Commodity 73 28 17 1 14 14 627 39902 Other Tangible Property - Servers - S/W 6.6 P, S, T & D Plant - Commodity 0 - - - - - 628 39903 Other Tangible Property - Network - H/W 6.6 P, S, T & D Plant - Commodity 712 270 167 9 131 136 629 39904 Other Tang. Property - CPU 6.6 P, S, T & D Plant - Commodity 0 - - - - - 630 39905 Other Tangible Property - MF - Hardware 6.6 P, S, T & D Plant - Commodity 0 - - - - - 631 39906 Other Tang. Property - PC Hardware 6.6 P, S, T & D Plant - Commodity 1,236 468 290 16 227 235 632 39907 Other Tang. Property - PC Software 6.6 P, S, T & D Plant - Commodity 0 - - - - - 633 39908 Other Tang. Property - Mainframe S/W 6.6 P, S, T & D Plant - Commodity 0 - - - - - 634 39909 Other Tang. Property - Application Software 6.6 P, S, T & D Plant - Commodity 1,299 492 304 17 239 247 635 Other Tang. Property - General Startup Costs 6.6 P, S, T & D Plant - Commodity 0 - - - - - 636 Retirement Work in Progress 6.6 P, S, T & D Plant - Commodity (70,209) (26,583) (16,449) (900) (12,906) (13,371) 637 AR 15 general plant amortization 6.6 P, S, T & D Plant - Commodity 0 - - - - - 638639 Total General Plant 20,422 7,732 4,785 262 3,754 3,889 640641 TOTAL DIRECT RESERVE FOR DEPRECIATION 2,656,651 1,005,885 622,419 34,037 488,373 505,936642643 Kentucky Mid-States General Office:644645 Intangible Plant:646647 30100 Organization 99.0 - 0 - - - - - 648 30200 Franchises & Consents 99.0 - 0 - - - - - 649 30300 Misc Intangible Plant 99.0 - 0 - - - - - 650651 Total Intangible Plant:652653 General:654655 37400 Land & Land Rights 6.6 P, S, T & D Plant - Commodity 0 - - - - - 656 39001 Structures Frame 6.6 P, S, T & D Plant - Commodity 581 220 136 7 107 111 657 36602 Structures & Improvements 6.6 P, S, T & D Plant - Commodity 0 - - - - - 658 38900 Land & Land Rights 6.6 P, S, T & D Plant - Commodity 0 - - - - - 659 39004 Air Conditioning Equipment 6.6 P, S, T & D Plant - Commodity 56 21 13 1 10 11 660 39009 Improvement to leased Premises 6.6 P, S, T & D Plant - Commodity 213 81 50 3 39 41 661 39100 Office Furniture & Equipment 6.6 P, S, T & D Plant - Commodity 212 80 50 3 39 40 662 39102 Remittance Processing Equip 6.6 P, S, T & D Plant - Commodity 0 - - - - - 663 39103 Office Machines 6.6 P, S, T & D Plant - Commodity 0 - - - - - 664 39200 Transportation Equipment 6.6 P, S, T & D Plant - Commodity 98 37 23 1 18 19 665 39201 Trucks 6.6 P, S, T & D Plant - Commodity 0 - - - - - 666 39202 Trailers 6.6 P, S, T & D Plant - Commodity 0 - - - - - 667 39300 Stores Equipment 6.6 P, S, T & D Plant - Commodity 0 - - - - - 668 39400 Tools, Shop & Garage Equipment 6.6 P, S, T & D Plant - Commodity 789 299 185 10 145 150 669 39600 Power Operated Equipment 6.6 P, S, T & D Plant - Commodity 48 18 11 1 9 9 670 39603 Ditchers 6.6 P, S, T & D Plant - Commodity 0 - - - - - 671 39604 Backhoes 6.6 P, S, T & D Plant - Commodity 0 - - - - - 672 39605 Welders 6.6 P, S, T & D Plant - Commodity 0 - - - - - 673 39700 Communication Equipment 6.6 P, S, T & D Plant - Commodity (33) (12) (8) (0) (6) (6) 674 39701 Communication Equipment - Mobile Radios 6.6 P, S, T & D Plant - Commodity 0 - - - - - 675 39702 Communication Equipment - Fixed Radios 6.6 P, S, T & D Plant - Commodity 0 - - - - - 676 39705 Communication Equip. - Telemetering 6.6 P, S, T & D Plant - Commodity 0 - - - - - 677 39800 Miscellaneous Equipment 6.6 P, S, T & D Plant - Commodity 3,958 1,498 927 51 728 754 678 39900 Other Tangible Property 6.6 P, S, T & D Plant - Commodity 0 - - - - - 679 39901 Other Tangible Property - Servers - H/W 6.6 P, S, T & D Plant - Commodity (191) (72) (45) (2) (35) (36) 680 39902 Other Tangible Property - Servers - S/W 6.6 P, S, T & D Plant - Commodity 0 - - - - - 681 39903 Other Tangible Property - Network - H/W 6.6 P, S, T & D Plant - Commodity 0 - - - - - 682 39904 Other Tang. Property - CPU 6.6 P, S, T & D Plant - Commodity 0 - - - - - 683 39905 Other Tangible Property - MF - Hardware 6.6 P, S, T & D Plant - Commodity 0 - - - - - 684 39906 Other Tang. Property - PC Hardware 6.6 P, S, T & D Plant - Commodity 385 146 90 5 71 73 685 39907 Other Tang. Property - PC Software 6.6 P, S, T & D Plant - Commodity 232 88 54 3 43 44 686 39908 Other Tang. Property - Mainframe S/W 6.6 P, S, T & D Plant - Commodity 4,542 1,720 1,064 58 835 865 687 39909 Other Tang. Property - Application Software 6.6 P, S, T & D Plant - Commodity 0 - - - - - 688 39924 Other Tang. Property - General Startup Costs 6.6 P, S, T & D Plant - Commodity 0 - - - - - 689 Retirement Work in Progress 6.6 P, S, T & D Plant - Commodity 288 109 67 4 53 55 690691 Total General Plant 11,177 4,232 2,619 143 2,055 2,129

Exhibit PHR-2Page 40 of 75
Atmos Energy Corporation, Kentucky/Mid-States DivisionClass Cost of Service - Customer/Demand StudyForecasted Test Period: Twelve Months Ended March 31, 2020
ALLOCATION OF RESERVE FOR DEPRECIATION692693 Shared Services General Office:694695 General:696697 37400 Land & Land Rights 6.6 P, S, T & D Plant - Commodity 0 - - - - - 698 39000 Structures & Improvements 6.6 P, S, T & D Plant - Commodity 1,001 379 234 13 184 191 699 36602 Structures & Improvements 6.6 P, S, T & D Plant - Commodity 0 - - - - - 700 37503 Improvements 6.6 P, S, T & D Plant - Commodity 0 - - - - - 701 39004 Air Conditioning Equipment 6.6 P, S, T & D Plant - Commodity 0 - - - - - 702 39009 Improvement to leased Premises 6.6 P, S, T & D Plant - Commodity 5,313 2,012 1,245 68 977 1,012 703 39100 Office Furniture & Equipment 6.6 P, S, T & D Plant - Commodity 1,280 485 300 16 235 244 704 39102 Remittance Processing Equip 6.6 P, S, T & D Plant - Commodity 0 0 0 0 0 0 705 39103 Office Machines 6.6 P, S, T & D Plant - Commodity 0 0 0 0 0 0 706 39200 Transportation Equipment 6.6 P, S, T & D Plant - Commodity 3 1 1 0 1 1 707 39201 Trucks 6.6 P, S, T & D Plant - Commodity 0 - - - - - 708 39202 Trailers 6.6 P, S, T & D Plant - Commodity 0 - - - - - 709 39300 Stores Equipment 6.6 P, S, T & D Plant - Commodity 0 - - - - - 710 39400 Tools, Shop & Garage Equipment 6.6 P, S, T & D Plant - Commodity 19 7 4 0 3 4 711 39600 Power Operated Equipment 6.6 P, S, T & D Plant - Commodity 0 - - - - - 712 39603 Ditchers 6.6 P, S, T & D Plant - Commodity 0 - - - - - 713 39604 Backhoes 6.6 P, S, T & D Plant - Commodity 0 - - - - - 714 39605 Welders 6.6 P, S, T & D Plant - Commodity 0 - - - - - 715 39700 Communication Equipment 6.6 P, S, T & D Plant - Commodity 312 118 73 4 57 59 716 39701 Communication Equipment - Mobile Radios 6.6 P, S, T & D Plant - Commodity 0 - - - - - 717 39702 Communication Equipment - Fixed Radios 6.6 P, S, T & D Plant - Commodity 0 - - - - - 718 39705 Communication Equip. - Telemetering 6.6 P, S, T & D Plant - Commodity 0 - - - - - 719 39800 Miscellaneous Equipment 6.6 P, S, T & D Plant - Commodity 31 12 7 0 6 6 720 39900 Other Tangible Property 6.6 P, S, T & D Plant - Commodity 93 35 22 1 17 18 721 39901 Other Tangible Property - Servers - H/W 6.6 P, S, T & D Plant - Commodity 14,709 5,569 3,446 188 2,704 2,801 722 39902 Other Tangible Property - Servers - S/W 6.6 P, S, T & D Plant - Commodity 10,681 4,044 2,502 137 1,963 2,034 723 39903 Other Tangible Property - Network - H/W 6.6 P, S, T & D Plant - Commodity 1,478 560 346 19 272 281 724 39904 Other Tang. Property - CPU 6.6 P, S, T & D Plant - Commodity 0 - - - - - 725 39905 Other Tangible Property - MF - Hardware 6.6 P, S, T & D Plant - Commodity 0 - - - - - 726 39906 Other Tang. Property - PC Hardware 6.6 P, S, T & D Plant - Commodity 1,036 392 243 13 190 197 727 39907 Other Tang. Property - PC Software 6.6 P, S, T & D Plant - Commodity 1,013 383 237 13 186 193 728 39908 Other Tang. Property - Mainframe S/W 6.6 P, S, T & D Plant - Commodity 25 10 6 0 5 5 729 39909 Other Tang. Property - Application Software 6.6 P, S, T & D Plant - Commodity 27,826 10,536 6,519 357 5,115 5,299 730 39924 Other Tang. Property - General Startup Costs 6.6 P, S, T & D Plant - Commodity 0 - - - - - 731 Retirement Work in Progress 6.6 P, S, T & D Plant - Commodity 0 - - - - - 732733 Total General Plant 64,818 24,542 15,186 830 11,916 12,344 734 18,270 6,918 4,280 234 3,359 3,479735 Shared Services Customer Support:736737 General:738739 37400 Land & Land Rights 6.6 P, S, T & D Plant - Commodity 0 - - - - - 740 39001 Structures Frame 6.6 P, S, T & D Plant - Commodity 0 - - - - - 741 36602 Structures & Improvements 6.6 P, S, T & D Plant - Commodity 2,254 854 528 29 414 429 742 37503 Improvements 6.6 P, S, T & D Plant - Commodity 0 - - - - - 743 39004 Air Conditioning Equipment 6.6 P, S, T & D Plant - Commodity 0 - - - - - 744 39009 Improvement to leased Premises 6.6 P, S, T & D Plant - Commodity 1,098 416 257 14 202 209 745 39100 Office Furniture & Equipment 6.6 P, S, T & D Plant - Commodity 603 228 141 8 111 115 746 39102 Remittance Processing Equip 6.6 P, S, T & D Plant - Commodity 0 - - - - - 747 39103 Office Machines 6.6 P, S, T & D Plant - Commodity 0 - - - - - 748 39200 Transportation Equipment 6.6 P, S, T & D Plant - Commodity 25 9 6 0 5 5 749 39201 Trucks 6.6 P, S, T & D Plant - Commodity 0 - - - - - 750 39202 Trailers 6.6 P, S, T & D Plant - Commodity 0 - - - - - 751 39300 Stores Equipment 6.6 P, S, T & D Plant - Commodity 0 - - - - - 752 39400 Tools, Shop & Garage Equipment 6.6 P, S, T & D Plant - Commodity 40 15 9 1 7 8 753 39500 Laboratory Equipment 6.6 P, S, T & D Plant - Commodity 5 2 1 0 1 1 754 39603 Ditchers 6.6 P, S, T & D Plant - Commodity 0 - - - - - 755 39604 Backhoes 6.6 P, S, T & D Plant - Commodity 0 - - - - - 756 39605 Welders 6.6 P, S, T & D Plant - Commodity 0 - - - - - 757 39700 Communication Equipment 6.6 P, S, T & D Plant - Commodity 773 293 181 10 142 147 758 39701 Communication Equipment - Mobile Radios 6.6 P, S, T & D Plant - Commodity 0 - - - - - 759 39702 Communication Equipment - Fixed Radios 6.6 P, S, T & D Plant - Commodity 0 - - - - - 760 39705 Communication Equip. - Telemetering 6.6 P, S, T & D Plant - Commodity 0 - - - - - 761 39800 Miscellaneous Equipment 6.6 P, S, T & D Plant - Commodity 54 20 13 1 10 10 762 39900 Other Tangible Property 6.6 P, S, T & D Plant - Commodity 350 133 82 4 64 67 763 39901 Other Tangible Property - Servers - H/W 6.6 P, S, T & D Plant - Commodity 3,724 1,410 873 48 685 709 764 39902 Other Tangible Property - Servers - S/W 6.6 P, S, T & D Plant - Commodity 852 323 200 11 157 162 765 39903 Other Tangible Property - Network - H/W 6.6 P, S, T & D Plant - Commodity 253 96 59 3 46 48 766 39904 Other Tang. Property - CPU 6.6 P, S, T & D Plant - Commodity 0 - - - - - 767 39905 Other Tangible Property - MF - Hardware 6.6 P, S, T & D Plant - Commodity 0 - - - - - 768 39906 Other Tang. Property - PC Hardware 6.6 P, S, T & D Plant - Commodity 483 183 113 6 89 92 769 39907 Other Tang. Property - PC Software 6.6 P, S, T & D Plant - Commodity 112 42 26 1 21 21 770 39908 Other Tang. Property - Mainframe S/W 6.6 P, S, T & D Plant - Commodity 22,583 8,551 5,291 289 4,151 4,301 771 39909 Other Tang. Property - Application Software 6.6 P, S, T & D Plant - Commodity 54 20 13 1 10 10 772 39924 Other Tang. Property - General Startup Costs 6.6 P, S, T & D Plant - Commodity 0 - - - - - 773 Retirement Work in Progress 6.6 P, S, T & D Plant - Commodity 0 - - - - - 774775 Total General Plant 33,263 12,594 7,793 426 6,115 6,335 776777 TOTAL RESERVE FOR DEPRECIATION - COMMODITY 2,765,910 1,047,254 648,017 35,437 508,458 526,744

Exhibit PHR-2Page 41 of 75
Atmos Energy Corporation, Kentucky/Mid-States DivisionClass Cost of Service - Customer/Demand StudyForecasted Test Period: Twelve Months Ended March 31, 2020
ALLOCATION OF RESERVE FOR DEPRECIATION
Total Reserve for Depreciation
Line Acct. Allocation Allocation Total Residential Non-Res Sales Non-Res Sales Transport TransportNo. No. Factor Basis Company Sales Firm Interruptible Firm Interruptible
778 Intangible Plant:779780 30100 Organization 8,330 5,457 1,791 50 545 487 781 30200 Franchises & Consents 119,853 78,517 25,766 726 7,837 7,007 782 30300 Misc Intangible Plant 0 - - - - - 783784 Total Intangible Plant: 128,182 83,974 27,556 776 8,382 7,494785786 Production Plant:787788 32520 Producing Leaseholds 0 - - - - - 789 32540 Rights of Ways 0 - - - - - 790 33100 Production Gas Wells Equipment 0 - - - - - 791 33201 Field Lines 0 - - - - - 792 33202 Tributary Lines 0 - - - - - 793 33400 Field Meas. & Reg. Sta. Equip 0 - - - - - 794 33600 Purification Equipment 0 - - - - - 795796 Total Production Plant 0 0 0 0 0 0797798 Storage Plant:799800 35010 Land 0 - - - - - 801 35020 Rights of Way 4,453 1,850 1,097 59 732 715 802 35100 Structures and Improvements 6,289 2,612 1,550 83 1,033 1,010 803 35102 Compression Station Equipment 113,744 47,247 28,028 1,502 18,692 18,275 804 35103 Meas. & Reg. Sta. Structues 20,483 8,508 5,047 270 3,366 3,291 805 35104 Other Structures 100,144 41,598 24,677 1,322 16,457 16,089 806 35200 Wells \ Rights of Way 1,190,830 494,649 293,436 15,725 195,697 191,322 807 35201 Well Construction 1,419,511 589,639 349,786 18,745 233,278 228,063 808 35202 Well Equipment 450,595 187,169 111,033 5,950 74,049 72,394 809 35203 Cushion Gas 758,594 315,106 186,928 10,017 124,665 121,878 810 35210 Leaseholds 168,062 69,810 41,413 2,219 27,619 27,001 811 35211 Storage Rights 43,956 18,258 10,831 580 7,224 7,062 812 35301 Field Lines (88,396) (36,718) (21,782) (1,167) (14,527) (14,202) 813 35302 Tributary Lines 189,177 78,581 46,616 2,498 31,089 30,394 814 35400 Compressor Station Equipment 497,853 206,799 122,678 6,574 81,815 79,986 815 35500 Meas & Reg. Equipment 202,544 84,133 49,909 2,675 33,285 32,541 816 35600 Purification Equipment 191,797 79,669 47,261 2,533 31,519 30,815 817818 Total Storage Plant 5,269,635 2,188,910 1,298,508 69,587 865,995 846,635 819820 Transmission:821822 36510 Land & Land Rights 0 - - - - - 823 36520 Rights of Way 428,096 193,557 110,680 5,821 62,007 56,031 824 36602 Structures & Improvements 16,837 7,613 4,353 229 2,439 2,204 825 36603 Other Structues 53,066 23,993 13,720 722 7,686 6,946 826 36700 Mains Cathodic Protection 98,316 44,452 25,419 1,337 14,240 12,868 827 36701 Mains - Steel 16,387,961 7,409,562 4,236,933 222,852 2,373,684 2,144,929 828 36900 Meas. & Reg. Equipment 353,469 159,816 91,386 4,807 51,198 46,264 829 36901 Meas. & Reg. Equipment 1,774,251 802,200 458,714 24,127 256,988 232,222 830831 Total Transmission Plant 19,111,996 8,641,192 4,941,204 259,895 2,768,242 2,501,463 832833 Distribution:834835 37400 Land & Land Rights 0 - - - - - 836 37401 Land 0 - - - - - 837 37402 Land Rights 235,363 140,926 49,027 2,134 22,743 20,533 838 37403 Land Other 0 - - - - - 839 37500 Structures & Improvements 113,695 68,076 23,683 1,031 10,986 9,919 840 37501 Structures & Improvements T.B. 71,449 42,781 14,883 648 6,904 6,233 841 37502 Land Rights 35,399 21,196 7,374 321 3,421 3,088 842 37503 Improvements 1,920 1,150 400 17 186 168 843 37600 Mains Cathodic Protection 13,210,658 7,910,019 2,751,808 119,805 1,276,538 1,152,489 844 37601 Mains - Steel 33,671,112 20,160,928 7,013,763 305,357 3,253,619 2,937,445 845 37602 Mains - Plastic 19,028,671 11,393,614 3,963,712 172,567 1,838,729 1,660,048 846 37800 Meas & Reg. Sta. Equip - General 2,894,799 1,733,291 602,993 26,252 279,723 252,540 847 37900 Meas & Reg. Sta. Equip - City Gate 984,409 589,425 205,054 8,927 95,123 85,879 848 37905 Meas & Reg. Sta. Equipment T.b. 1,038,111 621,580 216,241 9,414 100,312 90,564 849 38000 Services 30,562,139 27,216,572 3,310,936 1,683 21,040 11,908 850 38100 Meters 21,386,354 13,797,005 7,076,398 24,923 311,648 176,380 851 38200 Meter Installaitons 26,987,899 17,410,737 8,929,858 31,450 393,275 222,578 852 38300 House Regulators 4,321,265 2,787,783 1,429,836 5,036 62,971 35,639 853 38400 House Reg. Installations 94,403 60,903 31,237 110 1,376 779 854 38500 Ind. Meas. & Reg. Sta. Equipment 2,958,741 - 2,928,115 1,488 18,607 10,531 855 38600 Other Prop. On Cust. Prem 0 - - - - - 856857 Total Distribution Plant 157,596,387 103,955,984 38,555,318 711,165 7,697,199 6,676,721

Exhibit PHR-2Page 42 of 75
Atmos Energy Corporation, Kentucky/Mid-States DivisionClass Cost of Service - Customer/Demand StudyForecasted Test Period: Twelve Months Ended March 31, 2020
ALLOCATION OF RESERVE FOR DEPRECIATION858859 General:860861 38900 Land & Land Rights 0 - - - - - 862 39000 Structures & Improvements 1,253,482 821,177 269,470 7,588 81,966 73,281 863 39002 Structures - Brick 107,583 70,479 23,128 651 7,035 6,289 864 39003 Improvements 292,730 191,772 62,930 1,772 19,142 17,114 865 39003 Air Conditioning Equipment 5,049 3,308 1,086 31 330 295 866 39004 Improvement to Leased Premises 1,248,110 817,657 268,315 7,555 81,615 72,967 867 39009 Office Furniture & Equipment 1,144,609 749,853 246,065 6,929 74,847 66,916 868 39100 Remittance Processing Equip 0 - - - - - 869 39102 Office Machines 0 - - - - - 870 39103 Transportation Equipment 113,788 74,544 24,462 689 7,441 6,652 871 39200 Trucks 0 - - - - - 872 39201 Trailers (2,529) (1,657) (544) (15) (165) (148) 873 39202 Stores Equipment 0 - - - - - 874 39400 Tools, Shop & Garage Equipment 1,300,851 852,209 279,654 7,874 85,064 76,050 875 39600 Power Operated Equipment 0 - - - - - 876 39603 Ditchers 39,655 25,978 8,525 240 2,593 2,318 877 39604 Backhoes 62,818 41,153 13,504 380 4,108 3,672 878 39605 Welders 19,456 12,746 4,183 118 1,272 1,137 879 39700 Communication Equipment 269,010 176,233 57,831 1,628 17,591 15,727 880 39701 Communication Equipment - Mobile Radios 0 - - - - - 881 39702 Communication Equipment - Fixed Radios 0 - - - - - 882 39705 Communication Equip. - Telemetering 0 - - - - - 883 39800 Miscellaneous Equipment 2,072,883 1,357,980 445,623 12,548 135,548 121,184 884 39900 Other Tangible Property 0 - - - - - 885 39901 Other Tangible Property - Servers - H/W 6,670 4,370 1,434 40 436 390 886 39902 Other Tangible Property - Servers - S/W 0 - - - - - 887 39903 Other Tangible Property - Network - H/W 64,644 42,350 13,897 391 4,227 3,779 888 39904 Other Tang. Property - CPU 0 - - - - - 889 39905 Other Tangible Property - MF - Hardware 0 - - - - - 890 39906 Other Tang. Property - PC Hardware 112,226 73,521 24,126 679 7,339 6,561 891 39907 Other Tang. Property - PC Software 0 - - - - - 892 39908 Other Tang. Property - Mainframe S/W 0 - - - - - 893 39909 Other Tang. Property - Application Software 117,916 77,249 25,349 714 7,711 6,894 894 Other Tang. Property - General Startup Costs 0 - - - - - 895 Retirement Work in Progress (6,374,709) (4,176,178) (1,370,419) (38,588) (416,848) (372,677) 896 AR 15 general plant amortization 0 - - - - - 897898 Total General Plant 1,854,243 1,214,745 398,620 11,224 121,251 108,402 899900 TOTAL DIRECT RESERVE FOR DEPRECIATION 183,960,444 116,084,806 45,221,207 1,052,647 11,461,069 10,140,715901902 Kentucky Mid-States General Office:903904 Intangible Plant:905906 30100 Organization 0 - - - - - 907 30200 Franchises & Consents 0 - - - - - 908 30300 Misc Intangible Plant 0 - - - - - 909910 Total Intangible Plant:911912 General:913914 37400 Land & Land Rights 0 - - - - - 915 39001 Structures Frame 52,708 34,530 11,331 319 3,447 3,081 916 36602 Structures & Improvements 0 - - - - - 917 38900 Land & Land Rights 0 - - - - - 918 39004 Air Conditioning Equipment 5,090 3,334 1,094 31 333 298 919 39009 Improvement to leased Premises 19,332 12,664 4,156 117 1,264 1,130 920 39100 Office Furniture & Equipment 19,220 12,591 4,132 116 1,257 1,124 921 39102 Remittance Processing Equip 0 - - - - - 922 39103 Office Machines 0 - - - - - 923 39200 Transportation Equipment 8,895 5,827 1,912 54 582 520 924 39201 Trucks 0 - - - - - 925 39202 Trailers 0 - - - - - 926 39300 Stores Equipment 0 - - - - - 927 39400 Tools, Shop & Garage Equipment 71,611 46,913 15,395 433 4,683 4,186 928 39600 Power Operated Equipment 4,375 2,866 941 26 286 256 929 39603 Ditchers 0 - - - - - 930 39604 Backhoes 0 - - - - - 931 39605 Welders 0 - - - - - 932 39700 Communication Equipment (2,991) (1,960) (643) (18) (196) (175) 933 39701 Communication Equipment - Mobile Radios 0 - - - - - 934 39702 Communication Equipment - Fixed Radios 0 - - - - - 935 39705 Communication Equip. - Telemetering 0 - - - - - 936 39800 Miscellaneous Equipment 359,341 235,410 77,250 2,175 23,498 21,008 937 39900 Other Tangible Property 0 - - - - - 938 39901 Other Tangible Property - Servers - H/W (17,306) (11,338) (3,720) (105) (1,132) (1,012) 939 39902 Other Tangible Property - Servers - S/W 0 - - - - - 940 39903 Other Tangible Property - Network - H/W 0 - - - - - 941 39904 Other Tang. Property - CPU 0 - - - - - 942 39905 Other Tangible Property - MF - Hardware 0 - - - - - 943 39906 Other Tang. Property - PC Hardware 34,944 22,892 7,512 212 2,285 2,043 944 39907 Other Tang. Property - PC Software 21,086 13,814 4,533 128 1,379 1,233 945 39908 Other Tang. Property - Mainframe S/W 412,432 270,191 88,664 2,497 26,969 24,112 946 39909 Other Tang. Property - Application Software 0 - - - - - 947 39924 Other Tang. Property - General Startup Costs 0 - - - - - 948 Retirement Work in Progress 26,143 17,127 5,620 158 1,710 1,528 949950 Total General Plant 1,014,877 664,863 218,176 6,143 66,364 59,332

Exhibit PHR-2Page 43 of 75
Atmos Energy Corporation, Kentucky/Mid-States DivisionClass Cost of Service - Customer/Demand StudyForecasted Test Period: Twelve Months Ended March 31, 2020
ALLOCATION OF RESERVE FOR DEPRECIATION951952 Shared Services General Office:953954 General:955956 37400 Land & Land Rights 0 - - - - - 957 39000 Structures & Improvements 90,855 59,520 19,532 550 5,941 5,312 958 36602 Structures & Improvements 0 - - - - - 959 37503 Improvements 0 - - - - - 960 39004 Air Conditioning Equipment 0 - - - - - 961 39009 Improvement to leased Premises 482,368 316,007 103,698 2,920 31,542 28,200 962 39100 Office Furniture & Equipment 116,207 76,129 24,982 703 7,599 6,794 963 39102 Remittance Processing Equip 0 0 0 0 0 0 964 39103 Office Machines 0 0 0 0 0 0 965 39200 Transportation Equipment 284 186 61 2 19 17 966 39201 Trucks 0 - - - - - 967 39202 Trailers 0 - - - - - 968 39300 Stores Equipment 0 - - - - - 969 39400 Tools, Shop & Garage Equipment 1,722 1,128 370 10 113 101 970 39600 Power Operated Equipment 0 - - - - - 971 39603 Ditchers 0 - - - - - 972 39604 Backhoes 0 - - - - - 973 39605 Welders 0 - - - - - 974 39700 Communication Equipment 28,314 18,549 6,087 171 1,851 1,655 975 39701 Communication Equipment - Mobile Radios 0 - - - - - 976 39702 Communication Equipment - Fixed Radios 0 - - - - - 977 39705 Communication Equip. - Telemetering 0 - - - - - 978 39800 Miscellaneous Equipment 2,855 1,870 614 17 187 167 979 39900 Other Tangible Property 8,438 5,528 1,814 51 552 493 980 39901 Other Tangible Property - Servers - H/W 1,335,526 874,925 287,108 8,084 87,331 78,077 981 39902 Other Tangible Property - Servers - S/W 969,778 635,318 208,480 5,870 63,415 56,695 982 39903 Other Tangible Property - Network - H/W 134,188 87,908 28,847 812 8,775 7,845 983 39904 Other Tang. Property - CPU 0 - - - - - 984 39905 Other Tangible Property - MF - Hardware 0 - - - - - 985 39906 Other Tang. Property - PC Hardware 94,055 61,617 20,220 569 6,150 5,499 986 39907 Other Tang. Property - PC Software 91,932 60,226 19,763 556 6,012 5,375 987 39908 Other Tang. Property - Mainframe S/W 2,311 1,514 497 14 151 135 988 39909 Other Tang. Property - Application Software 2,526,463 1,655,128 543,133 15,294 165,208 147,702 989 39924 Other Tang. Property - General Startup Costs 0 - - - - - 990 Retirement Work in Progress 0 - - - - - 991992 Total General Plant 5,885,295 3,855,554 1,265,206 35,626 384,845 344,065 993994 Shared Services Customer Support:995996 General:997998 37400 Land & Land Rights 0 - - - - - 999 39001 Structures Frame 0 - - - - -
1000 36602 Structures & Improvements 204,679 134,089 44,001 1,239 13,384 11,966 1001 37503 Improvements 0 - - - - - 1002 39004 Air Conditioning Equipment 0 - - - - - 1003 39009 Improvement to leased Premises 99,706 65,319 21,434 604 6,520 5,829 1004 39100 Office Furniture & Equipment 54,761 35,875 11,772 331 3,581 3,201 1005 39102 Remittance Processing Equip 0 - - - - - 1006 39103 Office Machines 0 - - - - - 1007 39200 Transportation Equipment 2,235 1,464 480 14 146 131 1008 39201 Trucks 0 - - - - - 1009 39202 Trailers 0 - - - - - 1010 39300 Stores Equipment 0 - - - - - 1011 39400 Tools, Shop & Garage Equipment 3,654 2,394 785 22 239 214 1012 39500 Laboratory Equipment 426 279 92 3 28 25 1013 39603 Ditchers 0 - - - - - 1014 39604 Backhoes 0 - - - - - 1015 39605 Welders 0 - - - - - 1016 39700 Communication Equipment 70,180 45,976 15,087 425 4,589 4,103 1017 39701 Communication Equipment - Mobile Radios 0 - - - - - 1018 39702 Communication Equipment - Fixed Radios 0 - - - - - 1019 39705 Communication Equip. - Telemetering 0 - - - - - 1020 39800 Miscellaneous Equipment 4,862 3,185 1,045 29 318 284 1021 39900 Other Tangible Property 31,781 20,820 6,832 192 2,078 1,858 1022 39901 Other Tangible Property - Servers - H/W 338,151 221,528 72,695 2,047 22,112 19,769 1023 39902 Other Tangible Property - Servers - S/W 77,363 50,682 16,631 468 5,059 4,523 1024 39903 Other Tangible Property - Network - H/W 22,965 15,045 4,937 139 1,502 1,343 1025 39904 Other Tang. Property - CPU 0 - - - - - 1026 39905 Other Tangible Property - MF - Hardware 0 - - - - - 1027 39906 Other Tang. Property - PC Hardware 43,877 28,745 9,433 266 2,869 2,565 1028 39907 Other Tang. Property - PC Software 10,171 6,663 2,186 62 665 595 1029 39908 Other Tang. Property - Mainframe S/W 2,050,478 1,343,302 440,807 12,412 134,083 119,875 1030 39909 Other Tang. Property - Application Software 4,865 3,187 1,046 29 318 284 1031 39924 Other Tang. Property - General Startup Costs 0 - - - - - 1032 Retirement Work in Progress 0 - - - - - 10331034 Total General Plant 3,020,151 1,978,551 649,264 18,282 197,490 176,563 10351036 TOTAL RESERVE FOR DEPRECIATION 193,880,768 122,583,775 47,353,852 1,112,698 12,109,768 10,720,675

Exhibit PHR-2Page 44 of 75
Atmos Energy Corporation, Kentucky/Mid-States DivisionClass Cost of Service - Customer/Demand StudyForecasted Test Period: Twelve Months Ended March 31, 2020
ALLOCATION OF OTHER RATE BASE
Customer
Line Allocation Allocation Total Residential Non-Res Sales Non-Res Sales Transport TransportNo. Factor Basis Company Sales Firm Interruptible Firm Interruptible
1 Rate Base Additions:23 Materials and Supplies - KY Direct 7.2 Allocated O&M Expenses - Cust (59,842) (49,202) (10,322) (28) (185) (105) 4 Materials and Supplies - KY Mid-States GO 7.2 Allocated O&M Expenses - Cust 77,382 63,623 13,347 36 240 136 5 Materials and Supplies - Shared Services GO 7.2 Allocated O&M Expenses - Cust (0) (0) (0) (0) (0) (0) 6 Materials and Supplies - Shared Services CS 7.2 Allocated O&M Expenses - Cust 0 - - - - - 7 Gas Storage Inventory 99.0 - 0 - - - - - 8 Prepayments - KY Direct 7.2 Allocated O&M Expenses - Cust 0 - - - - - 9 Prepayments - KY Mid-States GO 7.2 Allocated O&M Expenses - Cust 0 - - - - -
10 Prepayments - Shared Services GO 7.2 Allocated O&M Expenses - Cust 0 - - - - - 11 Prepayments - Shared Services CS 7.2 Allocated O&M Expenses - Cust 0 - - - - - 12 Cash Working Capital 7.2 Allocated O&M Expenses - Cust 400,723 329,472 69,119 188 1,241 703 13 Regulatory Assets 7.2 Allocated O&M Expenses - Cust (4,913,977) (4,040,242) (847,591) (2,308) (15,219) (8,616) 1415 Total Rate Base Additions (4,495,713) (3,696,348) (775,447) (2,112) (13,924) (7,883)161718 Rate Base Deductions:1920 Customer Advances - KY Direct 2.0 Bills (747,234) (665,436) (80,951) (41) (514) (291) 21 Customer Advances - KY Mid-States GO 2.0 Bills 0 - - - - - 22 Customer Advances - Shared Services GO 2.0 Bills 0 - - - - - 23 Customer Advances - Shared Services CS 2.0 Bills 0 - - - - - 24 ADIT - KY Direct 9.2 Allocated Net Plant - Cust (41,950,948) (34,853,614) (6,843,930) (12,312) (153,957) (87,134) 25 ADIT - KY Mid-States GO 9.2 Allocated Net Plant - Cust 12,759,018 10,600,426 2,081,522 3,745 46,825 26,501 26 ADIT - Shared Services GO 9.2 Allocated Net Plant - Cust (473,848) (393,682) (77,304) (139) (1,739) (984) 27 ADIT - Shared Services CS 9.2 Allocated Net Plant - Cust 37,760 31,372 6,160 11 139 78 28 Change in Net Operating Loss Carryforward 9.2 Allocated Net Plant - Cust 723,651 601,222 118,057 212 2,656 1,503 2930 Total Rate Base Deductions (29,651,601) (24,679,712) (4,796,446) (8,524) (106,592) (60,327) 313233 TOTAL OTHER RB - CUSTOMER (34,147,314) (28,376,061) (5,571,893) (10,636) (120,515) (68,209) 3435 Interest on Customer Deposits 2.0 Bills 0 - - - - -

Exhibit PHR-2Page 45 of 75
Atmos Energy Corporation, Kentucky/Mid-States DivisionClass Cost of Service - Customer/Demand StudyForecasted Test Period: Twelve Months Ended March 31, 2020
ALLOCATION OF OTHER RATE BASE
Demand
Line Allocation Allocation Total Residential Non-Res Sales Non-Res Sales Transport TransportNo. Factor Basis Company Sales Firm Interruptible Firm Interruptible35 Rate Base Additions:3637 Materials and Supplies - KY Direct 7.4 Allocated O&M Expenses - Demand (42,645) (19,281) (11,025) (580) (6,177) (5,582) 38 Materials and Supplies - KY Mid-States GO 7.4 Allocated O&M Expenses - Demand 55,144 24,933 14,257 750 7,987 7,218 39 Materials and Supplies - Shared Services GO 7.4 Allocated O&M Expenses - Demand (0) (0) (0) (0) (0) (0) 40 Materials and Supplies - Shared Services CS 7.4 Allocated O&M Expenses - Demand 0 - - - - - 41 Gas Storage Inventory 99.0 - 0 - - - - - 42 Prepayments - KY Direct 7.4 Allocated O&M Expenses - Demand 0 - - - - - 43 Prepayments - KY Mid-States GO 7.4 Allocated O&M Expenses - Demand 0 - - - - - 44 Prepayments - Shared Services GO 7.4 Allocated O&M Expenses - Demand 0 - - - - - 45 Prepayments - Shared Services CS 7.4 Allocated O&M Expenses - Demand 0 - - - - - 46 Cash Working Capital 7.4 Allocated O&M Expenses - Demand 285,564 129,113 73,829 3,883 41,362 37,376 47 Regulatory Assets 7.4 Allocated O&M Expenses - Demand (3,501,799) (1,583,284) (905,353) (47,619) (507,212) (458,331) 4849 Total Rate Base Additions (3,203,736) (1,448,520) (828,292) (43,566) (464,039) (419,319)505152 Rate Base Deductions:5354 Customer Advances - KY Direct 99.0 - 0 - - - - - 55 Customer Advances - KY Mid-States GO 99.0 - 0 - - - - - 56 Customer Advances - Shared Services GO 99.0 - 0 - - - - - 57 Customer Advances - Shared Services CS 99.0 - 0 - - - - - 58 ADIT - KY Direct 9.4 Allocated Net Plant - Demand (32,422,107) (14,659,152) (8,382,392) (440,893) (4,696,121) (4,243,549) 59 ADIT - KY Mid-States GO 9.4 Allocated Net Plant - Demand 9,860,904 4,458,455 2,549,432 134,094 1,428,285 1,290,639 60 ADIT - Shared Services GO 9.4 Allocated Net Plant - Demand (366,217) (165,579) (94,682) (4,980) (53,044) (47,932) 61 ADIT - Shared Services CS 9.4 Allocated Net Plant - Demand 29,183 13,195 7,545 397 4,227 3,820 62 Change in Net Operating Loss Carryforward 9.4 Allocated Net Plant - Demand 559,279 252,869 144,596 7,605 81,008 73,201 6364 Total Rate Base Deductions (22,338,958) (10,100,213) (5,775,501) (303,777) (3,235,646) (2,923,822) 656667 TOTAL OTHER RB - DEMAND (25,542,694) (11,548,733) (6,603,793) (347,343) (3,699,685) (3,343,141) 6869 Interest on Customer Deposits 3.0 Peak Day 0 - - - - -

Exhibit PHR-2Page 46 of 75
Atmos Energy Corporation, Kentucky/Mid-States DivisionClass Cost of Service - Customer/Demand StudyForecasted Test Period: Twelve Months Ended March 31, 2020
ALLOCATION OF OTHER RATE BASE
Commodity
Line Allocation Allocation Total Residential Non-Res Sales Non-Res Sales Transport TransportNo. Factor Basis Company Sales Firm Interruptible Firm Interruptible69 Rate Base Additions:7071 Materials and Supplies - KY Direct 7.6 Allocated O&M Expenses - Comm (299,637) (175,607) (119,309) (4,252) (227) (240) 72 Materials and Supplies - KY Mid-States GO 7.6 Allocated O&M Expenses - Comm 387,463 227,079 154,280 5,499 294 311 73 Materials and Supplies - Shared Services GO 7.6 Allocated O&M Expenses - Comm (0) (0) (0) (0) (0) (0) 74 Materials and Supplies - Shared Services CS 7.6 Allocated O&M Expenses - Comm 0 - - - - - 75 Gas Storage Inventory 1.0 Mcf 8,905,991 2,696,819 1,827,594 90,291 2,021,444 2,269,843 76 Prepayments - KY Direct 7.6 Allocated O&M Expenses - Comm 0 - - - - - 77 Prepayments - KY Mid-States GO 7.6 Allocated O&M Expenses - Comm 0 - - - - - 78 Prepayments - Shared Services GO 7.6 Allocated O&M Expenses - Comm 0 - - - - - 79 Prepayments - Shared Services CS 7.6 Allocated O&M Expenses - Comm 0 - - - - - 80 Cash Working Capital 7.6 Allocated O&M Expenses - Comm 2,006,472 1,175,928 798,937 28,475 1,522 1,609 81 Regulatory Assets 7.6 Allocated O&M Expenses - Comm (24,604,894) (14,420,124) (9,797,181) (349,187) (18,665) (19,737) 8283 Total Rate Base Additions (13,604,604) (10,495,905) (7,135,679) (229,175) 2,004,368 2,251,786848586 Rate Base Deductions:8788 Customer Advances - KY Direct 99.0 - 0 - - - - - 89 Customer Advances - KY Mid-States GO 99.0 - 0 - - - - - 90 Customer Advances - Shared Services GO 99.0 - 0 - - - - - 91 Customer Advances - Shared Services CS 99.0 - 0 - - - - - 92 ADIT - KY Direct 9.6 Allocated Net Plant - Comm (744,201) (281,776) (174,357) (9,535) (136,807) (141,727) 93 ADIT - KY Mid-States GO 9.6 Allocated Net Plant - Comm 226,342 85,700 53,029 2,900 41,609 43,105 94 ADIT - Shared Services GO 9.6 Allocated Net Plant - Comm (8,406) (3,183) (1,969) (108) (1,545) (1,601) 95 ADIT - Shared Services CS 9.6 Allocated Net Plant - Comm 670 254 157 9 123 128 96 Change in Net Operating Loss Carryforward 9.6 Allocated Net Plant - Comm 12,837 4,861 3,008 164 2,360 2,445 9798 Total Rate Base Deductions (512,758) (194,145) (120,133) (6,569) (94,260) (97,650) 99
100101 TOTAL OTHER RB - COMMODITY (14,117,362) (10,690,050) (7,255,811) (235,744) 1,910,108 2,154,136 102103 Interest on Customer Deposits 1.0 Mcf 0 - - - - -

Exhibit PHR-2Page 47 of 75
Atmos Energy Corporation, Kentucky/Mid-States DivisionClass Cost of Service - Customer/Demand StudyForecasted Test Period: Twelve Months Ended March 31, 2020
ALLOCATION OF OTHER RATE BASE
Total Other Rate Base
Line Allocation Allocation Total Residential Non-Res Sales Non-Res Sales Transport TransportNo. Factor Basis Company Sales Firm Interruptible Firm Interruptible103 Rate Base Additions:104105 Materials and Supplies - KY Direct (402,124) (244,090) (140,657) (4,860) (6,589) (5,927) 106 Materials and Supplies - KY Mid-States GO 519,990 315,635 181,884 6,285 8,521 7,664 107 Materials and Supplies - Shared Services GO (0) (0) (0) (0) (0) (0) 108 Materials and Supplies - Shared Services CS 0 - - - - - 109 Gas Storage Inventory 8,905,991 2,696,819 1,827,594 90,291 2,021,444 2,269,843 110 Prepayments - KY Direct 0 - - - - - 111 Prepayments - KY Mid-States GO 0 - - - - - 112 Prepayments - Shared Services GO 0 - - - - - 113 Prepayments - Shared Services CS 0 - - - - - 114 Cash Working Capital 2,692,759 1,634,513 941,886 32,547 44,125 39,688 115 Regulatory Assets (33,020,670) (20,043,651) (11,550,125) (399,115) (541,096) (486,684) 116117 Total Rate Base Additions (21,304,054) (15,640,773) (8,739,417) (274,853) 1,526,405 1,824,584118119120 Rate Base Deductions:121122 Customer Advances - KY Direct (747,234) (665,436) (80,951) (41) (514) (291) 123 Customer Advances - KY Mid-States GO 0 - - - - - 124 Customer Advances - Shared Services GO 0 - - - - - 125 Customer Advances - Shared Services CS 0 - - - - - 126 ADIT - KY Direct (75,117,257) (49,794,543) (15,400,679) (462,740) (4,986,885) (4,472,409) 127 ADIT - KY Mid-States GO 22,846,265 15,144,580 4,683,983 140,738 1,516,718 1,360,245 128 ADIT - Shared Services GO (848,471) (562,444) (173,955) (5,227) (56,328) (50,517) 129 ADIT - Shared Services CS 67,614 44,820 13,862 417 4,489 4,026 130 Change in Net Operating Loss Carryforward 1,295,767 858,952 265,661 7,982 86,023 77,149 131132 Total Rate Base Deductions (52,503,316) (34,974,070) (10,692,079) (318,871) (3,436,498) (3,081,799) 133134135 TOTAL OTHER RB (73,807,370) (50,614,844) (19,431,496) (593,724) (1,910,092) (1,257,214) 136137 Interest on Customer Deposits 0 - - - - -

Exhibit PHR-2Page 48 of 75
Atmos Energy Corporation, Kentucky/Mid-States DivisionClass Cost of Service - Customer/Demand StudyForecasted Test Period: Twelve Months Ended March 31, 2020
ALLOCATION OF O&M EXPENSES
Customer
Line Acct. Allocation Allocation Total Residential Non-Res Sales Non-Res Sales Transport TransportNo. No. Factor Basis Company Sales Firm Interruptible Firm Interruptible
1 Production & Gathering:2 Operation3 7500 Op., Sup., & Eng. 99.0 - 0 - - - - - 4 7510 Production Maps & Records 99.0 - 0 - - - - - 5 7530 Field Lines Expenses 99.0 - 0 - - - - - 6 7540 Field Compressor Station Expense 99.0 - 0 - - - - - 7 7550 Field Compressor Sta. Fuel & Pwr. 99.0 - 0 - - - - - 8 7560 Field Meas. & Regul. Station Exp 99.0 - 0 - - - - - 9 7570 Purification Expense 99.0 - 0 - - - - -
10 7590 Other Expenses 99.0 - 0 - - - - - 11 Maintenance12 7610 Maint. Sup., & Eng. 99.0 - 0 - - - - - 13 7620 Structures and Improvements 99.0 - 0 - - - - - 14 7640 Field Line Maintenance 99.0 - 0 - - - - - 15 7650 Compressor Station Equip. Maint. 99.0 - 0 - - - - - 16 7660 Meas. & Regul. Station Equip Maint 99.0 - 0 - - - - - 17 7670 Purification Equipment Maintenance 99.0 - 0 - - - - - 18 7680 Other Equipment Maintenance 99.0 - 0 - - - - - 19 7690 Gas Processed By Others 99.0 - 0 - - - - - 20 Total Production & Gathering 0 0 0 0 0 02122 Other Gas Supply Expenses:23 Operation24 8001 Intercompany Gas Well-head Purchases 99.0 - 0 - - - - - 25 8010 Natural gas field line purchases 99.0 - 0 - - - - - 26 8040 Natural gas city gate purchases 99.0 - 0 - - - - - 27 8050 Other purchases 99.0 - 0 - - - - - 28 8051 PGA for Residential 99.0 - 0 - - - - - 29 8052 PGA for Commercial 99.0 - 0 - - - - - 30 8053 PGA for Industrial 99.0 - 0 - - - - - 31 8054 PGA for Public Authorities 99.0 - 0 - - - - - 32 8058 Unbilled PGA Cost 99.0 - 0 - - - - - 33 8059 PGA Offset to Unrecovered Gas Cost 99.0 - 0 - - - - - 34 8060 Exchange gas 99.0 - 0 - - - - - 35 8081 Gas withdrawn from storage-Debit 99.0 - 0 - - - - - 36 8082 Gas delivered to storage-Credit 99.0 - 0 - - - - - 37 8120 Gas used for other utility operations-Credit 99.0 - 0 - - - - - 38 8580 Transmission and compression of gas by others 99.0 - 0 - - - - - 39 Maintenance40 8350 Maint. Of Purch. Gas Meas. Sta. 99.0 - 0 - - - - - 41 Total Other Gas Supply Expenses 0 0 0 0 0 04243 Underground Storage:44 Operation45 8140 Storage-Operation supervision and engineering 99.0 - 0 - - - - - 46 8160 Wells expenses 99.0 - 0 - - - - - 47 8170 Lines expenses 99.0 - 0 - - - - - 48 8180 Compressor station expenses 99.0 - 0 - - - - - 49 8190 Compressor station fuel and power 99.0 - 0 - - - - - 50 8200 Storage-Measuring and regulating station expenses 99.0 - 0 - - - - - 51 8210 Storage-Purification expenses 99.0 - 0 - - - - - 52 8240 Storage-Other expenses 99.0 - 0 - - - - - 53 8250 Storage well royalties 99.0 - 0 - - - - - 54 8260 Rents 99.0 - 0 - - - - - 55 Maintenance56 8300 Maint. Sup., & Eng. 99.0 - 0 - - - - - 57 8310 Structures and Improvements 99.0 - 0 - - - - - 58 8320 Reservoirs & Wells Maintenance 99.0 - 0 - - - - - 59 8330 Line Maintenance 99.0 - 0 - - - - - 60 8340 Compressor Station Equip Maint 99.0 - 0 - - - - - 61 8350 Meas. & Regul. Station Equip Maint 99.0 - 0 - - - - - 62 8360 Purification Equipment Maintenance 99.0 - 0 - - - - - 63 8410 Other storage expenses-Operation labor and expenses 99.0 - 0 - - - - - 64 Total Underground Storage Expense 0 0 0 0 0 06566 Transmission:67 Operation68 8500 Op., Sup., & Eng. 99.0 - 0 - - - - - 69 8510 System Control & Load Dispatching 99.0 - 0 - - - - - 70 8520 Communication Systems Expense 99.0 - 0 - - - - - 71 8530 Compressor Station Labor Expense 99.0 - 0 - - - - - 72 8540 Compressor Station Fuel Gas 99.0 - 0 - - - - - 73 8550 Compressor Station Fuel & Power 99.0 - 0 - - - - - 74 8560 Mains Expense 99.0 - 0 - - - - - 75 8570 Meas. & Regul. Station Expenses 99.0 - 0 - - - - - 76 8580 LDC Payment 99.0 - 0 - - - - - 77 8580 LDC Payment - A&G 99.0 - 0 - - - - - 78 8590 Other Expenses 99.0 - 0 - - - - - 79 8600 Rents 99.0 - 0 - - - - - 80 Maintenance81 8610 Maint. Sup., & Eng. 99.0 - 0 - - - - - 82 8620 Structures and Improvements 99.0 - 0 - - - - - 83 8630 Mains 99.0 - 0 - - - - - 84 8640 Compressor Station Equip Maint 99.0 - 0 - - - - - 85 8650 Meas. & Regul. Station Equip Maint 99.0 - 0 - - - - - 86 8660 Communication Equipment Maintenance 99.0 - 0 - - - - - 87 8670 Other Equipment Maintenance 99.0 - 0 - - - - - 88 Total Transmission Expense 0 0 0 0 0 0

Exhibit PHR-2Page 49 of 75
Atmos Energy Corporation, Kentucky/Mid-States DivisionClass Cost of Service - Customer/Demand StudyForecasted Test Period: Twelve Months Ended March 31, 2020
ALLOCATION OF O&M EXPENSES8990 Distribution:91 Operation92 8700 Supervision and Engineering 10.2 Composite of Accts. 871-879 & 886-893 - Cust 422,826 326,681 92,474 178 2,230 1,262 93 8710 Distribution Load Dispatching 99.0 - 0 - - - - - 94 8711 Odorization 99.0 - 0 - - - - - 94 8720 Compressor Station Labor & Expenses 11.2 Composite of Accts. 376 & 380 - Cust 0 - - - - - 95 8740 Mains & Services 12.2 Composite of Accts. 374-379 - Cust 1,445,101 1,286,909 156,554 80 995 563 96 8750 Measuring and Regulating Station Exp. - Gen 11.2 Composite of Accts. 376 & 380 - Cust 192,218 171,176 20,824 11 132 75 97 8760 Measuring and Regulating Station Exp. - Ind. 2.2 Non-Residential Bills 120,928 - 119,676 61 761 430 98 8770 Measuring and Regulating Sta. Exp. - City Gate 11.2 Composite of Accts. 376 & 380 - Cust 12,805 11,403 1,387 1 9 5 99 8780 Meters and House Regulator Expense 13.2 Composite of Accts. 381-383 - Cust 820,621 529,408 271,530 956 11,958 6,768
100 8790 Customer Installations Expense 2.0 Bills 2,246 2,000 243 0 2 1 101 8800 Other Expense 10.2 Composite of Accts. 871-879 & 886-893 - Cust 1,406 1,086 307 1 7 4 102 8810 Rents 10.2 Composite of Accts. 871-879 & 886-893 - Cust 162,285 125,384 35,493 68 856 484 103 Maintenance104 8850 Maintenance Supervision and Engineering 10.2 Composite of Accts. 871-879 & 886-893 - Cust 697 538 152 0 4 2 105 8860 Maintenance of Structures and Improvements 12.2 Composite of Accts. 374-379 - Cust 33 29 4 0 0 0 106 8870 Maintenance of Mains 12.2 Composite of Accts. 374-379 - Cust 9,650 8,593 1,045 1 7 4 107 8890 Maintenance of compressor station equipment 99.0 - 0 - - - - - 108 8900 Maint. of Measuring and Regulating Station Equip. - General 12.2 Composite of Accts. 374-379 - Cust 21,931 19,530 2,376 1 15 9 109 8910 Maint. of Measuring and Regulating Station Equip. - Industrial 2.2 Non-Residential Bills 1,723 - 1,705 1 11 6 110 8920 Maint. of Measuring and Regulating Station Equip. - City Gate 12.2 Composite of Accts. 374-379 - Cust 266 237 29 0 0 0 111 8930 Maintenance of Services 14.2 Account 380 - Cust 6,533 5,817 708 0 4 3 112 8940 Maintenance of Meters and House Regulators 13.2 Composite of Accts. 381-383 - Cust 0 - - - - - 113 8950 Maintenance of Other Equipment 10.2 Composite of Accts. 871-879 & 886-893 - Cust 2,575 1,989 563 1 14 8 114 Total Distribution 3,223,843 2,490,783 705,072 1,360 17,005 9,624115116 Customer Accounts:117 9010 Supervision 2.0 Bills 0 - - - - - 118 9020 Meter Reading Expense 2.0 Bills 1,085,047 966,269 117,548 60 747 423 119 9030 Customer Records and Collection Expenses 2.0 Bills 1,220,802 1,087,164 132,255 67 840 476 120 9040 Uncollectible Accounts 8.0 Customer Deposit Balances 341,050 208,226 129,278 3,493 29 25 121 9050 Miscellaneous Customer Accounts Expenses 2.0 Bills 0 - - - - - 122 Total Customer Accounts 2,646,900 2,261,659 379,081 3,620 1,616 924 123124 Customer Service and Information:125 9070 Supervision 2.0 Bills 0 - - - - - 126 9080 Customer Assistance Expenses 2.0 Bills 0 - - - - - 127 9090 Informational and Instructional Advertising Expenses 2.0 Bills 128,272 114,230 13,896 7 88 50 128 9100 Miscellaneous Customer Service and Informational Expenses 2.0 Bills 0 - - - - - 129 Total Customer Service and Information 128,272 114,230 13,896 7 88 50 130131 Sales:132 9110 Supervision 2.0 Bills 253,468 225,721 27,459 14 174 99 133 9120 Demonstrating and Selling Expenses 2.0 Bills 115,937 103,246 12,560 6 80 45 134 9130 Advertising Expenses 2.0 Bills 35,170 31,320 3,810 2 24 14 135 9160 Miscellaneous Sales Expenses 2.0 Bills (196,297) (174,809) (21,266) (11) (135) (76) 136 Total Sales 208,278 185,478 22,564 11 143 81 137138 Administrative & General:139 Operation140 9200 Administrative and General Salaries 17.2 Composite of Accts. 870-902, 905-916, 924 & 928-930.1 - Cust (476,980) (391,790) (82,539) (129) (1,611) (912) 141 9210 Office Supplies and Expenses 17.2 Composite of Accts. 870-902, 905-916, 924 & 928-930.1 - Cust 10,068 8,270 1,742 3 34 19 142 9220 Administrative Expenses Transferred - Customer Support 2.0 Bills 0 - - - - - 143 9220 Administrative Expenses Transferred - General 17.2 Composite of Accts. 870-902, 905-916, 924 & 928-930.1 - Cust 8,286,720 6,806,682 1,433,970 2,238 27,989 15,841 144 9230 Outside Services Employed 17.2 Composite of Accts. 870-902, 905-916, 924 & 928-930.1 - Cust 194,153 159,476 33,597 52 656 371 145 9240 Property Insurance 9.2 Allocated Net Plant - Cust 2,077 1,725 339 1 8 4 146 9250 Injuries and Damages 17.2 Composite of Accts. 870-902, 905-916, 924 & 928-930.1 - Cust 42,300 34,745 7,320 11 143 81 147 9260 Employee Pensions and Benefits 17.2 Composite of Accts. 870-902, 905-916, 924 & 928-930.1 - Cust 618,951 508,404 107,106 167 2,091 1,183 148 9270 Franchise Requirements 2.0 Bills 646 576 70 0 0 0 149 9280 Regulatory Commission Expenses 2.0 Bills 852,920 759,553 92,401 47 587 332 150 930.1 General Advertising Expenses 2.0 Bills 0 - - - - - 151 930.2 Miscellaneous General Expense 17.2 Composite of Accts. 870-902, 905-916, 924 & 928-930.1 - Cust (24,191) (19,870) (4,186) (7) (82) (46) 152 9310 Rents 17.2 Composite of Accts. 870-902, 905-916, 924 & 928-930.1 - Cust (4,730) (3,885) (818) (1) (16) (9) 153 Maintenance154 9320 Maintenance of General Plant 17.2 Composite of Accts. 870-902, 905-916, 924 & 928-930.1 - Cust 6,746 5,541 1,167 2 23 13 155 Total A&G 9,508,682 7,869,429 1,590,169 2,385 29,821 16,878156157 TOTAL O&M EXPENSE - CUSTOMER 15,715,974 12,921,579 2,710,782 7,383 48,674 27,556

Exhibit PHR-2Page 50 of 75
Atmos Energy Corporation, Kentucky/Mid-States DivisionClass Cost of Service - Customer/Demand StudyForecasted Test Period: Twelve Months Ended March 31, 2020
ALLOCATION OF O&M EXPENSES
Demand
Line Acct. Allocation Allocation Total Residential Non-Res Sales Non-Res Sales Transport TransportNo. No. Factor Basis Company Sales Firm Interruptible Firm Interruptible158 Production & Gathering:159 Operation160 7500 Op., Sup., & Eng. 99.0 - 0 - - - - - 161 7510 Production Maps & Records 99.0 - 0 - - - - - 162 7530 Field Lines Expenses 99.0 - 0 - - - - - 163 7540 Field Compressor Station Expense 99.0 - 0 - - - - - 164 7550 Field Compressor Sta. Fuel & Pwr. 99.0 - 0 - - - - - 165 7560 Field Meas. & Regul. Station Exp 99.0 - 0 - - - - - 166 7570 Purification Expense 99.0 - 0 - - - - - 167 7590 Other Expenses 99.0 - 0 - - - - - 168 Maintenance169 7610 Maint. Sup., & Eng. 99.0 - 0 - - - - - 170 7620 Structures and Improvements 99.0 - 0 - - - - - 171 7640 Field Line Maintenance 99.0 - 0 - - - - - 172 7650 Compressor Station Equip. Maint. 99.0 - 0 - - - - - 173 7660 Meas. & Regul. Station Equip Maint 99.0 - 0 - - - - - 174 7670 Purification Equipment Maintenance 99.0 - 0 - - - - - 175 7680 Other Equipment Maintenance 99.0 - 0 - - - - - 176 7690 Gas Processed By Others 99.0 - 0 - - - - - 177 Total Production & Gathering 0 0 0 0 0 0178179 Other Gas Supply Expenses:180 Operation181 8001 Intercompany Gas Well-head Purchases 99.0 - 0 - - - - - 182 8010 Natural gas field line purchases 99.0 - 0 - - - - - 183 8040 Natural gas city gate purchases 99.0 - 0 - - - - - 184 8050 Other purchases 99.0 - 0 - - - - - 185 8051 PGA for Residential 99.0 - 0 - - - - - 186 8052 PGA for Commercial 99.0 - 0 - - - - - 187 8053 PGA for Industrial 99.0 - 0 - - - - - 188 8054 PGA for Public Authorities 99.0 - 0 - - - - - 189 8058 Unbilled PGA Cost 99.0 - 0 - - - - - 190 8059 PGA Offset to Unrecovered Gas Cost 99.0 - 0 - - - - - 191 8060 Exchange gas 99.0 - 0 - - - - - 192 8081 Gas withdrawn from storage-Debit 99.0 - 0 - - - - - 193 8082 Gas delivered to storage-Credit 99.0 - 0 - - - - - 194 8120 Gas used for other utility operations-Credit 99.0 - 0 - - - - - 195 8580 Transmission and compression of gas by others 99.0 - 0 - - - - - 196 Maintenance197 8350 Maint. Of Purch. Gas Meas. Sta. 99.0 - 0 - - - - - 198 Total Other Gas Supply Expenses 0 0 0 0 0 0199200 Underground Storage:201 Operation202 8140 Storage-Operation supervision and engineering 3.0 Peak Day 0 - - - - - 203 8160 Wells expenses 3.0 Peak Day 145,959 65,993 37,736 1,985 21,141 19,104 204 8170 Lines expenses 3.0 Peak Day 10,626 4,804 2,747 144 1,539 1,391 205 8180 Compressor station expenses 3.0 Peak Day 12,530 5,665 3,240 170 1,815 1,640 206 8190 Compressor station fuel and power 3.0 Peak Day 368 166 95 5 53 48 207 8200 Storage-Measuring and regulating station expenses 3.0 Peak Day 3,090 1,397 799 42 448 404 208 8210 Storage-Purification expenses 3.0 Peak Day 24,928 11,271 6,445 339 3,611 3,263 209 8240 Storage-Other expenses 3.0 Peak Day 0 - - - - - 210 8250 Storage well royalties 3.0 Peak Day 4,382 1,981 1,133 60 635 573 211 8260 Rents 3.0 Peak Day 0 - - - - - 212 Maintenance213 8300 Maint. Sup., & Eng. 3.0 Peak Day 0 - - - - - 214 8310 Structures and Improvements 3.0 Peak Day 6,368 2,879 1,646 87 922 833 215 8320 Reservoirs & Wells Maintenance 3.0 Peak Day 0 - - - - - 216 8330 Line Maintenance 3.0 Peak Day 0 - - - - - 217 8340 Compressor Station Equip Maint 3.0 Peak Day 1,665 753 431 23 241 218 218 8350 Meas. & Regul. Station Equip Maint 3.0 Peak Day 0 - - - - - 219 8360 Purification Equipment Maintenance 3.0 Peak Day 0 - - - - - 220 8410 Other storage expenses-Operation labor and expenses 3.0 Peak Day 34,542 15,617 8,930 470 5,003 4,521 221 Total Underground Storage Expense 244,457 110,527 63,202 3,324 35,408 31,996222223 Transmission:224 Operation225 8500 Op., Sup., & Eng. 3.0 Peak Day 35 16 9 0 5 5 226 8510 System Control & Load Dispatching 3.0 Peak Day 0 - - - - - 227 8520 Communication Systems Expense 3.0 Peak Day 0 - - - - - 228 8530 Compressor Station Labor Expense 3.0 Peak Day 0 - - - - - 229 8540 Compressor Station Fuel Gas 3.0 Peak Day 0 - - - - - 230 8550 Compressor Station Fuel & Power 3.0 Peak Day 308 139 80 4 45 40 231 8560 Mains Expense 3.0 Peak Day 366,202 165,573 94,678 4,980 53,042 47,930 232 8570 Meas. & Regul. Station Expenses 3.0 Peak Day 27,278 12,333 7,052 371 3,951 3,570 233 8580 LDC Payment 3.0 Peak Day 0 - - - - - 234 8580 LDC Payment - A&G 3.0 Peak Day 0 - - - - - 235 8590 Other Expenses 3.0 Peak Day 0 - - - - - 236 8600 Rents 3.0 Peak Day 0 - - - - - 237 Maintenance238 8610 Maint. Sup., & Eng. 3.0 Peak Day 0 - - - - - 239 8620 Structures and Improvements 3.0 Peak Day 0 - - - - - 240 8630 Mains 3.0 Peak Day 16,280 7,361 4,209 221 2,358 2,131 241 8640 Compressor Station Equip Maint 3.0 Peak Day 0 - - - - - 242 8650 Meas. & Regul. Station Equip Maint 3.0 Peak Day 0 - - - - - 243 8660 Communication Equipment Maintenance 3.0 Peak Day 0 - - - - - 244 8670 Other Equipment Maintenance 3.0 Peak Day 0 - - - - - 245 Total Transmission Expense 410,103 185,422 106,028 5,577 59,401 53,676

Exhibit PHR-2Page 51 of 75
Atmos Energy Corporation, Kentucky/Mid-States DivisionClass Cost of Service - Customer/Demand StudyForecasted Test Period: Twelve Months Ended March 31, 2020
ALLOCATION OF O&M EXPENSES246247 Distribution:248 Operation249 8700 Supervision and Engineering 10.4 Composite of Accts. 871-879 & 886-893 - Demand 537,275 242,921 138,907 7,306 77,821 70,321 250 8710 Distribution Load Dispatching 99.0 - 0 - - - - - 251 8711 Odorization 99.0 - 0 - - - - - 251 8720 Compressor Station Labor & Expenses 11.4 Composite of Accts. 376 & 380 - Demand 0 - - - - - 252 8740 Mains & Services 12.4 Composite of Accts. 374-379 - Demand 2,875,617 1,300,166 743,460 39,104 416,514 376,374 253 8750 Measuring and Regulating Station Exp. - Gen 12.4 Composite of Accts. 374-379 - Demand 382,496 172,939 98,890 5,201 55,402 50,063 254 8760 Measuring and Regulating Station Exp. - Ind. 99.0 - 0 - - - - - 255 8770 Measuring and Regulating Sta. Exp. - City Gate 12.4 Composite of Accts. 374-379 - Demand 25,481 11,521 6,588 347 3,691 3,335 256 8780 Meters and House Regulator Expense 13.4 Composite of Accts. 381-383 - Demand 0 - - - - - 257 8790 Customer Installations Expense 99.0 - 0 - - - - - 258 8800 Other Expense 10.4 Composite of Accts. 871-879 & 886-893 - Demand 1,787 808 462 24 259 234 259 8810 Rents 10.4 Composite of Accts. 871-879 & 886-893 - Demand 206,212 93,236 53,314 2,804 29,868 26,990 260 Maintenance261 8850 Maintenance Supervision and Engineering 10.4 Composite of Accts. 871-879 & 886-893 - Demand 886 400 229 12 128 116 262 8860 Maintenance of Structures and Improvements 12.4 Composite of Accts. 374-379 - Demand 65 30 17 1 9 9 263 8870 Maintenance of Mains 12.4 Composite of Accts. 374-379 - Demand 19,202 8,682 4,965 261 2,781 2,513 264 8890 Maintenance of compressor station equipment 99.0 - 0 - - - - - 265 8900 Maint. of Measuring and Regulating Station Equip. - General 12.4 Composite of Accts. 374-379 - Demand 43,641 19,732 11,283 593 6,321 5,712 266 8910 Maint. of Measuring and Regulating Station Equip. - Industrial 99.0 - 0 - - - - - 267 8920 Maint. of Measuring and Regulating Station Equip. - City Gate 12.4 Composite of Accts. 374-379 - Demand 529 239 137 7 77 69 268 8930 Maintenance of Services 14.4 Account 380 - Demand 0 - - - - - 269 8940 Maintenance of Meters and House Regulators 13.4 Composite of Accts. 381-383 - Demand 0 - - - - - 270 8950 Maintenance of Other Equipment 10.4 Composite of Accts. 871-879 & 886-893 - Demand 3,271 1,479 846 44 474 428 271 Total Distribution 4,096,462 1,852,152 1,059,097 55,706 593,345 536,163272273 Customer Accounts:274 9010 Supervision 99.0 - 0 - - - - - 275 9020 Meter Reading Expense 99.0 - 0 - - - - - 276 9030 Customer Records and Collection Expenses 99.0 - 0 - - - - - 277 9040 Uncollectible Accounts 99.0 - 0 - - - - - 278 9050 Miscellaneous Customer Accounts Expenses 99.0 - 0 - - - - - 279 Total Customer Accounts 0 - - - - - 280281 Customer Service and Information:282 9070 Supervision 99.0 - 0 - - - - - 283 9080 Customer Assistance Expenses 99.0 - 0 - - - - - 284 9090 Informational and Instructional Advertising Expenses 99.0 - 0 - - - - - 285 9100 Miscellaneous Customer Service and Informational Expenses 99.0 - 0 - - - - - 286 Total Customer Service and Information 0 - - - - - 287288 Sales:289 9110 Supervision 99.0 - 0 - - - - - 290 9120 Demonstrating and Selling Expenses 99.0 - 0 - - - - - 291 9130 Advertising Expenses 99.0 - 0 - - - - - 292 9160 Miscellaneous Sales Expenses 99.0 - 0 - - - - - 293 Total Sales 0 - - - - - 294295 Administrative & General:296 Operation297 9200 Administrative and General Salaries 17.4 Composite of Accts. 870-902, 905-916, 924 & 928-930.1 - Demand (355,371) (160,676) (91,877) (4,833) (51,473) (46,513) 298 9210 Office Supplies and Expenses 17.4 Composite of Accts. 870-902, 905-916, 924 & 928-930.1 - Demand 7,501 3,392 1,939 102 1,086 982 299 9220 Administrative Expenses Transferred - Customer Support 99.0 - 0 - - - - - 300 9220 Administrative Expenses Transferred - General 17.4 Composite of Accts. 870-902, 905-916, 924 & 928-930.1 - Demand 6,173,971 2,791,465 1,596,215 83,957 894,258 808,077 301 9230 Outside Services Employed 17.4 Composite of Accts. 870-902, 905-916, 924 & 928-930.1 - Demand 144,652 65,402 37,398 1,967 20,952 18,933 302 9240 Property Insurance 9.4 Allocated Net Plant - Demand 1,605 726 415 22 232 210 303 9250 Injuries and Damages 17.4 Composite of Accts. 870-902, 905-916, 924 & 928-930.1 - Demand 31,516 14,249 8,148 429 4,565 4,125 304 9260 Employee Pensions and Benefits 17.4 Composite of Accts. 870-902, 905-916, 924 & 928-930.1 - Demand 461,146 208,500 119,224 6,271 66,794 60,357 305 9270 Franchise Requirements 99.0 - 0 - - - - - 306 9280 Regulatory Commission Expenses 99.0 - 0 - - - - - 307 930.1 General Advertising Expenses 99.0 - 0 - - - - - 308 930.2 Miscellaneous General Expense 17.4 Composite of Accts. 870-902, 905-916, 924 & 928-930.1 - Demand (18,023) (8,149) (4,660) (245) (2,611) (2,359) 309 9310 Rents 17.4 Composite of Accts. 870-902, 905-916, 924 & 928-930.1 - Demand (3,524) (1,593) (911) (48) (510) (461) 310 Maintenance311 9320 Maintenance of General Plant 17.4 Composite of Accts. 870-902, 905-916, 924 & 928-930.1 - Demand 5,026 2,273 1,300 68 728 658 312 Total A&G 6,448,499 2,915,589 1,667,191 87,690 934,021 844,008313314 TOTAL O&M EXPENSE - DEMAND 11,199,521 5,063,690 2,895,517 152,297 1,622,174 1,465,843

Exhibit PHR-2Page 52 of 75
Atmos Energy Corporation, Kentucky/Mid-States DivisionClass Cost of Service - Customer/Demand StudyForecasted Test Period: Twelve Months Ended March 31, 2020
ALLOCATION OF O&M EXPENSES
Commodity
Line Acct. Allocation Allocation Total Residential Non-Res Sales Non-Res Sales Transport TransportNo. No. Factor Basis Company Sales Firm Interruptible Firm Interruptible315 Production & Gathering:316 Operation317 7500 Op., Sup., & Eng. 99.0 - 0 - - - - - 318 7510 Production Maps & Records 99.0 - 0 - - - - - 319 7530 Field Lines Expenses 99.0 - 0 - - - - - 320 7540 Field Compressor Station Expense 99.0 - 0 - - - - - 321 7550 Field Compressor Sta. Fuel & Pwr. 99.0 - 0 - - - - - 322 7560 Field Meas. & Regul. Station Exp 18.4 Gas Costs 0 - - - - - 323 7570 Purification Expense 99.0 - 0 - - - - - 324 7590 Other Expenses 99.0 - 0 - - - - - 325 Maintenance326 7610 Maint. Sup., & Eng. 99.0 - 0 - - - - - 327 7620 Structures and Improvements 99.0 - 0 - - - - - 328 7640 Field Line Maintenance 99.0 - 0 - - - - - 329 7650 Compressor Station Equip. Maint. 99.0 - 0 - - - - - 330 7660 Meas. & Regul. Station Equip Maint 99.0 - 0 - - - - - 331 7670 Purification Equipment Maintenance 99.0 - 0 - - - - - 332 7680 Other Equipment Maintenance 99.0 - 0 - - - - - 333 7690 Gas Processed By Others 99.0 - 0 - - - - - 334 Total Production & Gathering 0 0 0 0 0 0335336 Other Gas Supply Expenses:337 Operation338 8001 Intercompany Gas Well-head Purchases 18.4 Gas Costs 0 - - - - - 339 8010 Natural gas field line purchases 18.4 Gas Costs 61,240 35,945 24,426 870 - - 340 8040 Natural gas city gate purchases 18.4 Gas Costs 51,401,318 30,169,962 20,501,486 729,870 - - 341 8050 Other purchases 18.4 Gas Costs (7,602) (4,462) (3,032) (108) - - 342 8051 PGA for Residential 18.4 Gas Costs 47,517,427 27,890,315 18,952,391 674,721 - - 343 8052 PGA for Commercial 18.4 Gas Costs 24,564,311 14,418,002 9,797,509 348,799 - - 344 8053 PGA for Industrial 18.4 Gas Costs 4,854,142 2,849,135 1,936,081 68,926 - - 345 8054 PGA for Public Authorities 18.4 Gas Costs 4,585,482 2,691,445 1,828,926 65,111 - - 346 8058 Unbilled PGA Cost 18.4 Gas Costs (3,124,678) (1,834,027) (1,246,282) (44,369) - - 347 8059 PGA Offset to Unrecovered Gas Cost 18.4 Gas Costs (71,826,171) (42,158,313) (28,647,966) (1,019,892) - - 348 8060 Exchange gas 18.4 Gas Costs (2,147,338) (1,260,379) (856,469) (30,491) - - 349 8081 Gas withdrawn from storage-Debit 18.4 Gas Costs 12,436,037 7,299,322 4,960,130 176,585 - - 350 8082 Gas delivered to storage-Credit 18.4 Gas Costs (12,626,734) (7,411,252) (5,036,190) (179,293) - - 351 8120 Gas used for other utility operations-Credit 18.4 Gas Costs (14,329) (8,410) (5,715) (203) - - 352 8580 Transmission and compression of gas by others 18.4 Gas Costs 22,709,250 13,329,176 9,057,616 322,459 - - 353 Maintenance354 8350 Maint. Of Purch. Gas Meas. Sta. 18.4 Gas Costs 0 - - - - - 355 Total Other Gas Supply Expenses 78,382,354 46,006,460 31,262,909 1,112,986 0 0356357 Underground Storage:358 Operation359 8140 Storage-Operation supervision and engineering 1.5 Winter Volumes 0 - - - - - 360 8160 Wells expenses 1.5 Winter Volumes 145,959 55,264 34,196 1,870 26,832 27,797 361 8170 Lines expenses 1.5 Winter Volumes 10,626 4,023 2,489 136 1,953 2,024 362 8180 Compressor station expenses 1.5 Winter Volumes 12,530 4,744 2,936 161 2,303 2,386 363 8190 Compressor station fuel and power 1.5 Winter Volumes 368 139 86 5 68 70 364 8200 Storage-Measuring and regulating station expenses 1.5 Winter Volumes 3,090 1,170 724 40 568 589 365 8210 Storage-Purification expenses 1.5 Winter Volumes 24,928 9,438 5,840 319 4,582 4,747 366 8240 Storage-Other expenses 1.5 Winter Volumes 0 - - - - - 367 8250 Storage well royalties 1.5 Winter Volumes 4,382 1,659 1,027 56 805 834 368 8260 Rents 1.5 Winter Volumes 0 - - - - - 369 Maintenance370 8300 Maint. Sup., & Eng. 1.5 Winter Volumes 0 - - - - - 371 8310 Structures and Improvements 1.5 Winter Volumes 6,368 2,411 1,492 82 1,171 1,213 372 8320 Reservoirs & Wells Maintenance 1.5 Winter Volumes 0 - - - - - 373 8330 Line Maintenance 1.5 Winter Volumes 0 - - - - - 374 8340 Compressor Station Equip Maint 1.5 Winter Volumes 1,665 631 390 21 306 317 375 8350 Meas. & Regul. Station Equip Maint 1.5 Winter Volumes 0 - - - - - 376 8360 Purification Equipment Maintenance 1.5 Winter Volumes 0 - - - - - 377 8410 Other storage expenses-Operation labor and expenses 1.5 Winter Volumes 34,542 13,078 8,093 443 6,350 6,578 378 Total Underground Storage Expense 244,457 92,559 57,273 3,132 44,939 46,555379380 Transmission:381 Operation382 8500 Op., Sup., & Eng. 99.0 - 0 - - - - - 383 8510 System Control & Load Dispatching 99.0 - 0 - - - - - 384 8520 Communication Systems Expense 99.0 - 0 - - - - - 385 8530 Compressor Station Labor Expense 99.0 - 0 - - - - - 386 8540 Compressor Station Fuel Gas 99.0 - 0 - - - - - 387 8550 Compressor Station Fuel & Power 99.0 - 0 - - - - - 388 8560 Mains Expense 99.0 - 0 - - - - - 389 8570 Meas. & Regul. Station Expenses 99.0 - 0 - - - - - 390 8580 LDC Payment 99.0 - 0 - - - - - 391 8580 LDC Payment - A&G 99.0 - 0 - - - - - 392 8590 Other Expenses 99.0 - 0 - - - - - 393 8600 Rents 99.0 - 0 - - - - - 394 Maintenance395 8610 Maint. Sup., & Eng. 99.0 - 0 - - - - - 396 8620 Structures and Improvements 99.0 - 0 - - - - - 397 8630 Mains 99.0 - 0 - - - - - 398 8640 Compressor Station Equip Maint 99.0 - 0 - - - - - 399 8650 Meas. & Regul. Station Equip Maint 99.0 - 0 - - - - - 400 8660 Communication Equipment Maintenance 99.0 - 0 - - - - - 401 8670 Other Equipment Maintenance 99.0 - 0 - - - - - 402 Total Transmission Expense 0 0 0 0 0 0

Exhibit PHR-2Page 53 of 75
Atmos Energy Corporation, Kentucky/Mid-States DivisionClass Cost of Service - Customer/Demand StudyForecasted Test Period: Twelve Months Ended March 31, 2020
ALLOCATION OF O&M EXPENSES403404 Distribution:405 Operation406 8700 Supervision and Engineering 10.6 Composite of Accts. 871-879 & 886-893 - Comm 3,310 1,002 679 34 751 844 407 8710 Distribution Load Dispatching 1.0 Mcf 663 201 136 7 150 169 408 8711 Odorization 1.0 Mcf 19,956 6,043 4,095 202 4,529 5,086 408 8720 Compressor Station Labor & Expenses 99.0 - 0 - - - - - 409 8740 Mains & Services 12.6 Composite of Accts. 374-379 - Comm 0 - - - - - 410 8750 Measuring and Regulating Station Exp. - Gen 12.6 Composite of Accts. 374-379 - Comm 0 - - - - - 411 8760 Measuring and Regulating Station Exp. - Ind. 99.0 - 0 - - - - - 412 8770 Measuring and Regulating Sta. Exp. - City Gate 12.6 Composite of Accts. 374-379 - Comm 0 - - - - - 413 8780 Meters and House Regulator Expense 99.0 - 0 - - - - - 414 8790 Customer Installations Expense 99.0 - 0 - - - - - 415 8800 Other Expense 10.6 Composite of Accts. 871-879 & 886-893 - Comm 11 3 2 0 2 3 416 8810 Rents 10.6 Composite of Accts. 871-879 & 886-893 - Comm 1,270 385 261 13 288 324 417 Maintenance418 8850 Maintenance Supervision and Engineering 10.6 Composite of Accts. 871-879 & 886-893 - Comm 5 2 1 0 1 1 419 8860 Maintenance of Structures and Improvements 12.6 Composite of Accts. 374-379 - Comm 0 - - - - - 420 8870 Maintenance of Mains 12.6 Composite of Accts. 374-379 - Comm 0 - - - - - 421 8890 Maintenance of compressor station equipment 1.0 Mcf 0 - - - - - 422 8900 Maint. of Measuring and Regulating Station Equip. - General 12.6 Composite of Accts. 374-379 - Comm 0 - - - - - 423 8910 Maint. of Measuring and Regulating Station Equip. - Industrial 5.0 Direct to Transport 0 - - - - - 424 8920 Maint. of Measuring and Regulating Station Equip. - City Gate 12.6 Composite of Accts. 374-379 - Comm 0 - - - - - 425 8930 Maintenance of Services 14.6 Account 380 - Comm 0 - - - - - 426 8940 Maintenance of Meters and House Regulators 13.6 Composite of Accts. 381-383 - Comm 0 - - - - - 427 8950 Maintenance of Other Equipment 10.6 Composite of Accts. 871-879 & 886-893 - Comm 20 6 4 0 5 5 428 Total Distribution 25,235 7,641 5,178 256 5,728 6,432429430 Customer Accounts:431 9010 Supervision 99.0 - 0 - - - - - 432 9020 Meter Reading Expense 99.0 - 0 - - - - - 433 9030 Customer Records and Collection Expenses 99.0 - 0 - - - - - 434 9040 Uncollectible Accounts 99.0 - 0 - - - - - 435 9050 Miscellaneous Customer Accounts Expenses 99.0 - 0 - - - - - 436 Total Customer Accounts 0 - - - - - 437438 Customer Service and Information:439 9070 Supervision 99.0 - 0 - - - - - 440 9080 Customer Assistance Expenses 99.0 - 0 - - - - - 441 9090 Informational and Instructional Advertising Expenses 99.0 - 0 - - - - - 442 9100 Miscellaneous Customer Service and Informational Expenses 99.0 - 0 - - - - - 443 Total Customer Service and Information 0 - - - - - 444445 Sales:446 9110 Supervision 99.0 - 0 - - - - - 447 9120 Demonstrating and Selling Expenses 99.0 - 0 - - - - - 448 9130 Advertising Expenses 99.0 - 0 - - - - - 449 9160 Miscellaneous Sales Expenses 99.0 - 0 - - - - - 450 Total Sales 0 - - - - - 451452 Administrative & General:453 Operation454 9200 Administrative and General Salaries 17.6 Composite of Accts. 870-902, 905-916, 924 & 928-930.1 - Comm (2,191) (664) (450) (22) (497) (558) 455 9210 Office Supplies and Expenses 17.6 Composite of Accts. 870-902, 905-916, 924 & 928-930.1 - Comm 46 14 9 0 10 12 456 9220 Administrative Expenses Transferred - Customer Support 99.0 - 0 - - - - - 457 9220 Administrative Expenses Transferred - General 17.6 Composite of Accts. 870-902, 905-916, 924 & 928-930.1 - Comm 38,074 11,533 7,815 386 8,639 9,700 458 9230 Outside Services Employed 17.6 Composite of Accts. 870-902, 905-916, 924 & 928-930.1 - Comm 892 270 183 9 202 227 459 9240 Property Insurance 9.6 Allocated Net Plant - Comm 37 14 9 0 7 7 460 9250 Injuries and Damages 17.6 Composite of Accts. 870-902, 905-916, 924 & 928-930.1 - Comm 194 59 40 2 44 50 461 9260 Employee Pensions and Benefits 17.6 Composite of Accts. 870-902, 905-916, 924 & 928-930.1 - Comm 2,844 861 584 29 645 725 462 9270 Franchise Requirements 99.0 - 0 - - - - - 463 9280 Regulatory Commission Expenses 99.0 - 0 - - - - - 464 930.1 General Advertising Expenses 99.0 - 0 - - - - - 465 930.2 Miscellaneous General Expense 17.6 Composite of Accts. 870-902, 905-916, 924 & 928-930.1 - Comm (111) (34) (23) (1) (25) (28) 466 9310 Rents 17.6 Composite of Accts. 870-902, 905-916, 924 & 928-930.1 - Comm (22) (7) (4) (0) (5) (6) 467 Maintenance468 9320 Maintenance of General Plant 17.6 Composite of Accts. 870-902, 905-916, 924 & 928-930.1 - Comm 31 9 6 0 7 8 469 Total A&G 39,793 12,057 8,169 404 9,028 10,136470471 TOTAL O&M EXPENSE - COMMODITY 78,691,840 46,118,716 31,333,529 1,116,777 59,694 63,122

Exhibit PHR-2Page 54 of 75
Atmos Energy Corporation, Kentucky/Mid-States DivisionClass Cost of Service - Customer/Demand StudyForecasted Test Period: Twelve Months Ended March 31, 2020
ALLOCATION OF O&M EXPENSES
Total O&M Expenses
Line Acct. Allocation Allocation Total Residential Non-Res Sales Non-Res Sales Transport TransportNo. No. Factor Basis Company Sales Firm Interruptible Firm Interruptible472 Production & Gathering:473 Operation474 7500 Op., Sup., & Eng. 0 0 0 0 0 0475 7510 Production Maps & Records 0 0 0 0 0 0476 7530 Field Lines Expenses 0 0 0 0 0 0477 7540 Field Compressor Station Expense 0 0 0 0 0 0478 7550 Field Compressor Sta. Fuel & Pwr. 0 0 0 0 0 0479 7560 Field Meas. & Regul. Station Exp 0 0 0 0 0 0480 7570 Purification Expense 0 0 0 0 0 0481 7590 Other Expenses 0 0 0 0 0 0482 Maintenance483 7610 Maint. Sup., & Eng. 0 0 0 0 0 0484 7620 Structures and Improvements 0 0 0 0 0 0485 7640 Field Line Maintenance 0 0 0 0 0 0486 7650 Compressor Station Equip. Maint. 0 0 0 0 0 0487 7660 Meas. & Regul. Station Equip Maint 0 0 0 0 0 0488 7670 Purification Equipment Maintenance 0 0 0 0 0 0489 7680 Other Equipment Maintenance 0 0 0 0 0 0490 7690 Gas Processed By Others 0 0 0 0 0 0491 Total Production & Gathering 0 0 0 0 0 0492493 Other Gas Supply Expenses:494 Operation495 8001 Intercompany Gas Well-head Purchases 0 0 0 0 0 0496 8010 Natural gas field line purchases 61,240 35,945 24,426 870 0 0497 8040 Natural gas city gate purchases 51,401,318 30,169,962 20,501,486 729,870 0 0498 8050 Other purchases (7,602) (4,462) (3,032) (108) 0 0499 8051 PGA for Residential 47,517,427 27,890,315 18,952,391 674,721 0 0500 8052 PGA for Commercial 24,564,311 14,418,002 9,797,509 348,799 0 0501 8053 PGA for Industrial 4,854,142 2,849,135 1,936,081 68,926 0 0502 8054 PGA for Public Authorities 4,585,482 2,691,445 1,828,926 65,111 0 0503 8058 Unbilled PGA Cost (3,124,678) (1,834,027) (1,246,282) (44,369) 0 0504 8059 PGA Offset to Unrecovered Gas Cost (71,826,171) (42,158,313) (28,647,966) (1,019,892) 0 0505 8060 Exchange gas (2,147,338) (1,260,379) (856,469) (30,491) 0 0506 8081 Gas withdrawn from storage-Debit 12,436,037 7,299,322 4,960,130 176,585 0 0507 8082 Gas delivered to storage-Credit (12,626,734) (7,411,252) (5,036,190) (179,293) 0 0508 8120 Gas used for other utility operations-Credit (14,329) (8,410) (5,715) (203) 0 0509 8580 Transmission and compression of gas by others 22,709,250 13,329,176 9,057,616 322,459 0 0510 Maintenance511 8350 Maint. Of Purch. Gas Meas. Sta. 0 0 0 0 0 0512 Total Other Gas Supply Expenses 78,382,354 46,006,460 31,262,909 1,112,986 0 0513514 Underground Storage:515 Operation516 8140 Storage-Operation supervision and engineering 0 0 0 0 0 0517 8160 Wells expenses 291,917 121,257 71,932 3,855 47,973 46,900518 8170 Lines expenses 21,251 8,827 5,237 281 3,492 3,414519 8180 Compressor station expenses 25,060 10,410 6,175 331 4,118 4,026520 8190 Compressor station fuel and power 735 305 181 10 121 118521 8200 Storage-Measuring and regulating station expenses 6,181 2,567 1,523 82 1,016 993522 8210 Storage-Purification expenses 49,856 20,709 12,285 658 8,193 8,010523 8240 Storage-Other expenses 0 0 0 0 0 0524 8250 Storage well royalties 8,763 3,640 2,159 116 1,440 1,408525 8260 Rents 0 0 0 0 0 0526 Maintenance527 8300 Maint. Sup., & Eng. 0 0 0 0 0 0528 8310 Structures and Improvements 12,736 5,290 3,138 168 2,093 2,046529 8320 Reservoirs & Wells Maintenance 0 0 0 0 0 0530 8330 Line Maintenance 0 0 0 0 0 0531 8340 Compressor Station Equip Maint 3,331 1,384 821 44 547 535532 8350 Meas. & Regul. Station Equip Maint 0 0 0 0 0 0533 8360 Purification Equipment Maintenance 0 0 0 0 0 0534 8410 Other storage expenses-Operation labor and expenses 69,083 28,696 17,023 912 11,353 11,099535 Total Underground Storage Expense 488,914 203,086 120,475 6,456 80,347 78,550536537 Transmission:538 Operation539 8500 Op., Sup., & Eng. 35 16 9 0 5 5540 8510 System Control & Load Dispatching 0 0 0 0 0 0541 8520 Communication Systems Expense 0 0 0 0 0 0542 8530 Compressor Station Labor Expense 0 0 0 0 0 0543 8540 Compressor Station Fuel Gas 0 0 0 0 0 0544 8550 Compressor Station Fuel & Power 308 139 80 4 45 40545 8560 Mains Expense 366,202 165,573 94,678 4,980 53,042 47,930546 8570 Meas. & Regul. Station Expenses 27,278 12,333 7,052 371 3,951 3,570547 8580 LDC Payment 0 0 0 0 0 0548 8580 LDC Payment - A&G 0 0 0 0 0 0549 8590 Other Expenses 0 0 0 0 0 0550 8600 Rents 0 0 0 0 0 0551 Maintenance552 8610 Maint. Sup., & Eng. 0 0 0 0 0 0553 8620 Structures and Improvements 0 0 0 0 0 0554 8630 Mains 16,280 7,361 4,209 221 2,358 2,131555 8640 Compressor Station Equip Maint 0 0 0 0 0 0556 8650 Meas. & Regul. Station Equip Maint 0 0 0 0 0 0557 8660 Communication Equipment Maintenance 0 0 0 0 0 0558 8670 Other Equipment Maintenance 0 0 0 0 0 0559 Total Transmission Expense 410,103 185,422 106,028 5,577 59,401 53,676

Exhibit PHR-2Page 55 of 75
Atmos Energy Corporation, Kentucky/Mid-States DivisionClass Cost of Service - Customer/Demand StudyForecasted Test Period: Twelve Months Ended March 31, 2020
ALLOCATION OF O&M EXPENSES560561 Distribution:562 Operation563 8700 Supervision and Engineering 963,411 570,604 232,060 7,518 80,802 72,427564 8710 Distribution Load Dispatching 663 201 136 7 150 169565 8711 Odorization 19,956 6,043 4,095 202 4,529 5,086565 8720 Compressor Station Labor & Expenses 0 0 0 0 0 0566 8740 Mains & Services 4,320,719 2,587,075 900,015 39,184 417,508 376,937567 8750 Measuring and Regulating Station Exp. - Gen 574,714 344,116 119,714 5,212 55,534 50,138568 8760 Measuring and Regulating Station Exp. - Ind. 120,928 0 119,676 61 761 430569 8770 Measuring and Regulating Sta. Exp. - City Gate 38,286 22,924 7,975 347 3,700 3,340570 8780 Meters and House Regulator Expense 820,621 529,408 271,530 956 11,958 6,768571 8790 Customer Installations Expense 2,246 2,000 243 0 2 1572 8800 Other Expense 3,204 1,897 772 25 269 241573 8810 Rents 369,768 219,004 89,067 2,886 31,013 27,798574 Maintenance575 8850 Maintenance Supervision and Engineering 1,588 941 383 12 133 119576 8860 Maintenance of Structures and Improvements 98 59 20 1 9 9577 8870 Maintenance of Mains 28,852 17,275 6,010 262 2,788 2,517578 8890 Maintenance of compressor station equipment 0 0 0 0 0 0579 8900 Maint. of Measuring and Regulating Station Equip. - General 65,572 39,262 13,659 595 6,336 5,720580 8910 Maint. of Measuring and Regulating Station Equip. - Industrial 1,723 0 1,705 1 11 6581 8920 Maint. of Measuring and Regulating Station Equip. - City Gate 795 476 166 7 77 69582 8930 Maintenance of Services 6,533 5,817 708 0 4 3583 8940 Maintenance of Meters and House Regulators 0 0 0 0 0 0584 8950 Maintenance of Other Equipment 5,866 3,474 1,413 46 492 441585 Total Distribution 7,345,541 4,350,576 1,769,347 57,322 616,077 552,219586587 Customer Accounts:588 9010 Supervision 0 0 0 0 0 0589 9020 Meter Reading Expense 1,085,047 966,269 117,548 60 747 423590 9030 Customer Records and Collection Expenses 1,220,802 1,087,164 132,255 67 840 476591 9040 Uncollectible Accounts 341,050 208,226 129,278 3,493 29 25592 9050 Miscellaneous Customer Accounts Expenses 0 0 0 0 0 0593 Total Customer Accounts 2,646,900 2,261,659 379,081 3,620 1,616 924594595 Customer Service and Information:596 9070 Supervision 0 0 0 0 0 0597 9080 Customer Assistance Expenses 0 0 0 0 0 0598 9090 Informational and Instructional Advertising Expenses 128,272 114,230 13,896 7 88 50599 9100 Miscellaneous Customer Service and Informational Expenses 0 0 0 0 0 0600 Total Customer Service and Information 128,272 114,230 13,896 7 88 50601602 Sales:603 9110 Supervision 253,468 225,721 27,459 14 174 99604 9120 Demonstrating and Selling Expenses 115,937 103,246 12,560 6 80 45605 9130 Advertising Expenses 35,170 31,320 3,810 2 24 14606 9160 Miscellaneous Sales Expenses (196,297) (174,809) (21,266) (11) (135) (76)607 Total Sales 208,278 185,478 22,564 11 143 81608609 Administrative & General:610 Operation611 9200 Administrative and General Salaries (834,543) (553,129) (174,866) (4,984) (53,581) (47,983)612 9210 Office Supplies and Expenses 17,616 11,675 3,691 105 1,131 1,013613 9220 Administrative Expenses Transferred - Customer Support 0 0 0 0 0 0614 9220 Administrative Expenses Transferred - General 14,498,764 9,609,680 3,037,999 86,581 930,886 833,617615 9230 Outside Services Employed 339,697 225,149 71,178 2,029 21,810 19,531616 9240 Property Insurance 3,718 2,465 762 23 247 221617 9250 Injuries and Damages 74,010 49,054 15,508 442 4,752 4,255618 9260 Employee Pensions and Benefits 1,082,941 717,766 226,914 6,467 69,530 62,265619 9270 Franchise Requirements 646 576 70 0 0 0620 9280 Regulatory Commission Expenses 852,920 759,553 92,401 47 587 332621 930.1 General Advertising Expenses 0 0 0 0 0 0622 930.2 Miscellaneous General Expense (42,325) (28,053) (8,869) (253) (2,717) (2,434)623 9310 Rents (8,275) (5,485) (1,734) (49) (531) (476)624 Maintenance625 9320 Maintenance of General Plant 11,804 7,823 2,473 70 758 679626 Total A&G 15,996,974 10,797,075 3,265,529 90,479 972,870 871,022627628 TOTAL O&M EXPENSE 105,607,336 64,103,985 36,939,829 1,276,457 1,730,542 1,556,521

Exhibit PHR-2Page 56 of 75
Atmos Energy Corporation, Kentucky/Mid-States DivisionClass Cost of Service - Customer/Demand StudyForecasted Test Period: Twelve Months Ended March 31, 2020
ALLOCATION OF DEPRECIATION EXPENSE
Customer
Line Acct. Allocation Allocation Total Residential Non-Res Sales Non-Res Sales Transport TransportNo. No. Factor Basis Company Sales Firm Interruptible Firm Interruptible
1 Intangible Plant:23 30100 Organization 99.0 - 0 - - - - - 4 30200 Franchises & Consents 99.0 - 0 - - - - - 5 30300 Misc Intangible Plant 99.0 - 0 - - - - - 67 Total Intangible Plant: 0 - - - - - 89 Production Plant:
10 99.0 - 0 - - - - - 11 32520 Producing Leaseholds 99.0 - 0 - - - - - 12 32540 Rights of Ways 99.0 - 0 - - - - - 13 33100 Production Gas Wells Equipment 99.0 - 0 - - - - - 14 33201 Field Lines 99.0 - 0 - - - - - 15 33202 Tributary Lines 99.0 - 0 - - - - - 16 33400 Field Meas. & Reg. Sta. Equip 99.0 - 0 - - - - - 17 33600 Purification Equipment 99.0 - 0 - - - - - 1819 Total Production Plant 0 - - - - - 2021 Storage Plant:2223 35010 Land 99.0 - 0 - - - - - 24 35020 Rights of Way 99.0 - 0 - - - - - 25 35100 Structures and Improvements 99.0 - 0 - - - - - 26 35102 Compression Station Equipment 99.0 - 0 - - - - - 27 35103 Meas. & Reg. Sta. Structues 99.0 - 0 - - - - - 28 35104 Other Structures 99.0 - 0 - - - - - 29 35200 Wells \ Rights of Way 99.0 - 0 - - - - - 30 35201 Well Construction 99.0 - 0 - - - - - 31 35202 Well Equipment 99.0 - 0 - - - - - 32 35203 Cushion Gas 99.0 - 0 - - - - - 33 35210 Leaseholds 99.0 - 0 - - - - - 34 35211 Storage Rights 99.0 - 0 - - - - - 35 35301 Field Lines 99.0 - 0 - - - - - 36 35302 Tributary Lines 99.0 - 0 - - - - - 37 35400 Compressor Station Equipment 99.0 - 0 - - - - - 38 35500 Meas & Reg. Equipment 99.0 - 0 - - - - - 39 35600 Purification Equipment 99.0 - 0 - - - - - 4041 Total Storage Plant 0 - - - - - 4243 Transmission:4445 36510 Land & Land Rights 99.0 - 0 - - - - - 46 36520 Rights of Way 99.0 - 0 - - - - - 47 36602 Structures & Improvements 99.0 - 0 - - - - - 48 36603 Other Structues 99.0 - 0 - - - - - 49 36700 Mains Cathodic Protection 99.0 - 0 - - - - - 50 36701 Mains - Steel 99.0 - 0 - - - - - 51 36900 Meas. & Reg. Equipment 99.0 - 0 - - - - - 52 36901 Meas. & Reg. Equipment 99.0 - 0 - - - - - 5354 Total Transmission Plant 0 - - - - - 5556 Distribution:5758 37400 Land & Land Rights 2.0 Bills 0 - - - - - 59 37401 Land 2.0 Bills 0 - - - - - 60 37402 Land Rights 2.0 Bills 16,692 14,865 1,808 1 11 7 61 37403 Land Other 2.0 Bills 0 - - - - - 62 37500 Structures & Improvements 2.0 Bills 2,013 1,792 218 0 1 1 63 37501 Structures & Improvements T.B. 2.0 Bills 598 532 65 0 0 0 64 37502 Land Rights 2.0 Bills 277 247 30 0 0 0 65 37503 Improvements 2.0 Bills 24 21 3 0 0 0 66 37600 Mains Cathodic Protection 2.0 Bills 292,164 260,181 31,651 16 201 114 67 37601 Mains - Steel 2.0 Bills 1,489,960 1,326,858 161,414 82 1,026 581 68 37602 Mains - Plastic 2.0 Bills 1,129,199 1,005,588 122,331 62 777 440 69 37800 Meas & Reg. Sta. Equip - General 2.0 Bills 309,588 275,698 33,539 17 213 121 70 37900 Meas & Reg. Sta. Equip - City Gate 2.0 Bills 48,799 43,457 5,287 3 34 19 71 37905 Meas & Reg. Sta. Equipment T.b. 2.0 Bills 15,639 13,927 1,694 1 11 6 72 38000 Services 2.0 Bills 4,817,588 4,290,218 521,911 265 3,317 1,877 73 38100 Meters 4.0 Meter Investment 2,741,749 1,768,788 907,200 3,195 39,954 22,612 74 38200 Meter Installaitons 4.0 Meter Investment 2,232,937 1,440,537 738,843 2,602 32,539 18,416 75 38300 House Regulators 4.0 Meter Investment 514,355 331,827 170,192 599 7,495 4,242 76 38400 House Reg. Installations 4.0 Meter Investment 8,807 5,681 2,914 10 128 73 77 38500 Ind. Meas. & Reg. Sta. Equipment 2.2 Non-Residential Bills 112,194 - 111,033 56 706 399 78 38600 Other Prop. On Cust. Prem 99.0 - 0 - - - - - 7980 Total Distribution Plant 13,732,582 10,780,217 2,810,134 6,911 86,414 48,907

Exhibit PHR-2Page 57 of 75
Atmos Energy Corporation, Kentucky/Mid-States DivisionClass Cost of Service - Customer/Demand StudyForecasted Test Period: Twelve Months Ended March 31, 2020
ALLOCATION OF DEPRECIATION EXPENSE8182 General:8384 38900 Land & Land Rights 6.2 P, S, T & D Plant - Customer 0 - - - - - 85 39000 Structures Frame 6.2 P, S, T & D Plant - Customer 139,539 112,997 25,474 52 649 367 86 39001 Structures & Improvements 6.2 P, S, T & D Plant - Customer 3,176 2,572 580 1 15 8 87 39002 Improvements 6.2 P, S, T & D Plant - Customer 13,012 10,537 2,375 5 61 34 88 39003 Air Conditioning Equipment 6.2 P, S, T & D Plant - Customer 416 337 76 0 2 1 89 39004 Improvement to leased Premises 6.2 P, S, T & D Plant - Customer 0 - - - - - 90 39009 Office Furniture & Equipment 6.2 P, S, T & D Plant - Customer 53,247 43,119 9,721 20 248 140 91 39100 Remittance Processing Equip 6.2 P, S, T & D Plant - Customer 0 - - - - - 92 39102 Office Machines 6.2 P, S, T & D Plant - Customer 0 - - - - - 93 39103 Transportation Equipment 6.2 P, S, T & D Plant - Customer 2,958 2,395 540 1 14 8 94 39200 Trucks 6.2 P, S, T & D Plant - Customer 0 - - - - - 95 39201 Trailers 6.2 P, S, T & D Plant - Customer 0 - - - - - 96 39202 Stores Equipment 6.2 P, S, T & D Plant - Customer 0 - - - - - 97 39300 Tools, Shop & Garage Equipment 6.2 P, S, T & D Plant - Customer 66,585 53,919 12,156 25 310 175 98 39400 Power Operated Equipment 6.2 P, S, T & D Plant - Customer 0 - - - - - 99 39600 Ditchers 6.2 P, S, T & D Plant - Customer 0 - - - - -
100 39603 Backhoes 6.2 P, S, T & D Plant - Customer 0 - - - - - 101 39604 Welders 6.2 P, S, T & D Plant - Customer 0 - - - - - 102 39605 Communication Equipment 6.2 P, S, T & D Plant - Customer 19,925 16,135 3,637 7 93 52 103 39700 Communication Equipment - Mobile Radios 6.2 P, S, T & D Plant - Customer 0 - - - - - 104 39701 Communication Equipment - Fixed Radios 6.2 P, S, T & D Plant - Customer 0 - - - - - 105 39702 Communication Equip. - Telemetering 6.2 P, S, T & D Plant - Customer 0 - - - - - 106 39705 Miscellaneous Equipment 6.2 P, S, T & D Plant - Customer 110,878 89,787 20,242 41 516 292 107 39800 Other Tangible Property 6.2 P, S, T & D Plant - Customer 0 - - - - - 108 39900 Other Tangible Property - Servers - H/W 6.2 P, S, T & D Plant - Customer 1,172 949 214 0 5 3 109 39901 Other Tangible Property - Servers - S/W 6.2 P, S, T & D Plant - Customer 0 - - - - - 110 39902 Other Tangible Property - Network - H/W 6.2 P, S, T & D Plant - Customer 7,670 6,211 1,400 3 36 20 111 39903 Other Tang. Property - CPU 6.2 P, S, T & D Plant - Customer 0 - - - - - 112 39904 Other Tangible Property - MF - Hardware 6.2 P, S, T & D Plant - Customer 0 - - - - - 113 39905 Other Tang. Property - PC Hardware 6.2 P, S, T & D Plant - Customer 50,913 41,228 9,295 19 237 134 114 39906 Other Tang. Property - PC Software 6.2 P, S, T & D Plant - Customer 0 - - - - - 115 39907 Other Tang. Property - Mainframe S/W 6.2 P, S, T & D Plant - Customer 0 - - - - - 116 39908 Other Tang. Property - Application Software 6.2 P, S, T & D Plant - Customer 5,863 4,747 1,070 2 27 15 117 40600 Amortization of gas plant acquisition adjustments 6.2 P, S, T & D Plant - Customer 0 - - - - - 118119120 Total General Plant 475,354 384,934 86,780 177 2,212 1,252121122 TOTAL DIRECT DEPRECIATION EXPENSE 14,207,936 11,165,152 2,896,913 7,087 88,625 50,158123124 Kentucky Mid-States General Office:125126 Intangible Plant:127128 30100 Organization 99.0 - 0 - - - - - 129 30200 Franchises & Consents 99.0 - 0 - - - - - 130 30300 Misc Intangible Plant 99.0 - 0 - - - - - 131132 Total Intangible Plant: 0 - - - - - 133134 General:135136 37400 Land & Land Rights 6.2 P, S, T & D Plant - Customer 0 - - - - - 137 39001 Structures Frame 6.2 P, S, T & D Plant - Customer 1,424 1,153 260 1 7 4 138 36602 Structures & Improvements 6.2 P, S, T & D Plant - Customer 0 - - - - - 139 38900 Land & Land Rights 6.2 P, S, T & D Plant - Customer 0 - - - - - 140 39004 Air Conditioning Equipment 6.2 P, S, T & D Plant - Customer 320 259 58 0 1 1 141 39009 Improvement to leased Premises 6.2 P, S, T & D Plant - Customer 0 - - - - - 142 39100 Office Furniture & Equipment 6.2 P, S, T & D Plant - Customer 0 - - - - - 143 39102 Remittance Processing Equip 6.2 P, S, T & D Plant - Customer 0 - - - - - 144 39103 Office Machines 6.2 P, S, T & D Plant - Customer 0 - - - - - 145 39200 Transportation Equipment 6.2 P, S, T & D Plant - Customer 228 184 42 0 1 1 146 39201 Trucks 6.2 P, S, T & D Plant - Customer 0 - - - - - 147 39202 Trailers 6.2 P, S, T & D Plant - Customer 0 - - - - - 148 39300 Stores Equipment 6.2 P, S, T & D Plant - Customer 0 - - - - - 149 39400 Tools, Shop & Garage Equipment 6.2 P, S, T & D Plant - Customer 1,154 934 211 0 5 3 150 39600 Power Operated Equipment 6.2 P, S, T & D Plant - Customer 7 6 1 0 0 0 151 39603 Ditchers 6.2 P, S, T & D Plant - Customer 0 - - - - - 152 39604 Backhoes 6.2 P, S, T & D Plant - Customer 0 - - - - - 153 39605 Welders 6.2 P, S, T & D Plant - Customer 0 - - - - - 154 39700 Communication Equipment 6.2 P, S, T & D Plant - Customer 941 762 172 0 4 2 155 39701 Communication Equipment - Mobile Radios 6.2 P, S, T & D Plant - Customer 0 - - - - - 156 39702 Communication Equipment - Fixed Radios 6.2 P, S, T & D Plant - Customer 0 - - - - - 157 39705 Communication Equip. - Telemetering 6.2 P, S, T & D Plant - Customer 0 - - - - - 158 39800 Miscellaneous Equipment 6.2 P, S, T & D Plant - Customer 6,974 5,648 1,273 3 32 18 159 39900 Other Tangible Property 6.2 P, S, T & D Plant - Customer 0 - - - - - 160 39901 Other Tangible Property - Servers - H/W 6.2 P, S, T & D Plant - Customer 0 - - - - - 161 39902 Other Tangible Property - Servers - S/W 6.2 P, S, T & D Plant - Customer 0 - - - - - 162 39903 Other Tangible Property - Network - H/W 6.2 P, S, T & D Plant - Customer 0 - - - - - 163 39904 Other Tang. Property - CPU 6.2 P, S, T & D Plant - Customer 0 - - - - - 164 39905 Other Tangible Property - MF - Hardware 6.2 P, S, T & D Plant - Customer 0 - - - - - 165 39906 Other Tang. Property - PC Hardware 6.2 P, S, T & D Plant - Customer 0 - - - - - 166 39907 Other Tang. Property - PC Software 6.2 P, S, T & D Plant - Customer 6,351 5,143 1,159 2 30 17 167 39908 Other Tang. Property - Mainframe S/W 6.2 P, S, T & D Plant - Customer 0 - - - - - 168 39909 Other Tang. Property - Application Software 6.2 P, S, T & D Plant - Customer 0 - - - - - 169 39924 Other Tang. Property - General Startup Costs 6.2 P, S, T & D Plant - Customer 0 - - - - - 170171172 Total General Plant 17,399 14,089 3,176 6 81 46

Exhibit PHR-2Page 58 of 75
Atmos Energy Corporation, Kentucky/Mid-States DivisionClass Cost of Service - Customer/Demand StudyForecasted Test Period: Twelve Months Ended March 31, 2020
ALLOCATION OF DEPRECIATION EXPENSE173174 Shared Services General Office:175176 General:177178 37400 Land & Land Rights 6.2 P, S, T & D Plant - Customer 0 - - - - - 179 39000 Structures & Improvements 6.2 P, S, T & D Plant - Customer 4,064 3,291 742 2 19 11 180 36602 Structures & Improvements 6.2 P, S, T & D Plant - Customer 0 - - - - - 181 37503 Improvements 6.2 P, S, T & D Plant - Customer 0 - - - - - 182 39004 Air Conditioning Equipment 6.2 P, S, T & D Plant - Customer 0 - - - - - 183 39009 Improvement to leased Premises 6.2 P, S, T & D Plant - Customer 20 16 4 0 0 0 184 39100 Office Furniture & Equipment 6.2 P, S, T & D Plant - Customer 6,149 4,979 1,122 2 29 16 185 39102 Remittance Processing Equip 6.2 P, S, T & D Plant - Customer 0 - - - - - 186 39103 Office Machines 6.2 P, S, T & D Plant - Customer 0 - - - - - 187 39200 Transportation Equipment 6.2 P, S, T & D Plant - Customer 0 - - - - - 188 39201 Trucks 6.2 P, S, T & D Plant - Customer 0 - - - - - 189 39202 Trailers 6.2 P, S, T & D Plant - Customer 0 - - - - - 190 39300 Stores Equipment 6.2 P, S, T & D Plant - Customer 0 - - - - - 191 39400 Tools, Shop & Garage Equipment 6.2 P, S, T & D Plant - Customer 0 - - - - - 192 39600 Power Operated Equipment 6.2 P, S, T & D Plant - Customer 0 - - - - - 193 39603 Ditchers 6.2 P, S, T & D Plant - Customer 0 - - - - - 194 39604 Backhoes 6.2 P, S, T & D Plant - Customer 0 - - - - - 195 39605 Welders 6.2 P, S, T & D Plant - Customer 0 - - - - - 196 39700 Communication Equipment 6.2 P, S, T & D Plant - Customer 15 12 3 0 0 0 197 39701 Communication Equipment - Mobile Radios 6.2 P, S, T & D Plant - Customer 0 - - - - - 198 39702 Communication Equipment - Fixed Radios 6.2 P, S, T & D Plant - Customer 0 - - - - - 199 39705 Communication Equip. - Telemetering 6.2 P, S, T & D Plant - Customer 0 - - - - - 200 39800 Miscellaneous Equipment 6.2 P, S, T & D Plant - Customer 37 30 7 0 0 0 201 39900 Other Tangible Property 6.2 P, S, T & D Plant - Customer 0 - - - - - 202 39901 Other Tangible Property - Servers - H/W 6.2 P, S, T & D Plant - Customer 76,287 61,776 13,927 28 355 201 203 39902 Other Tangible Property - Servers - S/W 6.2 P, S, T & D Plant - Customer 22,863 18,514 4,174 9 106 60 204 39903 Other Tangible Property - Network - H/W 6.2 P, S, T & D Plant - Customer 0 - - - - - 205 39904 Other Tang. Property - CPU 6.2 P, S, T & D Plant - Customer 0 - - - - - 206 39905 Other Tangible Property - MF - Hardware 6.2 P, S, T & D Plant - Customer 0 - - - - - 207 39906 Other Tang. Property - PC Hardware 6.2 P, S, T & D Plant - Customer 5,170 4,186 944 2 24 14 208 39907 Other Tang. Property - PC Software 6.2 P, S, T & D Plant - Customer 0 - - - - - 209 39908 Other Tang. Property - Mainframe S/W 6.2 P, S, T & D Plant - Customer 0 - - - - - 210 39909 Other Tang. Property - Application Software 6.2 P, S, T & D Plant - Customer 778 630 142 0 4 2 211 39924 Other Tang. Property - General Startup Costs 6.2 P, S, T & D Plant - Customer 0 - - - - - 212213214 Total General Plant 115,383 93,435 21,064 43 537 304 215216 Shared Services Customer Support:217218 General:219220 37400 Land & Land Rights 6.2 P, S, T & D Plant - Customer 0 - - - - - 221 39001 Structures Frame 6.2 P, S, T & D Plant - Customer 0 - - - - - 222 36602 Structures & Improvements 6.2 P, S, T & D Plant - Customer 17,151 13,889 3,131 6 80 45 223 37503 Improvements 6.2 P, S, T & D Plant - Customer 0 - - - - - 224 39004 Air Conditioning Equipment 6.2 P, S, T & D Plant - Customer 0 - - - - - 225 39009 Improvement to leased Premises 6.2 P, S, T & D Plant - Customer 2,947 2,386 538 1 14 8 226 39100 Office Furniture & Equipment 6.2 P, S, T & D Plant - Customer 3,498 2,833 639 1 16 9 227 39102 Remittance Processing Equip 6.2 P, S, T & D Plant - Customer 0 - - - - - 228 39103 Office Machines 6.2 P, S, T & D Plant - Customer 0 - - - - - 229 39200 Transportation Equipment 6.2 P, S, T & D Plant - Customer 0 - - - - - 230 39201 Trucks 6.2 P, S, T & D Plant - Customer 0 - - - - - 231 39202 Trailers 6.2 P, S, T & D Plant - Customer 0 - - - - - 232 39300 Stores Equipment 6.2 P, S, T & D Plant - Customer 0 - - - - - 233 39400 Tools, Shop & Garage Equipment 6.2 P, S, T & D Plant - Customer 679 550 124 0 3 2 234 39600 Power Operated Equipment 6.2 P, S, T & D Plant - Customer 31 25 6 0 0 0 235 39603 Ditchers 6.2 P, S, T & D Plant - Customer 0 - - - - - 236 39604 Backhoes 6.2 P, S, T & D Plant - Customer 0 - - - - - 237 39605 Welders 6.2 P, S, T & D Plant - Customer 0 - - - - - 238 39700 Communication Equipment 6.2 P, S, T & D Plant - Customer 3,823 3,096 698 1 18 10 239 39701 Communication Equipment - Mobile Radios 6.2 P, S, T & D Plant - Customer 0 - - - - - 240 39702 Communication Equipment - Fixed Radios 6.2 P, S, T & D Plant - Customer 0 - - - - - 241 39705 Communication Equip. - Telemetering 6.2 P, S, T & D Plant - Customer 0 - - - - - 242 39800 Miscellaneous Equipment 6.2 P, S, T & D Plant - Customer 475 385 87 0 2 1 243 39900 Other Tangible Property 6.2 P, S, T & D Plant - Customer 3,227 2,613 589 1 15 8 244 39901 Other Tangible Property - Servers - H/W 6.2 P, S, T & D Plant - Customer 31,519 25,523 5,754 12 147 83 245 39902 Other Tangible Property - Servers - S/W 6.2 P, S, T & D Plant - Customer 5,810 4,705 1,061 2 27 15 246 39903 Other Tangible Property - Network - H/W 6.2 P, S, T & D Plant - Customer 1,414 1,145 258 1 7 4 247 39904 Other Tang. Property - CPU 6.2 P, S, T & D Plant - Customer 0 - - - - - 248 39905 Other Tangible Property - MF - Hardware 6.2 P, S, T & D Plant - Customer 0 - - - - - 249 39906 Other Tang. Property - PC Hardware 6.2 P, S, T & D Plant - Customer 4,165 3,373 760 2 19 11 250 39907 Other Tang. Property - PC Software 6.2 P, S, T & D Plant - Customer 496 402 91 0 2 1 251 39908 Other Tang. Property - Mainframe S/W 6.2 P, S, T & D Plant - Customer 0 - - - - - 252 39909 Other Tang. Property - Application Software 6.2 P, S, T & D Plant - Customer 195,174 158,048 35,630 73 908 514 253 39924 Other Tang. Property - General Startup Costs 6.2 P, S, T & D Plant - Customer 18 14 3 0 0 0 254255256 Total General Plant 270,426 218,987 49,368 101 1,258 712 257258 TOTAL DEPRECIATION EXPENSE - CUSTOMER 14,611,144 11,491,663 2,970,522 7,237 90,501 51,220

Exhibit PHR-2Page 59 of 75
Atmos Energy Corporation, Kentucky/Mid-States DivisionClass Cost of Service - Customer/Demand StudyForecasted Test Period: Twelve Months Ended March 31, 2020
ALLOCATION OF DEPRECIATION EXPENSE
Demand
Line Acct. Allocation Allocation Total Residential Non-Res Sales Non-Res Sales Transport TransportNo. No. Factor Basis Company Sales Firm Interruptible Firm Interruptible
259 Intangible Plant:260261 30100 Organization 99.0 - 0 - - - - - 262 30200 Franchises & Consents 99.0 - 0 - - - - - 263 30300 Misc Intangible Plant 99.0 - 0 - - - - - 264265 Total Intangible Plant: 0 - - - - - 266267 Production Plant:268 3.0 Peak Day 0 - - - - - 269 32520 Producing Leaseholds 3.0 Peak Day 0 - - - - - 270 32540 Rights of Ways 3.0 Peak Day 0 - - - - - 271 33100 Production Gas Wells Equipment 3.0 Peak Day 0 - - - - - 272 33201 Field Lines 3.0 Peak Day 0 - - - - - 273 33202 Tributary Lines 3.0 Peak Day 0 - - - - - 274 33400 Field Meas. & Reg. Sta. Equip 3.0 Peak Day 0 - - - - - 275 33600 Purification Equipment 3.0 Peak Day 0 - - - - - 276277 Total Production Plant 0 - - - - - 278279 Storage Plant:280281 35010 Land 3.0 Peak Day 0 - - - - - 282 35020 Rights of Way 3.0 Peak Day 11 5 3 0 2 1 283 35100 Structures and Improvements 3.0 Peak Day 149 67 38 2 22 19 284 35102 Compression Station Equipment 3.0 Peak Day 958 433 248 13 139 125 285 35103 Meas. & Reg. Sta. Structues 3.0 Peak Day 104 47 27 1 15 14 286 35104 Other Structures 3.0 Peak Day 887 401 229 12 128 116 287 35200 Wells \ Rights of Way 3.0 Peak Day 80,561 36,424 20,828 1,096 11,669 10,544 288 35201 Well Construction 3.0 Peak Day 12,920 5,842 3,340 176 1,871 1,691 289 35202 Well Equipment 3.0 Peak Day 0 - - - - - 290 35203 Cushion Gas 3.0 Peak Day 11,694 5,287 3,023 159 1,694 1,531 291 35210 Leaseholds 3.0 Peak Day 277 125 72 4 40 36 292 35211 Storage Rights 3.0 Peak Day 240 109 62 3 35 31 293 35301 Field Lines 3.0 Peak Day 798 361 206 11 116 104 294 35302 Tributary Lines 3.0 Peak Day 952 431 246 13 138 125 295 35400 Compressor Station Equipment 3.0 Peak Day 7,849 3,549 2,029 107 1,137 1,027 296 35500 Meas & Reg. Equipment 3.0 Peak Day 2,280 1,031 590 31 330 298 297 35600 Purification Equipment 3.0 Peak Day 4,105 1,856 1,061 56 595 537 298299 Total Storage Plant 123,785 55,968 32,003 1,683 17,929 16,202 300301 Transmission:302303 36510 Land & Land Rights 3.0 Peak Day 0 - - - - - 304 36520 Rights of Way 3.0 Peak Day 9,112 4,120 2,356 124 1,320 1,193 305 36602 Structures & Improvements 3.0 Peak Day 608 275 157 8 88 80 306 36603 Other Structues 3.0 Peak Day 754 341 195 10 109 99 307 36700 Mains Cathodic Protection 3.0 Peak Day 5,362 2,424 1,386 73 777 702 308 36701 Mains - Steel 3.0 Peak Day 381,167 172,339 98,547 5,183 55,209 49,889 309 36900 Meas. & Reg. Equipment 3.0 Peak Day 11,265 5,093 2,912 153 1,632 1,474 310 36901 Meas. & Reg. Equipment 3.0 Peak Day 34,951 15,803 9,036 475 5,062 4,575 311312 Total Transmission Plant 443,218 200,394 114,589 6,027 64,197 58,010 313314 Distribution:315316 37400 Land & Land Rights 3.0 Peak Day 0 - - - - - 317 37401 Land 3.0 Peak Day 0 - - - - - 318 37402 Land Rights 3.0 Peak Day 33,216 15,018 8,588 452 4,811 4,347 319 37403 Land Other 3.0 Peak Day 0 - - - - - 320 37500 Structures & Improvements 3.0 Peak Day 4,005 1,811 1,035 54 580 524 321 37501 Structures & Improvements T.B. 3.0 Peak Day 1,189 538 307 16 172 156 322 37502 Land Rights 3.0 Peak Day 551 249 142 7 80 72 323 37503 Improvements 3.0 Peak Day 48 22 12 1 7 6 324 37600 Mains Cathodic Protection 3.0 Peak Day 581,379 262,861 150,309 7,906 84,209 76,093 325 37601 Mains - Steel 3.0 Peak Day 2,964,882 1,340,526 766,539 40,318 429,443 388,057 326 37602 Mains - Plastic 3.0 Peak Day 2,247,002 1,015,947 580,938 30,556 325,463 294,097 327 37800 Meas & Reg. Sta. Equip - General 3.0 Peak Day 616,052 278,538 159,274 8,377 89,231 80,632 328 37900 Meas & Reg. Sta. Equip - City Gate 3.0 Peak Day 97,105 43,904 25,105 1,320 14,065 12,710 329 37905 Meas & Reg. Sta. Equipment T.b. 3.0 Peak Day 31,120 14,070 8,046 423 4,508 4,073 330 38000 Services 99.0 - 0 - - - - - 331 38100 Meters 99.0 - 0 - - - - - 332 38200 Meter Installaitons 99.0 - 0 - - - - - 333 38300 House Regulators 99.0 - 0 - - - - - 334 38400 House Reg. Installations 99.0 - 0 - - - - - 335 38500 Ind. Meas. & Reg. Sta. Equipment 99.0 - 0 - - - - - 336 38600 Other Prop. On Cust. Prem 99.0 - 0 - - - - - 337338 Total Distribution Plant 6,576,548 2,973,484 1,700,297 89,431 952,568 860,768

Exhibit PHR-2Page 60 of 75
Atmos Energy Corporation, Kentucky/Mid-States DivisionClass Cost of Service - Customer/Demand StudyForecasted Test Period: Twelve Months Ended March 31, 2020
ALLOCATION OF DEPRECIATION EXPENSE339340 General:341342 38900 Land & Land Rights 6.4 P, S, T & D Plant - Demand 0 - - - - - 343 39000 Structures Frame 6.4 P, S, T & D Plant - Demand 102,652 46,412 26,540 1,396 14,868 13,436 344 39001 Structures & Improvements 6.4 P, S, T & D Plant - Demand 2,337 1,056 604 32 338 306 345 39002 Improvements 6.4 P, S, T & D Plant - Demand 9,572 4,328 2,475 130 1,387 1,253 346 39003 Air Conditioning Equipment 6.4 P, S, T & D Plant - Demand 306 138 79 4 44 40 347 39004 Improvement to leased Premises 6.4 P, S, T & D Plant - Demand 0 - - - - - 348 39009 Office Furniture & Equipment 6.4 P, S, T & D Plant - Demand 39,171 17,711 10,127 533 5,674 5,127 349 39100 Remittance Processing Equip 6.4 P, S, T & D Plant - Demand 0 - - - - - 350 39102 Office Machines 6.4 P, S, T & D Plant - Demand 0 - - - - - 351 39103 Transportation Equipment 6.4 P, S, T & D Plant - Demand 2,176 984 563 30 315 285 352 39200 Trucks 6.4 P, S, T & D Plant - Demand 0 - - - - - 353 39201 Trailers 6.4 P, S, T & D Plant - Demand 0 - - - - - 354 39202 Stores Equipment 6.4 P, S, T & D Plant - Demand 0 - - - - - 355 39300 Tools, Shop & Garage Equipment 6.4 P, S, T & D Plant - Demand 48,983 22,147 12,664 666 7,095 6,411 356 39400 Power Operated Equipment 6.4 P, S, T & D Plant - Demand 0 - - - - - 357 39600 Ditchers 6.4 P, S, T & D Plant - Demand 0 - - - - - 358 39603 Backhoes 6.4 P, S, T & D Plant - Demand 0 - - - - - 359 39604 Welders 6.4 P, S, T & D Plant - Demand 0 - - - - - 360 39605 Communication Equipment 6.4 P, S, T & D Plant - Demand 14,658 6,627 3,790 199 2,123 1,918 361 39700 Communication Equipment - Mobile Radios 6.4 P, S, T & D Plant - Demand 0 - - - - - 362 39701 Communication Equipment - Fixed Radios 6.4 P, S, T & D Plant - Demand 0 - - - - - 363 39702 Communication Equip. - Telemetering 6.4 P, S, T & D Plant - Demand 0 - - - - - 364 39705 Miscellaneous Equipment 6.4 P, S, T & D Plant - Demand 81,567 36,879 21,088 1,109 11,814 10,676 365 39800 Other Tangible Property 6.4 P, S, T & D Plant - Demand 0 - - - - - 366 39900 Other Tangible Property - Servers - H/W 6.4 P, S, T & D Plant - Demand 862 390 223 12 125 113 367 39901 Other Tangible Property - Servers - S/W 6.4 P, S, T & D Plant - Demand 0 - - - - - 368 39902 Other Tangible Property - Network - H/W 6.4 P, S, T & D Plant - Demand 5,642 2,551 1,459 77 817 738 369 39903 Other Tang. Property - CPU 6.4 P, S, T & D Plant - Demand 0 - - - - - 370 39904 Other Tangible Property - MF - Hardware 6.4 P, S, T & D Plant - Demand 0 - - - - - 371 39905 Other Tang. Property - PC Hardware 6.4 P, S, T & D Plant - Demand 37,454 16,934 9,683 509 5,425 4,902 372 39906 Other Tang. Property - PC Software 6.4 P, S, T & D Plant - Demand 0 - - - - - 373 39907 Other Tang. Property - Mainframe S/W 6.4 P, S, T & D Plant - Demand 0 - - - - - 374 39908 Other Tang. Property - Application Software 6.4 P, S, T & D Plant - Demand 4,313 1,950 1,115 59 625 564 375 40600 Amortization of gas plant acquisition adjustments 6.4 P, S, T & D Plant - Demand 0 - - - - - 376377378 Total General Plant 349,693 158,108 90,409 4,755 50,651 45,769379380 TOTAL DIRECT DEPRECIATION EXPENSE 7,493,244 3,387,954 1,937,299 101,897 1,085,345 980,749381382 Kentucky Mid-States General Office:383384 Intangible Plant:385386 30100 Organization 99.0 - 0 - - - - - 387 30200 Franchises & Consents 99.0 - 0 - - - - - 388 30300 Misc Intangible Plant 99.0 - 0 - - - - - 389390 Total Intangible Plant: 0 - - - - - 391392 General:393394 37400 Land & Land Rights 6.4 P, S, T & D Plant - Demand 0 - - - - - 395 39001 Structures Frame 6.4 P, S, T & D Plant - Demand 1,048 474 271 14 152 137 396 36602 Structures & Improvements 6.4 P, S, T & D Plant - Demand 0 - - - - - 397 38900 Land & Land Rights 6.4 P, S, T & D Plant - Demand 0 - - - - - 398 39004 Air Conditioning Equipment 6.4 P, S, T & D Plant - Demand 235 106 61 3 34 31 399 39009 Improvement to leased Premises 6.4 P, S, T & D Plant - Demand 0 - - - - - 400 39100 Office Furniture & Equipment 6.4 P, S, T & D Plant - Demand 0 - - - - - 401 39102 Remittance Processing Equip 6.4 P, S, T & D Plant - Demand 0 - - - - - 402 39103 Office Machines 6.4 P, S, T & D Plant - Demand 0 - - - - - 403 39200 Transportation Equipment 6.4 P, S, T & D Plant - Demand 168 76 43 2 24 22 404 39201 Trucks 6.4 P, S, T & D Plant - Demand 0 - - - - - 405 39202 Trailers 6.4 P, S, T & D Plant - Demand 0 - - - - - 406 39300 Stores Equipment 6.4 P, S, T & D Plant - Demand 0 - - - - - 407 39400 Tools, Shop & Garage Equipment 6.4 P, S, T & D Plant - Demand 849 384 219 12 123 111 408 39600 Power Operated Equipment 6.4 P, S, T & D Plant - Demand 5 2 1 0 1 1 409 39603 Ditchers 6.4 P, S, T & D Plant - Demand 0 - - - - - 410 39604 Backhoes 6.4 P, S, T & D Plant - Demand 0 - - - - - 411 39605 Welders 6.4 P, S, T & D Plant - Demand 0 - - - - - 412 39700 Communication Equipment 6.4 P, S, T & D Plant - Demand 692 313 179 9 100 91 413 39701 Communication Equipment - Mobile Radios 6.4 P, S, T & D Plant - Demand 0 - - - - - 414 39702 Communication Equipment - Fixed Radios 6.4 P, S, T & D Plant - Demand 0 - - - - - 415 39705 Communication Equip. - Telemetering 6.4 P, S, T & D Plant - Demand 0 - - - - - 416 39800 Miscellaneous Equipment 6.4 P, S, T & D Plant - Demand 5,131 2,320 1,326 70 743 672 417 39900 Other Tangible Property 6.4 P, S, T & D Plant - Demand 0 - - - - - 418 39901 Other Tangible Property - Servers - H/W 6.4 P, S, T & D Plant - Demand 0 - - - - - 419 39902 Other Tangible Property - Servers - S/W 6.4 P, S, T & D Plant - Demand 0 - - - - - 420 39903 Other Tangible Property - Network - H/W 6.4 P, S, T & D Plant - Demand 0 - - - - - 421 39904 Other Tang. Property - CPU 6.4 P, S, T & D Plant - Demand 0 - - - - - 422 39905 Other Tangible Property - MF - Hardware 6.4 P, S, T & D Plant - Demand 0 - - - - - 423 39906 Other Tang. Property - PC Hardware 6.4 P, S, T & D Plant - Demand 0 - - - - - 424 39907 Other Tang. Property - PC Software 6.4 P, S, T & D Plant - Demand 4,672 2,112 1,208 64 677 611 425 39908 Other Tang. Property - Mainframe S/W 6.4 P, S, T & D Plant - Demand 0 - - - - - 426 39909 Other Tang. Property - Application Software 6.4 P, S, T & D Plant - Demand 0 - - - - - 427 39924 Other Tang. Property - General Startup Costs 6.4 P, S, T & D Plant - Demand 0 - - - - - 428429430 Total General Plant 12,800 5,787 3,309 174 1,854 1,675

Exhibit PHR-2Page 61 of 75
Atmos Energy Corporation, Kentucky/Mid-States DivisionClass Cost of Service - Customer/Demand StudyForecasted Test Period: Twelve Months Ended March 31, 2020
ALLOCATION OF DEPRECIATION EXPENSE431432 Shared Services General Office:433434 General:435436 37400 Land & Land Rights 6.4 P, S, T & D Plant - Demand 0 - - - - - 437 39000 Structures & Improvements 6.4 P, S, T & D Plant - Demand 2,990 1,352 773 41 433 391 438 36602 Structures & Improvements 6.4 P, S, T & D Plant - Demand 0 - - - - - 439 37503 Improvements 6.4 P, S, T & D Plant - Demand 0 - - - - - 440 39004 Air Conditioning Equipment 6.4 P, S, T & D Plant - Demand 0 - - - - - 441 39009 Improvement to leased Premises 6.4 P, S, T & D Plant - Demand 15 7 4 0 2 2 442 39100 Office Furniture & Equipment 6.4 P, S, T & D Plant - Demand 4,523 2,045 1,169 62 655 592 443 39102 Remittance Processing Equip 6.4 P, S, T & D Plant - Demand 0 - - - - - 444 39103 Office Machines 6.4 P, S, T & D Plant - Demand 0 - - - - - 445 39200 Transportation Equipment 6.4 P, S, T & D Plant - Demand 0 - - - - - 446 39201 Trucks 6.4 P, S, T & D Plant - Demand 0 - - - - - 447 39202 Trailers 6.4 P, S, T & D Plant - Demand 0 - - - - - 448 39300 Stores Equipment 6.4 P, S, T & D Plant - Demand 0 - - - - - 449 39400 Tools, Shop & Garage Equipment 6.4 P, S, T & D Plant - Demand 0 - - - - - 450 39600 Power Operated Equipment 6.4 P, S, T & D Plant - Demand 0 - - - - - 451 39603 Ditchers 6.4 P, S, T & D Plant - Demand 0 - - - - - 452 39604 Backhoes 6.4 P, S, T & D Plant - Demand 0 - - - - - 453 39605 Welders 6.4 P, S, T & D Plant - Demand 0 - - - - - 454 39700 Communication Equipment 6.4 P, S, T & D Plant - Demand 11 5 3 0 2 1 455 39701 Communication Equipment - Mobile Radios 6.4 P, S, T & D Plant - Demand 0 - - - - - 456 39702 Communication Equipment - Fixed Radios 6.4 P, S, T & D Plant - Demand 0 - - - - - 457 39705 Communication Equip. - Telemetering 6.4 P, S, T & D Plant - Demand 0 - - - - - 458 39800 Miscellaneous Equipment 6.4 P, S, T & D Plant - Demand 28 12 7 0 4 4 459 39900 Other Tangible Property 6.4 P, S, T & D Plant - Demand 0 - - - - - 460 39901 Other Tangible Property - Servers - H/W 6.4 P, S, T & D Plant - Demand 56,121 25,374 14,509 763 8,129 7,345 461 39902 Other Tangible Property - Servers - S/W 6.4 P, S, T & D Plant - Demand 16,819 7,604 4,348 229 2,436 2,201 462 39903 Other Tangible Property - Network - H/W 6.4 P, S, T & D Plant - Demand 0 - - - - - 463 39904 Other Tang. Property - CPU 6.4 P, S, T & D Plant - Demand 0 - - - - - 464 39905 Other Tangible Property - MF - Hardware 6.4 P, S, T & D Plant - Demand 0 - - - - - 465 39906 Other Tang. Property - PC Hardware 6.4 P, S, T & D Plant - Demand 3,803 1,719 983 52 551 498 466 39907 Other Tang. Property - PC Software 6.4 P, S, T & D Plant - Demand 0 - - - - - 467 39908 Other Tang. Property - Mainframe S/W 6.4 P, S, T & D Plant - Demand 0 - - - - - 468 39909 Other Tang. Property - Application Software 6.4 P, S, T & D Plant - Demand 572 259 148 8 83 75 469 39924 Other Tang. Property - General Startup Costs 6.4 P, S, T & D Plant - Demand 0 - - - - - 470471472 Total General Plant 84,881 38,378 21,945 1,154 12,294 11,110 473474 Shared Services Customer Support:475476 General:477478 37400 Land & Land Rights 6.4 P, S, T & D Plant - Demand 0 - - - - - 479 39001 Structures Frame 6.4 P, S, T & D Plant - Demand 0 - - - - - 480 36602 Structures & Improvements 6.4 P, S, T & D Plant - Demand 12,617 5,705 3,262 172 1,828 1,651 481 37503 Improvements 6.4 P, S, T & D Plant - Demand 0 - - - - - 482 39004 Air Conditioning Equipment 6.4 P, S, T & D Plant - Demand 0 - - - - - 483 39009 Improvement to leased Premises 6.4 P, S, T & D Plant - Demand 2,168 980 560 29 314 284 484 39100 Office Furniture & Equipment 6.4 P, S, T & D Plant - Demand 2,573 1,164 665 35 373 337 485 39102 Remittance Processing Equip 6.4 P, S, T & D Plant - Demand 0 - - - - - 486 39103 Office Machines 6.4 P, S, T & D Plant - Demand 0 - - - - - 487 39200 Transportation Equipment 6.4 P, S, T & D Plant - Demand 0 - - - - - 488 39201 Trucks 6.4 P, S, T & D Plant - Demand 0 - - - - - 489 39202 Trailers 6.4 P, S, T & D Plant - Demand 0 - - - - - 490 39300 Stores Equipment 6.4 P, S, T & D Plant - Demand 0 - - - - - 491 39400 Tools, Shop & Garage Equipment 6.4 P, S, T & D Plant - Demand 499 226 129 7 72 65 492 39600 Power Operated Equipment 6.4 P, S, T & D Plant - Demand 23 10 6 0 3 3 493 39603 Ditchers 6.4 P, S, T & D Plant - Demand 0 - - - - - 494 39604 Backhoes 6.4 P, S, T & D Plant - Demand 0 - - - - - 495 39605 Welders 6.4 P, S, T & D Plant - Demand 0 - - - - - 496 39700 Communication Equipment 6.4 P, S, T & D Plant - Demand 2,812 1,272 727 38 407 368 497 39701 Communication Equipment - Mobile Radios 6.4 P, S, T & D Plant - Demand 0 - - - - - 498 39702 Communication Equipment - Fixed Radios 6.4 P, S, T & D Plant - Demand 0 - - - - - 499 39705 Communication Equip. - Telemetering 6.4 P, S, T & D Plant - Demand 0 - - - - - 500 39800 Miscellaneous Equipment 6.4 P, S, T & D Plant - Demand 349 158 90 5 51 46 501 39900 Other Tangible Property 6.4 P, S, T & D Plant - Demand 2,374 1,073 614 32 344 311 502 39901 Other Tangible Property - Servers - H/W 6.4 P, S, T & D Plant - Demand 23,187 10,483 5,995 315 3,358 3,035 503 39902 Other Tangible Property - Servers - S/W 6.4 P, S, T & D Plant - Demand 4,274 1,932 1,105 58 619 559 504 39903 Other Tangible Property - Network - H/W 6.4 P, S, T & D Plant - Demand 1,040 470 269 14 151 136 505 39904 Other Tang. Property - CPU 6.4 P, S, T & D Plant - Demand 0 - - - - - 506 39905 Other Tangible Property - MF - Hardware 6.4 P, S, T & D Plant - Demand 0 - - - - - 507 39906 Other Tang. Property - PC Hardware 6.4 P, S, T & D Plant - Demand 3,064 1,385 792 42 444 401 508 39907 Other Tang. Property - PC Software 6.4 P, S, T & D Plant - Demand 365 165 94 5 53 48 509 39908 Other Tang. Property - Mainframe S/W 6.4 P, S, T & D Plant - Demand 0 - - - - - 510 39909 Other Tang. Property - Application Software 6.4 P, S, T & D Plant - Demand 143,579 64,917 37,121 1,952 20,796 18,792 511 39924 Other Tang. Property - General Startup Costs 6.4 P, S, T & D Plant - Demand 13 6 3 0 2 2 512513514 Total General Plant 198,938 89,947 51,433 2,705 28,815 26,038 515516 TOTAL DEPRECIATION EXPENSE - DEMAND 7,789,863 3,522,066 2,013,986 105,931 1,128,309 1,019,572

Exhibit PHR-2Page 62 of 75
Atmos Energy Corporation, Kentucky/Mid-States DivisionClass Cost of Service - Customer/Demand StudyForecasted Test Period: Twelve Months Ended March 31, 2020
ALLOCATION OF DEPRECIATION EXPENSE
Commodity
Line Acct. Allocation Allocation Total Residential Non-Res Sales Non-Res Sales Transport TransportNo. No. Factor Basis Company Sales Firm Interruptible Firm Interruptible
517 Intangible Plant:518519 30100 Organization 99.0 - 0 - - - - - 520 30200 Franchises & Consents 99.0 - 0 - - - - - 521 30300 Misc Intangible Plant 99.0 - 0 - - - - - 522523 Total Intangible Plant: 0 - - - - - 524525 Production Plant:526 99.0 - 0 - - - - - 527 32520 Producing Leaseholds 99.0 - 0 - - - - - 528 32540 Rights of Ways 99.0 - 0 - - - - - 529 33100 Production Gas Wells Equipment 99.0 - 0 - - - - - 530 33201 Field Lines 99.0 - 0 - - - - - 531 33202 Tributary Lines 99.0 - 0 - - - - - 532 33400 Field Meas. & Reg. Sta. Equip 99.0 - 0 - - - - - 533 33600 Purification Equipment 99.0 - 0 - - - - - 534535 Total Production Plant 0 - - - - - 536537 Storage Plant:538539 35010 Land 1.5 Winter Volumes 0 - - - - - 540 35020 Rights of Way 1.5 Winter Volumes 11 4 3 0 2 2 541 35100 Structures and Improvements 1.5 Winter Volumes 149 56 35 2 27 28 542 35102 Compression Station Equipment 1.5 Winter Volumes 958 363 224 12 176 182 543 35103 Meas. & Reg. Sta. Structues 1.5 Winter Volumes 104 39 24 1 19 20 544 35104 Other Structures 1.5 Winter Volumes 887 336 208 11 163 169 545 35200 Wells \ Rights of Way 1.5 Winter Volumes 80,561 30,503 18,874 1,032 14,810 15,342 546 35201 Well Construction 1.5 Winter Volumes 12,920 4,892 3,027 166 2,375 2,461 547 35202 Well Equipment 1.5 Winter Volumes 0 - - - - - 548 35203 Cushion Gas 1.5 Winter Volumes 11,694 4,428 2,740 150 2,150 2,227 549 35210 Leaseholds 1.5 Winter Volumes 277 105 65 4 51 53 550 35211 Storage Rights 1.5 Winter Volumes 240 91 56 3 44 46 551 35301 Field Lines 1.5 Winter Volumes 798 302 187 10 147 152 552 35302 Tributary Lines 1.5 Winter Volumes 952 361 223 12 175 181 553 35400 Compressor Station Equipment 1.5 Winter Volumes 7,849 2,972 1,839 101 1,443 1,495 554 35500 Meas & Reg. Equipment 1.5 Winter Volumes 2,280 863 534 29 419 434 555 35600 Purification Equipment 1.5 Winter Volumes 4,105 1,554 962 53 755 782 556557 Total Storage Plant 123,785 46,869 29,001 1,586 22,756 23,574 558559 Transmission:560561 36510 Land & Land Rights 99.0 - 0 - - - - - 562 36520 Rights of Way 99.0 - 0 - - - - - 563 36602 Structures & Improvements 99.0 - 0 - - - - - 564 36603 Other Structues 99.0 - 0 - - - - - 565 36700 Mains Cathodic Protection 99.0 - 0 - - - - - 566 36701 Mains - Steel 99.0 - 0 - - - - - 567 36900 Meas. & Reg. Equipment 99.0 - 0 - - - - - 568 36901 Meas. & Reg. Equipment 99.0 - 0 - - - - - 569570 Total Transmission Plant 0 - - - - - 571572 Distribution:573574 37400 Land & Land Rights 99.0 - 0 - - - - - 575 37401 Land 99.0 - 0 - - - - - 576 37402 Land Rights 1.0 Mcf 0 - - - - - 577 37403 Land Other 99.0 - 0 - - - - - 578 37500 Structures & Improvements 1.0 Mcf 0 - - - - - 579 37501 Structures & Improvements T.B. 1.0 Mcf 0 - - - - - 580 37502 Land Rights 1.0 Mcf 0 - - - - - 581 37503 Improvements 1.0 Mcf 0 - - - - - 582 37600 Mains Cathodic Protection 1.0 Mcf 0 - - - - - 583 37601 Mains - Steel 1.0 Mcf 0 - - - - - 584 37602 Mains - Plastic 1.0 Mcf 0 - - - - - 585 37800 Meas & Reg. Sta. Equip - General 1.0 Mcf 0 - - - - - 586 37900 Meas & Reg. Sta. Equip - City Gate 1.0 Mcf 0 - - - - - 587 37905 Meas & Reg. Sta. Equipment T.b. 1.0 Mcf 0 - - - - - 588 38000 Services 99.0 - 0 - - - - - 589 38100 Meters 99.0 - 0 - - - - - 590 38200 Meter Installaitons 99.0 - 0 - - - - - 591 38300 House Regulators 99.0 - 0 - - - - - 592 38400 House Reg. Installations 99.0 - 0 - - - - - 593 38500 Ind. Meas. & Reg. Sta. Equipment 99.0 - 0 - - - - - 594 38600 Other Prop. On Cust. Prem 99.0 - 0 - - - - - 595596 Total Distribution Plant 0 - - - - -

Exhibit PHR-2Page 63 of 75
Atmos Energy Corporation, Kentucky/Mid-States DivisionClass Cost of Service - Customer/Demand StudyForecasted Test Period: Twelve Months Ended March 31, 2020
ALLOCATION OF DEPRECIATION EXPENSE597598 General:599600 38900 Land & Land Rights 6.6 P, S, T & D Plant - Commodity 0 - - - - - 601 39000 Structures Frame 6.6 P, S, T & D Plant - Commodity 2,697 1,021 632 35 496 514 602 39001 Structures & Improvements 6.6 P, S, T & D Plant - Commodity 61 23 14 1 11 12 603 39002 Improvements 6.6 P, S, T & D Plant - Commodity 252 95 59 3 46 48 604 39003 Air Conditioning Equipment 6.6 P, S, T & D Plant - Commodity 8 3 2 0 1 2 605 39004 Improvement to leased Premises 6.6 P, S, T & D Plant - Commodity 0 - - - - - 606 39009 Office Furniture & Equipment 6.6 P, S, T & D Plant - Commodity 1,029 390 241 13 189 196 607 39100 Remittance Processing Equip 6.6 P, S, T & D Plant - Commodity 0 - - - - - 608 39102 Office Machines 6.6 P, S, T & D Plant - Commodity 0 - - - - - 609 39103 Transportation Equipment 6.6 P, S, T & D Plant - Commodity 57 22 13 1 11 11 610 39200 Trucks 6.6 P, S, T & D Plant - Commodity 0 - - - - - 611 39201 Trailers 6.6 P, S, T & D Plant - Commodity 0 - - - - - 612 39202 Stores Equipment 6.6 P, S, T & D Plant - Commodity 0 - - - - - 613 39300 Tools, Shop & Garage Equipment 6.6 P, S, T & D Plant - Commodity 1,287 487 302 16 237 245 614 39400 Power Operated Equipment 6.6 P, S, T & D Plant - Commodity 0 - - - - - 615 39600 Ditchers 6.6 P, S, T & D Plant - Commodity 0 - - - - - 616 39603 Backhoes 6.6 P, S, T & D Plant - Commodity 0 - - - - - 617 39604 Welders 6.6 P, S, T & D Plant - Commodity 0 - - - - - 618 39605 Communication Equipment 6.6 P, S, T & D Plant - Commodity 385 146 90 5 71 73 619 39700 Communication Equipment - Mobile Radios 6.6 P, S, T & D Plant - Commodity 0 - - - - - 620 39701 Communication Equipment - Fixed Radios 6.6 P, S, T & D Plant - Commodity 0 - - - - - 621 39702 Communication Equip. - Telemetering 6.6 P, S, T & D Plant - Commodity 0 - - - - - 622 39705 Miscellaneous Equipment 6.6 P, S, T & D Plant - Commodity 2,143 811 502 27 394 408 623 39800 Other Tangible Property 6.6 P, S, T & D Plant - Commodity 0 - - - - - 624 39900 Other Tangible Property - Servers - H/W 6.6 P, S, T & D Plant - Commodity 23 9 5 0 4 4 625 39901 Other Tangible Property - Servers - S/W 6.6 P, S, T & D Plant - Commodity 0 - - - - - 626 39902 Other Tangible Property - Network - H/W 6.6 P, S, T & D Plant - Commodity 148 56 35 2 27 28 627 39903 Other Tang. Property - CPU 6.6 P, S, T & D Plant - Commodity 0 - - - - - 628 39904 Other Tangible Property - MF - Hardware 6.6 P, S, T & D Plant - Commodity 0 - - - - - 629 39905 Other Tang. Property - PC Hardware 6.6 P, S, T & D Plant - Commodity 984 373 231 13 181 187 630 39906 Other Tang. Property - PC Software 6.6 P, S, T & D Plant - Commodity 0 - - - - - 631 39907 Other Tang. Property - Mainframe S/W 6.6 P, S, T & D Plant - Commodity 0 - - - - - 632 39908 Other Tang. Property - Application Software 6.6 P, S, T & D Plant - Commodity 113 43 27 1 21 22 633 40600 Amortization of gas plant acquisition adjustments 6.6 P, S, T & D Plant - Commodity 0 - - - - - 634635636 Total General Plant 9,188 3,479 2,153 118 1,689 1,750637638 TOTAL DIRECT DEPRECIATION EXPENSE 132,973 50,348 31,154 1,704 24,445 25,324639640 Kentucky Mid-States General Office:641642 Intangible Plant:643644 30100 Organization 99.0 - 0 - - - - - 645 30200 Franchises & Consents 99.0 - 0 - - - - - 646 30300 Misc Intangible Plant 99.0 - 0 - - - - - 647648 Total Intangible Plant: 0 - - - - - 649650 General:651652 37400 Land & Land Rights 6.6 P, S, T & D Plant - Commodity 0 - - - - - 653 39001 Structures Frame 6.6 P, S, T & D Plant - Commodity 28 10 6 0 5 5 654 36602 Structures & Improvements 6.6 P, S, T & D Plant - Commodity 0 - - - - - 655 38900 Land & Land Rights 6.6 P, S, T & D Plant - Commodity 0 - - - - - 656 39004 Air Conditioning Equipment 6.6 P, S, T & D Plant - Commodity 6 2 1 0 1 1 657 39009 Improvement to leased Premises 6.6 P, S, T & D Plant - Commodity 0 - - - - - 658 39100 Office Furniture & Equipment 6.6 P, S, T & D Plant - Commodity 0 - - - - - 659 39102 Remittance Processing Equip 6.6 P, S, T & D Plant - Commodity 0 - - - - - 660 39103 Office Machines 6.6 P, S, T & D Plant - Commodity 0 - - - - - 661 39200 Transportation Equipment 6.6 P, S, T & D Plant - Commodity 4 2 1 0 1 1 662 39201 Trucks 6.6 P, S, T & D Plant - Commodity 0 - - - - - 663 39202 Trailers 6.6 P, S, T & D Plant - Commodity 0 - - - - - 664 39300 Stores Equipment 6.6 P, S, T & D Plant - Commodity 0 - - - - - 665 39400 Tools, Shop & Garage Equipment 6.6 P, S, T & D Plant - Commodity 22 8 5 0 4 4 666 39600 Power Operated Equipment 6.6 P, S, T & D Plant - Commodity 0 0 0 0 0 0 667 39603 Ditchers 6.6 P, S, T & D Plant - Commodity 0 - - - - - 668 39604 Backhoes 6.6 P, S, T & D Plant - Commodity 0 - - - - - 669 39605 Welders 6.6 P, S, T & D Plant - Commodity 0 - - - - - 670 39700 Communication Equipment 6.6 P, S, T & D Plant - Commodity 18 7 4 0 3 3 671 39701 Communication Equipment - Mobile Radios 6.6 P, S, T & D Plant - Commodity 0 - - - - - 672 39702 Communication Equipment - Fixed Radios 6.6 P, S, T & D Plant - Commodity 0 - - - - - 673 39705 Communication Equip. - Telemetering 6.6 P, S, T & D Plant - Commodity 0 - - - - - 674 39800 Miscellaneous Equipment 6.6 P, S, T & D Plant - Commodity 135 51 32 2 25 26 675 39900 Other Tangible Property 6.6 P, S, T & D Plant - Commodity 0 - - - - - 676 39901 Other Tangible Property - Servers - H/W 6.6 P, S, T & D Plant - Commodity 0 - - - - - 677 39902 Other Tangible Property - Servers - S/W 6.6 P, S, T & D Plant - Commodity 0 - - - - - 678 39903 Other Tangible Property - Network - H/W 6.6 P, S, T & D Plant - Commodity 0 - - - - - 679 39904 Other Tang. Property - CPU 6.6 P, S, T & D Plant - Commodity 0 - - - - - 680 39905 Other Tangible Property - MF - Hardware 6.6 P, S, T & D Plant - Commodity 0 - - - - - 681 39906 Other Tang. Property - PC Hardware 6.6 P, S, T & D Plant - Commodity 0 - - - - - 682 39907 Other Tang. Property - PC Software 6.6 P, S, T & D Plant - Commodity 123 46 29 2 23 23 683 39908 Other Tang. Property - Mainframe S/W 6.6 P, S, T & D Plant - Commodity 0 - - - - - 684 39909 Other Tang. Property - Application Software 6.6 P, S, T & D Plant - Commodity 0 - - - - - 685 39924 Other Tang. Property - General Startup Costs 6.6 P, S, T & D Plant - Commodity 0 - - - - - 686687688 Total General Plant 336 127 79 4 62 64 689690 Shared Services General Office:

Exhibit PHR-2Page 64 of 75
Atmos Energy Corporation, Kentucky/Mid-States DivisionClass Cost of Service - Customer/Demand StudyForecasted Test Period: Twelve Months Ended March 31, 2020
ALLOCATION OF DEPRECIATION EXPENSE691692 General:693694 37400 Land & Land Rights 6.6 P, S, T & D Plant - Commodity 0 - - - - - 695 39000 Structures & Improvements 6.6 P, S, T & D Plant - Commodity 79 30 18 1 14 15 696 36602 Structures & Improvements 6.6 P, S, T & D Plant - Commodity 0 - - - - - 697 37503 Improvements 6.6 P, S, T & D Plant - Commodity 0 - - - - - 698 39004 Air Conditioning Equipment 6.6 P, S, T & D Plant - Commodity 0 - - - - - 699 39009 Improvement to leased Premises 6.6 P, S, T & D Plant - Commodity 0 0 0 0 0 0 700 39100 Office Furniture & Equipment 6.6 P, S, T & D Plant - Commodity 119 45 28 2 22 23 701 39102 Remittance Processing Equip 6.6 P, S, T & D Plant - Commodity 0 - - - - - 702 39103 Office Machines 6.6 P, S, T & D Plant - Commodity 0 - - - - - 703 39200 Transportation Equipment 6.6 P, S, T & D Plant - Commodity 0 - - - - - 704 39201 Trucks 6.6 P, S, T & D Plant - Commodity 0 - - - - - 705 39202 Trailers 6.6 P, S, T & D Plant - Commodity 0 - - - - - 706 39300 Stores Equipment 6.6 P, S, T & D Plant - Commodity 0 - - - - - 707 39400 Tools, Shop & Garage Equipment 6.6 P, S, T & D Plant - Commodity 0 - - - - - 708 39600 Power Operated Equipment 6.6 P, S, T & D Plant - Commodity 0 - - - - - 709 39603 Ditchers 6.6 P, S, T & D Plant - Commodity 0 - - - - - 710 39604 Backhoes 6.6 P, S, T & D Plant - Commodity 0 - - - - - 711 39605 Welders 6.6 P, S, T & D Plant - Commodity 0 - - - - - 712 39700 Communication Equipment 6.6 P, S, T & D Plant - Commodity 0 0 0 0 0 0 713 39701 Communication Equipment - Mobile Radios 6.6 P, S, T & D Plant - Commodity 0 - - - - - 714 39702 Communication Equipment - Fixed Radios 6.6 P, S, T & D Plant - Commodity 0 - - - - - 715 39705 Communication Equip. - Telemetering 6.6 P, S, T & D Plant - Commodity 0 - - - - - 716 39800 Miscellaneous Equipment 6.6 P, S, T & D Plant - Commodity 1 0 0 0 0 0 717 39900 Other Tangible Property 6.6 P, S, T & D Plant - Commodity 0 - - - - - 718 39901 Other Tangible Property - Servers - H/W 6.6 P, S, T & D Plant - Commodity 1,475 558 345 19 271 281 719 39902 Other Tangible Property - Servers - S/W 6.6 P, S, T & D Plant - Commodity 442 167 104 6 81 84 720 39903 Other Tangible Property - Network - H/W 6.6 P, S, T & D Plant - Commodity 0 - - - - - 721 39904 Other Tang. Property - CPU 6.6 P, S, T & D Plant - Commodity 0 - - - - - 722 39905 Other Tangible Property - MF - Hardware 6.6 P, S, T & D Plant - Commodity 0 - - - - - 723 39906 Other Tang. Property - PC Hardware 6.6 P, S, T & D Plant - Commodity 100 38 23 1 18 19 724 39907 Other Tang. Property - PC Software 6.6 P, S, T & D Plant - Commodity 0 - - - - - 725 39908 Other Tang. Property - Mainframe S/W 6.6 P, S, T & D Plant - Commodity 0 - - - - - 726 39909 Other Tang. Property - Application Software 6.6 P, S, T & D Plant - Commodity 15 6 4 0 3 3 727 39924 Other Tang. Property - General Startup Costs 6.6 P, S, T & D Plant - Commodity 0 - - - - - 728729730 Total General Plant 2,230 844 523 29 410 425 731732 Shared Services Customer Support:733734 General:735736 37400 Land & Land Rights 6.6 P, S, T & D Plant - Commodity 0 - - - - - 737 39001 Structures Frame 6.6 P, S, T & D Plant - Commodity 0 - - - - - 738 36602 Structures & Improvements 6.6 P, S, T & D Plant - Commodity 332 126 78 4 61 63 739 37503 Improvements 6.6 P, S, T & D Plant - Commodity 0 - - - - - 740 39004 Air Conditioning Equipment 6.6 P, S, T & D Plant - Commodity 0 - - - - - 741 39009 Improvement to leased Premises 6.6 P, S, T & D Plant - Commodity 57 22 13 1 10 11 742 39100 Office Furniture & Equipment 6.6 P, S, T & D Plant - Commodity 68 26 16 1 12 13 743 39102 Remittance Processing Equip 6.6 P, S, T & D Plant - Commodity 0 - - - - - 744 39103 Office Machines 6.6 P, S, T & D Plant - Commodity 0 - - - - - 745 39200 Transportation Equipment 6.6 P, S, T & D Plant - Commodity 0 - - - - - 746 39201 Trucks 6.6 P, S, T & D Plant - Commodity 0 - - - - - 747 39202 Trailers 6.6 P, S, T & D Plant - Commodity 0 - - - - - 748 39300 Stores Equipment 6.6 P, S, T & D Plant - Commodity 0 - - - - - 749 39400 Tools, Shop & Garage Equipment 6.6 P, S, T & D Plant - Commodity 13 5 3 0 2 2 750 39600 Power Operated Equipment 6.6 P, S, T & D Plant - Commodity 1 0 0 0 0 0 751 39603 Ditchers 6.6 P, S, T & D Plant - Commodity 0 - - - - - 752 39604 Backhoes 6.6 P, S, T & D Plant - Commodity 0 - - - - - 753 39605 Welders 6.6 P, S, T & D Plant - Commodity 0 - - - - - 754 39700 Communication Equipment 6.6 P, S, T & D Plant - Commodity 74 28 17 1 14 14 755 39701 Communication Equipment - Mobile Radios 6.6 P, S, T & D Plant - Commodity 0 - - - - - 756 39702 Communication Equipment - Fixed Radios 6.6 P, S, T & D Plant - Commodity 0 - - - - - 757 39705 Communication Equip. - Telemetering 6.6 P, S, T & D Plant - Commodity 0 - - - - - 758 39800 Miscellaneous Equipment 6.6 P, S, T & D Plant - Commodity 9 3 2 0 2 2 759 39900 Other Tangible Property 6.6 P, S, T & D Plant - Commodity 62 24 15 1 11 12 760 39901 Other Tangible Property - Servers - H/W 6.6 P, S, T & D Plant - Commodity 609 231 143 8 112 116 761 39902 Other Tangible Property - Servers - S/W 6.6 P, S, T & D Plant - Commodity 112 43 26 1 21 21 762 39903 Other Tangible Property - Network - H/W 6.6 P, S, T & D Plant - Commodity 27 10 6 0 5 5 763 39904 Other Tang. Property - CPU 6.6 P, S, T & D Plant - Commodity 0 - - - - - 764 39905 Other Tangible Property - MF - Hardware 6.6 P, S, T & D Plant - Commodity 0 - - - - - 765 39906 Other Tang. Property - PC Hardware 6.6 P, S, T & D Plant - Commodity 80 30 19 1 15 15 766 39907 Other Tang. Property - PC Software 6.6 P, S, T & D Plant - Commodity 10 4 2 0 2 2 767 39908 Other Tang. Property - Mainframe S/W 6.6 P, S, T & D Plant - Commodity 0 - - - - - 768 39909 Other Tang. Property - Application Software 6.6 P, S, T & D Plant - Commodity 3,772 1,428 884 48 693 718 769 39924 Other Tang. Property - General Startup Costs 6.6 P, S, T & D Plant - Commodity 0 0 0 0 0 0 770771772 Total General Plant 5,227 1,979 1,225 67 961 995 773774 TOTAL DEPRECIATION EXPENSE - COMMODITY 140,767 53,298 32,980 1,804 25,877 26,808

Exhibit PHR-2Page 65 of 75
Atmos Energy Corporation, Kentucky/Mid-States DivisionClass Cost of Service - Customer/Demand StudyForecasted Test Period: Twelve Months Ended March 31, 2020
ALLOCATION OF DEPRECIATION EXPENSE
Total Depreciation Expense
Line Acct. Allocation Allocation Total Residential Non-Res Sales Non-Res Sales Transport TransportNo. No. Factor Basis Company Sales Firm Interruptible Firm Interruptible
775 Intangible Plant:776777 30100 Organization 0 - - - - - 778 30200 Franchises & Consents 0 - - - - - 779 30300 Misc Intangible Plant 0 - - - - - 780781 Total Intangible Plant: 0 - - - - - 782783 Production Plant:784 0 - - - - - 785 32520 Producing Leaseholds 0 - - - - - 786 32540 Rights of Ways 0 - - - - - 787 33100 Production Gas Wells Equipment 0 - - - - - 788 33201 Field Lines 0 - - - - - 789 33202 Tributary Lines 0 - - - - - 790 33400 Field Meas. & Reg. Sta. Equip 0 - - - - - 791 33600 Purification Equipment 0 - - - - - 792793 Total Production Plant 0 - - - - - 794795 Storage Plant:796797 35010 Land 0 - - - - - 798 35020 Rights of Way 22 9 5 0 4 4 799 35100 Structures and Improvements 297 124 73 4 49 48 800 35102 Compression Station Equipment 1,916 796 472 25 315 308 801 35103 Meas. & Reg. Sta. Structues 208 87 51 3 34 33 802 35104 Other Structures 1,773 736 437 23 291 285 803 35200 Wells \ Rights of Way 161,122 66,927 39,703 2,128 26,478 25,886 804 35201 Well Construction 25,840 10,733 6,367 341 4,246 4,152 805 35202 Well Equipment 0 - - - - - 806 35203 Cushion Gas 23,389 9,715 5,763 309 3,844 3,758 807 35210 Leaseholds 553 230 136 7 91 89 808 35211 Storage Rights 481 200 118 6 79 77 809 35301 Field Lines 1,596 663 393 21 262 256 810 35302 Tributary Lines 1,905 791 469 25 313 306 811 35400 Compressor Station Equipment 15,699 6,521 3,868 207 2,580 2,522 812 35500 Meas & Reg. Equipment 4,561 1,894 1,124 60 749 733 813 35600 Purification Equipment 8,210 3,410 2,023 108 1,349 1,319 814815 Total Storage Plant 247,571 102,836 61,005 3,269 40,685 39,775 816817 Transmission:818819 36510 Land & Land Rights 0 - - - - - 820 36520 Rights of Way 9,112 4,120 2,356 124 1,320 1,193 821 36602 Structures & Improvements 608 275 157 8 88 80 822 36603 Other Structues 754 341 195 10 109 99 823 36700 Mains Cathodic Protection 5,362 2,424 1,386 73 777 702 824 36701 Mains - Steel 381,167 172,339 98,547 5,183 55,209 49,889 825 36900 Meas. & Reg. Equipment 11,265 5,093 2,912 153 1,632 1,474 826 36901 Meas. & Reg. Equipment 34,951 15,803 9,036 475 5,062 4,575 827828 Total Transmission Plant 443,218 200,394 114,589 6,027 64,197 58,010 829830 Distribution:831832 37400 Land & Land Rights 0 - - - - - 833 37401 Land 0 - - - - - 834 37402 Land Rights 49,908 29,883 10,396 453 4,823 4,354 835 37403 Land Other 0 - - - - - 836 37500 Structures & Improvements 6,017 3,603 1,253 55 581 525 837 37501 Structures & Improvements T.B. 1,787 1,070 372 16 173 156 838 37502 Land Rights 828 496 173 8 80 72 839 37503 Improvements 72 43 15 1 7 6 840 37600 Mains Cathodic Protection 873,542 523,042 181,961 7,922 84,410 76,207 841 37601 Mains - Steel 4,454,842 2,667,383 927,953 40,400 430,469 388,637 842 37602 Mains - Plastic 3,376,201 2,021,535 703,270 30,618 326,240 294,537 843 37800 Meas & Reg. Sta. Equip - General 925,640 554,237 192,813 8,394 89,444 80,752 844 37900 Meas & Reg. Sta. Equip - City Gate 145,903 87,361 30,392 1,323 14,099 12,729 845 37905 Meas & Reg. Sta. Equipment T.b. 46,759 27,997 9,740 424 4,518 4,079 846 38000 Services 4,817,588 4,290,218 521,911 265 3,317 1,877 847 38100 Meters 2,741,749 1,768,788 907,200 3,195 39,954 22,612 848 38200 Meter Installaitons 2,232,937 1,440,537 738,843 2,602 32,539 18,416 849 38300 House Regulators 514,355 331,827 170,192 599 7,495 4,242 850 38400 House Reg. Installations 8,807 5,681 2,914 10 128 73 851 38500 Ind. Meas. & Reg. Sta. Equipment 112,194 - 111,033 56 706 399 852 38600 Other Prop. On Cust. Prem 0 - - - - - 853854 Total Distribution Plant 20,309,129 13,753,701 4,510,430 96,342 1,038,982 909,674

Exhibit PHR-2Page 66 of 75
Atmos Energy Corporation, Kentucky/Mid-States DivisionClass Cost of Service - Customer/Demand StudyForecasted Test Period: Twelve Months Ended March 31, 2020
ALLOCATION OF DEPRECIATION EXPENSE855856 General:857858 38900 Land & Land Rights 0 - - - - - 859 39000 Structures Frame 244,888 160,430 52,645 1,482 16,013 14,317 860 39001 Structures & Improvements 5,574 3,652 1,198 34 365 326 861 39002 Improvements 22,836 14,960 4,909 138 1,493 1,335 862 39003 Air Conditioning Equipment 731 479 157 4 48 43 863 39004 Improvement to leased Premises 0 - - - - - 864 39009 Office Furniture & Equipment 93,448 61,219 20,089 566 6,111 5,463 865 39100 Remittance Processing Equip 0 - - - - - 866 39102 Office Machines 0 - - - - - 867 39103 Transportation Equipment 5,191 3,401 1,116 31 339 303 868 39200 Trucks 0 - - - - - 869 39201 Trailers 0 - - - - - 870 39202 Stores Equipment 0 - - - - - 871 39300 Tools, Shop & Garage Equipment 116,855 76,553 25,121 707 7,641 6,832 872 39400 Power Operated Equipment 0 - - - - - 873 39600 Ditchers 0 - - - - - 874 39603 Backhoes 0 - - - - - 875 39604 Welders 0 - - - - - 876 39605 Communication Equipment 34,968 22,908 7,517 212 2,287 2,044 877 39700 Communication Equipment - Mobile Radios 0 - - - - - 878 39701 Communication Equipment - Fixed Radios 0 - - - - - 879 39702 Communication Equip. - Telemetering 0 - - - - - 880 39705 Miscellaneous Equipment 194,589 127,478 41,832 1,178 12,724 11,376 881 39800 Other Tangible Property 0 - - - - - 882 39900 Other Tangible Property - Servers - H/W 2,056 1,347 442 12 134 120 883 39901 Other Tangible Property - Servers - S/W 0 - - - - - 884 39902 Other Tangible Property - Network - H/W 13,460 8,818 2,894 81 880 787 885 39903 Other Tang. Property - CPU 0 - - - - - 886 39904 Other Tangible Property - MF - Hardware 0 - - - - - 887 39905 Other Tang. Property - PC Hardware 89,351 58,535 19,208 541 5,843 5,224 888 39906 Other Tang. Property - PC Software 0 - - - - - 889 39907 Other Tang. Property - Mainframe S/W 0 - - - - - 890 39908 Other Tang. Property - Application Software 10,289 6,740 2,212 62 673 602 891 40600 Amortization of gas plant acquisition adjustments 0 - - - - - 892893894 Total General Plant 834,236 546,522 179,342 5,050 54,551 48,771 895896 TOTAL DIRECT DEPRECIATION EXPENSE 21,834,154 14,603,453 4,865,366 110,688 1,198,415 1,056,231 897898 Kentucky Mid-States General Office:899900 Intangible Plant:901902 30100 Organization 0 - - - - - 903 30200 Franchises & Consents 0 - - - - - 904 30300 Misc Intangible Plant 0 - - - - - 905906 Total Intangible Plant: 0 - - - - - 907908 General:909910 37400 Land & Land Rights 0 - - - - - 911 39001 Structures Frame 2,500 1,638 537 15 163 146 912 36602 Structures & Improvements 0 - - - - - 913 38900 Land & Land Rights 0 - - - - - 914 39004 Air Conditioning Equipment 561 368 121 3 37 33 915 39009 Improvement to leased Premises 0 - - - - - 916 39100 Office Furniture & Equipment 0 - - - - - 917 39102 Remittance Processing Equip 0 - - - - - 918 39103 Office Machines 0 - - - - - 919 39200 Transportation Equipment 400 262 86 2 26 23 920 39201 Trucks 0 - - - - - 921 39202 Trailers 0 - - - - - 922 39300 Stores Equipment 0 - - - - - 923 39400 Tools, Shop & Garage Equipment 2,025 1,326 435 12 132 118 924 39600 Power Operated Equipment 12 8 3 0 1 1 925 39603 Ditchers 0 - - - - - 926 39604 Backhoes 0 - - - - - 927 39605 Welders 0 - - - - - 928 39700 Communication Equipment 1,652 1,082 355 10 108 97 929 39701 Communication Equipment - Mobile Radios 0 - - - - - 930 39702 Communication Equipment - Fixed Radios 0 - - - - - 931 39705 Communication Equip. - Telemetering 0 - - - - - 932 39800 Miscellaneous Equipment 12,240 8,019 2,631 74 800 716 933 39900 Other Tangible Property 0 - - - - - 934 39901 Other Tangible Property - Servers - H/W 0 - - - - - 935 39902 Other Tangible Property - Servers - S/W 0 - - - - - 936 39903 Other Tangible Property - Network - H/W 0 - - - - - 937 39904 Other Tang. Property - CPU 0 - - - - - 938 39905 Other Tangible Property - MF - Hardware 0 - - - - - 939 39906 Other Tang. Property - PC Hardware 0 - - - - - 940 39907 Other Tang. Property - PC Software 11,145 7,302 2,396 67 729 652 941 39908 Other Tang. Property - Mainframe S/W 0 - - - - - 942 39909 Other Tang. Property - Application Software 0 - - - - - 943 39924 Other Tang. Property - General Startup Costs 0 - - - - - 944945946 Total General Plant 30,535 20,004 6,564 185 1,997 1,785 947948 Shared Services General Office:

Exhibit PHR-2Page 67 of 75
Atmos Energy Corporation, Kentucky/Mid-States DivisionClass Cost of Service - Customer/Demand StudyForecasted Test Period: Twelve Months Ended March 31, 2020
ALLOCATION OF DEPRECIATION EXPENSE949950 General:951952 37400 Land & Land Rights 0 - - - - - 953 39000 Structures & Improvements 7,132 4,672 1,533 43 466 417 954 36602 Structures & Improvements 0 - - - - - 955 37503 Improvements 0 - - - - - 956 39004 Air Conditioning Equipment 0 - - - - - 957 39009 Improvement to leased Premises 35 23 8 0 2 2 958 39100 Office Furniture & Equipment 10,791 7,069 2,320 65 706 631 959 39102 Remittance Processing Equip 0 - - - - - 960 39103 Office Machines 0 - - - - - 961 39200 Transportation Equipment 0 - - - - - 962 39201 Trucks 0 - - - - - 963 39202 Trailers 0 - - - - - 964 39300 Stores Equipment 0 - - - - - 965 39400 Tools, Shop & Garage Equipment 0 - - - - - 966 39600 Power Operated Equipment 0 - - - - - 967 39603 Ditchers 0 - - - - - 968 39604 Backhoes 0 - - - - - 969 39605 Welders 0 - - - - - 970 39700 Communication Equipment 27 18 6 0 2 2 971 39701 Communication Equipment - Mobile Radios 0 - - - - - 972 39702 Communication Equipment - Fixed Radios 0 - - - - - 973 39705 Communication Equip. - Telemetering 0 - - - - - 974 39800 Miscellaneous Equipment 66 43 14 0 4 4 975 39900 Other Tangible Property 0 - - - - - 976 39901 Other Tangible Property - Servers - H/W 133,882 87,708 28,782 810 8,755 7,827 977 39902 Other Tangible Property - Servers - S/W 40,124 26,286 8,626 243 2,624 2,346 978 39903 Other Tangible Property - Network - H/W 0 - - - - - 979 39904 Other Tang. Property - CPU 0 - - - - - 980 39905 Other Tangible Property - MF - Hardware 0 - - - - - 981 39906 Other Tang. Property - PC Hardware 9,073 5,944 1,950 55 593 530 982 39907 Other Tang. Property - PC Software 0 - - - - - 983 39908 Other Tang. Property - Mainframe S/W 0 - - - - - 984 39909 Other Tang. Property - Application Software 1,366 895 294 8 89 80 985 39924 Other Tang. Property - General Startup Costs 0 - - - - - 986987988 Total General Plant 202,494 132,657 43,532 1,226 13,241 11,838 989990 Shared Services Customer Support:991992 General:993994 37400 Land & Land Rights 0 - - - - - 995 39001 Structures Frame 0 - - - - - 996 36602 Structures & Improvements 30,100 19,719 6,471 182 1,968 1,760 997 37503 Improvements 0 - - - - - 998 39004 Air Conditioning Equipment 0 - - - - - 999 39009 Improvement to leased Premises 5,171 3,388 1,112 31 338 302
1000 39100 Office Furniture & Equipment 6,139 4,022 1,320 37 401 359 1001 39102 Remittance Processing Equip 0 - - - - - 1002 39103 Office Machines 0 - - - - - 1003 39200 Transportation Equipment 0 - - - - - 1004 39201 Trucks 0 - - - - - 1005 39202 Trailers 0 - - - - - 1006 39300 Stores Equipment 0 - - - - - 1007 39400 Tools, Shop & Garage Equipment 1,191 780 256 7 78 70 1008 39600 Power Operated Equipment 55 36 12 0 4 3 1009 39603 Ditchers 0 - - - - - 1010 39604 Backhoes 0 - - - - - 1011 39605 Welders 0 - - - - - 1012 39700 Communication Equipment 6,709 4,395 1,442 41 439 392 1013 39701 Communication Equipment - Mobile Radios 0 - - - - - 1014 39702 Communication Equipment - Fixed Radios 0 - - - - - 1015 39705 Communication Equip. - Telemetering 0 - - - - - 1016 39800 Miscellaneous Equipment 834 546 179 5 55 49 1017 39900 Other Tangible Property 5,664 3,710 1,218 34 370 331 1018 39901 Other Tangible Property - Servers - H/W 55,314 36,237 11,891 335 3,617 3,234 1019 39902 Other Tangible Property - Servers - S/W 10,196 6,679 2,192 62 667 596 1020 39903 Other Tangible Property - Network - H/W 2,481 1,625 533 15 162 145 1021 39904 Other Tang. Property - CPU 0 - - - - - 1022 39905 Other Tangible Property - MF - Hardware 0 - - - - - 1023 39906 Other Tang. Property - PC Hardware 7,309 4,788 1,571 44 478 427 1024 39907 Other Tang. Property - PC Software 871 571 187 5 57 51 1025 39908 Other Tang. Property - Mainframe S/W 0 - - - - - 1026 39909 Other Tang. Property - Application Software 342,525 224,394 73,635 2,073 22,398 20,025 1027 39924 Other Tang. Property - General Startup Costs 31 20 7 0 2 2 102810291030 Total General Plant 474,591 310,912 102,026 2,873 31,034 27,745 10311032 TOTAL DEPRECIATION EXPENSE 22,541,774 15,067,027 5,017,488 114,972 1,244,687 1,097,600

Exhibit PHR-2Page 68 of 75
Atmos Energy Corporation, Kentucky/Mid-States DivisionClass Cost of Service - Customer/Demand StudyForecasted Test Period: Twelve Months Ended March 31, 2020
ALLOCATION OF TAXES, OTHER THAN INCOME & NET DEDUCTIONS FOR INCOME TAX
Customer
Line Allocation Allocation Total Residential Non-Res Sales Non-Res Sales Transport TransportNo. Factor Basis Company Sales Firm Interruptible Firm Interruptible
1 Taxes Other Than Income23 Non Revenue Related:4 Payroll Related 7.2 Allocated O&M Expenses - Cust 138,081 113,529 23,817 65 428 242 5 Property Related 6.2 P, S, T & D Plant - Customer 3,423,620 2,772,392 625,009 1,274 15,929 9,015 6 DOT transmission User Tax 7.2 Allocated O&M Expenses - Cust 20,397 16,770 3,518 10 63 36 7 Other 7.2 Allocated O&M Expenses - Cust 14,747 12,125 2,544 7 46 26 8 Total Non Revenue Related: 3,596,845 2,914,817 654,888 1,355 16,466 9,3199
10 Revenue Related:11 State Gross Receipts - Tax 99.0 - 0 - - - - - 12 Local Gross Receipts - Tax 99.0 - 0 - - - - - 13 Public Service Commission Assessment 99.0 - 0 - - - - - 14 Total Revenue Related: 0 - - - - - 1516 Total Taxes, Other Than Income 3,596,845 2,914,817 654,888 1,355 16,466 9,319 171819 Interest Expense 19.2 Rate Base - Cust 5,365,163 4,457,365 875,259 1,563 19,781 11,195 2021 Amortization of Excess ADIT 20.2 Cost of Service - Cust (493,187) (403,218) (86,680) (198) (1,985) (1,106)

Exhibit PHR-2Page 69 of 75
Atmos Energy Corporation, Kentucky/Mid-States DivisionClass Cost of Service - Customer/Demand StudyForecasted Test Period: Twelve Months Ended March 31, 2020
ALLOCATION OF TAXES, OTHER THAN INCOME & NET DEDUCTIONS FOR INCOME TAX
Demand
Line Allocation Allocation Total Residential Non-Res Sales Non-Res Sales Transport TransportNo. Factor Basis Company Sales Firm Interruptible Firm Interruptible
20 Taxes Other Than Income2122 Non Revenue Related:23 Payroll Related 7.4 Allocated O&M Expenses - Demand 98,399 44,490 25,440 1,338 14,252 12,879 24 Property Related 6.4 P, S, T & D Plant - Demand 2,518,577 1,138,736 651,151 34,249 364,799 329,643 25 DOT transmission User Tax 7.4 Allocated O&M Expenses - Demand 14,535 6,572 3,758 198 2,105 1,902 26 Other 7.4 Allocated O&M Expenses - Demand 10,509 4,752 2,717 143 1,522 1,376 27 Total Non Revenue Related: 2,642,021 1,194,549 683,067 35,928 382,679 345,7992829 Revenue Related:30 State Gross Receipts - Tax 99.0 - 0 - - - - - 31 Local Gross Receipts - Tax 99.0 - 0 - - - - - 32 Public Service Commission Assessment 99.0 - 0 - - - - - 33 Total Revenue Related: 0 - - - - - 3435 Total Taxes, Other Than Income 2,642,021 1,194,549 683,067 35,928 382,679 345,799 363738 Interest Expense 19.4 Rate Base - Demand 4,162,525 1,882,021 1,076,177 56,604 602,913 544,810 3940 Amortization of Excess ADIT 20.4 Cost of Service - Demand (345,668) (156,466) (89,291) (4,706) (50,010) (45,196)

Exhibit PHR-2Page 70 of 75
Atmos Energy Corporation, Kentucky/Mid-States DivisionClass Cost of Service - Customer/Demand StudyForecasted Test Period: Twelve Months Ended March 31, 2020
ALLOCATION OF TAXES, OTHER THAN INCOME & NET DEDUCTIONS FOR INCOME TAX
Commodity
Line Allocation Allocation Total Residential Non-Res Sales Non-Res Sales Transport TransportNo. Factor Basis Company Sales Firm Interruptible Firm Interruptible
39 Taxes Other Than Income4041 Non Revenue Related:42 Payroll Related 7.6 Allocated O&M Expenses - Comm 691,389 405,201 275,297 9,812 524 555 43 Property Related 6.6 P, S, T & D Plant - Commodity 66,174 25,055 15,504 848 12,165 12,602 44 DOT transmission User Tax 7.6 Allocated O&M Expenses - Comm 102,130 59,855 40,666 1,449 77 82 45 Other 7.6 Allocated O&M Expenses - Comm 73,842 43,276 29,402 1,048 56 59 46 Total Non Revenue Related: 933,535 533,387 360,870 13,157 12,823 13,2984748 Revenue Related:49 State Gross Receipts - Tax 99.0 - 0 - - - - - 50 Local Gross Receipts - Tax 99.0 - 0 - - - - - 51 Public Service Commission Assessment 1.0 Mcf 339,436 102,784 69,655 3,441 77,044 86,511 52 Total Revenue Related: 339,436 102,784 69,655 3,441 77,044 86,511 5354 Total Taxes, Other Than Income 1,272,971 636,172 430,525 16,598 89,866 99,809 555657 Interest Expense 19.6 Rate Base - Comm (159,953) (161,485) (112,028) (3,085) 55,666 60,979 5859 Amortization of Excess ADIT 20.6 Cost of Service - Comm (624,911) (362,294) (246,010) (8,821) (3,725) (4,061)

Exhibit PHR-2Page 71 of 75
Atmos Energy Corporation, Kentucky/Mid-States DivisionClass Cost of Service - Customer/Demand StudyForecasted Test Period: Twelve Months Ended March 31, 2020
ALLOCATION OF TAXES, OTHER THAN INCOME & NET DEDUCTIONS FOR INCOME TAX
Total Taxes Other
Line Allocation Allocation Total Residential Non-Res Sales Non-Res Sales Transport TransportNo. Factor Basis Company Sales Firm Interruptible Firm Interruptible
58 Taxes Other Than Income5960 Non Revenue Related:61 Payroll Related 927,870 563,220 324,555 11,215 15,205 13,676 62 Property Related 6,008,371 3,936,183 1,291,664 36,371 392,893 351,260 63 DOT transmission User Tax 137,062 83,197 47,942 1,657 2,246 2,020 64 Other 99,099 60,153 34,663 1,198 1,624 1,461 65 Total Non Revenue Related: 7,172,401 4,642,753 1,698,824 50,440 411,967 368,417 6667 Revenue Related:68 State Gross Receipts - Tax 0 - - - - - 69 Local Gross Receipts - Tax 0 - - - - - 70 Public Service Commission Assessment 339,436 102,784 69,655 3,441 77,044 86,511 71 Total Revenue Related: 339,436 102,784 69,655 3,441 77,044 86,511 7273 Total Taxes, Other Than Income 7,511,837 4,745,538 1,768,479 53,881 489,011 454,927 747576 Interest Expense 9,367,735 6,177,901 1,839,408 55,082 678,360 616,984 7778 Amortization of Excess ADIT (1,463,766) (921,978) (421,980) (13,725) (55,720) (50,363)

Exhibit PHR-2Page 72 of 75
Atmos Energy Corporation, Kentucky/Mid-States DivisionClass Cost of Service - Customer/Demand StudyForecasted Test Period: Twelve Months Ended March 31, 2020
ALLOCATION OF REVENUES
Total Revenues
Line Allocation Allocation Total Residential Non-Res Sales Non-Res Sales Transport TransportNo. Factor Basis Company Sales Firm Interruptible Firm Interruptible
1 Rate Schedule Revenue:23 Base Revenues Input 86,746,747 50,513,031 21,051,850 300,483 7,930,117 6,951,266 4 Base Revenue Increase Input 0 - - - - - 5 Gas Costs Input 78,382,354 46,006,460 31,262,909 1,112,986 - - 6 Rider FF and Rider Tax Input 0 - - - - - 78 Total Rate Schedule Revenue 165,129,101 96,519,490 52,314,759 1,413,469 7,930,117 6,951,2669
10 Other Revenue:1112 Forfeited Discounts 18.6 Total Rate Schedule Revenues 1,304,965 762,764 413,427 11,170 62,669 54,934 13 Misc. Service Revenues 18.6 Total Rate Schedule Revenues 806,054 471,146 255,367 6,900 38,710 33,932 14 NTB 18.2 Base Revenues (17) (10) (4) (0) (2) (1) 15 Other Gas Revenue 18.2 Base Revenues 2,477,763 1,442,813 601,308 8,583 226,509 198,550 1617 Total Non-Rate Revenue 4,588,765 2,676,713 1,270,098 26,653 327,887 287,4141819 TOTAL REVENUE 169,717,866 99,196,203 53,584,857 1,440,122 8,258,004 7,238,681

Exhibit PHR-2Page 73 of 75
Atmos Energy Corporation, Kentucky/Mid-States DivisionClass Cost of Service - Customer/Demand StudyForecasted Test Period: Twelve Months Ended March 31, 2020
CLASSIFICATION FACTORS
Total Company Customer Demand Commodity
Input Values 1 1 0 01.0 Customer % 100.0000% 100.0000% 0.0000% 0.0000%
Input Values 1 0 1 02.0 Demand % 100.0000% 0.0000% 100.0000% 0.0000%
Input Values 1 0 0 13.0 Commodity % 100.0000% 0.0000% 0.0000% 100.0000%
Input Values 100 0 50 503.5 Storage (50/50) % 100.0000% 0.0000% 50.0000% 50.0000%
Input Values 255,402,252 85,421,465 169,980,788 04.0 Mains (Minimum System) % 100.0000% 33.4459% 66.5541% 0.0000%
Internally Generated Values 383,700,807 208,005,510 175,695,297 04.1 Mains & Services % 100.0000% 54.2103% 45.7897% 0.0000%
Internally Generated Values 681,841,791 388,519,111 285,813,125 7,509,5555.4 P, S, T & D Plant % 100.0000% 56.9808% 41.9178% 1.1014%
Internally Generated Values 569,918,798 318,284,171 245,988,328 5,646,2985.7 Net Plant % 100.0000% 55.8473% 43.1620% 0.9907%
Internally Generated Values 105,607,336 15,715,974 11,199,521 78,691,8409.1 Allocated O&M Expenses % 100.0000% 14.8815% 10.6049% 74.5136%
Internally Generated Values 6,001,704 2,634,055 3,347,032 20,61810.0 Composite of Accts. 871-879 & 886-893 % 100.0000% 43.8884% 55.7680% 0.3435%
Internally Generated Values 300,006,847 100,339,852 199,666,995 - 12.0 Composite of Accts. 374-379 % 100.0000% 33.4459% 66.5541% 0.0000%
Internally Generated Values 496,111,427 284,136,858 220,445,634 (8,471,064) 13.0 Rate Base % 100.0000% 57.2728% 44.4347% -1.7075%
Internally Generated Values 9,623,776 5,500,437 4,098,067 25,272 17.0 Composite of Accts. 870-902, 905-916, 924 & 928-930.1 % 100.0000% 57.1547% 42.5827% 0.2626%
Internally Generated Values 185,637,186 62,546,750 43,838,199 79,252,237 18.0 Total Cost of Service at Equalized ROR % 100.0000% 33.6930% 23.6150% 42.6920%
Values 0 0 0 099.0 - % 0.0000% 0.0000% 0.0000% 0.0000%

Exhibit PHR-2Page 74 of 75
Atmos Energy Corporation, Kentucky/Mid-States DivisionClass Cost of Service - Customer/Demand StudyForecasted Test Period: Twelve Months Ended March 31, 2020
ALLOCATION FACTORS
Total Residential Non-Res Sales Non-Res Sales Transport TransportCompany Sales Firm Interruptible Firm Interruptible
Input Value 33,298,463 10,083,093 6,833,161 337,587 7,557,945 8,486,677 1.0 Mcf % 100.0000% 30.2810% 20.5209% 1.0138% 22.6976% 25.4867%
Input Value 17,253,841 10,083,093 6,833,161 337,587 - - 1.2 Sales Mcf % 100.0000% 58.4397% 39.6037% 1.9566% 0.0000% 0.0000%
Input Value 20,546,467 7,779,490 4,813,775 263,242 3,777,063 3,912,897 1.5 Winter Volumes % 100.0000% 37.8629% 23.4287% 1.2812% 18.3830% 19.0441%
Input Value 2,125,194 1,892,554 230,232 117 1,463 828 2.0 Bills % 100.0000% 89.0532% 10.8335% 0.0055% 0.0688% 0.0390%
Input Value 232,640 0 230,232 117 1,463 828 2.2 Non-Residential Bills % 100.0000% 0.0000% 98.9649% 0.0503% 0.6289% 0.3559%
Input Value 288,074 130,248 74,478 3,917 41,726 37,7043.0 Peak Day % 100.0000% 45.2134% 25.8539% 1.3599% 14.4843% 13.0884%
Input Value 42,429,546 27,372,625 14,039,249 49,445 618,296 349,9314.0 Meter Investment % 100.0000% 64.5131% 33.0884% 0.1165% 1.4572% 0.8247%
Input Value 1 1 - - - - 4.2 Direct to Residential % 100.0000% 100.0000% 0.0000% 0.0000% 0.0000% 0.0000%
Input Value 1 - 1 - - - 4.4 Direct to Commercial % 100.0000% 0.0000% 100.0000% 0.0000% 0.0000% 0.0000%
Input Value 1 - 1 - - - 4.6 Direct to Industrial % 100.0000% 0.0000% 100.0000% 0.0000% 0.0000% 0.0000%
Input Value 1 - 1 - - - 4.8 Direct to Public Authority % 100.0000% 0.0000% 100.0000% 0.0000% 0.0000% 0.0000%
Input Value 1 - - - 1 - 5.0 Direct to Transport % 100.0000% 0.0000% 0.0000% 0.0000% 100.0000% 0.0000%
Internally Generated Value 681,841,791 446,685,845 146,580,588 4,127,415 44,586,248 39,861,6946.0 P, S, T & D Plant % 100.0000% 65.5117% 21.4977% 0.6053% 6.5391% 5.8462%
Internally Generated Value 388,519,111 314,616,542 70,927,245 144,561 1,807,685 1,023,078 6.2 P, S, T & D Plant - Customer % 100.0000% 80.9784% 18.2558% 0.0372% 0.4653% 0.2633%
Internally Generated Value 285,813,125 129,225,967 73,893,950 3,886,642 41,398,080 37,408,4866.4 P, S, T & D Plant - Demand % 100.0000% 45.2134% 25.8539% 1.3599% 14.4843% 13.0884%
Internally Generated Value 7,509,555 2,843,336 1,759,393 96,213 1,380,484 1,430,1306.6 P, S, T & D Plant - Commodity % 100.0000% 37.8629% 23.4287% 1.2812% 18.3830% 19.0441%
Internally Generated Value 105,607,336 64,103,985 36,939,829 1,276,457 1,730,542 1,556,521 7.0 Allocated O&M Expenses % 100.0000% 60.7003% 34.9785% 1.2087% 1.6387% 1.4739%
Internally Generated Value 15,715,974 12,921,579 2,710,782 7,383 48,674 27,5567.2 Allocated O&M Expenses - Cust % 100.0000% 82.2194% 17.2486% 0.0470% 0.3097% 0.1753%
Internally Generated Value 11,199,521 5,063,690 2,895,517 152,297 1,622,174 1,465,843 7.4 Allocated O&M Expenses - Demand % 100.0000% 45.2134% 25.8539% 1.3599% 14.4843% 13.0884%
Internally Generated Value 78,691,840 46,118,716 31,333,529 1,116,777 59,694 63,1227.6 Allocated O&M Expenses - Comm % 100.0000% 58.6067% 39.8180% 1.4192% 0.0759% 0.0802%
Input Value 26,564,782 16,218,920 10,069,596 272,066 2,238 1,962 8.0 Customer Deposit Balances % 100.0000% 61.0542% 37.9058% 1.0242% 0.0084% 0.0074%
Internally Generated Value 569,918,798 377,793,965 116,845,806 3,510,835 37,835,773 33,932,418 9.0 Allocated Net Plant % 100.0000% 66.2891% 20.5022% 0.6160% 6.6388% 5.9539%
Internally Generated Value 318,284,171 264,436,309 51,925,279 93,412 1,168,083 661,0899.2 Allocated Net Plant - Cust % 100.0000% 83.0818% 16.3141% 0.0293% 0.3670% 0.2077%
Internally Generated Value 245,988,328 111,219,803 63,597,672 3,345,082 35,629,730 32,196,040 9.4 Allocated Net Plant - Demand % 100.0000% 45.2134% 25.8539% 1.3599% 14.4843% 13.0884%
Internally Generated Value 5,646,298 2,137,853 1,322,856 72,340 1,037,961 1,075,2899.6 Allocated Net Plant - Comm % 100.0000% 37.8629% 23.4287% 1.2812% 18.3830% 19.0441%
Internally Generated Value 6,001,704 3,554,656 1,445,653 46,835 503,368 451,192 10.0 Composite of Accts. 871-879 & 886-893 % 100.0000% 59.2274% 24.0874% 0.7804% 8.3871% 7.5177%
Internally Generated Value 2,634,055 2,035,105 576,082 1,111 13,894 7,86310.2 Composite of Accts. 871-879 & 886-893 - Cust % 100.0000% 77.2613% 21.8705% 0.0422% 0.5275% 0.2985%
Internally Generated Value 3,347,032 1,513,308 865,339 45,515 484,795 438,074 10.4 Composite of Accts. 871-879 & 886-893 - Demand % 100.0000% 45.2134% 25.8539% 1.3599% 14.4843% 13.0884%
Internally Generated Value 20,618 6,243 4,231 209 4,680 5,25510.6 Composite of Accts. 871-879 & 886-893 - Comm % 100.0000% 30.2810% 20.5209% 1.0138% 22.6976% 25.4867%
Internally Generated Value 383,700,807 264,673,530 67,958,344 2,400,651 25,591,461 23,076,821 11.0 Composite of Accts. 376 & 380 % 100.0000% 68.9791% 17.7113% 0.6257% 6.6696% 6.0143%
Internally Generated Value 208,005,510 185,235,629 22,534,189 11,451 143,197 81,04411.2 Composite of Accts. 376 & 380 - Cust % 100.0000% 89.0532% 10.8335% 0.0055% 0.0688% 0.0390%
Internally Generated Value 175,695,297 79,437,901 45,424,155 2,389,200 25,448,264 22,995,778 11.4 Composite of Accts. 376 & 380 - Demand % 100.0000% 45.2134% 25.8539% 1.3599% 14.4843% 13.0884%

Exhibit PHR-2Page 75 of 75
Atmos Energy Corporation, Kentucky/Mid-States DivisionClass Cost of Service - Customer/Demand StudyForecasted Test Period: Twelve Months Ended March 31, 2020
ALLOCATION FACTORS
Total Residential Non-Res Sales Non-Res Sales Transport TransportCompany Sales Firm Interruptible Firm Interruptible
Internally Generated Value 0 0 0 0 0 011.6 Composite of Accts. 376 & 380 - Comm % 0.0000% 0.0000% 0.0000% 0.0000% 0.0000% 0.0000%
Internally Generated Value 300,006,847 179,632,213 62,492,058 2,720,704 28,989,478 26,172,394 12.0 Composite of Accts. 374-379 % 100.0000% 59.8760% 20.8302% 0.9069% 9.6629% 8.7239%
Internally Generated Value 100,339,852 89,355,881 10,870,275 5,524 69,077 39,09512.2 Composite of Accts. 374-379 - Cust % 100.0000% 89.0532% 10.8335% 0.0055% 0.0688% 0.0390%
Internally Generated Value 199,666,995 90,276,332 51,621,783 2,715,180 28,920,401 26,133,300 12.4 Composite of Accts. 374-379 - Demand % 100.0000% 45.2134% 25.8539% 1.3599% 14.4843% 13.0884%
Internally Generated Value 0 0 0 0 0 012.6 Composite of Accts. 374-379 - Comm % 0.0000% 0.0000% 0.0000% 0.0000% 0.0000% 0.0000%
Internally Generated Value 55,873,600 36,045,805 18,487,669 65,112 814,206 460,808 13.0 Composite of Accts. 381-383 % 100.0000% 64.5131% 33.0884% 0.1165% 1.4572% 0.8247%
Internally Generated Value 55,873,600 36,045,805 18,487,669 65,112 814,206 460,80813.2 Composite of Accts. 381-383 - Cust % 100.0000% 64.5131% 33.0884% 0.1165% 1.4572% 0.8247%
Internally Generated Value 0 0 0 0 0 0 13.4 Composite of Accts. 381-383 - Demand % 0.0000% 0.0000% 0.0000% 0.0000% 0.0000% 0.0000%
Internally Generated Value 0 0 0 0 0 013.6 Composite of Accts. 381-383 - Comm % 0.0000% 0.0000% 0.0000% 0.0000% 0.0000% 0.0000%
Internally Generated Value 119,712,299 106,607,671 12,968,981 6,591 82,413 46,643 14.0 Account 380 % 100.0000% 89.0532% 10.8335% 0.0055% 0.0688% 0.0390%
Internally Generated Value 119,712,299 106,607,671 12,968,981 6,591 82,413 46,64314.2 Account 380 - Cust % 100.0000% 89.0532% 10.8335% 0.0055% 0.0688% 0.0390%
Internally Generated Value 0 0 0 0 0 0 14.4 Account 380 - Demand % 0.0000% 0.0000% 0.0000% 0.0000% 0.0000% 0.0000%
Internally Generated Value 0 0 0 0 0 014.6 Account 380 - Comm % 0.0000% 0.0000% 0.0000% 0.0000% 0.0000% 0.0000%
Internally Generated Value 9,623,776 6,378,572 2,016,518 57,470 617,890 553,326 17.0 Composite of Accts. 870-902, 905-916, 924 & 928-930.1 % 100.0000% 66.2793% 20.9535% 0.5972% 6.4204% 5.7496%
Internally Generated Value 5,500,437 4,518,039 951,820 1,486 18,578 10,51417.2 Composite of Accts. 870-902, 905-916, 924 & 928-930.1 - Cust % 100.0000% 82.1396% 17.3044% 0.0270% 0.3378% 0.1912%
Internally Generated Value 4,098,067 1,852,878 1,059,512 55,728 593,577 536,37317.4 Composite of Accts. 870-902, 905-916, 924 & 928-930.1 - Dema % 100.0000% 45.2134% 25.8539% 1.3599% 14.4843% 13.0884%
Internally Generated Value 25,272 7,655 5,187 256 5,735 6,439 17.6 Composite of Accts. 870-902, 905-916, 924 & 928-930.1 - Comm % 100.0000% 30.2920% 20.5252% 1.0142% 22.6913% 25.4773%
Internally Generated Value 1,494,118,837 961,319,271 488,286,164 44,490,351 14,720 8,331 18.0 Revenues % 100.0000% 64.3402% 32.6805% 2.9777% 0.0010% 0.0006%
Internally Generated Value 86,746,747 50,513,031 21,051,850 300,483 7,930,117 6,951,266 18.2 Base Revenues % 100.0000% 58.2305% 24.2682% 0.3464% 9.1417% 8.0133%
Internally Generated Value 78,382,354 46,006,460 31,262,909 1,112,986 - - 18.4 Gas Costs % 100.0000% 58.6949% 39.8851% 1.4199% 0.0000% 0.0000%
Internally Generated Value 165,129,101 96,519,490 52,314,759 1,413,469 7,930,117 6,951,266 18.6 Total Rate Schedule Revenues % 100.0000% 58.4509% 31.6811% 0.8560% 4.8024% 4.2096%
Internally Generated Value 496,111,427 327,179,122 97,414,310 2,917,111 35,925,681 32,675,203 19.0 Rate Base % 100.0000% 65.9487% 19.6356% 0.5880% 7.2415% 6.5863%
Internally Generated Value 284,136,858 236,060,248 46,353,387 82,776 1,047,568 592,87919.2 Rate Base - Cust % 100.0000% 83.0798% 16.3138% 0.0291% 0.3687% 0.2087%
Internally Generated Value 220,445,634 99,671,071 56,993,879 2,997,739 31,930,045 28,852,900 19.4 Rate Base - Demand % 100.0000% 45.2134% 25.8539% 1.3599% 14.4843% 13.0884%
Internally Generated Value (8,471,064) (8,552,198) (5,932,956) (163,404) 2,948,068 3,229,42419.6 Rate Base - Comm % 100.0000% 100.9578% 70.0379% 1.9290% -34.8016% -38.1230%
Internally Generated Value 185,637,186 116,926,721 53,516,176 1,740,641 7,066,559 6,387,089 20.0 Cost of Service % 100.0000% 62.9867% 28.8284% 0.9377% 3.8067% 3.4406%
Internally Generated Value 62,546,750 51,136,795 10,992,837 25,144 251,771 140,20320.2 Cost of Service - Cust % 100.0000% 81.7577% 17.5754% 0.0402% 0.4025% 0.2242%
Internally Generated Value 43,838,199 19,843,253 11,323,966 596,779 6,342,373 5,731,828 20.4 Cost of Service - Demand % 100.0000% 45.2648% 25.8313% 1.3613% 14.4677% 13.0750%
Internally Generated Value 79,252,237 45,946,673 31,199,373 1,118,719 472,414 515,05820.6 Cost of Service - Comm % 100.0000% 57.9752% 39.3672% 1.4116% 0.5961% 0.6499%
Value 0 0 0 0 0 099.0 - % 0.0000% 0.0000% 0.0000% 0.0000% 0.0000% 0.0000%
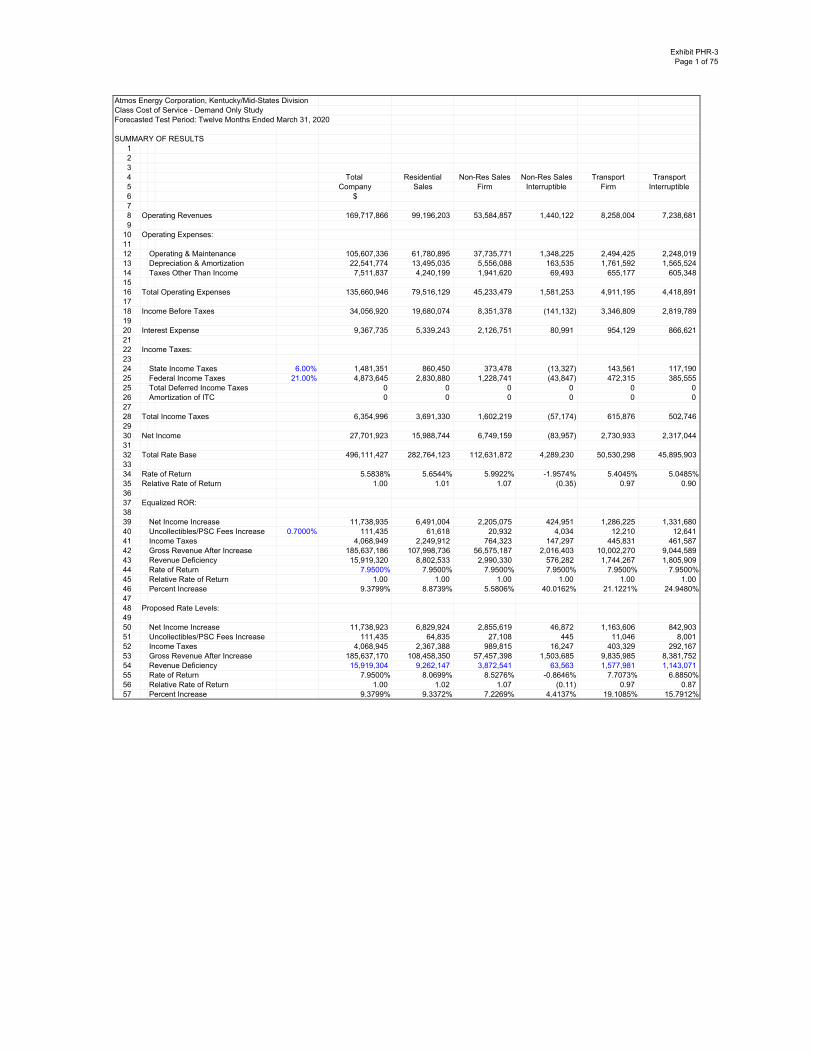
Exhibit PHR-3Page 1 of 75
Atmos Energy Corporation, Kentucky/Mid-States DivisionClass Cost of Service - Demand Only StudyForecasted Test Period: Twelve Months Ended March 31, 2020
SUMMARY OF RESULTS1234 Total Residential Non-Res Sales Non-Res Sales Transport Transport5 Company Sales Firm Interruptible Firm Interruptible6 $78 Operating Revenues 169,717,866 99,196,203 53,584,857 1,440,122 8,258,004 7,238,6819
10 Operating Expenses:1112 Operating & Maintenance 105,607,336 61,780,895 37,735,771 1,348,225 2,494,425 2,248,01913 Depreciation & Amortization 22,541,774 13,495,035 5,556,088 163,535 1,761,592 1,565,52414 Taxes Other Than Income 7,511,837 4,240,199 1,941,620 69,493 655,177 605,3481516 Total Operating Expenses 135,660,946 79,516,129 45,233,479 1,581,253 4,911,195 4,418,8911718 Income Before Taxes 34,056,920 19,680,074 8,351,378 (141,132) 3,346,809 2,819,7891920 Interest Expense 9,367,735 5,339,243 2,126,751 80,991 954,129 866,6212122 Income Taxes:2324 State Income Taxes 6.00% 1,481,351 860,450 373,478 (13,327) 143,561 117,19025 Federal Income Taxes 21.00% 4,873,645 2,830,880 1,228,741 (43,847) 472,315 385,55525 Total Deferred Income Taxes 0 0 0 0 0 026 Amortization of ITC 0 0 0 0 0 02728 Total Income Taxes 6,354,996 3,691,330 1,602,219 (57,174) 615,876 502,7462930 Net Income 27,701,923 15,988,744 6,749,159 (83,957) 2,730,933 2,317,0443132 Total Rate Base 496,111,427 282,764,123 112,631,872 4,289,230 50,530,298 45,895,9033334 Rate of Return 5.5838% 5.6544% 5.9922% -1.9574% 5.4045% 5.0485%35 Relative Rate of Return 1.00 1.01 1.07 (0.35) 0.97 0.90 3637 Equalized ROR:3839 Net Income Increase 11,738,935 6,491,004 2,205,075 424,951 1,286,225 1,331,68040 Uncollectibles/PSC Fees Increase 0.7000% 111,435 61,618 20,932 4,034 12,210 12,64141 Income Taxes 4,068,949 2,249,912 764,323 147,297 445,831 461,58742 Gross Revenue After Increase 185,637,186 107,998,736 56,575,187 2,016,403 10,002,270 9,044,58943 Revenue Deficiency 15,919,320 8,802,533 2,990,330 576,282 1,744,267 1,805,90944 Rate of Return 7.9500% 7.9500% 7.9500% 7.9500% 7.9500% 7.9500%45 Relative Rate of Return 1.00 1.00 1.00 1.00 1.00 1.00 46 Percent Increase 9.3799% 8.8739% 5.5806% 40.0162% 21.1221% 24.9480%4748 Proposed Rate Levels:4950 Net Income Increase 11,738,923 6,829,924 2,855,619 46,872 1,163,606 842,90351 Uncollectibles/PSC Fees Increase 111,435 64,835 27,108 445 11,046 8,00152 Income Taxes 4,068,945 2,367,388 989,815 16,247 403,329 292,16753 Gross Revenue After Increase 185,637,170 108,458,350 57,457,398 1,503,685 9,835,985 8,381,75254 Revenue Deficiency 15,919,304 9,262,147 3,872,541 63,563 1,577,981 1,143,07155 Rate of Return 7.9500% 8.0699% 8.5276% -0.8646% 7.7073% 6.8850%56 Relative Rate of Return 1.00 1.02 1.07 (0.11) 0.97 0.87 57 Percent Increase 9.3799% 9.3372% 7.2269% 4.4137% 19.1085% 15.7912%

Exhibit PHR-3Page 2 of 75
Atmos Energy Corporation, Kentucky/Mid-States DivisionClass Cost of Service - Demand Only StudyForecasted Test Period: Twelve Months Ended March 31, 2020
SUMMARY OF CUSTOMER COSTS
Total Residential Non-Res Sales Non-Res Sales Transport TransportCompany Sales Firm Interruptible Firm Interruptible
$
1 Rate Base 182,824,775 145,838,565 35,377,785 77,198 977,822 553,40623 Return @ Realized ROR 10,208,589 8,216,953 2,144,949 (114,889) 21,218 (59,642)4 O&M Expenses 10,416,928 8,202,608 2,136,712 7,091 45,026 25,4925 Depreciation Expense 11,025,378 8,298,422 2,582,060 7,040 88,033 49,8236 Taxes, Other 2,444,150 1,888,305 530,011 1,292 15,672 8,87078 Interest Expense 3,452,156 2,753,770 668,015 1,458 18,464 10,4509
10 Income Taxes:1112 State Income Taxes # 545,901 441,410 119,332 (9,401) 223 (5,663)13 Federal Income Taxes # 1,796,014 1,452,238 392,603 (30,928) 732 (18,632)14 Deferred Income Taxes 0 0 0 0 0 015 Amortization of ITC 0 0 0 0 0 01617 Total Income Taxes 2,341,915 1,893,648 511,935 (40,328) 955 (24,295)1819 Total Customer-Related Costs @ Realized ROR 36,436,961 28,499,937 7,905,667 (139,794) 170,904 24820 Total Customers 177,100 157,713 19,186 10 122 6921 Customer Costs ($/customer/month) 15.06$ 34.34$ (1,194.82)$ 116.81$ 0.30$ 222324 Incremental Return @ Equalized ROR 4,325,980 3,377,213 667,585 121,027 56,518 103,63825 Incremental Income Taxes 1,499,471 1,170,609 231,398 41,950 19,590 35,92326 Incremental Uncollectibles/PSC Fees Increase # 41,066 32,059 6,337 1,149 537 9842728 Total Customer-Related Costs @ Equalized ROR 42,303,478 33,079,818 8,810,987 24,331 247,549 140,79229 Customers 177,100 157,713 19,186 10 122 6930 Dollars/Customer/Month 19.91$ 17.48$ 38.27$ 207.96$ 169.20$ 170.03$ 313233 Incremental Return @ Proposed Rates 4,325,976 3,502,109 907,321 (18,302) 11,332 (76,484)34 Incremental Income Taxes 1,499,470 1,213,901 314,496 (6,344) 3,928 (26,511)35 Incremental Uncollectibles/PSC Fees Increase 41,066 33,245 8,613 (174) 108 (726)3637 Total Customer-Related Costs @ Proposed Rates 42,303,472 33,249,191 9,136,096 (164,613) 186,271 (103,473)38 Customers 177,100 157,713 19,186 10 122 6939 Dollars/Customer/Month 19.91$ 17.57$ 39.68$ (1,406.95)$ 127.32$ (124.96)$

Exhibit PHR-3Page 3 of 75
Atmos Energy Corporation, Kentucky/Mid-States DivisionClass Cost of Service - Demand Only StudyForecasted Test Period: Twelve Months Ended March 31, 2020
SUMMARY OF DEMAND COSTS
Total Residential Non-Res Sales Non-Res Sales Transport TransportCompany Sales Firm Interruptible Firm Interruptible
$
1 Rate Base 321,757,716 145,477,756 83,187,043 4,375,436 46,604,408 42,113,07323 Return @ Realized ROR 17,966,342 8,252,740 4,943,350 34,533 2,543,554 2,192,1664 O&M Expenses 16,498,567 7,459,571 4,265,530 224,356 2,389,705 2,159,4055 Depreciation Expense 11,375,629 5,143,314 2,941,048 154,692 1,647,682 1,488,8936 Taxes, Other 3,794,716 1,715,722 981,084 51,603 549,639 496,66978 Interest Expense 6,075,532 2,746,958 1,570,764 82,618 879,999 795,1939
10 Income Taxes:1112 State Income Taxes # 960,744 444,852 272,495 (3,885) 134,411 112,87213 Federal Income Taxes # 3,160,848 1,463,562 896,510 (12,782) 442,211 371,34714 Deferred Income Taxes 0 0 0 0 0 015 Amortization of ITC 0 0 0 0 0 01617 Total Income Taxes 4,121,592 1,908,414 1,169,006 (16,667) 576,621 484,2191819 Total Demand-Related Costs @ Realized ROR 53,756,847 24,479,761 14,300,017 448,517 7,707,200 6,821,352202122 Incremental Return @ Equalized ROR 7,613,396 3,312,742 1,670,020 313,314 1,161,497 1,155,82423 Incremental Income Taxes 2,638,955 1,148,263 578,862 108,601 402,598 400,63224 Incremental Uncollectibles/PSC Fees Increase # 72,272 31,447 15,853 2,974 11,026 10,9722526 Total Demand-Related Costs @ Equalized ROR 64,081,471 28,972,213 16,564,752 873,406 9,282,321 8,388,779272829 Incremental Return @ Proposed Rates 7,613,389 3,532,553 2,091,936 68,107 1,081,971 838,82230 Incremental Income Taxes 2,638,953 1,224,453 725,107 23,607 375,033 290,75331 Incremental Uncollectibles/PSC Fees Increase # 72,272 33,534 19,858 647 10,271 7,9633233 Total Demand-Related Costs @ Proposed Rates 64,081,461 29,270,301 17,136,918 540,877 9,174,475 7,958,889

Exhibit PHR-3Page 4 of 75
Atmos Energy Corporation, Kentucky/Mid-States DivisionClass Cost of Service - Demand Only StudyForecasted Test Period: Twelve Months Ended March 31, 2020
SUMMARY OF COMMODITY COSTS
Total Residential Non-Res Sales Non-Res Sales Transport TransportCompany Sales Firm Interruptible Firm Interruptible
$
1 Rate Base (8,471,064) (8,552,198) (5,932,956) (163,404) 2,948,068 3,229,42423 Return @ Realized ROR (473,008) (477,539) (331,285) (9,124) 164,615 180,3254 O&M Expenses 78,691,840 46,118,716 31,333,529 1,116,777 59,694 63,1225 Depreciation Expense 140,767 53,298 32,980 1,804 25,877 26,8086 Taxes, Other 1,272,971 636,172 430,525 16,598 89,866 99,80978 Interest Expense (159,953) (161,485) (112,028) (3,085) 55,666 60,9799
10 Income Taxes:1112 State Income Taxes # (25,294) (25,536) (17,715) (488) 8,803 9,64313 Federal Income Taxes # (83,217) (84,014) (58,284) (1,605) 28,961 31,72514 Deferred Income Taxes 0 0 0 0 0 015 Amortization of ITC 0 0 0 0 0 01617 Total Income Taxes (108,511) (109,550) (75,999) (2,093) 37,764 41,3681819 Total Commodity-Related Costs 79,524,058 46,221,098 31,389,750 1,123,962 377,816 411,43220 Total Throughput 33,298,463 10,083,093 6,833,161 337,587 7,557,945 8,486,67721 Commodity Costs ($/Mcf) 4.58402$ 4.59374$ 3.32940$ 0.04999$ 0.05$ 222324 Incremental Return @ Equalized ROR (200,441) (202,361) (140,385) (3,866) 69,757 76,41425 Incremental Income Taxes (69,477) (70,142) (48,660) (1,340) 24,179 26,48726 Incremental Uncollectibles/PSC Fees Increase # (1,903) (1,921) (1,333) (37) 662 7252728 Total Commodity-Related Costs @ Equalized ROR 79,252,237 45,946,673 31,199,373 1,118,719 472,414 515,05829 Total Throughput 33,298,463 10,083,093 6,833,161 337,587 7,557,945 8,486,67730 Commodity Costs ($/Mcf) 2.38$ 4.56$ 4.57$ 3.31$ 0.06$ 0.06$ 313233 Incremental Return @ Proposed Rates (200,441) (208,148) (151,493) 2,589 71,851 84,76034 Incremental Income Taxes (69,477) (72,148) (52,510) 897 24,905 29,38035 Incremental Uncollectibles/PSC Fees Increase (1,903) (1,976) (1,438) 25 682 8053637 Total Commodity-Related Costs @ Proposed Rates 79,252,237 45,938,825 31,184,309 1,127,473 475,254 526,37638 Total Throughput 33,298,463 10,083,093 6,833,161 337,587 7,557,945 8,486,67739 Commodity Costs ($/Mcf) 2.38$ 4.56$ 4.56$ 3.34$ 0.06$ 0.06$

Exhibit PHR-3Page 5 of 75
Atmos Energy Corporation, Kentucky/Mid-States DivisionClass Cost of Service - Demand Only StudyForecasted Test Period: Twelve Months Ended March 31, 2020
TOTAL COST OF SERVICE
Total Residential Non-Res Sales Non-Res Sales Transport TransportCompany Sales Firm Interruptible Firm Interruptible
$
1 Rate Base 496,111,427 282,764,123 112,631,872 4,289,230 50,530,298 45,895,90323 Return @ Realized ROR 27,701,923 15,992,155 6,757,014 (89,480) 2,729,387 2,312,8494 O&M Expenses 105,607,336 61,780,895 37,735,771 1,348,225 2,494,425 2,248,0195 Depreciation Expense 22,541,774 13,495,035 5,556,088 163,535 1,761,592 1,565,5246 Taxes, Other 7,511,837 4,240,199 1,941,620 69,493 655,177 605,34878 Interest Expense 9,367,735 5,339,243 2,126,751 80,991 954,129 866,6219
10 Income Taxes:1112 State Income Taxes 1,481,351 860,725 374,112 (13,774) 143,436 116,85113 Federal Income Taxes 4,873,645 2,831,787 1,230,829 (45,315) 471,904 384,44014 Deferred Income Taxes 0 0 0 0 0 015 Amortization of ITC 0 0 0 0 0 01617 Total Income Taxes 6,354,996 3,692,512 1,604,942 (59,089) 615,340 501,2911819 Total Cost of Service @ Realized ROR 169,717,866 99,200,796 53,595,434 1,432,684 8,255,921 7,233,031202122 Incremental Return @ Equalized ROR 11,738,935 6,487,593 2,197,220 430,474 1,287,772 1,335,87623 Incremental Income Taxes 4,068,949 2,248,729 761,600 149,211 446,368 463,04124 Incremental Uncollectibles/PSC Fees Increase 111,435 61,585 20,858 4,086 12,225 12,6812526 Total Cost of Service @ Equalized ROR 185,637,186 107,998,703 56,575,112 2,016,456 10,002,285 9,044,629272829 Incremental Return @ Proposed Rates 11,738,923 6,826,514 2,847,764 52,395 1,165,153 847,09830 Incremental Income Taxes 4,068,945 2,366,206 987,092 18,161 403,865 293,62131 Incremental Uncollectibles/PSC Fees Increase 111,435 64,803 27,033 497 11,061 8,0413233 Total Cost of Service @ Proposed Rates 185,637,170 108,458,318 57,457,324 1,503,737 9,836,000 8,381,791

Exhibit PHR-3Page 6 of 75
Atmos Energy Corporation, Kentucky/Mid-States DivisionClass Cost of Service - Demand Only StudyForecasted Test Period: Twelve Months Ended March 31, 2020
CLASSIFICATION OF GROSS PLANT IN SERVICE
Test Year Classif. Classif. Customer Demand CommodityLine Acct. $ Factor Basis $ $ $No. No.
1 Intangible Plant:23 30100 Organization 8,330 5.4 P, S, T & D Plant 3,229 5,009 92 4 30200 Franchises & Consents 119,853 5.4 P, S, T & D Plant 46,465 72,068 1,320 5 30300 Misc Intangible Plant - 99.0 - - - - 67 Total Intangible Plant: 128,182 49,694 77,077 1,41289 Production Plant:
1011 32520 Producing Leaseholds - 99.0 - - - - 12 32540 Rights of Ways - 99.0 - - - - 13 33100 Production Gas Wells Equipment - 99.0 - - - - 14 33201 Field Lines - 99.0 - - - - 15 33202 Tributary Lines - 99.0 - - - - 16 33400 Field Meas. & Reg. Sta. Equip - 99.0 - - - - 17 33600 Purification Equipment - 99.0 - - - - 1819 Total Production Plant 0 0 0 02021 Storage Plant:2223 35010 Land 261,127 3.5 Storage (50/50) - 130,563 130,563 24 35020 Rights of Way 4,682 3.5 Storage (50/50) - 2,341 2,341 25 35100 Structures and Improvements 17,916 3.5 Storage (50/50) - 8,958 8,958 26 35102 Compression Station Equipment 153,261 3.5 Storage (50/50) - 76,631 76,631 27 35103 Meas. & Reg. Sta. Structues 23,138 3.5 Storage (50/50) - 11,569 11,569 28 35104 Other Structures 137,443 3.5 Storage (50/50) - 68,721 68,721 29 35200 Wells \ Rights of Way 8,348,396 3.5 Storage (50/50) - 4,174,198 4,174,198 30 35201 Well Construction 1,699,999 3.5 Storage (50/50) - 849,999 849,999 31 35202 Well Equipment 449,309 3.5 Storage (50/50) - 224,655 224,655 32 35203 Cushion Gas 1,694,833 3.5 Storage (50/50) - 847,416 847,416 33 35210 Leaseholds 178,530 3.5 Storage (50/50) - 89,265 89,265 34 35211 Storage Rights 54,614 3.5 Storage (50/50) - 27,307 27,307 35 35301 Field Lines 175,350 3.5 Storage (50/50) - 87,675 87,675 36 35302 Tributary Lines 209,319 3.5 Storage (50/50) - 104,659 104,659 37 35400 Compressor Station Equipment 923,446 3.5 Storage (50/50) - 461,723 461,723 38 35500 Meas & Reg. Equipment 273,084 3.5 Storage (50/50) - 136,542 136,542 39 35600 Purification Equipment 414,663 3.5 Storage (50/50) - 207,332 207,332 4041 Total Storage Plant 15,019,110 0 7,509,555 7,509,5554243 Transmission:4445 36510 Land & Land Rights 26,970 2.0 Demand - 26,970 - 46 36520 Rights of Way 867,772 2.0 Demand - 867,772 - 47 36602 Structures & Improvements 49,002 2.0 Demand - 49,002 - 48 36603 Other Structues 60,826 2.0 Demand - 60,826 - 49 36700 Mains Cathodic Protection 139,638 2.0 Demand - 139,638 - 50 36701 Mains - Steel 27,047,831 2.0 Demand - 27,047,831 - 51 36900 Meas. & Reg. Equipment 731,467 2.0 Demand - 731,467 - 52 36901 Meas. & Reg. Equipment 2,269,556 2.0 Demand - 2,269,556 - 5354 Total Transmission Plant 31,193,061 0 31,193,061 05556 Distribution:5758 37400 Land & Land Rights 531,167 4.0 Mains (All Demand) - 531,167 - 59 37401 Land 37,326 4.0 Mains (All Demand) - 37,326 - 60 37402 Land Rights 3,645,749 4.0 Mains (All Demand) - 3,645,749 - 61 37403 Land Other 2,784 4.0 Mains (All Demand) - 2,784 - 62 37500 Structures & Improvements 336,168 4.0 Mains (All Demand) - 336,168 - 63 37501 Structures & Improvements T.B. 99,818 4.0 Mains (All Demand) - 99,818 - 64 37502 Land Rights 46,264 4.0 Mains (All Demand) - 46,264 - 65 37503 Improvements 4,005 4.0 Mains (All Demand) - 4,005 - 66 37600 Mains Cathodic Protection 20,611,541 4.0 Mains (All Demand) - 20,611,541 - 67 37601 Mains - Steel 176,025,498 4.0 Mains (All Demand) - 176,025,498 - 68 37602 Mains - Plastic 133,261,910 4.0 Mains (All Demand) - 133,261,910 - 69 37800 Meas & Reg. Sta. Equip - General 29,911,913 4.0 Mains (All Demand) - 29,911,913 - 70 37900 Meas & Reg. Sta. Equip - City Gate 5,126,032 4.0 Mains (All Demand) - 5,126,032 - 71 37905 Meas & Reg. Sta. Equipment T.b. 1,652,259 4.0 Mains (All Demand) - 1,652,259 - 72 38000 Services 150,274,437 1.0 Customer 150,274,437 - - 73 38100 Meters 38,722,015 1.0 Customer 38,722,015 - - 74 38200 Meter Installations 57,067,155 1.0 Customer 57,067,155 - - 75 38300 House Regulators 12,779,948 1.0 Customer 12,779,948 - - 76 38400 House Reg. Installations 252,587 1.0 Customer 252,587 - - 77 38500 Ind. Meas. & Reg. Sta. Equipment 5,241,043 1.0 Customer 5,241,043 - - 78 38600 Other Prop. On Cust. Prem - 99.0 - - - - 7980 Total Distribution Plant 635,629,619 264,337,185 371,292,434 081

Exhibit PHR-3Page 7 of 75
Atmos Energy Corporation, Kentucky/Mid-States DivisionClass Cost of Service - Demand Only StudyForecasted Test Period: Twelve Months Ended March 31, 2020
CLASSIFICATION OF GROSS PLANT IN SERVICE
Test Year Classif. Classif. Customer Demand CommodityLine Acct. $ Factor Basis $ $ $No. No.
82 General:8384 38900 Land & Land Rights 1,211,697 5.4 P, S, T & D Plant 469,752 728,600 13,345 85 39000 Structures & Improvements 7,595,600 5.4 P, S, T & D Plant 2,944,671 4,567,274 83,655 86 39001 Structures Frame - 5.4 P, S, T & D Plant - - - 87 39002 Structures-Brick 173,115 5.4 P, S, T & D Plant 67,113 104,095 1,907 88 39003 Improvements 709,199 5.4 P, S, T & D Plant 274,943 426,445 7,811 89 39004 Air Conditioning Equipment 12,955 5.4 P, S, T & D Plant 5,022 7,790 143 90 39009 Improvement to leased Premises 1,246,194 5.4 P, S, T & D Plant 483,126 749,343 13,725 91 39100 Office Furniture & Equipment 1,866,038 5.4 P, S, T & D Plant 723,428 1,122,059 20,552 92 39102 Remittance Processing Equip - 5.4 P, S, T & D Plant - - - 93 39103 Office Machines - 5.4 P, S, T & D Plant - - - 94 39200 Transportation Equipment 220,987 5.4 P, S, T & D Plant 85,672 132,881 2,434 95 39201 Trucks - 5.4 P, S, T & D Plant - - - 96 39202 Trailers - 5.4 P, S, T & D Plant - - - 97 39300 Stores Equipment - 5.4 P, S, T & D Plant - - - 98 39400 Tools, Shop & Garage Equipment 4,078,361 5.4 P, S, T & D Plant 1,581,103 2,452,340 44,918 99 39600 Power Operated Equipment - 5.4 P, S, T & D Plant - - -
100 39603 Ditchers 39,610 5.4 P, S, T & D Plant 15,356 23,818 436 101 39604 Backhoes 62,747 5.4 P, S, T & D Plant 24,326 37,730 691 102 39605 Welders 19,427 5.4 P, S, T & D Plant 7,532 11,682 214 103 39700 Communication Equipment 524,257 5.4 P, S, T & D Plant 203,245 315,239 5,774 104 39701 Communication Equipment - Mobile Radios - 5.4 P, S, T & D Plant - - - 105 39702 Communication Equipment - Fixed Radios - 5.4 P, S, T & D Plant - - - 106 39705 Communication Equip. - Telemetering - 5.4 P, S, T & D Plant - - - 107 39800 Miscellaneous Equipment 3,891,771 5.4 P, S, T & D Plant 1,508,766 2,340,142 42,863 108 39900 Other Tangible Property - 5.4 P, S, T & D Plant - - - 109 39901 Other Tangible Property - Servers - H/W 14,390 5.4 P, S, T & D Plant 5,579 8,653 158 110 39902 Other Tangible Property - Servers - S/W - 5.4 P, S, T & D Plant - - - 111 39903 Other Tangible Property - Network - H/W 134,599 5.4 P, S, T & D Plant 52,181 80,935 1,482 112 39904 Other Tang. Property - CPU - 5.4 P, S, T & D Plant - - - 113 39905 Other Tangible Property - MF - Hardware - 5.4 P, S, T & D Plant - - - 114 39906 Other Tang. Property - PC Hardware 461,888 5.4 P, S, T & D Plant 179,065 277,736 5,087 115 39907 Other Tang. Property - PC Software - 5.4 P, S, T & D Plant - - - 116 39908 Other Tang. Property - Mainframe S/W 123,515 5.4 P, S, T & D Plant 47,884 74,270 1,360 117 39909 Other Tang. Property - Application Software - 5.4 P, S, T & D Plant - - - 118 39924 Other Tang. Property - General Startup Costs - 5.4 P, S, T & D Plant - - - 119120 Total General Plant 22,386,350 8,678,765 13,461,030 246,555121122 TOTAL DIRECT PLANT 704,356,323 273,065,644 423,533,157 7,757,522123124 CWIP w/o AFUDC 38,154,809 5.4 P, S, T & D Plant 14,791,899 22,942,687 420,223 125126 Kentucky Mid-States General Office:127128 Intangible Plant:129130 30100 Organization 92,247 5.4 P, S, T & D Plant 35,762 55,469 1,016 131 30200 Franchises & Consents - 5.4 P, S, T & D Plant - - - 132 30300 Misc Intangible Plant 552,335 5.4 P, S, T & D Plant 214,130 332,122 6,083 133134 Total Intangible Plant: 644,582 249,892 387,590 7,099135136 General:137138 37400 Land & Land Rights - 5.4 P, S, T & D Plant - - - 139 39001 Structures Frame 89,275 5.4 P, S, T & D Plant 34,610 53,681 983 140 36602 Structures & Improvements - 5.4 P, S, T & D Plant - - - 141 38900 Land & Land Rights - 5.4 P, S, T & D Plant - - - 142 39004 Air Conditioning Equipment 7,658 5.4 P, S, T & D Plant 2,969 4,605 84 143 39009 Improvement to leased Premises 19,332 5.4 P, S, T & D Plant 7,494 11,624 213 144 39100 Office Furniture & Equipment 19,220 5.4 P, S, T & D Plant 7,451 11,557 212 145 39102 Remittance Processing Equip - 5.4 P, S, T & D Plant - - - 146 39103 Office Machines - 5.4 P, S, T & D Plant - - - 147 39200 Transportation Equipment 13,582 5.4 P, S, T & D Plant 5,266 8,167 150 148 39201 Trucks - 5.4 P, S, T & D Plant - - - 149 39202 Trailers - 5.4 P, S, T & D Plant - - - 150 39300 Stores Equipment - 5.4 P, S, T & D Plant - - - 151 39400 Tools, Shop & Garage Equipment 87,547 5.4 P, S, T & D Plant 33,940 52,642 964 152 39600 Power Operated Equipment 10,213 5.4 P, S, T & D Plant 3,959 6,141 112 153 39603 Ditchers - 5.4 P, S, T & D Plant - - - 154 39604 Backhoes - 5.4 P, S, T & D Plant - - - 155 39605 Welders - 5.4 P, S, T & D Plant - - - 156 39700 Communication Equipment 18,688 5.4 P, S, T & D Plant 7,245 11,237 206 157 39701 Communication Equipment - Mobile Radios - 5.4 P, S, T & D Plant - - - 158 39702 Communication Equipment - Fixed Radios - 5.4 P, S, T & D Plant - - - 159 39705 Communication Equip. - Telemetering - 5.4 P, S, T & D Plant - - - 160 39800 Miscellaneous Equipment 405,292 5.4 P, S, T & D Plant 157,124 243,704 4,464 161 39900 Other Tangible Property - 5.4 P, S, T & D Plant - - - 162 39901 Other Tangible Property - Servers - H/W - 5.4 P, S, T & D Plant - - - 163 39902 Other Tangible Property - Servers - S/W - 5.4 P, S, T & D Plant - - - 164 39903 Other Tangible Property - Network - H/W - 5.4 P, S, T & D Plant - - - 165 39904 Other Tang. Property - CPU - 5.4 P, S, T & D Plant - - - 166 39905 Other Tangible Property - MF - Hardware - 5.4 P, S, T & D Plant - - - 167 39906 Other Tang. Property - PC Hardware 34,934 5.4 P, S, T & D Plant 13,543 21,006 385 168 39907 Other Tang. Property - PC Software 82,288 5.4 P, S, T & D Plant 31,902 49,480 906 169 39908 Other Tang. Property - Mainframe S/W 412,432 5.4 P, S, T & D Plant 159,892 247,998 4,542 170 39909 Other Tang. Property - Application Software - 5.4 P, S, T & D Plant - - - 171 39924 Other Tang. Property - General Startup Costs - 5.4 P, S, T & D Plant - - - 172173 Total General Plant 1,200,461 465,396 721,843 13,221174175 CWIP w/o AFUDC 2,311 5.4 P, S, T & D Plant 896 1,389 25 176

Exhibit PHR-3Page 8 of 75
Atmos Energy Corporation, Kentucky/Mid-States DivisionClass Cost of Service - Demand Only StudyForecasted Test Period: Twelve Months Ended March 31, 2020
CLASSIFICATION OF GROSS PLANT IN SERVICE
Test Year Classif. Classif. Customer Demand CommodityLine Acct. $ Factor Basis $ $ $No. No.177 Shared Services General Office:178179 General:180181 37400 Land & Land Rights - 5.4 P, S, T & D Plant - - - 182 39001 Structures Frame - 5.4 P, S, T & D Plant - - - 183 36602 Structures & Improvements 236,424 5.4 P, S, T & D Plant 91,657 142,163 2,604 184 37503 Improvements - 5.4 P, S, T & D Plant - - - 185 39004 Air Conditioning Equipment - 5.4 P, S, T & D Plant - - - 186 39009 Improvement to leased Premises 483,357 5.4 P, S, T & D Plant 187,389 290,645 5,324 187 39100 Office Furniture & Equipment 286,918 5.4 P, S, T & D Plant 111,233 172,525 3,160 188 39102 Remittance Processing Equip - 5.4 P, S, T & D Plant - - - 189 39103 Office Machines - 5.4 P, S, T & D Plant - - - 190 39200 Transportation Equipment 369 5.4 P, S, T & D Plant 143 222 4 191 39201 Trucks - 5.4 P, S, T & D Plant - - - 192 39202 Trailers - 5.4 P, S, T & D Plant - - - 193 39300 Stores Equipment - 5.4 P, S, T & D Plant - - - 194 39400 Tools, Shop & Garage Equipment 3,938 5.4 P, S, T & D Plant 1,527 2,368 43 195 39500 Tools, Shop & Garage Equipment - 5.4 P, S, T & D Plant - - - 196 39603 Ditchers - 5.4 P, S, T & D Plant - - - 197 39604 Backhoes - 5.4 P, S, T & D Plant - - - 198 39605 Welders - 5.4 P, S, T & D Plant - - - 199 39700 Communication Equipment 54,370 5.4 P, S, T & D Plant 21,078 32,693 599 200 39701 Communication Equipment - Mobile Radios - 5.4 P, S, T & D Plant - - - 201 39702 Communication Equipment - Fixed Radios - 5.4 P, S, T & D Plant - - - 202 39705 Communication Equip. - Telemetering - 5.4 P, S, T & D Plant - - - 203 39800 Miscellaneous Equipment 7,537 5.4 P, S, T & D Plant 2,922 4,532 83 204 39900 Other Tangible Property 8,377 5.4 P, S, T & D Plant 3,248 5,037 92 205 39901 Other Tangible Property - Servers - H/W 2,321,928 5.4 P, S, T & D Plant 900,168 1,396,188 25,573 206 39902 Other Tangible Property - Servers - S/W 1,402,428 5.4 P, S, T & D Plant 543,695 843,287 15,446 207 39903 Other Tangible Property - Network - H/W 442,303 5.4 P, S, T & D Plant 171,472 265,959 4,871 208 39904 Other Tang. Property - CPU - 5.4 P, S, T & D Plant - - - 209 39905 Other Tangible Property - MF - Hardware - 5.4 P, S, T & D Plant - - - 210 39906 Other Tang. Property - PC Hardware 155,862 5.4 P, S, T & D Plant 60,425 93,720 1,717 211 39907 Other Tang. Property - PC Software 86,214 5.4 P, S, T & D Plant 33,424 51,841 950 212 39908 Other Tang. Property - Mainframe S/W 3,879,643 5.4 P, S, T & D Plant 1,504,064 2,332,850 42,729 213 39909 Other Tang. Property - Application Software 1,322,956 5.4 P, S, T & D Plant 512,885 795,501 14,571 214 39931 Other Tang. Property - ALGN - 5.4 P, S, T & D Plant - - - 215216 Total General Plant 10,692,624 4,145,328 6,429,531 117,765217218 CWIP w/o AFUDC 748,344 5.4 P, S, T & D Plant 290,119 449,983 8,242 219220 Shared Services Customer Support:221222 General:223224 37400 Land & Land Rights 205,882 5.4 P, S, T & D Plant 79,816 123,798 2,268 225 39001 Structures Frame - 5.4 P, S, T & D Plant - - - 226 36602 Structures & Improvements 1,000,011 5.4 P, S, T & D Plant 387,685 601,312 11,014 227 37503 Improvements - 5.4 P, S, T & D Plant - - - 228 39004 Air Conditioning Equipment - 5.4 P, S, T & D Plant - - - 229 39009 Improvement to leased Premises 159,117 5.4 P, S, T & D Plant 61,687 95,678 1,752 230 39100 Office Furniture & Equipment 154,692 5.4 P, S, T & D Plant 59,971 93,017 1,704 231 39102 Remittance Processing Equip - 5.4 P, S, T & D Plant - - - 232 39103 Office Machines - 5.4 P, S, T & D Plant - - - 233 39200 Transportation Equipment 2,233 5.4 P, S, T & D Plant 866 1,342 25 234 39201 Trucks - 5.4 P, S, T & D Plant - - - 235 39202 Trailers - 5.4 P, S, T & D Plant - - - 236 39300 Stores Equipment - 5.4 P, S, T & D Plant - - - 237 39400 Tools, Shop & Garage Equipment 14,093 5.4 P, S, T & D Plant 5,463 8,474 155 238 39510 Laboratory Equip 548 5.4 P, S, T & D Plant 212 329 6 239 39603 Ditchers - 5.4 P, S, T & D Plant - - - 240 39604 Backhoes - 5.4 P, S, T & D Plant - - - 241 39605 Welders - 5.4 P, S, T & D Plant - - - 242 39700 Communication Equipment 114,682 5.4 P, S, T & D Plant 44,460 68,959 1,263 243 39701 Communication Equipment - Mobile Radios - 5.4 P, S, T & D Plant - - - 244 39702 Communication Equipment - Fixed Radios - 5.4 P, S, T & D Plant - - - 245 39705 Communication Equip. - Telemetering - 5.4 P, S, T & D Plant - - - 246 39800 Miscellaneous Equipment 15,758 5.4 P, S, T & D Plant 6,109 9,475 174 247 39900 Other Tangible Property 43,368 5.4 P, S, T & D Plant 16,813 26,077 478 248 39901 Other Tangible Property - Servers - H/W 583,485 5.4 P, S, T & D Plant 226,206 350,853 6,426 249 39902 Other Tangible Property - Servers - S/W 114,175 5.4 P, S, T & D Plant 44,263 68,654 1,257 250 39903 Other Tangible Property - Network - H/W 35,496 5.4 P, S, T & D Plant 13,761 21,344 391 251 39904 Other Tang. Property - CPU - 5.4 P, S, T & D Plant - - - 252 39905 Other Tangible Property - MF - Hardware - 5.4 P, S, T & D Plant - - - 253 39906 Other Tang. Property - PC Hardware 69,473 5.4 P, S, T & D Plant 26,933 41,774 765 254 39907 Other Tang. Property - PC Software 13,141 5.4 P, S, T & D Plant 5,095 7,902 145 255 39908 Other Tang. Property - Mainframe S/W 5,248,748 5.4 P, S, T & D Plant 2,034,841 3,156,100 57,808 256 39909 Other Tang. Property - Application Software 477 5.4 P, S, T & D Plant 185 287 5 257 39924 Other Tang. Property - General Startup Costs - 5.4 P, S, T & D Plant - - - 258259 Total General Plant 7,775,377 3,014,367 4,675,375 85,635260261 CWIP w/o AFUDC 224,734 5.4 P, S, T & D Plant 87,125 135,134 2,475 262263 TOTAL PLANT IN SERVICE 724,669,367 280,940,628 435,747,497 7,981,242264265 TOTAL CWIP W/O AFUDC 39,130,198 15,170,039 23,529,194 430,966

Exhibit PHR-3Page 9 of 75
Atmos Energy Corporation, Kentucky/Mid-States DivisionClass Cost of Service - Demand Only StudyForecasted Test Period: Twelve Months Ended March 31, 2020
CLASSIFICATION OF RESERVE FOR DEPRECIATION AND AMORTIZATION
Test Year Classif. Classif. Customer Demand CommodityLine Acct. $ Factor Basis $ $ $No. No.
1 Intangible Plant:23 30100 Organization 8,330 5.4 P, S, T & D Plant 3,229 5,009 92 4 30200 Franchises & Consents 119,853 5.4 P, S, T & D Plant 46,465 72,068 1,320 5 30300 Misc Intangible Plant - 99.0 - - - - 67 Total Intangible Plant: 128,182 49,694 77,077 1,41289 Production Plant:
1011 32520 Producing Leaseholds - 99.0 - - - - 12 32540 Rights of Ways - 99.0 - - - - 13 33100 Production Gas Wells Equipment - 99.0 - - - - 14 33201 Field Lines - 99.0 - - - - 15 33202 Tributary Lines - 99.0 - - - - 16 33400 Field Meas. & Reg. Sta. Equip - 99.0 - - - - 17 33600 Purification Equipment - 99.0 - - - - 1819 Total Production Plant - 0 0 02021 Storage Plant:2223 35010 Land - 3.5 Storage (50/50) - - - 24 35020 Rights of Way 4,453 3.5 Storage (50/50) - 2,227 2,227 25 35100 Structures and Improvements 6,289 3.5 Storage (50/50) - 3,144 3,144 26 35102 Compression Station Equipment 113,744 3.5 Storage (50/50) - 56,872 56,872 27 35103 Meas. & Reg. Sta. Structues 20,483 3.5 Storage (50/50) - 10,242 10,242 28 35104 Other Structures 100,144 3.5 Storage (50/50) - 50,072 50,072 29 35200 Wells \ Rights of Way 1,190,830 3.5 Storage (50/50) - 595,415 595,415 30 35201 Well Construction 1,419,511 3.5 Storage (50/50) - 709,755 709,755 31 35202 Well Equipment 450,595 3.5 Storage (50/50) - 225,298 225,298 32 35203 Cushion Gas 758,594 3.5 Storage (50/50) - 379,297 379,297 33 35210 Leaseholds 168,062 3.5 Storage (50/50) - 84,031 84,031 34 35211 Storage Rights 43,956 3.5 Storage (50/50) - 21,978 21,978 35 35301 Field Lines (88,396) 3.5 Storage (50/50) - (44,198) (44,198) 36 35302 Tributary Lines 189,177 3.5 Storage (50/50) - 94,588 94,588 37 35400 Compressor Station Equipment 497,853 3.5 Storage (50/50) - 248,926 248,926 38 35500 Meas & Reg. Equipment 202,544 3.5 Storage (50/50) - 101,272 101,272 39 35600 Purification Equipment 191,797 3.5 Storage (50/50) - 95,899 95,899 4041 Total Storage Plant 5,269,635 0 2,634,817 2,634,8174243 Transmission:4445 36510 Land & Land Rights - 2.0 Demand - - - 46 36520 Rights of Way 428,096 2.0 Demand - 428,096 - 47 36602 Structures & Improvements 16,837 2.0 Demand - 16,837 - 48 36603 Other Structues 53,066 2.0 Demand - 53,066 - 49 36700 Mains Cathodic Protection 98,316 2.0 Demand - 98,316 - 50 36701 Mains - Steel 16,387,961 2.0 Demand - 16,387,961 - 51 36900 Meas. & Reg. Equipment 353,469 2.0 Demand - 353,469 - 52 36901 Meas. & Reg. Equipment 1,774,251 2.0 Demand - 1,774,251 - 5354 Total Transmission Plant 19,111,996 0 19,111,996 05556 Distribution:5758 37400 Land & Land Rights - 4.0 Mains (All Demand) - - - 59 37401 Land - 4.0 Mains (All Demand) - - - 60 37402 Land Rights 235,363 4.0 Mains (All Demand) - 235,363 - 61 37403 Land Other - 4.0 Mains (All Demand) - - - 62 37500 Structures & Improvements 113,695 4.0 Mains (All Demand) - 113,695 - 63 37501 Structures & Improvements T.B. 71,449 4.0 Mains (All Demand) - 71,449 - 64 37502 Land Rights 35,399 4.0 Mains (All Demand) - 35,399 - 65 37503 Improvements 1,920 4.0 Mains (All Demand) - 1,920 - 66 37600 Mains Cathodic Protection 13,210,658 4.0 Mains (All Demand) - 13,210,658 - 67 37601 Mains - Steel 33,671,112 4.0 Mains (All Demand) - 33,671,112 - 68 37602 Mains - Plastic 19,028,671 4.0 Mains (All Demand) - 19,028,671 - 69 37800 Meas & Reg. Sta. Equip - General 2,894,799 4.0 Mains (All Demand) - 2,894,799 - 70 37900 Meas & Reg. Sta. Equip - City Gate 984,409 4.0 Mains (All Demand) - 984,409 - 71 37905 Meas & Reg. Sta. Equipment T.b. 1,038,111 4.0 Mains (All Demand) - 1,038,111 - 72 38000 Services 30,562,139 1.0 Customer 30,562,139 - - 73 38100 Meters 21,386,354 1.0 Customer 21,386,354 - - 74 38200 Meter Installaitons 26,987,899 1.0 Customer 26,987,899 - - 75 38300 House Regulators 4,321,265 1.0 Customer 4,321,265 - - 76 38400 House Reg. Installations 94,403 1.0 Customer 94,403 - - 77 38500 Ind. Meas. & Reg. Sta. Equipment 2,958,741 1.0 Customer 2,958,741 - - 78 38600 Other Prop. On Cust. Prem - 99.0 - - - - 7980 Total Distribution Plant 157,596,387 86,310,801 71,285,587 081

Exhibit PHR-3Page 10 of 75
Atmos Energy Corporation, Kentucky/Mid-States DivisionClass Cost of Service - Demand Only StudyForecasted Test Period: Twelve Months Ended March 31, 2020
CLASSIFICATION OF RESERVE FOR DEPRECIATION AND AMORTIZATION
Test Year Classif. Classif. Customer Demand CommodityLine Acct. $ Factor Basis $ $ $No. No.
82 General:8384 38900 Land & Land Rights - 5.4 P, S, T & D Plant - - - 85 39000 Structures & Improvements 1,253,482 5.4 P, S, T & D Plant 485,951 753,725 13,805 86 39002 Structures - Brick 107,583 5.4 P, S, T & D Plant 41,708 64,690 1,185 87 39003 Improvements 292,730 5.4 P, S, T & D Plant 113,486 176,020 3,224 88 39003 Air Conditioning Equipment 5,049 5.4 P, S, T & D Plant 1,958 3,036 56 89 39004 Improvement to Leased Premises 1,248,110 5.4 P, S, T & D Plant 483,869 750,495 13,746 90 39009 Office Furniture & Equipment 1,144,609 5.4 P, S, T & D Plant 443,743 688,260 12,606 91 39100 Remittance Processing Equip - 5.4 P, S, T & D Plant - - - 92 39102 Office Machines - 5.4 P, S, T & D Plant - - - 93 39103 Transportation Equipment 113,788 5.4 P, S, T & D Plant 44,113 68,421 1,253 94 39200 Trucks - 5.4 P, S, T & D Plant - - - 95 39201 Trailers (2,529) 5.4 P, S, T & D Plant (981) (1,521) (28) 96 39202 Stores Equipment - 5.4 P, S, T & D Plant - - - 97 39400 Tools, Shop & Garage Equipment 1,300,851 5.4 P, S, T & D Plant 504,316 782,209 14,327 98 39600 Power Operated Equipment - 5.4 P, S, T & D Plant - - - 99 39603 Ditchers 39,655 5.4 P, S, T & D Plant 15,373 23,845 437
100 39604 Backhoes 62,818 5.4 P, S, T & D Plant 24,353 37,773 692 101 39605 Welders 19,456 5.4 P, S, T & D Plant 7,543 11,699 214 102 39700 Communication Equipment 269,010 5.4 P, S, T & D Plant 104,290 161,757 2,963 103 39701 Communication Equipment - Mobile Radios - 5.4 P, S, T & D Plant - - - 104 39702 Communication Equipment - Fixed Radios - 5.4 P, S, T & D Plant - - - 105 39705 Communication Equip. - Telemetering - 5.4 P, S, T & D Plant - - - 106 39800 Miscellaneous Equipment 2,072,883 5.4 P, S, T & D Plant 803,618 1,246,435 22,830 107 39900 Other Tangible Property - 5.4 P, S, T & D Plant - - - 108 39901 Other Tangible Property - Servers - H/W 6,670 5.4 P, S, T & D Plant 2,586 4,011 73 109 39902 Other Tangible Property - Servers - S/W - 5.4 P, S, T & D Plant - - - 110 39903 Other Tangible Property - Network - H/W 64,644 5.4 P, S, T & D Plant 25,061 38,871 712 111 39904 Other Tang. Property - CPU - 5.4 P, S, T & D Plant - - - 112 39905 Other Tangible Property - MF - Hardware - 5.4 P, S, T & D Plant - - - 113 39906 Other Tang. Property - PC Hardware 112,226 5.4 P, S, T & D Plant 43,508 67,482 1,236 114 39907 Other Tang. Property - PC Software - 5.4 P, S, T & D Plant - - - 115 39908 Other Tang. Property - Mainframe S/W - 5.4 P, S, T & D Plant - - - 116 39909 Other Tang. Property - Application Software 117,916 5.4 P, S, T & D Plant 45,714 70,904 1,299 117 Other Tang. Property - General Startup Costs - 5.4 P, S, T & D Plant - - - 118 Retirement Work in Progress (6,374,709) 5.4 P, S, T & D Plant (2,471,354) (3,833,146) (70,209) 119 AR 15 general plant amortization - 5.4 P, S, T & D Plant - - - 120121 Total General Plant 1,854,243 718,855 1,114,966 20,422122123 TOTAL DIRECT RESERVE FOR DEPRECIATION 183,960,444 87,079,350 94,224,443 2,656,651124125 Kentucky Mid-States General Office:126127 Intangible Plant:128129 30100 Organization - 5.4 P, S, T & D Plant - - - 130 30200 Franchises & Consents - 5.4 P, S, T & D Plant - - - 131 30300 Misc Intangible Plant - 5.4 P, S, T & D Plant - - - 132133 Total Intangible Plant: - 0 0 0134135 General:136137 37400 Land & Land Rights - 5.4 P, S, T & D Plant - - - 138 39001 Structures Frame 52,708 5.4 P, S, T & D Plant 20,434 31,693 581 139 36602 Structures & Improvements - 5.4 P, S, T & D Plant - - - 140 38900 Land & Land Rights - 5.4 P, S, T & D Plant - - - 141 39004 Air Conditioning Equipment 5,090 5.4 P, S, T & D Plant 1,973 3,060 56 142 39009 Improvement to leased Premises 19,332 5.4 P, S, T & D Plant 7,494 11,624 213 143 39100 Office Furniture & Equipment 19,220 5.4 P, S, T & D Plant 7,451 11,557 212 144 39102 Remittance Processing Equip - 5.4 P, S, T & D Plant - - - 145 39103 Office Machines - 5.4 P, S, T & D Plant - - - 146 39200 Transportation Equipment 8,895 5.4 P, S, T & D Plant 3,449 5,349 98 147 39201 Trucks - 5.4 P, S, T & D Plant - - - 148 39202 Trailers - 5.4 P, S, T & D Plant - - - 149 39300 Stores Equipment - 5.4 P, S, T & D Plant - - - 150 39400 Tools, Shop & Garage Equipment 71,611 5.4 P, S, T & D Plant 27,762 43,060 789 151 39600 Power Operated Equipment 4,375 5.4 P, S, T & D Plant 1,696 2,631 48 152 39603 Ditchers - 5.4 P, S, T & D Plant - - - 153 39604 Backhoes - 5.4 P, S, T & D Plant - - - 154 39605 Welders - 5.4 P, S, T & D Plant - - - 155 39700 Communication Equipment (2,991) 5.4 P, S, T & D Plant (1,160) (1,799) (33) 156 39701 Communication Equipment - Mobile Radios - 5.4 P, S, T & D Plant - - - 157 39702 Communication Equipment - Fixed Radios - 5.4 P, S, T & D Plant - - - 158 39705 Communication Equip. - Telemetering - 5.4 P, S, T & D Plant - - - 159 39800 Miscellaneous Equipment 359,341 5.4 P, S, T & D Plant 139,310 216,074 3,958 160 39900 Other Tangible Property - 5.4 P, S, T & D Plant - - - 161 39901 Other Tangible Property - Servers - H/W (17,306) 5.4 P, S, T & D Plant (6,709) (10,406) (191) 162 39902 Other Tangible Property - Servers - S/W - 5.4 P, S, T & D Plant - - - 163 39903 Other Tangible Property - Network - H/W - 5.4 P, S, T & D Plant - - - 164 39904 Other Tang. Property - CPU - 5.4 P, S, T & D Plant - - - 165 39905 Other Tangible Property - MF - Hardware - 5.4 P, S, T & D Plant - - - 166 39906 Other Tang. Property - PC Hardware 34,944 5.4 P, S, T & D Plant 13,547 21,012 385 167 39907 Other Tang. Property - PC Software 21,086 5.4 P, S, T & D Plant 8,175 12,679 232 168 39908 Other Tang. Property - Mainframe S/W 412,432 5.4 P, S, T & D Plant 159,892 247,998 4,542 169 39909 Other Tang. Property - Application Software - 5.4 P, S, T & D Plant - - - 170 39924 Other Tang. Property - General Startup Costs - 5.4 P, S, T & D Plant - - - 171 Retirement Work in Progress 26,143 5.4 P, S, T & D Plant 10,135 15,720 288 172173 Total General Plant 1,014,877 393,449 610,251 11,177174

Exhibit PHR-3Page 11 of 75
Atmos Energy Corporation, Kentucky/Mid-States DivisionClass Cost of Service - Demand Only StudyForecasted Test Period: Twelve Months Ended March 31, 2020
CLASSIFICATION OF RESERVE FOR DEPRECIATION AND AMORTIZATION
Test Year Classif. Classif. Customer Demand CommodityLine Acct. $ Factor Basis $ $ $No. No.175 Shared Services General Office:176177 General:178179 37400 Land & Land Rights - 5.4 P, S, T & D Plant - - - 180 39000 Structures & Improvements 90,855 5.4 P, S, T & D Plant 35,223 54,631 1,001 181 36602 Structures & Improvements - 5.4 P, S, T & D Plant - - - 182 37503 Improvements - 5.4 P, S, T & D Plant - - - 183 39004 Air Conditioning Equipment - 5.4 P, S, T & D Plant - - - 184 39009 Improvement to leased Premises 482,368 5.4 P, S, T & D Plant 187,005 290,050 5,313 185 39100 Office Furniture & Equipment 116,207 5.4 P, S, T & D Plant 45,051 69,876 1,280 186 39102 Remittance Processing Equip 0 5.4 P, S, T & D Plant 0 0 0 187 39103 Office Machines 0 5.4 P, S, T & D Plant 0 0 0 188 39200 Transportation Equipment 284 5.4 P, S, T & D Plant 110 171 3 189 39201 Trucks - 5.4 P, S, T & D Plant - - - 190 39202 Trailers - 5.4 P, S, T & D Plant - - - 191 39300 Stores Equipment - 5.4 P, S, T & D Plant - - - 192 39400 Tools, Shop & Garage Equipment 1,722 5.4 P, S, T & D Plant 668 1,035 19 193 39500 39500-Laboratory Equipment - 5.4 P, S, T & D Plant - - - 194 39603 Ditchers - 5.4 P, S, T & D Plant - - - 195 39604 Backhoes - 5.4 P, S, T & D Plant - - - 196 39605 Welders - 5.4 P, S, T & D Plant - - - 197 39700 Communication Equipment 28,314 5.4 P, S, T & D Plant 10,977 17,025 312 198 39701 Communication Equipment - Mobile Radios - 5.4 P, S, T & D Plant - - - 199 39702 Communication Equipment - Fixed Radios - 5.4 P, S, T & D Plant - - - 200 39705 Communication Equip. - Telemetering - 5.4 P, S, T & D Plant - - - 201 39800 Miscellaneous Equipment 2,855 5.4 P, S, T & D Plant 1,107 1,717 31 202 39900 Other Tangible Property 8,438 5.4 P, S, T & D Plant 3,271 5,074 93 203 39901 Other Tangible Property - Servers - H/W 1,335,526 5.4 P, S, T & D Plant 517,758 803,059 14,709 204 39902 Other Tangible Property - Servers - S/W 969,778 5.4 P, S, T & D Plant 375,965 583,133 10,681 205 39903 Other Tangible Property - Network - H/W 134,188 5.4 P, S, T & D Plant 52,022 80,688 1,478 206 39904 Other Tang. Property - CPU - 5.4 P, S, T & D Plant - - - 207 39905 Other Tangible Property - MF - Hardware - 5.4 P, S, T & D Plant - - - 208 39906 Other Tang. Property - PC Hardware 94,055 5.4 P, S, T & D Plant 36,463 56,556 1,036 209 39907 Other Tang. Property - PC Software 91,932 5.4 P, S, T & D Plant 35,640 55,279 1,013 210 39908 Other Tang. Property - Mainframe S/W 2,311 5.4 P, S, T & D Plant 896 1,389 25 211 39909 Other Tang. Property - Application Software 2,526,463 5.4 P, S, T & D Plant 979,462 1,519,175 27,826 212 39924 Other Tang. Property - General Startup Costs - 5.4 P, S, T & D Plant - - - 213 Retirement Work in Progress - 5.4 P, S, T & D Plant - - - 214215 Total General Plant 5,885,295 2,281,618 3,538,859 64,818216217 Shared Services Customer Support:218219 General:220221 37400 Land & Land Rights - 5.4 P, S, T & D Plant - - - 222 39001 Structures Frame - 5.4 P, S, T & D Plant - - - 223 36602 Structures & Improvements 204,679 5.4 P, S, T & D Plant 79,350 123,075 2,254 224 37503 Improvements - 5.4 P, S, T & D Plant - - - 225 39004 Air Conditioning Equipment - 5.4 P, S, T & D Plant - - - 226 39009 Improvement to leased Premises 99,706 5.4 P, S, T & D Plant 38,654 59,954 1,098 227 39100 Office Furniture & Equipment 54,761 5.4 P, S, T & D Plant 21,230 32,928 603 228 39102 Remittance Processing Equip - 5.4 P, S, T & D Plant - - - 229 39103 Office Machines - 5.4 P, S, T & D Plant - - - 230 39200 Transportation Equipment 2,235 5.4 P, S, T & D Plant 866 1,344 25 231 39201 Trucks - 5.4 P, S, T & D Plant - - - 232 39202 Trailers - 5.4 P, S, T & D Plant - - - 233 39300 Stores Equipment - 5.4 P, S, T & D Plant - - - 234 39400 Tools, Shop & Garage Equipment 3,654 5.4 P, S, T & D Plant 1,416 2,197 40 235 39500 Laboratory Equipment 426 5.4 P, S, T & D Plant 165 256 5 236 39603 Ditchers - 5.4 P, S, T & D Plant - - - 237 39604 Backhoes - 5.4 P, S, T & D Plant - - - 238 39605 Welders - 5.4 P, S, T & D Plant - - - 239 39700 Communication Equipment 70,180 5.4 P, S, T & D Plant 27,208 42,200 773 240 39701 Communication Equipment - Mobile Radios - 5.4 P, S, T & D Plant - - - 241 39702 Communication Equipment - Fixed Radios - 5.4 P, S, T & D Plant - - - 242 39705 Communication Equip. - Telemetering - 5.4 P, S, T & D Plant - - - 243 39800 Miscellaneous Equipment 4,862 5.4 P, S, T & D Plant 1,885 2,923 54 244 39900 Other Tangible Property 31,781 5.4 P, S, T & D Plant 12,321 19,110 350 245 39901 Other Tangible Property - Servers - H/W 338,151 5.4 P, S, T & D Plant 131,095 203,332 3,724 246 39902 Other Tangible Property - Servers - S/W 77,363 5.4 P, S, T & D Plant 29,992 46,519 852 247 39903 Other Tangible Property - Network - H/W 22,965 5.4 P, S, T & D Plant 8,903 13,809 253 248 39904 Other Tang. Property - CPU - 5.4 P, S, T & D Plant - - - 249 39905 Other Tangible Property - MF - Hardware - 5.4 P, S, T & D Plant - - - 250 39906 Other Tang. Property - PC Hardware 43,877 5.4 P, S, T & D Plant 17,010 26,384 483 251 39907 Other Tang. Property - PC Software 10,171 5.4 P, S, T & D Plant 3,943 6,116 112 252 39908 Other Tang. Property - Mainframe S/W 2,050,478 5.4 P, S, T & D Plant 794,932 1,232,963 22,583 253 39909 Other Tang. Property - Application Software 4,865 5.4 P, S, T & D Plant 1,886 2,925 54 254 39924 Other Tang. Property - General Startup Costs - 5.4 P, S, T & D Plant - - - 255 Retirement Work in Progress - 5.4 P, S, T & D Plant - - - 256257 Total General Plant 3,020,151 1,170,856 1,816,033 33,263258259 TOTAL RESERVE FOR DEPRECIATION 193,880,768 90,925,272 100,189,586 2,765,910

Exhibit PHR-3Page 12 of 75
Atmos Energy Corporation, Kentucky/Mid-States DivisionClass Cost of Service - Demand Only StudyForecasted Test Period: Twelve Months Ended March 31, 2020
CLASSIFICATION OF OTHER RATE BASE
Test Year Classif. Classif. Customer Demand Commodity$ Factor Basis $ $ $
1 Rate Base Additions:23 Materials and Supplies - KY Direct (402,124) 9.1 Allocated O&M Expenses (39,665) (62,822) (299,637) 4 Materials and Supplies - KY Mid-States GO 519,990 9.1 Allocated O&M Expenses 51,291 81,236 387,463 5 Materials and Supplies - Shared Services GO (0) 9.1 Allocated O&M Expenses (0) (0) (0) 6 Materials and Supplies - Shared Services CS 0 9.1 Allocated O&M Expenses - - - 7 Gas Storage Inventory 8,905,991 3.0 Commodity - - 8,905,991 8 Prepayments - KY Direct 0 9.1 Allocated O&M Expenses - - - 9 Prepayments - KY Mid-States GO 0 9.1 Allocated O&M Expenses - - -
10 Prepayments - Shared Services GO 0 9.1 Allocated O&M Expenses - - - 11 Prepayments - Shared Services CS 0 9.1 Allocated O&M Expenses - - - 12 Cash Working Capital 2,692,759 9.1 Allocated O&M Expenses 265,609 420,678 2,006,472 13 Regulatory Assets (33,020,670) 9.1 Allocated O&M Expenses (3,257,103) (5,158,673) (24,604,894) 1415 Total Rate Base Additions (21,304,054) (2,979,868) (4,719,582) (13,604,604)161718 Rate Base Deductions:1920 Customer Advances - KY Direct (747,234) 1.0 Customer (747,234) - - 21 Customer Advances - KY Mid-States GO 0 1.0 Customer - - - 22 Customer Advances - Shared Services GO 0 1.0 Customer - - - 23 Customer Advances - Shared Services CS 0 1.0 Customer - - - 24 ADIT - KY Direct (75,117,257) 5.7 Net Plant (27,044,140) (47,328,915) (744,201) 25 ADIT - KY Mid-States GO 22,846,265 5.7 Net Plant 8,225,242 14,394,681 226,342 26 ADIT - Shared Services GO (848,471) 5.7 Net Plant (305,471) (534,594) (8,406) 27 ADIT - Shared Services CS 67,614 5.7 Net Plant 24,343 42,601 670 28 Change in Net Operating Loss Carryforward 1,295,767 5.7 Net Plant 466,510 816,420 12,837 2930 Total Rate Base Deductions (52,503,316) (19,380,752) (32,609,807) (512,758)313233 TOTAL OTHER RB (73,807,370) (22,360,620) (37,329,389) (14,117,362)3435 Interest on Customer Deposits 0 1.0 Customer - - -

Exhibit PHR-3Page 13 of 75
Atmos Energy Corporation, Kentucky/Mid-States DivisionClass Cost of Service - Demand Only StudyForecasted Test Period: Twelve Months Ended March 31, 2020
CLASSIFICATION OF O&M EXPENSE
Test Year Classif. Classif. Customer Demand CommodityLine Acct. $ Factor Basis $ $ $No. No.
1 Production & Gathering:2 Operation3 7500 Op., Sup., & Eng. 0 99.0 - - - - 4 7510 Production Maps & Records 0 99.0 - - - - 5 7530 Field Lines Expenses 0 99.0 - - - - 6 7540 Field Compressor Station Expense 0 99.0 - - - - 7 7550 Field Compressor Sta. Fuel & Pwr. 0 99.0 - - - - 8 7560 Field Meas. & Regul. Station Exp 0 99.0 - - - - 9 7570 Purification Expense 0 99.0 - - - -
10 7590 Other Expenses 0 99.0 - - - - 11 Maintenance12 7610 Maint. Sup., & Eng. 0 99.0 - - - - 13 7620 Structures and Improvements 0 99.0 - - - - 14 7640 Field Line Maintenance 0 99.0 - - - - 15 7650 Compressor Station Equip. Maint. 0 99.0 - - - - 16 7660 Meas. & Regul. Station Equip Maint 0 99.0 - - - - 17 7670 Purification Equipment Maintenance 0 99.0 - - - - 18 7680 Other Equipment Maintenance 0 99.0 - - - - 19 7690 Gas Processed By Others 0 99.0 - - - - 20 Total Production & Gathering 0 0 0 02122 Other Gas Supply Expenses:23 Operation24 8001 Intercompany Gas Well-head Purchases 0 3.0 Commodity - - - 25 8010 Natural gas field line purchases 61,240 3.0 Commodity - - 61,240 26 8040 Natural gas city gate purchases 51,401,318 3.0 Commodity - - 51,401,318 27 8050 Other purchases (7,602) 3.0 Commodity - - (7,602) 28 8051 PGA for Residential 47,517,427 3.0 Commodity - - 47,517,427 29 8052 PGA for Commercial 24,564,311 3.0 Commodity - - 24,564,311 30 8053 PGA for Industrial 4,854,142 3.0 Commodity - - 4,854,142 31 8054 PGA for Public Authorities 4,585,482 3.0 Commodity - - 4,585,482 32 8058 Unbilled PGA Cost (3,124,678) 3.0 Commodity - - (3,124,678) 33 8059 PGA Offset to Unrecovered Gas Cost (71,826,171) 3.0 Commodity - - (71,826,171) 34 8060 Exchange gas (2,147,338) 3.0 Commodity - - (2,147,338) 35 8081 Gas withdrawn from storage-Debit 12,436,037 3.0 Commodity - - 12,436,037 36 8082 Gas delivered to storage-Credit (12,626,734) 3.0 Commodity - - (12,626,734) 37 8120 Gas used for other utility operations-Credit (14,329) 3.0 Commodity - - (14,329) 38 8580 Transmission and compression of gas by others 22,709,250 3.0 Commodity - - 22,709,250 39 Maintenance40 8350 Maint. Of Purch. Gas Meas. Sta. 0 3.0 Commodity - - - 41 Total Other Gas Supply Expenses 78,382,354 0 0 78,382,3544243 Underground Storage:44 Operation45 8140 Storage-Operation supervision and engineering 0 3.5 Storage (50/50) - - - 46 8160 Wells expenses 291,917 3.5 Storage (50/50) - 145,959 145,959 47 8170 Lines expenses 21,251 3.5 Storage (50/50) - 10,626 10,626 48 8180 Compressor station expenses 25,060 3.5 Storage (50/50) - 12,530 12,530 49 8190 Compressor station fuel and power 735 3.5 Storage (50/50) - 368 368 50 8200 Storage-Measuring and regulating station expenses 6,181 3.5 Storage (50/50) - 3,090 3,090 51 8210 Storage-Purification expenses 49,856 3.5 Storage (50/50) - 24,928 24,928 52 8240 Storage-Other expenses 0 3.5 Storage (50/50) - - - 53 8250 Storage well royalties 8,763 3.5 Storage (50/50) - 4,382 4,382 54 8260 Rents 0 3.5 Storage (50/50) - - - 55 Maintenance56 8300 Maint. Sup., & Eng. 0 3.5 Storage (50/50) - - - 57 8310 Structures and Improvements 12,736 3.5 Storage (50/50) - 6,368 6,368 58 8320 Reservoirs & Wells Maintenance 0 3.5 Storage (50/50) - - - 59 8330 Line Maintenance 0 3.5 Storage (50/50) - - - 60 8340 Compressor Station Equip Maint 3,331 3.5 Storage (50/50) - 1,665 1,665 61 8350 Meas. & Regul. Station Equip Maint 0 3.5 Storage (50/50) - - - 62 8360 Purification Equipment Maintenance 0 3.5 Storage (50/50) - - - 63 8410 Other storage expenses-Operation labor and expenses 69,083 3.5 Storage (50/50) - 34,542 34,542 64 Total Underground Storage Expense 488,914 0 244,457 244,4576566 Transmission:67 Operation68 8500 Op., Sup., & Eng. 35 2.0 Demand - 35 - 69 8510 System Control & Load Dispatching 0 2.0 Demand - - - 70 8520 Communication Systems Expense 0 2.0 Demand - - - 71 8530 Compressor Station Labor Expense 0 2.0 Demand - - - 72 8540 Compressor Station Fuel Gas 0 2.0 Demand - - - 73 8550 Compressor Station Fuel & Power 308 2.0 Demand - 308 - 74 8560 Mains Expense 366,202 2.0 Demand - 366,202 - 75 8570 Meas. & Regul. Station Expenses 27,278 2.0 Demand - 27,278 - 76 8580 LDC Payment 0 2.0 Demand - - - 77 8580 LDC Payment - A&G 0 2.0 Demand - - - 78 8590 Other Expenses 0 2.0 Demand - - - 79 8600 Rents 0 2.0 Demand - - - 80 Maintenance81 8610 Maint. Sup., & Eng. 0 2.0 Demand - - - 82 8620 Structures and Improvements 0 2.0 Demand - - - 83 8630 Mains 16,280 2.0 Demand - 16,280 - 84 8640 Compressor Station Equip Maint 0 2.0 Demand - - - 85 8650 Meas. & Regul. Station Equip Maint 0 2.0 Demand - - - 86 8660 Communication Equipment Maintenance 0 2.0 Demand - - - 87 8670 Other Equipment Maintenance 0 2.0 Demand - - - 88 Total Transmission Expense 410,103 0 410,103 089

Exhibit PHR-3Page 14 of 75
Atmos Energy Corporation, Kentucky/Mid-States DivisionClass Cost of Service - Demand Only StudyForecasted Test Period: Twelve Months Ended March 31, 2020
CLASSIFICATION OF O&M EXPENSE
Test Year Classif. Classif. Customer Demand CommodityLine Acct. $ Factor Basis $ $ $No. No.
90 Distribution:91 Operation92 8700 Supervision and Engineering 963,411 10.0 Composite of Accts. 871-879 & 886-893 152,826 807,275 3,310 93 8710 Distribution Load Dispatching 663 3.0 Commodity - - 663 94 8711 Odorization 19,956 3.0 Commodity - - 19,956 94 8720 Compressor Station Labor & Expenses 0 3.0 Commodity - - - 95 8740 Mains & Services 4,320,719 12.0 Composite of Accts. 374-379 - 4,320,719 - 96 8750 Measuring and Regulating Station Exp. - Gen 574,714 12.0 Composite of Accts. 374-379 - 574,714 - 97 8760 Measuring and Regulating Station Exp. - Ind. 120,928 1.0 Customer 120,928 - - 98 8770 Measuring and Regulating Sta. Exp. - City Gate 38,286 12.0 Composite of Accts. 374-379 - 38,286 - 99 8780 Meters and House Regulator Expense 820,621 1.0 Customer 820,621 - -
100 8790 Customer Installations Expense 2,246 1.0 Customer 2,246 - - 101 8800 Other Expense 3,204 10.0 Composite of Accts. 871-879 & 886-893 508 2,684 11 102 8810 Rents 369,768 10.0 Composite of Accts. 871-879 & 886-893 58,656 309,841 1,270 103 Maintenance104 8850 Maintenance Supervision and Engineering 1,588 10.0 Composite of Accts. 871-879 & 886-893 252 1,331 5 105 8860 Maintenance of Structures and Improvements 98 12.0 Composite of Accts. 374-379 - 98 - 106 8870 Maintenance of Mains 28,852 12.0 Composite of Accts. 374-379 - 28,852 - 107 8890 Maintenance of compressor station equipment 0 3.0 Commodity - - - 108 8900 Maint. of Measuring and Regulating Station Equip. - General 65,572 12.0 Composite of Accts. 374-379 - 65,572 - 109 8910 Maint. of Measuring and Regulating Station Equip. - Industrial 1,723 1.0 Customer 1,723 - - 110 8920 Maint. of Measuring and Regulating Station Equip. - City Gate 795 12.0 Composite of Accts. 374-379 - 795 - 111 8930 Maintenance of Services 6,533 1.0 Customer 6,533 - - 112 8940 Maintenance of Meters and House Regulators 0 1.0 Customer - - - 113 8950 Maintenance of Other Equipment 5,866 10.0 Composite of Accts. 871-879 & 886-893 931 4,915 20 114 Total Distribution 7,345,541 1,165,224 6,155,082 25,235115116 Customer Accounts:117 9010 Supervision 0 1.0 Customer - - - 118 9020 Meter Reading Expense 1,085,047 1.0 Customer 1,085,047 - - 119 9030 Customer Records and Collection Expenses 1,220,802 1.0 Customer 1,220,802 - - 120 9040 Uncollectible Accounts 341,050 1.0 Customer 341,050 - - 121 9050 Miscellaneous Customer Accounts Expenses 0 1.0 Customer - - - 122 Total Customer Accounts 2,646,900 2,646,900 0 0123124 Customer Service and Information:125 9070 Supervision 0 1.0 Customer - - - 126 9080 Customer Assistance Expenses 0 1.0 Customer - - - 127 9090 Informational and Instructional Advertising Expenses 128,272 1.0 Customer 128,272 - - 128 9100 Miscellaneous Customer Service and Informational Expenses 0 1.0 Customer - - - 129 Total Customer Service and Information 128,272 128,272 0 0130131 Sales:132 9110 Supervision 253,468 1.0 Customer 253,468 - - 133 9120 Demonstrating and Selling Expenses 115,937 1.0 Customer 115,937 - - 134 9130 Advertising Expenses 35,170 1.0 Customer 35,170 - - 135 9160 Miscellaneous Sales Expenses (196,297) 1.0 Customer (196,297) - - 136 Total Sales 208,278 208,278 0 0137138 Administrative & General:139 Operation140 9200 Administrative and General Salaries (834,543) 17.0 Composite of Accts. 870-902, 905-916, 924 & 928-930.1 (298,399) (533,952) (2,191) 141 9210 Office Supplies and Expenses 17,616 17.0 Composite of Accts. 870-902, 905-916, 924 & 928-930.1 6,299 11,271 46 142 9220 Administrative Expenses Transferred - Customer Support - 1.0 Customer - - - 143 9220 Administrative Expenses Transferred - General 14,498,764 17.0 Composite of Accts. 870-902, 905-916, 924 & 928-930.1 5,184,181 9,276,510 38,074 144 9230 Outside Services Employed 339,697 17.0 Composite of Accts. 870-902, 905-916, 924 & 928-930.1 121,462 217,343 892 145 9240 Property Insurance 3,718 5.7 Net Plant 1,339 2,343 37 146 9250 Injuries and Damages 74,010 17.0 Composite of Accts. 870-902, 905-916, 924 & 928-930.1 26,463 47,353 194 147 9260 Employee Pensions and Benefits 1,082,941 17.0 Composite of Accts. 870-902, 905-916, 924 & 928-930.1 387,217 692,881 2,844 148 9270 Franchise Requirements 646 1.0 Customer 646 - - 149 9280 Regulatory Commission Expenses 852,920 1.0 Customer 852,920 - - 150 930.1 General Advertising Expenses - 1.0 Customer - - - 151 930.2 Miscellaneous General Expense (42,325) 17.0 Composite of Accts. 870-902, 905-916, 924 & 928-930.1 (15,134) (27,080) (111) 152 9310 Rents (8,275) 17.0 Composite of Accts. 870-902, 905-916, 924 & 928-930.1 (2,959) (5,294) (22) 153 Maintenance154 9320 Maintenance of General Plant 11,804 17.0 Composite of Accts. 870-902, 905-916, 924 & 928-930.1 4,221 7,552 31 155 Total A&G 15,996,974 6,268,256 9,688,925 39,793156157 TOTAL O&M EXPENSE 105,607,336 10,416,928 16,498,567 78,691,840

Exhibit PHR-3Page 15 of 75
Atmos Energy Corporation, Kentucky/Mid-States DivisionClass Cost of Service - Demand Only StudyForecasted Test Period: Twelve Months Ended March 31, 2020
CLASSIFICATION OF DEPRECIATION EXPENSE
Test Year Classif. Classif. Customer Demand CommodityLine Acct. $ Factor Basis $ $ $No. No.
1 Intangible Plant:23 30100 Organization - 99.0 - - - - 4 30200 Franchises & Consents - 99.0 - - - - 5 30300 Misc Intangible Plant - 99.0 - - - - 67 Total Intangible Plant: 0 0 0 089 Production Plant:
1011 32520 Producing Leaseholds - 99.0 - - - - 12 32540 Rights of Ways - 99.0 - - - - 13 33100 Production Gas Wells Equipment - 99.0 - - - - 14 33201 Field Lines - 99.0 - - - - 15 33202 Tributary Lines - 99.0 - - - - 16 33400 Field Meas. & Reg. Sta. Equip - 99.0 - - - - 17 33600 Purification Equipment - 99.0 - - - - 1819 Total Production Plant 0 0 0 02021 Storage Plant:2223 35010 Land - 3.5 Storage (50/50) - - - 24 35020 Rights of Way 22 3.5 Storage (50/50) - 11 11 25 35100 Structures and Improvements 297 3.5 Storage (50/50) - 149 149 26 35102 Compression Station Equipment 1,916 3.5 Storage (50/50) - 958 958 27 35103 Meas. & Reg. Sta. Structues 208 3.5 Storage (50/50) - 104 104 28 35104 Other Structures 1,773 3.5 Storage (50/50) - 887 887 29 35200 Wells \ Rights of Way 161,122 3.5 Storage (50/50) - 80,561 80,561 30 35201 Well Construction 25,840 3.5 Storage (50/50) - 12,920 12,920 31 35202 Well Equipment - 3.5 Storage (50/50) - - - 32 35203 Cushion Gas 23,389 3.5 Storage (50/50) - 11,694 11,694 33 35210 Leaseholds 553 3.5 Storage (50/50) - 277 277 34 35211 Storage Rights 481 3.5 Storage (50/50) - 240 240 35 35301 Field Lines 1,596 3.5 Storage (50/50) - 798 798 36 35302 Tributary Lines 1,905 3.5 Storage (50/50) - 952 952 37 35400 Compressor Station Equipment 15,699 3.5 Storage (50/50) - 7,849 7,849 38 35500 Meas & Reg. Equipment 4,561 3.5 Storage (50/50) - 2,280 2,280 39 35600 Purification Equipment 8,210 3.5 Storage (50/50) - 4,105 4,105 4041 Total Storage Plant 247,571 0 123,785 123,7854243 Transmission:4445 36510 Land & Land Rights - 2.0 Demand - - - 46 36520 Rights of Way 9,112 2.0 Demand - 9,112 - 47 36602 Structures & Improvements 608 2.0 Demand - 608 - 48 36603 Other Structues 754 2.0 Demand - 754 - 49 36700 Mains Cathodic Protection 5,362 2.0 Demand - 5,362 - 50 36701 Mains - Steel 381,167 2.0 Demand - 381,167 - 51 36900 Meas. & Reg. Equipment 11,265 2.0 Demand - 11,265 - 52 36901 Meas. & Reg. Equipment 34,951 2.0 Demand - 34,951 - 5354 Total Transmission Plant 443,218 0 443,218 05556 Distribution:5758 37400 Land & Land Rights - 4.0 Mains (All Demand) - - - 59 37401 Land - 4.0 Mains (All Demand) - - - 60 37402 Land Rights 49,908 4.0 Mains (All Demand) - 49,908 - 61 37403 Land Other - 4.0 Mains (All Demand) - - - 62 37500 Structures & Improvements 6,017 4.0 Mains (All Demand) - 6,017 - 63 37501 Structures & Improvements T.B. 1,787 4.0 Mains (All Demand) - 1,787 - 64 37502 Land Rights 828 4.0 Mains (All Demand) - 828 - 65 37503 Improvements 72 4.0 Mains (All Demand) - 72 - 66 37600 Mains Cathodic Protection 873,542 4.0 Mains (All Demand) - 873,542 - 67 37601 Mains - Steel 4,454,842 4.0 Mains (All Demand) - 4,454,842 - 68 37602 Mains - Plastic 3,376,201 4.0 Mains (All Demand) - 3,376,201 - 69 37800 Meas & Reg. Sta. Equip - General 925,640 4.0 Mains (All Demand) - 925,640 - 70 37900 Meas & Reg. Sta. Equip - City Gate 145,903 4.0 Mains (All Demand) - 145,903 - 71 37905 Meas & Reg. Sta. Equipment T.b. 46,759 4.0 Mains (All Demand) - 46,759 - 72 38000 Services 4,817,588 1.0 Customer 4,817,588 - - 73 38100 Meters 2,741,749 1.0 Customer 2,741,749 - - 74 38200 Meter Installaitons 2,232,937 1.0 Customer 2,232,937 - - 75 38300 House Regulators 514,355 1.0 Customer 514,355 - - 76 38400 House Reg. Installations 8,807 1.0 Customer 8,807 - - 77 38500 Ind. Meas. & Reg. Sta. Equipment 112,194 1.0 Customer 112,194 - - 78 38600 Other Prop. On Cust. Prem - 99.0 - - - - 7980 Total Distribution Plant 20,309,129 10,427,630 9,881,500 081

Exhibit PHR-3Page 16 of 75
Atmos Energy Corporation, Kentucky/Mid-States DivisionClass Cost of Service - Demand Only StudyForecasted Test Period: Twelve Months Ended March 31, 2020
CLASSIFICATION OF DEPRECIATION EXPENSE
Test Year Classif. Classif. Customer Demand CommodityLine Acct. $ Factor Basis $ $ $No. No.
82 General:8384 38900 Land & Land Rights - 5.4 P, S, T & D Plant - - - 85 39000 Structures & Improvements 244,888 5.4 P, S, T & D Plant 94,939 147,253 2,697 86 39001 Structures - Brick 5,574 5.4 P, S, T & D Plant 2,161 3,352 61 87 39002 Improvements 22,836 5.4 P, S, T & D Plant 8,853 13,732 252 88 39003 Air Conditioning Equipment 731 5.4 P, S, T & D Plant 283 439 8 89 39004 Improvement to leased Premises - 5.4 P, S, T & D Plant - - - 90 39009 Office Furniture & Equipment 93,448 5.4 P, S, T & D Plant 36,228 56,191 1,029 91 39100 Remittance Processing Equip - 5.4 P, S, T & D Plant - - - 92 39102 Office Machines - 5.4 P, S, T & D Plant - - - 93 39200 Transportation Equipment 5,191 5.4 P, S, T & D Plant 2,013 3,122 57 94 39201 Trucks - 5.4 P, S, T & D Plant - - - 95 39202 Trailers - 5.4 P, S, T & D Plant - - - 96 39300 Stores Equipment - 5.4 P, S, T & D Plant - - - 97 39400 Tools, Shop & Garage Equipment 116,855 5.4 P, S, T & D Plant 45,302 70,265 1,287 98 39600 Power Operated Equipment - 5.4 P, S, T & D Plant - - - 99 39603 Ditchers - 5.4 P, S, T & D Plant - - -
100 39604 Backhoes - 5.4 P, S, T & D Plant - - - 101 39605 Welders - 5.4 P, S, T & D Plant - - - 102 39700 Communication Equipment 34,968 5.4 P, S, T & D Plant 13,556 21,026 385 103 39701 Communication Equipment - Mobile Radios - 5.4 P, S, T & D Plant - - - 104 39702 Communication Equipment - Fixed Radios - 5.4 P, S, T & D Plant - - - 105 39705 Communication Equip. - Telemetering - 5.4 P, S, T & D Plant - - - 106 39800 Miscellaneous Equipment 194,589 5.4 P, S, T & D Plant 75,438 117,007 2,143 107 39900 Other Tangible Property - 5.4 P, S, T & D Plant - - - 108 39901 Other Tangible Property - Servers - H/W 2,056 5.4 P, S, T & D Plant 797 1,236 23 109 39902 Other Tangible Property - Servers - S/W - 5.4 P, S, T & D Plant - - - 110 39903 Other Tangible Property - Network - H/W 13,460 5.4 P, S, T & D Plant 5,218 8,094 148 111 39904 Other Tang. Property - CPU - 5.4 P, S, T & D Plant - - - 112 39905 Other Tangible Property - MF - Hardware - 5.4 P, S, T & D Plant - - - 113 39906 Other Tang. Property - PC Hardware 89,351 5.4 P, S, T & D Plant 34,640 53,727 984 114 39907 Other Tang. Property - PC Software - 5.4 P, S, T & D Plant - - - 115 39908 Other Tang. Property - Mainframe S/W - 5.4 P, S, T & D Plant - - - 116 39908 Other Tang. Property - Application Software 10,289 5.4 P, S, T & D Plant 3,989 6,187 113 117 40600 Amortization of gas plant acquisition adjustments - 5.4 P, S, T & D Plant - - - 118119120 Total General Plant 834,236 323,417 501,630 9,188121122 TOTAL DIRECT DEPRECIATION EXPENSE 21,834,154 10,751,047 10,950,133 132,973123124 Kentucky Mid-States General Office:125126 Intangible Plant:127128 30100 Organization - 5.4 P, S, T & D Plant - - - 129 30200 Franchises & Consents - 5.4 P, S, T & D Plant - - - 130 30300 Misc Intangible Plant - 5.4 P, S, T & D Plant - - - 131132 Total Intangible Plant: 0 0 0 0133134 General:135136 37400 Land & Land Rights - 5.4 P, S, T & D Plant - - - 137 39001 Structures Frame 2,500 5.4 P, S, T & D Plant 969 1,503 28 138 36602 Structures & Improvements - 5.4 P, S, T & D Plant - - - 139 38900 Land & Land Rights - 5.4 P, S, T & D Plant - - - 140 39004 Air Conditioning Equipment 561 5.4 P, S, T & D Plant 218 338 6 141 39009 Improvement to leased Premises - 5.4 P, S, T & D Plant - - - 142 39100 Office Furniture & Equipment - 5.4 P, S, T & D Plant - - - 143 39102 Remittance Processing Equip - 5.4 P, S, T & D Plant - - - 144 39103 Office Machines - 5.4 P, S, T & D Plant - - - 145 39200 Transportation Equipment 400 5.4 P, S, T & D Plant 155 240 4 146 39201 Trucks - 5.4 P, S, T & D Plant - - - 147 39202 Trailers - 5.4 P, S, T & D Plant - - - 148 39300 Stores Equipment - 5.4 P, S, T & D Plant - - - 149 39400 Tools, Shop & Garage Equipment 2,025 5.4 P, S, T & D Plant 785 1,217 22 150 39600 Power Operated Equipment 12 5.4 P, S, T & D Plant 5 7 0 151 39603 Ditchers - 5.4 P, S, T & D Plant - - - 152 39604 Backhoes - 5.4 P, S, T & D Plant - - - 153 39605 Welders - 5.4 P, S, T & D Plant - - - 154 39700 Communication Equipment 1,652 5.4 P, S, T & D Plant 640 993 18 155 39701 Communication Equipment - Mobile Radios - 5.4 P, S, T & D Plant - - - 156 39702 Communication Equipment - Fixed Radios - 5.4 P, S, T & D Plant - - - 157 39705 Communication Equip. - Telemetering - 5.4 P, S, T & D Plant - - - 158 39800 Miscellaneous Equipment 12,240 5.4 P, S, T & D Plant 4,745 7,360 135 159 39900 Other Tangible Property - 5.4 P, S, T & D Plant - - - 160 39901 Other Tangible Property - Servers - H/W - 5.4 P, S, T & D Plant - - - 161 39902 Other Tangible Property - Servers - S/W - 5.4 P, S, T & D Plant - - - 162 39903 Other Tangible Property - Network - H/W - 5.4 P, S, T & D Plant - - - 163 39904 Other Tang. Property - CPU - 5.4 P, S, T & D Plant - - - 164 39905 Other Tangible Property - MF - Hardware - 5.4 P, S, T & D Plant - - - 165 39906 Other Tang. Property - PC Hardware - 5.4 P, S, T & D Plant - - - 166 39907 Other Tang. Property - PC Software 11,145 5.4 P, S, T & D Plant 4,321 6,702 123 167 39908 Other Tang. Property - Mainframe S/W - 5.4 P, S, T & D Plant - - - 168 39909 Other Tang. Property - Application Software - 5.4 P, S, T & D Plant - - - 169 39924 Other Tang. Property - General Startup Costs - 5.4 P, S, T & D Plant - - - 170171172 Total General Plant 30,535 11,838 18,361 336

Exhibit PHR-3Page 17 of 75
Atmos Energy Corporation, Kentucky/Mid-States DivisionClass Cost of Service - Demand Only StudyForecasted Test Period: Twelve Months Ended March 31, 2020
CLASSIFICATION OF DEPRECIATION EXPENSE
Test Year Classif. Classif. Customer Demand CommodityLine Acct. $ Factor Basis $ $ $No. No.173174 Shared Services General Office:175176 General:177178 37400 Land & Land Rights - 5.4 P, S, T & D Plant - - - 179 39000 Structures & Improvements 7,132 5.4 P, S, T & D Plant 2,765 4,289 79 180 36602 Structures & Improvements - 5.4 P, S, T & D Plant - - - 181 37503 Improvements - 5.4 P, S, T & D Plant - - - 182 39004 Air Conditioning Equipment - 5.4 P, S, T & D Plant - - - 183 39009 Improvement to leased Premises 35 5.4 P, S, T & D Plant 14 21 0 184 39100 Office Furniture & Equipment 10,791 5.4 P, S, T & D Plant 4,183 6,488 119 185 39102 Remittance Processing Equip - 5.4 P, S, T & D Plant - - - 186 39103 Office Machines - 5.4 P, S, T & D Plant - - - 187 39200 Transportation Equipment - 5.4 P, S, T & D Plant - - - 188 39201 Trucks - 5.4 P, S, T & D Plant - - - 189 39202 Trailers - 5.4 P, S, T & D Plant - - - 190 39300 Stores Equipment - 5.4 P, S, T & D Plant - - - 191 39400 Tools, Shop & Garage Equipment - 5.4 P, S, T & D Plant - - - 192 39500 Laboratory Equipment - 5.4 P, S, T & D Plant - - - 193 39603 Ditchers - 5.4 P, S, T & D Plant - - - 194 39604 Backhoes - 5.4 P, S, T & D Plant - - - 195 39605 Welders - 5.4 P, S, T & D Plant - - - 196 39700 Communication Equipment 27 5.4 P, S, T & D Plant 10 16 0 197 39701 Communication Equipment - Mobile Radios - 5.4 P, S, T & D Plant - - - 198 39702 Communication Equipment - Fixed Radios - 5.4 P, S, T & D Plant - - - 199 39705 Communication Equip. - Telemetering - 5.4 P, S, T & D Plant - - - 200 39800 Miscellaneous Equipment 66 5.4 P, S, T & D Plant 25 39 1 201 39900 Other Tangible Property - 5.4 P, S, T & D Plant - - - 202 39901 Other Tangible Property - Servers - H/W 133,882 5.4 P, S, T & D Plant 51,904 80,504 1,475 203 39902 Other Tangible Property - Servers - S/W 40,124 5.4 P, S, T & D Plant 15,555 24,127 442 204 39903 Other Tangible Property - Network - H/W - 5.4 P, S, T & D Plant - - - 205 39904 Other Tang. Property - CPU - 5.4 P, S, T & D Plant - - - 206 39905 Other Tangible Property - MF - Hardware - 5.4 P, S, T & D Plant - - - 207 39906 Other Tang. Property - PC Hardware 9,073 5.4 P, S, T & D Plant 3,517 5,455 100 208 39907 Other Tang. Property - PC Software - 5.4 P, S, T & D Plant - - - 209 39908 Other Tang. Property - Mainframe S/W - 5.4 P, S, T & D Plant - - - 210 39909 Other Tang. Property - Application Software 1,366 5.4 P, S, T & D Plant 529 821 15 211 39924 Other Tang. Property - General Startup Costs - 5.4 P, S, T & D Plant - - - 212213214 Total General Plant 202,494 78,503 121,761 2,230215216 Shared Services Customer Support:217218 General:219220 37400 Land & Land Rights - 5.4 P, S, T & D Plant - - - 221 39001 Structures Frame - 5.4 P, S, T & D Plant - - - 222 36602 Structures & Improvements 30,100 5.4 P, S, T & D Plant 11,669 18,099 332 223 37503 Improvements - 5.4 P, S, T & D Plant - - - 224 39004 Air Conditioning Equipment - 5.4 P, S, T & D Plant - - - 225 39009 Improvement to leased Premises 5,171 5.4 P, S, T & D Plant 2,005 3,110 57 226 39100 Office Furniture & Equipment 6,139 5.4 P, S, T & D Plant 2,380 3,692 68 227 39102 Remittance Processing Equip - 5.4 P, S, T & D Plant - - - 228 39103 Office Machines - 5.4 P, S, T & D Plant - - - 229 39200 Transportation Equipment - 5.4 P, S, T & D Plant - - - 230 39201 Trucks - 5.4 P, S, T & D Plant - - - 231 39202 Trailers - 5.4 P, S, T & D Plant - - - 232 39300 Stores Equipment - 5.4 P, S, T & D Plant - - - 233 39500 Laboratory Equipment 1,191 5.4 P, S, T & D Plant 462 716 13 234 39600 Power Operated Equipment 55 5.4 P, S, T & D Plant 21 33 1 235 39603 Ditchers - 5.4 P, S, T & D Plant - - - 236 39604 Backhoes - 5.4 P, S, T & D Plant - - - 237 39605 Welders - 5.4 P, S, T & D Plant - - - 238 39700 Communication Equipment 6,709 5.4 P, S, T & D Plant 2,601 4,034 74 239 39701 Communication Equipment - Mobile Radios - 5.4 P, S, T & D Plant - - - 240 39702 Communication Equipment - Fixed Radios - 5.4 P, S, T & D Plant - - - 241 39705 Communication Equip. - Telemetering - 5.4 P, S, T & D Plant - - - 242 39800 Miscellaneous Equipment 834 5.4 P, S, T & D Plant 323 501 9 243 39900 Other Tangible Property 5,664 5.4 P, S, T & D Plant 2,196 3,406 62 244 39901 Other Tangible Property - Servers - H/W 55,314 5.4 P, S, T & D Plant 21,444 33,261 609 245 39902 Other Tangible Property - Servers - S/W 10,196 5.4 P, S, T & D Plant 3,953 6,131 112 246 39903 Other Tangible Property - Network - H/W 2,481 5.4 P, S, T & D Plant 962 1,492 27 247 39904 Other Tang. Property - CPU - 5.4 P, S, T & D Plant - - - 248 39905 Other Tangible Property - MF - Hardware - 5.4 P, S, T & D Plant - - - 249 39906 Other Tang. Property - PC Hardware 7,309 5.4 P, S, T & D Plant 2,834 4,395 80 250 39907 Other Tang. Property - PC Software 871 5.4 P, S, T & D Plant 338 524 10 251 39908 Other Tang. Property - Mainframe S/W - 5.4 P, S, T & D Plant - - - 252 39909 Other Tang. Property - Application Software 342,525 5.4 P, S, T & D Plant 132,791 205,962 3,772 253 39924 Other Tang. Property - General Startup Costs 31 5.4 P, S, T & D Plant 12 19 0 254255256 Total General Plant 474,591 183,990 285,374 5,227257258 TOTAL DEPRECIATION EXPENSE 22,541,774 11,025,378 11,375,629 140,767

Exhibit PHR-3Page 18 of 75
Atmos Energy Corporation, Kentucky/Mid-States DivisionClass Cost of Service - Demand Only StudyForecasted Test Period: Twelve Months Ended March 31, 2020
CLASSIFICATION OF TAXES, OTHER THAN INCOME & NET DEDUCTIONS FOR INCOME TAX
Test Year Classif. Classif. Customer Demand Commodity$ Factor Basis $ $ $
1 Taxes Other Than Income23 Non Revenue Related:4 Payroll Related 927,870 9.1 Allocated O&M Expenses 91,523 144,957 691,389 5 Property Related 6,008,371 5.4 P, S, T & D Plant 2,329,332 3,612,865 66,174 6 DOT Transmission User Tax 137,062 9.1 Allocated O&M Expenses 13,520 21,413 102,130 7 Other 99,099 9.1 Allocated O&M Expenses 9,775 15,482 73,842 8 Total Non Revenue Related: 7,172,401 2,444,150 3,794,716 933,5359
10 Revenue Related:11 State Gross Receipts - Tax 0 99.0 - - - - 12 Local Gross Receipts - Tax 0 99.0 - - - - 13 Public Service Commission Assessment 339,436 3.0 Commodity - - 339,436 14 Total Revenue Related: 339,436 0 0 339,4361516 Total Taxes, Other Than Income 7,511,837 2,444,150 3,794,716 1,272,971171819 Interest Expense 9,367,735 13.0 Rate Base 3,452,156 6,075,532 (159,953) 2021 Amortization of Excess ADIT (1,463,766) 18.0 Total Cost of Service at Equalized ROR (333,567) (505,288) (624,911)

Exhibit PHR-3Page 19 of 75
Atmos Energy Corporation, Kentucky/Mid-States DivisionClass Cost of Service - Demand Only StudyForecasted Test Period: Twelve Months Ended March 31, 2020
SUMMARY OF CLASSIFICATION1234 Test Year Classif. Classif. Customer Demand Commodity5 $ Factor Basis $ $ $67 Operating Revenues 169,717,866 36,436,961 53,756,847 79,524,05889 Operating Expenses:
1011 Operating & Maintenance 105,607,336 10,416,928 16,498,567 78,691,84012 Depreciation & Amortization 22,541,774 11,025,378 11,375,629 140,76713 Taxes Other Than Income 7,511,837 2,444,150 3,794,716 1,272,9711415 Total Operating Expenses 135,660,946 23,886,456 31,668,913 80,105,5771617 Income Before Taxes 34,056,920 12,550,504 22,087,934 (581,519)1819 Interest Expense 9,367,735 3,452,156 6,075,532 (159,953)2021 Income Taxes:2223 State Income Taxes 1,481,351 6.00% 545,901 960,744 (25,294)24 Federal Income Taxes 4,873,645 21.00% 1,796,014 3,160,848 (83,217)25 Total Deferred Income Taxes 0 0 0 026 Amortization of ITC 0 0 0 02728 Total Income Taxes 6,354,996 2,341,915 4,121,592 (108,511)2930 Net Income 27,701,923 10,208,589 17,966,342 (473,008) 3132 Total Rate Base 496,111,427 182,824,775 321,757,716 (8,471,064)3334 Rate of Return 5.5838% 5.5838% 5.5838% 5.5838%

Exhibit PHR-3Page 20 of 75
Atmos Energy Corporation, Kentucky/Mid-States DivisionClass Cost of Service - Demand Only StudyForecasted Test Period: Twelve Months Ended March 31, 2020
ALLOCATION OF PLANT IN SERVICE
Customer
Allocation Allocation Total Residential Non-Res Sales Non-Res Sales Transport TransportLine Acct. Factor Basis Company Sales Firm Interruptible Firm InterruptibleNo. No.
1 Intangible Plant:23 30100 Organization 6.2 P, S, T & D Plant - Customer 3,229 2,493 702 2 21 12 4 30200 Franchises & Consents 6.2 P, S, T & D Plant - Customer 46,465 35,864 10,103 24 303 171 5 30300 Misc Intangible Plant 99.0 - 0 - - - - - 67 Total Intangible Plant: 49,694 38,356 10,805 26 324 18389 Production Plant:
1011 32520 Producing Leaseholds 99.0 - 0 - - - - - 12 32540 Rights of Ways 99.0 - 0 - - - - - 13 33100 Production Gas Wells Equipment 99.0 - 0 - - - - - 14 33201 Field Lines 99.0 - 0 - - - - - 15 33202 Tributary Lines 99.0 - 0 - - - - - 16 33400 Field Meas. & Reg. Sta. Equip 99.0 - 0 - - - - - 17 33600 Purification Equipment 99.0 - 0 - - - - - 1819 Total Production Plant 0 0 0 0 0 02021 Storage Plant:2223 35010 Land 99.0 - 0 - - - - - 24 35020 Rights of Way 99.0 - 0 - - - - - 25 35100 Structures and Improvements 99.0 - 0 - - - - - 26 35102 Compression Station Equipment 99.0 - 0 - - - - - 27 35103 Meas. & Reg. Sta. Structues 99.0 - 0 - - - - - 28 35104 Other Structures 99.0 - 0 - - - - - 29 35200 Wells \ Rights of Way 99.0 - 0 - - - - - 30 35201 Well Construction 99.0 - 0 - - - - - 31 35202 Well Equipment 99.0 - 0 - - - - - 32 35203 Cushion Gas 99.0 - 0 - - - - - 33 35210 Leaseholds 99.0 - 0 - - - - - 34 35211 Storage Rights 99.0 - 0 - - - - - 35 35301 Field Lines 99.0 - 0 - - - - - 36 35302 Tributary Lines 99.0 - 0 - - - - - 37 35400 Compressor Station Equipment 99.0 - 0 - - - - - 38 35500 Meas & Reg. Equipment 99.0 - 0 - - - - - 39 35600 Purification Equipment 99.0 - 0 - - - - - 4041 Total Storage Plant 0 0 0 0 0 04243 Transmission:4445 36510 Land & Land Rights 99.0 - 0 - - - - - 46 36520 Rights of Way 99.0 - 0 - - - - - 47 36602 Structures & Improvements 99.0 - 0 - - - - - 48 36603 Other Structues 99.0 - 0 - - - - - 49 36700 Mains Cathodic Protection 99.0 - 0 - - - - - 50 36701 Mains - Steel 99.0 - 0 - - - - - 51 36900 Meas. & Reg. Equipment 99.0 - 0 - - - - - 52 36901 Meas. & Reg. Equipment 99.0 - 0 - - - - - 5354 Total Transmission Plant 0 0 0 0 0 05556 Distribution:5758 37400 Land & Land Rights 2.0 Bills 0 - - - - - 59 37401 Land 2.0 Bills 0 - - - - - 60 37402 Land Rights 2.0 Bills 0 - - - - - 61 37403 Land Other 2.0 Bills 0 - - - - - 62 37500 Structures & Improvements 2.0 Bills 0 - - - - - 63 37501 Structures & Improvements T.B. 2.0 Bills 0 - - - - - 64 37502 Land Rights 2.0 Bills 0 - - - - - 65 37503 Improvements 2.0 Bills 0 - - - - - 66 37600 Mains Cathodic Protection 2.0 Bills 0 - - - - - 67 37601 Mains - Steel 2.0 Bills 0 - - - - - 68 37602 Mains - Plastic 2.0 Bills 0 - - - - - 69 37800 Meas & Reg. Sta. Equip - General 2.0 Bills 0 - - - - - 70 37900 Meas & Reg. Sta. Equip - City Gate 2.0 Bills 0 - - - - - 71 37905 Meas & Reg. Sta. Equipment T.b. 2.0 Bills 0 - - - - - 72 38000 Services 2.0 Bills 150,274,437 133,824,243 16,279,918 8,273 103,453 58,550 73 38100 Meters 4.0 Meter Investment 38,722,015 24,980,781 12,812,487 45,125 564,268 319,353 74 38200 Meter Installaitons 4.0 Meter Investment 57,067,155 36,815,804 18,882,597 66,503 831,599 470,652 75 38300 House Regulators 4.0 Meter Investment 12,779,948 8,244,744 4,228,678 14,893 186,233 105,401 76 38400 House Reg. Installations 4.0 Meter Investment 252,587 162,952 83,577 294 3,681 2,083 77 38500 Ind. Meas. & Reg. Sta. Equipment 2.2 Non-Residential Bills 5,241,043 - 5,186,793 2,636 32,960 18,654 78 38600 Other Prop. On Cust. Prem 99.0 - 0 - - - - - 7980 Total Distribution Plant 264,337,185 204,028,524 57,474,048 137,724 1,722,195 974,694

Exhibit PHR-3Page 21 of 75
Atmos Energy Corporation, Kentucky/Mid-States DivisionClass Cost of Service - Demand Only StudyForecasted Test Period: Twelve Months Ended March 31, 2020
ALLOCATION OF PLANT IN SERVICE8182 General:8384 38900 Land & Land Rights 6.2 P, S, T & D Plant - Customer 469,752 362,578 102,137 245 3,061 1,732 85 39000 Structures & Improvements 6.2 P, S, T & D Plant - Customer 2,944,671 2,272,843 640,251 1,534 19,185 10,858 86 39001 Structures Frame 6.2 P, S, T & D Plant - Customer 0 - - - - - 87 39002 Structures-Brick 6.2 P, S, T & D Plant - Customer 67,113 51,801 14,592 35 437 247 88 39003 Improvements 6.2 P, S, T & D Plant - Customer 274,943 212,215 59,780 143 1,791 1,014 89 39004 Air Conditioning Equipment 6.2 P, S, T & D Plant - Customer 5,022 3,876 1,092 3 33 19 90 39009 Improvement to leased Premises 6.2 P, S, T & D Plant - Customer 483,126 372,901 105,045 252 3,148 1,781 91 39100 Office Furniture & Equipment 6.2 P, S, T & D Plant - Customer 723,428 558,377 157,293 377 4,713 2,668 92 39102 Remittance Processing Equip 6.2 P, S, T & D Plant - Customer 0 - - - - - 93 39103 Office Machines 6.2 P, S, T & D Plant - Customer 0 - - - - - 94 39200 Transportation Equipment 6.2 P, S, T & D Plant - Customer 85,672 66,126 18,628 45 558 316 95 39201 Trucks 6.2 P, S, T & D Plant - Customer 0 - - - - - 96 39202 Trailers 6.2 P, S, T & D Plant - Customer 0 - - - - - 97 39300 Stores Equipment 6.2 P, S, T & D Plant - Customer 0 - - - - - 98 39400 Tools, Shop & Garage Equipment 6.2 P, S, T & D Plant - Customer 1,581,103 1,220,374 343,775 824 10,301 5,830 99 39600 Power Operated Equipment 6.2 P, S, T & D Plant - Customer 0 - - - - -
100 39603 Ditchers 6.2 P, S, T & D Plant - Customer 15,356 11,853 3,339 8 100 57 101 39604 Backhoes 6.2 P, S, T & D Plant - Customer 24,326 18,776 5,289 13 158 90 102 39605 Welders 6.2 P, S, T & D Plant - Customer 7,532 5,813 1,638 4 49 28 103 39700 Communication Equipment 6.2 P, S, T & D Plant - Customer 203,245 156,874 44,191 106 1,324 749 104 39701 Communication Equipment - Mobile Radios 6.2 P, S, T & D Plant - Customer 0 - - - - - 105 39702 Communication Equipment - Fixed Radios 6.2 P, S, T & D Plant - Customer 0 - - - - - 106 39705 Communication Equip. - Telemetering 6.2 P, S, T & D Plant - Customer 0 - - - - - 107 39800 Miscellaneous Equipment 6.2 P, S, T & D Plant - Customer 1,508,766 1,164,540 328,047 786 9,830 5,563 108 39900 Other Tangible Property 6.2 P, S, T & D Plant - Customer 0 - - - - - 109 39901 Other Tangible Property - Servers - H/W 6.2 P, S, T & D Plant - Customer 5,579 4,306 1,213 3 36 21 110 39902 Other Tangible Property - Servers - S/W 6.2 P, S, T & D Plant - Customer 0 - - - - - 111 39903 Other Tangible Property - Network - H/W 6.2 P, S, T & D Plant - Customer 52,181 40,276 11,346 27 340 192 112 39904 Other Tang. Property - CPU 6.2 P, S, T & D Plant - Customer 0 - - - - - 113 39905 Other Tangible Property - MF - Hardware 6.2 P, S, T & D Plant - Customer 0 - - - - - 114 39906 Other Tang. Property - PC Hardware 6.2 P, S, T & D Plant - Customer 179,065 138,211 38,934 93 1,167 660 115 39907 Other Tang. Property - PC Software 6.2 P, S, T & D Plant - Customer 0 - - - - - 116 39908 Other Tang. Property - Mainframe S/W 6.2 P, S, T & D Plant - Customer 47,884 36,960 10,411 25 312 177 117 39909 Other Tang. Property - Application Software 6.2 P, S, T & D Plant - Customer 0 - - - - - 118 39924 Other Tang. Property - General Startup Costs 6.2 P, S, T & D Plant - Customer 0 - - - - - 119120 Total General Plant 8,678,765 6,698,701 1,886,998 4,522 56,543 32,001121122 TOTAL DIRECT PLANT 273,065,644 210,765,581 59,371,851 142,272 1,779,062 1,006,878123124 CWIP w/o AFUDC 6.2 P, S, T & D Plant - Customer 14,791,899 11,417,120 3,216,159 7,707 96,371 54,542 125126 Kentucky Mid-States General Office:127128 Intangible Plant:129130 30100 Organization 6.2 P, S, T & D Plant - Customer 35,762 27,603 7,776 19 233 132 131 30200 Franchises & Consents 6.2 P, S, T & D Plant - Customer 0 - - - - - 132 30300 Misc Intangible Plant 6.2 P, S, T & D Plant - Customer 214,130 165,276 46,558 112 1,395 790 133134 Total Intangible Plant 249,892 192,879 54,333 130 1,628 921135136 General:137138 37400 Land & Land Rights 6.2 P, S, T & D Plant - Customer 0 - - - - - 139 39001 Structures Frame 6.2 P, S, T & D Plant - Customer 34,610 26,714 7,525 18 225 128 140 36602 Structures & Improvements 6.2 P, S, T & D Plant - Customer 0 - - - - - 141 38900 Land & Land Rights 6.2 P, S, T & D Plant - Customer 0 - - - - - 142 39004 Air Conditioning Equipment 6.2 P, S, T & D Plant - Customer 2,969 2,292 646 2 19 11 143 39009 Improvement to leased Premises 6.2 P, S, T & D Plant - Customer 7,494 5,785 1,630 4 49 28 144 39100 Office Furniture & Equipment 6.2 P, S, T & D Plant - Customer 7,451 5,751 1,620 4 49 27 145 39102 Remittance Processing Equip 6.2 P, S, T & D Plant - Customer 0 - - - - - 146 39103 Office Machines 6.2 P, S, T & D Plant - Customer 0 - - - - - 147 39200 Transportation Equipment 6.2 P, S, T & D Plant - Customer 5,266 4,064 1,145 3 34 19 148 39201 Trucks 6.2 P, S, T & D Plant - Customer 0 - - - - - 149 39202 Trailers 6.2 P, S, T & D Plant - Customer 0 - - - - - 150 39300 Stores Equipment 6.2 P, S, T & D Plant - Customer 0 - - - - - 151 39400 Tools, Shop & Garage Equipment 6.2 P, S, T & D Plant - Customer 33,940 26,197 7,380 18 221 125 152 39600 Power Operated Equipment 6.2 P, S, T & D Plant - Customer 3,959 3,056 861 2 26 15 153 39603 Ditchers 6.2 P, S, T & D Plant - Customer 0 - - - - - 154 39604 Backhoes 6.2 P, S, T & D Plant - Customer 0 - - - - - 155 39605 Welders 6.2 P, S, T & D Plant - Customer 0 - - - - - 156 39700 Communication Equipment 6.2 P, S, T & D Plant - Customer 7,245 5,592 1,575 4 47 27 157 39701 Communication Equipment - Mobile Radios 6.2 P, S, T & D Plant - Customer 0 - - - - - 158 39702 Communication Equipment - Fixed Radios 6.2 P, S, T & D Plant - Customer 0 - - - - - 159 39705 Communication Equip. - Telemetering 6.2 P, S, T & D Plant - Customer 0 - - - - - 160 39800 Miscellaneous Equipment 6.2 P, S, T & D Plant - Customer 157,124 121,276 34,163 82 1,024 579 161 39900 Other Tangible Property 6.2 P, S, T & D Plant - Customer 0 - - - - - 162 39901 Other Tangible Property - Servers - H/W 6.2 P, S, T & D Plant - Customer 0 - - - - - 163 39902 Other Tangible Property - Servers - S/W 6.2 P, S, T & D Plant - Customer 0 - - - - - 164 39903 Other Tangible Property - Network - H/W 6.2 P, S, T & D Plant - Customer 0 - - - - - 165 39904 Other Tang. Property - CPU 6.2 P, S, T & D Plant - Customer 0 - - - - - 166 39905 Other Tangible Property - MF - Hardware 6.2 P, S, T & D Plant - Customer 0 - - - - - 167 39906 Other Tang. Property - PC Hardware 6.2 P, S, T & D Plant - Customer 13,543 10,453 2,945 7 88 50 168 39907 Other Tang. Property - PC Software 6.2 P, S, T & D Plant - Customer 31,902 24,623 6,936 17 208 118 169 39908 Other Tang. Property - Mainframe S/W 6.2 P, S, T & D Plant - Customer 159,892 123,413 34,765 83 1,042 590 170 39909 Other Tang. Property - Application Software 6.2 P, S, T & D Plant - Customer 0 - - - - - 171 39924 Other Tang. Property - General Startup Costs 6.2 P, S, T & D Plant - Customer 0 - - - - - 172173 Total General Plant 465,396 359,216 101,190 242 3,032 1,716174175 CWIP w/o AFUDC 6.2 P, S, T & D Plant - Customer 896 691 195 0 6 3

Exhibit PHR-3Page 22 of 75
Atmos Energy Corporation, Kentucky/Mid-States DivisionClass Cost of Service - Demand Only StudyForecasted Test Period: Twelve Months Ended March 31, 2020
ALLOCATION OF PLANT IN SERVICE176177 Shared Services General Office:178179 General:180181 37400 Land & Land Rights 6.2 P, S, T & D Plant - Customer 0 - - - - - 182 39001 Structures Frame 6.2 P, S, T & D Plant - Customer 0 - - - - - 183 36602 Structures & Improvements 6.2 P, S, T & D Plant - Customer 91,657 70,745 19,929 48 597 338 184 37503 Improvements 6.2 P, S, T & D Plant - Customer 0 - - - - - 185 39004 Air Conditioning Equipment 6.2 P, S, T & D Plant - Customer 0 - - - - - 186 39009 Improvement to leased Premises 6.2 P, S, T & D Plant - Customer 187,389 144,636 40,743 98 1,221 691 187 39100 Office Furniture & Equipment 6.2 P, S, T & D Plant - Customer 111,233 85,855 24,185 58 725 410 188 39102 Remittance Processing Equip 6.2 P, S, T & D Plant - Customer 0 - - - - - 189 39103 Office Machines 6.2 P, S, T & D Plant - Customer 0 - - - - - 190 39200 Transportation Equipment 6.2 P, S, T & D Plant - Customer 143 110 31 0 1 1 191 39201 Trucks 6.2 P, S, T & D Plant - Customer 0 - - - - - 192 39202 Trailers 6.2 P, S, T & D Plant - Customer 0 - - - - - 193 39300 Stores Equipment 6.2 P, S, T & D Plant - Customer 0 - - - - - 194 39400 Tools, Shop & Garage Equipment 6.2 P, S, T & D Plant - Customer 1,527 1,178 332 1 10 6 195 39600 Power Operated Equipment 6.2 P, S, T & D Plant - Customer 0 - - - - - 196 39603 Ditchers 6.2 P, S, T & D Plant - Customer 0 - - - - - 197 39604 Backhoes 6.2 P, S, T & D Plant - Customer 0 - - - - - 198 39605 Welders 6.2 P, S, T & D Plant - Customer 0 - - - - - 199 39700 Communication Equipment 6.2 P, S, T & D Plant - Customer 21,078 16,269 4,583 11 137 78 200 39701 Communication Equipment - Mobile Radios 6.2 P, S, T & D Plant - Customer 0 - - - - - 201 39702 Communication Equipment - Fixed Radios 6.2 P, S, T & D Plant - Customer 0 - - - - - 202 39705 Communication Equip. - Telemetering 6.2 P, S, T & D Plant - Customer 0 - - - - - 203 39800 Miscellaneous Equipment 6.2 P, S, T & D Plant - Customer 2,922 2,255 635 2 19 11 204 39900 Other Tangible Property 6.2 P, S, T & D Plant - Customer 3,248 2,507 706 2 21 12 205 39901 Other Tangible Property - Servers - H/W 6.2 P, S, T & D Plant - Customer 900,168 694,794 195,721 469 5,865 3,319 206 39902 Other Tangible Property - Servers - S/W 6.2 P, S, T & D Plant - Customer 543,695 419,651 118,214 283 3,542 2,005 207 39903 Other Tangible Property - Network - H/W 6.2 P, S, T & D Plant - Customer 171,472 132,351 37,283 89 1,117 632 208 39904 Other Tang. Property - CPU 6.2 P, S, T & D Plant - Customer 0 - - - - - 209 39905 Other Tangible Property - MF - Hardware 6.2 P, S, T & D Plant - Customer 0 - - - - - 210 39906 Other Tang. Property - PC Hardware 6.2 P, S, T & D Plant - Customer 60,425 46,639 13,138 31 394 223 211 39907 Other Tang. Property - PC Software 6.2 P, S, T & D Plant - Customer 33,424 25,798 7,267 17 218 123 212 39908 Other Tang. Property - Mainframe S/W 6.2 P, S, T & D Plant - Customer 1,504,064 1,160,911 327,024 784 9,799 5,546 213 39909 Other Tang. Property - Application Software 6.2 P, S, T & D Plant - Customer 512,885 395,870 111,515 267 3,342 1,891 214 39931 Other Tang. Property - ALGN 6.2 P, S, T & D Plant - Customer 0 - - - - - 215216 Total General Plant 4,145,328 3,199,570 901,306 2,160 27,007 15,285217218 CWIP w/o AFUDC 6.2 P, S, T & D Plant - Customer 290,119 223,928 63,080 151 1,890 1,070 219220 Shared Services Customer Support:221222 General:223224 37400 Land & Land Rights 6.2 P, S, T & D Plant - Customer 79,816 61,606 17,354 42 520 294 225 39001 Structures Frame 6.2 P, S, T & D Plant - Customer 0 - - - - - 226 36602 Structures & Improvements 6.2 P, S, T & D Plant - Customer 387,685 299,235 84,293 202 2,526 1,430 227 37503 Improvements 6.2 P, S, T & D Plant - Customer 0 - - - - - 228 39004 Air Conditioning Equipment 6.2 P, S, T & D Plant - Customer 0 - - - - - 229 39009 Improvement to leased Premises 6.2 P, S, T & D Plant - Customer 61,687 47,613 13,412 32 402 227 230 39100 Office Furniture & Equipment 6.2 P, S, T & D Plant - Customer 59,971 46,289 13,039 31 391 221 231 39102 Remittance Processing Equip 6.2 P, S, T & D Plant - Customer 0 - - - - - 232 39103 Office Machines 6.2 P, S, T & D Plant - Customer 0 - - - - - 233 39200 Transportation Equipment 6.2 P, S, T & D Plant - Customer 866 668 188 0 6 3 234 39201 Trucks 6.2 P, S, T & D Plant - Customer 0 - - - - - 235 39202 Trailers 6.2 P, S, T & D Plant - Customer 0 - - - - - 236 39300 Stores Equipment 6.2 P, S, T & D Plant - Customer 0 - - - - - 237 39400 Tools, Shop & Garage Equipment 6.2 P, S, T & D Plant - Customer 5,463 4,217 1,188 3 36 20 238 39600 Power Operated Equipment 6.2 P, S, T & D Plant - Customer 212 164 46 0 1 1 239 39603 Ditchers 6.2 P, S, T & D Plant - Customer 0 - - - - - 240 39604 Backhoes 6.2 P, S, T & D Plant - Customer 0 - - - - - 241 39605 Welders 6.2 P, S, T & D Plant - Customer 0 - - - - - 242 39700 Communication Equipment 6.2 P, S, T & D Plant - Customer 44,460 34,316 9,667 23 290 164 243 39701 Communication Equipment - Mobile Radios 6.2 P, S, T & D Plant - Customer 0 - - - - - 244 39702 Communication Equipment - Fixed Radios 6.2 P, S, T & D Plant - Customer 0 - - - - - 245 39705 Communication Equip. - Telemetering 6.2 P, S, T & D Plant - Customer 0 - - - - - 246 39800 Miscellaneous Equipment 6.2 P, S, T & D Plant - Customer 6,109 4,715 1,328 3 40 23 247 39900 Other Tangible Property 6.2 P, S, T & D Plant - Customer 16,813 12,977 3,656 9 110 62 248 39901 Other Tangible Property - Servers - H/W 6.2 P, S, T & D Plant - Customer 226,206 174,597 49,183 118 1,474 834 249 39902 Other Tangible Property - Servers - S/W 6.2 P, S, T & D Plant - Customer 44,263 34,165 9,624 23 288 163 250 39903 Other Tangible Property - Network - H/W 6.2 P, S, T & D Plant - Customer 13,761 10,622 2,992 7 90 51 251 39904 Other Tang. Property - CPU 6.2 P, S, T & D Plant - Customer 0 - - - - - 252 39905 Other Tangible Property - MF - Hardware 6.2 P, S, T & D Plant - Customer 0 - - - - - 253 39906 Other Tang. Property - PC Hardware 6.2 P, S, T & D Plant - Customer 26,933 20,788 5,856 14 175 99 254 39907 Other Tang. Property - PC Software 6.2 P, S, T & D Plant - Customer 5,095 3,932 1,108 3 33 19 255 39908 Other Tang. Property - Mainframe S/W 6.2 P, S, T & D Plant - Customer 2,034,841 1,570,591 442,429 1,060 13,257 7,503 256 39909 Other Tang. Property - Application Software 6.2 P, S, T & D Plant - Customer 185 143 40 0 1 1 257 39924 Other Tang. Property - General Startup Costs 6.2 P, S, T & D Plant - Customer 0 - - - - - 258259 Total General Plant 3,014,367 2,326,638 655,405 1,571 19,639 11,115260261 CWIP w/o AFUDC 6.2 P, S, T & D Plant - Customer 87,125 67,248 18,943 45 568 321 262263 TOTAL PLANT IN SERVICE - CUSTOMER 280,940,628 216,843,883 61,084,086 146,375 1,830,368 1,035,916264265 TOTAL CWIP W/O AFUDC - CUSTOMER 15,170,039 11,708,987 3,298,376 7,904 98,835 55,937

Exhibit PHR-3Page 23 of 75
Atmos Energy Corporation, Kentucky/Mid-States DivisionClass Cost of Service - Demand Only StudyForecasted Test Period: Twelve Months Ended March 31, 2020
ALLOCATION OF PLANT IN SERVICE
Demand
Allocation Allocation Total Residential Non-Res Sales Non-Res Sales Transport TransportLine Acct. Factor Basis Company Sales Firm Interruptible Firm InterruptibleNo. No.
266 Intangible Plant:267268 30100 Organization 6.4 P, S, T & D Plant - Demand 5,009 2,265 1,295 68 725 656 269 30200 Franchises & Consents 6.4 P, S, T & D Plant - Demand 72,068 32,584 18,632 980 10,439 9,433 270 30300 Misc Intangible Plant 99.0 - 0 - - - - - 271272 Total Intangible Plant: 77,077 34,849 19,927 1,048 11,164 10,088273274 Production Plant:275276 32520 Producing Leaseholds 3.0 Peak Day 0 - - - - - 277 32540 Rights of Ways 3.0 Peak Day 0 - - - - - 278 33100 Production Gas Wells Equipment 3.0 Peak Day 0 - - - - - 279 33201 Field Lines 3.0 Peak Day 0 - - - - - 280 33202 Tributary Lines 3.0 Peak Day 0 - - - - - 281 33400 Field Meas. & Reg. Sta. Equip 3.0 Peak Day 0 - - - - - 282 33600 Purification Equipment 3.0 Peak Day 0 - - - - - 283284 Total Production Plant 0 0 0 0 0 0285286 Storage Plant:287288 35010 Land 3.0 Peak Day 130,563 59,032 33,756 1,775 18,911 17,089 289 35020 Rights of Way 3.0 Peak Day 2,341 1,058 605 32 339 306 290 35100 Structures and Improvements 3.0 Peak Day 8,958 4,050 2,316 122 1,298 1,172 291 35102 Compression Station Equipment 3.0 Peak Day 76,631 34,647 19,812 1,042 11,099 10,030 292 35103 Meas. & Reg. Sta. Structues 3.0 Peak Day 11,569 5,231 2,991 157 1,676 1,514 293 35104 Other Structures 3.0 Peak Day 68,721 31,071 17,767 935 9,954 8,995 294 35200 Wells \ Rights of Way 3.0 Peak Day 4,174,198 1,887,299 1,079,195 56,763 604,604 546,337 295 35201 Well Construction 3.0 Peak Day 849,999 384,314 219,758 11,559 123,117 111,252 296 35202 Well Equipment 3.0 Peak Day 224,655 101,574 58,082 3,055 32,540 29,404 297 35203 Cushion Gas 3.0 Peak Day 847,416 383,146 219,091 11,524 122,742 110,914 298 35210 Leaseholds 3.0 Peak Day 89,265 40,360 23,079 1,214 12,929 11,683 299 35211 Storage Rights 3.0 Peak Day 27,307 12,346 7,060 371 3,955 3,574 300 35301 Field Lines 3.0 Peak Day 87,675 39,641 22,667 1,192 12,699 11,475 301 35302 Tributary Lines 3.0 Peak Day 104,659 47,320 27,059 1,423 15,159 13,698 302 35400 Compressor Station Equipment 3.0 Peak Day 461,723 208,761 119,374 6,279 66,877 60,432 303 35500 Meas & Reg. Equipment 3.0 Peak Day 136,542 61,735 35,302 1,857 19,777 17,871 304 35600 Purification Equipment 3.0 Peak Day 207,332 93,742 53,603 2,819 30,031 27,136 305306 Total Storage Plant 7,509,555 3,395,329 1,941,516 102,119 1,087,708 982,884307308 Transmission:309310 36510 Land & Land Rights 3.0 Peak Day 26,970 12,194 6,973 367 3,906 3,530 311 36520 Rights of Way 3.0 Peak Day 867,772 392,350 224,353 11,800 125,691 113,578 312 36602 Structures & Improvements 3.0 Peak Day 49,002 22,155 12,669 666 7,098 6,414 313 36603 Other Structues 3.0 Peak Day 60,826 27,502 15,726 827 8,810 7,961 314 36700 Mains Cathodic Protection 3.0 Peak Day 139,638 63,135 36,102 1,899 20,226 18,276 315 36701 Mains - Steel 3.0 Peak Day 27,047,831 12,229,257 6,992,930 367,811 3,917,694 3,540,140 316 36900 Meas. & Reg. Equipment 3.0 Peak Day 731,467 330,721 189,113 9,947 105,948 95,738 317 36901 Meas. & Reg. Equipment 3.0 Peak Day 2,269,556 1,026,144 586,770 30,863 328,730 297,050 318319 Total Transmission Plant 31,193,061 14,103,458 8,064,635 424,180 4,518,102 4,082,686320321 Distribution:322323 37400 Land & Land Rights 3.0 Peak Day 531,167 240,159 137,328 7,223 76,936 69,521 324 37401 Land 3.0 Peak Day 37,326 16,877 9,650 508 5,406 4,885 325 37402 Land Rights 3.0 Peak Day 3,645,749 1,648,369 942,570 49,577 528,062 477,172 326 37403 Land Other 3.0 Peak Day 2,784 1,259 720 38 403 364 327 37500 Structures & Improvements 3.0 Peak Day 336,168 151,993 86,913 4,571 48,692 43,999 328 37501 Structures & Improvements T.B. 3.0 Peak Day 99,818 45,131 25,807 1,357 14,458 13,065 329 37502 Land Rights 3.0 Peak Day 46,264 20,918 11,961 629 6,701 6,055 330 37503 Improvements 3.0 Peak Day 4,005 1,811 1,035 54 580 524 331 37600 Mains Cathodic Protection 3.0 Peak Day 20,611,541 9,319,188 5,328,895 280,287 2,985,441 2,697,730 332 37601 Mains - Steel 3.0 Peak Day 176,025,498 79,587,196 45,509,525 2,393,690 25,496,092 23,038,996 333 37602 Mains - Plastic 3.0 Peak Day 133,261,910 60,252,304 34,453,453 1,812,168 19,302,078 17,441,908 334 37800 Meas & Reg. Sta. Equip - General 3.0 Peak Day 29,911,913 13,524,207 7,733,408 406,758 4,332,536 3,915,003 335 37900 Meas & Reg. Sta. Equip - City Gate 3.0 Peak Day 5,126,032 2,317,656 1,325,281 69,707 742,471 670,918 336 37905 Meas & Reg. Sta. Equipment T.b. 3.0 Peak Day 1,652,259 747,043 427,174 22,468 239,318 216,255 337 38000 Services 99.0 - 0 - - - - - 338 38100 Meters 99.0 - 0 - - - - - 339 38200 Meter Installaitons 99.0 - 0 - - - - - 340 38300 House Regulators 99.0 - 0 - - - - - 341 38400 House Reg. Installations 99.0 - 0 - - - - - 342 38500 Ind. Meas. & Reg. Sta. Equipment 99.0 - 0 - - - - - 343 38600 Other Prop. On Cust. Prem 99.0 - 0 - - - - - 344345 Total Distribution Plant 371,292,434 167,874,109 95,993,719 5,049,035 53,779,174 48,596,396

Exhibit PHR-3Page 24 of 75
Atmos Energy Corporation, Kentucky/Mid-States DivisionClass Cost of Service - Demand Only StudyForecasted Test Period: Twelve Months Ended March 31, 2020
ALLOCATION OF PLANT IN SERVICE346347 General:348349 38900 Land & Land Rights 6.4 P, S, T & D Plant - Demand 728,600 329,425 188,372 9,908 105,533 95,362 350 39000 Structures & Improvements 6.4 P, S, T & D Plant - Demand 4,567,274 2,065,022 1,180,820 62,108 661,538 597,785 351 39001 Structures Frame 6.4 P, S, T & D Plant - Demand 0 - - - - - 352 39002 Structures-Brick 6.4 P, S, T & D Plant - Demand 104,095 47,065 26,913 1,416 15,077 13,624 353 39003 Improvements 6.4 P, S, T & D Plant - Demand 426,445 192,811 110,253 5,799 61,768 55,815 354 39004 Air Conditioning Equipment 6.4 P, S, T & D Plant - Demand 7,790 3,522 2,014 106 1,128 1,020 355 39009 Improvement to leased Premises 6.4 P, S, T & D Plant - Demand 749,343 338,804 193,735 10,190 108,537 98,077 356 39100 Office Furniture & Equipment 6.4 P, S, T & D Plant - Demand 1,122,059 507,321 290,096 15,258 162,523 146,860 357 39102 Remittance Processing Equip 6.4 P, S, T & D Plant - Demand 0 - - - - - 358 39103 Office Machines 6.4 P, S, T & D Plant - Demand 0 - - - - - 359 39200 Transportation Equipment 6.4 P, S, T & D Plant - Demand 132,881 60,080 34,355 1,807 19,247 17,392 360 39201 Trucks 6.4 P, S, T & D Plant - Demand 0 - - - - - 361 39202 Trailers 6.4 P, S, T & D Plant - Demand 0 - - - - - 362 39300 Stores Equipment 6.4 P, S, T & D Plant - Demand 0 - - - - - 363 39400 Tools, Shop & Garage Equipment 6.4 P, S, T & D Plant - Demand 2,452,340 1,108,787 634,026 33,348 355,205 320,973 364 39600 Power Operated Equipment 6.4 P, S, T & D Plant - Demand 0 - - - - - 365 39603 Ditchers 6.4 P, S, T & D Plant - Demand 23,818 10,769 6,158 324 3,450 3,117 366 39604 Backhoes 6.4 P, S, T & D Plant - Demand 37,730 17,059 9,755 513 5,465 4,938 367 39605 Welders 6.4 P, S, T & D Plant - Demand 11,682 5,282 3,020 159 1,692 1,529 368 39700 Communication Equipment 6.4 P, S, T & D Plant - Demand 315,239 142,530 81,502 4,287 45,660 41,260 369 39701 Communication Equipment - Mobile Radios 6.4 P, S, T & D Plant - Demand 0 - - - - - 370 39702 Communication Equipment - Fixed Radios 6.4 P, S, T & D Plant - Demand 0 - - - - - 371 39705 Communication Equip. - Telemetering 6.4 P, S, T & D Plant - Demand 0 - - - - - 372 39800 Miscellaneous Equipment 6.4 P, S, T & D Plant - Demand 2,340,142 1,058,059 605,019 31,823 338,954 306,288 373 39900 Other Tangible Property 6.4 P, S, T & D Plant - Demand 0 - - - - - 374 39901 Other Tangible Property - Servers - H/W 6.4 P, S, T & D Plant - Demand 8,653 3,912 2,237 118 1,253 1,132 375 39902 Other Tangible Property - Servers - S/W 6.4 P, S, T & D Plant - Demand 0 - - - - - 376 39903 Other Tangible Property - Network - H/W 6.4 P, S, T & D Plant - Demand 80,935 36,594 20,925 1,101 11,723 10,593 377 39904 Other Tang. Property - CPU 6.4 P, S, T & D Plant - Demand 0 - - - - - 378 39905 Other Tangible Property - MF - Hardware 6.4 P, S, T & D Plant - Demand 0 - - - - - 379 39906 Other Tang. Property - PC Hardware 6.4 P, S, T & D Plant - Demand 277,736 125,574 71,806 3,777 40,228 36,351 380 39907 Other Tang. Property - PC Software 6.4 P, S, T & D Plant - Demand 0 - - - - - 381 39908 Other Tang. Property - Mainframe S/W 6.4 P, S, T & D Plant - Demand 74,270 33,580 19,202 1,010 10,758 9,721 382 39909 Other Tang. Property - Application Software 6.4 P, S, T & D Plant - Demand 0 - - - - - 383 39924 Other Tang. Property - General Startup Costs 6.4 P, S, T & D Plant - Demand 0 - - - - - 384385 Total General Plant 13,461,030 6,086,196 3,480,206 183,050 1,949,738 1,761,839386387 TOTAL DIRECT PLANT 423,533,157 191,493,941 109,500,003 5,759,433 61,345,886 55,433,893388389 CWIP w/o AFUDC 6.4 P, S, T & D Plant - Demand 22,942,687 10,373,180 5,931,588 311,987 3,323,092 3,002,840 390391 Kentucky Mid-States General Office:392393 Intangible Plant:394395 30100 Organization 6.4 P, S, T & D Plant - Demand 55,469 25,079 14,341 754 8,034 7,260 396 30200 Franchises & Consents 6.4 P, S, T & D Plant - Demand 0 - - - - - 397 30300 Misc Intangible Plant 6.4 P, S, T & D Plant - Demand 332,122 150,164 85,867 4,516 48,106 43,470 398399 Total Intangible Plant: 387,590 175,243 100,207 5,271 56,140 50,730400401 General:402403 37400 Land & Land Rights 6.4 P, S, T & D Plant - Demand 0 - - - - - 404 39001 Structures Frame 6.4 P, S, T & D Plant - Demand 53,681 24,271 13,879 730 7,775 7,026 405 36602 Structures & Improvements 6.4 P, S, T & D Plant - Demand 0 - - - - - 406 38900 Land & Land Rights 6.4 P, S, T & D Plant - Demand 0 - - - - - 407 39004 Air Conditioning Equipment 6.4 P, S, T & D Plant - Demand 4,605 2,082 1,191 63 667 603 408 39009 Improvement to leased Premises 6.4 P, S, T & D Plant - Demand 11,624 5,256 3,005 158 1,684 1,521 409 39100 Office Furniture & Equipment 6.4 P, S, T & D Plant - Demand 11,557 5,225 2,988 157 1,674 1,513 410 39102 Remittance Processing Equip 6.4 P, S, T & D Plant - Demand 0 - - - - - 411 39103 Office Machines 6.4 P, S, T & D Plant - Demand 0 - - - - - 412 39200 Transportation Equipment 6.4 P, S, T & D Plant - Demand 8,167 3,693 2,112 111 1,183 1,069 413 39201 Trucks 6.4 P, S, T & D Plant - Demand 0 - - - - - 414 39202 Trailers 6.4 P, S, T & D Plant - Demand 0 - - - - - 415 39300 Stores Equipment 6.4 P, S, T & D Plant - Demand 0 - - - - - 416 39400 Tools, Shop & Garage Equipment 6.4 P, S, T & D Plant - Demand 52,642 23,801 13,610 716 7,625 6,890 417 39600 Power Operated Equipment 6.4 P, S, T & D Plant - Demand 6,141 2,777 1,588 84 889 804 418 39603 Ditchers 6.4 P, S, T & D Plant - Demand 0 - - - - - 419 39604 Backhoes 6.4 P, S, T & D Plant - Demand 0 - - - - - 420 39605 Welders 6.4 P, S, T & D Plant - Demand 0 - - - - - 421 39700 Communication Equipment 6.4 P, S, T & D Plant - Demand 11,237 5,081 2,905 153 1,628 1,471 422 39701 Communication Equipment - Mobile Radios 6.4 P, S, T & D Plant - Demand 0 - - - - - 423 39702 Communication Equipment - Fixed Radios 6.4 P, S, T & D Plant - Demand 0 - - - - - 424 39705 Communication Equip. - Telemetering 6.4 P, S, T & D Plant - Demand 0 - - - - - 425 39800 Miscellaneous Equipment 6.4 P, S, T & D Plant - Demand 243,704 110,187 63,007 3,314 35,299 31,897 426 39900 Other Tangible Property 6.4 P, S, T & D Plant - Demand 0 - - - - - 427 39901 Other Tangible Property - Servers - H/W 6.4 P, S, T & D Plant - Demand 0 - - - - - 428 39902 Other Tangible Property - Servers - S/W 6.4 P, S, T & D Plant - Demand 0 - - - - - 429 39903 Other Tangible Property - Network - H/W 6.4 P, S, T & D Plant - Demand 0 - - - - - 430 39904 Other Tang. Property - CPU 6.4 P, S, T & D Plant - Demand 0 - - - - - 431 39905 Other Tangible Property - MF - Hardware 6.4 P, S, T & D Plant - Demand 0 - - - - - 432 39906 Other Tang. Property - PC Hardware 6.4 P, S, T & D Plant - Demand 21,006 9,498 5,431 286 3,043 2,749 433 39907 Other Tang. Property - PC Software 6.4 P, S, T & D Plant - Demand 49,480 22,372 12,793 673 7,167 6,476 434 39908 Other Tang. Property - Mainframe S/W 6.4 P, S, T & D Plant - Demand 247,998 112,128 64,117 3,372 35,921 32,459 435 39909 Other Tang. Property - Application Software 6.4 P, S, T & D Plant - Demand 0 - - - - - 436 39924 Other Tang. Property - General Startup Costs 6.4 P, S, T & D Plant - Demand 0 - - - - - 437438 Total General Plant 721,843 326,370 186,625 9,816 104,554 94,478439440 CWIP w/o AFUDC 6.4 P, S, T & D Plant - Demand 1,389 628 359 19 201 182

Exhibit PHR-3Page 25 of 75
Atmos Energy Corporation, Kentucky/Mid-States DivisionClass Cost of Service - Demand Only StudyForecasted Test Period: Twelve Months Ended March 31, 2020
ALLOCATION OF PLANT IN SERVICE441442 Shared Services General Office:443444 General:445446 37400 Land & Land Rights 6.4 P, S, T & D Plant - Demand 0 - - - - - 447 39001 Structures Frame 6.4 P, S, T & D Plant - Demand 0 - - - - - 448 36602 Structures & Improvements 6.4 P, S, T & D Plant - Demand 142,163 64,277 36,755 1,933 20,591 18,607 449 37503 Improvements 6.4 P, S, T & D Plant - Demand 0 - - - - - 450 39004 Air Conditioning Equipment 6.4 P, S, T & D Plant - Demand 0 - - - - - 451 39009 Improvement to leased Premises 6.4 P, S, T & D Plant - Demand 290,645 131,411 75,143 3,952 42,098 38,041 452 39100 Office Furniture & Equipment 6.4 P, S, T & D Plant - Demand 172,525 78,005 44,605 2,346 24,989 22,581 453 39102 Remittance Processing Equip 6.4 P, S, T & D Plant - Demand 0 - - - - - 454 39103 Office Machines 6.4 P, S, T & D Plant - Demand 0 - - - - - 455 39200 Transportation Equipment 6.4 P, S, T & D Plant - Demand 222 100 57 3 32 29 456 39201 Trucks 6.4 P, S, T & D Plant - Demand 0 - - - - - 457 39202 Trailers 6.4 P, S, T & D Plant - Demand 0 - - - - - 458 39300 Stores Equipment 6.4 P, S, T & D Plant - Demand 0 - - - - - 459 39400 Tools, Shop & Garage Equipment 6.4 P, S, T & D Plant - Demand 2,368 1,071 612 32 343 310 460 39600 Power Operated Equipment 6.4 P, S, T & D Plant - Demand 0 - - - - - 461 39603 Ditchers 6.4 P, S, T & D Plant - Demand 0 - - - - - 462 39604 Backhoes 6.4 P, S, T & D Plant - Demand 0 - - - - - 463 39605 Welders 6.4 P, S, T & D Plant - Demand 0 - - - - - 464 39700 Communication Equipment 6.4 P, S, T & D Plant - Demand 32,693 14,781 8,452 445 4,735 4,279 465 39701 Communication Equipment - Mobile Radios 6.4 P, S, T & D Plant - Demand 0 - - - - - 466 39702 Communication Equipment - Fixed Radios 6.4 P, S, T & D Plant - Demand 0 - - - - - 467 39705 Communication Equip. - Telemetering 6.4 P, S, T & D Plant - Demand 0 - - - - - 468 39800 Miscellaneous Equipment 6.4 P, S, T & D Plant - Demand 4,532 2,049 1,172 62 656 593 469 39900 Other Tangible Property 6.4 P, S, T & D Plant - Demand 5,037 2,278 1,302 69 730 659 470 39901 Other Tangible Property - Servers - H/W 6.4 P, S, T & D Plant - Demand 1,396,188 631,265 360,969 18,986 202,228 182,739 471 39902 Other Tangible Property - Servers - S/W 6.4 P, S, T & D Plant - Demand 843,287 381,279 218,023 11,467 122,144 110,373 472 39903 Other Tangible Property - Network - H/W 6.4 P, S, T & D Plant - Demand 265,959 120,249 68,761 3,617 38,522 34,810 473 39904 Other Tang. Property - CPU 6.4 P, S, T & D Plant - Demand 0 - - - - - 474 39905 Other Tangible Property - MF - Hardware 6.4 P, S, T & D Plant - Demand 0 - - - - - 475 39906 Other Tang. Property - PC Hardware 6.4 P, S, T & D Plant - Demand 93,720 42,374 24,230 1,274 13,575 12,267 476 39907 Other Tang. Property - PC Software 6.4 P, S, T & D Plant - Demand 51,841 23,439 13,403 705 7,509 6,785 477 39908 Other Tang. Property - Mainframe S/W 6.4 P, S, T & D Plant - Demand 2,332,850 1,054,762 603,134 31,723 337,897 305,334 478 39909 Other Tang. Property - Application Software 6.4 P, S, T & D Plant - Demand 795,501 359,673 205,668 10,818 115,223 104,119 479 39931 Other Tang. Property - ALGN 6.4 P, S, T & D Plant - Demand 0 - - - - - 480481 Total General Plant 6,429,531 2,907,013 1,662,287 87,432 931,274 841,525482483 CWIP w/o AFUDC 6.4 P, S, T & D Plant - Demand 449,983 203,453 116,338 6,119 65,177 58,896 484485 Shared Services Customer Support:486487 General:488489 37400 Land & Land Rights 6.4 P, S, T & D Plant - Demand 123,798 55,973 32,007 1,683 17,931 16,203 490 39001 Structures Frame 6.4 P, S, T & D Plant - Demand 0 - - - - - 491 36602 Structures & Improvements 6.4 P, S, T & D Plant - Demand 601,312 271,874 155,463 8,177 87,096 78,702 492 37503 Improvements 6.4 P, S, T & D Plant - Demand 0 - - - - - 493 39004 Air Conditioning Equipment 6.4 P, S, T & D Plant - Demand 0 - - - - - 494 39009 Improvement to leased Premises 6.4 P, S, T & D Plant - Demand 95,678 43,259 24,736 1,301 13,858 12,523 495 39100 Office Furniture & Equipment 6.4 P, S, T & D Plant - Demand 93,017 42,056 24,049 1,265 13,473 12,174 496 39102 Remittance Processing Equip 6.4 P, S, T & D Plant - Demand 0 - - - - - 497 39103 Office Machines 6.4 P, S, T & D Plant - Demand 0 - - - - - 498 39200 Transportation Equipment 6.4 P, S, T & D Plant - Demand 1,342 607 347 18 194 176 499 39201 Trucks 6.4 P, S, T & D Plant - Demand 0 - - - - - 500 39202 Trailers 6.4 P, S, T & D Plant - Demand 0 - - - - - 501 39300 Stores Equipment 6.4 P, S, T & D Plant - Demand 0 - - - - - 502 39400 Tools, Shop & Garage Equipment 6.4 P, S, T & D Plant - Demand 8,474 3,831 2,191 115 1,227 1,109 503 39600 Power Operated Equipment 6.4 P, S, T & D Plant - Demand 329 149 85 4 48 43 504 39603 Ditchers 6.4 P, S, T & D Plant - Demand 0 - - - - - 505 39604 Backhoes 6.4 P, S, T & D Plant - Demand 0 - - - - - 506 39605 Welders 6.4 P, S, T & D Plant - Demand 0 - - - - - 507 39700 Communication Equipment 6.4 P, S, T & D Plant - Demand 68,959 31,179 17,829 938 9,988 9,026 508 39701 Communication Equipment - Mobile Radios 6.4 P, S, T & D Plant - Demand 0 - - - - - 509 39702 Communication Equipment - Fixed Radios 6.4 P, S, T & D Plant - Demand 0 - - - - - 510 39705 Communication Equip. - Telemetering 6.4 P, S, T & D Plant - Demand 0 - - - - - 511 39800 Miscellaneous Equipment 6.4 P, S, T & D Plant - Demand 9,475 4,284 2,450 129 1,372 1,240 512 39900 Other Tangible Property 6.4 P, S, T & D Plant - Demand 26,077 11,790 6,742 355 3,777 3,413 513 39901 Other Tangible Property - Servers - H/W 6.4 P, S, T & D Plant - Demand 350,853 158,633 90,709 4,771 50,819 45,921 514 39902 Other Tangible Property - Servers - S/W 6.4 P, S, T & D Plant - Demand 68,654 31,041 17,750 934 9,944 8,986 515 39903 Other Tangible Property - Network - H/W 6.4 P, S, T & D Plant - Demand 21,344 9,650 5,518 290 3,092 2,794 516 39904 Other Tang. Property - CPU 6.4 P, S, T & D Plant - Demand 0 - - - - - 517 39905 Other Tangible Property - MF - Hardware 6.4 P, S, T & D Plant - Demand 0 - - - - - 518 39906 Other Tang. Property - PC Hardware 6.4 P, S, T & D Plant - Demand 41,774 18,888 10,800 568 6,051 5,468 519 39907 Other Tang. Property - PC Software 6.4 P, S, T & D Plant - Demand 7,902 3,573 2,043 107 1,145 1,034 520 39908 Other Tang. Property - Mainframe S/W 6.4 P, S, T & D Plant - Demand 3,156,100 1,426,982 815,976 42,918 457,140 413,084 521 39909 Other Tang. Property - Application Software 6.4 P, S, T & D Plant - Demand 287 130 74 4 42 38 522 39924 Other Tang. Property - General Startup Costs 6.4 P, S, T & D Plant - Demand 0 - - - - - 523524 Total General Plant 4,675,375 2,113,898 1,208,769 63,578 677,196 611,934525526 CWIP w/o AFUDC 6.4 P, S, T & D Plant - Demand 135,134 61,099 34,937 1,838 19,573 17,687 527528 TOTAL PLANT IN SERVICE - DEMAND 435,747,497 197,016,466 112,657,891 5,925,530 63,115,050 57,032,560529530 TOTAL CWIP W/O AFUDC - DEMAND 23,529,194 10,638,360 6,083,223 319,963 3,408,043 3,079,605

Exhibit PHR-3Page 26 of 75
Atmos Energy Corporation, Kentucky/Mid-States DivisionClass Cost of Service - Demand Only StudyForecasted Test Period: Twelve Months Ended March 31, 2020
ALLOCATION OF PLANT IN SERVICE
Commodity
Allocation Allocation Total Residential Non-Res Sales Non-Res Sales Transport TransportLine Acct. Factor Basis Company Sales Firm Interruptible Firm InterruptibleNo. No.
531 Intangible Plant:532533 30100 Organization 6.6 P, S, T & D Plant - Commodity 92 35 21 1 17 17 534 30200 Franchises & Consents 6.6 P, S, T & D Plant - Commodity 1,320 500 309 17 243 251 535 30300 Misc Intangible Plant 99.0 - 0 - - - - - 536537 Total Intangible Plant: 1,412 535 331 18 260 269538539 Production Plant:540541 32520 Producing Leaseholds 99.0 - 0 - - - - - 542 32540 Rights of Ways 99.0 - 0 - - - - - 543 33100 Production Gas Wells Equipment 99.0 - 0 - - - - - 544 33201 Field Lines 99.0 - 0 - - - - - 545 33202 Tributary Lines 99.0 - 0 - - - - - 546 33400 Field Meas. & Reg. Sta. Equip 99.0 - 0 - - - - - 547 33600 Purification Equipment 99.0 - 0 - - - - - 548549 Total Production Plant 0 0 0 0 0 0550551 Storage Plant:552553 35010 Land 1.5 Winter Volumes 130,563 49,435 30,589 1,673 24,001 24,865 554 35020 Rights of Way 1.5 Winter Volumes 2,341 886 548 30 430 446 555 35100 Structures and Improvements 1.5 Winter Volumes 8,958 3,392 2,099 115 1,647 1,706 556 35102 Compression Station Equipment 1.5 Winter Volumes 76,631 29,015 17,954 982 14,087 14,594 557 35103 Meas. & Reg. Sta. Structues 1.5 Winter Volumes 11,569 4,380 2,711 148 2,127 2,203 558 35104 Other Structures 1.5 Winter Volumes 68,721 26,020 16,101 880 12,633 13,087 559 35200 Wells \ Rights of Way 1.5 Winter Volumes 4,174,198 1,580,473 977,961 53,480 767,344 794,940 560 35201 Well Construction 1.5 Winter Volumes 849,999 321,834 199,144 10,890 156,256 161,875 561 35202 Well Equipment 1.5 Winter Volumes 224,655 85,061 52,634 2,878 41,298 42,784 562 35203 Cushion Gas 1.5 Winter Volumes 847,416 320,857 198,539 10,857 155,781 161,383 563 35210 Leaseholds 1.5 Winter Volumes 89,265 33,798 20,914 1,144 16,410 17,000 564 35211 Storage Rights 1.5 Winter Volumes 27,307 10,339 6,398 350 5,020 5,200 565 35301 Field Lines 1.5 Winter Volumes 87,675 33,196 20,541 1,123 16,117 16,697 566 35302 Tributary Lines 1.5 Winter Volumes 104,659 39,627 24,520 1,341 19,240 19,931 567 35400 Compressor Station Equipment 1.5 Winter Volumes 461,723 174,822 108,176 5,916 84,879 87,931 568 35500 Meas & Reg. Equipment 1.5 Winter Volumes 136,542 51,699 31,990 1,749 25,101 26,003 569 35600 Purification Equipment 1.5 Winter Volumes 207,332 78,502 48,575 2,656 38,114 39,485 570571 Total Storage Plant 7,509,555 2,843,336 1,759,393 96,213 1,380,484 1,430,130572573 Transmission:574575 36510 Land & Land Rights 99.0 - 0 - - - - - 576 36520 Rights of Way 99.0 - 0 - - - - - 577 36602 Structures & Improvements 99.0 - 0 - - - - - 578 36603 Other Structues 99.0 - 0 - - - - - 579 36700 Mains Cathodic Protection 99.0 - 0 - - - - - 580 36701 Mains - Steel 99.0 - 0 - - - - - 581 36900 Meas. & Reg. Equipment 99.0 - 0 - - - - - 582 36901 Meas. & Reg. Equipment 99.0 - 0 - - - - - 583584 Total Transmission Plant 0 0 0 0 0 0585586 Distribution:587588 37400 Land & Land Rights 1.0 Mcf 0 - - - - - 589 37401 Land 1.0 Mcf 0 - - - - - 590 37402 Land Rights 1.0 Mcf 0 - - - - - 591 37403 Land Other 1.0 Mcf 0 - - - - - 592 37500 Structures & Improvements 1.0 Mcf 0 - - - - - 593 37501 Structures & Improvements T.B. 1.0 Mcf 0 - - - - - 594 37502 Land Rights 1.0 Mcf 0 - - - - - 595 37503 Improvements 1.0 Mcf 0 - - - - - 596 37600 Mains Cathodic Protection 1.0 Mcf 0 - - - - - 597 37601 Mains - Steel 1.0 Mcf 0 - - - - - 598 37602 Mains - Plastic 1.0 Mcf 0 - - - - - 599 37800 Meas & Reg. Sta. Equip - General 1.0 Mcf 0 - - - - - 600 37900 Meas & Reg. Sta. Equip - City Gate 1.0 Mcf 0 - - - - - 601 37905 Meas & Reg. Sta. Equipment T.b. 1.0 Mcf 0 - - - - - 602 38000 Services 99.0 - 0 - - - - - 603 38100 Meters 99.0 - 0 - - - - - 604 38200 Meter Installaitons 99.0 - 0 - - - - - 605 38300 House Regulators 99.0 - 0 - - - - - 606 38400 House Reg. Installations 99.0 - 0 - - - - - 607 38500 Ind. Meas. & Reg. Sta. Equipment 99.0 - 0 - - - - - 608 38600 Other Prop. On Cust. Prem 99.0 - 0 - - - - - 609610 Total Distribution Plant 0 0 0 0 0 0

Exhibit PHR-3Page 27 of 75
Atmos Energy Corporation, Kentucky/Mid-States DivisionClass Cost of Service - Demand Only StudyForecasted Test Period: Twelve Months Ended March 31, 2020
ALLOCATION OF PLANT IN SERVICE611612 General:613614 38900 Land & Land Rights 6.6 P, S, T & D Plant - Commodity 13,345 5,053 3,127 171 2,453 2,541 615 39000 Structures & Improvements 6.6 P, S, T & D Plant - Commodity 83,655 31,674 19,599 1,072 15,378 15,931 616 39001 Structures Frame 6.6 P, S, T & D Plant - Commodity 0 - - - - - 617 39002 Structures-Brick 6.6 P, S, T & D Plant - Commodity 1,907 722 447 24 350 363 618 39003 Improvements 6.6 P, S, T & D Plant - Commodity 7,811 2,957 1,830 100 1,436 1,488 619 39004 Air Conditioning Equipment 6.6 P, S, T & D Plant - Commodity 143 54 33 2 26 27 620 39009 Improvement to leased Premises 6.6 P, S, T & D Plant - Commodity 13,725 5,197 3,216 176 2,523 2,614 621 39100 Office Furniture & Equipment 6.6 P, S, T & D Plant - Commodity 20,552 7,782 4,815 263 3,778 3,914 622 39102 Remittance Processing Equip 6.6 P, S, T & D Plant - Commodity 0 - - - - - 623 39103 Office Machines 6.6 P, S, T & D Plant - Commodity 0 - - - - - 624 39200 Transportation Equipment 6.6 P, S, T & D Plant - Commodity 2,434 922 570 31 447 464 625 39201 Trucks 6.6 P, S, T & D Plant - Commodity 0 - - - - - 626 39202 Trailers 6.6 P, S, T & D Plant - Commodity 0 - - - - - 627 39300 Stores Equipment 6.6 P, S, T & D Plant - Commodity 0 - - - - - 628 39400 Tools, Shop & Garage Equipment 6.6 P, S, T & D Plant - Commodity 44,918 17,007 10,524 575 8,257 8,554 629 39600 Power Operated Equipment 6.6 P, S, T & D Plant - Commodity 0 - - - - - 630 39603 Ditchers 6.6 P, S, T & D Plant - Commodity 436 165 102 6 80 83 631 39604 Backhoes 6.6 P, S, T & D Plant - Commodity 691 262 162 9 127 132 632 39605 Welders 6.6 P, S, T & D Plant - Commodity 214 81 50 3 39 41 633 39700 Communication Equipment 6.6 P, S, T & D Plant - Commodity 5,774 2,186 1,353 74 1,061 1,100 634 39701 Communication Equipment - Mobile Radios 6.6 P, S, T & D Plant - Commodity 0 - - - - - 635 39702 Communication Equipment - Fixed Radios 6.6 P, S, T & D Plant - Commodity 0 - - - - - 636 39705 Communication Equip. - Telemetering 6.6 P, S, T & D Plant - Commodity 0 - - - - - 637 39800 Miscellaneous Equipment 6.6 P, S, T & D Plant - Commodity 42,863 16,229 10,042 549 7,879 8,163 638 39900 Other Tangible Property 6.6 P, S, T & D Plant - Commodity 0 - - - - - 639 39901 Other Tangible Property - Servers - H/W 6.6 P, S, T & D Plant - Commodity 158 60 37 2 29 30 640 39902 Other Tangible Property - Servers - S/W 6.6 P, S, T & D Plant - Commodity 0 - - - - - 641 39903 Other Tangible Property - Network - H/W 6.6 P, S, T & D Plant - Commodity 1,482 561 347 19 273 282 642 39904 Other Tang. Property - CPU 6.6 P, S, T & D Plant - Commodity 0 - - - - - 643 39905 Other Tangible Property - MF - Hardware 6.6 P, S, T & D Plant - Commodity 0 - - - - - 644 39906 Other Tang. Property - PC Hardware 6.6 P, S, T & D Plant - Commodity 5,087 1,926 1,192 65 935 969 645 39907 Other Tang. Property - PC Software 6.6 P, S, T & D Plant - Commodity 0 - - - - - 646 39908 Other Tang. Property - Mainframe S/W 6.6 P, S, T & D Plant - Commodity 1,360 515 319 17 250 259 647 39909 Other Tang. Property - Application Software 6.6 P, S, T & D Plant - Commodity 0 - - - - - 648 39924 Other Tang. Property - General Startup Costs 6.6 P, S, T & D Plant - Commodity 0 - - - - - 649650 Total General Plant 246,555 93,353 57,765 3,159 45,324 46,954651652 TOTAL DIRECT PLANT 7,757,522 2,937,224 1,817,488 99,389 1,426,068 1,477,353653654 CWIP w/o AFUDC 6.6 P, S, T & D Plant - Commodity 420,223 159,109 98,453 5,384 77,250 80,028 655656 Kentucky Mid-States General Office:657658 Intangible Plant:659660 30100 Organization 6.6 P, S, T & D Plant - Commodity 1,016 385 238 13 187 193 661 30200 Franchises & Consents 6.6 P, S, T & D Plant - Commodity 0 - - - - - 662 30300 Misc Intangible Plant 6.6 P, S, T & D Plant - Commodity 6,083 2,303 1,425 78 1,118 1,158 663664 Total Intangible Plant: 7,099 2,688 1,663 91 1,305 1,352665666 General:667668 37400 Land & Land Rights 6.6 P, S, T & D Plant - Commodity 0 - - - - - 669 39001 Structures Frame 6.6 P, S, T & D Plant - Commodity 983 372 230 13 181 187 670 36602 Structures & Improvements 6.6 P, S, T & D Plant - Commodity 0 - - - - - 671 38900 Land & Land Rights 6.6 P, S, T & D Plant - Commodity 0 - - - - - 672 39004 Air Conditioning Equipment 6.6 P, S, T & D Plant - Commodity 84 32 20 1 16 16 673 39009 Improvement to leased Premises 6.6 P, S, T & D Plant - Commodity 213 81 50 3 39 41 674 39100 Office Furniture & Equipment 6.6 P, S, T & D Plant - Commodity 212 80 50 3 39 40 675 39102 Remittance Processing Equip 6.6 P, S, T & D Plant - Commodity 0 - - - - - 676 39103 Office Machines 6.6 P, S, T & D Plant - Commodity 0 - - - - - 677 39200 Transportation Equipment 6.6 P, S, T & D Plant - Commodity 150 57 35 2 27 28 678 39201 Trucks 6.6 P, S, T & D Plant - Commodity 0 - - - - - 679 39202 Trailers 6.6 P, S, T & D Plant - Commodity 0 - - - - - 680 39300 Stores Equipment 6.6 P, S, T & D Plant - Commodity 0 - - - - - 681 39400 Tools, Shop & Garage Equipment 6.6 P, S, T & D Plant - Commodity 964 365 226 12 177 184 682 39600 Power Operated Equipment 6.6 P, S, T & D Plant - Commodity 112 43 26 1 21 21 683 39603 Ditchers 6.6 P, S, T & D Plant - Commodity 0 - - - - - 684 39604 Backhoes 6.6 P, S, T & D Plant - Commodity 0 - - - - - 685 39605 Welders 6.6 P, S, T & D Plant - Commodity 0 - - - - - 686 39700 Communication Equipment 6.6 P, S, T & D Plant - Commodity 206 78 48 3 38 39 687 39701 Communication Equipment - Mobile Radios 6.6 P, S, T & D Plant - Commodity 0 - - - - - 688 39702 Communication Equipment - Fixed Radios 6.6 P, S, T & D Plant - Commodity 0 - - - - - 689 39705 Communication Equip. - Telemetering 6.6 P, S, T & D Plant - Commodity 0 - - - - - 690 39800 Miscellaneous Equipment 6.6 P, S, T & D Plant - Commodity 4,464 1,690 1,046 57 821 850 691 39900 Other Tangible Property 6.6 P, S, T & D Plant - Commodity 0 - - - - - 692 39901 Other Tangible Property - Servers - H/W 6.6 P, S, T & D Plant - Commodity 0 - - - - - 693 39902 Other Tangible Property - Servers - S/W 6.6 P, S, T & D Plant - Commodity 0 - - - - - 694 39903 Other Tangible Property - Network - H/W 6.6 P, S, T & D Plant - Commodity 0 - - - - - 695 39904 Other Tang. Property - CPU 6.6 P, S, T & D Plant - Commodity 0 - - - - - 696 39905 Other Tangible Property - MF - Hardware 6.6 P, S, T & D Plant - Commodity 0 - - - - - 697 39906 Other Tang. Property - PC Hardware 6.6 P, S, T & D Plant - Commodity 385 146 90 5 71 73 698 39907 Other Tang. Property - PC Software 6.6 P, S, T & D Plant - Commodity 906 343 212 12 167 173 699 39908 Other Tang. Property - Mainframe S/W 6.6 P, S, T & D Plant - Commodity 4,542 1,720 1,064 58 835 865 700 39909 Other Tang. Property - Application Software 6.6 P, S, T & D Plant - Commodity 0 - - - - - 701 39924 Other Tang. Property - General Startup Costs 6.6 P, S, T & D Plant - Commodity 0 - - - - - 702703 Total General Plant 13,221 5,006 3,098 169 2,431 2,518704705 CWIP w/o AFUDC 6.6 P, S, T & D Plant - Commodity 25 10 6 0 5 5

Exhibit PHR-3Page 28 of 75
Atmos Energy Corporation, Kentucky/Mid-States DivisionClass Cost of Service - Demand Only StudyForecasted Test Period: Twelve Months Ended March 31, 2020
ALLOCATION OF PLANT IN SERVICE706707 Shared Services General Office:708709 General:710711 37400 Land & Land Rights 6.6 P, S, T & D Plant - Commodity 0 - - - - - 712 39001 Structures Frame 6.6 P, S, T & D Plant - Commodity 0 - - - - - 713 36602 Structures & Improvements 6.6 P, S, T & D Plant - Commodity 2,604 986 610 33 479 496 714 37503 Improvements 6.6 P, S, T & D Plant - Commodity 0 - - - - - 715 39004 Air Conditioning Equipment 6.6 P, S, T & D Plant - Commodity 0 - - - - - 716 39009 Improvement to leased Premises 6.6 P, S, T & D Plant - Commodity 5,324 2,016 1,247 68 979 1,014 717 39100 Office Furniture & Equipment 6.6 P, S, T & D Plant - Commodity 3,160 1,196 740 40 581 602 718 39102 Remittance Processing Equip 6.6 P, S, T & D Plant - Commodity 0 - - - - - 719 39103 Office Machines 6.6 P, S, T & D Plant - Commodity 0 - - - - - 720 39200 Transportation Equipment 6.6 P, S, T & D Plant - Commodity 4 2 1 0 1 1 721 39201 Trucks 6.6 P, S, T & D Plant - Commodity 0 - - - - - 722 39202 Trailers 6.6 P, S, T & D Plant - Commodity 0 - - - - - 723 39300 Stores Equipment 6.6 P, S, T & D Plant - Commodity 0 - - - - - 724 39400 Tools, Shop & Garage Equipment 6.6 P, S, T & D Plant - Commodity 43 16 10 1 8 8 725 39600 Power Operated Equipment 6.6 P, S, T & D Plant - Commodity 0 - - - - - 726 39603 Ditchers 6.6 P, S, T & D Plant - Commodity 0 - - - - - 727 39604 Backhoes 6.6 P, S, T & D Plant - Commodity 0 - - - - - 728 39605 Welders 6.6 P, S, T & D Plant - Commodity 0 - - - - - 729 39700 Communication Equipment 6.6 P, S, T & D Plant - Commodity 599 227 140 8 110 114 730 39701 Communication Equipment - Mobile Radios 6.6 P, S, T & D Plant - Commodity 0 - - - - - 731 39702 Communication Equipment - Fixed Radios 6.6 P, S, T & D Plant - Commodity 0 - - - - - 732 39705 Communication Equip. - Telemetering 6.6 P, S, T & D Plant - Commodity 0 - - - - - 733 39800 Miscellaneous Equipment 6.6 P, S, T & D Plant - Commodity 83 31 19 1 15 16 734 39900 Other Tangible Property 6.6 P, S, T & D Plant - Commodity 92 35 22 1 17 18 735 39901 Other Tangible Property - Servers - H/W 6.6 P, S, T & D Plant - Commodity 25,573 9,683 5,991 328 4,701 4,870 736 39902 Other Tangible Property - Servers - S/W 6.6 P, S, T & D Plant - Commodity 15,446 5,848 3,619 198 2,839 2,942 737 39903 Other Tangible Property - Network - H/W 6.6 P, S, T & D Plant - Commodity 4,871 1,844 1,141 62 896 928 738 39904 Other Tang. Property - CPU 6.6 P, S, T & D Plant - Commodity 0 - - - - - 739 39905 Other Tangible Property - MF - Hardware 6.6 P, S, T & D Plant - Commodity 0 - - - - - 740 39906 Other Tang. Property - PC Hardware 6.6 P, S, T & D Plant - Commodity 1,717 650 402 22 316 327 741 39907 Other Tang. Property - PC Software 6.6 P, S, T & D Plant - Commodity 950 360 222 12 175 181 742 39908 Other Tang. Property - Mainframe S/W 6.6 P, S, T & D Plant - Commodity 42,729 16,178 10,011 547 7,855 8,137 743 39909 Other Tang. Property - Application Software 6.6 P, S, T & D Plant - Commodity 14,571 5,517 3,414 187 2,679 2,775 744 39931 Other Tang. Property - ALGN 6.6 P, S, T & D Plant - Commodity 0 - - - - - 745746 Total General Plant 117,765 44,589 27,591 1,509 21,649 22,427747748 CWIP w/o AFUDC 6.6 P, S, T & D Plant - Commodity 8,242 3,121 1,931 106 1,515 1,570 749750 Shared Services Customer Support:751752 General:753754 37400 Land & Land Rights 6.6 P, S, T & D Plant - Commodity 2,268 859 531 29 417 432 755 39001 Structures Frame 6.6 P, S, T & D Plant - Commodity 0 - - - - - 756 36602 Structures & Improvements 6.6 P, S, T & D Plant - Commodity 11,014 4,170 2,580 141 2,025 2,097 757 37503 Improvements 6.6 P, S, T & D Plant - Commodity 0 - - - - - 758 39004 Air Conditioning Equipment 6.6 P, S, T & D Plant - Commodity 0 - - - - - 759 39009 Improvement to leased Premises 6.6 P, S, T & D Plant - Commodity 1,752 664 411 22 322 334 760 39100 Office Furniture & Equipment 6.6 P, S, T & D Plant - Commodity 1,704 645 399 22 313 324 761 39102 Remittance Processing Equip 6.6 P, S, T & D Plant - Commodity 0 - - - - - 762 39103 Office Machines 6.6 P, S, T & D Plant - Commodity 0 - - - - - 763 39200 Transportation Equipment 6.6 P, S, T & D Plant - Commodity 25 9 6 0 5 5 764 39201 Trucks 6.6 P, S, T & D Plant - Commodity 0 - - - - - 765 39202 Trailers 6.6 P, S, T & D Plant - Commodity 0 - - - - - 766 39300 Stores Equipment 6.6 P, S, T & D Plant - Commodity 0 - - - - - 767 39400 Tools, Shop & Garage Equipment 6.6 P, S, T & D Plant - Commodity 155 59 36 2 29 30 768 39600 Power Operated Equipment 6.6 P, S, T & D Plant - Commodity 6 2 1 0 1 1 769 39603 Ditchers 6.6 P, S, T & D Plant - Commodity 0 - - - - - 770 39604 Backhoes 6.6 P, S, T & D Plant - Commodity 0 - - - - - 771 39605 Welders 6.6 P, S, T & D Plant - Commodity 0 - - - - - 772 39700 Communication Equipment 6.6 P, S, T & D Plant - Commodity 1,263 478 296 16 232 241 773 39701 Communication Equipment - Mobile Radios 6.6 P, S, T & D Plant - Commodity 0 - - - - - 774 39702 Communication Equipment - Fixed Radios 6.6 P, S, T & D Plant - Commodity 0 - - - - - 775 39705 Communication Equip. - Telemetering 6.6 P, S, T & D Plant - Commodity 0 - - - - - 776 39800 Miscellaneous Equipment 6.6 P, S, T & D Plant - Commodity 174 66 41 2 32 33 777 39900 Other Tangible Property 6.6 P, S, T & D Plant - Commodity 478 181 112 6 88 91 778 39901 Other Tangible Property - Servers - H/W 6.6 P, S, T & D Plant - Commodity 6,426 2,433 1,506 82 1,181 1,224 779 39902 Other Tangible Property - Servers - S/W 6.6 P, S, T & D Plant - Commodity 1,257 476 295 16 231 239 780 39903 Other Tangible Property - Network - H/W 6.6 P, S, T & D Plant - Commodity 391 148 92 5 72 74 781 39904 Other Tang. Property - CPU 6.6 P, S, T & D Plant - Commodity 0 - - - - - 782 39905 Other Tangible Property - MF - Hardware 6.6 P, S, T & D Plant - Commodity 0 - - - - - 783 39906 Other Tang. Property - PC Hardware 6.6 P, S, T & D Plant - Commodity 765 290 179 10 141 146 784 39907 Other Tang. Property - PC Software 6.6 P, S, T & D Plant - Commodity 145 55 34 2 27 28 785 39908 Other Tang. Property - Mainframe S/W 6.6 P, S, T & D Plant - Commodity 57,808 21,888 13,544 741 10,627 11,009 786 39909 Other Tang. Property - Application Software 6.6 P, S, T & D Plant - Commodity 5 2 1 0 1 1 787 39924 Other Tang. Property - General Startup Costs 6.6 P, S, T & D Plant - Commodity 0 - - - - - 788789 Total General Plant 85,635 32,424 20,063 1,097 15,742 16,308790791 CWIP w/o AFUDC 6.6 P, S, T & D Plant - Commodity 2,475 937 580 32 455 471 792793 TOTAL PLANT IN SERVICE - COMMODITY 7,981,242 3,021,931 1,869,903 102,256 1,467,194 1,519,959794795 TOTAL CWIP W/O AFUDC - COMMODITY 430,966 163,176 100,970 5,522 79,225 82,074

Exhibit PHR-3Page 29 of 75
Atmos Energy Corporation, Kentucky/Mid-States DivisionClass Cost of Service - Demand Only StudyForecasted Test Period: Twelve Months Ended March 31, 2020
ALLOCATION OF PLANT IN SERVICE
Total Plant in Service
Allocation Allocation Total Residential Non-Res Sales Non-Res Sales Transport TransportLine Acct. Factor Basis Company Sales Firm Interruptible Firm InterruptibleNo. No.
796 Intangible Plant:797798 30100 Organization 8,330 4,792 2,019 71 763 685 799 30200 Franchises & Consents 119,853 68,948 29,044 1,021 10,984 9,855 800 30300 Misc Intangible Plant 0 - - - - - 801802 Total Intangible Plant: 128,182 73,740 31,063 1,092 11,747 10,540803804 Production Plant:805806 32520 Producing Leaseholds 0 - - - - - 807 32540 Rights of Ways 0 - - - - - 808 33100 Production Gas Wells Equipment 0 - - - - - 809 33201 Field Lines 0 - - - - - 810 33202 Tributary Lines 0 - - - - - 811 33400 Field Meas. & Reg. Sta. Equip 0 - - - - - 812 33600 Purification Equipment 0 - - - - - 813814 Total Production Plant 0 0 0 0 0 0815816 Storage Plant:817818 35010 Land 261,127 108,467 64,345 3,448 42,913 41,953 819 35020 Rights of Way 4,682 1,945 1,154 62 769 752 820 35100 Structures and Improvements 17,916 7,442 4,415 237 2,944 2,878 821 35102 Compression Station Equipment 153,261 63,662 37,766 2,024 25,186 24,623 822 35103 Meas. & Reg. Sta. Structues 23,138 9,611 5,702 306 3,802 3,717 823 35104 Other Structures 137,443 57,091 33,868 1,815 22,587 22,082 824 35200 Wells \ Rights of Way 8,348,396 3,467,772 2,057,156 110,243 1,371,948 1,341,277 825 35201 Well Construction 1,699,999 706,148 418,902 22,449 279,372 273,127 826 35202 Well Equipment 449,309 186,635 110,716 5,933 73,838 72,187 827 35203 Cushion Gas 1,694,833 704,003 417,629 22,381 278,523 272,297 828 35210 Leaseholds 178,530 74,158 43,992 2,358 29,339 28,683 829 35211 Storage Rights 54,614 22,686 13,458 721 8,975 8,774 830 35301 Field Lines 175,350 72,837 43,209 2,316 28,817 28,172 831 35302 Tributary Lines 209,319 86,947 51,579 2,764 34,399 33,630 832 35400 Compressor Station Equipment 923,446 383,583 227,549 12,194 151,756 148,364 833 35500 Meas & Reg. Equipment 273,084 113,434 67,292 3,606 44,878 43,875 834 35600 Purification Equipment 414,663 172,244 102,179 5,476 68,144 66,621 835836 Total Storage Plant 15,019,110 6,238,665 3,700,909 198,331 2,468,192 2,413,014837838 Transmission:839840 36510 Land & Land Rights 26,970 12,194 6,973 367 3,906 3,530 841 36520 Rights of Way 867,772 392,350 224,353 11,800 125,691 113,578 842 36602 Structures & Improvements 49,002 22,155 12,669 666 7,098 6,414 843 36603 Other Structues 60,826 27,502 15,726 827 8,810 7,961 844 36700 Mains Cathodic Protection 139,638 63,135 36,102 1,899 20,226 18,276 845 36701 Mains - Steel 27,047,831 12,229,257 6,992,930 367,811 3,917,694 3,540,140 846 36900 Meas. & Reg. Equipment 731,467 330,721 189,113 9,947 105,948 95,738 847 36901 Meas. & Reg. Equipment 2,269,556 1,026,144 586,770 30,863 328,730 297,050 848849 Total Transmission Plant 31,193,061 14,103,458 8,064,635 424,180 4,518,102 4,082,686850851 Distribution:852853 37400 Land & Land Rights 531,167 240,159 137,328 7,223 76,936 69,521 854 37401 Land 37,326 16,877 9,650 508 5,406 4,885 855 37402 Land Rights 3,645,749 1,648,369 942,570 49,577 528,062 477,172 856 37403 Land Other 2,784 1,259 720 38 403 364 857 37500 Structures & Improvements 336,168 151,993 86,913 4,571 48,692 43,999 858 37501 Structures & Improvements T.B. 99,818 45,131 25,807 1,357 14,458 13,065 859 37502 Land Rights 46,264 20,918 11,961 629 6,701 6,055 860 37503 Improvements 4,005 1,811 1,035 54 580 524 861 37600 Mains Cathodic Protection 20,611,541 9,319,188 5,328,895 280,287 2,985,441 2,697,730 862 37601 Mains - Steel 176,025,498 79,587,196 45,509,525 2,393,690 25,496,092 23,038,996 863 37602 Mains - Plastic 133,261,910 60,252,304 34,453,453 1,812,168 19,302,078 17,441,908 864 37800 Meas & Reg. Sta. Equip - General 29,911,913 13,524,207 7,733,408 406,758 4,332,536 3,915,003 865 37900 Meas & Reg. Sta. Equip - City Gate 5,126,032 2,317,656 1,325,281 69,707 742,471 670,918 866 37905 Meas & Reg. Sta. Equipment T.b. 1,652,259 747,043 427,174 22,468 239,318 216,255 867 38000 Services 150,274,437 133,824,243 16,279,918 8,273 103,453 58,550 868 38100 Meters 38,722,015 24,980,781 12,812,487 45,125 564,268 319,353 869 38200 Meter Installaitons 57,067,155 36,815,804 18,882,597 66,503 831,599 470,652 870 38300 House Regulators 12,779,948 8,244,744 4,228,678 14,893 186,233 105,401 871 38400 House Reg. Installations 252,587 162,952 83,577 294 3,681 2,083 872 38500 Ind. Meas. & Reg. Sta. Equipment 5,241,043 - 5,186,793 2,636 32,960 18,654 873 38600 Other Prop. On Cust. Prem 0 - - - - - 874875 Total Distribution Plant 635,629,619 371,902,633 153,467,767 5,186,760 55,501,369 49,571,090

Exhibit PHR-3Page 30 of 75
Atmos Energy Corporation, Kentucky/Mid-States DivisionClass Cost of Service - Demand Only StudyForecasted Test Period: Twelve Months Ended March 31, 2020
ALLOCATION OF PLANT IN SERVICE876877 General:878879 38900 Land & Land Rights 1,211,697 697,056 293,635 10,324 111,046 99,636 880 39000 Structures & Improvements 7,595,600 4,369,539 1,840,671 64,714 696,102 624,574 881 39001 Structures Frame 0 - - - - - 882 39002 Structures-Brick 173,115 99,588 41,952 1,475 15,865 14,235 883 39003 Improvements 709,199 407,983 171,863 6,042 64,995 58,316 884 39004 Air Conditioning Equipment 12,955 7,453 3,139 110 1,187 1,065 885 39009 Improvement to leased Premises 1,246,194 716,901 301,995 10,618 114,208 102,473 886 39100 Office Furniture & Equipment 1,866,038 1,073,480 452,204 15,899 171,014 153,441 887 39102 Remittance Processing Equip 0 - - - - - 888 39103 Office Machines 0 - - - - - 889 39200 Transportation Equipment 220,987 127,128 53,553 1,883 20,252 18,171 890 39201 Trucks 0 - - - - - 891 39202 Trailers 0 - - - - - 892 39300 Stores Equipment 0 - - - - - 893 39400 Tools, Shop & Garage Equipment 4,078,361 2,346,168 988,325 34,748 373,763 335,357 894 39600 Power Operated Equipment 0 - - - - - 895 39603 Ditchers 39,610 22,787 9,599 337 3,630 3,257 896 39604 Backhoes 62,747 36,097 15,206 535 5,751 5,160 897 39605 Welders 19,427 11,176 4,708 166 1,780 1,597 898 39700 Communication Equipment 524,257 301,591 127,045 4,467 48,046 43,109 899 39701 Communication Equipment - Mobile Radios 0 - - - - - 900 39702 Communication Equipment - Fixed Radios 0 - - - - - 901 39705 Communication Equip. - Telemetering 0 - - - - - 902 39800 Miscellaneous Equipment 3,891,771 2,238,828 943,108 33,158 356,663 320,014 903 39900 Other Tangible Property 0 - - - - - 904 39901 Other Tangible Property - Servers - H/W 14,390 8,278 3,487 123 1,319 1,183 905 39902 Other Tangible Property - Servers - S/W 0 - - - - - 906 39903 Other Tangible Property - Network - H/W 134,599 77,431 32,618 1,147 12,335 11,068 907 39904 Other Tang. Property - CPU 0 - - - - - 908 39905 Other Tangible Property - MF - Hardware 0 - - - - - 909 39906 Other Tang. Property - PC Hardware 461,888 265,711 111,931 3,935 42,330 37,980 910 39907 Other Tang. Property - PC Software 0 - - - - - 911 39908 Other Tang. Property - Mainframe S/W 123,515 71,055 29,932 1,052 11,320 10,156 912 39909 Other Tang. Property - Application Software 0 - - - - - 913 39924 Other Tang. Property - General Startup Costs 0 - - - - - 914915 Total General Plant 22,386,350 12,878,249 5,424,969 190,731 2,051,606 1,840,795 916917 TOTAL DIRECT PLANT 704,356,323 405,196,746 170,689,343 6,001,095 64,551,015 57,918,124918919 CWIP w/o AFUDC 38,154,809 21,949,408 9,246,200 325,078 3,496,713 3,137,411 920921 Kentucky Mid-States General Office:922923 Intangible Plant:924925 30100 Organization 92,247 53,067 22,355 786 8,454 7,585 926 30200 Franchises & Consents 0 - - - - - 927 30300 Misc Intangible Plant 552,335 317,743 133,849 4,706 50,619 45,418 928929 Total Intangible Plant: 644,582 370,810 156,204 5,492 59,073 53,003930931 General:932933 37400 Land & Land Rights 0 - - - - - 934 39001 Structures Frame 89,275 51,357 21,634 761 8,182 7,341 935 36602 Structures & Improvements 0 - - - - - 936 38900 Land & Land Rights 0 - - - - - 937 39004 Air Conditioning Equipment 7,658 4,405 1,856 65 702 630 938 39009 Improvement to leased Premises 19,332 11,121 4,685 165 1,772 1,590 939 39100 Office Furniture & Equipment 19,220 11,057 4,658 164 1,761 1,580 940 39102 Remittance Processing Equip 0 - - - - - 941 39103 Office Machines 0 - - - - - 942 39200 Transportation Equipment 13,582 7,814 3,291 116 1,245 1,117 943 39201 Trucks 0 - - - - - 944 39202 Trailers 0 - - - - - 945 39300 Stores Equipment 0 - - - - - 946 39400 Tools, Shop & Garage Equipment 87,547 50,363 21,216 746 8,023 7,199 947 39600 Power Operated Equipment 10,213 5,875 2,475 87 936 840 948 39603 Ditchers 0 - - - - - 949 39604 Backhoes 0 - - - - - 950 39605 Welders 0 - - - - - 951 39700 Communication Equipment 18,688 10,751 4,529 159 1,713 1,537 952 39701 Communication Equipment - Mobile Radios 0 - - - - - 953 39702 Communication Equipment - Fixed Radios 0 - - - - - 954 39705 Communication Equip. - Telemetering 0 - - - - - 955 39800 Miscellaneous Equipment 405,292 233,153 98,216 3,453 37,143 33,327 956 39900 Other Tangible Property 0 - - - - - 957 39901 Other Tangible Property - Servers - H/W 0 - - - - - 958 39902 Other Tangible Property - Servers - S/W 0 - - - - - 959 39903 Other Tangible Property - Network - H/W 0 - - - - - 960 39904 Other Tang. Property - CPU 0 - - - - - 961 39905 Other Tangible Property - MF - Hardware 0 - - - - - 962 39906 Other Tang. Property - PC Hardware 34,934 20,097 8,466 298 3,202 2,873 963 39907 Other Tang. Property - PC Software 82,288 47,338 19,941 701 7,541 6,766 964 39908 Other Tang. Property - Mainframe S/W 412,432 237,261 99,946 3,514 37,797 33,914 965 39909 Other Tang. Property - Application Software 0 - - - - - 966 39924 Other Tang. Property - General Startup Costs 0 - - - - - 967968 Total General Plant 1,200,461 690,592 290,912 10,228 110,017 98,712969970 CWIP w/o AFUDC 2,311 1,329 560 20 212 190

Exhibit PHR-3Page 31 of 75
Atmos Energy Corporation, Kentucky/Mid-States DivisionClass Cost of Service - Demand Only StudyForecasted Test Period: Twelve Months Ended March 31, 2020
ALLOCATION OF PLANT IN SERVICE971972 Shared Services General Office:973974 General:975976 37400 Land & Land Rights 0 - - - - - 977 39001 Structures Frame 0 - - - - - 978 36602 Structures & Improvements 236,424 136,008 57,293 2,014 21,667 19,441 979 37503 Improvements 0 - - - - - 980 39004 Air Conditioning Equipment 0 - - - - - 981 39009 Improvement to leased Premises 483,357 278,062 117,134 4,118 44,297 39,746 982 39100 Office Furniture & Equipment 286,918 165,056 69,530 2,445 26,295 23,593 983 39102 Remittance Processing Equip 0 - - - - - 984 39103 Office Machines 0 - - - - - 985 39200 Transportation Equipment 369 212 89 3 34 30 986 39201 Trucks 0 - - - - - 987 39202 Trailers 0 - - - - - 988 39300 Stores Equipment 0 - - - - - 989 39400 Tools, Shop & Garage Equipment 3,938 2,266 954 34 361 324 990 39600 Power Operated Equipment 0 - - - - - 991 39603 Ditchers 0 - - - - - 992 39604 Backhoes 0 - - - - - 993 39605 Welders 0 - - - - - 994 39700 Communication Equipment 54,370 31,277 13,176 463 4,983 4,471 995 39701 Communication Equipment - Mobile Radios 0 - - - - - 996 39702 Communication Equipment - Fixed Radios 0 - - - - - 997 39705 Communication Equip. - Telemetering 0 - - - - - 998 39800 Miscellaneous Equipment 7,537 4,336 1,827 64 691 620 999 39900 Other Tangible Property 8,377 4,819 2,030 71 768 689
1000 39901 Other Tangible Property - Servers - H/W 2,321,928 1,335,741 562,682 19,783 212,794 190,929 1001 39902 Other Tangible Property - Servers - S/W 1,402,428 806,778 339,856 11,949 128,526 115,319 1002 39903 Other Tangible Property - Network - H/W 442,303 254,445 107,185 3,768 40,535 36,370 1003 39904 Other Tang. Property - CPU 0 - - - - - 1004 39905 Other Tangible Property - MF - Hardware 0 - - - - - 1005 39906 Other Tang. Property - PC Hardware 155,862 89,663 37,771 1,328 14,284 12,816 1006 39907 Other Tang. Property - PC Software 86,214 49,597 20,893 735 7,901 7,089 1007 39908 Other Tang. Property - Mainframe S/W 3,879,643 2,231,851 940,169 33,054 355,551 319,017 1008 39909 Other Tang. Property - Application Software 1,322,956 761,060 320,597 11,272 121,243 108,785 1009 39931 Other Tang. Property - ALGN 0 - - - - - 10101011 Total General Plant 10,692,624 6,151,171 2,591,184 91,101 979,930 879,23810121013 CWIP w/o AFUDC 748,344 430,502 181,349 6,376 68,582 61,535 10141015 Shared Services Customer Support:10161017 General:10181019 37400 Land & Land Rights 205,882 118,438 49,892 1,754 18,868 16,929 1020 39001 Structures Frame 0 - - - - - 1021 36602 Structures & Improvements 1,000,011 575,279 242,337 8,520 91,646 82,229 1022 37503 Improvements 0 - - - - - 1023 39004 Air Conditioning Equipment 0 - - - - - 1024 39009 Improvement to leased Premises 159,117 91,536 38,559 1,356 14,582 13,084 1025 39100 Office Furniture & Equipment 154,692 88,990 37,487 1,318 14,177 12,720 1026 39102 Remittance Processing Equip 0 - - - - - 1027 39103 Office Machines 0 - - - - - 1028 39200 Transportation Equipment 2,233 1,284 541 19 205 184 1029 39201 Trucks 0 - - - - - 1030 39202 Trailers 0 - - - - - 1031 39300 Stores Equipment 0 - - - - - 1032 39400 Tools, Shop & Garage Equipment 14,093 8,107 3,415 120 1,292 1,159 1033 39600 Power Operated Equipment 548 315 133 5 50 45 1034 39603 Ditchers 0 - - - - - 1035 39604 Backhoes 0 - - - - - 1036 39605 Welders 0 - - - - - 1037 39700 Communication Equipment 114,682 65,973 27,791 977 10,510 9,430 1038 39701 Communication Equipment - Mobile Radios 0 - - - - - 1039 39702 Communication Equipment - Fixed Radios 0 - - - - - 1040 39705 Communication Equip. - Telemetering 0 - - - - - 1041 39800 Miscellaneous Equipment 15,758 9,065 3,819 134 1,444 1,296 1042 39900 Other Tangible Property 43,368 24,948 10,510 369 3,974 3,566 1043 39901 Other Tangible Property - Servers - H/W 583,485 335,663 141,398 4,971 53,474 47,979 1044 39902 Other Tangible Property - Servers - S/W 114,175 65,682 27,668 973 10,464 9,388 1045 39903 Other Tangible Property - Network - H/W 35,496 20,420 8,602 302 3,253 2,919 1046 39904 Other Tang. Property - CPU 0 - - - - - 1047 39905 Other Tangible Property - MF - Hardware 0 - - - - - 1048 39906 Other Tang. Property - PC Hardware 69,473 39,966 16,836 592 6,367 5,713 1049 39907 Other Tang. Property - PC Software 13,141 7,560 3,185 112 1,204 1,081 1050 39908 Other Tang. Property - Mainframe S/W 5,248,748 3,019,460 1,271,949 44,719 481,024 431,596 1051 39909 Other Tang. Property - Application Software 477 274 116 4 44 39 1052 39924 Other Tang. Property - General Startup Costs 0 - - - - - 10531054 Total General Plant 7,775,377 4,472,960 1,884,237 66,246 712,578 639,35710551056 CWIP w/o AFUDC 224,734 129,284 54,461 1,915 20,596 18,480 10571058 TOTAL PLANT IN SERVICE 724,669,367 416,882,279 175,611,880 6,174,161 66,412,612 59,588,43410591060 TOTAL CWIP W/O AFUDC 39,130,198 22,510,523 9,482,570 333,388 3,586,103 3,217,615

Exhibit PHR-3Page 32 of 75
Atmos Energy Corporation, Kentucky/Mid-States DivisionClass Cost of Service - Demand Only StudyForecasted Test Period: Twelve Months Ended March 31, 2020
ALLOCATION OF RESERVE FOR DEPRECIATION
Customer
Line Acct. Allocation Allocation Total Residential Non-Res Sales Non-Res Sales Transport TransportNo. No. Factor Basis Company Sales Firm Interruptible Firm Interruptible
1 Intangible Plant:23 30100 Organization 6.2 P, S, T & D Plant - Customer 3,229 2,493 702 2 21 12 4 30200 Franchises & Consents 6.2 P, S, T & D Plant - Customer 46,465 35,864 10,103 24 303 171 5 30300 Misc Intangible Plant 99.0 - 0 - - - - - 67 Total Intangible Plant: 49,694 38,356 10,805 26 324 18389 Production Plant:
1011 32520 Producing Leaseholds 99.0 - 0 - - - - - 12 32540 Rights of Ways 99.0 - 0 - - - - - 13 33100 Production Gas Wells Equipment 99.0 - 0 - - - - - 14 33201 Field Lines 99.0 - 0 - - - - - 15 33202 Tributary Lines 99.0 - 0 - - - - - 16 33400 Field Meas. & Reg. Sta. Equip 99.0 - 0 - - - - - 17 33600 Purification Equipment 99.0 - 0 - - - - - 1819 Total Production Plant 0 0 0 0 0 02021 Storage Plant:2223 35010 Land 99.0 - 0 - - - - - 24 35020 Rights of Way 99.0 - 0 - - - - - 25 35100 Structures and Improvements 99.0 - 0 - - - - - 26 35102 Compression Station Equipment 99.0 - 0 - - - - - 27 35103 Meas. & Reg. Sta. Structues 99.0 - 0 - - - - - 28 35104 Other Structures 99.0 - 0 - - - - - 29 35200 Wells \ Rights of Way 99.0 - 0 - - - - - 30 35201 Well Construction 99.0 - 0 - - - - - 31 35202 Well Equipment 99.0 - 0 - - - - - 32 35203 Cushion Gas 99.0 - 0 - - - - - 33 35210 Leaseholds 99.0 - 0 - - - - - 34 35211 Storage Rights 99.0 - 0 - - - - - 35 35301 Field Lines 99.0 - 0 - - - - - 36 35302 Tributary Lines 99.0 - 0 - - - - - 37 35400 Compressor Station Equipment 99.0 - 0 - - - - - 38 35500 Meas & Reg. Equipment 99.0 - 0 - - - - - 39 35600 Purification Equipment 99.0 - 0 - - - - - 4041 Total Storage Plant 0 - - - - - 4243 Transmission:4445 36510 Land & Land Rights 99.0 - 0 - - - - - 46 36520 Rights of Way 99.0 - 0 - - - - - 47 36602 Structures & Improvements 99.0 - 0 - - - - - 48 36603 Other Structues 99.0 - 0 - - - - - 49 36700 Mains Cathodic Protection 99.0 - 0 - - - - - 50 36701 Mains - Steel 99.0 - 0 - - - - - 51 36900 Meas. & Reg. Equipment 99.0 - 0 - - - - - 52 36901 Meas. & Reg. Equipment 99.0 - 0 - - - - - 5354 Total Transmission Plant 0 - - - - - 5556 Distribution:5758 37400 Land & Land Rights 2.0 Bills 0 - - - - - 59 37401 Land 2.0 Bills 0 - - - - - 60 37402 Land Rights 2.0 Bills 0 - - - - - 61 37403 Land Other 2.0 Bills 0 - - - - - 62 37500 Structures & Improvements 2.0 Bills 0 - - - - - 63 37501 Structures & Improvements T.B. 2.0 Bills 0 - - - - - 64 37502 Land Rights 2.0 Bills 0 - - - - - 65 37503 Improvements 2.0 Bills 0 - - - - - 66 37600 Mains Cathodic Protection 2.0 Bills 0 - - - - - 67 37601 Mains - Steel 2.0 Bills 0 - - - - - 68 37602 Mains - Plastic 2.0 Bills 0 - - - - - 69 37800 Meas & Reg. Sta. Equip - General 2.0 Bills 0 - - - - - 70 37900 Meas & Reg. Sta. Equip - City Gate 2.0 Bills 0 - - - - - 71 37905 Meas & Reg. Sta. Equipment T.b. 2.0 Bills 0 - - - - - 72 38000 Services 2.0 Bills 30,562,139 27,216,572 3,310,936 1,683 21,040 11,908 73 38100 Meters 4.0 Meter Investment 21,386,354 13,797,005 7,076,398 24,923 311,648 176,380 74 38200 Meter Installaitons 4.0 Meter Investment 26,987,899 17,410,737 8,929,858 31,450 393,275 222,578 75 38300 House Regulators 4.0 Meter Investment 4,321,265 2,787,783 1,429,836 5,036 62,971 35,639 76 38400 House Reg. Installations 4.0 Meter Investment 94,403 60,903 31,237 110 1,376 779 77 38500 Ind. Meas. & Reg. Sta. Equipment 2.2 Non-Residential Bills 2,958,741 - 2,928,115 1,488 18,607 10,531 78 38600 Other Prop. On Cust. Prem 99.0 - 0 - - - - - 7980 Total Distribution Plant 86,310,801 61,272,999 23,706,380 64,689 808,917 457,815

Exhibit PHR-3Page 33 of 75
Atmos Energy Corporation, Kentucky/Mid-States DivisionClass Cost of Service - Demand Only StudyForecasted Test Period: Twelve Months Ended March 31, 2020
ALLOCATION OF RESERVE FOR DEPRECIATION8182 General:8384 38900 Land & Land Rights 6.2 P, S, T & D Plant - Customer 0 - - - - - 85 39000 Structures & Improvements 6.2 P, S, T & D Plant - Customer 485,951 375,081 105,659 253 3,166 1,792 86 39002 Structures - Brick 6.2 P, S, T & D Plant - Customer 41,708 32,192 9,068 22 272 154 87 39003 Improvements 6.2 P, S, T & D Plant - Customer 113,486 87,594 24,675 59 739 418 88 39003 Air Conditioning Equipment 6.2 P, S, T & D Plant - Customer 1,958 1,511 426 1 13 7 89 39004 Improvement to Leased Premises 6.2 P, S, T & D Plant - Customer 483,869 373,474 105,206 252 3,152 1,784 90 39009 Office Furniture & Equipment 6.2 P, S, T & D Plant - Customer 443,743 342,503 96,482 231 2,891 1,636 91 39100 Remittance Processing Equip 6.2 P, S, T & D Plant - Customer 0 - - - - - 92 39102 Office Machines 6.2 P, S, T & D Plant - Customer 0 - - - - - 93 39103 Transportation Equipment 6.2 P, S, T & D Plant - Customer 44,113 34,049 9,591 23 287 163 94 39200 Trucks 6.2 P, S, T & D Plant - Customer 0 - - - - - 95 39201 Trailers 6.2 P, S, T & D Plant - Customer (981) (757) (213) (1) (6) (4) 96 39202 Stores Equipment 6.2 P, S, T & D Plant - Customer 0 - - - - - 97 39400 Tools, Shop & Garage Equipment 6.2 P, S, T & D Plant - Customer 504,316 389,256 109,652 263 3,286 1,860 98 39600 Power Operated Equipment 6.2 P, S, T & D Plant - Customer 0 - - - - - 99 39603 Ditchers 6.2 P, S, T & D Plant - Customer 15,373 11,866 3,343 8 100 57
100 39604 Backhoes 6.2 P, S, T & D Plant - Customer 24,353 18,797 5,295 13 159 90 101 39605 Welders 6.2 P, S, T & D Plant - Customer 7,543 5,822 1,640 4 49 28 102 39700 Communication Equipment 6.2 P, S, T & D Plant - Customer 104,290 80,496 22,676 54 679 385 103 39701 Communication Equipment - Mobile Radios 6.2 P, S, T & D Plant - Customer 0 - - - - - 104 39702 Communication Equipment - Fixed Radios 6.2 P, S, T & D Plant - Customer 0 - - - - - 105 39705 Communication Equip. - Telemetering 6.2 P, S, T & D Plant - Customer 0 - - - - - 106 39800 Miscellaneous Equipment 6.2 P, S, T & D Plant - Customer 803,618 620,272 174,728 419 5,236 2,963 107 39900 Other Tangible Property 6.2 P, S, T & D Plant - Customer 0 - - - - - 108 39901 Other Tangible Property - Servers - H/W 6.2 P, S, T & D Plant - Customer 2,586 1,996 562 1 17 10 109 39902 Other Tangible Property - Servers - S/W 6.2 P, S, T & D Plant - Customer 0 - - - - - 110 39903 Other Tangible Property - Network - H/W 6.2 P, S, T & D Plant - Customer 25,061 19,344 5,449 13 163 92 111 39904 Other Tang. Property - CPU 6.2 P, S, T & D Plant - Customer 0 - - - - - 112 39905 Other Tangible Property - MF - Hardware 6.2 P, S, T & D Plant - Customer 0 - - - - - 113 39906 Other Tang. Property - PC Hardware 6.2 P, S, T & D Plant - Customer 43,508 33,582 9,460 23 283 160 114 39907 Other Tang. Property - PC Software 6.2 P, S, T & D Plant - Customer 0 - - - - - 115 39908 Other Tang. Property - Mainframe S/W 6.2 P, S, T & D Plant - Customer 0 - - - - - 116 39909 Other Tang. Property - Application Software 6.2 P, S, T & D Plant - Customer 45,714 35,284 9,939 24 298 169 117 Other Tang. Property - General Startup Costs 6.2 P, S, T & D Plant - Customer 0 - - - - - 118 Retirement Work in Progress 6.2 P, S, T & D Plant - Customer (2,471,354) (1,907,514) (537,339) (1,288) (16,101) (9,113) 119 AR 15 general plant amortization 6.2 P, S, T & D Plant - Customer 0 - - - - - 120121 Total General Plant 718,855 554,848 156,299 375 4,683 2,651 122123 TOTAL DIRECT RESERVE FOR DEPRECIATION 87,079,350 61,866,203 23,873,484 65,090 813,924 460,649124125 Kentucky Mid-States General Office:126127 Intangible Plant:128129 30100 Organization 99.0 - 0 - - - - - 130 30200 Franchises & Consents 99.0 - 0 - - - - - 131 30300 Misc Intangible Plant 99.0 - 0 - - - - - 132133 Total Intangible Plant:134135 General:136137 37400 Land & Land Rights 6.2 P, S, T & D Plant - Customer 0 - - - - - 138 39001 Structures Frame 6.2 P, S, T & D Plant - Customer 20,434 15,772 4,443 11 133 75 139 36602 Structures & Improvements 6.2 P, S, T & D Plant - Customer 0 - - - - - 140 38900 Land & Land Rights 6.2 P, S, T & D Plant - Customer 0 - - - - - 141 39004 Air Conditioning Equipment 6.2 P, S, T & D Plant - Customer 1,973 1,523 429 1 13 7 142 39009 Improvement to leased Premises 6.2 P, S, T & D Plant - Customer 7,494 5,785 1,630 4 49 28 143 39100 Office Furniture & Equipment 6.2 P, S, T & D Plant - Customer 7,451 5,751 1,620 4 49 27 144 39102 Remittance Processing Equip 6.2 P, S, T & D Plant - Customer 0 - - - - - 145 39103 Office Machines 6.2 P, S, T & D Plant - Customer 0 - - - - - 146 39200 Transportation Equipment 6.2 P, S, T & D Plant - Customer 3,449 2,662 750 2 22 13 147 39201 Trucks 6.2 P, S, T & D Plant - Customer 0 - - - - - 148 39202 Trailers 6.2 P, S, T & D Plant - Customer 0 - - - - - 149 39300 Stores Equipment 6.2 P, S, T & D Plant - Customer 0 - - - - - 150 39400 Tools, Shop & Garage Equipment 6.2 P, S, T & D Plant - Customer 27,762 21,428 6,036 14 181 102 151 39600 Power Operated Equipment 6.2 P, S, T & D Plant - Customer 1,696 1,309 369 1 11 6 152 39603 Ditchers 6.2 P, S, T & D Plant - Customer 0 - - - - - 153 39604 Backhoes 6.2 P, S, T & D Plant - Customer 0 - - - - - 154 39605 Welders 6.2 P, S, T & D Plant - Customer 0 - - - - - 155 39700 Communication Equipment 6.2 P, S, T & D Plant - Customer (1,160) (895) (252) (1) (8) (4) 156 39701 Communication Equipment - Mobile Radios 6.2 P, S, T & D Plant - Customer 0 - - - - - 157 39702 Communication Equipment - Fixed Radios 6.2 P, S, T & D Plant - Customer 0 - - - - - 158 39705 Communication Equip. - Telemetering 6.2 P, S, T & D Plant - Customer 0 - - - - - 159 39800 Miscellaneous Equipment 6.2 P, S, T & D Plant - Customer 139,310 107,526 30,290 73 908 514 160 39900 Other Tangible Property 6.2 P, S, T & D Plant - Customer 0 - - - - - 161 39901 Other Tangible Property - Servers - H/W 6.2 P, S, T & D Plant - Customer (6,709) (5,179) (1,459) (3) (44) (25) 162 39902 Other Tangible Property - Servers - S/W 6.2 P, S, T & D Plant - Customer 0 - - - - - 163 39903 Other Tangible Property - Network - H/W 6.2 P, S, T & D Plant - Customer 0 - - - - - 164 39904 Other Tang. Property - CPU 6.2 P, S, T & D Plant - Customer 0 - - - - - 165 39905 Other Tangible Property - MF - Hardware 6.2 P, S, T & D Plant - Customer 0 - - - - - 166 39906 Other Tang. Property - PC Hardware 6.2 P, S, T & D Plant - Customer 13,547 10,456 2,945 7 88 50 167 39907 Other Tang. Property - PC Software 6.2 P, S, T & D Plant - Customer 8,175 6,310 1,777 4 53 30 168 39908 Other Tang. Property - Mainframe S/W 6.2 P, S, T & D Plant - Customer 159,892 123,413 34,765 83 1,042 590 169 39909 Other Tang. Property - Application Software 6.2 P, S, T & D Plant - Customer 0 - - - - - 170 39924 Other Tang. Property - General Startup Costs 6.2 P, S, T & D Plant - Customer 0 - - - - - 171 Retirement Work in Progress 6.2 P, S, T & D Plant - Customer 10,135 7,823 2,204 5 66 37 172173 Total General Plant 393,449 303,683 85,546 205 2,563 1,451

Exhibit PHR-3Page 34 of 75
Atmos Energy Corporation, Kentucky/Mid-States DivisionClass Cost of Service - Demand Only StudyForecasted Test Period: Twelve Months Ended March 31, 2020
ALLOCATION OF RESERVE FOR DEPRECIATION174175 Shared Services General Office:176177 General:178179 37400 Land & Land Rights 6.2 P, S, T & D Plant - Customer 0 - - - - - 180 39000 Structures & Improvements 6.2 P, S, T & D Plant - Customer 35,223 27,187 7,658 18 229 130 181 36602 Structures & Improvements 6.2 P, S, T & D Plant - Customer 0 - - - - - 182 37503 Improvements 6.2 P, S, T & D Plant - Customer 0 - - - - - 183 39004 Air Conditioning Equipment 6.2 P, S, T & D Plant - Customer 0 - - - - - 184 39009 Improvement to leased Premises 6.2 P, S, T & D Plant - Customer 187,005 144,340 40,660 97 1,218 690 185 39100 Office Furniture & Equipment 6.2 P, S, T & D Plant - Customer 45,051 34,773 9,795 23 294 166 186 39102 Remittance Processing Equip 6.2 P, S, T & D Plant - Customer 0 0 0 0 0 0 187 39103 Office Machines 6.2 P, S, T & D Plant - Customer 0 0 0 0 0 0 188 39200 Transportation Equipment 6.2 P, S, T & D Plant - Customer 110 85 24 0 1 0 189 39201 Trucks 6.2 P, S, T & D Plant - Customer 0 - - - - - 190 39202 Trailers 6.2 P, S, T & D Plant - Customer 0 - - - - - 191 39300 Stores Equipment 6.2 P, S, T & D Plant - Customer 0 - - - - - 192 39400 Tools, Shop & Garage Equipment 6.2 P, S, T & D Plant - Customer 668 515 145 0 4 2 193 39600 Power Operated Equipment 6.2 P, S, T & D Plant - Customer 0 - - - - - 194 39603 Ditchers 6.2 P, S, T & D Plant - Customer 0 - - - - - 195 39604 Backhoes 6.2 P, S, T & D Plant - Customer 0 - - - - - 196 39605 Welders 6.2 P, S, T & D Plant - Customer 0 - - - - - 197 39700 Communication Equipment 6.2 P, S, T & D Plant - Customer 10,977 8,472 2,387 6 72 40 198 39701 Communication Equipment - Mobile Radios 6.2 P, S, T & D Plant - Customer 0 - - - - - 199 39702 Communication Equipment - Fixed Radios 6.2 P, S, T & D Plant - Customer 0 - - - - - 200 39705 Communication Equip. - Telemetering 6.2 P, S, T & D Plant - Customer 0 - - - - - 201 39800 Miscellaneous Equipment 6.2 P, S, T & D Plant - Customer 1,107 854 241 1 7 4 202 39900 Other Tangible Property 6.2 P, S, T & D Plant - Customer 3,271 2,525 711 2 21 12 203 39901 Other Tangible Property - Servers - H/W 6.2 P, S, T & D Plant - Customer 517,758 399,631 112,575 270 3,373 1,909 204 39902 Other Tangible Property - Servers - S/W 6.2 P, S, T & D Plant - Customer 375,965 290,188 81,745 196 2,449 1,386 205 39903 Other Tangible Property - Network - H/W 6.2 P, S, T & D Plant - Customer 52,022 40,153 11,311 27 339 192 206 39904 Other Tang. Property - CPU 6.2 P, S, T & D Plant - Customer 0 - - - - - 207 39905 Other Tangible Property - MF - Hardware 6.2 P, S, T & D Plant - Customer 0 - - - - - 208 39906 Other Tang. Property - PC Hardware 6.2 P, S, T & D Plant - Customer 36,463 28,144 7,928 19 238 134 209 39907 Other Tang. Property - PC Software 6.2 P, S, T & D Plant - Customer 35,640 27,509 7,749 19 232 131 210 39908 Other Tang. Property - Mainframe S/W 6.2 P, S, T & D Plant - Customer 896 691 195 0 6 3 211 39909 Other Tang. Property - Application Software 6.2 P, S, T & D Plant - Customer 979,462 755,997 212,962 510 6,381 3,612 212 39924 Other Tang. Property - General Startup Costs 6.2 P, S, T & D Plant - Customer 0 - - - - - 213 Retirement Work in Progress 6.2 P, S, T & D Plant - Customer 0 - - - - - 214215 Total General Plant 2,281,618 1,761,066 496,085 1,189 14,865 8,413 216 643,103 496,378 139,828 335 4,190 2,371217 Shared Services Customer Support:218219 General:220221 37400 Land & Land Rights 6.2 P, S, T & D Plant - Customer 0 - - - - - 222 39001 Structures Frame 6.2 P, S, T & D Plant - Customer 0 - - - - - 223 36602 Structures & Improvements 6.2 P, S, T & D Plant - Customer 79,350 61,246 17,253 41 517 293 224 37503 Improvements 6.2 P, S, T & D Plant - Customer 0 - - - - - 225 39004 Air Conditioning Equipment 6.2 P, S, T & D Plant - Customer 0 - - - - - 226 39009 Improvement to leased Premises 6.2 P, S, T & D Plant - Customer 38,654 29,835 8,404 20 252 143 227 39100 Office Furniture & Equipment 6.2 P, S, T & D Plant - Customer 21,230 16,386 4,616 11 138 78 228 39102 Remittance Processing Equip 6.2 P, S, T & D Plant - Customer 0 - - - - - 229 39103 Office Machines 6.2 P, S, T & D Plant - Customer 0 - - - - - 230 39200 Transportation Equipment 6.2 P, S, T & D Plant - Customer 866 669 188 0 6 3 231 39201 Trucks 6.2 P, S, T & D Plant - Customer 0 - - - - - 232 39202 Trailers 6.2 P, S, T & D Plant - Customer 0 - - - - - 233 39300 Stores Equipment 6.2 P, S, T & D Plant - Customer 0 - - - - - 234 39400 Tools, Shop & Garage Equipment 6.2 P, S, T & D Plant - Customer 1,416 1,093 308 1 9 5 235 39500 Laboratory Equipment 6.2 P, S, T & D Plant - Customer 165 127 36 0 1 1 236 39603 Ditchers 6.2 P, S, T & D Plant - Customer 0 - - - - - 237 39604 Backhoes 6.2 P, S, T & D Plant - Customer 0 - - - - - 238 39605 Welders 6.2 P, S, T & D Plant - Customer 0 - - - - - 239 39700 Communication Equipment 6.2 P, S, T & D Plant - Customer 27,208 21,000 5,916 14 177 100 240 39701 Communication Equipment - Mobile Radios 6.2 P, S, T & D Plant - Customer 0 - - - - - 241 39702 Communication Equipment - Fixed Radios 6.2 P, S, T & D Plant - Customer 0 - - - - - 242 39705 Communication Equip. - Telemetering 6.2 P, S, T & D Plant - Customer 0 - - - - - 243 39800 Miscellaneous Equipment 6.2 P, S, T & D Plant - Customer 1,885 1,455 410 1 12 7 244 39900 Other Tangible Property 6.2 P, S, T & D Plant - Customer 12,321 9,510 2,679 6 80 45 245 39901 Other Tangible Property - Servers - H/W 6.2 P, S, T & D Plant - Customer 131,095 101,185 28,504 68 854 483 246 39902 Other Tangible Property - Servers - S/W 6.2 P, S, T & D Plant - Customer 29,992 23,149 6,521 16 195 111 247 39903 Other Tangible Property - Network - H/W 6.2 P, S, T & D Plant - Customer 8,903 6,872 1,936 5 58 33 248 39904 Other Tang. Property - CPU 6.2 P, S, T & D Plant - Customer 0 - - - - - 249 39905 Other Tangible Property - MF - Hardware 6.2 P, S, T & D Plant - Customer 0 - - - - - 250 39906 Other Tang. Property - PC Hardware 6.2 P, S, T & D Plant - Customer 17,010 13,129 3,699 9 111 63 251 39907 Other Tang. Property - PC Software 6.2 P, S, T & D Plant - Customer 3,943 3,043 857 2 26 15 252 39908 Other Tang. Property - Mainframe S/W 6.2 P, S, T & D Plant - Customer 794,932 613,568 172,840 414 5,179 2,931 253 39909 Other Tang. Property - Application Software 6.2 P, S, T & D Plant - Customer 1,886 1,456 410 1 12 7 254 39924 Other Tang. Property - General Startup Costs 6.2 P, S, T & D Plant - Customer 0 - - - - - 255 Retirement Work in Progress 6.2 P, S, T & D Plant - Customer 0 - - - - - 256257 Total General Plant 1,170,856 903,724 254,576 610 7,628 4,317 258259 TOTAL RESERVE FOR DEPRECIATION - CUSTOMER 90,925,272 64,834,677 24,709,691 67,094 838,981 474,830

Exhibit PHR-3Page 35 of 75
Atmos Energy Corporation, Kentucky/Mid-States DivisionClass Cost of Service - Demand Only StudyForecasted Test Period: Twelve Months Ended March 31, 2020
ALLOCATION OF RESERVE FOR DEPRECIATION
Demand
Line Acct. Allocation Allocation Total Residential Non-Res Sales Non-Res Sales Transport TransportNo. No. Factor Basis Company Sales Firm Interruptible Firm Interruptible
260 Intangible Plant:261262 30100 Organization 6.4 P, S, T & D Plant - Demand 5,009 2,265 1,295 68 725 656 263 30200 Franchises & Consents 6.4 P, S, T & D Plant - Demand 72,068 32,584 18,632 980 10,439 9,433 264 30300 Misc Intangible Plant 99.0 - 0 - - - - - 265266 Total Intangible Plant: 77,077 34,849 19,927 1,048 11,164 10,088267268 Production Plant:269270 32520 Producing Leaseholds 3.0 Peak Day 0 - - - - - 271 32540 Rights of Ways 3.0 Peak Day 0 - - - - - 272 33100 Production Gas Wells Equipment 3.0 Peak Day 0 - - - - - 273 33201 Field Lines 3.0 Peak Day 0 - - - - - 274 33202 Tributary Lines 3.0 Peak Day 0 - - - - - 275 33400 Field Meas. & Reg. Sta. Equip 3.0 Peak Day 0 - - - - - 276 33600 Purification Equipment 3.0 Peak Day 0 - - - - - 277278 Total Production Plant 0 0 0 0 0 0279280 Storage Plant:281282 35010 Land 3.0 Peak Day 0 - - - - - 283 35020 Rights of Way 3.0 Peak Day 2,227 1,007 576 30 323 291 284 35100 Structures and Improvements 3.0 Peak Day 3,144 1,422 813 43 455 412 285 35102 Compression Station Equipment 3.0 Peak Day 56,872 25,714 14,704 773 8,238 7,444 286 35103 Meas. & Reg. Sta. Structues 3.0 Peak Day 10,242 4,631 2,648 139 1,483 1,340 287 35104 Other Structures 3.0 Peak Day 50,072 22,639 12,946 681 7,253 6,554 288 35200 Wells \ Rights of Way 3.0 Peak Day 595,415 269,208 153,938 8,097 86,242 77,931 289 35201 Well Construction 3.0 Peak Day 709,755 320,905 183,500 9,652 102,803 92,896 290 35202 Well Equipment 3.0 Peak Day 225,298 101,865 58,248 3,064 32,633 29,488 291 35203 Cushion Gas 3.0 Peak Day 379,297 171,493 98,063 5,158 54,939 49,644 292 35210 Leaseholds 3.0 Peak Day 84,031 37,993 21,725 1,143 12,171 10,998 293 35211 Storage Rights 3.0 Peak Day 21,978 9,937 5,682 299 3,183 2,877 294 35301 Field Lines 3.0 Peak Day (44,198) (19,983) (11,427) (601) (6,402) (5,785) 295 35302 Tributary Lines 3.0 Peak Day 94,588 42,767 24,455 1,286 13,700 12,380 296 35400 Compressor Station Equipment 3.0 Peak Day 248,926 112,548 64,357 3,385 36,055 32,581 297 35500 Meas & Reg. Equipment 3.0 Peak Day 101,272 45,788 26,183 1,377 14,669 13,255 298 35600 Purification Equipment 3.0 Peak Day 95,899 43,359 24,794 1,304 13,890 12,552 299300 Total Storage Plant 2,634,817 1,191,292 681,204 35,830 381,635 344,857 301302 Transmission:303304 36510 Land & Land Rights 3.0 Peak Day 0 - - - - - 305 36520 Rights of Way 3.0 Peak Day 428,096 193,557 110,680 5,821 62,007 56,031 306 36602 Structures & Improvements 3.0 Peak Day 16,837 7,613 4,353 229 2,439 2,204 307 36603 Other Structues 3.0 Peak Day 53,066 23,993 13,720 722 7,686 6,946 308 36700 Mains Cathodic Protection 3.0 Peak Day 98,316 44,452 25,419 1,337 14,240 12,868 309 36701 Mains - Steel 3.0 Peak Day 16,387,961 7,409,562 4,236,933 222,852 2,373,684 2,144,929 310 36900 Meas. & Reg. Equipment 3.0 Peak Day 353,469 159,816 91,386 4,807 51,198 46,264 311 36901 Meas. & Reg. Equipment 3.0 Peak Day 1,774,251 802,200 458,714 24,127 256,988 232,222 312313 Total Transmission Plant 19,111,996 8,641,192 4,941,204 259,895 2,768,242 2,501,463 314315 Distribution:316317 37400 Land & Land Rights 3.0 Peak Day 0 - - - - - 318 37401 Land 3.0 Peak Day 0 - - - - - 319 37402 Land Rights 3.0 Peak Day 235,363 106,416 60,851 3,201 34,091 30,805 320 37403 Land Other 3.0 Peak Day 0 - - - - - 321 37500 Structures & Improvements 3.0 Peak Day 113,695 51,405 29,395 1,546 16,468 14,881 322 37501 Structures & Improvements T.B. 3.0 Peak Day 71,449 32,305 18,472 972 10,349 9,352 323 37502 Land Rights 3.0 Peak Day 35,399 16,005 9,152 481 5,127 4,633 324 37503 Improvements 3.0 Peak Day 1,920 868 496 26 278 251 325 37600 Mains Cathodic Protection 3.0 Peak Day 13,210,658 5,972,994 3,415,475 179,646 1,913,474 1,729,069 326 37601 Mains - Steel 3.0 Peak Day 33,671,112 15,223,870 8,705,309 457,878 4,877,031 4,407,024 327 37602 Mains - Plastic 3.0 Peak Day 19,028,671 8,603,518 4,919,661 258,762 2,756,173 2,490,557 328 37800 Meas & Reg. Sta. Equip - General 3.0 Peak Day 2,894,799 1,308,838 748,420 39,365 419,292 378,884 329 37900 Meas & Reg. Sta. Equip - City Gate 3.0 Peak Day 984,409 445,085 254,508 13,387 142,585 128,844 330 37905 Meas & Reg. Sta. Equipment T.b. 3.0 Peak Day 1,038,111 469,366 268,393 14,117 150,363 135,873 331 38000 Services 99.0 - 0 - - - - - 332 38100 Meters 99.0 - 0 - - - - - 333 38200 Meter Installaitons 99.0 - 0 - - - - - 334 38300 House Regulators 99.0 - 0 - - - - - 335 38400 House Reg. Installations 99.0 - 0 - - - - - 336 38500 Ind. Meas. & Reg. Sta. Equipment 99.0 - 0 - - - - - 337 38600 Other Prop. On Cust. Prem 99.0 - 0 - - - - - 338339 Total Distribution Plant 71,285,587 32,230,671 18,430,132 969,380 10,325,230 9,330,173

Exhibit PHR-3Page 36 of 75
Atmos Energy Corporation, Kentucky/Mid-States DivisionClass Cost of Service - Demand Only StudyForecasted Test Period: Twelve Months Ended March 31, 2020
ALLOCATION OF RESERVE FOR DEPRECIATION340341 General:342343 38900 Land & Land Rights 6.4 P, S, T & D Plant - Demand 0 - - - - - 344 39000 Structures & Improvements 6.4 P, S, T & D Plant - Demand 753,725 340,785 194,868 10,250 109,172 98,651 345 39002 Structures - Brick 6.4 P, S, T & D Plant - Demand 64,690 29,249 16,725 880 9,370 8,467 346 39003 Improvements 6.4 P, S, T & D Plant - Demand 176,020 79,585 45,508 2,394 25,495 23,038 347 39003 Air Conditioning Equipment 6.4 P, S, T & D Plant - Demand 3,036 1,373 785 41 440 397 348 39004 Improvement to Leased Premises 6.4 P, S, T & D Plant - Demand 750,495 339,325 194,033 10,206 108,704 98,228 349 39009 Office Furniture & Equipment 6.4 P, S, T & D Plant - Demand 688,260 311,186 177,942 9,359 99,690 90,082 350 39100 Remittance Processing Equip 6.4 P, S, T & D Plant - Demand 0 - - - - - 351 39102 Office Machines 6.4 P, S, T & D Plant - Demand 0 - - - - - 352 39103 Transportation Equipment 6.4 P, S, T & D Plant - Demand 68,421 30,936 17,690 930 9,910 8,955 353 39200 Trucks 6.4 P, S, T & D Plant - Demand 0 - - - - - 354 39201 Trailers 6.4 P, S, T & D Plant - Demand (1,521) (688) (393) (21) (220) (199) 355 39202 Stores Equipment 6.4 P, S, T & D Plant - Demand 0 - - - - - 356 39400 Tools, Shop & Garage Equipment 6.4 P, S, T & D Plant - Demand 782,209 353,664 202,232 10,637 113,298 102,379 357 39600 Power Operated Equipment 6.4 P, S, T & D Plant - Demand 0 - - - - - 358 39603 Ditchers 6.4 P, S, T & D Plant - Demand 23,845 10,781 6,165 324 3,454 3,121 359 39604 Backhoes 6.4 P, S, T & D Plant - Demand 37,773 17,078 9,766 514 5,471 4,944 360 39605 Welders 6.4 P, S, T & D Plant - Demand 11,699 5,290 3,025 159 1,695 1,531 361 39700 Communication Equipment 6.4 P, S, T & D Plant - Demand 161,757 73,136 41,821 2,200 23,429 21,172 362 39701 Communication Equipment - Mobile Radios 6.4 P, S, T & D Plant - Demand 0 - - - - - 363 39702 Communication Equipment - Fixed Radios 6.4 P, S, T & D Plant - Demand 0 - - - - - 364 39705 Communication Equip. - Telemetering 6.4 P, S, T & D Plant - Demand 0 - - - - - 365 39800 Miscellaneous Equipment 6.4 P, S, T & D Plant - Demand 1,246,435 563,556 322,253 16,950 180,538 163,139 366 39900 Other Tangible Property 6.4 P, S, T & D Plant - Demand 0 - - - - - 367 39901 Other Tangible Property - Servers - H/W 6.4 P, S, T & D Plant - Demand 4,011 1,813 1,037 55 581 525 368 39902 Other Tangible Property - Servers - S/W 6.4 P, S, T & D Plant - Demand 0 - - - - - 369 39903 Other Tangible Property - Network - H/W 6.4 P, S, T & D Plant - Demand 38,871 17,575 10,050 529 5,630 5,088 370 39904 Other Tang. Property - CPU 6.4 P, S, T & D Plant - Demand 0 - - - - - 371 39905 Other Tangible Property - MF - Hardware 6.4 P, S, T & D Plant - Demand 0 - - - - - 372 39906 Other Tang. Property - PC Hardware 6.4 P, S, T & D Plant - Demand 67,482 30,511 17,447 918 9,774 8,832 373 39907 Other Tang. Property - PC Software 6.4 P, S, T & D Plant - Demand 0 - - - - - 374 39908 Other Tang. Property - Mainframe S/W 6.4 P, S, T & D Plant - Demand 0 - - - - - 375 39909 Other Tang. Property - Application Software 6.4 P, S, T & D Plant - Demand 70,904 32,058 18,331 964 10,270 9,280 376 Other Tang. Property - General Startup Costs 6.4 P, S, T & D Plant - Demand 0 - - - - - 377 Retirement Work in Progress 6.4 P, S, T & D Plant - Demand (3,833,146) (1,733,098) (991,019) (52,125) (555,205) (501,699) 378 AR 15 general plant amortization 6.4 P, S, T & D Plant - Demand 0 - - - - - 379380 Total General Plant 1,114,966 504,115 288,263 15,162 161,495 145,932 381382 TOTAL DIRECT RESERVE FOR DEPRECIATION 94,224,443 42,602,119 24,360,730 1,281,315 13,647,767 12,332,512383384 Kentucky Mid-States General Office:385386 Intangible Plant:387388 30100 Organization 99.0 - 0 - - - - - 389 30200 Franchises & Consents 99.0 - 0 - - - - - 390 30300 Misc Intangible Plant 99.0 - 0 - - - - - 391392 Total Intangible Plant:393394 General:395396 37400 Land & Land Rights 6.4 P, S, T & D Plant - Demand 0 - - - - - 397 39001 Structures Frame 6.4 P, S, T & D Plant - Demand 31,693 14,330 8,194 431 4,591 4,148 398 36602 Structures & Improvements 6.4 P, S, T & D Plant - Demand 0 - - - - - 399 38900 Land & Land Rights 6.4 P, S, T & D Plant - Demand 0 - - - - - 400 39004 Air Conditioning Equipment 6.4 P, S, T & D Plant - Demand 3,060 1,384 791 42 443 401 401 39009 Improvement to leased Premises 6.4 P, S, T & D Plant - Demand 11,624 5,256 3,005 158 1,684 1,521 402 39100 Office Furniture & Equipment 6.4 P, S, T & D Plant - Demand 11,557 5,225 2,988 157 1,674 1,513 403 39102 Remittance Processing Equip 6.4 P, S, T & D Plant - Demand 0 - - - - - 404 39103 Office Machines 6.4 P, S, T & D Plant - Demand 0 - - - - - 405 39200 Transportation Equipment 6.4 P, S, T & D Plant - Demand 5,349 2,418 1,383 73 775 700 406 39201 Trucks 6.4 P, S, T & D Plant - Demand 0 - - - - - 407 39202 Trailers 6.4 P, S, T & D Plant - Demand 0 - - - - - 408 39300 Stores Equipment 6.4 P, S, T & D Plant - Demand 0 - - - - - 409 39400 Tools, Shop & Garage Equipment 6.4 P, S, T & D Plant - Demand 43,060 19,469 11,133 586 6,237 5,636 410 39600 Power Operated Equipment 6.4 P, S, T & D Plant - Demand 2,631 1,189 680 36 381 344 411 39603 Ditchers 6.4 P, S, T & D Plant - Demand 0 - - - - - 412 39604 Backhoes 6.4 P, S, T & D Plant - Demand 0 - - - - - 413 39605 Welders 6.4 P, S, T & D Plant - Demand 0 - - - - - 414 39700 Communication Equipment 6.4 P, S, T & D Plant - Demand (1,799) (813) (465) (24) (261) (235) 415 39701 Communication Equipment - Mobile Radios 6.4 P, S, T & D Plant - Demand 0 - - - - - 416 39702 Communication Equipment - Fixed Radios 6.4 P, S, T & D Plant - Demand 0 - - - - - 417 39705 Communication Equip. - Telemetering 6.4 P, S, T & D Plant - Demand 0 - - - - - 418 39800 Miscellaneous Equipment 6.4 P, S, T & D Plant - Demand 216,074 97,694 55,864 2,938 31,297 28,281 419 39900 Other Tangible Property 6.4 P, S, T & D Plant - Demand 0 - - - - - 420 39901 Other Tangible Property - Servers - H/W 6.4 P, S, T & D Plant - Demand (10,406) (4,705) (2,690) (142) (1,507) (1,362) 421 39902 Other Tangible Property - Servers - S/W 6.4 P, S, T & D Plant - Demand 0 - - - - - 422 39903 Other Tangible Property - Network - H/W 6.4 P, S, T & D Plant - Demand 0 - - - - - 423 39904 Other Tang. Property - CPU 6.4 P, S, T & D Plant - Demand 0 - - - - - 424 39905 Other Tangible Property - MF - Hardware 6.4 P, S, T & D Plant - Demand 0 - - - - - 425 39906 Other Tang. Property - PC Hardware 6.4 P, S, T & D Plant - Demand 21,012 9,500 5,432 286 3,043 2,750 426 39907 Other Tang. Property - PC Software 6.4 P, S, T & D Plant - Demand 12,679 5,733 3,278 172 1,836 1,660 427 39908 Other Tang. Property - Mainframe S/W 6.4 P, S, T & D Plant - Demand 247,998 112,128 64,117 3,372 35,921 32,459 428 39909 Other Tang. Property - Application Software 6.4 P, S, T & D Plant - Demand 0 - - - - - 429 39924 Other Tang. Property - General Startup Costs 6.4 P, S, T & D Plant - Demand 0 - - - - - 430 Retirement Work in Progress 6.4 P, S, T & D Plant - Demand 15,720 7,108 4,064 214 2,277 2,058 431432 Total General Plant 610,251 275,916 157,774 8,299 88,391 79,872

Exhibit PHR-3Page 37 of 75
Atmos Energy Corporation, Kentucky/Mid-States DivisionClass Cost of Service - Demand Only StudyForecasted Test Period: Twelve Months Ended March 31, 2020
ALLOCATION OF RESERVE FOR DEPRECIATION433434 Shared Services General Office:435436 General:437438 37400 Land & Land Rights 6.4 P, S, T & D Plant - Demand 0 - - - - - 439 39000 Structures & Improvements 6.4 P, S, T & D Plant - Demand 54,631 24,701 14,124 743 7,913 7,150 440 36602 Structures & Improvements 6.4 P, S, T & D Plant - Demand 0 - - - - - 441 37503 Improvements 6.4 P, S, T & D Plant - Demand 0 - - - - - 442 39004 Air Conditioning Equipment 6.4 P, S, T & D Plant - Demand 0 - - - - - 443 39009 Improvement to leased Premises 6.4 P, S, T & D Plant - Demand 290,050 131,142 74,989 3,944 42,012 37,963 444 39100 Office Furniture & Equipment 6.4 P, S, T & D Plant - Demand 69,876 31,593 18,066 950 10,121 9,146 445 39102 Remittance Processing Equip 6.4 P, S, T & D Plant - Demand 0 0 0 0 0 0 446 39103 Office Machines 6.4 P, S, T & D Plant - Demand 0 0 0 0 0 0 447 39200 Transportation Equipment 6.4 P, S, T & D Plant - Demand 171 77 44 2 25 22 448 39201 Trucks 6.4 P, S, T & D Plant - Demand 0 - - - - - 449 39202 Trailers 6.4 P, S, T & D Plant - Demand 0 - - - - - 450 39300 Stores Equipment 6.4 P, S, T & D Plant - Demand 0 - - - - - 451 39400 Tools, Shop & Garage Equipment 6.4 P, S, T & D Plant - Demand 1,035 468 268 14 150 136 452 39600 Power Operated Equipment 6.4 P, S, T & D Plant - Demand 0 - - - - - 453 39603 Ditchers 6.4 P, S, T & D Plant - Demand 0 - - - - - 454 39604 Backhoes 6.4 P, S, T & D Plant - Demand 0 - - - - - 455 39605 Welders 6.4 P, S, T & D Plant - Demand 0 - - - - - 456 39700 Communication Equipment 6.4 P, S, T & D Plant - Demand 17,025 7,698 4,402 232 2,466 2,228 457 39701 Communication Equipment - Mobile Radios 6.4 P, S, T & D Plant - Demand 0 - - - - - 458 39702 Communication Equipment - Fixed Radios 6.4 P, S, T & D Plant - Demand 0 - - - - - 459 39705 Communication Equip. - Telemetering 6.4 P, S, T & D Plant - Demand 0 - - - - - 460 39800 Miscellaneous Equipment 6.4 P, S, T & D Plant - Demand 1,717 776 444 23 249 225 461 39900 Other Tangible Property 6.4 P, S, T & D Plant - Demand 5,074 2,294 1,312 69 735 664 462 39901 Other Tangible Property - Servers - H/W 6.4 P, S, T & D Plant - Demand 803,059 363,090 207,622 10,920 116,318 105,108 463 39902 Other Tangible Property - Servers - S/W 6.4 P, S, T & D Plant - Demand 583,133 263,654 150,763 7,930 84,463 76,323 464 39903 Other Tangible Property - Network - H/W 6.4 P, S, T & D Plant - Demand 80,688 36,482 20,861 1,097 11,687 10,561 465 39904 Other Tang. Property - CPU 6.4 P, S, T & D Plant - Demand 0 - - - - - 466 39905 Other Tangible Property - MF - Hardware 6.4 P, S, T & D Plant - Demand 0 - - - - - 467 39906 Other Tang. Property - PC Hardware 6.4 P, S, T & D Plant - Demand 56,556 25,571 14,622 769 8,192 7,402 468 39907 Other Tang. Property - PC Software 6.4 P, S, T & D Plant - Demand 55,279 24,994 14,292 752 8,007 7,235 469 39908 Other Tang. Property - Mainframe S/W 6.4 P, S, T & D Plant - Demand 1,389 628 359 19 201 182 470 39909 Other Tang. Property - Application Software 6.4 P, S, T & D Plant - Demand 1,519,175 686,872 392,767 20,659 220,042 198,836 471 39924 Other Tang. Property - General Startup Costs 6.4 P, S, T & D Plant - Demand 0 - - - - - 472 Retirement Work in Progress 6.4 P, S, T & D Plant - Demand 0 - - - - - 473474 Total General Plant 3,538,859 1,600,040 914,934 48,123 512,580 463,182 475476 Shared Services Customer Support:477478 General:479480 37400 Land & Land Rights 6.4 P, S, T & D Plant - Demand 0 - - - - - 481 39001 Structures Frame 6.4 P, S, T & D Plant - Demand 0 - - - - - 482 36602 Structures & Improvements 6.4 P, S, T & D Plant - Demand 123,075 55,646 31,820 1,674 17,827 16,109 483 37503 Improvements 6.4 P, S, T & D Plant - Demand 0 - - - - - 484 39004 Air Conditioning Equipment 6.4 P, S, T & D Plant - Demand 0 - - - - - 485 39009 Improvement to leased Premises 6.4 P, S, T & D Plant - Demand 59,954 27,107 15,500 815 8,684 7,847 486 39100 Office Furniture & Equipment 6.4 P, S, T & D Plant - Demand 32,928 14,888 8,513 448 4,769 4,310 487 39102 Remittance Processing Equip 6.4 P, S, T & D Plant - Demand 0 - - - - - 488 39103 Office Machines 6.4 P, S, T & D Plant - Demand 0 - - - - - 489 39200 Transportation Equipment 6.4 P, S, T & D Plant - Demand 1,344 608 347 18 195 176 490 39201 Trucks 6.4 P, S, T & D Plant - Demand 0 - - - - - 491 39202 Trailers 6.4 P, S, T & D Plant - Demand 0 - - - - - 492 39300 Stores Equipment 6.4 P, S, T & D Plant - Demand 0 - - - - - 493 39400 Tools, Shop & Garage Equipment 6.4 P, S, T & D Plant - Demand 2,197 993 568 30 318 288 494 39500 Laboratory Equipment 6.4 P, S, T & D Plant - Demand 256 116 66 3 37 34 495 39603 Ditchers 6.4 P, S, T & D Plant - Demand 0 - - - - - 496 39604 Backhoes 6.4 P, S, T & D Plant - Demand 0 - - - - - 497 39605 Welders 6.4 P, S, T & D Plant - Demand 0 - - - - - 498 39700 Communication Equipment 6.4 P, S, T & D Plant - Demand 42,200 19,080 10,910 574 6,112 5,523 499 39701 Communication Equipment - Mobile Radios 6.4 P, S, T & D Plant - Demand 0 - - - - - 500 39702 Communication Equipment - Fixed Radios 6.4 P, S, T & D Plant - Demand 0 - - - - - 501 39705 Communication Equip. - Telemetering 6.4 P, S, T & D Plant - Demand 0 - - - - - 502 39800 Miscellaneous Equipment 6.4 P, S, T & D Plant - Demand 2,923 1,322 756 40 423 383 503 39900 Other Tangible Property 6.4 P, S, T & D Plant - Demand 19,110 8,640 4,941 260 2,768 2,501 504 39901 Other Tangible Property - Servers - H/W 6.4 P, S, T & D Plant - Demand 203,332 91,933 52,569 2,765 29,451 26,613 505 39902 Other Tangible Property - Servers - S/W 6.4 P, S, T & D Plant - Demand 46,519 21,033 12,027 633 6,738 6,089 506 39903 Other Tangible Property - Network - H/W 6.4 P, S, T & D Plant - Demand 13,809 6,243 3,570 188 2,000 1,807 507 39904 Other Tang. Property - CPU 6.4 P, S, T & D Plant - Demand 0 - - - - - 508 39905 Other Tangible Property - MF - Hardware 6.4 P, S, T & D Plant - Demand 0 - - - - - 509 39906 Other Tang. Property - PC Hardware 6.4 P, S, T & D Plant - Demand 26,384 11,929 6,821 359 3,821 3,453 510 39907 Other Tang. Property - PC Software 6.4 P, S, T & D Plant - Demand 6,116 2,765 1,581 83 886 800 511 39908 Other Tang. Property - Mainframe S/W 6.4 P, S, T & D Plant - Demand 1,232,963 557,465 318,770 16,767 178,586 161,376 512 39909 Other Tang. Property - Application Software 6.4 P, S, T & D Plant - Demand 2,925 1,323 756 40 424 383 513 39924 Other Tang. Property - General Startup Costs 6.4 P, S, T & D Plant - Demand 0 - - - - - 514 Retirement Work in Progress 6.4 P, S, T & D Plant - Demand 0 - - - - - 515516 Total General Plant 1,816,033 821,091 469,516 24,695 263,040 237,690 517518 TOTAL RESERVE FOR DEPRECIATION - DEMAND 100,189,586 45,299,166 25,902,954 1,362,432 14,511,777 13,113,256

Exhibit PHR-3Page 38 of 75
Atmos Energy Corporation, Kentucky/Mid-States DivisionClass Cost of Service - Demand Only StudyForecasted Test Period: Twelve Months Ended March 31, 2020
ALLOCATION OF RESERVE FOR DEPRECIATION
Commodity
Line Acct. Allocation Allocation Total Residential Non-Res Sales Non-Res Sales Transport TransportNo. No. Factor Basis Company Sales Firm Interruptible Firm Interruptible
519 Intangible Plant:520521 30100 Organization 6.6 P, S, T & D Plant - Commodity 92 35 21 1 17 17 522 30200 Franchises & Consents 6.6 P, S, T & D Plant - Commodity 1,320 500 309 17 243 251 523 30300 Misc Intangible Plant 99.0 - 0 - - - - - 524525 Total Intangible Plant: 1,412 535 331 18 260 269526527 Production Plant:528529 32520 Producing Leaseholds 99.0 - 0 - - - - - 530 32540 Rights of Ways 99.0 - 0 - - - - - 531 33100 Production Gas Wells Equipment 99.0 - 0 - - - - - 532 33201 Field Lines 99.0 - 0 - - - - - 533 33202 Tributary Lines 1.2 Sales Mcf 0 - - - - - 534 33400 Field Meas. & Reg. Sta. Equip 1.2 Sales Mcf 0 - - - - - 535 33600 Purification Equipment 99.0 - 0 - - - - - 536537 Total Production Plant 0 0 0 0 0 0538539 Storage Plant:540541 35010 Land 1.5 Winter Volumes 0 - - - - - 542 35020 Rights of Way 1.5 Winter Volumes 2,227 843 522 29 409 424 543 35100 Structures and Improvements 1.5 Winter Volumes 3,144 1,191 737 40 578 599 544 35102 Compression Station Equipment 1.5 Winter Volumes 56,872 21,533 13,324 729 10,455 10,831 545 35103 Meas. & Reg. Sta. Structues 1.5 Winter Volumes 10,242 3,878 2,399 131 1,883 1,950 546 35104 Other Structures 1.5 Winter Volumes 50,072 18,959 11,731 642 9,205 9,536 547 35200 Wells \ Rights of Way 1.5 Winter Volumes 595,415 225,442 139,498 7,628 109,455 113,392 548 35201 Well Construction 1.5 Winter Volumes 709,755 268,734 166,287 9,093 130,475 135,167 549 35202 Well Equipment 1.5 Winter Volumes 225,298 85,304 52,784 2,887 41,417 42,906 550 35203 Cushion Gas 1.5 Winter Volumes 379,297 143,613 88,864 4,860 69,726 72,234 551 35210 Leaseholds 1.5 Winter Volumes 84,031 31,817 19,687 1,077 15,447 16,003 552 35211 Storage Rights 1.5 Winter Volumes 21,978 8,321 5,149 282 4,040 4,185 553 35301 Field Lines 1.5 Winter Volumes (44,198) (16,735) (10,355) (566) (8,125) (8,417) 554 35302 Tributary Lines 1.5 Winter Volumes 94,588 35,814 22,161 1,212 17,388 18,014 555 35400 Compressor Station Equipment 1.5 Winter Volumes 248,926 94,251 58,320 3,189 45,760 47,406 556 35500 Meas & Reg. Equipment 1.5 Winter Volumes 101,272 38,344 23,727 1,297 18,617 19,286 557 35600 Purification Equipment 1.5 Winter Volumes 95,899 36,310 22,468 1,229 17,629 18,263 558559 Total Storage Plant 2,634,817 997,619 617,304 33,757 484,359 501,778 560561 Transmission:562563 36510 Land & Land Rights 99.0 - 0 - - - - - 564 36520 Rights of Way 99.0 - 0 - - - - - 565 36602 Structures & Improvements 99.0 - 0 - - - - - 566 36603 Other Structues 99.0 - 0 - - - - - 567 36700 Mains Cathodic Protection 99.0 - 0 - - - - - 568 36701 Mains - Steel 99.0 - 0 - - - - - 569 36900 Meas. & Reg. Equipment 99.0 - 0 - - - - - 570 36901 Meas. & Reg. Equipment 99.0 - 0 - - - - - 571572 Total Transmission Plant 0 - - - - - 573574 Distribution:575576 37400 Land & Land Rights 99.0 - 0 - - - - - 577 37401 Land 99.0 - 0 - - - - - 578 37402 Land Rights 1.0 Mcf 0 - - - - - 579 37403 Land Other 99.0 - 0 - - - - - 580 37500 Structures & Improvements 1.0 Mcf 0 - - - - - 581 37501 Structures & Improvements T.B. 1.0 Mcf 0 - - - - - 582 37502 Land Rights 1.0 Mcf 0 - - - - - 583 37503 Improvements 1.0 Mcf 0 - - - - - 584 37600 Mains Cathodic Protection 1.0 Mcf 0 - - - - - 585 37601 Mains - Steel 1.0 Mcf 0 - - - - - 586 37602 Mains - Plastic 1.0 Mcf 0 - - - - - 587 37800 Meas & Reg. Sta. Equip - General 1.0 Mcf 0 - - - - - 588 37900 Meas & Reg. Sta. Equip - City Gate 1.0 Mcf 0 - - - - - 589 37905 Meas & Reg. Sta. Equipment T.b. 1.0 Mcf 0 - - - - - 590 38000 Services 99.0 - 0 - - - - - 591 38100 Meters 99.0 - 0 - - - - - 592 38200 Meter Installaitons 99.0 - 0 - - - - - 593 38300 House Regulators 99.0 - 0 - - - - - 594 38400 House Reg. Installations 99.0 - 0 - - - - - 595 38500 Ind. Meas. & Reg. Sta. Equipment 99.0 - 0 - - - - - 596 38600 Other Prop. On Cust. Prem 99.0 - 0 - - - - - 597598 Total Distribution Plant 0 - - - - -

Exhibit PHR-3Page 39 of 75
Atmos Energy Corporation, Kentucky/Mid-States DivisionClass Cost of Service - Demand Only StudyForecasted Test Period: Twelve Months Ended March 31, 2020
ALLOCATION OF RESERVE FOR DEPRECIATION599600 General:601602 38900 Land & Land Rights 6.6 P, S, T & D Plant - Commodity 0 - - - - - 603 39000 Structures & Improvements 6.6 P, S, T & D Plant - Commodity 13,805 5,227 3,234 177 2,538 2,629 604 39002 Structures - Brick 6.6 P, S, T & D Plant - Commodity 1,185 449 278 15 218 226 605 39003 Improvements 6.6 P, S, T & D Plant - Commodity 3,224 1,221 755 41 593 614 606 39003 Air Conditioning Equipment 6.6 P, S, T & D Plant - Commodity 56 21 13 1 10 11 607 39004 Improvement to Leased Premises 6.6 P, S, T & D Plant - Commodity 13,746 5,205 3,221 176 2,527 2,618 608 39009 Office Furniture & Equipment 6.6 P, S, T & D Plant - Commodity 12,606 4,773 2,953 162 2,317 2,401 609 39100 Remittance Processing Equip 6.6 P, S, T & D Plant - Commodity 0 - - - - - 610 39102 Office Machines 6.6 P, S, T & D Plant - Commodity 0 - - - - - 611 39103 Transportation Equipment 6.6 P, S, T & D Plant - Commodity 1,253 475 294 16 230 239 612 39200 Trucks 6.6 P, S, T & D Plant - Commodity 0 - - - - - 613 39201 Trailers 6.6 P, S, T & D Plant - Commodity (28) (11) (7) (0) (5) (5) 614 39202 Stores Equipment 6.6 P, S, T & D Plant - Commodity 0 - - - - - 615 39400 Tools, Shop & Garage Equipment 6.6 P, S, T & D Plant - Commodity 14,327 5,425 3,357 184 2,634 2,728 616 39600 Power Operated Equipment 6.6 P, S, T & D Plant - Commodity 0 - - - - - 617 39603 Ditchers 6.6 P, S, T & D Plant - Commodity 437 165 102 6 80 83 618 39604 Backhoes 6.6 P, S, T & D Plant - Commodity 692 262 162 9 127 132 619 39605 Welders 6.6 P, S, T & D Plant - Commodity 214 81 50 3 39 41 620 39700 Communication Equipment 6.6 P, S, T & D Plant - Commodity 2,963 1,122 694 38 545 564 621 39701 Communication Equipment - Mobile Radios 6.6 P, S, T & D Plant - Commodity 0 - - - - - 622 39702 Communication Equipment - Fixed Radios 6.6 P, S, T & D Plant - Commodity 0 - - - - - 623 39705 Communication Equip. - Telemetering 6.6 P, S, T & D Plant - Commodity 0 - - - - - 624 39800 Miscellaneous Equipment 6.6 P, S, T & D Plant - Commodity 22,830 8,644 5,349 292 4,197 4,348 625 39900 Other Tangible Property 6.6 P, S, T & D Plant - Commodity 0 - - - - - 626 39901 Other Tangible Property - Servers - H/W 6.6 P, S, T & D Plant - Commodity 73 28 17 1 14 14 627 39902 Other Tangible Property - Servers - S/W 6.6 P, S, T & D Plant - Commodity 0 - - - - - 628 39903 Other Tangible Property - Network - H/W 6.6 P, S, T & D Plant - Commodity 712 270 167 9 131 136 629 39904 Other Tang. Property - CPU 6.6 P, S, T & D Plant - Commodity 0 - - - - - 630 39905 Other Tangible Property - MF - Hardware 6.6 P, S, T & D Plant - Commodity 0 - - - - - 631 39906 Other Tang. Property - PC Hardware 6.6 P, S, T & D Plant - Commodity 1,236 468 290 16 227 235 632 39907 Other Tang. Property - PC Software 6.6 P, S, T & D Plant - Commodity 0 - - - - - 633 39908 Other Tang. Property - Mainframe S/W 6.6 P, S, T & D Plant - Commodity 0 - - - - - 634 39909 Other Tang. Property - Application Software 6.6 P, S, T & D Plant - Commodity 1,299 492 304 17 239 247 635 Other Tang. Property - General Startup Costs 6.6 P, S, T & D Plant - Commodity 0 - - - - - 636 Retirement Work in Progress 6.6 P, S, T & D Plant - Commodity (70,209) (26,583) (16,449) (900) (12,906) (13,371) 637 AR 15 general plant amortization 6.6 P, S, T & D Plant - Commodity 0 - - - - - 638639 Total General Plant 20,422 7,732 4,785 262 3,754 3,889 640641 TOTAL DIRECT RESERVE FOR DEPRECIATION 2,656,651 1,005,885 622,419 34,037 488,373 505,936642643 Kentucky Mid-States General Office:644645 Intangible Plant:646647 30100 Organization 99.0 - 0 - - - - - 648 30200 Franchises & Consents 99.0 - 0 - - - - - 649 30300 Misc Intangible Plant 99.0 - 0 - - - - - 650651 Total Intangible Plant:652653 General:654655 37400 Land & Land Rights 6.6 P, S, T & D Plant - Commodity 0 - - - - - 656 39001 Structures Frame 6.6 P, S, T & D Plant - Commodity 581 220 136 7 107 111 657 36602 Structures & Improvements 6.6 P, S, T & D Plant - Commodity 0 - - - - - 658 38900 Land & Land Rights 6.6 P, S, T & D Plant - Commodity 0 - - - - - 659 39004 Air Conditioning Equipment 6.6 P, S, T & D Plant - Commodity 56 21 13 1 10 11 660 39009 Improvement to leased Premises 6.6 P, S, T & D Plant - Commodity 213 81 50 3 39 41 661 39100 Office Furniture & Equipment 6.6 P, S, T & D Plant - Commodity 212 80 50 3 39 40 662 39102 Remittance Processing Equip 6.6 P, S, T & D Plant - Commodity 0 - - - - - 663 39103 Office Machines 6.6 P, S, T & D Plant - Commodity 0 - - - - - 664 39200 Transportation Equipment 6.6 P, S, T & D Plant - Commodity 98 37 23 1 18 19 665 39201 Trucks 6.6 P, S, T & D Plant - Commodity 0 - - - - - 666 39202 Trailers 6.6 P, S, T & D Plant - Commodity 0 - - - - - 667 39300 Stores Equipment 6.6 P, S, T & D Plant - Commodity 0 - - - - - 668 39400 Tools, Shop & Garage Equipment 6.6 P, S, T & D Plant - Commodity 789 299 185 10 145 150 669 39600 Power Operated Equipment 6.6 P, S, T & D Plant - Commodity 48 18 11 1 9 9 670 39603 Ditchers 6.6 P, S, T & D Plant - Commodity 0 - - - - - 671 39604 Backhoes 6.6 P, S, T & D Plant - Commodity 0 - - - - - 672 39605 Welders 6.6 P, S, T & D Plant - Commodity 0 - - - - - 673 39700 Communication Equipment 6.6 P, S, T & D Plant - Commodity (33) (12) (8) (0) (6) (6) 674 39701 Communication Equipment - Mobile Radios 6.6 P, S, T & D Plant - Commodity 0 - - - - - 675 39702 Communication Equipment - Fixed Radios 6.6 P, S, T & D Plant - Commodity 0 - - - - - 676 39705 Communication Equip. - Telemetering 6.6 P, S, T & D Plant - Commodity 0 - - - - - 677 39800 Miscellaneous Equipment 6.6 P, S, T & D Plant - Commodity 3,958 1,498 927 51 728 754 678 39900 Other Tangible Property 6.6 P, S, T & D Plant - Commodity 0 - - - - - 679 39901 Other Tangible Property - Servers - H/W 6.6 P, S, T & D Plant - Commodity (191) (72) (45) (2) (35) (36) 680 39902 Other Tangible Property - Servers - S/W 6.6 P, S, T & D Plant - Commodity 0 - - - - - 681 39903 Other Tangible Property - Network - H/W 6.6 P, S, T & D Plant - Commodity 0 - - - - - 682 39904 Other Tang. Property - CPU 6.6 P, S, T & D Plant - Commodity 0 - - - - - 683 39905 Other Tangible Property - MF - Hardware 6.6 P, S, T & D Plant - Commodity 0 - - - - - 684 39906 Other Tang. Property - PC Hardware 6.6 P, S, T & D Plant - Commodity 385 146 90 5 71 73 685 39907 Other Tang. Property - PC Software 6.6 P, S, T & D Plant - Commodity 232 88 54 3 43 44 686 39908 Other Tang. Property - Mainframe S/W 6.6 P, S, T & D Plant - Commodity 4,542 1,720 1,064 58 835 865 687 39909 Other Tang. Property - Application Software 6.6 P, S, T & D Plant - Commodity 0 - - - - - 688 39924 Other Tang. Property - General Startup Costs 6.6 P, S, T & D Plant - Commodity 0 - - - - - 689 Retirement Work in Progress 6.6 P, S, T & D Plant - Commodity 288 109 67 4 53 55 690691 Total General Plant 11,177 4,232 2,619 143 2,055 2,129

Exhibit PHR-3Page 40 of 75
Atmos Energy Corporation, Kentucky/Mid-States DivisionClass Cost of Service - Demand Only StudyForecasted Test Period: Twelve Months Ended March 31, 2020
ALLOCATION OF RESERVE FOR DEPRECIATION692693 Shared Services General Office:694695 General:696697 37400 Land & Land Rights 6.6 P, S, T & D Plant - Commodity 0 - - - - - 698 39000 Structures & Improvements 6.6 P, S, T & D Plant - Commodity 1,001 379 234 13 184 191 699 36602 Structures & Improvements 6.6 P, S, T & D Plant - Commodity 0 - - - - - 700 37503 Improvements 6.6 P, S, T & D Plant - Commodity 0 - - - - - 701 39004 Air Conditioning Equipment 6.6 P, S, T & D Plant - Commodity 0 - - - - - 702 39009 Improvement to leased Premises 6.6 P, S, T & D Plant - Commodity 5,313 2,012 1,245 68 977 1,012 703 39100 Office Furniture & Equipment 6.6 P, S, T & D Plant - Commodity 1,280 485 300 16 235 244 704 39102 Remittance Processing Equip 6.6 P, S, T & D Plant - Commodity 0 0 0 0 0 0 705 39103 Office Machines 6.6 P, S, T & D Plant - Commodity 0 0 0 0 0 0 706 39200 Transportation Equipment 6.6 P, S, T & D Plant - Commodity 3 1 1 0 1 1 707 39201 Trucks 6.6 P, S, T & D Plant - Commodity 0 - - - - - 708 39202 Trailers 6.6 P, S, T & D Plant - Commodity 0 - - - - - 709 39300 Stores Equipment 6.6 P, S, T & D Plant - Commodity 0 - - - - - 710 39400 Tools, Shop & Garage Equipment 6.6 P, S, T & D Plant - Commodity 19 7 4 0 3 4 711 39600 Power Operated Equipment 6.6 P, S, T & D Plant - Commodity 0 - - - - - 712 39603 Ditchers 6.6 P, S, T & D Plant - Commodity 0 - - - - - 713 39604 Backhoes 6.6 P, S, T & D Plant - Commodity 0 - - - - - 714 39605 Welders 6.6 P, S, T & D Plant - Commodity 0 - - - - - 715 39700 Communication Equipment 6.6 P, S, T & D Plant - Commodity 312 118 73 4 57 59 716 39701 Communication Equipment - Mobile Radios 6.6 P, S, T & D Plant - Commodity 0 - - - - - 717 39702 Communication Equipment - Fixed Radios 6.6 P, S, T & D Plant - Commodity 0 - - - - - 718 39705 Communication Equip. - Telemetering 6.6 P, S, T & D Plant - Commodity 0 - - - - - 719 39800 Miscellaneous Equipment 6.6 P, S, T & D Plant - Commodity 31 12 7 0 6 6 720 39900 Other Tangible Property 6.6 P, S, T & D Plant - Commodity 93 35 22 1 17 18 721 39901 Other Tangible Property - Servers - H/W 6.6 P, S, T & D Plant - Commodity 14,709 5,569 3,446 188 2,704 2,801 722 39902 Other Tangible Property - Servers - S/W 6.6 P, S, T & D Plant - Commodity 10,681 4,044 2,502 137 1,963 2,034 723 39903 Other Tangible Property - Network - H/W 6.6 P, S, T & D Plant - Commodity 1,478 560 346 19 272 281 724 39904 Other Tang. Property - CPU 6.6 P, S, T & D Plant - Commodity 0 - - - - - 725 39905 Other Tangible Property - MF - Hardware 6.6 P, S, T & D Plant - Commodity 0 - - - - - 726 39906 Other Tang. Property - PC Hardware 6.6 P, S, T & D Plant - Commodity 1,036 392 243 13 190 197 727 39907 Other Tang. Property - PC Software 6.6 P, S, T & D Plant - Commodity 1,013 383 237 13 186 193 728 39908 Other Tang. Property - Mainframe S/W 6.6 P, S, T & D Plant - Commodity 25 10 6 0 5 5 729 39909 Other Tang. Property - Application Software 6.6 P, S, T & D Plant - Commodity 27,826 10,536 6,519 357 5,115 5,299 730 39924 Other Tang. Property - General Startup Costs 6.6 P, S, T & D Plant - Commodity 0 - - - - - 731 Retirement Work in Progress 6.6 P, S, T & D Plant - Commodity 0 - - - - - 732733 Total General Plant 64,818 24,542 15,186 830 11,916 12,344 734 18,270 6,918 4,280 234 3,359 3,479735 Shared Services Customer Support:736737 General:738739 37400 Land & Land Rights 6.6 P, S, T & D Plant - Commodity 0 - - - - - 740 39001 Structures Frame 6.6 P, S, T & D Plant - Commodity 0 - - - - - 741 36602 Structures & Improvements 6.6 P, S, T & D Plant - Commodity 2,254 854 528 29 414 429 742 37503 Improvements 6.6 P, S, T & D Plant - Commodity 0 - - - - - 743 39004 Air Conditioning Equipment 6.6 P, S, T & D Plant - Commodity 0 - - - - - 744 39009 Improvement to leased Premises 6.6 P, S, T & D Plant - Commodity 1,098 416 257 14 202 209 745 39100 Office Furniture & Equipment 6.6 P, S, T & D Plant - Commodity 603 228 141 8 111 115 746 39102 Remittance Processing Equip 6.6 P, S, T & D Plant - Commodity 0 - - - - - 747 39103 Office Machines 6.6 P, S, T & D Plant - Commodity 0 - - - - - 748 39200 Transportation Equipment 6.6 P, S, T & D Plant - Commodity 25 9 6 0 5 5 749 39201 Trucks 6.6 P, S, T & D Plant - Commodity 0 - - - - - 750 39202 Trailers 6.6 P, S, T & D Plant - Commodity 0 - - - - - 751 39300 Stores Equipment 6.6 P, S, T & D Plant - Commodity 0 - - - - - 752 39400 Tools, Shop & Garage Equipment 6.6 P, S, T & D Plant - Commodity 40 15 9 1 7 8 753 39500 Laboratory Equipment 6.6 P, S, T & D Plant - Commodity 5 2 1 0 1 1 754 39603 Ditchers 6.6 P, S, T & D Plant - Commodity 0 - - - - - 755 39604 Backhoes 6.6 P, S, T & D Plant - Commodity 0 - - - - - 756 39605 Welders 6.6 P, S, T & D Plant - Commodity 0 - - - - - 757 39700 Communication Equipment 6.6 P, S, T & D Plant - Commodity 773 293 181 10 142 147 758 39701 Communication Equipment - Mobile Radios 6.6 P, S, T & D Plant - Commodity 0 - - - - - 759 39702 Communication Equipment - Fixed Radios 6.6 P, S, T & D Plant - Commodity 0 - - - - - 760 39705 Communication Equip. - Telemetering 6.6 P, S, T & D Plant - Commodity 0 - - - - - 761 39800 Miscellaneous Equipment 6.6 P, S, T & D Plant - Commodity 54 20 13 1 10 10 762 39900 Other Tangible Property 6.6 P, S, T & D Plant - Commodity 350 133 82 4 64 67 763 39901 Other Tangible Property - Servers - H/W 6.6 P, S, T & D Plant - Commodity 3,724 1,410 873 48 685 709 764 39902 Other Tangible Property - Servers - S/W 6.6 P, S, T & D Plant - Commodity 852 323 200 11 157 162 765 39903 Other Tangible Property - Network - H/W 6.6 P, S, T & D Plant - Commodity 253 96 59 3 46 48 766 39904 Other Tang. Property - CPU 6.6 P, S, T & D Plant - Commodity 0 - - - - - 767 39905 Other Tangible Property - MF - Hardware 6.6 P, S, T & D Plant - Commodity 0 - - - - - 768 39906 Other Tang. Property - PC Hardware 6.6 P, S, T & D Plant - Commodity 483 183 113 6 89 92 769 39907 Other Tang. Property - PC Software 6.6 P, S, T & D Plant - Commodity 112 42 26 1 21 21 770 39908 Other Tang. Property - Mainframe S/W 6.6 P, S, T & D Plant - Commodity 22,583 8,551 5,291 289 4,151 4,301 771 39909 Other Tang. Property - Application Software 6.6 P, S, T & D Plant - Commodity 54 20 13 1 10 10 772 39924 Other Tang. Property - General Startup Costs 6.6 P, S, T & D Plant - Commodity 0 - - - - - 773 Retirement Work in Progress 6.6 P, S, T & D Plant - Commodity 0 - - - - - 774775 Total General Plant 33,263 12,594 7,793 426 6,115 6,335 776777 TOTAL RESERVE FOR DEPRECIATION - COMMODITY 2,765,910 1,047,254 648,017 35,437 508,458 526,744

Exhibit PHR-3Page 41 of 75
Atmos Energy Corporation, Kentucky/Mid-States DivisionClass Cost of Service - Demand Only StudyForecasted Test Period: Twelve Months Ended March 31, 2020
ALLOCATION OF RESERVE FOR DEPRECIATION
Total Reserve for Depreciation
Line Acct. Allocation Allocation Total Residential Non-Res Sales Non-Res Sales Transport TransportNo. No. Factor Basis Company Sales Firm Interruptible Firm Interruptible
778 Intangible Plant:779780 30100 Organization 8,330 4,792 2,019 71 763 685 781 30200 Franchises & Consents 119,853 68,948 29,044 1,021 10,984 9,855 782 30300 Misc Intangible Plant 0 - - - - - 783784 Total Intangible Plant: 128,182 73,740 31,063 1,092 11,747 10,540785786 Production Plant:787788 32520 Producing Leaseholds 0 - - - - - 789 32540 Rights of Ways 0 - - - - - 790 33100 Production Gas Wells Equipment 0 - - - - - 791 33201 Field Lines 0 - - - - - 792 33202 Tributary Lines 0 - - - - - 793 33400 Field Meas. & Reg. Sta. Equip 0 - - - - - 794 33600 Purification Equipment 0 - - - - - 795796 Total Production Plant 0 0 0 0 0 0797798 Storage Plant:799800 35010 Land 0 - - - - - 801 35020 Rights of Way 4,453 1,850 1,097 59 732 715 802 35100 Structures and Improvements 6,289 2,612 1,550 83 1,033 1,010 803 35102 Compression Station Equipment 113,744 47,247 28,028 1,502 18,692 18,275 804 35103 Meas. & Reg. Sta. Structues 20,483 8,508 5,047 270 3,366 3,291 805 35104 Other Structures 100,144 41,598 24,677 1,322 16,457 16,089 806 35200 Wells \ Rights of Way 1,190,830 494,649 293,436 15,725 195,697 191,322 807 35201 Well Construction 1,419,511 589,639 349,786 18,745 233,278 228,063 808 35202 Well Equipment 450,595 187,169 111,033 5,950 74,049 72,394 809 35203 Cushion Gas 758,594 315,106 186,928 10,017 124,665 121,878 810 35210 Leaseholds 168,062 69,810 41,413 2,219 27,619 27,001 811 35211 Storage Rights 43,956 18,258 10,831 580 7,224 7,062 812 35301 Field Lines (88,396) (36,718) (21,782) (1,167) (14,527) (14,202) 813 35302 Tributary Lines 189,177 78,581 46,616 2,498 31,089 30,394 814 35400 Compressor Station Equipment 497,853 206,799 122,678 6,574 81,815 79,986 815 35500 Meas & Reg. Equipment 202,544 84,133 49,909 2,675 33,285 32,541 816 35600 Purification Equipment 191,797 79,669 47,261 2,533 31,519 30,815 817818 Total Storage Plant 5,269,635 2,188,910 1,298,508 69,587 865,995 846,635 819820 Transmission:821822 36510 Land & Land Rights 0 - - - - - 823 36520 Rights of Way 428,096 193,557 110,680 5,821 62,007 56,031 824 36602 Structures & Improvements 16,837 7,613 4,353 229 2,439 2,204 825 36603 Other Structues 53,066 23,993 13,720 722 7,686 6,946 826 36700 Mains Cathodic Protection 98,316 44,452 25,419 1,337 14,240 12,868 827 36701 Mains - Steel 16,387,961 7,409,562 4,236,933 222,852 2,373,684 2,144,929 828 36900 Meas. & Reg. Equipment 353,469 159,816 91,386 4,807 51,198 46,264 829 36901 Meas. & Reg. Equipment 1,774,251 802,200 458,714 24,127 256,988 232,222 830831 Total Transmission Plant 19,111,996 8,641,192 4,941,204 259,895 2,768,242 2,501,463 832833 Distribution:834835 37400 Land & Land Rights 0 - - - - - 836 37401 Land 0 - - - - - 837 37402 Land Rights 235,363 106,416 60,851 3,201 34,091 30,805 838 37403 Land Other 0 - - - - - 839 37500 Structures & Improvements 113,695 51,405 29,395 1,546 16,468 14,881 840 37501 Structures & Improvements T.B. 71,449 32,305 18,472 972 10,349 9,352 841 37502 Land Rights 35,399 16,005 9,152 481 5,127 4,633 842 37503 Improvements 1,920 868 496 26 278 251 843 37600 Mains Cathodic Protection 13,210,658 5,972,994 3,415,475 179,646 1,913,474 1,729,069 844 37601 Mains - Steel 33,671,112 15,223,870 8,705,309 457,878 4,877,031 4,407,024 845 37602 Mains - Plastic 19,028,671 8,603,518 4,919,661 258,762 2,756,173 2,490,557 846 37800 Meas & Reg. Sta. Equip - General 2,894,799 1,308,838 748,420 39,365 419,292 378,884 847 37900 Meas & Reg. Sta. Equip - City Gate 984,409 445,085 254,508 13,387 142,585 128,844 848 37905 Meas & Reg. Sta. Equipment T.b. 1,038,111 469,366 268,393 14,117 150,363 135,873 849 38000 Services 30,562,139 27,216,572 3,310,936 1,683 21,040 11,908 850 38100 Meters 21,386,354 13,797,005 7,076,398 24,923 311,648 176,380 851 38200 Meter Installaitons 26,987,899 17,410,737 8,929,858 31,450 393,275 222,578 852 38300 House Regulators 4,321,265 2,787,783 1,429,836 5,036 62,971 35,639 853 38400 House Reg. Installations 94,403 60,903 31,237 110 1,376 779 854 38500 Ind. Meas. & Reg. Sta. Equipment 2,958,741 - 2,928,115 1,488 18,607 10,531 855 38600 Other Prop. On Cust. Prem 0 - - - - - 856857 Total Distribution Plant 157,596,387 93,503,670 42,136,512 1,034,069 11,134,147 9,787,988

Exhibit PHR-3Page 42 of 75
Atmos Energy Corporation, Kentucky/Mid-States DivisionClass Cost of Service - Demand Only StudyForecasted Test Period: Twelve Months Ended March 31, 2020
ALLOCATION OF RESERVE FOR DEPRECIATION858859 General:860861 38900 Land & Land Rights 0 - - - - - 862 39000 Structures & Improvements 1,253,482 721,094 303,761 10,680 114,876 103,072 863 39002 Structures - Brick 107,583 61,889 26,071 917 9,859 8,846 864 39003 Improvements 292,730 168,399 70,938 2,494 26,827 24,071 865 39003 Air Conditioning Equipment 5,049 2,905 1,224 43 463 415 866 39004 Improvement to Leased Premises 1,248,110 718,003 302,459 10,634 114,384 102,630 867 39009 Office Furniture & Equipment 1,144,609 658,462 277,378 9,752 104,898 94,119 868 39100 Remittance Processing Equip 0 - - - - - 869 39102 Office Machines 0 - - - - - 870 39103 Transportation Equipment 113,788 65,459 27,575 969 10,428 9,357 871 39200 Trucks 0 - - - - - 872 39201 Trailers (2,529) (1,455) (613) (22) (232) (208) 873 39202 Stores Equipment 0 - - - - - 874 39400 Tools, Shop & Garage Equipment 1,300,851 748,344 315,240 11,083 119,217 106,967 875 39600 Power Operated Equipment 0 - - - - - 876 39603 Ditchers 39,655 22,812 9,610 338 3,634 3,261 877 39604 Backhoes 62,818 36,137 15,223 535 5,757 5,165 878 39605 Welders 19,456 11,193 4,715 166 1,783 1,600 879 39700 Communication Equipment 269,010 154,754 65,190 2,292 24,654 22,120 880 39701 Communication Equipment - Mobile Radios 0 - - - - - 881 39702 Communication Equipment - Fixed Radios 0 - - - - - 882 39705 Communication Equip. - Telemetering 0 - - - - - 883 39800 Miscellaneous Equipment 2,072,883 1,192,472 502,330 17,661 189,970 170,450 884 39900 Other Tangible Property 0 - - - - - 885 39901 Other Tangible Property - Servers - H/W 6,670 3,837 1,616 57 611 548 886 39902 Other Tangible Property - Servers - S/W 0 - - - - - 887 39903 Other Tangible Property - Network - H/W 64,644 37,188 15,666 551 5,924 5,316 888 39904 Other Tang. Property - CPU 0 - - - - - 889 39905 Other Tangible Property - MF - Hardware 0 - - - - - 890 39906 Other Tang. Property - PC Hardware 112,226 64,560 27,196 956 10,285 9,228 891 39907 Other Tang. Property - PC Software 0 - - - - - 892 39908 Other Tang. Property - Mainframe S/W 0 - - - - - 893 39909 Other Tang. Property - Application Software 117,916 67,834 28,575 1,005 10,806 9,696 894 Other Tang. Property - General Startup Costs 0 - - - - - 895 Retirement Work in Progress (6,374,709) (3,667,194) (1,544,808) (54,312) (584,213) (524,182) 896 AR 15 general plant amortization 0 - - - - - 897898 Total General Plant 1,854,243 1,066,695 449,346 15,798 169,933 152,472 899900 TOTAL DIRECT RESERVE FOR DEPRECIATION 183,960,444 105,474,208 48,856,633 1,380,442 14,950,064 13,299,097901902 Kentucky Mid-States General Office:903904 Intangible Plant:905906 30100 Organization 0 - - - - - 907 30200 Franchises & Consents 0 - - - - - 908 30300 Misc Intangible Plant 0 - - - - - 909910 Total Intangible Plant:911912 General:913914 37400 Land & Land Rights 0 - - - - - 915 39001 Structures Frame 52,708 30,321 12,773 449 4,830 4,334 916 36602 Structures & Improvements 0 - - - - - 917 38900 Land & Land Rights 0 - - - - - 918 39004 Air Conditioning Equipment 5,090 2,928 1,233 43 466 419 919 39009 Improvement to leased Premises 19,332 11,121 4,685 165 1,772 1,590 920 39100 Office Furniture & Equipment 19,220 11,057 4,658 164 1,761 1,580 921 39102 Remittance Processing Equip 0 - - - - - 922 39103 Office Machines 0 - - - - - 923 39200 Transportation Equipment 8,895 5,117 2,156 76 815 731 924 39201 Trucks 0 - - - - - 925 39202 Trailers 0 - - - - - 926 39300 Stores Equipment 0 - - - - - 927 39400 Tools, Shop & Garage Equipment 71,611 41,196 17,354 610 6,563 5,888 928 39600 Power Operated Equipment 4,375 2,517 1,060 37 401 360 929 39603 Ditchers 0 - - - - - 930 39604 Backhoes 0 - - - - - 931 39605 Welders 0 - - - - - 932 39700 Communication Equipment (2,991) (1,721) (725) (25) (274) (246) 933 39701 Communication Equipment - Mobile Radios 0 - - - - - 934 39702 Communication Equipment - Fixed Radios 0 - - - - - 935 39705 Communication Equip. - Telemetering 0 - - - - - 936 39800 Miscellaneous Equipment 359,341 206,719 87,080 3,062 32,932 29,548 937 39900 Other Tangible Property 0 - - - - - 938 39901 Other Tangible Property - Servers - H/W (17,306) (9,956) (4,194) (147) (1,586) (1,423) 939 39902 Other Tangible Property - Servers - S/W 0 - - - - - 940 39903 Other Tangible Property - Network - H/W 0 - - - - - 941 39904 Other Tang. Property - CPU 0 - - - - - 942 39905 Other Tangible Property - MF - Hardware 0 - - - - - 943 39906 Other Tang. Property - PC Hardware 34,944 20,102 8,468 298 3,202 2,873 944 39907 Other Tang. Property - PC Software 21,086 12,130 5,110 180 1,932 1,734 945 39908 Other Tang. Property - Mainframe S/W 412,432 237,261 99,946 3,514 37,797 33,914 946 39909 Other Tang. Property - Application Software 0 - - - - - 947 39924 Other Tang. Property - General Startup Costs 0 - - - - - 948 Retirement Work in Progress 26,143 15,039 6,335 223 2,396 2,150 949950 Total General Plant 1,014,877 583,831 245,939 8,647 93,009 83,452

Exhibit PHR-3Page 43 of 75
Atmos Energy Corporation, Kentucky/Mid-States DivisionClass Cost of Service - Demand Only StudyForecasted Test Period: Twelve Months Ended March 31, 2020
ALLOCATION OF RESERVE FOR DEPRECIATION951952 Shared Services General Office:953954 General:955956 37400 Land & Land Rights 0 - - - - - 957 39000 Structures & Improvements 90,855 52,266 22,017 774 8,326 7,471 958 36602 Structures & Improvements 0 - - - - - 959 37503 Improvements 0 - - - - - 960 39004 Air Conditioning Equipment 0 - - - - - 961 39009 Improvement to leased Premises 482,368 277,493 116,894 4,110 44,207 39,664 962 39100 Office Furniture & Equipment 116,207 66,851 28,161 990 10,650 9,556 963 39102 Remittance Processing Equip 0 0 0 0 0 0 964 39103 Office Machines 0 0 0 0 0 0 965 39200 Transportation Equipment 284 164 69 2 26 23 966 39201 Trucks 0 - - - - - 967 39202 Trailers 0 - - - - - 968 39300 Stores Equipment 0 - - - - - 969 39400 Tools, Shop & Garage Equipment 1,722 991 417 15 158 142 970 39600 Power Operated Equipment 0 - - - - - 971 39603 Ditchers 0 - - - - - 972 39604 Backhoes 0 - - - - - 973 39605 Welders 0 - - - - - 974 39700 Communication Equipment 28,314 16,288 6,861 241 2,595 2,328 975 39701 Communication Equipment - Mobile Radios 0 - - - - - 976 39702 Communication Equipment - Fixed Radios 0 - - - - - 977 39705 Communication Equip. - Telemetering 0 - - - - - 978 39800 Miscellaneous Equipment 2,855 1,643 692 24 262 235 979 39900 Other Tangible Property 8,438 4,854 2,045 72 773 694 980 39901 Other Tangible Property - Servers - H/W 1,335,526 768,291 323,643 11,379 122,395 109,818 981 39902 Other Tangible Property - Servers - S/W 969,778 557,886 235,010 8,262 88,876 79,743 982 39903 Other Tangible Property - Network - H/W 134,188 77,194 32,518 1,143 12,298 11,034 983 39904 Other Tang. Property - CPU 0 - - - - - 984 39905 Other Tangible Property - MF - Hardware 0 - - - - - 985 39906 Other Tang. Property - PC Hardware 94,055 54,107 22,793 801 8,620 7,734 986 39907 Other Tang. Property - PC Software 91,932 52,886 22,278 783 8,425 7,559 987 39908 Other Tang. Property - Mainframe S/W 2,311 1,329 560 20 212 190 988 39909 Other Tang. Property - Application Software 2,526,463 1,453,404 612,247 21,525 231,539 207,747 989 39924 Other Tang. Property - General Startup Costs 0 - - - - - 990 Retirement Work in Progress 0 - - - - - 991992 Total General Plant 5,885,295 3,385,648 1,426,206 50,143 539,360 483,939 993994 Shared Services Customer Support:995996 General:997998 37400 Land & Land Rights 0 - - - - - 999 39001 Structures Frame 0 - - - - -
1000 36602 Structures & Improvements 204,679 117,746 49,601 1,744 18,758 16,830 1001 37503 Improvements 0 - - - - - 1002 39004 Air Conditioning Equipment 0 - - - - - 1003 39009 Improvement to leased Premises 99,706 57,358 24,162 849 9,138 8,199 1004 39100 Office Furniture & Equipment 54,761 31,502 13,270 467 5,019 4,503 1005 39102 Remittance Processing Equip 0 - - - - - 1006 39103 Office Machines 0 - - - - - 1007 39200 Transportation Equipment 2,235 1,286 542 19 205 184 1008 39201 Trucks 0 - - - - - 1009 39202 Trailers 0 - - - - - 1010 39300 Stores Equipment 0 - - - - - 1011 39400 Tools, Shop & Garage Equipment 3,654 2,102 885 31 335 300 1012 39500 Laboratory Equipment 426 245 103 4 39 35 1013 39603 Ditchers 0 - - - - - 1014 39604 Backhoes 0 - - - - - 1015 39605 Welders 0 - - - - - 1016 39700 Communication Equipment 70,180 40,373 17,007 598 6,432 5,771 1017 39701 Communication Equipment - Mobile Radios 0 - - - - - 1018 39702 Communication Equipment - Fixed Radios 0 - - - - - 1019 39705 Communication Equip. - Telemetering 0 - - - - - 1020 39800 Miscellaneous Equipment 4,862 2,797 1,178 41 446 400 1021 39900 Other Tangible Property 31,781 18,283 7,702 271 2,913 2,613 1022 39901 Other Tangible Property - Servers - H/W 338,151 194,529 81,945 2,881 30,990 27,806 1023 39902 Other Tangible Property - Servers - S/W 77,363 44,505 18,748 659 7,090 6,361 1024 39903 Other Tangible Property - Network - H/W 22,965 13,211 5,565 196 2,105 1,888 1025 39904 Other Tang. Property - CPU 0 - - - - - 1026 39905 Other Tangible Property - MF - Hardware 0 - - - - - 1027 39906 Other Tang. Property - PC Hardware 43,877 25,241 10,633 374 4,021 3,608 1028 39907 Other Tang. Property - PC Software 10,171 5,851 2,465 87 932 836 1029 39908 Other Tang. Property - Mainframe S/W 2,050,478 1,179,584 496,900 17,470 187,917 168,608 1030 39909 Other Tang. Property - Application Software 4,865 2,799 1,179 41 446 400 1031 39924 Other Tang. Property - General Startup Costs 0 - - - - - 1032 Retirement Work in Progress 0 - - - - - 10331034 Total General Plant 3,020,151 1,737,410 731,885 25,732 276,783 248,342 10351036 TOTAL RESERVE FOR DEPRECIATION 193,880,768 111,181,096 51,260,663 1,464,963 15,859,216 14,114,830

Exhibit PHR-3Page 44 of 75
Atmos Energy Corporation, Kentucky/Mid-States DivisionClass Cost of Service - Demand Only StudyForecasted Test Period: Twelve Months Ended March 31, 2020
ALLOCATION OF OTHER RATE BASE
Customer
Line Allocation Allocation Total Residential Non-Res Sales Non-Res Sales Transport TransportNo. Factor Basis Company Sales Firm Interruptible Firm Interruptible
1 Rate Base Additions:23 Materials and Supplies - KY Direct 7.2 Allocated O&M Expenses - Cust (39,665) (31,233) (8,136) (27) (171) (97) 4 Materials and Supplies - KY Mid-States GO 7.2 Allocated O&M Expenses - Cust 51,291 40,388 10,521 35 222 126 5 Materials and Supplies - Shared Services GO 7.2 Allocated O&M Expenses - Cust (0) (0) (0) (0) (0) (0) 6 Materials and Supplies - Shared Services CS 7.2 Allocated O&M Expenses - Cust 0 - - - - - 7 Gas Storage Inventory 99.0 - 0 - - - - - 8 Prepayments - KY Direct 7.2 Allocated O&M Expenses - Cust 0 - - - - - 9 Prepayments - KY Mid-States GO 7.2 Allocated O&M Expenses - Cust 0 - - - - -
10 Prepayments - Shared Services GO 7.2 Allocated O&M Expenses - Cust 0 - - - - - 11 Prepayments - Shared Services CS 7.2 Allocated O&M Expenses - Cust 0 - - - - - 12 Cash Working Capital 7.2 Allocated O&M Expenses - Cust 265,609 209,149 54,482 181 1,148 650 13 Regulatory Assets 7.2 Allocated O&M Expenses - Cust (3,257,103) (2,564,742) (668,094) (2,217) (14,078) (7,971) 1415 Total Rate Base Additions (2,979,868) (2,346,439) (611,228) (2,029) (12,880) (7,292)161718 Rate Base Deductions:1920 Customer Advances - KY Direct 2.0 Bills (747,234) (665,436) (80,951) (41) (514) (291) 21 Customer Advances - KY Mid-States GO 2.0 Bills 0 - - - - - 22 Customer Advances - Shared Services GO 2.0 Bills 0 - - - - - 23 Customer Advances - Shared Services CS 2.0 Bills 0 - - - - - 24 ADIT - KY Direct 9.2 Allocated Net Plant - Cust (27,044,140) (21,578,621) (5,229,008) (11,491) (143,695) (81,326) 25 ADIT - KY Mid-States GO 9.2 Allocated Net Plant - Cust 8,225,242 6,562,951 1,590,357 3,495 43,704 24,735 26 ADIT - Shared Services GO 9.2 Allocated Net Plant - Cust (305,471) (243,737) (59,063) (130) (1,623) (919) 27 ADIT - Shared Services CS 9.2 Allocated Net Plant - Cust 24,343 19,423 4,707 10 129 73 28 Change in Net Operating Loss Carryforward 9.2 Allocated Net Plant - Cust 466,510 372,230 90,200 198 2,479 1,403 2930 Total Rate Base Deductions (19,380,752) (15,533,190) (3,683,758) (7,959) (99,521) (56,325) 313233 TOTAL OTHER RB - CUSTOMER (22,360,620) (17,879,629) (4,294,986) (9,987) (112,401) (63,617) 3435 Interest on Customer Deposits 2.0 Bills 0 - - - - -

Exhibit PHR-3Page 45 of 75
Atmos Energy Corporation, Kentucky/Mid-States DivisionClass Cost of Service - Demand Only StudyForecasted Test Period: Twelve Months Ended March 31, 2020
ALLOCATION OF OTHER RATE BASE
Demand
Line Allocation Allocation Total Residential Non-Res Sales Non-Res Sales Transport TransportNo. Factor Basis Company Sales Firm Interruptible Firm Interruptible35 Rate Base Additions:3637 Materials and Supplies - KY Direct 7.4 Allocated O&M Expenses - Demand (62,822) (28,404) (16,242) (854) (9,099) (8,222) 38 Materials and Supplies - KY Mid-States GO 7.4 Allocated O&M Expenses - Demand 81,236 36,729 21,003 1,105 11,766 10,632 39 Materials and Supplies - Shared Services GO 7.4 Allocated O&M Expenses - Demand (0) (0) (0) (0) (0) (0) 40 Materials and Supplies - Shared Services CS 7.4 Allocated O&M Expenses - Demand 0 - - - - - 41 Gas Storage Inventory 99.0 - 0 - - - - - 42 Prepayments - KY Direct 7.4 Allocated O&M Expenses - Demand 0 - - - - - 43 Prepayments - KY Mid-States GO 7.4 Allocated O&M Expenses - Demand 0 - - - - - 44 Prepayments - Shared Services GO 7.4 Allocated O&M Expenses - Demand 0 - - - - - 45 Prepayments - Shared Services CS 7.4 Allocated O&M Expenses - Demand 0 - - - - - 46 Cash Working Capital 7.4 Allocated O&M Expenses - Demand 420,678 190,203 108,762 5,721 60,932 55,060 47 Regulatory Assets 7.4 Allocated O&M Expenses - Demand (5,158,673) (2,332,414) (1,333,720) (70,150) (747,199) (675,190) 4849 Total Rate Base Additions (4,719,582) (2,133,886) (1,220,198) (64,179) (683,599) (617,720)505152 Rate Base Deductions:5354 Customer Advances - KY Direct 99.0 - 0 - - - - - 55 Customer Advances - KY Mid-States GO 99.0 - 0 - - - - - 56 Customer Advances - Shared Services GO 99.0 - 0 - - - - - 57 Customer Advances - Shared Services CS 99.0 - 0 - - - - - 58 ADIT - KY Direct 9.4 Allocated Net Plant - Demand (47,328,915) (21,399,034) (12,236,389) (643,604) (6,855,270) (6,194,618) 59 ADIT - KY Mid-States GO 9.4 Allocated Net Plant - Demand 14,394,681 6,508,331 3,721,592 195,747 2,084,971 1,884,039 60 ADIT - Shared Services GO 9.4 Allocated Net Plant - Demand (534,594) (241,708) (138,214) (7,270) (77,432) (69,970) 61 ADIT - Shared Services CS 9.4 Allocated Net Plant - Demand 42,601 19,261 11,014 579 6,170 5,576 62 Change in Net Operating Loss Carryforward 9.4 Allocated Net Plant - Demand 816,420 369,132 211,077 11,102 118,253 106,857 6364 Total Rate Base Deductions (32,609,807) (14,744,018) (8,430,919) (443,446) (4,723,308) (4,268,116) 656667 TOTAL OTHER RB - DEMAND (37,329,389) (16,877,903) (9,651,117) (507,625) (5,406,907) (4,885,835) 6869 Interest on Customer Deposits 3.0 Peak Day 0 - - - - -

Exhibit PHR-3Page 46 of 75
Atmos Energy Corporation, Kentucky/Mid-States DivisionClass Cost of Service - Demand Only StudyForecasted Test Period: Twelve Months Ended March 31, 2020
ALLOCATION OF OTHER RATE BASE
Commodity
Line Allocation Allocation Total Residential Non-Res Sales Non-Res Sales Transport TransportNo. Factor Basis Company Sales Firm Interruptible Firm Interruptible69 Rate Base Additions:7071 Materials and Supplies - KY Direct 7.6 Allocated O&M Expenses - Comm (299,637) (175,607) (119,309) (4,252) (227) (240) 72 Materials and Supplies - KY Mid-States GO 7.6 Allocated O&M Expenses - Comm 387,463 227,079 154,280 5,499 294 311 73 Materials and Supplies - Shared Services GO 7.6 Allocated O&M Expenses - Comm (0) (0) (0) (0) (0) (0) 74 Materials and Supplies - Shared Services CS 7.6 Allocated O&M Expenses - Comm 0 - - - - - 75 Gas Storage Inventory 1.0 Mcf 8,905,991 2,696,819 1,827,594 90,291 2,021,444 2,269,843 76 Prepayments - KY Direct 7.6 Allocated O&M Expenses - Comm 0 - - - - - 77 Prepayments - KY Mid-States GO 7.6 Allocated O&M Expenses - Comm 0 - - - - - 78 Prepayments - Shared Services GO 7.6 Allocated O&M Expenses - Comm 0 - - - - - 79 Prepayments - Shared Services CS 7.6 Allocated O&M Expenses - Comm 0 - - - - - 80 Cash Working Capital 7.6 Allocated O&M Expenses - Comm 2,006,472 1,175,928 798,937 28,475 1,522 1,609 81 Regulatory Assets 7.6 Allocated O&M Expenses - Comm (24,604,894) (14,420,124) (9,797,181) (349,187) (18,665) (19,737) 8283 Total Rate Base Additions (13,604,604) (10,495,905) (7,135,679) (229,175) 2,004,368 2,251,786848586 Rate Base Deductions:8788 Customer Advances - KY Direct 99.0 - 0 - - - - - 89 Customer Advances - KY Mid-States GO 99.0 - 0 - - - - - 90 Customer Advances - Shared Services GO 99.0 - 0 - - - - - 91 Customer Advances - Shared Services CS 99.0 - 0 - - - - - 92 ADIT - KY Direct 9.6 Allocated Net Plant - Comm (744,201) (281,776) (174,357) (9,535) (136,807) (141,727) 93 ADIT - KY Mid-States GO 9.6 Allocated Net Plant - Comm 226,342 85,700 53,029 2,900 41,609 43,105 94 ADIT - Shared Services GO 9.6 Allocated Net Plant - Comm (8,406) (3,183) (1,969) (108) (1,545) (1,601) 95 ADIT - Shared Services CS 9.6 Allocated Net Plant - Comm 670 254 157 9 123 128 96 Change in Net Operating Loss Carryforward 9.6 Allocated Net Plant - Comm 12,837 4,861 3,008 164 2,360 2,445 9798 Total Rate Base Deductions (512,758) (194,145) (120,133) (6,569) (94,260) (97,650) 99
100101 TOTAL OTHER RB - COMMODITY (14,117,362) (10,690,050) (7,255,811) (235,744) 1,910,108 2,154,136 102103 Interest on Customer Deposits 1.0 Mcf 0 - - - - -

Exhibit PHR-3Page 47 of 75
Atmos Energy Corporation, Kentucky/Mid-States DivisionClass Cost of Service - Demand Only StudyForecasted Test Period: Twelve Months Ended March 31, 2020
ALLOCATION OF OTHER RATE BASE
Total Other Rate Base
Line Allocation Allocation Total Residential Non-Res Sales Non-Res Sales Transport TransportNo. Factor Basis Company Sales Firm Interruptible Firm Interruptible103 Rate Base Additions:104105 Materials and Supplies - KY Direct (402,124) (235,245) (143,687) (5,134) (9,498) (8,560) 106 Materials and Supplies - KY Mid-States GO 519,990 304,197 185,803 6,638 12,282 11,069 107 Materials and Supplies - Shared Services GO (0) (0) (0) (0) (0) (0) 108 Materials and Supplies - Shared Services CS 0 - - - - - 109 Gas Storage Inventory 8,905,991 2,696,819 1,827,594 90,291 2,021,444 2,269,843 110 Prepayments - KY Direct 0 - - - - - 111 Prepayments - KY Mid-States GO 0 - - - - - 112 Prepayments - Shared Services GO 0 - - - - - 113 Prepayments - Shared Services CS 0 - - - - - 114 Cash Working Capital 2,692,759 1,575,279 962,181 34,377 63,602 57,320 115 Regulatory Assets (33,020,670) (19,317,281) (11,798,995) (421,555) (779,942) (702,897) 116117 Total Rate Base Additions (21,304,054) (14,976,230) (8,967,105) (295,383) 1,307,889 1,626,774118119120 Rate Base Deductions:121122 Customer Advances - KY Direct (747,234) (665,436) (80,951) (41) (514) (291) 123 Customer Advances - KY Mid-States GO 0 - - - - - 124 Customer Advances - Shared Services GO 0 - - - - - 125 Customer Advances - Shared Services CS 0 - - - - - 126 ADIT - KY Direct (75,117,257) (43,259,431) (17,639,753) (664,630) (7,135,772) (6,417,670) 127 ADIT - KY Mid-States GO 22,846,265 13,156,982 5,364,979 202,142 2,170,283 1,951,879 128 ADIT - Shared Services GO (848,471) (488,628) (199,246) (7,507) (80,601) (72,489) 129 ADIT - Shared Services CS 67,614 38,938 15,878 598 6,423 5,777 130 Change in Net Operating Loss Carryforward 1,295,767 746,222 304,284 11,465 123,092 110,704 131132 Total Rate Base Deductions (52,503,316) (30,471,353) (12,234,810) (457,974) (4,917,089) (4,422,091) 133134135 TOTAL OTHER RB (73,807,370) (45,447,582) (21,201,915) (753,357) (3,609,200) (2,795,317) 136137 Interest on Customer Deposits 0 - - - - -

Exhibit PHR-3Page 48 of 75
Atmos Energy Corporation, Kentucky/Mid-States DivisionClass Cost of Service - Demand Only StudyForecasted Test Period: Twelve Months Ended March 31, 2020
ALLOCATION OF O&M EXPENSES
Customer
Line Acct. Allocation Allocation Total Residential Non-Res Sales Non-Res Sales Transport TransportNo. No. Factor Basis Company Sales Firm Interruptible Firm Interruptible
1 Production & Gathering:2 Operation3 7500 Op., Sup., & Eng. 99.0 - 0 - - - - - 4 7510 Production Maps & Records 99.0 - 0 - - - - - 5 7530 Field Lines Expenses 99.0 - 0 - - - - - 6 7540 Field Compressor Station Expense 99.0 - 0 - - - - - 7 7550 Field Compressor Sta. Fuel & Pwr. 99.0 - 0 - - - - - 8 7560 Field Meas. & Regul. Station Exp 99.0 - 0 - - - - - 9 7570 Purification Expense 99.0 - 0 - - - - -
10 7590 Other Expenses 99.0 - 0 - - - - - 11 Maintenance12 7610 Maint. Sup., & Eng. 99.0 - 0 - - - - - 13 7620 Structures and Improvements 99.0 - 0 - - - - - 14 7640 Field Line Maintenance 99.0 - 0 - - - - - 15 7650 Compressor Station Equip. Maint. 99.0 - 0 - - - - - 16 7660 Meas. & Regul. Station Equip Maint 99.0 - 0 - - - - - 17 7670 Purification Equipment Maintenance 99.0 - 0 - - - - - 18 7680 Other Equipment Maintenance 99.0 - 0 - - - - - 19 7690 Gas Processed By Others 99.0 - 0 - - - - - 20 Total Production & Gathering 0 0 0 0 0 02122 Other Gas Supply Expenses:23 Operation24 8001 Intercompany Gas Well-head Purchases 99.0 - 0 - - - - - 25 8010 Natural gas field line purchases 99.0 - 0 - - - - - 26 8040 Natural gas city gate purchases 99.0 - 0 - - - - - 27 8050 Other purchases 99.0 - 0 - - - - - 28 8051 PGA for Residential 99.0 - 0 - - - - - 29 8052 PGA for Commercial 99.0 - 0 - - - - - 30 8053 PGA for Industrial 99.0 - 0 - - - - - 31 8054 PGA for Public Authorities 99.0 - 0 - - - - - 32 8058 Unbilled PGA Cost 99.0 - 0 - - - - - 33 8059 PGA Offset to Unrecovered Gas Cost 99.0 - 0 - - - - - 34 8060 Exchange gas 99.0 - 0 - - - - - 35 8081 Gas withdrawn from storage-Debit 99.0 - 0 - - - - - 36 8082 Gas delivered to storage-Credit 99.0 - 0 - - - - - 37 8120 Gas used for other utility operations-Credit 99.0 - 0 - - - - - 38 8580 Transmission and compression of gas by others 99.0 - 0 - - - - - 39 Maintenance40 8350 Maint. Of Purch. Gas Meas. Sta. 99.0 - 0 - - - - - 41 Total Other Gas Supply Expenses 0 0 0 0 0 04243 Underground Storage:44 Operation45 8140 Storage-Operation supervision and engineering 99.0 - 0 - - - - - 46 8160 Wells expenses 99.0 - 0 - - - - - 47 8170 Lines expenses 99.0 - 0 - - - - - 48 8180 Compressor station expenses 99.0 - 0 - - - - - 49 8190 Compressor station fuel and power 99.0 - 0 - - - - - 50 8200 Storage-Measuring and regulating station expenses 99.0 - 0 - - - - - 51 8210 Storage-Purification expenses 99.0 - 0 - - - - - 52 8240 Storage-Other expenses 99.0 - 0 - - - - - 53 8250 Storage well royalties 99.0 - 0 - - - - - 54 8260 Rents 99.0 - 0 - - - - - 55 Maintenance56 8300 Maint. Sup., & Eng. 99.0 - 0 - - - - - 57 8310 Structures and Improvements 99.0 - 0 - - - - - 58 8320 Reservoirs & Wells Maintenance 99.0 - 0 - - - - - 59 8330 Line Maintenance 99.0 - 0 - - - - - 60 8340 Compressor Station Equip Maint 99.0 - 0 - - - - - 61 8350 Meas. & Regul. Station Equip Maint 99.0 - 0 - - - - - 62 8360 Purification Equipment Maintenance 99.0 - 0 - - - - - 63 8410 Other storage expenses-Operation labor and expenses 99.0 - 0 - - - - - 64 Total Underground Storage Expense 0 0 0 0 0 06566 Transmission:67 Operation68 8500 Op., Sup., & Eng. 99.0 - 0 - - - - - 69 8510 System Control & Load Dispatching 99.0 - 0 - - - - - 70 8520 Communication Systems Expense 99.0 - 0 - - - - - 71 8530 Compressor Station Labor Expense 99.0 - 0 - - - - - 72 8540 Compressor Station Fuel Gas 99.0 - 0 - - - - - 73 8550 Compressor Station Fuel & Power 99.0 - 0 - - - - - 74 8560 Mains Expense 99.0 - 0 - - - - - 75 8570 Meas. & Regul. Station Expenses 99.0 - 0 - - - - - 76 8580 LDC Payment 99.0 - 0 - - - - - 77 8580 LDC Payment - A&G 99.0 - 0 - - - - - 78 8590 Other Expenses 99.0 - 0 - - - - - 79 8600 Rents 99.0 - 0 - - - - - 80 Maintenance81 8610 Maint. Sup., & Eng. 99.0 - 0 - - - - - 82 8620 Structures and Improvements 99.0 - 0 - - - - - 83 8630 Mains 99.0 - 0 - - - - - 84 8640 Compressor Station Equip Maint 99.0 - 0 - - - - - 85 8650 Meas. & Regul. Station Equip Maint 99.0 - 0 - - - - - 86 8660 Communication Equipment Maintenance 99.0 - 0 - - - - - 87 8670 Other Equipment Maintenance 99.0 - 0 - - - - - 88 Total Transmission Expense 0 0 0 0 0 0

Exhibit PHR-3Page 49 of 75
Atmos Energy Corporation, Kentucky/Mid-States DivisionClass Cost of Service - Demand Only StudyForecasted Test Period: Twelve Months Ended March 31, 2020
ALLOCATION OF O&M EXPENSES8990 Distribution:91 Operation92 8700 Supervision and Engineering 10.2 Composite of Accts. 871-879 & 886-893 - Cust 152,826 86,237 63,224 163 2,044 1,157 93 8710 Distribution Load Dispatching 99.0 - 0 - - - - - 94 8711 Odorization 99.0 - 0 - - - - - 94 8720 Compressor Station Labor & Expenses 11.2 Composite of Accts. 376 & 380 - Cust 0 - - - - - 95 8740 Mains & Services 12.2 Composite of Accts. 374-379 - Cust 0 - - - - - 96 8750 Measuring and Regulating Station Exp. - Gen 11.2 Composite of Accts. 376 & 380 - Cust 0 - - - - - 97 8760 Measuring and Regulating Station Exp. - Ind. 2.2 Non-Residential Bills 120,928 - 119,676 61 761 430 98 8770 Measuring and Regulating Sta. Exp. - City Gate 11.2 Composite of Accts. 376 & 380 - Cust 0 - - - - - 99 8780 Meters and House Regulator Expense 13.2 Composite of Accts. 381-383 - Cust 820,621 529,408 271,530 956 11,958 6,768
100 8790 Customer Installations Expense 2.0 Bills 2,246 2,000 243 0 2 1 101 8800 Other Expense 10.2 Composite of Accts. 871-879 & 886-893 - Cust 508 287 210 1 7 4 102 8810 Rents 10.2 Composite of Accts. 871-879 & 886-893 - Cust 58,656 33,099 24,266 63 785 444 103 Maintenance104 8850 Maintenance Supervision and Engineering 10.2 Composite of Accts. 871-879 & 886-893 - Cust 252 142 104 0 3 2 105 8860 Maintenance of Structures and Improvements 12.2 Composite of Accts. 374-379 - Cust 0 - - - - - 106 8870 Maintenance of Mains 12.2 Composite of Accts. 374-379 - Cust 0 - - - - - 107 8890 Maintenance of compressor station equipment 99.0 - 0 - - - - - 108 8900 Maint. of Measuring and Regulating Station Equip. - General 12.2 Composite of Accts. 374-379 - Cust 0 - - - - - 109 8910 Maint. of Measuring and Regulating Station Equip. - Industrial 2.2 Non-Residential Bills 1,723 - 1,705 1 11 6 110 8920 Maint. of Measuring and Regulating Station Equip. - City Gate 12.2 Composite of Accts. 374-379 - Cust 0 - - - - - 111 8930 Maintenance of Services 14.2 Account 380 - Cust 6,533 5,817 708 0 4 3 112 8940 Maintenance of Meters and House Regulators 13.2 Composite of Accts. 381-383 - Cust 0 - - - - - 113 8950 Maintenance of Other Equipment 10.2 Composite of Accts. 871-879 & 886-893 - Cust 931 525 385 1 12 7 114 Total Distribution 1,165,224 657,516 482,052 1,247 15,587 8,822115116 Customer Accounts:117 9010 Supervision 2.0 Bills 0 - - - - - 118 9020 Meter Reading Expense 2.0 Bills 1,085,047 966,269 117,548 60 747 423 119 9030 Customer Records and Collection Expenses 2.0 Bills 1,220,802 1,087,164 132,255 67 840 476 120 9040 Uncollectible Accounts 8.0 Customer Deposit Balances 341,050 208,226 129,278 3,493 29 25 121 9050 Miscellaneous Customer Accounts Expenses 2.0 Bills 0 - - - - - 122 Total Customer Accounts 2,646,900 2,261,659 379,081 3,620 1,616 924 123124 Customer Service and Information:125 9070 Supervision 2.0 Bills 0 - - - - - 126 9080 Customer Assistance Expenses 2.0 Bills 0 - - - - - 127 9090 Informational and Instructional Advertising Expenses 2.0 Bills 128,272 114,230 13,896 7 88 50 128 9100 Miscellaneous Customer Service and Informational Expenses 2.0 Bills 0 - - - - - 129 Total Customer Service and Information 128,272 114,230 13,896 7 88 50 130131 Sales:132 9110 Supervision 2.0 Bills 253,468 225,721 27,459 14 174 99 133 9120 Demonstrating and Selling Expenses 2.0 Bills 115,937 103,246 12,560 6 80 45 134 9130 Advertising Expenses 2.0 Bills 35,170 31,320 3,810 2 24 14 135 9160 Miscellaneous Sales Expenses 2.0 Bills (196,297) (174,809) (21,266) (11) (135) (76) 136 Total Sales 208,278 185,478 22,564 11 143 81 137138 Administrative & General:139 Operation140 9200 Administrative and General Salaries 17.2 Composite of Accts. 870-902, 905-916, 924 & 928-930.1 - Cust (298,399) (232,758) (63,192) (119) (1,488) (842) 141 9210 Office Supplies and Expenses 17.2 Composite of Accts. 870-902, 905-916, 924 & 928-930.1 - Cust 6,299 4,913 1,334 3 31 18 142 9220 Administrative Expenses Transferred - Customer Support 2.0 Bills 0 - - - - - 143 9220 Administrative Expenses Transferred - General 17.2 Composite of Accts. 870-902, 905-916, 924 & 928-930.1 - Cust 5,184,181 4,043,771 1,097,858 2,067 25,853 14,632 144 9230 Outside Services Employed 17.2 Composite of Accts. 870-902, 905-916, 924 & 928-930.1 - Cust 121,462 94,743 25,722 48 606 343 145 9240 Property Insurance 9.2 Allocated Net Plant - Cust 1,339 1,068 259 1 7 4 146 9250 Injuries and Damages 17.2 Composite of Accts. 870-902, 905-916, 924 & 928-930.1 - Cust 26,463 20,642 5,604 11 132 75 147 9260 Employee Pensions and Benefits 17.2 Composite of Accts. 870-902, 905-916, 924 & 928-930.1 - Cust 387,217 302,037 82,001 154 1,931 1,093 148 9270 Franchise Requirements 2.0 Bills 646 576 70 0 0 0 149 9280 Regulatory Commission Expenses 2.0 Bills 852,920 759,553 92,401 47 587 332 150 930.1 General Advertising Expenses 2.0 Bills 0 - - - - - 151 930.2 Miscellaneous General Expense 17.2 Composite of Accts. 870-902, 905-916, 924 & 928-930.1 - Cust (15,134) (11,805) (3,205) (6) (75) (43) 152 9310 Rents 17.2 Composite of Accts. 870-902, 905-916, 924 & 928-930.1 - Cust (2,959) (2,308) (627) (1) (15) (8) 153 Maintenance154 9320 Maintenance of General Plant 17.2 Composite of Accts. 870-902, 905-916, 924 & 928-930.1 - Cust 4,221 3,292 894 2 21 12 155 Total A&G 6,268,256 4,983,725 1,239,119 2,206 27,591 15,615156157 TOTAL O&M EXPENSE - CUSTOMER 10,416,928 8,202,608 2,136,712 7,091 45,026 25,492
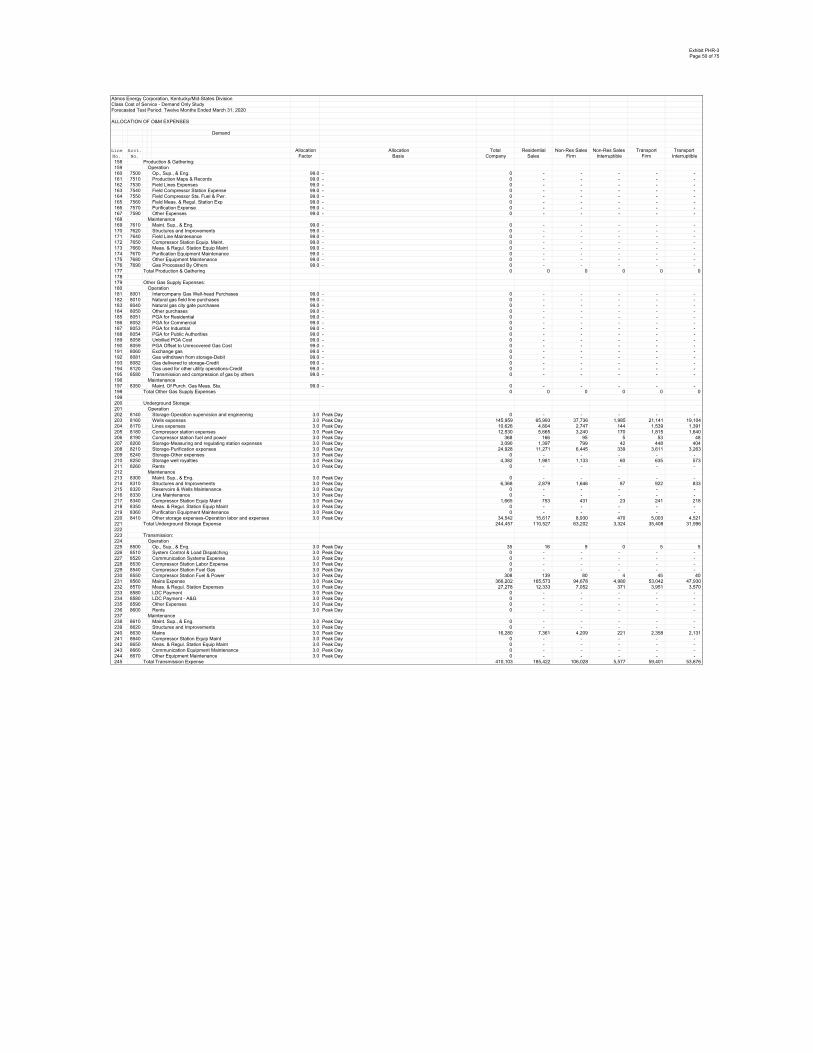
Exhibit PHR-3Page 50 of 75
Atmos Energy Corporation, Kentucky/Mid-States DivisionClass Cost of Service - Demand Only StudyForecasted Test Period: Twelve Months Ended March 31, 2020
ALLOCATION OF O&M EXPENSES
Demand
Line Acct. Allocation Allocation Total Residential Non-Res Sales Non-Res Sales Transport TransportNo. No. Factor Basis Company Sales Firm Interruptible Firm Interruptible158 Production & Gathering:159 Operation160 7500 Op., Sup., & Eng. 99.0 - 0 - - - - - 161 7510 Production Maps & Records 99.0 - 0 - - - - - 162 7530 Field Lines Expenses 99.0 - 0 - - - - - 163 7540 Field Compressor Station Expense 99.0 - 0 - - - - - 164 7550 Field Compressor Sta. Fuel & Pwr. 99.0 - 0 - - - - - 165 7560 Field Meas. & Regul. Station Exp 99.0 - 0 - - - - - 166 7570 Purification Expense 99.0 - 0 - - - - - 167 7590 Other Expenses 99.0 - 0 - - - - - 168 Maintenance169 7610 Maint. Sup., & Eng. 99.0 - 0 - - - - - 170 7620 Structures and Improvements 99.0 - 0 - - - - - 171 7640 Field Line Maintenance 99.0 - 0 - - - - - 172 7650 Compressor Station Equip. Maint. 99.0 - 0 - - - - - 173 7660 Meas. & Regul. Station Equip Maint 99.0 - 0 - - - - - 174 7670 Purification Equipment Maintenance 99.0 - 0 - - - - - 175 7680 Other Equipment Maintenance 99.0 - 0 - - - - - 176 7690 Gas Processed By Others 99.0 - 0 - - - - - 177 Total Production & Gathering 0 0 0 0 0 0178179 Other Gas Supply Expenses:180 Operation181 8001 Intercompany Gas Well-head Purchases 99.0 - 0 - - - - - 182 8010 Natural gas field line purchases 99.0 - 0 - - - - - 183 8040 Natural gas city gate purchases 99.0 - 0 - - - - - 184 8050 Other purchases 99.0 - 0 - - - - - 185 8051 PGA for Residential 99.0 - 0 - - - - - 186 8052 PGA for Commercial 99.0 - 0 - - - - - 187 8053 PGA for Industrial 99.0 - 0 - - - - - 188 8054 PGA for Public Authorities 99.0 - 0 - - - - - 189 8058 Unbilled PGA Cost 99.0 - 0 - - - - - 190 8059 PGA Offset to Unrecovered Gas Cost 99.0 - 0 - - - - - 191 8060 Exchange gas 99.0 - 0 - - - - - 192 8081 Gas withdrawn from storage-Debit 99.0 - 0 - - - - - 193 8082 Gas delivered to storage-Credit 99.0 - 0 - - - - - 194 8120 Gas used for other utility operations-Credit 99.0 - 0 - - - - - 195 8580 Transmission and compression of gas by others 99.0 - 0 - - - - - 196 Maintenance197 8350 Maint. Of Purch. Gas Meas. Sta. 99.0 - 0 - - - - - 198 Total Other Gas Supply Expenses 0 0 0 0 0 0199200 Underground Storage:201 Operation202 8140 Storage-Operation supervision and engineering 3.0 Peak Day 0 - - - - - 203 8160 Wells expenses 3.0 Peak Day 145,959 65,993 37,736 1,985 21,141 19,104 204 8170 Lines expenses 3.0 Peak Day 10,626 4,804 2,747 144 1,539 1,391 205 8180 Compressor station expenses 3.0 Peak Day 12,530 5,665 3,240 170 1,815 1,640 206 8190 Compressor station fuel and power 3.0 Peak Day 368 166 95 5 53 48 207 8200 Storage-Measuring and regulating station expenses 3.0 Peak Day 3,090 1,397 799 42 448 404 208 8210 Storage-Purification expenses 3.0 Peak Day 24,928 11,271 6,445 339 3,611 3,263 209 8240 Storage-Other expenses 3.0 Peak Day 0 - - - - - 210 8250 Storage well royalties 3.0 Peak Day 4,382 1,981 1,133 60 635 573 211 8260 Rents 3.0 Peak Day 0 - - - - - 212 Maintenance213 8300 Maint. Sup., & Eng. 3.0 Peak Day 0 - - - - - 214 8310 Structures and Improvements 3.0 Peak Day 6,368 2,879 1,646 87 922 833 215 8320 Reservoirs & Wells Maintenance 3.0 Peak Day 0 - - - - - 216 8330 Line Maintenance 3.0 Peak Day 0 - - - - - 217 8340 Compressor Station Equip Maint 3.0 Peak Day 1,665 753 431 23 241 218 218 8350 Meas. & Regul. Station Equip Maint 3.0 Peak Day 0 - - - - - 219 8360 Purification Equipment Maintenance 3.0 Peak Day 0 - - - - - 220 8410 Other storage expenses-Operation labor and expenses 3.0 Peak Day 34,542 15,617 8,930 470 5,003 4,521 221 Total Underground Storage Expense 244,457 110,527 63,202 3,324 35,408 31,996222223 Transmission:224 Operation225 8500 Op., Sup., & Eng. 3.0 Peak Day 35 16 9 0 5 5 226 8510 System Control & Load Dispatching 3.0 Peak Day 0 - - - - - 227 8520 Communication Systems Expense 3.0 Peak Day 0 - - - - - 228 8530 Compressor Station Labor Expense 3.0 Peak Day 0 - - - - - 229 8540 Compressor Station Fuel Gas 3.0 Peak Day 0 - - - - - 230 8550 Compressor Station Fuel & Power 3.0 Peak Day 308 139 80 4 45 40 231 8560 Mains Expense 3.0 Peak Day 366,202 165,573 94,678 4,980 53,042 47,930 232 8570 Meas. & Regul. Station Expenses 3.0 Peak Day 27,278 12,333 7,052 371 3,951 3,570 233 8580 LDC Payment 3.0 Peak Day 0 - - - - - 234 8580 LDC Payment - A&G 3.0 Peak Day 0 - - - - - 235 8590 Other Expenses 3.0 Peak Day 0 - - - - - 236 8600 Rents 3.0 Peak Day 0 - - - - - 237 Maintenance238 8610 Maint. Sup., & Eng. 3.0 Peak Day 0 - - - - - 239 8620 Structures and Improvements 3.0 Peak Day 0 - - - - - 240 8630 Mains 3.0 Peak Day 16,280 7,361 4,209 221 2,358 2,131 241 8640 Compressor Station Equip Maint 3.0 Peak Day 0 - - - - - 242 8650 Meas. & Regul. Station Equip Maint 3.0 Peak Day 0 - - - - - 243 8660 Communication Equipment Maintenance 3.0 Peak Day 0 - - - - - 244 8670 Other Equipment Maintenance 3.0 Peak Day 0 - - - - - 245 Total Transmission Expense 410,103 185,422 106,028 5,577 59,401 53,676

Exhibit PHR-3Page 51 of 75
Atmos Energy Corporation, Kentucky/Mid-States DivisionClass Cost of Service - Demand Only StudyForecasted Test Period: Twelve Months Ended March 31, 2020
ALLOCATION OF O&M EXPENSES246247 Distribution:248 Operation249 8700 Supervision and Engineering 10.4 Composite of Accts. 871-879 & 886-893 - Demand 807,275 364,997 208,712 10,978 116,928 105,660 250 8710 Distribution Load Dispatching 99.0 - 0 - - - - - 251 8711 Odorization 99.0 - 0 - - - - - 251 8720 Compressor Station Labor & Expenses 11.4 Composite of Accts. 376 & 380 - Demand 0 - - - - - 252 8740 Mains & Services 12.4 Composite of Accts. 374-379 - Demand 4,320,719 1,953,546 1,117,076 58,755 625,827 565,515 253 8750 Measuring and Regulating Station Exp. - Gen 12.4 Composite of Accts. 374-379 - Demand 574,714 259,848 148,586 7,815 83,243 75,221 254 8760 Measuring and Regulating Station Exp. - Ind. 99.0 - 0 - - - - - 255 8770 Measuring and Regulating Sta. Exp. - City Gate 12.4 Composite of Accts. 374-379 - Demand 38,286 17,310 9,898 521 5,545 5,011 256 8780 Meters and House Regulator Expense 13.4 Composite of Accts. 381-383 - Demand 0 - - - - - 257 8790 Customer Installations Expense 99.0 - 0 - - - - - 258 8800 Other Expense 10.4 Composite of Accts. 871-879 & 886-893 - Demand 2,684 1,214 694 37 389 351 259 8810 Rents 10.4 Composite of Accts. 871-879 & 886-893 - Demand 309,841 140,090 80,106 4,213 44,878 40,553 260 Maintenance261 8850 Maintenance Supervision and Engineering 10.4 Composite of Accts. 871-879 & 886-893 - Demand 1,331 602 344 18 193 174 262 8860 Maintenance of Structures and Improvements 12.4 Composite of Accts. 374-379 - Demand 98 44 25 1 14 13 263 8870 Maintenance of Mains 12.4 Composite of Accts. 374-379 - Demand 28,852 13,045 7,459 392 4,179 3,776 264 8890 Maintenance of compressor station equipment 99.0 - 0 - - - - - 265 8900 Maint. of Measuring and Regulating Station Equip. - General 12.4 Composite of Accts. 374-379 - Demand 65,572 29,647 16,953 892 9,498 8,582 266 8910 Maint. of Measuring and Regulating Station Equip. - Industrial 99.0 - 0 - - - - - 267 8920 Maint. of Measuring and Regulating Station Equip. - City Gate 12.4 Composite of Accts. 374-379 - Demand 795 360 206 11 115 104 268 8930 Maintenance of Services 14.4 Account 380 - Demand 0 - - - - - 269 8940 Maintenance of Meters and House Regulators 13.4 Composite of Accts. 381-383 - Demand 0 - - - - - 270 8950 Maintenance of Other Equipment 10.4 Composite of Accts. 871-879 & 886-893 - Demand 4,915 2,222 1,271 67 712 643 271 Total Distribution 6,155,082 2,782,925 1,591,331 83,700 891,522 805,604272273 Customer Accounts:274 9010 Supervision 99.0 - 0 - - - - - 275 9020 Meter Reading Expense 99.0 - 0 - - - - - 276 9030 Customer Records and Collection Expenses 99.0 - 0 - - - - - 277 9040 Uncollectible Accounts 99.0 - 0 - - - - - 278 9050 Miscellaneous Customer Accounts Expenses 99.0 - 0 - - - - - 279 Total Customer Accounts 0 - - - - - 280281 Customer Service and Information:282 9070 Supervision 99.0 - 0 - - - - - 283 9080 Customer Assistance Expenses 99.0 - 0 - - - - - 284 9090 Informational and Instructional Advertising Expenses 99.0 - 0 - - - - - 285 9100 Miscellaneous Customer Service and Informational Expenses 99.0 - 0 - - - - - 286 Total Customer Service and Information 0 - - - - - 287288 Sales:289 9110 Supervision 99.0 - 0 - - - - - 290 9120 Demonstrating and Selling Expenses 99.0 - 0 - - - - - 291 9130 Advertising Expenses 99.0 - 0 - - - - - 292 9160 Miscellaneous Sales Expenses 99.0 - 0 - - - - - 293 Total Sales 0 - - - - - 294295 Administrative & General:296 Operation297 9200 Administrative and General Salaries 17.4 Composite of Accts. 870-902, 905-916, 924 & 928-930.1 - Demand (533,952) (241,418) (138,048) (7,261) (77,339) (69,886) 298 9210 Office Supplies and Expenses 17.4 Composite of Accts. 870-902, 905-916, 924 & 928-930.1 - Demand 11,271 5,096 2,914 153 1,632 1,475 299 9220 Administrative Expenses Transferred - Customer Support 99.0 - 0 - - - - - 300 9220 Administrative Expenses Transferred - General 17.4 Composite of Accts. 870-902, 905-916, 924 & 928-930.1 - Demand 9,276,510 4,194,230 2,398,343 126,147 1,343,639 1,214,151 301 9230 Outside Services Employed 17.4 Composite of Accts. 870-902, 905-916, 924 & 928-930.1 - Demand 217,343 98,268 56,192 2,956 31,481 28,447 302 9240 Property Insurance 9.4 Allocated Net Plant - Demand 2,343 1,059 606 32 339 307 303 9250 Injuries and Damages 17.4 Composite of Accts. 870-902, 905-916, 924 & 928-930.1 - Demand 47,353 21,410 12,243 644 6,859 6,198 304 9260 Employee Pensions and Benefits 17.4 Composite of Accts. 870-902, 905-916, 924 & 928-930.1 - Demand 692,881 313,275 179,137 9,422 100,359 90,687 305 9270 Franchise Requirements 99.0 - 0 - - - - - 306 9280 Regulatory Commission Expenses 99.0 - 0 - - - - - 307 930.1 General Advertising Expenses 99.0 - 0 - - - - - 308 930.2 Miscellaneous General Expense 17.4 Composite of Accts. 870-902, 905-916, 924 & 928-930.1 - Demand (27,080) (12,244) (7,001) (368) (3,922) (3,544) 309 9310 Rents 17.4 Composite of Accts. 870-902, 905-916, 924 & 928-930.1 - Demand (5,294) (2,394) (1,369) (72) (767) (693) 310 Maintenance311 9320 Maintenance of General Plant 17.4 Composite of Accts. 870-902, 905-916, 924 & 928-930.1 - Demand 7,552 3,415 1,953 103 1,094 988 312 Total A&G 9,688,925 4,380,697 2,504,969 131,755 1,403,375 1,268,129313314 TOTAL O&M EXPENSE - DEMAND 16,498,567 7,459,571 4,265,530 224,356 2,389,705 2,159,405

Exhibit PHR-3Page 52 of 75
Atmos Energy Corporation, Kentucky/Mid-States DivisionClass Cost of Service - Demand Only StudyForecasted Test Period: Twelve Months Ended March 31, 2020
ALLOCATION OF O&M EXPENSES
Commodity
Line Acct. Allocation Allocation Total Residential Non-Res Sales Non-Res Sales Transport TransportNo. No. Factor Basis Company Sales Firm Interruptible Firm Interruptible315 Production & Gathering:316 Operation317 7500 Op., Sup., & Eng. 99.0 - 0 - - - - - 318 7510 Production Maps & Records 99.0 - 0 - - - - - 319 7530 Field Lines Expenses 99.0 - 0 - - - - - 320 7540 Field Compressor Station Expense 99.0 - 0 - - - - - 321 7550 Field Compressor Sta. Fuel & Pwr. 99.0 - 0 - - - - - 322 7560 Field Meas. & Regul. Station Exp 18.4 Gas Costs 0 - - - - - 323 7570 Purification Expense 99.0 - 0 - - - - - 324 7590 Other Expenses 99.0 - 0 - - - - - 325 Maintenance326 7610 Maint. Sup., & Eng. 99.0 - 0 - - - - - 327 7620 Structures and Improvements 99.0 - 0 - - - - - 328 7640 Field Line Maintenance 99.0 - 0 - - - - - 329 7650 Compressor Station Equip. Maint. 99.0 - 0 - - - - - 330 7660 Meas. & Regul. Station Equip Maint 99.0 - 0 - - - - - 331 7670 Purification Equipment Maintenance 99.0 - 0 - - - - - 332 7680 Other Equipment Maintenance 99.0 - 0 - - - - - 333 7690 Gas Processed By Others 99.0 - 0 - - - - - 334 Total Production & Gathering 0 0 0 0 0 0335336 Other Gas Supply Expenses:337 Operation338 8001 Intercompany Gas Well-head Purchases 18.4 Gas Costs 0 - - - - - 339 8010 Natural gas field line purchases 18.4 Gas Costs 61,240 35,945 24,426 870 - - 340 8040 Natural gas city gate purchases 18.4 Gas Costs 51,401,318 30,169,962 20,501,486 729,870 - - 341 8050 Other purchases 18.4 Gas Costs (7,602) (4,462) (3,032) (108) - - 342 8051 PGA for Residential 18.4 Gas Costs 47,517,427 27,890,315 18,952,391 674,721 - - 343 8052 PGA for Commercial 18.4 Gas Costs 24,564,311 14,418,002 9,797,509 348,799 - - 344 8053 PGA for Industrial 18.4 Gas Costs 4,854,142 2,849,135 1,936,081 68,926 - - 345 8054 PGA for Public Authorities 18.4 Gas Costs 4,585,482 2,691,445 1,828,926 65,111 - - 346 8058 Unbilled PGA Cost 18.4 Gas Costs (3,124,678) (1,834,027) (1,246,282) (44,369) - - 347 8059 PGA Offset to Unrecovered Gas Cost 18.4 Gas Costs (71,826,171) (42,158,313) (28,647,966) (1,019,892) - - 348 8060 Exchange gas 18.4 Gas Costs (2,147,338) (1,260,379) (856,469) (30,491) - - 349 8081 Gas withdrawn from storage-Debit 18.4 Gas Costs 12,436,037 7,299,322 4,960,130 176,585 - - 350 8082 Gas delivered to storage-Credit 18.4 Gas Costs (12,626,734) (7,411,252) (5,036,190) (179,293) - - 351 8120 Gas used for other utility operations-Credit 18.4 Gas Costs (14,329) (8,410) (5,715) (203) - - 352 8580 Transmission and compression of gas by others 18.4 Gas Costs 22,709,250 13,329,176 9,057,616 322,459 - - 353 Maintenance354 8350 Maint. Of Purch. Gas Meas. Sta. 18.4 Gas Costs 0 - - - - - 355 Total Other Gas Supply Expenses 78,382,354 46,006,460 31,262,909 1,112,986 0 0356357 Underground Storage:358 Operation359 8140 Storage-Operation supervision and engineering 1.5 Winter Volumes 0 - - - - - 360 8160 Wells expenses 1.5 Winter Volumes 145,959 55,264 34,196 1,870 26,832 27,797 361 8170 Lines expenses 1.5 Winter Volumes 10,626 4,023 2,489 136 1,953 2,024 362 8180 Compressor station expenses 1.5 Winter Volumes 12,530 4,744 2,936 161 2,303 2,386 363 8190 Compressor station fuel and power 1.5 Winter Volumes 368 139 86 5 68 70 364 8200 Storage-Measuring and regulating station expenses 1.5 Winter Volumes 3,090 1,170 724 40 568 589 365 8210 Storage-Purification expenses 1.5 Winter Volumes 24,928 9,438 5,840 319 4,582 4,747 366 8240 Storage-Other expenses 1.5 Winter Volumes 0 - - - - - 367 8250 Storage well royalties 1.5 Winter Volumes 4,382 1,659 1,027 56 805 834 368 8260 Rents 1.5 Winter Volumes 0 - - - - - 369 Maintenance370 8300 Maint. Sup., & Eng. 1.5 Winter Volumes 0 - - - - - 371 8310 Structures and Improvements 1.5 Winter Volumes 6,368 2,411 1,492 82 1,171 1,213 372 8320 Reservoirs & Wells Maintenance 1.5 Winter Volumes 0 - - - - - 373 8330 Line Maintenance 1.5 Winter Volumes 0 - - - - - 374 8340 Compressor Station Equip Maint 1.5 Winter Volumes 1,665 631 390 21 306 317 375 8350 Meas. & Regul. Station Equip Maint 1.5 Winter Volumes 0 - - - - - 376 8360 Purification Equipment Maintenance 1.5 Winter Volumes 0 - - - - - 377 8410 Other storage expenses-Operation labor and expenses 1.5 Winter Volumes 34,542 13,078 8,093 443 6,350 6,578 378 Total Underground Storage Expense 244,457 92,559 57,273 3,132 44,939 46,555379380 Transmission:381 Operation382 8500 Op., Sup., & Eng. 99.0 - 0 - - - - - 383 8510 System Control & Load Dispatching 99.0 - 0 - - - - - 384 8520 Communication Systems Expense 99.0 - 0 - - - - - 385 8530 Compressor Station Labor Expense 99.0 - 0 - - - - - 386 8540 Compressor Station Fuel Gas 99.0 - 0 - - - - - 387 8550 Compressor Station Fuel & Power 99.0 - 0 - - - - - 388 8560 Mains Expense 99.0 - 0 - - - - - 389 8570 Meas. & Regul. Station Expenses 99.0 - 0 - - - - - 390 8580 LDC Payment 99.0 - 0 - - - - - 391 8580 LDC Payment - A&G 99.0 - 0 - - - - - 392 8590 Other Expenses 99.0 - 0 - - - - - 393 8600 Rents 99.0 - 0 - - - - - 394 Maintenance395 8610 Maint. Sup., & Eng. 99.0 - 0 - - - - - 396 8620 Structures and Improvements 99.0 - 0 - - - - - 397 8630 Mains 99.0 - 0 - - - - - 398 8640 Compressor Station Equip Maint 99.0 - 0 - - - - - 399 8650 Meas. & Regul. Station Equip Maint 99.0 - 0 - - - - - 400 8660 Communication Equipment Maintenance 99.0 - 0 - - - - - 401 8670 Other Equipment Maintenance 99.0 - 0 - - - - - 402 Total Transmission Expense 0 0 0 0 0 0

Exhibit PHR-3Page 53 of 75
Atmos Energy Corporation, Kentucky/Mid-States DivisionClass Cost of Service - Demand Only StudyForecasted Test Period: Twelve Months Ended March 31, 2020
ALLOCATION OF O&M EXPENSES403404 Distribution:405 Operation406 8700 Supervision and Engineering 10.6 Composite of Accts. 871-879 & 886-893 - Comm 3,310 1,002 679 34 751 844 407 8710 Distribution Load Dispatching 1.0 Mcf 663 201 136 7 150 169 408 8711 Odorization 1.0 Mcf 19,956 6,043 4,095 202 4,529 5,086 408 8720 Compressor Station Labor & Expenses 99.0 - 0 - - - - - 409 8740 Mains & Services 12.6 Composite of Accts. 374-379 - Comm 0 - - - - - 410 8750 Measuring and Regulating Station Exp. - Gen 12.6 Composite of Accts. 374-379 - Comm 0 - - - - - 411 8760 Measuring and Regulating Station Exp. - Ind. 99.0 - 0 - - - - - 412 8770 Measuring and Regulating Sta. Exp. - City Gate 12.6 Composite of Accts. 374-379 - Comm 0 - - - - - 413 8780 Meters and House Regulator Expense 99.0 - 0 - - - - - 414 8790 Customer Installations Expense 99.0 - 0 - - - - - 415 8800 Other Expense 10.6 Composite of Accts. 871-879 & 886-893 - Comm 11 3 2 0 2 3 416 8810 Rents 10.6 Composite of Accts. 871-879 & 886-893 - Comm 1,270 385 261 13 288 324 417 Maintenance418 8850 Maintenance Supervision and Engineering 10.6 Composite of Accts. 871-879 & 886-893 - Comm 5 2 1 0 1 1 419 8860 Maintenance of Structures and Improvements 12.6 Composite of Accts. 374-379 - Comm 0 - - - - - 420 8870 Maintenance of Mains 12.6 Composite of Accts. 374-379 - Comm 0 - - - - - 421 8890 Maintenance of compressor station equipment 1.0 Mcf 0 - - - - - 422 8900 Maint. of Measuring and Regulating Station Equip. - General 12.6 Composite of Accts. 374-379 - Comm 0 - - - - - 423 8910 Maint. of Measuring and Regulating Station Equip. - Industrial 5.0 Direct to Transport 0 - - - - - 424 8920 Maint. of Measuring and Regulating Station Equip. - City Gate 12.6 Composite of Accts. 374-379 - Comm 0 - - - - - 425 8930 Maintenance of Services 14.6 Account 380 - Comm 0 - - - - - 426 8940 Maintenance of Meters and House Regulators 13.6 Composite of Accts. 381-383 - Comm 0 - - - - - 427 8950 Maintenance of Other Equipment 10.6 Composite of Accts. 871-879 & 886-893 - Comm 20 6 4 0 5 5 428 Total Distribution 25,235 7,641 5,178 256 5,728 6,432429430 Customer Accounts:431 9010 Supervision 99.0 - 0 - - - - - 432 9020 Meter Reading Expense 99.0 - 0 - - - - - 433 9030 Customer Records and Collection Expenses 99.0 - 0 - - - - - 434 9040 Uncollectible Accounts 99.0 - 0 - - - - - 435 9050 Miscellaneous Customer Accounts Expenses 99.0 - 0 - - - - - 436 Total Customer Accounts 0 - - - - - 437438 Customer Service and Information:439 9070 Supervision 99.0 - 0 - - - - - 440 9080 Customer Assistance Expenses 99.0 - 0 - - - - - 441 9090 Informational and Instructional Advertising Expenses 99.0 - 0 - - - - - 442 9100 Miscellaneous Customer Service and Informational Expenses 99.0 - 0 - - - - - 443 Total Customer Service and Information 0 - - - - - 444445 Sales:446 9110 Supervision 99.0 - 0 - - - - - 447 9120 Demonstrating and Selling Expenses 99.0 - 0 - - - - - 448 9130 Advertising Expenses 99.0 - 0 - - - - - 449 9160 Miscellaneous Sales Expenses 99.0 - 0 - - - - - 450 Total Sales 0 - - - - - 451452 Administrative & General:453 Operation454 9200 Administrative and General Salaries 17.6 Composite of Accts. 870-902, 905-916, 924 & 928-930.1 - Comm (2,191) (664) (450) (22) (497) (558) 455 9210 Office Supplies and Expenses 17.6 Composite of Accts. 870-902, 905-916, 924 & 928-930.1 - Comm 46 14 9 0 10 12 456 9220 Administrative Expenses Transferred - Customer Support 99.0 - 0 - - - - - 457 9220 Administrative Expenses Transferred - General 17.6 Composite of Accts. 870-902, 905-916, 924 & 928-930.1 - Comm 38,074 11,533 7,815 386 8,639 9,700 458 9230 Outside Services Employed 17.6 Composite of Accts. 870-902, 905-916, 924 & 928-930.1 - Comm 892 270 183 9 202 227 459 9240 Property Insurance 9.6 Allocated Net Plant - Comm 37 14 9 0 7 7 460 9250 Injuries and Damages 17.6 Composite of Accts. 870-902, 905-916, 924 & 928-930.1 - Comm 194 59 40 2 44 50 461 9260 Employee Pensions and Benefits 17.6 Composite of Accts. 870-902, 905-916, 924 & 928-930.1 - Comm 2,844 861 584 29 645 725 462 9270 Franchise Requirements 99.0 - 0 - - - - - 463 9280 Regulatory Commission Expenses 99.0 - 0 - - - - - 464 930.1 General Advertising Expenses 99.0 - 0 - - - - - 465 930.2 Miscellaneous General Expense 17.6 Composite of Accts. 870-902, 905-916, 924 & 928-930.1 - Comm (111) (34) (23) (1) (25) (28) 466 9310 Rents 17.6 Composite of Accts. 870-902, 905-916, 924 & 928-930.1 - Comm (22) (7) (4) (0) (5) (6) 467 Maintenance468 9320 Maintenance of General Plant 17.6 Composite of Accts. 870-902, 905-916, 924 & 928-930.1 - Comm 31 9 6 0 7 8 469 Total A&G 39,793 12,057 8,169 404 9,028 10,136470471 TOTAL O&M EXPENSE - COMMODITY 78,691,840 46,118,716 31,333,529 1,116,777 59,694 63,122

Exhibit PHR-3Page 54 of 75
Atmos Energy Corporation, Kentucky/Mid-States DivisionClass Cost of Service - Demand Only StudyForecasted Test Period: Twelve Months Ended March 31, 2020
ALLOCATION OF O&M EXPENSES
Total O&M Expenses
Line Acct. Allocation Allocation Total Residential Non-Res Sales Non-Res Sales Transport TransportNo. No. Factor Basis Company Sales Firm Interruptible Firm Interruptible472 Production & Gathering:473 Operation474 7500 Op., Sup., & Eng. 0 0 0 0 0 0475 7510 Production Maps & Records 0 0 0 0 0 0476 7530 Field Lines Expenses 0 0 0 0 0 0477 7540 Field Compressor Station Expense 0 0 0 0 0 0478 7550 Field Compressor Sta. Fuel & Pwr. 0 0 0 0 0 0479 7560 Field Meas. & Regul. Station Exp 0 0 0 0 0 0480 7570 Purification Expense 0 0 0 0 0 0481 7590 Other Expenses 0 0 0 0 0 0482 Maintenance483 7610 Maint. Sup., & Eng. 0 0 0 0 0 0484 7620 Structures and Improvements 0 0 0 0 0 0485 7640 Field Line Maintenance 0 0 0 0 0 0486 7650 Compressor Station Equip. Maint. 0 0 0 0 0 0487 7660 Meas. & Regul. Station Equip Maint 0 0 0 0 0 0488 7670 Purification Equipment Maintenance 0 0 0 0 0 0489 7680 Other Equipment Maintenance 0 0 0 0 0 0490 7690 Gas Processed By Others 0 0 0 0 0 0491 Total Production & Gathering 0 0 0 0 0 0492493 Other Gas Supply Expenses:494 Operation495 8001 Intercompany Gas Well-head Purchases 0 0 0 0 0 0496 8010 Natural gas field line purchases 61,240 35,945 24,426 870 0 0497 8040 Natural gas city gate purchases 51,401,318 30,169,962 20,501,486 729,870 0 0498 8050 Other purchases (7,602) (4,462) (3,032) (108) 0 0499 8051 PGA for Residential 47,517,427 27,890,315 18,952,391 674,721 0 0500 8052 PGA for Commercial 24,564,311 14,418,002 9,797,509 348,799 0 0501 8053 PGA for Industrial 4,854,142 2,849,135 1,936,081 68,926 0 0502 8054 PGA for Public Authorities 4,585,482 2,691,445 1,828,926 65,111 0 0503 8058 Unbilled PGA Cost (3,124,678) (1,834,027) (1,246,282) (44,369) 0 0504 8059 PGA Offset to Unrecovered Gas Cost (71,826,171) (42,158,313) (28,647,966) (1,019,892) 0 0505 8060 Exchange gas (2,147,338) (1,260,379) (856,469) (30,491) 0 0506 8081 Gas withdrawn from storage-Debit 12,436,037 7,299,322 4,960,130 176,585 0 0507 8082 Gas delivered to storage-Credit (12,626,734) (7,411,252) (5,036,190) (179,293) 0 0508 8120 Gas used for other utility operations-Credit (14,329) (8,410) (5,715) (203) 0 0509 8580 Transmission and compression of gas by others 22,709,250 13,329,176 9,057,616 322,459 0 0510 Maintenance511 8350 Maint. Of Purch. Gas Meas. Sta. 0 0 0 0 0 0512 Total Other Gas Supply Expenses 78,382,354 46,006,460 31,262,909 1,112,986 0 0513514 Underground Storage:515 Operation516 8140 Storage-Operation supervision and engineering 0 0 0 0 0 0517 8160 Wells expenses 291,917 121,257 71,932 3,855 47,973 46,900518 8170 Lines expenses 21,251 8,827 5,237 281 3,492 3,414519 8180 Compressor station expenses 25,060 10,410 6,175 331 4,118 4,026520 8190 Compressor station fuel and power 735 305 181 10 121 118521 8200 Storage-Measuring and regulating station expenses 6,181 2,567 1,523 82 1,016 993522 8210 Storage-Purification expenses 49,856 20,709 12,285 658 8,193 8,010523 8240 Storage-Other expenses 0 0 0 0 0 0524 8250 Storage well royalties 8,763 3,640 2,159 116 1,440 1,408525 8260 Rents 0 0 0 0 0 0526 Maintenance527 8300 Maint. Sup., & Eng. 0 0 0 0 0 0528 8310 Structures and Improvements 12,736 5,290 3,138 168 2,093 2,046529 8320 Reservoirs & Wells Maintenance 0 0 0 0 0 0530 8330 Line Maintenance 0 0 0 0 0 0531 8340 Compressor Station Equip Maint 3,331 1,384 821 44 547 535532 8350 Meas. & Regul. Station Equip Maint 0 0 0 0 0 0533 8360 Purification Equipment Maintenance 0 0 0 0 0 0534 8410 Other storage expenses-Operation labor and expenses 69,083 28,696 17,023 912 11,353 11,099535 Total Underground Storage Expense 488,914 203,086 120,475 6,456 80,347 78,550536537 Transmission:538 Operation539 8500 Op., Sup., & Eng. 35 16 9 0 5 5540 8510 System Control & Load Dispatching 0 0 0 0 0 0541 8520 Communication Systems Expense 0 0 0 0 0 0542 8530 Compressor Station Labor Expense 0 0 0 0 0 0543 8540 Compressor Station Fuel Gas 0 0 0 0 0 0544 8550 Compressor Station Fuel & Power 308 139 80 4 45 40545 8560 Mains Expense 366,202 165,573 94,678 4,980 53,042 47,930546 8570 Meas. & Regul. Station Expenses 27,278 12,333 7,052 371 3,951 3,570547 8580 LDC Payment 0 0 0 0 0 0548 8580 LDC Payment - A&G 0 0 0 0 0 0549 8590 Other Expenses 0 0 0 0 0 0550 8600 Rents 0 0 0 0 0 0551 Maintenance552 8610 Maint. Sup., & Eng. 0 0 0 0 0 0553 8620 Structures and Improvements 0 0 0 0 0 0554 8630 Mains 16,280 7,361 4,209 221 2,358 2,131555 8640 Compressor Station Equip Maint 0 0 0 0 0 0556 8650 Meas. & Regul. Station Equip Maint 0 0 0 0 0 0557 8660 Communication Equipment Maintenance 0 0 0 0 0 0558 8670 Other Equipment Maintenance 0 0 0 0 0 0559 Total Transmission Expense 410,103 185,422 106,028 5,577 59,401 53,676

Exhibit PHR-3Page 55 of 75
Atmos Energy Corporation, Kentucky/Mid-States DivisionClass Cost of Service - Demand Only StudyForecasted Test Period: Twelve Months Ended March 31, 2020
ALLOCATION OF O&M EXPENSES560561 Distribution:562 Operation563 8700 Supervision and Engineering 963,411 452,236 272,616 11,175 119,724 107,660564 8710 Distribution Load Dispatching 663 201 136 7 150 169565 8711 Odorization 19,956 6,043 4,095 202 4,529 5,086565 8720 Compressor Station Labor & Expenses 0 0 0 0 0 0566 8740 Mains & Services 4,320,719 1,953,546 1,117,076 58,755 625,827 565,515567 8750 Measuring and Regulating Station Exp. - Gen 574,714 259,848 148,586 7,815 83,243 75,221568 8760 Measuring and Regulating Station Exp. - Ind. 120,928 0 119,676 61 761 430569 8770 Measuring and Regulating Sta. Exp. - City Gate 38,286 17,310 9,898 521 5,545 5,011570 8780 Meters and House Regulator Expense 820,621 529,408 271,530 956 11,958 6,768571 8790 Customer Installations Expense 2,246 2,000 243 0 2 1572 8800 Other Expense 3,204 1,504 907 37 398 358573 8810 Rents 369,768 173,573 104,633 4,289 45,951 41,321574 Maintenance575 8850 Maintenance Supervision and Engineering 1,588 745 449 18 197 177576 8860 Maintenance of Structures and Improvements 98 44 25 1 14 13577 8870 Maintenance of Mains 28,852 13,045 7,459 392 4,179 3,776578 8890 Maintenance of compressor station equipment 0 0 0 0 0 0579 8900 Maint. of Measuring and Regulating Station Equip. - General 65,572 29,647 16,953 892 9,498 8,582580 8910 Maint. of Measuring and Regulating Station Equip. - Industrial 1,723 0 1,705 1 11 6581 8920 Maint. of Measuring and Regulating Station Equip. - City Gate 795 360 206 11 115 104582 8930 Maintenance of Services 6,533 5,817 708 0 4 3583 8940 Maintenance of Meters and House Regulators 0 0 0 0 0 0584 8950 Maintenance of Other Equipment 5,866 2,754 1,660 68 729 656585 Total Distribution 7,345,541 3,448,082 2,078,562 85,203 912,837 820,858586587 Customer Accounts:588 9010 Supervision 0 0 0 0 0 0589 9020 Meter Reading Expense 1,085,047 966,269 117,548 60 747 423590 9030 Customer Records and Collection Expenses 1,220,802 1,087,164 132,255 67 840 476591 9040 Uncollectible Accounts 341,050 208,226 129,278 3,493 29 25592 9050 Miscellaneous Customer Accounts Expenses 0 0 0 0 0 0593 Total Customer Accounts 2,646,900 2,261,659 379,081 3,620 1,616 924594595 Customer Service and Information:596 9070 Supervision 0 0 0 0 0 0597 9080 Customer Assistance Expenses 0 0 0 0 0 0598 9090 Informational and Instructional Advertising Expenses 128,272 114,230 13,896 7 88 50599 9100 Miscellaneous Customer Service and Informational Expenses 0 0 0 0 0 0600 Total Customer Service and Information 128,272 114,230 13,896 7 88 50601602 Sales:603 9110 Supervision 253,468 225,721 27,459 14 174 99604 9120 Demonstrating and Selling Expenses 115,937 103,246 12,560 6 80 45605 9130 Advertising Expenses 35,170 31,320 3,810 2 24 14606 9160 Miscellaneous Sales Expenses (196,297) (174,809) (21,266) (11) (135) (76)607 Total Sales 208,278 185,478 22,564 11 143 81608609 Administrative & General:610 Operation611 9200 Administrative and General Salaries (834,543) (474,840) (201,690) (7,402) (79,325) (71,287)612 9210 Office Supplies and Expenses 17,616 10,023 4,257 156 1,674 1,505613 9220 Administrative Expenses Transferred - Customer Support 0 0 0 0 0 0614 9220 Administrative Expenses Transferred - General 14,498,764 8,249,534 3,504,016 128,601 1,378,131 1,238,482615 9230 Outside Services Employed 339,697 193,281 82,097 3,013 32,289 29,017616 9240 Property Insurance 3,718 2,141 873 33 353 318617 9250 Injuries and Damages 74,010 42,111 17,887 656 7,035 6,322618 9260 Employee Pensions and Benefits 1,082,941 616,174 261,722 9,605 102,935 92,505619 9270 Franchise Requirements 646 576 70 0 0 0620 9280 Regulatory Commission Expenses 852,920 759,553 92,401 47 587 332621 930.1 General Advertising Expenses 0 0 0 0 0 0622 930.2 Miscellaneous General Expense (42,325) (24,082) (10,229) (375) (4,023) (3,615)623 9310 Rents (8,275) (4,708) (2,000) (73) (787) (707)624 Maintenance625 9320 Maintenance of General Plant 11,804 6,716 2,853 105 1,122 1,008626 Total A&G 15,996,974 9,376,479 3,752,256 134,365 1,439,993 1,293,880627628 TOTAL O&M EXPENSE 105,607,336 61,780,895 37,735,771 1,348,225 2,494,425 2,248,019

Exhibit PHR-3Page 56 of 75
Atmos Energy Corporation, Kentucky/Mid-States DivisionClass Cost of Service - Demand Only StudyForecasted Test Period: Twelve Months Ended March 31, 2020
ALLOCATION OF DEPRECIATION EXPENSE
Customer
Line Acct. Allocation Allocation Total Residential Non-Res Sales Non-Res Sales Transport TransportNo. No. Factor Basis Company Sales Firm Interruptible Firm Interruptible
1 Intangible Plant:23 30100 Organization 99.0 - 0 - - - - - 4 30200 Franchises & Consents 99.0 - 0 - - - - - 5 30300 Misc Intangible Plant 99.0 - 0 - - - - - 67 Total Intangible Plant: 0 - - - - - 89 Production Plant:
10 99.0 - 0 - - - - - 11 32520 Producing Leaseholds 99.0 - 0 - - - - - 12 32540 Rights of Ways 99.0 - 0 - - - - - 13 33100 Production Gas Wells Equipment 99.0 - 0 - - - - - 14 33201 Field Lines 99.0 - 0 - - - - - 15 33202 Tributary Lines 99.0 - 0 - - - - - 16 33400 Field Meas. & Reg. Sta. Equip 99.0 - 0 - - - - - 17 33600 Purification Equipment 99.0 - 0 - - - - - 1819 Total Production Plant 0 - - - - - 2021 Storage Plant:2223 35010 Land 99.0 - 0 - - - - - 24 35020 Rights of Way 99.0 - 0 - - - - - 25 35100 Structures and Improvements 99.0 - 0 - - - - - 26 35102 Compression Station Equipment 99.0 - 0 - - - - - 27 35103 Meas. & Reg. Sta. Structues 99.0 - 0 - - - - - 28 35104 Other Structures 99.0 - 0 - - - - - 29 35200 Wells \ Rights of Way 99.0 - 0 - - - - - 30 35201 Well Construction 99.0 - 0 - - - - - 31 35202 Well Equipment 99.0 - 0 - - - - - 32 35203 Cushion Gas 99.0 - 0 - - - - - 33 35210 Leaseholds 99.0 - 0 - - - - - 34 35211 Storage Rights 99.0 - 0 - - - - - 35 35301 Field Lines 99.0 - 0 - - - - - 36 35302 Tributary Lines 99.0 - 0 - - - - - 37 35400 Compressor Station Equipment 99.0 - 0 - - - - - 38 35500 Meas & Reg. Equipment 99.0 - 0 - - - - - 39 35600 Purification Equipment 99.0 - 0 - - - - - 4041 Total Storage Plant 0 - - - - - 4243 Transmission:4445 36510 Land & Land Rights 99.0 - 0 - - - - - 46 36520 Rights of Way 99.0 - 0 - - - - - 47 36602 Structures & Improvements 99.0 - 0 - - - - - 48 36603 Other Structues 99.0 - 0 - - - - - 49 36700 Mains Cathodic Protection 99.0 - 0 - - - - - 50 36701 Mains - Steel 99.0 - 0 - - - - - 51 36900 Meas. & Reg. Equipment 99.0 - 0 - - - - - 52 36901 Meas. & Reg. Equipment 99.0 - 0 - - - - - 5354 Total Transmission Plant 0 - - - - - 5556 Distribution:5758 37400 Land & Land Rights 2.0 Bills 0 - - - - - 59 37401 Land 2.0 Bills 0 - - - - - 60 37402 Land Rights 2.0 Bills 0 - - - - - 61 37403 Land Other 2.0 Bills 0 - - - - - 62 37500 Structures & Improvements 2.0 Bills 0 - - - - - 63 37501 Structures & Improvements T.B. 2.0 Bills 0 - - - - - 64 37502 Land Rights 2.0 Bills 0 - - - - - 65 37503 Improvements 2.0 Bills 0 - - - - - 66 37600 Mains Cathodic Protection 2.0 Bills 0 - - - - - 67 37601 Mains - Steel 2.0 Bills 0 - - - - - 68 37602 Mains - Plastic 2.0 Bills 0 - - - - - 69 37800 Meas & Reg. Sta. Equip - General 2.0 Bills 0 - - - - - 70 37900 Meas & Reg. Sta. Equip - City Gate 2.0 Bills 0 - - - - - 71 37905 Meas & Reg. Sta. Equipment T.b. 2.0 Bills 0 - - - - - 72 38000 Services 2.0 Bills 4,817,588 4,290,218 521,911 265 3,317 1,877 73 38100 Meters 4.0 Meter Investment 2,741,749 1,768,788 907,200 3,195 39,954 22,612 74 38200 Meter Installaitons 4.0 Meter Investment 2,232,937 1,440,537 738,843 2,602 32,539 18,416 75 38300 House Regulators 4.0 Meter Investment 514,355 331,827 170,192 599 7,495 4,242 76 38400 House Reg. Installations 4.0 Meter Investment 8,807 5,681 2,914 10 128 73 77 38500 Ind. Meas. & Reg. Sta. Equipment 2.2 Non-Residential Bills 112,194 - 111,033 56 706 399 78 38600 Other Prop. On Cust. Prem 99.0 - 0 - - - - - 7980 Total Distribution Plant 10,427,630 7,837,051 2,452,093 6,729 84,138 47,619

Exhibit PHR-3Page 57 of 75
Atmos Energy Corporation, Kentucky/Mid-States DivisionClass Cost of Service - Demand Only StudyForecasted Test Period: Twelve Months Ended March 31, 2020
ALLOCATION OF DEPRECIATION EXPENSE8182 General:8384 38900 Land & Land Rights 6.2 P, S, T & D Plant - Customer 0 - - - - - 85 39000 Structures Frame 6.2 P, S, T & D Plant - Customer 94,939 73,278 20,642 49 619 350 86 39001 Structures & Improvements 6.2 P, S, T & D Plant - Customer 2,161 1,668 470 1 14 8 87 39002 Improvements 6.2 P, S, T & D Plant - Customer 8,853 6,833 1,925 5 58 33 88 39003 Air Conditioning Equipment 6.2 P, S, T & D Plant - Customer 283 219 62 0 2 1 89 39004 Improvement to leased Premises 6.2 P, S, T & D Plant - Customer 0 - - - - - 90 39009 Office Furniture & Equipment 6.2 P, S, T & D Plant - Customer 36,228 27,963 7,877 19 236 134 91 39100 Remittance Processing Equip 6.2 P, S, T & D Plant - Customer 0 - - - - - 92 39102 Office Machines 6.2 P, S, T & D Plant - Customer 0 - - - - - 93 39103 Transportation Equipment 6.2 P, S, T & D Plant - Customer 2,013 1,553 438 1 13 7 94 39200 Trucks 6.2 P, S, T & D Plant - Customer 0 - - - - - 95 39201 Trailers 6.2 P, S, T & D Plant - Customer 0 - - - - - 96 39202 Stores Equipment 6.2 P, S, T & D Plant - Customer 0 - - - - - 97 39300 Tools, Shop & Garage Equipment 6.2 P, S, T & D Plant - Customer 45,302 34,967 9,850 24 295 167 98 39400 Power Operated Equipment 6.2 P, S, T & D Plant - Customer 0 - - - - - 99 39600 Ditchers 6.2 P, S, T & D Plant - Customer 0 - - - - -
100 39603 Backhoes 6.2 P, S, T & D Plant - Customer 0 - - - - - 101 39604 Welders 6.2 P, S, T & D Plant - Customer 0 - - - - - 102 39605 Communication Equipment 6.2 P, S, T & D Plant - Customer 13,556 10,464 2,948 7 88 50 103 39700 Communication Equipment - Mobile Radios 6.2 P, S, T & D Plant - Customer 0 - - - - - 104 39701 Communication Equipment - Fixed Radios 6.2 P, S, T & D Plant - Customer 0 - - - - - 105 39702 Communication Equip. - Telemetering 6.2 P, S, T & D Plant - Customer 0 - - - - - 106 39705 Miscellaneous Equipment 6.2 P, S, T & D Plant - Customer 75,438 58,227 16,402 39 491 278 107 39800 Other Tangible Property 6.2 P, S, T & D Plant - Customer 0 - - - - - 108 39900 Other Tangible Property - Servers - H/W 6.2 P, S, T & D Plant - Customer 797 615 173 0 5 3 109 39901 Other Tangible Property - Servers - S/W 6.2 P, S, T & D Plant - Customer 0 - - - - - 110 39902 Other Tangible Property - Network - H/W 6.2 P, S, T & D Plant - Customer 5,218 4,028 1,135 3 34 19 111 39903 Other Tang. Property - CPU 6.2 P, S, T & D Plant - Customer 0 - - - - - 112 39904 Other Tangible Property - MF - Hardware 6.2 P, S, T & D Plant - Customer 0 - - - - - 113 39905 Other Tang. Property - PC Hardware 6.2 P, S, T & D Plant - Customer 34,640 26,737 7,532 18 226 128 114 39906 Other Tang. Property - PC Software 6.2 P, S, T & D Plant - Customer 0 - - - - - 115 39907 Other Tang. Property - Mainframe S/W 6.2 P, S, T & D Plant - Customer 0 - - - - - 116 39908 Other Tang. Property - Application Software 6.2 P, S, T & D Plant - Customer 3,989 3,079 867 2 26 15 117 40600 Amortization of gas plant acquisition adjustments 6.2 P, S, T & D Plant - Customer 0 - - - - - 118119120 Total General Plant 323,417 249,630 70,320 169 2,107 1,193121122 TOTAL DIRECT DEPRECIATION EXPENSE 10,751,047 8,086,680 2,522,413 6,897 86,245 48,812123124 Kentucky Mid-States General Office:125126 Intangible Plant:127128 30100 Organization 99.0 - 0 - - - - - 129 30200 Franchises & Consents 99.0 - 0 - - - - - 130 30300 Misc Intangible Plant 99.0 - 0 - - - - - 131132 Total Intangible Plant: 0 - - - - - 133134 General:135136 37400 Land & Land Rights 6.2 P, S, T & D Plant - Customer 0 - - - - - 137 39001 Structures Frame 6.2 P, S, T & D Plant - Customer 969 748 211 1 6 4 138 36602 Structures & Improvements 6.2 P, S, T & D Plant - Customer 0 - - - - - 139 38900 Land & Land Rights 6.2 P, S, T & D Plant - Customer 0 - - - - - 140 39004 Air Conditioning Equipment 6.2 P, S, T & D Plant - Customer 218 168 47 0 1 1 141 39009 Improvement to leased Premises 6.2 P, S, T & D Plant - Customer 0 - - - - - 142 39100 Office Furniture & Equipment 6.2 P, S, T & D Plant - Customer 0 - - - - - 143 39102 Remittance Processing Equip 6.2 P, S, T & D Plant - Customer 0 - - - - - 144 39103 Office Machines 6.2 P, S, T & D Plant - Customer 0 - - - - - 145 39200 Transportation Equipment 6.2 P, S, T & D Plant - Customer 155 120 34 0 1 1 146 39201 Trucks 6.2 P, S, T & D Plant - Customer 0 - - - - - 147 39202 Trailers 6.2 P, S, T & D Plant - Customer 0 - - - - - 148 39300 Stores Equipment 6.2 P, S, T & D Plant - Customer 0 - - - - - 149 39400 Tools, Shop & Garage Equipment 6.2 P, S, T & D Plant - Customer 785 606 171 0 5 3 150 39600 Power Operated Equipment 6.2 P, S, T & D Plant - Customer 5 4 1 0 0 0 151 39603 Ditchers 6.2 P, S, T & D Plant - Customer 0 - - - - - 152 39604 Backhoes 6.2 P, S, T & D Plant - Customer 0 - - - - - 153 39605 Welders 6.2 P, S, T & D Plant - Customer 0 - - - - - 154 39700 Communication Equipment 6.2 P, S, T & D Plant - Customer 640 494 139 0 4 2 155 39701 Communication Equipment - Mobile Radios 6.2 P, S, T & D Plant - Customer 0 - - - - - 156 39702 Communication Equipment - Fixed Radios 6.2 P, S, T & D Plant - Customer 0 - - - - - 157 39705 Communication Equip. - Telemetering 6.2 P, S, T & D Plant - Customer 0 - - - - - 158 39800 Miscellaneous Equipment 6.2 P, S, T & D Plant - Customer 4,745 3,663 1,032 2 31 17 159 39900 Other Tangible Property 6.2 P, S, T & D Plant - Customer 0 - - - - - 160 39901 Other Tangible Property - Servers - H/W 6.2 P, S, T & D Plant - Customer 0 - - - - - 161 39902 Other Tangible Property - Servers - S/W 6.2 P, S, T & D Plant - Customer 0 - - - - - 162 39903 Other Tangible Property - Network - H/W 6.2 P, S, T & D Plant - Customer 0 - - - - - 163 39904 Other Tang. Property - CPU 6.2 P, S, T & D Plant - Customer 0 - - - - - 164 39905 Other Tangible Property - MF - Hardware 6.2 P, S, T & D Plant - Customer 0 - - - - - 165 39906 Other Tang. Property - PC Hardware 6.2 P, S, T & D Plant - Customer 0 - - - - - 166 39907 Other Tang. Property - PC Software 6.2 P, S, T & D Plant - Customer 4,321 3,335 939 2 28 16 167 39908 Other Tang. Property - Mainframe S/W 6.2 P, S, T & D Plant - Customer 0 - - - - - 168 39909 Other Tang. Property - Application Software 6.2 P, S, T & D Plant - Customer 0 - - - - - 169 39924 Other Tang. Property - General Startup Costs 6.2 P, S, T & D Plant - Customer 0 - - - - - 170171172 Total General Plant 11,838 9,137 2,574 6 77 44

Exhibit PHR-3Page 58 of 75
Atmos Energy Corporation, Kentucky/Mid-States DivisionClass Cost of Service - Demand Only StudyForecasted Test Period: Twelve Months Ended March 31, 2020
ALLOCATION OF DEPRECIATION EXPENSE173174 Shared Services General Office:175176 General:177178 37400 Land & Land Rights 6.2 P, S, T & D Plant - Customer 0 - - - - - 179 39000 Structures & Improvements 6.2 P, S, T & D Plant - Customer 2,765 2,134 601 1 18 10 180 36602 Structures & Improvements 6.2 P, S, T & D Plant - Customer 0 - - - - - 181 37503 Improvements 6.2 P, S, T & D Plant - Customer 0 - - - - - 182 39004 Air Conditioning Equipment 6.2 P, S, T & D Plant - Customer 0 - - - - - 183 39009 Improvement to leased Premises 6.2 P, S, T & D Plant - Customer 14 11 3 0 0 0 184 39100 Office Furniture & Equipment 6.2 P, S, T & D Plant - Customer 4,183 3,229 910 2 27 15 185 39102 Remittance Processing Equip 6.2 P, S, T & D Plant - Customer 0 - - - - - 186 39103 Office Machines 6.2 P, S, T & D Plant - Customer 0 - - - - - 187 39200 Transportation Equipment 6.2 P, S, T & D Plant - Customer 0 - - - - - 188 39201 Trucks 6.2 P, S, T & D Plant - Customer 0 - - - - - 189 39202 Trailers 6.2 P, S, T & D Plant - Customer 0 - - - - - 190 39300 Stores Equipment 6.2 P, S, T & D Plant - Customer 0 - - - - - 191 39400 Tools, Shop & Garage Equipment 6.2 P, S, T & D Plant - Customer 0 - - - - - 192 39600 Power Operated Equipment 6.2 P, S, T & D Plant - Customer 0 - - - - - 193 39603 Ditchers 6.2 P, S, T & D Plant - Customer 0 - - - - - 194 39604 Backhoes 6.2 P, S, T & D Plant - Customer 0 - - - - - 195 39605 Welders 6.2 P, S, T & D Plant - Customer 0 - - - - - 196 39700 Communication Equipment 6.2 P, S, T & D Plant - Customer 10 8 2 0 0 0 197 39701 Communication Equipment - Mobile Radios 6.2 P, S, T & D Plant - Customer 0 - - - - - 198 39702 Communication Equipment - Fixed Radios 6.2 P, S, T & D Plant - Customer 0 - - - - - 199 39705 Communication Equip. - Telemetering 6.2 P, S, T & D Plant - Customer 0 - - - - - 200 39800 Miscellaneous Equipment 6.2 P, S, T & D Plant - Customer 25 20 6 0 0 0 201 39900 Other Tangible Property 6.2 P, S, T & D Plant - Customer 0 - - - - - 202 39901 Other Tangible Property - Servers - H/W 6.2 P, S, T & D Plant - Customer 51,904 40,062 11,285 27 338 191 203 39902 Other Tangible Property - Servers - S/W 6.2 P, S, T & D Plant - Customer 15,555 12,006 3,382 8 101 57 204 39903 Other Tangible Property - Network - H/W 6.2 P, S, T & D Plant - Customer 0 - - - - - 205 39904 Other Tang. Property - CPU 6.2 P, S, T & D Plant - Customer 0 - - - - - 206 39905 Other Tangible Property - MF - Hardware 6.2 P, S, T & D Plant - Customer 0 - - - - - 207 39906 Other Tang. Property - PC Hardware 6.2 P, S, T & D Plant - Customer 3,517 2,715 765 2 23 13 208 39907 Other Tang. Property - PC Software 6.2 P, S, T & D Plant - Customer 0 - - - - - 209 39908 Other Tang. Property - Mainframe S/W 6.2 P, S, T & D Plant - Customer 0 - - - - - 210 39909 Other Tang. Property - Application Software 6.2 P, S, T & D Plant - Customer 529 409 115 0 3 2 211 39924 Other Tang. Property - General Startup Costs 6.2 P, S, T & D Plant - Customer 0 - - - - - 212213214 Total General Plant 78,503 60,593 17,069 41 511 289 215216 Shared Services Customer Support:217218 General:219220 37400 Land & Land Rights 6.2 P, S, T & D Plant - Customer 0 - - - - - 221 39001 Structures Frame 6.2 P, S, T & D Plant - Customer 0 - - - - - 222 36602 Structures & Improvements 6.2 P, S, T & D Plant - Customer 11,669 9,007 2,537 6 76 43 223 37503 Improvements 6.2 P, S, T & D Plant - Customer 0 - - - - - 224 39004 Air Conditioning Equipment 6.2 P, S, T & D Plant - Customer 0 - - - - - 225 39009 Improvement to leased Premises 6.2 P, S, T & D Plant - Customer 2,005 1,547 436 1 13 7 226 39100 Office Furniture & Equipment 6.2 P, S, T & D Plant - Customer 2,380 1,837 517 1 16 9 227 39102 Remittance Processing Equip 6.2 P, S, T & D Plant - Customer 0 - - - - - 228 39103 Office Machines 6.2 P, S, T & D Plant - Customer 0 - - - - - 229 39200 Transportation Equipment 6.2 P, S, T & D Plant - Customer 0 - - - - - 230 39201 Trucks 6.2 P, S, T & D Plant - Customer 0 - - - - - 231 39202 Trailers 6.2 P, S, T & D Plant - Customer 0 - - - - - 232 39300 Stores Equipment 6.2 P, S, T & D Plant - Customer 0 - - - - - 233 39400 Tools, Shop & Garage Equipment 6.2 P, S, T & D Plant - Customer 462 356 100 0 3 2 234 39600 Power Operated Equipment 6.2 P, S, T & D Plant - Customer 21 16 5 0 0 0 235 39603 Ditchers 6.2 P, S, T & D Plant - Customer 0 - - - - - 236 39604 Backhoes 6.2 P, S, T & D Plant - Customer 0 - - - - - 237 39605 Welders 6.2 P, S, T & D Plant - Customer 0 - - - - - 238 39700 Communication Equipment 6.2 P, S, T & D Plant - Customer 2,601 2,008 566 1 17 10 239 39701 Communication Equipment - Mobile Radios 6.2 P, S, T & D Plant - Customer 0 - - - - - 240 39702 Communication Equipment - Fixed Radios 6.2 P, S, T & D Plant - Customer 0 - - - - - 241 39705 Communication Equip. - Telemetering 6.2 P, S, T & D Plant - Customer 0 - - - - - 242 39800 Miscellaneous Equipment 6.2 P, S, T & D Plant - Customer 323 249 70 0 2 1 243 39900 Other Tangible Property 6.2 P, S, T & D Plant - Customer 2,196 1,695 477 1 14 8 244 39901 Other Tangible Property - Servers - H/W 6.2 P, S, T & D Plant - Customer 21,444 16,552 4,663 11 140 79 245 39902 Other Tangible Property - Servers - S/W 6.2 P, S, T & D Plant - Customer 3,953 3,051 859 2 26 15 246 39903 Other Tangible Property - Network - H/W 6.2 P, S, T & D Plant - Customer 962 742 209 1 6 4 247 39904 Other Tang. Property - CPU 6.2 P, S, T & D Plant - Customer 0 - - - - - 248 39905 Other Tangible Property - MF - Hardware 6.2 P, S, T & D Plant - Customer 0 - - - - - 249 39906 Other Tang. Property - PC Hardware 6.2 P, S, T & D Plant - Customer 2,834 2,187 616 1 18 10 250 39907 Other Tang. Property - PC Software 6.2 P, S, T & D Plant - Customer 338 261 73 0 2 1 251 39908 Other Tang. Property - Mainframe S/W 6.2 P, S, T & D Plant - Customer 0 - - - - - 252 39909 Other Tang. Property - Application Software 6.2 P, S, T & D Plant - Customer 132,791 102,494 28,872 69 865 490 253 39924 Other Tang. Property - General Startup Costs 6.2 P, S, T & D Plant - Customer 12 9 3 0 0 0 254255256 Total General Plant 183,990 142,013 40,004 96 1,199 678 257258 TOTAL DEPRECIATION EXPENSE - CUSTOMER 11,025,378 8,298,422 2,582,060 7,040 88,033 49,823

Exhibit PHR-3Page 59 of 75
Atmos Energy Corporation, Kentucky/Mid-States DivisionClass Cost of Service - Demand Only StudyForecasted Test Period: Twelve Months Ended March 31, 2020
ALLOCATION OF DEPRECIATION EXPENSE
Demand
Line Acct. Allocation Allocation Total Residential Non-Res Sales Non-Res Sales Transport TransportNo. No. Factor Basis Company Sales Firm Interruptible Firm Interruptible
259 Intangible Plant:260261 30100 Organization 99.0 - 0 - - - - - 262 30200 Franchises & Consents 99.0 - 0 - - - - - 263 30300 Misc Intangible Plant 99.0 - 0 - - - - - 264265 Total Intangible Plant: 0 - - - - - 266267 Production Plant:268 3.0 Peak Day 0 - - - - - 269 32520 Producing Leaseholds 3.0 Peak Day 0 - - - - - 270 32540 Rights of Ways 3.0 Peak Day 0 - - - - - 271 33100 Production Gas Wells Equipment 3.0 Peak Day 0 - - - - - 272 33201 Field Lines 3.0 Peak Day 0 - - - - - 273 33202 Tributary Lines 3.0 Peak Day 0 - - - - - 274 33400 Field Meas. & Reg. Sta. Equip 3.0 Peak Day 0 - - - - - 275 33600 Purification Equipment 3.0 Peak Day 0 - - - - - 276277 Total Production Plant 0 - - - - - 278279 Storage Plant:280281 35010 Land 3.0 Peak Day 0 - - - - - 282 35020 Rights of Way 3.0 Peak Day 11 5 3 0 2 1 283 35100 Structures and Improvements 3.0 Peak Day 149 67 38 2 22 19 284 35102 Compression Station Equipment 3.0 Peak Day 958 433 248 13 139 125 285 35103 Meas. & Reg. Sta. Structues 3.0 Peak Day 104 47 27 1 15 14 286 35104 Other Structures 3.0 Peak Day 887 401 229 12 128 116 287 35200 Wells \ Rights of Way 3.0 Peak Day 80,561 36,424 20,828 1,096 11,669 10,544 288 35201 Well Construction 3.0 Peak Day 12,920 5,842 3,340 176 1,871 1,691 289 35202 Well Equipment 3.0 Peak Day 0 - - - - - 290 35203 Cushion Gas 3.0 Peak Day 11,694 5,287 3,023 159 1,694 1,531 291 35210 Leaseholds 3.0 Peak Day 277 125 72 4 40 36 292 35211 Storage Rights 3.0 Peak Day 240 109 62 3 35 31 293 35301 Field Lines 3.0 Peak Day 798 361 206 11 116 104 294 35302 Tributary Lines 3.0 Peak Day 952 431 246 13 138 125 295 35400 Compressor Station Equipment 3.0 Peak Day 7,849 3,549 2,029 107 1,137 1,027 296 35500 Meas & Reg. Equipment 3.0 Peak Day 2,280 1,031 590 31 330 298 297 35600 Purification Equipment 3.0 Peak Day 4,105 1,856 1,061 56 595 537 298299 Total Storage Plant 123,785 55,968 32,003 1,683 17,929 16,202 300301 Transmission:302303 36510 Land & Land Rights 3.0 Peak Day 0 - - - - - 304 36520 Rights of Way 3.0 Peak Day 9,112 4,120 2,356 124 1,320 1,193 305 36602 Structures & Improvements 3.0 Peak Day 608 275 157 8 88 80 306 36603 Other Structues 3.0 Peak Day 754 341 195 10 109 99 307 36700 Mains Cathodic Protection 3.0 Peak Day 5,362 2,424 1,386 73 777 702 308 36701 Mains - Steel 3.0 Peak Day 381,167 172,339 98,547 5,183 55,209 49,889 309 36900 Meas. & Reg. Equipment 3.0 Peak Day 11,265 5,093 2,912 153 1,632 1,474 310 36901 Meas. & Reg. Equipment 3.0 Peak Day 34,951 15,803 9,036 475 5,062 4,575 311312 Total Transmission Plant 443,218 200,394 114,589 6,027 64,197 58,010 313314 Distribution:315316 37400 Land & Land Rights 3.0 Peak Day 0 - - - - - 317 37401 Land 3.0 Peak Day 0 - - - - - 318 37402 Land Rights 3.0 Peak Day 49,908 22,565 12,903 679 7,229 6,532 319 37403 Land Other 3.0 Peak Day 0 - - - - - 320 37500 Structures & Improvements 3.0 Peak Day 6,017 2,721 1,556 82 872 788 321 37501 Structures & Improvements T.B. 3.0 Peak Day 1,787 808 462 24 259 234 322 37502 Land Rights 3.0 Peak Day 828 374 214 11 120 108 323 37503 Improvements 3.0 Peak Day 72 32 19 1 10 9 324 37600 Mains Cathodic Protection 3.0 Peak Day 873,542 394,959 225,845 11,879 126,527 114,333 325 37601 Mains - Steel 3.0 Peak Day 4,454,842 2,014,188 1,151,752 60,579 645,254 583,069 326 37602 Mains - Plastic 3.0 Peak Day 3,376,201 1,526,497 872,881 45,911 489,020 441,892 327 37800 Meas & Reg. Sta. Equip - General 3.0 Peak Day 925,640 418,514 239,314 12,587 134,073 121,152 328 37900 Meas & Reg. Sta. Equip - City Gate 3.0 Peak Day 145,903 65,968 37,722 1,984 21,133 19,096 329 37905 Meas & Reg. Sta. Equipment T.b. 3.0 Peak Day 46,759 21,141 12,089 636 6,773 6,120 330 38000 Services 99.0 - 0 - - - - - 331 38100 Meters 99.0 - 0 - - - - - 332 38200 Meter Installaitons 99.0 - 0 - - - - - 333 38300 House Regulators 99.0 - 0 - - - - - 334 38400 House Reg. Installations 99.0 - 0 - - - - - 335 38500 Ind. Meas. & Reg. Sta. Equipment 99.0 - 0 - - - - - 336 38600 Other Prop. On Cust. Prem 99.0 - 0 - - - - - 337338 Total Distribution Plant 9,881,500 4,467,767 2,554,757 134,374 1,431,268 1,293,334

Exhibit PHR-3Page 60 of 75
Atmos Energy Corporation, Kentucky/Mid-States DivisionClass Cost of Service - Demand Only StudyForecasted Test Period: Twelve Months Ended March 31, 2020
ALLOCATION OF DEPRECIATION EXPENSE339340 General:341342 38900 Land & Land Rights 6.4 P, S, T & D Plant - Demand 0 - - - - - 343 39000 Structures Frame 6.4 P, S, T & D Plant - Demand 147,253 66,578 38,071 2,002 21,329 19,273 344 39001 Structures & Improvements 6.4 P, S, T & D Plant - Demand 3,352 1,515 867 46 485 439 345 39002 Improvements 6.4 P, S, T & D Plant - Demand 13,732 6,209 3,550 187 1,989 1,797 346 39003 Air Conditioning Equipment 6.4 P, S, T & D Plant - Demand 439 199 114 6 64 58 347 39004 Improvement to leased Premises 6.4 P, S, T & D Plant - Demand 0 - - - - - 348 39009 Office Furniture & Equipment 6.4 P, S, T & D Plant - Demand 56,191 25,406 14,528 764 8,139 7,354 349 39100 Remittance Processing Equip 6.4 P, S, T & D Plant - Demand 0 - - - - - 350 39102 Office Machines 6.4 P, S, T & D Plant - Demand 0 - - - - - 351 39103 Transportation Equipment 6.4 P, S, T & D Plant - Demand 3,122 1,411 807 42 452 409 352 39200 Trucks 6.4 P, S, T & D Plant - Demand 0 - - - - - 353 39201 Trailers 6.4 P, S, T & D Plant - Demand 0 - - - - - 354 39202 Stores Equipment 6.4 P, S, T & D Plant - Demand 0 - - - - - 355 39300 Tools, Shop & Garage Equipment 6.4 P, S, T & D Plant - Demand 70,265 31,769 18,166 956 10,177 9,197 356 39400 Power Operated Equipment 6.4 P, S, T & D Plant - Demand 0 - - - - - 357 39600 Ditchers 6.4 P, S, T & D Plant - Demand 0 - - - - - 358 39603 Backhoes 6.4 P, S, T & D Plant - Demand 0 - - - - - 359 39604 Welders 6.4 P, S, T & D Plant - Demand 0 - - - - - 360 39605 Communication Equipment 6.4 P, S, T & D Plant - Demand 21,026 9,507 5,436 286 3,046 2,752 361 39700 Communication Equipment - Mobile Radios 6.4 P, S, T & D Plant - Demand 0 - - - - - 362 39701 Communication Equipment - Fixed Radios 6.4 P, S, T & D Plant - Demand 0 - - - - - 363 39702 Communication Equip. - Telemetering 6.4 P, S, T & D Plant - Demand 0 - - - - - 364 39705 Miscellaneous Equipment 6.4 P, S, T & D Plant - Demand 117,007 52,903 30,251 1,591 16,948 15,314 365 39800 Other Tangible Property 6.4 P, S, T & D Plant - Demand 0 - - - - - 366 39900 Other Tangible Property - Servers - H/W 6.4 P, S, T & D Plant - Demand 1,236 559 320 17 179 162 367 39901 Other Tangible Property - Servers - S/W 6.4 P, S, T & D Plant - Demand 0 - - - - - 368 39902 Other Tangible Property - Network - H/W 6.4 P, S, T & D Plant - Demand 8,094 3,659 2,092 110 1,172 1,059 369 39903 Other Tang. Property - CPU 6.4 P, S, T & D Plant - Demand 0 - - - - - 370 39904 Other Tangible Property - MF - Hardware 6.4 P, S, T & D Plant - Demand 0 - - - - - 371 39905 Other Tang. Property - PC Hardware 6.4 P, S, T & D Plant - Demand 53,727 24,292 13,891 731 7,782 7,032 372 39906 Other Tang. Property - PC Software 6.4 P, S, T & D Plant - Demand 0 - - - - - 373 39907 Other Tang. Property - Mainframe S/W 6.4 P, S, T & D Plant - Demand 0 - - - - - 374 39908 Other Tang. Property - Application Software 6.4 P, S, T & D Plant - Demand 6,187 2,797 1,600 84 896 810 375 40600 Amortization of gas plant acquisition adjustments 6.4 P, S, T & D Plant - Demand 0 - - - - - 376377378 Total General Plant 501,630 226,804 129,691 6,821 72,658 65,656379380 TOTAL DIRECT DEPRECIATION EXPENSE 10,950,133 4,950,933 2,831,041 148,906 1,586,052 1,433,202381382 Kentucky Mid-States General Office:383384 Intangible Plant:385386 30100 Organization 99.0 - 0 - - - - - 387 30200 Franchises & Consents 99.0 - 0 - - - - - 388 30300 Misc Intangible Plant 99.0 - 0 - - - - - 389390 Total Intangible Plant: 0 - - - - - 391392 General:393394 37400 Land & Land Rights 6.4 P, S, T & D Plant - Demand 0 - - - - - 395 39001 Structures Frame 6.4 P, S, T & D Plant - Demand 1,503 680 389 20 218 197 396 36602 Structures & Improvements 6.4 P, S, T & D Plant - Demand 0 - - - - - 397 38900 Land & Land Rights 6.4 P, S, T & D Plant - Demand 0 - - - - - 398 39004 Air Conditioning Equipment 6.4 P, S, T & D Plant - Demand 338 153 87 5 49 44 399 39009 Improvement to leased Premises 6.4 P, S, T & D Plant - Demand 0 - - - - - 400 39100 Office Furniture & Equipment 6.4 P, S, T & D Plant - Demand 0 - - - - - 401 39102 Remittance Processing Equip 6.4 P, S, T & D Plant - Demand 0 - - - - - 402 39103 Office Machines 6.4 P, S, T & D Plant - Demand 0 - - - - - 403 39200 Transportation Equipment 6.4 P, S, T & D Plant - Demand 240 109 62 3 35 31 404 39201 Trucks 6.4 P, S, T & D Plant - Demand 0 - - - - - 405 39202 Trailers 6.4 P, S, T & D Plant - Demand 0 - - - - - 406 39300 Stores Equipment 6.4 P, S, T & D Plant - Demand 0 - - - - - 407 39400 Tools, Shop & Garage Equipment 6.4 P, S, T & D Plant - Demand 1,217 550 315 17 176 159 408 39600 Power Operated Equipment 6.4 P, S, T & D Plant - Demand 7 3 2 0 1 1 409 39603 Ditchers 6.4 P, S, T & D Plant - Demand 0 - - - - - 410 39604 Backhoes 6.4 P, S, T & D Plant - Demand 0 - - - - - 411 39605 Welders 6.4 P, S, T & D Plant - Demand 0 - - - - - 412 39700 Communication Equipment 6.4 P, S, T & D Plant - Demand 993 449 257 14 144 130 413 39701 Communication Equipment - Mobile Radios 6.4 P, S, T & D Plant - Demand 0 - - - - - 414 39702 Communication Equipment - Fixed Radios 6.4 P, S, T & D Plant - Demand 0 - - - - - 415 39705 Communication Equip. - Telemetering 6.4 P, S, T & D Plant - Demand 0 - - - - - 416 39800 Miscellaneous Equipment 6.4 P, S, T & D Plant - Demand 7,360 3,328 1,903 100 1,066 963 417 39900 Other Tangible Property 6.4 P, S, T & D Plant - Demand 0 - - - - - 418 39901 Other Tangible Property - Servers - H/W 6.4 P, S, T & D Plant - Demand 0 - - - - - 419 39902 Other Tangible Property - Servers - S/W 6.4 P, S, T & D Plant - Demand 0 - - - - - 420 39903 Other Tangible Property - Network - H/W 6.4 P, S, T & D Plant - Demand 0 - - - - - 421 39904 Other Tang. Property - CPU 6.4 P, S, T & D Plant - Demand 0 - - - - - 422 39905 Other Tangible Property - MF - Hardware 6.4 P, S, T & D Plant - Demand 0 - - - - - 423 39906 Other Tang. Property - PC Hardware 6.4 P, S, T & D Plant - Demand 0 - - - - - 424 39907 Other Tang. Property - PC Software 6.4 P, S, T & D Plant - Demand 6,702 3,030 1,733 91 971 877 425 39908 Other Tang. Property - Mainframe S/W 6.4 P, S, T & D Plant - Demand 0 - - - - - 426 39909 Other Tang. Property - Application Software 6.4 P, S, T & D Plant - Demand 0 - - - - - 427 39924 Other Tang. Property - General Startup Costs 6.4 P, S, T & D Plant - Demand 0 - - - - - 428429430 Total General Plant 18,361 8,302 4,747 250 2,659 2,403

Exhibit PHR-3Page 61 of 75
Atmos Energy Corporation, Kentucky/Mid-States DivisionClass Cost of Service - Demand Only StudyForecasted Test Period: Twelve Months Ended March 31, 2020
ALLOCATION OF DEPRECIATION EXPENSE431432 Shared Services General Office:433434 General:435436 37400 Land & Land Rights 6.4 P, S, T & D Plant - Demand 0 - - - - - 437 39000 Structures & Improvements 6.4 P, S, T & D Plant - Demand 4,289 1,939 1,109 58 621 561 438 36602 Structures & Improvements 6.4 P, S, T & D Plant - Demand 0 - - - - - 439 37503 Improvements 6.4 P, S, T & D Plant - Demand 0 - - - - - 440 39004 Air Conditioning Equipment 6.4 P, S, T & D Plant - Demand 0 - - - - - 441 39009 Improvement to leased Premises 6.4 P, S, T & D Plant - Demand 21 10 5 0 3 3 442 39100 Office Furniture & Equipment 6.4 P, S, T & D Plant - Demand 6,488 2,934 1,678 88 940 849 443 39102 Remittance Processing Equip 6.4 P, S, T & D Plant - Demand 0 - - - - - 444 39103 Office Machines 6.4 P, S, T & D Plant - Demand 0 - - - - - 445 39200 Transportation Equipment 6.4 P, S, T & D Plant - Demand 0 - - - - - 446 39201 Trucks 6.4 P, S, T & D Plant - Demand 0 - - - - - 447 39202 Trailers 6.4 P, S, T & D Plant - Demand 0 - - - - - 448 39300 Stores Equipment 6.4 P, S, T & D Plant - Demand 0 - - - - - 449 39400 Tools, Shop & Garage Equipment 6.4 P, S, T & D Plant - Demand 0 - - - - - 450 39600 Power Operated Equipment 6.4 P, S, T & D Plant - Demand 0 - - - - - 451 39603 Ditchers 6.4 P, S, T & D Plant - Demand 0 - - - - - 452 39604 Backhoes 6.4 P, S, T & D Plant - Demand 0 - - - - - 453 39605 Welders 6.4 P, S, T & D Plant - Demand 0 - - - - - 454 39700 Communication Equipment 6.4 P, S, T & D Plant - Demand 16 7 4 0 2 2 455 39701 Communication Equipment - Mobile Radios 6.4 P, S, T & D Plant - Demand 0 - - - - - 456 39702 Communication Equipment - Fixed Radios 6.4 P, S, T & D Plant - Demand 0 - - - - - 457 39705 Communication Equip. - Telemetering 6.4 P, S, T & D Plant - Demand 0 - - - - - 458 39800 Miscellaneous Equipment 6.4 P, S, T & D Plant - Demand 39 18 10 1 6 5 459 39900 Other Tangible Property 6.4 P, S, T & D Plant - Demand 0 - - - - - 460 39901 Other Tangible Property - Servers - H/W 6.4 P, S, T & D Plant - Demand 80,504 36,399 20,813 1,095 11,660 10,537 461 39902 Other Tangible Property - Servers - S/W 6.4 P, S, T & D Plant - Demand 24,127 10,908 6,238 328 3,495 3,158 462 39903 Other Tangible Property - Network - H/W 6.4 P, S, T & D Plant - Demand 0 - - - - - 463 39904 Other Tang. Property - CPU 6.4 P, S, T & D Plant - Demand 0 - - - - - 464 39905 Other Tangible Property - MF - Hardware 6.4 P, S, T & D Plant - Demand 0 - - - - - 465 39906 Other Tang. Property - PC Hardware 6.4 P, S, T & D Plant - Demand 5,455 2,467 1,410 74 790 714 466 39907 Other Tang. Property - PC Software 6.4 P, S, T & D Plant - Demand 0 - - - - - 467 39908 Other Tang. Property - Mainframe S/W 6.4 P, S, T & D Plant - Demand 0 - - - - - 468 39909 Other Tang. Property - Application Software 6.4 P, S, T & D Plant - Demand 821 371 212 11 119 107 469 39924 Other Tang. Property - General Startup Costs 6.4 P, S, T & D Plant - Demand 0 - - - - - 470471472 Total General Plant 121,761 55,052 31,480 1,656 17,636 15,937 473474 Shared Services Customer Support:475476 General:477478 37400 Land & Land Rights 6.4 P, S, T & D Plant - Demand 0 - - - - - 479 39001 Structures Frame 6.4 P, S, T & D Plant - Demand 0 - - - - - 480 36602 Structures & Improvements 6.4 P, S, T & D Plant - Demand 18,099 8,183 4,679 246 2,622 2,369 481 37503 Improvements 6.4 P, S, T & D Plant - Demand 0 - - - - - 482 39004 Air Conditioning Equipment 6.4 P, S, T & D Plant - Demand 0 - - - - - 483 39009 Improvement to leased Premises 6.4 P, S, T & D Plant - Demand 3,110 1,406 804 42 450 407 484 39100 Office Furniture & Equipment 6.4 P, S, T & D Plant - Demand 3,692 1,669 954 50 535 483 485 39102 Remittance Processing Equip 6.4 P, S, T & D Plant - Demand 0 - - - - - 486 39103 Office Machines 6.4 P, S, T & D Plant - Demand 0 - - - - - 487 39200 Transportation Equipment 6.4 P, S, T & D Plant - Demand 0 - - - - - 488 39201 Trucks 6.4 P, S, T & D Plant - Demand 0 - - - - - 489 39202 Trailers 6.4 P, S, T & D Plant - Demand 0 - - - - - 490 39300 Stores Equipment 6.4 P, S, T & D Plant - Demand 0 - - - - - 491 39400 Tools, Shop & Garage Equipment 6.4 P, S, T & D Plant - Demand 716 324 185 10 104 94 492 39600 Power Operated Equipment 6.4 P, S, T & D Plant - Demand 33 15 9 0 5 4 493 39603 Ditchers 6.4 P, S, T & D Plant - Demand 0 - - - - - 494 39604 Backhoes 6.4 P, S, T & D Plant - Demand 0 - - - - - 495 39605 Welders 6.4 P, S, T & D Plant - Demand 0 - - - - - 496 39700 Communication Equipment 6.4 P, S, T & D Plant - Demand 4,034 1,824 1,043 55 584 528 497 39701 Communication Equipment - Mobile Radios 6.4 P, S, T & D Plant - Demand 0 - - - - - 498 39702 Communication Equipment - Fixed Radios 6.4 P, S, T & D Plant - Demand 0 - - - - - 499 39705 Communication Equip. - Telemetering 6.4 P, S, T & D Plant - Demand 0 - - - - - 500 39800 Miscellaneous Equipment 6.4 P, S, T & D Plant - Demand 501 227 130 7 73 66 501 39900 Other Tangible Property 6.4 P, S, T & D Plant - Demand 3,406 1,540 881 46 493 446 502 39901 Other Tangible Property - Servers - H/W 6.4 P, S, T & D Plant - Demand 33,261 15,038 8,599 452 4,818 4,353 503 39902 Other Tangible Property - Servers - S/W 6.4 P, S, T & D Plant - Demand 6,131 2,772 1,585 83 888 802 504 39903 Other Tangible Property - Network - H/W 6.4 P, S, T & D Plant - Demand 1,492 675 386 20 216 195 505 39904 Other Tang. Property - CPU 6.4 P, S, T & D Plant - Demand 0 - - - - - 506 39905 Other Tangible Property - MF - Hardware 6.4 P, S, T & D Plant - Demand 0 - - - - - 507 39906 Other Tang. Property - PC Hardware 6.4 P, S, T & D Plant - Demand 4,395 1,987 1,136 60 637 575 508 39907 Other Tang. Property - PC Software 6.4 P, S, T & D Plant - Demand 524 237 135 7 76 69 509 39908 Other Tang. Property - Mainframe S/W 6.4 P, S, T & D Plant - Demand 0 - - - - - 510 39909 Other Tang. Property - Application Software 6.4 P, S, T & D Plant - Demand 205,962 93,123 53,249 2,801 29,832 26,957 511 39924 Other Tang. Property - General Startup Costs 6.4 P, S, T & D Plant - Demand 19 8 5 0 3 2 512513514 Total General Plant 285,374 129,027 73,780 3,881 41,334 37,351 515516 TOTAL DEPRECIATION EXPENSE - DEMAND 11,375,629 5,143,314 2,941,048 154,692 1,647,682 1,488,893

Exhibit PHR-3Page 62 of 75
Atmos Energy Corporation, Kentucky/Mid-States DivisionClass Cost of Service - Demand Only StudyForecasted Test Period: Twelve Months Ended March 31, 2020
ALLOCATION OF DEPRECIATION EXPENSE
Commodity
Line Acct. Allocation Allocation Total Residential Non-Res Sales Non-Res Sales Transport TransportNo. No. Factor Basis Company Sales Firm Interruptible Firm Interruptible
517 Intangible Plant:518519 30100 Organization 99.0 - 0 - - - - - 520 30200 Franchises & Consents 99.0 - 0 - - - - - 521 30300 Misc Intangible Plant 99.0 - 0 - - - - - 522523 Total Intangible Plant: 0 - - - - - 524525 Production Plant:526 99.0 - 0 - - - - - 527 32520 Producing Leaseholds 99.0 - 0 - - - - - 528 32540 Rights of Ways 99.0 - 0 - - - - - 529 33100 Production Gas Wells Equipment 99.0 - 0 - - - - - 530 33201 Field Lines 99.0 - 0 - - - - - 531 33202 Tributary Lines 99.0 - 0 - - - - - 532 33400 Field Meas. & Reg. Sta. Equip 99.0 - 0 - - - - - 533 33600 Purification Equipment 99.0 - 0 - - - - - 534535 Total Production Plant 0 - - - - - 536537 Storage Plant:538539 35010 Land 1.5 Winter Volumes 0 - - - - - 540 35020 Rights of Way 1.5 Winter Volumes 11 4 3 0 2 2 541 35100 Structures and Improvements 1.5 Winter Volumes 149 56 35 2 27 28 542 35102 Compression Station Equipment 1.5 Winter Volumes 958 363 224 12 176 182 543 35103 Meas. & Reg. Sta. Structues 1.5 Winter Volumes 104 39 24 1 19 20 544 35104 Other Structures 1.5 Winter Volumes 887 336 208 11 163 169 545 35200 Wells \ Rights of Way 1.5 Winter Volumes 80,561 30,503 18,874 1,032 14,810 15,342 546 35201 Well Construction 1.5 Winter Volumes 12,920 4,892 3,027 166 2,375 2,461 547 35202 Well Equipment 1.5 Winter Volumes 0 - - - - - 548 35203 Cushion Gas 1.5 Winter Volumes 11,694 4,428 2,740 150 2,150 2,227 549 35210 Leaseholds 1.5 Winter Volumes 277 105 65 4 51 53 550 35211 Storage Rights 1.5 Winter Volumes 240 91 56 3 44 46 551 35301 Field Lines 1.5 Winter Volumes 798 302 187 10 147 152 552 35302 Tributary Lines 1.5 Winter Volumes 952 361 223 12 175 181 553 35400 Compressor Station Equipment 1.5 Winter Volumes 7,849 2,972 1,839 101 1,443 1,495 554 35500 Meas & Reg. Equipment 1.5 Winter Volumes 2,280 863 534 29 419 434 555 35600 Purification Equipment 1.5 Winter Volumes 4,105 1,554 962 53 755 782 556557 Total Storage Plant 123,785 46,869 29,001 1,586 22,756 23,574 558559 Transmission:560561 36510 Land & Land Rights 99.0 - 0 - - - - - 562 36520 Rights of Way 99.0 - 0 - - - - - 563 36602 Structures & Improvements 99.0 - 0 - - - - - 564 36603 Other Structues 99.0 - 0 - - - - - 565 36700 Mains Cathodic Protection 99.0 - 0 - - - - - 566 36701 Mains - Steel 99.0 - 0 - - - - - 567 36900 Meas. & Reg. Equipment 99.0 - 0 - - - - - 568 36901 Meas. & Reg. Equipment 99.0 - 0 - - - - - 569570 Total Transmission Plant 0 - - - - - 571572 Distribution:573574 37400 Land & Land Rights 99.0 - 0 - - - - - 575 37401 Land 99.0 - 0 - - - - - 576 37402 Land Rights 1.0 Mcf 0 - - - - - 577 37403 Land Other 99.0 - 0 - - - - - 578 37500 Structures & Improvements 1.0 Mcf 0 - - - - - 579 37501 Structures & Improvements T.B. 1.0 Mcf 0 - - - - - 580 37502 Land Rights 1.0 Mcf 0 - - - - - 581 37503 Improvements 1.0 Mcf 0 - - - - - 582 37600 Mains Cathodic Protection 1.0 Mcf 0 - - - - - 583 37601 Mains - Steel 1.0 Mcf 0 - - - - - 584 37602 Mains - Plastic 1.0 Mcf 0 - - - - - 585 37800 Meas & Reg. Sta. Equip - General 1.0 Mcf 0 - - - - - 586 37900 Meas & Reg. Sta. Equip - City Gate 1.0 Mcf 0 - - - - - 587 37905 Meas & Reg. Sta. Equipment T.b. 1.0 Mcf 0 - - - - - 588 38000 Services 99.0 - 0 - - - - - 589 38100 Meters 99.0 - 0 - - - - - 590 38200 Meter Installaitons 99.0 - 0 - - - - - 591 38300 House Regulators 99.0 - 0 - - - - - 592 38400 House Reg. Installations 99.0 - 0 - - - - - 593 38500 Ind. Meas. & Reg. Sta. Equipment 99.0 - 0 - - - - - 594 38600 Other Prop. On Cust. Prem 99.0 - 0 - - - - - 595596 Total Distribution Plant 0 - - - - -

Exhibit PHR-3Page 63 of 75
Atmos Energy Corporation, Kentucky/Mid-States DivisionClass Cost of Service - Demand Only StudyForecasted Test Period: Twelve Months Ended March 31, 2020
ALLOCATION OF DEPRECIATION EXPENSE597598 General:599600 38900 Land & Land Rights 6.6 P, S, T & D Plant - Commodity 0 - - - - - 601 39000 Structures Frame 6.6 P, S, T & D Plant - Commodity 2,697 1,021 632 35 496 514 602 39001 Structures & Improvements 6.6 P, S, T & D Plant - Commodity 61 23 14 1 11 12 603 39002 Improvements 6.6 P, S, T & D Plant - Commodity 252 95 59 3 46 48 604 39003 Air Conditioning Equipment 6.6 P, S, T & D Plant - Commodity 8 3 2 0 1 2 605 39004 Improvement to leased Premises 6.6 P, S, T & D Plant - Commodity 0 - - - - - 606 39009 Office Furniture & Equipment 6.6 P, S, T & D Plant - Commodity 1,029 390 241 13 189 196 607 39100 Remittance Processing Equip 6.6 P, S, T & D Plant - Commodity 0 - - - - - 608 39102 Office Machines 6.6 P, S, T & D Plant - Commodity 0 - - - - - 609 39103 Transportation Equipment 6.6 P, S, T & D Plant - Commodity 57 22 13 1 11 11 610 39200 Trucks 6.6 P, S, T & D Plant - Commodity 0 - - - - - 611 39201 Trailers 6.6 P, S, T & D Plant - Commodity 0 - - - - - 612 39202 Stores Equipment 6.6 P, S, T & D Plant - Commodity 0 - - - - - 613 39300 Tools, Shop & Garage Equipment 6.6 P, S, T & D Plant - Commodity 1,287 487 302 16 237 245 614 39400 Power Operated Equipment 6.6 P, S, T & D Plant - Commodity 0 - - - - - 615 39600 Ditchers 6.6 P, S, T & D Plant - Commodity 0 - - - - - 616 39603 Backhoes 6.6 P, S, T & D Plant - Commodity 0 - - - - - 617 39604 Welders 6.6 P, S, T & D Plant - Commodity 0 - - - - - 618 39605 Communication Equipment 6.6 P, S, T & D Plant - Commodity 385 146 90 5 71 73 619 39700 Communication Equipment - Mobile Radios 6.6 P, S, T & D Plant - Commodity 0 - - - - - 620 39701 Communication Equipment - Fixed Radios 6.6 P, S, T & D Plant - Commodity 0 - - - - - 621 39702 Communication Equip. - Telemetering 6.6 P, S, T & D Plant - Commodity 0 - - - - - 622 39705 Miscellaneous Equipment 6.6 P, S, T & D Plant - Commodity 2,143 811 502 27 394 408 623 39800 Other Tangible Property 6.6 P, S, T & D Plant - Commodity 0 - - - - - 624 39900 Other Tangible Property - Servers - H/W 6.6 P, S, T & D Plant - Commodity 23 9 5 0 4 4 625 39901 Other Tangible Property - Servers - S/W 6.6 P, S, T & D Plant - Commodity 0 - - - - - 626 39902 Other Tangible Property - Network - H/W 6.6 P, S, T & D Plant - Commodity 148 56 35 2 27 28 627 39903 Other Tang. Property - CPU 6.6 P, S, T & D Plant - Commodity 0 - - - - - 628 39904 Other Tangible Property - MF - Hardware 6.6 P, S, T & D Plant - Commodity 0 - - - - - 629 39905 Other Tang. Property - PC Hardware 6.6 P, S, T & D Plant - Commodity 984 373 231 13 181 187 630 39906 Other Tang. Property - PC Software 6.6 P, S, T & D Plant - Commodity 0 - - - - - 631 39907 Other Tang. Property - Mainframe S/W 6.6 P, S, T & D Plant - Commodity 0 - - - - - 632 39908 Other Tang. Property - Application Software 6.6 P, S, T & D Plant - Commodity 113 43 27 1 21 22 633 40600 Amortization of gas plant acquisition adjustments 6.6 P, S, T & D Plant - Commodity 0 - - - - - 634635636 Total General Plant 9,188 3,479 2,153 118 1,689 1,750637638 TOTAL DIRECT DEPRECIATION EXPENSE 132,973 50,348 31,154 1,704 24,445 25,324639640 Kentucky Mid-States General Office:641642 Intangible Plant:643644 30100 Organization 99.0 - 0 - - - - - 645 30200 Franchises & Consents 99.0 - 0 - - - - - 646 30300 Misc Intangible Plant 99.0 - 0 - - - - - 647648 Total Intangible Plant: 0 - - - - - 649650 General:651652 37400 Land & Land Rights 6.6 P, S, T & D Plant - Commodity 0 - - - - - 653 39001 Structures Frame 6.6 P, S, T & D Plant - Commodity 28 10 6 0 5 5 654 36602 Structures & Improvements 6.6 P, S, T & D Plant - Commodity 0 - - - - - 655 38900 Land & Land Rights 6.6 P, S, T & D Plant - Commodity 0 - - - - - 656 39004 Air Conditioning Equipment 6.6 P, S, T & D Plant - Commodity 6 2 1 0 1 1 657 39009 Improvement to leased Premises 6.6 P, S, T & D Plant - Commodity 0 - - - - - 658 39100 Office Furniture & Equipment 6.6 P, S, T & D Plant - Commodity 0 - - - - - 659 39102 Remittance Processing Equip 6.6 P, S, T & D Plant - Commodity 0 - - - - - 660 39103 Office Machines 6.6 P, S, T & D Plant - Commodity 0 - - - - - 661 39200 Transportation Equipment 6.6 P, S, T & D Plant - Commodity 4 2 1 0 1 1 662 39201 Trucks 6.6 P, S, T & D Plant - Commodity 0 - - - - - 663 39202 Trailers 6.6 P, S, T & D Plant - Commodity 0 - - - - - 664 39300 Stores Equipment 6.6 P, S, T & D Plant - Commodity 0 - - - - - 665 39400 Tools, Shop & Garage Equipment 6.6 P, S, T & D Plant - Commodity 22 8 5 0 4 4 666 39600 Power Operated Equipment 6.6 P, S, T & D Plant - Commodity 0 0 0 0 0 0 667 39603 Ditchers 6.6 P, S, T & D Plant - Commodity 0 - - - - - 668 39604 Backhoes 6.6 P, S, T & D Plant - Commodity 0 - - - - - 669 39605 Welders 6.6 P, S, T & D Plant - Commodity 0 - - - - - 670 39700 Communication Equipment 6.6 P, S, T & D Plant - Commodity 18 7 4 0 3 3 671 39701 Communication Equipment - Mobile Radios 6.6 P, S, T & D Plant - Commodity 0 - - - - - 672 39702 Communication Equipment - Fixed Radios 6.6 P, S, T & D Plant - Commodity 0 - - - - - 673 39705 Communication Equip. - Telemetering 6.6 P, S, T & D Plant - Commodity 0 - - - - - 674 39800 Miscellaneous Equipment 6.6 P, S, T & D Plant - Commodity 135 51 32 2 25 26 675 39900 Other Tangible Property 6.6 P, S, T & D Plant - Commodity 0 - - - - - 676 39901 Other Tangible Property - Servers - H/W 6.6 P, S, T & D Plant - Commodity 0 - - - - - 677 39902 Other Tangible Property - Servers - S/W 6.6 P, S, T & D Plant - Commodity 0 - - - - - 678 39903 Other Tangible Property - Network - H/W 6.6 P, S, T & D Plant - Commodity 0 - - - - - 679 39904 Other Tang. Property - CPU 6.6 P, S, T & D Plant - Commodity 0 - - - - - 680 39905 Other Tangible Property - MF - Hardware 6.6 P, S, T & D Plant - Commodity 0 - - - - - 681 39906 Other Tang. Property - PC Hardware 6.6 P, S, T & D Plant - Commodity 0 - - - - - 682 39907 Other Tang. Property - PC Software 6.6 P, S, T & D Plant - Commodity 123 46 29 2 23 23 683 39908 Other Tang. Property - Mainframe S/W 6.6 P, S, T & D Plant - Commodity 0 - - - - - 684 39909 Other Tang. Property - Application Software 6.6 P, S, T & D Plant - Commodity 0 - - - - - 685 39924 Other Tang. Property - General Startup Costs 6.6 P, S, T & D Plant - Commodity 0 - - - - - 686687688 Total General Plant 336 127 79 4 62 64 689690 Shared Services General Office:

Exhibit PHR-3Page 64 of 75
Atmos Energy Corporation, Kentucky/Mid-States DivisionClass Cost of Service - Demand Only StudyForecasted Test Period: Twelve Months Ended March 31, 2020
ALLOCATION OF DEPRECIATION EXPENSE691692 General:693694 37400 Land & Land Rights 6.6 P, S, T & D Plant - Commodity 0 - - - - - 695 39000 Structures & Improvements 6.6 P, S, T & D Plant - Commodity 79 30 18 1 14 15 696 36602 Structures & Improvements 6.6 P, S, T & D Plant - Commodity 0 - - - - - 697 37503 Improvements 6.6 P, S, T & D Plant - Commodity 0 - - - - - 698 39004 Air Conditioning Equipment 6.6 P, S, T & D Plant - Commodity 0 - - - - - 699 39009 Improvement to leased Premises 6.6 P, S, T & D Plant - Commodity 0 0 0 0 0 0 700 39100 Office Furniture & Equipment 6.6 P, S, T & D Plant - Commodity 119 45 28 2 22 23 701 39102 Remittance Processing Equip 6.6 P, S, T & D Plant - Commodity 0 - - - - - 702 39103 Office Machines 6.6 P, S, T & D Plant - Commodity 0 - - - - - 703 39200 Transportation Equipment 6.6 P, S, T & D Plant - Commodity 0 - - - - - 704 39201 Trucks 6.6 P, S, T & D Plant - Commodity 0 - - - - - 705 39202 Trailers 6.6 P, S, T & D Plant - Commodity 0 - - - - - 706 39300 Stores Equipment 6.6 P, S, T & D Plant - Commodity 0 - - - - - 707 39400 Tools, Shop & Garage Equipment 6.6 P, S, T & D Plant - Commodity 0 - - - - - 708 39600 Power Operated Equipment 6.6 P, S, T & D Plant - Commodity 0 - - - - - 709 39603 Ditchers 6.6 P, S, T & D Plant - Commodity 0 - - - - - 710 39604 Backhoes 6.6 P, S, T & D Plant - Commodity 0 - - - - - 711 39605 Welders 6.6 P, S, T & D Plant - Commodity 0 - - - - - 712 39700 Communication Equipment 6.6 P, S, T & D Plant - Commodity 0 0 0 0 0 0 713 39701 Communication Equipment - Mobile Radios 6.6 P, S, T & D Plant - Commodity 0 - - - - - 714 39702 Communication Equipment - Fixed Radios 6.6 P, S, T & D Plant - Commodity 0 - - - - - 715 39705 Communication Equip. - Telemetering 6.6 P, S, T & D Plant - Commodity 0 - - - - - 716 39800 Miscellaneous Equipment 6.6 P, S, T & D Plant - Commodity 1 0 0 0 0 0 717 39900 Other Tangible Property 6.6 P, S, T & D Plant - Commodity 0 - - - - - 718 39901 Other Tangible Property - Servers - H/W 6.6 P, S, T & D Plant - Commodity 1,475 558 345 19 271 281 719 39902 Other Tangible Property - Servers - S/W 6.6 P, S, T & D Plant - Commodity 442 167 104 6 81 84 720 39903 Other Tangible Property - Network - H/W 6.6 P, S, T & D Plant - Commodity 0 - - - - - 721 39904 Other Tang. Property - CPU 6.6 P, S, T & D Plant - Commodity 0 - - - - - 722 39905 Other Tangible Property - MF - Hardware 6.6 P, S, T & D Plant - Commodity 0 - - - - - 723 39906 Other Tang. Property - PC Hardware 6.6 P, S, T & D Plant - Commodity 100 38 23 1 18 19 724 39907 Other Tang. Property - PC Software 6.6 P, S, T & D Plant - Commodity 0 - - - - - 725 39908 Other Tang. Property - Mainframe S/W 6.6 P, S, T & D Plant - Commodity 0 - - - - - 726 39909 Other Tang. Property - Application Software 6.6 P, S, T & D Plant - Commodity 15 6 4 0 3 3 727 39924 Other Tang. Property - General Startup Costs 6.6 P, S, T & D Plant - Commodity 0 - - - - - 728729730 Total General Plant 2,230 844 523 29 410 425 731732 Shared Services Customer Support:733734 General:735736 37400 Land & Land Rights 6.6 P, S, T & D Plant - Commodity 0 - - - - - 737 39001 Structures Frame 6.6 P, S, T & D Plant - Commodity 0 - - - - - 738 36602 Structures & Improvements 6.6 P, S, T & D Plant - Commodity 332 126 78 4 61 63 739 37503 Improvements 6.6 P, S, T & D Plant - Commodity 0 - - - - - 740 39004 Air Conditioning Equipment 6.6 P, S, T & D Plant - Commodity 0 - - - - - 741 39009 Improvement to leased Premises 6.6 P, S, T & D Plant - Commodity 57 22 13 1 10 11 742 39100 Office Furniture & Equipment 6.6 P, S, T & D Plant - Commodity 68 26 16 1 12 13 743 39102 Remittance Processing Equip 6.6 P, S, T & D Plant - Commodity 0 - - - - - 744 39103 Office Machines 6.6 P, S, T & D Plant - Commodity 0 - - - - - 745 39200 Transportation Equipment 6.6 P, S, T & D Plant - Commodity 0 - - - - - 746 39201 Trucks 6.6 P, S, T & D Plant - Commodity 0 - - - - - 747 39202 Trailers 6.6 P, S, T & D Plant - Commodity 0 - - - - - 748 39300 Stores Equipment 6.6 P, S, T & D Plant - Commodity 0 - - - - - 749 39400 Tools, Shop & Garage Equipment 6.6 P, S, T & D Plant - Commodity 13 5 3 0 2 2 750 39600 Power Operated Equipment 6.6 P, S, T & D Plant - Commodity 1 0 0 0 0 0 751 39603 Ditchers 6.6 P, S, T & D Plant - Commodity 0 - - - - - 752 39604 Backhoes 6.6 P, S, T & D Plant - Commodity 0 - - - - - 753 39605 Welders 6.6 P, S, T & D Plant - Commodity 0 - - - - - 754 39700 Communication Equipment 6.6 P, S, T & D Plant - Commodity 74 28 17 1 14 14 755 39701 Communication Equipment - Mobile Radios 6.6 P, S, T & D Plant - Commodity 0 - - - - - 756 39702 Communication Equipment - Fixed Radios 6.6 P, S, T & D Plant - Commodity 0 - - - - - 757 39705 Communication Equip. - Telemetering 6.6 P, S, T & D Plant - Commodity 0 - - - - - 758 39800 Miscellaneous Equipment 6.6 P, S, T & D Plant - Commodity 9 3 2 0 2 2 759 39900 Other Tangible Property 6.6 P, S, T & D Plant - Commodity 62 24 15 1 11 12 760 39901 Other Tangible Property - Servers - H/W 6.6 P, S, T & D Plant - Commodity 609 231 143 8 112 116 761 39902 Other Tangible Property - Servers - S/W 6.6 P, S, T & D Plant - Commodity 112 43 26 1 21 21 762 39903 Other Tangible Property - Network - H/W 6.6 P, S, T & D Plant - Commodity 27 10 6 0 5 5 763 39904 Other Tang. Property - CPU 6.6 P, S, T & D Plant - Commodity 0 - - - - - 764 39905 Other Tangible Property - MF - Hardware 6.6 P, S, T & D Plant - Commodity 0 - - - - - 765 39906 Other Tang. Property - PC Hardware 6.6 P, S, T & D Plant - Commodity 80 30 19 1 15 15 766 39907 Other Tang. Property - PC Software 6.6 P, S, T & D Plant - Commodity 10 4 2 0 2 2 767 39908 Other Tang. Property - Mainframe S/W 6.6 P, S, T & D Plant - Commodity 0 - - - - - 768 39909 Other Tang. Property - Application Software 6.6 P, S, T & D Plant - Commodity 3,772 1,428 884 48 693 718 769 39924 Other Tang. Property - General Startup Costs 6.6 P, S, T & D Plant - Commodity 0 0 0 0 0 0 770771772 Total General Plant 5,227 1,979 1,225 67 961 995 773774 TOTAL DEPRECIATION EXPENSE - COMMODITY 140,767 53,298 32,980 1,804 25,877 26,808

Exhibit PHR-3Page 65 of 75
Atmos Energy Corporation, Kentucky/Mid-States DivisionClass Cost of Service - Demand Only StudyForecasted Test Period: Twelve Months Ended March 31, 2020
ALLOCATION OF DEPRECIATION EXPENSE
Total Depreciation Expense
Line Acct. Allocation Allocation Total Residential Non-Res Sales Non-Res Sales Transport TransportNo. No. Factor Basis Company Sales Firm Interruptible Firm Interruptible
775 Intangible Plant:776777 30100 Organization 0 - - - - - 778 30200 Franchises & Consents 0 - - - - - 779 30300 Misc Intangible Plant 0 - - - - - 780781 Total Intangible Plant: 0 - - - - - 782783 Production Plant:784 0 - - - - - 785 32520 Producing Leaseholds 0 - - - - - 786 32540 Rights of Ways 0 - - - - - 787 33100 Production Gas Wells Equipment 0 - - - - - 788 33201 Field Lines 0 - - - - - 789 33202 Tributary Lines 0 - - - - - 790 33400 Field Meas. & Reg. Sta. Equip 0 - - - - - 791 33600 Purification Equipment 0 - - - - - 792793 Total Production Plant 0 - - - - - 794795 Storage Plant:796797 35010 Land 0 - - - - - 798 35020 Rights of Way 22 9 5 0 4 4 799 35100 Structures and Improvements 297 124 73 4 49 48 800 35102 Compression Station Equipment 1,916 796 472 25 315 308 801 35103 Meas. & Reg. Sta. Structues 208 87 51 3 34 33 802 35104 Other Structures 1,773 736 437 23 291 285 803 35200 Wells \ Rights of Way 161,122 66,927 39,703 2,128 26,478 25,886 804 35201 Well Construction 25,840 10,733 6,367 341 4,246 4,152 805 35202 Well Equipment 0 - - - - - 806 35203 Cushion Gas 23,389 9,715 5,763 309 3,844 3,758 807 35210 Leaseholds 553 230 136 7 91 89 808 35211 Storage Rights 481 200 118 6 79 77 809 35301 Field Lines 1,596 663 393 21 262 256 810 35302 Tributary Lines 1,905 791 469 25 313 306 811 35400 Compressor Station Equipment 15,699 6,521 3,868 207 2,580 2,522 812 35500 Meas & Reg. Equipment 4,561 1,894 1,124 60 749 733 813 35600 Purification Equipment 8,210 3,410 2,023 108 1,349 1,319 814815 Total Storage Plant 247,571 102,836 61,005 3,269 40,685 39,775 816817 Transmission:818819 36510 Land & Land Rights 0 - - - - - 820 36520 Rights of Way 9,112 4,120 2,356 124 1,320 1,193 821 36602 Structures & Improvements 608 275 157 8 88 80 822 36603 Other Structues 754 341 195 10 109 99 823 36700 Mains Cathodic Protection 5,362 2,424 1,386 73 777 702 824 36701 Mains - Steel 381,167 172,339 98,547 5,183 55,209 49,889 825 36900 Meas. & Reg. Equipment 11,265 5,093 2,912 153 1,632 1,474 826 36901 Meas. & Reg. Equipment 34,951 15,803 9,036 475 5,062 4,575 827828 Total Transmission Plant 443,218 200,394 114,589 6,027 64,197 58,010 829830 Distribution:831832 37400 Land & Land Rights 0 - - - - - 833 37401 Land 0 - - - - - 834 37402 Land Rights 49,908 22,565 12,903 679 7,229 6,532 835 37403 Land Other 0 - - - - - 836 37500 Structures & Improvements 6,017 2,721 1,556 82 872 788 837 37501 Structures & Improvements T.B. 1,787 808 462 24 259 234 838 37502 Land Rights 828 374 214 11 120 108 839 37503 Improvements 72 32 19 1 10 9 840 37600 Mains Cathodic Protection 873,542 394,959 225,845 11,879 126,527 114,333 841 37601 Mains - Steel 4,454,842 2,014,188 1,151,752 60,579 645,254 583,069 842 37602 Mains - Plastic 3,376,201 1,526,497 872,881 45,911 489,020 441,892 843 37800 Meas & Reg. Sta. Equip - General 925,640 418,514 239,314 12,587 134,073 121,152 844 37900 Meas & Reg. Sta. Equip - City Gate 145,903 65,968 37,722 1,984 21,133 19,096 845 37905 Meas & Reg. Sta. Equipment T.b. 46,759 21,141 12,089 636 6,773 6,120 846 38000 Services 4,817,588 4,290,218 521,911 265 3,317 1,877 847 38100 Meters 2,741,749 1,768,788 907,200 3,195 39,954 22,612 848 38200 Meter Installaitons 2,232,937 1,440,537 738,843 2,602 32,539 18,416 849 38300 House Regulators 514,355 331,827 170,192 599 7,495 4,242 850 38400 House Reg. Installations 8,807 5,681 2,914 10 128 73 851 38500 Ind. Meas. & Reg. Sta. Equipment 112,194 - 111,033 56 706 399 852 38600 Other Prop. On Cust. Prem 0 - - - - - 853854 Total Distribution Plant 20,309,129 12,304,817 5,006,850 141,103 1,515,406 1,340,953

Exhibit PHR-3Page 66 of 75
Atmos Energy Corporation, Kentucky/Mid-States DivisionClass Cost of Service - Demand Only StudyForecasted Test Period: Twelve Months Ended March 31, 2020
ALLOCATION OF DEPRECIATION EXPENSE855856 General:857858 38900 Land & Land Rights 0 - - - - - 859 39000 Structures Frame 244,888 140,877 59,345 2,086 22,443 20,137 860 39001 Structures & Improvements 5,574 3,207 1,351 47 511 458 861 39002 Improvements 22,836 13,137 5,534 195 2,093 1,878 862 39003 Air Conditioning Equipment 731 420 177 6 67 60 863 39004 Improvement to leased Premises 0 - - - - - 864 39009 Office Furniture & Equipment 93,448 53,758 22,646 796 8,564 7,684 865 39100 Remittance Processing Equip 0 - - - - - 866 39102 Office Machines 0 - - - - - 867 39103 Transportation Equipment 5,191 2,986 1,258 44 476 427 868 39200 Trucks 0 - - - - - 869 39201 Trailers 0 - - - - - 870 39202 Stores Equipment 0 - - - - - 871 39300 Tools, Shop & Garage Equipment 116,855 67,223 28,318 996 10,709 9,609 872 39400 Power Operated Equipment 0 - - - - - 873 39600 Ditchers 0 - - - - - 874 39603 Backhoes 0 - - - - - 875 39604 Welders 0 - - - - - 876 39605 Communication Equipment 34,968 20,116 8,474 298 3,205 2,875 877 39700 Communication Equipment - Mobile Radios 0 - - - - - 878 39701 Communication Equipment - Fixed Radios 0 - - - - - 879 39702 Communication Equip. - Telemetering 0 - - - - - 880 39705 Miscellaneous Equipment 194,589 111,941 47,155 1,658 17,833 16,001 881 39800 Other Tangible Property 0 - - - - - 882 39900 Other Tangible Property - Servers - H/W 2,056 1,183 498 18 188 169 883 39901 Other Tangible Property - Servers - S/W 0 - - - - - 884 39902 Other Tangible Property - Network - H/W 13,460 7,743 3,262 115 1,234 1,107 885 39903 Other Tang. Property - CPU 0 - - - - - 886 39904 Other Tangible Property - MF - Hardware 0 - - - - - 887 39905 Other Tang. Property - PC Hardware 89,351 51,401 21,653 761 8,189 7,347 888 39906 Other Tang. Property - PC Software 0 - - - - - 889 39907 Other Tang. Property - Mainframe S/W 0 - - - - - 890 39908 Other Tang. Property - Application Software 10,289 5,919 2,493 88 943 846 891 40600 Amortization of gas plant acquisition adjustments 0 - - - - - 892893894 Total General Plant 834,236 479,913 202,163 7,108 76,454 68,598 895896 TOTAL DIRECT DEPRECIATION EXPENSE 21,834,154 13,087,961 5,384,607 157,507 1,696,742 1,507,337 897898 Kentucky Mid-States General Office:899900 Intangible Plant:901902 30100 Organization 0 - - - - - 903 30200 Franchises & Consents 0 - - - - - 904 30300 Misc Intangible Plant 0 - - - - - 905906 Total Intangible Plant: 0 - - - - - 907908 General:909910 37400 Land & Land Rights 0 - - - - - 911 39001 Structures Frame 2,500 1,438 606 21 229 206 912 36602 Structures & Improvements 0 - - - - - 913 38900 Land & Land Rights 0 - - - - - 914 39004 Air Conditioning Equipment 561 323 136 5 51 46 915 39009 Improvement to leased Premises 0 - - - - - 916 39100 Office Furniture & Equipment 0 - - - - - 917 39102 Remittance Processing Equip 0 - - - - - 918 39103 Office Machines 0 - - - - - 919 39200 Transportation Equipment 400 230 97 3 37 33 920 39201 Trucks 0 - - - - - 921 39202 Trailers 0 - - - - - 922 39300 Stores Equipment 0 - - - - - 923 39400 Tools, Shop & Garage Equipment 2,025 1,165 491 17 186 166 924 39600 Power Operated Equipment 12 7 3 0 1 1 925 39603 Ditchers 0 - - - - - 926 39604 Backhoes 0 - - - - - 927 39605 Welders 0 - - - - - 928 39700 Communication Equipment 1,652 950 400 14 151 136 929 39701 Communication Equipment - Mobile Radios 0 - - - - - 930 39702 Communication Equipment - Fixed Radios 0 - - - - - 931 39705 Communication Equip. - Telemetering 0 - - - - - 932 39800 Miscellaneous Equipment 12,240 7,041 2,966 104 1,122 1,006 933 39900 Other Tangible Property 0 - - - - - 934 39901 Other Tangible Property - Servers - H/W 0 - - - - - 935 39902 Other Tangible Property - Servers - S/W 0 - - - - - 936 39903 Other Tangible Property - Network - H/W 0 - - - - - 937 39904 Other Tang. Property - CPU 0 - - - - - 938 39905 Other Tangible Property - MF - Hardware 0 - - - - - 939 39906 Other Tang. Property - PC Hardware 0 - - - - - 940 39907 Other Tang. Property - PC Software 11,145 6,412 2,701 95 1,021 916 941 39908 Other Tang. Property - Mainframe S/W 0 - - - - - 942 39909 Other Tang. Property - Application Software 0 - - - - - 943 39924 Other Tang. Property - General Startup Costs 0 - - - - - 944945946 Total General Plant 30,535 17,566 7,400 260 2,798 2,511 947948 Shared Services General Office:

Exhibit PHR-3Page 67 of 75
Atmos Energy Corporation, Kentucky/Mid-States DivisionClass Cost of Service - Demand Only StudyForecasted Test Period: Twelve Months Ended March 31, 2020
ALLOCATION OF DEPRECIATION EXPENSE949950 General:951952 37400 Land & Land Rights 0 - - - - - 953 39000 Structures & Improvements 7,132 4,103 1,728 61 654 586 954 36602 Structures & Improvements 0 - - - - - 955 37503 Improvements 0 - - - - - 956 39004 Air Conditioning Equipment 0 - - - - - 957 39009 Improvement to leased Premises 35 20 9 0 3 3 958 39100 Office Furniture & Equipment 10,791 6,207 2,615 92 989 887 959 39102 Remittance Processing Equip 0 - - - - - 960 39103 Office Machines 0 - - - - - 961 39200 Transportation Equipment 0 - - - - - 962 39201 Trucks 0 - - - - - 963 39202 Trailers 0 - - - - - 964 39300 Stores Equipment 0 - - - - - 965 39400 Tools, Shop & Garage Equipment 0 - - - - - 966 39600 Power Operated Equipment 0 - - - - - 967 39603 Ditchers 0 - - - - - 968 39604 Backhoes 0 - - - - - 969 39605 Welders 0 - - - - - 970 39700 Communication Equipment 27 15 6 0 2 2 971 39701 Communication Equipment - Mobile Radios 0 - - - - - 972 39702 Communication Equipment - Fixed Radios 0 - - - - - 973 39705 Communication Equip. - Telemetering 0 - - - - - 974 39800 Miscellaneous Equipment 66 38 16 1 6 5 975 39900 Other Tangible Property 0 - - - - - 976 39901 Other Tangible Property - Servers - H/W 133,882 77,019 32,444 1,141 12,270 11,009 977 39902 Other Tangible Property - Servers - S/W 40,124 23,082 9,723 342 3,677 3,299 978 39903 Other Tangible Property - Network - H/W 0 - - - - - 979 39904 Other Tang. Property - CPU 0 - - - - - 980 39905 Other Tangible Property - MF - Hardware 0 - - - - - 981 39906 Other Tang. Property - PC Hardware 9,073 5,219 2,199 77 831 746 982 39907 Other Tang. Property - PC Software 0 - - - - - 983 39908 Other Tang. Property - Mainframe S/W 0 - - - - - 984 39909 Other Tang. Property - Application Software 1,366 786 331 12 125 112 985 39924 Other Tang. Property - General Startup Costs 0 - - - - - 986987988 Total General Plant 202,494 116,489 49,071 1,725 18,558 16,651 989990 Shared Services Customer Support:991992 General:993994 37400 Land & Land Rights 0 - - - - - 995 39001 Structures Frame 0 - - - - - 996 36602 Structures & Improvements 30,100 17,316 7,294 256 2,759 2,475 997 37503 Improvements 0 - - - - - 998 39004 Air Conditioning Equipment 0 - - - - - 999 39009 Improvement to leased Premises 5,171 2,975 1,253 44 474 425
1000 39100 Office Furniture & Equipment 6,139 3,532 1,488 52 563 505 1001 39102 Remittance Processing Equip 0 - - - - - 1002 39103 Office Machines 0 - - - - - 1003 39200 Transportation Equipment 0 - - - - - 1004 39201 Trucks 0 - - - - - 1005 39202 Trailers 0 - - - - - 1006 39300 Stores Equipment 0 - - - - - 1007 39400 Tools, Shop & Garage Equipment 1,191 685 289 10 109 98 1008 39600 Power Operated Equipment 55 32 13 0 5 5 1009 39603 Ditchers 0 - - - - - 1010 39604 Backhoes 0 - - - - - 1011 39605 Welders 0 - - - - - 1012 39700 Communication Equipment 6,709 3,859 1,626 57 615 552 1013 39701 Communication Equipment - Mobile Radios 0 - - - - - 1014 39702 Communication Equipment - Fixed Radios 0 - - - - - 1015 39705 Communication Equip. - Telemetering 0 - - - - - 1016 39800 Miscellaneous Equipment 834 480 202 7 76 69 1017 39900 Other Tangible Property 5,664 3,258 1,373 48 519 466 1018 39901 Other Tangible Property - Servers - H/W 55,314 31,821 13,405 471 5,069 4,548 1019 39902 Other Tangible Property - Servers - S/W 10,196 5,865 2,471 87 934 838 1020 39903 Other Tangible Property - Network - H/W 2,481 1,427 601 21 227 204 1021 39904 Other Tang. Property - CPU 0 - - - - - 1022 39905 Other Tangible Property - MF - Hardware 0 - - - - - 1023 39906 Other Tang. Property - PC Hardware 7,309 4,205 1,771 62 670 601 1024 39907 Other Tang. Property - PC Software 871 501 211 7 80 72 1025 39908 Other Tang. Property - Mainframe S/W 0 - - - - - 1026 39909 Other Tang. Property - Application Software 342,525 197,045 83,005 2,918 31,391 28,165 1027 39924 Other Tang. Property - General Startup Costs 31 18 8 0 3 3 102810291030 Total General Plant 474,591 273,019 115,009 4,044 43,494 39,025 10311032 TOTAL DEPRECIATION EXPENSE 22,541,774 13,495,035 5,556,088 163,535 1,761,592 1,565,524
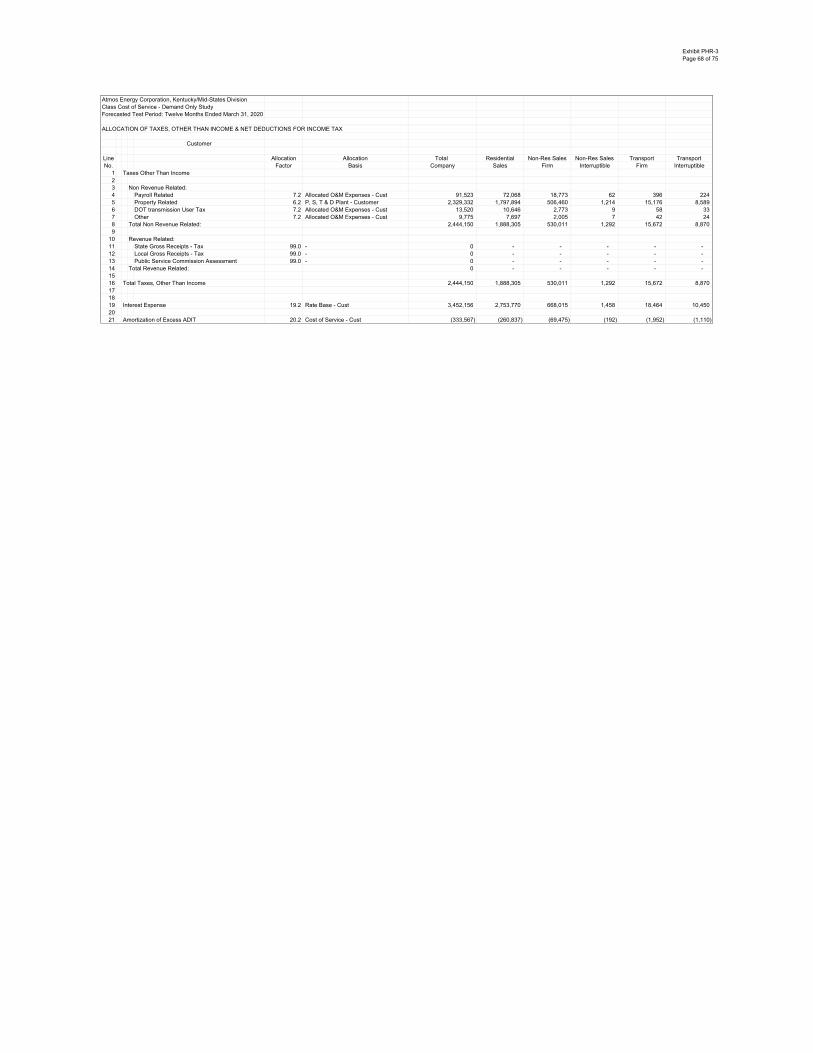
Exhibit PHR-3Page 68 of 75
Atmos Energy Corporation, Kentucky/Mid-States DivisionClass Cost of Service - Demand Only StudyForecasted Test Period: Twelve Months Ended March 31, 2020
ALLOCATION OF TAXES, OTHER THAN INCOME & NET DEDUCTIONS FOR INCOME TAX
Customer
Line Allocation Allocation Total Residential Non-Res Sales Non-Res Sales Transport TransportNo. Factor Basis Company Sales Firm Interruptible Firm Interruptible
1 Taxes Other Than Income23 Non Revenue Related:4 Payroll Related 7.2 Allocated O&M Expenses - Cust 91,523 72,068 18,773 62 396 224 5 Property Related 6.2 P, S, T & D Plant - Customer 2,329,332 1,797,894 506,460 1,214 15,176 8,589 6 DOT transmission User Tax 7.2 Allocated O&M Expenses - Cust 13,520 10,646 2,773 9 58 33 7 Other 7.2 Allocated O&M Expenses - Cust 9,775 7,697 2,005 7 42 24 8 Total Non Revenue Related: 2,444,150 1,888,305 530,011 1,292 15,672 8,8709
10 Revenue Related:11 State Gross Receipts - Tax 99.0 - 0 - - - - - 12 Local Gross Receipts - Tax 99.0 - 0 - - - - - 13 Public Service Commission Assessment 99.0 - 0 - - - - - 14 Total Revenue Related: 0 - - - - - 1516 Total Taxes, Other Than Income 2,444,150 1,888,305 530,011 1,292 15,672 8,870 171819 Interest Expense 19.2 Rate Base - Cust 3,452,156 2,753,770 668,015 1,458 18,464 10,450 2021 Amortization of Excess ADIT 20.2 Cost of Service - Cust (333,567) (260,837) (69,475) (192) (1,952) (1,110)

Exhibit PHR-3Page 69 of 75
Atmos Energy Corporation, Kentucky/Mid-States DivisionClass Cost of Service - Demand Only StudyForecasted Test Period: Twelve Months Ended March 31, 2020
ALLOCATION OF TAXES, OTHER THAN INCOME & NET DEDUCTIONS FOR INCOME TAX
Demand
Line Allocation Allocation Total Residential Non-Res Sales Non-Res Sales Transport TransportNo. Factor Basis Company Sales Firm Interruptible Firm Interruptible
20 Taxes Other Than Income2122 Non Revenue Related:23 Payroll Related 7.4 Allocated O&M Expenses - Demand 144,957 65,540 37,477 1,971 20,996 18,973 24 Property Related 6.4 P, S, T & D Plant - Demand 3,612,865 1,633,501 934,068 49,130 523,299 472,868 25 DOT transmission User Tax 7.4 Allocated O&M Expenses - Demand 21,413 9,681 5,536 291 3,101 2,803 26 Other 7.4 Allocated O&M Expenses - Demand 15,482 7,000 4,003 211 2,242 2,026 27 Total Non Revenue Related: 3,794,716 1,715,722 981,084 51,603 549,639 496,6692829 Revenue Related:30 State Gross Receipts - Tax 99.0 - 0 - - - - - 31 Local Gross Receipts - Tax 99.0 - 0 - - - - - 32 Public Service Commission Assessment 99.0 - 0 - - - - - 33 Total Revenue Related: 0 - - - - - 3435 Total Taxes, Other Than Income 3,794,716 1,715,722 981,084 51,603 549,639 496,669 363738 Interest Expense 19.4 Rate Base - Demand 6,075,532 2,746,958 1,570,764 82,618 879,999 795,193 3940 Amortization of Excess ADIT 20.4 Cost of Service - Demand (505,288) (228,449) (130,615) (6,887) (73,192) (66,146)

Exhibit PHR-3Page 70 of 75
Atmos Energy Corporation, Kentucky/Mid-States DivisionClass Cost of Service - Demand Only StudyForecasted Test Period: Twelve Months Ended March 31, 2020
ALLOCATION OF TAXES, OTHER THAN INCOME & NET DEDUCTIONS FOR INCOME TAX
Commodity
Line Allocation Allocation Total Residential Non-Res Sales Non-Res Sales Transport TransportNo. Factor Basis Company Sales Firm Interruptible Firm Interruptible
39 Taxes Other Than Income4041 Non Revenue Related:42 Payroll Related 7.6 Allocated O&M Expenses - Comm 691,389 405,201 275,297 9,812 524 555 43 Property Related 6.6 P, S, T & D Plant - Commodity 66,174 25,055 15,504 848 12,165 12,602 44 DOT transmission User Tax 7.6 Allocated O&M Expenses - Comm 102,130 59,855 40,666 1,449 77 82 45 Other 7.6 Allocated O&M Expenses - Comm 73,842 43,276 29,402 1,048 56 59 46 Total Non Revenue Related: 933,535 533,387 360,870 13,157 12,823 13,2984748 Revenue Related:49 State Gross Receipts - Tax 99.0 - 0 - - - - - 50 Local Gross Receipts - Tax 99.0 - 0 - - - - - 51 Public Service Commission Assessment 1.0 Mcf 339,436 102,784 69,655 3,441 77,044 86,511 52 Total Revenue Related: 339,436 102,784 69,655 3,441 77,044 86,511 5354 Total Taxes, Other Than Income 1,272,971 636,172 430,525 16,598 89,866 99,809 555657 Interest Expense 19.6 Rate Base - Comm (159,953) (161,485) (112,028) (3,085) 55,666 60,979 5859 Amortization of Excess ADIT 20.6 Cost of Service - Comm (624,911) (362,294) (246,010) (8,821) (3,725) (4,061)

Exhibit PHR-3Page 71 of 75
Atmos Energy Corporation, Kentucky/Mid-States DivisionClass Cost of Service - Demand Only StudyForecasted Test Period: Twelve Months Ended March 31, 2020
ALLOCATION OF TAXES, OTHER THAN INCOME & NET DEDUCTIONS FOR INCOME TAX
Total Taxes Other
Line Allocation Allocation Total Residential Non-Res Sales Non-Res Sales Transport TransportNo. Factor Basis Company Sales Firm Interruptible Firm Interruptible
58 Taxes Other Than Income5960 Non Revenue Related:61 Payroll Related 927,870 542,809 331,548 11,846 21,916 19,751 62 Property Related 6,008,371 3,456,450 1,456,031 51,191 550,640 494,059 63 DOT transmission User Tax 137,062 80,182 48,975 1,750 3,237 2,918 64 Other 99,099 57,973 35,410 1,265 2,341 2,109 65 Total Non Revenue Related: 7,172,401 4,137,414 1,871,964 66,052 578,134 518,837 6667 Revenue Related:68 State Gross Receipts - Tax 0 - - - - - 69 Local Gross Receipts - Tax 0 - - - - - 70 Public Service Commission Assessment 339,436 102,784 69,655 3,441 77,044 86,511 71 Total Revenue Related: 339,436 102,784 69,655 3,441 77,044 86,511 7273 Total Taxes, Other Than Income 7,511,837 4,240,199 1,941,620 69,493 655,177 605,348 747576 Interest Expense 9,367,735 5,339,243 2,126,751 80,991 954,129 866,621 7778 Amortization of Excess ADIT (1,463,766) (851,580) (446,100) (15,900) (78,869) (71,318)

Exhibit PHR-3Page 72 of 75
Atmos Energy Corporation, Kentucky/Mid-States DivisionClass Cost of Service - Demand Only StudyForecasted Test Period: Twelve Months Ended March 31, 2020
ALLOCATION OF REVENUES
Total Revenues
Line Allocation Allocation Total Residential Non-Res Sales Non-Res Sales Transport TransportNo. Factor Basis Company Sales Firm Interruptible Firm Interruptible
1 Rate Schedule Revenue:23 Base Revenues Input 86,746,747 50,513,031 21,051,850 300,483 7,930,117 6,951,266 4 Base Revenue Increase Input 0 - - - - - 5 Gas Costs Input 78,382,354 46,006,460 31,262,909 1,112,986 - - 6 Rider FF and Rider Tax Input 0 - - - - - 78 Total Rate Schedule Revenue 165,129,101 96,519,490 52,314,759 1,413,469 7,930,117 6,951,2669
10 Other Revenue:1112 Forfeited Discounts 18.6 Total Rate Schedule Revenues 1,304,965 762,764 413,427 11,170 62,669 54,934 13 Misc. Service Revenues 18.6 Total Rate Schedule Revenues 806,054 471,146 255,367 6,900 38,710 33,932 14 NTB 18.2 Base Revenues (17) (10) (4) (0) (2) (1) 15 Other Gas Revenue 18.2 Base Revenues 2,477,763 1,442,813 601,308 8,583 226,509 198,550 1617 Total Non-Rate Revenue 4,588,765 2,676,713 1,270,098 26,653 327,887 287,4141819 TOTAL REVENUE 169,717,866 99,196,203 53,584,857 1,440,122 8,258,004 7,238,681

Exhibit PHR-3Page 73 of 75
Atmos Energy Corporation, Kentucky/Mid-States DivisionClass Cost of Service - Demand Only StudyForecasted Test Period: Twelve Months Ended March 31, 2020
CLASSIFICATION FACTORS
Total Company Customer Demand Commodity
Input Values 1 1 0 01.0 Customer % 100.0000% 100.0000% 0.0000% 0.0000%
Input Values 1 0 1 02.0 Demand % 100.0000% 0.0000% 100.0000% 0.0000%
Input Values 1 0 0 13.0 Commodity % 100.0000% 0.0000% 0.0000% 100.0000%
Input Values 100 0 50 503.5 Storage (50/50) % 100.0000% 0.0000% 50.0000% 50.0000%
Input Values 100 - 100 04.0 Mains (All Demand) % 100.0000% 0.0000% 100.0000% 0.0000%
Internally Generated Values 383,700,807 119,712,299 263,988,509 04.1 Mains & Services % 100.0000% 31.1994% 68.8006% 0.0000%
Internally Generated Values 681,841,791 264,337,185 409,995,050 7,509,5555.4 P, S, T & D Plant % 100.0000% 38.7681% 60.1305% 1.1014%
Internally Generated Values 569,918,798 205,185,395 359,087,105 5,646,2985.7 Net Plant % 100.0000% 36.0026% 63.0067% 0.9907%
Internally Generated Values 105,607,336 10,416,928 16,498,567 78,691,8409.1 Allocated O&M Expenses % 100.0000% 9.8638% 15.6226% 74.5136%
Internally Generated Values 6,001,704 952,051 5,029,035 20,61810.0 Composite of Accts. 871-879 & 886-893 % 100.0000% 15.8630% 83.7935% 0.3435%
Internally Generated Values 300,006,847 - 300,006,847 - 12.0 Composite of Accts. 374-379 % 100.0000% 0.0000% 100.0000% 0.0000%
Internally Generated Values 496,111,427 182,824,775 321,757,716 (8,471,064) 13.0 Rate Base % 100.0000% 36.8516% 64.8559% -1.7075%
Internally Generated Values 9,623,776 3,441,079 6,157,425 25,272 17.0 Composite of Accts. 870-902, 905-916, 924 & 928-930.1 % 100.0000% 35.7560% 63.9814% 0.2626%
Internally Generated Values 185,637,186 42,303,478 64,081,471 79,252,237 18.0 Total Cost of Service at Equalized ROR % 100.0000% 22.7883% 34.5197% 42.6920%
Values 0 0 0 099.0 - % 0.0000% 0.0000% 0.0000% 0.0000%

Exhibit PHR-3Page 74 of 75
Atmos Energy Corporation, Kentucky/Mid-States DivisionClass Cost of Service - Demand Only StudyForecasted Test Period: Twelve Months Ended March 31, 2020
ALLOCATION FACTORS
Total Residential Non-Res Sales Non-Res Sales Transport TransportCompany Sales Firm Interruptible Firm Interruptible
Input Value 33,298,463 10,083,093 6,833,161 337,587 7,557,945 8,486,677 1.0 Mcf % 100.0000% 30.2810% 20.5209% 1.0138% 22.6976% 25.4867%
Input Value 17,253,841 10,083,093 6,833,161 337,587 - - 1.2 Sales Mcf % 100.0000% 58.4397% 39.6037% 1.9566% 0.0000% 0.0000%
Input Value 20,546,467 7,779,490 4,813,775 263,242 3,777,063 3,912,897 1.5 Winter Volumes % 100.0000% 37.8629% 23.4287% 1.2812% 18.3830% 19.0441%
Input Value 2,125,194 1,892,554 230,232 117 1,463 828 2.0 Bills % 100.0000% 89.0532% 10.8335% 0.0055% 0.0688% 0.0390%
Input Value 232,640 0 230,232 117 1,463 828 2.2 Non-Residential Bills % 100.0000% 0.0000% 98.9649% 0.0503% 0.6289% 0.3559%
Input Value 288,074 130,248 74,478 3,917 41,726 37,7043.0 Peak Day % 100.0000% 45.2134% 25.8539% 1.3599% 14.4843% 13.0884%
Input Value 42,429,546 27,372,625 14,039,249 49,445 618,296 349,9314.0 Meter Investment % 100.0000% 64.5131% 33.0884% 0.1165% 1.4572% 0.8247%
Input Value 1 1 - - - - 4.2 Direct to Residential % 100.0000% 100.0000% 0.0000% 0.0000% 0.0000% 0.0000%
Input Value 1 - 1 - - - 4.4 Direct to Commercial % 100.0000% 0.0000% 100.0000% 0.0000% 0.0000% 0.0000%
Input Value 1 - 1 - - - 4.6 Direct to Industrial % 100.0000% 0.0000% 100.0000% 0.0000% 0.0000% 0.0000%
Input Value 1 - 1 - - - 4.8 Direct to Public Authority % 100.0000% 0.0000% 100.0000% 0.0000% 0.0000% 0.0000%
Input Value 1 - - - 1 - 5.0 Direct to Transport % 100.0000% 0.0000% 0.0000% 0.0000% 100.0000% 0.0000%
Internally Generated Value 681,841,791 392,244,757 165,233,311 5,809,272 62,487,662 56,066,7896.0 P, S, T & D Plant % 100.0000% 57.5272% 24.2334% 0.8520% 9.1645% 8.2228%
Internally Generated Value 264,337,185 204,028,524 57,474,048 137,724 1,722,195 974,694 6.2 P, S, T & D Plant - Customer % 100.0000% 77.1849% 21.7427% 0.0521% 0.6515% 0.3687%
Internally Generated Value 409,995,050 185,372,897 105,999,869 5,575,335 59,384,984 53,661,9666.4 P, S, T & D Plant - Demand % 100.0000% 45.2134% 25.8539% 1.3599% 14.4843% 13.0884%
Internally Generated Value 7,509,555 2,843,336 1,759,393 96,213 1,380,484 1,430,1306.6 P, S, T & D Plant - Commodity % 100.0000% 37.8629% 23.4287% 1.2812% 18.3830% 19.0441%
Internally Generated Value 105,607,336 61,780,895 37,735,771 1,348,225 2,494,425 2,248,019 7.0 Allocated O&M Expenses % 100.0000% 58.5006% 35.7321% 1.2766% 2.3620% 2.1287%
Internally Generated Value 10,416,928 8,202,608 2,136,712 7,091 45,026 25,4927.2 Allocated O&M Expenses - Cust % 100.0000% 78.7431% 20.5119% 0.0681% 0.4322% 0.2447%
Internally Generated Value 16,498,567 7,459,571 4,265,530 224,356 2,389,705 2,159,405 7.4 Allocated O&M Expenses - Demand % 100.0000% 45.2134% 25.8539% 1.3599% 14.4843% 13.0884%
Internally Generated Value 78,691,840 46,118,716 31,333,529 1,116,777 59,694 63,1227.6 Allocated O&M Expenses - Comm % 100.0000% 58.6067% 39.8180% 1.4192% 0.0759% 0.0802%
Input Value 26,564,782 16,218,920 10,069,596 272,066 2,238 1,962 8.0 Customer Deposit Balances % 100.0000% 61.0542% 37.9058% 1.0242% 0.0084% 0.0074%
Internally Generated Value 569,918,798 328,211,705 133,833,787 5,042,587 54,139,499 48,691,220 9.0 Allocated Net Plant % 100.0000% 57.5892% 23.4830% 0.8848% 9.4995% 8.5435%
Internally Generated Value 205,185,395 163,718,193 39,672,771 87,185 1,090,223 617,0239.2 Allocated Net Plant - Cust % 100.0000% 79.7904% 19.3351% 0.0425% 0.5313% 0.3007%
Internally Generated Value 359,087,105 162,355,659 92,838,160 4,883,061 52,011,315 46,998,909 9.4 Allocated Net Plant - Demand % 100.0000% 45.2134% 25.8539% 1.3599% 14.4843% 13.0884%
Internally Generated Value 5,646,298 2,137,853 1,322,856 72,340 1,037,961 1,075,2899.6 Allocated Net Plant - Comm % 100.0000% 37.8629% 23.4287% 1.2812% 18.3830% 19.0441%
Internally Generated Value 6,001,704 2,817,270 1,698,298 69,615 745,837 670,685 10.0 Composite of Accts. 871-879 & 886-893 % 100.0000% 46.9412% 28.2969% 1.1599% 12.4271% 11.1749%
Internally Generated Value 952,051 537,226 393,863 1,018 12,736 7,20810.2 Composite of Accts. 871-879 & 886-893 - Cust % 100.0000% 56.4283% 41.3699% 0.1070% 1.3377% 0.7571%
Internally Generated Value 5,029,035 2,273,800 1,300,204 68,388 728,421 658,222 10.4 Composite of Accts. 871-879 & 886-893 - Demand % 100.0000% 45.2134% 25.8539% 1.3599% 14.4843% 13.0884%
Internally Generated Value 20,618 6,243 4,231 209 4,680 5,25510.6 Composite of Accts. 871-879 & 886-893 - Comm % 100.0000% 30.2810% 20.5209% 1.0138% 22.6976% 25.4867%
Internally Generated Value 383,700,807 225,965,977 81,220,409 3,596,449 38,319,346 34,598,626 11.0 Composite of Accts. 376 & 380 % 100.0000% 58.8912% 21.1676% 0.9373% 9.9868% 9.0171%
Internally Generated Value 119,712,299 106,607,671 12,968,981 6,591 82,413 46,64311.2 Composite of Accts. 376 & 380 - Cust % 100.0000% 89.0532% 10.8335% 0.0055% 0.0688% 0.0390%
Internally Generated Value 263,988,509 119,358,306 68,251,428 3,589,859 38,236,933 34,551,984 11.4 Composite of Accts. 376 & 380 - Demand % 100.0000% 45.2134% 25.8539% 1.3599% 14.4843% 13.0884%

Exhibit PHR-3Page 75 of 75
Atmos Energy Corporation, Kentucky/Mid-States DivisionClass Cost of Service - Demand Only StudyForecasted Test Period: Twelve Months Ended March 31, 2020
ALLOCATION FACTORS
Total Residential Non-Res Sales Non-Res Sales Transport TransportCompany Sales Firm Interruptible Firm Interruptible
Internally Generated Value 0 0 0 0 0 011.6 Composite of Accts. 376 & 380 - Comm % 0.0000% 0.0000% 0.0000% 0.0000% 0.0000% 0.0000%
Internally Generated Value 300,006,847 135,643,438 77,563,587 4,079,656 43,453,943 39,266,223 12.0 Composite of Accts. 374-379 % 100.0000% 45.2134% 25.8539% 1.3599% 14.4843% 13.0884%
Internally Generated Value 0 0 0 0 0 012.2 Composite of Accts. 374-379 - Cust % 0.0000% 0.0000% 0.0000% 0.0000% 0.0000% 0.0000%
Internally Generated Value 300,006,847 135,643,438 77,563,587 4,079,656 43,453,943 39,266,223 12.4 Composite of Accts. 374-379 - Demand % 100.0000% 45.2134% 25.8539% 1.3599% 14.4843% 13.0884%
Internally Generated Value 0 0 0 0 0 012.6 Composite of Accts. 374-379 - Comm % 0.0000% 0.0000% 0.0000% 0.0000% 0.0000% 0.0000%
Internally Generated Value 55,873,600 36,045,805 18,487,669 65,112 814,206 460,808 13.0 Composite of Accts. 381-383 % 100.0000% 64.5131% 33.0884% 0.1165% 1.4572% 0.8247%
Internally Generated Value 55,873,600 36,045,805 18,487,669 65,112 814,206 460,80813.2 Composite of Accts. 381-383 - Cust % 100.0000% 64.5131% 33.0884% 0.1165% 1.4572% 0.8247%
Internally Generated Value 0 0 0 0 0 0 13.4 Composite of Accts. 381-383 - Demand % 0.0000% 0.0000% 0.0000% 0.0000% 0.0000% 0.0000%
Internally Generated Value 0 0 0 0 0 013.6 Composite of Accts. 381-383 - Comm % 0.0000% 0.0000% 0.0000% 0.0000% 0.0000% 0.0000%
Internally Generated Value 119,712,299 106,607,671 12,968,981 6,591 82,413 46,643 14.0 Account 380 % 100.0000% 89.0532% 10.8335% 0.0055% 0.0688% 0.0390%
Internally Generated Value 119,712,299 106,607,671 12,968,981 6,591 82,413 46,64314.2 Account 380 - Cust % 100.0000% 89.0532% 10.8335% 0.0055% 0.0688% 0.0390%
Internally Generated Value 0 0 0 0 0 0 14.4 Account 380 - Demand % 0.0000% 0.0000% 0.0000% 0.0000% 0.0000% 0.0000%
Internally Generated Value 0 0 0 0 0 014.6 Account 380 - Comm % 0.0000% 0.0000% 0.0000% 0.0000% 0.0000% 0.0000%
Internally Generated Value 9,623,776 5,475,754 2,325,844 85,361 914,756 822,062 17.0 Composite of Accts. 870-902, 905-916, 924 & 928-930.1 % 100.0000% 56.8982% 24.1677% 0.8870% 9.5052% 8.5420%
Internally Generated Value 3,441,079 2,684,115 728,720 1,372 17,160 9,71217.2 Composite of Accts. 870-902, 905-916, 924 & 928-930.1 - Cust % 100.0000% 78.0021% 21.1771% 0.0399% 0.4987% 0.2822%
Internally Generated Value 6,157,425 2,783,984 1,591,937 83,732 891,861 805,91117.4 Composite of Accts. 870-902, 905-916, 924 & 928-930.1 - Dema % 100.0000% 45.2134% 25.8539% 1.3599% 14.4843% 13.0884%
Internally Generated Value 25,272 7,655 5,187 256 5,735 6,439 17.6 Composite of Accts. 870-902, 905-916, 924 & 928-930.1 - Comm % 100.0000% 30.2920% 20.5252% 1.0142% 22.6913% 25.4773%
Internally Generated Value 1,494,116,945 961,319,271 488,286,164 44,490,351 13,512 7,647 18.0 Revenues % 100.0000% 64.3403% 32.6806% 2.9777% 0.0009% 0.0005%
Internally Generated Value 86,746,747 50,513,031 21,051,850 300,483 7,930,117 6,951,266 18.2 Base Revenues % 100.0000% 58.2305% 24.2682% 0.3464% 9.1417% 8.0133%
Internally Generated Value 78,382,354 46,006,460 31,262,909 1,112,986 - - 18.4 Gas Costs % 100.0000% 58.6949% 39.8851% 1.4199% 0.0000% 0.0000%
Internally Generated Value 165,129,101 96,519,490 52,314,759 1,413,469 7,930,117 6,951,266 18.6 Total Rate Schedule Revenues % 100.0000% 58.4509% 31.6811% 0.8560% 4.8024% 4.2096%
Internally Generated Value 496,111,427 282,764,123 112,631,872 4,289,230 50,530,298 45,895,903 19.0 Rate Base % 100.0000% 56.9961% 22.7029% 0.8646% 10.1853% 9.2511%
Internally Generated Value 182,824,775 145,838,565 35,377,785 77,198 977,822 553,40619.2 Rate Base - Cust % 100.0000% 79.7696% 19.3507% 0.0422% 0.5348% 0.3027%
Internally Generated Value 321,757,716 145,477,756 83,187,043 4,375,436 46,604,408 42,113,073 19.4 Rate Base - Demand % 100.0000% 45.2134% 25.8539% 1.3599% 14.4843% 13.0884%
Internally Generated Value (8,471,064) (8,552,198) (5,932,956) (163,404) 2,948,068 3,229,42419.6 Rate Base - Comm % 100.0000% 100.9578% 70.0379% 1.9290% -34.8016% -38.1230%
Internally Generated Value 185,637,186 107,998,703 56,575,112 2,016,456 10,002,285 9,044,629 20.0 Cost of Service % 100.0000% 58.1773% 30.4762% 1.0862% 5.3881% 4.8722%
Internally Generated Value 42,303,478 33,079,818 8,810,987 24,331 247,549 140,79220.2 Cost of Service - Cust % 100.0000% 78.1964% 20.8280% 0.0575% 0.5852% 0.3328%
Internally Generated Value 64,081,471 28,972,213 16,564,752 873,406 9,282,321 8,388,779 20.4 Cost of Service - Demand % 100.0000% 45.2115% 25.8495% 1.3630% 14.4852% 13.0908%
Internally Generated Value 79,252,237 45,946,673 31,199,373 1,118,719 472,414 515,05820.6 Cost of Service - Comm % 100.0000% 57.9752% 39.3672% 1.4116% 0.5961% 0.6499%
Value 0 0 0 0 0 099.0 - % 0.0000% 0.0000% 0.0000% 0.0000% 0.0000% 0.0000%

Exhibit PHR-4Page 1 of 75
Atmos Energy Corporation, Kentucky/Mid-States DivisionClass Cost of Service - Demand/Commodity StudyForecasted Test Period: Twelve Months Ended March 31, 2020
SUMMARY OF RESULTS1234 Total Residential Non-Res Sales Non-Res Sales Transport Transport5 Company Sales Firm Interruptible Firm Interruptible6 $78 Operating Revenues 169,717,866 99,196,203 53,584,857 1,440,122 8,258,004 7,238,6819
10 Operating Expenses:1112 Operating & Maintenance 105,607,336 60,952,823 37,440,033 1,329,036 2,949,887 2,935,55713 Depreciation & Amortization 22,541,774 12,934,694 5,355,967 150,551 2,069,795 2,030,76814 Taxes Other Than Income 7,511,837 4,060,069 1,877,288 65,319 754,253 754,9071516 Total Operating Expenses 135,660,946 77,947,585 44,673,289 1,544,905 5,773,935 5,721,2321718 Income Before Taxes 34,056,920 21,248,618 8,911,568 (104,784) 2,484,069 1,517,4481920 Interest Expense 9,367,735 5,040,300 2,019,987 74,063 1,118,555 1,114,8292122 Income Taxes:2324 State Income Taxes 6.00% 1,481,351 972,499 413,495 (10,731) 81,931 24,15725 Federal Income Taxes 21.00% 4,873,645 3,199,522 1,360,398 (35,304) 269,552 79,47725 Total Deferred Income Taxes 0 0 0 0 0 026 Amortization of ITC 0 0 0 0 0 02728 Total Income Taxes 6,354,996 4,172,021 1,773,893 (46,035) 351,483 103,6342930 Net Income 27,701,923 17,076,597 7,137,675 (58,748) 2,132,586 1,413,8143132 Total Rate Base 496,111,427 266,932,262 106,977,682 3,922,356 59,238,237 59,040,8903334 Rate of Return 5.5838% 6.3974% 6.6721% -1.4978% 3.6000% 2.3946%35 Relative Rate of Return 1.00 1.15 1.19 (0.27) 0.64 0.43 3637 Equalized ROR:3839 Net Income Increase 11,738,935 4,144,518 1,367,051 370,576 2,576,854 3,279,93740 Uncollectibles/PSC Fees Increase 0.7000% 111,435 39,343 12,977 3,518 24,462 31,13641 Income Taxes 4,068,949 1,436,573 473,847 128,449 893,189 1,136,89242 Gross Revenue After Increase 185,637,186 104,816,637 55,438,732 1,942,664 11,752,508 11,686,64543 Revenue Deficiency 15,919,320 5,620,434 1,853,875 502,542 3,494,505 4,447,96444 Rate of Return 7.9500% 7.9500% 7.9500% 7.9500% 7.9500% 7.9500%45 Relative Rate of Return 1.00 1.00 1.00 1.00 1.00 1.00 46 Percent Increase 9.3799% 5.6660% 3.4597% 34.8958% 42.3166% 61.4472%4748 Proposed Rate Levels:4950 Net Income Increase 11,738,923 6,811,446 2,849,024 46,439 1,173,770 858,24451 Uncollectibles/PSC Fees Increase 111,435 64,660 27,045 441 11,142 8,14752 Income Taxes 4,068,945 2,360,983 987,529 16,097 406,852 297,48553 Gross Revenue After Increase 185,637,170 108,433,291 57,448,455 1,503,099 9,849,768 8,402,55654 Revenue Deficiency 15,919,304 9,237,088 3,863,598 62,977 1,591,765 1,163,87655 Rate of Return 7.9500% 8.9491% 9.3353% -0.3138% 5.5815% 3.8483%56 Relative Rate of Return 1.00 1.13 1.17 (0.04) 0.70 0.48 57 Percent Increase 9.3799% 9.3119% 7.2102% 4.3730% 19.2754% 16.0786%

Exhibit PHR-4Page 2 of 75
Atmos Energy Corporation, Kentucky/Mid-States DivisionClass Cost of Service - Demand/Commodity StudyForecasted Test Period: Twelve Months Ended March 31, 2020
SUMMARY OF CUSTOMER COSTS
Total Residential Non-Res Sales Non-Res Sales Transport TransportCompany Sales Firm Interruptible Firm Interruptible
$
1 Rate Base 182,824,775 145,838,565 35,377,785 77,198 977,822 553,40623 Return @ Realized ROR 10,208,589 8,943,619 2,404,470 (98,050) (378,467) (662,983)4 O&M Expenses 10,416,928 8,202,608 2,136,712 7,091 45,026 25,4925 Depreciation Expense 11,025,378 8,298,422 2,582,060 7,040 88,033 49,8236 Taxes, Other 2,444,150 1,888,305 530,011 1,292 15,672 8,87078 Interest Expense 3,452,156 2,753,770 668,015 1,458 18,464 10,4509
10 Income Taxes:1112 State Income Taxes # 545,901 500,122 140,301 (8,040) (32,071) (54,411)13 Federal Income Taxes # 1,796,014 1,645,403 461,590 (26,451) (105,513) (179,014)14 Deferred Income Taxes 0 0 0 0 0 015 Amortization of ITC 0 0 0 0 0 01617 Total Income Taxes 2,341,915 2,145,525 601,890 (34,491) (137,584) (233,425)1819 Total Customer-Related Costs @ Realized ROR 36,436,961 29,478,480 8,255,144 (117,119) (367,320) (812,224)20 Total Customers 177,100 157,713 19,186 10 122 6921 Customer Costs ($/customer/month) 15.58$ 35.86$ (1,001.01)$ (251.07)$ (980.92)$ 222324 Incremental Return @ Equalized ROR 4,325,980 2,650,546 408,063 104,187 456,204 706,97925 Incremental Income Taxes 1,499,471 918,732 141,443 36,113 158,129 245,05326 Incremental Uncollectibles/PSC Fees Increase # 41,066 25,161 3,874 989 4,331 6,7112728 Total Customer-Related Costs @ Equalized ROR 42,303,478 33,072,920 8,808,524 24,171 251,343 146,51929 Customers 177,100 157,713 19,186 10 122 6930 Dollars/Customer/Month 19.91$ 17.48$ 38.26$ 206.59$ 171.80$ 176.95$ 313233 Incremental Return @ Proposed Rates 4,325,976 3,633,350 954,194 (15,262) (60,854) (185,452)34 Incremental Income Taxes 1,499,470 1,259,392 330,743 (5,290) (21,093) (64,281)35 Incremental Uncollectibles/PSC Fees Increase 41,066 34,491 9,058 (145) (578) (1,760)3637 Total Customer-Related Costs @ Proposed Rates 42,303,472 34,405,711 9,549,138 (137,815) (449,845) (1,063,717)38 Customers 177,100 157,713 19,186 10 122 6939 Dollars/Customer/Month 19.91$ 18.18$ 41.48$ (1,177.91)$ (307.47)$ (1,284.65)$

Exhibit PHR-4Page 3 of 75
Atmos Energy Corporation, Kentucky/Mid-States DivisionClass Cost of Service - Demand/Commodity StudyForecasted Test Period: Twelve Months Ended March 31, 2020
SUMMARY OF DEMAND COSTS
Total Residential Non-Res Sales Non-Res Sales Transport TransportCompany Sales Firm Interruptible Firm Interruptible
$
1 Rate Base 215,734,814 97,541,147 55,775,947 2,933,679 31,247,715 28,236,32723 Return @ Realized ROR 12,046,224 6,390,839 3,620,696 43,024 1,233,791 757,8744 O&M Expenses 10,953,126 4,952,286 2,831,814 148,947 1,586,485 1,433,5945 Depreciation Expense 7,623,132 3,446,681 1,970,880 103,663 1,104,159 997,7496 Taxes, Other 2,588,423 1,170,315 669,209 35,199 374,915 338,78478 Interest Expense 4,073,574 1,841,803 1,053,179 55,395 590,029 533,1679
10 Income Taxes:1112 State Income Taxes # 644,168 367,549 207,448 (999) 52,014 18,15613 Federal Income Taxes # 2,119,312 1,209,237 682,505 (3,288) 171,126 59,73214 Deferred Income Taxes 0 0 0 0 0 015 Amortization of ITC 0 0 0 0 0 01617 Total Income Taxes 2,763,480 1,576,787 889,953 (4,288) 223,141 77,8881819 Total Demand-Related Costs @ Realized ROR 35,974,385 17,536,907 9,982,553 326,545 4,522,491 3,605,888202122 Incremental Return @ Equalized ROR 5,104,694 1,363,683 813,491 190,203 1,250,402 1,486,91423 Incremental Income Taxes 1,769,389 472,680 281,972 65,928 433,414 515,39424 Incremental Uncollectibles/PSC Fees Increase # 48,458 12,945 7,722 1,806 11,870 14,1152526 Total Demand-Related Costs @ Equalized ROR 42,896,925 19,386,214 11,085,739 584,482 6,218,178 5,622,312272829 Incremental Return @ Proposed Rates 5,104,689 2,523,401 1,457,929 49,252 640,269 433,83830 Incremental Income Taxes 1,769,387 874,661 505,347 17,072 221,930 150,37731 Incremental Uncollectibles/PSC Fees Increase # 48,458 23,954 13,840 468 6,078 4,1183233 Total Demand-Related Costs @ Proposed Rates 42,896,918 20,958,923 11,959,670 393,337 5,390,768 4,194,221

Exhibit PHR-4Page 4 of 75
Atmos Energy Corporation, Kentucky/Mid-States DivisionClass Cost of Service - Demand/Commodity StudyForecasted Test Period: Twelve Months Ended March 31, 2020
SUMMARY OF COMMODITY COSTS
Total Residential Non-Res Sales Non-Res Sales Transport TransportCompany Sales Firm Interruptible Firm Interruptible
$
1 Rate Base 97,551,838 23,552,551 15,823,950 911,479 27,012,700 30,251,15723 Return @ Realized ROR 5,447,110 1,315,130 883,579 50,895 1,508,338 1,689,1674 O&M Expenses 84,237,281 47,797,929 32,471,507 1,172,998 1,318,375 1,476,4725 Depreciation Expense 3,893,264 1,189,590 803,028 39,847 877,603 983,1956 Taxes, Other 2,479,264 1,001,449 678,068 28,828 363,666 407,25378 Interest Expense 1,842,005 444,727 298,793 17,211 510,062 571,2129
10 Income Taxes:1112 State Income Taxes # 291,282 70,326 47,249 2,722 80,658 90,32813 Federal Income Taxes # 958,319 231,373 155,450 8,954 265,364 297,17814 Deferred Income Taxes 0 0 0 0 0 015 Amortization of ITC 0 0 0 0 0 01617 Total Income Taxes 1,249,601 301,699 202,699 11,676 346,022 387,5061819 Total Commodity-Related Costs 97,306,521 51,605,797 35,038,881 1,304,244 4,414,005 4,943,59420 Total Throughput 33,298,463 10,083,093 6,833,161 337,587 7,557,945 8,486,67721 Commodity Costs ($/Mcf) 5.11805$ 5.12777$ 3.86343$ 0.58402$ 0.58$ 222324 Incremental Return @ Equalized ROR 2,308,261 557,298 374,425 21,567 639,172 715,80025 Incremental Income Taxes 800,089 193,171 129,783 7,476 221,550 248,11026 Incremental Uncollectibles/PSC Fees Increase # 21,912 5,290 3,554 205 6,068 6,7952728 Total Commodity-Related Costs @ Equalized ROR 100,436,783 52,361,556 35,546,643 1,333,492 5,280,794 5,914,29929 Total Throughput 33,298,463 10,083,093 6,833,161 337,587 7,557,945 8,486,67730 Commodity Costs ($/Mcf) 3.02$ 5.19$ 5.20$ 3.95$ 0.70$ 0.70$ 313233 Incremental Return @ Proposed Rates 2,308,259 1,081,704 665,829 (42,169) 363,279 239,61534 Incremental Income Taxes 800,089 374,940 230,790 (14,616) 125,920 83,05535 Incremental Uncollectibles/PSC Fees Increase 21,912 10,268 6,321 (400) 3,449 2,2753637 Total Commodity-Related Costs @ Proposed Rates 100,436,780 53,072,711 35,941,820 1,247,059 4,906,652 5,268,53838 Total Throughput 33,298,463 10,083,093 6,833,161 337,587 7,557,945 8,486,67739 Commodity Costs ($/Mcf) 3.02$ 5.26$ 5.26$ 3.69$ 0.65$ 0.62$

Exhibit PHR-4Page 5 of 75
Atmos Energy Corporation, Kentucky/Mid-States DivisionClass Cost of Service - Demand/Commodity StudyForecasted Test Period: Twelve Months Ended March 31, 2020
TOTAL COST OF SERVICE
Total Residential Non-Res Sales Non-Res Sales Transport TransportCompany Sales Firm Interruptible Firm Interruptible
$
1 Rate Base 496,111,427 266,932,262 106,977,682 3,922,356 59,238,237 59,040,89023 Return @ Realized ROR 27,701,923 16,649,588 6,908,746 (4,131) 2,363,662 1,784,0584 O&M Expenses 105,607,336 60,952,823 37,440,033 1,329,036 2,949,887 2,935,5575 Depreciation Expense 22,541,774 12,934,694 5,355,967 150,551 2,069,795 2,030,7686 Taxes, Other 7,511,837 4,060,069 1,877,288 65,319 754,253 754,90778 Interest Expense 9,367,735 5,040,300 2,019,987 74,063 1,118,555 1,114,8299
10 Income Taxes:1112 State Income Taxes 1,481,351 937,998 394,998 (6,318) 100,601 54,07213 Federal Income Taxes 4,873,645 3,086,013 1,299,544 (20,786) 330,978 177,89614 Deferred Income Taxes 0 0 0 0 0 015 Amortization of ITC 0 0 0 0 0 01617 Total Income Taxes 6,354,996 4,024,011 1,694,542 (27,104) 431,579 231,9681819 Total Cost of Service @ Realized ROR 169,717,866 98,621,184 53,276,577 1,513,671 8,569,175 7,737,258202122 Incremental Return @ Equalized ROR 11,738,935 4,571,527 1,595,979 315,958 2,345,778 2,909,69323 Incremental Income Taxes 4,068,949 1,584,583 553,198 109,517 813,093 1,008,55824 Incremental Uncollectibles/PSC Fees Increase 111,435 43,397 15,150 2,999 22,268 27,6212526 Total Cost of Service @ Equalized ROR 185,637,186 104,820,690 55,440,905 1,942,146 11,750,315 11,683,130272829 Incremental Return @ Proposed Rates 11,738,923 7,238,455 3,077,953 (8,178) 942,694 488,00130 Incremental Income Taxes 4,068,945 2,508,993 1,066,880 (2,835) 326,757 169,15131 Incremental Uncollectibles/PSC Fees Increase 111,435 68,713 29,218 (78) 8,949 4,6323233 Total Cost of Service @ Proposed Rates 185,637,170 108,437,345 57,450,628 1,502,580 9,847,575 8,399,042

Exhibit PHR-4Page 6 of 75
Atmos Energy Corporation, Kentucky/Mid-States DivisionClass Cost of Service - Demand/Commodity StudyForecasted Test Period: Twelve Months Ended March 31, 2020
CLASSIFICATION OF GROSS PLANT IN SERVICE
Test Year Classif. Classif. Customer Demand CommodityLine Acct. $ Factor Basis $ $ $No. No.
1 Intangible Plant:23 30100 Organization 8,330 5.4 P, S, T & D Plant 3,229 3,421 1,679 4 30200 Franchises & Consents 119,853 5.4 P, S, T & D Plant 46,465 49,225 24,163 5 30300 Misc Intangible Plant - 99.0 - - - - 67 Total Intangible Plant: 128,182 49,694 52,646 25,84389 Production Plant:
1011 32520 Producing Leaseholds - 99.0 - - - - 12 32540 Rights of Ways - 99.0 - - - - 13 33100 Production Gas Wells Equipment - 99.0 - - - - 14 33201 Field Lines - 99.0 - - - - 15 33202 Tributary Lines - 99.0 - - - - 16 33400 Field Meas. & Reg. Sta. Equip - 99.0 - - - - 17 33600 Purification Equipment - 99.0 - - - - 1819 Total Production Plant 0 0 0 02021 Storage Plant:2223 35010 Land 261,127 3.5 Storage (50/50) - 130,563 130,563 24 35020 Rights of Way 4,682 3.5 Storage (50/50) - 2,341 2,341 25 35100 Structures and Improvements 17,916 3.5 Storage (50/50) - 8,958 8,958 26 35102 Compression Station Equipment 153,261 3.5 Storage (50/50) - 76,631 76,631 27 35103 Meas. & Reg. Sta. Structues 23,138 3.5 Storage (50/50) - 11,569 11,569 28 35104 Other Structures 137,443 3.5 Storage (50/50) - 68,721 68,721 29 35200 Wells \ Rights of Way 8,348,396 3.5 Storage (50/50) - 4,174,198 4,174,198 30 35201 Well Construction 1,699,999 3.5 Storage (50/50) - 849,999 849,999 31 35202 Well Equipment 449,309 3.5 Storage (50/50) - 224,655 224,655 32 35203 Cushion Gas 1,694,833 3.5 Storage (50/50) - 847,416 847,416 33 35210 Leaseholds 178,530 3.5 Storage (50/50) - 89,265 89,265 34 35211 Storage Rights 54,614 3.5 Storage (50/50) - 27,307 27,307 35 35301 Field Lines 175,350 3.5 Storage (50/50) - 87,675 87,675 36 35302 Tributary Lines 209,319 3.5 Storage (50/50) - 104,659 104,659 37 35400 Compressor Station Equipment 923,446 3.5 Storage (50/50) - 461,723 461,723 38 35500 Meas & Reg. Equipment 273,084 3.5 Storage (50/50) - 136,542 136,542 39 35600 Purification Equipment 414,663 3.5 Storage (50/50) - 207,332 207,332 4041 Total Storage Plant 15,019,110 0 7,509,555 7,509,5554243 Transmission:4445 36510 Land & Land Rights 26,970 2.0 Demand - 26,970 - 46 36520 Rights of Way 867,772 2.0 Demand - 867,772 - 47 36602 Structures & Improvements 49,002 2.0 Demand - 49,002 - 48 36603 Other Structues 60,826 2.0 Demand - 60,826 - 49 36700 Mains Cathodic Protection 139,638 2.0 Demand - 139,638 - 50 36701 Mains - Steel 27,047,831 2.0 Demand - 27,047,831 - 51 36900 Meas. & Reg. Equipment 731,467 2.0 Demand - 731,467 - 52 36901 Meas. & Reg. Equipment 2,269,556 2.0 Demand - 2,269,556 - 5354 Total Transmission Plant 31,193,061 0 31,193,061 05556 Distribution:5758 37400 Land & Land Rights 531,167 4.0 Mains (Peak and Average) - 345,253 185,914 59 37401 Land 37,326 4.0 Mains (Peak and Average) - 24,262 13,065 60 37402 Land Rights 3,645,749 4.0 Mains (Peak and Average) - 2,369,699 1,276,049 61 37403 Land Other 2,784 4.0 Mains (Peak and Average) - 1,810 974 62 37500 Structures & Improvements 336,168 4.0 Mains (Peak and Average) - 218,505 117,662 63 37501 Structures & Improvements T.B. 99,818 4.0 Mains (Peak and Average) - 64,881 34,937 64 37502 Land Rights 46,264 4.0 Mains (Peak and Average) - 30,071 16,193 65 37503 Improvements 4,005 4.0 Mains (Peak and Average) - 2,603 1,402 66 37600 Mains Cathodic Protection 20,611,541 4.0 Mains (Peak and Average) - 13,397,291 7,214,250 67 37601 Mains - Steel 176,025,498 4.0 Mains (Peak and Average) - 114,414,774 61,610,725 68 37602 Mains - Plastic 133,261,910 4.0 Mains (Peak and Average) - 86,618,879 46,643,031 69 37800 Meas & Reg. Sta. Equip - General 29,911,913 4.0 Mains (Peak and Average) - 19,442,438 10,469,475 70 37900 Meas & Reg. Sta. Equip - City Gate 5,126,032 4.0 Mains (Peak and Average) - 3,331,868 1,794,164 71 37905 Meas & Reg. Sta. Equipment T.b. 1,652,259 4.0 Mains (Peak and Average) - 1,073,951 578,307 72 38000 Services 150,274,437 1.0 Customer 150,274,437 - - 73 38100 Meters 38,722,015 1.0 Customer 38,722,015 - - 74 38200 Meter Installations 57,067,155 1.0 Customer 57,067,155 - - 75 38300 House Regulators 12,779,948 1.0 Customer 12,779,948 - - 76 38400 House Reg. Installations 252,587 1.0 Customer 252,587 - - 77 38500 Ind. Meas. & Reg. Sta. Equipment 5,241,043 1.0 Customer 5,241,043 - - 78 38600 Other Prop. On Cust. Prem - 99.0 - - - - 7980 Total Distribution Plant 635,629,619 264,337,185 241,336,285 129,956,14981

Exhibit PHR-4Page 7 of 75
Atmos Energy Corporation, Kentucky/Mid-States DivisionClass Cost of Service - Demand/Commodity StudyForecasted Test Period: Twelve Months Ended March 31, 2020
CLASSIFICATION OF GROSS PLANT IN SERVICE
Test Year Classif. Classif. Customer Demand CommodityLine Acct. $ Factor Basis $ $ $No. No.
82 General:8384 38900 Land & Land Rights 1,211,697 5.4 P, S, T & D Plant 469,752 497,656 244,290 85 39000 Structures & Improvements 7,595,600 5.4 P, S, T & D Plant 2,944,671 3,119,585 1,531,344 86 39001 Structures Frame - 5.4 P, S, T & D Plant - - - 87 39002 Structures-Brick 173,115 5.4 P, S, T & D Plant 67,113 71,100 34,902 88 39003 Improvements 709,199 5.4 P, S, T & D Plant 274,943 291,275 142,981 89 39004 Air Conditioning Equipment 12,955 5.4 P, S, T & D Plant 5,022 5,321 2,612 90 39009 Improvement to leased Premises 1,246,194 5.4 P, S, T & D Plant 483,126 511,824 251,244 91 39100 Office Furniture & Equipment 1,866,038 5.4 P, S, T & D Plant 723,428 766,400 376,211 92 39102 Remittance Processing Equip - 5.4 P, S, T & D Plant - - - 93 39103 Office Machines - 5.4 P, S, T & D Plant - - - 94 39200 Transportation Equipment 220,987 5.4 P, S, T & D Plant 85,672 90,761 44,553 95 39201 Trucks - 5.4 P, S, T & D Plant - - - 96 39202 Trailers - 5.4 P, S, T & D Plant - - - 97 39300 Stores Equipment - 5.4 P, S, T & D Plant - - - 98 39400 Tools, Shop & Garage Equipment 4,078,361 5.4 P, S, T & D Plant 1,581,103 1,675,022 822,236 99 39600 Power Operated Equipment - 5.4 P, S, T & D Plant - - -
100 39603 Ditchers 39,610 5.4 P, S, T & D Plant 15,356 16,268 7,986 101 39604 Backhoes 62,747 5.4 P, S, T & D Plant 24,326 25,771 12,650 102 39605 Welders 19,427 5.4 P, S, T & D Plant 7,532 7,979 3,917 103 39700 Communication Equipment 524,257 5.4 P, S, T & D Plant 203,245 215,317 105,695 104 39701 Communication Equipment - Mobile Radios - 5.4 P, S, T & D Plant - - - 105 39702 Communication Equipment - Fixed Radios - 5.4 P, S, T & D Plant - - - 106 39705 Communication Equip. - Telemetering - 5.4 P, S, T & D Plant - - - 107 39800 Miscellaneous Equipment 3,891,771 5.4 P, S, T & D Plant 1,508,766 1,598,387 784,618 108 39900 Other Tangible Property - 5.4 P, S, T & D Plant - - - 109 39901 Other Tangible Property - Servers - H/W 14,390 5.4 P, S, T & D Plant 5,579 5,910 2,901 110 39902 Other Tangible Property - Servers - S/W - 5.4 P, S, T & D Plant - - - 111 39903 Other Tangible Property - Network - H/W 134,599 5.4 P, S, T & D Plant 52,181 55,281 27,136 112 39904 Other Tang. Property - CPU - 5.4 P, S, T & D Plant - - - 113 39905 Other Tangible Property - MF - Hardware - 5.4 P, S, T & D Plant - - - 114 39906 Other Tang. Property - PC Hardware 461,888 5.4 P, S, T & D Plant 179,065 189,702 93,121 115 39907 Other Tang. Property - PC Software - 5.4 P, S, T & D Plant - - - 116 39908 Other Tang. Property - Mainframe S/W 123,515 5.4 P, S, T & D Plant 47,884 50,729 24,902 117 39909 Other Tang. Property - Application Software - 5.4 P, S, T & D Plant - - - 118 39924 Other Tang. Property - General Startup Costs - 5.4 P, S, T & D Plant - - - 119120 Total General Plant 22,386,350 8,678,765 9,194,287 4,513,298121122 TOTAL DIRECT PLANT 704,356,323 273,065,644 289,285,834 142,004,845123124 CWIP w/o AFUDC 38,154,809 5.4 P, S, T & D Plant 14,791,899 15,670,542 7,692,367 125126 Kentucky Mid-States General Office:127128 Intangible Plant:129130 30100 Organization 92,247 5.4 P, S, T & D Plant 35,762 37,887 18,598 131 30200 Franchises & Consents - 5.4 P, S, T & D Plant - - - 132 30300 Misc Intangible Plant 552,335 5.4 P, S, T & D Plant 214,130 226,849 111,356 133134 Total Intangible Plant: 644,582 249,892 264,736 129,954135136 General:137138 37400 Land & Land Rights - 5.4 P, S, T & D Plant - - - 139 39001 Structures Frame 89,275 5.4 P, S, T & D Plant 34,610 36,666 17,999 140 36602 Structures & Improvements - 5.4 P, S, T & D Plant - - - 141 38900 Land & Land Rights - 5.4 P, S, T & D Plant - - - 142 39004 Air Conditioning Equipment 7,658 5.4 P, S, T & D Plant 2,969 3,145 1,544 143 39009 Improvement to leased Premises 19,332 5.4 P, S, T & D Plant 7,494 7,940 3,897 144 39100 Office Furniture & Equipment 19,220 5.4 P, S, T & D Plant 7,451 7,894 3,875 145 39102 Remittance Processing Equip - 5.4 P, S, T & D Plant - - - 146 39103 Office Machines - 5.4 P, S, T & D Plant - - - 147 39200 Transportation Equipment 13,582 5.4 P, S, T & D Plant 5,266 5,578 2,738 148 39201 Trucks - 5.4 P, S, T & D Plant - - - 149 39202 Trailers - 5.4 P, S, T & D Plant - - - 150 39300 Stores Equipment - 5.4 P, S, T & D Plant - - - 151 39400 Tools, Shop & Garage Equipment 87,547 5.4 P, S, T & D Plant 33,940 35,956 17,650 152 39600 Power Operated Equipment 10,213 5.4 P, S, T & D Plant 3,959 4,194 2,059 153 39603 Ditchers - 5.4 P, S, T & D Plant - - - 154 39604 Backhoes - 5.4 P, S, T & D Plant - - - 155 39605 Welders - 5.4 P, S, T & D Plant - - - 156 39700 Communication Equipment 18,688 5.4 P, S, T & D Plant 7,245 7,675 3,768 157 39701 Communication Equipment - Mobile Radios - 5.4 P, S, T & D Plant - - - 158 39702 Communication Equipment - Fixed Radios - 5.4 P, S, T & D Plant - - - 159 39705 Communication Equip. - Telemetering - 5.4 P, S, T & D Plant - - - 160 39800 Miscellaneous Equipment 405,292 5.4 P, S, T & D Plant 157,124 166,457 81,711 161 39900 Other Tangible Property - 5.4 P, S, T & D Plant - - - 162 39901 Other Tangible Property - Servers - H/W - 5.4 P, S, T & D Plant - - - 163 39902 Other Tangible Property - Servers - S/W - 5.4 P, S, T & D Plant - - - 164 39903 Other Tangible Property - Network - H/W - 5.4 P, S, T & D Plant - - - 165 39904 Other Tang. Property - CPU - 5.4 P, S, T & D Plant - - - 166 39905 Other Tangible Property - MF - Hardware - 5.4 P, S, T & D Plant - - - 167 39906 Other Tang. Property - PC Hardware 34,934 5.4 P, S, T & D Plant 13,543 14,348 7,043 168 39907 Other Tang. Property - PC Software 82,288 5.4 P, S, T & D Plant 31,902 33,797 16,590 169 39908 Other Tang. Property - Mainframe S/W 412,432 5.4 P, S, T & D Plant 159,892 169,390 83,150 170 39909 Other Tang. Property - Application Software - 5.4 P, S, T & D Plant - - - 171 39924 Other Tang. Property - General Startup Costs - 5.4 P, S, T & D Plant - - - 172173 Total General Plant 1,200,461 465,396 493,041 242,024174175 CWIP w/o AFUDC 2,311 5.4 P, S, T & D Plant 896 949 466 176

Exhibit PHR-4Page 8 of 75
Atmos Energy Corporation, Kentucky/Mid-States DivisionClass Cost of Service - Demand/Commodity StudyForecasted Test Period: Twelve Months Ended March 31, 2020
CLASSIFICATION OF GROSS PLANT IN SERVICE
Test Year Classif. Classif. Customer Demand CommodityLine Acct. $ Factor Basis $ $ $No. No.177 Shared Services General Office:178179 General:180181 37400 Land & Land Rights - 5.4 P, S, T & D Plant - - - 182 39001 Structures Frame - 5.4 P, S, T & D Plant - - - 183 36602 Structures & Improvements 236,424 5.4 P, S, T & D Plant 91,657 97,102 47,665 184 37503 Improvements - 5.4 P, S, T & D Plant - - - 185 39004 Air Conditioning Equipment - 5.4 P, S, T & D Plant - - - 186 39009 Improvement to leased Premises 483,357 5.4 P, S, T & D Plant 187,389 198,519 97,449 187 39100 Office Furniture & Equipment 286,918 5.4 P, S, T & D Plant 111,233 117,840 57,845 188 39102 Remittance Processing Equip - 5.4 P, S, T & D Plant - - - 189 39103 Office Machines - 5.4 P, S, T & D Plant - - - 190 39200 Transportation Equipment 369 5.4 P, S, T & D Plant 143 152 74 191 39201 Trucks - 5.4 P, S, T & D Plant - - - 192 39202 Trailers - 5.4 P, S, T & D Plant - - - 193 39300 Stores Equipment - 5.4 P, S, T & D Plant - - - 194 39400 Tools, Shop & Garage Equipment 3,938 5.4 P, S, T & D Plant 1,527 1,617 794 195 39500 Tools, Shop & Garage Equipment - 5.4 P, S, T & D Plant - - - 196 39603 Ditchers - 5.4 P, S, T & D Plant - - - 197 39604 Backhoes - 5.4 P, S, T & D Plant - - - 198 39605 Welders - 5.4 P, S, T & D Plant - - - 199 39700 Communication Equipment 54,370 5.4 P, S, T & D Plant 21,078 22,330 10,961 200 39701 Communication Equipment - Mobile Radios - 5.4 P, S, T & D Plant - - - 201 39702 Communication Equipment - Fixed Radios - 5.4 P, S, T & D Plant - - - 202 39705 Communication Equip. - Telemetering - 5.4 P, S, T & D Plant - - - 203 39800 Miscellaneous Equipment 7,537 5.4 P, S, T & D Plant 2,922 3,096 1,520 204 39900 Other Tangible Property 8,377 5.4 P, S, T & D Plant 3,248 3,441 1,689 205 39901 Other Tangible Property - Servers - H/W 2,321,928 5.4 P, S, T & D Plant 900,168 953,638 468,123 206 39902 Other Tangible Property - Servers - S/W 1,402,428 5.4 P, S, T & D Plant 543,695 575,990 282,743 207 39903 Other Tangible Property - Network - H/W 442,303 5.4 P, S, T & D Plant 171,472 181,658 89,172 208 39904 Other Tang. Property - CPU - 5.4 P, S, T & D Plant - - - 209 39905 Other Tangible Property - MF - Hardware - 5.4 P, S, T & D Plant - - - 210 39906 Other Tang. Property - PC Hardware 155,862 5.4 P, S, T & D Plant 60,425 64,014 31,423 211 39907 Other Tang. Property - PC Software 86,214 5.4 P, S, T & D Plant 33,424 35,409 17,382 212 39908 Other Tang. Property - Mainframe S/W 3,879,643 5.4 P, S, T & D Plant 1,504,064 1,593,406 782,172 213 39909 Other Tang. Property - Application Software 1,322,956 5.4 P, S, T & D Plant 512,885 543,351 266,720 214 39931 Other Tang. Property - ALGN - 5.4 P, S, T & D Plant - - - 215216 Total General Plant 10,692,624 4,145,328 4,391,562 2,155,733217218 CWIP w/o AFUDC 748,344 5.4 P, S, T & D Plant 290,119 307,352 150,873 219220 Shared Services Customer Support:221222 General:223224 37400 Land & Land Rights 205,882 5.4 P, S, T & D Plant 79,816 84,557 41,508 225 39001 Structures Frame - 5.4 P, S, T & D Plant - - - 226 36602 Structures & Improvements 1,000,011 5.4 P, S, T & D Plant 387,685 410,714 201,612 227 37503 Improvements - 5.4 P, S, T & D Plant - - - 228 39004 Air Conditioning Equipment - 5.4 P, S, T & D Plant - - - 229 39009 Improvement to leased Premises 159,117 5.4 P, S, T & D Plant 61,687 65,351 32,079 230 39100 Office Furniture & Equipment 154,692 5.4 P, S, T & D Plant 59,971 63,533 31,187 231 39102 Remittance Processing Equip - 5.4 P, S, T & D Plant - - - 232 39103 Office Machines - 5.4 P, S, T & D Plant - - - 233 39200 Transportation Equipment 2,233 5.4 P, S, T & D Plant 866 917 450 234 39201 Trucks - 5.4 P, S, T & D Plant - - - 235 39202 Trailers - 5.4 P, S, T & D Plant - - - 236 39300 Stores Equipment - 5.4 P, S, T & D Plant - - - 237 39400 Tools, Shop & Garage Equipment 14,093 5.4 P, S, T & D Plant 5,463 5,788 2,841 238 39510 Laboratory Equip 548 5.4 P, S, T & D Plant 212 225 110 239 39603 Ditchers - 5.4 P, S, T & D Plant - - - 240 39604 Backhoes - 5.4 P, S, T & D Plant - - - 241 39605 Welders - 5.4 P, S, T & D Plant - - - 242 39700 Communication Equipment 114,682 5.4 P, S, T & D Plant 44,460 47,101 23,121 243 39701 Communication Equipment - Mobile Radios - 5.4 P, S, T & D Plant - - - 244 39702 Communication Equipment - Fixed Radios - 5.4 P, S, T & D Plant - - - 245 39705 Communication Equip. - Telemetering - 5.4 P, S, T & D Plant - - - 246 39800 Miscellaneous Equipment 15,758 5.4 P, S, T & D Plant 6,109 6,472 3,177 247 39900 Other Tangible Property 43,368 5.4 P, S, T & D Plant 16,813 17,812 8,743 248 39901 Other Tangible Property - Servers - H/W 583,485 5.4 P, S, T & D Plant 226,206 239,643 117,636 249 39902 Other Tangible Property - Servers - S/W 114,175 5.4 P, S, T & D Plant 44,263 46,893 23,019 250 39903 Other Tangible Property - Network - H/W 35,496 5.4 P, S, T & D Plant 13,761 14,579 7,156 251 39904 Other Tang. Property - CPU - 5.4 P, S, T & D Plant - - - 252 39905 Other Tangible Property - MF - Hardware - 5.4 P, S, T & D Plant - - - 253 39906 Other Tang. Property - PC Hardware 69,473 5.4 P, S, T & D Plant 26,933 28,533 14,006 254 39907 Other Tang. Property - PC Software 13,141 5.4 P, S, T & D Plant 5,095 5,397 2,649 255 39908 Other Tang. Property - Mainframe S/W 5,248,748 5.4 P, S, T & D Plant 2,034,841 2,155,711 1,058,197 256 39909 Other Tang. Property - Application Software 477 5.4 P, S, T & D Plant 185 196 96 257 39924 Other Tang. Property - General Startup Costs - 5.4 P, S, T & D Plant - - - 258259 Total General Plant 7,775,377 3,014,367 3,193,421 1,567,589260261 CWIP w/o AFUDC 224,734 5.4 P, S, T & D Plant 87,125 92,301 45,309 262263 TOTAL PLANT IN SERVICE 724,669,367 280,940,628 297,628,594 146,100,145264265 TOTAL CWIP W/O AFUDC 39,130,198 15,170,039 16,071,144 7,889,015

Exhibit PHR-4Page 9 of 75
Atmos Energy Corporation, Kentucky/Mid-States DivisionClass Cost of Service - Demand/Commodity StudyForecasted Test Period: Twelve Months Ended March 31, 2020
CLASSIFICATION OF RESERVE FOR DEPRECIATION AND AMORTIZATION
Test Year Classif. Classif. Customer Demand CommodityLine Acct. $ Factor Basis $ $ $No. No.
1 Intangible Plant:23 30100 Organization 8,330 5.4 P, S, T & D Plant 3,229 3,421 1,679 4 30200 Franchises & Consents 119,853 5.4 P, S, T & D Plant 46,465 49,225 24,163 5 30300 Misc Intangible Plant - 99.0 - - - - 67 Total Intangible Plant: 128,182 49,694 52,646 25,84389 Production Plant:
1011 32520 Producing Leaseholds - 99.0 - - - - 12 32540 Rights of Ways - 99.0 - - - - 13 33100 Production Gas Wells Equipment - 99.0 - - - - 14 33201 Field Lines - 99.0 - - - - 15 33202 Tributary Lines - 99.0 - - - - 16 33400 Field Meas. & Reg. Sta. Equip - 99.0 - - - - 17 33600 Purification Equipment - 99.0 - - - - 1819 Total Production Plant - 0 0 02021 Storage Plant:2223 35010 Land - 3.5 Storage (50/50) - - - 24 35020 Rights of Way 4,453 3.5 Storage (50/50) - 2,227 2,227 25 35100 Structures and Improvements 6,289 3.5 Storage (50/50) - 3,144 3,144 26 35102 Compression Station Equipment 113,744 3.5 Storage (50/50) - 56,872 56,872 27 35103 Meas. & Reg. Sta. Structues 20,483 3.5 Storage (50/50) - 10,242 10,242 28 35104 Other Structures 100,144 3.5 Storage (50/50) - 50,072 50,072 29 35200 Wells \ Rights of Way 1,190,830 3.5 Storage (50/50) - 595,415 595,415 30 35201 Well Construction 1,419,511 3.5 Storage (50/50) - 709,755 709,755 31 35202 Well Equipment 450,595 3.5 Storage (50/50) - 225,298 225,298 32 35203 Cushion Gas 758,594 3.5 Storage (50/50) - 379,297 379,297 33 35210 Leaseholds 168,062 3.5 Storage (50/50) - 84,031 84,031 34 35211 Storage Rights 43,956 3.5 Storage (50/50) - 21,978 21,978 35 35301 Field Lines (88,396) 3.5 Storage (50/50) - (44,198) (44,198) 36 35302 Tributary Lines 189,177 3.5 Storage (50/50) - 94,588 94,588 37 35400 Compressor Station Equipment 497,853 3.5 Storage (50/50) - 248,926 248,926 38 35500 Meas & Reg. Equipment 202,544 3.5 Storage (50/50) - 101,272 101,272 39 35600 Purification Equipment 191,797 3.5 Storage (50/50) - 95,899 95,899 4041 Total Storage Plant 5,269,635 0 2,634,817 2,634,8174243 Transmission:4445 36510 Land & Land Rights - 2.0 Demand - - - 46 36520 Rights of Way 428,096 2.0 Demand - 428,096 - 47 36602 Structures & Improvements 16,837 2.0 Demand - 16,837 - 48 36603 Other Structues 53,066 2.0 Demand - 53,066 - 49 36700 Mains Cathodic Protection 98,316 2.0 Demand - 98,316 - 50 36701 Mains - Steel 16,387,961 2.0 Demand - 16,387,961 - 51 36900 Meas. & Reg. Equipment 353,469 2.0 Demand - 353,469 - 52 36901 Meas. & Reg. Equipment 1,774,251 2.0 Demand - 1,774,251 - 5354 Total Transmission Plant 19,111,996 0 19,111,996 05556 Distribution:5758 37400 Land & Land Rights - 4.0 Mains (Peak and Average) - - - 59 37401 Land - 4.0 Mains (Peak and Average) - - - 60 37402 Land Rights 235,363 4.0 Mains (Peak and Average) - 152,984 82,380 61 37403 Land Other - 4.0 Mains (Peak and Average) - - - 62 37500 Structures & Improvements 113,695 4.0 Mains (Peak and Average) - 73,901 39,794 63 37501 Structures & Improvements T.B. 71,449 4.0 Mains (Peak and Average) - 46,441 25,008 64 37502 Land Rights 35,399 4.0 Mains (Peak and Average) - 23,009 12,390 65 37503 Improvements 1,920 4.0 Mains (Peak and Average) - 1,248 672 66 37600 Mains Cathodic Protection 13,210,658 4.0 Mains (Peak and Average) - 8,586,793 4,623,865 67 37601 Mains - Steel 33,671,112 4.0 Mains (Peak and Average) - 21,885,878 11,785,233 68 37602 Mains - Plastic 19,028,671 4.0 Mains (Peak and Average) - 12,368,442 6,660,230 69 37800 Meas & Reg. Sta. Equip - General 2,894,799 4.0 Mains (Peak and Average) - 1,881,590 1,013,209 70 37900 Meas & Reg. Sta. Equip - City Gate 984,409 4.0 Mains (Peak and Average) - 639,856 344,553 71 37905 Meas & Reg. Sta. Equipment T.b. 1,038,111 4.0 Mains (Peak and Average) - 674,762 363,349 72 38000 Services 30,562,139 1.0 Customer 30,562,139 - - 73 38100 Meters 21,386,354 1.0 Customer 21,386,354 - - 74 38200 Meter Installaitons 26,987,899 1.0 Customer 26,987,899 - - 75 38300 House Regulators 4,321,265 1.0 Customer 4,321,265 - - 76 38400 House Reg. Installations 94,403 1.0 Customer 94,403 - - 77 38500 Ind. Meas. & Reg. Sta. Equipment 2,958,741 1.0 Customer 2,958,741 - - 78 38600 Other Prop. On Cust. Prem - 99.0 - - - - 7980 Total Distribution Plant 157,596,387 86,310,801 46,334,902 24,950,68481

Exhibit PHR-4Page 10 of 75
Atmos Energy Corporation, Kentucky/Mid-States DivisionClass Cost of Service - Demand/Commodity StudyForecasted Test Period: Twelve Months Ended March 31, 2020
CLASSIFICATION OF RESERVE FOR DEPRECIATION AND AMORTIZATION
Test Year Classif. Classif. Customer Demand CommodityLine Acct. $ Factor Basis $ $ $No. No.
82 General:8384 38900 Land & Land Rights - 5.4 P, S, T & D Plant - - - 85 39000 Structures & Improvements 1,253,482 5.4 P, S, T & D Plant 485,951 514,817 252,714 86 39002 Structures - Brick 107,583 5.4 P, S, T & D Plant 41,708 44,185 21,690 87 39003 Improvements 292,730 5.4 P, S, T & D Plant 113,486 120,227 59,017 88 39003 Air Conditioning Equipment 5,049 5.4 P, S, T & D Plant 1,958 2,074 1,018 89 39004 Improvement to Leased Premises 1,248,110 5.4 P, S, T & D Plant 483,869 512,611 251,631 90 39009 Office Furniture & Equipment 1,144,609 5.4 P, S, T & D Plant 443,743 470,102 230,764 91 39100 Remittance Processing Equip - 5.4 P, S, T & D Plant - - - 92 39102 Office Machines - 5.4 P, S, T & D Plant - - - 93 39103 Transportation Equipment 113,788 5.4 P, S, T & D Plant 44,113 46,734 22,941 94 39200 Trucks - 5.4 P, S, T & D Plant - - - 95 39201 Trailers (2,529) 5.4 P, S, T & D Plant (981) (1,039) (510) 96 39202 Stores Equipment - 5.4 P, S, T & D Plant - - - 97 39400 Tools, Shop & Garage Equipment 1,300,851 5.4 P, S, T & D Plant 504,316 534,272 262,264 98 39600 Power Operated Equipment - 5.4 P, S, T & D Plant - - - 99 39603 Ditchers 39,655 5.4 P, S, T & D Plant 15,373 16,287 7,995
100 39604 Backhoes 62,818 5.4 P, S, T & D Plant 24,353 25,800 12,665 101 39605 Welders 19,456 5.4 P, S, T & D Plant 7,543 7,991 3,923 102 39700 Communication Equipment 269,010 5.4 P, S, T & D Plant 104,290 110,485 54,235 103 39701 Communication Equipment - Mobile Radios - 5.4 P, S, T & D Plant - - - 104 39702 Communication Equipment - Fixed Radios - 5.4 P, S, T & D Plant - - - 105 39705 Communication Equip. - Telemetering - 5.4 P, S, T & D Plant - - - 106 39800 Miscellaneous Equipment 2,072,883 5.4 P, S, T & D Plant 803,618 851,353 417,913 107 39900 Other Tangible Property - 5.4 P, S, T & D Plant - - - 108 39901 Other Tangible Property - Servers - H/W 6,670 5.4 P, S, T & D Plant 2,586 2,740 1,345 109 39902 Other Tangible Property - Servers - S/W - 5.4 P, S, T & D Plant - - - 110 39903 Other Tangible Property - Network - H/W 64,644 5.4 P, S, T & D Plant 25,061 26,550 13,033 111 39904 Other Tang. Property - CPU - 5.4 P, S, T & D Plant - - - 112 39905 Other Tangible Property - MF - Hardware - 5.4 P, S, T & D Plant - - - 113 39906 Other Tang. Property - PC Hardware 112,226 5.4 P, S, T & D Plant 43,508 46,092 22,626 114 39907 Other Tang. Property - PC Software - 5.4 P, S, T & D Plant - - - 115 39908 Other Tang. Property - Mainframe S/W - 5.4 P, S, T & D Plant - - - 116 39909 Other Tang. Property - Application Software 117,916 5.4 P, S, T & D Plant 45,714 48,429 23,773 117 Other Tang. Property - General Startup Costs - 5.4 P, S, T & D Plant - - - 118 Retirement Work in Progress (6,374,709) 5.4 P, S, T & D Plant (2,471,354) (2,618,154) (1,285,201) 119 AR 15 general plant amortization - 5.4 P, S, T & D Plant - - - 120121 Total General Plant 1,854,243 718,855 761,555 373,833122123 TOTAL DIRECT RESERVE FOR DEPRECIATION 183,960,444 87,079,350 68,895,917 27,985,177124125 Kentucky Mid-States General Office:126127 Intangible Plant:128129 30100 Organization - 5.4 P, S, T & D Plant - - - 130 30200 Franchises & Consents - 5.4 P, S, T & D Plant - - - 131 30300 Misc Intangible Plant - 5.4 P, S, T & D Plant - - - 132133 Total Intangible Plant: - 0 0 0134135 General:136137 37400 Land & Land Rights - 5.4 P, S, T & D Plant - - - 138 39001 Structures Frame 52,708 5.4 P, S, T & D Plant 20,434 21,648 10,626 139 36602 Structures & Improvements - 5.4 P, S, T & D Plant - - - 140 38900 Land & Land Rights - 5.4 P, S, T & D Plant - - - 141 39004 Air Conditioning Equipment 5,090 5.4 P, S, T & D Plant 1,973 2,090 1,026 142 39009 Improvement to leased Premises 19,332 5.4 P, S, T & D Plant 7,494 7,940 3,897 143 39100 Office Furniture & Equipment 19,220 5.4 P, S, T & D Plant 7,451 7,894 3,875 144 39102 Remittance Processing Equip - 5.4 P, S, T & D Plant - - - 145 39103 Office Machines - 5.4 P, S, T & D Plant - - - 146 39200 Transportation Equipment 8,895 5.4 P, S, T & D Plant 3,449 3,653 1,793 147 39201 Trucks - 5.4 P, S, T & D Plant - - - 148 39202 Trailers - 5.4 P, S, T & D Plant - - - 149 39300 Stores Equipment - 5.4 P, S, T & D Plant - - - 150 39400 Tools, Shop & Garage Equipment 71,611 5.4 P, S, T & D Plant 27,762 29,411 14,437 151 39600 Power Operated Equipment 4,375 5.4 P, S, T & D Plant 1,696 1,797 882 152 39603 Ditchers - 5.4 P, S, T & D Plant - - - 153 39604 Backhoes - 5.4 P, S, T & D Plant - - - 154 39605 Welders - 5.4 P, S, T & D Plant - - - 155 39700 Communication Equipment (2,991) 5.4 P, S, T & D Plant (1,160) (1,229) (603) 156 39701 Communication Equipment - Mobile Radios - 5.4 P, S, T & D Plant - - - 157 39702 Communication Equipment - Fixed Radios - 5.4 P, S, T & D Plant - - - 158 39705 Communication Equip. - Telemetering - 5.4 P, S, T & D Plant - - - 159 39800 Miscellaneous Equipment 359,341 5.4 P, S, T & D Plant 139,310 147,585 72,447 160 39900 Other Tangible Property - 5.4 P, S, T & D Plant - - - 161 39901 Other Tangible Property - Servers - H/W (17,306) 5.4 P, S, T & D Plant (6,709) (7,108) (3,489) 162 39902 Other Tangible Property - Servers - S/W - 5.4 P, S, T & D Plant - - - 163 39903 Other Tangible Property - Network - H/W - 5.4 P, S, T & D Plant - - - 164 39904 Other Tang. Property - CPU - 5.4 P, S, T & D Plant - - - 165 39905 Other Tangible Property - MF - Hardware - 5.4 P, S, T & D Plant - - - 166 39906 Other Tang. Property - PC Hardware 34,944 5.4 P, S, T & D Plant 13,547 14,352 7,045 167 39907 Other Tang. Property - PC Software 21,086 5.4 P, S, T & D Plant 8,175 8,660 4,251 168 39908 Other Tang. Property - Mainframe S/W 412,432 5.4 P, S, T & D Plant 159,892 169,390 83,150 169 39909 Other Tang. Property - Application Software - 5.4 P, S, T & D Plant - - - 170 39924 Other Tang. Property - General Startup Costs - 5.4 P, S, T & D Plant - - - 171 Retirement Work in Progress 26,143 5.4 P, S, T & D Plant 10,135 10,737 5,271 172173 Total General Plant 1,014,877 393,449 416,820 204,609174

Exhibit PHR-4Page 11 of 75
Atmos Energy Corporation, Kentucky/Mid-States DivisionClass Cost of Service - Demand/Commodity StudyForecasted Test Period: Twelve Months Ended March 31, 2020
CLASSIFICATION OF RESERVE FOR DEPRECIATION AND AMORTIZATION
Test Year Classif. Classif. Customer Demand CommodityLine Acct. $ Factor Basis $ $ $No. No.175 Shared Services General Office:176177 General:178179 37400 Land & Land Rights - 5.4 P, S, T & D Plant - - - 180 39000 Structures & Improvements 90,855 5.4 P, S, T & D Plant 35,223 37,315 18,317 181 36602 Structures & Improvements - 5.4 P, S, T & D Plant - - - 182 37503 Improvements - 5.4 P, S, T & D Plant - - - 183 39004 Air Conditioning Equipment - 5.4 P, S, T & D Plant - - - 184 39009 Improvement to leased Premises 482,368 5.4 P, S, T & D Plant 187,005 198,113 97,250 185 39100 Office Furniture & Equipment 116,207 5.4 P, S, T & D Plant 45,051 47,728 23,429 186 39102 Remittance Processing Equip 0 5.4 P, S, T & D Plant 0 0 0 187 39103 Office Machines 0 5.4 P, S, T & D Plant 0 0 0 188 39200 Transportation Equipment 284 5.4 P, S, T & D Plant 110 117 57 189 39201 Trucks - 5.4 P, S, T & D Plant - - - 190 39202 Trailers - 5.4 P, S, T & D Plant - - - 191 39300 Stores Equipment - 5.4 P, S, T & D Plant - - - 192 39400 Tools, Shop & Garage Equipment 1,722 5.4 P, S, T & D Plant 668 707 347 193 39500 39500-Laboratory Equipment - 5.4 P, S, T & D Plant - - - 194 39603 Ditchers - 5.4 P, S, T & D Plant - - - 195 39604 Backhoes - 5.4 P, S, T & D Plant - - - 196 39605 Welders - 5.4 P, S, T & D Plant - - - 197 39700 Communication Equipment 28,314 5.4 P, S, T & D Plant 10,977 11,629 5,708 198 39701 Communication Equipment - Mobile Radios - 5.4 P, S, T & D Plant - - - 199 39702 Communication Equipment - Fixed Radios - 5.4 P, S, T & D Plant - - - 200 39705 Communication Equip. - Telemetering - 5.4 P, S, T & D Plant - - - 201 39800 Miscellaneous Equipment 2,855 5.4 P, S, T & D Plant 1,107 1,173 576 202 39900 Other Tangible Property 8,438 5.4 P, S, T & D Plant 3,271 3,466 1,701 203 39901 Other Tangible Property - Servers - H/W 1,335,526 5.4 P, S, T & D Plant 517,758 548,513 269,254 204 39902 Other Tangible Property - Servers - S/W 969,778 5.4 P, S, T & D Plant 375,965 398,297 195,516 205 39903 Other Tangible Property - Network - H/W 134,188 5.4 P, S, T & D Plant 52,022 55,112 27,053 206 39904 Other Tang. Property - CPU - 5.4 P, S, T & D Plant - - - 207 39905 Other Tangible Property - MF - Hardware - 5.4 P, S, T & D Plant - - - 208 39906 Other Tang. Property - PC Hardware 94,055 5.4 P, S, T & D Plant 36,463 38,629 18,962 209 39907 Other Tang. Property - PC Software 91,932 5.4 P, S, T & D Plant 35,640 37,757 18,534 210 39908 Other Tang. Property - Mainframe S/W 2,311 5.4 P, S, T & D Plant 896 949 466 211 39909 Other Tang. Property - Application Software 2,526,463 5.4 P, S, T & D Plant 979,462 1,037,642 509,359 212 39924 Other Tang. Property - General Startup Costs - 5.4 P, S, T & D Plant - - - 213 Retirement Work in Progress - 5.4 P, S, T & D Plant - - - 214215 Total General Plant 5,885,295 2,281,618 2,417,147 1,186,531216217 Shared Services Customer Support:218219 General:220221 37400 Land & Land Rights - 5.4 P, S, T & D Plant - - - 222 39001 Structures Frame - 5.4 P, S, T & D Plant - - - 223 36602 Structures & Improvements 204,679 5.4 P, S, T & D Plant 79,350 84,064 41,265 224 37503 Improvements - 5.4 P, S, T & D Plant - - - 225 39004 Air Conditioning Equipment - 5.4 P, S, T & D Plant - - - 226 39009 Improvement to leased Premises 99,706 5.4 P, S, T & D Plant 38,654 40,950 20,102 227 39100 Office Furniture & Equipment 54,761 5.4 P, S, T & D Plant 21,230 22,491 11,040 228 39102 Remittance Processing Equip - 5.4 P, S, T & D Plant - - - 229 39103 Office Machines - 5.4 P, S, T & D Plant - - - 230 39200 Transportation Equipment 2,235 5.4 P, S, T & D Plant 866 918 451 231 39201 Trucks - 5.4 P, S, T & D Plant - - - 232 39202 Trailers - 5.4 P, S, T & D Plant - - - 233 39300 Stores Equipment - 5.4 P, S, T & D Plant - - - 234 39400 Tools, Shop & Garage Equipment 3,654 5.4 P, S, T & D Plant 1,416 1,501 737 235 39500 Laboratory Equipment 426 5.4 P, S, T & D Plant 165 175 86 236 39603 Ditchers - 5.4 P, S, T & D Plant - - - 237 39604 Backhoes - 5.4 P, S, T & D Plant - - - 238 39605 Welders - 5.4 P, S, T & D Plant - - - 239 39700 Communication Equipment 70,180 5.4 P, S, T & D Plant 27,208 28,824 14,149 240 39701 Communication Equipment - Mobile Radios - 5.4 P, S, T & D Plant - - - 241 39702 Communication Equipment - Fixed Radios - 5.4 P, S, T & D Plant - - - 242 39705 Communication Equip. - Telemetering - 5.4 P, S, T & D Plant - - - 243 39800 Miscellaneous Equipment 4,862 5.4 P, S, T & D Plant 1,885 1,997 980 244 39900 Other Tangible Property 31,781 5.4 P, S, T & D Plant 12,321 13,053 6,407 245 39901 Other Tangible Property - Servers - H/W 338,151 5.4 P, S, T & D Plant 131,095 138,882 68,174 246 39902 Other Tangible Property - Servers - S/W 77,363 5.4 P, S, T & D Plant 29,992 31,774 15,597 247 39903 Other Tangible Property - Network - H/W 22,965 5.4 P, S, T & D Plant 8,903 9,432 4,630 248 39904 Other Tang. Property - CPU - 5.4 P, S, T & D Plant - - - 249 39905 Other Tangible Property - MF - Hardware - 5.4 P, S, T & D Plant - - - 250 39906 Other Tang. Property - PC Hardware 43,877 5.4 P, S, T & D Plant 17,010 18,021 8,846 251 39907 Other Tang. Property - PC Software 10,171 5.4 P, S, T & D Plant 3,943 4,177 2,050 252 39908 Other Tang. Property - Mainframe S/W 2,050,478 5.4 P, S, T & D Plant 794,932 842,151 413,396 253 39909 Other Tang. Property - Application Software 4,865 5.4 P, S, T & D Plant 1,886 1,998 981 254 39924 Other Tang. Property - General Startup Costs - 5.4 P, S, T & D Plant - - - 255 Retirement Work in Progress - 5.4 P, S, T & D Plant - - - 256257 Total General Plant 3,020,151 1,170,856 1,240,405 608,891258259 TOTAL RESERVE FOR DEPRECIATION 193,880,768 90,925,272 72,970,288 29,985,208

Exhibit PHR-4Page 12 of 75
Atmos Energy Corporation, Kentucky/Mid-States DivisionClass Cost of Service - Demand/Commodity StudyForecasted Test Period: Twelve Months Ended March 31, 2020
CLASSIFICATION OF OTHER RATE BASE
Test Year Classif. Classif. Customer Demand Commodity$ Factor Basis $ $ $
1 Rate Base Additions:23 Materials and Supplies - KY Direct (402,124) 9.1 Allocated O&M Expenses (39,665) (41,706) (320,752) 4 Materials and Supplies - KY Mid-States GO 519,990 9.1 Allocated O&M Expenses 51,291 53,931 414,768 5 Materials and Supplies - Shared Services GO (0) 9.1 Allocated O&M Expenses (0) (0) (0) 6 Materials and Supplies - Shared Services CS 0 9.1 Allocated O&M Expenses - - - 7 Gas Storage Inventory 8,905,991 3.0 Commodity - - 8,905,991 8 Prepayments - KY Direct 0 9.1 Allocated O&M Expenses - - - 9 Prepayments - KY Mid-States GO 0 9.1 Allocated O&M Expenses - - -
10 Prepayments - Shared Services GO 0 9.1 Allocated O&M Expenses - - - 11 Prepayments - Shared Services CS 0 9.1 Allocated O&M Expenses - - - 12 Cash Working Capital 2,692,759 9.1 Allocated O&M Expenses 265,609 279,281 2,147,869 13 Regulatory Assets (33,020,670) 9.1 Allocated O&M Expenses (3,257,103) (3,424,758) (26,338,809) 1415 Total Rate Base Additions (21,304,054) (2,979,868) (3,133,252) (15,190,934)161718 Rate Base Deductions:1920 Customer Advances - KY Direct (747,234) 1.0 Customer (747,234) - - 21 Customer Advances - KY Mid-States GO 0 1.0 Customer - - - 22 Customer Advances - Shared Services GO 0 1.0 Customer - - - 23 Customer Advances - Shared Services CS 0 1.0 Customer - - - 24 ADIT - KY Direct (75,117,257) 5.7 Net Plant (27,044,140) (31,728,969) (16,344,147) 25 ADIT - KY Mid-States GO 22,846,265 5.7 Net Plant 8,225,242 9,650,092 4,970,931 26 ADIT - Shared Services GO (848,471) 5.7 Net Plant (305,471) (358,388) (184,612) 27 ADIT - Shared Services CS 67,614 5.7 Net Plant 24,343 28,559 14,711 28 Change in Net Operating Loss Carryforward 1,295,767 5.7 Net Plant 466,510 547,322 281,935 2930 Total Rate Base Deductions (52,503,316) (19,380,752) (21,861,383) (11,261,181)313233 TOTAL OTHER RB (73,807,370) (22,360,620) (24,994,636) (26,452,115)3435 Interest on Customer Deposits 0 1.0 Customer - - -

Exhibit PHR-4Page 13 of 75
Atmos Energy Corporation, Kentucky/Mid-States DivisionClass Cost of Service - Demand/Commodity StudyForecasted Test Period: Twelve Months Ended March 31, 2020
CLASSIFICATION OF O&M EXPENSE
Test Year Classif. Classif. Customer Demand CommodityLine Acct. $ Factor Basis $ $ $No. No.
1 Production & Gathering:2 Operation3 7500 Op., Sup., & Eng. 0 99.0 - - - - 4 7510 Production Maps & Records 0 99.0 - - - - 5 7530 Field Lines Expenses 0 99.0 - - - - 6 7540 Field Compressor Station Expense 0 99.0 - - - - 7 7550 Field Compressor Sta. Fuel & Pwr. 0 99.0 - - - - 8 7560 Field Meas. & Regul. Station Exp 0 99.0 - - - - 9 7570 Purification Expense 0 99.0 - - - -
10 7590 Other Expenses 0 99.0 - - - - 11 Maintenance12 7610 Maint. Sup., & Eng. 0 99.0 - - - - 13 7620 Structures and Improvements 0 99.0 - - - - 14 7640 Field Line Maintenance 0 99.0 - - - - 15 7650 Compressor Station Equip. Maint. 0 99.0 - - - - 16 7660 Meas. & Regul. Station Equip Maint 0 99.0 - - - - 17 7670 Purification Equipment Maintenance 0 99.0 - - - - 18 7680 Other Equipment Maintenance 0 99.0 - - - - 19 7690 Gas Processed By Others 0 99.0 - - - - 20 Total Production & Gathering 0 0 0 02122 Other Gas Supply Expenses:23 Operation24 8001 Intercompany Gas Well-head Purchases 0 3.0 Commodity - - - 25 8010 Natural gas field line purchases 61,240 3.0 Commodity - - 61,240 26 8040 Natural gas city gate purchases 51,401,318 3.0 Commodity - - 51,401,318 27 8050 Other purchases (7,602) 3.0 Commodity - - (7,602) 28 8051 PGA for Residential 47,517,427 3.0 Commodity - - 47,517,427 29 8052 PGA for Commercial 24,564,311 3.0 Commodity - - 24,564,311 30 8053 PGA for Industrial 4,854,142 3.0 Commodity - - 4,854,142 31 8054 PGA for Public Authorities 4,585,482 3.0 Commodity - - 4,585,482 32 8058 Unbilled PGA Cost (3,124,678) 3.0 Commodity - - (3,124,678) 33 8059 PGA Offset to Unrecovered Gas Cost (71,826,171) 3.0 Commodity - - (71,826,171) 34 8060 Exchange gas (2,147,338) 3.0 Commodity - - (2,147,338) 35 8081 Gas withdrawn from storage-Debit 12,436,037 3.0 Commodity - - 12,436,037 36 8082 Gas delivered to storage-Credit (12,626,734) 3.0 Commodity - - (12,626,734) 37 8120 Gas used for other utility operations-Credit (14,329) 3.0 Commodity - - (14,329) 38 8580 Transmission and compression of gas by others 22,709,250 3.0 Commodity - - 22,709,250 39 Maintenance40 8350 Maint. Of Purch. Gas Meas. Sta. 0 3.0 Commodity - - - 41 Total Other Gas Supply Expenses 78,382,354 0 0 78,382,3544243 Underground Storage:44 Operation45 8140 Storage-Operation supervision and engineering 0 3.5 Storage (50/50) - - - 46 8160 Wells expenses 291,917 3.5 Storage (50/50) - 145,959 145,959 47 8170 Lines expenses 21,251 3.5 Storage (50/50) - 10,626 10,626 48 8180 Compressor station expenses 25,060 3.5 Storage (50/50) - 12,530 12,530 49 8190 Compressor station fuel and power 735 3.5 Storage (50/50) - 368 368 50 8200 Storage-Measuring and regulating station expenses 6,181 3.5 Storage (50/50) - 3,090 3,090 51 8210 Storage-Purification expenses 49,856 3.5 Storage (50/50) - 24,928 24,928 52 8240 Storage-Other expenses 0 3.5 Storage (50/50) - - - 53 8250 Storage well royalties 8,763 3.5 Storage (50/50) - 4,382 4,382 54 8260 Rents 0 3.5 Storage (50/50) - - - 55 Maintenance56 8300 Maint. Sup., & Eng. 0 3.5 Storage (50/50) - - - 57 8310 Structures and Improvements 12,736 3.5 Storage (50/50) - 6,368 6,368 58 8320 Reservoirs & Wells Maintenance 0 3.5 Storage (50/50) - - - 59 8330 Line Maintenance 0 3.5 Storage (50/50) - - - 60 8340 Compressor Station Equip Maint 3,331 3.5 Storage (50/50) - 1,665 1,665 61 8350 Meas. & Regul. Station Equip Maint 0 3.5 Storage (50/50) - - - 62 8360 Purification Equipment Maintenance 0 3.5 Storage (50/50) - - - 63 8410 Other storage expenses-Operation labor and expenses 69,083 3.5 Storage (50/50) - 34,542 34,542 64 Total Underground Storage Expense 488,914 0 244,457 244,4576566 Transmission:67 Operation68 8500 Op., Sup., & Eng. 35 2.0 Demand - 35 - 69 8510 System Control & Load Dispatching 0 2.0 Demand - - - 70 8520 Communication Systems Expense 0 2.0 Demand - - - 71 8530 Compressor Station Labor Expense 0 2.0 Demand - - - 72 8540 Compressor Station Fuel Gas 0 2.0 Demand - - - 73 8550 Compressor Station Fuel & Power 308 2.0 Demand - 308 - 74 8560 Mains Expense 366,202 2.0 Demand - 366,202 - 75 8570 Meas. & Regul. Station Expenses 27,278 2.0 Demand - 27,278 - 76 8580 LDC Payment 0 2.0 Demand - - - 77 8580 LDC Payment - A&G 0 2.0 Demand - - - 78 8590 Other Expenses 0 2.0 Demand - - - 79 8600 Rents 0 2.0 Demand - - - 80 Maintenance81 8610 Maint. Sup., & Eng. 0 2.0 Demand - - - 82 8620 Structures and Improvements 0 2.0 Demand - - - 83 8630 Mains 16,280 2.0 Demand - 16,280 - 84 8640 Compressor Station Equip Maint 0 2.0 Demand - - - 85 8650 Meas. & Regul. Station Equip Maint 0 2.0 Demand - - - 86 8660 Communication Equipment Maintenance 0 2.0 Demand - - - 87 8670 Other Equipment Maintenance 0 2.0 Demand - - - 88 Total Transmission Expense 410,103 0 410,103 089

Exhibit PHR-4Page 14 of 75
Atmos Energy Corporation, Kentucky/Mid-States DivisionClass Cost of Service - Demand/Commodity StudyForecasted Test Period: Twelve Months Ended March 31, 2020
CLASSIFICATION OF O&M EXPENSE
Test Year Classif. Classif. Customer Demand CommodityLine Acct. $ Factor Basis $ $ $No. No.
90 Distribution:91 Operation92 8700 Supervision and Engineering 963,411 10.0 Composite of Accts. 871-879 & 886-893 152,826 524,720 285,864 93 8710 Distribution Load Dispatching 663 3.0 Commodity - - 663 94 8711 Odorization 19,956 3.0 Commodity - - 19,956 94 8720 Compressor Station Labor & Expenses 0 3.0 Commodity - - - 95 8740 Mains & Services 4,320,719 12.0 Composite of Accts. 374-379 - 2,808,423 1,512,296 96 8750 Measuring and Regulating Station Exp. - Gen 574,714 12.0 Composite of Accts. 374-379 - 373,558 201,156 97 8760 Measuring and Regulating Station Exp. - Ind. 120,928 1.0 Customer 120,928 - - 98 8770 Measuring and Regulating Sta. Exp. - City Gate 38,286 12.0 Composite of Accts. 374-379 - 24,885 13,400 99 8780 Meters and House Regulator Expense 820,621 1.0 Customer 820,621 - -
100 8790 Customer Installations Expense 2,246 1.0 Customer 2,246 - - 101 8800 Other Expense 3,204 10.0 Composite of Accts. 871-879 & 886-893 508 1,745 951 102 8810 Rents 369,768 10.0 Composite of Accts. 871-879 & 886-893 58,656 201,394 109,718 103 Maintenance104 8850 Maintenance Supervision and Engineering 1,588 10.0 Composite of Accts. 871-879 & 886-893 252 865 471 105 8860 Maintenance of Structures and Improvements 98 12.0 Composite of Accts. 374-379 - 64 34 106 8870 Maintenance of Mains 28,852 12.0 Composite of Accts. 374-379 - 18,754 10,099 107 8890 Maintenance of compressor station equipment 0 3.0 Commodity - - - 108 8900 Maint. of Measuring and Regulating Station Equip. - General 65,572 12.0 Composite of Accts. 374-379 - 42,621 22,951 109 8910 Maint. of Measuring and Regulating Station Equip. - Industrial 1,723 1.0 Customer 1,723 - - 110 8920 Maint. of Measuring and Regulating Station Equip. - City Gate 795 12.0 Composite of Accts. 374-379 - 517 278 111 8930 Maintenance of Services 6,533 1.0 Customer 6,533 - - 112 8940 Maintenance of Meters and House Regulators 0 1.0 Customer - - - 113 8950 Maintenance of Other Equipment 5,866 10.0 Composite of Accts. 871-879 & 886-893 931 3,195 1,741 114 Total Distribution 7,345,541 1,165,224 4,000,740 2,179,577115116 Customer Accounts:117 9010 Supervision 0 1.0 Customer - - - 118 9020 Meter Reading Expense 1,085,047 1.0 Customer 1,085,047 - - 119 9030 Customer Records and Collection Expenses 1,220,802 1.0 Customer 1,220,802 - - 120 9040 Uncollectible Accounts 341,050 1.0 Customer 341,050 - - 121 9050 Miscellaneous Customer Accounts Expenses 0 1.0 Customer - - - 122 Total Customer Accounts 2,646,900 2,646,900 0 0123124 Customer Service and Information:125 9070 Supervision 0 1.0 Customer - - - 126 9080 Customer Assistance Expenses 0 1.0 Customer - - - 127 9090 Informational and Instructional Advertising Expenses 128,272 1.0 Customer 128,272 - - 128 9100 Miscellaneous Customer Service and Informational Expenses 0 1.0 Customer - - - 129 Total Customer Service and Information 128,272 128,272 0 0130131 Sales:132 9110 Supervision 253,468 1.0 Customer 253,468 - - 133 9120 Demonstrating and Selling Expenses 115,937 1.0 Customer 115,937 - - 134 9130 Advertising Expenses 35,170 1.0 Customer 35,170 - - 135 9160 Miscellaneous Sales Expenses (196,297) 1.0 Customer (196,297) - - 136 Total Sales 208,278 208,278 0 0137138 Administrative & General:139 Operation140 9200 Administrative and General Salaries (834,543) 17.0 Composite of Accts. 870-902, 905-916, 924 & 928-930.1 (298,399) (347,067) (189,076) 141 9210 Office Supplies and Expenses 17,616 17.0 Composite of Accts. 870-902, 905-916, 924 & 928-930.1 6,299 7,326 3,991 142 9220 Administrative Expenses Transferred - Customer Support - 1.0 Customer - - - 143 9220 Administrative Expenses Transferred - General 14,498,764 17.0 Composite of Accts. 870-902, 905-916, 924 & 928-930.1 5,184,181 6,029,709 3,284,875 144 9230 Outside Services Employed 339,697 17.0 Composite of Accts. 870-902, 905-916, 924 & 928-930.1 121,462 141,272 76,963 145 9240 Property Insurance 3,718 5.7 Net Plant 1,339 1,571 809 146 9250 Injuries and Damages 74,010 17.0 Composite of Accts. 870-902, 905-916, 924 & 928-930.1 26,463 30,779 16,768 147 9260 Employee Pensions and Benefits 1,082,941 17.0 Composite of Accts. 870-902, 905-916, 924 & 928-930.1 387,217 450,371 245,354 148 9270 Franchise Requirements 646 1.0 Customer 646 - - 149 9280 Regulatory Commission Expenses 852,920 1.0 Customer 852,920 - - 150 930.1 General Advertising Expenses - 1.0 Customer - - - 151 930.2 Miscellaneous General Expense (42,325) 17.0 Composite of Accts. 870-902, 905-916, 924 & 928-930.1 (15,134) (17,602) (9,589) 152 9310 Rents (8,275) 17.0 Composite of Accts. 870-902, 905-916, 924 & 928-930.1 (2,959) (3,441) (1,875) 153 Maintenance154 9320 Maintenance of General Plant 11,804 17.0 Composite of Accts. 870-902, 905-916, 924 & 928-930.1 4,221 4,909 2,674 155 Total A&G 15,996,974 6,268,256 6,297,825 3,430,893156157 TOTAL O&M EXPENSE 105,607,336 10,416,928 10,953,126 84,237,281

Exhibit PHR-4Page 15 of 75
Atmos Energy Corporation, Kentucky/Mid-States DivisionClass Cost of Service - Demand/Commodity StudyForecasted Test Period: Twelve Months Ended March 31, 2020
CLASSIFICATION OF DEPRECIATION EXPENSE
Test Year Classif. Classif. Customer Demand CommodityLine Acct. $ Factor Basis $ $ $No. No.
1 Intangible Plant:23 30100 Organization - 99.0 - - - - 4 30200 Franchises & Consents - 99.0 - - - - 5 30300 Misc Intangible Plant - 99.0 - - - - 67 Total Intangible Plant: 0 0 0 089 Production Plant:
1011 32520 Producing Leaseholds - 99.0 - - - - 12 32540 Rights of Ways - 99.0 - - - - 13 33100 Production Gas Wells Equipment - 99.0 - - - - 14 33201 Field Lines - 99.0 - - - - 15 33202 Tributary Lines - 99.0 - - - - 16 33400 Field Meas. & Reg. Sta. Equip - 99.0 - - - - 17 33600 Purification Equipment - 99.0 - - - - 1819 Total Production Plant 0 0 0 02021 Storage Plant:2223 35010 Land - 3.5 Storage (50/50) - - - 24 35020 Rights of Way 22 3.5 Storage (50/50) - 11 11 25 35100 Structures and Improvements 297 3.5 Storage (50/50) - 149 149 26 35102 Compression Station Equipment 1,916 3.5 Storage (50/50) - 958 958 27 35103 Meas. & Reg. Sta. Structues 208 3.5 Storage (50/50) - 104 104 28 35104 Other Structures 1,773 3.5 Storage (50/50) - 887 887 29 35200 Wells \ Rights of Way 161,122 3.5 Storage (50/50) - 80,561 80,561 30 35201 Well Construction 25,840 3.5 Storage (50/50) - 12,920 12,920 31 35202 Well Equipment - 3.5 Storage (50/50) - - - 32 35203 Cushion Gas 23,389 3.5 Storage (50/50) - 11,694 11,694 33 35210 Leaseholds 553 3.5 Storage (50/50) - 277 277 34 35211 Storage Rights 481 3.5 Storage (50/50) - 240 240 35 35301 Field Lines 1,596 3.5 Storage (50/50) - 798 798 36 35302 Tributary Lines 1,905 3.5 Storage (50/50) - 952 952 37 35400 Compressor Station Equipment 15,699 3.5 Storage (50/50) - 7,849 7,849 38 35500 Meas & Reg. Equipment 4,561 3.5 Storage (50/50) - 2,280 2,280 39 35600 Purification Equipment 8,210 3.5 Storage (50/50) - 4,105 4,105 4041 Total Storage Plant 247,571 0 123,785 123,7854243 Transmission:4445 36510 Land & Land Rights - 2.0 Demand - - - 46 36520 Rights of Way 9,112 2.0 Demand - 9,112 - 47 36602 Structures & Improvements 608 2.0 Demand - 608 - 48 36603 Other Structues 754 2.0 Demand - 754 - 49 36700 Mains Cathodic Protection 5,362 2.0 Demand - 5,362 - 50 36701 Mains - Steel 381,167 2.0 Demand - 381,167 - 51 36900 Meas. & Reg. Equipment 11,265 2.0 Demand - 11,265 - 52 36901 Meas. & Reg. Equipment 34,951 2.0 Demand - 34,951 - 5354 Total Transmission Plant 443,218 0 443,218 05556 Distribution:5758 37400 Land & Land Rights - 4.0 Mains (Peak and Average) - - - 59 37401 Land - 4.0 Mains (Peak and Average) - - - 60 37402 Land Rights 49,908 4.0 Mains (Peak and Average) - 32,440 17,468 61 37403 Land Other - 4.0 Mains (Peak and Average) - - - 62 37500 Structures & Improvements 6,017 4.0 Mains (Peak and Average) - 3,911 2,106 63 37501 Structures & Improvements T.B. 1,787 4.0 Mains (Peak and Average) - 1,161 625 64 37502 Land Rights 828 4.0 Mains (Peak and Average) - 538 290 65 37503 Improvements 72 4.0 Mains (Peak and Average) - 47 25 66 37600 Mains Cathodic Protection 873,542 4.0 Mains (Peak and Average) - 567,793 305,749 67 37601 Mains - Steel 4,454,842 4.0 Mains (Peak and Average) - 2,895,602 1,559,240 68 37602 Mains - Plastic 3,376,201 4.0 Mains (Peak and Average) - 2,194,496 1,181,705 69 37800 Meas & Reg. Sta. Equip - General 925,640 4.0 Mains (Peak and Average) - 601,657 323,984 70 37900 Meas & Reg. Sta. Equip - City Gate 145,903 4.0 Mains (Peak and Average) - 94,836 51,068 71 37905 Meas & Reg. Sta. Equipment T.b. 46,759 4.0 Mains (Peak and Average) - 30,393 16,366 72 38000 Services 4,817,588 1.0 Customer 4,817,588 - - 73 38100 Meters 2,741,749 1.0 Customer 2,741,749 - - 74 38200 Meter Installaitons 2,232,937 1.0 Customer 2,232,937 - - 75 38300 House Regulators 514,355 1.0 Customer 514,355 - - 76 38400 House Reg. Installations 8,807 1.0 Customer 8,807 - - 77 38500 Ind. Meas. & Reg. Sta. Equipment 112,194 1.0 Customer 112,194 - - 78 38600 Other Prop. On Cust. Prem - 99.0 - - - - 7980 Total Distribution Plant 20,309,129 10,427,630 6,422,874 3,458,62681

Exhibit PHR-4Page 16 of 75
Atmos Energy Corporation, Kentucky/Mid-States DivisionClass Cost of Service - Demand/Commodity StudyForecasted Test Period: Twelve Months Ended March 31, 2020
CLASSIFICATION OF DEPRECIATION EXPENSE
Test Year Classif. Classif. Customer Demand CommodityLine Acct. $ Factor Basis $ $ $No. No.
82 General:8384 38900 Land & Land Rights - 5.4 P, S, T & D Plant - - - 85 39000 Structures & Improvements 244,888 5.4 P, S, T & D Plant 94,939 100,578 49,372 86 39001 Structures - Brick 5,574 5.4 P, S, T & D Plant 2,161 2,289 1,124 87 39002 Improvements 22,836 5.4 P, S, T & D Plant 8,853 9,379 4,604 88 39003 Air Conditioning Equipment 731 5.4 P, S, T & D Plant 283 300 147 89 39004 Improvement to leased Premises - 5.4 P, S, T & D Plant - - - 90 39009 Office Furniture & Equipment 93,448 5.4 P, S, T & D Plant 36,228 38,380 18,840 91 39100 Remittance Processing Equip - 5.4 P, S, T & D Plant - - - 92 39102 Office Machines - 5.4 P, S, T & D Plant - - - 93 39200 Transportation Equipment 5,191 5.4 P, S, T & D Plant 2,013 2,132 1,047 94 39201 Trucks - 5.4 P, S, T & D Plant - - - 95 39202 Trailers - 5.4 P, S, T & D Plant - - - 96 39300 Stores Equipment - 5.4 P, S, T & D Plant - - - 97 39400 Tools, Shop & Garage Equipment 116,855 5.4 P, S, T & D Plant 45,302 47,993 23,559 98 39600 Power Operated Equipment - 5.4 P, S, T & D Plant - - - 99 39603 Ditchers - 5.4 P, S, T & D Plant - - -
100 39604 Backhoes - 5.4 P, S, T & D Plant - - - 101 39605 Welders - 5.4 P, S, T & D Plant - - - 102 39700 Communication Equipment 34,968 5.4 P, S, T & D Plant 13,556 14,362 7,050 103 39701 Communication Equipment - Mobile Radios - 5.4 P, S, T & D Plant - - - 104 39702 Communication Equipment - Fixed Radios - 5.4 P, S, T & D Plant - - - 105 39705 Communication Equip. - Telemetering - 5.4 P, S, T & D Plant - - - 106 39800 Miscellaneous Equipment 194,589 5.4 P, S, T & D Plant 75,438 79,919 39,231 107 39900 Other Tangible Property - 5.4 P, S, T & D Plant - - - 108 39901 Other Tangible Property - Servers - H/W 2,056 5.4 P, S, T & D Plant 797 845 415 109 39902 Other Tangible Property - Servers - S/W - 5.4 P, S, T & D Plant - - - 110 39903 Other Tangible Property - Network - H/W 13,460 5.4 P, S, T & D Plant 5,218 5,528 2,714 111 39904 Other Tang. Property - CPU - 5.4 P, S, T & D Plant - - - 112 39905 Other Tangible Property - MF - Hardware - 5.4 P, S, T & D Plant - - - 113 39906 Other Tang. Property - PC Hardware 89,351 5.4 P, S, T & D Plant 34,640 36,697 18,014 114 39907 Other Tang. Property - PC Software - 5.4 P, S, T & D Plant - - - 115 39908 Other Tang. Property - Mainframe S/W - 5.4 P, S, T & D Plant - - - 116 39908 Other Tang. Property - Application Software 10,289 5.4 P, S, T & D Plant 3,989 4,226 2,074 117 40600 Amortization of gas plant acquisition adjustments - 5.4 P, S, T & D Plant - - - 118119120 Total General Plant 834,236 323,417 342,628 168,190121122 TOTAL DIRECT DEPRECIATION EXPENSE 21,834,154 10,751,047 7,332,506 3,750,601123124 Kentucky Mid-States General Office:125126 Intangible Plant:127128 30100 Organization - 5.4 P, S, T & D Plant - - - 129 30200 Franchises & Consents - 5.4 P, S, T & D Plant - - - 130 30300 Misc Intangible Plant - 5.4 P, S, T & D Plant - - - 131132 Total Intangible Plant: 0 0 0 0133134 General:135136 37400 Land & Land Rights - 5.4 P, S, T & D Plant - - - 137 39001 Structures Frame 2,500 5.4 P, S, T & D Plant 969 1,027 504 138 36602 Structures & Improvements - 5.4 P, S, T & D Plant - - - 139 38900 Land & Land Rights - 5.4 P, S, T & D Plant - - - 140 39004 Air Conditioning Equipment 561 5.4 P, S, T & D Plant 218 231 113 141 39009 Improvement to leased Premises - 5.4 P, S, T & D Plant - - - 142 39100 Office Furniture & Equipment - 5.4 P, S, T & D Plant - - - 143 39102 Remittance Processing Equip - 5.4 P, S, T & D Plant - - - 144 39103 Office Machines - 5.4 P, S, T & D Plant - - - 145 39200 Transportation Equipment 400 5.4 P, S, T & D Plant 155 164 81 146 39201 Trucks - 5.4 P, S, T & D Plant - - - 147 39202 Trailers - 5.4 P, S, T & D Plant - - - 148 39300 Stores Equipment - 5.4 P, S, T & D Plant - - - 149 39400 Tools, Shop & Garage Equipment 2,025 5.4 P, S, T & D Plant 785 832 408 150 39600 Power Operated Equipment 12 5.4 P, S, T & D Plant 5 5 2 151 39603 Ditchers - 5.4 P, S, T & D Plant - - - 152 39604 Backhoes - 5.4 P, S, T & D Plant - - - 153 39605 Welders - 5.4 P, S, T & D Plant - - - 154 39700 Communication Equipment 1,652 5.4 P, S, T & D Plant 640 678 333 155 39701 Communication Equipment - Mobile Radios - 5.4 P, S, T & D Plant - - - 156 39702 Communication Equipment - Fixed Radios - 5.4 P, S, T & D Plant - - - 157 39705 Communication Equip. - Telemetering - 5.4 P, S, T & D Plant - - - 158 39800 Miscellaneous Equipment 12,240 5.4 P, S, T & D Plant 4,745 5,027 2,468 159 39900 Other Tangible Property - 5.4 P, S, T & D Plant - - - 160 39901 Other Tangible Property - Servers - H/W - 5.4 P, S, T & D Plant - - - 161 39902 Other Tangible Property - Servers - S/W - 5.4 P, S, T & D Plant - - - 162 39903 Other Tangible Property - Network - H/W - 5.4 P, S, T & D Plant - - - 163 39904 Other Tang. Property - CPU - 5.4 P, S, T & D Plant - - - 164 39905 Other Tangible Property - MF - Hardware - 5.4 P, S, T & D Plant - - - 165 39906 Other Tang. Property - PC Hardware - 5.4 P, S, T & D Plant - - - 166 39907 Other Tang. Property - PC Software 11,145 5.4 P, S, T & D Plant 4,321 4,578 2,247 167 39908 Other Tang. Property - Mainframe S/W - 5.4 P, S, T & D Plant - - - 168 39909 Other Tang. Property - Application Software - 5.4 P, S, T & D Plant - - - 169 39924 Other Tang. Property - General Startup Costs - 5.4 P, S, T & D Plant - - - 170171172 Total General Plant 30,535 11,838 12,541 6,156

Exhibit PHR-4Page 17 of 75
Atmos Energy Corporation, Kentucky/Mid-States DivisionClass Cost of Service - Demand/Commodity StudyForecasted Test Period: Twelve Months Ended March 31, 2020
CLASSIFICATION OF DEPRECIATION EXPENSE
Test Year Classif. Classif. Customer Demand CommodityLine Acct. $ Factor Basis $ $ $No. No.173174 Shared Services General Office:175176 General:177178 37400 Land & Land Rights - 5.4 P, S, T & D Plant - - - 179 39000 Structures & Improvements 7,132 5.4 P, S, T & D Plant 2,765 2,929 1,438 180 36602 Structures & Improvements - 5.4 P, S, T & D Plant - - - 181 37503 Improvements - 5.4 P, S, T & D Plant - - - 182 39004 Air Conditioning Equipment - 5.4 P, S, T & D Plant - - - 183 39009 Improvement to leased Premises 35 5.4 P, S, T & D Plant 14 14 7 184 39100 Office Furniture & Equipment 10,791 5.4 P, S, T & D Plant 4,183 4,432 2,175 185 39102 Remittance Processing Equip - 5.4 P, S, T & D Plant - - - 186 39103 Office Machines - 5.4 P, S, T & D Plant - - - 187 39200 Transportation Equipment - 5.4 P, S, T & D Plant - - - 188 39201 Trucks - 5.4 P, S, T & D Plant - - - 189 39202 Trailers - 5.4 P, S, T & D Plant - - - 190 39300 Stores Equipment - 5.4 P, S, T & D Plant - - - 191 39400 Tools, Shop & Garage Equipment - 5.4 P, S, T & D Plant - - - 192 39500 Laboratory Equipment - 5.4 P, S, T & D Plant - - - 193 39603 Ditchers - 5.4 P, S, T & D Plant - - - 194 39604 Backhoes - 5.4 P, S, T & D Plant - - - 195 39605 Welders - 5.4 P, S, T & D Plant - - - 196 39700 Communication Equipment 27 5.4 P, S, T & D Plant 10 11 5 197 39701 Communication Equipment - Mobile Radios - 5.4 P, S, T & D Plant - - - 198 39702 Communication Equipment - Fixed Radios - 5.4 P, S, T & D Plant - - - 199 39705 Communication Equip. - Telemetering - 5.4 P, S, T & D Plant - - - 200 39800 Miscellaneous Equipment 66 5.4 P, S, T & D Plant 25 27 13 201 39900 Other Tangible Property - 5.4 P, S, T & D Plant - - - 202 39901 Other Tangible Property - Servers - H/W 133,882 5.4 P, S, T & D Plant 51,904 54,987 26,992 203 39902 Other Tangible Property - Servers - S/W 40,124 5.4 P, S, T & D Plant 15,555 16,479 8,089 204 39903 Other Tangible Property - Network - H/W - 5.4 P, S, T & D Plant - - - 205 39904 Other Tang. Property - CPU - 5.4 P, S, T & D Plant - - - 206 39905 Other Tangible Property - MF - Hardware - 5.4 P, S, T & D Plant - - - 207 39906 Other Tang. Property - PC Hardware 9,073 5.4 P, S, T & D Plant 3,517 3,726 1,829 208 39907 Other Tang. Property - PC Software - 5.4 P, S, T & D Plant - - - 209 39908 Other Tang. Property - Mainframe S/W - 5.4 P, S, T & D Plant - - - 210 39909 Other Tang. Property - Application Software 1,366 5.4 P, S, T & D Plant 529 561 275 211 39924 Other Tang. Property - General Startup Costs - 5.4 P, S, T & D Plant - - - 212213214 Total General Plant 202,494 78,503 83,166 40,825215216 Shared Services Customer Support:217218 General:219220 37400 Land & Land Rights - 5.4 P, S, T & D Plant - - - 221 39001 Structures Frame - 5.4 P, S, T & D Plant - - - 222 36602 Structures & Improvements 30,100 5.4 P, S, T & D Plant 11,669 12,362 6,069 223 37503 Improvements - 5.4 P, S, T & D Plant - - - 224 39004 Air Conditioning Equipment - 5.4 P, S, T & D Plant - - - 225 39009 Improvement to leased Premises 5,171 5.4 P, S, T & D Plant 2,005 2,124 1,043 226 39100 Office Furniture & Equipment 6,139 5.4 P, S, T & D Plant 2,380 2,521 1,238 227 39102 Remittance Processing Equip - 5.4 P, S, T & D Plant - - - 228 39103 Office Machines - 5.4 P, S, T & D Plant - - - 229 39200 Transportation Equipment - 5.4 P, S, T & D Plant - - - 230 39201 Trucks - 5.4 P, S, T & D Plant - - - 231 39202 Trailers - 5.4 P, S, T & D Plant - - - 232 39300 Stores Equipment - 5.4 P, S, T & D Plant - - - 233 39500 Laboratory Equipment 1,191 5.4 P, S, T & D Plant 462 489 240 234 39600 Power Operated Equipment 55 5.4 P, S, T & D Plant 21 23 11 235 39603 Ditchers - 5.4 P, S, T & D Plant - - - 236 39604 Backhoes - 5.4 P, S, T & D Plant - - - 237 39605 Welders - 5.4 P, S, T & D Plant - - - 238 39700 Communication Equipment 6,709 5.4 P, S, T & D Plant 2,601 2,755 1,353 239 39701 Communication Equipment - Mobile Radios - 5.4 P, S, T & D Plant - - - 240 39702 Communication Equipment - Fixed Radios - 5.4 P, S, T & D Plant - - - 241 39705 Communication Equip. - Telemetering - 5.4 P, S, T & D Plant - - - 242 39800 Miscellaneous Equipment 834 5.4 P, S, T & D Plant 323 342 168 243 39900 Other Tangible Property 5,664 5.4 P, S, T & D Plant 2,196 2,326 1,142 244 39901 Other Tangible Property - Servers - H/W 55,314 5.4 P, S, T & D Plant 21,444 22,718 11,152 245 39902 Other Tangible Property - Servers - S/W 10,196 5.4 P, S, T & D Plant 3,953 4,188 2,056 246 39903 Other Tangible Property - Network - H/W 2,481 5.4 P, S, T & D Plant 962 1,019 500 247 39904 Other Tang. Property - CPU - 5.4 P, S, T & D Plant - - - 248 39905 Other Tangible Property - MF - Hardware - 5.4 P, S, T & D Plant - - - 249 39906 Other Tang. Property - PC Hardware 7,309 5.4 P, S, T & D Plant 2,834 3,002 1,474 250 39907 Other Tang. Property - PC Software 871 5.4 P, S, T & D Plant 338 358 176 251 39908 Other Tang. Property - Mainframe S/W - 5.4 P, S, T & D Plant - - - 252 39909 Other Tang. Property - Application Software 342,525 5.4 P, S, T & D Plant 132,791 140,678 69,056 253 39924 Other Tang. Property - General Startup Costs 31 5.4 P, S, T & D Plant 12 13 6 254255256 Total General Plant 474,591 183,990 194,919 95,682257258 TOTAL DEPRECIATION EXPENSE 22,541,774 11,025,378 7,623,132 3,893,264

Exhibit PHR-4Page 18 of 75
Atmos Energy Corporation, Kentucky/Mid-States DivisionClass Cost of Service - Demand/Commodity StudyForecasted Test Period: Twelve Months Ended March 31, 2020
CLASSIFICATION OF TAXES, OTHER THAN INCOME & NET DEDUCTIONS FOR INCOME TAX
Test Year Classif. Classif. Customer Demand Commodity$ Factor Basis $ $ $
1 Taxes Other Than Income23 Non Revenue Related:4 Payroll Related 927,870 9.1 Allocated O&M Expenses 91,523 96,235 740,112 5 Property Related 6,008,371 5.4 P, S, T & D Plant 2,329,332 2,467,695 1,211,344 6 DOT Transmission User Tax 137,062 9.1 Allocated O&M Expenses 13,520 14,215 109,327 7 Other 99,099 9.1 Allocated O&M Expenses 9,775 10,278 79,046 8 Total Non Revenue Related: 7,172,401 2,444,150 2,588,423 2,139,8289
10 Revenue Related:11 State Gross Receipts - Tax 0 99.0 - - - - 12 Local Gross Receipts - Tax 0 99.0 - - - - 13 Public Service Commission Assessment 339,436 3.0 Commodity - - 339,436 14 Total Revenue Related: 339,436 0 0 339,4361516 Total Taxes, Other Than Income 7,511,837 2,444,150 2,588,423 2,479,264171819 Interest Expense 9,367,735 13.0 Rate Base 3,452,156 4,073,574 1,842,005 2021 Amortization of Excess ADIT (1,463,766) 18.0 Total Cost of Service at Equalized ROR (333,567) (338,246) (791,953)

Exhibit PHR-4Page 19 of 75
Atmos Energy Corporation, Kentucky/Mid-States DivisionClass Cost of Service - Demand/Commodity StudyForecasted Test Period: Twelve Months Ended March 31, 2020
SUMMARY OF CLASSIFICATION1234 Test Year Classif. Classif. Customer Demand Commodity5 $ Factor Basis $ $ $67 Operating Revenues 169,717,866 36,436,961 35,974,385 97,306,52189 Operating Expenses:
1011 Operating & Maintenance 105,607,336 10,416,928 10,953,126 84,237,28112 Depreciation & Amortization 22,541,774 11,025,378 7,623,132 3,893,26413 Taxes Other Than Income 7,511,837 2,444,150 2,588,423 2,479,2641415 Total Operating Expenses 135,660,946 23,886,456 21,164,681 90,609,8091617 Income Before Taxes 34,056,920 12,550,504 14,809,704 6,696,7111819 Interest Expense 9,367,735 3,452,156 4,073,574 1,842,0052021 Income Taxes:2223 State Income Taxes 1,481,351 6.00% 545,901 644,168 291,28224 Federal Income Taxes 4,873,645 21.00% 1,796,014 2,119,312 958,31925 Total Deferred Income Taxes 0 0 0 026 Amortization of ITC 0 0 0 02728 Total Income Taxes 6,354,996 2,341,915 2,763,480 1,249,6012930 Net Income 27,701,923 10,208,589 12,046,224 5,447,110 3132 Total Rate Base 496,111,427 182,824,775 215,734,814 97,551,8383334 Rate of Return 5.5838% 5.5838% 5.5838% 5.5838%

Exhibit PHR-4Page 20 of 75
Atmos Energy Corporation, Kentucky/Mid-States DivisionClass Cost of Service - Demand/Commodity StudyForecasted Test Period: Twelve Months Ended March 31, 2020
ALLOCATION OF PLANT IN SERVICE
Customer
Allocation Allocation Total Residential Non-Res Sales Non-Res Sales Transport TransportLine Acct. Factor Basis Company Sales Firm Interruptible Firm InterruptibleNo. No.
1 Intangible Plant:23 30100 Organization 6.2 P, S, T & D Plant - Customer 3,229 2,493 702 2 21 12 4 30200 Franchises & Consents 6.2 P, S, T & D Plant - Customer 46,465 35,864 10,103 24 303 171 5 30300 Misc Intangible Plant 99.0 - 0 - - - - - 67 Total Intangible Plant: 49,694 38,356 10,805 26 324 18389 Production Plant:
1011 32520 Producing Leaseholds 99.0 - 0 - - - - - 12 32540 Rights of Ways 99.0 - 0 - - - - - 13 33100 Production Gas Wells Equipment 99.0 - 0 - - - - - 14 33201 Field Lines 99.0 - 0 - - - - - 15 33202 Tributary Lines 99.0 - 0 - - - - - 16 33400 Field Meas. & Reg. Sta. Equip 99.0 - 0 - - - - - 17 33600 Purification Equipment 99.0 - 0 - - - - - 1819 Total Production Plant 0 0 0 0 0 02021 Storage Plant:2223 35010 Land 99.0 - 0 - - - - - 24 35020 Rights of Way 99.0 - 0 - - - - - 25 35100 Structures and Improvements 99.0 - 0 - - - - - 26 35102 Compression Station Equipment 99.0 - 0 - - - - - 27 35103 Meas. & Reg. Sta. Structues 99.0 - 0 - - - - - 28 35104 Other Structures 99.0 - 0 - - - - - 29 35200 Wells \ Rights of Way 99.0 - 0 - - - - - 30 35201 Well Construction 99.0 - 0 - - - - - 31 35202 Well Equipment 99.0 - 0 - - - - - 32 35203 Cushion Gas 99.0 - 0 - - - - - 33 35210 Leaseholds 99.0 - 0 - - - - - 34 35211 Storage Rights 99.0 - 0 - - - - - 35 35301 Field Lines 99.0 - 0 - - - - - 36 35302 Tributary Lines 99.0 - 0 - - - - - 37 35400 Compressor Station Equipment 99.0 - 0 - - - - - 38 35500 Meas & Reg. Equipment 99.0 - 0 - - - - - 39 35600 Purification Equipment 99.0 - 0 - - - - - 4041 Total Storage Plant 0 0 0 0 0 04243 Transmission:4445 36510 Land & Land Rights 99.0 - 0 - - - - - 46 36520 Rights of Way 99.0 - 0 - - - - - 47 36602 Structures & Improvements 99.0 - 0 - - - - - 48 36603 Other Structues 99.0 - 0 - - - - - 49 36700 Mains Cathodic Protection 99.0 - 0 - - - - - 50 36701 Mains - Steel 99.0 - 0 - - - - - 51 36900 Meas. & Reg. Equipment 99.0 - 0 - - - - - 52 36901 Meas. & Reg. Equipment 99.0 - 0 - - - - - 5354 Total Transmission Plant 0 0 0 0 0 05556 Distribution:5758 37400 Land & Land Rights 2.0 Bills 0 - - - - - 59 37401 Land 2.0 Bills 0 - - - - - 60 37402 Land Rights 2.0 Bills 0 - - - - - 61 37403 Land Other 2.0 Bills 0 - - - - - 62 37500 Structures & Improvements 2.0 Bills 0 - - - - - 63 37501 Structures & Improvements T.B. 2.0 Bills 0 - - - - - 64 37502 Land Rights 2.0 Bills 0 - - - - - 65 37503 Improvements 2.0 Bills 0 - - - - - 66 37600 Mains Cathodic Protection 2.0 Bills 0 - - - - - 67 37601 Mains - Steel 2.0 Bills 0 - - - - - 68 37602 Mains - Plastic 2.0 Bills 0 - - - - - 69 37800 Meas & Reg. Sta. Equip - General 2.0 Bills 0 - - - - - 70 37900 Meas & Reg. Sta. Equip - City Gate 2.0 Bills 0 - - - - - 71 37905 Meas & Reg. Sta. Equipment T.b. 2.0 Bills 0 - - - - - 72 38000 Services 2.0 Bills 150,274,437 133,824,243 16,279,918 8,273 103,453 58,550 73 38100 Meters 4.0 Meter Investment 38,722,015 24,980,781 12,812,487 45,125 564,268 319,353 74 38200 Meter Installaitons 4.0 Meter Investment 57,067,155 36,815,804 18,882,597 66,503 831,599 470,652 75 38300 House Regulators 4.0 Meter Investment 12,779,948 8,244,744 4,228,678 14,893 186,233 105,401 76 38400 House Reg. Installations 4.0 Meter Investment 252,587 162,952 83,577 294 3,681 2,083 77 38500 Ind. Meas. & Reg. Sta. Equipment 2.2 Non-Residential Bills 5,241,043 - 5,186,793 2,636 32,960 18,654 78 38600 Other Prop. On Cust. Prem 99.0 - 0 - - - - - 7980 Total Distribution Plant 264,337,185 204,028,524 57,474,048 137,724 1,722,195 974,694

Exhibit PHR-4Page 21 of 75
Atmos Energy Corporation, Kentucky/Mid-States DivisionClass Cost of Service - Demand/Commodity StudyForecasted Test Period: Twelve Months Ended March 31, 2020
ALLOCATION OF PLANT IN SERVICE8182 General:8384 38900 Land & Land Rights 6.2 P, S, T & D Plant - Customer 469,752 362,578 102,137 245 3,061 1,732 85 39000 Structures & Improvements 6.2 P, S, T & D Plant - Customer 2,944,671 2,272,843 640,251 1,534 19,185 10,858 86 39001 Structures Frame 6.2 P, S, T & D Plant - Customer 0 - - - - - 87 39002 Structures-Brick 6.2 P, S, T & D Plant - Customer 67,113 51,801 14,592 35 437 247 88 39003 Improvements 6.2 P, S, T & D Plant - Customer 274,943 212,215 59,780 143 1,791 1,014 89 39004 Air Conditioning Equipment 6.2 P, S, T & D Plant - Customer 5,022 3,876 1,092 3 33 19 90 39009 Improvement to leased Premises 6.2 P, S, T & D Plant - Customer 483,126 372,901 105,045 252 3,148 1,781 91 39100 Office Furniture & Equipment 6.2 P, S, T & D Plant - Customer 723,428 558,377 157,293 377 4,713 2,668 92 39102 Remittance Processing Equip 6.2 P, S, T & D Plant - Customer 0 - - - - - 93 39103 Office Machines 6.2 P, S, T & D Plant - Customer 0 - - - - - 94 39200 Transportation Equipment 6.2 P, S, T & D Plant - Customer 85,672 66,126 18,628 45 558 316 95 39201 Trucks 6.2 P, S, T & D Plant - Customer 0 - - - - - 96 39202 Trailers 6.2 P, S, T & D Plant - Customer 0 - - - - - 97 39300 Stores Equipment 6.2 P, S, T & D Plant - Customer 0 - - - - - 98 39400 Tools, Shop & Garage Equipment 6.2 P, S, T & D Plant - Customer 1,581,103 1,220,374 343,775 824 10,301 5,830 99 39600 Power Operated Equipment 6.2 P, S, T & D Plant - Customer 0 - - - - -
100 39603 Ditchers 6.2 P, S, T & D Plant - Customer 15,356 11,853 3,339 8 100 57 101 39604 Backhoes 6.2 P, S, T & D Plant - Customer 24,326 18,776 5,289 13 158 90 102 39605 Welders 6.2 P, S, T & D Plant - Customer 7,532 5,813 1,638 4 49 28 103 39700 Communication Equipment 6.2 P, S, T & D Plant - Customer 203,245 156,874 44,191 106 1,324 749 104 39701 Communication Equipment - Mobile Radios 6.2 P, S, T & D Plant - Customer 0 - - - - - 105 39702 Communication Equipment - Fixed Radios 6.2 P, S, T & D Plant - Customer 0 - - - - - 106 39705 Communication Equip. - Telemetering 6.2 P, S, T & D Plant - Customer 0 - - - - - 107 39800 Miscellaneous Equipment 6.2 P, S, T & D Plant - Customer 1,508,766 1,164,540 328,047 786 9,830 5,563 108 39900 Other Tangible Property 6.2 P, S, T & D Plant - Customer 0 - - - - - 109 39901 Other Tangible Property - Servers - H/W 6.2 P, S, T & D Plant - Customer 5,579 4,306 1,213 3 36 21 110 39902 Other Tangible Property - Servers - S/W 6.2 P, S, T & D Plant - Customer 0 - - - - - 111 39903 Other Tangible Property - Network - H/W 6.2 P, S, T & D Plant - Customer 52,181 40,276 11,346 27 340 192 112 39904 Other Tang. Property - CPU 6.2 P, S, T & D Plant - Customer 0 - - - - - 113 39905 Other Tangible Property - MF - Hardware 6.2 P, S, T & D Plant - Customer 0 - - - - - 114 39906 Other Tang. Property - PC Hardware 6.2 P, S, T & D Plant - Customer 179,065 138,211 38,934 93 1,167 660 115 39907 Other Tang. Property - PC Software 6.2 P, S, T & D Plant - Customer 0 - - - - - 116 39908 Other Tang. Property - Mainframe S/W 6.2 P, S, T & D Plant - Customer 47,884 36,960 10,411 25 312 177 117 39909 Other Tang. Property - Application Software 6.2 P, S, T & D Plant - Customer 0 - - - - - 118 39924 Other Tang. Property - General Startup Costs 6.2 P, S, T & D Plant - Customer 0 - - - - - 119120 Total General Plant 8,678,765 6,698,701 1,886,998 4,522 56,543 32,001121122 TOTAL DIRECT PLANT 273,065,644 210,765,581 59,371,851 142,272 1,779,062 1,006,878123124 CWIP w/o AFUDC 6.2 P, S, T & D Plant - Customer 14,791,899 11,417,120 3,216,159 7,707 96,371 54,542 125126 Kentucky Mid-States General Office:127128 Intangible Plant:129130 30100 Organization 6.2 P, S, T & D Plant - Customer 35,762 27,603 7,776 19 233 132 131 30200 Franchises & Consents 6.2 P, S, T & D Plant - Customer 0 - - - - - 132 30300 Misc Intangible Plant 6.2 P, S, T & D Plant - Customer 214,130 165,276 46,558 112 1,395 790 133134 Total Intangible Plant 249,892 192,879 54,333 130 1,628 921135136 General:137138 37400 Land & Land Rights 6.2 P, S, T & D Plant - Customer 0 - - - - - 139 39001 Structures Frame 6.2 P, S, T & D Plant - Customer 34,610 26,714 7,525 18 225 128 140 36602 Structures & Improvements 6.2 P, S, T & D Plant - Customer 0 - - - - - 141 38900 Land & Land Rights 6.2 P, S, T & D Plant - Customer 0 - - - - - 142 39004 Air Conditioning Equipment 6.2 P, S, T & D Plant - Customer 2,969 2,292 646 2 19 11 143 39009 Improvement to leased Premises 6.2 P, S, T & D Plant - Customer 7,494 5,785 1,630 4 49 28 144 39100 Office Furniture & Equipment 6.2 P, S, T & D Plant - Customer 7,451 5,751 1,620 4 49 27 145 39102 Remittance Processing Equip 6.2 P, S, T & D Plant - Customer 0 - - - - - 146 39103 Office Machines 6.2 P, S, T & D Plant - Customer 0 - - - - - 147 39200 Transportation Equipment 6.2 P, S, T & D Plant - Customer 5,266 4,064 1,145 3 34 19 148 39201 Trucks 6.2 P, S, T & D Plant - Customer 0 - - - - - 149 39202 Trailers 6.2 P, S, T & D Plant - Customer 0 - - - - - 150 39300 Stores Equipment 6.2 P, S, T & D Plant - Customer 0 - - - - - 151 39400 Tools, Shop & Garage Equipment 6.2 P, S, T & D Plant - Customer 33,940 26,197 7,380 18 221 125 152 39600 Power Operated Equipment 6.2 P, S, T & D Plant - Customer 3,959 3,056 861 2 26 15 153 39603 Ditchers 6.2 P, S, T & D Plant - Customer 0 - - - - - 154 39604 Backhoes 6.2 P, S, T & D Plant - Customer 0 - - - - - 155 39605 Welders 6.2 P, S, T & D Plant - Customer 0 - - - - - 156 39700 Communication Equipment 6.2 P, S, T & D Plant - Customer 7,245 5,592 1,575 4 47 27 157 39701 Communication Equipment - Mobile Radios 6.2 P, S, T & D Plant - Customer 0 - - - - - 158 39702 Communication Equipment - Fixed Radios 6.2 P, S, T & D Plant - Customer 0 - - - - - 159 39705 Communication Equip. - Telemetering 6.2 P, S, T & D Plant - Customer 0 - - - - - 160 39800 Miscellaneous Equipment 6.2 P, S, T & D Plant - Customer 157,124 121,276 34,163 82 1,024 579 161 39900 Other Tangible Property 6.2 P, S, T & D Plant - Customer 0 - - - - - 162 39901 Other Tangible Property - Servers - H/W 6.2 P, S, T & D Plant - Customer 0 - - - - - 163 39902 Other Tangible Property - Servers - S/W 6.2 P, S, T & D Plant - Customer 0 - - - - - 164 39903 Other Tangible Property - Network - H/W 6.2 P, S, T & D Plant - Customer 0 - - - - - 165 39904 Other Tang. Property - CPU 6.2 P, S, T & D Plant - Customer 0 - - - - - 166 39905 Other Tangible Property - MF - Hardware 6.2 P, S, T & D Plant - Customer 0 - - - - - 167 39906 Other Tang. Property - PC Hardware 6.2 P, S, T & D Plant - Customer 13,543 10,453 2,945 7 88 50 168 39907 Other Tang. Property - PC Software 6.2 P, S, T & D Plant - Customer 31,902 24,623 6,936 17 208 118 169 39908 Other Tang. Property - Mainframe S/W 6.2 P, S, T & D Plant - Customer 159,892 123,413 34,765 83 1,042 590 170 39909 Other Tang. Property - Application Software 6.2 P, S, T & D Plant - Customer 0 - - - - - 171 39924 Other Tang. Property - General Startup Costs 6.2 P, S, T & D Plant - Customer 0 - - - - - 172173 Total General Plant 465,396 359,216 101,190 242 3,032 1,716174175 CWIP w/o AFUDC 6.2 P, S, T & D Plant - Customer 896 691 195 0 6 3

Exhibit PHR-4Page 22 of 75
Atmos Energy Corporation, Kentucky/Mid-States DivisionClass Cost of Service - Demand/Commodity StudyForecasted Test Period: Twelve Months Ended March 31, 2020
ALLOCATION OF PLANT IN SERVICE176177 Shared Services General Office:178179 General:180181 37400 Land & Land Rights 6.2 P, S, T & D Plant - Customer 0 - - - - - 182 39001 Structures Frame 6.2 P, S, T & D Plant - Customer 0 - - - - - 183 36602 Structures & Improvements 6.2 P, S, T & D Plant - Customer 91,657 70,745 19,929 48 597 338 184 37503 Improvements 6.2 P, S, T & D Plant - Customer 0 - - - - - 185 39004 Air Conditioning Equipment 6.2 P, S, T & D Plant - Customer 0 - - - - - 186 39009 Improvement to leased Premises 6.2 P, S, T & D Plant - Customer 187,389 144,636 40,743 98 1,221 691 187 39100 Office Furniture & Equipment 6.2 P, S, T & D Plant - Customer 111,233 85,855 24,185 58 725 410 188 39102 Remittance Processing Equip 6.2 P, S, T & D Plant - Customer 0 - - - - - 189 39103 Office Machines 6.2 P, S, T & D Plant - Customer 0 - - - - - 190 39200 Transportation Equipment 6.2 P, S, T & D Plant - Customer 143 110 31 0 1 1 191 39201 Trucks 6.2 P, S, T & D Plant - Customer 0 - - - - - 192 39202 Trailers 6.2 P, S, T & D Plant - Customer 0 - - - - - 193 39300 Stores Equipment 6.2 P, S, T & D Plant - Customer 0 - - - - - 194 39400 Tools, Shop & Garage Equipment 6.2 P, S, T & D Plant - Customer 1,527 1,178 332 1 10 6 195 39600 Power Operated Equipment 6.2 P, S, T & D Plant - Customer 0 - - - - - 196 39603 Ditchers 6.2 P, S, T & D Plant - Customer 0 - - - - - 197 39604 Backhoes 6.2 P, S, T & D Plant - Customer 0 - - - - - 198 39605 Welders 6.2 P, S, T & D Plant - Customer 0 - - - - - 199 39700 Communication Equipment 6.2 P, S, T & D Plant - Customer 21,078 16,269 4,583 11 137 78 200 39701 Communication Equipment - Mobile Radios 6.2 P, S, T & D Plant - Customer 0 - - - - - 201 39702 Communication Equipment - Fixed Radios 6.2 P, S, T & D Plant - Customer 0 - - - - - 202 39705 Communication Equip. - Telemetering 6.2 P, S, T & D Plant - Customer 0 - - - - - 203 39800 Miscellaneous Equipment 6.2 P, S, T & D Plant - Customer 2,922 2,255 635 2 19 11 204 39900 Other Tangible Property 6.2 P, S, T & D Plant - Customer 3,248 2,507 706 2 21 12 205 39901 Other Tangible Property - Servers - H/W 6.2 P, S, T & D Plant - Customer 900,168 694,794 195,721 469 5,865 3,319 206 39902 Other Tangible Property - Servers - S/W 6.2 P, S, T & D Plant - Customer 543,695 419,651 118,214 283 3,542 2,005 207 39903 Other Tangible Property - Network - H/W 6.2 P, S, T & D Plant - Customer 171,472 132,351 37,283 89 1,117 632 208 39904 Other Tang. Property - CPU 6.2 P, S, T & D Plant - Customer 0 - - - - - 209 39905 Other Tangible Property - MF - Hardware 6.2 P, S, T & D Plant - Customer 0 - - - - - 210 39906 Other Tang. Property - PC Hardware 6.2 P, S, T & D Plant - Customer 60,425 46,639 13,138 31 394 223 211 39907 Other Tang. Property - PC Software 6.2 P, S, T & D Plant - Customer 33,424 25,798 7,267 17 218 123 212 39908 Other Tang. Property - Mainframe S/W 6.2 P, S, T & D Plant - Customer 1,504,064 1,160,911 327,024 784 9,799 5,546 213 39909 Other Tang. Property - Application Software 6.2 P, S, T & D Plant - Customer 512,885 395,870 111,515 267 3,342 1,891 214 39931 Other Tang. Property - ALGN 6.2 P, S, T & D Plant - Customer 0 - - - - - 215216 Total General Plant 4,145,328 3,199,570 901,306 2,160 27,007 15,285217218 CWIP w/o AFUDC 6.2 P, S, T & D Plant - Customer 290,119 223,928 63,080 151 1,890 1,070 219220 Shared Services Customer Support:221222 General:223224 37400 Land & Land Rights 6.2 P, S, T & D Plant - Customer 79,816 61,606 17,354 42 520 294 225 39001 Structures Frame 6.2 P, S, T & D Plant - Customer 0 - - - - - 226 36602 Structures & Improvements 6.2 P, S, T & D Plant - Customer 387,685 299,235 84,293 202 2,526 1,430 227 37503 Improvements 6.2 P, S, T & D Plant - Customer 0 - - - - - 228 39004 Air Conditioning Equipment 6.2 P, S, T & D Plant - Customer 0 - - - - - 229 39009 Improvement to leased Premises 6.2 P, S, T & D Plant - Customer 61,687 47,613 13,412 32 402 227 230 39100 Office Furniture & Equipment 6.2 P, S, T & D Plant - Customer 59,971 46,289 13,039 31 391 221 231 39102 Remittance Processing Equip 6.2 P, S, T & D Plant - Customer 0 - - - - - 232 39103 Office Machines 6.2 P, S, T & D Plant - Customer 0 - - - - - 233 39200 Transportation Equipment 6.2 P, S, T & D Plant - Customer 866 668 188 0 6 3 234 39201 Trucks 6.2 P, S, T & D Plant - Customer 0 - - - - - 235 39202 Trailers 6.2 P, S, T & D Plant - Customer 0 - - - - - 236 39300 Stores Equipment 6.2 P, S, T & D Plant - Customer 0 - - - - - 237 39400 Tools, Shop & Garage Equipment 6.2 P, S, T & D Plant - Customer 5,463 4,217 1,188 3 36 20 238 39600 Power Operated Equipment 6.2 P, S, T & D Plant - Customer 212 164 46 0 1 1 239 39603 Ditchers 6.2 P, S, T & D Plant - Customer 0 - - - - - 240 39604 Backhoes 6.2 P, S, T & D Plant - Customer 0 - - - - - 241 39605 Welders 6.2 P, S, T & D Plant - Customer 0 - - - - - 242 39700 Communication Equipment 6.2 P, S, T & D Plant - Customer 44,460 34,316 9,667 23 290 164 243 39701 Communication Equipment - Mobile Radios 6.2 P, S, T & D Plant - Customer 0 - - - - - 244 39702 Communication Equipment - Fixed Radios 6.2 P, S, T & D Plant - Customer 0 - - - - - 245 39705 Communication Equip. - Telemetering 6.2 P, S, T & D Plant - Customer 0 - - - - - 246 39800 Miscellaneous Equipment 6.2 P, S, T & D Plant - Customer 6,109 4,715 1,328 3 40 23 247 39900 Other Tangible Property 6.2 P, S, T & D Plant - Customer 16,813 12,977 3,656 9 110 62 248 39901 Other Tangible Property - Servers - H/W 6.2 P, S, T & D Plant - Customer 226,206 174,597 49,183 118 1,474 834 249 39902 Other Tangible Property - Servers - S/W 6.2 P, S, T & D Plant - Customer 44,263 34,165 9,624 23 288 163 250 39903 Other Tangible Property - Network - H/W 6.2 P, S, T & D Plant - Customer 13,761 10,622 2,992 7 90 51 251 39904 Other Tang. Property - CPU 6.2 P, S, T & D Plant - Customer 0 - - - - - 252 39905 Other Tangible Property - MF - Hardware 6.2 P, S, T & D Plant - Customer 0 - - - - - 253 39906 Other Tang. Property - PC Hardware 6.2 P, S, T & D Plant - Customer 26,933 20,788 5,856 14 175 99 254 39907 Other Tang. Property - PC Software 6.2 P, S, T & D Plant - Customer 5,095 3,932 1,108 3 33 19 255 39908 Other Tang. Property - Mainframe S/W 6.2 P, S, T & D Plant - Customer 2,034,841 1,570,591 442,429 1,060 13,257 7,503 256 39909 Other Tang. Property - Application Software 6.2 P, S, T & D Plant - Customer 185 143 40 0 1 1 257 39924 Other Tang. Property - General Startup Costs 6.2 P, S, T & D Plant - Customer 0 - - - - - 258259 Total General Plant 3,014,367 2,326,638 655,405 1,571 19,639 11,115260261 CWIP w/o AFUDC 6.2 P, S, T & D Plant - Customer 87,125 67,248 18,943 45 568 321 262263 TOTAL PLANT IN SERVICE - CUSTOMER 280,940,628 216,843,883 61,084,086 146,375 1,830,368 1,035,916264265 TOTAL CWIP W/O AFUDC - CUSTOMER 15,170,039 11,708,987 3,298,376 7,904 98,835 55,937

Exhibit PHR-4Page 23 of 75
Atmos Energy Corporation, Kentucky/Mid-States DivisionClass Cost of Service - Demand/Commodity StudyForecasted Test Period: Twelve Months Ended March 31, 2020
ALLOCATION OF PLANT IN SERVICE
Demand
Allocation Allocation Total Residential Non-Res Sales Non-Res Sales Transport TransportLine Acct. Factor Basis Company Sales Firm Interruptible Firm InterruptibleNo. No.
266 Intangible Plant:267268 30100 Organization 6.4 P, S, T & D Plant - Demand 3,421 1,547 884 47 496 448 269 30200 Franchises & Consents 6.4 P, S, T & D Plant - Demand 49,225 22,256 12,727 669 7,130 6,443 270 30300 Misc Intangible Plant 99.0 - 0 - - - - - 271272 Total Intangible Plant: 52,646 23,803 13,611 716 7,625 6,891273274 Production Plant:275276 32520 Producing Leaseholds 3.0 Peak Day 0 - - - - - 277 32540 Rights of Ways 3.0 Peak Day 0 - - - - - 278 33100 Production Gas Wells Equipment 3.0 Peak Day 0 - - - - - 279 33201 Field Lines 3.0 Peak Day 0 - - - - - 280 33202 Tributary Lines 3.0 Peak Day 0 - - - - - 281 33400 Field Meas. & Reg. Sta. Equip 3.0 Peak Day 0 - - - - - 282 33600 Purification Equipment 3.0 Peak Day 0 - - - - - 283284 Total Production Plant 0 0 0 0 0 0285286 Storage Plant:287288 35010 Land 3.0 Peak Day 130,563 59,032 33,756 1,775 18,911 17,089 289 35020 Rights of Way 3.0 Peak Day 2,341 1,058 605 32 339 306 290 35100 Structures and Improvements 3.0 Peak Day 8,958 4,050 2,316 122 1,298 1,172 291 35102 Compression Station Equipment 3.0 Peak Day 76,631 34,647 19,812 1,042 11,099 10,030 292 35103 Meas. & Reg. Sta. Structues 3.0 Peak Day 11,569 5,231 2,991 157 1,676 1,514 293 35104 Other Structures 3.0 Peak Day 68,721 31,071 17,767 935 9,954 8,995 294 35200 Wells \ Rights of Way 3.0 Peak Day 4,174,198 1,887,299 1,079,195 56,763 604,604 546,337 295 35201 Well Construction 3.0 Peak Day 849,999 384,314 219,758 11,559 123,117 111,252 296 35202 Well Equipment 3.0 Peak Day 224,655 101,574 58,082 3,055 32,540 29,404 297 35203 Cushion Gas 3.0 Peak Day 847,416 383,146 219,091 11,524 122,742 110,914 298 35210 Leaseholds 3.0 Peak Day 89,265 40,360 23,079 1,214 12,929 11,683 299 35211 Storage Rights 3.0 Peak Day 27,307 12,346 7,060 371 3,955 3,574 300 35301 Field Lines 3.0 Peak Day 87,675 39,641 22,667 1,192 12,699 11,475 301 35302 Tributary Lines 3.0 Peak Day 104,659 47,320 27,059 1,423 15,159 13,698 302 35400 Compressor Station Equipment 3.0 Peak Day 461,723 208,761 119,374 6,279 66,877 60,432 303 35500 Meas & Reg. Equipment 3.0 Peak Day 136,542 61,735 35,302 1,857 19,777 17,871 304 35600 Purification Equipment 3.0 Peak Day 207,332 93,742 53,603 2,819 30,031 27,136 305306 Total Storage Plant 7,509,555 3,395,329 1,941,516 102,119 1,087,708 982,884307308 Transmission:309310 36510 Land & Land Rights 3.0 Peak Day 26,970 12,194 6,973 367 3,906 3,530 311 36520 Rights of Way 3.0 Peak Day 867,772 392,350 224,353 11,800 125,691 113,578 312 36602 Structures & Improvements 3.0 Peak Day 49,002 22,155 12,669 666 7,098 6,414 313 36603 Other Structues 3.0 Peak Day 60,826 27,502 15,726 827 8,810 7,961 314 36700 Mains Cathodic Protection 3.0 Peak Day 139,638 63,135 36,102 1,899 20,226 18,276 315 36701 Mains - Steel 3.0 Peak Day 27,047,831 12,229,257 6,992,930 367,811 3,917,694 3,540,140 316 36900 Meas. & Reg. Equipment 3.0 Peak Day 731,467 330,721 189,113 9,947 105,948 95,738 317 36901 Meas. & Reg. Equipment 3.0 Peak Day 2,269,556 1,026,144 586,770 30,863 328,730 297,050 318319 Total Transmission Plant 31,193,061 14,103,458 8,064,635 424,180 4,518,102 4,082,686320321 Distribution:322323 37400 Land & Land Rights 3.0 Peak Day 345,253 156,101 89,261 4,695 50,008 45,188 324 37401 Land 3.0 Peak Day 24,262 10,970 6,273 330 3,514 3,175 325 37402 Land Rights 3.0 Peak Day 2,369,699 1,071,423 612,661 32,224 343,235 310,157 326 37403 Land Other 3.0 Peak Day 1,810 818 468 25 262 237 327 37500 Structures & Improvements 3.0 Peak Day 218,505 98,794 56,492 2,971 31,649 28,599 328 37501 Structures & Improvements T.B. 3.0 Peak Day 64,881 29,335 16,774 882 9,398 8,492 329 37502 Land Rights 3.0 Peak Day 30,071 13,596 7,775 409 4,356 3,936 330 37503 Improvements 3.0 Peak Day 2,603 1,177 673 35 377 341 331 37600 Mains Cathodic Protection 3.0 Peak Day 13,397,291 6,057,377 3,463,727 182,184 1,940,506 1,753,497 332 37601 Mains - Steel 3.0 Peak Day 114,414,774 51,730,864 29,580,726 1,555,874 16,572,199 14,975,112 333 37602 Mains - Plastic 3.0 Peak Day 86,618,879 39,163,381 22,394,392 1,177,890 12,546,153 11,337,062 334 37800 Meas & Reg. Sta. Equip - General 3.0 Peak Day 19,442,438 8,790,596 5,026,636 264,389 2,816,104 2,544,712 335 37900 Meas & Reg. Sta. Equip - City Gate 3.0 Peak Day 3,331,868 1,506,453 861,419 45,309 482,598 436,090 336 37905 Meas & Reg. Sta. Equipment T.b. 3.0 Peak Day 1,073,951 485,570 277,659 14,604 155,554 140,563 337 38000 Services 99.0 - 0 - - - - - 338 38100 Meters 99.0 - 0 - - - - - 339 38200 Meter Installaitons 99.0 - 0 - - - - - 340 38300 House Regulators 99.0 - 0 - - - - - 341 38400 House Reg. Installations 99.0 - 0 - - - - - 342 38500 Ind. Meas. & Reg. Sta. Equipment 99.0 - 0 - - - - - 343 38600 Other Prop. On Cust. Prem 99.0 - 0 - - - - - 344345 Total Distribution Plant 241,336,285 109,116,454 62,394,935 3,281,821 34,955,913 31,587,160

Exhibit PHR-4Page 24 of 75
Atmos Energy Corporation, Kentucky/Mid-States DivisionClass Cost of Service - Demand/Commodity StudyForecasted Test Period: Twelve Months Ended March 31, 2020
ALLOCATION OF PLANT IN SERVICE346347 General:348349 38900 Land & Land Rights 6.4 P, S, T & D Plant - Demand 497,656 225,007 128,664 6,767 72,082 65,135 350 39000 Structures & Improvements 6.4 P, S, T & D Plant - Demand 3,119,585 1,410,472 806,536 42,422 451,851 408,305 351 39001 Structures Frame 6.4 P, S, T & D Plant - Demand 0 - - - - - 352 39002 Structures-Brick 6.4 P, S, T & D Plant - Demand 71,100 32,147 18,382 967 10,298 9,306 353 39003 Improvements 6.4 P, S, T & D Plant - Demand 291,275 131,695 75,306 3,961 42,189 38,123 354 39004 Air Conditioning Equipment 6.4 P, S, T & D Plant - Demand 5,321 2,406 1,376 72 771 696 355 39009 Improvement to leased Premises 6.4 P, S, T & D Plant - Demand 511,824 231,413 132,327 6,960 74,134 66,990 356 39100 Office Furniture & Equipment 6.4 P, S, T & D Plant - Demand 766,400 346,516 198,144 10,422 111,008 100,310 357 39102 Remittance Processing Equip 6.4 P, S, T & D Plant - Demand 0 - - - - - 358 39103 Office Machines 6.4 P, S, T & D Plant - Demand 0 - - - - - 359 39200 Transportation Equipment 6.4 P, S, T & D Plant - Demand 90,761 41,036 23,465 1,234 13,146 11,879 360 39201 Trucks 6.4 P, S, T & D Plant - Demand 0 - - - - - 361 39202 Trailers 6.4 P, S, T & D Plant - Demand 0 - - - - - 362 39300 Stores Equipment 6.4 P, S, T & D Plant - Demand 0 - - - - - 363 39400 Tools, Shop & Garage Equipment 6.4 P, S, T & D Plant - Demand 1,675,022 757,335 433,059 22,778 242,615 219,234 364 39600 Power Operated Equipment 6.4 P, S, T & D Plant - Demand 0 - - - - - 365 39603 Ditchers 6.4 P, S, T & D Plant - Demand 16,268 7,355 4,206 221 2,356 2,129 366 39604 Backhoes 6.4 P, S, T & D Plant - Demand 25,771 11,652 6,663 350 3,733 3,373 367 39605 Welders 6.4 P, S, T & D Plant - Demand 7,979 3,608 2,063 109 1,156 1,044 368 39700 Communication Equipment 6.4 P, S, T & D Plant - Demand 215,317 97,352 55,668 2,928 31,187 28,182 369 39701 Communication Equipment - Mobile Radios 6.4 P, S, T & D Plant - Demand 0 - - - - - 370 39702 Communication Equipment - Fixed Radios 6.4 P, S, T & D Plant - Demand 0 - - - - - 371 39705 Communication Equip. - Telemetering 6.4 P, S, T & D Plant - Demand 0 - - - - - 372 39800 Miscellaneous Equipment 6.4 P, S, T & D Plant - Demand 1,598,387 722,686 413,246 21,736 231,515 209,204 373 39900 Other Tangible Property 6.4 P, S, T & D Plant - Demand 0 - - - - - 374 39901 Other Tangible Property - Servers - H/W 6.4 P, S, T & D Plant - Demand 5,910 2,672 1,528 80 856 774 375 39902 Other Tangible Property - Servers - S/W 6.4 P, S, T & D Plant - Demand 0 - - - - - 376 39903 Other Tangible Property - Network - H/W 6.4 P, S, T & D Plant - Demand 55,281 24,994 14,292 752 8,007 7,235 377 39904 Other Tang. Property - CPU 6.4 P, S, T & D Plant - Demand 0 - - - - - 378 39905 Other Tangible Property - MF - Hardware 6.4 P, S, T & D Plant - Demand 0 - - - - - 379 39906 Other Tang. Property - PC Hardware 6.4 P, S, T & D Plant - Demand 189,702 85,771 49,045 2,580 27,477 24,829 380 39907 Other Tang. Property - PC Software 6.4 P, S, T & D Plant - Demand 0 - - - - - 381 39908 Other Tang. Property - Mainframe S/W 6.4 P, S, T & D Plant - Demand 50,729 22,936 13,115 690 7,348 6,640 382 39909 Other Tang. Property - Application Software 6.4 P, S, T & D Plant - Demand 0 - - - - - 383 39924 Other Tang. Property - General Startup Costs 6.4 P, S, T & D Plant - Demand 0 - - - - - 384385 Total General Plant 9,194,287 4,157,054 2,377,085 125,029 1,331,730 1,203,389386387 TOTAL DIRECT PLANT 289,285,834 130,796,098 74,791,782 3,933,865 41,901,078 37,863,010388389 CWIP w/o AFUDC 6.4 P, S, T & D Plant - Demand 15,670,542 7,085,192 4,051,452 213,097 2,269,771 2,051,030 390391 Kentucky Mid-States General Office:392393 Intangible Plant:394395 30100 Organization 6.4 P, S, T & D Plant - Demand 37,887 17,130 9,795 515 5,488 4,959 396 30200 Franchises & Consents 6.4 P, S, T & D Plant - Demand 0 - - - - - 397 30300 Misc Intangible Plant 6.4 P, S, T & D Plant - Demand 226,849 102,566 58,649 3,085 32,858 29,691 398399 Total Intangible Plant: 264,736 119,696 68,445 3,600 38,345 34,650400401 General:402403 37400 Land & Land Rights 6.4 P, S, T & D Plant - Demand 0 - - - - - 404 39001 Structures Frame 6.4 P, S, T & D Plant - Demand 36,666 16,578 9,480 499 5,311 4,799 405 36602 Structures & Improvements 6.4 P, S, T & D Plant - Demand 0 - - - - - 406 38900 Land & Land Rights 6.4 P, S, T & D Plant - Demand 0 - - - - - 407 39004 Air Conditioning Equipment 6.4 P, S, T & D Plant - Demand 3,145 1,422 813 43 456 412 408 39009 Improvement to leased Premises 6.4 P, S, T & D Plant - Demand 7,940 3,590 2,053 108 1,150 1,039 409 39100 Office Furniture & Equipment 6.4 P, S, T & D Plant - Demand 7,894 3,569 2,041 107 1,143 1,033 410 39102 Remittance Processing Equip 6.4 P, S, T & D Plant - Demand 0 - - - - - 411 39103 Office Machines 6.4 P, S, T & D Plant - Demand 0 - - - - - 412 39200 Transportation Equipment 6.4 P, S, T & D Plant - Demand 5,578 2,522 1,442 76 808 730 413 39201 Trucks 6.4 P, S, T & D Plant - Demand 0 - - - - - 414 39202 Trailers 6.4 P, S, T & D Plant - Demand 0 - - - - - 415 39300 Stores Equipment 6.4 P, S, T & D Plant - Demand 0 - - - - - 416 39400 Tools, Shop & Garage Equipment 6.4 P, S, T & D Plant - Demand 35,956 16,257 9,296 489 5,208 4,706 417 39600 Power Operated Equipment 6.4 P, S, T & D Plant - Demand 4,194 1,896 1,084 57 608 549 418 39603 Ditchers 6.4 P, S, T & D Plant - Demand 0 - - - - - 419 39604 Backhoes 6.4 P, S, T & D Plant - Demand 0 - - - - - 420 39605 Welders 6.4 P, S, T & D Plant - Demand 0 - - - - - 421 39700 Communication Equipment 6.4 P, S, T & D Plant - Demand 7,675 3,470 1,984 104 1,112 1,005 422 39701 Communication Equipment - Mobile Radios 6.4 P, S, T & D Plant - Demand 0 - - - - - 423 39702 Communication Equipment - Fixed Radios 6.4 P, S, T & D Plant - Demand 0 - - - - - 424 39705 Communication Equip. - Telemetering 6.4 P, S, T & D Plant - Demand 0 - - - - - 425 39800 Miscellaneous Equipment 6.4 P, S, T & D Plant - Demand 166,457 75,261 43,036 2,264 24,110 21,787 426 39900 Other Tangible Property 6.4 P, S, T & D Plant - Demand 0 - - - - - 427 39901 Other Tangible Property - Servers - H/W 6.4 P, S, T & D Plant - Demand 0 - - - - - 428 39902 Other Tangible Property - Servers - S/W 6.4 P, S, T & D Plant - Demand 0 - - - - - 429 39903 Other Tangible Property - Network - H/W 6.4 P, S, T & D Plant - Demand 0 - - - - - 430 39904 Other Tang. Property - CPU 6.4 P, S, T & D Plant - Demand 0 - - - - - 431 39905 Other Tangible Property - MF - Hardware 6.4 P, S, T & D Plant - Demand 0 - - - - - 432 39906 Other Tang. Property - PC Hardware 6.4 P, S, T & D Plant - Demand 14,348 6,487 3,709 195 2,078 1,878 433 39907 Other Tang. Property - PC Software 6.4 P, S, T & D Plant - Demand 33,797 15,281 8,738 460 4,895 4,423 434 39908 Other Tang. Property - Mainframe S/W 6.4 P, S, T & D Plant - Demand 169,390 76,587 43,794 2,303 24,535 22,170 435 39909 Other Tang. Property - Application Software 6.4 P, S, T & D Plant - Demand 0 - - - - - 436 39924 Other Tang. Property - General Startup Costs 6.4 P, S, T & D Plant - Demand 0 - - - - - 437438 Total General Plant 493,041 222,921 127,470 6,705 71,414 64,531439440 CWIP w/o AFUDC 6.4 P, S, T & D Plant - Demand 949 429 245 13 137 124

Exhibit PHR-4Page 25 of 75
Atmos Energy Corporation, Kentucky/Mid-States DivisionClass Cost of Service - Demand/Commodity StudyForecasted Test Period: Twelve Months Ended March 31, 2020
ALLOCATION OF PLANT IN SERVICE441442 Shared Services General Office:443444 General:445446 37400 Land & Land Rights 6.4 P, S, T & D Plant - Demand 0 - - - - - 447 39001 Structures Frame 6.4 P, S, T & D Plant - Demand 0 - - - - - 448 36602 Structures & Improvements 6.4 P, S, T & D Plant - Demand 97,102 43,903 25,105 1,320 14,064 12,709 449 37503 Improvements 6.4 P, S, T & D Plant - Demand 0 - - - - - 450 39004 Air Conditioning Equipment 6.4 P, S, T & D Plant - Demand 0 - - - - - 451 39009 Improvement to leased Premises 6.4 P, S, T & D Plant - Demand 198,519 89,757 51,325 2,700 28,754 25,983 452 39100 Office Furniture & Equipment 6.4 P, S, T & D Plant - Demand 117,840 53,279 30,466 1,602 17,068 15,423 453 39102 Remittance Processing Equip 6.4 P, S, T & D Plant - Demand 0 - - - - - 454 39103 Office Machines 6.4 P, S, T & D Plant - Demand 0 - - - - - 455 39200 Transportation Equipment 6.4 P, S, T & D Plant - Demand 152 69 39 2 22 20 456 39201 Trucks 6.4 P, S, T & D Plant - Demand 0 - - - - - 457 39202 Trailers 6.4 P, S, T & D Plant - Demand 0 - - - - - 458 39300 Stores Equipment 6.4 P, S, T & D Plant - Demand 0 - - - - - 459 39400 Tools, Shop & Garage Equipment 6.4 P, S, T & D Plant - Demand 1,617 731 418 22 234 212 460 39600 Power Operated Equipment 6.4 P, S, T & D Plant - Demand 0 - - - - - 461 39603 Ditchers 6.4 P, S, T & D Plant - Demand 0 - - - - - 462 39604 Backhoes 6.4 P, S, T & D Plant - Demand 0 - - - - - 463 39605 Welders 6.4 P, S, T & D Plant - Demand 0 - - - - - 464 39700 Communication Equipment 6.4 P, S, T & D Plant - Demand 22,330 10,096 5,773 304 3,234 2,923 465 39701 Communication Equipment - Mobile Radios 6.4 P, S, T & D Plant - Demand 0 - - - - - 466 39702 Communication Equipment - Fixed Radios 6.4 P, S, T & D Plant - Demand 0 - - - - - 467 39705 Communication Equip. - Telemetering 6.4 P, S, T & D Plant - Demand 0 - - - - - 468 39800 Miscellaneous Equipment 6.4 P, S, T & D Plant - Demand 3,096 1,400 800 42 448 405 469 39900 Other Tangible Property 6.4 P, S, T & D Plant - Demand 3,441 1,556 890 47 498 450 470 39901 Other Tangible Property - Servers - H/W 6.4 P, S, T & D Plant - Demand 953,638 431,173 246,553 12,968 138,128 124,816 471 39902 Other Tangible Property - Servers - S/W 6.4 P, S, T & D Plant - Demand 575,990 260,425 148,916 7,833 83,428 75,388 472 39903 Other Tangible Property - Network - H/W 6.4 P, S, T & D Plant - Demand 181,658 82,134 46,966 2,470 26,312 23,776 473 39904 Other Tang. Property - CPU 6.4 P, S, T & D Plant - Demand 0 - - - - - 474 39905 Other Tangible Property - MF - Hardware 6.4 P, S, T & D Plant - Demand 0 - - - - - 475 39906 Other Tang. Property - PC Hardware 6.4 P, S, T & D Plant - Demand 64,014 28,943 16,550 870 9,272 8,378 476 39907 Other Tang. Property - PC Software 6.4 P, S, T & D Plant - Demand 35,409 16,010 9,155 482 5,129 4,634 477 39908 Other Tang. Property - Mainframe S/W 6.4 P, S, T & D Plant - Demand 1,593,406 720,434 411,958 21,668 230,794 208,552 478 39909 Other Tang. Property - Application Software 6.4 P, S, T & D Plant - Demand 543,351 245,668 140,478 7,389 78,701 71,116 479 39931 Other Tang. Property - ALGN 6.4 P, S, T & D Plant - Demand 0 - - - - - 480481 Total General Plant 4,391,562 1,985,577 1,135,392 59,719 636,088 574,787482483 CWIP w/o AFUDC 6.4 P, S, T & D Plant - Demand 307,352 138,965 79,463 4,180 44,518 40,228 484485 Shared Services Customer Support:486487 General:488489 37400 Land & Land Rights 6.4 P, S, T & D Plant - Demand 84,557 38,231 21,861 1,150 12,248 11,067 490 39001 Structures Frame 6.4 P, S, T & D Plant - Demand 0 - - - - - 491 36602 Structures & Improvements 6.4 P, S, T & D Plant - Demand 410,714 185,698 106,186 5,585 59,489 53,756 492 37503 Improvements 6.4 P, S, T & D Plant - Demand 0 - - - - - 493 39004 Air Conditioning Equipment 6.4 P, S, T & D Plant - Demand 0 - - - - - 494 39009 Improvement to leased Premises 6.4 P, S, T & D Plant - Demand 65,351 29,547 16,896 889 9,466 8,553 495 39100 Office Furniture & Equipment 6.4 P, S, T & D Plant - Demand 63,533 28,726 16,426 864 9,202 8,316 496 39102 Remittance Processing Equip 6.4 P, S, T & D Plant - Demand 0 - - - - - 497 39103 Office Machines 6.4 P, S, T & D Plant - Demand 0 - - - - - 498 39200 Transportation Equipment 6.4 P, S, T & D Plant - Demand 917 415 237 12 133 120 499 39201 Trucks 6.4 P, S, T & D Plant - Demand 0 - - - - - 500 39202 Trailers 6.4 P, S, T & D Plant - Demand 0 - - - - - 501 39300 Stores Equipment 6.4 P, S, T & D Plant - Demand 0 - - - - - 502 39400 Tools, Shop & Garage Equipment 6.4 P, S, T & D Plant - Demand 5,788 2,617 1,496 79 838 758 503 39600 Power Operated Equipment 6.4 P, S, T & D Plant - Demand 225 102 58 3 33 29 504 39603 Ditchers 6.4 P, S, T & D Plant - Demand 0 - - - - - 505 39604 Backhoes 6.4 P, S, T & D Plant - Demand 0 - - - - - 506 39605 Welders 6.4 P, S, T & D Plant - Demand 0 - - - - - 507 39700 Communication Equipment 6.4 P, S, T & D Plant - Demand 47,101 21,296 12,177 641 6,822 6,165 508 39701 Communication Equipment - Mobile Radios 6.4 P, S, T & D Plant - Demand 0 - - - - - 509 39702 Communication Equipment - Fixed Radios 6.4 P, S, T & D Plant - Demand 0 - - - - - 510 39705 Communication Equip. - Telemetering 6.4 P, S, T & D Plant - Demand 0 - - - - - 511 39800 Miscellaneous Equipment 6.4 P, S, T & D Plant - Demand 6,472 2,926 1,673 88 937 847 512 39900 Other Tangible Property 6.4 P, S, T & D Plant - Demand 17,812 8,053 4,605 242 2,580 2,331 513 39901 Other Tangible Property - Servers - H/W 6.4 P, S, T & D Plant - Demand 239,643 108,351 61,957 3,259 34,711 31,366 514 39902 Other Tangible Property - Servers - S/W 6.4 P, S, T & D Plant - Demand 46,893 21,202 12,124 638 6,792 6,138 515 39903 Other Tangible Property - Network - H/W 6.4 P, S, T & D Plant - Demand 14,579 6,591 3,769 198 2,112 1,908 516 39904 Other Tang. Property - CPU 6.4 P, S, T & D Plant - Demand 0 - - - - - 517 39905 Other Tangible Property - MF - Hardware 6.4 P, S, T & D Plant - Demand 0 - - - - - 518 39906 Other Tang. Property - PC Hardware 6.4 P, S, T & D Plant - Demand 28,533 12,901 7,377 388 4,133 3,735 519 39907 Other Tang. Property - PC Software 6.4 P, S, T & D Plant - Demand 5,397 2,440 1,395 73 782 706 520 39908 Other Tang. Property - Mainframe S/W 6.4 P, S, T & D Plant - Demand 2,155,711 974,671 557,336 29,315 312,240 282,149 521 39909 Other Tang. Property - Application Software 6.4 P, S, T & D Plant - Demand 196 89 51 3 28 26 522 39924 Other Tang. Property - General Startup Costs 6.4 P, S, T & D Plant - Demand 0 - - - - - 523524 Total General Plant 3,193,421 1,443,856 825,625 43,426 462,545 417,969525526 CWIP w/o AFUDC 6.4 P, S, T & D Plant - Demand 92,301 41,732 23,863 1,255 13,369 12,081 527528 TOTAL PLANT IN SERVICE - DEMAND 297,628,594 134,568,148 76,948,715 4,047,315 43,109,470 38,954,947529530 TOTAL CWIP W/O AFUDC - DEMAND 16,071,144 7,266,318 4,155,024 218,544 2,327,796 2,103,462

Exhibit PHR-4Page 26 of 75
Atmos Energy Corporation, Kentucky/Mid-States DivisionClass Cost of Service - Demand/Commodity StudyForecasted Test Period: Twelve Months Ended March 31, 2020
ALLOCATION OF PLANT IN SERVICE
Commodity
Allocation Allocation Total Residential Non-Res Sales Non-Res Sales Transport TransportLine Acct. Factor Basis Company Sales Firm Interruptible Firm InterruptibleNo. No.
531 Intangible Plant:532533 30100 Organization 6.6 P, S, T & D Plant - Commodity 1,679 515 347 17 377 422 534 30200 Franchises & Consents 6.6 P, S, T & D Plant - Commodity 24,163 7,417 4,997 249 5,428 6,073 535 30300 Misc Intangible Plant 99.0 - 0 - - - - - 536537 Total Intangible Plant: 25,843 7,932 5,344 266 5,805 6,496538539 Production Plant:540541 32520 Producing Leaseholds 99.0 - 0 - - - - - 542 32540 Rights of Ways 99.0 - 0 - - - - - 543 33100 Production Gas Wells Equipment 99.0 - 0 - - - - - 544 33201 Field Lines 99.0 - 0 - - - - - 545 33202 Tributary Lines 99.0 - 0 - - - - - 546 33400 Field Meas. & Reg. Sta. Equip 99.0 - 0 - - - - - 547 33600 Purification Equipment 99.0 - 0 - - - - - 548549 Total Production Plant 0 0 0 0 0 0550551 Storage Plant:552553 35010 Land 1.5 Winter Volumes 130,563 49,435 30,589 1,673 24,001 24,865 554 35020 Rights of Way 1.5 Winter Volumes 2,341 886 548 30 430 446 555 35100 Structures and Improvements 1.5 Winter Volumes 8,958 3,392 2,099 115 1,647 1,706 556 35102 Compression Station Equipment 1.5 Winter Volumes 76,631 29,015 17,954 982 14,087 14,594 557 35103 Meas. & Reg. Sta. Structues 1.5 Winter Volumes 11,569 4,380 2,711 148 2,127 2,203 558 35104 Other Structures 1.5 Winter Volumes 68,721 26,020 16,101 880 12,633 13,087 559 35200 Wells \ Rights of Way 1.5 Winter Volumes 4,174,198 1,580,473 977,961 53,480 767,344 794,940 560 35201 Well Construction 1.5 Winter Volumes 849,999 321,834 199,144 10,890 156,256 161,875 561 35202 Well Equipment 1.5 Winter Volumes 224,655 85,061 52,634 2,878 41,298 42,784 562 35203 Cushion Gas 1.5 Winter Volumes 847,416 320,857 198,539 10,857 155,781 161,383 563 35210 Leaseholds 1.5 Winter Volumes 89,265 33,798 20,914 1,144 16,410 17,000 564 35211 Storage Rights 1.5 Winter Volumes 27,307 10,339 6,398 350 5,020 5,200 565 35301 Field Lines 1.5 Winter Volumes 87,675 33,196 20,541 1,123 16,117 16,697 566 35302 Tributary Lines 1.5 Winter Volumes 104,659 39,627 24,520 1,341 19,240 19,931 567 35400 Compressor Station Equipment 1.5 Winter Volumes 461,723 174,822 108,176 5,916 84,879 87,931 568 35500 Meas & Reg. Equipment 1.5 Winter Volumes 136,542 51,699 31,990 1,749 25,101 26,003 569 35600 Purification Equipment 1.5 Winter Volumes 207,332 78,502 48,575 2,656 38,114 39,485 570571 Total Storage Plant 7,509,555 2,843,336 1,759,393 96,213 1,380,484 1,430,130572573 Transmission:574575 36510 Land & Land Rights 99.0 - 0 - - - - - 576 36520 Rights of Way 99.0 - 0 - - - - - 577 36602 Structures & Improvements 99.0 - 0 - - - - - 578 36603 Other Structues 99.0 - 0 - - - - - 579 36700 Mains Cathodic Protection 99.0 - 0 - - - - - 580 36701 Mains - Steel 99.0 - 0 - - - - - 581 36900 Meas. & Reg. Equipment 99.0 - 0 - - - - - 582 36901 Meas. & Reg. Equipment 99.0 - 0 - - - - - 583584 Total Transmission Plant 0 0 0 0 0 0585586 Distribution:587588 37400 Land & Land Rights 1.0 Mcf 185,914 56,296 38,151 1,885 42,198 47,383 589 37401 Land 1.0 Mcf 13,065 3,956 2,681 132 2,965 3,330 590 37402 Land Rights 1.0 Mcf 1,276,049 386,400 261,857 12,937 289,632 325,223 591 37403 Land Other 1.0 Mcf 974 295 200 10 221 248 592 37500 Structures & Improvements 1.0 Mcf 117,662 35,629 24,145 1,193 26,706 29,988 593 37501 Structures & Improvements T.B. 1.0 Mcf 34,937 10,579 7,169 354 7,930 8,904 594 37502 Land Rights 1.0 Mcf 16,193 4,903 3,323 164 3,675 4,127 595 37503 Improvements 1.0 Mcf 1,402 424 288 14 318 357 596 37600 Mains Cathodic Protection 1.0 Mcf 7,214,250 2,184,544 1,480,433 73,140 1,637,460 1,838,674 597 37601 Mains - Steel 1.0 Mcf 61,610,725 18,656,317 12,643,106 624,623 13,984,143 15,702,537 598 37602 Mains - Plastic 1.0 Mcf 46,643,031 14,123,956 9,571,593 472,877 10,586,839 11,887,767 599 37800 Meas & Reg. Sta. Equip - General 1.0 Mcf 10,469,475 3,170,257 2,148,436 106,142 2,376,317 2,668,323 600 37900 Meas & Reg. Sta. Equip - City Gate 1.0 Mcf 1,794,164 543,290 368,179 18,190 407,232 457,273 601 37905 Meas & Reg. Sta. Equipment T.b. 1.0 Mcf 578,307 175,117 118,674 5,863 131,262 147,391 602 38000 Services 99.0 - 0 - - - - - 603 38100 Meters 99.0 - 0 - - - - - 604 38200 Meter Installaitons 99.0 - 0 - - - - - 605 38300 House Regulators 99.0 - 0 - - - - - 606 38400 House Reg. Installations 99.0 - 0 - - - - - 607 38500 Ind. Meas. & Reg. Sta. Equipment 99.0 - 0 - - - - - 608 38600 Other Prop. On Cust. Prem 99.0 - 0 - - - - - 609610 Total Distribution Plant 129,956,149 39,351,965 26,668,236 1,317,523 29,496,899 33,121,526

Exhibit PHR-4Page 27 of 75
Atmos Energy Corporation, Kentucky/Mid-States DivisionClass Cost of Service - Demand/Commodity StudyForecasted Test Period: Twelve Months Ended March 31, 2020
ALLOCATION OF PLANT IN SERVICE611612 General:613614 38900 Land & Land Rights 6.6 P, S, T & D Plant - Commodity 244,290 74,985 50,519 2,512 54,872 61,402 615 39000 Structures & Improvements 6.6 P, S, T & D Plant - Commodity 1,531,344 470,048 316,679 15,749 343,969 384,899 616 39001 Structures Frame 6.6 P, S, T & D Plant - Commodity 0 - - - - - 617 39002 Structures-Brick 6.6 P, S, T & D Plant - Commodity 34,902 10,713 7,218 359 7,840 8,772 618 39003 Improvements 6.6 P, S, T & D Plant - Commodity 142,981 43,888 29,568 1,470 32,116 35,938 619 39004 Air Conditioning Equipment 6.6 P, S, T & D Plant - Commodity 2,612 802 540 27 587 656 620 39009 Improvement to leased Premises 6.6 P, S, T & D Plant - Commodity 251,244 77,120 51,957 2,584 56,434 63,150 621 39100 Office Furniture & Equipment 6.6 P, S, T & D Plant - Commodity 376,211 115,478 77,800 3,869 84,504 94,560 622 39102 Remittance Processing Equip 6.6 P, S, T & D Plant - Commodity 0 - - - - - 623 39103 Office Machines 6.6 P, S, T & D Plant - Commodity 0 - - - - - 624 39200 Transportation Equipment 6.6 P, S, T & D Plant - Commodity 44,553 13,676 9,213 458 10,007 11,198 625 39201 Trucks 6.6 P, S, T & D Plant - Commodity 0 - - - - - 626 39202 Trailers 6.6 P, S, T & D Plant - Commodity 0 - - - - - 627 39300 Stores Equipment 6.6 P, S, T & D Plant - Commodity 0 - - - - - 628 39400 Tools, Shop & Garage Equipment 6.6 P, S, T & D Plant - Commodity 822,236 252,386 170,037 8,456 184,690 206,667 629 39600 Power Operated Equipment 6.6 P, S, T & D Plant - Commodity 0 - - - - - 630 39603 Ditchers 6.6 P, S, T & D Plant - Commodity 7,986 2,451 1,651 82 1,794 2,007 631 39604 Backhoes 6.6 P, S, T & D Plant - Commodity 12,650 3,883 2,616 130 2,842 3,180 632 39605 Welders 6.6 P, S, T & D Plant - Commodity 3,917 1,202 810 40 880 984 633 39700 Communication Equipment 6.6 P, S, T & D Plant - Commodity 105,695 32,443 21,858 1,087 23,741 26,566 634 39701 Communication Equipment - Mobile Radios 6.6 P, S, T & D Plant - Commodity 0 - - - - - 635 39702 Communication Equipment - Fixed Radios 6.6 P, S, T & D Plant - Commodity 0 - - - - - 636 39705 Communication Equip. - Telemetering 6.6 P, S, T & D Plant - Commodity 0 - - - - - 637 39800 Miscellaneous Equipment 6.6 P, S, T & D Plant - Commodity 784,618 240,840 162,257 8,069 176,240 197,212 638 39900 Other Tangible Property 6.6 P, S, T & D Plant - Commodity 0 - - - - - 639 39901 Other Tangible Property - Servers - H/W 6.6 P, S, T & D Plant - Commodity 2,901 891 600 30 652 729 640 39902 Other Tangible Property - Servers - S/W 6.6 P, S, T & D Plant - Commodity 0 - - - - - 641 39903 Other Tangible Property - Network - H/W 6.6 P, S, T & D Plant - Commodity 27,136 8,330 5,612 279 6,095 6,821 642 39904 Other Tang. Property - CPU 6.6 P, S, T & D Plant - Commodity 0 - - - - - 643 39905 Other Tangible Property - MF - Hardware 6.6 P, S, T & D Plant - Commodity 0 - - - - - 644 39906 Other Tang. Property - PC Hardware 6.6 P, S, T & D Plant - Commodity 93,121 28,584 19,257 958 20,917 23,406 645 39907 Other Tang. Property - PC Software 6.6 P, S, T & D Plant - Commodity 0 - - - - - 646 39908 Other Tang. Property - Mainframe S/W 6.6 P, S, T & D Plant - Commodity 24,902 7,644 5,150 256 5,593 6,259 647 39909 Other Tang. Property - Application Software 6.6 P, S, T & D Plant - Commodity 0 - - - - - 648 39924 Other Tang. Property - General Startup Costs 6.6 P, S, T & D Plant - Commodity 0 - - - - - 649650 Total General Plant 4,513,298 1,385,364 933,341 46,416 1,013,772 1,134,406651652 TOTAL DIRECT PLANT 142,004,845 43,588,597 29,366,314 1,460,417 31,896,960 35,692,558653654 CWIP w/o AFUDC 6.6 P, S, T & D Plant - Commodity 7,692,367 2,361,184 1,590,766 79,110 1,727,850 1,933,457 655656 Kentucky Mid-States General Office:657658 Intangible Plant:659660 30100 Organization 6.6 P, S, T & D Plant - Commodity 18,598 5,709 3,846 191 4,177 4,675 661 30200 Franchises & Consents 6.6 P, S, T & D Plant - Commodity 0 - - - - - 662 30300 Misc Intangible Plant 6.6 P, S, T & D Plant - Commodity 111,356 34,181 23,028 1,145 25,013 27,989 663664 Total Intangible Plant: 129,954 39,889 26,874 1,336 29,190 32,664665666 General:667668 37400 Land & Land Rights 6.6 P, S, T & D Plant - Commodity 0 - - - - - 669 39001 Structures Frame 6.6 P, S, T & D Plant - Commodity 17,999 5,525 3,722 185 4,043 4,524 670 36602 Structures & Improvements 6.6 P, S, T & D Plant - Commodity 0 - - - - - 671 38900 Land & Land Rights 6.6 P, S, T & D Plant - Commodity 0 - - - - - 672 39004 Air Conditioning Equipment 6.6 P, S, T & D Plant - Commodity 1,544 474 319 16 347 388 673 39009 Improvement to leased Premises 6.6 P, S, T & D Plant - Commodity 3,897 1,196 806 40 875 980 674 39100 Office Furniture & Equipment 6.6 P, S, T & D Plant - Commodity 3,875 1,189 801 40 870 974 675 39102 Remittance Processing Equip 6.6 P, S, T & D Plant - Commodity 0 - - - - - 676 39103 Office Machines 6.6 P, S, T & D Plant - Commodity 0 - - - - - 677 39200 Transportation Equipment 6.6 P, S, T & D Plant - Commodity 2,738 841 566 28 615 688 678 39201 Trucks 6.6 P, S, T & D Plant - Commodity 0 - - - - - 679 39202 Trailers 6.6 P, S, T & D Plant - Commodity 0 - - - - - 680 39300 Stores Equipment 6.6 P, S, T & D Plant - Commodity 0 - - - - - 681 39400 Tools, Shop & Garage Equipment 6.6 P, S, T & D Plant - Commodity 17,650 5,418 3,650 182 3,965 4,436 682 39600 Power Operated Equipment 6.6 P, S, T & D Plant - Commodity 2,059 632 426 21 462 518 683 39603 Ditchers 6.6 P, S, T & D Plant - Commodity 0 - - - - - 684 39604 Backhoes 6.6 P, S, T & D Plant - Commodity 0 - - - - - 685 39605 Welders 6.6 P, S, T & D Plant - Commodity 0 - - - - - 686 39700 Communication Equipment 6.6 P, S, T & D Plant - Commodity 3,768 1,156 779 39 846 947 687 39701 Communication Equipment - Mobile Radios 6.6 P, S, T & D Plant - Commodity 0 - - - - - 688 39702 Communication Equipment - Fixed Radios 6.6 P, S, T & D Plant - Commodity 0 - - - - - 689 39705 Communication Equip. - Telemetering 6.6 P, S, T & D Plant - Commodity 0 - - - - - 690 39800 Miscellaneous Equipment 6.6 P, S, T & D Plant - Commodity 81,711 25,081 16,898 840 18,354 20,538 691 39900 Other Tangible Property 6.6 P, S, T & D Plant - Commodity 0 - - - - - 692 39901 Other Tangible Property - Servers - H/W 6.6 P, S, T & D Plant - Commodity 0 - - - - - 693 39902 Other Tangible Property - Servers - S/W 6.6 P, S, T & D Plant - Commodity 0 - - - - - 694 39903 Other Tangible Property - Network - H/W 6.6 P, S, T & D Plant - Commodity 0 - - - - - 695 39904 Other Tang. Property - CPU 6.6 P, S, T & D Plant - Commodity 0 - - - - - 696 39905 Other Tangible Property - MF - Hardware 6.6 P, S, T & D Plant - Commodity 0 - - - - - 697 39906 Other Tang. Property - PC Hardware 6.6 P, S, T & D Plant - Commodity 7,043 2,162 1,457 72 1,582 1,770 698 39907 Other Tang. Property - PC Software 6.6 P, S, T & D Plant - Commodity 16,590 5,092 3,431 171 3,726 4,170 699 39908 Other Tang. Property - Mainframe S/W 6.6 P, S, T & D Plant - Commodity 83,150 25,523 17,195 855 18,677 20,900 700 39909 Other Tang. Property - Application Software 6.6 P, S, T & D Plant - Commodity 0 - - - - - 701 39924 Other Tang. Property - General Startup Costs 6.6 P, S, T & D Plant - Commodity 0 - - - - - 702703 Total General Plant 242,024 74,290 50,050 2,489 54,363 60,832704705 CWIP w/o AFUDC 6.6 P, S, T & D Plant - Commodity 466 143 96 5 105 117

Exhibit PHR-4Page 28 of 75
Atmos Energy Corporation, Kentucky/Mid-States DivisionClass Cost of Service - Demand/Commodity StudyForecasted Test Period: Twelve Months Ended March 31, 2020
ALLOCATION OF PLANT IN SERVICE706707 Shared Services General Office:708709 General:710711 37400 Land & Land Rights 6.6 P, S, T & D Plant - Commodity 0 - - - - - 712 39001 Structures Frame 6.6 P, S, T & D Plant - Commodity 0 - - - - - 713 36602 Structures & Improvements 6.6 P, S, T & D Plant - Commodity 47,665 14,631 9,857 490 10,707 11,981 714 37503 Improvements 6.6 P, S, T & D Plant - Commodity 0 - - - - - 715 39004 Air Conditioning Equipment 6.6 P, S, T & D Plant - Commodity 0 - - - - - 716 39009 Improvement to leased Premises 6.6 P, S, T & D Plant - Commodity 97,449 29,912 20,152 1,002 21,889 24,494 717 39100 Office Furniture & Equipment 6.6 P, S, T & D Plant - Commodity 57,845 17,756 11,962 595 12,993 14,539 718 39102 Remittance Processing Equip 6.6 P, S, T & D Plant - Commodity 0 - - - - - 719 39103 Office Machines 6.6 P, S, T & D Plant - Commodity 0 - - - - - 720 39200 Transportation Equipment 6.6 P, S, T & D Plant - Commodity 74 23 15 1 17 19 721 39201 Trucks 6.6 P, S, T & D Plant - Commodity 0 - - - - - 722 39202 Trailers 6.6 P, S, T & D Plant - Commodity 0 - - - - - 723 39300 Stores Equipment 6.6 P, S, T & D Plant - Commodity 0 - - - - - 724 39400 Tools, Shop & Garage Equipment 6.6 P, S, T & D Plant - Commodity 794 244 164 8 178 200 725 39600 Power Operated Equipment 6.6 P, S, T & D Plant - Commodity 0 - - - - - 726 39603 Ditchers 6.6 P, S, T & D Plant - Commodity 0 - - - - - 727 39604 Backhoes 6.6 P, S, T & D Plant - Commodity 0 - - - - - 728 39605 Welders 6.6 P, S, T & D Plant - Commodity 0 - - - - - 729 39700 Communication Equipment 6.6 P, S, T & D Plant - Commodity 10,961 3,365 2,267 113 2,462 2,755 730 39701 Communication Equipment - Mobile Radios 6.6 P, S, T & D Plant - Commodity 0 - - - - - 731 39702 Communication Equipment - Fixed Radios 6.6 P, S, T & D Plant - Commodity 0 - - - - - 732 39705 Communication Equip. - Telemetering 6.6 P, S, T & D Plant - Commodity 0 - - - - - 733 39800 Miscellaneous Equipment 6.6 P, S, T & D Plant - Commodity 1,520 466 314 16 341 382 734 39900 Other Tangible Property 6.6 P, S, T & D Plant - Commodity 1,689 518 349 17 379 425 735 39901 Other Tangible Property - Servers - H/W 6.6 P, S, T & D Plant - Commodity 468,123 143,691 96,807 4,814 105,149 117,661 736 39902 Other Tangible Property - Servers - S/W 6.6 P, S, T & D Plant - Commodity 282,743 86,788 58,471 2,908 63,509 71,067 737 39903 Other Tangible Property - Network - H/W 6.6 P, S, T & D Plant - Commodity 89,172 27,372 18,441 917 20,030 22,413 738 39904 Other Tang. Property - CPU 6.6 P, S, T & D Plant - Commodity 0 - - - - - 739 39905 Other Tangible Property - MF - Hardware 6.6 P, S, T & D Plant - Commodity 0 - - - - - 740 39906 Other Tang. Property - PC Hardware 6.6 P, S, T & D Plant - Commodity 31,423 9,645 6,498 323 7,058 7,898 741 39907 Other Tang. Property - PC Software 6.6 P, S, T & D Plant - Commodity 17,382 5,335 3,594 179 3,904 4,369 742 39908 Other Tang. Property - Mainframe S/W 6.6 P, S, T & D Plant - Commodity 782,172 240,089 161,752 8,044 175,691 196,597 743 39909 Other Tang. Property - Application Software 6.6 P, S, T & D Plant - Commodity 266,720 81,870 55,157 2,743 59,910 67,039 744 39931 Other Tang. Property - ALGN 6.6 P, S, T & D Plant - Commodity 0 - - - - - 745746 Total General Plant 2,155,733 661,706 445,801 22,170 484,218 541,838747748 CWIP w/o AFUDC 6.6 P, S, T & D Plant - Commodity 150,873 46,311 31,200 1,552 33,889 37,922 749750 Shared Services Customer Support:751752 General:753754 37400 Land & Land Rights 6.6 P, S, T & D Plant - Commodity 41,508 12,741 8,584 427 9,323 10,433 755 39001 Structures Frame 6.6 P, S, T & D Plant - Commodity 0 - - - - - 756 36602 Structures & Improvements 6.6 P, S, T & D Plant - Commodity 201,612 61,885 41,693 2,073 45,286 50,675 757 37503 Improvements 6.6 P, S, T & D Plant - Commodity 0 - - - - - 758 39004 Air Conditioning Equipment 6.6 P, S, T & D Plant - Commodity 0 - - - - - 759 39009 Improvement to leased Premises 6.6 P, S, T & D Plant - Commodity 32,079 9,847 6,634 330 7,206 8,063 760 39100 Office Furniture & Equipment 6.6 P, S, T & D Plant - Commodity 31,187 9,573 6,449 321 7,005 7,839 761 39102 Remittance Processing Equip 6.6 P, S, T & D Plant - Commodity 0 - - - - - 762 39103 Office Machines 6.6 P, S, T & D Plant - Commodity 0 - - - - - 763 39200 Transportation Equipment 6.6 P, S, T & D Plant - Commodity 450 138 93 5 101 113 764 39201 Trucks 6.6 P, S, T & D Plant - Commodity 0 - - - - - 765 39202 Trailers 6.6 P, S, T & D Plant - Commodity 0 - - - - - 766 39300 Stores Equipment 6.6 P, S, T & D Plant - Commodity 0 - - - - - 767 39400 Tools, Shop & Garage Equipment 6.6 P, S, T & D Plant - Commodity 2,841 872 588 29 638 714 768 39600 Power Operated Equipment 6.6 P, S, T & D Plant - Commodity 110 34 23 1 25 28 769 39603 Ditchers 6.6 P, S, T & D Plant - Commodity 0 - - - - - 770 39604 Backhoes 6.6 P, S, T & D Plant - Commodity 0 - - - - - 771 39605 Welders 6.6 P, S, T & D Plant - Commodity 0 - - - - - 772 39700 Communication Equipment 6.6 P, S, T & D Plant - Commodity 23,121 7,097 4,781 238 5,193 5,811 773 39701 Communication Equipment - Mobile Radios 6.6 P, S, T & D Plant - Commodity 0 - - - - - 774 39702 Communication Equipment - Fixed Radios 6.6 P, S, T & D Plant - Commodity 0 - - - - - 775 39705 Communication Equip. - Telemetering 6.6 P, S, T & D Plant - Commodity 0 - - - - - 776 39800 Miscellaneous Equipment 6.6 P, S, T & D Plant - Commodity 3,177 975 657 33 714 799 777 39900 Other Tangible Property 6.6 P, S, T & D Plant - Commodity 8,743 2,684 1,808 90 1,964 2,198 778 39901 Other Tangible Property - Servers - H/W 6.6 P, S, T & D Plant - Commodity 117,636 36,109 24,327 1,210 26,423 29,568 779 39902 Other Tangible Property - Servers - S/W 6.6 P, S, T & D Plant - Commodity 23,019 7,066 4,760 237 5,170 5,786 780 39903 Other Tangible Property - Network - H/W 6.6 P, S, T & D Plant - Commodity 7,156 2,197 1,480 74 1,607 1,799 781 39904 Other Tang. Property - CPU 6.6 P, S, T & D Plant - Commodity 0 - - - - - 782 39905 Other Tangible Property - MF - Hardware 6.6 P, S, T & D Plant - Commodity 0 - - - - - 783 39906 Other Tang. Property - PC Hardware 6.6 P, S, T & D Plant - Commodity 14,006 4,299 2,896 144 3,146 3,520 784 39907 Other Tang. Property - PC Software 6.6 P, S, T & D Plant - Commodity 2,649 813 548 27 595 666 785 39908 Other Tang. Property - Mainframe S/W 6.6 P, S, T & D Plant - Commodity 1,058,197 324,815 218,833 10,883 237,691 265,975 786 39909 Other Tang. Property - Application Software 6.6 P, S, T & D Plant - Commodity 96 30 20 1 22 24 787 39924 Other Tang. Property - General Startup Costs 6.6 P, S, T & D Plant - Commodity 0 - - - - - 788789 Total General Plant 1,567,589 481,174 324,174 16,122 352,110 394,010790791 CWIP w/o AFUDC 6.6 P, S, T & D Plant - Commodity 45,309 13,908 9,370 466 10,177 11,388 792793 TOTAL PLANT IN SERVICE - COMMODITY 146,100,145 44,845,655 30,213,213 1,502,535 32,816,841 36,721,901794795 TOTAL CWIP W/O AFUDC - COMMODITY 7,889,015 2,421,545 1,631,432 81,133 1,772,021 1,982,884

Exhibit PHR-4Page 29 of 75
Atmos Energy Corporation, Kentucky/Mid-States DivisionClass Cost of Service - Demand/Commodity StudyForecasted Test Period: Twelve Months Ended March 31, 2020
ALLOCATION OF PLANT IN SERVICE
Total Plant in Service
Allocation Allocation Total Residential Non-Res Sales Non-Res Sales Transport TransportLine Acct. Factor Basis Company Sales Firm Interruptible Firm InterruptibleNo. No.
796 Intangible Plant:797798 30100 Organization 8,330 4,555 1,934 65 894 882 799 30200 Franchises & Consents 119,853 65,537 27,826 942 12,860 12,687 800 30300 Misc Intangible Plant 0 - - - - - 801802 Total Intangible Plant: 128,182 70,092 29,760 1,008 13,754 13,569803804 Production Plant:805806 32520 Producing Leaseholds 0 - - - - - 807 32540 Rights of Ways 0 - - - - - 808 33100 Production Gas Wells Equipment 0 - - - - - 809 33201 Field Lines 0 - - - - - 810 33202 Tributary Lines 0 - - - - - 811 33400 Field Meas. & Reg. Sta. Equip 0 - - - - - 812 33600 Purification Equipment 0 - - - - - 813814 Total Production Plant 0 0 0 0 0 0815816 Storage Plant:817818 35010 Land 261,127 108,467 64,345 3,448 42,913 41,953 819 35020 Rights of Way 4,682 1,945 1,154 62 769 752 820 35100 Structures and Improvements 17,916 7,442 4,415 237 2,944 2,878 821 35102 Compression Station Equipment 153,261 63,662 37,766 2,024 25,186 24,623 822 35103 Meas. & Reg. Sta. Structues 23,138 9,611 5,702 306 3,802 3,717 823 35104 Other Structures 137,443 57,091 33,868 1,815 22,587 22,082 824 35200 Wells \ Rights of Way 8,348,396 3,467,772 2,057,156 110,243 1,371,948 1,341,277 825 35201 Well Construction 1,699,999 706,148 418,902 22,449 279,372 273,127 826 35202 Well Equipment 449,309 186,635 110,716 5,933 73,838 72,187 827 35203 Cushion Gas 1,694,833 704,003 417,629 22,381 278,523 272,297 828 35210 Leaseholds 178,530 74,158 43,992 2,358 29,339 28,683 829 35211 Storage Rights 54,614 22,686 13,458 721 8,975 8,774 830 35301 Field Lines 175,350 72,837 43,209 2,316 28,817 28,172 831 35302 Tributary Lines 209,319 86,947 51,579 2,764 34,399 33,630 832 35400 Compressor Station Equipment 923,446 383,583 227,549 12,194 151,756 148,364 833 35500 Meas & Reg. Equipment 273,084 113,434 67,292 3,606 44,878 43,875 834 35600 Purification Equipment 414,663 172,244 102,179 5,476 68,144 66,621 835836 Total Storage Plant 15,019,110 6,238,665 3,700,909 198,331 2,468,192 2,413,014837838 Transmission:839840 36510 Land & Land Rights 26,970 12,194 6,973 367 3,906 3,530 841 36520 Rights of Way 867,772 392,350 224,353 11,800 125,691 113,578 842 36602 Structures & Improvements 49,002 22,155 12,669 666 7,098 6,414 843 36603 Other Structues 60,826 27,502 15,726 827 8,810 7,961 844 36700 Mains Cathodic Protection 139,638 63,135 36,102 1,899 20,226 18,276 845 36701 Mains - Steel 27,047,831 12,229,257 6,992,930 367,811 3,917,694 3,540,140 846 36900 Meas. & Reg. Equipment 731,467 330,721 189,113 9,947 105,948 95,738 847 36901 Meas. & Reg. Equipment 2,269,556 1,026,144 586,770 30,863 328,730 297,050 848849 Total Transmission Plant 31,193,061 14,103,458 8,064,635 424,180 4,518,102 4,082,686850851 Distribution:852853 37400 Land & Land Rights 531,167 212,397 127,413 6,580 92,205 92,572 854 37401 Land 37,326 14,926 8,954 462 6,480 6,505 855 37402 Land Rights 3,645,749 1,457,823 874,518 45,161 632,867 635,380 856 37403 Land Other 2,784 1,113 668 34 483 485 857 37500 Structures & Improvements 336,168 134,423 80,638 4,164 58,355 58,587 858 37501 Structures & Improvements T.B. 99,818 39,914 23,944 1,236 17,327 17,396 859 37502 Land Rights 46,264 18,500 11,098 573 8,031 8,063 860 37503 Improvements 4,005 1,602 961 50 695 698 861 37600 Mains Cathodic Protection 20,611,541 8,241,921 4,944,160 255,323 3,577,966 3,592,171 862 37601 Mains - Steel 176,025,498 70,387,180 42,223,831 2,180,497 30,556,342 30,677,649 863 37602 Mains - Plastic 133,261,910 53,287,337 31,965,985 1,650,767 23,132,992 23,224,829 864 37800 Meas & Reg. Sta. Equip - General 29,911,913 11,960,854 7,175,072 370,531 5,192,422 5,213,035 865 37900 Meas & Reg. Sta. Equip - City Gate 5,126,032 2,049,742 1,229,599 63,498 889,830 893,363 866 37905 Meas & Reg. Sta. Equipment T.b. 1,652,259 660,687 396,333 20,467 286,816 287,955 867 38000 Services 150,274,437 133,824,243 16,279,918 8,273 103,453 58,550 868 38100 Meters 38,722,015 24,980,781 12,812,487 45,125 564,268 319,353 869 38200 Meter Installaitons 57,067,155 36,815,804 18,882,597 66,503 831,599 470,652 870 38300 House Regulators 12,779,948 8,244,744 4,228,678 14,893 186,233 105,401 871 38400 House Reg. Installations 252,587 162,952 83,577 294 3,681 2,083 872 38500 Ind. Meas. & Reg. Sta. Equipment 5,241,043 - 5,186,793 2,636 32,960 18,654 873 38600 Other Prop. On Cust. Prem 0 - - - - - 874875 Total Distribution Plant 635,629,619 352,496,943 146,537,219 4,737,069 66,175,007 65,683,380

Exhibit PHR-4Page 30 of 75
Atmos Energy Corporation, Kentucky/Mid-States DivisionClass Cost of Service - Demand/Commodity StudyForecasted Test Period: Twelve Months Ended March 31, 2020
ALLOCATION OF PLANT IN SERVICE876877 General:878879 38900 Land & Land Rights 1,211,697 662,570 281,319 9,524 130,015 128,269 880 39000 Structures & Improvements 7,595,600 4,153,363 1,763,465 59,705 815,004 804,062 881 39001 Structures Frame 0 - - - - - 882 39002 Structures-Brick 173,115 94,661 40,192 1,361 18,575 18,326 883 39003 Improvements 709,199 387,798 164,654 5,575 76,097 75,075 884 39004 Air Conditioning Equipment 12,955 7,084 3,008 102 1,390 1,371 885 39009 Improvement to leased Premises 1,246,194 681,434 289,328 9,796 133,716 131,921 886 39100 Office Furniture & Equipment 1,866,038 1,020,371 433,237 14,668 200,225 197,537 887 39102 Remittance Processing Equip 0 - - - - - 888 39103 Office Machines 0 - - - - - 889 39200 Transportation Equipment 220,987 120,838 51,306 1,737 23,712 23,393 890 39201 Trucks 0 - - - - - 891 39202 Trailers 0 - - - - - 892 39300 Stores Equipment 0 - - - - - 893 39400 Tools, Shop & Garage Equipment 4,078,361 2,230,095 946,870 32,058 437,606 431,731 894 39600 Power Operated Equipment 0 - - - - - 895 39603 Ditchers 39,610 21,659 9,196 311 4,250 4,193 896 39604 Backhoes 62,747 34,311 14,568 493 6,733 6,642 897 39605 Welders 19,427 10,623 4,510 153 2,085 2,057 898 39700 Communication Equipment 524,257 286,670 121,716 4,121 56,253 55,497 899 39701 Communication Equipment - Mobile Radios 0 - - - - - 900 39702 Communication Equipment - Fixed Radios 0 - - - - - 901 39705 Communication Equip. - Telemetering 0 - - - - - 902 39800 Miscellaneous Equipment 3,891,771 2,128,066 903,550 30,591 417,585 411,979 903 39900 Other Tangible Property 0 - - - - - 904 39901 Other Tangible Property - Servers - H/W 14,390 7,868 3,341 113 1,544 1,523 905 39902 Other Tangible Property - Servers - S/W 0 - - - - - 906 39903 Other Tangible Property - Network - H/W 134,599 73,600 31,250 1,058 14,442 14,248 907 39904 Other Tang. Property - CPU 0 - - - - - 908 39905 Other Tangible Property - MF - Hardware 0 - - - - - 909 39906 Other Tang. Property - PC Hardware 461,888 252,566 107,236 3,631 49,560 48,895 910 39907 Other Tang. Property - PC Software 0 - - - - - 911 39908 Other Tang. Property - Mainframe S/W 123,515 67,539 28,676 971 13,253 13,075 912 39909 Other Tang. Property - Application Software 0 - - - - - 913 39924 Other Tang. Property - General Startup Costs 0 - - - - - 914915 Total General Plant 22,386,350 12,241,118 5,197,424 175,967 2,402,045 2,369,796 916917 TOTAL DIRECT PLANT 704,356,323 385,150,276 163,529,947 5,536,555 75,577,099 74,562,445918919 CWIP w/o AFUDC 38,154,809 20,863,496 8,858,377 299,914 4,093,993 4,039,029 920921 Kentucky Mid-States General Office:922923 Intangible Plant:924925 30100 Organization 92,247 50,442 21,417 725 9,898 9,765 926 30200 Franchises & Consents 0 - - - - - 927 30300 Misc Intangible Plant 552,335 302,023 128,235 4,342 59,265 58,470 928929 Total Intangible Plant: 644,582 352,465 149,652 5,067 69,163 68,235930931 General:932933 37400 Land & Land Rights 0 - - - - - 934 39001 Structures Frame 89,275 48,816 20,727 702 9,579 9,451 935 36602 Structures & Improvements 0 - - - - - 936 38900 Land & Land Rights 0 - - - - - 937 39004 Air Conditioning Equipment 7,658 4,188 1,778 60 822 811 938 39009 Improvement to leased Premises 19,332 10,571 4,488 152 2,074 2,046 939 39100 Office Furniture & Equipment 19,220 10,510 4,462 151 2,062 2,035 940 39102 Remittance Processing Equip 0 - - - - - 941 39103 Office Machines 0 - - - - - 942 39200 Transportation Equipment 13,582 7,427 3,153 107 1,457 1,438 943 39201 Trucks 0 - - - - - 944 39202 Trailers 0 - - - - - 945 39300 Stores Equipment 0 - - - - - 946 39400 Tools, Shop & Garage Equipment 87,547 47,872 20,326 688 9,394 9,268 947 39600 Power Operated Equipment 10,213 5,584 2,371 80 1,096 1,081 948 39603 Ditchers 0 - - - - - 949 39604 Backhoes 0 - - - - - 950 39605 Welders 0 - - - - - 951 39700 Communication Equipment 18,688 10,219 4,339 147 2,005 1,978 952 39701 Communication Equipment - Mobile Radios 0 - - - - - 953 39702 Communication Equipment - Fixed Radios 0 - - - - - 954 39705 Communication Equip. - Telemetering 0 - - - - - 955 39800 Miscellaneous Equipment 405,292 221,619 94,096 3,186 43,488 42,904 956 39900 Other Tangible Property 0 - - - - - 957 39901 Other Tangible Property - Servers - H/W 0 - - - - - 958 39902 Other Tangible Property - Servers - S/W 0 - - - - - 959 39903 Other Tangible Property - Network - H/W 0 - - - - - 960 39904 Other Tang. Property - CPU 0 - - - - - 961 39905 Other Tangible Property - MF - Hardware 0 - - - - - 962 39906 Other Tang. Property - PC Hardware 34,934 19,103 8,111 275 3,748 3,698 963 39907 Other Tang. Property - PC Software 82,288 44,996 19,105 647 8,829 8,711 964 39908 Other Tang. Property - Mainframe S/W 412,432 225,523 95,754 3,242 44,254 43,660 965 39909 Other Tang. Property - Application Software 0 - - - - - 966 39924 Other Tang. Property - General Startup Costs 0 - - - - - 967968 Total General Plant 1,200,461 656,426 278,710 9,436 128,809 127,080969970 CWIP w/o AFUDC 2,311 1,263 536 18 248 245

Exhibit PHR-4Page 31 of 75
Atmos Energy Corporation, Kentucky/Mid-States DivisionClass Cost of Service - Demand/Commodity StudyForecasted Test Period: Twelve Months Ended March 31, 2020
ALLOCATION OF PLANT IN SERVICE971972 Shared Services General Office:973974 General:975976 37400 Land & Land Rights 0 - - - - - 977 39001 Structures Frame 0 - - - - - 978 36602 Structures & Improvements 236,424 129,279 54,890 1,858 25,368 25,028 979 37503 Improvements 0 - - - - - 980 39004 Air Conditioning Equipment 0 - - - - - 981 39009 Improvement to leased Premises 483,357 264,305 112,221 3,799 51,864 51,168 982 39100 Office Furniture & Equipment 286,918 156,890 66,614 2,255 30,786 30,373 983 39102 Remittance Processing Equip 0 - - - - - 984 39103 Office Machines 0 - - - - - 985 39200 Transportation Equipment 369 202 86 3 40 39 986 39201 Trucks 0 - - - - - 987 39202 Trailers 0 - - - - - 988 39300 Stores Equipment 0 - - - - - 989 39400 Tools, Shop & Garage Equipment 3,938 2,154 914 31 423 417 990 39600 Power Operated Equipment 0 - - - - - 991 39603 Ditchers 0 - - - - - 992 39604 Backhoes 0 - - - - - 993 39605 Welders 0 - - - - - 994 39700 Communication Equipment 54,370 29,730 12,623 427 5,834 5,756 995 39701 Communication Equipment - Mobile Radios 0 - - - - - 996 39702 Communication Equipment - Fixed Radios 0 - - - - - 997 39705 Communication Equip. - Telemetering 0 - - - - - 998 39800 Miscellaneous Equipment 7,537 4,121 1,750 59 809 798 999 39900 Other Tangible Property 8,377 4,581 1,945 66 899 887
1000 39901 Other Tangible Property - Servers - H/W 2,321,928 1,269,657 539,081 18,251 249,142 245,797 1001 39902 Other Tangible Property - Servers - S/W 1,402,428 766,864 325,601 11,024 150,480 148,460 1002 39903 Other Tangible Property - Network - H/W 442,303 241,856 102,689 3,477 47,459 46,822 1003 39904 Other Tang. Property - CPU 0 - - - - - 1004 39905 Other Tangible Property - MF - Hardware 0 - - - - - 1005 39906 Other Tang. Property - PC Hardware 155,862 85,227 36,186 1,225 16,724 16,499 1006 39907 Other Tang. Property - PC Software 86,214 47,143 20,016 678 9,251 9,127 1007 39908 Other Tang. Property - Mainframe S/W 3,879,643 2,121,434 900,734 30,496 416,284 410,695 1008 39909 Other Tang. Property - Application Software 1,322,956 723,408 307,150 10,399 141,953 140,047 1009 39931 Other Tang. Property - ALGN 0 - - - - - 10101011 Total General Plant 10,692,624 5,846,852 2,482,500 84,049 1,147,313 1,131,91010121013 CWIP w/o AFUDC 748,344 409,204 173,743 5,882 80,297 79,219 10141015 Shared Services Customer Support:10161017 General:10181019 37400 Land & Land Rights 205,882 112,578 47,799 1,618 22,091 21,794 1020 39001 Structures Frame 0 - - - - - 1021 36602 Structures & Improvements 1,000,011 546,818 232,172 7,861 107,301 105,860 1022 37503 Improvements 0 - - - - - 1023 39004 Air Conditioning Equipment 0 - - - - - 1024 39009 Improvement to leased Premises 159,117 87,007 36,942 1,251 17,073 16,844 1025 39100 Office Furniture & Equipment 154,692 84,587 35,915 1,216 16,598 16,376 1026 39102 Remittance Processing Equip 0 - - - - - 1027 39103 Office Machines 0 - - - - - 1028 39200 Transportation Equipment 2,233 1,221 518 18 240 236 1029 39201 Trucks 0 - - - - - 1030 39202 Trailers 0 - - - - - 1031 39300 Stores Equipment 0 - - - - - 1032 39400 Tools, Shop & Garage Equipment 14,093 7,706 3,272 111 1,512 1,492 1033 39600 Power Operated Equipment 548 300 127 4 59 58 1034 39603 Ditchers 0 - - - - - 1035 39604 Backhoes 0 - - - - - 1036 39605 Welders 0 - - - - - 1037 39700 Communication Equipment 114,682 62,709 26,626 901 12,305 12,140 1038 39701 Communication Equipment - Mobile Radios 0 - - - - - 1039 39702 Communication Equipment - Fixed Radios 0 - - - - - 1040 39705 Communication Equip. - Telemetering 0 - - - - - 1041 39800 Miscellaneous Equipment 15,758 8,617 3,659 124 1,691 1,668 1042 39900 Other Tangible Property 43,368 23,714 10,069 341 4,653 4,591 1043 39901 Other Tangible Property - Servers - H/W 583,485 319,057 135,467 4,586 62,608 61,767 1044 39902 Other Tangible Property - Servers - S/W 114,175 62,432 26,508 897 12,251 12,086 1045 39903 Other Tangible Property - Network - H/W 35,496 19,410 8,241 279 3,809 3,758 1046 39904 Other Tang. Property - CPU 0 - - - - - 1047 39905 Other Tangible Property - MF - Hardware 0 - - - - - 1048 39906 Other Tang. Property - PC Hardware 69,473 37,988 16,129 546 7,454 7,354 1049 39907 Other Tang. Property - PC Software 13,141 7,186 3,051 103 1,410 1,391 1050 39908 Other Tang. Property - Mainframe S/W 5,248,748 2,870,077 1,218,599 41,258 563,188 555,627 1051 39909 Other Tang. Property - Application Software 477 261 111 4 51 50 1052 39924 Other Tang. Property - General Startup Costs 0 - - - - - 10531054 Total General Plant 7,775,377 4,251,667 1,805,204 61,118 834,294 823,09410551056 CWIP w/o AFUDC 224,734 122,887 52,176 1,767 24,114 23,790 10571058 TOTAL PLANT IN SERVICE 724,669,367 396,257,686 168,246,014 5,696,224 77,756,679 76,712,76410591060 TOTAL CWIP W/O AFUDC 39,130,198 21,396,850 9,084,833 307,581 4,198,652 4,142,283

Exhibit PHR-4Page 32 of 75
Atmos Energy Corporation, Kentucky/Mid-States DivisionClass Cost of Service - Demand/Commodity StudyForecasted Test Period: Twelve Months Ended March 31, 2020
ALLOCATION OF RESERVE FOR DEPRECIATION
Customer
Line Acct. Allocation Allocation Total Residential Non-Res Sales Non-Res Sales Transport TransportNo. No. Factor Basis Company Sales Firm Interruptible Firm Interruptible
1 Intangible Plant:23 30100 Organization 6.2 P, S, T & D Plant - Customer 3,229 2,493 702 2 21 12 4 30200 Franchises & Consents 6.2 P, S, T & D Plant - Customer 46,465 35,864 10,103 24 303 171 5 30300 Misc Intangible Plant 99.0 - 0 - - - - - 67 Total Intangible Plant: 49,694 38,356 10,805 26 324 18389 Production Plant:
1011 32520 Producing Leaseholds 99.0 - 0 - - - - - 12 32540 Rights of Ways 99.0 - 0 - - - - - 13 33100 Production Gas Wells Equipment 99.0 - 0 - - - - - 14 33201 Field Lines 99.0 - 0 - - - - - 15 33202 Tributary Lines 99.0 - 0 - - - - - 16 33400 Field Meas. & Reg. Sta. Equip 99.0 - 0 - - - - - 17 33600 Purification Equipment 99.0 - 0 - - - - - 1819 Total Production Plant 0 0 0 0 0 02021 Storage Plant:2223 35010 Land 99.0 - 0 - - - - - 24 35020 Rights of Way 99.0 - 0 - - - - - 25 35100 Structures and Improvements 99.0 - 0 - - - - - 26 35102 Compression Station Equipment 99.0 - 0 - - - - - 27 35103 Meas. & Reg. Sta. Structues 99.0 - 0 - - - - - 28 35104 Other Structures 99.0 - 0 - - - - - 29 35200 Wells \ Rights of Way 99.0 - 0 - - - - - 30 35201 Well Construction 99.0 - 0 - - - - - 31 35202 Well Equipment 99.0 - 0 - - - - - 32 35203 Cushion Gas 99.0 - 0 - - - - - 33 35210 Leaseholds 99.0 - 0 - - - - - 34 35211 Storage Rights 99.0 - 0 - - - - - 35 35301 Field Lines 99.0 - 0 - - - - - 36 35302 Tributary Lines 99.0 - 0 - - - - - 37 35400 Compressor Station Equipment 99.0 - 0 - - - - - 38 35500 Meas & Reg. Equipment 99.0 - 0 - - - - - 39 35600 Purification Equipment 99.0 - 0 - - - - - 4041 Total Storage Plant 0 - - - - - 4243 Transmission:4445 36510 Land & Land Rights 99.0 - 0 - - - - - 46 36520 Rights of Way 99.0 - 0 - - - - - 47 36602 Structures & Improvements 99.0 - 0 - - - - - 48 36603 Other Structues 99.0 - 0 - - - - - 49 36700 Mains Cathodic Protection 99.0 - 0 - - - - - 50 36701 Mains - Steel 99.0 - 0 - - - - - 51 36900 Meas. & Reg. Equipment 99.0 - 0 - - - - - 52 36901 Meas. & Reg. Equipment 99.0 - 0 - - - - - 5354 Total Transmission Plant 0 - - - - - 5556 Distribution:5758 37400 Land & Land Rights 2.0 Bills 0 - - - - - 59 37401 Land 2.0 Bills 0 - - - - - 60 37402 Land Rights 2.0 Bills 0 - - - - - 61 37403 Land Other 2.0 Bills 0 - - - - - 62 37500 Structures & Improvements 2.0 Bills 0 - - - - - 63 37501 Structures & Improvements T.B. 2.0 Bills 0 - - - - - 64 37502 Land Rights 2.0 Bills 0 - - - - - 65 37503 Improvements 2.0 Bills 0 - - - - - 66 37600 Mains Cathodic Protection 2.0 Bills 0 - - - - - 67 37601 Mains - Steel 2.0 Bills 0 - - - - - 68 37602 Mains - Plastic 2.0 Bills 0 - - - - - 69 37800 Meas & Reg. Sta. Equip - General 2.0 Bills 0 - - - - - 70 37900 Meas & Reg. Sta. Equip - City Gate 2.0 Bills 0 - - - - - 71 37905 Meas & Reg. Sta. Equipment T.b. 2.0 Bills 0 - - - - - 72 38000 Services 2.0 Bills 30,562,139 27,216,572 3,310,936 1,683 21,040 11,908 73 38100 Meters 4.0 Meter Investment 21,386,354 13,797,005 7,076,398 24,923 311,648 176,380 74 38200 Meter Installaitons 4.0 Meter Investment 26,987,899 17,410,737 8,929,858 31,450 393,275 222,578 75 38300 House Regulators 4.0 Meter Investment 4,321,265 2,787,783 1,429,836 5,036 62,971 35,639 76 38400 House Reg. Installations 4.0 Meter Investment 94,403 60,903 31,237 110 1,376 779 77 38500 Ind. Meas. & Reg. Sta. Equipment 2.2 Non-Residential Bills 2,958,741 - 2,928,115 1,488 18,607 10,531 78 38600 Other Prop. On Cust. Prem 99.0 - 0 - - - - - 7980 Total Distribution Plant 86,310,801 61,272,999 23,706,380 64,689 808,917 457,815

Exhibit PHR-4Page 33 of 75
Atmos Energy Corporation, Kentucky/Mid-States DivisionClass Cost of Service - Demand/Commodity StudyForecasted Test Period: Twelve Months Ended March 31, 2020
ALLOCATION OF RESERVE FOR DEPRECIATION8182 General:8384 38900 Land & Land Rights 6.2 P, S, T & D Plant - Customer 0 - - - - - 85 39000 Structures & Improvements 6.2 P, S, T & D Plant - Customer 485,951 375,081 105,659 253 3,166 1,792 86 39002 Structures - Brick 6.2 P, S, T & D Plant - Customer 41,708 32,192 9,068 22 272 154 87 39003 Improvements 6.2 P, S, T & D Plant - Customer 113,486 87,594 24,675 59 739 418 88 39003 Air Conditioning Equipment 6.2 P, S, T & D Plant - Customer 1,958 1,511 426 1 13 7 89 39004 Improvement to Leased Premises 6.2 P, S, T & D Plant - Customer 483,869 373,474 105,206 252 3,152 1,784 90 39009 Office Furniture & Equipment 6.2 P, S, T & D Plant - Customer 443,743 342,503 96,482 231 2,891 1,636 91 39100 Remittance Processing Equip 6.2 P, S, T & D Plant - Customer 0 - - - - - 92 39102 Office Machines 6.2 P, S, T & D Plant - Customer 0 - - - - - 93 39103 Transportation Equipment 6.2 P, S, T & D Plant - Customer 44,113 34,049 9,591 23 287 163 94 39200 Trucks 6.2 P, S, T & D Plant - Customer 0 - - - - - 95 39201 Trailers 6.2 P, S, T & D Plant - Customer (981) (757) (213) (1) (6) (4) 96 39202 Stores Equipment 6.2 P, S, T & D Plant - Customer 0 - - - - - 97 39400 Tools, Shop & Garage Equipment 6.2 P, S, T & D Plant - Customer 504,316 389,256 109,652 263 3,286 1,860 98 39600 Power Operated Equipment 6.2 P, S, T & D Plant - Customer 0 - - - - - 99 39603 Ditchers 6.2 P, S, T & D Plant - Customer 15,373 11,866 3,343 8 100 57
100 39604 Backhoes 6.2 P, S, T & D Plant - Customer 24,353 18,797 5,295 13 159 90 101 39605 Welders 6.2 P, S, T & D Plant - Customer 7,543 5,822 1,640 4 49 28 102 39700 Communication Equipment 6.2 P, S, T & D Plant - Customer 104,290 80,496 22,676 54 679 385 103 39701 Communication Equipment - Mobile Radios 6.2 P, S, T & D Plant - Customer 0 - - - - - 104 39702 Communication Equipment - Fixed Radios 6.2 P, S, T & D Plant - Customer 0 - - - - - 105 39705 Communication Equip. - Telemetering 6.2 P, S, T & D Plant - Customer 0 - - - - - 106 39800 Miscellaneous Equipment 6.2 P, S, T & D Plant - Customer 803,618 620,272 174,728 419 5,236 2,963 107 39900 Other Tangible Property 6.2 P, S, T & D Plant - Customer 0 - - - - - 108 39901 Other Tangible Property - Servers - H/W 6.2 P, S, T & D Plant - Customer 2,586 1,996 562 1 17 10 109 39902 Other Tangible Property - Servers - S/W 6.2 P, S, T & D Plant - Customer 0 - - - - - 110 39903 Other Tangible Property - Network - H/W 6.2 P, S, T & D Plant - Customer 25,061 19,344 5,449 13 163 92 111 39904 Other Tang. Property - CPU 6.2 P, S, T & D Plant - Customer 0 - - - - - 112 39905 Other Tangible Property - MF - Hardware 6.2 P, S, T & D Plant - Customer 0 - - - - - 113 39906 Other Tang. Property - PC Hardware 6.2 P, S, T & D Plant - Customer 43,508 33,582 9,460 23 283 160 114 39907 Other Tang. Property - PC Software 6.2 P, S, T & D Plant - Customer 0 - - - - - 115 39908 Other Tang. Property - Mainframe S/W 6.2 P, S, T & D Plant - Customer 0 - - - - - 116 39909 Other Tang. Property - Application Software 6.2 P, S, T & D Plant - Customer 45,714 35,284 9,939 24 298 169 117 Other Tang. Property - General Startup Costs 6.2 P, S, T & D Plant - Customer 0 - - - - - 118 Retirement Work in Progress 6.2 P, S, T & D Plant - Customer (2,471,354) (1,907,514) (537,339) (1,288) (16,101) (9,113) 119 AR 15 general plant amortization 6.2 P, S, T & D Plant - Customer 0 - - - - - 120121 Total General Plant 718,855 554,848 156,299 375 4,683 2,651 122123 TOTAL DIRECT RESERVE FOR DEPRECIATION 87,079,350 61,866,203 23,873,484 65,090 813,924 460,649124125 Kentucky Mid-States General Office:126127 Intangible Plant:128129 30100 Organization 99.0 - 0 - - - - - 130 30200 Franchises & Consents 99.0 - 0 - - - - - 131 30300 Misc Intangible Plant 99.0 - 0 - - - - - 132133 Total Intangible Plant:134135 General:136137 37400 Land & Land Rights 6.2 P, S, T & D Plant - Customer 0 - - - - - 138 39001 Structures Frame 6.2 P, S, T & D Plant - Customer 20,434 15,772 4,443 11 133 75 139 36602 Structures & Improvements 6.2 P, S, T & D Plant - Customer 0 - - - - - 140 38900 Land & Land Rights 6.2 P, S, T & D Plant - Customer 0 - - - - - 141 39004 Air Conditioning Equipment 6.2 P, S, T & D Plant - Customer 1,973 1,523 429 1 13 7 142 39009 Improvement to leased Premises 6.2 P, S, T & D Plant - Customer 7,494 5,785 1,630 4 49 28 143 39100 Office Furniture & Equipment 6.2 P, S, T & D Plant - Customer 7,451 5,751 1,620 4 49 27 144 39102 Remittance Processing Equip 6.2 P, S, T & D Plant - Customer 0 - - - - - 145 39103 Office Machines 6.2 P, S, T & D Plant - Customer 0 - - - - - 146 39200 Transportation Equipment 6.2 P, S, T & D Plant - Customer 3,449 2,662 750 2 22 13 147 39201 Trucks 6.2 P, S, T & D Plant - Customer 0 - - - - - 148 39202 Trailers 6.2 P, S, T & D Plant - Customer 0 - - - - - 149 39300 Stores Equipment 6.2 P, S, T & D Plant - Customer 0 - - - - - 150 39400 Tools, Shop & Garage Equipment 6.2 P, S, T & D Plant - Customer 27,762 21,428 6,036 14 181 102 151 39600 Power Operated Equipment 6.2 P, S, T & D Plant - Customer 1,696 1,309 369 1 11 6 152 39603 Ditchers 6.2 P, S, T & D Plant - Customer 0 - - - - - 153 39604 Backhoes 6.2 P, S, T & D Plant - Customer 0 - - - - - 154 39605 Welders 6.2 P, S, T & D Plant - Customer 0 - - - - - 155 39700 Communication Equipment 6.2 P, S, T & D Plant - Customer (1,160) (895) (252) (1) (8) (4) 156 39701 Communication Equipment - Mobile Radios 6.2 P, S, T & D Plant - Customer 0 - - - - - 157 39702 Communication Equipment - Fixed Radios 6.2 P, S, T & D Plant - Customer 0 - - - - - 158 39705 Communication Equip. - Telemetering 6.2 P, S, T & D Plant - Customer 0 - - - - - 159 39800 Miscellaneous Equipment 6.2 P, S, T & D Plant - Customer 139,310 107,526 30,290 73 908 514 160 39900 Other Tangible Property 6.2 P, S, T & D Plant - Customer 0 - - - - - 161 39901 Other Tangible Property - Servers - H/W 6.2 P, S, T & D Plant - Customer (6,709) (5,179) (1,459) (3) (44) (25) 162 39902 Other Tangible Property - Servers - S/W 6.2 P, S, T & D Plant - Customer 0 - - - - - 163 39903 Other Tangible Property - Network - H/W 6.2 P, S, T & D Plant - Customer 0 - - - - - 164 39904 Other Tang. Property - CPU 6.2 P, S, T & D Plant - Customer 0 - - - - - 165 39905 Other Tangible Property - MF - Hardware 6.2 P, S, T & D Plant - Customer 0 - - - - - 166 39906 Other Tang. Property - PC Hardware 6.2 P, S, T & D Plant - Customer 13,547 10,456 2,945 7 88 50 167 39907 Other Tang. Property - PC Software 6.2 P, S, T & D Plant - Customer 8,175 6,310 1,777 4 53 30 168 39908 Other Tang. Property - Mainframe S/W 6.2 P, S, T & D Plant - Customer 159,892 123,413 34,765 83 1,042 590 169 39909 Other Tang. Property - Application Software 6.2 P, S, T & D Plant - Customer 0 - - - - - 170 39924 Other Tang. Property - General Startup Costs 6.2 P, S, T & D Plant - Customer 0 - - - - - 171 Retirement Work in Progress 6.2 P, S, T & D Plant - Customer 10,135 7,823 2,204 5 66 37 172173 Total General Plant 393,449 303,683 85,546 205 2,563 1,451

Exhibit PHR-4Page 34 of 75
Atmos Energy Corporation, Kentucky/Mid-States DivisionClass Cost of Service - Demand/Commodity StudyForecasted Test Period: Twelve Months Ended March 31, 2020
ALLOCATION OF RESERVE FOR DEPRECIATION174175 Shared Services General Office:176177 General:178179 37400 Land & Land Rights 6.2 P, S, T & D Plant - Customer 0 - - - - - 180 39000 Structures & Improvements 6.2 P, S, T & D Plant - Customer 35,223 27,187 7,658 18 229 130 181 36602 Structures & Improvements 6.2 P, S, T & D Plant - Customer 0 - - - - - 182 37503 Improvements 6.2 P, S, T & D Plant - Customer 0 - - - - - 183 39004 Air Conditioning Equipment 6.2 P, S, T & D Plant - Customer 0 - - - - - 184 39009 Improvement to leased Premises 6.2 P, S, T & D Plant - Customer 187,005 144,340 40,660 97 1,218 690 185 39100 Office Furniture & Equipment 6.2 P, S, T & D Plant - Customer 45,051 34,773 9,795 23 294 166 186 39102 Remittance Processing Equip 6.2 P, S, T & D Plant - Customer 0 0 0 0 0 0 187 39103 Office Machines 6.2 P, S, T & D Plant - Customer 0 0 0 0 0 0 188 39200 Transportation Equipment 6.2 P, S, T & D Plant - Customer 110 85 24 0 1 0 189 39201 Trucks 6.2 P, S, T & D Plant - Customer 0 - - - - - 190 39202 Trailers 6.2 P, S, T & D Plant - Customer 0 - - - - - 191 39300 Stores Equipment 6.2 P, S, T & D Plant - Customer 0 - - - - - 192 39400 Tools, Shop & Garage Equipment 6.2 P, S, T & D Plant - Customer 668 515 145 0 4 2 193 39600 Power Operated Equipment 6.2 P, S, T & D Plant - Customer 0 - - - - - 194 39603 Ditchers 6.2 P, S, T & D Plant - Customer 0 - - - - - 195 39604 Backhoes 6.2 P, S, T & D Plant - Customer 0 - - - - - 196 39605 Welders 6.2 P, S, T & D Plant - Customer 0 - - - - - 197 39700 Communication Equipment 6.2 P, S, T & D Plant - Customer 10,977 8,472 2,387 6 72 40 198 39701 Communication Equipment - Mobile Radios 6.2 P, S, T & D Plant - Customer 0 - - - - - 199 39702 Communication Equipment - Fixed Radios 6.2 P, S, T & D Plant - Customer 0 - - - - - 200 39705 Communication Equip. - Telemetering 6.2 P, S, T & D Plant - Customer 0 - - - - - 201 39800 Miscellaneous Equipment 6.2 P, S, T & D Plant - Customer 1,107 854 241 1 7 4 202 39900 Other Tangible Property 6.2 P, S, T & D Plant - Customer 3,271 2,525 711 2 21 12 203 39901 Other Tangible Property - Servers - H/W 6.2 P, S, T & D Plant - Customer 517,758 399,631 112,575 270 3,373 1,909 204 39902 Other Tangible Property - Servers - S/W 6.2 P, S, T & D Plant - Customer 375,965 290,188 81,745 196 2,449 1,386 205 39903 Other Tangible Property - Network - H/W 6.2 P, S, T & D Plant - Customer 52,022 40,153 11,311 27 339 192 206 39904 Other Tang. Property - CPU 6.2 P, S, T & D Plant - Customer 0 - - - - - 207 39905 Other Tangible Property - MF - Hardware 6.2 P, S, T & D Plant - Customer 0 - - - - - 208 39906 Other Tang. Property - PC Hardware 6.2 P, S, T & D Plant - Customer 36,463 28,144 7,928 19 238 134 209 39907 Other Tang. Property - PC Software 6.2 P, S, T & D Plant - Customer 35,640 27,509 7,749 19 232 131 210 39908 Other Tang. Property - Mainframe S/W 6.2 P, S, T & D Plant - Customer 896 691 195 0 6 3 211 39909 Other Tang. Property - Application Software 6.2 P, S, T & D Plant - Customer 979,462 755,997 212,962 510 6,381 3,612 212 39924 Other Tang. Property - General Startup Costs 6.2 P, S, T & D Plant - Customer 0 - - - - - 213 Retirement Work in Progress 6.2 P, S, T & D Plant - Customer 0 - - - - - 214215 Total General Plant 2,281,618 1,761,066 496,085 1,189 14,865 8,413 216 643,103 496,378 139,828 335 4,190 2,371217 Shared Services Customer Support:218219 General:220221 37400 Land & Land Rights 6.2 P, S, T & D Plant - Customer 0 - - - - - 222 39001 Structures Frame 6.2 P, S, T & D Plant - Customer 0 - - - - - 223 36602 Structures & Improvements 6.2 P, S, T & D Plant - Customer 79,350 61,246 17,253 41 517 293 224 37503 Improvements 6.2 P, S, T & D Plant - Customer 0 - - - - - 225 39004 Air Conditioning Equipment 6.2 P, S, T & D Plant - Customer 0 - - - - - 226 39009 Improvement to leased Premises 6.2 P, S, T & D Plant - Customer 38,654 29,835 8,404 20 252 143 227 39100 Office Furniture & Equipment 6.2 P, S, T & D Plant - Customer 21,230 16,386 4,616 11 138 78 228 39102 Remittance Processing Equip 6.2 P, S, T & D Plant - Customer 0 - - - - - 229 39103 Office Machines 6.2 P, S, T & D Plant - Customer 0 - - - - - 230 39200 Transportation Equipment 6.2 P, S, T & D Plant - Customer 866 669 188 0 6 3 231 39201 Trucks 6.2 P, S, T & D Plant - Customer 0 - - - - - 232 39202 Trailers 6.2 P, S, T & D Plant - Customer 0 - - - - - 233 39300 Stores Equipment 6.2 P, S, T & D Plant - Customer 0 - - - - - 234 39400 Tools, Shop & Garage Equipment 6.2 P, S, T & D Plant - Customer 1,416 1,093 308 1 9 5 235 39500 Laboratory Equipment 6.2 P, S, T & D Plant - Customer 165 127 36 0 1 1 236 39603 Ditchers 6.2 P, S, T & D Plant - Customer 0 - - - - - 237 39604 Backhoes 6.2 P, S, T & D Plant - Customer 0 - - - - - 238 39605 Welders 6.2 P, S, T & D Plant - Customer 0 - - - - - 239 39700 Communication Equipment 6.2 P, S, T & D Plant - Customer 27,208 21,000 5,916 14 177 100 240 39701 Communication Equipment - Mobile Radios 6.2 P, S, T & D Plant - Customer 0 - - - - - 241 39702 Communication Equipment - Fixed Radios 6.2 P, S, T & D Plant - Customer 0 - - - - - 242 39705 Communication Equip. - Telemetering 6.2 P, S, T & D Plant - Customer 0 - - - - - 243 39800 Miscellaneous Equipment 6.2 P, S, T & D Plant - Customer 1,885 1,455 410 1 12 7 244 39900 Other Tangible Property 6.2 P, S, T & D Plant - Customer 12,321 9,510 2,679 6 80 45 245 39901 Other Tangible Property - Servers - H/W 6.2 P, S, T & D Plant - Customer 131,095 101,185 28,504 68 854 483 246 39902 Other Tangible Property - Servers - S/W 6.2 P, S, T & D Plant - Customer 29,992 23,149 6,521 16 195 111 247 39903 Other Tangible Property - Network - H/W 6.2 P, S, T & D Plant - Customer 8,903 6,872 1,936 5 58 33 248 39904 Other Tang. Property - CPU 6.2 P, S, T & D Plant - Customer 0 - - - - - 249 39905 Other Tangible Property - MF - Hardware 6.2 P, S, T & D Plant - Customer 0 - - - - - 250 39906 Other Tang. Property - PC Hardware 6.2 P, S, T & D Plant - Customer 17,010 13,129 3,699 9 111 63 251 39907 Other Tang. Property - PC Software 6.2 P, S, T & D Plant - Customer 3,943 3,043 857 2 26 15 252 39908 Other Tang. Property - Mainframe S/W 6.2 P, S, T & D Plant - Customer 794,932 613,568 172,840 414 5,179 2,931 253 39909 Other Tang. Property - Application Software 6.2 P, S, T & D Plant - Customer 1,886 1,456 410 1 12 7 254 39924 Other Tang. Property - General Startup Costs 6.2 P, S, T & D Plant - Customer 0 - - - - - 255 Retirement Work in Progress 6.2 P, S, T & D Plant - Customer 0 - - - - - 256257 Total General Plant 1,170,856 903,724 254,576 610 7,628 4,317 258259 TOTAL RESERVE FOR DEPRECIATION - CUSTOMER 90,925,272 64,834,677 24,709,691 67,094 838,981 474,830

Exhibit PHR-4Page 35 of 75
Atmos Energy Corporation, Kentucky/Mid-States DivisionClass Cost of Service - Demand/Commodity StudyForecasted Test Period: Twelve Months Ended March 31, 2020
ALLOCATION OF RESERVE FOR DEPRECIATION
Demand
Line Acct. Allocation Allocation Total Residential Non-Res Sales Non-Res Sales Transport TransportNo. No. Factor Basis Company Sales Firm Interruptible Firm Interruptible
260 Intangible Plant:261262 30100 Organization 6.4 P, S, T & D Plant - Demand 3,421 1,547 884 47 496 448 263 30200 Franchises & Consents 6.4 P, S, T & D Plant - Demand 49,225 22,256 12,727 669 7,130 6,443 264 30300 Misc Intangible Plant 99.0 - 0 - - - - - 265266 Total Intangible Plant: 52,646 23,803 13,611 716 7,625 6,891267268 Production Plant:269270 32520 Producing Leaseholds 3.0 Peak Day 0 - - - - - 271 32540 Rights of Ways 3.0 Peak Day 0 - - - - - 272 33100 Production Gas Wells Equipment 3.0 Peak Day 0 - - - - - 273 33201 Field Lines 3.0 Peak Day 0 - - - - - 274 33202 Tributary Lines 3.0 Peak Day 0 - - - - - 275 33400 Field Meas. & Reg. Sta. Equip 3.0 Peak Day 0 - - - - - 276 33600 Purification Equipment 3.0 Peak Day 0 - - - - - 277278 Total Production Plant 0 0 0 0 0 0279280 Storage Plant:281282 35010 Land 3.0 Peak Day 0 - - - - - 283 35020 Rights of Way 3.0 Peak Day 2,227 1,007 576 30 323 291 284 35100 Structures and Improvements 3.0 Peak Day 3,144 1,422 813 43 455 412 285 35102 Compression Station Equipment 3.0 Peak Day 56,872 25,714 14,704 773 8,238 7,444 286 35103 Meas. & Reg. Sta. Structues 3.0 Peak Day 10,242 4,631 2,648 139 1,483 1,340 287 35104 Other Structures 3.0 Peak Day 50,072 22,639 12,946 681 7,253 6,554 288 35200 Wells \ Rights of Way 3.0 Peak Day 595,415 269,208 153,938 8,097 86,242 77,931 289 35201 Well Construction 3.0 Peak Day 709,755 320,905 183,500 9,652 102,803 92,896 290 35202 Well Equipment 3.0 Peak Day 225,298 101,865 58,248 3,064 32,633 29,488 291 35203 Cushion Gas 3.0 Peak Day 379,297 171,493 98,063 5,158 54,939 49,644 292 35210 Leaseholds 3.0 Peak Day 84,031 37,993 21,725 1,143 12,171 10,998 293 35211 Storage Rights 3.0 Peak Day 21,978 9,937 5,682 299 3,183 2,877 294 35301 Field Lines 3.0 Peak Day (44,198) (19,983) (11,427) (601) (6,402) (5,785) 295 35302 Tributary Lines 3.0 Peak Day 94,588 42,767 24,455 1,286 13,700 12,380 296 35400 Compressor Station Equipment 3.0 Peak Day 248,926 112,548 64,357 3,385 36,055 32,581 297 35500 Meas & Reg. Equipment 3.0 Peak Day 101,272 45,788 26,183 1,377 14,669 13,255 298 35600 Purification Equipment 3.0 Peak Day 95,899 43,359 24,794 1,304 13,890 12,552 299300 Total Storage Plant 2,634,817 1,191,292 681,204 35,830 381,635 344,857 301302 Transmission:303304 36510 Land & Land Rights 3.0 Peak Day 0 - - - - - 305 36520 Rights of Way 3.0 Peak Day 428,096 193,557 110,680 5,821 62,007 56,031 306 36602 Structures & Improvements 3.0 Peak Day 16,837 7,613 4,353 229 2,439 2,204 307 36603 Other Structues 3.0 Peak Day 53,066 23,993 13,720 722 7,686 6,946 308 36700 Mains Cathodic Protection 3.0 Peak Day 98,316 44,452 25,419 1,337 14,240 12,868 309 36701 Mains - Steel 3.0 Peak Day 16,387,961 7,409,562 4,236,933 222,852 2,373,684 2,144,929 310 36900 Meas. & Reg. Equipment 3.0 Peak Day 353,469 159,816 91,386 4,807 51,198 46,264 311 36901 Meas. & Reg. Equipment 3.0 Peak Day 1,774,251 802,200 458,714 24,127 256,988 232,222 312313 Total Transmission Plant 19,111,996 8,641,192 4,941,204 259,895 2,768,242 2,501,463 314315 Distribution:316317 37400 Land & Land Rights 3.0 Peak Day 0 - - - - - 318 37401 Land 3.0 Peak Day 0 - - - - - 319 37402 Land Rights 3.0 Peak Day 152,984 69,169 39,552 2,080 22,159 20,023 320 37403 Land Other 3.0 Peak Day 0 - - - - - 321 37500 Structures & Improvements 3.0 Peak Day 73,901 33,413 19,106 1,005 10,704 9,672 322 37501 Structures & Improvements T.B. 3.0 Peak Day 46,441 20,998 12,007 632 6,727 6,078 323 37502 Land Rights 3.0 Peak Day 23,009 10,403 5,949 313 3,333 3,012 324 37503 Improvements 3.0 Peak Day 1,248 564 323 17 181 163 325 37600 Mains Cathodic Protection 3.0 Peak Day 8,586,793 3,882,385 2,220,024 116,768 1,243,738 1,123,877 326 37601 Mains - Steel 3.0 Peak Day 21,885,878 9,895,360 5,658,362 297,616 3,170,020 2,864,521 327 37602 Mains - Plastic 3.0 Peak Day 12,368,442 5,592,199 3,197,729 168,193 1,791,484 1,618,836 328 37800 Meas & Reg. Sta. Equip - General 3.0 Peak Day 1,881,590 850,732 486,465 25,587 272,535 246,271 329 37900 Meas & Reg. Sta. Equip - City Gate 3.0 Peak Day 639,856 289,301 165,428 8,701 92,679 83,747 330 37905 Meas & Reg. Sta. Equipment T.b. 3.0 Peak Day 674,762 305,083 174,452 9,176 97,735 88,316 331 38000 Services 99.0 - 0 - - - - - 332 38100 Meters 99.0 - 0 - - - - - 333 38200 Meter Installaitons 99.0 - 0 - - - - - 334 38300 House Regulators 99.0 - 0 - - - - - 335 38400 House Reg. Installations 99.0 - 0 - - - - - 336 38500 Ind. Meas. & Reg. Sta. Equipment 99.0 - 0 - - - - - 337 38600 Other Prop. On Cust. Prem 99.0 - 0 - - - - - 338339 Total Distribution Plant 46,334,902 20,949,607 11,979,397 630,087 6,711,294 6,064,517

Exhibit PHR-4Page 36 of 75
Atmos Energy Corporation, Kentucky/Mid-States DivisionClass Cost of Service - Demand/Commodity StudyForecasted Test Period: Twelve Months Ended March 31, 2020
ALLOCATION OF RESERVE FOR DEPRECIATION340341 General:342343 38900 Land & Land Rights 6.4 P, S, T & D Plant - Demand 0 - - - - - 344 39000 Structures & Improvements 6.4 P, S, T & D Plant - Demand 514,817 232,767 133,100 7,001 74,568 67,382 345 39002 Structures - Brick 6.4 P, S, T & D Plant - Demand 44,185 19,978 11,424 601 6,400 5,783 346 39003 Improvements 6.4 P, S, T & D Plant - Demand 120,227 54,359 31,083 1,635 17,414 15,736 347 39003 Air Conditioning Equipment 6.4 P, S, T & D Plant - Demand 2,074 938 536 28 300 271 348 39004 Improvement to Leased Premises 6.4 P, S, T & D Plant - Demand 512,611 231,769 132,530 6,971 74,248 67,093 349 39009 Office Furniture & Equipment 6.4 P, S, T & D Plant - Demand 470,102 212,549 121,540 6,393 68,091 61,529 350 39100 Remittance Processing Equip 6.4 P, S, T & D Plant - Demand 0 - - - - - 351 39102 Office Machines 6.4 P, S, T & D Plant - Demand 0 - - - - - 352 39103 Transportation Equipment 6.4 P, S, T & D Plant - Demand 46,734 21,130 12,082 636 6,769 6,117 353 39200 Trucks 6.4 P, S, T & D Plant - Demand 0 - - - - - 354 39201 Trailers 6.4 P, S, T & D Plant - Demand (1,039) (470) (269) (14) (150) (136) 355 39202 Stores Equipment 6.4 P, S, T & D Plant - Demand 0 - - - - - 356 39400 Tools, Shop & Garage Equipment 6.4 P, S, T & D Plant - Demand 534,272 241,563 138,130 7,265 77,386 69,928 357 39600 Power Operated Equipment 6.4 P, S, T & D Plant - Demand 0 - - - - - 358 39603 Ditchers 6.4 P, S, T & D Plant - Demand 16,287 7,364 4,211 221 2,359 2,132 359 39604 Backhoes 6.4 P, S, T & D Plant - Demand 25,800 11,665 6,670 351 3,737 3,377 360 39605 Welders 6.4 P, S, T & D Plant - Demand 7,991 3,613 2,066 109 1,157 1,046 361 39700 Communication Equipment 6.4 P, S, T & D Plant - Demand 110,485 49,954 28,565 1,502 16,003 14,461 362 39701 Communication Equipment - Mobile Radios 6.4 P, S, T & D Plant - Demand 0 - - - - - 363 39702 Communication Equipment - Fixed Radios 6.4 P, S, T & D Plant - Demand 0 - - - - - 364 39705 Communication Equip. - Telemetering 6.4 P, S, T & D Plant - Demand 0 - - - - - 365 39800 Miscellaneous Equipment 6.4 P, S, T & D Plant - Demand 851,353 384,926 220,108 11,577 123,313 111,429 366 39900 Other Tangible Property 6.4 P, S, T & D Plant - Demand 0 - - - - - 367 39901 Other Tangible Property - Servers - H/W 6.4 P, S, T & D Plant - Demand 2,740 1,239 708 37 397 359 368 39902 Other Tangible Property - Servers - S/W 6.4 P, S, T & D Plant - Demand 0 - - - - - 369 39903 Other Tangible Property - Network - H/W 6.4 P, S, T & D Plant - Demand 26,550 12,004 6,864 361 3,846 3,475 370 39904 Other Tang. Property - CPU 6.4 P, S, T & D Plant - Demand 0 - - - - - 371 39905 Other Tangible Property - MF - Hardware 6.4 P, S, T & D Plant - Demand 0 - - - - - 372 39906 Other Tang. Property - PC Hardware 6.4 P, S, T & D Plant - Demand 46,092 20,840 11,917 627 6,676 6,033 373 39907 Other Tang. Property - PC Software 6.4 P, S, T & D Plant - Demand 0 - - - - - 374 39908 Other Tang. Property - Mainframe S/W 6.4 P, S, T & D Plant - Demand 0 - - - - - 375 39909 Other Tang. Property - Application Software 6.4 P, S, T & D Plant - Demand 48,429 21,897 12,521 659 7,015 6,339 376 Other Tang. Property - General Startup Costs 6.4 P, S, T & D Plant - Demand 0 - - - - - 377 Retirement Work in Progress 6.4 P, S, T & D Plant - Demand (2,618,154) (1,183,758) (676,896) (35,603) (379,222) (342,676) 378 AR 15 general plant amortization 6.4 P, S, T & D Plant - Demand 0 - - - - - 379380 Total General Plant 761,555 344,325 196,892 10,356 110,306 99,676 381382 TOTAL DIRECT RESERVE FOR DEPRECIATION 68,895,917 31,150,219 17,812,308 936,884 9,979,103 9,017,402383384 Kentucky Mid-States General Office:385386 Intangible Plant:387388 30100 Organization 99.0 - 0 - - - - - 389 30200 Franchises & Consents 99.0 - 0 - - - - - 390 30300 Misc Intangible Plant 99.0 - 0 - - - - - 391392 Total Intangible Plant:393394 General:395396 37400 Land & Land Rights 6.4 P, S, T & D Plant - Demand 0 - - - - - 397 39001 Structures Frame 6.4 P, S, T & D Plant - Demand 21,648 9,788 5,597 294 3,135 2,833 398 36602 Structures & Improvements 6.4 P, S, T & D Plant - Demand 0 - - - - - 399 38900 Land & Land Rights 6.4 P, S, T & D Plant - Demand 0 - - - - - 400 39004 Air Conditioning Equipment 6.4 P, S, T & D Plant - Demand 2,090 945 540 28 303 274 401 39009 Improvement to leased Premises 6.4 P, S, T & D Plant - Demand 7,940 3,590 2,053 108 1,150 1,039 402 39100 Office Furniture & Equipment 6.4 P, S, T & D Plant - Demand 7,894 3,569 2,041 107 1,143 1,033 403 39102 Remittance Processing Equip 6.4 P, S, T & D Plant - Demand 0 - - - - - 404 39103 Office Machines 6.4 P, S, T & D Plant - Demand 0 - - - - - 405 39200 Transportation Equipment 6.4 P, S, T & D Plant - Demand 3,653 1,652 945 50 529 478 406 39201 Trucks 6.4 P, S, T & D Plant - Demand 0 - - - - - 407 39202 Trailers 6.4 P, S, T & D Plant - Demand 0 - - - - - 408 39300 Stores Equipment 6.4 P, S, T & D Plant - Demand 0 - - - - - 409 39400 Tools, Shop & Garage Equipment 6.4 P, S, T & D Plant - Demand 29,411 13,298 7,604 400 4,260 3,849 410 39600 Power Operated Equipment 6.4 P, S, T & D Plant - Demand 1,797 812 465 24 260 235 411 39603 Ditchers 6.4 P, S, T & D Plant - Demand 0 - - - - - 412 39604 Backhoes 6.4 P, S, T & D Plant - Demand 0 - - - - - 413 39605 Welders 6.4 P, S, T & D Plant - Demand 0 - - - - - 414 39700 Communication Equipment 6.4 P, S, T & D Plant - Demand (1,229) (556) (318) (17) (178) (161) 415 39701 Communication Equipment - Mobile Radios 6.4 P, S, T & D Plant - Demand 0 - - - - - 416 39702 Communication Equipment - Fixed Radios 6.4 P, S, T & D Plant - Demand 0 - - - - - 417 39705 Communication Equip. - Telemetering 6.4 P, S, T & D Plant - Demand 0 - - - - - 418 39800 Miscellaneous Equipment 6.4 P, S, T & D Plant - Demand 147,585 66,728 38,156 2,007 21,377 19,317 419 39900 Other Tangible Property 6.4 P, S, T & D Plant - Demand 0 - - - - - 420 39901 Other Tangible Property - Servers - H/W 6.4 P, S, T & D Plant - Demand (7,108) (3,214) (1,838) (97) (1,030) (930) 421 39902 Other Tangible Property - Servers - S/W 6.4 P, S, T & D Plant - Demand 0 - - - - - 422 39903 Other Tangible Property - Network - H/W 6.4 P, S, T & D Plant - Demand 0 - - - - - 423 39904 Other Tang. Property - CPU 6.4 P, S, T & D Plant - Demand 0 - - - - - 424 39905 Other Tangible Property - MF - Hardware 6.4 P, S, T & D Plant - Demand 0 - - - - - 425 39906 Other Tang. Property - PC Hardware 6.4 P, S, T & D Plant - Demand 14,352 6,489 3,710 195 2,079 1,878 426 39907 Other Tang. Property - PC Software 6.4 P, S, T & D Plant - Demand 8,660 3,916 2,239 118 1,254 1,133 427 39908 Other Tang. Property - Mainframe S/W 6.4 P, S, T & D Plant - Demand 169,390 76,587 43,794 2,303 24,535 22,170 428 39909 Other Tang. Property - Application Software 6.4 P, S, T & D Plant - Demand 0 - - - - - 429 39924 Other Tang. Property - General Startup Costs 6.4 P, S, T & D Plant - Demand 0 - - - - - 430 Retirement Work in Progress 6.4 P, S, T & D Plant - Demand 10,737 4,855 2,776 146 1,555 1,405 431432 Total General Plant 416,820 188,459 107,764 5,668 60,374 54,555

Exhibit PHR-4Page 37 of 75
Atmos Energy Corporation, Kentucky/Mid-States DivisionClass Cost of Service - Demand/Commodity StudyForecasted Test Period: Twelve Months Ended March 31, 2020
ALLOCATION OF RESERVE FOR DEPRECIATION433434 Shared Services General Office:435436 General:437438 37400 Land & Land Rights 6.4 P, S, T & D Plant - Demand 0 - - - - - 439 39000 Structures & Improvements 6.4 P, S, T & D Plant - Demand 37,315 16,871 9,647 507 5,405 4,884 440 36602 Structures & Improvements 6.4 P, S, T & D Plant - Demand 0 - - - - - 441 37503 Improvements 6.4 P, S, T & D Plant - Demand 0 - - - - - 442 39004 Air Conditioning Equipment 6.4 P, S, T & D Plant - Demand 0 - - - - - 443 39009 Improvement to leased Premises 6.4 P, S, T & D Plant - Demand 198,113 89,574 51,220 2,694 28,695 25,930 444 39100 Office Furniture & Equipment 6.4 P, S, T & D Plant - Demand 47,728 21,579 12,339 649 6,913 6,247 445 39102 Remittance Processing Equip 6.4 P, S, T & D Plant - Demand 0 0 0 0 0 0 446 39103 Office Machines 6.4 P, S, T & D Plant - Demand 0 0 0 0 0 0 447 39200 Transportation Equipment 6.4 P, S, T & D Plant - Demand 117 53 30 2 17 15 448 39201 Trucks 6.4 P, S, T & D Plant - Demand 0 - - - - - 449 39202 Trailers 6.4 P, S, T & D Plant - Demand 0 - - - - - 450 39300 Stores Equipment 6.4 P, S, T & D Plant - Demand 0 - - - - - 451 39400 Tools, Shop & Garage Equipment 6.4 P, S, T & D Plant - Demand 707 320 183 10 102 93 452 39600 Power Operated Equipment 6.4 P, S, T & D Plant - Demand 0 - - - - - 453 39603 Ditchers 6.4 P, S, T & D Plant - Demand 0 - - - - - 454 39604 Backhoes 6.4 P, S, T & D Plant - Demand 0 - - - - - 455 39605 Welders 6.4 P, S, T & D Plant - Demand 0 - - - - - 456 39700 Communication Equipment 6.4 P, S, T & D Plant - Demand 11,629 5,258 3,007 158 1,684 1,522 457 39701 Communication Equipment - Mobile Radios 6.4 P, S, T & D Plant - Demand 0 - - - - - 458 39702 Communication Equipment - Fixed Radios 6.4 P, S, T & D Plant - Demand 0 - - - - - 459 39705 Communication Equip. - Telemetering 6.4 P, S, T & D Plant - Demand 0 - - - - - 460 39800 Miscellaneous Equipment 6.4 P, S, T & D Plant - Demand 1,173 530 303 16 170 153 461 39900 Other Tangible Property 6.4 P, S, T & D Plant - Demand 3,466 1,567 896 47 502 454 462 39901 Other Tangible Property - Servers - H/W 6.4 P, S, T & D Plant - Demand 548,513 248,002 141,812 7,459 79,448 71,792 463 39902 Other Tangible Property - Servers - S/W 6.4 P, S, T & D Plant - Demand 398,297 180,084 102,975 5,416 57,691 52,131 464 39903 Other Tangible Property - Network - H/W 6.4 P, S, T & D Plant - Demand 55,112 24,918 14,249 749 7,983 7,213 465 39904 Other Tang. Property - CPU 6.4 P, S, T & D Plant - Demand 0 - - - - - 466 39905 Other Tangible Property - MF - Hardware 6.4 P, S, T & D Plant - Demand 0 - - - - - 467 39906 Other Tang. Property - PC Hardware 6.4 P, S, T & D Plant - Demand 38,629 17,466 9,987 525 5,595 5,056 468 39907 Other Tang. Property - PC Software 6.4 P, S, T & D Plant - Demand 37,757 17,071 9,762 513 5,469 4,942 469 39908 Other Tang. Property - Mainframe S/W 6.4 P, S, T & D Plant - Demand 949 429 245 13 137 124 470 39909 Other Tang. Property - Application Software 6.4 P, S, T & D Plant - Demand 1,037,642 469,154 268,271 14,110 150,295 135,811 471 39924 Other Tang. Property - General Startup Costs 6.4 P, S, T & D Plant - Demand 0 - - - - - 472 Retirement Work in Progress 6.4 P, S, T & D Plant - Demand 0 - - - - - 473474 Total General Plant 2,417,147 1,092,875 624,928 32,870 350,107 316,367 475476 Shared Services Customer Support:477478 General:479480 37400 Land & Land Rights 6.4 P, S, T & D Plant - Demand 0 - - - - - 481 39001 Structures Frame 6.4 P, S, T & D Plant - Demand 0 - - - - - 482 36602 Structures & Improvements 6.4 P, S, T & D Plant - Demand 84,064 38,008 21,734 1,143 12,176 11,003 483 37503 Improvements 6.4 P, S, T & D Plant - Demand 0 - - - - - 484 39004 Air Conditioning Equipment 6.4 P, S, T & D Plant - Demand 0 - - - - - 485 39009 Improvement to leased Premises 6.4 P, S, T & D Plant - Demand 40,950 18,515 10,587 557 5,931 5,360 486 39100 Office Furniture & Equipment 6.4 P, S, T & D Plant - Demand 22,491 10,169 5,815 306 3,258 2,944 487 39102 Remittance Processing Equip 6.4 P, S, T & D Plant - Demand 0 - - - - - 488 39103 Office Machines 6.4 P, S, T & D Plant - Demand 0 - - - - - 489 39200 Transportation Equipment 6.4 P, S, T & D Plant - Demand 918 415 237 12 133 120 490 39201 Trucks 6.4 P, S, T & D Plant - Demand 0 - - - - - 491 39202 Trailers 6.4 P, S, T & D Plant - Demand 0 - - - - - 492 39300 Stores Equipment 6.4 P, S, T & D Plant - Demand 0 - - - - - 493 39400 Tools, Shop & Garage Equipment 6.4 P, S, T & D Plant - Demand 1,501 678 388 20 217 196 494 39500 Laboratory Equipment 6.4 P, S, T & D Plant - Demand 175 79 45 2 25 23 495 39603 Ditchers 6.4 P, S, T & D Plant - Demand 0 - - - - - 496 39604 Backhoes 6.4 P, S, T & D Plant - Demand 0 - - - - - 497 39605 Welders 6.4 P, S, T & D Plant - Demand 0 - - - - - 498 39700 Communication Equipment 6.4 P, S, T & D Plant - Demand 28,824 13,032 7,452 392 4,175 3,773 499 39701 Communication Equipment - Mobile Radios 6.4 P, S, T & D Plant - Demand 0 - - - - - 500 39702 Communication Equipment - Fixed Radios 6.4 P, S, T & D Plant - Demand 0 - - - - - 501 39705 Communication Equip. - Telemetering 6.4 P, S, T & D Plant - Demand 0 - - - - - 502 39800 Miscellaneous Equipment 6.4 P, S, T & D Plant - Demand 1,997 903 516 27 289 261 503 39900 Other Tangible Property 6.4 P, S, T & D Plant - Demand 13,053 5,902 3,375 177 1,891 1,708 504 39901 Other Tangible Property - Servers - H/W 6.4 P, S, T & D Plant - Demand 138,882 62,793 35,906 1,889 20,116 18,177 505 39902 Other Tangible Property - Servers - S/W 6.4 P, S, T & D Plant - Demand 31,774 14,366 8,215 432 4,602 4,159 506 39903 Other Tangible Property - Network - H/W 6.4 P, S, T & D Plant - Demand 9,432 4,264 2,439 128 1,366 1,234 507 39904 Other Tang. Property - CPU 6.4 P, S, T & D Plant - Demand 0 - - - - - 508 39905 Other Tangible Property - MF - Hardware 6.4 P, S, T & D Plant - Demand 0 - - - - - 509 39906 Other Tang. Property - PC Hardware 6.4 P, S, T & D Plant - Demand 18,021 8,148 4,659 245 2,610 2,359 510 39907 Other Tang. Property - PC Software 6.4 P, S, T & D Plant - Demand 4,177 1,889 1,080 57 605 547 511 39908 Other Tang. Property - Mainframe S/W 6.4 P, S, T & D Plant - Demand 842,151 380,765 217,729 11,452 121,980 110,224 512 39909 Other Tang. Property - Application Software 6.4 P, S, T & D Plant - Demand 1,998 903 517 27 289 262 513 39924 Other Tang. Property - General Startup Costs 6.4 P, S, T & D Plant - Demand 0 - - - - - 514 Retirement Work in Progress 6.4 P, S, T & D Plant - Demand 0 - - - - - 515516 Total General Plant 1,240,405 560,830 320,694 16,868 179,664 162,350 517518 TOTAL RESERVE FOR DEPRECIATION - DEMAND 72,970,288 32,992,383 18,865,694 992,289 10,569,248 9,550,674

Exhibit PHR-4Page 38 of 75
Atmos Energy Corporation, Kentucky/Mid-States DivisionClass Cost of Service - Demand/Commodity StudyForecasted Test Period: Twelve Months Ended March 31, 2020
ALLOCATION OF RESERVE FOR DEPRECIATION
Commodity
Line Acct. Allocation Allocation Total Residential Non-Res Sales Non-Res Sales Transport TransportNo. No. Factor Basis Company Sales Firm Interruptible Firm Interruptible
519 Intangible Plant:520521 30100 Organization 6.6 P, S, T & D Plant - Commodity 1,679 515 347 17 377 422 522 30200 Franchises & Consents 6.6 P, S, T & D Plant - Commodity 24,163 7,417 4,997 249 5,428 6,073 523 30300 Misc Intangible Plant 99.0 - 0 - - - - - 524525 Total Intangible Plant: 25,843 7,932 5,344 266 5,805 6,496526527 Production Plant:528529 32520 Producing Leaseholds 99.0 - 0 - - - - - 530 32540 Rights of Ways 99.0 - 0 - - - - - 531 33100 Production Gas Wells Equipment 99.0 - 0 - - - - - 532 33201 Field Lines 99.0 - 0 - - - - - 533 33202 Tributary Lines 1.2 Sales Mcf 0 - - - - - 534 33400 Field Meas. & Reg. Sta. Equip 1.2 Sales Mcf 0 - - - - - 535 33600 Purification Equipment 99.0 - 0 - - - - - 536537 Total Production Plant 0 0 0 0 0 0538539 Storage Plant:540541 35010 Land 1.5 Winter Volumes 0 - - - - - 542 35020 Rights of Way 1.5 Winter Volumes 2,227 843 522 29 409 424 543 35100 Structures and Improvements 1.5 Winter Volumes 3,144 1,191 737 40 578 599 544 35102 Compression Station Equipment 1.5 Winter Volumes 56,872 21,533 13,324 729 10,455 10,831 545 35103 Meas. & Reg. Sta. Structues 1.5 Winter Volumes 10,242 3,878 2,399 131 1,883 1,950 546 35104 Other Structures 1.5 Winter Volumes 50,072 18,959 11,731 642 9,205 9,536 547 35200 Wells \ Rights of Way 1.5 Winter Volumes 595,415 225,442 139,498 7,628 109,455 113,392 548 35201 Well Construction 1.5 Winter Volumes 709,755 268,734 166,287 9,093 130,475 135,167 549 35202 Well Equipment 1.5 Winter Volumes 225,298 85,304 52,784 2,887 41,417 42,906 550 35203 Cushion Gas 1.5 Winter Volumes 379,297 143,613 88,864 4,860 69,726 72,234 551 35210 Leaseholds 1.5 Winter Volumes 84,031 31,817 19,687 1,077 15,447 16,003 552 35211 Storage Rights 1.5 Winter Volumes 21,978 8,321 5,149 282 4,040 4,185 553 35301 Field Lines 1.5 Winter Volumes (44,198) (16,735) (10,355) (566) (8,125) (8,417) 554 35302 Tributary Lines 1.5 Winter Volumes 94,588 35,814 22,161 1,212 17,388 18,014 555 35400 Compressor Station Equipment 1.5 Winter Volumes 248,926 94,251 58,320 3,189 45,760 47,406 556 35500 Meas & Reg. Equipment 1.5 Winter Volumes 101,272 38,344 23,727 1,297 18,617 19,286 557 35600 Purification Equipment 1.5 Winter Volumes 95,899 36,310 22,468 1,229 17,629 18,263 558559 Total Storage Plant 2,634,817 997,619 617,304 33,757 484,359 501,778 560561 Transmission:562563 36510 Land & Land Rights 99.0 - 0 - - - - - 564 36520 Rights of Way 99.0 - 0 - - - - - 565 36602 Structures & Improvements 99.0 - 0 - - - - - 566 36603 Other Structues 99.0 - 0 - - - - - 567 36700 Mains Cathodic Protection 99.0 - 0 - - - - - 568 36701 Mains - Steel 99.0 - 0 - - - - - 569 36900 Meas. & Reg. Equipment 99.0 - 0 - - - - - 570 36901 Meas. & Reg. Equipment 99.0 - 0 - - - - - 571572 Total Transmission Plant 0 - - - - - 573574 Distribution:575576 37400 Land & Land Rights 99.0 - 0 - - - - - 577 37401 Land 99.0 - 0 - - - - - 578 37402 Land Rights 1.0 Mcf 82,380 24,945 16,905 835 18,698 20,996 579 37403 Land Other 99.0 - 0 - - - - - 580 37500 Structures & Improvements 1.0 Mcf 39,794 12,050 8,166 403 9,032 10,142 581 37501 Structures & Improvements T.B. 1.0 Mcf 25,008 7,573 5,132 254 5,676 6,374 582 37502 Land Rights 1.0 Mcf 12,390 3,752 2,543 126 2,812 3,158 583 37503 Improvements 1.0 Mcf 672 204 138 7 153 171 584 37600 Mains Cathodic Protection 1.0 Mcf 4,623,865 1,400,151 948,861 46,878 1,049,506 1,178,470 585 37601 Mains - Steel 1.0 Mcf 11,785,233 3,568,681 2,418,442 119,481 2,674,963 3,003,666 586 37602 Mains - Plastic 1.0 Mcf 6,660,230 2,016,781 1,366,742 67,523 1,511,711 1,697,472 587 37800 Meas & Reg. Sta. Equip - General 1.0 Mcf 1,013,209 306,809 207,920 10,272 229,974 258,234 588 37900 Meas & Reg. Sta. Equip - City Gate 1.0 Mcf 344,553 104,334 70,706 3,493 78,205 87,815 589 37905 Meas & Reg. Sta. Equipment T.b. 1.0 Mcf 363,349 110,026 74,563 3,684 82,472 92,606 590 38000 Services 99.0 - 0 - - - - - 591 38100 Meters 99.0 - 0 - - - - - 592 38200 Meter Installaitons 99.0 - 0 - - - - - 593 38300 House Regulators 99.0 - 0 - - - - - 594 38400 House Reg. Installations 99.0 - 0 - - - - - 595 38500 Ind. Meas. & Reg. Sta. Equipment 99.0 - 0 - - - - - 596 38600 Other Prop. On Cust. Prem 99.0 - 0 - - - - - 597598 Total Distribution Plant 24,950,684 7,555,306 5,120,117 252,955 5,663,201 6,359,105

Exhibit PHR-4Page 39 of 75
Atmos Energy Corporation, Kentucky/Mid-States DivisionClass Cost of Service - Demand/Commodity StudyForecasted Test Period: Twelve Months Ended March 31, 2020
ALLOCATION OF RESERVE FOR DEPRECIATION599600 General:601602 38900 Land & Land Rights 6.6 P, S, T & D Plant - Commodity 0 - - - - - 603 39000 Structures & Improvements 6.6 P, S, T & D Plant - Commodity 252,714 77,571 52,261 2,599 56,764 63,519 604 39002 Structures - Brick 6.6 P, S, T & D Plant - Commodity 21,690 6,658 4,485 223 4,872 5,452 605 39003 Improvements 6.6 P, S, T & D Plant - Commodity 59,017 18,115 12,205 607 13,256 14,834 606 39003 Air Conditioning Equipment 6.6 P, S, T & D Plant - Commodity 1,018 312 211 10 229 256 607 39004 Improvement to Leased Premises 6.6 P, S, T & D Plant - Commodity 251,631 77,238 52,037 2,588 56,521 63,247 608 39009 Office Furniture & Equipment 6.6 P, S, T & D Plant - Commodity 230,764 70,833 47,722 2,373 51,834 58,002 609 39100 Remittance Processing Equip 6.6 P, S, T & D Plant - Commodity 0 - - - - - 610 39102 Office Machines 6.6 P, S, T & D Plant - Commodity 0 - - - - - 611 39103 Transportation Equipment 6.6 P, S, T & D Plant - Commodity 22,941 7,042 4,744 236 5,153 5,766 612 39200 Trucks 6.6 P, S, T & D Plant - Commodity 0 - - - - - 613 39201 Trailers 6.6 P, S, T & D Plant - Commodity (510) (157) (105) (5) (115) (128) 614 39202 Stores Equipment 6.6 P, S, T & D Plant - Commodity 0 - - - - - 615 39400 Tools, Shop & Garage Equipment 6.6 P, S, T & D Plant - Commodity 262,264 80,502 54,236 2,697 58,909 65,919 616 39600 Power Operated Equipment 6.6 P, S, T & D Plant - Commodity 0 - - - - - 617 39603 Ditchers 6.6 P, S, T & D Plant - Commodity 7,995 2,454 1,653 82 1,796 2,009 618 39604 Backhoes 6.6 P, S, T & D Plant - Commodity 12,665 3,887 2,619 130 2,845 3,183 619 39605 Welders 6.6 P, S, T & D Plant - Commodity 3,923 1,204 811 40 881 986 620 39700 Communication Equipment 6.6 P, S, T & D Plant - Commodity 54,235 16,648 11,216 558 12,182 13,632 621 39701 Communication Equipment - Mobile Radios 6.6 P, S, T & D Plant - Commodity 0 - - - - - 622 39702 Communication Equipment - Fixed Radios 6.6 P, S, T & D Plant - Commodity 0 - - - - - 623 39705 Communication Equip. - Telemetering 6.6 P, S, T & D Plant - Commodity 0 - - - - - 624 39800 Miscellaneous Equipment 6.6 P, S, T & D Plant - Commodity 417,913 128,279 86,423 4,298 93,871 105,041 625 39900 Other Tangible Property 6.6 P, S, T & D Plant - Commodity 0 - - - - - 626 39901 Other Tangible Property - Servers - H/W 6.6 P, S, T & D Plant - Commodity 1,345 413 278 14 302 338 627 39902 Other Tangible Property - Servers - S/W 6.6 P, S, T & D Plant - Commodity 0 - - - - - 628 39903 Other Tangible Property - Network - H/W 6.6 P, S, T & D Plant - Commodity 13,033 4,000 2,695 134 2,927 3,276 629 39904 Other Tang. Property - CPU 6.6 P, S, T & D Plant - Commodity 0 - - - - - 630 39905 Other Tangible Property - MF - Hardware 6.6 P, S, T & D Plant - Commodity 0 - - - - - 631 39906 Other Tang. Property - PC Hardware 6.6 P, S, T & D Plant - Commodity 22,626 6,945 4,679 233 5,082 5,687 632 39907 Other Tang. Property - PC Software 6.6 P, S, T & D Plant - Commodity 0 - - - - - 633 39908 Other Tang. Property - Mainframe S/W 6.6 P, S, T & D Plant - Commodity 0 - - - - - 634 39909 Other Tang. Property - Application Software 6.6 P, S, T & D Plant - Commodity 23,773 7,297 4,916 244 5,340 5,975 635 Other Tang. Property - General Startup Costs 6.6 P, S, T & D Plant - Commodity 0 - - - - - 636 Retirement Work in Progress 6.6 P, S, T & D Plant - Commodity (1,285,201) (394,494) (265,777) (13,217) (288,680) (323,032) 637 AR 15 general plant amortization 6.6 P, S, T & D Plant - Commodity 0 - - - - - 638639 Total General Plant 373,833 114,749 77,308 3,845 83,970 93,962 640641 TOTAL DIRECT RESERVE FOR DEPRECIATION 27,985,177 8,675,605 5,820,073 290,823 6,237,335 6,961,340642643 Kentucky Mid-States General Office:644645 Intangible Plant:646647 30100 Organization 99.0 - 0 - - - - - 648 30200 Franchises & Consents 99.0 - 0 - - - - - 649 30300 Misc Intangible Plant 99.0 - 0 - - - - - 650651 Total Intangible Plant:652653 General:654655 37400 Land & Land Rights 6.6 P, S, T & D Plant - Commodity 0 - - - - - 656 39001 Structures Frame 6.6 P, S, T & D Plant - Commodity 10,626 3,262 2,198 109 2,387 2,671 657 36602 Structures & Improvements 6.6 P, S, T & D Plant - Commodity 0 - - - - - 658 38900 Land & Land Rights 6.6 P, S, T & D Plant - Commodity 0 - - - - - 659 39004 Air Conditioning Equipment 6.6 P, S, T & D Plant - Commodity 1,026 315 212 11 230 258 660 39009 Improvement to leased Premises 6.6 P, S, T & D Plant - Commodity 3,897 1,196 806 40 875 980 661 39100 Office Furniture & Equipment 6.6 P, S, T & D Plant - Commodity 3,875 1,189 801 40 870 974 662 39102 Remittance Processing Equip 6.6 P, S, T & D Plant - Commodity 0 - - - - - 663 39103 Office Machines 6.6 P, S, T & D Plant - Commodity 0 - - - - - 664 39200 Transportation Equipment 6.6 P, S, T & D Plant - Commodity 1,793 550 371 18 403 451 665 39201 Trucks 6.6 P, S, T & D Plant - Commodity 0 - - - - - 666 39202 Trailers 6.6 P, S, T & D Plant - Commodity 0 - - - - - 667 39300 Stores Equipment 6.6 P, S, T & D Plant - Commodity 0 - - - - - 668 39400 Tools, Shop & Garage Equipment 6.6 P, S, T & D Plant - Commodity 14,437 4,432 2,986 148 3,243 3,629 669 39600 Power Operated Equipment 6.6 P, S, T & D Plant - Commodity 882 271 182 9 198 222 670 39603 Ditchers 6.6 P, S, T & D Plant - Commodity 0 - - - - - 671 39604 Backhoes 6.6 P, S, T & D Plant - Commodity 0 - - - - - 672 39605 Welders 6.6 P, S, T & D Plant - Commodity 0 - - - - - 673 39700 Communication Equipment 6.6 P, S, T & D Plant - Commodity (603) (185) (125) (6) (135) (152) 674 39701 Communication Equipment - Mobile Radios 6.6 P, S, T & D Plant - Commodity 0 - - - - - 675 39702 Communication Equipment - Fixed Radios 6.6 P, S, T & D Plant - Commodity 0 - - - - - 676 39705 Communication Equip. - Telemetering 6.6 P, S, T & D Plant - Commodity 0 - - - - - 677 39800 Miscellaneous Equipment 6.6 P, S, T & D Plant - Commodity 72,447 22,238 14,982 745 16,273 18,209 678 39900 Other Tangible Property 6.6 P, S, T & D Plant - Commodity 0 - - - - - 679 39901 Other Tangible Property - Servers - H/W 6.6 P, S, T & D Plant - Commodity (3,489) (1,071) (722) (36) (784) (877) 680 39902 Other Tangible Property - Servers - S/W 6.6 P, S, T & D Plant - Commodity 0 - - - - - 681 39903 Other Tangible Property - Network - H/W 6.6 P, S, T & D Plant - Commodity 0 - - - - - 682 39904 Other Tang. Property - CPU 6.6 P, S, T & D Plant - Commodity 0 - - - - - 683 39905 Other Tangible Property - MF - Hardware 6.6 P, S, T & D Plant - Commodity 0 - - - - - 684 39906 Other Tang. Property - PC Hardware 6.6 P, S, T & D Plant - Commodity 7,045 2,162 1,457 72 1,582 1,771 685 39907 Other Tang. Property - PC Software 6.6 P, S, T & D Plant - Commodity 4,251 1,305 879 44 955 1,069 686 39908 Other Tang. Property - Mainframe S/W 6.6 P, S, T & D Plant - Commodity 83,150 25,523 17,195 855 18,677 20,900 687 39909 Other Tang. Property - Application Software 6.6 P, S, T & D Plant - Commodity 0 - - - - - 688 39924 Other Tang. Property - General Startup Costs 6.6 P, S, T & D Plant - Commodity 0 - - - - - 689 Retirement Work in Progress 6.6 P, S, T & D Plant - Commodity 5,271 1,618 1,090 54 1,184 1,325 690691 Total General Plant 204,609 62,805 42,313 2,104 45,959 51,428

Exhibit PHR-4Page 40 of 75
Atmos Energy Corporation, Kentucky/Mid-States DivisionClass Cost of Service - Demand/Commodity StudyForecasted Test Period: Twelve Months Ended March 31, 2020
ALLOCATION OF RESERVE FOR DEPRECIATION692693 Shared Services General Office:694695 General:696697 37400 Land & Land Rights 6.6 P, S, T & D Plant - Commodity 0 - - - - - 698 39000 Structures & Improvements 6.6 P, S, T & D Plant - Commodity 18,317 5,622 3,788 188 4,114 4,604 699 36602 Structures & Improvements 6.6 P, S, T & D Plant - Commodity 0 - - - - - 700 37503 Improvements 6.6 P, S, T & D Plant - Commodity 0 - - - - - 701 39004 Air Conditioning Equipment 6.6 P, S, T & D Plant - Commodity 0 - - - - - 702 39009 Improvement to leased Premises 6.6 P, S, T & D Plant - Commodity 97,250 29,851 20,111 1,000 21,844 24,444 703 39100 Office Furniture & Equipment 6.6 P, S, T & D Plant - Commodity 23,429 7,191 4,845 241 5,262 5,889 704 39102 Remittance Processing Equip 6.6 P, S, T & D Plant - Commodity 0 0 0 0 0 0 705 39103 Office Machines 6.6 P, S, T & D Plant - Commodity 0 0 0 0 0 0 706 39200 Transportation Equipment 6.6 P, S, T & D Plant - Commodity 57 18 12 1 13 14 707 39201 Trucks 6.6 P, S, T & D Plant - Commodity 0 - - - - - 708 39202 Trailers 6.6 P, S, T & D Plant - Commodity 0 - - - - - 709 39300 Stores Equipment 6.6 P, S, T & D Plant - Commodity 0 - - - - - 710 39400 Tools, Shop & Garage Equipment 6.6 P, S, T & D Plant - Commodity 347 107 72 4 78 87 711 39600 Power Operated Equipment 6.6 P, S, T & D Plant - Commodity 0 - - - - - 712 39603 Ditchers 6.6 P, S, T & D Plant - Commodity 0 - - - - - 713 39604 Backhoes 6.6 P, S, T & D Plant - Commodity 0 - - - - - 714 39605 Welders 6.6 P, S, T & D Plant - Commodity 0 - - - - - 715 39700 Communication Equipment 6.6 P, S, T & D Plant - Commodity 5,708 1,752 1,180 59 1,282 1,435 716 39701 Communication Equipment - Mobile Radios 6.6 P, S, T & D Plant - Commodity 0 - - - - - 717 39702 Communication Equipment - Fixed Radios 6.6 P, S, T & D Plant - Commodity 0 - - - - - 718 39705 Communication Equip. - Telemetering 6.6 P, S, T & D Plant - Commodity 0 - - - - - 719 39800 Miscellaneous Equipment 6.6 P, S, T & D Plant - Commodity 576 177 119 6 129 145 720 39900 Other Tangible Property 6.6 P, S, T & D Plant - Commodity 1,701 522 352 17 382 428 721 39901 Other Tangible Property - Servers - H/W 6.6 P, S, T & D Plant - Commodity 269,254 82,648 55,681 2,769 60,480 67,676 722 39902 Other Tangible Property - Servers - S/W 6.6 P, S, T & D Plant - Commodity 195,516 60,014 40,432 2,011 43,917 49,143 723 39903 Other Tangible Property - Network - H/W 6.6 P, S, T & D Plant - Commodity 27,053 8,304 5,595 278 6,077 6,800 724 39904 Other Tang. Property - CPU 6.6 P, S, T & D Plant - Commodity 0 - - - - - 725 39905 Other Tangible Property - MF - Hardware 6.6 P, S, T & D Plant - Commodity 0 - - - - - 726 39906 Other Tang. Property - PC Hardware 6.6 P, S, T & D Plant - Commodity 18,962 5,821 3,921 195 4,259 4,766 727 39907 Other Tang. Property - PC Software 6.6 P, S, T & D Plant - Commodity 18,534 5,689 3,833 191 4,163 4,659 728 39908 Other Tang. Property - Mainframe S/W 6.6 P, S, T & D Plant - Commodity 466 143 96 5 105 117 729 39909 Other Tang. Property - Application Software 6.6 P, S, T & D Plant - Commodity 509,359 156,348 105,334 5,238 114,412 128,026 730 39924 Other Tang. Property - General Startup Costs 6.6 P, S, T & D Plant - Commodity 0 - - - - - 731 Retirement Work in Progress 6.6 P, S, T & D Plant - Commodity 0 - - - - - 732733 Total General Plant 1,186,531 364,207 245,372 12,203 266,517 298,231 734 334,439 102,656 69,161 3,439 75,121 84,060735 Shared Services Customer Support:736737 General:738739 37400 Land & Land Rights 6.6 P, S, T & D Plant - Commodity 0 - - - - - 740 39001 Structures Frame 6.6 P, S, T & D Plant - Commodity 0 - - - - - 741 36602 Structures & Improvements 6.6 P, S, T & D Plant - Commodity 41,265 12,666 8,534 424 9,269 10,372 742 37503 Improvements 6.6 P, S, T & D Plant - Commodity 0 - - - - - 743 39004 Air Conditioning Equipment 6.6 P, S, T & D Plant - Commodity 0 - - - - - 744 39009 Improvement to leased Premises 6.6 P, S, T & D Plant - Commodity 20,102 6,170 4,157 207 4,515 5,052 745 39100 Office Furniture & Equipment 6.6 P, S, T & D Plant - Commodity 11,040 3,389 2,283 114 2,480 2,775 746 39102 Remittance Processing Equip 6.6 P, S, T & D Plant - Commodity 0 - - - - - 747 39103 Office Machines 6.6 P, S, T & D Plant - Commodity 0 - - - - - 748 39200 Transportation Equipment 6.6 P, S, T & D Plant - Commodity 451 138 93 5 101 113 749 39201 Trucks 6.6 P, S, T & D Plant - Commodity 0 - - - - - 750 39202 Trailers 6.6 P, S, T & D Plant - Commodity 0 - - - - - 751 39300 Stores Equipment 6.6 P, S, T & D Plant - Commodity 0 - - - - - 752 39400 Tools, Shop & Garage Equipment 6.6 P, S, T & D Plant - Commodity 737 226 152 8 165 185 753 39500 Laboratory Equipment 6.6 P, S, T & D Plant - Commodity 86 26 18 1 19 22 754 39603 Ditchers 6.6 P, S, T & D Plant - Commodity 0 - - - - - 755 39604 Backhoes 6.6 P, S, T & D Plant - Commodity 0 - - - - - 756 39605 Welders 6.6 P, S, T & D Plant - Commodity 0 - - - - - 757 39700 Communication Equipment 6.6 P, S, T & D Plant - Commodity 14,149 4,343 2,926 146 3,178 3,556 758 39701 Communication Equipment - Mobile Radios 6.6 P, S, T & D Plant - Commodity 0 - - - - - 759 39702 Communication Equipment - Fixed Radios 6.6 P, S, T & D Plant - Commodity 0 - - - - - 760 39705 Communication Equip. - Telemetering 6.6 P, S, T & D Plant - Commodity 0 - - - - - 761 39800 Miscellaneous Equipment 6.6 P, S, T & D Plant - Commodity 980 301 203 10 220 246 762 39900 Other Tangible Property 6.6 P, S, T & D Plant - Commodity 6,407 1,967 1,325 66 1,439 1,610 763 39901 Other Tangible Property - Servers - H/W 6.6 P, S, T & D Plant - Commodity 68,174 20,926 14,098 701 15,313 17,135 764 39902 Other Tangible Property - Servers - S/W 6.6 P, S, T & D Plant - Commodity 15,597 4,788 3,225 160 3,503 3,920 765 39903 Other Tangible Property - Network - H/W 6.6 P, S, T & D Plant - Commodity 4,630 1,421 957 48 1,040 1,164 766 39904 Other Tang. Property - CPU 6.6 P, S, T & D Plant - Commodity 0 - - - - - 767 39905 Other Tangible Property - MF - Hardware 6.6 P, S, T & D Plant - Commodity 0 - - - - - 768 39906 Other Tang. Property - PC Hardware 6.6 P, S, T & D Plant - Commodity 8,846 2,715 1,829 91 1,987 2,223 769 39907 Other Tang. Property - PC Software 6.6 P, S, T & D Plant - Commodity 2,050 629 424 21 461 515 770 39908 Other Tang. Property - Mainframe S/W 6.6 P, S, T & D Plant - Commodity 413,396 126,892 85,489 4,251 92,856 103,906 771 39909 Other Tang. Property - Application Software 6.6 P, S, T & D Plant - Commodity 981 301 203 10 220 247 772 39924 Other Tang. Property - General Startup Costs 6.6 P, S, T & D Plant - Commodity 0 - - - - - 773 Retirement Work in Progress 6.6 P, S, T & D Plant - Commodity 0 - - - - - 774775 Total General Plant 608,891 186,900 125,917 6,262 136,768 153,043 776777 TOTAL RESERVE FOR DEPRECIATION - COMMODITY 29,985,208 9,289,518 6,233,676 311,392 6,686,580 7,464,043

Exhibit PHR-4Page 41 of 75
Atmos Energy Corporation, Kentucky/Mid-States DivisionClass Cost of Service - Demand/Commodity StudyForecasted Test Period: Twelve Months Ended March 31, 2020
ALLOCATION OF RESERVE FOR DEPRECIATION
Total Reserve for Depreciation
Line Acct. Allocation Allocation Total Residential Non-Res Sales Non-Res Sales Transport TransportNo. No. Factor Basis Company Sales Firm Interruptible Firm Interruptible
778 Intangible Plant:779780 30100 Organization 8,330 4,555 1,934 65 894 882 781 30200 Franchises & Consents 119,853 65,537 27,826 942 12,860 12,687 782 30300 Misc Intangible Plant 0 - - - - - 783784 Total Intangible Plant: 128,182 70,092 29,760 1,008 13,754 13,569785786 Production Plant:787788 32520 Producing Leaseholds 0 - - - - - 789 32540 Rights of Ways 0 - - - - - 790 33100 Production Gas Wells Equipment 0 - - - - - 791 33201 Field Lines 0 - - - - - 792 33202 Tributary Lines 0 - - - - - 793 33400 Field Meas. & Reg. Sta. Equip 0 - - - - - 794 33600 Purification Equipment 0 - - - - - 795796 Total Production Plant 0 0 0 0 0 0797798 Storage Plant:799800 35010 Land 0 - - - - - 801 35020 Rights of Way 4,453 1,850 1,097 59 732 715 802 35100 Structures and Improvements 6,289 2,612 1,550 83 1,033 1,010 803 35102 Compression Station Equipment 113,744 47,247 28,028 1,502 18,692 18,275 804 35103 Meas. & Reg. Sta. Structues 20,483 8,508 5,047 270 3,366 3,291 805 35104 Other Structures 100,144 41,598 24,677 1,322 16,457 16,089 806 35200 Wells \ Rights of Way 1,190,830 494,649 293,436 15,725 195,697 191,322 807 35201 Well Construction 1,419,511 589,639 349,786 18,745 233,278 228,063 808 35202 Well Equipment 450,595 187,169 111,033 5,950 74,049 72,394 809 35203 Cushion Gas 758,594 315,106 186,928 10,017 124,665 121,878 810 35210 Leaseholds 168,062 69,810 41,413 2,219 27,619 27,001 811 35211 Storage Rights 43,956 18,258 10,831 580 7,224 7,062 812 35301 Field Lines (88,396) (36,718) (21,782) (1,167) (14,527) (14,202) 813 35302 Tributary Lines 189,177 78,581 46,616 2,498 31,089 30,394 814 35400 Compressor Station Equipment 497,853 206,799 122,678 6,574 81,815 79,986 815 35500 Meas & Reg. Equipment 202,544 84,133 49,909 2,675 33,285 32,541 816 35600 Purification Equipment 191,797 79,669 47,261 2,533 31,519 30,815 817818 Total Storage Plant 5,269,635 2,188,910 1,298,508 69,587 865,995 846,635 819820 Transmission:821822 36510 Land & Land Rights 0 - - - - - 823 36520 Rights of Way 428,096 193,557 110,680 5,821 62,007 56,031 824 36602 Structures & Improvements 16,837 7,613 4,353 229 2,439 2,204 825 36603 Other Structues 53,066 23,993 13,720 722 7,686 6,946 826 36700 Mains Cathodic Protection 98,316 44,452 25,419 1,337 14,240 12,868 827 36701 Mains - Steel 16,387,961 7,409,562 4,236,933 222,852 2,373,684 2,144,929 828 36900 Meas. & Reg. Equipment 353,469 159,816 91,386 4,807 51,198 46,264 829 36901 Meas. & Reg. Equipment 1,774,251 802,200 458,714 24,127 256,988 232,222 830831 Total Transmission Plant 19,111,996 8,641,192 4,941,204 259,895 2,768,242 2,501,463 832833 Distribution:834835 37400 Land & Land Rights 0 - - - - - 836 37401 Land 0 - - - - - 837 37402 Land Rights 235,363 94,115 56,457 2,916 40,857 41,019 838 37403 Land Other 0 - - - - - 839 37500 Structures & Improvements 113,695 45,463 27,272 1,408 19,736 19,815 840 37501 Structures & Improvements T.B. 71,449 28,570 17,139 885 12,403 12,452 841 37502 Land Rights 35,399 14,155 8,491 439 6,145 6,169 842 37503 Improvements 1,920 768 461 24 333 335 843 37600 Mains Cathodic Protection 13,210,658 5,282,536 3,168,885 163,646 2,293,244 2,302,348 844 37601 Mains - Steel 33,671,112 13,464,041 8,076,803 417,097 5,844,983 5,868,187 845 37602 Mains - Plastic 19,028,671 7,608,980 4,564,472 235,716 3,303,195 3,316,309 846 37800 Meas & Reg. Sta. Equip - General 2,894,799 1,157,541 694,385 35,859 502,509 504,504 847 37900 Meas & Reg. Sta. Equip - City Gate 984,409 393,635 236,133 12,194 170,884 171,562 848 37905 Meas & Reg. Sta. Equipment T.b. 1,038,111 415,109 249,015 12,859 180,206 180,922 849 38000 Services 30,562,139 27,216,572 3,310,936 1,683 21,040 11,908 850 38100 Meters 21,386,354 13,797,005 7,076,398 24,923 311,648 176,380 851 38200 Meter Installaitons 26,987,899 17,410,737 8,929,858 31,450 393,275 222,578 852 38300 House Regulators 4,321,265 2,787,783 1,429,836 5,036 62,971 35,639 853 38400 House Reg. Installations 94,403 60,903 31,237 110 1,376 779 854 38500 Ind. Meas. & Reg. Sta. Equipment 2,958,741 - 2,928,115 1,488 18,607 10,531 855 38600 Other Prop. On Cust. Prem 0 - - - - - 856857 Total Distribution Plant 157,596,387 89,777,912 40,805,895 947,732 13,183,412 12,881,436

Exhibit PHR-4Page 42 of 75
Atmos Energy Corporation, Kentucky/Mid-States DivisionClass Cost of Service - Demand/Commodity StudyForecasted Test Period: Twelve Months Ended March 31, 2020
ALLOCATION OF RESERVE FOR DEPRECIATION858859 General:860861 38900 Land & Land Rights 0 - - - - - 862 39000 Structures & Improvements 1,253,482 685,419 291,020 9,853 134,498 132,692 863 39002 Structures - Brick 107,583 58,827 24,977 846 11,544 11,389 864 39003 Improvements 292,730 160,068 67,963 2,301 31,410 30,988 865 39003 Air Conditioning Equipment 5,049 2,761 1,172 40 542 535 866 39004 Improvement to Leased Premises 1,248,110 682,481 289,773 9,811 133,922 132,124 867 39009 Office Furniture & Equipment 1,144,609 625,886 265,743 8,997 122,816 121,167 868 39100 Remittance Processing Equip 0 - - - - - 869 39102 Office Machines 0 - - - - - 870 39103 Transportation Equipment 113,788 62,220 26,418 894 12,209 12,045 871 39200 Trucks 0 - - - - - 872 39201 Trailers (2,529) (1,383) (587) (20) (271) (268) 873 39202 Stores Equipment 0 - - - - - 874 39400 Tools, Shop & Garage Equipment 1,300,851 711,321 302,018 10,225 139,581 137,707 875 39600 Power Operated Equipment 0 - - - - - 876 39603 Ditchers 39,655 21,684 9,207 312 4,255 4,198 877 39604 Backhoes 62,818 34,350 14,584 494 6,740 6,650 878 39605 Welders 19,456 10,639 4,517 153 2,088 2,060 879 39700 Communication Equipment 269,010 147,098 62,456 2,115 28,865 28,477 880 39701 Communication Equipment - Mobile Radios 0 - - - - - 881 39702 Communication Equipment - Fixed Radios 0 - - - - - 882 39705 Communication Equip. - Telemetering 0 - - - - - 883 39800 Miscellaneous Equipment 2,072,883 1,133,477 481,260 16,294 222,419 219,433 884 39900 Other Tangible Property 0 - - - - - 885 39901 Other Tangible Property - Servers - H/W 6,670 3,647 1,549 52 716 706 886 39902 Other Tangible Property - Servers - S/W 0 - - - - - 887 39903 Other Tangible Property - Network - H/W 64,644 35,348 15,008 508 6,936 6,843 888 39904 Other Tang. Property - CPU 0 - - - - - 889 39905 Other Tangible Property - MF - Hardware 0 - - - - - 890 39906 Other Tang. Property - PC Hardware 112,226 61,366 26,055 882 12,042 11,880 891 39907 Other Tang. Property - PC Software 0 - - - - - 892 39908 Other Tang. Property - Mainframe S/W 0 - - - - - 893 39909 Other Tang. Property - Application Software 117,916 64,478 27,377 927 12,652 12,482 894 Other Tang. Property - General Startup Costs 0 - - - - - 895 Retirement Work in Progress (6,374,709) (3,485,766) (1,480,012) (50,108) (684,003) (674,820) 896 AR 15 general plant amortization 0 - - - - - 897898 Total General Plant 1,854,243 1,013,922 430,498 14,575 198,959 196,288 899900 TOTAL DIRECT RESERVE FOR DEPRECIATION 183,960,444 101,692,028 47,505,865 1,292,797 17,030,362 16,439,391901902 Kentucky Mid-States General Office:903904 Intangible Plant:905906 30100 Organization 0 - - - - - 907 30200 Franchises & Consents 0 - - - - - 908 30300 Misc Intangible Plant 0 - - - - - 909910 Total Intangible Plant:911912 General:913914 37400 Land & Land Rights 0 - - - - - 915 39001 Structures Frame 52,708 28,821 12,237 414 5,656 5,580 916 36602 Structures & Improvements 0 - - - - - 917 38900 Land & Land Rights 0 - - - - - 918 39004 Air Conditioning Equipment 5,090 2,783 1,182 40 546 539 919 39009 Improvement to leased Premises 19,332 10,571 4,488 152 2,074 2,046 920 39100 Office Furniture & Equipment 19,220 10,510 4,462 151 2,062 2,035 921 39102 Remittance Processing Equip 0 - - - - - 922 39103 Office Machines 0 - - - - - 923 39200 Transportation Equipment 8,895 4,864 2,065 70 954 942 924 39201 Trucks 0 - - - - - 925 39202 Trailers 0 - - - - - 926 39300 Stores Equipment 0 - - - - - 927 39400 Tools, Shop & Garage Equipment 71,611 39,157 16,626 563 7,684 7,581 928 39600 Power Operated Equipment 4,375 2,392 1,016 34 469 463 929 39603 Ditchers 0 - - - - - 930 39604 Backhoes 0 - - - - - 931 39605 Welders 0 - - - - - 932 39700 Communication Equipment (2,991) (1,636) (695) (24) (321) (317) 933 39701 Communication Equipment - Mobile Radios 0 - - - - - 934 39702 Communication Equipment - Fixed Radios 0 - - - - - 935 39705 Communication Equip. - Telemetering 0 - - - - - 936 39800 Miscellaneous Equipment 359,341 196,492 83,428 2,825 38,557 38,039 937 39900 Other Tangible Property 0 - - - - - 938 39901 Other Tangible Property - Servers - H/W (17,306) (9,463) (4,018) (136) (1,857) (1,832) 939 39902 Other Tangible Property - Servers - S/W 0 - - - - - 940 39903 Other Tangible Property - Network - H/W 0 - - - - - 941 39904 Other Tang. Property - CPU 0 - - - - - 942 39905 Other Tangible Property - MF - Hardware 0 - - - - - 943 39906 Other Tang. Property - PC Hardware 34,944 19,108 8,113 275 3,749 3,699 944 39907 Other Tang. Property - PC Software 21,086 11,530 4,896 166 2,263 2,232 945 39908 Other Tang. Property - Mainframe S/W 412,432 225,523 95,754 3,242 44,254 43,660 946 39909 Other Tang. Property - Application Software 0 - - - - - 947 39924 Other Tang. Property - General Startup Costs 0 - - - - - 948 Retirement Work in Progress 26,143 14,295 6,070 205 2,805 2,767 949950 Total General Plant 1,014,877 554,947 235,623 7,977 108,896 107,434

Exhibit PHR-4Page 43 of 75
Atmos Energy Corporation, Kentucky/Mid-States DivisionClass Cost of Service - Demand/Commodity StudyForecasted Test Period: Twelve Months Ended March 31, 2020
ALLOCATION OF RESERVE FOR DEPRECIATION951952 Shared Services General Office:953954 General:955956 37400 Land & Land Rights 0 - - - - - 957 39000 Structures & Improvements 90,855 49,680 21,094 714 9,749 9,618 958 36602 Structures & Improvements 0 - - - - - 959 37503 Improvements 0 - - - - - 960 39004 Air Conditioning Equipment 0 - - - - - 961 39009 Improvement to leased Premises 482,368 263,764 111,991 3,792 51,758 51,063 962 39100 Office Furniture & Equipment 116,207 63,544 26,980 913 12,469 12,302 963 39102 Remittance Processing Equip 0 0 0 0 0 0 964 39103 Office Machines 0 0 0 0 0 0 965 39200 Transportation Equipment 284 156 66 2 31 30 966 39201 Trucks 0 - - - - - 967 39202 Trailers 0 - - - - - 968 39300 Stores Equipment 0 - - - - - 969 39400 Tools, Shop & Garage Equipment 1,722 942 400 14 185 182 970 39600 Power Operated Equipment 0 - - - - - 971 39603 Ditchers 0 - - - - - 972 39604 Backhoes 0 - - - - - 973 39605 Welders 0 - - - - - 974 39700 Communication Equipment 28,314 15,482 6,574 223 3,038 2,997 975 39701 Communication Equipment - Mobile Radios 0 - - - - - 976 39702 Communication Equipment - Fixed Radios 0 - - - - - 977 39705 Communication Equip. - Telemetering 0 - - - - - 978 39800 Miscellaneous Equipment 2,855 1,561 663 22 306 302 979 39900 Other Tangible Property 8,438 4,614 1,959 66 905 893 980 39901 Other Tangible Property - Servers - H/W 1,335,526 730,281 310,068 10,498 143,301 141,377 981 39902 Other Tangible Property - Servers - S/W 969,778 530,286 225,153 7,623 104,057 102,660 982 39903 Other Tangible Property - Network - H/W 134,188 73,375 31,154 1,055 14,398 14,205 983 39904 Other Tang. Property - CPU 0 - - - - - 984 39905 Other Tangible Property - MF - Hardware 0 - - - - - 985 39906 Other Tang. Property - PC Hardware 94,055 51,430 21,837 739 10,092 9,957 986 39907 Other Tang. Property - PC Software 91,932 50,269 21,344 723 9,864 9,732 987 39908 Other Tang. Property - Mainframe S/W 2,311 1,263 536 18 248 245 988 39909 Other Tang. Property - Application Software 2,526,463 1,381,500 586,567 19,859 271,088 267,449 989 39924 Other Tang. Property - General Startup Costs 0 - - - - - 990 Retirement Work in Progress 0 - - - - - 991992 Total General Plant 5,885,295 3,218,148 1,366,385 46,261 631,489 623,011 993994 Shared Services Customer Support:995996 General:997998 37400 Land & Land Rights 0 - - - - - 999 39001 Structures Frame 0 - - - - -
1000 36602 Structures & Improvements 204,679 111,921 47,520 1,609 21,962 21,667 1001 37503 Improvements 0 - - - - - 1002 39004 Air Conditioning Equipment 0 - - - - - 1003 39009 Improvement to leased Premises 99,706 54,520 23,149 784 10,698 10,555 1004 39100 Office Furniture & Equipment 54,761 29,944 12,714 430 5,876 5,797 1005 39102 Remittance Processing Equip 0 - - - - - 1006 39103 Office Machines 0 - - - - - 1007 39200 Transportation Equipment 2,235 1,222 519 18 240 237 1008 39201 Trucks 0 - - - - - 1009 39202 Trailers 0 - - - - - 1010 39300 Stores Equipment 0 - - - - - 1011 39400 Tools, Shop & Garage Equipment 3,654 1,998 848 29 392 387 1012 39500 Laboratory Equipment 426 233 99 3 46 45 1013 39603 Ditchers 0 - - - - - 1014 39604 Backhoes 0 - - - - - 1015 39605 Welders 0 - - - - - 1016 39700 Communication Equipment 70,180 38,375 16,294 552 7,530 7,429 1017 39701 Communication Equipment - Mobile Radios 0 - - - - - 1018 39702 Communication Equipment - Fixed Radios 0 - - - - - 1019 39705 Communication Equip. - Telemetering 0 - - - - - 1020 39800 Miscellaneous Equipment 4,862 2,658 1,129 38 522 515 1021 39900 Other Tangible Property 31,781 17,378 7,378 250 3,410 3,364 1022 39901 Other Tangible Property - Servers - H/W 338,151 184,905 78,508 2,658 36,283 35,796 1023 39902 Other Tangible Property - Servers - S/W 77,363 42,303 17,961 608 8,301 8,190 1024 39903 Other Tangible Property - Network - H/W 22,965 12,557 5,332 181 2,464 2,431 1025 39904 Other Tang. Property - CPU 0 - - - - - 1026 39905 Other Tangible Property - MF - Hardware 0 - - - - - 1027 39906 Other Tang. Property - PC Hardware 43,877 23,993 10,187 345 4,708 4,645 1028 39907 Other Tang. Property - PC Software 10,171 5,561 2,361 80 1,091 1,077 1029 39908 Other Tang. Property - Mainframe S/W 2,050,478 1,121,225 476,058 16,118 220,015 217,062 1030 39909 Other Tang. Property - Application Software 4,865 2,660 1,129 38 522 515 1031 39924 Other Tang. Property - General Startup Costs 0 - - - - - 1032 Retirement Work in Progress 0 - - - - - 10331034 Total General Plant 3,020,151 1,651,454 701,187 23,740 324,061 319,710 10351036 TOTAL RESERVE FOR DEPRECIATION 193,880,768 107,116,577 49,809,060 1,370,775 18,094,809 17,489,547

Exhibit PHR-4Page 44 of 75
Atmos Energy Corporation, Kentucky/Mid-States DivisionClass Cost of Service - Demand/Commodity StudyForecasted Test Period: Twelve Months Ended March 31, 2020
ALLOCATION OF OTHER RATE BASE
Customer
Line Allocation Allocation Total Residential Non-Res Sales Non-Res Sales Transport TransportNo. Factor Basis Company Sales Firm Interruptible Firm Interruptible
1 Rate Base Additions:23 Materials and Supplies - KY Direct 7.2 Allocated O&M Expenses - Cust (39,665) (31,233) (8,136) (27) (171) (97) 4 Materials and Supplies - KY Mid-States GO 7.2 Allocated O&M Expenses - Cust 51,291 40,388 10,521 35 222 126 5 Materials and Supplies - Shared Services GO 7.2 Allocated O&M Expenses - Cust (0) (0) (0) (0) (0) (0) 6 Materials and Supplies - Shared Services CS 7.2 Allocated O&M Expenses - Cust 0 - - - - - 7 Gas Storage Inventory 99.0 - 0 - - - - - 8 Prepayments - KY Direct 7.2 Allocated O&M Expenses - Cust 0 - - - - - 9 Prepayments - KY Mid-States GO 7.2 Allocated O&M Expenses - Cust 0 - - - - -
10 Prepayments - Shared Services GO 7.2 Allocated O&M Expenses - Cust 0 - - - - - 11 Prepayments - Shared Services CS 7.2 Allocated O&M Expenses - Cust 0 - - - - - 12 Cash Working Capital 7.2 Allocated O&M Expenses - Cust 265,609 209,149 54,482 181 1,148 650 13 Regulatory Assets 7.2 Allocated O&M Expenses - Cust (3,257,103) (2,564,742) (668,094) (2,217) (14,078) (7,971) 1415 Total Rate Base Additions (2,979,868) (2,346,439) (611,228) (2,029) (12,880) (7,292)161718 Rate Base Deductions:1920 Customer Advances - KY Direct 2.0 Bills (747,234) (665,436) (80,951) (41) (514) (291) 21 Customer Advances - KY Mid-States GO 2.0 Bills 0 - - - - - 22 Customer Advances - Shared Services GO 2.0 Bills 0 - - - - - 23 Customer Advances - Shared Services CS 2.0 Bills 0 - - - - - 24 ADIT - KY Direct 9.2 Allocated Net Plant - Cust (27,044,140) (21,578,621) (5,229,008) (11,491) (143,695) (81,326) 25 ADIT - KY Mid-States GO 9.2 Allocated Net Plant - Cust 8,225,242 6,562,951 1,590,357 3,495 43,704 24,735 26 ADIT - Shared Services GO 9.2 Allocated Net Plant - Cust (305,471) (243,737) (59,063) (130) (1,623) (919) 27 ADIT - Shared Services CS 9.2 Allocated Net Plant - Cust 24,343 19,423 4,707 10 129 73 28 Change in Net Operating Loss Carryforward 9.2 Allocated Net Plant - Cust 466,510 372,230 90,200 198 2,479 1,403 2930 Total Rate Base Deductions (19,380,752) (15,533,190) (3,683,758) (7,959) (99,521) (56,325) 313233 TOTAL OTHER RB - CUSTOMER (22,360,620) (17,879,629) (4,294,986) (9,987) (112,401) (63,617) 3435 Interest on Customer Deposits 2.0 Bills 0 - - - - -

Exhibit PHR-4Page 45 of 75
Atmos Energy Corporation, Kentucky/Mid-States DivisionClass Cost of Service - Demand/Commodity StudyForecasted Test Period: Twelve Months Ended March 31, 2020
ALLOCATION OF OTHER RATE BASE
Demand
Line Allocation Allocation Total Residential Non-Res Sales Non-Res Sales Transport TransportNo. Factor Basis Company Sales Firm Interruptible Firm Interruptible35 Rate Base Additions:3637 Materials and Supplies - KY Direct 7.4 Allocated O&M Expenses - Demand (41,706) (18,857) (10,783) (567) (6,041) (5,459) 38 Materials and Supplies - KY Mid-States GO 7.4 Allocated O&M Expenses - Demand 53,931 24,384 13,943 733 7,812 7,059 39 Materials and Supplies - Shared Services GO 7.4 Allocated O&M Expenses - Demand (0) (0) (0) (0) (0) (0) 40 Materials and Supplies - Shared Services CS 7.4 Allocated O&M Expenses - Demand 0 - - - - - 41 Gas Storage Inventory 99.0 - 0 - - - - - 42 Prepayments - KY Direct 7.4 Allocated O&M Expenses - Demand 0 - - - - - 43 Prepayments - KY Mid-States GO 7.4 Allocated O&M Expenses - Demand 0 - - - - - 44 Prepayments - Shared Services GO 7.4 Allocated O&M Expenses - Demand 0 - - - - - 45 Prepayments - Shared Services CS 7.4 Allocated O&M Expenses - Demand 0 - - - - - 46 Cash Working Capital 7.4 Allocated O&M Expenses - Demand 279,281 126,273 72,205 3,798 40,452 36,554 47 Regulatory Assets 7.4 Allocated O&M Expenses - Demand (3,424,758) (1,548,451) (885,435) (46,572) (496,053) (448,247) 4849 Total Rate Base Additions (3,133,252) (1,416,651) (810,069) (42,608) (453,830) (410,094)505152 Rate Base Deductions:5354 Customer Advances - KY Direct 99.0 - 0 - - - - - 55 Customer Advances - KY Mid-States GO 99.0 - 0 - - - - - 56 Customer Advances - Shared Services GO 99.0 - 0 - - - - - 57 Customer Advances - Shared Services CS 99.0 - 0 - - - - - 58 ADIT - KY Direct 9.4 Allocated Net Plant - Demand (31,728,969) (14,345,761) (8,203,188) (431,468) (4,595,725) (4,152,828) 59 ADIT - KY Mid-States GO 9.4 Allocated Net Plant - Demand 9,650,092 4,363,139 2,494,929 131,227 1,397,750 1,263,047 60 ADIT - Shared Services GO 9.4 Allocated Net Plant - Demand (358,388) (162,040) (92,657) (4,874) (51,910) (46,907) 61 ADIT - Shared Services CS 9.4 Allocated Net Plant - Demand 28,559 12,913 7,384 388 4,137 3,738 62 Change in Net Operating Loss Carryforward 9.4 Allocated Net Plant - Demand 547,322 247,463 141,504 7,443 79,276 71,636 6364 Total Rate Base Deductions (21,861,383) (9,884,285) (5,652,029) (297,283) (3,166,472) (2,861,315) 656667 TOTAL OTHER RB - DEMAND (24,994,636) (11,300,936) (6,462,098) (339,891) (3,620,302) (3,271,408) 6869 Interest on Customer Deposits 3.0 Peak Day 0 - - - - -

Exhibit PHR-4Page 46 of 75
Atmos Energy Corporation, Kentucky/Mid-States DivisionClass Cost of Service - Demand/Commodity StudyForecasted Test Period: Twelve Months Ended March 31, 2020
ALLOCATION OF OTHER RATE BASE
Commodity
Line Allocation Allocation Total Residential Non-Res Sales Non-Res Sales Transport TransportNo. Factor Basis Company Sales Firm Interruptible Firm Interruptible69 Rate Base Additions:7071 Materials and Supplies - KY Direct 7.6 Allocated O&M Expenses - Comm (320,752) (182,001) (123,643) (4,466) (5,020) (5,622) 72 Materials and Supplies - KY Mid-States GO 7.6 Allocated O&M Expenses - Comm 414,768 235,348 159,883 5,776 6,491 7,270 73 Materials and Supplies - Shared Services GO 7.6 Allocated O&M Expenses - Comm (0) (0) (0) (0) (0) (0) 74 Materials and Supplies - Shared Services CS 7.6 Allocated O&M Expenses - Comm 0 - - - - - 75 Gas Storage Inventory 1.0 Mcf 8,905,991 2,696,819 1,827,594 90,291 2,021,444 2,269,843 76 Prepayments - KY Direct 7.6 Allocated O&M Expenses - Comm 0 - - - - - 77 Prepayments - KY Mid-States GO 7.6 Allocated O&M Expenses - Comm 0 - - - - - 78 Prepayments - Shared Services GO 7.6 Allocated O&M Expenses - Comm 0 - - - - - 79 Prepayments - Shared Services CS 7.6 Allocated O&M Expenses - Comm 0 - - - - - 80 Cash Working Capital 7.6 Allocated O&M Expenses - Comm 2,147,869 1,218,744 827,953 29,909 33,616 37,647 81 Regulatory Assets 7.6 Allocated O&M Expenses - Comm (26,338,809) (14,945,171) (10,152,996) (366,766) (412,222) (461,654) 8283 Total Rate Base Additions (15,190,934) (10,976,261) (7,461,209) (245,257) 1,644,310 1,847,483848586 Rate Base Deductions:8788 Customer Advances - KY Direct 99.0 - 0 - - - - - 89 Customer Advances - KY Mid-States GO 99.0 - 0 - - - - - 90 Customer Advances - Shared Services GO 99.0 - 0 - - - - - 91 Customer Advances - Shared Services CS 99.0 - 0 - - - - - 92 ADIT - KY Direct 9.6 Allocated Net Plant - Comm (16,344,147) (5,005,589) (3,375,614) (167,690) (3,677,617) (4,117,637) 93 ADIT - KY Mid-States GO 9.6 Allocated Net Plant - Comm 4,970,931 1,522,407 1,026,664 51,002 1,118,515 1,252,344 94 ADIT - Shared Services GO 9.6 Allocated Net Plant - Comm (184,612) (56,540) (38,129) (1,894) (41,540) (46,510) 95 ADIT - Shared Services CS 9.6 Allocated Net Plant - Comm 14,711 4,506 3,038 151 3,310 3,706 96 Change in Net Operating Loss Carryforward 9.6 Allocated Net Plant - Comm 281,935 86,346 58,229 2,893 63,439 71,029 9798 Total Rate Base Deductions (11,261,181) (3,448,870) (2,325,811) (115,539) (2,533,892) (2,837,068) 99
100101 TOTAL OTHER RB - COMMODITY (26,452,115) (14,425,132) (9,787,020) (360,796) (889,582) (989,585) 102103 Interest on Customer Deposits 1.0 Mcf 0 - - - - -

Exhibit PHR-4Page 47 of 75
Atmos Energy Corporation, Kentucky/Mid-States DivisionClass Cost of Service - Demand/Commodity StudyForecasted Test Period: Twelve Months Ended March 31, 2020
ALLOCATION OF OTHER RATE BASE
Total Other Rate Base
Line Allocation Allocation Total Residential Non-Res Sales Non-Res Sales Transport TransportNo. Factor Basis Company Sales Firm Interruptible Firm Interruptible103 Rate Base Additions:104105 Materials and Supplies - KY Direct (402,124) (232,092) (142,561) (5,061) (11,232) (11,178) 106 Materials and Supplies - KY Mid-States GO 519,990 300,120 184,347 6,544 14,525 14,454 107 Materials and Supplies - Shared Services GO (0) (0) (0) (0) (0) (0) 108 Materials and Supplies - Shared Services CS 0 - - - - - 109 Gas Storage Inventory 8,905,991 2,696,819 1,827,594 90,291 2,021,444 2,269,843 110 Prepayments - KY Direct 0 - - - - - 111 Prepayments - KY Mid-States GO 0 - - - - - 112 Prepayments - Shared Services GO 0 - - - - - 113 Prepayments - Shared Services CS 0 - - - - - 114 Cash Working Capital 2,692,759 1,554,165 954,640 33,888 75,216 74,850 115 Regulatory Assets (33,020,670) (19,058,364) (11,706,526) (415,555) (922,353) (917,872) 116117 Total Rate Base Additions (21,304,054) (14,739,351) (8,882,506) (289,893) 1,177,600 1,430,097118119120 Rate Base Deductions:121122 Customer Advances - KY Direct (747,234) (665,436) (80,951) (41) (514) (291) 123 Customer Advances - KY Mid-States GO 0 - - - - - 124 Customer Advances - Shared Services GO 0 - - - - - 125 Customer Advances - Shared Services CS 0 - - - - - 126 ADIT - KY Direct (75,117,257) (40,929,970) (16,807,810) (610,649) (8,417,036) (8,351,791) 127 ADIT - KY Mid-States GO 22,846,265 12,448,497 5,111,950 185,724 2,559,969 2,540,125 128 ADIT - Shared Services GO (848,471) (462,316) (189,849) (6,897) (95,073) (94,336) 129 ADIT - Shared Services CS 67,614 36,841 15,129 550 7,576 7,518 130 Change in Net Operating Loss Carryforward 1,295,767 706,039 289,934 10,534 145,193 144,068 131132 Total Rate Base Deductions (52,503,316) (28,866,345) (11,661,598) (420,781) (5,799,885) (5,754,707) 133134135 TOTAL OTHER RB (73,807,370) (43,605,697) (20,544,103) (710,674) (4,622,286) (4,324,610) 136137 Interest on Customer Deposits 0 - - - - -

Exhibit PHR-4Page 48 of 75
Atmos Energy Corporation, Kentucky/Mid-States DivisionClass Cost of Service - Demand/Commodity StudyForecasted Test Period: Twelve Months Ended March 31, 2020
ALLOCATION OF O&M EXPENSES
Customer
Line Acct. Allocation Allocation Total Residential Non-Res Sales Non-Res Sales Transport TransportNo. No. Factor Basis Company Sales Firm Interruptible Firm Interruptible
1 Production & Gathering:2 Operation3 7500 Op., Sup., & Eng. 99.0 - 0 - - - - - 4 7510 Production Maps & Records 99.0 - 0 - - - - - 5 7530 Field Lines Expenses 99.0 - 0 - - - - - 6 7540 Field Compressor Station Expense 99.0 - 0 - - - - - 7 7550 Field Compressor Sta. Fuel & Pwr. 99.0 - 0 - - - - - 8 7560 Field Meas. & Regul. Station Exp 99.0 - 0 - - - - - 9 7570 Purification Expense 99.0 - 0 - - - - -
10 7590 Other Expenses 99.0 - 0 - - - - - 11 Maintenance12 7610 Maint. Sup., & Eng. 99.0 - 0 - - - - - 13 7620 Structures and Improvements 99.0 - 0 - - - - - 14 7640 Field Line Maintenance 99.0 - 0 - - - - - 15 7650 Compressor Station Equip. Maint. 99.0 - 0 - - - - - 16 7660 Meas. & Regul. Station Equip Maint 99.0 - 0 - - - - - 17 7670 Purification Equipment Maintenance 99.0 - 0 - - - - - 18 7680 Other Equipment Maintenance 99.0 - 0 - - - - - 19 7690 Gas Processed By Others 99.0 - 0 - - - - - 20 Total Production & Gathering 0 0 0 0 0 02122 Other Gas Supply Expenses:23 Operation24 8001 Intercompany Gas Well-head Purchases 99.0 - 0 - - - - - 25 8010 Natural gas field line purchases 99.0 - 0 - - - - - 26 8040 Natural gas city gate purchases 99.0 - 0 - - - - - 27 8050 Other purchases 99.0 - 0 - - - - - 28 8051 PGA for Residential 99.0 - 0 - - - - - 29 8052 PGA for Commercial 99.0 - 0 - - - - - 30 8053 PGA for Industrial 99.0 - 0 - - - - - 31 8054 PGA for Public Authorities 99.0 - 0 - - - - - 32 8058 Unbilled PGA Cost 99.0 - 0 - - - - - 33 8059 PGA Offset to Unrecovered Gas Cost 99.0 - 0 - - - - - 34 8060 Exchange gas 99.0 - 0 - - - - - 35 8081 Gas withdrawn from storage-Debit 99.0 - 0 - - - - - 36 8082 Gas delivered to storage-Credit 99.0 - 0 - - - - - 37 8120 Gas used for other utility operations-Credit 99.0 - 0 - - - - - 38 8580 Transmission and compression of gas by others 99.0 - 0 - - - - - 39 Maintenance40 8350 Maint. Of Purch. Gas Meas. Sta. 99.0 - 0 - - - - - 41 Total Other Gas Supply Expenses 0 0 0 0 0 04243 Underground Storage:44 Operation45 8140 Storage-Operation supervision and engineering 99.0 - 0 - - - - - 46 8160 Wells expenses 99.0 - 0 - - - - - 47 8170 Lines expenses 99.0 - 0 - - - - - 48 8180 Compressor station expenses 99.0 - 0 - - - - - 49 8190 Compressor station fuel and power 99.0 - 0 - - - - - 50 8200 Storage-Measuring and regulating station expenses 99.0 - 0 - - - - - 51 8210 Storage-Purification expenses 99.0 - 0 - - - - - 52 8240 Storage-Other expenses 99.0 - 0 - - - - - 53 8250 Storage well royalties 99.0 - 0 - - - - - 54 8260 Rents 99.0 - 0 - - - - - 55 Maintenance56 8300 Maint. Sup., & Eng. 99.0 - 0 - - - - - 57 8310 Structures and Improvements 99.0 - 0 - - - - - 58 8320 Reservoirs & Wells Maintenance 99.0 - 0 - - - - - 59 8330 Line Maintenance 99.0 - 0 - - - - - 60 8340 Compressor Station Equip Maint 99.0 - 0 - - - - - 61 8350 Meas. & Regul. Station Equip Maint 99.0 - 0 - - - - - 62 8360 Purification Equipment Maintenance 99.0 - 0 - - - - - 63 8410 Other storage expenses-Operation labor and expenses 99.0 - 0 - - - - - 64 Total Underground Storage Expense 0 0 0 0 0 06566 Transmission:67 Operation68 8500 Op., Sup., & Eng. 99.0 - 0 - - - - - 69 8510 System Control & Load Dispatching 99.0 - 0 - - - - - 70 8520 Communication Systems Expense 99.0 - 0 - - - - - 71 8530 Compressor Station Labor Expense 99.0 - 0 - - - - - 72 8540 Compressor Station Fuel Gas 99.0 - 0 - - - - - 73 8550 Compressor Station Fuel & Power 99.0 - 0 - - - - - 74 8560 Mains Expense 99.0 - 0 - - - - - 75 8570 Meas. & Regul. Station Expenses 99.0 - 0 - - - - - 76 8580 LDC Payment 99.0 - 0 - - - - - 77 8580 LDC Payment - A&G 99.0 - 0 - - - - - 78 8590 Other Expenses 99.0 - 0 - - - - - 79 8600 Rents 99.0 - 0 - - - - - 80 Maintenance81 8610 Maint. Sup., & Eng. 99.0 - 0 - - - - - 82 8620 Structures and Improvements 99.0 - 0 - - - - - 83 8630 Mains 99.0 - 0 - - - - - 84 8640 Compressor Station Equip Maint 99.0 - 0 - - - - - 85 8650 Meas. & Regul. Station Equip Maint 99.0 - 0 - - - - - 86 8660 Communication Equipment Maintenance 99.0 - 0 - - - - - 87 8670 Other Equipment Maintenance 99.0 - 0 - - - - - 88 Total Transmission Expense 0 0 0 0 0 0

Exhibit PHR-4Page 49 of 75
Atmos Energy Corporation, Kentucky/Mid-States DivisionClass Cost of Service - Demand/Commodity StudyForecasted Test Period: Twelve Months Ended March 31, 2020
ALLOCATION OF O&M EXPENSES8990 Distribution:91 Operation92 8700 Supervision and Engineering 10.2 Composite of Accts. 871-879 & 886-893 - Cust 152,826 86,237 63,224 163 2,044 1,157 93 8710 Distribution Load Dispatching 99.0 - 0 - - - - - 94 8711 Odorization 99.0 - 0 - - - - - 94 8720 Compressor Station Labor & Expenses 11.2 Composite of Accts. 376 & 380 - Cust 0 - - - - - 95 8740 Mains & Services 12.2 Composite of Accts. 374-379 - Cust 0 - - - - - 96 8750 Measuring and Regulating Station Exp. - Gen 11.2 Composite of Accts. 376 & 380 - Cust 0 - - - - - 97 8760 Measuring and Regulating Station Exp. - Ind. 2.2 Non-Residential Bills 120,928 - 119,676 61 761 430 98 8770 Measuring and Regulating Sta. Exp. - City Gate 11.2 Composite of Accts. 376 & 380 - Cust 0 - - - - - 99 8780 Meters and House Regulator Expense 13.2 Composite of Accts. 381-383 - Cust 820,621 529,408 271,530 956 11,958 6,768
100 8790 Customer Installations Expense 2.0 Bills 2,246 2,000 243 0 2 1 101 8800 Other Expense 10.2 Composite of Accts. 871-879 & 886-893 - Cust 508 287 210 1 7 4 102 8810 Rents 10.2 Composite of Accts. 871-879 & 886-893 - Cust 58,656 33,099 24,266 63 785 444 103 Maintenance104 8850 Maintenance Supervision and Engineering 10.2 Composite of Accts. 871-879 & 886-893 - Cust 252 142 104 0 3 2 105 8860 Maintenance of Structures and Improvements 12.2 Composite of Accts. 374-379 - Cust 0 - - - - - 106 8870 Maintenance of Mains 12.2 Composite of Accts. 374-379 - Cust 0 - - - - - 107 8890 Maintenance of compressor station equipment 99.0 - 0 - - - - - 108 8900 Maint. of Measuring and Regulating Station Equip. - General 12.2 Composite of Accts. 374-379 - Cust 0 - - - - - 109 8910 Maint. of Measuring and Regulating Station Equip. - Industrial 2.2 Non-Residential Bills 1,723 - 1,705 1 11 6 110 8920 Maint. of Measuring and Regulating Station Equip. - City Gate 12.2 Composite of Accts. 374-379 - Cust 0 - - - - - 111 8930 Maintenance of Services 14.2 Account 380 - Cust 6,533 5,817 708 0 4 3 112 8940 Maintenance of Meters and House Regulators 13.2 Composite of Accts. 381-383 - Cust 0 - - - - - 113 8950 Maintenance of Other Equipment 10.2 Composite of Accts. 871-879 & 886-893 - Cust 931 525 385 1 12 7 114 Total Distribution 1,165,224 657,516 482,052 1,247 15,587 8,822115116 Customer Accounts:117 9010 Supervision 2.0 Bills 0 - - - - - 118 9020 Meter Reading Expense 2.0 Bills 1,085,047 966,269 117,548 60 747 423 119 9030 Customer Records and Collection Expenses 2.0 Bills 1,220,802 1,087,164 132,255 67 840 476 120 9040 Uncollectible Accounts 8.0 Customer Deposit Balances 341,050 208,226 129,278 3,493 29 25 121 9050 Miscellaneous Customer Accounts Expenses 2.0 Bills 0 - - - - - 122 Total Customer Accounts 2,646,900 2,261,659 379,081 3,620 1,616 924 123124 Customer Service and Information:125 9070 Supervision 2.0 Bills 0 - - - - - 126 9080 Customer Assistance Expenses 2.0 Bills 0 - - - - - 127 9090 Informational and Instructional Advertising Expenses 2.0 Bills 128,272 114,230 13,896 7 88 50 128 9100 Miscellaneous Customer Service and Informational Expenses 2.0 Bills 0 - - - - - 129 Total Customer Service and Information 128,272 114,230 13,896 7 88 50 130131 Sales:132 9110 Supervision 2.0 Bills 253,468 225,721 27,459 14 174 99 133 9120 Demonstrating and Selling Expenses 2.0 Bills 115,937 103,246 12,560 6 80 45 134 9130 Advertising Expenses 2.0 Bills 35,170 31,320 3,810 2 24 14 135 9160 Miscellaneous Sales Expenses 2.0 Bills (196,297) (174,809) (21,266) (11) (135) (76) 136 Total Sales 208,278 185,478 22,564 11 143 81 137138 Administrative & General:139 Operation140 9200 Administrative and General Salaries 17.2 Composite of Accts. 870-902, 905-916, 924 & 928-930.1 - Cust (298,399) (232,758) (63,192) (119) (1,488) (842) 141 9210 Office Supplies and Expenses 17.2 Composite of Accts. 870-902, 905-916, 924 & 928-930.1 - Cust 6,299 4,913 1,334 3 31 18 142 9220 Administrative Expenses Transferred - Customer Support 2.0 Bills 0 - - - - - 143 9220 Administrative Expenses Transferred - General 17.2 Composite of Accts. 870-902, 905-916, 924 & 928-930.1 - Cust 5,184,181 4,043,771 1,097,858 2,067 25,853 14,632 144 9230 Outside Services Employed 17.2 Composite of Accts. 870-902, 905-916, 924 & 928-930.1 - Cust 121,462 94,743 25,722 48 606 343 145 9240 Property Insurance 9.2 Allocated Net Plant - Cust 1,339 1,068 259 1 7 4 146 9250 Injuries and Damages 17.2 Composite of Accts. 870-902, 905-916, 924 & 928-930.1 - Cust 26,463 20,642 5,604 11 132 75 147 9260 Employee Pensions and Benefits 17.2 Composite of Accts. 870-902, 905-916, 924 & 928-930.1 - Cust 387,217 302,037 82,001 154 1,931 1,093 148 9270 Franchise Requirements 2.0 Bills 646 576 70 0 0 0 149 9280 Regulatory Commission Expenses 2.0 Bills 852,920 759,553 92,401 47 587 332 150 930.1 General Advertising Expenses 2.0 Bills 0 - - - - - 151 930.2 Miscellaneous General Expense 17.2 Composite of Accts. 870-902, 905-916, 924 & 928-930.1 - Cust (15,134) (11,805) (3,205) (6) (75) (43) 152 9310 Rents 17.2 Composite of Accts. 870-902, 905-916, 924 & 928-930.1 - Cust (2,959) (2,308) (627) (1) (15) (8) 153 Maintenance154 9320 Maintenance of General Plant 17.2 Composite of Accts. 870-902, 905-916, 924 & 928-930.1 - Cust 4,221 3,292 894 2 21 12 155 Total A&G 6,268,256 4,983,725 1,239,119 2,206 27,591 15,615156157 TOTAL O&M EXPENSE - CUSTOMER 10,416,928 8,202,608 2,136,712 7,091 45,026 25,492

Exhibit PHR-4Page 50 of 75
Atmos Energy Corporation, Kentucky/Mid-States DivisionClass Cost of Service - Demand/Commodity StudyForecasted Test Period: Twelve Months Ended March 31, 2020
ALLOCATION OF O&M EXPENSES
Demand
Line Acct. Allocation Allocation Total Residential Non-Res Sales Non-Res Sales Transport TransportNo. No. Factor Basis Company Sales Firm Interruptible Firm Interruptible158 Production & Gathering:159 Operation160 7500 Op., Sup., & Eng. 99.0 - 0 - - - - - 161 7510 Production Maps & Records 99.0 - 0 - - - - - 162 7530 Field Lines Expenses 99.0 - 0 - - - - - 163 7540 Field Compressor Station Expense 99.0 - 0 - - - - - 164 7550 Field Compressor Sta. Fuel & Pwr. 99.0 - 0 - - - - - 165 7560 Field Meas. & Regul. Station Exp 99.0 - 0 - - - - - 166 7570 Purification Expense 99.0 - 0 - - - - - 167 7590 Other Expenses 99.0 - 0 - - - - - 168 Maintenance169 7610 Maint. Sup., & Eng. 99.0 - 0 - - - - - 170 7620 Structures and Improvements 99.0 - 0 - - - - - 171 7640 Field Line Maintenance 99.0 - 0 - - - - - 172 7650 Compressor Station Equip. Maint. 99.0 - 0 - - - - - 173 7660 Meas. & Regul. Station Equip Maint 99.0 - 0 - - - - - 174 7670 Purification Equipment Maintenance 99.0 - 0 - - - - - 175 7680 Other Equipment Maintenance 99.0 - 0 - - - - - 176 7690 Gas Processed By Others 99.0 - 0 - - - - - 177 Total Production & Gathering 0 0 0 0 0 0178179 Other Gas Supply Expenses:180 Operation181 8001 Intercompany Gas Well-head Purchases 99.0 - 0 - - - - - 182 8010 Natural gas field line purchases 99.0 - 0 - - - - - 183 8040 Natural gas city gate purchases 99.0 - 0 - - - - - 184 8050 Other purchases 99.0 - 0 - - - - - 185 8051 PGA for Residential 99.0 - 0 - - - - - 186 8052 PGA for Commercial 99.0 - 0 - - - - - 187 8053 PGA for Industrial 99.0 - 0 - - - - - 188 8054 PGA for Public Authorities 99.0 - 0 - - - - - 189 8058 Unbilled PGA Cost 99.0 - 0 - - - - - 190 8059 PGA Offset to Unrecovered Gas Cost 99.0 - 0 - - - - - 191 8060 Exchange gas 99.0 - 0 - - - - - 192 8081 Gas withdrawn from storage-Debit 99.0 - 0 - - - - - 193 8082 Gas delivered to storage-Credit 99.0 - 0 - - - - - 194 8120 Gas used for other utility operations-Credit 99.0 - 0 - - - - - 195 8580 Transmission and compression of gas by others 99.0 - 0 - - - - - 196 Maintenance197 8350 Maint. Of Purch. Gas Meas. Sta. 99.0 - 0 - - - - - 198 Total Other Gas Supply Expenses 0 0 0 0 0 0199200 Underground Storage:201 Operation202 8140 Storage-Operation supervision and engineering 3.0 Peak Day 0 - - - - - 203 8160 Wells expenses 3.0 Peak Day 145,959 65,993 37,736 1,985 21,141 19,104 204 8170 Lines expenses 3.0 Peak Day 10,626 4,804 2,747 144 1,539 1,391 205 8180 Compressor station expenses 3.0 Peak Day 12,530 5,665 3,240 170 1,815 1,640 206 8190 Compressor station fuel and power 3.0 Peak Day 368 166 95 5 53 48 207 8200 Storage-Measuring and regulating station expenses 3.0 Peak Day 3,090 1,397 799 42 448 404 208 8210 Storage-Purification expenses 3.0 Peak Day 24,928 11,271 6,445 339 3,611 3,263 209 8240 Storage-Other expenses 3.0 Peak Day 0 - - - - - 210 8250 Storage well royalties 3.0 Peak Day 4,382 1,981 1,133 60 635 573 211 8260 Rents 3.0 Peak Day 0 - - - - - 212 Maintenance213 8300 Maint. Sup., & Eng. 3.0 Peak Day 0 - - - - - 214 8310 Structures and Improvements 3.0 Peak Day 6,368 2,879 1,646 87 922 833 215 8320 Reservoirs & Wells Maintenance 3.0 Peak Day 0 - - - - - 216 8330 Line Maintenance 3.0 Peak Day 0 - - - - - 217 8340 Compressor Station Equip Maint 3.0 Peak Day 1,665 753 431 23 241 218 218 8350 Meas. & Regul. Station Equip Maint 3.0 Peak Day 0 - - - - - 219 8360 Purification Equipment Maintenance 3.0 Peak Day 0 - - - - - 220 8410 Other storage expenses-Operation labor and expenses 3.0 Peak Day 34,542 15,617 8,930 470 5,003 4,521 221 Total Underground Storage Expense 244,457 110,527 63,202 3,324 35,408 31,996222223 Transmission:224 Operation225 8500 Op., Sup., & Eng. 3.0 Peak Day 35 16 9 0 5 5 226 8510 System Control & Load Dispatching 3.0 Peak Day 0 - - - - - 227 8520 Communication Systems Expense 3.0 Peak Day 0 - - - - - 228 8530 Compressor Station Labor Expense 3.0 Peak Day 0 - - - - - 229 8540 Compressor Station Fuel Gas 3.0 Peak Day 0 - - - - - 230 8550 Compressor Station Fuel & Power 3.0 Peak Day 308 139 80 4 45 40 231 8560 Mains Expense 3.0 Peak Day 366,202 165,573 94,678 4,980 53,042 47,930 232 8570 Meas. & Regul. Station Expenses 3.0 Peak Day 27,278 12,333 7,052 371 3,951 3,570 233 8580 LDC Payment 3.0 Peak Day 0 - - - - - 234 8580 LDC Payment - A&G 3.0 Peak Day 0 - - - - - 235 8590 Other Expenses 3.0 Peak Day 0 - - - - - 236 8600 Rents 3.0 Peak Day 0 - - - - - 237 Maintenance238 8610 Maint. Sup., & Eng. 3.0 Peak Day 0 - - - - - 239 8620 Structures and Improvements 3.0 Peak Day 0 - - - - - 240 8630 Mains 3.0 Peak Day 16,280 7,361 4,209 221 2,358 2,131 241 8640 Compressor Station Equip Maint 3.0 Peak Day 0 - - - - - 242 8650 Meas. & Regul. Station Equip Maint 3.0 Peak Day 0 - - - - - 243 8660 Communication Equipment Maintenance 3.0 Peak Day 0 - - - - - 244 8670 Other Equipment Maintenance 3.0 Peak Day 0 - - - - - 245 Total Transmission Expense 410,103 185,422 106,028 5,577 59,401 53,676

Exhibit PHR-4Page 51 of 75
Atmos Energy Corporation, Kentucky/Mid-States DivisionClass Cost of Service - Demand/Commodity StudyForecasted Test Period: Twelve Months Ended March 31, 2020
ALLOCATION OF O&M EXPENSES246247 Distribution:248 Operation249 8700 Supervision and Engineering 10.4 Composite of Accts. 871-879 & 886-893 - Demand 524,720 237,244 135,661 7,135 76,002 68,678 250 8710 Distribution Load Dispatching 99.0 - 0 - - - - - 251 8711 Odorization 99.0 - 0 - - - - - 251 8720 Compressor Station Labor & Expenses 11.4 Composite of Accts. 376 & 380 - Demand 0 - - - - - 252 8740 Mains & Services 12.4 Composite of Accts. 374-379 - Demand 2,808,423 1,269,785 726,088 38,190 406,781 367,579 253 8750 Measuring and Regulating Station Exp. - Gen 12.4 Composite of Accts. 374-379 - Demand 373,558 168,898 96,579 5,080 54,107 48,893 254 8760 Measuring and Regulating Station Exp. - Ind. 99.0 - 0 - - - - - 255 8770 Measuring and Regulating Sta. Exp. - City Gate 12.4 Composite of Accts. 374-379 - Demand 24,885 11,252 6,434 338 3,604 3,257 256 8780 Meters and House Regulator Expense 13.4 Composite of Accts. 381-383 - Demand 0 - - - - - 257 8790 Customer Installations Expense 99.0 - 0 - - - - - 258 8800 Other Expense 10.4 Composite of Accts. 871-879 & 886-893 - Demand 1,745 789 451 24 253 228 259 8810 Rents 10.4 Composite of Accts. 871-879 & 886-893 - Demand 201,394 91,057 52,068 2,739 29,171 26,359 260 Maintenance261 8850 Maintenance Supervision and Engineering 10.4 Composite of Accts. 871-879 & 886-893 - Demand 865 391 224 12 125 113 262 8860 Maintenance of Structures and Improvements 12.4 Composite of Accts. 374-379 - Demand 64 29 16 1 9 8 263 8870 Maintenance of Mains 12.4 Composite of Accts. 374-379 - Demand 18,754 8,479 4,849 255 2,716 2,455 264 8890 Maintenance of compressor station equipment 99.0 - 0 - - - - - 265 8900 Maint. of Measuring and Regulating Station Equip. - General 12.4 Composite of Accts. 374-379 - Demand 42,621 19,270 11,019 580 6,173 5,578 266 8910 Maint. of Measuring and Regulating Station Equip. - Industrial 99.0 - 0 - - - - - 267 8920 Maint. of Measuring and Regulating Station Equip. - City Gate 12.4 Composite of Accts. 374-379 - Demand 517 234 134 7 75 68 268 8930 Maintenance of Services 14.4 Account 380 - Demand 0 - - - - - 269 8940 Maintenance of Meters and House Regulators 13.4 Composite of Accts. 381-383 - Demand 0 - - - - - 270 8950 Maintenance of Other Equipment 10.4 Composite of Accts. 871-879 & 886-893 - Demand 3,195 1,445 826 43 463 418 271 Total Distribution 4,000,740 1,808,873 1,034,349 54,404 579,480 523,635272273 Customer Accounts:274 9010 Supervision 99.0 - 0 - - - - - 275 9020 Meter Reading Expense 99.0 - 0 - - - - - 276 9030 Customer Records and Collection Expenses 99.0 - 0 - - - - - 277 9040 Uncollectible Accounts 99.0 - 0 - - - - - 278 9050 Miscellaneous Customer Accounts Expenses 99.0 - 0 - - - - - 279 Total Customer Accounts 0 - - - - - 280281 Customer Service and Information:282 9070 Supervision 99.0 - 0 - - - - - 283 9080 Customer Assistance Expenses 99.0 - 0 - - - - - 284 9090 Informational and Instructional Advertising Expenses 99.0 - 0 - - - - - 285 9100 Miscellaneous Customer Service and Informational Expenses 99.0 - 0 - - - - - 286 Total Customer Service and Information 0 - - - - - 287288 Sales:289 9110 Supervision 99.0 - 0 - - - - - 290 9120 Demonstrating and Selling Expenses 99.0 - 0 - - - - - 291 9130 Advertising Expenses 99.0 - 0 - - - - - 292 9160 Miscellaneous Sales Expenses 99.0 - 0 - - - - - 293 Total Sales 0 - - - - - 294295 Administrative & General:296 Operation297 9200 Administrative and General Salaries 17.4 Composite of Accts. 870-902, 905-916, 924 & 928-930.1 - Demand (347,067) (156,921) (89,731) (4,720) (50,270) (45,426) 298 9210 Office Supplies and Expenses 17.4 Composite of Accts. 870-902, 905-916, 924 & 928-930.1 - Demand 7,326 3,312 1,894 100 1,061 959 299 9220 Administrative Expenses Transferred - Customer Support 99.0 - 0 - - - - - 300 9220 Administrative Expenses Transferred - General 17.4 Composite of Accts. 870-902, 905-916, 924 & 928-930.1 - Demand 6,029,709 2,726,239 1,558,917 81,995 873,362 789,195 301 9230 Outside Services Employed 17.4 Composite of Accts. 870-902, 905-916, 924 & 928-930.1 - Demand 141,272 63,874 36,524 1,921 20,462 18,490 302 9240 Property Insurance 9.4 Allocated Net Plant - Demand 1,571 710 406 21 227 206 303 9250 Injuries and Damages 17.4 Composite of Accts. 870-902, 905-916, 924 & 928-930.1 - Demand 30,779 13,916 7,958 419 4,458 4,029 304 9260 Employee Pensions and Benefits 17.4 Composite of Accts. 870-902, 905-916, 924 & 928-930.1 - Demand 450,371 203,628 116,439 6,124 65,233 58,947 305 9270 Franchise Requirements 99.0 - 0 - - - - - 306 9280 Regulatory Commission Expenses 99.0 - 0 - - - - - 307 930.1 General Advertising Expenses 99.0 - 0 - - - - - 308 930.2 Miscellaneous General Expense 17.4 Composite of Accts. 870-902, 905-916, 924 & 928-930.1 - Demand (17,602) (7,959) (4,551) (239) (2,550) (2,304) 309 9310 Rents 17.4 Composite of Accts. 870-902, 905-916, 924 & 928-930.1 - Demand (3,441) (1,556) (890) (47) (498) (450) 310 Maintenance311 9320 Maintenance of General Plant 17.4 Composite of Accts. 870-902, 905-916, 924 & 928-930.1 - Demand 4,909 2,219 1,269 67 711 643 312 Total A&G 6,297,825 2,847,464 1,628,236 85,641 912,197 824,287313314 TOTAL O&M EXPENSE - DEMAND 10,953,126 4,952,286 2,831,814 148,947 1,586,485 1,433,594

Exhibit PHR-4Page 52 of 75
Atmos Energy Corporation, Kentucky/Mid-States DivisionClass Cost of Service - Demand/Commodity StudyForecasted Test Period: Twelve Months Ended March 31, 2020
ALLOCATION OF O&M EXPENSES
Commodity
Line Acct. Allocation Allocation Total Residential Non-Res Sales Non-Res Sales Transport TransportNo. No. Factor Basis Company Sales Firm Interruptible Firm Interruptible315 Production & Gathering:316 Operation317 7500 Op., Sup., & Eng. 99.0 - 0 - - - - - 318 7510 Production Maps & Records 99.0 - 0 - - - - - 319 7530 Field Lines Expenses 99.0 - 0 - - - - - 320 7540 Field Compressor Station Expense 99.0 - 0 - - - - - 321 7550 Field Compressor Sta. Fuel & Pwr. 99.0 - 0 - - - - - 322 7560 Field Meas. & Regul. Station Exp 18.4 Gas Costs 0 - - - - - 323 7570 Purification Expense 99.0 - 0 - - - - - 324 7590 Other Expenses 99.0 - 0 - - - - - 325 Maintenance326 7610 Maint. Sup., & Eng. 99.0 - 0 - - - - - 327 7620 Structures and Improvements 99.0 - 0 - - - - - 328 7640 Field Line Maintenance 99.0 - 0 - - - - - 329 7650 Compressor Station Equip. Maint. 99.0 - 0 - - - - - 330 7660 Meas. & Regul. Station Equip Maint 99.0 - 0 - - - - - 331 7670 Purification Equipment Maintenance 99.0 - 0 - - - - - 332 7680 Other Equipment Maintenance 99.0 - 0 - - - - - 333 7690 Gas Processed By Others 99.0 - 0 - - - - - 334 Total Production & Gathering 0 0 0 0 0 0335336 Other Gas Supply Expenses:337 Operation338 8001 Intercompany Gas Well-head Purchases 18.4 Gas Costs 0 - - - - - 339 8010 Natural gas field line purchases 18.4 Gas Costs 61,240 35,945 24,426 870 - - 340 8040 Natural gas city gate purchases 18.4 Gas Costs 51,401,318 30,169,962 20,501,486 729,870 - - 341 8050 Other purchases 18.4 Gas Costs (7,602) (4,462) (3,032) (108) - - 342 8051 PGA for Residential 18.4 Gas Costs 47,517,427 27,890,315 18,952,391 674,721 - - 343 8052 PGA for Commercial 18.4 Gas Costs 24,564,311 14,418,002 9,797,509 348,799 - - 344 8053 PGA for Industrial 18.4 Gas Costs 4,854,142 2,849,135 1,936,081 68,926 - - 345 8054 PGA for Public Authorities 18.4 Gas Costs 4,585,482 2,691,445 1,828,926 65,111 - - 346 8058 Unbilled PGA Cost 18.4 Gas Costs (3,124,678) (1,834,027) (1,246,282) (44,369) - - 347 8059 PGA Offset to Unrecovered Gas Cost 18.4 Gas Costs (71,826,171) (42,158,313) (28,647,966) (1,019,892) - - 348 8060 Exchange gas 18.4 Gas Costs (2,147,338) (1,260,379) (856,469) (30,491) - - 349 8081 Gas withdrawn from storage-Debit 18.4 Gas Costs 12,436,037 7,299,322 4,960,130 176,585 - - 350 8082 Gas delivered to storage-Credit 18.4 Gas Costs (12,626,734) (7,411,252) (5,036,190) (179,293) - - 351 8120 Gas used for other utility operations-Credit 18.4 Gas Costs (14,329) (8,410) (5,715) (203) - - 352 8580 Transmission and compression of gas by others 18.4 Gas Costs 22,709,250 13,329,176 9,057,616 322,459 - - 353 Maintenance354 8350 Maint. Of Purch. Gas Meas. Sta. 18.4 Gas Costs 0 - - - - - 355 Total Other Gas Supply Expenses 78,382,354 46,006,460 31,262,909 1,112,986 0 0356357 Underground Storage:358 Operation359 8140 Storage-Operation supervision and engineering 1.5 Winter Volumes 0 - - - - - 360 8160 Wells expenses 1.5 Winter Volumes 145,959 55,264 34,196 1,870 26,832 27,797 361 8170 Lines expenses 1.5 Winter Volumes 10,626 4,023 2,489 136 1,953 2,024 362 8180 Compressor station expenses 1.5 Winter Volumes 12,530 4,744 2,936 161 2,303 2,386 363 8190 Compressor station fuel and power 1.5 Winter Volumes 368 139 86 5 68 70 364 8200 Storage-Measuring and regulating station expenses 1.5 Winter Volumes 3,090 1,170 724 40 568 589 365 8210 Storage-Purification expenses 1.5 Winter Volumes 24,928 9,438 5,840 319 4,582 4,747 366 8240 Storage-Other expenses 1.5 Winter Volumes 0 - - - - - 367 8250 Storage well royalties 1.5 Winter Volumes 4,382 1,659 1,027 56 805 834 368 8260 Rents 1.5 Winter Volumes 0 - - - - - 369 Maintenance370 8300 Maint. Sup., & Eng. 1.5 Winter Volumes 0 - - - - - 371 8310 Structures and Improvements 1.5 Winter Volumes 6,368 2,411 1,492 82 1,171 1,213 372 8320 Reservoirs & Wells Maintenance 1.5 Winter Volumes 0 - - - - - 373 8330 Line Maintenance 1.5 Winter Volumes 0 - - - - - 374 8340 Compressor Station Equip Maint 1.5 Winter Volumes 1,665 631 390 21 306 317 375 8350 Meas. & Regul. Station Equip Maint 1.5 Winter Volumes 0 - - - - - 376 8360 Purification Equipment Maintenance 1.5 Winter Volumes 0 - - - - - 377 8410 Other storage expenses-Operation labor and expenses 1.5 Winter Volumes 34,542 13,078 8,093 443 6,350 6,578 378 Total Underground Storage Expense 244,457 92,559 57,273 3,132 44,939 46,555379380 Transmission:381 Operation382 8500 Op., Sup., & Eng. 99.0 - 0 - - - - - 383 8510 System Control & Load Dispatching 99.0 - 0 - - - - - 384 8520 Communication Systems Expense 99.0 - 0 - - - - - 385 8530 Compressor Station Labor Expense 99.0 - 0 - - - - - 386 8540 Compressor Station Fuel Gas 99.0 - 0 - - - - - 387 8550 Compressor Station Fuel & Power 99.0 - 0 - - - - - 388 8560 Mains Expense 99.0 - 0 - - - - - 389 8570 Meas. & Regul. Station Expenses 99.0 - 0 - - - - - 390 8580 LDC Payment 99.0 - 0 - - - - - 391 8580 LDC Payment - A&G 99.0 - 0 - - - - - 392 8590 Other Expenses 99.0 - 0 - - - - - 393 8600 Rents 99.0 - 0 - - - - - 394 Maintenance395 8610 Maint. Sup., & Eng. 99.0 - 0 - - - - - 396 8620 Structures and Improvements 99.0 - 0 - - - - - 397 8630 Mains 99.0 - 0 - - - - - 398 8640 Compressor Station Equip Maint 99.0 - 0 - - - - - 399 8650 Meas. & Regul. Station Equip Maint 99.0 - 0 - - - - - 400 8660 Communication Equipment Maintenance 99.0 - 0 - - - - - 401 8670 Other Equipment Maintenance 99.0 - 0 - - - - - 402 Total Transmission Expense 0 0 0 0 0 0

Exhibit PHR-4Page 53 of 75
Atmos Energy Corporation, Kentucky/Mid-States DivisionClass Cost of Service - Demand/Commodity StudyForecasted Test Period: Twelve Months Ended March 31, 2020
ALLOCATION OF O&M EXPENSES403404 Distribution:405 Operation406 8700 Supervision and Engineering 10.6 Composite of Accts. 871-879 & 886-893 - Comm 285,864 86,562 58,662 2,898 64,884 72,857 407 8710 Distribution Load Dispatching 1.0 Mcf 663 201 136 7 150 169 408 8711 Odorization 1.0 Mcf 19,956 6,043 4,095 202 4,529 5,086 408 8720 Compressor Station Labor & Expenses 99.0 - 0 - - - - - 409 8740 Mains & Services 12.6 Composite of Accts. 374-379 - Comm 1,512,296 457,938 310,337 15,332 343,255 385,434 410 8750 Measuring and Regulating Station Exp. - Gen 12.6 Composite of Accts. 374-379 - Comm 201,156 60,912 41,279 2,039 45,657 51,268 411 8760 Measuring and Regulating Station Exp. - Ind. 99.0 - 0 - - - - - 412 8770 Measuring and Regulating Sta. Exp. - City Gate 12.6 Composite of Accts. 374-379 - Comm 13,400 4,058 2,750 136 3,042 3,415 413 8780 Meters and House Regulator Expense 99.0 - 0 - - - - - 414 8790 Customer Installations Expense 99.0 - 0 - - - - - 415 8800 Other Expense 10.6 Composite of Accts. 871-879 & 886-893 - Comm 951 288 195 10 216 242 416 8810 Rents 10.6 Composite of Accts. 871-879 & 886-893 - Comm 109,718 33,224 22,515 1,112 24,903 27,963 417 Maintenance418 8850 Maintenance Supervision and Engineering 10.6 Composite of Accts. 871-879 & 886-893 - Comm 471 143 97 5 107 120 419 8860 Maintenance of Structures and Improvements 12.6 Composite of Accts. 374-379 - Comm 34 10 7 0 8 9 420 8870 Maintenance of Mains 12.6 Composite of Accts. 374-379 - Comm 10,099 3,058 2,072 102 2,292 2,574 421 8890 Maintenance of compressor station equipment 1.0 Mcf 0 - - - - - 422 8900 Maint. of Measuring and Regulating Station Equip. - General 12.6 Composite of Accts. 374-379 - Comm 22,951 6,950 4,710 233 5,209 5,849 423 8910 Maint. of Measuring and Regulating Station Equip. - Industrial 5.0 Direct to Transport 0 - - - - - 424 8920 Maint. of Measuring and Regulating Station Equip. - City Gate 12.6 Composite of Accts. 374-379 - Comm 278 84 57 3 63 71 425 8930 Maintenance of Services 14.6 Account 380 - Comm 0 - - - - - 426 8940 Maintenance of Meters and House Regulators 13.6 Composite of Accts. 381-383 - Comm 0 - - - - - 427 8950 Maintenance of Other Equipment 10.6 Composite of Accts. 871-879 & 886-893 - Comm 1,741 527 357 18 395 444 428 Total Distribution 2,179,577 659,997 447,270 22,097 494,711 555,502429430 Customer Accounts:431 9010 Supervision 99.0 - 0 - - - - - 432 9020 Meter Reading Expense 99.0 - 0 - - - - - 433 9030 Customer Records and Collection Expenses 99.0 - 0 - - - - - 434 9040 Uncollectible Accounts 99.0 - 0 - - - - - 435 9050 Miscellaneous Customer Accounts Expenses 99.0 - 0 - - - - - 436 Total Customer Accounts 0 - - - - - 437438 Customer Service and Information:439 9070 Supervision 99.0 - 0 - - - - - 440 9080 Customer Assistance Expenses 99.0 - 0 - - - - - 441 9090 Informational and Instructional Advertising Expenses 99.0 - 0 - - - - - 442 9100 Miscellaneous Customer Service and Informational Expenses 99.0 - 0 - - - - - 443 Total Customer Service and Information 0 - - - - - 444445 Sales:446 9110 Supervision 99.0 - 0 - - - - - 447 9120 Demonstrating and Selling Expenses 99.0 - 0 - - - - - 448 9130 Advertising Expenses 99.0 - 0 - - - - - 449 9160 Miscellaneous Sales Expenses 99.0 - 0 - - - - - 450 Total Sales 0 - - - - - 451452 Administrative & General:453 Operation454 9200 Administrative and General Salaries 17.6 Composite of Accts. 870-902, 905-916, 924 & 928-930.1 - Comm (189,076) (57,254) (38,800) (1,917) (42,916) (48,189) 455 9210 Office Supplies and Expenses 17.6 Composite of Accts. 870-902, 905-916, 924 & 928-930.1 - Comm 3,991 1,209 819 40 906 1,017 456 9220 Administrative Expenses Transferred - Customer Support 99.0 - 0 - - - - - 457 9220 Administrative Expenses Transferred - General 17.6 Composite of Accts. 870-902, 905-916, 924 & 928-930.1 - Comm 3,284,875 994,696 674,089 33,303 745,585 837,202 458 9230 Outside Services Employed 17.6 Composite of Accts. 870-902, 905-916, 924 & 928-930.1 - Comm 76,963 23,305 15,793 780 17,469 19,615 459 9240 Property Insurance 9.6 Allocated Net Plant - Comm 809 248 167 8 182 204 460 9250 Injuries and Damages 17.6 Composite of Accts. 870-902, 905-916, 924 & 928-930.1 - Comm 16,768 5,078 3,441 170 3,806 4,274 461 9260 Employee Pensions and Benefits 17.6 Composite of Accts. 870-902, 905-916, 924 & 928-930.1 - Comm 245,354 74,296 50,349 2,487 55,689 62,532 462 9270 Franchise Requirements 99.0 - 0 - - - - - 463 9280 Regulatory Commission Expenses 99.0 - 0 - - - - - 464 930.1 General Advertising Expenses 99.0 - 0 - - - - - 465 930.2 Miscellaneous General Expense 17.6 Composite of Accts. 870-902, 905-916, 924 & 928-930.1 - Comm (9,589) (2,904) (1,968) (97) (2,177) (2,444) 466 9310 Rents 17.6 Composite of Accts. 870-902, 905-916, 924 & 928-930.1 - Comm (1,875) (568) (385) (19) (426) (478) 467 Maintenance468 9320 Maintenance of General Plant 17.6 Composite of Accts. 870-902, 905-916, 924 & 928-930.1 - Comm 2,674 810 549 27 607 682 469 Total A&G 3,430,893 1,038,914 704,055 34,783 778,726 874,415470471 TOTAL O&M EXPENSE - COMMODITY 84,237,281 47,797,929 32,471,507 1,172,998 1,318,375 1,476,472

Exhibit PHR-4Page 54 of 75
Atmos Energy Corporation, Kentucky/Mid-States DivisionClass Cost of Service - Demand/Commodity StudyForecasted Test Period: Twelve Months Ended March 31, 2020
ALLOCATION OF O&M EXPENSES
Total O&M Expenses
Line Acct. Allocation Allocation Total Residential Non-Res Sales Non-Res Sales Transport TransportNo. No. Factor Basis Company Sales Firm Interruptible Firm Interruptible472 Production & Gathering:473 Operation474 7500 Op., Sup., & Eng. 0 0 0 0 0 0475 7510 Production Maps & Records 0 0 0 0 0 0476 7530 Field Lines Expenses 0 0 0 0 0 0477 7540 Field Compressor Station Expense 0 0 0 0 0 0478 7550 Field Compressor Sta. Fuel & Pwr. 0 0 0 0 0 0479 7560 Field Meas. & Regul. Station Exp 0 0 0 0 0 0480 7570 Purification Expense 0 0 0 0 0 0481 7590 Other Expenses 0 0 0 0 0 0482 Maintenance483 7610 Maint. Sup., & Eng. 0 0 0 0 0 0484 7620 Structures and Improvements 0 0 0 0 0 0485 7640 Field Line Maintenance 0 0 0 0 0 0486 7650 Compressor Station Equip. Maint. 0 0 0 0 0 0487 7660 Meas. & Regul. Station Equip Maint 0 0 0 0 0 0488 7670 Purification Equipment Maintenance 0 0 0 0 0 0489 7680 Other Equipment Maintenance 0 0 0 0 0 0490 7690 Gas Processed By Others 0 0 0 0 0 0491 Total Production & Gathering 0 0 0 0 0 0492493 Other Gas Supply Expenses:494 Operation495 8001 Intercompany Gas Well-head Purchases 0 0 0 0 0 0496 8010 Natural gas field line purchases 61,240 35,945 24,426 870 0 0497 8040 Natural gas city gate purchases 51,401,318 30,169,962 20,501,486 729,870 0 0498 8050 Other purchases (7,602) (4,462) (3,032) (108) 0 0499 8051 PGA for Residential 47,517,427 27,890,315 18,952,391 674,721 0 0500 8052 PGA for Commercial 24,564,311 14,418,002 9,797,509 348,799 0 0501 8053 PGA for Industrial 4,854,142 2,849,135 1,936,081 68,926 0 0502 8054 PGA for Public Authorities 4,585,482 2,691,445 1,828,926 65,111 0 0503 8058 Unbilled PGA Cost (3,124,678) (1,834,027) (1,246,282) (44,369) 0 0504 8059 PGA Offset to Unrecovered Gas Cost (71,826,171) (42,158,313) (28,647,966) (1,019,892) 0 0505 8060 Exchange gas (2,147,338) (1,260,379) (856,469) (30,491) 0 0506 8081 Gas withdrawn from storage-Debit 12,436,037 7,299,322 4,960,130 176,585 0 0507 8082 Gas delivered to storage-Credit (12,626,734) (7,411,252) (5,036,190) (179,293) 0 0508 8120 Gas used for other utility operations-Credit (14,329) (8,410) (5,715) (203) 0 0509 8580 Transmission and compression of gas by others 22,709,250 13,329,176 9,057,616 322,459 0 0510 Maintenance511 8350 Maint. Of Purch. Gas Meas. Sta. 0 0 0 0 0 0512 Total Other Gas Supply Expenses 78,382,354 46,006,460 31,262,909 1,112,986 0 0513514 Underground Storage:515 Operation516 8140 Storage-Operation supervision and engineering 0 0 0 0 0 0517 8160 Wells expenses 291,917 121,257 71,932 3,855 47,973 46,900518 8170 Lines expenses 21,251 8,827 5,237 281 3,492 3,414519 8180 Compressor station expenses 25,060 10,410 6,175 331 4,118 4,026520 8190 Compressor station fuel and power 735 305 181 10 121 118521 8200 Storage-Measuring and regulating station expenses 6,181 2,567 1,523 82 1,016 993522 8210 Storage-Purification expenses 49,856 20,709 12,285 658 8,193 8,010523 8240 Storage-Other expenses 0 0 0 0 0 0524 8250 Storage well royalties 8,763 3,640 2,159 116 1,440 1,408525 8260 Rents 0 0 0 0 0 0526 Maintenance527 8300 Maint. Sup., & Eng. 0 0 0 0 0 0528 8310 Structures and Improvements 12,736 5,290 3,138 168 2,093 2,046529 8320 Reservoirs & Wells Maintenance 0 0 0 0 0 0530 8330 Line Maintenance 0 0 0 0 0 0531 8340 Compressor Station Equip Maint 3,331 1,384 821 44 547 535532 8350 Meas. & Regul. Station Equip Maint 0 0 0 0 0 0533 8360 Purification Equipment Maintenance 0 0 0 0 0 0534 8410 Other storage expenses-Operation labor and expenses 69,083 28,696 17,023 912 11,353 11,099535 Total Underground Storage Expense 488,914 203,086 120,475 6,456 80,347 78,550536537 Transmission:538 Operation539 8500 Op., Sup., & Eng. 35 16 9 0 5 5540 8510 System Control & Load Dispatching 0 0 0 0 0 0541 8520 Communication Systems Expense 0 0 0 0 0 0542 8530 Compressor Station Labor Expense 0 0 0 0 0 0543 8540 Compressor Station Fuel Gas 0 0 0 0 0 0544 8550 Compressor Station Fuel & Power 308 139 80 4 45 40545 8560 Mains Expense 366,202 165,573 94,678 4,980 53,042 47,930546 8570 Meas. & Regul. Station Expenses 27,278 12,333 7,052 371 3,951 3,570547 8580 LDC Payment 0 0 0 0 0 0548 8580 LDC Payment - A&G 0 0 0 0 0 0549 8590 Other Expenses 0 0 0 0 0 0550 8600 Rents 0 0 0 0 0 0551 Maintenance552 8610 Maint. Sup., & Eng. 0 0 0 0 0 0553 8620 Structures and Improvements 0 0 0 0 0 0554 8630 Mains 16,280 7,361 4,209 221 2,358 2,131555 8640 Compressor Station Equip Maint 0 0 0 0 0 0556 8650 Meas. & Regul. Station Equip Maint 0 0 0 0 0 0557 8660 Communication Equipment Maintenance 0 0 0 0 0 0558 8670 Other Equipment Maintenance 0 0 0 0 0 0559 Total Transmission Expense 410,103 185,422 106,028 5,577 59,401 53,676

Exhibit PHR-4Page 55 of 75
Atmos Energy Corporation, Kentucky/Mid-States DivisionClass Cost of Service - Demand/Commodity StudyForecasted Test Period: Twelve Months Ended March 31, 2020
ALLOCATION OF O&M EXPENSES560561 Distribution:562 Operation563 8700 Supervision and Engineering 963,411 410,044 257,547 10,197 142,931 142,692564 8710 Distribution Load Dispatching 663 201 136 7 150 169565 8711 Odorization 19,956 6,043 4,095 202 4,529 5,086565 8720 Compressor Station Labor & Expenses 0 0 0 0 0 0566 8740 Mains & Services 4,320,719 1,727,722 1,036,425 53,522 750,035 753,013567 8750 Measuring and Regulating Station Exp. - Gen 574,714 229,810 137,858 7,119 99,765 100,161568 8760 Measuring and Regulating Station Exp. - Ind. 120,928 0 119,676 61 761 430569 8770 Measuring and Regulating Sta. Exp. - City Gate 38,286 15,309 9,184 474 6,646 6,672570 8780 Meters and House Regulator Expense 820,621 529,408 271,530 956 11,958 6,768571 8790 Customer Installations Expense 2,246 2,000 243 0 2 1572 8800 Other Expense 3,204 1,363 856 34 475 474573 8810 Rents 369,768 157,379 98,849 3,914 54,858 54,767574 Maintenance575 8850 Maintenance Supervision and Engineering 1,588 676 425 17 236 235576 8860 Maintenance of Structures and Improvements 98 39 24 1 17 17577 8870 Maintenance of Mains 28,852 11,537 6,921 357 5,008 5,028578 8890 Maintenance of compressor station equipment 0 0 0 0 0 0579 8900 Maint. of Measuring and Regulating Station Equip. - General 65,572 26,220 15,729 812 11,383 11,428580 8910 Maint. of Measuring and Regulating Station Equip. - Industrial 1,723 0 1,705 1 11 6581 8920 Maint. of Measuring and Regulating Station Equip. - City Gate 795 318 191 10 138 139582 8930 Maintenance of Services 6,533 5,817 708 0 4 3583 8940 Maintenance of Meters and House Regulators 0 0 0 0 0 0584 8950 Maintenance of Other Equipment 5,866 2,497 1,568 62 870 869585 Total Distribution 7,345,541 3,126,385 1,963,671 77,748 1,089,778 1,087,958586587 Customer Accounts:588 9010 Supervision 0 0 0 0 0 0589 9020 Meter Reading Expense 1,085,047 966,269 117,548 60 747 423590 9030 Customer Records and Collection Expenses 1,220,802 1,087,164 132,255 67 840 476591 9040 Uncollectible Accounts 341,050 208,226 129,278 3,493 29 25592 9050 Miscellaneous Customer Accounts Expenses 0 0 0 0 0 0593 Total Customer Accounts 2,646,900 2,261,659 379,081 3,620 1,616 924594595 Customer Service and Information:596 9070 Supervision 0 0 0 0 0 0597 9080 Customer Assistance Expenses 0 0 0 0 0 0598 9090 Informational and Instructional Advertising Expenses 128,272 114,230 13,896 7 88 50599 9100 Miscellaneous Customer Service and Informational Expenses 0 0 0 0 0 0600 Total Customer Service and Information 128,272 114,230 13,896 7 88 50601602 Sales:603 9110 Supervision 253,468 225,721 27,459 14 174 99604 9120 Demonstrating and Selling Expenses 115,937 103,246 12,560 6 80 45605 9130 Advertising Expenses 35,170 31,320 3,810 2 24 14606 9160 Miscellaneous Sales Expenses (196,297) (174,809) (21,266) (11) (135) (76)607 Total Sales 208,278 185,478 22,564 11 143 81608609 Administrative & General:610 Operation611 9200 Administrative and General Salaries (834,543) (446,933) (191,723) (6,756) (94,674) (94,457)612 9210 Office Supplies and Expenses 17,616 9,434 4,047 143 1,998 1,994613 9220 Administrative Expenses Transferred - Customer Support 0 0 0 0 0 0614 9220 Administrative Expenses Transferred - General 14,498,764 7,764,706 3,330,864 117,366 1,644,800 1,641,029615 9230 Outside Services Employed 339,697 181,922 78,040 2,750 38,537 38,448616 9240 Property Insurance 3,718 2,026 832 30 417 413617 9250 Injuries and Damages 74,010 39,636 17,003 599 8,396 8,377618 9260 Employee Pensions and Benefits 1,082,941 579,961 248,789 8,766 122,853 122,572619 9270 Franchise Requirements 646 576 70 0 0 0620 9280 Regulatory Commission Expenses 852,920 759,553 92,401 47 587 332621 930.1 General Advertising Expenses 0 0 0 0 0 0622 930.2 Miscellaneous General Expense (42,325) (22,667) (9,724) (343) (4,802) (4,791)623 9310 Rents (8,275) (4,432) (1,901) (67) (939) (937)624 Maintenance625 9320 Maintenance of General Plant 11,804 6,321 2,712 96 1,339 1,336626 Total A&G 15,996,974 8,870,103 3,571,409 122,631 1,718,513 1,714,318627628 TOTAL O&M EXPENSE 105,607,336 60,952,823 37,440,033 1,329,036 2,949,887 2,935,557

Exhibit PHR-4Page 56 of 75
Atmos Energy Corporation, Kentucky/Mid-States DivisionClass Cost of Service - Demand/Commodity StudyForecasted Test Period: Twelve Months Ended March 31, 2020
ALLOCATION OF DEPRECIATION EXPENSE
Customer
Line Acct. Allocation Allocation Total Residential Non-Res Sales Non-Res Sales Transport TransportNo. No. Factor Basis Company Sales Firm Interruptible Firm Interruptible
1 Intangible Plant:23 30100 Organization 99.0 - 0 - - - - - 4 30200 Franchises & Consents 99.0 - 0 - - - - - 5 30300 Misc Intangible Plant 99.0 - 0 - - - - - 67 Total Intangible Plant: 0 - - - - - 89 Production Plant:
10 99.0 - 0 - - - - - 11 32520 Producing Leaseholds 99.0 - 0 - - - - - 12 32540 Rights of Ways 99.0 - 0 - - - - - 13 33100 Production Gas Wells Equipment 99.0 - 0 - - - - - 14 33201 Field Lines 99.0 - 0 - - - - - 15 33202 Tributary Lines 99.0 - 0 - - - - - 16 33400 Field Meas. & Reg. Sta. Equip 99.0 - 0 - - - - - 17 33600 Purification Equipment 99.0 - 0 - - - - - 1819 Total Production Plant 0 - - - - - 2021 Storage Plant:2223 35010 Land 99.0 - 0 - - - - - 24 35020 Rights of Way 99.0 - 0 - - - - - 25 35100 Structures and Improvements 99.0 - 0 - - - - - 26 35102 Compression Station Equipment 99.0 - 0 - - - - - 27 35103 Meas. & Reg. Sta. Structues 99.0 - 0 - - - - - 28 35104 Other Structures 99.0 - 0 - - - - - 29 35200 Wells \ Rights of Way 99.0 - 0 - - - - - 30 35201 Well Construction 99.0 - 0 - - - - - 31 35202 Well Equipment 99.0 - 0 - - - - - 32 35203 Cushion Gas 99.0 - 0 - - - - - 33 35210 Leaseholds 99.0 - 0 - - - - - 34 35211 Storage Rights 99.0 - 0 - - - - - 35 35301 Field Lines 99.0 - 0 - - - - - 36 35302 Tributary Lines 99.0 - 0 - - - - - 37 35400 Compressor Station Equipment 99.0 - 0 - - - - - 38 35500 Meas & Reg. Equipment 99.0 - 0 - - - - - 39 35600 Purification Equipment 99.0 - 0 - - - - - 4041 Total Storage Plant 0 - - - - - 4243 Transmission:4445 36510 Land & Land Rights 99.0 - 0 - - - - - 46 36520 Rights of Way 99.0 - 0 - - - - - 47 36602 Structures & Improvements 99.0 - 0 - - - - - 48 36603 Other Structues 99.0 - 0 - - - - - 49 36700 Mains Cathodic Protection 99.0 - 0 - - - - - 50 36701 Mains - Steel 99.0 - 0 - - - - - 51 36900 Meas. & Reg. Equipment 99.0 - 0 - - - - - 52 36901 Meas. & Reg. Equipment 99.0 - 0 - - - - - 5354 Total Transmission Plant 0 - - - - - 5556 Distribution:5758 37400 Land & Land Rights 2.0 Bills 0 - - - - - 59 37401 Land 2.0 Bills 0 - - - - - 60 37402 Land Rights 2.0 Bills 0 - - - - - 61 37403 Land Other 2.0 Bills 0 - - - - - 62 37500 Structures & Improvements 2.0 Bills 0 - - - - - 63 37501 Structures & Improvements T.B. 2.0 Bills 0 - - - - - 64 37502 Land Rights 2.0 Bills 0 - - - - - 65 37503 Improvements 2.0 Bills 0 - - - - - 66 37600 Mains Cathodic Protection 2.0 Bills 0 - - - - - 67 37601 Mains - Steel 2.0 Bills 0 - - - - - 68 37602 Mains - Plastic 2.0 Bills 0 - - - - - 69 37800 Meas & Reg. Sta. Equip - General 2.0 Bills 0 - - - - - 70 37900 Meas & Reg. Sta. Equip - City Gate 2.0 Bills 0 - - - - - 71 37905 Meas & Reg. Sta. Equipment T.b. 2.0 Bills 0 - - - - - 72 38000 Services 2.0 Bills 4,817,588 4,290,218 521,911 265 3,317 1,877 73 38100 Meters 4.0 Meter Investment 2,741,749 1,768,788 907,200 3,195 39,954 22,612 74 38200 Meter Installaitons 4.0 Meter Investment 2,232,937 1,440,537 738,843 2,602 32,539 18,416 75 38300 House Regulators 4.0 Meter Investment 514,355 331,827 170,192 599 7,495 4,242 76 38400 House Reg. Installations 4.0 Meter Investment 8,807 5,681 2,914 10 128 73 77 38500 Ind. Meas. & Reg. Sta. Equipment 2.2 Non-Residential Bills 112,194 - 111,033 56 706 399 78 38600 Other Prop. On Cust. Prem 99.0 - 0 - - - - - 7980 Total Distribution Plant 10,427,630 7,837,051 2,452,093 6,729 84,138 47,619

Exhibit PHR-4Page 57 of 75
Atmos Energy Corporation, Kentucky/Mid-States DivisionClass Cost of Service - Demand/Commodity StudyForecasted Test Period: Twelve Months Ended March 31, 2020
ALLOCATION OF DEPRECIATION EXPENSE8182 General:8384 38900 Land & Land Rights 6.2 P, S, T & D Plant - Customer 0 - - - - - 85 39000 Structures Frame 6.2 P, S, T & D Plant - Customer 94,939 73,278 20,642 49 619 350 86 39001 Structures & Improvements 6.2 P, S, T & D Plant - Customer 2,161 1,668 470 1 14 8 87 39002 Improvements 6.2 P, S, T & D Plant - Customer 8,853 6,833 1,925 5 58 33 88 39003 Air Conditioning Equipment 6.2 P, S, T & D Plant - Customer 283 219 62 0 2 1 89 39004 Improvement to leased Premises 6.2 P, S, T & D Plant - Customer 0 - - - - - 90 39009 Office Furniture & Equipment 6.2 P, S, T & D Plant - Customer 36,228 27,963 7,877 19 236 134 91 39100 Remittance Processing Equip 6.2 P, S, T & D Plant - Customer 0 - - - - - 92 39102 Office Machines 6.2 P, S, T & D Plant - Customer 0 - - - - - 93 39103 Transportation Equipment 6.2 P, S, T & D Plant - Customer 2,013 1,553 438 1 13 7 94 39200 Trucks 6.2 P, S, T & D Plant - Customer 0 - - - - - 95 39201 Trailers 6.2 P, S, T & D Plant - Customer 0 - - - - - 96 39202 Stores Equipment 6.2 P, S, T & D Plant - Customer 0 - - - - - 97 39300 Tools, Shop & Garage Equipment 6.2 P, S, T & D Plant - Customer 45,302 34,967 9,850 24 295 167 98 39400 Power Operated Equipment 6.2 P, S, T & D Plant - Customer 0 - - - - - 99 39600 Ditchers 6.2 P, S, T & D Plant - Customer 0 - - - - -
100 39603 Backhoes 6.2 P, S, T & D Plant - Customer 0 - - - - - 101 39604 Welders 6.2 P, S, T & D Plant - Customer 0 - - - - - 102 39605 Communication Equipment 6.2 P, S, T & D Plant - Customer 13,556 10,464 2,948 7 88 50 103 39700 Communication Equipment - Mobile Radios 6.2 P, S, T & D Plant - Customer 0 - - - - - 104 39701 Communication Equipment - Fixed Radios 6.2 P, S, T & D Plant - Customer 0 - - - - - 105 39702 Communication Equip. - Telemetering 6.2 P, S, T & D Plant - Customer 0 - - - - - 106 39705 Miscellaneous Equipment 6.2 P, S, T & D Plant - Customer 75,438 58,227 16,402 39 491 278 107 39800 Other Tangible Property 6.2 P, S, T & D Plant - Customer 0 - - - - - 108 39900 Other Tangible Property - Servers - H/W 6.2 P, S, T & D Plant - Customer 797 615 173 0 5 3 109 39901 Other Tangible Property - Servers - S/W 6.2 P, S, T & D Plant - Customer 0 - - - - - 110 39902 Other Tangible Property - Network - H/W 6.2 P, S, T & D Plant - Customer 5,218 4,028 1,135 3 34 19 111 39903 Other Tang. Property - CPU 6.2 P, S, T & D Plant - Customer 0 - - - - - 112 39904 Other Tangible Property - MF - Hardware 6.2 P, S, T & D Plant - Customer 0 - - - - - 113 39905 Other Tang. Property - PC Hardware 6.2 P, S, T & D Plant - Customer 34,640 26,737 7,532 18 226 128 114 39906 Other Tang. Property - PC Software 6.2 P, S, T & D Plant - Customer 0 - - - - - 115 39907 Other Tang. Property - Mainframe S/W 6.2 P, S, T & D Plant - Customer 0 - - - - - 116 39908 Other Tang. Property - Application Software 6.2 P, S, T & D Plant - Customer 3,989 3,079 867 2 26 15 117 40600 Amortization of gas plant acquisition adjustments 6.2 P, S, T & D Plant - Customer 0 - - - - - 118119120 Total General Plant 323,417 249,630 70,320 169 2,107 1,193121122 TOTAL DIRECT DEPRECIATION EXPENSE 10,751,047 8,086,680 2,522,413 6,897 86,245 48,812123124 Kentucky Mid-States General Office:125126 Intangible Plant:127128 30100 Organization 99.0 - 0 - - - - - 129 30200 Franchises & Consents 99.0 - 0 - - - - - 130 30300 Misc Intangible Plant 99.0 - 0 - - - - - 131132 Total Intangible Plant: 0 - - - - - 133134 General:135136 37400 Land & Land Rights 6.2 P, S, T & D Plant - Customer 0 - - - - - 137 39001 Structures Frame 6.2 P, S, T & D Plant - Customer 969 748 211 1 6 4 138 36602 Structures & Improvements 6.2 P, S, T & D Plant - Customer 0 - - - - - 139 38900 Land & Land Rights 6.2 P, S, T & D Plant - Customer 0 - - - - - 140 39004 Air Conditioning Equipment 6.2 P, S, T & D Plant - Customer 218 168 47 0 1 1 141 39009 Improvement to leased Premises 6.2 P, S, T & D Plant - Customer 0 - - - - - 142 39100 Office Furniture & Equipment 6.2 P, S, T & D Plant - Customer 0 - - - - - 143 39102 Remittance Processing Equip 6.2 P, S, T & D Plant - Customer 0 - - - - - 144 39103 Office Machines 6.2 P, S, T & D Plant - Customer 0 - - - - - 145 39200 Transportation Equipment 6.2 P, S, T & D Plant - Customer 155 120 34 0 1 1 146 39201 Trucks 6.2 P, S, T & D Plant - Customer 0 - - - - - 147 39202 Trailers 6.2 P, S, T & D Plant - Customer 0 - - - - - 148 39300 Stores Equipment 6.2 P, S, T & D Plant - Customer 0 - - - - - 149 39400 Tools, Shop & Garage Equipment 6.2 P, S, T & D Plant - Customer 785 606 171 0 5 3 150 39600 Power Operated Equipment 6.2 P, S, T & D Plant - Customer 5 4 1 0 0 0 151 39603 Ditchers 6.2 P, S, T & D Plant - Customer 0 - - - - - 152 39604 Backhoes 6.2 P, S, T & D Plant - Customer 0 - - - - - 153 39605 Welders 6.2 P, S, T & D Plant - Customer 0 - - - - - 154 39700 Communication Equipment 6.2 P, S, T & D Plant - Customer 640 494 139 0 4 2 155 39701 Communication Equipment - Mobile Radios 6.2 P, S, T & D Plant - Customer 0 - - - - - 156 39702 Communication Equipment - Fixed Radios 6.2 P, S, T & D Plant - Customer 0 - - - - - 157 39705 Communication Equip. - Telemetering 6.2 P, S, T & D Plant - Customer 0 - - - - - 158 39800 Miscellaneous Equipment 6.2 P, S, T & D Plant - Customer 4,745 3,663 1,032 2 31 17 159 39900 Other Tangible Property 6.2 P, S, T & D Plant - Customer 0 - - - - - 160 39901 Other Tangible Property - Servers - H/W 6.2 P, S, T & D Plant - Customer 0 - - - - - 161 39902 Other Tangible Property - Servers - S/W 6.2 P, S, T & D Plant - Customer 0 - - - - - 162 39903 Other Tangible Property - Network - H/W 6.2 P, S, T & D Plant - Customer 0 - - - - - 163 39904 Other Tang. Property - CPU 6.2 P, S, T & D Plant - Customer 0 - - - - - 164 39905 Other Tangible Property - MF - Hardware 6.2 P, S, T & D Plant - Customer 0 - - - - - 165 39906 Other Tang. Property - PC Hardware 6.2 P, S, T & D Plant - Customer 0 - - - - - 166 39907 Other Tang. Property - PC Software 6.2 P, S, T & D Plant - Customer 4,321 3,335 939 2 28 16 167 39908 Other Tang. Property - Mainframe S/W 6.2 P, S, T & D Plant - Customer 0 - - - - - 168 39909 Other Tang. Property - Application Software 6.2 P, S, T & D Plant - Customer 0 - - - - - 169 39924 Other Tang. Property - General Startup Costs 6.2 P, S, T & D Plant - Customer 0 - - - - - 170171172 Total General Plant 11,838 9,137 2,574 6 77 44

Exhibit PHR-4Page 58 of 75
Atmos Energy Corporation, Kentucky/Mid-States DivisionClass Cost of Service - Demand/Commodity StudyForecasted Test Period: Twelve Months Ended March 31, 2020
ALLOCATION OF DEPRECIATION EXPENSE173174 Shared Services General Office:175176 General:177178 37400 Land & Land Rights 6.2 P, S, T & D Plant - Customer 0 - - - - - 179 39000 Structures & Improvements 6.2 P, S, T & D Plant - Customer 2,765 2,134 601 1 18 10 180 36602 Structures & Improvements 6.2 P, S, T & D Plant - Customer 0 - - - - - 181 37503 Improvements 6.2 P, S, T & D Plant - Customer 0 - - - - - 182 39004 Air Conditioning Equipment 6.2 P, S, T & D Plant - Customer 0 - - - - - 183 39009 Improvement to leased Premises 6.2 P, S, T & D Plant - Customer 14 11 3 0 0 0 184 39100 Office Furniture & Equipment 6.2 P, S, T & D Plant - Customer 4,183 3,229 910 2 27 15 185 39102 Remittance Processing Equip 6.2 P, S, T & D Plant - Customer 0 - - - - - 186 39103 Office Machines 6.2 P, S, T & D Plant - Customer 0 - - - - - 187 39200 Transportation Equipment 6.2 P, S, T & D Plant - Customer 0 - - - - - 188 39201 Trucks 6.2 P, S, T & D Plant - Customer 0 - - - - - 189 39202 Trailers 6.2 P, S, T & D Plant - Customer 0 - - - - - 190 39300 Stores Equipment 6.2 P, S, T & D Plant - Customer 0 - - - - - 191 39400 Tools, Shop & Garage Equipment 6.2 P, S, T & D Plant - Customer 0 - - - - - 192 39600 Power Operated Equipment 6.2 P, S, T & D Plant - Customer 0 - - - - - 193 39603 Ditchers 6.2 P, S, T & D Plant - Customer 0 - - - - - 194 39604 Backhoes 6.2 P, S, T & D Plant - Customer 0 - - - - - 195 39605 Welders 6.2 P, S, T & D Plant - Customer 0 - - - - - 196 39700 Communication Equipment 6.2 P, S, T & D Plant - Customer 10 8 2 0 0 0 197 39701 Communication Equipment - Mobile Radios 6.2 P, S, T & D Plant - Customer 0 - - - - - 198 39702 Communication Equipment - Fixed Radios 6.2 P, S, T & D Plant - Customer 0 - - - - - 199 39705 Communication Equip. - Telemetering 6.2 P, S, T & D Plant - Customer 0 - - - - - 200 39800 Miscellaneous Equipment 6.2 P, S, T & D Plant - Customer 25 20 6 0 0 0 201 39900 Other Tangible Property 6.2 P, S, T & D Plant - Customer 0 - - - - - 202 39901 Other Tangible Property - Servers - H/W 6.2 P, S, T & D Plant - Customer 51,904 40,062 11,285 27 338 191 203 39902 Other Tangible Property - Servers - S/W 6.2 P, S, T & D Plant - Customer 15,555 12,006 3,382 8 101 57 204 39903 Other Tangible Property - Network - H/W 6.2 P, S, T & D Plant - Customer 0 - - - - - 205 39904 Other Tang. Property - CPU 6.2 P, S, T & D Plant - Customer 0 - - - - - 206 39905 Other Tangible Property - MF - Hardware 6.2 P, S, T & D Plant - Customer 0 - - - - - 207 39906 Other Tang. Property - PC Hardware 6.2 P, S, T & D Plant - Customer 3,517 2,715 765 2 23 13 208 39907 Other Tang. Property - PC Software 6.2 P, S, T & D Plant - Customer 0 - - - - - 209 39908 Other Tang. Property - Mainframe S/W 6.2 P, S, T & D Plant - Customer 0 - - - - - 210 39909 Other Tang. Property - Application Software 6.2 P, S, T & D Plant - Customer 529 409 115 0 3 2 211 39924 Other Tang. Property - General Startup Costs 6.2 P, S, T & D Plant - Customer 0 - - - - - 212213214 Total General Plant 78,503 60,593 17,069 41 511 289 215216 Shared Services Customer Support:217218 General:219220 37400 Land & Land Rights 6.2 P, S, T & D Plant - Customer 0 - - - - - 221 39001 Structures Frame 6.2 P, S, T & D Plant - Customer 0 - - - - - 222 36602 Structures & Improvements 6.2 P, S, T & D Plant - Customer 11,669 9,007 2,537 6 76 43 223 37503 Improvements 6.2 P, S, T & D Plant - Customer 0 - - - - - 224 39004 Air Conditioning Equipment 6.2 P, S, T & D Plant - Customer 0 - - - - - 225 39009 Improvement to leased Premises 6.2 P, S, T & D Plant - Customer 2,005 1,547 436 1 13 7 226 39100 Office Furniture & Equipment 6.2 P, S, T & D Plant - Customer 2,380 1,837 517 1 16 9 227 39102 Remittance Processing Equip 6.2 P, S, T & D Plant - Customer 0 - - - - - 228 39103 Office Machines 6.2 P, S, T & D Plant - Customer 0 - - - - - 229 39200 Transportation Equipment 6.2 P, S, T & D Plant - Customer 0 - - - - - 230 39201 Trucks 6.2 P, S, T & D Plant - Customer 0 - - - - - 231 39202 Trailers 6.2 P, S, T & D Plant - Customer 0 - - - - - 232 39300 Stores Equipment 6.2 P, S, T & D Plant - Customer 0 - - - - - 233 39400 Tools, Shop & Garage Equipment 6.2 P, S, T & D Plant - Customer 462 356 100 0 3 2 234 39600 Power Operated Equipment 6.2 P, S, T & D Plant - Customer 21 16 5 0 0 0 235 39603 Ditchers 6.2 P, S, T & D Plant - Customer 0 - - - - - 236 39604 Backhoes 6.2 P, S, T & D Plant - Customer 0 - - - - - 237 39605 Welders 6.2 P, S, T & D Plant - Customer 0 - - - - - 238 39700 Communication Equipment 6.2 P, S, T & D Plant - Customer 2,601 2,008 566 1 17 10 239 39701 Communication Equipment - Mobile Radios 6.2 P, S, T & D Plant - Customer 0 - - - - - 240 39702 Communication Equipment - Fixed Radios 6.2 P, S, T & D Plant - Customer 0 - - - - - 241 39705 Communication Equip. - Telemetering 6.2 P, S, T & D Plant - Customer 0 - - - - - 242 39800 Miscellaneous Equipment 6.2 P, S, T & D Plant - Customer 323 249 70 0 2 1 243 39900 Other Tangible Property 6.2 P, S, T & D Plant - Customer 2,196 1,695 477 1 14 8 244 39901 Other Tangible Property - Servers - H/W 6.2 P, S, T & D Plant - Customer 21,444 16,552 4,663 11 140 79 245 39902 Other Tangible Property - Servers - S/W 6.2 P, S, T & D Plant - Customer 3,953 3,051 859 2 26 15 246 39903 Other Tangible Property - Network - H/W 6.2 P, S, T & D Plant - Customer 962 742 209 1 6 4 247 39904 Other Tang. Property - CPU 6.2 P, S, T & D Plant - Customer 0 - - - - - 248 39905 Other Tangible Property - MF - Hardware 6.2 P, S, T & D Plant - Customer 0 - - - - - 249 39906 Other Tang. Property - PC Hardware 6.2 P, S, T & D Plant - Customer 2,834 2,187 616 1 18 10 250 39907 Other Tang. Property - PC Software 6.2 P, S, T & D Plant - Customer 338 261 73 0 2 1 251 39908 Other Tang. Property - Mainframe S/W 6.2 P, S, T & D Plant - Customer 0 - - - - - 252 39909 Other Tang. Property - Application Software 6.2 P, S, T & D Plant - Customer 132,791 102,494 28,872 69 865 490 253 39924 Other Tang. Property - General Startup Costs 6.2 P, S, T & D Plant - Customer 12 9 3 0 0 0 254255256 Total General Plant 183,990 142,013 40,004 96 1,199 678 257258 TOTAL DEPRECIATION EXPENSE - CUSTOMER 11,025,378 8,298,422 2,582,060 7,040 88,033 49,823

Exhibit PHR-4Page 59 of 75
Atmos Energy Corporation, Kentucky/Mid-States DivisionClass Cost of Service - Demand/Commodity StudyForecasted Test Period: Twelve Months Ended March 31, 2020
ALLOCATION OF DEPRECIATION EXPENSE
Demand
Line Acct. Allocation Allocation Total Residential Non-Res Sales Non-Res Sales Transport TransportNo. No. Factor Basis Company Sales Firm Interruptible Firm Interruptible
259 Intangible Plant:260261 30100 Organization 99.0 - 0 - - - - - 262 30200 Franchises & Consents 99.0 - 0 - - - - - 263 30300 Misc Intangible Plant 99.0 - 0 - - - - - 264265 Total Intangible Plant: 0 - - - - - 266267 Production Plant:268 3.0 Peak Day 0 - - - - - 269 32520 Producing Leaseholds 3.0 Peak Day 0 - - - - - 270 32540 Rights of Ways 3.0 Peak Day 0 - - - - - 271 33100 Production Gas Wells Equipment 3.0 Peak Day 0 - - - - - 272 33201 Field Lines 3.0 Peak Day 0 - - - - - 273 33202 Tributary Lines 3.0 Peak Day 0 - - - - - 274 33400 Field Meas. & Reg. Sta. Equip 3.0 Peak Day 0 - - - - - 275 33600 Purification Equipment 3.0 Peak Day 0 - - - - - 276277 Total Production Plant 0 - - - - - 278279 Storage Plant:280281 35010 Land 3.0 Peak Day 0 - - - - - 282 35020 Rights of Way 3.0 Peak Day 11 5 3 0 2 1 283 35100 Structures and Improvements 3.0 Peak Day 149 67 38 2 22 19 284 35102 Compression Station Equipment 3.0 Peak Day 958 433 248 13 139 125 285 35103 Meas. & Reg. Sta. Structues 3.0 Peak Day 104 47 27 1 15 14 286 35104 Other Structures 3.0 Peak Day 887 401 229 12 128 116 287 35200 Wells \ Rights of Way 3.0 Peak Day 80,561 36,424 20,828 1,096 11,669 10,544 288 35201 Well Construction 3.0 Peak Day 12,920 5,842 3,340 176 1,871 1,691 289 35202 Well Equipment 3.0 Peak Day 0 - - - - - 290 35203 Cushion Gas 3.0 Peak Day 11,694 5,287 3,023 159 1,694 1,531 291 35210 Leaseholds 3.0 Peak Day 277 125 72 4 40 36 292 35211 Storage Rights 3.0 Peak Day 240 109 62 3 35 31 293 35301 Field Lines 3.0 Peak Day 798 361 206 11 116 104 294 35302 Tributary Lines 3.0 Peak Day 952 431 246 13 138 125 295 35400 Compressor Station Equipment 3.0 Peak Day 7,849 3,549 2,029 107 1,137 1,027 296 35500 Meas & Reg. Equipment 3.0 Peak Day 2,280 1,031 590 31 330 298 297 35600 Purification Equipment 3.0 Peak Day 4,105 1,856 1,061 56 595 537 298299 Total Storage Plant 123,785 55,968 32,003 1,683 17,929 16,202 300301 Transmission:302303 36510 Land & Land Rights 3.0 Peak Day 0 - - - - - 304 36520 Rights of Way 3.0 Peak Day 9,112 4,120 2,356 124 1,320 1,193 305 36602 Structures & Improvements 3.0 Peak Day 608 275 157 8 88 80 306 36603 Other Structues 3.0 Peak Day 754 341 195 10 109 99 307 36700 Mains Cathodic Protection 3.0 Peak Day 5,362 2,424 1,386 73 777 702 308 36701 Mains - Steel 3.0 Peak Day 381,167 172,339 98,547 5,183 55,209 49,889 309 36900 Meas. & Reg. Equipment 3.0 Peak Day 11,265 5,093 2,912 153 1,632 1,474 310 36901 Meas. & Reg. Equipment 3.0 Peak Day 34,951 15,803 9,036 475 5,062 4,575 311312 Total Transmission Plant 443,218 200,394 114,589 6,027 64,197 58,010 313314 Distribution:315316 37400 Land & Land Rights 3.0 Peak Day 0 - - - - - 317 37401 Land 3.0 Peak Day 0 - - - - - 318 37402 Land Rights 3.0 Peak Day 32,440 14,667 8,387 441 4,699 4,246 319 37403 Land Other 3.0 Peak Day 0 - - - - - 320 37500 Structures & Improvements 3.0 Peak Day 3,911 1,768 1,011 53 567 512 321 37501 Structures & Improvements T.B. 3.0 Peak Day 1,161 525 300 16 168 152 322 37502 Land Rights 3.0 Peak Day 538 243 139 7 78 70 323 37503 Improvements 3.0 Peak Day 47 21 12 1 7 6 324 37600 Mains Cathodic Protection 3.0 Peak Day 567,793 256,719 146,797 7,721 82,241 74,315 325 37601 Mains - Steel 3.0 Peak Day 2,895,602 1,309,202 748,627 39,376 419,408 378,989 326 37602 Mains - Plastic 3.0 Peak Day 2,194,496 992,207 567,364 29,842 317,858 287,225 327 37800 Meas & Reg. Sta. Equip - General 3.0 Peak Day 601,657 272,030 155,552 8,182 87,146 78,747 328 37900 Meas & Reg. Sta. Equip - City Gate 3.0 Peak Day 94,836 42,879 24,519 1,290 13,736 12,413 329 37905 Meas & Reg. Sta. Equipment T.b. 3.0 Peak Day 30,393 13,742 7,858 413 4,402 3,978 330 38000 Services 99.0 - 0 - - - - - 331 38100 Meters 99.0 - 0 - - - - - 332 38200 Meter Installaitons 99.0 - 0 - - - - - 333 38300 House Regulators 99.0 - 0 - - - - - 334 38400 House Reg. Installations 99.0 - 0 - - - - - 335 38500 Ind. Meas. & Reg. Sta. Equipment 99.0 - 0 - - - - - 336 38600 Other Prop. On Cust. Prem 99.0 - 0 - - - - - 337338 Total Distribution Plant 6,422,874 2,904,003 1,660,566 87,342 930,309 840,654

Exhibit PHR-4Page 60 of 75
Atmos Energy Corporation, Kentucky/Mid-States DivisionClass Cost of Service - Demand/Commodity StudyForecasted Test Period: Twelve Months Ended March 31, 2020
ALLOCATION OF DEPRECIATION EXPENSE339340 General:341342 38900 Land & Land Rights 6.4 P, S, T & D Plant - Demand 0 - - - - - 343 39000 Structures Frame 6.4 P, S, T & D Plant - Demand 100,578 45,475 26,003 1,368 14,568 13,164 344 39001 Structures & Improvements 6.4 P, S, T & D Plant - Demand 2,289 1,035 592 31 332 300 345 39002 Improvements 6.4 P, S, T & D Plant - Demand 9,379 4,241 2,425 128 1,358 1,228 346 39003 Air Conditioning Equipment 6.4 P, S, T & D Plant - Demand 300 136 78 4 43 39 347 39004 Improvement to leased Premises 6.4 P, S, T & D Plant - Demand 0 - - - - - 348 39009 Office Furniture & Equipment 6.4 P, S, T & D Plant - Demand 38,380 17,353 9,923 522 5,559 5,023 349 39100 Remittance Processing Equip 6.4 P, S, T & D Plant - Demand 0 - - - - - 350 39102 Office Machines 6.4 P, S, T & D Plant - Demand 0 - - - - - 351 39103 Transportation Equipment 6.4 P, S, T & D Plant - Demand 2,132 964 551 29 309 279 352 39200 Trucks 6.4 P, S, T & D Plant - Demand 0 - - - - - 353 39201 Trailers 6.4 P, S, T & D Plant - Demand 0 - - - - - 354 39202 Stores Equipment 6.4 P, S, T & D Plant - Demand 0 - - - - - 355 39300 Tools, Shop & Garage Equipment 6.4 P, S, T & D Plant - Demand 47,993 21,699 12,408 653 6,952 6,282 356 39400 Power Operated Equipment 6.4 P, S, T & D Plant - Demand 0 - - - - - 357 39600 Ditchers 6.4 P, S, T & D Plant - Demand 0 - - - - - 358 39603 Backhoes 6.4 P, S, T & D Plant - Demand 0 - - - - - 359 39604 Welders 6.4 P, S, T & D Plant - Demand 0 - - - - - 360 39605 Communication Equipment 6.4 P, S, T & D Plant - Demand 14,362 6,493 3,713 195 2,080 1,880 361 39700 Communication Equipment - Mobile Radios 6.4 P, S, T & D Plant - Demand 0 - - - - - 362 39701 Communication Equipment - Fixed Radios 6.4 P, S, T & D Plant - Demand 0 - - - - - 363 39702 Communication Equip. - Telemetering 6.4 P, S, T & D Plant - Demand 0 - - - - - 364 39705 Miscellaneous Equipment 6.4 P, S, T & D Plant - Demand 79,919 36,134 20,662 1,087 11,576 10,460 365 39800 Other Tangible Property 6.4 P, S, T & D Plant - Demand 0 - - - - - 366 39900 Other Tangible Property - Servers - H/W 6.4 P, S, T & D Plant - Demand 845 382 218 11 122 111 367 39901 Other Tangible Property - Servers - S/W 6.4 P, S, T & D Plant - Demand 0 - - - - - 368 39902 Other Tangible Property - Network - H/W 6.4 P, S, T & D Plant - Demand 5,528 2,499 1,429 75 801 724 369 39903 Other Tang. Property - CPU 6.4 P, S, T & D Plant - Demand 0 - - - - - 370 39904 Other Tangible Property - MF - Hardware 6.4 P, S, T & D Plant - Demand 0 - - - - - 371 39905 Other Tang. Property - PC Hardware 6.4 P, S, T & D Plant - Demand 36,697 16,592 9,488 499 5,315 4,803 372 39906 Other Tang. Property - PC Software 6.4 P, S, T & D Plant - Demand 0 - - - - - 373 39907 Other Tang. Property - Mainframe S/W 6.4 P, S, T & D Plant - Demand 0 - - - - - 374 39908 Other Tang. Property - Application Software 6.4 P, S, T & D Plant - Demand 4,226 1,911 1,093 57 612 553 375 40600 Amortization of gas plant acquisition adjustments 6.4 P, S, T & D Plant - Demand 0 - - - - - 376377378 Total General Plant 342,628 154,914 88,583 4,659 49,627 44,845379380 TOTAL DIRECT DEPRECIATION EXPENSE 7,332,506 3,315,279 1,895,742 99,711 1,062,063 959,711381382 Kentucky Mid-States General Office:383384 Intangible Plant:385386 30100 Organization 99.0 - 0 - - - - - 387 30200 Franchises & Consents 99.0 - 0 - - - - - 388 30300 Misc Intangible Plant 99.0 - 0 - - - - - 389390 Total Intangible Plant: 0 - - - - - 391392 General:393394 37400 Land & Land Rights 6.4 P, S, T & D Plant - Demand 0 - - - - - 395 39001 Structures Frame 6.4 P, S, T & D Plant - Demand 1,027 464 265 14 149 134 396 36602 Structures & Improvements 6.4 P, S, T & D Plant - Demand 0 - - - - - 397 38900 Land & Land Rights 6.4 P, S, T & D Plant - Demand 0 - - - - - 398 39004 Air Conditioning Equipment 6.4 P, S, T & D Plant - Demand 231 104 60 3 33 30 399 39009 Improvement to leased Premises 6.4 P, S, T & D Plant - Demand 0 - - - - - 400 39100 Office Furniture & Equipment 6.4 P, S, T & D Plant - Demand 0 - - - - - 401 39102 Remittance Processing Equip 6.4 P, S, T & D Plant - Demand 0 - - - - - 402 39103 Office Machines 6.4 P, S, T & D Plant - Demand 0 - - - - - 403 39200 Transportation Equipment 6.4 P, S, T & D Plant - Demand 164 74 42 2 24 21 404 39201 Trucks 6.4 P, S, T & D Plant - Demand 0 - - - - - 405 39202 Trailers 6.4 P, S, T & D Plant - Demand 0 - - - - - 406 39300 Stores Equipment 6.4 P, S, T & D Plant - Demand 0 - - - - - 407 39400 Tools, Shop & Garage Equipment 6.4 P, S, T & D Plant - Demand 832 376 215 11 120 109 408 39600 Power Operated Equipment 6.4 P, S, T & D Plant - Demand 5 2 1 0 1 1 409 39603 Ditchers 6.4 P, S, T & D Plant - Demand 0 - - - - - 410 39604 Backhoes 6.4 P, S, T & D Plant - Demand 0 - - - - - 411 39605 Welders 6.4 P, S, T & D Plant - Demand 0 - - - - - 412 39700 Communication Equipment 6.4 P, S, T & D Plant - Demand 678 307 175 9 98 89 413 39701 Communication Equipment - Mobile Radios 6.4 P, S, T & D Plant - Demand 0 - - - - - 414 39702 Communication Equipment - Fixed Radios 6.4 P, S, T & D Plant - Demand 0 - - - - - 415 39705 Communication Equip. - Telemetering 6.4 P, S, T & D Plant - Demand 0 - - - - - 416 39800 Miscellaneous Equipment 6.4 P, S, T & D Plant - Demand 5,027 2,273 1,300 68 728 658 417 39900 Other Tangible Property 6.4 P, S, T & D Plant - Demand 0 - - - - - 418 39901 Other Tangible Property - Servers - H/W 6.4 P, S, T & D Plant - Demand 0 - - - - - 419 39902 Other Tangible Property - Servers - S/W 6.4 P, S, T & D Plant - Demand 0 - - - - - 420 39903 Other Tangible Property - Network - H/W 6.4 P, S, T & D Plant - Demand 0 - - - - - 421 39904 Other Tang. Property - CPU 6.4 P, S, T & D Plant - Demand 0 - - - - - 422 39905 Other Tangible Property - MF - Hardware 6.4 P, S, T & D Plant - Demand 0 - - - - - 423 39906 Other Tang. Property - PC Hardware 6.4 P, S, T & D Plant - Demand 0 - - - - - 424 39907 Other Tang. Property - PC Software 6.4 P, S, T & D Plant - Demand 4,578 2,070 1,183 62 663 599 425 39908 Other Tang. Property - Mainframe S/W 6.4 P, S, T & D Plant - Demand 0 - - - - - 426 39909 Other Tang. Property - Application Software 6.4 P, S, T & D Plant - Demand 0 - - - - - 427 39924 Other Tang. Property - General Startup Costs 6.4 P, S, T & D Plant - Demand 0 - - - - - 428429430 Total General Plant 12,541 5,670 3,242 171 1,816 1,641

Exhibit PHR-4Page 61 of 75
Atmos Energy Corporation, Kentucky/Mid-States DivisionClass Cost of Service - Demand/Commodity StudyForecasted Test Period: Twelve Months Ended March 31, 2020
ALLOCATION OF DEPRECIATION EXPENSE431432 Shared Services General Office:433434 General:435436 37400 Land & Land Rights 6.4 P, S, T & D Plant - Demand 0 - - - - - 437 39000 Structures & Improvements 6.4 P, S, T & D Plant - Demand 2,929 1,324 757 40 424 383 438 36602 Structures & Improvements 6.4 P, S, T & D Plant - Demand 0 - - - - - 439 37503 Improvements 6.4 P, S, T & D Plant - Demand 0 - - - - - 440 39004 Air Conditioning Equipment 6.4 P, S, T & D Plant - Demand 0 - - - - - 441 39009 Improvement to leased Premises 6.4 P, S, T & D Plant - Demand 14 7 4 0 2 2 442 39100 Office Furniture & Equipment 6.4 P, S, T & D Plant - Demand 4,432 2,004 1,146 60 642 580 443 39102 Remittance Processing Equip 6.4 P, S, T & D Plant - Demand 0 - - - - - 444 39103 Office Machines 6.4 P, S, T & D Plant - Demand 0 - - - - - 445 39200 Transportation Equipment 6.4 P, S, T & D Plant - Demand 0 - - - - - 446 39201 Trucks 6.4 P, S, T & D Plant - Demand 0 - - - - - 447 39202 Trailers 6.4 P, S, T & D Plant - Demand 0 - - - - - 448 39300 Stores Equipment 6.4 P, S, T & D Plant - Demand 0 - - - - - 449 39400 Tools, Shop & Garage Equipment 6.4 P, S, T & D Plant - Demand 0 - - - - - 450 39600 Power Operated Equipment 6.4 P, S, T & D Plant - Demand 0 - - - - - 451 39603 Ditchers 6.4 P, S, T & D Plant - Demand 0 - - - - - 452 39604 Backhoes 6.4 P, S, T & D Plant - Demand 0 - - - - - 453 39605 Welders 6.4 P, S, T & D Plant - Demand 0 - - - - - 454 39700 Communication Equipment 6.4 P, S, T & D Plant - Demand 11 5 3 0 2 1 455 39701 Communication Equipment - Mobile Radios 6.4 P, S, T & D Plant - Demand 0 - - - - - 456 39702 Communication Equipment - Fixed Radios 6.4 P, S, T & D Plant - Demand 0 - - - - - 457 39705 Communication Equip. - Telemetering 6.4 P, S, T & D Plant - Demand 0 - - - - - 458 39800 Miscellaneous Equipment 6.4 P, S, T & D Plant - Demand 27 12 7 0 4 4 459 39900 Other Tangible Property 6.4 P, S, T & D Plant - Demand 0 - - - - - 460 39901 Other Tangible Property - Servers - H/W 6.4 P, S, T & D Plant - Demand 54,987 24,861 14,216 748 7,964 7,197 461 39902 Other Tangible Property - Servers - S/W 6.4 P, S, T & D Plant - Demand 16,479 7,451 4,261 224 2,387 2,157 462 39903 Other Tangible Property - Network - H/W 6.4 P, S, T & D Plant - Demand 0 - - - - - 463 39904 Other Tang. Property - CPU 6.4 P, S, T & D Plant - Demand 0 - - - - - 464 39905 Other Tangible Property - MF - Hardware 6.4 P, S, T & D Plant - Demand 0 - - - - - 465 39906 Other Tang. Property - PC Hardware 6.4 P, S, T & D Plant - Demand 3,726 1,685 963 51 540 488 466 39907 Other Tang. Property - PC Software 6.4 P, S, T & D Plant - Demand 0 - - - - - 467 39908 Other Tang. Property - Mainframe S/W 6.4 P, S, T & D Plant - Demand 0 - - - - - 468 39909 Other Tang. Property - Application Software 6.4 P, S, T & D Plant - Demand 561 254 145 8 81 73 469 39924 Other Tang. Property - General Startup Costs 6.4 P, S, T & D Plant - Demand 0 - - - - - 470471472 Total General Plant 83,166 37,602 21,502 1,131 12,046 10,885 473474 Shared Services Customer Support:475476 General:477478 37400 Land & Land Rights 6.4 P, S, T & D Plant - Demand 0 - - - - - 479 39001 Structures Frame 6.4 P, S, T & D Plant - Demand 0 - - - - - 480 36602 Structures & Improvements 6.4 P, S, T & D Plant - Demand 12,362 5,590 3,196 168 1,791 1,618 481 37503 Improvements 6.4 P, S, T & D Plant - Demand 0 - - - - - 482 39004 Air Conditioning Equipment 6.4 P, S, T & D Plant - Demand 0 - - - - - 483 39009 Improvement to leased Premises 6.4 P, S, T & D Plant - Demand 2,124 960 549 29 308 278 484 39100 Office Furniture & Equipment 6.4 P, S, T & D Plant - Demand 2,521 1,140 652 34 365 330 485 39102 Remittance Processing Equip 6.4 P, S, T & D Plant - Demand 0 - - - - - 486 39103 Office Machines 6.4 P, S, T & D Plant - Demand 0 - - - - - 487 39200 Transportation Equipment 6.4 P, S, T & D Plant - Demand 0 - - - - - 488 39201 Trucks 6.4 P, S, T & D Plant - Demand 0 - - - - - 489 39202 Trailers 6.4 P, S, T & D Plant - Demand 0 - - - - - 490 39300 Stores Equipment 6.4 P, S, T & D Plant - Demand 0 - - - - - 491 39400 Tools, Shop & Garage Equipment 6.4 P, S, T & D Plant - Demand 489 221 126 7 71 64 492 39600 Power Operated Equipment 6.4 P, S, T & D Plant - Demand 23 10 6 0 3 3 493 39603 Ditchers 6.4 P, S, T & D Plant - Demand 0 - - - - - 494 39604 Backhoes 6.4 P, S, T & D Plant - Demand 0 - - - - - 495 39605 Welders 6.4 P, S, T & D Plant - Demand 0 - - - - - 496 39700 Communication Equipment 6.4 P, S, T & D Plant - Demand 2,755 1,246 712 37 399 361 497 39701 Communication Equipment - Mobile Radios 6.4 P, S, T & D Plant - Demand 0 - - - - - 498 39702 Communication Equipment - Fixed Radios 6.4 P, S, T & D Plant - Demand 0 - - - - - 499 39705 Communication Equip. - Telemetering 6.4 P, S, T & D Plant - Demand 0 - - - - - 500 39800 Miscellaneous Equipment 6.4 P, S, T & D Plant - Demand 342 155 89 5 50 45 501 39900 Other Tangible Property 6.4 P, S, T & D Plant - Demand 2,326 1,052 601 32 337 304 502 39901 Other Tangible Property - Servers - H/W 6.4 P, S, T & D Plant - Demand 22,718 10,272 5,874 309 3,291 2,973 503 39902 Other Tangible Property - Servers - S/W 6.4 P, S, T & D Plant - Demand 4,188 1,893 1,083 57 607 548 504 39903 Other Tangible Property - Network - H/W 6.4 P, S, T & D Plant - Demand 1,019 461 263 14 148 133 505 39904 Other Tang. Property - CPU 6.4 P, S, T & D Plant - Demand 0 - - - - - 506 39905 Other Tangible Property - MF - Hardware 6.4 P, S, T & D Plant - Demand 0 - - - - - 507 39906 Other Tang. Property - PC Hardware 6.4 P, S, T & D Plant - Demand 3,002 1,357 776 41 435 393 508 39907 Other Tang. Property - PC Software 6.4 P, S, T & D Plant - Demand 358 162 93 5 52 47 509 39908 Other Tang. Property - Mainframe S/W 6.4 P, S, T & D Plant - Demand 0 - - - - - 510 39909 Other Tang. Property - Application Software 6.4 P, S, T & D Plant - Demand 140,678 63,606 36,371 1,913 20,376 18,413 511 39924 Other Tang. Property - General Startup Costs 6.4 P, S, T & D Plant - Demand 13 6 3 0 2 2 512513514 Total General Plant 194,919 88,130 50,394 2,651 28,233 25,512 515516 TOTAL DEPRECIATION EXPENSE - DEMAND 7,623,132 3,446,681 1,970,880 103,663 1,104,159 997,749

Exhibit PHR-4Page 62 of 75
Atmos Energy Corporation, Kentucky/Mid-States DivisionClass Cost of Service - Demand/Commodity StudyForecasted Test Period: Twelve Months Ended March 31, 2020
ALLOCATION OF DEPRECIATION EXPENSE
Commodity
Line Acct. Allocation Allocation Total Residential Non-Res Sales Non-Res Sales Transport TransportNo. No. Factor Basis Company Sales Firm Interruptible Firm Interruptible
517 Intangible Plant:518519 30100 Organization 99.0 - 0 - - - - - 520 30200 Franchises & Consents 99.0 - 0 - - - - - 521 30300 Misc Intangible Plant 99.0 - 0 - - - - - 522523 Total Intangible Plant: 0 - - - - - 524525 Production Plant:526 99.0 - 0 - - - - - 527 32520 Producing Leaseholds 99.0 - 0 - - - - - 528 32540 Rights of Ways 99.0 - 0 - - - - - 529 33100 Production Gas Wells Equipment 99.0 - 0 - - - - - 530 33201 Field Lines 99.0 - 0 - - - - - 531 33202 Tributary Lines 99.0 - 0 - - - - - 532 33400 Field Meas. & Reg. Sta. Equip 99.0 - 0 - - - - - 533 33600 Purification Equipment 99.0 - 0 - - - - - 534535 Total Production Plant 0 - - - - - 536537 Storage Plant:538539 35010 Land 1.5 Winter Volumes 0 - - - - - 540 35020 Rights of Way 1.5 Winter Volumes 11 4 3 0 2 2 541 35100 Structures and Improvements 1.5 Winter Volumes 149 56 35 2 27 28 542 35102 Compression Station Equipment 1.5 Winter Volumes 958 363 224 12 176 182 543 35103 Meas. & Reg. Sta. Structues 1.5 Winter Volumes 104 39 24 1 19 20 544 35104 Other Structures 1.5 Winter Volumes 887 336 208 11 163 169 545 35200 Wells \ Rights of Way 1.5 Winter Volumes 80,561 30,503 18,874 1,032 14,810 15,342 546 35201 Well Construction 1.5 Winter Volumes 12,920 4,892 3,027 166 2,375 2,461 547 35202 Well Equipment 1.5 Winter Volumes 0 - - - - - 548 35203 Cushion Gas 1.5 Winter Volumes 11,694 4,428 2,740 150 2,150 2,227 549 35210 Leaseholds 1.5 Winter Volumes 277 105 65 4 51 53 550 35211 Storage Rights 1.5 Winter Volumes 240 91 56 3 44 46 551 35301 Field Lines 1.5 Winter Volumes 798 302 187 10 147 152 552 35302 Tributary Lines 1.5 Winter Volumes 952 361 223 12 175 181 553 35400 Compressor Station Equipment 1.5 Winter Volumes 7,849 2,972 1,839 101 1,443 1,495 554 35500 Meas & Reg. Equipment 1.5 Winter Volumes 2,280 863 534 29 419 434 555 35600 Purification Equipment 1.5 Winter Volumes 4,105 1,554 962 53 755 782 556557 Total Storage Plant 123,785 46,869 29,001 1,586 22,756 23,574 558559 Transmission:560561 36510 Land & Land Rights 99.0 - 0 - - - - - 562 36520 Rights of Way 99.0 - 0 - - - - - 563 36602 Structures & Improvements 99.0 - 0 - - - - - 564 36603 Other Structues 99.0 - 0 - - - - - 565 36700 Mains Cathodic Protection 99.0 - 0 - - - - - 566 36701 Mains - Steel 99.0 - 0 - - - - - 567 36900 Meas. & Reg. Equipment 99.0 - 0 - - - - - 568 36901 Meas. & Reg. Equipment 99.0 - 0 - - - - - 569570 Total Transmission Plant 0 - - - - - 571572 Distribution:573574 37400 Land & Land Rights 99.0 - 0 - - - - - 575 37401 Land 99.0 - 0 - - - - - 576 37402 Land Rights 1.0 Mcf 17,468 5,290 3,585 177 3,965 4,452 577 37403 Land Other 99.0 - 0 - - - - - 578 37500 Structures & Improvements 1.0 Mcf 2,106 638 432 21 478 537 579 37501 Structures & Improvements T.B. 1.0 Mcf 625 189 128 6 142 159 580 37502 Land Rights 1.0 Mcf 290 88 59 3 66 74 581 37503 Improvements 1.0 Mcf 25 8 5 0 6 6 582 37600 Mains Cathodic Protection 1.0 Mcf 305,749 92,584 62,743 3,100 69,398 77,925 583 37601 Mains - Steel 1.0 Mcf 1,559,240 472,153 319,971 15,808 353,910 397,399 584 37602 Mains - Plastic 1.0 Mcf 1,181,705 357,831 242,497 11,980 268,218 301,177 585 37800 Meas & Reg. Sta. Equip - General 1.0 Mcf 323,984 98,105 66,485 3,285 73,536 82,573 586 37900 Meas & Reg. Sta. Equip - City Gate 1.0 Mcf 51,068 15,464 10,480 518 11,591 13,015 587 37905 Meas & Reg. Sta. Equipment T.b. 1.0 Mcf 16,366 4,956 3,358 166 3,715 4,171 588 38000 Services 99.0 - 0 - - - - - 589 38100 Meters 99.0 - 0 - - - - - 590 38200 Meter Installaitons 99.0 - 0 - - - - - 591 38300 House Regulators 99.0 - 0 - - - - - 592 38400 House Reg. Installations 99.0 - 0 - - - - - 593 38500 Ind. Meas. & Reg. Sta. Equipment 99.0 - 0 - - - - - 594 38600 Other Prop. On Cust. Prem 99.0 - 0 - - - - - 595596 Total Distribution Plant 3,458,626 1,047,305 709,743 35,064 785,024 881,489

Exhibit PHR-4Page 63 of 75
Atmos Energy Corporation, Kentucky/Mid-States DivisionClass Cost of Service - Demand/Commodity StudyForecasted Test Period: Twelve Months Ended March 31, 2020
ALLOCATION OF DEPRECIATION EXPENSE597598 General:599600 38900 Land & Land Rights 6.6 P, S, T & D Plant - Commodity 0 - - - - - 601 39000 Structures Frame 6.6 P, S, T & D Plant - Commodity 49,372 15,155 10,210 508 11,090 12,409 602 39001 Structures & Improvements 6.6 P, S, T & D Plant - Commodity 1,124 345 232 12 252 282 603 39002 Improvements 6.6 P, S, T & D Plant - Commodity 4,604 1,413 952 47 1,034 1,157 604 39003 Air Conditioning Equipment 6.6 P, S, T & D Plant - Commodity 147 45 30 2 33 37 605 39004 Improvement to leased Premises 6.6 P, S, T & D Plant - Commodity 0 - - - - - 606 39009 Office Furniture & Equipment 6.6 P, S, T & D Plant - Commodity 18,840 5,783 3,896 194 4,232 4,735 607 39100 Remittance Processing Equip 6.6 P, S, T & D Plant - Commodity 0 - - - - - 608 39102 Office Machines 6.6 P, S, T & D Plant - Commodity 0 - - - - - 609 39103 Transportation Equipment 6.6 P, S, T & D Plant - Commodity 1,047 321 216 11 235 263 610 39200 Trucks 6.6 P, S, T & D Plant - Commodity 0 - - - - - 611 39201 Trailers 6.6 P, S, T & D Plant - Commodity 0 - - - - - 612 39202 Stores Equipment 6.6 P, S, T & D Plant - Commodity 0 - - - - - 613 39300 Tools, Shop & Garage Equipment 6.6 P, S, T & D Plant - Commodity 23,559 7,231 4,872 242 5,292 5,921 614 39400 Power Operated Equipment 6.6 P, S, T & D Plant - Commodity 0 - - - - - 615 39600 Ditchers 6.6 P, S, T & D Plant - Commodity 0 - - - - - 616 39603 Backhoes 6.6 P, S, T & D Plant - Commodity 0 - - - - - 617 39604 Welders 6.6 P, S, T & D Plant - Commodity 0 - - - - - 618 39605 Communication Equipment 6.6 P, S, T & D Plant - Commodity 7,050 2,164 1,458 73 1,584 1,772 619 39700 Communication Equipment - Mobile Radios 6.6 P, S, T & D Plant - Commodity 0 - - - - - 620 39701 Communication Equipment - Fixed Radios 6.6 P, S, T & D Plant - Commodity 0 - - - - - 621 39702 Communication Equip. - Telemetering 6.6 P, S, T & D Plant - Commodity 0 - - - - - 622 39705 Miscellaneous Equipment 6.6 P, S, T & D Plant - Commodity 39,231 12,042 8,113 403 8,812 9,861 623 39800 Other Tangible Property 6.6 P, S, T & D Plant - Commodity 0 - - - - - 624 39900 Other Tangible Property - Servers - H/W 6.6 P, S, T & D Plant - Commodity 415 127 86 4 93 104 625 39901 Other Tangible Property - Servers - S/W 6.6 P, S, T & D Plant - Commodity 0 - - - - - 626 39902 Other Tangible Property - Network - H/W 6.6 P, S, T & D Plant - Commodity 2,714 833 561 28 610 682 627 39903 Other Tang. Property - CPU 6.6 P, S, T & D Plant - Commodity 0 - - - - - 628 39904 Other Tangible Property - MF - Hardware 6.6 P, S, T & D Plant - Commodity 0 - - - - - 629 39905 Other Tang. Property - PC Hardware 6.6 P, S, T & D Plant - Commodity 18,014 5,529 3,725 185 4,046 4,528 630 39906 Other Tang. Property - PC Software 6.6 P, S, T & D Plant - Commodity 0 - - - - - 631 39907 Other Tang. Property - Mainframe S/W 6.6 P, S, T & D Plant - Commodity 0 - - - - - 632 39908 Other Tang. Property - Application Software 6.6 P, S, T & D Plant - Commodity 2,074 637 429 21 466 521 633 40600 Amortization of gas plant acquisition adjustments 6.6 P, S, T & D Plant - Commodity 0 - - - - - 634635636 Total General Plant 168,190 51,626 34,781 1,730 37,779 42,274637638 TOTAL DIRECT DEPRECIATION EXPENSE 3,750,601 1,145,800 773,526 38,380 845,558 947,337639640 Kentucky Mid-States General Office:641642 Intangible Plant:643644 30100 Organization 99.0 - 0 - - - - - 645 30200 Franchises & Consents 99.0 - 0 - - - - - 646 30300 Misc Intangible Plant 99.0 - 0 - - - - - 647648 Total Intangible Plant: 0 - - - - - 649650 General:651652 37400 Land & Land Rights 6.6 P, S, T & D Plant - Commodity 0 - - - - - 653 39001 Structures Frame 6.6 P, S, T & D Plant - Commodity 504 155 104 5 113 127 654 36602 Structures & Improvements 6.6 P, S, T & D Plant - Commodity 0 - - - - - 655 38900 Land & Land Rights 6.6 P, S, T & D Plant - Commodity 0 - - - - - 656 39004 Air Conditioning Equipment 6.6 P, S, T & D Plant - Commodity 113 35 23 1 25 28 657 39009 Improvement to leased Premises 6.6 P, S, T & D Plant - Commodity 0 - - - - - 658 39100 Office Furniture & Equipment 6.6 P, S, T & D Plant - Commodity 0 - - - - - 659 39102 Remittance Processing Equip 6.6 P, S, T & D Plant - Commodity 0 - - - - - 660 39103 Office Machines 6.6 P, S, T & D Plant - Commodity 0 - - - - - 661 39200 Transportation Equipment 6.6 P, S, T & D Plant - Commodity 81 25 17 1 18 20 662 39201 Trucks 6.6 P, S, T & D Plant - Commodity 0 - - - - - 663 39202 Trailers 6.6 P, S, T & D Plant - Commodity 0 - - - - - 664 39300 Stores Equipment 6.6 P, S, T & D Plant - Commodity 0 - - - - - 665 39400 Tools, Shop & Garage Equipment 6.6 P, S, T & D Plant - Commodity 408 125 84 4 92 103 666 39600 Power Operated Equipment 6.6 P, S, T & D Plant - Commodity 2 1 1 0 1 1 667 39603 Ditchers 6.6 P, S, T & D Plant - Commodity 0 - - - - - 668 39604 Backhoes 6.6 P, S, T & D Plant - Commodity 0 - - - - - 669 39605 Welders 6.6 P, S, T & D Plant - Commodity 0 - - - - - 670 39700 Communication Equipment 6.6 P, S, T & D Plant - Commodity 333 102 69 3 75 84 671 39701 Communication Equipment - Mobile Radios 6.6 P, S, T & D Plant - Commodity 0 - - - - - 672 39702 Communication Equipment - Fixed Radios 6.6 P, S, T & D Plant - Commodity 0 - - - - - 673 39705 Communication Equip. - Telemetering 6.6 P, S, T & D Plant - Commodity 0 - - - - - 674 39800 Miscellaneous Equipment 6.6 P, S, T & D Plant - Commodity 2,468 757 510 25 554 620 675 39900 Other Tangible Property 6.6 P, S, T & D Plant - Commodity 0 - - - - - 676 39901 Other Tangible Property - Servers - H/W 6.6 P, S, T & D Plant - Commodity 0 - - - - - 677 39902 Other Tangible Property - Servers - S/W 6.6 P, S, T & D Plant - Commodity 0 - - - - - 678 39903 Other Tangible Property - Network - H/W 6.6 P, S, T & D Plant - Commodity 0 - - - - - 679 39904 Other Tang. Property - CPU 6.6 P, S, T & D Plant - Commodity 0 - - - - - 680 39905 Other Tangible Property - MF - Hardware 6.6 P, S, T & D Plant - Commodity 0 - - - - - 681 39906 Other Tang. Property - PC Hardware 6.6 P, S, T & D Plant - Commodity 0 - - - - - 682 39907 Other Tang. Property - PC Software 6.6 P, S, T & D Plant - Commodity 2,247 690 465 23 505 565 683 39908 Other Tang. Property - Mainframe S/W 6.6 P, S, T & D Plant - Commodity 0 - - - - - 684 39909 Other Tang. Property - Application Software 6.6 P, S, T & D Plant - Commodity 0 - - - - - 685 39924 Other Tang. Property - General Startup Costs 6.6 P, S, T & D Plant - Commodity 0 - - - - - 686687688 Total General Plant 6,156 1,890 1,273 63 1,383 1,547 689690 Shared Services General Office:

Exhibit PHR-4Page 64 of 75
Atmos Energy Corporation, Kentucky/Mid-States DivisionClass Cost of Service - Demand/Commodity StudyForecasted Test Period: Twelve Months Ended March 31, 2020
ALLOCATION OF DEPRECIATION EXPENSE691692 General:693694 37400 Land & Land Rights 6.6 P, S, T & D Plant - Commodity 0 - - - - - 695 39000 Structures & Improvements 6.6 P, S, T & D Plant - Commodity 1,438 441 297 15 323 361 696 36602 Structures & Improvements 6.6 P, S, T & D Plant - Commodity 0 - - - - - 697 37503 Improvements 6.6 P, S, T & D Plant - Commodity 0 - - - - - 698 39004 Air Conditioning Equipment 6.6 P, S, T & D Plant - Commodity 0 - - - - - 699 39009 Improvement to leased Premises 6.6 P, S, T & D Plant - Commodity 7 2 1 0 2 2 700 39100 Office Furniture & Equipment 6.6 P, S, T & D Plant - Commodity 2,175 668 450 22 489 547 701 39102 Remittance Processing Equip 6.6 P, S, T & D Plant - Commodity 0 - - - - - 702 39103 Office Machines 6.6 P, S, T & D Plant - Commodity 0 - - - - - 703 39200 Transportation Equipment 6.6 P, S, T & D Plant - Commodity 0 - - - - - 704 39201 Trucks 6.6 P, S, T & D Plant - Commodity 0 - - - - - 705 39202 Trailers 6.6 P, S, T & D Plant - Commodity 0 - - - - - 706 39300 Stores Equipment 6.6 P, S, T & D Plant - Commodity 0 - - - - - 707 39400 Tools, Shop & Garage Equipment 6.6 P, S, T & D Plant - Commodity 0 - - - - - 708 39600 Power Operated Equipment 6.6 P, S, T & D Plant - Commodity 0 - - - - - 709 39603 Ditchers 6.6 P, S, T & D Plant - Commodity 0 - - - - - 710 39604 Backhoes 6.6 P, S, T & D Plant - Commodity 0 - - - - - 711 39605 Welders 6.6 P, S, T & D Plant - Commodity 0 - - - - - 712 39700 Communication Equipment 6.6 P, S, T & D Plant - Commodity 5 2 1 0 1 1 713 39701 Communication Equipment - Mobile Radios 6.6 P, S, T & D Plant - Commodity 0 - - - - - 714 39702 Communication Equipment - Fixed Radios 6.6 P, S, T & D Plant - Commodity 0 - - - - - 715 39705 Communication Equip. - Telemetering 6.6 P, S, T & D Plant - Commodity 0 - - - - - 716 39800 Miscellaneous Equipment 6.6 P, S, T & D Plant - Commodity 13 4 3 0 3 3 717 39900 Other Tangible Property 6.6 P, S, T & D Plant - Commodity 0 - - - - - 718 39901 Other Tangible Property - Servers - H/W 6.6 P, S, T & D Plant - Commodity 26,992 8,285 5,582 278 6,063 6,784 719 39902 Other Tangible Property - Servers - S/W 6.6 P, S, T & D Plant - Commodity 8,089 2,483 1,673 83 1,817 2,033 720 39903 Other Tangible Property - Network - H/W 6.6 P, S, T & D Plant - Commodity 0 - - - - - 721 39904 Other Tang. Property - CPU 6.6 P, S, T & D Plant - Commodity 0 - - - - - 722 39905 Other Tangible Property - MF - Hardware 6.6 P, S, T & D Plant - Commodity 0 - - - - - 723 39906 Other Tang. Property - PC Hardware 6.6 P, S, T & D Plant - Commodity 1,829 561 378 19 411 460 724 39907 Other Tang. Property - PC Software 6.6 P, S, T & D Plant - Commodity 0 - - - - - 725 39908 Other Tang. Property - Mainframe S/W 6.6 P, S, T & D Plant - Commodity 0 - - - - - 726 39909 Other Tang. Property - Application Software 6.6 P, S, T & D Plant - Commodity 275 85 57 3 62 69 727 39924 Other Tang. Property - General Startup Costs 6.6 P, S, T & D Plant - Commodity 0 - - - - - 728729730 Total General Plant 40,825 12,531 8,442 420 9,170 10,261 731732 Shared Services Customer Support:733734 General:735736 37400 Land & Land Rights 6.6 P, S, T & D Plant - Commodity 0 - - - - - 737 39001 Structures Frame 6.6 P, S, T & D Plant - Commodity 0 - - - - - 738 36602 Structures & Improvements 6.6 P, S, T & D Plant - Commodity 6,069 1,863 1,255 62 1,363 1,525 739 37503 Improvements 6.6 P, S, T & D Plant - Commodity 0 - - - - - 740 39004 Air Conditioning Equipment 6.6 P, S, T & D Plant - Commodity 0 - - - - - 741 39009 Improvement to leased Premises 6.6 P, S, T & D Plant - Commodity 1,043 320 216 11 234 262 742 39100 Office Furniture & Equipment 6.6 P, S, T & D Plant - Commodity 1,238 380 256 13 278 311 743 39102 Remittance Processing Equip 6.6 P, S, T & D Plant - Commodity 0 - - - - - 744 39103 Office Machines 6.6 P, S, T & D Plant - Commodity 0 - - - - - 745 39200 Transportation Equipment 6.6 P, S, T & D Plant - Commodity 0 - - - - - 746 39201 Trucks 6.6 P, S, T & D Plant - Commodity 0 - - - - - 747 39202 Trailers 6.6 P, S, T & D Plant - Commodity 0 - - - - - 748 39300 Stores Equipment 6.6 P, S, T & D Plant - Commodity 0 - - - - - 749 39400 Tools, Shop & Garage Equipment 6.6 P, S, T & D Plant - Commodity 240 74 50 2 54 60 750 39600 Power Operated Equipment 6.6 P, S, T & D Plant - Commodity 11 3 2 0 2 3 751 39603 Ditchers 6.6 P, S, T & D Plant - Commodity 0 - - - - - 752 39604 Backhoes 6.6 P, S, T & D Plant - Commodity 0 - - - - - 753 39605 Welders 6.6 P, S, T & D Plant - Commodity 0 - - - - - 754 39700 Communication Equipment 6.6 P, S, T & D Plant - Commodity 1,353 415 280 14 304 340 755 39701 Communication Equipment - Mobile Radios 6.6 P, S, T & D Plant - Commodity 0 - - - - - 756 39702 Communication Equipment - Fixed Radios 6.6 P, S, T & D Plant - Commodity 0 - - - - - 757 39705 Communication Equip. - Telemetering 6.6 P, S, T & D Plant - Commodity 0 - - - - - 758 39800 Miscellaneous Equipment 6.6 P, S, T & D Plant - Commodity 168 52 35 2 38 42 759 39900 Other Tangible Property 6.6 P, S, T & D Plant - Commodity 1,142 351 236 12 256 287 760 39901 Other Tangible Property - Servers - H/W 6.6 P, S, T & D Plant - Commodity 11,152 3,423 2,306 115 2,505 2,803 761 39902 Other Tangible Property - Servers - S/W 6.6 P, S, T & D Plant - Commodity 2,056 631 425 21 462 517 762 39903 Other Tangible Property - Network - H/W 6.6 P, S, T & D Plant - Commodity 500 154 103 5 112 126 763 39904 Other Tang. Property - CPU 6.6 P, S, T & D Plant - Commodity 0 - - - - - 764 39905 Other Tangible Property - MF - Hardware 6.6 P, S, T & D Plant - Commodity 0 - - - - - 765 39906 Other Tang. Property - PC Hardware 6.6 P, S, T & D Plant - Commodity 1,474 452 305 15 331 370 766 39907 Other Tang. Property - PC Software 6.6 P, S, T & D Plant - Commodity 176 54 36 2 39 44 767 39908 Other Tang. Property - Mainframe S/W 6.6 P, S, T & D Plant - Commodity 0 - - - - - 768 39909 Other Tang. Property - Application Software 6.6 P, S, T & D Plant - Commodity 69,056 21,197 14,281 710 15,511 17,357 769 39924 Other Tang. Property - General Startup Costs 6.6 P, S, T & D Plant - Commodity 6 2 1 0 1 2 770771772 Total General Plant 95,682 29,370 19,787 984 21,492 24,049 773774 TOTAL DEPRECIATION EXPENSE - COMMODITY 3,893,264 1,189,590 803,028 39,847 877,603 983,195

Exhibit PHR-4Page 65 of 75
Atmos Energy Corporation, Kentucky/Mid-States DivisionClass Cost of Service - Demand/Commodity StudyForecasted Test Period: Twelve Months Ended March 31, 2020
ALLOCATION OF DEPRECIATION EXPENSE
Total Depreciation Expense
Line Acct. Allocation Allocation Total Residential Non-Res Sales Non-Res Sales Transport TransportNo. No. Factor Basis Company Sales Firm Interruptible Firm Interruptible
775 Intangible Plant:776777 30100 Organization 0 - - - - - 778 30200 Franchises & Consents 0 - - - - - 779 30300 Misc Intangible Plant 0 - - - - - 780781 Total Intangible Plant: 0 - - - - - 782783 Production Plant:784 0 - - - - - 785 32520 Producing Leaseholds 0 - - - - - 786 32540 Rights of Ways 0 - - - - - 787 33100 Production Gas Wells Equipment 0 - - - - - 788 33201 Field Lines 0 - - - - - 789 33202 Tributary Lines 0 - - - - - 790 33400 Field Meas. & Reg. Sta. Equip 0 - - - - - 791 33600 Purification Equipment 0 - - - - - 792793 Total Production Plant 0 - - - - - 794795 Storage Plant:796797 35010 Land 0 - - - - - 798 35020 Rights of Way 22 9 5 0 4 4 799 35100 Structures and Improvements 297 124 73 4 49 48 800 35102 Compression Station Equipment 1,916 796 472 25 315 308 801 35103 Meas. & Reg. Sta. Structues 208 87 51 3 34 33 802 35104 Other Structures 1,773 736 437 23 291 285 803 35200 Wells \ Rights of Way 161,122 66,927 39,703 2,128 26,478 25,886 804 35201 Well Construction 25,840 10,733 6,367 341 4,246 4,152 805 35202 Well Equipment 0 - - - - - 806 35203 Cushion Gas 23,389 9,715 5,763 309 3,844 3,758 807 35210 Leaseholds 553 230 136 7 91 89 808 35211 Storage Rights 481 200 118 6 79 77 809 35301 Field Lines 1,596 663 393 21 262 256 810 35302 Tributary Lines 1,905 791 469 25 313 306 811 35400 Compressor Station Equipment 15,699 6,521 3,868 207 2,580 2,522 812 35500 Meas & Reg. Equipment 4,561 1,894 1,124 60 749 733 813 35600 Purification Equipment 8,210 3,410 2,023 108 1,349 1,319 814815 Total Storage Plant 247,571 102,836 61,005 3,269 40,685 39,775 816817 Transmission:818819 36510 Land & Land Rights 0 - - - - - 820 36520 Rights of Way 9,112 4,120 2,356 124 1,320 1,193 821 36602 Structures & Improvements 608 275 157 8 88 80 822 36603 Other Structues 754 341 195 10 109 99 823 36700 Mains Cathodic Protection 5,362 2,424 1,386 73 777 702 824 36701 Mains - Steel 381,167 172,339 98,547 5,183 55,209 49,889 825 36900 Meas. & Reg. Equipment 11,265 5,093 2,912 153 1,632 1,474 826 36901 Meas. & Reg. Equipment 34,951 15,803 9,036 475 5,062 4,575 827828 Total Transmission Plant 443,218 200,394 114,589 6,027 64,197 58,010 829830 Distribution:831832 37400 Land & Land Rights 0 - - - - - 833 37401 Land 0 - - - - - 834 37402 Land Rights 49,908 19,957 11,972 618 8,664 8,698 835 37403 Land Other 0 - - - - - 836 37500 Structures & Improvements 6,017 2,406 1,443 75 1,045 1,049 837 37501 Structures & Improvements T.B. 1,787 714 429 22 310 311 838 37502 Land Rights 828 331 199 10 144 144 839 37503 Improvements 72 29 17 1 12 12 840 37600 Mains Cathodic Protection 873,542 349,303 209,540 10,821 151,639 152,241 841 37601 Mains - Steel 4,454,842 1,781,354 1,068,598 55,184 773,318 776,388 842 37602 Mains - Plastic 3,376,201 1,350,039 809,861 41,822 586,076 588,403 843 37800 Meas & Reg. Sta. Equip - General 925,640 370,135 222,036 11,466 160,682 161,320 844 37900 Meas & Reg. Sta. Equip - City Gate 145,903 58,342 34,998 1,807 25,327 25,428 845 37905 Meas & Reg. Sta. Equipment T.b. 46,759 18,697 11,216 579 8,117 8,149 846 38000 Services 4,817,588 4,290,218 521,911 265 3,317 1,877 847 38100 Meters 2,741,749 1,768,788 907,200 3,195 39,954 22,612 848 38200 Meter Installaitons 2,232,937 1,440,537 738,843 2,602 32,539 18,416 849 38300 House Regulators 514,355 331,827 170,192 599 7,495 4,242 850 38400 House Reg. Installations 8,807 5,681 2,914 10 128 73 851 38500 Ind. Meas. & Reg. Sta. Equipment 112,194 - 111,033 56 706 399 852 38600 Other Prop. On Cust. Prem 0 - - - - - 853854 Total Distribution Plant 20,309,129 11,788,358 4,822,402 129,135 1,799,472 1,769,763

Exhibit PHR-4Page 66 of 75
Atmos Energy Corporation, Kentucky/Mid-States DivisionClass Cost of Service - Demand/Commodity StudyForecasted Test Period: Twelve Months Ended March 31, 2020
ALLOCATION OF DEPRECIATION EXPENSE855856 General:857858 38900 Land & Land Rights 0 - - - - - 859 39000 Structures Frame 244,888 133,908 56,856 1,925 26,276 25,924 860 39001 Structures & Improvements 5,574 3,048 1,294 44 598 590 861 39002 Improvements 22,836 12,487 5,302 180 2,450 2,417 862 39003 Air Conditioning Equipment 731 400 170 6 78 77 863 39004 Improvement to leased Premises 0 - - - - - 864 39009 Office Furniture & Equipment 93,448 51,098 21,696 735 10,027 9,892 865 39100 Remittance Processing Equip 0 - - - - - 866 39102 Office Machines 0 - - - - - 867 39103 Transportation Equipment 5,191 2,839 1,205 41 557 550 868 39200 Trucks 0 - - - - - 869 39201 Trailers 0 - - - - - 870 39202 Stores Equipment 0 - - - - - 871 39300 Tools, Shop & Garage Equipment 116,855 63,898 27,130 919 12,538 12,370 872 39400 Power Operated Equipment 0 - - - - - 873 39600 Ditchers 0 - - - - - 874 39603 Backhoes 0 - - - - - 875 39604 Welders 0 - - - - - 876 39605 Communication Equipment 34,968 19,121 8,118 275 3,752 3,702 877 39700 Communication Equipment - Mobile Radios 0 - - - - - 878 39701 Communication Equipment - Fixed Radios 0 - - - - - 879 39702 Communication Equip. - Telemetering 0 - - - - - 880 39705 Miscellaneous Equipment 194,589 106,403 45,177 1,530 20,879 20,599 881 39800 Other Tangible Property 0 - - - - - 882 39900 Other Tangible Property - Servers - H/W 2,056 1,124 477 16 221 218 883 39901 Other Tangible Property - Servers - S/W 0 - - - - - 884 39902 Other Tangible Property - Network - H/W 13,460 7,360 3,125 106 1,444 1,425 885 39903 Other Tang. Property - CPU 0 - - - - - 886 39904 Other Tangible Property - MF - Hardware 0 - - - - - 887 39905 Other Tang. Property - PC Hardware 89,351 48,858 20,744 702 9,587 9,459 888 39906 Other Tang. Property - PC Software 0 - - - - - 889 39907 Other Tang. Property - Mainframe S/W 0 - - - - - 890 39908 Other Tang. Property - Application Software 10,289 5,626 2,389 81 1,104 1,089 891 40600 Amortization of gas plant acquisition adjustments 0 - - - - - 892893894 Total General Plant 834,236 456,170 193,684 6,557 89,513 88,311 895896 TOTAL DIRECT DEPRECIATION EXPENSE 21,834,154 12,547,759 5,191,680 144,988 1,993,867 1,955,860 897898 Kentucky Mid-States General Office:899900 Intangible Plant:901902 30100 Organization 0 - - - - - 903 30200 Franchises & Consents 0 - - - - - 904 30300 Misc Intangible Plant 0 - - - - - 905906 Total Intangible Plant: 0 - - - - - 907908 General:909910 37400 Land & Land Rights 0 - - - - - 911 39001 Structures Frame 2,500 1,367 580 20 268 265 912 36602 Structures & Improvements 0 - - - - - 913 38900 Land & Land Rights 0 - - - - - 914 39004 Air Conditioning Equipment 561 307 130 4 60 59 915 39009 Improvement to leased Premises 0 - - - - - 916 39100 Office Furniture & Equipment 0 - - - - - 917 39102 Remittance Processing Equip 0 - - - - - 918 39103 Office Machines 0 - - - - - 919 39200 Transportation Equipment 400 219 93 3 43 42 920 39201 Trucks 0 - - - - - 921 39202 Trailers 0 - - - - - 922 39300 Stores Equipment 0 - - - - - 923 39400 Tools, Shop & Garage Equipment 2,025 1,107 470 16 217 214 924 39600 Power Operated Equipment 12 7 3 0 1 1 925 39603 Ditchers 0 - - - - - 926 39604 Backhoes 0 - - - - - 927 39605 Welders 0 - - - - - 928 39700 Communication Equipment 1,652 903 384 13 177 175 929 39701 Communication Equipment - Mobile Radios 0 - - - - - 930 39702 Communication Equipment - Fixed Radios 0 - - - - - 931 39705 Communication Equip. - Telemetering 0 - - - - - 932 39800 Miscellaneous Equipment 12,240 6,693 2,842 96 1,313 1,296 933 39900 Other Tangible Property 0 - - - - - 934 39901 Other Tangible Property - Servers - H/W 0 - - - - - 935 39902 Other Tangible Property - Servers - S/W 0 - - - - - 936 39903 Other Tangible Property - Network - H/W 0 - - - - - 937 39904 Other Tang. Property - CPU 0 - - - - - 938 39905 Other Tangible Property - MF - Hardware 0 - - - - - 939 39906 Other Tang. Property - PC Hardware 0 - - - - - 940 39907 Other Tang. Property - PC Software 11,145 6,094 2,588 88 1,196 1,180 941 39908 Other Tang. Property - Mainframe S/W 0 - - - - - 942 39909 Other Tang. Property - Application Software 0 - - - - - 943 39924 Other Tang. Property - General Startup Costs 0 - - - - - 944945946 Total General Plant 30,535 16,697 7,089 240 3,276 3,232 947948 Shared Services General Office:

Exhibit PHR-4Page 67 of 75
Atmos Energy Corporation, Kentucky/Mid-States DivisionClass Cost of Service - Demand/Commodity StudyForecasted Test Period: Twelve Months Ended March 31, 2020
ALLOCATION OF DEPRECIATION EXPENSE949950 General:951952 37400 Land & Land Rights 0 - - - - - 953 39000 Structures & Improvements 7,132 3,900 1,656 56 765 755 954 36602 Structures & Improvements 0 - - - - - 955 37503 Improvements 0 - - - - - 956 39004 Air Conditioning Equipment 0 - - - - - 957 39009 Improvement to leased Premises 35 19 8 0 4 4 958 39100 Office Furniture & Equipment 10,791 5,900 2,505 85 1,158 1,142 959 39102 Remittance Processing Equip 0 - - - - - 960 39103 Office Machines 0 - - - - - 961 39200 Transportation Equipment 0 - - - - - 962 39201 Trucks 0 - - - - - 963 39202 Trailers 0 - - - - - 964 39300 Stores Equipment 0 - - - - - 965 39400 Tools, Shop & Garage Equipment 0 - - - - - 966 39600 Power Operated Equipment 0 - - - - - 967 39603 Ditchers 0 - - - - - 968 39604 Backhoes 0 - - - - - 969 39605 Welders 0 - - - - - 970 39700 Communication Equipment 27 15 6 0 3 3 971 39701 Communication Equipment - Mobile Radios 0 - - - - - 972 39702 Communication Equipment - Fixed Radios 0 - - - - - 973 39705 Communication Equip. - Telemetering 0 - - - - - 974 39800 Miscellaneous Equipment 66 36 15 1 7 7 975 39900 Other Tangible Property 0 - - - - - 976 39901 Other Tangible Property - Servers - H/W 133,882 73,208 31,083 1,052 14,366 14,173 977 39902 Other Tangible Property - Servers - S/W 40,124 21,940 9,315 315 4,305 4,247 978 39903 Other Tangible Property - Network - H/W 0 - - - - - 979 39904 Other Tang. Property - CPU 0 - - - - - 980 39905 Other Tangible Property - MF - Hardware 0 - - - - - 981 39906 Other Tang. Property - PC Hardware 9,073 4,961 2,106 71 973 960 982 39907 Other Tang. Property - PC Software 0 - - - - - 983 39908 Other Tang. Property - Mainframe S/W 0 - - - - - 984 39909 Other Tang. Property - Application Software 1,366 747 317 11 147 145 985 39924 Other Tang. Property - General Startup Costs 0 - - - - - 986987988 Total General Plant 202,494 110,726 47,013 1,592 21,728 21,436 989990 Shared Services Customer Support:991992 General:993994 37400 Land & Land Rights 0 - - - - - 995 39001 Structures Frame 0 - - - - - 996 36602 Structures & Improvements 30,100 16,459 6,988 237 3,230 3,186 997 37503 Improvements 0 - - - - - 998 39004 Air Conditioning Equipment 0 - - - - - 999 39009 Improvement to leased Premises 5,171 2,828 1,201 41 555 547
1000 39100 Office Furniture & Equipment 6,139 3,357 1,425 48 659 650 1001 39102 Remittance Processing Equip 0 - - - - - 1002 39103 Office Machines 0 - - - - - 1003 39200 Transportation Equipment 0 - - - - - 1004 39201 Trucks 0 - - - - - 1005 39202 Trailers 0 - - - - - 1006 39300 Stores Equipment 0 - - - - - 1007 39400 Tools, Shop & Garage Equipment 1,191 651 277 9 128 126 1008 39600 Power Operated Equipment 55 30 13 0 6 6 1009 39603 Ditchers 0 - - - - - 1010 39604 Backhoes 0 - - - - - 1011 39605 Welders 0 - - - - - 1012 39700 Communication Equipment 6,709 3,668 1,558 53 720 710 1013 39701 Communication Equipment - Mobile Radios 0 - - - - - 1014 39702 Communication Equipment - Fixed Radios 0 - - - - - 1015 39705 Communication Equip. - Telemetering 0 - - - - - 1016 39800 Miscellaneous Equipment 834 456 194 7 89 88 1017 39900 Other Tangible Property 5,664 3,097 1,315 45 608 600 1018 39901 Other Tangible Property - Servers - H/W 55,314 30,247 12,842 435 5,935 5,856 1019 39902 Other Tangible Property - Servers - S/W 10,196 5,575 2,367 80 1,094 1,079 1020 39903 Other Tangible Property - Network - H/W 2,481 1,357 576 20 266 263 1021 39904 Other Tang. Property - CPU 0 - - - - - 1022 39905 Other Tangible Property - MF - Hardware 0 - - - - - 1023 39906 Other Tang. Property - PC Hardware 7,309 3,997 1,697 57 784 774 1024 39907 Other Tang. Property - PC Software 871 476 202 7 93 92 1025 39908 Other Tang. Property - Mainframe S/W 0 - - - - - 1026 39909 Other Tang. Property - Application Software 342,525 187,297 79,524 2,692 36,753 36,259 1027 39924 Other Tang. Property - General Startup Costs 31 17 7 0 3 3 102810291030 Total General Plant 474,591 259,512 110,186 3,730 50,923 50,240 10311032 TOTAL DEPRECIATION EXPENSE 22,541,774 12,934,694 5,355,967 150,551 2,069,795 2,030,768

Exhibit PHR-4Page 68 of 75
Atmos Energy Corporation, Kentucky/Mid-States DivisionClass Cost of Service - Demand/Commodity StudyForecasted Test Period: Twelve Months Ended March 31, 2020
ALLOCATION OF TAXES, OTHER THAN INCOME & NET DEDUCTIONS FOR INCOME TAX
Customer
Line Allocation Allocation Total Residential Non-Res Sales Non-Res Sales Transport TransportNo. Factor Basis Company Sales Firm Interruptible Firm Interruptible
1 Taxes Other Than Income23 Non Revenue Related:4 Payroll Related 7.2 Allocated O&M Expenses - Cust 91,523 72,068 18,773 62 396 224 5 Property Related 6.2 P, S, T & D Plant - Customer 2,329,332 1,797,894 506,460 1,214 15,176 8,589 6 DOT transmission User Tax 7.2 Allocated O&M Expenses - Cust 13,520 10,646 2,773 9 58 33 7 Other 7.2 Allocated O&M Expenses - Cust 9,775 7,697 2,005 7 42 24 8 Total Non Revenue Related: 2,444,150 1,888,305 530,011 1,292 15,672 8,8709
10 Revenue Related:11 State Gross Receipts - Tax 99.0 - 0 - - - - - 12 Local Gross Receipts - Tax 99.0 - 0 - - - - - 13 Public Service Commission Assessment 99.0 - 0 - - - - - 14 Total Revenue Related: 0 - - - - - 1516 Total Taxes, Other Than Income 2,444,150 1,888,305 530,011 1,292 15,672 8,870 171819 Interest Expense 19.2 Rate Base - Cust 3,452,156 2,753,770 668,015 1,458 18,464 10,450 2021 Amortization of Excess ADIT 20.2 Cost of Service - Cust (333,567) (260,783) (69,456) (191) (1,982) (1,155)

Exhibit PHR-4Page 69 of 75
Atmos Energy Corporation, Kentucky/Mid-States DivisionClass Cost of Service - Demand/Commodity StudyForecasted Test Period: Twelve Months Ended March 31, 2020
ALLOCATION OF TAXES, OTHER THAN INCOME & NET DEDUCTIONS FOR INCOME TAX
Demand
Line Allocation Allocation Total Residential Non-Res Sales Non-Res Sales Transport TransportNo. Factor Basis Company Sales Firm Interruptible Firm Interruptible
20 Taxes Other Than Income2122 Non Revenue Related:23 Payroll Related 7.4 Allocated O&M Expenses - Demand 96,235 43,511 24,880 1,309 13,939 12,596 24 Property Related 6.4 P, S, T & D Plant - Demand 2,467,695 1,115,730 637,996 33,557 357,429 322,983 25 DOT transmission User Tax 7.4 Allocated O&M Expenses - Demand 14,215 6,427 3,675 193 2,059 1,861 26 Other 7.4 Allocated O&M Expenses - Demand 10,278 4,647 2,657 140 1,489 1,345 27 Total Non Revenue Related: 2,588,423 1,170,315 669,209 35,199 374,915 338,7842829 Revenue Related:30 State Gross Receipts - Tax 99.0 - 0 - - - - - 31 Local Gross Receipts - Tax 99.0 - 0 - - - - - 32 Public Service Commission Assessment 99.0 - 0 - - - - - 33 Total Revenue Related: 0 - - - - - 3435 Total Taxes, Other Than Income 2,588,423 1,170,315 669,209 35,199 374,915 338,784 363738 Interest Expense 19.4 Rate Base - Demand 4,073,574 1,841,803 1,053,179 55,395 590,029 533,167 3940 Amortization of Excess ADIT 20.4 Cost of Service - Demand (338,246) (152,862) (87,412) (4,609) (49,031) (44,332)

Exhibit PHR-4Page 70 of 75
Atmos Energy Corporation, Kentucky/Mid-States DivisionClass Cost of Service - Demand/Commodity StudyForecasted Test Period: Twelve Months Ended March 31, 2020
ALLOCATION OF TAXES, OTHER THAN INCOME & NET DEDUCTIONS FOR INCOME TAX
Commodity
Line Allocation Allocation Total Residential Non-Res Sales Non-Res Sales Transport TransportNo. Factor Basis Company Sales Firm Interruptible Firm Interruptible
39 Taxes Other Than Income4041 Non Revenue Related:42 Payroll Related 7.6 Allocated O&M Expenses - Comm 740,112 419,954 285,296 10,306 11,583 12,972 43 Property Related 6.6 P, S, T & D Plant - Commodity 1,211,344 371,824 250,503 12,458 272,091 304,468 44 DOT transmission User Tax 7.6 Allocated O&M Expenses - Comm 109,327 62,034 42,143 1,522 1,711 1,916 45 Other 7.6 Allocated O&M Expenses - Comm 79,046 44,852 30,470 1,101 1,237 1,385 46 Total Non Revenue Related: 2,139,828 898,664 608,412 25,387 286,622 320,7424748 Revenue Related:49 State Gross Receipts - Tax 99.0 - 0 - - - - - 50 Local Gross Receipts - Tax 99.0 - 0 - - - - - 51 Public Service Commission Assessment 1.0 Mcf 339,436 102,784 69,655 3,441 77,044 86,511 52 Total Revenue Related: 339,436 102,784 69,655 3,441 77,044 86,511 5354 Total Taxes, Other Than Income 2,479,264 1,001,449 678,068 28,828 363,666 407,253 555657 Interest Expense 19.6 Rate Base - Comm 1,842,005 444,727 298,793 17,211 510,062 571,212 5859 Amortization of Excess ADIT 20.6 Cost of Service - Comm (791,953) (412,876) (280,289) (10,515) (41,640) (46,635)

Exhibit PHR-4Page 71 of 75
Atmos Energy Corporation, Kentucky/Mid-States DivisionClass Cost of Service - Demand/Commodity StudyForecasted Test Period: Twelve Months Ended March 31, 2020
ALLOCATION OF TAXES, OTHER THAN INCOME & NET DEDUCTIONS FOR INCOME TAX
Total Taxes Other
Line Allocation Allocation Total Residential Non-Res Sales Non-Res Sales Transport TransportNo. Factor Basis Company Sales Firm Interruptible Firm Interruptible
58 Taxes Other Than Income5960 Non Revenue Related:61 Payroll Related 927,870 535,534 328,949 11,677 25,918 25,792 62 Property Related 6,008,371 3,285,448 1,394,960 47,228 644,695 636,040 63 DOT transmission User Tax 137,062 79,107 48,591 1,725 3,828 3,810 64 Other 99,099 57,196 35,133 1,247 2,768 2,755 65 Total Non Revenue Related: 7,172,401 3,957,285 1,807,633 61,877 677,210 668,397 6667 Revenue Related:68 State Gross Receipts - Tax 0 - - - - - 69 Local Gross Receipts - Tax 0 - - - - - 70 Public Service Commission Assessment 339,436 102,784 69,655 3,441 77,044 86,511 71 Total Revenue Related: 339,436 102,784 69,655 3,441 77,044 86,511 7273 Total Taxes, Other Than Income 7,511,837 4,060,069 1,877,288 65,319 754,253 754,907 747576 Interest Expense 9,367,735 5,040,300 2,019,987 74,063 1,118,555 1,114,829 7778 Amortization of Excess ADIT (1,463,766) (826,521) (437,157) (15,314) (92,652) (92,123)

Exhibit PHR-4Page 72 of 75
Atmos Energy Corporation, Kentucky/Mid-States DivisionClass Cost of Service - Demand/Commodity StudyForecasted Test Period: Twelve Months Ended March 31, 2020
ALLOCATION OF REVENUES
Total Revenues
Line Allocation Allocation Total Residential Non-Res Sales Non-Res Sales Transport TransportNo. Factor Basis Company Sales Firm Interruptible Firm Interruptible
1 Rate Schedule Revenue:23 Base Revenues Input 86,746,747 50,513,031 21,051,850 300,483 7,930,117 6,951,266 4 Base Revenue Increase Input 0 - - - - - 5 Gas Costs Input 78,382,354 46,006,460 31,262,909 1,112,986 - - 6 Rider FF and Rider Tax Input 0 - - - - - 78 Total Rate Schedule Revenue 165,129,101 96,519,490 52,314,759 1,413,469 7,930,117 6,951,2669
10 Other Revenue:1112 Forfeited Discounts 18.6 Total Rate Schedule Revenues 1,304,965 762,764 413,427 11,170 62,669 54,934 13 Misc. Service Revenues 18.6 Total Rate Schedule Revenues 806,054 471,146 255,367 6,900 38,710 33,932 14 NTB 18.2 Base Revenues (17) (10) (4) (0) (2) (1) 15 Other Gas Revenue 18.2 Base Revenues 2,477,763 1,442,813 601,308 8,583 226,509 198,550 1617 Total Non-Rate Revenue 4,588,765 2,676,713 1,270,098 26,653 327,887 287,4141819 TOTAL REVENUE 169,717,866 99,196,203 53,584,857 1,440,122 8,258,004 7,238,681

Exhibit PHR-4Page 73 of 75
Atmos Energy Corporation, Kentucky/Mid-States DivisionClass Cost of Service - Demand/Commodity StudyForecasted Test Period: Twelve Months Ended March 31, 2020
CLASSIFICATION FACTORS
Total Company Customer Demand Commodity
Input Values 1 1 0 01.0 Customer % 100.0000% 100.0000% 0.0000% 0.0000%
Input Values 1 0 1 02.0 Demand % 100.0000% 0.0000% 100.0000% 0.0000%
Input Values 1 0 0 13.0 Commodity % 100.0000% 0.0000% 0.0000% 100.0000%
Input Values 100 0 50 503.5 Storage (50/50) % 100.0000% 0.0000% 50.0000% 50.0000%
Input Values 1.00 0.00 0.65 0.354.0 Mains (Peak and Average) % 100.0000% 0.0000% 64.9990% 35.0010%
Internally Generated Values 383,700,807 119,712,299 171,589,831 92,398,6784.1 Mains & Services % 100.0000% 31.1994% 44.7197% 24.0809%
Internally Generated Values 681,841,791 264,337,185 280,038,901 137,465,7045.4 P, S, T & D Plant % 100.0000% 38.7681% 41.0710% 20.1609%
Internally Generated Values 569,918,798 205,185,395 240,729,450 124,003,9535.7 Net Plant % 100.0000% 36.0026% 42.2393% 21.7582%
Internally Generated Values 105,607,336 10,416,928 10,953,126 84,237,2819.1 Allocated O&M Expenses % 100.0000% 9.8638% 10.3716% 79.7646%
Internally Generated Values 6,001,704 952,051 3,268,822 1,780,83210.0 Composite of Accts. 871-879 & 886-893 % 100.0000% 15.8630% 54.4649% 29.6721%
Internally Generated Values 300,006,847 - 195,001,383 105,005,465 12.0 Composite of Accts. 374-379 % 100.0000% 0.0000% 64.9990% 35.0010%
Internally Generated Values 496,111,427 182,824,775 215,734,814 97,551,838 13.0 Rate Base % 100.0000% 36.8516% 43.4852% 19.6633%
Internally Generated Values 9,623,776 3,441,079 4,002,311 2,180,386 17.0 Composite of Accts. 870-902, 905-916, 924 & 928-930.1 % 100.0000% 35.7560% 41.5877% 22.6562%
Internally Generated Values 185,637,186 42,303,478 42,896,925 100,436,783 18.0 Total Cost of Service at Equalized ROR % 100.0000% 22.7883% 23.1079% 54.1038%
Values 0 0 0 099.0 - % 0.0000% 0.0000% 0.0000% 0.0000%

Exhibit PHR-4Page 74 of 75
Atmos Energy Corporation, Kentucky/Mid-States DivisionClass Cost of Service - Demand/Commodity StudyForecasted Test Period: Twelve Months Ended March 31, 2020
ALLOCATION FACTORS
Total Residential Non-Res Sales Non-Res Sales Transport TransportCompany Sales Firm Interruptible Firm Interruptible
Input Value 33,298,463 10,083,093 6,833,161 337,587 7,557,945 8,486,677 1.0 Mcf % 100.0000% 30.2810% 20.5209% 1.0138% 22.6976% 25.4867%
Input Value 17,253,841 10,083,093 6,833,161 337,587 - - 1.2 Sales Mcf % 100.0000% 58.4397% 39.6037% 1.9566% 0.0000% 0.0000%
Input Value 20,546,467 7,779,490 4,813,775 263,242 3,777,063 3,912,897 1.5 Winter Volumes % 100.0000% 37.8629% 23.4287% 1.2812% 18.3830% 19.0441%
Input Value 2,125,194 1,892,554 230,232 117 1,463 828 2.0 Bills % 100.0000% 89.0532% 10.8335% 0.0055% 0.0688% 0.0390%
Input Value 232,640 0 230,232 117 1,463 828 2.2 Non-Residential Bills % 100.0000% 0.0000% 98.9649% 0.0503% 0.6289% 0.3559%
Input Value 288,074 130,248 74,478 3,917 41,726 37,7043.0 Peak Day % 100.0000% 45.2134% 25.8539% 1.3599% 14.4843% 13.0884%
Input Value 42,429,546 27,372,625 14,039,249 49,445 618,296 349,9314.0 Meter Investment % 100.0000% 64.5131% 33.0884% 0.1165% 1.4572% 0.8247%
Input Value 1 1 - - - - 4.2 Direct to Residential % 100.0000% 100.0000% 0.0000% 0.0000% 0.0000% 0.0000%
Input Value 1 - 1 - - - 4.4 Direct to Commercial % 100.0000% 0.0000% 100.0000% 0.0000% 0.0000% 0.0000%
Input Value 1 - 1 - - - 4.6 Direct to Industrial % 100.0000% 0.0000% 100.0000% 0.0000% 0.0000% 0.0000%
Input Value 1 - 1 - - - 4.8 Direct to Public Authority % 100.0000% 0.0000% 100.0000% 0.0000% 0.0000% 0.0000%
Input Value 1 - - - 1 - 5.0 Direct to Transport % 100.0000% 0.0000% 0.0000% 0.0000% 100.0000% 0.0000%
Internally Generated Value 681,841,791 372,839,066 158,302,763 5,359,581 73,161,301 72,179,0806.0 P, S, T & D Plant % 100.0000% 54.6812% 23.2169% 0.7860% 10.7300% 10.5859%
Internally Generated Value 264,337,185 204,028,524 57,474,048 137,724 1,722,195 974,694 6.2 P, S, T & D Plant - Customer % 100.0000% 77.1849% 21.7427% 0.0521% 0.6515% 0.3687%
Internally Generated Value 280,038,901 126,615,242 72,401,086 3,808,121 40,561,723 36,652,7306.4 P, S, T & D Plant - Demand % 100.0000% 45.2134% 25.8539% 1.3599% 14.4843% 13.0884%
Internally Generated Value 137,465,704 42,195,301 28,427,628 1,413,736 30,877,383 34,551,6566.6 P, S, T & D Plant - Commodity % 100.0000% 30.6951% 20.6798% 1.0284% 22.4619% 25.1347%
Internally Generated Value 105,607,336 60,952,823 37,440,033 1,329,036 2,949,887 2,935,557 7.0 Allocated O&M Expenses % 100.0000% 57.7165% 35.4521% 1.2585% 2.7933% 2.7797%
Internally Generated Value 10,416,928 8,202,608 2,136,712 7,091 45,026 25,4927.2 Allocated O&M Expenses - Cust % 100.0000% 78.7431% 20.5119% 0.0681% 0.4322% 0.2447%
Internally Generated Value 10,953,126 4,952,286 2,831,814 148,947 1,586,485 1,433,594 7.4 Allocated O&M Expenses - Demand % 100.0000% 45.2134% 25.8539% 1.3599% 14.4843% 13.0884%
Internally Generated Value 84,237,281 47,797,929 32,471,507 1,172,998 1,318,375 1,476,4727.6 Allocated O&M Expenses - Comm % 100.0000% 56.7420% 38.5477% 1.3925% 1.5651% 1.7528%
Input Value 26,564,782 16,218,920 10,069,596 272,066 2,238 1,962 8.0 Customer Deposit Balances % 100.0000% 61.0542% 37.9058% 1.0242% 0.0084% 0.0074%
Internally Generated Value 569,918,798 310,537,959 127,521,786 4,633,030 63,860,523 63,365,500 9.0 Allocated Net Plant % 100.0000% 54.4881% 22.3754% 0.8129% 11.2052% 11.1183%
Internally Generated Value 205,185,395 163,718,193 39,672,771 87,185 1,090,223 617,0239.2 Allocated Net Plant - Cust % 100.0000% 79.7904% 19.3351% 0.0425% 0.5313% 0.3007%
Internally Generated Value 240,729,450 108,842,083 62,238,045 3,273,569 34,868,017 31,507,735 9.4 Allocated Net Plant - Demand % 100.0000% 45.2134% 25.8539% 1.3599% 14.4843% 13.0884%
Internally Generated Value 124,003,953 37,977,683 25,610,970 1,272,275 27,902,283 31,240,7429.6 Allocated Net Plant - Comm % 100.0000% 30.6262% 20.6533% 1.0260% 22.5011% 25.1933%
Internally Generated Value 6,001,704 2,554,426 1,604,426 63,524 890,408 888,921 10.0 Composite of Accts. 871-879 & 886-893 % 100.0000% 42.5617% 26.7328% 1.0584% 14.8359% 14.8111%
Internally Generated Value 952,051 537,226 393,863 1,018 12,736 7,20810.2 Composite of Accts. 871-879 & 886-893 - Cust % 100.0000% 56.4283% 41.3699% 0.1070% 1.3377% 0.7571%
Internally Generated Value 3,268,822 1,477,947 845,119 44,451 473,466 427,838 10.4 Composite of Accts. 871-879 & 886-893 - Demand % 100.0000% 45.2134% 25.8539% 1.3599% 14.4843% 13.0884%
Internally Generated Value 1,780,832 539,253 365,444 18,054 404,206 453,87510.6 Composite of Accts. 871-879 & 886-893 - Comm % 100.0000% 30.2810% 20.5209% 1.0138% 22.6976% 25.4867%
Internally Generated Value 383,700,807 212,168,552 76,292,797 3,276,719 45,908,292 46,054,447 11.0 Composite of Accts. 376 & 380 % 100.0000% 55.2953% 19.8834% 0.8540% 11.9646% 12.0027%
Internally Generated Value 119,712,299 106,607,671 12,968,981 6,591 82,413 46,64311.2 Composite of Accts. 376 & 380 - Cust % 100.0000% 89.0532% 10.8335% 0.0055% 0.0688% 0.0390%
Internally Generated Value 171,589,831 77,581,678 44,362,730 2,333,371 24,853,615 22,458,436 11.4 Composite of Accts. 376 & 380 - Demand % 100.0000% 45.2134% 25.8539% 1.3599% 14.4843% 13.0884%

Exhibit PHR-4Page 75 of 75
Atmos Energy Corporation, Kentucky/Mid-States DivisionClass Cost of Service - Demand/Commodity StudyForecasted Test Period: Twelve Months Ended March 31, 2020
ALLOCATION FACTORS
Total Residential Non-Res Sales Non-Res Sales Transport TransportCompany Sales Firm Interruptible Firm Interruptible
Internally Generated Value 92,398,678 27,979,203 18,961,086 936,757 20,972,263 23,549,36811.6 Composite of Accts. 376 & 380 - Comm % 100.0000% 30.2810% 20.5209% 1.0138% 22.6976% 25.4867%
Internally Generated Value 300,006,847 119,963,507 71,963,656 3,716,302 52,078,317 52,285,065 12.0 Composite of Accts. 374-379 % 100.0000% 39.9869% 23.9873% 1.2387% 17.3590% 17.4280%
Internally Generated Value 0 0 0 0 0 012.2 Composite of Accts. 374-379 - Cust % 0.0000% 0.0000% 0.0000% 0.0000% 0.0000% 0.0000%
Internally Generated Value 195,001,383 88,166,848 50,415,538 2,651,734 28,244,619 25,522,644 12.4 Composite of Accts. 374-379 - Demand % 100.0000% 45.2134% 25.8539% 1.3599% 14.4843% 13.0884%
Internally Generated Value 105,005,465 31,796,659 21,548,118 1,064,568 23,833,698 26,762,42212.6 Composite of Accts. 374-379 - Comm % 100.0000% 30.2810% 20.5209% 1.0138% 22.6976% 25.4867%
Internally Generated Value 55,873,600 36,045,805 18,487,669 65,112 814,206 460,808 13.0 Composite of Accts. 381-383 % 100.0000% 64.5131% 33.0884% 0.1165% 1.4572% 0.8247%
Internally Generated Value 55,873,600 36,045,805 18,487,669 65,112 814,206 460,80813.2 Composite of Accts. 381-383 - Cust % 100.0000% 64.5131% 33.0884% 0.1165% 1.4572% 0.8247%
Internally Generated Value 0 0 0 0 0 0 13.4 Composite of Accts. 381-383 - Demand % 0.0000% 0.0000% 0.0000% 0.0000% 0.0000% 0.0000%
Internally Generated Value 0 0 0 0 0 013.6 Composite of Accts. 381-383 - Comm % 0.0000% 0.0000% 0.0000% 0.0000% 0.0000% 0.0000%
Internally Generated Value 119,712,299 106,607,671 12,968,981 6,591 82,413 46,643 14.0 Account 380 % 100.0000% 89.0532% 10.8335% 0.0055% 0.0688% 0.0390%
Internally Generated Value 119,712,299 106,607,671 12,968,981 6,591 82,413 46,64314.2 Account 380 - Cust % 100.0000% 89.0532% 10.8335% 0.0055% 0.0688% 0.0390%
Internally Generated Value 0 0 0 0 0 0 14.4 Account 380 - Demand % 0.0000% 0.0000% 0.0000% 0.0000% 0.0000% 0.0000%
Internally Generated Value 0 0 0 0 0 014.6 Account 380 - Comm % 0.0000% 0.0000% 0.0000% 0.0000% 0.0000% 0.0000%
Internally Generated Value 9,623,776 5,153,942 2,210,912 77,903 1,091,761 1,089,258 17.0 Composite of Accts. 870-902, 905-916, 924 & 928-930.1 % 100.0000% 53.5543% 22.9734% 0.8095% 11.3444% 11.3184%
Internally Generated Value 3,441,079 2,684,115 728,720 1,372 17,160 9,71217.2 Composite of Accts. 870-902, 905-916, 924 & 928-930.1 - Cust % 100.0000% 78.0021% 21.1771% 0.0399% 0.4987% 0.2822%
Internally Generated Value 4,002,311 1,809,583 1,034,755 54,426 579,707 523,84017.4 Composite of Accts. 870-902, 905-916, 924 & 928-930.1 - Dema % 100.0000% 45.2134% 25.8539% 1.3599% 14.4843% 13.0884%
Internally Generated Value 2,180,386 660,244 447,437 22,105 494,893 555,706 17.6 Composite of Accts. 870-902, 905-916, 924 & 928-930.1 - Comm % 100.0000% 30.2811% 20.5210% 1.0138% 22.6975% 25.4866%
Internally Generated Value 1,494,116,945 961,319,271 488,286,164 44,490,351 13,512 7,647 18.0 Revenues % 100.0000% 64.3403% 32.6806% 2.9777% 0.0009% 0.0005%
Internally Generated Value 86,746,747 50,513,031 21,051,850 300,483 7,930,117 6,951,266 18.2 Base Revenues % 100.0000% 58.2305% 24.2682% 0.3464% 9.1417% 8.0133%
Internally Generated Value 78,382,354 46,006,460 31,262,909 1,112,986 - - 18.4 Gas Costs % 100.0000% 58.6949% 39.8851% 1.4199% 0.0000% 0.0000%
Internally Generated Value 165,129,101 96,519,490 52,314,759 1,413,469 7,930,117 6,951,266 18.6 Total Rate Schedule Revenues % 100.0000% 58.4509% 31.6811% 0.8560% 4.8024% 4.2096%
Internally Generated Value 496,111,427 266,932,262 106,977,682 3,922,356 59,238,237 59,040,890 19.0 Rate Base % 100.0000% 53.8049% 21.5632% 0.7906% 11.9405% 11.9007%
Internally Generated Value 182,824,775 145,838,565 35,377,785 77,198 977,822 553,40619.2 Rate Base - Cust % 100.0000% 79.7696% 19.3507% 0.0422% 0.5348% 0.3027%
Internally Generated Value 215,734,814 97,541,147 55,775,947 2,933,679 31,247,715 28,236,327 19.4 Rate Base - Demand % 100.0000% 45.2134% 25.8539% 1.3599% 14.4843% 13.0884%
Internally Generated Value 97,551,838 23,552,551 15,823,950 911,479 27,012,700 30,251,15719.6 Rate Base - Comm % 100.0000% 24.1436% 16.2211% 0.9344% 27.6906% 31.0103%
Internally Generated Value 185,637,186 104,820,690 55,440,905 1,942,146 11,750,315 11,683,130 20.0 Cost of Service % 100.0000% 56.4654% 29.8652% 1.0462% 6.3297% 6.2935%
Internally Generated Value 42,303,478 33,072,920 8,808,524 24,171 251,343 146,51920.2 Cost of Service - Cust % 100.0000% 78.1801% 20.8222% 0.0571% 0.5941% 0.3464%
Internally Generated Value 42,896,925 19,386,214 11,085,739 584,482 6,218,178 5,622,312 20.4 Cost of Service - Demand % 100.0000% 45.1926% 25.8427% 1.3625% 14.4956% 13.1066%
Internally Generated Value 100,436,783 52,361,556 35,546,643 1,333,492 5,280,794 5,914,29920.6 Cost of Service - Comm % 100.0000% 52.1338% 35.3921% 1.3277% 5.2578% 5.8886%
Value 0 0 0 0 0 099.0 - % 0.0000% 0.0000% 0.0000% 0.0000% 0.0000% 0.0000%

Line No.
Return at Present Rates
Relative Return at
Present Rates
Revenue Deficiency at Equalized Proposed Return
Allocation of Amortization of Excess ADIT
Revenue Increase at Equalized Proposed Return
Customer‐Related Costs
1 Total Company 5.58% 1.00 15,919,320$ (1,463,766)$ 14,455,554$ 29.43$ 2 Residential Sales 3.95% 0.71 17,729,653$ (921,978)$ 16,807,675$ 27.02$ 3 Non‐Residential Firm Sales 8.00% 1.43 (68,299)$ (421,980)$ (490,279)$ 47.75$ 4 Non‐Residential Interruptible Sales 0.35% 0.06 300,495$ (13,725)$ 286,770$ 214.90$ 5 Firm Transport 10.39% 1.86 (1,191,165)$ (55,720)$ (1,246,885)$ 172.09$ 6 Interruptible Transport 9.87% 1.77 (851,364)$ (50,363)$ (901,727)$ 169.32$
Return at Present Rates
Relative Return at
Present Rates
Revenue Deficiency at Equalized Proposed Return
Allocation of Amortization of Excess ADIT
Revenue Increase at Equalized Proposed Return
Customer‐Related Costs
7 Total Company 5.58% 1.00 15,919,320$ (1,463,766)$ 14,455,554$ 19.91$ 8 Residential Sales 5.65% 1.01 8,802,533$ (851,580)$ 7,950,953$ 17.48$ 9 Non‐Residential Firm Sales 5.99% 1.07 2,990,330$ (446,100)$ 2,544,230$ 38.27$ 10 Non‐Residential Interruptible Sales ‐1.96% (0.35) 576,282$ (15,900)$ 560,382$ 207.96$ 11 Firm Transport 5.40% 0.97 1,744,267$ (78,869)$ 1,665,398$ 169.20$ 12 Interruptible Transport 5.05% 0.90 1,805,909$ (71,318)$ 1,734,591$ 170.03$
Return at Present Rates
Relative Return at
Present Rates
Revenue Deficiency at Equalized Proposed Return
Allocation of Amortization of Excess ADIT
Revenue Increase at Equalized Proposed Return
Customer‐Related Costs
13 Total Company 5.58% 1.00 15,919,320$ (1,463,766)$ 14,455,554$ 19.91$ 14 Residential Sales 6.40% 1.15 5,620,434$ (826,521)$ 4,793,913$ 17.48$ 15 Non‐Residential Firm Sales 6.67% 1.19 1,853,875$ (437,157)$ 1,416,718$ 38.26$ 16 Non‐Residential Interruptible Sales ‐1.50% (0.27) 502,542$ (15,314)$ 487,228$ 206.59$ 17 Firm Transport 3.60% 0.64 3,494,505$ (92,652)$ 3,401,852$ 171.80$ 18 Interruptible Transport 2.39% 0.43 4,447,964$ (92,123)$ 4,355,841$ 176.95$
Demand‐Only Study
Demand/Commodity Study
Exhibit PHR‐5Page 1 of 2
Customer/Demand Study
SUMMARY OF ALTERNATIVE CLASS COST OF SERVICE STUDIES

Line No.
Minimum Revenue Increase
Indicated
Maximum Revenue Increase
IndicatedAverage Revenue Increase Indicated
Proposed Revenue Increase
1 Total Company 14,455,554$ 14,455,554$ 14,455,554$ 14,455,538$ 2 Residential Sales 4,793,913$ 16,807,675$ 9,850,847$ 8,410,568$ 3 Non‐Residential Firm Sales (490,279)$ 2,544,230$ 1,156,890$ 3,426,441$ 4 Non‐Residential Interruptible Sales 286,770$ 560,382$ 444,793$ 47,663$ 5 Firm Transport (1,246,885)$ 3,401,852$ 1,273,455$ 1,499,112$ 6 Interruptible Transport (901,727)$ 4,355,841$ 1,729,568$ 1,071,753$
Minimum Customer‐Related Cost Indicated
Maximum Customer‐Related Cost Indicated
Average Customer‐Related Cost Indicated
Proposed Customer‐Related
Cost7 Total Company 19.91$ 29.43$ 23.08$ 8 Residential Sales 17.48$ 27.02$ 20.66$ 20.50$ 9 Non‐Residential Firm Sales 38.26$ 47.75$ 41.43$ 51.75$ 10 Non‐Residential Interruptible Sales 206.59$ 214.90$ 209.82$ 435.00$ 11 Firm Transport 169.20$ 172.09$ 171.03$ 435.00$ 12 Interruptible Transport 169.32$ 176.95$ 172.10$ 435.00$
Revenue Deficiency at Equalized Proposed Return
Customer‐Related Costs at Equalized Proposed Return
Exhibit PHR‐5Page 2 of 2
SUMMARY OF ALTERNATIVE CLASS COST OF SERVICE STUDIES

Case No. 2018-00281 Atmos Energy Corporation, Kentucky Division
Forecasted Test Period Filing Requirements MFR FR 16(7)(a)
Page 1 of 1 REQUEST: Section 16. Applications for General Adjustments of Existing Rates. (7) Each application requesting a general adjustment in rates supported by a fully
forecasted test period shall include the following or a statement explaining why the required information does not exist and is not applicable to the utility's application: (a) The written testimony of each witness the utility proposes to use to support
its application, which shall include testimony from the utility's chief officer in charge of Kentucky operations on the existing programs to achieve improvements in efficiency and productivity, including an explanation of the purpose of the program;
RESPONSE: Please see the Direct Testimony of witnesses Joe Christian, Josh Densman, Laura Gillham, Mark Martin, Paul Raab, Greg Smith, Jennifer Story, James Vander Weide, Greg Waller and Dane Watson. Respondents: Joe Christian, Josh Densman, Laura Gillham, Mark Martin, Paul Raab, Greg Smith, Jennifer Story, James Vander Weide, Greg Waller and Dane Watson