
Are energy statistics useful for making energy scenarios?
13
ARE ENERGY STATISTICS USEFUL FOR MAKING ENERGY SCENARIOS? Mario Giampietro* 1 and Alevgul H. Sorman 2 1 ICREA Research Prof., Institute of Environmental Science and Technology (ICTA) Universitat Autònoma de Barcelona (UAB) 2 Institute of Environmental Science and Technology (ICTA) Universitat Autònoma de Barcelona (UAB) ABSTRACT This paper addresses first of all the deep epistemological problem faced when attempting any energy accounting. Energy is a semantic concept which is very difficult to formalize in general terms, let alone when characterizing the complex functioning of socio-economic systems. The paper starts with a theoretical part, which explains the need of making a clear distinction between three relevant semantic categories of energy forms (Primary Energy Sources, Energy Carriers, and End Uses). Then it shows that when dealing with the analysis of the metabolic pattern of complex societies it is unavoidable to find logical bifurcations (non-equivalent quantitative assessments of the same semantic concept, when expressed in energy terms). The accounting for the energy consumption of a modern society cannot be obtained using a single number. In the second part, the paper provides a critical appraisal of the usefulness of the information of found in energy statistics. It first examines very briefly the problems associated with the conventional approach of linear representation of energy conversions, typical of old fashion statistics. Then it discusses the latest development of IEA and Eurostat which have introduced a “semantically challenging” new category of energy forms – energy commodities. This category ignores the most elementary rules of energy accounting developed in the field of energetics. Finally, the last section proposes an innovative scheme of energy accounting, which explicitly address the autocatalytic nature of energy transformations (typical of autopoietic systems) and that preserves the distinction between relevant energy forms (PES, EC; and EU) in the accounting carried out across different hierarchical levels. Keywords: Energetic Statistics, Energetics, Energy Accounting, Energy Scenarios, Primary Energy Sources, Energy Carriers, End Uses, Metabolic Pattern of societies 1. Basic epistemological problems with accounting of energy 1.1 The huge misunderstanding about the concept of energy Even though energy is handled by the “queen of hard sciences” – physics – energy is a semantic concept, which is quite tricky to formalize. Unfortunately, many, including a few of those working in the business of energy statistics, seem to have a very naïf view of energy and its quantification. Many seem to believe that energy is the ultimate example of an exact and deterministic variable. Since physicists have shown that it is possible to measure specific energy transformations - at a given point in space and time and after a careful setting of a measurement scheme within a controlled experimental setting – then energetic assessments expressed in Joules are considered to be very robust. This assumption is totally invalid. The generic definition of energy: the ability to generate a change in a given state space is impredicative in its nature (Chemero and Turvey, 2006). That is, the pre- analytical definition of the state space (the type of changes, which can be represented in
Transcript of Are energy statistics useful for making energy scenarios?

ARE ENERGY STATISTICS USEFUL FOR MAKING ENERGY SCENARIOS?
Mario Giampietro*1 and Alevgul H. Sorman2
1 ICREA Research Prof., Institute of Environmental Science and Technology (ICTA)
Universitat Autònoma de Barcelona (UAB) 2 Institute of Environmental Science and Technology (ICTA)
Universitat Autònoma de Barcelona (UAB)
ABSTRACT This paper addresses first of all the deep epistemological problem faced when attempting any energy accounting. Energy is a semantic concept which is very difficult to formalize in general terms, let alone when characterizing the complex functioning of socio-economic systems. The paper starts with a theoretical part, which explains the need of making a clear distinction between three relevant semantic categories of energy forms (Primary Energy Sources, Energy Carriers, and End Uses). Then it shows that when dealing with the analysis of the metabolic pattern of complex societies it is unavoidable to find logical bifurcations (non-equivalent quantitative assessments of the same semantic concept, when expressed in energy terms). The accounting for the energy consumption of a modern society cannot be obtained using a single number. In the second part, the paper provides a critical appraisal of the usefulness of the information of found in energy statistics. It first examines very briefly the problems associated with the conventional approach of linear representation of energy conversions, typical of old fashion statistics. Then it discusses the latest development of IEA and Eurostat which have introduced a “semantically challenging” new category of energy forms – energy commodities. This category ignores the most elementary rules of energy accounting developed in the field of energetics. Finally, the last section proposes an innovative scheme of energy accounting, which explicitly address the autocatalytic nature of energy transformations (typical of autopoietic systems) and that preserves the distinction between relevant energy forms (PES, EC; and EU) in the accounting carried out across different hierarchical levels. Keywords: Energetic Statistics, Energetics, Energy Accounting, Energy Scenarios, Primary Energy Sources, Energy Carriers, End Uses, Metabolic Pattern of societies 1. Basic epistemological problems with accounting of energy 1.1 The huge misunderstanding about the concept of energy Even though energy is handled by the “queen of hard sciences” – physics – energy is a semantic concept, which is quite tricky to formalize. Unfortunately, many, including a few of those working in the business of energy statistics, seem to have a very naïf view of energy and its quantification. Many seem to believe that energy is the ultimate example of an exact and deterministic variable. Since physicists have shown that it is possible to measure specific energy transformations - at a given point in space and time and after a careful setting of a measurement scheme within a controlled experimental setting – then energetic assessments expressed in Joules are considered to be very robust. This assumption is totally invalid.
The generic definition of energy: the ability to generate a change in a given state space is impredicative in its nature (Chemero and Turvey, 2006). That is, the pre-analytical definition of the state space (the type of changes, which can be represented in

quantitative terms) will define the quantitative output of the accounting. However, the choice of the types of changes (the energy forms of interest) to be observed, depends on their relevance for the analysis. When travelling by car, if we want to calculate the miles we can do, it is not wise to account as useful energy inputs either incoming solar energy or French fries stored in the car. On the other hand, when travelling for three days by boat, when filling the kitchen, we neither should include gallons of gasoline among the food energy required to feed the crew, but then French fries would be relevant.
In general terms, we can say that quantitative assessment of energy can only be measured and aggregated after having agreed on a pre-analytical definition of a given set of energy forms and the conversion factors to be applied to a given set of transformation in a given setting. The aggregation of quantitative assessments of different energy forms is only possible after having agreed on two semantic decisions:
(1) the lexicon of energy forms which will be included in the analysis (the energy graph required in engineering); (2) the rationale to be used to choose the criterion of equivalence (what makes it possible the definition of conversion factors in the first place).
The summing of different energy forms is like the summing of different currencies. Nobody will sum 100 US$ to 100 € to 100 Japanese Yens into an overall sum of 300 “monetary units”. Such a sum would not carry any meaning. However, as discussed below this is a standard operation in many energy statistics (see section 2.2 of this paper about the summing of “energy commodities”). As matter of fact, the Energy Statistics Manual of the International Energy Agency literally says in the section entitled “how to calculate energy balances”: The balance is calculated according to the arithmetic rules shown in Figure 1.3 – Pag. 30 OECD/IEA, 2004.
Different energy forms can all be expressed in the same unit Joules or in units (kWh, kcal, BTU), but this does not necessarily imply that they can all be summed in arithmetic way. It is the decision of a criterion of aggregation (the logical definition of an equivalent class), which makes it possible the summing. Let’s imagine that we sum kg of grain, kg of fruits and kg of wood. The resulting sum would be useful for a truck driver checking the overall load of his truck. However, this very same sum would result not only useless but misleading to someone trying to calculate the supply of food, provided by that truck, to a refugee camp. As a matter of fact, energy accounting can be called as the art of choosing how to aggregate “apples and oranges” (Giampietro, 2006; Giampietro and Mayumi, 2009). As the Nobel Prize winner in physics Richard Feynman pointed out: “it is important to realize that in physics today, we have no knowledge of what energy is… it is an abstract thing in that it does not tell us the mechanism or the reasons for the various formulas.” (Feynman et al. 1963, Chapter 4, p. 2). In practice, energy can be perceived and described in a large number of different forms: gravitational energy, kinetic energy, heat energy, elastic energy, electrical energy, chemical energy, radiant energy, nuclear energy, mass energy, etc.
However, these are semantic categories, which can be translated into formal categories, only after choosing an adequate proxy variable within a well specified formalization (definition of a descriptive domain, scale, lexicon, boundaries). For example, the quantitative method useful to assess the energy input for a virus (based on the lexicon of biochemistry in which fuel is represented by energy-rich molecules) even if measurable in Joules, is not reducible to the quantitative method useful to assess the energy input for the industrial sector of Germany (based on the lexicon of technical

energy conversions). When handling definitions and quantifications of energy obtained in different descriptive domains, any reduction and/or aggregation requires, first of all, deciding a set of criteria of equivalence (what is the equivalent of 1 J of the energy input for a virus, when expressed in 1 J of energy input to the industrial sector of Germany?).
A sentence, taken again from the explanations given in the Energy Statistics Manual on the chosen system of accounting is quite illuminating: “For example, the gross electricity production from hydro plants is used as the primary energy form rather than the kinetic energy of the falling water because there is no statistical benefit from pursuing the adoption of the kinetic energy as the primary energy form (?!). It does not, however, say how the amount of energy to be attributed to the primary energy form is calculated but in this case it is natural to adopt the amount of electricity generated as the measure” (?!) [question and exclamation marks are ours] - OECD/IEA, 2004 pag. 136. In this example, it is clear that without a pre-analytical structuring of the formal analysis and a definition of the logic associated with the choice of aggregation everything goes. The accounting becomes a series of arbitrary decisions taken by the accountant to patch here and there the available data into a protocol of accounting that does not have meaning, but which only carry out the formal task of balancing inputs and outputs in quantitative terms.
It should be noted that another classic definition of energy (found in elementary physics textbooks), is often used by many non-expert of this field, is “the potential to do work”. However, this definition refers to the concept of “free energy” or “exergy” (which is another potential source of confusion). Also in this case, we are in a confusing situation: both the concept of “free energy” or “exergy” can be quantified. But again this quantification can only be done within a specific, formal definition of work. Such a formal definition of work requires a clear definition of operational settings which must be necessarily referring to a given descriptive domain – scale, boundary, duration of the process to be quantified, end state, power levels (Giampietro and Mayumi, 2004; Mayumi and Giampietro, 2004). There is no formal definition of work which could be applied to “the activities performed in the Industrial sectors” or the “activities performed in the Household sector”, let alone if we want to consider the efficiency of the whole economy. 1.2 The definition of three semantic categories for energy forms Primary Energy Sources – This expression refers to the energy forms required by the energy sector to generate the supply of energy carriers used by human society. According to the laws of thermodynamics primary energy sources cannot be produced. Therefore, they must be available to society, in order to make possible the production of energy carriers. Examples of Primary Energy Sources include below-ground fossil energy reserves (coal, gas, oil), blowing wind, falling water, sun, and biomass. Primary Energy Sources are accounted in physical quantities and not in energy!!! That is, we measure them in Tons of Oil Equivalent, kg of uranium, Tons of Coal Equivalent. This to stress the role of this accounting, which is aimed at illustrating the existence of biophysical constraints: they indicate the requirement of favourable gradients which must be available (to be recorded into databases), in order to be able to produce an adequate supply of energy carriers. Any given amount of PES can be expressed in an energetic equivalent - e.g. 1 TOE = 42 GJ - and this is the source of the confusion found in energy statistics. In fact, this conversion requires the definition of a criterion of equivalence. In the case of TOE the criterion is the calorific value of oil, but the same

criterion cannot be applied to other PES (falling water, the set of processes used to make liquid biofuels, uranium, photovoltaic). Energy Carriers – This expression refers to the various forms of energy inputs required by the various sectors of a society to perform their functions. Energy carriers are produced by the Energy Sector of a society by using Primary Energy Sources. Examples of energy carriers include liquid fuel in a furnace, gasoline in a pump, electricity used in a factory, and hydrogen in a tank of a car. An energy carrier, therefore entails an energy cost for its production (1 MJ of energy carriers for its production requires a larger amount of energy spent in terms of MJ of PES). The distinction between “Energy Carriers” and “Primary Energy Sources” is extremely important since these two labels refer to energy forms of different quality. Like for the concept of money (it is not possible to sum US$, € and Japanese Yens, without applying conversion factors), we cannot sum 1 kWh of electricity (3.6 MegaJoules of Energy Carriers) to 3.6 MJ of crude oil (a Primary Energy Source). In fact, electricity has a cost of production and distribution which is different from that of crude oil This implies that every time we perform a quantitative analysis dealing with energy accounting we must specify first of all the energy form of reference: MJ of Energy Carriers are not the same as MJ of Primary Energy Sources! Energy end-uses – This expression refers to the useful tasks/works performed by the various sectors of society when converting energy carriers into applied power. Examples of end-uses include moving goods, melting iron, building a road, regulating traffic by moving hands, and air-conditioning of a room. 1.3 The unavoidable bifurcations in energy data found on existing energy statistics In this section we want to use a practical example to show the unavoidable emergence of bifurcations in the quantitative accounting of energy transformations, when representing the pattern of energy metabolism of a country.
In Fig. 1 we use an overall representation of the network of energy consumption of Spain (in 2005) to illustrate this point. Fig. 1 The flows of energy consumed in Spain quantified using: 2 semantic categories - Primary Energy Sources (PES) and Energy Carriers (EC). Then 7 formal categories [coal, oil, natural gas, nuclear, hydro, solar&geo, other renewables] in PES and 3 formal categories [electricity, heat and fuel] in EC.
Figure 1. The PES and EC mis of Energy Consumption for Spain 2005
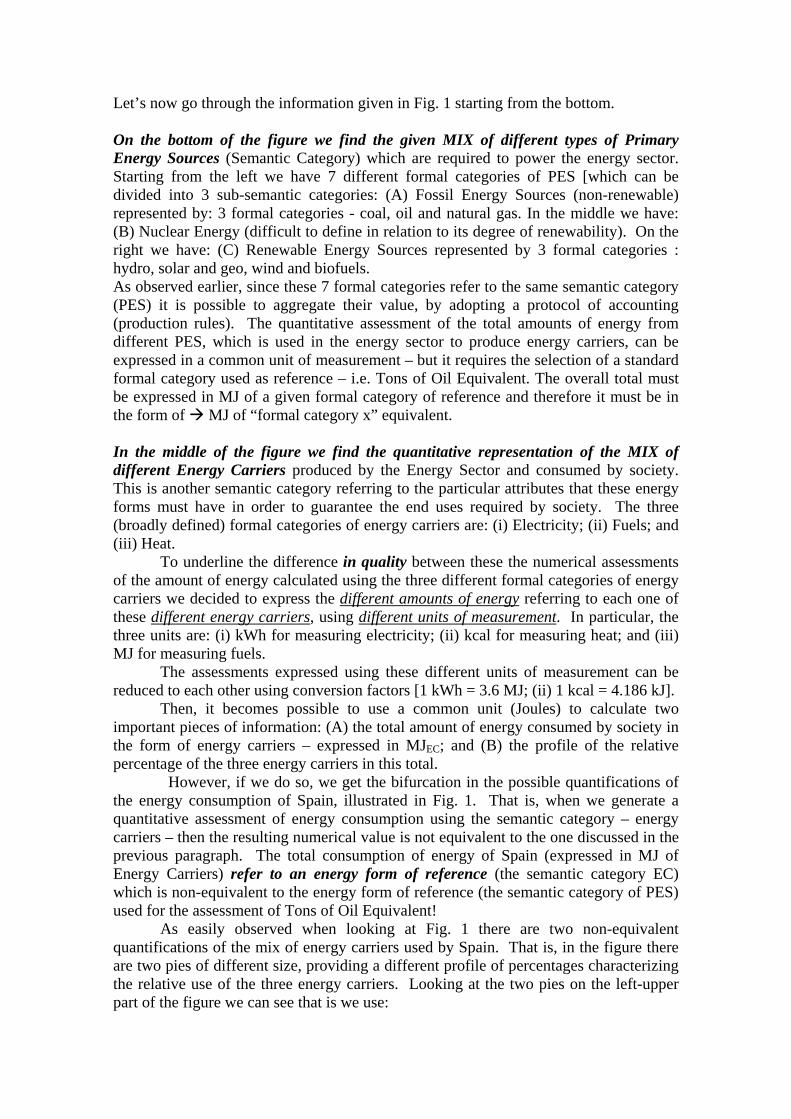
Let’s now go through the information given in Fig. 1 starting from the bottom. On the bottom of the figure we find the given MIX of different types of Primary Energy Sources (Semantic Category) which are required to power the energy sector. Starting from the left we have 7 different formal categories of PES [which can be divided into 3 sub-semantic categories: (A) Fossil Energy Sources (non-renewable) represented by: 3 formal categories - coal, oil and natural gas. In the middle we have: (B) Nuclear Energy (difficult to define in relation to its degree of renewability). On the right we have: (C) Renewable Energy Sources represented by 3 formal categories : hydro, solar and geo, wind and biofuels. As observed earlier, since these 7 formal categories refer to the same semantic category (PES) it is possible to aggregate their value, by adopting a protocol of accounting (production rules). The quantitative assessment of the total amounts of energy from different PES, which is used in the energy sector to produce energy carriers, can be expressed in a common unit of measurement – but it requires the selection of a standard formal category used as reference – i.e. Tons of Oil Equivalent. The overall total must be expressed in MJ of a given formal category of reference and therefore it must be in the form of MJ of “formal category x” equivalent.
In the middle of the figure we find the quantitative representation of the MIX of different Energy Carriers produced by the Energy Sector and consumed by society. This is another semantic category referring to the particular attributes that these energy forms must have in order to guarantee the end uses required by society. The three (broadly defined) formal categories of energy carriers are: (i) Electricity; (ii) Fuels; and (iii) Heat.
To underline the difference in quality between these the numerical assessments of the amount of energy calculated using the three different formal categories of energy carriers we decided to express the different amounts of energy referring to each one of these different energy carriers, using different units of measurement. In particular, the three units are: (i) kWh for measuring electricity; (ii) kcal for measuring heat; and (iii) MJ for measuring fuels.
The assessments expressed using these different units of measurement can be reduced to each other using conversion factors [1 kWh = 3.6 MJ; (ii) 1 kcal = 4.186 kJ].
Then, it becomes possible to use a common unit (Joules) to calculate two important pieces of information: (A) the total amount of energy consumed by society in the form of energy carriers – expressed in MJEC; and (B) the profile of the relative percentage of the three energy carriers in this total.
However, if we do so, we get the bifurcation in the possible quantifications of the energy consumption of Spain, illustrated in Fig. 1. That is, when we generate a quantitative assessment of energy consumption using the semantic category – energy carriers – then the resulting numerical value is not equivalent to the one discussed in the previous paragraph. The total consumption of energy of Spain (expressed in MJ of Energy Carriers) refer to an energy form of reference (the semantic category EC) which is non-equivalent to the energy form of reference (the semantic category of PES) used for the assessment of Tons of Oil Equivalent!
As easily observed when looking at Fig. 1 there are two non-equivalent quantifications of the mix of energy carriers used by Spain. That is, in the figure there are two pies of different size, providing a different profile of percentages characterizing the relative use of the three energy carriers. Looking at the two pies on the left-upper part of the figure we can see that is we use:

(A) when using Tons of Oil Equivalent for the quantitative assessment (based on the consumption of Primary Energy Sources) then: 4.6 ExaJoules of PES are consumed and 36% of this energy goes in the making of electricity; (B) when using MJ of energy carriers for the quantitative assessment (after eliminating from the accounting the conversion losses) then: 3.1 ExaJoules of EC are consumed and only 18% of the energy spent in Spain is in the form of electricity (when converting the three different units in MJ and without applying any quality/conversion factor).
Needless to say, that this bifurcation in the quantitative assessments of the same semantic concept (a representation of how energy is used in Spain) is a natural phenomenon. There is nothing wrong with it, but, in fact, has to be acknowledged. As discussed below, the dataset of BP, IEA and Eurostat presents just a single set of numbers, which is perfectly balanced, and which is based on the accounting and summing together of items belonging to the two semantic categories of Primary Energy Sources and Energy Carriers. This is certainly a reason for concern.
The second observation to be made about Fig. 1, refers to the implications of the structure of the network of energy transformations. In fact, not all the MJ of fossil energy (formal categories within the semantic category PES) are the same. It is well known that 1 MJ of natural gas is more effective than 1 MJ of oil, and 1 MJ of oil is more effective than 1 MJ of coal. Therefore, the same amount of Total Energy Throughput (expressed in Joules of PES) can have different effects on the economy depending on the profile of distribution of the total amount of Tons of Oil Equivalent over the set of 7 formal categories. In this regard, it is well known that in the last decades for developed countries, an important factor determining the increase in performance of the economy has been a continuous adjustment in the mix of Primary Energy Sources (Hall et al. 1986; Ayres et al. 2003) - oil replaced coal and now natural gas is replacing oil. The same phenomenon took place in relation to the mix of energy carriers (the upper pies on the left). The post-industrialization coincides with a continuous adjustment in the mix (relative importance of the 3 formal categories) of Energy Carriers (Ayres and Warr, 2005). The fraction of electricity (due to its versatility and convenience in terms of instant access) has been continuously expanding now for decades within the pie of energy carriers.
So if we want to study the changes in the efficiency of the economic process in terms of energy analysis, it is essential to be able to study changes in both pies, addressing the implications of both: (i) changes in PES (affecting the seriousness of external constraints); and (ii) changes in EC (affecting internal efficiency in the conversion of energy carriers into end uses).
To makes things more difficult, the amount of energy accounted over the various formal categories (7) included in the category PES are not all equally useful for generating all sorts of energy carriers for the society. For example, nuclear, hydroelectric and wind power, at the moment, can only generate electricity. Depending on the particular mix of energy carriers required for a given task, this may represent a problem. In fact, even if electricity is the most valuable among the energy carriers potentially used in every energy consuming sector, there are some tasks (e.g. powering a jumbo airplane), which cannot be performed using electricity and currently only depend on jet fuel Smil (2003). Therefore, it is important to be aware of the importance of considering the various connections over the network of energy transformations shown in Fig. 1: who is producing what on the supply side and who is consuming what on the consumption side.
This entails two distinct feasibility/viability checks:

(1) a check on the feasibility of the energy sector (supply side) - the mix of 7 formal categories, included in the semantic category Primary Energy Sources has to be able to match in terms of supply the requirement of the mix of 3 formal categories, included in the semantic category Energy Carriers; which is required by society (EXTERNAL CONSTRAINTS); (2) a check on the viability of the metabolic patterns of society (consumption side) - the mix of 3 formal categories, included in the semantic category Energy Carriers, has to be able to match, in terms of supply, the requirement associated with the mix of formal categories of functions to be carried out by the end uses for the sustenance of the society, included in the semantic categories End Uses (INTERNAL CONSTRAINTS).
This observation is very important if we want to use energy data to discuss of possible alternative future energy scenarios, no longer based on fossil energy.
2. A critical appraisal of the actual system of accounting in energy statistics 2.1 The old fashion representation of energy consumption of developed countries The old-fashion characterization of national energy consumption, for the purpose of energy accounting, is still very popular. An example of the standard map-flow (mapping the chains of energy flows in the form of a sankey diagram) is given in Fig. 2. This example is taken from the Energy Information Agency of the USA, and it refers to the energy balance of USA in 2001.
Figure 2. Linear map-flow of energy consumption in the USA 2001
What is important to observer in this figure is the choice of adopting a linear representation of the various flows. The representation is based on the idea that you have energy forms entering the system from the left side, then these energy forms are transformed (in the middle) and they are finally used on the right side of the graph - with the input numbers perfectly adding up to the output numbers throughout the linear mapping. This implies that during this trajectory the energy flows considered in the analysis must change both their values and their identity, across the linear trajectory,

which starts form left and end to right. Assuming that it is possible to perform this quantification, therefore, means assuming that it is possible to define in a substantive way (semantic and formal, with no uncertainty and disagreement among the users of data) the series of two conversions: (A) Primary Energy Sources Energy Carriers (when moving from the left to the center of the figure); and (B) Energy Carriers End Uses (when moving from the center of the figure to the right). We claim that this assumption is not valid. As illustrated in Fig. 1, the conversion (A) PES EC can be quantified in two non-equivalent ways (depending on the energy form we decide to use are reference, either PES of EC); and the conversion (B) EC EU cannot be quantified at all, since the proxy variables needed to quantify End Uses (the work done in the different final compartments) are not commensurable with the proxy variables needed to quantify Energy Carriers.
Looking at Fig. 2 in details, we can see on the left of the graph a quantity of primary energy sources (semantic category - PES ) which then becomes a flow of energy carriers (semantic category - EC), in the middle. The logical difference between the semantic categories PES and EC entails an unavoidable amount of energy losses (second law of thermodynamics) due to the transformation PES EC. Finally, the linear flow ends (on the right of the graph) with the definition of yet another semantic category End Uses. It should be noted though, that in this representation, the formal representation of “energy losses” (the quantitative representation) is located on the right of the graph, for balancing the accounting, as if it were playing the same role of end uses. Moreover, with such a representation, it is quite impossible to interpret what kind of losses this aggregated quantity refers to. (e.g. transformational, distributional?). In fact, the balancing of the accounting (done using numbers referring to formal categories) over the chosen set of semantic categories is everything but easy . . .
What can we do with the quantitative information found in energy statistics of the type illustrated in Fig. 2? In relation to the two numerical values of PES and EC we can say: (a) The total amount of energy consumption, expressed in PES (found on the left of the graph) is useful for comparing the total consumption of countries, in relation to a given PES of reference [= Tons of Oil Equivalent]. However, even if we adopt (as reference) a given category of PES such as Tons of Oil Equivalent, then we have a problem with the electricity which enters into the system from the top (hydroelectric, nuclear, photovoltaic) – that is, the electricity not produced with fossil energy – which can no longer be expressed in Tons of Oil Equivalent, unless we invent a “virtual” consumption of TOE which would be required to produce this electricity using virtual conventional power plants fed with fossil energy. In this way we can generate a number (as done by BP, IEA statistics) which can only provide a meaningful comparison in relation to the importance that the production of electricity with non-fossil energy PES plays in different economies. For example, if a country like Sweden produces a very large fraction of electricity using hydroelectric power, by adopting an accounting based on EC (referring to the physical energy content method in use by international statistics1 – where for example hydroelectricity is valued by the energy content of the electricity converted to primary energy directly (1 MWh = 0.086 toe)), it would seem that Sweden uses much less energy than other countries. Whereas by adding a virtual consumption of TOE (as done by the partial substitution method (the old IEA method) – for hydro and nuclear electricity are both valued by the primary energy which would be needed to obtain them, if fossil fuels were used, at an average
1 OECD/IEA, 2004

efficiency of 38.5% (thus; making 1Mwh = 0.086 toe/0.385) equivalent we correct with a quality factor the larger presence of MJ of electricity in the mix of energy carriers. (b) IF we would use only the total amount of energy consumption expressed in EC, THEN the resulting characterization of consumption, both in absolute value and in percentage over the pie, will not reflect either the total initial consumption of energy – expressed in PES – nor the final achievement in terms of end uses. 2.2 A few problems with the actual system of accounting in Eurostat statistics When reading the explanations of the system of accounting adopted for generating the Energy Balances by both the International Energy Agency and Eurostat it is difficult to understand the logic used for organizing the dataset. As a matter of fact, the basic framing is similar to that adopted by BP energy statistics (linear), however, the semantic used for the choice of categories is not clear (at least for us). The first problem comes with the semantic concepts used to define what type of information is given with the dataset. For example, the dataset uses the expression of “energy commodities” and “commodities balance” to justify the summing of different forms of energy without defining conversion factors. This is like aggregating different currencies (US$, € and Japanes Yens) into a common category “monetary units” and then summing them as such. How robust is the semantic behind the chosen protocol of accounting for energy transformations? A few examples are discussed below: #1 The confusing handling of the category Primary Energy Sources The semantic associated with the concept of Primary Energy Source is pretty straightforward. It derives directly from the application of the fundamental laws of thermodynamics. Human technology can not produce energy. Human technology can only use a given source of primary energy (a useful gradient of something, found already in the environment) to generate energy carriers. The problem is that the various categories of PES cannot be aggregated and compared as such. In fact, each one of the considered categories of PES (e.g. the 7 categories considered in Fig. 1) provides a certain amount of either kWh of electricity, kcal of heat or MJ of fuels (the OUTPUT), and consumes different amounts and types of INPUT – e.g. kg of uranium, or cubic meter of water, or hours of winds or cubic meter of natural gas (the primary energy).
In order to be able to sum together quantitative assessments of energy referring to different formal categories of PES we have to adopt some logical criterion of equivalence for both the output and the primary energy. The logic to be used for this choice will determine the semantic category in relation to which we want to perform the aggregation. If we want to aggregate these different quantitative assessments in relation to their CO2 emission (the OUTPUT), then we have to adopt a given production rule (introducing semantic sub-categories – fossil energy PES vs. non-fossil energy PES). If we want to aggregate these different quantitative assessments in relation to their labour demand (total workers required by the energy sector to deliver the required supply of energy carriers), we will have to aggregate the various PES using a different production rule, and so on. The IEA and Eurostat does not have any logic criterion of aggregation (even though it does aggregate a lot of numbers in just one way). #2 The confusing handling of the relations between semantic and formal categories The most disturbing fact, is that this label of “energy commodities” seems to refer indistinctly not only to: (i) different semantic categories (both PES and EC); but also to (ii) different formal categories within each one of these semantic categories.
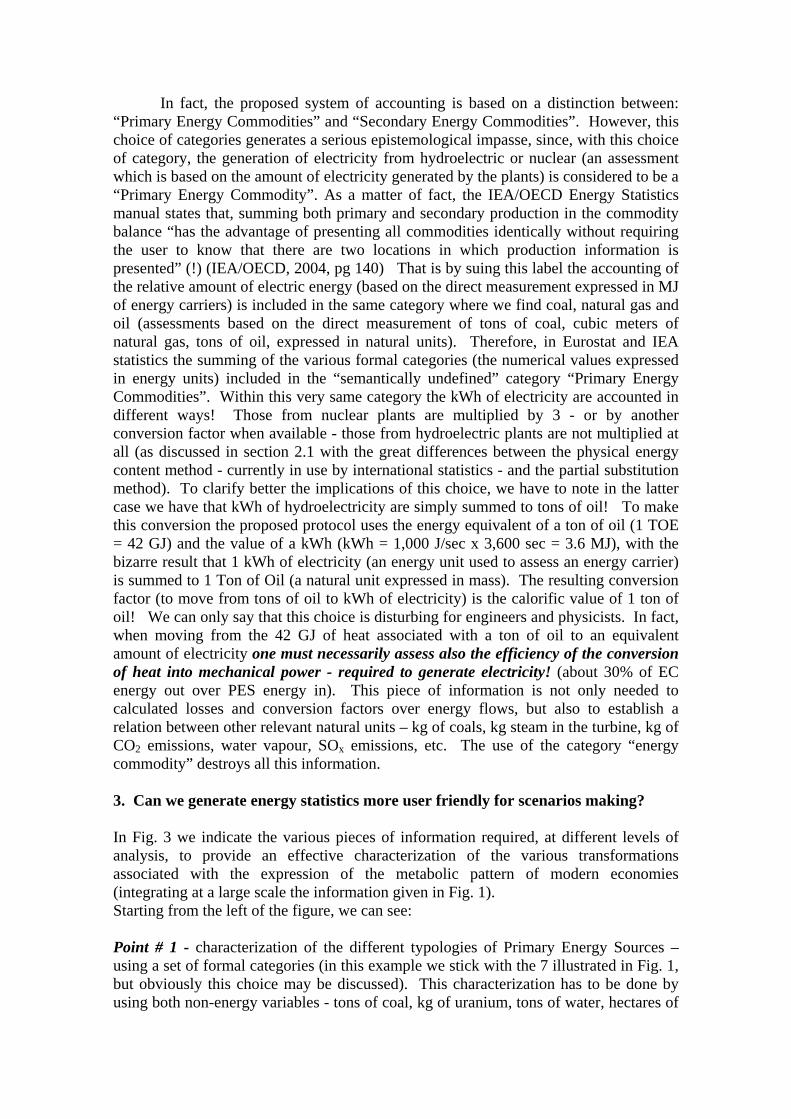
In fact, the proposed system of accounting is based on a distinction between: “Primary Energy Commodities” and “Secondary Energy Commodities”. However, this choice of categories generates a serious epistemological impasse, since, with this choice of category, the generation of electricity from hydroelectric or nuclear (an assessment which is based on the amount of electricity generated by the plants) is considered to be a “Primary Energy Commodity”. As a matter of fact, the IEA/OECD Energy Statistics manual states that, summing both primary and secondary production in the commodity balance “has the advantage of presenting all commodities identically without requiring the user to know that there are two locations in which production information is presented” (!) (IEA/OECD, 2004, pg 140) That is by suing this label the accounting of the relative amount of electric energy (based on the direct measurement expressed in MJ of energy carriers) is included in the same category where we find coal, natural gas and oil (assessments based on the direct measurement of tons of coal, cubic meters of natural gas, tons of oil, expressed in natural units). Therefore, in Eurostat and IEA statistics the summing of the various formal categories (the numerical values expressed in energy units) included in the “semantically undefined” category “Primary Energy Commodities”. Within this very same category the kWh of electricity are accounted in different ways! Those from nuclear plants are multiplied by 3 - or by another conversion factor when available - those from hydroelectric plants are not multiplied at all (as discussed in section 2.1 with the great differences between the physical energy content method - currently in use by international statistics - and the partial substitution method). To clarify better the implications of this choice, we have to note in the latter case we have that kWh of hydroelectricity are simply summed to tons of oil! To make this conversion the proposed protocol uses the energy equivalent of a ton of oil (1 TOE = 42 GJ) and the value of a kWh (kWh = 1,000 J/sec x 3,600 sec = 3.6 MJ), with the bizarre result that 1 kWh of electricity (an energy unit used to assess an energy carrier) is summed to 1 Ton of Oil (a natural unit expressed in mass). The resulting conversion factor (to move from tons of oil to kWh of electricity) is the calorific value of 1 ton of oil! We can only say that this choice is disturbing for engineers and physicists. In fact, when moving from the 42 GJ of heat associated with a ton of oil to an equivalent amount of electricity one must necessarily assess also the efficiency of the conversion of heat into mechanical power - required to generate electricity! (about 30% of EC energy out over PES energy in). This piece of information is not only needed to calculated losses and conversion factors over energy flows, but also to establish a relation between other relevant natural units – kg of coals, kg steam in the turbine, kg of CO2 emissions, water vapour, SOx emissions, etc. The use of the category “energy commodity” destroys all this information. 3. Can we generate energy statistics more user friendly for scenarios making? In Fig. 3 we indicate the various pieces of information required, at different levels of analysis, to provide an effective characterization of the various transformations associated with the expression of the metabolic pattern of modern economies (integrating at a large scale the information given in Fig. 1). Starting from the left of the figure, we can see: Point # 1 - characterization of the different typologies of Primary Energy Sources – using a set of formal categories (in this example we stick with the 7 illustrated in Fig. 1, but obviously this choice may be discussed). This characterization has to be done by using both non-energy variables - tons of coal, kg of uranium, tons of water, hectares of

land – and energy equivalent. In this way it becomes possible to assess the relevance of external constraints, which affect the potential supply of energy carriers, using specific indicators for the various typologies of PES considered (for each MJ of energy carriers generated). This information is essential for discussing of energy scenarios no longer based on fossil energy;
Figure 3. The autocatalytic loops of energy tarsnforamtion within societies
Point # 2 - characterization of the type of energy carriers supplied by the various typologies of PES. This requires a graph indicating the connections over the relative flows of energy carriers. This information has to be complemented by the relative characterization of their technical coefficients (refer to Fig.1 for details); Point # 3 - establishing a relation between the MIX of PES and the relative MIX of EC. In this first assessment, we quantify the MIX of EC using MJ of PES equivalent. In this way, we assess the performance of the energy sector over the conversion PES EC. Point # 4 – establishing a relation between the MIX of EC and the MIX of EU. Starting from the record of the total amount of MJ consumed for each energy carrier and the profile over the mix one can perform an analysis of the metabolism of the various sectors of the economy based on the direct flow of energy carriers (see the paper Sorman and Giampietro presented at this same conference within the proceedings). In this way it becomes possible to establish a relation between the dataset developed in energy balances and the analysis of the pattern of metabolism of modern societies. Point # 5 - calculating the profile of consumption of energy carriers (mix and amount of each of the carriers) per each one of the relevant compartment of the economy: Household, Agriculture, Productive Sector (called there Industry); Service and Government, including the energy sector (see next Point #6). In this way, we can assess the performance of the socio-economic system over the conversion EC EU.

Point # 6 - providing the crucial information about the consumption of energy carriers (mix and amount of each of the carriers) used in the energy sector, which is determined by the exploitation of the given mix of 7 categories of PES. This information is crucial since it makes it possible to calculate the overall EROI – Energy Return On the Investment - the “biophysical costs” for generating the required supply of energy carriers in the other compartments. The energy consumed by the energy sector, should not be considered as a generic loss to be summed to the others! Rather it is a valuable information about the required investment of energy, which is needed to make it possible the production of energy carriers (Fig. 3). In this way, we can finally assess the performance of the socio-economic system over the autocatalytic loop of conversions: PES EC EU PES. Ultimately with such a representation, we are no longer representing a linear set of energy transformations, but the basic autocatalytic loop of non-equivalent energy forms, needed to generate and stabilize the metabolic pattern of modern societies! Energy carriers are used also to make themselves (taking advantage of the gradients provided by Primary Energy Sources) and in this autocatalytic loop they generate a surplus, which can be used by society to stabilize the structures/functions expressed in the various compartments of the society. Conclusion Using the scheme of Fig. 3 it is possible to use available energy data to generate a description and characterization of the pattern of production and use of energy carriers associated with the expression of the required set of functions expected in a modern society . All the information needed to make such a description is already available to statistical offices. However, these data are at the moment processed using dubious (see to sections 2.1. and 2.2) production rules to generate a quantitative representation which, in our view, does not provide the required information to generate informed and robust scenarios, especially when looking for different metabolic patterns in the future. ACKNOWLEDGEMENTS The authors would like to acknowledge the financial support provided by the EU FP7 Project of SMILE - Synergies in Multi-scale Inter-Linkages of Eco-social systems FP7-SSH-2007-1 (Project no.217213). References Ayres, R.U. and Warr, B. (2005) ‘Accounting for growth: The role of physical work’, Structural Change
and Economic Dynamics, vol 16, no 2, pp 181-209 Ayres R.U., Ayres L.W. and Warr B. (2003) ‘Exergy, power and work in the US economy, 1900-1998’,
Energy, vol 28, no 3, pp 219-273 Chemero A. and Turvey M.T.2006 Complexity and “Closure to Efficient Cause” In: K. Ruiz-Mirazo and R. Barandiaran (eds.), Proceedings of AlifeX: Workshop on Artificial Autonomy Feynman, R., Leighton, B. and Sands, M., 1963. The Feynman Lectures on Physics: Mainly Mechanics,
Radiation, and Heat, Volume I. Addison-Wesley Publishing Company, Menlo Park, California. Giampietro, M. (2006) ‘Theoretical and practical considerations on the meaning and usefulness of
traditional energy analysis’, Journal of Industrial Ecology vol 10, no 4, pp 173-185 Giampietro, M. and Mayumi, K. (2009) The Biofuel Delusion: The Fallacy of Large-scale Agro-biofuel
Production, London: Earthscan. Giampietro, M. and Mayumi, K. (2004) ‘Complex systems and energy’, in C. Cleveland (ed)
Encyclopedia of Energy, vol. 1, Elsevier, San Diego, CA, pp. 617-631

Mayumi, K. and Giampietro, M. (2004) ‘Entropy in ecological economics’, in J. Proops and P. Safonov (eds) Modeling in Ecological Economics, Edward Elgar, Cheltenham, UK, pp 80-101
Hall, C.A.S., Cleveland, C.J. and Kaufman, R. (1986) Energy and Resource Quality, John Wiley & Sons, New York
OECD/IEA, 2004, Energy Statistics Manual, Available Online: http://www.iea.org/textbase/nppdf/free/2004/statistics_manual.pdf
Smil, V. (2003) Energy at the crossroads: Global Perspectives and Uncertainties, MIT Press, Cambridge, MA