A comparison of the energy consumption of rainfed durum wheat under different management scenarios...
11
A comparison of the energy consumption of rainfed durum wheat under different management scenarios in southern Italy Salem Alhajj Ali * , Luigi Tedone, Giuseppe De Mastro University of Bari, Department of Agricultural and Environmental Science, Via Amendola, 165/A, 70126, Italy article info Article history: Received 7 February 2013 Received in revised form 14 June 2013 Accepted 16 August 2013 Available online 24 September 2013 Keywords: Durum wheat Energy indices Tillage Nitrogen fertilizer Management system abstract An energy consumption analysis comparing 12 management scenarios of durum wheat grown in southern Italy was carried out in order to identify the most energy efficient system with regard to productivity. The results showed that yield parameters were significantly affected by the tillage system and revealed that conservation tillage entailed the fewest field operations and lowest energy requirements with higher yield. Nitrogen rates had slight effects on yield parameters, whereas a linear relationship was found between increasing energy input and increasing nitrogen fertilizer. The highest proportion of energy input came from diesel fuel, followed by nitrogen fertilizer. Total input energy used per hectare increased with the increase in management intensity. However, per 1 kg of grain, energy intensity was directly linked to grain yield. The lowest average of 1.8 MJ kg 1 was for conservation tillage, followed by intensive tillage with 2.9 MJ kg 1 , whereas reduced tillage was the most energy intense with 3.1 MJ kg 1 . Conservation tillage of durum wheat in southern Italy can be used to maintain or increase productivity with only a minimum energy input. Ó 2013 Elsevier Ltd. All rights reserved. 1. Introduction The agricultural sector requires energy as an essential input to production [1]. Recently, it has become more energy-intensive in order to supply more food to the increasing population [2]. Energy use analysis in agriculture is essential for an efficient, sustainable and financially viable production [3], since such production entails lower costs and reduces resilience on fossil fuels [4]. Traditionally, grain production systems rely heavily on the input of non-renewable or fossil energy [5]. These energy inputs are in direct forms such as diesel and electricity used for cultivation, transport, and other on-farm production activities, and in indirect forms such as the energy used in the manufacture and transport of fertilizers, herbicides and farm machinery [6]. All of these have direct effects on the depletion of fossil fuel resources and have varying effects during the life cycle on the final product of 1 kg of durum wheat. Hopper [7], for example, estimated that Canadian prairie agriculture required about 4.5 MJ of non-renewable energy to produce 1 kg of wheat in 1981; but this indicator varies with the cropping system and management practices being used. In Italy, it has been estimated that the energy consumption in agriculture amounts to around 0.42 10 9 GJ year 1 , of which 55% is related to arable crops [8]. In Italy the high demand for durum wheat as a raw material for bread and pasta requires a high input of energy. Durum wheat is one of the most widespread cereals in Italy, thus it is fundamental to study it in depth in order to save energy for sustainable pro- duction. Alternative management systems in durum wheat culti- vation are needed to maintain acceptable levels of productivity yet also reduce economic and environmental costs. The energy use for tillage in wheat production is a major direct expense in terms of fuel costs for farmers. High energy use for tillage is usually associated with high machinery costs and labor inputs [9], which differ greatly according to the tillage systems used [10]. A study conducted by Zugec et al. [11], for instance, demon- strates that conventional tillage such as moldboard plowing is one of the most expensive and organizationally slow systems, and is a significantly greater energy and labor consumer. Others like Har- man et al. [12] and Smart and Bradford [13] agree that reduced and/ or no-till is increasingly attractive to farmers because it clearly reduces input costs such as fuel, labor and machinery repair and depreciation costs as compared with a conventional system. * Corresponding author. Tel.: þ39 0805442501. E-mail address: [email protected] (S. Alhajj Ali). Contents lists available at ScienceDirect Energy journal homepage: www.elsevier.com/locate/energy 0360-5442/$ e see front matter Ó 2013 Elsevier Ltd. All rights reserved. http://dx.doi.org/10.1016/j.energy.2013.08.028 Energy 61 (2013) 308e318
Transcript of A comparison of the energy consumption of rainfed durum wheat under different management scenarios...
lable at ScienceDirect
Energy 61 (2013) 308e318
Contents lists avai
Energy
journal homepage: www.elsevier .com/locate/energy
A comparison of the energy consumption of rainfed durum wheatunder different management scenarios in southern Italy
Salem Alhajj Ali*, Luigi Tedone, Giuseppe De MastroUniversity of Bari, Department of Agricultural and Environmental Science, Via Amendola, 165/A, 70126, Italy
a r t i c l e i n f o
Article history:Received 7 February 2013Received in revised form14 June 2013Accepted 16 August 2013Available online 24 September 2013
Keywords:Durum wheatEnergy indicesTillageNitrogen fertilizerManagement system
* Corresponding author. Tel.: þ39 0805442501.E-mail address: [email protected] (S. Alhajj A
0360-5442/$ e see front matter � 2013 Elsevier Ltd.http://dx.doi.org/10.1016/j.energy.2013.08.028
a b s t r a c t
An energy consumption analysis comparing 12 management scenarios of durum wheat grown insouthern Italy was carried out in order to identify the most energy efficient system with regard toproductivity.
The results showed that yield parameters were significantly affected by the tillage system and revealedthat conservation tillage entailed the fewest field operations and lowest energy requirements withhigher yield.
Nitrogen rates had slight effects on yield parameters, whereas a linear relationship was found betweenincreasing energy input and increasing nitrogen fertilizer. The highest proportion of energy input camefrom diesel fuel, followed by nitrogen fertilizer.
Total input energy used per hectare increased with the increase in management intensity. However,per 1 kg of grain, energy intensity was directly linked to grain yield. The lowest average of 1.8 MJ kg�1
was for conservation tillage, followed by intensive tillage with 2.9 MJ kg�1, whereas reduced tillage wasthe most energy intense with 3.1 MJ kg�1.
Conservation tillage of durumwheat in southern Italy can be used to maintain or increase productivitywith only a minimum energy input.
� 2013 Elsevier Ltd. All rights reserved.
1. Introduction
The agricultural sector requires energy as an essential input toproduction [1]. Recently, it has become more energy-intensive inorder to supply more food to the increasing population [2]. Energyuse analysis in agriculture is essential for an efficient, sustainableand financially viable production [3], since such production entailslower costs and reduces resilience on fossil fuels [4].
Traditionally, grain production systems rely heavily on the inputof non-renewable or fossil energy [5]. These energy inputs are indirect forms such as diesel and electricity used for cultivation,transport, and other on-farm production activities, and in indirectforms such as the energy used in the manufacture and transport offertilizers, herbicides and farm machinery [6]. All of these havedirect effects on the depletion of fossil fuel resources and havevarying effects during the life cycle on the final product of 1 kg ofdurum wheat. Hopper [7], for example, estimated that Canadianprairie agriculture required about 4.5 MJ of non-renewable energyto produce 1 kg of wheat in 1981; but this indicator varies with the
li).
All rights reserved.
cropping system and management practices being used. In Italy, ithas been estimated that the energy consumption in agricultureamounts to around 0.42 � 109 GJ year�1, of which 55% is related toarable crops [8].
In Italy the high demand for durumwheat as a raw material forbread and pasta requires a high input of energy. Durum wheat isone of the most widespread cereals in Italy, thus it is fundamentalto study it in depth in order to save energy for sustainable pro-duction. Alternative management systems in durum wheat culti-vation are needed to maintain acceptable levels of productivityyet also reduce economic and environmental costs.
The energy use for tillage in wheat production is a major directexpense in terms of fuel costs for farmers. High energy use fortillage is usually associated with high machinery costs and laborinputs [9], which differ greatly according to the tillage systems used[10]. A study conducted by Zugec et al. [11], for instance, demon-strates that conventional tillage such as moldboard plowing is oneof the most expensive and organizationally slow systems, and is asignificantly greater energy and labor consumer. Others like Har-man et al. [12] and Smart and Bradford [13] agree that reduced and/or no-till is increasingly attractive to farmers because it clearlyreduces input costs such as fuel, labor and machinery repair anddepreciation costs as compared with a conventional system.
Table 1Soil characteristics of the study site.
Characteristics M. Unit Value
Total nitrogen % 0.196P2O5 assimilabile (Olsen Method) ppm 40Nitrate ppm 14.3Ammonium ppm TraceOrganic matter (WalkleyeBlack method) % 2.8Total lime % 8.8pH 7.72Sand % 39.78Silt % 37.40Clay % 22.82
S. Alhajj Ali et al. / Energy 61 (2013) 308e318 309
As a response to the negative impact of soil degradation pro-cesses under different tillage systems, conservation tillage practiceswith protective cover of crop residue are being developed in manyparts of the world [14]. Increased depth merely increases draft re-quirements, energy consumption and tillage time. Tillage shouldthus be kept to the minimum depth required to create an accept-able seedbed [15]. Tabatabaeefar et al. [16] reported that reducingtillage results in lower energy consumption as well as protectionagainst soil erosion and a reduction in the time and energy requiredfor seedbed preparation. However, inmost cases, there is a decreasein yield when reduced tillage systems are used [17].
Energy and the environment are mutually dependent [18]. Forexample, Helsel [19], and Clark and Parmenter [20] reported thatthe energy equivalent value used to calculate energy consumptionattributed to nitrogen fertilizer include the production, packaging,transportation and application. On the other hand, energy con-sumption for environmentalists represents the energy used in theentire production chain of wheat, which could lead to environ-mental problems such as depletion of fossil fuel resources.
The effects of different tillage systems in Mediterranean condi-tions have been studied in terms of agronomical aspects. Yield re-sponses to tillage systems can differ widely with respect to soiltype, crop species, precipitation and region [21]. However, there islittle information in the literature concerning the energy balance ofdurum wheat.
Some producers adoptminimum and/or no-tillage as alternativemanagement practices to reduce fuel consumption and reduce soilerosion and other forms of environmental degradation [22e24].Several studies [25e29] have confirmed ecological and economicadvantages of direct seeding. Despite the potential benefits of directseeding from an environmental and financial point of view alongwith the possibility of its application in most European countries,the evolution of conservation agriculture has been slower in theEuropean Union than in other parts of the world.
Apart from the positive effects on soil conservation and sus-tained land productivity, another major impact of conservationtillage is lower labor costs, generally leading to higher income and abetter standard of living for the farmers [14]. However, a conser-vation tillage system with direct drilling has proven successful,especially in South America [14], but the impacts of this system inthe Mediterranean climate, especially in the southern Italy, are stillnot well known.
2. Materials and methods
The study was conducted at an experimental farm belonging tothe University of Bari, in a typical Mediterranean area (southernItaly), located in Policoro; 40�1002000 N,16�3900400 E. This site is 15mabove sea level and is characterized by a Mediterranean climateaccording to the De Martonne classification [30] with an average
annual rainfall of 560 mm distributed mainly during autumn andwinter, and with a maximum temperature reaching 40e42 �C inthe summer. The soil is loamy (Canadian texture) and has thecharacteristics shown in (Table 1).
In the framework of a three-year crop rotation experimentstarted in 2009e10 season, 9 ha of durumwheat (Triticum turgidumL. var durum) cv IRIDE was sown in parallel with 9 ha of faba bean(Vicia fabavar. equina Pers.) cv PROTHABAT 69, both of which wereorganized in a split-plot designwith three replicates. Both phases ofwheat and faba bean were present and rotated each year with themain plots being wheat and faba bean.
Within each main plot of wheat, treatments consisted of fournitrogen fertilizer rates (0, 30, 60 and 90 kg nitrogen ha�1) appliedin the subplots. Intensive, reduced, and conservation tillage e seedefinitions below e were employed as the main treatment. Thefaba bean phase of the rotation was subjected to the same tillagesystems as the wheat, but no nitrogen fertilizer was used. A total of12 scenarios resulting from the interaction between tillage andnitrogen fertilizer rates were compared in terms of energy con-sumption during production in order to identify the most energyefficient system with regard to productivity.
The tillage systems used were designed based on their in-tensities in terms of fuel consumption, time required and depth asfollowing:
� Conservation tillage (CT) i.e. planting crops in unprepared soilto obtain appropriate seed coverage using a direct drill seeder(IGEA 2700 SEMINASODO, Italy).
� Reduced tillage (RT) i.e. a subsoiler at 20 cm depth in lateAugust usinga volgarino chisel with 7 dents. Disc harrowing at adepth of 15 cm was performed in November to obtain theoptimum level of soil disturbance for producing the crop and,at the same time, minimizing damage to the soil structure.
� Intensive tillage (IT) i.e. an intensive method to a depth thatentails using higher fossil fuels. Furthermore, mouldboardplowing at a depth of 35 cm was performed in late August,followed by disc harrowing at 15 cm in November to preparethe seedbed.
To reach the objective of the study, intensive tillage wasdesigned to be higher than the other two tillage systemsmentionedabove in terms of time and fuel consumption. Plant yield parame-ters and energy indices were either measured or calculated.
2.1. Wheat yield parameters
Harvesting was affected directly on the field using a plotcombine harvester with a 1.4 m width to measure grain and strawyield at plot level. Ten-meter long were harvested from the centerof each plot to obtain a harvesting area of 14 m2 for both wheatgrain yield and straw. Considering the wide dimension of eachsingle plot (27 � 30 m), the harvesting was repeated 3 times foreach plot to obtain a more accurate measures. At the end, data usedper plot was the average of the three harvesting times.Wheat strawwas weighed directly in the field, whereas wheat grain was trans-ported to the lab for cleaning so as to obtain the total weight perharvested area, which was then converted into kg ha�1.
2.2. Energy and time requirement
Using the data shown in Table 2 for fuel consumption and thework duration of machinery used for crop establishment in the 12scenarios, the amount of input and output energy required for thecultivation of 1 ha of durumwheat was calculated based on energyequivalent values given in the literature (Table 3), for the following
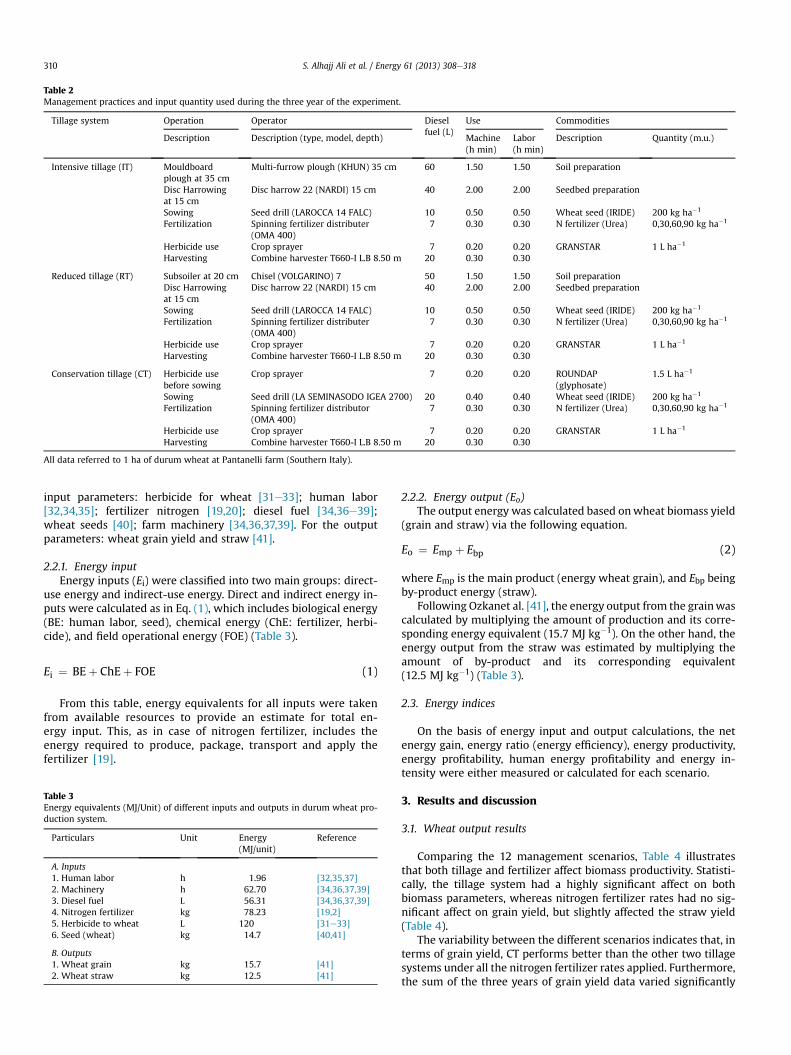
Table 2Management practices and input quantity used during the three year of the experiment.
Tillage system Operation Operator Dieselfuel (L)
Use Commodities
Description Description (type, model, depth) Machine(h min)
Labor(h min)
Description Quantity (m.u.)
Intensive tillage (IT) Mouldboardplough at 35 cm
Multi-furrow plough (KHUN) 35 cm 60 1.50 1.50 Soil preparation
Disc Harrowingat 15 cm
Disc harrow 22 (NARDI) 15 cm 40 2.00 2.00 Seedbed preparation
Sowing Seed drill (LAROCCA 14 FALC) 10 0.50 0.50 Wheat seed (IRIDE) 200 kg ha�1
Fertilization Spinning fertilizer distributer(OMA 400)
7 0.30 0.30 N fertilizer (Urea) 0,30,60,90 kg ha�1
Herbicide use Crop sprayer 7 0.20 0.20 GRANSTAR 1 L ha�1
Harvesting Combine harvester T660-I L.B 8.50 m 20 0.30 0.30
Reduced tillage (RT) Subsoiler at 20 cm Chisel (VOLGARINO) 7 50 1.50 1.50 Soil preparationDisc Harrowingat 15 cm
Disc harrow 22 (NARDI) 15 cm 40 2.00 2.00 Seedbed preparation
Sowing Seed drill (LAROCCA 14 FALC) 10 0.50 0.50 Wheat seed (IRIDE) 200 kg ha�1
Fertilization Spinning fertilizer distributer(OMA 400)
7 0.30 0.30 N fertilizer (Urea) 0,30,60,90 kg ha�1
Herbicide use Crop sprayer 7 0.20 0.20 GRANSTAR 1 L ha�1
Harvesting Combine harvester T660-I L.B 8.50 m 20 0.30 0.30
Conservation tillage (CT) Herbicide usebefore sowing
Crop sprayer 7 0.20 0.20 ROUNDAP(glyphosate)
1.5 L ha�1
Sowing Seed drill (LA SEMINASODO IGEA 2700) 20 0.40 0.40 Wheat seed (IRIDE) 200 kg ha�1
Fertilization Spinning fertilizer distributor(OMA 400)
7 0.30 0.30 N fertilizer (Urea) 0,30,60,90 kg ha�1
Herbicide use Crop sprayer 7 0.20 0.20 GRANSTAR 1 L ha�1
Harvesting Combine harvester T660-I L.B 8.50 m 20 0.30 0.30
All data referred to 1 ha of durum wheat at Pantanelli farm (Southern Italy).
S. Alhajj Ali et al. / Energy 61 (2013) 308e318310
input parameters: herbicide for wheat [31e33]; human labor[32,34,35]; fertilizer nitrogen [19,20]; diesel fuel [34,36e39];wheat seeds [40]; farm machinery [34,36,37,39]. For the outputparameters: wheat grain yield and straw [41].
2.2.1. Energy inputEnergy inputs (Ei) were classified into two main groups: direct-
use energy and indirect-use energy. Direct and indirect energy in-puts were calculated as in Eq. (1), which includes biological energy(BE: human labor, seed), chemical energy (ChE: fertilizer, herbi-cide), and field operational energy (FOE) (Table 3).
Ei ¼ BEþ ChEþ FOE (1)
From this table, energy equivalents for all inputs were takenfrom available resources to provide an estimate for total en-ergy input. This, as in case of nitrogen fertilizer, includes theenergy required to produce, package, transport and apply thefertilizer [19].
Table 3Energy equivalents (MJ/Unit) of different inputs and outputs in durum wheat pro-duction system.
Particulars Unit Energy(MJ/unit)
Reference
A. Inputs1. Human labor h 1.96 [32,35,37]2. Machinery h 62.70 [34,36,37,39]3. Diesel fuel L 56.31 [34,36,37,39]4. Nitrogen fertilizer kg 78.23 [19,2]5. Herbicide to wheat L 120 [31e33]6. Seed (wheat) kg 14.7 [40,41]
B. Outputs1. Wheat grain kg 15.7 [41]2. Wheat straw kg 12.5 [41]
2.2.2. Energy output (Eo)The output energy was calculated based onwheat biomass yield
(grain and straw) via the following equation.
Eo ¼ Emp þ Ebp (2)
where Emp is the main product (energy wheat grain), and Ebp beingby-product energy (straw).
Following Ozkanet al. [41], the energy output from the grainwascalculated by multiplying the amount of production and its corre-sponding energy equivalent (15.7 MJ kg�1). On the other hand, theenergy output from the straw was estimated by multiplying theamount of by-product and its corresponding equivalent(12.5 MJ kg�1) (Table 3).
2.3. Energy indices
On the basis of energy input and output calculations, the netenergy gain, energy ratio (energy efficiency), energy productivity,energy profitability, human energy profitability and energy in-tensity were either measured or calculated for each scenario.
3. Results and discussion
3.1. Wheat output results
Comparing the 12 management scenarios, Table 4 illustratesthat both tillage and fertilizer affect biomass productivity. Statisti-cally, the tillage system had a highly significant affect on bothbiomass parameters, whereas nitrogen fertilizer rates had no sig-nificant affect on grain yield, but slightly affected the straw yield(Table 4).
The variability between the different scenarios indicates that, interms of grain yield, CT performs better than the other two tillagesystems under all the nitrogen fertilizer rates applied. Furthermore,the sum of the three years of grain yield data varied significantly

Table 4Effect of treatments and interaction between them on three years average of durum wheat biomass productivity (kg/ha) at Pantanelli farm in southern Italy.
Nitrogen rates kg/ha Straw yield Grain yield
0 30 60 90 0 30 60 90
Tillage systemIntensive (IT) 5866.6 6324.9 6024.1 6721.3 5244.3 5209.5 5197.5 4907.9Reduced (RT) 5920.2 5726.6 5600.9 5610.3 5383.8 4754.5 4482.7 4355.6Conservation (CT) 5185.7 5698.8 6274.8 6215.4 5524.2 5716.6 5756.8 5892.3
Means 5657.5 5916.8 5966.6 6182.3 5384.1 5226.9 5145.7 5051.9Error % 3.4 2.8 2.7 4.2 1.2 4.3 5.9 7.3
ANOVAEffect of tillage *** *** *** *** *** *** *** ***Effect of nitrogen * * * * ns ns ns nsEffect of year *** *** *** *** *** *** *** ***
S. Alhajj Ali et al. / Energy 61 (2013) 308e318 311
between the three tillage systems employed, based on analysis ofvariance at a 5% level of significance (Fig. 1).
CT had the highest grain yield with mean production of5722.5 kg ha�1, ranging from a minimum of 5524.2 to a maximumof 5892.3 kg ha�1 in the control plot and 90 kg ha�1 of nitrogen plot,respectively. IT gave an average value of 5139.8 kg ha�1, whereas RThad the lowest mean production with 4744.2 kg ha�1 (Table 4).These results agreewith Lawrence et al. [42] who concluded, in fouryears of study, that no-till had a higher wheat yield than reduced orintensive tillage, but they contrast with Arshad and Gill [43] whocompared conventional, reduced and no-till systems and found,during three years of study, that the greatest average wheat yieldwas with reduced tillage.
Straw yield was affected by nitrogen fertilizer rates and wassignificantly higher in IT with an average of 6234.2 kg ha�1 andlowest in RT with an average of 5714.5 kg ha�1. An average value of5843.7 kg ha�1 was found for CT.
During the three years of the study, there was a significant in-crease in grain and straw yield (Fig. 2). Table 4 shows that theprevious crop has a significant effect on durum wheat biomassproductivity. This is due to the fact that the nitrogen level in the soilincreased, as it was affected by the accumulation of nitrogen fixedby faba beanwhich occurred during the second and the third years.Thus grain and straw yield significantly increased in the second andthird years, after the nutrients had stabilized in the field. This in-crease in grain yield was observed as 4.2 ton ha�1 was reported inthe first year, and 5.0 and 6.3 ton ha�1 in the second and third years,respectively. On the other hand, straw increased from 5.7 ton ha�1
in the first year to 6.5 and 8.5 ton ha�1 in the second and the thirdyear, respectively (Fig. 2).
Fig. 1. Effects of tillage systems and previous crop on wheat grain yield during thethree years of the study. Letters (a, b and c) show between years significant differenceat P � 0.05 as determined by Duncan test. WW ¼ wheat sown after wheat;FW ¼ wheat sown after faba bean; 2010 ¼ (2009e2010 season); 2011 ¼ (2010e2011season); 2012 ¼ (2011e2012 season).
3.2. Fuel consumption and related input energy for different tillagesystems
Table 5 shows the various amounts of diesel fuel used for theproduction of durum wheat in southern Italy under differentmanagement scenarios. These amounts were converted to energyvalues i.e. input energy linked to the consumption of diesel fuel(Table 6) using appropriate energy conversion factors (Table 3).
In fact, an average fuel consumption of 111 L ha�1 was reportedin rainfed durumwheat in southern Italy. In IT this was 142 L ha�1,followed by RT with 132 L ha�1, and CT with 59 L ha�1 (i.e. a muchlower fuel consumption). Total fuel consumption for wheat pro-duction in New Zealand was estimated at 65.3 L ha�1 [44].
Table 5 highlights that the IT system was the highest fuel con-sumer due to the longer work duration. CT had the lowest fuelconsumption due to the reduction in tillage.
Fuel consumption for the three type of tillage varied accordingto the intensity. IT and RT were responsible for 69% and 67%,respectively, of all the diesel consumed to operate the farm ma-chinery, (Fig. 3). Furthermore, the mouldboard plow at 35 cm usedmore fuel with 60 L ha�1 and was responsible for 42% of the totaldiesel used in IT. On the other hand, 50 L ha�1 of diesel fuel used forthe Subsoiler at 20 cm represents 37% of the total diesel used in RT.The normal disc harrowing at 15 cm for the seedbed preparation,used in both IT and RT, consumed 40 L ha�1 of diesel and wasresponsible for 28% and 30% of the total diesel fuel used in bothsystems, respectively. The highest amount of diesel consumed in ITand RT was used in the primary and the secondary tillage, followedby combine harvesting and sowing in CT with 20 L ha�1 (Table 2).
Fig. 2. Wheat biomass productivity as affected by previous crop during the three yearsof the study. Letters (a, b and c) show significant difference at P � 0.05 as determinedby Duncan test. WW ¼ wheat sown after wheat; FW ¼ wheat sown after faba bean;2010 ¼ (2009e2010 season); 2011 ¼ (2010e2011 season); 2012 ¼ (2011e2012 season).
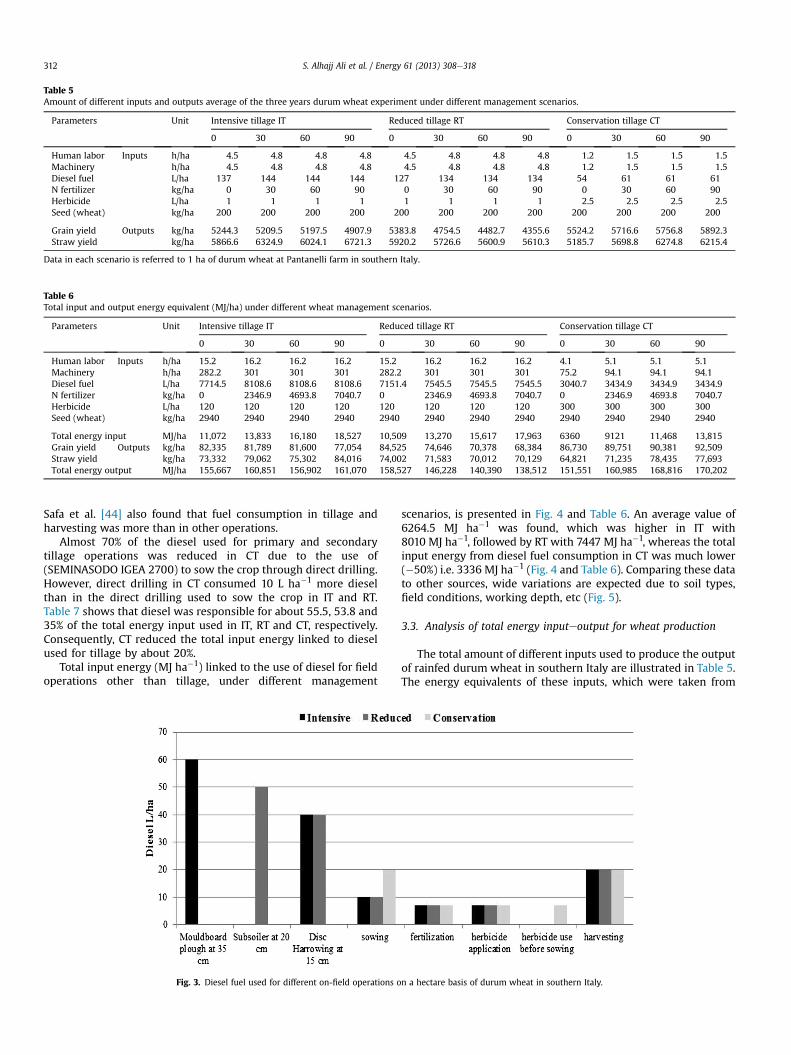
Table 5Amount of different inputs and outputs average of the three years durum wheat experiment under different management scenarios.
Parameters Unit Intensive tillage IT Reduced tillage RT Conservation tillage CT
0 30 60 90 0 30 60 90 0 30 60 90
Human labor Inputs h/ha 4.5 4.8 4.8 4.8 4.5 4.8 4.8 4.8 1.2 1.5 1.5 1.5Machinery h/ha 4.5 4.8 4.8 4.8 4.5 4.8 4.8 4.8 1.2 1.5 1.5 1.5Diesel fuel L/ha 137 144 144 144 127 134 134 134 54 61 61 61N fertilizer kg/ha 0 30 60 90 0 30 60 90 0 30 60 90Herbicide L/ha 1 1 1 1 1 1 1 1 2.5 2.5 2.5 2.5Seed (wheat) kg/ha 200 200 200 200 200 200 200 200 200 200 200 200
Grain yield Outputs kg/ha 5244.3 5209.5 5197.5 4907.9 5383.8 4754.5 4482.7 4355.6 5524.2 5716.6 5756.8 5892.3Straw yield kg/ha 5866.6 6324.9 6024.1 6721.3 5920.2 5726.6 5600.9 5610.3 5185.7 5698.8 6274.8 6215.4
Data in each scenario is referred to 1 ha of durum wheat at Pantanelli farm in southern Italy.
Table 6Total input and output energy equivalent (MJ/ha) under different wheat management scenarios.
Parameters Unit Intensive tillage IT Reduced tillage RT Conservation tillage CT
0 30 60 90 0 30 60 90 0 30 60 90
Human labor Inputs h/ha 15.2 16.2 16.2 16.2 15.2 16.2 16.2 16.2 4.1 5.1 5.1 5.1Machinery h/ha 282.2 301 301 301 282.2 301 301 301 75.2 94.1 94.1 94.1Diesel fuel L/ha 7714.5 8108.6 8108.6 8108.6 7151.4 7545.5 7545.5 7545.5 3040.7 3434.9 3434.9 3434.9N fertilizer kg/ha 0 2346.9 4693.8 7040.7 0 2346.9 4693.8 7040.7 0 2346.9 4693.8 7040.7Herbicide L/ha 120 120 120 120 120 120 120 120 300 300 300 300Seed (wheat) kg/ha 2940 2940 2940 2940 2940 2940 2940 2940 2940 2940 2940 2940
Total energy input MJ/ha 11,072 13,833 16,180 18,527 10,509 13,270 15,617 17,963 6360 9121 11,468 13,815Grain yield Outputs kg/ha 82,335 81,789 81,600 77,054 84,525 74,646 70,378 68,384 86,730 89,751 90,381 92,509Straw yield kg/ha 73,332 79,062 75,302 84,016 74,002 71,583 70,012 70,129 64,821 71,235 78,435 77,693Total energy output MJ/ha 155,667 160,851 156,902 161,070 158,527 146,228 140,390 138,512 151,551 160,985 168,816 170,202
S. Alhajj Ali et al. / Energy 61 (2013) 308e318312
Safa et al. [44] also found that fuel consumption in tillage andharvesting was more than in other operations.
Almost 70% of the diesel used for primary and secondarytillage operations was reduced in CT due to the use of(SEMINASODO IGEA 2700) to sow the crop through direct drilling.However, direct drilling in CT consumed 10 L ha�1 more dieselthan in the direct drilling used to sow the crop in IT and RT.Table 7 shows that diesel was responsible for about 55.5, 53.8 and35% of the total energy input used in IT, RT and CT, respectively.Consequently, CT reduced the total input energy linked to dieselused for tillage by about 20%.
Total input energy (MJ ha�1) linked to the use of diesel for fieldoperations other than tillage, under different management
Fig. 3. Diesel fuel used for different on-field operations o
scenarios, is presented in Fig. 4 and Table 6. An average value of6264.5 MJ ha�1 was found, which was higher in IT with8010 MJ ha�1, followed by RT with 7447 MJ ha�1, whereas the totalinput energy from diesel fuel consumption in CT was much lower(�50%) i.e. 3336 MJ ha�1 (Fig. 4 and Table 6). Comparing these datato other sources, wide variations are expected due to soil types,field conditions, working depth, etc (Fig. 5).
3.3. Analysis of total energy inputeoutput for wheat production
The total amount of different inputs used to produce the outputof rainfed durum wheat in southern Italy are illustrated in Table 5.The energy equivalents of these inputs, which were taken from
n a hectare basis of durum wheat in southern Italy.
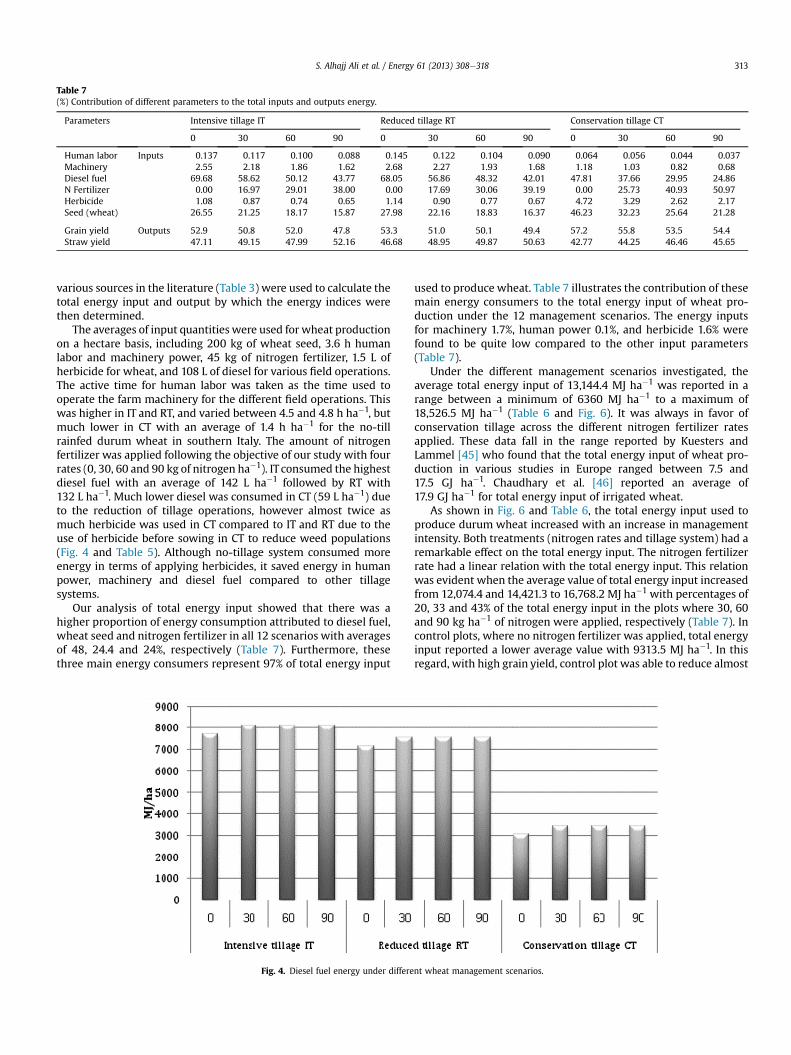
Table 7(%) Contribution of different parameters to the total inputs and outputs energy.
Parameters Intensive tillage IT Reduced tillage RT Conservation tillage CT
0 30 60 90 0 30 60 90 0 30 60 90
Human labor Inputs 0.137 0.117 0.100 0.088 0.145 0.122 0.104 0.090 0.064 0.056 0.044 0.037Machinery 2.55 2.18 1.86 1.62 2.68 2.27 1.93 1.68 1.18 1.03 0.82 0.68Diesel fuel 69.68 58.62 50.12 43.77 68.05 56.86 48.32 42.01 47.81 37.66 29.95 24.86N Fertilizer 0.00 16.97 29.01 38.00 0.00 17.69 30.06 39.19 0.00 25.73 40.93 50.97Herbicide 1.08 0.87 0.74 0.65 1.14 0.90 0.77 0.67 4.72 3.29 2.62 2.17Seed (wheat) 26.55 21.25 18.17 15.87 27.98 22.16 18.83 16.37 46.23 32.23 25.64 21.28
Grain yield Outputs 52.9 50.8 52.0 47.8 53.3 51.0 50.1 49.4 57.2 55.8 53.5 54.4Straw yield 47.11 49.15 47.99 52.16 46.68 48.95 49.87 50.63 42.77 44.25 46.46 45.65
S. Alhajj Ali et al. / Energy 61 (2013) 308e318 313
various sources in the literature (Table 3) were used to calculate thetotal energy input and output by which the energy indices werethen determined.
The averages of input quantities were used for wheat productionon a hectare basis, including 200 kg of wheat seed, 3.6 h humanlabor and machinery power, 45 kg of nitrogen fertilizer, 1.5 L ofherbicide for wheat, and 108 L of diesel for various field operations.The active time for human labor was taken as the time used tooperate the farm machinery for the different field operations. Thiswas higher in IT and RT, and varied between 4.5 and 4.8 h ha�1, butmuch lower in CT with an average of 1.4 h ha�1 for the no-tillrainfed durum wheat in southern Italy. The amount of nitrogenfertilizer was applied following the objective of our study with fourrates (0, 30, 60 and 90 kg of nitrogen ha�1). IT consumed the highestdiesel fuel with an average of 142 L ha�1 followed by RT with132 L ha�1. Much lower diesel was consumed in CT (59 L ha�1) dueto the reduction of tillage operations, however almost twice asmuch herbicide was used in CT compared to IT and RT due to theuse of herbicide before sowing in CT to reduce weed populations(Fig. 4 and Table 5). Although no-tillage system consumed moreenergy in terms of applying herbicides, it saved energy in humanpower, machinery and diesel fuel compared to other tillagesystems.
Our analysis of total energy input showed that there was ahigher proportion of energy consumption attributed to diesel fuel,wheat seed and nitrogen fertilizer in all 12 scenarios with averagesof 48, 24.4 and 24%, respectively (Table 7). Furthermore, thesethree main energy consumers represent 97% of total energy input
Fig. 4. Diesel fuel energy under differe
used to produce wheat. Table 7 illustrates the contribution of thesemain energy consumers to the total energy input of wheat pro-duction under the 12 management scenarios. The energy inputsfor machinery 1.7%, human power 0.1%, and herbicide 1.6% werefound to be quite low compared to the other input parameters(Table 7).
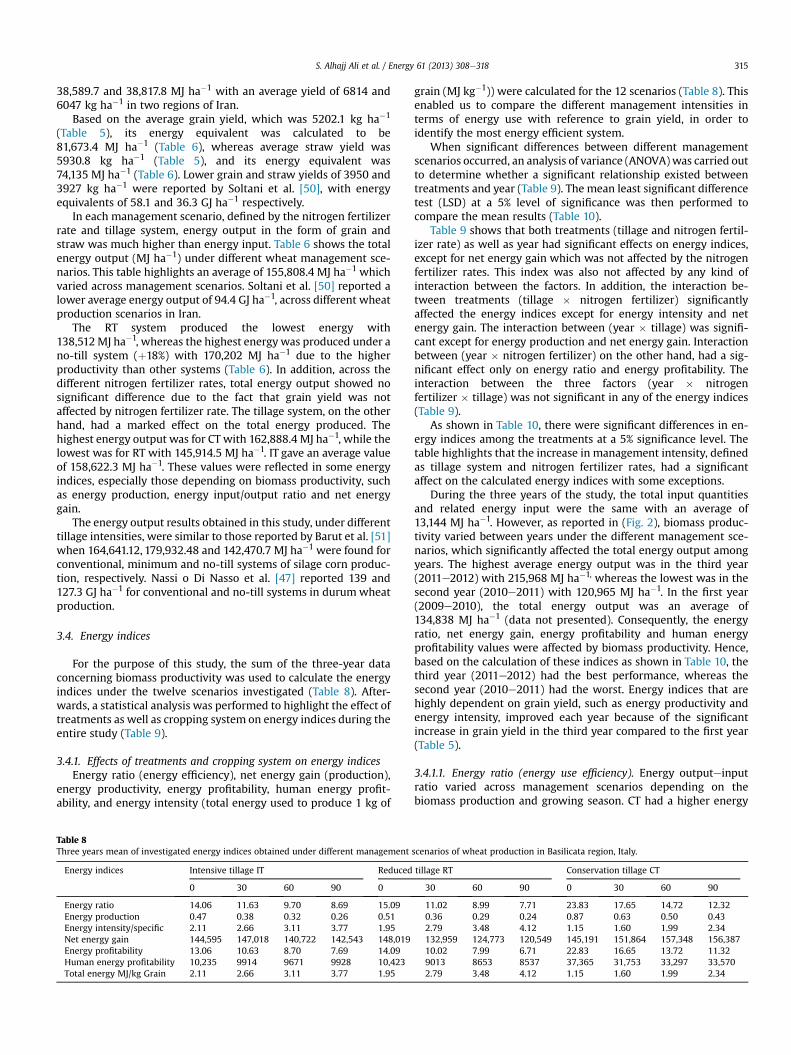
Under the different management scenarios investigated, theaverage total energy input of 13,144.4 MJ ha�1 was reported in arange between a minimum of 6360 MJ ha�1 to a maximum of18,526.5 MJ ha�1 (Table 6 and Fig. 6). It was always in favor ofconservation tillage across the different nitrogen fertilizer ratesapplied. These data fall in the range reported by Kuesters andLammel [45] who found that the total energy input of wheat pro-duction in various studies in Europe ranged between 7.5 and17.5 GJ ha�1. Chaudhary et al. [46] reported an average of17.9 GJ ha�1 for total energy input of irrigated wheat.
As shown in Fig. 6 and Table 6, the total energy input used toproduce durum wheat increased with an increase in managementintensity. Both treatments (nitrogen rates and tillage system) had aremarkable effect on the total energy input. The nitrogen fertilizerrate had a linear relation with the total energy input. This relationwas evident when the average value of total energy input increasedfrom 12,074.4 and 14,421.3 to 16,768.2 MJ ha�1 with percentages of20, 33 and 43% of the total energy input in the plots where 30, 60and 90 kg ha�1 of nitrogen were applied, respectively (Table 7). Incontrol plots, where no nitrogen fertilizer was applied, total energyinput reported a lower average value with 9313.5 MJ ha�1. In thisregard, with high grain yield, control plot was able to reduce almost
nt wheat management scenarios.
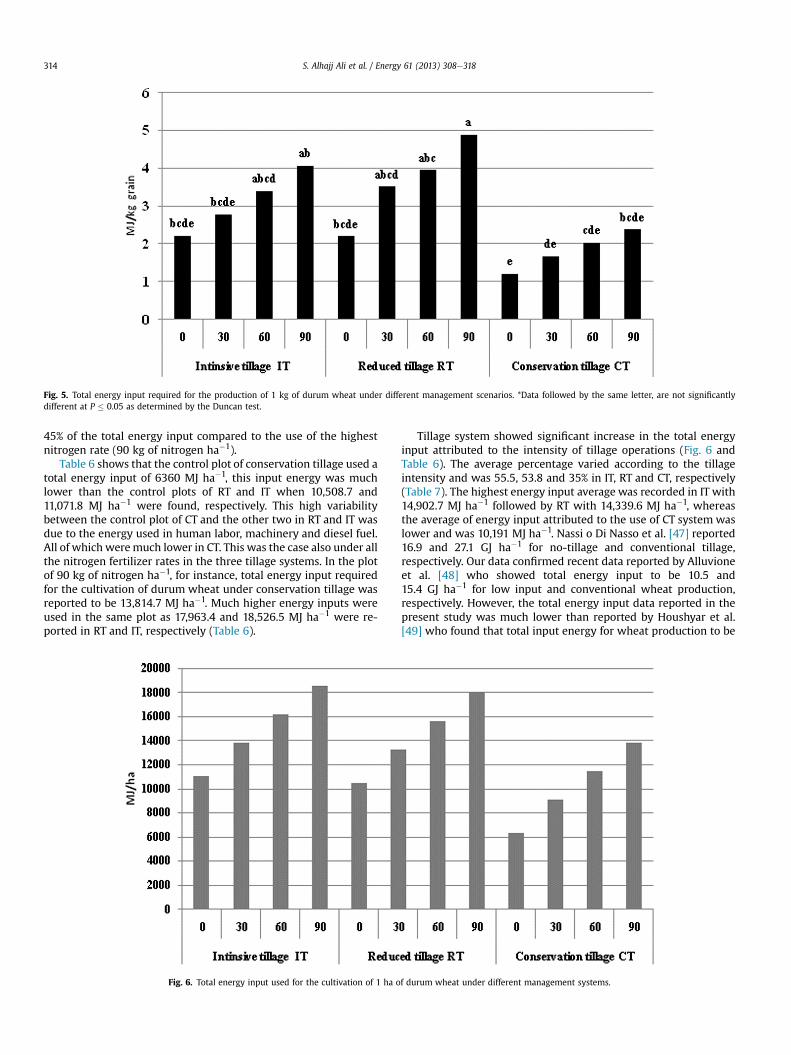
Fig. 5. Total energy input required for the production of 1 kg of durum wheat under different management scenarios. *Data followed by the same letter, are not significantlydifferent at P � 0.05 as determined by the Duncan test.
S. Alhajj Ali et al. / Energy 61 (2013) 308e318314
45% of the total energy input compared to the use of the highestnitrogen rate (90 kg of nitrogen ha�1).
Table 6 shows that the control plot of conservation tillage used atotal energy input of 6360 MJ ha�1, this input energy was muchlower than the control plots of RT and IT when 10,508.7 and11,071.8 MJ ha�1 were found, respectively. This high variabilitybetween the control plot of CT and the other two in RT and IT wasdue to the energy used in human labor, machinery and diesel fuel.All of which weremuch lower in CT. This was the case also under allthe nitrogen fertilizer rates in the three tillage systems. In the plotof 90 kg of nitrogen ha�1, for instance, total energy input requiredfor the cultivation of durum wheat under conservation tillage wasreported to be 13,814.7 MJ ha�1. Much higher energy inputs wereused in the same plot as 17,963.4 and 18,526.5 MJ ha�1 were re-ported in RT and IT, respectively (Table 6).
Fig. 6. Total energy input used for the cultivation of 1 ha o
Tillage system showed significant increase in the total energyinput attributed to the intensity of tillage operations (Fig. 6 andTable 6). The average percentage varied according to the tillageintensity and was 55.5, 53.8 and 35% in IT, RT and CT, respectively(Table 7). The highest energy input average was recorded in IT with14,902.7 MJ ha�1 followed by RT with 14,339.6 MJ ha�1, whereasthe average of energy input attributed to the use of CT system waslower and was 10,191 MJ ha�1. Nassi o Di Nasso et al. [47] reported16.9 and 27.1 GJ ha�1 for no-tillage and conventional tillage,respectively. Our data confirmed recent data reported by Alluvioneet al. [48] who showed total energy input to be 10.5 and15.4 GJ ha�1 for low input and conventional wheat production,respectively. However, the total energy input data reported in thepresent study was much lower than reported by Houshyar et al.[49] who found that total input energy for wheat production to be
f durum wheat under different management systems.
S. Alhajj Ali et al. / Energy 61 (2013) 308e318 315
38,589.7 and 38,817.8 MJ ha�1 with an average yield of 6814 and6047 kg ha�1 in two regions of Iran.
Based on the average grain yield, which was 5202.1 kg ha�1
(Table 5), its energy equivalent was calculated to be81,673.4 MJ ha�1 (Table 6), whereas average straw yield was5930.8 kg ha�1 (Table 5), and its energy equivalent was74,135 MJ ha�1 (Table 6). Lower grain and straw yields of 3950 and3927 kg ha�1 were reported by Soltani et al. [50], with energyequivalents of 58.1 and 36.3 GJ ha�1 respectively.
In each management scenario, defined by the nitrogen fertilizerrate and tillage system, energy output in the form of grain andstraw was much higher than energy input. Table 6 shows the totalenergy output (MJ ha�1) under different wheat management sce-narios. This table highlights an average of 155,808.4 MJ ha�1 whichvaried across management scenarios. Soltani et al. [50] reported alower average energy output of 94.4 GJ ha�1, across different wheatproduction scenarios in Iran.
The RT system produced the lowest energy with138,512MJ ha�1, whereas the highest energy was produced under ano-till system (þ18%) with 170,202 MJ ha�1 due to the higherproductivity than other systems (Table 6). In addition, across thedifferent nitrogen fertilizer rates, total energy output showed nosignificant difference due to the fact that grain yield was notaffected by nitrogen fertilizer rate. The tillage system, on the otherhand, had a marked effect on the total energy produced. Thehighest energy output was for CT with 162,888.4 MJ ha�1, while thelowest was for RT with 145,914.5 MJ ha�1. IT gave an average valueof 158,622.3 MJ ha�1. These values were reflected in some energyindices, especially those depending on biomass productivity, suchas energy production, energy input/output ratio and net energygain.
The energy output results obtained in this study, under differenttillage intensities, were similar to those reported by Barut et al. [51]when 164,641.12, 179,932.48 and 142,470.7 MJ ha�1 were found forconventional, minimum and no-till systems of silage corn produc-tion, respectively. Nassi o Di Nasso et al. [47] reported 139 and127.3 GJ ha�1 for conventional and no-till systems in durumwheatproduction.
3.4. Energy indices
For the purpose of this study, the sum of the three-year dataconcerning biomass productivity was used to calculate the energyindices under the twelve scenarios investigated (Table 8). After-wards, a statistical analysis was performed to highlight the effect oftreatments as well as cropping system on energy indices during theentire study (Table 9).
3.4.1. Effects of treatments and cropping system on energy indicesEnergy ratio (energy efficiency), net energy gain (production),
energy productivity, energy profitability, human energy profit-ability, and energy intensity (total energy used to produce 1 kg of
Table 8Three years mean of investigated energy indices obtained under different management
Energy indices Intensive tillage IT Reduced
0 30 60 90 0
Energy ratio 14.06 11.63 9.70 8.69 15.09Energy production 0.47 0.38 0.32 0.26 0.51Energy intensity/specific 2.11 2.66 3.11 3.77 1.95Net energy gain 144,595 147,018 140,722 142,543 148,019Energy profitability 13.06 10.63 8.70 7.69 14.09Human energy profitability 10,235 9914 9671 9928 10,423Total energy MJ/kg Grain 2.11 2.66 3.11 3.77 1.95
grain (MJ kg�1)) were calculated for the 12 scenarios (Table 8). Thisenabled us to compare the different management intensities interms of energy use with reference to grain yield, in order toidentify the most energy efficient system.
When significant differences between different managementscenarios occurred, an analysis of variance (ANOVA)was carried outto determine whether a significant relationship existed betweentreatments and year (Table 9). The mean least significant differencetest (LSD) at a 5% level of significance was then performed tocompare the mean results (Table 10).
Table 9 shows that both treatments (tillage and nitrogen fertil-izer rate) as well as year had significant effects on energy indices,except for net energy gain which was not affected by the nitrogenfertilizer rates. This index was also not affected by any kind ofinteraction between the factors. In addition, the interaction be-tween treatments (tillage � nitrogen fertilizer) significantlyaffected the energy indices except for energy intensity and netenergy gain. The interaction between (year � tillage) was signifi-cant except for energy production and net energy gain. Interactionbetween (year � nitrogen fertilizer) on the other hand, had a sig-nificant effect only on energy ratio and energy profitability. Theinteraction between the three factors (year � nitrogenfertilizer � tillage) was not significant in any of the energy indices(Table 9).
As shown in Table 10, there were significant differences in en-ergy indices among the treatments at a 5% significance level. Thetable highlights that the increase in management intensity, definedas tillage system and nitrogen fertilizer rates, had a significantaffect on the calculated energy indices with some exceptions.
During the three years of the study, the total input quantitiesand related energy input were the same with an average of13,144 MJ ha�1. However, as reported in (Fig. 2), biomass produc-tivity varied between years under the different management sce-narios, which significantly affected the total energy output amongyears. The highest average energy output was in the third year(2011e2012) with 215,968 MJ ha�1, whereas the lowest was in thesecond year (2010e2011) with 120,965 MJ ha�1. In the first year(2009e2010), the total energy output was an average of134,838 MJ ha�1 (data not presented). Consequently, the energyratio, net energy gain, energy profitability and human energyprofitability values were affected by biomass productivity. Hence,based on the calculation of these indices as shown in Table 10, thethird year (2011e2012) had the best performance, whereas thesecond year (2010e2011) had the worst. Energy indices that arehighly dependent on grain yield, such as energy productivity andenergy intensity, improved each year because of the significantincrease in grain yield in the third year compared to the first year(Table 5).
3.4.1.1. Energy ratio (energy use efficiency). Energy outputeinputratio varied across management scenarios depending on thebiomass production and growing season. CT had a higher energy
scenarios of wheat production in Basilicata region, Italy.
tillage RT Conservation tillage CT
30 60 90 0 30 60 90
11.02 8.99 7.71 23.83 17.65 14.72 12.320.36 0.29 0.24 0.87 0.63 0.50 0.432.79 3.48 4.12 1.15 1.60 1.99 2.34132,959 124,773 120,549 145,191 151,864 157,348 156,38710.02 7.99 6.71 22.83 16.65 13.72 11.329013 8653 8537 37,365 31,753 33,297 33,5702.79 3.48 4.12 1.15 1.60 1.99 2.34
Table 9Analysis of variance (ANOVA) for energy indices as affected by treatments and the interaction between them.
Main effects Energyratio
Energyproduction
Energyintensity
Netenergy gain
Energyprofitability
Human energyprofitability
Total energyMJ/kg grain
Year (Y) *** *** *** *** *** *** ***Tillage (T) *** *** *** ** *** ** ***Nitrogen (N) *** *** *** ns *** ** ***
InteractionN � T *** *** ns ns *** * nsY � T * ns * ns * *** *Y � N * ns ns ns * ns nsY � N � T ns ns ns ns ns ns ns
S. Alhajj Ali et al. / Energy 61 (2013) 308e318316
outputeinput ratio with an average of 17.13, where the lowest totalenergy input and the highest total energy output were recorded.The IT system gave an average of 11.02, whereas RT had the lowestaverage energy outputeinput ratio with 10.7. Comparing the 12management scenarios investigated, the highest energy outputeinput ratio was observed with low production intensities, inparticular, in the control plot under CT which gave 23.8. The lowestenergy outputeinput ratio value was for RT, where 90 kg of nitro-gen ha�1 was applied, with 7.7 (Table 8) showing the possibility ofeffective use of energy in wheat production, using different man-agement intensities, with regard to productivity.
This wide range was due to the variability in the total energyoutput which ranged from a minimum of 138,512.4 to a maximumof 170,201.6 MJ ha�1 (Table 6). The lowest and the highest biomassproductivity (grain þ straw yield) were 9966 and 12,108 kg ha�1 in90 kg of nitrogen ha�1 plot in RT and CT, respectively (Table 5). Thiswas influenced by grain and straw productivity both of whichmadethe total energy output much higher than the total energy inputand, therefore, increased the energy outputeinput ratio. Kuestersand Lammel [45] reported a minimum of 6 and a maximum of 13for the energy ratio of winter wheat. Singh et al. [52] reported amuch lower energy outputeinput ratio with a minimum of 2.9 anda maximum of 5.2 for different irrigated durum wheat regions inIndia, whereas Nassi o Di Nasso et al. [47] reported 5.1 and 7.5 forconventional and no-tillage systems, respectively.
The statistical analysis showed that the energy ratio index var-ied significantly under different management scenarios. As shown
Table 10The mean least significant difference test (LSD) at 5% significant level for energy indices
Energy indices Energyratio
Energyproduction
Energyintensity
Ng
Nitrogen rates kg/haTest 17.7a 0.62a 1.9c 130 13.4b 0.45b 2.7b 160 11.1c 0.37c 3.1ab 190 9.6d 0.31d 3.8a 1
Means 13.0 0.44 2.9 1Error % 15.7 17.8 15.9 1
Tillage systemConservation CT 17.1a 0.61a 1.8b 1Reduced RT 10.7b 0.35b 3.6a 1Intensive IT 11b 0.36b 3.1a 1
Means 12.9 0.4 2.8 1Error % 13.2 15.8 15.5 3
Cropping year2010 11.5b 0.37c 3.67a 12011 10.4c 0.42b 2.74b 12012 17a 0.53a 2.15c 1
Means 13.0 0.4 2.9 1Error % 12.9 8.8 12.7 1
in Table 9, the analysis of variance indicates that the energy ratiowas significantly affected by both treatments (tillage and nitrogenfertilizer rate) as well as the year. Furthermore, the interactionbetween the treatments also had a significant effect on the energyratio index.
3.4.1.2. Energy production. Energy production enabled us to un-derstand the ratio of grain productivity relative to the total energyrequired to produce it. Grain yield along with total energy inputsignificantly affected the energy production. This value was higherin CT with average of 0.61 kg MJ�1 when higher grain productivityand total input energy were obtained. Lower energy productionvalues were recorded in RT and IT with averages of 0.35 and0.36 kg MJ�1, respectively (Table 8). The reason for these lowervalues was due to the lower grain yield and higher input energyused under these systems compared to CT. This means that 0.61,0.36 and 0.35 kg of output was obtained per 1 Mega joule of energyused in CT, IT and RT, respectively with an average of 0.44 kg MJ�1
across the different scenarios. Soltani et al. [50] reported an averageof 0.27 across different wheat management scenarios.
Both grain yield and total energy input had a direct effect onenergy production. In addition, the total energy input values had aninverse relation with energy production, where the lowest(0.24 kg MJ�1) and the highest (0.87 kg MJ�1) energy productionwere obtained when the highest (17,963.4 MJ ha�1) and the lowest(6360 MJ ha�1) total energy input values were used. Treatments aswell as cropping year had a significant effect on energy production,
of durum wheat.
et energyain
Energyprofitability
Human energyprofitability
Total energyMJ/kg grain
45,934.9 16.7a 19,340.6a 1.9c43,947.0 12.4b 16,893.3b 2.7b40,947.8 10.1c 17,207b 3.1ab39,826.0 8.6d 17,345.2b 3.8a
42,663.9 12.0 17,696.5 2.9.1 17.1 3.6 15.9
52,698a 16.13a 33,996a 1.82b31,575b 9.7b 9156.6b 3.63a43,720a 10b 9937b 3.1a
42,664.3 11.9 17,696.5 2.9.5 14.3 37.6 15.4
24,596b 10.9b 15,831.7b 3.6a11,460.7c 9.8c 14,236.2c 2.7b91,935.3a 17a 23,245.9a 2.1c
42,664.0 12.6 17,771.3 2.84.3 14.5 12.8 12.7

S. Alhajj Ali et al. / Energy 61 (2013) 308e318 317
whereas the interaction between them was not significant exceptfor tillage� nitrogen rate (Table 9). The significant effect of differentfactors was due to the fact that these factors had a significant effecton grain yield (Table 4) except for Nitrogen fertilizer rate, whichsignificantly affected energy production but had no effect on grainyield. This is because the energy used for the Nitrogen fertilizer incontrol plots, for instance, reduced the total energy input and as aconsequence increased the energy productivity.
3.4.1.3. Energy intensity/specific. Energy intensity increased withthe increase in management intensity which was greatly affectedby grain productivity (Table 8). Both, nitrogen fertilizer rates andthe tillage system had significant effects on the amount of energyrequired to obtain 1 kg of wheat grain (Tables 9 and 10). However,no significant effect was found in the interaction between thetreatments except for year � tillage (Table 9).
Based on the three year average data, the total energy used toproduce 1 kg of durumwheat was inversely linked with grain yieldwith an average value of 2.6 MJ kg�1 of grain (Table 8). This variedbetween a minimum of 1.2 in the CT control plot to a maximum of4.1 MJ kg�1 of grain in RT when 90 kg ha�1 of nitrogenwas applied.Furthermore, CTwas less energy intense and performed better thanthe other two tillage systems under all nitrogen fertilizer rates withan average of 1.8 MJ kg�1 of grain. This was followed by IT with2.9 MJ kg�1, whereas RT had the highest energy intensity with anaverage value of 3.1 MJ kg�1 (Table 8). Energy intensity values ob-tained in this study were in agreement with those reported byAlluvione et al. [48] who reported an average value of 2.6 andvaried from 2.1 in the low input system to 3.3 in the conventionalsystem. However our values were lower than those showed bySingh et al. [52] where minimum specific energy values of4.6 MJ kg�1 and 6.0 MJ kg�1 were reported for two different wheatgrowing regions in Indiawith an average yield of 2550.5 kg ha�1 forthe regions considered.
The analysis of data between years showed a marked reductionin the energy required to produce 1 kg of wheat grain (Table 10).Due to the increasing productivity over the years, the energy in-tensity declined by 43% from 3.7 MJ ha�1 in the first year to2.1 MJ ha�1 in the final year. With a 5% significance level, Table 10highlights that energy intensity had a significant effect in all thescenarios. Furthermore, the total energy input required to obtain1 kg of wheat increased with an increase in nitrogen fertilizer ratefrom 1.8 in the control plot to 3.7 MJ kg�1 in the plot where 90 kgnitrogen ha�1 was applied. The intensity of the tillage system hadthe same effect where the lowest values obtained were 1.7 MJ kg�1
in CTand 3.1MJ kg�1 in IT. The highest energy was in RTwith 3.6MJkg�1 which had the lowest grain productivity (Table 4).
3.4.1.4. Net energy gain (production). On the basis of 1 ha of durumwheat cultivated in southern Italy for this study, the gross energyproduced (output) was much higher than the total energy requiredto obtain it (input). Thus the low input energy used in CT comparedto RT and IT, increased the gross energy output produced. This wasvery much related to the biomass productivity (grain and strawyield) and the amount of input used for the different managementscenarios. The average net energy gain of 142,664 MJ ha�1 reportedin this study was close to that reported by Alluvione et al. [48](182,200 MJ ha�1), however a much lower value of 78,800 MJ ha�1
was reported by Soltani et al. [50].The tillage system had a significant effect on net energy gain,
whereas the nitrogen fertilizer rate was not significant (Table 9). Themean least significant difference test (LSD) at 5% (Table 10) showedthat CT had the highest net energy gain, whereas RT had the lowestvalue. In addition, CT gave an average of 152,697.5 MJ ha�1 in whichthe highest value was recorded with 157,348 MJ ha�1 in the plot
where 60 kg ha�1 of nitrogen was applied. A significantly loweraverage of 131,575 MJ ha�1, on the other hand, was found for RTwhere also the lowest value, across the twelve scenarios, wasrecorded with 120,549 MJ ha�1 in the 90 kg ha�1 nitrogen plot. ITgave an average net energy gain of 143,720 MJ ha�1 (Table 8). Thecropping year significantly affected the net energy gain and led to anincrease of 42% when there was a significantly higher net energy of191,935.3 MJ ha�1 in the last year (Table 10). In fact, grain yieldincreased from 4.2 ton ha�1 in the first year to 6.3 ton ha�1 in thethird year (Fig. 2). Nitrogen fertilizer rate had no significant effect onnet energy gain, as this factor had no or a slight (in the case of straw)effect on productivity (Table 9).
3.4.1.5. Energy profitability. Energy profitability increased with adecrease in management intensity and was highly correlated withbiomass productivity (Table 8). Both treatments and cropping yearas well as the interaction between them had a significant effect onthis index (Table 9). Increasing the nitrogen fertilizer rate decreasedthis value where the highest was in the control plot with 16.7, andthe lowest in the 90 kg ha�1 of nitrogenwith 8.6. As with the tillagesystem, CT had the highest energy profitability with 16.13, whereasRT had the lowest with 9.7 (Table 10). Across the different man-agement scenarios investigated, an average value of 12 was recor-ded. The highest value which was obtained in the control plot of CTwith 22.8, and the lowest was obtained from 90 kg nitrogen ha�1 inRT with 6.7 (Table 8). Barut et al. [51] reported an average energyprofitability of 7.59, 7.78 and 7.26 for conventional, minimum andno-till systems, respectively.
3.4.1.6. Human energy profitability. Human energy profitability wascalculated based on man power and its energy equivalent used toproduce the output. In the modern cultivation of rainfed durumwheat in southern Italy, two workers were enough to operate thefarm machinery for the cultivation of 1 ha of rainfed durum wheat.Furthermore, as illustrated in (Table 2), energy used in manpowerwas reduced in CT by almost 70%, as much of this energy was used toconduct the primary and the secondary tillage in both RTand IT.Withhigher output energy and lower human labour, CT gave a muchhigher human energy profitability with an average of 33,996compared to RT and IT where 9156.6 and 9936.9 were reported,respectively (Table 8). Table 9 indicates that there were significantdifferences between the different management scenarios as affectedby both treatments and growing season. The cropping system had aclear effect on human energy profitability, as this index significantlyincreased from 15,831.7 in the first growing season (2009e2010) to23,245.9 in the third year (2011e2012) (Table 10).
4. Conclusions
On the basis of the data collected from three years of field ex-periments conducted at pantanelli farm in southern Italy (Basilicataregione), twelve management scenarios were evaluated in terms ofthe energy consumption required to produce durumwheat. Energyindicesweremeasured based on the calculation of input and outputenergy. Results show that grain yield did not compensate thehigher input energy used in intensive input scenarios. Furthermore,with lower inputs and higher energy outputs resulting from ahigher productivity, CT performed better under all energy indicescalculated compared to other systems. IT was the highest energyconsumer with a moderate yield followed by RT but with thelowest yield, whereas CT was the lowest energy consumer. Theenergy consumption required to produce 1 kg of wheat grain washigher in RT with an average of 3.6 MJ kg�1 followed by IT and CTwith average values of 3.1 and 1.8 MJ kg�1 respectively. The highproportion of energy consumed in RT and IT was linked to the
S. Alhajj Ali et al. / Energy 61 (2013) 308e318318
tillage operations, i.e. primary and secondary tillage for cropestablishment. This reveals the impact of the tillage system in termsof both energy consumption and its impact on fossil fuel depletionfrom an environmental prospective. The nitrogen fertilizer did notcompensate for the additional energy used in the production ofwheat as it did not show a significant effect on productivity thanksto the rotation with faba beans.
Findings of this study show that strategies for a more energyefficient wheat production could focus on the reduction of nitrogenfertilizers through the introduction of legume crops, and onlowering fuel consumption by adopting a no-till/direct drill system.The nitrogen fertilizer and tillage could be minimized or replacedby conservation practices in order to reduce the financial andenvironmental costs.
In our specific study area, conservation practices showedpromising results in terms of increasing productivity and reducingthe reliance on fossil fuel. Such practices could be proposed as analternative management of wheat production in dry areas ofsouthern Italy in order to maintain the productivity and sustain-ability of the agro-ecosystem.
References
[1] Conforti P, Giampietro M. Fossil energy use in agriculture: an internationalcomparison. Agric Ecosyst Environ 1997;65:231e43.
[2] Hatirli SA, Ozkan B, Fert C. An econometric analysis of energy inputeoutput inTurkish agriculture. Renew Sustain Energy Rev 2005;9:608e23.
[3] Kiani S, Houshyar E. Energy consumption of rainfed wheat production inconventional and conservation tillage systems. Int J Agric Crop Sci 2012;4-5:213e9.
[4] Uhlin H. Why energy productivity is increasing: an IeO analysis of Swedishvagriculture. Agric Syst 1998;56(4):443e65.
[5] Stirling B. Use of non-renewable energy on Saskatchewan farms. BackgroundStudy 2. Province of Saskatchewan, Regina, SK: Saskatchewan Science Council,Science Policy Secretariat; 1979. p. 38.
[6] Tewari DD, Kulshreshtha SN. Energy use and cropping patterns under a risingenergy price regime. J Soil Water Conserv 1988;43:499e502.
[7] Hopper GR. The energetics of Canadian Prairie wheat production 1948e1981.In: Proc. Energex 1984, energy developments: new forms, renewables, con-servation. Regina 1984. p. 677e83. SK.
[8] Borin M, Menini C, Sartori L. Effects of tillage systems on energy and carbonbalance in north-eastern Italy. Soil Till Res 1997;40:209e26.
[9] Arvidsson J. Energy use efficiency in different tillage systems for winter wheaton a clay and silt loam in Sweden. Eur J Agron 2010;33:250e6.
[10] Kosutic S, Filipovic D, Gospodaric Z, Husnjak S, Kovacev I, Copec K. Effects ofdifferent soil tillage systems on yields of maize, winter wheat and soybean onalbicluvisol in north-west Slavonia. J Central Eur Agric 2005;6:241e8.
[11] Zugec I, Stipesevic B, Kelava I. Ratio al soil tillage for cereals (winter wheat-dTriticum aestivum L. and spring barleydHordem vulgar L.) in eastern Croatia.In: Proceedings of the 15th ISTRO conference, Fort Worth, Texas 2000.
[12] Harman WL, Daves RM, Morrison JE, Potter KN. Economics of wide-bedfarming systems for Vertisol (clay) soils: chisel tillage vs. no-tillage. J AmSoc Farm Manage Rural Appraise 1996;19:129e34.
[13] Smart JR, Bradford JM. No-tillage cotton yields and economics for south Texas.Beltsville, MD: USDA-ARS; 1998.
[14] Mohammadreza K, Jean-Claude M, Pierre R. Yield and energy requirement ofdurum wheat under no-tillage and conventional tillage in the Mediterraneanclimate. J Biol Environ Sci 2012;6(16):59e66.
[15] Vyn TJ. Tillage practices for winter wheat production. Department of CropScience, Ontario Agricultural College; 1980. http://eap.mcgill.ca/CPW_6.htm.
[16] Tabatabaeefar A, Emamzadeh H, Ghasemi VM, Rahimizadeh R, Karimi M. Com-parison of energy of tillage systems in wheat production. Energy 2009;34:41e5.
[17] Ribera LA, Hons FM, Richardson JW. Tillage and cropping systems: an eco-nomic comparison between conventional and no-tillage farming systems inBurleson Country, Texas. Agron J 2004;96:415e24.
[18] Pimentel D, Herdendorf M, Eisenfeld S, Olander L, Carroquino M, Corson C.Achieving a secure energy future: environmental and economic issues. EcolEcon 1994;9(3):201e19.
[19] Helsel ZR. Energy and alternatives for fertilizer and pesticide use. In: Fluck R,editor. Energy in world agriculture, 6. Amsterdam: Elsevier Sci. Publ. Co.;1992. p. 177e202.
[20] Clark WG, Parmenter KE. Energy efficiency in fertilizer production and use. In:Clark WG, Kornelis B, editors. Efficient use and conservation of energy, inEncyclopedia of life support systems (EOLSS). Oxford, UK: Eolss Publishers;2004. Developed under the Auspices of the UNESCO, http://www.eolss.net.
[21] Khaledian M, Mailhol JC, Ruelle P. Yield and energy requirement of durumwheat under no-tillage and conventional tillage in the Mediterranean climate.J Biol Environ Sci 2012;6(16):59e65.
[22] Campbell CA, Tessier JSJ, Selles F. Challenges and limitations to adoption ofconservation tillage e soil organic matter, fertility, moisture and soil envi-ronment. In: Land degradation and conservation tillage. 34th Ann. MeetingCanadian Society of soil science, Calgary, AB 1988. p. 140e85.
[23] Lindwall CW, Larney FJ. Why direct seeding will work and is profitable. In:Saskatchewan, editor. Soil conservation Assoc. 5th Ann. meeting and tradeshow. Direct seeding: making it works in the drier soil zones. Moose Jaw, SK1993. p. 1e20.
[24] Zentner RP, McConkey BG, Campbell CA, Dyck FB, Selles F. Economics ofconservation tillage in the semiarid prairie. Can J Plant Sci 1996;76:697e705.
[25] Koller K. Machinery requirements and possible energy saving by reducedtillage. In: Report on agriculture energy saving by reduced soil tillage. Com-mission of the European Communities; 1989.
[26] Lal R. Conservation tillage for sustainable agriculture: tropics versustemperate environments. Adv Agron 1989;42:85e197.
[27] Blevins RL, Frye WW. Conservation tillage: an ecological approach to soilmanagement. Adv Agron 1993;51:33e76.
[28] Fischer RA, Santiveri F, Vidal IR. Crop rotation, tillage and crop residue man-agement for wheat and maize in the sub-humid tropical highlands: I. Wheatand legume performance. Field Crops Res 2002;79:107e22.
[29] Bueno J, Amiama C, Hernanz JL. No-tillage drilling of Italian ryegrass(Loliummultiflorum L.): crop residue effects, yields and economic benefits.Soil Till Res 2007;95:61e8.
[30] Cantore V, Iovino F, Pontecorvo G. Aspetti climatici e ionejìtoclimatiche dellaBasilicata. CNR, 1st. di Ecologia e Idrologia Forestale, pubbl. n. 2, Cosenza; 1987.
[31] Green MB. Energy in pesticide manufacture, distribution and use. In:Helsel ZR, editor. Energy in world agriculture, 2. New York: Elsevier; 1987.p. 165e77.
[32] Chaudhary VP, Gangwar B, Pandey DK. Auditing of energy use and output ofdifferent cropping systems in India. Agric Eng Int CIGR EJ 2006;8:1e13.
[33] Audsley E, Brander M, Chatterton J, Murphy-Bokern D, Webster C, Williams A.How low can we go? An assessment of Greenhouse gas emissions from the UKfood system and the scope to reduce them by 2050. WWF-UK and FCRN;2009. Report, http://www.fcrn.org.uk/fcrnPublications/publications/PDFs/howlow/WWF_How_Low_Report.pdf.
[34] Singh JM. On farm energy use pattern in different cropping systems in Har-yana, India. Master of Science. Germany: International Institute of Manage-ment, University of Flensburg; 2002.
[35] Yilmaz I, Akcaoz H, Ozkan B. An analysis of energy use and input costs forcotton production in Turkey. Renew Energy 2005;30:145e55.
[36] Verma SR. Energy in production agriculture and food processing. In: Pro-ceedings of the National conference held at the Punjab agricultural University,Ludhana October 30e31, 1987.
[37] Singh H, Mishra D, Nahar NM. “Energy use pattern in production agriculture ofa typical village in Arid Zone” IndiaeParteI. Energy Convers Manage2002;43(16):2275e86.
[38] Esengun HE, Erdal KG, Gunduz O, Erdal H. An economic analysis and energyuse in stake tomato production in Tokat province of Turkey. Renew Energy2007;32:1873e81.
[39] Erdal GK, Esengun HE, Gunduz O. Energy use and economical analysis of sugarbeet production in Tokat province of Turkey. Energy 2007;32:35e41.
[40] Richard CF. Energy in farm production. In: Energy in world agriculture, vol. 6.Elsevier; 1992. p. 367.
[41] Ozkan B, Akcaoz H, Karadeniz F. Energy requirement and economic analysis ofcitrus production in Turkey. Energy Convers Manage 2004;45:1821e30.
[42] Lawrence PA, Radford BJ, Thomas GA, Sinclair DP, Key AJ. Effect of tillagepractices on wheat performance in a semi-arid environment. Soil Tillage Res1994;28:347e64.
[43] Arshad MA, Gill KS. Barley canola and wheat production under differenttillageefallowegreen manure combinations on a clay soil in a cold semiaridclimate. Soil Tillage Res 1997;43:263e75.
[44] Safa M, Samarasinghe S, Mohssen M. Determination of fuel consumption andindirect factors affecting it in wheat production in Canterbury, New Zealand.Energy 2010;35:400e5.
[45] Kuesters J, Lammel J. Investigations of the energy efficiency of the productionof winter wheat and sugar beet in Europe. Eur J Agron 1999;11:35e43.
[46] Chaudhary VP, Gangwar B, Pandey DK, Gangwar KS. Energy auditing ofdiversified riceewheat cropping systems in Indo-Gangetic plains. Energy2009;34:1091e6.
[47] Nassi o Di Nasso N, Bosco S, Di Bene C, Coli A, Mazzoncini M, Bonari E. Energyefficiency in long-term Mediterranean cropping systems with differentmanagement intensities. Energy 2011;36:1924e30.
[48] Alluvione F, Moretti B, Sacco D, Grignani C. EUE (energy use efficiency) ofcropping systems for a sustainable agriculture. Energy 2011;36:4468e81.
[49] Houshyar E, Sheikh Davoodi MJ, Nassiri SM. Energy efficiency for wheatproduction using data envelopment analysis (DEA) technique. J Agric Technol2010;6(4):663e72.
[50] Soltani A, Rajabi MH, Zeinali E, Soltani E. Energy inputs and greenhousegases emissions in wheat production in Gorgan, Iran. Energy 2013;50:54e61.
[51] Barut ZB, Ertekin C, Karaagac HA. Tillage effects on energy use for corn silagein Mediterranean Coastal of Turkey. Energy 2011;36:5466e75.
[52] Singh H, Singh AK, Kushwaha HL, Singh A. Energy consumption pattern ofwheat production in India. Energy 2007;32:1848e54.