Development of Durum Wheat Breads Low in Sodium Using a ...
18
Foods 2020, 9, 752; doi:10.3390/foods9060752 www.mdpi.com/journal/foods Article Development of Durum Wheat Breads Low in Sodium Using a Natural Low-Sodium Sea Salt Elena Arena 1 , Serena Muccilli 2 , Agata Mazzaglia 1 , Virgilio Giannone 3 , Selina Brighina 1 , Paolo Rapisarda 2 , Biagio Fallico 1 , Maria Allegra 2 and Alfio Spina 4, * 1 Di3A—Dipartimento di Agricoltura, Alimentazione e Ambiente, University of Catania, via S. Sofia 100, 95123 Catania, Italy; [email protected] (E.A.); [email protected] (A.M.); [email protected] (S.B.); [email protected] (B.F.) 2 CREA—Consiglio per la ricerca in agricoltura e l'analisi dell'economia agraria. Centro di Ricerca Olivicoltura, Frutticoltura e Agrumicoltura, Corso Savoia 190, 95024 Acireale (Catania), Italy; [email protected] (S.M.); [email protected] (P.R.); [email protected] (M.A.) 3 DSAAF— Dipartimento di Scienze Agrarie, Alimentari e Forestali, University of Palermo, Viale delle Scienze, Ed. 4, 90128, Palermo, Italy; [email protected] 4 CREA— Consiglio per la Ricerca in Agricoltura e L'analisi Dell'economia Agraria. Centro di Ricerca Cerealicoltura e Colture Industriali, Corso Savoia 190, 95024 Acireale (Catania), Italy; [email protected] * Correspondence: [email protected] Received: 11 May 2020; Accepted: 04 June 2020; Published: 5 June 2020 Abstract: Durum wheat is widespread in the Mediterranean area, mainly in southern Italy, where traditional durum wheat breadmaking is consolidated. Bread is often prepared by adding a lot of salt to the dough. However, evidence suggests that excessive salt in a diet is a disease risk factor. The aim of this work is to study the effect of a natural low-sodium sea salt (Saltwell ® ) on bread- quality parameters and shelf-life. Bread samples were prepared using different levels of traditional sea salt and Saltwell ® . The loaves were packaged in modified atmosphere conditions (MAPs) and monitored over 90 days of storage. No significant differences (p ≤ 0.05) were found in specific volumes and bread yield between the breads and over storage times, regardless of the type and quantity of salt used. Textural data, however, showed some significant differences (p ≤ 0.01) between the breads and storage times. 5-hydroxymethylfurfural (HMF) is considered, nowadays, as an emerging ubiquitous processing contaminant; bread with the lowest level of Saltwell ® had the lowest HMF content, and during storage, a decrease content was highlighted. Sensory data showed that the loaves had a similar rating (p ≤ 0.05) and differed only in salt content before storage. This study has found that durum wheat bread can make a nutritional claim of being “low in sodium” and “very low in sodium”. Keywords: Triticum turgidum L. subsp. durum Desf.; bread; NaCl; low-sodium sea salt; Na + reduction; physico-chemical and textural attributes; sensory evaluation 1. Introduction There is much evidence suggesting that excessive salt intake endangers our health [1–3], and reducing its consumption is one of the first steps to preventing noncommunicable diseases [4]. Dietary habits are often developed during childhood [5–7], so nutritional education towards a low- sodium diet with adequate potassium intake should be encouraged [8,9]. In Italy, salt consumption by children and adolescents suggests that the average daily sodium consumption exceeds the official recommendations [10].
-
Upload
khangminh22 -
Category
Documents
-
view
1 -
download
0
Transcript of Development of Durum Wheat Breads Low in Sodium Using a ...

Foods 2020, 9, 752; doi:10.3390/foods9060752 www.mdpi.com/journal/foods
Article
Development of Durum Wheat Breads Low in
Sodium Using a Natural Low-Sodium Sea Salt
Elena Arena 1, Serena Muccilli 2, Agata Mazzaglia 1, Virgilio Giannone 3, Selina Brighina 1,
Paolo Rapisarda 2, Biagio Fallico 1, Maria Allegra 2 and Alfio Spina 4,*
1 Di3A—Dipartimento di Agricoltura, Alimentazione e Ambiente, University of Catania, via S. Sofia 100,
95123 Catania, Italy; [email protected] (E.A.); [email protected] (A.M.); [email protected] (S.B.);
[email protected] (B.F.) 2 CREA—Consiglio per la ricerca in agricoltura e l'analisi dell'economia agraria. Centro di Ricerca
Olivicoltura, Frutticoltura e Agrumicoltura, Corso Savoia 190, 95024 Acireale (Catania), Italy;
[email protected] (S.M.); [email protected] (P.R.); [email protected] (M.A.) 3 DSAAF— Dipartimento di Scienze Agrarie, Alimentari e Forestali, University of Palermo, Viale delle
Scienze, Ed. 4, 90128, Palermo, Italy; [email protected] 4 CREA— Consiglio per la Ricerca in Agricoltura e L'analisi Dell'economia Agraria. Centro di Ricerca
Cerealicoltura e Colture Industriali, Corso Savoia 190, 95024 Acireale (Catania), Italy;
* Correspondence: [email protected]
Received: 11 May 2020; Accepted: 04 June 2020; Published: 5 June 2020
Abstract: Durum wheat is widespread in the Mediterranean area, mainly in southern Italy, where
traditional durum wheat breadmaking is consolidated. Bread is often prepared by adding a lot of
salt to the dough. However, evidence suggests that excessive salt in a diet is a disease risk factor.
The aim of this work is to study the effect of a natural low-sodium sea salt (Saltwell®) on bread-
quality parameters and shelf-life. Bread samples were prepared using different levels of traditional
sea salt and Saltwell®. The loaves were packaged in modified atmosphere conditions (MAPs) and
monitored over 90 days of storage. No significant differences (p ≤ 0.05) were found in specific
volumes and bread yield between the breads and over storage times, regardless of the type and
quantity of salt used. Textural data, however, showed some significant differences (p ≤ 0.01) between
the breads and storage times. 5-hydroxymethylfurfural (HMF) is considered, nowadays, as an
emerging ubiquitous processing contaminant; bread with the lowest level of Saltwell® had the
lowest HMF content, and during storage, a decrease content was highlighted. Sensory data showed
that the loaves had a similar rating (p ≤ 0.05) and differed only in salt content before storage. This
study has found that durum wheat bread can make a nutritional claim of being “low in sodium”
and “very low in sodium”.
Keywords: Triticum turgidum L. subsp. durum Desf.; bread; NaCl; low-sodium sea salt; Na+
reduction; physico-chemical and textural attributes; sensory evaluation
1. Introduction
There is much evidence suggesting that excessive salt intake endangers our health [1–3], and
reducing its consumption is one of the first steps to preventing noncommunicable diseases [4].
Dietary habits are often developed during childhood [5–7], so nutritional education towards a low-
sodium diet with adequate potassium intake should be encouraged [8,9]. In Italy, salt consumption
by children and adolescents suggests that the average daily sodium consumption exceeds the official
recommendations [10].
Foods 2020, 9, 752 2 of 18
Natural foods contain modest amounts of sodium [11], and approximately two-thirds of salt
intake come from its addition during food preparation [12]. Eighty food categories were identified as
significant contributors to salt intake, and targets were set for the food industry to meet in each
category within a certain period [13].
The WHO member states have agreed to reduce the global population’s intake of salt by a
relative 30 % by 2025, and several strategies have been undertaken to improve the consumer’s
understanding of healthy eating recommendations [14–19].
Nutrition claims of “low sodium/salt”, “very low sodium/salt”, and “sodium/salt-free” for foods
containing 1.2, 0.4, and 0.05 g kg−1 of sodium, respectively, (or the equivalent value for salt) on food
labels, informs consumers about salt content [20–22].
Salt is an essential ingredient in breadmaking: it retards gas production, enhances bread flavor,
affects the rheological properties of dough, controls fermentation (decreasing yeast activity in the
dough), and it can affect the quality parameters of bread [23,24]. Furthermore, NaCl has a
strengthening effect on gluten, increasing its resistance or elasticity, and decreasing the extensibility
of the dough [25,26].
The strategies to reduce sodium in bread include the use of reduced-sodium sea salt [27], the
partial replacement of sodium chloride with potassium chloride and yeast extract [28], the use of a
salt substitute with 57% of sodium chloride [29], and heterogeneous NaCl distribution, leading to
enhanced saltiness by taste contrast [30].
In bread wheat (Triticum aestivum L.), salt is generally used at levels of about 1–2% based on
flour weight [31]. A survey of salt content in artisan and industrial bread produced in all Italian
regions was conducted in 2009/2010, its data having been recently published [32]. Artisan breads
contained between 0.7% and 2.3% g/100 g of salt, while industrial bread, on average, contained 1.6%
salt, most samples (56%) having a very high content. In the Mediterranean area, the cultivation of
durum wheat (Triticum turgidum L. subsp. durum Desf.) is widespread compared to that of bread
wheat [33] as it has a greater tolerance to drought, high temperatures, and fungal diseases, but less
resistance to winter and spring cold. According to traditional uses, mainly in Southern Italy, bread is
prepared from remilled durum wheat semolina [34]. Durum wheat milling products are
characterized by peculiar chemical, rheological, colorimetric, and baking properties [35–39]. The
bread has a compact texture, being in some cases excessively dense, with lower specific volume and
harder crumbs than white bread [39], and the characteristic taste and flavor are generally enhanced
by adding a high percentage of salt, from 20 to 25 g kg−1 [28].
In the last few years, the use of low-sodium salts in foods has been recommended.
However, almost all the commercially available low-sodium salts are produced by blending
purified potassium chloride with ordinary table salts to achieve a reduced sodium content.
Natural low-sodium sea salt not only provides less sodium and does not affect the taste profile,
but contains lots of essential trace minerals such as magnesium, potassium, calcium, and other
nutrients the body requires.
Therefore, the aim of this paper is to evaluate the effect of substituting salt with low-sodium sea
salt to measure the quality parameters of durum wheat bread over long storage.
2. Materials and Methods
2.1. Materials
Durum wheat (Triticum turgidum L. subsp. durum Desf.) remilled semolina for breadmaking [39]
was provided by “Valle del Dittaino Società Cooperativa Agricola” (Assoro, Italy), an industrial
bakery with a durum wheat mill.
The bread ingredients were food grade. Compressed yeast (AB Mauri, Casteggio, Italy) and
traditional sea salt (99.5% NaCl; Mulino S. Giuseppe, Catenanuova, Italy) employed in the
breadmaking process were purchased in a local retailer. Saltwell® (Salinity Group, Saltwell AB
Göteborg Sweden) is a natural low-sodium sea salt (less than 35%) extracted from an underground
sea below the Atacama desert (Chile). This natural sea salt contains 65 ± 1% NaCl, 30 ± 1.5% KCl, 1.0

Foods 2020, 9, 752 3 of 18
± 0.1% of MgSO4, 0.5 ± 0.1% of CaSO4, and traces of other salts and minerals. Saltwell® was kindly
donated by Medsalt—Mediterranean Salt Company S.r.l. (Rome, Italy).
Various levels (1.70%, 0.35%, 0.15% on semolina basis) of traditional sea salt and Saltwell® were
used in dough formulations, as listed in Table 1.
Table 1. Bread type code and percentage of two salts on remilled semolina basis.
Bread Types Code Salt added
(% w/w Remilled Semolina)
Control A 1.70% Traditional sea salt
Control B 1.70% Saltwell®
1A 0.35% Traditional sea salt
1B 0.35% Saltwell®
2A 0.15% Traditional sea salt
2B 0.15% Saltwell®
2.2. Methods
2.2.1. Physico-Chemical and Rheological Analyses of Remilled Semolina
The physico-chemical analyses of remilled semolina were carried out following the methods
indicated by Giannone et al. (2018) and Palumbo et al. (2002) [39–41]: moisture content was
determined according to the AACC 08-01 method (AACC, 2000) [42]. Protein content was determined
by means of the Infratec 1241 Grain Analyzer (Foss Tecator, Höganäs, Sweden), based on near
infrared transmittance. Ash content was determined according to the AACC 44-19 method (AACC,
2000) [42]. The particle size distribution was determined by a LabSifter (KBF7SN, Buhler,
Switzerland). Remilled semolina for breadmaking was sieved for exactly 5 min on sieves with
openings of 300, 200, 180, and 160 μm. Wet and dry gluten and gluten index were obtained by using
a Glutomatic System (Glutomatic 2200, Centrifuge 2015, Glutork 2020; Perten Instruments AB,
Huddinge, Sweden), according to the UNI 10690 method (UNI, 1979) [43]. The α-amylase activity
was obtained by using the Falling Number 1500 apparatus (Perten Instruments AB, Huddinge,
Sweden), according to the ISO 3093:2009 method (ISO, 2009) [44].
The CIELAB color parameters (L*, a*, b*) were determined by Chromameter CR-300 (Minolta,
Osaka, Japan), using the illuminant D65. Alveograph indices were determined according to the AACC
method 54-30A (AACC, 2000) [42] using an alveograph model MA 87 equipped with the software
Alveolink NG (Tripette et Renaud, Villeneuve-la-Garenne, France). Farinograph parameters were
obtained according to the AACC 54-21 method (AACC, 2000) [42] using a Farinograph, equipped
with the software Farinograph® (Brabender instrument, Duisburg, Germany).
2.2.2. Bread Sample Production and Packaging
Bread samples were produced in a local breadmaking company (“Valle del Dittaino Società
Cooperativa Agricola”, Assoro, Italy), according to a proven industrial formulation: remilled durum
wheat semolina (65 kg), compressed yeast (0.9% on semolina basis), water (66.0% on semolina basis)
and the corresponding amount of salt. Six bread formulations containing different levels of
traditional sea salt and low-sodium sea salt were produced (Table 1). The dough was mixed for 17
min in a high-speed mixer (San Cassiano, Italy). The final dough temperature was 26 ± 1 °C. The
dough was left to rest in bulk for 15 min, divided into 980 ± 20 g portions (100 loaves for each
production), proofed for 150 min at 32 ± 1 °C and 66 ± 2 % relative humidity (RH) and baked at 220
°C for 60 min, in industrial tunnel ovens measuring 33 × 3 m (Pavailler Engineering, Galliate, Italy).
The baked loaves, with an approximate weight of 1 kg each, were automatically transported to a
cooling chamber (Tecnopool, Italy) set at 20 ± 2 °C for 120 min. After cooling, the loaves were sliced
by means of an automatic slicing machine (Brevetti Gasparin, Marano Vicentino, Italy) to 11 ± 1 mm
thickness. About 450 g of sliced bread per loaf was packaged under modified atmosphere conditions

Foods 2020, 9, 752 4 of 18
(MAPs) using inert gas (70:30 N2:CO2). The bread packaging materials consisted of two plastic films
provided by Cryovac Sealed Air (Elmwood Park, NJ, USA).
The samples were stored for up to 90 days at 20 ± 2 °C and 60 ± 2% RH. The quality parameters
were determined at regular intervals in triplicate for each batch.
The following parameters and properties were tested for each bread sample during each
sampling: volume, height, weight, diameter basis, crumb porosity, internal structure, top and base
crust thickness, texture profile analysis, water activity, moisture, pH, 5-hydroxymethylfurfural
(HMF) content, crust and crumb color, and sensory evaluation.
2.2.3. Bread Quality Evaluation
Determination of the Physico-Chemical Properties of the Breads
The volume was determined in a loaf volume meter by measuring the volume of rapeseed
displaced by the bread, according to the AACC method 10.05.01 (AACC, 2000) [42]. The specific
volume (mL/g) was calculated as a ratio of the loaf volume and the bread weight. The specific weight
was calculated as the ratio of the loaf weight and bread volume. The h/d ratio was obtained as the
ratio of the bread height and bread diameter of the loaf base. The crumb porosity was estimated using
the Mohs scale. The CIELAB space L* a* b* color parameters were measured for the crumb, in the
transversely cut bread, and on the crust surface, averaging ten distinct points in each case, using a
chromameter (CR-200, Konica Minolta, Osaka, Japan) with illuminant D65.
Bread samples were analyzed for Na+ (mg Kg−1) content by inductively coupled plasma optical
emission spectrometry (ICP-OES Optima 2000DV, Perkin Elmer, Italy). The samples were first
ground to a powder, and oven-dried at 105 °C for 4 h until constant weight, then an aliquot equal to
0.5 g was weighed and placed in a muffle furnace at 600 °C for 12 h. After mineralization, the ashes
were dissolved in 4 mL of distilled water and 0.5 mL of nitric acid at 69.5% (Superpure; Merck,
Darmastadt, Germany). The solutions were poured into 50 mL flasks and brought to volume with
distilled water before the analyses.
Water activity (aw) was determined by a Hygropalm 40 AW (Rotronic Instruments Ltd.,
Crawley, UK) according to the manufacturer’s instructions. Three bread slices (11 ± 1 mm thickness)
were used, after removal of the crust. For each set of determinations, separate loaves were used.
The moisture content of bread crumb was determined by oven drying at 105 °C until constant
weight, according to AOAC method no. 945.15 [45]. The pH was measured according to [46] using a
pH meter (Mettler Toledo, MP 220).
2.3. Texture Profile Analysis of Breads
The texture profile analysis (TPA) of bread was determined using a Universal testing machine
(model 3344, Instron, Norwood, MA, USA.) equipped with a cylindrical probe of 50 mm of diameter
and a 2000 N load cell. Data were acquired through Bluehill® 2 software (Instron, Norwood, MA,
U.S.A.). Cyclic compression tests (a 30-s gap between first and second compression) were set up: the
crosshead speed was 3.3 mm/s, the force required to compress the samples by 40% was recorded on
5-cm side square portions of 24-mm thick slices, and the average value of five replicates was taken.
The TPA profile recorded four primary parameters: hardness (N), springiness (mm), resilience,
gumminess, and one derived parameters (chewiness, N mm).
2.4. HMF Extraction and HPLC Analysis
HMF was extracted and determined following the methodology proposed by [28]. Ground bread
samples (5 g; La Moulinette, Moulinex, 2002) and 25 mL of water (J.T. Baker, Deventer, Holland) were
put into a volumetric flask (50 mL) and stirred for 10 min. Then the sample was diluted up to 50 mL
with water (JT. Baker, Deventer, Holland) and centrifuged for 45 min at 5000 rpm. An aliquot of the
supernatant was filtered through a 0.45-μm filter (Albet) and injected into an HPLC system
(Shimadzu Class VP LC-10ADvp) equipped with a DAD (Shimadzu SPD-M10Avp). The column was
a Gemini NX C18 (150 × 4.6 mm, 5 μm; Phenomenex) fitted with a guard cartridge packed with the

Foods 2020, 9, 752 5 of 18
same stationary phase. The HPLC conditions were the following: isocratic mobile phase, 90% water
(J.T. Baker) at 1% acetic acid (Merck), and 10% methanol (Merck); flow rate, 0.7 mL/min; injection
volume, 20 μL. The wavelength range was 220–660 nm, and the chromatograms were monitored at
283 nm. HMF was identified by splitting the peak of the HMF from the bread-solution sample with
a standard of HMF (p > 98% Sigma-Aldrich, St. Louis, Mo., USA) and by comparing the UV spectra
of the HMF standard with that of the bread samples. All analyses were performed in duplicate,
including the extraction procedure, and the reported HMF concentration was, therefore, the average
of four values. The results were expressed as mg of HMF per kilogram of dry matter.
2.5. Sensory Evaluation
The sensory profile [28,47] was defined by a trained [48] panel of 12 judges (six females and six
males, 28–40 years old). The judges, recruited for their individual abilities, had more than five years
of experience in the sensory analysis of bread and bakery products, and they were submitted to
further training over 4 weeks to generate attributes using handmade and industrial breads and to
familiarize themselves with the scales and procedures. The judges, using a discontinuous scale
between 1 (absence of the sensation) and 9 (extremely intense), have evaluated the intensity of the 11
sensory attributes selected on the basis of frequency (≥60%), following the definitions given by [49–
51] (Table 2).
Table 2. Descriptive terms used for sensory profiling of bread.
Attributes Definition Scale Anchors
Crumb
appearance
Crumb
color Color intensity of crumb Whitish Light yellow
Alveolar
structure Porosity of crumb
Fine and
uniform
Coarse and
poorly
homogeneous
Visual-tactile
Elasticity
Ability of the crumb to recover
from compression exerted by
fingers
Slow and
partial
recovery
Fast and
complete
recovery
Humidity Humidity perceived at the
surface of bread crumb Dry Humid
Aroma/Flavor
Bread
The typical aroma/flavor of
bread just taken out of the
oven
Weak Strong
Yeasty The aroma/flavor of a
fermented yeast-like None Strong
Wheat The typical aroma/flavor of
wheat None Strong
Off-odour/
Off-flavour
Aroma/Flavor unpleasant, not
characteristic of bread
perceived through taste and
smell when swallowing
None Strong
Taste
Sweet A basic taste factor produced
by sugars None Strong
Salty A basic taste factor produced
by sodium chloride None Strong
Sour A basic taste factor produced
by acids None Strong
Bitter A basic taste factor produced
by caffeine None Strong
Mouthfeel Astringent Sensory perception in the oral
cavity that may include drying None Strong

Foods 2020, 9, 752 6 of 18
sensation and roughing of the
oral tissue
Texture Softness Force required to compress the
product with the molars Hard Soft
Overall
evaluation
An overall assessment
expressed by considering all of
the attributes
Low High
The evaluation sessions, performed at 0, 15, 30, 60, and 90 days of storage, were conducted in
the sensory laboratory [52] of Di3A (University of Catania, Italy) from 11:00 a.m. to 12:00 a.m. in
individual booths illuminated with white light. The sliced bread samples were served on plates,
coded with three-digit numbers, and water was provided to judges for rinsing between samples. The
order presentation was randomized among judges and sessions using a randomized complete block.
All data were acquired by a direct computerized registration system (FIZZ Biosystems. ver. 2.00 M,
Couternon, France).
2.6. Statistical Analysis
The statistical analysis was performed using the Statgraphics® Centurion XVI software package
(Statpoint Technologies, INC.). A two-way analysis of variance (ANOVA), followed by Tukey’s HSD
test (p ≤ 0.001; p ≤ 0.01; p ≤ 0.05), was carried out on physico-chemical and textural attributes. The data
were expressed as means ± standard deviations. The sensory data for each attribute were submitted
to one-way ANOVA. The significance was tested by means of the F-test. A principal component
analysis (PCA) was performed using PAST, Paleontological Statistics software package, 2011 [53].
3. Results and Discussion
3.1. Physico-Chemical and Rheological Characterization of the Durum Wheat Remilled Semolina
Physico-chemical characteristics of remilled semolina were moisture 13.8 ± 0.07 g/100 g, protein
12.2 ± 0.10 g/100 g, and ash 0.87 ± 0.01 g/100 g. These quality parameters met the Italian legal
requirements [54]. Particle size distribution was > 300 μm: 11.0 ± 1.73 g/100 g; between 200–300 μm:
26.3 ± 1.15 g/100 g; between 180–200 μm: 22.0 ± 2.00 g/100 g; between 160–180 μm: 20.0 ± 1.00 g/100 g;
<160 μm: 20.7 ± 4.04 g/100 g. These findings agreed with those reported by other authors for remilled
semolina [39]. Dry gluten content was 10.0 ± 0.1 g/100 g. The gluten index value was 80.7 ± 4.0, and
the value of amylase activity at the falling number was low (577 ± 3.0 s). Regarding dry gluten content
and relative qualitative index, the sample exhibited regular gluten quantities and high gluten
tenacity. Similar values were reported by [28,39,55].
As regards color parameters, the values were lightness (L*) 71.0 ± 0.3, red index (a*) - 2.12 ± 0.02,
yellow index (b*) 18.52 ± 0.05.
Rheological behavior was evaluated by alveograph. Deformation energy (W) was 209 ± 4 10−4 x
J, while the tenacity/extensibility (P/L) value showed a tenacious dough (value = 2.5). Strong gluten
is expected in remilled durum wheat semolina [24].
Mixing behavior was evaluated by a farinograph apparatus. The semolina sample indicated the
quantity of water absorbed at 500 BU (Brabender Unit), and the dough consistency was 60.6 ± 0.04%
due to high protein content. The values of dough development time (1 min, 48 s ± 3.0 s), dough
stability (4 min ± 12 s), and softening index (58 ± 1 BU) agreed with those reported by other authors
on remilled semolina [28,38,39,55].
3.2. Sodium Content in Bread
The levels of the two salts used in the loaves, the sodium content, and the minimum limits
established by EU regulations [20,21] applying to nutritional claims are shown in Table 3.

Foods 2020, 9, 752 7 of 18
Table 3. Percentage of two salts in bread, sodium content and limits established by EU regulations [21,22]
(data are means ± standard deviations).
Type Salt in Experimental
Bread (%)
Na+ Content
(g/100g)
Regulations (EU) No. 1924/2006
and No. 1047/2012—Nutritional
Claims
Control A 1.22% Traditional sea salt 0.430 ± 0.014A -
Control B 1.22% Saltwell® 0.240 ± 0.014B -
1A 0.25% Traditional sea salt 0.087 ± 0.001C 0.12 g of Na+—low in sodium
1B 0.25% Saltwell® 0.064 ± 0.001C 0.12 g of Na+—low in sodium
2A 0.11% Traditional sea salt 0.048 ± 0.001C -
2B 0.11% Saltwell® 0.035 ± 0.000C 0.04 g of Na+—very low in sodium
Different capital letters in the same column indicate significant difference (p ≤ 0.001).
3.3. The Quality Parameters of Breads and Their Evolution during Storage
The p-values for all the physical and textural parameters of the bread types with respect to
storage time are reported in Table 4.
Table 4. Analysis of variance of the physical and textural parameters studied on the loaves (p-values).
Factors of
variability
Degrees
of
Freedo
m
Specif
ic
Volu
me
Specific
Weight
h/d
Rati
o
Porosi
ty
Internal
Structure
Top
Crust
Thicknes
s
Basis
Crust
Thicknes
s
Hard
ness
Spring
iness
Resili
ence
Gummi
ness
Chewi
ness
Type (A) 5 0.002 0.014 0.00
0 0.000 0.000 0.000 0.444
0.00
0 0.000 0.000 0.000 0.000
Storage
time (B) 4 0.000 0.000
0.00
0 0.156 0.007 0.000 0.571
0.00
0 0.000 0.000 0.000 0.000
A x B 20 0.011 0.008 0.00
0 0.021 0.824 0.064 0.568
0.00
0 0.529 0.088 0.000 0.000
The specific volumes and weights of the loaves were significant for each of the two factors of
variability (type (A), storage time (B), and their interaction (A × B), even with different p levels (p ≤
0.001 for storage time, p ≤ 0.01 A × B interaction, and p ≤ 0.05 per type; see Table 4).
The results of the physical and textural properties of the industrial breads in the MAP conditions
during 90 days of storage are shown in Tables 5 and 6.
Table 5. Evaluation of physical properties during storage of the bread samples produced using
different types and levels of sea salt (data are means ± standard deviations).
Days of
Storage Type
Specific
Volume
(mL/g)
Specific
Weight
(g/mL)
h/d
Ratio
Porosity
(1-8) a
Internal
Structur
e (1-2) b
Top Crust
Thicknes
s (mm)
Basis
Crust
Thicknes
s (mm)
0 Control A 3.03 ± 0.09
gh 0.33 ± 0.01 ab
4.46 ± 0.25
a
6.00 ±
0.00 abc
2.00 ±
0.00 3.50 ± 0.00 4.50 ± 0.00
Control B 3.14 ± 0.20
cdefgh
0.32 ± 0.02
abcd
3.75 ± 0.11
bcd
6.00 ±
0.00 abc
1.00 ±
0.00 3.00 ± 0.00 4.17 ± 0.29
1A 3.06 ± 0.04
fgh 0.33 ± 0.00 abc
3.60 ± 0.16
bcdefg
6.00 ±
0.00 abc
1.00 ±
0.00 3.17 ± 0.29 4.00 ± 0.00
1 B 3.09 ± 0.04
defgh
0.32 ± 0.00
abcd
3.58 ± 0.06
bcdefg
6.00 ±
0.00 abc
1.00 ±
0.00 3.83 ± 0.29 4.50 ± 0.50
2 A 3.09 ± 0.04
efgh
0.32 ± 0.00
abcd
3.23 ± 0.11
defgh
6.00 ±
0.00 abc
1.33 ±
0.58 3.83 ± 0.29 4.67 ± 0.29
2 B 2.96 ± 0.07
h 0.34 ± 0.01 a
3.11 ± 0.04
gh
7.00 ±
0.00 a
1.00 ±
0.00 4.00 ± 0.00 4.83 ± 0.29
15 Control A 3.20 ± 0.09
cdefgh
0.31 ± 0.01
abcdef
3.77 ± 0.09
bc
5.67 ±
0.00 bc
2.00 ±
0.00 3.50 ± 0.50 4.33 ± 0.29

Foods 2020, 9, 752 8 of 18
Control B 3.13 ± 0.18
cdefgh
0.32 ± 0.02
abcd
3.70 ± 0.12
bcde
6.00 ±
0.00 abc
1.33 ±
0.58 3.17 ± 0.29 5.00 ± 0.00
1A 3.33 ± 0.03
abcdefgh
0.30 ± 0.00
abcdefg
3.42 ± 0.16
bcdefgh
6.00 ±
0.00 abc
1.00 ±
0.00 3.83 ± 0.29 4.83 ± 0.29
1 B 3.23 ± 0.23
bcdefgh
0.31 ± 0.02
abcdefg
3.65 ± 0.20
bcdef
6.00 ±
0.00 abc
1.00 ±
0.00 4.33 ± 0.29 4.67 ± 0.29
2 A 3.35 ± 0.11
abcdefgh
0.30 ± 0.01
abcdefg
3.29 ± 0.27
bcdefgh
6.50 ±
0.00 ab
1.00 ±
0.00 4.33 ± 0.29 5.50 ± 0.50
2 B 3.43 ± 0.05
abcdefgh
0.29 ± 0.00
bcdefg
3.23 ± 0.04
defgh
7.00 ±
0.00 a
1.00 ±
0.00 4.67 ± 0.29 5.17 ± 0.29
30 Control A 3.33 ± 0.31
abcdefgh
0.30 ± 0.03
abcdefg
3.77 ± 0.22
bc
5.67 ±
0.00 bc
2.00 ±
0.00 3.67 ± 0.00 4.50 ± 0.00
Control B 3.59 ± 0.04
abc
0.28 ± 0.00
defg
3.83 ± 0.03
b
5.67 ±
0.00 bc
1.67 ±
0.58 3.67 ± 0.29 4.50 ± 0.00
1A 3.52 ± 0.03
abcdef
0.28 ± 0.00
cdefg
3.39 ± 0.06
bcdefgh
6.00 ±
0.00 abc
1.67 ±
0.58 3.67 ± 0.29 5.00 ± 0.00
1 B 3.30 ± 0.09
abcdefgh
0.30 ± 0.01
abcdefg
3.27 ± 0.07
cdefgh
6.00 ±
0.00 abc
1.67 ±
0.58 4.33 ± 0.29 4.67 ± 0.29
2 A 3.45 ± 0.01
abcdefg
0.29 ± 0.00
bcdefg
3.32 ± 0.13
bcdefgh
7.00 ±
0.00 a
1.33 ±
0.58 4.17 ± 0.29 5.50 ± 0.50
2 B 3.23 ± 0.06
bcdefgh
0.31 ± 0.01
abcdefg
3.34 ± 0.09
bcdefgh
7.00 ±
0.00 a
1.00 ±
0.00 3.83 ± 0.29 4.83 ± 0.29
60 Control A 3.17 ± 0.17
cdefgh
0.32 ± 0.02
abcde
3.62 ± 0.08
bcdefg
5.33 ±
0.00 c
2.00 ±
0.00 3.33 ± 0.58 4.83 ± 0.76
Control B 3.51 ± 0.19
abcdef
0.29 ± 0.02
bcdefg
3.71 ± 0.09
bcde
5.67 ±
0.00 bc
1.33 ±
0.58 3.33 ± 0.58 5.17 ± 0.29
1A 3.40 ± 0.10
abcdefgh
0.29 ± 0.01
abcdefg
3.52 ± 0.14
bcdefgh
5.67 ±
0.00 bc
2.00 ±
0.00 3.50 ± 0.50 5.17 ± 0.29
1 B 3.42 ± 0.05
abcdefgh
0.29 ± 0.00
abcdefg
3.55 ± 0.09
bcdefgh
5.33 ±
0.00 c
1.00 ±
0.00 3.33 ± 0.29 5.17 ± 0.29
2 A 3.54 ± 0.09
abcde
0.28 ± 0.01
cdefg
3.16 ± 0.16
fgh
7.00 ±
0.00 a
1.67 ±
0.58 3.50 ± 0.50 5.00 ± 0.00
2 B 3.42 ± 0.08
abcdefgh
0.29 ± 0.01
abcdefg
3.18 ± 0.04
efgh
7.00 ±
0.00 a
1.33 ±
0.58 3.50 ± 0.00 4.50 ± 0.50
90 Control A 3.57 ± 0.19
abcd 0.27 ± 0.03 g
3.49 ± 0.16
bcdefgh
5.33 ±
0.00 c
2.00 ±
0.00 3.00 ± 0.50 4.50 ± 0.00
Control B 3.54 ± 0.12
abcde
0.28 ± 0.01
cdefg
3.74 ± 0.30
bcd
5.67 ±
0.00 bc
1.33 ±
0.58 2.67 ± 0.58 4.00 ± 0.00
1A 3.71 ± 0.15
a 0.27 ± 0.01 fg
3.33 ± 0.07
bcdefgh
5.67 ±
0.00 bc
2.00 ±
0.00 3.33 ± 0.58 4.33 ± 0.58
1 B 3.54 ± 0.15
abcde
0.28 ± 0.01
cdefg
3.40 ± 0.07
bcdefgh
5.33 ±
0.00 c
1.33 ±
0.58 3.17 ± 0.29 4.00 ± 0.00
2 A 3.68 ± 0.17
ab 0.27 ± 0.01 efg
3.25 ± 0.09
cdefgh
7.00 ±
0.00 a
1.33 ±
0.58 3.17 ± 0.29 4.00 ± 0.00
2 B 3.28 ± 0.11
abcdefgh
0.30 ± 0.01
abcdefg
3.03 ± 0.25
h
7.00 ±
0.00 a
1.00 ±
0.00 3.17 ± 0.29 3.83 ± 0.29
a 1, most porous; 8, least porous.b 1, regular; 2, irregular. Different letters in the same column indicate
significant difference (p ≤ 0.01).
No significant differences in specific volumes were shown among the bread samples, regardless
of the type and level of sea salt (Table 4).
These findings agree with those reported by [23], but they disagree with those reported by [24].
Additionally, no significant differences in specific weight were observed among the controls and
other bread samples or during storage time. The addition of different types and quantities of sea salt
did not decrease bread yield. After 60 days of storage, the specific weight decreased.
The ratio between the height and diameter of the loaves used in the baking industry to
parametrize possible dough failure was significant (p ≤ 0.001) for all the factors and their interaction
Foods 2020, 9, 752 9 of 18
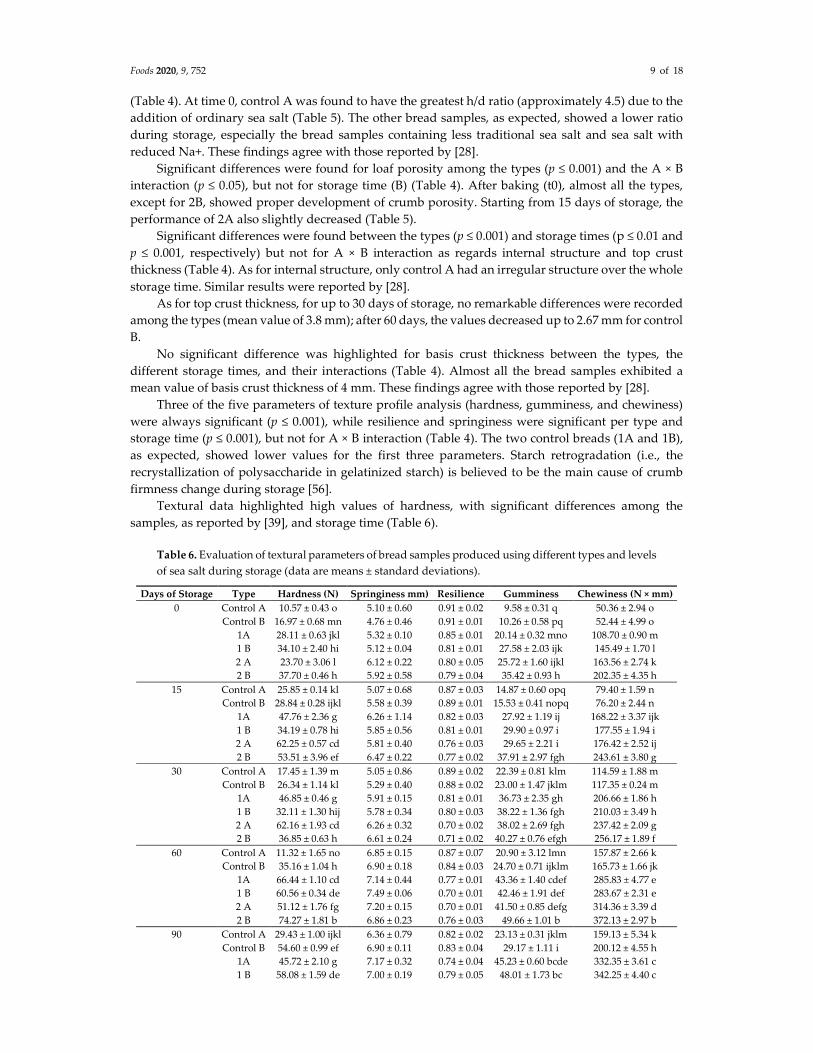
(Table 4). At time 0, control A was found to have the greatest h/d ratio (approximately 4.5) due to the
addition of ordinary sea salt (Table 5). The other bread samples, as expected, showed a lower ratio
during storage, especially the bread samples containing less traditional sea salt and sea salt with
reduced Na+. These findings agree with those reported by [28].
Significant differences were found for loaf porosity among the types (p ≤ 0.001) and the A × B
interaction (p ≤ 0.05), but not for storage time (B) (Table 4). After baking (t0), almost all the types,
except for 2B, showed proper development of crumb porosity. Starting from 15 days of storage, the
performance of 2A also slightly decreased (Table 5).
Significant differences were found between the types (p ≤ 0.001) and storage times (p ≤ 0.01 and
p ≤ 0.001, respectively) but not for A × B interaction as regards internal structure and top crust
thickness (Table 4). As for internal structure, only control A had an irregular structure over the whole
storage time. Similar results were reported by [28].
As for top crust thickness, for up to 30 days of storage, no remarkable differences were recorded
among the types (mean value of 3.8 mm); after 60 days, the values decreased up to 2.67 mm for control
B.
No significant difference was highlighted for basis crust thickness between the types, the
different storage times, and their interactions (Table 4). Almost all the bread samples exhibited a
mean value of basis crust thickness of 4 mm. These findings agree with those reported by [28].
Three of the five parameters of texture profile analysis (hardness, gumminess, and chewiness)
were always significant (p ≤ 0.001), while resilience and springiness were significant per type and
storage time (p ≤ 0.001), but not for A × B interaction (Table 4). The two control breads (1A and 1B),
as expected, showed lower values for the first three parameters. Starch retrogradation (i.e., the
recrystallization of polysaccharide in gelatinized starch) is believed to be the main cause of crumb
firmness change during storage [56].
Textural data highlighted high values of hardness, with significant differences among the
samples, as reported by [39], and storage time (Table 6).
Table 6. Evaluation of textural parameters of bread samples produced using different types and levels
of sea salt during storage (data are means ± standard deviations).
Days of Storage Type Hardness (N) Springiness mm) Resilience Gumminess Chewiness (N × mm)
0 Control A 10.57 ± 0.43 o 5.10 ± 0.60 0.91 ± 0.02 9.58 ± 0.31 q 50.36 ± 2.94 o Control B 16.97 ± 0.68 mn 4.76 ± 0.46 0.91 ± 0.01 10.26 ± 0.58 pq 52.44 ± 4.99 o 1A 28.11 ± 0.63 jkl 5.32 ± 0.10 0.85 ± 0.01 20.14 ± 0.32 mno 108.70 ± 0.90 m 1 B 34.10 ± 2.40 hi 5.12 ± 0.04 0.81 ± 0.01 27.58 ± 2.03 ijk 145.49 ± 1.70 l 2 A 23.70 ± 3.06 l 6.12 ± 0.22 0.80 ± 0.05 25.72 ± 1.60 ijkl 163.56 ± 2.74 k 2 B 37.70 ± 0.46 h 5.92 ± 0.58 0.79 ± 0.04 35.42 ± 0.93 h 202.35 ± 4.35 h
15 Control A 25.85 ± 0.14 kl 5.07 ± 0.68 0.87 ± 0.03 14.87 ± 0.60 opq 79.40 ± 1.59 n Control B 28.84 ± 0.28 ijkl 5.58 ± 0.39 0.89 ± 0.01 15.53 ± 0.41 nopq 76.20 ± 2.44 n 1A 47.76 ± 2.36 g 6.26 ± 1.14 0.82 ± 0.03 27.92 ± 1.19 ij 168.22 ± 3.37 ijk 1 B 34.19 ± 0.78 hi 5.85 ± 0.56 0.81 ± 0.01 29.90 ± 0.97 i 177.55 ± 1.94 i 2 A 62.25 ± 0.57 cd 5.81 ± 0.40 0.76 ± 0.03 29.65 ± 2.21 i 176.42 ± 2.52 ij 2 B 53.51 ± 3.96 ef 6.47 ± 0.22 0.77 ± 0.02 37.91 ± 2.97 fgh 243.61 ± 3.80 g
30 Control A 17.45 ± 1.39 m 5.05 ± 0.86 0.89 ± 0.02 22.39 ± 0.81 klm 114.59 ± 1.88 m Control B 26.34 ± 1.14 kl 5.29 ± 0.40 0.88 ± 0.02 23.00 ± 1.47 jklm 117.35 ± 0.24 m 1A 46.85 ± 0.46 g 5.91 ± 0.15 0.81 ± 0.01 36.73 ± 2.35 gh 206.66 ± 1.86 h 1 B 32.11 ± 1.30 hij 5.78 ± 0.34 0.80 ± 0.03 38.22 ± 1.36 fgh 210.03 ± 3.49 h 2 A 62.16 ± 1.93 cd 6.26 ± 0.32 0.70 ± 0.02 38.02 ± 2.69 fgh 237.42 ± 2.09 g 2 B 36.85 ± 0.63 h 6.61 ± 0.24 0.71 ± 0.02 40.27 ± 0.76 efgh 256.17 ± 1.89 f
60 Control A 11.32 ± 1.65 no 6.85 ± 0.15 0.87 ± 0.07 20.90 ± 3.12 lmn 157.87 ± 2.66 k Control B 35.16 ± 1.04 h 6.90 ± 0.18 0.84 ± 0.03 24.70 ± 0.71 ijklm 165.73 ± 1.66 jk 1A 66.44 ± 1.10 cd 7.14 ± 0.44 0.77 ± 0.01 43.36 ± 1.40 cdef 285.83 ± 4.77 e 1 B 60.56 ± 0.34 de 7.49 ± 0.06 0.70 ± 0.01 42.46 ± 1.91 def 283.67 ± 2.31 e 2 A 51.12 ± 1.76 fg 7.20 ± 0.15 0.70 ± 0.01 41.50 ± 0.85 defg 314.36 ± 3.39 d 2 B 74.27 ± 1.81 b 6.86 ± 0.23 0.76 ± 0.03 49.66 ± 1.01 b 372.13 ± 2.97 b
90 Control A 29.43 ± 1.00 ijkl 6.36 ± 0.79 0.82 ± 0.02 23.13 ± 0.31 jklm 159.13 ± 5.34 k Control B 54.60 ± 0.99 ef 6.90 ± 0.11 0.83 ± 0.04 29.17 ± 1.11 i 200.12 ± 4.55 h 1A 45.72 ± 2.10 g 7.17 ± 0.32 0.74 ± 0.04 45.23 ± 0.60 bcde 332.35 ± 3.61 c 1 B 58.08 ± 1.59 de 7.00 ± 0.19 0.79 ± 0.05 48.01 ± 1.73 bc 342.25 ± 4.40 c

Foods 2020, 9, 752 10 of 18
2 A 51.04 ± 1.27 fg 7.57 ± 0.32 0.70 ± 0.01 46.21 ± 1.20 bcd 362.72 ± 4.90 b 2 B 80.69 ± 0.02 a 7.41 ± 0.11 0.71 ± 0.01 57.97 ± 0.04 a 425.86 ± 1.38 a
Different letters in the same column indicate significant differences (p ≤ 0.01).
The hardness values, as expected, increased as the storage period progressed. As regards the
bread samples, control A reported the lowest values during the entire storage period. Up to t30, the
two controls, albeit with statistically different values, recorded the lowest hardness values. From t60,
the control A values remained low, while the control B values increased until reaching about 55 N at
the end of storage.
No significant differences in springiness or resilience were shown among the bread samples and
during the storage times, whatever the type and level of salt (Table 6). Up to 30 days of storage, no
remarkable differences were recorded among the breads (mean value of 5.7 mm); after 60 days, the
values of springiness increased by up to 7.0 mm. These findings do not agree with those reported by
[39].
As for resilience, the average value was around 0.80. During the entire storage period, the two
controls showed higher resilience values. From the end of the baking to the end of storage, resilience
values decreased slightly. These findings agree with those reported by [39].
With regard to gumminess and chewiness, they increased progressively with increasing storage
times and with decreasing salt content, regardless of type, until they reach the maximum at t90 for
2B (58.0 and 426.0). During the entire storage time, the two controls always showed the lowest values,
and were similar to each other, except for t90.
Water activity (aw) and moisture content were significant compared to all the factors of
variability (Table 7). As for pH and HMF, they were significant compared to all the factors of
variability (p ≤ 0.001; Table 7).
Crumb lightness and redness were significant compared to all the factors of variability. Crumb
yellowness was significant for bread (A) and storage time (B) (p ≤ 0.001) but not for their interaction
(A × B) (Table 7). The effect of the addition of sea salt with reduced Na+ on the L* parameter of crumb
during the entire time storage was not significant (Table 7).
Table 7. Analysis of variance of the chemical and color parameters studied on the loaves (p-values).
Factors of
Variability
Degrees
of
Freedom
aw Moisture pH HMF Crumb Crust
L* a* b* L* a* b*
Type (A) 5 0.000 0.000 0.000 0.000 0.005 0.000 0.000 0.000 0.000 0.000
Storage
time (B) 4 0.000 0.032 0.000 0.000 0.020 0.000 0.000 0.009 0.000 0.116
A × B 20 0.000 0.000 0.000 0.000 0.011 0.033 0.069 0.002 0.007 0.133
Chemical properties of the breads during the storage time are reported in Table 8.
Table 8. Evaluation of the chemical characteristics of the bread samples produced using different
types and levels of sea salt during storage (data are means ± standard deviations).
Days of
Storage Type aw Moisture (%) pH
HMF
(mg/kg Dry
Matter)
0 Control A 0.92 ± 0.00 abc 35.5 ± 0.07 n 5.65 ± 0.01 i 28.9 ± 1.73 fghi Control B 0.92 ± 0.00 a 37.1 ± 0.02 g 5.81 ± 0.00 efg 32.6 ± 2.18 de 1A 0.92 ± 0.00 ab 36.1 ± 0.05 l 5.88 ± 0.01 cde 34.3 ± 1.40 cd 1B 0.92 ± 0.00 ab 38.4 ± 0.04 b 5.94 ± 0.01 abc 38.2 ± 1.19 b 2A 0.93 ± 0.00 a 35.8 ± 0.07 m 5.36 ± 0.00 l 39.2 ± 2.81 b 2B 0.92 ± 0.00 a 36.7 ± 0.07 h 5.93 ± 0.02 abc 23.0 ± 1.07 mnopqr
15 Control A 0.91 ± 0.00 bcdef 36.6 ± 0.02 hi 5.80 ± 0.00 g 37.6 ± 0.58 bc Control B 0.92 ± 0.00 abcde 35.7 ± 0.08 mn 5.88 ± 0.01 cdef 29.2 ± 0.51 efgh

Foods 2020, 9, 752 11 of 18
1A 0.92 ± 0.00 abcd 39.5 ± 0.04 a 5.92 ± 0.01 abc 30.3 ± 0.98 efg 1B 0.92 ± 0.00 abcd 37.9 ± 0.06 cd 5.93 ± 0.02 abc 30.8 ± 1.61 def 2A 0.92 ± 0.00 abcd 37.12 ± 0.04 g 5.92 ± 0.01 abc 29.2 ± 0.64 efgh 2B 0.92 ± 0.01 abcd 36.7 ± 0.08 h 5.96 ± 0.01 ab 27.9 ± 1.37 fghij
30 Control A 0.91 ± 0.00 defgh 35.9 ± 0.04 lm 5.73 ± 0.01 h 24.9 ± 0.27 jklmnop Control B 0.91 ± 0.01 cdefg 35.8 ± 0.02 m 5.78 ± 0.00 gh 21.0 ± 0.14 qr 1A 0.92 ± 0.00 abcd 37.7 ± 0.05 de 5.99 ± 0.04 a 21.5 ± 0.03 pqr 1B 0.92 ± 0.00 abcde 36.4 ± 0.07 i 5.88 ± 0.02 cdef 24.1 ± 1.14 lmnopqr 2A 0.92 ± 0.00 abcd 37.3 ± 0.04 fg 5.84 ± 0.02 defg 37.8 ± 0.09 bc 2B 0.92 ± 0.00 abcd 35.9 ± 0.03 lm 5.93 ± 0.02 abc 16.3 ± 0.03 s
60 Control A 0.90 ± 0.00 j 37.3 ± 0.07 fg 5.82 ± 0.03 efg 45.8 ± 0.07 a Control B 0.90 ± 0.00 ghij 35.0 ± 0.02 p 5.81 ± 0.01 fg 22.4 ± 0.20 nopqr 1A 0.91 ± 0.00 efghij 37.5 ± 0.16 ef 5.83 ± 0.01 efg 27.7 ± 0.05 fghijk 1B 0.91 ± 0.00 efghij 38.1 ± 0.06 c 5.78 ± 0.01 gh 26.0 ± 0.15 hijklm 2A 0.91 ± 0.00 defghi 36.1 ± 0.02 l 5.83 ± 0.00 efg 25.0 ± 0.03 jklmno 2B 0.91 ± 0.00 defgh 38.1 ± 0.08 c 5.91 ± 0.01 bcd 26.8 ± 0.08 ghijkl
90 Control A 0.88 ± 0.01 k 34.8 ± 0.06 p 5.73 ± 0.04 h 25.5 ± 0.13 ijklmn Control B 0.90 ± 0.00 ij 34.2 ± 0.02 q 5.81 ± 0.01 fg 24.2 ± 0.30 klmnopq 1A 0.90 ± 0.00 hij 35.3 ± 0.07 o 5.78 ± 0.00 gh 20.6 ± 0.13 r 1B 0.90 ± 0.00 fghij 34.2 ± 0.01 q 5.82 ± 0.08 efg 22.6 ± 0.03 mnopqr 2A 0.90 ± 0.00 fghij 32.4 ± 0.04 r 5.80 ± 0.01 gh 21.5 ± 0.27 opqr 2B 0.90 ± 0.00 fghij 32.4 ± 0.01 r 5.82 ± 0.00 efg 21.8 ± 0.00 opqr
Different letters in the same column indicate significant difference (p ≤ 0.01).
Crumb aw is an important parameter of food processing and conservation technologies that
comes into play for food stability and safety. It indicates the amount of free water not linked by bonds
with the soluble constituents of the food, i.e., the water that can participate in chemical, physical,
biological, and enzymatic reactions.
In general, water activity is a relatively easy parameter to measure, which can be an advantage,
especially in the food industry [57].
The aw value ranged from about 0.88 for Control A at t90, to 0.93 for 2A at t0 (Table 7). Similar
values have been reported by [55].
After baking, and up to t15, there is no difference among the breads. From t30, water activity
decreases for both controls. From t60 to the end of storage, aw decreases slightly for all the types. At
t90, only the aw value of Control A is lower than the other types. Moisture content ranged from about
35.5–38.4% at the beginning (Table 8). Bread samples containing natural low Na+ sea salt show the
highest moisture content, and significant differences were found between all the breads. During
storage, the breads with NaCl generally show the highest levels of moisture, and at 90 days of storage,
the moisture content decreased, ranging from 35.3–32.4%. No significant differences were found
between control B and samples 1B (1.22% and 0.25% Saltwell®) and the bread samples with the lowest
levels of salt (2A and 2B).
The pH ranges from 5.36 to 5.93 at the beginning; at 90 days of storage, it ranges from 5.73 to
5.82 (Table 8). The variability seems to be more related to the storage time rather than to the different
levels and salts used in the recipe. Similar trends were reported both for durum wheat bread with
yeast extract and fortified with fiber [28,50].
HMF is a widely used compound as heat induces the chemical index generally used for
monitoring thermal abuse [58–61]. In bread and in other baking products, HMF is used to monitor
the heating process, and several factors influence its formation, such as manufacturing conditions
and recipe [57–59]. Even if the toxicity risk of HMF is still debated, nowadays, HMF is under
evaluation as an emerging ubiquitous processing contaminant since there is evidence to suggest that
HMF and its metabolites may have harmful effects on human health [60–63].
Foods 2020, 9, 752 12 of 18
Among foods, coffee and bread contribute the most HMF exposure, about 85% of total intake
[64].
The HMF parameter was significant compared to all the factors of variability (p ≤ 0.001; Table 7).
HMF levels at the beginning ranged from about 23 to 39 mg/kg of dry matter (Table 8), and significant
differences were found between all samples. These levels were lower than those reported for durum
wheat bread with KCl and taste enhancer [28], and it is known that differences in water content in
the leavening and/or baking time and the ratio between crumb and crust of the loaf could influence
HMF content [58]. Bread samples with the lowest levels of natural low Na+ sea salt (2 B) had the
lowest HMF content. During storage, a decrease in HMF amount was highlighted, though the trend
in decrease was not regular. Generally, the bread samples with the lowest levels of salt had the lowest
HMF content due to the effects of a high level of NaCl on starch degradation and yeast growth,
resulting, in both cases, in higher levels of Maillard indicators [65]. At 90 days of storage, this
parameter ranged from about 20.6 to 25.5 mg/kg of dry matter. The HMF trend during storage was
similar to those reported by [28,50], suggesting that HMF decrease is more related to storage time
rather than recipe.
During storage, crumb redness in the traditional sea salt (control A) test slowly decreased. After
t15, the a* value begins to decrease for all breads (Table S1).
3.4. Sensory Evaluation
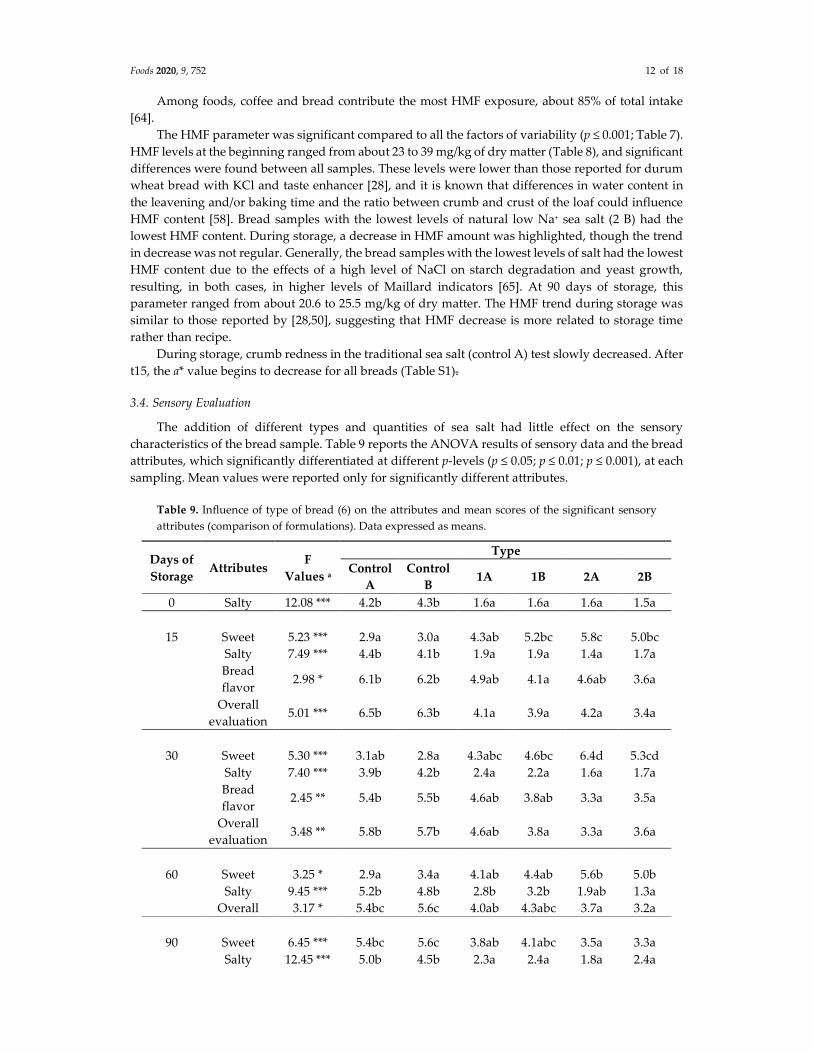
The addition of different types and quantities of sea salt had little effect on the sensory
characteristics of the bread sample. Table 9 reports the ANOVA results of sensory data and the bread
attributes, which significantly differentiated at different p-levels (p ≤ 0.05; p ≤ 0.01; p ≤ 0.001), at each
sampling. Mean values were reported only for significantly different attributes.
Table 9. Influence of type of bread (6) on the attributes and mean scores of the significant sensory
attributes (comparison of formulations). Data expressed as means.
Days of
Storage Attributes
F
Values a
Type
Control
A
Control
B 1A 1B 2A 2B
0 Salty 12.08 *** 4.2b 4.3b 1.6a 1.6a 1.6a 1.5a
15 Sweet 5.23 *** 2.9a 3.0a 4.3ab 5.2bc 5.8c 5.0bc
Salty 7.49 *** 4.4b 4.1b 1.9a 1.9a 1.4a 1.7a
Bread
flavor 2.98 * 6.1b 6.2b 4.9ab 4.1a 4.6ab 3.6a
Overall
evaluation 5.01 *** 6.5b 6.3b 4.1a 3.9a 4.2a 3.4a
30 Sweet 5.30 *** 3.1ab 2.8a 4.3abc 4.6bc 6.4d 5.3cd
Salty 7.40 *** 3.9b 4.2b 2.4a 2.2a 1.6a 1.7a
Bread
flavor 2.45 ** 5.4b 5.5b 4.6ab 3.8ab 3.3a 3.5a
Overall
evaluation 3.48 ** 5.8b 5.7b 4.6ab 3.8a 3.3a 3.6a
60 Sweet 3.25 * 2.9a 3.4a 4.1ab 4.4ab 5.6b 5.0b
Salty 9.45 *** 5.2b 4.8b 2.8b 3.2b 1.9ab 1.3a
Overall 3.17 * 5.4bc 5.6c 4.0ab 4.3abc 3.7a 3.2a
90 Sweet 6.45 *** 5.4bc 5.6c 3.8ab 4.1abc 3.5a 3.3a
Salty 12.45 *** 5.0b 4.5b 2.3a 2.4a 1.8a 2.4a
Foods 2020, 9, 752 13 of 18
Overall
evaluation 2.87 * 5.4bc 5.6c 3.8ab 4.1abc 3.5a 3.3a
Different letters in the same row indicate significant differences at p ≤ 0.05 *, p ≤ 0.01 **, p ≤ 0.001 ***.
At t0, the bread samples were evaluated similarly by panellists, with the exception of the “salty”
attribute. Obviously, the control breads (Control A and Control B) had the highest value of saltiness.
At 15 and 30 days of storage, the samples were significantly different for the attributes sweet,
salty, bread flavor, and overall evaluation. The 0.15 NaCl sample showed the highest intensity of
sweet taste, while the control samples, as expected, had the highest score of salt, bread flavor, and
overall evaluation.
At 60 and 90 days of storage, the attributes of sweet, salty, and overall significantly differentiated
the bread samples. The 0.15 NaCl and 0.15 Saltwell® bread samples had the highest intensity of sweet
and the lowest of the attributes salt and overall. The control samples showed the highest intensity of
the attribute overall.
The different levels of sea salt did not influence the attributes of texture (i.e., softness), as
reported by [28].
Table 10 reports the sensory attributes which significantly differentiated (p ≤ 0.05) during the 90
days of storage.
Table 10. Mean values of the significantly different sensory attributes (comparison during storage).
Three bread loaves were collected at each sampling.
Attribute Days of Storage Control A Control B 1A 1B 2A 2B
Elasticity
0
15
30
60
90
6.1 ab
7.5 b
6.5 ab
5.0 a
5.5 a
Humidity
0
15
30
60
90
7.2 b
6.7 b
4.3 a
4.4 a
4.8 a
6.5 b
6.1 b
5.6 b
3.8 a
5.2 ab
7.2 b
5.7 ab
5.1 a
4.0 a
4.4 a
Softness
0
15
30
60
90
6.5 bc
6.8 c
5.2 abc
4.4 a
4.9 ab
6.3 b
6.8 b
5.4 ab
4.2 a
5.4 ab
Different letters in the same column indicate significant difference at p ≤ 0.05.
Control A showed a significant decrease during storage but only for the attributes of humidity
and softness. At 0 and 15 days of storage, Control A had the highest intensity of these two sensory
attributes.
Control B showed a significant decrease during storage for the attributes of elasticity, humidity,
and softness. These attributes began to decrease after 30 days of storage.
Sample 2A showed a significant decrease only for the attribute humidity, while bread samples
1A, 1B, and 2B did not show any significant differences during the 90 days of storage.
During storage, the bread samples did not develop off-odors or off-flavors in agreement with
those reported by [28].
3.5. Multivariate Statistical Analysis
Principal component analysis (PCA) is a multivariate analysis that allows the reduction and
interpretation of large multivariate datasets with some underlying linear structure. In this trial, it was

Foods 2020, 9, 752 14 of 18
carried out to determine if and which salt (type and concentration) had an influence on the qualitative
and sensory traits of the breads. The PCA included the following 24 dependent variables: specific
volume, specific weight, h/d ratio, crumb porosity, hardness, gumminess, chewiness, springiness,
resilience, water activity, moisture, pH, HMF, acidity, and crust and crumb color parameters (as L*,
a*, b*, h, C°).
The two main factors accounting for 56.92% of the total variance were PC1 and PC2 at 37.08%
and 19.84% (Figure 1).
Figure 1. Principal component analysis (PCA) scatter diagram defined by the first two principal
components (i.e., PC1, PC2) and convex hulls for the measured physico-chemical and textural traits
of the breads, grouped by storage time.
There are two types of trends on the first axis: (1) based on salt content, the groups shift from
the negative to the positive section, from the breads with minimum salt concentrations (2A and 2B),
to those with more (Control A and Control B) (Figure 1); (2) based on days of storage, from the longest
(t90) to the shortest (t0) (Figure 1). Convex hulls were used to highlight these trends. They can be
defined as the intersection of all convex sets containing a given subset of a Euclidean space. The
convex hull of a set of data is the smallest convex set that contains it.
The variables that determined these trends were resilience, crust color (as a*, C), h/d ratio, crumb
color (h), and moisture, which showed the highest positive loading values (0.272, 0.230, 0.227, 0.228,
0.218, and 0.209 respectively), chewiness, hardness, gumminess, and springiness, with the highest
negative loadings (−0.314, −0.311, −0.309, −0.263, respectively).
The groups also showed a gradient with respect to the days of storage, if PC2 is observed: from
the positive scores of the longer storage time to the gradually lower scores of the shorter ones (Figure
1).
The variables that positively correlated with PC2 were crust color parameters (L*, h, b*) and
moisture (loading values, 0.367, 0.334, 0.271, 0.292, respectively). Moreover, PC2 negatively
correlated with aw, specific volume, and crust hardness (−0.294, −0.266, −0.248, respectively).
In summary, sorting the data according to the first two axes distributes the groups in relation to
the lowest salt concentration with the maximum storage time, and so on, up to the breads with the
highest salt concentrations with the shortest storage times.

Foods 2020, 9, 752 15 of 18
PCA loadings did not have the necessary strength to affect the net separation of groups, but this
seems to support the hypothesis that the different breads and salt concentrations do not lead to
substantial differences in the overall qualitative characteristics and acceptability of the product.
4. Conclusions
The results of this study showed that replacing traditional sea salt with Saltwell® in durum
wheat bread is a possible strategy for reducing sodium intake while maintaining the quality and
sensorial characteristics of the bread.
There were no significant differences in the specific volume and bread yield among bread
samples and during storage times, regardless of the type and level of sea salt used. The textural data
showed high hardness and chewiness values, with significant differences between samples and
storage times.
Sensory data showed that the different levels of sea salt did not influence the attributes of
softness.
Principal component analysis (PCA) seems to support these findings since, overall, the
parameters analyzed were unable to differentiate groups effectively.
Natural low sodium sea salt has made it possible to obtain durum wheat bread with the
nutritional claim “low in sodium” (<0.12 g/100 g) and/or “very low in sodium” (<0.04 g/100 g) on food
labels, in accordance with EU regulations [20–22]. However, the breads showed good taste and flavor.
These results should encourage the opportunity to produce low-sodium or very low-sodium
bread because of consumers’ increasing interest in durum wheat bread in accordance with the
guidelines for a healthy diet.
Supplementary Materials: The following are available online at www.mdpi.com/2304-8158/9/6/752/s1, Table
S1:Colour parameters of the bread samples produced using different types and levels of sea salt during storage
(data are means ± standard deviations). Three bread loaves were collected at each sampling..
Author Contributions: Conceptualization, E.A., S.M., V.G., and A.S.; data curation, S.M., A.M., and M.A.; formal
analysis, S.M., A.M., V.G., and S.B.; funding acquisition, P.R. and B.P.; investigation, E.A. and A.S.; methodology,
E.A., S.M., A.M., V.G., S.B., and A.S.; project administration, P.R. and B.P.; resources, E.A., P.R., B.P., and A.S.;
software, S.M. and M.A.; supervision, E.A., P.R., B.P., and A.S.; validation, E.A., S.M., A.M., V.G., S.B., M.A., and
A.S.; visualization, A.S.; writing—original draft, E.A., S.M., A.M., V.G., and A.S.; writing—review and editing,
E.A, M.A. and A.S. All authors have read and agreed to the published version of the manuscript.
Funding: Part of this research was funded by the Regional Operational Program of “Regione Siciliana” PO FESR
2007–2013—Asse IV, Obiettivo 4.1.1—Linea di Intervento 4.1.1.2 with the title of the research program “Impiego
e valutazione di fibre e sostanze nutraceutiche per l’ottenimento di prodotti da forno salutistici”, grant number
5787/3 of the 14/12/2011.
Acknowledgments: The authors wish to thank Nick Field for scientific English language editorial assistance.
The authors thank Medsalt—Mediterranean Salt Company S.r.l. (Rome, Italy) for kindly donating a sample of
Saltwell®.
Conflicts of Interest: The authors declare no conflict of interest. The funders had no role in the design of the
study; in the collection, analyses, or interpretation of data; in the writing of the manuscript, or in the decision to
publish the results.
References
1. Whelton, P.K.; He, J.; Gail, T.L. Lifestyle Modifications for the Prevention and Treatment of Hypertension;
Whelton, P.K., He, J., Gail, T.L., Eds.; Marcel Dekker, Inc. Publisher's Location: New York, NY, USA;, 2003;
p. 403.
2. Appel, L.J.; Frohlich, E.D.; Hall, J.E.; Pearson, T.A.; Sacco, R.L.; Seals, D.R.; Sacks, F.M.; Smith, S.C.; Vafiadis,
D.K.; Van Horn, L.V. The importance of population-wide sodium reduction as a means to prevent
cardiovascular disease and stroke: A call to action from the American Heart Association. Circulation 2011,
123, 1138–1143.
3. Strazzullo, P.; D’Elia, L.; Kandala, N.B.; Cappuccio, F.P. Salt intake, stroke and cardiovascular disease:

Foods 2020, 9, 752 16 of 18
Meta-analysis of prospective studies. Br. Med. J. 2009, 339, b4567. doi:10.1136/bmj.b4567.
4. Beaglehole, R.; Bonita, R.; Horton, R.; Adams, C.; Alleyne, G.; Asaria, P.; Baugh, V.; Bekedam, H.; Billo, N.;
Casswell, S.; et al. Priority actions for the non-communicable disease crisis. Lancet 2011, 377, 1438–1447.
doi:10.1016/S0140-6736(11)60393-0.
5. Beauchamp, G.K.; Mennella, J.A. Early flavour learning and its impact on later feeding behaviour. J. Pediatr.
Gastroenterol. Nutr. 2009, 48, S25–S30. doi:10.1097/MPG.0b013e31819774a5.
6. Stein, L.J.; Cowart, B.J.; Beauchamp, G.K. The development of salty taste acceptance is related to dietary
experience in human infants: A prospective study. Am. J. Clin. Nutr. 2012, 94, 123–129.
7. Strazzullo, P.; Campanozzi, A.; Avallone, S. Does salt intake in the first two years of life affect the
development of cardiovascular disorders in adult hood? Nutr. Metab. Cardiovasc. Dis. 2012, 22, 787–792.
doi:10. 1016/j.numecd.2012.04.003.
8. Strazzullo, P.; Cairella, G.; Campanozzi, A.; Carcea, M.; Galeone, D.; Galletti, F.; Giampaoli, S.; Iacoviello,
L.; Scalfi, L. Population based strategy for dietary salt intake reduction: Italian initiatives in the European
framework. Nutr. Metab. Cardiovasc. Dis. 2012, 22, 161–166.
9. Donfrancesco, C.; Ippolito, R.; Lo Noce, C.; Palmieri, L.; Iacone, R.; Russo, O.; Vanuzzo, D.; Galletti, F.;
Galeone, D.; Giampaoli, S.; et al. Excess dietary sodium and inadequate potassium intake in Italy: Results
of the MINISAL study. Nutr. Metab. Cardiovasc. Dis. 2013, 23, 850–856. doi:10.1016/ j.numecd.2012.04.004.
10. Campanozzi, A.; Avallone, S.; Barbato, A.; Iacone, R.; Russo, O.; De Filippo, G.; D’Angelo, G.; Pensabene,
L.; Malamisura, B.; Cecere, G.; et al. High Sodium and Low Potassium Intake among Italian Children:
Relationship with Age, Body Mass and Blood Pressure. PLoS ONE 2015, 10, e0121183.
doi:10.1371/journal.pone.0121183.
11. Eaton, S.B.; Konner, M. Paleolithic nutrition. A consideration of its nature and current implications. N. Engl.
J. Med. 1985, 312, 283–289.
12. Leclercq, C.; Ferro-Luzzi, A. Total and domestic consumption of salt and their determinants in three regions
of Italy. Eur. J. Clin. Nutr. 1991, 45, 151–159.
13. European Food Safety Authority (EFSA). Opinion of the scientific panel on dietetic products, nutrition and
allergies on a request from the commission related to the tolerable upper intake level of sodium. EFSA J.
2005, 209, 1–26.
14. WASH World Action on Salt & Health. Available online: http://www.worldactiononsalt.com/ (accessed on
3 May 2020).
15. CASH Consensus Action on Salt and Health. Available online: http://www.actiononsalt.org.uk/about
(accessed on 3 May 2020).
16. Food Standard Agency, Food. Using Traffic Lights to Make Healthier Choices. Ancient House Printing
Group; Ipswich; UK. Available online:
http://www.resourcesorg.co.uk/assets/pdfs/foodtrafficlight1107.pdf. (accessed on 3 May 2020).
17. Wyness, L.A.; Butriss, J.L.; Stanner, S.A. Reducing the population's sodium intake: The UK Food Standards
Agency's salt reduction programme. Public Health Nutr. 2012, 15, 254–261.
18. WHO & FAO - World Health Organisation & Food and Agriculture Organisation. Diet, Nutrition and the
Prevention of Chronic Diseases; WHO Technical Report: Geneva, Switzerland, 2003; Volume 916, p. 149.
19. WHO World Health Organisation. Reducing Salt Intake in Populations. Report of a WHO Forum and
Technical Meeting 5–7 October 2006, Paris, France. Geneva, Switzerland 2007. Available online:
http://www.who.int/dietphysicalactivity/Salt_Report_VC_april07.pdf (accessed on 3 May 2020).
20. European Parliament & Council of the European Union. Regulation (EC) No. 1924/2006 of the European
Parliament and of the Council of 20 December 2006 on nutrition and health claims made on foods. Off. J.
Eur. Union (OJEU) 2006, L404, 9–25.
21. Commission Regulation (EU) No. 1047/2012 of 8 November 2012 amending Regulation (EC) No 1924/2006
with regard to the list of nutrition claims (Text with EEA relevance). Off. J. Eur. Union (OJEU) 2012, L310,
36–37.
22. European Parliament & Council of the European Union. Regulation (EU) No. 1169/2011 of the European
Parliament and of the Council of 25 October 2011 on the provision of food information to consumers. Off.
J. Eur. Union (OJEU) 2011, L304, 18–63.
23. Lynch, E.J.; Dal Bello, F.; Sheehan, E.M.; Cashman, K.D.; Arendt, E.K. Fundamental studies on the reduction
of salt on dough and bread characteristics. Food Res. Int. 2009, 42, 885–891.
24. Pasqualone, A.; Caponio, F.; Pagani, M.A.; Summo, C.; Paradiso, V.M. Effect of salt reduction on quality

Foods 2020, 9, 752 17 of 18
and acceptability of durum wheat bread. Food Chem. 2019, 289, 575–581.
25. Noort, J.H.F.; Bult, M.; Stieger, M. Saltiness enhancement by taste contrast in bread prepared with
encapsulated salt. J. Cereal Sci. 2012, 2, 55, 218–225. doi:10.1016/j.jcs.2011.11.012.
26. Simsek, S.; Martinez, M.O. Quality of dough and bread prepared with sea salt or sodium chloride. J. Food
Process Eng. 2016, 39, 44–52. doi:10.1111/jfpe.12197.
27. Miller, R.A.; Jeong, J. Sodium reduction in bread using low-sodium sea salt. Cereal Chem. 2014, 91, 41–44.
28. Spina, A.; Brighina, S.; Muccilli, S.; Mazzaglia, A.; Rapisarda, P.; Fallico, B.; Arena, E. Partial Replacement
of NaCl in Bread from Durum Wheat (Triticum turgidum L subsp. durum Desf.) with KCl and Yeast Extract:
Evaluation of Quality Parameters During Long Storage. Food Bioprocess Technol. 2015, 8, 1089–1101.
29. Raffo, A.; Carcea, M.; Moneta, E.; Narducci, V.; Nicoli, S.; Peparaio, M.; Sinesio, F.; Turfani, V. Influence of
different levels of sodium chloride and of a reduced-sodium salt substitute on volatiles formation and
sensory quality of wheat bread. J. Cereal Sci. 2018, 79, 518–526.
30. Sinesio, F.; Raffo, A.; Peparaio, M.; Moneta, E.; Civitelli, E.S.; Narducci, V.; Turfani, V.; Ferrari Nicoli, S.;
Carcea, M. Impact of sodium reduction strategies on volatile compounds; sensory properties and consumer
perception in commercial wheat bread. Food Chem. 2019, 301, 125252. doi:10.1016/j.foodchem.2019.
31. Delcour, J.; Hoseney, R.C. Principles of Cereal Science and Technology; AACC International: St. Paul, MN,
USA, 2010.
32. Carcea, M.; Narducci, V.; Turfani, V.; Aguzzi, A. A survey of sodium chloride content in Italian artisanal
and industrial bread. Foods 2018, 7, 181. doi:10.3390/foods7110181.
33. Fiore, M.C.; Mercati, F.; Spina, A.; Blangiforti, S.; Venora, G.; Dell’Acqua, M.; Lupini, A.; Preiti, G.; Monti,
M.; Pè, M.E.; et al. High-throughput genotyping, morphological and quality traits to assess genetic
diversity of wheat landraces from Sicily. Plants 2019, 8, 116. doi:10.3390/plants8050116.
34. Pasqualone, A. Italian Durum Wheat Breads. In Bread Consumption and Health; Pedrosa Silva Clerici, M.T.,
Ed.; Nova Science Publisher Inc.: Hauppauge, NY, USA, 2012; pp. 57–79.
35. Boyacioglu, M.H.; D’Appolonia, B.L. Characterization and utilization of durum wheat for breadmaking. I.
Comparison of chemical, rheological, and baking properties between bread wheat flour and durum wheat
flours. Cereal Chem. 1994, 71, 21–28.
36. Boyacioglu, M.H.; D’Appolonia, B.L. Characterization and utilization of durum wheat for breadmaking. II.
Study of flour blends and various additives. Cereal Chem. 1994, 71, 28–34.
37. Liu, C.Y.; Shepherd, K.W.; Rathjen, A.J. Improvement of durum wheat pastamaking and breadmaking
qualities. Cereal Chem. 1996, 73, 155–166.
38. Pasqualone, A.; De Angelis, D.; Squeo, G.; Difonzo, G.; Caponio, F.; Summo, C. The Effect of the Addition
of Apulian black Chickpea Flour on the Nutritional and Qualitative Properties of Durum Wheat-Based
Bakery Products. Foods 2019, 8, 504.
39. Giannone, V.; Giarnetti, M.; Spina, A.; Todaro, A.; Pecorino, B.; Summo, C.; Caponio, F.; Paradiso, V.M.;
Pasqualone, A. Physico-chemical properties and sensory profile of durum wheat Dittaino PDO (Protected
Designation of Origin) bread and quality of re-milled semolina used for its production. Food Chem. 2018,
241, 242–249.
40. Pasqualone, A.; Piergiovanni, A.R.; Caponio, F.; Paradiso, V.M.; Summo, C.; Simeone, R. Evaluation of the
technological characteristics and bread-making quality of alternative wheat cereals in comparison with
common and durum wheat. Food Sci. Technol. Int. 2011, 17, 135–142.
41. Palumbo, M.; Spina, A.; Boggini, G. Bread-making quality of Italian durum wheat (Triticum durum Desf.)
cultivars. Ital. J. Food Sci. 2002, 14, 123–134.
42. AACC International. Approved Methods of Analysis, 10th ed.; American Association of Cereal Chemists: St
Paul, MN, USA, 2000.
43. UNI. UNI Method no. 10690. Durum Wheat and Semolina. Determination of Gluten Quality. Gluten Index Method;
UNI: Milan, Italy, 1979.
44. ISO. ISO 3093:2009. Wheat, Rye and Their Flours, Durum Wheat and Durum Wheat Semolina. Determination of
the Falling Number according to Hagberg-Perten; ISO: Geneva, Switzerland, 2009.
45. AOAC. Official methods of analysis, 17th Edition. The Association of Official Analytical Chemists,
Gaithersburg, MD, USA, 2000.
46. Lefebvre, D.; Gabriel, V.; Vayssier, Y.; Fontagne’-Faucher, C. Simultaneous HPLC determination of sugars,
organic acids and ethanol in sourdough process. Lebensm.-Wiss. u.-Technol. 2002, 35, 407–414.
47. Lanza, C.M.; Mazzaglia, A.; Scacco, A.; Pecorino, B. Changes in sensory and instrumental features of

Foods 2020, 9, 752 18 of 18
industrial Sicilian bread during storage. Ital. J. Food Sci. 2011, 23, 6–12.
48. UNI EN ISO 8586:2014. Sensory Analysis. General Guidelines for the Selection, Training and Monitoring
of Selected Assessors and Expert Sensory Assessors. UNI, Ente Nazionale Italiano di Unificazione, Milano,
Italy.
49. Raffo, A.; Pasqualone, A.; Sinesio, F.; Paoletti, F.; Quaglia, G.; Simeone, R. Influence of durum wheat
cultivar on the sensory profile and staling rate of Altamura bread. Eur. Food Res. Technol. 2003, 218, 49–55.
50. Spina, A.; Brighina, S.; Muccilli, S.; Mazzaglia, A.; Fabroni, S.; Fallico, B.; Rapisarda, P.; Arena, E.
Wholegrain durum wheat bread fortified with citrus fibers: Evaluation of quality parameters during long
storage. Front. Nutr. 2019, 6, 13. doi:10.3389/fnut.2019.00013.
51. Ficco, D.B.M.; Muccilli, S.; Padalino, L.; Giannone, V.; Lecce, L.; Giovanniello, V.; Del Nobile, M.A.; De Vita,
P.; Spina, A. Durum wheat breads ‘high in fibre’and with reduced in vitro glycaemic response obtained by
partial semolina replacement with minor cereals and pulses. J. Food Sci. Technol. 2018, 55, 4458–4467.
52. UNI EN ISO 8589:2014. Sensory Analysis – General Guidance for the Design of Test Rooms. UNI, Ente
Nazionale Italiano di Unificazione, Milano, Italy.,
53. Hammer, Ø.; Harper, D.A.T.; Ryan, P.D. PAST: Paleontological statistics software package for education
and data analysis. Palaeontol. Electron. 2001, 4, 9.
54. D.P.R. 187. Decreto del Presidente della Repubblica 9 febbraio 2001, n. 187, “Regolamento per la revisione
della normativa sulla produzione e commercializzazione di sfarinati e paste alimentari, a norma
dell'articolo 50 della legge 22 febbraio 1994, n. 146”, 2001; p.13. Gazzetta Ufficiale della Repubblica Italiana,
serie generale, 22 maggio 2001, n. 117. Roma, Italy. (In Italian).
55. Giannone, V.; Lauro, M.R.; Spina, A.; Pasqualone, A.; Auditore, L.; Puglisi, I.; Puglisi, G. A novel α-amylase-
lipase formulation as anti-staling agent in durum wheat bread. LWT-Food Sci. Technol. 2016, 65, 381–389.
56. Siswoyo, T.A.; Tanaka, N.; Morita, N. Effect of lipase combined with alpha-amylase on retrogradation of
bread. Food Sci. Technol. Res. 1999, 5, 356–361.
57. Schmidt, S.J. Water and solids mobility in foods. In Advances in Food and Nutrition Research; Steve, L.T., Ed.;
Elsevier academic press 525 B street, Suite 1900: San Diego, CA, USA, 2004; Volume 48, pp. 1–89.
58. Arena, E.; Fallico, B.; Maccarone, E. Thermal damage in blood orange juice: Kinetics of 5-hydroxymethyl-
2-furancarboxaldehyde formation. Int. J. Food. Sci. Technol. 2001, 36, 145–151. doi:10.1046/j.1365-
2621.2001.00436.x.
59. Fallico, B.; Zappalà, M.; Arena, E.; Verzera, A. Effect of conditioning on HMF content in unifloral honeys.
Food Chem. 2004, 85, 305–313. doi:10.1016/j.foodchem.2003.07.010.
60. Capuano, E.; Fogliano, V. Acrylamide and 5-hydroxymethylfurfural (HMF): A review on metabolism,
toxicity, occurrence in food and mitigation strategies. LWT - Food Sci. Technol. 2011, 44, 793–810.
doi:10.1016/j.lwt.2010.11.002.
61. Mesias, M.; Delgado-Andrade, C.; Morales, F.J. Process contaminants in battered and breaded foods
prepared at public food service establishments. Food Control 2020, 114, 107217.
doi:10.1016/j.foodcont.2020.107217.
62. Abraham, K.; Gürtler, R.; Berg, K.; Heinemeyer, G.; Lampen, A.; Appel, K.E. Toxicology and risk
assessment of 5-Hydroxymethylfurfural in food. Mol. Nutr. Food. Res. 2011, 55, 667–678.
doi:10.1002/mnfr.201000564.
63. Choudhary, A.; Kumar, V.; Kumar, S.; Majid, I.; Aggarwal, P.; Suri, S. 5-Hydroxymethylfurfural (HMF)
formation, occurrence and potential health concerns: Recent developments. Toxin Rev. 2020, 1–17.
doi:10.1080/15569543.2020.1756857.
64. Rufián-Henares, J.A.; de la Cueva, S.P. Assessment of hydroxymethylfurfural intake in the Spanish diet.
Food Addit. Contam. A. 2008, 25, 1306–1312. doi:10.1080/02652030802163406.
65. Moreau, L.; Bindzus, W.; Hill, S. Influence of salts on starch degradation: Part II—salt classification and
caramelisation. Starch-Starke 2011, 63, 676–682.
© 2020 by the authors. Licensee MDPI, Basel, Switzerland. This article is an open access
article distributed under the terms and conditions of the Creative Commons Attribution
(CC BY) license (http://creativecommons.org/licenses/by/4.0/).