Worldwide Patterns of Ancestry, Divergence, and Admixture in Domesticated Cattle
38
1 Worldwide Patterns of Ancestry, Divergence, and Admixture in Domesticated Cattle Short Title: Ancestry, Divergence, and Admixture in Cattle
-
Upload
independent -
Category
Documents
-
view
1 -
download
0
Transcript of Worldwide Patterns of Ancestry, Divergence, and Admixture in Domesticated Cattle

1
Worldwide Patterns of Ancestry, Divergence, and Admixture in Domesticated Cattle
Short Title: Ancestry, Divergence, and Admixture in Cattle

2
Jared E. Decker, Division of Animal Sciences, University of Missouri, Columbia, Missouri, United States of America
Stephanie D. McKay, Department of Animal Science, The University of Vermont, Burlington, Vermont, United States of America
Megan M. Rolf, Department of Animal Sciences, Oklahoma State University, Stillwater, Oklahoma, United States of America
JaeWoo Kim, Division of Animal Sciences, University of Missouri, Columbia, Missouri, United States of America
Antonio Molina Alcalá, Departamento de Genética, Facultad de Veterinaria, Universidad de Córdoba, Córdoba, Spain
Tad S. Sonstegard, USDA-ARS Bovine Functional Genomics Lab, Beltsville, Maryland, United States of America
Olivier Hanotte, Medicine & Health Sciences, The University of Nottingham, Nottingham, United Kingdom
Anders Götherström, Evolutionary Biology Centre, Uppsala Universitet, Uppsala, Sweden Christopher M. Seabury, Department of Veterinary Pathobiology, College of Veterinary
Medicine, Texas A&M University, College Station, Texas, United States of America Lisa Praharani, Indonesian Research Institute for Animal Production, Ciawi, Bogor, Indonesia Masroor Ellahi Babar, Institute of Biochemistry & Biotechnology, University of Veterinary and
Animal Sciences, Lahore, Pakistan Luciana Correia de Almeida Regitano, Animal Molecular Genetics, Embrapa Pecuaria Sudeste,
Sao Carlos - Sao Paulo, Brasil Mehmet Ali Yildiz, Animal Science, Biometry and Genetics, Ankara University, Diskapi –
Ankara, Turkey Michael P. Heaton, USDA-ARS Meat Animal Research Center, Clay Center, Nebraska, United
States of America Wansheng Lui, Department of Dairy and Animal Science, Pennsylvania State University,
University Park, Pennsylvania, United States of America Chu-Zhao Lei, College of Animal Science and Technology, Northwest A&F University, Yangling,
Shaanxi 712100, China James M. Reecy, Department of Animal Science, Iowa State University, Ames, Iowa, United
States of America Muhammad Saif-Ur-Rehman, Department of Animal Breeding and Genetics, University of
Agriculture, Faisalabad, Pakistan Robert D. Schnabel, Division of Animal Sciences, University of Missouri, Columbia, Missouri,
United States of America Jeremy F. Taylor, Division of Animal Sciences, University of Missouri, Columbia, Missouri,
United States of America
Corresponding Authors Jared E. Decker Email: [email protected] Jeremy F. Taylor E-mail: [email protected]

3
Abstract The domestication and development of cattle has considerably impacted human societies, but the histories of cattle breeds have been poorly understood especially for African, Asian, and American breeds. Using genotypes from 43,043 autosomal single nucleotide polymorphism markers scored in 1,543 animals, we evaluate the population structure of 134 domesticated bovid breeds. Regardless of the analytical method or sample subset, the three major groups of Asian indicine, Eurasian taurine, and African taurine were consistently observed. Patterns of geographic dispersal resulting from co-migration with humans and exportation are recognizable in phylogenetic networks. All analytical methods reveal patterns of hybridization which occurred after divergence. Using 19 breeds, we map the cline of indicine introgression into Africa. We infer that African taurine possess a large portion of wild African auroch ancestry, causing their divergence from Eurasian taurine. We detect exportation patterns in Asia and identify a cline of Eurasian taurine/indicine hybridization in Asia. We also identify the influence of species other than Bos taurus in the formation of Asian breeds. We detect the pronounced influence of Shorthorn cattle in the formation of European breeds. Iberian and Italian cattle possess introgression from African taurine. American Criollo cattle are shown to be of Iberian, and not African, decent. Indicine introgression into American cattle occurred in the Americas, and not Europe. We argue that cattle migration, movement and trading followed by admixture have been important forces in shaping modern bovine genomic variation.
Author Summary The DNA of domesticated plants and animals contains information about how species were domesticated, exported, and bred by early farmers. Modern breeds were developed by lengthy and complex processes; however, our use of 134 breeds and new analytical models enabled us to elucidate some of the processes that created modern cattle diversity. In Asia, Africa, North and South America, humpless (Bos t. taurus or taurine) and humped (Bos t. indicus or indicine) cattle were crossbred to produce hybrids adapted to the environment and endemic production systems. The history of Asian cattle involves the domestication and admixture of several species whereas African taurines arose through the introduction of domesticated Fertile Crescent taurines and their hybridization with wild African aurochs. African taurine introgression was common among European Mediterranean breeds. The absence of indicine introgression within most European taurine breeds, but presence within three Italian breeds is consistent with two separate migrations, one from the Middle East which captured taurines in which indicine introgression had already occurred and the second from western Africa into Spain with no indicine introgression. This second group seems to have radiated from Spain into the Mediterranean resulting in a cline of African taurine introgression into European taurines.
Keywords cattle, breeds, migration, admixture, domestication
Introduction High-throughput genotyping assays have allowed population geneticists to use genome-wide marker sets to analyze the histories of many species, including human [1], cattle

4
[2–4], sheep [5], dog [6], horse [7], yeast [8], mouse [9,10], rice [11,12], maize [13–16], grape [17], and wheat [18]. We previously described the phylogeny of domesticated bovine populations using their genetic variation inferred from a sample of 40,843 single-nucleotide polymorphisms (SNPs) [3]. Although we had sampled 48 cattle breeds, we did not have samples from key geographic regions including China and Southeast Asia, Anatolia, the Baltic States, southern and eastern Africa, and the Iberian Peninsula. As a consequence of those gaps in geographic sampling, we were unable to address the origins of cattle in these regions and the extent to which these cattle influenced the population structure of regions such as the New World. We have assembled a genomic data set which represents the largest population sampling of any mammalian species. This allows for an extremely detailed description of the population structure of domesticated cattle worldwide. Using this data set, we accurately establish the patterns of exportation, divergence, and admixture for domesticated cattle.
Materials and Methods
Sample selection We used 1,543 samples in total, including 234 samples from [3] and 425 samples from [4], see Table S1. We selected samples that had fewer than 10% missing genotypes, and for breeds with fewer than 20 genotyped samples, we used all available samples which passed the missing genotype data threshold. When pedigree data was absent for a breed, the 20 samples with the highest genotype call rates were selected. For breeds which had pedigree information, we filtered any animals whose sire or dam was also genotyped. For identified half-siblings, we sampled only the sibling with the highest genotype call rate. After removing genotyped animals known to be related, we selected the 20 animals with the highest genotype call rate to represent the breed.
Genotyping Samples were genotyped with the Illumina BovineSNP50 BeadChip [19]. Autosomal SNPs and a single pseudoautosomal SNP were analyzed, because the data set from Gautier et al. [4] excluded SNPs located exclusively on the X chromosome. We also filtered all SNPs which mapped to “chromosome unknown” of the UMD 3.1 assembly [20]. In PLINK [21,22], we removed SNPs with greater than 10% missing genotypes and with minor allele frequencies less than 0.0005 (1/[2*Number of Samples] = 0.000324, thus the minor allele had to be observed at least once in our data set). The average total genotype call rate in the remaining individuals was 0.993. Genotype data is deposited at DRYAD.
Principal component analysis The sample genotype covariance matrix was decomposed using SMARTPCA, part of EIGENSOFT 4.2 [23]. To limit the effects of linkage disequilibrium on the estimation of principal components, for each SNP the residual of a regression on the previous two SNPs was input to the principal component analysis (see EIGENSOFT POPGEN README).

5
TreeMix analysis TreeMix [24] was used to create a maximum likelihood phylogeny of the 134 breeds. Because TreeMix was slow to add migration events (modeled as “edges”) to the complete data set of 134 breeds, we also analyzed subsets of the data containing considerably fewer breeds. For these subsets, breeds with fewer than 4 samples were removed. To speed up the process, we iteratively used the previous graph with m-1 migrations as the starting graph and added one migration edge for a total of m migrations. We rooted the graphs with Bali cattle, used blocks of 1000 SNPs, and used the -se option to calculate standard errors of migration rates. Migration edges were added until 99.8% of the variance in ancestry between populations was explained by the model. We also ensured that the incorporated migration edges were statistically significant.
Admixture analysis ADMIXTURE 1.21 was used to evaluate ancestry proportions for K ancestral populations [25]. We ran ADMIXTURE with cross-validation for values of K from 1 through 20 to examine patterns of ancestry and admixture in our data set.
f3 and f4 statistics The THREEPOP program from TreeMix was used to calculate f3 statistics [26] for all possible triplets from the 134 breeds. The FOURPOP program of TreeMix was used to calculate f4 statistics for subsets of the breeds.
Results and Discussion We used principal component analysis (PCA) [23], ancestry graphs implemented in TreeMix [24], and ancestry models implemented in ADMIXTURE [25] to analyze the relationships between 134 breeds of domesticated bovids (Table S1). These breeds arose from three domesticated (sub)species: Bos javanicus, Bos taurus indicus and Bos taurus taurus (we use the terms breed and population interchangeably, due to the different definitions of breed worldwide). The principal source of SNP genotype variation was between Bos t. taurus and Bos t. indicus breeds (Figure 1). This split corresponds to the cattle which originated from the two separate major centers of domestication in the Fertile Crescent and Indus Valley [27]. Although Bos javanicus has a more distant common ancestor compared with Bos t. indicus and Bos t. taurus [3], the uneven sample sizes and ascertainment of SNPs common in Bos t. taurus in the design of the BovineSNP50 assay [28] caused the Bos t. indicus/Bos t. taurus split to be the main source of variation in these data. The second principal component split African taurine cattle from Eurasian taurine, indicine, and Bali cattle. Early farmers were able to expand their habitat range because of the availability of a reliable supply of food and likely displaced indigenous hunter-gatherer populations by introducing new diseases [29]. The genomes of modern cattle reflect the history of animal movements by migratory farmers out of the ancient centers of cattle domestication. We first ran TreeMix with all 134 populations to identify patterns of divergence (Figure 2). We next ran TreeMix with 74 representative populations (Figure 3, residuals presented in Figure S1) and began to add migration edges to the phylogenetic model (Figure 4, residuals presented in Figure S2). The proportion of the

6
variance in relatedness between populations explained by the model began to asymptote at 0.998 (a value also obtained by simulations [24]) when 17 migration edges were fit (Figure S3). In addition to the migratory routes previously described from the Fertile Crescent to Europe [3], we now find strong evidence of exportations from the Indian subcontinent to China and southeast Asia, India to Africa, Africa to the Iberian peninsula and Mediterranean Europe, India to the Americas, and Europe to the Americas (Figure 4). Subsequent to these initial exportations, there have been countless exportations and importations of cattle worldwide. When domesticated cattle were present and new germplasm was imported, the introduced cattle were frequently crossed with the local cattle resulting in an admixed population. Admixed populations were most readily identified when Bos t. indicus and Bos t. taurus animals were hybridized, which occurred in China, Africa, and the Americas (crosses in Figure 1). In the late 18th and 19th centuries, European cattlemen began forming closed herds which they developed into breeds [30]. Because breeds are typically reproductively isolated with little or no interbreeding, we found that the cross-validation error estimates continued to decrease as we increased the number of ancestral populations K modeled in the admixture analysis (Table 1). This reflects the large differences in allele frequencies that exist between breeds resulting from separate domestication events, geographic dispersal and isolation, breed formation, and the use of artificial insemination. The method of Evanno et al. [31], which evaluates the second order rate of change of the likelihood function with respect to K (∆K), identified K = 2 as the optimum level of K. This method was overwhelmed by the early divergence between indicine and taurine cattle, and was not sensitive to the hierarchical relationships of populations and breeds [32]. As we increased the value of K, we recapitulated the increasingly fine structure represented in the branches of the phylogeny (Figures 5, S4-S9). Anatolian breeds (AB, EAR, TG, ASY, and SAR) are admixed between European, African, and Asian cattle, and do not represent the populations originally domesticated in this region. Zavot (ZVT), a crossbred breed [30], has a different history with a large portion of ancestry similar to Holsteins (Figures 2 and S7-S9). The placement of Anatolian breeds along principal components 1 and 2 in Figure 1 [28], the ancestry estimates in Figure 5, their extremely short branch lengths in Figures 2-4, and significant f3 statistics confirm that modern Anatolian breeds are admixed. For example, the Anatolian Southern Yellow (ASY) has 3,003 significant f3 tests, the most extreme of which has Vosgienne (VOS, a taurine breed) and Achai (ACH, an indicine breed) as sister groups with a Z-score of -43.69. Our results support previous work using microsatellite loci [33] which inferred Anatolian cattle to possess indicine introgression. We also demonstrate that Anatolian breeds are admixed between European and African. We calculated f4 statistics with East Anatolian Red, Anatolian Southern Yellow, and Anatolian Black as sister, and N’Dama, Somba, Lagune, Baole, Simmental, Holstein, Hereford, and Shorthorn as the opposing sister group. From Figure 2, we would expect these relationships to be tree-like. But 45 of the possible 84 f4 tests indicated significant levels of admixture. The most significant was f4(East Anatolian Red, Anatolian Southern Yellow; Somba, Shorthorn) = -0.0026 ± 0.0003 (Z-score = -8.10).

7
If African and Asian taurines were both exported from the Fertile Crescent in similar numbers at about the same time, we would expect them to be approximately equally diverged from European taurines. However, African taurines were consistently revealed to be more diverged from European and Asian taurines (Figures 1, 2, 3, and 5, Anatolian breeds are not considered in this comparison because of their admixed history). Two factors influence this divergence. First, European cattle were exported into Asia and admixed with Asian taurines. In the admixture models in which K = 15 or 20 (Figures S8 and S9), there was evidence of European taurine admixture in the Mongolian (MG), Hanwoo (HANW), and Wagyu (WAGY) breeds. We ran TreeMix with 14 representative populations and estimated Wagyu to have 0.188 ± 0.069 (p-value = 0.003) of their genome originating from northwestern European ancestry (Figure 6). We ran f4 tests with Mongolian, Hanwoo, Wagyu, Tharparkar (THA), or Kankraj (KAN) as sister populations, and Piedmontese (PIED), Simmental (SIM), Brown Swiss (BSW), Braunvieh (BRVH), Devon (DEV), Angus (AN), Shorthorn (SH), or Holstein (HO) as the opposing pair of sister groups. For 53 of the possible 280 tests, the Z-score was more extreme than ±2.575829. The most extreme test statistics were f4(Wagyu, Mongolian; Simmental, Shorthorn) = -0.003 (Z-score = -5.21) and f4(Hanwoo, Wagyu; Piedmontese, Shorthorn) = 0.002 (Z-score = 4.90). When K = 20, Hanwoo seem to have a Mediterranean influence, whereas Wagyu seem to have a northwestern European, including British, influence (Figure S9). We conclude that there were two waves of European introgression into Far East Asian cattle, first with Mediterranean cattle (which carried African taurine and indicine alleles) brought along the Silk Road and later from 1868 to 1918 when Japanese cattle were crossed with British and Northwest European cattle [30]. The second factor that seems to underlie the divergence of African taurine is a high level of wild auroch introgression in Africa. Principal component (Figure 1), phylogenetic trees (Figures 2 and 3), and admixture (Figure 5) analyses all reveal African taurines as the most diverged of the taurine populations. Because of this divergence it has been hypothesized that there was a third domestication of cattle in Africa [34–38]. When no migration events were fit in the TreeMix analyses, African cattle were the most diverged of the taurine populations (Figures 2 and 3), but when admixture was modeled to include 17 migrations, all African cattle, except for East African Shorthorn Zebu and Zebu from Madagascar which have high indicine ancestry, were sister to European cattle and were less diverged than Asian or Anatolian cattle (Figure 4). Our phylogenetic network (Figure 4) shows there was not a third domestication process, rather there was a single origin of domesticated taurine, followed by admixture with wild aurochs in Africa. We believe that African taurines received as much as 26% (estimated as 0.263 in the network, p-value < 2.2e-308) of their ancestry from admixture with wild African auroch (migration edge a in Figure 4). Three other migration edges originate from the branch between indicine and taurine (such as edge b), but all of the receiving populations show indicine ancestry in the ADMIXTURE models. But African auroch samples were not available for the ADMIXTURE model, thus the admixed ancestry of African taurines cannot specifically be discovered by this model [32,39] and they are depicted as having a single ancestry (without indicine influence, see f3 and f4 statistics

8
reported later). Others have observed distinct patterns of linkage disequilibrium in African taurines, resulting in larger estimates of ancestral effective population size than for either Bos t. taurus or Bos t. indicus breeds [2] consistent with greater levels of admixture from wild aurochs. Just as Near Eastern domesticated pig mitochondrial lineages were replaced by mitochondria from indigenous wild populations [40], we infer that the divergent African mitochondrial sequences [34] previously observed result from admixture with wild African auroch. Similar patterns of admixture from wild forebears have been observed in other species [40], such as pig [41–43], chicken [44], and corn [14]. The introgression in Africa may have been driven by trypanosomiasis resistance in African auroch which very well may be the source of resistance in African taurine populations [45]. Admixture with distant relatives has had an important impact on the immune system of other species, such as human [46] and possibly chicken [47]. More sophisticated demographic models and unbiased whole-genome sequence data will be needed to further test these hypotheses. African cattle also demonstrate a geographical gradient of indicine ancestry [48]. Taurine cattle in western Africa possess from 0% to 19.9% indicine ancestry (Figure 5, LAG, ND1, ND2, NDAM, BAO, OUL, SOM), with an average of 3.3%. Moving from west to east and from south to central Africa, the percent of indicine ancestry increases from 22.7% to 74.1% (Figure 5, ZFU, ZBO, ZMA, BORG, TULI, BOR, SHK, ZEB, ANKW, LAMB, an AFR), with an average of 56.9%. As we increased values of K to 10, 15, and 20 (Figures S7-S9), we revealed two clusters of indicine ancestry possibly resulting from the two waves of indicine importation into Africa, the first occurring in the second millennium BC and the second during and after the Islamic conquests [30,36,49]. The presence of two separate clades of African cattle in Figure 4 also supports the idea of two waves of indicine introgression. Asian cattle breeds were derived from cattle domesticated in the Indian subcontinent or imported from the Fertile Crescent and Europe. Cattle in the north and northeast are primarily of Bos t. taurus ancestry (Figure 5; HANW, WAGY, and MG), but Hanwoo and Mongolian also have Bos t. indicus ancestry (Figures 6, S8, and S9). Cattle in Pakistan, India, southern China and Indonesia are predominantly Bos t. indicus (Figure 5; ONG, MAD, BRE, HN, ACE, PES, ACH, HAR, BAG, GUZ, SAHW, GBI, CHO, GIR, KAN, THA, RSIN, HIS, LOH, ROJ, DHA, and DAJ). Cattle located between these two geographical regions are Bos t. taurus × Bos t. indicus hybrids (Figures 1, 4, and 5; QC and LX). The demographic model of Murray et al. [50] suggests that indicine cattle were admixed with wild aurochs after domestication. Our results suggest an additional source for increased indicine diversity—admixture with domesticated cattle from other species. In addition to cattle domesticated from aurochs (Bos primigenius), bovids were also domesticated from water buffalo (Bubalus bubalis), yak (Bos grunniens), gaur (Bos gaurus), and banteng (Bos javanicus), represented in our sample by the Bali breed [30,51]. We find that the Brebes (BRE) and Madura (MAD) breeds have significant Bos javanicus (BALI) ancestry demonstrated by the short branch lengths in Figures 2-4, shared ancestry with Bali in ADMIXTURE analyses (light green in Figures S7-S9), and significant f3 statistics (Table S2). The Pesisir, Aceh, Hainan, and Luxi breeds also have Bali ancestry (migration edge c in Figure 4, and light green in Figures S7 and S8). While

9
Bali cattle were not crossed with the Indian breeds sampled by Murray et al., mithun (Bos frontalis, domesticated gaur) or wild auroch could have been the source of introgression. Cattle were imported into Europe from the southeast to the northwest. The descendants of Durham Shorthorns were the most distinct group of European cattle as they clustered at the extremes of principal component 2 (lower left hand corner of Figure 1), and they formed a distinct cluster in the ADMIXTURE analyses whenever K was greater than 4 (Figures S6-S9). As shown in Figures S6 through S9, many breeds share ancestry with Shorthorn cattle, including Milking Shorthorn, Beef Shorthorn, Lincoln Red, Maine-Anjou, Belgian Blue, Holstein, Charolais, Santa Gertrudis, and Beefmaster [30]. From the previous placement of American Criollo breeds including Romosinuano, Texas Longhorn, and Corriente, it has been posited that Iberian cattle became admixed as a result of an introgression of cattle from Africa into the local European cattle [3,52,53]. Our genotyping of individuals from 11 Spanish breeds supported, but clarified, this hypothesis. On average, Spanish cattle had 19.3% of African ancestry when K = 3, with a minimum of 8.8% and a maximum of 23.4%, which supports previous analyses of mitochondrial DNA [54,55]. Migration edge d in the phylogenetic network (Figure 4) estimates that Iberian cattle, Texas Longhorn, and Romosinuano derive 7.5% of their ancestry from African taurine introgression, similar to the ancestry estimates from the models with larger K values (Figures S7-S9). The Oulmès Zaer (OUL) breed from Morocco also shows that cattle were transported from Iberia and France to Africa (tan and red in Figure S9, and short branch length in Figure 4). However, the 11 Spanish breeds had no more indicine ancestry than all other European taurine breeds (Figure. 5). Maraichine (MAR), Gascon (GAS), Limousin (LIM), and other breeds from France, and Piedmontese cattle (PIED) from northwest Italy have a similar ancestry. These data indicated that the reason the American Criollo breeds were more basal in our previous work [3] was because of their higher proportion of indicine ancestry. The 5 sampled American Criollo breeds had, on average, 14.7% African ancestry (minimum of 6.2% and maximum of 20.4%) and 8.0% indicine ancestry (minimum of 0.6% and maximum of 20.3%). Other Italian breeds (MCHI, CHIA, and RMG) share ancestry with both African taurine and indicine cattle (Figures 5, S5-S7). This introgression may have come from Anatolian or East African cattle that carried both African taurine and indicine ancestry, which is modeled as migration edge b in Figure 4. It has recently been concluded that indicine ancestry is a common feature of European cattle genomes [56]. However, our data refute this conclusion. McTavish et al. relied on the Evanno test to arrive at an optimal number of ancestral populations of K = 2, which masks the fact that there are cattle breeds in Africa with 100% African taurine ancestry (Figure 5). Although our K = 2 ADMIXTURE results suggested that most African breeds had at least 20% indicine ancestry (Figure S4), when we increased K to 3, Lagune (LAG) revealed no indicine ancestry, and Baoule (BAO) and N’Dama (NDAM) possess very little indicine ancestry. If the K = 2 model was correct, we would expect to see

10
numerous significant f3 and f4 tests with Eurasian taurine and indicine as sister groups. Whereas, if the K = 3 model more accurately reflected the heritage of European and African taurines, we would not observe any significant f3 or f4 tests showing admixture of taurine and indicine in the ancestry of African taurine. For the Lagune, Baoule and N’Dama (NDAM and ND2) breeds we found no significant f3 statistics. Among the 225 f4 statistics calculated with NDAM, LAG, BAO, ND2, SH, and MONT as sisters and BALI, GIR, HAR, SAHW, PES, and ACE as the opposing sister group, only 36 were significantly different from 0 (Table 2). When ND2 was excluded from the results, only 4 tests were significant (Table 2), and we have no evidence that the Lagune breed harbors indicine alleles. Thus, we conclude that indicine ancestry in European taurine cattle is extremely rare, and that some breeds, especially those prevalent near the Mediterranean, possess African taurine introgression—but with the exception of the Italian Marchigiana, Chianina and Romagnola breeds—not African hybrid or African indicine introgression. We concur that Texas Longhorn and other American Criollo breeds possess indicine ancestry, but infer that this introgression occurred after the arrival of Spanish cattle in the New World and likely originated from Brahman cattle (migration edges e and f in Figure 4). Domestication, exportation, admixture, and breed formation have had tremendous impacts on the variation present within and between cattle breeds. In Asia, Africa, North and South America, cattle breeders have crossbred Bos t. taurus and Bos t. indicus cattle to produce hybrids which were well suited to the environment and endemic production systems. In this study, we clarify the relationships between breeds of cattle worldwide, and present the most accurate cattle “Tree of Life” to date in Figure 4. We elucidate the complicated history of Asian cattle involving the domestication and subsequent admixture of several bovid species. We provide evidence for admixture between domesticated Fertile Crescent taurine and wild African auroch in Africa to form the extant African taurine breeds. We also observe African taurine content within the genomes of European Mediterranean taurine breeds. The absence of indicine content within the majority of European taurine breeds, but the presence of indicine within three Italian breeds is consistent with two separate introductions, one from the Middle East potentially by the Romans which captured African taurines in which indicine introgression had already occurred and the second from western Africa into Spain which included African taurines with no indicine introgression. It was this second group of cattle which likely radiated from Spain into Southern France and the Alps. The prevalence of admixture further convolutes the cryptic history of cattle domestication.
Acknowledgments We gratefully acknowledge the provision of samples and genotypes from breed associations, cattle breeders, semen distributors and the Bovine HapMap Project. This project was supported by National Research Initiative grants number 2008-35205-04687 and 2008-35205-18864 from the USDA Cooperative State Research, Education and Extension Service and National Research Initiative grant number 2009-65205-05635 from the USDA National Institute of Food and Agriculture. We thank Daniel G. Bradley for insightful comments on the analysis and manuscript.

11
References
1. Novembre J, Ramachandran S (2011) Perspectives on human population structure at the cusp of the sequencing era. Annual Review of Genomics and Human Genetics 12: 245–274. Available: http://www.ncbi.nlm.nih.gov/pubmed/21801023.
2. Gibbs RA, Taylor JF, Van Tassell CP, Barendse W, Eversole KA, et al. (2009) Genome-wide survey of SNP variation uncovers the genetic structure of cattle breeds. Science 324: 528–532. Available: http://www.ncbi.nlm.nih.gov/pubmed/19390050.
3. Decker JE, Pires JC, Conant GC, McKay SD, Heaton MP, et al. (2009) Resolving the evolution of extant and extinct ruminants with high-throughput phylogenomics. Proceedings of the National Academy of Sciences of the United States of America 106: 18644–18649. Available: http://www.pubmedcentral.nih.gov/articlerender.fcgi?artid=2765454&tool=pmcentrez&rendertype=abstract.
4. Gautier M, Laloë D, Moazami-Goudarzi K (2010) Insights into the genetic history of French cattle from dense SNP data on 47 worldwide breeds. PLoS One 5: e13038. Available: http://www.pubmedcentral.nih.gov/articlerender.fcgi?artid=2948016&tool=pmcentrez&rendertype=abstract. Accessed 13 September 2013.
5. Kijas JW, Townley D, Dalrymple BP, Heaton MP, Maddox JF, et al. (2009) A genome wide survey of SNP variation reveals the genetic structure of sheep breeds. PLoS One 4: e4668. Available: http://www.pubmedcentral.nih.gov/articlerender.fcgi?artid=2652362&tool=pmcentrez&rendertype=abstract. Accessed 29 February 2012.
6. Vonholdt BM, Pollinger JP, Lohmueller KE, Han E, Parker HG, et al. (2010) Genome-wide SNP and haplotype analyses reveal a rich history underlying dog domestication. Nature 464: 898–902. Available: http://www.ncbi.nlm.nih.gov/pubmed/20237475. Accessed 2 March 2012.
7. McCue ME, Bannasch DL, Petersen JL, Gurr J, Bailey E, et al. (2012) A high density SNP array for the domestic horse and extant Perissodactyla: Utility for association mapping, genetic diversity, and phylogeny studies. PLoS Genetics 8: e1002451. Available: http://dx.plos.org/10.1371/journal.pgen.1002451. Accessed 16 January 2012.
8. Schacherer J, Shapiro JA, Ruderfer DM, Kruglyak L (2009) Comprehensive polymorphism survey elucidates population structure of Saccharomyces cerevisiae. Nature 458: 342–345. Available:

12
http://www.pubmedcentral.nih.gov/articlerender.fcgi?artid=2782482&tool=pmcentrez&rendertype=abstract. Accessed 31 July 2013.
9. Yang H, Wang JR, Didion JP, Buus RJ, Bell TA, et al. (2011) Subspecific origin and haplotype diversity in the laboratory mouse. Nature Genetics 43: 648–655. Available: http://www.pubmedcentral.nih.gov/articlerender.fcgi?artid=3125408&tool=pmcentrez&rendertype=abstract.
10. Staubach F, Lorenc A, Messer PW, Tang K, Petrov DA, et al. (2012) Genome patterns of selection and introgression of haplotypes in natural populations of the house mouse (Mus musculus). PLoS Genetics 8: e1002891. Available: http://dx.plos.org/10.1371/journal.pgen.1002891. Accessed 31 July 2013.
11. McNally KL, Childs KL, Bohnert R, Davidson RM, Zhao K, et al. (2009) Genomewide SNP variation reveals relationships among landraces and modern varieties of rice. Proceedings of the National Academy of Sciences of the United States of America 106: 12273–12278. Available: http://www.pnas.org/cgi/content/long/106/30/12273. Accessed 31 July 2013.
12. Zhao K, Wright M, Kimball J, Eizenga G, McClung A, et al. (2010) Genomic diversity and introgression in O. sativa reveal the impact of domestication and breeding on the rice genome. PLoS One 5: e10780. Available: http://dx.plos.org/10.1371/journal.pone.0010780. Accessed 31 July 2013.
13. Yan J, Shah T, Warburton ML, Buckler ES, McMullen MD, et al. (2009) Genetic characterization and linkage disequilibrium estimation of a global maize collection using SNP markers. PLoS One 4: e8451. Available: http://dx.plos.org/10.1371/journal.pone.0008451. Accessed 31 July 2013.
14. Van Heerwaarden J, Doebley J, Briggs WH, Glaubitz JC, Goodman MM, et al. (2011) Genetic signals of origin, spread, and introgression in a large sample of maize landraces. Proceedings of the National Academy of Sciences of the United States of America 108: 1088–1092. Available: http://www.pnas.org/cgi/content/long/1013011108v1. Accessed 4 December 2012.
15. Van Heerwaarden J, Hufford MB, Ross-Ibarra J (2012) Historical genomics of North American maize. Proceedings of the National Academy of Sciences of the United States of America 109: 12420–12425. Available: http://www.pnas.org/cgi/content/long/109/31/12420. Accessed 31 July 2013.
16. Hufford MB, Lubinksy P, Pyhäjärvi T, Devengenzo MT, Ellstrand NC, et al. (2013) The genomic signature of crop-wild introgression in maize. PLoS Genetics 9: e1003477. Available: http://dx.plos.org/10.1371/journal.pgen.1003477. Accessed 31 July 2013.

13
17. Myles S, Boyko AR, Owens CL, Brown PJ, Grassi F, et al. (2011) Genetic structure and domestication history of the grape. Proceedings of the National Academy of Sciences of the United States of America 108: 3530–3535. Available: http://www.pubmedcentral.nih.gov/articlerender.fcgi?artid=3048109&tool=pmcentrez&rendertype=abstract. Accessed 14 March 2012.
18. Cavanagh CR, Chao S, Wang S, Huang BE, Stephen S, et al. (2013) Genome-wide comparative diversity uncovers multiple targets of selection for improvement in hexaploid wheat landraces and cultivars. Proceedings of the National Academy of Sciences of the United States of America 110: 8057–8062. Available: http://www.pnas.org/cgi/content/long/110/20/8057. Accessed 31 July 2013.
19. Matukumalli LK, Lawley CT, Schnabel RD, Taylor JF, Allan MF, et al. (2009) Development and characterization of a high density SNP genotyping assay for cattle. PLoS One 4: e5350. Available: http://www.ncbi.nlm.nih.gov/pubmed/19390634.
20. Zimin A V., Delcher AL, Florea L, Kelley DR, Schatz MC, et al. (2009) A whole-genome assembly of the domestic cow, Bos taurus. Genome Biology 10: R42. Available: http://www.ncbi.nlm.nih.gov/pubmed/19393038. Accessed 5 March 2012.
21. Purcell SM, Neale B, Todd-Brown K, Thomas L, Ferreira MAR, et al. (2007) PLINK: A tool set for whole-genome association and population-based linkage analyses. American Journal of Human Genetics 81: 559–575. Available: http://pngu.mgh.harvard.edu/purcell/plink/. Accessed 1 March 2012.
22. Purcell SM (2009) PLINK. Available: http://pngu.mgh.harvard.edu/purcell/plink/.
23. Patterson NJ, Price AL, Reich D (2006) Population structure and eigenanalysis. PLoS Genetics 2: e190. Available: http://www.ncbi.nlm.nih.gov/pubmed/17194218. Accessed 12 March 2012.
24. Pickrell JK, Pritchard JK (2012) Inference of population splits and mixtures from genome-wide allele frequency data. PLoS Genetics 8: e1002967. Available: http://dx.plos.org/10.1371/journal.pgen.1002967. Accessed 16 November 2012.
25. Alexander DH, Novembre J, Lange K (2009) Fast model-based estimation of ancestry in unrelated individuals. Genome Research 19: 1655–1664. Available: http://www.ncbi.nlm.nih.gov/pubmed/19648217.
26. Patterson N, Moorjani P, Luo Y, Mallick S, Rohland N, et al. (2012) Ancient admixture in human history. Genetics 192: 1065–1093. Available: http://www.ncbi.nlm.nih.gov/pubmed/22960212. Accessed 13 September 2013.

14
27. Loftus RT, MacHugh DE, Bradley DG, Sharp PM, Cunningham P (1994) Evidence for two independent domestications of cattle. Proceedings of the National Academy of Sciences of the United States of America 91: 2757–2761. Available: http://www.ncbi.nlm.nih.gov/pubmed/8146187.
28. McVean G (2009) A genealogical interpretation of principal components analysis. PLoS Genetics 5: e1000686. Available: http://www.pubmedcentral.nih.gov/articlerender.fcgi?artid=2757795&tool=pmcentrez&rendertype=abstract. Accessed 11 July 2011.
29. Diamond J (2002) Evolution, consequences and future of plant and animal domestication. Nature 418: 700–707. Available: http://www.ncbi.nlm.nih.gov/pubmed/12167878.
30. Felius M (1995) Cattle breeds - an encyclopedia. Doetinchem, Netherlands: Misset.
31. Evanno G, Regnaut S, Goudet J (2005) Detecting the number of clusters of individuals using the software STRUCTURE: a simulation study. Molecular Ecology 14: 2611–2620. Available: http://www.ncbi.nlm.nih.gov/pubmed/15969739. Accessed 3 October 2012.
32. Reich D, Thangaraj K, Patterson NJ, Price AL, Singh L (2009) Reconstructing Indian population history. Nature 461: 489–494. Available: http://www.ncbi.nlm.nih.gov/pubmed/19779445.
33. Loftus RT, Ertugrul O, Harba AH, El-Barody MA, MacHugh DE, et al. (1999) A microsatellite survey of cattle from a centre of origin: the Near East. Molecular Ecology 8: 2015–2022. Available: http://www.ncbi.nlm.nih.gov/pubmed/10632853. Accessed 5 September 2013.
34. Troy CS, MacHugh DE, Bailey JF, Magee DA, Loftus RT, et al. (2001) Genetic evidence for Near-Eastern origins of European cattle. Nature 410: 1088–1091. Available: http://www.ncbi.nlm.nih.gov/pubmed/11323670.
35. Bradley DG, MacHugh DE, Cunningham P, Loftus RT (1996) Mitochondrial diversity and the origins of African and European cattle. Proceedings of the National Academy of Sciences of the United States of America 93: 5131–5135. Available: http://www.pubmedcentral.nih.gov/articlerender.fcgi?artid=39419&tool=pmcentrez&rendertype=abstract.
36. Hanotte O, Bradley DG, Ochieng JW, Verjee Y, Hill EW, et al. (2002) African pastoralism: genetic imprints of origins and migrations. Science 296: 336–339. Available: http://www.ncbi.nlm.nih.gov/pubmed/11951043.

15
37. Marshall F, Weissbrod L (2011) Domestication Processes and Morphological Change. Current Anthropology 52: S397–S413. Available: http://www.jstor.org/stable/info/10.1086/658389. Accessed 24 August 2013.
38. Pérez-Pardal L, Royo LJ, Beja-Pereira a, Chen S, Cantet RJC, et al. (2010) Multiple paternal origins of domestic cattle revealed by Y-specific interspersed multilocus microsatellites. Heredity 105: 511–519. Available: http://www.ncbi.nlm.nih.gov/pubmed/20332805. Accessed 11 September 2013.
39. Falush D, Stephens M, Pritchard JK (2003) Inference of population structure using multilocus genotype data: linked loci and correlated allele frequencies. Genetics 164: 1567–1587. Available: http://www.pubmedcentral.nih.gov/articlerender.fcgi?artid=1462648&tool=pmcentrez&rendertype=abstract.
40. Larson G, Burger J (2013) A population genetics view of animal domestication. Trends in Genetics : TIG 29: 197–205. Available: http://www.ncbi.nlm.nih.gov/pubmed/23415592. Accessed 22 May 2013.
41. Larson G, Albarella U, Dobney K, Rowley-Conwy P, Schibler J, et al. (2007) Ancient DNA, pig domestication, and the spread of the Neolithic into Europe. Proceedings of the National Academy of Sciences of the United States of America 104: 15276–15281. Available: http://www.pnas.org/content/104/39/15276.short. Accessed 28 August 2013.
42. Ottoni C, Flink LG, Evin A, Geörg C, De Cupere B, et al. (2013) Pig domestication and human-mediated dispersal in western Eurasia revealed through ancient DNA and geometric morphometrics. Molecular biology and evolution 30: 824–832. Available: http://www.ncbi.nlm.nih.gov/pubmed/23180578. Accessed 13 September 2013.
43. Larson G, Cucchi T, Fujita M, Matisoo-Smith E, Robins J, et al. (2007) Phylogeny and ancient DNA of Sus provides insights into neolithic expansion in Island Southeast Asia and Oceania. Proceedings of the National Academy of Sciences of the United States of America 104: 4834–4839. Available: http://www.pubmedcentral.nih.gov/articlerender.fcgi?artid=1829225&tool=pmcentrez&rendertype=abstract.
44. Eriksson J, Larson G, Gunnarsson U, Bed’hom B, Tixier-Boichard M, et al. (2008) Identification of the yellow skin gene reveals a hybrid origin of the domestic chicken. PLoS Genetics 4: e1000010. Available: http://www.pubmedcentral.nih.gov/articlerender.fcgi?artid=2265484&tool=pmcentrez&rendertype=abstract. Accessed 22 May 2013.
45. Stewart JL (1951) The West African Shorthorn cattle. Their value to Africa as trypanosomiasis-resistant animals. Veterinary Record 63: 454.

16
46. Abi-Rached L, Jobin MJ, Kulkarni S, McWhinnie A, Dalva K, et al. (2011) The shaping of modern human immune systems by multiregional admixture with archaic humans. Science (New York, NY) 334: 89–94. Available: http://www.ncbi.nlm.nih.gov/pubmed/21868630. Accessed 6 August 2013.
47. Downing T, Lynn DJ, Connell S, Lloyd AT, Bhuiyan a K, et al. (2009) Evidence of balanced diversity at the chicken interleukin 4 receptor alpha chain locus. BMC Evolutionary Biology 9: 136. Available: http://www.pubmedcentral.nih.gov/articlerender.fcgi?artid=3224688&tool=pmcentrez&rendertype=abstract. Accessed 6 September 2013.
48. MacHugh DE, Shriver MD, Loftus RT, Cunningham P, Bradley DG (1997) Microsatellite DNA variation and the evolution, domestication and phylogeography of taurine and zebu cattle (Bos taurus and Bos indicus). Genetics 146: 1071–1086. Available: http://www.genetics.org/cgi/content/abstract/146/3/1071.
49. Ajmone-Marsan P, Garcia JF, Lenstra JA (2010) On the origin of cattle: How aurochs became cattle and colonized the world. Evolutionary Anthropology: Issues, News, and Reviews 19: 148–157. Available: http://doi.wiley.com/10.1002/evan.20267. Accessed 5 September 2013.
50. Murray C, Huerta-Sanchez E, Casey F, Bradley DG (2010) Cattle demographic history modelled from autosomal sequence variation. Philosophical Transactions of the Royal Society of London Series B, Biological Sciences 365: 2531–2539. Available: http://www.pubmedcentral.nih.gov/articlerender.fcgi?artid=2935105&tool=pmcentrez&rendertype=abstract. Accessed 13 April 2012.
51. Cockrill WR (1974) The husbandry and health of the domestic buffalo. Cockrill WR, editor Rome: Food and Agriculture Organization of the United Nations.
52. Cymbron T, Loftus RT, Malheiro MI, Bradley DG (1999) Mitochondrial sequence variation suggests an African influence in Portuguese cattle. Proceedings Biological Sciences / The Royal Society 266: 597–603. Available: http://www.pubmedcentral.nih.gov/articlerender.fcgi?artid=1689806&tool=pmcentrez&rendertype=abstract. Accessed 23 July 2013.
53. Cymbron T, Freeman AR, Isabel Malheiro M, Vigne J-D, Bradley DG (2005) Microsatellite diversity suggests different histories for Mediterranean and Northern European cattle populations. Proceedings Biological Sciences / The Royal Society 272: 1837–1843. Available: http://www.pubmedcentral.nih.gov/articlerender.fcgi?artid=1559860&tool=pmcentrez&rendertype=abstract. Accessed 31 December 2012.
17
54. Mirol PM, Giovambattista G, Lirón JP, Dulout FN (2003) African and European mitochondrial haplotypes in South American Creole cattle. Heredity 91: 248–254. Available: http://www.ncbi.nlm.nih.gov/pubmed/12939625.
55. Lirón JP, Bravi CM, Mirol PM, Peral-García P, Giovambattista G (2006) African matrilineages in American Creole cattle: evidence of two independent continental sources. Animal Genetics 37: 379–382. Available: http://www.ncbi.nlm.nih.gov/pubmed/16879351. Accessed 5 September 2013.
56. McTavish EJ, Decker JE, Schnabel RD, Taylor JF, Hillis DM (2013) New World cattle show ancestry from multiple independent domestication events. Proceedings of the National Academy of Sciences of the United States of America 110: E1398–406. Available: http://www.pubmedcentral.nih.gov/articlerender.fcgi?artid=3625352&tool=pmcentrez&rendertype=abstract. Accessed 21 May 2013.

18
Figure Legends
Figure 1. Principal component analysis of 1,543 animals genotyped with 43,043 SNPs. Points were colored according to geographic origin of breed; black: Africa, green: Asia, red: North and South America, orange: Australia, and blue: Europe.
19

20
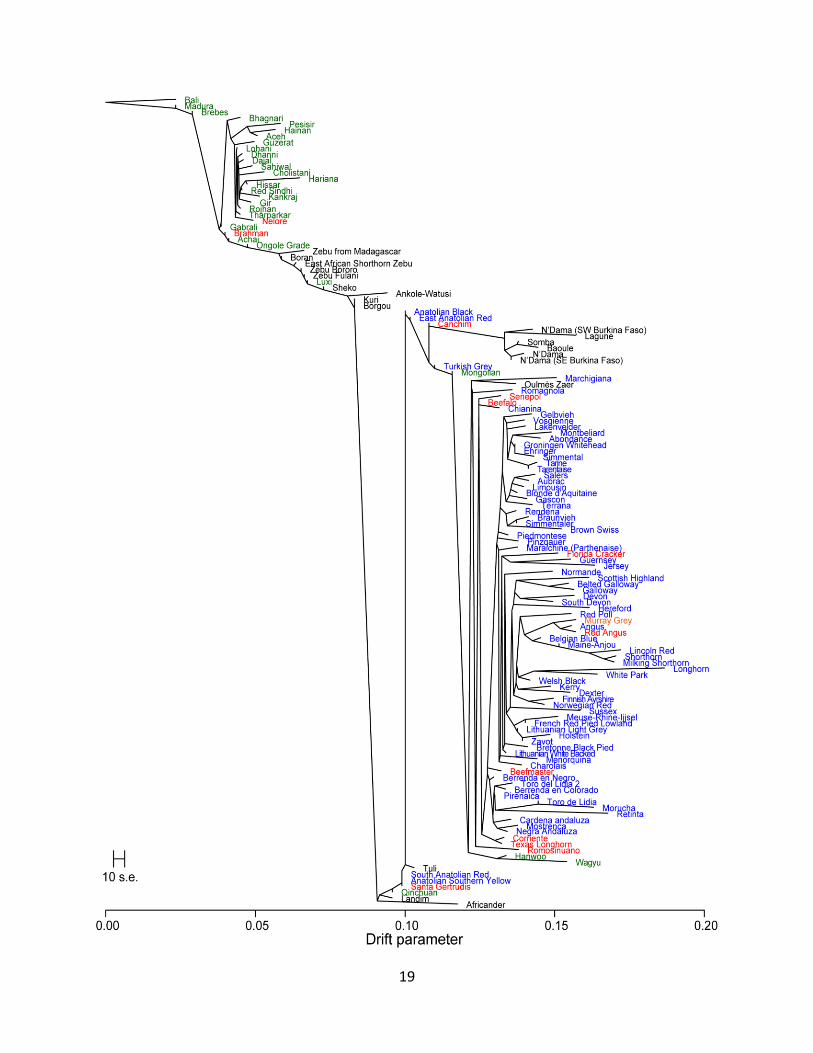
Figure 2. Phylogram of the inferred relationships between 134 cattle breeds. Breeds were colored according to their geographic origin; black: Africa, green: Asia, red: North and South America, orange: Australia, and blue: Europe. Scale bar shows 10 times the average standard error of the estimated entries in the sample covariance matrix (See [24]).

21

22
Figure 3. Phylogram of the inferred relationships between 74 cattle breeds. Breeds were colored according to their geographic origin; black: Africa, green: Asia, red: North and South America, orange: Australia, and blue: Europe. Scale bar shows 10 times the average standard error of the estimated entries in the sample covariance matrix.

23

24
Figure 4. Phylogenetic network of the inferred relationships between 74 cattle breeds. Breeds were colored according to their geographic origin; black: Africa, green: Asia, red: North and South America, orange: Australia, and blue: Europe. Scale bar shows 10 times the average standard error of the estimated entries in the sample covariance matrix. Migration edges were colored according to percent ancestry received from the donor population. Migration edge a is hypothesized to be from wild African auroch into domesticates from the Fertile Crescent. Migration edge b is hypothesized to be introgression from hybrid African cattle. Migration edge c is hypothesized to be introgression from Bali/indicine hybrids into other Indonesian cattle. Migration edge d signals introgression of African taurine into Iberia. Migration edges e and f represent introgression from Brahman into American Criollo.

25
Figure 5. Ancestry models with 3 ancestral populations (K = 3). Blue represents Eurasian Bos t. taurus ancestry, green represents Bos javanicus and Bos t. indicus ancestry, and dark grey represents African Bos. t. taurus ancestry. See Supplementary Figures S4-S9 for other values of K.

26
Figure 6. Phylogenetic network of the inferred relationships between 14 cattle breeds. Breeds were colored according to their geographic origin; green: Asia, and blue: Europe. Scale bar shows 10 times the average standard error of the estimated entries in the sample covariance matrix. Migration edges were colored according to percent ancestry received from the donor population. Migration edges show indicine introgression into Mongolian cattle, African taurine and indicine ancestry in Marchigiana, and a northern European influence on Wagyu.

27
Figure S1. Plot of residuals from the phylogeny model depicted in Figure 3 when no migration edges were fit.

28
Figure S2. Plot of residuals from the phylogenetic network model depicted in Figure 4 when 17 migration edges were fit.

29
Figure S3. The fraction of variance in relatedness between populations accounted for by phylogenetic models with 0 through 19 migrations. The fraction of variance
in the sample covariance matrix (W ) accounted for by the model covariance matrix (W ). Pickrell and Pritchard [24] showed that the fraction began to asymptote at 0.998 when the models accurately depicted relationships between simulated populations. We also observed this asymptote near 0.998 in our empirical analysis, leading us to conclude that the relationships between the 74 cattle breeds were accurately described by a phylogenetic network with 17 migration edges.

30
Figure S4. Ancestry models with 2 ancestral populations (K = 2). Blue represents Bos t. taurus ancestry, and green represents Bos javanicus and Bos t. indicus ancestry.

31
Figure S5. Ancestry models with 4 ancestral populations (K = 4). Blue represents Eurasian Bos t. taurus ancestry, green represents Bos javanicus and Bos t. indicus ancestry, dark grey represents African Bos. t. taurus ancestry, and cyan represents ancestry similar to Durham Shorthorns.

32
Figure S6. Ancestry models with 5 ancestral populations (K = 5). Blue represents Eurasian Bos t. taurus ancestry, green represents Bos javanicus and Bos t. indicus ancestry, dark grey represents African Bos. t. taurus ancestry, cyan represents ancestry similar to Durham Shorthorns, and deep sky blue represents British and Northern European ancestry.

33
Figure S7. Ancestry models with 10 ancestral populations (K = 10).

34
Figure S8. Ancestry models with 15 ancestral populations (K = 15).

35
Figure S9. Ancestry models with 20 ancestral populations (K = 20).

36
Tables
Table 1. Cross-validation and K values for ADMIXTURE ancestry models with K ranging from 1 to 20.
K Cross-validation
error Log-likelihood L'(K) L''(K)
1 0.63636 -65702704 N/A N/A
2 0.54374 -59538328 6164375.96 4545316.79
3 0.51985 -57919269 1619059.17 1105462.91
4 0.51288 -57405673 513596.27 253401.84
5 0.50983 -57145478 260194.42 26732.82
6 0.50693 -56912017 233461.61 9346.55
7 0.50424 -56687902 224115.05 -163722.93
8 0.49888 -56300064 387837.99 450205.28
9 0.50094 -56362431 -62367.29 -547943.87
10 0.49428 -55876855 485576.58 382526.32
11 0.49325 -55773804 103050.26 -68045.84
12 0.49175 -55602708 171096.10 46476.86
13 0.49041 -55478089 124619.24 -79680.06
14 0.48836 -55273790 204299.30 81316.25
15 0.48708 -55150807 122983.05 37711.26
16 0.48640 -55065535 85271.79 -65609.06
17 0.48497 -54914654 150880.84 72573.21
18 0.48455 -54836346 78307.63 -63149.16
19 0.48293 -54694890 141456.79 38935.55
20 0.48206 -54592368 102521.24 102521.24

37
Table 2. Significant f4 statistics for African taurine breeds and populations1.
Population A Population B Population C Population D f4 Standard Error Z-score N'Dama (ND2) Shorthorn Bali Hariana -0.00298 0.00061 -4.91 N'Dama (ND2) Shorthorn Bali Sahiwal -0.00254 0.00056 -4.54 N'Dama (ND2) Montbeliard Bali Hariana -0.00246 0.00051 -4.82 N'Dama (ND2) Shorthorn Bali Gir -0.00245 0.00058 -4.21 N'Dama (ND2) Shorthorn Bali Aceh -0.00217 0.00050 -4.30 N'Dama (ND2) Shorthorn Bali Pesisir -0.00206 0.00048 -4.28 N'Dama (ND2) Montbeliard Bali Sahiwal -0.00199 0.00048 -4.11 N'Dama (ND2) Montbeliard Bali Gir -0.00189 0.00053 -3.55 N'Dama (ND2) Montbeliard Bali Aceh -0.00175 0.00044 -3.98 N'Dama (NDAM) Shorthorn Bali Hariana -0.00156 0.00059 -2.67 N'Dama (ND2) Montbeliard Bali Pesisir -0.00151 0.00041 -3.71 Lagune N'Dama Hariana Pesisir -0.00136 0.00028 -4.78 Baoule Shorthorn Bali Pesisir -0.00134 0.00049 -2.73 Baoule N'Dama (ND2) Hariana Pesisir -0.00091 0.00028 -3.18 Lagune N'Dama (ND2) Hariana Aceh -0.00080 0.00024 -3.35 Lagune N'Dama (ND2) Hariana Sahiwal -0.00073 0.00019 -3.84 Lagune N'Dama (ND2) Gir Pesisir -0.00072 0.00023 -3.10 Baoule N'Dama (ND2) Gir Pesisir -0.00063 0.00019 -3.31 Lagune N'Dama (ND2) Pesisir Aceh 0.00055 0.00020 2.73 N'Dama (NDAM) Lagune Hariana Sahiwal 0.00056 0.00018 3.10 Lagune N'Dama (ND2) Gir Hariana 0.00064 0.00020 3.16 Baoule N'Dama (ND2) Bali Pesisir 0.00072 0.00028 2.59 N'Dama (NDAM) Lagune Hariana Pesisir 0.00085 0.00022 3.81 N'Dama N'Dama (ND2) Bali Pesisir 0.00091 0.00025 3.62 N'Dama N'Dama (ND2) Bali Aceh 0.00105 0.00026 4.09 Baoule N'Dama (ND2) Bali Aceh 0.00112 0.00029 3.87 N'Dama N'Dama (ND2) Bali Gir 0.00114 0.00028 4.08 Baoule N'Dama (ND2) Bali Sahiwal 0.00122 0.00033 3.72 N'Dama N'Dama (ND2) Bali Sahiwal 0.00125 0.00028 4.44 Baoule N'Dama (ND2) Bali Gir 0.00135 0.00032 4.20 Lagune N'Dama (ND2) Bali Aceh 0.00140 0.00033 4.23 N'Dama N'Dama (ND2) Bali Hariana 0.00142 0.00031 4.55 Lagune N'Dama (ND2) Bali Sahiwal 0.00148 0.00038 3.91 Lagune N'Dama (ND2) Bali Gir 0.00157 0.00037 4.29 Baoule N'Dama (ND2) Bali Hariana 0.00162 0.00036 4.47 Lagune N'Dama (ND2) Bali Hariana 0.00221 0.00036 6.11
1Significant results with ND2 excluded from the analysis are indicated in bold italics.

38
Table S1. Provenance for all samples included in the analyses. Species and subspecies assignments are according to [30].
Table S2. Significant f3 statistics for Madura and Brebes showing Bali (Bos javanicus) introgression.