The Case for Geomagnetic Alignment of Precolumbian Mesoamerican Sites - The Maya
Upload
independentCategory
view
4download
0
Pre-Hispanic Mesoamerican Demography Approximatesthe Present-Day Ancestry of Mestizos Throughout theTerritory of Mexico
Rodrigo Rubi-Castellanos,1 Gabriela Martınez-Cortes,1 Jose Francisco Munoz-Valle,2
Antonio Gonzalez-Martın,3 Ricardo M. Cerda-Flores,4 Manuel Anaya-Palafox,5
and Hector Rangel-Villalobos1
1Instituto de Investigacion en Genetica Molecular, Centro Universitario de la Cienega, (CUCienega-UdeG),Ocotlan, Jalisco, Mexico2Instituto de Investigacion en Reumatologıa y del Sistema Musculo-Esqueletico,Centro Universitario de Ciencias de la Salud (CUCS-UdeG), Guadalajara, Jalisco, Mexico3Departamento de Zoologıa y Antropologıa Fısica, Universidad Complutense de Madrid (UCM),28040 Madrid, Spain4Departamento de Genetica de Poblaciones y Bioinformatica, Centro de Investigacion Biomedicadel Noreste (CIBN-IMSS), Monterrey, Nuevo Leon, Mexico5Laboratorio de Genetica Forense, Instituto Jalisciense de Ciencias Forenses (IJCF), Tlaquepaque,Jalisco, Mexico
KEY WORDS STRs; CODIS; Mexican; Mestizo; admixture; STRUCTURE
ABSTRACT Over the last 500 years, admixtureamong Amerindians, Europeans, and Africans, princi-pally, has come to shape the present-day gene pool ofMexicans, particularly Mestizos, who represent about93% of the total Mexican population. In this work, weanalyze the genetic data of 13 combined DNA index sys-tem-short tandem repeats (CODIS-STRs) in 1,984 unre-lated Mestizos representing 10 population samples fromdifferent regions of Mexico, namely North, West, Cen-tral, and Southeast. The analysis of molecular variance(AMOVA) test demonstrated low but significant differ-entiation among Mestizos from different regions (FST 50.34%; P 5 0.0000). Although the spatial analysis ofmolecular variance (SAMOVA) predicted clusteringMestizo populations into four well-delimited groups, themain differentiation was observed between Northwestwhen compared with Central and Southeast regions. In
addition, we included analysis of individuals of Amerin-dian (Purepechas), European (Huelva, Spain), andAfrican (Fang) origin. Thus, STRUCTURE analysis wasperformed identifying three well-differentiated ances-tral populations (k 5 3). STRUCTURE results andadmixture estimations by means of LEADMIX softwarein Mestizo populations demonstrated genetic heteroge-neity or asymmetric admixture throughout Mexico,displaying an increasing North-to-South gradient ofAmerindian ancestry, and vice versa regarding theEuropean component. Interestingly, this distribution ofAmerindian ancestry roughly reflects pre-HispanicNative-population density, particularly toward theMesoamerican area. The forensic, epidemiological, andevolutionary implications of these findings are dis-cussed herein. Am J Phys Anthropol 139:284–294,2009. VVC 2009 Wiley-Liss, Inc.
The admixture process presupposes the contact of an-cestral populations that have previously been in relativeisolation from each another and generated hybrid popu-lations; identification of the admixture process requiresrecognition of modern populations that represent, asclosely as possible, the genetic diversity of parental pop-ulations in this hybrid. Population structure describesthe presence of individuals or subpopulations with sig-nificant differences in admixture components (Joblinget al., 2004), which is important for the following diversepurposes: admixture and association mapping; evolution-ary studies; forensic casework; medical risk prediction;and wildlife management (Sans, 2000; Liu et al., 2005).In particular, there has been increasing interest aboutadmixed populations in the biomedical field, because it ispossible to make use of recent admixture for mappinggenes underlying ethnic variation in disease risk(Martınez-Marignac et al., 2007).In Latin America, hybrid populations have been gener-
ated since the time of European contact with the NewWorld in 1492. The Americas were first colonized by
Native Americans who arrived in the last 15,000–25,000years according to molecular data (Schurr and Sherry,2004; Kemp et al., 2007; Tamm et al., 2007; Achilli et al.,
Additional Supporting Information may be found in the onlineversion of this article.
Grant sponsor: CONACyT 48710.
Rodrigo Rubi-Castellanos and Hector Rangel-Villalobos contrib-uted equally to this work.
*Correspondence to: Hector Rangel-Villalobos, Instituto de Inves-tigacion en Genetica Molecular, Universidad de Guadalajara, CP47810 Ocotlan, Jalisco, Mexico. E-mail: [email protected]
Received 25 May 2008; accepted 24 October 2008
DOI 10.1002/ajpa.20980Published online 12 January 2009 in Wiley InterScience
(www.interscience.wiley.com).
VVC 2009 WILEY-LISS, INC.
AMERICAN JOURNAL OF PHYSICAL ANTHROPOLOGY 139:284–294 (2009)

2008; Fagundes et al., 2008; Kitchen et al., 2008). InMexico, the process of European colonization began in1519 when the Spaniards reached the Southeast regionof the country (presently the island of Cozumel), passingthrough the state of Tabasco, and subsequently estab-lishing the first town hall in the New World in the pres-ent-day state of Veracruz (baptized in the Colony as VillaRica de la Vera Cruz). Subsequent events included theconquest of the Mayas and Aztecs, the largest Amerin-dian tribes at the time. After the conquest of Tenochti-tlan, the Aztec capital city, nearly 85% of the Spanishconquerors remained in the new state, christened TheNew Spain partitioned certain parts of the territory andformed several cities in this native land. The origin ofthe Spanish conquerors was as follows: 35% from Anda-lusia; nearly 50% from Leon, Extremadura, and Old andNew Castilla; 14% from other regions of Spain; and theremaining 6% from outside of Spain, principally individ-uals from Portugal and Genoa, Italy (Grunberg, 2004).In addition to European ancestry in Mexico, African line-ages emerged when the number of natives decreasedconsiderably in some regions; the Spaniards subse-quently brought slaves from several regions of Africa,including Cape Verde, Guinea, Angola, and the Congo,principally, with Bantu, Congo, and Mandinga languageaffiliations (Aguirre-Beltran, 1989). In fact, Spanish con-querors imported slaves by means of contracts with Por-tuguese slave traders, who initially exported Africansthrough their West African port at Elmina in Ghana(Douglas-Price et al., 2006). Additionally, differentgenetic studies have described the possible origins ofthese African people in America. For instance, mitochon-drial DNA (mtDNA) analysis has suggested both Westand West-Central Africa as the most important suppliersof African ancestry in Central and North America (Salaset al., 2004). In Mexico, 30- and 50-haplotype analysis inbA and bS chromosomes, respectively, has confirmed theAfrican roots of Mestizos from the Costa Chica region inthe states of Oaxaca and Guerrero in South-CentralMexico (Magana et al., 2002). However, we must bear inmind that African genes could have arrived in Mexicofrom Spanish soldiers with Moorish ancestry (Aguirre-Beltran, 1989) as a result of the Islamic occupation ofthe Iberian Peninsula for nearly eight centuries (Gerardet al., 2006). Moreover, several authors do not excludethe existence of a certain degree of gene flow betweensub-Saharan and Mediterranean regions (Pereira et al.,2005); this evidence can explain African contributions tothe Mexican gene pool that did not result directly fromslave trade.The 500 years of admixture among Native Americans,
African slaves, and Europeans, primarily Spaniards, hasformed the majority of the contemporary population ofMexico. This present-day Spanish-speaking population iscommonly referred to as Mestizo. In 1570, Mestizos con-stituted \0.5%, but in 1810 they comprised nearly 40%of the total Mexican population (Aguirre-Beltran, 1989)and currently make up about 93% of the total popula-tion, in addition to Mexican ethnic groups (INEGI,2008). The National Institute of Anthropology defines aMestizo as a person born in Mexico, who has a Spanish-derived last name, and has a family with Mexican ances-tors who can be traced back to the third generation(Sanchez-Serrano, 1996). However, the extent to whichseveral generations of intermarriage and interbreedingamong ancestral populations have determined theiractual genetic structure remains largely unknown. One
of the most accepted models for describing the present-day biological diversity of Mexican Mestizos is the trihy-brid, which presents different admixture componentsdepending on the geographical area (Lisker et al., 1996);this model is represented in a tripolar diagram in whichthe edges are very narrow, indicating that the number ofindividuals who are ‘‘genetically pure’’ for any of thethree racial components is insignificant (Gorodezkyet al., 2001). Indeed, analysis of autosomal, uniparental(mtDNA and Y-chromosome), and ancestry informativemarkers (AIMs) in a rural Guerrero-state population,allowed to suggest that heterogeneity—also described asasymmetric admixture (Falush et al., 2003)—is a majorcharacteristic of the Mexican population (Bonilla et al.,2005). A similar analysis with different genetic systemsin population samples from Mexico City demonstratedgenetic stratification, which has been associated with ei-ther socioeconomic or educational factors (Lisker et al.,2004; Martınez-Marignac et al., 2007). In fact, differentlevels of Amerindian, European, and African componentshave been estimated in Mexican populations, rangingfrom 27.6 to 94.5, 4.2 to 70.8, and 0.9 to 40.5%, respec-tively (reviewed by Bonilla et al., 2005). Concurrently,significant paternal heterogeneity has been demon-strated by comparison of Y-STR haplotypes among threeMestizo populations from North, West, and Central Mex-ico, which has been attributable to the highest Amerin-dian ancestry in Mexico City (Rangel-Villalobos et al.,2008). Similarly, this genetic heterogeneity has also beenestablished in Hispanic populations from the UnitedStates by means of autosomal DNA markers, due to adiminishing West-East gradient of Native-Americanancestry (Bertoni et al., 2003). Contrariwise, D1S80,HLA-DQA1, and STR loci analysis has displayed nondif-ferentiation among three Mestizo populations fromNorth, West, and Central Mexico, suggesting relativegenetic homogeneity (Cerda-Flores et al., 2002a,b). Simi-lar homogeneity has been demonstrated in Hispanic-American populations (excluding those from the state ofTexas in the United States) by means of Y-STRs andmtDNA (Kayser et al., 2003). Finally, a recent genome-wide characterization of Latin American Mestizos hasdisplayed extensive variation in Native American andEuropean ancestry, principally (Wang et al., 2008).Nevertheless, conclusions concerning admixture andstructure in Mexico are limited by the scarce number ofMestizo populations analyzed from different geographi-cal regions and the insufficiency of studies that include aconsiderable number and/or type of DNA markers.Ideally, noncoding or neutral genetic markers are
selected in an attempt to exclude the selection process asan explanation for modern genetic-diversity patterns(Kayser et al., 2003; Jobling et al., 2004). Among thesemarkers, microsatellites or short tandem repeats (STRs)have proven useful for linkage analysis, forensics, pater-nity cases, and anthropological studies. Some STR char-acteristics, such as heterozygosity, abundance, polymor-phism, mutation rate, and ease of polymerase chainreaction (PCR) amplification, are important in the fourpreviously mentioned fields. Thus, STRs have become asuitable tool in human population genetics, specificallyfor population substructure evaluation (Bosch et al.,2000; Bamshad et al., 2003). The relatively high muta-tion rate of STRs allow one to use these markers toaddress recent population history, rather than employingbinary markers (indels and single nucleotide polymor-phisms [SNPs]), which are accumulated more slowly
285ADMIXTURE AND STRUCTURE ANALYSIS IN MEXICAN MESTIZOS
American Journal of Physical Anthropology
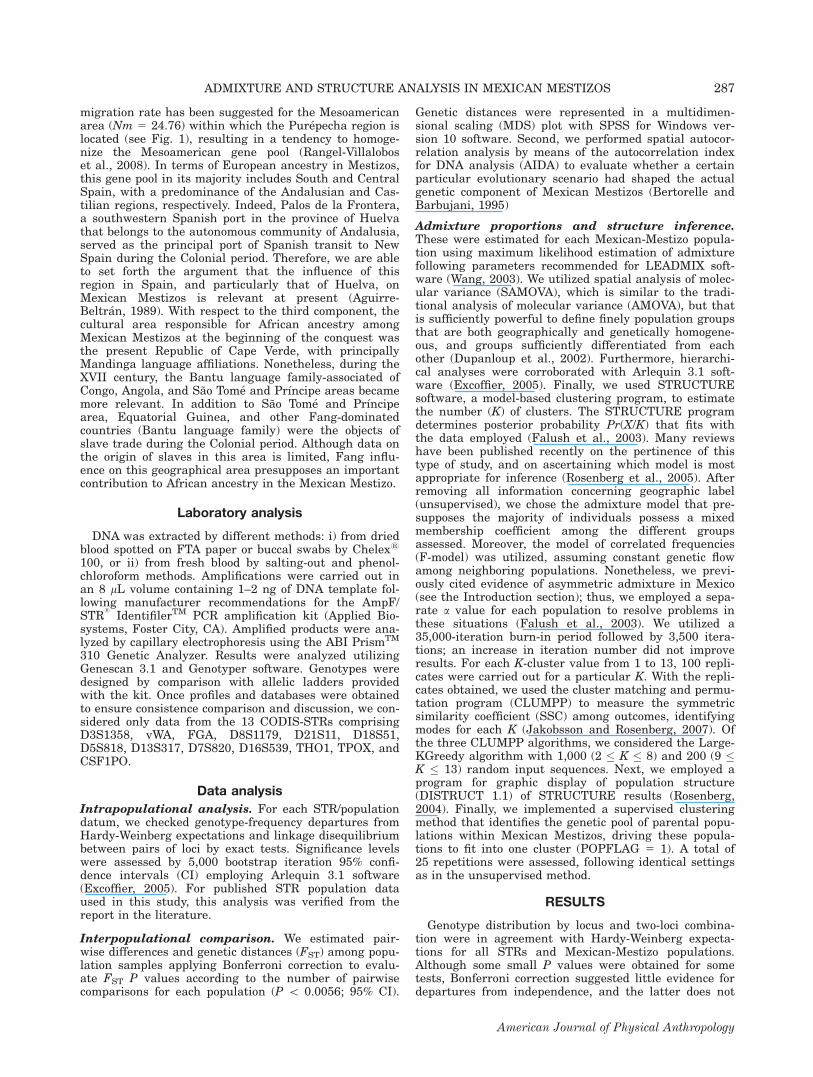
throughout evolutionary time (Sahoo and Kashyap,2005). It is probable that the most widely used STRs arethose employed in forensic casework, particularly the 13core loci of the combined DNA index systems (CODIS),introduced by the US Federal Bureau of Investigation(FBI); these 13 CODIS core loci have been analyzed indifferent countries, resulting in CODIS-STR populationdatabases worldwide (Butler, 2006). Furthermore,CODIS-STR population data have been utilized for struc-ture inference and admixture estimation in differentpopulations (Bosch et al., 2000; Cerda-Flores et al.,2002a; Sahoo and Kashyap, 2005).In this article, we analyzed the genetic data of 13
CODIS-STRs in 1,984 individuals of 10 Mestizo popula-tion samples from different regions of Mexico (North,West, Central, and Southeast). For admixture andpopulation structure estimation in this country, we alsoincluded STR data of three populations considered as an-cestral: Mexican Amerindians; Spaniards from the Southof Spain; and West Africans. Results were fitted to thetrihybrid model, involving Amerindian, European, andAfrican ancestries, to estimate significant variation inadmixture components throughout Mexico. This supportedgenetic heterogeneity or asymmetric admixture amongMexican-Mestizo populations, which seems to be relatedwith pre-Hispanic Native-population demography.
SUBJECTS AND METHODS
Population sample
We analyzed the STR genetic data of 2,389 individualsfrom 13 population samples, including 10 Mestizo popu-lations from different regions of Mexico, and three pa-rental populations (Table 1); the geographical location ofeach Mexican population sample is represented inFigure 1. Before study inclusion, all volunteers signedan informed consent form, according to Helsinki Declara-tion Ethical Guidelines.Each parental population was selected according to
reasons exposed as follows. With respect to the Purepe-chas, the tribe considered as the Amerindian ancestor,these derive from a mixture of Chichimecas, Nahuas,and pre-Tarascos established at Lake Patzcuaro in pres-ent-day Michoacan State at the end of the XII century.This tribe was noteworthy because the Purepechas
employed agricultural copper instruments, exceptional inthe Mesoamerican area. Historical records show Purepe-chas as one of the most important pre-Hispanic cultures:the Purepechas came to control the majority of westernMexico (70,000 km2) including the states of Michoacan,Guerrero, Jalisco, and Colima. In point of fact, the Pure-pechas were one of the few groups who resisted Aztecexpansion before the Spanish Conquest (Michelet, 2001;CDI, 2008). At the time of the conquest, the fall of theAztec capital city (Tenochtitlan) gave rise-without oppo-sition-to the subjugation and control of the Purepechanstate; as a reward, this Amerindian tribe received agreat degree of autonomy that was not conferred onother tribes (CDI, 2008; Haskell, 2003). Regarding thesuitability of Purepechas as the Amerindian ancestor, wecan argue the following: 1) their high gene and Y-haplo-type diversity, 2) their even distribution in a networkjoining tree of Amerindian Y-haplotypes, and 3) theirnull European paternal admixture (Paez-Riberos et al.,2006). Taken together, this suggests that the Purepechashave been the beneficiaries of different Amerindianancestries, in agreement with their late conformationduring the post-classical era, becoming a ‘‘cosmopolitanpre-Hispanic state’’ (Michelet, 2001). Accordingly, a high
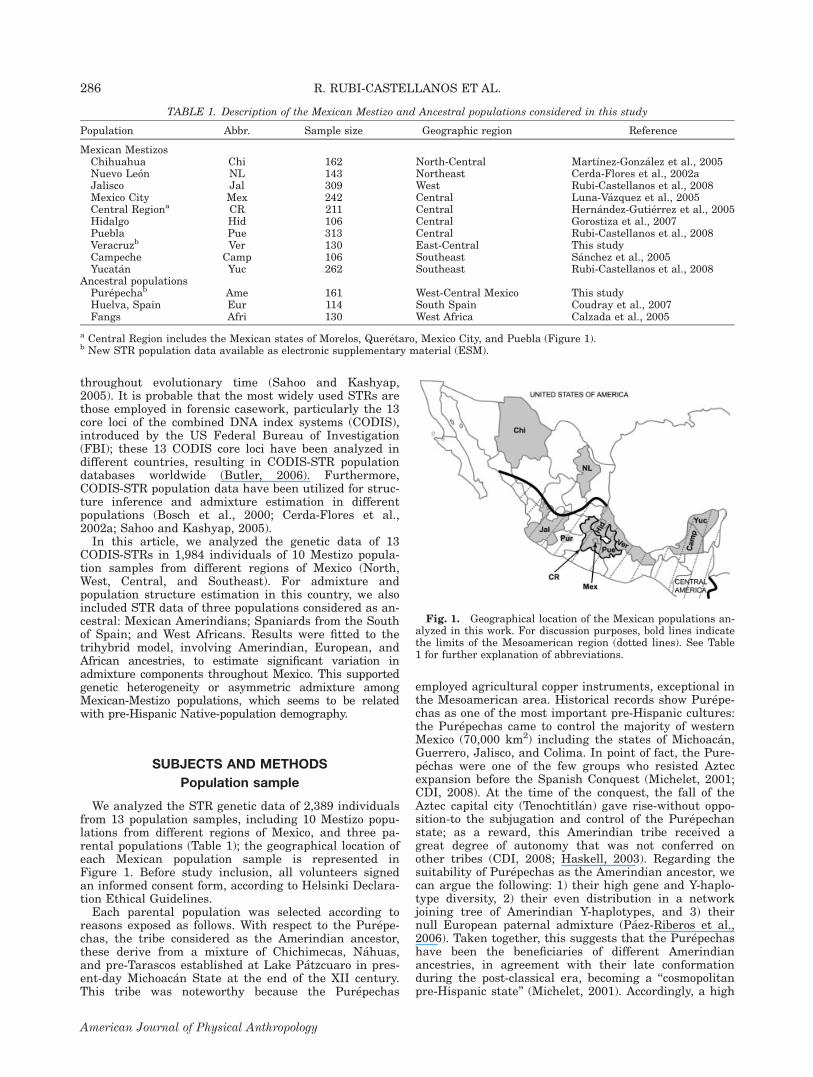
Fig. 1. Geographical location of the Mexican populations an-alyzed in this work. For discussion purposes, bold lines indicatethe limits of the Mesoamerican region (dotted lines). See Table1 for further explanation of abbreviations.
TABLE 1. Description of the Mexican Mestizo and Ancestral populations considered in this study
Population Abbr. Sample size Geographic region Reference
Mexican MestizosChihuahua Chi 162 North-Central Martınez-Gonzalez et al., 2005Nuevo Leon NL 143 Northeast Cerda-Flores et al., 2002aJalisco Jal 309 West Rubi-Castellanos et al., 2008Mexico City Mex 242 Central Luna-Vazquez et al., 2005Central Regiona CR 211 Central Hernandez-Gutierrez et al., 2005Hidalgo Hid 106 Central Gorostiza et al., 2007Puebla Pue 313 Central Rubi-Castellanos et al., 2008Veracruzb Ver 130 East-Central This studyCampeche Camp 106 Southeast Sanchez et al., 2005Yucatan Yuc 262 Southeast Rubi-Castellanos et al., 2008
Ancestral populationsPurepechab Ame 161 West-Central Mexico This studyHuelva, Spain Eur 114 South Spain Coudray et al., 2007Fangs Afri 130 West Africa Calzada et al., 2005
a Central Region includes the Mexican states of Morelos, Queretaro, Mexico City, and Puebla (Figure 1).b New STR population data available as electronic supplementary material (ESM).
286 R. RUBI-CASTELLANOS ET AL.
American Journal of Physical Anthropology
migration rate has been suggested for the Mesoamericanarea (Nm 5 24.76) within which the Purepecha region islocated (see Fig. 1), resulting in a tendency to homoge-nize the Mesoamerican gene pool (Rangel-Villaloboset al., 2008). In terms of European ancestry in Mestizos,this gene pool in its majority includes South and CentralSpain, with a predominance of the Andalusian and Cas-tilian regions, respectively. Indeed, Palos de la Frontera,a southwestern Spanish port in the province of Huelvathat belongs to the autonomous community of Andalusia,served as the principal port of Spanish transit to NewSpain during the Colonial period. Therefore, we are ableto set forth the argument that the influence of thisregion in Spain, and particularly that of Huelva, onMexican Mestizos is relevant at present (Aguirre-Beltran, 1989). With respect to the third component, thecultural area responsible for African ancestry amongMexican Mestizos at the beginning of the conquest wasthe present Republic of Cape Verde, with principallyMandinga language affiliations. Nonetheless, during theXVII century, the Bantu language family-associated ofCongo, Angola, and Sao Tome and Prıncipe areas becamemore relevant. In addition to Sao Tome and Prıncipearea, Equatorial Guinea, and other Fang-dominatedcountries (Bantu language family) were the objects ofslave trade during the Colonial period. Although data onthe origin of slaves in this area is limited, Fang influ-ence on this geographical area presupposes an importantcontribution to African ancestry in the Mexican Mestizo.
Laboratory analysis
DNA was extracted by different methods: i) from driedblood spotted on FTA paper or buccal swabs by Chelex1
100, or ii) from fresh blood by salting-out and phenol-chloroform methods. Amplifications were carried out inan 8 lL volume containing 1–2 ng of DNA template fol-lowing manufacturer recommendations for the AmpF/STR
1
IdentifilerTM PCR amplification kit (Applied Bio-systems, Foster City, CA). Amplified products were ana-lyzed by capillary electrophoresis using the ABI PrismTM
310 Genetic Analyzer. Results were analyzed utilizingGenescan 3.1 and Genotyper software. Genotypes weredesigned by comparison with allelic ladders providedwith the kit. Once profiles and databases were obtainedto ensure consistence comparison and discussion, we con-sidered only data from the 13 CODIS-STRs comprisingD3S1358, vWA, FGA, D8S1179, D21S11, D18S51,D5S818, D13S317, D7S820, D16S539, THO1, TPOX, andCSF1PO.
Data analysis
Intrapopulational analysis. For each STR/populationdatum, we checked genotype-frequency departures fromHardy-Weinberg expectations and linkage disequilibriumbetween pairs of loci by exact tests. Significance levelswere assessed by 5,000 bootstrap iteration 95% confi-dence intervals (CI) employing Arlequin 3.1 software(Excoffier, 2005). For published STR population dataused in this study, this analysis was verified from thereport in the literature.
Interpopulational comparison. We estimated pair-wise differences and genetic distances (FST) among popu-lation samples applying Bonferroni correction to evalu-ate FST P values according to the number of pairwisecomparisons for each population (P \ 0.0056; 95% CI).
Genetic distances were represented in a multidimen-sional scaling (MDS) plot with SPSS for Windows ver-sion 10 software. Second, we performed spatial autocor-relation analysis by means of the autocorrelation indexfor DNA analysis (AIDA) to evaluate whether a certainparticular evolutionary scenario had shaped the actualgenetic component of Mexican Mestizos (Bertorelle andBarbujani, 1995)
Admixture proportions and structure inference.These were estimated for each Mexican-Mestizo popula-tion using maximum likelihood estimation of admixturefollowing parameters recommended for LEADMIX soft-ware (Wang, 2003). We utilized spatial analysis of molec-ular variance (SAMOVA), which is similar to the tradi-tional analysis of molecular variance (AMOVA), but thatis sufficiently powerful to define finely population groupsthat are both geographically and genetically homogene-ous, and groups sufficiently differentiated from eachother (Dupanloup et al., 2002). Furthermore, hierarchi-cal analyses were corroborated with Arlequin 3.1 soft-ware (Excoffier, 2005). Finally, we used STRUCTUREsoftware, a model-based clustering program, to estimatethe number (K) of clusters. The STRUCTURE programdetermines posterior probability Pr(X/K) that fits withthe data employed (Falush et al., 2003). Many reviewshave been published recently on the pertinence of thistype of study, and on ascertaining which model is mostappropriate for inference (Rosenberg et al., 2005). Afterremoving all information concerning geographic label(unsupervised), we chose the admixture model that pre-supposes the majority of individuals possess a mixedmembership coefficient among the different groupsassessed. Moreover, the model of correlated frequencies(F-model) was utilized, assuming constant genetic flowamong neighboring populations. Nonetheless, we previ-ously cited evidence of asymmetric admixture in Mexico(see the Introduction section); thus, we employed a sepa-rate a value for each population to resolve problems inthese situations (Falush et al., 2003). We utilized a35,000-iteration burn-in period followed by 3,500 itera-tions; an increase in iteration number did not improveresults. For each K-cluster value from 1 to 13, 100 repli-cates were carried out for a particular K. With the repli-cates obtained, we used the cluster matching and permu-tation program (CLUMPP) to measure the symmetricsimilarity coefficient (SSC) among outcomes, identifyingmodes for each K (Jakobsson and Rosenberg, 2007). Ofthe three CLUMPP algorithms, we considered the Large-KGreedy algorithm with 1,000 (2 � K � 8) and 200 (9 �K � 13) random input sequences. Next, we employed aprogram for graphic display of population structure(DISTRUCT 1.1) of STRUCTURE results (Rosenberg,2004). Finally, we implemented a supervised clusteringmethod that identifies the genetic pool of parental popu-lations within Mexican Mestizos, driving these popula-tions to fit into one cluster (POPFLAG 5 1). A total of25 repetitions were assessed, following identical settingsas in the unsupervised method.
RESULTS
Genotype distribution by locus and two-loci combina-tion were in agreement with Hardy-Weinberg expecta-tions for all STRs and Mexican-Mestizo populations.Although some small P values were obtained for sometests, Bonferroni correction suggested little evidence fordepartures from independence, and the latter does not
287ADMIXTURE AND STRUCTURE ANALYSIS IN MEXICAN MESTIZOS
American Journal of Physical Anthropology
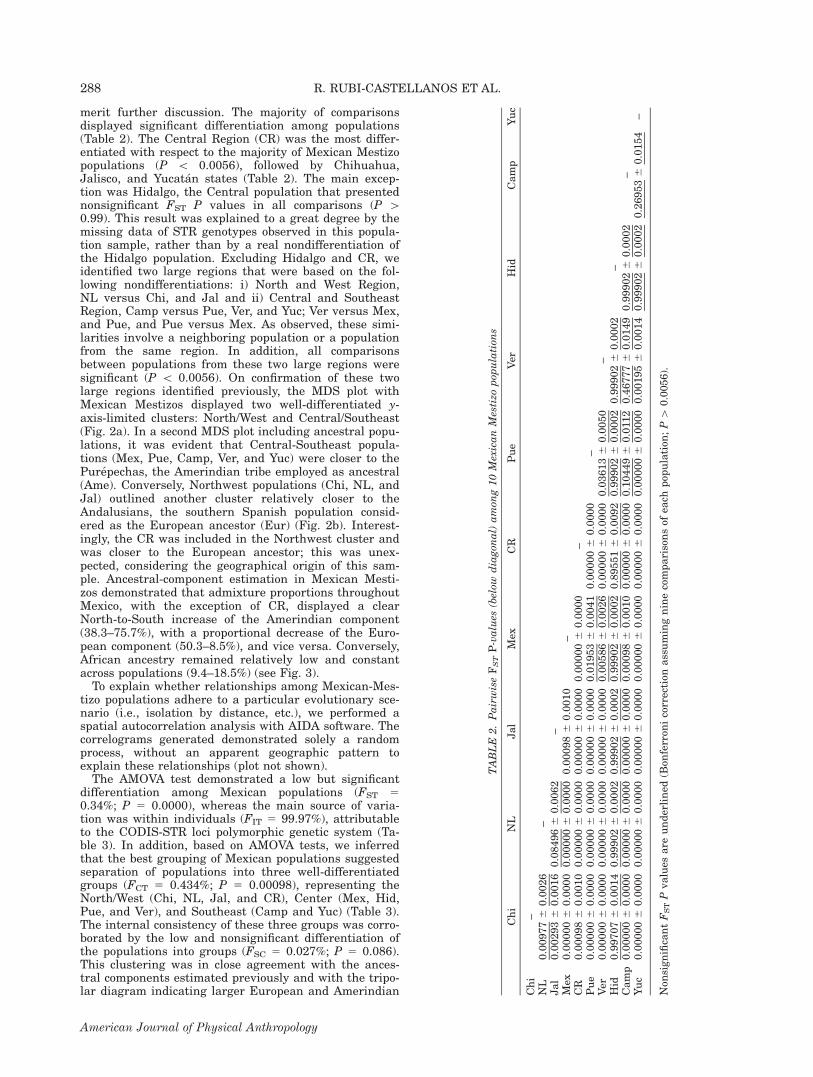
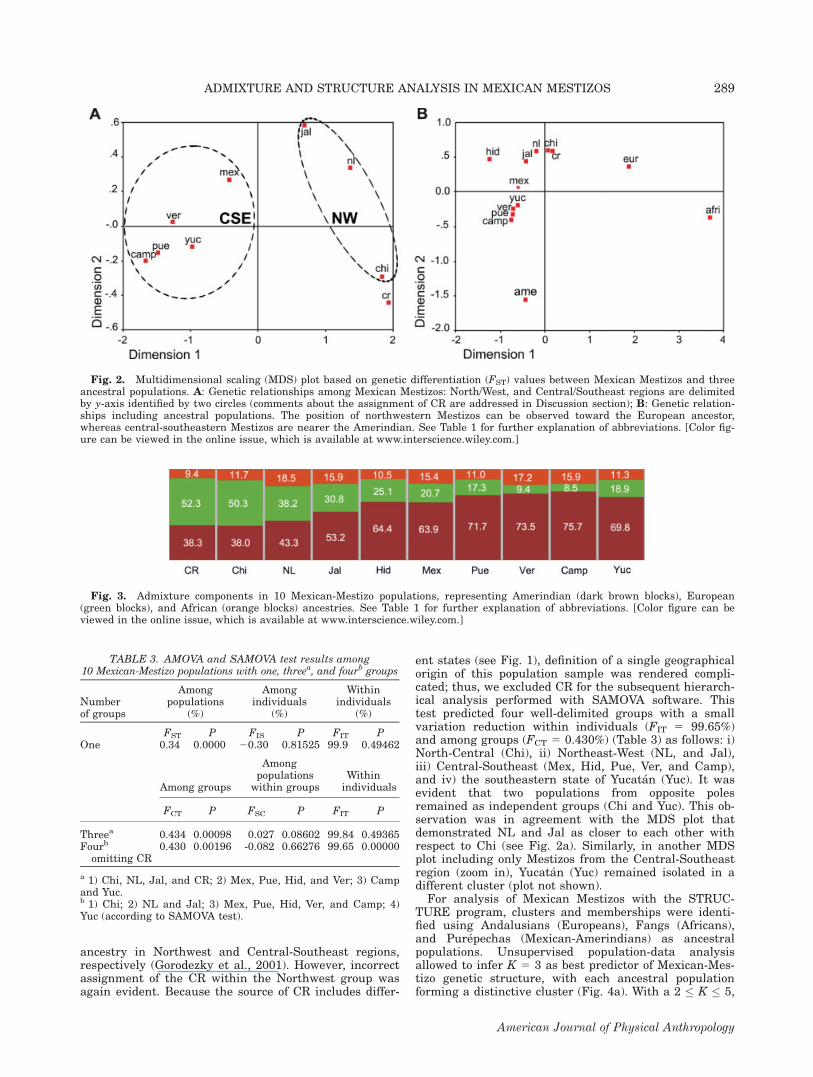
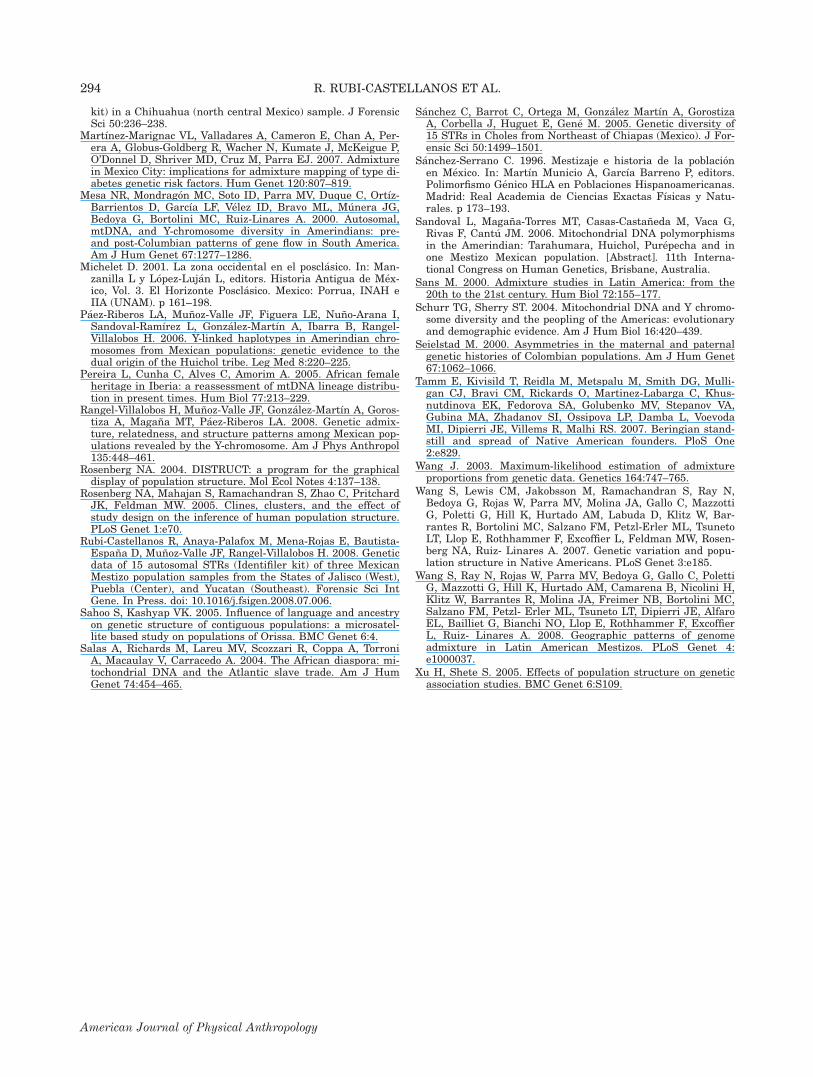
merit further discussion. The majority of comparisonsdisplayed significant differentiation among populations(Table 2). The Central Region (CR) was the most differ-entiated with respect to the majority of Mexican Mestizopopulations (P \ 0.0056), followed by Chihuahua,Jalisco, and Yucatan states (Table 2). The main excep-tion was Hidalgo, the Central population that presentednonsignificant FST P values in all comparisons (P [0.99). This result was explained to a great degree by themissing data of STR genotypes observed in this popula-tion sample, rather than by a real nondifferentiation ofthe Hidalgo population. Excluding Hidalgo and CR, weidentified two large regions that were based on the fol-lowing nondifferentiations: i) North and West Region,NL versus Chi, and Jal and ii) Central and SoutheastRegion, Camp versus Pue, Ver, and Yuc; Ver versus Mex,and Pue, and Pue versus Mex. As observed, these simi-larities involve a neighboring population or a populationfrom the same region. In addition, all comparisonsbetween populations from these two large regions weresignificant (P \ 0.0056). On confirmation of these twolarge regions identified previously, the MDS plot withMexican Mestizos displayed two well-differentiated y-axis-limited clusters: North/West and Central/Southeast(Fig. 2a). In a second MDS plot including ancestral popu-lations, it was evident that Central-Southeast popula-tions (Mex, Pue, Camp, Ver, and Yuc) were closer to thePurepechas, the Amerindian tribe employed as ancestral(Ame). Conversely, Northwest populations (Chi, NL, andJal) outlined another cluster relatively closer to theAndalusians, the southern Spanish population consid-ered as the European ancestor (Eur) (Fig. 2b). Interest-ingly, the CR was included in the Northwest cluster andwas closer to the European ancestor; this was unex-pected, considering the geographical origin of this sam-ple. Ancestral-component estimation in Mexican Mesti-zos demonstrated that admixture proportions throughoutMexico, with the exception of CR, displayed a clearNorth-to-South increase of the Amerindian component(38.3–75.7%), with a proportional decrease of the Euro-pean component (50.3–8.5%), and vice versa. Conversely,African ancestry remained relatively low and constantacross populations (9.4–18.5%) (see Fig. 3).To explain whether relationships among Mexican-Mes-
tizo populations adhere to a particular evolutionary sce-nario (i.e., isolation by distance, etc.), we performed aspatial autocorrelation analysis with AIDA software. Thecorrelograms generated demonstrated solely a randomprocess, without an apparent geographic pattern toexplain these relationships (plot not shown).The AMOVA test demonstrated a low but significant
differentiation among Mexican populations (FST 50.34%; P 5 0.0000), whereas the main source of varia-tion was within individuals (FIT 5 99.97%), attributableto the CODIS-STR loci polymorphic genetic system (Ta-ble 3). In addition, based on AMOVA tests, we inferredthat the best grouping of Mexican populations suggestedseparation of populations into three well-differentiatedgroups (FCT 5 0.434%; P 5 0.00098), representing theNorth/West (Chi, NL, Jal, and CR), Center (Mex, Hid,Pue, and Ver), and Southeast (Camp and Yuc) (Table 3).The internal consistency of these three groups was corro-borated by the low and nonsignificant differentiation ofthe populations into groups (FSC 5 0.027%; P 5 0.086).This clustering was in close agreement with the ances-tral components estimated previously and with the tripo-lar diagram indicating larger European and Amerindian
TA
BL
E2.
Pa
irw
iseF
STP
-va
lues
(bel
owd
iagon
al)
am
ong
10
Mex
ica
nM
esti
zop
opu
lati
ons
Chi
NL
Jal
Mex
CR
Pue
Ver
Hid
Camp
Yuc
Chi
–NL
0.009776
0.0026
–Jal
0.002936
0.0016
0.084966
0.0062
–Mex
0.000006
0.0000
0.000006
0.0000
0.000986
0.0010
–CR
0.000986
0.0010
0.000006
0.0000
0.000006
0.0000
0.000006
0.0000
–Pue
0.000006
0.0000
0.000006
0.0000
0.000006
0.0000
0.019536
0.0041
0.000006
0.0000
–Ver
0.000006
0.0000
0.000006
0.0000
0.000006
0.0000
0.005866
0.0026
0.000006
0.0000
0.036136
0.0050
–Hid
0.997076
0.0014
0.999026
0.0002
0.999026
0.0002
0.999026
0.0002
0.895516
0.0092
0.999026
0.0002
0.999026
0.0002
–Camp
0.000006
0.0000
0.000006
0.0000
0.000006
0.0000
0.000986
0.0010
0.000006
0.0000
0.104496
0.011
20.467776
0.0149
0.999026
0.0002
–Yuc
0.000006
0.0000
0.000006
0.0000
0.000006
0.0000
0.000006
0.0000
0.000006
0.0000
0.000006
0.0000
0.001956
0.0014
0.999026
0.0002
0.269536
0.0154
–
Non
significant
FST
Pvalues
are
underlined
(Bon
ferron
icorrection
assumingninecomparisonsof
each
pop
ulation
;P[
0.0056).
288 R. RUBI-CASTELLANOS ET AL.
American Journal of Physical Anthropology
ancestry in Northwest and Central-Southeast regions,respectively (Gorodezky et al., 2001). However, incorrectassignment of the CR within the Northwest group wasagain evident. Because the source of CR includes differ-
ent states (see Fig. 1), definition of a single geographicalorigin of this population sample was rendered compli-cated; thus, we excluded CR for the subsequent hierarch-ical analysis performed with SAMOVA software. Thistest predicted four well-delimited groups with a smallvariation reduction within individuals (FIT 5 99.65%)and among groups (FCT 5 0.430%) (Table 3) as follows: i)North-Central (Chi), ii) Northeast-West (NL, and Jal),iii) Central-Southeast (Mex, Hid, Pue, Ver, and Camp),and iv) the southeastern state of Yucatan (Yuc). It wasevident that two populations from opposite polesremained as independent groups (Chi and Yuc). This ob-servation was in agreement with the MDS plot thatdemonstrated NL and Jal as closer to each other withrespect to Chi (see Fig. 2a). Similarly, in another MDSplot including only Mestizos from the Central-Southeastregion (zoom in), Yucatan (Yuc) remained isolated in adifferent cluster (plot not shown).For analysis of Mexican Mestizos with the STRUC-
TURE program, clusters and memberships were identi-fied using Andalusians (Europeans), Fangs (Africans),and Purepechas (Mexican-Amerindians) as ancestralpopulations. Unsupervised population-data analysisallowed to infer K 5 3 as best predictor of Mexican-Mes-tizo genetic structure, with each ancestral populationforming a distinctive cluster (Fig. 4a). With a 2 � K � 5,
Fig. 3. Admixture components in 10 Mexican-Mestizo populations, representing Amerindian (dark brown blocks), European(green blocks), and African (orange blocks) ancestries. See Table 1 for further explanation of abbreviations. [Color figure can beviewed in the online issue, which is available at www.interscience.wiley.com.]
Fig. 2. Multidimensional scaling (MDS) plot based on genetic differentiation (FST) values between Mexican Mestizos and threeancestral populations. A: Genetic relationships among Mexican Mestizos: North/West, and Central/Southeast regions are delimitedby y-axis identified by two circles (comments about the assignment of CR are addressed in Discussion section); B: Genetic relation-ships including ancestral populations. The position of northwestern Mestizos can be observed toward the European ancestor,whereas central-southeastern Mestizos are nearer the Amerindian. See Table 1 for further explanation of abbreviations. [Color fig-ure can be viewed in the online issue, which is available at www.interscience.wiley.com.]
TABLE 3. AMOVA and SAMOVA test results among10 Mexican-Mestizo populations with one, threea, and fourb groups
Numberof groups
Amongpopulations
(%)
Amongindividuals
(%)
Withinindividuals
(%)
FST P FIS P FIT POne 0.34 0.0000 20.30 0.81525 99.9 0.49462
Among groups
Amongpopulations
within groupsWithinindividuals
FCT P FSC P FIT P
Threea 0.434 0.00098 0.027 0.08602 99.84 0.49365Fourb
omitting CR0.430 0.00196 -0.082 0.66276 99.65 0.00000
a 1) Chi, NL, Jal, and CR; 2) Mex, Pue, Hid, and Ver; 3) Campand Yuc.b 1) Chi; 2) NL and Jal; 3) Mex, Pue, Hid, Ver, and Camp; 4)Yuc (according to SAMOVA test).
289ADMIXTURE AND STRUCTURE ANALYSIS IN MEXICAN MESTIZOS
American Journal of Physical Anthropology

Amerindian was determined as a separated cluster; thisis in agreement with the excessive similarity of individ-ual genomes within the Americas compared withgenomes in other regions (Wang et al., 2007). Conversely,any distinctive cluster was made up of different K val-ues, and the membership coefficient of all populationswas divided among the different Ks assessed. Subse-quently, we implemented a supervised analysis (POP-FLAG 5 1) labeling Africans, Europeans, and Amerin-dians as ancestors, compelling these to yield correspon-dence of Mexican Mestizos to each ancestor (Fig. 4b).This assessment allowed to observe a North-to-Southgradient for European and Amerindian components thatdecreased and increased, respectively, with a relativelyconstant African ancestry analogous to the unsupervisedanalysis and to admixture estimates presented previ-ously (Figs. 3 and 4a). As previously noted, the Central-Region population sample (CR) was the exception to theaforementioned ancestral-component gradient.
DISCUSSION
In recent years, Mexico has been the focus of attentionregarding its ancestral components, which have beenevaluated by classical blood markers, HLA genes, auto-somal STRs, and most recently, by Y-STRs and AIMs(Lisker et al., 1996; Gorodezky et al., 2001; Cerda-Floreset al., 2002a,b; Bonilla et al., 2005; Martınez-Marignacet al., 2007). In concordance with ethnohistory, thesestudies have described three main ancestral componentsin Mexican Mestizos: Amerindian; European; and Afri-can. However, consistent admixture estimates andSTRUCTURE analysis in different Mexican Mestizo pop-ulations obtained with a reliable and widely used meth-odology (i.e., autosomal CODIS-STRs) had not been con-ducted throughout the country. To our knowledge, thisreport constitutes the first and largest study of Mestizosthat includes the most important regions of Mexico:North; West; Central; and Southeast. This analysis con-ducted evaluation of admixture components (trihybridmodel) and population structure in Mexico, including thedata of 13 CODIS-STR loci of 2,389 individuals from 10different Mestizo population samples and from threepopulations representing Amerindian, European, andAfrican ancestries.
Ancestral populations
The success of admixture studies resides in the choiceof ancestral populations in conjunction with evidencefrom several fields (ethnohistory, archeology, etc.) toobtain ancestors who are as similar as possible to thepast founders and conquerors of the nation, which willaid in achieving a better explanation for the geneticadmixed-population composition observed at present(Jobling et al., 2004). However, it is obvious that thecomplexity of human population history renders it diffi-cult—or even impossible—to achieve an appropriateselection of a representative parental population. Thesuitability of Purepechas, Andalusians, and Fangs to beconsidered as Amerindian, European, and African ances-tors of Mexican Mestizos, respectively, was properlyexplained in the Population sample section. In fact, theappropriateness of ancestor selection seems to be con-firmed by the congruency of our results, because theseformed particular and very distinctive clusters in theanalyses here performed, such as genetic distances(MDS plot, Fig. 2b) and unsupervised populationSTRUCTURE analysis (Fig. 4a).
Admixture estimates
Recently, admixture estimates have received attentionin particular areas, mainly association mapping, evolu-tionary studies, and disease-risk prediction (Sans, 2000;Liu et al., 2005; Wang et al., 2008). Notwithstandingthis, the sources promoting changes in estimates play akey role in the analysis. If only 5–15% of total geneticvariation results from differences among human popula-tions, it is evident that alleles common in one populationare also common in others. Within this context, we foundtwo related situations: i) the majority of genetic markersare unaffected by admixture, and some authors suggestselection of markers that exhibit sufficient allelic differ-ences among parental populations (Halder and Shriver,2003), and ii) erroneous or incomplete archeological andethnohistoric data complicate genetic-background assess-ment (Jobling et al., 2004). Despite that in Mexico avariable amount of African, European, and Amerindianancestry has been estimated by means of differentgenetic systems (reviewed by Bonilla et al., 2005), weimplemented a maximum likelihood estimation of admix-
Fig. 4. Bar plot of the membership coefficient for each individual from Mexican-Mestizo populations. (A) Unsupervised and (B)supervised model are represented. All blocks match among different K. Black lines separate individuals from different populations.Label above the bar indicates ancestral population or geographical region, and label below the bar indicates the particular popula-tion or state where the sample was obtained. See Table 1 for further explanation of abbreviations. [Color figure can be viewed inthe online issue, which is available at www.interscience.wiley.com.]
290 R. RUBI-CASTELLANOS ET AL.
American Journal of Physical Anthropology

ture with the LEADMIX program, including a number ofpopulation samples that are extensively distributedthroughout the Mexican territory and utilizing informa-tive markers widely employed for human identificationpurposes. Finally, our admixture estimates were concord-ant with previous estimates achieved with differentgenetic systems evaluated by means of ethnohistoricrecords (Bonilla et al., 2005).Comparisons with other genetic systems show that our
estimates of ancestry components for western Mestizos(European, 53.2%; Amerindian, 30.8%; and African,15.9%) were very close to those reported by binary Y-linked loci (European, 60–64%; Amerindian, �25–21%;and African, �15%). Moreover, and in agreement withour present results, European and Amerindian predomi-nance also was inferred, particularly in North and Cen-tral Mestizos, respectively (Rangel-Villalobos et al.,2008). Although unfortunately an exact paternal Mexi-can-Mestizo contribution from all regions of the countrydoes not exist, available Y-linked data also suggest thedecreasing European North-to-South gradient that wasclearly observed in this study. Conversely, the maternalcounterpart (mtDNA) suggests relative homogeneity inMexican Mestizos because of the predominance of Amer-indian haplogroups (A, B, C, and D), considering avail-able data from the North (89.1%), West (82%), Central(90.5%), and Southeast (98%) (Green et al., 2000; Bonillaet al., 2005; Sandoval et al., 2006; Martınez-Marignacet al., 2007). At present, the maternal composition ofMexican-Mestizo populations deserves further research.In fact, it is expected that a larger admixture impact canbe found in paternal ancestry, considering that Spanishmales were preferentially carried out during the Con-quest of the New World; their mating with indigenousfemales, this could explain the effect known as asymmet-ric gene flow, which has been widely described in Latin-American populations (Batista-Dos-Santos et al., 1999;Carvajal-Carmona et al., 2000; Mesa et al., 2000;Seielstad, 2000; Campos-Sanchez et al., 2006; Wanget al., 2008).Regarding the African component, the northern state
of Nuevo Leon exhibited the highest level (18.5%), threetimes greater than previous estimates (5.02 6 2.82%)(Cerda-Flores et al., 2002a). Explanations concerning dif-ferences in these ancestry estimates could include thefollowing: 1) the parental populations selected, 2) thestatistical approaches employed for determining ances-tral proportions, 3) the amount of loci employed (13 vs.10), and 4) a population sample bias, especially in sub-structured populations. However, the latter explanationdoes not apply in this case because both studies utilizedthe same STR database. Although AIMs analysis couldresolve these components to a profound degree, ourstudy provides a robust landscape of ancestry through-out the Mexican territory, whichever genetic system isemployed.Considering previous descriptions of higher African
ancestry in different regions along the Mexican littorals(Lisker et al., 1996; Gorodezky et al., 2001), we expectedto find highest African ancestry levels in the coastalstate of Veracruz (see Fig. 1); however, this was notobserved (17.2%). The majority of these proposals havearisen from historical records describing the African con-tribution (Aguirre-Beltran, 1989), and some of thesehave received support from genetic studies, for instance,the Costa Chica region in the states of Oaxaca and Guer-rero (Magana et al., 2002). Although the increase of Afri-
can ancestry could be true in particular regions (such asin Costa Chica-region villages), our results suggest thatthis is not necessarily true for population samples fromlarger cities (such as the sample studied herein). In fact,preliminary results detecting African Y-chromosomes(xYAP) in the Costa Chica region have also failed todetect higher African ancestry (Rangel-Villalobos et al.,2008). Alternatively, gene flow over time of non-Africanindividuals into these communities (the diluting effect)could explain their current genetic composition. A simi-lar effect has been suggested in the Colombian popula-tion of Antioquia, where ongoing admixture with Span-ish males (but not with native females) has increasedthe European nuclear ancestry of this Latin-Americanpopulation (Bedoya et al., 2006).As demonstrated in the majority of Latin-American
populations, modern Mexican Mestizos basically presenttrihybrid ancestry; namely, Amerindian, European, andAfrican. However, our estimates indicate different levelsfor each ancestry throughout the country, demonstratinggenetic heterogeneity or asymmetric admixture, whichhas been previously described in Mexico (Lisker et al.,1996; Gorodezky et al., 2001) and in Latin-AmericanMestizos (Sans, 2000; Wang et al., 2008). Although addi-tional minor ancestries could exist in Mexican popula-tion (i.e., Asian), previous results in Latin AmericanMestizos suggest these would be poorly represented(Wang et al., 2008); thus, the purpose of this study wasnot identification and characterization of these minorancestries. Nonetheless, we obtained unexpected resultsin the CR, which presented closer similarities to Northand West populations (Figs. 2 and 3) and significant dif-ferentiation with regard to Central and Southeast popu-lations, which are geographically closer to-or evenincluded in-the CR region (see Fig. 1). The main pointthat could explain this contradictory result lies in the or-igin of the CR sample, which was obtained from the Uni-versidad Panamericana, a private educational institutionthat offers paternity testing services whose populationsample comprises individuals from middle to upper socio-economic strata (Hernandez-Gutierrez et al., 2005; per-sonal communication). In fact, both higher socioeconomicand educational status have been associated with higherEuropean ancestry (Lisker et al., 2004; Gonzalez-Burchard et al., 2005). Higher educational status, partic-ularly in Mexico City, has been demonstrated, whichincreases European admixture proportions significantly(odds ratio [OR] 5 9.4; 95% CI 3.8–22.6) (Martınez-Marignac et al., 2007). In conclusion, contradictoryresults in the CR grouping are probably explained by asampling bias, this an outcome of stratification demon-strated in Mestizos from Mexico. Considering thisinformation, we could anticipate that these populationsamples involving higher socioeconomic or educationalstatus that were obtained from the Central (or even theSoutheast) region will probably exhibit a similar Euro-pean ancestry to that of samples obtained from theNorth and West regions of Mexico.
Structure and asymmetric admixture
In addition to the ancestry gradients discussed previ-ously, results allowed clustering of Mexican-Mestizo pop-ulations in different regions. In fact, SAMOVA analysisidentified four groups as best-data predictors (Table 3).Discussion can arise concerning grouping (or separating)populations from the same region, the limited number of
291ADMIXTURE AND STRUCTURE ANALYSIS IN MEXICAN MESTIZOS
American Journal of Physical Anthropology

populations and STR loci analyzed herein, populationstructure by socioeconomic and educational status aspreviously discussed, and considering that ancestralcomponents at present could be observed as a clinethroughout the Mexican Republic. Notwithstanding this,differentiation between Central/Southeast and North/West regions was clearly shaped, demonstrating anasymmetric admixture. The apparent difference betweenChihuahua (North) and Yucatan (Southeast) depicts thecontrasting genetic composition among Mestizos. Thisasymmetry in Mexican Mestizos plays a key role in thedesign of epidemiological studies, particularly for case-control assays in which, considering the present results,similar ancestry must be demonstrated in both case andcontrol population samples to avoid flawed gene-diseaseassociations (Xu and Shete, 2005; Choudhry et al., 2006).Our results are in agreement with admixture conclu-sions with ancestry informative markers (AIMs)obtained recently in Mestizos from Mexico City(Martınez-Marignac et al., 2007; Wang et al., 2008).Similarly, in terms of human identification purposes inMexican Mestizos, results compel us to employ the STRdatabase of the relevant population when DNA matchingis found in forensic casework or paternity testing. Inaddition, when the appropriate STR database is notavailable, our results could allow inferring the best-nearby-population for DNA profile interpretation.Taken together, supervised and unsupervised STRUC-
TURE analysis, admixture estimates, genetic differentia-tion pattern (FST P values), and MDS plot indicated thatthe Amerindian membership of Mestizos decrease to-ward the northern region, simultaneously increasingtheir European membership, with a relatively stableAfrican membership throughout the country. This pat-tern probably reflects a complex admixture process thatinvolved several historic factors including warfare, epi-demical diseases, slave trading, Spanish-immigrationdensity, Native-population density, etc. (Schurr andSherry, 2004). Regarding population density, the approxi-mate Native-population size of Mexico and the Carib-bean in contact with Spaniards has been estimated at25 million inhabitants (Cook and Borah, 1971); theseNative-Americans were mainly concentrated in Mesoa-merica, where important chiefdoms and states had beenformed and/or destroyed, and included, for example, theOlmec, Teotihuacan, Toltec, Maya, and Aztec civiliza-tions, among many others. These civilizations can beclassified as agricultural societies, which possess denserand larger human populations than foraging societies(Fiedel, 1992). Human depopulation by warfare and epi-demic diseases (principally smallpox) in this areareduced the Native population to nearly 3% of its origi-nal size in 1623 (Cook and Borah, 1971). Although somedifferences in the depopulation rate have been described,as in the Tlaxcalteca tribe that was allied with Span-iards during the Conquest, the depopulation processaffected all Native-American populations in general(Crawford, 1998). Nonetheless, Native groups recuper-ated their original sizes in 1810, principally because oftheir higher growth rates with respect to Europeans andAfricans (Aguirre-Beltran, 1989). As a result, a roughcorrespondence can be observed between the higher pre-Hispanic population density of Mesoamerica and contem-porary higher Amerindian ancestry in Central andSoutheast regions of Mexico. In brief, although manyand important historic and demographic factors havebeen involved, we suggest that pre-Hispanic Native-pop-
ulation density has operated as the main factor forshaping Amerindian ancestry in present-day Mexican-Mestizo populations. Recently, a similar conclusion hasbeen obtained for Latin American Mestizos across thecontinent based on genome-wide admixture analysis(Wang et al., 2008).
CONCLUSIONS
Analysis based on CODIS-STRs in Mexican Mestizosconfirmed their admixture pattern comprises the trihy-brid model. An ancestral-component gradient was estab-lished, increasing European toward the North and Amer-indian to the Southeast, whereas the African componentremained relatively constant. Two principal clusterswere formed by Mestizos in the Northwest when com-pared with those in the Central-Southeast. Finally, wepropose that the present ancestral composition of Mexi-can Mestizos geographically throughout the country cor-responds to the pre-Hispanic Native-population densitythat involves the Mesoamerican region in particular.
ACKNOWLEDGMENTS
The authors thank the anonymous reviewers who pro-vided helpful comments to improve the manuscript.
LITERATURE CITED
Achilli A, Perego UA, Bravi CM, Coble MD, Kong QP, Wood-ward SR, Salas A, Torroni A, Bandelt HJ. 2008. The phylog-eny of the four pan-American MtDNA haplogroups: implica-tions for evolutionary and disease studies. PLoS ONE 3:e1764.
Aguirre-Beltran G. 1989. La poblacion negra de Mexico, estudioetnohistorico, Vol. 2. Mexico: Fondo de Cultura Economica,S.A. de C.V.
Bamshad MJ, Wooding S, Watkins WS, Ostler CT, Batzer MA,Jorde LB. 2003. Human population genetic structure and in-ference of group membership. Am J Hum Genet 72:578–589.
Batista-dos-Santos SE, Rodrigues JD, Ribeiro-dos-Santos AK,Zago MA. 1999. Differential contribution of indigenous menand women to the formation of an urban population in theAmazon region as revealed by mtDNA and Y-DNA. Am JPhys Anthropol 109:175–180.
Bedoya G, Montoya P, Garcıa J, Soto I, Bourgeois S, Carvajal L,Labuda D, Alvarez V, Ospina J, Hedrick PW, Ruiz-Linares A.2006. Admixture dynamics in Hispanics: a shift in the nucleargenetic ancestry of a South American population isolate. ProcNatl Acad Sci USA 103:7234–7239.
Bertoni B, Budowle B, Sans M, Barton S, Chakraborty R. 2003.Admixture in Hispanics: distribution of ancestral population con-tributions in the continentalUnited States. HumBiol 75:1–11.
Bertorelle G, Barbujani G. 1995. Analysis of DNA diversity byspatial autocorrelation. Genetics 139:811–819.
Bonilla C, Gutierrez G, Parra EJ, Kline C, Shriver MD. 2005.Admixture analysis of a rural population of the state of Guer-rero, Mexico. Am J Phys Anthropol 128:861–869.
Bosch E, Calafell F, Perez-Lezaun A, Clarimon J, Comas D,Mateu E, Martınez-Arias R, Morera B, Brakez Z, Akhayat O,Sefiani A, Hariti G, Cambon-Thomsen A, Bertranpetit J.2000. Genetic structure of north-west Africa revealed by STRanalysis. Eur J Hum Genet 8:360–366.
Butler JM. 2006. Genetics and genomics of core short tandemrepeat loci used in human identity testing. J Forensic Sci51:253–265.
Calzada P, Suarez I, Garcıa S, Barrot C, Sanchez C, Ortega M,Mas J, Huguet E, Corbella J, Gene M. 2005. The Fang popu-lation of Equatorial Guinea characterised by 15 STR-PCRpolymorphisms. Int J Legal Med 119:107–110.
292 R. RUBI-CASTELLANOS ET AL.
American Journal of Physical Anthropology

Campos-Sanchez R, Barrantes R, Silva S, Escamilla M, Onti-veros A, Nicolini H, Mendoza R, Munoz R, Raventos H. 2006.Genetic structure analysis of three Hispanic populations fromCosta Rica, Mexico, and the southwestern United States usingY-chromosome STR markers and mtDNA sequences. HumBiol 78:551–563.
Carvajal-Carmona LG, Soto ID, Pineda N, Ortız-Barrientos D,Duque C, Ospina-Duque J, McCarthy M, Montoya P, AlvarezVM, Bedoya G, Ruiz-Linares A. 2000. Strong Amerind/whitesex bias and a possible Sephardic contribution among thefounders of a population in northwest Colombia. Am J HumGenet 67:1287–1295.
Cerda-Flores RM, Budowle B, Jin L, Barton SA, Deka R, Chak-raborty R. 2002a. Maximum likelihood estimates of admixturein northeastern Mexico using 13 short tandem repeat loci. AmJ Hum Biol 14:429–439.
Cerda-Flores RM, Villalobos-Torres MC, Barrera-Saldana HA,Cortes-Prieto LM, Barajas LO, Rivas F, Carracedo A, ZhongY, Barton SA, Chakraborty R. 2002b. Genetic admixture inthree Mexican Mestizo populations based on D1S80 and HLA-DQA1 loci. Am J Hum Biol 14:257–263.
Choudhry S, Coyle NE, Tang H, Salari K, Lind D, Clark SL,Tsai HJ, Naqvi M, Phong A, Ung N, Matallana H, Avila PC,Casal J, Torres A, Nazario S, Castro R, Battle NC, Perez-Sta-ble EJ, Kwok PY, Sheppard D, Shriver MD, Rodrıguez-Cin-tron W, Risch N, Ziv E, Burchard EG; Genetics of Asthma inLatino Americans GALA Study. 2006. Population stratificationconfounds genetic association studies among Latinos. HumGenet 118:652–664.
Comision Nacional para el Desarrollo de los Pueblos Indıgenas(CDI). [updated 2008 February 1]. Purepechas. In: Los Pue-blos Indıgenas de Mexico. [cited 2008 February 12]. Availableat: http://www.cdi.gob.mx/index.php?id_seccion5339
Cook SF, Borah W. 1971. Essays in population history: Mexicoand the Caribbean. Berkeley, CA: University of CaliforniaPress.
Coudray C, Calderon R, Guitard E, Ambrosio B, Gonzalez-Mar-tın A, Dugoujon JM. 2007. Allele frequencies of 15 tetramericshort tandem repeats (STRs) in Andalusians from Huelva(Spain). Forensic Sci Int 168:e21–e24.
Crawford MH. 1998. The origin of Native Americans. Evidencefrom anthropological genetics. UK: Cambridge UniversityPress.
Douglas-Price T, Tiesler V, Burton JH. 2006. Early African dias-pora in colonial Campeche, Mexico: strontium isotopic evi-dence. Am J Phys Anthropol 130:485–490.
Dupanloup I, Schneider S, Excoffier L. 2002. A simulatedannealing approach to define the genetic structure of popula-tions. Mol Ecol 11:2571–2581.
Excoffier L, Laval G, Schneider S. 2005. Arlequin ver. 3.0: anintegrated software package for population genetics data anal-ysis. Evol Bioinform Online 1:47–50.
Fagundes NJ, Kanitz R, Eckert R, Valls AC, Bogo MR, SalzanoFM, Smith DG, Silva WA, Zago MA, Ribeiro-dos-Santos AK,Santos S, Petzl-Erler ML, Bonatto SL. 2008. Mitochondrialpopulation genomics supports a single pre-Clovis origin witha coastal route for the peopling of the Americas. Am J HumGenet 82:583–592.
Falush D, Stephens M, Pritchard JK. 2003. Inference of popula-tion structure using multilocus genotype data: linked loci andcorrelated allele frequencies. Genetics 164:1567–1587.
Fiedel SJ. 1992. Prehistory of the Americas, 2nd ed. UK: Cam-bridge University Press.
Gerard N, Berriche S, Aouizerate A, Dieterlen F, Lucotte G.2006. North African Berber and Arab influences in the west-ern Mediterranean revealed by Y-chromosome DNA haplo-types. Hum Biol 78:307–316.
Gonzalez Burchard E, Borrell LN, Choudhry S, Naqvi M, TsaiHJ, Rodrıguez-Santana JR, Chapela R, Rogers SD, Mei R,Rodrıguez-Cintron W, Arena JF, Kittles R, Perez-Stable EJ,Ziv E, Risch N. 2005. Latino populations: a unique opportu-nity for the study of race, genetics, and social environmentin epidemiological research. Am J Public Health 95:2161–2168.
Gorodezky C, Alaez C, Vazquez-Garcıa MN, de la Rosa G,Infante E, Balladares S, Toribio R, Perez-Luque E, Munoz L.2001. The genetic structure of Mexican Mestizos of differentlocations: tracking back their origins through MHC genes,blood group systems, and microsatellites. Hum Immunol 62:979–991.
Gorostiza A, Gonzalez-Martın A, Ramırez CL, Sanchez C, Bar-rot C, Ortega M, Huguet E, Corbella J, Gene M. 2007. Allelefrequencies of the 15 AmpF/STR Identifiler loci in the popula-tion of Metztitlan (Estado de Hidalgo), Mexico. Forensic SciInt 166:230–232.
Green LD, Derr JN, Knight A. 2000. mtDNA affinities of thepeoples of North-Central Mexico. Am J Hum Genet 66:989–998.
Grunberg B. 2004. El universo de los conquistadores: resultadode una investigacion prosopografica. Signos Historicos, Julio-diciembre, numero 012. Mexico: Universidad Autonoma Met-ropolitana-Iztapalapa, D.F. p 94–118.
Halder I, Shriver MD. 2003. Measuring and using admixture tostudy the genetics of complex diseases. Hum Genomics 1:52–62.
Haskell DL. 2003. History and the construction of hierarchyand ethnicity in the prehispanic Tarascan state: a syntag-matic analysis of the Relacion de Michoacan [Thesis]. Univer-sity of Florida, FL, USA.
Hernandez-Gutierrez S, Hernandez-Franco P, Martınez-Tripp S,Ramos-Kuri M, Rangel-Villalobos H. 2005. STR data for 15loci in a population sample from the central region of Mexico.Forensic Sci Int 151:97–100.
Instituto Nacional de Estadıstica Geografıa e Informatica(INEGI). [updated 2008 February 1]. II Conteo de poblacion yvivienda 2005; [cited 2008 March 1]. Available at:http://www.inegi.gob.mx/inegi/default.aspx?s5est&c510215.
Jakobsson M, Rosenberg NA. 2007. CLUMPP: a cluster match-ing and permutation program for dealing with label switchingand multimodality in analysis of population structure. Bioin-formatics 23:1801–1806.
Jobling MA, Hurles ME, Tyler-Smith C. 2004. Human evolu-tionary genetics: origins, peoples and disease. New York:Garland Science.
Kayser M, Brauer S, Schadlich H, Prinz M, Batzer MA, Zim-merman PA, Boatin BA, Stoneking M. 2003. Y chromosomeSTR haplotypes and the genetic structure of U.S. populationsof African, European, and Hispanic ancestry. Genome Res13:624–634.
Kemp BM, Malhi RS, McDonough J, Bolnick DA, Eshleman JA,Rickards O, Martinez-Labarga C, Johnson JR, Lorenz JG,Dixon EJ, Fifield TE, Heaton TH, Worl R, Smith DG. 2007.Genetic analysis of early Holocene skeletal remains fromAlaska and its implication for the timing of the peopling ofthe Americas. Am J Phys Anthropol 132:605–621.
Kitchen A, Miyamoto MM, Mulligan CJ. 2008. A three-stage col-onization model for the peopling of the Americas. PLoS ONE3:e1596.
Lisker R, Malacara A, Ramırez E, Mutchinik O. 2004. Admix-ture estimates in a Mexican population stratified by socioeco-nomic status. Am J Phys Anthropol 123(S38):136.
Lisker R, Ramırez E, Babinsky V. 1996. Genetic structure of au-tochthonous populations of Mesoamerica: Mexico. Hum Biol68:395–404.
Liu N, Chen L, Wang S, Oh C, Zhao H. 2005. Comparison ofsingle-nucleotide polymorphism and microsatellites in infer-ence of population structure. BMC Genet 6:S26–S30.
Luna-Vazquez A, Vılchis-Dorantes G, Aguilar-Ruiz MO, Bau-tista-Rivas A, Rojo-Nava AL, Rıos-Barrios E, Rangel-Villalo-bos H. 2005. Population data for 15 loci (Identifiler Kit) in asample from the Valley of Mexico. Leg Med 7:331–333.
Magana MT, Ongay Z, Tagle J, Bentura G, Cobian JG, PereaFJ, Casas-Castaneda M, Sanchez-Lopez YJ, Ibarra B. 2002.Analysis of betaS and betaA genes in a Mexican populationwith African roots. Blood Cells Mol Dis 28:121–126.
Martınez-Gonzalez LJ, Martınez-Espın EM, Fernandez-RosadoF, Moguel MA, Entrala C, Alvarez C, Lorente JA, Budowle B.2005. Mexican population data on fifteen STR loci (Identifiler
293ADMIXTURE AND STRUCTURE ANALYSIS IN MEXICAN MESTIZOS
American Journal of Physical Anthropology
kit) in a Chihuahua (north central Mexico) sample. J ForensicSci 50:236–238.
Martınez-Marignac VL, Valladares A, Cameron E, Chan A, Per-era A, Globus-Goldberg R, Wacher N, Kumate J, McKeigue P,O’Donnel D, Shriver MD, Cruz M, Parra EJ. 2007. Admixturein Mexico City: implications for admixture mapping of type di-abetes genetic risk factors. Hum Genet 120:807–819.
Mesa NR, Mondragon MC, Soto ID, Parra MV, Duque C, Ortız-Barrientos D, Garcıa LF, Velez ID, Bravo ML, Munera JG,Bedoya G, Bortolini MC, Ruiz-Linares A. 2000. Autosomal,mtDNA, and Y-chromosome diversity in Amerindians: pre-and post-Columbian patterns of gene flow in South America.Am J Hum Genet 67:1277–1286.
Michelet D. 2001. La zona occidental en el posclasico. In: Man-zanilla L y Lopez-Lujan L, editors. Historia Antigua de Mex-ico, Vol. 3. El Horizonte Posclasico. Mexico: Porrua, INAH eIIA (UNAM). p 161–198.
Paez-Riberos LA, Munoz-Valle JF, Figuera LE, Nuno-Arana I,Sandoval-Ramırez L, Gonzalez-Martın A, Ibarra B, Rangel-Villalobos H. 2006. Y-linked haplotypes in Amerindian chro-mosomes from Mexican populations: genetic evidence to thedual origin of the Huichol tribe. Leg Med 8:220–225.
Pereira L, Cunha C, Alves C, Amorim A. 2005. African femaleheritage in Iberia: a reassessment of mtDNA lineage distribu-tion in present times. Hum Biol 77:213–229.
Rangel-Villalobos H, Munoz-Valle JF, Gonzalez-Martın A, Goros-tiza A, Magana MT, Paez-Riberos LA. 2008. Genetic admix-ture, relatedness, and structure patterns among Mexican pop-ulations revealed by the Y-chromosome. Am J Phys Anthropol135:448–461.
Rosenberg NA. 2004. DISTRUCT: a program for the graphicaldisplay of population structure. Mol Ecol Notes 4:137–138.
Rosenberg NA, Mahajan S, Ramachandran S, Zhao C, PritchardJK, Feldman MW. 2005. Clines, clusters, and the effect ofstudy design on the inference of human population structure.PLoS Genet 1:e70.
Rubi-Castellanos R, Anaya-Palafox M, Mena-Rojas E, Bautista-Espana D, Munoz-Valle JF, Rangel-Villalobos H. 2008. Geneticdata of 15 autosomal STRs (Identifiler kit) of three MexicanMestizo population samples from the States of Jalisco (West),Puebla (Center), and Yucatan (Southeast). Forensic Sci IntGene. In Press. doi: 10.1016/j.fsigen.2008.07.006.
Sahoo S, Kashyap VK. 2005. Influence of language and ancestryon genetic structure of contiguous populations: a microsatel-lite based study on populations of Orissa. BMC Genet 6:4.
Salas A, Richards M, Lareu MV, Scozzari R, Coppa A, TorroniA, Macaulay V, Carracedo A. 2004. The African diaspora: mi-tochondrial DNA and the Atlantic slave trade. Am J HumGenet 74:454–465.
Sanchez C, Barrot C, Ortega M, Gonzalez Martın A, GorostizaA, Corbella J, Huguet E, Gene M. 2005. Genetic diversity of15 STRs in Choles from Northeast of Chiapas (Mexico). J For-ensic Sci 50:1499–1501.
Sanchez-Serrano C. 1996. Mestizaje e historia de la poblacionen Mexico. In: Martın Municio A, Garcıa Barreno P, editors.Polimorfismo Genico HLA en Poblaciones Hispanoamericanas.Madrid: Real Academia de Ciencias Exactas Fısicas y Natu-rales. p 173–193.
Sandoval L, Magana-Torres MT, Casas-Castaneda M, Vaca G,Rivas F, Cantu JM. 2006. Mitochondrial DNA polymorphismsin the Amerindian: Tarahumara, Huichol, Purepecha and inone Mestizo Mexican population. [Abstract]. 11th Interna-tional Congress on Human Genetics, Brisbane, Australia.
Sans M. 2000. Admixture studies in Latin America: from the20th to the 21st century. Hum Biol 72:155–177.
Schurr TG, Sherry ST. 2004. Mitochondrial DNA and Y chromo-some diversity and the peopling of the Americas: evolutionaryand demographic evidence. Am J Hum Biol 16:420–439.
Seielstad M. 2000. Asymmetries in the maternal and paternalgenetic histories of Colombian populations. Am J Hum Genet67:1062–1066.
Tamm E, Kivisild T, Reidla M, Metspalu M, Smith DG, Mulli-gan CJ, Bravi CM, Rickards O, Martinez-Labarga C, Khus-nutdinova EK, Fedorova SA, Golubenko MV, Stepanov VA,Gubina MA, Zhadanov SI, Ossipova LP, Damba L, VoevodaMI, Dipierri JE, Villems R, Malhi RS. 2007. Beringian stand-still and spread of Native American founders. PloS One2:e829.
Wang J. 2003. Maximum-likelihood estimation of admixtureproportions from genetic data. Genetics 164:747–765.
Wang S, Lewis CM, Jakobsson M, Ramachandran S, Ray N,Bedoya G, Rojas W, Parra MV, Molina JA, Gallo C, MazzottiG, Poletti G, Hill K, Hurtado AM, Labuda D, Klitz W, Bar-rantes R, Bortolini MC, Salzano FM, Petzl-Erler ML, TsunetoLT, Llop E, Rothhammer F, Excoffier L, Feldman MW, Rosen-berg NA, Ruiz- Linares A. 2007. Genetic variation and popu-lation structure in Native Americans. PLoS Genet 3:e185.
Wang S, Ray N, Rojas W, Parra MV, Bedoya G, Gallo C, PolettiG, Mazzotti G, Hill K, Hurtado AM, Camarena B, Nicolini H,Klitz W, Barrantes R, Molina JA, Freimer NB, Bortolini MC,Salzano FM, Petzl- Erler ML, Tsuneto LT, Dipierri JE, AlfaroEL, Bailliet G, Bianchi NO, Llop E, Rothhammer F, ExcoffierL, Ruiz- Linares A. 2008. Geographic patterns of genomeadmixture in Latin American Mestizos. PLoS Genet 4:e1000037.
Xu H, Shete S. 2005. Effects of population structure on geneticassociation studies. BMC Genet 6:S109.
294 R. RUBI-CASTELLANOS ET AL.
American Journal of Physical Anthropology
Copyright © 2022 FDOKUMEN