Associations Between Learning Environment and Students ...
185
Science and Mathematics Education Centre Associations Between Learning Environment and Students’ Attitudes and Understanding of Nature of Science Sheila Raja This thesis is presented for the Degree of Doctor of Philosophy of Curtin University May 2016
-
Upload
khangminh22 -
Category
Documents
-
view
2 -
download
0
Transcript of Associations Between Learning Environment and Students ...

Science and Mathematics Education Centre
Associations Between Learning Environment and Students’Attitudes and Understanding of Nature of Science
Sheila Raja
This thesis is presented for the Degree ofDoctor of Philosophy
ofCurtin University
May 2016


iii
DEDICATION
To the memory of my sister Geeta Raja who believed in the goodness of everybody.To the memory of my mother PC Ratnam Raja who always believed in me.To the memory of my father KG Varma Raja who believed education was the path to everything.
iv
ACKNOWLEDGEMENTS
You can’t cross the sea by merely standing and staring at the water.
Rabindranath Tagore (1861-1941)
As I often stared at the water, I am eternally indebted to Dr. Barry Fraser for his
wisdom, guidance, and infinite patience. Through him, I have been introduced to
people and ideas I would never had encountered. He is a historian, expert, advocate,
and keeper of more knowledge than can be imagined. His expertise and knowledge
in the field of Learning Environments is unmatched.
I am also grateful to Dr. Rekha Koul who provided invaluable assistance with the
analysis of the data. I would be remiss if I did not extend my appreciation to Ms.
Rosalie Wood, without whose help this thesis would look like a disaster.
For their support and patience, I am especially grateful to my husband, Leo and
daughter, Meena and to my in-laws Trini and Don. I would also like to extend my
gratitude to my colleagues Cathleen and Carl for their friendship and support.

v
ABSTRACT
The purpose of the study was the validation of questionnaires assessing classroom
learning environments – What Is Happening In this Class? (WIHIC), attitudes to
science – Test of Science Related Attitudes (TOSRA), and understanding of the
nature of science (NOS) – Scientific Attitude Inventory: Revised (SAI-II) and Views
On Science and Education (VOSE) among urban secondary school students; and the
investigation of characteristics of the science classroom learning environment that
are related to students’ attitudes to science and understanding of NOS.
Modified versions of existing instruments were used to assess the learning
environment (WIHIC); student attitudes (TOSRA); and understanding of NOS (SAI-
II and VOSE). To avoid confusing students and to maintain consistency, the same
Likert response scale (Strongly Agree, Agree, Not sure, Disagree, and Strongly
Disagree) was used for all scales and items. The modified questionnaires were
administered to a sample of 246 students in a Midwestern United States secondary
school with urban demographics. Factor analysis on the data with varimax rotation
and Kaiser normalization was performed on the data and were used for determining
factor loadings for: the 32 WIHIC learning environment items; the 12 TOSRA
attitude items; and the 18 SAI-II/VOSE NOS items. The two criteria for the retention
of any item was that it must have a factor loading of at least 0.40 with its own scale
and less than 0.40 with all other scales.
After slight modifications, the 31 learning environment items accounted for 52.12%
of the variance of the WIHIC scales, and the 11 NOS items accounted for 45.78% of
the variance of the SAI-II/VOSE scales. The 12 attitude items accounted for 51.33%

vi
of the TOSRA scales. With the individual student as the unit of analysis,
environment scales were statistically significantly correlated (p<0.01) with each
attitude scale (Social Implications and Normality) and with each NOS scale
(Tentative Nature and Scientific Method).
Investigation and Task Orientation were statistically independent predictors for
student attitudes to the Social Implications of Science. Task Orientation was a
statistically significant independent predictor for Normality of Scientists.
Investigation, Cooperation and Task Orientation were statistically significant
independent predictors for Tentative Nature of Science. Investigation and Task
Orientation was statistically significant independent predictors for Scientific Method.
The study replicated prior research on associations between the learning environment
and student attitudes towards science at the secondary level. Consistent with past
research, all bivariate and multivariate associations were positive. Overall, the results
of the study suggest the existence of statistically significant associations between
students’ learning environment and their attitude to science and understanding of
NOS. These results suggest that greater emphasis on the classroom learning
environment dimensions investigated in my study – Involvement, Investigation,
Cooperation, and Task Orientation – is linked with improving student attitudes
toward science and understanding of NOS.
To confirm the findings of the study and to reduce the limitations associated with the
study, additional studies could involve more diverse samples, include qualitative
information, and include other educational constructs.
vii
Table of Contents
Declaration ...........................................................................................................................ii
Dedication............................................................................................................................iii
Acknowledgements .............................................................................................................iv
Abstract.................................................................................................................................v
List of Tables ......................................................................................................................xii
List of Figures ...................................................................................................................xiii
CHAPTER 1 .............................................................................................................................1
Introduction..........................................................................................................................1
1.1 Context of the study ...............................................................................................1
1.2 Theoretical Framework ..........................................................................................4
1.2.1 Learning Environment .......................................................................................4
1.2.2 Science Attitudes................................................................................................6
1.2.3 Nature of Science (NOS) ...................................................................................6
1.3 Research Questions ................................................................................................7
1.4 Significance............................................................................................................8
1.5 Overview of the Thesis ..........................................................................................9
CHAPTER 2 ...........................................................................................................................11
Literature review................................................................................................................11
2.1 Introduction ..........................................................................................................11
2.2 Historical Background of Learning Environments ..............................................12
2.3 Instruments for Assessing Learning Environment ...............................................16
2.3.1 Learning Environments Inventory (LEI) .........................................................17

viii
2.3.2 Classroom Environment Scale (CES) ..............................................................19
2.3.3 Individualized Classroom Environment Questionnaire (ICEQ) ......................19
2.3.4 College and University Classroom Environment Inventory (CUCEI) ............20
2.3.5 My Class Inventory (MCI)...............................................................................21
2.3.6 Questionnaire on Teacher Interactions (QTI) ..................................................23
2.3.7 Science Laboratory Environment Inventory (SLEI) ........................................27
2.3.8 Constructivist Learning Environment Survey (CLES) ....................................29
2.4 What Is Happening In this Class? (WIHIC) ........................................................32
2.4.1 Use of WIHIC in Australia ..............................................................................34
2.4.2 Use of WIHIC in Asia......................................................................................36
2.4.3 Use of WIHIC in North America .....................................................................40
2.4.4 Use of WIHIC in Africa/Middle East ..............................................................46
2.5 Research Involving Classroom Environment Instruments...................................49
2.5.1 Associations between Student Outcomes and Environment ............................50
2.5.2 Evaluation of Educational Innovations ............................................................57
2.5.3 Teachers’ Attempts to Improve Classroom and School Environments ...........59
2.5.4 Differences between Students’ and Teachers’ Perceptions of Learning
Environment.................................................................................................................61
2.5.5 Combining Quantitative and Qualitative Methods ..........................................62
2.5.6 School Psychology ...........................................................................................63
2.5.7 Links between Educational Environments.......................................................63
2.5.8 Cross-National Studies.....................................................................................64
2.5.9 Transitions between Different Levels of Schooling.........................................65
2.5.10 Typologies Classroom Environments ..............................................................65
2.6 Assessment of Attitudes toward Science .............................................................67
ix
2.6.1 Attitudes toward Science..................................................................................67
2.6.2 Attitudes Towards Science Inventory (ATSI)..................................................68
2.6.3 Upper Secondary Attitudes Questionnaire.......................................................69
2.6.4 Test of Science Related Attitudes (TOSRA) ...................................................70
2.7 Assessment of Understanding of Nature of Science (NOS) ................................72
2.7.1 Understanding Nature of Science (NOS).........................................................74
2.7.2 Scientific Attitude Inventory–Revision (SAI-II) .............................................76
2.7.3 Views on Science and Education Questionnaire (VOSE)................................79
2.8 Chapter Summary.................................................................................................84
CHAPTER 3 ...........................................................................................................................87
Methodology .......................................................................................................................87
3.1 Introduction ..........................................................................................................87
3.2 Research Objectives .............................................................................................87
3.3 Development of the Questionnaire.......................................................................89
3.3.1 Learning Environment Scales ..........................................................................90
3.3.2 Attitude to Science Scales ................................................................................92
3.3.2 Understanding Nature of Science Scales .........................................................96
3.3.3 Questionnaire Used in My Study ...................................................................100
3.4 Sample................................................................................................................101
3.5 Data Collection...................................................................................................102
3.6 Data Analyses.....................................................................................................103
3.6.1 Research Question 1.......................................................................................103
3.6.2 Research Question 2.......................................................................................105
3.7 Chapter Summary...............................................................................................106

x
CHAPTER 4 .........................................................................................................................109
Data Analysis and Results ...............................................................................................109
4.1 Introduction ........................................................................................................109
4.2 Details of the Questionnaire...............................................................................110
4.2.1 What Is Happening In this Class? (WIHIC) ..................................................111
4.2.2 Test Of Science Related Attitudes (TOSRA).................................................111
4.2.3 Scientific Attitudes Inventory: Revision (SAI-II) and Views on
Science and Education (VOSE) .................................................................................112
4.2.4 Validity of WIHIC, TOSRA and SAI-II/VOSE ............................................113
4.2.5 Factor Structure and Internal Consistency Reliability of WIHIC..................115
4.2.6 Factor Structure and Internal Consistency Reliability of TOSRA.................119
4.2.7 Factor Structure and Internal Consistency Reliability of SAI-II/VOSE........121
4.2.8 Relationships between Learning Environment and Student Outcomes
of Attitudes and Understanding of Nature of Science ...............................................124
4.3 Chapter Summary...............................................................................................127
CHAPTER 5 .........................................................................................................................132
Discussion and Conclusion ..............................................................................................132
5.1 Introduction ........................................................................................................132
5.2 Summary of Chapters 1–3..................................................................................132
5.3 Summary of Research Findings .........................................................................134
5.4 Significance and Implications ............................................................................137
5.5 Limitations .........................................................................................................138
5.6 Suggestions for Future Research........................................................................139
5.7 Chapter Conclusion............................................................................................140

xi
References .........................................................................................................................141
Appendix A .......................................................................................................................168
Questionnaire Assessing Classroom Environment, Attitudes........................................168

xii
LIST OF TABLES
Table 2.1 .....Overview of Scales Contained in 11 Classroom Environment
Instruments...............................................................................................................................18
Table 2.2 .....Scale Description and Sample Item for Each Scale of the WIHIC......................33
Table 2.3 .....Overview of Studies Involving Use of the WIHIC..............................................54
Table 3.1 .....Description of Scales and a Sample Item for Each WIHIC Scale .......................91
Table 3.2 .....Description of Scales and Their Relevance to K–12 Science Frameworks
and Next Generation Science Standards ..................................................................................94
Table 3.3 .....Description of Scales and a Sample Item for Each Scale of the Modified
TOSRA ....................................................................................................................................95
Table 3.4 .....Description of Scales and a Sample Item for Each Scale of the Modified
SAI-II/VOSE..........................................................................................................................100
Table 4.1 .....Factor Analysis Results for WIHIC Scales ........................................................116
Table 4.2 .....Mean, Standard Deviation, and Internal Consistency Reliability (Alpha
Coefficient) for Learning Environment, Attitude, and Nature of Science Scales..................117
Table 4.3 .....Factor Analysis Results for TOSRA Scales.......................................................119
Table 4.4 .....Factor Analysis Results for SAI-II/VOSE Scales ..............................................122
Table 4.5 .....Simple Correlations and Multiple Regression Analyses for Associations
Between Learning Environment Scales and Student Outcomes of Attitudes to
Science and Nature of Science ...............................................................................................125

xiii
LIST OF FIGURES
Figure 2.1 ...Model for Interpersonal Teacher Behavior (Wubbels & Brekelmans,
2012) ........................................................................................................................................25
Figure 2.2 ...Example of Mean Actual and Preferred COLES Scores for Students’
Perceptions of the Learning Environment (Aldridge et al., 2012) ...........................................61

1
Chapter 1
INTRODUCTION
1.1 Context of the study
As educators, we complain about the inability and/or lack of desire among many of
our students to think for themselves. Many students cannot evaluate data, analyze
data, or draw conclusions without specific instructions and often students want to be
told the ‘right’ answer without concern for the process because they are
unaccustomed to being asked to evaluate their own or others responses. This is of
particular concern when their conceptions are contrary to accepted scientific
knowledge; telling the right answer will not change their belief in the wrong answer.
Unfortunately, many students believe science is an unchanging collection of facts.
They believe what an authority figure (e.g. the television, radio, or newspaper) tells
them. There is a strong need for students to evaluate the legitimacy of a scientific
claim; to understand the ethics of controversial issues (stem cell research, global
warming, weapons of mass destruction, etc.); and to be informed decision makers
(Belardo, 2001; Rutherford & Ahlgren, 1990). Part of the reason they cannot do
these things is that students have not been taught how.
Too often science is taught as a set of procedures and facts, and it is not seen as a
process that builds and grows. The goal, then, is to teach students how to do science.
To teach doing, teachers must model the ways of doing science and allow students
opportunities to also do, discuss, and communicate about science. These
opportunities help to form students’ understanding of nature of science and fall into
two broad categories – explicit and implicit instruction. The explicit curriculum

2
comes from textbooks, procedural laboratory experiences, and explanations by the
teacher. The implicit curriculum comes from the language used by the teacher, the
intellectual freedoms allowed to students and laboratory experiences (both
procedural and open-ended). This implicit curriculum can be inferred from the
classroom learning environment.
Research has shown that teachers typically view the learning environment in their
own classroom more positively than the students do (Fraser, 1998a, 2002, 2012). It is
often difficult to separate what is thought to be taught (content) or modeled
(attitudes) from what is learned. The literature also shows that the learning
environment not only affects student achievement, but that it also influences the
affective domains of attitude and interest (Fraser, 2012).
How the learning environment in a science classroom affects student achievement
has been studied frequently (Fraser, 2012). But the value of the affective domain
must also be recognized. In other words, there is a value in how students feel and
think about science. There have been numerous studies of the relationship between
learning environments, achievement, and affective outcomes (Aldridge, Dorman, &
Fraser, 2004; H. B. Kim, Fisher, & Fraser, 1999, 2000; Koul & Fisher, 2005;
Turkmen & Bonnstetter, 1999; Waxman & Huang, 1997). Meyers and Fouts argue
“that attitude toward school subjects is itself an important and desirable educational
outcome.” (1992, p. 929). Positive attitudes toward science and science learning are
necessary to engage students in learning (Bruce, Bruce, Conrad, & Huang, 1997). In
addition, students with a positive attitude toward a subject tend to want to learn more

3
about it, both positive and negative attitudes can be shared with others even after
leaving school (Myers & Fouts, 1992).
In my study, I investigated associations between the learning environment as
perceived by students and their attitudes toward science and understanding of nature
of science. In addition, I provided validity for an instrument used to investigate
students’ understanding of nature of science. To these ends, I decided to use the
What Is Happening In this Class (WIHIC), Test Of Science Related Attitudes
(TOSRA), Scientific Attitude Inventory: Revision (SAI-II) and Views on Science
and Education Questionnaire (VOSE) to investigate the associations between
perceptions of the classroom learning environment, attitudes, and understanding of
nature of science.
This chapter provides a context for my study by briefly considering a theoretical
framework for learning environments, attitudes towards science, and understanding
nature of science; the research questions; and the significance of my study. The
chapter includes the following sections:
Theoretical Framework (1.2)
Research Questions (1.3)
Significance (1.4)
Overview of the Thesis (1.5).

4
1.2 Theoretical Framework
This section provides brief background information regarding the fields of leaning
environments (Section 1.2.1), attitudes towards science (Section 1.2.2), and
understanding nature of science (Section 1.2.3). A more-comprehensive review of
literature in each of these three areas is provided in Chapter 2.
1.2.1 Learning Environment
Early learning environments research was motivated by the ideas of Lewin (1936a)
and Murray (1938) who recognized a relationship between a person and his or her
environment. Lewin (1936a) described an individual’s behavior (B) as a function (f)
of personal characteristics (P) and the environment (E): B=f(P, E). The individual’s
personal characteristics are a combination of many factors (Lewin, 1943). The
environment of the educational setting and is dependent on realizing that “education
is in itself a social process” (1936b, p. 266) and leads to behaviors and attitudes in
both students and teachers. Following Lewin’s approach of behavior, Murray (1938)
proposed a need–press model, in which needs are an individual’s personal
requirements and the desire to achieve them, and press consists of influences on the
individual. He characterizes internal self-reported influences as ‘beta press’ and
external observable influences as ‘alpha press’ (Murray, 1938).
In the 1960s and 1970s, the pioneering work by Moos (1974) and Walberg (Walberg
& Anderson, 1968) led to research on classroom learning environments. Walberg’s
work identified the learning environment as one of nine factors that affect
educational productivity (Reynolds & Walberg, 1991). Walberg (1980) proposed that
5
educational productivity is a function of nine factors, is multiplicative and has
diminishing returns. These factors can be grouped into properties of the individual
(student ability, cognitive development, and student motivation), the instruction
(quality of instruction and quantity of instruction), and the environment (the
psychosocial classroom environment, educationally stimulating conditions in the
home and among peer groups, and exposure to mass media).
Moos began developing the first of his social climate scales, the Ward Atmosphere
Scale, for use in psychiatric hospitals to assess the social climate of hospital-based
ward treatment environments (Moos, 1973). He found that individual aspects of all
human environments could be described by three dimensions: Relationship, Personal
Development, and System Maintenance and System Change. Moos’ work in nine
human environments (Moos, 1974) eventually led to the development of the
Classroom Environment Scale (CES) (Moos & Trickett, 1974).
Unlike Moos, Walberg began his research in an educational environment. Prior to
developing the Learning Environment Inventory (LEI), Walberg (1968) created the
Classroom Climate Questionnaire (CCQ) based on the work of Hemphill and Westie
(1950). When the CCQ was found to have several weak scales, it was modified to
form the LEI (Walberg & Anderson, 1968) and used in evaluating the effectiveness
of a new curriculum (Harvard Project Physics) for high-school students.

6
1.2.2 Science Attitudes
Students’ attitudes towards studying science have received much attention in science
education for over 40 years (Tytler & Osborne, 2012), partly because of declining
interest in school science and a disinterest in science careers (Blalock et al., 2008).
According to Gardner (1975, 1995), ‘attitudes towards science’ involve how
individuals feel about science. These attitudes are variables such as relevance, value,
and enjoyment, whereas ‘scientific attitudes’ refer to qualities that an individual has
that are generally considered desirable in a good scientist. These attitudes are
variables such as empiricism, skepticism, and determinism.
Klopfer (1976) helped to resolve the semantic confusion with the term ‘attitude’ by
delineating six conceptually-distinct categories of science attitudes. The problem of
meaning is further compounded by the understanding that attitude toward science is a
multifaceted concept (Tytler & Osborne, 2012) that includes overlapping concepts
of: attitudes towards science and scientists; attitudes towards school science;
enjoyment of science learning; interest in science and science-related activities; and
interest in pursuing a career in science. A review of the literature regarding science
attitudes is given in Chapter 2, Section 2.6.
1.2.3 Nature of Science (NOS)
For many decades, science education and educators have identified the need for
students to develop an understanding of nature of science (Heiss, 1958), but this does
not usually appear as a topic in science course syllabi (Martin-Dunlop & Hodum,
2009). An important issue to clarify is the meaning of ‘nature of science’ and its

7
meaning in different disciplines. Alters (1997) identified 39 tenets of NOS in the
science education literature, including characteristics that have reached consensus
(Giddings, 1982), such as that science is observation oriented (Cleminson, 1990), a
human endeavor (Aikenhead & Ryan, 1992), and dependent on culture (AAAS,
1993). In addition, different scientists (i.e., biologists, chemists, and physicists) could
view statements differently, with additional differences between scientists, science
educators, and science philosophers (Doran, Guerin, & Cavalieri, 1974). In spite of
these differences, researchers have developed instruments to investigate
understanding of NOS.
An instrument for assessing students’ understanding of NOS should have four
characteristics: be based upon specification of the particular attitude to be assessed;
use several items to assess each attitude; allow the respondent to indicate the extent
of his acceptance or rejection of an attitude statement; and be concerned with
intellectual and emotional scientific attitudes. A more-thorough review of the
literature regarding NOS is given in Chapter 2, Section 2.7.
1.3 Research Questions
The goal of my study was to investigate associations between the classroom learning
environment and the student outcomes of attitudes toward science and understanding
nature of science. My two research questions were:
8
Research Question 1
Are learning environment scales based on the WIHIC, attitudes scales based on the
TOSRA, and nature of science scales based on the SAI-II and VOSE valid when
used with students in a suburban secondary school with urban demographics in mid-
western USA?
Research Question 2
What are the characteristics of the science classroom environment that enhance
students’ attitudes to science and understanding of nature of science?
1.4 Significance
My study is substantively significant because it included the three fields of classroom
learning environments, students’ attitudes toward science, and students’
understanding of nature of science; these three areas have not often been studied
together. If one of the primary goals of science education is to ensure that students
become scientifically literate members of society, what does a science classroom that
develops scientifically-literate students look like?
A methodological contribution of this study is that it led to the development and
validation of economical and widely-applicable scales for assessing classroom
environment and students’ attitudes to science and understanding of the nature of
science.
9
The research is practically significant because it identified associations between what
students perceive is happening in the classroom environment and their attitudes
towards science and their understanding of nature of science. This research evidence
tentatively provides guidance to teachers about what emphases in their classroom
environments are likely to promote student attitudes and understanding of NOS.
1.5 Overview of the Thesis
Chapter 1 introduced the context of my study and provided brief background
information about learning environment, science attitudes, and nature of science. It
also identified my two research questions and the significance of the study.
A review of relevant literature is presented in Chapter 2. The review includes
historical background in learning environments, instruments for assessing learning
environments, and past research on learning environments. Specific attention is given
to the WIHIC in Section 2.4 because it was chosen for assessing classroom
environment in my study. Similarly, instruments and past research are reviewed for
attitudes towards science and understanding of nature of science, with particular
attention to the questionnaires used in my study.
In Chapter 3, the development of the questionnaire, sample, procedures for collecting
data, and procedures for analyzing the data are described. The modifications made to
existing instruments when combined into one instrument are described.

10
The results of the data analyses are reported in Chapter 4 in order to answer my
research questions. The validity and reliability of the modified questionnaire are
reported. In addition, associations between the classroom learning environment and
the student outcomes of attitudes toward science and understanding nature of science
are identified.
Chapter 5 concludes the thesis by summarizing the whole thesis and further
discussing its results. As well, the study’s limitations are identified and some
desirable future research directions are suggested. Substantive, methodological and
practical implications of my research are delineated.
11
Chapter 2
LITERATURE REVIEW
2.1 Introduction
Whereas the previous chapter introduced a context for this study, this chapter
provides a review of the literature on topics related to my study. Because the main
constructs investigated in my study were the learning environment, student attitudes
to science, and student understanding of the nature of science, literature on these
areas is reviewed in this chapter using the following headings:
Historical Background of Learning Environments (2.2)
Instruments for Assessing Learning Environments (2.3)
What Is Happening In this Class? (2.4)
Research Involving Classroom Environment Instruments (2.5)
Assessment of Attitudes towards Science (2.6)
Assessment of Understanding of Nature of Science (2.7)
Chapter Summary (2.8).
The literature on learning environments is extensive. In 1998, Fraser completed a
thorough review of learning environments literature spanning the previous four
decades, namely, the 1960s to the 1990s (1998b). He has visited the literature again
recently to document the growth and development in the field (Fraser, 2012). In
particular, there have been numerous studies of the relationship between learning
environment, achievement, and affective outcomes conducted at the regional
(Waxman & Huang, 1997), national (H. B. Kim et al., 2000; Koul & Fisher, 2005;

12
Turkmen & Bonnstetter, 1999), and cross–national levels (Aldridge & Fraser, 2000;
Dorman & Ferguson, 2004; Fraser, Aldridge, & Adolphe, 2010).
2.2 Historical Background of Learning Environments
Historically, classroom environments have been studied in a quantitative way based
on participants’ perceptions, but recent approaches in educational research include
interpretative methods (Fraser & Tobin, 1991; Tobin & Fraser, 1998). Two
fundamental beliefs underpin the perceptual approach. The first is that students, as
members of the classroom, are in a position to provide insights that an outside
observer might not have. Secondly, these students are capable of conveying those
insights (Fraser, 1998a). With the acceptance of these beliefs comes the ability to
learn about what is happening in classrooms by asking the students. Past research has
shown that, even within the same environment, there can be differences in these
insights based on student gender, ethnicity, and ability (Fraser, 1998a, 1998b, 2002).
Early learning environments research was motivated by the ideas of Lewin (1936a)
and Murray (1938). Both of these researchers recognized the existence of a
relationship between a person and his or her environment. School environment
instruments were developed as early as 1958, but they were awkward and did not
have a clear theoretical basis (Fisher & Fraser, 1990). In the 1960s and 1970s, the
pioneering work by Moos (1974) and Walberg (Walberg & Anderson, 1968) led to
research on classroom learning environments. While Moos’ original work was not
about educational settings, it was easily adaptable (Fisher & Fraser, 1990).
13
Walberg’s work identified the learning environment as one of nine factors that affect
educational productivity (Reynolds & Walberg, 1991).
Lewin (1936a) describes an individual’s behavior (B) as a function (f) of the
individual’s personal characteristics (P) and the environment (E): B=f(P, E). The
individual’s personal characteristics are a combination of many factors and depend
on what is happening ‘at that time’ (Lewin, 1943). Personal characteristics include
physical aspects such as gender, race, and age (Van Petegem, Aelterman, Van Keer,
& Rosseel, 2008), educational aspects such as “cognitive complexity and
interpersonal maturity” (Hunt, 1975, p. 217), and the individual’s traits, values, and
modes of function (Mitchell, 1969). The second variable is the environment of the
educational setting, which recognizes that “education is in itself a social process”
(Lewin, 1936b, p. 266) and develops behaviors and attitudes in both students and
teachers. Factors that influence an educational setting are the sociological properties
of that group, both expressed and tacit. The environment is also influenced by the
larger social group of which the educational setting is a part. The general atmosphere
of this larger group, therefore, affects the smaller educational group (Lewin, 1936b).
Following Lewin’s approach, Murray (1938) proposed a need–press model, in which
needs are an individual’s personal requirements and the desire to achieve them, and
press consists of influences on the individual. He characterizes the internal self-
reported influences as beta press and the external observable influences as alpha
press (Murray, 1938). Beta press has been further differentiated as either private (as
viewed by the individual) or consensual (as viewed by the group) (Stern, Stein, &
Bloom, 1956). Private and consensual press involve different units of analysis, the
individual and the group, respectively.

14
Bandura (1978) further extended the conceptualization of the relationship between
behavior, personal characteristics, and the environment. Not only do the individual
and the environment influence behavior, but behavior influences the individual and
the environment. All three influence each other with the process being iterative.
In the early 1960s, Moos and Walberg, independently, were studying psychiatric and
learning environments, respectively. Moos began developing the first of his social
climate scales, the Ward Atmosphere Scale, for use in psychiatric hospitals for
assessing the social climate of hospital-based ward treatment environments (Moos,
1973). Patients and staff were asked individually about the usual patterns of behavior
in their program. Moos (1974) asserted that human behavior is shaped and directed
by the environment as perceived subjectively by the people in it and that patients and
staff members often perceive the same environment somewhat differently. He found
that individual aspects of human environments could be described by three
dimensions: Relationship, Personal Development, and System Maintenance and
System Change.
The Relationship dimension assesses how well someone supports and is supported in
his/her environment. The Personal Development dimension assesses how well
someone improves in the environment. The System Maintenance and System Change
dimension assesses how much order, organization, clarity, and control there is in the
environment (1973). These dimensions characterize the nine types of social
environments studied by Moos and his associates – psychiatric wards, community-
oriented psychiatric programs, correctional facilities, military basic training

15
companies, university residences, junior and senior high school classrooms, social
task-oriented therapeutic groups, work environments, and families (1973). Based on
Moos' theoretical perspectives, a number of questionnaires have been developed for
assessing classroom learning environments.
Unlike Moos, Walberg began his research in educational settings. Prior to developing
the Learning Environment Inventory (LEI), Walberg (1968) created the Classroom
Climate Questionnaire (CCQ) based on the work of Hemphill and Westie (1950).
The CCQ was found to have several weak scales, and two-thirds of the scales only
had two or three items. In addition, the CCQ did not represent classroom
interactions well and omitted some important dimensions (Fraser, Anderson, &
Walberg, 1982). Because of these shortcomings and problems with the instrument,
the CCQ was modified to create an early version of the LEI (Walberg & Anderson,
1968), which was revised in 1971 (Anderson, 1973) and again in 1982 (Fraser et al.).
The CCQ, and subsequently the LEI, was created in response to a need to measure
the effectiveness of a new curriculum, Harvard Project Physics, for high school
students. The method used in evaluating the curriculum was guided by three factors:
monetary cost, the need for codeable information on interactions that was not related
to student learning, and the belief that students were a more reliable source of
information than outside observers (Fraser et al., 1982).
In addition to the LEI, Walberg has also contributed to classroom learning
environments research through his theory of educational productivity. He proposed
that educational productivity is a function of nine factors, is multiplicative and has
16
diminishing returns (Walberg, 1980). These factors can be grouped into properties of
the individual (student ability, cognitive development, and student motivation), the
instruction (quality of instruction and quantity of instruction), and the environment
(the psychosocial classroom environment, educationally stimulating conditions in the
home and among peer groups, and exposure to mass media) (Reynolds & Walberg,
1991). Four of these factors (student ability and motivation, and instructional quality
and quantity) are necessary and must be present at some minimum level for
classroom learning to occur. In addition, the four environmental factors also correlate
to classroom learning outcomes; however, their roles are less clear (Haertel,
Walberg, & Weinstein, 1983).
Several factors seem important for improving educational productivity – instructional
quality and time appear to have a significant effect on learning (Walberg, 1986).
There is then the question of whether the four necessary factors can overcome the
negative causal influences of the environmental factors. In fact, “instructional time
appears to be a particularly important variable, in that it mediates motivation, class
environment, peer environment, and mass media” (Reynolds & Walberg, 1991, p.
105). In addition, the effects of prior achievement could be tied to motivation and
home environment, resulting in the last two factors having a more indirect effect.
2.3 Instruments for Assessing Learning Environment
There is a variety of research instruments available for assessing the learning
environment in classroom settings. Not only have researchers employed several
major questionnaires, but they have also modified these instruments to more suitably

17
serve their own research purposes. The result is the availability of a growing set of
valid and reliable instruments.
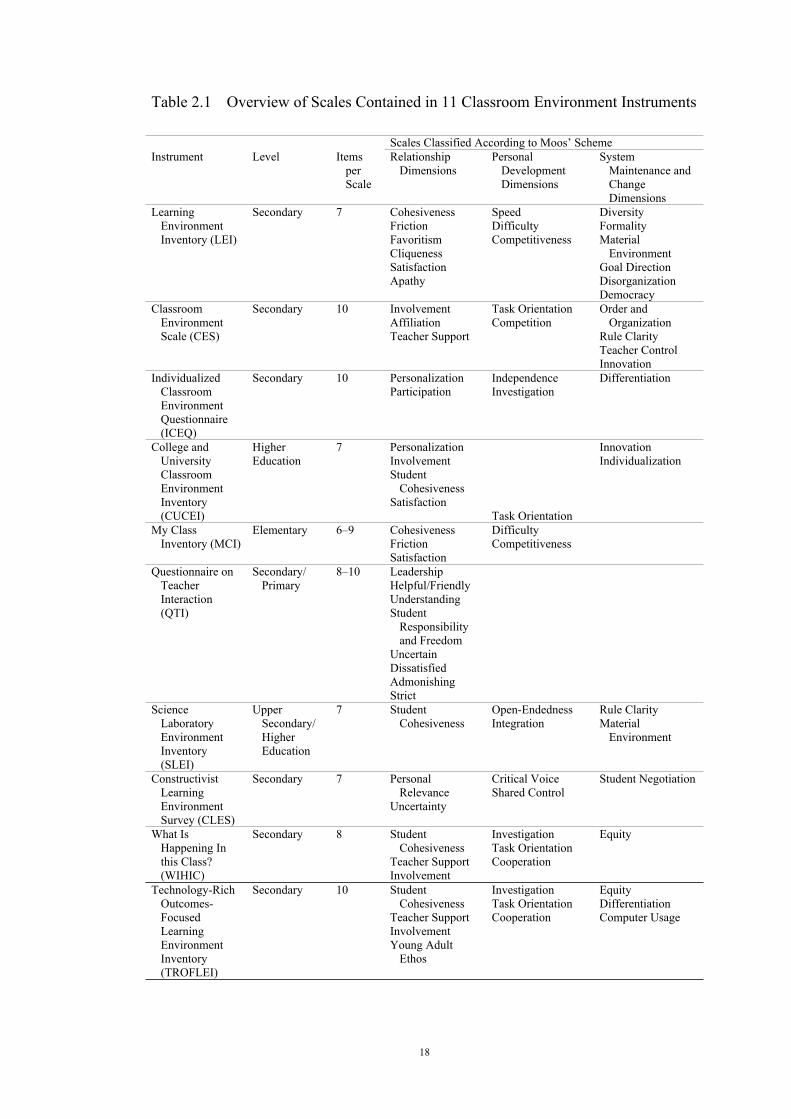
Table 2.1 provides an overview of 11 of these historically-significant and
contemporary classroom learning environment questionnaires. For each
questionnaire, this table shows the applicable educational level, the number of items
contained in each scale, scale names, and the classification of each scale according to
Moos’ (1974) three types of dimensions (Relationship, Personal Development, and
System Maintenance and Change). This table is based on Fraser (2012).
2.3.1 Learning Environments Inventory (LEI)
The LEI was initially developed and validated in the USA during late 1960s when
Walberg evaluated and researched Harvard Project Physics (Walberg & Anderson,
1968) with senior high-school students. The questionnaire uses a four-point Likert
scale to express agreement or disagreement with 105 questions evenly distributed
across 15 scales. The scales can be classified using the three dimensions identified by
Moos – Relationship (six scales), Personal Development (three scales), and System
Maintenance and Change (six scales). There are some questions that are phrased
negatively, and therefore are scored with reverse polarity. The LEI has been
translated and validated into languages other than English, including Hindi (Walberg,
Singh, & Rasher, 1977).
18
Table 2.1 Overview of Scales Contained in 11 Classroom Environment Instruments
Scales Classified According to Moos’ SchemeInstrument Level Items
per Scale
Relationship Dimensions
Personal Development Dimensions
System Maintenance and Change Dimensions
Learning Environment Inventory (LEI)
Secondary 7 Cohesiveness FrictionFavoritismCliquenessSatisfaction Apathy
SpeedDifficultyCompetitiveness
DiversityFormalityMaterial
EnvironmentGoal DirectionDisorganizationDemocracy
Classroom Environment Scale (CES)
Secondary 10 InvolvementAffiliationTeacher Support
Task OrientationCompetition
Order and Organization
Rule ClarityTeacher ControlInnovation
Individualized Classroom Environment Questionnaire (ICEQ)
Secondary 10 PersonalizationParticipation
IndependenceInvestigation
Differentiation
College and University Classroom Environment Inventory (CUCEI)
HigherEducation
7 PersonalizationInvolvement Student
CohesivenessSatisfaction
Task Orientation
InnovationIndividualization
My Class Inventory (MCI)
Elementary 6–9 CohesivenessFrictionSatisfaction
DifficultyCompetitiveness
Questionnaire on Teacher Interaction (QTI)
Secondary/ Primary
8–10 LeadershipHelpful/FriendlyUnderstandingStudent
Responsibility and Freedom
UncertainDissatisfiedAdmonishingStrict
Science Laboratory Environment Inventory (SLEI)
Upper Secondary/Higher Education
7 Student Cohesiveness
Open-EndednessIntegration
Rule ClarityMaterial
Environment
Constructivist Learning Environment Survey (CLES)
Secondary 7 Personal Relevance
Uncertainty
Critical VoiceShared Control
Student Negotiation
What Is Happening In this Class? (WIHIC)
Secondary 8 Student Cohesiveness
Teacher SupportInvolvement
InvestigationTask OrientationCooperation
Equity
Technology-Rich Outcomes-Focused Learning Environment Inventory (TROFLEI)
Secondary 10 Student Cohesiveness
Teacher SupportInvolvementYoung Adult
Ethos
InvestigationTask OrientationCooperation
EquityDifferentiationComputer Usage

19
Constructivist-Oriented Learning Environment Survey (COLES)
Secondary 11 Student Cohesiveness
Teacher SupportInvolvementYoung Adult
EthosPersonal
Relevance
Task OrientationCooperation
EquityDifferentiationFormative
AssessmentAssessment Criteria
Based on Fraser (2012)
2.3.2 Classroom Environment Scale (CES)
The CES was also initially developed in the late 1960s. Unlike the LEI, the purview
of the original research was not the school classroom, but rather a variety of human
environments such as psychiatric hospitals, prisons, and work places (Moos, 1974).
Like the LEI, the CES is also suited to the secondary-school level. The questionnaire
uses a True/False response format for expressing agreement or disagreement with 90
questions that are evenly distributed across nine scales (Moos & Trickett, 1974;
Trickett & Moos, 1973). The scales of the CES can also be classified using Moos’
three dimensions – Relationship (three scales), Personal Development (two scales),
and System Maintenance and Change (four scales). Approximately half of the
questions are phrased negatively, and therefore are scored with reverse polarity. The
CES has also been translated and validated into languages other than English,
including Japanese (Hirata & Sako, 1998) and Indonesian (Paige, 1979). It has been
cross-validated and successfully used in Australia (Fisher & Fraser, 1983).
2.3.3 Individualized Classroom Environment Questionnaire (ICEQ)
The ICEQ was developed for classrooms that are open-ended or inquiry-based in
contrast to traditional settings (Fraser, 1990; Rentoul & Fraser, 1979). Like the LEI
and CES, the ICEQ is aimed at secondary-school classrooms. The questionnaire uses
a five-point frequency response scale to express the frequency of occurrence of

20
events in the classroom (ranging from Almost Never to Almost Always). There are
50 items evenly distributed across five scales. The scales of the ICEQ can also be
classified using Moos’ three dimensions – Relationship (two scales), Personal
Development (two scales), and System Maintenance and Change (one scale). Many
of the questions are phrased negatively, and therefore are scored with reverse
polarity. The ICEQ was developed for investigating the effect of the environment on
student outcomes and differences between student and teacher perceptions, as well as
for evaluating educational innovations or new curricula (Fraser & Fisher, 1986).
2.3.4 College and University Classroom Environment Inventory (CUCEI)
The CUCEI was developed for use in smaller university or other post-secondary
classrooms (~30 students) (Fraser & Fisher, 1986). It contains 49 items evenly
distributed across seven scales. The scales of the CUCEI can also be classified in
terms of Moos’ three dimensions – Relationship (four scales), Personal Development
(one scale), and System Maintenance and Change (two scales). About half of the
items have reverse polarity (Fraser & Treagust, 1986).
Fraser, Williamson, and Tobin (1987) used the CUCEI to assess students’
perceptions of the classroom environment in two alternative high schools (senior
colleges). Participating students completed an actual and a preferred form. The senior
colleges were compared with three other control groups: students in two technical
colleges offering evening interest classes, three Grade 11 and 12 classes in a
conventional high school with adolescent and adult students, and three Grade 11 and
12 classes in a conventional high school with only adolescent students. Students in
21
the alternative high school perceived their environment as having greater
Involvement, Satisfaction, Innovation, and Individualization.
When the CUCEI was also used in first-year tertiary and Grade 12 and 13 secondary
computing classrooms in New Zealand, some potential problems occurred with
appropriateness, wording, length, and perceptions of repetitiveness between the
actual and preferred versions (Logan, Crump, & Rennie, 2006). Negatively-worded
questions caused some confusion and some students found that the time taken to
complete each version was too long. An Arabic version of the CUCEI (Hasan &
Fraser, 2015) was administered in the United Arab Emirates (UAE) to 84 males in
college-level mathematics classes. The effectiveness of a mathematics program was
investigated in terms of the nature of and changes in the learning environment and
student satisfaction. Statistically significant pretest–posttest differences supported the
effectiveness of using activity-based teaching strategies.
2.3.5 My Class Inventory (MCI)
The MCI is a simplified version of the LEI to be used with eight-to-ten year-old
children, as well as with junior high school students who experience reading
difficulties (Fraser et al., 1982). Simplification was accomplished by: reducing the
number of items to minimize fatigue; modifying the wording to increase readability;
reducing the four-point response format to a two-point (Yes–No) response format;
and having students answer on the question sheet to avoid transfer errors. There are
38 items that are unevenly distributed across five scales (Fisher & Fraser, 1981), but
a shorter 25-item version has been developed (Fraser & O'Brien, 1985). The scales of
the MCI can be classified into two of Moos’ three dimensions – Relationship (three
22
scales) and Personal Development (two scales). One-fifth of the items have reverse
polarity. A form of the MCI with a three-point response format (Seldom, Sometimes,
and Most Times) has also been successfully used by Goh and Fraser (1998) in
Singapore.
MCI was used in an evaluation of science kits (Houston, Fraser, & Ledbetter, 2008)
among 588 Grades 3–5 students in three demographically-similar schools in Texas.
One school used a textbook exclusively, one used science kits exclusively, and one
used a combination of a textbook and science kits. For both Cohesiveness and
Satisfaction, the group using the science kits experienced an improvement in learning
environment and attitude scores, while the other two groups experienced a decline,
with the group using a combination of a textbook and science kits experiencing a
smaller decline than the textbook-only group.
In a study of learning environments in lower-secondary mathematics classrooms in
Brunei Darussalam, the MCI was validated in a non-Western country (Majeed,
Fraser, & Aldridge, 2002). Results regarding gender differences were consistent
with earlier research in indicating that boys and girls perceived the same learning
environment differently (Fisher, Henderson, & Fraser, 1997; Wong & Fraser, 1996).
The MCI scale of Satisfaction was used as a dependent variable, while the three other
scales (Cohesiveness, Difficulty, and Competition) were independent variables.
Statistically significant associations were found between Satisfaction and the three
MCI scales.

23
When a revised version of the MCI was used to evaluate the school environment
(Sink & Spencer, 2005), the original My Class Inventory-Short Form was found to
have some psychometric limitations. A revised MCI-SF was found to be valid and
reliable when used with upper-elementary American students. The original 25-
question, five-scale MCI-SF was revised to an 18-question, four-scale instrument.
The original scales of Satisfaction, Cohesion, Competitiveness, and Friction were
kept. The Difficulty scale, as well as some problematic items, was removed. The
resulting instrument was used with a sample of approximately 3000 Grades 3–5
students. Elementary-school counselors can use the revised MCI-SF to evaluate the
climate in the classrooms that they serve and thereby evaluate how they are
influencing students and the climate of the school.
2.3.6 Questionnaire on Teacher Interactions (QTI)
The QTI was created for researchers and teachers for assessing student–teacher
relationships in classrooms (Wubbels, 1993; Wubbels & Brekelmans, 1998, 2012;
Wubbels, Créton, Levy, & Hooymayers, 1993). The premise is that the behavior of
students influences the behavior of the teacher, and the behavior of the teacher
influences the behavior of the students. The QTI was originally developed in the
Netherlands for work with senior high school students, but it has since been cross-
validated internationally (Wubbels & Brekelmans, 2012) and has been adapted to
assess teachers’ perceptions of a principal’s interactions with teachers (Fisher &
Cresswell, 1998). There are 77 items distributed unevenly across eight scales in the
original version (Wubbels, 1993). All of the scales of the QTI can be classified as
Moos’ Relationship dimension (Fraser, 2012). The questionnaire uses a five-point
frequency scale for each item about student–teacher interactions.

24
The QTI was developed based on a model for interactional teacher behavior that
involves dimensions of Influence (Dominance–Submission) and Proximity
(Opposition–Cooperation), each of which can be represented on an axis of a two-
dimensional orthogonal system. The two dimensions underlie eight types of teacher
behavior – student responsibility/freedom, understanding, helping/friendly,
leadership, strict, admonishing, dissatisfied, and uncertain. Typical items are
“She/he gives a lot of free time” (Student Responsibility and Freedom behavior) and
“She/he gets angry” (Admonishing behavior). The eight scale scores from the QTI
can be graphed using a polar coordinate system to create a spider web graph. A
higher score for a given dimension results in a larger area of the corresponding sector
being shaded (see Figure 2.1).
Based on research using the QTI, Wubbels and Brekelmans (2012) have several
recommendations for improving science education. When communicating with
students, both verbally and non-verbally, teachers’ behaviors should be characterized
by qualities of leadership, helpful/friendly, and understanding, while maintaining
visual and verbal control. Teachers should also be reflective in their teaching and use
questionnaires to get feedback from students about relationships in the classroom.
From a professional perspective, staff development should focus on changing teacher
behavior more than teacher attitudes. Teachers should focus on self-behavior when
undesirable classroom situations arise. This includes being aware of expectations for
different students that can result in lower performance because of lower expectations.

25
Figure 2.1 Model for Interpersonal Teacher Behavior (Wubbels & Brekelmans, 2012)
The QTI was found to be valid at the university level in Indonesia when modified
and translated into the Indonesian language (Fraser, Aldridge, & Soerjaningsih,
2010). Attitudes towards computers were investigated as an outcome of the learning
environment. The sample consisted of 422 students from research methods classes in
two departments (Computer Science and Management) that were perceived as being
different in their difficulty, learning strategies, and content. When compared to
students in Computer Science courses, students in Management courses tended to be
less motivated and not as academically strong. Students enrolled in Management
courses had more favorable perceptions of their lecturers’ interpersonal behaviors
than did those enrolled in Computer science, particularly for Leadership,
Helping/Friendly, and Understanding behaviors.

26
Along with the MCI, Goh and Fraser (1998) used the QTI (Primary) with 1512
students (ages 10–11 years) in 39 Singaporean mathematics classes in 13 government
coeducational primary schools. The QTI (Primary) incorporates modifications to the
original and short forms to make them more appropriate for younger students –
language was modified to lower the reading level and the five-point response scale
was reduced to a three-point scale. Better achievement and student attitudes were
found in classes with more teacher Leadership, Helping/Friendly, and Understanding
behaviors and less Uncertain behavior. Both interpersonal teacher behavior and
classroom climate made a sizable and unique contribution to variance in students’
attitudes, but not to student achievement.
The QTI (Primary) was validated with 3104 students (Years 4–6) in 136 classes in 25
primary schools in Brunei Darussalam (Scott & Fisher, 2004) after it was translated
into Standard Malay and modified to meet the cultural and language needs of the
students, creating the Questionnaire on Teacher Interaction (Elementary) – QTIE.
Students had favorable perceptions of their teachers’ interpersonal behaviors in terms
of Leadership, Helping/Friendly Understanding, and Strict behaviors, but this was
less so in terms of Student Responsibility/Freedom, Uncertain, and Admonishing
behaviors. There were statistically significant associations between all eight scales of
the QTIE and students’ Enjoyment of Science Lessons and six of the eight QTIE
scales were statistically significantly associated with achievement – Leadership,
Helping/Friendly, Understanding, Strict, Student Responsibility/Freedom, and
Admonishing.

27
2.3.7 Science Laboratory Environment Inventory (SLEI)
The SLEI was developed to assess the unique classroom learning environment of
science laboratory classes at the senior high school and post-secondary levels when
laboratory work is conducted in a separate classroom (Fraser, Giddings, &
McRobbie, 1992). The questionnaire has a frequency response (Almost Never,
Seldom, Sometimes, Often, and Very Often) and 35 questions evenly distributed
across five scales. The scales of the SLEI can also be classified into Moos’ three
dimensions – Relationship (one scale), Personal Development (two scales), and
System Maintenance and Change (two scales). The instrument was field tested and
validated simultaneously in six countries (USA, Canada, England, Australia, Israel
and Nigeria) with a sample of 5477 students in 269 classes (Fraser & McRobbie,
1995; Wong & Fraser, 1995). Later it also was cross-validated in Australia by Fisher,
Henderson and Fraser (1997).
A modified version of the SLEI was used in conjunction with an attitude
questionnaire based on the Fennema-Sherman Science Attitude Scales (Fennema &
Sherman, 1976) to evaluate the use of innovative anthropometric activities in terms
of the learning environment and the student outcomes of attitudes and achievement
(Lightburn & Fraser, 2007). The modified SLEI consisted of four scales (Student
Cohesiveness, Integration, Rule Clarity, and Material Environment) with six items
each. The attitude instrument also consisted of four scales (Personal Confidence
about Science, Usefulness of the Subject Matter, Perception of Teachers’ Attitudes,
and Attitude to Scientific Inquiry) consisting of six items each. The questionnaires
were found to be valid and reliable with a sample of 761 students in 25 high-school
classes in Florida. There were statistically significant changes between pretest and
28
posttest in achievement, attitudes and learning environment when compared with a
control group.
The SLEI and four scales from the TOSRA (Social Implications of Science,
Normality of Scientists, Attitude to Scientific Inquiry, and Interest in Science) were
translated into the Korean language and were found to be valid, reliable, and able to
differentiate between the perceptions of students in different classes (Fraser & Lee,
2009). The sample consisted of 439 high school science students in one of three
streams (science-independent, science-oriented, and humanities). With the individual
used as the unit of analysis, there was a statistically significant correlation between
two TOSRA scales (Social Implications of Science and Attitude to Scientific Inquiry)
and the SLEI scale of Open-Endedness. There was also a statistically significant
correlation between the two TOSRA scales of Normality of Scientists and Interest in
Science and the SLEI scale of Material Environment. Generally students in the
science-independent stream had the most favorable perceptions of their laboratory
classroom environments when compared with students in the other two streams.
Using a chemistry-centric version of the SLEI and TOSRA, the Chemistry
Laboratory Environment Inventory (CLEI) and Questionnaire on Chemistry Related
Attitudes (QOCRA), respectively, Wong and Fraser (1996) investigated associations
between students’ perceptions of their chemistry laboratory classroom environment
and their attitudes towards chemistry. A sample of 1592 Grade 10 chemistry
students in 56 classes in 28 coeducational government schools in Singapore were
administered the actual and preferred versions of the CLEI and the QOCRA. In all
three instruments the word ‘science’ was changed to ‘chemistry’. In addition, the

29
three TOSRA attitude scales were changed to Attitude to Scientific Inquiry in
Chemistry, Adoption of Scientific Attitudes in Chemistry, and Enjoyment of
Chemistry Lessons. All five CLEI scales were associated significantly with each of
the three attitude scales. In particular, Integration and Rule Clarity were strong and
consistent predictors of student attitudes.
In a later study, Singaporean students' perceptions of their chemistry laboratory
classroom environments and their interactions with their chemistry teachers, together
with their attitudes towards chemistry, were investigated by administering four
questionnaires – CLEI (actual and preferred versions), QTI, and QOCRA (Quek,
Wong, & Fraser, 2005). A sample of 497 Grade 10 chemistry students in 18 classes
in three independent single-sex schools in Singapore were distributed between two
streams, namely, Gifted (GEP) or non-gifted (Express). For the CLEI, Open-
Endedness was a statistically significant independent predictor of all three attitude
scales, while Student Cohesiveness was a statistically significant independent
predictor of Adoption of Scientific Attitudes in Chemistry, and Rule Clarity was a
significant independent predictor of Attitude to Scientific Inquiry in Chemistry. For
the QTI, however, only Enjoyment of Chemistry Lessons was significantly related to
QTI scales. In addition, the CLEI and the QTI made unique and independent
contributions to variance in attitudes.
2.3.8 Constructivist Learning Environment Survey (CLES)
The CLES assesses the degree to which a particular classroom environment is
consistent with constructivist epistemology (P. C. Taylor, Fraser, & Fisher, 1997).
The instrument can be used to help teachers to reflect on their assumptions and to

30
adjust their teaching practices. The CLES has been used to compare the effectiveness
of alternative educational programs (Nix, Fraser, & Ledbetter, 2005). The
questionnaire uses a frequency response scale (Almost Never, Seldom, Sometimes,
Often, and Very Often) for responding to its 35 questions that are evenly distributed
across five scales. The scales of the CLES can be classified using Moos’ three
dimensions – Relationship (two scales), Personal Development (two scales), and
System Maintenance and Change (one scale).
The actual and preferred versions of the CLES were translated into the Korean
language and found to be valid and reliable (H. B. Kim et al., 1999). The CLES and a
seven-item Attitude to This Class scale, based on the TOSRA, were administered to
1083 students in 24 classes in 12 schools with a Grade 10 class and a Grade 11 class
from each school. Grade 10 students studied general science with a constructivist
approach, while Grade 11 studied a specific science, such as physics, chemistry,
biology, or earth science with strong academic content. There were statistically
significant correlations between the scales of Personal Relevance, Shared Control,
and Student Negotiation and student attitudes in Grade 10, while Personal Relevance,
Uncertainty, and Shared Control were statistically significantly related to student
attitudes for Grade 11. For Grades 10 and 11, Personal Relevance was the strongest
independent predictor of students’ attitudes towards their science classes. In a
subsequent study in Korea, a modified 25-item five-scale version of the CLES in the
Korean language was validated with 440 science students in 18 grade 10 and 11
classes. Also, this study replicated past findings of associations between classroom
environment and students’ attitudes to science.

31
In Singapore, the CLES was used to evaluate the effectiveness of using a Mixed
Mode Delivery (MMD) framework in terms of classroom learning environment and
student attitudes (Koh & Fraser, 2014). A modified version of the CLES consisting
of five scales (Personal Relevance, Uncertainty, Critical Voice, Shared Control, and
Negotiation) was administered to 2216 secondary-school students taught by
preservice teachers in an MMD group and 991 students in a control group taught by
preservice teachers using primarily traditional teacher-centered methods (TA). Both
groups were business-studies students. The CLES was found to be valid, reliable, and
capable of differentiating between the perceptions of students in the different classes.
While both groups of students perceived a gap between their actual environment and
their preferred environment, the effect sizes for actual–preferred differences were
considerably larger for the TA students than for the MMD students.
The CLES was translated into Mandarin in a cross-national study in Taiwan and
Australia and was found to be valid, reliable, and capable of differentiating between
the perceptions of students in different classes (Aldridge, Fraser, Taylor, & Chen,
2000). With the individual as the unit of analysis, and for both Australia and Taiwan,
there were positive and statistically significant independent associations between
student attitudes and Personal Relevance, Shared Control, and Student Negotiation.
However, it is worth noting the authors found that students in Taiwan and Australia
did not always interpret statements in the same way.
In South Africa, a modified version of the CLES (actual and preferred) was used
with 1804 mathematics students in Grades 4–9 in 43 classes in six schools with 29
teachers (Aldridge, Fraser, & Sebela, 2004). The instrument was found to be valid
32
and reliable, as well as being able to significantly differentiate between the
perceptions of students in different classes. The study used the CLES in teacher
action research aimed at increasing the constructivist emphasis of two teachers’
classrooms. The feedback from the initial administration of the CLES guided
teachers in making their classrooms more constructivist in nature as measured by
pre–post changes. In addition, actual posttest scores were close to what students
would prefer.
When the CLES was translated into Spanish and administered in English and
Spanish to 739 Grade K–3 students in Miami, it was found to be valid, reliable, and
able to differentiate between the perceptions of students in different classes (Peiro &
Fraser, 2009). Associations between the nature of the classroom environment and
students’ attitudes were found to be strong and positive. A three-month classroom
intervention led to educationally-important changes in the classroom environment.
2.4 What Is Happening In this Class? (WIHIC)
Because the WIHIC was used in my study to assess students’ perceptions of the
classroom learning environment, it is discussed in detail in this section. The WIHIC
(Aldridge & Fraser, 2000; Aldridge, Fraser, & Huang, 1999; Dorman, 2003)
combines scales from previous instruments and includes contemporary dimensions
such as constructivism and equity. The WIHIC, along with the SLEI and CLES, are
more relevant to student-centered as opposed to teacher-centered classrooms (Fraser,
1998b, 2012; Koul & Fisher, 2005).
33
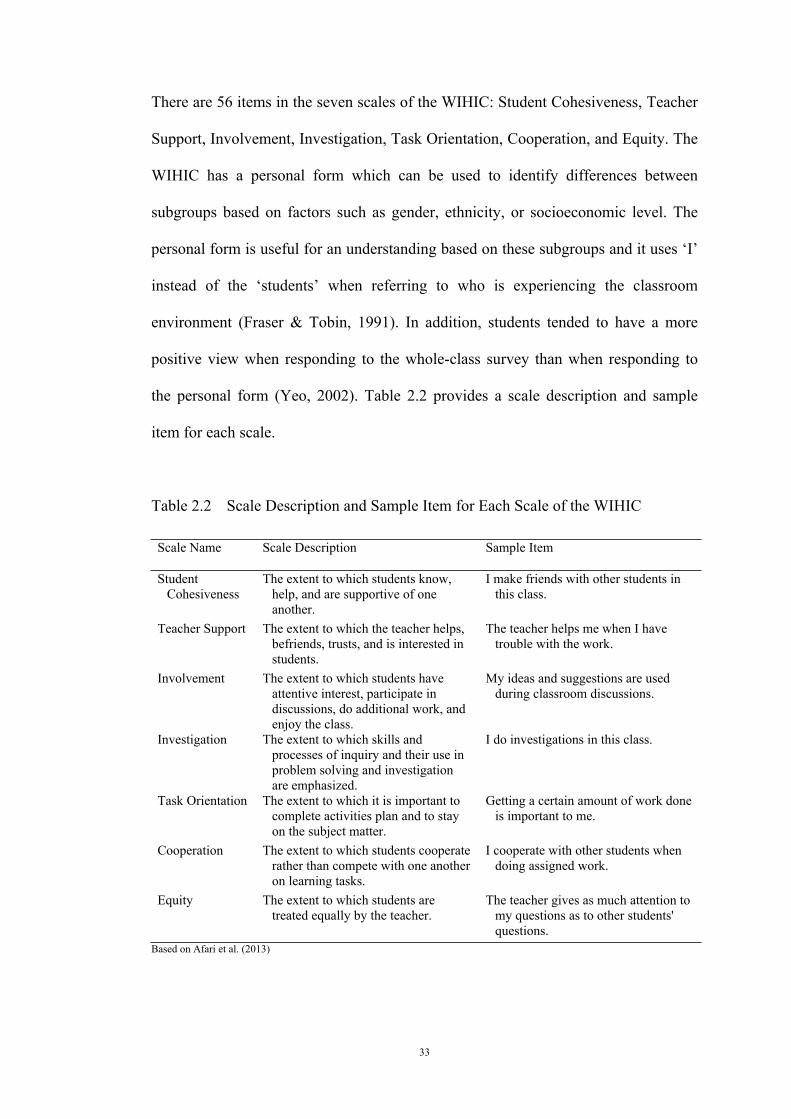
There are 56 items in the seven scales of the WIHIC: Student Cohesiveness, Teacher
Support, Involvement, Investigation, Task Orientation, Cooperation, and Equity. The
WIHIC has a personal form which can be used to identify differences between
subgroups based on factors such as gender, ethnicity, or socioeconomic level. The
personal form is useful for an understanding based on these subgroups and it uses ‘I’
instead of the ‘students’ when referring to who is experiencing the classroom
environment (Fraser & Tobin, 1991). In addition, students tended to have a more
positive view when responding to the whole-class survey than when responding to
the personal form (Yeo, 2002). Table 2.2 provides a scale description and sample
item for each scale.
Table 2.2 Scale Description and Sample Item for Each Scale of the WIHIC
Scale Name Scale Description Sample Item
Student Cohesiveness
The extent to which students know, help, and are supportive of one another.
I make friends with other students in this class.
Teacher Support The extent to which the teacher helps, befriends, trusts, and is interested in students.
The teacher helps me when I have trouble with the work.
Involvement The extent to which students have attentive interest, participate in discussions, do additional work, and enjoy the class.
My ideas and suggestions are used during classroom discussions.
Investigation The extent to which skills and processes of inquiry and their use in problem solving and investigation are emphasized.
I do investigations in this class.
Task Orientation The extent to which it is important to complete activities plan and to stay on the subject matter.
Getting a certain amount of work done is important to me.
Cooperation The extent to which students cooperate rather than compete with one another on learning tasks.
I cooperate with other students when doing assigned work.
Equity The extent to which students are treated equally by the teacher.
The teacher gives as much attention to my questions as to other students' questions.
Based on Afari et al. (2013)

34
When the WIHIC has been used in numerous studies (Aldridge & Fraser, 2000;
Dorman, 2003; H. B. Kim et al., 2000; Koul & Fisher, 2005), it has been shown it to
be valid and reliable for assessing the nature of classroom environments. The WIHIC
has been extensively validated in both Western and non-Western countries, with the
findings from non-Western countries are generally consistent with results from
Western contexts. These studies reported strong associations between classroom
environment and student outcomes for most scales (Fraser, 2012). Statistical analyses
have established the cross-cultural validity of the WIHIC (Aldridge et al., 1999) in
Australia and Taiwan and in Australia and Indonesia (Fraser, Aldridge, & Adolphe,
2010).
The following Sections 2.4.1 to 2.4.4 review the use of the WIHIC internationally,
specifically in Australia, Asia, North America, and Africa and the Middle East. This
is followed by Sections 2.5.1 to 2.5.4 reviewing the research on classroom learning
environments with a special focus on the WIHIC.
2.4.1 Use of WIHIC in Australia
In a study of both physical and psychosocial learning environments, Zandvliet and
Fraser (2005) used the WIHIC in computer networked classrooms. The sample
consisted of 1404 students in 81 high school classes in Australia and Canada. Five
scales of the WIHIC, one scale of the TOSRA, and five scales of the Computerized
Classroom Ergonomic Inventory (CCEI) were used. The WIHIC scales were Student
Cohesiveness, Involvement, Autonomy/Independence, Task Orientation, and
Cooperation; the TOSRA scale was Student Satisfaction; and the CCEI scales were
Workspace Environment, Computer Environment, Visual Environment, Spatial

35
Environment, and Overall Air Quality. The scales of the WIHIC were found to have
statistically significant associations with Student Satisfaction. In addition, the
physical environment contributed to Student Satisfaction through its statistically
significant independent link to the WIHIC scales.
Dorman (2008) also validated the actual and preferred forms of the WIHIC. In a
study with 978 secondary students in Queensland, Australia, he found a large amount
of score variance was explained by the scales rather than the forms. The instrument
was validated using confirmatory factor analysis, as opposed to the typical
exploratory factor analysis. Multitrait–multimethod modeling also supported the
instrument’s construct validity.
In a study combining items from the seven scales of the WIHIC and two scales
(Satisfaction and Difficulty) from the MCI, Ly and Malone (2010) used a 56-item
nine-scale instrument with 18 English-as-a-Second Language (ESL) geometry
teachers in Southwest Sydney. The number of items in each scale varied from four to
eight. The instrument was found to be valid and reliable. Positive associations were
indicated between the learning environment and teachers’ views of geometry
instruction and the achievement of their classroom goals. In addition, teachers’
perceptions of teaching geometry were positive.
In a cross-national study in Australia and Indonesia, a modified version of the
WIHIC was used to investigate differences in perceptions of the learning
environment between countries and genders (Fraser, Aldridge, & Adolphe, 2010).
The sample consisted of 594 students in 18 classes in Indonesia and 567 students in
36
18 classes in Australia, making a total of 1161 students in 36 classes. The original
eight-scale, 80-item WIHIC was translated into Bahasa Indonesian and administered
to Grade 9 and 10 students in eight private coeducational schools (four each in
Indonesia and Australia). Factor analysis resulted in 55 items in six scales (Student
Cohesiveness, Teacher Support, Involvement, Investigation, Task Orientation, and
Equity). Each WIHIC scale differentiated significantly between classrooms for both
Indonesian and Australian students. Indonesian students perceived their learning
environment more positively than Australian students with respect to Involvement
and Investigation. However, Australian students perceived their learning
environment more positively than Indonesian students with respect to Task
Orientation and Equity.
2.4.2 Use of WIHIC in Asia
Using Korean versions of the WIHIC and QTI (H. B. Kim et al., 2000) with 543
students in 12 Korean single-sex schools, students’ attitudes towards science and
their perceptions of the classroom learning environment were investigated. In
addition to supporting the cross-cultural validity of the instruments when translated
into Korean, each scale of both instruments was found to be reliable, valid, and able
to distinguish between perceptions of students in different classrooms. There were
significant positive attitude–environment relationships for most scales of the WIHIC.
While boys perceived their learning environment, their teacher’s interpersonal
behavior, and their attitudes toward science class more positively than did girls, the
interpretation was not clear because the boys and girls were not in the same schools.

37
A modified form of the WIHIC was translated into Indonesian and administered to
1400 students and their teachers in 16 schools in Indonesia (Wahyudi & Treagust,
2004). The Indonesian version was found to be valid and reliable as a measure of the
classroom learning environment and was able to differentiate between the
perceptions of students in different groups. In addition, there were significant
differences between students’ perceptions of the actual and preferred learning
environment, and female students generally held more positive perceptions than
males. Students, in general, also held less favorable perceptions than their teachers
across all scales except Task Orientation, for which perceptions were similar. Rural
students held less favorable perceptions than did urban and suburban students.
Koul and Fisher (2005) used the WIHIC to study differences between cultures, as
determined by the language spoken at home, in student perceptions of the classroom
environment. Differences in students’ perceptions of their learning environment were
associated with their cultural background. The 1021 Grade 9 and Grade 10 students
came from 31 classes in seven different schools in Jammu, India. The diversity of the
area is reflected in the diversity of the 13 languages spoken at home. Of these 13
languages, only four groups were large enough for analysis – Hindi (522), Kashmiri
(221), Dogri (175), and Punjabi (82); the remaining 21 students were distributed
among the other nine languages. The Kashmiri students had the most positive
perceptions of their classroom environment, specifically for the scales of Student
Cohesiveness, Task Orientation, Cooperation, and Equity. The Dogri students had
the most negative perceptions of their classroom environment, specifically for the
scales of Investigation, Task Orientation, Cooperation, and Equity. The authors
attributed this to the value placed on education by each of these cultural groups:

38
generally Kashmiri value education and see it as a way to maintain ‘a relatively good
life,’ while Dogri generally tend to have family businesses and see education as
providing enough skills to run the business.
In two private schools in India, Smith (2013) explored the relationship between the
learning environment and “students’ sense of life purpose and personal meaning” (p.
262). The sample consisted of 267 students aged 16 to 21 years in secondary and
undergraduate education. A modified version of the WIHIC with six scales (Student
Cohesiveness, Teacher Support, Involvement, Task Orientation, Cooperation, and
Equity), as well as with rewording to allow for school-level analysis (In this
school… instead of In this class…), was used together with four scales of a Personal
Meaning System (Purpose, Coherence, Choice/Responsibility, and Satisfaction with
Education) that were combined to construct a global measure of concerns and
attitudes towards life – Agentic Personal meaning (APM). All four scales of the
WIHIC were found to have a significant relationship with Purpose and Coherence.
In Singapore, the WIHIC was modified for use with 250 adults attending classes in
five computer education centers (Khoo & Fraser, 2008). The instrument was
modified to include the six scales of Trainer Support, Involvement,
Autonomy/Independence, Task Orientation, Equity, and Student Cohesiveness
(which was removed to improve the factor structure). The researchers found that
males perceived greater Trainer Support and Involvement, but females perceived
more Equity. In addition, older students were generally more satisfied than younger
students and older females perceived more Trainer Support than younger females.

39
The data analysis supported the WIHIC’s validity, reliability, and ability to
differentiate between classrooms.
Chionh and Fraser (2009) validated a seven-scale version of the WIHIC with 2310
Singaporean Grade 10 students in 75 geography and mathematics classes in 38
schools. The instrument was modified to include the eight scales of Student
Cohesiveness, Teacher Support, Involvement, Investigation, Task Orientation,
Cooperation, Equity, and Autonomy/Independence (which was removed to improve
the factor structure). Each student in the study responded to an actual and a preferred
form for both their mathematics classroom and their geography classroom. For every
scale of the WIHIC, an attitude scale (Enjoyment of Lessons, Leisure Interest, and
Career Interest) or self-esteem scale was statistically significantly related to
classroom learning environment for mathematics and geography. However, only two
WIHIC scales (Student Cohesiveness and Task Orientation) were statistically
significantly related to attitudes for geography; and three WIHIC scales (Student
Cohesiveness, Task Orientation, and Equity) were significantly related to attitudes to
mathematics. In addition, each of the seven WIHIC scales was a statistically
significant independent predictor of at least one of the attitude or self-esteem scales.
Teacher Support, Task Orientation, and Equity were significant and independent
predictors of multiple attitudinal outcomes, while Student Cohesiveness was the
strongest independent predictor of achievement.
Peer and Fraser (2015) also used scales from the WIHIC in an investigation of
primary science classrooms in Singapore involving 1081 students in 55 classes.
Attitudes were statistically significantly associated with scales from the WIHIC
40
(Involvement, Teacher Support, Investigation, Task Orientation and Cooperation).
Significant gender differences emerged for Involvement, Teacher Support, Task
Orientation and Cooperation; significant grade-level differences were found for
Teacher Support, Task Orientation and Cooperation; and significant stream
differences were present for Involvement and Cooperation. There were also
significant stream–by–gender interactions for Task Orientation; significant grade–
by–stream interactions for Investigation; and no significant grade–by–gender or
stream–by–gender–by–grade interaction for any WIHIC scale.
Yang, Wang, and Kao (2012) used a Chinese translation of WIHIC with 113 Grade
6 students in Taiwan to study the influence of the use of Interactive Whiteboards
(IAW) compared with traditional information communication technology (ICT) on
learning and the learning environment in health and physical education classrooms.
Students in the IWB group were found to have higher scores on all seven scales of
the WIHIC, which the researchers attributed mainly to the physical size and
interactive nature of the Whiteboard.
2.4.3 Use of WIHIC in North America
The WIHIC was used in an investigation of the effects of student, teacher, and school
demographics on students’ perceptions of their learning environment (den Brok,
Fisher, Rickards, & Bull, 2006) among 665 California middle-school science
students in 11 schools. The WIHIC was found to be valid and reliable, but only the
scales of Student Cohesiveness, Task Orientation, and Involvement were able to
differentiate between perceptions of students in different classrooms. Female
students had more favorable perceptions of their science classroom environment than

41
males. In addition, there was a positive association between the number of ethnic
groups in the classroom and students’ perceptions of Student Cohesiveness.
A modified three-scale version of the WIHIC was used to investigate middle-school
mathematics classroom environments (Ogbuehi & Fraser, 2007) among 661 students
in 22 classrooms in four inner-city Californian schools. The study focused on the
effectiveness of innovative teaching strategies for improving the classroom
environment, students’ attitudes, and students’ conceptual development. The
classroom environment was measured using modified versions of the WIHIC and
CLES, whereas attitudes were measured using modified versions of the TOMRA.
There were moderate positive associations between the learning environment,
especially as measured by the WIHIC dimensions of Involvement and Task
Orientation, and students’ attitudes to mathematics as measured by the TOMRA.
In an investigation of relationships between the learning environment and students’
mathematics anxiety, as well as differences between the sexes in perceptions of
learning environment and anxiety, Taylor and Fraser (2013) cross-validated the
WIHIC and an updated Revised Mathematics Anxiety Rating scale with a sample of
745 high-school students in Southern California. Females perceived a more positive
classroom environment and more anxiety about mathematics evaluation than males,
but males perceived more anxiety about mathematics learning than females. Some
statistically significant associations were found between learning mathematics
anxiety and learning environment scales.
42
With a sample of 520 Grade 4 and 5 students and 120 of their parents in South
Florida, Allen and Fraser (2007) found a modified version of the WIHIC to be valid,
reliable, and able to differentiate between the perceptions of students in different
classrooms. The students from 22 classes and some of their parents completed an
actual version and a preferred version. The parents also completed an actual version
and a preferred version; however, the parents were all from the same school. The
wording was simplified and the number of items in the WIHIC was reduced to be
more appropriate for these students. In addition, the parents’ form was reworded to
reflect perceptions of the parent. Six of original WIHIC scales were used – Student
Cohesiveness, Teacher Support, Involvement, Task Orientation, Equity, and
Investigation. Associations between achievement and classroom environment were
stronger for parents than for students, with associations being weak for students.
However, the associations between student attitudes and the Task Orientation and
Investigation scales were somewhat stronger. In addition, associations between
students’ attitudes and parents’ perceptions of the learning environment were
relatively weak, except for the Task Orientation scale.
When the WIHIC was used with 1434 Grade 7 and 8 students in 71 coeducational
classrooms in 18 schools (Wolf & Fraser, 2008), it was found to be valid, reliable,
and able to differentiate between the perceptions of students in different classrooms.
Inquiry and non-inquiry laboratory teaching was compared in terms of the classroom
learning environment, attitudes to science, and achievement among Grade 7 physical
science students. A subsample of 165 Grade 7 students in eight classes in Long
Island, New York conducted laboratory experiments based on the science
curriculum. The eight classes were taught by two teachers, with each teacher
43
teaching two classes using inquiry laboratory activities and two classes using non-
inquiry laboratory activities. Students in the inquiry classrooms perceived a
statistically significantly greater amount of Student Cohesiveness than did students in
the non-inquiry classes. In addition, females perceived more Student Cohesiveness
and Cooperation, and less Teacher Support and Investigation, than did males.
Females benefited more than males from non-inquiry activities in terms of attitudes
to science and the learning environment scales of Task Orientation, Cooperation, and
Equity; however, males benefited more than females from inquiry activities in terms
of attitudes to science and the scales of Task Orientation, Cooperation, and Equity.
Although there were strong and consistent associations between learning
environment scales and student attitudes, associations between the learning
environment and achievement were weaker.
Martin-Dunlop and Fraser (2008) used the WIHIC with 525 female preservice
elementary teachers in 27 classes in a large urban university in Southern California.
The purpose was to evaluate the effectiveness of an innovative science course for
improving preservice elementary teachers’ perceptions of the laboratory learning
environment. Four scales of the WIHIC (Student Cohesiveness, Instructor Support,
Investigation, and Cooperation) were used with two scales of the SLEI (Open-
Endedness and Material Environment) and one scale from the TOSRA (Enjoyment
of Science Lessons). During the course, students’ perceptions for all four scales of
the WIHIC and both scales of the SLEI showed positive gains. Associations between
student attitudes (Enjoyment of Science Lessons) and the learning environment were
high, especially for the Instructor Support scale.

44
In a study comparing self-reported learning styles and the learning environment
preferences of education and nursing students, Roberge, Gagnon, and Oddson (2011)
used the visual, aural, read/write, kinesthetic (VARK) learning style inventory and
the preferred form of the WIHIC in English and French. A sample of 101
predominantly-female students with at least two years post-secondary school
experience consisted of 80 education students and 21 nursing students. In terms of
the WIHIC scales, education students preferred a more positive learning environment
than the nursing students preferred. Both student groups preferred a classroom
environment with high level of Task Orientation.
In a study of American kindergarten students’ and their parents’ perceptions of the
actual and preferred learning environment, Robinson and Fraser (2013) used a
modified version of the WIHIC appropriate for young students. The sample consisted
of 172 kindergarten students and 78 of their parents in six classes in an elementary
school in a large urban district in South Florida. The original WIHIC was reduced to
16 items in the four scales of Teacher Support, Involvement, Cooperation, Equity,
and Student Cohesiveness (which was removed to improve the factor structure). The
four scales were found to be valid and reliable and able to differentiate between
perceptions of students in different classrooms. Both students and parents preferred a
more positive learning environment than was perceived. However, parents perceived
a more favorable actual learning environment than students perceived, while students
preferred a more favorable learning environment than parents preferred. Teacher
Support, Involvement, Cooperation and Equity were significantly and positively
related to achievement, Equity was significantly and positively related with Adoption
of Science Attitudes, and Teacher Support and Equity were significantly and

45
positively related to Attitude to Scientific Inquiry. In addition, all four learning
environment scales were significantly and positively related to science achievement.
In evaluating the effectiveness of National Board Certified (NBC) teachers in terms
of their students’ perceptions of their classroom environments, their attitudes, and
their achievement, Helding and Fraser (2013) used a slightly modified form of the
WIHIC, the Enjoyment of Science Lessons scale of the TOSRA, and the science
component of the Florida Comprehensive Achievement Test. The sample consisted
of 443 Grade 8 and 10 science students in 21 classes taught by NBC teachers and
484 Grade 8 and 10 science students in 17 classes taught by non-NBC teachers in
South Florida (a total of 927 students in 38 classes in 13 schools). The WIHIC,
modified by rewording a small number of statements, maintained its validity,
reliability, and ability to differentiate between the perceptions of students in different
classrooms. The learning environment was strongly related to student outcomes, and
more strongly to students’ attitudes than to achievement. Differences between
students of NBC teachers and of non-NBC teachers were statistically significant for
the five scales of Teacher Support, Involvement, Task Orientation, Investigation and
Cooperation and for the Enjoyment of Science Lessons scale. However, differences
between the two groups were nonsignificant for the scales of Student Cohesiveness
and Equity and for achievement.
In an investigation of perceptions of the learning environment in science and
mathematics classrooms in which laptop computers were used in Ontario, Fraser and
Raaflaub (2013) used the WIHIC with 1173 Grade 7–12 students. Their data
supported the factorial validity and internal consistence reliability of the WIHIC and

46
attitude scales. Large and statistically significant differences were reported for
differences between preferred and actual classroom learning environments. Science
students reported a more positive learning environment in terms of perceptions and
attitudes than did mathematics students; males reported more positive attitudes, but
females held more favorable perceptions of the learning environment.
2.4.4 Use of WIHIC in Africa/Middle East
The WIHIC has been translated into IsiZulu for use in South Africa at the primary-
school level (Aldridge, Fraser, & Ntuli, 2009). A modified version of the WIHIC
(WIHIC-Primary) was administered to 1077 mathematics students in Grades 4 to 7 in
31 rural and semi-rural schools. Students responded to both the actual and preferred
versions in order to provide feedback to guide improvements in the teaching
practices of teachers engaged in distance in-service teacher training. Modifications to
the WIHIC included reducing the number of scales to six, removing the Investigation
scale and reducing the number of items from eight per scale to six, giving a total of
36 items. The language of questions was simplified to be more appropriate for
primary students and student was changed to learner as recommended by the South
African Department of Education. Finally, the WIHIC was translated into IsiZulu for
students in Grades 4 and 5 and the five-point frequency response scale was reduced
to a three-point scale. Factor analysis confirmed a four-scale structure (Teacher
Support, Involvement, Task Orientation, and Equity) with 19 items. The WIHIC-
Primary was found to be valid and reliable and was able to differentiate between the
perceptions of students in different classrooms. Learners preferred a more favorable
environment than was perceived to be present for each of the four scales, and actual–

47
preferred differences were statistically significant for Involvement, Task Orientation,
and Equity.
In a Ugandan study of secondary-school mathematics students, Opolot-Okurut
(2010) used a modified version of the WIHIC to study associations between student
perceptions of the learning environment and motivation towards mathematics for a
high-performing (HP) and a low-performing (LP) school. The sample consisted of 81
students (19 males and 62 females) aged 14 to 20 years in government-aided schools.
The modified WIHIC contained eight items in each of the five scales of Teacher
Support, Student Involvement, Task Orientation, Cooperation, and Equity. The
instrument was found to be valid and reliable. In addition, all scales of the WIHIC
had statistically significant positive correlations with motivation for the HP school.
Similarly, scales of the WIHIC had significant positive correlations with motivation
for the LP school on all scales but Cooperation. However, students in the LP school
perceived Teacher Support and Student Involvement as occurring more frequently
than did students in the HP school.
An Arabic version of a modified WIHIC, called the Learning Environment
Questionnaire (LEQ), and an Attitudes Toward Biology Questionnaire (ATBQ) were
pilot tested with 190 Grade 11 students to ensure comprehensibility, validity, and
reliability (Zeidan, 2010). The LEQ consisted of the four scales of Student
Cohesiveness, Instructor Support, Investigation, and Cooperation that were used with
a different sample of 190 Grade 11 students in the district of Tulkarm, Palestine. The
students were all enrolled in the science stream in single-sex schools and
proportionately represented the Grade 11 population in regards to gender
48
(male/female) and residency (city/village). There was a significant positive
correlation between attitudes toward biology and the learning environment. As well,
differences in attitudes towards biology and in perceptions of the learning
environment were significant for gender (favoring females) and nonsignificant for
residency.
Three WIHIC scales, a scale from the CLES, and a scale from the Technology-Rich
Outcomes-Focused Learning Environment Inventory (TROFLEI) were administered
in Arabic and English to 763 college students in 82 classes at Dubai Women’s
College in the United Arab Emirates (UAE) (MacLeod & Fraser, 2010). The WIHIC
scales were Teacher Support, Involvement, and Cooperation; the CLES scale was
Personal Relevance; and the TROFLEI scale was Computer Usage. Students
responded to both an actual and a preferred form. The modified questionnaire was
found to be valid, reliable, and able to differentiate between the perceptions of
students in different classrooms. Students preferred a more favorable classroom
environment on all scales than the environment that they perceived as being present.
In a study in the UAE, Afari, Aldridge, Fraser, and Khine (2013) used the WIHIC to
assess the effectiveness of using Jeopardy-type games for improving students’
perceptions of their learning environment and their attitudes towards mathematics.
For a sample of 352 students in 33 college-level mathematics classes in three
colleges, eight classes (90 students) were exposed to mathematical games as an
instructional strategy. Students were administered a pretest and posttest of a modified
version of the WIHIC in English and Arabic. Five scales of the WIHIC were selected
(Student Cohesiveness, Teacher Support, Involvement, Cooperation, and Equity) and
49
one scale of the CLES (Personal Relevance). The instrument was translated into
Arabic and some phrasing was modified to be more appropriate for the UAE setting.
The modified Arabic version of the WIHIC was found to be valid, reliable, and able
to differentiate between the perceptions of students in different classrooms. With the
individual as the unit of analysis, all of the learning environment scales were
positively and statistically significantly related to attitudes; however, with the class
mean as the unit of analysis, none of the learning environment scales were
statistically significantly related to attitudes.
2.5 Research Involving Classroom Environment Instruments
Fraser (1998a, 2012) identified several types of research applications of classroom
learning environment instruments: 1) associations between student outcomes and
environment, 2) evaluation of educational innovations, 3) teachers’ attempts to
improve classroom and school environments, 4) differences between students’ and
teachers’ perceptions of the environment, 5) combining quantitative and qualitative
methods, 6) school psychology, 7) links between educational environments, 8) cross-
national studies, 9) transitions between different levels of schooling, and 10)
typologies of classroom environments. Each of the above areas is discussed below.
A review of associations between student outcomes and the learning environment
illuminates how students’ perceptions of their environment impact such outcomes as
attitudes, achievement, and self-esteem (Section 2.5.1). In evaluating the
effectiveness of educational innovations, learning environment instruments can
identify those innovations that improve the learning environment (Section 2.5.2). The

50
use of action research and learning environment instruments can help teachers to
develop and identify strategies to improve their classroom environment (Section
2.5.3). Classroom learning environment instruments can also be used by teachers to
compare their own perceptions with their students’ perceptions of the same learning
environment (Section 2.5.4). When learning environment instruments are used in
combination with qualitative methods, the combination can provide insights
unavailable from the use of instruments alone (Section 2.5.5). School counselors can
use learning environment instruments to evaluate school counseling programs
(Section 2.5.6).
The link between school, home, and peer environments and the classroom
environment can also be considered (Section 2.5.7). In addition, cultural factors that
affect perceptions of the learning environment can be researched through cross-
national studies (Section 2.5.8). When students transition from close-knit primary
schools to departmentally-organized middle/lower secondary schools, classroom
environment instruments can be used to identify perceived changes in the learning
environment (Section 2.5.9). Learning environment instruments can also be used to
categorize classrooms based on different typologies of classrooms (Section 2.5.10).
2.5.1 Associations between Student Outcomes and Environment
Early research on learning environments explored associations between student
outcomes and the classroom environment. This continues to be an area of
considerable interest as researchers investigate associations between a variety of
student outcomes and their learning environment. Associations between outcomes

51
and perceptions of the classroom learning environment cut across languages,
countries, and grade levels (Fraser, 2012).
In a meta–analysis aimed at estimating the sign and size of correlations between
student perceptions of classroom learning environment and learning outcomes,
Haertel, Walberg, and Haertel (1981) analyzed 734 correlations from 12 studies
involving 823 classes in eight areas (general science, life sciences, physical sciences,
mathematics, social sciences, humanities, general studies, miscellaneous) and
representing 17,805 students in four countries (USA, Canada, Australia, and India).
All 12 studies employed the Learning Environment Inventory in its original, a
simplified, or a shortened form. Learning outcomes and gains were positively
associated with Cohesiveness, Satisfaction, Task Difficulty, Formality, Goal
Direction, Democracy, and the Material Environment, but negatively associated with
Friction, Cliqueness, Apathy, and Disorganization. Regression analysis showed that
the magnitudes of the correlations depended on specific scales, level of aggregation,
and nation, but not on sample size, subject matter, domain of learning outcome
(cognitive, affective, or behavioral), or the use of statistical adjustments for ability
and pretests. In another synthesis of research, (Wang, Haertel, & Walberg, 1993)
analyzed 179 handbook and annual review chapters, as well as other reviews related
to learning and affective outcomes. The analysis suggested that the “quality and
quantity of instruction are roughly equal in importance to student characteristics and
out-of-school contextual items” (p. 94). In contrast, those variables most affected by
policy, state-, district-, and school-level factors had markedly lower importance.
52
Wong and Fraser (1996) and Wong, Young, and Fraser (1997) reported significant
associations between classroom environment and the outcomes of student attitudes
using the Chemistry Laboratory Environment Inventory (CLEI), which is a modified
version of the SLEI, and the TOSRA. Significant associations were found between
the chemistry laboratory classroom environment and chemistry-related attitudes for
1592 final-year secondary school students in 56 chemistry classes and 28
government schools in Singapore. In a subsequent study in Singapore with the CLEI
and the QTI, Quek, Fraser, and Wong (2005) reported associations between students’
attitudes towards chemistry and their laboratory classroom environment and the
interpersonal behavior of their teachers. Statistically significant associations were
found between the laboratory classroom environment and students’ attitude toward
chemistry.
Fisher, Henderson, and Fraser (1997) used the SLEI and TOSRA to reveal
associations between the laboratory learning environment and student outcomes of
attitude, achievement, and practical performance. Numerous positive associations
with the nature of the chemistry laboratory classroom and students’ science-related
attitudes were reported for 489 students in 28 biology classes in Tasmania.
Afari, Aldridge, Fraser, and Khine (2013) reported associations between the learning
environment and attitudes towards mathematics for 352 college mathematics students
in 33 classes in the United Arab Emirates.
Table 2.3 provides an overview of how extensively the WIHIC has been used by
presenting 23 studies using the WIHIC; most of these studies involved investigation

53
of associations between learning outcomes and classroom environment. The first six
studies show that the WIHIC was used in cross-national studies in Australia and each
of four other countries – Taiwan (Aldridge & Fraser, 2000; Aldridge et al., 1999), the
United Kingdom (Dorman, 2003), Indonesia (Fraser, Aldridge, & Adolphe, 2010),
and Canada (Zandvliet & Fraser, 2004, 2005). The next six studies involved
administering the WIHIC in English in Singapore (Chionh & Fraser, 2009; Khoo &
Fraser, 2008), India (Koul & Fisher, 2005), Australia (Dorman, 2008), Canada
(Fraser & Raaflaub, 2013) and South Africa (Aldridge et al., 2009). The next four
studies involved translating the WIHIC into Korean (H. B. Kim et al., 2000),
Indonesian (Wahyudi & Treagust, 2004), and Arabic (Afari et al., 2013; MacLeod &
Fraser, 2010). The final nine studies were conducted in the USA in California (den
Brok et al., 2006; Martin-Dunlop & Fraser, 2008; Ogbuehi & Fraser, 2007; B. A.
Taylor & Fraser, 2013), New York (Wolf & Fraser, 2008), and Florida (Allen &
Fraser, 2007; Helding & Fraser, 2013; Pickett & Fraser, 2009; Robinson & Fraser,
2013). Although Table 2.3 is based on Fraser (2012), it has been updated and
expanded to include some additional recent studies.

54
Table 2.3 Overview of Studies Involving Use of the WIHIC
Reference(s) Country(ies) Language(s) Sample(s) Factorial Validity and Reliability
Associations with Environment for:
Unique Contributions
Aldridge et al. (1999)
Aldridge and Fraser (2000)
AustraliaTaiwan
EnglishMandarin
1,081 (Australia) and 1,879 (Taiwan) junior high science students in 50 classes
Enjoyment Mandarin translationCombined quantitative and
qualitative methods
Dorman (2003) AustraliaUKCanada
English 3,980 high school students NA Confirmatory factor analysis substantiated
Fraser et al. (2010) AustraliaIndonesia
EnglishBahasa
567 students (Australia) and 594 students (Indonesia) in 18 secondary science classes
Several attitude scales Differences were found between countries and sexes.
Zandvliet and Fraser (2004, 2005)
AustraliaCanada
English 1,404 students in 81 networked classes
Satisfaction Involved both physical (ergonomic) and psychosocial environments
Chionh and Fraser (2009)
Singapore English 2,310 grade 10 geography and mathematics students
AchievementAttitudesSelf-esteem
Differences between geography and mathematics classroom environments were smaller than between actual and preferred environments.
Khoo and Fraser (2008)
Singapore English 250 working adults attending computer education courses
Satisfaction Adult populationMales perceived more trainer
support and Involvement but less equity.
Koul and Fisher (2005)
India English 1,021 science students NA Differences in classroom environment according to student cultural background.
54

55
Dornan (2008) Australia English 978 secondary school students
NA Multitrait-multimethod modeling validated actual and preferred forms.
Fraser and Raaflaub (2013)
Canada English 1173 Grade 7–10 students Attitudes Large differences between preferred and actual classroom learning environments.
Learning environment more positive for science than mathematics
More positive attitudes for males, but more favorable perceptions of learning environment for females
Aldridge et al. (2009)
South Africa English 1,077 grade 4-7 students NA Pre-service teachers undertaking a distance- education program used environment assessments to improve teaching practices.
Kim et al. (2000) Korea Korean 543 grade 8 science students in 12 schools
Attitudes Korean translationSex differences in WIHIC scores
Wahyudi and Treagust (2004)
Indonesian Indonesian 1,400 lower-secondary science students in 16 schools
NA Indonesian translationUrban students perceived greater
cooperation and less teacher support than suburban students.
MacLeod and Fraser (2010)
UAE Arabic 763 college students in 82 classes
NA Arabic translationStudents preferred a more positive
actual environmentAfari et al. (2013) UAE Arabic 352 college students in 33
classes Enjoyment
Academic efficacyArabic translationUse of games promoted a positive
classroom environmentden Brok et al.
(2006)California, USA English 665 middle-school science
students in 11 schools NA Girls perceived the environment
more favorablyMartin-Dunlop and
Fraser (2008)California, USA English 525 female university
science students in 27 classes
Attitude Very large increases in learning environment scores for an innovative course
Ogbuehi and Fraser (2007)
California, USA English 661 middle-school mathematics students
Two attitude scales Used 3 WIHIC & 3 CLES scales Innovative teaching strategies promoted task orientation.
55

56
Taylor and Fraser (2013)
California USA English 745 high-school students Mathematics Anxiety Females were more anxious than males regarding testing of mathematical concepts, but males were more anxious than females regarding the learning of mathematics
Wolf and Fraser (2008)
New York, USA English 1,434 middle-school science students in 71 classes
AttitudesAchievement
Inquiry-based laboratory activities promoted cohesiveness and were differentially effective for males and females.
Pickett and Fraser (2009)
Florida, USA English 573 grade 3–5 students NA Mentoring program for beginning teachers was evaluated in terms of changes in learning environment in teachers' school classrooms.
Allen and Fraser ( 2 0 0 7 )
Florida, USA English Spanish
120 parents and 520 grade 4 and 5 students
AttitudesAchievement
Involved both parents and studentsActual–preferred differences were
larger for parents than students.Robinson and
Fraser (2013)Florida, USA English
Spanish78 parents and 172
kindergarten science students
AchievementAttitudes
Kindergarten levelInvolved parentsSpanish translationRelative to students, parents
perceived a more favorable environment but preferred a less favorable environment.
Helding and Fraser (2013)
Florida, USA EnglishSpanish
924 students in 38 grade 8 and 10 science classes
AttitudesAchievement
Spanish translationStudents of NBC teachers had more
favorable classroom environment perceptions.
Based on Fraser (2012)
56

57
2.5.2 Evaluation of Educational Innovations
Classroom learning environment instruments can be useful when evaluating the
effectiveness of innovative educational programs because they can provide insight
beyond standard achievement goals (Fraser et al., 1987) and can also differentiate
between traditional classrooms and those with innovative programs (Rentoul &
Fraser, 1979; Tisher & Power, 1978). Nix, Fraser, and Ledbetter (2005) evaluated an
innovative science teacher development program based on the Integrated Science
Learning Environment model (ISLE). A comparative student version of the CLES
(CLES-CS) was able to distinguish between different classes and groups. Students
whose science teachers had attended the innovative science teacher development
program had more-positive classroom learning environment perceptions when
compared to classrooms of other teachers in the same schools who had not.
Lightburn and Fraser (2007) evaluated the use of anthropometric activities in terms
of student outcomes and classroom learning environment with a sample of 761
secondary school biology students. Results supported the positive influence of the
activities in terms of student attitudes and the classroom learning environment.
Houston, Fraser, and Ledbetter (2008) investigated whether using science kits was
associated with a more positive learning environment in terms student satisfaction
and cohesiveness with a sample of 588 Grades 3–5 students in Texas. Students were
in one of three treatment groups – textbook only, science kits only, and a
combination of textbook and science kits. Using science kits was associated with a
more positive learning environments; this was also generally supported with
qualitative data.

58
Afari, Aldridge, Fraser, and Khine (2013) explored whether the introduction of
games into college-level mathematics classes in the United Arab Emirates (UAE)
was effective in terms of improving students’ perceptions of the learning
environment and their attitudes towards mathematics. A comparison of pretest and
posttest scores on the WIHIC suggested that students who had been involved in
games had significantly higher Teacher Support and Involvement scores than before
they were exposed to the games.
Using the WIHIC with 1474 middle-school physical science students in New York,
the effectiveness of inquiry-based laboratory activities was evaluated in terms of
classroom learning environment, attitudes, and achievement (Wolf & Fraser, 2008).
The WIHIC was used to monitor the success of a mentoring program for beginning
elementary-school teachers and their 573 school students in Florida in terms of
changes in their classroom learning environment (Pickett & Fraser, 2009). Helding
and Fraser (2013) used the WIHIC with 927 Grade 8 and 10 students to evaluate the
effectiveness of National Board Certified Teachers in South Florida in terms of their
students’ perceptions of the learning environment. In Singapore, Khoo and Fraser
(2008) used the WIHIC to evaluate computer application courses for 250 adults in
terms of the classroom environment as perceived by students. Maor and Fraser
(2005) developed the Constructivist Multimedia Learning Environment Survey to
evaluate computer-assisted learning among 221 Grade 11 and 12 students. Teh and
Fraser (1995) used the Geography Classroom Environment Inventory with 671 high-
school geography students to evaluate computer-assisted learning in terms of Gender
Equity, Investigation, Innovation, and Resource Adequacy.

59
Three recent studies in the US employed learning environment criteria in evaluation
studies with samples of 367 grade 8 science students from two US states (Long &
Fraser, 2015), 1097 grade 7 and 8 science students in New York (Cohn & Fraser, in
press) and 322 grade 8–10 students in the USA (Oser & Fraser, 2015). When Long
and Fraser evaluated the effectiveness of two alternative middle-school science
curriculum sequences – namely, a general science model and a topic-specific model
(i.e., physics, chemistry, etc.) – they reported that science was enjoyed more by
students following the topic-specific sequence. Also, the general curriculum model
was more effective for Hispanic students in terms of task orientation, whereas the
two alternative sequences were equally effective for Caucasian students. When Cohn
and Fraser compared users and non-users of student response systems, large
differences ranging from 1.17 to 2.45 standard deviations in favor of users emerged
for various learning environment, attitude, and achievement scales. When Oser and
Fraser investigated the effectiveness of virtual laboratories in genetics, they reported
no significant differences between instructional groups in terms of learning
environment and student outcomes.
2.5.3 Teachers’ Attempts to Improve Classroom and School Environments
Action research is undertaken by teachers in order to better understand and improve
their classrooms (Lewin, 1946). Teacher–researchers can assess the current
classroom learning environment, develop and implement strategies for the purpose of
improving the environment, and re-assess the learning environment. In South Africa,
Aldridge, Fraser, and Sebela (2004) used the CLES to compare students’ preferred
learning environment with their perceived environment. Using this feedback, two
teachers designed teaching strategies whose implementation was able to improve the

60
level of one of the CLES dimensions in each of their classrooms. Using the WIHIC,
Aldridge, Fraser, and Ntuli (2009) also used feedback from learners in South Africa.
In-service teachers taking a distance-learning program used feedback to improve
their classroom environments. Each of the 31 teachers achieved a varying degree of
success.
Using the Inventory of Classroom Environments (ICE), based on the WIHIC,
Sinclair and Fraser (2002) used student feedback on perceived and preferred
classroom environment in an urban North Texas school. Teachers’ participation in
action research was evaluated in terms of improvement in classroom environment.
Aldridge, Fraser, Bell and Dorman (2012) developed the Constructivist-Oriented
Learning Environment Survey (COLES) to investigate students’ perceptions of
aspects of the learning environment that could be used by teachers to help them to
reflect on what is happening in their classroom as viewed by their students. Feedback
was provided to teachers in the form of a circular profile (designed and generated for
the purpose of the study) that provided a comparison of scale means for actual and
preferred responses. (See Figure 2.2 for an example of a circular profile.) Student
feedback from the COLES led to changes by teachers that resulted in improvements
in their classroom learning environments as perceived by the students.

61
Figure 2.2 Example of Mean Actual and Preferred COLES Scores for Students’ Perceptions of the Learning Environment (Aldridge et al., 2012)
2.5.4 Differences between Students’ and Teachers’ Perceptions of Learning Environment
An investigation of differences between students and their teachers in their
perceptions of the same classroom learning environment was reported by Fisher and
Fraser (1983) using the ICEQ. Students tended to prefer a more positive environment
in terms of the scales measured by the ICEQ than they perceived as being present. In
addition, teachers tended to perceive a more positive environment than their students
in the same classroom.
Secondary-school students were asked about their perceptions of the behavior of
their mathematics and science teachers and the behavior of their best teachers

62
(Wubbels, 1993). Similarly, teachers were asked about their perceptions of their own
behavior and the behavior that they would like to display. On average, teachers did
not meet their own ideal and they also differed from the students’ perceptions of the
best teacher. Using the QTI, Brekelmans, Mainhard, den Brok, and Wubbels (2011)
asked teachers of various subjects about their self-perceptions of teacher Control and
Affiliation. Similarly, students aged 12 to 18 years were asked about their
perceptions of teacher Control and Affiliation. Teachers with a high level of
interpersonal competence tended to underestimate their Control and Affiliation,
while teachers with a lower level of interpersonal competence tended to overestimate
their Control and, especially, Affiliation when compared to their students’
perceptions.
2.5.5 Combining Quantitative and Qualitative Methods
Fraser and Tobin have extolled the value of thinking beyond quantitative or
qualitative methods and embracing quantitative and qualitative methods (Fraser &
Tobin, 1991; Tobin & Fraser, 1998). The inclusion of interpretive data is grounded in
the belief “that people know themselves best and can describe, interpret and talk
about their own environment” (Anderson & Arsenault, 1998, p. 134).
In Taiwan and Australia, a combination of quantitative and qualitative methods was
used to gain understanding of the classroom environments in each country (Aldridge
et al., 1999). Quantitative data were gathered through the use of the WIHIC, while
qualitative data were gathered through observations and interviews. Even though
students in Australia had more favorable perceptions of the classroom environment,
students in Taiwan had more positive attitude toward their science class.

63
Working in Coastal Australia, a team of six researchers investigated two grade 10
science classes over a 10-week period of collecting quantitative and qualitative data
(Tobin, Kahle, & Fraser, 1990). The ICEQ and CES were used to collect quantitative
data about the students’ perceptions of their environment. Other forms of quantitative
data included student–teacher interactions, time on task, and documenting social
behaviors. Qualitative data included interviews with students and teachers and was
found to be consistent with the interpretation of the quantitative data.
2.5.6 School Psychology
Burden and Fraser (1993) investigated the use of the ICEQ as part of British school
counselors’ assessment tools. The data supported a shift in counselors’ focus on
academic achievement and other traditional school outcomes to a more holistic
approach that also includes the learning environment.
Sink and Spencer (2005) recommend that upper-elementary counselors use a
shortened form of the MCI (MCI-SF) to evaluate the efficacy of their programs in
terms of improved classroom environment. They found the MCI-SF to be a sound
and easy-to-use measurement tool for determining whether counselors’ classroom
work is fostering a positive learning environment.
2.5.7 Links between Educational Environments
Classroom environments are not isolated, but form part of an ecosystem that consists
of the school, parents, and cultural background. For a sample of 37 elementary
schools in Maryland, Koth, Bradshaw, and Leaf (2008) found that school-level
64
factors had a smaller influence on students’ perceptions of the school environment
than did student-level and classroom-level factors. Similarly, Aldridge, Fraser, and
Laugksch (2011) reported that, overall, the school environment is not a strong
influence on what happens in the classroom based on a sample of secondary schools
in South Africa.
In the USA, Fraser and Kahle (2007) used secondary analysis of a large database
from a Statewide Systemic Initiative (SSI) to examine the effects of multiple
environments on student outcomes. A sample of almost 7000 middle-school science
and mathematics students in 392 classes in 200 schools who had participated in the
SSI responded to a questionnaire assessing classroom, home, and peer environments
as well as student attitudes. All three environments accounted for statistically
significant amounts of unique variance in student attitudes.
2.5.8 Cross-National Studies
In a cross-national study in Taiwan and Australia, Aldridge and Fraser (2000) used
the WIHIC and reported that, while the quantitative data made an important
contribution, qualitative data gave meaning to the comparison. Students from
Taiwan and Australia responded to the questions that were meaningful based on their
own schema which were influenced by social and cultural factors. Aldridge, Fraser,
Taylor, and Chen (2000) also found that qualitative data were helpful in interpreting
the quantitative data from the CLES. While some scales (Critical Voice and Student
Negotiation) had lower scores in Taiwan and thus suggested a less favorable
environment in a Western sense, the scores also reflect the value placed on these
constructs in each country.

65
As with the Taiwan/Australia studies, a cross-national study in Australia and
Indonesia (Fraser, Aldridge, & Adolphe, 2010) also revealed cultural differences. For
some scales (Involvement and Investigation), Indonesian students perceived their
learning environments significantly more positively than did Australian students.
However, for other scales (Task Orientation and Equity), Australian students had
significantly more positive perceptions of their classroom environments.
2.5.9 Transitions between Different Levels of Schooling
When students move from elementary school to junior high school, the classroom
environment can change significantly (Feldlaufer, Midgley & Eccles, 1988). In a
longitudinal study of 1040 students from 47 feeder primary and 16 linked secondary
schools in Tasmania, the MCI and QTI were used to identify changes in students’
perception of the learning environment. It was found the classroom climate was
perceived more favorably in secondary schools than in primary schools, whereas the
quality of student–teacher interactions was perceived more favorably in primary
schools than in secondary schools (Ferguson & Fraser, 1998). This study identified
both positive and negative changes in learning environment perceptions during the
transition from primary to secondary school, but these changes varied with student
gender and the size of the primary school.
2.5.10 Typologies Classroom Environments
Moos (1978) assessed nine dimensions of the social environments among 200 junior-
high and high-school classrooms using the CES. Scores on these nine scales were
analyzed to yield five distinct orientations of classes: Control oriented, Innovation
66
oriented, Affiliation (structured and unstructured), Task (structured and
unstructured), and Competition (structured and unstructured, and Student affiliation).
Each cluster showed differences in student and teacher satisfaction.
In the Netherlands and the USA, Brekelmans, Levy, and Rodriguez (1993) used the
QTI to identify eight interpersonal clusters: Directive, Authoritative, Tolerant–
Authoritative, Tolerant, Uncertain–Tolerant, Uncertain–Aggressive, Repressive, and
Drudging. Also using the QTI, Rickards, den Brok, and Fisher (2005), found the
same eight clusters for an Australian sample. However, several profiles were found
to be less common in the Australian context, while two new ones (Flexible and
Cooperative–Supportive) were found in the Australian context.
Applying cluster analysis to data from the Technology-Rich Outcomes-Focused
Learning Environment Inventory (TROFLEI) with an Australian sample of 4146
students, a classroom typology of five groups of classes was identified (Dorman,
Aldridge, & Fraser, 2006). These five groups were identified as safe and
conservative, non-technological teacher-centered, contested technological,
exemplary, and contested non-technological.
Because my study investigated students’ attitudes toward science and their
understanding of the nature of science as outcomes associated with students’
perceptions of the classroom learning environment, the following sections review
literature related to attitudes to science (Section 2.6) and nature of science (Section
2.7).

67
2.6 Assessment of Attitudes toward Science
Because students’ attitudes are an important factor in determining student success
(Bennett, 2001), the study of students’ attitudes towards studying science have
received much attention in the science education research community for over 40
years (Tytler & Osborne, 2012). Although students are still interested in science,
typically, there is declining interest in school science and a disinterest in science
careers (Blalock et al., 2008).
According to Gardner (1975, 1995), there are two broad categories of ‘attitude’:
attitudes toward science and scientific attitudes. In some sense, attitudes towards
science involve how individuals feel about science. These attitudes are variables such
as relevance, value, and enjoyment. Scientific attitudes refer to qualities that an
individual has that are generally considered desirable in a good scientist. These
attitudes are variables such as empiricism, skepticism, and determinism. A further
distinction involves identifying an object to have feelings about (attitudes toward
science) as opposed to a way of thinking (scientific attitude).
2.6.1 Attitudes toward Science
A significant hurdle that must be overcome is the meaning of ‘attitudes toward
science’ as part of the affective domain. Klopfer (1976) delineated “the phenomena
toward which some affective behavior by the student is sought or hoped for in
science education” (p. 301). These were grouped into four divisions – events in the
natural world, activities, science, and inquiry. As students pass through each of the
divisions, more formal structured attention is required by the student.

68
The problem of meaning is further compounded by the understanding that attitude
toward science is a multifaceted concept (Tytler & Osborne, 2012) that includes
overlapping concepts of attitudes towards science and scientists; attitudes towards
school science; enjoyment of science learning; interest in science and science-related
activities; and interest in pursuing a career in science. Of particular interest in my
study were attitudes towards science and scientists in terms of the Social
Implications of Science and Normality of Scientists. Just as there is a variety of
instruments to study the learning environment, there are several questionnaires
available to study attitudes towards science; some of these instruments are reviewed
below.
2.6.2 Attitudes Towards Science Inventory (ATSI)
The ATSI was developed to assess attitudes toward science (Gogolin & Swartz,
1992) by modifying the Mathematics Attitude Inventory that was developed by
Sandman (1973) to assess attitudes towards mathematics. The ATSI is a 48-item
Likert-type instrument of six scales with eight items per scales: perceptions of the
science teacher, anxiety toward science, value of science in society, self-concept in
science, enjoyment of science, and motivation science. Content validity was reported
for the mathematics version (Sandman, 1973) and construct validity was reported by
Gogolin and Swartz (1992) and Weinburgh (1994).
In a study examining teachers’ feelings of preparedness to teach about ocean literacy
and their attitudes toward ocean science, Eidietis and Jewkes (2011) modified the
ATSI by changing the word ‘science’ to ‘ocean science’. Findings indicated that
69
feelings of preparedness and attitude toward ocean science predicted the frequency of
teaching about ocean literacy.
2.6.3 Upper Secondary Attitudes Questionnaire
The Upper Secondary Attitudes Questionnaire was developed for investigating the
affective components of science teaching goals of the 1980s. During this time, the
United States was one of 24 nations participating in the International Association for
the Evaluation of Educational Achievement (IEA) Second International Science
Study (SISS) project (Menis, 1989). This 28-item Likert-type questionnaire has three
levels of agreement: agree, disagree, and uncertain. The 28 items are distributed
unevenly across four scales with five to ten items per scale – attitudes toward science
(five items), importance of science (ten items), careers in science (six items), and
science in school (seven items). Face and content validity were claimed based on an
evaluation of the questionnaires by representatives of various nations. The reliability
of the questionnaire (KR-20) was reported as being 0.82.
When using three subscales of this instrument (importance of science, science as a
career, and science in school) in Northern Ireland, Francis and Greer (1999) found
that gender, age, and religion were related to attitudes toward science. Fifth-form
girls and students in Catholic schools had less positive attitudes toward school
science and science as a career than did boys, third formers, and students in
Protestant schools.
In New Zealand, the ATSI was used with high-achieving Year 13 students from rural
and low-decile (in terms of social economic status) schools who were participating in

70
the Otago University Advanced School Sciences Academy (OUASSA) project (K.
W. Lai, 2013). Students were administered the questionnaire while they resided at
the university for five days in January and five days in July. Composite scores
indicated that students had positive attitudes toward science.
2.6.4 Test of Science Related Attitudes (TOSRA)
In the 1970s, using the work of Klopfer (1971), Fraser (1977) developed five attitude
scales for science teaching: Social Implications of Science; Attitude Toward Inquiry;
Adoption of Scientific Attitudes; Enjoyment of Science Lessons; and Interest in
Science Outside Lessons. The Social Implications of Science scale is a modified
version of the scale developed by Ormerod (1971). The second scale, Attitude
Toward Inquiry, is based on a subscale of Meyer’s (1969) A Test of Interests. The
third scale, Adoption of Scientific Attitudes, is a modified version of the Tests of
Perceptions of Scientists and Self, developed by White and Mackay (1976). The final
two scales (Enjoyment of Science Lessons, Interest in Science Outside Lessons) are
adapted from the Schools Council Project for Evaluation of Science Teaching
Methods (Fraser, 1977).
The instrument was improved and extended to form the Test of Science Related
Attitudes (Fraser, 1978). The addition of the Normality of Scientists and Career
Interest in Science took the number of scales from five to seven. Additional changes
to the original five scales included improvement in uniformity of administration
directions, response format, and number of items per scale.

71
The TOSRA is designed to measure seven distinct science-related attitudes among
secondary school students. There are 70 items in the seven scales of the TOSRA:
Social Implications for Science, Normality of Scientists, Attitude to Scientific
Inquiry, Adoption of Scientific Attitudes, Enjoyment of Science Lessons, Leisure
Interest in Science, and Career Interest in science (Fraser, 1981). It was developed to
be used with secondary-school science students (Dalgety, Coll, & Jones, 2003). The
TOSRA has been field tested and validated in Australia (Fraser, 1981), the United
States (Khalili, 1987; Welch, 2010), Korea (Fraser & Lee, 2009; H. B. Kim et al.,
2000), Singapore (Wong & Fraser, 1996) and Indonesia (Fraser, Aldridge, &
Adolphe, 2010; Schibeci & Fraser, 1987). In addition, an eight-item scale based on
the TOSRA was used to assess student outcomes in terms of enjoyment, interest, and
how much they look forward to science classes (Aldridge et al., 2000).
Quek, Wong, and Fraser (2005) modified the TOSRA to form the Questionnaire on
Chemistry Related Attitudes (QOCRA) and used it with gifted and non-gifted
students in Singapore. Three of the scales – Attitude to Scientific Inquiry, Adoption
of Scientific Attitudes, and Enjoyment of Science Lessons – were renamed as
Attitude to Scientific Inquiry in Chemistry, Adoption of Scientific Attitudes in
Chemistry, and Enjoyment of Chemistry Lessons.
The TOSRA has also been modified to assess students’ attitudes about mathematics
(Afari et al., 2013; Ogbuehi & Fraser, 2007; Spinner & Fraser, 2005) to create the
Test of Mathematics-Related Attitudes (TOMRA). Walker (2006) modified the
TOSRA to measure student attitudes to geography using four scales – leisure interest
in geography, enjoyment of geographic education, career interest in geography, and
72
interest in place. This instrument was named the Test of Geography Related
Attitudes (ToGRA). Richardson and Brouillette (2013) used the ToGRA to
investigate the effect of implementing music history workshops on attitudes and
student understanding of geographic concepts.
The Test of Spanish-Related Attitudes (TOSRA-L1) (Adamski, Fraser, & Peiro,
2013) has modified versions of two of the seven scales of the TOSRA (Adoption of
Scientific Attitudes and Enjoyment of Science Lessons) that are renamed Cultural
Attitudes and Enjoyment of Spanish Lessons, respectively. The TOSRA-L1
incorporates rewording of the TOSRA to focus on attitudes toward Spanish, and it
was translated into Spanish. The TOSRA was also adapted for use in China to
measure students’ attitudes toward English. The English Classroom Learning
Environment Inventory (ECLEI) is an eight-item scale based on the Enjoyment of
Science scale of the TOSRA (Liu & Fraser, 2013).
2.7 Assessment of Understanding of Nature of Science (NOS)
Although science education literature and organizations state that nature of science is
“a major, if not the major, goal in science education” (Alters, 1997, p. 39), it is often
not explicitly taught. According to Noll (1935), teachers of science have believed
that instruction in science leads to developing what he calls the scientific attitude.
(Noll explains that this scientific attitude is based on habits of thinking that we call
understanding of nature of science.) This belief is still prevalent and the nature of
science does not usually appear as a topic in science course syllabi (Martin-Dunlop
& Hodum, 2009).

73
A significant hurdle to overcome when discussing the nature of science is clarifying
the meaning of ‘nature of science’ and specifically what it means to different
disciplines. In some cases, different scientists (i.e., biologist, chemist, and physicist)
could view statements differently. In addition, there can be differences between
scientists, science educators, and philosophers of science (Doran et al., 1974). Based
on the work of Lederman (1983), Giddings (1982), Cleminson (1990), Aikenhead
and Ryan (1992), and the American Association for the Advancement of Science
(1993), Alters (1997) identified 39 tenets of NOS in the science education literature,
including: characteristics that have reached consensus (Giddings, 1982), science is
observation oriented (Cleminson, 1990), science is a human endeavor (Aikenhead &
Ryan, 1992), and science is dependent on culture (AAAS, 1993).
Of particular interest in my study was students’ understanding of nature of science in
terms of the Tentative Nature of Science and the Scientific Method. Just as there is a
variety of instruments for studying the learning environment and attitudes towards
science, there are also several available questionnaires for assessing students’
understanding of nature of science (NOS). An instrument for assessing students’
understanding of NOS should have four characteristics (using Noll’s interpretation of
scientific attitudes):
1. Preparation based upon specification of the particular attitude to be
assessed.
2. Use of several items to assess each attitude.
3. Provision for the respondent to indicate the extent of his acceptance or
rejection of an attitude statement.

74
4. Concern with intellectual and emotional scientific attitudes (Moore &
Sutman, 1970).
2.7.1 Understanding Nature of Science (NOS)
The Test on Understanding Science (TOUS) was developed in 1961 by generating a
pool of about 200 multiple-choice items. These were revised and reduced to 120
items that were distributed at several institutions to consultants whose input
contributed to more revisions. The TOUS was then administered to a group of 900
high-school students and two smaller groups of high-school students; after each
administration, the instrument was further edited into a 60-item instrument with four
alternatives per item.
The instrument measures three major areas: understanding about the scientific
enterprise, understanding about scientists, and understanding about the methods and
aims of science. All items have four choices including a correct response. A sample
item in the methods and aims area is:
Which one of the following statements best describes the most important way that scientists contribute to our society?A. They provide knowledge about nature. (correct response)B. They make improved products for better living.C. They provide skilled services or advice to others.D. They show us what we should strive for.
The TOUS was used to evaluate the effectiveness of the History of Science Cases for
High School instructional method (Cooley & Klopfer, 1963). The case studies were
to be used as units within existing high-school courses (Klopfer & Cooley, 1963).
Using the TOUS, Mackay (1971) evaluated changes in understanding of NOS of

75
students between grades 7 to 10 and found a number of deficiencies. However,
Schmidt (1967) notes that working scientists in Iowa scored more highly than
science teachers and students, but their mean score was still almost ten points below
the maximum, suggesting that a respectable score on the TOUS is less than was
previously thought.
Like the TOUS, the Views on Science-Technology-Society (VOSTS) questionnaire
is also a multiple-choice instrument. The authors consider that it is an inventory of
students’ viewpoints about science. It consists of a pool of 114 items (Aikenhead,
Ryan, & Fleming, 1989) which were developed to avoid the assumption that the
researcher and student would interpret items in the same way (Aikenhead, 1988).
The items were developed over a six-year period through a five-step process with
upper-secondary students in Canada (Aikenhead & Ryan, 1992). The steps started
with students responding to items using a three-point Likert scale (agree, disagree,
cannot tell) and writing a paragraph justifying their choice; then the evaluator
analyzed student responses to find common student positions and, in the third step,
another group of students responded to revised statements by writing a paragraph,
choosing one of the student position statements, and participating in an interview
with the evaluator, resulting in another revision. In the fourth step, another group of
students went through the revised VOSTS, talking about the choices that they made;
when a final sample of students responded to the VOSTS, items with no response
and uninteresting feedback were eliminated.
Two instruments used in my study were the Scientific Attitude Inventory: Revision
(SAI-II) and the Views on Science and Education Questionnaire (VOSE). The
76
original Scientific Attitude Inventory (SAI) and the VOSE were developed to
investigate understanding of nature of science with different students at different
levels of education. The SAI was developed in response to a need for a single
instrument to assess understanding of nature of science at the high-school level
(Moore & Sutman, 1970). The VOSE was developed to create in-depth profiles
about the views of college students regarding the nature of science and science
instruction using a valid, meaningful, and practical instrument (S. Chen, 2006b). The
SAI-II and VOSE are discussed further below in Sections 2.7.2 and 2.7.3.
2.7.2 Scientific Attitude Inventory–Revision (SAI-II)
The SAI contains 12 position statements, six positive and six negative. The
statements are also categorized as intellectual or emotional attitudes, again with six
statements for each. The six position statements are Tentative Nature of Science,
Empirical Basis of Science, Scientific Method, Science as an Idea-Generating
Activity, Necessity for Public Support of Science, and Personal Attributes Necessary
for a Career in Science. The SAI-II is a revised version of the original SAI in
response to criticism about “…vocabulary, item difficulty, and format…” (Moore &
Foy, 1997, p. 329). The revision focused on three goals: eliminating gender-biased
references; eliminating words that could be too difficult; and shortening the
instrument. In the process, the original 12 position statements were maintained and
no new ones were added.
There are 40 five-point Likert-type attitude statements in the six position statements
of the SAI-II. While the instrument is called the Scientific Attitude Inventory II, the
statements of the inventory are consistent with Lederman’s conception of NOS:

77
Although the “nature of science” has been defined in numerous ways, it most commonly refers to the values and assumptions inherent to the development of scientific knowledge For example, an individual’s beliefs concerning whether or not scientific knowledge is amoral, tentative, empirically based, a product of human creativity, or parsimonious reflect that individual’s conception of the nature of science. (Lederman & Zeidler, 1987, p. 721)
The validity claimed for the SAI-II is based on content validation of the SAI, which
involved selecting items on the basis of data obtained from high-school students and
a panel of judges that “consisted of 4 science educators, 4 practicing scientists, and 2
liberal arts science professors” (Moore & Foy, 1997, p. 328). Items selected received
the greatest support from the panel of judges and were not unanimously endorsed or
rejected by the students (Moore & Sutman, 1970). Construct validity of the SAI-II
was also claimed based on the demonstrated validity of the SAI in the original field
test. Psychometric validity is often not reported for nature of science instruments
because researchers might view items as only being open to one interpretation and
therefore do not requiring validation (Tytler & Osborne, 2012). This position is
supported by Nadelson and Viskupic (2010) who assert that some groups of
respondents might interpret items in the same way as the researcher.
For a sample of 557 Grade 6, 9, and 12 rural/suburban students, Moore and Foy
(1997) reported that the SAI-II had a Cronbach alpha coefficient of 0.781 for the
whole instrument, but they provided no factor analysis results to support the
instrument’s scale structure. However, the SAI-II was able to distinguish between the
responses of the upper 27% and lower 27% of respondents on the instrument’s total
score.

78
Demirbaş and Yağbasan (2006) used a Turkish translation of the SAI-II with a
sample of 300 middle-school students and reported a Cronbach alpha coefficient of
0.76. When used in a study with a sample of 94 Grade 7 students, a Thai version of
the SAI-II was found to have an alpha coefficient of 0.81 (Cojorn, Koocharoenpisal,
Haemaprasith, & Siripankaew, 2013). In New Mexico, a modified SAI-II was used
with a sample of 95 middle-school students, 88% of whom self-identified as
Hispanic (Sorge, Newsom, & Hagerty, 2000), and was found to have an alpha
coefficient of 0.734.
In the USA, the SAI-II was found to have an alpha coefficient of 0.78 when used in a
study with a sample of 117 Grade 11 students (Liang, 2002). In the Boston Public
Schools, a modified version of the SAI-II was used over a two-year period with
secondary science students (Barnett et al., 2006) and found to have scale reliabilities
ranging from 0.67 to 0.85.
At the post-secondary level in the USA, when Nadelson and Viskupic (2010) used
the SAI-II with a sample of 61 lower- and upper-division geoscience students, they
reported a Cronbach alpha coefficient of 0.83. In another study with 89 preservice
teachers from two universities (Nadelson & Sinatra, 2010), an alpha coefficient of
0.79 was reported.
Demirbaş (2009) also found an alpha coefficient of 0.72 when the SAI-II was piloted
with a sample of 100 Turkish science teachers. Another Turkish study with
preservice elementary teachers (Cavas, Ozdem, Cavas, Cakiroglu, & Ertepinar,
2013) reported that the SAI-II had an alpha reliability coefficient of 0.72. A version

79
of the SAI-II modified for the Indian context was used in a study of 300 preservice
teachers from four teacher training colleges and was found to have an alpha
reliability of 0.927 (Lahiri, 2011).
It is worth noting that in all but one (Barnett et al., 2006) of the above ten studies, the
Cronbach alpha coefficient is reported for the total score and not for individual
scales. In addition, factor structure was not reported for any of these studies.
Therefore, my study is distinctive because it provided evidence for the factorial
validity of NOS scales, as well as for the reliability of each individual NOS scale.
2.7.3 Views on Science and Education Questionnaire (VOSE)
The VOSE was developed in response to a need for an instrument that addressed the
difficulty in administering NOS instruments to large samples. After the late 1980s,
NOS studies typically used a more qualitative approach. These instruments were
open-ended, resulting in two particular types if difficulties – participants finding it
challenging to completely and accurately articulate their NOS beliefs; and
researchers spending considerable time in obtaining the intended information from
participants (S. Chen, 2006a). The VOSE is based on the Views on Science-
Technology-Society (VOSTS) developed in Canada over a six-year period
(Aikenhead & Ryan, 1992). However, the VOSTS was developed in response to the
identification of an erroneous assumption on the part of researchers – that students
and researchers perceive the same meaning (Aikenhead, 1988). The researchers
developed a pool of 114 items “that capture students’ reasoned viewpoints on STS
(Science-Technology-Society) topics, and does so with greater clarity than paragraph
80
responses, and with much greater clarity than Likert-type responses” (Aikenhead &
Ryan, 1992, p. 488).
The VOSE contains 15 questions followed by several items representing various
philosophical positions, totaling 85 statements (S. Chen, 2006b). There are 10
questions addressing seven aspects of NOS and five questions covering the teaching
attitudes corresponding to five of the NOS aspects. The seven aspects are:
Tentativeness of Scientific Knowledge; Nature of Observation; Scientific Methods;
Hypotheses, Laws, and Theories; Imagination; Validation of Scientific Knowledge;
and Objectivity and Subjectivity in Science. The five teaching attitudes correspond to
the five nature of science topics of Tentativeness of Scientific Knowledge; Nature of
Observation; Scientific Methods; Hypotheses, Laws, and Theories; and Objectivity
and Subjectivity in Science.
The 85 five-point Likert-type statements align with Lederman’s conception of nature
of science (Lederman & Zeidler, 1987). Although the VOSE was designed for
college students, 10th to 12th grade students could also find it appropriate because it
uses language similar to the VOSTS, which was designed for high-school students
(S. Chen, 2006b).
Content validity is claimed for the VOSE based on reviews by two panels of experts,
who also examined the philosophical meaning of each item. In addition, seven
student interviews provided information about content clarity and revealed that, for
83 of the 85 items, the interpretation was 90% similar for respondent and researcher.

81
Finally, a final test, a retest, interviews, and data analysis established validity and
reliability (S. Chen, 2006a).
Based on the ideas of Aikenhead and Ryan (1992) and Rubba, Harkness, and
Bradford (1996) that conventional concepts of validity and reliability cannot apply to
empirically-developed instruments, Chen (2006a) focused on the quality and
meaningfulness of the items rather than pursuing high internal consistency. The
reliability of each scale was expected to be within a range of reasonable values, but
was not a main criterion for item selection. Cronbach’s alpha was used to identify
items to be discarded during the pilot test.
The VOSE was administered to 302 junior and senior students majoring in biology,
life science, chemistry, physics, foreign languages and literature, and Chinese
literature at two research universities in Taiwan. Twenty-four participants completed
the questionnaire again within 1 to 3 months for test-retest reliability. In addition,
these participants were interviewed following the retest. The test–retest coefficient of
0.82 is satisfactory considering the small sample size (n=24) and the relatively long
duration between test and retest (1–3 months). The Cronbach alpha coefficient for
the different scales ranged from 0.34 to 0.80.
The VOSE was administered to 17 secondary science teachers in six public schools
in a rural school district in the United States as part of the evaluation of the
effectiveness of a professional development activity (Burton, 2013). While reliability
and validity were not reported, a statistically significant difference between the
pretest and posttest responses was reported for items representing Scientific Methods,

82
t(1,16) = 6.67, p < 0.001, Theories and Laws, t(1,16) = 5.00, p < 0.001, and
Subjectivity and Objectivity, t(1,16) = 5.15, p < 0.001. In addition, scores for the
scales of Tentativeness, Nature of Observations, and Use of Imagination were not
found to change statistically significantly different between pretest to posttest. Items
representing the Validation of Scientific Knowledge had scores of below 2.0 on a 0–
4 scale.
In quantitatively examining the extent to which the understanding levels of NOS and
the quality of argumentation correlate, Lai (2012) used a mixed-method approach
that included the VOSE. Participants were 57 third-year biology majors enrolled in a
second-semester evolution course in Taiwan. Lai reported that, for the Class of 2010
(n = 24), the highest score on the VOSE questionnaire was 178, the lowest score was
133, and the mean score was 155.76 (SD = 11.907). While Cronbach’s alpha
coefficient was not reported, it was used to remove items that detracted from the
reliability. Items 14 and 15 were not included in the calculation of total scores. For
the Class of 2011 (n = 32), the highest score was 169, the lowest score was 140, and
the mean score was 153.78 (SD = 8.031).
In a study with 63 secondary biology students in the Midwest USA, Smith (2010)
examined the use of short stories to improve students’ understanding of nature of
science. The control group used the textbook, while the treatment group read short
stories about scientists (Mendel and Darwin). She used the Views on Science
Questionnaire 1 and 2 (VSQ1 and VSQ2, respectively) to assess students’
understanding of nature of science. VSQ1 consists of a subset of VOSE items, while
VSQ2 comprises VOSE-like questions. Cronbach's alpha coefficients were reported

83
as ranging from 0.266 to 0.875 for VSQ1 items in the initial analysis. Further
statistical analysis using MANCOVA revealed significant differences between the
control and treatment groups for both the combined VSQ1 components (F (4,52) =
3.803, p = 0.009, Wilks’ Lambda = 0.774, partial eta squared= 0.226) and the
combined VSQ2 items (F (3, 54) = 3.398, p = 0.024, Wilks’ Lambda = 0.841, partial
eta squared = 0.159). No significant differences between control or treatment group
existed for the combined non-explicit VSQ1 components (F (3, 54) = 0.867,
p=0.464, Wilks’ Lambda= 0.945, eta squared= 0.046).
With a sample of 700 preservice science teachers in West Bengal India,
Mukhopadhyay (2013) examined the correlation between teaching competence and
understanding of nature of science. Using the correlation of teachers’ competence in
teaching science with each of the other selected variables (nature of science) he
reported that teaching competence in science was significantly correlated with
understanding of nature of science. In addition, a multiple regression model predicted
57.76% of variance in scores of competence in teaching. Stepwise regression
analyses showed that a major percentage of the variance was explained by some of
the nature of science variables; with this result, he reported that teachers’
understanding of nature of science significantly predicted their teaching competence.
Past studies support associations between the classroom learning environment and
various student outcomes. Of particular interest in my study were the outcomes of
student attitudes to science and student understanding of nature of science; therefore
I chose to use a modified version the TOSRA and SAI-II/VOSE in my research.
84
2.8 Chapter Summary
This chapter provided a review of the literature relevant to this study. Section 2.2
reviewed the historical context of learning environments research, beginning with the
work of Lewin (1936a) and Murray (1938), both of whom recognized and identified
the existence of a relationship between a person and his or her environment. In the
1960s and 1970s, work by Moos (1974) and Walberg (Walberg & Anderson, 1968)
led to research specifically on classroom learning environments. Factors that affect
classroom learning environment and educational productivity include demographic
characteristics such as gender race and age; educational characteristics such as
cognitive complexity and interpersonal the maturity; and the individual’s traits,
values, and modes of functioning.
Section 2.3 reviewed numerous instruments that are available to assess the learning
environment, including the Learning Environment Inventory (LEI), the Classroom
Environment Scale (CES), the Individualized Classroom Environment Questionnaire
(ICEQ), the College and University Classroom Environment Inventory (CUCEI), the
My Class Inventory (MCI), the Questionnaire on Teacher Interaction (QTI), the
Science Laboratory Environment Inventory (SLEI), and the Constructivist Learning
Environment Survey (CLES), Technology-Rich Outcomes-Focused Learning
Environment Inventory (TROFLEI), and Constructivist-Oriented Learning
Environment Survey (COLES).
The next section specifically focused on the What Is Happening In this Class?
(WIHIC) instrument because it was used in my study. Reviewed were the

85
psychometric properties of the WIHIC and various studies that have used the WIHIC
internationally. Overall, these studies have shown the WIHIC to be valid, reliable
and useful in a variety of classrooms.
Section 2.5 focused on specific research areas within the field of learning
environments, such as associations between student outcomes and environment;
evaluation of educational innovations; teachers attempts to improve classroom and
school environments; differences between students’ and teachers’ perceptions of the
environment; use of quantitative and qualitative methods; school psychology; links
between educational environments; cross-national studies; transition between
different levels of schooling; and typologies of classroom environments.
Section 2.6 focused on student attitudes toward science and reviewed questionnaires
such as the Attitudes Toward Science Inventory (ATSI), the Upper Secondary
Attitudes Questionnaire, and the Test of Science Related Attitudes (TOSRA). The
TOSRA, specifically, was designed to measure seven distinct science-related
attitudes among secondary school students. It has been adapted for and used in a
variety of situations, has been found to be valid and reliable, and was selected for
inclusion in my study.
Section 2.7 focused on student understanding of nature of science, including
reviewing the Test of Understanding Science (TOUS) and the Views on Science-
Technology-Society (VOSTS). The Scientific Attitude Inventory-Revision (SAI-II)
and the Views on Science and Education (VOSE) were used to assess understanding
86
of Nature of Science (NOS) in my study. For the VOSE and SAI, content and
construct validity have been based on input from experts and students.
The next chapter describes research methodology used in this study. Included is
information about the research objectives, the design of the study, the sample, the
instruments used, and the methods of data collection and analysis.

87
Chapter 3
METHODOLOGY
3.1 Introduction
The previous chapter provided a review of literature relevant to this study; this
chapter describes and justifies the methods used in my research. The chapter includes
descriptions of the development of the questionnaire scales, the sample, and the
procedures for collecting and analyzing the data. This chapter includes the following
sections:
Research Objectives (3.2)
Development of the Questionnaire (3.3)
Sample (3.4)
Data Collection (3.5)
Data Analyses (3.6)
Chapter Summary (3.7).
3.2 Research Objectives
As previously identified, the two main research objectives of this study were:
To validate scales based on the What Is Happening In this Class? (WIHIC),
Test of Science Related Attitudes (TOSRA), and Scientific Attitude
Inventory – Revision/Views on Science and Education (SAI-II/VOSE) with

88
students in a suburban secondary school with urban demographics in mid-
western USA.
Identify characteristics of the science classroom environment that enhance
students’ attitudes to science and understanding of nature of science.
After reviewing literature about various questionnaires available, scales from four
questionnaires were selected to measure students’ perceptions of the classroom
learning environment, attitudes towards science, and understanding of nature of
science. To measure perceptions of the learning environment, four scales from the
What Is Happening In this Class? (WIHIC) were selected. To measure attitudes
towards science, two scales from the Test Of Science Related Attitudes (TOSRA)
were selected. Finally, to measure understanding of nature of science, three scales
were selected from the Scientific Attitude Inventory Revision (SAI-II) and Views on
Science and Education (VOSE).
Based on convenience and practical considerations when administering the scales,
the four learning environment scales, two attitude scales, and three nature of science
scales were assembled into one questionnaire with a single response format. Prior to
using the questionnaire for investigating the second research question in the study,
the questionnaire had to be validated, which addressed my first research question.
After validating the questionnaire, associations between the classroom learning
environment and attitudes and understanding of nature of science were investigated
(my second research question).
89
3.3 Development of the Questionnaire
Instead of using four questionnaires (one each for the classroom learning
environment, attitudes to science, and two for understanding of nature of science) or
creating an entirely new questionnaire, scales from four established instruments were
modified and assembled into one – What Is Happening In this Class? (WIHIC), Test
of Science Related Attitudes (TOSRA), Scientific Attitudes Inventory Revision
(SAI-II), and Views on Science and Education (VOSE). Four scales were chosen
from the WIHIC (learning environment), two scales were chosen from the TOSRA
(attitude to science), and two scales were chosen from the SAI-II and VOSE
(understanding of nature of science).
The modification and combination of scales from four established instruments into
one was designed to reduced students’ reluctance to thoughtfully complete multiple
or long questionnaires. The original frequency response format of the WIHIC was
changed to the same Likert-type response of the TOSRA and SAI-II – Strongly
Agree, Agree, Uncertain, Strongly Disagree, and Disagree. This avoided confusing
students and maintained consistency throughout the questionnaire. In addition, the
same instructions were used for all scales throughout the questionnaire and placed at
the top of every page – “Please select the one choice that best describes your
response.” Another modification was the use of the common stem “In this science
class…” This was placed below each scale label.

90
3.3.1 Learning Environment Scales
The WIHIC was used in this study to assess students’ perceptions of the classroom
learning environment because it combines scales from previous instruments and
includes contemporary dimensions such as constructivism and equity. There are 56
items in the seven original scales of the WIHIC: Student Cohesiveness, Teacher
Support, Involvement, Investigation, Task Orientation, Cooperation, and Equity. Of
the seven scales of the WIHIC, four were chosen as being most salient for my study
– Involvement, Investigation, Cooperation, and Task Orientation. The Involvement
scale measures the extent to which students have attentive interest, participate in
discussions, do additional work and enjoy the class. The Investigation scale measures
the extent to which skills and processes of inquiry and their use in problem solving
and investigation are emphasized. The Cooperation scale measures the extent to
which students cooperate rather than compete with one another on learning tasks.
The Task Orientation scale measures the extent to which it is important to complete
activities planned and to stay on the subject matter.
A review of the literature (see Section 2.4) shows the WIHIC has been found to be
valid and reliable when used with 978 high-school students in Australia (Dorman,
2008); 1404 high-school students in Australia and Canada (Zandvliet & Fraser,
2005); 1161 high-school students in Indonesia and Australia (Fraser, Aldridge, &
Adolphe, 2010); 543 Korean high-school students (H. B. Kim et al., 2000); 1021
high-school students in India (Koul & Fisher, 2005); 250 adults in Singapore (Khoo
& Fraser, 2008); 2310 Singaporean high-school students in geography and
mathematics (Chionh & Fraser, 2009); 113 middle-school students in Taiwan (Yang
et al., 2012); 665 middle-school students in the USA (den Brok et al., 2006); 661

91
students in the USA (Ogbuehi & Fraser, 2007); 520 elementary students in the USA
(Allen & Fraser, 2007); and 525 preservice elementary teachers in the USA (Martin-
Dunlop & Fraser, 2008).
The number of items in, a description of, and a sample item for each of the four
scales used in my study are given in Table 3.1. In the context of the study,
Involvement measured the extent to which students perceived that they shared and
communicated ideas; Investigation measured the extent to which students perceived
that they engaged in problem solving; Cooperation measured the extent to which
students perceived that they worked with others; and Task Orientation measured the
extent to which students perceived that they knew the goals of the class and focused
on them.
Table 3.1 Description of Scales and a Sample Item for Each WIHIC Scale
Scale No of Items Description of Scale Sample Item
Involvement 8 The extent to which students have attentive interest, participate in discussions, do additional work and enjoy the class
I discuss ideas in class.
Investigation 8 The extent to which skills and processes of inquiry and their use in problem solving and investigation are emphasized
I carry out investigations to test my ideas.
Cooperation 8 The extent to which students cooperate rather than compete with one another on learning tasks
I learn from other students in this class.
Task Orientation 8a The extent to which it is important to complete activities planned and to stay on the subject matter
I know the goals for this class.
Based on Dorman (2003)a One item (number 4) was omitted after the data analysis described in Chapter 4.
92
The four learning environment scales in Table 3.1 were selected for my study for
three main reasons. First, the scales have consistently exhibited strong validity and
reliability in the considerable past international research reviewed above. Second, of
the seven WIHIC scales, these four scales were most salient for my specific study
and research questions. Third, the constructs assessed by these four WIHIC scales
are relevant to the standards for science that have been adopted in the US state
(namely, Illinois) where my study was undertaken.
The standards adopted in Illinois are A framework for K–12 science education
(National Research Council, 2012) and the Next Generation Science Standards
(NGSS Lead States, 2013). Table 3.2 provides, for each learning environment scale
in my study, a scale description and a quote from one of the two standards
documents that demonstrates the relevance of each learning environment construct to
the standards. Overall, Table 3.2 helps to justify my choice of learning environment
scales in terms of their consistency with prevailing science standards.
3.3.2 Attitude to Science Scales
Whereas Section 3.3.1 described the scales used to assess the learning environment
in my research, the current section considers the scales that I used for assessing
students’ attitudes to science. Fraser (1978) developed the TOSRA to measure
separate affective aims for science education. In the 1970s, using the work of Klopfer
(1971), Fraser selected five attitude scales for science teaching: Social Implications
of Science; Attitude Toward Inquiry; Adoption of Scientific Attitudes; Enjoyment of
Science Lessons; and Interest in Science Outside Lessons (1977). Two more scales –

93
Normality of Scientists and Career Interest in Science – were added making a total of
70 items in seven scales (Fraser, 1978).
A review of the literature (see Section 2.6.4) shows the TOSRA has been found to be
valid and reliable when used with 543 secondary-school students in Korea (H. B.
Kim et al., 2000); 439 senior high-school students in Korea (Fraser & Lee, 2009);
752 secondary-school students in Indonesia (Schibeci & Fraser, 1987); 1161 Grade 9
and students in Indonesia and Australia (Fraser, Aldridge, & Adolphe, 2010); 1879
high-school students in Taiwan and Australia (Aldridge et al., 2000); 352
mathematics students in the United Arab Emirates (Afari et al., 2013); 497 secondary
students in Singapore (Quek et al., 2005); 1592 secondary-school chemistry students
in Singapore (Wong & Fraser, 1996); 3526 secondary-school students from Pakistan
(Anwer, Iqbal, & Harrison, 2012); 311 middle-school students in the USA (C. H.
Chen & Howard, 2010); 2961 middle school students in Turkey (Hacieminoglu,
Yilmaz-Tuzun, & Ertepinar, 2011); 132 high-school students in the USA (Welch,
2010); and 1434 middle-school students in the USA (Wolf & Fraser, 2008).
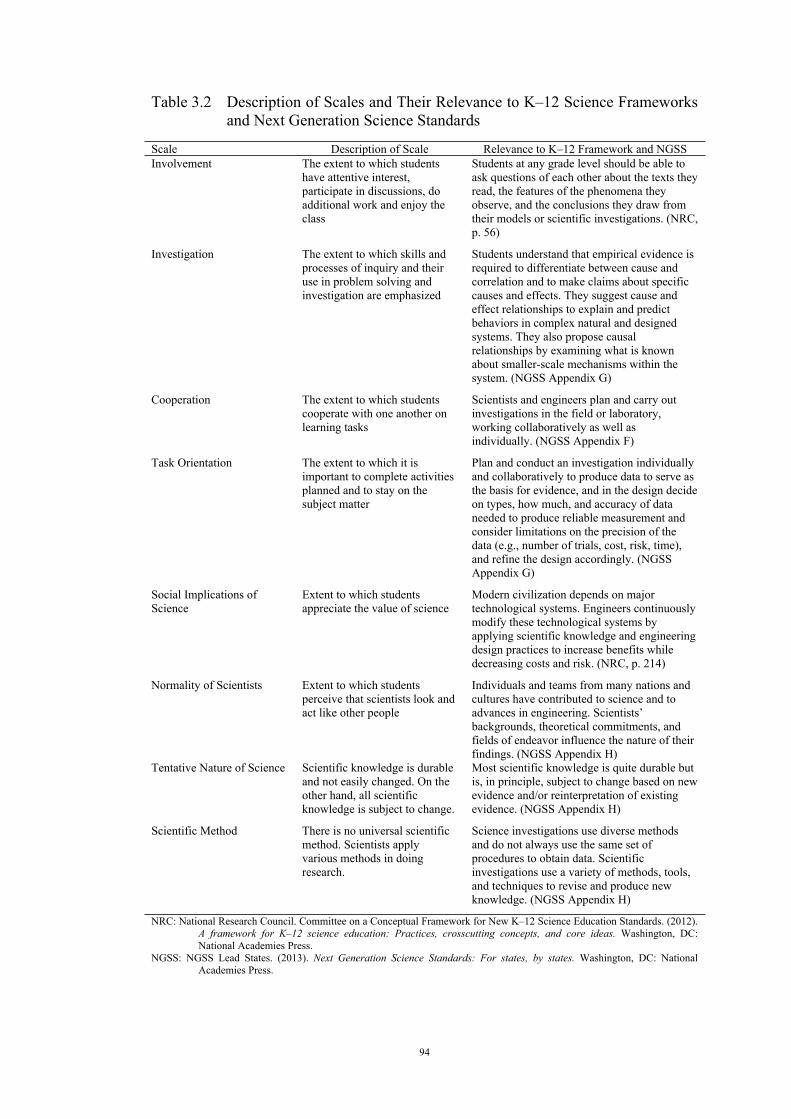
94
Table 3.2 Description of Scales and Their Relevance to K–12 Science Frameworks and Next Generation Science Standards
Scale Description of Scale Relevance to K–12 Framework and NGSSInvolvement The extent to which students
have attentive interest, participate in discussions, do additional work and enjoy the class
Students at any grade level should be able to ask questions of each other about the texts they read, the features of the phenomena they observe, and the conclusions they draw from their models or scientific investigations. (NRC, p. 56)
Investigation The extent to which skills and processes of inquiry and their use in problem solving and investigation are emphasized
Students understand that empirical evidence is required to differentiate between cause and correlation and to make claims about specific causes and effects. They suggest cause and effect relationships to explain and predict behaviors in complex natural and designed systems. They also propose causal relationships by examining what is known about smaller-scale mechanisms within the system. (NGSS Appendix G)
Cooperation The extent to which students cooperate with one another on learning tasks
Scientists and engineers plan and carry out investigations in the field or laboratory, working collaboratively as well as individually. (NGSS Appendix F)
Task Orientation The extent to which it is important to complete activities planned and to stay on the subject matter
Plan and conduct an investigation individually and collaboratively to produce data to serve as the basis for evidence, and in the design decide on types, how much, and accuracy of data needed to produce reliable measurement and consider limitations on the precision of the data (e.g., number of trials, cost, risk, time), and refine the design accordingly. (NGSS Appendix G)
Social Implications of Science
Extent to which students appreciate the value of science
Modern civilization depends on major technological systems. Engineers continuously modify these technological systems by applying scientific knowledge and engineering design practices to increase benefits while decreasing costs and risk. (NRC, p. 214)
Normality of Scientists Extent to which students perceive that scientists look and act like other people
Individuals and teams from many nations and cultures have contributed to science and to advances in engineering. Scientists’ backgrounds, theoretical commitments, and fields of endeavor influence the nature of their findings. (NGSS Appendix H)
Tentative Nature of Science Scientific knowledge is durable and not easily changed. On the other hand, all scientific knowledge is subject to change.
Most scientific knowledge is quite durable but is, in principle, subject to change based on new evidence and/or reinterpretation of existing evidence. (NGSS Appendix H)
Scientific Method There is no universal scientific method. Scientists apply various methods in doing research.
Science investigations use diverse methods and do not always use the same set of procedures to obtain data. Scientific investigations use a variety of methods, tools, and techniques to revise and produce new knowledge. (NGSS Appendix H)
NRC: National Research Council. Committee on a Conceptual Framework for New K–12 Science Education Standards. (2012). A framework for K–12 science education: Practices, crosscutting concepts, and core ideas. Washington, DC: National Academies Press.
NGSS: NGSS Lead States. (2013). Next Generation Science Standards: For states, by states. Washington, DC: National Academies Press.

95
Two scales of the TOSRA were chosen – Social Implications of Science and
Normality of Scientists – consisting of six items each (see Table 3.2). The Social
Implications scale measures one aspect of manifestation of favorable attitudes
towards science, such as the social benefits and problems that accompany scientific
progress. The Normality of Scientists scale measures one aspect of manifestation of
favorable attitudes towards scientists, such as an appreciation that scientists are
normal people rather than eccentrics as is often depicted in the mass media (Mead &
Métraux, 1957).
The number of items in, a description of, and a sample item for each of the two
scales used is given in Table 3.3. In the context of the study, Social Implications of
Science measured the extent to which students appreciated the value of science.
Normality of Scientists measured the extent to which students perceived that
scientists look and act like people students know.
Table 3.3 Description of Scales and a Sample Item for Each Scale of the Modified TOSRA
Scale No of Items Description of Scale Sample Item
Social Implications of Science
6 Extent to which students appreciate the value of science
Science helps to make life better.
Normality of Scientists
6 Extent to which students perceive that scientists look and act like other people.
Scientists like sports as much as other people do.
Based on Fraser (1978)
As with learning environment scales, attitude scales were chosen for the same
reasons: convincing validity evidences from many past international studies; salience
to my study’s research questions; and consistency with the standards for science
education adopted in Illinois. Table 3.2 provides a quote from these standards

96
documents (National Research Council (NRC). Committee on a Conceptual
Framework for New K-12 Science Education Standards, 2012; NGSS Lead States,
2013) in order to demonstrate the consistency of these attitude constructs with the
standards and therefore justify their inclusion in my study.
3.3.2 Understanding Nature of Science Scales
Understanding of nature of science scales in my study was assessed by combining
items from the Scientific Attitude Inventory-Revision (SAI-II) and the Views on
Science and Education (VOSE). The SAI-II was developed by Moore and Sutman
(1970) in response to a need for a single instrument to assess understanding of nature
of science for the high-school level. The VOSE was developed in response to
criticisms regarding the researcher vs. participant interpretation of survey or
questionnaire items and the difficulty of administering and analyzing open-ended
questions to a large number of participants.
The six scales of the SAI-II are Tentative Nature of Science, Empirical Basis of
Science, Scientific Method, Science as an Idea-Generating Activity, Necessity for
Public Support of Science, and Personal Attributes Necessary for a Career in
Science. The SAI-II is a revised version of the original SAI in response to criticism
about gender bias and readability (Moore & Foy, 1997). The inventory has been
identified as the most well-known and frequently-used instrument for measuring
student understanding of nature of science (Munby, 1997; Osborne, Simon, &
Collins, 2003).

97
A review of the literature (see Section 2.7.2) shows that validity claims for the SAI-II
have been based on the original SAI. It has been found to be reliable when used with
557 Grade 6, 9, and 12 rural/suburban students in the USA (Moore & Foy, 1997);
300 middle-school students in Turkey (Demirbaş & Yağbasan, 2006); 100 Turkish
science teachers (Demirbaş, 2009); 1072 Turkish preservice elementary teachers
(Cavas et al., 2013); 94 Grade 7 students in Thailand (Cojorn et al., 2013); 300
preservice teachers in India (Lahiri, 2011); 117 Grade 11 students in the USA (Liang,
2002); 95 middle-school students in the USA (Sorge et al., 2000); 61 lower- and
upper-division geoscience university students in the USA (Nadelson & Viskupic,
2010); and 89 preservice teachers in the USA (Nadelson & Sinatra, 2010). It is
noteworthy that factor structure was not reported in any of the above studies (and
therefore was a priority in my study).
Of the 40 questions in six scales identified by Moore and Sutman (1970) as position
statements, I used 11 questions in two scales. The Tentative Nature of Science scale
measures understanding that the laws and/or theories of science are approximations
of truth and are subject to change. The Scientific Method scale measures the
understanding that, to operate in a scientific manner, one must display such traits as
intellectual honesty, dependence upon objective observation of natural events, and
willingness to alter one’s position on the basis of sufficient evidence.
The VOSE contains 15 questions followed by several items representing various
philosophical positions, totaling 85 statements (S. Chen, 2006b). The seven aspects
of nature of science are: Tentativeness of Scientific Knowledge; Nature of
Observation; Scientific Methods; Hypotheses, Laws, and Theories; Imagination;

98
Validation of Scientific Knowledge; and Objectivity and Subjectivity in Science. In
addition to the seven aspects of NOS, there are five questions covering teaching
attitudes corresponding to five of the NOS aspects: Tentativeness of Scientific
Knowledge; Nature of Observation; Scientific Methods; Hypotheses, Laws, and
Theories; and Objectivity and Subjectivity in Science.
A third scale of the SAI-II and VOSE (Empirical Basis of Science/Objectivity and
Subjectivity in Science) was initially included in my study. But, as reported later in
Chapter 4, this did not meet statistical criteria for retention, namely, that every item
must have a factor loading of at least 0.40 with its own scale and less than 0.40 with
all other scales. This scale measures understanding that observation of natural
phenomena and experimentation is the basis of scientific explanation, science is
limited in that it can only answer questions about natural phenomena, and sometimes
it is not able to do that.
A review of the literature (see Section 2.7.3) revealed that a test–retest reliability
coefficient of 0.82 was reported for the VOSE when administered to 302 junior and
senior students in Taiwan and with a relatively long duration between test and retest
(S. Chen, 2006a). When administered to 17 secondary science teachers in the United
States, there was a statistically significant difference between the pretest and posttest
responses (Burton, 2013). An improvement in understanding of nature of science was
found for 57 biology majors in Taiwan (M. C. Lai, 2012) and 63 secondary biology
students in the Midwest USA (J. A. R. Smith, 2010). A correlation was reported
between understanding of nature of science and teaching competency with 700
preservice science teachers in West Bengal India (Mukhopadhyay, 2013).
99
The Tentativeness of Science scale measures that, although scientific knowledge is
durable and not easily changed, it is also subject to change. The Scientific Method
scale measures the understanding that there is no universal scientific method –
scientists apply various methods in doing research.
These two scales of the SAI-II and VOSE, namely, Tentative Nature of Science and
Scientific Method, were selected because they were the most relevant to my study. In
the context of the study, Tentative Nature of Science measured the extent to which
students understood that scientific knowledge changes, but not easily, and Scientific
Method measured the extent to which students understood that scientific methods
depend on careful observations. The number of items in, a description of, and a
sample item for each of the two scales used are given in Table 3.4.
These two NOS scales that survived the validity analyses reported later in Chapter 4
are Tentative Nature of Science and Scientific Method. Therefore these two scales
are included in Table 3.2 to demonstrate their relevance to the science education
standards adopted in Illinois. That is, the selection of these two NOS scales for my
study can be justified in part in terms of their consistency with the science education
standards.

100
Table 3.4 Description of Scales and a Sample Item for Each Scale of the Modified SAI-II/VOSE
Scale No of Items Description of Scale Sample ItemTentative Nature
of Science3 The laws and/or theories of science
are approximations to truth and are subject to change
Scientific ideas can be changed. (SAI-II)
Tentative Nature of Science
3 Scientific knowledge is durable and not easily changed. On the other hand, all scientific knowledge is subject to change.
Scientific research will face change and old theories will be replaced. (VOSE)
Empirical Basis of Science
3a Observation of natural phenomena and experimentation are the basis of scientific explanation
Some questions cannot be answered by science. (SAI-II)
Objectivity and Subjectivity in Science
3a Scientific knowledge is empirically based. Scientists try to be open-minded and apply mechanisms such as peer review and data triangulation to improve objectivity. On the other hand, personal beliefs, values, intuition, judgment, creativity, opportunity, and psychology all play a role.
Two theories can provide explanations from different viewpoints. (VOSE)
Scientific Method
3 To operate in a scientific manner, one must display such traits as intellectual honesty, dependence upon objective observation of natural events, and willingness to alter one’s position on the basis of sufficient evidence
Scientific questions are answered by observing things. (SAI-II)
Scientific Method
3b There is no universal scientific method. Scientists apply various methods in doing research.
There is no fixed scientific method. (VOSE)
Based on Moore and Foy (1997) and Chen (2006a)a Empirical Basis of Science scale was omitted after data analysis.b One item (number 6) was omitted.
3.3.3 Questionnaire Used in My Study
The questionnaire used in my study initially consisted of nine scales with six or eight
items in each scale. The four classroom learning environment scales each consisted
of eight items, while the two attitude and three nature of science scales each
consisted of six items, making a total of 62 questions. The questionnaire is provided
in Appendix A. The classroom learning environment and attitude scales are taken
directly from the WIHIC and TOSRA, respectively. The nature of science scales are
a combination of SAI-II and VOSE items. The Tentative Nature of Science scale

101
from the SAI-II is combined with the Tentativeness of Scientific Knowledge scale
from the VOSE; the Empirical Basis of Science scale from the SAI-II is combined
with the Nature of Observation scale from the VOSE; and the Scientific Method
scale from the SAI-II is combined with the Scientific Methods scale from the VOSE.
Each nature of science scale has three items from the SAI-II and three from the
VOSE. (However, as reported in Chapter 4, one NOS scale was lost during the factor
analysis.)
After the selection and modification of the desired scales of the WIHIC, TOSRA,
and SAI-II/VOSE, they were combined to create a single questionnaire. So that
students were not discouraged by numerous different questionnaires or an overly
long questionnaire, a single one was formed. To reduce the length and complexity of
the instrument, a single set of instructions was located at the beginning and all
questions were scored using the same five-point Likert scale – Strongly Agree (5),
Agree (4), Uncertain (3), Strongly Disagree (2), and Disagree (1). (The original
WIHIC employs a frequency response scale with alternatives ranging from Almost
Never to Almost Always.)
3.4 Sample
The sample consisted of 246 secondary students in a medium-sized, Midwestern,
suburban secondary school with urban demographics in the USA. All students were
enrolled in a science class in grades 10 to 12. According to the United States
Department of Education (Geverdt & Phan, 2006), the school’s community is
classified as suburban (i.e. a large “territory outside a principal city and inside an
102
urbanized area with population of 250,000 or more”). In addition, the racial and
ethnic characteristics of the school are similar to those in large urban districts –
African-American and Hispanic students representing a larger percentage of the
student population than the White minority (Frankenberg, 2009).
While students were enrolled in a science course, the questionnaire was completed in
either their mathematics class or a high-stakes test preparation class. In no case, did a
student complete the questionnaire in the presence of his or her science teacher. In
addition, students were guaranteed confidentiality and anonymity. Not only were
student responses not to be shared with their science teacher, but questionnaires
results were not returned to the school.
3.5 Data Collection
A pilot study was completed to check the questionnaire’s readability and
administration logistics. A group of 16 students completed a web-based version of
the questionnaire. This small group of students, in their third or fourth year of
secondary science (grades 11 and 12), checked the readability and comprehensibility
of the instructions and items in the questionnaire. The pilot study was also used to
check the logistics of administering the questionnaire – amount of time needed,
instructions for the proctor, etc. All students completed the questionnaire within 15
minutes, including logging on to the computers, accessing the website, and
completing the questionnaire. The selection of 16 students by grade level and school
science experience was designed to minimize differences in age and science
experience.

103
After the pilot administration of the questionnaire, students were interviewed in
groups of three or four to identify any problem areas. It was apparent that the
students understood the wording of the questions and their intent. In addition, two
typographical errors were found and corrected.
In preparing to administer the questionnaire for the main study, it was identified that
access to computers for completion of the survey would be an issue. Therefore, the
questionnaire was printed and administered as a paper-and-pencil/pen version.
Students were allotted 30 minutes to complete the questionnaire. Once completed,
the questionnaires were sorted by the class in which they were administered and
coded for data entry.
3.6 Data Analyses
Quantitative data were entered using Microsoft Excel. Students’ responses were
coded using Strongly Agree=5, Agree=4, Uncertain=3, Strongly Disagree=2, and
Disagree=1. In addition, the class in which the questionnaire was administered and
the student’s science teacher were coded and entered into the spreadsheets. The data
were uploaded to SPSS statistical analysis software for analysis.
3.6.1 Research Question 1
In order to answer the first research question – concerning whether learning
environment scales based on the WIHIC, attitudes scales based on the TOSRA, and
nature of science scales based on the SAI-II and VOSE were valid when used with

104
my sample of secondary students from a Midwestern and suburban secondary school
with urban demographics – factor analysis was applied to the scales. In order to yield
meaningful results, items must all be indicators of some common underlying
construct (Gardner, 1995):
Factor analysis provides the strongest line of evidence to support a claim that a scale is unidimensional [sic]. A finding that all the items have substantial loadings on a single factor can be used to justify adding the item scores together to generate a single scale score. (p. 283)
Factor analysis (J. O. Kim & Mueller, 1978) is a statistical technique used in data
reduction to identify a small number of underlying variables, or factors, that explain
most of the variance observed in a much larger number of manifest variables. Using
a separate factor analysis for the WIHIC, TOSRA and SAI-II/VOSE, I identified
faulty items that could be removed to improve the factor structure and internal
consistency reliability.
To examine the factor structure, and answer the first research question, the data were
subjected to principal axis factor analysis with varimax rotation and Kaiser
normalization separately for the learning environment items, the attitude items, and
the nature of science items. In Chapter 4, it is reported that the analysis identified the
Empirical Basis of Science scale as not meeting the two criteria for retention of any
item – a factor loading of at least 0.4 with its own scale and less than 0.4 with all
other scales – and it was removed.
In addition, the individual items should have a common underlying construct and
therefore have internal consistency. A common measure of internal consistency is

105
Cronbach’s alpha coefficient (Cronbach, 1951), which is high when every item in a
scale shares a common variance with at least some other items in the scale and
avoids clusters within a scale (Cronbach, 1951; Gardner, 1995).
A higher alpha value (i.e., closer to 1) indicates a more reliable scale, with a value of
0.7 being considered acceptable (Nunnally, 1978). Nunnally acknowledges that the
level of reliability is situation dependent and that “in many applied settings a
reliability of 0.80 is not nearly high enough. In basic research, the concern is with the
size of correlations and with the differences in means for different experimental
treatments, for which purposes a reliability of 0.80 for the different measures is
adequate” (Nunnally, 1978, p. 245). However, he notes that “one saves time and
energy by working with instruments that have only modest reliability, for which
purpose reliabilities of 0.70 or higher will suffice” (Nunnally, 1978, p. 245).
Cronbach’s alpha coefficient was used to provide a measure of the internal reliability
of each WIHIC, TOSRA, and SAI-II/VOSE scale used in my study.
3.6.2 Research Question 2
In order to answer the second research question – concerning the characteristics of
the science classroom environment that enhance students’ attitudes to science and
understanding of nature of science – simple correlation and multiple regression
analyses were performed with the individual as the unit of analysis.
Simple correlation analysis (r) was used to identify the bivariate relationship between
two specific variables (a learning environment scale and either an attitude scale or an

106
understanding nature of science scale). The multiple correlation from multiple
regression analysis provided information about the multivariate association between
an attitude or understanding scale and the whole set of four environment scales.
Standardized regression coefficients (β) were used to identify which environment
scales contributed uniquely and significantly to the explanation of the variance in an
attitude or an understanding scale when all the other WIHIC scales were mutually
controlled.
3.7 Chapter Summary
This chapter discussed the methods used in my study for validating a questionnaire
based on the WIHIC, TOSRA, SAI-II/VOSE scales and for investigating
associations between the classroom learning environment and students’ attitudes
towards science and understanding of nature of science.
Section 3.3 described the development of the instrument based on the modification of
four existing instruments – the WIHIC, TOSRA, SAI-II, and VOSE. The selection of
the four scales of the WIHIC – Involvement, Investigation, Cooperation, and Task
Orientation – was based on their relevance to the study. In the context of the study,
Involvement measured the extent to which students perceived that they shared and
communicated ideas; Investigation measured the extent to which students perceived
that they engaged in problem solving; Cooperation measured the extent to which
students perceived that they worked with others; and Task Orientation measured the
extent to which students perceived that they knew the goals of the class and focused
on them. The selection of the two scales of the TOSRA – Social Implications of

107
Science and Normality of Scientists – also was based on their relevance to the study.
In the context of the study, Social Implications of Science measured the extent to
which students appreciated the value of science and Normality of Scientists
measured the extent to which students perceived that scientists look and act like
people they know. The selection of the three NOS scales based on the SAI-II and
VOSE – Tentative Nature of Science, Empirical Basis of Science, and Scientific
Method – similarly was based on their relevance to the study. In the context of the
study, Tentative Nature of Science measured the extent to which students understood
that scientific knowledge changes, but not easily; Scientific Method measured the
extent to which students understood that scientific methods depend on careful
observations; Empirical Basis of Science measured the understanding that
observation of natural phenomena and experimentation is the basis of scientific
explanation and that science is limited in that it can only answer questions about
natural phenomena and sometimes it is not able to do that. (However, the Empirical
Basis of Science scale did not meet statistical criteria for retention as reported later in
Chapter 4.)
Section 3.4 identified the 246 participants in the study as students in a Midwest USA
suburban high school with urban demographics. No student completed the
questionnaire in their science class.
Section 3.5 described how data were collected during a pilot study (whose aim was
to check the readability and logistics of administration of the questionnaire) and in
the main study. Because access to computers became an issue for the main study,
students completed the questionnaire using paper-and-pencil/pen version.
108
Section 3.6 described the methods of statistical analysis for validating the
questionnaire in order to answer the first research question concerning whether
learning environment scales based on the WIHIC, attitudes scales based on the
TOSRA, and nature of science scales based on the SAI-II and VOSE were valid
when used with my sample. Factor analysis was used to check the structure of scales,
whereas the alpha coefficient was used as an index of the internal reliability of each
scale. This section also discussed the use of simple correlation and multiple
regression analyses to answer the second research question concerning the
characteristics of the science classroom environment that enhance students’ attitudes
to science and understanding of nature of science.
Whereas the present chapter (Chapter 3) was devoted to the research methods used in
my study, the next chapter (Chapter 4) reports the analyses and results associated
with my research questions.

109
Chapter 4
DATA ANALYSIS AND RESULTS
4.1 Introduction
The purposes of this research were two-fold: to validate modified versions of the
WIHIC (What Is Happening In this Class?), TOSRA (Test of Science Related
Attitudes), and SAI-II/VOSE (Scientific Attitudes Inventory/Views on Science and
Education) in a medium, Midwestern, suburban secondary school with urban
demographics; and to identify characteristics of the science classroom environment
that enhance students’ attitudes to science and understanding of nature of science.
Data were collected from a sample of 246 secondary school students as described in
Section 3.4. These data were analyzed separately for the 32 WIHIC learning
environment items, the 12 TOSRA attitude items, and the 18 SAI-II/VOSE nature of
science items to check the validity. Once validated, the questionnaires were used to
investigate associations between the constructs. The results are reported in the
following sections:
Details of the Questionnaire (4.2)
Validity of WIHIC, TOSRA, SAI-II/VOSE (4.3)
Relationships between Learning Environment and Student Outcomes of
Attitudes and Understanding of Nature of Science (4.4)
Chapter Summary (4.5).
110
4.2 Details of the Questionnaire
Modified versions of existing instruments were used in my study: the WIHIC was
used to assess the learning environment; the TOSRA was used to assess student
attitudes; and the SAI-II/VOSE was used to assess understanding of nature of
science. These questionnaires were discussed in detail in Chapter 3 and are
considered again briefly below in Sections 4.2.1 to 4.2.3.
The WIHIC, TOSRA, SAI-II,/VOSE all use a five-point response scale, with the
original WIHIC using a frequency scale (Almost Always, Often, Sometimes,
Seldom, and Almost Never) and the original TOSRA and SAI-II/VOSE using a
Likert scale (Strongly Agree, Agree, Not sure, Disagree, and Strongly Disagree). The
response scale for the WIHIC was modified to match the same Likert response scale
as the TOSRA and SAI-II/VOSE (Strongly Agree, Agree, Not sure, Disagree, and
Strongly Disagree) in order to avoid confusing students by having two different
response scales and to maintain consistency throughout the questionnaire (see
Section 3.3).
A small sample of students in their third or fourth years of secondary science (Grades
11 and 12) were involved in a pilot study to check the readability and
comprehensibility of the instructions and items in the questionnaire. The pilot study
was also used to check the logistics of administering the questionnaire – time,
instructions for proctor, etc. The selection of 16 students minimized differences in
grade levels and school science experience (see Section 3.5).

111
4.2.1 What Is Happening In this Class? (WIHIC)
The original What Is Happening In this Class? (WIHIC) consists of 56 items in seven
scales: Student Cohesiveness, Teacher Support, Involvement, Investigation,
Cooperation, Task Orientation, and Equity. The WIHIC has been used in numerous
studies (Aldridge & Fraser, 2000) which showed it to be valid and reliable in
describing the nature of classroom learning environments. A significant feature of
the WIHIC is that it combines scales from previous instruments and includes
contemporary dimensions (P. C. Taylor et al., 1997). My research used the
Involvement, Investigation, Cooperation, and Task Orientation scales. Section 3.3.1
and Table 3.2 justify the selection of these four scales for my study.
4.2.2 Test Of Science Related Attitudes (TOSRA)
The Test Of Science Related Attitudes (TOSRA) was designed to measure seven
distinct science-related attitudes among secondary school students. The original
version of the TOSRA consists of 70 items in seven scales: Social Implications for
Science, Normality of Scientists, Attitude to Scientific Inquiry, Adoption of
Scientific Attitudes, Enjoyment of Science Lessons, Leisure Interest in Science, and
Career Interest in Science (Fraser, 1981). It was developed to be used with secondary
school science students (Dalgety et al., 2003). The TOSRA has been field tested and
validated in Australia (Fraser, 1981), the United States (Khalili, 1987; Welch, 2010),
Korea (Fraser & Lee, 2009; H. B. Kim et al., 2000), Singapore (Wong & Fraser,
1996) and Indonesia (Fraser, Aldridge, & Adolphe, 2010; Schibeci & Fraser, 1987).
My research used the Social Implications for Science and Normality of Scientists
scales. Table 3.2 and Section 3.3.2 justify how these two scales were chosen for my

112
study because of their consistency with the national science education standards
adopted in Illinois.
4.2.3 Scientific Attitudes Inventory: Revision (SAI-II) and Views on Science and Education (VOSE)
The Scientific Attitudes Inventory: Revision SAI-II is a revision of the original SAI
that was altered in response to criticism about “…vocabulary, item difficulty, and
format…” (Moore & Foy, 1997, p. 329). There are 36 items in the six position
statements of the SAI-II: Tentative Nature of Science, Empirical Basis of Science,
Scientific Method, Science as an Idea-Generating Activity, Necessity for Public
Support of Science, and Personal Attributes Necessary for a Career in Science.
Although the SAI-II uses the term ‘attitude’, it addresses understanding of nature of
science topics such as the Tentative Nature of Science, Empirical Basis of Science,
and Scientific Method (Lederman, 1992).
The original SAI contained 12 position statements (six positive and six negative).
The statements are also categorized as intellectual or emotional attitudes, again with
six statements for each attitude (Moore & Sutman, 1970). My research used the
Tentative Nature of Science, Empirical Basis of Science, and Scientific Method
scales. As discussed in Section 3.3.2, these scales were chosen because they were
considered salient for my study.
The Views on Science and Education Questionnaire (VOSE) is based on the Views
on Science-Technology-Society (VOSTS) questionnaire. As discussed in Section
2.7.1, the VOSTS was developed to avoid the assumption that the researcher and

113
student would interpret an item in the same way (Aikenhead, 1988). The VOSE was
designed to measure students’ concepts of nature of science (NOS) and relevant
teaching attitudes. The VOSE contains 15 questions followed by several items
representing various philosophical positions to which students respond using a Likert
scale (S. Chen, 2006a, 2006b). There are 10 questions addressing seven aspects of
NOS and five questions covering the teaching attitudes corresponding to five of the
NOS aspects. The seven NOS aspects are Tentativeness of Scientific Knowledge,
Nature of Observation, Scientific Methods, Hypotheses, Laws, and Theories,
Imagination, Validation of Scientific Knowledge, and Objectivity and Subjectivity in
Science. The five teaching attitudes correspond to the five nature of science topics of
Tentativeness of Scientific Knowledge, Nature of Observation, Scientific Methods,
Hypotheses, Laws, and Theories, and Objectivity and Subjectivity in Science.
My research used the Tentativeness of Scientific Knowledge, Objectivity and
Subjectivity in Science, and Scientific Methods scales. These scales were chosen
because they were considered salient for my study and because of their consistency
with national science education standards (see Table 3.2).
4.2.4 Validity of WIHIC, TOSRA and SAI-II/VOSE
The first purpose of this study was to validate my modified versions of the WIHIC,
TOSRA, and SAI-II/VOSE with students from a medium, Midwestern secondary
school in the USA with urban demographics. In order for a scale to yield meaningful
results, the items must all be indicators of some common underlying construct
(Gardner, 1995).

114
Factor analysis (J. O. Kim & Mueller, 1978) is used in data reduction to identify a
small number of underlying variables, or factors, that explain most of the variance
observed in a much larger number of manifest variables. Using separate data analysis
for the WIHIC, TOSRA and SAI-II/VOSE, factor analysis was conducted in order to
identify faulty items whose removal would improve the factor structure and internal
consistency reliability. If the factor analysis results for an instrument with one
sample are consistent with results from previous analyses with other samples, then
that gives greater credibility to that instrument (Pallant, 2001).
In addition, the individual items should have a common underlying construct and
therefore have internal consistency. Internal consistency is commonly used to
provide a measure of scale reliability and provide information about the relationship
among different items in the same scale. A common measure of internal consistency
is Cronbach’s alpha coefficient (Cronbach, 1951), which is maximized when every
item in a scale shares a common variance with at least some other items in the scale
and avoids clusters within a scale (Cronbach, 1951; Gardner, 1995). The higher the
alpha value (i.e., closer to 1), the more reliable the scale is; a value of 0.7 is
considered acceptable (Nunnally, 1978) (see discussion in Section 3.6).
Data collected from administering the questionnaires to my sample of 246 students
were analyzed by performing principal axis factor analysis with varimax rotation and
Kaiser normalization separately for: the 32 WIHIC learning environment items in
four scales (namely, Involvement, Investigation, Cooperation and Task Orientation);
the 12 TOSRA attitude items in two scales (Social Implications of Science and
Normality of Scientists); and the 18 SAI-II/VOSE Nature of Science items in three

115
scales (Tentative Nature of Science, Empirical Basis of Science, and Scientific
Method). The two criteria for the retention of any item were that it must have a factor
loading of at least 0.40 with its own scale and less than 0.40 with all other scales.
The data from the WIHIC, TOSRA, and SAI-II/VOSE were subjected to scale
internal consistency analysis to investigate the extent to which items in the same
scale measure a common construct. The internal consistency reliability, using
Cronbach’s alpha coefficient, was calculated for each of the eight refined WIHIC,
TOSRA, and SAI-II/VOSE scales.
4.2.5 Factor Structure and Internal Consistency Reliability of WIHIC
With the goal of reducing the number of factors while maintaining important data, it
was considered useful to refine the existing instruments slightly. Application of my
two criteria for item retention (i.e. an item must have a factor loading of at least 0.4
with its own scale and less than 0.4 with all other scales) revealed that, with the
exception of Item 4 from the Task Orientation scale, all items satisfied the criteria. A
slightly-modified 31-item version of the WIHIC with the original four scales
(Involvement, Investigation, Cooperation and Task Orientation), but with Item 4
omitted from the Task Orientation scale, was found to provide an optimal factor
structure as shown by the factor loadings in Table 4.1.
The bottom of Table 4.1 shows the percentage of variance accounted for and the
eigenvalue for each scale in the refined version of the WIHIC. Different WIHIC
scales accounted for between 6.08% and 29.41% of the variance (total of 52.12%)
and had eigenvalues ranging from 1.95 to 9.41 (Table 4.1).

116
Table 4.1 Factor Analysis Results for WIHIC Scales
N=246Factor loadings less than 0.40 have been omitted from the table.Principal axis factoring with varimax rotation and Kaiser normalization.Item 4 in the Task Orientation scale was omitted.
The internal consistency reliability of each WIHIC scale was calculated using
Cronbach’s alpha coefficient. Table 4.2 shows that, with the student as the unit of
analysis, alpha coefficients for the four WIHIC scales ranged from 0.84 to 0.87. The
data in Table 4.1 and Table 4.2 support the conclusion that the four scales of the
WIHIC were valid and reliable when used with my sample of 246 Midwestern high
school students in the USA.
Item No Factor LoadingsInvolvement Investigation Cooperation Task Orientation
Invol 1 0.69Invol 2 0.70Invol 3 0.55Invol 4 0.66Invol 5 0.48Invol 6 0.49Invol 7 0.44Invol 8 0.59Invest1 0.67Invest 2 0.42Invest 3 0.59Invest 4 0.41Invest 5 0.69Invest 6 0.71Invest 7 0.67Invest 8 0.62Coop1 0.69Coop 2 0.54Coop 3 0.65Coop 4 0.62Coop 5 0.57Coop 6 0.77Coop 7 0.79Coop 8 0.62Task Orien 1 0.62Task Orien 2 0.66Task Orien 3 0.57Task Orien 5 0.64Task Orien 6 0.66Task Orien 7 0.57Task Orien 8 0.66% Variance 9.91 6.72 29.41 6.08Eigenvalue 3.17 2.15 9.41 1.95

117
Table 4.2 Mean, Standard Deviation, and Internal Consistency Reliability (Alpha Coefficient) for Learning Environment, Attitude, and Nature of Science Scales
Scale No of Items Mean SD Alpha
ReliabilityLearning EnvironmentInvolvement 8 3.57 0.77 0.84Investigation 8 3.43 0.74 0.86Cooperation 8 4.12 0.66 0.87Task Orientation 7 4.12 0.65 0.85
AttitudesSocial Implications of Science 6 3.52 0.66 0.79Normality of Scientists 6 3.52 0.66 0.82
Nature of ScienceTentative Nature of Science 6 3.78 0.58 0.75Scientific Method 5 3.87 0.57 0.70N= 246Factor loadings less than 0.40 have been omitted from the table.Principal axis factoring with varimax rotation and Kaiser normalization.Item 4 in the Task Orientation scale was omitted.
It is worth comparing how the factor structure and reliability for my research
compare with previous studies involving the WIHIC. This study is consistent with a
cross-national study in Australia, the UK, and Canada (Dorman, 2003) with 3980
students in Grades 8, 10, and 12. Dorman’s data also supported the factorial
invariance of the scales in that they functioned similarly across different populations.
Dorman (2008) also reported a validation of the WIHIC using a multitrait–
multimethod approach. Using a sample of 978 secondary school students in
Australia, this study revealed the instrument was a valid measure of classroom
environment.
Another cross-national study with 2960 junior high school students in Australia and
Taiwan supported the factorial validity and reliability of the WIHIC to (Aldridge &
Fraser, 2000). Fraser, Aldridge, and Adolphe (2010) also reported the factorial
validity and reliability of the WIHIC with 1161 Australian and Indonesian secondary

118
students. Another Indonesian version of the instrument (Wahyudi & Treagust, 2004)
was found to be factorially valid and reliable for measuring the classroom learning
environment in lower-secondary classroom with 1188 students.
Allen and Fraser (2007) found that the student and a parent versions of the WIHIC
were factorially valid and reliable for a sample of 520 Grade 4 and 5 students and
120 of their parents in South Florida.
Den Brok, Fisher, Rickards and Bull (2006) found the WIHIC valid and reliable with
665 middle-school science students in California. Ogbuehi and Fraser (2007) also
reported that the instrument was valid and reliable when used with 661 middle-
school mathematics students in California. Wolf and Fraser (2008) reported that the
WIHIC was factorially valid and reliable with a sample of 1434 middle-school
physical science students in New York.
For a sample of 1404 students in Australia and Canada, Zandvleit and Fraser (2005)
found the WIHIC exhibited sound factorial validity and reliability with students who
were using computers. In Ontario, Canada, Fraser and Raaflaub (2013) found a
modified WIHIC to be valid and reliable with a sample of 1172 secondary students
using notebook computers.
The results of my study are similar to the studies discussed above in terms of validity
and reliability. The WIHIC demonstrated a satisfactory factor structure and sound
internal consistency reliability for my sample.

119
4.2.6 Factor Structure and Internal Consistency Reliability of TOSRA
When principal axis factoring with varimax rotation and Kaiser normalization was
used with TOSRA data for my sample of 246 students, application of my two criteria
for item retention (i.e. an item must have a factor loading of at least 0.4 with its own
scale and less than 0.4 with all other scales) revealed that all items satisfied the
criteria. The original 12-item version of the TOSRA with two scales (Social
Implications of Science and Normality of Scientists), described in Table 4.3, was
found to provide an optimal factor structure.
The bottom of Table 4.3 shows the percentage of variance and the eigenvalue for
each scale in the refined version of the TOSRA. The two scales of the TOSRA
accounted for 13.29% and 38.04% of the variance (total of 51.33%) for the TOSRA
and had eigenvalues of 1.59 and 4.56 (Table 4.3).
Table 4.3 Factor Analysis Results for TOSRA Scales
Item No Factor LoadingsSocial Implications of Science Normality of Scientists
Social Implications 1 0.55Social Implications 2 0.49Social Implications 3 0.63Social Implications 4 0.68Social Implications 5 0.74Social Implications 6 0.49Normality 1 0.51Normality 2 0.75Normality 3 0.68Normality 4 0.66Normality 5 0.51Normality 6 0.59% Variance 13.29 38.04Eigenvalue 1.59 4.56N=246Factor loadings less than 0.40 have been omitted from the table.Principal axis factoring with varimax rotation and Kaiser normalization.

120
As Table 4.2 shows, with the student as the unit of analysis, alpha coefficients for the
two scales of the TOSRA were 0.79 and 0.82. The data in Table 4.2 and Table 4.3
support the conclusion that the two scales of the TOSRA were valid and reliable for
my sample.
Because my study incorporated two scales from the TOSRA, it is also worth noting
how the factor structure and reliability compare with previous studies involving the
TOSRA. Using an Australian sample of 1337 students in grades 7 through 10, the
scales of the TOSRA were found to have appropriate validity and internal
consistency reliability (Fraser, 1978).
In Florida, selected scales from the TOSRA exhibited sound factorial validity and
reliability with 172 kindergarteners and 78 of their parents (Robinson & Fraser,
2013), in Spanish with 223 elementary students (Adamski et al., 2013), and in
English and Spanish with 1105 Grade 2 to Grade 5 students (Soto-Rodriguez, 2005).
For a sample of 25 chemistry teachers and 224 high-school students in Alabama, the
TOSRA was found to be reliable when it was used as part of an evaluation of a state-
wide in-service and outreach program (Lott, 2002). As part of the evaluation of the
Alliance+ program involving seven teachers and 759 middle-school students in
Florida, the TOSRA was found to be valid and reliable (Biggs, 2008). In the
evaluation of a program at Challenger Learning Centers with 311 students and seven
teachers using live simulations to study Earth Science, Chen and Howard (2010)
found that the TOSRA had satisfactory reliability and an appropriate factor structure.

121
The TOSRA has also been found valid and reliable in Brunei Darussalam by den
Brok, Fisher, and Scott (2005) who reported that it exhibited satisfactory reliability
and an appropriate factor structure with a 1305 students aged nine to 14 years.
Similarly, Anwer, Iqbal, and Harrison (2012) found support for the TOSRA’s
validity with a sample of 3526 Grade 10 students in Pakistan.
In Australia, Fisher and Waldrip (1999) reported that the TOSRA was valid and
reliable with a sample of 3785 secondary science students. Fraser, Aldridge, and
Adolphe (2010), in a cross-national study in Australia and Indonesia, found the
TOSRA to be reliable and have a strong factor structure with a sample 1161
secondary science students.
The results of my study are similar to those reported in the studies reviewed above in
terms of validity and reliability. The TOSRA demonstrated both a sound factor
structure and satisfactory internal consistency reliability with my sample.
4.2.7 Factor Structure and Internal Consistency Reliability of SAI-II/VOSE
When factor analysis was conducted for my three-scale version of the SAI-II/VOSE
with my sample of 246 students, application of my two criteria for item retention (i.e.
an item must have a factor loading of at least 0.4 with its own scale and less than 0.4
with all other scales) revealed that the entire Empirical Basis of Science scale (SAI-II
Empirical Basis of Science and VOSE Objectivity and Subjectivity in Science scales)
and Item 6 from the Scientific Method scale (VOSE Scientific Methods scale) did
not satisfy the criteria. A modified 11-item version of the SAI-II/VOSE with the
original Empirical Basis of Science scale removed entirely and with Item 6 removed
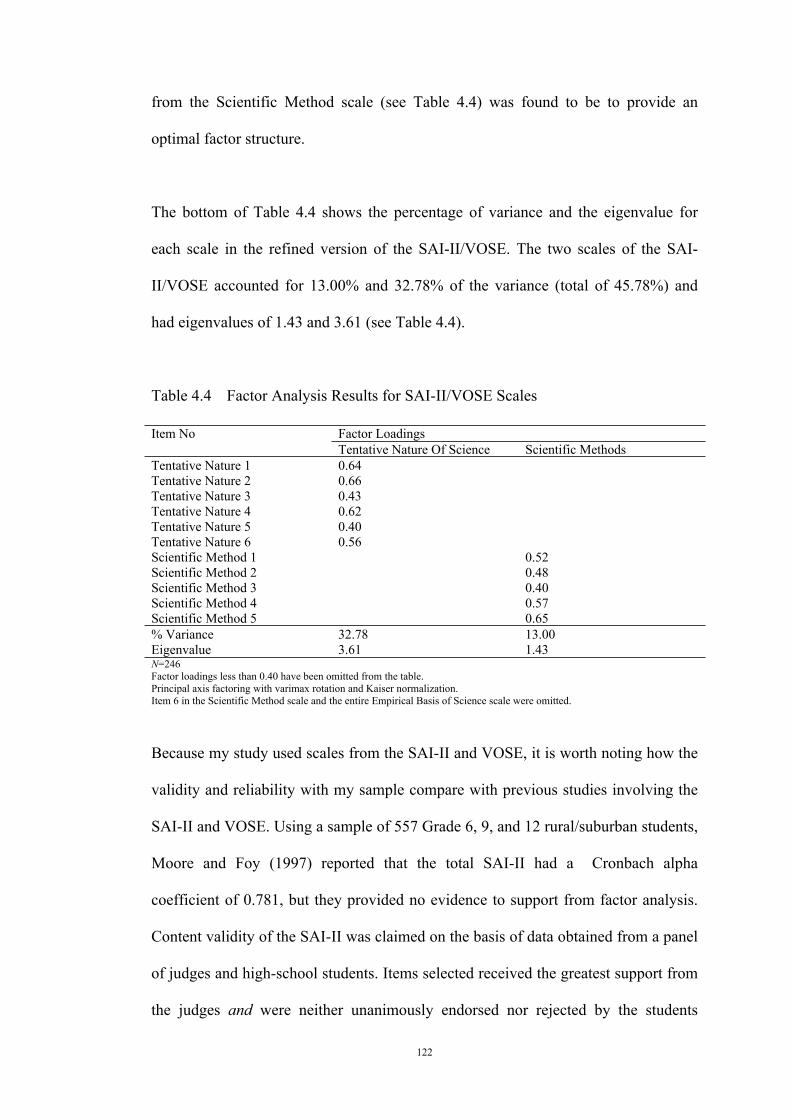
122
from the Scientific Method scale (see Table 4.4) was found to be to provide an
optimal factor structure.
The bottom of Table 4.4 shows the percentage of variance and the eigenvalue for
each scale in the refined version of the SAI-II/VOSE. The two scales of the SAI-
II/VOSE accounted for 13.00% and 32.78% of the variance (total of 45.78%) and
had eigenvalues of 1.43 and 3.61 (see Table 4.4).
Table 4.4 Factor Analysis Results for SAI-II/VOSE Scales
Item No Factor LoadingsTentative Nature Of Science Scientific Methods
Tentative Nature 1 0.64Tentative Nature 2 0.66Tentative Nature 3 0.43Tentative Nature 4 0.62Tentative Nature 5 0.40Tentative Nature 6 0.56Scientific Method 1 0.52Scientific Method 2 0.48Scientific Method 3 0.40Scientific Method 4 0.57Scientific Method 5 0.65% Variance 32.78 13.00Eigenvalue 3.61 1.43N=246Factor loadings less than 0.40 have been omitted from the table.Principal axis factoring with varimax rotation and Kaiser normalization.Item 6 in the Scientific Method scale and the entire Empirical Basis of Science scale were omitted.
Because my study used scales from the SAI-II and VOSE, it is worth noting how the
validity and reliability with my sample compare with previous studies involving the
SAI-II and VOSE. Using a sample of 557 Grade 6, 9, and 12 rural/suburban students,
Moore and Foy (1997) reported that the total SAI-II had a Cronbach alpha
coefficient of 0.781, but they provided no evidence to support from factor analysis.
Content validity of the SAI-II was claimed on the basis of data obtained from a panel
of judges and high-school students. Items selected received the greatest support from
the judges and were neither unanimously endorsed nor rejected by the students
123
(Moore & Sutman, 1970). Similarly, construct validity of the SAI-II was claimed
based on the demonstrated validity of the SAI in the original field test. However, the
SAI-II was able to distinguish between the responses of the upper and lower 27% of
respondents for the total instrument when compared with their scores on the various
subscales.
A Turkish translation of the SAI-II was used with a sample of 300 middle-school
students (Demirbaş & Yağbasan, 2006) and found to have a Cronbach alpha
coefficient of 0.76 for the entire instrument. Also an alpha coefficient of 0.72 was
found when piloted with a sample of 100 Turkish science teachers (Demirbaş, 2009).
In another Turkish study with preservice elementary teachers (Cavas et al., 2013),
SAI-II had an alpha reliability coefficient of 0.72.
The SAI-II has also been translated into Thai. When used in a study with a sample of
94 Grade 7 students, the Thai version’s total score was found to have an alpha
coefficient of 0.81 (Cojorn et al., 2013). A version of the SAI-II modified for the
Indian context was used in a study of 300 preservice teachers from four teacher
training colleges and found to have an alpha reliability of 0.927 (Lahiri, 2011).
In the USA, the SAI-II was found to have an alpha coefficient of 0.78 when used in a
study with a sample of 117 Grade 11 students (Liang, 2002). In the Boston Public
Schools, a modified version of the SAI-II was used over a two-year period with
secondary science students (Barnett et al., 2006) and found to have reliabilities
ranging from 0.67 to 0.85. In New Mexico, a modified SAI-II was used with a

124
sample of 95 middle-school students, 88% of whom self-identified as Hispanic
(Sorge et al., 2000), and was found to an alpha coefficient of 0.734.
At the post-secondary level in the USA, when Nadelson and Viskupic (2010) used
the SAI-II with a sample of 61 lower- and upper-division geoscience students, they
reported a Cronbach alpha coefficient of 0.83. In another study with 89 preservice
teachers from two universities (Nadelson & Sinatra, 2010), an alpha coefficient of
0.79 was reported.
The studies reviewed above either neglected to address validity or they followed
Moore and Foy (1997) and claimed only content and construct validity for the
original SAI. This could be explained by researchers viewing items to be only open
to one interpretation and therefore not requiring validation (Tytler & Osborne, 2012).
The results of my study for the SAI-II/VOSE are similar to those of studies discussed
above in terms of alpha reliability (but past studies did not report factor structure).
The SAI-II/VOSE has demonstrated satisfactory internal consistency reliability and
factorial validity with my sample.
4.2.8 Relationships between Learning Environment and Student Outcomes of Attitudes and Understanding of Nature of Science
The second purpose of this study was to identify characteristics of the science
classroom environment that enhance students’ attitudes to science and understanding
of nature of science. Simple correlation analysis (r) was used for examining the
bivariate relationship between one environment scale and one outcome scale.
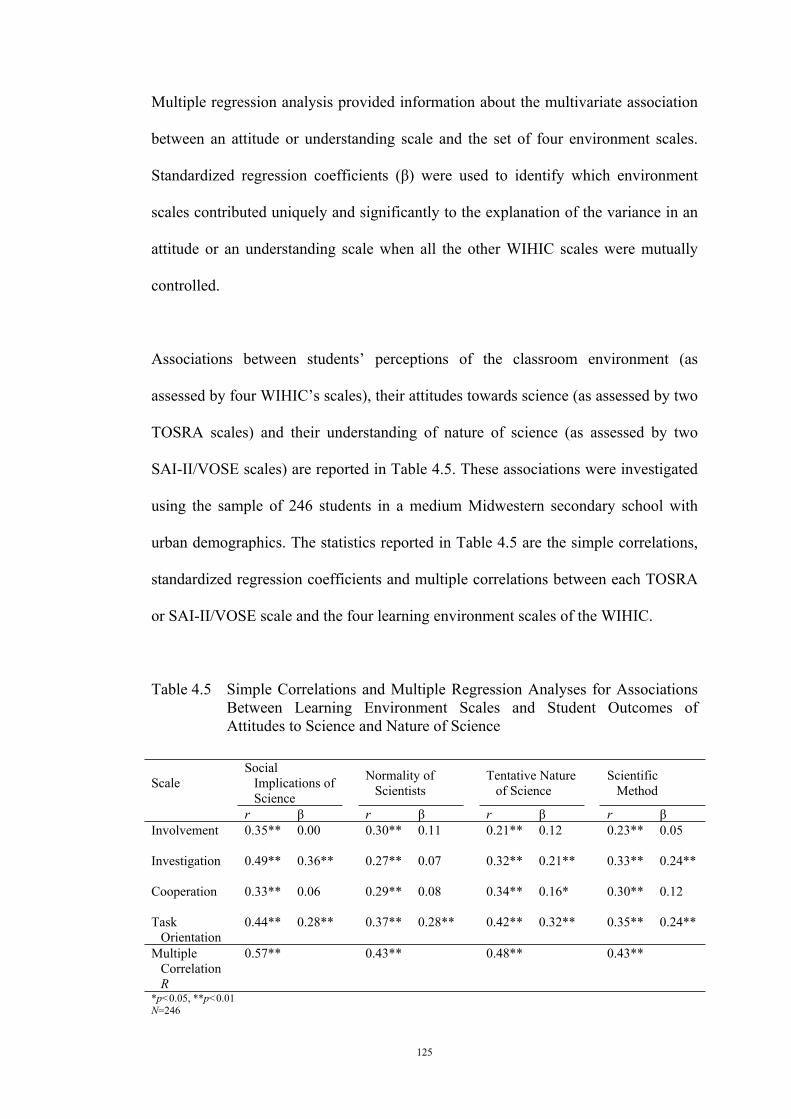
125
Multiple regression analysis provided information about the multivariate association
between an attitude or understanding scale and the set of four environment scales.
Standardized regression coefficients (β) were used to identify which environment
scales contributed uniquely and significantly to the explanation of the variance in an
attitude or an understanding scale when all the other WIHIC scales were mutually
controlled.
Associations between students’ perceptions of the classroom environment (as
assessed by four WIHIC’s scales), their attitudes towards science (as assessed by two
TOSRA scales) and their understanding of nature of science (as assessed by two
SAI-II/VOSE scales) are reported in Table 4.5. These associations were investigated
using the sample of 246 students in a medium Midwestern secondary school with
urban demographics. The statistics reported in Table 4.5 are the simple correlations,
standardized regression coefficients and multiple correlations between each TOSRA
or SAI-II/VOSE scale and the four learning environment scales of the WIHIC.
Table 4.5 Simple Correlations and Multiple Regression Analyses for Associations Between Learning Environment Scales and Student Outcomes of Attitudes to Science and Nature of Science
ScaleSocial
Implications of Science
Normality of Scientists
Tentative Nature of Science
Scientific Method
r β r β r β r βInvolvement 0.35** 0.00 0.30** 0.11 0.21** 0.12 0.23** 0.05
Investigation 0.49** 0.36** 0.27** 0.07 0.32** 0.21** 0.33** 0.24**
Cooperation 0.33** 0.06 0.29** 0.08 0.34** 0.16* 0.30** 0.12
Task Orientation
0.44** 0.28** 0.37** 0.28** 0.42** 0.32** 0.35** 0.24**
Multiple Correlation R
0.57** 0.43** 0.48** 0.43**
*p<0.05, **p<0.01N=246

126
Table 4.5 shows that, with the individual student as the unit of analysis, each of the
four environment scales was statistically significantly correlated (p<0.01) with each
attitude scale (Social Implications and Normality of Scientists) and to each nature of
science scale (Tentative Nature of Science and Scientific Method).
The multiple correlations (R) reported at the bottom of Table 4.5 for the set of four
WIHIC scales was statistically significant (p<0.05) for each of the two attitude and
two understanding scales.
To identify which classroom environment scales contributed most to the variance in
a specific attitude or understanding scale, the standardized regression weights (β)
were examined and yielded the following results:
Investigation and Task Orientation were positively, significantly, and
independently related to Social Implications of Science.
Task Orientation was positively, significantly, and independently related to
Normality of Scientists.
Investigation, Cooperation, and Task Orientation were positively,
significantly, and independently related to Tentative Nature of Science.
Investigation and Task Orientation were positively, significantly, and
independently related to Scientific Method.
It is noteworthy that every statistically significant simple correlation and regression
coefficient in Table 4.5 was positive, suggesting that a positive relationship existed

127
between a more favorable classroom learning environment and students’ attitudes
and understanding of the nature of science. This replicates considerable prior
research with the WIHIC (Chionh & Fraser, 2009; Fraser, Giddings, & McRobbie,
1995; Martin-Dunlop & Fraser, 2008; McRobbie & Fraser, 1993) reviewed in
Section 2.5.1 and Table 2.3.
Some particular associations in Table 4.5 between students’ perceptions of their
learning environments and their attitudes towards or understanding of science are
noteworthy. Investigation and Task Orientation had stronger multivariate
associations with attitudes/understanding than did the other two WIHIC scales of
Involvement and Cooperation. In fact, Involvement had a significant independent
association with none of the four attitude or understanding scales.
4.3 Chapter Summary
This chapter reported analyses and results for the two research questions in this study
– to validate the WIHIC, TOSRA, and SAI-II/VOSE in a medium, Midwestern
United States, suburban secondary school with urban demographics; and to identify
characteristics of the science classroom environment that enhance students’ attitudes
to science and understanding of nature of science.
The What Is Happening In this Class? (WIHIC) was modified to provide four scales:
Involvement, Investigation, Cooperation, and Task Orientation. Similarly, two scales
from the Test Of Science Related Attitudes (TOSRA) were modified and used:
Social Implications of Science and Normality of Scientists. As well, two scales from

128
the Scientific Attitudes Inventory Revised (SAI-II) and the Views On Science and
Education (VOSE) were modified and used: Tentative Nature of Science and
Scientific Method. Data from 246 secondary school students in the Midwest were
statistically analyzed to answer these questions. The SAI-II/VOSE Empirical Basis
of Science/Objectivity and Subjectivity in Science scale was omitted following factor
analysis.
As described in Chapter 3, modified versions of the WIHIC, TOSRA, SAI-II/ VOSE
were assembled into a single instrument for ease of administration. The validity and
the reliability of each component of the instrument were checked for factor structure
and internal consistency reliability. To examine the factor structure, and answer the
first research question, data were subjected to principal axis factor analysis with
varimax rotation and Kaiser normalization separately for the 32 WIHIC learning
environment items in four scales, the 12 TOSRA attitude items in two scales, and the
18 SAI-II/VOSE nature of science items in three scales.
The two criteria for the retention of any item were that it must have a factor loading
of at least 0.40 with its own scale and less than 0.40 with each of the other scales.
Application of these criteria led to eight items being removed (Item 4 from the Task
Orientation and Item 6 from Scientific Method scale, as well as the entire Empirical
Basis of Science scale), reducing the original 62 items to 54.
The percentage of variance ranged between 6.08% and 29.41% for the four WIHIC
scales, totaling 52.12%, and the eigenvalues ranged from 1.95 to 9.41 (see Table
4.1). The percentage of variance for the TOSRA for the two scales was 13.29% and

129
38.04%, totaling 51.33%, and the eigenvalues were 1.59 and 4.56 (see Table 4.3).
The percentage of variance for the SAI-II/VOSE for the two scales was 13.00% and
32.78%, totaling of 45.78%, and the eigenvalues were 1.43 and 3.61 (see Table 4.4).
The percentage of variance, the eigenvalues and the factor loadings support the factor
structure of the modified scales of the WIHIC, TOSRA, and SAI-II/VOSE.
Internal consistency was used to provide a measure of scale reliability and provide
information about the relationship among different items on the scale. A Cronbach
alpha value of 0.7 generally is considered acceptable. When using the individual as
the unit of analysis, alpha values for WIHIC scales ranged between 0.84 and 0.87,
with the lowest alpha value being found for the Involvement scale and the highest for
the Cooperation scale (see Table 4.2). Scale alpha values for the TOSRA were 0.79
and 0.82, with the lower alpha coefficient for the Social Implications of Science scale
and the higher value for the Normality of Scientists scale (see Table 4.2). Scale alpha
values for the SAI-II/VOSE were 0.70 and 0.75, with the lower value for the
Scientific Method scale and the higher coefficient for the Tentative Nature of
Science scale (see Table 4.2).
To answer my second research question, the data were analyzed to determine
associations between students’ perception of the classroom learning environment and
their attitudes toward science and understanding of nature of science. Simple
correlation analysis was used to examine the bivariate relationship between each of
the classroom learning environment scales and each of the two attitude scales and
two understanding on nature of science scales. Multiple regression analysis was used
to investigate the multivariate association between a student outcome measure and
130
the set of four learning environment scales. Standardized regression coefficients were
used to identify which environment scales contributed uniquely and significantly to
explaining the variance in an attitude or understanding scale when all of the other
learning environment scales were mutually controlled.
The results of the simple correlation analysis indicate that all four of the learning
environment scales were statistically significantly associated with both attitude scales
(Social Implications for Science and Normality of Scientists) and both understanding
scales (Tentative Nature of Science, and Scientific Method). Correlations with
learning environment scales ranged: between 0.33 and 0.49 for Social Implications
for Science; between 0.27 and 0.37 for Normality of Scientists; between 0.21 and
0.42 for Tentative Nature of Science; and between 0.23 and 0.35 for Scientific
Method (see Table 4.5). The results suggest that greater emphasis on the classroom
learning environment dimensions investigated in my study – Involvement,
Investigation, Cooperation, and Task Orientation – is linked with improved student
attitudes toward science and understanding of nature of science.
The multiple correlation between the four learning environment scales and each of
the two attitude and two understanding scales was statistically significant. The
multiple correlation for the set of learning environment scales was 0.57 for Social
Implications, 0.43 for Normality, 0.48 for Tentative Nature of Science, and 0.43 for
Scientific Method. The result suggests the classroom learning environment was
related to student attitudes to science and understanding of nature of science.

131
Using the standardized regression weights, Investigation and Task Orientation were
statistically significant independent predictors of Social Implications of Science and
Scientific Method. Task Orientation was a statistically significant independent
predictor of student attitudes to the Normality of Scientists. Investigation,
Cooperation, and Task Orientation were statistically significant independent
predictors of student understanding of the Tentative Nature of Science.
It is worth noting that Investigation and Task Orientation had stronger multivariate
associations with attitudes and understanding than did Involvement and Cooperation.
Overall, my results suggest the existence of statistically significant associations
between students’ learning environment and their attitude to science and
understanding of nature of science, which replicates past research (Burton, 2013; M.
C. Lai, 2012; Liang, 2002; P. R. Smith, 2013), including studies reviewed in Section
2.5.1.

132
Chapter 5
DISCUSSION AND CONCLUSION
5.1 Introduction
My study was conducted at a medium, suburban secondary school with urban
demographics in Midwestern USA. Data collected from 246 secondary-school
students were analyzed separately for my modified versions of a learning
environment instrument (WIHIC), attitude instrument (TOSRA), and nature of
science instrument (SAI-II/VOSE). In addition, I investigated associations between
the learning environment and student attitudes toward science and understanding of
nature of science. The chapter includes the following sections:
Summary of Chapters 1–3 (5.2)
Summary of Research Findings (5.3)
Significance and Implications (5.4)
Limitations (5.5)
Suggestions for Future Research (5.6)
Chapter Conclusion (5.7).
5.2 Summary of Chapters 1–3
Chapter 1 briefly provided background and contextual information in order to set the
scene for my study. My two research questions were delineated and selected
literature was reviewed for each of the three constructs in my study: learning
133
environment, attitudes to science, and understanding of the nature of science (NOS).
As well as identifying the significance of my research, Chapter 1 also provided an
overview of the other chapters in this thesis.
Chapter 2 was devoted to reviewing literature pertinent to my study. The topic most
comprehensively covered was the field of learning environments, including its
historical background, a range of questionnaires for assessing students’ perceptions
of their classroom environment, especially the instrument (What Is Happening In this
Class?, WIHIC) employed in my research, and types of past learning environment
research. A section was devoted to the assessment of attitudes to science, including
the Test of Science Related Attitudes (TOSRA) that was modified for use in my
research. Finally, the literature review focused on understanding the nature of science
(NOS) and encompassed questionnaires from which scales were drawn for my study
– the Scientific Attitude Inventory Revision (SAI-II) and Views on Science and
Education (VOSE).
Chapter 3 was devoted to research methods, beginning with a description of my
study’s learning environment scales (from the What Is Happening In this Class?,
WIHIC), attitude to science scales (from the Test of Science Related Attitudes,
TOSRA) and understanding of NOS scales (SAI-II/VOSE). My questionnaire
consisted of
32 learning environment items based on the WIHIC for assessing
Involvement, Investigation, Cooperation, and Task Orientation
12 attitude items based on the TOSRA for assessing Social Implications of
Science and Normality of Scientists
134
18 NOS items based on SAI-II/VOSE for assessing Tentative Nature of
Science, Empirical Basis of Science, and Scientific Method.
Data-collection methods with my sample of 246 secondary-school students were
considered. Finally, it was identified that the main methods of data analysis would be
factor analysis for questionnaire validation and multiple regression analysis for
exploring the association of learning environment with students’ attitudes and
understanding of NOS.
5.3 Summary of Research Findings
The validity of the questionnaire was examined using a principal axis factor analysis
with varimax rotation and Kaiser normalization separately for the learning
environment items, the attitude items, and the nature of science items. The criteria
for retention of any item were that it must have a factor loading of at least 0.4 with its
own scale and less than 0.4 with all of the other scales.
For the WIHIC, application of my two criteria for item retention (i.e. a factor loading
of at least 0.4 with its own scale and less than 0.4 with all other scales) revealed that,
with the exception of Item 4 from the Task Orientation scale, all items satisfied the
criteria. A slightly-modified 31-item version of the WIHIC with the original four
scales (Involvement, Investigation, Cooperation, and Task Orientation), but with
Item 4 omitted from the Task Orientation scale, was found to provide an optimal
factor structure. The four scales of the WIHIC accounted for between 6.08% and

135
29.41% (total of 52.12%) of the variance and had eigenvalues ranging from 1.95 to
9.41.
When principal axis factoring with varimax rotation and Kaiser normalization was
used with TOSRA data, application of my two criteria for item retention revealed
that all items satisfied the criteria. The original 12-item version of the TOSRA with
two scales (Social Implications of Science and Normality of Scientists) was found to
provide an optimal factor structure. The two scales of the TOSRA accounted for
13.29% and 38.04% (total of 51.33%) of the variance and had eigenvalues of 1.59
and 4.56.
When factor analysis was conducted for my three-scale version of the SAI-II/VOSE,
application of my two criteria for item retention revealed that the entire Empirical
Basis of Science scale and Item 6 from the Scientific Method scale did not satisfy the
criteria. A modified 11-item version of the SAI-II/VOSE with the original Empirical
Basis of Science scale removed entirely and with Item 6 removed from the Scientific
Method scale was found to be to provide an optimal factor structure. The two scales
in the refined version of the SAI-II/VOSE accounted for 13.00% and 32.78% (total
of 45.7%) of the variance and had eigenvalues of 1.43 and 3.61.
Not only was the factor structure of the modified scales of the WIHIC, TOSRA, and
SAI-II/VOSE supported, but also Cronbach’s alpha coefficient for different scales
ranged from 0.70 to 0.87. Therefore data analyses support the conclusion that the
modified scales from the WIHIC, TOSRA and SAI-II/VOSE were valid and reliable

136
for my sample. This finding is especially pertinent for the SAI-II/VOSE scales
because support for factorial validity had not been reported in the past research.
To answer my second research question, data were analyzed to determine
associations between students’ perception of the classroom learning environment and
their attitudes toward science and understanding of nature of science. The results of
simple correlation analysis indicated that all four learning environment scales were
statistically significantly associated with both attitude scales (Social Implications for
Science and Normality of Scientists) and both understanding scales (Tentative
Nature of Science, and Scientific Method). The multiple correlation was statistically
significant between the four learning environment scales and each of the two attitude
and two understanding scales.
Using the standardized regression weights, Investigation and Task Orientation were
statistically significant independent predictors of student attitudes to the Social
Implications of Science and understanding of Scientific Method. Task Orientation
was a statistically significant independent predictor of student attitudes to the
Normality of Scientists. Investigation, Cooperation, and Task Orientation were
statistically significant independent predictors of student understanding of the
Tentative Nature of Science.
Overall, the results of my study suggest the existence of statistically significant
associations between students’ learning environment and their attitude to science and
understanding of nature of science. These results suggest that greater emphasis on the
classroom learning environment dimensions investigated in my study – Involvement,

137
Investigation, Cooperation, and Task Orientation – is linked with improving student
attitudes toward science and understanding of nature of science. In general, these
findings replicate the results of many past studies of associations between classroom
environment and student outcomes (Fraser, 2012, 2014).
5.4 Significance and Implications
My research is substantively significant in that it brought together in a single study
the three separate fields of learning environment, attitudes to science, and
understanding of the nature of science (NOS). Only a very small number of prior
learning environment studies have explored the influence of the classroom
environment on students’ understanding of NOS.
A methodological contribution is that my research involved developing and
validating with secondary-school students in Midwestern USA some widely-
applicable and useful questionnaire scales for assessing classroom environment,
attitude to science, and understanding of NOS. In particular, my research probably is
the first study to provide evidence of the factorial validity of NOS scales based on
the SAI-II and VOSE.
The practical implication of my study is that teachers are provided with research
evidence about what emphases in the classroom environment are likely to improve
their students’ attitudes to science and understanding of NOS. In particular, positive
student attitudes to science and better student understanding of NOS are likely to be
promoted in classrooms with more investigation and task orientation.

138
5.5 Limitations
As with all educational research, my study had limitations. The first limitation was
associated with my sample. Because my sample size was only 246 students,
inevitably, the statistical power of data analyses would have been limited and, as
well, it wasn’t feasible to employ the class mean as the unit of statistical analysis.
Because my sample was drawn from a single school, the generalizability of my
results to other schools would be limited.
Although data analyses conducted with my data supported the validity and reliability
of my modified measure of classroom environment (WIHIC), attitudes (TOSRA) and
understanding of nature of science (SAI-II/VOSE), still it is possible that any
modifications made could have led to some loss of validity. Clearly, further cross-
validation in future studies would be desirable.
Tobin and Fraser (1998) have articulated the merits of combining quantitative and
qualitative methods in learning environment research. Unfortunately, practical
constraints associated with time limitations and coordination of schedules make the
collection of extensive qualitative information (e.g. student interviews) impractical.
Therefore, the lack of quality information to complement quantitative questionnaire
data in my study was a limitation.
Although the types of data analysis used in my study were both sophisticated and
useful, it is always possible to conduct alternative and even more-elaborate types of
analysis. For example, whereas my analyses were limited to exploratory factor
139
analysis (for scale validation) and multiple regression analyses (for outcome–
environment associations), additional analyses that could be considered in future
research include confirmatory factor analysis and multilevel analysis.
Having only two scales to measure each construct (learning environment, attitudes
and NOS) is potentially a limitation. Possibly having more or different constructs
might have led to some different patterns of findings.
5.6 Suggestions for Future Research
Given the promising findings from this study, it is recommended that it is replicated
and expanded in future research by including other educationally-important
constructs (e.g. student achievement) and reducing the above limitations associated
with my research.
The limitations identified in the previous section lead to these suggestions for future
research:
Involve a more-representative and diverse sample to enhance the
generalizability of findings
Increase the sample size to improve the statistical power of data analyses
Cross-validate questionnaires with different samples to increase confidence in
their use
Complement quantitative questionnaire data with qualitative information
from interviews and classroom observations
140
Undertake additional types of data analysis such as confirmatory factor
analysis and multilevel analysis
Add more scales to assess other aspects of the constructs included in my
study (learning environment, attitudes and NOS).
5.7 Chapter Conclusion
This study of the learning environments of secondary-school science classrooms has
illuminated what characteristics of the learning environment promote more positive
attitudes to science and better understanding of the nature of science.
When teachers assess their students and classrooms, they typically consider only
achievement and not the factors that might influence their students’ successful
outcomes (Fraser, 1989). Hopefully my study will encourage teachers to evaluate
their classroom environments and their effect on student outcomes.
In an increasingly technological and scientific society, citizens must be scientifically
literate. Considering that the learning environment does have an effect on student
cognitive and affective outcomes, it is important to continue to study this relationship
between the learning environment and outcomes.

141
REFERENCES
Adamski, A., Fraser, B. J., & Peiro, M. M. (2013). Parental involvement in
schooling, classroom environment and student outcomes. Learning
Environments Research, 16, 315-328.
Afari, E., Aldridge, J. M., Fraser, B. J., & Khine, M. S. (2013). Students’ perceptions
of the learning environment and attitudes in game-based mathematics
classrooms. Learning Environments Research, 16, 131-150. doi:
10.1007/s10984-012-9122-6
Aikenhead, G. S. (1988). An analysis of four ways of assessing student beliefs about
STS topics. Journal of Research in Science Teaching, 25, 607-629.
Aikenhead, G. S., & Ryan, A. G. (1992). The development of a new instrument:
“Views on science-technology-society” (VOSTS). Science Education, 76,
477-491.
Aikenhead, G. S., Ryan, A. G., & Fleming, R. W. (1989). Views on science-
technology-society Saskatoon: University of Saskatchewan.
Aldridge, J. M., Dorman, J. P., & Fraser, B. J. (2004). Use of Multitrait-Multimethod
Modelling to Validate Actual and Preferred Forms of the Technology-Rich
Outcomes-Focused Learning Environment Inventory (TROFLEI). Australian
Journal of Educational & Developmental Psychology, 4, 110-125.
Aldridge, J. M., & Fraser, B. J. (2000). A cross-cultural study of classroom learning
environments in Australia and Taiwan. Learning Environments Research, 3,
101-134.
Aldridge, J. M., Fraser, B. J., Bell, L., & Dorman, J. P. (2012). Using a New
Learning Environment Questionnaire for Reflection in Teacher Action

142
Research. Journal of Science Teacher Education, 23, 259-290. doi:
10.1007/s10972-012-9268-1
Aldridge, J. M., Fraser, B. J., & Huang, T. C. I. (1999). Investigating classroom
environments in Taiwan and Australia. Journal of Educational Research, 93,
48-62.
Aldridge, J. M., Fraser, B. J., & Laugksch, R. C. (2011). Relationships between the
school-level and classroom-level environment in secondary schools in South
Africa. South African Journal of Education, 31, 127-144.
Aldridge, J. M., Fraser, B. J., & Ntuli, S. (2009). Utilising learning environment
assessments to improve practices among in-service teachers undertaking a
distance-education programme. South African Journal of Education, 29.
Aldridge, J. M., Fraser, B. J., & Sebela, M. P. (2004). Using teacher action research
to promote constructivist learning environments in South Africa. South
African Journal of Education, 24, 245-253.
Aldridge, J. M., Fraser, B. J., Taylor, P. C., & Chen, C. (2000). Constructivist
learning environments in a crossnational study in Taiwan and Australia.
International Journal of Science Education, 22, 37-55.
Allen, D., & Fraser, B. J. (2007). Parent and student perceptions of classroom
learning environment and its association with student outcomes. Learning
Environments Research, 10, 67-82.
Alters, B. J. (1997). Whose nature of science? Journal of Research in Science
Teaching, 34, 39-55.
American Association for the Advancement of Science. (1993). Benchmarks for
science literacy. New York: Oxford University Press.
143
Anderson, G. J. (1973). The assessment of learning environments: A Manual for the
Learning Environment Inventory and the My Class Inventory. Halifax, Nova
Scotia, Canada: Atlantic Institute of Education.
Anderson, G. J., & Arsenault, N. (1998). Fundamentals of educational research (2nd
ed.). New York: Falmer.
Anwer, M., Iqbal, H. M., & Harrison, C. (2012). Students’ attitude towards science:
A case of Pakistan. Pakistan Journal of Social and Clinical Psychology, 9, 3-
9.
Bandura, A. (1978). The self system in reciprocal determinism. American
Psychologist, 33, 344-358.
Barnett, M., Lord, C., Strauss, E., Rosca, C., Langford, H., Chavez, D., & Deni, L.
(2006). Using the urban environment to engage youths in urban ecology field
studies. The Journal of Environmental Education, 37, 3-11.
Belardo, C. (2001). Inspiring future scientists: Developing a science enrichment
program for teens Retrieved from
http://www.ansp.org/education/pdf/Inspiring_Future_Scientist.pdf
Bennett, J. (2001). The development and use of an instrument to assess students'
attitude to the study of chemistry. International Journal of Science
Education, 23, 833-845.
Biggs, E. M. (2008). Evaluation of a professional development program on
integrating technology into middle schools: Classroom environment and
student attitudes. Unpublished doctoral thesis, Curtin University of
Technology, Science and Mathematics Education Centre, Perth.
Blalock, C. L., Lichtenstein, M. J., Owen, S., Pruski, L., Marshall, C., &
Toepperwein, M. (2008). In pursuit of validity: A comprehensive review of

144
science attitude instruments 1935–2005. International Journal of Science
Education, 30, 961-977.
Brekelmans, M., Levy, J., & Rodriguez, R. (1993). A typology of teacher
communication style. In T. Wubbels & J. Levy (Eds.), Do you know what you
look like?: Interpersonal relationships in education (pp. 46-55). London:
Falmer Press.
Brekelmans, M., Mainhard, T., den Brok, P., & Wubbels, T. (2011). Teacher control
and affiliation: Do students and teachers agree? Journal of Classroom
Interaction, 46, 17-26.
Bruce, B. C., Bruce, S. P., Conrad, R. L., & Huang, H. J. (1997). University science
students as curriculum planners, teachers, and role models in elementary
school classrooms. Journal of Research in Science Teaching, 34(1), 69-88.
Burden, R. L., & Fraser, B. J. (1993). Use of classroom environment assessments in
school psychology: A British perspective. Psychology in the Schools, 30,
232-240.
Burton, E. P. (2013). Student work products as a teaching tool for nature of science
pedagogical knowledge: A professional development project with in-service
secondary science teachers. Teaching and Teacher Education, 29, 156-166.
Cavas, P. H., Ozdem, Y., Cavas, B., Cakiroglu, J., & Ertepinar, H. (2013). Turkish
pre-service elementary science teachers' scientific literacy level and attitudes
toward science. Science Education International, 24, 383-401.
Chen, C. H., & Howard, B. C. (2010). Effect of live simulation on middle school
students' attitudes and learning toward science. Educational Technology &
Society, 13, 133-139.

145
Chen, S. (2006a). Development of an instrument to assess views on nature of science
and attitudes toward teaching science. Science Education, 90, 803-819.
Chen, S. (2006b). Views on Science and Education (VOSE) questionnaire. Asia-
Pacific Forum on Science Learning and Teaching, 7, Article 11.
http://www.ied.edu.hk/apfslt/download/v7_issue2_files/chensf.pdf
Chionh, Y. H., & Fraser, B. J. (2009). Classroom environment, achievement,
attitudes and self-esteem in geography and mathematics in Singapore.
International Research in Geographical and Environmental Education, 18,
29-44.
Cleminson, A. (1990). Establishing an epistemological base for science teaching in
the light of contemporary notions of the nature of science and of how children
learn science. Journal of Research in Science Teaching, 27, 429-445.
Cohn, S. T., & Fraser, B. J. (in press). Effectiveness of student response systems in
terms of learning environment, attitudes and achievement. Learning
Environments Research.
Cojorn, K., Koocharoenpisal, N., Haemaprasith, S., & Siripankaew, P. (2013).
Effects of the Creative Problem Solving (CPS) learning model on matter and
properties of matter for seventh grade students. Journal of Education, 35, 18-
30.
Cooley, W. W., & Klopfer, L. E. (1963). The evaluation of specific educational
innovations. Journal of Research in Science Teaching, 1, 73-80.
Cronbach, L. J. (1951). Coefficient alpha and the internal structure of tests.
Psychometrika, 16, 297-334.
146
Dalgety, J., Coll, R. K., & Jones, A. (2003). Development of chemistry attitudes and
experiences questionnaire (CAEQ). Journal of Research in Science Teaching,
40, 649-668.
Demirbaş, M. (2009). The relationships between the scientist perception and
scientific attitudes of science teacher candidates in Turkey: A case study.
Scientific Research and Essays, 4, 565-576.
Demirbaş, M., & Yağbasan, R. (2006). Fen bilgisi öğretiminde bilimsel tutumların
işlevsel önemi ve bilimsel tutum ölçeğinin Türkçeye uyarlanma çalışması
[The functional importance of scientific attitudes in science teaching and
adaptation of scientific attitude scale into Turkish]. Uludağ üniversitesi
eğitim fakültesi dergisi, 19, 271-299.
den Brok, P., Fisher, D., Rickards, T., & Bull, E. (2006). Californian science
students' perceptions of their classroom learning environments. Educational
Research and Evaluation, 12, 3-25.
den Brok, P., Fisher, D., & Scott, R. H. (2005). The importance of teacher
interpersonal behaviour for student attitudes in Brunei primary science
classes. International Journal of Science Education, 27, 765-779. doi:
10.1080/09500690500038488
Doran, R. L., Guerin, R. O., & Cavalieri, J. (1974). An analysis of several
instruments measuring “nature of science” objectives. Science Education, 58,
321-329.
Dorman, J. P. (2003). Cross-national validation of What Is Happening In this Class?
(WIHIC) questionnaire using confirmatory factor analysis. Learning
Environments Research, 6, 231-245.

147
Dorman, J. P. (2008). Use of multitrait–multimethod modelling to validate actual
and preferred forms of the What Is Happening In this Class?(WIHIC)
questionnaire. Learning Environments Research, 11, 179-193.
Dorman, J. P., Aldridge, J. M., & Fraser, B. J. (2006). Using students' assessment of
classroom environment to develop a typology of secondary school
classrooms. International Education Journal, 7, 906-915.
Dorman, J. P., & Ferguson, J. M. (2004). Associations between students' perceptions
of mathematics classroom environments and self-handicapping in Australian
and Canadian high schools. McGill Journal of Education, 39(1), 69-86.
Eidietis, L., & Jewkes, A. M. (2011). Making curriculum decisions in K–8 science:
The relationship between teacher dispositions and curriculum content.
Journal of Geoscience Education, 59, 242-250.
Fennema, E., & Sherman, J. A. (1976). Fennema-Sherman mathematics attitudes
scales: Instruments designed to measure attitudes toward the learning of
mathematics by females and males. Journal for Research in Mathematics
Education, 7, 324-326. doi: 10.2307/748467
Ferguson, P. D., & Fraser, B. J. (1998). Changes in learning environment during the
transition from primary to secondary school. Learning Environments
Research, 1, 369-383.
Fisher, D. L., & Cresswell, J. (1998). Actual and ideal principal interpersonal
behaviour. Learning Environments Research, 1, 231-247.
Fisher, D. L., & Fraser, B. J. (1981). Validity and use of the My Class Inventory.
Science Education, 65, 145-156.

148
Fisher, D. L., & Fraser, B. J. (1983). A comparison of actual and preferred classroom
environments as perceived by science teachers and students. Journal of
Research in Science Teaching, 20, 55-61.
Fisher, D. L., & Fraser, B. J. (1990). School climate (SET research information for
teachers No. 2, Items 4 & 5). Melbourne, Australia: Australian Council for
Educational Research.
Fisher, D. L., Henderson, D. G., & Fraser, B. J. (1997). Laboratory environments and
student outcomes in senior high school biology. American Biology Teacher,
59, 214-219.
Fisher, D. L., & Waldrip, B. G. (1999). Cultural Factors of Science Classroom
Learning Environments, Teacher‐Student Interactions and Student Outcomes.
Research in Science & Technological Education, 17, 83-96. doi:
10.1080/0263514990170107
Francis, L. J., & Greer, J. E. (1999). Attitude toward science among secondary
school pupils in Northern Ireland: Relationship with sex, age and religion.
Research in Science & Technological Education, 17, 67-74.
Frankenberg, E. (2009). The demographic context of urban schools and districts.
Equity & Excellence in Education, 42, 255-271.
Fraser, B. J. (1977). Selection and validation of attitude scales for curriculum
evaluation. Science Education, 61, 317-329.
Fraser, B. J. (1978). Development of a test of science-related attitudes. Science
Education, 62, 509-515.
Fraser, B. J. (1981). Test of Science-Related Attitudes (TOSRA). Melbourne,
Australia: Australian Council for Educational Research.

149
Fraser, B. J. (1989). Twenty years of classroom climate work: Progress and prospect.
Journal of Curriculum Studies, 21, 307-327.
Fraser, B. J. (1990). Individualised Classroom Environment Questionnaire:
Handbook. Melbourne: Australian Council for Educational Research, ACER.
Fraser, B. J. (1998a). Classroom environment instruments: Development, validity,
and application. Learning Environments Research, 1, 7-33.
Fraser, B. J. (1998b). Science learning environments: Assessments, effects and
determinants. In B. J. Fraser & K. G. Tobin (Eds.), International handbook of
science education (pp. 527-564). Dordrecht, The Netherlands: Kluwer
Academic Publishers.
Fraser, B. J. (2002). Learning environments research: Yesterday, today and
tomorrow. In S. C. Goh & M. S. Khine (Eds.), Studies in educational
learning environments: An international perspective (pp. 1-25). Singapore:
World Scientific Publishing.
Fraser, B. J. (2012). Classroom learning environments: Retrospect, context and
prospect. In B. J. Fraser, K. G. Tobin & C. J. McRobbie (Eds.), Second
international handbook of science education (pp. 1191-1239). New York:
Springer.
Fraser, B. J. (2014). Classroom learning environments: Historical and contemporary
perspectives. In N. G. Lederman & S. K. Abell (Eds.), Handbook of research
on science education (Vol. II, pp. 104-119). New York: Rutledge.
Fraser, B. J., Aldridge, J. M., & Adolphe, F. S. G. (2010). A cross-national study of
secondary science classroom environments in Australia and Indonesia.
Research in Science Education, 40, 551-571. doi: 10.1007/s11165-009-9133-
1

150
Fraser, B. J., Aldridge, J. M., & Soerjaningsih, W. (2010). Instructor-student
interpersonal interaction and student outcomes at the university level in
Indonesia. The Open Education Journal, 3, 32-44.
Fraser, B. J., Anderson, G. J., & Walberg, H. J. (1982). Assessment of learning
environments: Manual for Learning Environment Inventory (LEI) and My
Class Inventory (MCI) (Third version). Perth: Curtin University of
Technology.
Fraser, B. J., & Fisher, D. L. (1986). Using short forms of classroom climate
instruments to assess and improve classroom psychosocial environment.
Journal of Research in Science Teaching, 23, 387-413.
Fraser, B. J., Giddings, G. J., & McRobbie, C. J. (1992). Assessing the climate of
science laboratory classes (What Research Says to Science and Mathematics
Teachers, 8). Perth: Curtin University of Technology.
Fraser, B. J., Giddings, G. J., & McRobbie, C. J. (1995). Evolution and validation of
a personal form of an instrument for assessing science laboratory classroom
environments. Journal of Research in Science Teaching, 32, 399-422.
Fraser, B. J., & Kahle, J. B. (2007). Classroom, home and peer environment
influences on student outcomes in science and mathematics: An analysis of
systemic reform data. International Journal of Science Education, 29, 1891-
1909. doi: 10.1080/09500690601167178
Fraser, B. J., & Lee, S. U. (2009). Science laboratory classroom environments in
Korean high schools. Learning Environments Research, 12, 67-84.
Fraser, B. J., & McRobbie, C. J. (1995). Science laboratory classroom environments
at schools and universities: A cross‐national study. Educational Research and
Evaluation, 1, 289-317.

151
Fraser, B. J., & O'Brien, P. (1985). Student and teacher perceptions of the
environment of elementary school classrooms. The Elementary School
Journal, 85, 567-580.
Fraser, B. J., & Raaflaub, C. A. (2013). Subject and sex differences in the learning
environment-perceptions and attitudes of Canadian mathematics and science
students using laptop computers. Curriculum and Teaching, 28, 57-78.
Fraser, B. J., & Tobin, K. G. (1991). Combining qualitative and quantitative methods
in classroom environment research. In B. J. Fraser & H. J. Walberg (Eds.),
Educational environments: Evaluation, antecedents and consequences (pp.
271-291). London: Pergamon Press.
Fraser, B. J., & Treagust, D. F. (1986). Validity and use of an instrument for
assessing classroom psychosocial environment in higher education. Higher
Education, 15(1-2), 37-57.
Fraser, B. J., Williamson, J. C., & Tobin, K. G. (1987). Use of classroom and school
climate scales in evaluating alternative high schools. Teaching and Teacher
Education, 3, 219-231.
Gardner, P. L. (1975). Attitudes to science: A review. Studies in science education,
2(1), 1-41.
Gardner, P. L. (1995). Measuring attitudes to science: Unidimensionality and internal
consistency revisited. Research in Science Education, 25, 283-289.
Geverdt, D., & Phan, T. (2006). Documentation to the NCES Common Core of Data
Public Elementary/Secondary School Locale Code File: School Year 2003-
04. Version 1a. NCES 2006-332.
Giddings, G. J. (1982). Presuppositions in school science textbooks. (Ph.D.), The
University of Iowa, Ann Arbor.

152
Gogolin, L., & Swartz, F. (1992). A quantitative and qualitative inquiry into the
attitudes toward science of nonscience college students. Journal of Research
in Science Teaching, 29, 487-504.
Goh, S. C., & Fraser, B. J. (1998). Teacher interpersonal behaviour, classroom
environment and student outcomes in primary mathematics in Singapore.
Learning Environments Research, 1, 199-229.
Hacieminoglu, E., Yilmaz-Tuzun, O., & Ertepinar, H. (2011). Middle school
students' attittude toward science in constructivist curroculum environment.
International Journal on New Trends in Education and Their Implications, 2,
1-6.
Haertel, G. D., Walberg, H. J., & Haertel, E. H. (1981). Socio‐psychological
environments and learning: A quantitative synthesis. British Educational
Research Journal, 7, 27-36.
Haertel, G. D., Walberg, H. J., & Weinstein, T. (1983). Psychological models of
educational performance: A theoretical synthesis of constructs. Review of
educational research, 53, 75-91.
Hasan, A., & Fraser, B. J. (2015). Effectiveness of teaching strategies for engaging
adults who experienced childhood difficulties in learning mathematics.
Learning Environments Research, 18, 1-13.
Heiss, E. D. (1958). Helping students develop a scientific attitude. The Science
Teacher, 25, 371-373.
Helding, K. A., & Fraser, B. J. (2013). Effectiveness of National Board Certified
(NBC) teachers in terms of classroom environment, attitudes and
achievement among secondary science students. Learning Environments
Research, 16, 1-21.

153
Hemphill, J. K., & Westie, C. M. (1950). The measurement of group dimensions.
The Journal of Psychology, 29, 325-342.
Hirata, S., & Sako, T. (1998). Perceptions of school environment among Japanese
junior high school, non-attendant, and juvenile delinquent students. Learning
Environments Research, 1, 321-331.
Houston, L. S., Fraser, B. J., & Ledbetter, C. E. (2008). An evaluation of elementary
school science kits in terms of classroom environment and student attitudes.
Journal of Elementary Science Education, 20, 29-47.
Hunt, D. E. (1975). Person–environment interaction: A challenge found wanting
before it was tried. Review of educational research, 45, 209-230.
Khalili, K. Y. (1987). A crosscultural validation of a test of science related attitudes.
Journal of Research in Science Teaching, 24, 127-136.
Khoo, H. S., & Fraser, B. J. (2008). Using classroom psychosocial environment in
the evaluation of adult computer application courses in Singapore.
Technology, Pedagogy and Education, 17, 67-81.
Kim, H. B., Fisher, D. L., & Fraser, B. J. (1999). Assessment and investigation of
constructivist science learning environments in Korea. Research in Science &
Technological Education, 17, 239-249.
Kim, H. B., Fisher, D. L., & Fraser, B. J. (2000). Classroom environment and teacher
interpersonal behaviour in secondary classes in Korea. Evaluation and
Research in Education, 14, 3-22.
Kim, J. O., & Mueller, C. W. (1978). Factor analysis: Statistical methods and
practical issues. Newbury Park, CA: Sage.

154
Klopfer, L. E. (1971). Evaluation of learning in science. In B. S. Bloom, J. T.
Hastings & G. F. Madaus (Eds.), Handbook on formative and summative
evaluation of student learning (pp. 556-642). New York: McGraw-Hill.
Klopfer, L. E. (1976). A structure for the affective domain in relation to science
education. Science Education, 60, 299-312.
Klopfer, L. E., & Cooley, W. W. (1963). The history of science cases for high
schools in the development of student understanding of science and scientists:
A report on the HOSG instruction project. Journal of Research in Science
Teaching, 1, 33-47.
Koh, N. K., & Fraser, B. J. (2014). Learning environment associated with use of
mixed mode delivery model among secondary business studies students in
Singapore. Learning Environments Research, 17, 157-171. doi:
10.1007/s10984-013-9139-5
Koth, C. W., Bradshaw, C. P., & Leaf, P. J. (2008). A multilevel study of predictors
of student perceptions of school climate: The effect of classroom-level
factors. Journal of educational psychology, 100, 96-104.
Koul, R. B., & Fisher, D. L. (2005). Cultural background and students' perceptions of
science classroom learning environments and teacher interpersonal behaviour
in Jammu, India. Learning Environments Research, 8, 195-211.
Lahiri, S. (2011). Assessing the environmental attitude among pupil teachers in
relation to responsible environmental behavior: A leap towards sustainable
development. Journal of Social Sciences, 7, 33-41.
Lai, K. W. (2013). Knowledge building with senior secondary students: a New
Zealand study. Paper presented at the 10th World Conference on Computers
in Education, Toruń, Poland.
155
Lai, M. C. (2012). Nature of science knowledge and scientific argumentation skills in
Taiwanese college biology students. Unpublished doctoral thesis, The Ohio
State University.
Lederman, N. G. (1983). Delineating classroom variables related to students'
conceptions of the nature of science. (Ph.D.), Syracuse University, Ann
Arbor. ProQuest Dissertations & Theses Full Text database. (University
Microfims No. 84-10, 728)
Lederman, N. G. (1992). Students’ and teachers’ conceptions of the nature of
science: A review of the research. Journal of Research in Science Teaching,
29, 331-359.
Lederman, N. G., & Zeidler, D. L. (1987). Science teachers' conceptions of the
nature of science: Do they really influence teaching behavior? Science
Education, 71, 721-734.
Lewin, K. (1936a). Principles of topological psychology. New York: McGraw.
Lewin, K. (1936b). Some social‐psychological differences between the United States
and Germany. Journal of Personality, 4, 265-293.
Lewin, K. (1943). Defining the field at a given time. Psychological review, 50, 292.
Lewin, K. (1946). Action research and minority problems. Journal of social issues,
2, 34-46.
Liang, J. C. (2002). Exploring scientific creativity of eleventh-grade students in
Taiwan. Unpublished doctoral thesis, University of Texas at Austin.
Lightburn, M. E., & Fraser, B. J. (2007). Classroom environment and student
outcomes among students using anthropometry activities in high‐school
science. Research in Science and Technological Education, 25, 153-166.

156
Liu, L., & Fraser, B. J. (2013). Development and validation of an English classroom
learning environment inventory and its application in China. In M. S. Khine
(Ed.), Application of Structural Equation Modeling in Educational Research
and Practice (pp. 75-89). Rotterdam: SensePublishers.
Logan, K. A., Crump, B. J., & Rennie, L. J. (2006). Measuring the computer
classroom environment: Lessons learned from using a new instrument.
Learning Environments Research, 9, 67-93.
Long, C., & Fraser, B. J. (2015). Comparison of alternative sequencing of middle-
school science curriculum: Classroom learning environment and student
attitudes. Curriculum and Teaching, 30(1), 23-36.
Lott, K. (2002). The evaluation of a statewide in-service and outreach program -
Preliminary findings. Paper presented at the Annual Meeting of the National
Association for Research in Science Teaching, New Orleans, LA.
Ly, R. K., & Malone, J. A. (2010). Teachers' perceptions of geometry instruction and
the learning environment in Years 9–10 ESL classrooms L. Sparrow, B.
Kisane, & C. Hurst (Eds.), Shaping the future of mathematics education:
Proceedings of the 33rd annual conference of the Mathematics Education
Research Group of Australasia. Fremantle: MERGA (pp. 367-374).
Mackay, L. D. (1971). Development of understanding about the nature of science.
Journal of Research in Science Teaching, 8, 57-66.
Mackay, L. D., & White, R. T. (1976). Tests of perception of scientists and self.
Melbourne: ACER.
MacLeod, C., & Fraser, B. J. (2010). Development, validation and application of a
modified Arabic translation of the What Is Happening In this Class?(WIHIC)
questionnaire. Learning Environments Research, 13, 105-125.

157
Majeed, A., Fraser, B. J., & Aldridge, J. M. (2002). Learning environment and its
association with student satisfaction among mathematics students in Brunei
Darussalam. Learning Environments Research, 5, 203-226.
Maor, D., & Fraser, B. J. (2005). An online questionnaire for evaluating students' and
teachers' perceptions of constructivist multimedia learning environments.
Research in Science Education, 35, 221-244.
Martin-Dunlop, C., & Fraser, B. J. (2008). Learning environment and attitudes
associated with an innovative science course designed for prospective
elementary teachers. International Journal of Science and Mathematics
Education, 6, 163-190.
Martin-Dunlop, C., & Hodum, P. (2009). Scientist–science educator collaborations:
Do they improve students' understanding of the nature of science? Journal of
College Science Teaching, 39, 66-75.
McRobbie, C. J., & Fraser, B. J. (1993). Associations between student outcomes and
psychosocial science environment. The Journal of Educational Research, 87,
78-85.
Mead, M., & Métraux, R. (1957). Image of the scientist among high-school students.
Science, 126, 384-390. doi: 10.1126/science.126.3270.384
Menis, J. (1989). Attitudes towards school, chemistry and science among upper
secondary chemistry students in the United States. Research in Science &
Technological Education, 7(2), 183-190.
Meyer, G. R. (1969). A Test of Interests. Milton, Queensland: Jacaranda Press.
Mitchell, J. V., Jr. (1969). Education's challenge to psychology: The prediction of
behavior from person-environment interactions. Review of educational
research, 39, 695-721. doi: 10.2307/3516017
158
Moore, R. W., & Foy, R. L. H. (1997). The scientific attitude inventory: A revision
(SAI-II). Journal of Research in Science Teaching, 34, 327-336.
Moore, R. W., & Sutman, F. X. (1970). The development, field test and validation of
an inventory of scientific attitudes. Journal of Research in Science Teaching,
7, 85-94.
Moos, R. H. (1973). Conceptualizations of human environments. American
Psychologist, 28, 652-665.
Moos, R. H. (1974). The Social Climate Scales: An overview. Palo Alto, CA:
Consulting Psychologists Press.
Moos, R. H. (1978). A typology of junior high and high school classrooms.
American Educational Research Journal, 15, 53-66.
Moos, R. H., & Trickett, E. J. (1974). Classroom Environment Scale: Manual. Palo
Alto, CA: Consulting Psychologists Press.
Mukhopadhyay, R. (2013). Teachers’ understanding of the nature of science and
competence in teaching science–An investigation. Educationia Confab, 2(4),
2-11.
Munby, H. (1997). Issues of validity in science attitude measurement. Journal of
Research in Science Teaching, 34, 337-341.
Murray, H. A. (1938). Explorations in personality. New York: Oxford University
Press.
Myers, R. E., & Fouts, J. T. (1992). A cluster analysis of high school science
classroom environments and attitude toward science. Journal of Research in
Science Teaching, 29(9), 929-937.

159
Nadelson, L. S., & Sinatra, G. M. (2010). Shifting acceptance of evolution:
Promising evidence of the influence of the Understanding Evolution website.
The Researcher, 23, 13-29.
Nadelson, L. S., & Viskupic, K. (2010). Perceptions of the nature of science by
geoscience students experiencing two different courses of study. Journal of
Geoscience Education, 58, 275-285.
National Research Council (NRC). Committee on a Conceptual Framework for New
K-12 Science Education Standards. (2012). A framework for K-12 science
education : Practices, crosscutting concepts, and core ideas. Washington,
D.C.: The National Academies Press.
NGSS Lead States. (2013). Next Generation Science Standards : For states, by
states. Washington, D.C.: National Academies Press.
Nix, R. K., Fraser, B. J., & Ledbetter, C. E. (2005). Evaluating an integrated science
learning environment using the Constructivist Learning Environment Survey.
Learning Environments Research, 8, 109-133.
Noll, V. H. (1935). Measuring the scientific attitude. The Journal of Abnormal and
Social Psychology, 30(2), 145-154.
Nunnally, J. (1978). Psychometric methods. New York: McGraw.
Ogbuehi, P. I., & Fraser, B. J. (2007). Learning environment, attitudes and
conceptual development associated with innovative strategies in middle-
school mathematics. Learning Environments Research, 10, 101-114.
Opolot-Okurut, C. (2010). Classroom learning environment and motivation towards
mathematics among secondary school students in Uganda. Learning
Environments Research, 13, 267-277.

160
Ormerod, M. B. (1971). The 'Social Implications' factor in attitudes to science.
British journal of educational psychology, 41, 335-338.
Osborne, J., Simon, S., & Collins, S. (2003). Attitudes towards science: A review of
the literature and its implications. International Journal of Science Education,
25, 1049-1079.
Oser, R., & Fraser, B. J. (2015). Effectiveness of Virtual Laboratories in Terms of
Learning Environment, Attitudes and Achievement among high-school
genetics students. Curriculum and Teaching, 30(2), 65-80.
Paige, R. M. (1979). The learning of modern culture: Formal education and
psychosocial modernity in East Java, Indonesia. International Journal of
Intercultural Relations, 3, 333-364.
Pallant, J. (2001). SPSS survival manual. A step by step guide to data analysis using
SPSS (3rd ed.). Berkshire, UK: Open University Press.
Peer, J., & Fraser, B. J. (2015). Sex, grade-level and stream differences in learning
environment and attitudes to science in Singapore primary schools. Learning
Environments Research, 18, 143-161.
Peiro, M. M., & Fraser, B. J. (2009). Assessment and investigation of science
learning environments in the early childhood grades. In M. Ortiz & C. Rubio
(Eds.), Educational evaluation: 21st century issues and challenges (pp. 349-
365). New York: Nova Science Publishers.
Pickett, L. H., & Fraser, B. J. (2009). Evaluation of a mentoring program for
beginning teachers in terms of the learning environment and student
outcomes in participants’ school classrooms. In A. Selkirk & M. Tichenor
(Eds.), Teacher education: Policy, practice and research (pp. 1-51). New
York: Nova Science Publishing.

161
Quek, C. L., Wong, A. F. L., & Fraser, B. J. (2005). Student perceptions of chemistry
laboratory learning environments, student–teacher interactions and attitudes
in secondary school gifted education classes in Singapore. Research in
Science Education, 35, 299-321.
Rentoul, A. J., & Fraser, B. J. (1979). Conceptualization of enquiry‐based or open
classroom learning environments. Journal of Curriculum Studies, 11, 233-
245.
Reynolds, A. J., & Walberg, H. J. (1991). A structural model of science achievement.
Journal of educational psychology, 83, 97-107.
Richardson, R., & Brouillette, L. (2013). Historic and Ethnic Music Found to
Increase Geographic Understanding: A Quasi-Experimental Study. Journal
for Learning through the Arts: A Research Journal on Arts Integration in
Schools and Communities, 9, Article.
http://www.escholarship.org/uc/item/71g4x3cr
Rickards, T., den Brok, P., & Fisher, D. (2005). The Australian science teacher: A
typology of teacher–student interpersonal behaviour in Australian science
classes. Learning Environments Research, 8, 267-287.
Roberge, G. D., Gagnon, L. L., & Oddson, B. E. (2011). The ideal classroom: A
comparative study of education and nursing student learning and
psychosocial environmental preferences. Institute for Learning Styles
Journal, 1, 1-16.
Robinson, E., & Fraser, B. J. (2013). Kindergarten students’ and parents’ perceptions
of science classroom environments: Achievement and attitudes. Learning
Environments Research, 16, 1-17.

162
Rubba, P. A., Harkness, W. J., & Bradford, C. S. (1996). A new scoring procedure
for the Views on Science-Technology-Society instrument. International
Journal of Science Research, 18, 387-400.
Rutherford, J., & Ahlgren, A. (1990). Science for all Americans. New York: Oxford
University Press.
Sandman, R. S. (1973). The development, validation, and application of a multi-
dimensional mathematics attitude instrument. Unpublished doctoral thesis,
University of Minnesota. ProQuest Dissertations & Theses Full Text
database.
Schibeci, R. A., & Fraser, B. J. (1987). Effects of classroom environment on science
attitudes: A cross‐cultural replication in Indonesia. International Journal of
Science Education, 9, 169-186.
Schmidt, D. J. (1967). Test on understanding science: A comparison among several
groups. Journal of Research in Science Teaching, 5, 365-366.
Scott, R. H., & Fisher, D. L. (2004). Development, validation and application of a
Malay translation of an elementary version of the Questionnaire on Teacher
Interaction. Research in Science Education, 34, 173-194.
Sinclair, B. B., & Fraser, B. J. (2002). Changing classroom environments in urban
middle schools. Learning Environments Research, 5, 301-328.
Sink, C. A., & Spencer, L. R. (2005). My Class Inventory-Short Form as an
accountability tool for elementary school counselors to measure classroom
climate. Professional School Counseling, 9, 37-48.
Smith, J. A. R. (2010). Historical short stories and the nature of science in a high
school biology class. (MS), Unpublished masters thesis, Iowa State
University.

163
Smith, P. R. (2013). Psychosocial learning environments and the mediating effect of
personal meaning upon satisfaction with education. Learning Environments
Research, 16, 259-280.
Sorge, C., Newsom, H. E., & Hagerty, J. J. (2000). Fun is not enough: Attitudes of
Hispanic middle school students toward science and scientists. Hispanic
Journal of Behavioral Sciences, 22, 332-345.
Soto-Rodriguez, M. (2005). A comparison of the perceptions of classroom
environment, attitudes and achievement of LEP (Limited English Proficient)
and Non-LEP students in integrated science classrooms. Unpublished
doctoral thesis, Curtin University of Technology.
Spinner, H., & Fraser, B. J. (2005). Evaluation of an innovative mathematics
program in terms of classroom environment, student attitudes, and conceptual
development. International Journal of Science and Mathematics Education,
3, 267-293.
Stern, G. G., Stein, M. I., & Bloom, B. S. (1956). Methods in personality assessment:
Human behavior in complex social situations. Glencoe, IL: Free Press.
Taylor, B. A., & Fraser, B. J. (2013). Relationships between learning environment
and mathematics anxiety. Learning Environments Research, 16, 297-313.
doi: 10.1007/s10984-013-9134-x
Taylor, P. C., Fraser, B. J., & Fisher, D. L. (1997). Monitoring constructivist
classroom learning environments. International Journal of Educational
Research, 27, 293-302.
Teh, G. P. L., & Fraser, B. J. (1995). Associations between student outcomes and
geography classroom environment. International Research in Geographical
& Environmental Education, 4(1), 3-18.
164
Tisher, R. P., & Power, C. N. (1978). The learning environment associated with an
Australian curriculum innovation. Journal of Curriculum Studies, 10, 169-
184.
Tobin, K. G., & Fraser, B. J. (1998). Qualitative and quantitative landscapes of
classroom learning environments. In B. J. Fraser & K. G. Tobin (Eds.),
International handbook of science education (pp. 623-640). Dordrecht, The
Netherlands: Kluwer Academic Publishers.
Tobin, K. G., Kahle, J. B., & Fraser, B. J. (Eds.). (1990). Windows into science
classrooms: Problems associated with higher-level cognitive learning.
London: Falmer Press.
Trickett, E. J., & Moos, R. H. (1973). Social environment of junior high and high
school classrooms. Journal of educational psychology, 65, 93-102.
Turkmen, L., & Bonnstetter, R. (1999, April). A study of Turkish preservice science
teachers' attitudes toward science and science teaching. Paper presented at
the Annual Convention of National Association of Research in Science
Teaching, Boston, MA.
Tytler, R., & Osborne, J. (2012). Student attitudes and aspirations towards science. In
B. J. Fraser, K. G. Tobin & C. J. McRobbie (Eds.), Second international
handbook of science education (pp. 597-625). New York: Springer.
Van Petegem, K., Aelterman, A., Van Keer, H., & Rosseel, Y. (2008). The influence
of student characteristics and interpersonal teacher behaviour in the
classroom on student's wellbeing. Social Indicators Research, 85, 279-291.
doi: 10.2307/27734582
165
Wahyudi, & Treagust, D. F. (2004). The status of science classroom learning
environments in Indonesian lower secondary schools. Learning Environments
Research, 7, 43-63.
Walberg, H. J. (1968). Structural and affective aspects of classroom climate.
Psychology in the Schools, 5, 247-253.
Walberg, H. J. (1980). A psychological theory of educational productivity. In F. H.
Farley & N. Gordon (Eds.), Psychology and education: The state of the union
(pp. 81-108). Berkely, CA: McCutchan Publishing.
Walberg, H. J. (1986). Synthesis of research on teaching. In M. C. Wittrock (Ed.),
Handbook of research on teaching (Vol. 3, pp. 214-229). New York:
Macmillan.
Walberg, H. J., & Anderson, G. J. (1968). Classroom climate and individual learning.
Journal of educational psychology, 59, 414-429.
Walberg, H. J., Singh, R., & Rasher, S. P. (1977). Predictive validity of student
perceptions: A cross-cultural replication. American Educational Research
Journal, 14, 45-49.
Walker, S. L. (2006). Development and validation of the test of geography-related
attitudes (ToGRA). Journal of Geography, 105, 175-181.
Wang, M. C., Haertel, G. D., & Walberg, H. J. (1993). What influences learning? A
content analysis of review literature. Review of educational research, 63,
249-294.
Waxman, H. C., & Huang, S. Y. L. (1997). Classroom learning environments in
urban elementary, middle, and high schools. Learning Environments
Research, 1, 95-113.

166
Weinburgh, M. H. (1994, April). Achievement, grade level, and gender as predictors
of student attitudes toward science. Paper presented at the Distinguished
Research Session of the annual meeting of the American Educational
Research Association, New Orleans, LA.
Welch, A. G. (2010). Using the TOSRA to assess high school students attitudes
toward science after competing in the FIRST robotics competition: An
exploratory study. Eurasia Journal of Mathematics, Science & Technology
Education, 6(3), 187-197.
Wolf, S. J., & Fraser, B. (2008). Learning environment, attitudes and achievement
among middle-school science students using inquiry-based laboratory
activities. Research in Science Education, 38, 321-341.
Wong, A. F. L., & Fraser, B. J. (1995). Cross-validation in Singapore of the Science
Laboratory Environment Inventory. Psychological Reports, 76, 907-911.
Wong, A. F. L., & Fraser, B. J. (1996). Environment–attitude associations in the
chemistry laboratory classroom. Research in Science & Technological
Education, 14, 91-102. doi: 10.1080/0263514960140107
Wong, A. F. L., Young, D. J., & Fraser, B. J. (1997). A multilevel analysis of
learning environments and student attitudes. Educational Psychology, 17,
449-468.
Wubbels, T. (1993). Teacher–student relationships in science and mathematics
classes (What Research Says to the Science and Mathematics Teacher, 11)
Perth: Curtin University of Technology.
Wubbels, T., & Brekelmans, M. (1998). The teacher factor in the social climate of
the classroom. In B. J. Fraser & K. G. Tobin (Eds.), International handbook
of science education (pp. 565-580). Dordrecht, The Netherlands: Kluwer.
167
Wubbels, T., & Brekelmans, M. (2012). Teacher–students relationships in the
classroom. In B. J. Fraser, K. G. Tobin & C. J. McRobbie (Eds.), Second
International Handbook of Science Education (pp. 1241-1255). New York:
Springer.
Wubbels, T., Créton, H., Levy, J., & Hooymayers, H. (1993). The model for
interpersonal teacher behaviour. In T. Wubbels & J. Levy (Eds.), Do you
know what you look like? Interpersonal relationships in education (pp. 13-
28). London: Falmer Press.
Yang, K. T., Wang, T. H., & Kao, Y. C. (2012). How an interactive whiteboard
impacts a traditional classroom. Education as Change, 16, 313-332.
Yeo, S. R. (2002). Evaluation of university physics studio learning environment: The
interrelationships of students' perceptions, epistemological beliefs and
cognitive outcomes. Unpublished doctoral thesis, Curtin University of
Technology, Perth. Retrieved from
http://adt.curtin.edu.au/theses/available/adt-WCU20030506.115009/
Zandvliet, D. B., & Fraser, B. J. (2004). Learning environments in information and
communications technology classrooms. Technology, Pedagogy and
Education, 13(1), 97-123.
Zandvliet, D. B., & Fraser, B. J. (2005). Physical and psychosocial environments
associated with networked classrooms. Learning Environments Research, 8,
1-17.
Zeidan, A. (2010). The relationship between grade 11 Palestinian attitudes toward
biology and their perceptions of the biology learning environment.
International Journal of Science and Mathematics Education, 8, 783-800.
Every reasonable effort has been made to acknowledge the owners of copyright material. I would be pleased to hear from any copyright owner who has been omitted or incorrectly acknowledged.

168
APPENDIX A
Questionnaire Assessing Classroom Environment, Attitudes
and Understanding of Nature of Science
Please select the one choice that best describes your response.
INVOLVEMENTIn this science class ...
Strongly Disagree
Disagree Uncertain Agree Strongly Agree
I discuss ideas in class. ❏ ❏ ❏ ❏ ❏
I give my opinions during class
discussions.
❏ ❏ ❏ ❏ ❏
The teacher asks me questions. ❏ ❏ ❏ ❏ ❏
My ideas and suggestions are used during classroom discussions.
❏ ❏ ❏ ❏ ❏
I ask the teacher questions. ❏ ❏ ❏ ❏ ❏
I explain my ideas to other students. ❏ ❏ ❏ ❏ ❏
Students discuss with me how to go about solving problems.
❏ ❏ ❏ ❏ ❏
I am asked to explain how I solve problems.
❏ ❏ ❏ ❏ ❏
INVESTIGATIONIn this science class ...
Strongly Disagree
Disagree Uncertain Agree Strongly Agree
I carry out investigations to test my ideas.
❏ ❏ ❏ ❏ ❏
I am asked to think about the evidence for statements.
❏ ❏ ❏ ❏ ❏
I carry out investigations to answer questions coming from discussions.
❏ ❏ ❏ ❏ ❏
I explain the meaning of statements, diagrams, and graphs.
❏ ❏ ❏ ❏ ❏
I carry out investigations to answer questions which puzzle me.
❏ ❏ ❏ ❏ ❏
I carry out investigations to answer the teacher’s questions.
❏ ❏ ❏ ❏ ❏

169
I found out answers to questions by doing investigations.
❏ ❏ ❏ ❏ ❏
I solve problems by using information obtained from my own
investigations.
❏ ❏ ❏ ❏ ❏
COOPERATIONIn this science class ...
Strongly Disagree
Disagree Uncertain Agree Strongly Agree
I cooperate with other students when doing assignments.
❏ ❏ ❏ ❏ ❏
I share my books and other resources with other students when
doing assignments.
❏ ❏ ❏ ❏ ❏
When I work in groups in this class, there is teamwork.
❏ ❏ ❏ ❏ ❏
I work with other students on projects in this class.
❏ ❏ ❏ ❏ ❏
I learn from other students in this class.
❏ ❏ ❏ ❏ ❏
I work with other students in this class.
❏ ❏ ❏ ❏ ❏
I cooperate with other students on class activities.
❏ ❏ ❏ ❏ ❏
Students work with me to achieve class goals.
❏ ❏ ❏ ❏ ❏
TASK ORIENTATIONIn this science class ...
Strongly Disagree
Disagree Uncertain Agree Strongly Agree
Getting a certain amount of work done is important to me.
❏ ❏ ❏ ❏ ❏
I do as much as I set out to do. ❏ ❏ ❏ ❏ ❏
I know the goals for this class. ❏ ❏ ❏ ❏ ❏
I know what I am trying to accomplish in this class.
❏ ❏ ❏ ❏ ❏
I pay attention during this class. ❏ ❏ ❏ ❏ ❏
I am ready to start this class on time. ❏ ❏ ❏ ❏ ❏
I try to understand the work in this class.
❏ ❏ ❏ ❏ ❏
I know how much work I have to do.
❏ ❏ ❏ ❏ ❏

170
SOCIAL IMPLICATIONS OF SCIENCEStrongly Disagree
Disagree Uncertain Agree Strongly Agree
Money spent on science is worth spending.
❏ ❏ ❏ ❏ ❏
Public money spent on science in the last few years has been spent
wisely.
❏ ❏ ❏ ❏ ❏
The government should spend more money on scientific research.
❏ ❏ ❏ ❏ ❏
Science helps to make life better. ❏ ❏ ❏ ❏ ❏
Science can help to make the world a better place in the future.
❏ ❏ ❏ ❏ ❏
Scientific discoveries are doing more good than harm.
❏ ❏ ❏ ❏ ❏
NORMALITY OF SCIENTISTSStrongly Disagree
Disagree Uncertain Agree Strongly Agree
Scientists are about as fit and healthy as other people.
❏ ❏ ❏ ❏ ❏
Scientists like sports as much as other people do.
❏ ❏ ❏ ❏ ❏
Scientists can have a normal family life.
❏ ❏ ❏ ❏ ❏
Scientists are just as interested in art and music as other people are.
❏ ❏ ❏ ❏ ❏
If you met a scientist, he or she would probably look like anyone
else you might meet.
❏ ❏ ❏ ❏ ❏
Scientists are as friendly as other people.
❏ ❏ ❏ ❏ ❏

171
TENTATIVE NATURE OF SCIENCEStrongly Disagree
Disagree Uncertain Agree Strongly Agree
Scientists are interested in better explanations of things.
❏ ❏ ❏ ❏ ❏
Scientific ideas can be changed. ❏ ❏ ❏ ❏ ❏
Scientists believe that little is known for sure.
❏ ❏ ❏ ❏ ❏
Scientific research will face change and old theories will be replaced.
❏ ❏ ❏ ❏ ❏
Scientific advances cannot be made in a short time.
❏ ❏ ❏ ❏ ❏
Scientific theory will advance and improve with the addition of new
information.
❏ ❏ ❏ ❏ ❏
EMPIRICAL BASIS OF SCIENCEStrongly Disagree
Disagree Uncertain Agree Strongly Agree
Scientists cannot always find the answers to their questions.
❏ ❏ ❏ ❏ ❏
Some questions cannot be answered by science.
❏ ❏ ❏ ❏ ❏
The senses (e.g. sight, touch, hearing, taste, and smell) are
important in science.
❏ ❏ ❏ ❏ ❏
Two theories can provide explanations from different
viewpoints.
❏ ❏ ❏ ❏ ❏
Scientists tend to accept the theory they are more familiar with.
❏ ❏ ❏ ❏ ❏
Scientists prefer simpler theories to complex ones.
❏ ❏ ❏ ❏ ❏
SCIENTIFIC METHODStrongly Disagree
Disagree Uncertain Agree Strongly Agree
Scientific questions are answered by observing things.
❏ ❏ ❏ ❏ ❏
Good scientists are willing to change their ideas.
❏ ❏ ❏ ❏ ❏
Scientists must report exactly what they observe.
❏ ❏ ❏ ❏ ❏
The scientific method leads to valid, clear, logical, and accurate results.
❏ ❏ ❏ ❏ ❏
Most scientists use the scientific method because it is logical.
❏ ❏ ❏ ❏ ❏
There is no fixed scientific method. ❏ ❏ ❏ ❏ ❏

172
Your School:
Your Teacher, Subject, and Period:
Your Name (Remember, your information will be coded and will be kept confidential):
The Involvement, Investigation, Cooperation and Task Orientation scales are based on the What Is Happening In this Class? (WIHIC, Aldridge, Fraser & Huang, 1999), the Social Implications of Science and Normality of Scientists scales are based on the Test of Science Related Attitudes (TOSRA, Fraser, 1981), and the Tentative Nature of Science and Empirical Basis of Science scales are based on the Scientific Attitudes Scale (SAI, Moore & Sutman, 1970) and Views on Science and Education (VOSE, Aikenhead & Ryan, 1992).