
Certification of Pork Products
39
CERTIFICATION OF PORK PRODUCTS Tomas Nilsson and Ken Foster The objective of this paper is to provide insights on the welfare distributional impact on consumer and producer welfare resulting from the development and implementation of a credence certification program in the U.S. pork sector. The certification program can provide various levels of tracking and tracing in the marketing chain. The modeling framework follows that of Nilsson (2005), which encompasses product differentiation and substitution across meat products at the consumer level and across live animal types at the farm level. Processors and retailers have potentially bilateral market power and can supply either or both certified and conventional meat products. One of the key findings is that while as the conventional market contracts and the certified market expands as expected, the magnitude depends on whether suppliers are single-or multiproduct providers. On aggregate, total welfare increases by 15 to 24 percent depending on industry structure. Selected Paper prepared for presentation at the American Agricultural Economics Association Annual Meeting, Providence, Rhode Island, July 24-27, 2005 Copyright 2005 by Tomas K. H. Nilsson and Ken Foster. All rights reserved. Readers may make verbatim copies of this document for non-commercial purposes by any means, provided that this copyright notice appears on such copies. Corresponding author: Tomas Nilsson, [email protected] . Nilsson is Assistant professor in Department of Rural Economy at the University of Alberta. Foster is Professor in the Department of Agricultural Economics Purdue University. The authors wish to acknowledge the contributions from the members at the Department of Agricultural Economics and Department of Economics at Purdue University and Department of Economics, SLU, Uppsala. Special thanks to Phillip Abbott, Corinne Alexander, Hans Andersson, Jim Eales, Clas Eriksson, Joan Fulton, Jayson Lusk, Doug Miller, Valentina Galvani, Dan Kovenock, Dayton Lambert, Stephen Martin, Phillip Paarlberg, Paul Preckel and Bo Öhlmer for comments on earlier versions of this paper. Obviously, the usual disclaimer applies.
Transcript of Certification of Pork Products

CERTIFICATION OF PORK PRODUCTS
Tomas Nilsson and Ken Foster
The objective of this paper is to provide insights on the welfare distributional impact on consumer and producer welfare resulting from the development and implementation of a credence certification program in the U.S. pork sector. The certification program can provide various levels of tracking and tracing in the marketing chain. The modeling framework follows that of Nilsson (2005), which encompasses product differentiation and substitution across meat products at the consumer level and across live animal types at the farm level. Processors and retailers have potentially bilateral market power and can supply either or both certified and conventional meat products. One of the key findings is that while as the conventional market contracts and the certified market expands as expected, the magnitude depends on whether suppliers are single-or multiproduct providers. On aggregate, total welfare increases by 15 to 24 percent depending on industry structure.
Selected Paper prepared for presentation at the American Agricultural Economics Association Annual Meeting, Providence, Rhode Island, July 24-27, 2005 Copyright 2005 by Tomas K. H. Nilsson and Ken Foster. All rights reserved. Readers may make verbatim copies of this document for non-commercial purposes by any means, provided that this copyright notice appears on such copies. Corresponding author: Tomas Nilsson, [email protected]. Nilsson is Assistant professor in Department of Rural Economy at the University of Alberta. Foster is Professor in the Department of Agricultural Economics Purdue University. The authors wish to acknowledge the contributions from the members at the Department of Agricultural Economics and Department of Economics at Purdue University and Department of Economics, SLU, Uppsala. Special thanks to Phillip Abbott, Corinne Alexander, Hans Andersson, Jim Eales, Clas Eriksson, Joan Fulton, Jayson Lusk, Doug Miller, Valentina Galvani, Dan Kovenock, Dayton Lambert, Stephen Martin, Phillip Paarlberg, Paul Preckel and Bo Öhlmer for comments on earlier versions of this paper. Obviously, the usual disclaimer applies.

2
1. Introduction
An issue that has come to the forefront of economic inquiry today is the impact on
consumer well-being from new product standards through voluntary certification and
labeling programs. Certification programs are increasingly popular in the U.S. economy
especially in the live animal industry foremost because of two factors. First, crucial food
attributes are unverifiable and unobservable but important in the minds for some
consumer segments.1 There is immense pressure from the public and consumer interest
groups on agribusinesses to meet concerns regarding credence qualities such as
environmental degradation, food safety and animal welfare issues. Second, certification
presents an opportunity for upstream suppliers, i.e. live animal producers to secure
market access to profitable marketing opportunities and potentially alleviate oligopsony
power in the live animal stages.
In this vein, food credence certification can be of tremendous importance to food
suppliers because it does not only meet consumer concerns but also provides access to
potentially profitable niche-markets. For example, the National Pork Board has instituted
voluntary programs such as the Pork Quality Assurance program (PQA), the Swine
Welfare Assurance Program (SWAP), and the Take Care – Use Antibiotics Responsibly
program. The PQA and Take Care programs were instituted in 1989 and 2004
respectively to address proper antibiotic use on farms. SWAP started in 2003 as an effort
to guarantee ethical live animal treatment on farms and in slaughter plants. Furthermore,
the National Council of Chain Restaurants (NCCR), and the Food Marketing Institute
(FMI) launched the Animal Welfare Audit Program (AWAP) in February 2004 to meet 1 Credence attributes are unobservable and unverifiable product characteristics (Darby and Karni, 1973).
3
the public concerns about the housing and treatment of animals on farms and in slaughter
plants.2
Public decision-makers are also taking an active interest in implementing
certification programs. For example, Texas A&M University developed in cooperation
with industry representatives an animal welfare program targeted to live animal
transporters. On a federal level, U.S. Department of Agriculture (USDA) agencies are
controlling the National Organic Program (NOP), the Process Verification Programs
(PVP), and the Country of Origin Labeling Act (COOL). The NOP stipulates the
standards for organic food products, and uses independent auditors to certify compliance
with the NOP guidelines. Compliance with the PVPs also uses third party auditors but
program participants can design their own protocol. The COOL is a voluntary labeling
scheme to inform the consumer about the country of origin for meat. Here, the retailer
and the processor must document the country of origin for beef, lamb, pork, fish,
perishable agricultural commodities and peanuts. The program will become mandatory
on September 30, 2006.3
2 However, the compelling question is whether these industry initiatives provide creditability for concerned consumers and add value for compliant pork producers because strict supplier compliance is not ensured. The auditor is unable to fine suppliers that are in violation of the protocols. Hence, a credible certification scheme most likely requires design and oversight by an independent and nonpartisan third party or a group with recognized authority in the certification area. Roller (2004) studies suitable certification programs that may be appropriate for Indiana pork producers. He suggests that certification protocols such as the Animal Welfare Guidelines of the Humane Farm Animal Care Group may be an appropriate choice for certification in the U.S. pork markets. 3 Lack of political support is the main reason why the U.S. Department of Agriculture cannot implement the program. There is some discussion that the COOL may be implemented jointly with the National Animal Identification System, e.g. Anderson and Hudson (2004).

4
However, the welfare distributional impact from certification and labeling
programs in the U.S. food market is by in large an unresolved issue. Although there is
concern about food safety, environmental degradation and animal welfare, not all
consumers are willing to pay for a credence certification program that alleviates these
concerns. Hence, the certified products may be imperfectly substitutable to the existing
conventional food products on aggregate. The problem for the consumer that prefers the
certification program is whether the new product enhances consumer welfare. The
problem for the consumer that prefers the conventional product is whether the
certification causes adverse price movements and therefore worsens consumer welfare in
the conventional market. From the perspective of the live animal producer and the
intermediary firm, the problem is that the certification may cause a consumer demand
expansion or contraction. Specifically, the supplier problem is to choose to supply either
in the conventional or the certified market or in both markets.4 From a positive
perspective, the intriguing question is how firm strategic behavior and preference
heterogeneity determines economic efficiency and the distribution of welfare when
suppliers launch a voluntary certification program. When the certified product does not
fully replace the conventional product, the conventional market competes with its
certified counterpart. The interaction between the certified and conventional markets may
enhance or erode firm market power. Consequently, the welfare impact from the
4 Consumer well-being, consumer welfare or consumer surplus are utilized interchangeably throughout the paper and refer to the value in dollars that the consumer attach of being able to consume the particular product. Producer profitability, producer surplus refer to returns to the quasi-fixed factors of production, also known as Ricardian rents.

5
differentiation program depends on not only on relative prices and the distribution of
consumers’ preferences but also on the competitive structure between firms.
The objective of this study is to shed light on the economic implications of
certification and labeling, with an application to the U.S. pork markets. The research
question is, how does certification and labeling affect consumer and producer surplus
when consumers have heterogeneous preferences and firms have market power? The
hypothesis is that the welfare distributional impact on consumer and producer welfare is a
function of individual consumer preferences, firm marginal cost as well as the
competitive conduct in the industry.
The certification program provides a pre-specified range of credence attributes,
which are product quality attributes that are unverifiable from the consumer’s perspective
but verified in a third-party independent auditing scheme. The certification program
controls the presence of credence attributes as the product passes through the market
stages. For example, the program may regulate or prohibit the usage of antibiotics,
growth-promoting hormones, feed ingredients, regulate slaughtering practices and control
retail shelf location.5
This study is counterfactual in nature, because as of April 2005, a national
voluntary certification program is forthcoming in the U.S. pork markets.6 The pork
markets in this context involve the whole food supply chain from pork producers,
packers, processors, distributors to retailers or other food outlets. The reference point is
5 Retail shelf space and location is a key predictor in determining the number of units sold for a particular good, see Corstjens and Doyle (1981). 6 The analytical and numerical model however assumes that there is a small initial market share for the certified good. Currently a segment of niche-firms supplies pork products that provide credence guarantee. Moreover, these niche-firms are owned by larger conventional processing and retailing firms.

6
therefore the current market situation, which is referred to as the ex-ante equilibrium or
the pre-certification market situation. The hypothetical equilibrium subsequent to the
introduction of the certification program is referred to as the ex-post equilibrium, or the
post-certification market situation.
The analytical model builds on Random Utility Maximization (RUM) theory
(McFadden, 1974). Aggregate demand and supply are found by aggregating individual
demand and supply functions over the population. The product market in consideration in
this analysis is the U.S. fresh cut pork markets, which involves the live animal (pork
producer) stages, meatpacking and retailing industries. The meatpacking and retail
industry is treated as an intermediate firm in this analysis. Market sources argue that the
fresh cuts market represents the greatest market potential because the cuts are labeled in a
uniform and consistent manner and included in the food pyramid. Additionally, the four
largest meatpacking firms have a national scope and could potentially implement a food
system wide certification scheme because they carry brands that are recognized by the
consumers.
Information about supply and demand for the ex-ante equilibrium is obtained
from current prices and production levels. Demand information regarding the certified
good originates from the stated preference study by Nilsson. The marginal cost of
certification is approximated from cost studies of certification programs (Foster, 2004;
Roller, 2004). Stakeholders in the agribusiness industry and policy makers considering
implementing and supervising meat certification programs may find the results of
importance when developing audit schemes within the scope of voluntary certification
programs.

7
Throughout, the following notation is employed. For notational convenience,
denote scalars as lower- and uppercase letters, e.g. Xx, ; vectors are boldfaced lowercase
letters, e.g. [ ]′= mxxx ,..., 21x ; matrices are boldfaced uppercase letters, e.g. X .
Moreover, live animal and retail demand and supply is subscripted as ( )RF , ,
respectively. Because the products are otherwise homogenous, we refer to the
conventional product as the low (quality) product and the certified pork product as the
high (quality) product denoted as ( )HL, , respectively. The subsequent section reviews
some of the previous conceptual and empirical studies. Chapter 3 presents the model and
Chapter 5 continues with an empirical application. Chapter 6 concludes.
2. Previous studies
An important determinant of demand is the consumer perception of product
quality. However, if some products are superior to others in the minds of the consumers
the intriguing question that arise is what motivates a firm to become a multiproduct
supplier instead of providing just the highest-quality variety? Lancaster (1990) provides a
conceptual argument for the underlying motivations behind multiproduct behavior. In his
view, there are foremost three factors that may explain multiproduct firm behavior,
namely scope economies, entry-deterrence and providing better match between consumer

8
preferences and product attributes (1990: 201).7 Gilbert and Matutes (1993) develop a
model in which all consumers agree on the quality ranking to analyze the economic
implications of a new product introduction. They find that all firms have incentive to
introduce the maximum number of product varieties. From an entry deterrent perspective
thus, the incumbent firm has incentive to prevent entry by “filling up” the product space.8
With respect to Lancaster’s third factor, the firm has incentives to increase total demand
by providing a better match between heterogeneous consumers and differentiated
products. Brander and Eaton (1984) build on this notion and coin the terms market
segmentation and market interlacing. In market segmentation, multiproduct firms supply
products that are close own-brand substitutes. In market interlacing however, firms
supply products that compete with the competitor’s product. Brander and Eaton provide
some intuition why firm would have this type of strategic behavior. They argue that firm
strategic behavior can be regarded as a sequential three-stage game. In the first stage
firms choose whether to entry or to stay out. In the second stage, firms make decisions
about the product line. In the third stage, the firm maximizes profit with respect to price
7 The scope economies perspective comes derives Baumol, Panzar and Willig contestable market theory (Baumol, 1982; Baumol, Panzar and Willig, 1983). The contestable market theory in its essence states that markets are always perfectly competitive. If there is free entry and incumbent firms earn positive economic profits, potential entrants have incentives to enter the market thus thereby lowering firm profits. However, if the incumbent firms have economies of scale and/or scope in production, there is some question to whether the economic outcome as stipulated by Baumol and Baumol, Willig and Panzar holds. Nevertheless, the notion of firm level economies of scale and scope argument is somewhat formalized by the latter authors. 8 Two classical references in this direction are Schmalensee (1978) and Scherer’s (1979) studies of the 1972 case between Federal Trade Commission and, at that time, the three leading U.S. ready-to-eat breakfast cereals manufacturers. Schmalensee and Scherer argue that the incumbent firms engaged in product introduction to prevent new entry and altogether introduced more varieties than socially optimal. Hence, an excessive product introduction exceeded the benefits from matching heterogeneous consumer preferences with a diverse range of product attributes.

9
or quantities. They argue that their decision-making model hold particularly strong
relevance for business decision makers picture because they “understand, before anything
is actually produced, how the non-cooperative output game will work” (p.332). However,
despite the fact that they provide a rigorous treatment of firm behavior, consumers are
assumed having a quadratic utility function so the individual consumer would always
prefer to consume several differentiated varieties see LaFrance (1985) and LaFrance and
Hanemann (1989).
In a similar fashion, Bulow, Geanakoplos and Klemperer (1985a, 1985b) study
how the competitive behavior between suppliers changes when the option arises to serve
two independent markets. They show that producer profit, as well as consumer surplus
may decrease when firms segment the markets. However, there is no substitution in
demand because the product markets are disconnected.
The literature on food certification and labeling in imperfectly competitive
environments take somewhat of a different route. Caswell and Mojduszka (1996) and
others for example argue that the food marketplaces suffer from asymmetric information,
“consumers may have misperceptions of the risks and hazards of consuming particular
foods” (1996: 1248). They reckon, “Food producers will supply food quality if it is
profitable for them or if they are required to do so. The contribution to profitability may
stem from increased product differentiation, sales, perhaps price, or from avoidance of
costly events such as food borne illness outbreak with associated tort liability” (1996:
1248). Therefore, voluntary labeling and certification can increase total sales and provide
a cost effective solution without government interference (1996: 1251).

10
Marette, Crespi and Schiavina (1999), and Crespi and Marette (2001 and 2002)
also argue that the problem is one of asymmetric information but in addition there is
imperfect competition involved too. The certified product is assumed superior to the
conventional, or vertically differentiated: sold at same prices, all consumers would
strictly prefer the certified product. While their policy implications are rather
straightforward, the behavioral assumptions built in the model are important drivers of
these results. For example, there is some controversy whether it is a problem of
incomplete or asymmetric information. Gathering, analyzing and providing food quality
information are costly activities for the firm. Antle (2001) argues that if firms are not
required to collect this information there is a problem of incomplete information.
Moreover, from a consumer standpoint, because consumers have heterogeneous
preferences it is uncertain whether all consumers would prefer the certified product see
also Antle (1996). Furthermore, Lutz (1997), Lutz, Lyon and Maxwell (2000) and
Nilsson et al (2003) suggest that the functional forms of demand, production cost and
type of strategic behavior drives the results in the vertical product differentiation model
with vertical product differentiation. Additionally, in a real-world context the single-
product framework may hold little relevance, because retailers may choose to stock
several product varieties. In this spirit, Sexton (2000) remarks that agricultural economics
fails to incorporate the notion of multiple levels of market power and multiproduct
technology.
The model presented here capitalizes on some of the fundamental aspects brought
up in the literature review that may influence the welfare distributional impact of a
certification and labeling program. As suggested by Antle, not all consumers may prefer

11
the certified product because consumers have heterogeneous preferences. Moreover,
there is no asymmetric information, rather one of imperfect information. Therefore, the
certified product is relatively more expensive than the conventional product. Schroeter
and Azzam, Perloff and Hyde and Sexton suggest that firms are potentially both
multiproduct providers and have bilateral market power. In the model presented here,
consumers have heterogeneous preferences, intermediary firms have market power and
upstream firms may differ with respect to production costs.
Figure I presents the economic unit of analysis, which is adapted from Nilsson
and Foster (2004). The partial equilibrium economy consists of three types of agents:
consumers, intermediary firms and upstream firms. The upstream firm is also referred to
as the producer. The producer is involved in the primary production stage, and utilizes the
production inputs capital, labor and land to produce an intermediary product. The
intermediary firm, also referred to as the downstream firm, produces the finished good by
using the intermediary product and other production inputs such as capital and labor. The
consumer buys the finished good in the downstream consumer market. The downstream
market is also referred to as the retail market.9
Consumers in this economy have potentially heterogeneous preferences. Without
loss of generality, it is assumed that a consumer represented in the figure is one of three
types. First, there is a distribution of consumers denoted as HIGH strictly prefers the
certified finished good. This group may strictly prefer credence characteristics, be a high-
income group, exhibit high degrees of risk aversion, preferences for product attributes
etc. Second, the consumer distribution denoted as LOW strictly prefers the conventional
9 Recall that the letter L and H is to represent the conventional and certified good, respectively.

12
finished good. The group may be extremely price sensitive and care relatively less about
credence characteristics, further discussed below. The third group finally, denoted as the
INDIFFERENT group consists of consumers that are price and credence characteristic
sensitive. The purchase decision for the latter segment depends thus on the relative prices
and the individual preferences for certification. Therefore, the demand encompasses thus
aspects of both vertical and horizontal product differentiation because on aggregate, the
products are imperfect substitutes at equal product prices.

13
Figure I. Conceptual Model of the U.S. Pork Supply Chain. Source: author’s construction.
Intermediate Product H
Intermediate Product L
UPSTREAM FIRM
Production Inputs: Capital, Labor, and Land
INTERMEDIARY FIRM
Finished Good H Finished
Good L
HIGH INDIFFERENT LOW
UPSTREAM PRODUCT MARKET
DOWNSTREAM CONSUMER
MARKET
Other Processing Inputs: Capital and
Labor
HETEROGENEOUS CONSUMERS
14
3. Partial Equilibrium Model
The consumer face a set of discrete choices and maximize utility in a random-
utility fashion e.g. McFadden (1974).10 All other economic activities are exogenous in
this framework and referred to as the outside option or the outside good. In particular, the
consumer maximizes utility by choosing the option that provides the highest level of
utility. The options consist of buying and subsequently consuming one unit of
conventional or certified pork chop, or purchase an outside good. The population consists
of N consumers. The finite choice set each consumer faces is denoted as { }OHLC ,,= ,
where ( )L refers to the conventional product, ( )H the certified product and finally ( )O
the outside option. Thus, this is an incomplete demand system because all other choices
are aggregated into an outside option. The ith product contains a vector of attributes
[ ]′= iiii PAB ,,x , where iB is the brand dummy for the ith product, iA the credence
certification attribute dummy, and iP is the product price. The vector of attributes that
10 This model is similar to the one that is used by the U.S. Department of Justice (DOJ) and the Federal Trade Commission (FTC) in determining the consumer welfare impacts from mergers see Werden and Froeb (1994). The model presented here and the one used by DOJ and FTC both normalize the price of the outside good to zero (1994: 410). There are subtle differences, however. In the DOJ and FTC model for example, the market share for the outside good is a function of the aggregate demand elasticity and so is exogenous (1994: 410). In this paper, however, the market shares are endogenous. Additionally, the utility vector for the outside good is endogenous because it is a function of relative prices, market shares and elasticities, whereas the demand model by DOJ and FTC has normalized the utility vector for the outside good to a constant (1994: 411).

15
describe the conventional product is [ ]′= LLL PB ,0,x , the certified product
[ ]′= HHHH PAB ,,x and the outside good is normalized to a zero vector so [ ]′= 0,0,0Ox .
The indirect utility function consists of a systematic utility component that may
vary across individuals and an idiosyncratic error term that varies across individuals and
product choices. Let the nth individual’s observable utility component be the vector
[ ]′= PnAnBnn ,,, ,, ββββ where the subscript ( )n refers to the nth individual, ( )B the brand,
( )A the credence attribute, and ( )P the price, respectively. The idiosyncratic error term is
distributed according to some distribution ( )ΣI,~niu . The nth consumer conditional
indirect utility function for the ith product is a function of the inner product of the utility
vector and the product characteristics and an additive idiosyncratic error
niini uV +′= βx . (1)
The product βx ′i is the part-worth utility, also referred to as the systematic utility
(Louviere, Hensher and Swait, 2000). The part-worth utility can be regarded as a base
utility that all consumers receive independently on their location in the distribution. The
total level of utility is also a function of the idiosyncratic error, however. If the error
terms are IID double exponential the purchase probabilities becomes McFadden’s
conditional Multinomial Logit, a.k.a. the MNL (McFadden, 1974; Andersson, de Palma
and Thisse, 1991). The total direct demand for the ith product is found by summing the
purchase probabilities over the total market potential RM so total direct demand
becomes,
CisMQ iRRiR .,,, ∈= , (2)

16
where iRs , is the purchase probability, ( ) CiMQQ RiiiRiR .,,,;,, ∈= −xβx is demand and
the subscripts refers to the ith finished or retail market, which is a function of all product
characteristics, including prices, the utility vector ( )β and the total retail market size RM .
Inverse demand is found by solving for the prices in Equation (2). The indirect demand
for the ith product is,
HLiQQM
QP
HRLRR
iRPii ,,ln
,,
,1 =⎥⎥⎦
⎤
⎢⎢⎣
⎡
−−+= −βφ . (3)
A final remark is important at this point. While the specification presented above
is semi-logarithmic, there are subtle differences between this model and the linear
demand model. Hausman suggests that linearized models are preferred over discrete
demand models such as the logit presented here and the Spence-Dixit-Stiglitz model. The
reason is that the discrete demand models fare badly especially in an empirical context
because it enforces an unreasonable substitution pattern (1994: 22-23).11 However, the
utility function that generates linear demands under the conditions stated above is
quadratic so each consumer would strictly be better off consuming several product
varieties.12
11 Barry, Levinsohn and Pakes develop an empirical demand model from random utility theory that potentially has reasonable substitution patterns. However, the model does not have a closed form analytical solution. 12 Moreover, for a linear demand system to be well- behaved and integrate to a proper utility function, the assumption of no income effects must be imposed, which is the first part of La France’s Theorem 2 (pp. 160).

17
Moreover, because income effects is not in the inverse demand, the area under the
Marshallian demand curve but over the equilibrium price is the correct measure of
consumer surplus.13
The upstream supplier, i.e. the live animal producer maximizes utility of profit
and is a price-taker in the input and output markets. The production technology may be
characterized by jointness in output so that one unit produced can be sold into different
product markets. Because only one output market is of interest in this study it is assumed
that the supplier can sell to two output markets, one aggregate output market and the one
studied here. The demand for the aggregate market is assumed perfectly elastic. The
producer per-unit profit is,
( ) iiiiii wrzrz −−+= 01 1π , (4)
where the subscript denote the activity choice, ( )01, ii rr denote the prices the supplier
receives for the ith product from each product market and ( )iw is the constant marginal
cost of production. The superscript on the output prices refers to the product market,
where 1 is the active product market of study in this analysis and 0 the constant market.
The index ( )iz refers to the share of one unit of output that is allocated to the active
market, [ ]1,0∈iz . The per-unit profit can be seen as a residual claim left to cover other
economic costs not directly attributed to a particular production activity.
The producer faces the same choice set as the consumer, denoted as
{ }OHLC ,,= . It is natural to refer to the choice set as production activities, which are
13 Nilsson derives the analytical expression for the consumer surplus. Comparative statics on the surplus expressions are ambiguous however, because exogenous terms appear in both the numerator and the denominator.

18
conventional ( )L , certified ( )H intermediary products, or participates in an outside
activity ( )O . The latter production activity is referred to in this analysis as the outside
option.14 Hence, the utility maximization problem for the nth supplier for the ith product
becomes,
( ) ( ) niiiniinini vwrzrzU +−−+= 01 1π , (5)
where niv is an idiosyncratic utility error term that may vary across suppliers and
production activities. The share of output allocated to the active market may differ across
production volume and suppliers. For purpose of analytical tractability however, the
share parameter, the production costs and the other aggregate market is held constant.
Moreover, the idiosyncratic error term is assumed following an IID double exponential
distribution. The inverse supply is derived analogous to the demand case,
HLiQQM
Qr
HFLFF
iFrii ,,ln
,,
,1 =⎥⎥⎦
⎤
⎢⎢⎣
⎡
−−+= −αα . (6)
The producer surplus is calculated as the area over the supply curve under the
equilibrium price level. The surplus is Ricardian Rent, i.e. return to quasi-fixed
production factors see discussion in Schmitz et al (2002).
The intermediary firms play a Cournot-Nash-Novshek game, in which each firm
maximizes profit with respect to output levels with a constant marginal cost of
transforming the live animal into a retail product. The profit maximization problem for
the nth firm is,
14 See Lusk and Hudson (2004), and Windle and Rolfe (2005) for a recent empirical application of RUM theory in a supplier context.

19
( ) ( ) ( )( ) ( ) nHHnLLLHHnLHLL
nHLHHnLHLLnHnL
qcqcqQQrqQQr
qQQPqQQPqqMax
nH ,,,
,,,,
,,,
,,,
−−−−
+=π, (7)
where ( )jii QQP , and ( )jii QQr , are the inverse demand and supply, respectively, niq ,
the nth firm output, and ic the firm’s constant marginal cost of production for
( )jiHLji ≠= ,,, . Note that this formulation also encompasses the single product firm’s
optimization problem by omitting the expressions ( )jjjnj crPq ,,,, . For the multiproduct
firm, there are two first order conditions. Dropping the subscript for the firm to avoid
confusion, the first order conditions are,
( )
( ) 01
1
=⎟⎟⎠
⎞⎜⎜⎝
⎛−−
−⎟⎟⎠
⎞⎜⎜⎝
⎛
−−
−−
⎟⎟⎠
⎞⎜⎜⎝
⎛−−
+⎟⎟⎠
⎞⎜⎜⎝
⎛
−−
−+−−=
∂∂
HLF
j
HLFL
jFi
HLR
j
HLRi
jRiiii
i
QQMq
QQMQQMq
QQMq
QQMQQMq
crPq
αα
ββπ
, (8)
for ( )jiHLji ≠= ,,, . The expression ( ) ( )( ) 111 −−− −−− HLFiLFi QQMQQMq β is the
own-product markup whereas ( ) 11 −−− −− HLRi QQMq β is the cross-product markup in the
downstream markets. Consequently, in the multiproduct case, products in the product mix
can influence several product markets simultaneously. The expression
( ) ( )( ) 111 −−−
− −−− HLFiiFi QQMQQMqα is the own-product markdown and
( ) 11 −−− −− HLFi QQMq α the cross-product markdown. If the firm is a single-product
provider, the cross-product expressions cancel. If the conventional and certified product
are homogeneous, the first order conditions would reduce to those stated by previous
researchers, e.g. Appelbaum, Azzam and Sexton where the price spread is determined by

20
the own price elasticity of demand, the supply elasticity, as well as the conjectural
elasticities in the output and input markets.
Here, however, the new product introduction may have a countervailing market
power effect in several markets, i.e. the markup (markdown) in the output (input) market
may decrease as the degree of product differentiation increases. This occurs because of
the increased substitution possibilities provided to consumers (upstream suppliers) in the
downstream (upstream) market. Therefore, in the first order condition, the first term on
the right hand side and the first term on the left hand side of the equality sign is referred
to as the direct or own-competitive effect, whereas the second term is referred to as the
indirect or cross-competitive effect. It is therefore plausible that for the multiproduct
firm, there may be strong anti- or pro-competitive effects in the post-certification
scenario.
There are a total of ( )n intermediary firms in the certified and conventional
markets. In the ex-ante scenario, the certified market is assumed perfectly competitive.
Therefore, in the ex-ant scenario with single-product intermediary firms, there are ( )2n
firms that can influence the conventional upstream and downstream prices through their
strategic behavior whereas the ( )2n intermediary firms in the certified market are price-
takers. In the ex-post scenario however, the intermediary firms in the certified market can
influence the market price through their strategic behavior. The ex-ante scenario is
plausible in circumstances where the intermediary firm applies a simple cost-plus pricing
for the certified product while it is in its maturing stages. The ex-post scenario can thus
represent a situation where the manager knows more about the market conditions and can
price the certified product accordingly to his optimizing behavior.

21
4. An Application: U.S. Pork
The partial equilibrium model presented above is applied in the U.S. pork market.
The intermediary firm processes the live animal to a finished consumer good, fresh pork
cuts. The markets for other pork products are held constant in the analysis. The
certification program can control a particular product attribute or the processes by which
the product passes through the marketing channel. The program may for example
regulate, or prohibit the usage of antibiotics, growth-promoting substances, enforce
environmental compliance, require humane animal treatment in production, regulate the
retail-shelf location, etc.
It is assumed that the intermediary industry-C4 is 100 percent, so four firms
operate in the market. It is assumed that the intermediary firm is either perfectly
competitive, a single-product bilateral oligopolistic firm or a multiproduct bilateral
oligopolistic firm. 15
Total consumption of pork chop is derived from public sources. For the last
recorded year, 2003, the total consumption pork in carcass weight was 19.4 billion
pounds. The retail price for the conventional pork cut is 3.45 dollars per pound see
Nilsson for details. In 2003, the average farm price received for pork is 0.70 dollars per
pounds. The loin consists of 18% of the carcass (NPB, 2005). In this study, it is assumed
that only the pork loin can be labeled. It is however, a conservative level because up to
50% of the carcass can potentially be uniquely certified and labeled. The conversion
factor carcass to retail weight is 0.78 (ERS, 2005). Consumption of loin in retail weight is
therefore 2.71 billion pounds. The initial market share for certified is set at 5 percent of 15 See Nilsson for scenarios that are more elaborate. The scenarios presented here, however, encompasses the results presented in Nilsson.

22
total current consumption, 0.14 billion pounds. Nilsson describes the procedure for which
the demand, supply and intermediary firm marginal cost functions are parameterized and
Table 1 displays the results from calibrating demand and supply using the baseline data.
Table 1. Calibrated Inverse Demand and Supply Functions. Variable Units Conventional Certified None DEMAND Intercept 2.91* 3.57* --- Slope coefficient -1.52 -1.52 --- Price $/lbs 3.45* 6.13 0.00* Quantity billion lbs 2.58* 0.14* 5.85 Market share % 30.0 2.00 68.0 SUPPLY Intercept 1* 3.58 --- Slope coefficient 0.08 0.08 --- Price $/lbs 0.70* 1.33 0.00* Quantity billion lbs 2.58* 0.14* 46.3 Market share % 5.30 0.20 94.5 Notes: The figures are rounded. Total consumption in carcass weight is 19.4 billion pounds (bn lbs). The loin consists of 18% of the carcass. The conversion factor carcass to retail weight is 0.78. Consumption of loin in retail weight is 2.71 bn lbs. Fixed variables denoted by a “*”. Initial market share for certified is set at five percent of total current consumption, 0.14 bn lbs. Total retail market size (MR) is 8.57 and total farm market size (MF) is 49.0 bn lbs. Sources: USDA, NPB and author’s calculation.
The retail price premium for the certified good is 78 percent (=6.13/3.45-1),
whereas the farm price premium is somewhat higher at 90 percent. Because of the joint-
ness in output, the farm price represents the price for just a share of one unit of output.
That is, if the farmer supplies one certified live animal to the retail market, the total price
the farmer receives is ( ) HH wrzz −−+= 0133.1π , where z is the share of live animal
that can be sold as pork chops, i.e. 18 percent, and ( )Hwr ,0 the price received for the
other parts of the live animal and the production costs per live animal, respectively.
23
The calibrated marginal cost for the conventional multiproduct, single-product
and perfectly competitive firm is 2.33, 2.34 and 2.75 pounds per pound. The certified
marginal cost is 5.75, 5.97 and 6.31 dollars per pound. However, in the ex-post scenario,
the constant marginal cost for the certified products is assumed fifty percent higher than
the conventional marginal cost. Note that this assumption implies that the certified
marginal cost decreases in comparison to its ex-ante counterpart and the certified cost
decreases by 39, 58 and 35 percent, respectively. The relative reduction in marginal cost
can be motivated for two reasons. First, because the conventional and certified products
are otherwise homogonous and the certification program is launched in a national scale,
the certified supply chain can utilize the conventional supply channels. There are
anecdotal evidences that smaller firms have higher (constant) marginal cost of production
because of differences in production technology. Antle (2001: 315) shows that smaller
domestic processing firms have relatively higher variable production costs because of
technological differences. For example, the mean average animal and labor cost for the
small pork processing plants is 0.72, whereas 0.63 dollar per pound for large plants.
Large plants are defined as supplying more than 100 million pounds annually.
Additionally, Ollinger et al (2005) discusses the structural changes in the U.S. meat
supply chain and suggest that small firms exit over time because they have relatively
higher production costs than the larger counterparts. Therefore, it is assumed that the ex-
post suppliers adopts the conventional production and processing technologies and
thereby manage to lower production costs. Anecdotal evidence seems to support this
argument for certified firms that currently are serving markets with credence guaranteed
meat products, moreover these niche firms are privately owned by the large-scale

24
processing firms. Second, economic feasibility studies of certification indicate that an
animal certification program shifts the processor-retailer’s marginal cost by at most fifty
percent relative to conventional production (Roller, 2004; Foster, 2004).
5. Discussion of Results and Findings
Figure II depicts the demand and supply shifts in the conventional market under
perfect competition. Consumers and producers switch from the conventional market to
the certified market, so there is a decrease in demand and supply in the conventional
market.

25
3.36
3.38
3.40
3.42
3.44
3.46
3.48
3.50
3.52
3.54
2.35 2.40 2.45 2.50 2.55 2.60 2.65billion lbs
$/lb
s
D (pre)D (post)S (pre)S (post)
Figure II. The Conventional Market under Perfect Competition. The downward sloping demand curve is labeled “D”, the upward sloping supply curve “S” is the sum of the marginal cost of processing and the farm supply. The dotted lines represent the ex-ante scenario and the bold lines the ex-post scenario. Source: author’s calculation.
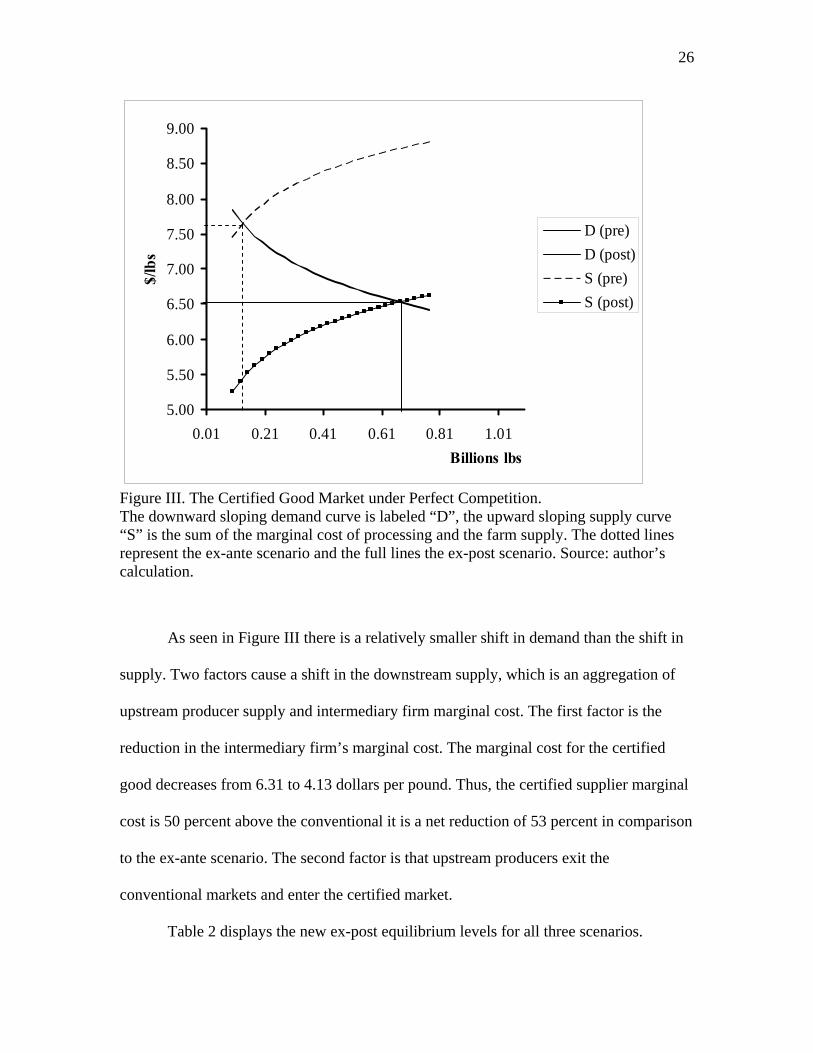
In the certified market, the retail price decreases by 15 percent from 7.64 to 6.53
dollars per pound. The farm price increases by 81 percent from 1.33 to 2.40 dollars per
pound, see Figure III.
26
5.00
5.50
6.00
6.50
7.00
7.50
8.00
8.50
9.00
0.01 0.21 0.41 0.61 0.81 1.01Billions lbs
$/lb
s
D (pre)D (post)S (pre)S (post)
Figure III. The Certified Good Market under Perfect Competition. The downward sloping demand curve is labeled “D”, the upward sloping supply curve “S” is the sum of the marginal cost of processing and the farm supply. The dotted lines represent the ex-ante scenario and the full lines the ex-post scenario. Source: author’s calculation.
As seen in Figure III there is a relatively smaller shift in demand than the shift in
supply. Two factors cause a shift in the downstream supply, which is an aggregation of
upstream producer supply and intermediary firm marginal cost. The first factor is the
reduction in the intermediary firm’s marginal cost. The marginal cost for the certified
good decreases from 6.31 to 4.13 dollars per pound. Thus, the certified supplier marginal
cost is 50 percent above the conventional it is a net reduction of 53 percent in comparison
to the ex-ante scenario. The second factor is that upstream producers exit the
conventional markets and enter the certified market.
Table 2 displays the new ex-post equilibrium levels for all three scenarios.

27
Table 2. Ex-Post Equilibrium. Perfect Competition Single-product Multiproduct Total volume (bn lbs) 3.14 3.36 3.05 Relative market share 0.27 0.40 0.29 Conventional Quantity (bn lbs) 2.46 2.40 2.36 Retail price ($/lbs) 3.43 3.42 3.47 Farm price ($/lbs) 0.68 0.66 0.65 Marginal cost ($/lbs) 2.75 2.20 2.33 Certified Quantity (bn lbs) 0.67 0.97 0.69 Retail price ($/lbs) 6.53 6.26 6.52 Farm price ($/lbs) 2.40 2.64 2.41 Marginal cost ($/lbs) 4.13 3.30 3.50 Notes: The single- and multiproduct scenarios refer to the 4-firm bilateral oligopoly. Source: author’s calculation.
The largest ex-post total consumption, measured as conventional plus certified
volume, resides in the single-product bilateral oligopoly case, whereas the multiproduct
case has the lowest ex-post volume. In perfect competition, however, the conventional
volume is the largest of the three scenarios. The reason is that the imperfectly competitive
firms can restrain the conventional output. In particular, the multiproduct firm restrains
output relatively more than does the single-product firm. Moreover, the certified volume
in the imperfectly competitive regime is relatively higher than in perfect competition. The
driving reason why these differences are observed is that the firm optimality conditions
are functions of relative prices and costs as well as firm conduct. The impact of
certification relative to the ex-ante equilibrium becomes clearer upon calculating the
percentage change in prices and quantities depicted in Table 3.

28
Table 3. Percentage Changes in Equilibrium Prices and Quantities. Perfect Competition Single-product Multiproduct Total volume (bn lbs) 16 24 13 Conventional Quantity (bn lbs) -4 -7 -8 Retail price ($/lbs) -1 -1 0 Farm price ($/lbs) -3 -5 -7 Certified Quantity (bn lbs) 398 614 409 Retail price ($/lbs) -15 -18 -15 Farm price ($/lbs) 81 99 81 Notes: The single- and multiproduct scenarios refer to the 4-firm bilateral oligopoly. Source: author’s calculation.
From the table it is clear that while as there is an expansion of total consumption
in the ex-post environment the changes in each of the markets is relatively different. For
example, for the multiproduct case the conventional market contracts relatively more and
the certified market expands relatively less than in perfect competition. This change is
accompanied by a relatively larger decrease in conventional farm price and an unchanged
retail price. This effect is caused by the fact that the multiproduct provider can influence
the price-spread through its direct and indirect effect. However, as indicated earlier,
although the multiproduct firm profit is lower than for the equivalent single-product case,
the multiproduct firm appears to be somewhat more resilient to change, i.e. it manages to
withhold its grip on both markets. This resilience to change can be seen in the single-
product case above where the conventional retail and farm prices decrease as much as in
perfect competition. Continuing, in the certified market, the prices in the multiproduct
and perfect competition case increased nearly the same amount, however, the volume
increased more in the former case. In the single-product case, there is a relatively larger

29
expansion in output and the price-spread shrunk relatively more than in the multiproduct
case. The relative changes in welfare are summarized in Table 4 below.
Table 4. Percentage Changes in Welfare. Perfect Competition Single-product Multiproduct Conventional CS -4 -6 -8 PS -4 -7 -8 Profit -12 7 TW -4 -6 -5 Certified CS 422 668 433 PS 401 621 412 TW 412 1036 655 Both markets CS 14 23 10 PS 15 24 12 Profit 27 46 TW 15 24 19 Notes: The single- and multiproduct scenarios refer to the 4-firm bilateral oligopoly. CS is consumer surplus; PS is producer surplus; Profit is intermediary firm profit; TW is the sum of consumer and producer surplus and intermediary firm profit. In the multiproduct case, the profit row in the both market section is total intermediary firm profits; the profit row in the conventional and certified section refers to the profit that accurse to the firm in the aforementioned markets. Source: author’s calculation.
As depicted by the table, the distributional impact from certification on consumers
and producers depends on the competitive structure of the industry. For both the single-
and multiproduct firm, conventional consumers and producers surplus decreases
relatively more than in perfect competition. For the multiproduct firm, consumer and
producer surplus decrease relatively more than in the single product case. Moreover, the
multiproduct firm profit increase in the conventional market whereas profit decreases for
the conventional single-product firm. In the certified market, consumer and producer
surplus increase more than in the other two scenarios.

30
On aggregate therefore, consumer and producer surplus increase relatively more
in the single-product than the multiproduct or perfect competition scenario. Moreover,
multiproduct firm profit increases relatively more than in the other two scenarios. Total
welfare, measured as the sum of consumer and producer surplus and intermediary firm
profits, increases the most in the single-product scenario because of the relatively larger
expansion in the certified market.
6. Summary
Introducing a voluntary certification and labeling program in a marketplace where
consumers have heterogeneous preferences and firms have potentially market power lead
to a situation in which the certified product cannot replace the conventional product.
Although the certified good market expanded by between 400 to 800 percent, the
conventional market remained quite large in the ex-post equilibrium. Thus, the certified
good could not replace the conventional product. Two determinants drive this result,
namely the distribution of consumer preferences and the upward sloping marginal cost
curve. There is a welfare increase by 15 percent in the perfect competition scenario.
Moreover, in comparison to a situation where the intermediary firms are single product
versus multiproduct providers, the model predicts that the multiproduct firm retains some
market power ex-post certification. The numerical results indicate that markets become
more competitive when firms are single product providers. In particular, the multiproduct
provider can cause a price increase in the conventional market despite the demand
contraction. The primary driver of this result comes from the fact that the firm can control
the output in both markets via a direct and indirect effect that act as a pro-competitive

31
dampening effect. This insight may be in somewhat contrast to Brander and Eaton’s
discussion. They argue, “A fairly common historical pattern is for firms to expand the
scope of their product offerings and compete more directly with each other as the market
grows” (1984, p.323). However, the results presented here indicate that markets become
relatively more competitive when firms are single product providers. The mere fact that
the firm can influence the market via the direct and indirect effect softens the
competition.
In summary, the contribution of this paper is three-fold. First, the firm strategic
behavior boils down to a simultaneous decision process, rather than sequential, via the
mere formulation of the optimization problem. Although Brander and Eaton argue that
sequential managerial decision processes are more realistic, it is not exactly the
contention of the workings of the studied industry. Firm strategic behavior is a
simultaneous process and not sequential. Second, the partial equilibrium economy is
consistent with utility maximization theory in which the consumers have heterogeneous
preferences and regard products as both vertically and horizontally differentiated. This is
an important distinction from previous studies. Stole derives the firm optimality
conditions in terms of elasticities. However, in our model, there is a shift in demand and
supply so the formulation provides little guidance. Gilbert and Matutes work in a vertical
product differentiation framework, whereas in this study, consumers have heterogeneous
preferences and thus value products differently.
The third contribution is that the study provides guidance to the stakeholders in
the industry. The certification program may be a profitable strategy that ensures market
access, alleviates market power, and expands the consumer-end market. While the model

32
predicts that a lion’s share of total consumption comes from the conventional supply
chain, the certified product market does expand. A pork producer weighting the pros and
cons of engaging in a certification program should consider its own cost of production. If
the pork producer cannot commit to the certification program, she may incur a surplus
loss. For the packer-retailer, the program may be a profitable strategy that matches
heterogeneous consumer demand preferences with extensive certified and conventional
product diversification. Thus, by supplying products with different product attributes,
firms differentiate among different consumers on basis of their different willingness to
pay for different product attributes.
For policy makers, the model offers insight on whether the program reduces the
intermediary firms’ abilities to influence the market price via its strategic behavior. An
increase of the product variety may provide a better match between consumers with
heterogeneous tastes and products with different quality attributes. Hence, consumers
concerned about the environment, animal welfare and antibiotic residues may find the
program beneficial as the retailer supply products that better match their preferences,
hence enhance their well-being.16
16 Moreover, the economic model presented here does not capture the potential economic benefits that the certification may provide from reducing or eliminating economic externalities. In such instance, the welfare increase presented here is likely to be understated.
33
REFERENCES
Aiginger, Karl, 1999, “The Use of Game Theoretical Models for Empirical Industrial Organization,” Competition, Efficiency, and Welfare: Essays in Honor of Manfred Neumann, Boston; Dordrecht and London: Kluwer Academic: 253-277.
Akerlof, George A., 2001, “Prize Lecture, Behavioral Macroeconomics and Macroeconomic Behavior,” In: Les Prix Nobel, the Nobel Prizes 2001, Tore Frängsmyr (Ed.), Stockholm: 365-394.
Anderson, John D., and Darren Hudson, 2004, “Potential Impact of Country-of-Origin Labeling on Beef Industry Structure,” Choices, 19(4): 21-24.
Andersson, Simon P., Andre de Palma, and Jacques-Francois Thisse, 2001, Discrete Choice Theory of Product Differentiation, Cambridge and London: the MIT Press, 423 p.
Antle, John M., 2000, “No Such Thing as a Free Safe Lunch: The Cost of Food Safety Regulation in the Meat Industry,” American Journal of Agricultural Economics, 82(2): 310-22.
Antle, John M., 2001, “Economic Analysis of Food Safety,” In: Handbook of Agricultural Economics, 1B, Marketing, Distribution and Consumers, Bruce L. Gardner, and Gordon C. Rausser (Eds.), Handbooks in Economics, 18, Amsterdam; London and New York: Elsevier Science, North-Holland: 1083-1136.
Baumol William J., 1982, “Contestable Markets - An Uprising in the Theory of Industry Structure,” American Economic Review, 72 (1): 1-15.
Baumol William J., John C. Panzar, and Robert D. Willig, 1983, “Contestable Markets - An Uprising in the Theory of Industry Structure - Reply,” American Economic Review, 73 (3): 491-496.
Boessen Christian, John D. Lawrence, and Glenn Grimes, 2003, “Production and Marketing Characteristics of U.S. Pork Producers,” Agricultural Economics Working Paper 2004-4. Internet: http://www.porkboard.org/EconMktInfo/Production%20and%20Marketing2003.doc, Accessed: 5 April, 2005.

34
Bulow, Jeremy I., John D. Geanakoplos, and Paul D. Klemperer, 1985, “Multimarket Oligopoly: Strategic Substitutes and Complements,” Journal of Political Economy, 93(3): 488-511.
Bulow, Jeremy I., John D. Geanakoplos, and Paul D. Klemperer, 1985, “Holding Idle Capacity to Deter Entry (The Role of Investment in Entry Deterrence),” Economic Journal, 95(127): 178-82.
Caswell, Julie A., and Eliza M. Mojduszka, 1996, “Using Informational Labeling to Influence the Market for Quality in Food Products,” American Journal of Agricultural Economics, 78(5): 1248–1253.
Corstjens, Marcel, and Peter Doyle, 1981, “A Model for Optimizing Retail Space Allocations,” Management Science 27(7): 822-833.
Crespi, John M., and Stéphan Marette, 2001, “How Should Food Safety Certification Be Financed?” American Journal of Agricultural Economics, 83(4): 852-862.
Darby, Michael R., and Edi Karni, 1973, “Free Competition and the Optimal Amount of Fraud,” Journal of Law and Economics, 16(1): 67-88.
Esfahani, Elizabeth, 2003, “PETA Accuses Smithfield Food Inc. of Cruelty to Pigs,” Richmond Times-Dispatch (VA), HTML: http://search.epnet.com/direct.asp?an=2W62287231476&db=nfh, Accessed: 7 May 2003.
Foster, Kenneth A., 2004, Education Committee of the Indiana Pork Producers Association, Purdue University Extension Meeting, 30 November 2004.
Gilbert, Richard J.; Matutes, Carmen, 1993, “Product Line Rivalry with Brand Differentiation,” Journal of Industrial Economics, 41(3): 223-241.
Golan, Elise, Fred Kuchler, and Lorraine Mitchell, 2001, “Economics of Food Labeling,” Journal of Consumer Policy, 24(2): 117–184.
Halkias, Maria, 2002, “Safeway Promises PETA It Will Dump Inhumane Suppliers,” The Dallas Morning News (TX), HTML: http://search.epnet.com/direct.asp?an=2W71827184115&db=nfh, Accessed: 7 May 2003.
Hausman, Jerry A., 1994, “Valuation of New Goods under Perfect and Imperfect Competition,” NBER Working Papers 4970, National Bureau of Economic Research Inc, 32 p.

35
Henderson, Jason R., 2001, “Market Conduct in the U.S. Pork Industry and the Impact of Changing Market Conditions and Capacity Constraints,” PhD Dissertation, Purdue University, 172 p.
Henson, Spencer, and Mario Mazzocchi, 2002, “Impact of Bovine Spongiform Encephalopathy on Agribusiness in the United Kingdom: Results of an Event Study of Equity Prices,” American Journal of Agricultural Economics, 84(2): 370-386.
Kinnucan, Henry W., 2003, “Optimal Generic Advertising in an Imperfectly Competitive Food Industry with Variable Proportions,” Agricultural Economics, 29(2): 143-158.
Klemperer, Paul, 1992, “Equilibrium Product Lines: Competing Head-to-Head May Be Less Competitive” American Economic Review, 82(4): 740-756.
LaFrance, Jeffrey T., 1985, “Linear Demand Functions in Theory and Practice,” Journal of Economic Theory, 37(1): 147-166.
LaFrance, Jeffrey T., and Michael W. Hanemann, 1989, “The Dual Structure of Incomplete Demand Systems,” American Journal of Agricultural Economics, 71(2): 262-274.
Lancaster, Kelvin, 1990, “The Economics of Product Variety – A Survey,” Marketing Science, 9(3): 189-206.
Lusk, Jayson L., and Ted C. Schroeder, 2002, “Effects of Meat Recalls on Futures Market Prices,” Agricultural and Resource Economics Review, 31(1): 47-58.
Lusk, Jayson L., Bailey Norwood, and Ross Pruitt, 2004, “Consumer Demand for a Ban on Subtherapeutic Antibiotic Use in Pork Production” in submission, 40 p.
Lutz, Stefan, 1997, “Vertical Product Differentiation and Entry Deterrence,” Journal of Economics, 65(1): 79-99.
Lutz, Stefan, Thomas P. Lyon, and John W. Maxwell 2000, “Quality Leadership When Regulatory Standards are Forthcoming,” Journal of Industrial Economics, 48(3): 331-349.
Marette, Stephan, John M. Crespi, and A. Schiavina, 1999, “The Role of Common Labeling In a Context of Asymmetric Information,” European Review of Agricultural Economics, 26(2): 167-178.

36
Martin, Stephen, 2002, Advanced Industrial Economics, Malden, Mass: Blackwell Publishers, 660 p.
McDonald’s Corporate Press Release, 2003, “McDonald’s Calls for Phase-Out of Growth Promoting Antibiotics in Meat Supply, Establishes Global Policy on Antibiotic Use.” McDonald's Corporation, HTML: http://www.mcdonalds.com/corporate/press/corporate/2003/06192003/index.html, Accessed: 21 June 2003.
Moorthy, K., and Sridhar I.P.L. Png, 1992, “Market Segmentation, Cannibalization, and the Timing of Product Introductions,” Management Science, 38(3): 345-360.
Mussa, Michael and Sherwin Rosen, 1978, “Monopoly and Product Quality,” Journal of Economic Theory, 18(2): 301-17.
Muth, Mary K., and Michael K. Wohlgenant, 1999, “A Test of Market Power Using Marginal Input and Output Prices with Application to the U.S. Beef Processing Industry,” American Journal of Agricultural Economics, 81(3): 638-643.
National Pork Board (NPB), 2005, http://www.porkboard.org/EconMktInfo/default.asp/, Accessed 5 April 2005.
Nelson Phillip, 1970, “Information and Consumer Behavior,” The Journal of Political Economy, 78(2): 311-329.
Nelson Phillip, 1974, “Advertising as Information,” The Journal of Political Economy, 82(4): 729-754.
Nelson Phillip, 1975, “The Economic Consequences of Advertising,” The Journal of Business, 48(2): 213-241.
Nevo, Aviv, 2001, “Measuring Market Power in the Ready-to-Eat Cereal Industry,” Econometrica, 69(2): 307-42.
Nevo, Aviv, 2003, “New Products, Quality Changes, and Welfare Measures Computed From Estimated Demand Systems,” Review of Economics & Statistics, 85(2): 266-276.
Nilsson, K. H. Tomas, 2005, “Essays on Product Choice, Certification and Imperfect Competition,” Unpublished Dissertation Chapter, Purdue University, 250 p.

37
Nilsson, K. H. Tomas, and Ken Foster, 2004, “Product and Process Certification in Imperfectly Competitive Markets,” Selected Paper American Agricultural Economics Association, 23 p.
Nilsson, K. H. Tomas, Paul Preckel, Bo Öhlmer, and Hans Andersson, 2003, “Revisiting the Role of Common Labeling in a Context of Asymmetric Information: Critique and Extensions,” ERSA Conference Papers, European Regional Science Association, 50 p.
Ollinger, Michael, Sang V. Nguyen, Donald Blayney, Bill Chambers, and Ken Nelson, 2005, “Structural Change in the Meat, Poultry, Dairy, and Grain Processing Industries,” Economic Research Report, ERR3, 32 pp.
Osterberg David, and David Wallinga, 2004, “Determinants of Rural Health, Addressing Externalities from Swine Production to Reduce Public Health and Environmental Impacts,” American Journal of Public Health, 94(10): 1703-1708.
Packaged Facts, 2005, http://www.packagedfacts.com/, Accessed 4 April 2005.
Piggott, Nicholas E., and Thomas L. Marsh, 2004, “Does Food Safety Information Impact U.S. Meat Demand?” American Journal of Agricultural Economics 86(1): 154-174.
Piggott, Nicholas E., and Thomas L. Marsh, 2004, “Does Food Safety Information Impact U.S. Meat Demand?” American Journal of Agricultural Economics 86 (1), 154-174.
Roller, Jason R., 2004, the Indiana Pork Certification Program: The Components, Costs, and Potential Viability, Masters Thesis, Purdue University, 170 p.
Scherer, F. M., 1979, “The Welfare Economics of Product Variety: An Application to the Ready-To-Eat Cereals Industry,” Journal of Industrial Economics, 28(2): 113-135.
Schmalensee, Richard, 1978, “Entry Deterrence in the Ready-To-Eat Breakfast Cereal Industry,” Bell Journal of Economics, 9(2): 305-328.
Schmitz, Andrew, Hartley Furtan, and Katherine Baylis, 2002, Agricultural Policy, Agribusiness, and Rent-Seeking Behaviour, University of Toronto Press, 511 p.
Schroeter John R., and Azzeddine Azzam, 1990, “Measuring Market Power in Multi-Product Oligopolies: The U.S. Meat Industry,” Applied Economics, 22(10): 1365-1376.

38
Sexton, Richard J., 2000, “Industrialization and Consolidation in the U.S. Food Sector: Implications for Competition and Welfare,” American Journal of Agricultural Economics, 82(5): 1087-1104.
Shaked, Avner, and John Sutton, 1982, “Relaxing Price Competition through Product Differentiation,” The Review of Economic Studies, 49(1): 3-13.
Spence, A. Michael, 2001, “Prize Lecture, Signaling in Retrospect and the Informational Structure of Markets,” In: Les Prix Nobel, The Nobel Prizes 2001, Tore Frängsmyr (Ed.), Stockholm: 407-444.
Spence, Michael, 1976, “Product Selection, Fixed Costs, and Monopolistic Competition,” The Review of Economic Studies, 43(134): 217-235.
Stole Lars, 2003, “Price Discrimination and Imperfect Competition,” Prepared for the Handbook of Industrial Organization version December 22, 2003, HTML: web.mit.edu/14.271/www/hio-pdic.pdf, Accessed 23 March 2005.
Sutton, John, 1986, “Vertical Product Differentiation: Some Basic Themes,” The American Economic Review, 76(2): 393-398.
Thomsen, Michael R., and Andrew M. McKenzie, 2001, “Market Incentives for Safe Foods: An Examination of Shareholder Losses from Meat and Poultry Recalls,” American Journal of Agricultural Economics 83(3): 526-537.
Tirole, Jean, 1988, the Theory of Industrial Organization, Cambridge, Mass, MIT Press, 479 p.
U.S. Department of Agriculture, Economic Research Service (ERS), 2005, “Red Meat Yearbook,” HTML: http://www.ers.usda.gov/Data/sdp/view.asp?f=livestock/94006/, Accessed: May 2, 2005.
U.S. Department of Health and Human Services (HHS), 2002, “HHS, USDA Take Next Step in Obesity Fight, Secretaries Thompson and Veneman Meet With Leaders from Food Industry,” News Release, HHS Press Office and USDA Press Office, HTML: http://www.hhs.gov/news/press/2002pres/20021015c.html, Accessed: March 27, 2005.
Van Ravenswaay, O. Eileen, and John P. Hoehn, 1996, “The Theoretical Benefits of Food Safety Policies: A Total Economic Value Framework,” American Journal of Agricultural Economics, 78(5): 1291-1296.

39
Werden, Gregory J., and Luke M. Froeb, 1994, “The Effects of Mergers in Differentiated Products Industries: Logit Demand and Merger Policy,” Journal of Law, Economics and Organization, 10(2): 407-426.