Cooking patties from a frozen state, endpoint temperature, and ...
45
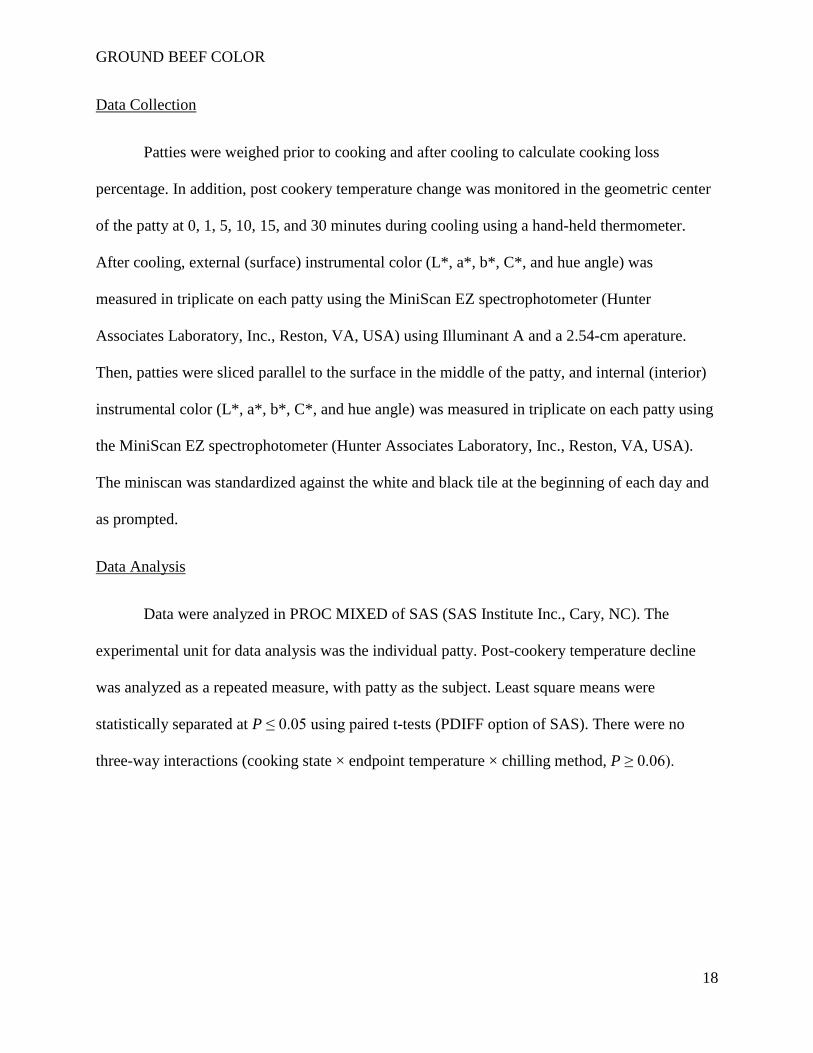
University of Arkansas, Fayeeville ScholarWorks@UARK Animal Science Undergraduate Honors eses Animal Science 5-2018 Cooking paies from a frozen state, endpoint temperature, and post-cookery chilling affect internal and external color and cooking losses in ground beef paies Zena Hicks Follow this and additional works at: hp://scholarworks.uark.edu/anscuht Part of the Meat Science Commons is esis is brought to you for free and open access by the Animal Science at ScholarWorks@UARK. It has been accepted for inclusion in Animal Science Undergraduate Honors eses by an authorized administrator of ScholarWorks@UARK. For more information, please contact [email protected], [email protected]. Recommended Citation Hicks, Zena, "Cooking paies from a frozen state, endpoint temperature, and post-cookery chilling affect internal and external color and cooking losses in ground beef paies" (2018). Animal Science Undergraduate Honors eses. 20. hp://scholarworks.uark.edu/anscuht/20
-
Upload
khangminh22 -
Category
Documents
-
view
0 -
download
0
Transcript of Cooking patties from a frozen state, endpoint temperature, and ...
University of Arkansas, FayettevilleScholarWorks@UARK
Animal Science Undergraduate Honors Theses Animal Science
5-2018
Cooking patties from a frozen state, endpointtemperature, and post-cookery chilling affectinternal and external color and cooking losses inground beef pattiesZena Hicks
Follow this and additional works at: http://scholarworks.uark.edu/anscuht
Part of the Meat Science Commons
This Thesis is brought to you for free and open access by the Animal Science at ScholarWorks@UARK. It has been accepted for inclusion in AnimalScience Undergraduate Honors Theses by an authorized administrator of ScholarWorks@UARK. For more information, please [email protected], [email protected].
Recommended CitationHicks, Zena, "Cooking patties from a frozen state, endpoint temperature, and post-cookery chilling affect internal and external colorand cooking losses in ground beef patties" (2018). Animal Science Undergraduate Honors Theses. 20.http://scholarworks.uark.edu/anscuht/20

GROUND BEEF COLOR
1
Cooking patties from a frozen state, endpoint temperature, and post-cookery chilling affect
internal and external color and cooking losses in ground beef patties.
Zena M. Hicks
University of Arkansas
GROUND BEEF COLOR
2
Table of Contents
Abstract .......................................................................................................................................... 3
Introduction ................................................................................................................................... 5
Literature Review ......................................................................................................................... 6
Materials and Methods ............................................................................................................... 17
Results .......................................................................................................................................... 19
Discussion .................................................................................................................................... 23
Conclusions .................................................................................................................................. 27
References .................................................................................................................................... 28
Figures and Tables ...................................................................................................................... 30
GROUND BEEF COLOR
3
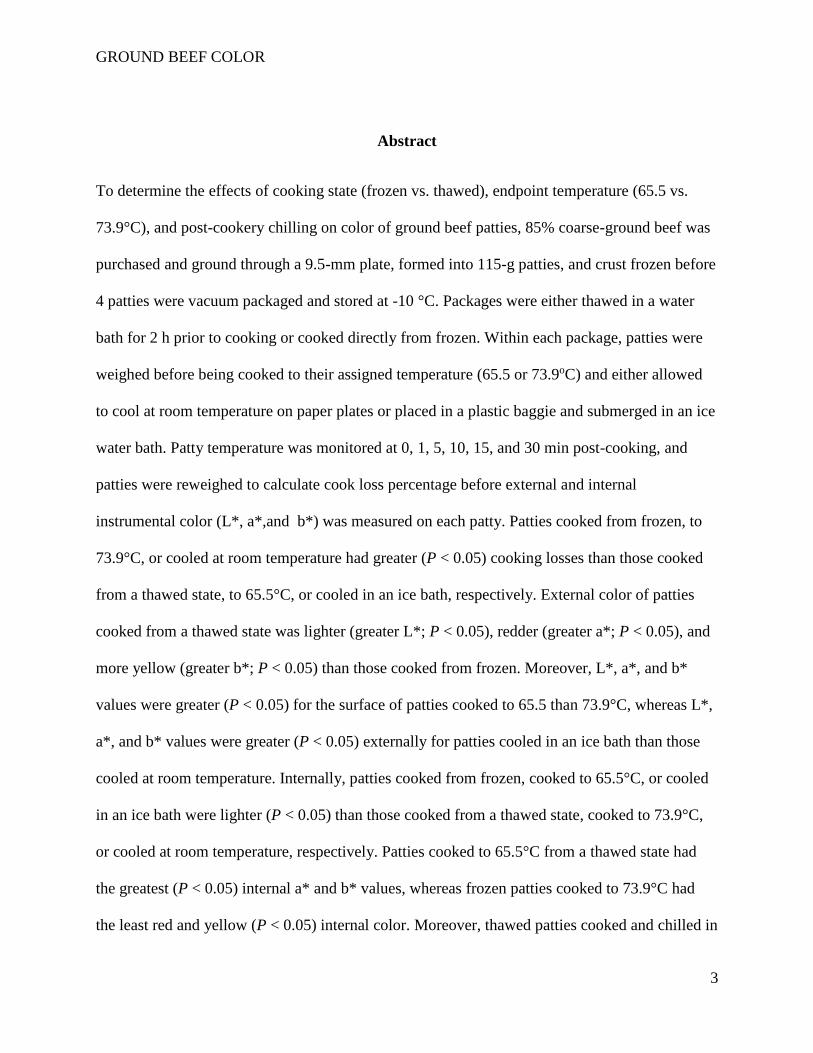
Abstract
To determine the effects of cooking state (frozen vs. thawed), endpoint temperature (65.5 vs.
73.9°C), and post-cookery chilling on color of ground beef patties, 85% coarse-ground beef was
purchased and ground through a 9.5-mm plate, formed into 115-g patties, and crust frozen before
4 patties were vacuum packaged and stored at -10 °C. Packages were either thawed in a water
bath for 2 h prior to cooking or cooked directly from frozen. Within each package, patties were
weighed before being cooked to their assigned temperature (65.5 or 73.9oC) and either allowed
to cool at room temperature on paper plates or placed in a plastic baggie and submerged in an ice
water bath. Patty temperature was monitored at 0, 1, 5, 10, 15, and 30 min post-cooking, and
patties were reweighed to calculate cook loss percentage before external and internal
instrumental color (L*, a*,and b*) was measured on each patty. Patties cooked from frozen, to
73.9°C, or cooled at room temperature had greater (P < 0.05) cooking losses than those cooked
from a thawed state, to 65.5°C, or cooled in an ice bath, respectively. External color of patties
cooked from a thawed state was lighter (greater L*; P < 0.05), redder (greater a*; P < 0.05), and
more yellow (greater b*; P < 0.05) than those cooked from frozen. Moreover, L*, a*, and b*
values were greater (P < 0.05) for the surface of patties cooked to 65.5 than 73.9°C, whereas L*,
a*, and b* values were greater (P < 0.05) externally for patties cooled in an ice bath than those
cooled at room temperature. Internally, patties cooked from frozen, cooked to 65.5°C, or cooled
in an ice bath were lighter (P < 0.05) than those cooked from a thawed state, cooked to 73.9°C,
or cooled at room temperature, respectively. Patties cooked to 65.5°C from a thawed state had
the greatest (P < 0.05) internal a* and b* values, whereas frozen patties cooked to 73.9°C had
the least red and yellow (P < 0.05) internal color. Moreover, thawed patties cooked and chilled in
GROUND BEEF COLOR
4
an ice bath were redder (P < 0.05) internally than other cooking state × cooling method
combinations. It was expected that cooking to 65.5°C would result in redder internal cooked
color, but persistent redness was also observed when patties were cooked from a thawed, rather
than frozen, state and when cooled in an ice bath.
Keywords: Ground beef; Cooked Color, Persistent Pinking,
GROUND BEEF COLOR
5
Introduction
Ground beef is the most popular product of the beef industry, in both the food service and
retail sector. Ground beef sales totaled $10.094 billion, accounting for 35% of the total beef
dollars (Technomic, 2016). In 2016, 5.023 billion pounds of ground beef were sold, accounting
for 64% of the total pound of beef sold (Lundeen et al., 2017). Ground beef makes up
approximately 65% of the total beef sales to foodservice industry and nearly 50% of the total
beef sold in the retail sector (Lundeen et al., 2017). Full-service restaurants served 1.7 billion
pounds of hamburger in 2016, and limited service restaurants (fast food restaurants) served an
additional 3.5 billion pounds (Technomic, 2016).
Although ground beef is sold in both fresh and frozen states, cookery state is often
dependent on the consumer. The majority of restaurants will cook patties from a preformed,
frozen state; however, usage in the home varies. Previous research has shown differences in
cooked ground beef color between the cooking states, with the majority reporting that cooking
from the frozen produces a redder, rarer looking patty (van Laack, Berry, and Solomon, 1996a;
Berry, 2001).
The cooked meat color phenomena of premature browning and persistent pinking have
been well documented. Premature browning is a condition in which the internal color of ground
beef patties possess a fully cooked color before it has reached the safe minimum internal
temperature (71.1oC). This poses a potential food safety issue for consumers. The other
condition, persistent pinking, exists when the interior of the ground beef patty still appears pink
and undercooked after it has reached the safe minimum internal temperature. This often leads to
overcooking and quality losses for consumers. For this reason, recommendations from the USDA
are to cook ground beef to an internal endpoint temperature of 71.1oC (USDA FSIS, 2015).
GROUND BEEF COLOR
6
However, using a thermometer to monitor endpoint temperature is still not a common practice
among consumers. To ensure a safe, high quality product, more research is needed to find the
causes and, thus, ways to prevent these issues in ground beef.
Experiments involving cooked color have no specific protocol for chilling method before
analyzing color. Because of this, chilling methods vary from no chilling to cooling at room
temperature. Dr. Melvin Hunt at Kansas State University suggested that meat be submerged in
ice to stop the cooking process before examining instrumental color. To date, though, no
research has examined directly differences in cooked color of ground beef chilled in ice or
chilled by other methods. Therefore, the objective of this study was to determine the effects of
cooking state, endpoint temperature, and chilling method on external and internal instrumental
color and cooking losses in ground beef.
Literature Review
Muscle Composition
Muscle is comprised of approximately 75% water, 20% protein, 3% fat, and 2% non-
protein substances. The non-protein substances consist of 45% non-protein nitrogen-containing
substances, 34% carbohydrates, 18% inorganic compounds, and 3% metals and vitamins
(Tornberg, 2005). According to Tornberg (2005), the proteins in meat can be broken down to
three main categories: myofibrillar proteins (50 to 55% of total protein), sarcoplasmic proteins
(30 to 34% of total protein), and stromal, or connective tissue proteins, (10 to 15% of total
protein). Proteins are the primary compound that provide the structure to the meat product.
(Tornberg, 2005).
GROUND BEEF COLOR
7
Protein Structure
Proteins, also known as polypeptides, are made of long chains of amino acids (Tornberg,
2005). Amino acids share a basic structure and differing side chains. The interactions between
the amino acid side chains in a protein strand determine the form of the protein molecule.
Proteins have four different structural levels: primary, secondary, tertiary, and quaternary.
The primary structure is made of the chain of amino acids and is determined by DNA
translation. The type of amino acids in the primary structure will determine the form of the
protein in the secondary structure. In the secondary structure, the protein can be arranged in an
alpha-helix, a beta-sheet, or other random coils (Tornberg, 2005). During formation of the
tertiary structures, the side chains of the amino acids in the protein will interact with each other
to form a three-dimensional structure (Tornberg, 2005). These tertiary structure subunits can then
interact with each other forming a quaternary structure. These interactions are often a mixture of
van der Waal’s forces, hydrogen bonding, and hydrophobic interactions (Tornberg, 2005).
Globular proteins, such as myoglobin, are formed through the hydrophobic interactions at
the tertiary level. Fibrous proteins, such as the structural meat proteins actin and myosin, as well
as the most abundant connective tissue protein collagen, are comprised primarily of alpha-helices
and anti-parallel beta-pleated sheets (Tornberg, 2005). Upon heating, protein structure is changed
in a process called denaturation. During cooking, typically the fibrous proteins will contract
while the globular proteins will expand (Tornberg, 2005).
Myoglobin
The primary protein that determines the color of fresh meat is the sarcoplasmic protein
myoglobin. It is the heat denaturation of this protein that gives cooked meats the dull-brown,
GROUND BEEF COLOR
8
characteristic cooked color (Suman et al., 2016). The variety of pigments formed in cooked
meats can be attributed to the state of myoglobin in raw meat.
Myoglobin exists in three states: deoxymyoglobin, oxymyoglobin, and metmyoglobin.
Deoxymyoglobin contains the reduced ferrous iron form (Fe2+) and is found in the absence of
oxygen (this produces a purple-red fresh meat color). This state exists in the center of meats and
when meat is stored in vacuum packaging (King and Whyte, 2006). When deoxymyoglobin is
exposed to oxygen, the reduced iron will bind to the oxygen, forming oxymyoglobin (this
produces the favorable bright red fresh meat color; King and Whyte, 2006). When meat is stored
in an oxidizing environment, the iron in the deoxymyoglobin and oxymyoglobin can be oxidized
to the ferric state (Fe3+) and the resulting pigment that is formed is called metmyoglobin, which
produces an undesirable brown color (King and Whyte, 2006).
The three forms of myoglobin will denature at different rates and form different end
products. When metmyoglobin is denatured, ferrihemochrome is formed, which gives a dull-
brown color. Denaturation of deoxymyoglobin and oxymyoglobin forms ferrohemochrome,
which is pink-red in color, but will be oxidized to form ferrihemochrome (Suman et al., 2016).
However, if the heme iron remains in the ferrohemochrome state, it is possible that a pink color
will remain in the cooked meat (Suman et al., 2016).
Myoglobin and other proteins begin to denature between 55 and 65oC, with almost all
denaturation occurring between 75 and 80oC (King and Whyte, 2006). However, myoglobin has
various resistance to heat denaturation, depending on the state it exists in. Deoxymyoglobin in
the most heat resistant formed, metmyoglobin is the least heat resistant form, and oxymyoglobin
has an intermediate heat resistance (Suman et al., 2016). Therefore, meat with high
concentrations of deoxymyoglobin is more prone to persistent pinking than meat containing
GROUND BEEF COLOR
9
higher amounts of metmyoglobin or oxymyoglobin (Suman et al., 2016). On the other hand,
when fresh meat contains higher amounts of oxymyoglobin or metmyoglobin, it is more
susceptible to experience premature browning (Kropf and Hunt, 1998).
Functions of Cooking
Cooking meat has two main functions to the consumer. First, the cooking of meat
changes the product to one having a favorable texture and taste to the consumer. Secondly,
cooking meat will deactivate any microorganisms that could be harmful to the consumer (King
and Whyte, 2006). The original recommendation given to consumers by the USDA-FSIS (1989)
was to cook meat patties until the juices run clear. Furthermore, the statement said the center of
the patty should be a grayish-brown color and have no evidence of pink (Kropf and Hunt, 1998).
These recommendations were amended in 1997 after numerous research projects disproved the
reliability of using cooked color as an indication of doneness. The most recent USDA
recommendations state that ground meat products should be cooked to an internal temperature of
71oC (Kropf and Hunt, 1998).
The new guidelines came about after researchers discovered two phenomena that were
occurring in meat products, especially ground beef. These phenomena were termed premature
browning and persistent pinking.
Premature Browning
Premature browning occurs when the interior portion of a ground beef patty will appear
brown and thoroughly cooked before it has reached an internal temperature (71.1oC) great
enough to inactivate microorganisms. Premature browning has been found to occur at
temperatures as low as 55oC (Kropf and Hunt, 1998). Factors that have been noted to have

GROUND BEEF COLOR
10
potential for premature browning include, meat that is pale, soft, and exudative (PSE), packaged
in an aerobic or oxygenated environment, cooked after a long thaw, or frozen in bulk (King and
Whyte, 2006).
Persistent Pinking
On the other hand, persistent pinking occurs when the inside of a patty still appears pink,
even after it has reached a safe internal temperature. This is especially an issue in the food
service industry, where consumers are unlikely to accept a product that is still appearing pink
internally (Ryan et al., 2006). Although internal color is not an accurate measure of meat safety,
many consumers still base food safety on color (Suman et al., 2016). Some of the factors that
may increase the potential for persistent pinking include, meat products with a high pH, products
that are dark, firm, and dry (DFD), products that stored in a modified atmosphere packaging that
includes carbon monoxide, vacuum packaging, cooking from frozen, or cooking after a short
thaw (Ryan et al., 2006).
In order to combat the problem of persistent pinking, the initial thought was to cook
product to higher temperatures to eliminate the pink color. Studies by Ryan et al. (2006) found
that an increase in endpoint temperature would generally lower the internal redness (a*) and
vividness (C*), but that the extent of that change was dependent upon the rate of cooking. It was
also assumed that with an increase in internal temperature came a decrease in tenderness and
juiciness. Berry and Bigner-George (1999) found that cooking patties to between 81 and 85oC
did result in lower a* values, higher hue angles, and higher degree of doneness scores, but patties
cooked to these temperatures had lower initial and final juiciness compared to patties cooked to
71oC.
GROUND BEEF COLOR
11
Effects of Cooking State
The effects of cooking patties from a frozen or thawed state have been inconsistent across
previous research projects. Even though some studies have found thawed patties to appear more
well done than frozen patties (van Laack, Berry, and Solomon, 1996a; Berry, 2001), other
studies found no difference in visual color when cooking from frozen or thawed (Berry 1998b).
Additionally, some studies have suggested the effects of freezing for long periods of time causes
unexplained changes in cooked color (van Laack, Berry, and Solomon, 1996b).
van Laack, Berry, and Solomon (1996a) found thawed patties had lesser cooking losses
and shorter cooking times, whereas thawed patties appeared more well done visually with
doneness scores increasing as thaw time increased. Additionally, instrumental color readings
supported this, as thawed patties were less red (lower a*) and less vivd (lower C*), with a greater
hue angles (van Laack et al., 1996a). These researchers hypothesized that the thawing process
produced physical or chemical changes that would affect myoglobin denaturation and, in turn,
cooked color. It was concluded that refreezing patties would not reverse the effects of thawing.
The second trial of the study echoed these results, as thawed patties were more done visually
than frozen patties, which appeared more done than fresh patties. Additionally, thawed patties
had the greatest myoglobin denaturation percentage; however, thawed patties were also more
prone to premature browning.
An additional study by van Laack et al. (1996b) report that internal redness (a* values)
was related to the denaturation of myoglobin. More importantly, they found that patties with a
high pH did not always result in persistent pink patties, but pH appeared to be related to
myoglobin denaturation. In the second trial, however, van Laack et al. (1996b) reported no
correlation between a* values and myoglobin denaturation. Although not all myoglobin was
GROUND BEEF COLOR
12
denatured at high pH values, other unexplained factors seemed to play a role in the denaturation
process. Additionally, though it was obvious storing the patties led to changes in cooked color,
those changes could not be explained by the metmyoglobin content or changes in reducing
capacity.
Berry (1998b) reported greater cooking yields and shorter cooking times for patties
cooked from thawed compared to those cooked from frozen. Visually, the degree of doneness
was unaffected by cooking state; however, instrumental color indicated thawed patties were
lighter (greater L*), had greater hue angles, and were generally more vivid colored (greater C*).
Frozen patties containing either 5, 20, or 25% fat were redder (greater a*) than thawed patties,
whereas patties cooked from thawed were more yellow (greater b*) at all fat levels, except 5%.
Most important, all patties in the study exhibited persistent pinking.
A second study by Berry (2001) found that thawed patties had shorter cooking times and
greater cooking yields compared to frozen patties. The internal color of thawed patties had
greater L*, and lower a* and b* values, as well as greater hue angles and lower C* values
compared to frozen patties. Visually, thawed patties appeared more done than frozen patties;
however, the mean visual color scores for both treatments indicated pink colors were present in
most patties.
Hunt, Sorheim, and Slinde (1999) reported patties cooked from thawed were redder
(greater a*) and had a smaller hue angle, regardless of the oxidative state of myoglobin. Thawed
patties were more yellow (greater b*) and more vivid (greater C*) than frozen patties only when
myoglobin was present in the deoxymyoglobin state.
GROUND BEEF COLOR
13
Effects of Endpoint Temperature
In general, studies have consistently shown that cooking patties to a greater internal
temperature produces a visually more well done product. However, instrumental color has varied
across and within certain studies.
When comparing ground beef patties of different blends, Berry (1998a) reported that
patties cooked to 68.3oC were more yellow (greater b*), more vivid (greater C*), had a smaller
hue angle, and required a shorter cooking time than patties cooked to 71.1oC, regardless of patty
composition. Redness (a*) was only different among the endpoint temperatures when patties
consisted of young cow hindquarter muscle processed immediately after slaughter. In this blend,
patties cooked to 68.3oC were redder than patties cooked to 71.1oC. Berry and Bigner-George
(1999) found that patties cooked to between 81 and 85oC were less red (lower a*), less vivid
(lower C*), and had greater hue angles than patties cooked to 71oC; however, lightness (L*) and
yellowness (b*) were not affected by increased internal temperatures.
Ryan et al. (2006) found differing results when patties were cooked rapidly (1.0oC/s)
from an oxymyoglobin compared to a deoxymyoglobin state. In the oxymyoglobin state, patties
were lighter (greater L*) at 71.1 or 76.7oC than at 82.2oC. Patties were more yellow (greater b*)
at 82.2oC than 71.1 or 76.6oC. Additionally, patties were most vivid (greater C*) at 82.2oC,
whereas redness (a*), visual doneness, and percent denatured myoglobin did not vary across
endpoint temperatures. Although L* and b* values did not differ among internal endpoint
temperatures, when patties were in the deoxymyoglobin state, those cooked to 71.1oC were the
reddest (greatest a*) and patties cooked to 82.2oC were the least red (lowest a*). Conversely,
patties cooked to 82.2oC appeared more done than those cooked to 76.6oC or 71.1oC.
Additionally, the proportion of denatured myoglobin was greatest for patties cooked to 82.2oC,
GROUND BEEF COLOR
14
whereas patties cooked to 71.1oC had the least percentage of denatured myoglobin, and patties
cooked to 76.7oC were intermediate.
Brewer and Novakofski (1999) reported that increases in internal temperature had a
greater effect on cook loss at low pH (5.3 to 5.5) than at high pH (6.0). Additionally, interactions
between pH and endpoint temperature existed for lightness (L*), redness (a*), and yellowness
(b*) values. As pH values increased, higher endpoint temperatures were needed to achieve
similar redness values, whereas the yellowness (b*) at each endpoint temperature decreased with
increasing patty pH.
Troutt et al. (1992) reported patties varying in lean percentage had greater cooking losses
and cooking times when cooked to an internal temperature of 77 than 71oC. Additionally, patties
were lighter (greater L*) and appeared less done visually when cooked to 71oC compared to
77oC. However, redness (a*) and yellowness (b*) values did not differ among endpoint
temperatures.
Effects of Chilling
The chilling method used before examining instrumental color differs widely between
experiments. Although some choose to chill in an ice bath after cooking (Ryan et al., 2006),
others chose to cool at room temperature for varying times (Hunt et al., 1999; Warren, Hunt, &
Kropf; 1996; van Laack et al., 1996a, 1996b;) or not at all (Brewer & Novakofski, 1999; Berry &
Bigner-George, 1999; Berry 1998a, 1998b; Mendenhall, 1989). However, a direct comparison
of the effects of different chilling method on color has not been reported in literature.
GROUND BEEF COLOR
15
Effects of Myoglobin State
It has been discovered in previous studies that premature browning and persistent pinking
have been linked to the state of myoglobin in meat. Premature browning is more likely to occur
in meats with high concentrations of oxymyoglobin or metmyoglobin, while persistent pinking is
most often seen in meats with high percentages of deoxymyoglobin (Suman et al., 2016).
Warren, Hunt, and Kropf (1996) found patties formulated from sources known to produce
a normal color cooked to 55oC where lightest (greatest L*), reddest, (greatest a*), and most vivid
(greatest C*) when cooked in the reduced state (deoxymyoglobin or oxymyoglobin). Visually,
these patties appeared the most rare. However, patties of the same formulation that were oxidized
were the darkest (lowest L*), least red (lowest a*), and least vivid (lowest C*). Additionally,
these patties appear the most well done visually. The results confirmed that oxidative state of the
raw patty was in fact important in determining cooked color.
Ryan et al. (2006) found that patties cooked from the deoxymyoglobin state were lighter
(greater L*), redder (greater a*), more vivid (greater C*), had a lesser percentage of denatured
myoglobin, and visually appeared more rare than patties in the oxymyoglobin state across three
different endpoint temperatures. Additionally, Hunt, Sorheim, and Slinde (1999) reported that
patties containing metmyoglobin or oxymyoglobin had greater hue angles and a greater
percentage of denatured myoglobin, whereas patties containing deoxymyoglobin were redder
(greater a*), more yellow (greater b*), and more vivid (greater C*) than all other patties.
Effects of Lean Percentage
The effects of lean percentage on instrumental color has been shown to vary, but, in
general, differences in lean percentage have not been found to effect visual doneness. Berry

GROUND BEEF COLOR
16
(1998b) compared ground beef at different lean percentages and found that patties containing
25% fat had the greatest cooking loss, whereas those that were 5 or 10% fat had the least cooking
loss. As the lean percentage of patties decreased, hue angles increased, but visual doneness did
not differ with differing lean percentages, with a pink color found in all fat levels. Troutt et al.
(1992) compared ground beef ranging from 70 to 95% lean and reported that as fat level
increased, internal cooked color of patties became lighter; however, no differences were found in
a* or b* among lean percentages, nor did visual doneness scores differ among lean percentages.
Effects of Cooking Rate
Ryan et al. (2006) examined the effects of a slow cooking rate (0.2oC/s), rapid cooking
rate (1oC/s), or rapid cooking rate with a holding time (1oC/s, 6 min post cooking hold time) at
different endpoint temperatures and found that patties cooked rapidly to either 65.6 or 71.1oC
were redder (greater a*), more vivid (greater C*), visually appeared less done, and less
myoglobin denaturation than patties that had a holding time or patties cooked at a slow rate. At
higher endpoint temperatures (82.2 vs. 87.8oC), patties cooked at a rapid rate did not differ from
those with a holding time in redness, vividness, or visual doneness. However, Brewer and
Novakofski (1999) found no differences in cooking loss, visual doneness, or instrumental color
when comparing ground beef cooked at a slow rate (0.7oC/min) to a rapid rate (3oC/min).
GROUND BEEF COLOR
17
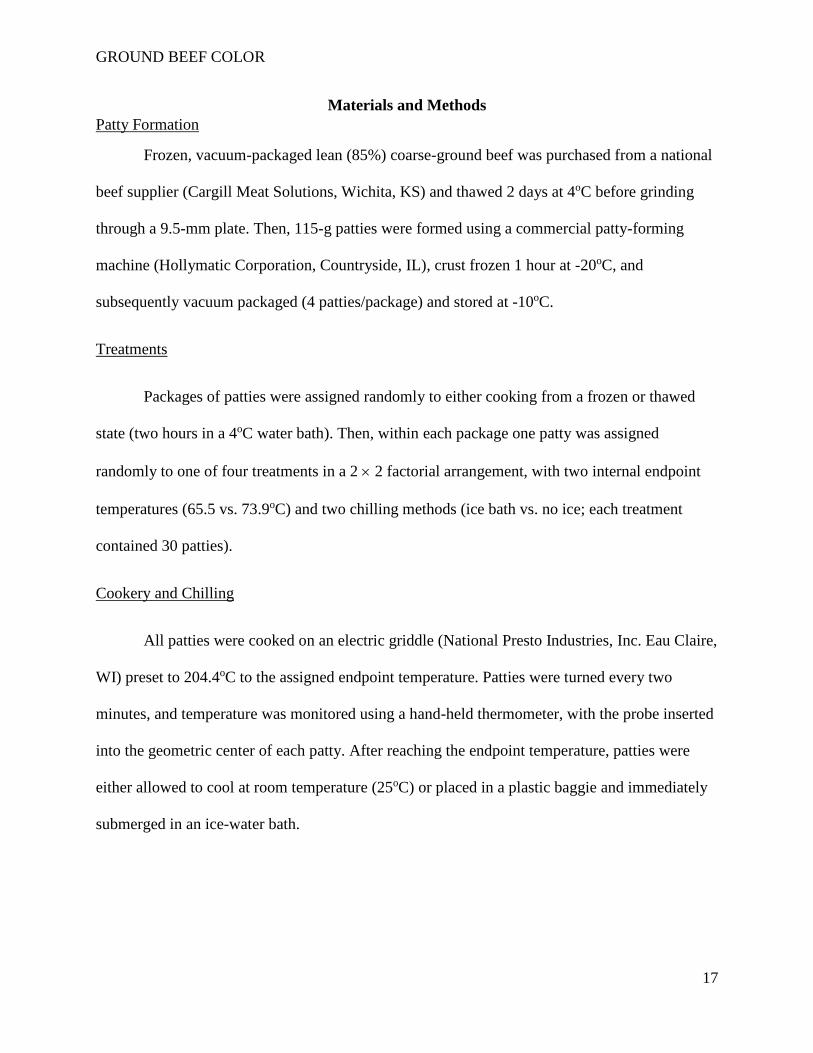
Materials and Methods
Patty Formation
Frozen, vacuum-packaged lean (85%) coarse-ground beef was purchased from a national
beef supplier (Cargill Meat Solutions, Wichita, KS) and thawed 2 days at 4oC before grinding
through a 9.5-mm plate. Then, 115-g patties were formed using a commercial patty-forming
machine (Hollymatic Corporation, Countryside, IL), crust frozen 1 hour at -20oC, and
subsequently vacuum packaged (4 patties/package) and stored at -10oC.
Treatments
Packages of patties were assigned randomly to either cooking from a frozen or thawed
state (two hours in a 4oC water bath). Then, within each package one patty was assigned
randomly to one of four treatments in a 2 2 factorial arrangement, with two internal endpoint
temperatures (65.5 vs. 73.9oC) and two chilling methods (ice bath vs. no ice; each treatment
contained 30 patties).
Cookery and Chilling
All patties were cooked on an electric griddle (National Presto Industries, Inc. Eau Claire,
WI) preset to 204.4oC to the assigned endpoint temperature. Patties were turned every two
minutes, and temperature was monitored using a hand-held thermometer, with the probe inserted
into the geometric center of each patty. After reaching the endpoint temperature, patties were
either allowed to cool at room temperature (25oC) or placed in a plastic baggie and immediately
submerged in an ice-water bath.
GROUND BEEF COLOR
18
Data Collection
Patties were weighed prior to cooking and after cooling to calculate cooking loss
percentage. In addition, post cookery temperature change was monitored in the geometric center
of the patty at 0, 1, 5, 10, 15, and 30 minutes during cooling using a hand-held thermometer.
After cooling, external (surface) instrumental color (L*, a*, b*, C*, and hue angle) was
measured in triplicate on each patty using the MiniScan EZ spectrophotometer (Hunter
Associates Laboratory, Inc., Reston, VA, USA) using Illuminant A and a 2.54-cm aperature.
Then, patties were sliced parallel to the surface in the middle of the patty, and internal (interior)
instrumental color (L*, a*, b*, C*, and hue angle) was measured in triplicate on each patty using
the MiniScan EZ spectrophotometer (Hunter Associates Laboratory, Inc., Reston, VA, USA).
The miniscan was standardized against the white and black tile at the beginning of each day and
as prompted.
Data Analysis
Data were analyzed in PROC MIXED of SAS (SAS Institute Inc., Cary, NC). The
experimental unit for data analysis was the individual patty. Post-cookery temperature decline
was analyzed as a repeated measure, with patty as the subject. Least square means were
statistically separated at P ≤ 0.05 using paired t-tests (PDIFF option of SAS). There were no
three-way interactions (cooking state × endpoint temperature × chilling method, P ≥ 0.06).
GROUND BEEF COLOR
19
Results
Cooking State
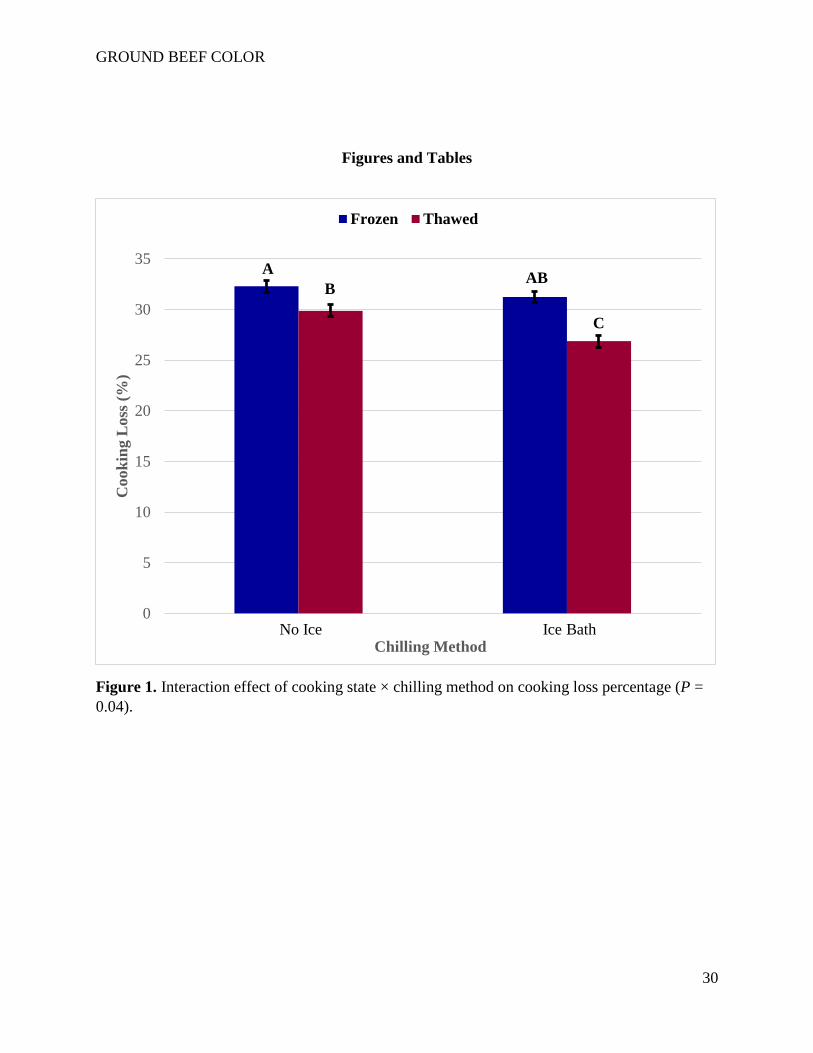
Frozen patties exhibited greater cooking loss than thawed patties (cooking state
chilling, P = 0.04; Figure 1). Externally, patties that were cooked from thawed were lighter
(greater L*; P = 0.001), redder (greater a*; P < 0.001), more yellow (greater b*; P < 0.001), and
more vivid (greater C*; P < 0.001) than patties cooked from frozen (Table 1). Among patties
cooled at room temperature, those cooked from thawed state had greater hue angles than those
cooked from frozen (cooking state chilling, P = 0.003; Figure 2). Among those chilled in an ice
bath, there were no differences in hue angle between frozen and thawed patties.
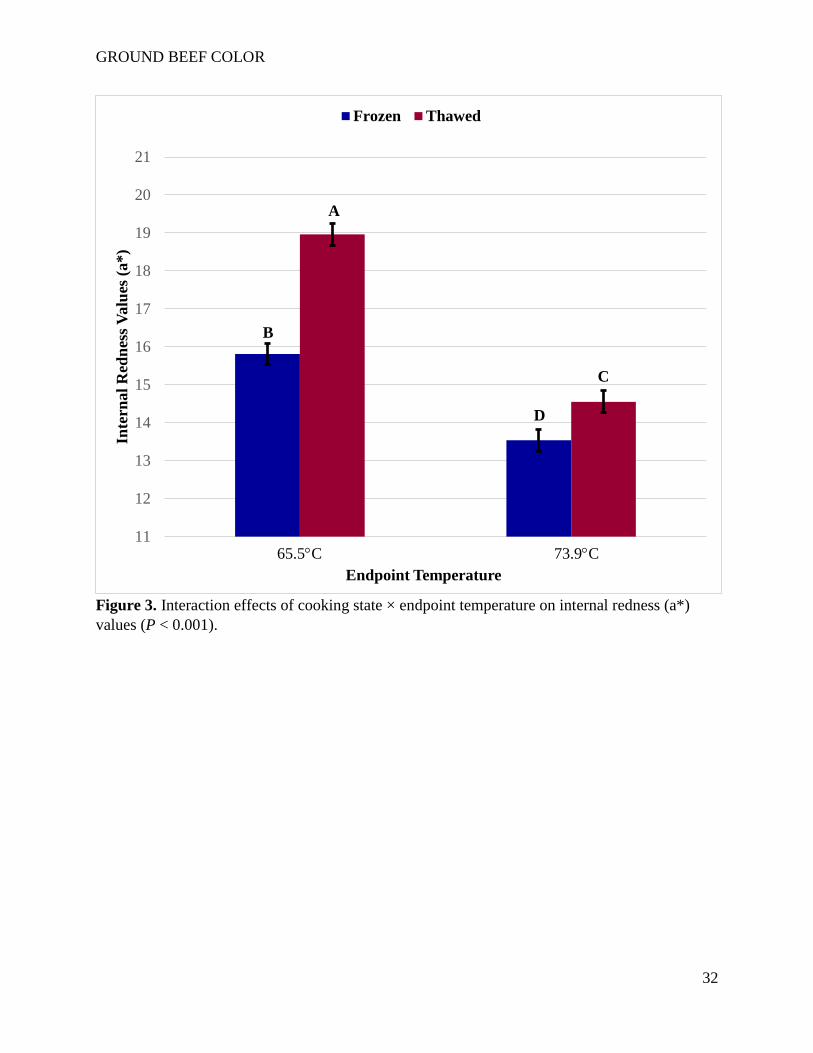
Internally, thawed patties were lighter (P < 0.001) than patties cooked from frozen
(Table 1). At both endpoint temperatures, thawed patties were redder than frozen patties
(cooking state endpoint temperature, P < 0.001; Figure 3). Thawed patties cooked to 65.5oC
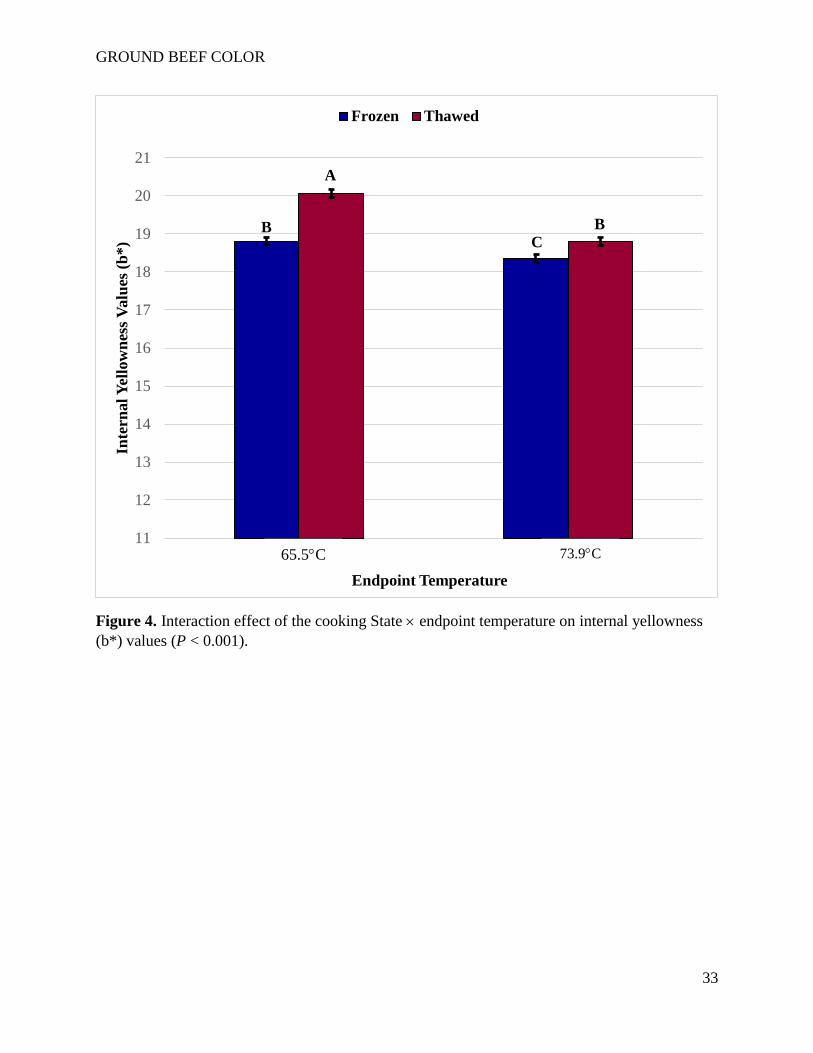
were the most yellow internally and frozen patties cooked to 65.5oC were the least yellow, but b*
values did not differ between thawed patties cooked to 73.9oC and frozen patties cooked to
65.5oC (cooking state endpoint temperature, P < 0.001; Figure 4). In addition, frozen patties
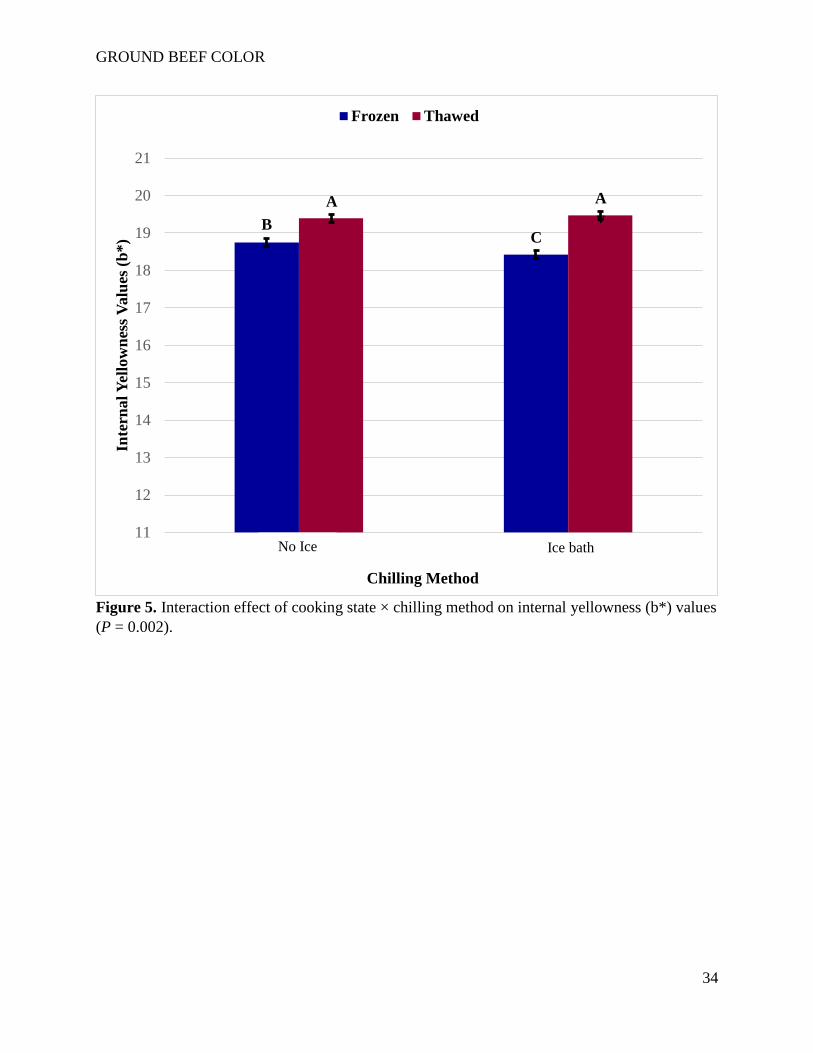
cooled at room temperature were more yellow than those chilled in an ice bath (cooking state
chilling, P = 0.002; Figure 5). At both endpoint temperatures, patties cooked from the thawed
state were more vivid than those cooked from frozen (cooking state endpoint temperature, P <
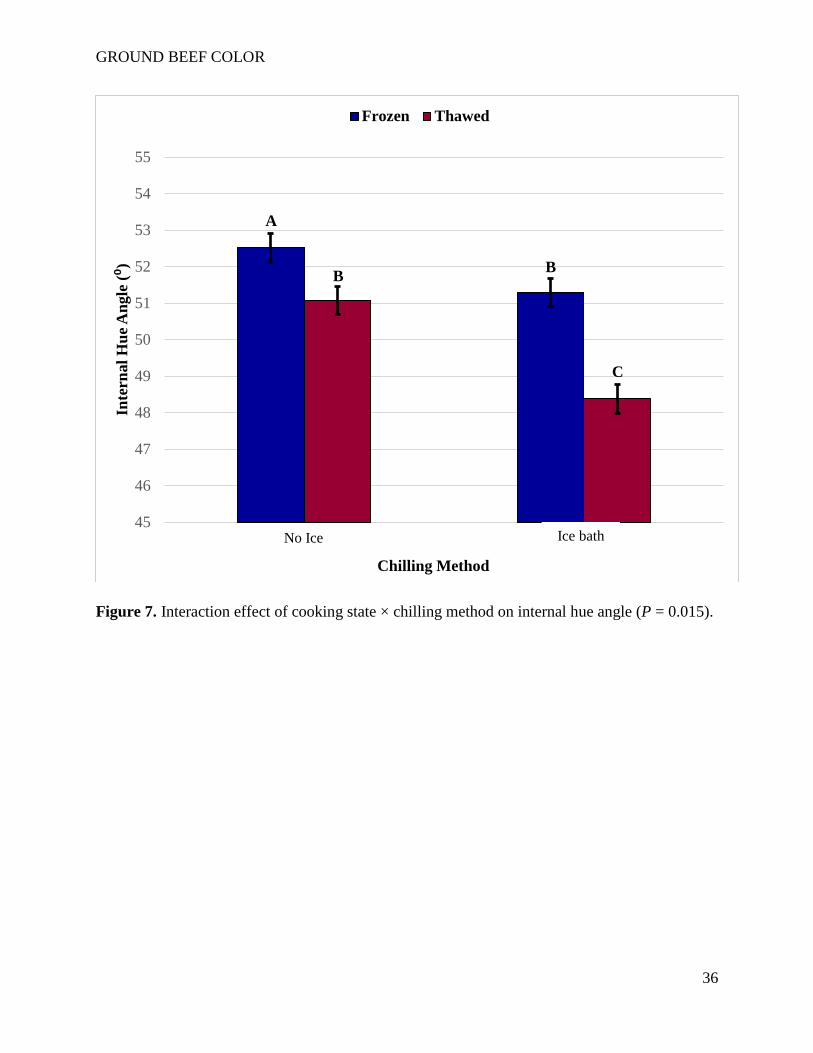
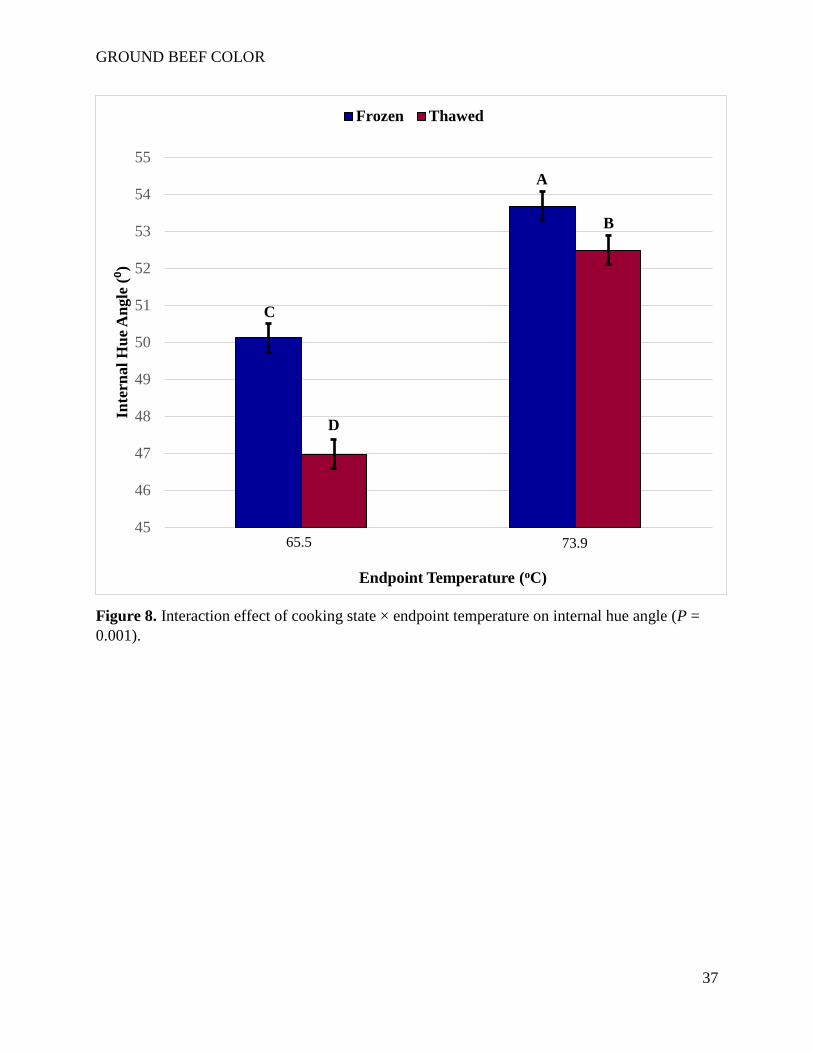
0.001; Figure 6). Patties cooked from frozen had greater hue angles for both chilling methods
(cooking state chilling method, P = 0.015; Figure 7) and at both endpoint temperatures
(cooking state endpoint temperature, P = 0.001; Figure 8)
GROUND BEEF COLOR
20
Endpoint Temperature
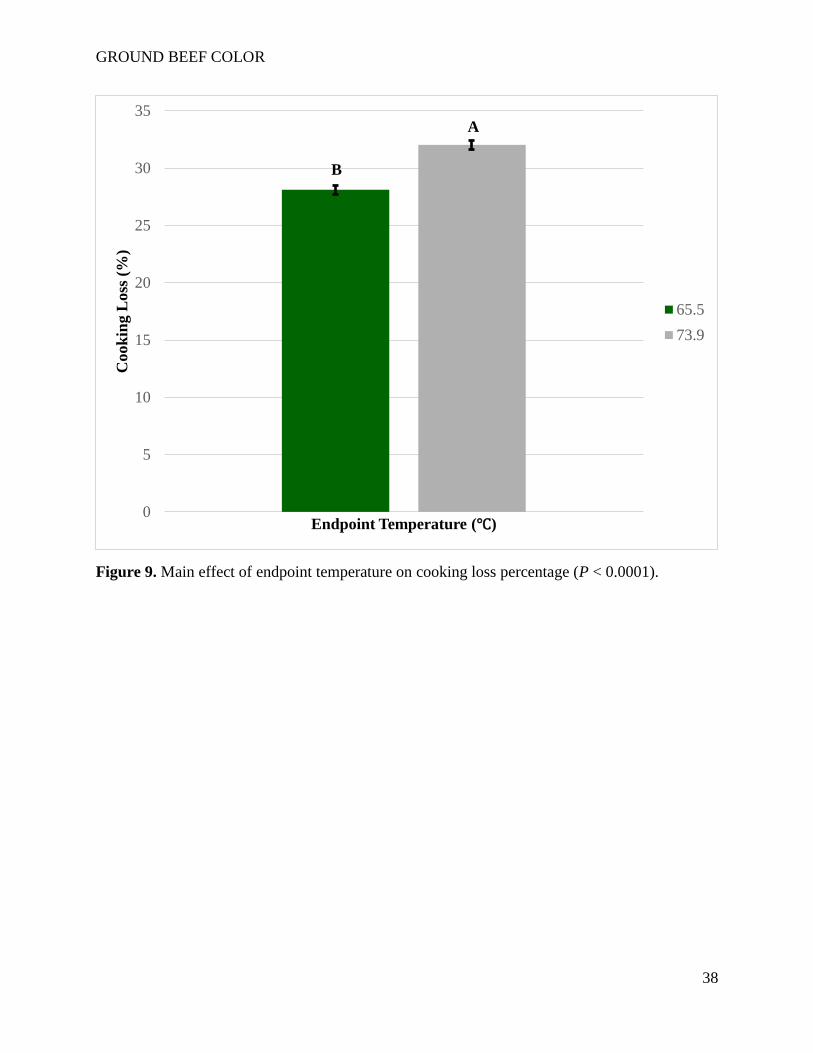
Cooking loss was greater for patties cooked to 73.9oC than 65.5oC (P < 0.001; Figure 9).
Externally, patties that were cooked to an internal temperature of 65.5oC were lighter (P <
0.001), redder (P < 0.001), more yellow (P = 0.001), and more vivid (P < 0.001) than patties
cooked to 73.9oC (Table 1).
Internally, patties cooked to 65.5oC were lighter (P = 0.032) than patties cooked to
73.9oC (Table 1). Patties that were cooked to 65.5oC were redder than those cooked to 73.9oC
(cooking state endpoint temperature, P < 0.001; Figure 4). Patties cooked to 65.5oC were more
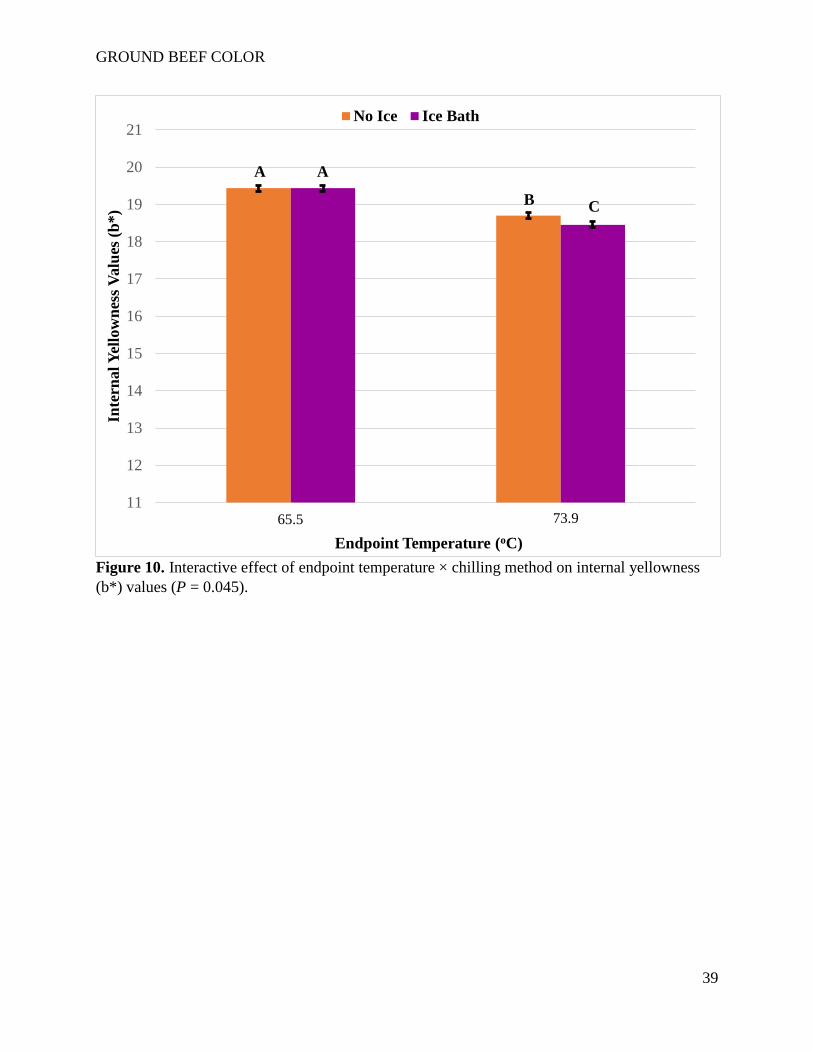
yellow than patties cooked to 73.9oC. Although a* values did not vary among patties cooked to
65.5oC, between patties cooked to 73.9oC those cooled at room temperature were more yellow
internally than those chilled in an ice bath (endpoint temperature chilling, P = 0.045; Figure
10). Patties cooked to an internal temperature of 65.5oC were more vivid than patties cooked to
73.9oC (cooking state endpoint temperature, P < 0.001; Figure 6). Additionally, patties that
were cooked to the greater internal temperature had greater hue angles than patties cooked to the
lower endpoint temperature (cooking state endpoint temperature, P = 0.001; Figure 8).
When post-cookery temperature decline was measured, as expected, patties that were
cooked to 73.9oC started at a greater temperature than those cooked to 65.5oC. Temperature
increased slightly between 0 and 1 min for patties cooked to 65.5oC, but temperature then
decreased from 1 to 30 min. The internal temperature for patties cooked to 73.9oC declined
throughout the entire post-cookery period. The patties reached the same internal temperature
after chilling for 30 minutes (Endpoint temperature time, P < 0.001; Figure 11).

GROUND BEEF COLOR
21
Chilling Method
Frozen patties that were allowed to cool at room temperature had greater cooking loss
than those chilled in an ice bath (cooking state chilling, P = 0.04; Figure 1). Externally, patties
that were chilled in an ice bath were lighter (P < 0.001), redder (P = 0.012), more yellow (P <
0.001), and more vivid (P < 0.001) than patties cooled at room temperature (Table 1).
Additionally, patties chilled in an ice bath had greater hue angles than those cooled at room
temperature (cooking state chilling, P = 0.003; Figure 2).
Internally, those chilled in an ice bath were lighter (P < 0.001) than patties cooled at
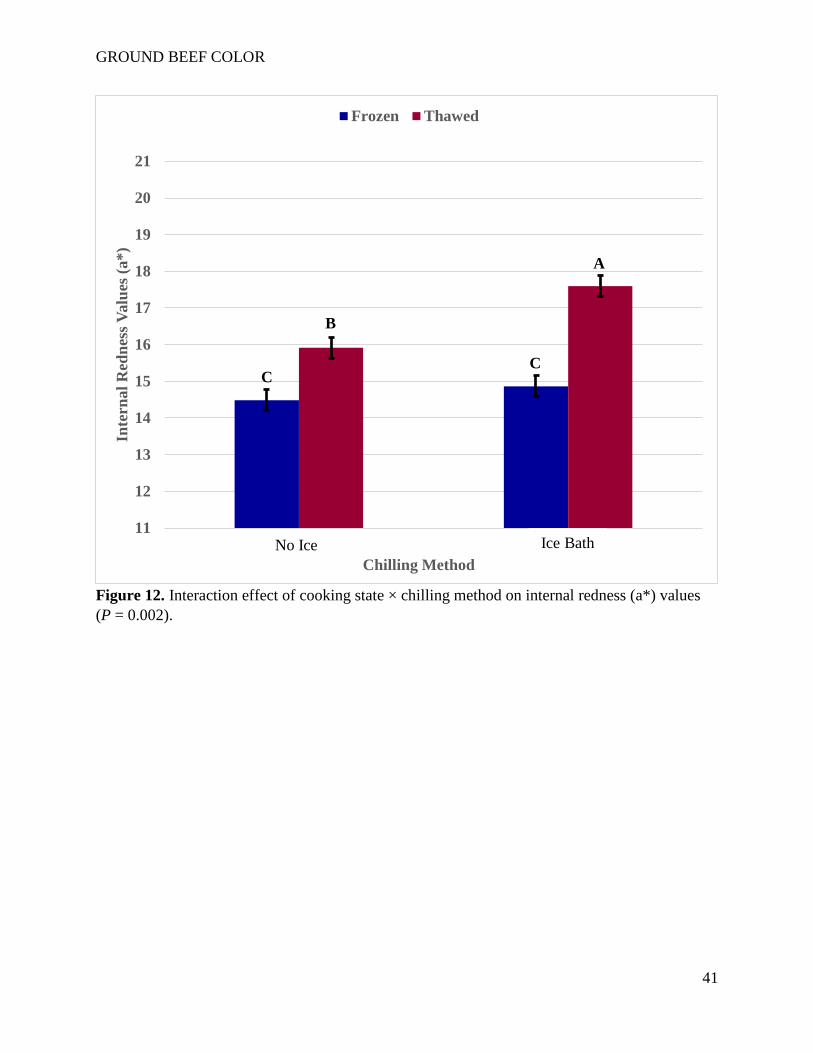
room temperature (Table 1). Among the thawed patties, those that were chilled in an ice bath
were redder than those cooled at room temperature (cooking state chilling, P = 0.002; Figure
12). Among frozen patties, there were no differences in a* values for those cooled at room
temperature and those chilled at room temperature. Frozen patties cooled at room temperature
were more yellow than those chilled in an ice bath (cooking state chilling, P = 0.002; Figure
5). However, among thawed patties b* values did not differ between chilling methods.
Furthermore, between patties cooked to 73.9oC, patties cooled at room temperature were more
yellow internally than those chilled in an ice bath, while b* values did not differ between chilling
methods when patties were cooked to 65.5oC (endpoint temperature chilling, P = 0.045; Figure
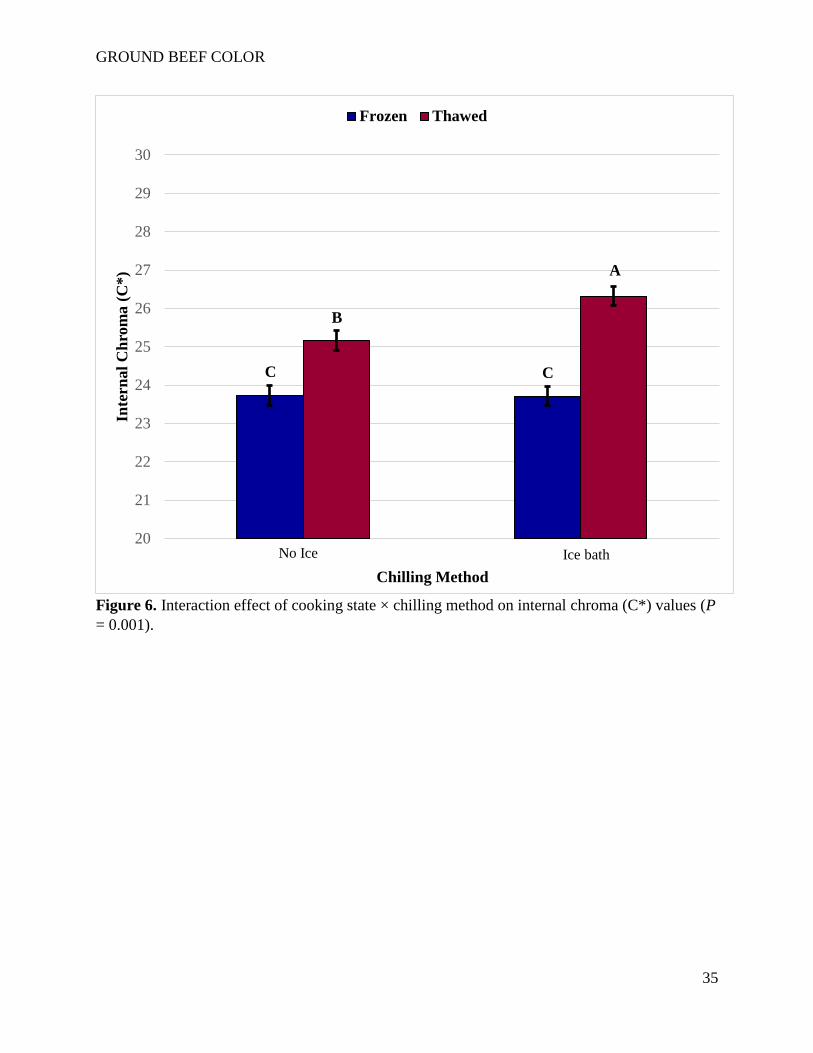
10). Between patties cooked from thawed, those chilled in the ice bath were more vivid than
those cooled at room temperature (cooking state chilling, P = 0.001; Figure 13). Among frozen
patties, there was no difference in C* values for those cooled at room temperature and those
chilled in an ice bath. Patties cooked from frozen that were allowed to cool at room temperature
had the greatest hue angles. Thawed patties that were chilled in an ice bath had the smallest hue
GROUND BEEF COLOR
22
angles, and frozen patties cooled in an ice bath and thawed patties cooled at room temperature
were intermediate (cooking state chilling method, P = 0.015; Figure 7).
While patties chilled in an ice bath and those cooled at room temperature started out at
the same temperature at time 0, patties cooled at room temperature had a slight increase in
internal temperature between times 0 and 1 before declining steadily. Patties chilled in an ice
bath declined throughout the chilling period, and saw the greatest decrease between time 0 and 5
minutes, with internal temperature dropping over 20oC. Additionally, patties chilled in an ice
bath had a final internal temperature at less than 10oC after 30 minutes, while those cooled at
room temperature had a final internal temperature at just under 35oC at 30 minutes (chilling
time, P < 0.001; Figure 14).
GROUND BEEF COLOR
23
Discussion
Cooking State
Patties cooked from thawed were lighter (greater L*), redder, (greater a*), more yellow
(greater b*), and more vivid (greater C*) externally. This was to be expected, as the cooking
time for frozen patties was on average 267.7 seconds longer (P < 0.05) than for thawed patties
(Table 1). Thawed patties exhibited less cooking loss than frozen patties. This agreed with
previous studies (van Laack, Berry, and Solomon, 1996a; Berry, 1998b; Berry, 2001). This also
agrees with the shorter cooking times for the thawed patties. Additionally, patties that were
thawed were susceptible to more water lost during the thawing process, which would lead to less
cooking loss.
Patties cooked from thawed were also lighter internally compared to those cooked from
frozen, as previously found in a study by Berry (2001). Thawed patties were also redder
internally, agreeing with results reported by Hunt, Sorheim, and Slinde (1999). However, other
studies (Berry, 2001; Berry, 1998b; van Laack, Berry, and Solomon, 1996a) found frozen patties
to be redder internally. Thawed patties were more yellow than frozen patties, as found previously
by Berry (1998b) and Hunt, Sorheim, & Slinde (1999). Conversely, Berry (2001) found thawed
patties to have decreased b* values than frozen patties. Thawed patties were found to be more
vivid than frozen patties, agreeing with results by Berry (1996b) and Hunt, Sorheim, and Slinde,
(1999) Conversely, Berry (2001) and van Laack, Berry, and Solomon (1996a) found frozen
patties to be more vivid.
Thawed patties had greater variation in internal color than frozen patties did. This agrees
with van Laack, Berry, and Solomon (1996a) who stated the thawing process caused physical
and chemical changes that could not be reversed by refreezing. These unexplained changes could
GROUND BEEF COLOR
24
be contributing factors to the variation within thawed patties. Additionally, when comparing
differences in results across studies, these difference could be linked to variations in thawing
times and conditions between various studies.
Endpoint Temperature
Externally, patties cooked to the lower endpoint temperature (65.5oC) were lighter,
redder, more yellow, and more vivid than patties cooked to a higher endpoint temperature.
Cooking loss was greater for patties cooked to 73.9oC than for patties cooked to 65.5oC, which
agrees with previous work by Trout et al. (1992). The main cause for external color differences
and cooking loss can likely be attributed to shorter (P < 0.05; Table 1) cooking times for patties
cooked to 65.5oC (564.4 seconds versus 663.8 seconds).
Internally, patties cooked to 65.5oC were lighter than patties cooked to 73.9oC. Ryan et
al. (2006) had similar results, but only found differences when the myoglobin in the patty was in
the oxymyoglobin form. Similarly, Troutt et al. (1992) found patties cooked to a lower degree of
doneness were lighter than those cooked to greater degrees of doneness. Additionally, Berry and
Bigner-George (1999) found no differences in lightness across various endpoint temperatures.
Patties cooked to a lower endpoint temperature were redder internally. Previous work by
Brewer and Novakofski (1999) found similar results, Ryan et al. (2006) found that if patties were
in the deoxymyoglobin state, redness increased with decreasing endpoint temperature. However,
the same study noted that if patties were in the oxymyoglobin state, redness values did not differ
among different endpoint temperatures. Berry (1998a) noted similar results, as redness values
only differed across endpoint temperatures in certain blends. Conversely, Troutt et al. (1992)
found no differences in redness values across different endpoint temperatures.
GROUND BEEF COLOR
25
Patties cooked to 65.5oC were more yellow than those cooked to 73.9oC, which agrees
with previous findings by Berry, 1998a. Ryan et al. (2006) only found differences in yellowness
when patties were in the oxymyoglobin state, and additionally, found that patties cooked to a
greater degree of doneness were more yellow. Brewer and Novakofski (1999) found that
yellowness values at each endpoint temperatures decreased as the pH of the patty increased.
Troutt et al. (1992) and Berry and Bigner-George (1999) reported no differences in yellowness
values across endpoint temperatures.
Furthermore, patties cooked to a lower endpoint temperature were more vivid than those
cooked to a higher endpoint temperature. This agrees with results of Berry (1998a) and Berry
and Bigner-George (1999). However, Ryan et al. (2006) found vividness to be related to the state
of myoglobin, reporting patties in the oxymyoglobin state were more vivid at a higher degree of
doneness while patties cooked from the deoxymyoglobin state were more vivid at a lower degree
of doneness.
Two different endpoint temperatures were chosen for this study, one below the minimum
safe internal temperature and one above to create different color conditions. However, a
persistent pink color was seen at 73.9oC.
Chilling Method
No previous research was found comparing differences in chilling method on external or
internal color. However, when chilled in an ice bath, patties were lighter, redder, more yellow,
and more vivid externally than those that were allowed to cool at room temperature. Internally,
patties chilled in the ice bath were lighter, redder when cooked from thawed, and more vivid
when cooked from thawed than those that were allowed to cool at room temperature. These
GROUND BEEF COLOR
26
differences might be attributed to the changes in post-cookery temperature for the different
chilling methods.
When comparing temperatures changes, those that were allowed to cool at room
temperature increased in internal temperature between zero and one minute, before declining.
Conversely, patties that were chilled in the ice bath declined throughout the entirety of the
chilling period. Additionally, patties that were chilled in an ice bath reached a final internal
temperature of less than 10oC after the 30 minute chilling period, while those that were cooled at
room temperature were still at 35oC.
These differences in internal temperature likely affected myoglobin denaturation
throughout the entirety of the chilling process, causing variations in internal color. Similarly,
surface temperature could have undergone similar changes leading to external color differences
between chilling methods. It is also plausible that variations in cooling methods between
different studies could impact cooked color results, as there is no set protocol for chilling before
taking color readings.
GROUND BEEF COLOR
27
Conclusions
Cooking from frozen instead of thawed, cooking to different internal endpoint
temperatures, and chilling in an ice bath or at room temperature caused differences in external
and internal instrumental color. Cooking from thawed, to a lower endpoint temperature, and
chilling in an ice bath produced patties that were lighter, redder, more yellow, and more vivid
externally. Similarly, those conditions produced patties that were lighter, redder, and more vivid
internally. Most importantly, persistent pinking was observed when patties were cooked from
thawed and when patties were cooled in an ice bath.
Differences in cooking state differed from results of previous studies. The
inconsistencies show further proof that cooked meat color is a dynamic process that is effected
by the interaction of many different factors. It is certain that many other factors have been found
to play a role in variation in cooked color including but not limited to cooking method, pH,
myoglobin state, and the age of the animal at harvest. While these factors did not contribute to
differences within this study, it is possible that they lead to differences between this study and
previous research. Since this data was not recorded, they cannot be compared. To further
understanding the phenomena associated with cooked color, more research should be done to
further examine the relationship these factors have with the cooking state, endpoint temperature,
and chilling methods.
GROUND BEEF COLOR
28
References
Berry, B.W. (1998a). Color of cooked beef patties as influenced by formulation and final internal
temperature. Food Research International, 30(7), 473-478.
Berry, B.W. (1998b). Cooked color in high pH beef patties as related to fat content and cooking
from the frozen or thawed state. Journal of Food Science, 63(5), 1-4.
Berry, B.W. (2001). Use of infrared thermography to assess temperature variability in beef
patties cooked from the frozen and thawed states. Foodservice Research International,
12, 255-262.
Berry, B.W. & Bigner-George, M.E. (1999). Properties of beef patties cooked to elevated
internal temperatures as a means of reducing pink color. Journal of Muscle Food, 10,
215-230.
Brewer, M.S., Novakofski, J. (1999). Cooking rate, pH, and final endpoint temperature effects on
color and cook loss of a lean ground beef model system. Journal of Meat Science, 52,
443-451.
Darcy, S. (2016). Fast food: quantitative survey and qualitative community of those who eat less
burgers in fast food restaurants. [PowerPoint slides]. Retrieved from
https://www.beefresearch.org/CMDocs/BeefResearch/MR_Presentations/Beef_Fast_Foo
d_Report.pdf
Hunt, M.C., Sorheim, O., Slinde, E. (1999). Color and heat denaturation of myoglobin forms in
ground beef. Journal of Food Science, 64(5), 847-851.
King, N.J. & Whyte, R. (2006). Does it looked cooked? A review of factors that influence
cooked meat color. Journal of Food Science, 71(4), R31-40.
Kropf, D.H. & Hunt, M.C. (1998). End point cooking temperature and meat color. Reciprocal
Meat Conference Proceeding, 51, 144-148.
Lundeen, J., Krebs, A., Moore, C., Darcy, S. (2017). Consumer Insights. [PowerPoint slides]
Retrieved from
http://www.beefissuesquarterly.com/CMDocs/BeefResearch/MR_Presentations/Consume
r_Insights_preso-Nashville2017_Distrib.pdf
Mendenhall, V.T. (1989). Effect of pH and total pigment concentration on the internal color of
cooked ground beef patties. Journal of Food Science, 54(1), 1-2.
Ryan, S.M., Seyfert, M., Hunt, M.C., Mancini, R.A. (2006). Influence of cooking rate, endpoint
temperature, post-cook hold time, and myoglobin redox state on internal color
development of cooked ground beef patties. Journal of Food Science, 71(3), C216-221.
Suman, S.P., Nair, M.N., Joseph, P., Hunt, M.C. (2016). Factors influencing internal color of
cooked meats. Journal of Meat Science, 120, 133-144.
Technomic. (2016). Usage and volumetric assessment of beef in foodservice. [PowerPoint
slides]. Retrieved from
GROUND BEEF COLOR
29
https://www.beefresearch.org/CMDocs/BeefResearch/MR_Presentations/16_Foodservice
_Volumetric.pdf
Tornberg, E. (2005). Effects of heat on meat proteins – implications on structure and quality of
meat products. Journal of Meat Science, 70, 493-508.
Troutt, E.S., Hunt, M.C., Johnson, D.E., Claus, J.R., Kastner, C.L., Kropf, D.H., Stroda, S.
(1992). Chemical, physical, and sensory characterization of ground beef containing 5 to
30 percent fat. Journal of Food Science, 57(1), 25-29.
United States Department of Agriculture Food Safety Inspection Service [USDA FSIS]. (2015).
Safe Minimum Internal Temperature Chart. Retrieved from
https://www.fsis.usda.gov/wps/portal/fsis/topics/food-safety-education/get-answers/food-
safety-fact-sheets/safe-food-handling/safe-minimum-internal-temperature-chart/ct_index.
van Laack, R.L.J.M., Berry, B.W., Solomon, M.B. (1996a). Effect of precooking conditions on
color of cooked beef patties. Journal of Food Protection, 59(9), 976-983.
van Laack, R.L.J.M., Berry, B.W., Solomon, M.B. (1996b). Variations in internal color of
cooked beef patties. Journal of Food Science, 61(2), 410-414.
Warren, K.E., Hunt, M.C., Kropf, D.H. (1996). Myoglobin oxidative state affects internal cooked
color development in ground beef patties. Journal of Food Science, 61(3), 513-515.
GROUND BEEF COLOR
30
Figures and Tables
Figure 1. Interaction effect of cooking state × chilling method on cooking loss percentage (P =
0.04).
0
5
10
15
20
25
30
35
Cook
ing L
oss
(%
)
Chilling Method
Frozen Thawed
No Ice Ice Bath
ABB
C
A

GROUND BEEF COLOR
31
Figure 2. Interaction effect of cooking state × chilling method on external hue angle (P = 0.003).
47
48
49
50
51
52
53
54
55
56
57
Hu
e A
ngle
()
Chilling Method
Frozen Thawed
No Ice Ice Bath
C
A A
B
GROUND BEEF COLOR
32
Figure 3. Interaction effects of cooking state × endpoint temperature on internal redness (a*)
values (P < 0.001).
11
12
13
14
15
16
17
18
19
20
21
Inte
rnal
Red
nes
s V
alu
es (
a*)
Endpoint Temperature
Frozen Thawed
65.5C 73.9C
A
B
C
D
GROUND BEEF COLOR
33
Figure 4. Interaction effect of the cooking State endpoint temperature on internal yellowness
(b*) values (P < 0.001).
11
12
13
14
15
16
17
18
19
20
21
Inte
rnal Y
ello
wn
ess
Valu
es (
b*)
Endpoint Temperature
Frozen Thawed
65.5C 73.9C
A
BBC
GROUND BEEF COLOR
34
Figure 5. Interaction effect of cooking state × chilling method on internal yellowness (b*) values
(P = 0.002).
11
12
13
14
15
16
17
18
19
20
21
Inte
rnal Y
ello
wn
ess
Valu
es (
b*)
Chilling Method
Frozen Thawed
Ice bathNo Ice
A
vA
BC
GROUND BEEF COLOR
35
Figure 6. Interaction effect of cooking state × chilling method on internal chroma (C*) values (P
= 0.001).
20
21
22
23
24
25
26
27
28
29
30
Inte
rna
l C
hro
ma (
C*)
Chilling Method
Frozen Thawed
No Ice Ice bath
A
B
CC
GROUND BEEF COLOR
36
Figure 7. Interaction effect of cooking state × chilling method on internal hue angle (P = 0.015).
45
46
47
48
49
50
51
52
53
54
55
Inte
rnal
Hu
e A
ngle
(⁰)
Chilling Method
Frozen Thawed
No Ice Ice bath
A
BB
C
GROUND BEEF COLOR
37
Figure 8. Interaction effect of cooking state × endpoint temperature on internal hue angle (P =
0.001).
45
46
47
48
49
50
51
52
53
54
55
Inte
rnal
Hu
e A
ngle
(⁰)
Endpoint Temperature (oC)
Frozen Thawed
65.5 73.9
A
B
C
D
GROUND BEEF COLOR
38
Figure 9. Main effect of endpoint temperature on cooking loss percentage (P < 0.0001).
0
5
10
15
20
25
30
35C
ook
ing L
oss
(%
)
Endpoint Temperature (℃)
65.5
73.9
A
B
GROUND BEEF COLOR
39
Figure 10. Interactive effect of endpoint temperature × chilling method on internal yellowness
(b*) values (P = 0.045).
11
12
13
14
15
16
17
18
19
20
21In
tern
al Y
ello
wn
ess
Valu
es (
b*)
Endpoint Temperature (oC)
No Ice Ice Bath
65.5
A A
B C
73.9

GROUND BEEF COLOR
40
Figure 11. Interaction between endpoint temperature time on internal temperature post
cookery (P < 0.001).
15
25
35
45
55
65
75
0 1 5 10 15 30
Tem
per
atu
re (
oC
)
Time (min)
65.5
73.9
AB
E
G
I
K
D C
F
H
J
K
GROUND BEEF COLOR
41
Figure 12. Interaction effect of cooking state × chilling method on internal redness (a*) values
(P = 0.002).
11
12
13
14
15
16
17
18
19
20
21
Inte
rnal
Red
nes
s V
alu
es (
a*)
Chilling Method
Frozen Thawed
Ice BathNo Ice
A
B
CC

GROUND BEEF COLOR
42
Figure 13. Interaction effect of cooking state × endpoint temperature on internal chroma (C*)
values (P < 0.001).
20
21
22
23
24
25
26
27
28
29
30
Inte
rnal
Ch
rom
a (
C*)
Endpoint Temperature (oC)
Frozen Thawed
65.5 73.9
D
C
A
B

GROUND BEEF COLOR
43
Figure 14. Interaction of chilling method temperature on internal temperature post cookery (P
< 0.001).
5
15
25
35
45
55
65
75
0 1 5 10 15 30
Tem
per
atu
re (
oC
)
Time (min)
Ice
No Ice
B A
D
E
F
G
C
G
I
J
K
GROUND BEEF COLOR
44
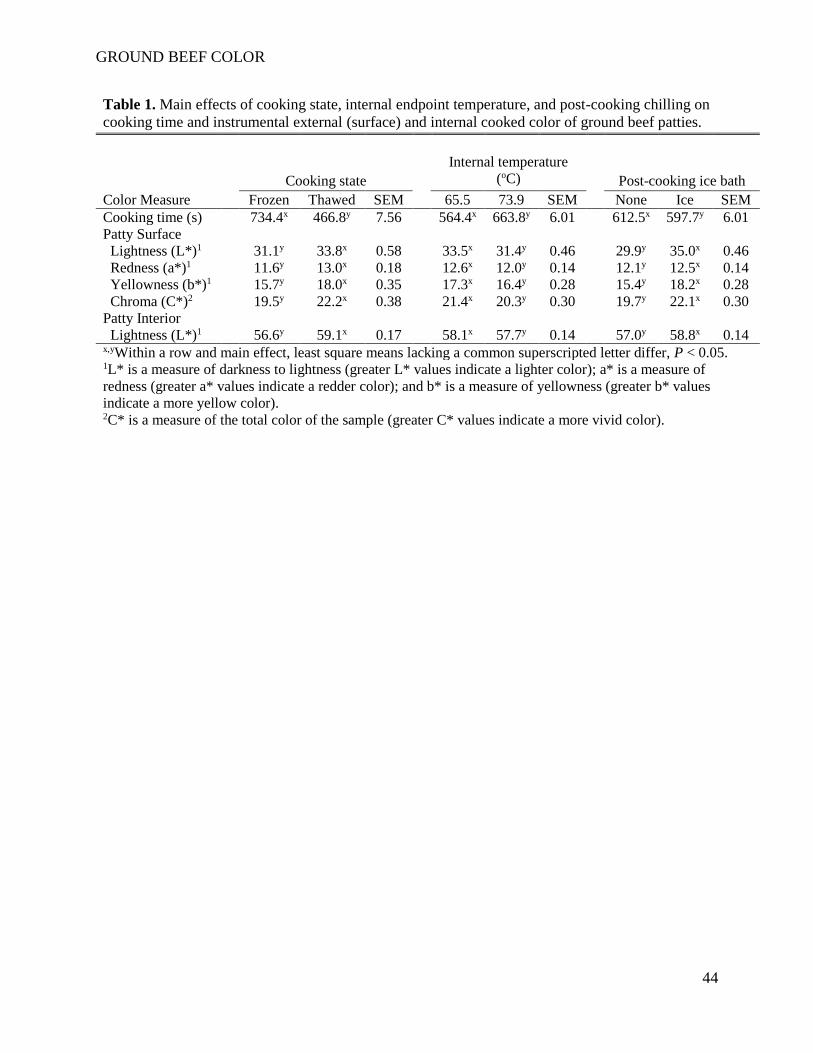
Table 1. Main effects of cooking state, internal endpoint temperature, and post-cooking chilling on
cooking time and instrumental external (surface) and internal cooked color of ground beef patties.
Internal temperature
(oC)
Cooking state Post-cooking ice bath
Color Measure Frozen Thawed SEM 65.5 73.9 SEM None Ice SEM
Cooking time (s) 734.4x 466.8y 7.56 564.4x 663.8y 6.01 612.5x 597.7y 6.01
Patty Surface
Lightness (L*)1 31.1y 33.8x 0.58 33.5x 31.4y 0.46 29.9y 35.0x 0.46
Redness (a*)1 11.6y 13.0x 0.18 12.6x 12.0y 0.14 12.1y 12.5x 0.14
Yellowness (b*)1 15.7y 18.0x 0.35 17.3x 16.4y 0.28 15.4y 18.2x 0.28
Chroma (C*)2 19.5y 22.2x 0.38 21.4x 20.3y 0.30 19.7y 22.1x 0.30
Patty Interior
Lightness (L*)1 56.6y 59.1x 0.17 58.1x 57.7y 0.14 57.0y 58.8x 0.14 x,yWithin a row and main effect, least square means lacking a common superscripted letter differ, P < 0.05. 1L* is a measure of darkness to lightness (greater L* values indicate a lighter color); a* is a measure of
redness (greater a* values indicate a redder color); and b* is a measure of yellowness (greater b* values
indicate a more yellow color). 2C* is a measure of the total color of the sample (greater C* values indicate a more vivid color).