The effects of soaking and cooking time on the cooking properties of two cowpea varieties
Upload
khangminh22Category
view
0download
0
eCook Zambia Cooking Diaries October 2019 Working Paper
(final report expected December 2019)
Main authors: J. Leary, N. Scott, N. Serenje, F. Mwila, S. Batchelor
Associate authors: M. Leach, E. Brown, F. Yamba
Innovate Project 132724 Implemented by:
Funded by:
With additional analysis by:
eCook Zambia Cooking Diaries | October 2019 Working Paper
[email protected] | PV-ecook.org
This research is funded by DfID/UK Aid and Gamos through the Innovate UK Energy Catalyst and the MECS programme.
2
Acknowledgement
This study would not have been possible without the dedication of the twenty participants, who spent
six weeks diligently recording everything they cooked. What is more, their willingness to experiment
with new appliances in their kitchen and share their experiences offered a rich learning opportunity, for
which we are very grateful. We are also very grateful to the staff of CEEEZ, both those named as authors
and the supporting staff, who helped us to reveal what really goes on in Zambian kitchens. Finally, we
thank the donors, UK AID via Innovate UK for partial funding and the directors and shareholders of
Gamos who matched the funding for the benefit and public good of Zambia. Additional analysis was
carried out under the Modern Energy Cooking Services (MECS) programme, also funded by UK Aid.
Rights, permissions & disclaimer
This work is available under the Creative Commons Attribution 4.0 International
license (CC BY 4.0) https://creativecommons.org/licenses/by/4.0/. Under the Creative
Commons Attribution license, you are free to: Share — copy and redistribute the material in any
medium or format; Adapt — remix, transform, and build upon the material; for any purpose, even
commercially.
Attribution: please cite this work as “Leary, J., Scott, N., Serenje, N., Mwila F., Batchelor S., Leach M.,
Brown, E., Yamba, F. 2019. “eCook Zambia Cooking Diaries Report – October 2019 Working Report.”
CEEEZ, Loughborough University, University of Surrey & Gamos Ltd. supported by Innovate UK, UK Aid &
Gamos Ltd. Available from: https://elstove.com/innovate-reports/”
This data and material have been funded by UK AID from the UK government; however, the views
expressed do not necessarily reflect the UK government’s official policies.
eCook Zambia Cooking Diaries | October 2019 Working Paper
[email protected] | PV-ecook.org
This research is funded by DfID/UK Aid and Gamos through the Innovate UK Energy Catalyst and the MECS programme.
3
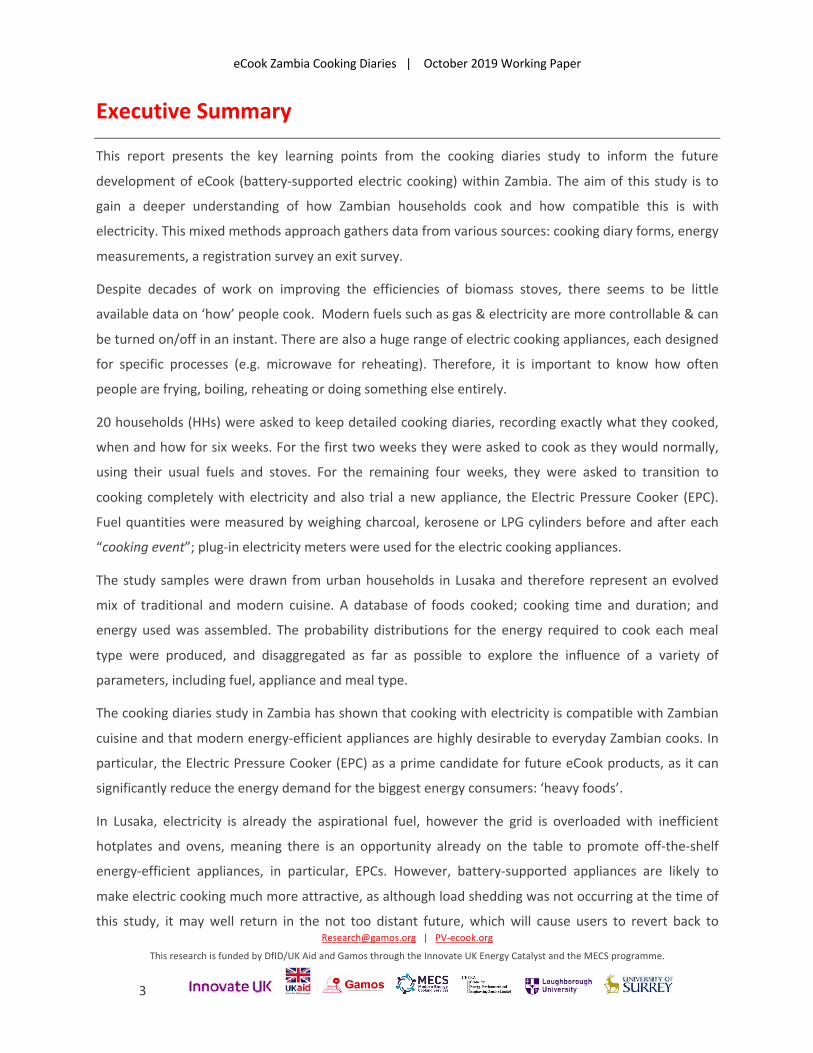
Executive Summary
This report presents the key learning points from the cooking diaries study to inform the future
development of eCook (battery-supported electric cooking) within Zambia. The aim of this study is to
gain a deeper understanding of how Zambian households cook and how compatible this is with
electricity. This mixed methods approach gathers data from various sources: cooking diary forms, energy
measurements, a registration survey an exit survey.
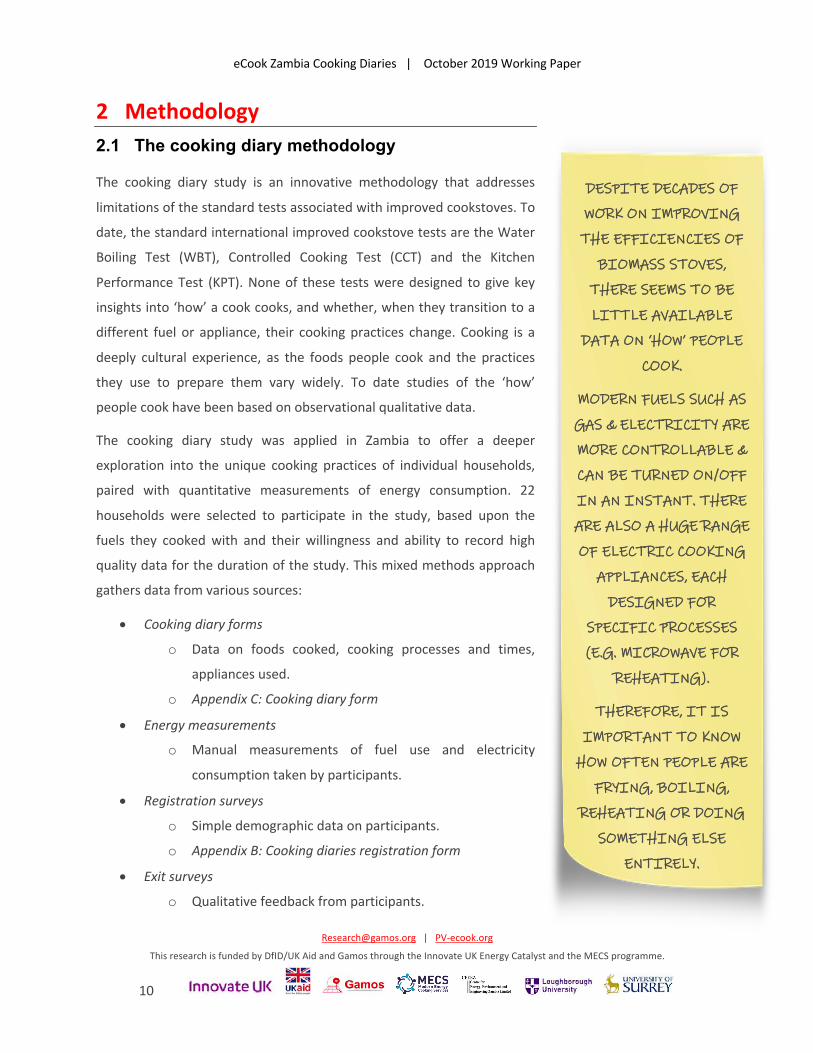
Despite decades of work on improving the efficiencies of biomass stoves, there seems to be little
available data on ‘how’ people cook. Modern fuels such as gas & electricity are more controllable & can
be turned on/off in an instant. There are also a huge range of electric cooking appliances, each designed
for specific processes (e.g. microwave for reheating). Therefore, it is important to know how often
people are frying, boiling, reheating or doing something else entirely.
20 households (HHs) were asked to keep detailed cooking diaries, recording exactly what they cooked,
when and how for six weeks. For the first two weeks they were asked to cook as they would normally,
using their usual fuels and stoves. For the remaining four weeks, they were asked to transition to
cooking completely with electricity and also trial a new appliance, the Electric Pressure Cooker (EPC).
Fuel quantities were measured by weighing charcoal, kerosene or LPG cylinders before and after each
“cooking event”; plug-in electricity meters were used for the electric cooking appliances.
The study samples were drawn from urban households in Lusaka and therefore represent an evolved
mix of traditional and modern cuisine. A database of foods cooked; cooking time and duration; and
energy used was assembled. The probability distributions for the energy required to cook each meal
type were produced, and disaggregated as far as possible to explore the influence of a variety of
parameters, including fuel, appliance and meal type.
The cooking diaries study in Zambia has shown that cooking with electricity is compatible with Zambian
cuisine and that modern energy-efficient appliances are highly desirable to everyday Zambian cooks. In
particular, the Electric Pressure Cooker (EPC) as a prime candidate for future eCook products, as it can
significantly reduce the energy demand for the biggest energy consumers: ‘heavy foods’.
In Lusaka, electricity is already the aspirational fuel, however the grid is overloaded with inefficient
hotplates and ovens, meaning there is an opportunity already on the table to promote off-the-shelf
energy-efficient appliances, in particular, EPCs. However, battery-supported appliances are likely to
make electric cooking much more attractive, as although load shedding was not occurring at the time of
this study, it may well return in the not too distant future, which will cause users to revert back to

eCook Zambia Cooking Diaries | October 2019 Working Paper
[email protected] | PV-ecook.org
This research is funded by DfID/UK Aid and Gamos through the Innovate UK Energy Catalyst and the MECS programme.
4
charcoal. LPG is not yet popular in Lusaka, as it is currently expensive and it is perceived as unsafe.
However if load shedding returns, it may well become an attractive option. If the LPG market is
established, the ability to cook faster and multi-task, whilst also saving money make a fuel stacking
scenario with EPCs is likely to be extremely attractive for modern Zambians.
eCook Zambia Cooking Diaries | October 2019 Working Paper
[email protected] | PV-ecook.org
This research is funded by DfID/UK Aid and Gamos through the Innovate UK Energy Catalyst and the MECS programme.
5
Table of Contents
ACKNOWLEDGEMENT .......................................................................................................................................... 2
RIGHTS, PERMISSIONS & DISCLAIMER .................................................................................................................. 2
EXECUTIVE SUMMARY ......................................................................................................................................... 3
1 INTRODUCTION ........................................................................................................................................... 7
1.1 BACKGROUND .................................................................................................................................................. 7 1.1.1 Context of the potential landscape change by eCook .............................................................................. 7 1.1.2 Introducing ‘eCook’ .................................................................................................................................. 8 1.1.3 eCook in Zambia ...................................................................................................................................... 9
1.2 AIM ............................................................................................................................................................... 9
2 METHODOLOGY ......................................................................................................................................... 10
2.1 THE COOKING DIARY METHODOLOGY .................................................................................................................. 10 2.2 COOKING DIARIES IN ZAMBIA ............................................................................................................................. 11
3 RESULTS .................................................................................................................................................... 14
3.1 TYPICAL ZAMBIAN FOODS ................................................................................................................................. 14 3.2 OVERVIEW OF DATA ........................................................................................................................................ 15
3.2.1 Overview of participants ............................................................................ Error! Bookmark not defined. 3.2.2 Overview of diaries data ........................................................................................................................ 15
3.3 ENERGY CONSUMPTIONS .................................................................................................................................. 22 3.3.1 Household meters .................................................................................................................................. 23 3.3.2 Mix of fuels ............................................................................................................................................ 25 3.3.3 Per capita consumptions ....................................................................................................................... 27 3.3.4 Energy consumption by heating event .................................................................................................. 31
3.4 ENERGY CONSUMPTION PER DAY ........................................................................................................................ 35 3.4.1 24 hour electricity load profiles .............................................................................................................. 43
3.5 MEALS COOKED .............................................................................................................................................. 46 3.5.1 Food types cooked ................................................................................................................................. 46 3.5.2 Reheating food ...................................................................................................................................... 48 3.5.3 Energy to cook food types ..................................................................................................................... 52
3.6 COOKING DEVICES ........................................................................................................................................... 56 3.6.1 Detail on how participants cook ............................................................................................................ 56 3.6.2 Characteristics of different cooking devices .......................................................................................... 58
eCook Zambia Cooking Diaries | October 2019 Working Paper
[email protected] | PV-ecook.org
This research is funded by DfID/UK Aid and Gamos through the Innovate UK Energy Catalyst and the MECS programme.
6
3.6.3 Fuel stacking .......................................................................................................................................... 61 3.7 ENERGY USED BY DIFFERENT ELECTRICAL APPLIANCES (PHASE 2) ............................................................................... 63 3.8 TIME TAKEN ................................................................................................................................................... 66
3.8.1 Time taken to cook food types ............................................................................................................... 66 3.8.2 Time taken to prepare meal .................................................................................................................. 68 3.8.3 Time of day ............................................................................................................................................ 72
3.9 WATER HEATING ............................................................................................................................................. 74 3.10 USER EXPERIENCE OF COOKING WITH ELECTRICITY ...................................................... ERROR! BOOKMARK NOT DEFINED.
4 EVALUATION ............................................................................................................................................. 78
4.1 ELECTRICITY MEASUREMENTS FROM HOUSEHOLD METERS ....................................................................................... 78 4.2 DATA LIMITATIONS .......................................................................................................................................... 79
4.2.1 Dish level data ....................................................................................................................................... 79 4.3 ENUMERATOR VISITS & DIGITISATION OF DATA ..................................................................................................... 80 4.4 SAMPLE DIVERSITY .......................................................................................................................................... 81
5 CONCLUSION ............................................................................................................................................. 82
6 APPENDIX .................................................................................................................................................. 83
6.1 APPENDIX A: PROBLEM STATEMENT AND BACKGROUND TO INNOVATE ECOOK PROJECT ................................................ 83 6.1.1 Beyond business as usual ....................................................................................................................... 83 6.1.2 Building on previous research ................................................................................................................ 85 6.1.3 Summary of related projects ................................................................................................................. 88 6.1.4 About the Modern Energy Cooking Services (MECS) Programme. ........................................................ 89
6.2 APPENDIX B: COOKING DIARIES REGISTRATION FORM ............................................................................................. 93 6.2.1 Checklist for enumerators ...................................................................................................................... 93 6.2.2 Cooking Diaries Registration Form ........................................................................................................ 94
6.3 APPENDIX C: COOKING DIARY FORM ................................................................................................................... 99 6.4 APPENDIX D: COOKING DIARIES EXIT SURVEY ...................................................................................................... 101
eCook Zambia Cooking Diaries | October 2019 Working Paper
[email protected] | PV-ecook.org
This research is funded by DfID/UK Aid and Gamos through the Innovate UK Energy Catalyst and the MECS programme.
7
1 Introduction
This report presents one part of the detailed in country research carried out to explore the market for
eCook in Zambia. In particular, this in country work aims to gain much greater insight into culturally
distinct cooking practices and explore how compatible they are with battery-supported electric cooking.
The report is rich with detail and is intended to provide decision makers, practitioners and researchers
with new knowledge and evidence.
This report presents the key learning points from the cooking diaries study, to inform the future
development of eCook within Zambia. It is one component of a broader study designed to assess the
opportunities and challenges that lay ahead for eCook in high impact potential markets, such as Zambia,
funded through Innovate UK’s Energy Catalyst Round 4 by DfID UK Aid and Gamos Ltd.
(https://elstove.com/innovate-reports/).
The overall aims of the Innovate project, plus the series of interrelated projects that precede and follow
on from it are summarised in in Appendix A: Problem statement and background to Innovate eCook
project. A much deeper analysis of the data collected during this project was supported by the Modern
Energy Cooking Services (MECS) programme, which included the writing of this report.
1.1 Background 1.1.1 Context of the potential landscape change by eCook
The use of biomass and solid fuels for cooking is the everyday experience of nearly 3 billion people. This
pervasive use of solid fuels and traditional cookstoves results in high levels of household air pollution
with serious health impacts; extensive daily drudgery required to collect fuels, light and tend fires; and
environmental degradation. Where households seek to use ‘clean’ fuels, they are often hindered by lack
of access to affordable and reliable electricity and/or LPG. The enduring problem of biomass cooking is
discussed further in Appendix A: Problem statement and background to Innovate eCook project, which
not only describes the scale of the problem, but also how changes in renewable energy technology and
energy storage open up new possibilities for addressing it.
eCook Zambia Cooking Diaries | October 2019 Working Paper
[email protected] | PV-ecook.org
This research is funded by DfID/UK Aid and Gamos through the Innovate UK Energy Catalyst and the MECS programme.
8
1.1.2 Introducing ‘eCook’
eCook is a potentially transformative battery-supported electric cooking concept designed to offer
access to clean cooking and electricity to poorer households (HHs) currently cooking on charcoal or
other polluting fuels (Batchelor 2013; Batchelor 2015a; Batchelor 2015b). Enabling affordable electric
cooking sourced from renewable energy technologies, could also provide households with sustainable,
reliable, modern energy for a variety of other purposes.
A series of initial feasibility studies were funded by DfID UK AID under the PEAKS mechanism (available
from https://elstove.com/dfid-uk-aid-reports/). Slade (2015) investigated the technical viability of the
proposition, highlighting the need for further work defining the performance of various battery
chemistries under high discharge and elevated temperature. Leach & Oduro (2015) constructed an
economic model, breaking down PV-eCook into its component parts and tracking key price trends,
concluding that by 2020, monthly repayments on PV-eCook were likely to be comparable with the cost
of cooking on charcoal. Brown & Sumanik-Leary's (2015), review of behavioural change challenges
highlighted two distinct opportunities, which open up very different markets for eCook:
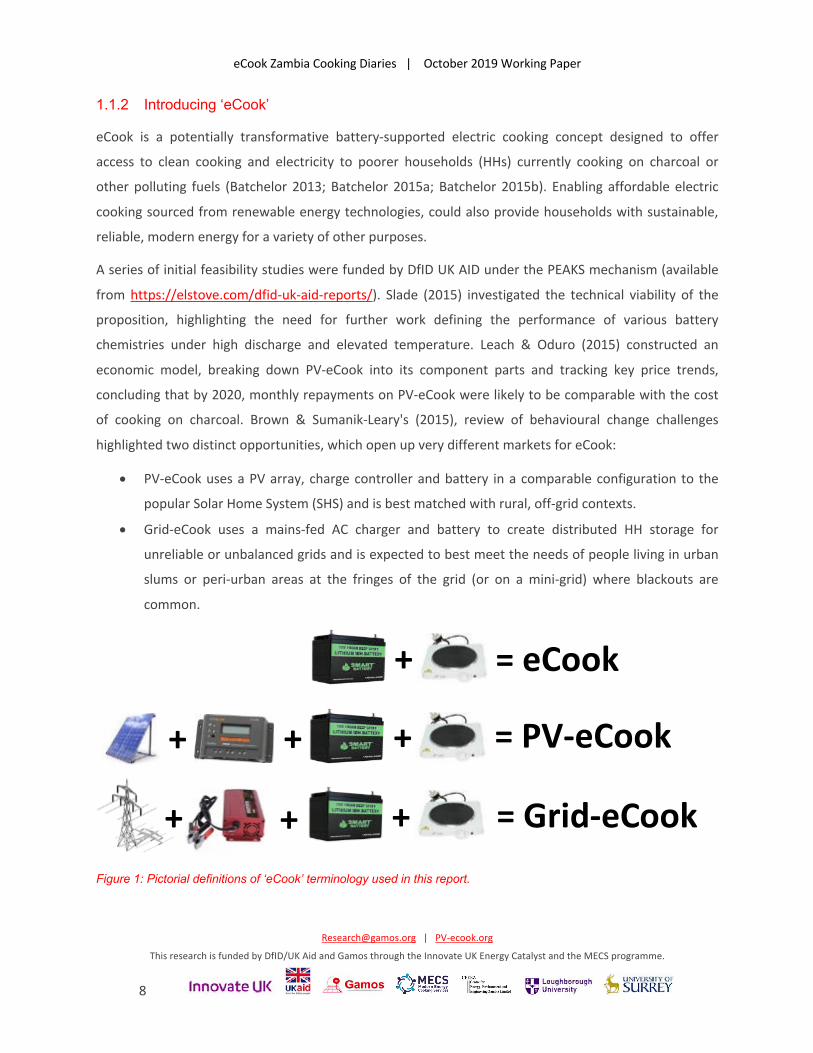
• PV-eCook uses a PV array, charge controller and battery in a comparable configuration to the
popular Solar Home System (SHS) and is best matched with rural, off-grid contexts.
• Grid-eCook uses a mains-fed AC charger and battery to create distributed HH storage for
unreliable or unbalanced grids and is expected to best meet the needs of people living in urban
slums or peri-urban areas at the fringes of the grid (or on a mini-grid) where blackouts are
common.
Figure 1: Pictorial definitions of ‘eCook’ terminology used in this report.
= PV-eCook + + +
+ + + = Grid-eCook
= eCook +
eCook Zambia Cooking Diaries | October 2019 Working Paper
[email protected] | PV-ecook.org
This research is funded by DfID/UK Aid and Gamos through the Innovate UK Energy Catalyst and the MECS programme.
9
1.1.3 eCook in Zambia
Given the technical and socio-economic feasibility of the systems in the near future, Gamos,
Loughborough University and the University of Surrey have sought to identify where to focus initial
marketing for eCook. Each country has unique market dynamics that must be understood in order to
determine which market segments to target are and how best to reach them. Leary et al. (2018) carried
out a global market assessment, which revealed Zambia as the third most viable context for PV-eCook,
as 10% of the population already cook on electricity and recent load shedding caused a significant
number of these users to revert back to charcoal, rapidly accelerating deforestation.
The accompanying reports from the other activities carried out in Zambia can be found at:
https://elstove.com/innovate-reports/.
1.2 Aim
The aim of this study is to gain a deeper understanding of how Zambian households cook and how
compatible this is with electricity.
In particular, the objectives of the study are:
• To find out what Zambian households cook and how
• To assess the user experience of electricity for cooking popular Zambian dishes
o Can people cook the foods they want?
o If so, which appliances are best matched with each food?
• To quantify the amount of energy Zambian households need to cook
o To make comparisons between electricity and popular fuels
o To generate cooking load profiles for typical households
eCook Zambia Cooking Diaries | October 2019 Working Paper
[email protected] | PV-ecook.org
This research is funded by DfID/UK Aid and Gamos through the Innovate UK Energy Catalyst and the MECS programme.
10
2 Methodology 2.1 The cooking diary methodology
The cooking diary study is an innovative methodology that addresses
limitations of the standard tests associated with improved cookstoves. To
date, the standard international improved cookstove tests are the Water
Boiling Test (WBT), Controlled Cooking Test (CCT) and the Kitchen
Performance Test (KPT). None of these tests were designed to give key
insights into ‘how’ a cook cooks, and whether, when they transition to a
different fuel or appliance, their cooking practices change. Cooking is a
deeply cultural experience, as the foods people cook and the practices
they use to prepare them vary widely. To date studies of the ‘how’
people cook have been based on observational qualitative data.
The cooking diary study was applied in Zambia to offer a deeper
exploration into the unique cooking practices of individual households,
paired with quantitative measurements of energy consumption. 22
households were selected to participate in the study, based upon the
fuels they cooked with and their willingness and ability to record high
quality data for the duration of the study. This mixed methods approach
gathers data from various sources:
• Cooking diary forms
o Data on foods cooked, cooking processes and times,
appliances used.
o Appendix C: Cooking diary form
• Energy measurements
o Manual measurements of fuel use and electricity
consumption taken by participants.
• Registration surveys
o Simple demographic data on participants.
o Appendix B: Cooking diaries registration form
• Exit surveys
o Qualitative feedback from participants.
DESPITE DECADES OF
WORK ON IMPROVING
THE EFFICIENCIES OF
BIOMASS STOVES,
THERE SEEMS TO BE
LITTLE AVAILABLE
DATA ON ‘HOW’ PEOPLE
COOK.
MODERN FUELS SUCH AS
GAS & ELECTRICITY ARE
MORE CONTROLLABLE &
CAN BE TURNED ON/OFF
IN AN INSTANT. THERE
ARE ALSO A HUGE RANGE
OF ELECTRIC COOKING
APPLIANCES, EACH
DESIGNED FOR
SPECIFIC PROCESSES
(E.G. MICROWAVE FOR
REHEATING).
THEREFORE, IT IS
IMPORTANT TO KNOW
HOW OFTEN PEOPLE ARE
FRYING, BOILING,
REHEATING OR DOING
SOMETHING ELSE
ENTIRELY.
eCook Zambia Cooking Diaries | October 2019 Working Paper
[email protected] | PV-ecook.org
This research is funded by DfID/UK Aid and Gamos through the Innovate UK Energy Catalyst and the MECS programme.
11
o Appendix D: Cooking diaries exit survey
Data was recorded in two stages:
• Baseline: cooking as normal. • Transition: cooking with electric appliances only.
2.2 Cooking diaries in Zambia
Enumerators visited participating households throughout the research. The study began with a
registration survey designed to capture basic information on who cooks are cooking for, the appliances
they use and why (Appendix B: Cooking diaries registration form). Enumerators explained the purpose of
the research, obtained informed consent from participants and showed participants how to take energy
measurements complete the diary forms (Appendix C: Cooking diary form).
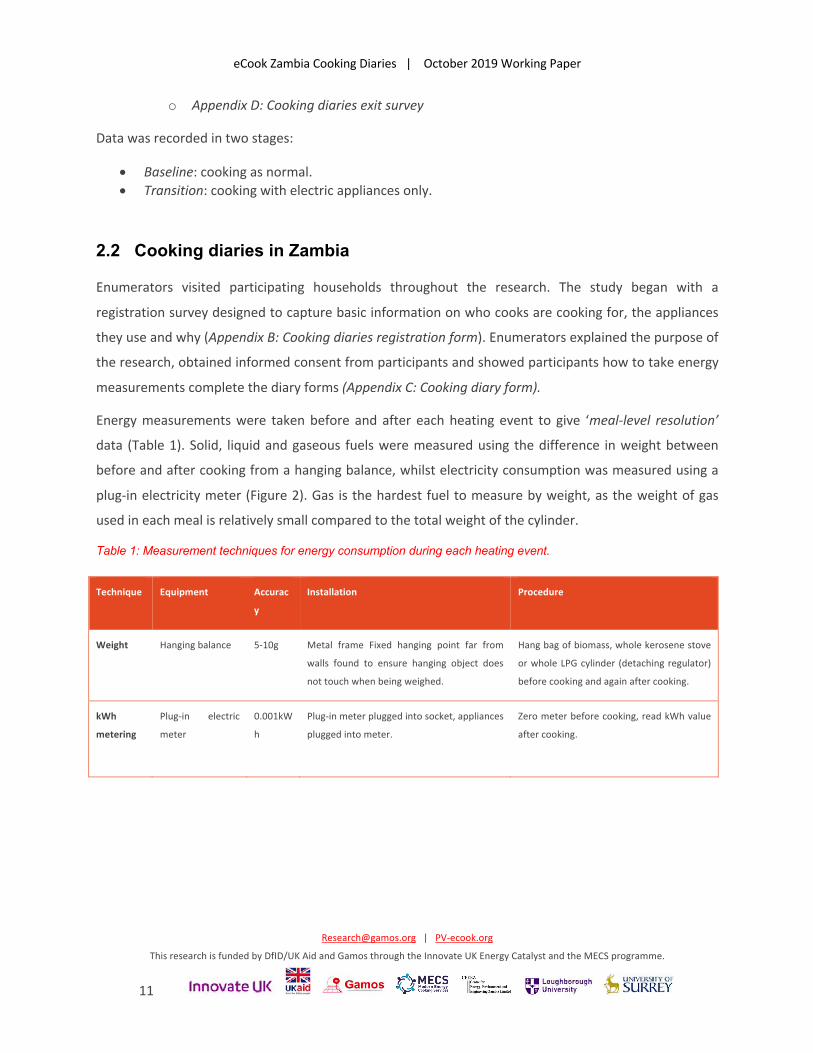
Energy measurements were taken before and after each heating event to give ‘meal-level resolution’
data (Table 1). Solid, liquid and gaseous fuels were measured using the difference in weight between
before and after cooking from a hanging balance, whilst electricity consumption was measured using a
plug-in electricity meter (Figure 2). Gas is the hardest fuel to measure by weight, as the weight of gas
used in each meal is relatively small compared to the total weight of the cylinder.
Table 1: Measurement techniques for energy consumption during each heating event.
Technique Equipment Accurac
y
Installation Procedure
Weight Hanging balance 5-10g Metal frame Fixed hanging point far from
walls found to ensure hanging object does
not touch when being weighed.
Hang bag of biomass, whole kerosene stove
or whole LPG cylinder (detaching regulator)
before cooking and again after cooking.
kWh
metering
Plug-in electric
meter
0.001kW
h
Plug-in meter plugged into socket, appliances
plugged into meter.
Zero meter before cooking, read kWh value
after cooking.
eCook Zambia Cooking Diaries | October 2019 Working Paper
[email protected] | PV-ecook.org
This research is funded by DfID/UK Aid and Gamos through the Innovate UK Energy Catalyst and the MECS programme.
12
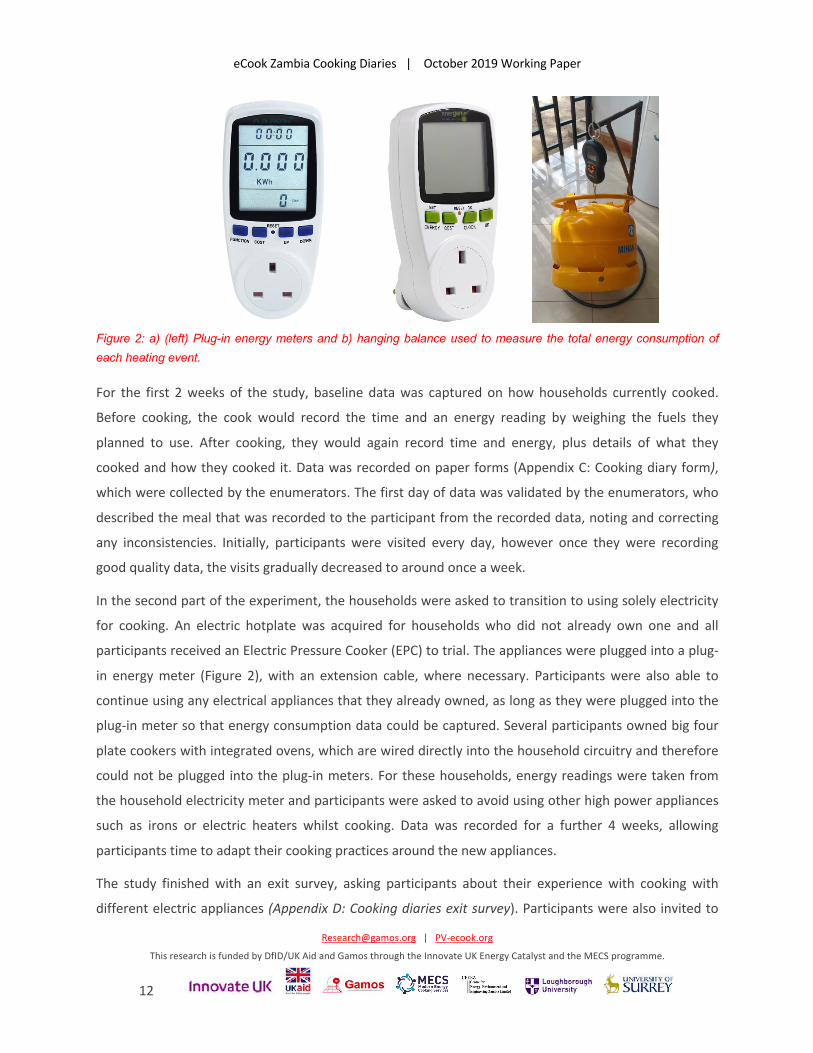
Figure 2: a) (left) Plug-in energy meters and b) hanging balance used to measure the total energy consumption of each heating event.
For the first 2 weeks of the study, baseline data was captured on how households currently cooked.
Before cooking, the cook would record the time and an energy reading by weighing the fuels they
planned to use. After cooking, they would again record time and energy, plus details of what they
cooked and how they cooked it. Data was recorded on paper forms (Appendix C: Cooking diary form),
which were collected by the enumerators. The first day of data was validated by the enumerators, who
described the meal that was recorded to the participant from the recorded data, noting and correcting
any inconsistencies. Initially, participants were visited every day, however once they were recording
good quality data, the visits gradually decreased to around once a week.
In the second part of the experiment, the households were asked to transition to using solely electricity
for cooking. An electric hotplate was acquired for households who did not already own one and all
participants received an Electric Pressure Cooker (EPC) to trial. The appliances were plugged into a plug-
in energy meter (Figure 2), with an extension cable, where necessary. Participants were also able to
continue using any electrical appliances that they already owned, as long as they were plugged into the
plug-in meter so that energy consumption data could be captured. Several participants owned big four
plate cookers with integrated ovens, which are wired directly into the household circuitry and therefore
could not be plugged into the plug-in meters. For these households, energy readings were taken from
the household electricity meter and participants were asked to avoid using other high power appliances
such as irons or electric heaters whilst cooking. Data was recorded for a further 4 weeks, allowing
participants time to adapt their cooking practices around the new appliances.
The study finished with an exit survey, asking participants about their experience with cooking with
different electric appliances (Appendix D: Cooking diaries exit survey). Participants were also invited to
eCook Zambia Cooking Diaries | October 2019 Working Paper
[email protected] | PV-ecook.org
This research is funded by DfID/UK Aid and Gamos through the Innovate UK Energy Catalyst and the MECS programme.
13
share their energy-efficient cooking practices by participating in the Bean Boiling Challenge. A prize was
offered to the participant who could cook one cup of beans using the least energy possible, whilst the
enumerators observed and recorded their cooking practices to understand exactly where energy was
being saved/wasted.
Paper records kept by participants were transcribed into digital form by the enumerators. An Excel
worksheet was designed to mimic the paper form, with a macro to copy data from each ‘sheet’ into a
separate column in the database. Subsequent analysis of the complete database was performed in both
SPSS and Excel.
The cooking diaries protocols offer a more complete guide to this methodology for those looking to
replicate the cooking diaries study: https://www.mecs.org.uk/working-papers/
eCook Zambia Cooking Diaries | October 2019 Working Paper
[email protected] | PV-ecook.org
This research is funded by DfID/UK Aid and Gamos through the Innovate UK Energy Catalyst and the MECS programme.
14
3 Results
3.1 Typical Zambian foods
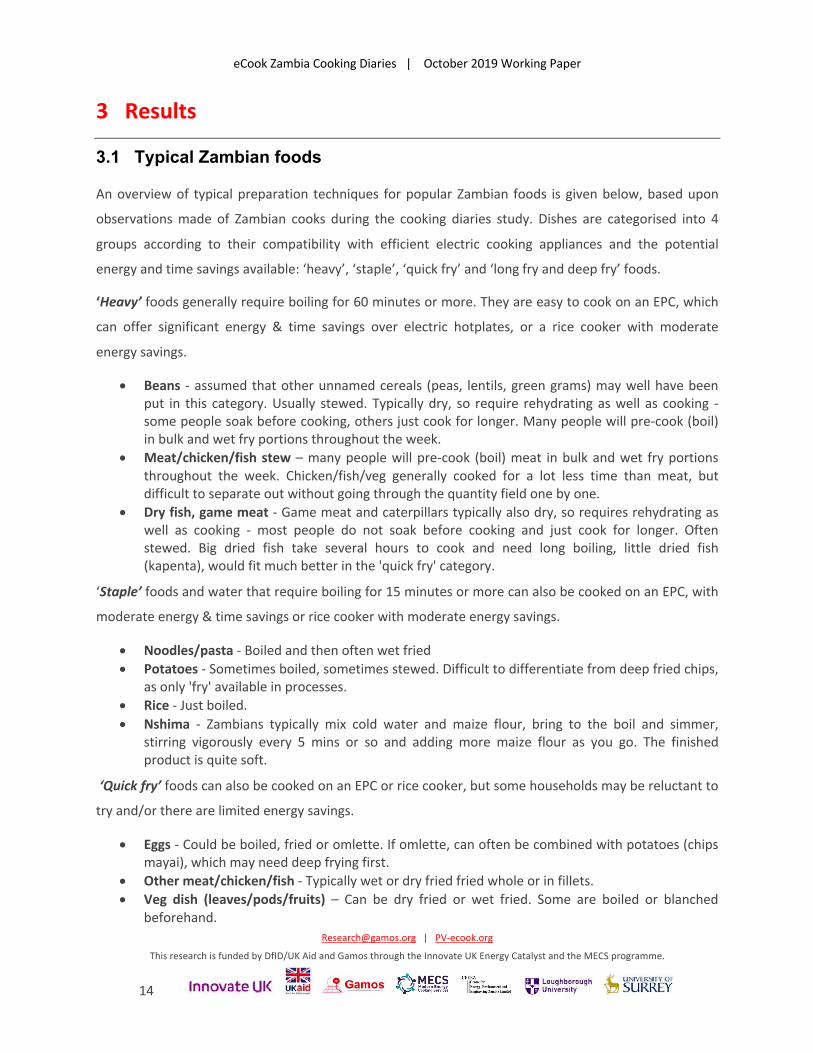
An overview of typical preparation techniques for popular Zambian foods is given below, based upon
observations made of Zambian cooks during the cooking diaries study. Dishes are categorised into 4
groups according to their compatibility with efficient electric cooking appliances and the potential
energy and time savings available: ‘heavy’, ‘staple’, ‘quick fry’ and ‘long fry and deep fry’ foods.
‘Heavy’ foods generally require boiling for 60 minutes or more. They are easy to cook on an EPC, which
can offer significant energy & time savings over electric hotplates, or a rice cooker with moderate
energy savings.
• Beans - assumed that other unnamed cereals (peas, lentils, green grams) may well have been put in this category. Usually stewed. Typically dry, so require rehydrating as well as cooking - some people soak before cooking, others just cook for longer. Many people will pre-cook (boil) in bulk and wet fry portions throughout the week.
• Meat/chicken/fish stew – many people will pre-cook (boil) meat in bulk and wet fry portions throughout the week. Chicken/fish/veg generally cooked for a lot less time than meat, but difficult to separate out without going through the quantity field one by one.
• Dry fish, game meat - Game meat and caterpillars typically also dry, so requires rehydrating as well as cooking - most people do not soak before cooking and just cook for longer. Often stewed. Big dried fish take several hours to cook and need long boiling, little dried fish (kapenta), would fit much better in the 'quick fry' category.
‘Staple’ foods and water that require boiling for 15 minutes or more can also be cooked on an EPC, with
moderate energy & time savings or rice cooker with moderate energy savings.
• Noodles/pasta - Boiled and then often wet fried • Potatoes - Sometimes boiled, sometimes stewed. Difficult to differentiate from deep fried chips,
as only 'fry' available in processes. • Rice - Just boiled. • Nshima - Zambians typically mix cold water and maize flour, bring to the boil and simmer,
stirring vigorously every 5 mins or so and adding more maize flour as you go. The finished product is quite soft.
‘Quick fry’ foods can also be cooked on an EPC or rice cooker, but some households may be reluctant to
try and/or there are limited energy savings.
• Eggs - Could be boiled, fried or omlette. If omlette, can often be combined with potatoes (chips mayai), which may need deep frying first.
• Other meat/chicken/fish - Typically wet or dry fried fried whole or in fillets. • Veg dish (leaves/pods/fruits) – Can be dry fried or wet fried. Some are boiled or blanched
beforehand.
eCook Zambia Cooking Diaries | October 2019 Working Paper
[email protected] | PV-ecook.org
This research is funded by DfID/UK Aid and Gamos through the Innovate UK Energy Catalyst and the MECS programme.
15
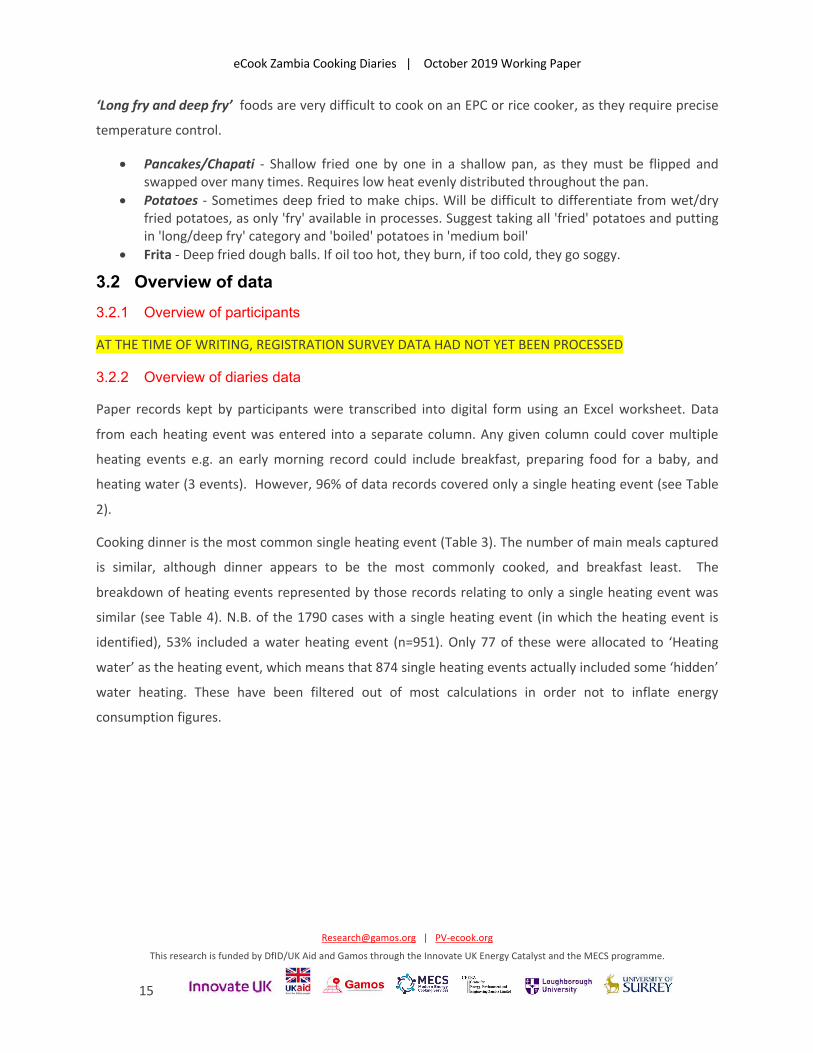
‘Long fry and deep fry’ foods are very difficult to cook on an EPC or rice cooker, as they require precise
temperature control.
• Pancakes/Chapati - Shallow fried one by one in a shallow pan, as they must be flipped and swapped over many times. Requires low heat evenly distributed throughout the pan.
• Potatoes - Sometimes deep fried to make chips. Will be difficult to differentiate from wet/dry fried potatoes, as only 'fry' available in processes. Suggest taking all 'fried' potatoes and putting in 'long/deep fry' category and 'boiled' potatoes in 'medium boil'
• Frita - Deep fried dough balls. If oil too hot, they burn, if too cold, they go soggy.
3.2 Overview of data 3.2.1 Overview of participants
AT THE TIME OF WRITING, REGISTRATION SURVEY DATA HAD NOT YET BEEN PROCESSED
3.2.2 Overview of diaries data
Paper records kept by participants were transcribed into digital form using an Excel worksheet. Data
from each heating event was entered into a separate column. Any given column could cover multiple
heating events e.g. an early morning record could include breakfast, preparing food for a baby, and
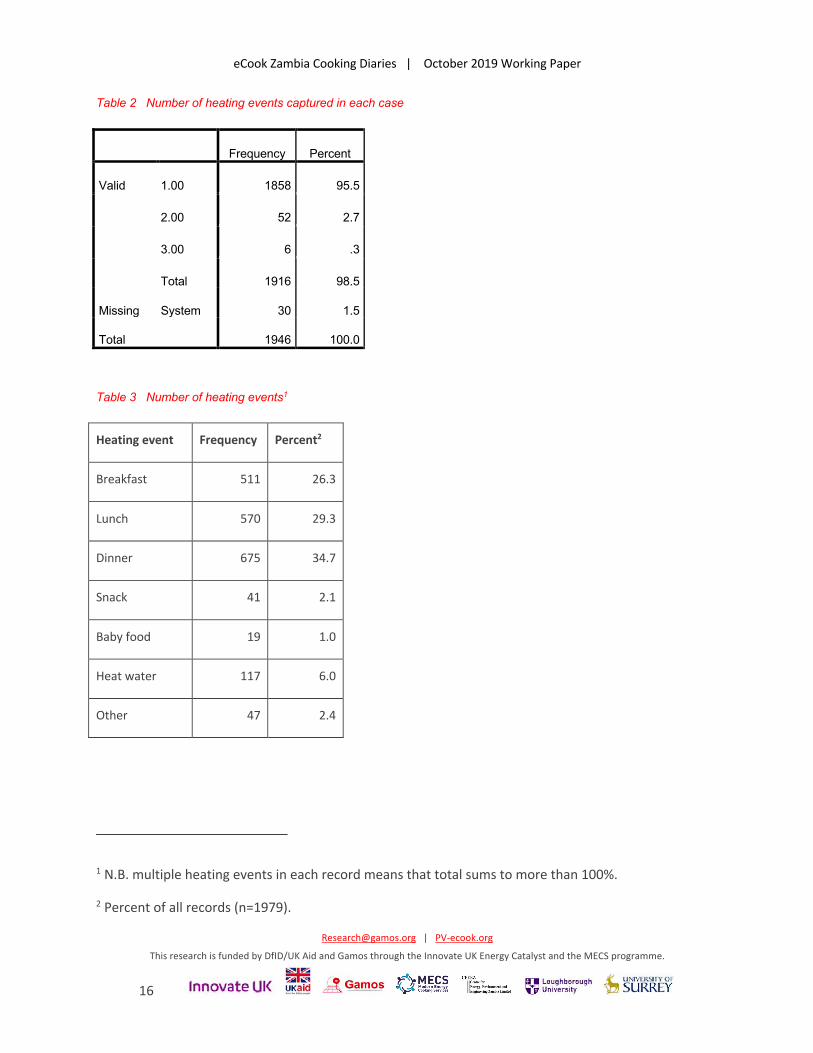
heating water (3 events). However, 96% of data records covered only a single heating event (see Table
2).
Cooking dinner is the most common single heating event (Table 3). The number of main meals captured
is similar, although dinner appears to be the most commonly cooked, and breakfast least. The
breakdown of heating events represented by those records relating to only a single heating event was
similar (see Table 4). N.B. of the 1790 cases with a single heating event (in which the heating event is
identified), 53% included a water heating event (n=951). Only 77 of these were allocated to ‘Heating
water’ as the heating event, which means that 874 single heating events actually included some ‘hidden’
water heating. These have been filtered out of most calculations in order not to inflate energy
consumption figures.
eCook Zambia Cooking Diaries | October 2019 Working Paper
[email protected] | PV-ecook.org
This research is funded by DfID/UK Aid and Gamos through the Innovate UK Energy Catalyst and the MECS programme.
16
Table 2 Number of heating events captured in each case
Frequency Percent
Valid 1.00 1858 95.5
2.00 52 2.7
3.00 6 .3
Total 1916 98.5
Missing System 30 1.5
Total 1946 100.0
Table 3 Number of heating events1
Heating event Frequency Percent2
Breakfast 511 26.3
Lunch 570 29.3
Dinner 675 34.7
Snack 41 2.1
Baby food 19 1.0
Heat water 117 6.0
Other 47 2.4
1 N.B. multiple heating events in each record means that total sums to more than 100%.
2 Percent of all records (n=1979).
eCook Zambia Cooking Diaries | October 2019 Working Paper
[email protected] | PV-ecook.org
This research is funded by DfID/UK Aid and Gamos through the Innovate UK Energy Catalyst and the MECS programme.
17
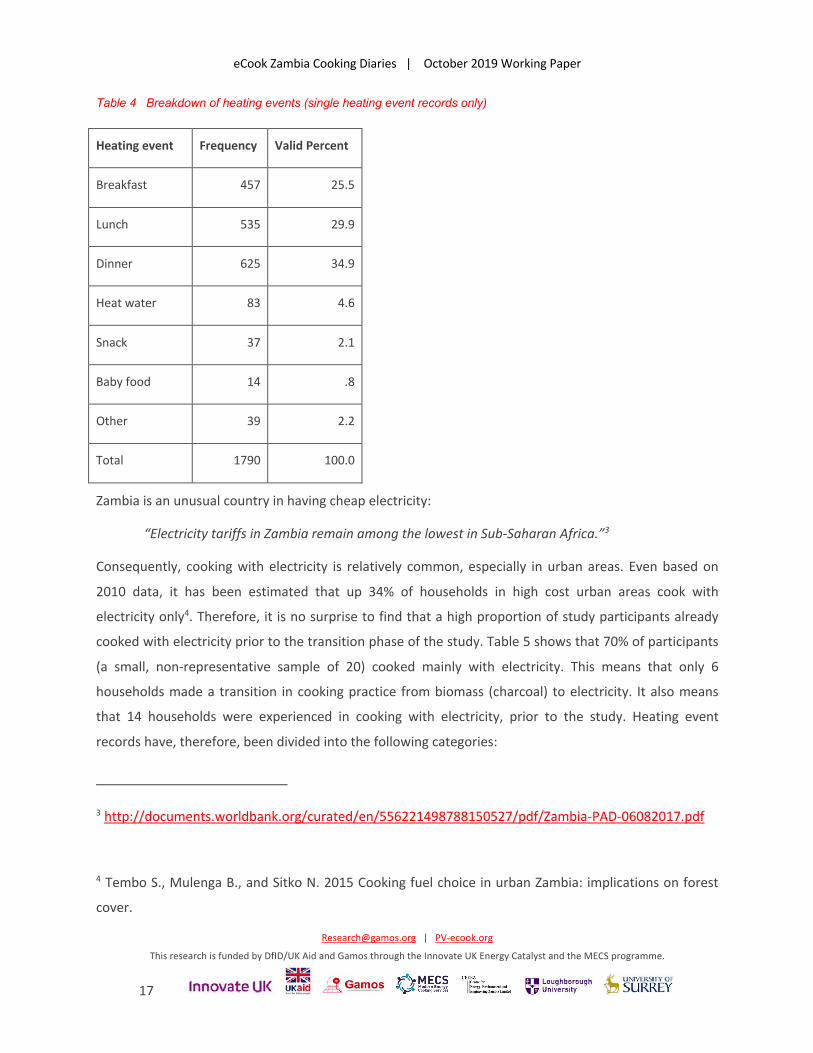
Table 4 Breakdown of heating events (single heating event records only)
Heating event Frequency Valid Percent
Breakfast 457 25.5
Lunch 535 29.9
Dinner 625 34.9
Heat water 83 4.6
Snack 37 2.1
Baby food 14 .8
Other 39 2.2
Total 1790 100.0
Zambia is an unusual country in having cheap electricity:
“Electricity tariffs in Zambia remain among the lowest in Sub-Saharan Africa.”3
Consequently, cooking with electricity is relatively common, especially in urban areas. Even based on
2010 data, it has been estimated that up 34% of households in high cost urban areas cook with
electricity only4. Therefore, it is no surprise to find that a high proportion of study participants already
cooked with electricity prior to the transition phase of the study. Table 5 shows that 70% of participants
(a small, non-representative sample of 20) cooked mainly with electricity. This means that only 6
households made a transition in cooking practice from biomass (charcoal) to electricity. It also means
that 14 households were experienced in cooking with electricity, prior to the study. Heating event
records have, therefore, been divided into the following categories:
3 http://documents.worldbank.org/curated/en/556221498788150527/pdf/Zambia-PAD-06082017.pdf
4 Tembo S., Mulenga B., and Sitko N. 2015 Cooking fuel choice in urban Zambia: implications on forest
cover.
eCook Zambia Cooking Diaries | October 2019 Working Paper
[email protected] | PV-ecook.org
This research is funded by DfID/UK Aid and Gamos through the Innovate UK Energy Catalyst and the MECS programme.
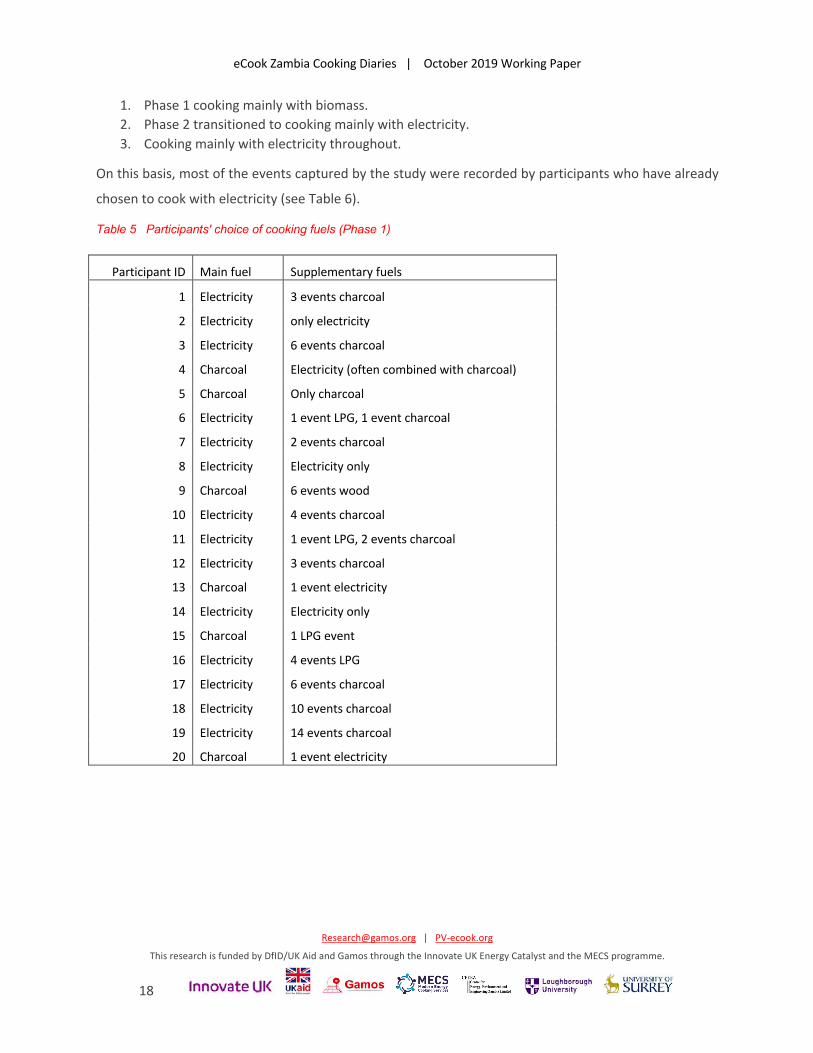
18
1. Phase 1 cooking mainly with biomass. 2. Phase 2 transitioned to cooking mainly with electricity. 3. Cooking mainly with electricity throughout.
On this basis, most of the events captured by the study were recorded by participants who have already
chosen to cook with electricity (see Table 6).
Table 5 Participants' choice of cooking fuels (Phase 1)
Participant ID Main fuel Supplementary fuels
1 Electricity 3 events charcoal
2 Electricity only electricity
3 Electricity 6 events charcoal
4 Charcoal Electricity (often combined with charcoal)
5 Charcoal Only charcoal
6 Electricity 1 event LPG, 1 event charcoal
7 Electricity 2 events charcoal
8 Electricity Electricity only
9 Charcoal 6 events wood
10 Electricity 4 events charcoal
11 Electricity 1 event LPG, 2 events charcoal
12 Electricity 3 events charcoal
13 Charcoal 1 event electricity
14 Electricity Electricity only
15 Charcoal 1 LPG event
16 Electricity 4 events LPG
17 Electricity 6 events charcoal
18 Electricity 10 events charcoal
19 Electricity 14 events charcoal
20 Charcoal 1 event electricity
eCook Zambia Cooking Diaries | October 2019 Working Paper
[email protected] | PV-ecook.org
This research is funded by DfID/UK Aid and Gamos through the Innovate UK Energy Catalyst and the MECS programme.
19
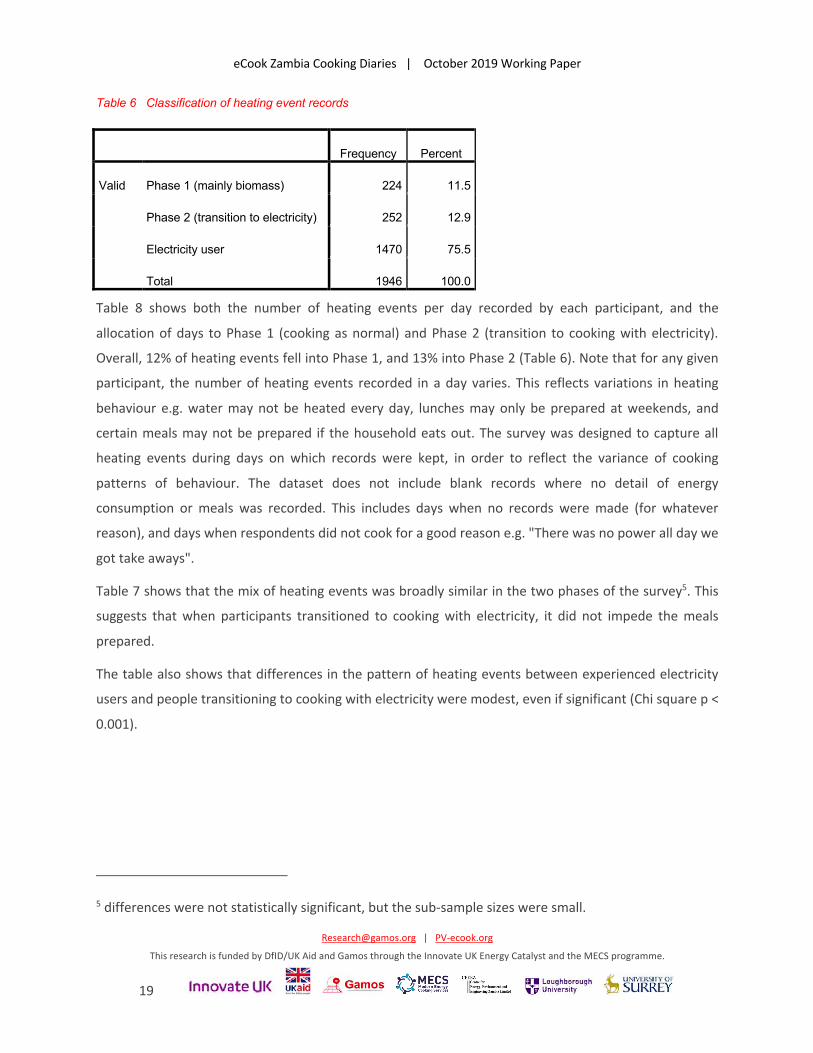
Table 6 Classification of heating event records
Frequency Percent
Valid Phase 1 (mainly biomass) 224 11.5
Phase 2 (transition to electricity) 252 12.9
Electricity user 1470 75.5
Total 1946 100.0
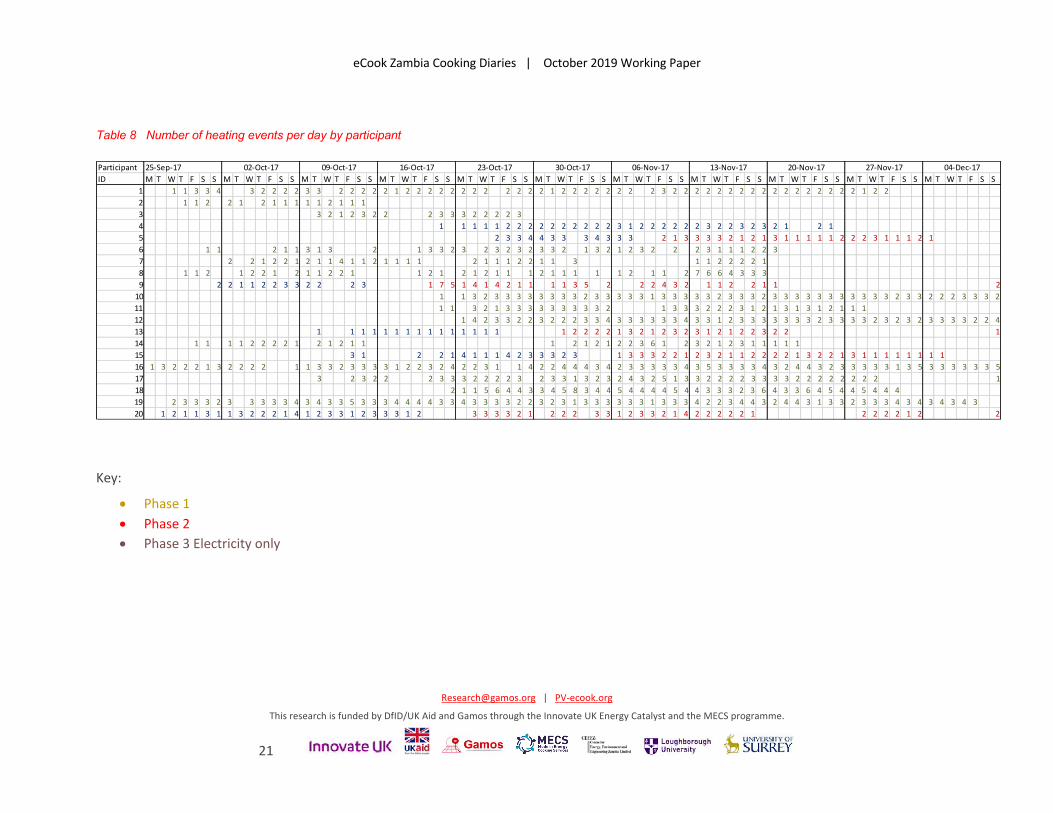
Table 8 shows both the number of heating events per day recorded by each participant, and the
allocation of days to Phase 1 (cooking as normal) and Phase 2 (transition to cooking with electricity).
Overall, 12% of heating events fell into Phase 1, and 13% into Phase 2 (Table 6). Note that for any given
participant, the number of heating events recorded in a day varies. This reflects variations in heating
behaviour e.g. water may not be heated every day, lunches may only be prepared at weekends, and
certain meals may not be prepared if the household eats out. The survey was designed to capture all
heating events during days on which records were kept, in order to reflect the variance of cooking
patterns of behaviour. The dataset does not include blank records where no detail of energy
consumption or meals was recorded. This includes days when no records were made (for whatever
reason), and days when respondents did not cook for a good reason e.g. "There was no power all day we
got take aways".
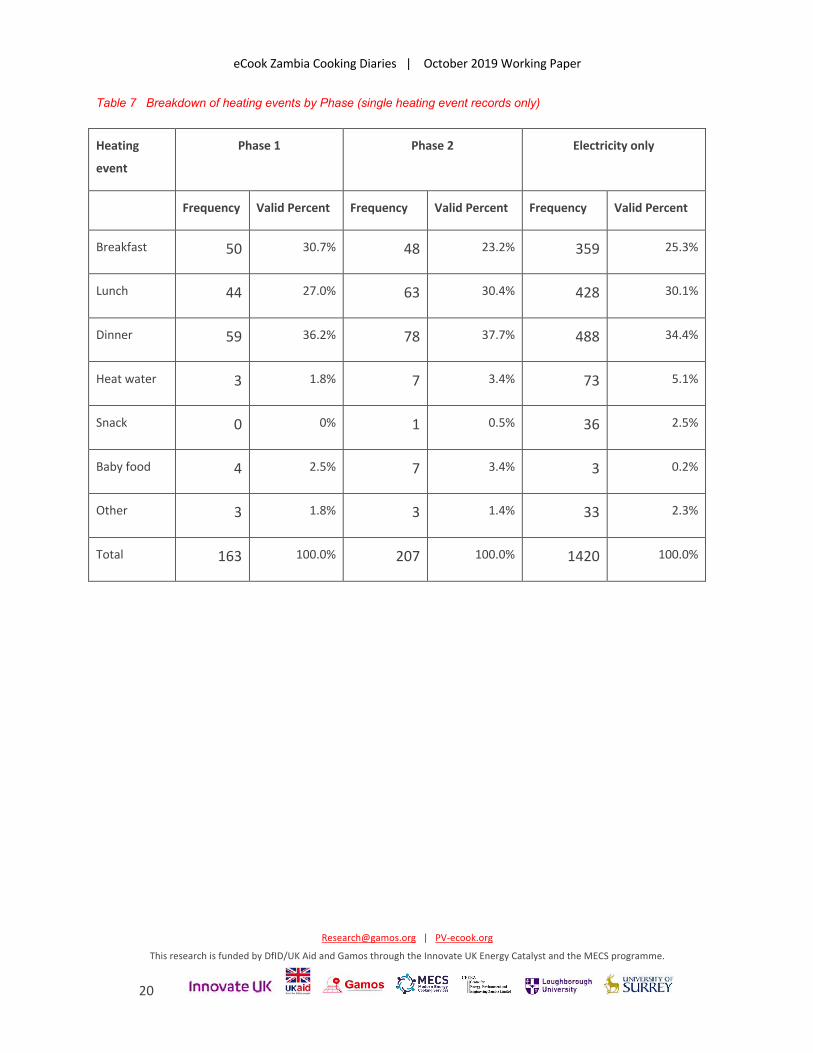
Table 7 shows that the mix of heating events was broadly similar in the two phases of the survey5. This
suggests that when participants transitioned to cooking with electricity, it did not impede the meals
prepared.
The table also shows that differences in the pattern of heating events between experienced electricity
users and people transitioning to cooking with electricity were modest, even if significant (Chi square p <
0.001).
5 differences were not statistically significant, but the sub-sample sizes were small.
eCook Zambia Cooking Diaries | October 2019 Working Paper
[email protected] | PV-ecook.org
This research is funded by DfID/UK Aid and Gamos through the Innovate UK Energy Catalyst and the MECS programme.
20
Table 7 Breakdown of heating events by Phase (single heating event records only)
Heating
event
Phase 1 Phase 2 Electricity only
Frequency Valid Percent Frequency Valid Percent Frequency Valid Percent
Breakfast 50 30.7% 48 23.2% 359 25.3%
Lunch 44 27.0% 63 30.4% 428 30.1%
Dinner 59 36.2% 78 37.7% 488 34.4%
Heat water 3 1.8% 7 3.4% 73 5.1%
Snack 0 0% 1 0.5% 36 2.5%
Baby food 4 2.5% 7 3.4% 3 0.2%
Other 3 1.8% 3 1.4% 33 2.3%
Total 163 100.0% 207 100.0% 1420 100.0%
eCook Zambia Cooking Diaries | October 2019 Working Paper
[email protected] | PV-ecook.org
This research is funded by DfID/UK Aid and Gamos through the Innovate UK Energy Catalyst and the MECS programme.
21
Table 8 Number of heating events per day by participant
Key:
• Phase 1 • Phase 2 • Phase 3 Electricity only
ParticipantID M T W T F S S M T W T F S S M T W T F S S M T W T F S S M T W T F S S M T W T F S S M T W T F S S M T W T F S S M T W T F S S M T W T F S S M T W T F S S
1 1 1 3 3 4 3 2 2 2 2 3 3 2 2 2 2 2 1 2 2 2 2 2 2 2 2 2 2 2 2 1 2 2 2 2 2 2 2 2 3 2 2 2 2 2 2 2 2 2 2 2 2 2 2 2 2 2 1 2 22 1 1 2 2 1 2 1 1 1 1 1 2 1 1 13 3 2 1 2 3 2 2 2 3 3 3 2 2 2 2 34 1 1 1 1 1 2 2 2 2 2 2 2 2 2 2 3 1 2 2 2 2 2 2 3 2 2 3 2 3 2 1 2 15 2 3 3 4 4 3 3 3 4 3 3 3 2 1 3 3 3 3 2 1 2 1 3 1 1 1 1 1 2 2 2 3 1 1 1 2 16 1 1 2 1 1 3 1 3 2 1 3 3 2 3 2 3 2 3 2 3 3 2 1 3 2 1 2 3 2 2 2 3 1 1 1 2 2 37 2 2 1 2 2 1 2 1 1 4 1 1 2 1 1 1 1 2 1 1 1 2 2 1 1 3 1 1 2 2 2 2 18 1 1 2 1 2 2 1 2 1 1 2 2 1 1 2 1 2 1 2 1 1 1 2 1 1 1 1 1 2 1 1 2 7 6 6 4 3 3 39 2 2 1 1 2 2 3 3 2 2 2 3 1 7 5 1 4 1 4 2 1 1 1 1 3 5 2 2 2 4 3 2 1 1 2 2 1 1 210 1 1 3 2 3 3 3 3 3 3 3 3 2 3 3 3 3 3 1 3 3 3 3 3 2 3 3 3 2 3 3 3 3 3 3 3 3 3 3 3 2 3 3 2 2 2 3 3 3 211 1 1 3 2 1 3 3 3 3 3 3 3 3 3 2 1 3 3 3 2 2 2 3 1 2 1 3 1 3 1 2 1 1 112 1 4 2 3 3 2 2 3 2 2 2 3 3 4 3 3 3 3 3 3 4 3 3 1 2 3 3 3 3 3 3 3 2 3 3 3 3 2 3 2 3 2 3 3 3 3 2 2 413 1 1 1 1 1 1 1 1 1 1 1 1 1 1 1 1 2 2 2 2 1 3 2 1 2 3 2 3 1 2 1 2 2 3 2 2 114 1 1 1 1 2 2 2 2 1 2 1 2 1 1 1 2 1 2 1 2 2 3 6 1 2 3 2 1 2 3 1 1 1 1 115 3 1 2 2 1 4 1 1 1 4 2 3 3 3 2 3 1 3 3 3 2 2 1 2 3 2 1 1 2 2 2 2 1 3 2 2 1 3 1 1 1 1 1 1 1 116 1 3 2 2 2 1 3 2 2 2 2 1 1 3 3 2 3 3 3 3 1 2 2 3 2 4 2 2 3 1 1 4 2 2 4 4 4 3 4 2 3 3 3 3 3 4 3 5 3 3 3 3 4 3 2 4 4 3 2 3 3 3 3 3 1 3 5 3 3 3 3 3 3 517 3 2 3 2 2 2 3 3 3 2 2 2 2 3 2 3 3 1 3 2 3 2 4 3 2 5 1 3 3 2 2 2 2 3 3 3 3 2 2 2 2 2 2 2 2 118 2 1 1 5 6 4 4 3 3 4 5 8 3 4 4 5 4 4 4 4 5 4 4 3 3 3 2 3 6 4 3 3 6 4 5 4 4 5 4 4 419 2 3 3 3 2 3 3 3 3 3 4 3 4 3 3 5 3 3 3 4 4 4 4 3 3 4 3 3 3 3 2 2 3 2 3 1 3 3 3 3 3 3 1 3 3 3 4 2 2 3 4 4 3 2 4 4 3 1 3 3 2 3 3 3 4 3 4 3 4 3 4 320 1 2 1 1 3 1 1 3 2 2 2 1 4 1 2 3 3 1 2 3 3 3 1 2 3 3 3 3 2 1 2 2 2 3 3 1 2 3 3 2 1 4 2 2 2 2 2 1 2 2 2 2 1 2 2
06-Nov-17 13-Nov-17 20-Nov-17 27-Nov-17 04-Dec-1725-Sep-17 02-Oct-17 09-Oct-17 16-Oct-17 23-Oct-17 30-Oct-17
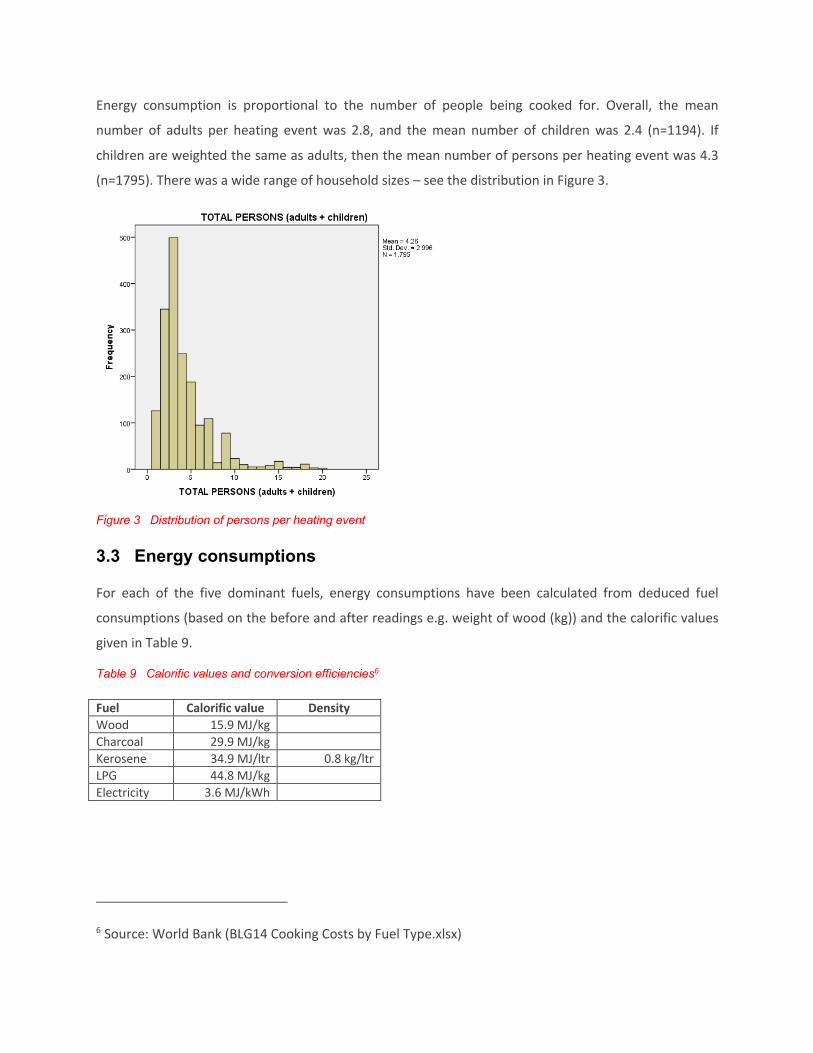
Energy consumption is proportional to the number of people being cooked for. Overall, the mean
number of adults per heating event was 2.8, and the mean number of children was 2.4 (n=1194). If
children are weighted the same as adults, then the mean number of persons per heating event was 4.3
(n=1795). There was a wide range of household sizes – see the distribution in Figure 3.
Figure 3 Distribution of persons per heating event
3.3 Energy consumptions
For each of the five dominant fuels, energy consumptions have been calculated from deduced fuel
consumptions (based on the before and after readings e.g. weight of wood (kg)) and the calorific values
given in Table 9.
Table 9 Calorific values and conversion efficiencies6
Fuel Calorific value Density Wood 15.9 MJ/kg Charcoal 29.9 MJ/kg Kerosene 34.9 MJ/ltr 0.8 kg/ltr LPG 44.8 MJ/kg Electricity 3.6 MJ/kWh
6 Source: World Bank (BLG14 Cooking Costs by Fuel Type.xlsx)
eCook Zambia Cooking Diaries | October 2019 Working Paper
[email protected] | PV-ecook.org
This research is funded by DfID/UK Aid and Gamos through the Innovate UK Energy Catalyst and the MECS programme.
23
3.3.1 Household meters
It has already been pointed out in Section 3.1 that many participants cooked with electricity prior to the
study. Most of these households had large electric ovens wired into wall mounted switches, meaning it
was not possible to measure the energy used for cooking using plug-in meters. Participants recorded
household meter readings at the beginning and end of heating events, but most ZESCO meters included
a function to press a button and get a reading of instantaneous power. These readings, along with the
duration of each heating event, have been used to estimate the amount of energy used in the
household for non-heating appliances during the heating event.
However, this process was not straight forward, as participants encountered a number of problems,
including:
• A code was required from ZESCO to unlock this function on some household meters, however there were delays in obtaining this code and for some households, it did not work;
• Some participants took the instantaneous power readings after switching a cooking device on or before it was switched off.
• Some participants recorded readings in kW, others in W.
After unrealistically high readings were omitted, distributions of instantaneous power (both beginning
and end of the heating event) showed a dip at around 600W, so this was taken as the upper threshold to
represent realistic background power readings. Of the 878 cases that recorded household meter
readings, only 332 met this criterion.
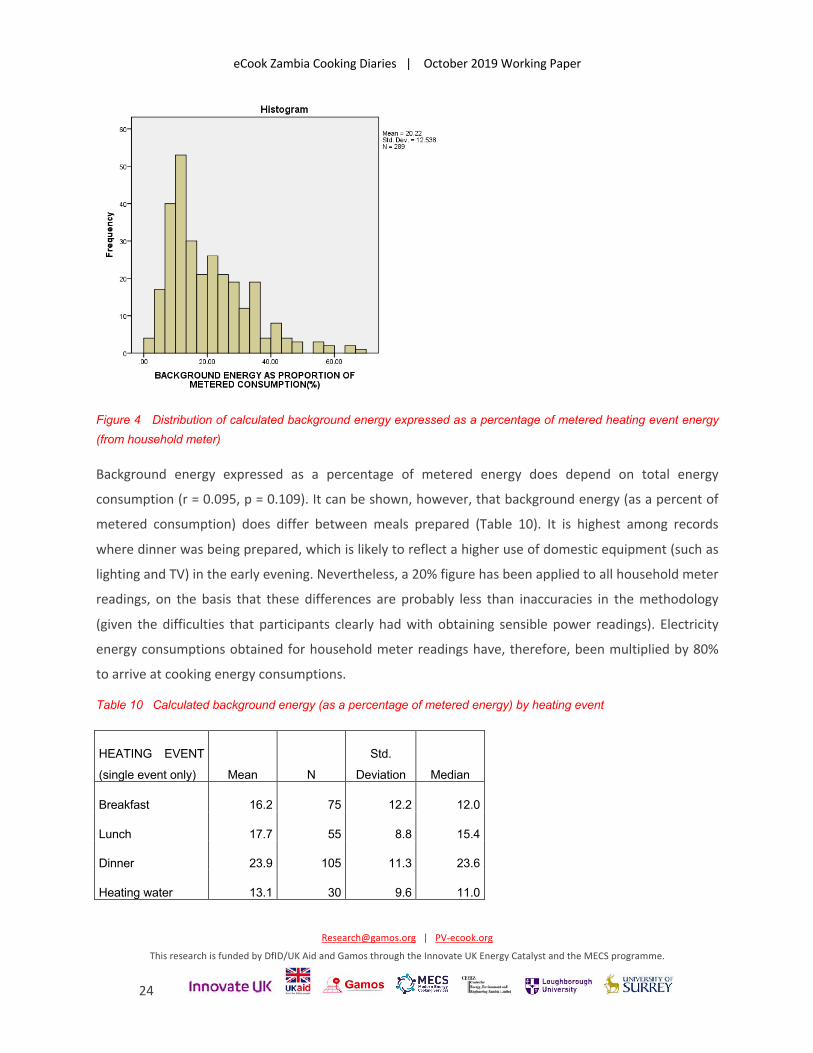
Average power values were then combined with duration of heating events to calculate background
energy consumptions over the duration of the heating event. This energy was then expressed as a
percentage of the metered consumption. The results in Figure 4 had a mean value of around 20%.
eCook Zambia Cooking Diaries | October 2019 Working Paper
[email protected] | PV-ecook.org
This research is funded by DfID/UK Aid and Gamos through the Innovate UK Energy Catalyst and the MECS programme.
24
Figure 4 Distribution of calculated background energy expressed as a percentage of metered heating event energy
(from household meter)
Background energy expressed as a percentage of metered energy does depend on total energy
consumption (r = 0.095, p = 0.109). It can be shown, however, that background energy (as a percent of
metered consumption) does differ between meals prepared (Table 10). It is highest among records
where dinner was being prepared, which is likely to reflect a higher use of domestic equipment (such as
lighting and TV) in the early evening. Nevertheless, a 20% figure has been applied to all household meter
readings, on the basis that these differences are probably less than inaccuracies in the methodology
(given the difficulties that participants clearly had with obtaining sensible power readings). Electricity
energy consumptions obtained for household meter readings have, therefore, been multiplied by 80%
to arrive at cooking energy consumptions.
Table 10 Calculated background energy (as a percentage of metered energy) by heating event
HEATING EVENT
(single event only) Mean N
Std.
Deviation Median
Breakfast 16.2 75 12.2 12.0
Lunch 17.7 55 8.8 15.4
Dinner 23.9 105 11.3 23.6
Heating water 13.1 30 9.6 11.0
eCook Zambia Cooking Diaries | October 2019 Working Paper
[email protected] | PV-ecook.org
This research is funded by DfID/UK Aid and Gamos through the Innovate UK Energy Catalyst and the MECS programme.
25
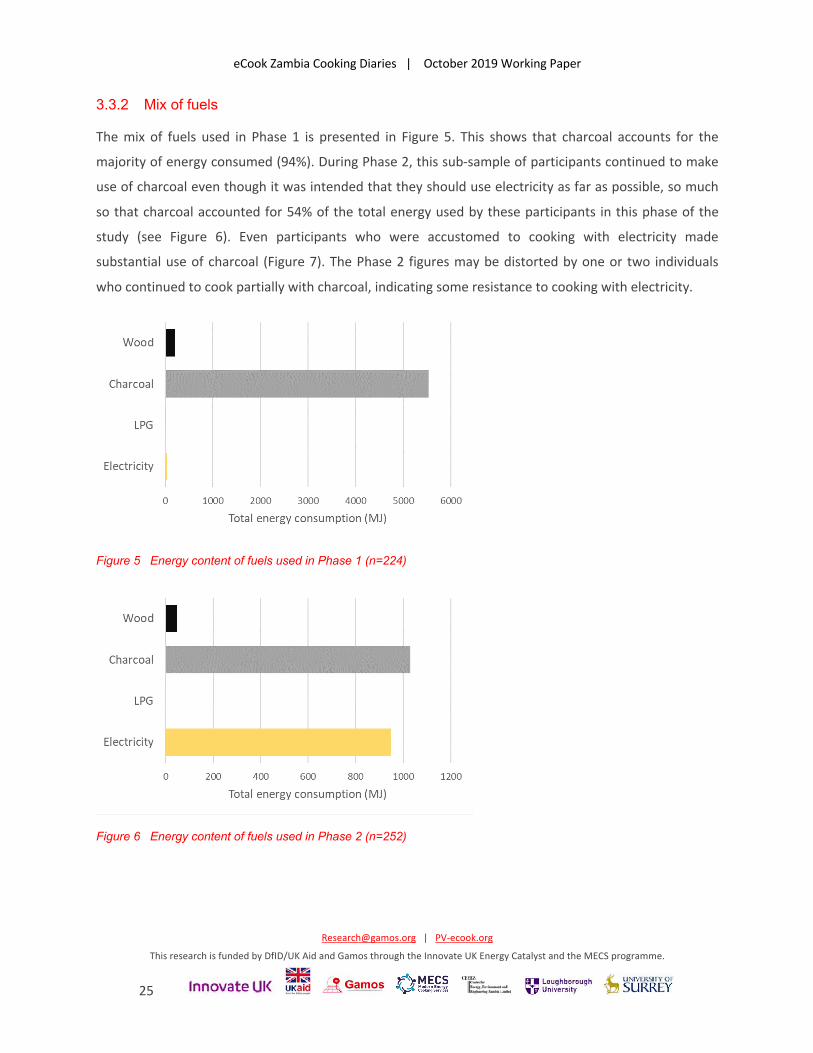
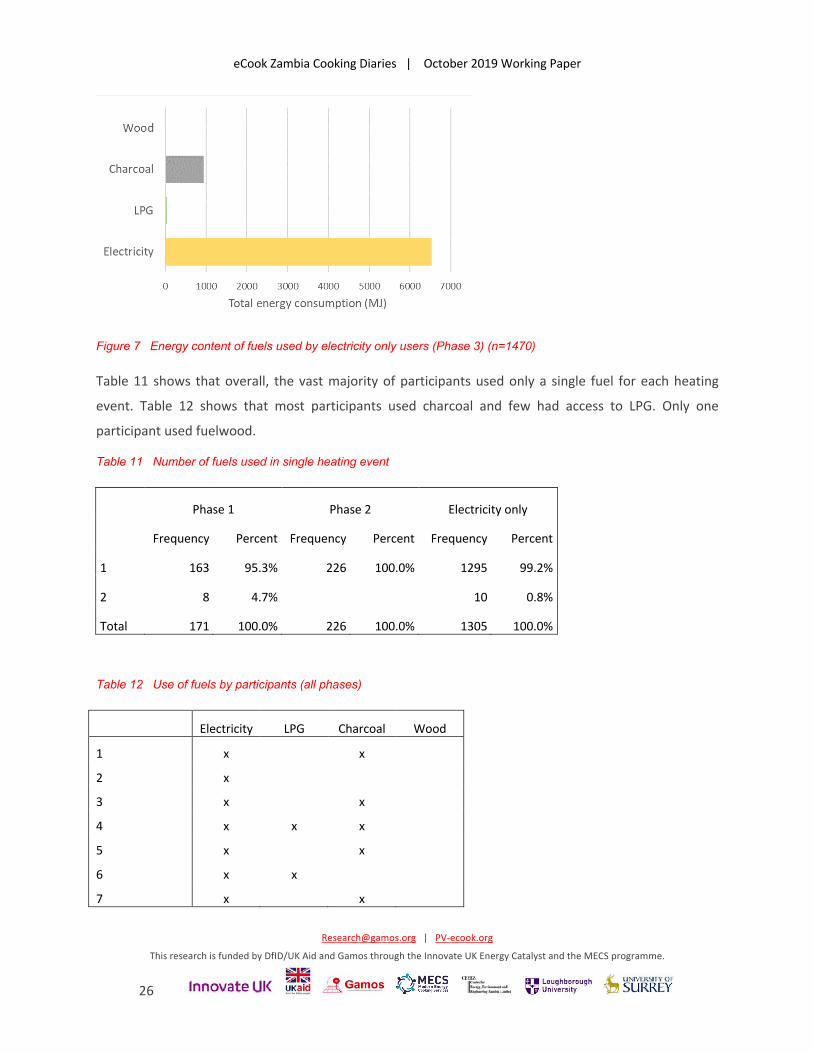
3.3.2 Mix of fuels
The mix of fuels used in Phase 1 is presented in Figure 5. This shows that charcoal accounts for the
majority of energy consumed (94%). During Phase 2, this sub-sample of participants continued to make
use of charcoal even though it was intended that they should use electricity as far as possible, so much
so that charcoal accounted for 54% of the total energy used by these participants in this phase of the
study (see Figure 6). Even participants who were accustomed to cooking with electricity made
substantial use of charcoal (Figure 7). The Phase 2 figures may be distorted by one or two individuals
who continued to cook partially with charcoal, indicating some resistance to cooking with electricity.
Figure 5 Energy content of fuels used in Phase 1 (n=224)
Figure 6 Energy content of fuels used in Phase 2 (n=252)
eCook Zambia Cooking Diaries | October 2019 Working Paper
[email protected] | PV-ecook.org
This research is funded by DfID/UK Aid and Gamos through the Innovate UK Energy Catalyst and the MECS programme.
26
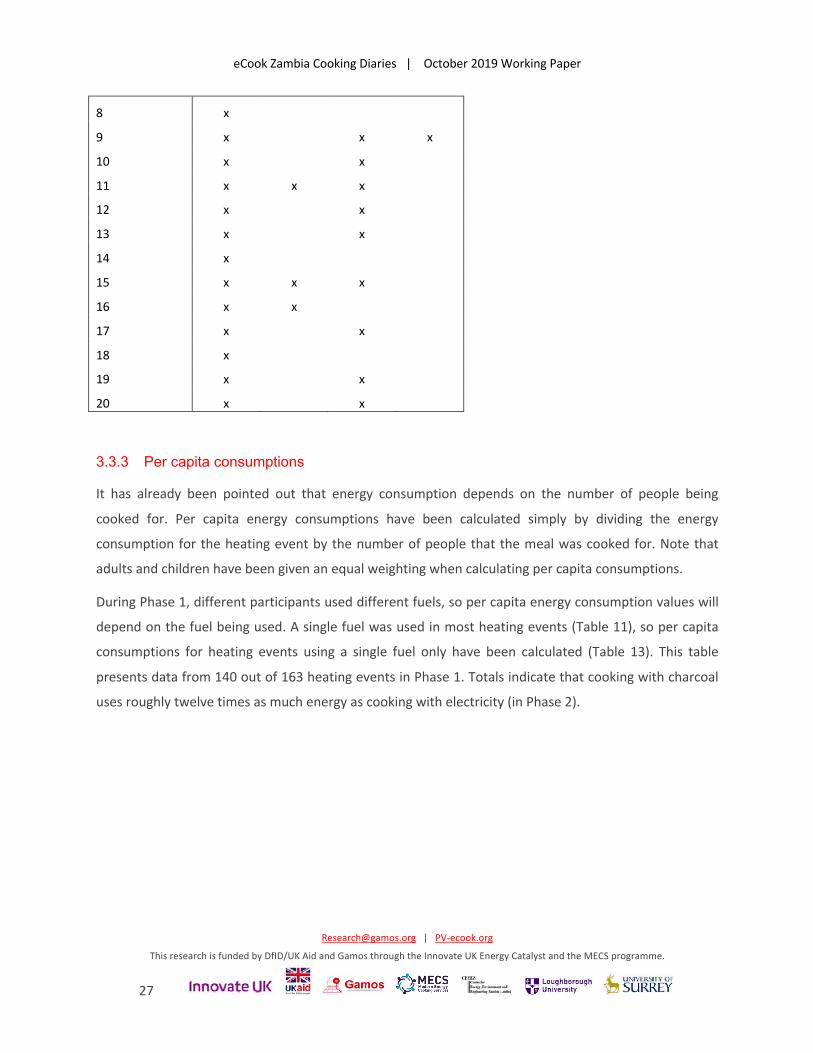
Figure 7 Energy content of fuels used by electricity only users (Phase 3) (n=1470)
Table 11 shows that overall, the vast majority of participants used only a single fuel for each heating
event. Table 12 shows that most participants used charcoal and few had access to LPG. Only one
participant used fuelwood.
Table 11 Number of fuels used in single heating event
Phase 1 Phase 2 Electricity only
Frequency Percent Frequency Percent Frequency Percent
1 163 95.3% 226 100.0% 1295 99.2%
2 8 4.7% 10 0.8%
Total 171 100.0% 226 100.0% 1305 100.0%
Table 12 Use of fuels by participants (all phases)
Electricity LPG Charcoal Wood
1 x x
2 x
3 x x
4 x x x
5 x x
6 x x
7 x x
eCook Zambia Cooking Diaries | October 2019 Working Paper
[email protected] | PV-ecook.org
This research is funded by DfID/UK Aid and Gamos through the Innovate UK Energy Catalyst and the MECS programme.
27
8 x
9 x x x
10 x x
11 x x x
12 x x
13 x x
14 x
15 x x x
16 x x
17 x x
18 x
19 x x
20 x x
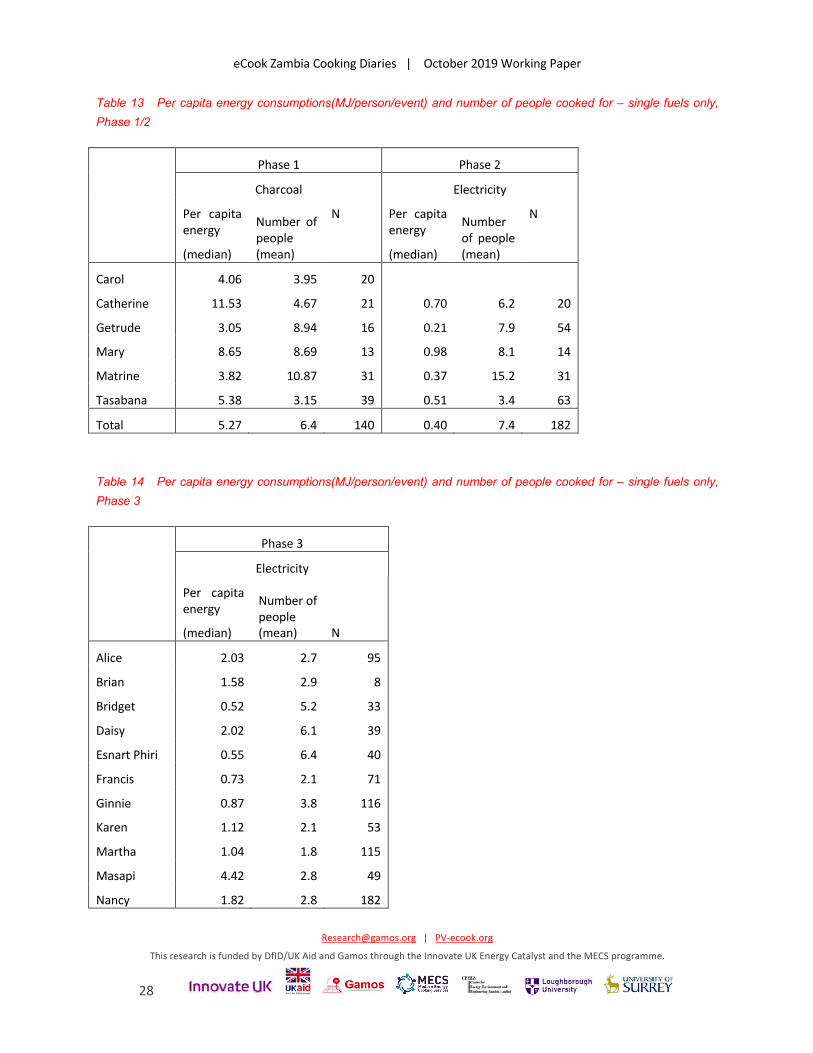
3.3.3 Per capita consumptions
It has already been pointed out that energy consumption depends on the number of people being
cooked for. Per capita energy consumptions have been calculated simply by dividing the energy
consumption for the heating event by the number of people that the meal was cooked for. Note that
adults and children have been given an equal weighting when calculating per capita consumptions.
During Phase 1, different participants used different fuels, so per capita energy consumption values will
depend on the fuel being used. A single fuel was used in most heating events (Table 11), so per capita
consumptions for heating events using a single fuel only have been calculated (Table 13). This table
presents data from 140 out of 163 heating events in Phase 1. Totals indicate that cooking with charcoal
uses roughly twelve times as much energy as cooking with electricity (in Phase 2).
eCook Zambia Cooking Diaries | October 2019 Working Paper
[email protected] | PV-ecook.org
This research is funded by DfID/UK Aid and Gamos through the Innovate UK Energy Catalyst and the MECS programme.
28
Table 13 Per capita energy consumptions(MJ/person/event) and number of people cooked for – single fuels only,
Phase 1/2
Phase 1 Phase 2
Charcoal Electricity
Per capita energy
(median)
Number of people (mean)
N Per capita energy
(median)
Number of people (mean)
N
Carol 4.06 3.95 20
Catherine 11.53 4.67 21 0.70 6.2 20
Getrude 3.05 8.94 16 0.21 7.9 54
Mary 8.65 8.69 13 0.98 8.1 14
Matrine 3.82 10.87 31 0.37 15.2 31
Tasabana 5.38 3.15 39 0.51 3.4 63
Total 5.27 6.4 140 0.40 7.4 182
Table 14 Per capita energy consumptions(MJ/person/event) and number of people cooked for – single fuels only,
Phase 3
Phase 3
Electricity
Per capita energy
(median)
Number of people (mean) N
Alice 2.03 2.7 95
Brian 1.58 2.9 8
Bridget 0.52 5.2 33
Daisy 2.02 6.1 39
Esnart Phiri 0.55 6.4 40
Francis 0.73 2.1 71
Ginnie 0.87 3.8 116
Karen 1.12 2.1 53
Martha 1.04 1.8 115
Masapi 4.42 2.8 49
Nancy 1.82 2.8 182
eCook Zambia Cooking Diaries | October 2019 Working Paper
[email protected] | PV-ecook.org
This research is funded by DfID/UK Aid and Gamos through the Innovate UK Energy Catalyst and the MECS programme.
29
Prisca 0.96 3.2 104
Rhoda 1.08 3.8 132
Serenje 1.73 3.6 153
Total 1.20 3.3 1190
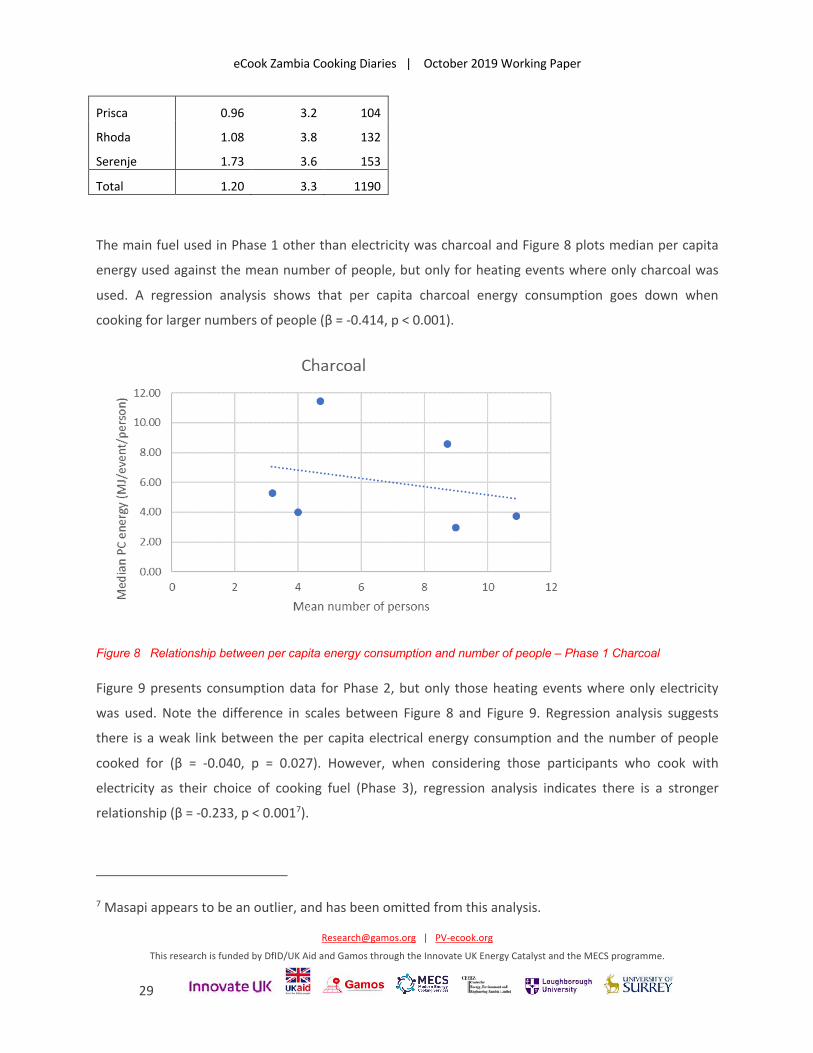
The main fuel used in Phase 1 other than electricity was charcoal and Figure 8 plots median per capita
energy used against the mean number of people, but only for heating events where only charcoal was
used. A regression analysis shows that per capita charcoal energy consumption goes down when
cooking for larger numbers of people (β = -0.414, p < 0.001).
Figure 8 Relationship between per capita energy consumption and number of people – Phase 1 Charcoal
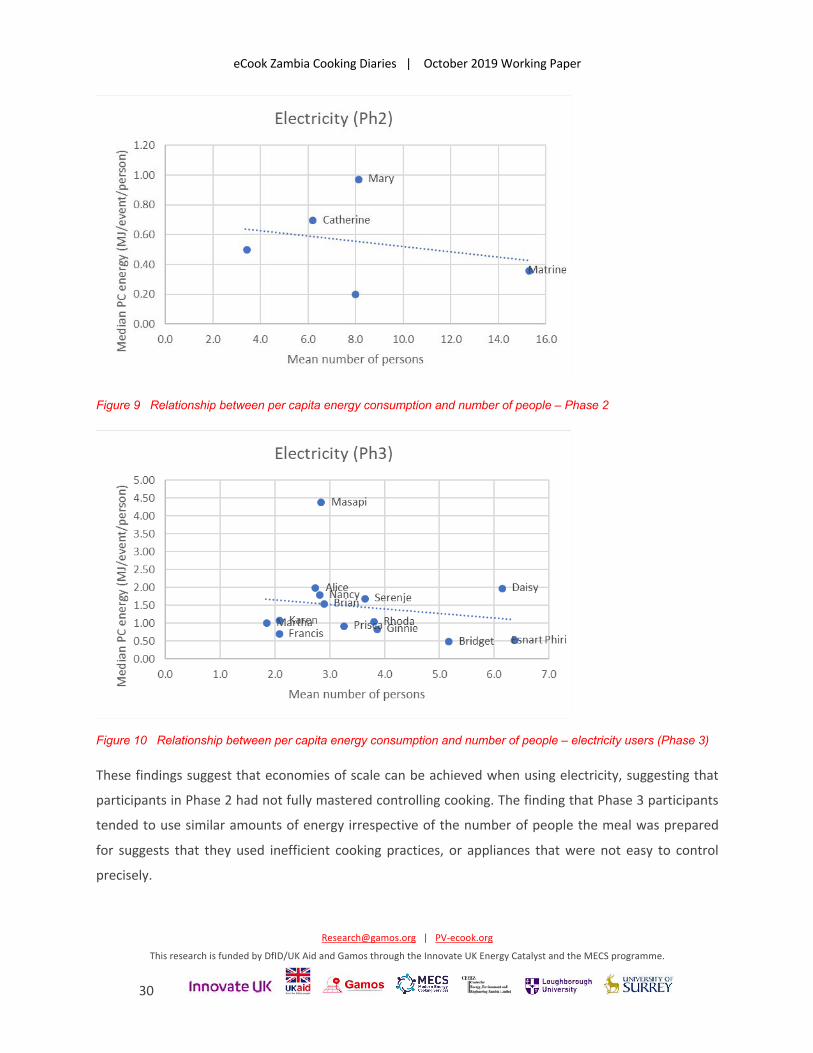
Figure 9 presents consumption data for Phase 2, but only those heating events where only electricity
was used. Note the difference in scales between Figure 8 and Figure 9. Regression analysis suggests
there is a weak link between the per capita electrical energy consumption and the number of people
cooked for (β = -0.040, p = 0.027). However, when considering those participants who cook with
electricity as their choice of cooking fuel (Phase 3), regression analysis indicates there is a stronger
relationship (β = -0.233, p < 0.0017).
7 Masapi appears to be an outlier, and has been omitted from this analysis.
eCook Zambia Cooking Diaries | October 2019 Working Paper
[email protected] | PV-ecook.org
This research is funded by DfID/UK Aid and Gamos through the Innovate UK Energy Catalyst and the MECS programme.
30
Figure 9 Relationship between per capita energy consumption and number of people – Phase 2
Figure 10 Relationship between per capita energy consumption and number of people – electricity users (Phase 3)
These findings suggest that economies of scale can be achieved when using electricity, suggesting that
participants in Phase 2 had not fully mastered controlling cooking. The finding that Phase 3 participants
tended to use similar amounts of energy irrespective of the number of people the meal was prepared
for suggests that they used inefficient cooking practices, or appliances that were not easy to control
precisely.
eCook Zambia Cooking Diaries | October 2019 Working Paper
[email protected] | PV-ecook.org
This research is funded by DfID/UK Aid and Gamos through the Innovate UK Energy Catalyst and the MECS programme.
31
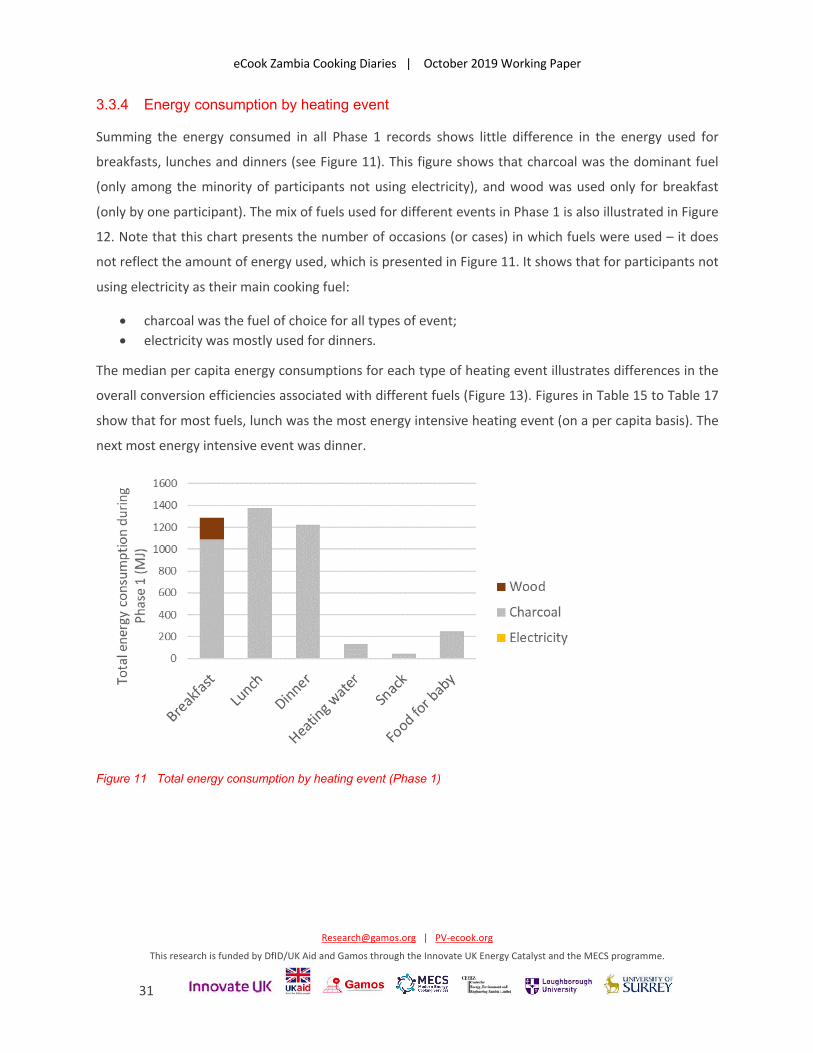
3.3.4 Energy consumption by heating event
Summing the energy consumed in all Phase 1 records shows little difference in the energy used for
breakfasts, lunches and dinners (see Figure 11). This figure shows that charcoal was the dominant fuel
(only among the minority of participants not using electricity), and wood was used only for breakfast
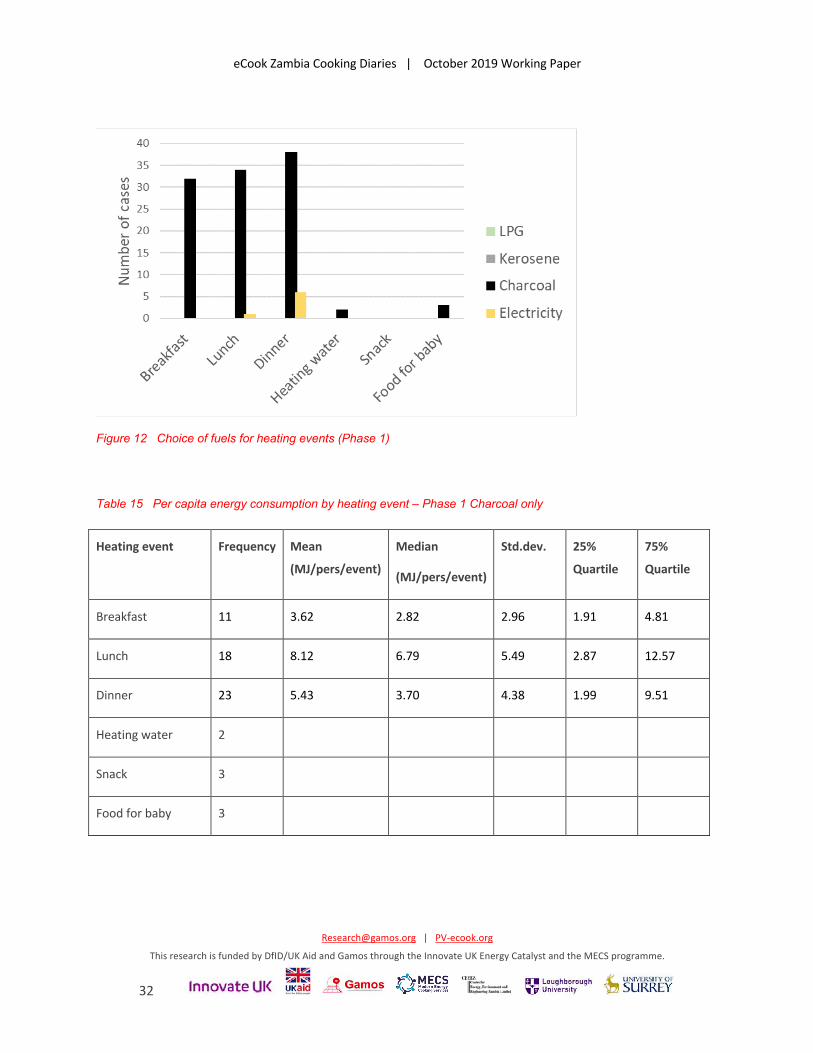
(only by one participant). The mix of fuels used for different events in Phase 1 is also illustrated in Figure
12. Note that this chart presents the number of occasions (or cases) in which fuels were used – it does
not reflect the amount of energy used, which is presented in Figure 11. It shows that for participants not
using electricity as their main cooking fuel:
• charcoal was the fuel of choice for all types of event; • electricity was mostly used for dinners.
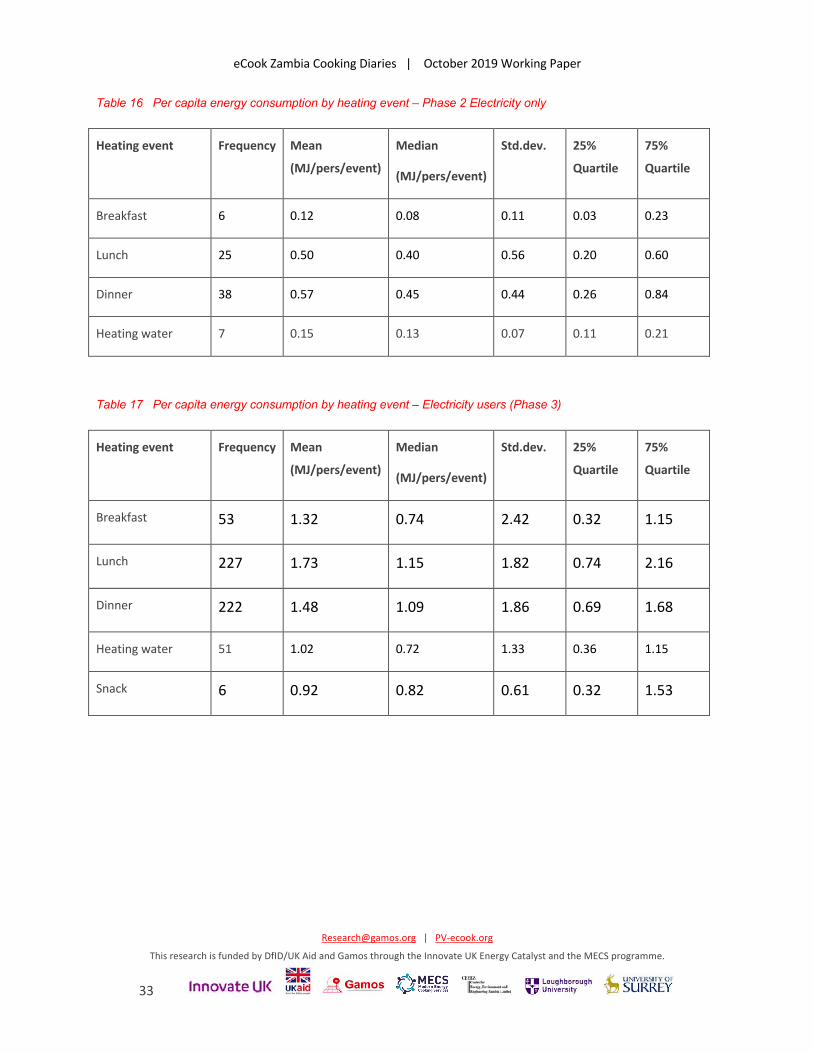
The median per capita energy consumptions for each type of heating event illustrates differences in the
overall conversion efficiencies associated with different fuels (Figure 13). Figures in Table 15 to Table 17
show that for most fuels, lunch was the most energy intensive heating event (on a per capita basis). The
next most energy intensive event was dinner.
Figure 11 Total energy consumption by heating event (Phase 1)
eCook Zambia Cooking Diaries | October 2019 Working Paper
[email protected] | PV-ecook.org
This research is funded by DfID/UK Aid and Gamos through the Innovate UK Energy Catalyst and the MECS programme.
32
Figure 12 Choice of fuels for heating events (Phase 1)
Table 15 Per capita energy consumption by heating event – Phase 1 Charcoal only
Heating event Frequency Mean
(MJ/pers/event)
Median
(MJ/pers/event)
Std.dev. 25%
Quartile
75%
Quartile
Breakfast 11 3.62 2.82 2.96 1.91 4.81
Lunch 18 8.12 6.79 5.49 2.87 12.57
Dinner 23 5.43 3.70 4.38 1.99 9.51
Heating water 2
Snack 3
Food for baby 3
eCook Zambia Cooking Diaries | October 2019 Working Paper
[email protected] | PV-ecook.org
This research is funded by DfID/UK Aid and Gamos through the Innovate UK Energy Catalyst and the MECS programme.
33
Table 16 Per capita energy consumption by heating event – Phase 2 Electricity only
Heating event Frequency Mean
(MJ/pers/event)
Median
(MJ/pers/event)
Std.dev. 25%
Quartile
75%
Quartile
Breakfast 6 0.12 0.08 0.11 0.03 0.23
Lunch 25 0.50 0.40 0.56 0.20 0.60
Dinner 38 0.57 0.45 0.44 0.26 0.84
Heating water 7 0.15 0.13 0.07 0.11 0.21
Table 17 Per capita energy consumption by heating event – Electricity users (Phase 3)
Heating event Frequency Mean
(MJ/pers/event)
Median
(MJ/pers/event)
Std.dev. 25%
Quartile
75%
Quartile
Breakfast 53 1.32 0.74 2.42 0.32 1.15
Lunch 227 1.73 1.15 1.82 0.74 2.16
Dinner 222 1.48 1.09 1.86 0.69 1.68
Heating water 51 1.02 0.72 1.33 0.36 1.15
Snack 6 0.92 0.82 0.61 0.32 1.53
eCook Zambia Cooking Diaries | October 2019 Working Paper
[email protected] | PV-ecook.org
This research is funded by DfID/UK Aid and Gamos through the Innovate UK Energy Catalyst and the MECS programme.
34
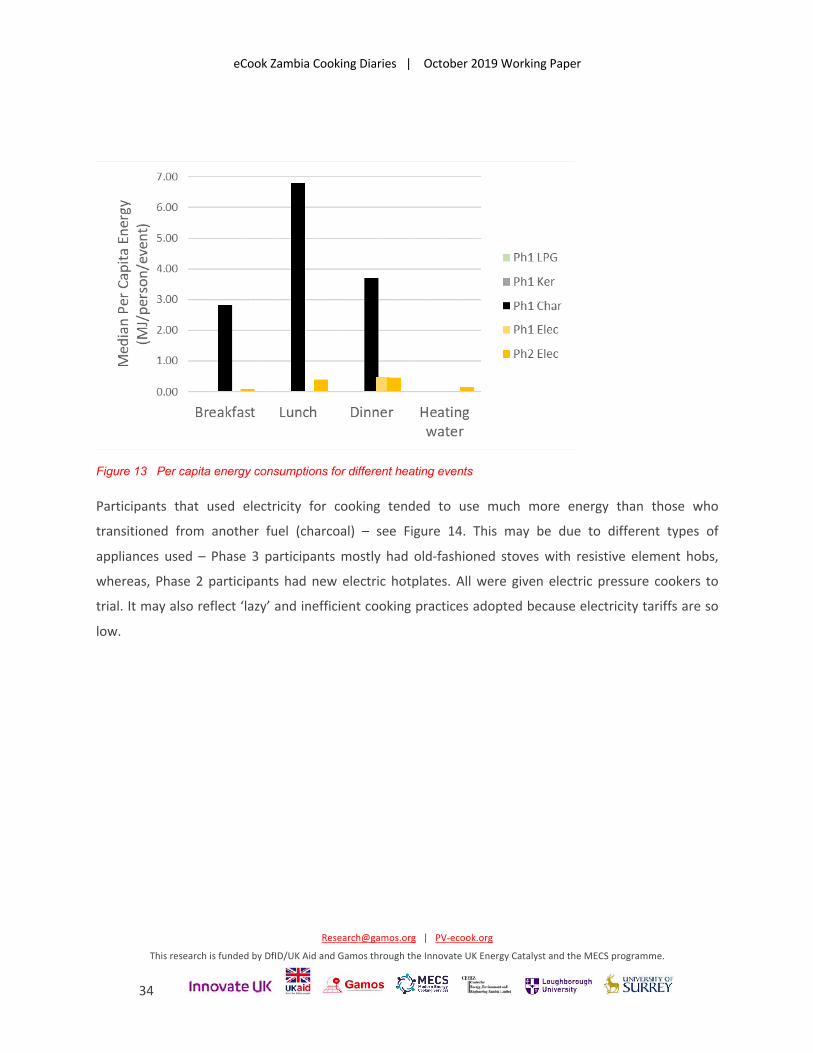
Figure 13 Per capita energy consumptions for different heating events
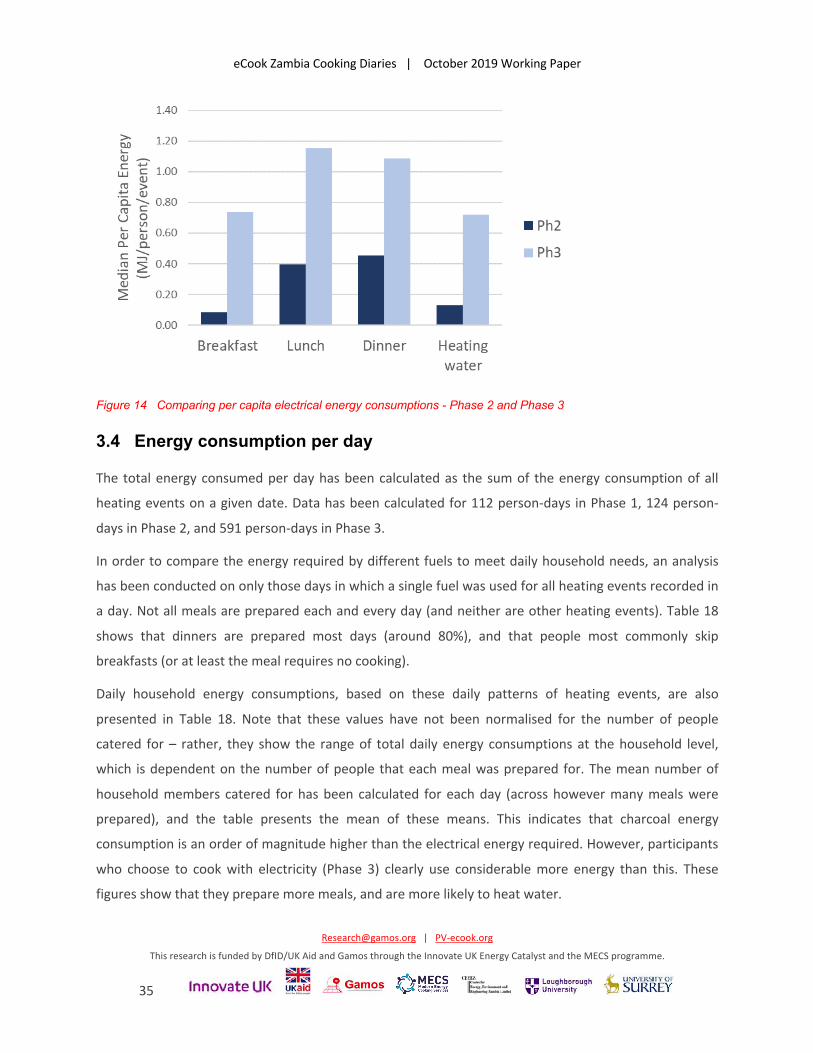
Participants that used electricity for cooking tended to use much more energy than those who
transitioned from another fuel (charcoal) – see Figure 14. This may be due to different types of
appliances used – Phase 3 participants mostly had old-fashioned stoves with resistive element hobs,
whereas, Phase 2 participants had new electric hotplates. All were given electric pressure cookers to
trial. It may also reflect ‘lazy’ and inefficient cooking practices adopted because electricity tariffs are so
low.
eCook Zambia Cooking Diaries | October 2019 Working Paper
[email protected] | PV-ecook.org
This research is funded by DfID/UK Aid and Gamos through the Innovate UK Energy Catalyst and the MECS programme.
35
Figure 14 Comparing per capita electrical energy consumptions - Phase 2 and Phase 3
3.4 Energy consumption per day
The total energy consumed per day has been calculated as the sum of the energy consumption of all
heating events on a given date. Data has been calculated for 112 person-days in Phase 1, 124 person-
days in Phase 2, and 591 person-days in Phase 3.
In order to compare the energy required by different fuels to meet daily household needs, an analysis
has been conducted on only those days in which a single fuel was used for all heating events recorded in
a day. Not all meals are prepared each and every day (and neither are other heating events). Table 18
shows that dinners are prepared most days (around 80%), and that people most commonly skip
breakfasts (or at least the meal requires no cooking).
Daily household energy consumptions, based on these daily patterns of heating events, are also
presented in Table 18. Note that these values have not been normalised for the number of people
catered for – rather, they show the range of total daily energy consumptions at the household level,
which is dependent on the number of people that each meal was prepared for. The mean number of
household members catered for has been calculated for each day (across however many meals were
prepared), and the table presents the mean of these means. This indicates that charcoal energy
consumption is an order of magnitude higher than the electrical energy required. However, participants
who choose to cook with electricity (Phase 3) clearly use considerable more energy than this. These
figures show that they prepare more meals, and are more likely to heat water.
eCook Zambia Cooking Diaries | October 2019 Working Paper
[email protected] | PV-ecook.org
This research is funded by DfID/UK Aid and Gamos through the Innovate UK Energy Catalyst and the MECS programme.
36
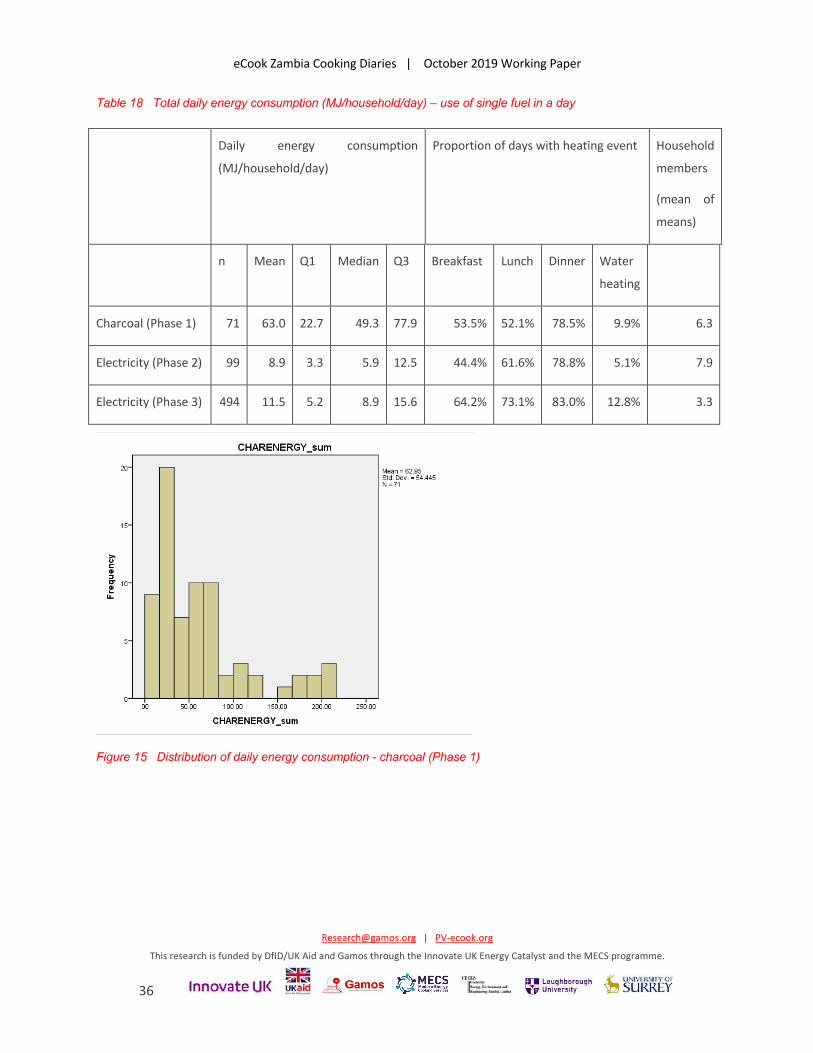
Table 18 Total daily energy consumption (MJ/household/day) – use of single fuel in a day
Daily energy consumption
(MJ/household/day)
Proportion of days with heating event Household
members
(mean of
means)
n Mean Q1 Median Q3 Breakfast Lunch Dinner Water
heating
Charcoal (Phase 1) 71 63.0 22.7 49.3 77.9 53.5% 52.1% 78.5% 9.9% 6.3
Electricity (Phase 2) 99 8.9 3.3 5.9 12.5 44.4% 61.6% 78.8% 5.1% 7.9
Electricity (Phase 3) 494 11.5 5.2 8.9 15.6 64.2% 73.1% 83.0% 12.8% 3.3
Figure 15 Distribution of daily energy consumption - charcoal (Phase 1)
eCook Zambia Cooking Diaries | October 2019 Working Paper
[email protected] | PV-ecook.org
This research is funded by DfID/UK Aid and Gamos through the Innovate UK Energy Catalyst and the MECS programme.
37
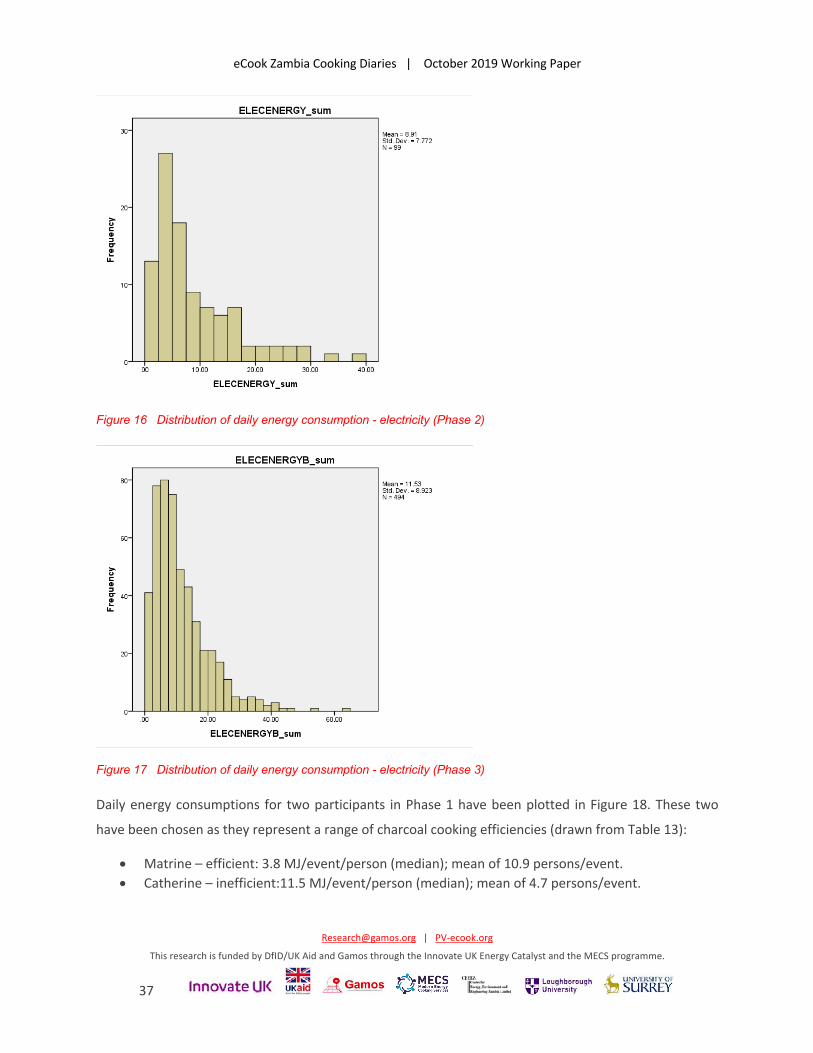
Figure 16 Distribution of daily energy consumption - electricity (Phase 2)
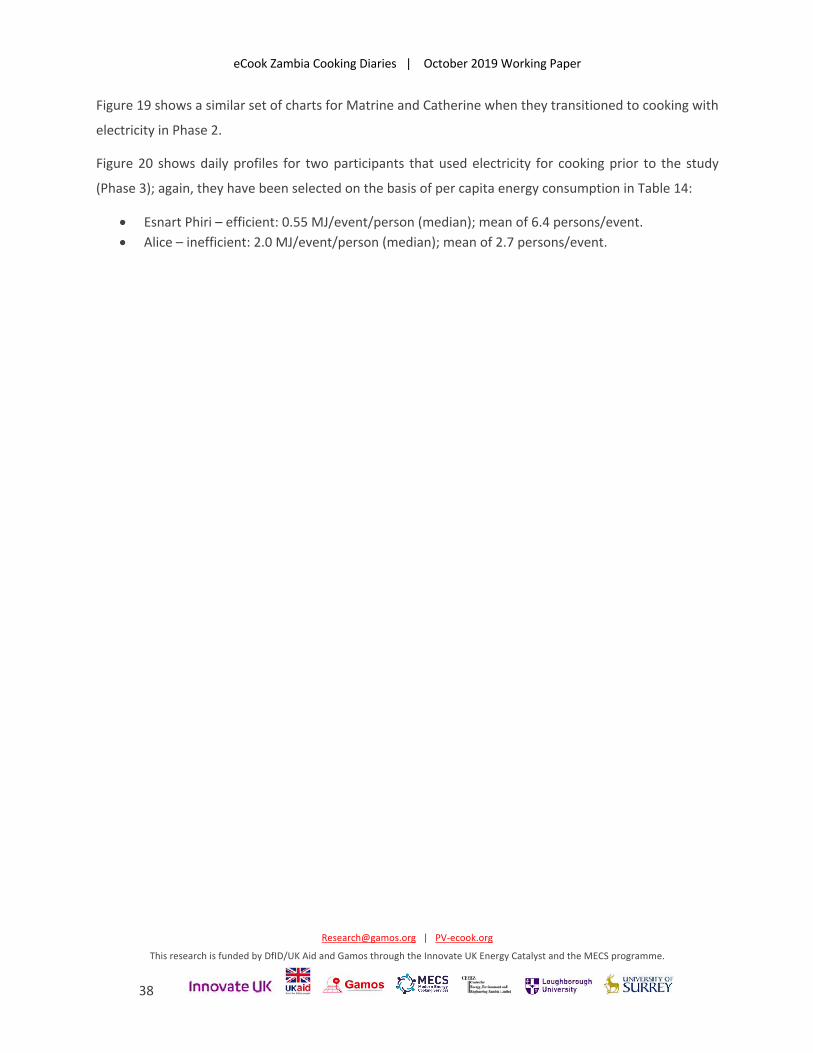
Figure 17 Distribution of daily energy consumption - electricity (Phase 3)
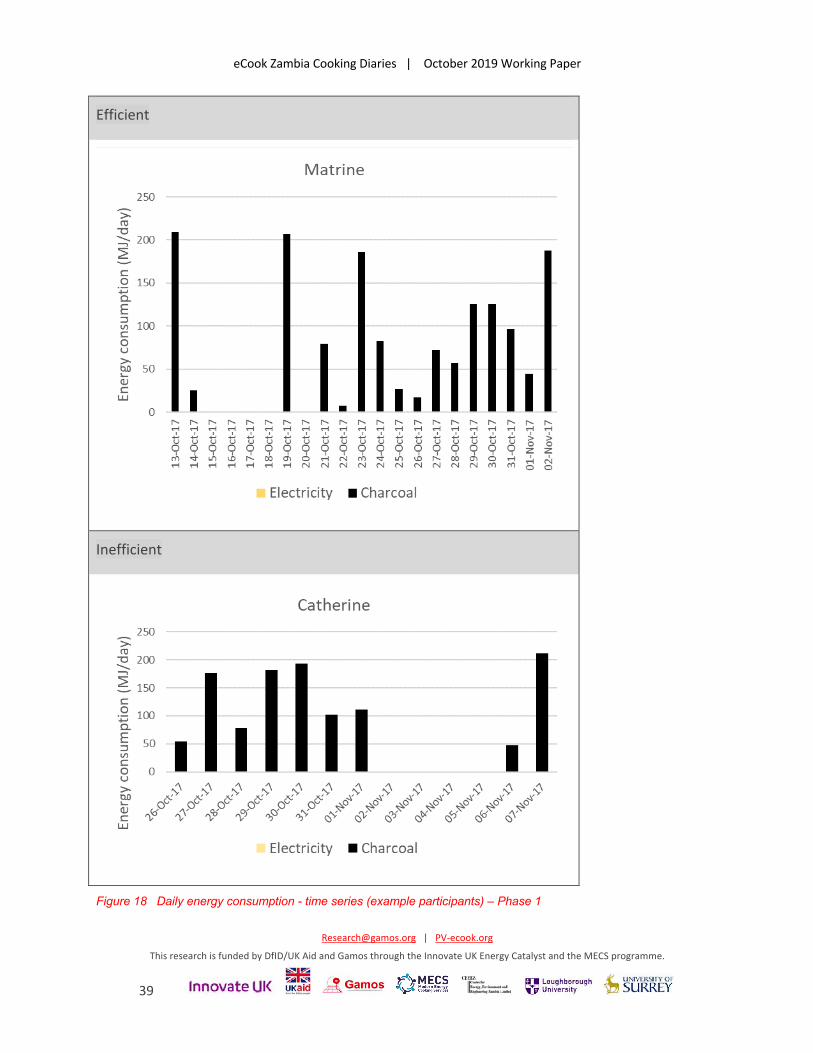
Daily energy consumptions for two participants in Phase 1 have been plotted in Figure 18. These two
have been chosen as they represent a range of charcoal cooking efficiencies (drawn from Table 13):
• Matrine – efficient: 3.8 MJ/event/person (median); mean of 10.9 persons/event. • Catherine – inefficient:11.5 MJ/event/person (median); mean of 4.7 persons/event.
eCook Zambia Cooking Diaries | October 2019 Working Paper
[email protected] | PV-ecook.org
This research is funded by DfID/UK Aid and Gamos through the Innovate UK Energy Catalyst and the MECS programme.
38
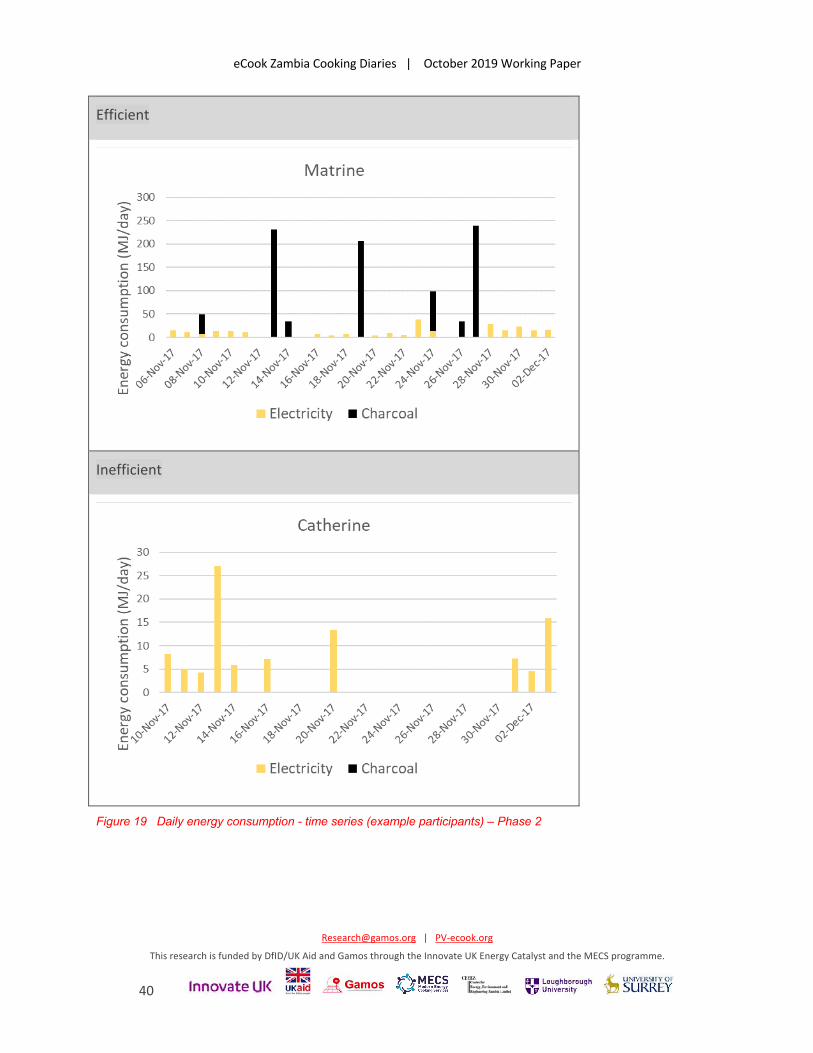
Figure 19 shows a similar set of charts for Matrine and Catherine when they transitioned to cooking with
electricity in Phase 2.
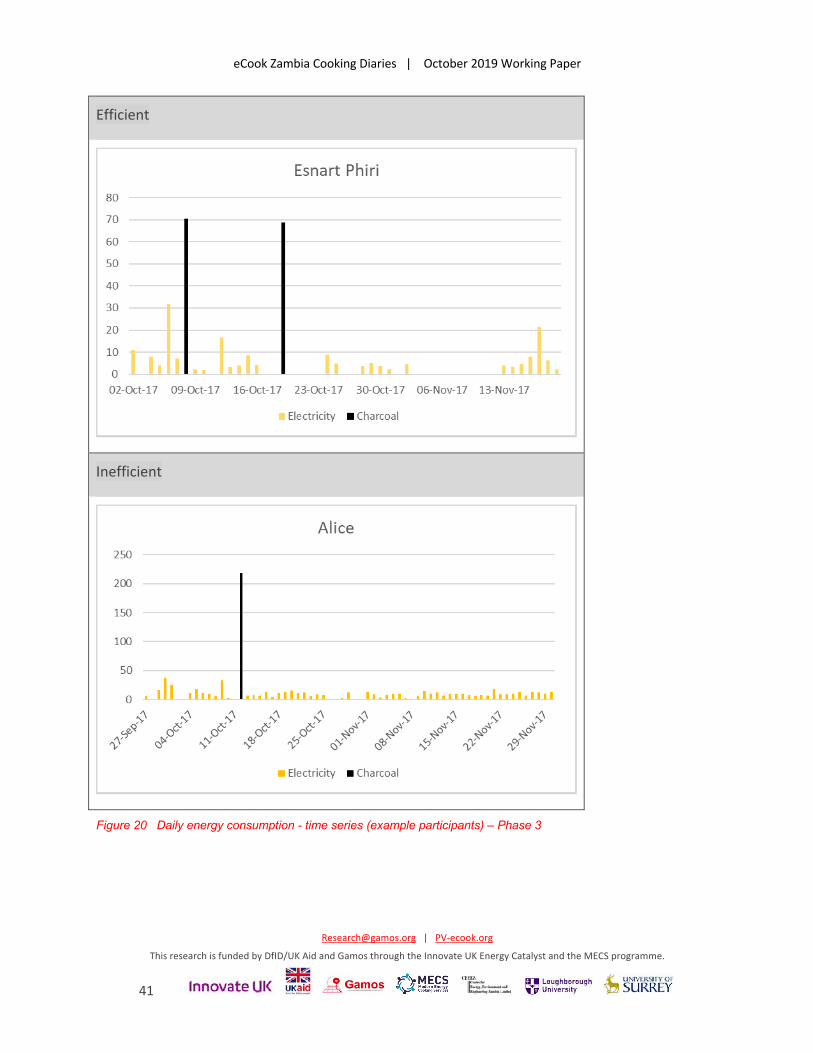
Figure 20 shows daily profiles for two participants that used electricity for cooking prior to the study
(Phase 3); again, they have been selected on the basis of per capita energy consumption in Table 14:
• Esnart Phiri – efficient: 0.55 MJ/event/person (median); mean of 6.4 persons/event. • Alice – inefficient: 2.0 MJ/event/person (median); mean of 2.7 persons/event.
eCook Zambia Cooking Diaries | October 2019 Working Paper
[email protected] | PV-ecook.org
This research is funded by DfID/UK Aid and Gamos through the Innovate UK Energy Catalyst and the MECS programme.
39
Efficient
Inefficient
Figure 18 Daily energy consumption - time series (example participants) – Phase 1
eCook Zambia Cooking Diaries | October 2019 Working Paper
[email protected] | PV-ecook.org
This research is funded by DfID/UK Aid and Gamos through the Innovate UK Energy Catalyst and the MECS programme.
40
Efficient
Inefficient
Figure 19 Daily energy consumption - time series (example participants) – Phase 2
eCook Zambia Cooking Diaries | October 2019 Working Paper
[email protected] | PV-ecook.org
This research is funded by DfID/UK Aid and Gamos through the Innovate UK Energy Catalyst and the MECS programme.
41
Efficient
Inefficient
Figure 20 Daily energy consumption - time series (example participants) – Phase 3
eCook Zambia Cooking Diaries | October 2019 Working Paper
[email protected] | PV-ecook.org
This research is funded by DfID/UK Aid and Gamos through the Innovate UK Energy Catalyst and the MECS programme.
42
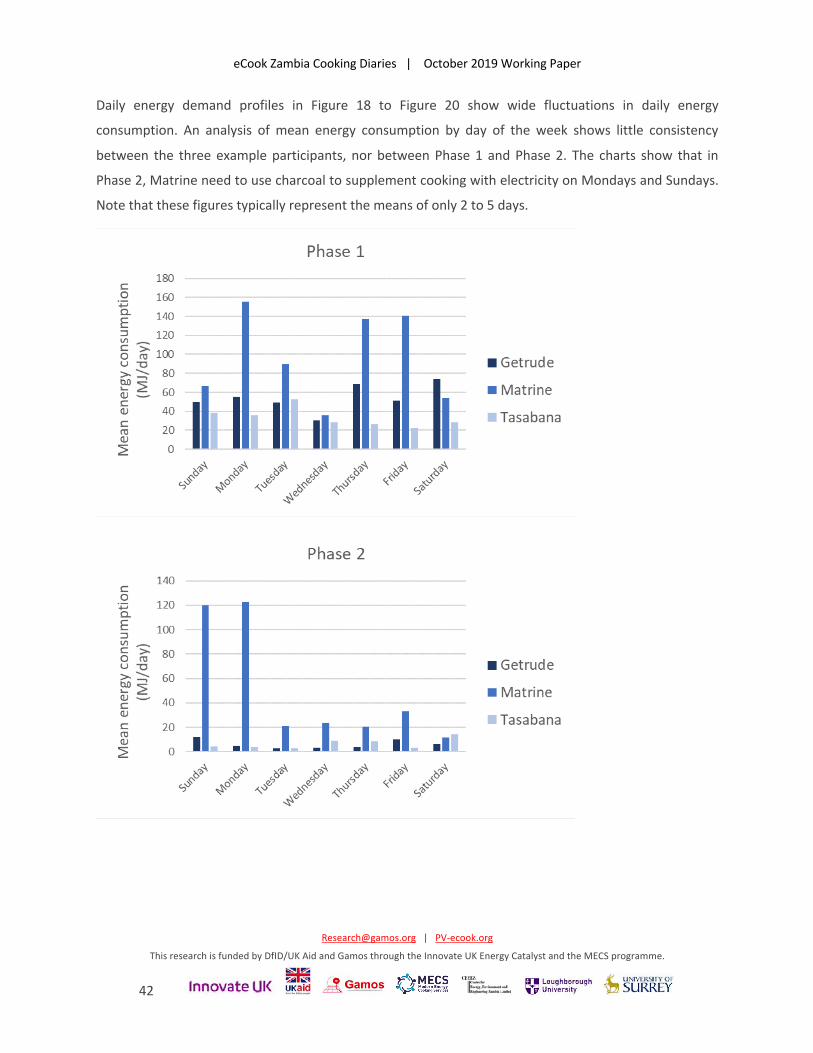
Daily energy demand profiles in Figure 18 to Figure 20 show wide fluctuations in daily energy
consumption. An analysis of mean energy consumption by day of the week shows little consistency
between the three example participants, nor between Phase 1 and Phase 2. The charts show that in
Phase 2, Matrine need to use charcoal to supplement cooking with electricity on Mondays and Sundays.
Note that these figures typically represent the means of only 2 to 5 days.
eCook Zambia Cooking Diaries | October 2019 Working Paper
[email protected] | PV-ecook.org
This research is funded by DfID/UK Aid and Gamos through the Innovate UK Energy Catalyst and the MECS programme.
43
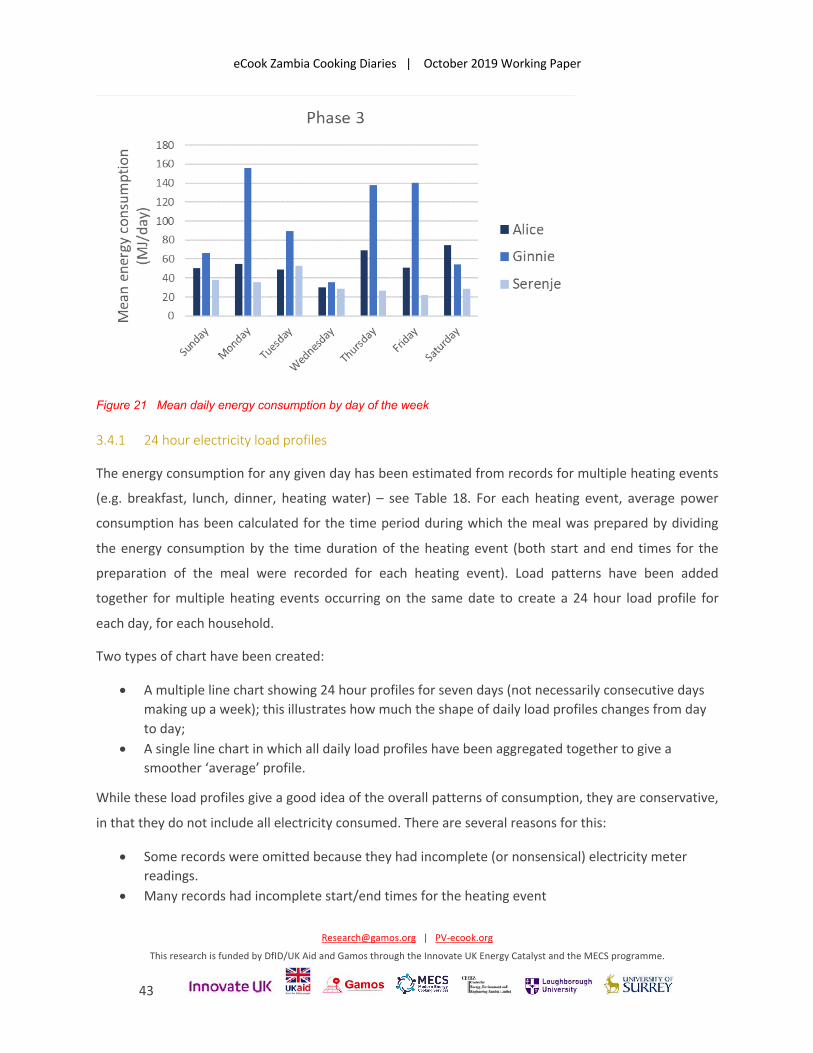
Figure 21 Mean daily energy consumption by day of the week
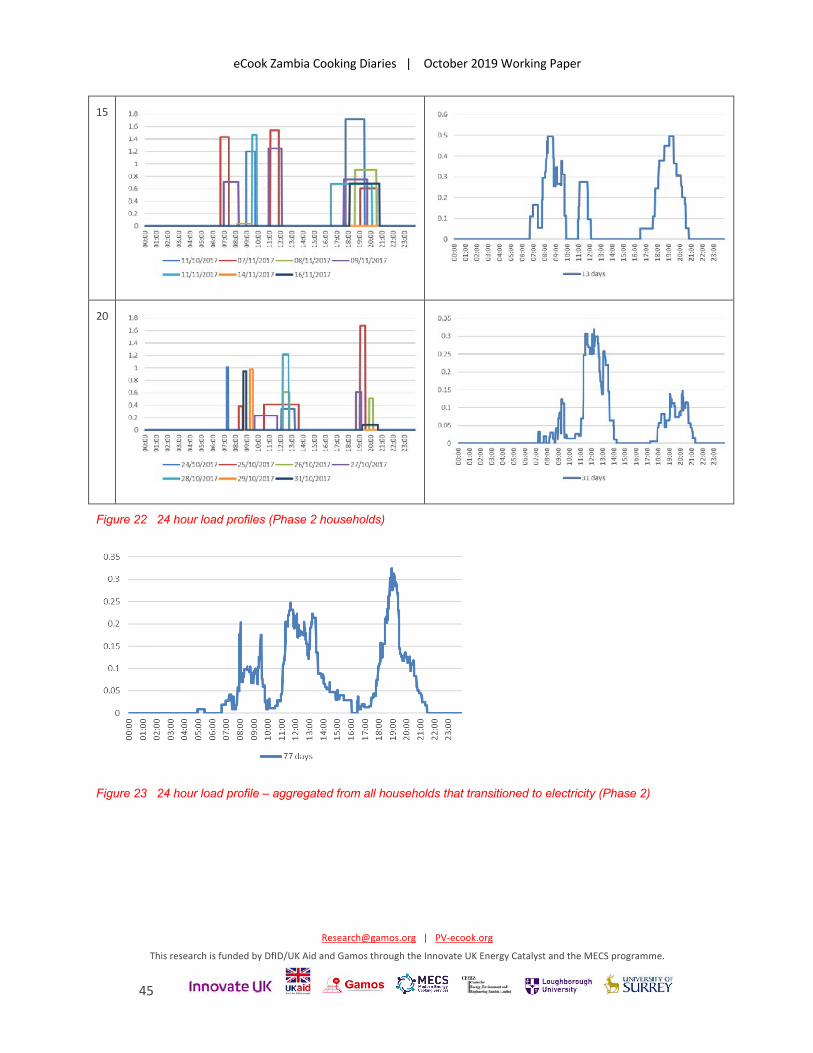
3.4.1 24 hour electricity load profiles
The energy consumption for any given day has been estimated from records for multiple heating events
(e.g. breakfast, lunch, dinner, heating water) – see Table 18. For each heating event, average power
consumption has been calculated for the time period during which the meal was prepared by dividing
the energy consumption by the time duration of the heating event (both start and end times for the
preparation of the meal were recorded for each heating event). Load patterns have been added
together for multiple heating events occurring on the same date to create a 24 hour load profile for
each day, for each household.
Two types of chart have been created:
• A multiple line chart showing 24 hour profiles for seven days (not necessarily consecutive days making up a week); this illustrates how much the shape of daily load profiles changes from day to day;
• A single line chart in which all daily load profiles have been aggregated together to give a smoother ‘average’ profile.
While these load profiles give a good idea of the overall patterns of consumption, they are conservative,
in that they do not include all electricity consumed. There are several reasons for this:
• Some records were omitted because they had incomplete (or nonsensical) electricity meter readings.
• Many records had incomplete start/end times for the heating event
eCook Zambia Cooking Diaries | October 2019 Working Paper
[email protected] | PV-ecook.org
This research is funded by DfID/UK Aid and Gamos through the Innovate UK Energy Catalyst and the MECS programme.
44
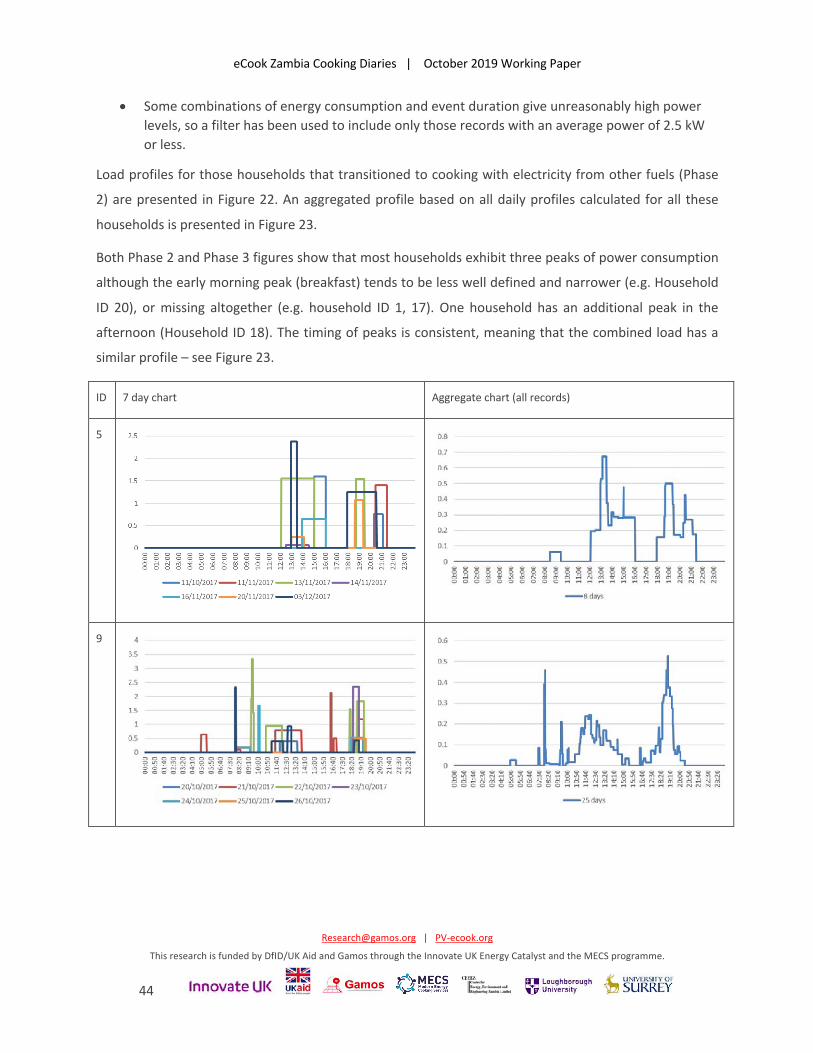
• Some combinations of energy consumption and event duration give unreasonably high power levels, so a filter has been used to include only those records with an average power of 2.5 kW or less.
Load profiles for those households that transitioned to cooking with electricity from other fuels (Phase
2) are presented in Figure 22. An aggregated profile based on all daily profiles calculated for all these
households is presented in Figure 23.
Both Phase 2 and Phase 3 figures show that most households exhibit three peaks of power consumption
although the early morning peak (breakfast) tends to be less well defined and narrower (e.g. Household
ID 20), or missing altogether (e.g. household ID 1, 17). One household has an additional peak in the
afternoon (Household ID 18). The timing of peaks is consistent, meaning that the combined load has a
similar profile – see Figure 23.
ID 7 day chart Aggregate chart (all records)
5
9
eCook Zambia Cooking Diaries | October 2019 Working Paper
[email protected] | PV-ecook.org
This research is funded by DfID/UK Aid and Gamos through the Innovate UK Energy Catalyst and the MECS programme.
45
15
20
Figure 22 24 hour load profiles (Phase 2 households)
Figure 23 24 hour load profile – aggregated from all households that transitioned to electricity (Phase 2)
eCook Zambia Cooking Diaries | October 2019 Working Paper
[email protected] | PV-ecook.org
This research is funded by DfID/UK Aid and Gamos through the Innovate UK Energy Catalyst and the MECS programme.
46
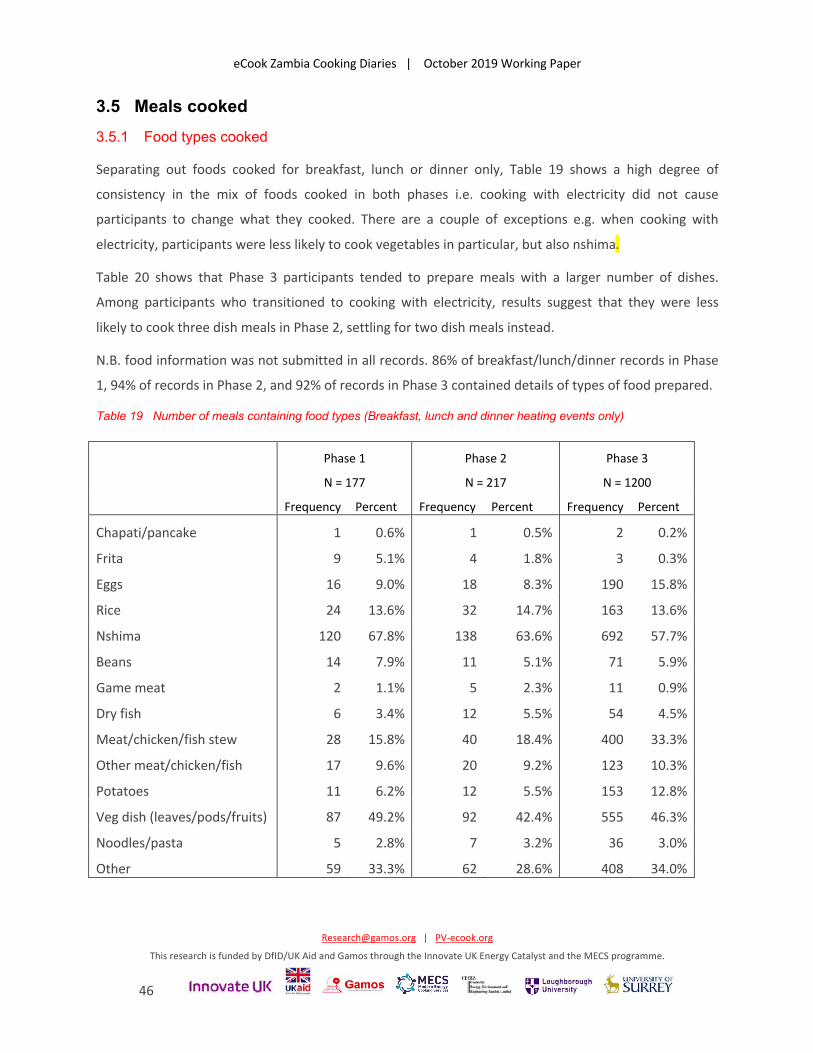
3.5 Meals cooked 3.5.1 Food types cooked
Separating out foods cooked for breakfast, lunch or dinner only, Table 19 shows a high degree of
consistency in the mix of foods cooked in both phases i.e. cooking with electricity did not cause
participants to change what they cooked. There are a couple of exceptions e.g. when cooking with
electricity, participants were less likely to cook vegetables in particular, but also nshima.
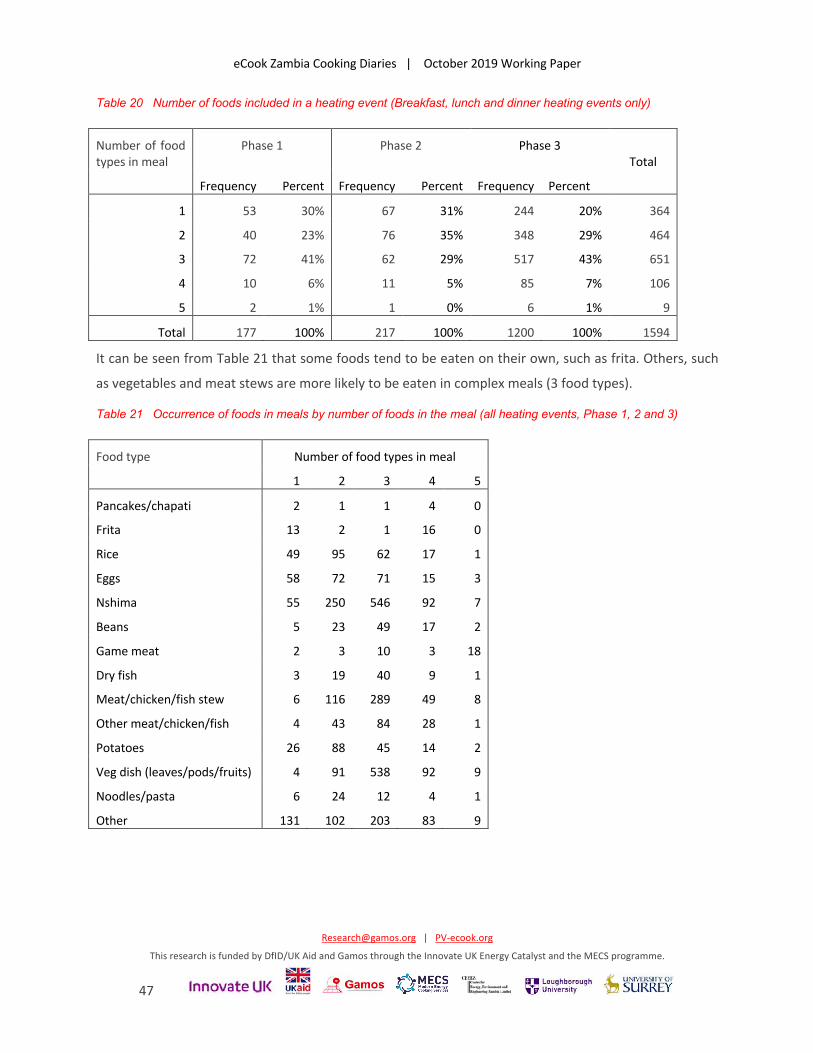
Table 20 shows that Phase 3 participants tended to prepare meals with a larger number of dishes.
Among participants who transitioned to cooking with electricity, results suggest that they were less
likely to cook three dish meals in Phase 2, settling for two dish meals instead.
N.B. food information was not submitted in all records. 86% of breakfast/lunch/dinner records in Phase
1, 94% of records in Phase 2, and 92% of records in Phase 3 contained details of types of food prepared.
Table 19 Number of meals containing food types (Breakfast, lunch and dinner heating events only)
Phase 1 Phase 2 Phase 3
N = 177 N = 217 N = 1200
Frequency Percent Frequency Percent Frequency Percent
Chapati/pancake 1 0.6% 1 0.5% 2 0.2%
Frita 9 5.1% 4 1.8% 3 0.3%
Eggs 16 9.0% 18 8.3% 190 15.8%
Rice 24 13.6% 32 14.7% 163 13.6%
Nshima 120 67.8% 138 63.6% 692 57.7%
Beans 14 7.9% 11 5.1% 71 5.9%
Game meat 2 1.1% 5 2.3% 11 0.9%
Dry fish 6 3.4% 12 5.5% 54 4.5%
Meat/chicken/fish stew 28 15.8% 40 18.4% 400 33.3%
Other meat/chicken/fish 17 9.6% 20 9.2% 123 10.3%
Potatoes 11 6.2% 12 5.5% 153 12.8%
Veg dish (leaves/pods/fruits) 87 49.2% 92 42.4% 555 46.3%
Noodles/pasta 5 2.8% 7 3.2% 36 3.0%
Other 59 33.3% 62 28.6% 408 34.0%
eCook Zambia Cooking Diaries | October 2019 Working Paper
[email protected] | PV-ecook.org
This research is funded by DfID/UK Aid and Gamos through the Innovate UK Energy Catalyst and the MECS programme.
47
Table 20 Number of foods included in a heating event (Breakfast, lunch and dinner heating events only)
Number of food types in meal
Phase 1 Phase 2 Phase 3 Total
Frequency Percent Frequency Percent Frequency Percent
1 53 30% 67 31% 244 20% 364
2 40 23% 76 35% 348 29% 464
3 72 41% 62 29% 517 43% 651
4 10 6% 11 5% 85 7% 106
5 2 1% 1 0% 6 1% 9
Total 177 100% 217 100% 1200 100% 1594
It can be seen from Table 21 that some foods tend to be eaten on their own, such as frita. Others, such
as vegetables and meat stews are more likely to be eaten in complex meals (3 food types).
Table 21 Occurrence of foods in meals by number of foods in the meal (all heating events, Phase 1, 2 and 3)
Food type Number of food types in meal
1 2 3 4 5
Pancakes/chapati 2 1 1 4 0
Frita 13 2 1 16 0
Rice 49 95 62 17 1
Eggs 58 72 71 15 3
Nshima 55 250 546 92 7
Beans 5 23 49 17 2
Game meat 2 3 10 3 18
Dry fish 3 19 40 9 1
Meat/chicken/fish stew 6 116 289 49 8
Other meat/chicken/fish 4 43 84 28 1
Potatoes 26 88 45 14 2
Veg dish (leaves/pods/fruits) 4 91 538 92 9
Noodles/pasta 6 24 12 4 1
Other 131 102 203 83 9
eCook Zambia Cooking Diaries | October 2019 Working Paper
[email protected] | PV-ecook.org
This research is funded by DfID/UK Aid and Gamos through the Innovate UK Energy Catalyst and the MECS programme.
48
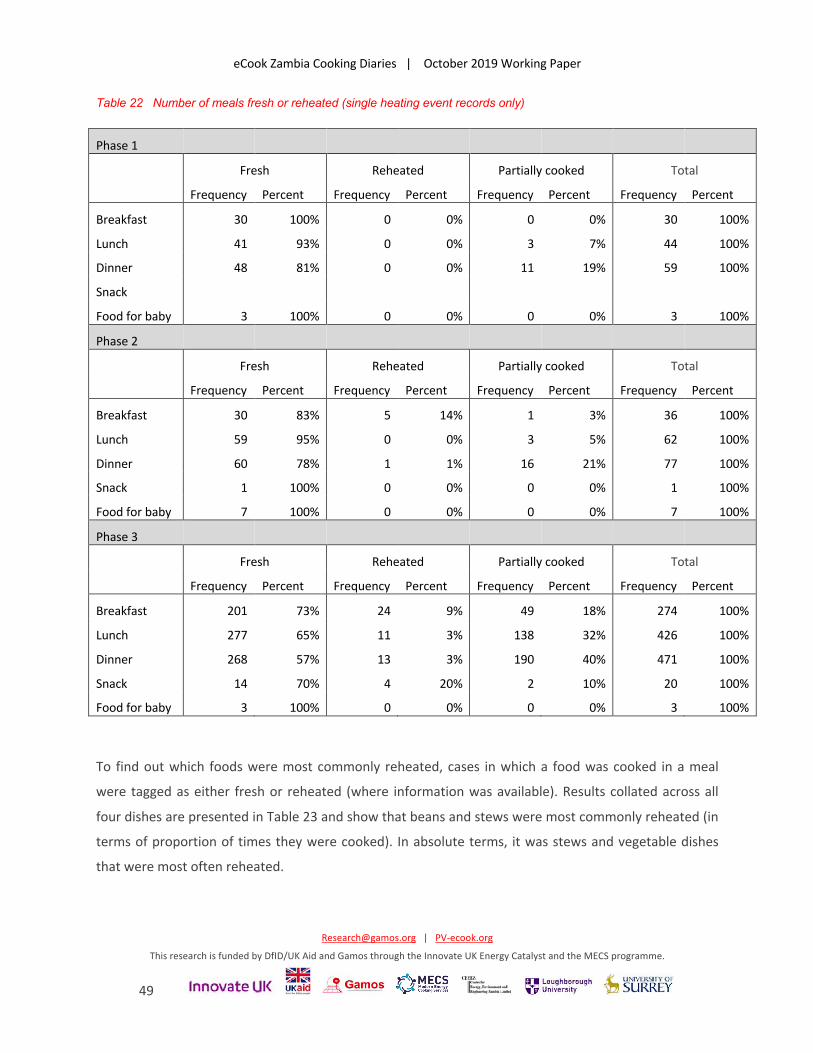
3.5.2 Reheating food
For each food item prepared (up to a maximum of four dishes per meal), participants were asked if each
dish was freshly cooked or reheated. If all dishes in a meal were reheated, then the meal was classified
as reheated, if all were freshly cooked, then the meal was classified as fresh, and if only some of the
dishes in the meal were reheated then the meal was classified as partially cooked. Results for all those
records that contained only a single heating event are presented in Table 22. This shows that dinners
were the meal that most commonly included some reheated dishes.
Note that participants who cooked with electricity (Phase 3) were much more likely to reheat food than
those who had transitioned to electric cooking (phase 2). This may be due the cooking capacity of
cooking devices. While participants in Phase 2 were cooking on one or two plug in devices, such as a
single electric hob, Phase 3 participants mostly used cookers with four hobs. Alternatively, participants
experienced in cooking with electricity may have figured out those dishes that can conveniently be
reheated using electric cookers.
eCook Zambia Cooking Diaries | October 2019 Working Paper
[email protected] | PV-ecook.org
This research is funded by DfID/UK Aid and Gamos through the Innovate UK Energy Catalyst and the MECS programme.
49
Table 22 Number of meals fresh or reheated (single heating event records only)
Phase 1
Fresh Reheated Partially cooked Total
Frequency Percent Frequency Percent Frequency Percent Frequency Percent
Breakfast 30 100% 0 0% 0 0% 30 100%
Lunch 41 93% 0 0% 3 7% 44 100%
Dinner 48 81% 0 0% 11 19% 59 100%
Snack
Food for baby 3 100% 0 0% 0 0% 3 100%
Phase 2
Fresh Reheated Partially cooked Total
Frequency Percent Frequency Percent Frequency Percent Frequency Percent
Breakfast 30 83% 5 14% 1 3% 36 100%
Lunch 59 95% 0 0% 3 5% 62 100%
Dinner 60 78% 1 1% 16 21% 77 100%
Snack 1 100% 0 0% 0 0% 1 100%
Food for baby 7 100% 0 0% 0 0% 7 100%
Phase 3
Fresh Reheated Partially cooked Total
Frequency Percent Frequency Percent Frequency Percent Frequency Percent
Breakfast 201 73% 24 9% 49 18% 274 100%
Lunch 277 65% 11 3% 138 32% 426 100%
Dinner 268 57% 13 3% 190 40% 471 100%
Snack 14 70% 4 20% 2 10% 20 100%
Food for baby 3 100% 0 0% 0 0% 3 100%
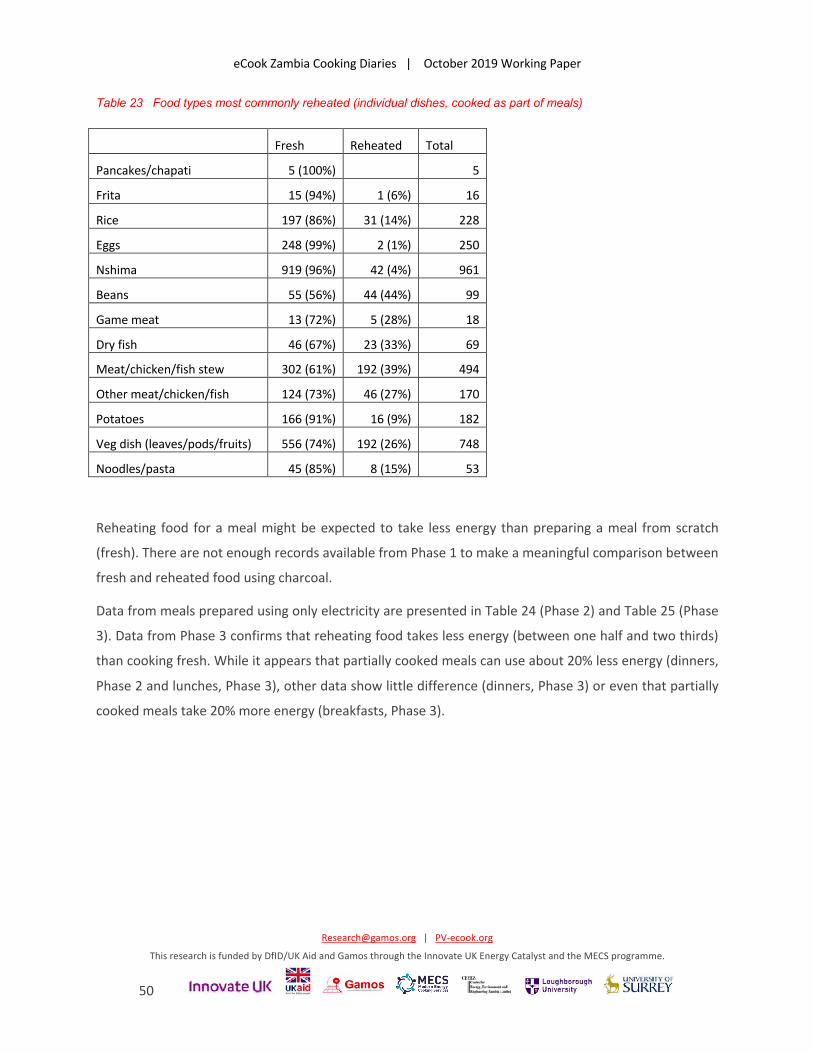
To find out which foods were most commonly reheated, cases in which a food was cooked in a meal
were tagged as either fresh or reheated (where information was available). Results collated across all
four dishes are presented in Table 23 and show that beans and stews were most commonly reheated (in
terms of proportion of times they were cooked). In absolute terms, it was stews and vegetable dishes
that were most often reheated.
eCook Zambia Cooking Diaries | October 2019 Working Paper
[email protected] | PV-ecook.org
This research is funded by DfID/UK Aid and Gamos through the Innovate UK Energy Catalyst and the MECS programme.
50
Table 23 Food types most commonly reheated (individual dishes, cooked as part of meals)
Fresh Reheated Total
Pancakes/chapati 5 (100%) 5
Frita 15 (94%) 1 (6%) 16
Rice 197 (86%) 31 (14%) 228
Eggs 248 (99%) 2 (1%) 250
Nshima 919 (96%) 42 (4%) 961
Beans 55 (56%) 44 (44%) 99
Game meat 13 (72%) 5 (28%) 18
Dry fish 46 (67%) 23 (33%) 69
Meat/chicken/fish stew 302 (61%) 192 (39%) 494
Other meat/chicken/fish 124 (73%) 46 (27%) 170
Potatoes 166 (91%) 16 (9%) 182
Veg dish (leaves/pods/fruits) 556 (74%) 192 (26%) 748
Noodles/pasta 45 (85%) 8 (15%) 53
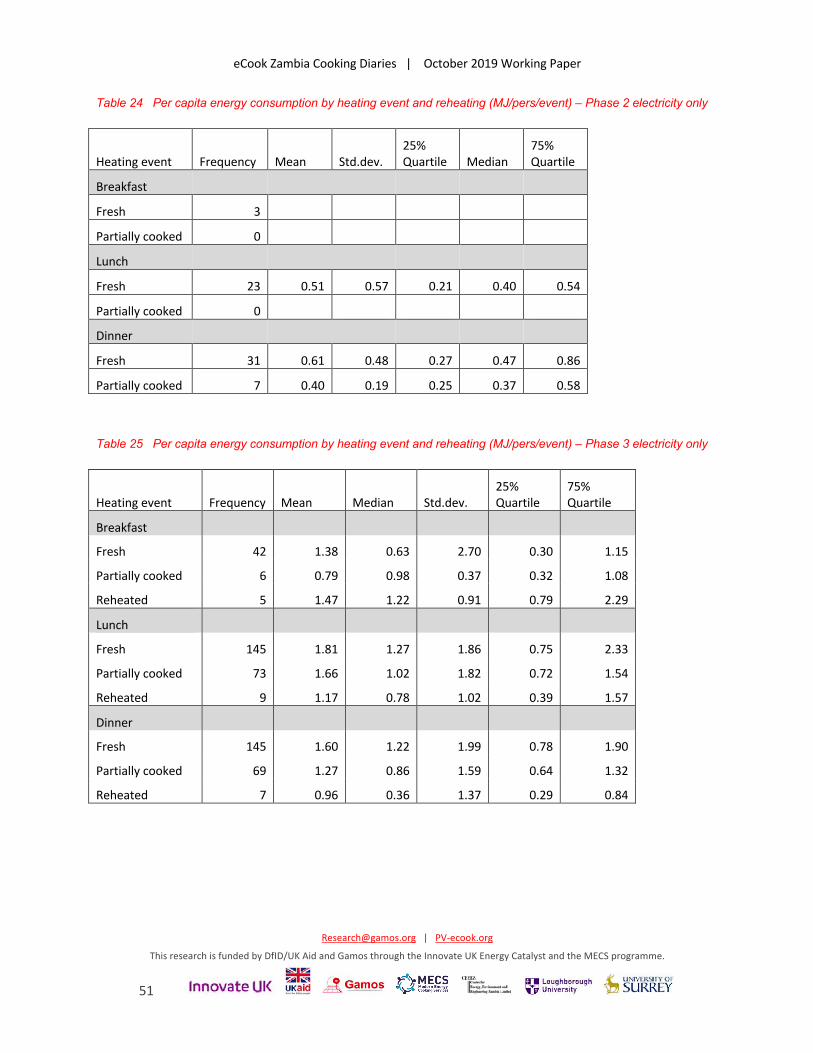
Reheating food for a meal might be expected to take less energy than preparing a meal from scratch
(fresh). There are not enough records available from Phase 1 to make a meaningful comparison between
fresh and reheated food using charcoal.
Data from meals prepared using only electricity are presented in Table 24 (Phase 2) and Table 25 (Phase
3). Data from Phase 3 confirms that reheating food takes less energy (between one half and two thirds)
than cooking fresh. While it appears that partially cooked meals can use about 20% less energy (dinners,
Phase 2 and lunches, Phase 3), other data show little difference (dinners, Phase 3) or even that partially
cooked meals take 20% more energy (breakfasts, Phase 3).
eCook Zambia Cooking Diaries | October 2019 Working Paper
[email protected] | PV-ecook.org
This research is funded by DfID/UK Aid and Gamos through the Innovate UK Energy Catalyst and the MECS programme.
51
Table 24 Per capita energy consumption by heating event and reheating (MJ/pers/event) – Phase 2 electricity only
Heating event Frequency Mean Std.dev. 25% Quartile Median
75% Quartile
Breakfast
Fresh 3
Partially cooked 0
Lunch
Fresh 23 0.51 0.57 0.21 0.40 0.54
Partially cooked 0
Dinner
Fresh 31 0.61 0.48 0.27 0.47 0.86
Partially cooked 7 0.40 0.19 0.25 0.37 0.58
Table 25 Per capita energy consumption by heating event and reheating (MJ/pers/event) – Phase 3 electricity only
Heating event Frequency Mean Median Std.dev. 25% Quartile
75% Quartile
Breakfast Fresh 42 1.38 0.63 2.70 0.30 1.15
Partially cooked 6 0.79 0.98 0.37 0.32 1.08
Reheated 5 1.47 1.22 0.91 0.79 2.29
Lunch Fresh 145 1.81 1.27 1.86 0.75 2.33
Partially cooked 73 1.66 1.02 1.82 0.72 1.54
Reheated 9 1.17 0.78 1.02 0.39 1.57
Dinner Fresh 145 1.60 1.22 1.99 0.78 1.90
Partially cooked 69 1.27 0.86 1.59 0.64 1.32
Reheated 7 0.96 0.36 1.37 0.29 0.84
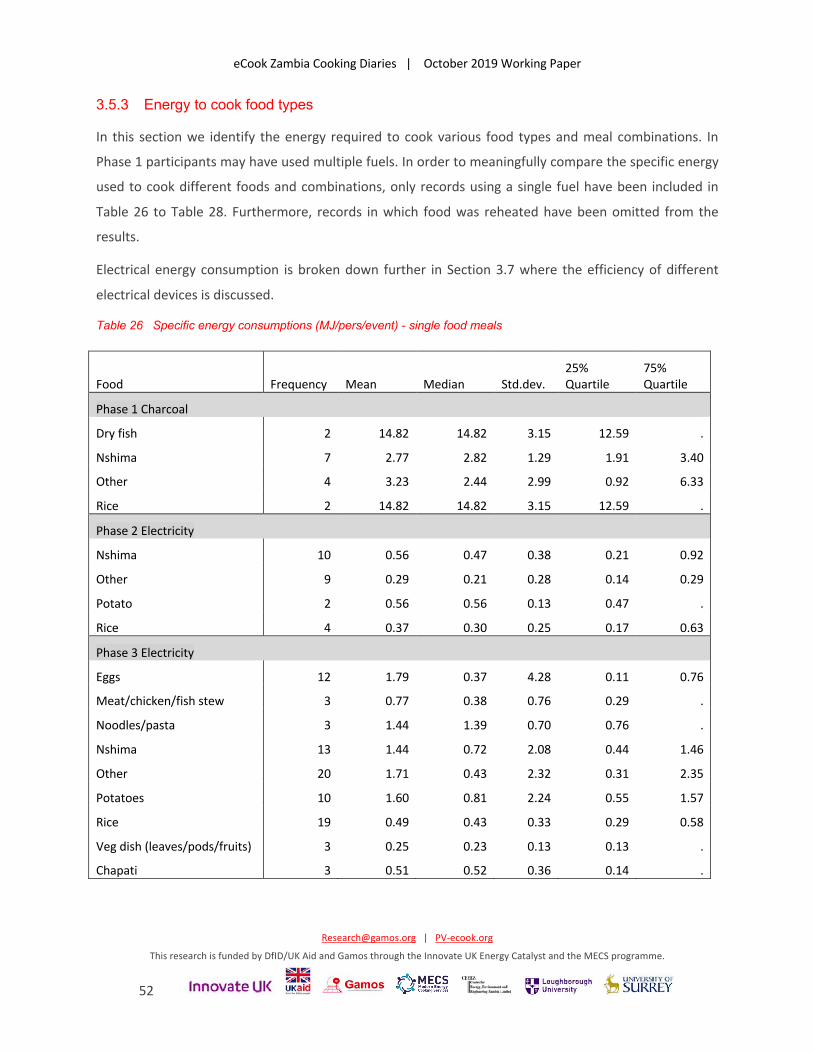
eCook Zambia Cooking Diaries | October 2019 Working Paper
[email protected] | PV-ecook.org
This research is funded by DfID/UK Aid and Gamos through the Innovate UK Energy Catalyst and the MECS programme.
52
3.5.3 Energy to cook food types
In this section we identify the energy required to cook various food types and meal combinations. In
Phase 1 participants may have used multiple fuels. In order to meaningfully compare the specific energy
used to cook different foods and combinations, only records using a single fuel have been included in
Table 26 to Table 28. Furthermore, records in which food was reheated have been omitted from the
results.
Electrical energy consumption is broken down further in Section 3.7 where the efficiency of different
electrical devices is discussed.
Table 26 Specific energy consumptions (MJ/pers/event) - single food meals
Food Frequency Mean Median Std.dev. 25% Quartile
75% Quartile
Phase 1 Charcoal
Dry fish 2 14.82 14.82 3.15 12.59 .
Nshima 7 2.77 2.82 1.29 1.91 3.40
Other 4 3.23 2.44 2.99 0.92 6.33
Rice 2 14.82 14.82 3.15 12.59 .
Phase 2 Electricity
Nshima 10 0.56 0.47 0.38 0.21 0.92
Other 9 0.29 0.21 0.28 0.14 0.29
Potato 2 0.56 0.56 0.13 0.47 .
Rice 4 0.37 0.30 0.25 0.17 0.63
Phase 3 Electricity
Eggs 12 1.79 0.37 4.28 0.11 0.76
Meat/chicken/fish stew 3 0.77 0.38 0.76 0.29 .
Noodles/pasta 3 1.44 1.39 0.70 0.76 .
Nshima 13 1.44 0.72 2.08 0.44 1.46
Other 20 1.71 0.43 2.32 0.31 2.35
Potatoes 10 1.60 0.81 2.24 0.55 1.57
Rice 19 0.49 0.43 0.33 0.29 0.58
Veg dish (leaves/pods/fruits) 3 0.25 0.23 0.13 0.13 .
Chapati 3 0.51 0.52 0.36 0.14 .
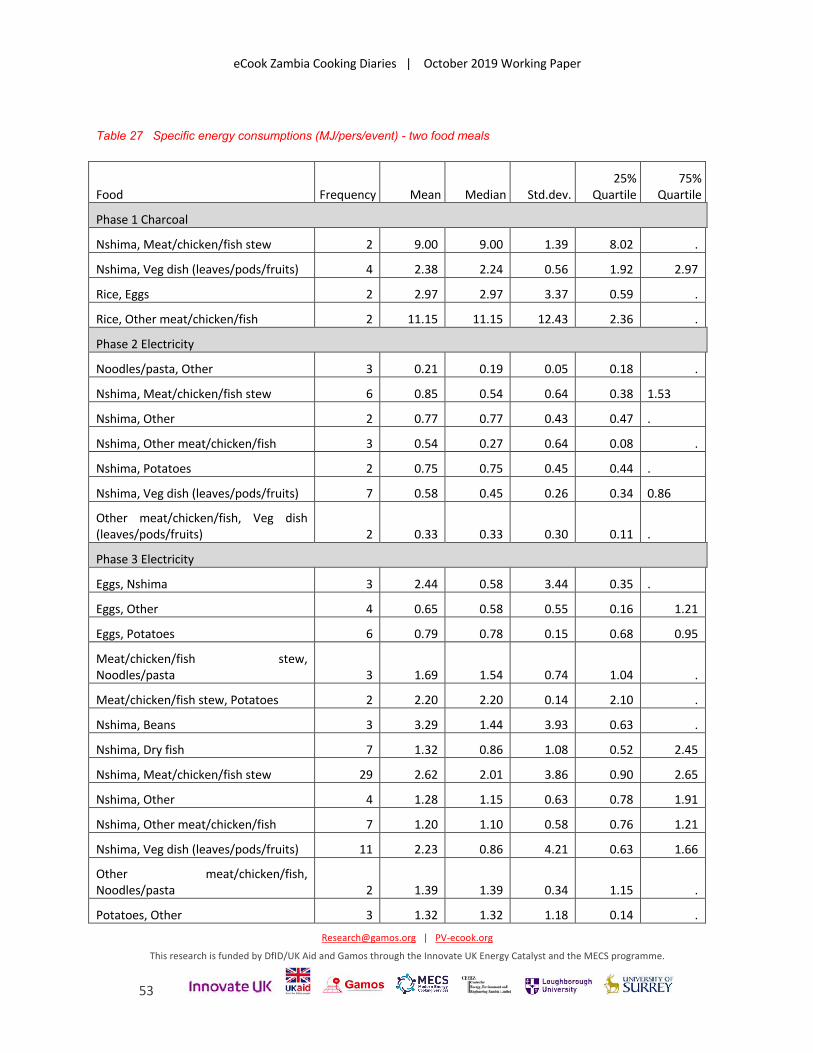
eCook Zambia Cooking Diaries | October 2019 Working Paper
[email protected] | PV-ecook.org
This research is funded by DfID/UK Aid and Gamos through the Innovate UK Energy Catalyst and the MECS programme.
53
Table 27 Specific energy consumptions (MJ/pers/event) - two food meals
Food Frequency Mean Median Std.dev. 25%
Quartile 75%
Quartile
Phase 1 Charcoal
Nshima, Meat/chicken/fish stew 2 9.00 9.00 1.39 8.02 .
Nshima, Veg dish (leaves/pods/fruits) 4 2.38 2.24 0.56 1.92 2.97
Rice, Eggs 2 2.97 2.97 3.37 0.59 .
Rice, Other meat/chicken/fish 2 11.15 11.15 12.43 2.36 .
Phase 2 Electricity
Noodles/pasta, Other 3 0.21 0.19 0.05 0.18 .
Nshima, Meat/chicken/fish stew 6 0.85 0.54 0.64 0.38 1.53
Nshima, Other 2 0.77 0.77 0.43 0.47 .
Nshima, Other meat/chicken/fish 3 0.54 0.27 0.64 0.08 .
Nshima, Potatoes 2 0.75 0.75 0.45 0.44 .
Nshima, Veg dish (leaves/pods/fruits) 7 0.58 0.45 0.26 0.34 0.86
Other meat/chicken/fish, Veg dish (leaves/pods/fruits) 2 0.33 0.33 0.30 0.11 .
Phase 3 Electricity
Eggs, Nshima 3 2.44 0.58 3.44 0.35 .
Eggs, Other 4 0.65 0.58 0.55 0.16 1.21
Eggs, Potatoes 6 0.79 0.78 0.15 0.68 0.95
Meat/chicken/fish stew, Noodles/pasta 3 1.69 1.54 0.74 1.04 .
Meat/chicken/fish stew, Potatoes 2 2.20 2.20 0.14 2.10 .
Nshima, Beans 3 3.29 1.44 3.93 0.63 .
Nshima, Dry fish 7 1.32 0.86 1.08 0.52 2.45
Nshima, Meat/chicken/fish stew 29 2.62 2.01 3.86 0.90 2.65
Nshima, Other 4 1.28 1.15 0.63 0.78 1.91
Nshima, Other meat/chicken/fish 7 1.20 1.10 0.58 0.76 1.21
Nshima, Veg dish (leaves/pods/fruits) 11 2.23 0.86 4.21 0.63 1.66
Other meat/chicken/fish, Noodles/pasta 2 1.39 1.39 0.34 1.15 .
Potatoes, Other 3 1.32 1.32 1.18 0.14 .
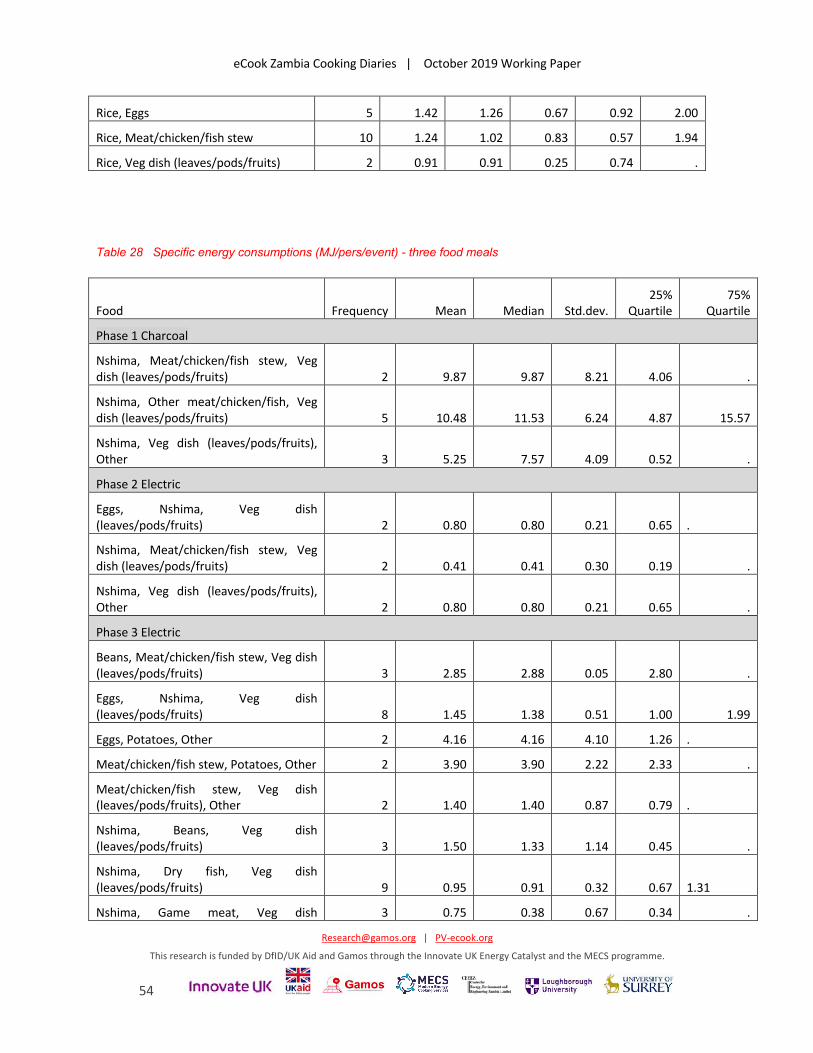
eCook Zambia Cooking Diaries | October 2019 Working Paper
[email protected] | PV-ecook.org
This research is funded by DfID/UK Aid and Gamos through the Innovate UK Energy Catalyst and the MECS programme.
54
Rice, Eggs 5 1.42 1.26 0.67 0.92 2.00
Rice, Meat/chicken/fish stew 10 1.24 1.02 0.83 0.57 1.94
Rice, Veg dish (leaves/pods/fruits) 2 0.91 0.91 0.25 0.74 .
Table 28 Specific energy consumptions (MJ/pers/event) - three food meals
Food Frequency Mean Median Std.dev. 25%
Quartile 75%
Quartile
Phase 1 Charcoal
Nshima, Meat/chicken/fish stew, Veg dish (leaves/pods/fruits) 2 9.87 9.87 8.21 4.06 .
Nshima, Other meat/chicken/fish, Veg dish (leaves/pods/fruits) 5 10.48 11.53 6.24 4.87 15.57
Nshima, Veg dish (leaves/pods/fruits), Other 3 5.25 7.57 4.09 0.52 .
Phase 2 Electric
Eggs, Nshima, Veg dish (leaves/pods/fruits) 2 0.80 0.80 0.21 0.65 .
Nshima, Meat/chicken/fish stew, Veg dish (leaves/pods/fruits) 2 0.41 0.41 0.30 0.19 .
Nshima, Veg dish (leaves/pods/fruits), Other 2 0.80 0.80 0.21 0.65 .
Phase 3 Electric
Beans, Meat/chicken/fish stew, Veg dish (leaves/pods/fruits) 3 2.85 2.88 0.05 2.80 .
Eggs, Nshima, Veg dish (leaves/pods/fruits) 8 1.45 1.38 0.51 1.00 1.99
Eggs, Potatoes, Other 2 4.16 4.16 4.10 1.26 .
Meat/chicken/fish stew, Potatoes, Other 2 3.90 3.90 2.22 2.33 .
Meat/chicken/fish stew, Veg dish (leaves/pods/fruits), Other 2 1.40 1.40 0.87 0.79 .
Nshima, Beans, Veg dish (leaves/pods/fruits) 3 1.50 1.33 1.14 0.45 .
Nshima, Dry fish, Veg dish (leaves/pods/fruits) 9 0.95 0.91 0.32 0.67 1.31
Nshima, Game meat, Veg dish 3 0.75 0.38 0.67 0.34 .
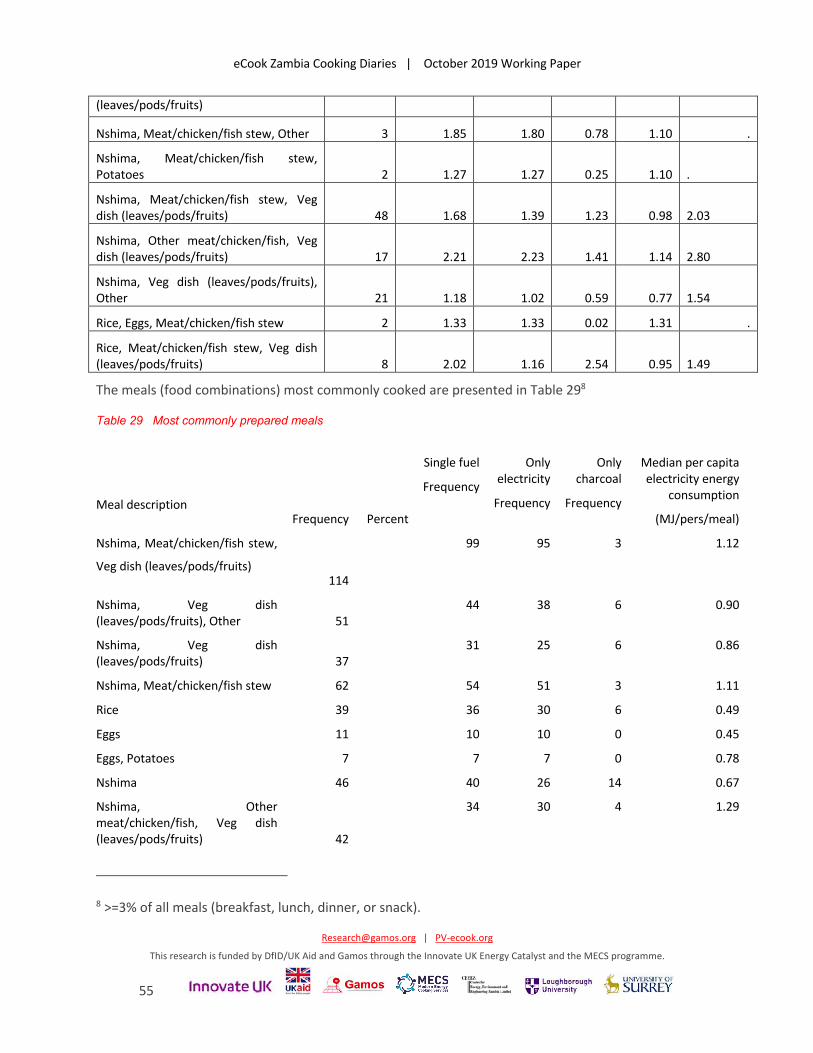
eCook Zambia Cooking Diaries | October 2019 Working Paper
[email protected] | PV-ecook.org
This research is funded by DfID/UK Aid and Gamos through the Innovate UK Energy Catalyst and the MECS programme.
55
(leaves/pods/fruits)
Nshima, Meat/chicken/fish stew, Other 3 1.85 1.80 0.78 1.10 .
Nshima, Meat/chicken/fish stew, Potatoes 2 1.27 1.27 0.25 1.10 .
Nshima, Meat/chicken/fish stew, Veg dish (leaves/pods/fruits) 48 1.68 1.39 1.23 0.98 2.03
Nshima, Other meat/chicken/fish, Veg dish (leaves/pods/fruits) 17 2.21 2.23 1.41 1.14 2.80
Nshima, Veg dish (leaves/pods/fruits), Other 21 1.18 1.02 0.59 0.77 1.54
Rice, Eggs, Meat/chicken/fish stew 2 1.33 1.33 0.02 1.31 .
Rice, Meat/chicken/fish stew, Veg dish (leaves/pods/fruits) 8 2.02 1.16 2.54 0.95 1.49
The meals (food combinations) most commonly cooked are presented in Table 298
Table 29 Most commonly prepared meals
Meal description Frequency Percent
Single fuel
Frequency
Only electricity
Frequency
Only charcoal
Frequency
Median per capita electricity energy
consumption
(MJ/pers/meal)
Nshima, Meat/chicken/fish stew,
Veg dish (leaves/pods/fruits) 114
99 95 3 1.12
Nshima, Veg dish (leaves/pods/fruits), Other 51
44 38 6 0.90
Nshima, Veg dish (leaves/pods/fruits) 37
31 25 6 0.86
Nshima, Meat/chicken/fish stew 62 54 51 3 1.11
Rice 39 36 30 6 0.49
Eggs 11 10 10 0 0.45
Eggs, Potatoes 7 7 7 0 0.78
Nshima 46 40 26 14 0.67
Nshima, Other meat/chicken/fish, Veg dish (leaves/pods/fruits) 42
34 30 4 1.29
8 >=3% of all meals (breakfast, lunch, dinner, or snack).
eCook Zambia Cooking Diaries | October 2019 Working Paper
[email protected] | PV-ecook.org
This research is funded by DfID/UK Aid and Gamos through the Innovate UK Energy Catalyst and the MECS programme.
56
3.6 Cooking devices 3.6.1 Detail on how participants cook
Participants were asked to record the following information on how they cooked:
• Cooking device used i.e. what type of stove. • Type of cooking pot / utensil. • How they used the lid. • Cooking process used e.g. fry, boil, bake etc.
The cooking appliances used to cook individual foods are presented in Table 30. Note that any single
record (or meal) can contain information on up to four foods, so the table includes each separate food–
appliance combination. This shows that 14% of foods were cooked with electricity in Phase 1. Table 31
shows that boiling is by far the most commonly used cooking process. Changing to cooking with
electricity in Phase 2 does not appear to have caused participants to change the mix of cooking
processes used. Note that pressure cookers were introduced as part of the study but were not widely
used. Table 32 shows little change in the utensils used to cook foods. Participants were less likely to use
lids only some of the time when cooking electricity only (see Table 33), which is a somewhat
inconclusive finding.
Although participants who used electricity for cooking (Phase 3) had access to a range of electric
appliances, the majority of dishes (83%) were cooked using conventional hobs (see Table 30). The most
commonly used additional appliance was a microwave, which can also be seen in Table 31. Food was
only really cooked in bowls / plates by those using electricity (Phase 3), and was linked to the use of
microwaves. Participants who were more experienced with cooking with electricity (Phase 3) were more
likely to use lids all of the time (than Phase 2 participants), which is assumed to reflect a greater
confidence that food will not burn.
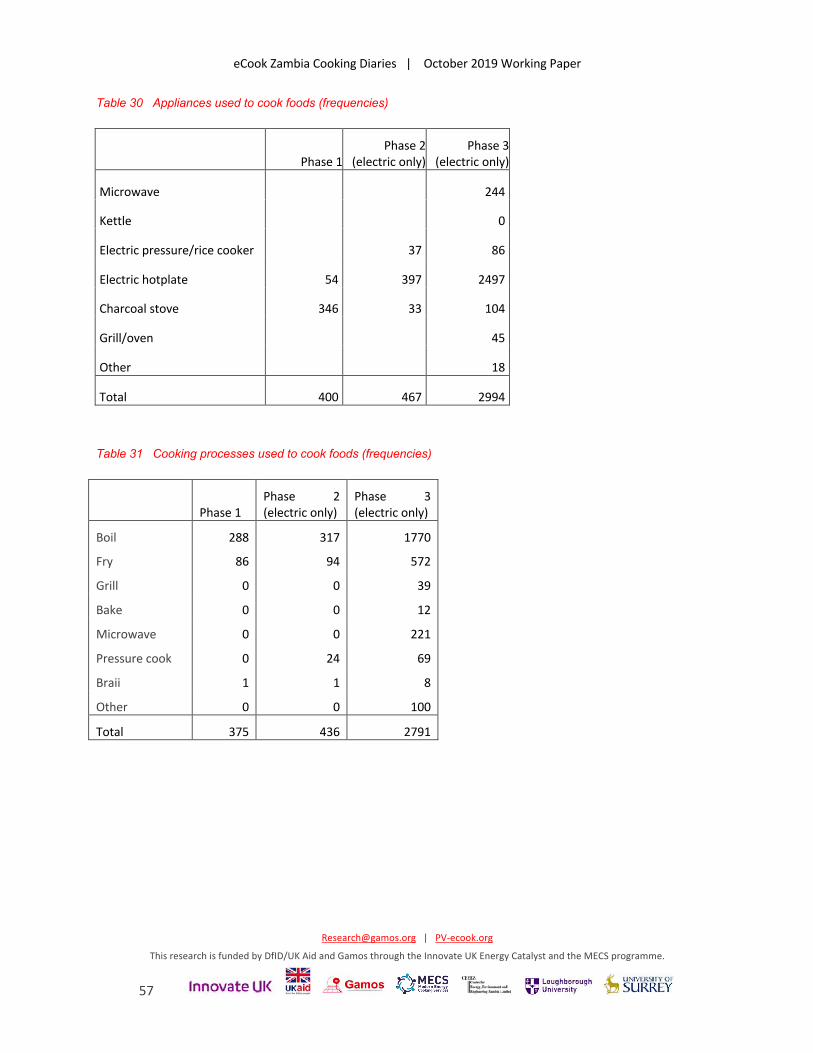
eCook Zambia Cooking Diaries | October 2019 Working Paper
[email protected] | PV-ecook.org
This research is funded by DfID/UK Aid and Gamos through the Innovate UK Energy Catalyst and the MECS programme.
57
Table 30 Appliances used to cook foods (frequencies)
Phase 1
Phase 2 (electric only)
Phase 3 (electric only)
Microwave 244
Kettle 0
Electric pressure/rice cooker 37 86
Electric hotplate 54 397 2497
Charcoal stove 346 33 104
Grill/oven 45
Other 18
Total 400 467 2994
Table 31 Cooking processes used to cook foods (frequencies)
Phase 1 Phase 2 (electric only)
Phase 3 (electric only)
Boil 288 317 1770
Fry 86 94 572
Grill 0 0 39
Bake 0 0 12
Microwave 0 0 221
Pressure cook 0 24 69
Braii 1 1 8
Other 0 0 100
Total 375 436 2791
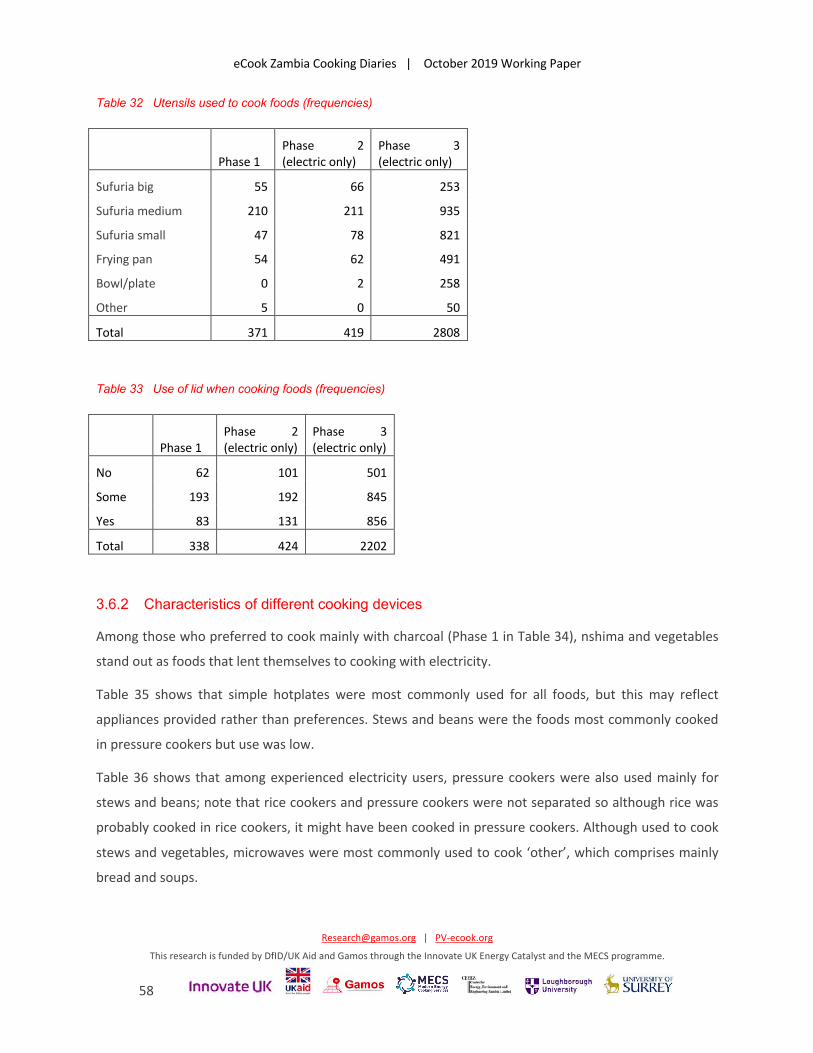
eCook Zambia Cooking Diaries | October 2019 Working Paper
[email protected] | PV-ecook.org
This research is funded by DfID/UK Aid and Gamos through the Innovate UK Energy Catalyst and the MECS programme.
58
Table 32 Utensils used to cook foods (frequencies)
Phase 1 Phase 2 (electric only)
Phase 3 (electric only)
Sufuria big 55 66 253
Sufuria medium 210 211 935
Sufuria small 47 78 821
Frying pan 54 62 491
Bowl/plate 0 2 258
Other 5 0 50
Total 371 419 2808
Table 33 Use of lid when cooking foods (frequencies)
Phase 1 Phase 2 (electric only)
Phase 3 (electric only)
No 62 101 501
Some 193 192 845
Yes 83 131 856
Total 338 424 2202
3.6.2 Characteristics of different cooking devices
Among those who preferred to cook mainly with charcoal (Phase 1 in Table 34), nshima and vegetables
stand out as foods that lent themselves to cooking with electricity.
Table 35 shows that simple hotplates were most commonly used for all foods, but this may reflect
appliances provided rather than preferences. Stews and beans were the foods most commonly cooked
in pressure cookers but use was low.
Table 36 shows that among experienced electricity users, pressure cookers were also used mainly for
stews and beans; note that rice cookers and pressure cookers were not separated so although rice was
probably cooked in rice cookers, it might have been cooked in pressure cookers. Although used to cook
stews and vegetables, microwaves were most commonly used to cook ‘other’, which comprises mainly
bread and soups.
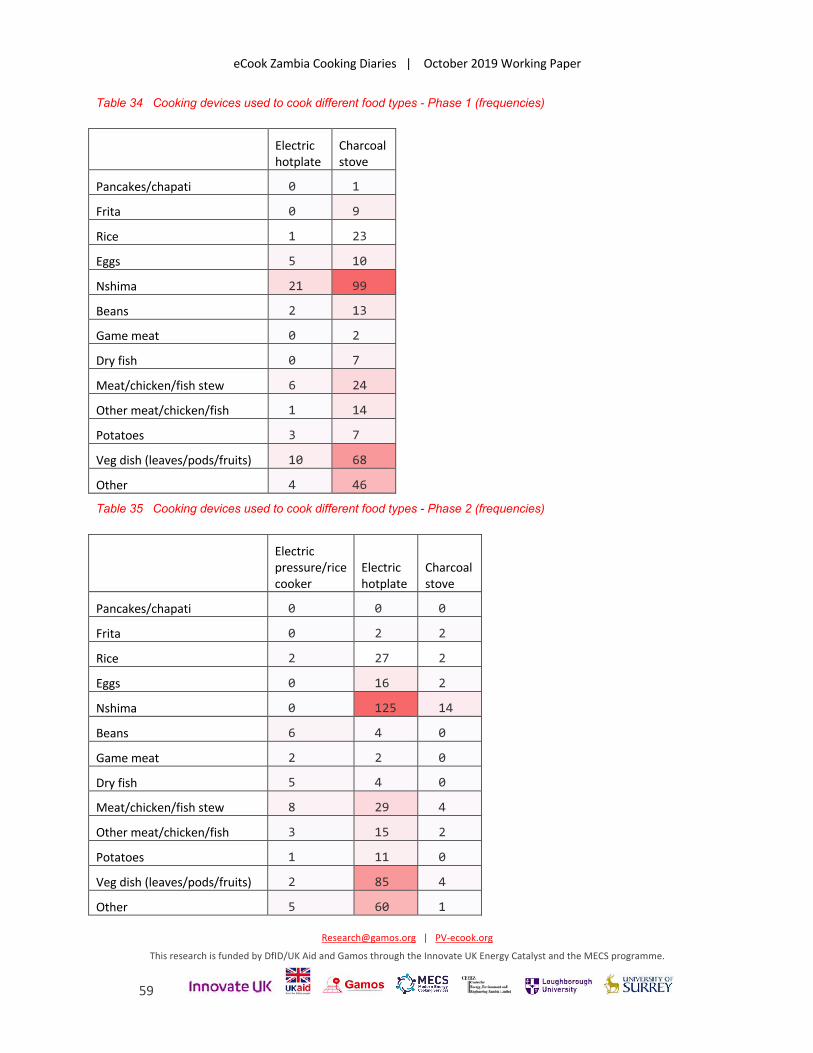
eCook Zambia Cooking Diaries | October 2019 Working Paper
[email protected] | PV-ecook.org
This research is funded by DfID/UK Aid and Gamos through the Innovate UK Energy Catalyst and the MECS programme.
59
Table 34 Cooking devices used to cook different food types - Phase 1 (frequencies)
Electric hotplate
Charcoal stove
Pancakes/chapati 0 1
Frita 0 9
Rice 1 23
Eggs 5 10
Nshima 21 99
Beans 2 13
Game meat 0 2
Dry fish 0 7
Meat/chicken/fish stew 6 24
Other meat/chicken/fish 1 14
Potatoes 3 7
Veg dish (leaves/pods/fruits) 10 68
Other 4 46
Table 35 Cooking devices used to cook different food types - Phase 2 (frequencies)
Electric pressure/rice cooker
Electric hotplate
Charcoal stove
Pancakes/chapati 0 0 0
Frita 0 2 2
Rice 2 27 2
Eggs 0 16 2
Nshima 0 125 14
Beans 6 4 0
Game meat 2 2 0
Dry fish 5 4 0
Meat/chicken/fish stew 8 29 4
Other meat/chicken/fish 3 15 2
Potatoes 1 11 0
Veg dish (leaves/pods/fruits) 2 85 4
Other 5 60 1
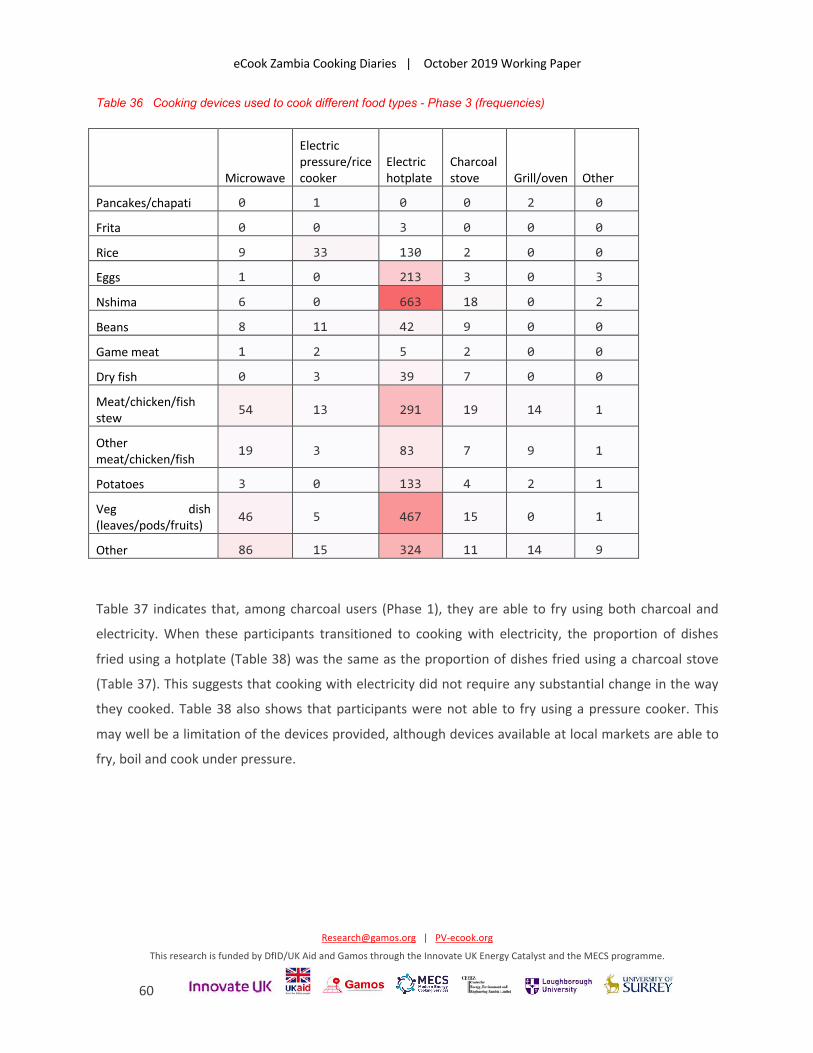
eCook Zambia Cooking Diaries | October 2019 Working Paper
[email protected] | PV-ecook.org
This research is funded by DfID/UK Aid and Gamos through the Innovate UK Energy Catalyst and the MECS programme.
60
Table 36 Cooking devices used to cook different food types - Phase 3 (frequencies)
Microwave
Electric pressure/rice cooker
Electric hotplate
Charcoal stove Grill/oven Other
Pancakes/chapati 0 1 0 0 2 0
Frita 0 0 3 0 0 0
Rice 9 33 130 2 0 0
Eggs 1 0 213 3 0 3
Nshima 6 0 663 18 0 2
Beans 8 11 42 9 0 0
Game meat 1 2 5 2 0 0
Dry fish 0 3 39 7 0 0
Meat/chicken/fish stew 54 13 291 19 14 1
Other meat/chicken/fish 19 3 83 7 9 1
Potatoes 3 0 133 4 2 1
Veg dish (leaves/pods/fruits) 46 5 467 15 0 1
Other 86 15 324 11 14 9
Table 37 indicates that, among charcoal users (Phase 1), they are able to fry using both charcoal and
electricity. When these participants transitioned to cooking with electricity, the proportion of dishes
fried using a hotplate (Table 38) was the same as the proportion of dishes fried using a charcoal stove
(Table 37). This suggests that cooking with electricity did not require any substantial change in the way
they cooked. Table 38 also shows that participants were not able to fry using a pressure cooker. This
may well be a limitation of the devices provided, although devices available at local markets are able to
fry, boil and cook under pressure.
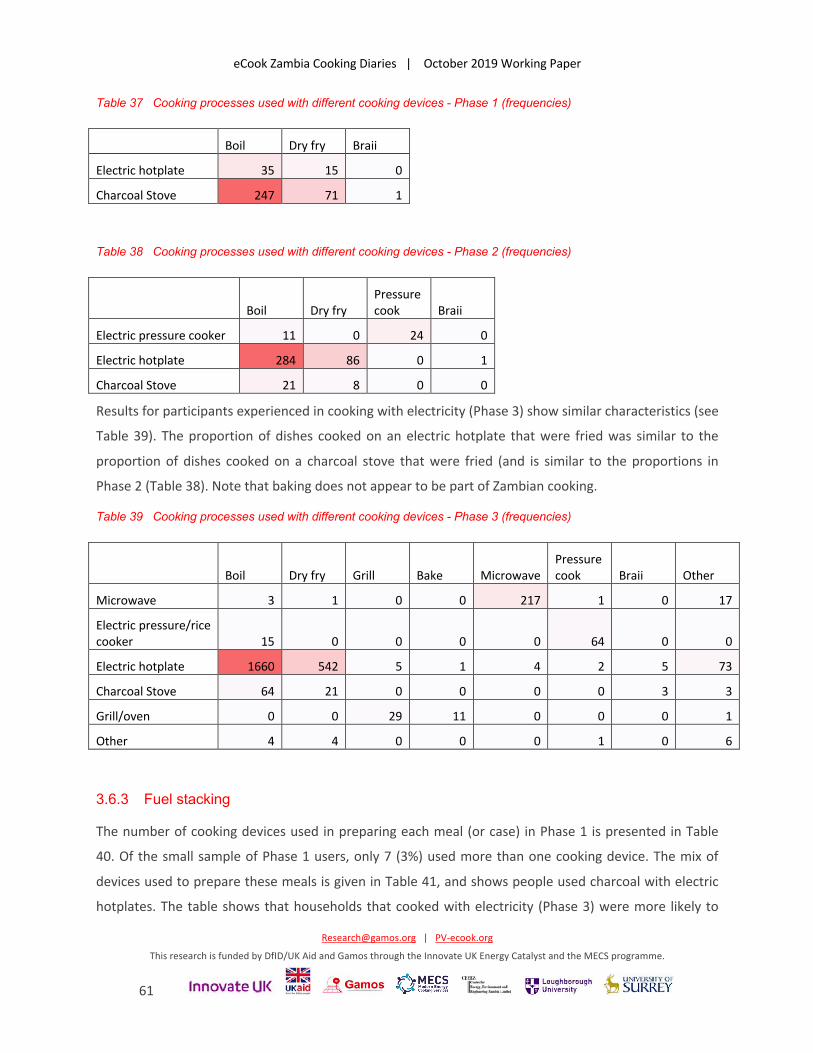
eCook Zambia Cooking Diaries | October 2019 Working Paper
[email protected] | PV-ecook.org
This research is funded by DfID/UK Aid and Gamos through the Innovate UK Energy Catalyst and the MECS programme.
61
Table 37 Cooking processes used with different cooking devices - Phase 1 (frequencies)
Boil Dry fry Braii
Electric hotplate 35 15 0
Charcoal Stove 247 71 1
Table 38 Cooking processes used with different cooking devices - Phase 2 (frequencies)
Boil Dry fry Pressure cook Braii
Electric pressure cooker 11 0 24 0
Electric hotplate 284 86 0 1
Charcoal Stove 21 8 0 0
Results for participants experienced in cooking with electricity (Phase 3) show similar characteristics (see
Table 39). The proportion of dishes cooked on an electric hotplate that were fried was similar to the
proportion of dishes cooked on a charcoal stove that were fried (and is similar to the proportions in
Phase 2 (Table 38). Note that baking does not appear to be part of Zambian cooking.
Table 39 Cooking processes used with different cooking devices - Phase 3 (frequencies)
Boil Dry fry Grill Bake Microwave Pressure cook Braii Other
Microwave 3 1 0 0 217 1 0 17
Electric pressure/rice cooker 15 0 0 0 0 64 0 0
Electric hotplate 1660 542 5 1 4 2 5 73
Charcoal Stove 64 21 0 0 0 0 3 3
Grill/oven 0 0 29 11 0 0 0 1
Other 4 4 0 0 0 1 0 6
3.6.3 Fuel stacking
The number of cooking devices used in preparing each meal (or case) in Phase 1 is presented in Table
40. Of the small sample of Phase 1 users, only 7 (3%) used more than one cooking device. The mix of
devices used to prepare these meals is given in Table 41, and shows people used charcoal with electric
hotplates. The table shows that households that cooked with electricity (Phase 3) were more likely to
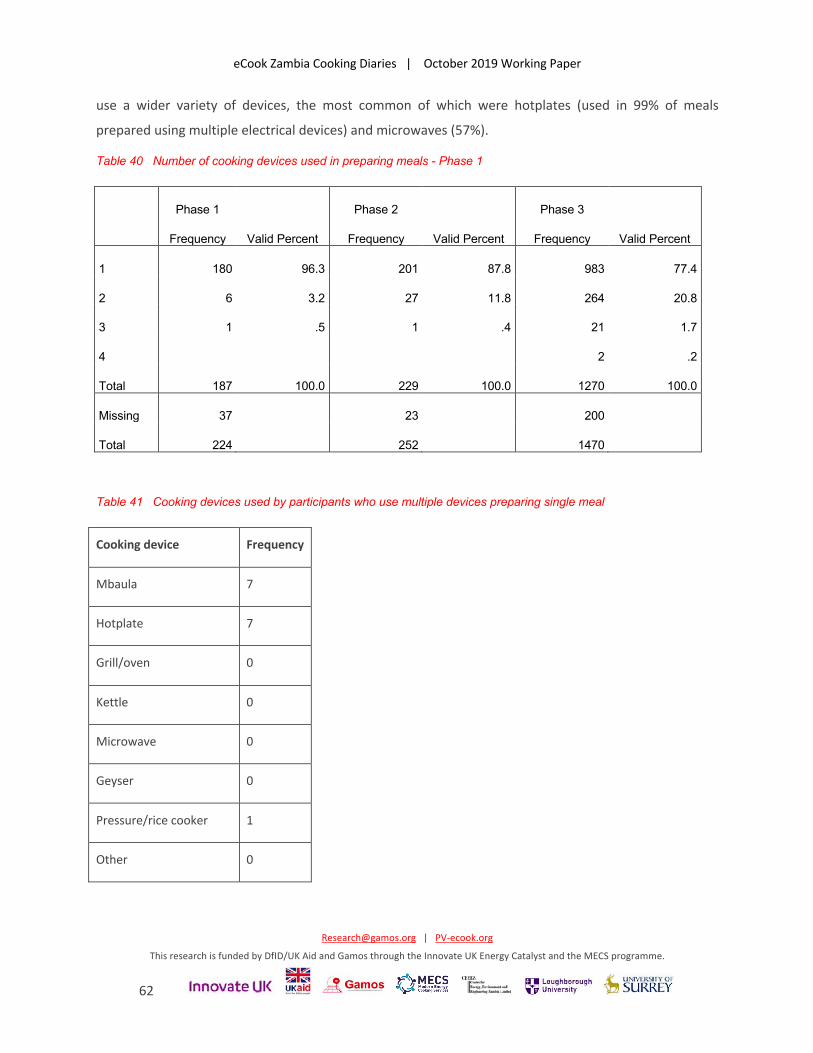
eCook Zambia Cooking Diaries | October 2019 Working Paper
[email protected] | PV-ecook.org
This research is funded by DfID/UK Aid and Gamos through the Innovate UK Energy Catalyst and the MECS programme.
62
use a wider variety of devices, the most common of which were hotplates (used in 99% of meals
prepared using multiple electrical devices) and microwaves (57%).
Table 40 Number of cooking devices used in preparing meals - Phase 1
Phase 1 Phase 2 Phase 3
Frequency Valid Percent Frequency Valid Percent Frequency Valid Percent
1 180 96.3 201 87.8 983 77.4
2 6 3.2 27 11.8 264 20.8
3 1 .5 1 .4 21 1.7
4 2 .2
Total 187 100.0 229 100.0 1270 100.0
Missing 37 23 200
Total 224 252 1470
Table 41 Cooking devices used by participants who use multiple devices preparing single meal
Cooking device Frequency
Mbaula 7
Hotplate 7
Grill/oven 0
Kettle 0
Microwave 0
Geyser 0
Pressure/rice cooker 1
Other 0
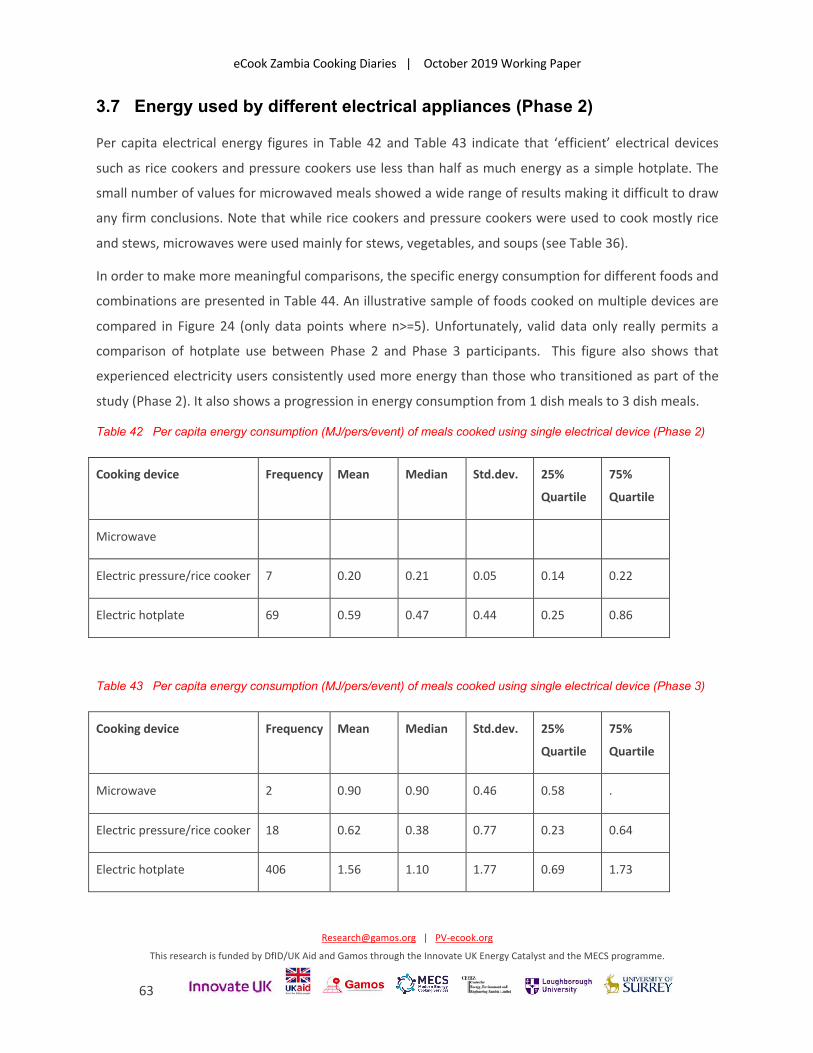
eCook Zambia Cooking Diaries | October 2019 Working Paper
[email protected] | PV-ecook.org
This research is funded by DfID/UK Aid and Gamos through the Innovate UK Energy Catalyst and the MECS programme.
63
3.7 Energy used by different electrical appliances (Phase 2)
Per capita electrical energy figures in Table 42 and Table 43 indicate that ‘efficient’ electrical devices
such as rice cookers and pressure cookers use less than half as much energy as a simple hotplate. The
small number of values for microwaved meals showed a wide range of results making it difficult to draw
any firm conclusions. Note that while rice cookers and pressure cookers were used to cook mostly rice
and stews, microwaves were used mainly for stews, vegetables, and soups (see Table 36).
In order to make more meaningful comparisons, the specific energy consumption for different foods and
combinations are presented in Table 44. An illustrative sample of foods cooked on multiple devices are
compared in Figure 24 (only data points where n>=5). Unfortunately, valid data only really permits a
comparison of hotplate use between Phase 2 and Phase 3 participants. This figure also shows that
experienced electricity users consistently used more energy than those who transitioned as part of the
study (Phase 2). It also shows a progression in energy consumption from 1 dish meals to 3 dish meals.
Table 42 Per capita energy consumption (MJ/pers/event) of meals cooked using single electrical device (Phase 2)
Cooking device Frequency Mean Median Std.dev. 25%
Quartile
75%
Quartile
Microwave
Electric pressure/rice cooker 7 0.20 0.21 0.05 0.14 0.22
Electric hotplate 69 0.59 0.47 0.44 0.25 0.86
Table 43 Per capita energy consumption (MJ/pers/event) of meals cooked using single electrical device (Phase 3)
Cooking device Frequency Mean Median Std.dev. 25%
Quartile
75%
Quartile
Microwave 2 0.90 0.90 0.46 0.58 .
Electric pressure/rice cooker 18 0.62 0.38 0.77 0.23 0.64
Electric hotplate 406 1.56 1.10 1.77 0.69 1.73
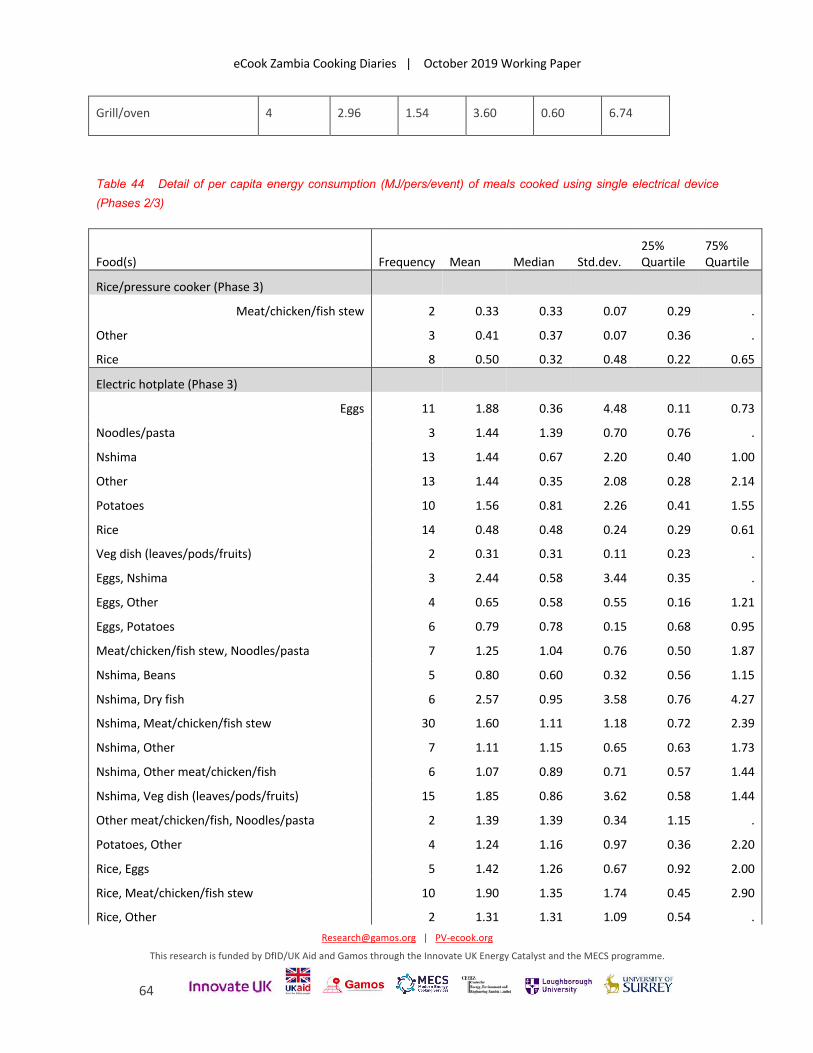
eCook Zambia Cooking Diaries | October 2019 Working Paper
[email protected] | PV-ecook.org
This research is funded by DfID/UK Aid and Gamos through the Innovate UK Energy Catalyst and the MECS programme.
64
Grill/oven 4 2.96 1.54 3.60 0.60 6.74
Table 44 Detail of per capita energy consumption (MJ/pers/event) of meals cooked using single electrical device
(Phases 2/3)
Food(s) Frequency Mean Median Std.dev. 25% Quartile
75% Quartile
Rice/pressure cooker (Phase 3)
Meat/chicken/fish stew 2 0.33 0.33 0.07 0.29 .
Other 3 0.41 0.37 0.07 0.36 .
Rice 8 0.50 0.32 0.48 0.22 0.65
Electric hotplate (Phase 3) Eggs 11 1.88 0.36 4.48 0.11 0.73
Noodles/pasta 3 1.44 1.39 0.70 0.76 .
Nshima 13 1.44 0.67 2.20 0.40 1.00
Other 13 1.44 0.35 2.08 0.28 2.14
Potatoes 10 1.56 0.81 2.26 0.41 1.55
Rice 14 0.48 0.48 0.24 0.29 0.61
Veg dish (leaves/pods/fruits) 2 0.31 0.31 0.11 0.23 .
Eggs, Nshima 3 2.44 0.58 3.44 0.35 .
Eggs, Other 4 0.65 0.58 0.55 0.16 1.21
Eggs, Potatoes 6 0.79 0.78 0.15 0.68 0.95
Meat/chicken/fish stew, Noodles/pasta 7 1.25 1.04 0.76 0.50 1.87
Nshima, Beans 5 0.80 0.60 0.32 0.56 1.15
Nshima, Dry fish 6 2.57 0.95 3.58 0.76 4.27
Nshima, Meat/chicken/fish stew 30 1.60 1.11 1.18 0.72 2.39
Nshima, Other 7 1.11 1.15 0.65 0.63 1.73
Nshima, Other meat/chicken/fish 6 1.07 0.89 0.71 0.57 1.44
Nshima, Veg dish (leaves/pods/fruits) 15 1.85 0.86 3.62 0.58 1.44
Other meat/chicken/fish, Noodles/pasta 2 1.39 1.39 0.34 1.15 .
Potatoes, Other 4 1.24 1.16 0.97 0.36 2.20
Rice, Eggs 5 1.42 1.26 0.67 0.92 2.00
Rice, Meat/chicken/fish stew 10 1.90 1.35 1.74 0.45 2.90
Rice, Other 2 1.31 1.31 1.09 0.54 .
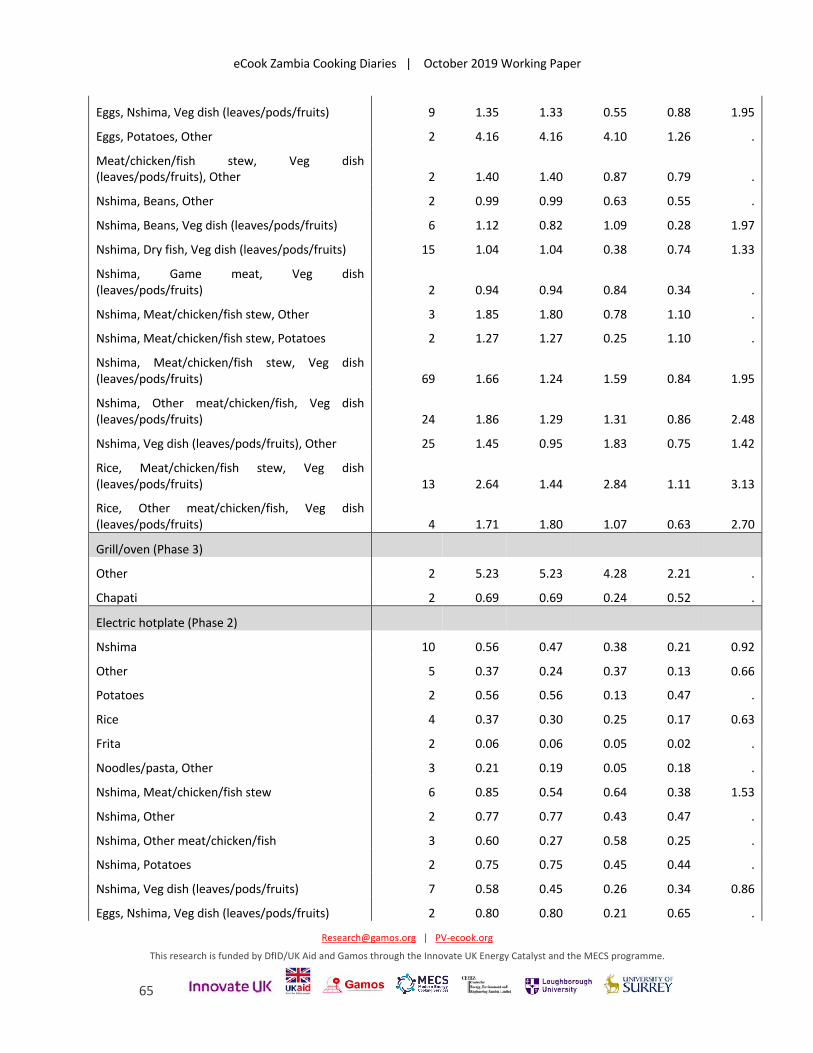
eCook Zambia Cooking Diaries | October 2019 Working Paper
[email protected] | PV-ecook.org
This research is funded by DfID/UK Aid and Gamos through the Innovate UK Energy Catalyst and the MECS programme.
65
Eggs, Nshima, Veg dish (leaves/pods/fruits) 9 1.35 1.33 0.55 0.88 1.95
Eggs, Potatoes, Other 2 4.16 4.16 4.10 1.26 .
Meat/chicken/fish stew, Veg dish (leaves/pods/fruits), Other 2 1.40 1.40 0.87 0.79 .
Nshima, Beans, Other 2 0.99 0.99 0.63 0.55 .
Nshima, Beans, Veg dish (leaves/pods/fruits) 6 1.12 0.82 1.09 0.28 1.97
Nshima, Dry fish, Veg dish (leaves/pods/fruits) 15 1.04 1.04 0.38 0.74 1.33
Nshima, Game meat, Veg dish (leaves/pods/fruits) 2 0.94 0.94 0.84 0.34 .
Nshima, Meat/chicken/fish stew, Other 3 1.85 1.80 0.78 1.10 .
Nshima, Meat/chicken/fish stew, Potatoes 2 1.27 1.27 0.25 1.10 .
Nshima, Meat/chicken/fish stew, Veg dish (leaves/pods/fruits) 69 1.66 1.24 1.59 0.84 1.95
Nshima, Other meat/chicken/fish, Veg dish (leaves/pods/fruits) 24 1.86 1.29 1.31 0.86 2.48
Nshima, Veg dish (leaves/pods/fruits), Other 25 1.45 0.95 1.83 0.75 1.42
Rice, Meat/chicken/fish stew, Veg dish (leaves/pods/fruits) 13 2.64 1.44 2.84 1.11 3.13
Rice, Other meat/chicken/fish, Veg dish (leaves/pods/fruits) 4 1.71 1.80 1.07 0.63 2.70
Grill/oven (Phase 3) Other 2 5.23 5.23 4.28 2.21 .
Chapati 2 0.69 0.69 0.24 0.52 .
Electric hotplate (Phase 2) Nshima 10 0.56 0.47 0.38 0.21 0.92
Other 5 0.37 0.24 0.37 0.13 0.66
Potatoes 2 0.56 0.56 0.13 0.47 .
Rice 4 0.37 0.30 0.25 0.17 0.63
Frita 2 0.06 0.06 0.05 0.02 .
Noodles/pasta, Other 3 0.21 0.19 0.05 0.18 .
Nshima, Meat/chicken/fish stew 6 0.85 0.54 0.64 0.38 1.53
Nshima, Other 2 0.77 0.77 0.43 0.47 .
Nshima, Other meat/chicken/fish 3 0.60 0.27 0.58 0.25 .
Nshima, Potatoes 2 0.75 0.75 0.45 0.44 .
Nshima, Veg dish (leaves/pods/fruits) 7 0.58 0.45 0.26 0.34 0.86
Eggs, Nshima, Veg dish (leaves/pods/fruits) 2 0.80 0.80 0.21 0.65 .
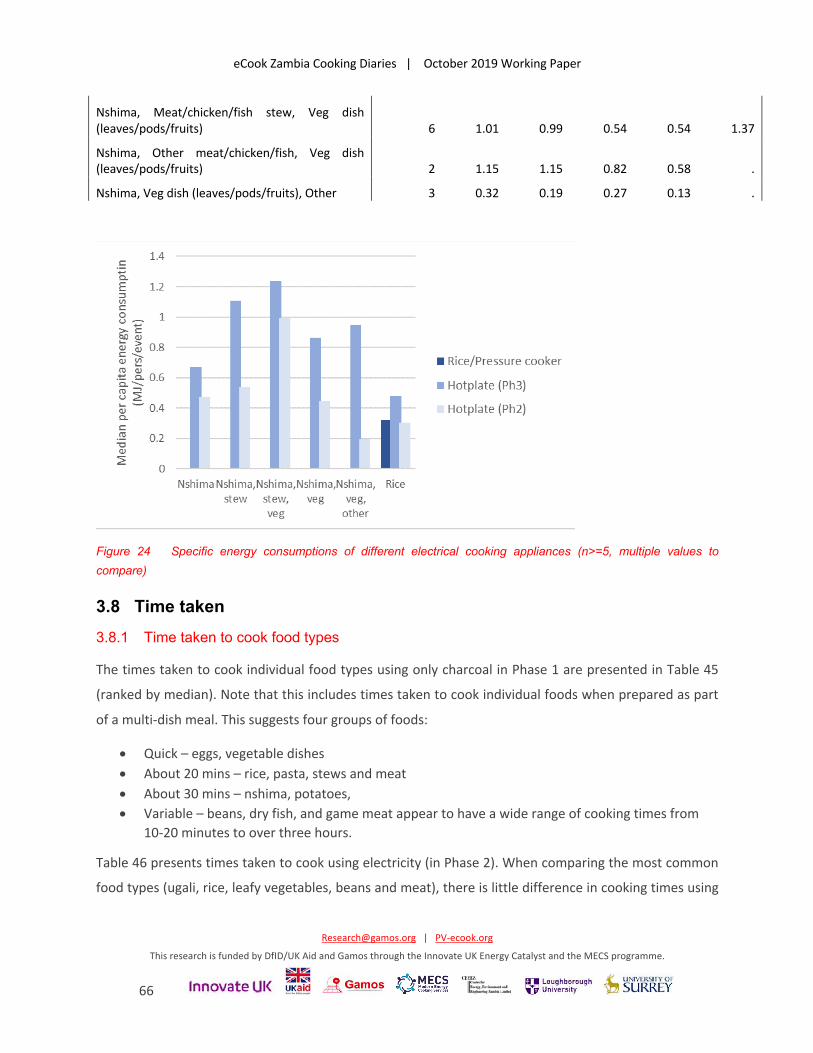
eCook Zambia Cooking Diaries | October 2019 Working Paper
[email protected] | PV-ecook.org
This research is funded by DfID/UK Aid and Gamos through the Innovate UK Energy Catalyst and the MECS programme.
66
Nshima, Meat/chicken/fish stew, Veg dish (leaves/pods/fruits) 6 1.01 0.99 0.54 0.54 1.37
Nshima, Other meat/chicken/fish, Veg dish (leaves/pods/fruits) 2 1.15 1.15 0.82 0.58 .
Nshima, Veg dish (leaves/pods/fruits), Other 3 0.32 0.19 0.27 0.13 .
Figure 24 Specific energy consumptions of different electrical cooking appliances (n>=5, multiple values to
compare)
3.8 Time taken 3.8.1 Time taken to cook food types
The times taken to cook individual food types using only charcoal in Phase 1 are presented in Table 45
(ranked by median). Note that this includes times taken to cook individual foods when prepared as part
of a multi-dish meal. This suggests four groups of foods:
• Quick – eggs, vegetable dishes • About 20 mins – rice, pasta, stews and meat • About 30 mins – nshima, potatoes, • Variable – beans, dry fish, and game meat appear to have a wide range of cooking times from
10-20 minutes to over three hours.
Table 46 presents times taken to cook using electricity (in Phase 2). When comparing the most common
food types (ugali, rice, leafy vegetables, beans and meat), there is little difference in cooking times using
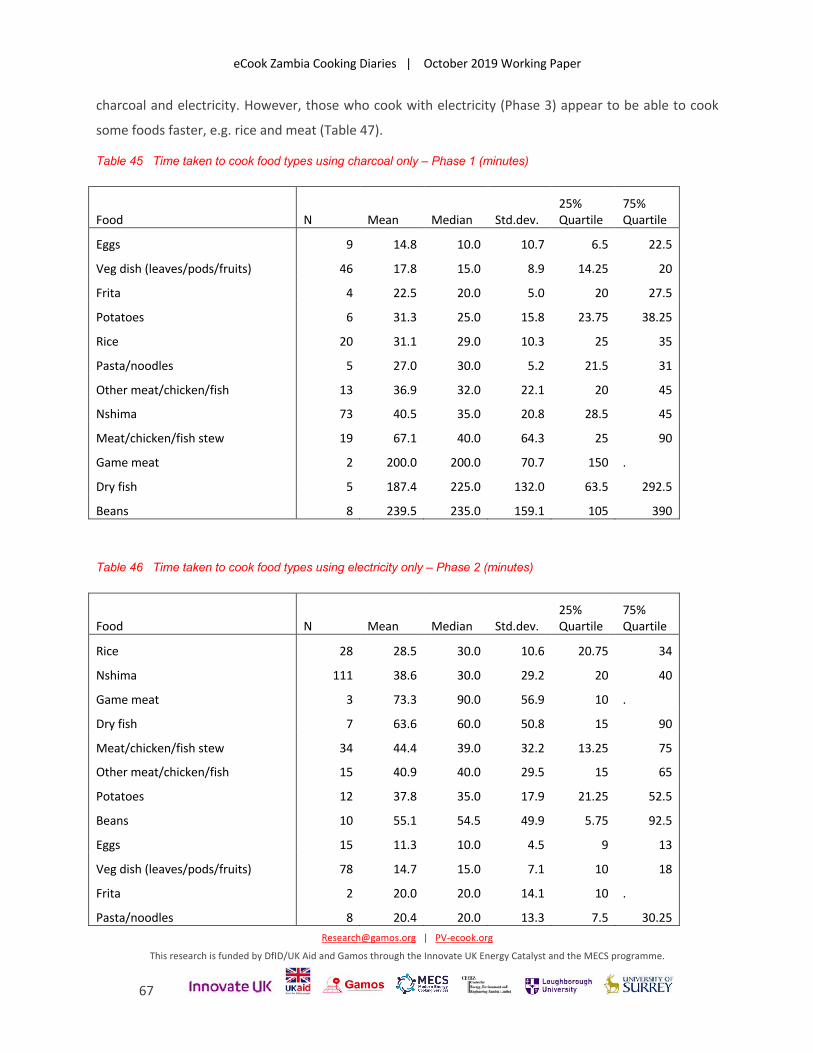
eCook Zambia Cooking Diaries | October 2019 Working Paper
[email protected] | PV-ecook.org
This research is funded by DfID/UK Aid and Gamos through the Innovate UK Energy Catalyst and the MECS programme.
67
charcoal and electricity. However, those who cook with electricity (Phase 3) appear to be able to cook
some foods faster, e.g. rice and meat (Table 47).
Table 45 Time taken to cook food types using charcoal only – Phase 1 (minutes)
Food N Mean Median Std.dev. 25% Quartile
75% Quartile
Eggs 9 14.8 10.0 10.7 6.5 22.5
Veg dish (leaves/pods/fruits) 46 17.8 15.0 8.9 14.25 20
Frita 4 22.5 20.0 5.0 20 27.5
Potatoes 6 31.3 25.0 15.8 23.75 38.25
Rice 20 31.1 29.0 10.3 25 35
Pasta/noodles 5 27.0 30.0 5.2 21.5 31
Other meat/chicken/fish 13 36.9 32.0 22.1 20 45
Nshima 73 40.5 35.0 20.8 28.5 45
Meat/chicken/fish stew 19 67.1 40.0 64.3 25 90
Game meat 2 200.0 200.0 70.7 150 .
Dry fish 5 187.4 225.0 132.0 63.5 292.5
Beans 8 239.5 235.0 159.1 105 390
Table 46 Time taken to cook food types using electricity only – Phase 2 (minutes)
Food N Mean Median Std.dev. 25% Quartile
75% Quartile
Rice 28 28.5 30.0 10.6 20.75 34
Nshima 111 38.6 30.0 29.2 20 40
Game meat 3 73.3 90.0 56.9 10 .
Dry fish 7 63.6 60.0 50.8 15 90
Meat/chicken/fish stew 34 44.4 39.0 32.2 13.25 75
Other meat/chicken/fish 15 40.9 40.0 29.5 15 65
Potatoes 12 37.8 35.0 17.9 21.25 52.5
Beans 10 55.1 54.5 49.9 5.75 92.5
Eggs 15 11.3 10.0 4.5 9 13
Veg dish (leaves/pods/fruits) 78 14.7 15.0 7.1 10 18
Frita 2 20.0 20.0 14.1 10 .
Pasta/noodles 8 20.4 20.0 13.3 7.5 30.25
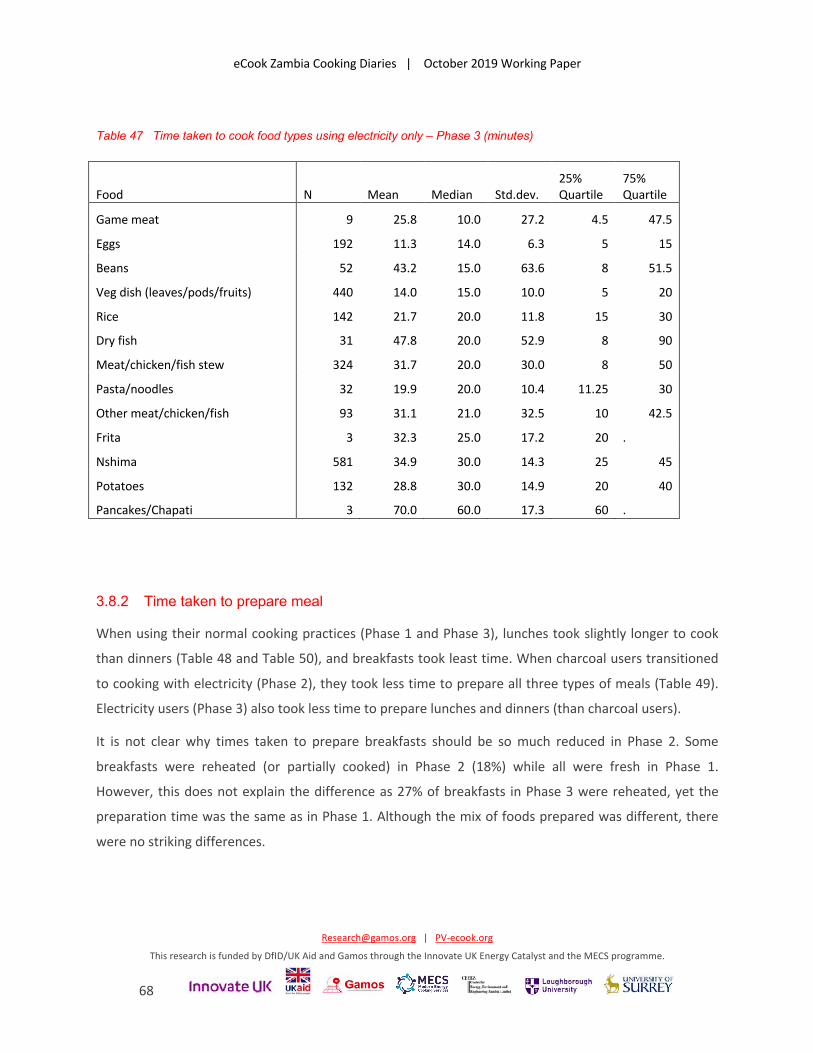
eCook Zambia Cooking Diaries | October 2019 Working Paper
[email protected] | PV-ecook.org
This research is funded by DfID/UK Aid and Gamos through the Innovate UK Energy Catalyst and the MECS programme.
68
Table 47 Time taken to cook food types using electricity only – Phase 3 (minutes)
Food N Mean Median Std.dev. 25% Quartile
75% Quartile
Game meat 9 25.8 10.0 27.2 4.5 47.5
Eggs 192 11.3 14.0 6.3 5 15
Beans 52 43.2 15.0 63.6 8 51.5
Veg dish (leaves/pods/fruits) 440 14.0 15.0 10.0 5 20
Rice 142 21.7 20.0 11.8 15 30
Dry fish 31 47.8 20.0 52.9 8 90
Meat/chicken/fish stew 324 31.7 20.0 30.0 8 50
Pasta/noodles 32 19.9 20.0 10.4 11.25 30
Other meat/chicken/fish 93 31.1 21.0 32.5 10 42.5
Frita 3 32.3 25.0 17.2 20 .
Nshima 581 34.9 30.0 14.3 25 45
Potatoes 132 28.8 30.0 14.9 20 40
Pancakes/Chapati 3 70.0 60.0 17.3 60 .
3.8.2 Time taken to prepare meal
When using their normal cooking practices (Phase 1 and Phase 3), lunches took slightly longer to cook
than dinners (Table 48 and Table 50), and breakfasts took least time. When charcoal users transitioned
to cooking with electricity (Phase 2), they took less time to prepare all three types of meals (Table 49).
Electricity users (Phase 3) also took less time to prepare lunches and dinners (than charcoal users).
It is not clear why times taken to prepare breakfasts should be so much reduced in Phase 2. Some
breakfasts were reheated (or partially cooked) in Phase 2 (18%) while all were fresh in Phase 1.
However, this does not explain the difference as 27% of breakfasts in Phase 3 were reheated, yet the
preparation time was the same as in Phase 1. Although the mix of foods prepared was different, there
were no striking differences.
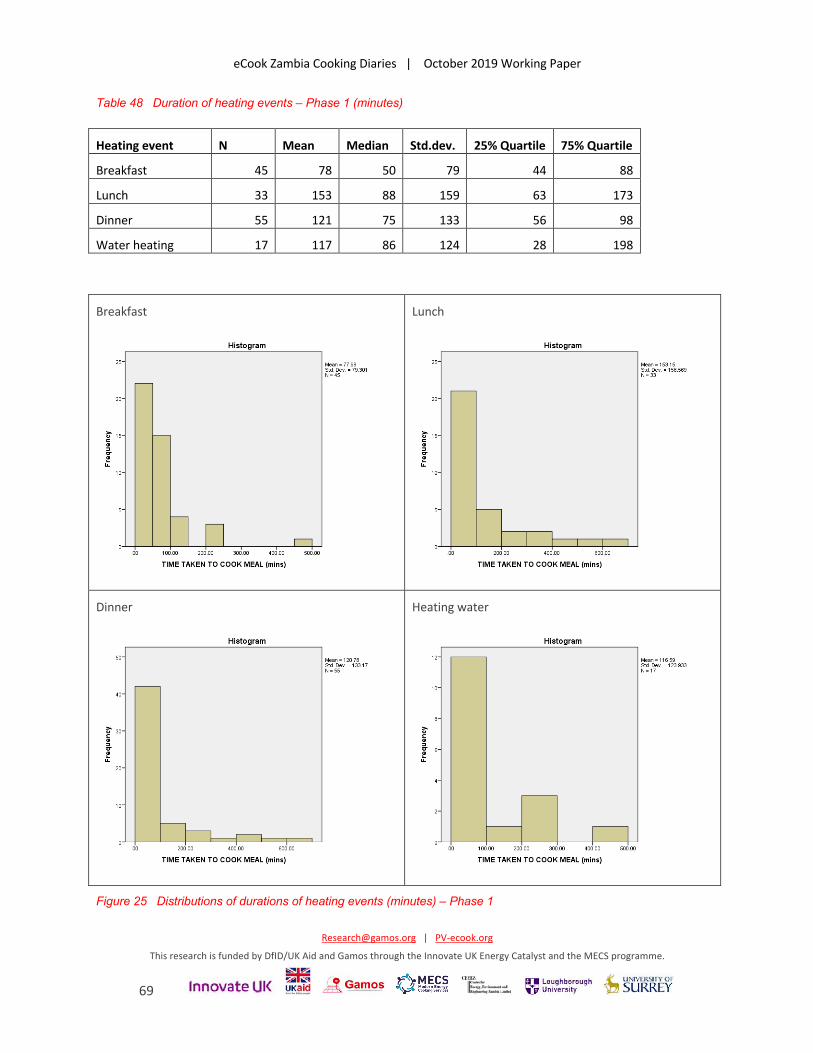
eCook Zambia Cooking Diaries | October 2019 Working Paper
[email protected] | PV-ecook.org
This research is funded by DfID/UK Aid and Gamos through the Innovate UK Energy Catalyst and the MECS programme.
69
Table 48 Duration of heating events – Phase 1 (minutes)
Heating event N Mean Median Std.dev. 25% Quartile 75% Quartile
Breakfast 45 78 50 79 44 88
Lunch 33 153 88 159 63 173
Dinner 55 121 75 133 56 98
Water heating 17 117 86 124 28 198
Breakfast
Lunch
Dinner
Heating water
Figure 25 Distributions of durations of heating events (minutes) – Phase 1
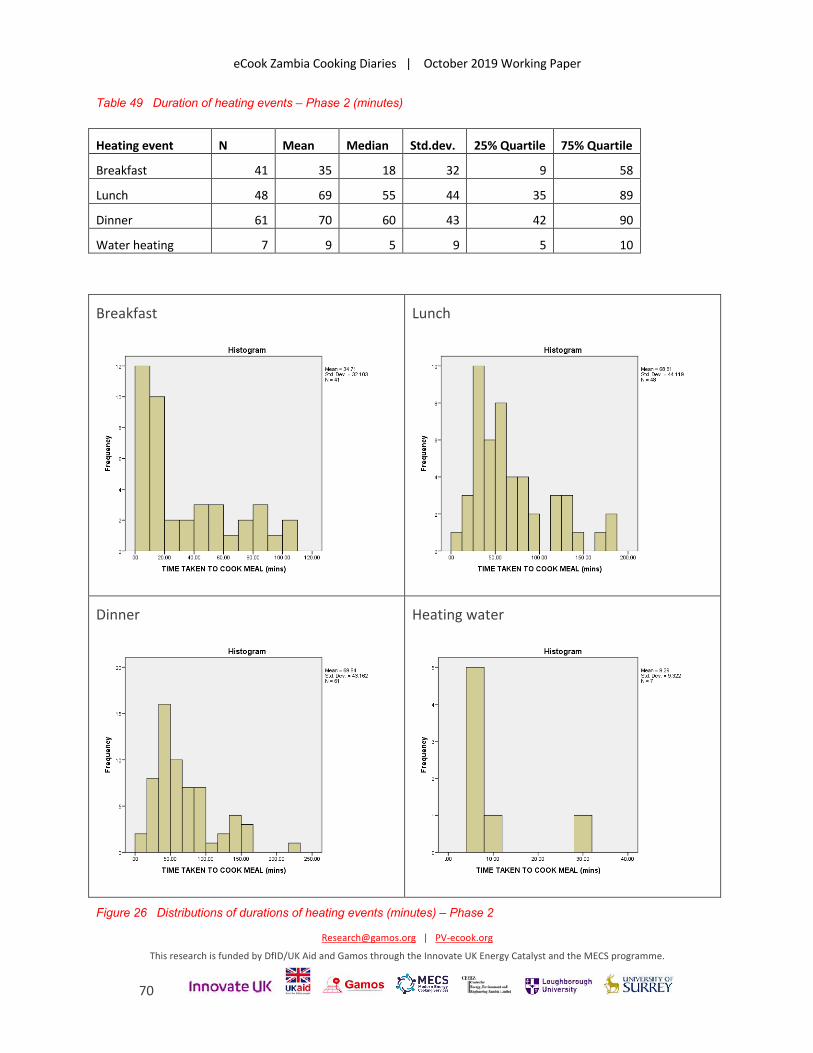
eCook Zambia Cooking Diaries | October 2019 Working Paper
[email protected] | PV-ecook.org
This research is funded by DfID/UK Aid and Gamos through the Innovate UK Energy Catalyst and the MECS programme.
70
Table 49 Duration of heating events – Phase 2 (minutes)
Heating event N Mean Median Std.dev. 25% Quartile 75% Quartile
Breakfast 41 35 18 32 9 58
Lunch 48 69 55 44 35 89
Dinner 61 70 60 43 42 90
Water heating 7 9 5 9 5 10
Breakfast
Lunch
Dinner
Heating water
Figure 26 Distributions of durations of heating events (minutes) – Phase 2
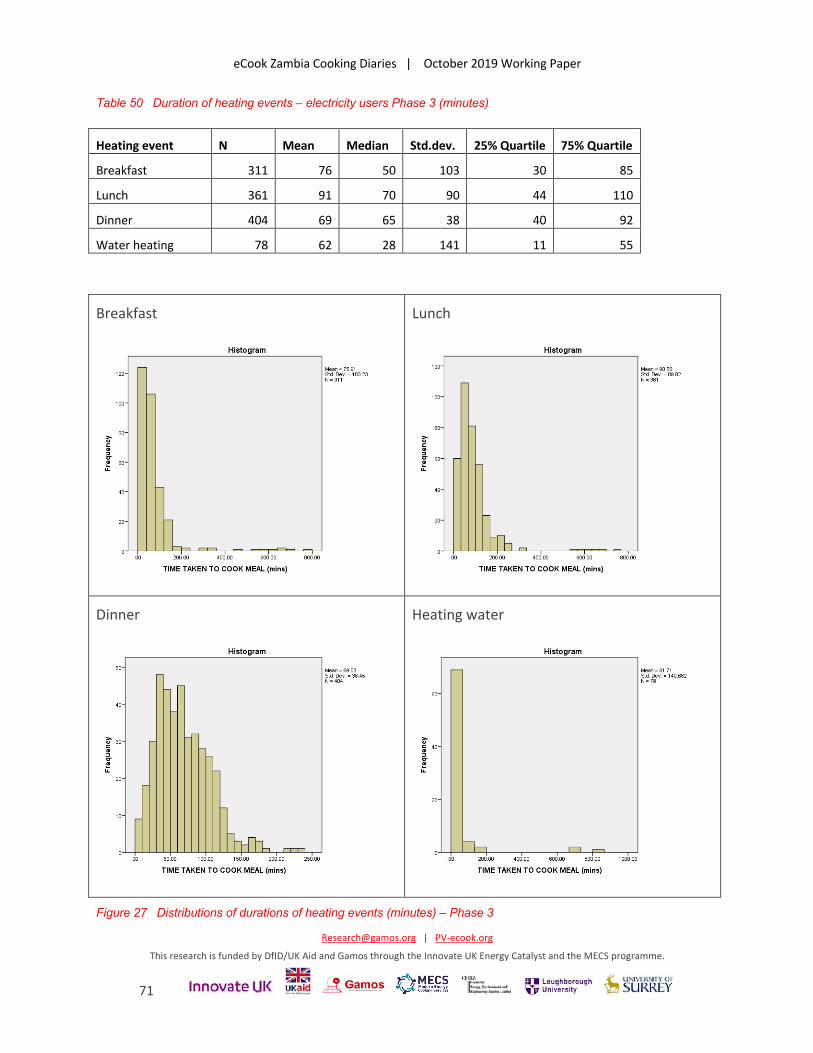
eCook Zambia Cooking Diaries | October 2019 Working Paper
[email protected] | PV-ecook.org
This research is funded by DfID/UK Aid and Gamos through the Innovate UK Energy Catalyst and the MECS programme.
71
Table 50 Duration of heating events – electricity users Phase 3 (minutes)
Heating event N Mean Median Std.dev. 25% Quartile 75% Quartile
Breakfast 311 76 50 103 30 85
Lunch 361 91 70 90 44 110
Dinner 404 69 65 38 40 92
Water heating 78 62 28 141 11 55
Breakfast
Lunch
Dinner
Heating water
Figure 27 Distributions of durations of heating events (minutes) – Phase 3
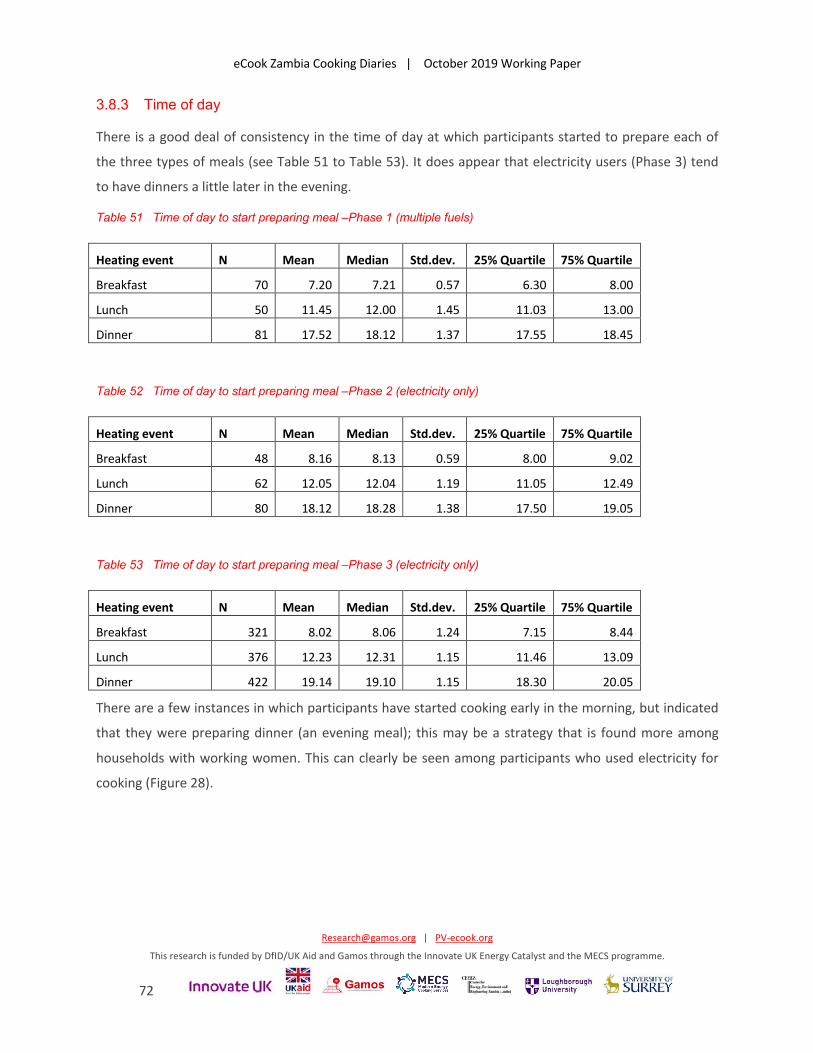
eCook Zambia Cooking Diaries | October 2019 Working Paper
[email protected] | PV-ecook.org
This research is funded by DfID/UK Aid and Gamos through the Innovate UK Energy Catalyst and the MECS programme.
72
3.8.3 Time of day
There is a good deal of consistency in the time of day at which participants started to prepare each of
the three types of meals (see Table 51 to Table 53). It does appear that electricity users (Phase 3) tend
to have dinners a little later in the evening.
Table 51 Time of day to start preparing meal –Phase 1 (multiple fuels)
Heating event N Mean Median Std.dev. 25% Quartile 75% Quartile
Breakfast 70 7.20 7.21 0.57 6.30 8.00
Lunch 50 11.45 12.00 1.45 11.03 13.00
Dinner 81 17.52 18.12 1.37 17.55 18.45
Table 52 Time of day to start preparing meal –Phase 2 (electricity only)
Heating event N Mean Median Std.dev. 25% Quartile 75% Quartile
Breakfast 48 8.16 8.13 0.59 8.00 9.02
Lunch 62 12.05 12.04 1.19 11.05 12.49
Dinner 80 18.12 18.28 1.38 17.50 19.05
Table 53 Time of day to start preparing meal –Phase 3 (electricity only)
Heating event N Mean Median Std.dev. 25% Quartile 75% Quartile
Breakfast 321 8.02 8.06 1.24 7.15 8.44
Lunch 376 12.23 12.31 1.15 11.46 13.09
Dinner 422 19.14 19.10 1.15 18.30 20.05
There are a few instances in which participants have started cooking early in the morning, but indicated
that they were preparing dinner (an evening meal); this may be a strategy that is found more among
households with working women. This can clearly be seen among participants who used electricity for
cooking (Figure 28).
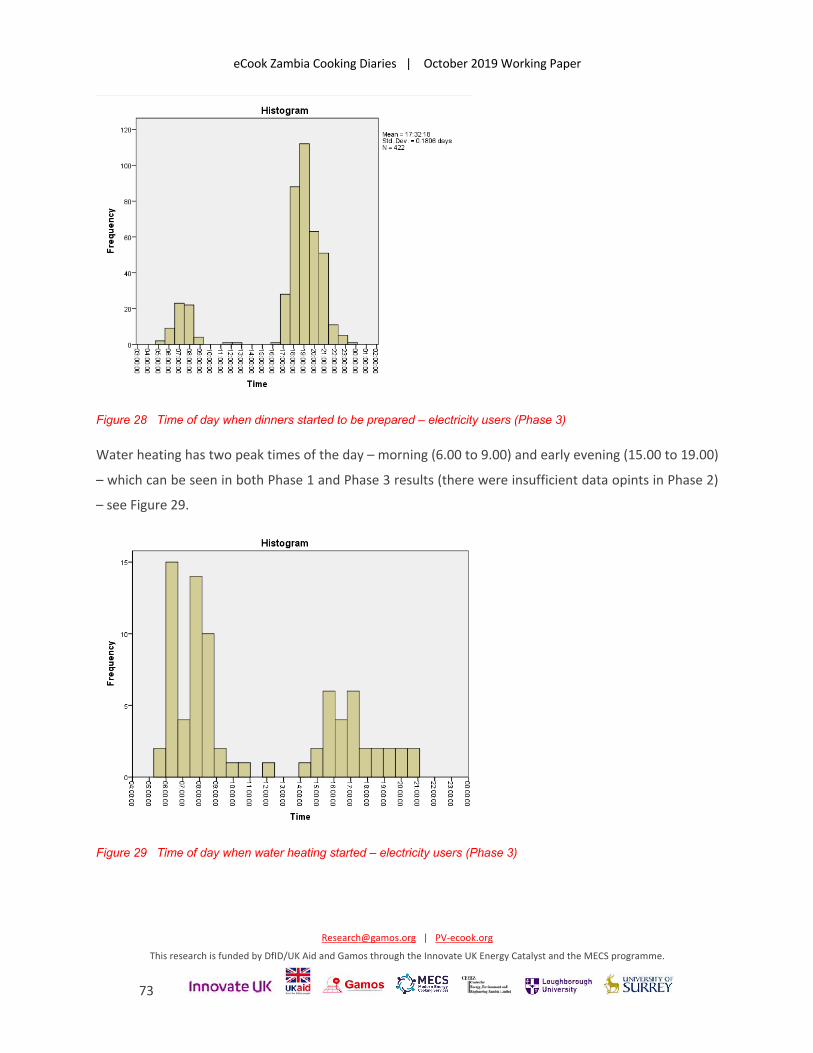
eCook Zambia Cooking Diaries | October 2019 Working Paper
[email protected] | PV-ecook.org
This research is funded by DfID/UK Aid and Gamos through the Innovate UK Energy Catalyst and the MECS programme.
73
Figure 28 Time of day when dinners started to be prepared – electricity users (Phase 3)
Water heating has two peak times of the day – morning (6.00 to 9.00) and early evening (15.00 to 19.00)
– which can be seen in both Phase 1 and Phase 3 results (there were insufficient data opints in Phase 2)
– see Figure 29.
Figure 29 Time of day when water heating started – electricity users (Phase 3)
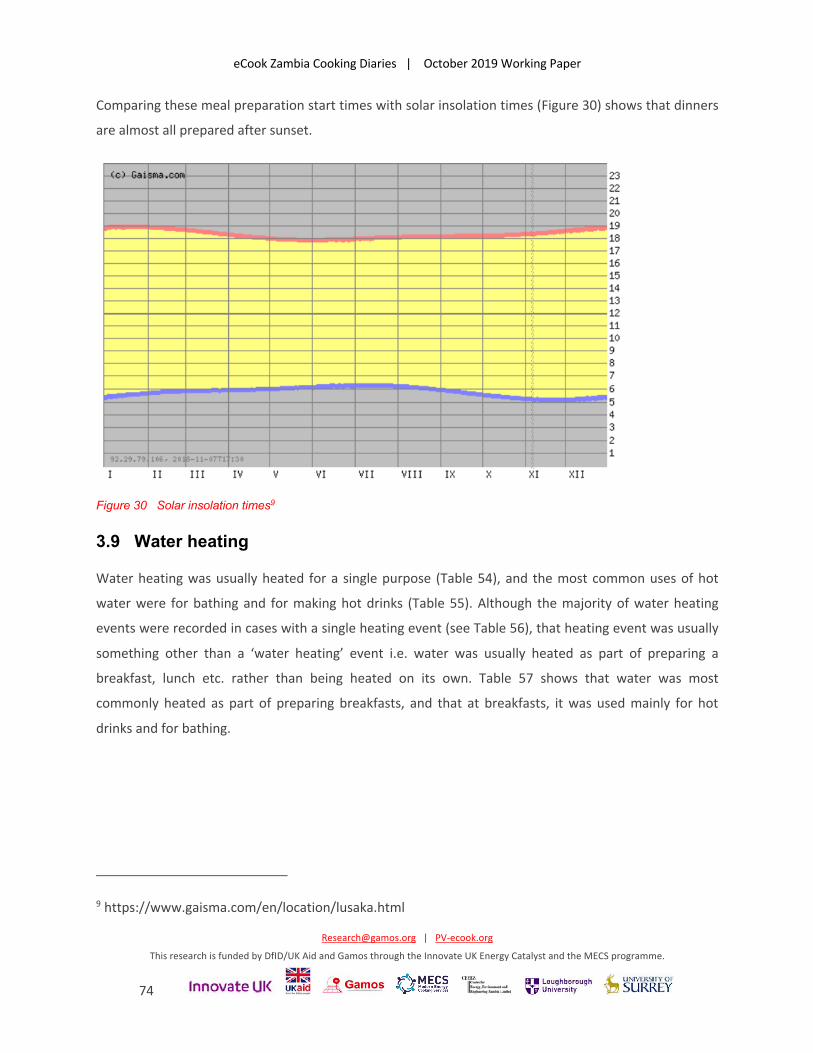
eCook Zambia Cooking Diaries | October 2019 Working Paper
[email protected] | PV-ecook.org
This research is funded by DfID/UK Aid and Gamos through the Innovate UK Energy Catalyst and the MECS programme.
74
Comparing these meal preparation start times with solar insolation times (Figure 30) shows that dinners
are almost all prepared after sunset.
Figure 30 Solar insolation times9
3.9 Water heating
Water heating was usually heated for a single purpose (Table 54), and the most common uses of hot
water were for bathing and for making hot drinks (Table 55). Although the majority of water heating
events were recorded in cases with a single heating event (see Table 56), that heating event was usually
something other than a ‘water heating’ event i.e. water was usually heated as part of preparing a
breakfast, lunch etc. rather than being heated on its own. Table 57 shows that water was most
commonly heated as part of preparing breakfasts, and that at breakfasts, it was used mainly for hot
drinks and for bathing.
9 https://www.gaisma.com/en/location/lusaka.html
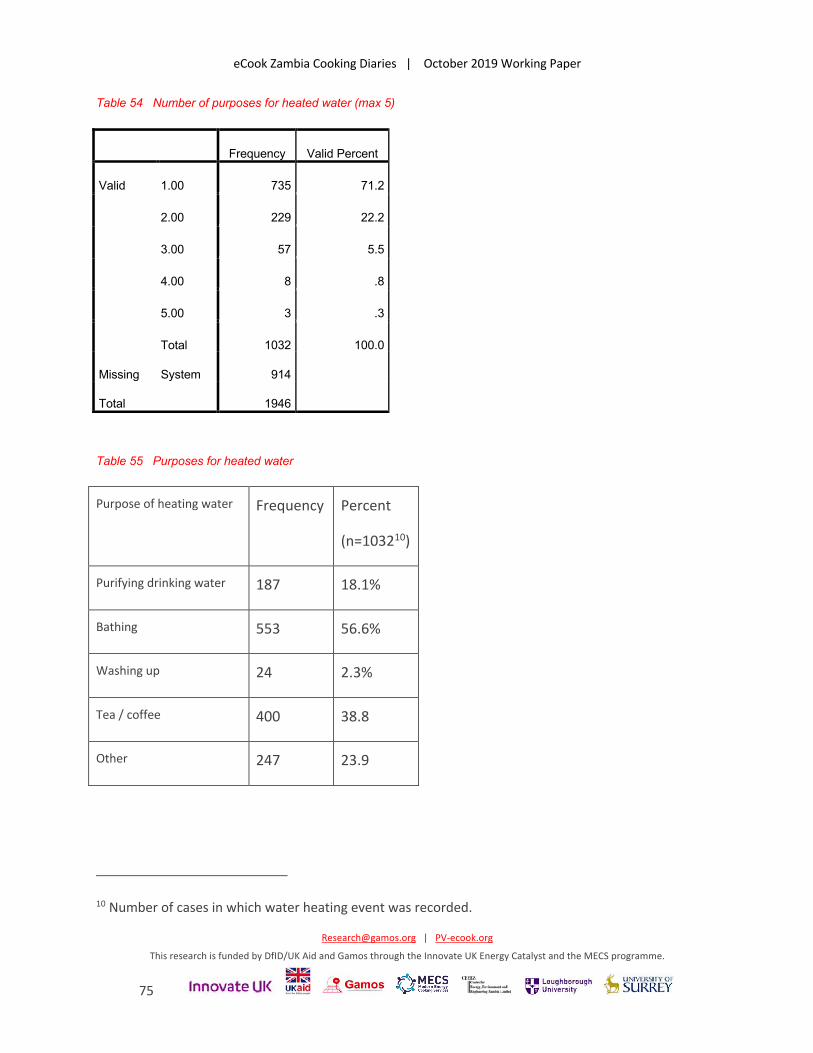
eCook Zambia Cooking Diaries | October 2019 Working Paper
[email protected] | PV-ecook.org
This research is funded by DfID/UK Aid and Gamos through the Innovate UK Energy Catalyst and the MECS programme.
75
Table 54 Number of purposes for heated water (max 5)
Frequency Valid Percent
Valid 1.00 735 71.2
2.00 229 22.2
3.00 57 5.5
4.00 8 .8
5.00 3 .3
Total 1032 100.0
Missing System 914
Total 1946
Table 55 Purposes for heated water
Purpose of heating water Frequency Percent
(n=103210)
Purifying drinking water 187 18.1%
Bathing 553 56.6%
Washing up 24 2.3%
Tea / coffee 400 38.8
Other 247 23.9
10 Number of cases in which water heating event was recorded.
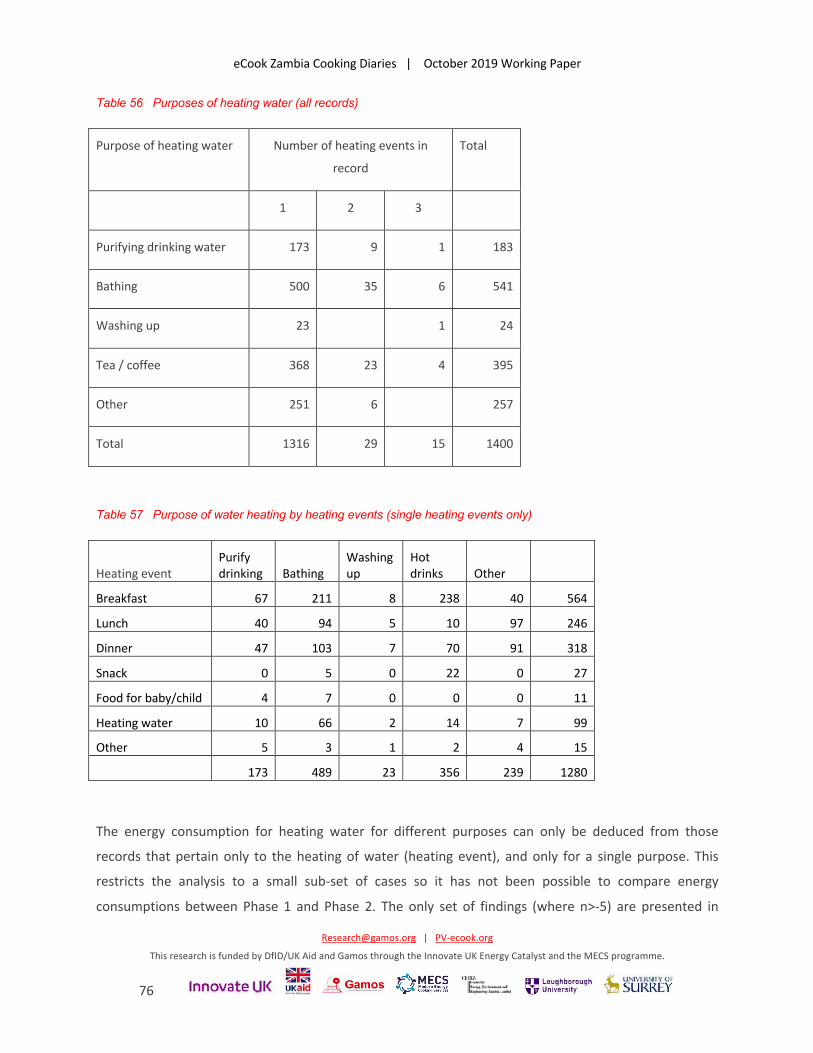
eCook Zambia Cooking Diaries | October 2019 Working Paper
[email protected] | PV-ecook.org
This research is funded by DfID/UK Aid and Gamos through the Innovate UK Energy Catalyst and the MECS programme.
76
Table 56 Purposes of heating water (all records)
Purpose of heating water Number of heating events in
record
Total
1 2 3
Purifying drinking water 173 9 1 183
Bathing 500 35 6 541
Washing up 23 1 24
Tea / coffee 368 23 4 395
Other 251 6 257
Total 1316 29 15 1400
Table 57 Purpose of water heating by heating events (single heating events only)
Heating event Purify drinking Bathing
Washing up
Hot drinks Other
Breakfast 67 211 8 238 40 564
Lunch 40 94 5 10 97 246
Dinner 47 103 7 70 91 318
Snack 0 5 0 22 0 27
Food for baby/child 4 7 0 0 0 11
Heating water 10 66 2 14 7 99
Other 5 3 1 2 4 15
173 489 23 356 239 1280
The energy consumption for heating water for different purposes can only be deduced from those
records that pertain only to the heating of water (heating event), and only for a single purpose. This
restricts the analysis to a small sub-set of cases so it has not been possible to compare energy
consumptions between Phase 1 and Phase 2. The only set of findings (where n>-5) are presented in
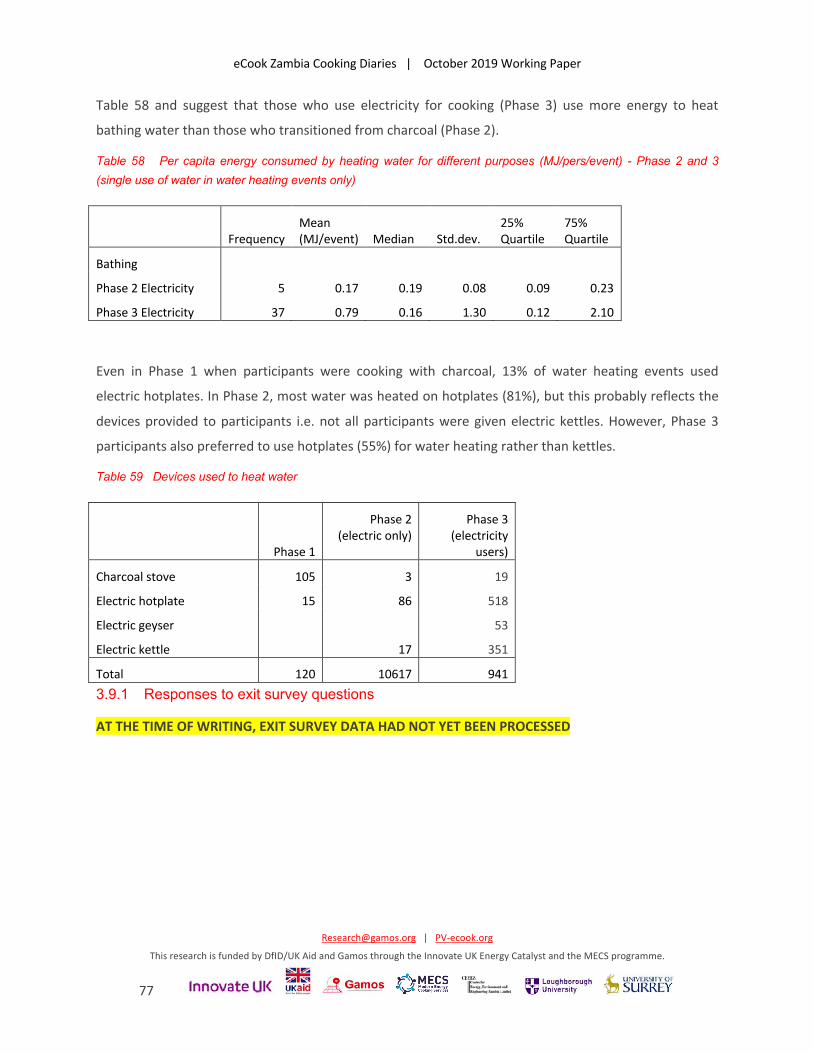
eCook Zambia Cooking Diaries | October 2019 Working Paper
[email protected] | PV-ecook.org
This research is funded by DfID/UK Aid and Gamos through the Innovate UK Energy Catalyst and the MECS programme.
77
Table 58 and suggest that those who use electricity for cooking (Phase 3) use more energy to heat
bathing water than those who transitioned from charcoal (Phase 2).
Table 58 Per capita energy consumed by heating water for different purposes (MJ/pers/event) - Phase 2 and 3
(single use of water in water heating events only)
Frequency Mean (MJ/event) Median Std.dev.
25% Quartile
75% Quartile
Bathing Phase 2 Electricity 5 0.17 0.19 0.08 0.09 0.23
Phase 3 Electricity 37 0.79 0.16 1.30 0.12 2.10
Even in Phase 1 when participants were cooking with charcoal, 13% of water heating events used
electric hotplates. In Phase 2, most water was heated on hotplates (81%), but this probably reflects the
devices provided to participants i.e. not all participants were given electric kettles. However, Phase 3
participants also preferred to use hotplates (55%) for water heating rather than kettles.
Table 59 Devices used to heat water
Phase 1
Phase 2 (electric only)
Phase 3 (electricity
users)
Charcoal stove 105 3 19
Electric hotplate 15 86 518
Electric geyser 53
Electric kettle 17 351
Total 120 10617 941 3.9.1 Responses to exit survey questions
AT THE TIME OF WRITING, EXIT SURVEY DATA HAD NOT YET BEEN PROCESSED
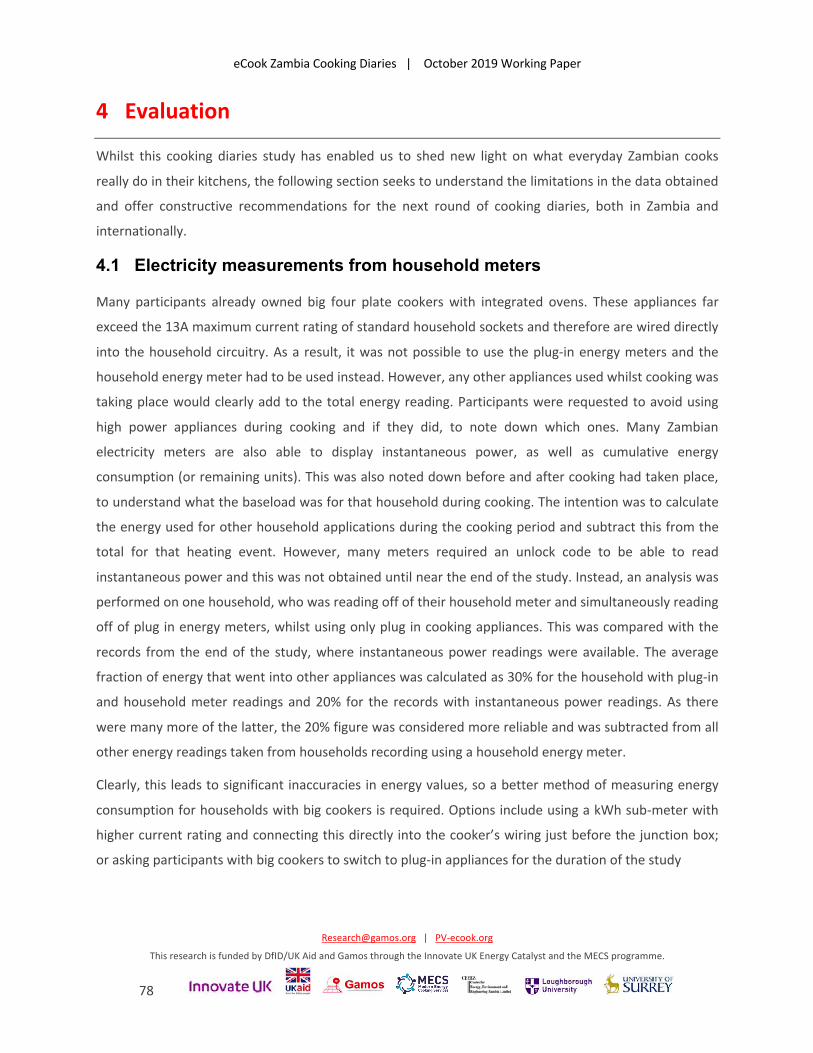
eCook Zambia Cooking Diaries | October 2019 Working Paper
[email protected] | PV-ecook.org
This research is funded by DfID/UK Aid and Gamos through the Innovate UK Energy Catalyst and the MECS programme.
78
4 Evaluation
Whilst this cooking diaries study has enabled us to shed new light on what everyday Zambian cooks
really do in their kitchens, the following section seeks to understand the limitations in the data obtained
and offer constructive recommendations for the next round of cooking diaries, both in Zambia and
internationally.
4.1 Electricity measurements from household meters
Many participants already owned big four plate cookers with integrated ovens. These appliances far
exceed the 13A maximum current rating of standard household sockets and therefore are wired directly
into the household circuitry. As a result, it was not possible to use the plug-in energy meters and the
household energy meter had to be used instead. However, any other appliances used whilst cooking was
taking place would clearly add to the total energy reading. Participants were requested to avoid using
high power appliances during cooking and if they did, to note down which ones. Many Zambian
electricity meters are also able to display instantaneous power, as well as cumulative energy
consumption (or remaining units). This was also noted down before and after cooking had taken place,
to understand what the baseload was for that household during cooking. The intention was to calculate
the energy used for other household applications during the cooking period and subtract this from the
total for that heating event. However, many meters required an unlock code to be able to read
instantaneous power and this was not obtained until near the end of the study. Instead, an analysis was
performed on one household, who was reading off of their household meter and simultaneously reading
off of plug in energy meters, whilst using only plug in cooking appliances. This was compared with the
records from the end of the study, where instantaneous power readings were available. The average
fraction of energy that went into other appliances was calculated as 30% for the household with plug-in
and household meter readings and 20% for the records with instantaneous power readings. As there
were many more of the latter, the 20% figure was considered more reliable and was subtracted from all
other energy readings taken from households recording using a household energy meter.
Clearly, this leads to significant inaccuracies in energy values, so a better method of measuring energy
consumption for households with big cookers is required. Options include using a kWh sub-meter with
higher current rating and connecting this directly into the cooker’s wiring just before the junction box;
or asking participants with big cookers to switch to plug-in appliances for the duration of the study
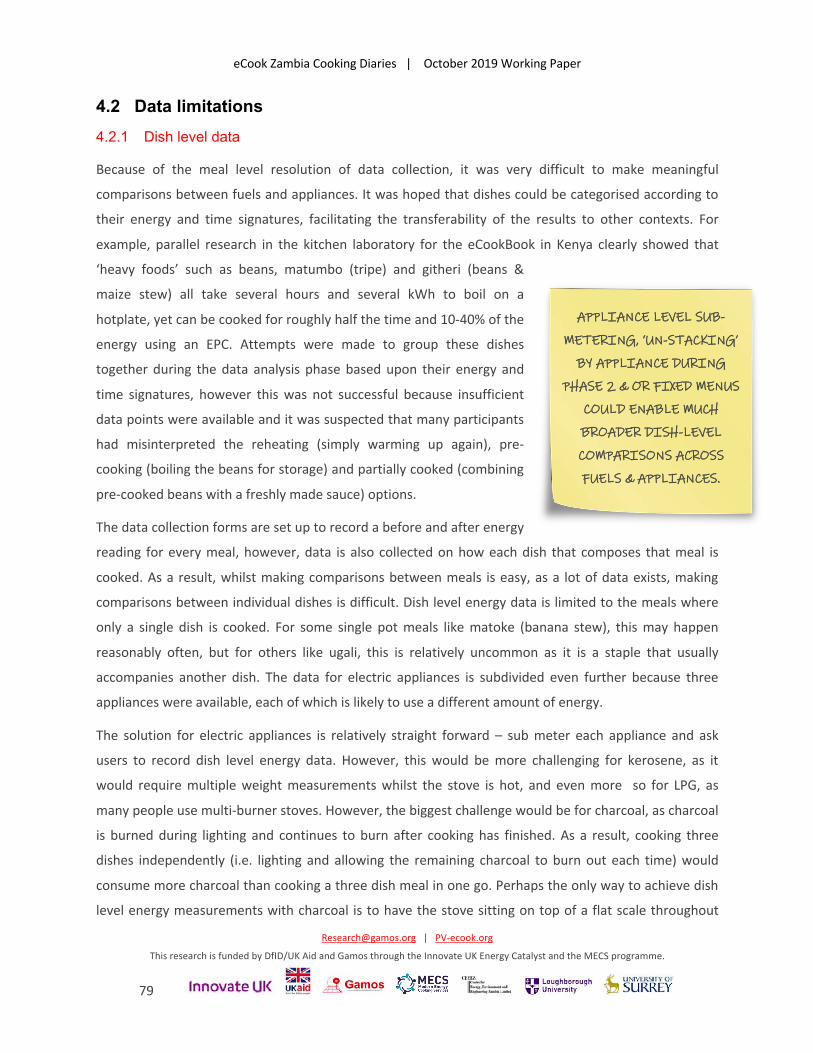
eCook Zambia Cooking Diaries | October 2019 Working Paper
[email protected] | PV-ecook.org
This research is funded by DfID/UK Aid and Gamos through the Innovate UK Energy Catalyst and the MECS programme.
79
4.2 Data limitations 4.2.1 Dish level data
Because of the meal level resolution of data collection, it was very difficult to make meaningful
comparisons between fuels and appliances. It was hoped that dishes could be categorised according to
their energy and time signatures, facilitating the transferability of the results to other contexts. For
example, parallel research in the kitchen laboratory for the eCookBook in Kenya clearly showed that
‘heavy foods’ such as beans, matumbo (tripe) and githeri (beans &
maize stew) all take several hours and several kWh to boil on a
hotplate, yet can be cooked for roughly half the time and 10-40% of the
energy using an EPC. Attempts were made to group these dishes
together during the data analysis phase based upon their energy and
time signatures, however this was not successful because insufficient
data points were available and it was suspected that many participants
had misinterpreted the reheating (simply warming up again), pre-
cooking (boiling the beans for storage) and partially cooked (combining
pre-cooked beans with a freshly made sauce) options.
The data collection forms are set up to record a before and after energy
reading for every meal, however, data is also collected on how each dish that composes that meal is
cooked. As a result, whilst making comparisons between meals is easy, as a lot of data exists, making
comparisons between individual dishes is difficult. Dish level energy data is limited to the meals where
only a single dish is cooked. For some single pot meals like matoke (banana stew), this may happen
reasonably often, but for others like ugali, this is relatively uncommon as it is a staple that usually
accompanies another dish. The data for electric appliances is subdivided even further because three
appliances were available, each of which is likely to use a different amount of energy.
The solution for electric appliances is relatively straight forward – sub meter each appliance and ask
users to record dish level energy data. However, this would be more challenging for kerosene, as it
would require multiple weight measurements whilst the stove is hot, and even more so for LPG, as
many people use multi-burner stoves. However, the biggest challenge would be for charcoal, as charcoal
is burned during lighting and continues to burn after cooking has finished. As a result, cooking three
dishes independently (i.e. lighting and allowing the remaining charcoal to burn out each time) would
consume more charcoal than cooking a three dish meal in one go. Perhaps the only way to achieve dish
level energy measurements with charcoal is to have the stove sitting on top of a flat scale throughout
APPLIANCE LEVEL SUB-
METERING, ‘UN-STACKING’
BY APPLIANCE DURING
PHASE 2 & OR FIXED MENUS
COULD ENABLE MUCH
BROADER DISH-LEVEL
COMPARISONS ACROSS
FUELS & APPLIANCES.
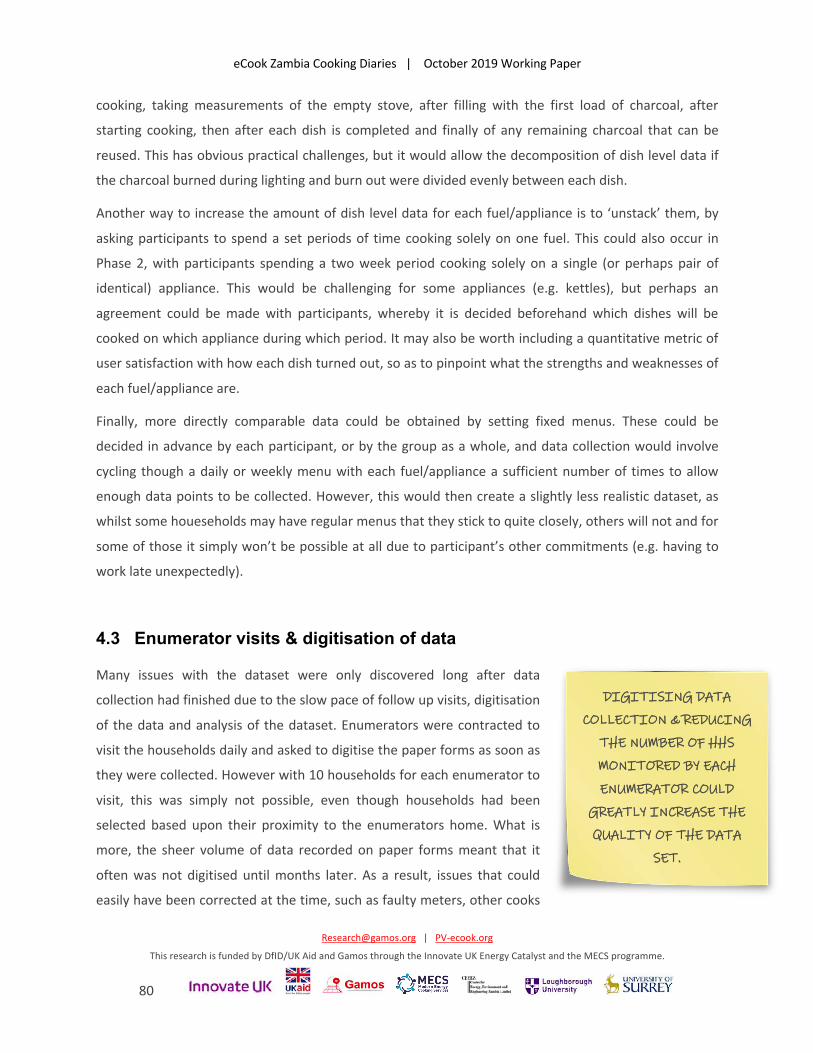
eCook Zambia Cooking Diaries | October 2019 Working Paper
[email protected] | PV-ecook.org
This research is funded by DfID/UK Aid and Gamos through the Innovate UK Energy Catalyst and the MECS programme.
80
cooking, taking measurements of the empty stove, after filling with the first load of charcoal, after
starting cooking, then after each dish is completed and finally of any remaining charcoal that can be
reused. This has obvious practical challenges, but it would allow the decomposition of dish level data if
the charcoal burned during lighting and burn out were divided evenly between each dish.
Another way to increase the amount of dish level data for each fuel/appliance is to ‘unstack’ them, by
asking participants to spend a set periods of time cooking solely on one fuel. This could also occur in
Phase 2, with participants spending a two week period cooking solely on a single (or perhaps pair of
identical) appliance. This would be challenging for some appliances (e.g. kettles), but perhaps an
agreement could be made with participants, whereby it is decided beforehand which dishes will be
cooked on which appliance during which period. It may also be worth including a quantitative metric of
user satisfaction with how each dish turned out, so as to pinpoint what the strengths and weaknesses of
each fuel/appliance are.
Finally, more directly comparable data could be obtained by setting fixed menus. These could be
decided in advance by each participant, or by the group as a whole, and data collection would involve
cycling though a daily or weekly menu with each fuel/appliance a sufficient number of times to allow
enough data points to be collected. However, this would then create a slightly less realistic dataset, as
whilst some houeseholds may have regular menus that they stick to quite closely, others will not and for
some of those it simply won’t be possible at all due to participant’s other commitments (e.g. having to
work late unexpectedly).
4.3 Enumerator visits & digitisation of data
Many issues with the dataset were only discovered long after data
collection had finished due to the slow pace of follow up visits, digitisation
of the data and analysis of the dataset. Enumerators were contracted to
visit the households daily and asked to digitise the paper forms as soon as
they were collected. However with 10 households for each enumerator to
visit, this was simply not possible, even though households had been
selected based upon their proximity to the enumerators home. What is
more, the sheer volume of data recorded on paper forms meant that it
often was not digitised until months later. As a result, issues that could
easily have been corrected at the time, such as faulty meters, other cooks
DIGITISING DATA
COLLECTION & REDUCING
THE NUMBER OF HHS
MONITORED BY EACH
ENUMERATOR COULD
GREATLY INCREASE THE
QUALITY OF THE DATA
SET.
eCook Zambia Cooking Diaries | October 2019 Working Paper
[email protected] | PV-ecook.org
This research is funded by DfID/UK Aid and Gamos through the Innovate UK Energy Catalyst and the MECS programme.
81
in the household not recording data properly or not recording during blackouts, often went undetected,
resulting in data having to be corrected or excluded.
To increase the quality of the dataset, it is recommended that if collecting data as detailed as this in the
future, each enumerator monitor just 5 households and a digital data collection system be created.
Although most participants (15/17) stated that enumerator visits were helpful and frequent enough,
more frequent visits could greatly increase the quality of the data, as small issues could be corrected on
the day, rather than having to correct of completely remove questionable data at a later date. It was
noticed that many participants were writing down the key bits of information (time, energy & basic
information about the dish) on a notepad during cooking. They would later transcribe this onto the full
diary form when they had more time available. This suggests that if an enumerator were to visit each
day, they could sit down with the participant and enter the data from the notepad into a digital form,
for example using a tablet with a specially designed questionnaire in a data collection app such as Kobo
Collect. This data would be uploaded to the server by each enumerator at the end of each day, then
downloaded and checked by the lead researcher the following day. This would also help to reduce the
errors in the transcription phase, as the participant would be able to remember any missing details
(except energy readings) from that same day. Digitising the paper forms
was often done in bulk under extreme time pressure, making the
possibility of errors during transcription high.
4.4 Sample diversity
This study used convenience sampling as a means to get some initial data
as quickly as possible. As a result, most participants were middle class and
all were urban. Future studies in Zambia should seek to understand how
different sectors of society cook, in particular poorer households and rural
households, and identify regional differences in cooking.
THIS STUDY HAS OFFERED
AN INITIAL
EXPLORATION OF
ZAMBIAN COOKING.
FOLLOW UP STUDIES
SHOULD EXPLORE THE
DIFFERENCES BETWEEN
URBAN/RURAL,
POOR/WEALTHY &
DIFFERENT REGIONS OF
THE COUNTRY.
eCook Zambia Cooking Diaries | October 2019 Working Paper
[email protected] | PV-ecook.org
This research is funded by DfID/UK Aid and Gamos through the Innovate UK Energy Catalyst and the MECS programme.
82
5 Conclusion
The cooking diaries study in Zambia has shown that cooking with electricity is compatible with Zambian
cuisine and that modern energy-efficient appliances are highly desirable to everyday Zambian cooks. In
particular, the Electric Pressure Cooker (EPC) as a prime candidate for future eCook products, as it can
significantly reduce the energy demand for the biggest energy consumers: ‘heavy foods’. In Lusaka,
electricity is already the aspirational fuel, however the grid is overloaded with inefficient hotplates and
ovens, meaning there is an opportunity already on the table to promote off-the-shelf energy-efficient
appliances, in particular, EPCs. However, battery-supported appliances are likely to make electric
cooking much more attractive, as although load shedding was not occurring at the time of this study, it
may well return in the not too distant future, which will cause users to revert back to charcoal. LPG is
not yet popular in Lusaka, as it is currently expensive and it is perceived as unsafe. However if load
shedding returns, it may well become an attractive option. If the LPG market is established, the ability to
cook faster and multi-task, whilst also saving money make a fuel stacking scenario with EPCs is likely to
be extremely attractive for modern Zambians.
The findings from this study will be combined with those from the other activities that have been carried
under the eCook Zambia Market Assessment. Together they will build a more complete picture of the
opportunities and challenges that await this emerging concept. Further outputs will be available from
https://elstove.com/innovate-reports/ and www.MECS.org.uk.
eCook Zambia Cooking Diaries | October 2019 Working Paper
[email protected] | PV-ecook.org
This research is funded by DfID/UK Aid and Gamos through the Innovate UK Energy Catalyst and the MECS programme.
83
6 Appendix 6.1 Appendix A: Problem statement and background to Innovate eCook
project 6.1.1 Beyond business as usual
The use of biomass and solid fuels for cooking is the everyday experience of nearly 3 Billion people. This
pervasive use of solid fuels––including wood, coal, straw, and dung––and traditional cookstoves results
in high levels of household air pollution, extensive daily drudgery required to collect fuels, and serious
health impacts. It is well known that open fires and primitive stoves are inefficient ways of converting
energy into heat for cooking. The average amount of biomass cooking fuel used by a typical family can
be as high as two tons per year. Indoor biomass cooking smoke also is associated with a number of
diseases, including acute respiratory illnesses, cataracts, heart disease and even cancer. Women and
children in particular are exposed to indoor cooking smoke in the form of small particulates up to 20
times higher than the maximum recommended levels of the World Health Organization. It is estimated
that smoke from cooking fuels accounts for nearly 4 million premature deaths annually worldwide –
more than the deaths from malaria and tuberculosis combined.
While there has been considerable investment in improving the use of energy for cooking, the emphasis
so far has been on improving the energy conversion efficiency of biomass. Indeed in a recent overview
of the state of the art in Improved Cookstoves (ICS), ESMAP & GACC (2015), World Bank (2014), note
that the use of biomass for cooking is likely to continue to dominate through to 2030.
“Consider, for a moment, the simple act of cooking. Imagine if we could change the way nearly five hundred
million families cook their food each day. It could slow climate change, drive gender equality, and reduce
poverty. The health benefits would be enormous.” ESMAP & GACC (2015)
The main report goes on to say that “The “business-as-usual” scenario for the sector is encouraging but
will fall far short of potential.” (ibid,) It notes that without major new interventions, over 180 million
households globally will gain access to, at least, minimally improved11 cooking solutions by the end of
the decade. However, they state that this business-as-usual scenario will still leave over one- half (57%)
of the developing world’s population without access to clean cooking in 2020, and 38% without even
11 A minimally improved stove does not significantly change the health impacts of kitchen emissions. “For biomass cooking,
pending further evidence from the field, significant health benefits are possible only with the highest quality fan gasifier stoves;
more moderate health impacts may be realized with natural draft gasifiers and vented intermediate ICS” (ibid)
eCook Zambia Cooking Diaries | October 2019 Working Paper
[email protected] | PV-ecook.org
This research is funded by DfID/UK Aid and Gamos through the Innovate UK Energy Catalyst and the MECS programme.
84
minimally improved cooking solutions. The report also states that ‘cleaner’ stoves are barely affecting
the health issues, and that only those with forced gasification make a significant improvement to health.
Against this backdrop, there is a need for a different approach aimed at accelerating the uptake of truly
‘clean’ cooking.
Even though improved cooking solutions are expected to reach an increasing proportion of the poor, the
absolute numbers of people without access to even ‘cleaner’ energy, let alone ‘clean’ energy, will
increase due to population growth. The new Sustainable Development Goal 7 calls for the world to
“ensure access to affordable, reliable, sustainable and modern energy for all”. Modern energy
(electricity or LPG) would indeed be ‘clean’ energy for cooking, with virtually no kitchen emissions (other
than those from the pot). However, in the past, modern energy has tended to mean access to electricity
(mainly light) and cooking was often left off the agenda for sustainable energy for all.
Even in relation to electricity access, key papers emphasise the need for a step change in investment
finance, a change from ‘business as usual’. IEG World Bank Group (2015) note that 22 countries in the
Africa Region have less than 25 percent access, and of those, 7 have less than 10 percent access. Their
tone is pessimistic in line with much of the recent literature on access to modern energy, albeit in
contrast to the stated SDG7. They discuss how population growth is likely to outstrip new supplies and
they argue that “unless there is a big break from recent trends the population without electricity access
in Sub-Saharan Africa is projected to increase by 58 percent, from 591 million in 2010 to 935 million in
2030.” They lament that about 40% of Sub-Saharan Africa’s population is under 14 years old and
conclude that if the current level of investment in access continues, yet another generation of children
will be denied the benefits of modern service delivery facilitated by the provision of electricity (IEG
World Bank Group 2015).
“Achieving universal access within 15 years for the low-access countries (those with under 50 percent
coverage) requires a quantum leap from their present pace of 1.6 million connections per year to 14.6 million
per year until 2030.” (ibid)
Once again, the language is a call for a something other than business as usual. The World Bank
conceives of this as a step change in investment. It estimates that the investment needed to really
address global electricity access targets would be about $37 billion per year, including erasing
generation deficits and additional electrical infrastructure to meet demand from economic growth. “By
comparison, in recent years, low-access countries received an average of $3.6 billion per year for their
electricity sectors from public and private sources” (ibid). The document calls for the Bank Group‘s
eCook Zambia Cooking Diaries | October 2019 Working Paper
[email protected] | PV-ecook.org
This research is funded by DfID/UK Aid and Gamos through the Innovate UK Energy Catalyst and the MECS programme.
85
energy practice to adopt a new and transformative strategy to help country clients orchestrate a
national, sustained, sector-level engagement for universal access.
In the following paragraphs, we explore how increasing access to electricity could include the use of
solar electric cooking systems, meeting the needs of both supplying electricity and clean cooking to a
number of households in developing countries with sufficient income.
6.1.2 Building on previous research
Gamos first noted the trends in PV and battery prices in May 2013. We asked ourselves the question, is
it now cost effective to cook with solar photovoltaics? The answer in 2013 was ‘no’, but the trends
suggested that by 2020 the answer would be yes. We published a concept note and started to present
the idea to industry and government. Considerable interest was shown but uncertainty about the cost
model held back significant support. Gamos has since used its own funds to undertake many of the
activities, as well as IP protection (a defensive patent application has been made for the battery/cooker
combination) with the intention is to make all learning and technology developed in this project open
access, and awareness raising amongst the electrification and clean cooking communities (e.g. creation
of the infographic shown in Figure 31 to communicate the concept quickly to busy research and policy
actors).
Gamos has made a number of strategic alliances, in particular with the University of Surrey (the Centre
for Environmental Strategy) and Loughborough University Department of Geography and seat of the
Low Carbon Energy for Development Network). In October 2015, DFID commissioned these actors to
explore assumptions surrounding solar electric cooking12 (Batchelor 2015b; Brown & Sumanik-Leary
2015; Leach & Oduro 2015; Slade 2015). The commission arose from discussions between consortium
members, DFID, and a number of other entities with an interest in technological options for cleaner
cooking e.g. Shell Foundation and the Global Alliance for Clean Cookstoves.
Drawing on evidence from the literature, the papers show that the concept is technically feasible and
could increase household access to a clean and reliable modern source of energy. Using a bespoke
economic model, the Leach and Oduro paper also confirm that by 2020 a solar based cooking system
could be comparable in terms of monthly repayments to the most common alternative fuels, charcoal
and LPG. Drawing on published and grey literatures, many variables were considered (e.g. cooking
energy needs, technology performance, component costs). There is uncertainty in many of the
12 The project has been commissioned through the PEAKS framework agreement held by DAI Europe Ltd.
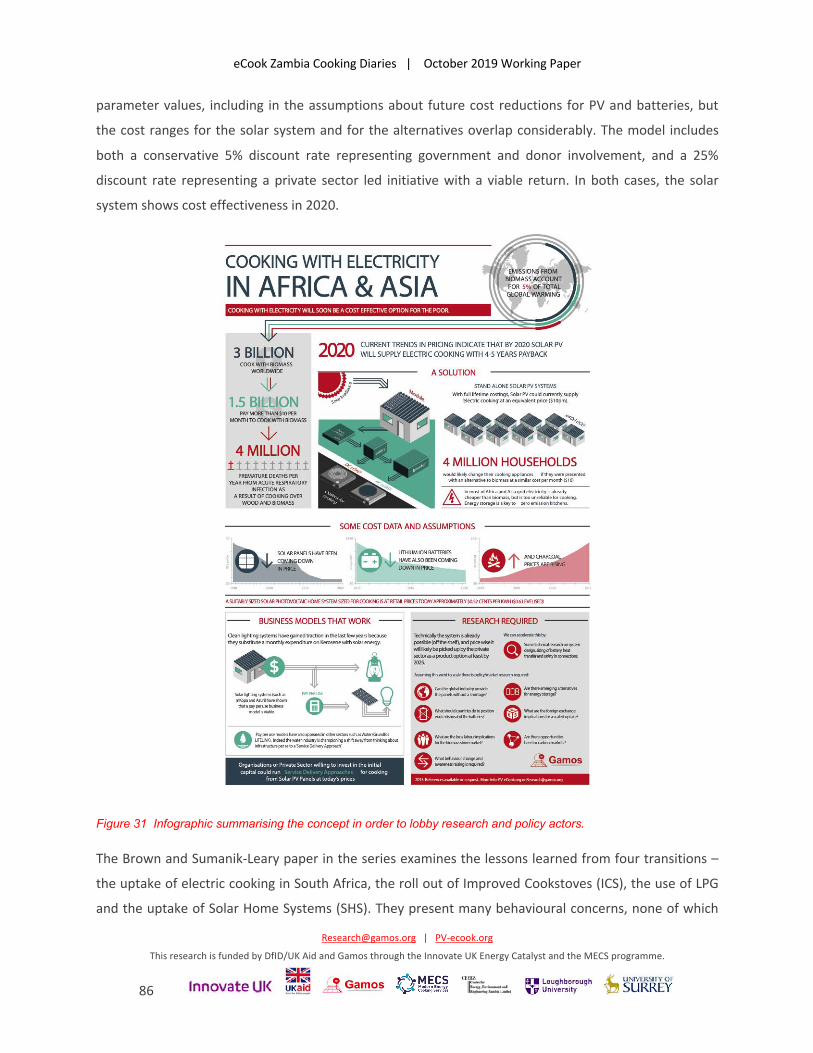
eCook Zambia Cooking Diaries | October 2019 Working Paper
[email protected] | PV-ecook.org
This research is funded by DfID/UK Aid and Gamos through the Innovate UK Energy Catalyst and the MECS programme.
86
parameter values, including in the assumptions about future cost reductions for PV and batteries, but
the cost ranges for the solar system and for the alternatives overlap considerably. The model includes
both a conservative 5% discount rate representing government and donor involvement, and a 25%
discount rate representing a private sector led initiative with a viable return. In both cases, the solar
system shows cost effectiveness in 2020.
Figure 31 Infographic summarising the concept in order to lobby research and policy actors.
The Brown and Sumanik-Leary paper in the series examines the lessons learned from four transitions –
the uptake of electric cooking in South Africa, the roll out of Improved Cookstoves (ICS), the use of LPG
and the uptake of Solar Home Systems (SHS). They present many behavioural concerns, none of which
eCook Zambia Cooking Diaries | October 2019 Working Paper
[email protected] | PV-ecook.org
This research is funded by DfID/UK Aid and Gamos through the Innovate UK Energy Catalyst and the MECS programme.
87
preclude the proposition as such, but all of which suggest that any action to create a scaled use of solar
electric cooking would need in depth market analysis; products that are modular and paired with locally
appropriate appliances; the creation of new, or upgrading of existing, service networks; consumer
awareness raising; and room for participatory development of the products and associated equipment.
A synthesis paper summarising the above concludes by emphasising that the proposition is not a single
product – it is a new genre of action and is potentially transformative. Whether solar energy is utilised
within household systems or as part of a mini, micro or nano grid, linking descending solar PV and
battery costs with the role of cooking in African households (and the Global South more broadly) creates
a significant potential contribution to SDG7. Cooking is a major expenditure of 500 million households. It
is a major consumer of time and health. Where households pay for their fuelwood and charcoal
(approximately 300 Million) this is a significant cash expense. Solar electric cooking holds the potential
to turn this (fuelwood and charcoal) cash into investment in modern energy. This “consumer
expenditure” is of an order of magnitude more than current investment in modern energy in Africa and
to harness it might fulfil the calls for a step change in investment in electrical infrastructure.
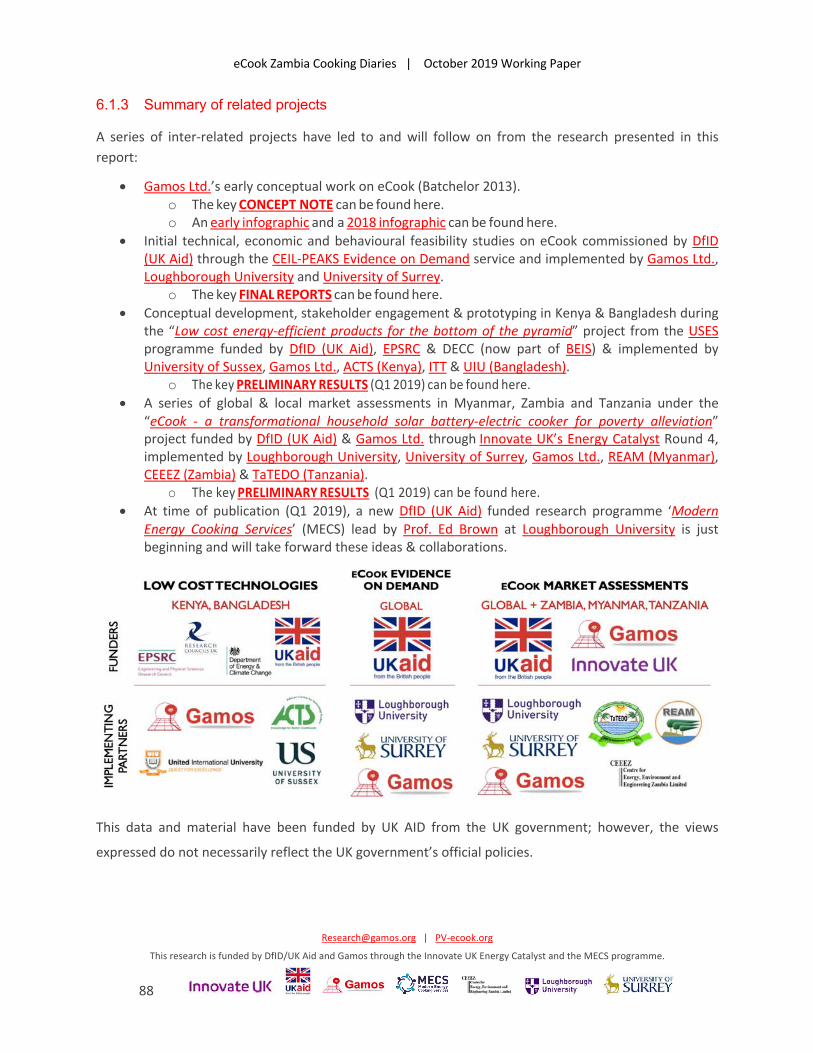
eCook Zambia Cooking Diaries | October 2019 Working Paper
[email protected] | PV-ecook.org
This research is funded by DfID/UK Aid and Gamos through the Innovate UK Energy Catalyst and the MECS programme.
88
6.1.3 Summary of related projects
A series of inter-related projects have led to and will follow on from the research presented in this report:
• Gamos Ltd.’s early conceptual work on eCook (Batchelor 2013). o The key CONCEPT NOTE can be found here. o An early infographic and a 2018 infographic can be found here.
• Initial technical, economic and behavioural feasibility studies on eCook commissioned by DfID (UK Aid) through the CEIL-PEAKS Evidence on Demand service and implemented by Gamos Ltd., Loughborough University and University of Surrey.
o The key FINAL REPORTS can be found here. • Conceptual development, stakeholder engagement & prototyping in Kenya & Bangladesh during
the “Low cost energy-efficient products for the bottom of the pyramid” project from the USES programme funded by DfID (UK Aid), EPSRC & DECC (now part of BEIS) & implemented by University of Sussex, Gamos Ltd., ACTS (Kenya), ITT & UIU (Bangladesh).
o The key PRELIMINARY RESULTS (Q1 2019) can be found here. • A series of global & local market assessments in Myanmar, Zambia and Tanzania under the
“eCook - a transformational household solar battery-electric cooker for poverty alleviation” project funded by DfID (UK Aid) & Gamos Ltd. through Innovate UK’s Energy Catalyst Round 4, implemented by Loughborough University, University of Surrey, Gamos Ltd., REAM (Myanmar), CEEEZ (Zambia) & TaTEDO (Tanzania).
o The key PRELIMINARY RESULTS (Q1 2019) can be found here. • At time of publication (Q1 2019), a new DfID (UK Aid) funded research programme ‘Modern
Energy Cooking Services’ (MECS) lead by Prof. Ed Brown at Loughborough University is just beginning and will take forward these ideas & collaborations.
This data and material have been funded by UK AID from the UK government; however, the views
expressed do not necessarily reflect the UK government’s official policies.
eCook Zambia Cooking Diaries | October 2019 Working Paper
[email protected] | PV-ecook.org
This research is funded by DfID/UK Aid and Gamos through the Innovate UK Energy Catalyst and the MECS programme.
89
6.1.4 About the Modern Energy Cooking Services (MECS) Programme.
Sparking a cooking revolution: catalysing Africa’s transition to clean electric/gas cooking.
www.mecs.org.uk | [email protected]
Modern Energy Cooking Services (MECS) is a five-year research and innovation programme funded by
UK Aid (DFID). MECS hopes to leverage investment in renewable energies (both grid and off-grid) to
address the clean cooking challenge by integrating modern energy cooking services into the planning for
access to affordable, reliable and sustainable electricity.
Existing strategies are struggling to solve the problem of unsustainable, unhealthy but enduring cooking
practices which place a particular burden on women. After decades of investments in improving
biomass cooking, focused largely on increasing the efficiency of biomass use in domestic stoves, the
technologies developed are said to have had limited impact on development outcomes. The Modern
Energy Cooking Services (MECS) programme aims to break out of this “business-as-usual” cycle by
investigating how to rapidly accelerate a transition from biomass to genuinely ‘clean’ cooking (i.e. with
electricity or gas).
Worldwide, nearly three billion people rely on traditional solid fuels (such as wood or coal) and
technologies for cooking and heating13. This has severe implications for health, gender relations,
economic livelihoods, environmental quality and global and local climates. According to the World
Health Organization (WHO), household air pollution from cooking with traditional solid fuels causes to
3.8 million premature deaths every year – more than HIV, malaria and tuberculosis combined14. Women
and children are disproportionally affected by health impacts and bear much of the burden of collecting
firewood or other traditional fuels.
Greenhouse gas emissions from non-renewable wood fuels alone total a gigaton of CO2e per year (1.9-
2.3% of global emissions)15. The short-lived climate pollutant black carbon, which results from
incomplete combustion, is estimated to contribute the equivalent of 25 to 50 percent of carbon dioxide
13 http://www.who.int/indoorair/health_impacts/he_database/en/
14 https://www.who.int/en/news-room/fact-sheets/detail/household-air-pollution-and-health https://www.who.int/gho/hiv/epidemic_status/deaths_text/en/, https://www.who.int/en/news-room/fact-
sheets/detail/malaria, https://www.who.int/en/news-room/fact-sheets/detail/tuberculosis
15 Nature Climate Change 5, 266–272 (2015) doi:10.1038/nclimate2491
eCook Zambia Cooking Diaries | October 2019 Working Paper
[email protected] | PV-ecook.org
This research is funded by DfID/UK Aid and Gamos through the Innovate UK Energy Catalyst and the MECS programme.
90
warming globally – residential solid fuel burning accounts for up to 25 percent of global black carbon
emissions16. Up to 34% of woodfuel harvested is unsustainable, contributing to climate change and local
forest degradation. In addition, approximately 275 million people live in woodfuel depletion ‘hotspots’ –
concentrated in South Asia and East Africa – where most demand is unsustainable17.
Africa’s cities are growing – another Nigeria will be added to the continent’s total urban population by
202518 which is set to double in size over the next 25 years, reaching 1 billion people by 2040. Within
urban and peri-urban locations, much of Sub Saharan Africa continues to use purchased traditional
biomass and kerosene for their cooking. Liquid Petroleum Gas (LPG) has achieved some penetration
within urban conurbations, however, the supply chain is often weak resulting in strategies of fuel
stacking with traditional fuels. Even where electricity is used for lighting and other amenities, it is rarely
used for cooking (with the exception of South Africa). The same is true for parts of Asia and Latin
America. Global commitments to rapidly increasing access to reliable and quality modern energy need
to much more explicitly include cooking services or else household and localized pollution will continue
to significantly erode the well-being of communities.
Where traditional biomass fuels are used, either collected in rural areas or purchased in peri urban and
urban conurbations, they are a significant economic burden on households either in the form of time or
expenditure. The McKinsey Global Institute outlines that much of women’s unpaid work hours are
spent on fuel collection and cooking19. The report shows that if the global gender gap embodied in such
activities were to be closed, as much as $28 trillion, or 26 percent, could be added to the global annual
GDP in 2025. Access to modern energy services for cooking could redress some of this imbalance by
releasing women’s time into the labour market.
16 http://cleancookstoves.org/impact-areas/environment/
17 Nature Climate Change 5, 266–272 (2015) doi:10.1038/nclimate2491
18 https://openknowledge.worldbank.org/handle/10986/25896
19 McKinsey Global Institute. The Power of Parity: How Advancing Women’s Equality can add $12 Trillion to Global
Growth; McKinsey Global Institute: New York, NY, USA, 2015.
eCook Zambia Cooking Diaries | October 2019 Working Paper
[email protected] | PV-ecook.org
This research is funded by DfID/UK Aid and Gamos through the Innovate UK Energy Catalyst and the MECS programme.
91
To address this global issue and increase access to clean cooking services on a large scale, investment
needs are estimated to be at least US$4.4 billion annually20. Despite some improvements in recent
years, this cross-cutting sector continues to struggle to reach scale and remains the least likely SE4All
target to be achieved by 203021, hindering the achievement of the UN’s Sustainable Development Goal
(SDG) 7 on access to affordable, reliable, sustainable and modern energy for all.
Against this backdrop, MECS draws on the UK’s world-leading universities and innovators with the aim
of sparking a revolution in this sector. A key driver is the cost trajectories that show that cooking with
(clean, renewable) electricity has the potential to reach a price point of affordability with associated
reliability and sustainability within a few years, which will open completely new possibilities and
markets. Beyond the technologies, by engaging with the World Bank (ESMAP), MECS will also identify
and generate evidence on other drivers for transition including understanding and optimisation of multi-
fuel use (fuel stacking); cooking demand and behaviour change; and establishing the evidence base to
support policy enabling environments that can underpin a pathway to scale and support well
understood markets and enterprises.
The five-year programme combines creating a stronger evidence base for transitions to modern energy
cooking services in DFID priority countries with socio-economic technological innovations that will drive
the transition forward. It is managed as an integrated whole; however, the programme is contracted
via two complementary workstream arrangements as follows:
• An Accountable Grant with Loughborough University (LU) as leader of the UK University Partnership.
• An amendment to the existing Administrative Arrangement underlying DFID’s contribution to the ESMAP Trust Fund managed by the World Bank.
The intended outcome of MECS is a market-ready range of innovations (technology and business
models) which lead to improved choice of affordable and reliable modern energy cooking services for
20 The SE4ALL Global Tracking Report shows that the investment needed for universal access to modern
cooking (not including heating) by 2030 is about $4.4 billion annually. In 2012 investment was in cooking
was just $0.1 billion. Progress toward Sustainable Energy: Global Tracking Report 2015, World Bank.
21 The 2017 SE4All Global Tracking Framework Report laments that, “Relative to electricity, only a small
handful of countries are showing encouraging progress on access to clean cooking, most notably
Indonesia, as well as Peru and Vietnam.”
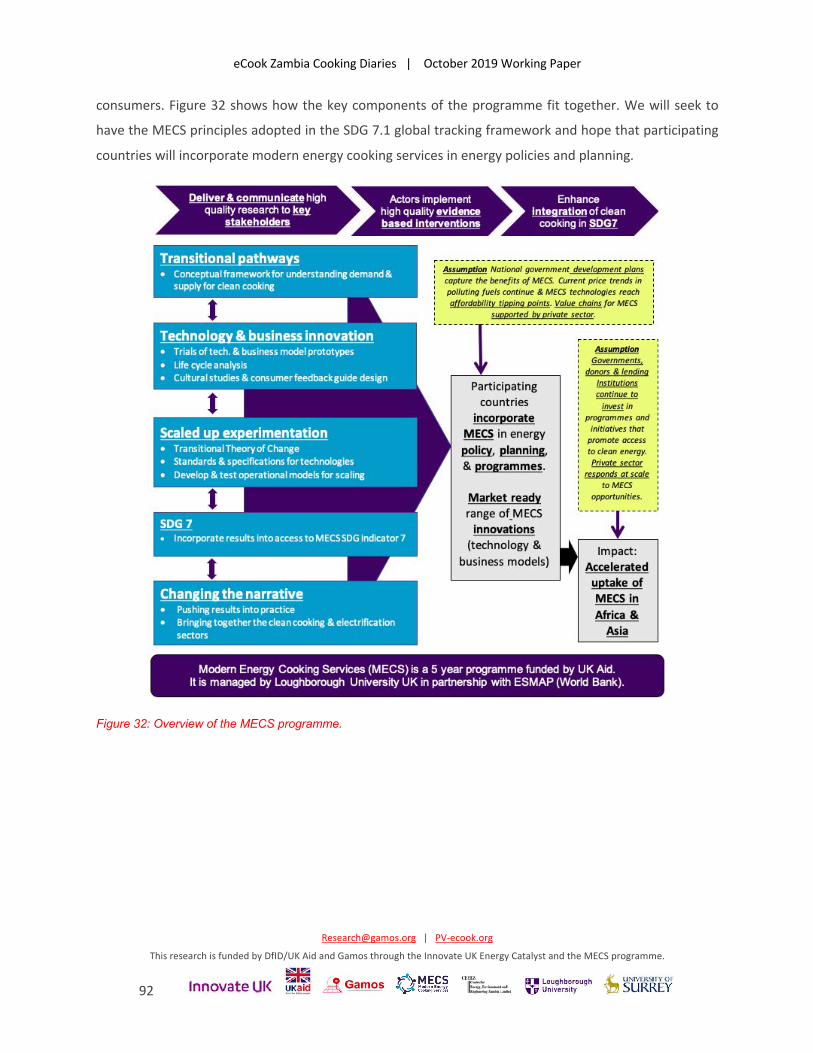
eCook Zambia Cooking Diaries | October 2019 Working Paper
[email protected] | PV-ecook.org
This research is funded by DfID/UK Aid and Gamos through the Innovate UK Energy Catalyst and the MECS programme.
92
consumers. Figure 32 shows how the key components of the programme fit together. We will seek to
have the MECS principles adopted in the SDG 7.1 global tracking framework and hope that participating
countries will incorporate modern energy cooking services in energy policies and planning.
Figure 32: Overview of the MECS programme.
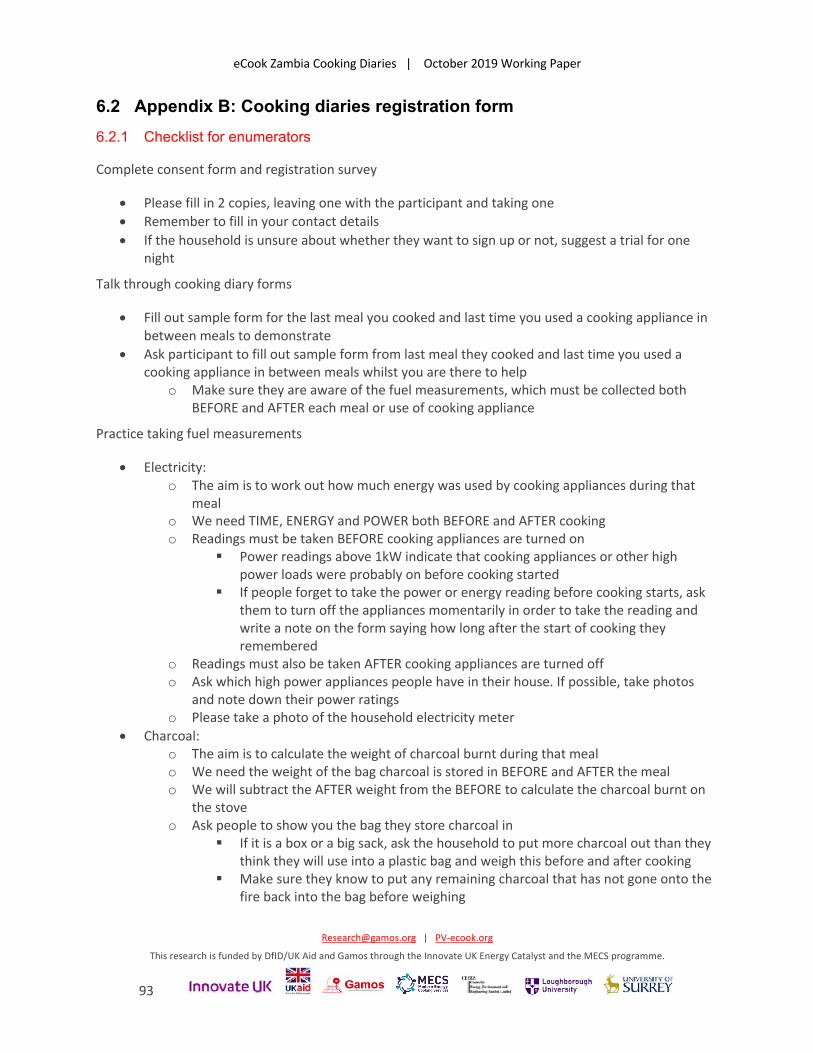
eCook Zambia Cooking Diaries | October 2019 Working Paper
[email protected] | PV-ecook.org
This research is funded by DfID/UK Aid and Gamos through the Innovate UK Energy Catalyst and the MECS programme.
93
6.2 Appendix B: Cooking diaries registration form 6.2.1 Checklist for enumerators
Complete consent form and registration survey
• Please fill in 2 copies, leaving one with the participant and taking one • Remember to fill in your contact details • If the household is unsure about whether they want to sign up or not, suggest a trial for one
night
Talk through cooking diary forms
• Fill out sample form for the last meal you cooked and last time you used a cooking appliance in between meals to demonstrate
• Ask participant to fill out sample form from last meal they cooked and last time you used a cooking appliance in between meals whilst you are there to help
o Make sure they are aware of the fuel measurements, which must be collected both BEFORE and AFTER each meal or use of cooking appliance
Practice taking fuel measurements
• Electricity: o The aim is to work out how much energy was used by cooking appliances during that
meal o We need TIME, ENERGY and POWER both BEFORE and AFTER cooking o Readings must be taken BEFORE cooking appliances are turned on
§ Power readings above 1kW indicate that cooking appliances or other high power loads were probably on before cooking started
§ If people forget to take the power or energy reading before cooking starts, ask them to turn off the appliances momentarily in order to take the reading and write a note on the form saying how long after the start of cooking they remembered
o Readings must also be taken AFTER cooking appliances are turned off o Ask which high power appliances people have in their house. If possible, take photos
and note down their power ratings o Please take a photo of the household electricity meter
• Charcoal: o The aim is to calculate the weight of charcoal burnt during that meal o We need the weight of the bag charcoal is stored in BEFORE and AFTER the meal o We will subtract the AFTER weight from the BEFORE to calculate the charcoal burnt on
the stove o Ask people to show you the bag they store charcoal in
§ If it is a box or a big sack, ask the household to put more charcoal out than they think they will use into a plastic bag and weigh this before and after cooking
§ Make sure they know to put any remaining charcoal that has not gone onto the fire back into the bag before weighing
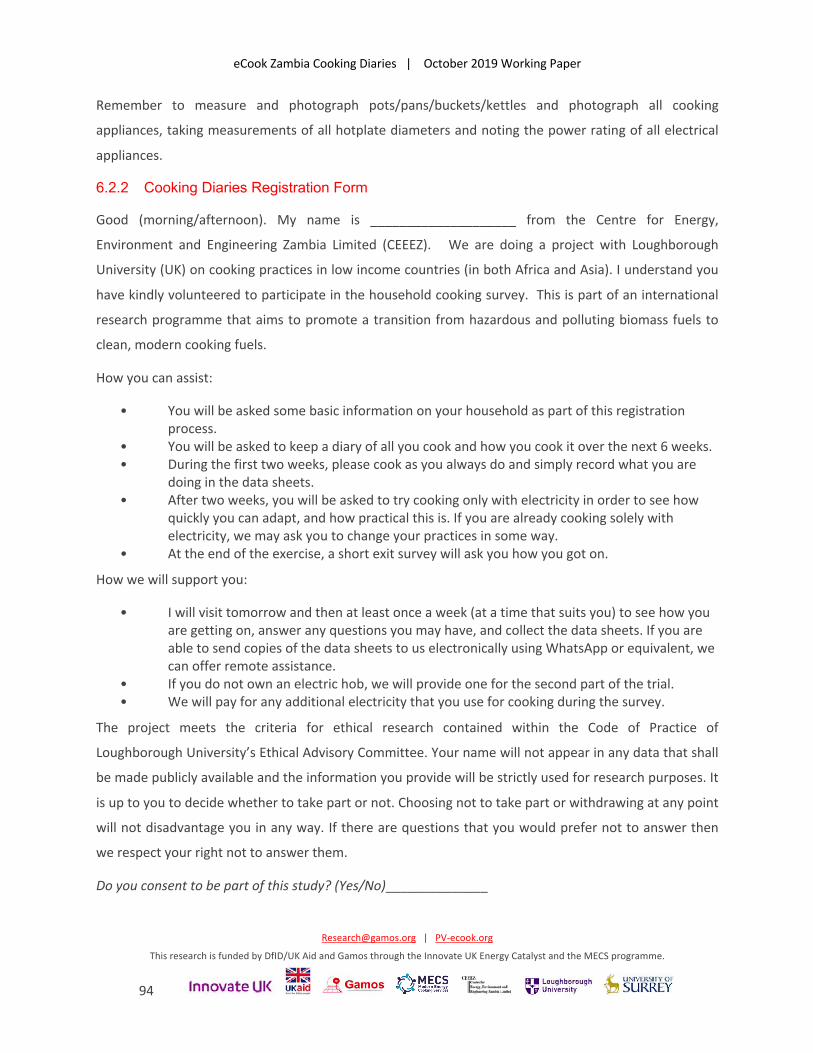
eCook Zambia Cooking Diaries | October 2019 Working Paper
[email protected] | PV-ecook.org
This research is funded by DfID/UK Aid and Gamos through the Innovate UK Energy Catalyst and the MECS programme.
94
Remember to measure and photograph pots/pans/buckets/kettles and photograph all cooking
appliances, taking measurements of all hotplate diameters and noting the power rating of all electrical
appliances.
6.2.2 Cooking Diaries Registration Form
Good (morning/afternoon). My name is ____________________ from the Centre for Energy,
Environment and Engineering Zambia Limited (CEEEZ). We are doing a project with Loughborough
University (UK) on cooking practices in low income countries (in both Africa and Asia). I understand you
have kindly volunteered to participate in the household cooking survey. This is part of an international
research programme that aims to promote a transition from hazardous and polluting biomass fuels to
clean, modern cooking fuels.
How you can assist:
• You will be asked some basic information on your household as part of this registration process.
• You will be asked to keep a diary of all you cook and how you cook it over the next 6 weeks. • During the first two weeks, please cook as you always do and simply record what you are
doing in the data sheets. • After two weeks, you will be asked to try cooking only with electricity in order to see how
quickly you can adapt, and how practical this is. If you are already cooking solely with electricity, we may ask you to change your practices in some way.
• At the end of the exercise, a short exit survey will ask you how you got on.
How we will support you:
• I will visit tomorrow and then at least once a week (at a time that suits you) to see how you are getting on, answer any questions you may have, and collect the data sheets. If you are able to send copies of the data sheets to us electronically using WhatsApp or equivalent, we can offer remote assistance.
• If you do not own an electric hob, we will provide one for the second part of the trial. • We will pay for any additional electricity that you use for cooking during the survey.
The project meets the criteria for ethical research contained within the Code of Practice of
Loughborough University’s Ethical Advisory Committee. Your name will not appear in any data that shall
be made publicly available and the information you provide will be strictly used for research purposes. It
is up to you to decide whether to take part or not. Choosing not to take part or withdrawing at any point
will not disadvantage you in any way. If there are questions that you would prefer not to answer then
we respect your right not to answer them.
Do you consent to be part of this study? (Yes/No)______________

eCook Zambia Cooking Diaries | October 2019 Working Paper
[email protected] | PV-ecook.org
This research is funded by DfID/UK Aid and Gamos through the Innovate UK Energy Catalyst and the MECS programme.
95
We will produce reports, guidance materials and academic papers detailing the findings from the
research, which will be used to inform manufacturers and policy-makers in Zambia, Africa, and globally.
Do you consent to any photos taken during the course of this study being used in such publications?
(Yes/No) ______________
Name: __________________________ Signature: _____________ Contact No.: _____________
Date: ______________ Location:_____________
Enumerator to give the participant details of who to contact with queries (or complaints).
Enumerator name: _____________ Enumerator phone number: _____________
DETAILS OF PARTICIPANT
1. Name of participant:……………………………………………………………….. 2. Age:………………………………. 3. Gender: c Male c Female c Other 4. What is the highest level of school you have attended?
c None c Incomplete primary c Completed primary c Incomplete secondary c Completed
secondary c Higher than secondary
INFORMATION ON YOUR HOUSEHOLD
5. Type of area:
c Urban c Peri-urban c Rural
6. How many people live in the household? ______________ 7. How many rooms in the dwelling? _______________ 8. Type of dwelling (options to be edited to suit country context):
c Compound house c Flat/apartment c Semi-detatched house c Separate house
9. Construction a. Walls
c Wood / mud / thatch c Mud bricks (traditional) c Corrugated iron sheet c Cement
block (plastered or unplastered) c Bricks (burnt) c Other………………………………………….
b. Roof
c Thatch/palm leaf c Wood c Corrugated iron / cement sheet c Cement c Tiles
c Other
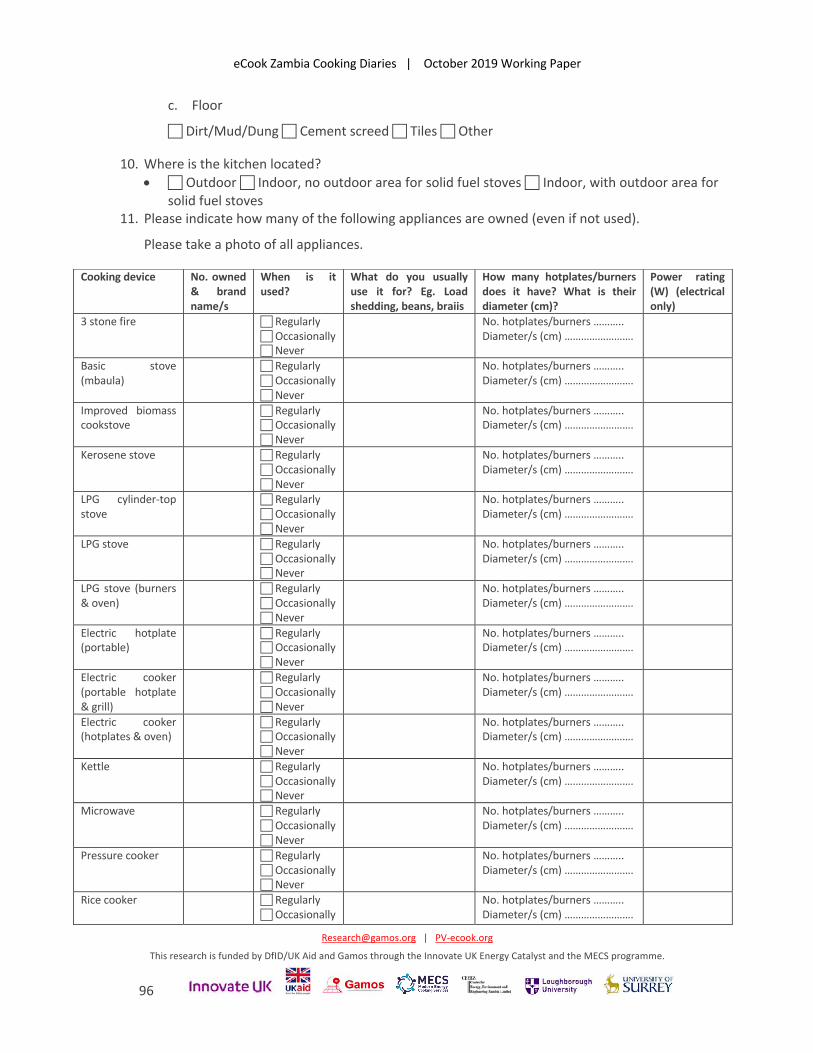
eCook Zambia Cooking Diaries | October 2019 Working Paper
[email protected] | PV-ecook.org
This research is funded by DfID/UK Aid and Gamos through the Innovate UK Energy Catalyst and the MECS programme.
96
c. Floor
c Dirt/Mud/Dung c Cement screed c Tiles c Other
10. Where is the kitchen located? • c Outdoor c Indoor, no outdoor area for solid fuel stoves c Indoor, with outdoor area for
solid fuel stoves 11. Please indicate how many of the following appliances are owned (even if not used).
Please take a photo of all appliances.
Cooking device No. owned & brand name/s
When is it used?
What do you usually use it for? Eg. Load shedding, beans, braiis
How many hotplates/burners does it have? What is their diameter (cm)?
Power rating (W) (electrical only)
3 stone fire c Regularly c Occasionally c Never
No. hotplates/burners ……….. Diameter/s (cm) …………………….
Basic stove (mbaula)
c Regularly c Occasionally c Never
No. hotplates/burners ……….. Diameter/s (cm) …………………….
Improved biomass cookstove
c Regularly c Occasionally c Never
No. hotplates/burners ……….. Diameter/s (cm) …………………….
Kerosene stove c Regularly c Occasionally c Never
No. hotplates/burners ……….. Diameter/s (cm) …………………….
LPG cylinder-top stove
c Regularly c Occasionally c Never
No. hotplates/burners ……….. Diameter/s (cm) …………………….
LPG stove c Regularly c Occasionally c Never
No. hotplates/burners ……….. Diameter/s (cm) …………………….
LPG stove (burners & oven)
c Regularly c Occasionally c Never
No. hotplates/burners ……….. Diameter/s (cm) …………………….
Electric hotplate (portable)
c Regularly c Occasionally c Never
No. hotplates/burners ……….. Diameter/s (cm) …………………….
Electric cooker (portable hotplate & grill)
c Regularly c Occasionally c Never
No. hotplates/burners ……….. Diameter/s (cm) …………………….
Electric cooker (hotplates & oven)
c Regularly c Occasionally c Never
No. hotplates/burners ……….. Diameter/s (cm) …………………….
Kettle c Regularly c Occasionally c Never
No. hotplates/burners ……….. Diameter/s (cm) …………………….
Microwave c Regularly c Occasionally c Never
No. hotplates/burners ……….. Diameter/s (cm) …………………….
Pressure cooker c Regularly c Occasionally c Never
No. hotplates/burners ……….. Diameter/s (cm) …………………….
Rice cooker c Regularly c Occasionally
No. hotplates/burners ……….. Diameter/s (cm) …………………….
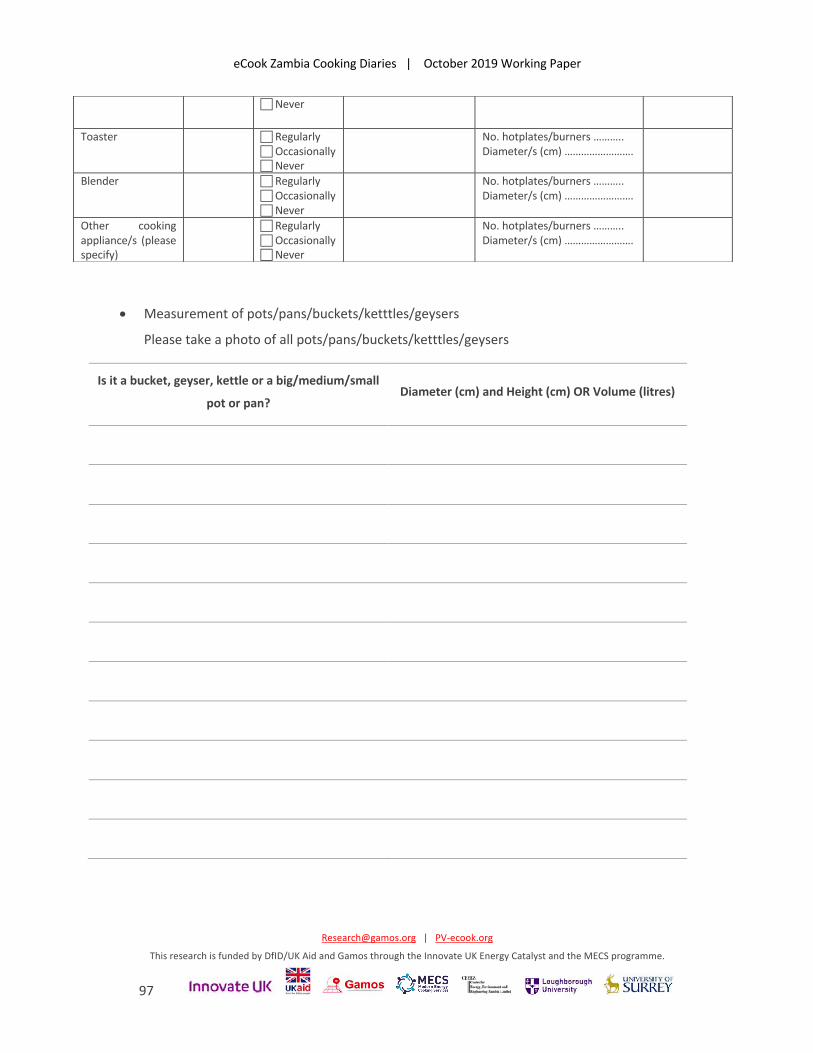
eCook Zambia Cooking Diaries | October 2019 Working Paper
[email protected] | PV-ecook.org
This research is funded by DfID/UK Aid and Gamos through the Innovate UK Energy Catalyst and the MECS programme.
97
• Measurement of pots/pans/buckets/ketttles/geysers
Please take a photo of all pots/pans/buckets/ketttles/geysers
Is it a bucket, geyser, kettle or a big/medium/small
pot or pan? Diameter (cm) and Height (cm) OR Volume (litres)
c Never
Toaster c Regularly c Occasionally c Never
No. hotplates/burners ……….. Diameter/s (cm) …………………….
Blender c Regularly c Occasionally c Never
No. hotplates/burners ……….. Diameter/s (cm) …………………….
Other cooking appliance/s (please specify)
c Regularly c Occasionally c Never
No. hotplates/burners ……….. Diameter/s (cm) …………………….
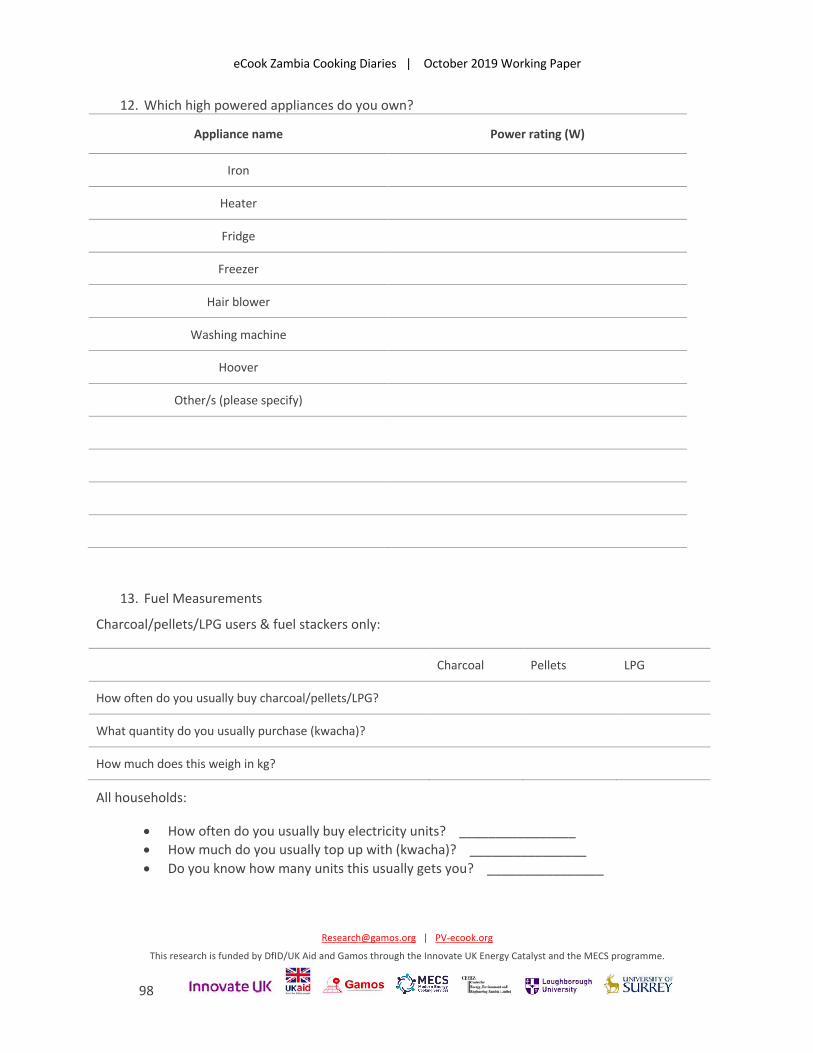
eCook Zambia Cooking Diaries | October 2019 Working Paper
[email protected] | PV-ecook.org
This research is funded by DfID/UK Aid and Gamos through the Innovate UK Energy Catalyst and the MECS programme.
98
12. Which high powered appliances do you own?
Appliance name Power rating (W)
Iron
Heater
Fridge
Freezer
Hair blower
Washing machine
Hoover
Other/s (please specify)
13. Fuel Measurements
Charcoal/pellets/LPG users & fuel stackers only:
Charcoal Pellets LPG
How often do you usually buy charcoal/pellets/LPG?
What quantity do you usually purchase (kwacha)?
How much does this weigh in kg?
All households:
• How often do you usually buy electricity units? ________________ • How much do you usually top up with (kwacha)? ________________ • Do you know how many units this usually gets you? ________________
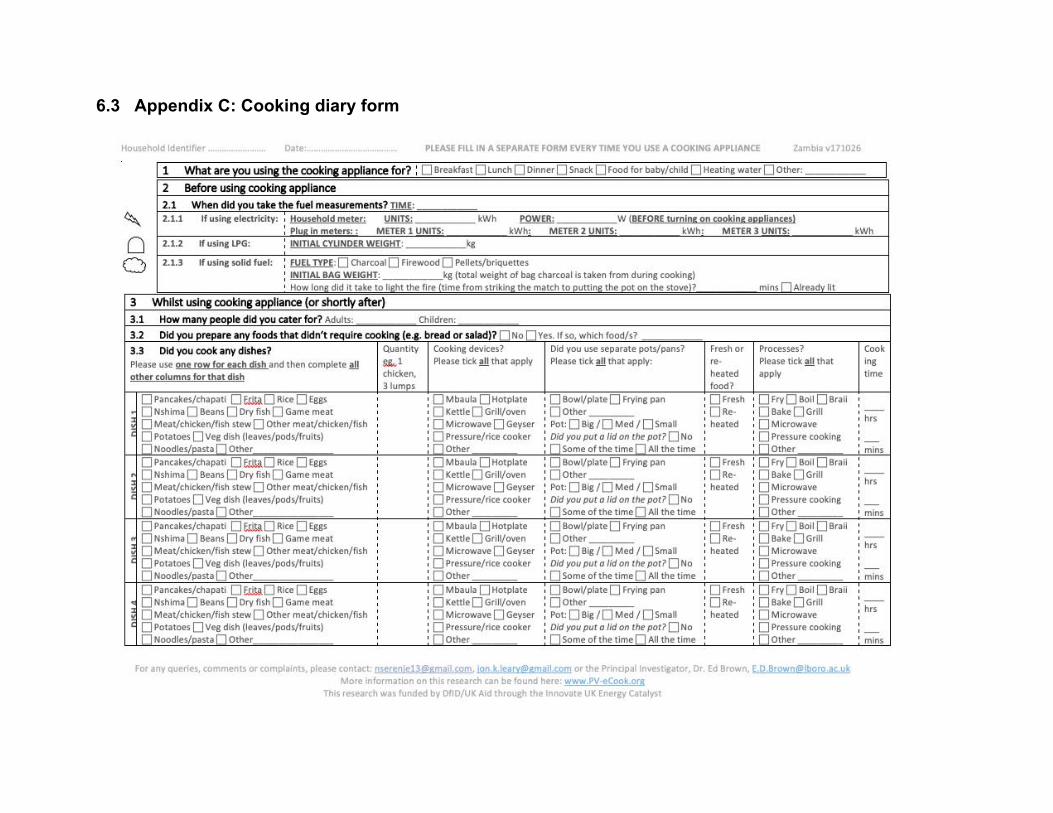
6.3 Appendix C: Cooking diary form
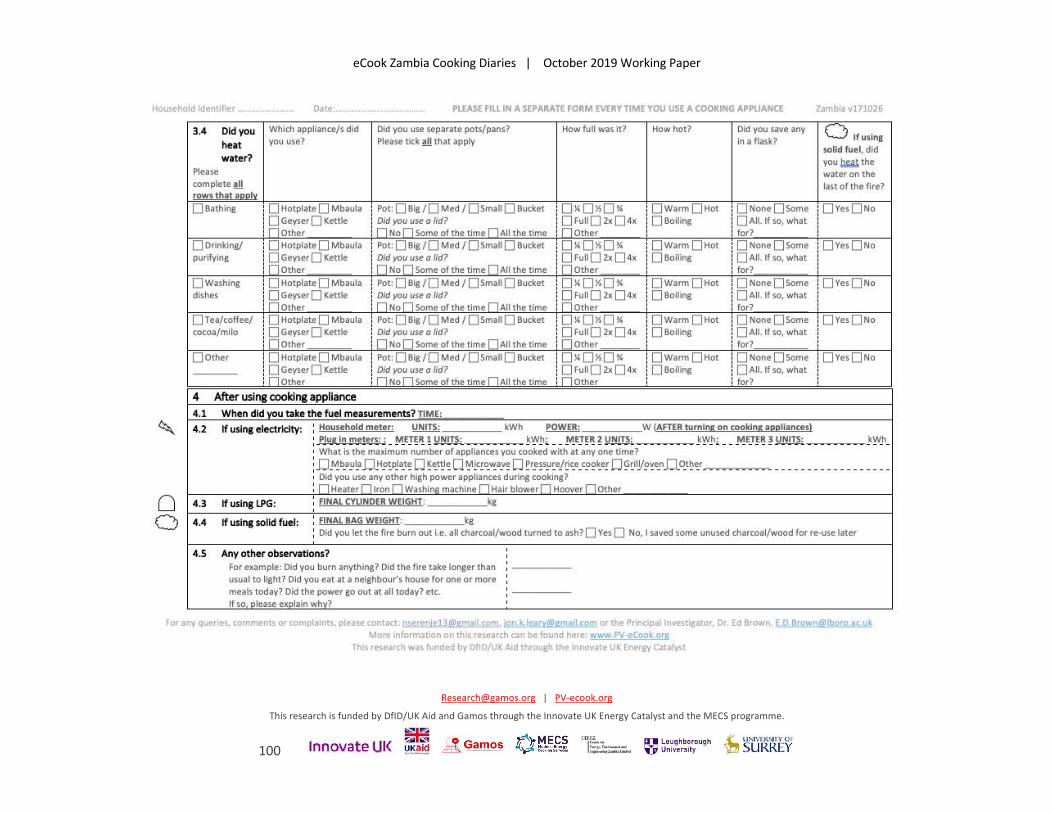
eCook Zambia Cooking Diaries | October 2019 Working Paper
[email protected] | PV-ecook.org
This research is funded by DfID/UK Aid and Gamos through the Innovate UK Energy Catalyst and the MECS programme.
100
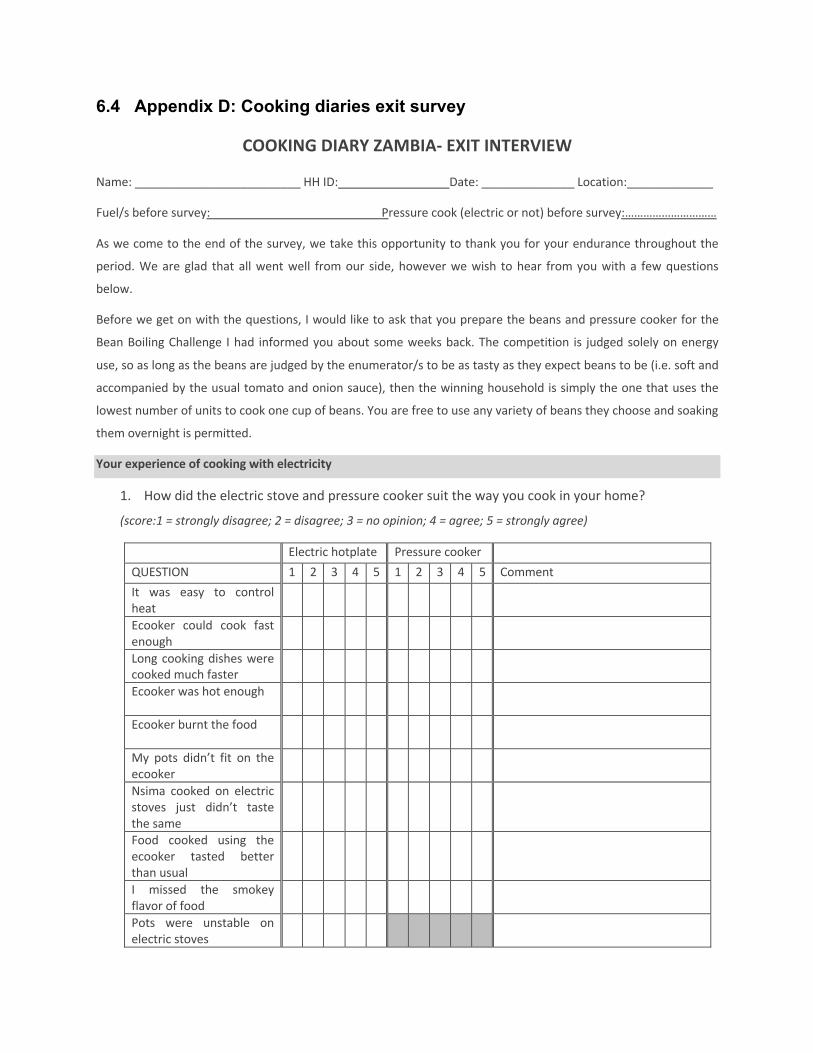
6.4 Appendix D: Cooking diaries exit survey
COOKING DIARY ZAMBIA- EXIT INTERVIEW
Name: _________________________ HH ID: Date: ______________ Location:_____________
Fuel/s before survey: Pressure cook (electric or not) before survey:…………………………
As we come to the end of the survey, we take this opportunity to thank you for your endurance throughout the
period. We are glad that all went well from our side, however we wish to hear from you with a few questions
below.
Before we get on with the questions, I would like to ask that you prepare the beans and pressure cooker for the
Bean Boiling Challenge I had informed you about some weeks back. The competition is judged solely on energy
use, so as long as the beans are judged by the enumerator/s to be as tasty as they expect beans to be (i.e. soft and
accompanied by the usual tomato and onion sauce), then the winning household is simply the one that uses the
lowest number of units to cook one cup of beans. You are free to use any variety of beans they choose and soaking
them overnight is permitted.
Your experience of cooking with electricity
1. How did the electric stove and pressure cooker suit the way you cook in your home?
(score:1 = strongly disagree; 2 = disagree; 3 = no opinion; 4 = agree; 5 = strongly agree)
Electric hotplate Pressure cooker QUESTION 1 2 3 4 5 1 2 3 4 5 Comment It was easy to control heat
Ecooker could cook fast enough
Long cooking dishes were cooked much faster
Ecooker was hot enough
Ecooker burnt the food
My pots didn’t fit on the ecooker
Nsima cooked on electric stoves just didn’t taste the same
Food cooked using the ecooker tasted better than usual
I missed the smokey flavor of food
Pots were unstable on electric stoves
eCook Zambia Cooking Diaries | October 2019 Working Paper
[email protected] | PV-ecook.org
This research is funded by DfID/UK Aid and Gamos through the Innovate UK Energy Catalyst and the MECS programme.
102
The ecooker didn’t make the pots dirty
The ecooker looked good in my kitchen
There is nowhere to put the ecooker
Operating the ecooker was easy
Ecooker was safe to use I prefer to use an electric kettle for water boiling
1. How many hobs (rings) do you need for cooking?
[ ] 1 [ ] 2 [ ] 3 [ ] 4 3. What were the best things about cooking with electricity?
……………………………………………………………………………………………………………………………………………………………………………
……………………………………………………………………………………………………………………………………………………………………………
……………………………………………………………………………………………………………………………………………………………………………
…………………………………………………………………………………………………………………………………………………………………………..
4. And what were the worst things about cooking with electricity?
……………………………………………………………………………………………………………………………………………………………………………
……………………………………………………………………………………………………………………………………………………………………………
……………………………………………………………………………………………………………………………………………………………………………
…………………………………………………………………………………………………………………………………………………………………………..
5. What do you like most about cooking with charcoal?
……………………………………………………………………………………………………………………………………………………………………………
……………………………………………………………………………………………………………………………………………………………………………
……………………………………………………………………………………………………………………………………………………………………………
…………………………………………………………………………………………………………………………………………………………………………..
6. What do you like most about cooking with LPG?
……………………………………………………………………………………………………………………………………………………………………………
……………………………………………………………………………………………………………………………………………………………………………
……………………………………………………………………………………………………………………………………………………………………………
…………………………………………………………………………………………………………………………………………………………………………..
7. What are the best things about not cooking with charcoal?
……………………………………………………………………………………………………………………………………………………………………………
……………………………………………………………………………………………………………………………………………………………………………
eCook Zambia Cooking Diaries | October 2019 Working Paper
[email protected] | PV-ecook.org
This research is funded by DfID/UK Aid and Gamos through the Innovate UK Energy Catalyst and the MECS programme.
103
……………………………………………………………………………………………………………………………………………………………………………
…………………………………………………………………………………………………………………………………………………………………………..
8. What are the best things about not cooking with LPG?
……………………………………………………………………………………………………………………………………………………………………………
……………………………………………………………………………………………………………………………………………………………………………
……………………………………………………………………………………………………………………………………………………………………………
…………………………………………………………………………………………………………………………………………………………………………..
9. Did you change your cooking behavior? If yes, how and why? …………………………………………………………………………………………………………………………………………………………………………………………………………………………………………………………………………………………………………………………………………………………………………………………………………………………………………………………………………………………………………………………………………………………………………………………………………………………………………………………………………………………….. 2.
Your feeling about cooking with electricity in comparison to other fuels
10. Do you think electric cooking is affordable? ………………………………………………………………………………………………………………………………………………………………………………………………………………………………………………………………………………………………………………………………………………………………………………………………………………………………………………………………………………………………………………………………………………………………………………………………………………………………………………………………………………………………
11. Do you think cooking with electricity is cheaper or more expensive than cooking with the fuels you normally use?
……………………………………………………………………………………………………………………………………………………………………………
……………………………………………………………………………………………………………………………………………………………………………
……………………………………………………………………………………………………………………………………………………………………………
……………………………………………………………………………………………………………………………………………………………………………
12. Were there times when the electricity was off and you wanted to cook or heat water? If so, what did you do?
………………………………………………………………………………………………………………………………………………………………………
………………………………………………………………………………………………………………………………………………………………………
………………………………………………………………………………………………………………………………………………………………………
………………………………………………………………………………………………………………………………………………………………………
13. Do you feel that cooking with the electric cooker is safer or more dangerous than cooking with your normal stove, and why? (e.g. risk of fires, burns)
Electric hotplate ……………..…………………………………………………………………………………………………………………………………. ……………………………………………………………………………………………………………………………………………………………………………
Pressure cooker…………………………………………………………………………………………………………………………………………………. ……………………………………………………………………………………………………………………………………………………………………………

eCook Zambia Cooking Diaries | October 2019 Working Paper
[email protected] | PV-ecook.org
This research is funded by DfID/UK Aid and Gamos through the Innovate UK Energy Catalyst and the MECS programme.
104
14. How easy is it to learn to cook on an electric stove?
Electric hotplate ……………..…………………………………………………………………………………………………………………………………. ……………………………………………………………………………………………………………………………………………………………………………
Pressure cooker…………………………………………………………………………………………………………………………………………………. ……………………………………………………………………………………………………………………………………………………………………………
15. Would people need training on how to use an electric cooker and pressure cooker, or would they be able to learn by themselves?
Electric hotplate ……………..…………………………………………………………………………………………………………………………………. ……………………………………………………………………………………………………………………………………………………………………………
Pressure cooker…………………………………………………………………………………………………………………………………………………. ……………………………………………………………………………………………………………………………………………………………………………
16. Would you ever cook using only electricity and no other fuels - and explain why?
……………………………………………………………………………………………………………………………………………………………………………
……………………………………………………………………………………………………………………………………………………………………………
……………………………………………………………………………………………………………………………………………………………………………
…………………………………………………………………………………………………………………………………………………………………………..
17. What would you change about the design of the electric stoves you have been using?
Electric hotplate ……………..…………………………………………………………………………………………………………………………………. ……………………………………………………………………………………………………………………………………………………………………………
Pressure cooker…………………………………………………………………………………………………………………………………………………. ……………………………………………………………………………………………………………………………………………………………………………
18. We are done with our survey and are leaving the cookers with you. Will you continue using the e-cookers or will you switch back to your old stove?
Electric hotplate ……………..…………………………………………………………………………………………………………………………………. ……………………………………………………………………………………………………………………………………………………………………………
Pressure cooker………………………………………………………………………………………………………………………………………………….
……………………………………………………………………………………………………………………………………………………………………………
19. We are not going to ask you to pay for the cooker. Would you buy this cooker if you saw one in a shop now? If so, how much would you be prepared to pay for this cooker (Zambian Kwacha)?
Electric hotplate ……………..…………………………………………………………………………………………………………………………………. ……………………………………………………………………………………………………………………………………………………………………………
Pressure cooker………………………………………………………………………………………………………………………………………………….
……………………………………………………………………………………………………………………………………………………………………………
Missing data
We have tried our best to learn as much as we can about how you cook, but we appreciate that the
tools we are using are limited. Please help us to understand what we may have missed.
eCook Zambia Cooking Diaries | October 2019 Working Paper
[email protected] | PV-ecook.org
This research is funded by DfID/UK Aid and Gamos through the Innovate UK Energy Catalyst and the MECS programme.
105
20. Are there any meals that were cooked in your household since the beginning of the study that were not recorded on the forms you have given to us?
……………………………………………………………………………………………………………………………………………………………………………
……………………………………………………………………………………………………………………………………………………………………………
……………………………………………………………………………………………………………………………………………………………………………
…………………………………………………………………………………………………………………………………………………………………………..
21. Is there anything else that you think is important about the way you cook that we have not yet captured?
……………………………………………………………………………………………………………………………………………………………………………
……………………………………………………………………………………………………………………………………………………………………………
……………………………………………………………………………………………………………………………………………………………………………
…………………………………………………………………………………………………………………………………………………………………………..
How you feel about the survey
22. In the table below, tick where appropriate, where 1 is the lowest and 5 being the highest
QUESTION 1(Low) 2 3 4 5(High)
Overall cooking survey
Choice of appliance to trial (hotplate)
Choice of appliance to trial (pressure cooker)
Training on how to use electric hotplate
Training on how to use pressure cooker
Relevance of questions
Duration of survey
23. When you were approached to be part of the electric cooking survey were you hesitant? Has it been different to what you expected? ……………………………………………...……………………………………………………………………………………………...……………………………………………………………………………………...……………………………………………………………………………………………………………………………………………………………………………………………………………………………………………………………………………………………………………………………………………………………………………………………………………………………………………………..

eCook Zambia Cooking Diaries | October 2019 Working Paper
[email protected] | PV-ecook.org
This research is funded by DfID/UK Aid and Gamos through the Innovate UK Energy Catalyst and the MECS programme.
106
24. At the beginning of the e-cooking, what was your expectation and was it met? ……………………………………………………………………………………………..………………………………………………………………………………………………..………………………………………………………………………………………………..……………………………………………………………………………………………………………………………………………………………………………………………………………………………………………………………………………………………………………………………………………………………………………………………
25. What do you think we could have done better in the survey? ……………………………………………………………………………………………………………………………………………………………………………………………………………………………………………………………………………………………………………………………………………………………………………………………………………………………………………………………………………………………………………………………………………………………………………………………………………………………………………………………………………………………….
26. Were the enumerator’s visits helpful or did you feel it was too much or too little? 3. ……………………………………………………………………………………………………………………………………………………
………………………………………………………………………………………………………………………………………………………………………………………………………………………………………………………………………………………………………………………………………………………………………………………………………………………………………………………………………………………………………………………………
27. If we were to do another similar survey in the future would you be willing to be part of it? ……………………………………………………………………………………………………………………………………………………………
END OF QUESTIONS
Wait for the beans to be completed and then note down the total number of units used and the key energy saving tips the households used.
Total units used to cook one cup of beans with tomato and onion sauce: ________kWh
Energy saving techniques employed: 4. c Soaking overnight 5. c Choosing quicker cooking variety of beans 6. c Pressure cooking sauce as well as beans 7. c Using salt to soften the beans 8. c Correctly judging the cooking time, so avoiding depressurising and re-pressurising 9. c Using hot/warm water from the kettle that had been boiled for something else (if boiling the
kettle especially for the beans then this energy should be included in the total as its probably less efficient)
10. c Other/s. Please describe ______________________________________________________________________________
Thank the household for participating in the survey and the Bean Boiling Challenge. The Prize will be presented to the winner after all exit survey interviews have been completed.
Copyright © 2022 FDOKUMEN