Zambia - Social Protection
268
Zambia Social Protection Expenditure and Performance Review and Social Budget
-
Upload
khangminh22 -
Category
Documents
-
view
0 -
download
0
Transcript of Zambia - Social Protection
ZambiaSocial Protection Expenditure and Performance Review and Social Budget


Social Protection Expenditure and Performance Review and Social Budget
Zambia
Social Security DepartmentInternational Labour Offi ce – GenevaSeptember 2008 ILO / DFID / Zambia / R.22

Zambia. Social Protection Expenditure and Performance Review and Social Budget International Labour Offi ce, Social Security Department – Geneva: ILO, 2008viii, 265 p.
ISBN 978-92-2-121251-5 (print)ISBN 978-92-2-121252-2 (web pdf)
International Labour Offi ce; Social Security Department
Social protection / social security / scope of coverage / social expenditure / social security fi nancing / informal economy / poverty / trend / Zambia
02.03.1
ILO Cataloguing in Publication Data
Copyright © International Labour Organization 2008
First published 2008
Publications of the International Labour Offi ce enjoy copyright under Protocol 2 of the Universal Copyright Convention. Nevertheless, short excerpts from them may be reproduced without authorization, on condition that the source is indicated. For rights of reproduction or translation, application should be made to ILO Publi-cations (Rights and Permissions), International Labour Offi ce, CH-1211 Geneva 22, Switzerland, or by email: [email protected]. Th e International Labour Offi ce welcomes such applications.
Libraries, institutions and other users registered with reproduction rights organizations may make copies in accordance with the licences issued to them for this purpose. Visit www.ifrro.org to fi nd the reproduction rights organization in your country.
Th e designations employed in ILO publications, which are in conformity with United Nations practice, and the presentation of material therein do not imply the expression of any opinion whatsoever on the part of the Inter-national Labour Offi ce concerning the legal status of any country, area or territory or of its authorities, or con-cerning the delimitation of its frontiers.
Th e responsibility for opinions expressed in signed articles, studies and other contributions rests solely with their authors, and publication does not constitute an endorsement by the International Labour Offi ce of the opinions expressed in them.
Reference to names of fi rms and commercial products and processes does not imply their endorsement by the International Labour Offi ce, and any failure to mention a particular fi rm, commercial product or process is not a sign of disapproval.
ILO publications and electronic products can be obtained through major booksellers or ILO local offi ces in many countries, or direct from ILO Publications, International Labour Offi ce, CH-1211 Geneva 22, Switzer-land. Catalogues or lists of new publications are available free of charge from the above address, or by email: [email protected]
Visit our website: www.ilo.org/publns
Printed in Switzerland PAP / WEI / STA

This report is the Social Protection Expenditure and Performance Review (SPER) and Social Budget (SB) for Zambia. It focuses on fi ve key issues with respect to the objective of extending social protection coverage in the country:
☐ Living conditions of households with a focus on the overall situation of poverty and key vulnerable groups;
☐ Working conditions and prevailing patterns of informality in the labour market;
☐ Coverage and performance of existing public social protection interventions;
☐ Current resource allocations to social protection within the current fiscal environment;
☐ Future trends in the Zambian social budget
Th e analysis presented is a result of a joint eff ort between staff at the ILO Social Secu-rity Department in Geneva (Pauline Barrett-Reid, Florence Bonnet, Krzysztof Hage-mejer, Mirtha Muñiz, † Raphael Muturi, Amjad Rabi) and the fi eld offi ce in Lusaka (Adrian Shikwe, Urszula Lonc, John Angelini). Florence Bonnet not only prepared LCMS 2004 and LFS 2005 datasets for the analysis but also developed the method-ology and calculated the indicators of the degree of informality in the labour market. Nknadu Chilombo, Mubita Lubawelba and Felix Masiye prepared background ana-lytical reports and/or direct inputs to the main report. Christine Smith was responsible for editing the text and Irene Brown for typing and formatting. Special thanks go also to those at the Zambian Central Statistical Offi ce who originally worked on all the surveys used, and shared and discussed the methodological questions with us.
5


7
Abbreviations . . . . . . . . . . . . . . . . . . . . . . . . . . . . . . . . . . . . . . . . . 10
Introduction . . . . . . . . . . . . . . . . . . . . . . . . . . . . . . . . . . . . . . . . . 11
1. Overview of the demographic, economic and social environment 161.1 Demographic trends . . . . . . . . . . . . . . . . . . . . . . . . . . . . . . . . 161.2 Economic situation and labour market trends . . . . . . . . . . . . . . . . 21
1.2.1 Recent economic performance . . . . . . . . . . . . . . . . . . . . . . 211.2.2 Labour market trends . . . . . . . . . . . . . . . . . . . . . . . . . . 24
1.3 Household incomes and inequality . . . . . . . . . . . . . . . . . . . . . . 291.3.1 Composition of incomes . . . . . . . . . . . . . . . . . . . . . . . . . . 291.3.2 Distribution of incomes and inequality . . . . . . . . . . . . . . . . 31
1.4 Selected human development indicators . . . . . . . . . . . . . . . . . . . 32
2. The poor and the poorest: Living conditions and vulnerability . . . 362.1 Contemporary poverty . . . . . . . . . . . . . . . . . . . . . . . . . . . . . . 382.2 Trends in poverty: 1991-2006 . . . . . . . . . . . . . . . . . . . . . . . . . . 412.3 Living conditions of the poor . . . . . . . . . . . . . . . . . . . . . . . . . . 442.4 Vulnerability . . . . . . . . . . . . . . . . . . . . . . . . . . . . . . . . . . . . 482.5 Conclusions . . . . . . . . . . . . . . . . . . . . . . . . . . . . . . . . . . . . . 56
3. Degrees of informality: Prevailing patterns in the Zambian labour market and social security coverage . . . . . . . . . . . . . . . . . . . . . 583.1 How people work: Th e employment status of the population . . . . . . 603.2 Where people work: Employment by legal form of establishment . . . . 613.3 Paid employees . . . . . . . . . . . . . . . . . . . . . . . . . . . . . . . . . . . 633.4 Informality of employment . . . . . . . . . . . . . . . . . . . . . . . . . . . 643.5 Conclusions . . . . . . . . . . . . . . . . . . . . . . . . . . . . . . . . . . . . . 67
Contents

8 Zambia – Social Protection Expenditure and Performance Review and Social Budget
4. Social protection schemes . . . . . . . . . . . . . . . . . . . . . . . . . . . . 684.1 Contributory and other employment related schemes . . . . . . . . . . . 68
4.1.1 Th e National Pensions Scheme Authority (NAPSA) . . . . . . . . 704.1.2 Public Service Pension Fund (PSPF) . . . . . . . . . . . . . . . . . 754.1.3 Local Authorities Superannuation Fund (LASF) . . . . . . . . . . 774.1.4 Workers Compensation Fund Control Board . . . . . . . . . . . . 794.1.5 Comparison of selected characteristics of contributory
social security schemes . . . . . . . . . . . . . . . . . . . . . . . . . . . 814.1.6 Occupational pension schemes . . . . . . . . . . . . . . . . . . . . . . 854.1.7 Pension system regulation . . . . . . . . . . . . . . . . . . . . . . . . 854.1.8 Other employment-related benefi ts . . . . . . . . . . . . . . . . . . . 874.1.9 Extending coverage by contributory schemes
to uncovered informal-economy workers . . . . . . . . . . . . . . . . 894.1.10 Micro-insurance in zambia . . . . . . . . . . . . . . . . . . . . . . . 904.1.11 Conclusion . . . . . . . . . . . . . . . . . . . . . . . . . . . . . . . . . 91
4.2 Non-contributory programmes . . . . . . . . . . . . . . . . . . . . . . . . . 984.2.1 Introduction . . . . . . . . . . . . . . . . . . . . . . . . . . . . . . . . 984.2.2 Main characteristics of individual non-contributory programmes 1014.2.3 Conclusions: Opportunities and challenges to extend
social protection coverage . . . . . . . . . . . . . . . . . . . . . . . . . 1104.3 Zambia’s health system . . . . . . . . . . . . . . . . . . . . . . . . . . . . . . 111
4.3.1 Introduction . . . . . . . . . . . . . . . . . . . . . . . . . . . . . . . . 1114.3.2 Current distribution of health care resources . . . . . . . . . . . . . 1134.3.3 Structure of public-sector health care fi nancing and expenditure . . 1184.3.4 Coverage of health services . . . . . . . . . . . . . . . . . . . . . . . . 1254.3.5 Conclusions . . . . . . . . . . . . . . . . . . . . . . . . . . . . . . . . . 131
5. Government expenditure and Zambia’s Social Budget . . . . . . . . . 1325.1 Government expenditure . . . . . . . . . . . . . . . . . . . . . . . . . . . . . 1335.2 Development cooperation and Government fi scal space . . . . . . . . . . 1395.3 Zambia’s Social Budget: 2005 and 2006 . . . . . . . . . . . . . . . . . . . 142
5.3.1 Health . . . . . . . . . . . . . . . . . . . . . . . . . . . . . . . . . . . . 1445.3.2 Education . . . . . . . . . . . . . . . . . . . . . . . . . . . . . . . . . . 1455.3.3 Social security schemes . . . . . . . . . . . . . . . . . . . . . . . . . . 1455.3.4 Short-term and social assistance benefi ts . . . . . . . . . . . . . . . . 147
5.4 Challenges in the provision of social protection in the country . . . . . 148
6. Future trends in social expenditure and fi nancing . . . . . . . . . . . 1506.1 Demographic and labour force trends . . . . . . . . . . . . . . . . . . . . . 150
7. Conclusions . . . . . . . . . . . . . . . . . . . . . . . . . . . . . . . . . . . . . . . 168
References . . . . . . . . . . . . . . . . . . . . . . . . . . . . . . . . . . . . . . . . . . 175

Contents 9
Appendix A. The Zambian Social Budget model . . . . . . . . . . . . . . 1831. Th e logic of the Social Budget model . . . . . . . . . . . . . . . . . . . . . 1842. Population and labour market module . . . . . . . . . . . . . . . . . . . . 1873. Economic module . . . . . . . . . . . . . . . . . . . . . . . . . . . . . . . . . 1904. Pension module . . . . . . . . . . . . . . . . . . . . . . . . . . . . . . . . . . . 1915. Social expenditure module . . . . . . . . . . . . . . . . . . . . . . . . . . . . 1966. Government module . . . . . . . . . . . . . . . . . . . . . . . . . . . . . . . 2017. Social Budget . . . . . . . . . . . . . . . . . . . . . . . . . . . . . . . . . . . . 202
Appendix B. Population projections . . . . . . . . . . . . . . . . . . . . . . . . 2031. Application of the ILO-POP model to Zambia . . . . . . . . . . . . . . . 2032. Comparison of model results with projections from diff erent sources . . 2073. Reasons for using the ILO-POP model . . . . . . . . . . . . . . . . . . . . 209
Appendix C. Data issues . . . . . . . . . . . . . . . . . . . . . . . . . . . . . . . . 2111. Government accounts . . . . . . . . . . . . . . . . . . . . . . . . . . . . . . . 2122. Labour market statistics . . . . . . . . . . . . . . . . . . . . . . . . . . . . . 2143. Information from pension schemes . . . . . . . . . . . . . . . . . . . . . . 2154. Social assistance programmes . . . . . . . . . . . . . . . . . . . . . . . . . . 218
Appendix D. Tables of the Social Budget model . . . . . . . . . . . . . . 219

10 Zambia – Social Protection Expenditure and Performance Review and Social Budget
Abbreviations
BHCP Basic Health Care PackageBoZ Bank of ZambiaCBoH Central Board of HealthCSO Central Statistical Offi ceDFID Department for International DevelopmentFNDP Fift h National Development PlanGRZ Government of the Republic of ZambiaGTZ Deutsche Gesellschaft für Technische Zusammenarbeit
(German technical cooperation agency)HICP Highly Indebted Poor CountriesIHE Integrating the Healthcare EnterpriseILO International Labour Offi ceIMF International Monetary FundLASF Local Authorities Superannuation FundLCMS Living Conditions Monitoring SurveyLuSE Lusaka Stock ExchangeMCDSS Ministry of Community Development and Social ServicesMDRI Multilateral Debt Relief InitiativeMTEF Medium-Term Expenditure FrameworkMoH Ministry of HealthMoFNP Ministry of Finances and National PlanningNAE National Average EarningsNAPSA National Pensions Scheme AuthorityNPS National Pension SchemePETS Public Expenditure Tracking SurveyPIA Pensions and Insurance AuthorityPSPF Public Service Pension FundPWAS Public Welfare Assistance SchemeRHVP Regional Hunger and Vulnerability ProgrammeSAGs Sectoral Advisory GroupsSCTS Social Cash Transfer SchemeSIDA Swedish International Development AgencyUNAIDS Joint United Nations Programme on HIV/AIDSUNDP United Nations Development ProgrammeUNZA University of ZambiaWCFCB Workers’ Compensation Fund Control BoardWFP World Food ProgrammeWHO World Health OrganisationZNPF Zambian National Provident Fund

11
In recent years, Zambia has witnessed steady economic expansion (with growth rates over 5 per cent in the last four years) and a fall in infl ation rates towards acceptable levels (below 10 per cent in 2006). Th is situation has been accompanied by lower
external vulnerability: Zambia benefi ted from signifi cant external debt reduction in 2005 and 2006. Given this relatively favourable context,1 it is an appropriate time to examine the performance of the Government and other public social actors (e.g., donors, NGOs and businesses) in improving the options for the population to make a decent living, notably by gradually extending the scope and coverage of the national social security (social protection) system.2
This report is an output of the first year of work of the ILO/DFID-funded project in Zambia: “ILO Global Campaign for Social Protection and Coverage for All as a Means to Reducing Poverty in Africa and Asia”. Th e ILO supports implementation of the Zambian Fift h National Development Plan with its Decent Work Country Pro-gramme (DWCP) which seeks to promote opportunities for women and men to obtain decent and productive work in conditions of freedom, equity, security and human dig-nity. Th e activities of the project are deeply integrated in the overall Zambian DWCP objectives and strategies.
Th e report also contributes to the ILO’s Global Campaign on Social Security and Coverage for All; and builds on earlier global analytical and policy development work undertaken jointly by the ILO, DFID and other cooperating partners. That work indicates that social security/protection is an indispensable factor in economic and social development and decent state-building, and that even a minimum social protection package (comprising basic benefi ts for children and basic pensions for the
1 It is not the purpose of this report to analyse in depth the sustainability of the economic expansion or the existing legal framework to attract foreign investment.2 ILO does not make any distinction between the terms “social security” and “social protection”. Both re-fl ect the same array of policy instruments and interventions undertaken usually by public (also sometimes by private) bodies, which seek to provide aff ordable access to health care and certain minimum income security and other support in case of old age, sickness and disability, death of the breadwinner (particularly when the breadwinner suff ers these contingencies as a result of employment-related accident or disease), unemployment, maternity and other family obligations. Social security/protection aims at preventing poverty but also at al-leviating existing poverty and exclusion resulting from these or other contingencies.
Introduction

12 Zambia – Social Protection Expenditure and Performance Review and Social Budget
elderly and persons with disabilities) would substantially reduce poverty in low-income countries and be aff ordable in the longer run.3
Social security/protection systems are usually described as consisting of contrib-utory and non-contributory schemes. It is common practice to judge such social pro-tection systems by three criteria: numbers of the population covered, scope of coverage and adequacy of benefi ts. Th ese are the main outputs of social security/protection sys-tems and individual programmes. To assess the performance of individual programmes and the overall social protection system, this report looks closely at these outputs for both types of scheme. A comprehensive picture of the formal schemes (including cov-erage, scope and adequacy of benefi ts) is available in subsequent chapters. Coverage by such schemes is generally limited to workers in formal employment, which is a small fraction of all the employed population. Scope is limited to old age, death, survivors, invalidity, maternity and workmen’s compensation and the levels of benefi ts are low. Most workers who work in the informal economy and their families are excluded from contributory schemes.
Non-contributory schemes are provided by the Government, international and national NGOs, donors, the church, as well as by traditional practices. Th e main non-contributory social protection programme in Zambia is, of course, public health-care services, for which user fees are gradually being eliminated starting in the poorest dis-tricts. Others are social-assistance type schemes providing mainly in-kind and some cash benefi ts to the most vulnerable. However, it has proved diffi cult to obtain a com-prehensive picture of numbers of the population covered, and the scope and depth of provision of these schemes. Th e situation is expected to improve as the Ministry of Community Development and Social Services (MCDSS) designed a monitoring and evaluation system, including questionnaires and a database, intended to look in detail at the outputs and costs of all social assistance-type programmes – both public and those run by international donors and NGOs.4 We looked mainly at public schemes on which a number of analytical studies have been undertaken, commissioned mainly by the MCDSS and funded by its cooperating partners. It is generally agreed that the coverage of benefi ts and services provided is very limited and that although there is evidence of positive impacts at the local level where they operate, signifi cant up-scaling would be needed to bring a measurable eff ect at national level.5
Although diff erent social programmes can be more or less eff ective in meeting policy objectives depending on their design and on governance quality, there is no doubt that if inputs in the form of available fi nancial resources to cover the costs and delivery of transfers are very low, then it is also diffi cult to expect high levels of output. It is also diffi cult to obtain far-reaching outcomes and strong impacts from such social transfers. In order to assess the performance of a social protection system, therefore, in addition to looking at the joint outputs of social security programmes in the country, one should examine the fi nancial inputs provided: government and donor allocations to social security/social protection, other sources of fi nancing (contributions paid by employees and employers, and income from investments of reserves accumulated by social insurance programmes).
3 See for example: Townsend, 2008.4 Proposed Monitoring & Evaluation System for Social Protection, MCDSS/GTZ, Lusaka, June 2007 (see also at: http://www.socialcashtransfers-zambia.org/pageID_2466950.html).5 We have not yet been able to include fi ndings of a very recent study looking at the experience of fi ve pilot cash-transfer social assistance schemes in Zambia (which also compares costs and benefi ts of diff erent tar-geting approaches): Ben Watkins: Alternative Methods for Targeting Social Assistance to Highly Vulnerable Groups, Kimetrica for the Technical Working Group on Social Assistance, Feb. 2008.
Contents 13
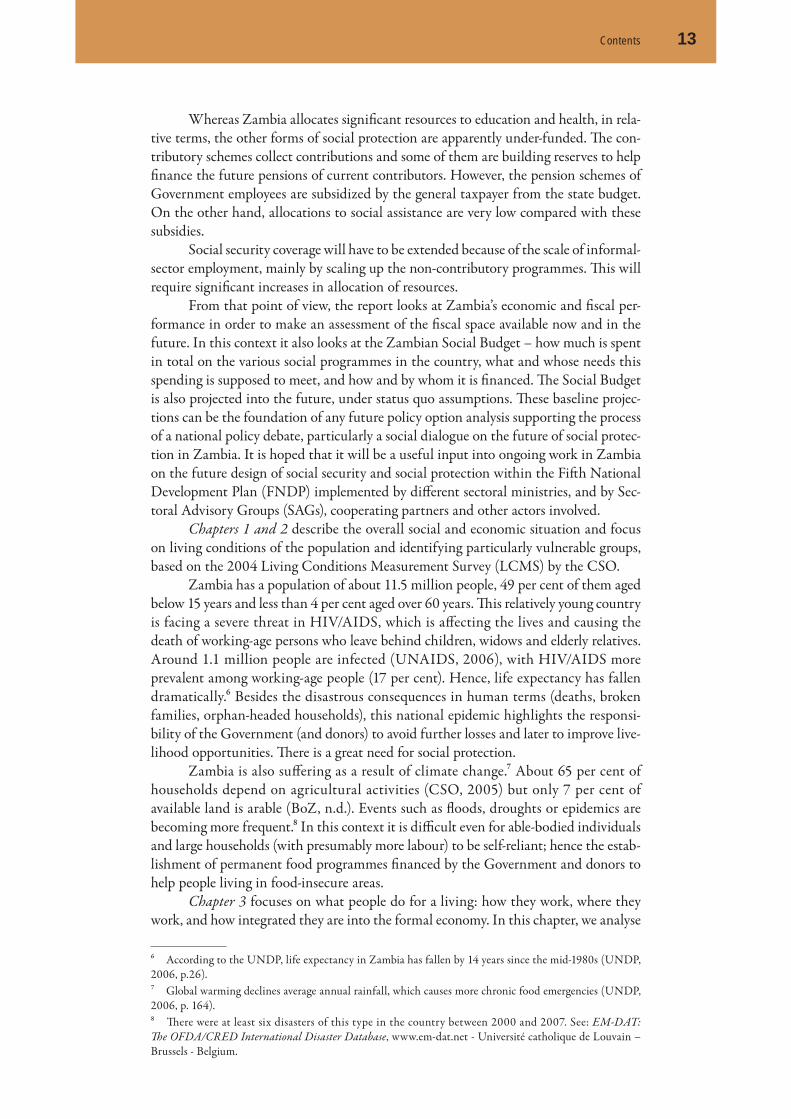
Whereas Zambia allocates signifi cant resources to education and health, in rela-tive terms, the other forms of social protection are apparently under-funded. Th e con-tributory schemes collect contributions and some of them are building reserves to help fi nance the future pensions of current contributors. However, the pension schemes of Government employees are subsidized by the general taxpayer from the state budget. On the other hand, allocations to social assistance are very low compared with these subsidies.
Social security coverage will have to be extended because of the scale of informal-sector employment, mainly by scaling up the non-contributory programmes. Th is will require signifi cant increases in allocation of resources.
From that point of view, the report looks at Zambia’s economic and fi scal per-formance in order to make an assessment of the fi scal space available now and in the future. In this context it also looks at the Zambian Social Budget – how much is spent in total on the various social programmes in the country, what and whose needs this spending is supposed to meet, and how and by whom it is fi nanced. Th e Social Budget is also projected into the future, under status quo assumptions. Th ese baseline projec-tions can be the foundation of any future policy option analysis supporting the process of a national policy debate, particularly a social dialogue on the future of social protec-tion in Zambia. It is hoped that it will be a useful input into ongoing work in Zambia on the future design of social security and social protection within the Fift h National Development Plan (FNDP) implemented by diff erent sectoral ministries, and by Sec-toral Advisory Groups (SAGs), cooperating partners and other actors involved.
Chapters 1 and 2 describe the overall social and economic situation and focus on living conditions of the population and identifying particularly vulnerable groups, based on the 2004 Living Conditions Measurement Survey (LCMS) by the CSO.
Zambia has a population of about 11.5 million people, 49 per cent of them aged below 15 years and less than 4 per cent aged over 60 years. Th is relatively young country is facing a severe threat in HIV/AIDS, which is aff ecting the lives and causing the death of working-age persons who leave behind children, widows and elderly relatives. Around 1.1 million people are infected (UNAIDS, 2006), with HIV/AIDS more prevalent among working-age people (17 per cent). Hence, life expectancy has fallen dramatically.6 Besides the disastrous consequences in human terms (deaths, broken families, orphan-headed households), this national epidemic highlights the responsi-bility of the Government (and donors) to avoid further losses and later to improve live-lihood opportunities. Th ere is a great need for social protection.
Zambia is also suff ering as a result of climate change.7 About 65 per cent of households depend on agricultural activities (CSO, 2005) but only 7 per cent of available land is arable (BoZ, n.d.). Events such as fl oods, droughts or epidemics are becoming more frequent.8 In this context it is diffi cult even for able-bodied individuals and large households (with presumably more labour) to be self-reliant; hence the estab-lishment of permanent food programmes fi nanced by the Government and donors to help people living in food-insecure areas.
Chapter 3 focuses on what people do for a living: how they work, where they work, and how integrated they are into the formal economy. In this chapter, we analyse
6 According to the UNDP, life expectancy in Zambia has fallen by 14 years since the mid-1980s (UNDP, 2006, p.26).7 Global warming declines average annual rainfall, which causes more chronic food emergencies (UNDP, 2006, p. 164).8 Th ere were at least six disasters of this type in the country between 2000 and 2007. See: EM-DAT: Th e OFDA/CRED International Disaster Database, www.em-dat.net - Université catholique de Louvain – Brussels - Belgium.

14 Zambia – Social Protection Expenditure and Performance Review and Social Budget
the range of economic activities (not necessarily income-generating activities) per-formed by individuals by age group, sex and location in rural or urban areas. With respect to income-related activities, we focus on paid employees and develop working defi nitions related to formality in employment. Our analysis is based on the datasets of the 2005 Labour Force Survey (LFS) prepared by the CSO.
Th is is the fi rst study of this kind carried out with existing national survey data and it is justifi ed, given that offi cial fi gures do not fully capture in a single indicator the complexity of the labour market and the working conditions of paid employees. For instance, an unemployment rate of around 16 per cent is not a useful indicator for policy-making because there are no unemployment benefits that justify people doing nothing to survive. Despite data constraints in the labour force survey, we car-ried out an exercise to explore the conditions of employment. Typically, informality in employment exists at diff erent levels, depending on the existence and enforcement of a legally binding contract with an employer, entitlement to paid leave, and employer participation in social security contributions. Consequently, opportunities to rely on existing social security provisions also diff er according to the degree of informality of employment.
Chapter 4 describes and analyses the scope of diff erent social protection schemes, including employment-related schemes and social assistance schemes. Considering that only 3 per cent of employed persons and 22 per cent of paid employees are ‘totally formal’ (see chapter 3) and that around half of the population lives in extreme pov-erty, it is necessary to analyse which population groups are being supported by social assistance schemes. Th ere is a donor-supported initiative to extend the current pilot cash-transfer schemes to reach the poorest and most vulnerable segments of the popu-lation, but there still remains the challenge of integrating the informal sector into well-established social protection schemes.
Chapter 5 outlines the current situation of government accounts and existing fiscal space. Donors are identified as important partners of the Government in expanding social expenditure, mainly in health and education sectors. Chapter 5 also presents our estimates of the Zambian Social Budget, the levels of social expenditure and sources of its fi nancing.
Chapter 6 presents results of status-quo simulations of the Social Budget revealing possible expenditure trends in the area of social policy resulting from the current legislative situation. It includes a set of initial and approximate estimates of a possible minimum package of social protection benefi ts: an old age benefi t, targeted social assistance and child benefi t.
Chapter 7 presents overall conclusions.


This chapter is in three parts. The first part examines demographic trends in Zambia and their main determinants. Th e second part describes recent economic developments and their effect on the labour market. The third part presents
broad aspects of the social environment in Zambia, including poverty incidence, income inequality and selected indicators of human development, preparing the way for an analysis in greater depth of the living conditions of the poorest and most vulner-able population groups, in Chapter 2.
Demographic trends
Currently, Zambia has a predominantly young and steadily growing population which, on the surface at least, has not changed since independence. Beneath the sur-face, however, there have been signifi cant changes in the demographic situation associ-ated with recent developments in urban population growth and the unabated spread of HIV/AIDS.
Zambia’s population was about 9.8 million inhabitants in 2000 and was pro-jected at 12.1 million for 2007 (CSO, 2006d). According to the census report, 2000 was the first year in which the male population slightly outnumbered the female population in Zambia (CSO, 2003a). Figure 1-1 shows the evolution of the popula-tion since 1980.
Zambia’s population is young and growing fast. During the 1990s, it grew on average by 2.4 per cent per year, whereas the world population increased by 1.5 per cent and other developing countries by 1.7 per cent.1 However, as Table 1-1 shows, there has been a slowdown over the last decades: the population annual growth rate of Zambia decreased from 3.1 per cent in the 1970s to 2.4 per cent in the 1990s.
1 Growth rates were obtained from UN Population Division estimates (UN, 2006). Th e total population in sub-Saharan Africa grew at a higher rate than Zambia’s: 2.7 per cent during the 1990s.
1.1
1
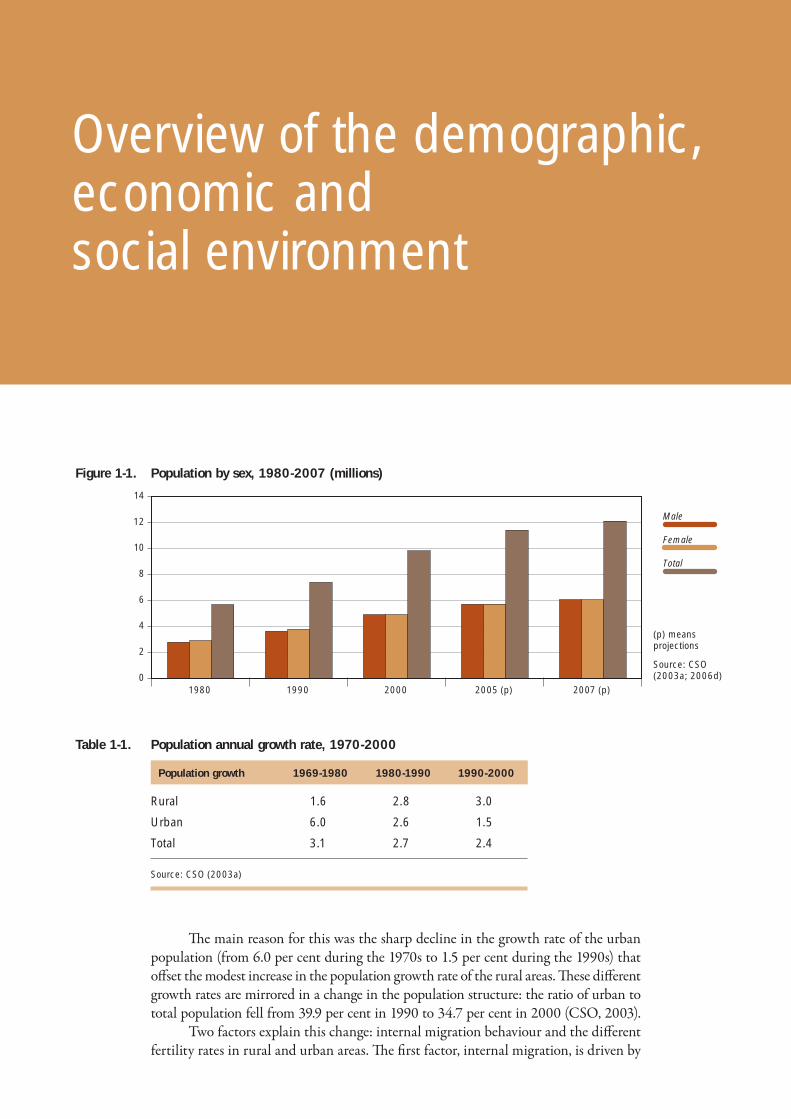
Th e main reason for this was the sharp decline in the growth rate of the urban population (from 6.0 per cent during the 1970s to 1.5 per cent during the 1990s) that off set the modest increase in the population growth rate of the rural areas. Th ese diff erent growth rates are mirrored in a change in the population structure: the ratio of urban to total population fell from 39.9 per cent in 1990 to 34.7 per cent in 2000 (CSO, 2003).
Two factors explain this change: internal migration behaviour and the diff erent fertility rates in rural and urban areas. Th e fi rst factor, internal migration, is driven by
Overview of the demographic, economic and social environment
Male
Female
Total
1980 1990 2000 2005 (p) 2007 (p)0
2
4
6
8
10
12
14
Figure 1-1. Population by sex, 1980-2007 (millions)
(p) means projections
Source: CSO (2003a; 2006d)
Table 1-1. Population annual growth rate, 1970-2000
Population growth 1969-1980 1980-1990 1990-2000
Rural 1.6 2.8 3.0
Urban 6.0 2.6 1.5
Total 3.1 2.7 2.4
Source: CSO (2003a)
18 Zambia – Social Protection Expenditure and Performance Review and Social Budget
economic conditions. During the period 1969-90, there was marked rural-to-urban migration, in line with the pro-urban economic policies applied during those years (see Chapter 2). Th e opposite phenomenon occurred during the 1990s: migration was from urban to rural areas, led by the crisis in the mining and manufacturing sectors.
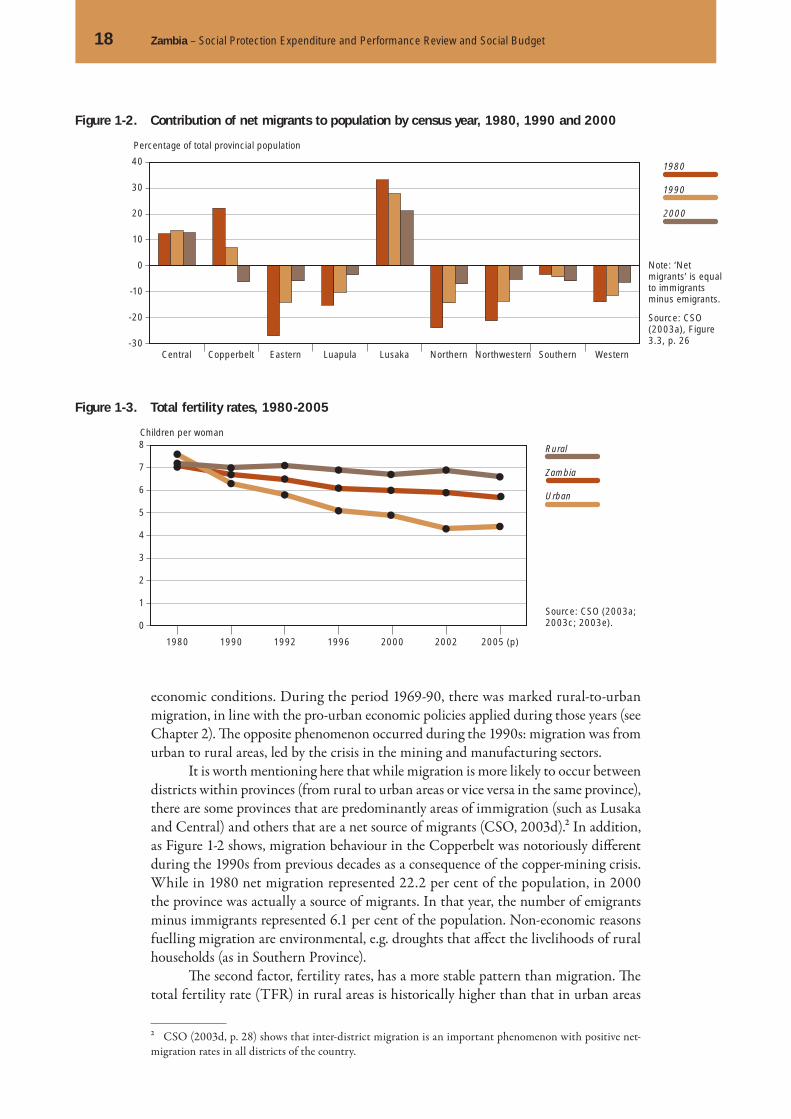
It is worth mentioning here that while migration is more likely to occur between districts within provinces (from rural to urban areas or vice versa in the same province), there are some provinces that are predominantly areas of immigration (such as Lusaka and Central) and others that are a net source of migrants (CSO, 2003d).2 In addition, as Figure 1-2 shows, migration behaviour in the Copperbelt was notoriously diff erent during the 1990s from previous decades as a consequence of the copper-mining crisis. While in 1980 net migration represented 22.2 per cent of the population, in 2000 the province was actually a source of migrants. In that year, the number of emigrants minus immigrants represented 6.1 per cent of the population. Non-economic reasons fuelling migration are environmental, e.g. droughts that aff ect the livelihoods of rural households (as in Southern Province).
Th e second factor, fertility rates, has a more stable pattern than migration. Th e total fertility rate (TFR) in rural areas is historically higher than that in urban areas
2 CSO (2003d, p. 28) shows that inter-district migration is an important phenomenon with positive net-migration rates in all districts of the country.
Zambia
Urban
Rural
Children per woman
1980 1990 1992 1996 2000 2002 2005 (p)
0
1
2
3
4
5
6
7
8
1980
1990
2000
Central Copperbelt Eastern Luapula Lusaka Northern Northwestern Southern Western-30
-20
-10
0
10
20
30
40
Percentage of total provincial population
Figure 1-2. Contribution of net migrants to population by census year, 1980, 1990 and 2000
Note: ‘Net migrants’ is equal to immigrants minus emigrants.
Source: CSO (2003a), Figure 3.3, p. 26
Figure 1-3. Total fertility rates, 1980-2005
Source: CSO (2003a; 2003c; 2003e).

1. Overview of the demographic, economic and social environment 19
(see Figure 1-3). Th e infl uence of diff erent fertility rates on the population structure is that the rural population grows much faster (with a TFR of 6.7 in 2000 versus 4.9 in urban areas) and that even without migration to rural areas, its share in the total population will increase.
Figure 1-3 shows that there is a decreasing trend in fertility rates: overall TFR for Zambia fell from 7.2 children per woman in 1980 to 5.7 children per woman in 2005. Much of the decline in TFR between 1980 and 2000 occurred in urban areas. TFR in rural areas remained almost constant over the same period and consequently moderated the rate of decrease of the overall TFR.
Nevertheless, better economic conditions during the 2000s than during the previous decade – with annual economic growth around 5 per cent between 2000 and 2006 – could explain a new phase of migration into urban areas, which could change the distribution of the population and also the path of the overall TFR, as most migrants are of reproductive age and urban areas are more likely to attract migrants with the lowest fertility rates (for instance, TFR in Lusaka was 4.3 in 2002).
Th e rise in the mortality rates is another increasingly important factor. While inhabitants of urban areas have easier access to health care services than those in rural areas, they are also more at risk of being infected with HIV than those in rural areas.
It is extremely difficult to foresee how this pandemic will evolve, because several factors must be taken into account. First, it is linked to risky sexual behav-iour, and behavioural changes take time. Second, in addition to the prevalence rates, there are variations in the progression from HIV infection to AIDS and from AIDS to death, access to treatment being a key determinant (UN, 2006). Th ird, levels of mother-to-child transmission also vary. However, the impact of HIV/AIDS on future population growth and composition is important because its prevalence is higher among people in their 20s and 30s (the prevalence rate is over 20 per cent in these age groups).
Without this terrible health hazard and the high incidence of other diseases that are still pandemic in the country (such as malaria), life expectancy would improve over time. Offi cial estimates of life expectancy based on the 2000 census report are shown in Table 1-2. Life expectancy at birth was estimated at 50 years (48 years in rural areas and 54 in urban areas), showing an improvement in relation to the 1990 indicator that was 47 years (CSO, 2003a). However, there is no consensus about this estimate and it seems that life expectancy could be much lower (see Appendix B).
Nevertheless, Zambia’s population is still young. Its average age is 20.9 years and the median age is around 17 years. Figure 1-4 depicts the age distribution of the popu-lation foreseen for 2007 (CSO, 2006a).
Table 1-2. Life expectancy at birth, 1980, 1990 and 2000
Life expectancy 1980 1990 2000
Female 53 48 52
Male 52 46 48
Zambia 52 47 50
Source: CSO (2003a)

20 Zambia – Social Protection Expenditure and Performance Review and Social Budget
Th e population pyramid reveals that the female population of reproductive age (between 15 and 49 years old) is nearly half of the total female population. Th is broad-based shape of the pyramid has changed little over the past 20 years: the proportion of the age group 0-14 years in the population was around 45 per cent in 1990 and in 2000. Similarly, child dependency ratios are high, although a decreasing trend has been observed, as Figure 1-5 shows.
In line with diff erent fertility patterns, rural areas show higher child depend-ency ratios than urban areas. Furthermore, the urban population is facing an ageing process shown by the decrease in the child dependency ratio from 104.3 in 1980 to 74.0 in 2005 (see Table 1-3) and slight increase in old-age dependency ratios. However, the evolution of the prevalence of HIV in the working-age population could aff ect these demographic ratios, thus increasing the burden on healthy people aged 15-64 supporting dependants and the actual labour force participation rates of older persons and young people just out of school.
Figure 1-4. Population pyramid, 2007 Figure 1-5. Dependency ratios, 1980, 1990, 2000 and 2005
0-4
10-14
20-24
30-34
40-44
50-54
60-64
70-74
80-84
90-94
Age
10%8%6%4%2%0%2%4%6%8%10%
1980 1990 2000 2005 (p)
0
20
40
60
80
100
120Demographic ratios
Total DR
Child DR
Old-age DRMales Females
DR = dependency ratio
Child DR is the ratio of the population aged 0-14 to the population aged 15-64. Old-age DR is the ratio of the population aged 65 years or over to the population aged 15-64. Total DR is the sum of the two previous ratios.
Source: CSO (2003a) for years 1980 and 1990 and CSO (2006d) for years 2000 and 2005
10%8%6%4%2%0%2%4%6%8%10%
Table 1-3. Dependency ratios in rural and urban areas, 1980, 1990, 2000 and 2005
1980 1990 2000 2005 (p)
Rural areas Child dependency ratio 104.3 90.1 94.0 93.1Old-age dependency ratio 8.6 7.1 6.8 6.2Total dependency ratio 112.9 97.3 100.8 99.3
Urban areas Child dependency ratio 104.3 82.9 77.7 74.0Old-age dependency ratio 0.2 1.9 2.5 2.6Total dependency ratio 106.3 84.7 80.3 76.6
Note: Child dependency ratio is the ratio of the population aged 0-14 to the population aged 15-64. Old-age dependency ratio is the ratio of the population aged 65 years or over to the population aged 15-64. Total dependency ratio is the sum of the two previous ratios.
Source: CSO (2003a; 2006d)

1. Overview of the demographic, economic and social environment 21
Economic situation and labour market trends
Over the past few years, Zambia’s economy has improved its performance with respect to the major macroeconomic indicators. Gross Domestic Product (GDP) grew by around 5 per cent per year from 2000 to 2006. It is important to analyse the main drivers of this growth and the implications of this on the living standards of the population.
Recent economic performance
Traditionally, the Zambian economy has depended on copper exports. As Box 1 explains, the fall in the international price of copper caused a deep economic crisis that later fuelled liberal economic reforms and public expenditure cuts. However, the economy is becoming more diversifi ed. Whereas in 1994 mining production repre-sented around 17 per cent of real GDP, it accounted for a little more than 9 per cent of GDP in 2006.
Trade and fi nancial services increased their participation in real GDP during 1994-2006 from almost 30 to 37 per cent. Th e agriculture sector remains important, representing around 14 per cent of real GDP. However, its performance is linked to climate conditions that in recent years have been adverse, with recurrent droughts or
1.2
1.2.1
Box 1. From independence to the new millennium
Following the country’s independence in 1960 Zambia was one of the better-off coun-tries in sub-Saharan Africa, with a strong extractive industries sector and viable social protection arrangements in place including key public service provisions. This situation was not to last, however, as international prices of copper declined in the 1970s and worldwide inflation fuelled by petroleum price hikes undermined the economy. The Government nevertheless maintained tight control over economic and social arrange-ments in the country during this period and it was not until the mid-1980s that key reforms to liberalize the economy were initiated. Alongside political liberalization that gained momentum in the early 1990s, economic reforms led to severe cutbacks in public provision and employment, which had previously accounted for more than half of national GDP. The 1990s were a particularly lean decade in which the various reforms commonly referred to as Structural Adjustment Policies (SAPs) had an adverse impact on all population groups, but especially on the poorest segments. As a result, poverty incidence increased substantially while the social protection programmes that had pre-viously been in place lost their ability to safeguard those most likely to suffer from the adverse effects of rapid change.
The unexpected effects of SAPs were not lost on the population and there were demands to rectify the situation. The 1990s saw, therefore for the first time, govern-ment efforts to examine more closely the impact of (the liberal) economic and social policies, including the initiation of national surveys to measure poverty and vulner-ability. At the same time the international community, notably bilateral donors, placed pressure on the Government to act on the downward-spiralling living standards. Thus the late 1990s saw nationwide social protection initiatives launched by the Govern-ment covering both the formal and the informal sectors of the economy. These efforts extended into the early years of the new millennium with greater international sup-port following recognition that something urgent had to be done about global poverty and failure to develop in countries like Zambia. Although such efforts have had some impact on the downward spiral of living conditions that began in the 1990s, the situ-ation in Zambia today is still dire.
Source: World Bank 2005

22 Zambia – Social Protection Expenditure and Performance Review and Social Budget
Copper exports
Current account
2001 2002 2003 2004 2005 2006 2007p-1000
-500
0
500
1000
1500
2000
2500
3000
3500
fl oods (see Chapter 2) as well as to Government policies, e.g., Fertilizer Support Pro-gramme and Food Reserve Agency encouraging maize production and a lack of invest-ment in irrigation.
During this decade, high GDP growth rates have been driven by the mining and construction sectors (the latter with growth rates over 10 per cent in recent years). As Figure 1-6 shows, agriculture has given a fl uctuating performance, with short-term contractions.
In contrast, mining production has grown strongly fuelled by a favourable inter-national context. Copper prices reached maximum values in May 2006. Furthermore, 2006 prices were on average over 80 per cent higher than those of 2005, so that copper exports were almost USD 3,000 million in 2006. In that year the current account of the balance of payments had a surplus that represented 1.6 per cent of nominal GDP (see Figure 1-7). Copper exports are even higher in 2007. However, the impact of rising international oil prices – Zambia is a net oil importer – would aff ect the balance of payments harder during this year than the previous one.
Figure 1-6. Recent trends in GDP, selected sectors for 2001-2006
Total
Trade
Agriculture
Mining
Annual % change
2001 2002 2003 2004 2005 2006-5
0
5
10
15
20
Source: CSO (n.d.)
Figure 1-7. Current account of the balance of payments and copper exports, 2001-2006 (USD millions)
Source: MoFNP (2007)
Copper exports for 2007 are estimated on the basis of exports in the first three quarters of the year. P = provisional

1. Overview of the demographic, economic and social environment 23
On the demand side, both public and private consumption have increased in recent years, in a context in which almost all economic activities have expanded. Table 1-4 presents aggregate indicators that signal an improvement in the Zambian economy, both in external and internal balances. Chapter 5 presents an assessment of general government accounts.
Th is improved performance has occurred in parallel with increased investors’ confi dence as shown by growing levels of investment. Investment has grown steadily since 1996 and represented almost 28 per cent of GDP in 2006 (almost 13 percentage points higher than a decade ago). In addition, there has been an unprecedented growth of short-term infl ows in the stock exchange during this decade, as shown in Figure 1-8.
The purchasing power of the kwacha has improved as inflation levels have reduced over time from a maximum of around 184 per cent in 1993 to 8.2 per cent in 2006. However, the value of the Zambian kwacha with respect to the US dollar is still not stable, as Figure 1-9 shows.
Th is erratic behaviour of the exchange rate in the short run has implications for the national budget that depends to a large extent on the availability of donor funds, which is reducing overtime from 43 per cent in 2003 to 16.6 per cent in 2008, denomi-nated in foreign currency. See Chapter 5.
Table 1-4. Main economic indicators, 2001-2006
2001 2002 2003 2004 2005 2006
Nominal GDP (USD billion) 3.7 3.8 4.3 5.5 7.4 10.5
Nominal GDP per capita (USD) 367.2 368.4 412.7 508.6 668.7 929.7
Real GDP (per cent growth) 4.9 3.3 5.1 5.4 5.2 6.2
Inflation rate (end period), per cent 21.4 22.2 32.0 17.5 15.9 8.2
Bank of Zambia interest rate (December) 52.5 34.0 21.3 18.3 17.1 10.7
Central Government overall balance (per cent of GDP) a n.a. n.a. -6.6 -3.3 -3.4 -1.1
Current account deficit ( per cent of GDP) b -19.1 -16.3 -15.0 -6.7 -8.4 1.6
External debt stock (USD billion) a n.a. n.a. 6.5 7.1 4.5 0.7
a MoFNP (2007a). b It includes grants, ILO calculations based on BoZ (2007b) and nominal GDP figures in USD from UN (2007b)
Source: BoZ (2007a), CSO (2007f), MoFNP (2007a)
Source:LuSE (2007)
LuSE all share index
Market capitalisation
2001 2002 2003 2004 2005 20060
300
600
900
1200
1500
1800
2100
0
500
1000
1500
2000
2500
3000
3500
Figure 1-8. Recent trends in the stock exchange market, 2001-2006 (USD millions)

24 Zambia – Social Protection Expenditure and Performance Review and Social Budget
Labour market trends
To understand the current reality of the labour market it is necessary to recall what happened during the 1990s with the structural adjustment packages and liberalization policies. Without the protection of import tariff s, the national industry collapsed and publicly managed companies were privatized. Public expenditure decreased from 25.7 to 7.3 per cent of real GDP during that decade.3 Consequently, formal employment fell and the labour force had to migrate to informal activities.
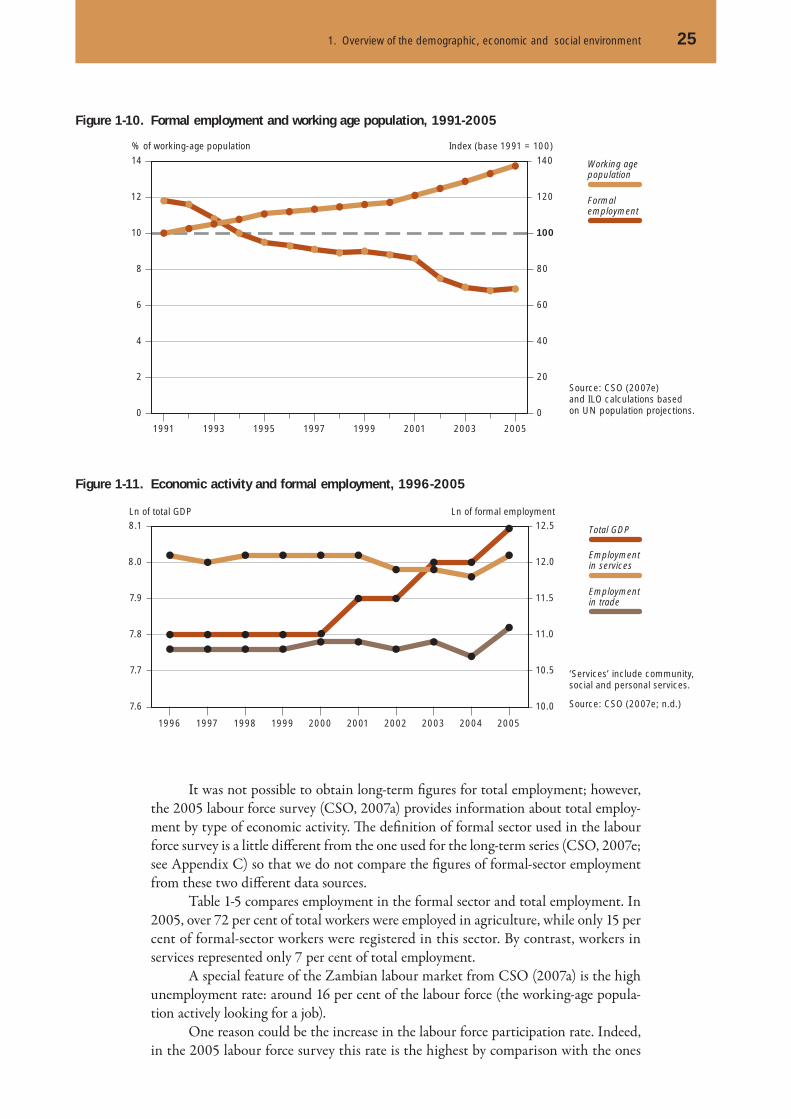
In absolute numbers, formal-sector employment, defi ned here as employment in formal businesses (a discussion about this and other related concepts is found in Chapter 3) reached its maximum level in 1991: around 545,000. Since then, formal-sector employment fell from about 12 to 7 per cent of the working-age population between 1991 and 2005.4 Th is trend is depicted in Figure 1-10. Th e working-age popu-lation is presented as an index, so that the slope of the curve shows the rate of growth.
Looking at the sectoral composition of the formal employment, it seems that:
1. Th ere are high fl uctuations in formal-sector employment for reasons other than eco-nomic performance. For instance, formal jobs in construction fell strongly in 2002 (by over 80 per cent) despite the fact that its production increased by 17 per cent, so that formal jobs in this sector in 2005 were about 58 per cent of the number existing in 2001 (calculations based on CSO, 2007e; n.d.).
2. Th ere is no direct link between economic performance and formal employment in the long run, especially in those sectors that are more labour-intensive, such as trade and general services. Figure 1-11 shows the evolution of total GDP (in real terms) and formal employment in these two sectors over the past decade.
3. In the short run, it seems that tertiary sectors are absorbing more employment than in previous years. In 2005, formal employment in these sectors accounted for over 65 per cent of total employment, while it was 58 per cent in 2004. Th erefore, in 2005, total employment in the formal sector grew the fi rst time in more than a decade.
3 Th ese fi gures were calculated based on UN (2007b). Th e CSO (2006e) states that public expenditure was 13.1 per cent of real GDP in 1994 and 8 per cent in 2000.4 Formal employment is expressed as a percentage of the working age population because there are no avail-able labour force fi gures for that period. Still, the trend is clearly negative and the absolute numbers reported by the CSO (2007e) declined lower and lower aft er 1991 (except in 2005).
1.2.2
Source: BoZ (2007)
Figure 1-9. Evolution of nominal exchange rate (kwachas per US dollar), 2005-2007
2006
Average 2006
2007
2005
Jan. Feb. Mar. Apr. May Jun. Jul. Aug. Sep. Oct. Nov. Dec.2500
3000
3500
4000
4500
5000
1. Overview of the demographic, economic and social environment 25
It was not possible to obtain long-term fi gures for total employment; however, the 2005 labour force survey (CSO, 2007a) provides information about total employ-ment by type of economic activity. Th e defi nition of formal sector used in the labour force survey is a little diff erent from the one used for the long-term series (CSO, 2007e; see Appendix C) so that we do not compare the fi gures of formal-sector employment from these two diff erent data sources.
Table 1-5 compares employment in the formal sector and total employment. In 2005, over 72 per cent of total workers were employed in agriculture, while only 15 per cent of formal-sector workers were registered in this sector. By contrast, workers in services represented only 7 per cent of total employment.
A special feature of the Zambian labour market from CSO (2007a) is the high unemployment rate: around 16 per cent of the labour force (the working-age popula-tion actively looking for a job).
One reason could be the increase in the labour force participation rate. Indeed, in the 2005 labour force survey this rate is the highest by comparison with the ones
Source: CSO (2007e) and ILO calculations based on UN population projections.
Figure 1-10. Formal employment and working age population, 1991-2005
‘Services’ include community, social and personal services.
Source: CSO (2007e; n.d.)
Formalemployment
Working agepopulation
1991 1993 1995 1997 1999 2001 2003 2005
0
2
4
6
8
10
12
14
0
20
40
60
80
100
120
140
Index (base 1991 = 100)% of working-age population
Figure 1-11. Economic activity and formal employment, 1996-2005
Employment in services
Total GDP
Employment in trade
1996 1997 1998 1999 2000 2001 2002 2003 2004 2005
7.6
7.7
7.8
7.9
8.0
8.1Ln of total GDP Ln of formal employment
10.0
10.5
11.0
11.5
12.0
12.5
26 Zambia – Social Protection Expenditure and Performance Review and Social Budget
recorded in the 2000 census report and in living conditions measurement surveys car-ried out over the past ten years. For instance, for those aged 20-24 the participation rate was 82, 73, 76, 67, and 86 per cent in years 1996, 1998, 2002-3, 2004, and 2005, respectively. Given the diff erent methodologies used over time in such household sur-veys, we did not consider it useful to analyse trends in total employment. Moreover, according to the 2000 census the participation rate was 61 per cent for the same cohort (aged 20-24).
However, it is relevant to identify the diff erent patterns in the distribution of labour force and employment based on 2005 fi gures. A detailed analysis about condi-tions of employment is carried out in Chapter 3.
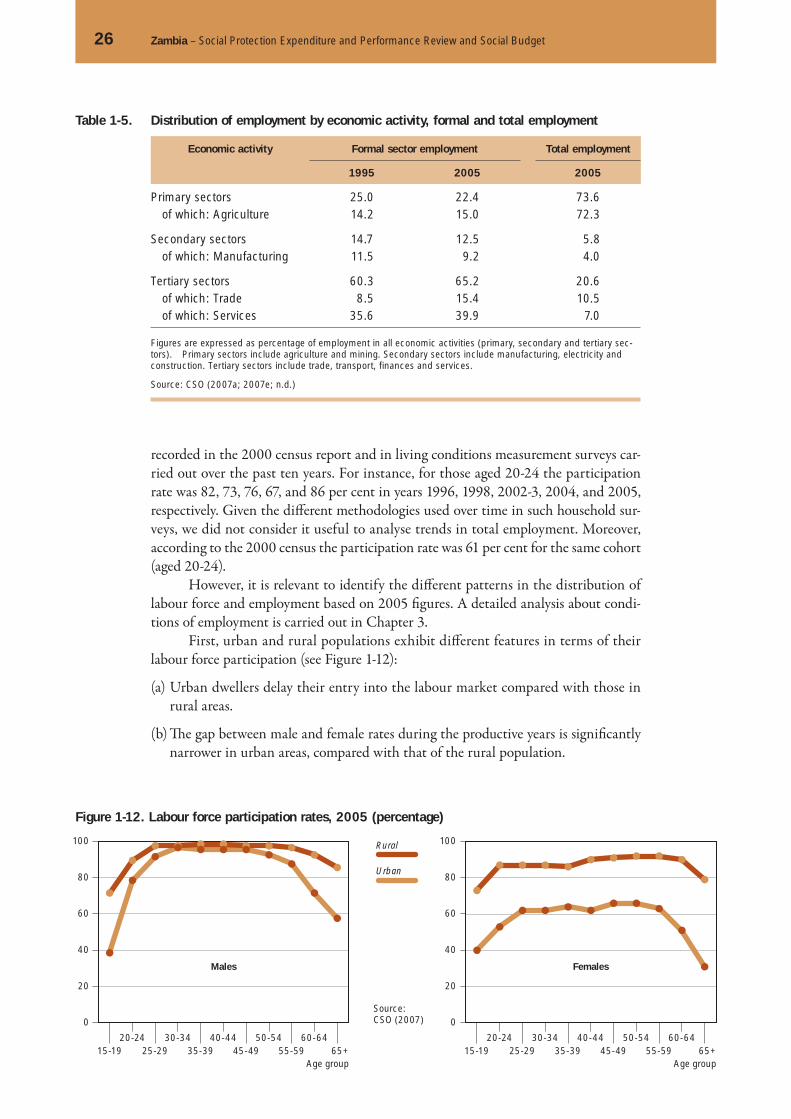
First, urban and rural populations exhibit diff erent features in terms of their labour force participation (see Figure 1-12):
(a) Urban dwellers delay their entry into the labour market compared with those in rural areas.
(b) Th e gap between male and female rates during the productive years is signifi cantly narrower in urban areas, compared with that of the rural population.
Table 1-5. Distribution of employment by economic activity, formal and total employment
Economic activity Formal sector employment Total employment
1995 2005 2005
Primary sectors 25.0 22.4 73.6of which: Agriculture 14.2 15.0 72.3
Secondary sectors 14.7 12.5 5.8of which: Manufacturing 11.5 9.2 4.0
Tertiary sectors 60.3 65.2 20.6of which: Trade 8.5 15.4 10.5of which: Services 35.6 39.9 7.0
Figures are expressed as percentage of employment in all economic activities (primary, secondary and tertiary sec-tors). Primary sectors include agriculture and mining. Secondary sectors include manufacturing, electricity and construction. Tertiary sectors include trade, transport, finances and services.
Source: CSO (2007a; 2007e; n.d.)
Source:CSO (2007)
Figure 1-12. Labour force participation rates, 2005 (percentage)
Rural
Urban
15-1920-24
25-2930-34
35-3940-44
45-4950-54
55-5960-64
65+
0
20
40
60
80
100
15-1920-24
25-2930-34
35-3940-44
45-4950-54
55-5960-64
Age group Age group65+
0
20
40
60
80
100
Males Females
1. Overview of the demographic, economic and social environment 27
While feature (a) can be attributed to the fact that school attendance in urban areas is higher than in rural areas, feature (b) is mainly the result of the diff erent fer-tility rates of the two population groups.
Second, younger people have the highest unemployment rates. About 25 and 22 per cent of people in the labour force aged 15-19 and 20-24, respectively, were unem-ployed in 2005. However, they represent a higher percentage of total employment than other cohorts, given the young profi le of the Zambian population.
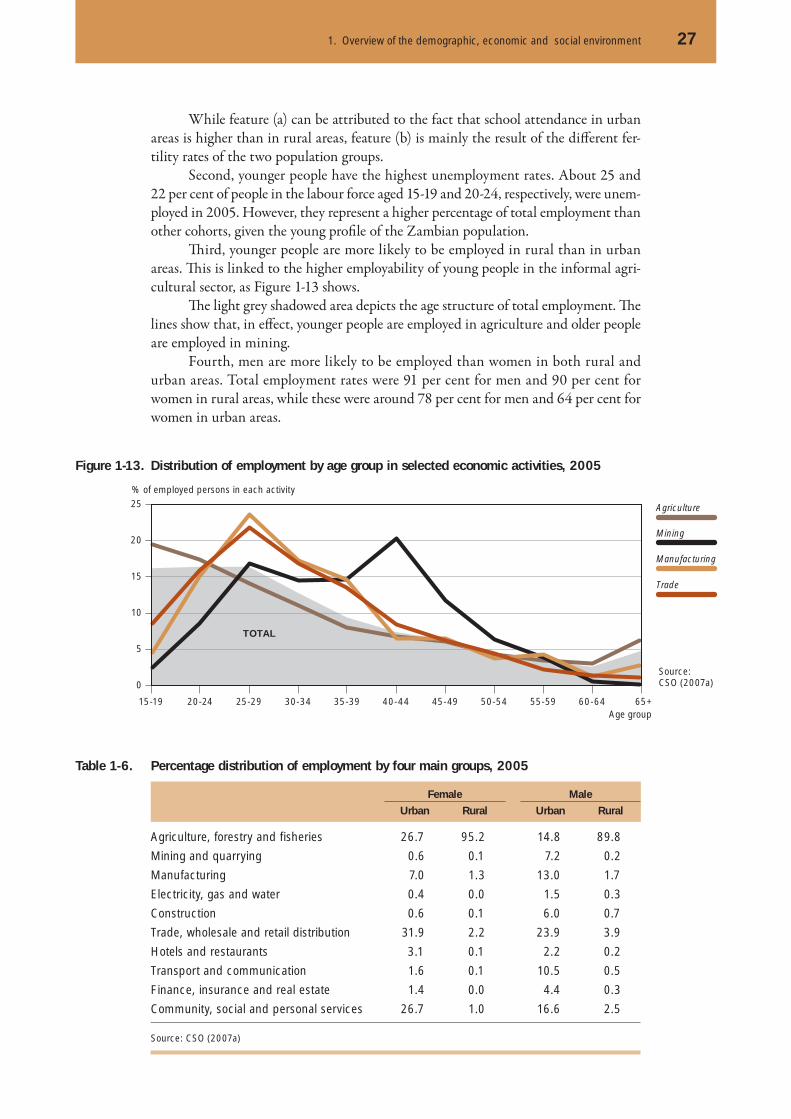
Th ird, younger people are more likely to be employed in rural than in urban areas. Th is is linked to the higher employability of young people in the informal agri-cultural sector, as Figure 1-13 shows.
Th e light grey shadowed area depicts the age structure of total employment. Th e lines show that, in eff ect, younger people are employed in agriculture and older people are employed in mining.
Fourth, men are more likely to be employed than women in both rural and urban areas. Total employment rates were 91 per cent for men and 90 per cent for women in rural areas, while these were around 78 per cent for men and 64 per cent for women in urban areas.
Source:CSO (2007a)
Figure 1-13. Distribution of employment by age group in selected economic activities, 2005
Agriculture
Mining
Manufacturing
Trade
% of employed persons in each activity
15-19 20-24 25-29 30-34 35-39 40-44 45-49 50-54 55-59 60-64 65+Age group
TOTAL
0
5
10
15
20
25
Table 1-6. Percentage distribution of employment by four main groups, 2005
Female Male Urban Rural Urban Rural
Agriculture, forestry and fisheries 26.7 95.2 14.8 89.8
Mining and quarrying 0.6 0.1 7.2 0.2
Manufacturing 7.0 1.3 13.0 1.7
Electricity, gas and water 0.4 0.0 1.5 0.3
Construction 0.6 0.1 6.0 0.7
Trade, wholesale and retail distribution 31.9 2.2 23.9 3.9
Hotels and restaurants 3.1 0.1 2.2 0.2
Transport and communication 1.6 0.1 10.5 0.5
Finance, insurance and real estate 1.4 0.0 4.4 0.3
Community, social and personal services 26.7 1.0 16.6 2.5
Source: CSO (2007a)

28 Zambia – Social Protection Expenditure and Performance Review and Social Budget
Fift h, employment in rural areas is concentrated in agricultural activities (95 per cent of female workers and 90 per cent of male workers) while employment in urban areas is more evenly distributed among three economic activities: trade, services and agriculture. Table 1-6 shows the distribution of employment by economic activity for females and males in urban and rural areas.
At this point, it is clear that recurrent shocks in agriculture indeed aff ect a large part of the population engaged in farming, especially in the informal sector.
In terms of employment by type of business, most employed persons were in the private sector, which is also a signal of the less important role that the public sector has in the overall economy by comparison with the situation in the 1980s. Table 1-7 shows some aggregate fi gures by sex that are the basis for the Social Budget to be presented in later chapters.
Table 1-7. Indicators of employment by sex, 2005 (in percentages)
Female Male Total
Basic classification
Paid workers (as per cent of employed persons) a 46.2 71.8 59.4
Paid employees (as per cent of paid workers) 20.1 30.6 26.6
Employed in the formal sector(as per cent of paid workers)
12.8 23.3 19.3
Paid workers in the formal sector by type of business
Central Government 33.3 18.4 22.1
Local Government 6.3 6.9 6.8
Parastatal 4.7 9.1 8.0
Private b 55.7 65.6 63.1
Total 100.00 100.00 100.00
a Paid workers’ include self-employed, employers and paid employees. b ‘Private’ includes private sector, NGOs, churches, international organizations and households.
Source: Cross-tabulations based on labour force survey 2005
Paid workers are defi ned here as all employed persons excepting unpaid family workers. Table 1-7 shows the limited coverage of the formal sector in terms of this group: less than 20 per cent of paid workers are employed in formal-sector employment and the situation is more diffi cult for female workers. In absolute terms, around 25 per cent of these formal-sector paid workers were female and 75 per cent were male.
Looking at diff erent businesses, the private sector employs around 63 per cent of paid workers in the formal sector. In the public sector, central Government employs 22 per cent; local Government, 7 per cent; and the parastatal sector, 8 per cent.
1. Overview of the demographic, economic and social environment 29
Household incomes and inequality
Detailed analysis of households’ living conditions is based throughout the report mostly on the results of 2004 LCMS as LCMS 2006 was not yet available when the analysis was conducted. Th e 2004 dataset which was made available by CSO required cleaning procedures which – in some cases – may lead to slightly diff erent results than those presented in the report on 2004 LCMS published by CSO.
One can also fi nd in the report references to preliminary results of 2006 LCMS, which have as source aggregate results published by the CSO by the end of 2007 and beginning of 2008. Th e LCMS 2006 dataset was made available to the project team only in the fi rst quarter of 2008 and thus we were not able to make use of it for the purpose of this report.
Composition of incomes
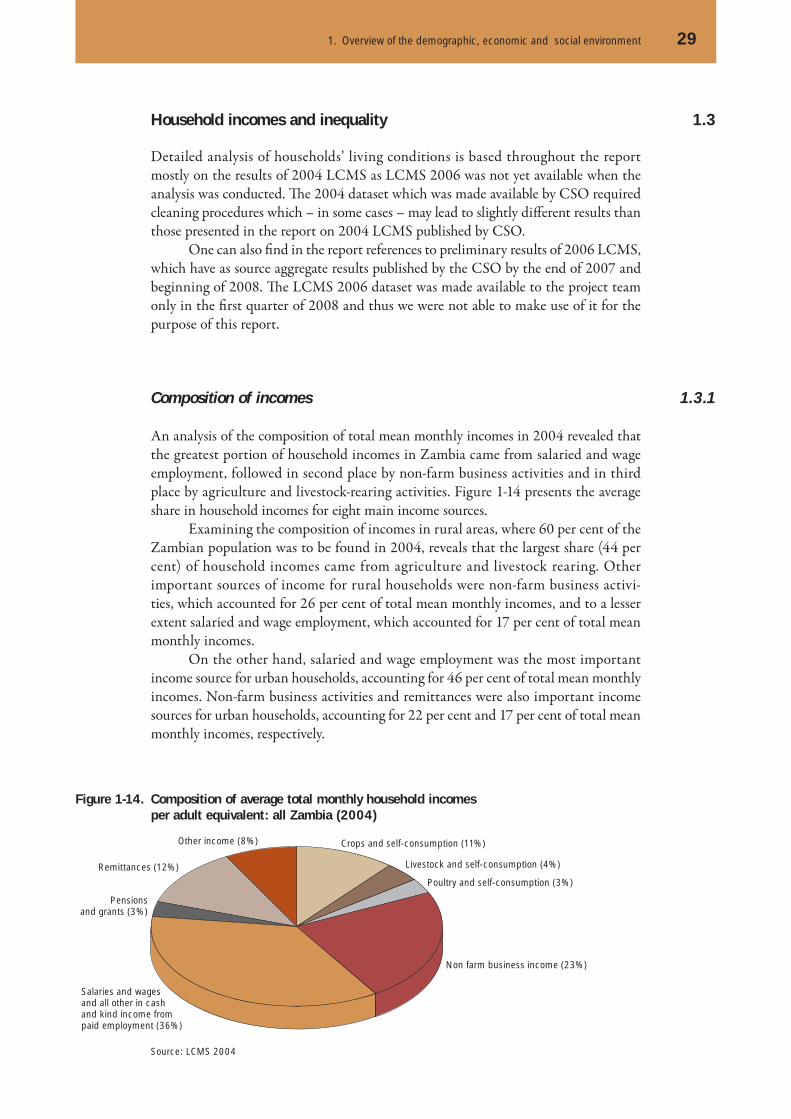
An analysis of the composition of total mean monthly incomes in 2004 revealed that the greatest portion of household incomes in Zambia came from salaried and wage employment, followed in second place by non-farm business activities and in third place by agriculture and livestock-rearing activities. Figure 1-14 presents the average share in household incomes for eight main income sources.
Examining the composition of incomes in rural areas, where 60 per cent of the Zambian population was to be found in 2004, reveals that the largest share (44 per cent) of household incomes came from agriculture and livestock rearing. Other important sources of income for rural households were non-farm business activi-ties, which accounted for 26 per cent of total mean monthly incomes, and to a lesser extent salaried and wage employment, which accounted for 17 per cent of total mean monthly incomes.
On the other hand, salaried and wage employment was the most important income source for urban households, accounting for 46 per cent of total mean monthly incomes. Non-farm business activities and remittances were also important income sources for urban households, accounting for 22 per cent and 17 per cent of total mean monthly incomes, respectively.
1.3
1.3.1
Figure 1-14. Composition of average total monthly household incomes per adult equivalent: all Zambia (2004)
Source: LCMS 2004
Crops and self-consumption (11%)
Livestock and self-consumption (4%)
Poultry and self-consumption (3%)
Non farm business income (23%)
Salaries and wagesand all other in cashand kind income frompaid employment (36%)
Pensionsand grants (3%)
Remittances (12%)
Other income (8%)

30 Zambia – Social Protection Expenditure and Performance Review and Social Budget
Figure 1-15 presents the average composition of monthly household incomes per adult equivalent for the whole of Zambia and separately for urban and rural populations.
Figure 1-16 presents the average composition of monthly household incomes for diff erent population groups ranked by average monthly consumption in 2004.
Source: CSO, 2005
Figure 1-16. Average share per month of different sources in total household income per equivalent adult by expenditure groups
Figure 1-15. Main sources of household income (2004)
Agricultural production(including own consumption)
Non-farming business
Regular salary
Other
% of total houshold income
0 20 40 60 80 100%
All Zambia
Rural
Urban
Share of Income from crops and self-consumption
Share of Income from livestock and self-consumption
Share of Income from Poultry and self-consumption
Share of Non Farm business income
Share of salaries and wages and all other in cash and kind income from paid employment
Share of Pensions and grants
Share of Remittances income
Share of Other income
Decile 1
Decile 2
Deciles 3-5
Deciles 6 and over
Total
Decile 1
Decile 2
Deciles 3-5
Deciles 6 and over
Total
Rural
Urban
0 20 40 60 80 9010 30 50 70 100

1. Overview of the demographic, economic and social environment 31
Distribution of incomes and inequality
Th e mean monthly income for a Zambian household in 2004 was K502,030 whereas the modal income ranged from K150,001-K300,000, representing 24 per cent of the population (CSO 2005, p. 85).
The majority of Zambian households (65 per cent) received mean monthly incomes at or below K450,000, which was below the threshold estimated as necessary to meet the cost of basic needs.
Findings from the LCMS 2004 point to high income inequality in the gen-eral population, with a bias towards urban areas. Urban households reported average per capita incomes over twice as large as those of rural households. Of 39 per cent of the population in 2004, urban households accounted for 60 per cent of total national incomes.
Th e Gini coeffi cient for the entire population in 2004 was 0.57. Individuals in the bottom two national income deciles accounted for only 4 per cent of national per capita incomes, while individuals in the top two income deciles accounted for 45 per cent of national per capita incomes.
Th e Gini coeffi cients for the urban population were 0.50 and for the rural popu-lation 0.55, indicating greater inequality within the rural population than within the urban population.
However, comparing the income shares of the 20 per cent poorest individuals within urban and rural areas shows the relative income situation of the poorest indi-viduals to have been less favourable within urban areas, where the bottom two income deciles accounted for only 1 per cent of average per capita incomes, compared with 8 per cent for the bottom two rural income deciles (CSO 2005, p. 89).
Figure 1-17 shows the number of households in various income groups in 2004.
1.3.2
Source: CSO, 2005
Figure 1-17. Distribution of households by income group (2004)
<50,000 50,001-150,000
150,001-300,000
300,001-450,000
450,001-600,000
600,001-800,000
> 800,000
Percent of all households
Total income in the last month (Kwacha)
0
5
10
15
20
25

32 Zambia – Social Protection Expenditure and Performance Review and Social Budget
Selected human development indicators
Despite the improved macro-economic performance of the country, the well-being of many Zambians has not improved. Figure 1-18 shows the evolution of real GDP per capita and the human development index (HDI). Th is index aggregates the achieve-ments of individuals in three aspects: life and health, education, and income (which is taken as a proxy of living standards).
1.4
The HDI includes three indicators: life expectancy at birth, adult literacy rate, and GDP per capita.
Sources: UN (2007b) for GDP per capita, and UNDP (2006) for HDI
Figure 1-18. Real GDP per capita and Human Development Index (HDI)
GDP per capita
HDI
1975 1980 1985 1990 1995 2000 2004
0.25
0.30
0.35
0.40
0.45
0.50HDI Index 1975 = 100
50
60
70
80
90
100
Figure 1-19. Top ten diseases 2005 and 2006 (based on second quarter data)
Diagnosis Year Incidence per1000 population
Totaldiagnosis
Inpatientdeaths
1 Malaria 2006 76.1 1 347 504 17062005 200.1 2 398 539 4139
2 Respiratory infection: non pneumonia 2006 34.5 125 686 8682005 78.7 943 042 432
3 Diarrhoea – non bloody 2006 13.0 230 673 5802005 34.2 410, 255 1331
4 Trauma: accidents, injuries, wounds, burns 2006 8.1 143 217 1582005 21.8 260 860 418
5 Respiratory infection: pneumonia 2006 7.1 125 686 8682005 21.9 263 085 2061
6 Skin infections 2006 6.5 115 286 482005 21.6 258 739 52
7 Musculoskeletal and connective tissue 2006 4.2 74 586 182005 8.9 106 977 35
8 Digestive system (not infectious) 2006 4.0 70 564 1152005 9.2 109 926 295
9 Anaemia 2006 2.3 41 860 6152005 3.2 37 895 555
10 Aids (suspected and confirmed cases) 2006 1.7 29 515 17072005 3.5 21 674 1384
Source: Zambia Economic Report 2006 (MoFNP 2006, p.98)

1. Overview of the demographic, economic and social environment 33
While GPD per capita has increased since the second half of the 1990s, the HDI has decreased or has not improved. Th is highlights the need to take additional action because economic growth by itself does not promote the well-being of all Zambians. In addition, as seen in section 1.3, income inequality is high (0.57) and therefore, the Government’s role in redistributing wealth and opportunities is paramount.
The Government’s task to improve the well-being of its citizens is difficult, given the catastrophic eff ect of HIV/AIDS on life expectancy. In addition to having intrinsic importance for people to promote their goals in life (e.g., supporting practical reasoning and thinking skills), education has an instrumental value because it creates possibilities for people to integrate into the labour market with more chances of fi nding decent work and of taking better care of their health by participating in prevention campaigns, keeping good hygiene habits, and so on.
As discussed in section 1.1, the low life expectancy in Zambia is largely attribut-able to a high disease burden. Among the leading causes of death in 2006 were malaria, non-pneumonia respiratory infections (including tuberculosis), diarrhoea, traumas, pneumonia and other HIV/AIDS-related complications (Figure 1-19).
Although malaria is still the leading cause of death in Zambia, there has been a substantial decline in its prevalence in recent years, with incidence rates per 1000 people falling from 400 in 2000, to just above 200 in 2004 (UNDP 2007, p. 72), and most recently estimated at 76 (MoFNP 2006, p.98).
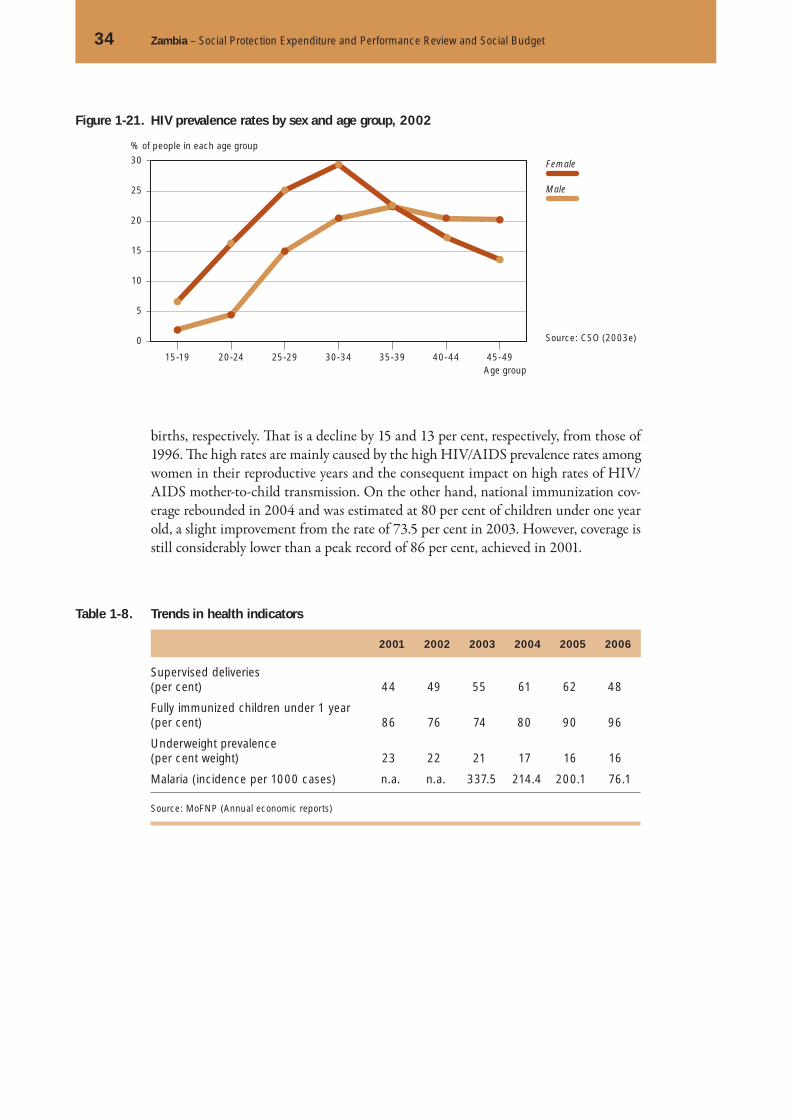
However, the same cannot be said for HIV/AIDS, of which the prevalence is still very high and showing little recent improvement. HIV prevalence was last esti-mated in 2002 at 15.6 per cent of the population in the age group 15-49 (ZDHS 2002). Th e concentration of death among those aged 30-44 is due particularly to the high HIV prevalence rate aff ecting this age group (see Figure 1-20).
Figure 1-21 clearly shows the disproportionate impact of HIV/AIDS on the female population. Th e female prevalence rate was estimated at 17.8 per cent, compared with 12.9 per cent in the male population. Th e urban population was found to be at higher risk, with a prevalence rate of 23 per cent, compared with about 11 per cent in rural areas.
HIV/AIDS is eroding human capacity on a broad front. Zambia now loses two-thirds of its trained teachers to HIV/AIDS, and in 2000 two in three agricultural exten-sion workers in the country reported having lost a co-worker in the past year. Th e spread of AIDS is a consequence as well as a cause of vulnerability. (UNDP, 2005, p. 22)
Positive trends include declining, but still high, under-5 mortality and infant mortality rates estimated in 2002 at 168 per 1000 live births and 95 per 1000 live
Figure 1-20. Percentage distribution of deaths by age, 2004
Source: CSO (2005)
Urban
Rural
Zambia
% of population
0
5
10
15
20
25
30
35
< 1 1-4 5-14 15-24 25-29 30-44 45-64 > 64
Age group
34 Zambia – Social Protection Expenditure and Performance Review and Social Budget
births, respectively. Th at is a decline by 15 and 13 per cent, respectively, from those of 1996. Th e high rates are mainly caused by the high HIV/AIDS prevalence rates among women in their reproductive years and the consequent impact on high rates of HIV/AIDS mother-to-child transmission. On the other hand, national immunization cov-erage rebounded in 2004 and was estimated at 80 per cent of children under one year old, a slight improvement from the rate of 73.5 per cent in 2003. However, coverage is still considerably lower than a peak record of 86 per cent, achieved in 2001.
Source: CSO (2003e)
Figure 1-21. HIV prevalence rates by sex and age group, 2002
Male
Female
% of people in each age group
Age group15-19 20-24 25-29 30-34 35-39 40-44 45-49
0
5
10
15
20
25
30
Table 1-8. Trends in health indicators
2001 2002 2003 2004 2005 2006
Supervised deliveries(per cent) 44 49 55 61 62 48
Fully immunized children under 1 year(per cent) 86 76 74 80 90 96
Underweight prevalence(per cent weight) 23 22 21 17 16 16
Malaria (incidence per 1000 cases) n.a. n.a. 337.5 214.4 200.1 76.1
Source: MoFNP (Annual economic reports)


Following the overview of the demographic, social and economic environments presented earlier, we examine poverty and vulnerability as two related and widely prevalent phenomena that characterize living conditions in Zambia, pointing
out the need for greater social protection coverage to address the needs not only of the majority of the population that is offi cially classifi ed as poor, but also of the poorest and most vulnerable population groups.
Poverty in Zambia is longstanding and its eradication has been a major focus of national development eff orts in the post-independence era. As a low-income country, Zambia faces numerous development challenges, e.g., historically low levels of human and material capital, inconsistent periods of economic growth and severe poverty implying an inability of the majority of the population to sustain basic needs. While poverty was known to be extensive, it is only since the early 1990s that systematic eff orts have been made to measure it. As a result of a series of national household sur-veys carried out since 1991, it is now possible to report on the extent of poverty in the population across the years. Such an examination reveals that poverty has remained extensive, with most of the population subsisting below what is considered to be the minimum standard of living.
An important aspect of contemporary poverty measurements in Zambia is that the actual living conditions of the population can be compared against objectively defi ned minimum living standards in the form of offi cial poverty lines. Two poverty lines are currently in use: the food poverty line, which marks a minimum level of food consumption and below which level households are characterized as extremely poor; and the basic needs poverty line, which marks the minimum level of consump-tion necessary to meet all basic needs and which demarcates the overall poor. Taking into account these distinctions, the Government estimated in 2006 that 51 per cent of Zambians were extremely poor and 64 per cent were overall poor.
By contrast, assessing vulnerability implies taking a more dynamic view of well-being, i.e., one which takes into account not only current livelihood outcomes but also the key risks faced by individuals and households in their daily lives, and their ability to deal with them when they occur. Like poverty, vulnerability is no stranger to Zambia. A large body of evidence points to the fact that most of the population is vulnerable to one or another poverty-threatening event. Such events are likely to
2

aff ect any household, for example, the death of a productive member of the household because of HIV/AIDS; or may aff ect only certain population groups, for example the loss of livestock to disease which is a risk faced particularly by rural livestock-rearing households. Poverty and vulnerability in Zambia are closely related. On the one hand, poverty itself refl ects a form of vulnerability, with the poor presumed to be especially likely to suff er in the event of ‘shocks’ due to their presumed limited ability to protect themselves. On the other hand, vulnerable groups such as orphans, elderly widows and persons living with HIV/AIDS are more likely than others to become poor, as their status almost always has some negative impact on their livelihoods and their ability to meet basic needs.
Because of their real and potential impact on welfare, poverty and vulnerability both imply states against which some form of social protection is required. Th is could be in terms of prevention, if negative outcomes are avoidable; reducing risks; or mitiga-tion, if negative outcomes are entrenched. As most of the population is poor, ensuring a minimum of social protection for all could play a major role in poverty reduction. At the same time, there is no doubt that even in the poor majority some are poorer and more vulnerable and especially in need of some form of public social assistance. Th e onus in this case is to identify such needy groups and determine how they can most eff ectively be targeted.
Although this is certainly not the fi rst attempt to examine poverty and vulner-ability in Zambia, the following analysis is distinguished in two ways. First, it makes use of the most up-to-date empirical data on living conditions in the country, notably data arising from the Living Conditions Monitoring Surveys series, complemented by evidence from a number of secondary sources.1 Second, the analysis responds to the challenge of how to extend coverage of social protection in a context of widespread poverty and vulnerability by identifying some of the characteristics which distinguish the neediest members of society from the erstwhile majority poor, and which could facilitate targeting of the former.
1 Although systematic investigations into conditions of poverty and vulnerability have not been the norm in Zambia, a recent and growing preoccupation with such analyses is evident, especially with the advent of the national Poverty Reduction Strategy Papers (PRSPs). Th e World Bank’s Poverty and Vulnerability Assess-ment (2005) marks one particularly recent and comprehensive attempt.
The poor and the poorest: Living conditions and vulnerability

38 Zambia – Social Protection Expenditure and Performance Review and Social Budget
Th e rest of the chapter is organized as follows:
☐ Part 1 discusses current estimates of the extent of poverty in Zambia and looks at past trends.
☐ Part 2 examines the living conditions experienced by the poor, referring to various indicators of well-being such as the ability to meet basic food needs, education and health status, and access to housing and safe drinking water.
☐ Part 3 examines vulnerability in Zambia from the perspective of major livelihood threats and the individual and household characteristics identifi ed with a greater susceptibility to poverty.
☐ Part 4 identifi es areas where public social protection interventions could be most eff ective in protecting the livelihoods of the poorest and most vulnerable.
Contemporary poverty
Th e Government of Zambia estimated that 64 per cent of the population were poor in 2006, including 51 per cent of the population classifi ed as extremely poor (living below the food poverty line), and a further 13 per cent of the population classifi ed as moderately poor living between the core (food) and overall (basic needs) poverty line (CSO 2007)). Although poverty headcount ratios such as those indicated above illus-trate overall poverty incidence, they only scratch the surface when it comes to showing the extent and nature of poverty in a country. Th is holds true in Zambia, where the incidence of poverty depends to a large extent on which particular area or population group is taken into account for the measurement, and where the poor themselves refl ect a wide range of welfare outcomes. In this section, we examine further aspects of pov-erty in Zambia, in particular the depth and severity of poverty 2 alongside its incidence in the population, and compare poverty measurements for diff erent population groups. We also examine poverty estimates dating from the early 1990s until the present, high-lighting patterns that have emerged over this period.
Poverty headcounts for the provinces in 2006 were calculated with reference to the same poverty lines and data sources used to calculate the national headcounts. Examining the headcounts in each province, it can be seen that in all but two provinces poverty rates exceeded 50 per cent, implying that in the majority of the provinces the populations were predominantly poor. However, even among such provinces there were some who were poorer than others: while the poor constituted over three-quarters of the population in Western, Northern and Eastern Provinces, they made up just above two-thirds of the population in Central, North-Western, Luapula and Southern Provinces.
Th e remaining two provinces, on the other hand, reported far lower poverty headcounts. In Lusaka Province just below a third of the population were found to be poor and around one-sixth of the population extremely poor. Likewise poverty rates
2 Regarding the decomposable poverty measures pioneered by Foster, Greer and Th orbecke (1984): depth of poverty refers to the ‘poverty gap’: the average distance, measured in monetary terms, between the mean consumption of the poor from the poverty line. Severity of poverty refers to the square of the poverty gap; which, in contrast to the other two measures, is sensitive to changes in income distribution (or inequality) among the poor and gives greater weight to an increase (or decrease) in welfare among those at the lowest end of the income distribution scale in refl ecting a reduction (or augmentation) of poverty. For more on the use and interpretation of these measures see chapter 3 of the UN Handbook on Poverty Statistics (2006).
2.1
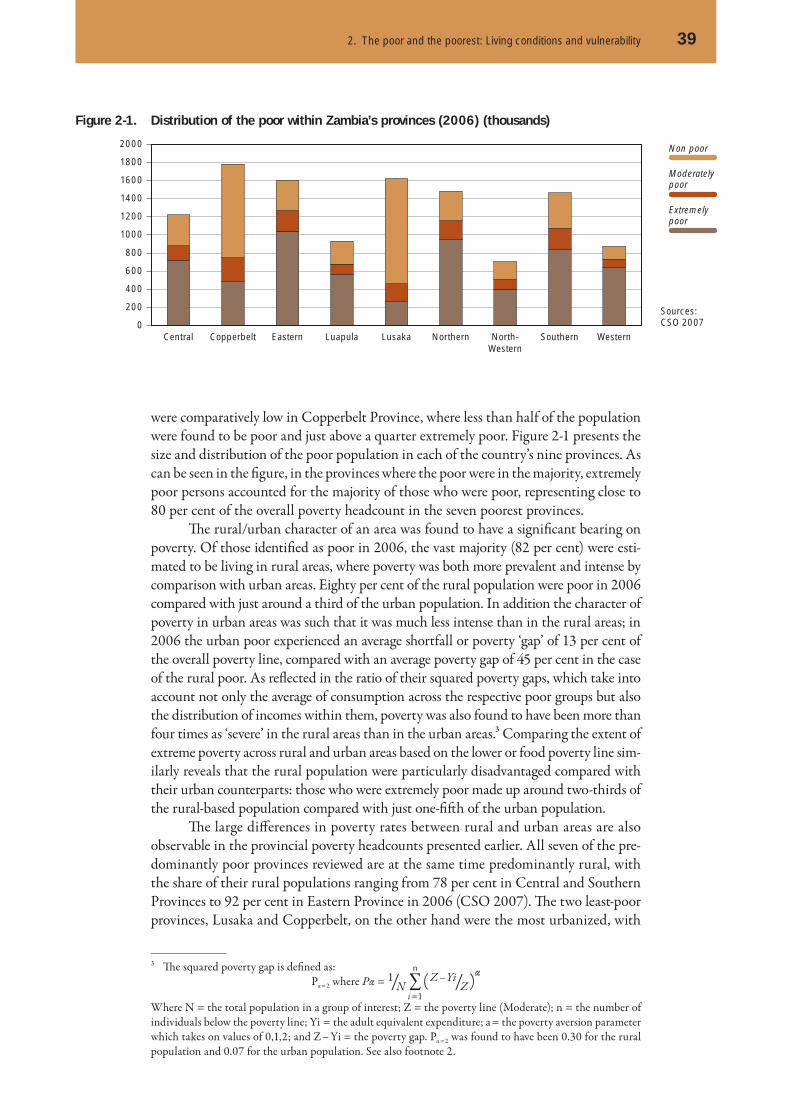
2. The poor and the poorest: Living conditions and vulnerability 39
were comparatively low in Copperbelt Province, where less than half of the population were found to be poor and just above a quarter extremely poor. Figure 2-1 presents the size and distribution of the poor population in each of the country’s nine provinces. As can be seen in the fi gure, in the provinces where the poor were in the majority, extremely poor persons accounted for the majority of those who were poor, representing close to 80 per cent of the overall poverty headcount in the seven poorest provinces.
Th e rural/urban character of an area was found to have a signifi cant bearing on poverty. Of those identifi ed as poor in 2006, the vast majority (82 per cent) were esti-mated to be living in rural areas, where poverty was both more prevalent and intense by comparison with urban areas. Eighty per cent of the rural population were poor in 2006 compared with just around a third of the urban population. In addition the character of poverty in urban areas was such that it was much less intense than in the rural areas; in 2006 the urban poor experienced an average shortfall or poverty ‘gap’ of 13 per cent of the overall poverty line, compared with an average poverty gap of 45 per cent in the case of the rural poor. As refl ected in the ratio of their squared poverty gaps, which take into account not only the average of consumption across the respective poor groups but also the distribution of incomes within them, poverty was also found to have been more than four times as ‘severe’ in the rural areas than in the urban areas.3 Comparing the extent of extreme poverty across rural and urban areas based on the lower or food poverty line sim-ilarly reveals that the rural population were particularly disadvantaged compared with their urban counterparts: those who were extremely poor made up around two-thirds of the rural-based population compared with just one-fi ft h of the urban population.
Th e large diff erences in poverty rates between rural and urban areas are also observable in the provincial poverty headcounts presented earlier. All seven of the pre-dominantly poor provinces reviewed are at the same time predominantly rural, with the share of their rural populations ranging from 78 per cent in Central and Southern Provinces to 92 per cent in Eastern Province in 2006 (CSO 2007). Th e two least-poor provinces, Lusaka and Copperbelt, on the other hand were the most urbanized, with
3 Th e squared poverty gap is defi ned as:Pα = 2 where Pα = 1/N ( Z – Yi/Z )
α
Where N = the total population in a group of interest; Z = the poverty line (Moderate); n = the number of individuals below the poverty line; Yi = the adult equivalent expenditure; a = the poverty aversion parameter which takes on values of 0,1,2; and Z – Yi = the poverty gap. Pα = 2 was found to have been 0.30 for the rural population and 0.07 for the urban population. See also footnote 2.
Figure 2-1. Distribution of the poor within Zambia’s provinces (2006) (thousands)
Sources:CSO 2007
Moderatelypoor
Extremelypoor
Non poor
Central Copperbelt Eastern Luapula Lusaka Northern North-Western
Southern Western0
200
400
600
800
1000
1200
1400
1600
1800
2000
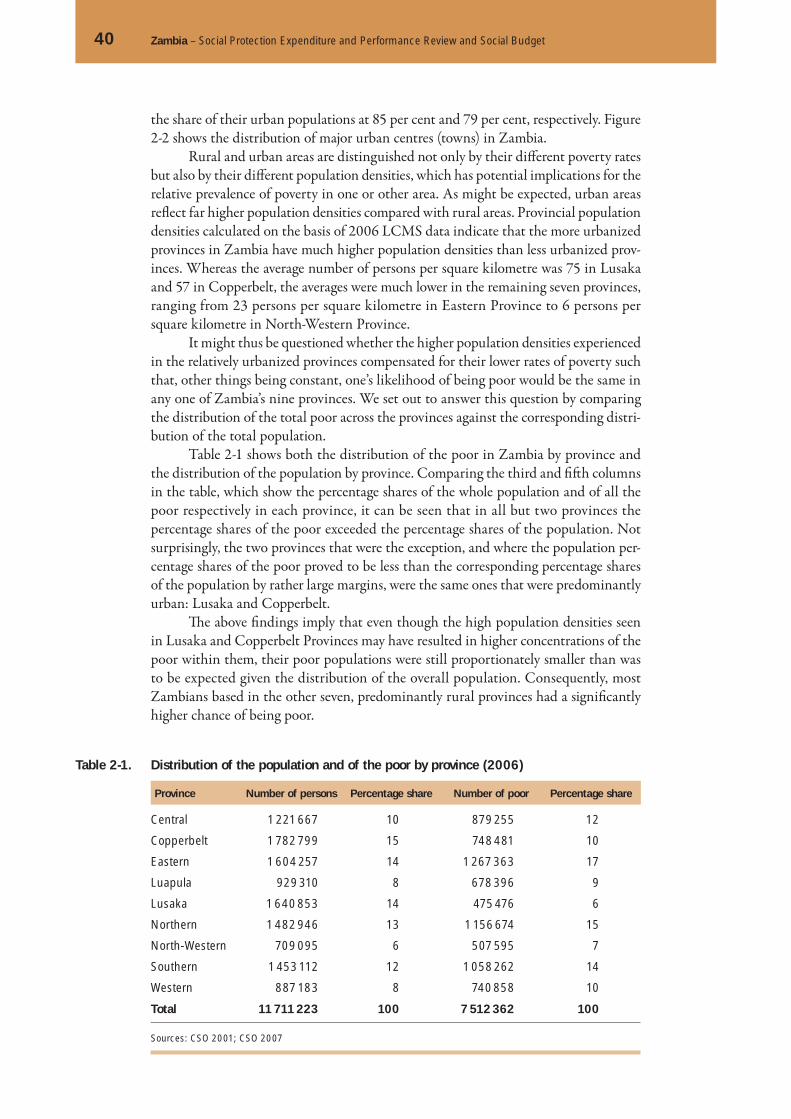
40 Zambia – Social Protection Expenditure and Performance Review and Social Budget
the share of their urban populations at 85 per cent and 79 per cent, respectively. Figure 2-2 shows the distribution of major urban centres (towns) in Zambia.
Rural and urban areas are distinguished not only by their diff erent poverty rates but also by their diff erent population densities, which has potential implications for the relative prevalence of poverty in one or other area. As might be expected, urban areas refl ect far higher population densities compared with rural areas. Provincial population densities calculated on the basis of 2006 LCMS data indicate that the more urbanized provinces in Zambia have much higher population densities than less urbanized prov-inces. Whereas the average number of persons per square kilometre was 75 in Lusaka and 57 in Copperbelt, the averages were much lower in the remaining seven provinces, ranging from 23 persons per square kilometre in Eastern Province to 6 persons per square kilometre in North-Western Province.
It might thus be questioned whether the higher population densities experienced in the relatively urbanized provinces compensated for their lower rates of poverty such that, other things being constant, one’s likelihood of being poor would be the same in any one of Zambia’s nine provinces. We set out to answer this question by comparing the distribution of the total poor across the provinces against the corresponding distri-bution of the total population.
Table 2-1 shows both the distribution of the poor in Zambia by province and the distribution of the population by province. Comparing the third and fi ft h columns in the table, which show the percentage shares of the whole population and of all the poor respectively in each province, it can be seen that in all but two provinces the percentage shares of the poor exceeded the percentage shares of the population. Not surprisingly, the two provinces that were the exception, and where the population per-centage shares of the poor proved to be less than the corresponding percentage shares of the population by rather large margins, were the same ones that were predominantly urban: Lusaka and Copperbelt.
Th e above fi ndings imply that even though the high population densities seen in Lusaka and Copperbelt Provinces may have resulted in higher concentrations of the poor within them, their poor populations were still proportionately smaller than was to be expected given the distribution of the overall population. Consequently, most Zambians based in the other seven, predominantly rural provinces had a signifi cantly higher chance of being poor.
Table 2-1. Distribution of the population and of the poor by province (2006)
Province Number of persons Percentage share Number of poor Percentage share
Central 1 221 667 10 879 255 12
Copperbelt 1 782 799 15 748 481 10
Eastern 1 604 257 14 1 267 363 17
Luapula 929 310 8 678 396 9
Lusaka 1 640 853 14 475 476 6
Northern 1 482 946 13 1 156 674 15
North-Western 709 095 6 507 595 7
Southern 1 453 112 12 1 058 262 14
Western 887 183 8 740 858 10
Total 11 711 223 100 7 512 362 100
Sources: CSO 2001; CSO 2007

2. The poor and the poorest: Living conditions and vulnerability 41
Trends in poverty: 1991-2006
We now turn to examine how poverty in Zambia has developed over the last fi ft een years based on a set of nationally representative household sample surveys conducted between 1991 and 2006. In principle, such trend analysis of poverty requires that only fi ndings from surveys similar in design be compared, so that any diff erences in the observed incidence of poverty between particular points in time follow as a result of actual changes in the welfare of the population rather than from changes in the survey methodology. Taking the series of surveys carried out in Zambia since 1991, six of the seven meet this criterion and are consequently used to examine trends in poverty in Zambia.4 In particular, two of the surveys the LCMS II conducted in 1998, and the LCMS V conducted in 2006, have been identifi ed as providing the best current basis for assessing poverty trends over a short-term period of eight years.5 Box 2 presents an overview of all the surveys.
Figure 2-2 shows the respective shares of the national, rural and urban populations living below the overall poverty line between 1991 and 2006. Examining the middle graph, which traces changes in the national poverty headcount ratio, it appears that
4 Poverty estimates based on the Integrated Household Budget Survey 2002/2003 (or LCMS III) are not examined here because of the diff erent way in which that survey was conducted compared with the other surveys. In particular, the 2002-2003 survey was based on a panel design, involving continuous data collec-tion over a twelve-month period with households recording their expenditures and other consumption data in monthly diaries, in contrast to the other surveys which employed a cross-sectional design where enumera-tors collected household data at only one point in time. Nonetheless, the same unique features of the survey of 2002-2003 prove particularly useful in analysing seasonal dynamics of poverty in Zambia.5 Another reason for taking the 1998 survey as a baseline for assessing short-term developments in poverty in the present analysis is that, at the time of its introduction, this survey was specifi cally intended to be a base-line instrument for the evaluation the fi rst Poverty Reduction Strategy of Zambia and, subsequently, also as a baseline instrument for monitoring national progress on the Millennium Development Goals.
2.2
Box 2. Introduction of national surveys to measure poverty in Zambia
The implementation of surveys specially designed to monitor different aspects of living conditions among the population is quite a recent phenomenon in Zambia. In the period since independence, no such surveys had been carried out, and it was only once the harsh effects of the Structural Adjustment Programmes (SAPS) become apparent in the early 1990s that monitoring was introduced. The first surveys carried out were the Social Dimensions of Adjustment Priority Surveys, carried out in 1991 and again in 1993 in order to track the effects of the SAPs on population welfare, and especially on the least well-off population groups. Although limited in scope compared with later sur-veys, PSI and PSII allowed relatively precise measurements of poverty to be conducted for the first time at national and sub-national levels. These initial surveys were followed by a series of Living Conditions Monitoring Surveys (LCMS) which began in 1996 and were subsequently carried out in 1998, 2002-2003, 2004 and 2006. Measuring var-ious aspects of living conditions such as income, expenditures, wealth, engagement in economic activities, access to basic infrastructure and public services, educational attainment and health status. The LCMS have further developed the use of household indicators, notably aggregate consumption, in measuring poverty. With the exception only of the 2002-2003 survey, which was based on a non-comparable design, it is now possible to examine poverty estimates from the 1991, 1993, 1996, 1998, 2004 and 2006 surveys and analyse with relative confidence the development of poverty between these years. National surveys measuring the living conditions of the population and poverty in particular are expected to continue in future, especially now that the National Development Plans have poverty reduction as their primary goal.

42 Zambia – Social Protection Expenditure and Performance Review and Social Budget
poverty in Zambia today is less prevalent than it was 15 years ago although there have been signifi cant fl uctuations in-between. Compared with 1993 when poverty was at its most widespread in Zambia with almost three-quarters of the population found to be poor, poverty incidence was much lower in 2006, when the poor made up just under two-thirds of the population.
As in 2006, poverty incidence in rural and urban areas diff ered substantially in the other survey years, with a far higher proportion of the rural population found to have been poor at any one time. However, mirroring the national trend, both rural and urban poverty appear to be lower today than they were in the 1990s. As the top graph in Figure 2-2 shows, rural poverty was most prevalent in 1993, when almost all the rural population were found to have been poor, and had decreased to its second-lowest level in 2006. As indicated by the bottom graph in Figure 2-2, urban poverty also decreased from a peak in 1998 to its lowest point in 2006, although this reduction was much greater compared with that seen in rural areas.
Figure 2-3 further shows that a decreasing share of the overall poor in the pop-ulation has been accompanied by a decreasing share of the extremely poor, indicating that in addition to actual poverty reduction, which could imply either a reduction in the prevalence of poverty or an absolute decrease in the number of the poor population, during this period there has also been a reduction in the intensity of poverty, with a
Source: CS0 2007
Source: CS0 2007
All Zambia
Rural
Urban
8892
82 8378 80
4945 46
5653
34
7074
6973
6864
1991 1993 1996 1998 2004 2006
0
10
20
30
40
50
60
70
80
90
100
All Zambia
Rural
Urban
1991 1993 1996 1998 2004 2006
0
10
20
30
40
50
60
70
80
90
100
8184
6871
53
67
32
2427
36 34
20
5861
5358 56
51
Figure 2-2. Trends in overall poverty (1991-2006) (percentage)
Figure 2-3. Trends in extreme poverty (1991-2006) (percentage)

2. The poor and the poorest: Living conditions and vulnerability 43
greater number of poor households approaching the poverty line than was previously the case. Th is is especially apparent in rural areas, where the share of extremely poor persons dropped from above 80 per cent in the early 1990s to just below 60 per cent in 2004. Urban extreme poverty also reduced signifi cantly during the same period from a high of 36 per cent in 1998 to a low of 20 per cent in 2006.
Although a smaller share of the population was found to have been living in pov-erty in recent years compared with the 1990s, a closer examination of the changes in rural and urban poverty between 1991 and 2006 reveals distinct developments in the sequencing and character of poverty reduction in either area during the period in ques-tion.6 On the one hand, poverty in urban areas seems to have reduced in both extent (how widespread it was among the population) and magnitude (how many people were actually poor) between 1991 and 2006. As Figure 2-2 shows, the percentage of the urban population living in poverty decreased slightly between 1991 and 1996, then increased substantially between 1996 and 1998. Aft er decreasing slightly between 1998 and 2004, urban poverty rates then experienced a sudden and spectacular drop between 2004 and 2006.7
Examining the period between 1998 and 2006 when urban poverty thus seems to have been on the decline, and when the urban poverty rate experienced a net per-centage decrease of 40 per cent, it was found that the number of urban poor at the same time decreased: there were almost three-quarters of a million fewer people living in poverty in urban areas in 2006 compared with the situation in 1998. Th is suggests that of those who were able to escape poverty over the past fi ft een years, many may have come from urban areas.
On the other hand, the reduction in poverty which occurred in rural areas over the past fi ft een years has been much more modest than that seen in urban areas, with only the extent of poverty in the rural population decreasing but not the abso-lute numbers of the poor, while even the timing of the former development has been diff erent. Figure 2-2 shows that the rural poverty rate increased somewhat between 1991 and 1993, but then reduced substantially between 1993 and 2004. From 1996 to 1998 there was not much change in poverty levels, while from 1998 onwards rural poverty rates experienced a slight drop. Th e overall pattern for rural areas is therefore of a sudden increase in the poverty rate followed by an also sudden and even larger decrease, both taking place in the fi rst half of the1990s aft er which there was not much change in the extent of rural poverty. However, a stabilization of the rural poverty rate over the last few years has not translated into a similar stabilization of the number of the rural poor: in the period between 1998 and 2006 more than 800,000 individuals were added to the ranks of the rural poor, off setting any progress that had been made over the same period in rolling back urban poverty.8
Th us, in contrast to the trend seen in urban areas where poverty reduction has been primarily a phenomenon of the last few years, the bulk of rural poverty reduc-tion seems to have taken place further back in time, notably in the period between
6 Various explanations can be found in the policy literature for the trends examined here. For one account relating the policy reforms on poverty and inequality, pursued in Zambia during the 1990s, see McCulloch et al. (2000).7 Although poverty estimates from the 2002/3 LCMS are not taken into account for reasons mentioned earlier, they seem to support the overall trends in rural and urban poverty the ILO indicates. As offi cially reported, the poverty rates over 2002/2003 were 67 per cent for the entire population, 74 per cent for the rural population and 52 per cent for the urban population (CSO 2004). 8 Diff erential rates of population growth in rural and urban areas over this period certainly contributed to the large increase seen in the number of rural poor, independently of any other poverty-inducing factors. How-ever, it is expected that one goal of national poverty reduction would be to slow down the growth in absolute numbers of the poor population, bearing in mind population growth patterns.

44 Zambia – Social Protection Expenditure and Performance Review and Social Budget
1993 and 1996. At the same time, whereas the number of the urban poor was found to have actually decreased between 1998 and 2006, the reverse was true in rural areas where there were more poor people in 2006 than at any point in the preceding fi ft een years. Th e outcome of the short-term movements in rural and urban poverty recorded between 1998-2006 is therefore that there was only a small net increase in the total number of poor persons in Zambia during this period. Between 1998 and 2006 the poor in Zambia increased by under 100,000 individuals, a number which falls far short of the increase that could have been projected to occur between these years taking into account actual population growth over this period, and which also falls far short of the actual increase in the number of poor persons between 1991 and 1998.9 Th e unique character of the urban poverty reduction that has taken place over the last eight or so years, in terms of both a reduced prevalence of poverty and a decrease in the poor popu-lation, thus accounts for much of the reduction in the incidence of poverty in Zambia during this period, and notably the dramatic halt in the growth of the national poor population.
As might be expected, diff erential rates of population growth in rural and urban areas have certainly contributed to the opposite shift s in the numbers of the rural and the urban poor, regardless of any other poverty-inducing factors. According to offi cial estimates and as also seen in the previous chapter, during the 1990s the rural popula-tion grew at twice the rate of the urban population. In the face of shift ing patterns of migration, fertility and the impact of HIV/AIDS as well as other known causes of mor-tality, it is still not known to what extent either population has grown in the years since 2000, and thus how the respective population growth rates could have impacted on the growth of the poor population. However, the current preponderance of rural dwellers in the population and the much higher prevalence of poverty among them implies that reducing rural poverty, both in terms of extent and the absolute number of the rural poor, is a key prerequisite if any of the national poverty reduction goals such as those articulated in the FNDP and Vision 2030 are to be met.
In the next section, we turn back to the present, to examine how poverty impacts on living conditions, looking particularly at health, education and access to safe drinking water. Later on we see how events such as droughts and deaths in the household repre-sent a major risk of falling into poverty, even for those who are not poor.
Living conditions of the poor
Now we consider various aspects of living conditions of the poorest population groups. As might be expected, poverty in Zambia translates into not only the inability to aff ord basic needs such as food and housing but also other adverse outcomes in health, educa-tion, access to safe water and sanitation.
9 Our calculations show that taking 1998 as the baseline and assuming an average annual population growth rate of 1.9 per cent (the average between 1998 and 2006) the size of the poor population in Zambia could be expected to have grown by more than one million individuals by 2006. On the other hand, our calculations show that in the period 1991-1998 the number of poor persons in Zambia actually increased by almost 1.5 million persons.
2.3

2. The poor and the poorest: Living conditions and vulnerability 45
Meeting basic food needs
As indicated in the reference to poverty lines, measuring poverty in Zambia follows a ‘cost of basic needs’ approach. On the one hand, a food basket has been defi ned based on the average monthly consumption of a household of six members in the middle-income quintile. Taking as a basis this value, the cost of other basic needs such as housing and clothing are estimated for the same ‘average’ household and their value added to the food basket in order to arrive at an estimated cost of all basic needs, referred to as the ‘basic needs basket’. Th e food basket subsequently determines the food poverty line while the basic needs basket determines the overall poverty line. Table 2-2 shows the composition of the food basket in December 2006.10
As noted before, the LCMS 2006 found 51 per cent of Zambian households to be ‘extremely poor’ or reporting average monthly consumption lower than the value of the food basket. Th at the majority of households in Zambia fi nd it diffi cult to meet even basic food needs is further indicated in households’ own assessments of their poverty status: only 42 per cent of households in the LCMS 2006 indicated that they could aff ord to have three meals a day.
Households’ ability to meet basic food needs is critically aff ected by the size of their incomes. Comparing incomes of extremely poor and moderately poor households as reported in the LCMS 2004, the modal monthly income of extremely poor house-holds was found to have been between two and three times smaller than that of moder-ately poor households. Further analysis of the LCMS 2004 data shows that households in the lowest consumption decile consumed on average only half of what households in the next lowest decile consumed, and four times less than what was consumed on
10 At that time the Food Basket was valued at K78,223 (approximately USD 20) per adult person per month and the Basic Needs Basket at K98,872 (approximately USD 25) per adult person per month.
Table 2-2. Food basket to meet monthly nutritional requirement of a household of six members (December 2006)
Item Product Quantity Calories per 100 grams
Protein Unit cost 12/2006
Average price 12/2006
1 White Roller 25 kg 3.6 10 712 221 26 288 94 636.80
2 Dried Kapenta Siavonga 1 kg 2 203 41 28 692 57 384.00
3 Dried bream 1 kg 1 100 21 22 317 22 317.00
4 Fresh milk (pasteurized) local 500 ml 4 43 2 2186 8744.00
5 Groundnuts 1 kg 3 570 27 5743 17 229.00
6 Eggs 1 unit 2 125 5660 11 320.00
7 Cooking oil imported 750 ml 6 619 - 5394 32 364.00
8 Onions 1 kg 4 14 - 3864 15 456.00
9 Tomatoes 1kg 4 7 1 2253 9012.00
10 Vegetables 7.5 74 6 1697 12 727.50
11 Dried beans 2 222 16 6041 12 082.00
12 Table salt 1 kg any brand 1 – – 2424 2424.00
TOTAL 12 689 335 295 696.30
Source: CSO (2007)
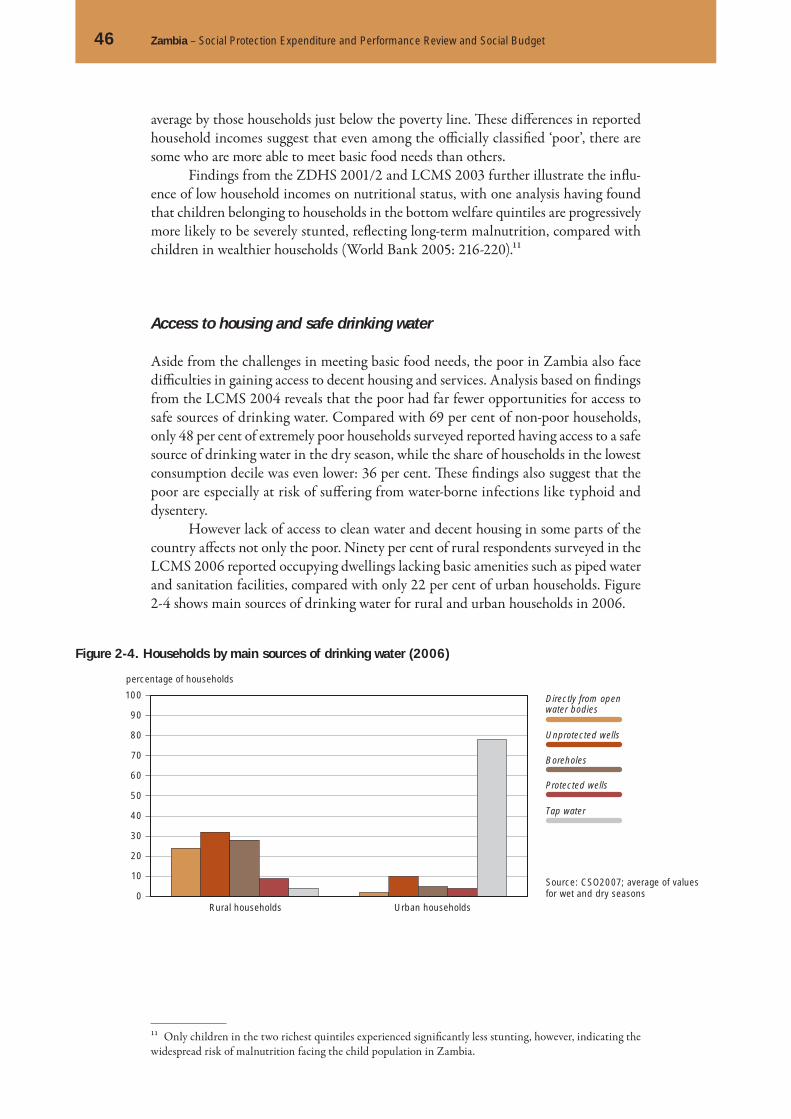
46 Zambia – Social Protection Expenditure and Performance Review and Social Budget
average by those households just below the poverty line. Th ese diff erences in reported household incomes suggest that even among the offi cially classifi ed ‘poor’, there are some who are more able to meet basic food needs than others.
Findings from the ZDHS 2001/2 and LCMS 2003 further illustrate the infl u-ence of low household incomes on nutritional status, with one analysis having found that children belonging to households in the bottom welfare quintiles are progressively more likely to be severely stunted, refl ecting long-term malnutrition, compared with children in wealthier households (World Bank 2005: 216-220).11
Access to housing and safe drinking water
Aside from the challenges in meeting basic food needs, the poor in Zambia also face diffi culties in gaining access to decent housing and services. Analysis based on fi ndings from the LCMS 2004 reveals that the poor had far fewer opportunities for access to safe sources of drinking water. Compared with 69 per cent of non-poor households, only 48 per cent of extremely poor households surveyed reported having access to a safe source of drinking water in the dry season, while the share of households in the lowest consumption decile was even lower: 36 per cent. Th ese fi ndings also suggest that the poor are especially at risk of suff ering from water-borne infections like typhoid and dysentery.
However lack of access to clean water and decent housing in some parts of the country aff ects not only the poor. Ninety per cent of rural respondents surveyed in the LCMS 2006 reported occupying dwellings lacking basic amenities such as piped water and sanitation facilities, compared with only 22 per cent of urban households. Figure 2-4 shows main sources of drinking water for rural and urban households in 2006.
11 Only children in the two richest quintiles experienced signifi cantly less stunting, however, indicating the widespread risk of malnutrition facing the child population in Zambia.
Source: CSO2007; average of values for wet and dry seasons
Figure 2-4. Households by main sources of drinking water (2006)
Unprotected wells
Directly from open water bodies
Boreholes
Protected wells
Tap water
Rural households Urban households0
10
20
30
40
50
60
70
80
90
100
percentage of households
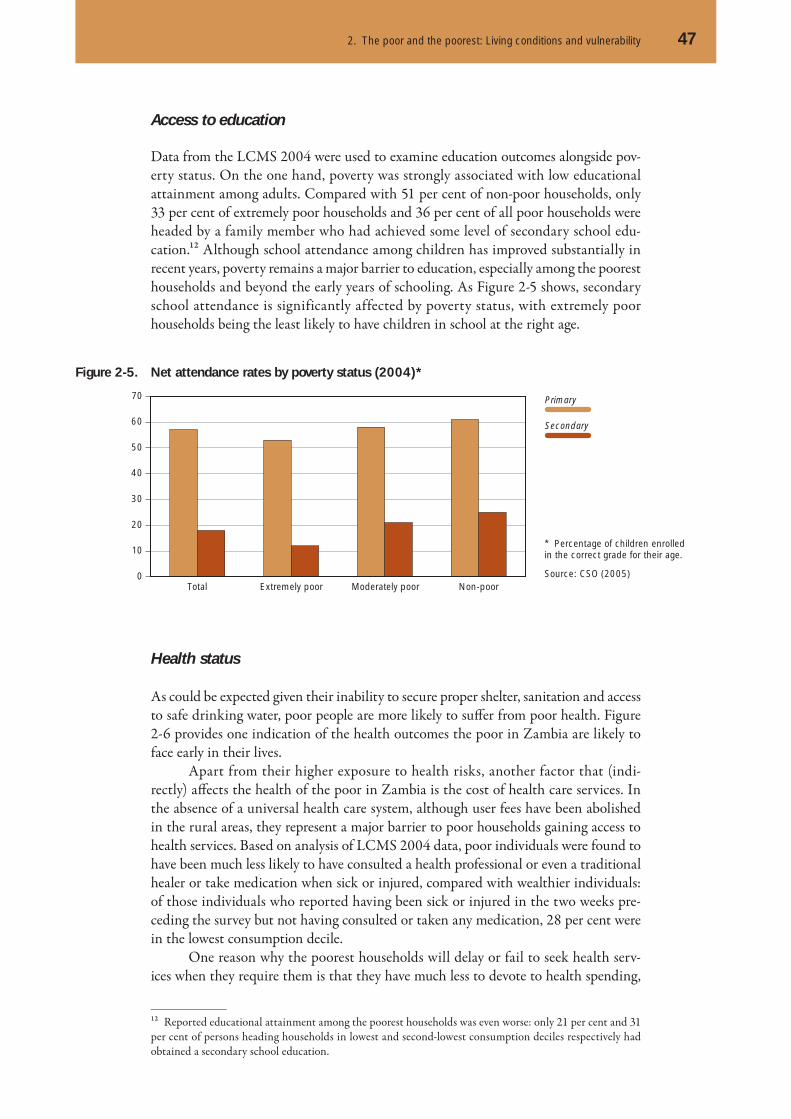
2. The poor and the poorest: Living conditions and vulnerability 47
Access to education
Data from the LCMS 2004 were used to examine education outcomes alongside pov-erty status. On the one hand, poverty was strongly associated with low educational attainment among adults. Compared with 51 per cent of non-poor households, only 33 per cent of extremely poor households and 36 per cent of all poor households were headed by a family member who had achieved some level of secondary school edu-cation.12 Although school attendance among children has improved substantially in recent years, poverty remains a major barrier to education, especially among the poorest households and beyond the early years of schooling. As Figure 2-5 shows, secondary school attendance is significantly affected by poverty status, with extremely poor households being the least likely to have children in school at the right age.
Health status
As could be expected given their inability to secure proper shelter, sanitation and access to safe drinking water, poor people are more likely to suff er from poor health. Figure 2-6 provides one indication of the health outcomes the poor in Zambia are likely to face early in their lives.
Apart from their higher exposure to health risks, another factor that (indi-rectly) aff ects the health of the poor in Zambia is the cost of health care services. In the absence of a universal health care system, although user fees have been abolished in the rural areas, they represent a major barrier to poor households gaining access to health services. Based on analysis of LCMS 2004 data, poor individuals were found to have been much less likely to have consulted a health professional or even a traditional healer or take medication when sick or injured, compared with wealthier individuals: of those individuals who reported having been sick or injured in the two weeks pre-ceding the survey but not having consulted or taken any medication, 28 per cent were in the lowest consumption decile.
One reason why the poorest households will delay or fail to seek health serv-ices when they require them is that they have much less to devote to health spending,
12 Reported educational attainment among the poorest households was even worse: only 21 per cent and 31 per cent of persons heading households in lowest and second-lowest consumption deciles respectively had obtained a secondary school education.
* Percentage of children enrolled in the correct grade for their age.
Source: CSO (2005)
Figure 2-5. Net attendance rates by poverty status (2004) *
Primary
Secondary
Total Extremely poor Moderately poor Non-poor0
10
20
30
40
50
60
70

48 Zambia – Social Protection Expenditure and Performance Review and Social Budget
compared with other population groups. Th is can again be seen in the LCMS 2004, where average spending on health reported by extremely poor individuals was less than a third of that reported by non-poor individuals, although the probability of illness was certainly higher among the former. Given the smaller incomes of the poorest house-holds, critical and unplanned health spending may also impose a signifi cant burden on household resources and therefore indirectly lead to a worsening of their ability to sus-tain a livelihood and meet other basic needs. Cheelo et al. (2006) estimate that costs of health care may on average account for 10 per cent of the expenditures of the poorest quartile of households, but less than 3 per cent for households in the second poorest quartile. Analysis of LCMS 2004 data reveals a similar trend, with health spending taking up almost a fi ft h of total consumption of households in the poorest decile, a level of health spending that could be termed catastrophic.
Vulnerability
In what follows we examine vulnerability from the perspective of events or conditions that subject households in Zambia to the risk of poverty. Of course, poverty defi ned in terms of the inability to meet basic needs is only one among many sub-optimal wel-fare outcomes that households in Zambia are likely to encounter. Others may include chronic or permanent loss of health and the loss of family members. Nevertheless, the focus on vulnerability to poverty is not misplaced: as demonstrated in the previous sec-tion, poverty in Zambia is associated with a range of adverse living conditions that in turn point to a greater susceptibility to other undesirable outcomes such as illness and long-term destitution.
Implied in the present approach are two questions that are vital from a social protection perspective. On the one hand, what are the (exogenous) risks that may hasten or entrench deterioration in households’ well-being to the point of lowering consumption below the poverty line? On the other hand, which (endogenous) char-acteristics are likely to predispose individuals, households or communities in Zambia to poverty? Although we cannot answer either question in its entirety, we do present evidence indicating some of the key risks engendering poverty in Zambia as well as identifying those which are particularly susceptible to poverty and should be targeted in anti-poverty measures.
2.4
Source: UNDP (2006) Human Development Report
Figure 2-6. Child mortality rates (2001)
Poorest 20%
Richest 20%
Infant mortality rate Under-5 mortality rate0
20
40
60
80
100
120
140
160
180
200

2. The poor and the poorest: Living conditions and vulnerability 49
Previous studies on vulnerability in Zambia have referred to any number of events whose occurrence may threaten households’ livelihoods or even their very sur-vival (del Ninno & Marini 2005). Th ese include natural disasters such as droughts and fl oods, serious illnesses, in particular HIV/AIDS, the death of productive house-hold members, and macroeconomic instability, to name but a few. In addition to such ‘shocks’, long-term structural conditions also engender vulnerability. Th e Fift h National Development Plan of Zambia in its chapter on social protection identifi es various such risk factors, including:
☐ lack of sustainable livelihoods in rural areas
☐ inadequate access to social security, education and training
☐ inadequate health services
☐ HIV/AIDS
☐ violence against women and children☐ and lack of legal entitlements for refugees.
In what follows, we examine two phenomena widely cited as engendering a risk of pov-erty in Zambia: natural disasters and HIV/AIDS. We examine diff erent aspects of the vulnerability arising from these phenomena, including how oft en or how widely they occur; particular groups they are likely to aff ect; and the causal processes by which they might lead households into poverty. Later on, we identify measures that, from a social protection perspective, could be considered to reduce the associated vulnerability.
Natural disasters
Table 2-3 shows the frequency of some natural disasters in Zambia in recent years. As can be seen, in only two of the eight years reviewed did no disaster occur, while in other years events such as epidemics, fl oods and droughts occurred simultaneously.
Various studies (e.g. Parker and Mwape, 2004; del Ninno & Marini, 2005) cite natural disasters as a key cause of downward mobility in Zambia. One reason is that their economic impact is oft en widely felt. For example, the disruption of agricultural production associated with droughts and other weather-related shocks acts simultane-ously to lower rural incomes and to raise food and commodity prices in urban areas, lowering consumption and exacerbating food insecurity in both areas. Another reason is that such events typically expose a population to several risks at once. For instance, apart from disrupting production and damaging assets, disasters like fl oods also act to spread diseases, especially where the drinking water and sanitation infrastructure is
Table 2-3. Incidence of natural disasters (2001-2007)*
2000 2001 2002 2003 2004 2005 2006 2007
Epidemic ✘ ✘ ✘ ✘ ✘
Flood/drought ✘ ✘ ✘ ✘
* The following events qualify as disasters: 10 or more people reported killed, 100 people reported affected, a call for international assistance, or declaration of a state of emergency (EM-DAT, 2007).

50 Zambia – Social Protection Expenditure and Performance Review and Social Budget
poor or non-existent. Recurrent shocks result in increasing vulnerability as people sell assets, etc., to survive each shock.
Natural disasters are expected to remain a major obstacle to development and pov-erty reduction in Zambia over the coming years. Global warming represents one partic-ular threat. According to the environment chapter of the FNDP, temperature warming is expected to lead to substantial reductions in rainfall and increase the frequency of droughts in some of the most fertile regions of the country (GRZ 2006: 304-305).
HIV/AIDS
HIV/AIDS, now a full-blown pandemic in Zambia, represents another grave risk facing the population. Apart from the direct suff ering of those infected and of their families, who spend vital resources caring for them through their illness and are even-tually left behind, the impact of HIV/AIDS is felt in other areas of society as the extended family and neighbours contribute to funeral costs and in many cases support households which have lost a breadwinner or caretaker. As was noted elsewhere.
For households whose economic standing is already insecure, the increased dependency ratio and added fi nancial burdens caused by illness and death in related households can push them below the poverty line. If they fully meet their traditional social obligations, then the requirements of HIV/AIDS-aff ected relatives may drain their saving and render them more vulnerable to impoverishment as a result of any shocks that they themselves might experience. (WB 2005: 193).
Further threats posed by the pandemic include the loss of skilled professionals such as teachers and health care workers, the disruption of the organized economic sectors, and a deterioration in food security as small-scale rural households, which are responsible for growing the bulk of food crops in the country, fi nd themselves labour-constrained as a consequence of HIV-related deaths.
Table 2-4 shows the number of people currently living with the disease and prevalence rates among various age groups. As discussed in Chapter 1, the risk posed by HIV/AIDS is not uniform for all individuals but varies according to age and sex. In the past, cases of infection were mostly restricted to older men, although now it is young women who are reporting the highest rates of infection. At the same time, the majority of HIV/AIDS cases continue to be reported in urban areas, implying that urban women constitute a key risk group (World Bank 2005).
In addition to the threats posed by natural disasters and HIV/AIDS, vulner-ability in Zambia also follows as a result of structural conditions such as long-run-ning under-investment in public education and the inability of the most vulnerable
Table 2-4. HIV/AIDS estimates (2007)
Number of people living with HIV 1,100,000
Prevalence among adults aged 15-49 years 17 per cent
Women aged 15 and over living with HIV 570,000
Children aged 0-14 living with HIV 130,000
Orphans aged 0 to 17 living with HIV 710,000
Source: UNAIDS: http://www.unaids.org/en/Regions_Countries/Countries/zambia.asp

2. The poor and the poorest: Living conditions and vulnerability 51
members of society to infl uence policy outcomes vital to any improvement in their living conditions. In such conditions, a large part of the population fi nds itself in a ‘trap’ from which there few opportunities for escape because of constant low returns on livelihood strategies.
In the next section we use data from the LCMS 2004 to assess endogenous vul-nerability, in which certain individual and household attributes are indicative of the risk of being poor.
Household size and composition
LCMS 2004 data reveal increasing household size to be associated with a greater likeli-hood of poverty. Th e average poor household in 2004 had six members compared with four members in the average non-poor household. Large households, consisting of six or more members, made up 54 per cent of extremely poor households, 42 per cent of moderately poor households and 27 per cent of non-poor households. Th e tendency to increasing household size was evident also among the poorest households, with the bottom two income deciles featuring the largest number of large households as shown in Figure 2-7. However, households in rural and urban areas were not markedly dif-ferent in size on average, suggesting this was not a factor contributing to diff erences in income between them.
Increasing household size has a most direct impact on household income levels via over-dependency. Th is comes about when a few productive members of the house-hold are responsible for a large number of non-productive members, as might occur for example in a household consisting of parents supporting many young children. Over-dependency may also refl ect the obligations imposed by traditional safety nets, where households welcome into their midst needy members of the extended family.
Another characteristic that has a bearing on poverty status is the generational composition of the household. An examination of the structure of Zambian house-holds based on the LCMS 2004 reveals the existence of several types of households made up of diff erent combinations of generations. Analysis of consumption data cor-responding to these household categories reveals significant disparities in welfare, depending on the presence of certain generations in the household which are deemed critical to poverty status.
Source: LCMS 2004
Figure 2-7. Households’ income distribution by average size
0
1
2
3
4
5
6
7
Household size (persons)
1 2 3 4 5 6 10Expenditure deciles
7 8 9
52 Zambia – Social Protection Expenditure and Performance Review and Social Budget
Th e vast majority of Zambians were found in households consisting of adults and children living together, which accounted for 70 per cent of all households.13 Th is type of household approximated a ‘standard household’ in terms of size, with on average close to six members per household. However, there was no typical level of consumption for households of this type, with the majority qualifying as ‘moder-ately poor’14 and a minority reporting consumption that clearly placed them in the top income brackets. Th is implies that additional household characteristics need to be known in order to identify who is likely to be poor among such households.
Much less common, accounting for only a tenth of all households, were extended households consisting of adults, children and elderly persons living together. Such households are by defi nition large, with on average seven members per household. Rep-resenting only a minority of households, their vulnerability in terms of their likelihood of being poor is at the same time more straightforward to determine: analysis reveals that households of this type were in most cases poor, if not extremely poor, with the lowest reported median consumption per adult equivalent and a mean just above the extreme poverty benchmark. Th e susceptibility of multi-generational households to poverty is also demonstrated by the fact that more than a third of such households counted among the bottom national welfare quintile.
Other household types were those of active-age adults living on their own, repre-senting 14 per cent of all households, elderly persons living on their own, representing 2 per cent of all households, adults living with elderly persons, representing 3 per cent of all households, and elderly persons living with children, representing 1 per cent of households.15 Households in the fi rst two categories were found to have been substan-tially better off than most other households, with median and mean consumption exceeding the poverty lines. Households consisting of active age-adults living with eld-erly persons mirrored the ‘standard’ household in terms of median and mean consump-tion, although with much less variation in welfare levels (refl ected in a lower standard deviation compared with the latter category). Households in the fi nal category however counted among the poorest sections of the population, with the second-lowest median consumption levels aft er the multi-generational household type and mean consump-tion levels below the poverty line.
Th e above fi ndings point to a telling pattern: households composed of adults living with children or elderly persons, or of all three generations living together, were signifi cantly more likely to be poor compared with households consisting either of adults or elderly persons living on their own. Below we examine some reasons why the presence of children and elderly persons in a household in addition to active-age adults might imply a greater likelihood of poverty.
One reason why households consisting exclusively of elderly persons might refl ect overall lower levels of welfare compared with households consisting exclusively of active-age adults could be the diff erent rates of economic activity exhibited by the two generations.
However, on its own, the presence of elderly persons in a household is not suf-ficient to imply any significant likelihood of poverty, as indicated in the fact that elderly-only households recorded the second highest mean and median consumption
13 For the purposes of the present analysis children are defined as between 0-14 years of age, adults 15-59 years, and elderly persons 60 years and above.14 Refl ected in a median aggregate expenditure value of K82,879 per adult equivalent, which was between the upper and lower poverty lines in 2004.15 Th e LCMS 2004 dataset also included a number of children-only households. Due to the very small numbers reported such households are omitted from this analysis but are examined in the later discussion on orphans.
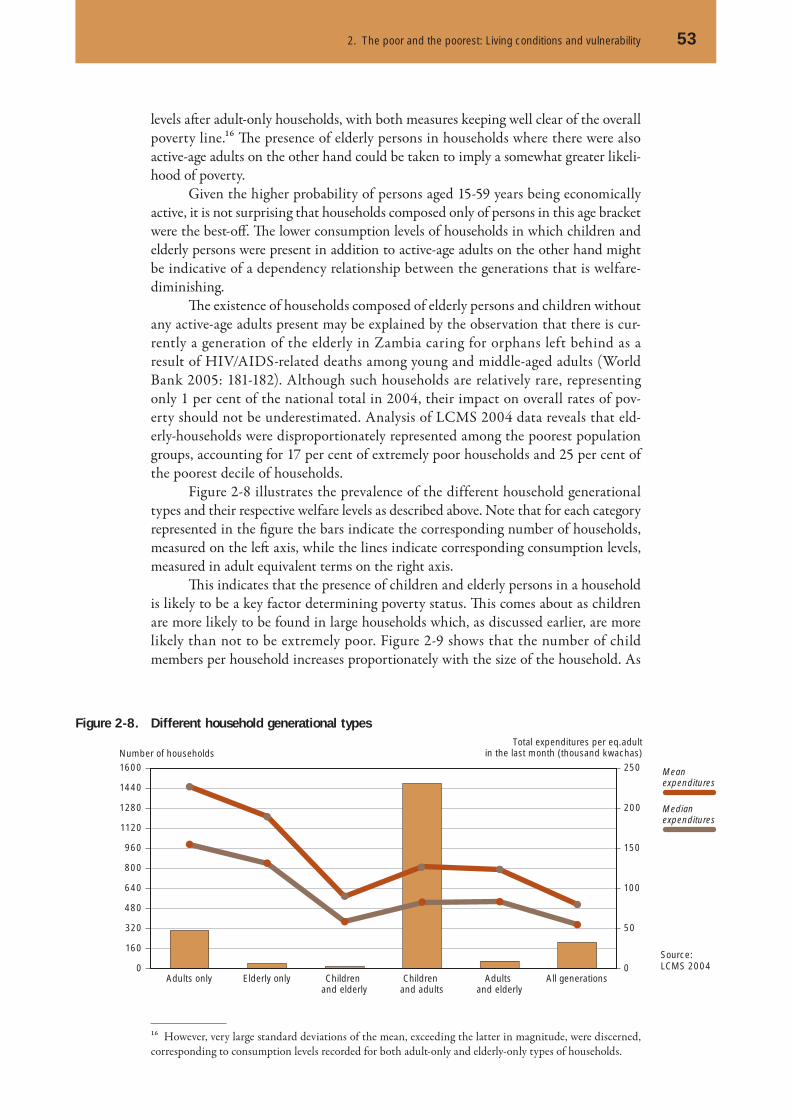
2. The poor and the poorest: Living conditions and vulnerability 53
levels aft er adult-only households, with both measures keeping well clear of the overall poverty line.16 Th e presence of elderly persons in households where there were also active-age adults on the other hand could be taken to imply a somewhat greater likeli-hood of poverty.
Given the higher probability of persons aged 15-59 years being economically active, it is not surprising that households composed only of persons in this age bracket were the best-off . Th e lower consumption levels of households in which children and elderly persons were present in addition to active-age adults on the other hand might be indicative of a dependency relationship between the generations that is welfare-diminishing.
Th e existence of households composed of elderly persons and children without any active-age adults present may be explained by the observation that there is cur-rently a generation of the elderly in Zambia caring for orphans left behind as a result of HIV/AIDS-related deaths among young and middle-aged adults (World Bank 2005: 181-182). Although such households are relatively rare, representing only 1 per cent of the national total in 2004, their impact on overall rates of pov-erty should not be underestimated. Analysis of LCMS 2004 data reveals that eld-erly-households were disproportionately represented among the poorest population groups, accounting for 17 per cent of extremely poor households and 25 per cent of the poorest decile of households.
Figure 2-8 illustrates the prevalence of the different household generational types and their respective welfare levels as described above. Note that for each category represented in the fi gure the bars indicate the corresponding number of households, measured on the left axis, while the lines indicate corresponding consumption levels, measured in adult equivalent terms on the right axis.
Th is indicates that the presence of children and elderly persons in a household is likely to be a key factor determining poverty status. Th is comes about as children are more likely to be found in large households which, as discussed earlier, are more likely than not to be extremely poor. Figure 2-9 shows that the number of child members per household increases proportionately with the size of the household. As
16 However, very large standard deviations of the mean, exceeding the latter in magnitude, were discerned, corresponding to consumption levels recorded for both adult-only and elderly-only types of households.
Figure 2-8. Different household generational types
Meanexpenditures
Medianexpenditures
Adults only Elderly only Children and elderly
Children and adults
Adults and elderly
All generations
Total expenditures per eq.adultin the last month (thousand kwachas)Number of households
0
160
320
480
640
800
960
1120
1280
1440
1600
0
50
100
150
200
250
Source:LCMS 2004
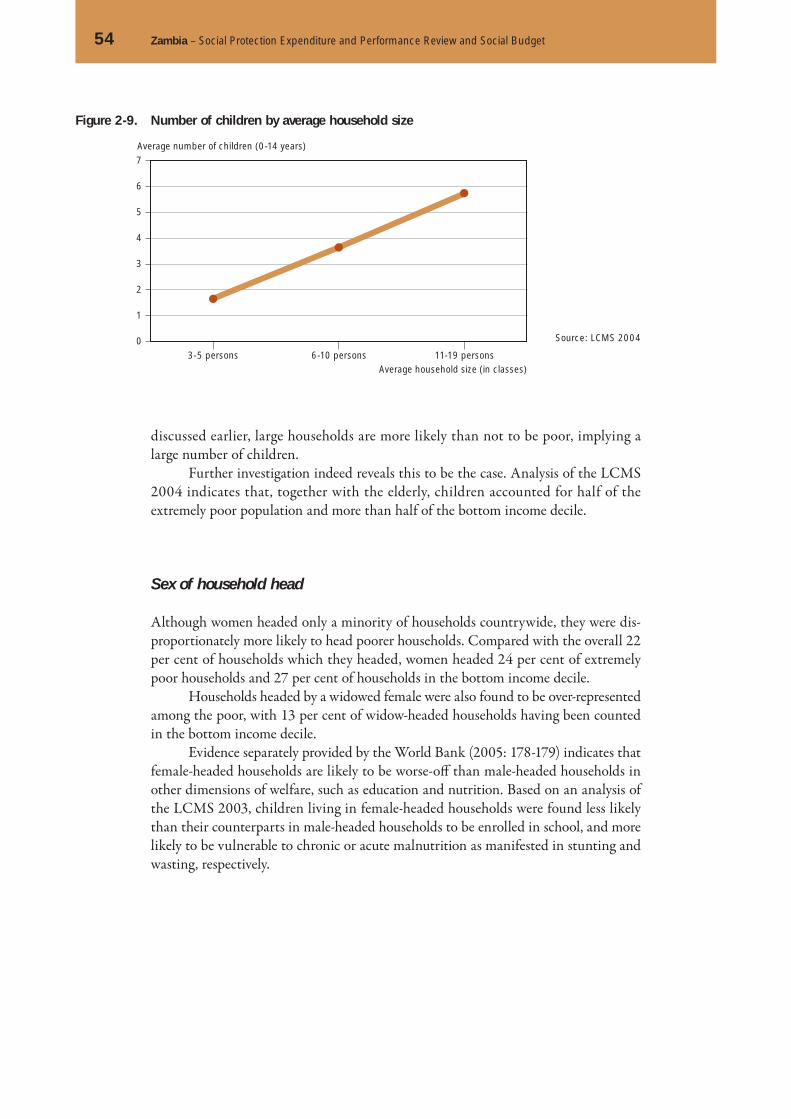
54 Zambia – Social Protection Expenditure and Performance Review and Social Budget
discussed earlier, large households are more likely than not to be poor, implying a large number of children.
Further investigation indeed reveals this to be the case. Analysis of the LCMS 2004 indicates that, together with the elderly, children accounted for half of the extremely poor population and more than half of the bottom income decile.
Sex of household head
Although women headed only a minority of households countrywide, they were dis-proportionately more likely to head poorer households. Compared with the overall 22 per cent of households which they headed, women headed 24 per cent of extremely poor households and 27 per cent of households in the bottom income decile.
Households headed by a widowed female were also found to be over-represented among the poor, with 13 per cent of widow-headed households having been counted in the bottom income decile.
Evidence separately provided by the World Bank (2005: 178-179) indicates that female-headed households are likely to be worse-off than male-headed households in other dimensions of welfare, such as education and nutrition. Based on an analysis of the LCMS 2003, children living in female-headed households were found less likely than their counterparts in male-headed households to be enrolled in school, and more likely to be vulnerable to chronic or acute malnutrition as manifested in stunting and wasting, respectively.
Source: LCMS 2004
Figure 2-9. Number of children by average household size
3-5 persons 6-10 persons 11-19 personsAverage household size (in classes)
0
1
2
3
4
5
6
7Average number of children (0-14 years)

2. The poor and the poorest: Living conditions and vulnerability 55
Disability
According to the LCMS 2004 less than 2 per cent of the population was disabled17. Elderly age groups experienced the highest rates of disability with 10 per cent of those aged 70 years and above, 5 per cent of those aged 65-69 years and 3 per cent of those aged 60-64 years having reported themselves as disabled.
Overall there were more disabled males than disabled females, except in the case of the bottom income decile, in which disabled females outnumbered disabled males. Disabled persons were found to be disproportionately likely to be extremely poor, with almost a quarter (24 per cent) of the disabled population having counted in the bottom two income deciles.
While the incidence of disability among persons aged 15-59 years was low com-pared with other age groups, disability rates were signifi cantly higher among extremely poor persons in this age group. Disabled persons reported being much less economi-cally active in comparison with the able-bodied population, with labour force partici-pation rates of around only 50 per cent in 2004.
Orphanhood
Th e LCMS 2004 revealed that 18 per cent of persons aged 0-20 years were orphans.18 Seventy-three per cent of orphans were partial orphans having lost only one parent, in most cases (78 per cent of the time), the father. Th is indicates that in 2004 approxi-mately 60 per cent of orphans were living with their mothers.
Th e incidence of orphanhood varied across the country, with Western Province recording the highest incidence, with 24 per cent of children aged 0-20 years orphaned, and North-Western Province recording the lowest incidence, with 12 per cent of chil-dren aged 0-20 years orphaned. Orphanhood was altogether more prevalent in urban areas than in rural areas.
Th e LCMS 2004 revealed that orphans experience some of the highest poverty rates in the country, notwithstanding already high rates of poverty among children. Of those orphans aged under 15 years, i.e. younger than the legal working age, 54 per cent were extremely poor compared with 52 per cent of non-orphans of a similar age. Orphans alone accounted for 9 per cent of the bottom income decile.
Evidence provided in the World Bank’s Poverty and Vulnerability Assessment Study of 2005 further illustrates the vulnerability experienced by today’s orphans. In conditions of widespread mortality occasioned by a maturing HIV/AIDS epidemic and where the loss of one’s parents represents just one facet of the catastrophe, along-side the death of spouses, breadwinners and adult caretaker children, the safety-net function once served by kinship ties is eroding. Th us, even when orphans come to be taken in by the extended family, they are less likely to receive an appropriate level of care compared with other children in the household. Th e World Bank data reveal that while the presence of orphans is not likely to signifi cantly aff ect households’ welfare status, orphans themselves (and particularly those who have lost their mother or who are female) are considerably likely to face discrimination compared with other children in the same household, for instance, by not being sent to school.
17 Th e specifi c question in the household survey was: ‘Is [the household member] blind, partially sighted, deaf, dumb, physically disabled, mentally retarded, mentally ill, or ex-mental?’ (Questionnaire, p.2).18 Orphans were defi ned as persons having lost either or both their parents and aged under 21 years.

56 Zambia – Social Protection Expenditure and Performance Review and Social Budget
Conclusions
From the starting-point that half of the Zambian population is extremely poor, being unable to aff ord even basic food items on a sustainable basis, it was found that:
☐ Households headed by the elderly and women are the most likely to experience extreme poverty. In the poorest decile 25 per cent of households were headed by elderly persons and 27 per cent by women. Households headed by persons with less than a secondary school education were also more likely to be extremely poor, with only 33 per cent of extremely poor households headed by a person with a secondary school education.
☐ Th e majority of extremely poor households in Zambia have six or more members most of whom are children. Children alone account for nearly half of the extremely poor population.
☐ Nearly one-fi ft h of all children are orphans, most having lost their parents to HIV/AIDS. The majority of orphans are partial orphans living with their mothers. Orphan children experience higher poverty rates than non-orphan children, with full orphans (having lost both parents) experiencing the highest poverty rates. Orphans alone account for 10 per cent of the poorest population decile.
☐ Th ere are disproportionately more women and disabled persons in the poorest income decile. Individuals in this group are also vulnerable because of their higher exposure to unsafe sources of drinking water, lower likelihood of consulting a health professional in case of sickness or injury, and higher susceptibility to chronic illness.
☐ Children in the poorest income decile are much less likely to attend school and when they do, they begin at an older age.
☐ Although the poorest individuals seem to be the most economically active, almost all work in the informal economy, with four-fi ft hs of workers in the poorest income decile based in traditional agriculture, forestry and fi shing sectors.
2.5

The previous chapter points to some sources of poverty and vulnerability. Such analysis may help in designing policies to build up the national social protec-tion system gradually. It may help in taking decisions about social risks and
contingencies as to which should be addressed fi rst and what target groups should be of particular concern. Th is chapter looks at levels of economic activity and the types of employment people are involved in: how many of those economically active are employees with a more or less formalized contractual relationship? For an employer, how many are self-employed, etc.? Experience in other countries shows that groups with different employment status (such as having an employer or not, having an employment contract or not, etc.) require diff erent institutional solutions to provide aff ordable access to health care and basic income security benefi ts in case of sickness, disability, old-age or other contingencies. Such analysis may thus help to decide what institutional forms of social protection would be the most desirable and feasible.
Everyone’s income security is endangered in cases of sickness, disability, old age, unemployment, death in the family, maternity or other family obligations such as the need to provide care to children or the sick. But the need for specifi c forms of social protection diff ers depending on employment status. For example, for those who are contract workers for an employer, with earnings from that employment as their only source of income and wealth, and with no degree of fl exibility with respect to when and how long they have to be available to work; and for the self-employed whose incomes are usually less regular and predictable but sometimes have greater fl exibility in plan-ning their working hours and may own certain productive assets.
Furthermore, with respect to the design of entitlements to social protection and to deciding on its fi nancing sources, what is desirable and feasible and for what groups depends on prevailing employment patterns in the labour market.
Mandatory contributory social insurance schemes providing income replacement (or supplements) in case of sickness, employment injury, disability, old-age, unemploy-ment or maternity and other family obligations are administratively feasible to imple-ment and enforce when employees have legally binding contracts with their employers. However, they are a challenge in every sense when it comes to covering the self-employed or employees whose employment is not formalized in any legal sense. In Zambia, employees and their employers in the public and the private sectors are obliged to
3
contribute to social security pension funds (administered by NAPSA, PSPF and LASF) but – as we will see – this obligation is not eff ectively enforced to cover all employees.
Similarly, in many countries labour codes or employment acts oblige employers to provide and fi nance certain types of social security benefi ts directly to their employees. In Zambia employers are obliged by the Employment Act to provide paid maternity leave and paid salary in case of sickness up to a certain maximum number of days during the year (see Chapter 4.2 for more details). Th ere are no data that would show the extent to which this regulation is enforced and how many workers actually enjoy these benefi ts. However, judging from the small percentage of employees who are enti-tled or are aware of their entitlements to paid annual leave, as reported in the CSO Labour Force Survey 2005, the actual coverage is not high.
Employees in the unionized sectors are oft en additionally covered – as some in Zambia – for additional social benefi ts specifi ed in collective agreements. Some employers also off er supplementary benefi ts such as health insurance or direct provision of health-care services, occupational pensions, housing allowances, family allowances or funeral benefi ts. No data exists but judging from the large degree of informality of employment even in the case of paid employees (as shown by the LFS 2005 results) and the low degree of unionization, coverage by such benefi ts must be low.
In Zambia, as in many other low-income countries, especially in sub-Saharan Africa, the majority of those employed are either self-employed or helping (unpaid) family members. Additionally, most of them work in traditional subsistence agricul-ture. Th eir economic activities are not formally registered, the nature of their activity makes it diffi cult to collect contributions, their incomes are irregular and, signifi cantly, are not regular monetary incomes.
Experience in some countries shows that even in such situations it is possible to build an effective universal health protection system through a combination of free basic public health care with contributory social health insurance linked with community-based micro-insurance schemes, where the participation of the poorest is subsidized by the State from general revenue. However, to provide at least minimum income security one would also need to rely on a combination of universal minimum basic income guarantees (such as social pensions for the elderly) and social assistance benefi ts targeting the most vulnerable.
Degrees of informality: Prevailing patterns inthe Zambian labour market and social security coverage

60 Zambia – Social Protection Expenditure and Performance Review and Social Budget
How people work: The employment status of the population
Th e employment to population ratio measures the percentage of the population in a given age group who were involved in gainful economic activity during the seven days preceding the survey. In Zambia, according to LFS 2005, overall employment rates are high: more than 75 per cent of all those aged 15 and over were employed (71 per cent of all women at this age and 79 per cent of all men). See Figure 3-1. Employment rates were 89 per cent in rural areas and 52 per cent in urban areas.
However, over 40 per cent of all those 6.2 million people employed worked as unpaid helping family members or workers (nearly 55 per cent of employed women and 27 per cent of employed men) – most of them in traditional agriculture. About 43 per cent were self-employed or employers (50 per cent of all employed men and 35 per cent of all employed women), while only 16 per cent were employed as paid employees (less then 10 per cent of employed women and 23 per cent of employed men)
Twenty-fi ve per cent of children aged under 15 were recorded in the survey as employed, but the large majority of them are unpaid family workers.
Th e lack of provision for income security in old age (except for a small minority) results in the employment rates of older people (at age 55 and over) being even higher than for those of working age (15-54 years). See Figure 3-2. Eighty-one per cent of older people were employed: 78 per cent of all older women and 84 per cent of all older men. It is interesting that the large majority of the employed elderly are reported as self-
3.1
As original LFS data set was slightly recoded, some results may be different than those in CSO, 2007 (Labour Force Survey Report).
Source: CSO LFS 2005
Source: CSO LFS 2005
Figure 3-1. Employment to population ratio, by sex and employment status (population 15 and over)
Figure 3-2. Employment rate by sex and employment status (population 55 and older)
Paid employees
Self-Employed /Employers
Unpaid workers
Men
Women
Total
0 20 40 60 80 100%
Paid employees
Self-Employed /Employers
Unpaid workers
Men
Women
Total
0 20 40 60 80 100%
3. Degrees of informality: Prevailing patterns in the Zambian labour market and social security coverage 61
employed or employers (68 per cent of all, 77 per cent of all men, nearly 60 per cent of all women), and that a much smaller percentage than that of the working-age-popula-tion are employed as unpaid family members: 23 per cent of both sexes, 9 per cent of all older men but a high proportion (38 per cent) of older women. Very few older people are employed as paid employees: 8 per cent of both sexes, 13 per cent of older men but only 2 per cent of older women.
Where people work: Employment by legal form of establishment
From the point of view of potential social security coverage, two important factors are employment status (e.g., employee versus self-employed), and also where a person is employed. In Zambia as elsewhere, social security coverage and entitlements diff er depending on whether someone works for central government, local government, a parastatal company, private business, NGO or international organization, or simply in the household.
In Zambia in 2005, 5 per cent of all employed persons (more than 6 per cent of working men and more than 3 per cent of working women) were employed by central or local government bodies or a parastatal company. Slightly over 30 per cent worked in private businesses (25 per cent of all working women and 35 per cent of all working men). Th e majority simply used their own household as a business environ-ment: 65 per cent of all employed persons, 71 per cent of working women, and 58 per cent of working men.
Figures 3-3 to 3-5 show the patterns of employment when employment status (employee, self-employed or unpaid family worker) is combined with type of business establishment or work: public, private or just household. One can see that these pat-terns are very diff erent for men and women and also for urban and rural populations.
Th e majority of those employed work in their own homes – either as unpaid family workers (1.5 million people) or self-employed (nearly 1.4 million people). Within this whole group working in households, women dominate the sub-group of unpaid family workers whereas most men are reported as self-employed.
Paid employees are the smallest employed group in the country (over 700,000) but they represent the largest (nearly 600,000) group in the urban employed popula-tion: 28 per cent of all the urban employed are employees, while 19 per cent are self-employed, and only 10 per cent unpaid family workers. More than twice as many people are employed as paid employees in the private sector than in public institutions: (central, local government or parastatals).1
Older workers, as stated earlier, are predominantly self-employed and most of them work at home; the second largest group works in more formal, private business environments.
Figures 3-3 to 3-5 show the percentage of employed people that falls under each category (e.g., paid employees in public establishments, self-employed in private estab-lishments, unpaid workers in households, etc.).
1 Employment in the private sector does not include household work.
3.2

62 Zambia – Social Protection Expenditure and Performance Review and Social Budget
Rural Urban
PublicPrivate
Household
PublicPrivate
HouseholdPaid employees
Self-employed
Unpaid workers
Paid employees
Self-employed
Unpaid workers
40
35
30
25
20
15
10
5
0
0
5
10
15
20
25
30
35
40
35
30
25
20
15
10
5
0
0
5
10
15
20
25
30
35
0
5
10
15
20
25
30
35
45
40
35
30
25
20
15
10
5
0
0
5
10
15
20
25
30
35
40
45
35
30
25
20
15
10
5
0
Men Women
PublicPrivate
Household
PublicPrivate
HouseholdPaid employees
Self-employed
Unpaid workers
Paid employees
Self-employed
Unpaid workers
35
30
25
20
15
10
5
0
0
5
10
15
20
25
30
35
0
10
20
30
40
50
60
PublicPrivate
Household
PublicPrivate
HouseholdPaid employees
Self-employed
Unpaid workers
Paid employees
Self-employed
Unpaid workers
a) All population 15 years and over b) All population 55 years and over
60
50
30
40
20
10
0
Figure 3-3. Employment distribution by employment status and type of establishment (percentage)
Source: CSO LFS 2005
Source: CSO LFS 2005
Source: CSO LFS 2005
Figure 3-4. Employment distribution by employment status and type of establishment (percentage)
a) Population 15 years and over by sex
b) Population 15 years and over by rural or urban area

3. Degrees of informality: Prevailing patterns in the Zambian labour market and social security coverage 63
Men Women
PublicPrivate
Household
PublicPrivate
HouseholdPaid employees
Self-employed
Unpaid workers
Paid employees
Self-employed
Unpaid workers
60
50
40
30
20
10
0
0
10
20
30
40
50
60
50
40
30
20
10
0
0
10
20
30
40
50
Paid employees
As most existing social security provision in Zambia specifi cally targets employees, it is important to look in greater detail at the characteristics of their employment relationship and why apparently not all of them are reached by existing social security provisions.2
☐ 95 per cent of employees are aged 15-55 and only 5 per cent are aged over 55 (the legal retirement age within the formal social security schemes). Less then 30 per cent of all employees are women; less then 20 per cent of employees work in the rural areas.
☐ 80 per cent of employees work in relatively large establishments, employing four or more persons; 30 per cent of women employees are employed in smaller establishments.
☐ 30 per cent of employees (27 per cent of men and 37 per cent of women) work in ‘informal’ locations: at home or in other informal locations outside home (e.g., in the street).
☐ 20 per cent of employees report their employment as being temporary (practically no gender diff erence here).
One of the obstacles to achieving greater social security coverage may be the fact, revealed by the survey, that nearly half (49 per cent of total, 54 per cent of women and 47 per cent of men) say either that they do not have a contract with their employer or that they do not know whether they have one. Of those who have a contract, 88 per cent say it is a written contract (92 per cent of public employees) and 12 per cent only an oral contract. Th e Employment Act requires written contracts of employment lasting six months or longer, and employers are obliged to keep records of all oral contracts.
2 While over 700,000 persons are reported in the survey as employees, overall coverage by all existing social security pension schemes seems to be well below 500,000. Th e latter fi gure is still uncertain owing to poor record-keeping standards in the social security institutions and diffi culties in establishing how many members and regular contributors they actually have.
3.3
Source: CSO LFS 2005
Figure 3-5. Employment distribution by employment status and type of establishment (percentage)
Population 55 years and over by sex

64 Zambia – Social Protection Expenditure and Performance Review and Social Budget
So it is thus not surprising that over half of all employees (but only 19 per cent of public-sector employees) say their employers do not contribute to social security or that they do not know whether their employer contributes. It seems there is widespread lack of awareness of social security membership and employers’ contributions, as the number of members and contributors reported by social security institutions are well over half the number of all employees. However, taking into account the poor status of member-ship and contributors’ records in social security institutions, there is a need to look closer at the issue of enforcement of social security laws, particularly in the private sector.
Similarly, more than half of all employees (19 per cent of public-sector employees) say they have no entitlement to paid leave or at least are not aware of this entitlement. Th e same situation could apply to other legal entitlements of employees regulated by the Employment Act, such as sick pay and paid maternity leave.
One of the explanations of the low level of enforcement of legal entitlements of employees and the low level of awareness of these entitlements may be the low level of unionization: only 30 per cent of employees belong to a trade union (while in the public sector the unionization rate is 60 per cent). Additionally, the social security funds have a responsibility to inform the public about what the schemes provide.
Th e Labour Force Survey 2005 reports that female employees’ earnings are on average 89 per cent of those of male employees. Th is gap is much larger for employees in the private sector: earnings of female employees are only two-thirds the earnings of male ones. Female employees in the public sector report earnings 18 per cent higher than men’s. However, the eff ect of low wages in the public sector should be taken into consideration here.
Informality of employment
Informality of employment3 is a multidimensional concept.4 It enlarges the previous concept of the informal sector and seeks to take into account precarious or unprotected forms of employment, including that of employees in formal-sector enterprises.
Th e defi nition of employment in the informal sector includes all jobs in informal-sector enterprises or all persons who, during a given reference period, were employed in at least one informal-sector enterprise, irrespective of their employment status and whether it was the main or secondary job (ILO, 1993). Th e informal sector – and the related concept of employment in the informal sector – is an enterprise-based concept. Working in the informal sector may mean working in an enterprise where its size, in terms of numbers employed, is below a certain threshold; or one which is not registered. It can also mean working in a household, home or in the street.
Informal employment is a job-based concept, directly linked to the workers’ employment conditions. It covers situations in which employees are in theory protected by labour legislation – and are covered by social security, entitled to employment ben-efi ts and so on – but are in practice unable to claim their rights, because mechanisms to enforce the existing regulations are lacking or defi cient. Informal employment may be determined by the existence of a formal contract, the type of contract involvement, the character of the job (temporary or not), and the actual entitlements to various benefi ts
3 Th is section contains the ILO original analysis about informality based on the Zambian Labour Force Survey.4 See Hussmans (2004) and ILO (2003; section 3.1 on Statistics of informal employment, p. 47).
3.4

3. Degrees of informality: Prevailing patterns in the Zambian labour market and social security coverage 65
envisaged by the law (e.g., paid leave). Even within the formal sector one fi nds workers who are informally employed (just as one can imagine that even in the informal sector some persons may be formally employed).
Th e scale presented in Tables 3-1 and 3-2 proposes diff erent degrees of employ-ment formality, in the formal sector and outside it. For the purpose of this analysis based on the LFS 2005 dataset, we adopted the following criteria of formality/infor-mality of employment.5
Employed in the formal sector
“Employed in the formal sector” applies to all those in the public employment service and all those employed elsewhere if establishments employ more than four persons and employment takes place on formal business premises. Th ese two proxy indicators (establishment size and formal business location) are used in the absence of any infor-mation about registration of the enterprise or its compliance with fi scal legislation. All the others are treated as employed in the informal sector.
Formal employment
In this case, we measure the degree of formality of employment using three criteria: (i) the existence (or awareness) of a formal contract (permanent or fi xed term) with an employer; (ii) the existence (or awareness) of entitlement to paid leave; and (iii) that the employer contributes to social security. We use a four-degree scale: if all criteria are met, we classify employment as totally formal (value 3); if none of the three criteria is met, employment is totally informal (value 0).
Formal economy
We introduced also a fi ve-degree scale for the informal economy, which is a combi-nation of the 0-1 scale for the informal sector and the four-degree scale for informal employment. Totally informally employed in the informal sector are in totally informal economy; those fully formally employed in the formal sector are in totally formal economy. In between however we have degrees of informality of the economy depending on the number of the four criteria met.
Tables 3-1 and 3-2 present the results for all employed persons and for paid employees.
Eighty-eight per cent of all those employed (but 93 per cent of all employed women) in Zambia work in the totally informal economy which means they are deprived of most of the rights and entitlements – including social security – associated
5 Formal/informal economy criteria overlap but are not identical to criteria applied by the CSO (2007) La-bour Force Survey Report to identify informal sector employment. Th e results presented here are thus dif-ferent and not easily comparable. Criteria of formality/informality and the approach are also diff erent from the ones applied in CSO (2006a) and CSO (2006c). Nearly 500,000 employees reported in CSO (2006c) as working in the formal sector are actually working in businesses which are formally registered, but they include employees with varying degrees of employment formality, according to the criteria applied here.
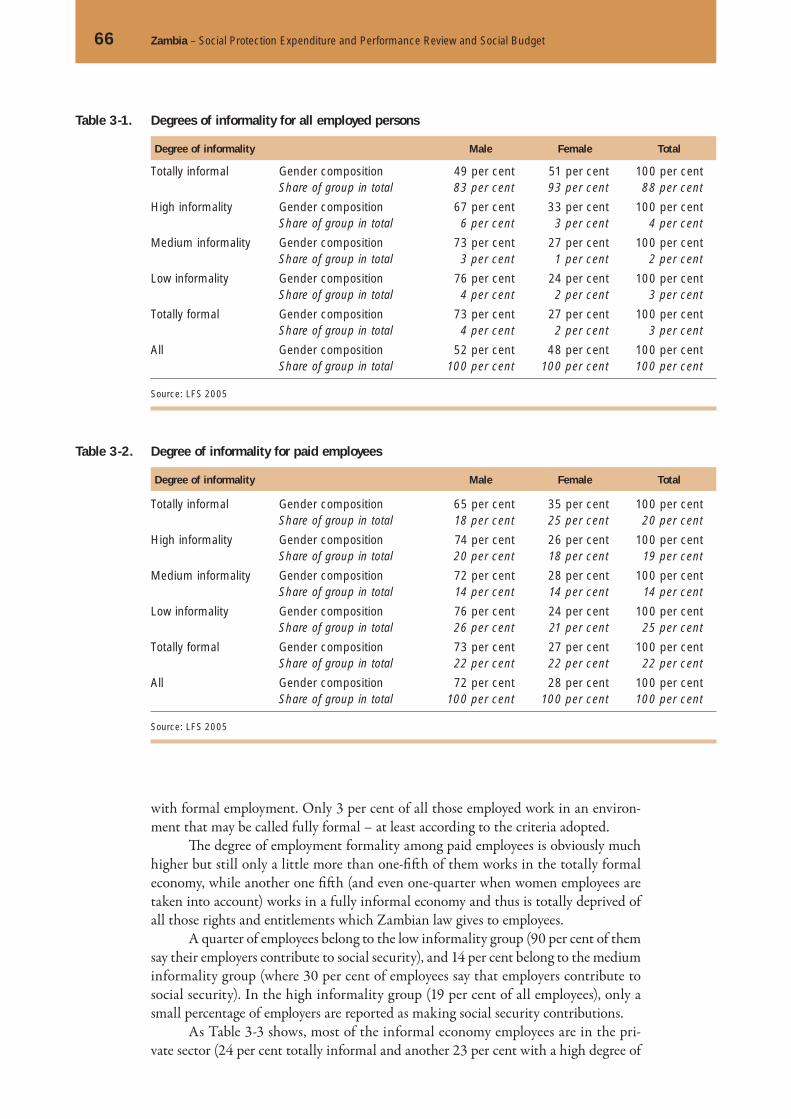
66 Zambia – Social Protection Expenditure and Performance Review and Social Budget
with formal employment. Only 3 per cent of all those employed work in an environ-ment that may be called fully formal – at least according to the criteria adopted.
Th e degree of employment formality among paid employees is obviously much higher but still only a little more than one-fi ft h of them works in the totally formal economy, while another one fi ft h (and even one-quarter when women employees are taken into account) works in a fully informal economy and thus is totally deprived of all those rights and entitlements which Zambian law gives to employees.
A quarter of employees belong to the low informality group (90 per cent of them say their employers contribute to social security), and 14 per cent belong to the medium informality group (where 30 per cent of employees say that employers contribute to social security). In the high informality group (19 per cent of all employees), only a small percentage of employers are reported as making social security contributions.
As Table 3-3 shows, most of the informal economy employees are in the pri-vate sector (24 per cent totally informal and another 23 per cent with a high degree of
Table 3-1. Degrees of informality for all employed persons
Degree of informality Male Female Total
Totally informal Gender composition 49 per cent 51 per cent 100 per centShare of group in total 83 per cent 93 per cent 88 per cent
High informality Gender composition 67 per cent 33 per cent 100 per centShare of group in total 6 per cent 3 per cent 4 per cent
Medium informality Gender composition 73 per cent 27 per cent 100 per centShare of group in total 3 per cent 1 per cent 2 per cent
Low informality Gender composition 76 per cent 24 per cent 100 per centShare of group in total 4 per cent 2 per cent 3 per cent
Totally formal Gender composition 73 per cent 27 per cent 100 per centShare of group in total 4 per cent 2 per cent 3 per cent
All Gender composition 52 per cent 48 per cent 100 per centShare of group in total 100 per cent 100 per cent 100 per cent
Source: LFS 2005
Table 3-2. Degree of informality for paid employees
Degree of informality Male Female Total
Totally informal Gender composition 65 per cent 35 per cent 100 per centShare of group in total 18 per cent 25 per cent 20 per cent
High informality Gender composition 74 per cent 26 per cent 100 per centShare of group in total 20 per cent 18 per cent 19 per cent
Medium informality Gender composition 72 per cent 28 per cent 100 per centShare of group in total 14 per cent 14 per cent 14 per cent
Low informality Gender composition 76 per cent 24 per cent 100 per centShare of group in total 26 per cent 21 per cent 25 per cent
Totally formal Gender composition 73 per cent 27 per cent 100 per centShare of group in total 22 per cent 22 per cent 22 per cent
All Gender composition 72 per cent 28 per cent 100 per centShare of group in total 100 per cent 100 per cent 100 per cent
Source: LFS 2005
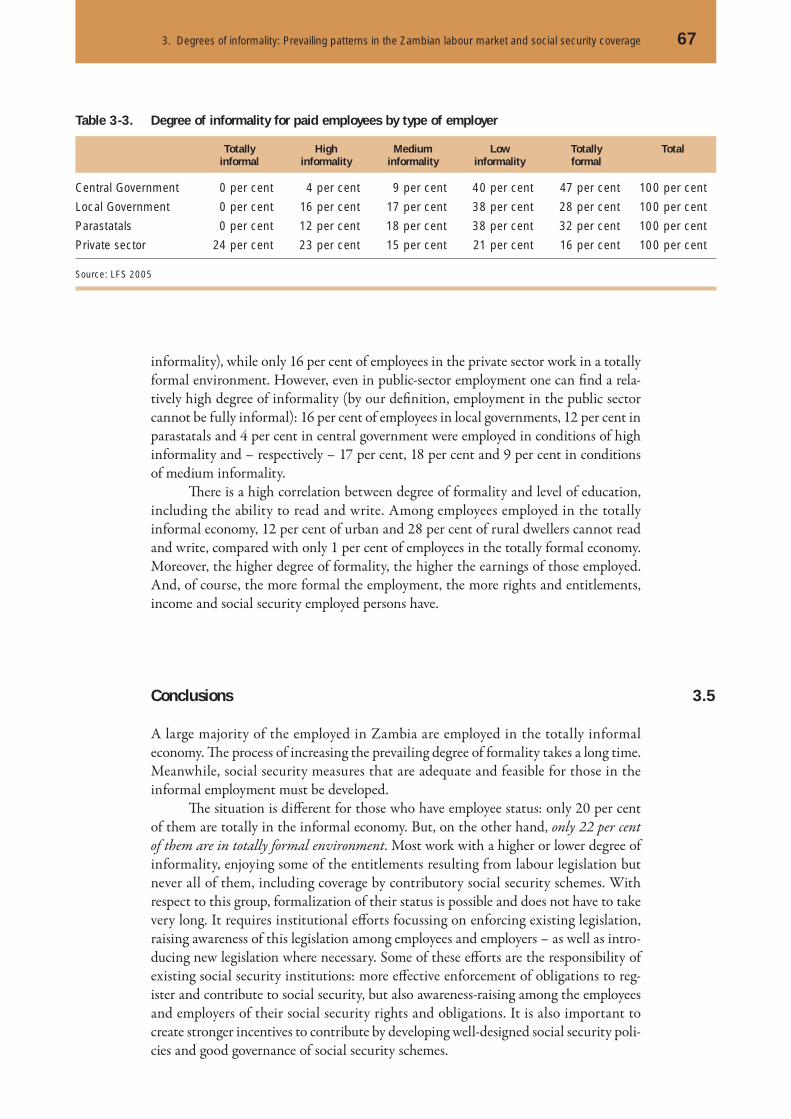
3. Degrees of informality: Prevailing patterns in the Zambian labour market and social security coverage 67
informality), while only 16 per cent of employees in the private sector work in a totally formal environment. However, even in public-sector employment one can fi nd a rela-tively high degree of informality (by our defi nition, employment in the public sector cannot be fully informal): 16 per cent of employees in local governments, 12 per cent in parastatals and 4 per cent in central government were employed in conditions of high informality and – respectively – 17 per cent, 18 per cent and 9 per cent in conditions of medium informality.
Th ere is a high correlation between degree of formality and level of education, including the ability to read and write. Among employees employed in the totally informal economy, 12 per cent of urban and 28 per cent of rural dwellers cannot read and write, compared with only 1 per cent of employees in the totally formal economy. Moreover, the higher degree of formality, the higher the earnings of those employed. And, of course, the more formal the employment, the more rights and entitlements, income and social security employed persons have.
Conclusions
A large majority of the employed in Zambia are employed in the totally informal economy. Th e process of increasing the prevailing degree of formality takes a long time. Meanwhile, social security measures that are adequate and feasible for those in the informal employment must be developed.
Th e situation is diff erent for those who have employee status: only 20 per cent of them are totally in the informal economy. But, on the other hand, only 22 per cent of them are in totally formal environment. Most work with a higher or lower degree of informality, enjoying some of the entitlements resulting from labour legislation but never all of them, including coverage by contributory social security schemes. With respect to this group, formalization of their status is possible and does not have to take very long. It requires institutional eff orts focussing on enforcing existing legislation, raising awareness of this legislation among employees and employers – as well as intro-ducing new legislation where necessary. Some of these eff orts are the responsibility of existing social security institutions: more eff ective enforcement of obligations to reg-ister and contribute to social security, but also awareness-raising among the employees and employers of their social security rights and obligations. It is also important to create stronger incentives to contribute by developing well-designed social security poli-cies and good governance of social security schemes.
3.5
Table 3-3. Degree of informality for paid employees by type of employer
Totally informal
High informality
Medium informality
Low informality
Totally formal
Total
Central Government 0 per cent 4 per cent 9 per cent 40 per cent 47 per cent 100 per cent
Local Government 0 per cent 16 per cent 17 per cent 38 per cent 28 per cent 100 per cent
Parastatals 0 per cent 12 per cent 18 per cent 38 per cent 32 per cent 100 per cent
Private sector 24 per cent 23 per cent 15 per cent 21 per cent 16 per cent 100 per cent
Source: LFS 2005

This section describes and analyses the main social protection schemes in the country, according to the conditions required and contingencies covered. Th e aim is to provide an overall assessment of the social protection system, not an
exhaustive exploration of all the schemes.As explained, a small share of the labour force is employed and an even smaller
share in the relatively formal economy. Th is group benefi ts to some extent from the employment-related contributory schemes described in the fi rst part of this chapter.
For most of the labour force burdened with heavy family responsibilities, very limited opportunities exist for protection against contingencies such as old age, sick-ness or death of the main breadwinner. There are non-contributory programmes financed by the Government, private households, communities, church organiza-tions, and donors who target specifi c, rather small, groups in the population. Th e most important of these programmes are presented in the second part of this chapter. Th e main funding source of these non-contributory schemes is the Government, which channels resources from domestic taxation and from donors.
Th e last part briefl y presents the health care system in Zambia.
Contributory and other employment-related schemes
Zambia has a long history of social security provision dating back to the pre-independ-ence period, and this has shaped the current institutional and benefi t structure. It is based largely on the social insurance model and limited to the provision of protec-tion against the loss or reduction of income resulting from retirement, disability and death.
The contingencies covered fall short of the ILO’s prescribed minimum standards 1 of social security which should include the following contingencies: sick-ness; unemployment; old age; work injury; maternity; invalidity; survivors, family/
1 Social Security (Minimum Standards) Convention, 1952 (No. 102).
4.1
4

child benefi ts and health care. Zambia has not ratifi ed any of the ILO’s main social security Conventions.
Th e national social security institutions operating in Zambia are the National Pensions Scheme Authority (NAPSA), the Public Service Pension Fund (PSPF), and the Local Authorities Superannuation Fund (LASF). In addition to several pri-vate occupational pension schemes, there is an occupational disease and work injury scheme: the Workers’ Compensation Fund Control Board (WCFCB). Th ese schemes, which mainly provide social security to persons in formal employment, are described in greater detail in the next section (Cheta, 2005).2
Although three statutory social security schemes currently operate in the country, a three-pillar social protection system was envisaged by the reform of the social security system which emerged aft er a protracted period of consultative processes and analytical studies and was implemented in 2000.
NAPSA was designed to be a mandatory fi rst-pillar pension scheme providing a basic pension income to all formal-economy workers, with an option to include workers not in formal employment (GRZ, 2007).
Th e second pillar was to be composed of all private occupational schemes and the statutory ones (Hantuba, 2005). Th e original proposal considered a fl oor and a ceiling to insurable earnings, so that the contribution would not aff ect the poorest and at the same time would provide incentives for the well-off to contribute to occupational schemes as a second pension pillar. Th e idea was that the private schemes would be con-tracted by the employers to provide supplementary social security.
Th e third pillar would be composed of all forms of private and informal protec-tion that people take, such as life insurance, though this is not widely undertaken in Zambia.
Hence, by design, NAPSA would offer lower replacement rates (and charge lower contribution rates) than those of the public schemes. However, the other statu-tory schemes are still not operating as second-pillar occupational or complementary schemes. Instead, they are working to restore the previous status quo, which is a very
2 Th e relevant legislation is: the Draft National Social Security Bill, 2007; the National Pensions Authority Act, 1996; the Public Service Pension Fund Act, 1996.
Social protection schemes
70 Zambia – Social Protection Expenditure and Performance Review and Social Budget
detrimental move, as the workers contributing to NAPSA have accumulated rights which cannot easily be moved. Th is will not solve the solvency problems these schemes have been facing as the root causes are the non-payment of contributions and costly investment decisions, coupled with other governance issues.
Social security schemes are regulated and supervised by the Pensions and Insur-ance Authority (PIA), which falls under the Ministry of Finance and National Plan-ning. However, it has more regulatory authority over the private occupational schemes than over the public ones, as these have reporting obligations to their respective gov-ernment authorities. On the other hand, Section 2 of the Pension Scheme Regulation Act exempts NAPSA from being regulated by the PIA. Th e Ministry of Labour and Social Security regulates NAPSA and WCFCB.
Th e Ministry of Labour and Social Security (through the Department of Social Security) is the lead government institution implementing and coordinating social security policies and programmes in Zambia. There has not been a policy or legal framework for the eff ective functioning of the Department of Social Security since it was established in 1998. Th e Ministry is only now working out these frameworks in consultation with various stakeholders.
Apart from the benefi ts provided by the schemes, employees are entitled to other benefi ts depending on collective bargaining agreements and the provisions of employ-ment legislation. Th ese benefi ts are also discussed in this chapter.
The National Pensions Scheme Authority (NAPSA)
Th e National Pension Scheme Authority (NAPSA) was established aft er Parliament passed Act No. 40 in 1996. It was established to replace the Zambia National Provident Fund (ZNPF), which had existed since 1966 but had a number of weaknesses, such as low contributions, inadequate benefi ts and an ineff ective structural design (Musonda, 2006). Th e Authority became operational on 1 February 2000 and is administered by an independent tripartite Board appointed by the Minister of Labour and Social Security.
NAPSA administers the assets of the National Pension Scheme (NPS) and the old Zambian National Provident Fund (ZNPF). Th e ZNPF was a compulsory savings scheme for private-sector employees that provided lump sums to its members based on the cumulated balances of their individual member accounts. Contribution rates to the ZNPF were very low which, coupled with unfavourable economic conditions, lack of indexation and governance issues, translated into low benefi t packages. In contrast, the NPS is a defi ned-benefi t, partially funded scheme that off ers pensions based on career-average adjusted earnings.
At the time of the reform (February 2000), members of the ZNPF could choose to commute their balances to be integrated into the NPS, but these would have a value of 30 per cent for the calculation of future pensions. In the case of lump sums, they could receive the full value. Alternatively, they could leave their balances in the ZNPF and start in the NPS as completely new contributors. In the latter case, they would receive a lump sum from the ZNPF and either a lump sum or a pension from the NPS at the time of their retirement, depending on the number of contribution.
4.1.1

4. Social protection schemes 71
Coverage
At the end of 2005, NAPSA was the largest pension scheme in Zambia with about 355,200 members drawn from about 15,000 registered employers. NAPSA is a com-pulsory scheme that covers “regularly employed persons in the private, parastatal sec-tors and all employees who joined the Public Service and Local Authorities on or aft er February 1, 2000” (Musonda, 2006). All members of the discontinued ZNPF became members of NAPSA when it started operating. Additionally, in an eff ort to streamline statutory pension schemes in Zambia, public-service and local authority employees engaged aft er 1 February 2000 now make contributions to NAPSA. Civil service and local authority employees engaged before the establishment of NAPSA have continued to be members of the other two statutory schemes that were initially to be converted into fully fl edged occupational schemes for workers from the sectors covered.
Nonetheless, employees of Konkola Copper Mines Plc, ZCCM (Smelterco) Limited and ZCCM (Mineco) Limited (now Mopani Copper Mines), were exempted from NAPSA through Statutory Instrument No. 14 of 2000. A possible reason for the exemption may be that contributions to NAPSA could have increased labour costs for the mining companies at a time when copper prices were very low and when the mining companies already had a contributory defi ned-benefi t pension scheme. Th e implica-tion of the exemption is that employees of the two mining companies have no form of retirement security, as the two employers have now converted to defi ned-contribution schemes which in practice do not provide periodic pension payments at retirement and have no form of redistribution. Th e minimum entry age into the scheme is 16 years and the worker needs to be employed by a registered contributing employer.3
According to the NAPSA Act, workers aged under 15 and those aged over 55, as well as those earning less than K15,000 4 per month, and the defence and armed forces are exempt from membership of the Scheme.
However, the Minister of Labour and Social Security may provide by statutory instrument for the conditions and procedures under which any person not eligible for membership may become a member.5 By means of this provision, the scheme can draw its members from the self-employed and workers in the informal sector. Th e scheme has yet to draw members from the informal sector, as the Minister has not provided the framework or modalities whereby membership can be extended to this group.
Th e contributions rate to NAPSA is 10 per cent of total gross earnings for each year up to a ceiling of four times the National Average Earnings (NAE). Th is is shared equally between the employee (the insured) and the employer, i.e., 5 per cent each. Pensions accrue at the ultimate rate of 40 per cent of career earnings over a maximum of 30 years.
3 See section 11(2) of the National Pension Scheme Act, 1996.4 Equivalent to USD 12.46, at the 1996 nominal exchange rate of USD 1 to ZMK 1203.17, when the NAPSA Act was enacted.5 See section 11 (3) of the National Pension Scheme Act, 1996.
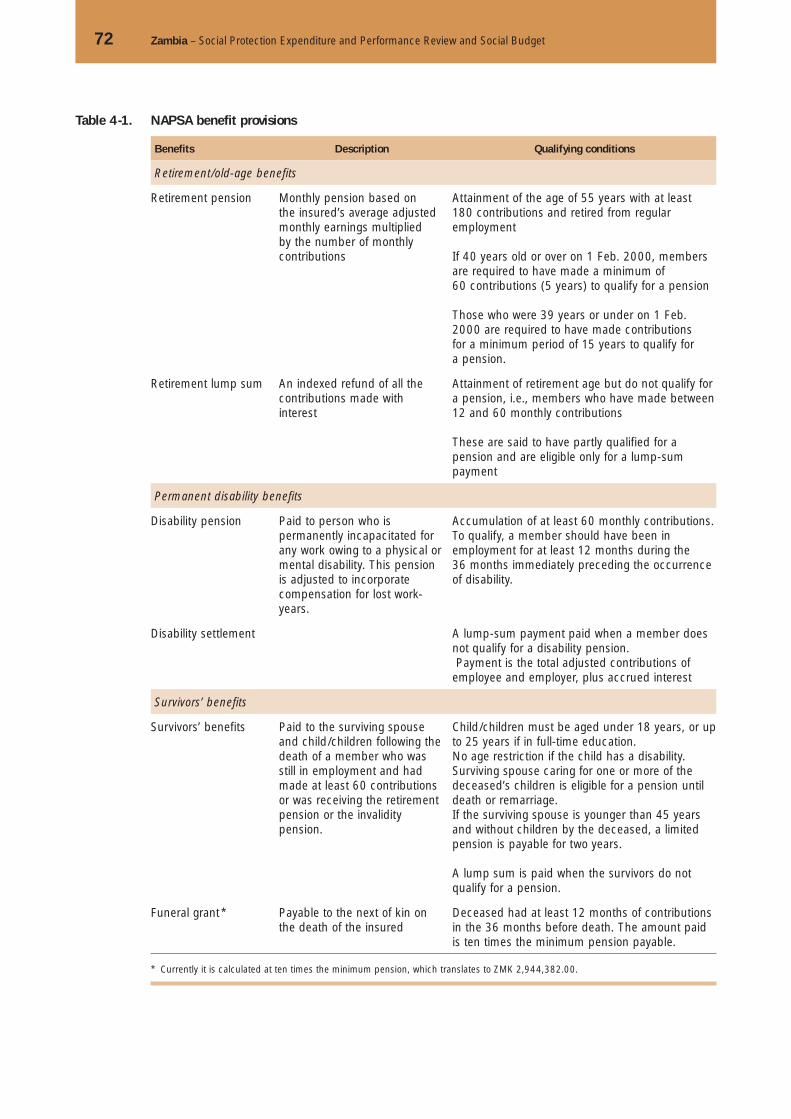
72 Zambia – Social Protection Expenditure and Performance Review and Social Budget
Table 4-1. NAPSA benefit provisions
Benefits Description Qualifying conditions
Retirement/old-age benefits
Retirement pension Monthly pension based on the insured’s average adjusted monthly earnings multiplied by the number of monthly contributions
Attainment of the age of 55 years with at least 180 contributions and retired from regular employment
If 40 years old or over on 1 Feb. 2000, members are required to have made a minimum of 60 contributions (5 years) to qualify for a pension
Those who were 39 years or under on 1 Feb. 2000 are required to have made contributions for a minimum period of 15 years to qualify for a pension.
Retirement lump sum An indexed refund of all the contributions made with interest
Attainment of retirement age but do not qualify for a pension, i.e., members who have made between 12 and 60 monthly contributions
These are said to have partly qualified for a pension and are eligible only for a lump-sum payment
Permanent disability benefits
Disability pension Paid to person who is permanently incapacitated for any work owing to a physical or mental disability. This pension is adjusted to incorporate compensation for lost work-years.
Accumulation of at least 60 monthly contributions. To qualify, a member should have been in employment for at least 12 months during the 36 months immediately preceding the occurrence of disability.
Disability settlement A lump-sum payment paid when a member does not qualify for a disability pension. Payment is the total adjusted contributions of employee and employer, plus accrued interest
Survivors’ benefits
Survivors’ benefits Paid to the surviving spouse and child/children following the death of a member who was still in employment and had made at least 60 contributions or was receiving the retirement pension or the invalidity pension.
Child/children must be aged under 18 years, or up to 25 years if in full-time education. No age restriction if the child has a disability. Surviving spouse caring for one or more of the deceased’s children is eligible for a pension until death or remarriage. If the surviving spouse is younger than 45 years and without children by the deceased, a limited pension is payable for two years.
A lump sum is paid when the survivors do not qualify for a pension.
Funeral grant * Payable to the next of kin on the death of the insured
Deceased had at least 12 months of contributions in the 36 months before death. The amount paid is ten times the minimum pension payable.
* Currently it is calculated at ten times the minimum pension, which translates to ZMK 2,944,382.00.
4. Social protection schemes 73
Benefits
To qualify for retirement benefits the member must have reached the retirement age (55 years) or fi ve years prior to retirement age but must have contributed to the scheme for a minimum period specifi ed by the Authority (currently 180 contribution months).
However, the qualifying criteria for older members were more fl exible, in order to get a retirement or invalidity pension, or a survivor’s pension, for their next of kin:
☐ members aged 48 and over on 1 February 2000 are required only to have made 60 monthly contributions
☐ members aged over 39 but below 48 on 1 February 2000 qualify according to a sliding scale of between 60 and 180 monthly contributions.
Th e minimum pension is set at 20 per cent of national average earnings which is deter-mined by the Authority annually aft er applying data from Central Statistical Offi ce. Th ere is no provision for transfer of pension rights between countries for expatriate staff . However, Zambians living abroad can contribute to NAPSA on a voluntary basis, for which they are required to contribute the total of 10 percent. Pensions accrue at the ultimate rate of 40 per cent of average career earnings over a maximum of 30 years (Cheta, 2005). See Table 4-1.
Indexation of benefits
Section 35 of the National Pension Scheme Act, 1996 requires benefi ts to be adjusted annually in line with increases in National Average Earnings. NAPSA is the only scheme to index its benefi ts. In other schemes, benefi ts are adjusted on the basis of the respective Minister’s decision following management advice.
Investment of reserve funds
In exercise of the powers contained in section 41 of the National Pension Scheme Act and in accordance with section 40 of the Act, the National Pension Scheme Authority is obliged to manage the National Pension Scheme in accordance with the prudential management principles specifi ed in the Pension Scheme Regulation Act No. 28 of 1996 (GRZ. 2001). Th e principles clearly set out guidelines for investments and specify fi du-ciary duties for those charged with managing investments. Investment decisions are made by the Investment Committee of the Board.
Th e investment portfolios of the NPS and the ZNPF both have a huge propor-tion invested in Government instruments, which reached 82 per cent in 2006 for the combined funds. Hence, the rate of return of both funds was 12.5 per cent in 2005 and 11.2 per cent in 2006. Th e latter is similar to the average interest rate of the Cen-tral Bank of Zambia: 11.5 per cent. Th ough Government securities are stable, this is not a very prudent way of investing. Figure 4-1 shows the composition of the portfolio in both years.
Th e return of the ZNPF was lower than that of NPS: 9.1 per cent versus 11.6 per cent respectively, in 2006. Note that all property investments are held by the ZNPF (NAPSA, 2007b).

74 Zambia – Social Protection Expenditure and Performance Review and Social Budget
Administrative cost
Th e NPS has defi ned a target for administrative costs as a percentage of contribution income, currently 10 per cent. However, the actual cost was higher: 19 per cent in 2005 and 16 per cent in 2006. Figure 4-2 shows the evolution of administrative costs. Th ese have decreased steadily, fuelled by the increase in contribution income, which in 2006 represented six times income in 2000.
In contrast, the ZNPF has very high costs and, now that it is no longer col-lecting contributions, these costs represent 81 per cent of benefi t expenditure (NAPSA, 2007b). Nevertheless, these costs dropped by almost 23 per cent in 2006 compared with 2005.
Source:NAPSA (2007b)
Figure 4-1. Composition of investment portfolio managed by NAPSA, 2005 and 2006
Other fixedinterestinstruments
Equities
Property
Government instruments
2005 2006
61%
26%
6%
82%
7%
6%5%7%
Source: NAPSA(2007a, 2007b)
Figure 4-2. Evolution of administrative costs of NAPSA, 2000-2006
Actual ratio
Cap
% of contribution income
2000 2001 2002 2003 2004 2005 2006
0
10
20
30
40
50
60
4. Social protection schemes 75
Public Service Pension Fund (PSPF)
Th e Public Service Pension Fund was established in 1997 by Act of Parliament, as a defi ned-benefi t scheme. Th e intention was to consolidate the law relating to pensions and other benefi ts for persons employed in the public service. Prior to 1997, pension benefi ts for public service employees were handled by the Civil Service (Local Condi-tions) Pensions Board that came into operation in 1961 following the enactment of the Civil Service (Local Conditions) Pensions Ordinance Cap 48 on 1 November 1961.
Coverage
Th e PSPF draws its membership from its forerunner, the Civil Servants Pension Fund and any other employees of the public service as the Board may prescribe.6 Th ough the NAPSA Act made it mandatory for newly recruited civil servants to be members, new members still join the PSPF from the Zambian Army, Zambian Air Force, Zambian National Security, and the Teaching Service (QED, n.d., p. 3). Employees joining the public service aft er the age of 45 years cannot join the scheme, but are put on contract and paid a gratuity at the end of the contract.
As at 31 December 2006, PSPF had 112,479 active members with an average age of 36 years. Th ere were about 58,233 pensioners, attracting an annual pension bill of approximately K70 billion. Th e average pension was K97,000 per person per month.
Contribution rate and ceiling
Contributions are made by the employer and the employee, each at the rate of 7.25 per cent, of insurable earnings. Pension claims by members who leave the scheme prior to attaining 55 years but qualify for benefi ts are settled using the government grant. In such instances, the PSPF acts as a paying agent for the State.
Th e greatest challenge that the PSPF faces, in terms of contributions, is that the Government as an employer has not kept its contribution payments up to date (QED, n.d., p. 15). Th is situation was exacerbated by stringent fi scal reforms that the Govern-ment was pursing from the early 1990s in order to stabilize the economy. By the end of 2005, 46 per cent of net assets were contributions in arrears.
Retirement age is 55 years, but members of the defence and security forces are allowed to retire at 45 years, as long as they have been members for more than 20 years. No service beyond retirement age is taken into account when calculating pension ben-efi ts, and any contribution paid beyond retirement age is refunded.
Retirement benefi ts for public offi cers or civil servants are protected by the Repub-lic’s Constitution, in article 124. Th is constitutional provision preserves the accrued rights by ensuring that members are not made worse off by any amendment to the Act.
Benefits
Th e Fund is designed to provide income security in the event of retirement, permanent invalidity and survivorship. Th e fi ve diff erent types of benefi ts provided are listed in Table 4-2.
6 See Section 10 of the Public Service Pensions Act, 1996.
4.1.2
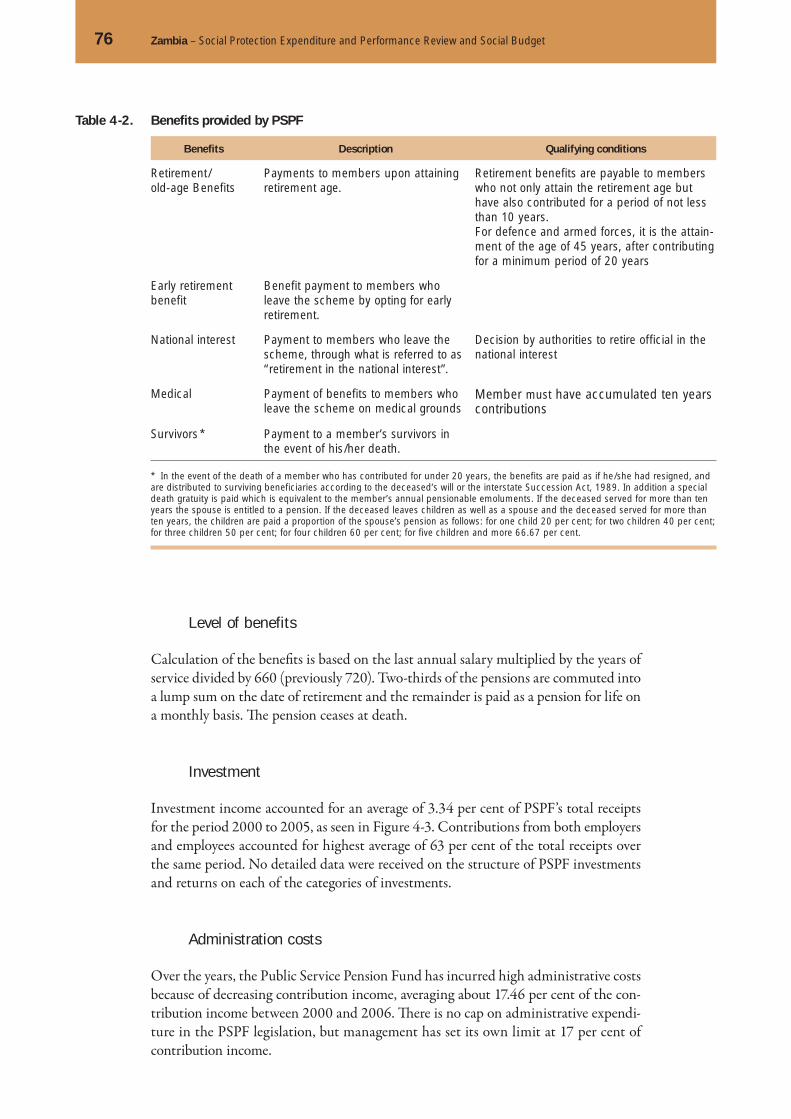
76 Zambia – Social Protection Expenditure and Performance Review and Social Budget
Level of benefits
Calculation of the benefi ts is based on the last annual salary multiplied by the years of service divided by 660 (previously 720). Two-thirds of the pensions are commuted into a lump sum on the date of retirement and the remainder is paid as a pension for life on a monthly basis. Th e pension ceases at death.
Investment
Investment income accounted for an average of 3.34 per cent of PSPF’s total receipts for the period 2000 to 2005, as seen in Figure 4-3. Contributions from both employers and employees accounted for highest average of 63 per cent of the total receipts over the same period. No detailed data were received on the structure of PSPF investments and returns on each of the categories of investments.
Administration costs
Over the years, the Public Service Pension Fund has incurred high administrative costs because of decreasing contribution income, averaging about 17.46 per cent of the con-tribution income between 2000 and 2006. Th ere is no cap on administrative expendi-ture in the PSPF legislation, but management has set its own limit at 17 per cent of contribution income.
Table 4-2. Benefits provided by PSPF
Benefits Description Qualifying conditions
Retirement/old-age Benefits
Payments to members upon attaining retirement age.
Retirement benefits are payable to members who not only attain the retirement age but have also contributed for a period of not less than 10 years.For defence and armed forces, it is the attain-ment of the age of 45 years, after contributing for a minimum period of 20 years
Early retirement benefit
Benefit payment to members who leave the scheme by opting for early retirement.
National interest Payment to members who leave the scheme, through what is referred to as “retirement in the national interest”.
Decision by authorities to retire official in the national interest
Medical Payment of benefits to members who leave the scheme on medical grounds
Member must have accumulated ten years contributions
Survivors * Payment to a member’s survivors in the event of his/her death.
* In the event of the death of a member who has contributed for under 20 years, the benefits are paid as if he/she had resigned, and are distributed to surviving beneficiaries according to the deceased’s will or the interstate Succession Act, 1989. In addition a special death gratuity is paid which is equivalent to the member’s annual pensionable emoluments. If the deceased served for more than ten years the spouse is entitled to a pension. If the deceased leaves children as well as a spouse and the deceased served for more than ten years, the children are paid a proportion of the spouse’s pension as follows: for one child 20 per cent; for two children 40 per cent; for three children 50 per cent; for four children 60 per cent; for five children and more 66.67 per cent.

4. Social protection schemes 77
Local Authorities Superannuation Fund (LASF)
Th e Local Authorities Superannuation Fund was created under Government Notice No. 314 of 1954. It is administered by a tripartite Board of Directors, appointed by the Minister of Local Government and Housing pursuant to Cap 284 of the Laws of Zambia. Like the PSPF, the LASF is a defi ned-benefi t scheme, based on a defi nite for-mula prescribed by the LASF Act.
Coverage
Th e Fund covers employees of the local authorities and water utility companies who joined the local authorities prior to 1 February 2000, including those employed by ZESCO Limited and the National Housing Authority.7 As at December 2006, the total membership of the Fund stood at 21,642.
Contribution rate ceiling
Th e Act specifi es the contribution rate at 10 per cent for members and 23 per cent for the employers.8 Th is means that even aft er an actuarial recommendation any change in contribution has to await a change in the law. Generally, actuarial recommendations are supposed to be implemented on a timely basis, as any delay in case of an actuarial defi cit will worsen the situation. Th e process of passing amendments to Acts of Parliament such as the LASF Act, is time-consuming, as recent experience in Zambia has shown.
Benefits
Th e Fund is designed to provide income security in the event of retirement, perma-nent invalidity and survivorship. Within this context, the benefi ts off ered by LASF are derived from the categories of employment terminations set out in Table 4-3.
7 www.lasf.org.zm {visited 22 July 2007}.8 See section 19 and 21 of the Local Authorities Superannuation Fund Act (Amendment) Act, 1996.
4.1.3
Figure 4-3. PSPF Receipts as percentage of total (2000-2006)
Contributionfrom employee
Contributionfrom employer
Generalgovernmentcontribution
Income frominvestmentand property
Other receipts
2000 2001 2002 2003 2004 2005 20060
10
20
30
40
50
60
70

78 Zambia – Social Protection Expenditure and Performance Review and Social Budget
Level of benefits
Benefi t computation is based on fi nal salary and commutation factors increased to match those applicable under the public service pensions fund.
In 2004, all pensions were adjusted upwards so that the minimum pension was K 100,000 for all pensioners. For those who received more than K 50,000, the increase was K100,000. Th ere would be increases in pensions every three years depending on the fi nancial situation of the scheme.
In 2003, there was an equity swap in which local Governments covered their debts and the ZPTF transferred K 7 billion of shares to the LASF valued at their market prices at the time of the transaction.
However, the fi nancial situation of the scheme and the living conditions of the pensioners are still worrying. Th e scheme does not pay benefi ts promptly because there are contribution arrears. In June 2006, these were about K 88 billion and the backlog of unpaid benefi ts to pensioners was of two years (LASF, 2006a). Furthermore, in Sep-tember 2006, out of K 22.5 billion collected, K 21.8 billion concerned previous years (LASF, 2006b).
Table 4-3. Benefits provided by LASF
Benefits Description Qualifying conditions
Retirement due to age
Employment terminates on attainment of retirement age (55 years).
Attainment of retirement age (55 years) and minimum contribution period of 10 years.
Retirement due to retrenchment
Granted if a member’s employment terminates as a result of staff reduc-tions by his/her employer or of reor-ganization or abolition of the member’s job in order to improve efficiency or for organization.
Should not be as a result of the member’s fault.If such a member has less than seven years’continuous service, a payment equal to the amount of the contributions paid by him/her together with 2 per cent of such amount in respect of each completed year by which his/her continuous service exceeds three years.If such a member has seven years or more continuous service, a payment is made equal to twice the amount of the contributions paid by him/her plus interest at the rate of 4 per cent per annum, compounded annually.
Dismissal, discharge or resignation
If the member is dismissed from the service of an employer as a result of grave misconduct, dishonesty or fraud, that member is paid a lump sum of the contributions the member had paid into the Fund up to the point of employment termination.
Leaving employment with member’s own accord or member’s own actions.
Retirement due to ill health
A member who has been proved permanently incapable of efficiently discharging duties by reason of illness of mind or body is retired on health grounds under section 27 of the LASF Act and qualifies for retirement benefits.
Recommendation by qualified people (after assessment) that member should be retired on health grounds.
Death benefits Survivors of a member who dies whilst in employment are entitled to benefits under Section 35 of the LASF Act.
If a male or female member in receipt of an annuity dies within six years of the date of his/her retirement, the dependants of the deceased are granted a lump sum equal to the sum of the annuity payable in respect of the unexpired por-tion of the said period of six years.

4. Social protection schemes 79
Investment
LASF’s investment income grew from an average of 4 per cent of total receipts before 2000 to about 28 per cent aft er 2001 as seen in Figure 4-4 above. Contribution income accounted for an average of 83 per cent of total receipts over the period 1997 to 2003.
Administration costs
LASF’s administrative expenditure is capped at 14 per cent of contribution income but over the years, its administration expenses have exceeded the cap because of non-remittance of increased contributions by employers.
Workers’ Compensation Fund Control Board
Th e Workers’ Compensation Fund Control Board was established by Act of Parlia-ment for the purposes of compensating workers disabled 9 or killed by occupational accidents and diseases. It dates back to 1930 when the Workmen’s (Non-native) Com-pensation Ordinance was passed. Several Amendments have been made since then.
In 1999 when Parliament passed the current Act, it repealed the Workmen’s Compensation Act Cap 271 and the Pneumoconiosis Compensation Act Cap 217, in order to merge the two schemes.
Coverage
As stipulated in Section 110 of the Workers’ Compensation Act, all employers are required to insure their workers with the Fund, other than the State and any other employer exempted by the Minister of Labour.
9 According to Section 2 (1) of the Workers’ Compensation Act, “Disablement, means disablement which results in the loss or diminution of wage-earning capacity or in the reduction of the chances of obtaining employment”.
4.1.4
Figure 4-4. LASF Receipts as percentage of total (1997-2003)
Contributions from employers
Contributions from insured
Taxes
Income from capital
1997 1998 1999 2000 2001 2002 20030
10
20
30
40
50
60
70

80 Zambia – Social Protection Expenditure and Performance Review and Social Budget
Contribution rates
Contribution to the Workers’ Compensation Fund is entirely the employer’s liability based on the declared earnings of their employees, assessed risks of the work place, cost of compensation payable and requirements of the Fund. Contribution rates, known as assessments, are derived from workers’ earnings from enterprises.
Benefits
Th e Workers’ Compensation Fund provides four benefi ts which are described in detail in Table 4-4.
Table 4-4. Benefits provided by the Workers Compensation Fund
Benefits Description
Total disablement Compensation for total disablement is a monthly pension amounting to 50 per cent of the worker’s assessed earnings.
Partial disablement Compensation for partial disablement is paid in relation to the level of disablement multiplied by 50 per cent of the worker’s assessed earnings. For both partial and total disablement, the period of receipt of the pension is limited to 18 months.
Permanent disablement
The compensation for permanent disablement is as for total disablement, i.e. 50 per cent of the worker’s assessed earnings.
Where the degree of disablement is under 100 per cent the compensation is calculated according to the degree of disablement multiplied by 50 per cent of the worker’s assessed earnings.
Where the level of disablement is below 10 per cent, a lump sum is paid, as prescribed by the Minister of Labour and Social Security.
Where a worker has sustained an injury or contracted a disease, he/she is regarded as permanently disabled at least to the degree set out for such injury or disease. Where the disease or injury is not specified in the schedule of the Act the degree of disablement is regarded as the minimum disablement for the degree
Death Where a worker dies as the result of an accident or disease compensation is paid as follows;
a) if the worker leaves a dependent spouse and no dependent children, a monthly pension worth 40 per cent of the worker’s assessed earnings;
b) child pension;c) if the worker leaves no dependent children or a person wholly dependent
upon him/her, but leaves partial dependants, an amount of three times the value of the benefits received by the dependant from the worker during the twelve months immediately preceding the accident or the onset of the disease;
d) where a worker receiving a monthly pension for permanent disablement or who was entitled to a pension dies of causes other than the accident or disease for which he/she was being paid compensation, the spouse is paid 40 per cent of the monthly pension which the deceased worker had been receiving or would have received if he/she had been entitled to a monthly pension;
e) funeral expenses are refunded in full to the person who paid them or such an amount as prescribed by the Minister.

4. Social protection schemes 81
Investment
Investment income accounted for an average of 11 per cent of WCFCB’s receipts between 2000 and 2005, see Figure 4-5. Contribution income accounted for an average of 87 per cent of the total receipts over the same period. No detailed data were received on the structure of WCFCB investments and returns on each of the categories of investments.
Administration costs
Between 2000 and 2006 the administration costs of the Workers’ Compensation Fund averaged about 82.16 per cent of contribution income.
Comparison of selected characteristicsof contributory social security schemes
Coverage
As Table 4-5 shows, the data on membership provided by the existing pension schemes suggest that they cover around 79 per cent of their target group (550,000 out of about 700,000) – that is, all those aged 15-55 years who are in employment. However, results of the Labour Force Survey suggest that eff ective coverage by these schemes may actu-ally be lower than that. Th is fi nding not only confi rms that most working people in Zambia lack adequate social security coverage but also that even those who could be rel-atively easily covered by existing social insurance schemes are far from fully covered.
Given this situation, some measures should be taken to give most Zambians some basic old-age income security and to extend basic social insurance coverage for some other contingencies. GRZ (2007, p. 11) argues that the rate of compliance should be increased (many registered members are not active) and that the schemes should extend coverage to workers in the informal economy.
4.1.5
Figure 4-5. WCFCB Receipts as percentage of total
Investment income
Contributions from employers
Other receipts
2000/1 2001/2 2002/3 2003/4 2004/5 2005/60
20
40
60
80
100

82 Zambia – Social Protection Expenditure and Performance Review and Social Budget
Contribution rates
Regarding contribution rates, the public schemes have higher contribution rates than NAPSA (see Table 4-6). From both employers and employees, PSPF collects 14.5 per cent of wages and LASF collects 33 per cent of wages, by contrast with NAPSA which collects only 10 per cent. However, the NAPSA law allows for scaled premium funding, which means that the contribution rate will increase over time to assure full-funding of future benefi t payments. Currently, this is not a problem because the scheme is still young. Th e case of WCFCB is diff erent: instead of contributions, the Fund collects an annual, risk-related premium, so-called assessments, which range from 1.88 to 3.75 per cent of insurable earnings (Cheta, 2005).
High contribution rates cannot be relied upon to meet expected benefi t expendi-tures if the Government, as the employer, fails to transfer these payments to the fund. The public pension schemes rely on such government transfers to be able to fulfill their obligations; which the Government, as an employer, has been failing to remit in a timely fashion, and has thus accumulated a huge debt with these schemes, that it is slowly liquidating. In 2006, pension arrears amounted to 4.4 per cent of total domestic debt or 1.0 per cent of GDP (MOFNP, 2007). Th is unfortunate situation has contrib-uted signifi cantly to the delayed payment of pensions to pensioners.
Financing
In practice, the schemes have slightly diff erent fi nancing mechanisms, as shown in Table 4-6. Currently, the LASF and the PSPF are PAYG while the new NAPSA is partially funded PAYG, with a scaled premium fi nancing system.
Th e funds mobilized by the pension schemes, and mostly invested in the country, are large by comparison with the total market capitalization (fi xed-income securities and stocks) and the gross domestic product, as shown in Figure 4-6.
Given the importance of such funds it is necessary to ensure sound investment policies that protect the entitlements of future pensioners and guarantee adequacy of benefi ts.
Table 4-5. Social Security Coverage in 2005
Active members
per cent labour force
per cent paid workers
Pensioners
NAPSA 1 355 200 8.0 16.1 0
PSPF 106 062 2.4 4.8 46 122
LASF 13 000 0.3 0.6 8 250
Occupational schemes 40 904 0.9 1.8 7 173
WCFCB 17 721
Labour force (15-54) 4,416,822
Paid workers (15-54) 2,212,336
Formal-sector paid workers (15-54) 435,588
1 estimate
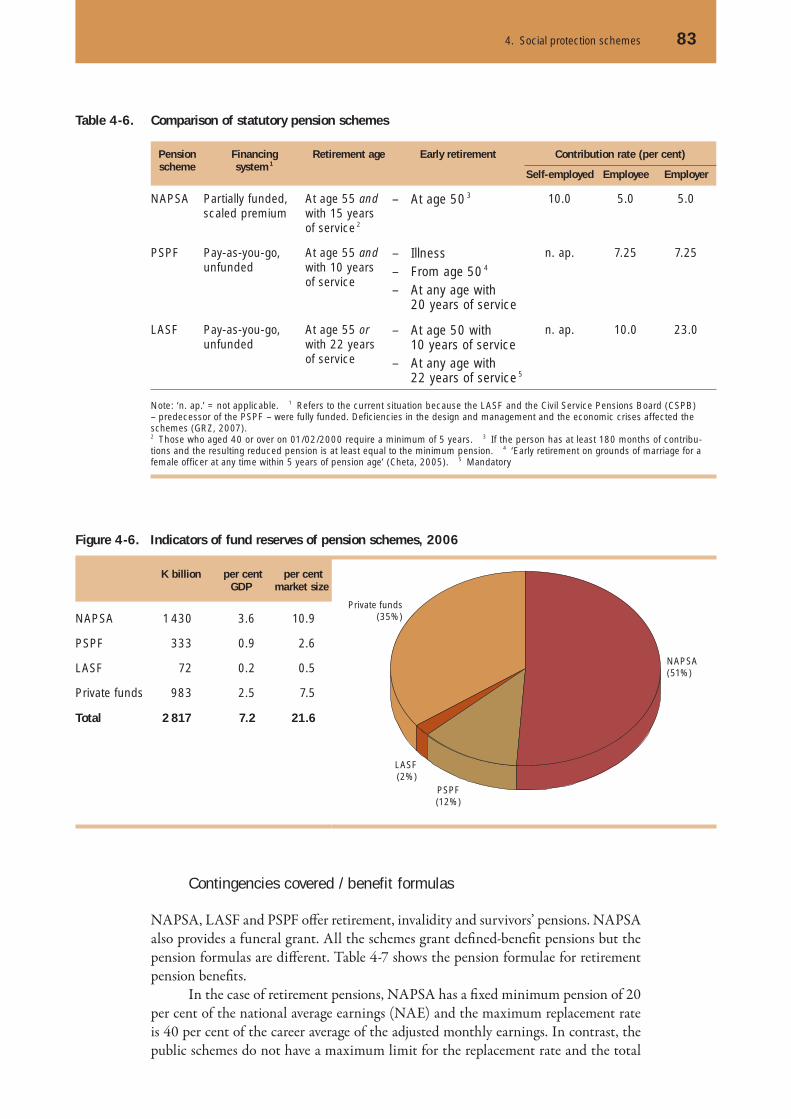
4. Social protection schemes 83
Contingencies covered / benefit formulas
NAPSA, LASF and PSPF off er retirement, invalidity and survivors’ pensions. NAPSA also provides a funeral grant. All the schemes grant defi ned-benefi t pensions but the pension formulas are diff erent. Table 4-7 shows the pension formulae for retirement pension benefi ts.
In the case of retirement pensions, NAPSA has a fi xed minimum pension of 20 per cent of the national average earnings (NAE) and the maximum replacement rate is 40 per cent of the career average of the adjusted monthly earnings. In contrast, the public schemes do not have a maximum limit for the replacement rate and the total
Table 4-6. Comparison of statutory pension schemes
Pension scheme
Financingsystem 1
Retirement age Early retirement Contribution rate (per cent)
Self-employed Employee Employer
NAPSA Partially funded, scaled premium
At age 55 and with 15 years of service 2
– At age 50 3 10.0 5.0 5.0
PSPF Pay-as-you-go, unfunded
At age 55 and with 10 years of service
– Illness– From age 50 4
– At any age with 20 years of service
n. ap. 7.25 7.25
LASF Pay-as-you-go, unfunded
At age 55 or with 22 yearsof service
– At age 50 with 10 years of service
– At any age with 22 years of service 5
n. ap. 10.0 23.0
Note: ‘n. ap.’ = not applicable. 1 Refers to the current situation because the LASF and the Civil Service Pensions Board (CSPB) – predecessor of the PSPF – were fully funded. Deficiencies in the design and management and the economic crises affected the schemes (GRZ, 2007).2 Those who aged 40 or over on 01/02/2000 require a minimum of 5 years. 3 If the person has at least 180 months of contribu-tions and the resulting reduced pension is at least equal to the minimum pension. 4 ‘Early retirement on grounds of marriage for a female officer at any time within 5 years of pension age’ (Cheta, 2005). 5 Mandatory
Figure 4-6. Indicators of fund reserves of pension schemes, 2006
K billion per cent GDP
per cent market size
NAPSA(51%)
PSPF(12%)
LASF(2%)
Private funds(35%)NAPSA 1 430 3.6 10.9
PSPF 333 0.9 2.6
LASF 72 0.2 0.5
Private funds 983 2.5 7.5
Total 2 817 7.2 21.6

84 Zambia – Social Protection Expenditure and Performance Review and Social Budget
balance depends on the fi nal salary. Th is means that the contributors to the pension schemes could reach a higher fi nal balance than contributors to NAPSA. For instance, if someone contributed 25 years to the PSPF, the replacement rate would be 45.5 per cent [25x12/660] of the last wage while if the same person contributed to NAPSA, he/she would get 33.3 per cent of his/her career average wage (which in most cases is lower than the fi nal wage).
In the case of survivors’ pensions, the formulas differ between schemes. All schemes off er benefi ts for surviving spouses and surviving children but the benefi ts for the latter might be lower. In the case of LASF, each child would receive 25 per cent of the benefi t provided to the spouse, up to a limit of 75 per cent for three surviving children or more. Survivors would receive a lump sum if the contributor had less than ten years of service in the case of PSPF, and less than fi ve years of service in the case of NAPSA. We do not have enough information to compare replacement rates for specifi c cases such as a widow with two children, or only surviving children receiving benefi ts under diff erent schemes.
On the other hand, the fact that contributors to LASF and PSPF can withdraw as a lump sum up to two-thirds of their fi nal balance at retirement raises doubts about the role of these pension schemes to ensure adequate income replacement to their pen-sioners in the last years of their lives. Th e minimum pension in the case of LASF was increased in 2004 so that it was equalized in nominal terms to the minimum pension in NAPSA. At that time, 60 per cent of pensioners were receiving the minimum pen-sion or around USD 20 (LASF, 2006).
Table 4.8 shows the retirement benefi t level if an employee in that scheme or cov-ered by the respective law retired assuming a pensionable service of 20 years. Further assumptions had to be made for NAPSA for it to be comparable with other schemes; for monthly pensions, the average index of monthly earnings has been assumed to be equal to the 2007 NAE applicable in 2008. Equally, there are diff erences in the rates of contribution for employees with one employer but contributing to two diff erent schemes, for instance, a water utility company will pay a total of 33 per cent into LASF for an employee employed before 31 January 2000 and contribute a total of 10 per cent capped at four times the national average wage; the same is true for civil servants who were employed before and aft er 31 January 2000.
Table 4-7. Comparison of retirement pension benefits
Pension scheme
Item Description
NAPSA Pensionformula
Gross annuity = 0.001111 (1/900) × Career average of adjusted monthly earnings x Number of monthly contributions. (This gives 1.333 per cent of earnings annually.)
Benefitspaid
Earnings and resulting pensions are indexed to the national average earnings
LASF / PSPF Pension formula
Gross annuity = (Last annual salary × Number of months of service) 1/660. (This gives 1.818 per cent of earnings annually.)
Benefitspaid
– Two-thirds are withdrawn as a lump sum– One-third is paid monthly as a perpetual annuity
(using age-specific commutation factors)Monthly pension is indexed to the IPC.
Based on LASF (n.d.), PSPF (n.d.), and NAPSA (1999).
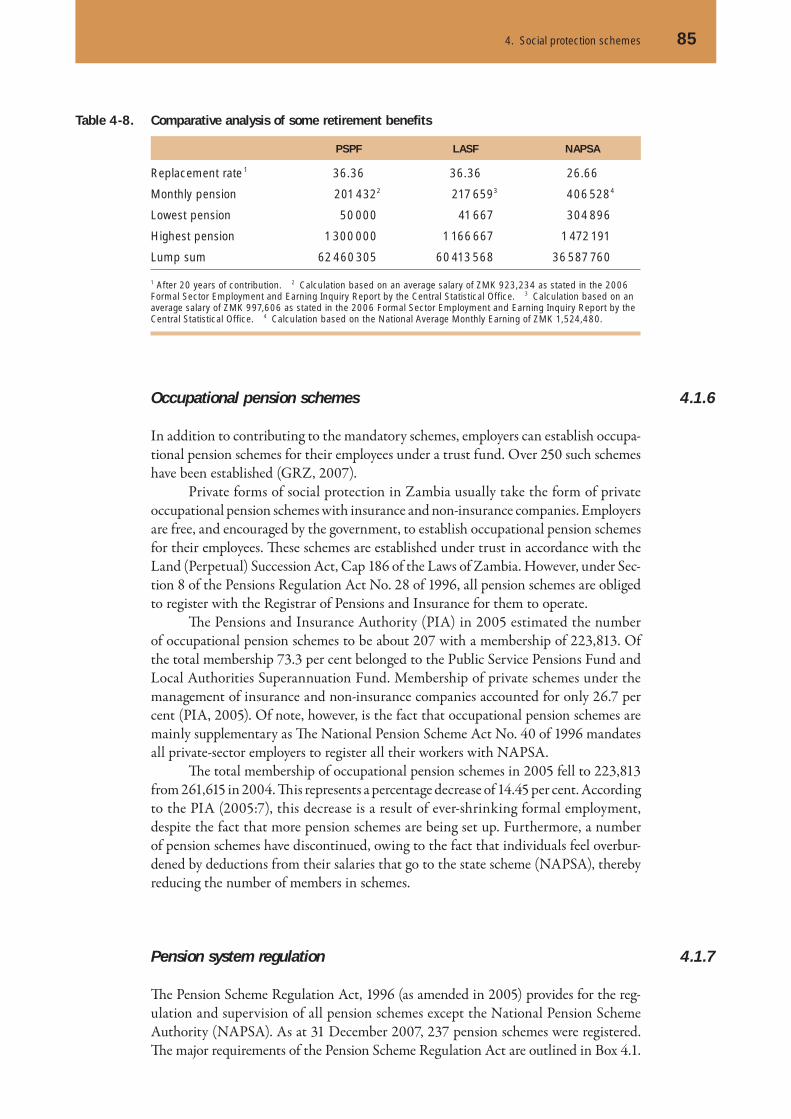
4. Social protection schemes 85
Occupational pension schemes
In addition to contributing to the mandatory schemes, employers can establish occupa-tional pension schemes for their employees under a trust fund. Over 250 such schemes have been established (GRZ, 2007).
Private forms of social protection in Zambia usually take the form of private occupational pension schemes with insurance and non-insurance companies. Employers are free, and encouraged by the government, to establish occupational pension schemes for their employees. Th ese schemes are established under trust in accordance with the Land (Perpetual) Succession Act, Cap 186 of the Laws of Zambia. However, under Sec-tion 8 of the Pensions Regulation Act No. 28 of 1996, all pension schemes are obliged to register with the Registrar of Pensions and Insurance for them to operate.
Th e Pensions and Insurance Authority (PIA) in 2005 estimated the number of occupational pension schemes to be about 207 with a membership of 223,813. Of the total membership 73.3 per cent belonged to the Public Service Pensions Fund and Local Authorities Superannuation Fund. Membership of private schemes under the management of insurance and non-insurance companies accounted for only 26.7 per cent (PIA, 2005). Of note, however, is the fact that occupational pension schemes are mainly supplementary as Th e National Pension Scheme Act No. 40 of 1996 mandates all private-sector employers to register all their workers with NAPSA.
Th e total membership of occupational pension schemes in 2005 fell to 223,813 from 261,615 in 2004. Th is represents a percentage decrease of 14.45 per cent. According to the PIA (2005:7), this decrease is a result of ever-shrinking formal employment, despite the fact that more pension schemes are being set up. Furthermore, a number of pension schemes have discontinued, owing to the fact that individuals feel overbur-dened by deductions from their salaries that go to the state scheme (NAPSA), thereby reducing the number of members in schemes.
Pension system regulation
Th e Pension Scheme Regulation Act, 1996 (as amended in 2005) provides for the reg-ulation and supervision of all pension schemes except the National Pension Scheme Authority (NAPSA). As at 31 December 2007, 237 pension schemes were registered. Th e major requirements of the Pension Scheme Regulation Act are outlined in Box 4.1.
4.1.6
4.1.7
Table 4-8. Comparative analysis of some retirement benefits
PSPF LASF NAPSA
Replacement rate 1 36.36 36.36 26.66
Monthly pension 201 4322 217 6593 406 5284
Lowest pension 50 000 41 667 304 896
Highest pension 1 300 000 1 166 667 1 472 191
Lump sum 62 460 305 60 413 568 36 587 760
1 After 20 years of contribution. 2 Calculation based on an average salary of ZMK 923,234 as stated in the 2006 Formal Sector Employment and Earning Inquiry Report by the Central Statistical Office. 3 Calculation based on an average salary of ZMK 997,606 as stated in the 2006 Formal Sector Employment and Earning Inquiry Report by the Central Statistical Office. 4 Calculation based on the National Average Monthly Earning of ZMK 1,524,480.

86 Zambia – Social Protection Expenditure and Performance Review and Social Budget
In practice, it is diffi cult to regulate public pension schemes as there are confl icts in the laws. Key confl icts are the composition of the governing boards, submission of returns, period of actuarial valuation, portability of benefi ts, investment of funds, pen-alties for delayed remittance of contributions etc.
The Pension Scheme Regulation (Amendment) Act, 2005 requires that the governing board of a pension scheme have equal representation of employers and employees, Th e PSPF, LASF and NAPSA have the composition of their governing bodies dominated mostly by employers and only one seat for workers’ representatives. Th e Pension Scheme Regulation Act, 1996 expressly states that it does not apply to the NAPSA yet, strangely, the National Pension Scheme Act, 1996 states in section 32 that the Authority shall ensure that the Scheme is managed in accordance with the pruden-tial management principles specifi ed in the Pension Scheme Regulation Act.
Th e Pension Scheme Regulation Act, 1996 empowers the Registrar of Pensions and Insurance to ensure that the actuarial recommendations are implemented by the Trustees of a scheme, yet the PSPF Act requires the intervention of the President if the directors fail to implement any of the recommendations from the actuary, while the LASF Act requires the Minister of Local Government to intervene and, in the case of NAPSA the Minister of Labour and Social Security, if the board fails to implement any of the recommendations of the actuary.
Th e Pension Scheme Regulation Act (PRSA) also requires that audited fi nancial statements be prepared within three months aft er the end of the fi nancial year, while both the PSPF and LASF Act have no provision about the deadline for the prepara-tion of audited accounts. NAPSA on the other hand is required to prepare audited accounts before the end of six months. It is imperative to note that delayed preparation of audited accounts has serious consequences on the operations of any pension scheme, as tasks such as the preparation of actuarial reports will not be completed on time. For instance, the PSPF has a draft actuarial report based on 2005 accounts. By the time the fi nal report is prepared, over two years will have passed since the period concerned and, in decision-making terms, it may no longer be valid.
Box 4-1. Key requirements of the Pension Scheme Regulation Act
• All pensions schemes, other than that established by written law need to be established under an irrevocable trust.
• The governing board of a pension scheme (Board of Trustees) must have equal representation of members and employers. The members elect their representatives and the employer nominates his/hers.
• Pension fund managers, administrators and custodians need to ensure that at least 51 per cent of their scheme’s share capital is owned by Zambians (effective May 2008).
• Defined-benefit schemes need to have an actuarial valuation every two years in the first four years of registration, thereafter every three years, so as to review the sound funding of the scheme.
• All pension schemes need to submit audited financial statements three months after the end of the financial year and submit quarterly returns 14 days after the end of each quarter.
• The Act requires the preservation of pension rights. Therefore, once attained, rights cannot be changed, meaning that as regards benefit levels amendments can only affect future rights.
• The Act also grants full portability of members’ benefits. Members can transfer their accrued ben-efits when they change employment.
• All pension schemes need to have an investment policy approved by the Regulator.• Pension schemes need to give a member a benefit statement every year, clearly stating the accrued
portable benefits. • Only a maximum of 30 per cent of the net assets of the pension scheme can be invested abroad.

4. Social protection schemes 87
In terms of reporting, the Pensions and Insurance Authority has a dual reporting role to the Minister of Finance and National Planning and also to the Minister of Labour and Social Security. Th e PSPF reports to the President, LASF reports to the Minister of Local Government and NAPSA reports to the Minister responsible for Labour and Social Security. The Minister of Labour and Social Security is absent from the LASF and PSPF Acts, yet he/she is the custodian and driver of social secu-rity policy.
Th e PSPF and LASF Acts do not contain explicit provisions regarding regula-tion. It is important also to note that the PSRA seems to focus only on the regulation of private occupational schemes. Th erefore for the Pensions and Insurance Authority (PIA) to regulate public schemes, specifi c regulations for the public schemes will be needed, as operational risks are so diff erent from those managed privately. Further, the PSRA grants full portability of benefi ts to persons who change employment, yet none of the other three Acts (the NAPSA, LASF, and PSPF) allows members transfer of accrued benefi ts. Th e NAPSA Act make no provision to cater for members who change employment from a contributing employer to an exempted employer (i.e. Konkola Copper Mines Plc.), and PSPF and LASF provide only for the refund of employees’ contributions, without any option of transfer to another scheme or deferring benefi ts to retirement. It is also worth noting that the fourth schedule of the Income Tax, Cap 323 allows the refund of both employer’s and employee’s contributions to an employee who leaves employment. Th e Income Tax Act, Cap 323 of the Laws of Zambia, allows only a maximum commutable amount of a pension yet a member of LASF or PSPF can commute up to two-thirds of their pension.
The Workers’ Compensation Fund Control Board has a Board of Directors who report to the Minister of Labour and Social Security. Th e Board is tripartite, rep-resenting Government, employers, and employees. Th e Board is required to appoint an actuary who should ascertain the fi nancial soundness of the Fund at intervals not exceeding three years. Further, the Board is required to have the fi nancial statements for the Fund and a report submitted to the Fund not later than six months aft er the end of the year. Th e Workers’ Compensation Fund Control Board Act has no section for prudential management and regulation of the Fund. Th ere is no restriction on the level of administration costs or required solvency levels at the end of each period.
Other employment-related benefits
Workers are entitled to other benefi t packages, as provided for in various pieces of leg-islation. Others benefi ts are agreed upon jointly by workers and employers. Examples of the benefi ts provided for in some selected collective bargaining agreements are pre-sented in Chart A.
Severance payment
An employee who has served with an employer for not less than ten years and has attained the age of 55 years, under the provisions of the supplementary law to the Minimum Wages and Conditions of Service Act (Cap 276) of the Laws of Zambia, is entitled to three months’ basic pay for each completed year of service. However, where the employer has established a pension scheme approved by the Minister of Labour and Social Security, such retirement benefi ts are paid in accordance with that pension scheme.
4.1.8
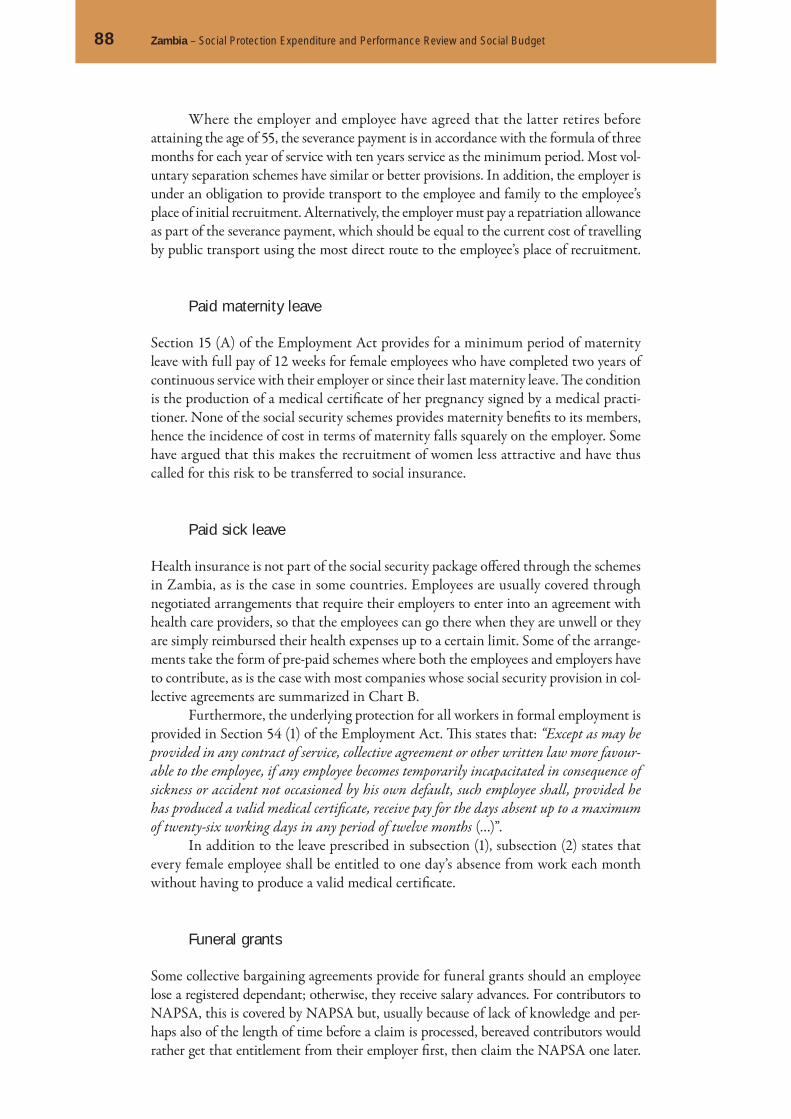
88 Zambia – Social Protection Expenditure and Performance Review and Social Budget
Where the employer and employee have agreed that the latter retires before attaining the age of 55, the severance payment is in accordance with the formula of three months for each year of service with ten years service as the minimum period. Most vol-untary separation schemes have similar or better provisions. In addition, the employer is under an obligation to provide transport to the employee and family to the employee’s place of initial recruitment. Alternatively, the employer must pay a repatriation allowance as part of the severance payment, which should be equal to the current cost of travelling by public transport using the most direct route to the employee’s place of recruitment.
Paid maternity leave
Section 15 (A) of the Employment Act provides for a minimum period of maternity leave with full pay of 12 weeks for female employees who have completed two years of continuous service with their employer or since their last maternity leave. Th e condition is the production of a medical certifi cate of her pregnancy signed by a medical practi-tioner. None of the social security schemes provides maternity benefi ts to its members, hence the incidence of cost in terms of maternity falls squarely on the employer. Some have argued that this makes the recruitment of women less attractive and have thus called for this risk to be transferred to social insurance.
Paid sick leave
Health insurance is not part of the social security package off ered through the schemes in Zambia, as is the case in some countries. Employees are usually covered through negotiated arrangements that require their employers to enter into an agreement with health care providers, so that the employees can go there when they are unwell or they are simply reimbursed their health expenses up to a certain limit. Some of the arrange-ments take the form of pre-paid schemes where both the employees and employers have to contribute, as is the case with most companies whose social security provision in col-lective agreements are summarized in Chart B.
Furthermore, the underlying protection for all workers in formal employment is provided in Section 54 (1) of the Employment Act. Th is states that: “Except as may be provided in any contract of service, collective agreement or other written law more favour-able to the employee, if any employee becomes temporarily incapacitated in consequence of sickness or accident not occasioned by his own default, such employee shall, provided he has produced a valid medical certifi cate, receive pay for the days absent up to a maximum of twenty-six working days in any period of twelve months (…)”.
In addition to the leave prescribed in subsection (1), subsection (2) states that every female employee shall be entitled to one day’s absence from work each month without having to produce a valid medical certifi cate.
Funeral grants
Some collective bargaining agreements provide for funeral grants should an employee lose a registered dependant; otherwise, they receive salary advances. For contributors to NAPSA, this is covered by NAPSA but, usually because of lack of knowledge and per-haps also of the length of time before a claim is processed, bereaved contributors would rather get that entitlement from their employer fi rst, then claim the NAPSA one later.

4. Social protection schemes 89
Some employers provide education and housing allowances to their employees. Th ese benefi ts, which apply to many long-term employees, are a major cause of the employers’ marked preference for short-term and casual employment contracts and for the relatively low penetration of occupational pension schemes (Petrauskis, 2005; Hantuba, 2005).
Provisions for vulnerable workers
Th e Minimum Wages and Conditions of Employment (General) Order sets out remu-neration and benefi t packages applicable to workers who are neither unionized nor in managerial positions. Statutory instruments which provide for these minimum wages and conditions of employment are normally reviewed every two years by the Min-ister of Labour and Social Security. Unionized workers have their packages negotiated annually and stipulated in collective bargaining agreements, while those in manage-ment positions have them specifi ed in their respective contracts of employment (GRZ, 2002). Th ere has however been some deliberate misapplication of the provisions on the minimum wages and conditions of employment statutory instruments by some people in managerial positions when awarding themselves a gratuity, which they usually base on three months’ pay for each year served. Th e Ministry of Labour has endeavoured to clarify the correct interpretation but the trend seems not to have diminished.
According to the 2006 Statutory Instrument on the Minimum Wages and Con-ditions of Employment (General) Order, employees without collective bargaining agree-ment protection have the right to sickness leave with three months of full pay and three additional months of half pay, if necessary. In case of pregnancy, women are entitled to 120 days of paid maternity leave –only for those with a minimum of two years at work. On the other hand, employers can provide health care and medical coverage through pri-vate providers and usually both employers and employees contribute equally (ZIC, 2006, p. 35). However, there are no data on actual coverage by these arrangements. Th e norm also regulates paid holidays (not less than 24 days per year) and special paid leave (e.g., due to death of a family member). Results of the LFS 2005 discussed in the previous chapter show that many employees are not actually able to enjoy these entitlements.
If the employee is declared redundant before the end of his/her contract (with at least one month’s notice), the employer has to pay the equivalent of two months of basic salary for each completed year of service (i.e., redundancy benefi t).
Extending coverage by contributory schemesto uncovered informal-economy workers
A major problem in the social insurance system in Zambia is that all pension contribu-tion schemes have been designed for people in the formal sector, which has tended to disadvantage non-formal workers. Th is targeting method implies that those working in the informal economy are excluded from contributing to the scheme. Although there is provision in the statutes relating to statutory pension schemes for voluntary affi li-ation of the self-employed and other categories of workers in the informal economy, no measures have been put in place to capture those working in this sector owing to the administrative and logistical challenges involved. However, in a country with an existing employed labour force of about 4.1 million people (CSO, 2007)10 of whom
10 Central Statistics Offi ce (2007): Labour Force Survey 2005. Lusaka: CSO.
4.1.9

90 Zambia – Social Protection Expenditure and Performance Review and Social Budget
only 495,784 are in the formal sector, there is a case for extending existing social insur-ance schemes to include non-formal workers.
With the contraction of the formal sector, the informal economy is increasingly the main sure source of employment in Zambia. In terms of disadvantaged groups, most working women in Zambia are excluded from access to social insurance, as a good number of them are engaged in non-formal jobs. A related and equally disadvantaged group is young people whose unemployment rate is quite high (over 16 per cent) and most of whom have never worked before, so have no basis for claiming the social insur-ance that in Zambia is targeted at those who have work or have worked before. Th us, the case for extending existing social insurance schemes to include non-formal workers would seem justifi ed (CSO, 2007).
Th is can be done by embarking on broad-based sensitization campaigns aimed at informal-economy workers who in most cases are not aware of the benefi ts of affi liating to a social insurance scheme or the dangers of not doing so. Th e main advantage of this approach is that it would make use of already existing institutional framework, exper-tise, and experience. Nevertheless, there might be a need to reform the existing schemes as they are designed to cater for workers in formal employment. Th e ILO (2002) gives examples of South Korea, Japan, and Portugal as places where social insurance schemes have been successfully extended to non-formal workers.
However (Van Ginneken, 2003) argues this approach has been diffi cult to apply in most low-income countries: because, “the benefi ts off ered do not correspond to the priority needs of most informal sector workers and that the contributions required are much higher than what informal sector workers are prepared to pay”.
Th e success of such an approach would therefore require the introduction of deliberate packages targeted at a clientele with the characteristics of informal-economy workers, for which most formal social protection institutions do not have the time and resources. Th e biggest drawback of this option is the extra administration costs that would be needed to come up with packages for non-formal workers at the same time as the scheme’s offi cials manage the main scheme for members in formal employment. Th erefore, the approach is a combined one: sensitization campaigns plus the off er of a new package. Th is requires further consideration.
Micro-insurance in Zambia
Th ere is no explicit government policy on micro-insurance, though the State has been lending support to micro-fi nance concepts. Th e Bank of Zambia has draft regulations for micro-fi nance institutions. However, micro-insurance aptly falls under the Pen-sions and Insurance Authority, which has not taken steps to regulate it. Nonetheless, the size and number of formal micro-insurance transactions have grown dramatically since 2001. However, the range of micro-insurance products has remained narrow, with most of the products being closely linked to micro-credit.
Formal micro-insurance in Zambia largely consists of credit life and funeral coverage for micro-fi nance borrowers and their family members. Micro-insurance in the form of contributory medical schemes is also slowly taking root in Zambia. For instance, an optional contributory medical scheme is available to civil servants that is managed by a private institution called Premier Medical Services Limited. Much of the recent interest in providing insurance to low-income households, however, comes from micro-fi nance institutions (MFIs) that want to protect their loan portfolios from default caused by death and illness.
4.1.10

4. Social protection schemes 91
Formal micro-insurance can be traced to CETZAM, one of the country’s leading MFIs, which introduced a funeral benefi ts insurance scheme in partnership with NICO insurance company in 2000. Th is product was in response to CETZAM’s market research, which indicated that death was the number one risk for its clients. Most MFIs facing similar challenges have also began to provide some informal, inter-nally managed insurance funds. For example PULSE, then still a micro-fi nance project under CARE International, introduced its Borrowers Protection Fund (BPF) in 2000. Since then it has been providing micro-insurance in the form of credit life, using a part-nership agent model (partnering with Madison Insurance Company Limited.).
In addition, a few examples of informal or unregistered micro-insurance activi-ties, such as funeral funds, can be found in market places and sometimes in church organizations, in which weekly premiums ranging from USD 0.13 to 0.33 are made. Th e premiums are not based on actuarial analysis but on what the members can aff ord. In general, however, risk management and insurance per se are not widely understood concepts in Zambia. Insurance penetration, which is between 1.0 and 1.5 per cent, ranks quite low (Churchill, 2006). However, based on the traditional concept and practices of Chilimba, which is widespread, it is reasonably possible that with a good regulatory framework, micro-insurance services could easily be accepted and estab-lished as a means to social protection in Zambia.
Conclusion
Th ere are a few key issues for the contributory schemes. NAPSA has recently received an actuarial report, which shows the scheme is in a healthy position for the medium term, but has funding problems for the longer term. It is actively considering the way forward. Th e Government pension schemes have liquidity problems due to non-pay-ment by the Government of monies due. Th ere is pressure to reverse the reforms, which were aimed at providing a multi-pillar system.
Issues of equality should be addressed in the respective Acts. For social security to be all-inclusive, gender needs should be incorporated in the legislation. Th e LASF Act, for instance, still assumes a male contributing member; there is urgent need for the Act to be amended so as to share suffi cient legal protection equally among the members.
Good governance principles need to be incorporated into the management of social security institutions. Board members should have suffi cient knowledge and skills to supervise management so as to provide adequate and reliable benefi ts. Govern-ment policy on who should be regulated also needs to be clear; currently it is not clear whether the PSPF and LASF should be regulated.
4.1.11
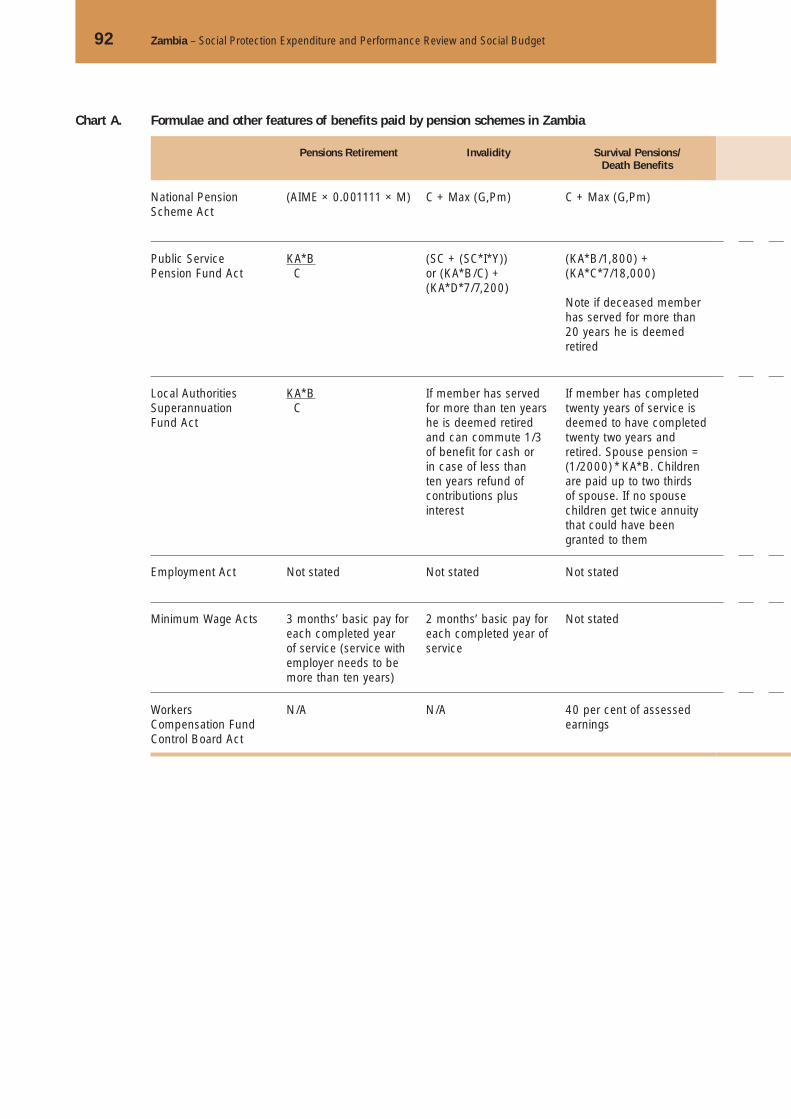
92 Zambia – Social Protection Expenditure and Performance Review and Social Budget
Chart A. Formulae and other features of benefits paid by pension schemes in Zambia
Pensions Retirement Invalidity Survival Pensions/ Death Benefits
National Pension Scheme Act
(AIME × 0.001111 × M) C + Max (G,Pm) C + Max (G,Pm)
Public Service Pension Fund Act
KA*B C
(SC + (SC*I*Y)) or (KA*B/C) + (KA*D*7/7,200)
(KA*B/1,800) + (KA*C*7/18,000)
Note if deceased member has served for more than 20 years he is deemed retired
Local Authorities Superannuation Fund Act
KA*B C
If member has served for more than ten years he is deemed retired and can commute 1/3 of benefit for cash or in case of less than ten years refund of contributions plus interest
If member has completed twenty years of service is deemed to have completed twenty two years and retired. Spouse pension = (1/2000) * KA*B. Children are paid up to two thirds of spouse. If no spouse children get twice annuity that could have been granted to them
Employment Act Not stated Not stated Not stated
Minimum Wage Acts 3 months’ basic pay for each completed year of service (service with employer needs to be more than ten years)
2 months’ basic pay for each completed year of service
Not stated
WorkersCompensation Fund Control Board Act
N/A N/A 40 per cent of assessed earnings

4. Social protection schemes 93
Redundancy Employment injury PaidMaternity
Funeral Indexation of benefits
N/A N/A N/A 10 Times minimum pension ( ZMK2,944,382.00
yes
(KA*B/C) + (KA*D/60)
(A/100) * 2/3B+ 1/3C
N/A NONE Board can adjust monthly pensions at such intervals as they may determine
If member has served for more than ten years he is deemed retired and can commute 1/3 of benefit for cash
N/A N/A NONE The Minister can increase upon Board and actuarial recommendation.
2 months’ basic pay for each year served
Twelve weeks Not stated N/A
2 months’ basic pay for each completed year of service
120 calendar days Funeral expenses plus ZMK 200,000 funeral grant
N/A
N/A 50 per cent of assessed earnings
N/A Refund of funeral expenses
No indexation stated

94 Zambia – Social Protection Expenditure and Performance Review and Social Budget
Chart B. Social protection provisions in selected collective bargaining agreements
Institution/Company name
Health Sick pay Paid maternity Redundancy Employment injury
INDO Zambia Reimbursement @12 per cent annual basic pay
First 12 months full pay, then next 3 months at half pay
90 calendar days
As per Employment Act
Not stated
PSPF- STAFF Contributory med-ical insurance
90 calendar days full pay+ next 90 days at half pay
90 calendar days
As per Employment Act
Not stated
Occupational Health & Safety
Medical scheme 6 months 3 months As per Employment Act
As per Workers Compensation Act
LBTCMB None 6 months 3 months
ZRA Medical scheme 90 calendar days full pay+ next 90 days at half pay
90 calendar days
Terminal gratuity GL
NAPSA-STAFF Medical Allowance 6 months 3 months 4.5 basic salary * each year served
GL
ZSIC Medical insurance (K 4 million per out of patient treatment or hospitalization)
12 months 3 Months 3 months per each year served
GPA (5* Annual basic salary)
CHILANGA CEMENT PLC
Medical Insurance plus two months basic pay for dis-charge on medical grounds
90 calendar days full pay+ next 90 days at half pay
120 calendar days
2 months for each year served or as varied by GRZ
Workers Com-pensation Fund Control Board
MOPANI PLC Company has hospitals
90 calendar days full pay+ next 90 days at half pay
90 calendar days
3 months for each year served
Workers Com-pensation Fund Control Board
KCM PLC Company has hospitals
90 calendar days full pay+ next 90 days at half pay
90 calendar days
3 months basic salary for each year served
Workers Com-pensation Fund Control Board
TAZARA Company has clinics and pays medical expenses at hospitals for staff (ZMK70,000 per month)
180 days full pay for normal sick-ness and 360 days as a result of sickness related to employment
90 calendar days
4.8 basic salary for each year served
Workers Com-pensation Fund Control Board
Development Bank of Zambia
Medical scheme Six months 120 days 4 basic salary for each year served
Workers Com-pensation Fund Control Board

4. Social protection schemes 95
Pensionsretirement
Disability pensions/ Invalidity
Survival pensions /death benefits
Funeral Employer sector
Size ofemployer
4 months basic salary for each completed year of service
4 months basic salary for each completed year of service
NAPSA Funeral expenses plus grant of ZMK 550,000
Banking Large
15 months basic salary plus three months salary for each year served
Not stated Accrued benefits 4-6 per cent of annual salary
Pension scheme
Medium
3 months basic pay plus NAPSA
3 months basic pay
Pension Scheme Grant of ZMK 600,000 plus transport
Public Medium
NAPSA NAPSA NAPSA Grant ofZMK 600,000,coffin plus transport
Education Small
Contract gratuity Not stated NAPSA and accrued benefits under contract
Some expenses plus grant
Public tax collector
Large
Staff scheme Not stated Staff scheme Grant of ZMK 800,000 + Full expenses
Pension scheme
Large
Staff scheme Not stated GLA and staff scheme
Grant of ZMK 1,500,000 + funeral expenses
Insurance Large
Defined contribu-tion Staff Scheme plus NAPSA
Workers Com-pensation Fund Control Board
Refund of employers and own contributions under DC only.
Grant of ZMK 3,500,000 + plus expenses
Manufacturing Large
Defined con-tribution Staff Scheme. Exempted from NAPSA
Workers Com-pensation Fund Control Board
Refund of employers and own contributions under DC only.
Grant of K 750,000 Mining Large
Defined con-tribution Staff Scheme. Exempted from NAPSA
Workers Com-pensation Fund Control Board
Refund of employers and own contributions under DC only.
Grant of K 750,000 Mining Large
Occupation scheme(1/45) plus NAPSA
Workers Com-pensation Fund Control Board
Staff scheme and NAPSA
Funeral expenses plus grant of ZMK 300,000
Railway Large
4 basic salary for each year served plus NAPSA
Workers Com-pensation Fund Control Board
Group life and NAPSA
Funeral expenses plus grant of ZMK 500,000
Banking Medium

96 Zambia – Social Protection Expenditure and Performance Review and Social Budget
Institution/Company name
Health Sick pay Paid maternity Redundancy Employment injury
Copperbelt Bottling Medical scheme three months on full pay then half pay till medical discharge
90 days 3 months basic salary for each year served
Workers Com-pensation Fund Control Board
Barclays Bank Zambia
Medical Insurance non contributory by staff
Paid till medically discharged
4 months at full pay
As agreed by the union subject to the law
Workers Com-pensation Fund Control Board
CRESTA GOLF VIEW HOTEL
NONE 90 days on full pay and half pay the next 90 days
120 days Contract Staff Workers Com-pensation Fund Control Board
ARMCOR Security NONE As permitted by doctor through sick note. But usually after pro-longed illness staff lose employment
120 days As per Employment Act
Workers Com-pensation Fund Control Board
PJP Associate Firm of Architects
Medical scheme (monthly cost not to exceed $100)
Sixty days at full pay and next 30 days at half pay
90 days Contract staff Not stated
INDENI OIL REFINARY
Medical Scheme 6 months 90 days As per Employment Act
Workers Com-pensation Fund Control Board
Securicor None One month As per minimum wage currently
120 days
As per Employment Act
Not stated
Continental Investment Ltd
Medical scheme As per Employment Act. Currently three months with full pay
90 days Contract staff Workers Com-pensation Fund Control Board
Shoprite Stores Only allowance in salary is provided
As per Employment Act. Currently three months with full pay
120 days 2.5 basic pay for each year served
Workers Com-pensation Fund Control Board rules

4. Social protection schemes 97
Pensionsretirement
Disability pensions/ Invalidity
Survival pensions /death benefits
Funeral Employer sector
Size ofemployer
Defined Contribu-tion scheme plus NAPSA
Defined benefit scheme
Group Life Plus refund of con-tributions plus interest in addi-tion to NAPSA
Funeral expenses plus ZMK 1.5 million
Manufacturing Medium
Defined Contribu-tion scheme plus NAPSA
Workers Com-pensation Fund Control Board
Group Life plus refund of con-tributions plus interest in addi-tion to NAPSA
Funeral expenses plus grant(max ZMK 4 Million)
Banking Large
NAPSA Plus employment contract gratuity
Workers Com-pensation Fund Control Board
NAPSA Plus accrued gratuity
ZMK 300,000 plus coffin
Hospitality Medium
NAPSA Workers Com-pensation Fund Control Board
NAPSA Help with funeral expenses and transport
Security firm Medium
NAPSA Not stated NAPSA Help with funeral expenses depending on availability of funds
Constructuring consultancy (mostly self employed)
Small
Defined Benefit Scheme(1/55)
Workers Com-pensation Fund Control Board
NAPSA plus staff occupational scheme
Funeral expenses plus grant
Manufacturing– oil refinery
Large
NAPSA Not stated NAPSA Help with funeral expenses (Grant for expenses) aximum ZMK 200,000 and transport
Security firm Medium
NAPSA and gratuity may be provided at Mgt discretion at 10 per cent of accu-mulated basic salary
Workers Com-pensation Fund Control Board
NAPSA Funeral expenses plus grant of ZMK 400,000
Information technology
Small
NAPSA plus retirement Fund set by employer at 3 months basic pay for each year served
Workers Compen-sation Fund Con-trol Board rules
NAPSA plus retirement Fund set by employer at 3 months basic pay for each year served
Funeral expenses plus grant
Shop chain (super-market)
Large

98 Zambia – Social Protection Expenditure and Performance Review and Social Budget
Non-contributory programmes
Introduction
Th is part reviews the main non-contributory social protection programmes found in Zambia at present. While social protection can be said to entail making transfers in form of cash, goods or services to persons at risk of or already experiencing adverse con-ditions such as poverty, unemployment and sickness, or otherwise vulnerable owing to their age, physical condition or household status, non-contributory programmes make such transfers unilaterally, i.e., without linking benefi ts to any contribution require-ment. Included within the scope of this review, therefore, are all public or private meas-ures providing some form of social security or assistance, with the specifi c exception of insurance-type schemes.
In reviewing existing non-contributory social protection programmes in Zambia, one focus will be to determine the extent of their coverage by identifying the social risks they address, the extent to which the benefi ts they provide prevent or reduce such risks, and the number of households or individuals they reach out of the total number in need of support. In this way it will be possible to assess the extent to which existing non-con-tributory programmes address needs for social protection among the large majority of individuals and households in Zambia excluded from existing social insurance schemes which are limited to formal-sector workers. An additional focus will be to assess the performance of existing non-contributory programmes in terms of their ability to meet stated objectives (their eff ectiveness), the ratio of programme costs to net benefi ts (their effi ciency), as well as their fi nancial and institutional sustainability. Based on these fi nd-ings, it will also be possible to identify opportunities and challenges to extend coverage to those population groups currently lacking any form of social protection.
Five non-contributory programmes in Zambia have been identifi ed as the most important in terms of their coverage and impact on social protection. Together these programmes address major social risks and situations of vulnerability, target rela-tively large numbers of benefi ciaries, and have achieved signifi cant results in terms of securing the well-being of the target populations.
☐ Th e Public Welfare Assistance Scheme (PWAS) has had its budget dramatically reduced in 2008 to K4.3 billion. PWAS reaches out to over 100,000 benefi ciaries countrywide, providing a range of benefi ts linked to better nutrition and health, income support, child protection, education and occupational training. PWAS will soon include elements of cash transfers (see below).
☐ A group of Social Cash Transfer schemes are financed by international donors and implemented under PWAS structures in a few districts of the country. Th ese schemes pay out modest monthly cash benefi ts reaching close to 7,000 households (30,000 persons). Th ere now exists a joint donor-Government strategy for scaling up cash transfer schemes.
☐ Th e Food Security Pack (FSP) is a Government-funded scheme providing basic agricultural inputs, technology transfers and training to vulnerable small-scale farming households across the country. Over the past fi ve years, between 30,000 and 160,000 farmers have benefi ted each year from the programme.
☐ The School-Feeding Programme in Zambia is funded by the World Food Pro-gramme and provides school meals and take-home rations to school-age children from poor families in drought-stricken areas. More than 170,000 children benefi ted from school-feeding in 2006.
4.2
4.2.1

4. Social protection schemes 99
☐ Th e Project Urban Self-Help is a government-funded public works programme that originated in the early 1990s and provides short-term employment for up to 50,000 persons in a given year.
Other non-contributory programmes in Zambia address one or another aspect of social protection, but these are not discussed in this review. Th is group includes programmes considered too small in scale, sporadically implemented programmes such as those in response to emergencies, and programmes exclusively addressed at long-term social and economic empowerment.
Th e fi ve programmes identifi ed above are then presented according to key aspects of their design, implementation and performance. Particular attention is paid to the institutional framework, referring to such elements as the actors involved with the programmes as well as fi nancing and administrative arrangements; coverage (not only the geographical areas of operation and beneficiary groups but also the social risks secured against and type of benefi ts provided); and performance indicators such as cost-effi ciency, eff ectiveness and impact on poverty and vulnerability among the targeted groups. In Part 4.2.3, an overall assessment is made about the extent of social protection coverage by the existing non-contributory programmes in Zambia and the prospects to extend coverage to reach individuals currently lacking in any form of social protection.
Diff erent sources have been consulted for the purpose of this comparison. Th ese include a number of overview and thematic studies on social assistance programmes conducted over the past few years, offi cial government strategy documents and expend-iture reports. However, information on some of the programmes was hard to come by, especially those without a stable institutional basis or not subject to systematic moni-toring and evaluation.
Table 4-9 shows the main programmes according to the kind of benefi t provided.
Table 4-9. Main social assistance programmes
Population groups Programme Main benefit
‘Incapacitated’ households* Social Cash Transfer Scheme (SCTS) /Public Welfare Assistance Scheme (PWAS)
Cash/in-kind transfers to cover basic material needs
National Trust for the Disabled (NTD) Credit facilities encouraging the setting-up of business enterprises
‘Vulnerable but viable’ farm households**
Food Security Pack (FSP) programme Micro-Bankers Trust (MBT)
Farm inputs
People living in food-insecure areas World Food Program Food
School Feeding Programme Food (also hygiene education, school gardens, etc.)
Food-for-assets and food-for-training projects
Food and skills training
Orphans and vulnerable children Strengthening Community Participation for the Empowerment of Orphans and Vulnerable Children (SCOPE OVC)
Psychological and educational support, food
Farmers Fertilizer Support Programme Farm Inputs
* Incapacitated households’ is the term used by the GRZ to refer to the 10 per cent poorest and most vulnerable households. ** Vulnerable but viable’ households are those which lack the financial resources but have the physical capacity to sow.
Source: WFP (n.d.), RHVP (2007a), MCDSS (2007)
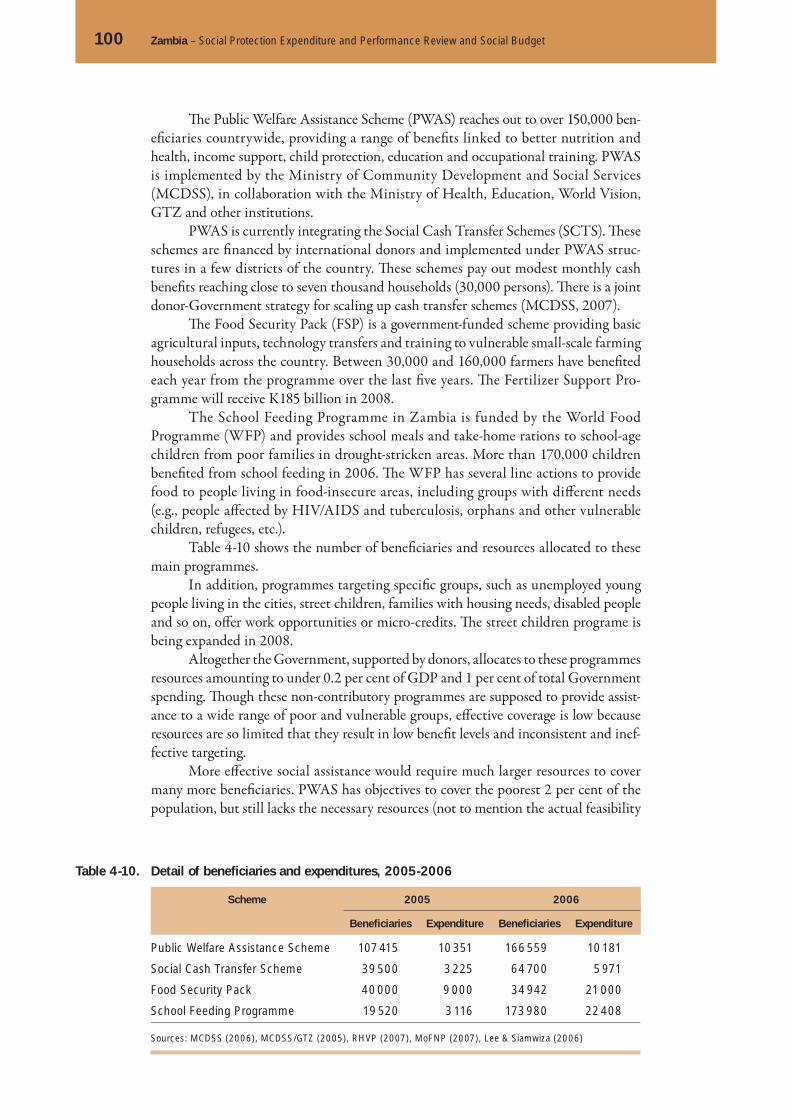
100 Zambia – Social Protection Expenditure and Performance Review and Social Budget
Th e Public Welfare Assistance Scheme (PWAS) reaches out to over 150,000 ben-efi ciaries countrywide, providing a range of benefi ts linked to better nutrition and health, income support, child protection, education and occupational training. PWAS is implemented by the Ministry of Community Development and Social Services (MCDSS), in collaboration with the Ministry of Health, Education, World Vision, GTZ and other institutions.
PWAS is currently integrating the Social Cash Transfer Schemes (SCTS). Th ese schemes are fi nanced by international donors and implemented under PWAS struc-tures in a few districts of the country. Th ese schemes pay out modest monthly cash benefi ts reaching close to seven thousand households (30,000 persons). Th ere is a joint donor-Government strategy for scaling up cash transfer schemes (MCDSS, 2007).
Th e Food Security Pack (FSP) is a government-funded scheme providing basic agricultural inputs, technology transfers and training to vulnerable small-scale farming households across the country. Between 30,000 and 160,000 farmers have benefi ted each year from the programme over the last fi ve years. Th e Fertilizer Support Pro-gramme will receive K185 billion in 2008.
The School Feeding Programme in Zambia is funded by the World Food Programme (WFP) and provides school meals and take-home rations to school-age children from poor families in drought-stricken areas. More than 170,000 children benefi ted from school feeding in 2006. Th e WFP has several line actions to provide food to people living in food-insecure areas, including groups with diff erent needs (e.g., people aff ected by HIV/AIDS and tuberculosis, orphans and other vulnerable children, refugees, etc.).
Table 4-10 shows the number of benefi ciaries and resources allocated to these main programmes.
In addition, programmes targeting specifi c groups, such as unemployed young people living in the cities, street children, families with housing needs, disabled people and so on, off er work opportunities or micro-credits. Th e street children programe is being expanded in 2008.
Altogether the Government, supported by donors, allocates to these programmes resources amounting to under 0.2 per cent of GDP and 1 per cent of total Government spending. Th ough these non-contributory programmes are supposed to provide assist-ance to a wide range of poor and vulnerable groups, eff ective coverage is low because resources are so limited that they result in low benefi t levels and inconsistent and inef-fective targeting.
More eff ective social assistance would require much larger resources to cover many more benefi ciaries. PWAS has objectives to cover the poorest 2 per cent of the population, but still lacks the necessary resources (not to mention the actual feasibility
Table 4-10. Detail of beneficiaries and expenditures, 2005-2006
Scheme 2005 2006
Beneficiaries Expenditure Beneficiaries Expenditure
Public Welfare Assistance Scheme 107 415 10 351 166 559 10 181
Social Cash Transfer Scheme 39 500 3 225 64 700 5 971
Food Security Pack 40 000 9 000 34 942 21 000
School Feeding Programme 19 520 3 116 173 980 22 408
Sources: MCDSS (2006), MCDSS/GTZ (2005), RHVP (2007), MoFNP (2007), Lee & Siamwiza (2006)

4. Social protection schemes 101
of identifying the most vulnerable 2 per cent). To cover the poorest 10 per cent of the population who most need social assistance would require identifying and covering a further 900,000 highly vulnerable but not yet covered individuals each year. Similar numbers of vulnerable farmers miss out on the Food Security Pack (MCDSS, 2007; MCDSS/GTZ, 2005). Also not covered are the 400,000 persons who would qualify for cash transfers, and between 500,000 and 750,000 informal-sector unemployed workers not covered by existing work-for-aid schemes (MoFNP, 2007; MCDSS/GTZ, 2007; MCDSS, 2007).
From the current national Social Protection Strategy it is clear that non-contrib-utory social assistance programmes will play a greater part in the extension of social protection coverage in Zambia, especially if the planned national rolling-out of cash transfers is implemented.
Main characteristics of individual non-contributory programmes
Public Welfare Assistance Scheme
Th e Public Welfare Assistance Scheme (PWAS) is the fl agship public social assistance programme. Established in the 1950s to provide support to Zambian war veterans, it is also the oldest welfare programme in the country. In the second half of the 1990s PWAS was redesigned to decentralize its operations and include elements of commu-nity decision-making in welfare assistance, with the new scheme launched in 2000.
Under the redesigned PWAS, the Department of Social Welfare (DSW) within the Ministry of Community Development and Social Services coordinates operations and provides training and other technical assistance to community partners. Most PWAS activities are decentralized, with volunteer-staff ed Community Welfare Assist-ance Committees (CWACs) responsible for identifying benefi ciaries and administering benefi ts. A smaller number of Area Coordinating Committees (ACCs) supervise the CWACs, while at district level a District Welfare Assistance Committee (DWAC), forming part of the District Social Welfare Offi ce, oversees operations.
PWAS aims to help the poorest and most vulnerable households throughout the country to meet their basic needs. Assistance is provided in health, education and social support. Th e scheme targets 200,000 individuals or around 2 per cent of the population comprising low-capacity or incapacitated households, out of an estimated one million (10 per cent of the population) estimated to be in dire need of social assist-ance. Targeted groups include: households where the head is elderly, chronically ill, a disabled women or child; households with no productive assets, relatives to provide assistance or adults capable of working; victims of natural disasters, people with poor-quality housing, orphans and children not at school, including street children. Benefi -ciaries typically receive assistance in the form of food, shelter, education, health, warm clothing and travel allowances to the value of USD 2-20 annually. Assistance in health and education was provided in the past through pilot programmes operating as part of PWAS, such as the Community Health Welfare Scheme (CHEWS) and the Com-munity Bursary Scheme.
PWAS has achieved a nationwide presence, covering all 72 districts in the country. Most districts were operating under the redesigned scheme at the beginning of 2007, with the change-over expected to be complete by the end of the year (MCDSS 2006). Th e scheme is currently estimated to cover 6500 communities, with 166,559 individuals having received benefi ts in 2006. Although this is higher than coverage in
4.2.2

102 Zambia – Social Protection Expenditure and Performance Review and Social Budget
2005, the programme is still operating below the target fi gure of 200,000 benefi ciaries per year (MCDSS 2006). Tables 4-11 and 4-12 present a functional breakdown of PWAS assistance in 2006, followed by a summary of the number of benefi ciaries and total programme expenditures between 2001 and 2006.
PWAS has received mixed reviews since the latest restructuring. On the one hand, the identifi cation of needy individuals and disbursement of benefi ts at com-munity level are considered an innovative, cost-effi cient and empowering way of deliv-ering social assistance to the needy. On the other hand, the scheme has been criticized because its funding base is too small and is greatly reduced in the 2008 budget making it diffi cult to respond adequately to the needs of even the 2 per cent of the popula-tion targeted. Available funds have been spread too thinly and support to individuals has been sporadic, because disbursements are distributed according to the availability of funds. Th e scheme is reported to suff er from weak administrative capacity, with supervising offi cers from the DSW having excessive workloads and being unable to respond in a timely manner to requests for assistance. Th e community-based targeting mechanism is also reported to be susceptible to manipulation and not sustainable in the long run, given the voluntary status of CWAC members. Finally, broader issues of programme design can be questioned, such as the decision to target only a fraction of those identifi ed as belonging to the most vulnerable population groups and the very low level of benefi ts provided.
Table 4-11. Breakdown of assistance by category in 2006
Type of assistance Number of beneficiaries Total
male female
Primary education 2308 1829 4137
Secondary education 6129 4819 10 948
Food 32 177 53 967 86 144
Health 1913 2027 3940
Shelter 783 790 1573
Clothing & bedding 29 074 22 684 51 758
Repatriation 3471 4588 8059
Total 75 855 90 704 166 559
Source: MCDSS, Department of Social Welfare Annual Report 2006
Table 4-12. PWAS expenditures and beneficiaries 2001-2006
Year Total funds received (K)
Male beneficiaries
Female beneficiaries
Total beneficiaries
2006 10 181 230 646 75 855 90 704 166 559
2005 10 350 901 822 53 621 53 794 107 415
2004 7 180 782 292 47 685 68 262 115 947
2003 5 329 477 288 43 361 61 682 105 043
2002 1 705 841 132 44 915 64 068 108 983
2001 718 152 714 40 260 54 783 95 043
Source: MCDSS, Department of Social Welfare Annual Report 2006

4. Social protection schemes 103
Social Cash Transfers
Cash transfers can be defi ned as one kind of social transfer involving regular and pre-dictable payments to vulnerable households or individuals in order to ensure a min-imum level of well-being and which can take the form of income support, child grants, disability benefi ts, foster care grants, scholarships and stipends, or non-contributory social pensions. Cash transfers can also be designed to be conditional, linking the granting of cash benefi ts to certain objectives usually linked to human development, for example child allowances tied to regular school attendance (Chapman, 2006, DFID, 2005). In Zambia, cash transfers are a relatively new yet increasingly accepted means of aff ording social protection to the most vulnerable, and so far have been imple-mented in fi ve districts of two provinces. Th e majority of cash transfer programmes in Zambia are unconditional.
The first programme to implement cash transfers in Zambia began in 2003 as a pilot scheme in Kalomo District of Southern Province. Th e Kalomo scheme ini-tially began as a pilot to investigate the feasibility, costs, benefi ts and impact of social cash transfers to very poor families. Ten per cent of the most destitute or incapaci-tated households were targeted, with priority given to single-parent households, those headed by the elderly and orphans affl icted by extreme poverty, hunger and work inca-pacitation. Selection of benefi ciaries was done through a participatory process at local level by Community Welfare Assistance Committees (CWACs). At the start of the pilot each benefi ciary household received a monthly basic grant equivalent to ZMK 30,000 (USD 7.5), while households with children, estimated at three-quarters of all benefi ciary households, received a child bonus of ZMK 10,000 (USD 2.5). Since 2007 the basic grant has been increased to ZMK 40,000 (USD 10). In addition, benefi ci-aries living close to Kalomo town were initially provided with bank accounts from which to collect the monthly payments. Th ese were later abolished in favour of a net-work of designated pay-points established around the district. Following a test phase lasting from November 2003 to April 2004, the cash transfer programme has been steadily expanded to cover the rest of Kalomo District. Starting with an initial group of 1000 households receiving benefi ts, the scheme coverage had increased to 2400 households by mid-2007, and reached full coverage of 3,500 households by the begin-ning of 2008.
Besides the Kalomo pilot, cash-transfer programmes have also been introduced in the following areas in Zambia.
☐ Kazungula District in Southern Province, run since January 2005 by MCDSS with technical support from CARE International with funding from the UK Department for International Development (DFID). Th e programme is a pilot to investigate how to administer cash transfers in a low-density district with a small population, and the impact of increased transfer levels on livelihood outcomes. Over 600 households had directly benefi ted by May 2007.
The Public Welfare Assistance Scheme constitutes the single most important public framework for social assistance in Zambia. However, the decision to target only one-fifth of the potential target group and the low levels of and inconsistency in benefits provided seriously compromise the impact of the programme concerning existing levels of poverty and vulnerability in the country.
Sources: JCTR 2007, MCDSS 2004, 2005, 2007, Petrauskis 2007, RHVP 2007

104 Zambia – Social Protection Expenditure and Performance Review and Social Budget
☐ Mongu and Kaoma Districts in Western Province, where, with funding from DFID, Oxfam Zambia ran a time-bound emergency response cash transfer scheme between November 2005 and March 2006, in response to a seasonal drought. Between 10,500 and 13,500 households received benefi ts during the period of operation.
☐ Chipata District in Eastern Province, run since February 2006 by MCDSS with support from CARE International with funding from DFID. Th e Chipata pilot is intended to study the eff ectiveness of cash transfers in an urban scenario with slightly higher benefi t levels and a focus on child education. Over 1200 households had directly benefi ted from the programme by May 2007, with 1400 households targeted at full capacity.
☐ Monze District in Southern Province, run by MCDSS since January 2007 with additional funding from DFID. Designed to replicate the Kalomo pilot, the Monze programme is being closely monitored by the MCDSS to learn lessons from the roll-out of cash transfers in a new district without direct technical assistance. In addi-tion, Monze is used to study the impact as well as administrative feasibility of soft conditionality. At full capacity, the programme intends to cover 3,300 households.
☐ Katete District in Eastern Province, run by MCDSS with support by CARE Inter-national as a universal pension scheme pilot targeting 1000 households.
Th ese schemes generally follow the Kalomo design, though some have innovated in areas such as target groups, level of benefi ts and conditions for receiving benefi ts. Th e DFID-CARE programme in Chipata District, for example, also targets the poorest 10 per cent of households in the district, relies on community volunteers to identify ben-efi ciaries, and provides approximately the same size of basic monthly benefi t.
Notwithstanding small diff erences between individual programmes, the overall experience with cash transfers in Zambia has been positive. Crucially, evaluations of the fi rst pilot scheme in Kalomo awarded it high scores for design, implementation and impact. Among the fi ndings were the following:
☐ Cash benefi ts allowed benefi ciary households signifi cant fl exibility in their con-sumption and investment decisions, so that they were able to buy household neces-sities, send their children to school and invest in a few farm animals.
☐ Community-based targeting allowed for a fairly accurate and context-sensitive means of identifying the neediest households, comparing favourably with proxy sta-tistical methods employed in other international projects involving cash transfers.
☐ Th e transfers were cost-effi cient. Administrative costs for the Kalomo pilot took up only about 13 per cent of the total programme budget and are expected to stay at similar low levels in the other programmes.11
☐ Cash transfers were linked to signifi cant improvements in nutrition, health, edu-cational attainment, and employment and psychological well-being among the individual benefi ciaries. Th ey also stimulated local economies in the pilot area and decreased adverse social dependencies in communities.
On the other hand, not all cash-transfer programmes introduced to date have per-formed as well as the Kalomo pilot, with problems such as recurrent delays in the
11 Th e Oxfam Zambia emergency cash transfer programme operated for fi ve months in Mongu and Kaoma districts is the exception, with non-cash costs of the project estimated at over 25% of total programme ex-penditures (over 30% of the benefi ts paid out), possibly due hurried implementation and rising infl ation at the time. See the discussion in Harvey and Marongwe 2006.

4. Social protection schemes 105
payment of benefi ts, errors in the selection of benefi ciaries and capacity constraints with regard to overseeing cash transfers at the provincial and district levels reported in some programmes, e.g., the Chipata District. All pilot projects are undergoing an impact evaluation. It will be important to evaluate and compare performance of the pilot projects. In general, it is still unclear whether the community-based targeting system used by all the programmes represents the best way of targeting social assist-ance in conditions of widespread poverty. Although defi nite advantages follow from a decentralized and largely voluntary system of benefi ciary targeting in a large and poorly connected country, to date, there is some information from the Kimetrica study but overall there is insuffi cient information about the accuracy of this method of targeting, particularly if compared with a more direct method based on age.
In the future, cash transfers are expected to be the main component of social assist-ance under PWAS and, ultimately, of a “government-resourced and government-deliv-ered national social safety net” (MCDSS 2006). Th e social protection strategy contained in the Fift h National Development Plan called for a national scaling-up of cash transfers targeting extremely poor and incapacitated households, starting in 2009. Following this, the MCDSS recently tabled a framework document for the scaling-up to a national system of cash transfers, which suggests that by 2008 the current pilot schemes will cover close to 10,000 households (approximately 58,000 people) in the fi ve districts, and from then on will gradually be expanded to cover the rest of the country by 2012 (MCDSS, 2006).
Among other factors, the decision to expand cash transfers beyond the current fi ve districts will depend on the lessons learnt from the existing pilot schemes as well as the availability of donor funding. Th e framework document mentioned above indicates that cash transfers in the present fi ve districts will cost ZMK 7.5 billion (USD 1.9 mil-lion) in 2008, up from ZMK 5.5 billion (USD 1.4 million) in 2007. Th is fi gure will rise to ZMK 31 billion (USD 7.8 million) if the scheme is expanded to cover an addi-tional 10 districts in 2009. Th e Government is reported for the fi rst time to have allo-cated funds for cash transfers, committing ZMK 1.5 billion (USD 350,000), roughly a quarter of all costs for the schemes in 2007. Th e rest of the funding until 2008 is to come from an established basket fund with DFID as the lead donor. Th e framework document further suggests that the Government will take up all costs of cash transfers by the completion of the national scaling-up.
Th e fi gures in Table 4-12a extracted from the framework document mentioned above, include cost of transfers, administration at district, provincial as well as national level and takes into account the expected infl ation. Th e budget for 2007 and 2008 is based on the diff erent pilot schemes with diff erent amounts and structures. For the budget calculation of a SCT programme scaling up nationwide from 2009, the Kalomo model is taken as a basis for calculation. Once a decision has been taken on the design of the national cash-transfer scheme, the fi gures need to be revised accordingly. It will be important to undertake detailed costing of scaling up cash transfers in the next stage of this project. Preliminary costings are to be found in Chapter 6.
Social cash transfers are an especially cost-efficient way of providing social assistance to vulnerable population groups in Zambia. Nonetheless, experience with the ongoing pilot schemes suggests that more will need to be done to investigate the advantages and disadvantages of specific design elements of the schemes. Although currently operating in only a few parts of the country, cash transfers are expected to be an increasingly important component of public social assistance, eventually becoming the main pillar of a government-delivered and -financed national social safety net.
Source: GTZ, 2005; Goodman and Harland, 2007; Harvey and Marongwe, 2006; MCDSS, 2006 and 2007; MCDSS/GTZ, 2007; Petrauskis, 2007; Schubert and Goldberg, 2004; http://www.socialcashtransfers-zambia.org

106 Zambia – Social Protection Expenditure and Performance Review and Social Budget
Food Security Pack
Th e Food Security Pack is a country-wide public programme off ering material and tech-nical assistance to small-scale farmers in the form of a low-interest loan. Established in 2000, it is operated by Project Against Malnutrition (PAM), a local NGO contracted by the Government. Th e FSP is targeted at small agricultural households that face food insecurity as a result of endemic poverty and/or insuffi cient seasonal rainfall. Every year, 200,000 households (20 per cent of a total of 800,000 households belonging to this group) are targeted. Targeting is done at community level by committees consisting of central and local Government offi cials, NGOs and local leaders who focus on particularly vulnerable households such as the victims of natural disasters, and households that are female-headed, or have orphan, elderly or disabled members. Each benefi ciary household is entitled to a food security pack consisting of basic agricultural inputs (seeds), training in conservation farming and food-processing, technology transfers and marketing assist-ance provided seasonally over a two-year period, with the average annual benefi t package valued at around ZMK 150,000 (USD 38) per household. Following the harvests, ben-efi ciaries are required to pay back a portion of their produce, (between 10 and 20 per cent of the value of inputs provided) which is then allocated to communal seed reserves.
At the most recent count, the FSP was present in all 72 districts of the country. Until 2006, less than half of the target group, only 300,000 households, had ben-efi ted under the programme. Of this number, about 10 per cent (slightly more than 30,000 households) “graduated”, becoming self-suffi cient in food production and able to gain access independently to commercial agricultural services. At the same time, 70 per cent of the loans were reported as having been recovered from households having graduated, with repayments used to support additional benefi ciaries.
Th e FSP has led to some signifi cant gains in food production at both household and national level. At the household level, those receiving the pack have witnessed increased crop yields, leading to improved nutrition and additional income from the sale of excess produce. Such households have therefore been able to escape the worst forms of poverty and in some instances even invest in human development, for instance by sending their children to school. Th e programme has also contributed to greater
Table 4-12a. Budget calculations for 2007-2012
2007 2008 2009 2010 2011 2012
Districts starting 1 2 10 15 20 22
Districts established 3 3 5 15 30 50
Transfers(in thousand K)
3 198 000 3 758 000 22 415 250 49 141 125 94 833 750 143 009 295
Admin districts(in thousand K)
667 000 768 000 3 349 405 7 342 927 14 170 560 21 369 205
Admin province(in thousand K)
32 000 69 000 161 100 305 700 500 100 698 100
Admin headquarters(in thousand K)
205 000 505 800 505 800 505 800 505 800 505 800
Total(in thousand K)
4 102 00 5 100 800 26 431 555 57 295 552 110 010 210 165 582 400
TOTAL US$ 1 025 500 1 275 200 6 607 889 14 323 888 27 502 553 41 395 600
Source: DFID Zambia and partners
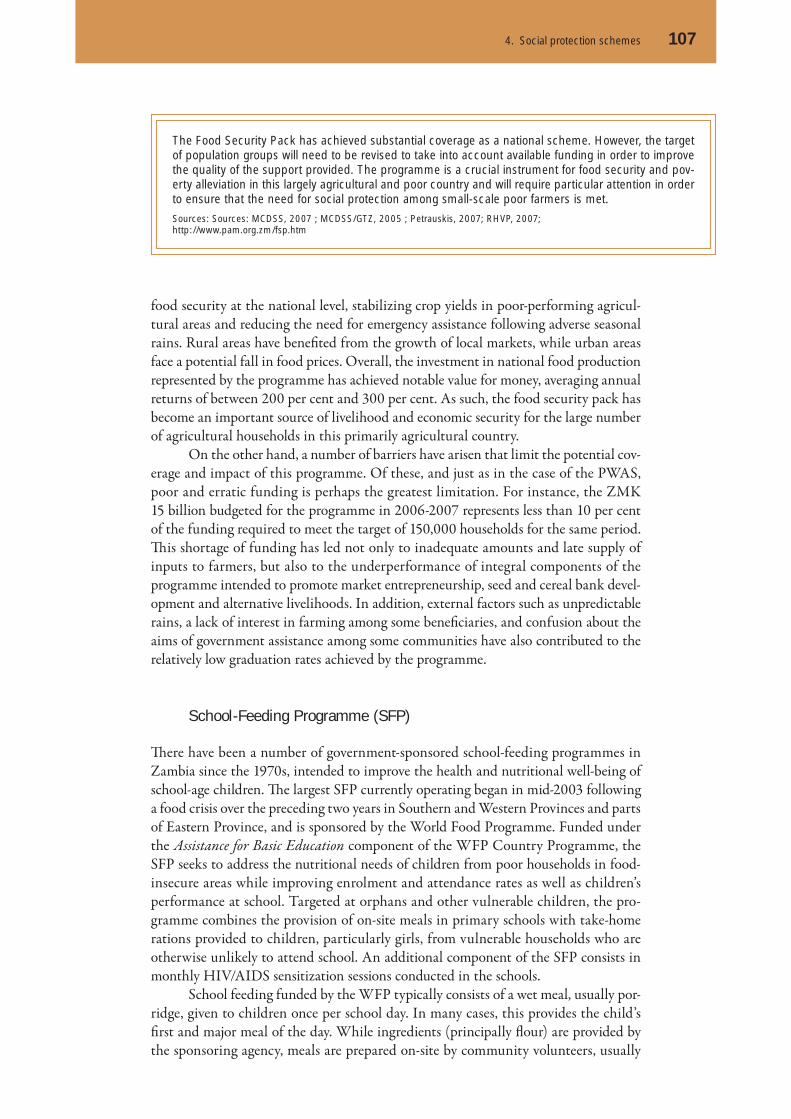
4. Social protection schemes 107
food security at the national level, stabilizing crop yields in poor-performing agricul-tural areas and reducing the need for emergency assistance following adverse seasonal rains. Rural areas have benefi ted from the growth of local markets, while urban areas face a potential fall in food prices. Overall, the investment in national food production represented by the programme has achieved notable value for money, averaging annual returns of between 200 per cent and 300 per cent. As such, the food security pack has become an important source of livelihood and economic security for the large number of agricultural households in this primarily agricultural country.
On the other hand, a number of barriers have arisen that limit the potential cov-erage and impact of this programme. Of these, and just as in the case of the PWAS, poor and erratic funding is perhaps the greatest limitation. For instance, the ZMK 15 billion budgeted for the programme in 2006-2007 represents less than 10 per cent of the funding required to meet the target of 150,000 households for the same period. Th is shortage of funding has led not only to inadequate amounts and late supply of inputs to farmers, but also to the underperformance of integral components of the programme intended to promote market entrepreneurship, seed and cereal bank devel-opment and alternative livelihoods. In addition, external factors such as unpredictable rains, a lack of interest in farming among some benefi ciaries, and confusion about the aims of government assistance among some communities have also contributed to the relatively low graduation rates achieved by the programme.
School-Feeding Programme (SFP)
Th ere have been a number of government-sponsored school-feeding programmes in Zambia since the 1970s, intended to improve the health and nutritional well-being of school-age children. Th e largest SFP currently operating began in mid-2003 following a food crisis over the preceding two years in Southern and Western Provinces and parts of Eastern Province, and is sponsored by the World Food Programme. Funded under the Assistance for Basic Education component of the WFP Country Programme, the SFP seeks to address the nutritional needs of children from poor households in food-insecure areas while improving enrolment and attendance rates as well as children’s performance at school. Targeted at orphans and other vulnerable children, the pro-gramme combines the provision of on-site meals in primary schools with take-home rations provided to children, particularly girls, from vulnerable households who are otherwise unlikely to attend school. An additional component of the SFP consists in monthly HIV/AIDS sensitization sessions conducted in the schools.
School feeding funded by the WFP typically consists of a wet meal, usually por-ridge, given to children once per school day. In many cases, this provides the child’s fi rst and major meal of the day. While ingredients (principally fl our) are provided by the sponsoring agency, meals are prepared on-site by community volunteers, usually
The Food Security Pack has achieved substantial coverage as a national scheme. However, the target of population groups will need to be revised to take into account available funding in order to improve the quality of the support provided. The programme is a crucial instrument for food security and pov-erty alleviation in this largely agricultural and poor country and will require particular attention in order to ensure that the need for social protection among small-scale poor farmers is met.
Sources: Sources: MCDSS, 2007 ; MCDSS/GTZ, 2005 ; Petrauskis, 2007; RHVP, 2007; http://www.pam.org.zm/fsp.htm

108 Zambia – Social Protection Expenditure and Performance Review and Social Budget
teachers or members of the children’s households. Th e take-home ration on the other hand consists of a month’s supply of cereal for an entire family, provided monthly to certain low-capacity, incapacitated and non-viable households, especially those headed by children or elderly persons (MCDSS, 2007). In addition to nutritional support, the programme facilitates basic health services for schoolchildren such as de-worming operations, and promotes the cultivation of school orchards as a means of generating additional income for schools.
Th e school-feeding programme had been extended to cover a total of 526 com-munity schools in 11 districts in four provinces at the end of 2006. Around 140,000 children benefi ted from on-site school feeding and close to 35,000 households from take-home rations in 2006. Planning documents from the WFP indicate that the programme will be extended to cover over 210,000 orphans and vulnerable children in 400 schools spread over ten districts in Southern, Western and Eastern Provinces in 2007. Unconfi rmed estimates also report over 220,000 child benefi ciaries in 786 schools in Lusaka, Southern, Western and Eastern Provinces (JCTR, 2007)
Implemented alongside a (recently introduced) government policy on free pri-mary education, school feeding is said to have a generally positive impact on child edu-cation through stabilized attendance rates at primary schools and improved academic performance among child benefi ciaries. At the same time, the take-home rations pro-vide a signifi cant form of food and income support for the most vulnerable households who otherwise choose to send their children to school. However, many aspects of the programme have been criticized. One recent assessment revealed serious weaknesses in the system of identifying households eligible for the take-home ration, which in addi-tion to compromising the targeting of vulnerable households was also reported to have led to a straining of community relations. Th e programme’s reliance on community volunteers to prepare and distribute the school meals as well as take-home rations has also been evaluated as not sustainable in the long run, especially where teachers are involved. School feeding has been criticized as too expensive, ineffi cient and donor-dependent. Th ere are also serious challenges about its eff ectiveness, with increased primary-school enrolment rates attributed to an increase in the number of commu-nity schools, rather than to programme incentives, and the increase in the number of schools (and thus vulnerable children) benefi ting contrasted with the quality of the food. More generally, it is noted that more systematic evaluations are needed before any conclusions about the eff ectiveness of school feeding can be drawn.
School-feeding programmes have been shown to have positive impacts on the nutrition and health status of orphans and other vulnerable children, while increasing school attendance. On the other hand there is a debate about the sustainability of such pro-grammes given the present heavy reliance upon funding from international donors.
Sources: JCTR, 2007; Lee and Siamwiza, 2006; MCDSS/GTZ, 2005; WFP 2006, 2007
Work-for-aid project: PUSH/PROSPECT
Various work-for-aid projects have been implemented in Zambia since the early 1990s. Although work-for-aid implies that participants are required to make certain contri-butions (in terms of labour) in return for social benefi ts, the present study examines programmes in which benefi ts have exceeded or are non-comparable with contribution requirements, implying some measure of social protection beyond a purely reciprocal or

4. Social protection schemes 109
market-based exchange. CARE has been involved in two projects: the Project Urban Self Help (PUSH), and the Programme of Support for Poverty Elimination and Com-munity Transformation (PROSPECT). PUSH is a notable example of a work-for-aid programme providing social protection through a mixture of contributory and non-contributory elements. Established in the early 1990s when Zambia experienced a severe food crisis, PUSH began as a work-for-food programme operating in peri-urban areas, where it aimed to promote the development of the urban poor through partici-patory and community-based public works projects. Benefi ciaries were typically the extreme poor yet able-bodied, whose family members had lost jobs as a result of eco-nomic reforms or else were victims of natural disasters, such as drought and fl oods, or were women and orphans.
Benefi ciaries of PUSH took part in public-works projects aiming at the upgrading of infrastructure and public services, in exchange for which they received food and other in-kind benefi ts such as clothing and shelter. Although the in-kind benefi ts were assessed as below the minimum formal sector wage (the average monthly benefi t in 2006 was estimated at ZMK 90,000 or USD 22), demand for participation in the programme has been consistently high and has frequently outstripped the number of available places. Th is refl ects not only the absence of opportunities for employment in Zambia for the poorest in the population, but also the degree of welfare function assumed by the programme, providing work and thereby an income where these are absent from the labour market. In addition, the public-works and training compo-nents of the programme have been seen to directly benefi t participants by improving the supply of clean water, providing usable roads, market centres and health facilities, and promoting better farming methods and entrepreneurial activities among benefi -ciary communities. Major reported outputs in 2006 included the construction of 540 water wells in Western Province, twocommunity markets in North-Western Province and three community schools in Eastern Province.
Nevertheless, monitoring of the programme has also revealed that in several cases infrastructure improvements were of poor quality, while the new skills obtained by participants were put to little use owing to poor macroeconomic conditions and a lack of access to capital. Although the original PUSH and PROSPECT programmes have since been wound up, the World Food Programme is currently operating food-for-assets and food-for-training programmes in the country, reaching around 45,000 poor households in 2006.
The degree to which work-for-aid programmes contribute to social protection can only be determined by distinguishing elements of welfare transfer within them from other objectives of the programmes. Based on reported past practice, such programmes pro-vided assistance in the form of cash and in-kind transfers earned in exchange for par-ticipation in public-works projects. In addition to providing below-market rate benefits, this form of assistance was only available to able-bodied persons. As such, the ability of this kind of programme to cover work-incapacitated persons is necessarily limited, as is its ability to become more than a temporary source of relief to a small proportion of those lacking employment or income-generating opportunities. Public works are gener-ally said to be less efficient, compared with other forms of social assistance.
Sources: Garrett, 2004; MCDSS, 2007; MoFNP, 2006; http://www.wfp.org/country_brief/indexcountry.asp?country=894
110 Zambia – Social Protection Expenditure and Performance Review and Social Budget
Conclusions: Opportunities and challenges to extend social protection coverage
This section summarizes the extent of social protection coverage achieved by the existing non-contributory programmes in Zambia, and goes on to identify the major challenges to the extension of this coverage, and the opportunities created.
Extent of social protection coverage
Although the existing non-contributory programmes provide assistance to a wide range of poor and vulnerable groups, including those affected by hunger, extreme poverty, sickness, old age, orphanhood, disability and death of family members, the same programmes fail to cover most people within such groups, because of excessively narrow targets, inaccurate targeting and low and inconsistent levels of benefi ts. For example, taking the estimate of the poorest 10 per cent of the population who are most in need of social assistance, around 900,000 highly vulnerable individuals miss out on PWAS assistance each year, while a similar number of vulnerable farmers miss out on the Food Security Pack. Also excluded are the 400,000 persons estimated to qualify for cash transfers, and 500,000-750,000 informal-sector unemployed workers not covered by existing work-for-aid schemes.
Moreover, several other groups requiring specialized interventions also missed out on any form of social assistance because of the absence of dedicated programmes. Th is has in the past included over 10,000 street-children estimated to have missed out on government and NGO support services in 2006 (MoFNP, 2006), and most of the 250,000 disabled persons who missed out on specialized government programmes sup-porting education, micro-credit and job-training objectives in recent years (MCDSS, 2007). Also largely excluded from the coverage of current programmes are persons living with HIV/AIDS, among whom only 10 to 20 per cent had received anti-retro-viral therapy by mid-2005.12 Th is refl ects the overall low coverage of social health pro-tection in the country where, despite the intention to introduce a community-based health waiver scheme, out-of-pocket payments by households make up nearly a third of all health spending 13 while pre-payment schemes operated by employers and pri-vate health insurance reach fewer than 30,000 people14 (CHEWS,2006;MoH,2005). Finally, the nature of social protection aff orded by some of the programmes in some instances excludes those who are otherwise in need of assistance, for instance in the case of work-for-aid schemes being limited to the able-bodied unemployed.
Major challenges to extending the coverage of existing non-contributory pro-grammes are outlined below:
☐ Th e fact that national programmes are under-funded and deliver low and incon-sistent benefi ts. On the other hand, better-funded programmes delivering more substantial benefi ts cover only pilot areas or small sections of the population, or are run for limited periods of time.
☐ Th e fact that in most cases targeting is decided on the basis of available funds with little reference to situations of poverty and vulnerability. Present community-based targeting methods may also lead to inclusion and exclusion errors.
12 UNAIDS: http://www.unaids.org/en/Regions_Countries/Regions/SubSaharanAfrica.asp.13 Household spending in health care accounted for 28.4 per cent of total health expenditure in 2004. Source: NHA2002-2004, MOH.14 Source: NHA2002-2004, MOH.
4.2.3

4. Social protection schemes 111
☐ Insuffi cient and erratic funding for established government programmes compro-mises their ability to meet targets and extend coverage. On the other hand, donor-funded programmes are also uncertain and in many cases do not leave behind lasting arrangements for social protection.
☐ Most programmes have failed to make adequate arrangements for monitoring and evaluation, limiting the extent to which design and implementation can be improved.
Implications for the development of comprehensive national social protection
A certain degree of consolidation of the existing non-contributory programmes on social protection is already taking place, for instance, Social Cash Transfers are being brought under the framework of the PWAS. Together with the adoption by the Gov-ernment of a Social Protection Strategy (SPS) included in the Fift h National Develop-ment Plan 2006-2010, there are strong indications of a move towards a national system of social protection. Th is is made particularly clear in the SPS, which outlines an ambi-tious plan to initiate and extend pilot programmes on food security, public works and social security in the private sector; extend the social cash transfers under PWAS; abolish all health user fees for children and expand the Community Health Waiver Scheme; establish a pilot programme providing anti-retroviral therapy to AIDS vic-tims; expand basic and rehabilitation services for street children; and extend support-services for victims of gender-violence to all provincial centres (MCDSS, 2005).
Th e commitment made in the SPS to allocate USD 25 million of government funding towards the running and expansion of the PWAS over the fi ve years further reinforces the Government’s intention to expand non-contributory public social pro-tection, including elements of cash transfers. However, under the current arrangement cash transfers will continue to be funded by donors over the next fi ve years, aft er which the Government has indicated it will take over. Th is however means that other social welfare programmes, in particular those linked to the provision of cash, food, health and education benefi ts, will continue to depend upon the funding capacity of donors.
Zambia’s health system
Introduction
Improving the health of all Zambians is intrinsic to the country’s social develop-ment goals. Improved health enhances social development in a variety of ways, such as: relieving individuals and households from the impoverishing eff ects of ill-health; averting poverty by keeping income-earners healthy; and giving households a greater ability to enjoy life.
Health policy in Zambia is anchored on the rights-based approach that treats health care as a basic human right guaranteed and accessible to every citizen. Over the past two decades, Zambia has undergone major demographic, epidemiological, economic and social changes, which have culminated in new health challenges, such as increased destitution, a high burden of disease, poor access to health care and poor population health outcomes. Th is makes increased health care expenditure to provide equal access to health care a policy imperative.
4.3
4.3.1
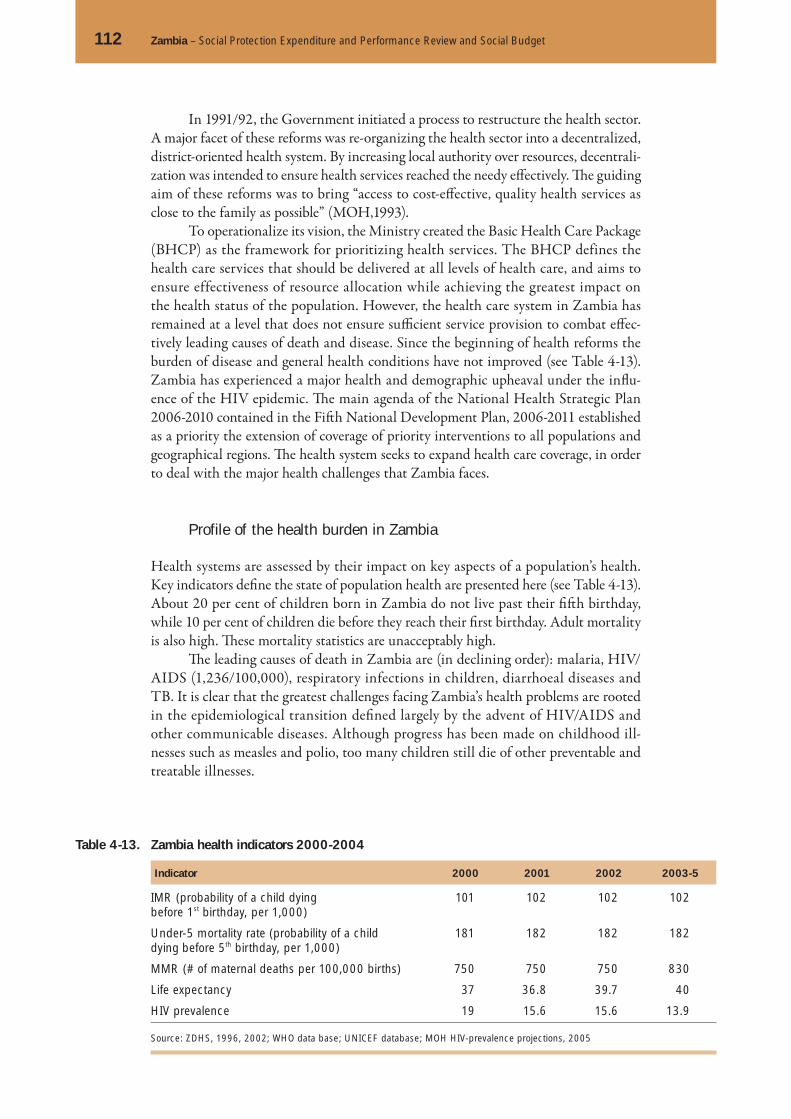
112 Zambia – Social Protection Expenditure and Performance Review and Social Budget
In 1991/92, the Government initiated a process to restructure the health sector. A major facet of these reforms was re-organizing the health sector into a decentralized, district-oriented health system. By increasing local authority over resources, decentrali-zation was intended to ensure health services reached the needy eff ectively. Th e guiding aim of these reforms was to bring “access to cost-eff ective, quality health services as close to the family as possible” (MOH,1993).
To operationalize its vision, the Ministry created the Basic Health Care Package (BHCP) as the framework for prioritizing health services. The BHCP defines the health care services that should be delivered at all levels of health care, and aims to ensure effectiveness of resource allocation while achieving the greatest impact on the health status of the population. However, the health care system in Zambia has remained at a level that does not ensure suffi cient service provision to combat eff ec-tively leading causes of death and disease. Since the beginning of health reforms the burden of disease and general health conditions have not improved (see Table 4-13). Zambia has experienced a major health and demographic upheaval under the infl u-ence of the HIV epidemic. Th e main agenda of the National Health Strategic Plan 2006-2010 contained in the Fift h National Development Plan, 2006-2011 established as a priority the extension of coverage of priority interventions to all populations and geographical regions. Th e health system seeks to expand health care coverage, in order to deal with the major health challenges that Zambia faces.
Profile of the health burden in Zambia
Health systems are assessed by their impact on key aspects of a population’s health. Key indicators defi ne the state of population health are presented here (see Table 4-13). About 20 per cent of children born in Zambia do not live past their fi ft h birthday, while 10 per cent of children die before they reach their fi rst birthday. Adult mortality is also high. Th ese mortality statistics are unacceptably high.
Th e leading causes of death in Zambia are (in declining order): malaria, HIV/AIDS (1,236/100,000), respiratory infections in children, diarrhoeal diseases and TB. It is clear that the greatest challenges facing Zambia’s health problems are rooted in the epidemiological transition defi ned largely by the advent of HIV/AIDS and other communicable diseases. Although progress has been made on childhood ill-nesses such as measles and polio, too many children still die of other preventable and treatable illnesses.
Table 4-13. Zambia health indicators 2000-2004
Indicator 2000 2001 2002 2003-5
IMR (probability of a child dying before 1st birthday, per 1,000)
101 102 102 102
Under-5 mortality rate (probability of a child dying before 5th birthday, per 1,000)
181 182 182 182
MMR (# of maternal deaths per 100,000 births) 750 750 750 830
Life expectancy 37 36.8 39.7 40
HIV prevalence 19 15.6 15.6 13.9
Source: ZDHS, 1996, 2002; WHO data base; UNICEF database; MOH HIV-prevalence projections, 2005

4. Social protection schemes 113
Overview of the health delivery system in Zambia
Decentralized health care is delivered at three levels: central, provincial and district. Th e Ministry of Health is in charge of policy, strategic planning, coordination, moni-toring and evaluation, and overall health system oversight, at central level. Th e central level is also responsible for procurement and distribution of medical supplies, capital investment and staff allocations for all levels of the system. Below the MOH head-quarters are the provincial health offi ces, which have a less operational role but serve as liaison between districts and the national MOH headquarters. Th e third tier is the district health management team (DHMT). Th e DHMT is responsible for service delivery at district level and also runs the district hospitals and a satellite of health centres and health posts within the district. Health Posts were intended to be the fi rst point of contact with the health system for populations of 3,500 in the rural areas or 7,000 in urban areas. A community volunteer usually runs the health post, and dis-penses simple interventions such as oral dehydration salts, anti-malarials, fi rst aid for injuries, and so on. Health centres off er basic curative and preventive care to com-munities. In urban areas, health centres are equipped with diagnostic capabilities to investigate most major ailments. Th e clinical offi cer, a laboratory assistant (if there is a laboratory), a midwife, an environment health technician and a nurse are the key per-sonnel operating health centres.
Parallel to DHMTs are higher-level referral hospitals (secondary and tertiary level). Th ese hospitals are run by Hospital Management Boards. Th e second-level hos-pitals receive referrals from district or level-1 hospitals. Th ey provide care in internal medicine, general surgery, pediatrics, obstetrics and gynecology, dental, psychiatry and intensive-care services. Th ese hospitals are also intended to act as referral facilities for the fi rst-level institutions. Th e tertiary hospitals serve as last referral centres. Th ey off er specialized care and off er medical training.
Current distribution of health care resources
Th is section provides an overview of the resources (facilities, personnel and fi nancial) available for provision of health care in Zambia. Th e focus is on distribution of these resources across geographical regions and across levels of care.
Health infrastructure
Th e Government still has a major role in the health care delivery system. Th e latest Living Conditions Monitoring Survey of 2004 showed that health care facilities run by the Government were found to off er most of the health care services in Zambia. About 82 per cent of those who consulted over their illness reported that they visited one of the government health facilities. Other providers of health care are mostly missions and private for-profi t health care providers.
Since the Health Services Act of 1995, Zambia has seen substantial growth in the number of private for-profi t clinics and hospitals, and in medical practitioners ranging from specialists, general practitioners, dentists and others who are in solo- or group-practice. Th ese are funded from employer or private insurance schemes, and out-of-pocket payments. In addition, there has been a rapidly expanding community of retail pharmacists.
4.3.2
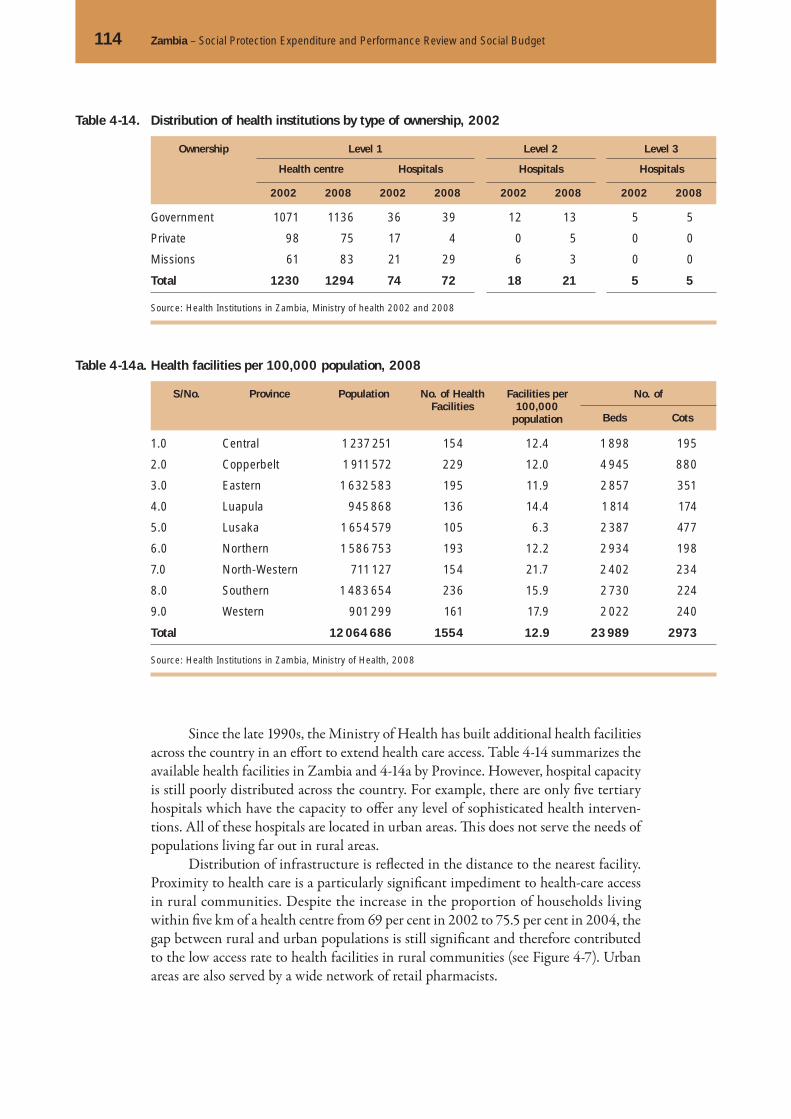
114 Zambia – Social Protection Expenditure and Performance Review and Social Budget
Since the late 1990s, the Ministry of Health has built additional health facilities across the country in an eff ort to extend health care access. Table 4-14 summarizes the available health facilities in Zambia and 4-14a by Province. However, hospital capacity is still poorly distributed across the country. For example, there are only fi ve tertiary hospitals which have the capacity to off er any level of sophisticated health interven-tions. All of these hospitals are located in urban areas. Th is does not serve the needs of populations living far out in rural areas.
Distribution of infrastructure is refl ected in the distance to the nearest facility. Proximity to health care is a particularly signifi cant impediment to health-care access in rural communities. Despite the increase in the proportion of households living within fi ve km of a health centre from 69 per cent in 2002 to 75.5 per cent in 2004, the gap between rural and urban populations is still signifi cant and therefore contributed to the low access rate to health facilities in rural communities (see Figure 4-7). Urban areas are also served by a wide network of retail pharmacists.
Table 4-14. Distribution of health institutions by type of ownership, 2002
Ownership Level 1 Level 2 Level 3
Health centre Hospitals Hospitals Hospitals
2002 2008 2002 2008 2002 2008 2002 2008
Government 1071 1136 36 39 12 13 5 5
Private 98 75 17 4 0 5 0 0
Missions 61 83 21 29 6 3 0 0
Total 1230 1294 74 72 18 21 5 5
Source: Health Institutions in Zambia, Ministry of health 2002 and 2008
Table 4-14a. Health facilities per 100,000 population, 2008
S/No. Province Population No. of Health Facilities
Facilities per 100,000
population
No. of
Beds Cots
1.0 Central 1 237 251 154 12.4 1 898 195
2.0 Copperbelt 1 911 572 229 12.0 4 945 880
3.0 Eastern 1 632 583 195 11.9 2 857 351
4.0 Luapula 945 868 136 14.4 1 814 174
5.0 Lusaka 1 654 579 105 6.3 2 387 477
6.0 Northern 1 586 753 193 12.2 2 934 198
7.0 North-Western 711 127 154 21.7 2 402 234
8.0 Southern 1 483 654 236 15.9 2 730 224
9.0 Western 901 299 161 17.9 2 022 240
Total 12 064 686 1554 12.9 23 989 2973
Source: Health Institutions in Zambia, Ministry of Health, 2008
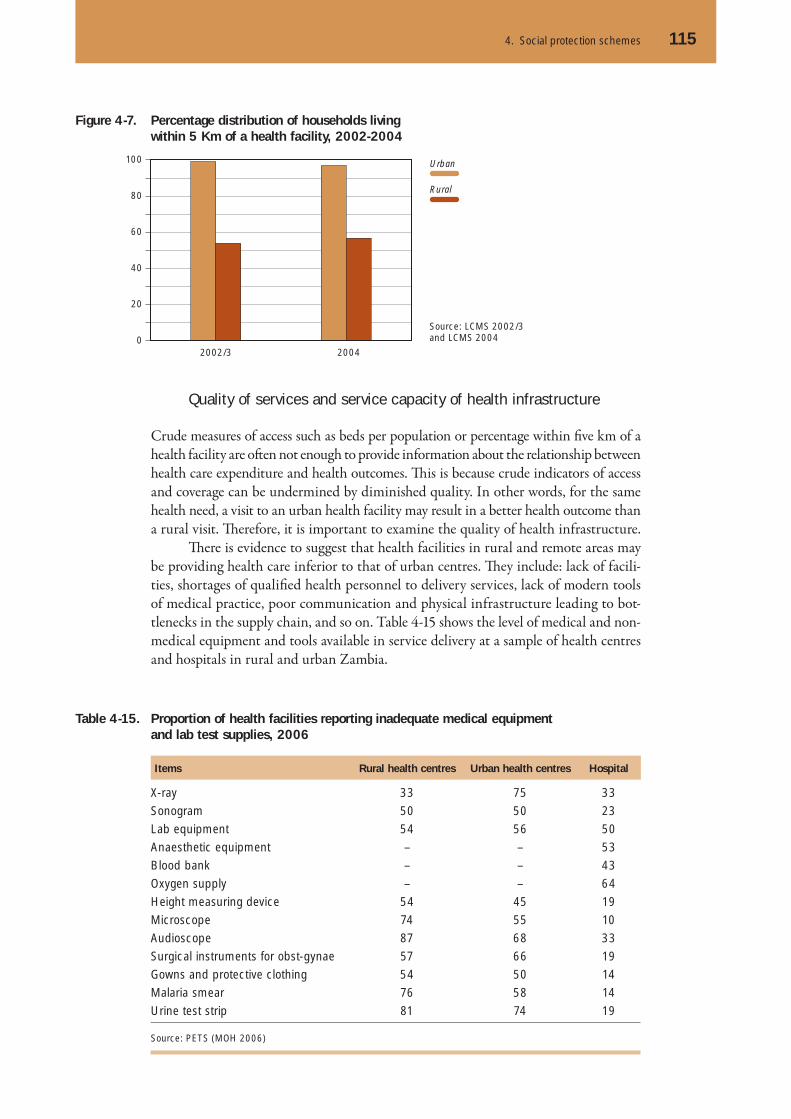
4. Social protection schemes 115
Quality of services and service capacity of health infrastructure
Crude measures of access such as beds per population or percentage within fi ve km of a health facility are oft en not enough to provide information about the relationship between health care expenditure and health outcomes. Th is is because crude indicators of access and coverage can be undermined by diminished quality. In other words, for the same health need, a visit to an urban health facility may result in a better health outcome than a rural visit. Th erefore, it is important to examine the quality of health infrastructure.
Th ere is evidence to suggest that health facilities in rural and remote areas may be providing health care inferior to that of urban centres. Th ey include: lack of facili-ties, shortages of qualifi ed health personnel to delivery services, lack of modern tools of medical practice, poor communication and physical infrastructure leading to bot-tlenecks in the supply chain, and so on. Table 4-15 shows the level of medical and non-medical equipment and tools available in service delivery at a sample of health centres and hospitals in rural and urban Zambia.
Figure 4-7. Percentage distribution of households living within 5 Km of a health facility, 2002-2004
Source: LCMS 2002/3 and LCMS 2004
Rural
Urban
2002/3 20040
20
40
60
80
100
Table 4-15. Proportion of health facilities reporting inadequate medical equipment and lab test supplies, 2006
Items Rural health centres Urban health centres Hospital
X-ray 33 75 33
Sonogram 50 50 23
Lab equipment 54 56 50
Anaesthetic equipment – – 53
Blood bank – – 43
Oxygen supply – – 64
Height measuring device 54 45 19
Microscope 74 55 10
Audioscope 87 68 33
Surgical instruments for obst-gynae 57 66 19
Gowns and protective clothing 54 50 14
Malaria smear 76 58 14
Urine test strip 81 74 19
Source: PETS (MOH 2006)

116 Zambia – Social Protection Expenditure and Performance Review and Social Budget
Waste disposal
Facilities for disposal of medical waste are still lacking in many facilities. More than a third of public hospitals and more than two-thirds of health centres in both rural and urban areas have incinerators. More than half of health facilities use a pit where waste is burnt, while the rest of the health centres dump their waste in a pit without burning. See Figures 4-8 and 4-9.
Figure 4-8. Health facilities with medical waste disposal (per cent), 2006
Figure 4-9. Proportion of health facilities with functional and non-functional utilities and transportation tools (per cent), 2006
Source: PETS (MOH 2006)
Source: PETS (MOH 2006)
Burnt pit
Incinerator
Unburnt pit
Public wastemanagement
Others
0 10 20 30 40 50 60 70
Hospitals
Urbanhealth
centres
Ruralhealth
centres
2465
61
4
3245
511
8
6238
000
Not working
Working
0 10 20 30 40 50 60 70
62 (1)
38 (16)
18 (6)
19 (18)
44 (20)
6 (3)
9 (3)
23 (9)
54 (8)Bi/tricycle
Motorcycle
4-wheel drive
Ambulance
1- or 2-way radio
Land phone
Generator set
Solar panel
Electricconnection
Distribution of health personnel
Th e public health care system has constantly faced a severe shortage of health staff , which undermines its capacity to cope with the worsening disease burden in Zambia. Th e Health Sector Joint Annual Review Report of 2005 indicated that the human resources situation in the health sector is close to disastrous. It further estimated the number of available staff in 2005 at less than 50 per cent of the recommended establishment.
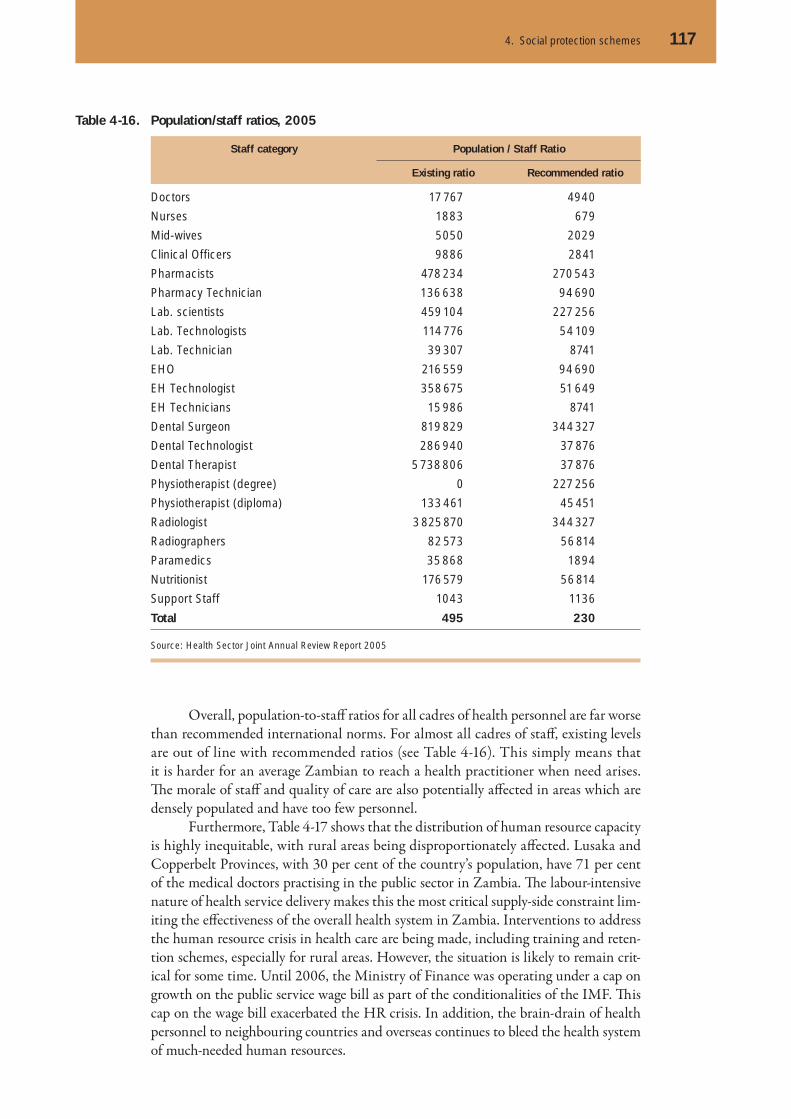
4. Social protection schemes 117
Overall, population-to-staff ratios for all cadres of health personnel are far worse than recommended international norms. For almost all cadres of staff , existing levels are out of line with recommended ratios (see Table 4-16). This simply means that it is harder for an average Zambian to reach a health practitioner when need arises. Th e morale of staff and quality of care are also potentially aff ected in areas which are densely populated and have too few personnel.
Furthermore, Table 4-17 shows that the distribution of human resource capacity is highly inequitable, with rural areas being disproportionately aff ected. Lusaka and Copperbelt Provinces, with 30 per cent of the country’s population, have 71 per cent of the medical doctors practising in the public sector in Zambia. Th e labour-intensive nature of health service delivery makes this the most critical supply-side constraint lim-iting the eff ectiveness of the overall health system in Zambia. Interventions to address the human resource crisis in health care are being made, including training and reten-tion schemes, especially for rural areas. However, the situation is likely to remain crit-ical for some time. Until 2006, the Ministry of Finance was operating under a cap on growth on the public service wage bill as part of the conditionalities of the IMF. Th is cap on the wage bill exacerbated the HR crisis. In addition, the brain-drain of health personnel to neighbouring countries and overseas continues to bleed the health system of much-needed human resources.
Table 4-16. Population/staff ratios, 2005
Staff category Population / Staff Ratio
Existing ratio Recommended ratio
Doctors 17 767 4940
Nurses 1883 679
Mid-wives 5050 2029
Clinical Officers 9886 2841
Pharmacists 478 234 270 543
Pharmacy Technician 136 638 94 690
Lab. scientists 459 104 227 256
Lab. Technologists 114 776 54 109
Lab. Technician 39 307 8741
EHO 216 559 94 690
EH Technologist 358 675 51 649
EH Technicians 15 986 8741
Dental Surgeon 819 829 344 327
Dental Technologist 286 940 37 876
Dental Therapist 5 738 806 37 876
Physiotherapist (degree) 0 227 256
Physiotherapist (diploma) 133 461 45 451
Radiologist 3 825 870 344 327
Radiographers 82 573 56 814
Paramedics 35 868 1894
Nutritionist 176 579 56 814
Support Staff 1043 1136
Total 495 230
Source: Health Sector Joint Annual Review Report 2005

118 Zambia – Social Protection Expenditure and Performance Review and Social Budget
Structure of public-sector health care financing and expenditure
Th is section focuses on assessing health-sector fi nancing in Zambia. In order to address the policy need for social protection and for reducing inequities inherent in current health care expenditure and service delivery, it is important to understand how many resources are available and how they are mobilized. We identify the sources of health care resources, the growth of the public health sector resource envelope, and how the resources are allocated to regions and various functions of the health system.
Sources of health care finances and flow of funds in the public health system
Three sources of financing (the Government, donors and households) account for 94 per cent of total health expenditure in Zambia. Employer-based and private medical insurance schemes remain a relatively small contributor to total health-sector resources. Since the late-1990s, the health sector has seen double-digit growth in the share of total expenditure attributable to donors, from around 15 per cent in 2000 to over 40 per cent in 2004. Although the Government has slightly increased its spending, its con-tribution to higher levels of spending has been overwhelmed by a dramatic increase in donor expenditure.
Household spending on health care accounted for 28.4 per cent of total health expenditure in 2004. Household expenditure also remained static in dollar terms, but fell slightly as a share of the total. Health care fi nancing in Zambia has relied heavily on out-of-pocket expenditure by households (see Figure 4-10). Household spending is mostly out-of-pocket in the form of user fees to consult at health facilities (private or public) and also to procure drugs from pharmacies.
Challenges to access and population health are associated with this method of raising revenue. Out-of-pocket tends to be inequitable and generally bad for population
4.3.3
Table 4-17. Population to staff ratios, by ProvinceP
rovi
nce
Med
ical
doct
ors
Clin
ical
offic
ers
Reg
iste
red
mid
wiv
es
Reg
iste
red
nurs
e
Enro
lled
mid
wiv
es
Enro
lled
Nur
se
Pha
rmac
ists
Labo
rato
ry
tech
nici
ans
and
tech
nolo
gist
s
Med
ical
licen
tiate
Par
amed
ical
staf
f
Envi
ronm
enta
lhe
alth
tech
nici
ans
Central 33 243 8815 19 392 13 851 4808 2999 129 280 31 446 0 25 294 12 511
Copperbelt 8998 9719 14 425 5091 3599 1567 55 076 16 523 0 12 982 23 006
Eastern 51 771 10 879 100 090 14 576 9442 2967 187 670 53 620 0 39 509 15 804
Luapula 59 414 13 711 89 122 24 756 22 852 3253 178 243 35 649 891 215 42 439 16 204
Lusaka 6247 7544 12 397 3799 5243 1577 319 847 15 527 0 9872 27 573
NorthWestern
31 930 12 191 134 104 17 645 16 354 2386 95 789 37 251 0 33 526 9185
Northern 65 763 13 521 80 377 15 391 9710 4521 289 357 48 226 0 41 337 16 075
Southern 36 665 8007 44 944 11 908 3881 2101 87 078 29 026 1 393 253 26 288 11 058
Western 31 408 9664 54 964 23 143 13 741 2513 219 854 48 856 0 29 314 10 857
National 17 589 9787 27 714 8822 6099 2293 123 509 27 249 5 681 402 20 849 15 150

4. Social protection schemes 119
health as needy people in the lowest income segments oft en go without life-saving health care. Reliance on out-of-pocket expenditure also has an impoverishing eff ect on the poorest households. A multi-country study by the WHO showed that there is a strong correlation between the share of out-of-pocket payments in total health expen-ditures and the proportion of households with catastrophic expenditures (Xu et al, 2003). In 2000 the World Health Organisation ranked Zambia 155 out of 191 coun-tries in terms of fairness of fi nancial contribution to the health sector total resource base. Th is refl ects the fact that a large proportion of Zambian households lack health insurance and therefore fi nancial protection from the cost of disease. Th is situation has contributed to the prevailing health inequalities and unfair health fi nancing.
Th e increased role of donor expenditure also raises various policy debates. For Zambia, a signifi cant portion of donor funding is linked to scaling up programmes aimed against major health problems. Donor funding helps to add to the fragility of domestic-revenue-based fi nancing. However, a strong national policy framework and stewardship are necessary to ensure that donor funding is targeted at worthwhile pro-grammes and does not duplicate government eff orts. Further, in order to be mean-ingful, the growth in revenue needs to have an impact on the budgets of regular organs of the health delivery system, such as DHMTs, Hospital Boards and other units. Finally, the sustainability of increased dependency on donor funding is also an issue of public debate (see Figure 4-11).
Source: NHA2002-2004, MOH
Figure 4-10. Households expenditure by provider, 2004
Private for Profit(44%)
Pharmacies/drugs(29%)
Traditional Healer(20%)
MOH facility: use fee(5%)
Others(2%)
Figure 4-11. Health care expenditure by financing source as percentage of total health expenditure, 2000-2004
Government
Household
Donors
PHI, employersand others
2000 2001 2002 2003 20040
5
10
15
20
25
30
35
40
45
Source:NHA2002-2004,MOH

120 Zambia – Social Protection Expenditure and Performance Review and Social Budget
Other players in the health care system are employers and private health insur-ance. Employers’ share of overall health expenditure increased slightly between 2002 and 2004 but remained low at less than 7 per cent and is largely through pre-payment schemes. Private health insurance is still minimal, with only 0.2 per cent of overall health spending channelled through private health insurance. Th e coverage was esti-mated at 30 000 members in 2004, which is less than 7 per cent of the total formal employment.
Flow of funds in the public health sector
As shown in Figure 4-12, the fl ow of funds through the health care delivery system from source of fi nance to providers follows a fairly straightforward pattern. Th ere are few fi nancial intermediaries because the insurance industry is still under-developed. As stated earlier, DFID and the EU are giving their support through the national treasury at the Ministry of Finance and Planning and other donors, such as SIDA, are considering moving to this position. However, some donors, such as the Global Fund, PEPFAR and others, still channel their support through the Ministry of Health and NGOs. Where households pay directly in the form of user fees to facilities, these fees are collected and returned to DHMTs or Hospital Management.
Figure 4-12. Flow of funds in the public health sector
Mission hospitals
and NGOs
Mission hospitals
District health management
team
Health centres and Level 1
hospitals
Provincial health offices
Statutory boards, training
institutionsOthers
Hospitalboards
Level 2 and 3
hospitals
Other Ministries involved with
health care delivery
Ministry of Health
Headquarters
Ministry of Finance and National Planning
(national treasury)
Donors
Households Medical insurance schemes

4. Social protection schemes 121
Th e Ministry of Health channels funding directly to DHMTs and Hospital Management Boards as well as to other statutory institutions (e.g. academic and training institutions, research, nutrition commission, etc.). In addition to fi nancing its own health facilities, the Government provides mission health facilities. Th e Ministry enters into annual service agreements with mission institutions which deliver services to areas where the Government does not have its own health facility.
National health policy framework
It is useful to discuss recent key developments in the national economic environment that have direct implications for health sector fi nancing. In 2003, the Government launched the Medium-Term Expenditure Framework (MTEF) as an instrument for harmonizing all public budgeting and expenditure in all ministries. In addition, the European Union and DFID who were giving support directly to the Ministry of Health under the Sector-wide Approach shift ed to direct budget support through the national treasury at the Ministry of Finance and National Planning. Under MTEF the Government is now able to commit resources to priority programmes and areas. Expenditure ceilings make it hard for misallocations away from priority areas. Further, unlike in the past, MTEF also provides greater stability of government expenditure. Th ree-year budget cycles are devel-oped based on carefully projected revenue. Indeed, the discrepancy between planned spending and actual disbursements has narrowed in recent years.
Health care as a proportion of GDP is planned to increase in the future. Th is development should enhance the capacity for greater public fi nancing of health care for all Zambians. A needs-based resource allocation was developed and became opera-tional in 1004. Th is formula is used to allocate fi nancial resources from the center to the districts. Th e MoH needs to work on intra-resource allocation formulas for the districts, and formulas for the second- and third-level hospitals, training institutions and statutory boards.
Levels of public sector health expenditure
Th e level of fi nancial resources available to the public health sector in Zambia is dis-played in Figure 4-13. Th e graph shows per capita total health care expenditure (all sources), per capita government expenditure and the proportion of total health expend-iture that is attributable to direct charges to households for health care or insurance payments. Th is provides a picture of resource availability in Zambia’s health sector. Th ese are the resources that are available for spending in the entire health sector
Th ere has been considerable growth in per capita health care expenditure since 2000. Since that date, Zambia has seen substantial investment in the health sector from both Government and external sources. If the goals of scaling up coverage and extending social protection are to be achieved, more resources are required. For example, there is evidence that coverage in specifi c programmes such as ART, PMTC in HIV/AIDS, bed-net usage in malaria, DOTS for TB, and so on, has made good progress, as a result of increased funding in the health sector. On the other hand, these initiatives are creating a huge negative impact on the overall health system. Emerging evidence is that most of the money from these initiatives (PEPFAR, Global funds, etc.) is defragmenting the health systems as it is ‘off -budget’, there is a lot of duplication, and the transaction costs are high, owing to use of separate systems of procurement, accounting, awaiting implementation and monitoring and evaluation.
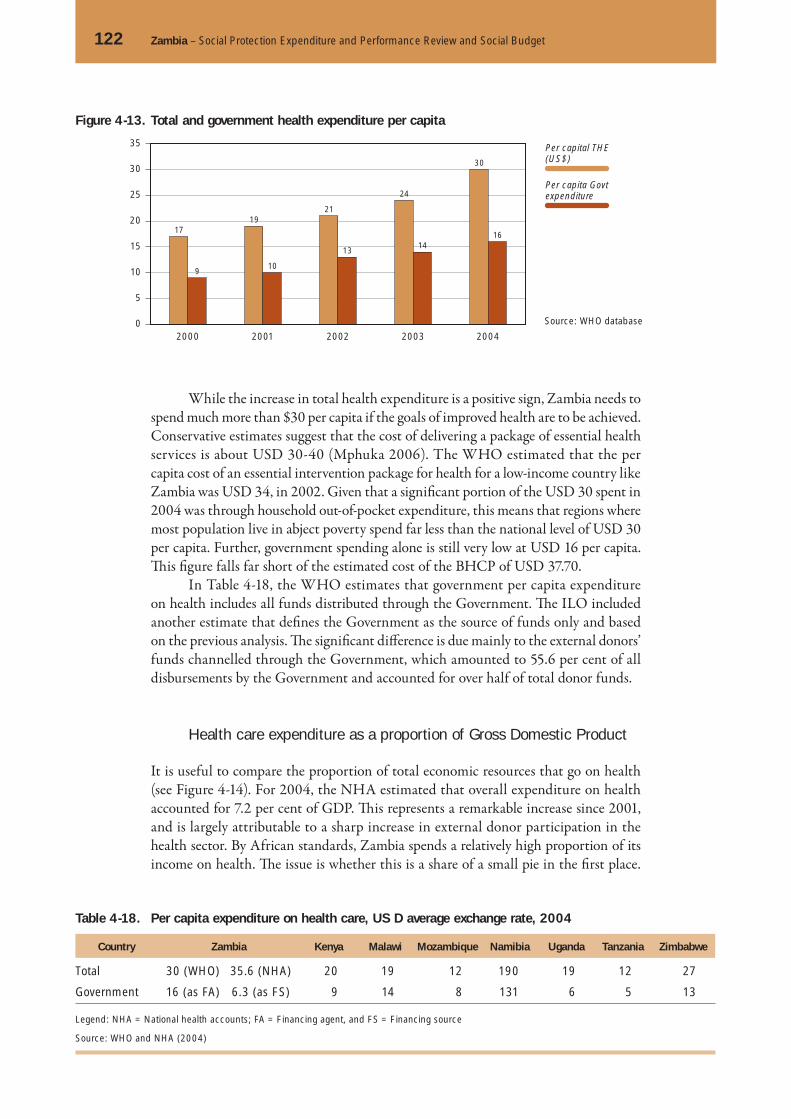
122 Zambia – Social Protection Expenditure and Performance Review and Social Budget
While the increase in total health expenditure is a positive sign, Zambia needs to spend much more than $30 per capita if the goals of improved health are to be achieved. Conservative estimates suggest that the cost of delivering a package of essential health services is about USD 30-40 (Mphuka 2006). The WHO estimated that the per capita cost of an essential intervention package for health for a low-income country like Zambia was USD 34, in 2002. Given that a signifi cant portion of the USD 30 spent in 2004 was through household out-of-pocket expenditure, this means that regions where most population live in abject poverty spend far less than the national level of USD 30 per capita. Further, government spending alone is still very low at USD 16 per capita. Th is fi gure falls far short of the estimated cost of the BHCP of USD 37.70.
In Table 4-18, the WHO estimates that government per capita expenditure on health includes all funds distributed through the Government. Th e ILO included another estimate that defi nes the Government as the source of funds only and based on the previous analysis. Th e signifi cant diff erence is due mainly to the external donors’ funds channelled through the Government, which amounted to 55.6 per cent of all disbursements by the Government and accounted for over half of total donor funds.
Health care expenditure as a proportion of Gross Domestic Product
It is useful to compare the proportion of total economic resources that go on health (see Figure 4-14). For 2004, the NHA estimated that overall expenditure on health accounted for 7.2 per cent of GDP. Th is represents a remarkable increase since 2001, and is largely attributable to a sharp increase in external donor participation in the health sector. By African standards, Zambia spends a relatively high proportion of its income on health. Th e issue is whether this is a share of a small pie in the fi rst place.
Source: WHO database
Figure 4-13. Total and government health expenditure per capita
Per capita Govtexpenditure
Per capital THE(US$)
2000 2001 2002 2003 2004
1719
21
24
30
1614
13
109
0
5
10
15
20
25
30
35
Table 4-18. Per capita expenditure on health care, US D average exchange rate, 2004
Country Zambia Kenya Malawi Mozambique Namibia Uganda Tanzania Zimbabwe
Total 30 (WHO) 35.6 (NHA) 20 19 12 190 19 12 27
Government 16 (as FA) 6.3 (as FS) 9 14 8 131 6 5 13
Legend: NHA = National health accounts; FA = Financing agent, and FS = Financing source
Source: WHO and NHA (2004)

4. Social protection schemes 123
Trends in financing sources suggest that the Government’s share of overall health expenditure declined (see Figure 4-15). Th is is partly explained by the signifi cant increase in donors’ contribution. However, the real growth of government expenditure on health started slowing down in 2001 and even became negative in 2002-2004, indi-cating that the increase in government allocation of funds to health care was not even suffi cient to off set infl ation.
Allocation of resources across levels of care and regions
One of the biggest challenges to the extension of social protection in Zambia is the effi cient allocation of available resources. Th e Ministry of Health acknowledges that resources will always be inadequate to deal with all health problems at hand; however, it has started down the path of allocating resources using a needs-based resource allo-cation formula, which was developed and operationalized in 2004. It would be useful to broaden the basis for allocation by considering whether the allocation between rural and urban areas is equitable in relation to capital projects and human capital.
Th ere are operational consequences to rationalizing health expenditure. Th ese have to do with how resources are to be allocated by levels of care and by geographical
Source:NHA2002-2004, MOH
Source: ILO calculation based on NHA2002-2004, MOH
Figure 4-14. Health care expenditure by financing source as percentage of GDP, 1996-2004
Donors
Household
Government
PHI, Employers,and others
1996 1997 1998 1999 2000 2001 2002 2003 20040
1
2
3
4
5
6
7
8
Figure 4-15. Real growth in health expenditure by source of financing, 2000-2004
Donors
Household
Government
PHI, Employers,and others
2000 2001 2002 2003 2004-40
-20
0
20
40
60
80
100
120
140
160
180
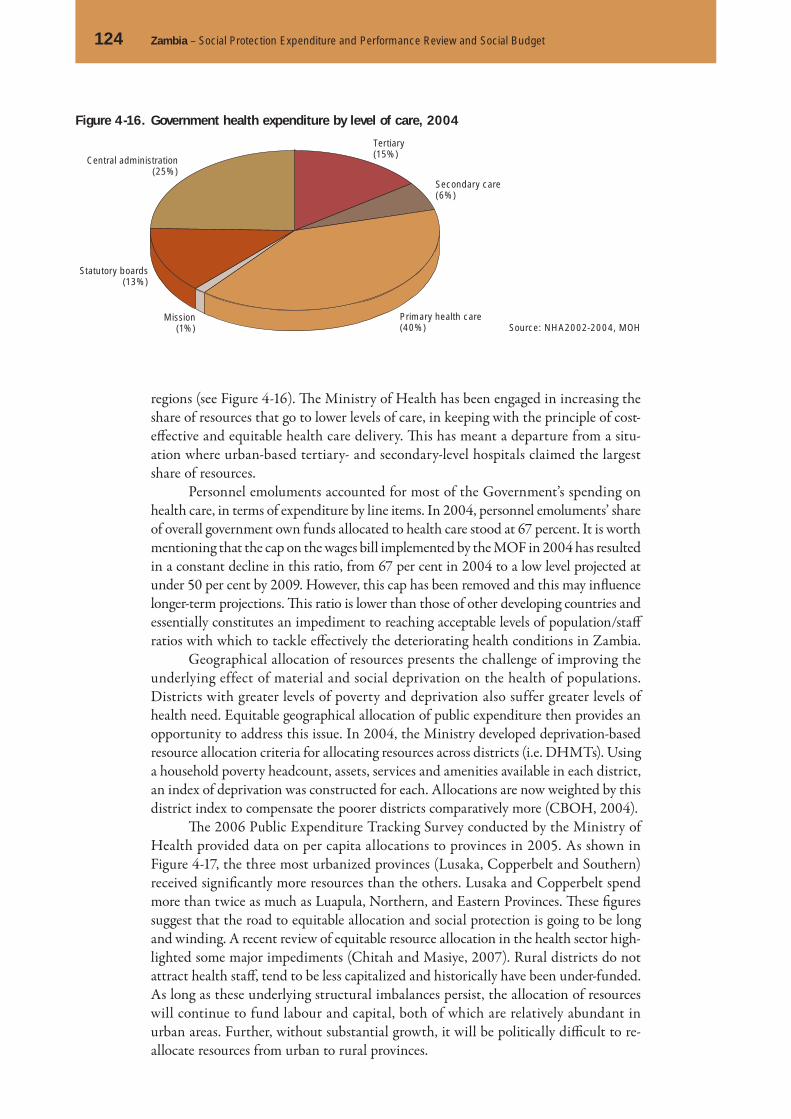
124 Zambia – Social Protection Expenditure and Performance Review and Social Budget
regions (see Figure 4-16). Th e Ministry of Health has been engaged in increasing the share of resources that go to lower levels of care, in keeping with the principle of cost-eff ective and equitable health care delivery. Th is has meant a departure from a situ-ation where urban-based tertiary- and secondary-level hospitals claimed the largest share of resources.
Personnel emoluments accounted for most of the Government’s spending on health care, in terms of expenditure by line items. In 2004, personnel emoluments’ share of overall government own funds allocated to health care stood at 67 percent. It is worth mentioning that the cap on the wages bill implemented by the MOF in 2004 has resulted in a constant decline in this ratio, from 67 per cent in 2004 to a low level projected at under 50 per cent by 2009. However, this cap has been removed and this may infl uence longer-term projections. Th is ratio is lower than those of other developing countries and essentially constitutes an impediment to reaching acceptable levels of population/staff ratios with which to tackle eff ectively the deteriorating health conditions in Zambia.
Geographical allocation of resources presents the challenge of improving the underlying effect of material and social deprivation on the health of populations. Districts with greater levels of poverty and deprivation also suffer greater levels of health need. Equitable geographical allocation of public expenditure then provides an opportunity to address this issue. In 2004, the Ministry developed deprivation-based resource allocation criteria for allocating resources across districts (i.e. DHMTs). Using a household poverty headcount, assets, services and amenities available in each district, an index of deprivation was constructed for each. Allocations are now weighted by this district index to compensate the poorer districts comparatively more (CBOH, 2004).
Th e 2006 Public Expenditure Tracking Survey conducted by the Ministry of Health provided data on per capita allocations to provinces in 2005. As shown in Figure 4-17, the three most urbanized provinces (Lusaka, Copperbelt and Southern) received signifi cantly more resources than the others. Lusaka and Copperbelt spend more than twice as much as Luapula, Northern, and Eastern Provinces. Th ese fi gures suggest that the road to equitable allocation and social protection is going to be long and winding. A recent review of equitable resource allocation in the health sector high-lighted some major impediments (Chitah and Masiye, 2007). Rural districts do not attract health staff , tend to be less capitalized and historically have been under-funded. As long as these underlying structural imbalances persist, the allocation of resources will continue to fund labour and capital, both of which are relatively abundant in urban areas. Further, without substantial growth, it will be politically diffi cult to re-allocate resources from urban to rural provinces.
Source: NHA2002-2004, MOH
Figure 4-16. Government health expenditure by level of care, 2004
Tertiary(15%)
Secondary care(6%)
Primary health care(40%)
Mission(1%)
Statutory boards(13%)
Central administration(25%)

4. Social protection schemes 125
Coverage of health services
Health care coverage provides an indication of how the benefi ts of health care expendi-ture are distributed across the population. Currently, poor access to health care remains one of the major impediments to achieving health targets in Zambia. Data from alter-native sources corroboratively show that vulnerable groups and citizens residing in hard-to-reach and under-served areas do have diffi culties getting access to services. Th e benefi ts of national health expenditure are disproportionately captured by relatively wealthy urban citizens. Further, although health is determined by a complex inter-play between many factors (poverty, education, sanitation, water, etc.) of which health care is only one, there is evidence that inadequate coverage of health interventions has played a central role in defi ning Zambia’s health profi le. For example extended cov-erage of simple-technology interventions such as measles immunization have already been shown to lead to improvements in child mortality. On the other hand, low cov-erage of the target populations is strongly associated with high mortality in children and women.
Coverage of interventions
Immunization coverage Immunization coverage is critical to the health of populations. Since the late 1990s, Zambia has stepped up its campaign to get children and women immunized against major infectious diseases. Table 4-19 shows trends in levels of coverage of selected inter-ventions. Overall, it is shown that immunization coverage has been high in Zambia. International support through the Global Alliance for Vaccines and Immunization has been crucial to this success.
4.3.4
Figure 4-17. Inter-provincial distribution of Government expenditure, per capita (Zambian Kwacha), 2005
0 5000 10000 15000 20000 25000 30000 35000 40000 45000 50000
Luapula
Northern
Eastern
Western
Northwestern
Central
Zambia
Southern
Copperbelt
Lusaka 42858
40279
29219
26369
21227
20840
20303
17369
15551
15462
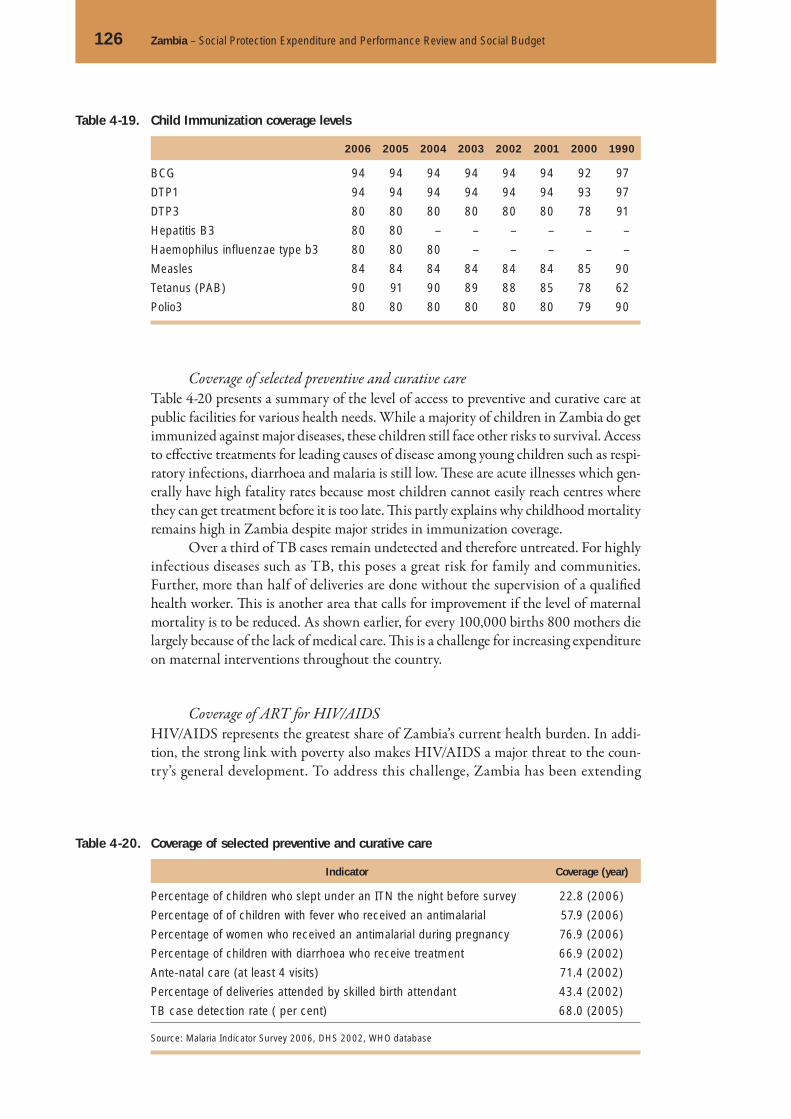
126 Zambia – Social Protection Expenditure and Performance Review and Social Budget
Coverage of selected preventive and curative care Table 4-20 presents a summary of the level of access to preventive and curative care at public facilities for various health needs. While a majority of children in Zambia do get immunized against major diseases, these children still face other risks to survival. Access to eff ective treatments for leading causes of disease among young children such as respi-ratory infections, diarrhoea and malaria is still low. Th ese are acute illnesses which gen-erally have high fatality rates because most children cannot easily reach centres where they can get treatment before it is too late. Th is partly explains why childhood mortality remains high in Zambia despite major strides in immunization coverage.
Over a third of TB cases remain undetected and therefore untreated. For highly infectious diseases such as TB, this poses a great risk for family and communities. Further, more than half of deliveries are done without the supervision of a qualifi ed health worker. Th is is another area that calls for improvement if the level of maternal mortality is to be reduced. As shown earlier, for every 100,000 births 800 mothers die largely because of the lack of medical care. Th is is a challenge for increasing expenditure on maternal interventions throughout the country.
Coverage of ART for HIV/AIDSHIV/AIDS represents the greatest share of Zambia’s current health burden. In addi-tion, the strong link with poverty also makes HIV/AIDS a major threat to the coun-try’s general development. To address this challenge, Zambia has been extending
Table 4-19. Child Immunization coverage levels
2006 2005 2004 2003 2002 2001 2000 1990
BCG 94 94 94 94 94 94 92 97
DTP1 94 94 94 94 94 94 93 97
DTP3 80 80 80 80 80 80 78 91
Hepatitis B3 80 80 – – – – – –
Haemophilus influenzae type b3 80 80 80 – – – – –
Measles 84 84 84 84 84 84 85 90
Tetanus (PAB) 90 91 90 89 88 85 78 62
Polio3 80 80 80 80 80 80 79 90
Table 4-20. Coverage of selected preventive and curative care
Indicator Coverage (year)
Percentage of children who slept under an ITN the night before survey 22.8 (2006)
Percentage of of children with fever who received an antimalarial 57.9 (2006)
Percentage of women who received an antimalarial during pregnancy 76.9 (2006)
Percentage of children with diarrhoea who receive treatment 66.9 (2002)
Ante-natal care (at least 4 visits) 71.4 (2002)
Percentage of deliveries attended by skilled birth attendant 43.4 (2002)
TB case detection rate ( per cent) 68.0 (2005)
Source: Malaria Indicator Survey 2006, DHS 2002, WHO database
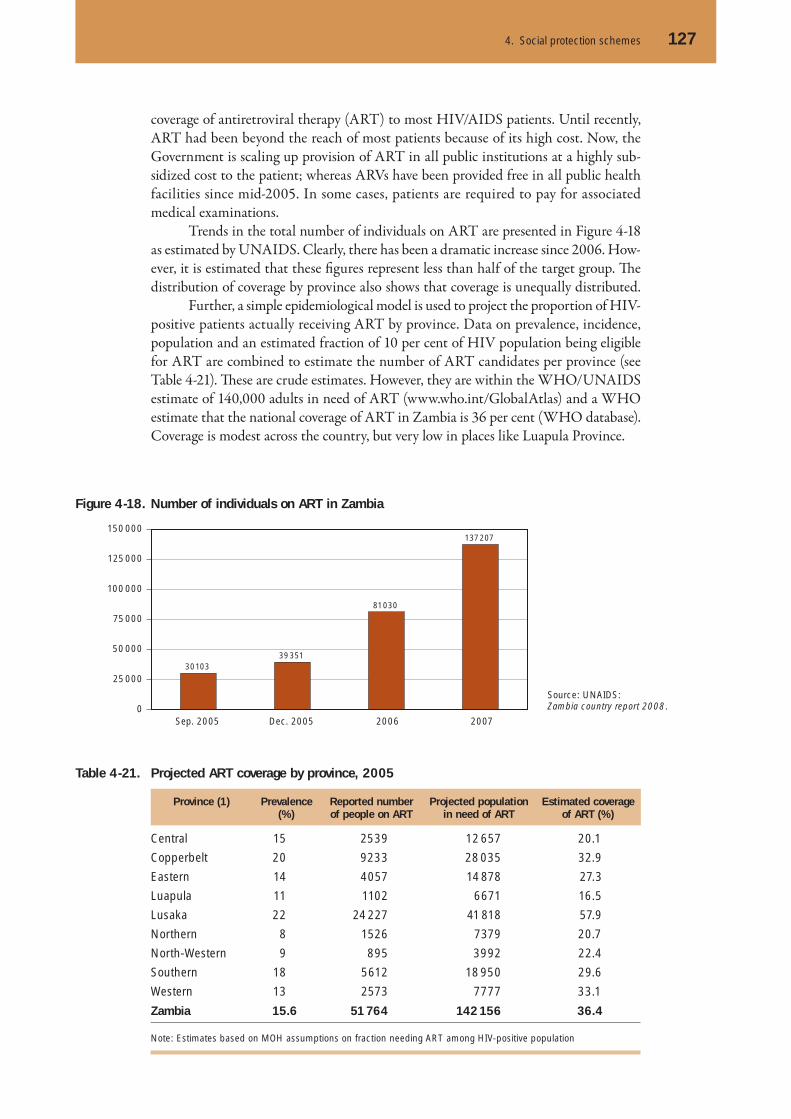
4. Social protection schemes 127
coverage of antiretroviral therapy (ART) to most HIV/AIDS patients. Until recently, ART had been beyond the reach of most patients because of its high cost. Now, the Government is scaling up provision of ART in all public institutions at a highly sub-sidized cost to the patient; whereas ARVs have been provided free in all public health facilities since mid-2005. In some cases, patients are required to pay for associated medical examinations.
Trends in the total number of individuals on ART are presented in Figure 4-18 as estimated by UNAIDS. Clearly, there has been a dramatic increase since 2006. How-ever, it is estimated that these fi gures represent less than half of the target group. Th e distribution of coverage by province also shows that coverage is unequally distributed.
Further, a simple epidemiological model is used to project the proportion of HIV-positive patients actually receiving ART by province. Data on prevalence, incidence, population and an estimated fraction of 10 per cent of HIV population being eligible for ART are combined to estimate the number of ART candidates per province (see Table 4-21). Th ese are crude estimates. However, they are within the WHO/UNAIDS estimate of 140,000 adults in need of ART (www.who.int/GlobalAtlas) and a WHO estimate that the national coverage of ART in Zambia is 36 per cent (WHO database). Coverage is modest across the country, but very low in places like Luapula Province.
Source: UNAIDS: Zambia country report 2008.
Figure 4-18. Number of individuals on ART in Zambia
Sep. 2005 Dec. 2005 2006 2007
3010339351
81030
137207
0
25000
50 000
75000
100 000
125000
150 000
Table 4-21. Projected ART coverage by province, 2005
Province (1) Prevalence(%)
Reported numberof people on ART
Projected population in need of ART
Estimated coverage of ART (%)
Central 15 2539 12 657 20.1
Copperbelt 20 9233 28 035 32.9
Eastern 14 4057 14 878 27.3
Luapula 11 1102 6671 16.5
Lusaka 22 24 227 41 818 57.9
Northern 8 1526 7379 20.7
North-Western 9 895 3992 22.4
Southern 18 5612 18 950 29.6
Western 13 2573 7777 33.1
Zambia 15.6 51 764 142 156 36.4
Note: Estimates based on MOH assumptions on fraction needing ART among HIV-positive population

128 Zambia – Social Protection Expenditure and Performance Review and Social Budget
Socio-economic inequities in access to health care
Besides geographical location, socio-economic status remains a key barrier to access in health care. Utilization of health services is dependent upon ability to pay transpor-tation costs to the facility. Cost barriers have made it harder for poor households to aff ord health care.
Constraints on health care utilizationTh e burden of health care costs falls disproportionately on the poor, leading many of them not to seek care when they need it. Th e LCMS of 2004 indicated that, overall, 56 per cent of those who reported illness consulted over their illness during the two-week study period. About a quarter of persons reporting illness used self-administered medi-cine and 18 per cent did nothing about it (see Figure 4-19). Th is demonstrates that the Government’s policy of delivering equitable access to health care has yet to be realized.
Diff erences were found between rural and urban populations in terms of con-sulting over illness see Figure 4-20). Th e LCMS 2004 indicated that 61 per cent of urban residents consulted over their illness compared with 54 per cent of residents in rural areas. Furthermore, the percentage of those who did nothing about their illness in rural areas was almost double that in urban areas.
Finally, while the LCMS of 2004 did not follow up surveyed persons on their reasons for not consulting health facilities when needed, the LCMS of 2002/2003 reported that 18 per cent of households that did not use a health facility stated that the
Source: LCMS 2004
Source: LCMS 2004
Figure 4-19. Health care consultation by age group as percentage of reported illness, 2004
Self-administered
None
Consulted
0-4 5-9 10-14 15-19 20-24 25-29 30-34 35-39 40-44 45-49 50+0
10
20
30
40
50
60
70
80
Figure 4-20. Health care consultation by urban/rural in per cent to reported illness, 2004
61
28
11
54
26
21
Urban Rural0
10
20
30
40
50
60
70
Self-administered
None
Consulted
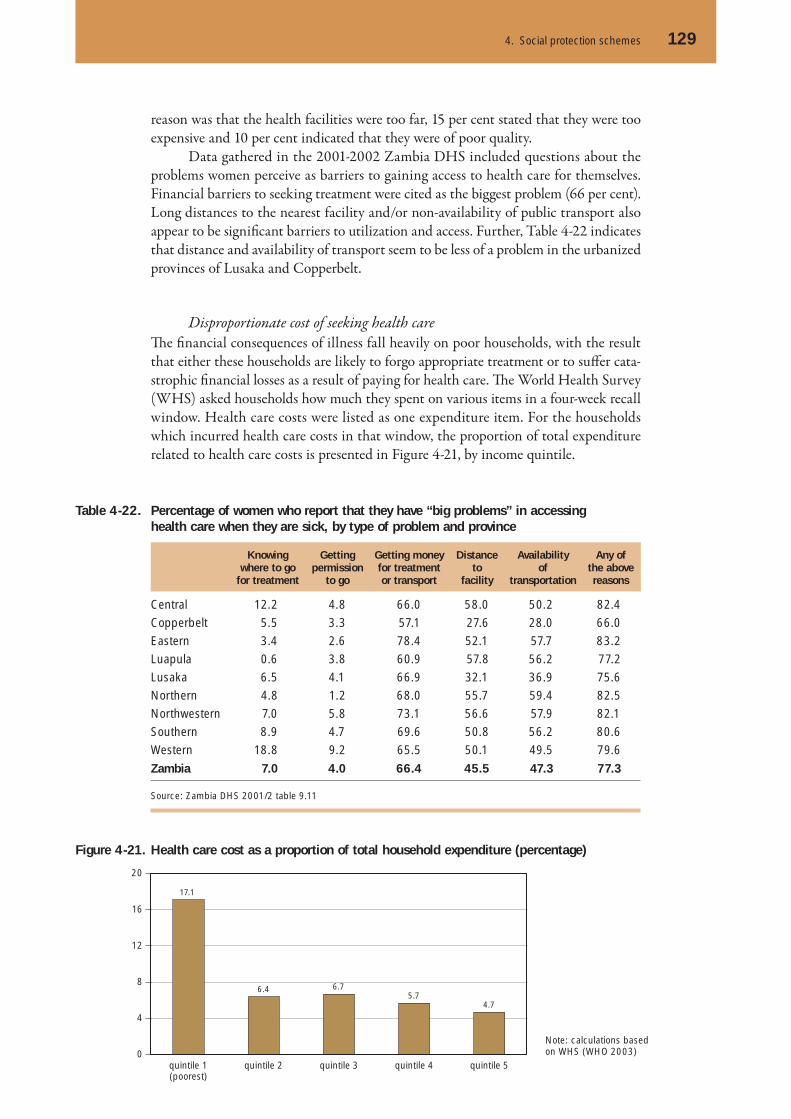
4. Social protection schemes 129
reason was that the health facilities were too far, 15 per cent stated that they were too expensive and 10 per cent indicated that they were of poor quality.
Data gathered in the 2001-2002 Zambia DHS included questions about the problems women perceive as barriers to gaining access to health care for themselves. Financial barriers to seeking treatment were cited as the biggest problem (66 per cent). Long distances to the nearest facility and/or non-availability of public transport also appear to be signifi cant barriers to utilization and access. Further, Table 4-22 indicates that distance and availability of transport seem to be less of a problem in the urbanized provinces of Lusaka and Copperbelt.
Disproportionate cost of seeking health care Th e fi nancial consequences of illness fall heavily on poor households, with the result that either these households are likely to forgo appropriate treatment or to suff er cata-strophic fi nancial losses as a result of paying for health care. Th e World Health Survey (WHS) asked households how much they spent on various items in a four-week recall window. Health care costs were listed as one expenditure item. For the households which incurred health care costs in that window, the proportion of total expenditure related to health care costs is presented in Figure 4-21, by income quintile.
Note: calculations based on WHS (WHO 2003)
Figure 4-21. Health care cost as a proportion of total household expenditure (percentage)
quintile 1(poorest)
quintile 2 quintile 3 quintile 4 quintile 5
17.1
6.4 6.75.7
4.7
0
4
8
12
16
20
Table 4-22. Percentage of women who report that they have “big problems” in accessing health care when they are sick, by type of problem and province
Knowing where to go
for treatment
Gettingpermission
to go
Getting money for treatment or transport
Distance to
facility
Availability of
transportation
Any of the above reasons
Central 12.2 4.8 66.0 58.0 50.2 82.4
Copperbelt 5.5 3.3 57.1 27.6 28.0 66.0
Eastern 3.4 2.6 78.4 52.1 57.7 83.2
Luapula 0.6 3.8 60.9 57.8 56.2 77.2
Lusaka 6.5 4.1 66.9 32.1 36.9 75.6
Northern 4.8 1.2 68.0 55.7 59.4 82.5
Northwestern 7.0 5.8 73.1 56.6 57.9 82.1
Southern 8.9 4.7 69.6 50.8 56.2 80.6
Western 18.8 9.2 65.5 50.1 49.5 79.6
Zambia 7.0 4.0 66.4 45.5 47.3 77.3
Source: Zambia DHS 2001/2 table 9.11
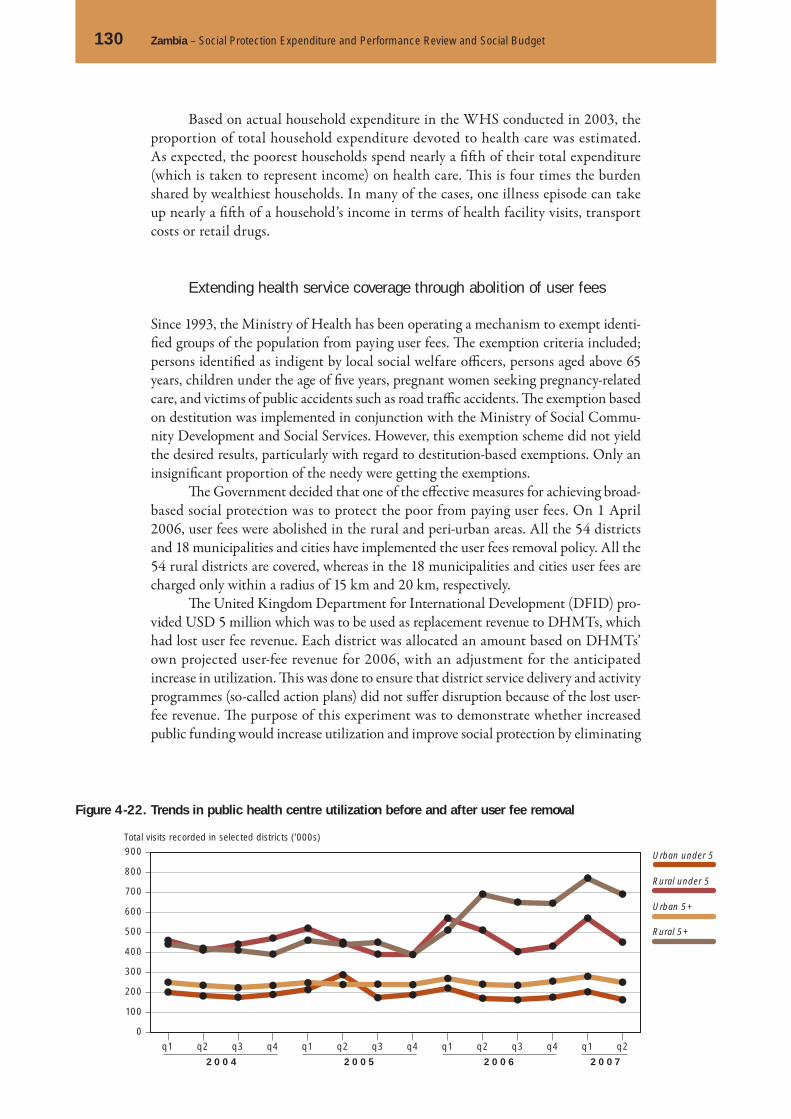
130 Zambia – Social Protection Expenditure and Performance Review and Social Budget
Based on actual household expenditure in the WHS conducted in 2003, the proportion of total household expenditure devoted to health care was estimated. As expected, the poorest households spend nearly a fi ft h of their total expenditure (which is taken to represent income) on health care. Th is is four times the burden shared by wealthiest households. In many of the cases, one illness episode can take up nearly a fi ft h of a household’s income in terms of health facility visits, transport costs or retail drugs.
Extending health service coverage through abolition of user fees
Since 1993, the Ministry of Health has been operating a mechanism to exempt identi-fi ed groups of the population from paying user fees. Th e exemption criteria included; persons identifi ed as indigent by local social welfare offi cers, persons aged above 65 years, children under the age of fi ve years, pregnant women seeking pregnancy-related care, and victims of public accidents such as road traffi c accidents. Th e exemption based on destitution was implemented in conjunction with the Ministry of Social Commu-nity Development and Social Services. However, this exemption scheme did not yield the desired results, particularly with regard to destitution-based exemptions. Only an insignifi cant proportion of the needy were getting the exemptions.
Th e Government decided that one of the eff ective measures for achieving broad-based social protection was to protect the poor from paying user fees. On 1 April 2006, user fees were abolished in the rural and peri-urban areas. All the 54 districts and 18 municipalities and cities have implemented the user fees removal policy. All the 54 rural districts are covered, whereas in the 18 municipalities and cities user fees are charged only within a radius of 15 km and 20 km, respectively.
Th e United Kingdom Department for International Development (DFID) pro-vided USD 5 million which was to be used as replacement revenue to DHMTs, which had lost user fee revenue. Each district was allocated an amount based on DHMTs’ own projected user-fee revenue for 2006, with an adjustment for the anticipated increase in utilization. Th is was done to ensure that district service delivery and activity programmes (so-called action plans) did not suff er disruption because of the lost user-fee revenue. Th e purpose of this experiment was to demonstrate whether increased public funding would increase utilization and improve social protection by eliminating
Figure 4-22. Trends in public health centre utilization before and after user fee removal
Rural under 5
Urban 5+
Rural 5+
Urban under 5
Total visits recorded in selected districts (’000s)
0
100
200
300
400
500
600
700
800
900
q1 q2 q3 q4 q1 q2 q3 q4 q1 q2 q3 q4 q1 q2
2 0 0 4 2 0 0 5 2 0 0 6 2 0 0 7

4. Social protection schemes 131
the fi nancial burden on households seeking health care. Th e intention was eventually to apply this user fee abolition policy to the rest of the country.
Following the removal of user fees, public facilities recorded a 50 per cent increase in utilization in rural areas. Th e trends presented in Figure 4-22 are based on data collected by the Health Management Information Systems Unit, at the Ministry of Health. Th e trend in utilization by patients aged at least fi ve years in rural areas con-trasts signifi cantly with trends in utilization in the urban districts where virtually no change was observed during the same period. Th is dramatic change occurred among patients aged at least fi ve in rural areas (children under the age of fi ve were already not required to pay user fees). Th is demonstrates that removing barriers to access can increase uptake of public services and extend social protection in a signifi cant way.
Conclusions
Achieving social protection in health-related matters is central to advancing progress in reducing poverty and sustainable development. Good health off ers protection from incapacitation and increases the capacity to enjoy life. Currently, Zambia’s health pro-fi le is characterized by a very high mortality among children and women of reproduc-tive age. Life expectancy at birth is only 40 years. Leading causes of death are infectious diseases, many of which could be prevented or treated with available medical technolo-gies. Unfortunately, access to either eff ective technologies or preventive care is a major problem for most Zambians. Constraints on both supply and demand prevent many interventions reaching the people who need them. Th is chapter has discussed some of the key issues that underlie the state of social health protection in Zambia today.
Zambia still has a limited health care infrastructure which is inequitably dis-tributed across the country. Further, the distribution of the most important resource, namely, health staff is perhaps the most important constraint on achieving greater health care coverage. Many preventable deaths occur because patients are too isolated from the trained medical personnel who could save their lives.
Th e positive news is that the level of investments in the health sector has increased considerably since 2000, largely because of donor infl ows. Many of the donor-funded programmes are targeted at priority diseases such as HIV/AIDS, TB and malaria and are making considerable progress in expanding health care coverage. However, health care expenditure is still skewed towards urban areas where the majority of the cost input (labour) is concentrated. Th e quality of most health infrastructure in rural areas falls below what is recommended and, in some cases, necessary to deliver life-saving interventions.
Importantly, the share of total health care resources mobilized through out-of-pocket payments in Zambia is one of the highest. One way of raising health care revenue, private payment, off ers the least protection to the population, and hurts the poorest the most. Th ere is strong evidence that private payments have constrained access to care and off ered no protection from the impoverishing health care expendi-ture. Th e Ministry of Health is exploring the option of social health insurance, which is viewed by the WHO, the World Bank and other international institutions as a more fi nancially and equitable method for raising revenue.
4.3.5
Previous chapters showed that there is very little paid formal employment in the country and just as little access by the population to social protection schemes. Chapter 2 identified the main determinants of poverty and vulnerability,
Chapter 3 the labour status of the population, and Chapter 4 presented the main benefi ts provided by the Government and other actors to protect people from var-ious contingencies. Th ere is an apparent mismatch between the scale of poverty and vulnerability and the fact that existing social protection programmes cover mostly workers in formal employment. Th is chapter focuses on the resources actually allo-cated to diff erent types of social protection against diff erent contingencies and to diff erent population groups. Th e overview of the national Social Budget attempts to show the scale of social protection fi nancing from diff erent sources and to set it against the overall fi scal envelope available.
With around 70 per cent of its population living in poverty, Zambia has ben-efi ted from international development cooperation, which has supported expenditure of over 8 per cent of GDP in recent years. Furthermore, public external debt fell by 90 per cent in 2006 with respect to 2004 as a consequence of the Highly Indebted Poor Countries (HICP) initiative and the Multilateral Debt Relief Initiative (MDRI). In this context, it is relevant to discuss the role of international partners and the eff ect that relieved foreign debt service has had on government social expenditure.
Th e chapter consists of four parts. Th e fi rst presents the main components of the Government’s budget and its social expenditure allocations. Th e second dis-cusses the role of international cooperation, focusing on aid fl ows and debt relief. Th e third presents the aggregate Social Budget and then explains some details by sector. Th e fourth discusses the main challenges to the provision of social protection in Zambia.
5
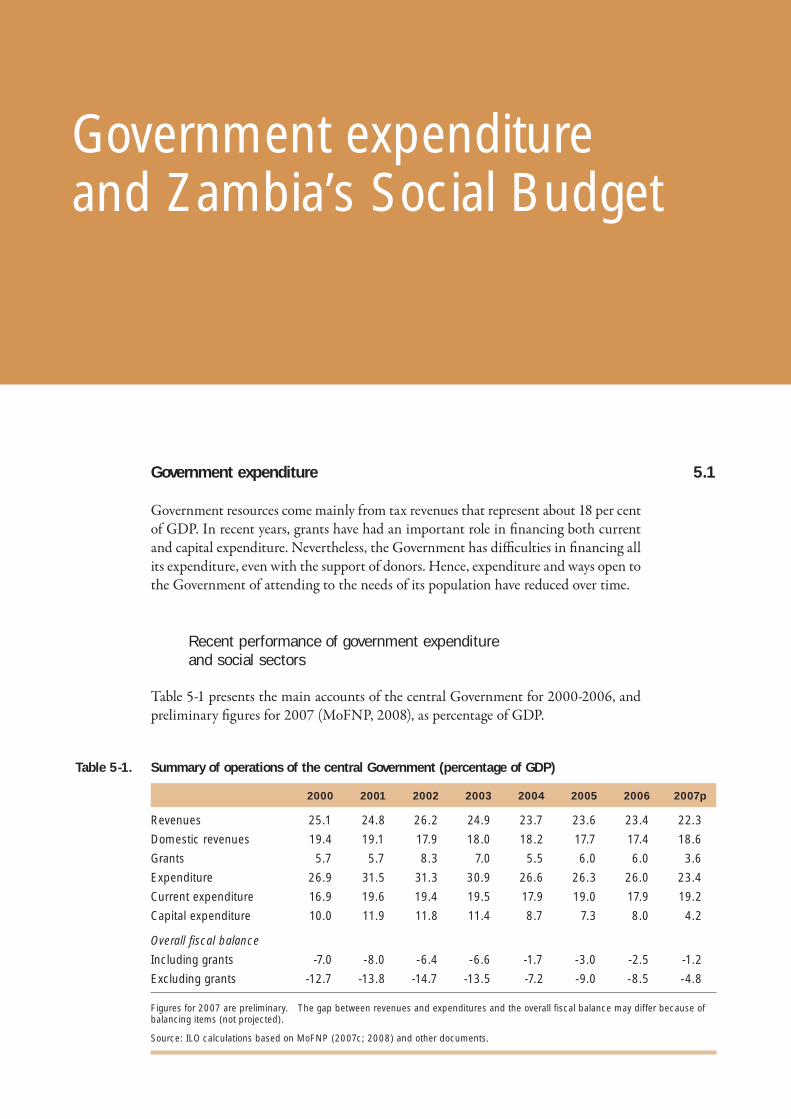
Government expenditure
Government resources come mainly from tax revenues that represent about 18 per cent of GDP. In recent years, grants have had an important role in fi nancing both current and capital expenditure. Nevertheless, the Government has diffi culties in fi nancing all its expenditure, even with the support of donors. Hence, expenditure and ways open to the Government of attending to the needs of its population have reduced over time.
Recent performance of government expenditure and social sectors
Table 5-1 presents the main accounts of the central Government for 2000-2006, and preliminary fi gures for 2007 (MoFNP, 2008), as percentage of GDP.
5.1
Government expenditure and Zambia’s Social Budget
Table 5-1. Summary of operations of the central Government (percentage of GDP)
2000 2001 2002 2003 2004 2005 2006 2007p
Revenues 25.1 24.8 26.2 24.9 23.7 23.6 23.4 22.3
Domestic revenues 19.4 19.1 17.9 18.0 18.2 17.7 17.4 18.6
Grants 5.7 5.7 8.3 7.0 5.5 6.0 6.0 3.6
Expenditure 26.9 31.5 31.3 30.9 26.6 26.3 26.0 23.4
Current expenditure 16.9 19.6 19.4 19.5 17.9 19.0 17.9 19.2
Capital expenditure 10.0 11.9 11.8 11.4 8.7 7.3 8.0 4.2
Overall fiscal balance
Including grants -7.0 -8.0 -6.4 -6.6 -1.7 -3.0 -2.5 -1.2
Excluding grants -12.7 -13.8 -14.7 -13.5 -7.2 -9.0 -8.5 -4.8
Figures for 2007 are preliminary. The gap between revenues and expenditures and the overall fiscal balance may differ because of balancing items (not projected).
Source: ILO calculations based on MoFNP (2007c; 2008) and other documents.
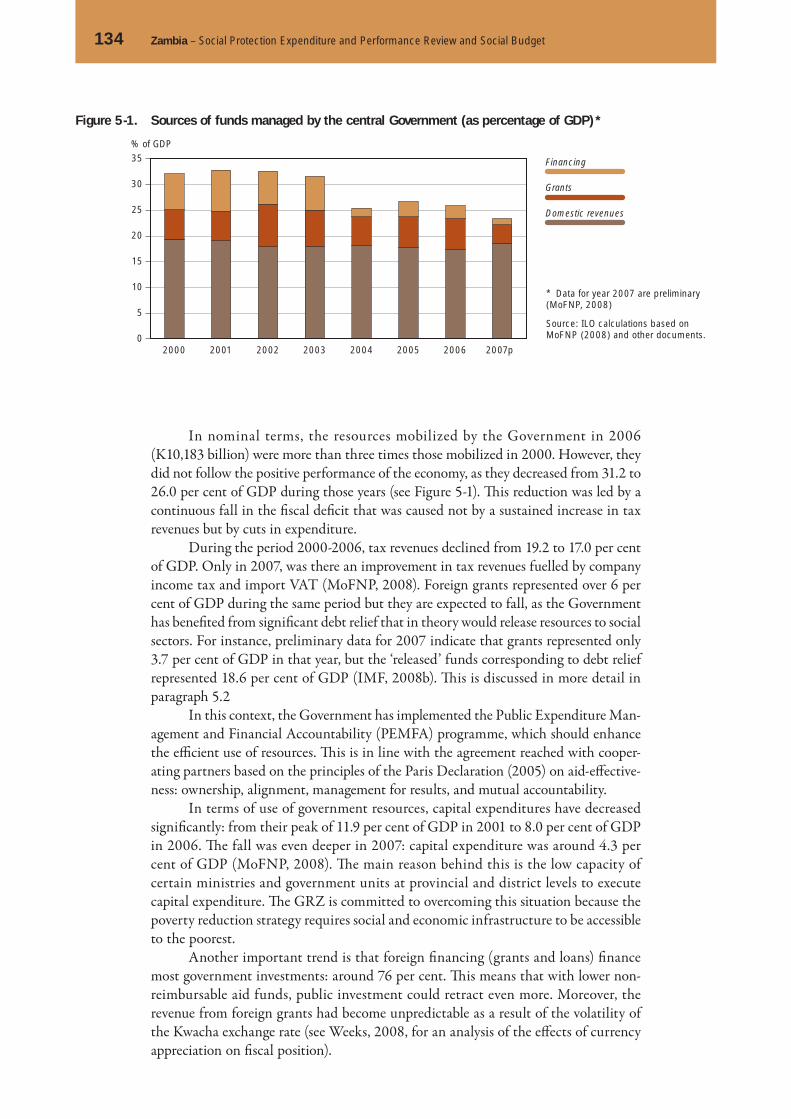
134 Zambia – Social Protection Expenditure and Performance Review and Social Budget
In nominal terms, the resources mobilized by the Government in 2006 (K10,183 billion) were more than three times those mobilized in 2000. However, they did not follow the positive performance of the economy, as they decreased from 31.2 to 26.0 per cent of GDP during those years (see Figure 5-1). Th is reduction was led by a continuous fall in the fi scal defi cit that was caused not by a sustained increase in tax revenues but by cuts in expenditure.
During the period 2000-2006, tax revenues declined from 19.2 to 17.0 per cent of GDP. Only in 2007, was there an improvement in tax revenues fuelled by company income tax and import VAT (MoFNP, 2008). Foreign grants represented over 6 per cent of GDP during the same period but they are expected to fall, as the Government has benefi ted from signifi cant debt relief that in theory would release resources to social sectors. For instance, preliminary data for 2007 indicate that grants represented only 3.7 per cent of GDP in that year, but the ‘released’ funds corresponding to debt relief represented 18.6 per cent of GDP (IMF, 2008b). Th is is discussed in more detail in paragraph 5.2
In this context, the Government has implemented the Public Expenditure Man-agement and Financial Accountability (PEMFA) programme, which should enhance the effi cient use of resources. Th is is in line with the agreement reached with cooper-ating partners based on the principles of the Paris Declaration (2005) on aid-eff ective-ness: ownership, alignment, management for results, and mutual accountability.
In terms of use of government resources, capital expenditures have decreased signifi cantly: from their peak of 11.9 per cent of GDP in 2001 to 8.0 per cent of GDP in 2006. Th e fall was even deeper in 2007: capital expenditure was around 4.3 per cent of GDP (MoFNP, 2008). Th e main reason behind this is the low capacity of certain ministries and government units at provincial and district levels to execute capital expenditure. Th e GRZ is committed to overcoming this situation because the poverty reduction strategy requires social and economic infrastructure to be accessible to the poorest.
Another important trend is that foreign fi nancing (grants and loans) fi nance most government investments: around 76 per cent. Th is means that with lower non-reimbursable aid funds, public investment could retract even more. Moreover, the revenue from foreign grants had become unpredictable as a result of the volatility of the Kwacha exchange rate (see Weeks, 2008, for an analysis of the eff ects of currency appreciation on fi scal position).
* Data for year 2007 are preliminary (MoFNP, 2008)
Source: ILO calculations based on MoFNP (2008) and other documents.
Figure 5-1. Sources of funds managed by the central Government (as percentage of GDP) *
Financing
Domestic revenues
Grants
% of GDP
2000 2001 2002 2003 2004 2005 2006 2007p0
5
10
15
20
25
30
35
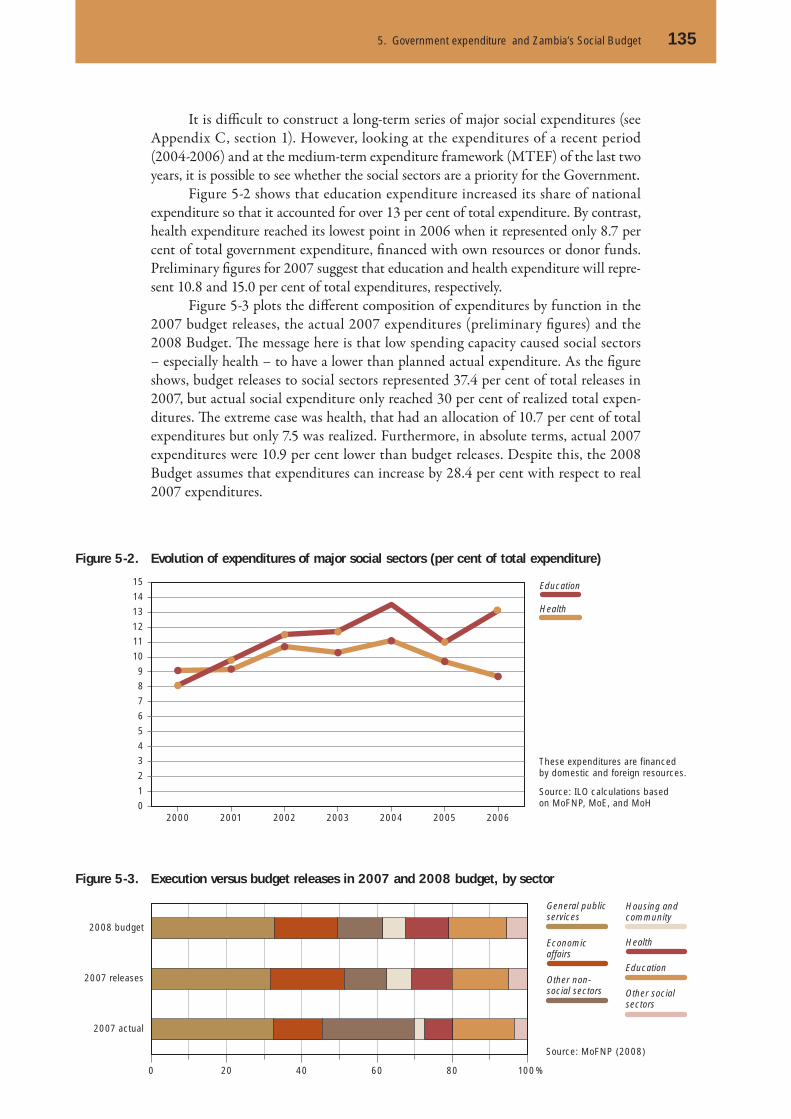
5. Government expenditure and Zambia’s Social Budget 135
It is diffi cult to construct a long-term series of major social expenditures (see Appendix C, section 1). However, looking at the expenditures of a recent period (2004-2006) and at the medium-term expenditure framework (MTEF) of the last two years, it is possible to see whether the social sectors are a priority for the Government.
Figure 5-2 shows that education expenditure increased its share of national expenditure so that it accounted for over 13 per cent of total expenditure. By contrast, health expenditure reached its lowest point in 2006 when it represented only 8.7 per cent of total government expenditure, fi nanced with own resources or donor funds. Preliminary fi gures for 2007 suggest that education and health expenditure will repre-sent 10.8 and 15.0 per cent of total expenditures, respectively.
Figure 5-3 plots the diff erent composition of expenditures by function in the 2007 budget releases, the actual 2007 expenditures (preliminary fi gures) and the 2008 Budget. Th e message here is that low spending capacity caused social sectors – especially health – to have a lower than planned actual expenditure. As the fi gure shows, budget releases to social sectors represented 37.4 per cent of total releases in 2007, but actual social expenditure only reached 30 per cent of realized total expen-ditures. Th e extreme case was health, that had an allocation of 10.7 per cent of total expenditures but only 7.5 was realized. Furthermore, in absolute terms, actual 2007 expenditures were 10.9 per cent lower than budget releases. Despite this, the 2008 Budget assumes that expenditures can increase by 28.4 per cent with respect to real 2007 expenditures.
These expenditures are financed by domestic and foreign resources.
Source: ILO calculations based on MoFNP, MoE, and MoH
Source: MoFNP (2008)
Figure 5-2. Evolution of expenditures of major social sectors (per cent of total expenditure)
Education
Health
2000 2001 2002 2003 2004 2005 20060
1
7
8
9
10
11
12
13
14
15
2
3
4
5
6
Figure 5-3. Execution versus budget releases in 2007 and 2008 budget, by sector
General publicservices
Other non-social sectors
Economic affairs
Housing and community
Education
Other social sectors
Health
0 20 40 60 80 100%
2007 actual
2007 releases
2008 budget

136 Zambia – Social Protection Expenditure and Performance Review and Social Budget
2007-2009 MTEF
2008-2010 MTEF
2007p 2008 2009 2010 2007p 2008 2009Health Education
20100
3
6
9
12
15
18
0
3
6
9
12
15
18
In terms of budget allocations, from 2006 to 2007 there has been an increase in health and education in total government expenditure, so that in 2010 these are expected to be 11.9 and 15.3 per cent of GDP, respectively. However, there has been a decrease in the 2008-2010 METF with respect to the allocations proposed in the 2007-2009 METF. Figure 5-4 depicts the selected social expenditures expressed as a percentage of total government expenditure. For instance, for 2009, the target for health expenditure is 14.1 per cent of total expenditures in the 2007-2009 METF, but it is 11.6 per cent in the 2008-2010 METF.
Creating fiscal space 1
A better picture of the fi scal situation of Zambia is obtained when foreign infl ows are not taken into consideration. Excluding grants, the fi scal defi cit reached its highest point in 2002 when it represented 14.7 per cent of GDP. From that level, it steadily decreased to reach almost 5 per cent of GDP in 2007.
Fiscal space can be created by increasing tax revenues, reallocating current expenditure or administering financial policy more efficiently. The Government plans to collect more tax revenues from mining companies with the reform intro-duced this year (see below). Regarding expenditure, the Fift h National Develop-ment Plan (FNDP) indicates that the priorities are social sectors and infrastructure, so that the execution of investment is crucial. In terms of fi nancial policy, the debt relief reduced the payment of interest to external lenders; however, domestic bor-rowing increased.
As explained earlier, it seems that tax revenues reflect their previous years’ declining trend. For future years, the Government has introduced a new fi scal and regulatory framework for the mining sector. Th is would allow the Government to raise important resources in a context of high copper prices from which it was not able to benefi t, because mining companies had generous tax exemptions – it must be recalled that copper exports represent over 75 per cent of exports of goods. Th e GRZ would also restructure the tax revenues by establishing new thresholds for personal
1 Fiscal space is ‘room in the Government’s budget that allows it to provide resources for a desired pur-pose without jeopardizing the sustainability of its fi nancial position or the stability of the economy’ (IMF, 2008a, p. 3).
Source: MoFNP(2006b; 2007b)
Figure 5-4. Priority social sectors in medium-term planning, 2007-2010 (percentage)

5. Government expenditure and Zambia’s Social Budget 137
income tax and revising VAT, in order to broaden the tax base and build sustained growth in domestic revenues. Among several measures, the export levy of 15 per cent on the export of copper concentrates and cotton seed would raise extra revenues of K148.7 billion (MoFNP, 2008).
Regarding current expenditure, the strategy basically consists of monitoring the adequate use of released funds and identifying bottlenecks especially those relating to under-spending institutions. Special eff orts are being made to expand the infrastructure investment in road, irrigation, water and sanitation, health, education and housing. Social sectors are increasing their share of total government expendi-tures. Here, it should be pointed out that wages and salaries represent a high per-centage of these expenditures so that any plan to expand social expenditure must also ensure adequate staff salaries. In 2006, education personnel received around 67 per cent of total expenditures and medical staff , around 33 per cent. Th ese shares are higher than the 29.6 per cent that wages and salaries represent in total expenditures of the central Government (around 7.8 per cent of GDP) and will probably increase, as the Government is to recruit more teachers and medical personnel.
Domestic debt has a higher impact on government accounts than foreign debt. In 2006, domestic debt reached K9,336.9 billion, which represented 23.8 per cent of GDP or 59.8 per cent of total fi nancing. Most of this debt corresponds to govern-ment securities (71.8 per cent in 2006 and 78.4 per cent in 2007). In parallel with this increase in government instruments, there was a reduction of arrears with suppliers and pension schemes – more sharply in 2007, when these arrears fell by K261.4 billion – that is expected to continue during 2008 (MoFNP, 2008).
Table 5-2 shows the composition of domestic debt. Pension arrears decreased in 2006, representing only 4.4 per cent of total domestic debt. Th e Government plans to pay off arrears to the Public Service Pension Fund (PSPF) and to suppliers of goods and services in full by 2009. Th is explains the increase in social protection expendi-ture in the 2008 Budget (MoFNP, 2007b; 2008) because, in other respects, social pro-grammes are not being expanded (except for some funds reallocated from the Public Welfare Assistance Scheme (PWAS) to the street children programme).2
2 Th e 2008 Budget proposes a cut of 54 per cent in the allocation to the PWAS. By contrast, resources to the street children programme increase by 55 per cent.
Table 5-2. Domestic debt (in billions of Kwacha), 2002-2006
2002 2003 2004 2005 2006
Government securities 1700.0 2459.7 2522.6 5336.9 6706.4
GRZ consolidated bond 1675.0 1907.7 1646.7 1646.7 1120.9
Suppliers arrears 433.6 636.8 577.4 509.3 515.3
Pension arrears 270.7 263.7 429.5 414.0 386.5
Employees contributions 262.7 262.7 370.1 – –
Other 504.8 737.6 718.3 885.7 607.8
Total 4846.8 6268.2 6264.6 8792.6 9336.9
Source: ILO calculations based on MoFNP and BoZ
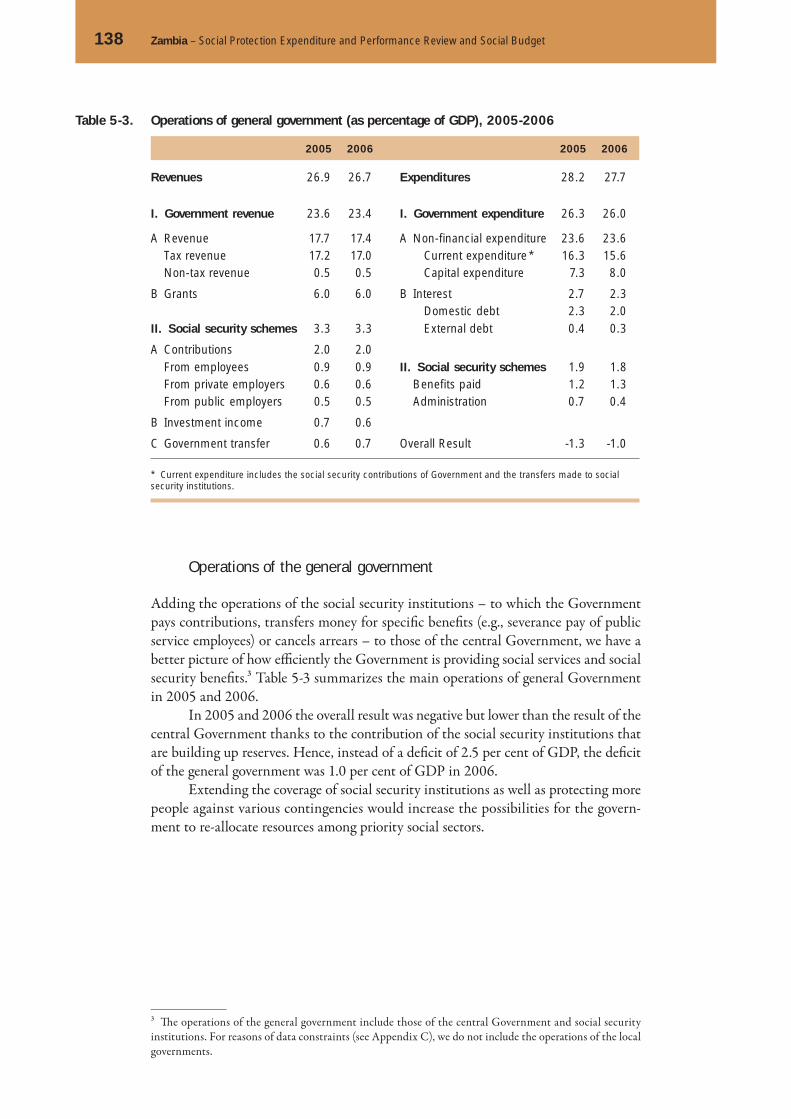
138 Zambia – Social Protection Expenditure and Performance Review and Social Budget
Operations of the general government
Adding the operations of the social security institutions – to which the Government pays contributions, transfers money for specifi c benefi ts (e.g., severance pay of public service employees) or cancels arrears – to those of the central Government, we have a better picture of how effi ciently the Government is providing social services and social security benefi ts.3 Table 5-3 summarizes the main operations of general Government in 2005 and 2006.
In 2005 and 2006 the overall result was negative but lower than the result of the central Government thanks to the contribution of the social security institutions that are building up reserves. Hence, instead of a defi cit of 2.5 per cent of GDP, the defi cit of the general government was 1.0 per cent of GDP in 2006.
Extending the coverage of social security institutions as well as protecting more people against various contingencies would increase the possibilities for the govern-ment to re-allocate resources among priority social sectors.
3 Th e operations of the general government include those of the central Government and social security institutions. For reasons of data constraints (see Appendix C), we do not include the operations of the local governments.
Table 5-3. Operations of general government (as percentage of GDP), 2005-2006
2005 2006 2005 2006
Revenues 26.9 26.7 Expenditures 28.2 27.7
I. Government revenue 23.6 23.4 I. Government expenditure 26.3 26.0
A Revenue 17.7 17.4 A Non-financial expenditure 23.6 23.6 Tax revenue 17.2 17.0 Current expenditure * 16.3 15.6 Non-tax revenue 0.5 0.5 Capital expenditure 7.3 8.0
B Grants 6.0 6.0 B Interest 2.7 2.3 Domestic debt 2.3 2.0II. Social security schemes 3.3 3.3 External debt 0.4 0.3
A Contributions 2.0 2.0 From employees 0.9 0.9 II. Social security schemes 1.9 1.8 From private employers 0.6 0.6 Benefits paid 1.2 1.3 From public employers 0.5 0.5 Administration 0.7 0.4
B Investment income 0.7 0.6
C Government transfer 0.6 0.7 Overall Result -1.3 -1.0
* Current expenditure includes the social security contributions of Government and the transfers made to social security institutions.

5. Government expenditure and Zambia’s Social Budget 139
Development cooperation and government fiscal space
Over the past ten years, Zambia has relied on foreign aid to sustain its operations. As seen earlier, total expenditures decreased given the rigidity of the structure of expendi-tures and the unpredictability of aid funds. In this context, the intention of the coop-erating partners (so far DFID and EU) is to move to budget support and also to move from project to programme grants, via pooled funds (e.g., health and education) so that the Government can manoeuvre and develop medium-term investment plans in priority social sectors with the cooperation of aid funders. In 2007, the Government implemented an aid management policy so that aid funds could be regularly reported on, monitored and their use evaluated in order to ensure that the development goals were achieved.
External funds come from two main sources: grants or non-reimbursable aid, and loans. During the decade, grants have been the main source of foreign funds for the central Government budget. Grants represented 52 per cent of total external fi nancing to central Government’s operations in 2000 and 85.5 per cent in 2006. MoFNP (2007b) projects that in 2010, around 62 per cent of grants would be linked to project support (lower than the 82.6 per cent of 2000).
Figure 5-5 shows the sources of external funds during 2002 and 2006. Project support still represents the largest part of funding (63.2 per cent of total in 2006) but the share of budget support and sector-wide approaches (SWAPs) has increased. Th is trend should continue if Zambia is to achieve one of the indicators agreed in the Paris Declaration: ‘for 2010, 66 per cent of aid fl ows are provided in the context of programme-based approaches’ (Paris Declaration, 2005, Indicator of Progress 9). However, this does not seem to be the case. External grants are still somewhat unpre-dictable and donors would prefer to fund directly specifi c projects under their control (see Box 5-1). Nevertheless, it could be that this may change as donors were still to confi rm their aid fl ows at the time of writing this report.
Th e total external funds raised to fi nance fi scal defi cit reached around 6.0 per cent of GDP in 2006 following a decreasing trend since their acme in 2002 (when they reached 12.6 per cent of GDP). Figure 5-5 shows in the right-side axis the funds recorded by OECD as offi cial development assistance (ODA). Th e divergence is large and although we cannot exactly explain it (most likely debt relief and also technical cooperation projects are infl ating the fi gures), it is useful to analyse the increasing trend.
5.2
Source: OECD (2007) and ILO calculations based on MoFNP.
Figure 5-5. External funds to central Government operations (in USD million)
Budget supportand SWAP’s
Project support
Loans
Net ODA
2002 2003 2004 2005 20060
300
600
900
1200
1500
1800
0
1000
2000
3000
4000
5000
6000
Net ODA fundsOfficial external grants

140 Zambia – Social Protection Expenditure and Performance Review and Social Budget
It is relevant to analyse the fi nancing structure of two sectors in which develop-ment cooperation has been very active: health and education. Figure 5-6 shows that education expenditure is mainly fi nanced by domestic resources (92 per cent of total), while only half of health expenditure is fi nanced by the central Government. On the other hand, project support is still an aid modality used in both sectors.
Debt relief (2005-2006) is an important vehicle for donors to transfer resources to aid-dependent countries such as Zambia. It reduced Zambia’s external debt a great deal and freed resources from interest payments to be allocated to social sectors. Total external debt decreased from USD7,080 million in 2004 to USD1,516 million in 2006. Public external debt fell by 90 per cent between those two years to reach USD676 million.
Box 5-1. The challenges of foreign grants to mobilize resources
Apparently, the GRZ is finding it more difficult to secure grants. In the Fifth National Development Plan (GRZ, 2006), the Government expected to raise a minimum of for-eign grants equivalent to 4.7 per cent of GDP in 2008, 4.6 per cent of GDP in 2009 and 4.7 per cent of GDP in 2010. Its targets to implement the new plan were much higher (see second row in table). However, the 2008-2010 MTEF (MoFNP, 2007b) sig-nificantly lowered the projections for 2009 and 2010, while the actual amount of grants in 2007 was quite disappointing (only 3.6 per cent of GDP).
Projections of external grants in official GRZ reports (percentage of GDP)
Issued on 2007 2008 2009 2010
FNDP (baseline) Dec. 2006 4.7 4.7 4.6 4.7
FNDP (target) Dec. 2006 4.7 5.6 6.1 6.5
2008-2010 MTEF Nov. 2007 4.8 4.6 4.2 3.6
2008 Budget Jan. 2008 3.6 4.7 n.a. n.a.
FNDP=Fifth National Development Plan, MTEF=Medium Term Expenditure Framework. n.a.: not applicable
Looking in detail at the baseline scenario proposed in the FNDP and the 2008-2010 MTEF, it is clear that sector-wide approaches would reduce their share while general budget support still does not represent the main transfer modality which would be expected following aid trends. It could be that donors are expecting Zambia to improve its financial information systems, and prefer to continue providing funds for specific projects (the only modality of support in the table below that has not declined as per-centage of GDP).
Structure of external grants estimated in the FNDP and the 2008-2010 MTEF (percentage of GDP)
2008 2009 2010
FNDP MTEF FNDP MTEF FNDP MTEF
External grants 4.7 4.6 4.6 4.2 4.7 3.6
General budget support 1.4 1.3 1.3 1.3 1.3 1.1
Sector wide approaches 0.9 0.8 1.1 0.6 1.2 0.2
Earmarked project support 2.4 2.6 2.2 2.3 2.2 2.3
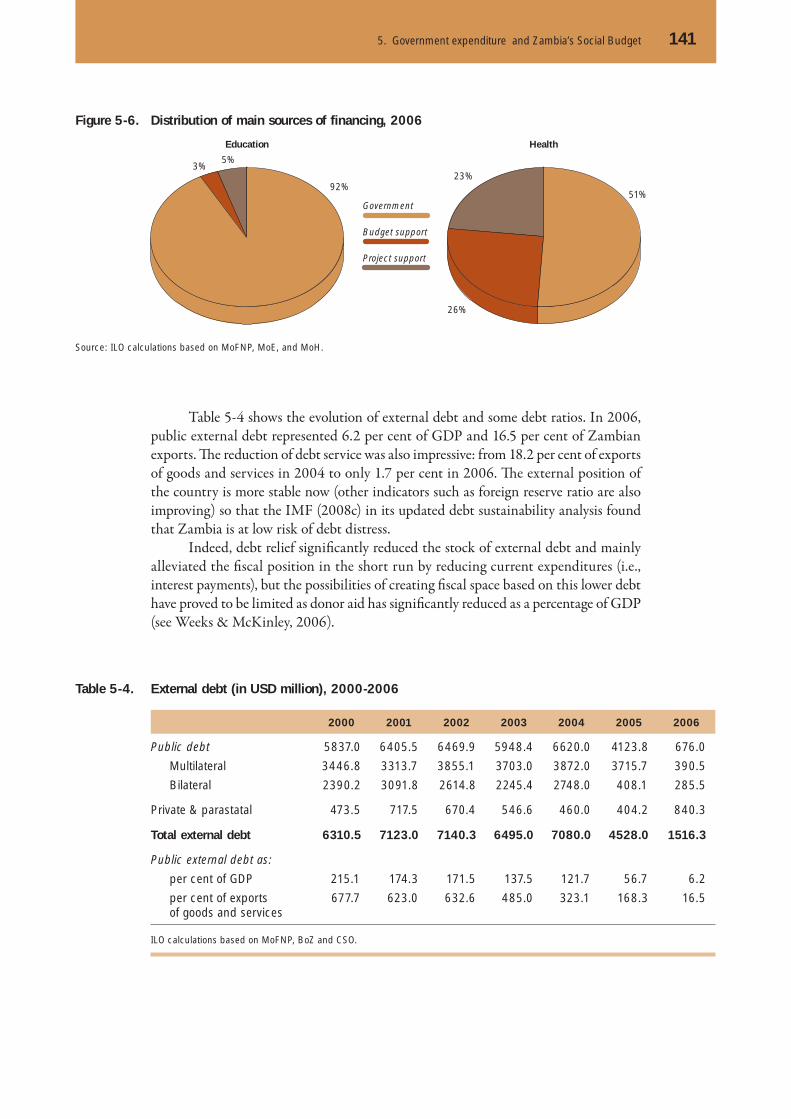
5. Government expenditure and Zambia’s Social Budget 141
Table 5-4 shows the evolution of external debt and some debt ratios. In 2006, public external debt represented 6.2 per cent of GDP and 16.5 per cent of Zambian exports. Th e reduction of debt service was also impressive: from 18.2 per cent of exports of goods and services in 2004 to only 1.7 per cent in 2006. Th e external position of the country is more stable now (other indicators such as foreign reserve ratio are also improving) so that the IMF (2008c) in its updated debt sustainability analysis found that Zambia is at low risk of debt distress.
Indeed, debt relief signifi cantly reduced the stock of external debt and mainly alleviated the fi scal position in the short run by reducing current expenditures (i.e., interest payments), but the possibilities of creating fi scal space based on this lower debt have proved to be limited as donor aid has signifi cantly reduced as a percentage of GDP (see Weeks & McKinley, 2006).
Source: ILO calculations based on MoFNP, MoE, and MoH.
Budget support
Project support
Government
Education Health
92%
3%5%
51%
26%
23%
Figure 5-6. Distribution of main sources of financing, 2006
Table 5-4. External debt (in USD million), 2000-2006
2000 2001 2002 2003 2004 2005 2006
Public debt 5837.0 6405.5 6469.9 5948.4 6620.0 4123.8 676.0
Multilateral 3446.8 3313.7 3855.1 3703.0 3872.0 3715.7 390.5
Bilateral 2390.2 3091.8 2614.8 2245.4 2748.0 408.1 285.5
Private & parastatal 473.5 717.5 670.4 546.6 460.0 404.2 840.3
Total external debt 6310.5 7123.0 7140.3 6495.0 7080.0 4528.0 1516.3
Public external debt as:
per cent of GDP 215.1 174.3 171.5 137.5 121.7 56.7 6.2
per cent of exports of goods and services
677.7 623.0 632.6 485.0 323.1 168.3 16.5
ILO calculations based on MoFNP, BoZ and CSO.

142 Zambia – Social Protection Expenditure and Performance Review and Social Budget
Zambia’s Social Budget: 2005 and 2006
Aft er reviewing the fi scal situation of Zambia, it is time to identify the revenues and expenditures involved in providing social protection in the country. An explanation of the methodology of the Social Budget model is in Appendix A. It must be said that we are including social protection sectors (contributory social protection, work-related benefi ts, and social assistance), together with education and health. Here, we will present the results for the most recent years. Th e projections will be discussed in the next chapter.
Table 5-5 summarizes the main components of the Social Budget, which will be explained in greater detail later. Th e main actors fi nancing social expenditure are under the ‘revenues’ heading. Th e criterion used is source of fi nancing so that resources man-aged by the Government but fi nanced by donors are classifi ed as ‘donors’. Expenditures appear according to a customized classifi cation thus including ‘benefi ts’ that are not directly consumed (i.e., administration). Change in reserves is the overall balance so that a positive change means surplus and a negative change, defi cit.
Revenues
For 2005 and 2006, total resources of the Social Budget in Zambia are estimated at around K4,818 billion and K5,939 billion, respectively. Th ese amounts represent 14.8 and 15.1 per cent of GDP.
Th e main actor in the provision of social protection is the Government with a share of 40 per cent of total revenues, which is fi nanced by tax revenues. Its K2,425 bil-lion are transferred in several ways: in-kind benefi ts (health and education), cash ben-efi ts (social assistance), grants, and contributions to social security institutions.
Next come households, fi nancing 25 per cent of social expenditure through out-of-pocket expenditure and employees’ contributions. Donors provide 21 per cent of resources through several mechanisms (e.g., grants to the Government and projects). Private enterprise contributes 9 per cent of resources via social security contributions, health insurance, etc. It must be noted that social security contributions are not so sig-nifi cant (13.6 per cent of total revenues) because of the low coverage of pension schemes
5.3
Table 5-5. Summary of the Social Budget, 2005-2006
2005 2006 2005 2006
K billion % GDP K billion % GDP K billion % GDP K billion % GDP
Revenues Expenditures
Government 1707 5.3 2353 6.0 Health 1920 5.9 2295 5.9
Households 1437 4.4 1505 3.8 Education 1451 4.5 1874 4.8
Donors 943 2.9 1236 3.2 Pension benefits 384 1.2 527 1.3
Private enterprises 426 1.3 508 1.3 Short term benefits * 141 0.4 172 0.4
Investment income 70 0.2 84 0.2 Administration 469 1.4 472 1.2
232 0.7 253 0.6 Total 4365 13.4 5341 13.6
Change in reserves 450 1.4 599 1.5
Grand total 4815 14.8 5939 15.1 Grand total 4815 14.8 5939 15.1
* Includes short-term work-related benefits and social assistance.
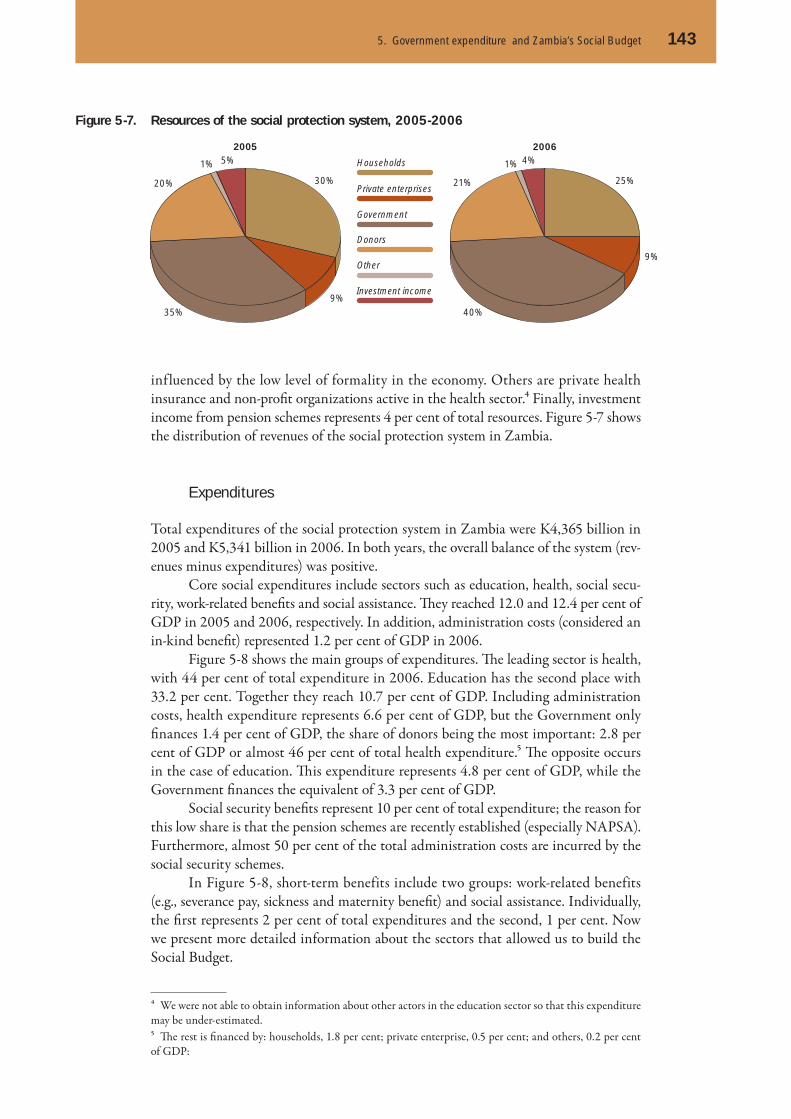
5. Government expenditure and Zambia’s Social Budget 143
influenced by the low level of formality in the economy. Others are private health insurance and non-profi t organizations active in the health sector.4 Finally, investment income from pension schemes represents 4 per cent of total resources. Figure 5-7 shows the distribution of revenues of the social protection system in Zambia.
Expenditures
Total expenditures of the social protection system in Zambia were K4,365 billion in 2005 and K5,341 billion in 2006. In both years, the overall balance of the system (rev-enues minus expenditures) was positive.
Core social expenditures include sectors such as education, health, social secu-rity, work-related benefi ts and social assistance. Th ey reached 12.0 and 12.4 per cent of GDP in 2005 and 2006, respectively. In addition, administration costs (considered an in-kind benefi t) represented 1.2 per cent of GDP in 2006.
Figure 5-8 shows the main groups of expenditures. Th e leading sector is health, with 44 per cent of total expenditure in 2006. Education has the second place with 33.2 per cent. Together they reach 10.7 per cent of GDP. Including administration costs, health expenditure represents 6.6 per cent of GDP, but the Government only fi nances 1.4 per cent of GDP, the share of donors being the most important: 2.8 per cent of GDP or almost 46 per cent of total health expenditure.5 Th e opposite occurs in the case of education. Th is expenditure represents 4.8 per cent of GDP, while the Government fi nances the equivalent of 3.3 per cent of GDP.
Social security benefi ts represent 10 per cent of total expenditure; the reason for this low share is that the pension schemes are recently established (especially NAPSA). Furthermore, almost 50 per cent of the total administration costs are incurred by the social security schemes.
In Figure 5-8, short-term benefits include two groups: work-related benefits (e.g., severance pay, sickness and maternity benefi t) and social assistance. Individually, the fi rst represents 2 per cent of total expenditures and the second, 1 per cent. Now we present more detailed information about the sectors that allowed us to build the Social Budget.
4 We were not able to obtain information about other actors in the education sector so that this expenditure may be under-estimated.5 Th e rest is fi nanced by: households, 1.8 per cent; private enterprise, 0.5 per cent; and others, 0.2 per cent of GDP:
Figure 5-7. Resources of the social protection system, 2005-2006
Private enterprises
Government
Households
Other
Investment income
Donors
2005 2006
30%
9%35%
20%
1% 5%
25%
9%
40%
21%
1% 4%
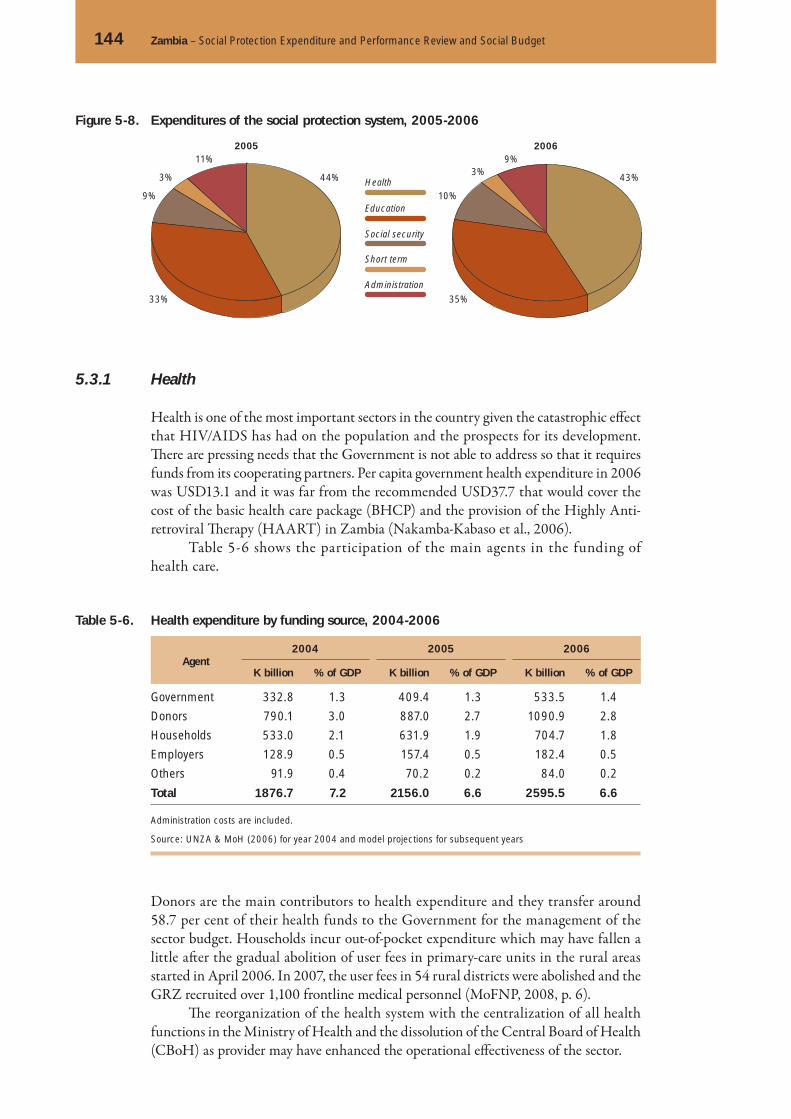
144 Zambia – Social Protection Expenditure and Performance Review and Social Budget
Health
Health is one of the most important sectors in the country given the catastrophic eff ect that HIV/AIDS has had on the population and the prospects for its development. Th ere are pressing needs that the Government is not able to address so that it requires funds from its cooperating partners. Per capita government health expenditure in 2006 was USD13.1 and it was far from the recommended USD37.7 that would cover the cost of the basic health care package (BHCP) and the provision of the Highly Anti-retroviral Th erapy (HAART) in Zambia (Nakamba-Kabaso et al., 2006).
Table 5-6 shows the participation of the main agents in the funding of health care.
5.3.1
Figure 5-8. Expenditures of the social protection system, 2005-2006
2005 2006
Education
Social security
Health
Administration
Short term
44%
33%
9%
3% 3%11%
43%
35%
10%
9%
Table 5-6. Health expenditure by funding source, 2004-2006
Agent
2004 2005 2006
K billion % of GDP K billion % of GDP K billion % of GDP
Government 332.8 1.3 409.4 1.3 533.5 1.4
Donors 790.1 3.0 887.0 2.7 1090.9 2.8
Households 533.0 2.1 631.9 1.9 704.7 1.8
Employers 128.9 0.5 157.4 0.5 182.4 0.5
Others 91.9 0.4 70.2 0.2 84.0 0.2
Total 1876.7 7.2 2156.0 6.6 2595.5 6.6
Administration costs are included.
Source: UNZA & MoH (2006) for year 2004 and model projections for subsequent years
Donors are the main contributors to health expenditure and they transfer around 58.7 per cent of their health funds to the Government for the management of the sector budget. Households incur out-of-pocket expenditure which may have fallen a little aft er the gradual abolition of user fees in primary-care units in the rural areas started in April 2006. In 2007, the user fees in 54 rural districts were abolished and the GRZ recruited over 1,100 frontline medical personnel (MoFNP, 2008, p. 6).
Th e reorganization of the health system with the centralization of all health functions in the Ministry of Health and the dissolution of the Central Board of Health (CBoH) as provider may have enhanced the operational eff ectiveness of the sector.
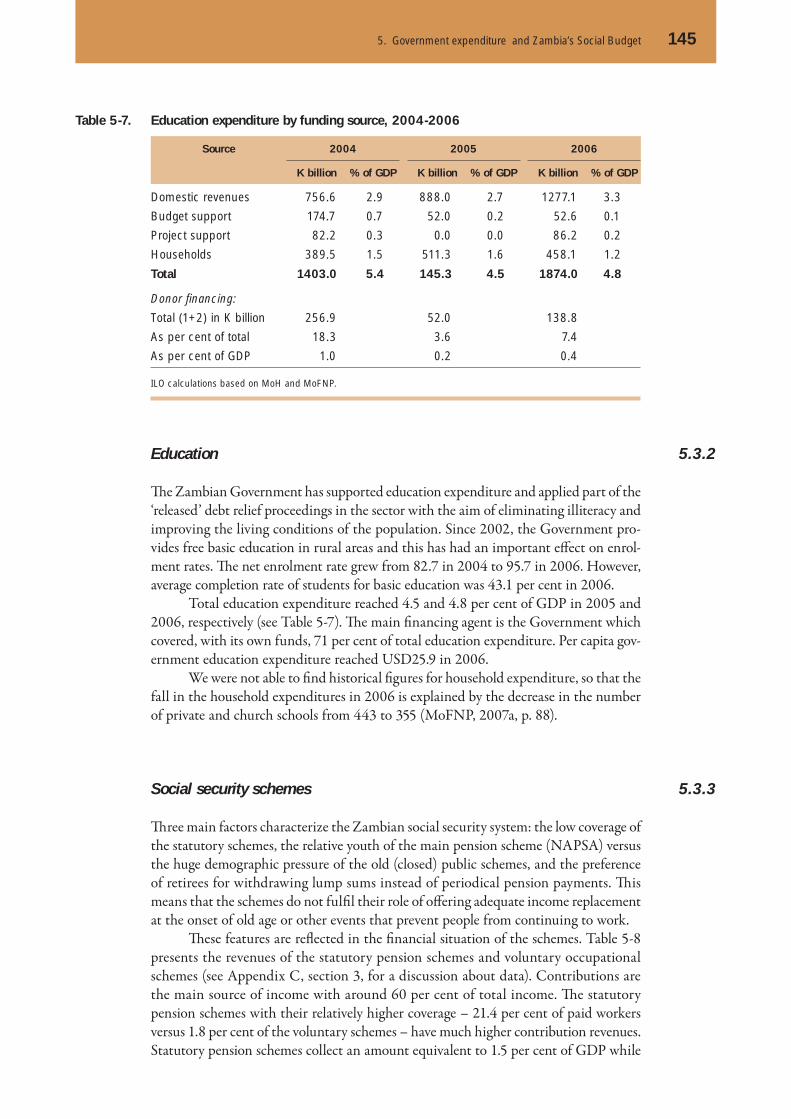
5. Government expenditure and Zambia’s Social Budget 145
Education
Th e Zambian Government has supported education expenditure and applied part of the ‘released’ debt relief proceedings in the sector with the aim of eliminating illiteracy and improving the living conditions of the population. Since 2002, the Government pro-vides free basic education in rural areas and this has had an important eff ect on enrol-ment rates. Th e net enrolment rate grew from 82.7 in 2004 to 95.7 in 2006. However, average completion rate of students for basic education was 43.1 per cent in 2006.
Total education expenditure reached 4.5 and 4.8 per cent of GDP in 2005 and 2006, respectively (see Table 5-7). Th e main fi nancing agent is the Government which covered, with its own funds, 71 per cent of total education expenditure. Per capita gov-ernment education expenditure reached USD25.9 in 2006.
We were not able to fi nd historical fi gures for household expenditure, so that the fall in the household expenditures in 2006 is explained by the decrease in the number of private and church schools from 443 to 355 (MoFNP, 2007a, p. 88).
Social security schemes
Th ree main factors characterize the Zambian social security system: the low coverage of the statutory schemes, the relative youth of the main pension scheme (NAPSA) versus the huge demographic pressure of the old (closed) public schemes, and the preference of retirees for withdrawing lump sums instead of periodical pension payments. Th is means that the schemes do not fulfi l their role of off ering adequate income replacement at the onset of old age or other events that prevent people from continuing to work.
Th ese features are refl ected in the fi nancial situation of the schemes. Table 5-8 presents the revenues of the statutory pension schemes and voluntary occupational schemes (see Appendix C, section 3, for a discussion about data). Contributions are the main source of income with around 60 per cent of total income. Th e statutory pension schemes with their relatively higher coverage – 21.4 per cent of paid workers versus 1.8 per cent of the voluntary schemes – have much higher contribution revenues. Statutory pension schemes collect an amount equivalent to 1.5 per cent of GDP while
5.3.2
5.3.3
Table 5-7. Education expenditure by funding source, 2004-2006
Source 2004 2005 2006
K billion % of GDP K billion % of GDP K billion % of GDP
Domestic revenues 756.6 2.9 888.0 2.7 1277.1 3.3
Budget support 174.7 0.7 52.0 0.2 52.6 0.1
Project support 82.2 0.3 0.0 0.0 86.2 0.2
Households 389.5 1.5 511.3 1.6 458.1 1.2
Total 1403.0 5.4 145.3 4.5 1874.0 4.8
Donor financing:
Total (1+2) in K billion 256.9 52.0 138.8
As per cent of total 18.3 3.6 7.4
As per cent of GDP 1.0 0.2 0.4
ILO calculations based on MoH and MoFNP.

146 Zambia – Social Protection Expenditure and Performance Review and Social Budget
occupational schemes collect around 0.4 per cent of GDP. NAPSA is the scheme with highest coverage, and it collects around 49 per cent of total contribution income of the statutory pension schemes, or 0.7 per cent of GDP.
Table 5-9 shows the structure of the expenditure of the pension schemes consid-ered all together. Benefi t expenditure represents 62.3 and 75.4 per cent of total expend-iture in 2005 and 2006, respectively. Statutory pension schemes provide the larger part of benefi ts, which reach around 1 per cent of GDP.
Administrative costs are quite high but decreased in 2006 with respect to 2005. Th e cash fl ow of the pension schemes is positive and this allows the schemes to build up reserves that in 2006 were 1.5 per cent of GDP.
Figure 5-9 shows the dependency ratio (i.e., the proportion of pensioners to active members) of the pension schemes. Among the statutory schemes, the LASF faces the highest dependency ratio, which complicates its fi nancial situation because every year its benefi t expenditure increases and its contribution collection falls as its
Table 5-8. Revenues of the overall pension system, 2005-2006
2005 2006
K billion per cent total
% of GDP K billion per cent total
% of GDP
REVENUEContributions 653 61.2 2.0 768 59.2 2.0
Statutory schemes 494 46.3 1.5 607 46.8 1.5Employer 274 25.7 0.8 339 26.1 0.9Employee 220 20.6 0.7 268 20.6 0.7
Occupational schemes 159 14.9 0.5 161 12.4 0.4Employer 85 8.0 0.3 86 6.6 0.2Employee 74 6.9 0.2 75 5.7 0.2
Investment income 232 21.8 0.7 253 19.5 0.6
Statutory schemes 134 12.6 0.4 161 12.4 0.4
Occupational schemes 98 9.2 0.3 92 7.1 0.2
Government transfer 182 17.1 0.6 277 21.3 0.7
Grand total 1067 100.0 3.3 1298 100.0 3.3
See Appendix D for individual financial information of the schemes. Appendices A and C explain the main data issues.
Table 5-9. Expenditures of the overall pension system, 2005-2006
2005 2006
K billion per cent total
% of GDP K billion per cent total
% of GDP
EXPENDITUREBenefits 384 62.3 1.2 527 75.4 1.3
Statutory schemes 286 46.3 0.9 442 63.2 1.1
Occupational schemes 99 16.0 0.3 85 12.2 0.2
Administrative & other 233 37.7 0.7 172 24.6 0.4
Total expenditure 617 100.0 1.9 699 100.0 1.8
Change of reserves 450 1.4 599 1.5
Grand total 1067 3.3 1298 3.3
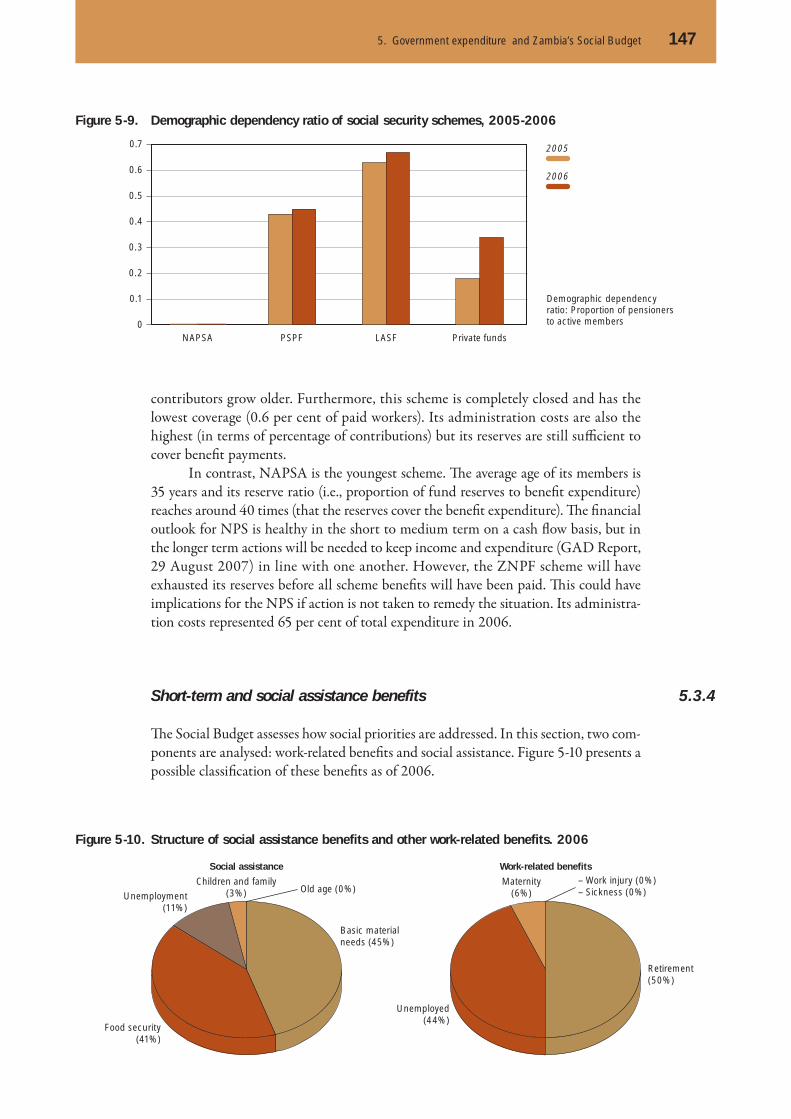
5. Government expenditure and Zambia’s Social Budget 147
contributors grow older. Furthermore, this scheme is completely closed and has the lowest coverage (0.6 per cent of paid workers). Its administration costs are also the highest (in terms of percentage of contributions) but its reserves are still suffi cient to cover benefi t payments.
In contrast, NAPSA is the youngest scheme. Th e average age of its members is 35 years and its reserve ratio (i.e., proportion of fund reserves to benefi t expenditure) reaches around 40 times (that the reserves cover the benefi t expenditure). Th e fi nancial outlook for NPS is healthy in the short to medium term on a cash fl ow basis, but in the longer term actions will be needed to keep income and expenditure (GAD Report, 29 August 2007) in line with one another. However, the ZNPF scheme will have exhausted its reserves before all scheme benefi ts will have been paid. Th is could have implications for the NPS if action is not taken to remedy the situation. Its administra-tion costs represented 65 per cent of total expenditure in 2006.
Short-term and social assistance benefits
Th e Social Budget assesses how social priorities are addressed. In this section, two com-ponents are analysed: work-related benefi ts and social assistance. Figure 5-10 presents a possible classifi cation of these benefi ts as of 2006.
5.3.4
Figure 5-9. Demographic dependency ratio of social security schemes, 2005-2006
Demographic dependency ratio: Proportion of pensioners to active members
2005
2006
NAPSA PSPF LASF Private funds0
0.1
0.2
0.3
0.4
0.5
0.6
0.7
Work-related benefitsSocial assistance
Basic materialneeds (45%)
Food security(41%)
Unemployment(11%)
Old age (0%)Children and family
(3%)
Retirement(50%)
Unemployed(44%)
Maternity(6%)
– Work injury (0%)– Sickness (0%)
Figure 5-10. Structure of social assistance benefits and other work-related benefits. 2006

148 Zambia – Social Protection Expenditure and Performance Review and Social Budget
Social assistance expenditure reached around K37 billion in 2006 (see Table 5-10). Benefi ts related to the provision of basic material needs were more impor-tant with 45 per cent of the total. Th e benefi ts classifi ed under that category are the PWAS, mainly fi nanced by the GRZ, and the SCTS fi nanced by donors.
Th e work-related benefi ts added up a total of K136 billion in 2006. Th e main two elements were the retirement benefi t or severance pay that applies to those reaching age 55 years but without registration in NAPSA or other pension schemes. Severance pay, or the so-called ‘redundancy benefi t’ is paid to those employees having worked the regular years and looking for a job. It represented 44 per cent of total work-related benefi ts. Th e amounts for these benefi ts were estimated based on our demographic and economic projections (see Appendix A, section 5b).
Challenges in the provision of social protection in Zambia
Zambia depends heavily on donor funds to fi nance the provision of social protection. Th is means that a reduction of external funds could aff ect the achievement of human development targets. In this context, the response of the GRZ has been to reallo-cate expenditure from non-social to social sectors and when the reduction has been unexpected, to cut investment expenditure. Th e implications of this latter decision are very important for the objective of reaching the poorest with adequate social and economic infrastructure and also to promote income-generating activities that require supportive infrastructure.
Th e Social Budget has shown that around 13.6 per cent of GDP are allocated to social expenditure, including education, and that the system has the resources to fi nance this expenditure and to build up reserves for the future. However, the question is who are protected and how they are getting these services. First, health and education are basic services that in theory are free to all Zambians, but households still cover a large part of the funds required to buy drugs, cover transportation costs and contribute with voluntary fees and materials. Indeed, household expenditure in these two items reaches 3.5 per cent of GDP, a high fi gure if we compare it with the amount spent by the GRZ: 4.0 per cent of GDP.
Second, social security schemes have very low coverage, which explains its low share in total revenues (2.0 per cent of GDP), but they are building up reserves.
5.4
Table 5-10. Main social assistance programmes, 2005-2006
Contingency Programmes 2005 2006
K billion per cent total
K billion per cent total
Basic material needs
Public Welfare Assistance Scheme, Social Cash Transfers
13 30.3 17 45.3
Food security World Food Programme 21 48.4 15 41.1
Unemployment Project Urban Self-Help 4 10.3 4 11.0
Old age (Old age pensions) 0 0.0 0 0.0
Children and family
Street children, juvenile welfare, matero after care
5 11.0 1 2.7
Total 43 100.0 37 100.0

5. Government expenditure and Zambia’s Social Budget 149
However, these reserves are to fi nance future pensioners liabilities. Th e Government had arrears with pension funds (unpaid employers’ and employees’ contributions) and it has been paying them off over these years.
Th ird, the largest share of the population – those unable to spend out-of-pocket to cover unexpected contingencies – is left to social assistance. However, this sector provides benefi ts for only 0.1 per cent of GDP and the coverage is very low. Th e largest programme – the PWAS – still fails to cover the most destitute 2 per cent of the population.
What should be done? Th e major challenge to Zambia is certainly the health sector. This means that health care should be accessible which necessarily requires higher non-reimbursable fi nancing. Th e possibility of using freed-up revenues conse-quential on further debt relief should be considered. However, this will only be possible if donors do not, at the same time, reduce their direct aid. Th e emphasis in the educa-tion sector seems adequate, although periodical assessments of quality are necessary – but this discussion is far from our work here.
Social assistance defi nitely needs priority attention because the large part of the population living in extreme poverty demands some protection from its Government. To do this, external funds will be necessary because although the Government is imple-menting tax reforms, the fi scal space is quite small by comparison with previous years. It is important for the cooperating partners to maintain or even increase aid, regardless of further debt relief, or because of a lack of confi dence in the Government’s capacity to execute, or because certain reforms of the public service are not taking place.
Previous chapters presented the existing arrangements to provide social protection in the country. Th is chapter presents the results of the projections carried out, based on the Social Budget model (see Appendix A) with respect to social pro-
tection schemes and simulations for specifi c modules.First, the demographics and labour market projections are presented. Th e eco-
nomic situation in the future is assumed stable with sustained rates of economic growth and decreasing infl ation rates. Exogenous assumptions are in line with estimates of multilateral agencies and the Government, although a little more conservative.
Th e projections give special emphasis to the statutory social security schemes, the occupational pension schemes, health care, and social assistance. Some general-ized assumptions were used to project education expenditure and work-related benefi ts (more details are given in Appendix A). In what follows, we focus on the presentation of revenues and expenditures projected for the period 2005-2025 and their impact on overall government accounts and the national Social Budget.
Demographic and labour force trends
Zambia has a young population that lives under the threat of the HIV epidemic. We based our assumptions on the life expectancy estimates of the UN Population Divi-sion, not on the offi cial estimates, in order to have a conservative scenario (see details in Appendix B). In our base-case scenario, with a slow reduction in the total fertility rate from 6.0 to 4.9 children per woman, the population of Zambia almost doubles between 2000 and 2025: it grows from about 9.8 to 18.1 million inhabitants, which implies an average annual growth rate of 2.5 per cent. In the same way, the average age of Zambians increases from 20.8 to 22.1 years with a higher proportion of men than of women in the long term.
6.1
6

Table 6-1 shows the population structure considering the legal working age (15-54 years).1 Th e youngest group reduces its share from 45.5 per cent to 42.2 per cent in a 25-year period which denotes that Zambia is indeed entering a period of demographic transition. Th e total dependency ratio decreases from 1.06 to 0.92 which means that the working-age population is larger than the youngest and oldest groups. Assuming that this group is healthy and employable, the country as a whole would be able to provide social protection to its population. However, there is uncertainty about how the health profi le of the population would develop (the economic aspect will be included later).
Th e status quo projections for the labour force assumes that the behaviour of people in the labour market is the one refl ected in the 2005 labour force survey, that is, the participation rates by cohort are constant over the projection period and the dis-tribution of employment across cohorts varies in line with labour force growth. Hence, the main factor that aff ects the employment projections is the economic context.
Based on the macroeconomic assumptions for the status quo situation, total employment increases over time, which leads to a sustained reduction in the
1 In addition to this legal feature, the threshold of 55 years (versus 60 or 65 years) is considered appropriate for analysing Zambia’s demographic situation because of the extremely low life expectancy of Zambians (below 40 years at birth).
Future trendsin social expenditureand financing
Table 6-1. Population structure by age group and sex, selected years
2000 2005 2010 2015 2020 2025
Pre-working age (0-14), per cent 45.5 44.6 43.7 43.8 43.3 42.2
Working age (15-54), per cent 48.6 50.1 51.2 51.1 51.3 52.0
Post-working age (55+), per cent 5.9 5.3 5.1 5.1 5.4 5.9
Total 100.0 100.0 100.0 100.0 100.0 100.0
Total dependency ratio * 1.06 0.99 0.95 0.96 0.95 0.92
* The number of people aged 0-14 plus those aged 55 and above, divided by the number of working-age people.
Source: ILO-POP calculations, base case scenario
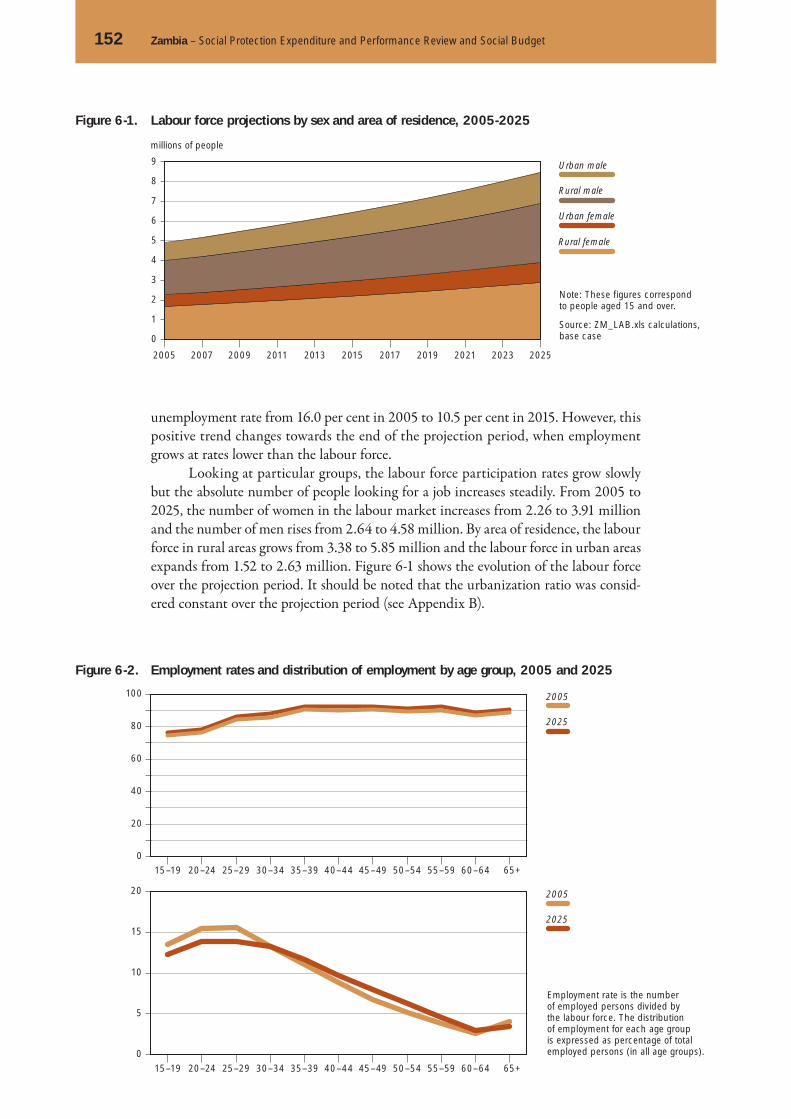
152 Zambia – Social Protection Expenditure and Performance Review and Social Budget
unemployment rate from 16.0 per cent in 2005 to 10.5 per cent in 2015. However, this positive trend changes towards the end of the projection period, when employment grows at rates lower than the labour force.
Looking at particular groups, the labour force participation rates grow slowly but the absolute number of people looking for a job increases steadily. From 2005 to 2025, the number of women in the labour market increases from 2.26 to 3.91 million and the number of men rises from 2.64 to 4.58 million. By area of residence, the labour force in rural areas grows from 3.38 to 5.85 million and the labour force in urban areas expands from 1.52 to 2.63 million. Figure 6-1 shows the evolution of the labour force over the projection period. It should be noted that the urbanization ratio was consid-ered constant over the projection period (see Appendix B).
Note: These figures correspond to people aged 15 and over.
Source: ZM_LAB.xls calculations, base case
Figure 6-1. Labour force projections by sex and area of residence, 2005-2025
Figure 6-2. Employment rates and distribution of employment by age group, 2005 and 2025
2005
2025
2005
2025
15–19 20–24 25–29 30–34 35–39 40–44 45–49 50–54 55–59 60–64 65+
15–19 20–24 25–29 30–34 35–39 40–44 45–49 50–54 55–59 60–64 65+
0
20
40
60
80
100
0
5
10
15
20
Employment rate is the number of employed persons divided by the labour force. The distribution of employment for each age group is expressed as percentage of total employed persons (in all age groups).
2005 2007 2009 2011 2013 2015 2017 2019 2021 2023 2025
0
1
2
3
4
5
6
7
8
9
millions of people
Urban male
Urban female
Rural female
Rural male
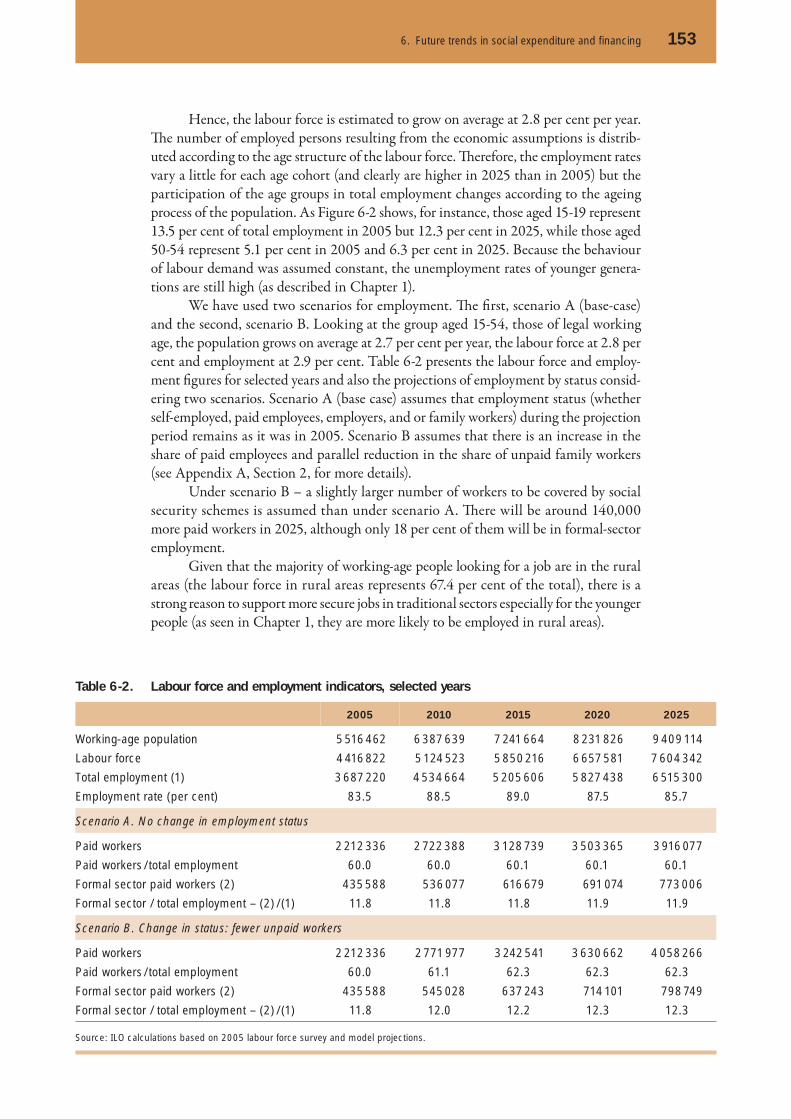
6. Future trends in social expenditure and fi nancing 153
Hence, the labour force is estimated to grow on average at 2.8 per cent per year. Th e number of employed persons resulting from the economic assumptions is distrib-uted according to the age structure of the labour force. Th erefore, the employment rates vary a little for each age cohort (and clearly are higher in 2025 than in 2005) but the participation of the age groups in total employment changes according to the ageing process of the population. As Figure 6-2 shows, for instance, those aged 15-19 represent 13.5 per cent of total employment in 2005 but 12.3 per cent in 2025, while those aged 50-54 represent 5.1 per cent in 2005 and 6.3 per cent in 2025. Because the behaviour of labour demand was assumed constant, the unemployment rates of younger genera-tions are still high (as described in Chapter 1).
We have used two scenarios for employment. Th e fi rst, scenario A (base-case) and the second, scenario B. Looking at the group aged 15-54, those of legal working age, the population grows on average at 2.7 per cent per year, the labour force at 2.8 per cent and employment at 2.9 per cent. Table 6-2 presents the labour force and employ-ment fi gures for selected years and also the projections of employment by status consid-ering two scenarios. Scenario A (base case) assumes that employment status (whether self-employed, paid employees, employers, and or family workers) during the projection period remains as it was in 2005. Scenario B assumes that there is an increase in the share of paid employees and parallel reduction in the share of unpaid family workers (see Appendix A, Section 2, for more details).
Under scenario B – a slightly larger number of workers to be covered by social security schemes is assumed than under scenario A. Th ere will be around 140,000 more paid workers in 2025, although only 18 per cent of them will be in formal-sector employment.
Given that the majority of working-age people looking for a job are in the rural areas (the labour force in rural areas represents 67.4 per cent of the total), there is a strong reason to support more secure jobs in traditional sectors especially for the younger people (as seen in Chapter 1, they are more likely to be employed in rural areas).
Table 6-2. Labour force and employment indicators, selected years
2005 2010 2015 2020 2025
Working-age population 5 516 462 6 387 639 7 241 664 8 231 826 9 409 114
Labour force 4 416 822 5 124 523 5 850 216 6 657 581 7 604 342
Total employment (1) 3 687 220 4 534 664 5 205 606 5 827 438 6 515 300
Employment rate (per cent) 83.5 88.5 89.0 87.5 85.7
Scenario A. No change in employment status
Paid workers 2 212 336 2 722 388 3 128 739 3 503 365 3 916 077
Paid workers / total employment 60.0 60.0 60.1 60.1 60.1
Formal sector paid workers (2) 435 588 536 077 616 679 691 074 773 006
Formal sector / total employment – (2) / (1) 11.8 11.8 11.8 11.9 11.9
Scenario B. Change in status: fewer unpaid workers
Paid workers 2 212 336 2 771 977 3 242 541 3 630 662 4 058 266
Paid workers / total employment 60.0 61.1 62.3 62.3 62.3
Formal sector paid workers (2) 435 588 545 028 637 243 714 101 798 749
Formal sector / total employment – (2) / (1) 11.8 12.0 12.2 12.3 12.3
Source: ILO calculations based on 2005 labour force survey and model projections.

154 Zambia – Social Protection Expenditure and Performance Review and Social Budget
Economic outlook
We drew up three scenarios (status quo, optimistic and pessimistic) around two main variables: real GDP growth and employment growth (see Appendix A, Section 3). Th e most likely scenario is the status quo with a GDP growth rate of around 6 per cent in 2007-2009 that decreases steadily to stay at around 3.0 per cent from 2016 onwards.
It is also possible that during the projection period the economy experiences a structural change, such as more investment in capital-intensive industries including the modernization of traditional activities (i.e., agriculture). MoFNP (2007b) indicates that the Government aims to ‘diversify exports in the agriculture, manufacturing and tourism sectors… in addition to supporting the existing sources of growth like mining, construction, and wholesale and retail trade’ (p. 2). Therefore, different scenarios regarding the elasticity of employment to GDP are also plausible.2 Th e main assump-tions of the status quo case are presented in Table 6-3.
Real GDP growth for 2006 was revised upwards from 5.9 to 6.2 per cent (CSO, 2007f). Th e Government is expecting growth of around 7 per cent for the next three years (MoFNP, 2007b). However, we consider that the external environment would not be as positive for Zambia as it was in 2006. Already the mining industry has expe-rienced a certain slowdown since the fi rst half of 2007. Furthermore, there is uncer-tainty about the eff ects of the world economic slowdown (led by the United States) and the response of investments to the tax reform. Th e optimistic scenario does incor-porate growth rates of 7 per cent. Infl ation picked up at the beginning of 2007 (it reached 12.7 per cent in March 2007) to close at 8.9 per cent in 2007 (CSO, 2007g). We project infl ation levels that are decreasing in the long term but are still relatively high in the short term.
The real interest rate of the Central Bank of Zambia (BoZ) would slowly increase to reach 4.5 per cent, which implies that the nominal rate would decrease from 11.5 per cent in 2006 to 7.6 per cent in 2025. As seen in Chapter 1, the exchange rate is still somewhat volatile so that we prefer to be conservative and project a continuous depreciation of the Zambian Kwacha.
2 Th e elasticity of employment to GDP indicates at which percentage the employment grows when the real GDP grows at 1 per cent. It refers to total employment, not necessarily formal-sector employment because the latter is more infl exible to expansive economic cycles while more fl exible to restrictive cycles.
Table 6-3. Main macro-economic assumptions, base case scenario
2007 2008 2009 2010 2011 2016 2025
Real Variables
Real GDP (per cent change) 6.0 6.0 6.0 5.0 4.0 3.5 3.5
Employment (per cent change) 4.2 4.2 4.2 3.5 2.8 2.4 2.4
Implicit elasticity* 0.70 0.70 0.70 0.70 0.70 0.69 0.69
Prices
GDP deflator (per cent change) 10.0 8.0 7.0 6.0 5.0 3.0 3.0
Inflation rate (per cent) 8.9 8.0 7.0 6.0 5.0 3.0 3.0
BoZ real interest rate (per cent) 3.0 3.0 3.0 3.0 4.0 4.5 4.5
Exchange rate (per cent change) 12.0 10.0 10.0 10.0 8.0 5.0 5.0
* Elasticity of total employment to GDP = Δ per cent employment / Δ per cent GDP

6. Future trends in social expenditure and fi nancing 155
A point that deserves special attention is the evolution of wages. We consider that the offi cial indicator called National Average Earnings (NAE) is not representative of the whole economy and has some measurement problems (see Appendix C, Section 2) shown by the high fl uctuation from quarter to quarter. We assume that in the future, this indicator would follow real labour productivity – independently of the values that the reported NAE could have. Th e offi cial NAE would be used for the adjustment of the pensions and insurable wages of the members of NAPSA (see Chapter 5). Based on the assumptions previously discussed (real GDP and employment), the growth rate in real wages would vary between 11.2 per cent in 2007 and 3.6 per cent in 2025, which means that it would always be above the infl ation rate.
Trends in government accounts
As seen in Chapter 5, the Government heavily relies on donor funds. However, MoFNP (2007b) estimates that grants would decrease to reach around 3.6 per cent of GDP in 2010. We assume that the reduction in grants would be smaller and gradual and so that by 2011 grants would reach 3.8 per cent of GDP and by 2020, 3.5 per cent of GDP. Th e fi scal defi cit (aft er grants) would fl uctuate between 1.8 and 2.2 per cent of GDP between 2007 and 2025. We assume that the economic situation would remain stable and tax revenues would increase to the estimated 18 per cent of GDP in 2007 (which already implies a jump from the 17.2 per cent of GDP of 2006) to 19 per cent of GDP from 2020 onwards.
Figure 6-3 shows the evolution of resources mobilized by the central Govern-ment in Zambia under the assumptions explained in Appendix A (Section 6). Under the status quo scenario, the fi scal space slightly improves: total resources rise from 24 per cent of GDP in 2007 to 25.2 per cent in 2025. Th is is possible by keeping a fi scal defi cit at the levels explained previously. Th e fi scal defi cit would be higher than that projected for 2007 (1.2 per cent of GDP) because we assume that the Government is committed to expanding social expenditure and improves its capacity to implement investment plans (overcoming the problems faced in 2007).
Figure 6-4 shows a change in the distribution of resources. Non-social current expenditure decreases in relative terms and both social current expenditure and invest-ment increase.
Social current expenditure (excluding pensions) goes up from 5.8 per cent of GDP in 2007 to 7.5 per cent of GDP in 2025. Social expenditure, including capital expenditure, grows from 6.5 to 8.8 per cent of GDP during the same period.
Figure 6-3. Evolution of resources managed by the central Government, 2005-2025 (per cent of GDP)
Financing
Grants
Domesticrevenues
2005 2007 2009 2011 2013 2015 2017 2019 2021 2023 20250
5
10
15
20
25
30

156 Zambia – Social Protection Expenditure and Performance Review and Social Budget
Regarding capital expenditure, it must be said that in 2006, foreign grants and loans fi nanced 77.3 per cent of total capital expenditure. Hence, if donor grants increased, public investment in productive and social sectors would expand. Th is is not the case for Zambia (see Box 5-1 Chapter 5).
With regards to the operations of the general government, the overall result would be negative and fl uctuate below 1 per cent of GDP. Central Government would provide resources to the social protection system in the country of around 10.8 per cent of GDP in 2025. By then, there would be a defi cit of 0.9 per cent of GDP including grants or a defi cit of 4.4 per cent of GDP excluding grants.
Financing the social protection system
During the projection period, the revenues of the total protection system would increase from 14.8 to 17.1 per cent of GDP (see Figure 6-5). Th e main contributor to this increase would be the central Government, shift ing spending from non-social to social expenditure. Th e highest increase would be in the education sector. Central Gov-ernment would increase its share in total education expenditure from 61.2 to 67.4 per cent over the projection period. The share of central Government in total health expenditure would rise from 19 to 36 per cent.
Figure 6-4. Evolution of expenditures of the central Government, 2005-2025 (per cent of GDP)
Capitalexpenditure
Social currentexpenditure
Non-socialcurrentexpenditure
2005 2007 2009 2011 2013 2015 2017 2019 2021 2023 20250
5
10
15
20
25
30
Figure 6-5. Main funding sources of the Social Budget, 2005-2025 (per cent of GDP)
Government
Households
Donors
Privateenterprises
Investment
Other
2005 2007 2009 2011 2013 2015 2017 2019 2021 2023 20250
3
6
9
12
15
18

6. Future trends in social expenditure and fi nancing 157
Households would be the second largest contributor to the social protection system. However, their share would fall from 29.8 to 23.8 per cent of total Social Budget. Around 45 per cent of their total social expenditure would be focused on health, as Figure 6-6 shows.
Donors would slightly reduce their funding to social expenditure from 2.9 to 2.8 per cent of GDP. In a context of decreasing external grants (to 3.5 of GDP in 2025), they would re-allocate their aid funds over time. Th e share of donor revenues to total revenues in the system would fall from 19.6 to 16.2 per cent.
Private enterprises would allocate more funds to social expenditure. In 2025, they would fi nance 7.8 per cent of total health expenditure, while their social secu-rity contributions would account for 5.0 per cent of total revenues in 2025 (versus 4.3 per cent in 2005). Th e Government would reduce its share in pension revenues as pri-vate employment would grow faster and the pension arrears would be cancelled at the beginning of the projection period.
Figure 6-7 shows the level and composition of total expenditure in the social protection system classifi ed by social function (see discussion in Appendix A, Sec-tion 7). Social security benefi ts include pensions and the WCFCB fund. Work-related benefi ts include others such as maternity and paid sick leave, redundancy benefi t, and so on. Under the status quo scenario, social assistance remains the least signifi cant item, while social security benefi ts slightly increase (as the schemes age). A worrying aspect is the high administration cost of the system: between 1.2 and 1.5 per cent of GDP.
Figure 6-7. Level and composition of total social protection expenditure, 2005-2025 (per cent of GDP)
Figure 6-6. Distribution of household expenditure among sectors, 2005-2025 (percentage)
Pensions
Education
Health
2005 2007 2009 2011 2013 2015 2017 2019 2021 2023 20250
20
40
60
80
100
Work-related
Social assistance
Administration
Education
Health
Social security
2005 2007 2009 2011 2013 2015 2017 2019 2021 2023 2025
0
2
4
6
8
10
12
14
16

158 Zambia – Social Protection Expenditure and Performance Review and Social Budget
Health care: Growing needs and constraints on extending services
Health care expenditure would increase in real terms at 5 per cent annually. How-ever, the share of health care expenditure in total social protection expenditure would decrease from 44 to 39.1 per cent, between 2005 and 2025, owing to the huge increase in education expenditure. The nominal per capita total health expenditure would increase from USD43.9 in 2005 to USD60.4 in 2025.
Th e main variable explaining the demand for health care services is the utili-zation rate (see Appendix A, Section 5c). Figure 6-8 depicts the evolution of utiliza-tion rates. Th e out-patient utilization rate grows from 1.017 to 1.516 consultations per person per year and in-patient utilization rate increases from 0.070 to 0.105 admissions per person per year, over the projection period.
Th e Government’s eff orts aim at extending a basic health care package off ering services at diff erent levels. Our projections follow this reasoning and especially the expansion of fi rst-level health care to all Zambians. Th e demand for primary care (with increasing utilization rates) would be served by the Government, that would allocate 70.7 per cent of public health expenditure to this level of care in 2025, a much higher percentage than the 53.6 per cent of 2005.
In terms of composition of total government expenditure, personnel costs would increase from 29.4 to 33.9 per cent of the total during the projection period.
Figure 6-8. Intensity of utilization of health care services, 2005-2025
Table 6-4. Projection of health expenditure by source of financing, selected years
Source of
financing
2007 2010 2015 2025
K billion
% total
%GDP
K billion
% total
%GDP
K billion
% total
%GDP
K billion
% total
%GDP
Government 636 21.4 1.4 993 23.9 1.5 2180 29.3 2.1 5056 36.0 2.6
Donors 1228 41.3 2.7 1616 38.8 2.4 2434 32.7 2.4 3889 27.7 2.0
Households 799 26.9 1.7 1106 26.6 1.7 1994 26.8 1.9 3563 25.4 1.8
Employers 212 7.1 0.5 315 7.6 0.5 601 8.1 0.6 1091 7.8 0.6
Others 96 3.2 0.2 134 3.2 0.2 238 3.2 0.2 444 3.2 0.2
Total 2972 100.0 6.5 4164 100.0 6.3 7447 100.0 7.3 14043 100.0 7.2
Inpatienthealth care
Outpatienthealth care
2005 2007 2009 2011 2013 2015 2017 2019 2021 2023 2025
0.40
0.60
0.80
1.00
1.20
1.40
1.60Number of consultations per person per year Number of admissions per person per year
0.05
0.06
0.07
0.08
0.09
0.10
0.11
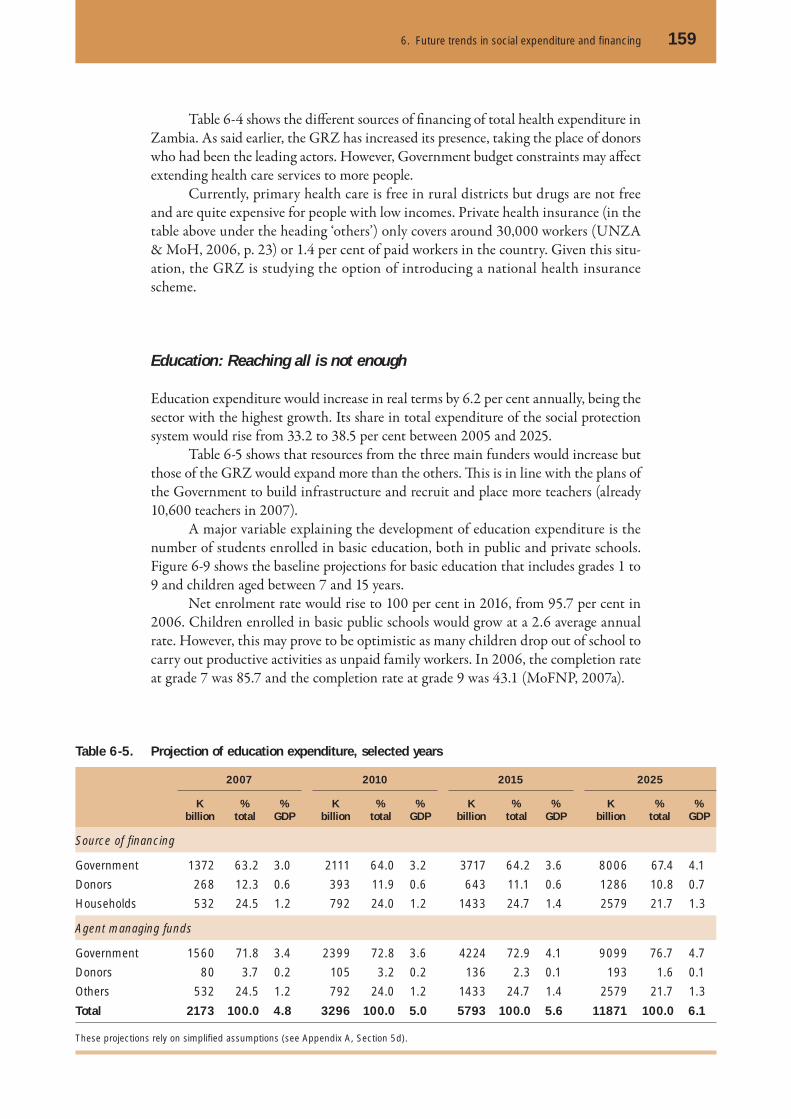
6. Future trends in social expenditure and fi nancing 159
Table 6-4 shows the diff erent sources of fi nancing of total health expenditure in Zambia. As said earlier, the GRZ has increased its presence, taking the place of donors who had been the leading actors. However, Government budget constraints may aff ect extending health care services to more people.
Currently, primary health care is free in rural districts but drugs are not free and are quite expensive for people with low incomes. Private health insurance (in the table above under the heading ‘others’) only covers around 30,000 workers (UNZA & MoH, 2006, p. 23) or 1.4 per cent of paid workers in the country. Given this situ-ation, the GRZ is studying the option of introducing a national health insurance scheme.
Education: Reaching all is not enough
Education expenditure would increase in real terms by 6.2 per cent annually, being the sector with the highest growth. Its share in total expenditure of the social protection system would rise from 33.2 to 38.5 per cent between 2005 and 2025.
Table 6-5 shows that resources from the three main funders would increase but those of the GRZ would expand more than the others. Th is is in line with the plans of the Government to build infrastructure and recruit and place more teachers (already 10,600 teachers in 2007).
A major variable explaining the development of education expenditure is the number of students enrolled in basic education, both in public and private schools. Figure 6-9 shows the baseline projections for basic education that includes grades 1 to 9 and children aged between 7 and 15 years.
Net enrolment rate would rise to 100 per cent in 2016, from 95.7 per cent in 2006. Children enrolled in basic public schools would grow at a 2.6 average annual rate. However, this may prove to be optimistic as many children drop out of school to carry out productive activities as unpaid family workers. In 2006, the completion rate at grade 7 was 85.7 and the completion rate at grade 9 was 43.1 (MoFNP, 2007a).
Table 6-5. Projection of education expenditure, selected years
2007 2010 2015 2025
K billion
% total
%GDP
K billion
% total
%GDP
K billion
% total
%GDP
K billion
% total
%GDP
Source of financing
Government 1372 63.2 3.0 2111 64.0 3.2 3717 64.2 3.6 8006 67.4 4.1
Donors 268 12.3 0.6 393 11.9 0.6 643 11.1 0.6 1286 10.8 0.7
Households 532 24.5 1.2 792 24.0 1.2 1433 24.7 1.4 2579 21.7 1.3
Agent managing funds
Government 1560 71.8 3.4 2399 72.8 3.6 4224 72.9 4.1 9099 76.7 4.7
Donors 80 3.7 0.2 105 3.2 0.2 136 2.3 0.1 193 1.6 0.1
Others 532 24.5 1.2 792 24.0 1.2 1433 24.7 1.4 2579 21.7 1.3
Total 2173 100.0 4.8 3296 100.0 5.0 5793 100.0 5.6 11871 100.0 6.1
These projections rely on simplified assumptions (see Appendix A, Section 5d).

160 Zambia – Social Protection Expenditure and Performance Review and Social Budget
Social security schemes: Relatively young but expensive
Th e scheme’s fi nancial situation depends on the development of numbers of contribu-tors. Figure 6-10 shows the assumed coverage rates for the schemes during the projec-tion period. Th e trend is positive only for NAPSA which is open to new contributors. Our assumptions are conservative (keeping coverage rate constant for the three statu-tory pension schemes) so that the coverage of NAPSA increases from 16.1 to 20.1 per cent of paid workers between 2005 and 2010.
Table 6-6 presents our projections of the main fi nancial indicators. Given that we do not have exact information about the insurable earnings of all pension schemes, we defi ned the indicators as follows:
☐ Th e fi nancial ratio is calculated as the average paid benefi t divided by the national average earnings (NAE). This means that the denominator is the same for all schemes despite the fact that the mix of contributors is diff erent. For instance, reg-istered members of NAPSA work in both private and public sectors while that is not the case for LASF and PSPF.
☐ Th e demographic ratio is the number of pensioners as percentage of contributors (active members).
☐ Th e PAYG cost rate is the amount of total paid benefi ts as percentage of total wage fund which is calculated using the NAE and the total number of contributors. Sim-ilarly, the PAYG cost is the product of the fi nancial ratio multiplied by the demo-graphic ratio.
The situation of the statutory pension schemes and the voluntary occupational schemes is diff erent. Th e former – considered all together but strongly infl uenced by NAPSA, the largest scheme – have a lower demographic ratio than the latter at the beginning because of the low number of pensioners, but over time this ratio increases. The opposite occurs with the occupational schemes: the number of contributors grows less than in previous years given the slowdown of the economy and their very low coverage rates.
In terms of individual schemes, the demographic ratio of NAPSA increases from 0.1 to 6.2 per cent, the one of PSPF grows from 60.4 to 167.2 per cent, and the one of LASF rises from 69.6 to 288.1 per cent, between 2007 and 2025.
Figure 6-9. School-age children and those enrolled in basic education, 2005-2025
Number ofschool-agechildren
Number ofstudents inprivate schools
Number of students in public schools
2005 2007 2009 2011 2013 2015 2017 2019 2021 2023 2025
0.00
0.50
1.00
1.50
2.00
2.50
3.00
3.50
4.00
4.50Million inhabitants

6. Future trends in social expenditure and fi nancing 161
Th e fi nancial ratios follow the demographic trends with a higher contribution base at the beginning and a higher growth rate in the paid benefi ts at the end of the projection period, except for the occupational schemes because the increase in the number of contributors was not so large in the fi rst years.3
Finally, the PAYG cost rate of the statutory schemes grows from 5.6 per cent in 2007 to 6.1 per cent in 2025. Th is rate would continue increasing over time as the contributors age. Assumptions in the macro-environment could delay this trend if, for instance, Zambia experiences a long period of economic expansion or formal activity increases so that the number of contributors would be higher.
However, as a whole the social security schemes (statutory and occupational pension schemes) look young and would keep building reserves over the projection period. Reserves would rise from 7.1 per cent of GDP in 2007 to 16.0 per cent of GDP in 2025. By then, investment income would represent 31.1 per cent of total income of the social security funds and 69.1 per cent of total benefi t expenditure. Th is is dependent on NAPSA taking necessary action to maintain income and expenditures
3 Th e projections used for the occupational schemes did not follow the ‘cohort-component’ method (see Appendix A, Section 4c), which could aff ect the results.
Figure 6-10. Coverage rate of social security schemes as percentage of paid workers, 2005-2025
Table 6-6. Main indicators for pension schemes (in percentage), 2005-2025
2007 2010 2015 2020 2025
Statutory schemes
Demographic ratio 14.0 13.2 13.1 12.9 14.4
Financial ratio 40.1 33.8 32.7 37.4 42.3
PAYG cost rate 5.6 4.5 4.3 4.8 6.1
Occupational schemes
Demographic ratio 33.5 34.5 38.5 36.7 33.0
Financial ratio 34.5 31.8 29.9 28.8 27.9
PAYG cost rate 11.6 11.0 11.5 10.6 9.2
‘Statutory schemes’ includes NAPSA, LASF and PSPF. Occupational schemes are over 200 private funds.
2005 2007 2009 2011 2013 2015 2017 2019 2021 2023 2025
0
5
10
15
20
25
% of workers
Privatefunds
LASF
PSPF
NAPSA

162 Zambia – Social Protection Expenditure and Performance Review and Social Budget
in line with one another for NPS and early action being taken to be able to meet lia-bilities for the ZNPF.
Figure 6-11 shows the composition of the main items of the income statement of the pension funds and WCFCB. Clearly, NAPSA increases its share over time, while the PSPF is still an important player in 2025, collecting 5.9 per cent of total contri-bution income and paying off 19.1 per cent of total benefi ts. LASF, which is a closed scheme, has a very low contribution income by 2025: around 0.01 per cent of GDP, versus 1.35 per cent of NAPSA and 0.08 per cent of PSPF.
As already stated, administrative costs are high. Around 21.8 per cent of rev-enues were allocated to these costs in 2007. Figure 6-12 plots the development of two indicators of the reserve ratio: one considers the benefi t expenditure, and the other the total expenditures. Th is makes clear the burden that administration costs still rep-resent for the social security system (status quo scenario). It should be noted that the reserve ratio considering total expenditures increases from 3.6 in 2005 to 8.2 in 2025, although as from 2020 there is a slowdown linked to demographic trends.
* In contrast to Table 6-6, this figure does include the WCFCB. Our projections assume that the fund membership follows the one of NAPSA.
Figure 6-11. Composition of contribution income and benefit expenditure, 2005-2025 *
WCFCB
Private funds
PSPF
NAPSA
LASF
Contribution income Benefit expenditure
2005 2009 2013 2017 2021 2025 2005 2009 2013 2017 2021 2025
0
20
40
60
80
100
0
20
40
60
80
100
Figure 6-12. Composition of contribution income and benefit expenditure, 2005-2025 (percentage)
Reservesto benefitexpenditure
Reservesto totalexpenditure
2005 2007 2009 2011 2013 2015 2017 2019 2021 2023 20250
2
4
6
8
10
12
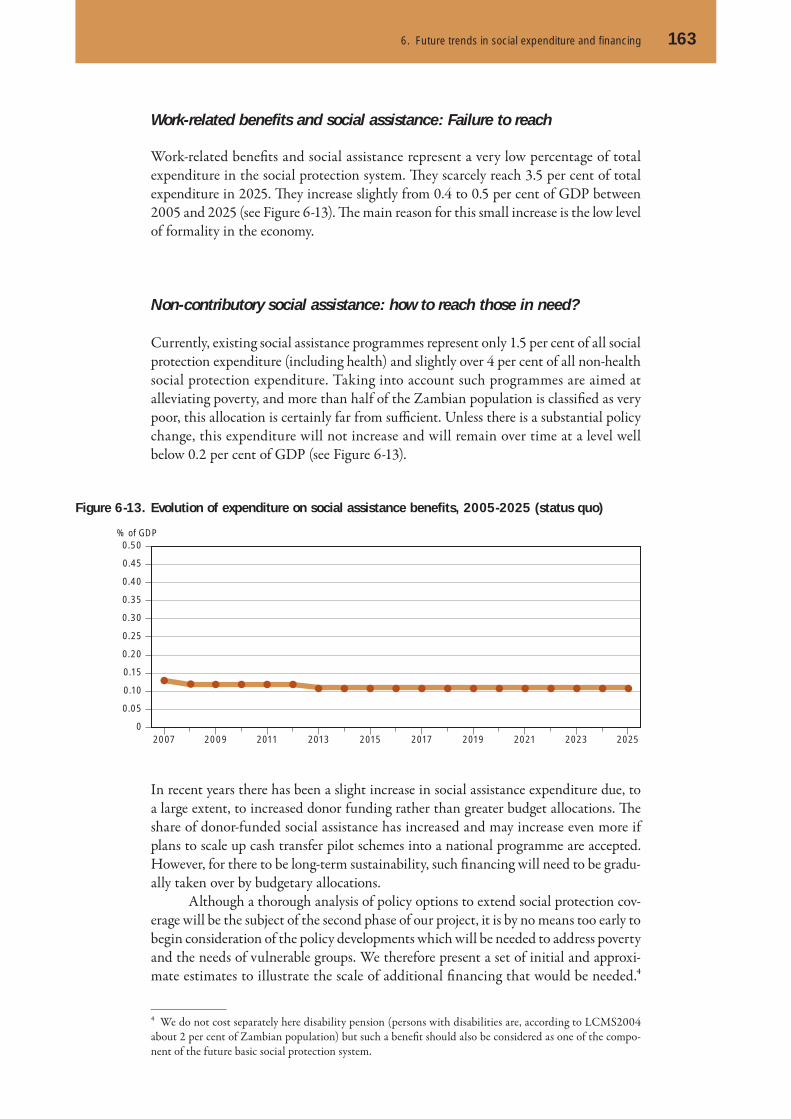
6. Future trends in social expenditure and fi nancing 163
Work-related benefits and social assistance: Failure to reach
Work-related benefi ts and social assistance represent a very low percentage of total expenditure in the social protection system. Th ey scarcely reach 3.5 per cent of total expenditure in 2025. Th ey increase slightly from 0.4 to 0.5 per cent of GDP between 2005 and 2025 (see Figure 6-13). Th e main reason for this small increase is the low level of formality in the economy.
Non-contributory social assistance: how to reach those in need?
Currently, existing social assistance programmes represent only 1.5 per cent of all social protection expenditure (including health) and slightly over 4 per cent of all non-health social protection expenditure. Taking into account such programmes are aimed at alleviating poverty, and more than half of the Zambian population is classifi ed as very poor, this allocation is certainly far from suffi cient. Unless there is a substantial policy change, this expenditure will not increase and will remain over time at a level well below 0.2 per cent of GDP (see Figure 6-13).
Figure 6-13. Evolution of expenditure on social assistance benefits, 2005-2025 (status quo)
2007 2009 2011 2013 2015 2017 2019 2021 2023 20250
0.05
0.10
0.15
0.20
0.25
0.30
0.35
0.40
0.45
0.50% of GDP
In recent years there has been a slight increase in social assistance expenditure due, to a large extent, to increased donor funding rather than greater budget allocations. Th e share of donor-funded social assistance has increased and may increase even more if plans to scale up cash transfer pilot schemes into a national programme are accepted. However, for there to be long-term sustainability, such fi nancing will need to be gradu-ally taken over by budgetary allocations.
Although a thorough analysis of policy options to extend social protection cov-erage will be the subject of the second phase of our project, it is by no means too early to begin consideration of the policy developments which will be needed to address poverty and the needs of vulnerable groups. We therefore present a set of initial and approxi-mate estimates to illustrate the scale of additional fi nancing that would be needed.4
4 We do not cost separately here disability pension (persons with disabilities are, according to LCMS2004 about 2 per cent of Zambian population) but such a benefi t should also be considered as one of the compo-nent of the future basic social protection system.

164 Zambia – Social Protection Expenditure and Performance Review and Social Budget
We looked at the future costs of three hypothetical benefi ts targeted at three specifi c groups of benefi ciaries:
☐ a targeted social assistance scheme: vulnerable households and covering 10 percent of all households. We have assumed that this scheme and other simulated schemes will cover 100 per cent of the target group in the fi rst year (2009). We have assumed a benefi t per household equivalent to the average amount of benefi t paid within the current cash transfer pilot schemes and adjusted annually for infl ation (estimated to be K 52,725 per household per month in 2009);
☐ a universal pension for all persons aged 60 and over, starting with a monthly amount of K 60,000 in 2009;
☐ a child benefi t with two variants:– paid to the fi rst child up to age six, K 30,000 per month;– paid to the fi rst child up to age fourteen, K 30,000 per month.
If fully implemented in 2009, such a targeted social assistance scheme would cost (without taking into account administration and delivery) K 154 billion. A pension for the elderly would cost K 291 billion – nearly twice as much due to a much greater number of benefi ciaries. It is assumed for child benefi t that in the fi rst year of imple-mentation all families with children will receive the benefi t (at the level for one child); whereas, from then onwards claims will be paid only upon the birth of the fi rst child. At the start the number of benefi ciaries and the cost would be signifi cantly higher than the two other programmes but would decrease quickly over the following years. Figure 6-14 shows benefi t costs of all three hypothetical schemes until 2025 presented as percentage of GDP per capita.
Th ese results should not be treated as policy recommendations, which should be developed as a result of a national debate involving all the stakeholders. Th ese results illustrate that by allocating resources equivalent in the longer run to not more than 1.5 per cent of GDP, it would be possible to build the foundations of a social protection system.
Figure 6-14. Costs of benefits provided by hypothetical non-contributory schemes (per cent of GDP)
2009 2011 2013 2015 2017 2019 2021 2023 2025
Child benefitunder 7
Old-age pension
Targeted socialassistance
Child benefitunder 15
0.0
0.2
0.4
0.6
0.8
1.0
1.2
1.4
1.6
1.8
2.0
2009 2011 2013 2015 2017 2019 2021 2023 2025
0.0
0.2
0.4
0.6
0.8
1.0
1.2
1.4
1.6
1.8
2.0

6. Future trends in social expenditure and fi nancing 165
Simulations
We have carried out a sensitivity analysis of our economic assumptions about GDP growth and employment growth. We have used two alternative scenarios to the status quo (scenario (1)). Th e optimistic scenario (2) with GDP growth rates of around 7 per cent that would decrease very slowly to reach 5 per cent in 2025. Th e pessimistic sce-nario (3) with a GDP growth rate of 4 per cent that falls sharply to 2 per cent and continues falling to reach zero in the last years of the projection period. Employment growth follows economic performance with an elasticity of around 7 per cent (see Appendix A, Section 3).
Both scenarios are extreme but allow us to check the consistency of our model. Table 6-7 presents a comparative summary of results under the three scenarios.
Th e main changes are in respect of government accounts. In the optimistic sce-nario, the Government probably would not need to intervene as actively and could delegate the provision of social protection to other actors. Th e funding of the system would not face problems in the medium term because the expansion of employment would ensure the basis for contributory benefi ts. In the pessimistic scenario, the Gov-ernment would need to mobilize more resources to act in the economy and this would probably imply higher fiscal deficits. The funding of the schemes would be at risk because households and private employers would be aff ected.
It is necessary to include some feedback mechanisms between the economy and the expenditure decisions of the Government (which could expand non-social expendi-ture to reactivate the economy and also focus on social assistance with donor support), the behavioural responses of the population (which could increase its labour force par-ticipation rate given the growing labour demand) and the functioning of the labour market (e.g., in the short term, wages may not follow real labour productivity).
Table 6-7. Results under three scenarios, 2007 and 2025
Changing 2007 2025
Scenario1
Scenario2
Scenario3
GDP growth (per cent) 6.0 3.5 5.0 0.0
Employment growth (per cent) 4.2 2.4 3.4 0.0
Results
Mobilized resources by GRZ (per cent of GDP) 24.0 25.2 25.0 25.9
Social current expenditure by GRZ (per cent of GDP) 5.8 7.5 7.0 8.9
Overall fiscal result (per cent of GDP) -1.2 -2.2 -2.0 -2.9
Social Budget
Total health expenditure (per cent of GDP)* 5.7 6.2 5.1 9.7
Total education expenditure (per cent of GDP) 4.8 6.1 5.8 7.1
Social security benefits (per cent of GDP)* 1.4 1.5 1.4 1.8
Other benefits (per cent of GDP) 0.5 0.5 0.5 0.6
Administration (per cent of GDP) 1.2 1.5 1.5 1.9
Overall result of the Social Budget (per cent GDP) 1.5 1.3 1.7 0.6
PAYG contribution rate (per cent) – 3 statutory schemes 5.6 6.1 4.8 10.3
* Excluding administration costs.

166 Zambia – Social Protection Expenditure and Performance Review and Social Budget
Implications
Th is chapter has presented the main results of the Social Budget modelling based on recent trends in the country. Zambia seems to be starting a demographic transition with an increase in the dependency ratios and, consequently, higher pressure on the working-age population to support children and elderly people. In the context of the HIV pandemic, the role of the State in promoting good health and living conditions is paramount.
A positive trend is expected with sustained economic growth that fuels employ-ment over time. However, poverty alleviation and inequality reduction are not direct consequences of economic growth. Hence, the Government needs to implement some redistributive measures. It is attempting to do that with the current tax changes but the results are yet to be seen as this could aff ect investment decisions. However, even assuming a non-negative eff ect on investments, this positive economic environ-ment would not be suffi cient to provide jobs to unskilled young people in rural areas. Income-generating strategies need infrastructure and the Government needs resources for this. Th e projections indicate that the overall mobilized resources would not exceed 25 per cent of GDP, which is insuffi cient (and lower than the 26 per cent managed in 2004-2006 and the 30 per cent managed in 2001-2003).
Th e assumptions used in this version of the Social Budget are quite conserva-tive and showed the GRZ has little maneuverability with the restricted funds avail-able. However, the Government can redistribute some resources and then increase its social expenditure from 5.8 per cent of GDP in 2007 to 6.2 per cent of GDP by 2025. With the cancellation of pension arrears by 2010, the Government could really focus on extending social protection to the poorest. In this respect the support of donors is crucial.
Th e next step is to refi ne the model and where possible update information; and, to go on to develop a number of comprehensive policy options in consultation with the tripartite constituents and the cooperation partners. Th e intention would be to cost these options over a 15-year period and up to 25-year period for the social security schemes and to make recommendations as to their fi nancing. As seen in this chapter, a universal old-age pension is aff ordable. Other alternatives can be tested as well.


This report has sought to present the results of the Social Protection Expenditure and Performance Review (SPER) and Social Budget (SB) for Zambia, under-taken in the framework of the ILO-DFID partnership on extending social pro-
tection and coverage for all as a means to reducing poverty. It has sought to describe the existing situation in Zambia for social protection generally and to undertake a number of status quo projections and to off er some preliminary options.
Poverty
Exploring the linkages between poverty and the social and economic conditions expe-rienced by the population in Zambia, poverty was found to be associated with ‘indi-vidual’ characteristics such as disability, early or advanced age and poor health; ‘social’ attributes such as low levels of education, single-parenthood and widowhood; and ‘economic’ factors such as type of work and employment conditions. Almost half of the population was found to be ‘extremely poor’ living below the offi cial poverty line, and almost two-thirds were found to be ’moderately poor‘, living below the basic needs poverty line (BNPL), implying that social protection measures will eventually have to be considered for the majority of the population.
Starting from the fact that half of Zambia’s population is extremely poor (being unable to aff ord even basic food items on a sustainable basis), it was found that:
☐ Households headed by the elderly and by women are the most likely to experience extreme poverty. In the poorest decile 25 per cent of households were headed by elderly persons and 27 per cent by women.
☐ Households headed by persons with less than a secondary school education were also more likely to be extremely poor, with only 33 per cent of extremely poor households headed by a person with a secondary-school education.
☐ Th e majority of extremely poor households in Zambia have six or more members most of whom are children. Children alone account for nearly half of the extremely poor population.
7

☐ Nearly one-fi ft h of all children are orphans, most having lost their parents to HIV/AIDS. Most orphans are partial orphans and live with their mothers. Orphans experience higher poverty rates than non-orphan children, with full orphans (having lost both parents) experiencing the highest poverty rates. Orphans account for 10 per cent of the poorest population decile.
☐ There are disproportionately more women and disabled persons in the poorest decile. Th e vulnerability of individuals in this group is also evident in their higher exposure to unsafe sources of drinking water, lower likelihood of consulting a health professional in case of sickness or injury, and their higher susceptibility to chronic illness.
☐ Children in the poorest population decile are much less likely to attend school and, when they do, they begin at an older age.
☐ Although the poorest individuals seem to be the most economically active, almost all work in the informal economy, with four-fi ft hs of workers in the poorest popu-lation decile based in traditional agriculture, and the forestry and fi shing sectors.
Even among the ‘majority poor’, it is possible to distinguish the poorest and most vul-nerable individuals. Th is includes especially those individuals found within the fi rst and second expenditure deciles, whose monthly expenditures were on average only 20 per cent and 40 per cent of the BNPL, respectively. Altogether these two groups, rep-resenting 20 per cent of the population, include a higher-than-proportionate number of children aged under 15, elderly aged over 59 and orphans. Households in the two poorest deciles are also more likely to be headed by a woman or by a widowed person, compared with those in higher income deciles.
Conclusions

170 Zambia – Social Protection Expenditure and Performance Review and Social Budget
The Labour Market
The economy as a whole has a high degree of informalization, with 83 per cent of economically active persons being either unpaid household workers or self-employed, and 88 per cent of all those in paid employment (as self-employed or employees) with no social security entitlements (majority) or entitlements. Th at huge gap in coverage cannot be fi lled by existing non-contributory social assistance: as it is, existing social assistance programmes reach under 4 per cent of the population. Th ere is hardly any coordination of these social assistance programmes, and thus the very scarce resources allocated to social protection (see below) are not used very eff ectively.
Non-Contributory Schemes
Although the existing social assistance programmes target a wide range of poor and vulnerable groups, including those aff ected by hunger, extreme poverty, sickness, old age, orphan-hood, disability and death of family members, the programmes fail to cover most persons within such groups, because of excessively narrow targets, inac-curate targeting and low and inconsistent levels of benefits and hugely inadequate funding. Additionally, the award of benefi ts has no legislative base and thus people have no well-specified rights to claim benefits when they need them or to appeal when they are refused. As a result of all this, taking the estimate of the poorest 10 per cent of the population who are most in need of social assistance, for example, around 900,000 highly vulnerable individuals miss out on PWAS assistance each year, while a similar number of vulnerable farmers miss out on the Food Security Pack. Also excluded are the 400,000 persons estimated to qualify for cash transfers, and 500,000-750,000 informal-sector unemployed workers not covered by existing work-for-aid schemes.
Major challenges to extending the coverage of social assistance programmes are thus the following:
☐ Th e government-funded programmes are under-funded and deliver low and incon-sistent benefi ts. On the other hand donor-funded programmes are delivering more substantial benefi ts but cover only pilot areas, or small sections of the population, or are operated for limited periods.
☐ Targeting is in most cases decided on the basis of available funds, with little refer-ence to the situation of poverty and vulnerability. Present community-based tar-geting methods may also lead to uncontrolled inclusion and exclusion errors.
☐ Insuffi cient and erratic funding for established government programmes compro-mises their ability to meet targets and extend coverage. On the other hand, donor-funded programmes are also uncertain and in many cases do not leave behind lasting arrangements for social protection.
☐ Until now, most government-funded programmes have failed to make adequate arrangements for monitoring and evaluation, limiting the extent to which design and implementation elements can be improved. Th e good news is that awareness of that fact has been raised.

7. Conclusions 171
Contributory Schemes
Th e coverage situation is diff erent for those who have employee status: only 20 per cent of them are totally in the informal economy. But, on the other hand, only 22 per cent of them are in a totally formal environment. Th e majority work with a higher or lower degree of informality, enjoying some of the entitlements resulting from labour legislation but never all of them, including coverage by contributory social security. With respect to this group, formalization of their status is possible and does not have to take long.
It requires institutional eff orts focusing on enforcing existing legislation, raising awareness of this legislation among employees and employers – apart from introducing new legislation wherever necessary. Some of these efforts are the responsibility of existing social security institutions: the data on membership provided by the pension schemes suggest that they cover around 79 per cent (550,000 out of about 700,000) of their target group – that is all those aged 15-55 years who are in employment. However, the results of the Labour Force Survey suggest that in fact eff ective coverage by these schemes may be lower.
These institutions and their supervisory bodies must increase coordinated eff orts on more eff ective enforcement of obligations to register and contribute to social security, and also on raising employees’ and employers’ awareness of their social security rights and obligations. It is also important to create stronger incentives to contribute, by developing both well-designed social insurance policies and good governance of social insurance schemes.
For these objectives to be achieved by the contributory social insurance system in Zambia, the system needs to be signifi cantly strengthened. Issues of equality and equity should be addressed in the respective legislation. Existing legislation should be revised to ensure gender equality. Th ere is also a need to consolidate good governance principles into the management and supervision of social security institutions.
Health Care
Currently, Zambia’s health profi le is characterized by a very high mortality among chil-dren and women of reproductive age. Life expectancy at birth is only 40 years. Leading causes of death are infectious diseases, many of which could be prevented or treated with available medical technologies. Unfortunately, access to either eff ective technolo-gies or preventive care is a major problem for most Zambians. Constraints on both supply and demand prevent many interventions reaching the people who need them.
Zambia still has a limited health care infrastructure which is unequally dis-tributed across the country. Further, the distribution of the most important resource (health staff ) is perhaps the most signifi cant constraint on achieving greater health care coverage. Many preventable deaths occur because patients are too isolated from trained medical personnel who could save their lives.
Th e positive news is that the level of investments in the health sector has increased considerably since 2000, largely due to donor infl ows. Many of the donor-funded pro-grammes are targeted at priority diseases such as HIV/AIDS, TB and malaria and are making considerable progress in expanding health care coverage. However, health care expenditure is still skewed towards urban areas where most of the cost input (labour) is concentrated. Th e quality of most health infrastructure in rural areas falls below what is recommended and, in some cases, necessary to deliver life-saving interventions.

172 Zambia – Social Protection Expenditure and Performance Review and Social Budget
Importantly, the share of total health care resources mobilized through out-of-pocket payments is high. Private payment as source of health care revenue off ers the least protection to the population, and hurts the poorest the most. Th ere is strong evidence in Zambia that private payments have constrained access to care and off ered no protection from the impoverishing health care expenditure. User fees are being phased out. Th e Ministry of Health is exploring the option of social health insur-ance, but which would most probably cover only those in the formal economy, at least at the beginning. Th at option can be supported only if such an additional source of fi nancing would not crowd out current fi nancing from general taxation and donor funds aimed at ensuring aff ordable basic health care services to everybody, particu-larly the poorer people.
Social Budget
Expenditure on health care dominates the social protection budget of Zambia sur-passing 4 per cent of GDP, due to foreign financing. Non-health social protection expenditure is dominated by expenditure on government employees’ pensions – at about 1 per cent of GDP. Expenditure on social security benefits to private-sector employees is still very low, as the contributory scheme is young and not many mem-bers are as yet entitled to benefi ts. However, NAPSA reserves are growing every year by more than 0.5 per cent of GDP and have already surpassed the level of 3 per cent of GDP but are expected to decrease from 2025 on current assumptions. A small group of benefi ciaries of occupational pension schemes receives annually about 0.3 per cent of GDP in diff erent benefi ts. Reserves of the occupational pension scheme surpassed another 3 per cent of GDP. At the same time budget allocations to all main govern-ment- and donor-funded non-contributory social assistance programmes is at 0.165 per cent of GDP. Th is seems barely suffi cient in a country where half the population is said to live in extreme poverty.
Zambia depends heavily on donor funds to fi nance the provision of social pro-tection. Th is means that any reduction in external funds would aff ect the achieve-ment of human development targets. When this has happened previously, GRZ has responded by reallocating expenditure from non-social to social sectors and, when the reduction has been unexpected, to cut investment expenditure.
Th e Social Budget has shown that around 13.6 per cent of GDP is allocated to social expenditure, including education, and that the system has the resources, based on the existing status quo, to fi nance this expenditure. However, there are serious ques-tions concerning equitable access to services and benefi ts:
☐ First, health and education are basic services that in theory are free to all Zam-bians, but households still cover a large part of the costs of buying drugs, cov-ering transport costs and contributing with voluntary fees and materials. Indeed, household expenditure on these two items reaches 3.5 per cent of GDP, a high fi gure if compared with the amount spent by the GRZ (4.0 per cent of GDP).
☐ Second, social security schemes have very low coverage (which explains its low share in total revenues – 2.0 per cent of GDP) but they are building up reserves. However, these reserves are to fi nance the pensions of future retirees. Impor-tantly, there are Government had arrears outstanding to the pension funds (unpaid employers’ and employees’ contributions) which it has been paying off gradually.

7. Conclusions 173
☐ Th ird, social assistance is the mechanism to provide for the majority of the popula-tion, i.e., those who cannot aff ord to make out-of-pocket payments to cover unex-pected contingencies. However, this sector provides benefi ts for only 0.1 per cent of GDP and coverage is very low. Th e largest programme – the PWAS – still fails to cover the most destitute 2 per cent of the population.
Options
In recent years there has been a slight increase in social assistance expenditure due, to a large extent, to increased donor funding rather than greater budget allocations. Th e share of donor-funded social assistance has increased and may increase even more if plans to scale up cash transfer pilot schemes into a national programme are accepted. However, for there to be long-term sustainability, such fi nancing will need to be grad-ually taken over by budgetary allocations.
Although a thorough analysis of policy options to extend social protection coverage will be the subject of the second phase of our project, it is by no means too early to begin consideration of the policy developments which will be needed to address poverty and the needs of vulnerable groups. We have therefore presented a set of initial and approximate estimates to illustrate the scale of additional fi nancing that would be needed.1
We looked at the future costs of three hypothetical benefi ts targeted at three specifi c groups of benefi ciaries:
☐ a targeted social assistance scheme: vulnerable households and covering 10 percent of all households. We have assumed that this scheme and other simulated schemes will cover 100 per cent of the target group in the fi rst year (2009). We have assumed a benefi t per household equivalent to the average amount of benefi t paid within the current cash transfer pilot schemes and adjusted annually for infl ation (estimated to be K 52,725 per household per month in 2009);
☐ a universal pension for all persons aged 60 and over, starting with a monthly amount of K 60,000 in 2009;
☐ a child benefi t with two variants:– paid to the fi rst child up to age six, K 30,000 per month;– paid to the fi rst child up to age fourteen, K 30,000 per month.
If fully implemented in 2009, such a targeted social assistance scheme would cost (without taking into account administration and delivery) K 154 billion. A pension for the elderly would cost K 291 billion – nearly twice as much due to a much greater number of benefi ciaries. It is assumed for child benefi t that in the fi rst year of imple-mentation all families with children will receive the benefi t (at the level for one child); whereas, from then onwards claims will be paid only upon the birth of the fi rst child. At the start the number of benefi ciaries and the cost would be signifi cantly higher than the two other programmes but would decrease quickly over the following years. Figure 6-14 shows benefi t costs of all three hypothetical schemes until 2025 presented as per-centage of GDP per capita.
1 We do not cost separately here disability pension (persons with disabilities are, according to LCMS2004 about 2 per cent of Zambian population) but such a benefi t should also be considered as one of the compo-nent of the future basic social protection system.

174 Zambia – Social Protection Expenditure and Performance Review and Social Budget
Th e importance of this Report is that it provides a comprehensive picture of existing social protection and allows the reader to look into the future on the basis of status quo projections for the next twenty years. It also includes a preliminary look at the possible provision of three benefi ts: universal old age pension; targeted social assistance; and child benefi t, in order to provide some indicators as to a possible future minimum benefi t package aimed at poverty alleviation. It confi rms much existing knowledge and points to issues in relation to which there is need for action.
Key Findings
Th ere are six key fi ndings:
☐ Half of Zambia’s population is extremely poor and programmes that are tar-geted to alleviate poverty are under-funded by the Government and highly donor-dependent.
☐ Th e labour market is highly informalized.
☐ Zambia is entering a demographic transition in a period of sustained economic growth: the population almost doubles with a large increase in the working-age population.
☐ Coverage by both non-contributory and contributory schemes is low, and benefi ts inadequate. Th ere is a lack of overall coordination.
☐ Zambia is highly dependent on donor funding for health care.
☐ Zambia’s external debt was greatly reduced (2006) but at the same time donor aid was reduced so that very limited fi scal space was created.
Way Forward
☐ Th e Government needs to undertake a detailed public expenditure review with the aim of assessing the basis for, and redistributive impact of all kinds of existing transfers, subsidies and tax privileges in order to identify the fi scal space needed to fi nance priority social policies.
☐ Th e results of the work on informality of employment should feed into policy dis-cussions on the extension of social protection coverage, together with a job creation strategy targeted at youth.
☐ Th ere is scope to extend coverage by existing contributory and non-contributory schemes.
☐ A minimum package of universally acceptable benefi ts would be aff ordable – tar-geted social assistance and a universal pension would cost less than 1 per cent of GDP. A universal but limited child benefi t scheme (fi rst child only) would have higher start-up costs (1.2 per cent of GDP) but reduce over time.
☐ Th e next stage of the project needs to address the composition of a comprehensive social protection system and funding mechanisms.
175
Bank of Zambia (BoZ). n.d. A snap shot: Country data. Retrieved 6 Aug. 2007, from http://www.boz.zm/snapshot_countrydata.htm
—. 2007a. Bank of Zambia fortnightly statistics. Available on: http://www.boz.zm (several entries)
—. 2007b. Zambia balance of payments 1997-2007. Delivered by electronic means on 26 Nov. 2007.
Care International. 2005. A simple form of social security: Giving out social cash trans-fers in Kazungula, Zambia. Online article 3 Nov. 2005. Available: http://www.careinternational.org.uk/A+simple+form+of+social+security+4484.twl.
Central Board of Health (CBoH). 2004. Zambia District Deprivation Index. Lusaka.CBoH, UNZA & IHE. 2004. Costs of a basic health care package for 1st, 2nd and
3rd level of referral in Zambia. Lusaka and Lund, Central Board of Health, University of Zambia and the Swedish Institute for Health Economics.
Central Statistical Offi ce (CSO). 2003a. 2000 Census report. 2000 Census of Popu-lation and Housing. Lusaka. Retrieved on 25 Feb. 2007, from http://www.zam-stats.gov.zm/census.php.
—. 2003b. Summary report for the 2000 Census of Population and Housing. Lusaka.—. 2003c. Population projections report. 2000 Census of Population and Housing. Lusaka.—. 2003d. Migration and urbanization. 2000 Census of Population and Housing.
Lusaka: —. 2003e. Zambia Demographic and Health Survey 2001-2002. Lusaka.—. 2004a. Quarterly Employment and Earnings Enquiry Report, fi rst quarter 2004.
Lusaka, Labour and Manpower Statistics Branch.—. 2004b. Living Conditions Monitoring Survey Report 2002-2003. Lusaka, Govern-
ment of Zambia, Nov.—. 2005. Living Conditions Monitoring Survey Report 2004. Lusaka.—. 2006a. Th e non-farm informal sector in Zambia 2002-2003. Lusaka.—. 2006b. Formal Sector Employment Earnings Enquiry Report. Lusaka.—. 2006c. 2000 Census of Population and Housing. Population projections by 5-year
age group and sex for the period between 2000 and 2025, separately for rural and urban populations considering two scenarios: with and without HIV/AIDS. Version of June 12, 2006, delivered by electronic means on April 16, 2007.
ReferencesReferences
176 Zambia – Social Protection Expenditure and Performance Review and Social Budget
—. 2006d. National Accounts Statistical Bulletin 2005. Lusaka.—. 2007a. Labour Force Survey Report 2005. Lusaka.—. 2007b. Quarterly Employment and Earnings Enquiry Report 2006. Labour and
Manpower Statistics Branch. Lusaka.—. 2007c. Th e Monthly, No. 54, Sept. 2007. Lusaka.—. 2007d. Th e Monthly, No. 55, Oct. 2007. Lusaka.—. 2007e. Formal-sector employment trends, 1960-2004. Delivered by electronic
means on 28 Sept. 2007.—. 2007f. Th e Monthly, No. 56, Nov. 2007. Lusaka.—. 2007g. Th e Monthly, No. 57, Dec. 2007. Lusaka.—. n.d. Tables of GDP by economic activity, 1994-2006. Lusaka.CSO & ORC Macro. 2003. Zambia DHS EdData Survey 2002: Education data for
decision-making. Lusaka and Maryland.Chapman, Katie. 2006. Using social transfers to scale up equitable access to education
and health services. DFID Background Paper. London, Jan.Cheelo, C.; Ndulo, M.; Odegaarqrd, K. 2006. Policy lessons and emerging challenges
in the Zambian health sector 2000-2005. Lusaka.Cheta, M. 2005. Coordination among multiple pension schemes: Th e experience of the
National Pension Scheme Authority. ISSA Regional Conference for Africa, Lusaka, 9-12 Aug. 2005. Geneva, ISSA.
Chitah, B.M.; Masiye F. 2007. Deprivation-based resource allocation criteria in the Zambian health service: A review of the implementation process. EQUINET Discussion Paper No. 51. Lusaka.
Churchill, C. 2006. Protecting the poor: A micro insurance compendium. Geneva, ILO.Department for International Development (DFID). 2005. Social transfers and chronic
poverty: Emerging evidence and the challenge ahead. DFID Practice Paper. Oct. Available: http://www.dfi d.gov.uk/pubs/fi les/social-transfers.pdf — Annex 3: Summaries of Country Case Studies: Zambia, pp.29-30. Available: http://www.dfi d.gov.uk/aboutdfi d/performance/fi les/taking-action-fi nal/annex3.pdf.
Education Development Center (EDC). 2004. Final report: Zambia’s interactive radio instruction program. Submitted to USAID/Zambia. Retrieved 23 Oct. 2007, from http://pdf.usaid.gov/pdf_docs/PNADB926.pdf
EM-DAT (2007). Th e OFDA/CRED International Disaster Database. Université catholique de Louvain (Brussels – Belgium). Retrieved 16 Sept. 2007, from http://www.em-dat.net/disasters/Visualisation/profi les/countryprofi le.php.
Foster, James; Greer, Joel; Th orbecke, Erik. 1984. “A class of decomposable poverty measures” in Econometrica, Vol. 52, No. 3, pp. 761-766.
Garrett, James. 2004. Community empowerment and scaling-up in urban areas: Th e evolution of PUSH/PROSPECT in Zambia. International Food Policy Research Institute, Apr. Available http://www.ifpri.org/divs/fcnd/dp/papers/fcnbr177.pdf.
Goodman, Ric; Harland, Charlotte. 2007. Scaling up cash transfers: Observations from Eastern Province Field Trip. May.
Government Actuary’s Department (GAD). 2007. National Pension Scheme, actu-arial valuation as at 31 December 2004. Prepared by C. Daykin (29 Aug. 2007). London.
Government of the Republic of Zambia (GRZ). 2001. Gazette Notice No. 457 of 2001 [000718876].
—. 2002. Th e Minimum Wages and Conditions of Employment (General) Order. Retrieved 16 Sept. 2007, from http://www.ilo.org/dyn/natlex/docs/SERIAL/61137/53596/F1971018378/ZMB61137.pdf.
—. 2005. Draft Social Protection Strategy. Lusaka. Apr. 2005. Available http://www.socialcashtransfers-zambia.org/mediapool/28/282961/data/sps_draft _may_2005_without_appendix.pdf.
—. 2006. Fift h National Development Plan 2006-2010: Broad-based wealth and job creation through citizenry participation and technological advancement. Lusaka.
—. 2007. National Social Security Policy Strategy Document [Draft ]. Lusaka, Ministry of Labour and Social Security.
—. 2008. 2008 Activity-based Annual Budget. Lusaka.GRZ, MCDSS & GTZ. 2004. Draft case study report: An assessment study in the
fr amework of the development of a social protection strategy. Submitted to the Social Protection Sector Advisory Group National Pension Scheme Authority. Lusaka.
GTZ. 2005. Social cash transfers – reaching the poorest. A contribution to the inter-national debate based on experience in Zambia. Eschborn. Available http://www.socialcashtransfers-zambia.org/mediapool/28/282961/data/gtzSCT.pdf.
Hantuba, M. 2005. Recent reforms and experiences of pension schemes: A case for pri-vatization of social security in Zambia. ISSA Regional Conference for Africa, Lusaka, 9-12 Aug. 2005. Geneva, ISSA.
Harvey, Paul; Marongwe, Nelson. 2006. Independent evaluation of Oxfam GB Zam-bia’s Emergency Cash-Transfer Programme. May. Available http://www.odi.org.uk/hpg/papers/OxfamZambiaCashEvaluation.pdf.
Hendricks, G. 2003. Pension reform in Zambia: Part I. Th e National Pension Scheme (NPS). Presentation for the World Bank Course on Pension Reform in Sub-Saharan Africa. Retrieved 12 Sept. 2007, from http://info.worldbank.org/etools/docs/library/76907/february2003/presentations/ghzambia.pdf
Hussmans, R. 2004. Measuring the informal economy: From employment in the informal sector to informal employment. Working Paper No. 53. Policy Integra-tion Department, Bureau of Statistics. Geneva, ILO.
ILO. 1993. 1993 Resolution concerning statistics of employment in the informal sector. Adopted by the Fift eenth International Conference of Labour Statisticians (Jan.). Available at http://www.ilo.org/public/english/bureau/stat/download/res/infsec.pdf
—. 1999. Social budgeting in Ukraine. Report of a Joint Task Force in collaboration with the International Labour Organization, the World Bank and the United Nations Development Programme in Ukraine. Geneva.
—. 2002. Decent work and the informal economy. International Labour Conference, 90th Session, Report VI. Geneva. Retrieved 3 May 2005 from: http://www.ilo.org/public/english/employment/infeco/download/report6.pdf
—. 2003. Seventeenth International Conference of Labour Statisticians: General Report. Geneva, 24 Nov.-3 Dec. 2003. Geneva.
ILO-FACTS. 2002. Th e ILO population projection model (ILO-POP). A technical guide. Version 1.1 8/2002. Geneva: Th e International Financial and Actuarial Service (ILO-FACTS), Financial, Actuarial and Statistical Services Branch, Social Protection Sector.
ILOLEX. 2007. International Labour Organization Labour Standards Database. Retrieved 11 Jan. 2007 from http://www.ilo.org/ilolex/.
International Monetary Fund (IMF). 2001. Government fi nance statistics manual 2001. Washington, DC, Statistics Department. Available from www.imf.org/external/pubs/ft /gfs/manual/pdf/all.pdf
References 177
178 Zambia – Social Protection Expenditure and Performance Review and Social Budget
—. 2007a. IMF country report, 07/209. Zambia: Fift h and sixth reviews under the poverty reduction and growth facility arrangement and request for waiver of non-observance of performance criteria—Staff report; Press release on the Executive Board discussion; and statement by the Executive Director for Zambia. Washington, DC, June.
—. 2007b. Public Information Notice (PIN) 07/144. IMF Executive Board concludes 2007 Article IV Consultation with Zambia. Washington, DC.
—. 2008a. IMF country report, 08/29. Zambia: Selected issues. Washington, DC, Jan.
—. 2008b. IMF country report, 08/30. Zambia: Statistical appendix. Washington, DC, Jan.
—. 2008c. IMF country report, 08/41. Zambia: 2007 Article IV Consultation – Staff Report; Staff Statement; Public Information Notice on the Executive Board Discussion; and Statement by the Executive Director for Zambia. Washington, DC, Jan.
JASZ. 2007. Joint Assistance Strategy for Zambia 2007-2010.Jesuit Centre for Th eological Refl ection (JCTR). 2007. Research on social protection
and children’s rights in Zambia. Draft 2006. Lusaka.Kafue District CHEWS Team. 2006. Zambia Community Health Waiver Scheme:
Final evaluation. Feb. Bethesda, MD, Th e Partners for Health Reformplus Project, Abt Associates Inc. Available http://www.phishare.org/documents/PHRplus/3877/.
Local Authorities Superannuation Fund (LASF). 2006a. “LASF reduces backlog of benefi t arrears” in Superannuation Update, No. 3, Jan. – June 2006. Lusaka.
—. 2006b. Financial highlights and budgetary performance as at 30th September, 2006. Appendix I. Electronic version.
—. 2006c. LASF company profi le. Retrieved 11 Sept. 2007, from http://www.lasf.org.zm/profi le.php
—. n.d. Income and expenditure account for year ended: 31st December 2004. Sub-mitted to the PIA.
Lee, D.; Siamwiza, R. 2006. Orphans and vulnerable children in Zambia: An assess-ment of vulnerability in selected districts. WFP Draft , Dec. Available: http://documents.wfp.org/stellent/groups/public/documents/vam/wfp117663.pdf
Lusaka Stock Exchange (LuSE). 2007. Statistics at the end of each year, 2002-2006. Lusaka.
McCulloch, Neil; Baluch, Bob; Cherel-Robson, M. 2000. Globalisation, poverty and inequality in Zambia during the 1990s. Paper prepared for the OECD Con-ference on Poverty and Income Inequality in Developing Countries: A Policy Dialogue on the Eff ects of Globalisation, 30 Nov.-1 Dec. 2000.
Ministry of Community Development and Social Services (MCDSS). 2004. Public Welfare Assistance Scheme Booklet. Available www.socialcashtransfers-zambia.org/mediapool/28/282961/data/PWAS_Booklet.pdf.
—. 2005. Social Protection Strategy: Draft , April, without Appendix. Available http://www.socialcashtransfers-zambia.org/mediapool/28/282961/data/sps_draft _may_2005_without_appendix.pdf.
—. 2006. 2006 Annual Report. Lusaka, Department of Social Welfare.—. 2007a. Evaluation study on appropriate models of livelihood strategies for social
protection in Zambia. Mar. Lusaka.—. 2007b. Implementation fr amework for scaling up to a national system of social
transfers in Zambia. Working Document, July. Lusaka.
References 179
MCDSS/GTZ. 2005. An assessment study in the fr amework of the development of a social protection strategy. Case Studies Final Draft Summary Report submitted to the Social Protection Sector Advisory Group. Lusaka, Feb. Available http://www.socialcashtransfers-zambia.org/mediapool/28/282961/data/Social per cent20Protection per cent20Assessment per cent20Study.pdf.
—. 2007. Th e Pilot Social Cash Transfer Scheme: Zambia. Summary Report, 5th edition. Lusaka, May. Available: http://www.socialcashtransfers-zambia.org/mediapool/28/282961/data/Scheme_documents/Summary_5th_.pdf
Ministry of Finance and National Planning (MoFNP). 2005. Economic Report 2004. Lusaka.
—. 2006a. Economic Report 2005. Lusaka.—. 2006b. 2007-2009 Medium-Term Expenditure Framework and the 2007 Budget.
Lusaka. —. 2007. 2007 Budget Speech. Lusaka—. 2007a. Economic Report 2006. Lusaka—. 2007b. 2008-2010 Medium-Term Expenditure Framework and the 2008 Budget.
Draft . Green Paper. Lusaka—. 2007c. Statistical tables for Government accounts, domestic and external debt.
Lusaka.—. 2008. Budget address by the Hon. Ng’Andu P.Magande, MP Minister of Finance
and National Planning, delivered to the National Assembly on 25 Jan. 2008.Ministry of Health (MoH). 1995. National Health Services Act, 1995.—. 2005a. 2004 Annual Report. Lusaka.—. 2005b. 2005 Annual Health Statistical Bulletin. Lusaka, Health Management
Information System (HMIS) Unit.—. 2006a. Health Sector Joint Annual Review Report 2005. Lusaka, Mar.—. 2006b. Zambia National Health Accounts 1999-2003. Lusaka.MoH & UNZA (2007). Zambia public expenditure tracking and quality of service
delivery survey in the health sector: Findings and implications. Lusaka, MoH and University of Zambia.
MS Zambia. 2007. Zambian NGOs are struggling against time. Danish Association for International Co-operation. Retrieved 10 Oct. 2007, from http://www.mstcdc.or.tz/sw78886.asp
Musenge, D.K. 2006. Social and economic investments of social security funds: Th e case of the National Pension Scheme Authority of Zambia. ISSA. International Social Security Association Meeting of Directors of Social Security Organiza-tions in English-Speaking Africa, held in Mahe, Seychelles, 3 – 6 Oct. 2006. Geneva, International Social Security Association.
Musonda C. 2006. Pensions: Coordination among multiple pension schemes: Th e experience of the National Pension Scheme Authority. Presentation at the ISSA Regional Conference for Africa, Lusaka 9 – 12 Aug. 2005. Geneva, Interna-tional Social Security Association.
Nakamba-Kabaso, P.; Cheelo, C.; Mungule, O.K.; Masiye, F.; Bwalya, S.; Öde-gaard, K.; Ghateneker, O.; Vwalika, B.; Nikisi, J.; Sinyinza, E.; Ngoma, K. 2006. “Th e Zambian costs of a basic health care package”, in Cheelo, C.; Ndulo, M.; Ödegaard, K. (eds.): Policy lessons and emerging challenges in the Zambian health sector 2000-2005. Lund, Department of Economics of the University of Zambia, and the Swedish Institute of Health Economics, pp. 33-57.
National Pension Schemes Authority (NAPSA). 1999. Retirement. Brochure. Lusaka, NAPSA, Th e Public Aff airs Offi ce.
180 Zambia – Social Protection Expenditure and Performance Review and Social Budget
—. 2005. Report and fi nancial statements for the year ended 31 December 2004. Audited by Deloitte & Touche, 2 Dec.
—. 2006. Balance sheet for year 2005. Lusaka.—. 2007a. Report and fi nancial statements for the year ended 31 December 2005.
Audited by Deloitte & Touche, 28 Feb.—. 2007b. Report and fi nancial statements for the year ended 31 December 2006.
Audited by Deloitte & Touche, 18 Sept.—. 2007c. Electronic data submitted on several dates, including personal communi-
cations and written questionnaire.OECD. 2007. Statistical Annex of the 2007 Development Co-operation Report.
Table 25a. Retrieved 8. Feb. from www.oecd.org/dac/stats/dac/dcrannex.Paris Declaration. 2005. Paris Declaration on Aid Eff ectiveness: Ownership, harmoni-
sation, alignment, results and mutual accountability. High-level Forum on Aid Eff ectiveness, Paris, 28 Feb. – 2 Mar.
Parker, Barbara; Mwape, Faustin. 2004. Poverty and vulnerability in Zambia, 2004: A qualitative study. Background paper prepared for PVA Consultation Work-shop, held in Lusaka, 1-2 Mar. 2004. Lusaka, June.
Pensions and Insurance Authority (PIA). 2005. Report of the pensions industry for 2004. Lusaka.
—. 2006. Report of the pension industry for 2005. Lusaka.—. n.d.. General aspects of pensions in Zambia as a social protection system. Retrieved
9 Aug. 2007, from http://www.pia.org.zm/pia per cent20and per cent20pen-sions per cent20industry.htm.
Petrauskis, C. 2005. Restoring dignity to employment in Zambia: Legal and moral motivation to promote the common good. Preliminary reactions. Lusaka, Jesuit Centre for Th eological Refl ection ‘Promoting Faith and Justice’.
—. 2007. Investing directly in the poor, the demand for social protection in Zambia. Lusaka, Jesuit Centre for Th eological Refl ection. Feb. 2007. Available http://www.jctr.org.zm/publications/AFLPresentation/SProtection07.pdf.
Phiri, F. ; Tien, M. 2004. Zambia National Health Accounts 2002: Main fi ndings. Lusaka, MoH and PHR plus.
Program Against Malnutrition. n.d. Th e Targeted Food Security Pack. Available http://www.pam.org.zm/fsp.htm (accessed 11.06.2007).
Public Service Pension fund (PSPF). n.d. Formulae for computing pension benefi ts. Retrieved 3 Sept. 2007, from http://www.pspf.org.zm/Documents/Formulae per cent20computation.pdf.
QED. n.d. Confi dential report on the statutory actuarial valuation of the Public Service Pension Fund as at 31 December 2002. Lusaka, QED Actuaries & Consultants (Pty) Ltd.
Queisser, M.; Bailey, C.; Woodall, J. 1997. Reforming pensions in Zambia: An analysis of existing schemes and options for reform. WB Policy Research Working Paper, No. 1716. Washington, DC, World Bank.
Regional Hunger and Vulnerability Programme (RHVP). 2007. Zambia: Sum-mary data on social protection schemes. Jan. 2007. Available at http://www.wahenga.net/uploads/documents/nationalsp/Zambia_SP_programs_Jan2007.pdf.
—. 2007a. Zambia: Summary data on social protection schemes. Lusaka.Schubert, Bernd and Goldberg, Jörg. 2004. Test Phase Results of the Pilot
Social Cash Transfer Scheme, Kalomo District. 4th Report. Kalomo, GTZ, May 2004. Available: http://www.socialcashtransfers-zambia.org/pageID_2616978.html.

References 181
Shijun Ding. 2007. Analysis of poverty and vulnerability and its determinants in rural Hubei. 6th PEP Research Network General Meeting, Lima, Peru 14-16 June 2007.
Simler, Kenneth R.; International Food Policy Research Institute (IFPRI). 2007. Micro-level estimates of poverty in Zambia. 30 April.
Social Security Administration (SSA). 2005. Social security programs throughout the world: Afr ica, 2005 - Zambia. Retrieved 15 Aug. 2007, from http://www.ssa.gov/policy/docs/progdesc/ssptw/2004-2005/africa/zambia.html.
United Nations (UN). 2006. Handbook on poverty statistics: Concepts, methods and policy use. New York, NYC, UN Statistics Division. Accessed 24.01.2007. http://unstats.un.org/unsd/methods/poverty/Chapters.htm.
— .2007a. World population prospects: Th e 2006 revision population database. Popula-tion Division of the Department of Economic and Social Aff airs of the United Nations Secretariat. Retrieved 11 Nov. 2007, from http://esa.un.org/unpp.
— .2007b. National account main aggregates database. Th e Economic Statistics Branch of the Statistics Division. Retrieved 19 Sept. 2007, from http://unstats.un.org/unsd/snaama/.
UNAIDS. 2006. Zambia: Country situation analysis. Retrieved 18 Sept. 2007, from http://www.unaids.org/en/Regions_Countries/Countries/zambia.asp.
UNAIDS & WHO. 2007. AIDS academic update, 7. Geneva, Joint United Nations Programme on HIV/AIDS and World Health Organisation.
—. 2008. Zambia: Country progress report 2008. WHO/UNAIDS website, accessed Feb 12 2008.
UNDP. 2005. Human Development Report 2005: International cooperation at a cross-roads: Aid, trade and security in an unequal world. New York, NYC.
—. 2007. Zambia Human Development Report 2007. Enhancing household capacity to respond to HIV and AIDS. Lusaka.
United Nations Economic and Social Council 2003. Report submitted by Mr. Juan Miguel Petit, Special Rapporteur on the sale of children, child prostitution and child pornography in accordance with Commission on Human Rights Resolu-tion 2002/92. E/CN.4/2003/79, 6 Jan. 2003. Available: http://www.hri.ca/fortherecord2003/documentation/commission/e-cn4-2003-79.htm.
UNZA & MoH (2006). National health accounts for Zambia 2002-2004. Lusaka, Department of Economics of the University of Zambia, Ministry of Health, the Swedish International Development Agency (SIDA) and the Swedish Institute of Health Economics.
USAID. 2007. Radio program draws young and old to school.van Ginneken, Wouter. 1997. Social security for the informal sector: Investigating the
feasibility of pilot projects in Benin, India, El Salvador and Tanzania. Issues in Social Protection Discussion Paper No. 5. Geneva, ILO. Retrieved 29 Dec. 2007 from: http://www.ilo.org/public/english/protection/socsec/publ/index.htm#discus5.
—. 2003. Extending social security: Policies for developing countries. Extension of Social Security (ESS) Paper No. 13. Geneva, ILO. Retrieved 24 Jan. 2008 from: http://www.ilo.org/public/english/protection/socsec/download/ess-paper13.pdf.
Vass, J. 2002. Th e relationship between labour market dynamics and HIV/AIDS preva-lence: A literature review. Th e Joint Centre for Political and Economic Studies, AusAID, DFID, USAID. Retrieved 28 Nov. 2007, from www.hsrc.ac.za/research/output/outputDocuments/2161_Vass_Th eRelationshipBetweenLa-bourMarket.pdf.

182 Zambia – Social Protection Expenditure and Performance Review and Social Budget
Workers’ Compensation Fund Control Bank (WCFCB). n.d. Income statement 2000-2005. Lusaka.
Weeks, J. 2008. “Th e reduction of fi scal space in Zambia – Dutch disease and tight-money conditionalities”, in Country Study, No. 14. Brasilia, International Pov-erty Centre and UNDP.
Weeks, J.; McKinley, T. 2006. “Does debt relief increase fi scal space in Zambia? Th e MDG implications,” in Country Study, No. 5. Brasilia, International Poverty Centre and UNDP.
WHO. 2007. Core health indicators: World health statistics 2007. Retrieved 11 Nov. 2007 from http://www.who.int/whosis/database/core/core_select.cfm.
—. 2008. World health statistics at WHOSIS, accessed 2 Feb. 2008.Wilkins, N. (n.d.) Informal sector: AIDS brief for sectoral planners and managers.
University of Kwazulu-Natal, Health Economics and HIV/AIDS Research Division (HEARD). Retrieved 28 Nov. 2007 from http://www.ukzn.ac.za/heard/publications/AidsBriefs/sec/Informal.pdf.
World Bank. 2005. Zambia poverty and vulnerability assessment. Discussion draft 29 June. Report No.32573-ZM DRAFT.
World Food Programme. 2006. Country Programme Zambia 10447.0 (2007-2010): Support for national capacity building for the management of hunger reduction programmes. WFP/EB.1/2007/8/2. 20 Dec. 2006.
—. 2007. Zambia: Projected 2007 needs for WFP projects and operations. http://www.wfp.org/country_brief/indexcountry.asp?region=3§ion=9&sub_section=3&country=894#WFP per cent20Activities. Last accessed 5 Dec. 2007.
Xu K.; Evans D.B.; Kawabata K. et al. 2003. “Household catastrophic health expend-iture: A multi-country analysis”, in Th e Lancet, Vol. 362, pp. 111-117.
Zambia Investment Centre (ZIC). 2006. Investors’ guide handbook. Lusaka.Zambia Open Community Schools (ZOCS). 2007. Community schools and their con-
tribution to education in Zambia: Resources. Lusaka. Retrieved 23 Oct. 2007, from http://www.zocs.org.zm/resources.php.

183
Projections were made with the help of the ILO Social Budget model, which was adapted to the Zambian case. Th is is an accounting model that estimates, projects and simulates the revenues and expenditures of the social protection
system in the country. It contains assumptions consistent with recent sectoral develop-ments and long-term national plans.
Th e fi rst step is mapping out the diff erent benefi ts provided by the national social protection system (in diff erent chapters of this report), which is mirrored in the structure of the Social Budget. Th e second step is projecting the revenues and expenditures based on assumptions made explicit throughout this Appendix and in Chapter 6. Th e third step is to make simulations or to explore the possible results of changes in the ‘status quo’ situation, for instance, in the benefi t provisions or in their fi nancing modalities.
Th e expenditures projected in this version of the Zambian Social Budget are: 1
☐ employment-related social security expenditure: national pension and civil servant pension schemes; short-term cash benefi ts, such as work injury compensation, sick-ness and maternity leave, severance pay;
☐ publicly fi nanced social protection expenditure: social assistance benefi ts such as cash transfers, public work and feeding programmes; and health care;
☐ non-public social protection expenditure: occupational (voluntary) pensions; and health care fi nanced by employers, households or donors.
Th e revenues projected are: social security contributions, tax revenues, grants from donors, private contributions (to private insurance, enterprise-based benefi ts, or out-of-pocket spending), and investment income.
Th ese items are arranged according to their function and presented in Table A-1. Th ese revenues and expenditures are projected over a medium-term period, from 2005 to 2025.
1 Th is is the fi rst version of the Zambian Social Budget. Th e model should be improved with the participa-tion of local stakeholders and whenever more accurate information is available.
Appendix A.
The Zambian Social Budget modelAppendix A.
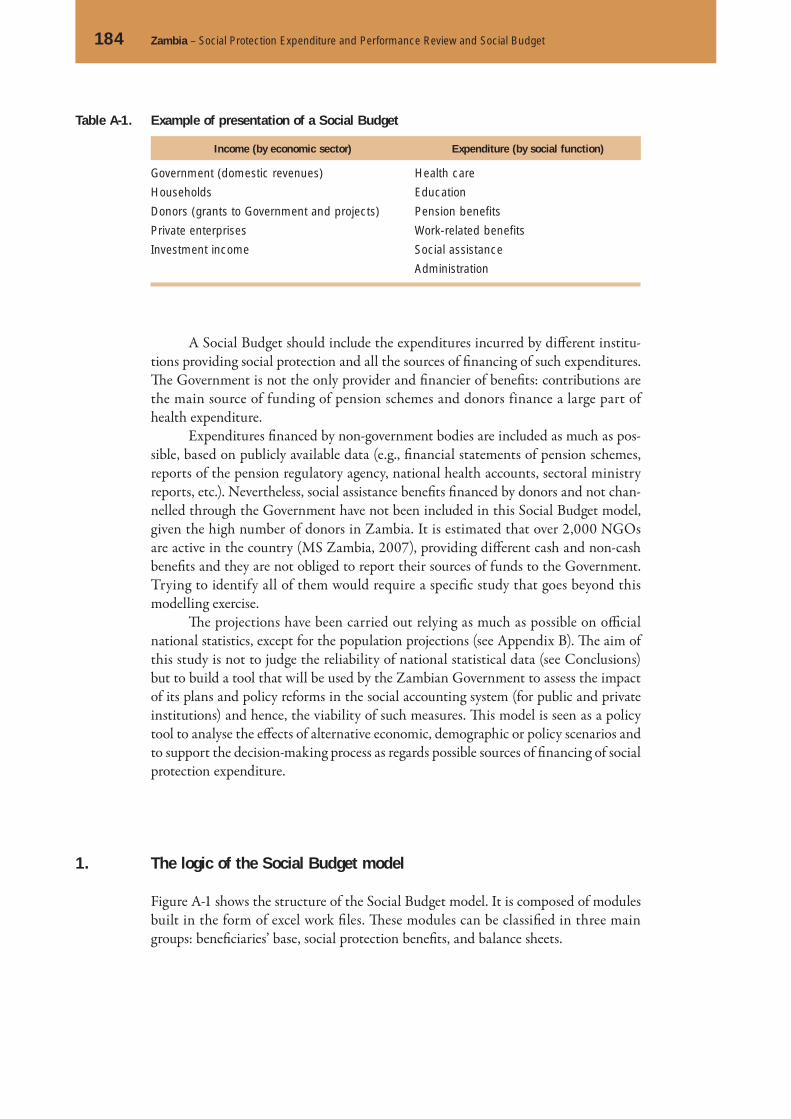
184 Zambia – Social Protection Expenditure and Performance Review and Social Budget
A Social Budget should include the expenditures incurred by diff erent institu-tions providing social protection and all the sources of fi nancing of such expenditures. Th e Government is not the only provider and fi nancier of benefi ts: contributions are the main source of funding of pension schemes and donors finance a large part of health expenditure.
Expenditures fi nanced by non-government bodies are included as much as pos-sible, based on publicly available data (e.g., fi nancial statements of pension schemes, reports of the pension regulatory agency, national health accounts, sectoral ministry reports, etc.). Nevertheless, social assistance benefi ts fi nanced by donors and not chan-nelled through the Government have not been included in this Social Budget model, given the high number of donors in Zambia. It is estimated that over 2,000 NGOs are active in the country (MS Zambia, 2007), providing diff erent cash and non-cash benefi ts and they are not obliged to report their sources of funds to the Government. Trying to identify all of them would require a specifi c study that goes beyond this modelling exercise.
Th e projections have been carried out relying as much as possible on offi cial national statistics, except for the population projections (see Appendix B). Th e aim of this study is not to judge the reliability of national statistical data (see Conclusions) but to build a tool that will be used by the Zambian Government to assess the impact of its plans and policy reforms in the social accounting system (for public and private institutions) and hence, the viability of such measures. Th is model is seen as a policy tool to analyse the eff ects of alternative economic, demographic or policy scenarios and to support the decision-making process as regards possible sources of fi nancing of social protection expenditure.
The logic of the Social Budget model
Figure A-1 shows the structure of the Social Budget model. It is composed of modules built in the form of excel work fi les. Th ese modules can be classifi ed in three main groups: benefi ciaries’ base, social protection benefi ts, and balance sheets.
1.
Table A-1. Example of presentation of a Social Budget
Income (by economic sector) Expenditure (by social function)
Government (domestic revenues) Health care
Households Education
Donors (grants to Government and projects) Pension benefits
Private enterprises Work-related benefits
Investment income Social assistance
Administration
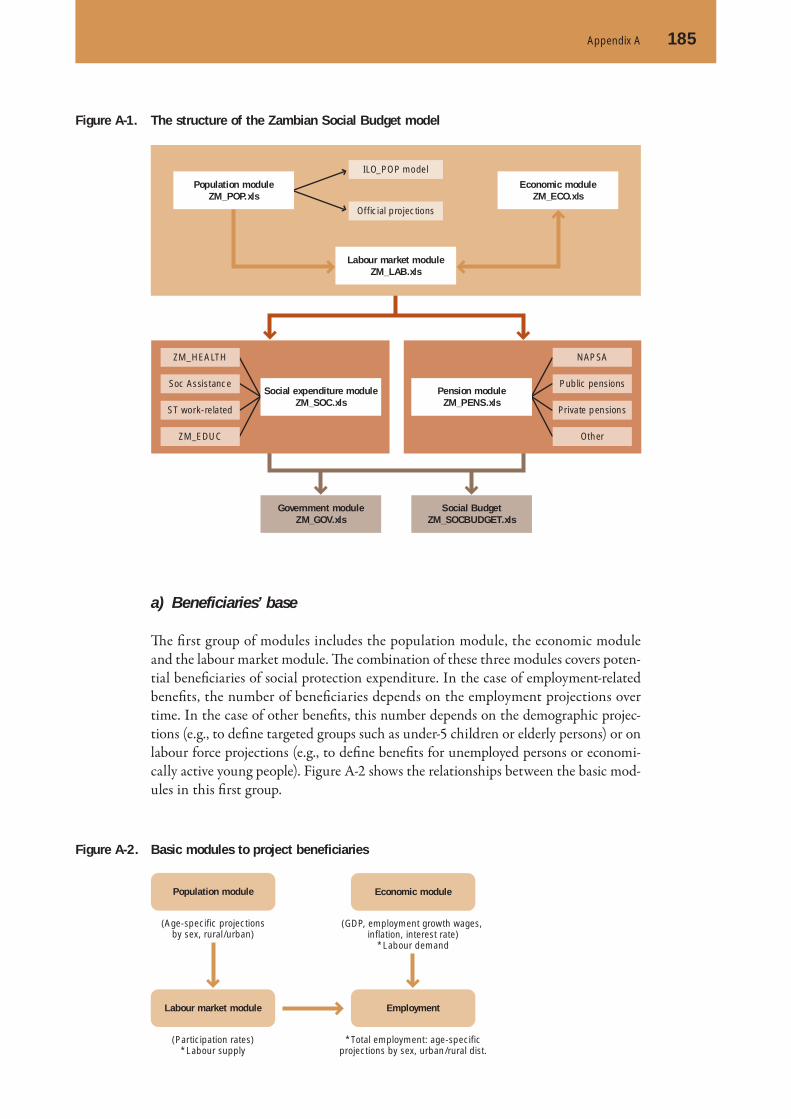
Appendix A 185
a) Beneficiaries’ base
Th e fi rst group of modules includes the population module, the economic module and the labour market module. Th e combination of these three modules covers poten-tial benefi ciaries of social protection expenditure. In the case of employment-related benefi ts, the number of benefi ciaries depends on the employment projections over time. In the case of other benefi ts, this number depends on the demographic projec-tions (e.g., to defi ne targeted groups such as under-5 children or elderly persons) or on labour force projections (e.g., to defi ne benefi ts for unemployed persons or economi-cally active young people). Figure A-2 shows the relationships between the basic mod-ules in this fi rst group.
Figure A-1. The structure of the Zambian Social Budget model
ILO_POP model
Economic moduleZM_ECO.xls
Official projections
Labour market moduleZM_LAB.xls
Government moduleZM_GOV.xls
Social BudgetZM_SOCBUDGET.xls
Population moduleZM_POP.xls
Pension moduleZM_PENS.xls
NAPSA
Public pensions
Private pensions
Other
ZM_HEALTH
Soc Assistance
ST work-related
ZM_EDUC
Social expenditure moduleZM_SOC.xls
Figure A-2. Basic modules to project beneficiaries
Population module
Labour market module
Economic module
Employment
(Age-specific projectionsby sex, rural/urban)
(GDP, employment growth wages, inflation, interest rate)
*Labour demand
(Participation rates)*Labour supply
*Total employment: age-specificprojections by sex, urban/rural dist.

186 Zambia – Social Protection Expenditure and Performance Review and Social Budget
Th e population projections can be obtained from offi cial projections or from an external model such as the ILO-POP (see Appendix B). Th e choice depends on the availability of detailed projections by sex age cohort. Population projections are the basis for the labour force projections or the labour supply. Assumptions about participa-tion rates by age group are based on the most recent labour force survey (2005).
On the other hand, the economic module provides the labour demand based on exogenous assumptions about the economic performance of the country and the relationship between economic growth and employment. Th e aggregate number of employed persons projected in this module is distributed among cohorts according to the existing labour supply. Th erefore, detailed employment projections are built simul-taneously (this is indicated by the two arrows pointing to employment which is not a separate module but part of the labour market module). Details are given later.
b) Social protection benefits
Two main modules compose this second group: the pension and the social expenditure module.
Th e number of benefi ciaries for each type of social protection expenditure is pro-jected over time considering the benefi ciaries’ base, the specifi c legal provisions of the benefi ts and the historical records of each scheme (when available). For instance, social security schemes are mandatory for paid employees but voluntary for the self-employed so we could not assume a coverage of 100 per cent of employed persons. Legal provi-sions were checked for each benefi t.
Th e expenditures and their source of fi nancing are estimated based on informa-tion specifi c to the schemes or programmes. Th e amount and detail of information required depend on the type of benefi t. For instance, in the case of employment-related benefi ts, this information would be necessary: collection rates, number of active and inactive contributors, number of pensioners, scheme-specifi c mortality and invalidity rates, earnings and benefi ts in payment, salary scale, and so on. Nevertheless, on several occasions the ideal data were not available and diff erent methods were used.
In general, we had more information on the pension schemes than on other ben-efi ts. Nevertheless, it was necessary to make assumptions based on global trends; for instance, we consider a constant coverage of social security schemes so that the number of active contributors grows at the same rate as the number of formal employees.
Regarding the social expenditure module, the current version of the model has emphasized health care expenditure for which high-quality information was available (e.g., UNZA & MoH, 2006, CBoH, UNZA & IHE, 2004). Social assistance and (non-social security) work-related benefi ts are related to projected economic and demo-graphic variables.
c) Balance sheets
Th e Government and Social Budget modules compose this third group. Both are fed by the previous detailed modules and are indeed summary sheets of the social protection expenditure. Th e Government module provides a balance of the general government accounts, that is, it includes accounts of the central Government, local Governments and social security schemes. It does not include accounts of parastatals or public

Appendix A 187
corporations (see IMF, 2001). Funds provided by donors to the central Government are also included. Th is module reveals the public fi nancing needs according to the probable future behaviour of the social protection system and fi scal scenarios.
Th e Social Budget module includes those accounts of the government module that refer to social protection sectors and the expenditures of the private sector (e.g., households, employers, churches, etc.) which are fi nanced by their own funds or by third-parties. Th is module provides a more complete picture of how the Zambian social protection system works: the relationships between agents and the system’s fi nancial sustainability.
Population and labour market module
Th e method for projection of the population fi gures is explained in Appendix B. Here we explain how the fi gures of labour force and employment were obtained. Popula-tion projections provide numbers of people in each single-age cohort by sex and area of residence. Hence, four groups were identifi ed: rural female, urban female, rural male, and urban male. Th e labour force projections are calculated based on the labour force participation rates of 2005 (labour force survey) but the model allows for changes in these rates over time.
It must be said that we use the participation rates but not the absolute numbers of the labour force coming from the labour force survey report. We rely on our popu-lation projections, so that –
For each 5-year age cohort ‘f’ in each of the four groups, the labour force for 2005 is:
Labour force f = Participation rate f * Population fWhere the participation rate comes from the LFS 2005 and the popula-tion is projected using the model.
Th e labour force for each single-age cohort is calculated using linear interpolation so that the assumption of participation rate for the fi ve-year cohort holds.
Next, the total fi gures of employment that come from the economic module are distributed across these four groups, considering the average employment rate for each group.
For the base year (2005), the employment rates from the labour force survey were: 90 per cent for rural females, 64 per cent for urban females, 91 per cent for rural
2.
For each of the four groups (g), the total number of employed persons in year (t) is:
Employment g (t) =Share in employment g (t) * Total employment (t)
Share in employment g (t) =Share in employment g (t-1) * [Labour force g (t) / Labour force g (t-1)]Where the share in labour force after 2005 and the total employment are calculated by using the model.The share in employment is adjusted to avoid a total over 100 per cent.

188 Zambia – Social Protection Expenditure and Performance Review and Social Budget
males, and 77 per cent for urban males. Having the projections of labour force for each group, a total number for employment was calculated which was adjusted so that the total employment rate in the country was 84 per cent. For the next years, the number of employed persons in each of the four groups is calculated assuming that the initial distribution of employment varies with the labour force growth in each group.
The employment within each group is distributed across cohorts following the same method, that is, taking into account the initial distribution of employment (2005) and the share of each cohort in the labour force for each year.
For each single-age cohort ‘x’ in each of the four groups, the number of employed persons in year ‘t’ is:
Employment x (t) =Share in employment x (t) * Total employment (t)
Share in employment x (t) =Share in employment x (t-1) * [Labour force x (t) / Labour force x (t-1)]
Th e implicit assumption is that employment follows the age structure of the labour supply over time, which makes sense because over 80 per cent of total employed persons in the country are self-employed or unpaid family workers. Th is means that they work at whatever they can fi nd to make a living. Hence, the higher the population, the higher the work activities despite the fact that the formal sector does not provide jobs.
Having the employment fi gures, the next step is to obtain the fi gures of employ-ment by status of employment: self-employed, employer, paid employee and unpaid family worker (see Table A-2). We used the initial percentages for year 2005 which we kept constant over the projection period. However, a possible scenario linked to the expected favourable economic performance is that the share of unpaid family workers would decrease to push up the numbers of paid employees. Th is possibility was simu-lated, considering that in rural areas the share of paid employees would increase by two percentage points by year 2015 and that in urban areas, this share would increase by four percentage points by year 2015.
Th e classifi cation of type of business (central Government, local government, parastatal and private sector) can also be incorporated to classify the workers who are potential contributors to social security schemes. However, there is a practical limit to the potential extension of social security schemes as currently designed: the degree of informality. As explained in Appendix C (Section 2), it seems that the diff erent reports published by the CSO do not follow a unifi ed criterion to classify employment in the formal sector or the informal economy. Th erefore, we based our model on the defi ni-tion of formal-sector employment (as Chapter 3 explains, based on establishments) and
Table A-2. Percentage of employed persons by status of employment, 2005
Rural female Rural male Urban female Urban male
Self-employed 36.1 57.6 37.4 30.8
Employer 0.5 0.5 0.4 0.6
Paid employees 1.8 6.6 35.5 56.3
Unpaid family worker and other 61.5 35.3 26.7 12.3
Total 100.0 100.0 100.0 100.0
Source: Cross-tabulation for people aged 15 and older, based on 2005 labour force survey.
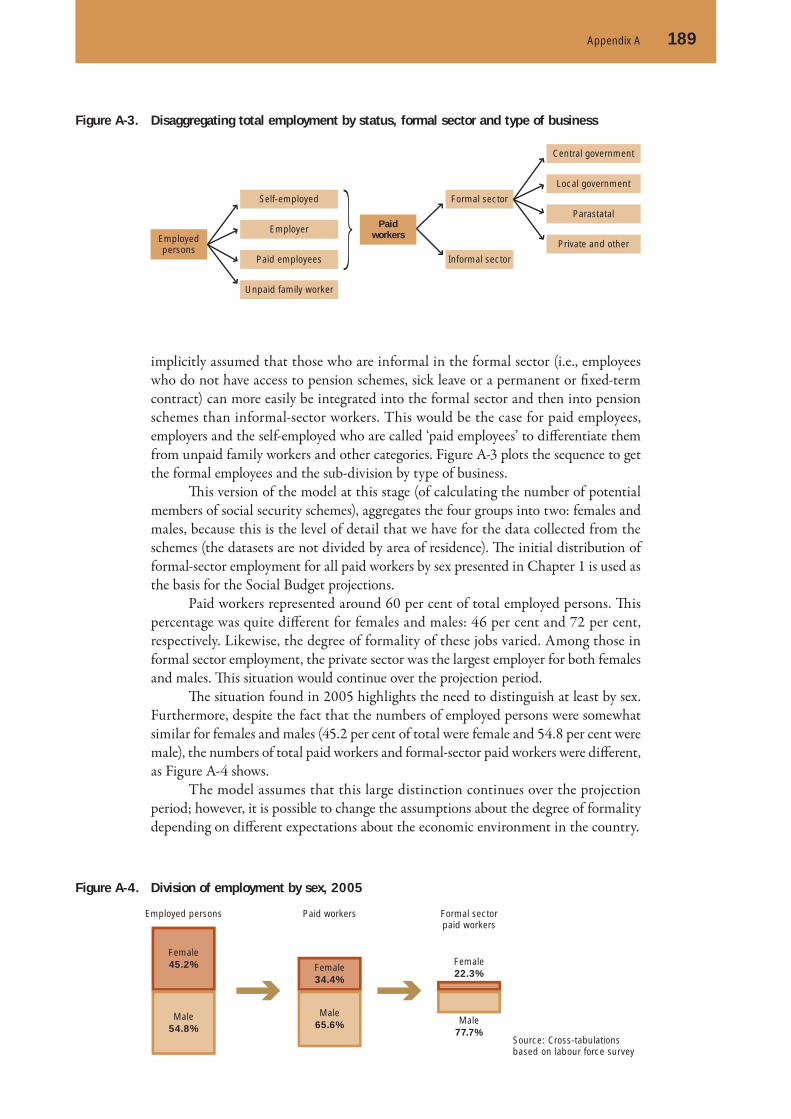
Appendix A 189
implicitly assumed that those who are informal in the formal sector (i.e., employees who do not have access to pension schemes, sick leave or a permanent or fi xed-term contract) can more easily be integrated into the formal sector and then into pension schemes than informal-sector workers. This would be the case for paid employees, employers and the self-employed who are called ‘paid employees’ to diff erentiate them from unpaid family workers and other categories. Figure A-3 plots the sequence to get the formal employees and the sub-division by type of business.
Th is version of the model at this stage (of calculating the number of potential members of social security schemes), aggregates the four groups into two: females and males, because this is the level of detail that we have for the data collected from the schemes (the datasets are not divided by area of residence). Th e initial distribution of formal-sector employment for all paid workers by sex presented in Chapter 1 is used as the basis for the Social Budget projections.
Paid workers represented around 60 per cent of total employed persons. Th is percentage was quite diff erent for females and males: 46 per cent and 72 per cent, respectively. Likewise, the degree of formality of these jobs varied. Among those in formal sector employment, the private sector was the largest employer for both females and males. Th is situation would continue over the projection period.
Th e situation found in 2005 highlights the need to distinguish at least by sex. Furthermore, despite the fact that the numbers of employed persons were somewhat similar for females and males (45.2 per cent of total were female and 54.8 per cent were male), the numbers of total paid workers and formal-sector paid workers were diff erent, as Figure A-4 shows.
The model assumes that this large distinction continues over the projection period; however, it is possible to change the assumptions about the degree of formality depending on diff erent expectations about the economic environment in the country.
Figure A-3. Disaggregating total employment by status, formal sector and type of business
Employedpersons
Formal sector
Informal sector
Central government
Local government
Parastatal
Private and other
PaidworkersEmployer
Paid employees
Unpaid family worker
Self-employed
Source: Cross-tabulations based on labour force survey
Figure A-4. Division of employment by sex, 2005
Paid workers
Female34.4%
Male65.6%
Female45.2%
Male54.8%
Employed persons
Female22.3%
Male77.7%
Formal sectorpaid workers

190 Zambia – Social Protection Expenditure and Performance Review and Social Budget
Having the numbers of formal-sector paid workers, the next step is to identify the coverage rate of work-related benefi ts and social security schemes and to make the assumptions for future years to determine the number of benefi ciaries and contribu-tors. Th is discussion will be continued in Section 4 on the pension module. Th e total number of formal-sector paid workers is distributed across cohorts according to their share of total employment.
Economic module
Th is module has basic assumptions about real GDP growth and employment growth, infl ation rates (GDP defl ator and CPI), devaluation and interest rates. Furthermore, employment growth is assumed in line with GDP growth so that an implicit ‘elasticity’ is traced.
Elasticity of employment to GDP = Δ per cent employment / Δ per cent GDP
Real wages are assumed to vary in line with real labour productivity, which results from assumptions of employment and GDP.
Real labour productivity = Real GDP / Total employment
Th is model does not emphasize the behaviour of real wages or the share of wages of total GDP (wage share) as other ILO Social Budget models have previously done, because there are serious doubts about the accuracy of the offi cial estimate for national average earnings (see Appendix C) and furthermore, the wage share is expected to fl uc-tuate even in the short run, given the situation of the labour market (with high infor-mality and temporary formal employment).
Two options for alternative scenarios complement the status quo projection. Option A is to change assumptions of GDP growth and employment growth, simul-taneously assuming a more or less constant implicit elasticity. Th e objective is to test the eff ect of an optimistic and a pessimistic scenario. Changes in other variables that could also be aff ected, such as infl ation and devaluation (that could become defl ation and appreciation, respectively) and interest rates (that could be reduced to fuel growth in a pessimistic scenario), are not included in this version of the model.
Option B is to change assumptions of employment growth keeping the base assumption of GDP growth constant. Th e underlying idea is that the growth could be led by more labour-intensive (e.g., services or agriculture) or more capital-intensive (e.g., manufacturing) economic sectors. Hence, the scenarios are about the overall elasticity of employment.
Th e analysis of scenarios for these options is exclusive, that is, if scenarios about GDP are analysed (option A), the status quo situation is considered for option B –
3.
Figure A-5. Types of scenarios to analyse
Option A
– GDP growth– Employment growth
– Employment growth
Option B
If status quo in A
1. Status quo2. Optimist3. Pessimist
1. Status quo2. More labour intensive growth3. More capital intensive growth

Appendix A 191
relatively constant elasticity of employment – while, if scenarios about elasticity of employment are considered (option B), the status quo situation is considered for option A. Figure A-5 shows the sequence of assumptions for options A and B.
Table A-3 shows the main assumptions for the scenarios in Option A. The assumptions in Option B consider that the elasticity that is currently 0.70 could vary in +/– 0.2.
Th ese scenarios have diff erent eff ects on the Social Budget because GDP has a relationship with poverty rates in the country and then it aff ects the need for social assistance, while employment fi gures determine the number of potential contributors to social security schemes (and future pensioners).
Pension module
Separate work fi les compose this module: a) NAPSA; b) ‘public pensions’ that include the other statutory schemes (PSPF and LASF); c) ‘private pensions’ that include the voluntary (occupational) pension schemes; and d) the WCFCB.
a) NAPSA module
Th is module also follows the ‘cohort component’ method so that the fi rst step was to estimate the number of contributors by sex and age. It must be pointed out that there is uncertainty about this number (see Appendix C, Section 3); however, we decided to estimate it based on the statistics of the annual number of contribution payments.
Th is information was partially disaggregated by age and sex. Th en we used the age structure of the part that was available (82 per cent) to allocate the total number. Th is number (by sex) was adjusted to calculate the number of contributors, using the following formula:
4.
Table A-3. Assumptions for GDP growth and employment
2007 2008 2009 2010 2011 2016 2025
Scenario 1: Status quo
GDP 6.0 6.0 6.0 5.0 4.0 3.5 3.5
Employment 4.2 4.2 4.2 3.5 2.8 2.4 2.4
Scenario 2: Optimistic
GDP 6.0 6.5 7.0 7.0 6.0 5.0 5.0
Employment 4.2 4.6 4.9 4.9 4.2 3.4 3.4
Scenario 3: Pessimistic
GDP 6.0 4.0 2.0 2.0 1.0 0.0 0.0
Employment 4.2 2.8 1.4 1.4 0.7 0.0 0.0
Implicit elasticity 0.70 0.70 0.70 0.70 0.70 0.69 0.69
Number of contributions = Number of contribution payments / (12 * Density of contributions)
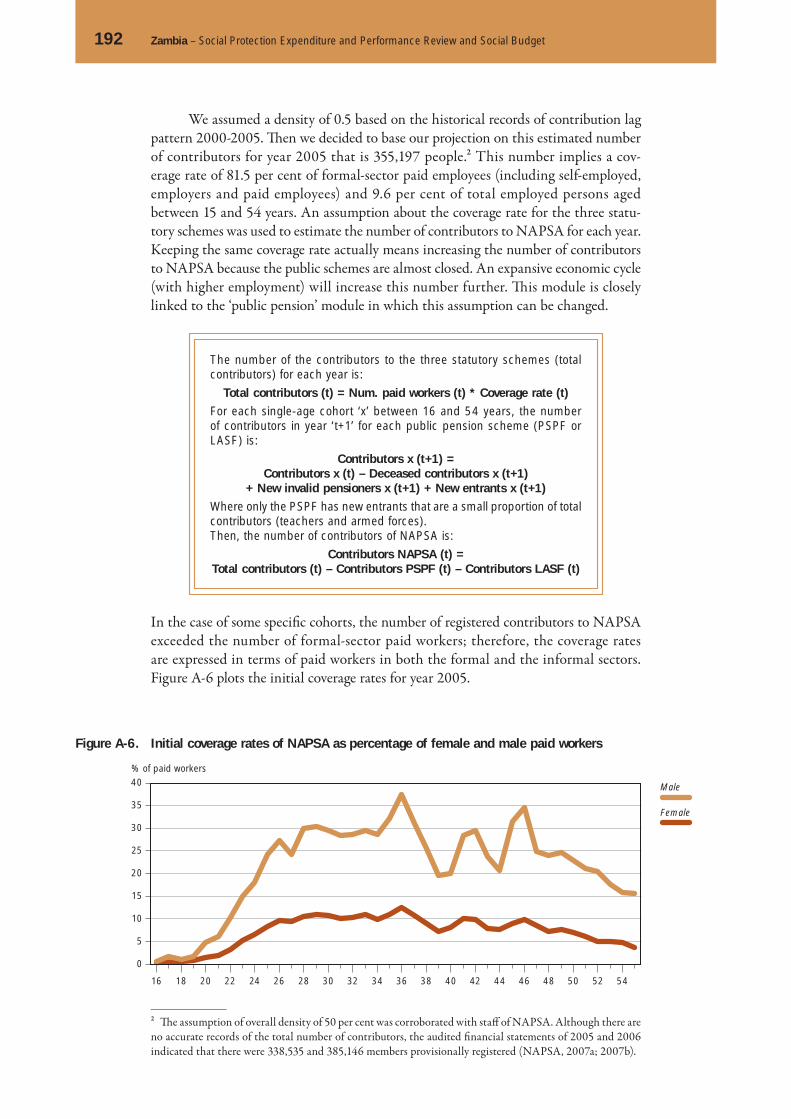
192 Zambia – Social Protection Expenditure and Performance Review and Social Budget
We assumed a density of 0.5 based on the historical records of contribution lag pattern 2000-2005. Th en we decided to base our projection on this estimated number of contributors for year 2005 that is 355,197 people.2 This number implies a cov-erage rate of 81.5 per cent of formal-sector paid employees (including self-employed, employers and paid employees) and 9.6 per cent of total employed persons aged between 15 and 54 years. An assumption about the coverage rate for the three statu-tory schemes was used to estimate the number of contributors to NAPSA for each year. Keeping the same coverage rate actually means increasing the number of contributors to NAPSA because the public schemes are almost closed. An expansive economic cycle (with higher employment) will increase this number further. Th is module is closely linked to the ‘public pension’ module in which this assumption can be changed.
The number of the contributors to the three statutory schemes (total contributors) for each year is:
Total contributors (t) = Num. paid workers (t) * Coverage rate (t)For each single-age cohort ‘x’ between 16 and 54 years, the number of contributors in year ‘t+1’ for each public pension scheme (PSPF or LASF) is:
Contributors x (t+1) =Contributors x (t) – Deceased contributors x (t+1)
+ New invalid pensioners x (t+1) + New entrants x (t+1)Where only the PSPF has new entrants that are a small proportion of total contributors (teachers and armed forces).Then, the number of contributors of NAPSA is:
Contributors NAPSA (t) = Total contributors (t) – Contributors PSPF (t) – Contributors LASF (t)
In the case of some specifi c cohorts, the number of registered contributors to NAPSA exceeded the number of formal-sector paid workers; therefore, the coverage rates are expressed in terms of paid workers in both the formal and the informal sectors. Figure A-6 plots the initial coverage rates for year 2005.
2 Th e assumption of overall density of 50 per cent was corroborated with staff of NAPSA. Although there are no accurate records of the total number of contributors, the audited fi nancial statements of 2005 and 2006 indicated that there were 338,535 and 385,146 members provisionally registered (NAPSA, 2007a; 2007b).
Figure A-6. Initial coverage rates of NAPSA as percentage of female and male paid workers
Male
Female
16 18 20 22 24 26 28 30 32 34 36 38 40 42 44 46 48 50 52 54
0
5
10
15
20
25
30
35
40% of paid workers

Appendix A 193
Th e lower coverage for those younger workers (especially women) refl ects the fact that contributors to NAPSA are older than the total employed persons in Zambia.
We assumed that all contributors are active, which means that their contribu-tion payments are made at least once a year. Th e number of contributors grows to keep the overall coverage rate and decreases according to the mortality and invalidity inci-dence rates.
The mortality rates are the same as those used for population projections, adjusted by a factor of 90 per cent, which means that mortality for contributors to NAPSA is a little lower than for the general population. Th is does not necessarily mean that the HIV prevalence is lower – actually diff erences in prevalence rates across economic sectors exist (Vass, 2002) – but that once someone is infected, the onset of an AIDS-related illness in a HIV-positive person and the death aft er developing AIDS occur later than in other cases, such as people working in informal-sector employment (Wilkins, n.d.). Th e invalidity incidence rate was calculated combining several data sources (see Appendix C, Section 3) because we were not able to obtain accurate esti-mates from scheme data.3
Th e wages of the contributors grow with the average wages and an ageing factor that corresponds to an additional increase for the increase in the average age of the contributors (trying to follow a salary scale). Compliance was assumed constant, based on 2006 data.
Since 2006, NAPSA started paying pensions to those who qualified on the ‘sliding scale’ that covers those aged between 39 and 48 years at 1 February 2000 (see Chapter 4). Hence, we assume that there is early retirement but that the incidence is very low: between 0.5 per cent and 1.5 per cent for those aged 50-54 so that the calcu-lated number of pensioners for 2006 is close to the actual number.
Th e number of retirees comes from the number of contributors and the mor-tality rates assumed. For those aged 55 and over, the next step is to place this number of retirees into two groups: those who receive lump sums and those who are entitled to receive monthly pensions. However, there is no record of contribution payments by member. In the actuarial valuation, GAD (2007) assumed two scenarios with distri-bution of career lengths called ‘short records’ and ‘long records’ for which in the long term on average contributors will have contributed: for one-third of a full career (i.e., 13 years out of 39) in the fi rst case, and for two-thirds of a full career (i.e., 26 years out of 39) in the second case. So, the proportion of contributors receiving pensions is higher under the ‘long records’ scenario (50 per cent vs. 90 per cent in the ‘short records’ sce-nario, both for year 2010) and it grows over time. In our case, we decided to assume directly the proportion diff erentiating between men and women (i.e., women with shorter records given that some preferred to stay out of the labour market when their children were small). In 2006 almost all benefi ts are assumed to be lump sums except 2 per cent of retirement benefi ts. Th ese percentages decrease steadily during the projec-tion period so that in 2025, the percentages of benefi ts received as lump sums (instead of annuities) are those shown in Table A-4.
Replacement rates were also assumed given that we did not have accurate earn-ings records of the contributors. Th ese assumptions are for the National Pension Scheme (NPS), not for the Zambian National Provident Fund (ZNPF). Th e 2006 fi nancial statements indicate that the contributions of members of the ZNPF only reached K 28,000 billion (vs. K 292 billion of the NPS). Th erefore, we assume that there is no
3 At most, we obtained the number of deceased members whose survivors qualifi ed for a funeral grant but this number was much higher than the number of deaths reported. Besides, as earlier explained, sex-age cohort-specifi c numbers of registered members were not available.
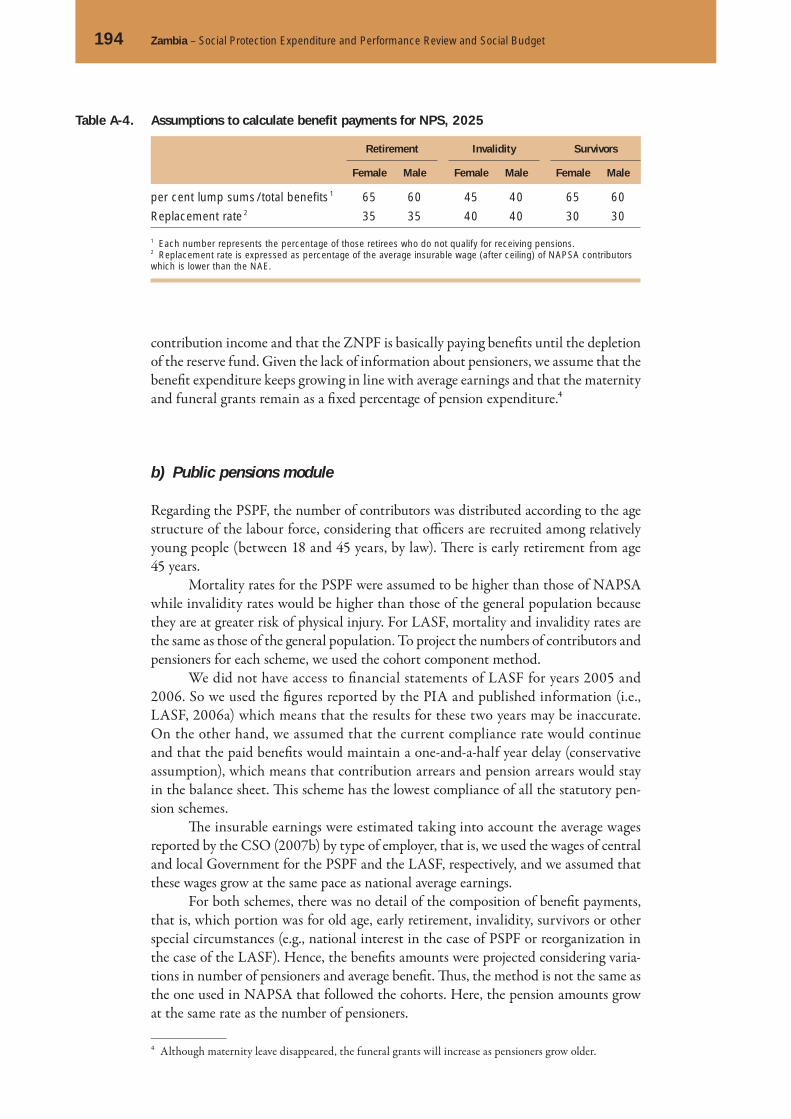
194 Zambia – Social Protection Expenditure and Performance Review and Social Budget
contribution income and that the ZNPF is basically paying benefi ts until the depletion of the reserve fund. Given the lack of information about pensioners, we assume that the benefi t expenditure keeps growing in line with average earnings and that the maternity and funeral grants remain as a fi xed percentage of pension expenditure.4
b) Public pensions module
Regarding the PSPF, the number of contributors was distributed according to the age structure of the labour force, considering that offi cers are recruited among relatively young people (between 18 and 45 years, by law). Th ere is early retirement from age 45 years.
Mortality rates for the PSPF were assumed to be higher than those of NAPSA while invalidity rates would be higher than those of the general population because they are at greater risk of physical injury. For LASF, mortality and invalidity rates are the same as those of the general population. To project the numbers of contributors and pensioners for each scheme, we used the cohort component method.
We did not have access to fi nancial statements of LASF for years 2005 and 2006. So we used the fi gures reported by the PIA and published information (i.e., LASF, 2006a) which means that the results for these two years may be inaccurate. On the other hand, we assumed that the current compliance rate would continue and that the paid benefi ts would maintain a one-and-a-half year delay (conservative assumption), which means that contribution arrears and pension arrears would stay in the balance sheet. Th is scheme has the lowest compliance of all the statutory pen-sion schemes.
Th e insurable earnings were estimated taking into account the average wages reported by the CSO (2007b) by type of employer, that is, we used the wages of central and local Government for the PSPF and the LASF, respectively, and we assumed that these wages grow at the same pace as national average earnings.
For both schemes, there was no detail of the composition of benefi t payments, that is, which portion was for old age, early retirement, invalidity, survivors or other special circumstances (e.g., national interest in the case of PSPF or reorganization in the case of the LASF). Hence, the benefi ts amounts were projected considering varia-tions in number of pensioners and average benefi t. Th us, the method is not the same as the one used in NAPSA that followed the cohorts. Here, the pension amounts grow at the same rate as the number of pensioners.
4 Although maternity leave disappeared, the funeral grants will increase as pensioners grow older.
Table A-4. Assumptions to calculate benefit payments for NPS, 2025
Retirement Invalidity Survivors
Female Male Female Male Female Male
per cent lump sums / total benefits 1 65 60 45 40 65 60
Replacement rate 2 35 35 40 40 30 30
1 Each number represents the percentage of those retirees who do not qualify for receiving pensions.2 Replacement rate is expressed as percentage of the average insurable wage (after ceiling) of NAPSA contributors which is lower than the NAE.
Appendix A 195
Th e transfers by the Government to the PSPF represented 54 per cent of 2006’s income, continue so that the arrears are completely paid off in 2009 – one year aft er the offi cial estimates (MoFNP, 2007b) – and the grants for retrenchment of civil serv-ants are constant as a percentage of total benefi ts. Th e grant by the Government to cover retirees under the national interest and early retirement provisions is not explic-itly projected given that we do not have specifi c projections for these benefi ts. Hence, we assume that this grant will be paid so that the scheme does not run a defi cit. Th e arrears with LASF are also cancelled by 2009 and we assume that these were the only transfers to the scheme (these should appear in the central Government accounts as part of the grants to local Governments; see Appendix C).
c) Private pensions module
Th is module relies on aggregate information published by the PIA. Given the large number of occupational schemes, it is not possible to make individual estimations for each fund. Th e number of contributors grows with formal-sector private employment, while the insurable wages vary with the NAE. Total contribution income is projected based on average wages but it is expected that the wealthier employees are registered with these voluntary schemes and that compliance is not 100 per cent. Average contri-butions from employers and employees are assumed to be 5.9 and 5.1 per cent of insur-able earnings, respectively.
The number of pensioners increases at the same pace as the number of pen-sioners of the ZNPF plus 5 per cent. Th e administrative costs would decrease steadily from 46 per cent of benefi t expenditure in 2006 to 15 per cent in 2025.
d) WCFCB module
Th is module is less developed than the previous ones given that, although all workers are obliged to be registered, its coverage is very low: around 2.1 per cent of active members of NAPSA. Th is coverage was assumed constant over time, although the reorganization plans of the management board are expected to improve it. Further-more, internal fi nancial information was not complete and some assumptions had to be made. For instance, the fund reserves were unknown and we had to deduct it, assuming an average rate of return for 2000-2005. Th e module does not follow the cohort component method but includes assumptions about the average injury risk (based on the 2005 labour force survey) and average mortality rates (based on NAPSA module).

196 Zambia – Social Protection Expenditure and Performance Review and Social Budget
Social expenditure module
Th ere are four elements to this module: a) social assistance; b) work-related benefi ts; c) health; and d) education. A new version of this Social Budget model should improve the education module that was prepared on the basis of much less information than the health module.
a) Social assistance
This module projects expenditures for the most relevant programmes currently in place, which are fi nanced by the Government and by donors. Th e main programmes are: the public welfare assistance scheme (PWAS), the social cash transfer programme, the self-help project urban, and the three components of the WFP country pro-gramme: (i) school feeding programme, including assistance for basic education, (ii) nutritional programme for vulnerable groups (NPVG) and health and nutrition educa-tion (HNE), and (iii) food for assets (FFA). We collected historical data from publicly available reports, websites and secondary data and projected the future expenditures based on these historical data.
Many changes are envisaged in the Zambian social protection system – for instance, a social cash transfer programme that would be scaled up has been planned to replace the PWAS – but at this point we do not know with certainty the feasibility of planned changes and ways of fi nancing. So we used the offi cial projections for the social cash transfers (MCDSS, 2007, p. 6) and assume that donors will continue their support. Likewise, the PWAS will continue according to the new baseline of the 2008 Budget and keep its current coverage (below 2 per cent of the population). A second scenario considered that, in place of these two programmes, a new universal old-age benefi t would be available for all individuals aged 60 years and over.
b) Work-related benefits
Th is module includes the following benefi ts: retirement, severance pay (redundancy benefi t), paid maternity leave, paid sick leave, and invalidity.Th e coverage rates or how many employees would benefi t are assumed to be very low. In principle, severance pay covers only those who are not registered in a pension scheme and have at least ten years of service. Hence the coverage is zero for public-sector employees and 10 per cent for private-sector employees. Th e incidence of redundancy benefi t is around 2 per cent and the coverage is 70 per cent for public employees and 20 per cent for private employees. Th e highest coverage rates are assumed for maternity and sickness benefi ts: 85 per cent in the public sector and 25 per cent in the private sector. Th ere were no data with which to contrast the validity of our assumptions. Th erefore, these projections must be taken with caution.
5.

Appendix A 197
c) Health module
Th is is the most elaborate element of the module based on offi cial fi gures for year 2004. Th is means that it needs to be calibrated when new information is available. Here, we explain the general features of the module and some details of the projection of gov-ernment health expenditure.
Th e module identifi es diff erent sources of funding and fi nancing agents (see UNZA & MoH, 2006). The latter concept refers to those who manage the funds coming from own or third-party sources. As seen in Chapter 4, the Government is the most important fi nancing agent although it fi nances less than half of the funds it administers. In contrast, donors are the main source of funding (whose funds are par-tially managed by the Government), followed by households. Th e general approach for projecting health expenditure for each fi nancing agent is explained below:
☐ Government expenditure on health (as fi nancing agent) is projected following a demand-driven approach that considers (i) specifi c age-group utilization rates, and (ii) referral rates between diff erent levels of health care service. Unit costs are pro-jected for specifi c items (e.g., drugs and supplies, and transport) of government expenditure and also for missions and other statutory bodies.
☐ The percentage of total Government health expenditure financed by donors is assumed to decrease from 55.6 per cent in 2005 to 48 per cent in 2012 and to 35 per cent in 2025. In contrast, the proportion of donor funds allocated to the Govern-ment (vs. the resources directly managed by donors) increases from 42.2 per cent in 2005 to 70 per cent in 2020, so that the overall donor resources decrease over time as a percentage of total health expenditure.
☐ Household expenditure is projected separately according to the type of provider: (i) for private and pharmacies, the calculation is based on unit costs; (ii) for tradi-tional healers, the costs decrease from 20 per cent (of total household expenditure) in 2004 to 15 per cent in 2025; (iii) for user fees in MoH facilities, the expenditure decreases in 2006 from 5 to 4.3 per cent of total household expenditure;5 and (iv) for other providers, the expenditure is a fi xed 2 per cent of the total.
☐ Private expenditures include those of private health insurance and employers. In the fi rst case, the number of covered people depends on private-sector employment; in the second case, that number depends on both public-sector (assumed coverage rate: 95 per cent) and private-sector (assumed coverage rate: 40 per cent of those without health insurance) employment.
Th e module gives more importance to the projection of government health expenditure which is the expenditure originating in government facilities. Hence, it includes the expenditure allocated by donors to the Government and also the services provided by missions and other statutory bodies that receive grants from the Government and whose medical staff are paid by the MoH. In what follows, we explain the calculation of number of cases (consultations and admissions to hospitals) and the calculation of health costs.
5 Th e reduction in user fees expenditures is low because rural health centres only collected 5.3 per cent of total user fees in 2005 (MoH & UNZA, 2007).
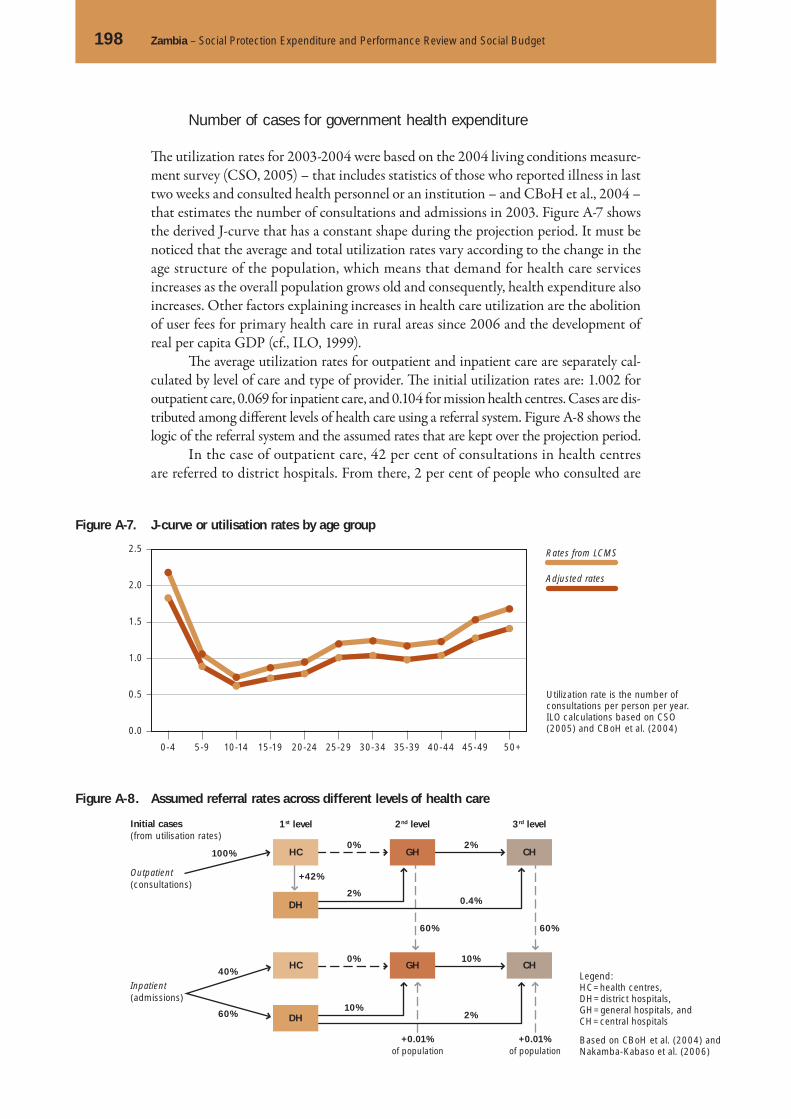
198 Zambia – Social Protection Expenditure and Performance Review and Social Budget
Number of cases for government health expenditure
Th e utilization rates for 2003-2004 were based on the 2004 living conditions measure-ment survey (CSO, 2005) – that includes statistics of those who reported illness in last two weeks and consulted health personnel or an institution – and CBoH et al., 2004 – that estimates the number of consultations and admissions in 2003. Figure A-7 shows the derived J-curve that has a constant shape during the projection period. It must be noticed that the average and total utilization rates vary according to the change in the age structure of the population, which means that demand for health care services increases as the overall population grows old and consequently, health expenditure also increases. Other factors explaining increases in health care utilization are the abolition of user fees for primary health care in rural areas since 2006 and the development of real per capita GDP (cf., ILO, 1999).
Th e average utilization rates for outpatient and inpatient care are separately cal-culated by level of care and type of provider. Th e initial utilization rates are: 1.002 for outpatient care, 0.069 for inpatient care, and 0.104 for mission health centres. Cases are dis-tributed among diff erent levels of health care using a referral system. Figure A-8 shows the logic of the referral system and the assumed rates that are kept over the projection period.
In the case of outpatient care, 42 per cent of consultations in health centres are referred to district hospitals. From there, 2 per cent of people who consulted are
Utilization rate is the number of consultations per person per year. ILO calculations based on CSO (2005) and CBoH et al. (2004)
Figure A-7. J-curve or utilisation rates by age group
Rates from LCMS
Adjusted rates
0-4 5-9 10-14 15-19 20-24 25-29 30-34 35-39 40-44 45-49 50+
0.0
0.5
1.0
1.5
2.0
2.5
Legend:HC=health centres,DH=district hospitals, GH=general hospitals, and CH=central hospitals
Based on CBoH et al. (2004) and Nakamba-Kabaso et al. (2006)
Figure A-8. Assumed referral rates across different levels of health care
Outpatient(consultations)
1st level
100%0%
2%0.4%
10%2%
0%
2%
10%
60%
+42%
60%
+0.01%of population
+0.01%of population
HC
DH
GH CH
Inpatient(admissions)
HC
DH
GH CH
2nd level 3rd levelInitial cases(from utilisation rates)
40%
60%
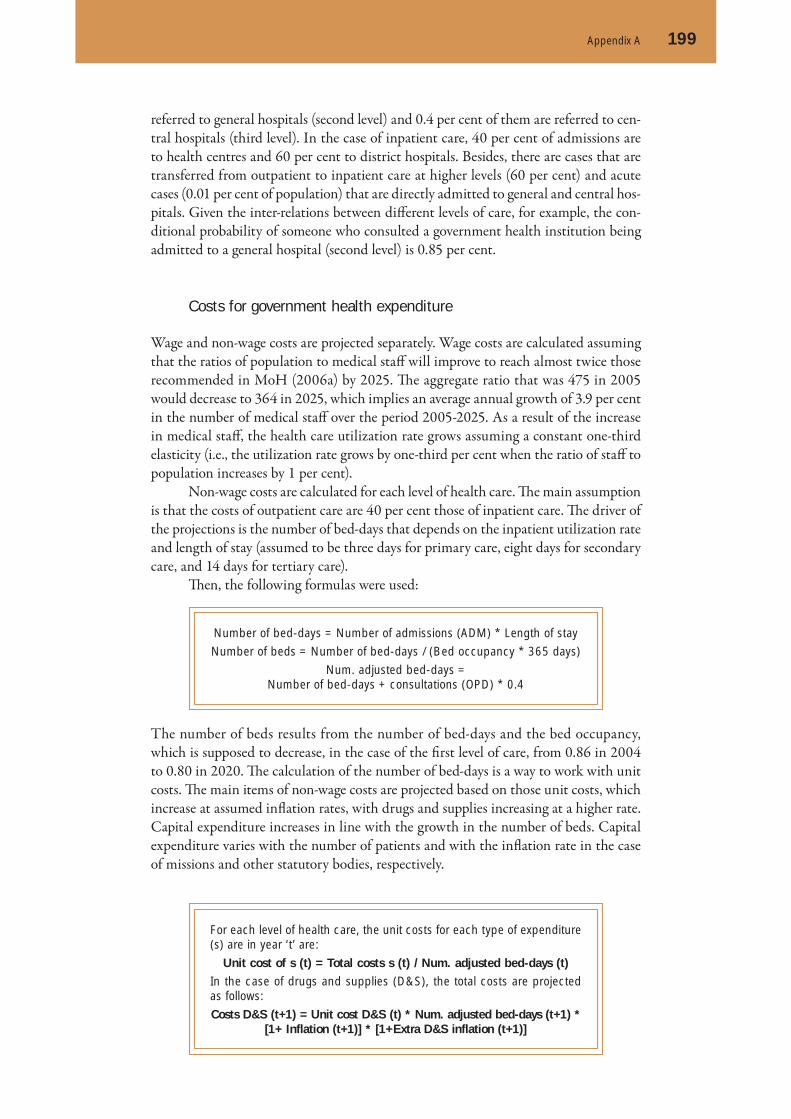
Appendix A 199
referred to general hospitals (second level) and 0.4 per cent of them are referred to cen-tral hospitals (third level). In the case of inpatient care, 40 per cent of admissions are to health centres and 60 per cent to district hospitals. Besides, there are cases that are transferred from outpatient to inpatient care at higher levels (60 per cent) and acute cases (0.01 per cent of population) that are directly admitted to general and central hos-pitals. Given the inter-relations between diff erent levels of care, for example, the con-ditional probability of someone who consulted a government health institution being admitted to a general hospital (second level) is 0.85 per cent.
Costs for government health expenditure
Wage and non-wage costs are projected separately. Wage costs are calculated assuming that the ratios of population to medical staff will improve to reach almost twice those recommended in MoH (2006a) by 2025. Th e aggregate ratio that was 475 in 2005 would decrease to 364 in 2025, which implies an average annual growth of 3.9 per cent in the number of medical staff over the period 2005-2025. As a result of the increase in medical staff , the health care utilization rate grows assuming a constant one-third elasticity (i.e., the utilization rate grows by one-third per cent when the ratio of staff to population increases by 1 per cent).
Non-wage costs are calculated for each level of health care. Th e main assumption is that the costs of outpatient care are 40 per cent those of inpatient care. Th e driver of the projections is the number of bed-days that depends on the inpatient utilization rate and length of stay (assumed to be three days for primary care, eight days for secondary care, and 14 days for tertiary care).
Th en, the following formulas were used:
Number of bed-days = Number of admissions (ADM) * Length of stay
Number of beds = Number of bed-days / (Bed occupancy * 365 days)
Num. adjusted bed-days =Number of bed-days + consultations (OPD) * 0.4
The number of beds results from the number of bed-days and the bed occupancy, which is supposed to decrease, in the case of the fi rst level of care, from 0.86 in 2004 to 0.80 in 2020. Th e calculation of the number of bed-days is a way to work with unit costs. Th e main items of non-wage costs are projected based on those unit costs, which increase at assumed infl ation rates, with drugs and supplies increasing at a higher rate. Capital expenditure increases in line with the growth in the number of beds. Capital expenditure varies with the number of patients and with the infl ation rate in the case of missions and other statutory bodies, respectively.
For each level of health care, the unit costs for each type of expenditure (s) are in year ‘t’ are:
Unit cost of s (t) = Total costs s (t) / Num. adjusted bed-days (t)In the case of drugs and supplies (D&S), the total costs are projected as follows:
Costs D&S (t+1) = Unit cost D&S (t) * Num. adjusted bed-days (t+1) * [1+ Inflation (t+1)] * [1+Extra D&S inflation (t+1)]

200 Zambia – Social Protection Expenditure and Performance Review and Social Budget
It should be noted that the nature of the module (demand-based approach) requires adjustments to government health expenditure to be done over time, as fund constraints can determine the retraction of non-wage costs (e.g., drugs and supplies). As seen in Chapter 4, this seems to have been the case in 2007.
d) Education module
Th is module was prepared based on preliminary fi gures from the MoFNP that reports Government-fi nanced expenditure in local currency and donor-fi nanced expenditure in foreign currency. Historical information may not be accurate because the exchange rate varied signifi cantly during 2005-2006. Th e projections were prepared in line with the following criteria:
☐ Th e projection of government education expenditure was made separately for cap-ital expenditures and recurrent expenditures, and non-wage and wage costs. Capital expenditures were assumed to increase from 16.7 per cent of total expenditure in 2006 to 18 per cent in 2025. Non-wage costs that were 24.8 per cent of wage costs in 2006 are expected to reach 33.3 per cent in 2011.
☐ Wage costs were projected using the number of students enrolled in basic educa-tion (level 1 to 9) and the ratio of students per teacher. Th e projected number of students enrolled in public schools depends on assumptions of net enrolment rates, attendance at private schools and projections of the number of school-age children (from ILO_POP.xls). Th e main assumptions are: (i) the ratio of students per teacher decreases from 54.2 in 2006 to 45 in 2016 and 40 in 2025; (ii) the net enrolment rate increases from 95.7 per cent in 2006 to 100 per cent in 2016; and (iii) the number of private school students to total basic school students increases from 4.6 per cent in 2006 to 7 per cent in 2016.
☐ Th e wage unit costs (calculated with the number of teachers) were used to project recurrent expenditures, using the formulae:
Recurrent costs =Unit wage cost * Num. teachers * [1 + per cent non-wage /wage costs]
Capital expenditure =Recurrent costs / [1 + per cent capital /total expenditure]
Government health expenditure =Recurrent costs + Capital expenditure
☐ Regarding donor funds, their high variability over time led us to base our assump-tions on the behaviour of the last fi ve years. Donor funds as a percentage of govern-ment education expenditure are assumed to be 12 per cent (the 2002-2006 average) over the projection period. Th e amount of donor funds allocated to the GRZ as per-centage of total donor funds in education are 70 per cent in 2007 and were assumed to reach 85 per cent in 2025, which is in line with eff orts of harmonization of aid funds and mutual accountability.
☐ Regarding household expenditure in health, we used the estimate in CSO & ORC Macro (2003) for the household expenditure per pupil in private school, which was projected to grow with the overall infl ation rate.

Appendix A 201
☐ Given the lack of information, we were not able to project expenditures by type of provider so implicitly assumed that the cost structure of the public schools and community schools is the same, which is not necessarily the case.
MoFNP (2007b) proposes to increase the number of teachers by 15,000 up to 2010, resulting in an important decrease of the students-to-teacher ratio. Th e projections presented in this report are more conservative considering the unpredictability of aid funds. However, our projections of total government expenditure are close to the offi cial ones.
Government module
Th e objective of this module is to compare the social expenditure with the general fi scal situation of the country, that is, to analyse the possibilities of sustaining such expendi-ture over the long term. Following IMF (2001), the general Government includes the central Government and social security institutions. Th e accounts of local Govern-ments are not included because no updated information was available.
Th e projections were based on general assumptions that allow us to have an over-view of the fi scal space of the country. We do not go deeper into the detail of specifi c items of the government accounts, so that our estimates such as the overall balance may diff er from other estimates.
Table A-5 presents the main assumptions used to project revenues and expendi-tures of central Government.
Domestic revenues experienced an important increase in 2007, which supports the assumption of tax revenues of about 18.5 per cent of GDP in 2011. Furthermore, the new fi scal and regulatory framework for the mining sector would generate addi-tional infl ows. We assume that this would not aff ect investment decisions in the sector or short-term infl ows.
A reduction of grants in the long run is expected from the improvement of eco-nomic conditions in the country. Likewise, the GRZ would increase the allocation to wages and salaries to improve the coverage of basic education and health services to the population. Th is variable is included in the projections of the specifi c modules.
In the short term, current expenditure (excepting social sectors included in this model) would increase because of the Government’s commitment to pay off domestic arrears. Aft er 2009, the current expenditure would show a declining trend owing to the re-allocation of spending from non-social to social sectors.
6.
Table A-5. Main assumptions to project central Government accounts
2006A 2007 2011 2025
Tax revenues (as per cent of GDP) 17.0 18.0 18.5 19.0
Grants (as per cent of GDP) 6.0 4.3 3.8 3.5
Initial current expenditure, except social sectors (as per cent of GDP)
12.1 12.9 12.6 11.0
Capital expenditure (as per cent of GDP) 8.0 5.2 6.5 7.0
A = actual; P = projected
202 Zambia – Social Protection Expenditure and Performance Review and Social Budget
Over the long term, capital expenditure, mainly related to rural infrastructure, would increase. Capital expenditure as a percentage of GDP is lower in 2011 than in 2006 because of the low absorption capacity of diff erent units of the Government (see Appendix C, Section 1). MoFNP (2007b) estimates that capital expenditure would be 5.85 per cent of GDP in 2007 and that it would increase to reach 7.23 per cent of GDP in 2010. However, we prefer more conservative estimates that would vary with the assumptions of donor grants.
Th e module also projects the situation of the general Government which includes central Government and social security institutions.
Social Budget
Th e Social Budget module, in addition to including the fi gures from the government module, considers all those expenditures incurred by non-government agents with the aim of providing social protection. Th erefore, it includes private expenditure, services provided by employers and coverage secured by households, etc. Although households do rely on informal mechanisms to secure a certain level of well-being, we were not able to have access to this information. So, informal mechanisms are not included in the Social Budget. An important point is that the Government is also an employer and it is important to diff erentiate between the social security contributions of the Govern-ment and other transfers (e.g., grants to the PSPF and transfers to cover specifi c legal benefi ts).
Th e Social Budget can be presented using diff erent classifi cations. For revenues, we used the criterion of economic sector. For expenditures, we used the criterion of social function. In the case of some pension schemes, we were not able to separate the paid benefi ts by specifi c functions such as old age and invalidity. In the latter case, for the PSPF, we were not able to say whether the invalidity was caused by work injury or an external cause. For these reasons, we used general categories for social function: health care, education, pension benefi ts, work-related benefi ts, and social assistance. However, some work-related benefi ts (e.g., paid sick leave) and health care could come under the same category. Likewise, some social assistance benefi ts (e.g., school feeding programme) and education could come under the same category.
To help with the presentation of results, work-related benefi ts and social assist-ance are shown together under the heading of ‘short-term benefi ts’, but this is not nec-essarily the case. Redundancy benefi ts – that are paid at once aft er a worker is made redundant – depend on the years of service and then are not purely short-term. A uni-versal old-age pension would be considered a long-term non-contributory benefi t.
Th e expenditures of the Social Budget include the item ‘administration’ that basically includes the management costs of social security funds and the general costs of the health system. We were not able to identify the administrative costs of the educa-tion sector, social assistance programmes and other benefi ts, given the lack of accurate information. It could be that these costs are under-estimated, which means that the social protection system would be more ineffi cient.
7.
203
The population projections were based on the ILO population projection model (ILO-POP) developed by the Financial, Actuarial and Statistical Services Branch of the ILO (see ILO-FACTS, 2002). Th e base year for the projection was 2000
because it is the year of the last population census. Th e projections then covered the period 2000-2025.
A description of the assumptions used and the logic of the model is provided below. In addition, these projections are compared with two other projections avail-able: the official projections from the Central Statistical Office of the Republic of Zambia and the projections of the Population Division of the Department for Eco-nomic and Social Aff airs of the United Nations Secretariat (named hereaft er: UN population division). Th e reasons for using the ILO-POP are discussed throughout the appendix.
Application of the ILO-POP model to Zambia
Th e model relies on the ‘cohort component’ method that consists of dividing the total population of the base year into cohorts or sex-age components and estimating the year-by-year transitions of each cohort. Th ese transitions take into account the cohort-specifi c survival and migration rates and the number of newborns based on the fertility rates and female population estimates.
Th e calculations require the following information: offi cial estimates of popula-tion for the base year, mortality rates by age and sex, the total and age-specifi c fertility rates, the sex ratio of the newborn, and the migration rates. However, the model allows the use of regional patterns and generalized assumptions to get some inputs based on aggregate national estimates.
1.
Appendix B.
Population projectionsAppendix B.
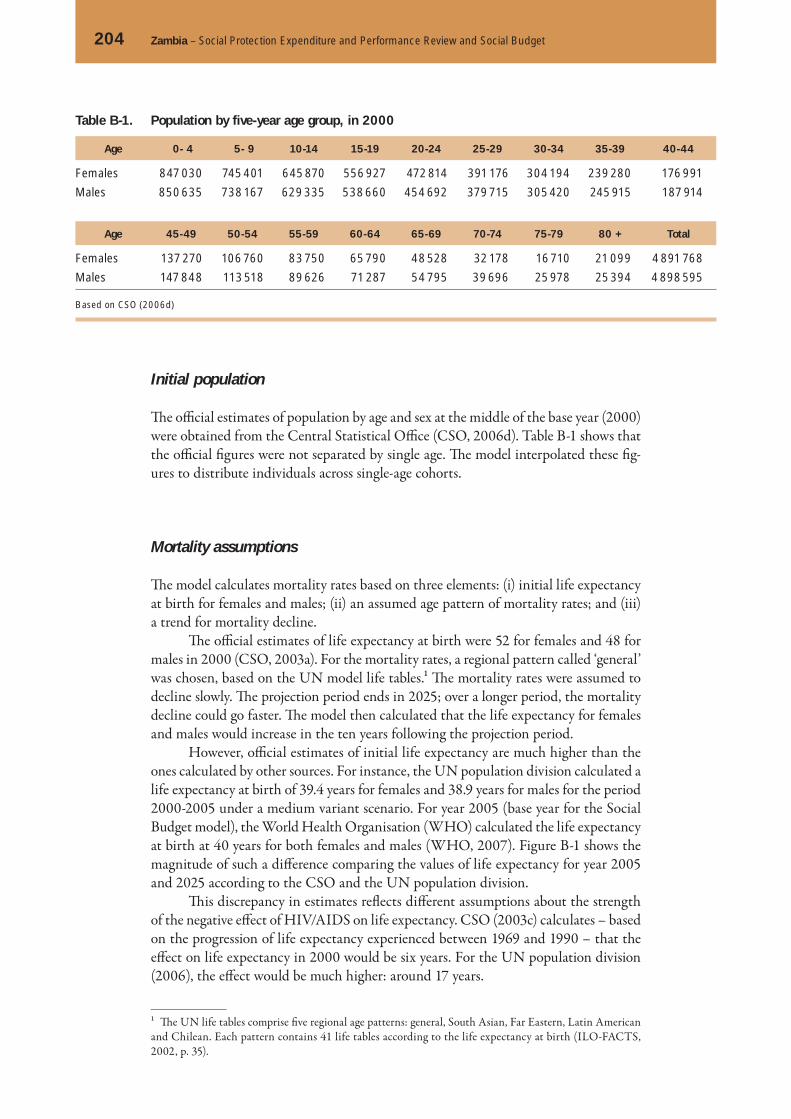
204 Zambia – Social Protection Expenditure and Performance Review and Social Budget
Initial population
Th e offi cial estimates of population by age and sex at the middle of the base year (2000) were obtained from the Central Statistical Offi ce (CSO, 2006d). Table B-1 shows that the offi cial fi gures were not separated by single age. Th e model interpolated these fi g-ures to distribute individuals across single-age cohorts.
Mortality assumptions
Th e model calculates mortality rates based on three elements: (i) initial life expectancy at birth for females and males; (ii) an assumed age pattern of mortality rates; and (iii) a trend for mortality decline.
Th e offi cial estimates of life expectancy at birth were 52 for females and 48 for males in 2000 (CSO, 2003a). For the mortality rates, a regional pattern called ‘general’ was chosen, based on the UN model life tables.1 Th e mortality rates were assumed to decline slowly. Th e projection period ends in 2025; over a longer period, the mortality decline could go faster. Th e model then calculated that the life expectancy for females and males would increase in the ten years following the projection period.
However, offi cial estimates of initial life expectancy are much higher than the ones calculated by other sources. For instance, the UN population division calculated a life expectancy at birth of 39.4 years for females and 38.9 years for males for the period 2000-2005 under a medium variant scenario. For year 2005 (base year for the Social Budget model), the World Health Organisation (WHO) calculated the life expectancy at birth at 40 years for both females and males (WHO, 2007). Figure B-1 shows the magnitude of such a diff erence comparing the values of life expectancy for year 2005 and 2025 according to the CSO and the UN population division.
Th is discrepancy in estimates refl ects diff erent assumptions about the strength of the negative eff ect of HIV/AIDS on life expectancy. CSO (2003c) calculates – based on the progression of life expectancy experienced between 1969 and 1990 – that the eff ect on life expectancy in 2000 would be six years. For the UN population division (2006), the eff ect would be much higher: around 17 years.
1 Th e UN life tables comprise fi ve regional age patterns: general, South Asian, Far Eastern, Latin American and Chilean. Each pattern contains 41 life tables according to the life expectancy at birth (ILO-FACTS, 2002, p. 35).
Table B-1. Population by five-year age group, in 2000
Age 0- 4 5- 9 10-14 15-19 20-24 25-29 30-34 35-39 40-44
Females 847 030 745 401 645 870 556 927 472 814 391 176 304 194 239 280 176 991
Males 850 635 738 167 629 335 538 660 454 692 379 715 305 420 245 915 187 914
Age 45-49 50-54 55-59 60-64 65-69 70-74 75-79 80 + Total
Females 137 270 106 760 83 750 65 790 48 528 32 178 16 710 21 099 4 891 768
Males 147 848 113 518 89 626 71 287 54 795 39 696 25 978 25 394 4 898 595
Based on CSO (2006d)

Appendix B 205
Regarding HIV prevalence, CSO considers under a medium variant scenario that adult HIV prevalence would decrease from 15.6 per cent in 2000 to 9.6 per cent in 2015 and 5.6 per cent in 2025 (CSO, 2003c, p. 11). In contrast, the UN population division projects that adult HIV prevalence would slightly decrease to reach 14.6 per cent in 2015 (UN, 2006, p. 68) under the medium variant scenario.2
Consequently, the overall results of the Social Budget model will vary a great deal depending on which estimates are chosen. Th e implications of using diff erent sce-narios are discussed in the next section.
Fertility assumptions
Th e model calculates age-specifi c fertility rates based on (i) the estimated total fertility rate, at the beginning and at the end of the projection period; (ii) an age fertility pat-tern out of 30 regional patterns; and (iii) an age of child-bearing pattern out of three options (late, intermediate, and early).
The official estimates for total fertility rate (TFR) are 6.0 and 4.9 children per woman for 2000 and 2025, respectively (CSO, 2003c). Th e age fertility pattern selected was the one of Eastern Africa and the age childbearing pattern chosen was the intermediate one. Th e resulting age-specifi c fertility rates are shown in Table B-2. In this table, the offi cial estimates for 2000 are also included.
Th e sex ratio of newborns or the proportion of male to female births was 0.971 in year 2000 according to the demographic and health survey 2001-2002 (CSO, 2003e). However, offi cial estimates of this ratio have fl uctuated signifi cantly even in the short run.3 Th erefore, we use the estimate from the UN population division (1.03) and keep it over the projection period.
2 Other HIV/AIDS-related scenarios considered are the most extreme cases: one in which no treatment is available; and another in which a perfectly eff ective vaccine against HIV is instantly available to everyone by 2010 (UN, 2007, ‘Assumptions’).3 CSO (2003e) reports that the sex ratio at birth was 109.5 in 1999 and 77.9 in 2002 (Table C-4, p. 277).
Source: CSO (2003a), UN (2007a), and model calculations for 2025 estimates
Figure B-1. Different estimates of life expectancy
Males
Females
2005 2025CSO UN
2005 20250
10
20
30
40
50
60
70
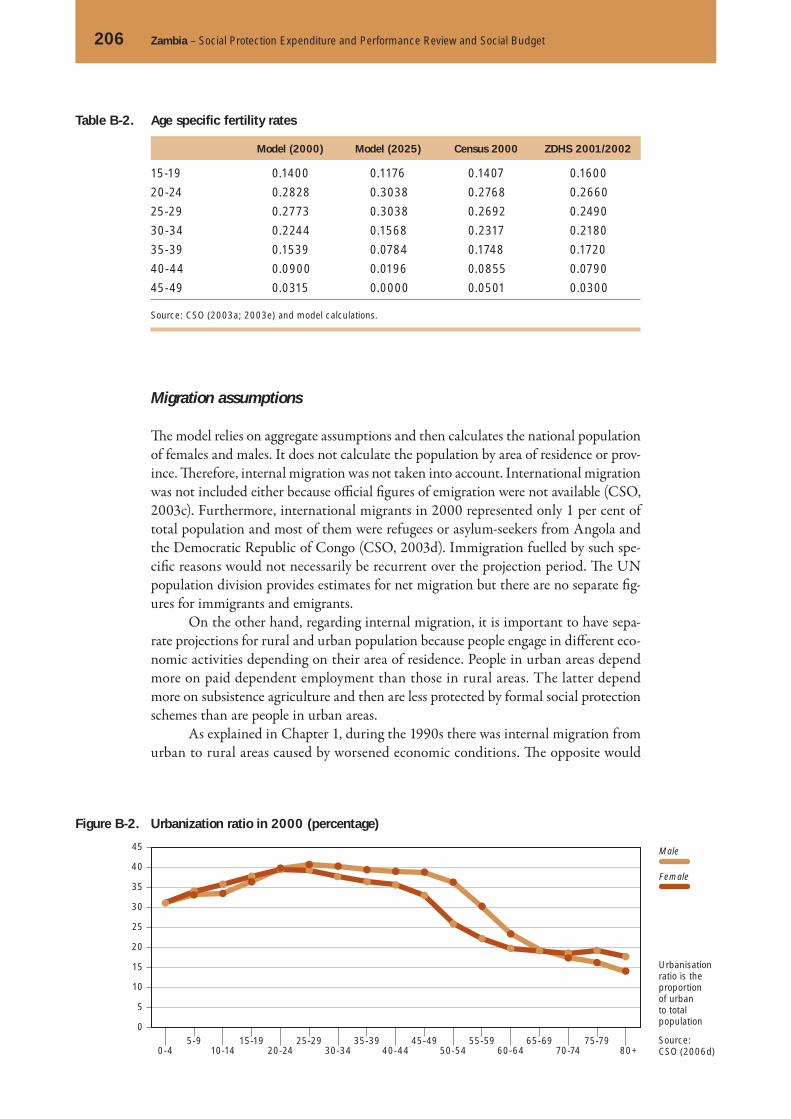
206 Zambia – Social Protection Expenditure and Performance Review and Social Budget
Migration assumptions
Th e model relies on aggregate assumptions and then calculates the national population of females and males. It does not calculate the population by area of residence or prov-ince. Th erefore, internal migration was not taken into account. International migration was not included either because offi cial fi gures of emigration were not available (CSO, 2003c). Furthermore, international migrants in 2000 represented only 1 per cent of total population and most of them were refugees or asylum-seekers from Angola and the Democratic Republic of Congo (CSO, 2003d). Immigration fuelled by such spe-cifi c reasons would not necessarily be recurrent over the projection period. Th e UN population division provides estimates for net migration but there are no separate fi g-ures for immigrants and emigrants.
On the other hand, regarding internal migration, it is important to have sepa-rate projections for rural and urban population because people engage in diff erent eco-nomic activities depending on their area of residence. People in urban areas depend more on paid dependent employment than those in rural areas. The latter depend more on subsistence agriculture and then are less protected by formal social protection schemes than are people in urban areas.
As explained in Chapter 1, during the 1990s there was internal migration from urban to rural areas caused by worsened economic conditions. Th e opposite would
Table B-2. Age specific fertility rates
Model (2000) Model (2025) Census 2000 ZDHS 2001/2002
15-19 0.1400 0.1176 0.1407 0.1600
20-24 0.2828 0.3038 0.2768 0.2660
25-29 0.2773 0.3038 0.2692 0.2490
30-34 0.2244 0.1568 0.2317 0.2180
35-39 0.1539 0.0784 0.1748 0.1720
40-44 0.0900 0.0196 0.0855 0.0790
45-49 0.0315 0.0000 0.0501 0.0300
Source: CSO (2003a; 2003e) and model calculations.
Urbanisation ratio is the proportion of urban to total population
Source: CSO (2006d)
Figure B-2. Urbanization ratio in 2000 (percentage)
Male
Female
0-45-9
10-1415-19
20-2425-29
30-3435-39
40-4445-49
50-5455-59
60-6465-69
70-7475-79
80+
0
5
10
15
20
25
30
35
40
45

Appendix B 207
have been expected to occur in the 2000s. Keeping migration assumptions based on the 2000 census (if available) would be inaccurate as we are unable to trace national migration trends based on single cases. Th e approach chosen here is to keep a constant ratio of urbanization (ratio of urban to total population) per cohort during the projec-tion period (see Figure B-2).
It should be noted that according to offi cial population projections this ratio decreases over time from 35.1 per cent in 2000 to 28.6 per cent in 2025 (on average for all age groups). Th is trend would be signalling the diff erent fertility rates of rural and urban population – the total fertility rate in 2001/2002 was 6.9 for rural and 4.3 for urban population (CSO, 2003e) –that would explain a higher population growth in rural areas than that in urban areas even assuming a constant migration pattern. In contrast, the UN population division projects an increase in the urbanization ratio from 34.8 per cent in 2000 to 41.5 per cent in 2025.
Comparison of model results with projections from different sources
We would have liked to use the offi cial assumptions of life expectancy but as explained earlier there are divergent estimates from other sources. Th is results in divergent pop-ulation projections. Th e total population of Zambia in 2025 would be 19.6 million according to offi cial projections and 16.5 million according to the UN projections, under a medium variant scenario.
Inputting the offi cial estimates of life expectancy in the ILO-POP model brings quite diff erent results from using the UN estimates: the diff erence is of around 4.3 mil-lion inhabitants. Furthermore, because this version of the model does not deal with the eff ect of HIV/AIDS separately, we decided to use the most conservative estimates of life expectancy.
Our model then produces results that seem to be at a mid-point between the official projections and the UN projections: 18.1 million inhabitants. Figure B-3 shows three series: (i) our projections using UN life expectancy; (ii) UN projections; and (iii) offi cial CSO projections. Our series is plotted in bars to diff erentiate it from the other two series.
2.
Source: CSO (2006d), UN (2007a) and model projections
Figure B-3. Population distribution in 2025 (three projections)
ILO
UN
CSO
0-45-9
10-1415-19
20-2425-29
30-3435-39
40-4445-49
50-5455-59
60-6465-69
70-7475-79
80+
0.0
0.5
1.0
1.5
2.0
2.5
3.0
3.5
Million inhabitants

208 Zambia – Social Protection Expenditure and Performance Review and Social Budget
Figure B-3 shows that the slope of the series of the UN projections is fl atter than the other two, which is a consequence of the lower estimates for total fertility rate (TFR): 5.65 children per woman for 2000-2005 and 3.69 children per woman for 2020-2025 (UN, 2007). However, the UN population division also considers a high-fertility scenario that assumes the values of 5.65 and 4.19, respectively.
In this respect, the UN population division assumes that the TFR in all coun-tries will converge towards a level of 1.85 children per woman in a given period of time (in the case of Zambia, a high-fertility country, this rate would be reached aft er 2050). Hence, it estimates a decline path for each country based on fertility models that con-sider the past experience of all countries during 1950-2000 and current fertility trends in each country.
So, we decided that the Social Budget model would be based on our projections using the offi cial estimates of total fertility rate but that a second scenario with the UN estimates would be explored. If detailed offi cial projections were available, they could be used in a third scenario. Analysing at least two scenarios is important because the other modules of the Social Budget depend on the population projections (see Appendix A). Hence, the portions of working-age to total population, the labour force and employment projections calculated under these two scenarios will be diff erent.
Figure B-4 shows four series of projections. Our projections using the ILO-POP model appear in bars. Results for scenario 1 come from using the offi cial estimates for TFR and results for scenario 2, from using the UN estimates. Th e UN projections appear in lines. Th e thicker (and fl atter) line corresponds to the medium-fertility sce-nario, and the upper line to the high-fertility scenario.
Table B-3 shows the population fi gures and some relevant ratios to compare the four cases depicted in the fi gure above.
The table shows that the population is ageing – the child dependency ratio decreases in all cases in relation to the situation in 2000 – and that this process seems to be less marked in offi cial statistics and more marked in those cases where fertility rates are assumed to decrease fast (scenario 2 for ILO projections and medium-fertility case for UN projections).
On the other hand, the percentage of working-age to total population increases in all cases while the percentage of people aged 25-39 – those who were at highest risk of HIV infection in 2002 – varies according to the case. Comparing all cases, it seems that our scenario 1 describes an intermediate situation in terms of total number of
Source: (2006d),UN (2007a) and model projections
Figure B-4. Population distribution in 2025, two models and different fertility assumptions
ILO (1)
ILO (2)
UN (medium)
UN (high)
0-45-9
10-1415-19
20-2425-29
30-3435-39
40-4445-49
50-5455-59
60-6465-69
70-7475-79
80+
Million inhabitants
0.0
0.5
1.0
1.5
2.0
2.5
3.0
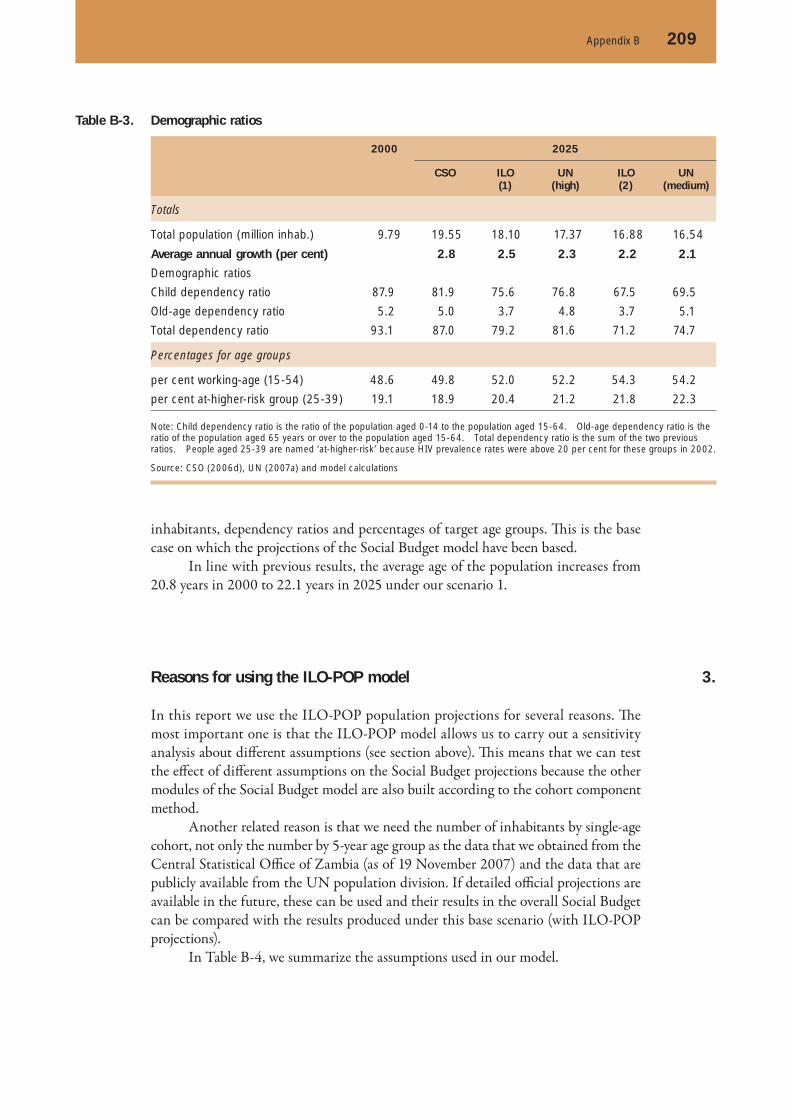
Appendix B 209
inhabitants, dependency ratios and percentages of target age groups. Th is is the base case on which the projections of the Social Budget model have been based.
In line with previous results, the average age of the population increases from 20.8 years in 2000 to 22.1 years in 2025 under our scenario 1.
Reasons for using the ILO-POP model
In this report we use the ILO-POP population projections for several reasons. Th e most important one is that the ILO-POP model allows us to carry out a sensitivity analysis about diff erent assumptions (see section above). Th is means that we can test the eff ect of diff erent assumptions on the Social Budget projections because the other modules of the Social Budget model are also built according to the cohort component method.
Another related reason is that we need the number of inhabitants by single-age cohort, not only the number by 5-year age group as the data that we obtained from the Central Statistical Offi ce of Zambia (as of 19 November 2007) and the data that are publicly available from the UN population division. If detailed offi cial projections are available in the future, these can be used and their results in the overall Social Budget can be compared with the results produced under this base scenario (with ILO-POP projections).
In Table B-4, we summarize the assumptions used in our model.
3.
Table B-3. Demographic ratios
2000 2025
CSO ILO (1)
UN (high)
ILO (2)
UN(medium)
Totals
Total population (million inhab.) 9.79 19.55 18.10 17.37 16.88 16.54
Average annual growth (per cent) 2.8 2.5 2.3 2.2 2.1
Demographic ratios
Child dependency ratio 87.9 81.9 75.6 76.8 67.5 69.5
Old-age dependency ratio 5.2 5.0 3.7 4.8 3.7 5.1
Total dependency ratio 93.1 87.0 79.2 81.6 71.2 74.7
Percentages for age groups
per cent working-age (15-54) 48.6 49.8 52.0 52.2 54.3 54.2
per cent at-higher-risk group (25-39) 19.1 18.9 20.4 21.2 21.8 22.3
Note: Child dependency ratio is the ratio of the population aged 0-14 to the population aged 15-64. Old-age dependency ratio is the ratio of the population aged 65 years or over to the population aged 15-64. Total dependency ratio is the sum of the two previous ratios. People aged 25-39 are named ‘at-higher-risk’ because HIV prevalence rates were above 20 per cent for these groups in 2002.
Source: CSO (2006d), UN (2007a) and model calculations

210 Zambia – Social Protection Expenditure and Performance Review and Social Budget
Table B-4. Summary of assumptions used in the ILO-POP model
Indicator Estimate Source
Mortality assumptions
Life expectancy at birth 39.4 years for females38.9 years for males
UN population division
Age pattern General UN life tables
Trend of mortality decline Slow
Fertility assumptions
Scenario 1 (base case)
Total fertility rate (2000) 6.00 (children per woman) CSO
Total fertility rate (2025) 4.90 (children per woman) CSO
Scenario 2
Total fertility rate (2000) 5.65 (children per woman) UN population division
Total fertility rate (2025) 3.69 (children per woman) UN population division
All scenarios
Age fertility pattern Southern Africa
Age child bearing pattern Intermediate
Sex ratio of newborns 1.03 (male to female births) UN population division
Migration assumptions
International migration Zero
Internal migration (Constant urbanisation ratio)
211
In this appendix we should like to make several points in order to signal the con-straints we faced during the preparation of this report and, most importantly, ways in which the information system could be improved.
Appendix B already pointed out that the project team did not receive timely and accurate population projections for single-age cohorts for a period of several months (since the start of the project in February 2007 until January 2008 when this report was written). This situation significantly delayed the work of the team because, as explained in Appendix A, the population projections are the foundation for all other projections in the Social Budget model. In future, if detailed offi cial projections are available and the assumptions underlying these projections are checked against other estimates and successfully agreed, the Social Budget model can be based on these offi -cial projections. Indeed, this would be ideal, because the Social Budget model is at its most useful when it is adopted and improved by policy-makers in a country relying on a sound statistical system with the resources to produce high-quality input data.
Because we are projecting the Social Budget of Zambia and the Government is the main provider of social protection in the country, reliable quantifi able information of the main operations of the central Government are necessary. However, we had dif-fi culty obtaining offi cial data from diff erent ministries, especially from the MoFNP. Th e CSO was starting its very fi rst economic census, which means that key staff were involved in meetings and training sessions and did not have much time to discuss data issues with the project team. As IMF (2007a, p. 56) states, there are resource constraints and organizational weakness within this institution that aff ected its performance.
Our work took place in a context in which the country was adapting its informa-tion system and reporting procedures to the requirements of the cooperating partners and the multilateral institutions. Programmes such as the Poverty Reduction Budget Support (PRBS) and the Public Expenditure Management and Financial Account-ability (PEMFA) currently underway were intended to improve the fi nancial infor-mation systems. Indeed, ‘the Integrated Financial Management Information System (IFMIS) pilot sites will “go live” in 2008’ (MoFNP, 2008, p. 12). Th is means that in future, the Social Budget model developed here could benefi t from better information and become a complementary tool to assess the Government’s capacity to address the needs of its population and improve their well-being.
Appendix C.
Data issues
Appendix C.
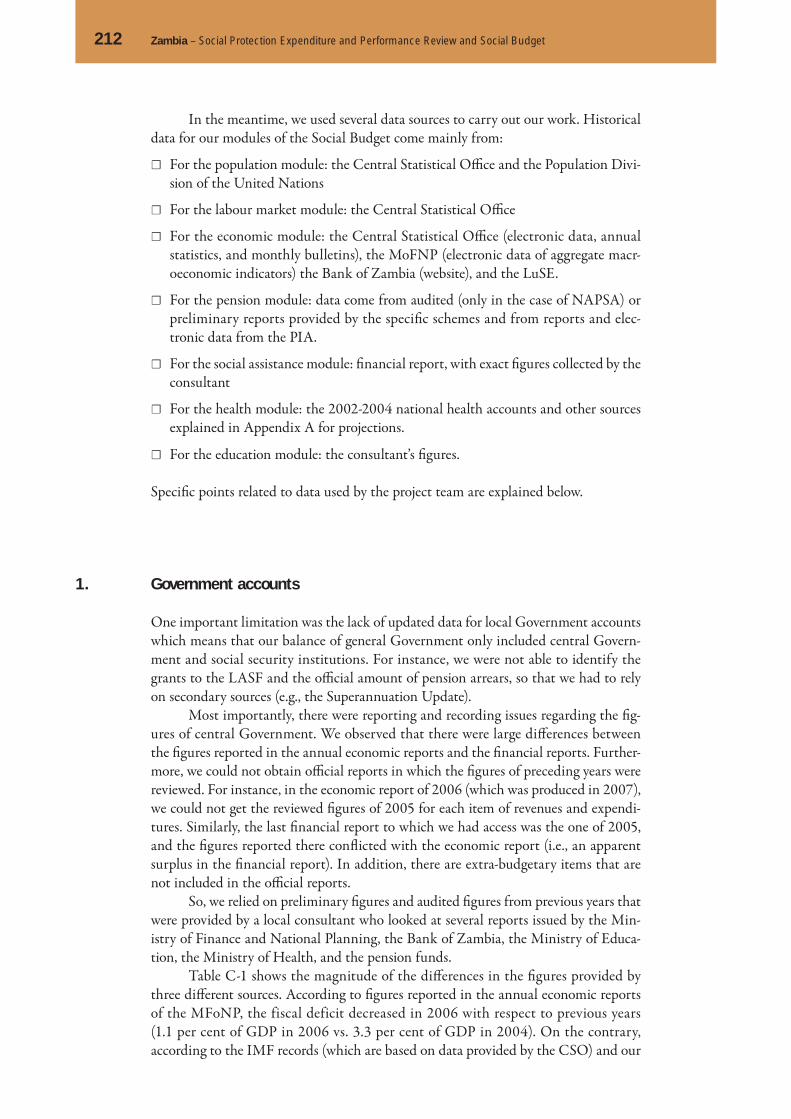
212 Zambia – Social Protection Expenditure and Performance Review and Social Budget
In the meantime, we used several data sources to carry out our work. Historical data for our modules of the Social Budget come mainly from:
☐ For the population module: the Central Statistical Offi ce and the Population Divi-sion of the United Nations
☐ For the labour market module: the Central Statistical Offi ce
☐ For the economic module: the Central Statistical Offi ce (electronic data, annual statistics, and monthly bulletins), the MoFNP (electronic data of aggregate macr-oeconomic indicators) the Bank of Zambia (website), and the LuSE.
☐ For the pension module: data come from audited (only in the case of NAPSA) or preliminary reports provided by the specifi c schemes and from reports and elec-tronic data from the PIA.
☐ For the social assistance module: fi nancial report, with exact fi gures collected by the consultant
☐ For the health module: the 2002-2004 national health accounts and other sources explained in Appendix A for projections.
☐ For the education module: the consultant’s fi gures.
Specifi c points related to data used by the project team are explained below.
Government accounts
One important limitation was the lack of updated data for local Government accounts which means that our balance of general Government only included central Govern-ment and social security institutions. For instance, we were not able to identify the grants to the LASF and the offi cial amount of pension arrears, so that we had to rely on secondary sources (e.g., the Superannuation Update).
Most importantly, there were reporting and recording issues regarding the fi g-ures of central Government. We observed that there were large diff erences between the fi gures reported in the annual economic reports and the fi nancial reports. Further-more, we could not obtain offi cial reports in which the fi gures of preceding years were reviewed. For instance, in the economic report of 2006 (which was produced in 2007), we could not get the reviewed fi gures of 2005 for each item of revenues and expendi-tures. Similarly, the last fi nancial report to which we had access was the one of 2005, and the fi gures reported there confl icted with the economic report (i.e., an apparent surplus in the fi nancial report). In addition, there are extra-budgetary items that are not included in the offi cial reports.
So, we relied on preliminary fi gures and audited fi gures from previous years that were provided by a local consultant who looked at several reports issued by the Min-istry of Finance and National Planning, the Bank of Zambia, the Ministry of Educa-tion, the Ministry of Health, and the pension funds.
Table C-1 shows the magnitude of the diff erences in the fi gures provided by three diff erent sources. According to fi gures reported in the annual economic reports of the MFoNP, the fiscal deficit decreased in 2006 with respect to previous years (1.1 per cent of GDP in 2006 vs. 3.3 per cent of GDP in 2004). On the contrary, according to the IMF records (which are based on data provided by the CSO) and our
1.
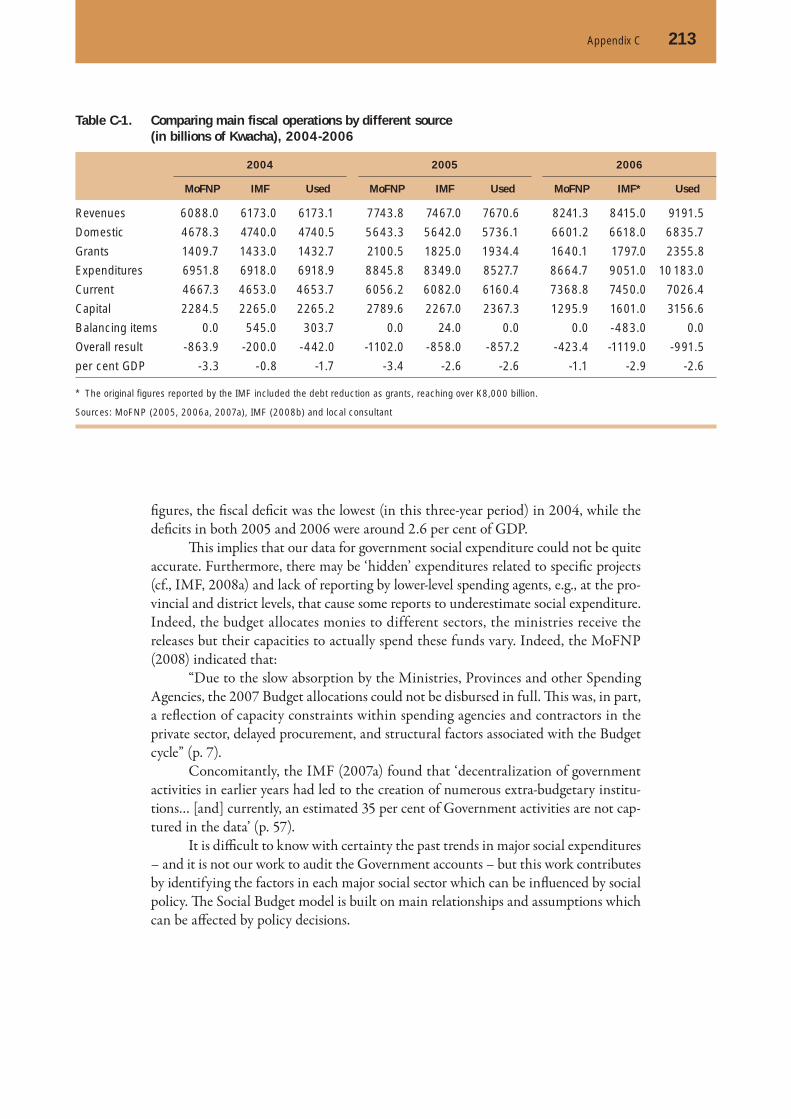
Appendix C 213
fi gures, the fi scal defi cit was the lowest (in this three-year period) in 2004, while the defi cits in both 2005 and 2006 were around 2.6 per cent of GDP.
Th is implies that our data for government social expenditure could not be quite accurate. Furthermore, there may be ‘hidden’ expenditures related to specifi c projects (cf., IMF, 2008a) and lack of reporting by lower-level spending agents, e.g., at the pro-vincial and district levels, that cause some reports to underestimate social expenditure. Indeed, the budget allocates monies to different sectors, the ministries receive the releases but their capacities to actually spend these funds vary. Indeed, the MoFNP (2008) indicated that:
“Due to the slow absorption by the Ministries, Provinces and other Spending Agencies, the 2007 Budget allocations could not be disbursed in full. Th is was, in part, a refl ection of capacity constraints within spending agencies and contractors in the private sector, delayed procurement, and structural factors associated with the Budget cycle” (p. 7).
Concomitantly, the IMF (2007a) found that ‘decentralization of government activities in earlier years had led to the creation of numerous extra-budgetary institu-tions… [and] currently, an estimated 35 per cent of Government activities are not cap-tured in the data’ (p. 57).
It is diffi cult to know with certainty the past trends in major social expenditures – and it is not our work to audit the Government accounts – but this work contributes by identifying the factors in each major social sector which can be infl uenced by social policy. Th e Social Budget model is built on main relationships and assumptions which can be aff ected by policy decisions.
Table C-1. Comparing main fiscal operations by different source (in billions of Kwacha), 2004-2006
2004 2005 2006
MoFNP IMF Used MoFNP IMF Used MoFNP IMF* Used
Revenues 6088.0 6173.0 6173.1 7743.8 7467.0 7670.6 8241.3 8415.0 9191.5
Domestic 4678.3 4740.0 4740.5 5643.3 5642.0 5736.1 6601.2 6618.0 6835.7
Grants 1409.7 1433.0 1432.7 2100.5 1825.0 1934.4 1640.1 1797.0 2355.8
Expenditures 6951.8 6918.0 6918.9 8845.8 8349.0 8527.7 8664.7 9051.0 10 183.0
Current 4667.3 4653.0 4653.7 6056.2 6082.0 6160.4 7368.8 7450.0 7026.4
Capital 2284.5 2265.0 2265.2 2789.6 2267.0 2367.3 1295.9 1601.0 3156.6
Balancing items 0.0 545.0 303.7 0.0 24.0 0.0 0.0 -483.0 0.0
Overall result -863.9 -200.0 -442.0 -1102.0 -858.0 -857.2 -423.4 -1119.0 -991.5
per cent GDP -3.3 -0.8 -1.7 -3.4 -2.6 -2.6 -1.1 -2.9 -2.6
* The original figures reported by the IMF included the debt reduction as grants, reaching over K8,000 billion.
Sources: MoFNP (2005, 2006a, 2007a), IMF (2008b) and local consultant
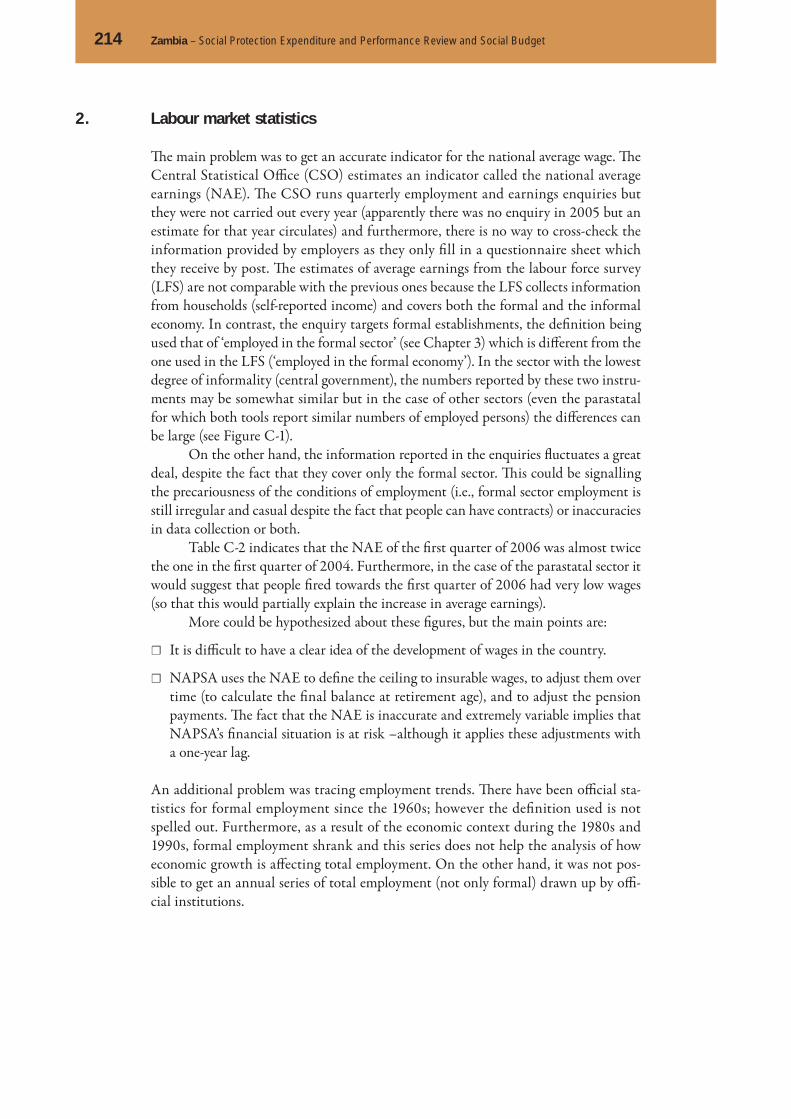
214 Zambia – Social Protection Expenditure and Performance Review and Social Budget
Labour market statistics
Th e main problem was to get an accurate indicator for the national average wage. Th e Central Statistical Offi ce (CSO) estimates an indicator called the national average earnings (NAE). Th e CSO runs quarterly employment and earnings enquiries but they were not carried out every year (apparently there was no enquiry in 2005 but an estimate for that year circulates) and furthermore, there is no way to cross-check the information provided by employers as they only fi ll in a questionnaire sheet which they receive by post. Th e estimates of average earnings from the labour force survey (LFS) are not comparable with the previous ones because the LFS collects information from households (self-reported income) and covers both the formal and the informal economy. In contrast, the enquiry targets formal establishments, the defi nition being used that of ‘employed in the formal sector’ (see Chapter 3) which is diff erent from the one used in the LFS (‘employed in the formal economy’). In the sector with the lowest degree of informality (central government), the numbers reported by these two instru-ments may be somewhat similar but in the case of other sectors (even the parastatal for which both tools report similar numbers of employed persons) the diff erences can be large (see Figure C-1).
On the other hand, the information reported in the enquiries fl uctuates a great deal, despite the fact that they cover only the formal sector. Th is could be signalling the precariousness of the conditions of employment (i.e., formal sector employment is still irregular and casual despite the fact that people can have contracts) or inaccuracies in data collection or both.
Table C-2 indicates that the NAE of the fi rst quarter of 2006 was almost twice the one in the fi rst quarter of 2004. Furthermore, in the case of the parastatal sector it would suggest that people fi red towards the fi rst quarter of 2006 had very low wages (so that this would partially explain the increase in average earnings).
More could be hypothesized about these fi gures, but the main points are:
☐ It is diffi cult to have a clear idea of the development of wages in the country.
☐ NAPSA uses the NAE to defi ne the ceiling to insurable wages, to adjust them over time (to calculate the fi nal balance at retirement age), and to adjust the pension payments. Th e fact that the NAE is inaccurate and extremely variable implies that NAPSA’s fi nancial situation is at risk –although it applies these adjustments with a one-year lag.
An additional problem was tracing employment trends. Th ere have been offi cial sta-tistics for formal employment since the 1960s; however the defi nition used is not spelled out. Furthermore, as a result of the economic context during the 1980s and 1990s, formal employment shrank and this series does not help the analysis of how economic growth is aff ecting total employment. On the other hand, it was not pos-sible to get an annual series of total employment (not only formal) drawn up by offi -cial institutions.
2.
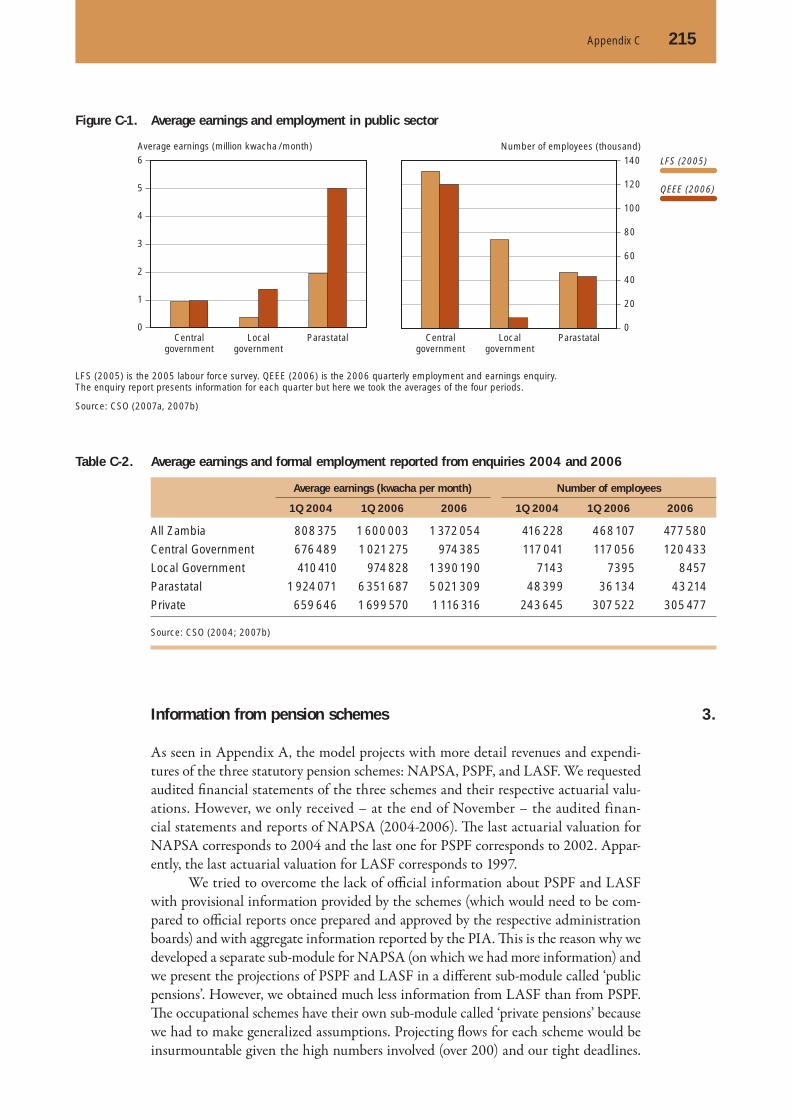
Appendix C 215
Information from pension schemes
As seen in Appendix A, the model projects with more detail revenues and expendi-tures of the three statutory pension schemes: NAPSA, PSPF, and LASF. We requested audited fi nancial statements of the three schemes and their respective actuarial valu-ations. However, we only received – at the end of November – the audited finan-cial statements and reports of NAPSA (2004-2006). Th e last actuarial valuation for NAPSA corresponds to 2004 and the last one for PSPF corresponds to 2002. Appar-ently, the last actuarial valuation for LASF corresponds to 1997.
We tried to overcome the lack of offi cial information about PSPF and LASF with provisional information provided by the schemes (which would need to be com-pared to offi cial reports once prepared and approved by the respective administration boards) and with aggregate information reported by the PIA. Th is is the reason why we developed a separate sub-module for NAPSA (on which we had more information) and we present the projections of PSPF and LASF in a diff erent sub-module called ‘public pensions’. However, we obtained much less information from LASF than from PSPF. Th e occupational schemes have their own sub-module called ‘private pensions’ because we had to make generalized assumptions. Projecting fl ows for each scheme would be insurmountable given the high numbers involved (over 200) and our tight deadlines.
3.
LFS (2005) is the 2005 labour force survey. QEEE (2006) is the 2006 quarterly employment and earnings enquiry. The enquiry report presents information for each quarter but here we took the averages of the four periods.
Source: CSO (2007a, 2007b)
Figure C-1. Average earnings and employment in public sector
LFS (2005)
QEEE (2006)
Number of employees (thousand)Average earnings (million kwacha /month)
0
20
40
60
80
100
120
140
0
1
2
3
4
5
6
Centralgovernment
Localgovernment
Parastatal Centralgovernment
Localgovernment
Parastatal
Table C-2. Average earnings and formal employment reported from enquiries 2004 and 2006
Average earnings (kwacha per month) Number of employees
1Q 2004 1Q 2006 2006 1Q 2004 1Q 2006 2006
All Zambia 808 375 1 600 003 1 372 054 416 228 468 107 477 580
Central Government 676 489 1 021 275 974 385 117 041 117 056 120 433
Local Government 410 410 974 828 1 390 190 7143 7395 8457
Parastatal 1 924 071 6 351 687 5 021 309 48 399 36 134 43 214
Private 659 646 1 699 570 1 116 316 243 645 307 522 305 477
Source: CSO (2004; 2007b)

216 Zambia – Social Protection Expenditure and Performance Review and Social Budget
Regarding the number of contributors of each scheme, we were provided with a total number of contributors for PSPF (as at 2006), LASF (as at 2005, coming from PIA reports), and occupational schemes (as at 2006, coming from PIA reports). In the case of PSPF, the number of contributors was provided separately by sex and grouped into three age groups. However, some assumptions were made to distribute a portion of contributions with ‘unknown’ sex and age.
In the case of NAPSA, there was no accurate estimate for the number of contributors (i.e., some estimates were even higher than the number of people in formal-sector employment and varied a lot from month to month). Looking at dif-ferent estimates and fi les provided, we decided to work with the number of contribu-tion payments (explained in Appendix A) which led to a consistent age structure of contributors.
Th e points expressed above indicate that the pension schemes have problems with their information systems. Although these systems seem to be more developed in NAPSA’s case, and indeed there are plans to improve the registration process of new members, there is still uncertainty about the contribution records of older mem-bers, especially those who contributed to the provident fund. It seems that many pension payments are made based on the documentation that the new pensioners themselves provide.
Regarding the number of pensioners of each scheme, NAPSA (being a young scheme) had the lowest number of them because it started paying pensions (not only lump sums) in 2006 and for those who qualifi ed for a retirement pension under the ‘sliding scale’ (NAPSA, 2007b). However, the numbers corresponding to the former provident fund were not available. PSPF gave us data of pensioners for diff erent types of benefi ts (i.e., old age, early retirement and survivors). We did not receive any more details from LASF than the numbers reported by the PIA.
Regarding the earnings of current contributors, we could infer them – in NAP-SA’s case – from the data of contribution payments (including some assumptions). Regarding the pension amounts we only had this information for NAPSA and PSPF although with diff erent degrees of detail and consistency. In order to match the totals of pension expenditure from specifi c cohorts’ numbers and average pensions with the totals reported in the income statements, we had to make assumptions. In other cases, we used aggregate fi gures of benefi t expenditure reported to the PIA and published in the annual industrial reports.
We did not obtain estimates of mortality rates or invalidity incidence rates from the schemes. So, we used the mortality rates applied for our population projections (see Annex A). Regarding incidence of invalidity, we tried to capture two elements: (i) work-related injuries with permanent incapacitating eff ect, by using information from the 2005 labour force survey (see Figure C-2); and (ii) HIV-related illnesses.
Th e second element was the most challenging one and so we used the infor-mation about HIV prevalence (CSO, 2003e) and adjusted it by an estimate of AIDS mortality.1 Th en, we took into account the work-related injuries reported in the 2005 labour force survey (permanently aff ected workers in Figure C-2), earlier estimates from the PROST model and HIV-related illness (see Figure C-3).2 Our estimates show
1 Roughly, based on UNAIDS and WHO (2007), there are 1.6 million deaths out of 22.5 million people living with HIV in sub-Saharan Africa, which implies a mortality rate of around 7.1 per cent.2 Th e PROST model is the Pension Reform Options Simulation Toolkit developed by the World Bank. It was used for the PSPF in 2002. We did not directly apply the incidence rates used there because the base year was 2002 (we incorporate some more updated data such as from the demographic and health survey and the labour force survey) and because we are not certain about the origin of these rates, which moreover were applied indiscriminately for females and males.

Appendix C 217
that females are more at risk of invalidity than males during their early years while the opposite occurs for males during their late years. Th ese trends are consistent with HIV prevalence rates. Th is assumption can be changed in the model when more accurate information is available. Figure C-3 shows also the calculated invalidity incidence rates by comparison with those coming from the PROST model.
We implicitly assumed that the gravity of injury was evenly distributed across age groups.
Permanently affected workers are those who became permanently disabled or were prevented from working perma-nently. Temporarily affected workers are those who stopped working temporarily or had to change jobs.
Based on CSO (2007).
Figure C-2. Incidence of work-related injuries by age group among all employed persons
1) The invalidity incidence rate is assumed to be an exponential function based on observed values calculated as two thirds of the maximum between the work-related injury rate (LFS) and the PROST rate plus one third of the HIV-related illness incidence rate.2) The PROST model did not use separate incident rates for males and females.
Based on CSO (2003e; 2007), PROST model provided by PSPF, and UNAIDS & WHO (2007)
15-19 20-24 25-29 30-34 35-39 40-44 45-49 50-54
Male
Female
Male
Female
0.000
0.005
0.010
0.015
0.020
0.025
0.030
0.035
0.0000
0.0005
0.0010
0.0015
0.0020
0.0025
0.0030
0.0035
15-19 20-24 25-29 30-34 35-39 40-44 45-49 50-54
Temporarily affected
Permanently affected
Figure C-3. Comparison of invalidity incidence rates
Male
Female
PROST
15 17 19 21 23 25 27 29 31 33 35 37 39 41 43 45 47 49 51 53
0.000
0.005
0.010
0.015
0.020
0.025

218 Zambia – Social Protection Expenditure and Performance Review and Social Budget
Th e resulting invalidity incidence rates correspond to the whole population and again we used adjustment factors for the pension schemes, assuming a higher incidence for PSPF workers than for others, but a lower incidence for workers in all schemes in comparison to the general population. In the case of NAPSA, the adjustment was very high (the incidence rates were very low) following the observations by GAD (2007) that members of NAPSA do not claim so many invalidity benefi ts.
Social assistance programmes
We had to rely on historical trends of social assistance to project the future trends as we did not have access to multi-year budget or plans for all the programmes, except for the Social Cash Transfer Scheme, which is to be scaled up, although with no clear fi nancing source.
But in the main, we based our fi gures on the fi nancial reports, as well as on sec-ondary sources, but with diff erent dates; this means that data diff ered and we thus had to make assumptions. For instance, regarding the three components of the World Food Programme (WFP) we did not know the exact contribution of the Government and we then assumed that the whole budget was fi nanced by donors.
4.
219
Appendix D.
Tables of the Social Budgetmodel
Appendix D.

220 Zambia – Social Protection Expenditure and Performance Review and Social Budget
Pension schemes: Table 1
STATUTORY AND PRIVATE PENSION SCHEMES (figures in millions of Kwacha)
2005 2006 2007 2008
INCOME
Contributions 652 717 767 653 887 274 1 021 248
Statutory schemes 494 023 606 918 699 134 802 875– Employer 274 002 339 152 392 299 451 854– Employee 220 021 267 766 306 835 351 021
Occupational schemes 158 694 160 735 188 139 218 373– Employer 85 118 86 213 100 911 117 127– Employee 73 577 74 523 87 228 101 246
Investment income 232 396 253 006 288 342 331 124
Statutory schemes 134 397 160 995 215 908 255 264
Occupational schemes 97 999 92 011 72 435 75 860
Government transfer 182 059 276 957 328 906 335 071
TOTAL INCOME 1 067 172 1 297 615 1 504 522 1 687 443
EXPENDITURE
Benefits 384 162 527 056 644 536 687 409
Statutory schemes 285 531 442 082 550 291 580 562– Old age 148 778 277 561 342 397 363 154– Invalidity 115 877 130 640 162 522 164 861– Survivors 6 050 10 631 12 211 16 405– Work injury 13 654 18 884 19 900 21 051– Other 1 173 4 366 13 260 15 092
Occupational schemes 98 630 84 973 94 245 106 847
Administrative & other, net 232 722 171 907 188 034 214 848
Change of reserves 450 289 598 652 671 952 785 186
TOTAL EXPENDITURE 1 067 172 1 297 615 1 504 522 1 687 443

Appendix D 221
2009 2010 2011 2012 2013 2014
1 167 069 1 303 726 1 422 971 1 555 651 1 703 274 1 867 225
915 939 1 022 133 1 115 168 1 219 072 1 335 072 1 464 313516 746 577 761 631 278 690 889 757 271 831 127399 193 444 372 483 890 528 183 577 801 633 186
251 130 281 593 307 802 336 579 368 202 402 912134 697 151 036 165 094 180 529 197 490 216 107116 433 130 557 142 708 156 050 170 712 186 805
369 631 400 796 474 965 557 264 649 398 752 235
291 292 320 749 384 324 455 102 534 474 623 171
78 339 80 047 90 641 102 162 114 925 129 064
300 439 272 059 279 409 285 355 291 473 300 041
1 837 140 1 976 581 2 177 344 2 398 270 2 644 145 2 919 502
736 693 792 695 853 948 922 555 999 815 1 091 685
617 038 658 941 705 550 758 943 819 420 892 859389 682 421 122 457 412 499 986 548 078 606 952167 313 170 502 174 163 178 076 182 971 189 41120 852 25 477 30 048 34 681 39 671 45 11622 100 22 754 22 972 23 209 23 455 23 66017 091 19 086 20 956 22 990 25 245 27 719
119 655 133 754 148 398 163 613 180 395 198 826
243 609 271 459 301 932 334 978 371 997 413 499
856 839 912 427 1 021 465 1 140 737 1 272 334 1 414 317
1 837 140 1 976 581 2 177 344 2 398 270 2 644 145 2 919 502

222 Zambia – Social Protection Expenditure and Performance Review and Social Budget
Pension schemes: Table 1
STATUTORY AND PRIVATE PENSION SCHEMES (figures in millions of Kwacha) (cont.)
2015 2016 2017 2018
INCOME
Contributions 2 048 692 2 188 119 2 337 797 2 498 080
Statutory schemes 1 608 169 1 720 082 1 840 782 1 970 489– Employer 913 009 976 325 1 044 325 1 117 234– Employee 695 160 743 756 796 457 853 255
Occupational schemes 440 523 468 038 497 015 527 591– Employer 236 280 251 038 266 581 282 981– Employee 204 242 216 999 230 434 244 611
Investment income 865 768 820 596 919 562 1 026 119
Statutory schemes 721 065 686 399 771 123 861 780
Occupational schemes 144 702 134 197 148 440 164 340
Government transfer 301 173 299 330 293 893 293 496
TOTAL INCOME 3 215 633 3 308 046 3 551 253 3 817 695
EXPENDITURE
Benefits 1 207 687 1 315 212 1 396 390 1 498 393
Statutory schemes 988 141 1 076 007 1 149 194 1 243 470– Old age 687 985 763 537 823 243 901 230– Invalidity 194 589 198 674 202 974 209 784– Survivors 51 070 56 979 63 724 70 734– Work injury 24 028 23 974 23 984 23 945– Other 30 468 32 844 35 268 37 776
Occupational schemes 219 546 239 205 247 196 254 924
Administrative & other, net 459 677 500 890 539 886 582 358
Change of reserves 1 548 269 1 491 944 1 614 978 1 736 945
TOTAL EXPENDITURE 3 215 633 3 308 046 3 551 253 3 817 695

Appendix D 223
2019 2020 2021 2022 2023 2024 2025
2 670 055 2 854 984 3 053 971 3 267 775 3 497 418 3 744 092 4 009 376
2 110 147 2 260 983 2 423 982 2 599 757 2 789 199 2 993 388 3 213 7791 195 545 1 279 939 1 370 920 1 468 825 1 574 204 1 687 630 1 809 745
914 602 981 043 1 053 062 1 130 932 1 214 995 1 305 758 1 404 034
559 908 594 001 629 988 668 018 708 218 750 704 795 597300 314 318 601 337 903 358 301 379 863 402 651 426 729259 594 275 401 292 086 309 717 328 356 348 054 368 868
1 139 563 1 259 256 1 386 011 1 520 814 1 662 834 1 809 836 1 958 568
957 510 1 057 536 1 162 512 1 273 234 1 388 662 1 506 353 1 622 847
182 052 201 720 223 499 247 580 274 173 303 483 335 721
293 426 296 910 296 831 297 370 306 769 312 379 329 169
4 103 044 4 411 151 4 736 813 5 085 959 5 467 021 5 866 307 6 297 112
1 629 736 1 779 033 1 916 113 2 065 993 2 266 018 2 511 049 2 832 385
1 366 750 1 507 403 1 635 569 1 776 800 1 968 028 2 203 826 2 515 3921 006 564 1 124 968 1 227 986 1 340 819 1 498 317 1 699 083 1 968 580
217 383 228 319 241 029 256 257 275 852 295 333 320 30978 479 86 974 96 230 106 042 116 657 128 447 141 40523 865 23 804 23 871 23 922 23 902 23 805 23 75440 460 43 338 46 454 49 760 53 300 57 158 61 345
262 986 271 630 280 544 289 193 297 990 307 223 316 992
628 808 679 537 735 119 795 502 861 219 932 727 1 010 328
1 844 499 1 952 580 2 085 580 2 224 464 2 339 784 2 422 531 2 454 400
4 103 044 4 411 151 4 736 813 5 085 959 5 467 021 5 866 307 6 297 112
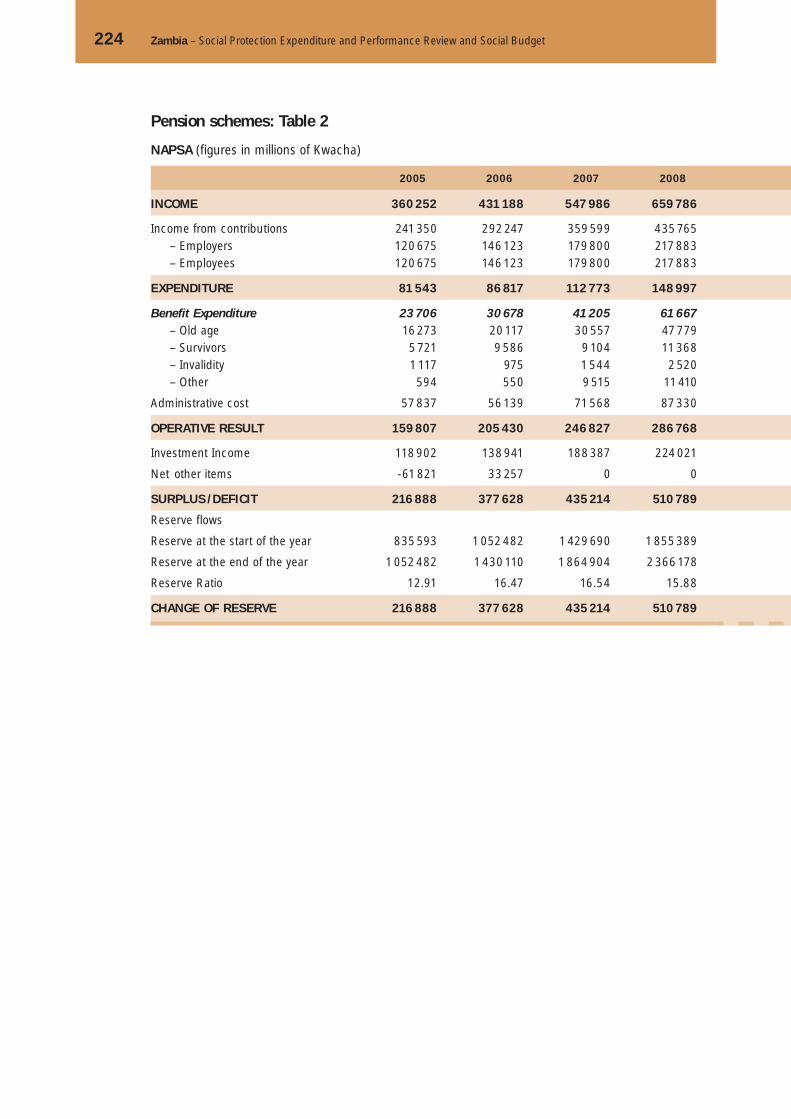
224 Zambia – Social Protection Expenditure and Performance Review and Social Budget
Pension schemes: Table 2
NAPSA (figures in millions of Kwacha)
2005 2006 2007 2008
INCOME 360 252 431 188 547 986 659 786
Income from contributions 241 350 292 247 359 599 435 765– Employers 120 675 146 123 179 800 217 883– Employees 120 675 146 123 179 800 217 883
EXPENDITURE 81 543 86 817 112 773 148 997
Benefit Expenditure 23 706 30 678 41 205 61 667– Old age 16 273 20 117 30 557 47 779– Survivors 5 721 9 586 9 104 11 368– Invalidity 1 117 975 1 544 2 520– Other 594 550 9 515 11 410
Administrative cost 57 837 56 139 71 568 87 330
OPERATIVE RESULT 159 807 205 430 246 827 286 768
Investment Income 118 902 138 941 188 387 224 021
Net other items -61 821 33 257 0 0
SURPLUS / DEFICIT 216 888 377 628 435 214 510 789
Reserve flows
Reserve at the start of the year 835 593 1 052 482 1 429 690 1 855 389
Reserve at the end of the year 1 052 482 1 430 110 1 864 904 2 366 178
Reserve Ratio 12.91 16.47 16.54 15.88
CHANGE OF RESERVE 216 888 377 628 435 214 510 789

Appendix D 225
2009 2010 2011 2012 2013 2014
778 298 891 889 1 031 567 1 187 839 1 363 389 1 560 382
521 834 607 442 687 523 777 436 878 592 992 462260 917 303 721 343 762 388 718 439 296 496 231260 917 303 721 343 762 388 718 439 296 496 231
194 124 245 685 302 917 370 339 447 645 539 499
88 743 121 426 159 942 206 802 260 635 325 67970 781 98 551 131 484 171 785 217 614 273 04414 011 16 995 20 119 23 536 27 524 32 1003 951 5 880 8 340 11 481 15 497 20 535
13 476 15 586 17 556 19 637 21 957 24 535
105 381 124 260 142 975 163 537 187 010 213 820
327 711 361 757 384 607 407 097 430 947 452 963
256 463 284 447 344 044 410 403 484 797 567 920
0 0 0 0 0 0
584 174 646 203 728 651 817 500 915 744 1 020 883
2 354 768 2 925 465 3 556 083 4 267 177 5 065 040 5 958 827
2 938 942 3 571 669 4 284 734 5 084 677 5 980 784 6 979 710
15.14 14.54 14.14 13.73 13.36 12.94
584 174 646 203 728 651 817 500 915 744 1 020 883
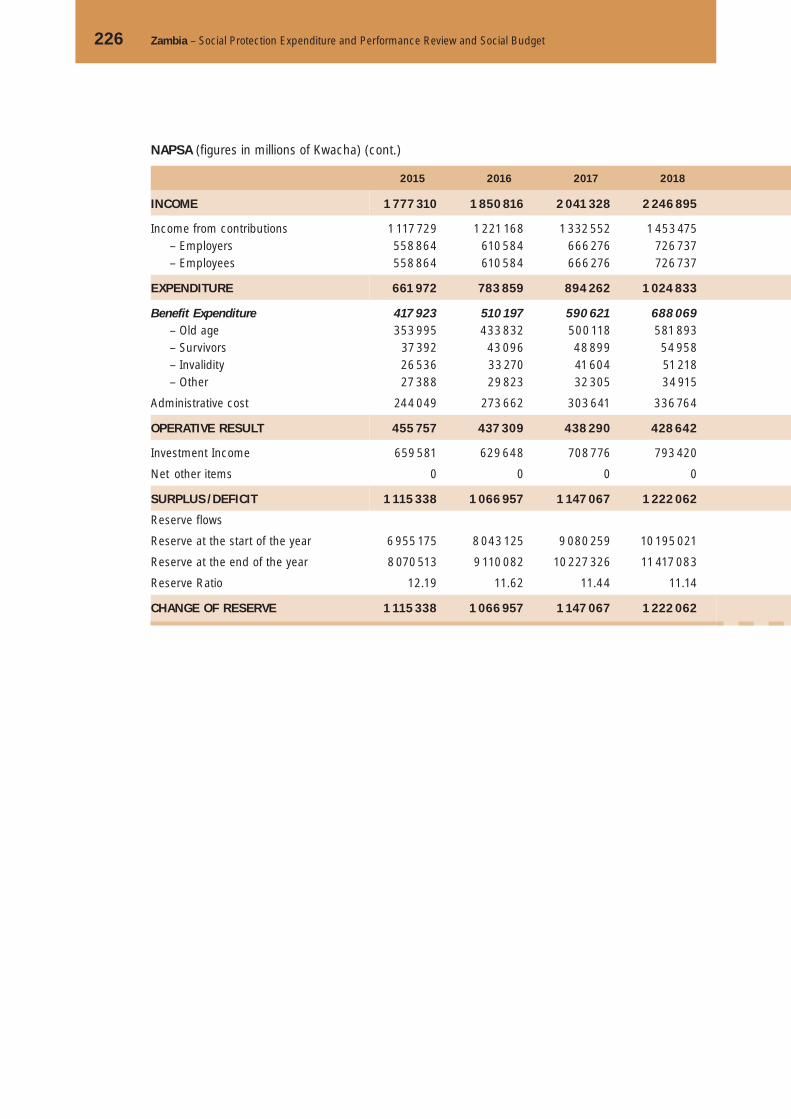
226 Zambia – Social Protection Expenditure and Performance Review and Social Budget
Pension schemes: Table 2
NAPSA (figures in millions of Kwacha) (cont.)
2015 2016 2017 2018
INCOME 1 777 310 1 850 816 2 041 328 2 246 895
Income from contributions 1 117 729 1 221 168 1 332 552 1 453 475– Employers 558 864 610 584 666 276 726 737– Employees 558 864 610 584 666 276 726 737
EXPENDITURE 661 972 783 859 894 262 1 024 833
Benefit Expenditure 417 923 510 197 590 621 688 069– Old age 353 995 433 832 500 118 581 893– Survivors 37 392 43 096 48 899 54 958– Invalidity 26 536 33 270 41 604 51 218– Other 27 388 29 823 32 305 34 915
Administrative cost 244 049 273 662 303 641 336 764
OPERATIVE RESULT 455 757 437 309 438 290 428 642
Investment Income 659 581 629 648 708 776 793 420
Net other items 0 0 0 0
SURPLUS / DEFICIT 1 115 338 1 066 957 1 147 067 1 222 062
Reserve flows
Reserve at the start of the year 6 955 175 8 043 125 9 080 259 10 195 021
Reserve at the end of the year 8 070 513 9 110 082 10 227 326 11 417 083
Reserve Ratio 12.19 11.62 11.44 11.14
CHANGE OF RESERVE 1 115 338 1 066 957 1 147 067 1 222 062

Appendix D 227
2019 2020 2021 2022 2023 2024 2025
2 467 561 2 702 417 2 952 762 3 221 127 3 507 866 3 811 702 4 129 195
1 584 818 1 726 449 1 879 029 2 044 304 2 223 686 2 418 357 2 628 352792 409 863 225 939 514 1 022 152 1 111 843 1 209 179 1 314 176792 409 863 225 939 514 1 022 152 1 111 843 1 209 179 1 314 176
1 187 833 1 368 311 1 543 179 1 735 488 1 975 074 2 269 150 2 633 287
814 493 954 749 1 085 495 1 229 377 1 415 831 1 651 696 1 952 282690 618 810 267 916 695 1 033 382 1 189 998 1 392 808 1 657 40861 822 69 731 78 468 87 667 97 803 109 423 122 70062 053 74 751 90 333 108 328 128 030 149 465 172 17337 744 40 821 44 113 47 571 51 281 55 313 59 684
373 340 413 562 457 683 506 111 559 244 617 454 681 005
396 985 358 139 335 850 308 817 248 612 149 207 -4 935
882 743 975 968 1 073 733 1 176 823 1 284 180 1 393 344 1 500 844
0 0 0 0 0 0 0
1 279 727 1 334 106 1 409 584 1 485 640 1 532 791 1 542 551 1 495 909
11 382 169 12 624 152 13 917 437 15 282 908 16 720 977 18 202 487 19 689 725
12 661 896 13 958 259 15 327 021 16 768 547 18 253 768 19 745 039 21 185 634
10.66 10.20 9.93 9.66 9.24 8.70 8.05
1 279 727 1 334 106 1 409 584 1 485 640 1 532 791 1 542 551 1 495 909
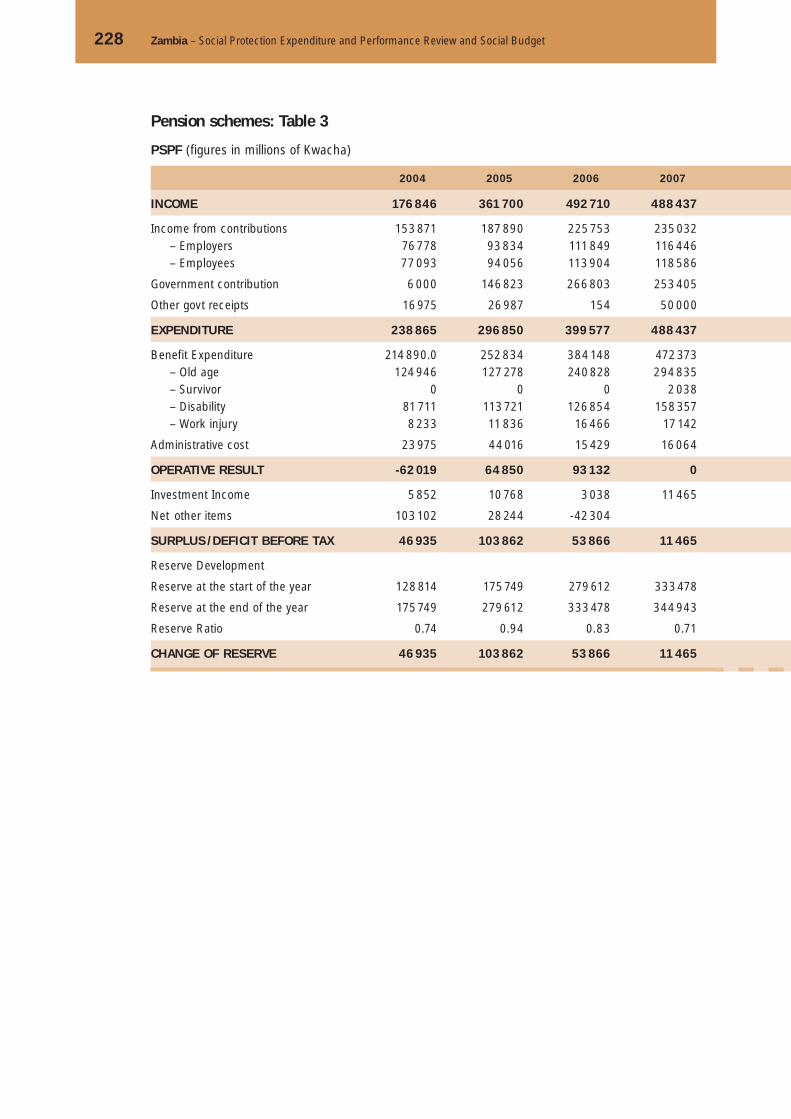
228 Zambia – Social Protection Expenditure and Performance Review and Social Budget
Pension schemes: Table 3
PSPF (figures in millions of Kwacha)
2004 2005 2006 2007
INCOME 176 846 361 700 492 710 488 437
Income from contributions 153 871 187 890 225 753 235 032– Employers 76 778 93 834 111 849 116 446– Employees 77 093 94 056 113 904 118 586
Government contribution 6 000 146 823 266 803 253 405
Other govt receipts 16 975 26 987 154 50 000
EXPENDITURE 238 865 296 850 399 577 488 437
Benefit Expenditure 214 890.0 252 834 384 148 472 373– Old age 124 946 127 278 240 828 294 835– Survivor 0 0 0 2 038– Disability 81 711 113 721 126 854 158 357– Work injury 8 233 11 836 16 466 17 142
Administrative cost 23 975 44 016 15 429 16 064
OPERATIVE RESULT -62 019 64 850 93 132 0
Investment Income 5 852 10 768 3 038 11 465
Net other items 103 102 28 244 -42 304
SURPLUS / DEFICIT BEFORE TAX 46 935 103 862 53 866 11 465
Reserve Development
Reserve at the start of the year 128 814 175 749 279 612 333 478
Reserve at the end of the year 175 749 279 612 333 478 344 943
Reserve Ratio 0.74 0.94 0.83 0.71
CHANGE OF RESERVE 46 935 103 862 53 866 11 465

Appendix D 229
2008 2009 2010 2011 2012 2013 2014
496 595 504 011 510 744 516 213 520 134 523 805 528 736
245 773 254 821 258 685 257 031 255 170 252 878 249 450121 768 126 251 128 165 127 345 126 423 125 288 123 589124 005 128 571 130 520 129 685 128 746 127 590 125 860
250 822 249 190 252 059 259 182 264 964 270 927 279 286
53 000 20 000 20 000 20 226 20 391 20 546 20 755
496 595 504 011 510 744 516 213 520 134 523 805 528 736
479 797 486 595 493 064 498 646 502 694 506 522 511 687298 016 301 047 304 215 307 151 309 172 311 200 314 282
3 945 5 718 7 328 8 748 9 948 10 936 11 782159 910 161 244 162 654 164 000 164 962 165 943 167 42917 926 18 586 18 868 18 747 18 611 18 444 18 194
16 798 17 416 17 680 17 567 17 440 17 283 17 049
0 0 0 0 0 0 0
10 955 10 267 9 498 9 765 10 019 10 280 10 547
10 955 10 267 9 498 9 765 10 019 10 280 10 547
344 943 355 898 366 165 375 663 385 428 395 448 405 728
355 898 366 165 375 663 385 428 395 448 405 728 416 275
0.72 0.73 0.74 0.75 0.76 0.77 0.79
10 955 10 267 9 498 9 765 10 019 10 280 10 547

230 Zambia – Social Protection Expenditure and Performance Review and Social Budget
Pension schemes: Table 3
PSPF (figures in millions of Kwacha) (cont.)
2015 2016 2017 2018
INCOME 528 096 520 464 509 892 503 150
Income from contributions 247 657 241 575 236 027 229 427– Employers 122 701 119 688 116 939 113 669– Employees 124 956 121 887 119 088 115 758
Government contribution 280 439 278 888 273 865 273 723
Other govt receipts 20 734 20 442 20 028 19 773
EXPENDITURE 528 096 520 464 509 892 503 150
Benefit Expenditure 511 169 503 953 493 761 487 469– Old age 313 905 309 556 302 871 298 795– Survivor 12 415 12 616 13 551 14 485– Disability 166 786 164 162 160 123 157 456– Work injury 18 063 17 620 17 215 16 734
Administrative cost 16 926 16 511 16 132 15 680
OPERATIVE RESULT 0 0 0 0
Investment Income 10 821 9 214 9 413 9 616
Net other items
SURPLUS / DEFICIT BEFORE TAX 10 821 9 214 9 413 9 616
Reserve Development
Reserve at the start of the year 416 275 427 096 436 310 445 722
Reserve at the end of the year 427 096 436 310 445 722 455 338
Reserve Ratio 0.81 0.84 0.87 0.90
CHANGE OF RESERVE 10 821 9 214 9 413 9 616

Appendix D 231
2019 2020 2021 2022 2023 2024 2025
495 791 491 707 484 348 476 824 476 270 470 403 475 209
221 860 214 148 206 591 198 245 188 298 176 615 164 859109 920 106 099 102 355 98 220 93 292 87 504 81 679111 940 108 049 104 236 100 025 95 006 89 112 83 180
273 930 277 559 277 757 278 578 287 972 293 787 310 350
19 496 19 351 19 074 18 792 18 797 18 591 18 819
495 791 491 707 484 348 476 824 476 270 470 403 475 209
480 627 477 071 470 228 463 274 463 401 458 332 463 941294 712 292 844 288 893 284 715 285 197 282 710 287 218
15 321 15 869 16 354 16 946 17 400 17 543 17 198154 413 152 739 149 914 147 154 147 070 145 198 147 50216 182 15 619 15 068 14 459 13 734 12 882 12 024
15 163 14 636 14 120 13 549 12 869 12 071 11 267
0 0 0 0 0 0 0
9 823 10 035 10 252 10 473 10 699 10 929 11 165
9 823 10 035 10 252 10 473 10 699 10 929 11 165
455 338 465 161 475 196 485 448 495 920 506 619 517 548
465 161 475 196 485 448 495 920 506 619 517 548 528 713
0.94 0.97 1.00 1.04 1.06 1.10 1.11
9 823 10 035 10 252 10 473 10 699 10 929 11 165

232 Zambia – Social Protection Expenditure and Performance Review and Social Budget
Pension schemes: Table 4
LASF (figures in millions of Kwacha)
2004 2005 2006 2007
INCOME 20 343 25 706 35 535 53 386
Income from contributions 18 481 17 456 25 535 27 885– Employers 12 881 12 166 17 797 19 435– Employees 5 600 5 290 7 738 8 450
Government 8 250 10 000 25 501
Other income 1 862
EXPENDITURE 20 622 10 651 31 704 33 247
Benefit Expenditure 16 606 7 173 22 654 24 440– Old age 5 251 16 893 17 005– Invalidity 1 016 2 536 2 621– Survivor 327 1 052 1 069– Funeral 579 3 817 3 745
Administrative Cost 4 016 3 478 9 050 8 807
OPERATIVE RESULT -279 15 056 3 831 20 139
Investment Income 1 912 1 432 15 011 10 777
SURPLUS / DEFICIT BEFORE TAX 9 786 16 488 18 842 30 916
Reserve Development
Reserve at the start of the year 26 561 36 347 52 835 71 676
Reserve at the end of the year 36 347 52 835 71 676 102 592
Reserve Ratio 1.76 4.96 2.26 3.09
CHANGE OF RESERVE 9 786 16 488 18 842 30 916
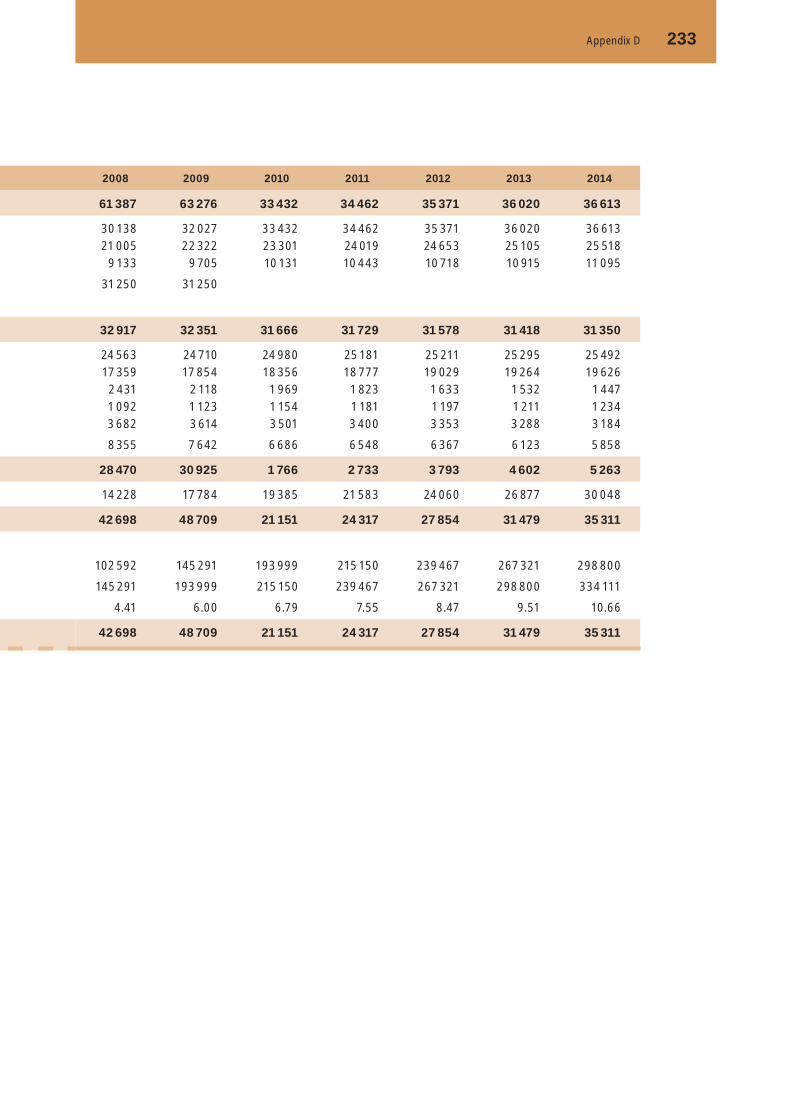
Appendix D 233
2008 2009 2010 2011 2012 2013 2014
61 387 63 276 33 432 34 462 35 371 36 020 36 613
30 138 32 027 33 432 34 462 35 371 36 020 36 61321 005 22 322 23 301 24 019 24 653 25 105 25 518
9 133 9 705 10 131 10 443 10 718 10 915 11 095
31 250 31 250
32 917 32 351 31 666 31 729 31 578 31 418 31 350
24 563 24 710 24 980 25 181 25 211 25 295 25 49217 359 17 854 18 356 18 777 19 029 19 264 19 6262 431 2 118 1 969 1 823 1 633 1 532 1 4471 092 1 123 1 154 1 181 1 197 1 211 1 2343 682 3 614 3 501 3 400 3 353 3 288 3 184
8 355 7 642 6 686 6 548 6 367 6 123 5 858
28 470 30 925 1 766 2 733 3 793 4 602 5 263
14 228 17 784 19 385 21 583 24 060 26 877 30 048
42 698 48 709 21 151 24 317 27 854 31 479 35 311
102 592 145 291 193 999 215 150 239 467 267 321 298 800
145 291 193 999 215 150 239 467 267 321 298 800 334 111
4.41 6.00 6.79 7.55 8.47 9.51 10.66
42 698 48 709 21 151 24 317 27 854 31 479 35 311

234 Zambia – Social Protection Expenditure and Performance Review and Social Budget
Pension schemes: Table 4
LASF (figures in millions of Kwacha) (cont.)
2015 2016 2017 2018
INCOME 37 423 37 240 36 607 35 506
Income from contributions 37 423 37 240 36 607 35 506– Employers 26 083 25 955 25 514 24 747– Employees 11 340 11 285 11 093 10 760
Government
Other income
EXPENDITURE 31 309 30 893 30 497 30 066
Benefit Expenditure 25 695 25 680 25 738 25 805– Old age 20 085 20 149 20 254 20 541– Invalidity 1 267 1 242 1 247 1 111– Survivor 1 263 1 267 1 274 1 292– Funeral 3 080 3 021 2 964 2 862
Administrative Cost 5 613 5 214 4 759 4 261
OPERATIVE RESULT 6 114 6 346 6 111 5 440
Investment Income 33 611 31 189 34 285 37 599
SURPLUS / DEFICIT BEFORE TAX 39 725 37 535 40 395 43 039
Reserve Development
Reserve at the start of the year 334 111 373 836 411 371 451 766
Reserve at the end of the year 373 836 411 371 451 766 494 805
Reserve Ratio 11.94 13.32 14.81 16.46
CHANGE OF RESERVE 39 725 37 535 40 395 43 039

Appendix D 235
2019 2020 2021 2022 2023 2024 2025
33 835 32 241 30 729 28 892 26 881 24 644 22 037
33 835 32 241 30 729 28 892 26 881 24 644 22 03723 582 22 471 21 417 20 137 18 736 17 176 15 35910 253 9 770 9 312 8 755 8 146 7 468 6 678
29 925 29 802 30 003 30 004 30 035 30 026 29 959
26 203 26 577 26 930 27 115 27 347 27 561 27 75521 234 21 858 22 398 22 721 23 122 23 565 23 954
918 829 782 775 751 670 6341 335 1 375 1 409 1 429 1 454 1 482 1 5062 716 2 516 2 341 2 190 2 019 1 844 1 661
3 722 3 224 3 073 2 889 2 688 2 464 2 204
3 910 2 440 726 -1 112 -3 154 -5 382 -7 921
41 096 44 758 48 592 52 596 56 771 61 114 65 620
45 006 47 198 49 318 51 484 53 617 55 732 57 698
494 805 539 811 587 009 636 327 687 811 741 428 797 160
539 811 587 009 636 327 687 811 741 428 797 160 854 858
18.04 19.70 21.21 22.92 24.69 26.55 28.53
45 006 47 198 49 318 51 484 53 617 55 732 57 698

236 Zambia – Social Protection Expenditure and Performance Review and Social Budget
Pension schemes: Table 5
WORKERS COMPENSATION (figures in millions of Kwacha)
2005 2006 2007 2008
INCOME 48 057 64 361 77 800 92 606
Income from contributions 47 326 63 383 76 618 91 199
Other income 730 978 1 182 1 407
EXPENDITURE 34 695 46 436 55 858 66 224
Benefit Expenditure 1 818 2 418 2 758 3 125– Short term (medical aid + periodical) 145 160 177 196– Long term (pensions + lump sums) 1 673 2 258 2 580 2 929
Administrative Cost 32 876 44 018 53 100 63 099
OPERATIVE RESULT 13 362 17 924 21 942 26 382
Investment Income 3 295 4 006 5 279 6 059
SURPLUS / DEFICIT BEFORE TAX 16 657 21 930 27 221 32 441
Reserve Development
Reserve at the start of the year 71 840 88 497 110 426 137 648
Reserve at the end of the year 88 497 110 426 137 648 170 089
Reserve Ratio 2.55 2.38 2.46 2.57
CHANGE OF RESERVE 16 657 21 930 27 221 32 441
2016 2017 2018 2019
INCOME 223 494 239 230 255 969 273 793
Income from contributions 220 099 235 595 252 080 269 634
Other income 3 395 3 634 3 889 4 160
EXPENDITURE 157 844 168 903 180 669 193 199
Benefit Expenditure 6 355 6 769 7 212 7 683– Short term (medical aid + periodical) 355 375 397 420– Long term (pensions + lump sums) 6 000 6 394 6 815 7 263
Administrative Cost 151 490 162 134 173 458 185 516
OPERATIVE RESULT 65 650 70 326 75 300 80 594
Investment Income 16 348 18 649 21 145 23 849
SURPLUS / DEFICIT BEFORE TAX 81 998 88 975 96 445 104 443
Reserve Development
Reserve at the start of the year 566 273 648 270 737 246 833 691
Reserve at the end of the year 648 270 737 246 833 691 938 134
Reserve Ratio 4.11 4.36 4.61 4.86
CHANGE OF RESERVE 81 998 88 975 96 445 104 443

Appendix D 237
2009 2010 2011 2012 2013 2014 2015
108 911 124 465 138 252 153 426 170 168 188 655 208 529
107 257 122 574 136 152 151 095 167 583 185 789 205 361
1 655 1 891 2 100 2 331 2 585 2 866 3 168
77 616 88 484 98 132 108 752 120 470 133 410 147 335
3 514 3 886 4 225 4 598 5 011 5 466 5 965214 232 249 268 289 311 335
3 300 3 654 3 975 4 330 4 722 5 155 5 629
74 102 84 598 93 907 104 154 115 459 127 943 141 370
31 295 35 981 40 120 44 674 49 698 55 245 61 194
6 778 7 420 8 931 10 619 12 520 14 656 17 053
38 073 43 401 49 051 55 293 62 218 69 901 78 247
170 089 208 162 251 562 300 614 355 907 418 125 488 026
208 162 251 562 300 614 355 907 418 125 488 026 566 273
2.68 2.84 3.06 3.27 3.47 3.66 3.84
38 073 43 401 49 051 55 293 62 218 69 901 78 247
2020 2021 2022 2023 2024 2025
292 590 312 380 333 381 355 738 379 538 404 679
288 144 307 634 328 316 350 334 373 772 398 531
4 445 4 746 5 065 5 404 5 766 6 148
206 419 220 488 235 426 251 333 268 271 286 181
8 185 8 803 9 463 10 169 10 923 11 730444 475 507 542 579 618
7 740 8 328 8 956 9 627 10 345 11 112
198 234 211 686 225 963 241 164 257 348 274 451
86 170 91 891 97 955 104 405 111 266 118 498
26 775 29 935 33 342 37 013 40 965 45 218
112 945 121 826 131 297 141 418 152 231 163 716
938 134 1 051 079 1 172 906 1 304 203 1 445 621 1 597 852
1 051 079 1 172 906 1 304 203 1 445 621 1 597 852 1 761 569
5.09 5.32 5.54 5.75 5.96 6.16
112 945 121 826 131 297 141 418 152 231 163 716
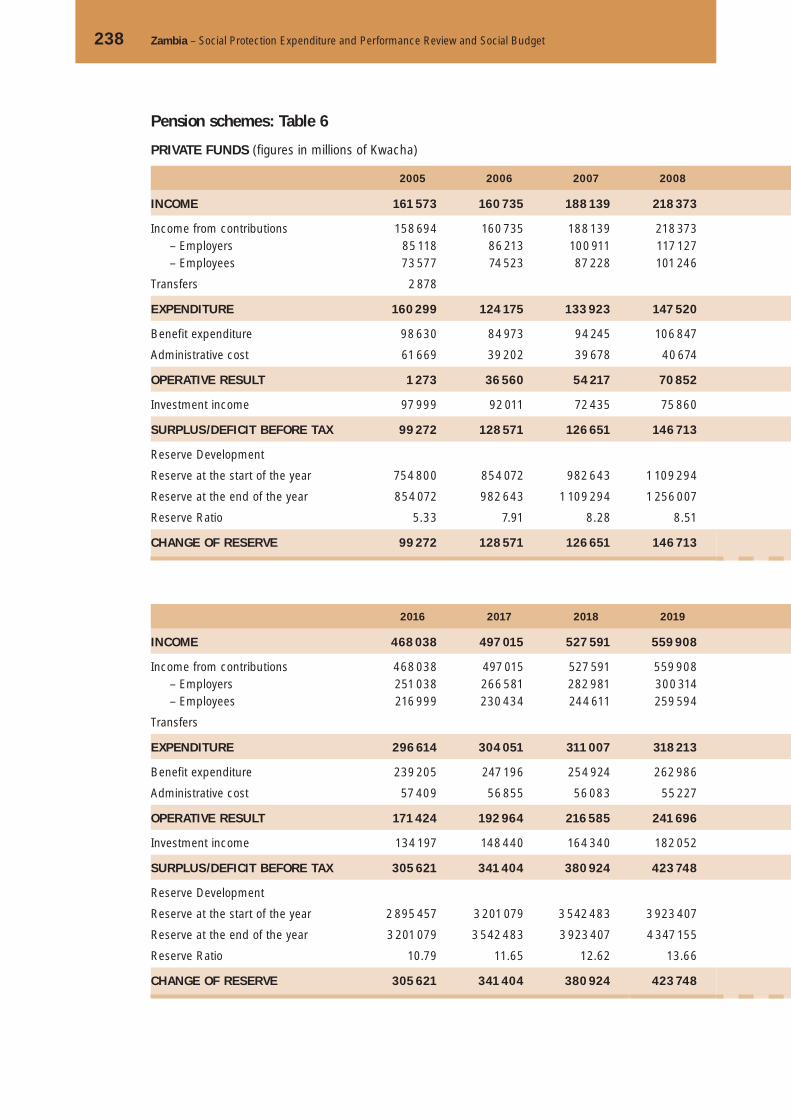
238 Zambia – Social Protection Expenditure and Performance Review and Social Budget
Pension schemes: Table 6
PRIVATE FUNDS (figures in millions of Kwacha)
2005 2006 2007 2008
INCOME 161 573 160 735 188 139 218 373
Income from contributions 158 694 160 735 188 139 218 373– Employers 85 118 86 213 100 911 117 127– Employees 73 577 74 523 87 228 101 246
Transfers 2 878
EXPENDITURE 160 299 124 175 133 923 147 520
Benefit expenditure 98 630 84 973 94 245 106 847
Administrative cost 61 669 39 202 39 678 40 674
OPERATIVE RESULT 1 273 36 560 54 217 70 852
Investment income 97 999 92 011 72 435 75 860
SURPLUS/DEFICIT BEFORE TAX 99 272 128 571 126 651 146 713
Reserve Development
Reserve at the start of the year 754 800 854 072 982 643 1 109 294
Reserve at the end of the year 854 072 982 643 1 109 294 1 256 007
Reserve Ratio 5.33 7.91 8.28 8.51
CHANGE OF RESERVE 99 272 128 571 126 651 146 713
2016 2017 2018 2019
INCOME 468 038 497 015 527 591 559 908
Income from contributions 468 038 497 015 527 591 559 908– Employers 251 038 266 581 282 981 300 314– Employees 216 999 230 434 244 611 259 594
Transfers
EXPENDITURE 296 614 304 051 311 007 318 213
Benefit expenditure 239 205 247 196 254 924 262 986
Administrative cost 57 409 56 855 56 083 55 227
OPERATIVE RESULT 171 424 192 964 216 585 241 696
Investment income 134 197 148 440 164 340 182 052
SURPLUS/DEFICIT BEFORE TAX 305 621 341 404 380 924 423 748
Reserve Development
Reserve at the start of the year 2 895 457 3 201 079 3 542 483 3 923 407
Reserve at the end of the year 3 201 079 3 542 483 3 923 407 4 347 155
Reserve Ratio 10.79 11.65 12.62 13.66
CHANGE OF RESERVE 305 621 341 404 380 924 423 748

Appendix D 239
2009 2010 2011 2012 2013 2014 2015
251 130 281 593 307 802 336 579 368 202 402 912 440 523
251 130 281 593 307 802 336 579 368 202 402 912 440 523134 697 151 036 165 094 180 529 197 490 216 107 236 280116 433 130 557 142 708 156 050 170 712 186 805 204 242
160 378 173 880 191 433 209 425 229 102 250 521 274 433
119 655 133 754 148 398 163 613 180 395 198 826 219 546
40 723 40 126 43 035 45 812 48 707 51 695 54 887
90 753 107 713 116 369 127 155 139 100 152 391 166 090
78 339 80 047 90 641 102 162 114 925 129 064 144 702
169 092 187 760 207 010 229 317 254 025 281 455 310 792
1 256 007 1 425 098 1 612 859 1 819 869 2 049 185 2 303 210 2 584 665
1 425 098 1 612 859 1 819 869 2 049 185 2 303 210 2 584 665 2 895 457
8.89 9.28 9.51 9.78 10.05 10.32 10.55
169 092 187 760 207 010 229 317 254 025 281 455 310 792
2020 2021 2022 2023 2024 2025
594 001 629 988 668 018 708 218 750 704 795 597
594 001 629 988 668 018 708 218 750 704 795 597318 601 337 903 358 301 379 863 402 651 426 729275 401 292 086 309 717 328 356 348 054 368 868
325 957 333 848 341 248 348 648 356 379 364 541
271 630 280 544 289 193 297 990 307 223 316 992
54 326 53 303 52 055 50 658 49 156 47 549
268 045 296 141 326 770 359 570 394 326 431 055
201 720 223 499 247 580 274 173 303 483 335 721
469 765 519 640 574 350 633 743 697 809 766 777
4 347 155 4 816 920 5 336 560 5 910 909 6 544 652 7 242 461
4 816 920 5 336 560 5 910 909 6 544 652 7 242 461 8 009 238
14.78 15.99 17.32 18.77 20.32 21.97
469 765 519 640 574 350 633 743 697 809 766 777
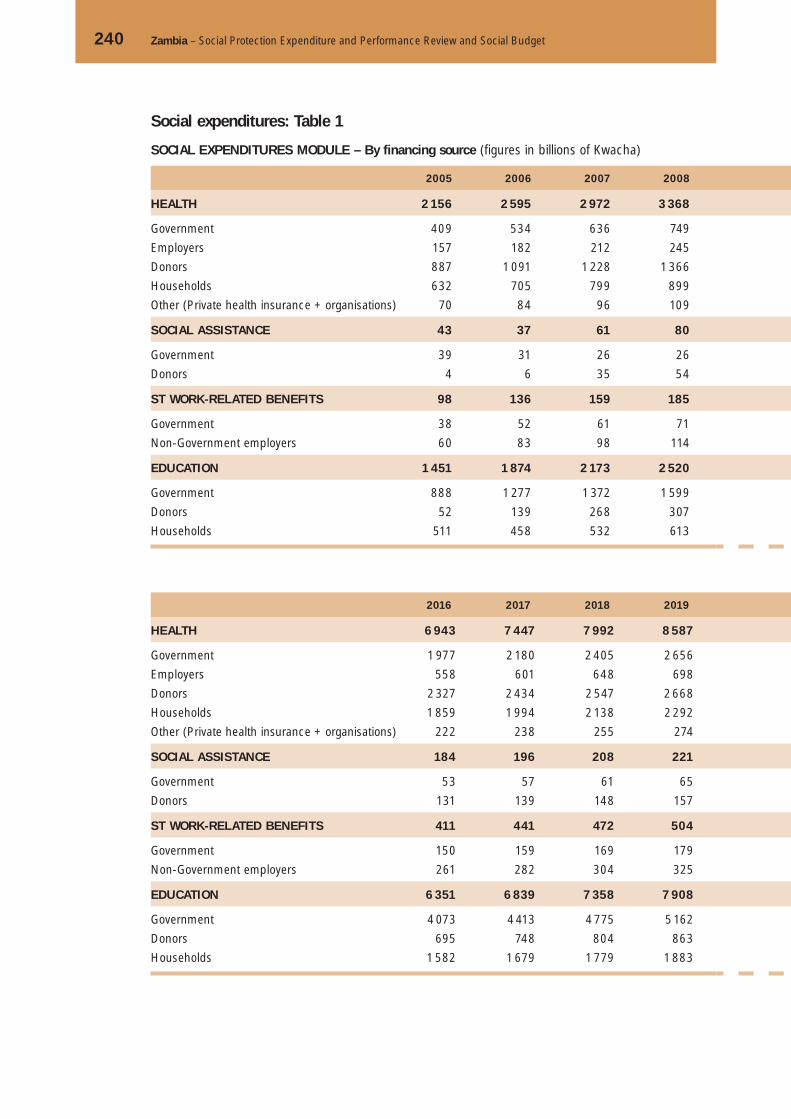
240 Zambia – Social Protection Expenditure and Performance Review and Social Budget
Social expenditures: Table 1
SOCIAL EXPENDITURES MODULE – By financing source (figures in billions of Kwacha)
2005 2006 2007 2008
HEALTH 2 156 2 595 2 972 3 368
Government 409 534 636 749
Employers 157 182 212 245
Donors 887 1 091 1 228 1 366
Households 632 705 799 899
Other (Private health insurance + organisations) 70 84 96 109
SOCIAL ASSISTANCE 43 37 61 80
Government 39 31 26 26
Donors 4 6 35 54
ST WORK-RELATED BENEFITS 98 136 159 185
Government 38 52 61 71
Non-Government employers 60 83 98 114
EDUCATION 1 451 1 874 2 173 2 520
Government 888 1 277 1 372 1 599
Donors 52 139 268 307
Households 511 458 532 613
2016 2017 2018 2019
HEALTH 6 943 7 447 7 992 8 587
Government 1 977 2 180 2 405 2 656
Employers 558 601 648 698
Donors 2 327 2 434 2 547 2 668
Households 1 859 1 994 2 138 2 292
Other (Private health insurance + organisations) 222 238 255 274
SOCIAL ASSISTANCE 184 196 208 221
Government 53 57 61 65
Donors 131 139 148 157
ST WORK-RELATED BENEFITS 411 441 472 504
Government 150 159 169 179
Non-Government employers 261 282 304 325
EDUCATION 6 351 6 839 7 358 7 908
Government 4 073 4 413 4 775 5 162
Donors 695 748 804 863
Households 1 582 1 679 1 779 1 883

Appendix D 241
2009 2010 2011 2012 2013 2014 2015
3 773 4 164 4 541 4 956 5 415 5 921 6 478
871 993 1 118 1 259 1 416 1 594 1 794
280 315 348 384 424 469 517
1 500 1 616 1 719 1 830 1 952 2 085 2 226
1 002 1 106 1 210 1 324 1 448 1 584 1 733
121 134 146 159 174 190 207
93 108 122 139 149 161 173
29 31 34 37 41 45 50
64 76 88 101 108 116 124
212 238 260 285 313 346 383
81 91 99 109 119 130 142
131 147 161 176 194 216 241
2 902 3 296 3 695 4 115 4 599 5 156 5 793
1 852 2 111 2 371 2 638 2 948 3 307 3 717
350 393 435 477 525 581 643
700 792 889 1 000 1 126 1 269 1 433
2020 2021 2022 2023 2024 2025
9 235 9 976 10 792 11 700 12 728 14 043
2 936 3 249 3 601 4 004 4 475 5 056
752 810 873 941 1 013 1 091
2 796 2 967 3 153 3 360 3 596 3 889
2 456 2 633 2 822 3 024 3 241 3 563
294 317 343 371 403 444
235 250 266 283 300 319
69 73 78 82 87 92
166 177 188 200 213 227
536 571 607 646 691 739
190 201 213 226 239 253
346 370 394 421 452 486
8 489 9 100 9 743 10 418 11 127 11 871
5 572 6 007 6 466 6 952 7 464 8 006
925 991 1059 1131 1207 1286
1 991 2 103 2 217 2 335 2 455 2 579
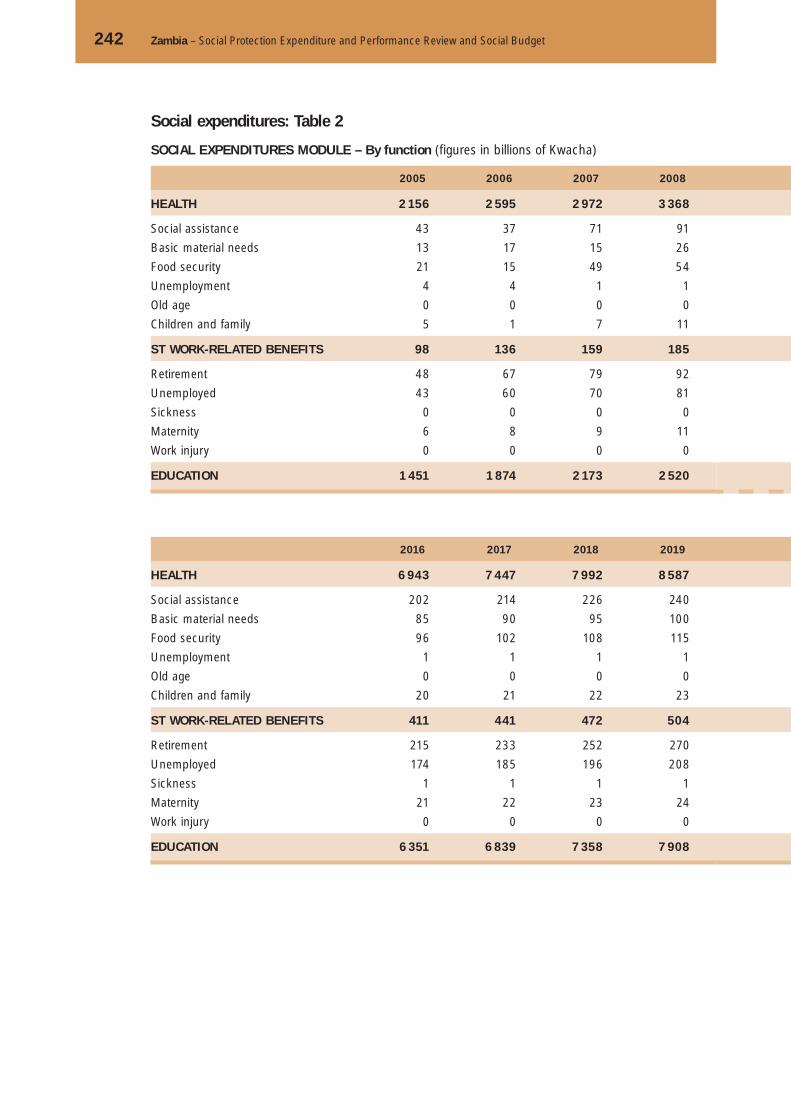
242 Zambia – Social Protection Expenditure and Performance Review and Social Budget
Social expenditures: Table 2
SOCIAL EXPENDITURES MODULE – By function (figures in billions of Kwacha)
2005 2006 2007 2008
HEALTH 2 156 2 595 2 972 3 368
Social assistance 43 37 71 91
Basic material needs 13 17 15 26
Food security 21 15 49 54
Unemployment 4 4 1 1
Old age 0 0 0 0
Children and family 5 1 7 11
ST WORK-RELATED BENEFITS 98 136 159 185
Retirement 48 67 79 92
Unemployed 43 60 70 81
Sickness 0 0 0 0
Maternity 6 8 9 11
Work injury 0 0 0 0
EDUCATION 1 451 1 874 2 173 2 520
2016 2017 2018 2019
HEALTH 6 943 7 447 7 992 8 587
Social assistance 202 214 226 240
Basic material needs 85 90 95 100
Food security 96 102 108 115
Unemployment 1 1 1 1
Old age 0 0 0 0
Children and family 20 21 22 23
ST WORK-RELATED BENEFITS 411 441 472 504
Retirement 215 233 252 270
Unemployed 174 185 196 208
Sickness 1 1 1 1
Maternity 21 22 23 24
Work injury 0 0 0 0
EDUCATION 6 351 6 839 7 358 7 908
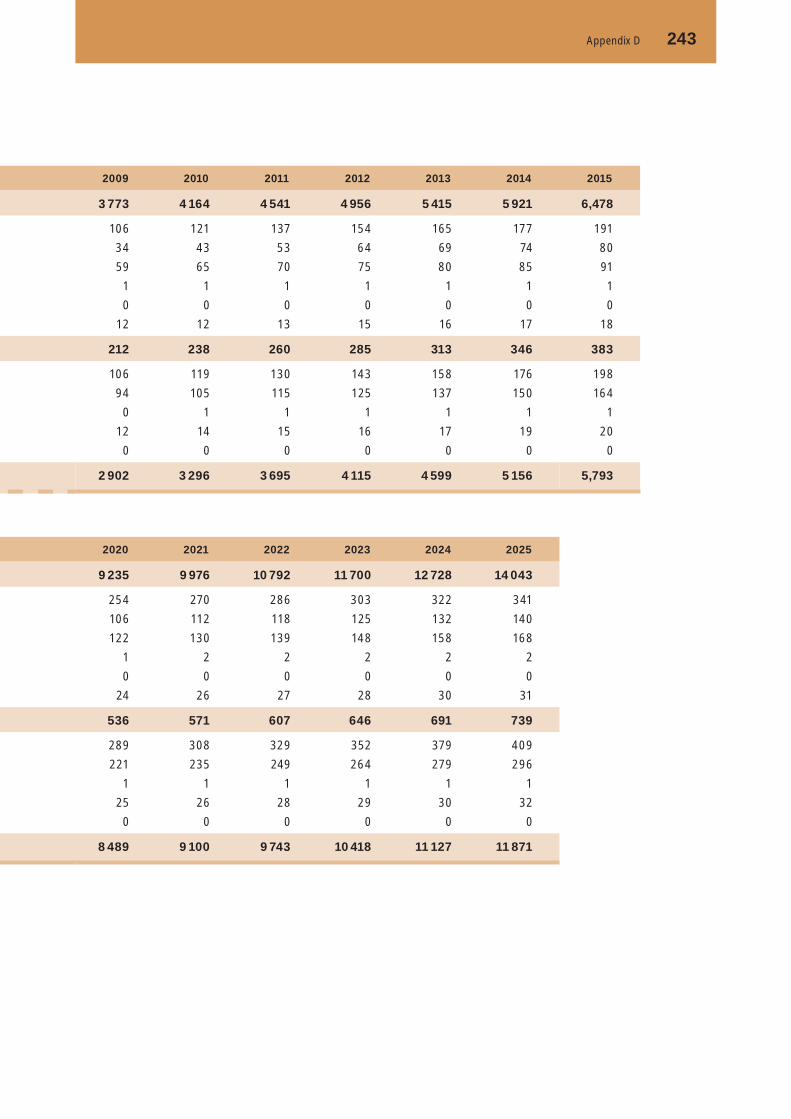
Appendix D 243
2009 2010 2011 2012 2013 2014 2015
3 773 4 164 4 541 4 956 5 415 5 921 6,478
106 121 137 154 165 177 191
34 43 53 64 69 74 80
59 65 70 75 80 85 91
1 1 1 1 1 1 1
0 0 0 0 0 0 0
12 12 13 15 16 17 18
212 238 260 285 313 346 383
106 119 130 143 158 176 198
94 105 115 125 137 150 164
0 1 1 1 1 1 1
12 14 15 16 17 19 20
0 0 0 0 0 0 0
2 902 3 296 3 695 4 115 4 599 5 156 5,793
2020 2021 2022 2023 2024 2025
9 235 9 976 10 792 11 700 12 728 14 043
254 270 286 303 322 341
106 112 118 125 132 140
122 130 139 148 158 168
1 2 2 2 2 2
0 0 0 0 0 0
24 26 27 28 30 31
536 571 607 646 691 739
289 308 329 352 379 409
221 235 249 264 279 296
1 1 1 1 1 1
25 26 28 29 30 32
0 0 0 0 0 0
8 489 9 100 9 743 10 418 11 127 11 871

244 Zambia – Social Protection Expenditure and Performance Review and Social Budget
Social expenditures: Table 3
TOTAL HEALTH EXPENDITURE – By financing agent (figures in millions of Kwacha)
2004 2005 2006 2007
TOTAL HEALTH EXPENDITURE (million) 1 876 660 2 155 996 2 595 472 2 971 773
Government 786 085 922 532 1 173 394 1 366 684
Household 524 287 631 919 704 662 798 964
Private HI 4 616 5 482 6 083 6 791
Employers 128 938 157 447 182 440 212 308
Other FA 79 895 64 703 77 891 89 184
Donors (as FAs) 352 839 373 913 451 002 497 842
TOTAL HEALTH EXPENDITURE (per cent) 100.0
Government 41.9 42.8 45.2 46.0
Household 27.9 29.3 27.1 26.9
Private HI 0.2 0.3 0.2 0.2
Employers 6.9 7.3 7.0 7.1
Other FA 4.3 3.0 3.0 3.0
Donors 18.8 17.3 17.4 16.8
2015 2016 2017 2018
TOTAL HEALTH EXPENDITURE (million) 6 478 079 6 943 468 7 446 774 7 992 141
Government 3 262 465 3 531 158 3 824 725 4 146 287
Household 1 732 869 1 858 814 1 993 509 2 137 541
Private HI 12 980 13 710 14 480 15 292
Employers 517 334 557 783 601 221 647 888
Other FA 194 410 208 377 223 482 239 848
Donors (as FAs) 758 021 773 626 789 358 805 285
TOTAL HEALTH EXPENDITURE (per cent)
Government 50.4 50.9 51.4 51.9
Household 26.7 26.8 26.8 26.7
Private HI 0.2 0.2 0.2 0.2
Employers 8.0 8.0 8.1 8.1
Other FA 3.0 3.0 3.0 3.0
Donors 11.7 11.1 10.6 10.1

Appendix D 245
2008 2009 2010 2011 2012 2013 2014
3 367 990 3 773 422 4 164 201 4 540 980 4 956 139 5 415 212 5 921 414
1 573 082 1 786 906 1 993 786 2 196 198 2 421 416 2 672 306 2 951 910
898 640 1 001 606 1 106 105 1 210 093 1 323 901 1 448 365 1 584 371
7 519 8 248 8 965 9 653 10 394 11 194 12 055
244 936 279 887 314 547 347 633 384 137 424 366 468 658
101 075 113 242 124 970 136 277 148 736 162 513 177 705
542 737 583 533 615 829 641 126 667 554 696 468 726 716
46.7 47.4 47.9 48.4 48.9 49.3 49.9
26.7 26.5 26.6 26.6 26.7 26.7 26.8
0.2 0.2 0.2 0.2 0.2 0.2 0.2
7.3 7.4 7.6 7.7 7.8 7.8 7.9
3.0 3.0 3.0 3.0 3.0 3.0 3.0
16.1 15.5 14.8 14.1 13.5 12.9 12.3
2019 2020 2021 2022 2023 2024 2025
8 587 204 9 235 239 9 976 247 10 792 375 11 700 051 12 727 770 14 043 475
4 501 797 4 893 670 5 325 691 5 808 867 6 356 332 6 991 440 7 778 589
2 291 570 2 456 336 2 632 673 2 821 550 3 024 024 3 241 288 3 562 920
16 149 17 052 18 007 19 014 20 078 21 202 22 388
698 076 752 112 810 332 873 043 940 560 1 013 194 1 091 337
257 706 277 154 299 392 323 885 351 125 381 967 421 452
821 907 838 915 890 151 946 015 1 007 933 1 078 679 1 166 788
52.4 53.0 53.4 53.8 54.3 54.9 55.4
26.7 26.6 26.4 26.1 25.8 25.5 25.4
0.2 0.2 0.2 0.2 0.2 0.2 0.2
8.1 8.1 8.1 8.1 8.0 8.0 7.8
3.0 3.0 3.0 3.0 3.0 3.0 3.0
9.6 9.1 8.9 8.8 8.6 8.5 8.3

246 Zambia – Social Protection Expenditure and Performance Review and Social Budget
Social expenditures: Table 4
TOTAL HEALTH EXPENDITURE – By funding sources (figures in millions of Kwacha)
2004 2005 2006 2007
TOTAL HEALTH EXPENDITURE (million) 1 876 660 2 155 996 2 595 472 2 971 773
Government 332 756 409 411 533 516 636 280
Household 532 972 631 919 704 662 798 964
Private HI 4 616 5 482 6 083 6 791
Employers 128 938 157 447 182 440 212 308
Other 87 311 64 703 77 891 89 184
Donors 790 067 887 034 1 090 880 1 228 246
TOTAL HEALTH EXPENDITURE (per cent) 100.0 100.0 100.0 100.0
Government 17.7 19.0 20.6 21.4
Household 28.4 29.3 27.1 26.9
Private HI 0.2 0.3 0.2 0.2
Employers 6.9 7.3 7.0 7.1
Other 4.7 3.0 3.0 3.0
Donors 42.1 41.1 42.0 41.3
External Financing as per cent to THE 42.5 41.1 42.0 41.3
2015 2016 2017 2018
TOTAL HEALTH EXPENDITURE (million) 6 478 079 6 943 468 7 446 774 7 992 141
Government 1 794 356 1 977 449 2 180 093 2 404 846
Household 1 732 869 1 858 814 1 993 509 2 137 541
Private HI 12 980 13 710 14 480 15 292
Employers 517 334 557 783 601 221 647 888
Other 194 410 208 377 223 482 239 848
Donors 2 226 130 2 327 335 2 433 990 2 546 726
TOTAL HEALTH EXPENDITURE (per cent) 100.0 100.0 100.0 100.0
Government 27.7 28.5 29.3 30.1
Household 26.7 26.8 26.8 26.7
Private HI 0.2 0.2 0.2 0.2
Employers 8.0 8.0 8.1 8.1
Other 3.0 3.0 3.0 3.0
Donors 34.4 33.5 32.7 31.9
External Financing as per cent to THE 34.4 33.5 32.7 31.9
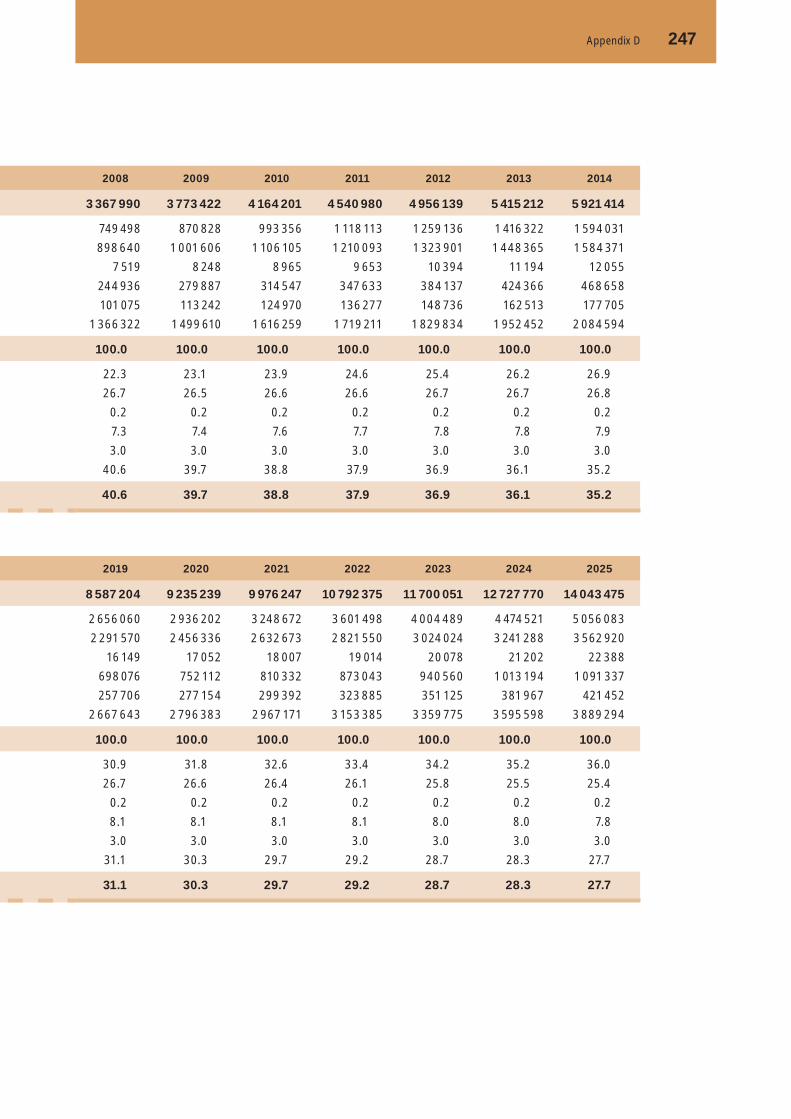
Appendix D 247
2008 2009 2010 2011 2012 2013 2014
3 367 990 3 773 422 4 164 201 4 540 980 4 956 139 5 415 212 5 921 414
749 498 870 828 993 356 1 118 113 1 259 136 1 416 322 1 594 031
898 640 1 001 606 1 106 105 1 210 093 1 323 901 1 448 365 1 584 371
7 519 8 248 8 965 9 653 10 394 11 194 12 055
244 936 279 887 314 547 347 633 384 137 424 366 468 658
101 075 113 242 124 970 136 277 148 736 162 513 177 705
1 366 322 1 499 610 1 616 259 1 719 211 1 829 834 1 952 452 2 084 594
100.0 100.0 100.0 100.0 100.0 100.0 100.0
22.3 23.1 23.9 24.6 25.4 26.2 26.9
26.7 26.5 26.6 26.6 26.7 26.7 26.8
0.2 0.2 0.2 0.2 0.2 0.2 0.2
7.3 7.4 7.6 7.7 7.8 7.8 7.9
3.0 3.0 3.0 3.0 3.0 3.0 3.0
40.6 39.7 38.8 37.9 36.9 36.1 35.2
40.6 39.7 38.8 37.9 36.9 36.1 35.2
2019 2020 2021 2022 2023 2024 2025
8 587 204 9 235 239 9 976 247 10 792 375 11 700 051 12 727 770 14 043 475
2 656 060 2 936 202 3 248 672 3 601 498 4 004 489 4 474 521 5 056 083
2 291 570 2 456 336 2 632 673 2 821 550 3 024 024 3 241 288 3 562 920
16 149 17 052 18 007 19 014 20 078 21 202 22 388
698 076 752 112 810 332 873 043 940 560 1 013 194 1 091 337
257 706 277 154 299 392 323 885 351 125 381 967 421 452
2 667 643 2 796 383 2 967 171 3 153 385 3 359 775 3 595 598 3 889 294
100.0 100.0 100.0 100.0 100.0 100.0 100.0
30.9 31.8 32.6 33.4 34.2 35.2 36.0
26.7 26.6 26.4 26.1 25.8 25.5 25.4
0.2 0.2 0.2 0.2 0.2 0.2 0.2
8.1 8.1 8.1 8.1 8.0 8.0 7.8
3.0 3.0 3.0 3.0 3.0 3.0 3.0
31.1 30.3 29.7 29.2 28.7 28.3 27.7
31.1 30.3 29.7 29.2 28.7 28.3 27.7
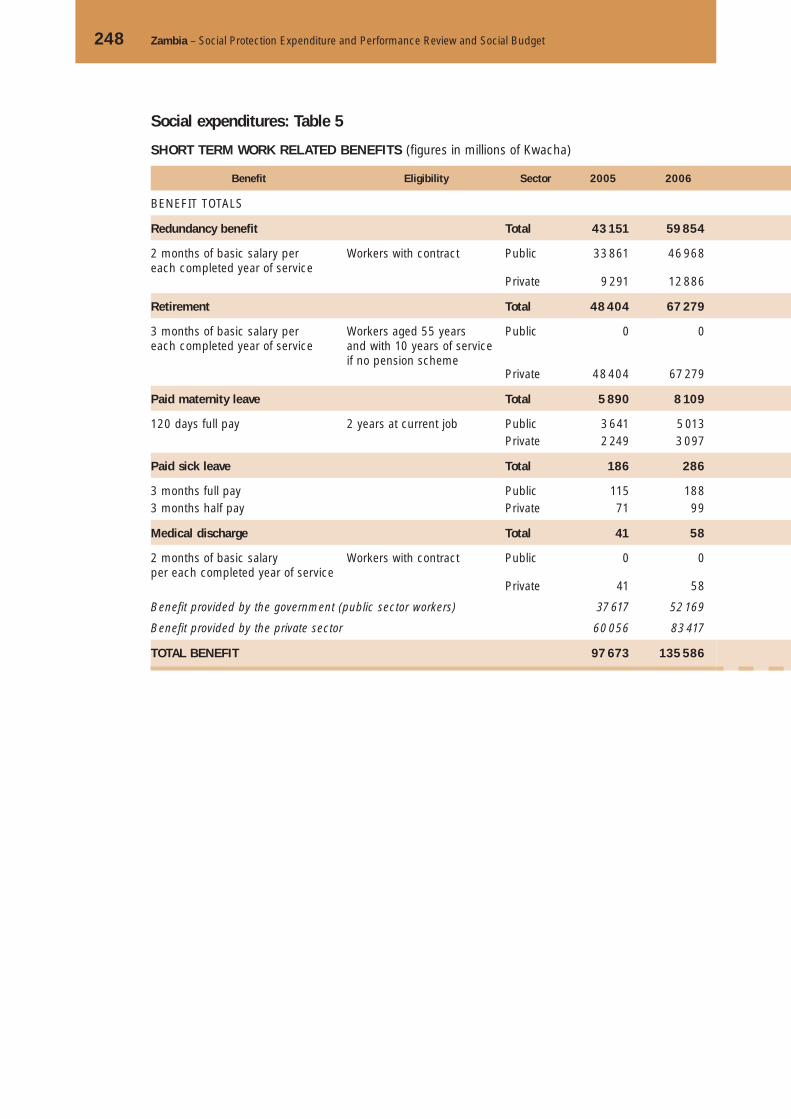
248 Zambia – Social Protection Expenditure and Performance Review and Social Budget
Social expenditures: Table 5
SHORT TERM WORK RELATED BENEFITS (figures in millions of Kwacha)
Benefit Eligibility Sector 2005 2006
BENEFIT TOTALS
Redundancy benefit Total 43 151 59 854
2 months of basic salary per each completed year of service
Workers with contract Public 33 861 46 968
Private 9 291 12 886
Retirement Total 48 404 67 279
3 months of basic salary per each completed year of service
Workers aged 55 years and with 10 years of service if no pension scheme
Public 0 0
Private 48 404 67 279
Paid maternity leave Total 5 890 8 109
120 days full pay 2 years at current job Public 3 641 5 013 Private 2 249 3 097
Paid sick leave Total 186 286
3 months full pay Public 115 1883 months half pay Private 71 99
Medical discharge Total 41 58
2 months of basic salary per each completed year of service
Workers with contract Public 0 0
Private 41 58
Benefit provided by the government (public sector workers) 37 617 52 169
Benefit provided by the private sector 60 056 83 417
TOTAL BENEFIT 97 673 135 586

Appendix D 249
2007 2008 2009 2010 2011 2012 2013 2014 2015
70 063 81 325 93 527 104 873 114 632 125 344 137 112 150 027 164 026
54 980 63 819 73 395 82 298 89 956 98 361 107 595 117 727 128 711
15 083 17 506 20 132 22 574 24 676 26 983 29 518 32 300 35 315
79 102 92 085 105 897 118 722 130 087 142 711 157 816 176 246 197 505
0 0 0 0 0 0 0 0 0
79 102 92 085 105 897 118 722 130 087 142 711 157 816 176 246 197 505
9 410 10 821 12 319 13 667 14 771 15 960 17 241 18 620 20 070
5 817 6 689 7 615 8 449 9 132 9 868 10 660 11 514 12 4113 593 4 132 4 704 5 218 5 639 6 093 6 581 7 106 7 659
335 389 447 502 548 599 656 717 784
220 255 293 329 360 393 430 471 514115 134 154 173 189 206 226 247 270
67 78 90 101 110 120 132 144 157
0 0 0 0 0 0 0 0 0
67 78 90 101 110 120 132 144 157
61 017 70 763 81 304 91 076 99 447 108 622 118 685 129 712 141 636
97 960 113 935 130 977 146 787 160 700 176 112 194 272 216 044 240 906
158 977 184 698 212 281 237 863 260 147 284 734 312 957 345 755 382 542

250 Zambia – Social Protection Expenditure and Performance Review and Social Budget
Social expenditures: Table 4
SHORT TERM WORK RELATED BENEFITS (figures in millions of Kwacha) (cont.)
Benefit Eligibility Sector 2016 2017
BENEFIT TOTALS
Redundancy benefit Total 174 264 185 047
2 months of basic salary per each completed year of service
Workers with contract Public 136 743 145 203
Private 37 521 39 844
Retirement Total 214 660 233 205
3 months of basic salary per each completed year of service
Workers aged 55 years and with 10 years of service if no pension scheme
Public 0 0
Private 214 660 233 205
Paid maternity leave Total 21 002 21 959
120 days full pay 2 years at current job Public 12 988 13 581 Private 8 014 8 378
Paid sick leave Total 833 885
3 months full pay Public 547 5803 months half pay Private 287 304
Medical discharge Total 167 178
2 months of basic salary per each completed year of service
Workers with contract Public 0 0
Private 167 178
Benefit provided by the government (public sector workers) 150 278 159 364
Benefit provided by the private sector 260 649 281 909
TOTAL BENEFIT 410 927 441 273

Appendix D 251
2018 2019 2020 2021 2022 2023 2024 2025
196 426 208 453 221 142 234 534 248 686 263 646 279 455 296 160
154 130 163 566 173 522 184 030 195 133 206 870 219 274 232 379
42 295 44 886 47 619 50 504 53 553 56 776 60 182 63 781
251 977 270 276 288 646 308 371 329 098 352 346 379 122 408 756
0 0 0 0 0 0 0 0
251 977 270 276 288 646 308 371 329 098 352 346 379 122 408 756
22 950 23 988 25 089 26 265 27 535 28 918 30 437 32 121
14 195 14 838 15 520 16 248 17 034 17 891 18 831 19 8748 755 9 150 9 570 10 017 10 501 11 028 11 606 12 247
939 996 1 057 1 121 1 189 1 260 1 336 1 415
616 654 694 736 780 827 876 929323 343 364 385 409 433 459 487
188 200 212 225 238 253 268 284
0 0 0 0 0 0 0 0
188 200 212 225 238 253 268 284
168 941 179 058 189 735 201 013 212 947 225 588 238 981 253 182
303 539 324 855 346 410 369 503 393 799 420 836 451 636 485 554
472 480 503 913 536 146 570 516 606 746 646 423 690 618 738 736

252 Zambia – Social Protection Expenditure and Performance Review and Social Budget
Social expenditures: Table 5
SOCIAL ASSISTANCE (figures in millions of Kwacha)
Scheme Elegibility Source of Funds 2004 2005
TOTAL BENEFITS (000 000) 38 434 42 995
Public Welfare Assistance Scheme means-tested Government 3 409 10 345
Social cash transfer means-tested Donors 185 2 669
Food Security Pack means-tested Government 29 000 19 926
Project Urban Self Help work Government 1 500 4 417
Street children Government 580
Juvenile welfare 231
Matero after care 70 125
Social safety net 3 806 3 806
WFP Comp. 1 – School Feeding Programme
targetedschools
Government & donor
464 895
of which: Government
Donor 464 895
WFP Comp. 2 –NPVG and HNE
vulnerable groups
Government & donor
of which: Government
Donor
WFP Comp. 3 –Food for Assets (FFA)
work Government & donor
of which: Government
Donor

Appendix D 253
2006 2007 2008 2009 2010 2011 2012 2013 2014
36 533 61 025 80 051 93 266 107 598 122 314 138 642 149 498 160 962
10 564 9 295 4 293 4 883 5 497 6 124 6 814 7 574 8 409
5 971 5 438 21 808 29 245 37 575 46 685 56 960 61 334 66 017
14 999 19 765 21 892 24 028 26 130 28 149 30 325 32 667 35 186
4 030 605 650 690 738 796 858 922 988
465 6 450 10 000 10 889 11 800 12 723 13 774 14 962 16 231
360 392 423 453 480 504 529 556 583
144 157 169 181 192 202 212 222 233
11 260 12 386 13 624 14 987 16 159 17 494 19 003 20 614
11 260 12 386 13 624 14 987 16 159 17 494 19 003 20 614
10 197 11 217 12 338 13 572 14 291 15 014 15 732 16 441
10 197 11 217 2 338 13 572 14 291 15 014 15 732 16 441
7 663 8 430 9 273 10 200 10 971 11 676 12 258 12 700
7 663 8 430 9 273 10 200 10 971 11 676 12 258 12 700
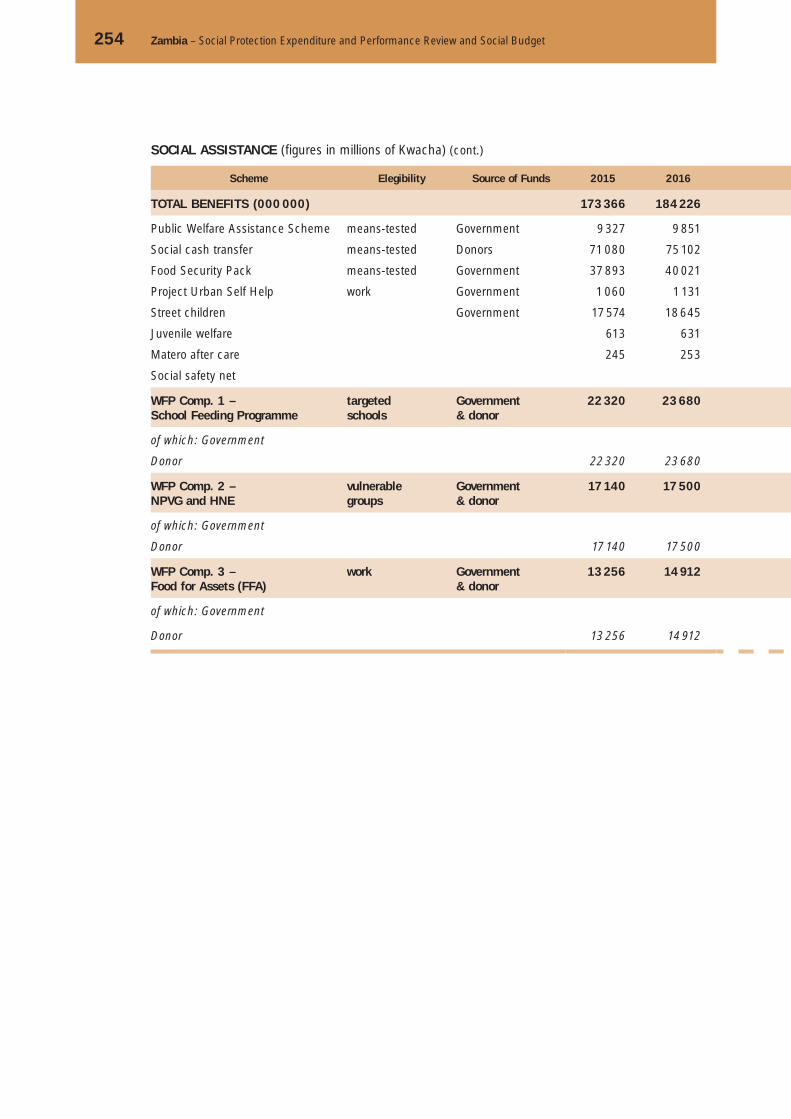
254 Zambia – Social Protection Expenditure and Performance Review and Social Budget
Social expenditures: Table 5
SOCIAL ASSISTANCE (figures in millions of Kwacha) (cont.)
Scheme Elegibility Source of Funds 2015 2016
TOTAL BENEFITS (000 000) 173 366 184 226
Public Welfare Assistance Scheme means-tested Government 9 327 9 851
Social cash transfer means-tested Donors 71 080 75 102
Food Security Pack means-tested Government 37 893 40 021
Project Urban Self Help work Government 1 060 1 131
Street children Government 17 574 18 645
Juvenile welfare 613 631
Matero after care 245 253
Social safety net
WFP Comp. 1 – School Feeding Programme
targetedschools
Government & donor
22 320 23 680
of which: Government
Donor 22 320 23 680
WFP Comp. 2 –NPVG and HNE
vulnerable groups
Government & donor
17 140 17 500
of which: Government
Donor 17 140 17 500
WFP Comp. 3 –Food for Assets (FFA)
work Government & donor
13 256 14 912
of which: Government
Donor 13 256 14 912

Appendix D 255
2017 2018 2019 2020 2021 2022 2023 2024 2025
195 804 208 111 221 178 235 114 249 976 265 780 282 561 300 364 319 271
10 402 10 982 11 591 12 233 12 908 13 620 14 371 15 164 16 003
79 367 83 888 88 679 93 754 99 129 104 823 110 854 117 244 124 012
42 260 44 615 47 091 49 697 52 440 55 332 58 382 61 605 65 015
1 208 1 290 1 378 1 473 1 577 1 688 1 808 1 937 2 075
19 761 20 920 22 121 23 363 24 641 25 951 27 290 28 659 30 060
650 669 690 710 732 753 776 799 823
260 268 276 284 293 302 311 320 329
25 097 26 569 28 095 29 672 31 295 32 959 34 660 36 398 38 178
- - - - -
25 097 26 569 28 095 29 672 31 295 32 959 34 660 36 398 38 178
17 864 18 238 18 633 19 061 19 533 20 068 20 668 21 345 22 107
17 864 18 238 18 633 19 061 19 533 20 068 20 668 21 345 22 107
16 799 18 911 21 257 23 928 26 962 30 354 34 109 38 239 42 775
16 799 18 911 21 257 23 928 26 962 30 354 34 109 38 239 42 775

256 Zambia – Social Protection Expenditure and Performance Review and Social Budget
General Government: Table 1
GENERAL GOVERNMENT OPERATIONS (in billions of Kwacha)
2005 2006 2007 2008
REVENUES 8 738 10 489 11 928 13 725
I. Government budget revenue 7 671 9 192 10 423 12 037
A Revenue 5 736 6 836 8 456 9 681 Tax revenue 5 578 6 654 8 232 9 424 Non-tax revenue 158 181 224 257
B Grants 1 934 2 356 1 967 2 356
II. Social security schemes 1 067 1 298 1 505 1 687
A Contributions 653 768 887 1 021 – From employees 294 342 394 452 – From private employers 209 242 291 346 – From public employers 150 183 202 223
B Investment income 232 253 288 331
C Government transfer 182 277 329 335
EXPENDITURES 9 145 10 882 11 807 13 894
I. Government budget expenditure 8 528 10 183 10 975 12 992
A Non-financial expenditure 7 645 9 276 9 934 11 939 Current expenditure 5 278 6 120 7 556 8 797 Capital expenditure 2 367 3 157 2 378 3 141
B Interest 882 907 1 041 1 053 Domestic debt 747 777 895 893 External debt 135 130 145 160
II. Social security schemes 617 699 833 902
Benefits paid 384 527 645 687
Administration 233 172 188 215
OVERALL RESULT -407 -393 120 -169
Overall result of Central Government -857 -991 -552 -955

Appendix D 257
2009 2010 2011 2012 2013 2014 2015
15 506 17 011 18 636 20 390 22 311 24 418 26 717
13 669 15 034 16 459 17 992 19 667 21 499 23 501
11 056 12 391 13 716 15 023 16 454 18 021 19 73810 763 12 062 13 352 14 625 16 018 17 544 19 215
293 329 364 398 436 478 523
2 613 2 644 2 743 2 969 3 213 3 477 3 763
1 837 1 977 2 177 2 398 2 644 2 920 3 216
1 167 1 304 1 423 1 556 1 703 1 867 2 049516 575 627 684 749 820 899407 466 519 578 643 716 796244 263 277 293 311 331 353
370 401 475 557 649 752 866
300 272 279 285 291 300 301
15 733 17 192 18 702 20 409 22 332 24 465 26 832
14 752 16 127 17 546 19 152 20 961 22 960 25 165
13 708 15 107 16 466 18 012 19 757 21 688 23 82210 145 11 332 12 486 13 613 14 892 16 305 17 8603 563 3 775 3 981 4 399 4 865 5 384 5 962
1 044 1 021 1 080 1 140 1 204 1 271 1 342868 828 871 914 960 1 008 1 059176 193 209 225 243 263 284
980 1 064 1 156 1 258 1 372 1 505 1 667
737 793 854 923 1 000 1 092 1 208
244 271 302 335 372 413 460
-226 -181 -66 -19 -21 -46 -116
-1 083 -1 093 -1 087 -1 160 -1 293 -1 461 -1 664

258 Zambia – Social Protection Expenditure and Performance Review and Social Budget
General Government: Table 1
GENERAL GOVERNMENT OPERATIONS (in billions of Kwacha) (cont.)
2016 2017 2018 2019
REVENUES 28 387 30 315 32 378 34 582
I. Government budget revenue 25 079 26 763 28 561 30 479
A Revenue 21 104 22 565 24 126 25 795 Tax revenue 20 545 21 966 23 486 25 111 Non-tax revenue 560 598 640 684
B Grants 3 975 4 199 4 435 4 683
II. Social security schemes 3 308 3 551 3 818 4 103
A Contributions 2 188 2 338 2 498 2 670 – From employees 961 1 027 1 098 1 174 – From private employers 858 924 996 1 072 – From public employers 369 386 405 424
B Investment income 821 920 1 026 1 140
C Government transfer 299 294 293 293
EXPENDITURES 28 706 30 629 32 697 34 930
I. Government budget expenditure 26 890 28 692 30 616 32 671
A Non-financial expenditure 25 687 27 447 29 328 31 338 Current expenditure 19 288 20 576 21 948 23 409 Capital expenditure 6 399 6 871 7 380 7 929
B Interest 1 203 1 245 1 289 1 334 Domestic debt 905 932 960 989 External debt 298 313 329 345
II. Social security schemes 1 816 1 936 2 081 2 259
Benefits paid 1 315 1 396 1 498 1 630
Administration 501 540 582 629
OVERALL RESULT -319 -314 -319 -348
Overall result of Central Government -1 811 -1 929 -2 056 -2 193

Appendix D 259
2020 2021 2022 2023 2024 2025
36 936 39 410 42 050 44 872 47 874 51 080
32 525 34 674 36 964 39 405 42 008 44 783
27 580 29 401 31 343 33 413 35 620 37 97326 848 28 622 30 512 32 527 34 676 36 966
731 780 831 886 944 1 007
4 946 5 272 5 621 5 992 6 388 6 810
4 411 4 737 5 086 5 467 5 866 6 297
2 855 3 054 3 268 3 497 3 744 4 0091 256 1 345 1 441 1 543 1 654 1 7731 154 1 241 1 334 1 435 1 543 1 658
445 468 493 519 548 578
1 259 1 386 1 521 1 663 1 810 1 959
297 297 297 307 312 329
37 324 39 925 42 767 45 868 49 254 52 816
34 865 37 274 39 905 42 741 45 810 48 973
33 484 35 845 38 426 41 208 44 223 47 33024 964 26 578 28 341 30 229 32 262 34 294
8 520 9 267 10 084 10 980 11 961 13 036
1 381 1 429 1 480 1 532 1 587 1 6431 018 1 049 1 080 1 113 1 146 1 181
362 380 400 419 440 462
2 459 2 651 2 861 3 127 3 444 3 843
1 779 1 916 2 066 2 266 2 511 2 832
680 735 796 861 933 1 010
-387 -515 -717 -996 -1 379 -1 736
-2 340 -2 600 -2 942 -3 336 -3 802 -4 190
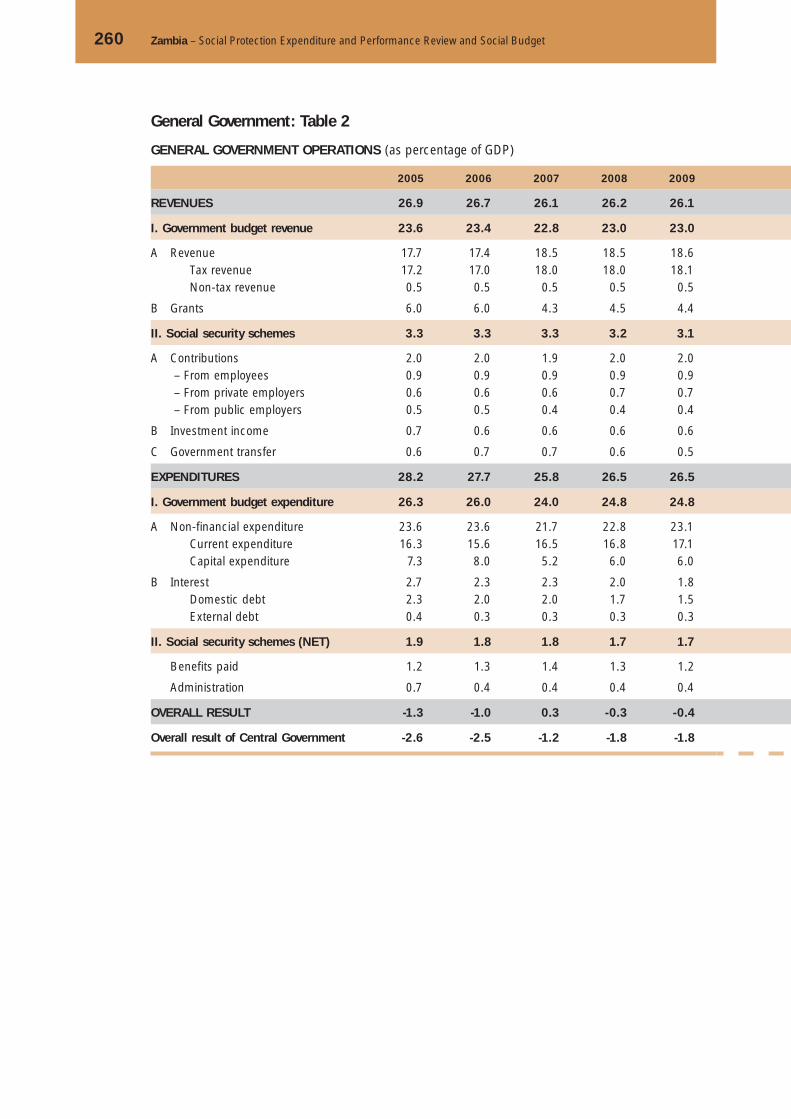
260 Zambia – Social Protection Expenditure and Performance Review and Social Budget
General Government: Table 2
GENERAL GOVERNMENT OPERATIONS (as percentage of GDP)
2005 2006 2007 2008 2009
REVENUES 26.9 26.7 26.1 26.2 26.1
I. Government budget revenue 23.6 23.4 22.8 23.0 23.0
A Revenue 17.7 17.4 18.5 18.5 18.6 Tax revenue 17.2 17.0 18.0 18.0 18.1 Non-tax revenue 0.5 0.5 0.5 0.5 0.5
B Grants 6.0 6.0 4.3 4.5 4.4
II. Social security schemes 3.3 3.3 3.3 3.2 3.1
A Contributions 2.0 2.0 1.9 2.0 2.0 – From employees 0.9 0.9 0.9 0.9 0.9 – From private employers 0.6 0.6 0.6 0.7 0.7 – From public employers 0.5 0.5 0.4 0.4 0.4
B Investment income 0.7 0.6 0.6 0.6 0.6
C Government transfer 0.6 0.7 0.7 0.6 0.5
EXPENDITURES 28.2 27.7 25.8 26.5 26.5
I. Government budget expenditure 26.3 26.0 24.0 24.8 24.8
A Non-financial expenditure 23.6 23.6 21.7 22.8 23.1 Current expenditure 16.3 15.6 16.5 16.8 17.1 Capital expenditure 7.3 8.0 5.2 6.0 6.0
B Interest 2.7 2.3 2.3 2.0 1.8 Domestic debt 2.3 2.0 2.0 1.7 1.5 External debt 0.4 0.3 0.3 0.3 0.3
II. Social security schemes (NET) 1.9 1.8 1.8 1.7 1.7
Benefits paid 1.2 1.3 1.4 1.3 1.2
Administration 0.7 0.4 0.4 0.4 0.4
OVERALL RESULT -1.3 -1.0 0.3 -0.3 -0.4
Overall result of Central Government -2.6 -2.5 -1.2 -1.8 -1.8
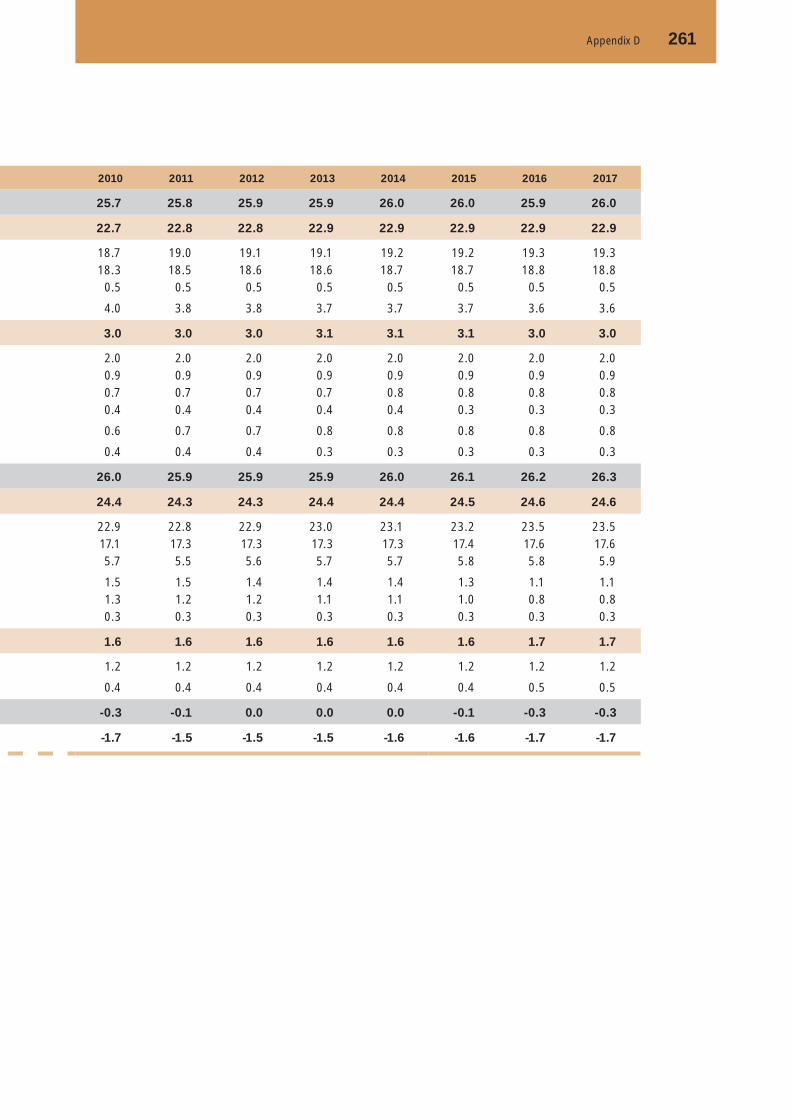
Appendix D 261
2010 2011 2012 2013 2014 2015 2016 2017
25.7 25.8 25.9 25.9 26.0 26.0 25.9 26.0
22.7 22.8 22.8 22.9 22.9 22.9 22.9 22.9
18.7 19.0 19.1 19.1 19.2 19.2 19.3 19.318.3 18.5 18.6 18.6 18.7 18.7 18.8 18.80.5 0.5 0.5 0.5 0.5 0.5 0.5 0.5
4.0 3.8 3.8 3.7 3.7 3.7 3.6 3.6
3.0 3.0 3.0 3.1 3.1 3.1 3.0 3.0
2.0 2.0 2.0 2.0 2.0 2.0 2.0 2.00.9 0.9 0.9 0.9 0.9 0.9 0.9 0.90.7 0.7 0.7 0.7 0.8 0.8 0.8 0.80.4 0.4 0.4 0.4 0.4 0.3 0.3 0.3
0.6 0.7 0.7 0.8 0.8 0.8 0.8 0.8
0.4 0.4 0.4 0.3 0.3 0.3 0.3 0.3
26.0 25.9 25.9 25.9 26.0 26.1 26.2 26.3
24.4 24.3 24.3 24.4 24.4 24.5 24.6 24.6
22.9 22.8 22.9 23.0 23.1 23.2 23.5 23.517.1 17.3 17.3 17.3 17.3 17.4 17.6 17.65.7 5.5 5.6 5.7 5.7 5.8 5.8 5.9
1.5 1.5 1.4 1.4 1.4 1.3 1.1 1.11.3 1.2 1.2 1.1 1.1 1.0 0.8 0.80.3 0.3 0.3 0.3 0.3 0.3 0.3 0.3
1.6 1.6 1.6 1.6 1.6 1.6 1.7 1.7
1.2 1.2 1.2 1.2 1.2 1.2 1.2 1.2
0.4 0.4 0.4 0.4 0.4 0.4 0.5 0.5
-0.3 -0.1 0.0 0.0 0.0 -0.1 -0.3 -0.3
-1.7 -1.5 -1.5 -1.5 -1.6 -1.6 -1.7 -1.7

262 Zambia – Social Protection Expenditure and Performance Review and Social Budget
General Government: Table 2
GENERAL GOVERNMENT OPERATIONS (as percentage of GDP) (cont.)
2018 2019 2020 2021 2022
REVENUES 26.0 26.1 26.1 26.2 26.2
I. Government budget revenue 23.0 23.0 23.0 23.0 23.0
A Revenue 19.4 19.5 19.5 19.5 19.5 Tax revenue 18.9 18.9 19.0 19.0 19.0 Non-tax revenue 0.5 0.5 0.5 0.5 0.5
B Grants 3.6 3.5 3.5 3.5 3.5
II. Social security schemes 3.1 3.1 3.1 3.1 3.2
A Contributions 2.0 2.0 2.0 2.0 2.0 – From employees 0.9 0.9 0.9 0.9 0.9 – From private employers 0.8 0.8 0.8 0.8 0.8 – From public employers 0.3 0.3 0.3 0.3 0.3
B Investment income 0.8 0.9 0.9 0.9 0.9
C Government transfer 0.2 0.2 0.2 0.2 0.2
EXPENDITURES 26.3 26.4 26.4 26.5 26.6
I. Government budget expenditure 24.6 24.6 24.7 24.7 24.8
A Non-financial expenditure 23.6 23.6 23.7 23.8 23.9 Current expenditure 17.7 17.7 17.7 17.6 17.6 Capital expenditure 5.9 6.0 6.0 6.2 6.3
B Interest 1.0 1.0 1.0 0.9 0.9 Domestic debt 0.8 0.7 0.7 0.7 0.7 External debt 0.3 0.3 0.3 0.3 0.2
II. Social security schemes (NET) 1.7 1.7 1.7 1.8 1.8
Benefits paid 1.2 1.2 1.3 1.3 1.3
Administration 0.5 0.5 0.5 0.5 0.5
OVERALL RESULT -0.3 -0.3 -0.3 -0.3 -0.4
Overall result of Central Government -1.7 -1.7 -1.7 -1.7 -1.8
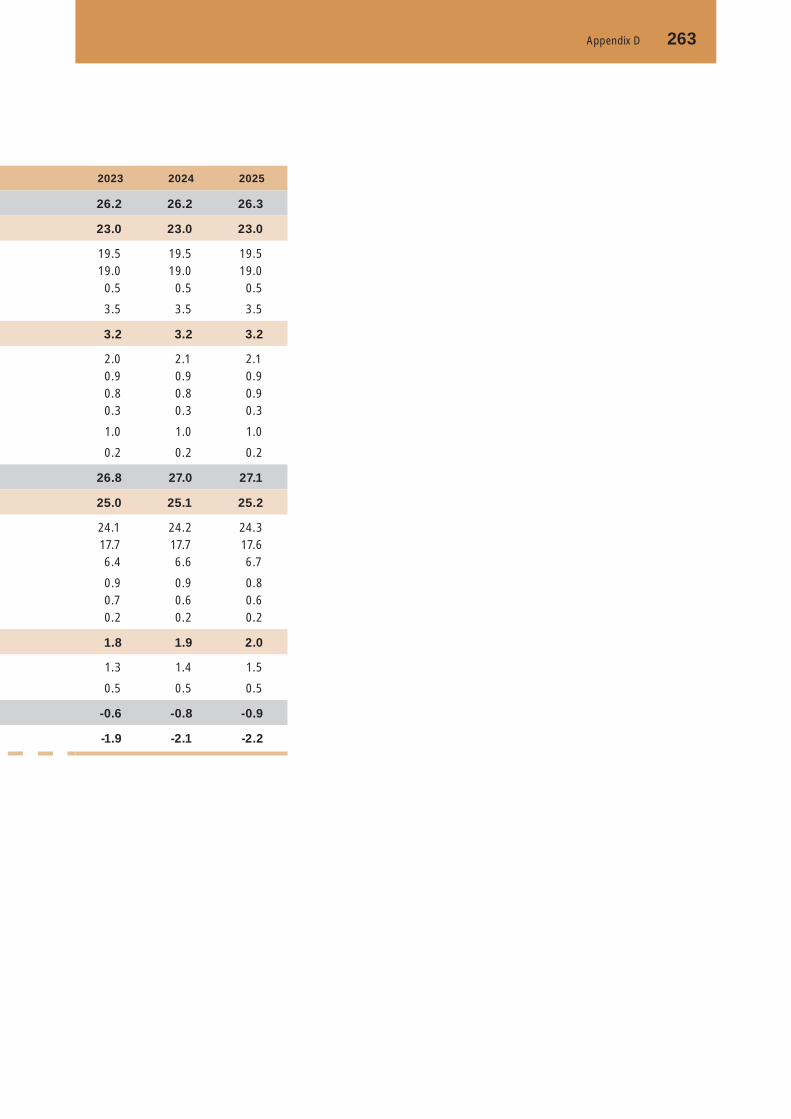
Appendix D 263
2023 2024 2025
26.2 26.2 26.3
23.0 23.0 23.0
19.5 19.5 19.519.0 19.0 19.00.5 0.5 0.5
3.5 3.5 3.5
3.2 3.2 3.2
2.0 2.1 2.10.9 0.9 0.90.8 0.8 0.90.3 0.3 0.3
1.0 1.0 1.0
0.2 0.2 0.2
26.8 27.0 27.1
25.0 25.1 25.2
24.1 24.2 24.317.7 17.7 17.66.4 6.6 6.7
0.9 0.9 0.80.7 0.6 0.60.2 0.2 0.2
1.8 1.9 2.0
1.3 1.4 1.5
0.5 0.5 0.5
-0.6 -0.8 -0.9
-1.9 -2.1 -2.2

264 Zambia – Social Protection Expenditure and Performance Review and Social Budget
Social Budget: Table 1
SOCIAL BUDGET (in billions of Kwacha)
2005 2006 2007 2008 2009
EXPENDITURES
Health 1 920 2 295 2 622 2 965 3 316
Education 1 451 1 874 2 173 2 520 2 902
Social security 384 527 645 687 737
Work-related 98 136 159 185 212
Social assistance 43 37 61 80 93
Administration 469 472 538 618 701
Change in reserves 450 599 672 785 857
Total 4 815 5 939 6 869 7 840 8 818
REVENUES
Households 1 437 1 505 1 725 1 964 2 217
Private enterprises 426 508 602 705 818
Government 1 707 2 353 2 627 3 003 3 377
Donors 943 1 236 1 531 1 727 1 914
Other 70 84 96 109 121
Investment income 232 253 288 331 370
Total 4 815 5 939 6 869 7 840 8 818
2017 2018 2019 2020 2021
EXPENDITURES
Health 6 467 6 930 7 434 7 982 8 613
Education 6 839 7 358 7 908 8 489 9 100
Social security 1 396 1 498 1 630 1 779 1 916
Work-related 441 472 504 536 571
Social assistance 196 208 221 235 250
Administration 1 519 1 644 1 782 1 933 2 099
Change in reserves 1 615 1 737 1 844 1 953 2 086
Total 18 475 19 849 21 323 22 906 24 633
REVENUES
Households 4 699 5 015 5 349 5 704 6 080
Private enterprises 1 808 1 947 2 095 2 252 2 421
Government 7 489 8 108 8 779 9 508 10 294
Donors 3 321 3 498 3 687 3 888 4 135
Other 238 255 274 294 317
Investment income 920 1 026 1 140 1 259 1 386
Total 18 475 19 849 21 323 22 906 24 633

Appendix D 265
2010 2011 2012 2013 2014 2015 2016
3 654 3 979 4 336 4 731 5 166 5 643 6 039
3 296 3 695 4 115 4 599 5 156 5 793 6 351
793 854 923 1 000 1 092 1 208 1 315
238 260 285 313 346 383 411
108 122 139 149 161 173 184
782 864 955 1 056 1 169 1 295 1 405
912 1 021 1 141 1 272 1 414 1 548 1 492
9 783 10 795 11 893 13 121 14 504 16 042 17 197
2 473 2 726 3 008 3 323 3 674 4 065 4 402
927 1 027 1 138 1 262 1 401 1 554 1 676
3 762 4 179 4 622 5 127 5 706 6 357 6 923
2 086 2 242 2 408 2 586 2 781 2 993 3 154
134 146 159 174 190 207 222
401 475 557 649 752 866 821
9 783 10 795 11 893 13 121 14 504 16 042 17 197
2022 2023 2024 2025
9 305 10 072 10 938 12 052
9 743 10 418 11 127 11 871
2 066 2 266 2 511 2 832
607 646 691 739
266 283 300 319
2 283 2 489 2 723 3 002
2 224 2 340 2 423 2 454
26 494 28 514 30 712 33 270
6 479 6 902 7 350 7 915
2 601 2 796 3 008 3 235
11 148 12 090 13 125 14 315
4 401 4 692 5 016 5 402
343 371 403 444
1 521 1 663 1 810 1 959
26 494 28 514 30 712 33 270

266 Zambia – Social Protection Expenditure and Performance Review and Social Budget
Social Budget: Table 2
SOCIAL BUDGET (as percentage of GDP)
2005 2006 2007 2008 2009
EXPENDITURES
Health 5.9 5.9 5.7 5.7 5.6
Education 4.5 4.8 4.8 4.8 4.9
Social security 1.2 1.3 1.4 1.3 1.2
Work-related 0.3 0.3 0.3 0.4 0.4
Social assistance 0.1 0.1 0.1 0.2 0.2
Administration 1.4 1.2 1.2 1.2 1.2
Change in reserves 1.4 1.5 1.5 1.5 1.4
Total 14.8 15.1 15.0 15.0 14.8
REVENUES
Households 4.4 3.8 3.8 3.8 3.7
Private enterprises 1.3 1.3 1.3 1.3 1.4
Government 5.3 6.0 5.7 5.7 5.7
Donors 2.9 3.2 3.3 3.3 3.2
Other 0.2 0.2 0.2 0.2 0.2
Investment income 0.7 0.6 0.6 0.6 0.6
Total 14.8 15.1 15.0 15.0 14.8
2017 2018 2019 2020 2021
EXPENDITURES
Health 5.5 5.6 5.6 5.6 5.7
Education 5.9 5.9 6.0 6.0 6.0
Social security 1.2 1.2 1.2 1.3 1.3
Work-related 0.4 0.4 0.4 0.4 0.4
Social assistance 0.2 0.2 0.2 0.2 0.2
Administration 1.3 1.3 1.3 1.4 1.4
Change in reserves 1.4 1.4 1.4 1.4 1.4
Total 15.8 16.0 16.1 16.2 16.4
REVENUES
Households 4.0 4.0 4.0 4.0 4.0
Private enterprises 1.5 1.6 1.6 1.6 1.6
Government 6.4 6.5 6.6 6.7 6.8
Donors 2.8 2.8 2.8 2.8 2.7
Other 0.2 0.2 0.2 0.2 0.2
Investment income 0.8 0.8 0.9 0.9 0.9
Total 15.8 16.0 16.1 16.2 16.4

Appendix D 267
2010 2011 2012 2013 2014 2015 2016
5.5 5.5 5.5 5.5 5.5 5.5 5.5
5.0 5.1 5.2 5.3 5.5 5.6 5.8
1.2 1.2 1.2 1.2 1.2 1.2 1.2
0.4 0.4 0.4 0.4 0.4 0.4 0.4
0.2 0.2 0.2 0.2 0.2 0.2 0.2
1.2 1.2 1.2 1.2 1.2 1.3 1.3
1.4 1.4 1.4 1.5 1.5 1.5 1.4
14.8 15.0 15.1 15.2 15.4 15.6 15.7
3.7 3.8 3.8 3.9 3.9 4.0 4.0
1.4 1.4 1.4 1.5 1.5 1.5 1.5
5.7 5.8 5.9 6.0 6.1 6.2 6.3
3.2 3.1 3.1 3.0 3.0 2.9 2.9
0.2 0.2 0.2 0.2 0.2 0.2 0.2
0.6 0.7 0.7 0.8 0.8 0.8 0.8
14.8 15.0 15.1 15.2 15.4 15.6 15.7
2022 2023 2024 2025
5.8 5.9 6.0 6.2
6.1 6.1 6.1 6.1
1.3 1.3 1.4 1.5
0.4 0.4 0.4 0.4
0.2 0.2 0.2 0.2
1.4 1.5 1.5 1.5
1.4 1.4 1.3 1.3
16.5 16.7 16.8 17.1
4.0 4.0 4.0 4.1
1.6 1.6 1.6 1.7
6.9 7.1 7.2 7.4
2.7 2.7 2.7 2.8
0.2 0.2 0.2 0.2
0.9 1.0 1.0 1.0
16.5 16.7 16.8 17.1