Final Draft NIGERIA: SOCIAL PROTECTION STATUS REPORT
155
Final Draft NIGERIA: SOCIAL PROTECTION STATUS REPORT [Type the document subtitle] 2/11/2015
-
Upload
khangminh22 -
Category
Documents
-
view
0 -
download
0
Transcript of Final Draft NIGERIA: SOCIAL PROTECTION STATUS REPORT

Final Draft NIGERIA: SOCIAL PROTECTION STATUS REPORT [Type the document subtitle] 2/11/2015

Social Protection Status Report for Nigeria
Page 2 of 155
NIGERIA: SOCIAL PROTECTION STATUS REPORT
Draft Final Report February, 2015

Acknowledgments

Social Protection Status Report for Nigeria
List of Acronyms
APAA Accelerated Poverty Alleviation Agency
BACYWORD Bauchi State Agency for Youth and Women Rehabilitation and Development
BOA Bank of Agriculture
BSC Business Support Center
BIC Business Information Center
BIG Basic Income Guarantee
CBHIS Community-Based Health Insurance Scheme
CCT Conditional Cash Transfer
COPE In Care of the People
CPS Contributory Pension Schemes
CR-RAMP Cross River Rural Access and Mobility Project
CR-ROMA Cross River Road Maintenance Agency
CUDA Calabar Urban Development Authority
DB Defined Benefit
DC Defined Contribution
DFID UK Department for International Development
DRG Debt Relief Gain
DOPT Department of Public Transportation
ECS Employees Compensation Scheme
EPV Ekiti Project Volunteers
FCT Federal Capital Territory
FMBN Federal Mortgage Bank of Nigeria
FMF Federal Ministry of Finance
GIS Graduate Internship Scheme
HGSFHP Home Grown School Feeding and Health Program
HNLSS Harmonized National Living Standard Survey
ICT Information and Communications Technology
ILO International Labor Organization
LEEDS Local Economic Empowerment and Development Strategy
LGA Local Government Authority
MCH Maternal and Child Healthcare
MDA Ministries, Departments, and Agencies
MDG Millennium Development Goal
MSME Micro, Small, and Medium Enterprises

Social Protection Status Report for Nigeria
MSWCD Ministry of Social Welfare and Community Development
MWA Ministry of Women Affairs
NAPEP National Poverty Eradication Programme
NARDB Nigerian Agricultural Credit and Rural Development Bank
NBS National Bureau of Statistics
NDE National Directorate of Employment
NEEDS National Economic Empowerment and Development Strategy
NEMA National Emergency Management Agency
NFDP National Fadama Development Project
NGO Non-Governmental Organization
NHF National Housing Fund
NHIS National Health Insurance Scheme
NPC National Planning Commission
NPPE National Policy on Poverty Eradication
NSITF Nigeria Social Insurance Trust Fund
NWCSS National Working Committee on Social Security
ODA Overseas Development Aid
OSSAP-MDG Office of the Senior Special Assistant to the President of Nigeria on MDGs
OVC Orphans and Vulnerable Children
OYES Osun Youth Empowerment Scheme
PENCOM National Pension Commission
PFA Pension Fund Administrator
PFC Pension Fund Custodian
PMT Proxy Means Test
POWER Partnership Opportunity for Women Empowerment Realisation
PRAI Poverty Reduction Accelerator Investment
PRSP Poverty Reduction Strategy Paper
SA Special Adviser
SEEDS State Economic Empowerment and Development Strategy
SHIP Social Health Insurance Program
SME Small and Medium Enterprises
SMEDAN Small and Medium Scale Enterprise Development Agency
SPAG Social Protection Advisory Group
SRM Social Risk Management
SSA Senior Special Assistant
SWF Sovereign Wealth Fund

Social Protection Status Report for Nigeria
UBE Universal Basic Education
UNFPA United Nations Population Fund
UNICEF United Nations Children’s Fund
VVF Vesicovaginal Fistula
WECA Wealth Creation Agency
WHO World Health Organization
YEP Youth Empowerment Programme
YES-O Empowerment Scheme of Oyo State
YESSO Youth Employment and Social Support Operation

Table of Contents
List of Acronyms
Table of Contents
Executive Summary i
Chapter One: Diagnostics of Risks and Vulnerability in Nigeria 1
1.1 Risk Profile and Shock Incidence in Nigeria 1
1.2 Profile of Vulnerability in Nigeria 6
Chapter Two: Current Social Protection Interventions in Nigeria 10 2.1 Social Protection Policies in Nigeria 10
2.2 Social Protection Programmes in Nigeria 16
Chapter Three: Fiscal Space for Social Protection in Nigeria 41
3.1. Applying Fiscal Space for Social Protection in Nigeria 42
3.2 Budget Provision for Social Safety Nets 43
3.2.1 Trend of Budget Estimates for Social Safety Nets 44
3.2.2 Composition of Budget Estimates for Social Safety Nets 46
3.3. Expenditure on Social Safety Nets 47
3.3.1 Trend of Spending on Social Safety Nets 47
3.3.2 Composition of Social Safety Net Spending 53
3.3.3 Sources of Funds for Social Safety Net 54
3.4. Data Availability and Quality of Social Safety Nets Budget Execution 55
3.4.1 Availability of Data on Social Safety Nets 56
3.4.2 Quality of Budget Execution 56
3.5 State Government Finances of SSN 58
3.6 Concluding Remark on Fiscal Space for Social Protection in Nigeria 62
Chapter Four: Governance and Corruption Issues in Social Protection
Programmes in Nigeria 63
4.1 Social Protection Governance issues in Bauchi state 64
4.2 Social Protection Governance issues in Cross River state 70
4.3 Social Protection Governance issues in Kwara state 73
4.4 Social Protection Governance issues in Oyo state 76
4.5 Social Protection Governance issues at Federal level 77
4.6 Concluding Remarks on Governance Issues in Nigeria 82
Chapter Five: Gaps and Challenges in the Social Protection Sector 84
Chapter Six: Policy Implications and Recommendations 88
6.1 Policy Implications 88
6.2 Recommendations 88
6.3 Recommendations for Future Research 92
References 93
Social Protection Status Report for Nigeria
Annex 1: Profile of Social Protection Programs in Selected States of Nigeria 101
Annex 2: Summary of Governance Structure across Selected States and Federal
Government Social Protection Activities 108
Annex 3: Social Protection Institutions and Actors 115 Annex 4: Review of Relevant Literature 116
Annex 5: Financing Social Protection in Nigeria 123
Annex 6: NIGERIA Poverty Numbers2003-04 and 2009-10 126
Annex 7: Tables on Nigeria’s Fiscal Space for Social Protection 128
Social Protection Status Report for Nigeria
List of Tables
Table 1: Major Risk and Key At-risk Groups 2
Table 2: Vulnerability Profile of Nigerian Households 2009/2010 8
Table 3: Poverty and Vulnerability Risks by Age Profile 9
Table 4: Structure of Poverty Alleviation Agencies after 2000 Merger 11
Table 5: Streamlined Functions of Poverty-related Ministries and Agencies, 2000 13
Table 6: Social Protection Programs in Nigeria 17
Table 6: Typology of Social Protection Programs 18
Table 7: NDE Programs and Target Groups 20
Table 8: NDE Beneficiaries, 2012 and 2013 20
Table 10: Programme Cost of the SURE-P Vocational Training Programme (Year end 2012) 22
Table11: MSMEs Receiving SMEDAN’s Information and Advisory Services, 2010 29
Table 12: NAPEP Programs and Target Groups 29
Table 13: Selected Pilot States for School Feeding Program 35
Table 94: World Bank Characterization of Multi-Pillar Pension System in Nigeria 38
Table 15: Change in Budgets of Education Health and Select SSN MDAs 46
Table 16: Actual Spending on Employment Creation by NDE, 2007-2010 (N’ Millions) 53
Table 17: Share of Fund Sources in Total Program Expenditure (%) 55 Table 18: Summary of Finances by Selected States on Public Works (2011-2013) 58
Table 19: Summary of Finances by Selected States on Skills for Job (2011-2013) 59
Table 20: Summary of Finances by Selected States on Education (2011-2013) 59
Table 21: Summary of Finances by Selected States on Education (2011-2013) 60
Table 22: Summary of Finances by Selected States on Social Protection (2011-2013) 61
Table 23: Summary of Finances by Selected States on Skills for Job (2011-2013) 61
Table 24: Coverage of Some Social Protection Programs 85
Table 25: Child-sensitive Approach to Social Protection 86
List of Figures
Figure 1: Incidence of Reported Shocks in Nigeria, 2009/2010 3
Figure 2: Relative Incidence of Shocks by Household and Location Characteristics 2009/2010 4
Figure 3: Nominal Total and Select Social Budgets (N'b) 45
Figure 4: Share of Select Social Activities in Total Budget (%) 47
Figure 5: NDE Budget and Expenditure Outlays (2007-2011) 48
Figure 6: Change in NDE Budget and Expenditure (2007-2011) 49
Figure 7: CCT Budget and Expenditure Allocations of NAPEP, 2009 - 2012, (N'billions) 50
Figure 9: MDGs Spendings on Select Activities (N'm) 51
Figure 10: Changes in MDG Spending on Select Activities 2008 – 2012 51
Figure 11: Share of Selected Activities in MDGs Total Spending 52
Figure 12: NDE Actual Spending as Percentage of Budget 57
Figure 13: NDE Budget Variance as Percentage of Budget 57
List of Boxes
Box 1: Key Features of 2004 Social Protection Strategy 14
Box 2: Short and Medium Term Social Protection Strategies Enunciated by the
New Social Protection Policy 16
Box 3: National Directorate of Employment (NDE) 21

Social Protection Status Report for Nigeria
Box 4: Child Protection and Social Protection 86

Social Protection Status Report for Nigeria
i
Executive Summary
1. Nigeria is the most populous African country with a population of about 168million,
about one-fifth of the population of the African continent. This means that the social context in
Nigeria largely determines the social status of a substantial proportion of the African populace.
Nonetheless, Nigeria’s social context is currently not very encouraging. As of 2004, using
National Bureau of Statistics (NBS) data, 48.7% percent of Nigerians were poor, with 43.2 and
53.3 percent living in poverty in urban and rural areas respectively. By 2010, the proportion of
people living in poverty is estimated at 45.7percent (NBS, 2012) but the number of the poor
increased beyond the 2004 figures. In addition to those who are currently living in poverty, there
are also many vulnerable groups who are likely to fall into poverty as a result of risks and
negative shocks. The proportion of vulnerable people in Nigeria is high. Alayande (2003)
estimated that 87 percent of households in the country are vulnerable to poverty, with 70.9
percent of urban households and 89 percent of rural households being in this position. Although
this proportion had declined to 59 percent by 2010, the over 100 million Nigerians who are
vulnerable need to be protected if poverty is not to be passed on to the next generation of
Nigerians.
2. The relatively high poverty incidence in the country is a paradox given that the country
has experienced robust economic growth in the past 10 years. In fact, Nigeria’s growth rate has
been one of the highest in the world (World Bank, 2010). However, it has been argued that this
growth has not been inclusive and thus has bypassed many poor Nigerians because of the
absence of social protection programs (Soyibo et al., 2011)and because of growing inequality
reflecting broader divide in the country in terms of educational outcomes, health care provision
and general economic opportunities(World Bank 2013). Nevertheless, economic growth and
higher incomes alone cannot alter the many social and political factors that create poverty. Even
if Nigeria’s recent growth had been inclusive, some people still would not have been able to take
advantage of economic opportunities because of their vulnerable circumstances. The existence of
these poor and vulnerable people means that there is a need for a rigorous social protection
strategy for the country for everyone to be included in the growth and development process.
3. Social protection encompasses a set of publicly mandated actions – state or private – to
address risk, vulnerability, and chronic poverty (Holmes et al., 2008). The aim is to prevent
adverse events, mitigate their impact, or enhance the capacity of poor people to cope with them.
The vulnerability of households can also be addressed by, for example, promoting collective
action in favor of workers’ rights or by supporting farmers’ organizations (Holmes et al., 2008).
4. An adequate social protection program must involve explicitly the government. Although,
the Nigerian government does not have a comprehensive social protection strategy, this does not
mean that no efforts have been made to provide social protection in the country. In 2004, the

Social Protection Status Report for Nigeria
ii
Federal Government through the Nigerian National Planning Commission recognized the
importance of social protection by including it as social charter in its National Economic
Empowerment and Development Strategy (NEEDS) and State Economic Empowerment and
Development Strategy (SEEDS). In these strategies, the government declared that effective
social protection strengthens social cohesion, human development, and the livelihoods of
Nigerians. The NEEDS policy paper set out its broad goals as being “wealth creation,
employment generation, poverty reduction, and value re-orientation.” The social protection
component of NEEDS was an offshoot of a national Social Protection Strategy (SPS) developed
by the National Planning Commission earlier the same year (Olaniyan et al., 2004).
5. The SPS document listed the kinds of social protection interventions needed to mitigate
the risks, shocks, and vulnerability experienced by each age group. They are as follows: (i) early
childhood development programs for children aged 0 to 5 years old; (ii) human capital
development programs for young people aged 6 to 24 years old; (iii) human development and
employment-related programs for adults aged 25 to 60 years old; and (iv) pension and health-
related programs for those aged 65 and above. A new national social protection policy is being
developed with draft prepared in November, 2013.
6. Despite the government’s commitment in 2004, Nigeria still lacks a
coherent/comprehensive social protection policy and implementation framework. However,
many programs exist that can be classified as some form of social protection activity. These
include the National Pension Commission (NPC), the National Emergency Management Agency
(NEMA), and National Health Insurance Scheme (NHIS). NEMA formulates policies relating to
emergency management activities as well as coordinating programs and plans for responding to
disasters in Nigeria. A small number of the social protection interventions operated either by the
government or by its development partners also provide safety nets for the poorest households
but these are few and far between. This explains why welfare costs resulting from exposure to
risks have been on the increase. (Olaniyan et al., 2012). It is imperative to examine these
programs, given Nigeria’s high poverty incidence and plethora of social protection and risk
management programs, to assess whether they are achieving their objectives and improving the
welfare of the all Nigerians.
7. The World Bank Africa Region Social Protection Strategy document established the fact
that social protection helps to reduce inequality and can promote social stability. Many
countries especially in the Africa region now appreciate that significant benefits can be realized
by creating integrated social protection systems. African countries that are emerging from
conflict situations have used social protection to foster peace and to rebuild their social capital
while those in chronic poverty as well as those with high level of vulnerability to economic,
natural and climatic shocks now recognize that safety nets are critical part of a government
capacity to respond to shocks and manage risks of falling into further poverty. So social
protection is now regarded among policymakers as a key component of poverty reduction
strategies in the region, and dialogue and debate on social protection has continued to expand.

Social Protection Status Report for Nigeria
iii
Governments are investing in social protection programs that are proving to be effective, and
lessons from the design and implementation of these programs are now informing the expansion
of social protection across the continent.
8. The central theme of this document therefore is to assess the status of social protection in
Nigeria since the advent of democracy, which refers broadly to the period from 1999 to the
present day. The terms of reference for this study involved reviewing the following three reports:
(i) the World Bank sponsored Vulnerability Study; (ii) assessments of current social safety net
interventions in 10 states in Nigeria; and (iii) the six reports related to the UNICEF Social
Protection Study and (iv) five commissioned reports on governance and political economy of
social safety nets.. In addition, other relevant academic and policy documents were consulted to
produce this summary report and to identify any gaps in the knowledge base that might require
the collection of data in the future. In sum, this report is essentially a desk review of documents
related to the status of the social protection in Nigeria.
9. However, before assessing the social protection programs, we first classify them in line
with the transformational framework of protection, prevention, promotion, and the voice that
was developed in the UNICEF Social Protection Study. Social protection programs are thus
organized according to the risks against which they are protecting their beneficiaries while also
isolating the gaps and challenges of social protection in Nigeria.
10. The social protection sector in Nigeria has so many gaps. The present state of social
protection programs is fragmented and ad hoc; the programs are extremely small, and coverage
is estimated to be only a tiny fraction of the poor. This low coverage is a result of a combination
of constraints, including political, financial, and capacity limitations. In addition, the value of
transfers is low, which inhibits the extent to which social protection interventions can reduce
poverty and inequality, and create opportunities for the poor and vulnerable.
11. There is narrow fiscal space for social protection in Nigeria: Both the federal
government and state governments allocate small proportion of their budgets to social protection
which at the federal level is about 0.5%. The low allocation in the budget notwithstanding, actual
expenditure always ranks below the budgeted amount. There is however space for fiscal
deepening for social protection through mobilisation of domestic resources, reprioritizing
expenditure, increased discretionary expenditure, improved financial management of
expenditure, to a lesser degree increase aid, and political commitment to support the expansion
of provision of social protection.
12. Most social protection interventions in Nigeria still lag behind in governance bordering
on rules of the game, roles and responsibilities of actors involved and controls and
accountability mechanisms to ensure getting right benefit to the right people at the right time:
The governance in social protection programs across states is limited by weak Monitoring and
Evaluation (M&E) and Management Information System (MIS). This is due to low level of
computerization; hence administrative activities are not integrated or are yet to be incorporated

Social Protection Status Report for Nigeria
iv
online. In most cases, communications are through dialogues, use of media, bills and text
messages. Some errors and corruption observed in the programmes include political interference
on selection of beneficiaries, payment errors, and presence of ghost beneficiaries,
mismanagement and irregular release of funds. Adequate measures are yet to be employed to
completely put such errors and corruption to a halt.
13. One of the key concerns is the limited coverage and reach of existing social protection
programs. While the majority of Nigerians live in poverty, most social protection programs –
including the federally-led MDG-DRG and NAPEP safety nets In Care of the People (COPE)
and Maternal and Child Healthcare (MCH) – reach only a few hundred to a few thousand
households. In fact, the benefits structure provides limited incentives, especially in the pension
scheme, conditional cash transfers (CCT), National Health Insurance Scheme (NHIS), and
School Feeding Program. Only the CBHIS has the explicit goal of reaching 100 percent of the
poor (in the informal sector). This may be due to its presidential mandate to achieve universal
health insurance coverage and access to healthcare for all Nigerians by 2015 (NHIS, 2008.
Coverage of Some Social Protection Programs
Program Projected Coverage Actual Coverage
(Number of Households / Percent of Poor)
COPE 22,000 households/less than 0.001% of poor
households nationally*
Currently not available
CCT Girls’
Education
Kano – scaling up to all eligible girls in LGAs
where CCT is implemented
12,000 girls, Kano/0.002% of the poor
(9.2 million population; poverty
incidence approx. 60%)
7,000 girls, Katsina / 0.001% of the poor
(6 million population; poverty incidence
approx. 70%)
MCH 851,198 women and girls as of June 2010
(Phase 1: 615,101, Phase 2: 236,097)
Less than 0.01% of the poor (assumption
75 million poor; poverty incidence 54%)
CBHIS 100% informal sector workers (when fully
rolled out, expected to cover 112 million
Nigerians in informal sector)**
Currently unavailable
Source: Holmes et al. (2012).
Note: *Dijkstra et al. (2011), **PATHS2 (2010).
14. Nigeria’s social protection programs also remain focused on a narrow set of risks and
target groups, and have undefined targeting mechanisms. For example, in the case of COPE,
while it has multiple objectives (health, education, and investment), its design does not take into
account the needs of households (especially if they are labor-constrained). Many of the other
interventions have no clear targets, goals, or benchmarks against which their performance can be
measured and monitored. In the rare cases where targets exist, their broad definition allows the

Social Protection Status Report for Nigeria
v
elite and the non-poor to receive benefits. This targeting problem can be further attributed to the
absence of an overall framework on social protection devised with the consensus of all
stakeholders, including the government, development partners, civil society, and the private
sector.
15. Even within the MDG-driven social protection agenda, productivity-enhancing
instruments have received little attention. And, although some programs are designed to be
gender and child sensitive, so far there has been no concerted approach to reducing inequities.
The following are challenges of social protection sector in Nigeria.
Financial Resources
16. Funding is a major challenge in implementation of social protection programs. The
operators of social protection programs indicated that funding is a major constraint, militating
against the achievement of program goals. An examination of the budgets of these organizations
indicates that they have been declining over time and that this might have adversely affected
their performance. Since most of the agencies and institutions depend on government financing,
it was evident that no mechanism has been put in place to ensure the sustainability of the
programs. In addition, financing that the various levels of government allocate to social
expenditure is low. The creation of appropriately financed and designed large-scale social
transfer schemes would benefit millions of people living in poverty, but affordability is a key
concern and Nigeria is already highly dependent on foreign aid (Holmqvis, 2012).
Political Commitment
17. The political commitment to protecting poor and vulnerable families is very low. Well-
targeted programs (e.g., AIDS widows with children) garner limited political support and thus
are allocated a small budget at the state and even at the federal level. In contrast, a more broadly
and ineffectively targeted program, like one that targets all vulnerable families, tends to elicit
greater political support and a larger budget. Therefore, the social protection sector in Nigeria is
encouraged to target broad programs for it to be guaranteed political commitment as well as
budget. That being said, most of the well-resourced social protection programmes are supported
by development partners, civil societies, or private sector organizations – with relatively low
counterpart contribution by the federal or state government (which require results to justify
budget allocation). With the close of such partner support, grave sustainability concerns arise.

Social Protection Status Report for Nigeria
vi
Service Delivery and Governance
18. Most of the social protection programs have no measurable indicators, targets, or
benchmarks with which to monitor the progress of the interventions. Nor can their impact –
either through objective measures or the subjective perceptions of beneficiaries – be measured
for lack of mechanisms and systems. To compound matters, all of the agencies seem to be
working independently irrespective of the other agencies involved in social protection and
among the agencies in the social protection sector, coordination is scant.
19. In the public sector, despite recent reforms, there are still indications of overlaps in the
functions and activities of the various social protection/poverty alleviation agencies (e.g., the
many agencies involved in microfinance activities). Furthermore, the governance structure of
some of the agencies inhibits their ability to fulfill their responsibility. For example, while the
Bank of Agriculture is able to provide micro-credit for the moderately poor, it lacks the
capability to provide these services to the very poor. On the other hand, the focus of NAPEP has
shifted toward interventions from its original mandate of coordination and M&E functions.
Six Policy Implications
a. Develop an overarching social protection policy framework that assigns clear
institutional roles and responsibilities and that guides the design and implementation of
social protection initiatives at the federal and state level. There is the need for a social
protection platform at State and Federal level for coordination of Social protection
interventions.
b. Support and generate political commitment for social protection at the federal and state
levels
c. Allocate and realign the resources needed to scale up social protection programs. There
is sub-optimal utilization of funds in social protection programs. Accountability and
result-based financing approach will ensure value for money.
d. Increase investment in service delivery for the poor. There is considerable fiscal space in
the Nigerian budget to fund social protection. However, the creation of fiscal space for social
protection should not come at the expense of other social sectors if the impact of social protection
on human development is to be maximized, hence the need to generally increase funding and
capacity for service directed at the poor. Early Child Assistance Program such as Nutrition,
School feeding Program, conditional cash transfers, School Materials Subsidy Program, Public
workfare, Elderly Pensions Scheme are examples of good service delivery interventions for the
poor and vulnerable that currently merit increased investment
e. Integrate an equity focus into the design and implementation of programs. A dynamic
unified register of poor household used as a basis for identifying beneficiaries of social
protection intervention will help improve equity and foster inclusion.
f. Strengthen the governance features of social protection programs and establish
integrated and coordinated social protection system. A strong monitoring and evaluation
system is imperative for effective and efficient social protection programs.

Social Protection Status Report for Nigeria
vii
20. Finally, this report is organized as follows. It begins by discussing the profile of risk and
vulnerability in Nigeria in Chapter 1. In Chapter 2, it goes on to give a detailed description of the
country’s existing social protection policies and programs, including the coverage, benefit
structure, and contribution rates of each program where these data are available. Information is
also given on the management and governance of the programs and on how federal, state, and
local governments are involved with them. Any gaps in provision according to the transformative
framework as well as the challenges that are likely to be involved in filling these gaps are
highlighted in in Chapter 3. Chapter 4 deals with fiscal space for social protection while chapter
five discusses governance issues in social protection in Nigeria. Finally, the report concludes in
Chapter 6 with a discussion of the policy implications of these findings as well as a set of
recommendations.

Social Protection Status Report for Nigeria
1 of155
1 Diagnostics of Risks and Vulnerability in Nigeria
1. The World Bank (Bank) has generated a sizeable amount of work on both individual and
household-level risk and vulnerability, especially since 2000 when the Bank developed its
social risk management (SRM) framework. The documents that were studied for this report
provide ample evidence of how these risk management strategies have been implemented in
Nigeria.1
1.1 Risk Profile and Shock Incidence in Nigeria
Nigeria is a country of enormous human and material resources and of high levels of poverty and poverty and rising inequality. The population of Nigeria is about a fifth of the African population population estimated at 168,833,776 in 2012. In spite of the sustained growth in the economy hovering around 6.5% and above in the last decade and half, there has not been appreciable improvement in the standard of living of Nigerians. The GDP per capita ranks the country as a a Low Middle Income Country (LMIC) with an amount of $1,555.4 per capita in 2012. As at 2012, the 2012, the highest quintile of the population controls 54 percent total wealth while only 4.4% is is accounted for by the lowest quintile. The income inequality as depicted by Gini coefficient at at 48.8% in 2010 confirms that there is still high disparity in the income distribution which can can lead to polarization of the population at both ends of the income pole. On human development, the UNDP ranks Nigeria as 153 with human development index of 0.471 in 2013 2013 moving a step up from the 2011 rating. According to the data from the World Bank Open Open Access Data more than 6 out of every 10 Nigerians are poor in 2012. Hence as many as 104,676,941 Nigerians are living below the poverty line. Poverty rate has been on the increase over increase over the years owing to the fact that a large number of people are likely to be poor at all all times (vulnerability issues) as a result of their exposure to one shocks or the other. Labour statistics does not fare better either with 23.9% total and 30.1% youth unemployment rates respectively in 2010. As at 2012, the unemployment rate has moved up by another 1.3 percentage percentage points (Yusuf, 2014). The policies and programs devised to reduce poverty have had had little effect,2 leaving most Nigerians to live a highly volatile and unpredictable life on a daily daily basis. The sources of risk supporting this profile are found in
1Olaniyanet al. (2003), Okunmadewa and Elder (2003), Alayande (2004), Oni (2008), Oni and Yusuf (2008), and
Olaniyanet al. (2012). 2Holmes et al. (2012).

Social Protection Status Report for Nigeria
2 of155
1. Table 10.

Social Protection Status Report for Nigeria
3 of155
Table 10: Major Risk and Key At-risk Groups
Sources Key Factors/Elements
Natural Earthquakes, erosion, droughts, floods, heavy rainfall, hurricanes, landslides, strong winds,
volcanic eruptions
Health Accidents, disability, epidemics, illness, injury, malnutrition
Environment Bush burning, deforestation, desertification, land degradation, overgrazing, pollution
Gender Burial rites of widows, lack of access to credit, lack of inheritance rights
Conflict Ethnic, indigenous/settler, religious, separation of family members
Labor
Market
Loss of job, lack of income, unemployment, lack of unemployment compensation, no
savings, displacement from place of business, lack of educational attainment, low
educational attainment
Life
Events
Birth, maternity, old age, family break-up, death of spouse, loss of land due to construction
work by the government
Economic
Risks
Unemployment, harvest failure, output collapse, balance of payments shock, financial
crisis, currency crisis, technological or trade-induced terms of trade shocks
Other Macro-
economic Risks
Political corruption, stunted growth of the economy, instability in economic policy,
irregular payment of salaries, delay/non-payment of pensions, high costs of business
Social Risks Crime, domestic violence, terrorism, gang wars, riots
Others Lack of access to healthcare, inability to pay children’s school fees, disability or chronic
illness, large family size, lack of access to justice, insecure access to food, displacement
due to government projects
Sources: Heitzmann et al. (2002) and Okunmadewa and Elder (2003).
A recent comprehensive analysis using data from the 2009/2010 Harmonized National Living Standard Living Standard Survey (HNLSS) indicated that respondents had reported experiencing at least 18 least 18 different kinds of shocks (Olaniyan et. al., 2012). The most prevalent shocks are the death of the death of the household head, conflicts in the community, the death of a spouse, the household head head being away, the spouse being away from home, the household head being hospitalized, and and personal theft. The shocks with the lowest incidence are the disability of a spouse, car vandalism, vandalism, and vehicle theft at 0.8, 1.2, and 1.4 percent respectively of the population. These shocks are shocks are idiosyncratic in nature in the sense that they are felt by only a few households within the within the sample unit, as opposed to a covariant shock such as an earthquake, which is felt by a large by a large proportion of the sample (

Social Protection Status Report for Nigeria
4 of155
2. Figure 3).

Social Protection Status Report for Nigeria
5 of155
Figure 3: Incidence of Reported Shocks in Nigeria, 2009/2010
Source: Olaniyan et. al. 2012The study also examined the relative incidence of reported shocks by household
and location characteristics. The household characteristics comprised gender, age, and educational level of the
household heads and the household’s poverty status. The location characteristics used were urban or rural
location and region (North-east, North-west, North-central, South-east, South-west, or South-south).
3. Figure 4 illustrates the relative incidence of the most prevalent shocks in Nigeria.3The
relative incidence of shock reported below 1 implies that the occurrence of the shock is lower
than the national average, while when it is higher than 1, this implies that the occurrence of
shock is more frequent than the national average. The shock with the highest incidence of
occurrence is the death of the household head at 6.8 percent. With respect to the gender of
the household head, the relative incidence of experiencing the shock of the death of a
household head is 0.6 for female-headed households and 0.8 for male-headed households.
The implication of this result is that male-headed households are more vulnerable to losing
the life of their head than female-headed households. Extremely poor households have an
incidence of 1.3 for this shock, while the moderately poor and non-poor have incidences of
1.02 and 0.6 respectively. Thus, the extreme poor experience the death of a household head
more than the moderately poor and non-poor.
4. There are also sectoral dimensions to the relative incidence of experiencing shocks
(Figure 4). The incidence of experiencing the death of the household head is 1.04 for rural
3The relative incidence is the ratio of the incidence of the shocks on a particular population relative to its country-
wide incidence (Tesluic and Lindert, 2000).

Social Protection Status Report for Nigeria
6 of155
and 0.88 for urban households, with a relative incidence of 4 percent higher and 12 percent
lower than average for the rural and urban sector respectively. This implies that rural
households experience the death of a household head more than the national average and
much more than urban households.
Figure 4: Relative Incidence of Shocks by Household and Location Characteristics 2009/2010
Gender Poverty Status
Age of Household Head Rural versus Urban Areas

Social Protection Status Report for Nigeria
7 of155
Education Level of Household Head Regions of Nigeria
Source: Olaniyanet. al. 2012
5. In terms of gender, female-headed households are less exposed to shocks than male-
headed households.
6. As regards poverty status, the spouse or the head of the household becoming disabled is
the main shock that the non-poor experience. The extreme poor are worse off than the

Social Protection Status Report for Nigeria
8 of155
national average in terms of how often they experience the death of a spouse, the death of a
household head, physical harm, personal theft, car vandalism, and robbery by force. The only
shock that moderately poor households experience more than the national average is home
burglary. Therefore, the extremely poor are worse off in terms of security and lifecycle risks.
7. The age of the household head also is indicative of the prevalence of shocks. The results
in Olaniyan et. al. (2012) reveal that households headed by people aged 60 years old and
over are more likely than average to experience the disability of a spouse or of the household
head. In contrast, households whose heads are aged between 25 and 59 years are more
vulnerable to the death of a spouse or the household head, robbery by force, and home
burglary. Households whose heads are aged between 15 and 24 years are more vulnerable to
shocks such as vehicle theft, car vandalism, bicycle theft, personal theft, and physical harm.
Therefore, the aged are more prone to health shocks and risks, while those in the active
working-age group are more apt to security and lifecycle shocks and risks.
8. Analysis by sector of residence reveals that rural households are more vulnerable than the
national average in all of the shocks highlighted in Figure 2, except for personal theft. This
implies that the rural households are worse off in terms of lifecycle, health, and security risks
than urban households. When further delineated by geopolitical zones, the North-west is,
thus, worse off in terms of security risks: it is more vulnerable than average to vehicle theft,
car vandalism, motorcycle theft, and bicycle theft as well as home burglary, robbery by force,
personal theft, and physical harm. On the other hand, households in the South-east are more
vulnerable to health and lifecycle risks than any other geopolitical zone in Nigeria, while the
North-east region is more vulnerable in terms of the death of a spouse (a lifecycle risk). The
implication of these findings is that the South-west and North-central geopolitical zones are
less vulnerable to shocks than the North-west, North-east, South-east, and South-south
geopolitical zones of Nigeria.
9. In summary, household and location characteristics are able to explain the relative
incidence of certain shocks. The results revealed that male-headed household reported
experiencing more shocks than their female-headed counterparts. The non-poor experience
more shocks relating to the spouse or the head of the household becoming disabled, with the
extreme poor experiencing the death of a household head more than the moderately poor and
non-poor. Health shocks and risks are more likely among the aged, while those in the active
working age group are more prone to security and lifecycle shocks and risks. The North-
western part of Nigeria is worse off in term of security risks, with the South-west and North-
central geopolitical zones being least vulnerable to shocks.
1.2 Profile of Vulnerability in Nigeria
10. According to Okunmadewa and Elder (2003), poverty and vulnerability to poverty in
Nigeria are driven by the same set of factors. The determinants of vulnerability to poverty
include unemployment, increasing age, household size (the dependency rate), and increasing

Social Protection Status Report for Nigeria
9 of155
number of wives, education level, and number of rooms available in the household. This was
supported by the findings of Hagen-Zanker and Holmes (2012) and Samuels et al. (2012).
Given this broad scope of vulnerability, Olaniyan et al. (2012) estimated a vulnerability
index for Nigeria based on different individual and household characteristics, as presented in
Table 11 It is noted that, in the same vein, based on the recent estimate, released by the NBS
in 2013, there is high poverty incidence across the region. See details in Annex 4.
11. As shown in Table 2, the vulnerability-to-poverty ratio forecasts that one out of every
100 rural households will fall into poverty in the future while households in urban areas are
likely to move out of poverty. Households are expected to move out of poverty in the North-
central, South-south, and South-west; whereas the reverse is true for households in North-
east, North-west, and South-east geopolitical zones, with three, nine, and two out of 100
households falling into poverty respectively.
12. Gender categorization shows that male-headed households are likely to be poorer in the
future than female-headed households, as two out of 100 male-headed households are
expected to fall into poverty, while female-headed households are more likely to rise out of
poverty. The impact of education on reducing poverty is confirmed in Table 11, which shows
that the higher the educational status of household heads, the lower the expected poverty
level of the household. Household heads with primary education are likely to become poorer
in the future closely followed by those with no formal education. Households whose heads
have secondary education and above are expected to move out of poverty.
13. Age groupings reveal that households whose heads are between 41 and 60 years old are
the most likely to be poor in future, while those under 21 years are likely to be the least poor.
Interestingly, Table 2 reveals a positive relationship between household size and expected
poverty. Specifically, the poorest households are the largest, as the predicted/observed
poverty ratio shows that 9 and 13 out of 100 households with five to six members or seven to
ten members are expected to fall into poverty. Households whose heads are agricultural
workers are expected to be poorer than those whose heads are non-agricultural workers.
Explicitly, four out of 100 households whose heads are agricultural workers are expected to
fall into poverty, while those in the non-agricultural sector are expected to move out of
poverty.

Social Protection Status Report for Nigeria
10 of155
Table 11: Vulnerability Profile of Nigerian Households 2009/2010
Dimensional
Variables
Share of
Vulnerable
Mean
Vulnerability
Vulnerability
Headcount
Vulnerability to
Poverty Ratio
Total 100 0.56 59.27 0.98
Urban 19.37 0.43 40.04 0.90
Rural 80.63 0.61 67.00 1.01
Region
North-central 18.94 0.55 58.90 0.90
North-east 15.55 0.66 74.49 1.03
North-west 30.59 0.69 79.65 1.09
South-east 13.61 0.52 52.50 1.02
South-south 8.67 0.51 51.02 0.95
South-west 12.64 0.42 36.80 0.84
Gender
Male 92.16 0.60 64.65 1.02
Female 7.84 0.36 29.99 0.70
No formal
education 53.47 0.62 69.11 1.03
Primary 26.14 0.59 64.40 1.05
Secondary 12.46 0.45 41.99 0.79
Post-secondary 6.11 0.47 44.25 0.93
College degree 1.82 0.31 25.02 0.72
Age Group
Under 21 years 0.69 0.37 28.54 0.86
21 - 40 years 35.01 0.52 53.97 0.95
41 - 60 years 46.5 0.63 70.27 1.04
Over 60 years 17.8 0.51 50.48 0.94
1 - 2 members 3.67 0.26 7.97 0.37
3 - 4 members 27.06 0.51 56.93 0.92
5 - 6 members 35.22 0.69 86.80 1.09
7 - 8 members 20.33 0.83 97.64 1.13
9 - 10 members 13.72 0.93 99.51 1.13
Occupation
Agric. worker 80.57 0.63 70.79 1.04
Non-agric. worker 19.43 0.41 35.22 0.81
Source: Olaniyan et al. (2012).
14. In recognition that vulnerability to poverty involves more than just consumption poverty,
Olaniyan (2012) assessed vulnerability using the lifecycle approach highlighted in Tesliuc
and Lindert (2002). Given the dearth of available lifecycle data on age and associated risks,
the study used households with children between the ages of 0 and 19 years old as a proxy
for the ages of the household heads.
Social Protection Status Report for Nigeria
11 of155
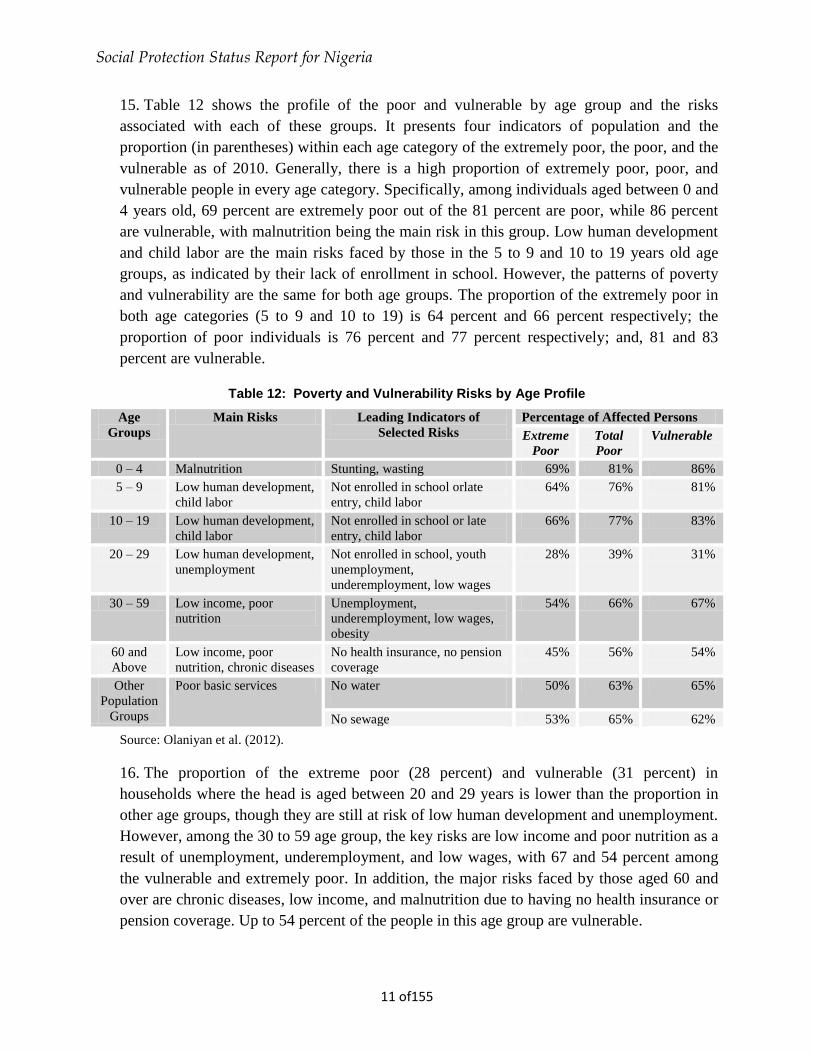
15. Table 12 shows the profile of the poor and vulnerable by age group and the risks
associated with each of these groups. It presents four indicators of population and the
proportion (in parentheses) within each age category of the extremely poor, the poor, and the
vulnerable as of 2010. Generally, there is a high proportion of extremely poor, poor, and
vulnerable people in every age category. Specifically, among individuals aged between 0 and
4 years old, 69 percent are extremely poor out of the 81 percent are poor, while 86 percent
are vulnerable, with malnutrition being the main risk in this group. Low human development
and child labor are the main risks faced by those in the 5 to 9 and 10 to 19 years old age
groups, as indicated by their lack of enrollment in school. However, the patterns of poverty
and vulnerability are the same for both age groups. The proportion of the extremely poor in
both age categories (5 to 9 and 10 to 19) is 64 percent and 66 percent respectively; the
proportion of poor individuals is 76 percent and 77 percent respectively; and, 81 and 83
percent are vulnerable.
Table 12: Poverty and Vulnerability Risks by Age Profile
Age
Groups
Main Risks Leading Indicators of
Selected Risks
Percentage of Affected Persons
Extreme
Poor
Total
Poor
Vulnerable
0 – 4 Malnutrition Stunting, wasting 69% 81% 86%
5 – 9 Low human development,
child labor
Not enrolled in school orlate
entry, child labor
64% 76% 81%
10 – 19 Low human development,
child labor
Not enrolled in school or late
entry, child labor
66% 77% 83%
20 – 29 Low human development,
unemployment
Not enrolled in school, youth
unemployment,
underemployment, low wages
28% 39% 31%
30 – 59 Low income, poor
nutrition
Unemployment,
underemployment, low wages,
obesity
54% 66% 67%
60 and
Above
Low income, poor
nutrition, chronic diseases
No health insurance, no pension
coverage
45% 56% 54%
Other
Population
Groups
Poor basic services No water
50% 63% 65%
No sewage 53% 65% 62%
Source: Olaniyan et al. (2012).
16. The proportion of the extreme poor (28 percent) and vulnerable (31 percent) in
households where the head is aged between 20 and 29 years is lower than the proportion in
other age groups, though they are still at risk of low human development and unemployment.
However, among the 30 to 59 age group, the key risks are low income and poor nutrition as a
result of unemployment, underemployment, and low wages, with 67 and 54 percent among
the vulnerable and extremely poor. In addition, the major risks faced by those aged 60 and
over are chronic diseases, low income, and malnutrition due to having no health insurance or
pension coverage. Up to 54 percent of the people in this age group are vulnerable.

Social Protection Status Report for Nigeria
12 of155
2 Current Social Protection Interventions in Nigeria
17. This chapter describes the social protection system in Nigeria. The first section presents
the various policies that have been adopted, and this is followed by an analysis of the social
protection programs that are in place in the country. The last section provides information on
the institutions responsible for the management of social protection in Nigeria.
2.1 Social Protection Policies in Nigeria
18. Social Protection are policies and programs designed to reduce poverty and vulnerability
by promoting efficient labour markets, diminishing people’s exposure to risks and enhancing
their capacity to manage economic and social risks. They are interventions that buffer
individuals from shocks and equip them to improve their livelihoods and create
opportunities. In a sense social protection is broader than poverty reduction, because it is
concerned with preventing, managing and overcoming situation that adversely affects
people’s well-being. It addresses poverty and the vulnerability to poverty. Social protection
policies and programs therefore consists of social safety nets, social insurance and social
legislation (labor laws and health and safety standards), which ensures minimum civic
standards to safeguard the interests of individuals. In some parlance social protection is a
basic human right.
19. While Nigeria currently has poverty reduction strategies, the country has no coherent
policy for social protection. Some of the poverty eradication policies, however do have
significant implications for social protection. Even then, the policies have not constituted a
consistent and coherent approach to human capital development and poverty alleviation as
well as to social protection.
20. The first major attempt at solving poverty problems in the country was the establishment
of different agencies and programs in key sectors (e.g., the health or education sectors). By
1999, there were so many programs under the supervision of so many different agencies that
their objectives, mandates, and activities had become fraught with overlaps and coordination
problems. It is in view of this that the Ango Abdullahi Committee (headed by Professor
Ango Abdullahi) was set up in 2000 to review various poverty alleviation agencies, policies,
and programs.
21. Thirteen years later, the Ango Abdullahi Committee report remains relevant to the
development and operations not just of poverty alleviation measures but also social
protection initiatives. One of the findings was that too many agencies and programs were
doing the same job and addressing the same issues, which reduced their efficiency and
Social Protection Status Report for Nigeria
13 of155
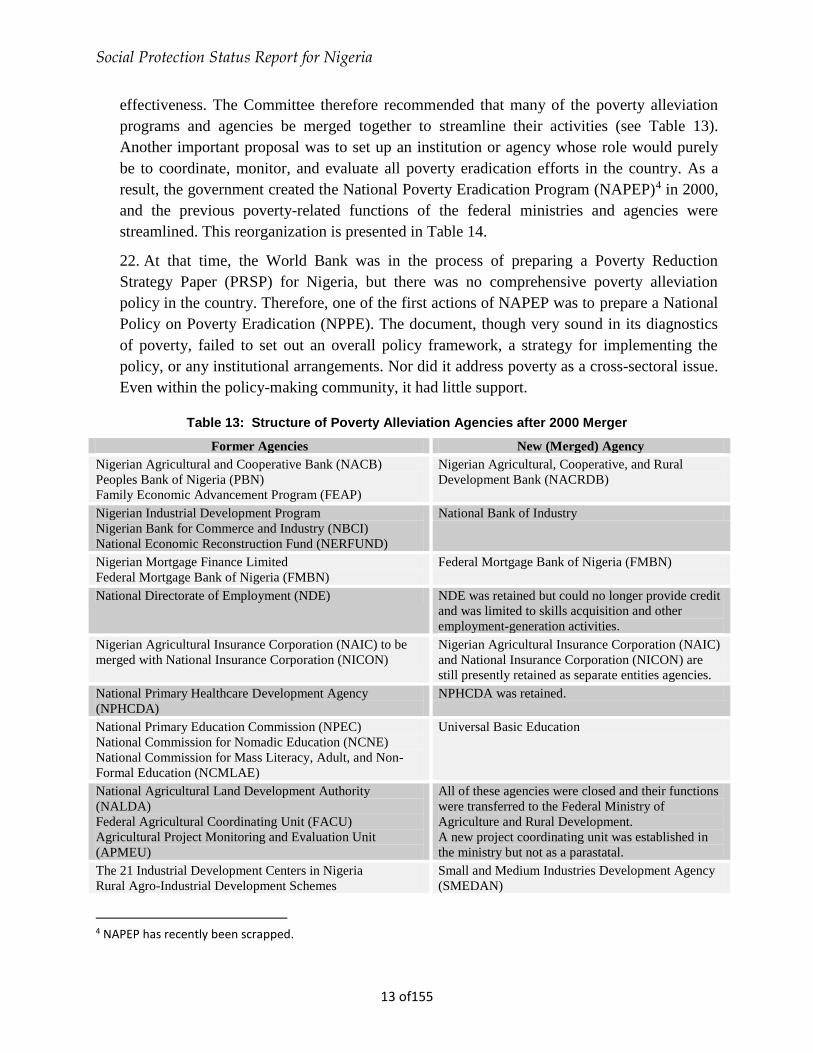
effectiveness. The Committee therefore recommended that many of the poverty alleviation
programs and agencies be merged together to streamline their activities (see Table 13).
Another important proposal was to set up an institution or agency whose role would purely
be to coordinate, monitor, and evaluate all poverty eradication efforts in the country. As a
result, the government created the National Poverty Eradication Program (NAPEP)4 in 2000,
and the previous poverty-related functions of the federal ministries and agencies were
streamlined. This reorganization is presented in Table 14.
22. At that time, the World Bank was in the process of preparing a Poverty Reduction
Strategy Paper (PRSP) for Nigeria, but there was no comprehensive poverty alleviation
policy in the country. Therefore, one of the first actions of NAPEP was to prepare a National
Policy on Poverty Eradication (NPPE). The document, though very sound in its diagnostics
of poverty, failed to set out an overall policy framework, a strategy for implementing the
policy, or any institutional arrangements. Nor did it address poverty as a cross-sectoral issue.
Even within the policy-making community, it had little support.
Table 13: Structure of Poverty Alleviation Agencies after 2000 Merger
Former Agencies New (Merged) Agency
Nigerian Agricultural and Cooperative Bank (NACB)
Peoples Bank of Nigeria (PBN)
Family Economic Advancement Program (FEAP)
Nigerian Agricultural, Cooperative, and Rural
Development Bank (NACRDB)
Nigerian Industrial Development Program
Nigerian Bank for Commerce and Industry (NBCI)
National Economic Reconstruction Fund (NERFUND)
National Bank of Industry
Nigerian Mortgage Finance Limited Federal Mortgage Bank of Nigeria (FMBN)
Federal Mortgage Bank of Nigeria (FMBN)
National Directorate of Employment (NDE) NDE was retained but could no longer provide credit
and was limited to skills acquisition and other
employment-generation activities. Nigerian Agricultural Insurance Corporation (NAIC) to be
merged with National Insurance Corporation (NICON) Nigerian Agricultural Insurance Corporation (NAIC)
and National Insurance Corporation (NICON) are
still presently retained as separate entities agencies. National Primary Healthcare Development Agency
(NPHCDA) NPHCDA was retained.
National Primary Education Commission (NPEC) National Commission for Nomadic Education (NCNE) National Commission for Mass Literacy, Adult, and Non-
Formal Education (NCMLAE)
Universal Basic Education
National Agricultural Land Development Authority
(NALDA) Federal Agricultural Coordinating Unit (FACU) Agricultural Project Monitoring and Evaluation Unit
(APMEU)
All of these agencies were closed and their functions
were transferred to the Federal Ministry of
Agriculture and Rural Development. A new project coordinating unit was established in
the ministry but not as a parastatal. The 21 Industrial Development Centers in Nigeria
Rural Agro-Industrial Development Schemes
Small and Medium Industries Development Agency
(SMEDAN)
4 NAPEP has recently been scrapped.

Social Protection Status Report for Nigeria
14 of155
(RAIDS),Ibadan National Center for Agricultural Mechanization Institute
(NCAM), Ilorin River Basin Development Authorities (RBDAs) Restructured for commercialization National Center for Women’s Development (NCWD) Transferred to the Federal Ministry of Women
Affairs and Youth Development Family Support Trust Fund Federal Urban Mass Transit Agency(FUMTA)
Closed
National Poverty Eradication Program (NAPEP) was
established for policy formulation, coordination, and
monitoring of all poverty eradication efforts by the
government and to fill the gaps in all the other
programs. NAPEP was to be the secretariat of the National
Poverty Eradication Council (NAPEC).
It was not to be an employment agency.
Source: Ango Abdullahi Committee (2000).

Social Protection Status Report for Nigeria
15 of155
Table 14: Streamlined Functions of Poverty-related Ministries and Agencies, 2000
Function Relevant Ministry/Department/Agency
Employment Federal Ministry of Labor and Productivity
National Directorate of Employment (NDE)
Education Federal Ministry of Education
Universal Basic Education
Agriculture and Rural
Development Federal Ministry of Agriculture and Rural Development
Nigerian Agricultural, Cooperative, and Rural Development Bank (NACRDB)
Water Resources Federal Ministry of Water Resources
River Basin Development Authorities
Energy Federal Ministry of Power and Steel
Federal Ministry of Petroleum
Federal Ministry of Science and Technology
National Electric Power Authority
Nigerian National Petroleum Corporation
Energy Corporation of Nigeria
Healthcare Federal Ministry of Health
National Program of Immunization
National Primary Healthcare Development Agency
Women, Youth, and Gender
Development Federal Ministry of Women’s Affairs
National Youth Service Corps (NYSC)
Industry Federal Ministry of Industry
National Bank of Industry
Small and Medium Enterprise Development Agency of Nigeria (SMEDAN)
Environment Federal Ministry of Environment
Ecology Fund
Transport and Shelter Federal Ministry of Works and Housing
National Housing Authority
Communications Federal Ministry of Communications
NITEL
Social, Recreational, and Public
Utilities Federal Ministry of Sports
Debt Management Federal Ministry of Finance
Debt Management Office
Privatization Bureau of Public Enterprises
Corruption ICPC
Coordination, Monitoring, and
Evaluation NAPEP
Source: Ango Abdulahi Commission (2000).
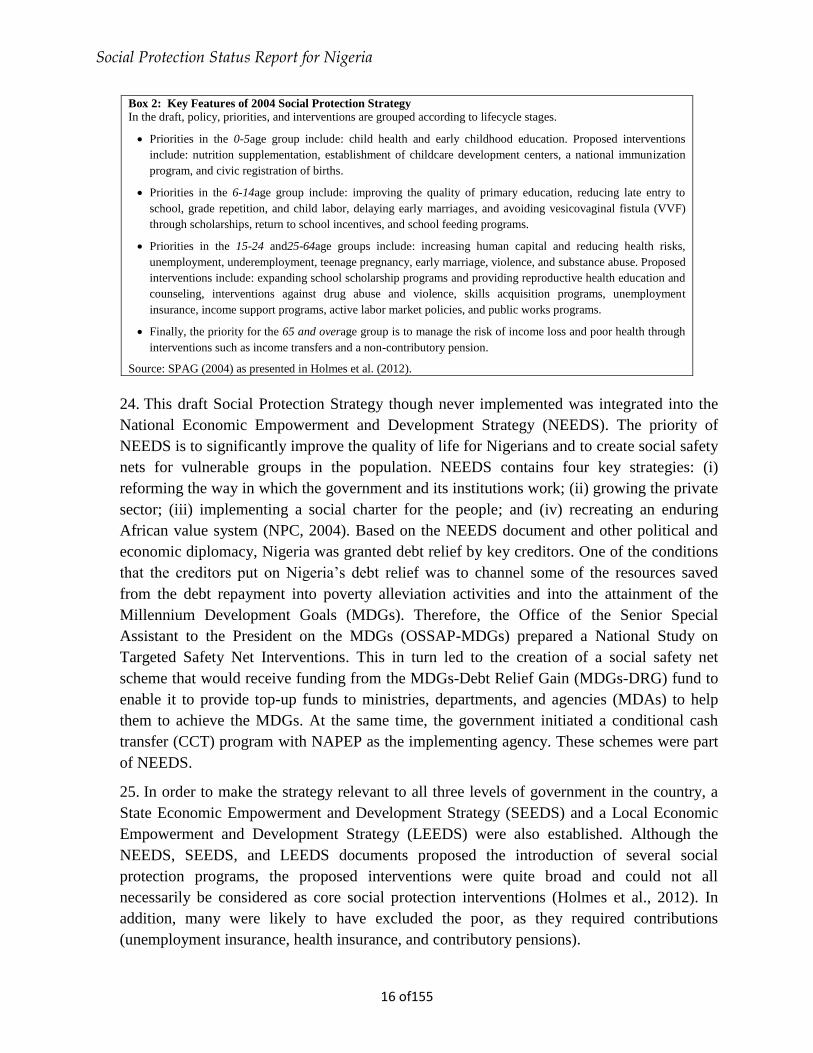
23. In recognition of these shortcomings, in 2004, the government created the Social
Protection Advisory Group (SPAG), comprising representatives of relevant ministries and
parastatals (assisted by the World Bank), to prepare a draft social protection strategy for
Nigeria (SPAG, 2004).The strategy laid out a vision for social protection that involved taking
a lifecycle approach to protecting the poor and vulnerable. Box 2 presents some of the key
issues discussed in the document. A new draft of social protection policy has been prepared
by the National Planning Commission. Highlights are contained in box 1 too.
Social Protection Status Report for Nigeria
16 of155
Box 2: Key Features of 2004 Social Protection Strategy In the draft, policy, priorities, and interventions are grouped according to lifecycle stages.
Priorities in the 0-5age group include: child health and early childhood education. Proposed interventions
include: nutrition supplementation, establishment of childcare development centers, a national immunization
program, and civic registration of births.
Priorities in the 6-14age group include: improving the quality of primary education, reducing late entry to
school, grade repetition, and child labor, delaying early marriages, and avoiding vesicovaginal fistula (VVF)
through scholarships, return to school incentives, and school feeding programs.
Priorities in the 15-24 and25-64age groups include: increasing human capital and reducing health risks,
unemployment, underemployment, teenage pregnancy, early marriage, violence, and substance abuse. Proposed
interventions include: expanding school scholarship programs and providing reproductive health education and
counseling, interventions against drug abuse and violence, skills acquisition programs, unemployment
insurance, income support programs, active labor market policies, and public works programs.
Finally, the priority for the 65 and overage group is to manage the risk of income loss and poor health through
interventions such as income transfers and a non-contributory pension.
Source: SPAG (2004) as presented in Holmes et al. (2012).
24. This draft Social Protection Strategy though never implemented was integrated into the
National Economic Empowerment and Development Strategy (NEEDS). The priority of
NEEDS is to significantly improve the quality of life for Nigerians and to create social safety
nets for vulnerable groups in the population. NEEDS contains four key strategies: (i)
reforming the way in which the government and its institutions work; (ii) growing the private
sector; (iii) implementing a social charter for the people; and (iv) recreating an enduring
African value system (NPC, 2004). Based on the NEEDS document and other political and
economic diplomacy, Nigeria was granted debt relief by key creditors. One of the conditions
that the creditors put on Nigeria’s debt relief was to channel some of the resources saved
from the debt repayment into poverty alleviation activities and into the attainment of the
Millennium Development Goals (MDGs). Therefore, the Office of the Senior Special
Assistant to the President on the MDGs (OSSAP-MDGs) prepared a National Study on
Targeted Safety Net Interventions. This in turn led to the creation of a social safety net
scheme that would receive funding from the MDGs-Debt Relief Gain (MDGs-DRG) fund to
enable it to provide top-up funds to ministries, departments, and agencies (MDAs) to help
them to achieve the MDGs. At the same time, the government initiated a conditional cash
transfer (CCT) program with NAPEP as the implementing agency. These schemes were part
of NEEDS.
25. In order to make the strategy relevant to all three levels of government in the country, a
State Economic Empowerment and Development Strategy (SEEDS) and a Local Economic
Empowerment and Development Strategy (LEEDS) were also established. Although the
NEEDS, SEEDS, and LEEDS documents proposed the introduction of several social
protection programs, the proposed interventions were quite broad and could not all
necessarily be considered as core social protection interventions (Holmes et al., 2012). In
addition, many were likely to have excluded the poor, as they required contributions
(unemployment insurance, health insurance, and contributory pensions).

Social Protection Status Report for Nigeria
17 of155
26. In 2009, there was an effort to produce a national Social Protection Bill when the Nigeria
Social Insurance Trust Fund (NSITF) and the National Working Committee on Social
Security (NWCSS) drafted the National Social Security Policy for Inclusiveness, Solidarity,
and Sustainable Peace and Prosperity and submitted it to the then National Assembly. The
bill sought to incorporate a formal social security framework with social protection
mechanisms for informal sector workers and the poor. Its main goal was the promotion and
protection of human dignity, in particular through measures to reduce vulnerability to risks
arising from poverty, unemployment, job loss, ill-health, loss of breadwinner, old age, or
disabilities (NWCSS, 2009). The bill emphasized the need to critically examine the gaps that
existed in the provision of social assistance for children less than five years of age, Orphans
and Vulnerable Children (OVC), people with physical and mental challenges, the elderly
with no employment history or pension, and people unable to join a contributory social
security scheme.
27. To date, the bill has not been passed. The implication of this is that the country does not
yet have a comprehensive approach to social protection, despite having identified safety nets
as a key policy in two recently developed national development plans (NEEDS and Vision
20: 2020), both of which aim to reduce poverty.
28. Holmeset al. (2012) summarized Nigeria’s policies for social protection over the last
decade as follows:
“Social protection as both a conceptual and a practical approach to addressing economic and
social risks in Nigeria has made some progress at the policy level. However, it remains
compartmentalized in the current national development strategy, Vision 20: 2020, with little
evidence of policy traction among key policy-makers to translate policy commitment into
implementation. The 2004 Social Protection Strategy was a good starting point to build on
for a future social protection strategy, but it has not enabled more than a programmatic focus
on cash transfers, health insurance, and health fee waivers. Meanwhile, despite its attempt at
a multi-sectoral approach, the 2009 National Social Security Policy for Inclusiveness,
Solidarity, and Sustainable Peace and Prosperity has failed to garner broad political support,
partly because NSITF is not seen as the most appropriate institute to lead on it. It is not clear
whether the bill will be passed and, if it is, whether it will result in implementation.”
The government through the National Planning Commission in 2013 produced a draft of the
new social protection policy framework for Nigeria. The key elements of the policy
framework are presented in Box 2.

Social Protection Status Report for Nigeria
18 of155
2.2. Social Protection Programmes in Nigeria
29. Even though there was no explicit Social Protection strategy, there are social protection
interventions in the country. This report reviewed existing social protection interventions in
Nigeria, by (a) examining the programs in terms of the risks that they address and (b) using
the UNICEF transformational approach. In this paper, both approaches were integrated. First,
the various social protection programs in the reviewed documents were identified using the
UNICEF transformational approach (see Table 6). Following this, the social protection
programs were reclassified according to the types of risks that they address (as presented in
Table 7). This is supported by information on social protection institutions and actors (see
Annex 1).
Box 2: Short and Medium Term Social Protection Strategy as enunciated by the New Social Protection
Policy
The government will establish and provide a Basic Minimum Social Protection package in the short to medium
term. For the short term measure, attention will be focused on the prioritized areas of interventions. In achieving
these, the policy objectives and strategies discussed below will be applied.
Policy Objectives
1. Poor and vulnerable citizens have access to essential health care benefits including maternity benefits, where
the government will accept the general responsibility for ensuring the adequacy of the delivery system and
financing of the benefits;
2. Children of poor and vulnerable families enjoy income security at least above the poverty level: through
family/child transfers aimed at facilitating access to nutrition, education and health care;
3. Targeted income support for the poor and unemployed in active age groups especially through cash-for-work
and other labour intensive programmes;
4. Residents in old age and disability enjoy income security through pensions and transfers granted at least
Strategies
1. The Government shall be committed to bringing service delivery closer to the people. Thus, the SP Policy will
prioritise the vulnerable in gaining access to basic services provided by the government.
2. For children to achieve security of income, access to nutrition, education and care, the Government shall
provide cash transfer (both conditional and unconditional).
3. Through links to youth and general employment promotion schemes, the SP strategy shall ensure these
schemes are inclusive of marginalized groups and individuals and target the poorest among the poor. Such
schemes will include the public work programmes of the government.
4. Income security for the aged and those with disabilities will be provided through social transfer projects of the
Governments. Government will target all those in need of support, based on agreed targeting criteria and
administrative systems for registration and payments.
Source: National Planning Commission (2013) Draft National Social Protection Policy (October)

Social Protection Status Report for Nigeria
19 of155
Table 6: Social Protection Programs in Nigeria
Protective Social Assistance Programs 1. Conditional Cash Transfers
In Care of the People (COPE)
Girls’ dropout reduction (Kano, Katsina, Bauchi)
Oil to Cash (Niger Delta)
Bayelsa Child Development Account (CDA Stars)
Social Security Allowance for physically disabled people (Jigawa)
2. School Subsidies / Fee Waivers (UBE)
Free uniforms for primary school girls (Adamawa)
Ambassador’s Girls’ Scholarship Program (AGSP) in 13 states funded by USAID
School scholarships and in-kind transfers (school materials) to orphans and vulnerable children by NGOs
- Center for Women and Adolescent Empowerment (CWAE) (Adamawa)
- Positive media support group under the Association of Women Living with HIV and AIDS in
Nigeria (ASHWAN) (Benue)
-Girls’ power initiative (Edo)
- School feeding programs (Osun, Oyo, and Delta)
3. Health Subsidies / Fee Waivers
Maternal and Child Healthcare (MCH) program
Health support programs in various states
4. Targeted Nutrition Programs
HIV and AIDS-related programs
Vitamin A supplements to children aged 6-59 months every six months as part of immunization program in
seven states
Iron foliate for pregnant women and de-worming of children 12-59 months (Benue)
Nutritional services and de-worming exercise for OVC every three months (Edo Girls‘ Power Initiative)
Preventive Social Insurance Programs
Community-based health insurance programs by NHIS and NPHCDA in Lagos
Productive Transfers, Public Works, and Subsidy Programs
1. Public Works Programs
National Job Creation Scheme
- Special Public Works by NDE, SMEDAN, and NAPEP
Job creation schemes in various states: Lagos, Osun (OYES), Oyo (YESO)
UNDP’s Local Development Program (Ondo and Balyesa)
2. Targeted Subsidized Inputs
Seeds/fertilizer subsidies
- Fertilizer Market Stabilization Program (Adamawa, Edo, and Benue)
Millennium Village Project (Kaduna and Ondo)
Microfinance
3. Training, Grants, and Savings
Social Equity/Transformative Social Protection Programs
Extant Laws for Equality and Human Rights
Civil and Political Rights Covenant (443)
Economic, Social, and Cultural Rights Covenant (444)
Convention on the Elimination of All Forms of Discrimination Against Women (CEDAW) (445)
Convention on the Rights of the Child (CRC) (446)
Children’s Rights Act
Social Protection Status Report for Nigeria
20 of155
Source: Holmes et al. (2011).
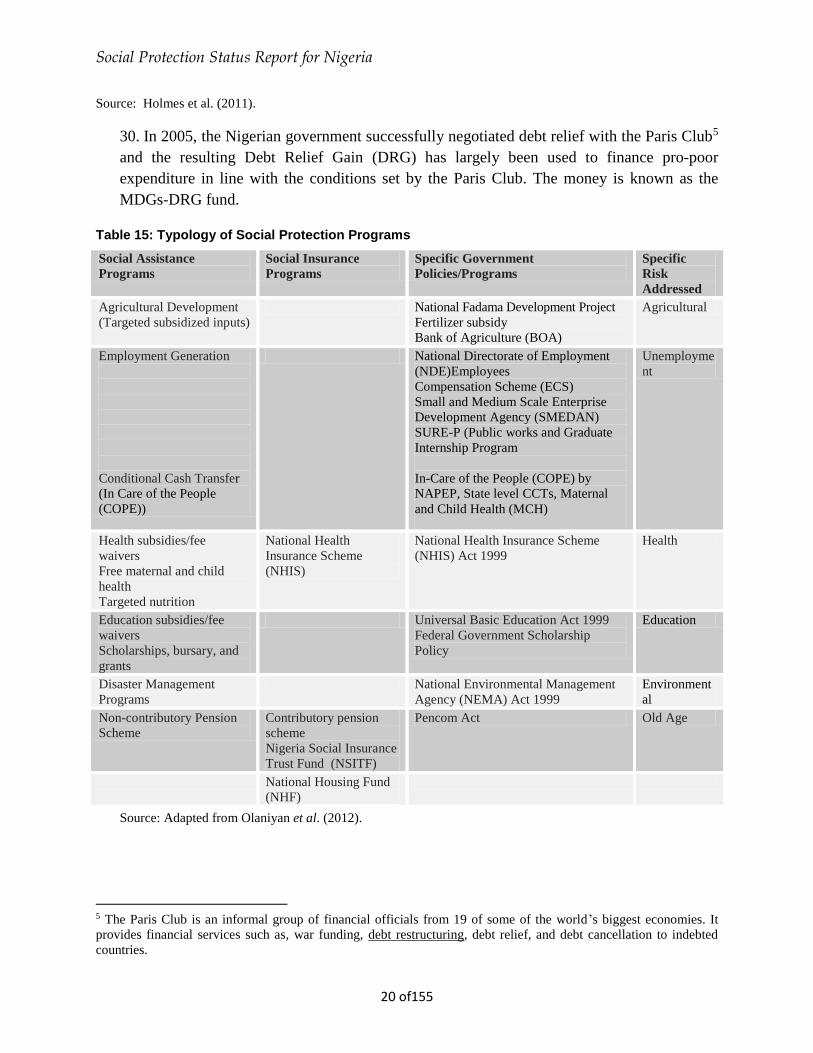
30. In 2005, the Nigerian government successfully negotiated debt relief with the Paris Club5
and the resulting Debt Relief Gain (DRG) has largely been used to finance pro-poor
expenditure in line with the conditions set by the Paris Club. The money is known as the
MDGs-DRG fund.
Table 15: Typology of Social Protection Programs
Social Assistance
Programs
Social Insurance
Programs
Specific Government
Policies/Programs
Specific
Risk
Addressed
Agricultural Development
(Targeted subsidized inputs)
National Fadama Development Project
Fertilizer subsidy
Bank of Agriculture (BOA)
Agricultural
Employment Generation
Conditional Cash Transfer
(In Care of the People
(COPE))
National Directorate of Employment
(NDE)Employees
Compensation Scheme (ECS)
Small and Medium Scale Enterprise
Development Agency (SMEDAN)
SURE-P (Public works and Graduate
Internship Program
In-Care of the People (COPE) by
NAPEP, State level CCTs, Maternal
and Child Health (MCH)
Unemployme
nt
Health subsidies/fee
waivers
Free maternal and child
health
Targeted nutrition
National Health
Insurance Scheme
(NHIS)
National Health Insurance Scheme
(NHIS) Act 1999
Health
Education subsidies/fee
waivers
Scholarships, bursary, and
grants
Universal Basic Education Act 1999
Federal Government Scholarship
Policy
Education
Disaster Management
Programs
National Environmental Management
Agency (NEMA) Act 1999
Environment
al
Non-contributory Pension
Scheme
Contributory pension
scheme
Nigeria Social Insurance
Trust Fund (NSITF)
Pencom Act Old Age
National Housing Fund
(NHF)
Source: Adapted from Olaniyan et al. (2012).
5 The Paris Club is an informal group of financial officials from 19 of some of the world’s biggest economies. It
provides financial services such as, war funding, debt restructuring, debt relief, and debt cancellation to indebted
countries.

Social Protection Status Report for Nigeria
21 of155
Protection against Agricultural Risk and Food Shortages
31. The main agricultural risk that Nigerians are being protected against is the risk of food
shortage. This protection is offered through the following initiatives among others:
i. The National Fadama Development Project (NFDP) aims to encourage and help resource-poor
farmers to engage in dry season cropping in order to generate more income and alleviate
poverty. Fadama targets groups of farmers involved in the same set of economic livelihood
activities. The World Bank contributes to project costs depending on components, while the
federal and state governments and the farmers themselves contribute counterpart funds. The
NFDP is funded from credit from World Bank and Africa Development Bank (AfDB). The
scheme is in its third phase.
ii. The federal government in 2012 introduced a subsidy on high-quality fertilizer and seeds to
rural farmers through the Growth Enhancement Support Scheme. This scheme delivers inputs
(fertilizer and seeds) to farmers directly by using their cell phones. Registered farmers are sent
electronic vouchers directly from the federal government to their cell phone. The vouchers or
e-wallets inform the farmers that he or she is entitled to buy two 50kg sacks of fertilizer at 50
percent of purchase price. The vouchers thus serve as cash on the farmer’s phone, with this
cash covering 50percent of market price of fertilizer. The farmer therefore pays only 50
percent of cost of retail fertilizer (www.harambefarmland.comAgrinews 2013).
iii. The Bank of Agriculture (BOA), formerly known as the Nigerian Agricultural Credit and
Rural Development Bank (NARDB),is a development bank owned by the federal
government. It provides low-cost credit to small-scale and commercial farmers as well as to
small- and medium-sized rural, non-agricultural enterprises. By ensuring the effective
delivery of agricultural and rural finance services on a sustainable basis, the BOA is
supporting the national economic development agenda that aims to increase food security,
reduce poverty, generate employment, reduce rural-to-urban migration, reduce dependency
on imported food items, and increase foreign exchange earnings. As a result, the BOA has
both a credit and a developmental function.
Protection against Unemployment Risks
32. In spite of high rates of broad-based growth in Nigeria in recent years, particularly in the
non-oil economy, unemployment has not fallen significantly since 2000. More alarmingly,
youth unemployment has risen (NBS, 2011). The 15 to 24 age group has the highest
unemployment rate of 37.7 percent; whereas the 45 to 59 age group has only 18 percent, and
60 to 64age group has 21.4 percent. This pattern applies equally to urban and rural areas.
Ever since the Nigerian government acknowledged unemployment as the main source of
poverty, policies, programs, and agencies have been put in place to reverse this trend.
The National Directorate of Employment (NDE) was established to facilitate the generation of generation of mass employment opportunities for the millions of unemployed school leavers,

Social Protection Status Report for Nigeria
22 of155
vulnerable members of the society, and graduates of tertiary institutions in the country. The NDE’s four basic programs essentially aim to equip beneficiaries with skills acquisition.
33. Table 16provides information on the NDE program and its target groups.
Table 16: NDE Programs and Target Groups
Program Target Groups
Vocational Skills Development Primary and secondary school leavers and disabled youths in
rural areas
Small-scale Enterprises Program Primary and secondary school leavers and disabled youths in
rural areas
Rural Employment Promotions Program Primary and secondary school leavers and disabled youths in
rural areas
Infrastructure Development through a
Special Public Works Program
States, local governments, and local communities
Source: Olaniyan(2008).
34. In 2012, the number of unemployed youths and women who benefitted from the various
NDE programs was 142,135 from a high of 182,937 in 2011. The breakdown of the number
of beneficiaries by components is presented in Table 17. The number of beneficiaries by
categories declined in 2013 except for enterprise creation and in labour based work.
Table 17: NDE Beneficiaries, 2012 and 2013
Programme Beneficiaries in 2012 Beneficiaries in 2013
Training in Skills Acquisition 33,205 26,087
Training in Entrepreneurship 60,146 8,020
Enterprise Creation 316 6,200
Transient Jobs/Labour-based Jobs 1,527 2,430
Job Centre Employment Counseling Services 48,001 39,101
Total 143,195 81,838
Source: National Directorate of Employment (2012 and 2013).

Social Protection Status Report for Nigeria
23 of155
Box 3: National Directorate of Employment (NDE)
The National Directorate of Employment (NDE) was established in November 1986, although it was not
established in law until Decree 24 was passed in October 1989. The mandates of NDE are as follows:
Design and implement programs to combat mass unemployment
Articulate policies aimed at developing labor-intensive programs
Maintain a database of employment vacancies to act as a clearing house to link jobseekers with
vacancies in collaboration with other government agencies
NDE focuses on two types of risks: employment and income. When it was founded, NDE was directed “to
design and implement program to combat mass unemployment and to articulate policies aimed at developing
work programs with labor intensive potentials.” The targeted beneficiaries of NDE programs are mainly
youths and the unemployed. The targeting mechanism covers a given geographical area (usually a state),
within which applications are sought from prospective participants who are then shortlisted and
employed/trained.
Four basic NDE programs (see table below) have the potential for mass job generation in various sectors of
the economy, and each has several sub-programs. The programs aim to provide beneficiaries with skill
acquisition or entrepreneurial training prior to providing them loan/starter packages. The dynamics of the
labor market were constantly taken into consideration, resulting in minor realignments where necessary.
Evidence from Olaniyan et al. (2003) reveals that, despite the large number of people who have applied to
NDE programs over the years, the Directorate has only been able to accommodate less than 20 percent of all
applicants. Apart from 1992 when 62.34 percent of those who applied were accepted, the percentage has been
much lower in the subsequent years. By 2001, NDE was accepting fewer than 3 percent of its applicants. Male
applicants have benefitted more than females, and most beneficiaries are non-poor. Between 2000 and 2006,
there were 896,388 beneficiaries. Over the next five years, NDE programs benefitted 3,675,311 people
throughout the country (NDE (2011)).
NDE programs are funded mainly by the federal government, with additional support from international
organizations in some cases. This means that NDE funding has fluctuated because of the volatility of
government revenues. The program encountered financial problems between 1989 and 1991 due to low
repayment rates by beneficiaries, but assistance from the International Labor Organization helped to revitalize it in
1991. While NDE is a laudable program, the major obstacles that it faces are the shortage of lendable funds and
the high default rates of loan beneficiaries. The sustainability of the program therefore is entirely dependent on the
commitment and finances of the federal government.
Employment Generated by the National Directorate of Employment
Activity Years Total
Beneficiaries
2000 2001 2002 2003 2004 2005 2006
Vocational Skills
Development
Program
13,871 31,283 16,495 36,874 30,295 42,252 26,848 197,918
Small-scale
Enterprises
Development
109,625 113,642 67682 98,944 174,894 135,558 141,523 841,868
Rural
Employment
Promotion
Program
996 2,378 2,777 3,867 8,768 19,062 1612 39,460
Special Public
Works Program
340 340 540 102,811 5,550 3,515 4,775 117,871
TOTAL
124,832 147,643 87,494 242,496 219,507 200,387 174,758
1,197,117
117,871
1,197,117

Social Protection Status Report for Nigeria
24 of155
35. SURE-P6 Labour Intensive Programmes: Vocational training programme is a component
of the SURE-P intervention aimed at helping to tackle the significant problem of youth
unemployment by training youth in selected areas of need. These include ICT/telecom,
Marine, Oil & Gas, Agro and Agro allied productions, creative industry, mass housing,
artisan, fabrication technology etc. by designated centres. The centres are spread across the
country with focus on strategic advantage that exists within the zone (SURE-P, 2013) The
SURE-P Vocational Training programme aims to reduce unemployment and poverty in
Nigeria through development of skills, building of institutional capacity and investing in
training Infrastructure. In specific terms, the programme is to boost the capacity of the youths
for gainful employment and enterprise thereby making them financially independent. The
Sub-Committee of the Project Implementation Unit serves as the custodian of the mandate of
the Committee in all projects under Vocational Training programme initiation, verification
and approval. It has been recorded that N1.4 billion has been spent on the programme since
it on-set (SURE-P Internship programme 2014). Table 10 shows the start up cost of the
vocational training programme based on approved commitments for 2012.
Table 10: Programme Cost of the SURE-P Vocational Training Programme (Year end 2012)
Project Activity Amount Expended
(N)
% of Total
Office rent for 42 staff, 2NO blocks
Personnel and Overhead cost
Facility tour/ inspection
Completion of procuring PIU and Zonal project vehicles
Additional advertisement/publicity
Completion of framing and design
States Beneficiaries selection, Orientation & placement
of trainees
Zonal Project retreat & stakeholders Engagement
21,050,000.00
102,510,000.00
10,000,000.00
91,959,000.00
5,000,000.00
12,800,000.00
96,000,000.00
10,000,000.00
6.0
29.3
2.9
26.3
1.4
3.7
27.5
2.9
Total 349,319,000.00 100.0
The selected focus areas of training activities include the following:
6 The Subsidy Reinvestment and Empowerment Programme (SURE-P) came into force in early 2012 in
response to the crises that accompanied the partial removal of the subsidy on petroleum products on January 1,
2012. The SURE-P is to ensure proper management of the funds that would accrue to the Federal Government
from the partial withdrawal of subsidy. The programme has a 21 man committee formerly chaired by Dr.
Christopher Kolade, CON with Maj. Gen. (rtd) Mamman Kontagora, CON as the Deputy Chairman. The
mandate from the President to the SURE-P Committee is to deliver service with integrity and restore people’s
confidence in the government. The Committee is supported by a Secretariat that will also be responsible for
communication and press briefing. SURE-P is to be implemented for the duration of the administration in 2015.
The main SSN programmes under SURE-P includes: Maternal and Child Health Care, Public Works (FERMA),
Vocational Training, Mass Transit and Community Service (which include Women and Youth Employment-
CSWYE and Graduate Internship Programme) programmes.

Social Protection Status Report for Nigeria
25 of155
Enterprise Support Platform in selected areas that can provide mass employment
opportunities via a youth Train and Retain programme in their business area.
Client Based Training for MDAs such as Federal Road Maintenance Agency (FERMA),
Nigerian Railway Corporation, Federal Ministry of Land and Urban Development,
Federal Ministry of Communications Technology, Federal Ministry of Water Resources
among others.
Citizens based training in the following focused area spread across the geopolitical
zones;: IT/ICT, Creative Industry, Agricultural Mechanisation/Irrigation and Agro Allied
Industry, Fabrications (SURE-P 2013, Annual Report)
36. The programme is training
150 Electrical/Mechanical Engineers for Power Industry at the National Power Training
Institute of Nigeria (NAPTIN)
1000 Auto Technicians at the National Automotive Council (NAC)
1000 Personnel including Rail Line Inspectors at the Nigerian Railway Corporation
(NRC)
A total of 18,593 trainees had been registered across the federation in areas of ICTs,
Agri-business, Hospitality, Mechanical/Fabrication, etc. (SURE-P final draft, 2013)
Challenges of the Vocational Training Program include;
Delay in the release of funds
Operational Monitoring capability hindered due to wide range of project coverage and
spread.
Effective manning and training of huge number of personnel is needed.
Effective stakeholder’s management of expectations are not available.
37. FERMA –SURE-P Road Maintenance Public Works and Skill Acquisition Project: The
FERMA-SURE-P road maintenance public works and skill acquisition is designed as a
component of the SURE-P to enhance job creation opportunities in labour intensive Public
Works Programme to create social safety nets, skills acquisition and economic empowerment
via maintenance of public infrastructure. The project is aimed at achieving Mr. President’s
Transformation Agenda of rehabilitation of key infrastructure such as roads, creating wealth
and employment through the implementation of Road Maintenance Public Works that will
provide safe and motorable road linkages across the economic zones of the country and
ultimately produce skilled manpower in the sector. The project is implemented by FERMA
under SURE-P Administration. The project is centred on the FERMA designed Preventive
Road Maintenance (PRM) programme. This involves periodic application of relatively
inexpensive pavement treatments to an existing roadway system in order to retard further
deterioration, prevent massive failures and make the roads safe and motorable all year round.
38. The key achievements include:
Drafting of Project design and selection criteria and approved work plan and budget.

Social Protection Status Report for Nigeria
26 of155
Set up of the Programme Implementation Unit (PIU) in FERMA
A facility audit of existing centres in Benin, Kaduna, Lagos, Badagry and 6 other
regional centres belonging to FMoW/FERMA for suitability and possible upgrading for
use of the programme.
Budgeting and project scheduling of various phases of 23 Major (Priority I) Federal roads
across the six geopolitical zones and FCT.
A pilot program on two major zones commenced (Abuja – Kaduna Road and Lagos
Zone). The pilot schemes were being funded via the counterpart funding from FERMA as
outlined in the approved PIU work plan and budget.
FERMA Public Works is constrained by:
Delay in the release of funds.
Operational Monitoring capability is ineffective due to wide range of project
coverage and spread.
High demand on effective manning and training of huge number of personnel.
Schedule slippages due to material and mobilisation delays.
Effective stakeholder’s management of expectations not available.
39. SURE-P Community Services Women and Youth Employment (CSWYE): The project
aims to create immediate short-term employment opportunities for women and youth through
labour intensive public workforce. The specific objectives of the project are as follows:
i. To create employment opportunities for up to 185,000 women and youth in the 36
states of the Federation and the FCT.
ii. To serve as a bridge to formal employment through empowering youths, women and
vulnerable groups.
iii. To reduce the vulnerability of women and youth through exposure to income support
opportunities offered by the programme
iv. To create good value systems and self- actualization in women and youth through
pre-works orientation sessions.
v. To enhance societal access to quality social and economic infrastructure and services
across the federation
40. At inception, the project was anchored by the Federal Ministry of Finance. This was later
handed over to the Ministry of Labour (Oyedele, 2013). The project is executed through the
use of community service scheme. The Community Service Scheme is an initiative of the
Federal Government with the aim of empowering unskilled and unemployed Nigerian
youths, women and people living with disabilities and at the same time improves the quality
of socio-economic infrastructures, especially in rural communities, and renews the
confidence and thrust of Nigerian masses in government policies and programmes (Soji-Eze
Fagbemi, 2013). The project involves the engagement of women and youth in labour
intensive activities meant to improve socio-economic infrastructural services in benefiting
Social Protection Status Report for Nigeria
27 of155
communities. Example of these services includes sanitation, tree planting, erosion control
and deforestation, security, traffic management etc.
41. The key achievements of CSWYE include:
Community Services Scheme (CSS) is operational in 36 states and the FCT
11 out of 14 pilot states have deployed beneficiaries.
Beneficiaries’ identification, Selection and Orientation completed in 12 states for the first
phase.
The project is operational in 96 communities distributed in the 12 states.
About 5,624males and 2,913 female have benefited from the programme in the 12 states.
Edo is yet to deploy but has 1000 beneficiaries already selected, orientated and
documented.
8,680 beneficiaries already placed in the scheme and benefit from income support
provided the individuals with multiplier effects to households from the scheme; these
8,680 beneficiaries have bank accounts through which stipends are being paid.
Additional 111,000 are also to enjoy income by end of January, 2013 across all the 774
LGAs;
Over 2900 women employed and have been economically empowered through provision
of income source
Over 360 Communities benefiting and have improved the quality of social and economic
infrastructures (e.g. drainages maintenance, waste/refuse disposal and security and traffic
control services;
Access to infrastructure and social services enhanced.
Community Services orientation and deployment guide formulated and in use
All states and the FCT are recruiting 3000 beneficiaries each and there will be 119,680
beneficiaries by the end of January, 2013.
N72, 030,000 disbursed to the beneficiaries as at November, 2012.
The scheme has already engaged 120,000 people out of the 185,000 persons targeted for
the year 2013 (Oyedele, 2013).
The project has trained 37 State Implementation Officers of the CSWYE on how to drive
the project at the grassroots level (Oyedele, 2013).
Community Services Women and Youth Employment (CSWYE) project of SURE-P has
created 21,000 job opportunities in the North-West Geo-political zone of Nigeria (FRN,
2013).
42. The main challenges of the scheme are:
i. Delayed inauguration of the State Implementation Committee (SIC).
ii. Overbearing influence of the SIC over the State Project Implementation Units (SPIU).
iii. High expectation of the SIC in terms of responsibility and remuneration from the project.
iv. Failure of the SIC to fully adhere to the approved operational implementation guidelines.
v. Some SIC are rejecting already selected beneficiaries in pilot state prior to their
inauguration.

Social Protection Status Report for Nigeria
28 of155
43. SURE-P Graduate Internship Scheme (GIS): The second component of the Community
Service programme is the Graduate Internship Scheme (GIS). Concerned with the wave of
graduate unemployment attributed to inadequacy of employability skills, Government
initiated the Graduate Internship Scheme to address the problem as part of social safety net
interventions of SURE-P. The GIS is domiciled in the Federal Ministry of Finance with a
mandate to provide short term employment for graduates. The Scheme aims to achieve this
by creating opportunity for them to be attached to firms /organizations, where they can work
for a year and enjoy a monthly stipend. Such interns can use the opportunity to develop skills
or gain working experience and enhance their employability. The specific objectives of the
program are:
To enhance the employability of up to 50,000 unemployed graduates by 2014 in the 36
states of the Federation and the FCT through internship programs in pre-selected
institutions
To reduce the vulnerability of unemployed graduates.
To build manpower base towards attaining national development operations.
Provide a social safety net and income supplement for unemployed graduates
The Scheme aims to achieve this by creating opportunity for them to be attached to firms
organizations, where they can work for a year and enjoy a monthly stipend of N18,000. Such
interns can use the opportunity to gain working experience and enhance their employability
(FMF, 2014). The interns are to enjoy Group Life and Accident Insurance (SURE-P, 2014).
The Scheme was created to check the growing rate of graduate unemployment.
The participating institutions are expected to provide adequate opportunities for training and
mentoring the interns. The GIS is designed as a short-term measure. It has high prospects for
job creation. The statistics of performance as at 2014 includes:
10,167 firms have registered on the GIS portal, out of which 3,000 have been approved
and activated to take interns across the country; many more have been disqualified for
failing to meet minimum requirements. 3,000 newly registered firms are being verified.
As for graduates, 227,429 have registered on the portal, far above the target figure of
50,000. Out of this, 9,499 have been deployed. 2012 interns have exited the scheme after
completing the 12 months of service. More than 500 of them have secured full
employment.
GIS has also experimented with Internship Fairs across the country to encourage
participation of private sector firms, so far many lessons are emerging, one of which is
speedy selection of interns. So far 5539 additional interns were matched in the last two
months through the fairs.
43. In order to facilitate the achievement of the transformation agenda, GIS has opened many
windows for the deployment of graduates for internship. These include promoting deployments
in the non oil sector as follows:

Social Protection Status Report for Nigeria
29 of155
a) Discussions are on with various state governments to deploy graduates in various critical
sectors like Agriculture, ICT, Construction, Health, Environment and Sanitation,
Education in order to buoy up capacity in these sectors. Such states are Kaduna, Katsina,
Sokoto, Zamfara, Kebbi, Gombe, Bauchi, Enugu, Ebonyi, Delta, Plateau, Ondo and Niger
states.
b) Internship Opportunities Fairs are being organized in all states to provide a window for
the private sector to have direct access to graduates for interaction and selection. This
was informed by many reasons; to control the high rate of rejection of matched graduates
by firms, to create more awareness and to achieve massive selection figures. So far, the
fair has been conducted Edo, Delta, Abia, Anambra, Benue,Cross River, Ondo, Enugu,
Katsina, Ogun, Kwara, Plateau, FCT, Enugu, Ekiti and Kogi states and the remaining
States will continue in October/November 2014. Three larger versions are to hold in
commercial town of Lagos, Port Harcourt and Kano. Over 7000 are being matched from
these events.
c) Partnership has been entered into with the Nigeria Export Promotion Council to integrate
GIS into the export trade with a view to encourage and train graduates to key in and
participate into government's divestment into the non oil sector. A special vehicle called
YEESAP has been established to achieve this and over 3000 graduates are to be engaged
at the first instance.
d) In the same vein GIS has considered the importance of the Creative Industries in the non
oil sector development and entered into partnership with the British Council with a view
to encouraging sector practitioners to take interns and expand expertise in the sector and
increase its contribution to the GDP.
e) Our partnership with an agricultural conglomerate in Zamfara state has opened new
windows, where interns are rekindling the agricultural extension and other practices.
These interns have set up and registered cooperative societies on livestock, fisheries,
poultry farming and have set up personal businesses. This will facilitate setting up and
getting financial support for enterprises to make exit from the scheme easier. Two of
these have won grants in the most recent YouWin awards.
f) The Scheme has also keyed into government policy on financial inclusion and cashless
banking, deploying 2000 graduates nationwide in the first instance. More graduates are to
be deployed in this prospective sector in the coming months.
g) One of the key results emerging from the scheme is the high rate of retention of interns
by their employers. Many interns have also found employment with other organizations
as a result of the skills they have acquired and improved personality they have developed
during internship.
h) GIS is gradually emerging as the bridge between educational institutions and the labour
market, providing a pool of skilled, trained, experienced and work ready graduates for
firms to select without having to go through a formal, costly process

Social Protection Status Report for Nigeria
30 of155
i) More Nigerians are calling for the institutionalization of the scheme beyond 2015, so that
results are sustained and expanded to cater for more graduates and firms, there are also
calls for academic reviews of the opportunities that GIS can create for national
development in the execution of its mandate.
j) 25,000 registered graduates who may never benefit from matching to firms are being
targeted for an online employability training in order to avail them an opportunity to
develop skills through online modules, which are to be developed in collaboration with
and certificated by sector professional bodies.
Challenges of the Graduate Internship Scheme (GIS) are:
i. Poor internet facility
ii. Security situation especially in the northern states.
iii. Poor state of potential firms/organization.
iv. Poor response from large organised private sector.
v. Weakness identified in the web operational system for matching of interns with firms.
vi. Lack of incentives to motivate staff is affecting performance.
vii. Lack of adequate office space.
viii. Requirement for additional staff for M & E, and Operational support for CSS & GIS.
44. The Small and Medium Scale Enterprise Development Agency (SMEDAN) was
established in 2003 to promote the development of micro, small, and medium enterprises
(MSMEs) in Nigeria. SMEDAN’s guiding principles are as follows:
Outreach: Reaching as many MSMEs as possible to achieve the goal of MSME-led
economic growth, industrialization, and job creation
Sustainability: Helping MSMEs to find ways to become independent of the program’s
support to prevent an over-dependence on subsidies
Impact: Delivering measurable results
Efficiency: Delivering quality services in the most cost-efficient manner by SMEDAN and
MSMEs
As at 2010 SMEDAN provides services through 15 Business Support Centers (BSCs) and 37 Business 37 Business Information Centers (BICs).In 2010, SMEDAN provided information on raw materials, materials, machinery, general business, advisory services, access to finance, and business counseling to counseling to a total of 29,993 prospective MSMEs (

Social Protection Status Report for Nigeria
31 of155
45. Table1).

Social Protection Status Report for Nigeria
32 of155
Table11: MSMEs Receiving SMEDAN’s Information and Advisory Services, 2010
Location 1st Quarter 2nd Quarter 3rd Quarter 4th Quarter Total
Head Office 152 255 159 169 735
BSCs 444 423 182 338 1,387
BICs 49 65 212 47 373
Other States 10,262 2,404 415 14,417 27,498
Total 10,907 3,147 968 14,971 29,993
Source: Preliminary Report on National MSME Collaborative Survey (2010).
46. The National Poverty Eradication Program (NAPEP), created in 2000 to coordinate and
monitor all poverty eradication projects in Nigeria, has initiated many interventions in four
main areas: skills acquisition and youth empowerment; micro credit activities; empowerment
of the poor; and social services. These programs and their corresponding target groups are
summarized in Table .
Table 182: NAPEP Programs and Target Groups
Program Target Groups
Skills Acquisition and Youth Empowerment Unemployed youths
Intervention by Direct Credit Poor and small-scale entrepreneurs
Intervention by Partnerships State governments (poor small-scale entrepreneurs)
Religious organizations (poor small-scale entrepreneurs)
Nigerians in the Diaspora (poor small-scale entrepreneurs)
Social Services Program VVF patients
All Nigerian citizens
Other NAPEPPrograms All Nigerian citizens
Source: Olaniyan (2008).
47. According to a 2008 analysis (Wohlmuth et al., 2008), NAPEP has been able to train
130,000 youths and has found jobs for 216,000 people. However, most of these beneficiaries
were non-poor.
48. The Employees Compensation Scheme (ECS), run by NSITF, provides workers with
adequate compensation in the event of any kind of workplace accident that may result in
partial or permanent disability or even death. The benefits come from a pool of employers’
contributions. The benefits include payment of compensation to the dependants of a deceased
worker who died in the course of work, compensation for permanent or partial disability,
medical treatment for any injuries sustained, and rehabilitation and vocational training for
workers who areno longer be able to work at their former workplace. Enacted in 2010, ECS
covers nine branches of social security, including, accidents, occupational diseases, and death
at the workplace or in the course of work. It covers the entire public sector and the organized
private sector (in total about 10 million employers). The scheme requires employers to pay
into the fund for the first two years a minimum contribution of 1 percent of their total
monthly payroll; thereafter, the contribution rate depends on the employer’s risk rating.
Social Protection Status Report for Nigeria
33 of155
Conditional Cash Transfers (CCTs): Cash transfers in Nigeria are based on the Latin
American model using conditions linked to education and/or health. There are currently two
main cash transfers being implemented in Nigeria – both are conditional cash transfers. The
basic idea of CCTs is human development and is strictly attached to regular income transfers,
tied to behaviour conditions, e.g. school attendance and health visits. The first of CCT in
Nigeria is “In Care of the People” (COPE), and is a federal government-run conditional cash
transfer which started as a pilot in 2007 and is reached its third phase. A variant of the COPE
is implemented under the Conditional Grants Scheme in the Office of the Senior Special
Assistant to the President on MDG (OSSAP-MDG). The second which is referred to as
“Conditional Cash Transfers (CCTs) for girls’ education” is currently being implemented
through the state education sector in Nigeria, supported by DFID, UNICEF and the World
Bank, in Kano, Bauchi and Katsina. The Maternal and Child Health Unit of the Federal
Ministry of Health also implements a CCT for mother and child.
49. The objective of COPE is to break intergenerational transfer of poverty and reduce
vulnerability of the core poor in society against existing socio economic risks and improve
the potential capacity for their contribution to economic development in the community, state
and nation. On the other hand, CCTs for girl’s education has as its objective to reduce girls’
drop-out rates due to early marriage specifically in the transition period from primary to
secondary school. The MCH-CCT aims to improve health, nutritional and educational
outcomes of children in poor households. COPE was designed at the national level by
NAPEP, OSSAP-MDGs and state representatives (including the Ministry of Education), with
support from the World Bank and is implemented through the state governments. In 2010 the
MDG Office announced that state governments would take control of the CCT through the
Conditional Grant Scheme (CGS) in order to improve sustainability.7 The criteria for
approval of CCTs under the CGS include the existence of an implementing agency, the state
being conversant with CCTs, and having the supply side in place (tied to school enrolment,
Primary Health Care, schools). At the state level, COPE is implemented mainly by NAPEP
in collaboration with the Small and Medium Scale Enterprise Development Agency
(SMEDAN) and the National Directorate of Employment (NDE), although this may vary by
state.
50. Beneficiary households receive a monthly Basic Income Guarantee (BIG) for one year
and then receive a Poverty Reduction Accelerator Investment (PRAI). The BIG ranges from
US$ 10 to US$ 33, depending on the number of children in the household (a maximum of
five) and a further US$ 50 per month is withheld as compulsory savings which is provided as
a lump sum (up to US$ 560) to the head of the household. Entrepreneurship and life skills
training are provided to a member of beneficiary households to maximize the PRAI payment.
The payments are based on households meeting two key conditions: the enrolment and
7 The CGS has a number of thematic areas including education, health, water and cash transfers.

Social Protection Status Report for Nigeria
34 of155
retention of children of basic school age in basic education (primary one to junior secondary
education) where a child must maintain at least 80% school attendance and participation in
all free health care programmes. The COPE programme is effectively the same across the
country even though the name might be different. The third phase the programme is being
implemented through the Conditional Grant Scheme which requires state governments to
match funding for the implementation of the programme.
The coverage of the programme is extremely small. Twelve states are reported to have
committed funding in this third stage:
NW: Katsina, Kebbi
NE: Bauchi, Adamawa
NC: Kogi, Niger
SS: Bayelsa, Cross River
SE: Anambra, Abia
SW: Osun, Lagos.
51. Nationally, NAPEP’s own estimations suggest that COPE has now reached about 22,000
households, and Dijkstra et. al. (2011b) finds that 18,750 households have been trained by
COPE. This results in coverage of less than 0.001% of the poor. The roll out has been
uneven, and currently even with matched funding, the resources to reach a wider population
are a constraint. For instance, in Jigawa, COPE reaches 50 households per LGA in 17 Local
Governments, covering 850 households in total (even though there is currently a proposal to
cover about 2,800 households in all the 27 LGAs) – the population of Jigawa is over 4
million and the poverty rate is 90%. In Adamawa, with a poverty of over 70% and a
population of over 3 million, only 50 households per LGA in 10 LGAs (out of 21) have been
targeted, reaching 500 households in total so far.
52. Targeting guidelines are set at the federal level and initially included a combination of
geographical, community-based and household targeting8 (NAPEP, 2007). COPE is targeted
at households with children of basic school age with the following characteristics: headed by
poor females; aged; physically challenged; VVF (vesico/vaginal fistula) patients; HIV/AIDS
patients. A Community Development Committee (CDC) coordinates the identification of
target beneficiaries which most often includes the district head, social welfare officer, health
assistant, headmaster of primary school, woman leader, councillor representing ward,
religious leaders (one Imam and one pastor).
8 Initial geographical targeting included: North Central – Kogi (88.55%) Kwara (85.22%); North East – Bauchi
(86.28%) Gombe (83.5%); North West – Jigawa (95.07%) Kebbi (89.65%); South East – Ebonyi (43.33%) Enugu
(31.12%); South South – Delta (45.35%) Cross River (41.61%); and South West – Ekiti (42.27%) Lagos (63.58%)
(NAPEP, 2007). Current COPE funding is dependent on states own financial commitment, not geographical
targeting.

Social Protection Status Report for Nigeria
35 of155
53. The programme is funded from the Millennium Development Goals and Debt Relief
Gains fund (MDG/DRGs) along with state counterpart funding. Budget data on COPE is
limited. Dijkstra et. al. (2011) report that the allocation to three “safety nets” in 2007 was N
10 billion (USD78 million) and N 2 billion (USD 13.2 million) in 2009 through the MDG-
DRG fund9. NAPEP (2007) states that in Phase 1, the programme cost N1 billion (USD 7.8
million) (NAPEP, 2007), with N2.4m (USD 18,720) allocated to each of the 12 states and
FCT. It is estimated that each state allocated N30m (USD234,000) for BIG; N42m (USD
327,600) for PRAI, and N2.4m (USD 18,720) for NGO Paymasters (funds for beneficiaries
in FCT was half that of the states, but paymasters received the same). Coordination and
monitoring was N131.8m (USD 1 million) (approximately 13% of total cost for Phase 1).
Currently, in Phase 3, states are required to match funding from the Federal government.
54. Dijkstra et al. (2011a and 2011b) submit that COPE has helped to retain over 100,000
children who would have dropped out of school due to poverty. Further, the cash transfer
received by beneficiaries was used for paying for children’s school fees and related school
expenses (such as note books), and beneficiaries noted that they were also able to take their
children to health centres. These are the two conditions attached to the cash transfer.
However, it is unclear as to whether at the end of the programme children continued in
school.
55. Some households were able to invest the PRAI lump-sum into small-scale income
generating activities. Reports show that the lump sum was spent on establishing a provision
store, expanding farms, petty trading, supporting cow meat market, buying a machine for
grinding cassava. In some states, such as Adamawa, more women than men have been
targeted, as female headed households are often seen to be most in need through community
targeting.
There are mixed findings of COPE’s effects at the community level in the four case studies.
In Care of the People has benefited the community as beneficiaries who had formerly
depended on donations and support from community members were now supported by the
cash transfer and were able to set up their small businesses in the community, thus
contributing positively to the economic profile of the area. The COPE programme has
provided an alternative positive coping strategy. This is an important mechanism in the
context of chronic poverty where many beneficiaries receive little or no other type of formal
support and usually rely on begging, children hawking in the street, and support from family
and friends. While no beneficiaries reported encountering any difficulties in meeting the
education and health conditional requirements, where LGAs were not chosen based on the
availability of the services, deficits in the supply-side did create challenges. The small value
9 Total expenditure includes COPE, the Youth Empowerment Project – Keke NAPEP (a soft loan scheme), and the
Village Economic Development Solutions Scheme.

Social Protection Status Report for Nigeria
36 of155
of the transfer was also highlighted as a key challenge, especially in the context of high rates
of inflation. Indeed, the value of the transfer in the context of the recent food, fuel and
financial crisis would appear to have diminished even further. As ODI (2011) find,
increasing food prices have increased in a number of states for households who
predominantly buy their food, including those living in urban areas. In addition, heightened
fuel prices have also increased transportation costs, making it more expensive for people to
travel to access basic services, particularly health care.
Protection against Health Risks
56. The National Health Insurance Scheme (NHIS) was established to ensure that every
Nigerian has access to good healthcare services. Its other aims are to protect families from
the financial hardship of catastrophic medical bills, to limit the rise in the cost of healthcare
services, to ensure the equitable distribution of healthcare costs among different income
groups, and to maintain a high standard of healthcare services within the Scheme. The rest
are; to ensure efficiency in healthcare services, improve and harness private sector
participation in the provision of healthcare services, to ensure the equitable distribution of
health facilities within the federation, to ensure that Nigerians can access all levels of
healthcare, and to ensure the continued availability of funds for the health sector (Olaniyan et
al., 2004).
57. In 1999, the Government of Nigeria established the NHIS in an effort to minimize the
burden of healthcare expenditure on households. In 2005, it was officially inaugurated as a
federally funded social health insurance scheme. The scheme is designed to facilitate the fair
financing of healthcare costs through risk pooling and cost-sharing arrangements for
individuals. The NHIS is officially organized into six social health insurance programs
(SHIPs): (i) formal sector, urban self-employed, and rural community;(ii) mothers and
children under the age of 5;(iii) the permanently disabled; (iv) prison inmates; (v) those in
tertiary institutions; and (vi) the armed forces, police, and other uniformed services. Of all
the programs, only the formal sector SHIP is currently operational. It is available to both
public and private organizations of 10 or more employees. The formal sector program is
mandatory for all organizations with 10 or more employees and is based on a 10 percent
employee and 5 percent employer contribution, which entitles the employee and four
children to healthcare, including family planning, immunizations, maternity care, and
outpatient care. In comparison, the urban self-employment and community programs require
beneficiaries to be members of a user group of at least 500 participants, who pay a flat rate
monthly contribution towards premiums (under 10 percent), with the funding shortfall made
up by donor contributions (Kannegiesser, 2009).
58. Though the country’s lack of data systems makes it difficult to evaluate the NHIS, it is
clear that the formal sector program has very limited coverage. Five years into operations, a

Social Protection Status Report for Nigeria
37 of155
total of 5.3 million beneficiaries (3.73 percent of the population) are said to have enrolled,
and largely represent formal public sector workers. Although a total of 95 percent of the
federal government workforce and their families are now covered, coverage at the state level
is abysmally poor with just the Bauchi and Cross River States fully endorsing the scheme for
their government staff.10
59. The Community-based Health Insurance Scheme (CBHIS) aims to protect the informal
sector and marginalized groups from the burden of high out-of-pocket health expenditures
(PATHS2, 2010) by pooling risks within a community. This program is not new to Nigeria;
the mismanagement of funds by community members thwarted the first attempt to implement
it.
60. The redesigned CBHIS model is being piloted in 12 states with the aim, when fully rolled
out, of covering 112 million Nigerians in the informal sector. The package offered by the
CBHIS varies across geographic areas, given the different epidemiologic profiles of the
zones of Nigeria. The core package covers essential cost-effective maternal, neonatal, and
child health services and control of highly prevalent diseases that contribute to the high
disease burden in Nigeria. Communities are pooled to spread risks, at least at the LGA level.
Fund managers are recruited, and checks occur on finances.
61. The Maternal and Child Healthcare (MCH) program provides health fee waivers on
primary healthcare for children under5 and on primary and secondary care for pregnant
women up to six weeks after childbirth. The coverage of the target groups is universal. The
MCH is supported through the DRG, and the state governments are expected to make
counterpart funding available to ensure full coverage. The MCH program, which started in
2008, is being implemented in phases. In Phase 1, it was implemented in one state from each
zone and in six LGAs in each of these states. Phase 2, which started in September 2009,
added six states on the basis of need. Interestingly, some states have implemented their own
fee waiver systems.
Protection against Education Risk
62. The Universal Basic Education (UBE)program, inaugurated in 1999 as a reform program,
aimed at providing greater access to and ensuring the quality of basic education throughout
Nigeria. The approach is to make basic education compulsory and universal up to the junior
secondary level. The first batch of primary 1 pupils for the program was enrolled nationwide
in the 2000/2001 academic session. The implementation of UBE is being funded by a
number of different sources: (i) a federal government block grant of not less than 2 percent of
the consolidated revenue fund; (ii) contributions in form of federal government guaranteed
credits; (iii) donor assistance; and (iv) states’ 50 percent counterpart funds. There is a UBE
Commission at the federal level, while each state has a corresponding UBE Board.
10Staff at the local government level arenot covered.

Social Protection Status Report for Nigeria
38 of155
63. The primary aim of UBE is to ensure that all children (poor or non-poor) are offered
basic (primary inclusive) and compulsory education for at least nine years. Current
enrollment rates are rising steadily at all levels. Between 1996 and 2010 enrollment rates
increased by about 14percent, 78percent and 207 percent in the primary, secondary and
tertiary levels respectively (UBEC, 2013). Also, the number of educational institutions
increased modestly within the same period, which can be attributed to the large sums of
money spent by all levels of the government on building and marketing infrastructure and
acquiring learning tools. The rehabilitation of schools under the UBE program could also be
said to have contributed to the increase in the number of schools.
Home Grown School Feeding and Health Program
64. The Home Grown School Feeding and Health Program (HGSFHP)was launched in
September 2005 by President Olusegun Obasanjo. The objectives of the program are to:
Reduce hunger among Nigerian schoolchildren
Increase school enrollment, attendance, retention, and completion, particularly among
children in rural communities and poor urban neighborhoods
Improve children’s nutritional and health status
Enhance students’ comprehension of learning
Correct the gender imbalance by increasing the female enrollment rate
Stimulate local food production and boost the incomes of farmers
65. The program aims to provide at least one nutritionally adequate meal per school day to all
children in Nigerian public primary and junior secondary schools. In the pilot stage of the
program, two states in each of the six geopolitical zones of the country were selected to
participate plus the Federal Capital Territory (FCT). Table 3 provides information on states
selected to pilot the school feeding program.
Table 13: Selected Pilot States for School Feeding Program
South South
Cross River
Rivers
North Central
Nasarawa
Kogi
South East
Enugu
Imo
North West
Kano
Kebbi
South West
Ogun
Osun
North East
Bauchi
Yobe
FCT, Abuja
Source: Olaniyan and Edgerton (2007)

Social Protection Status Report for Nigeria
39 of155
66. The organization and governance of the program is undertaken at all levels of
government (federal, state, and LGA) as well as at the community level. Two distinct
functions are associated with the governance structure: political and technocratic. The
political functions are carried out by various steering committees at all levels of government,
while the technocratic functions are carried out by implementation committees. Monitoring
teams for the HGSFHP exist at every level as well. A preliminary evaluation of the program
by NAPEP in 2006/2007 indicated that the program has increased the enrollment, retention,
and completion rates of primary schools in the pilot states. Nevertheless, the federal
government canceled the program in 2008 because there was no feasible or documented
results. A few states are trying to continue the program (Olaniyan and Edgerton, 2007).
67. The Federal Government Scholarship Policy aims to make higher education more
accessible to qualified Nigerian students and to help indigent and disabled students gain
access to higher education. Because the highly skilled labor needed for the economic,
scientific, and technological development of the nation is positively associated with greater
accessibility to higher education, the federal government has instituted a massive scholarship
program for postgraduate and undergraduate students in all federal and state universities,
polytechnics, and colleges of education. The agency responsible for administering these
scholarships is the Federal Scholarship Board, which has four branches:
Nigerian Award, which processes and implements scholarship awards for postgraduate,
undergraduate, and disabled candidates in all of the tertiary institutions.
Commonwealth Award branch (which operates as part of the Commonwealth Scholarship
and Fellowship Plan), which coordinates all correspondence with other Commonwealth
countries as well as with successful and prospective scholars, and receives and screens
application forms before awarding scholarships.
Overseas Award branch, which processes and implements scholarship awards received
from and granted to countries with which Nigeria has bilateral educational agreements.
Students Loan Scheme.
Protection against Environmental Risk
68. The most common environmental risks are drought, floods, and erosion. The National
Emergency Management Agency (NEMA), established in 1999, has a mandate to formulate
policies relating to emergency management activities and to coordinate programs and plans
for responding to disasters in Nigeria. It operates beyond the narrow concept of emergency
relief to embrace disaster prevention, control, mitigation, and rehabilitation.
69. NEMA is expected to be effective in promptly responding to and mitigating the effects of
disasters. In the area of Search and Rescue, in particular, it has been involved in mobilizing
humans and materials; providing food, clothing, and medical aid; and temporarily resettling
victims in camps, ensuring their security, and providing them with stipends for rehabilitation
thereafter. Although, it does not appear to possess the apparatus required to deal with
Social Protection Status Report for Nigeria
40 of155
disasters involving heavy human casualties, NEMA has a standing arrangement with private
sector companies and large-scale multinationals like Julius Berger, Shell Petroleum,
Chevron, and others to assist in emergencies that involve monumental losses.
Protection against Old Age Risk
70. Pensions are the most common form of social protection for the elderly. These can be
either private (contributory) or social (non-contributory), but both are targeted by age. Social
pensions have been found to have a significant poverty-reducing effect since the cash
transfers tend to be shared within the households of the elderly recipients. Social pensions
have been used successfully in a number of southern African countries (Devereux et al.,
2008). However, several studies that have reviewed the global experience with social
pensions (Palacios and Sluchynsky, 2006and Soyibo and Mwabu, 2011) have noted that it is
essential to take into account the country-specific context, the extent of coverage required,
and the relative poverty status of the elderly in the design of any social pension.
71. The World Bank has defined social protection as consisting of one or a combination of
five pillars as follows Holzmann and Hinz (2005); zero pillar, first pillar, second pillar, third
pillar and fourth pillar. The last four pillars are in one way or the other linked with different
forms and types of pension schemes. Detailed discussions on the last four pillars and how
they are linked with the pension schemes in Nigeria are discussed below.
Zero pillar: a minimum level of protection in the form of social welfare or social
assistance
First pillar: a publicly managed, unfunded plan
Second pillar: a mandatory, privately funded plan
Third pillar: a voluntary, privately funded plan
Fourth pillar: complementary services for the public and the poor
72. Nigeria’s social protection system can be described as multi-pillar (see Table14), with a
few schemes to cover different sectors of the economy. The zero pillar covers social
assistance and other poverty-targeted programs. This pillar would include programs provided
by different government departments and financed by the governments at various levels. The
first pillar comprises mandatory defined benefit (DB) schemes, including the government
pension schemes. The second pillar contains the defined contribution schemes, including the
contributory pension scheme run by the National Pension Commission (PenCom). The third
pillar covers voluntary occupational or personal pension schemes, which include the
company provident/pension schemes of large private corporations. The fourth pillar
encompasses voluntary supplementary schemes, and it includes individuals buying additional
pension plans or pre-need products for many contingencies in life, usually from the private
sector.
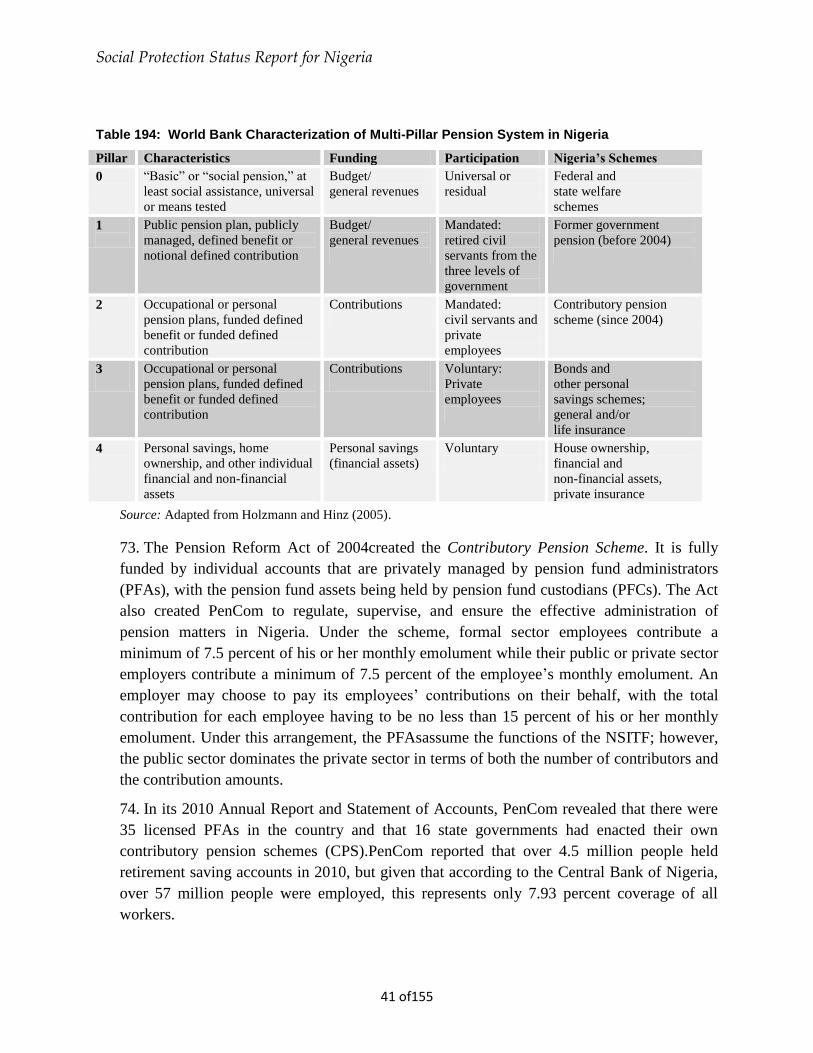
Social Protection Status Report for Nigeria
41 of155
Table 194: World Bank Characterization of Multi-Pillar Pension System in Nigeria
Pillar Characteristics Funding Participation Nigeria’s Schemes
0
“Basic” or “social pension,” at
least social assistance, universal
or means tested
Budget/
general revenues
Universal or
residual
Federal and
state welfare
schemes
1
Public pension plan, publicly
managed, defined benefit or
notional defined contribution
Budget/
general revenues
Mandated:
retired civil
servants from the
three levels of
government
Former government
pension (before 2004)
2
Occupational or personal
pension plans, funded defined
benefit or funded defined
contribution
Contributions
Mandated:
civil servants and
private
employees
Contributory pension
scheme (since 2004)
3
Occupational or personal
pension plans, funded defined
benefit or funded defined
contribution
Contributions
Voluntary:
Private
employees
Bonds and
other personal
savings schemes;
general and/or
life insurance
4
Personal savings, home
ownership, and other individual
financial and non-financial
assets
Personal savings
(financial assets)
Voluntary
House ownership,
financial and
non-financial assets,
private insurance
Source: Adapted from Holzmann and Hinz (2005).
73. The Pension Reform Act of 2004created the Contributory Pension Scheme. It is fully
funded by individual accounts that are privately managed by pension fund administrators
(PFAs), with the pension fund assets being held by pension fund custodians (PFCs). The Act
also created PenCom to regulate, supervise, and ensure the effective administration of
pension matters in Nigeria. Under the scheme, formal sector employees contribute a
minimum of 7.5 percent of his or her monthly emolument while their public or private sector
employers contribute a minimum of 7.5 percent of the employee’s monthly emolument. An
employer may choose to pay its employees’ contributions on their behalf, with the total
contribution for each employee having to be no less than 15 percent of his or her monthly
emolument. Under this arrangement, the PFAsassume the functions of the NSITF; however,
the public sector dominates the private sector in terms of both the number of contributors and
the contribution amounts.
74. In its 2010 Annual Report and Statement of Accounts, PenCom revealed that there were
35 licensed PFAs in the country and that 16 state governments had enacted their own
contributory pension schemes (CPS).PenCom reported that over 4.5 million people held
retirement saving accounts in 2010, but given that according to the Central Bank of Nigeria,
over 57 million people were employed, this represents only 7.93 percent coverage of all
workers.

Social Protection Status Report for Nigeria
42 of155
75. The National Housing Fund (NHF) requires that 2.5 percent of the income of both public
and private employees be paid into the Fund as mandatory savings. As of the end of 2011, a
total of 26 out of 36 states, including the Federal Capital Territory (FCT), were contributing
to the NHF. This marks an immense improvement over the2002 scenario when only three
states (Jigawa, Abia, and the FCT) were contributors.
76. A recent study (Ogunsola, 2012) found that NHF has 3,657,354 registered contributors,
of whom only 68,221 have received benefits, and 20,192 organizations (i.e., public and
private organization) are registered with the scheme. The cumulative amount collected in the
two decades between the inception of the NHF in 1992 and February 2012 was N83.3 billion.
Out of this amount, the Federal Mortgage Bank of Nigeria(FMBN) disbursed N34 billion as
mortgage loans, which has so far financed the construction of a total of 32,831 housing units
by 18,431 NHF beneficiaries.
77. The major constraint facing the operations of the NHF is the lack of enforcement of the
NHF Act, which is obviously and flagrantly violated by employers in both the public and
private sectors. It is worrying that the scheme has only 3.6million registered workers while
there is a large pool of unregistered workers, ensuring that the few registered employees
remit their required monthly contributions to the bank. This constitutes a huge challenge to
the Fund.
Other Social Assistance
78. The main components of social welfare services in Nigeria are family and child welfare,
rehabilitation of the poor and physically challenged/homeless, counseling and corrections,
care of the elderly, and employment generation for the unemployed, particularly youths and
young adults(as there are no unemployment benefits in Nigeria).
79. Several other social assistance programs are being implemented in an ad-hoc manner by
various government ministries, departments, and agencies at the state level, while others are
funded by international donors. Social welfare services are also provided within communities
by elders, title holders, traditional rulers, family heads, people of same age group, and
traditional religious leaders. These leaders are traditionally responsible for the maintenance
of discipline and the settlement of disputes in the community, and they also offer rewards
where appropriate.
82 Youth and Social Support Operation (YESSO): The YESSO is an operation put in place
to address some of the lapses noticed in social protection in Nigeria. It became operational in
September 2013. It aims at addressing the not too impressive impact of existing programs on
poverty and vulnerability as well as the need to tackle the surging unemployment especially for
youths. The operation supports existing institutions to effectively discharge their activities
around employment, social services and safety net systems. YESSO as instrument for tackling
poverty and vulnerability has as its project development objective to increase access of the poor
to youth employment opportunities, social services, and strengthened safety net systems in
participating states. There are four components as follows:

Social Protection Status Report for Nigeria
43 of155
Coordination
Public workfare (poor households having unemployed youth 18-35years with <JS3)
Skills for Job (poor households having unemployed youth 18-35years with at least JS3)
Conditional Cash Transfer (poor households with children of school age, pregnant
women and children aged 0-5 years)
83. YESSO is to be coordinated at the state level by the State Operations
Coordinating Unit (SOCU) and at the federal level by the Federal Operations
Coordinating Unit (FOCU). In particular, SOCU is to serve as warehouse for data for
poor and vulnerable households who can benefit in the three main interventions (public
workfare, skills for job and conditional cash transfer) while at the same time providing
single registry of the poor and vulnerable households for any other intervention. The
identification of poor and vulnerable households is done through geographical targeting
(to select poor LGAs and poor communities using agreeable criteria) and community
based targeting (to identify the poor and vulnerable in the communities using
communities self identified criteria for poverty and vulnerability). The identified poor
and vulnerable households are then enumerated using a checklist to collect data on every
member of the households. The data so collected is then used to populate the Single
Registry at SOCU. The single register is then tapped into by various interventions and
projects to select their beneficiaries based on relevant eligibility criteria. The database at
the SOCU level is also transmitted to FOCU for consolidation and warehousing of
national data on the poor and vulnerable households. The existence of coordinating
platform and database will assist in ensuring effective targeting that minimises errors of
inclusion and exclusion, reduction of duplication of efforts, reduction of double dips,
good monitoring and better impact evaluation of the programme outcomes. The first
round of Community Based Targeting and single registry is being completed among the
first phase states of Bauchi, Cross River, Ekiti, Kwara, Niger, Osun and Oyo.
Social Protection Status Report for Nigeria
44 of155
3. Fiscal Space for Social Protection in Nigeria
84. Financing is a centerpiece for the design of strategies for the implementation of universal
social protection systems. Without adequate and sustainable financing, government
interventions in this field will have difficulty in achieving their ultimate goals. For this
reason, the pursuit of fiscal space to finance the extension of social security is an issue that
lies at the heart of the concerns of policy makers in social protection (ILO, 2012).
85. Fiscal space is a term that refers to the flexibility of a government in its spending choices,
and, more generally, to the financial well-being of a government. It can also be defined “as
room in a government’s budget that allows it to provide resources for a desired purpose
without jeopardizing the sustainability of its financial position or the stability of the
economy.”The term “fiscal space” is used variously in the literature to refer to the scope for
financing the deficit tout court or for financing the deficit without either a sharp increase in
funding costs or undue crowding out of private investment. Therefore, fiscal space is the
difference between the current level of public debt and the debt limit implied by the
country’s historical record of fiscal adjustment (Heller, 2005).
86. "Fiscal space" has recently become fashionable in the aid community. The concept has
cropped up when governments have argued that fiscal constraints should be relaxed to
accommodate additional borrowing to finance infrastructure projects. The logic is that these
projects create productive assets that pay for themselves over the long term, thus creating the
fiscal space that they need. But recently, the term has also been used by advocates of higher
health and education outlays who have argued that these expenditures will eventually pay for
themselves through higher returns to human capital. Although the term is new, the concept is
not. It has long been an element of sound fiscal analysis. And the challenge of creating fiscal
space is one that has always confronted governments and their advisors, including
international financial institutions like the IMF (Heller, 2005)
87. Fiscal space can be determined by looking at both the scope for greater public saving
through expenditure rationalization and tax reform, and the extra resources that can be
mobilized from borrowing and grants. It also appraises underlying factors that affect the
outcome of government policies (Heller, 2005). Seven areas for improving fiscal space
include reprioritizing expenditure, boosting efficiency, raising revenue, increasing
borrowing, and monetary expansion, securing more external grants and pursuing sound
macroeconomic policies. Heller (2005) further posits that an analysis of fiscal space looks at
whether there is room in the budget for a government to provide greater resources for a
particular sector (e.g., social protection) without prejudice to the sustainability of its financial
position. It considers the following mechanisms: mobilization of domestic revenues;
increased discretionary expenditure through debt cancellation or increased borrowing;
reallocation of expenditure between sectors; larger aid flows; improved financial

Social Protection Status Report for Nigeria
45 of155
management of expenditure and increased political commitment to support an expansion in
social protection provision
88. Fiscal space actually reflects the importance of clarifying ways to facilitate expanded
spending by governments to foster growth through higher infrastructure spending and to
finance programs vital to the achievement of the MDG particularly those related to
HIV/AIDS.
3.1. Applying Fiscal Space for Social Protection in Nigeria
89. Social protection systems have historically been weak and under-resourced in most of
sub-Saharan Africa (where Nigeria remains the most populous), with total spending of 0.1%
of gross domestic product (GDP). This is significantly below expenditure in the sector in
other parts of the world, such as the Middle East and North Africa, where the average is
approximately 5.7% of GDP. Therefore there is a need to examine the current situation in
Nigeria with regards to fiscal space with a view to review the need for additional financing of
social protection systems and individual programmes and assessing whether there is the
potential to raise expenditure on social protection in some or all of the states in the country in
a sustainable manner (UNICEF, 2009).
90. In applying the fiscal space to Nigeria SP, an attempt was made to first describe the
Nigerian economy taking into cognizance the six main areas of mobilization of domestic
revenues; increased discretionary expenditure through debt cancellation or increased
borrowing; reallocation of expenditure between sectors; larger aid flows; improved financial
management of expenditure and increased political commitment to support an expansion in
social protection provision. Thereafter, an analysis of the budget provision for social safety
nets in Nigeria is carried out. It must be stated that analysis of fiscal space for social
protection is not new in Nigeria. Hagen-Zanker and Tavakoli (2011) carried out a
comprehensive review of Nigeria’s fiscal space. Their work provides some guide in the
discussion on the general economy and the fiscal space for social protection.
91. Is there really fiscal space for Social Protection in Nigeria? Ab. initio, there is the
need to realise that the Nigerian economy has been re-calibrated using 2010 as the base year.
This according to the World Bank (2014) has made the economy the largest in Africa and
26th in the world at current estimate of US$509 billion.11 The GDP growth rate is said to be
5.3, 4.2 and 5.5 percent respectively on the basis of the new GDP value. The GDP growth
11 World Bank (2014): Nigeria Economic Report No 2 July. This report indicates rebasing has not been done since
1990 and that the current estimate is subject to refinement with new data set.

Social Protection Status Report for Nigeria
46 of155
rate amounts to 6.9, 6.6 and 6.4 percent respectively for the three years using the former GDP
calibration at 1990 constant prices. The country’s revenue profile has been fluctuating since
2007. Total revenue was N5.9 trillion in 2007 and rose to 8.1 trillion in 2008 before
plummeting to just N5.0 trillion in 2009. The same pattern is noticed in 2010 through 2013.
Oil revenue accounts for the bulk of the total revenue in Nigeria making the country
susceptible to vagaries of unstable oil prices. Hence, depending on the nature of world
market price for crude oil and the stability of the situation in the oil producing region of the
country, there can be high discrepancy in earnings from one year to the other. The fluctuation
in revenue of the country has higher proportion of it from the fluctuations in the oil revenue.
The last two years (2012 and 2013) have witnessed falling oil prices with its attendant
implication for the entire economy.12 Table 1-10 in annex 7 provides data on Nigeria’s ability
to finance social protection. Figure 1 and 2 in the same annex show the GDP growth rate
between 2007 and 2014 and the debt service rate. The debt service to revenue ratio has been
on the increase since 2007 after debt cancellation of 2005. As at 2013, the value has risen to
9.26 percent of total revenue from a low of 3.61 percent in 2007. This has implication for
available resources for government activities inclusive of social protection. First, the trend
may lead to inability to spend as much as possible on other sectors thereby curtailing their
growth. Second, it portrays a growing debt profile for the country with its attendant debt
service and the possibility of not being able to source for more credit even for development
purpose. It also may affect the discretionary expenditure. However, resources can be made
available from the partial deregulation of the petroleum products which frees some money
for discretionary expenditure including social protection. The creation of Subsidy
Reinvestment Programme (SURE-P) is for this purpose. According to the data available from
the budget office of the federation, the social protection component of SURE-P amounted to
N38.44 billion or barely 21 percent in 2012. Sectoral allocation of government expenditure
shows that Nigeria government spending on social protection as quoted by Hagen-Zanker
and Tavakoti (2012) was not up to 1 percent between 2006 and 2009.
92. Though it will seem there is fiscal space for social protection, political commitment is
key. In recent time and consequent upon the partial deregulation of the oil sector coupled
with the rising youth unemployment, there is some growing interest in social protection by
the different tiers of government. This is further affected by the resources from the Debt
Relief Gains channeled to critical sectors by the OSSAP-MDG.
3.2 Budget Provision for Social Safety Nets
93. There has been a general increase in the nominal budgetary outlays to the Social Safety
Nets (SSN) activities in Nigeria during the period 2009 – 2012, just as there has been a
broad-spectrum increase in the budgetary allocations to almost all sectors and activities in the
economy during the period. This upward trend in government budgets is attributed to many
12 The situation will be worse as oil prices have recently fall to its lowest level in 4 years.

Social Protection Status Report for Nigeria
47 of155
factors including the general inflationary pressure in a developing economy; the rapid spread
of government intervention in development activities to virtually all areas of human
activities; deadweight costs of corruption in governance process and economic relations;
dealing with new social challenges such as insecurity and terrorism, health problems such as
HIV/AIDS and climate changes; and high costs of administration of democratic structures. In
the SSN sub-sector, the increase in budgetary allocations is due to the growth in
unemployment and the associated youth restiveness, high rate of violent crimes among youth
population, the spread of terrorist activities, encroachment of poverty and increase in
vulnerable population, among other factors.
94. Even though youth empowerment and development programme is administered in many
MDAs at the Federal Government level, only four project implementing MDAs (namely,
NDE, MDG Office, NAPEP and Federal Ministry of Finance) have been chosen for this
study. The trend of budgetary estimates and expenditure profiles for these three MDAs are
evaluated in this section of report. The data used in this section were collected from these
MDAs. The data were complimented by state level finances of social protection for four
(Bauchi, Cross River, Kwara and Oyo). In subsequent sections, the focus of the fiscal space
is on social safety net as a component of social protection.
3.2.1. Trend of Budget Estimates for Social Safety Nets
95. The Federal Government total budgeted outlays, and those of education, health, and of
NDE13, NAPEP and MDG for the period 2009 – 2012 are used to trace the trend of the
budget estimates for the SSN. The total budget outlays of the Federal Government have been
increasing from 2009 through 2011 but receded in 2012. The nominal budgets by sectors are
presented in figure 3. Thus while the government budget during the period has risen from
N3.049 trillion in 2009 to N4.971 trillion in 2011..
96. The SSN expenditure attracts less of government attention than education or health. Even
when the total budgets for three MDAs (namely, NDE, NAPEP and MDG) are pooled, it is
consistently less than that of either education or health over the years.
13 NDE did not give Appropriation/budget data for 2012. Even at that its average nominal total budget during the
2008 – 2011 was just N5.993 billion with its highest budgeted amount of being N10.254 billion of 2010 and lowest,
N4.031 billion of 2009. This cannot alter in any significant way the conclusion inferred from the pooled data. The
same cannot be said about MDG which is the expenditure leader of the three with an average budget of N119.35
billion during the period.

Social Protection Status Report for Nigeria
48 of155
97. The level of change in budgetary outlays is presented in Table 15. The nominal value of
planned expenditure in Nigeria has been increasing faster than the real value of planned
expenditure because of the imputation of inflation effects into the nominal values. Apart from
the low values of the expenditure in SSN, there is also the problem of unpredictable trend of
government expenditure in the activities comprising SSN. This is conferred by the
fluctuations in the trend depicted by the increase in 2010 (by 16.7% from the 2009 level) but
swung down by 21.1% in 2011 and then for the real budget rose back by 16.9% in 2011 to
about the same level as was in 2012.

Social Protection Status Report for Nigeria
49 of155
Table 15: Change in Budgets of Education Health and Select SSN MDAs
2010 2011 2012
Change in Federal Real Budgetary
Outlay
19.057
5.280
(6.049)
Change in Federal Nominal
Budgetary Outlay
51.132
7.878
(4.466)
Change in Real Education Budget
7.030
43.360
7.551
Change in Nominal Education
Budget
35.864 46.897 9.363
Change in Real Health Budget 22.825 22.618 36.758
Change in Nominal Health Budget 55.915 25.643 39.063
Change in Real NDE, MDG,
NAPEP Budget
16.719
(21.120)
16.855
Change in Nominal NDE, MDG,
NAPEP Budget
48.164
(19.174)
18.825
104. The rate of change in nominal budget is greater than the rate of change in real values
throughout Table 17. The rate of change in the nominal value is in 2010 is more than twice the
change in the real value of the budget in all the MDAs. (See the details in Table 15.)
3.2.2. Composition of Budget Estimates for Social Safety Nets
105. The shares of expenditure estimates for the social sector MDAs in the Federal
Government is presented in Figure 4 below. The general pattern has been that education sector
has the highest budget share throughout the period. This is followed by the health sector budget.
The share is trailed at the tail by the SSN. This is the picture in all years throughout the period
under consideration. The share of education in the total budget is close to twice that of any other
sector in every year during the period.
106. The combined component of NDE, NAPEP and MDG in the Federal Budget yields an
average of 2.98% of the Federal Government estimated expenditure throughout the period under
review. The highest share of these three MDAs combined was 3.29% of 2009, with least share of
2.41% recorded in 2011. The SSN implementing MDAs are given less provisions in the budget
estimate than education or health. However, it should be noted that even the provisions for
education and health are a part of social services and if well managed can reduce the need for

Social Protection Status Report for Nigeria
50 of155
high spending on social safety nets. Besides, expenditure on health and education and their
proper management can be a substitute for SSN provision in an economy.
3.3. Expenditure on Social Safety Nets
3.3.1 Trend of Spending on Social Safety Nets
107. The expenditure outlay for each of the three MDAs under study is highlighted in this
section. The NDE budget and expenditure for each for the period are presented in figure 4. It is
evident that NDE budgets over the years have never been fully implemented. So long as these
budgets have undergone reasonable process of appropriation approval at the National Assembly,
the consistent underfunding by the Federal Government of the programmes and projects that
have been approved does not reveal sufficient commitment of government to the resolution the
social problem of young or school leavers and vulnerable tertiary school leavers for which the
NDE was set up.

Social Protection Status Report for Nigeria
51 of155
108. Another appreciable fact from the trend of NDE expenditure is the vagary of both the
planned and realized expenditure. As revealed in figure 5, the budget estimate for NDE stood at
N4.3 billion in 2008, but fell to N4.03 billion in 2009. The budget leaped again to N10.3 billion
in 2010 only to nose-dive drastically to N5.1 billion in 2011. This is rather an unpredictable
trend. The expenditure trend in NDE is similarly and characteristically lacking in predictability
(See figure 5). The rate of change has been oscillating in leaps and bounds, demonstrating clearly
lack of predictability and instability in the funding and commitment to the programmes. For both
the budget and expenditure sides, the increase could rise by more than 150% as in 2008 for
expenditure and 2010 for budgeted outlay. There was sudden and drastic reduction in both the
budget and expenditure as typified the rate of change in actual expenditure of -5.42% in 2009
and -25.01% in 2011.

Social Protection Status Report for Nigeria
52 of155
109. The trend of budgetary and expenditure regimes NAPEP is relatively stable, with
expenditure matching as closely as possible the budget during the period under consideration.
Between 2009 and 2012, the budgeted outlays were fully financed in two years14 of the four-year
period (2009 and 2010). But in 2011, the actual expenditure lagged behind the budget with the
release of N1.266 billion instead of the budgeted N1.94 billion. This represented a variance of
N674.01 million, or 34.74% of the budget for the year. For the year 2012, NAPEP simply
presented no release because it could not access any part of the funds meant for financing the
budget that year (see the footnote 2 below for detail). The budget and expenditure activities of
NAPEP are presented in figure 7.
14 It would have been three years but for the very late release of funds for 2012 budget in December, followed by the
mop-back of the whole N2 billion that was released. For this reason NAPEP deemed that there was no release for
2012 because the release came too late to be used and was completely returned. NAPEP has been recently scrapped.

Social Protection Status Report for Nigeria
53 of155
110. For the MDG, the trend of budgeted expenditure profile is presented in figure 8. The total
outlay of planned expenditure for MDG an oscillating pattern of MDG budgets in the period
under review. Since MDG intervenes in many sectors of the economy, we selected the social
sector comprising expenditure on education, health, youth development, women affairs and
social safety nets. It was also necessary, because of the link with youth programme to single out
youth development spending and the SSN spending for separate evaluation, even though the
allocations to these two are low compared to MDG intervention in sectors such as power supply,
agriculture, water resources, and housing and urban development activities. The two lines of
activities (namely SSN and Youth Development) as shown in figure 8, retain the general trend of
fluctuations in the total spending. The sub-aggregate formed for the social sector services
declined in 2009 but thereafter has been marginally increasing.
111. The rate of change for the lines of expenditure chosen from MDG is presented in figure
9. The figure aligns with the features for figure 8. The oscillating swing in expenditure, marked
by positive change in value of spending (an increase) on activities followed by a negative value
of change in spending (a decrease), is common to all lines of activities and MDAs selected for
this exercise. For instance, in 2009 all activities in the social sector suffered a decline in funding
from MDG. This general decrease in expenditure was almost repeated in 2011 when two for
MDAs/activities exhibited reduction in expenditure. In 2011, MDG spending on SSN
programmes fell by 18.3% of the previous year level, while education spending declined slightly
by 4.19%. However, health sector received an increasing attention from MDG funding as
allocation to health sector was increased by 33.94% in that 2011.
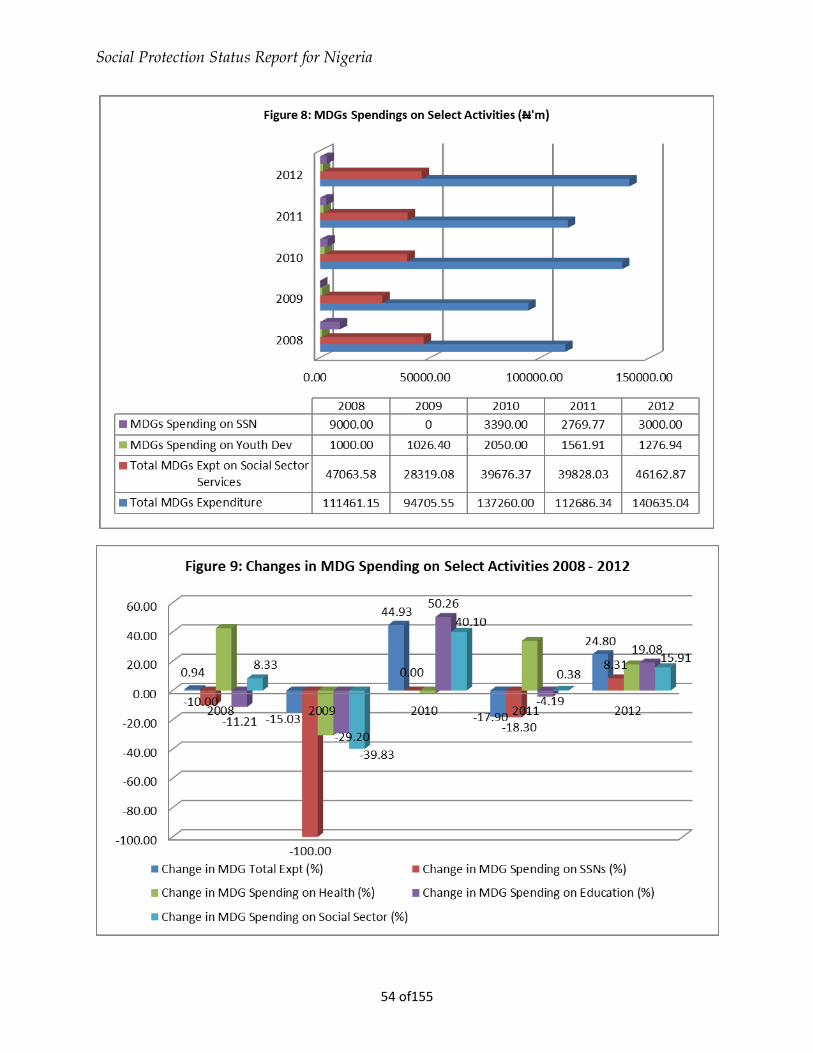
Social Protection Status Report for Nigeria
54 of155

Social Protection Status Report for Nigeria
55 of155
112. The shares of the expenditure of MDG on SSN and youth development activities are
important indicator of the relative preference given to SSN on the MDG allocations. Unlike the
relative shares in the federal budget where allocations for education were consistently higher
than those for health in the period under consideration, MDG placed higher priority on health
than education. The relative share of allocations to the health sector averaged 16.91% of the total
spending of MDG whereas the share of education in MDG spending only averaged 11.42% in
the period 2008 – 2012 per annum over the years. This can be inferred from figure 10.
113. Youth development activities attracted an average share of 1.15% with the highest share
being 1.49% in 2010. Spending on SSN by MDG was slightly higher with the average share
3.03% in MDG total expenditure during the period. The combination of the youth development
and SSN activities attracted an average share of 4.18% which is lower than that of health or
education. Again, it should be noted that some components of health services and other activities
of MDG undertaken by MDG fall into what should be regarded as SSN. Generally MDG
expenditure in the social sector yielded shares that ranged between 28.91% and 42.22%, with an
average share of 33.84% or one-third of its total spending per annum during the period.

Social Protection Status Report for Nigeria
56 of155
3.3.2 Composition of Social Safety Net Spending
114. The trend of actual spending on different programmes of employment creation by NDE
from 2007 to 2010 as contained in table 16 fluctuates greatly. From a highest of N178.18 million
in 2007 on Vocational Skill Acquisition Development (VSAD) Programme, the amount dropped
to N76.77 million in 2008 and thereafter rose to N125.96 million and N131.62 million in 2009
and 2010, respectively. Also the beneficiary expenditure per capita in 2008 which stood at
N2,158.65 rose to N2,490.34 in 2009 and dropped slightly to N2,282.63 in 2010. Interestingly, in
2008 actual spending on School – On – Wheels (SOW) which is a scheme under VSAD
programme was N13.14 million with the per capita beneficiary expenditure at N5, 037.85. Also,
actual spending on MDG special skills acquisition scheme, which is an NDE/MDG/DRG
combination under VSAD was N980.60 million in 2008 but declined to N219.35 in 2010.
115. Spending on Special Public Works (SPW) Programme at N37.24 million in 2007, rose to
N42.74 million in 2008 and dropped drastically to N22.05 million in 2009. Accordingly, the
beneficiary expenditure per capita dropped from N6, 863.33 in 2008 to N2, 891.87 in 2009.
Under Small Scale Enterprise (SSE) development Programme, actual spending rose from N11.08
million in 2007 to N91.05 million in 2008 from where it dropped to N33.42 million in 2009 and
rose to N248.25 million in 2010 as the highest. Also, per capita beneficiary expenditure dropped
from N877.09 in 2008 to N253.22 in 2009 and increased again to N1,688.67 in 2010.
Table 16: Actual Spending on Employment Creation by NDE, 2007-2010 (N’ Millions)
2007 2008 2009 2010
Expenditur
e
Exp. Per
Capita (N)
Expenditur
e
Exp. Per
Capita(N)
Expenditur
e
Exp. Per
Capita
(N)
Expenditur
e
Exp. Per
Capita(N
)
Rural
Employment
4.59 Dna 7.83 1,258.08 6.69 632.66 - -
Small Scale
Enterprises
11.08 Dna 91.05 877.09 33.42 253.22 248.25 1,688.67
Vocational
Skills
Developmen
t
175.18 Dna 76.77 2,158.65 125.96 2,490.3
4
131.62 2,282.63
School on
Wheels
- - 13.14 5,037.85 - - - -
Special
Public
Works
37.24 Dna 42.74 6,863.33 22.05 2,891.8
7
- -
MDG
Special
Skills
980.60 na - - 219.35 Na
Notes: Dna = disaggregated data not available; NA = Not available
Sources: NDE Additional Information 2 Handout, February, 2013; NDE Statement of Accounts for the
Various Years

Social Protection Status Report for Nigeria
57 of155
116. Finally, the Rural Employment Development (RED) programme had the least spending in
2007 at N4.59 million. In 2008, spending rose to N7.83 million and dropped again to N6.69
million in 2009. Accordingly, per capita beneficiary expenditure which stood at N1, 258.08 in
2008 reduced to N632.66 in 2009. It is worthy to note that disaggregated data on expenditure per
capita was not available in 2007 for all the programmes.
117. For NAPEP actual spending was equal to her budgets for CCT in 2009 and 2010. On the
contrary, in 2011 there was a shortfall of the actual spending from the budget, with a variance of
N0.67 billion or about 35% of the budget for the year.
3.3.3 Sources of Funds for Social Safety Nets
118. Unemployment reduction programmes by NDE are mostly funded by federal government
budgetary allocations. The only scheme that is minimally funded separately is the MDG special
skills which are the NDE/MDG Debt Relief Gains collaboration. At the initial years of CCT
implementation by NAPEP (2007/2008), the programme was funded by the MDG – Debt Relief
Gain (DRG). But from 2009, funding of CCT – COPE by NAPEP had been from direct
budgetary allocation to the agency. From 2009, the MDG is funding direct state implementation
of CCT under the Conditional Grant Scheme (CGS) through DRG.
119. The recently introduced SSNs component of Subsidy Re-investment and Empowerment
Programme (SURE-P) are funded by the proceeds from partial removal of the Petroleum Subsidy
which commenced in 2012. Of the N180 billion SURE-P fund for 2012, only N38.44 billion
was allocated to social safety nets (Okogu, 2012). The programmes are namely:
Community Services, Women and Youth Employment (CSWYE) consisting of Graduate
Internship Scheme (GIS), Community Services Scheme(CSS), and Vocational Skills
Training Scheme (VSTS) at N13.6 billion;
Maternity and Child Health Care Services at N15.94 billion; and
Urban Mass Transport at N8.9 billion.
.
120. The NDE gave some data on her internally generated revenue (IGR) for 2009 – 2011.
The sources of her IGR include tender fees, sales of I.D. cards, sales of unserviceable office
equipment, sales of government vehicle (during implementation of monetization policy), rent
advance repayment, bank interest received and sales of NDE land to staff. The proceeds from
each of these sources never exceeded N3,673,700 which was made from sales of NDE land to
Staff in 2011. The total sums of IGR for the period were N3,080,280, N6,614,508.15, and
N5,857,861.72 for 2009, 2010 and 2011, respectively. This is insignificant relative to NDE total
expenditure and budget funding requirement. However, the provision of the data on IGR in a

Social Protection Status Report for Nigeria
58 of155
well organized and tabulated form is a clear indication of high level of management of
information and data in NDE and by extension transparency and accountability.
121. All agencies engaging in SSN implementation depend almost 100% on the Federal
Government funding through budgetary subventions. The sustainability of programmes would be
more ensured if financial flows are timely and releases of allocations from the Federal
Government account are not delayed. There has been a case of which the Federal Government
released in December the N2 billion budgeted by NAPEP CCT programme in 2012; and in the
same month mop the money back fully. Thus the NAPEP CCT budget for 2012 is regarded by
NAPEP, and rightly so, as not being funded.
Table 17 below shows the share on sources of fund on the total expenditure on youth
employment programmes and CCT by the project implementing MDAs of the respective
agencies.
Table 17: Share of Fund Sources in Total Program Expenditure (%)
MDAs Safety
Net
Sources of Fund
DRG SURE-P Fed. Budget Partner Fund
NDE YEPs 20 - 80 -
NAPEP CCT 20 - 80 -
OSSAP –
MDG
CCT 100 - - -
PIU of FMF - - 100 - -
Sources: NDE, NAPEP, OSSAP-MDG, PIU-FMF July, 2013
3.4. Data Availability and Quality of Social Safety Nets Budget Execution
3.4.1 Availability of Data on Social Safety Nets
122. There is evidence that each of the MDAs still lacks data management capacity; besides
the fact that there is lack of coordination between MIS and data tracking mechanism. MDAs
visited for this study have been engaging the services of consultants for the evaluation of their
performance. However, the tracking of data from the reports that come out of such consultation
has been effected. Similarly, there has not been translation of monitoring and evaluation reports
in standard data, nor has there been any concerted coordination of activities among departments
and units within an MDA for integrated data collation and management.

Social Protection Status Report for Nigeria
59 of155
123. Out of the three agencies considered at the federal level, data were most readily available
at the NDE. There is annual auditing of their account with the statement of such account
available for public consumption. Public finance data are easily accessible from those reports.
Again, their publication of Annual Report gives a synopsis of each of their programme
performance.
124. NAPEP also has copious reports with a good amount of data on various aspects of
activities around its mandate. However, there is evidence of lack of coordinated data
management procedure within it. Nevertheless, available information and data are made
accessible at request. Public finance data made available for this study was lacking in detailed
breakdown. With respect to MDG Office, there are proofs that they also have periodic reports,
which contain some useful amount of information and data but such report could not be made
available even at official request.
125. No funding data was made available on the SSN components of SURE-P at the Project
Implementation Unit of Federal Ministry of Finance. The GIS programme and all others
administered under the SURE-P programme are just about a year or less, since SURE-P started
in May 2012. Lack of data on the programme may be ascribed to the fledgling stage of the
programme and not necessary a qualifying condition that is identifiable with the administering
unit.
3.4.2 Quality of Budget Execution
126. Execution of budget among the SSN implementing MDAs is fraught with inadequate
funding both in terms of short supply of funds and poor timing in release of funds for budgeted
programmes. This is the ubiquitous experience for all the implementing MDAs even though each
of them is affected to differing degrees. The NDE did not, throughout the period under review,
receive complete funds for any year’s budget. The detailed representation of yearly actual
execution of budget is shown in figure 11. The average actual spending as a percentage of the
total budget is 69.1%. This leaves a shortfall average of 30.9% which represents the average
variances as presented in figure 12. Intuitively during the period, for every N100.00 budgeted
only N69.00 was released. For NDE the year of greatest achievement of budget target was 2009
when the proportion of realized expenditure to budgeted amount was 81.81% leaving a budget
variance of 18.19%, while the worst budget performance was recorded in 2007 followed by
2010.

Social Protection Status Report for Nigeria
60 of155
127. The NAPEP budget implementation assessment shows that there was no budget
variance in 2009 and 2010 as the total value of budget for SSN was released for each year (see
figure 7). In 2011, however, the budget implementation fell short of the planned outlay, with a
budget variance of N0.67 billion representing 34.53% of the year’s budget. That was better
compared to the experience of 2012 where the budget for SSN was not implemented at all due
to lack of budget fund supply (see footnote 2 for more information). In 2012, available
information from NAPEP officials indicates that the sum of N2.0 billion appropriated was
actually released in December and was completely mopped up in the same month, leaving
actual budget variance of N2 billion or 100%. This clearly worsened the quality in budgetary

Social Protection Status Report for Nigeria
61 of155
execution by the Agency given an average budget variance of 33.63% during the period 2009 –
2012. With respect to MDG the budgeted figures were not made available. So quality of her
budget execution cannot be ascertained.
3.5. State Government Finances of SSN
128. The summary of budget and expenditure for four states as collected during field exercise
is presented in this section. The quality of budget execution was generally low in all the states
whose data were available given the margin between the estimated budget and the actual
expenditure on the public workfare. In 2011, over 80 percent budget execution performance was
recorded in the states examined. The performance dropped slightly in 2012 and the worst
scenario was recorded in public workfare budget execution in 2013 as less than 50 percent
performance was recorded throughout the states. Table 18 presents the situation across states.
Cross River allocated more than N3.6 billion in 2011. The allocation is however for youth
related development.
Table 18: Summary of Finances by Selected States on Public Works (2011-2013)
Public workfare
States 2011 2012 2013
Budget Actual Budget Actual Budget Actual
Bauchi 645,000,000 529,161,180 850,000,000 843,124,960 2,549,205,940 297,277,973
Cross
River
3,672,000,000 3,339,000,000 2,270,000,000 n.a. n.a. n.a.
Kwara 322,000,000 316,520,000 381,500,000 299,460,000 292,850,000 95,890,000*
Oyo n.a n.a 1,500,000,000 1,055,450,000 1,500,000,000 287,850,000**
n.a. = not available
129. The “Skills for Job” budget performance for 2011 was 100 percent in Oyo, 140 percent in
Kwara but 69 percent in Bauchi. In 2012, the budget performance was at least 99 percent for
Oyo and Bauchi but 120 percent for Kwara. However, the performance of Bauchi in terms of
Skill for Job execution in 2013 was just about 30 percent whereas 125 percent performance was
recorded for Kwara. Data for actual expenditure for Oyo in 2013 is not available (Table 19)

Social Protection Status Report for Nigeria
62 of155
Table 19: Summary of Finances by Selected States on Skills for Job (2011-2013)
Skills for Job
States 2011 2012 2013
Budget Actual Budget Actual Budget Actual
Bauchi 100,000,000 69,293,666 100,000,000 99,483,768 150,000,000 43,986,286
Cross
River
n.a n.a n.a n.a n.a n.a
Kwara 150,000,000 210,000,000 250,000,000 300,000,000 400,000,000 500,000,000
Oyo 1,500,000 1,500,000 10,000,000 10,000,000 100,000,000
n.a.: not available
130. The budget performance for education is given in table 20. The performance was barely
on average of about 60 percent for the three states considered in 2009 but less than 1 percent
performance was recorded for Federal in the same year. In 2010, the performance improved for
Bauchi, Cross River, and Kwara but a slightly low performance was recorded in Oyo State. In
2011, actual expenditure improved in the three states of Bauchi, Kwara and Cross River
respectively in that order but the performance also dropped for Oyo state and still very poor for
the federal. In 2012, the performance for Kwara still improved but a sharp drop was noted for
Cross River. See table 20.
Table 20: Summary of Finances by Selected States on Education (2011-2013)
Education Expenditure (Nb)
States 2009 2010 2011 2012
Budget Actual Budget Actual Budget Actual Budget Actual
Bauchi 11.81 5.89 9.94 6.75 11.99 8.75
Cross
River
12.86 9.99 10.54 9.60 18.54 18.26 17.64 9.58
Kwara 7.45 6.85 8.46 8.05 10.76 10.50
Oyo 25.0 15.7 27.8 17.2 44.8 23.8

Social Protection Status Report for Nigeria
63 of155
131. The actual expenditure on health was low generally for the period 2009 to 2012. In 2009,
the actual expenditures were less than 50 percent of the total except for Cross River that was
barely 50 percent. The situation improved in 2010 for Bauchi. Cross River and Kwara whose
performances were greater than 70 percent but a lower budgetary performance was recorded for
Oyo (43 percent). In 2011, it followed the same pattern as it was in 2010. In 2012, only Kwara
state achieved about 97 percent actual expenditure, Cross River was less than 50 percent (Table
21)
Table 21: Summary of Finances by Selected States on Health (2011-2013)
Health Expenditure (Nb)
States 2009 2010 2011 2012
Budget Actual Budget Actual Budget Actual Budget Actual
Bauchi 12.77 5.02 9.43 6.59 8.88 5.30
Cross
River
4.11 2.68 3.81 2.70 4.31 2.76 6.82 2.15
Kwara 3.50 3.08 2.64 2.93 5.37 5.21
Oyo 23.3 4.8 23.9 10.2 25.2 7.9
132. In 2009, only Cross River actualized about 60 percent of the planned budget, the rest
were somewhat poor in their actual expenditures, 42 percent for Bauchi, 20 percent for Oyo and
less than 1 percent for the federal. The year 2010 recorded an improvement in actual
expenditures for Bauchi, Cross River, and Oyo (though still less than 30 percent). Kwara state
also implemented the social protection policy and achieved 89 percent budgetary expenditure. In
2011, the performance of Bauchi dropped by about 16 percent, Oyo equally dropped by about 20
percent of the previous year, Cross River and Kwara improved in their budget actualization but
the federal performance of less than 1 percent was maintained. In 2012, Cross River recorded a
downturn in actual expenditure of about 7 percent; the Kwara also fell from 150 percent in the
previous year to 78 percent.

Social Protection Status Report for Nigeria
64 of155
Table 22: Summary of Finances by Selected States on Social Protection (2011-2013)
Social Protection Expenditure (Nb)
States 2009 2010 2011 2012
Budget Actual Budget Actual Budget Actual Budget Actual
Bauchi 4.15 1.74 3.25 1.67 9.83 4.24
Cross
River
1.54 0.92 2.09 1.33 4.39 3.06 3.59 0.24
Kwara 0.26 0.23 0.43 0.64 0.36 0.28
Oyo 3.5 0.7 3.9 1.0 3.9 0.8
133. The actual total expenditures were above 50 percent for Bauchi and Cross River but less
than 50 percent for Oyo state. In 2010, Bauchi, Cross River, and Kwara actualized more than 70
percent of the planned budget but Oyo state could only actualize barely 50 percent. The trend
was the same in 2011 though Oyo state actual expenditure dropped slightly. In 2012, Kwara state
performance was above 70 percent while data for other states were not available. (See table 23)
Table 23: Summary of Finances by Selected States on Skills for Job (2011-2013)
Total Expenditure (Nb)
States 2009 2010 2011 2012
Budget Actual Budget Actual Budget Actual Budget Actual
Bauchi 106.76 55.27 84.72 60.46 137.48 82.47
Cross
River
84.83 61.15 78.09 54.07 118.96 91.17 143.1
Kwara 75.29 57.28 69.51 66.69 104.16 74.53
Oyo 128.4 59.4 142.1 70.3 163.8 71.1
Federal 3,049.00 0.884 4,608.00 1.053 4971.00 1.108 4749.00 1.041

Social Protection Status Report for Nigeria
65 of155
3.6. Concluding Remark on Fiscal Space for Social Protection in Nigeria
134. The budgeted outlays for youth employment and CCT have been increasing on the
average both in nominal and real terms during the period under consideration. Even though the
average rate of budgetary changes is positive, indicating an increasing trend, the pattern is not
consistent increase rather it is fluctuating. The share of SSN spending in the total is lower than
the share of education or health in the social sector. The combined component of NDE, NAPEP
and MDG in the Federal Budget yields an average of 2.98% of the Federal Government
estimated expenditure throughout the period under review.
135. All agencies engaging in SSN implementation depend almost 100% on the Government
funding through budgetary subventions. The sustainability of programmes would be more
ensured if financial flows are timely and prompt releases of allocations to implementing MDAs
by the Federal Government. The NDE IGR was insignificant total sums of IGR for the period
were N3,080,280, N6,614,508.15, and N5,857,861.72 for 2009, 2010 and 2011, respectively.
This is very low relative their total expenditure and budget funding requirement.
136. Execution of budget among the SSN implementing MDAs is fraught with inadequate
funding both in terms short supply of funds and poor timing in release of funds for budgeted
programmes. The NDE average actual spending as a percentage of the total budget is 69.1%. For
NDE, the year of greatest achievement of budget target was 2009 when the proportion of realized
expenditure to budgeted amount was 81.81% leaving a budget variance of 18.19%, while the
worst budget performance was recorded in 2010 (given the study years of 2008 – 2012).
137. Availability of data from implementing MDAs is a major challenge. Out of the four
agencies implementing the SSNs at the federal level, data were most readily available at the
NDE.
Social Protection Status Report for Nigeria
66 of155
4. Governance and Corruption Issues in Social Protection Programmes in
Nigeria
138. Governance interpreted normatively in terms of good governance has main
characteristics of voice and accountability, political stability and lack of violence,
government effectiveness, regulatory quality, rule of law and control of corruption
(Kaufmann et al., 2010). The United Nations has considered “good” governance as an
essential component of the Millennium Development Goals (MDGs), because good
governance establishes a framework for fighting poverty, inequality and many of humanities
shortcomings (UNDESA, 2007). According to Nzongola-Ntalaja (2003) three aspects of
governance are interdependent in a society. Social governance provides a moral foundation,
economic governance provides a material foundation and political governance guaranties the
order and the cohesion of a society. The 2002 Human Development Report views good
governance as a democratic exigency, in order to rid of corruption in societies, give people
the rights, the means and the capacity to participate in the decisions that affect their lives and
to hold their governments accountable for what they do (Nzongola-Ntalaja, 2002).
139. Governance in Social Protection (SP) can be seen as the set of incentives and
accountability relationships that influence the way in which providers are held accountable
for their behaviours and ability to deliver services with quality and efficiency. It also focuses
on efficient service delivery, governance of social protection programmes and systems. There
are three SP governance issues. First, are the rules of the game which define the legal
framework governing the SP system, or individual programme? This includes legislation,
regulations and operational guidelines such as clear criteria for eligibility, entry, and exit
from programmes, and predictable and transparent mechanisms for setting benefit levels.
Second, are the roles and responsibilities of actors involved? And third, the controls and
accountability mechanisms which enforce broad set of mechanisms and implementation
procedures for ensuring that the right benefit gets to the right person at the right time (Basset
et al., 2012). Engagement through these three entry points contributes to improved
performance, reductions in error, fraud, and corruption, greater political support, credibility,
and trust in social protection programs and institutions.
140. Social protection programmes channel a large amount of public resources to
targeted beneficiaries with the aim of providing the right amount of benefit to the right
recipient on time. Evidence shows that no social protection programme is immune from
Error, Fraud, and corruption (EFC). According to Stolk and Tesliuc (2010) EFC present
significant challenges to the integrity of social protection systems across countries. They

Social Protection Status Report for Nigeria
67 of155
opine that the level of EFC applied to social protection programmes indicates the extent to
which the programme is compliant with its own rules. Using data from developed countries,
they submit that a four-pronged strategy to control EFC: prevention, detection, deterrence
and measurement are evident. A number of actions considered in the strategy can be mapped
to the governance framework. The EFC strategy emphasizes the need for developing
appropriate administrative procedures (Rubio, 2011). It pointed to the need for a better
definition of institutional responsibilities, adequate implementation of management
information systems and thorough control and accountability systems (World Bank, 2007).
141. This section presents the governance issues in social protection in Nigeria using
four state and federal government case studies. It highlights the interaction between social
protection governance and some shortcomings associated with the programmes. In achieving
this, information was collected from certain social protection programmes running at both
federal and state levels. These programmes are on public work and conditional cash transfers.
4.1. Social Protection Governance issues in Bauchi state
142. The target group under the Public workfare and skills for job programmes are
unemployed men and women between the ages of 16 and 35, youth with violent disposition
(sara-suka boys) and young men and women with zero or little education/skill and young
school leavers who at present could not gain admission into tertiary institutions due to
incomplete results and those with inadequate education. The school leavers seeking
admission into higher institutions are to be assisted with extra-mural if they have a minimum
of 3 Ordinary Level credits especially in science subjects. Those without 3 credits or credit in
sciences are enrolled and prepared for the National Business and Technical Examination
Board (NABTEB).
143. The of target CCT are vulnerable households with children or aged persons of 60
years and above, poor female or aged headed, households headed by physically challenged
/HIV/AIDs patients and households not benefiting in kind or cash from any other
programme. Poverty Alleviation Program target unemployed youths.
144. Beneficiaries of the programmes are selected based on the pre-set criteria of the
programmes, available records are scrutinized and beneficiaries are interviewed. The
Implementation Committees in the various communities used poverty and vulnerability
criteria they developed to identify poor and vulnerable households in the selection of
beneficiaries. Proxy Means Tests (PMT) were then applied to verify and establish accuracy.
Proxy means tests generate a score for applicant households based on fairly easy-to-observe

Social Protection Status Report for Nigeria
68 of155
household characteristics (e.g. location and quality of house, education, occupation,
ownership of durable goods).
145. Public Workfare and Skills for Job beneficiaries were selected by various Ward
level Stakeholder Committees in close collaboration with the Commission and verified by
Local Government Stakeholder Committees. To ensure equity, equal slots are allocated to the
20 Local Government Areas. Population size is used for the distribution of the beneficiaries
to the Local Governments. Other slots are allocated through stakeholders. The lists of
selected candidates are submitted to the Local Government Council. The Bauchi State
Agency for Youth and Women Rehabilitation and Development (BACYWORD) Desk
Officers in the Local Government Areas compile the list and forwards it to the Headquarters
for action. The trainees are screened by the screening committee of the commission.
146. Selection of beneficiaries into CCTs is done through the use of Community
Implementation Committees (CIC) using criteria and conditions specified in the State CCT
Operational Manual. Cash transfers are conditional on all age-relevant family members
complying with key human capital development conditionalities. Under the program, cash
incentives are provided to encourage poor households to invest in the education and health of
their children and women so that they can be more productive youths and adults. The
programme includes conditions that require beneficiary children to attend a minimum of 85%
of the school time. The health conditionalities of the CCT program include: (a) completion of
vaccines according to the recommended schedule, and regular health check-ups and growth
monitoring for children ages 0-7 years old; and (b) pre- and post-natal check-ups for pregnant
women. Pictures of the selected beneficiaries captured and their names and other details were
compiled. There is indication of adherence to the outlined procedure in the selection of
beneficiaries who are among the poorest of the poor in the selected communities.
147. In the case of the Poverty Alleviation Program of the Ministry of Cooperatives
and Poverty Alleviation, a committee is set up in each LGA to identify and screen potential
beneficiaries at ward level. The committee is made up of District Heads, Ward Heads, LGA
officials and staff of the Ministry of Cooperatives and Poverty Alleviation. A combination of
geographical and community-based targeting was used in selecting beneficiaries to ensure
equity of access. By geographic targeting mechanism, eligibility is determined based on the
location and community of the beneficiary’s residence. Areas with highest concentration of
poverty are targeted. In the Community-based approach, community groups or intermediary
agents are involved in identification of beneficiaries and monitoring the delivery of cash or
in-kind benefits. Three (3) LGAs were selected in each Senatorial Zone. The rural LGAs
were selected based on availability of facilities and incidence of family inability to send their
children to school, especially the girl-child. The other three (3) LGAs are metropolitan
LGAs. At the Local Government level, the LGA Implementation Committee identified and

Social Protection Status Report for Nigeria
69 of155
selected the benefitting Wards/Communities within their respective Local Government
together with the Traditional Rulers. At the Community level, the Community
Implementation Committee headed by the Community Leader, and other interest groups in
the Community selected the poor households to benefit from the scheme. Members of the
State Implementation Committee, Local Government Implementation Committee and staff of
the MDG Office were usually present at the community gatherings for validation of the
beneficiaries.
148. Payment of benefits to BACYWORD beneficiaries is contracted to the banks.
Three Accountants travel to the 3 Senatorial Zones of the State with an Officer from the
Economic Intervention Department of BACYWORD to promptly pay beneficiaries of the
Skill for Job programme using validated beneficiary list. Beneficiaries are paid their stipends
by cash monthly at pay points located in secured public places upon presentation of the
identity cards issued during enrolment. Selected locations are accessible to most
beneficiaries, thereby reducing their travel time and costs. Payments are made based on
attendance (duly recorded on attendance sheets), and satisfactory completion of daily
assigned duties. It was mentioned that 75% attendance is required for payment of
beneficiaries of the Skills for Job programme and payments are not made unless beneficiaries
meet this requirements
149. In the case of the CCT program, bank employees travel with the cash for
distribution to the beneficiaries who would otherwise have to travel to the nearest branch.
Beneficiaries usually received payments on presentation of the identity cards issued to them
during registration. The State, Local Government as well as Community Implementation
Committees monitor the payment of stipends to CCT beneficiaries. Also, Community-Based
Organizations, Community Leaders, Non-Governmental Organizations and Civil Society
Organizations are involved in overseeing the payment exercise.
150. Procurement of goods, works and services for SP programmes in Bauchi State is
backed by State procurement laws.15 Review of records and observations suggest strict
adherence to the fundamental principles of procurement as articulated in the State
procurement law and due process guidelines. Contracts are advertised, the Tender Evaluation
Committee analyze the pre-qualified Contractors based on the guidelines. Three (3) of the
Contractors are recommended to the Due Process Office for the preferred bidder to be
15 The law that established the Budget Monitoring, Price Intelligence and Procurement Unit in 2008, charged it with the
responsibility of monitoring all procurement of goods, works and services by the Bauchi State Government and all entities which
derive at least 35 per cent of the fund appropriated or proposed to be appropriated for any type of procurement from the State
share of the Consolidated Revenue Fund. A review of the various reports of the Auditor-General of Bauchi State did not reveal
any breach of State procurement laws or guidelines by agencies implementing youth employment programmes and conditional
cash transfers in the State.

Social Protection Status Report for Nigeria
70 of155
certified. In sum, the processes are transparent. Procurement records are properly kept, and
there is no indication of influence peddling or political interference in procurement processes
at BACYWORD and State MDGs office. There has been no significant procurement under
the CCT in the State.
151. Expenditures on the programs are subjected to routine internal audit procedures
which monitor payments, quality of work done and beneficiaries in the programmes. In
addition, the Office of the Auditor-General of the State usually conduct annual statutory
audit. Thus, the audit arrangement can be adjudged very effective.
152. Some common vulnerability that may increase the likelihood of error, fraud and
corruption (EFC) in the YEPs and CCT in Bauchi State are basically due to intentional and
unintentional irregularities. Such unintentional errors encountered are i) Wrong amount of
benefit payment ii) Payments to ineligible applicants. Intentional errors in transfer programs
include false statement or concealed or distortion of relevant information regarding income
or household composition to bias eligibility decisions. Possible “pressure points” for fraud
and errors include:
a) Interference or political biases in the geographic allocation of programme quotas;
b) Interference, political biases, and administrative errors in the registration process;
c) Clientelism, interference, and/or administrative errors in the payments process;
d) Interference in reporting on non-compliance with conditionalities; and
e) Procurement of service contracts.
153. Corruption issues in the programmes include manipulation of beneficiary rosters
e.g. diversion of funds to ghost beneficiaries. Others include bribes, collusion between staff,
collusion with claimants, inappropriate practices in the selection of beneficiaries and the
related risks of patronage and misappropriation of funds.
154. To reduce EFC in programmes, a number of mechanisms were employed which
include supervising interviews, verifying information, comparing targeting registries with
other data, carrying out random sample quality control reviews, and encouraging citizen
oversight (or social controls).
155. For effective management of social safety net programmes in the state, each of the
social safety net programmes has separate M&E system in place. Monitoring and evaluation
of Public Workfare and Skill Development Programmes is the responsibility of the
Directorate of Monitoring and Evaluation at BACYWORD. The organization is responsible
for monitoring the utilization of resources for programmes and projects and checking the
attendance of beneficiaries. Monitoring and Evaluation Officers from the Department
reportedly conduct monthly M&E visits to organizations to check attendance registers and

Social Protection Status Report for Nigeria
71 of155
confirm the number of beneficiaries. At present, there is no arrangement for beneficiary
assessment and third party monitoring of project processes and impacts in order to validate
progress and impacts and inform project implementation.
156. The CCT Unit of the MDGs Office and the Project Support Unit headed by the
Permanent Secretary is responsible for monitoring the compliance of CCT beneficiary
households with the predetermined conditionalities. School Headmasters and Officers-in-
Charge of health facilities in the affected communities are also said to be involved in the
monitoring activities of the intervention scheme. The CCTs attendance records were said to
have been destroyed in a fire incident at the MDG office. The CCT programme is relatively
new. Hence, no evaluation has been done. In effect, it is difficult to determine the extent to
which school and hospital attendance has improved due to the CCT program. Overall, the
M&E system in the programmes is very weak. The M&E arrangement is not results-based
and the involvement of stakeholders like CSOs is very limited. Only FAHIMTA Initiative, an
organization involved in youth empowerment is mentioned as being involved in monitoring
the CCT programme in the State.
157. A Management Information System (MIS) exists in the three main social safety
net programmes although not fully developed. The programmes have separate registries of
beneficiaries and no single or unified register from which beneficiaries can be drawn for
participation in the social safety net programmes. The BACYWORD has a database of
unemployed and eligible youth and women in the State. But the database is not online yet.16
158. In the case of CCT, data collected during enrolment was entered into a web-
oriented Management Information System. The system was used to generate the list of
beneficiary households. It was developed to monitor the implementation of the programme at
the community level with support from the LGAs. The system incorporates a paper-based
system at the community level and an interface of the LGA computerized system. The
names, pictures and other details of selected beneficiaries were captured and imputed into the
computer to develop the comprehensive database.
159. Some stakeholders are involved in social safety net programs in Bauchi State.
They include youth groups, community members, community/opinion leaders, government
officials, government ministries, civil society organizations, non-governmental organizations,
16 In 2007, the Commission registered a total number of 423,441 of such youth and women between the ages of 18 and 35 years
of different educational background. In February 2013, another comprehensive registration exercise for graduates of tertiary
institutions and secondary school leavers was carried out over seven days. The exercise includes capturing of biometric data and
verification of academic qualifications and permanent addresses. A total of 48,000 youth and women were registered. A new
Management Information System has been developed by BACYWORD for the Skills for Jobs and Public Workfare Programmes

Social Protection Status Report for Nigeria
72 of155
community-based organizations, legislators, media, and private sector organizations.
Assessment shows that stakeholders have very limited roles and responsibilities in the
administration of the programmes, especially in the supervision, and monitoring of
implementation, third party monitoring of fund flows and validation of project progress and
impacts.
160. Adequate consultation and dialogue with citizens, CSOs, private sector and other
actors are embarked upon in the SSNs programmes to inform them, involve them, collaborate
with them and empower them with relevant information. The information and
communication strategy includes the use of effective communication tools and channels such
as traditional leaders, face to face, radio, notice/information boards, town criers, churches,
mosques, handbills, field visits, community meetings, age groups, television, women's
associations, and youth groups. The media was used to create awareness about the CCT
programme to inform the public on the implementation strategies. Messages were translated
into local dialects and publicized using the media, posters and fliers. In addition, the modes
of communication are socially and culturally sensitive.
161. The key issues for improving governance of SP in Bauchi revolves around the
following:
1) Adoption modern benefit delivery systems to reduce administrative costs and leakage to
non-beneficiaries, to avoid corruption, and to make transfer of payments to beneficiaries
quick and flexible.
2) Staff SP programmes needs to know how to relate with the political class in the
implementation of SP efforts.
3) Awareness creation campaigns and rallies for the public can help to minimize or
eliminate political influences.
4) Establishment of the central database and ensure that beneficiaries are selected from the
database.
5) Periodic evaluation to strengthen accountability
6) Civil or criminal penalties can be used against those found perpetrating fraud in the
programmes
7) Investment in electronic systems for payments to reduce the number of errors in
processing and payment systems.
8) There should be clear guidelines on what irregularities are, when a sanction is to be
applied and who is responsible for enforcement.
9) Appropriate and effective monitoring and evaluation of the operations of the programmes
to identify any failure in controls.
10) For the weak transparency in the procurement process, it is important to ensure that key
stages of cash payments and procurement processes of all activities to be financed by SP
are open and competitive and published to key stakeholders like beneficiary-communities
11) Third Party monitoring and verification of programmes is necessary.

Social Protection Status Report for Nigeria
73 of155
4.2. Social Protection Governance issues in Cross River state
162. Governance in SP operations in Cross River State is based on decentralized
administration. Various MDAs assigned with specific SSN programmes have limited
linkages and synergies among them. Most of the SSN programmes were administered in
isolation by the implementing MDAs. Those programmes achieved most of their set out
objectives.
163. Targeting and selection of beneficiaries for SSN programmes in the State were
not based on unified registry of beneficiaries. Selection of beneficiaries was aimed at meeting
the criteria of fairness in representation and of poverty of the beneficiaries. Issues related to
ascertaining the level of poverty of beneficiaries were determined arbitrarily by the selecting
officials for many of the programmes. In the PW programmes, and for implementing MDA
like CUDA, CR-ROMA and DOPT, recruitments of beneficiaries into their programmes are
based on response to the advertisements of vacancies. The recruitment centre is often at
Calabar. The MSWCD and the MWA recently have adopted the use of unified biometric
captured register to conduct selections of beneficiaries for their programmes in CCTs. These
two MDAs also use LGAs as their centres for selection of beneficiaries.
164. The CCTs and Skills for Jobs, adopt banking procedure for payment of
beneficiaries. Some MDAs in PW also make payments of beneficiaries’ stipends via the
bank, while others in PW adopt both banking procedure and cahier-paying system of direct
dispensing of cash to beneficiaries.
165. Procurement of goods and services for SSNs programmes in Cross River State
follow strict adherence to procurement guidelines. The process is guided by the Cross River
State Due Process and Price Intelligence Bureau Law No. 15 of 2011. Procurement of items
within the limit of N5 million is handled internally by the MDAs, while those with greater
valuation are handled under a central procurement process.
166. Audit capacity in the state may be considered as high. Annual statutory audit is
usually conducted by the Office of the Auditor-General of the State. As at June 2013 when
this study was undertaken, the Auditor General Office was working on 2012 accounts of the
state. Up to 2011 accounts were ready and accessible. There is an Internal Auditor in every
MDA.

Social Protection Status Report for Nigeria
74 of155
167. The following are areas of operation in the implementation of SP programmes
that are vulnerable to fraud and corruption; some are more susceptible to errors.
a) The selection process may create the problem of unfair geographical spread and
representation in selection of beneficiaries for the fact that some potential beneficiaries
might not have access to information on available opportunity.
b) The process is also subjected to political pressure.
c) There is currently no preset cost distribution schedule for administering social protection
programmes in the state.
d) In the state, most of the approved items in the SSNs budgets have not been funded over
the years, while budgetary allocation in some other sectors have been rising and receiving
prompt funding attention.
e) Many of the public workfare programmes do not specify exit time except CCTs CCTs
program from the MDG and the skills for job component that MEDA anchors
168. Effective monitoring of SSNs programmes and projects in the State is done by the
budget monitoring units, the implementing MDAs, NGOs, CBOs and Community/Opinion
Leaders. However, there is no blueprint on monitoring of social safety net policy and
programmes. Besides, the administration of monitoring of SSN activities is not coordinated
as required by YESSO. The information in monitoring reports is not transformed into usable
data. Monitoring units of the implementing MDAs have been responsible for monitoring the
Public Workfare programmes. The work behaviour of beneficiaries as well as the adherence
of contractors to contract terms is monitored. In the case of large-scale construction
contracts, some private consulting firms are usually contracted for monitoring and
evaluation. Supervision and monitoring are fused together in PW programmes by some
implementing agencies concerned.
169. In CUDA, for example, all senior staff members are occasionally conscripted into
monitoring team. The effectiveness of monitoring of work activities of PW beneficiaries is
reflected in the level of cleanliness of the Calabar City. Currently, the monitoring efforts are
not linked with data generated on commitment to duties among beneficiaries. MEDA is the
agency that coordinated the skills for job programmes in the State. The agency is more
concerned with the effective repayment of loans by beneficiaries. The involvement of MEDA
in monitoring is more visible from the lending point through the repayment period. The
training in the skills for job programmes are handle by NGOs, such as POWER and Supreme
Coalition which have capacity to monitor the level of participation of beneficiaries. However,
there is no linkage of monitoring activities reports with MIS for effective assemblage of data.
The registration system for this component of SSN programme and the monitoring activities
are very effective, even though MIS linkage is also lacking. Reports on monitoring are filed
properly but the data contents in those reports are not separated and processed to retrievable
data. There are evidences that recommendations from monitoring reports are used for
decision making on the programmes.

Social Protection Status Report for Nigeria
75 of155
170. Stakeholders (including NGOs and CBOs) are involved in programme monitoring
and evaluation of SP interventions. The Supreme Coalition has been supportive in skills for
job and entrepreneurial development programmes, working with MEDA. They are involved
in the selection and training of beneficiaries and establishment of shops for
qualified/graduated trainees. One of the startling findings of their monitoring activities in
each stage of programme they monitor is that almost all those who have absconded from
their training programmes are the nominees of politicians. In the public workfare component,
CR-RAMP has used the CBOs in the rural communities which are corridors to their roads.
Members of the CBOs in the project communities monitor the activities of the contractors
and provide security for construction equipment and materials. This arrangement, according
to CR-RAMP, has engendered congenial working environment for the timely delivery of the
projects.
171. Information management is poor in all MDAs that are connected to the
implementation of Social Protection Programmes in the State. There is integration and
intensive interaction among departments within the participating MDAs. For this reason, data
management is so much uncoordinated, with poor work output of data. There is no intranet
and officially subscribed internet facilities. The PIU in Skills for Jobs component (MEDA)
MIS adaptation are reflective of the private sector orientation. Data are easily available and
accessible in this agency. The organization is also very responsive to public demands on
them. The NGOs like Supreme Coalition and POWER, participating in training and skills
development, are really backward in the adoption of effective MIS. Supreme Coalition only
has one old dysfunctional computer unit that the secretary manages for typesetting of
documents. For Conditional Cash Transfers programmes, computers are used, but this does
not translate to the adoption computer based MIS. The units/departments in those MDAs are
still unintegrated; middle level administrators are assigned personal computer sets. Data
management is still manually done and therefore not linked to every aspect of work-design.
There is no intranet and officially subscribed internet facilities. There is a need for capacity
building in human capital and equipment.
172. The following are necessary to strengthen institutional governance of SP
programmes in Cross River State:
1) Increase of manpower in MIS and computer applications and supply computers and
software for effective service delivery;
2) Clear harmonization of institutional functions, definition of organizational structures and
design of work-flow charts;
3) Embark on coordinated computerization and networking of the work-system in the
implementing MDAs;
4) Standardization of management information system and intensification of data
management for decision making;

Social Protection Status Report for Nigeria
76 of155
5) Conscious development of data-based decision making models for use by administration
of SP programmes.
173. Mitigating measure for corruption issues include:
• Strengthening of policy and programme monitoring processes and mechanisms;
• Public demand for social accountability responsiveness from the government;
• Encouraging the government and its MDAs to adhere to fiscal responsibility principles;
• Involvement of CBOs and NGOs in the M&E processes and demanding clarification
from government on issues raised from such independent monitoring units.
• Government institutions abiding by the Public Procurement (Due Process) Law.
4.3. Social Protection Governance issues in Kwara state
174. The Kwara state government in its commitment to address poverty and
unemployment has made effort to strengthen and institutionalise social safety nets in the
State. The set out objectives are rightly targeted following useful procedures.
175. The skill development program in Kwara State was designed for unemployed
graduates, semi-skilled, un-skilled and vulnerable youth within the 18-35 years age bracket.
The Community-Based Approach was used for the selection of beneficiaries in most of the
skills development programmes sponsored by the State Government. KWABES Corp
Members in 16 LGAs, Liason Officers in the LGAs and Ward Development Associations
were involved in the Selection of beneficiaries. Opportunities are provided for youth groups,
women groups as well as political and religious leaders to include names of candidates. The
lists of beneficiaries are compiled at the various LGAs. Selection was made based on
qualification, LG spread and gender adhering to rules, regulations and pre-set criteria. Rules,
regulations and pre-set criteria for offer of opportunities are adhered to especially as it relates
to qualification, local government spread and gender. Some are of the opinion that patronage
was less than 15 percent in the programmes. It was mentioned that two LGAs (Baruten and
Kaiama) did not have a single graduate during the selection of beneficiaries. The selection
criteria were lowered for them but the selected applicants were placed appropriately by
qualification. Eligible youth are encouraged to register on the portal provided by KWABES
through newspapers adverts and radio and television sensitization activities. Beneficiaries are
selected based on qualification, eligibility and available space.
176. The clean and green programme essentially has as its targeted beneficiary
vulnerable members of the society especially women who constitute about 90% of the
workforce and unemployed men (10%). Employment forms were issued out to prospective
operatives and selections made after an interactive oral interview. Selected applicants are
also distributed to the 16 LGAs of the State.

Social Protection Status Report for Nigeria
77 of155
177. Stipends of the beneficiaries are funded by the State Government but paid by the
respective contractors managing them. Funds are transferred electronically by the Ministry of
Finance to the accounts of the contractors managing the projects. The contractors in turn pay
the stipends of the beneficiaries to their respective bank accounts. The beneficiaries in the
Skills for Job receive their stipends through bank accounts.. Each beneficiary obtains a
clearance letter from his/her employer, endorsed at the KWABES office prior to payment.
There is indication of that delay in fund release sometimes constrains the smooth and
effective implementation of social safety net programmes in Kwara State. Beneficiaries
(especially the first two sets) indicated that money was paid to them during off-farm season.
Payment delays were also traced to the cumbersome demand of banks from the beneficiaries
of the programme.
178. State procurement law or guidelines were strictly adhered to by agencies
implementing Youth Employment Programmes and Conditional Cash Transfers programmes
in the State. Responses by key informants, review of records and observations during the
mission visit suggest strict adherence to the fundamental principles of procurement.
Expenditure on the programmes is subjected to routine internal audit procedures which
monitor payments, quality of work done and beneficiaries in the programmes. In addition,
the Office of the Auditor-General of the state usually conducts annual statutory audit. Thus,
the audit arrangement can be adjudged very effective. By July 2013 the Auditor General’s
Office was already working on the 2012 accounts of the State.
179. Operations of the various programmes are vulnerable to error, fraud and
corruption. Some susceptible/ recorded errors in the skill development programme include;
1) Bank mistakes - In one case, someone’s passbook was used to collect money at the bank
without the bank doing the necessary checks.
2) Error in the payment process like the payment of beneficiaries who did not work.
3) Administrative error in like double capturing of beneficiary's name and
4) Dual local government capturing of beneficiary.
5) There was allegation that funds meant for payment to fish farming trainees were diverted.
6) There is a high risk of the presence of ghost beneficiaries especially as the beneficiaries
do not wear uniforms.
7) The most apparent corrupt practice is political interference by politicians, traditional and
religious leaders in the State during the selection of beneficiaries.
180. The effectiveness of the programmes is monitored and evaluated. The Ministry of
Environment and Forestry undertakes the monitoring and evaluation of projects through its
Planning, Research and Statistics Units, the Directorates of Environment and Forestry
Services. Monitoring durations include mid-years monitoring, monthly meeting and periodic

Social Protection Status Report for Nigeria
78 of155
visit to sites. There is no evidence of stakeholder involvement in the monitoring of the Public
Workfare programme.
181. Monitoring activities for skill development programme include periodic head
count, issuance of clearance letter before monthly stipend is paid. The monitoring activity is
carried out by the KWABES monitoring and evaluation team. In addition, the Youth
Empowerment Coordinators in the 16 LGAs submit monthly monitoring reports to the Office
of the Special Assistant on Youth Empowerment. Some external NGOs like the National
Youth Council are engaged to embark on independent periodic monitoring exercises.
Monitoring exercises are usually done monthly but in some cases unplanned checks are
conducted. To reveal that there is a link between the M&E system and the payment system,
the organization where beneficiaries are posted are expected to submit a photocopy of the
register for the period. The Office of the Special Adviser (SA) Youth Empowerment submits
monthly reports to the Executive Governor. Monitoring reports are said to have been used in
planning and budgeting, improvement of programme strategy, and enhancing productivity.
182. The Office of the SA Youth Empowerment has a robust database of the
unemployed youth in the State. KWABES uses its online portal to register beneficiaries and
disseminate information.17 A strong networking system is in place to exchange information
within the office and with the Youth Empowerment Coordinators. Social media is also being
used as MIS tools in getting feedback from the public on its activities and necessary changes.
The MIS of the Clean and Green programme is coordinated in the Planning, Research and
Statistics Unit where data and information related to the projects are stored, analyzed and
interpreted.
183. KWABES communicates with stakeholders through dialogues/meetings,
correspondences, town hall meetings, and media channels such as radio, television and
newspapers. Also, electronic mails are sent through the internet and short message services
using mobile phones. In spite of the many channels of communication, many consider
current levels of advocacy and enlightenment by the Scheme inadequate.
184. Based on the findings the following are recommended;
1) It is also important to reduce the influence of political, traditional and religious leaders in
the selection of beneficiaries.
2) A central database is required for selection of beneficiaries.
3) Identify staff training needs and train relevant staff for effective project implementation.
4) Funding levels also need to be scaled up to enable the programme implementation
agencies to fulfil their mandates and have the desired impact.
17 About 73,000 unemployed youth have registered on the portal. Out of this, 55 percent are male while 45 percent are female.

Social Protection Status Report for Nigeria
79 of155
5) Local Government Area Councils need to show more interest in the Malete Farm
programme. The beneficiaries need to be provided with land cleared by the LGAs to
enable them step down their training to the grassroots.
6) More importantly, for continuity and further encouragement of the youth, release of loans
to beneficiaries as at when required while moratorium is extended based on the type of
activity.
7) All beneficiaries should be paid through their bank accounts.
8) A central database is required for selection of beneficiaries. This will overcome current
challenge of beneficiaries benefiting from multiple programmes.
9) A more robust M&E system needs to be introduced in all the social safety net
programmes and programme impact needs to be determined for greater effectiveness. The
involvement of stakeholders in programme monitoring is very important.
10) Effort should be made to assemble data on the social safety net programs for them to be
accessible in a unified format.
4.4. Social Protection Governance issues in Oyo state
185. Good governance is intended to support the State Government in its commitment
to strengthening and institutionalizing social safety nets in Oyo State.The social safety net
programmes that are implemented to address poverty and unemployment in the State. The set
out objective were rightly targeted following useful procedures.
186. YES-O beneficiaries were selected by the Agency for Youth Development with
the assistance of Zonal Officers through the Community Development Associations in all
wards in the state. The Local government Community Development Officers also supported
the process. Some beneficiaries had close associates holding official positions who might
have influenced their selection. The beneficiaries are paid their monthly stipends through the
banking system. Payments are made based on attendance records of beneficiaries. There were
complaints of delay in the payment of stipends.
187. State procurement laws or guidelines were strictly adhered to by agencies
implementing youth employment programmes in the State. A review of the various reports of
the Auditor-General of Oyo State did not reveal any breach of procurement. Expenditure on
the programmes is subjected to routine internal audit procedures which monitor payments,
quality of work done and beneficiaries in the programmes. The Office of the Auditor-General
of the State usually conduct annual statutory audit. Thus, the audit arrangement can be
adjudged very effective.
188. Common errors identified in the programmes include; Political interference in the
selection process, error in the payment process like the omission of beneficiaries and multiple
payments of beneficiaries.
Social Protection Status Report for Nigeria
80 of155
189. Programme Monitoring and Evaluation mechanism consists of monitoring of
attendance, supervision by Zonal Officers, CDAs, youth organizations and monthly
verification of the activities of the cadets. Although reports were produced at each stage,
effective M&E system is still lacking.
190. Information Management is manually operated in the SP programmes in the State.
The public workfare programme unified registry is evolving through MIS. The Skills for job
has a unified registry of beneficiaries, but MIS is also manually operated. However,
Communication Strategy adopted in the programmes is poor. The AYD communicates with
stakeholders through social media, letters posters and handbills. Also, short message services
are sent using mobile phones. The Agency has not considered using media channels such as
radio, television and newspapers.
191. Based on the findings the following are recommended;
1) Adhere to the criteria for the selection of beneficiaries and ensure stakeholders appreciate
the fact that the success of the programmes depends so much on in adhering to the rules
and ensuring equity.
2) A very robust central database is required for selection of beneficiaries. Use of unified
database will significantly address challenge of beneficiaries benefiting from multiple
programmes.
3) Train the MIS and M&E officers as identified and train other relevant staff as training
needs are identified for successful project implementation.
4) Funding levels also need to be scaled up to enable the programmes achieves the desired
results.
5) Delays in payment of stipends and errors associated with payment needs to be addressed.
6) Efforts should be made to involve Local Government Area Councils and the private
sector more in the financing of social safety nets in the State.
7) A proper M&E system needs to be introduced. The involvement of stakeholders in
programme monitoring is key.
8) Effort should be made to assemble data on the social SP for them to be accessible in a
unified format.
9) Dedicated telephone lines need to be provided to enable members of the public voice
their grievances
4.5. Social Protection Governance issues at Federal level
192. Targeting and selection of beneficiaries is done at the state level because
beneficiaries reside there. Criteria for targeting of beneficiaries by MDAs are duly set in their
respective programmes and schemes. Selection is done at the state level of the MDAs,
sometimes in collaboration with the related state MDAs. The selection of beneficiaries for
NAPEP and MDGs CCTs is based on pre-set criteria for core poor households such as:

Social Protection Status Report for Nigeria
81 of155
Households with children of under five years of age to benefit from free medical care and
immunization;
Households with children of primary and junior secondary school age to make 70%
attendance at school;
Households with pregnant women who must register and receive medical attention from
health centres or hospital;
Households headed by HIV/AIDS or with VVF patient; and
Child-headed households.
193. In the case of NDE training schemes the beneficiaries include all cadres of youth
(secondary school leavers, national diploma, higher diploma and graduates). On the other
hand, beneficiaries of GIS of the CSWYE of FMF must be graduate youth of tertiary
institutions, who must present their certificate for sighting or even as collateral for the
graduation loan for set-up of businesses. This is also an assertive means of right targeting.
Selection of beneficiaries for GIS is based on an existing database. Adverse targeting due to
factors such as communal pressure, local political influences, corruption on the part of field
officials, which are easily observable in the state programme targeting, are also noticeable in
social protection programmes administered by Federal MDAs under study. Every MDA is
mostly interested in the selection criterion of existence of fair representation in terms of
federal character and, within the state, spread through the LGAs. There is no central unified
register, at the moment, from which selection of beneficiaries is done in other MDAs
participating in YESSO programmes. Selection for each programme is usually done at the
inception of the programme, which is expensive in terms of time and financial resources
committed to the repetitive selection by each MDA.
194. All federal MDAs visited at the Federal level which had financial commitments to
beneficiaries make payments through the banks. This has been the practice in the MDGs and
NAPEP CCTs programmes. For the NDE programmes which involve some schemes in
entrepreneurship training may entails some financial capital outlay for start-up of business.
Such payments, normally treated as soft loans, are usually made through the bank accounts of
the beneficiaries.
195. The procurement process of programmes is guided by the Procurement Law of the
Federation. The NDE engages in procurement through sourcing for consultants and resource
persons and by purchases of goods (machine, equipment and tools) for establishing shops for
the graduates of training schemes. The process of procurement in NDE is conformable to
procurement due process.18
18 For any contractual transaction exceeding N5 million, NDE will have to advertise for expression of interests. The responses on
the expression of interests will be evaluated by the Procurement Committee; those who are rated well enough are then requested
to submit technical proposal and financial proposal on the contract. The technical proposal will be opened and graded by the
procurement team, which may bring experts in the field relevant to the proposed contract/procurement. From the technical
proposal two or three who make up to a pre-set score (may be 80%) are selected for competitive bidding which entails opening of
Social Protection Status Report for Nigeria
82 of155
196. The Audit Departments of MDAs are specifically concerned with the examination
of the accounting records and financial information. Evidence from those sources affirms
conformability of the financial system to established standards and principles. Auditing
considered include financial audit and project audit. Functional audit department is found in
every MDA, the department reports to the head of an MDA. In some of the MDAs visited,
the audited accounts are usually later than expected. NDE has accessible audited accounts
which are enclosed in their Annual Reports. For other MDAs, it is difficult to get their
audited accounts. Project Audit is administered by the Monitoring and Evaluation
Department of the respective MDAs. Project monitoring reports are more prompt and easily
accessible than audit reports because of the nature data/information input required for their
preparations. The NDE carries out its M&E through the inspectorate department and the
planning, research and statistics department.
197. All human-organized system or any public organization where agency
arrangement is adopted for execution of its functions is susceptible to errors, fraud or
corruption. The level of vulnerability depends on the degree of supervision/monitoring of
activities and behaviour of the officials charged with the responsibility of handling any duty
under consideration. In the social protection programmes, the areas that is susceptible to
mistake include adverse selection of beneficiaries wrong targeting and payments to
beneficiaries who may not meet the criteria to continue to benefit from the payments.
Fraudulent practices were sometimes spotted at the community level where some community
leaders were said to have placed corrupt demands on the CCT beneficiaries before being
selected. No fiscal corruption in terms of misappropriation of fiscal resources has been
reported in the social protection MDAs visited. Cases of poor timeliness in budgetary fund
releases are common practice.
198. Monitoring and evaluation framework involves several of activities. The NDE has
high capacity for monitoring its programmes all over the country. Its monitoring is handled
by the Monitoring and Evaluation Department at the Federal level, the Department is
replicated in NDE State offices all over the country. The State Monitoring and Evaluation
Units submit their monthly monitoring reports to the supervisory federal office.
199. The CCT programmes are handled by the NAPEP and MDG Office. CCTs
programmes are monitored from the selection, through the payments and exit of the
programme. The operational structure and modality for monitoring is similar to that adopted
by the NDE. The NAPEP has the Research, Monitoring and Evaluation Department which is
the financial proposal. The person or organization with the most reasonable low bidder, which may not necessarily be the lowest
bidder, is then awarded the contract.
Social Protection Status Report for Nigeria
83 of155
headed by a Director who reports to the Executive Secretary of Programmes. The programme
execution activities of the state offices are monitored by the M&E unit in the State Office and
such monitoring reports are forwarded to the Research, Monitoring and Evaluation
Department in the Headquarters for information. The decisions concerning the monitoring
outcome at the state level is taken in the state offices but the monitoring reports from all
states must be sent to the NAPEP office at Abuja on quarterly basis.
200. MDG CCT has a Monitoring and Evaluation Department in the Headquarters and
in all the 36 State Offices. The programme is monitored mainly at the state offices of the
MDG. Occasionally the monitoring official at Headquarters in Abuja also goes to the field
for a random on-the-spot assessment or for a case-specific assessment. The MDGs also have
been engaging the services of consultants to carry out systematic monitoring with some
official report given on the performance of every state office. The reports on monitoring
activities are usually evaluated by both the respective State and the Headquarters for the
purpose of using the inferential conclusions from such evaluations to guide decisions on
CCT.
201. Monitoring of programmes at the Federal Level is conducted in multiple stages:
the Federal Monitoring and Evaluation Units of the NDE, NAPEP and MDGs respective
Monitoring and Evaluation Unit in the Headquarters coordinates monitoring activities in all
states offices. The Monitoring Unit in their State Offices turns in their monitoring reports to
the headquarters, but the state offices have the responsibility to take steps to ameliorate the
situation contained in such reports. Apart from the monitoring units in the MDAs, Local
Government field officials such as Agricultural Extension Officers and Social Welfare
Officers perform vital monitoring functions for social protection programmes generally. The
NGOs and CBOs based at the states also have played major roles in project monitoring at all
stages of social protection programmes by offering some useful assistance in monitoring
programmes administered by the Federal MDAs.
202. All MDAs visited even at the state level identified the need for computerisation
and computer training for staff as a one of their focal objectives. For skill development
programmes, NDE has information management system which is more adaptable and closer
to the modern MIS. The NDE has a strong database. It has been publishing its annual reports
which contain organized set of information and data on activities of NDE. The Report
contains data on performance of each programme of the NDE. The collation of the
information and transmuting the information into dataset has been part of the processes of
MIS and a usual administration procedure in NDE.

Social Protection Status Report for Nigeria
84 of155
203. Integrated MIS adoption gaps in the NDE may include
1) Data publications may not represent the true picture of the readiness for the utilization of
MIS since such publications are mostly handled by consultants/contactors.
2) The level of computerization is still lower than can facilitate the use of modern MIS even
at the Headquarters.
3) Interdepartmental sharing of information is still low and it is difficult to obtain all
information concerning the organization from one point without going through many
offices.
204. The NAPEP and MDG which are the implementation unit for the CCTs share
similar difficulties with other MDAs with respect to MIS. The NAPEP has more information
structure and dataset than the MDG Office. Given the mandate of NAPEP as the coordinator
of poverty policies and programmes across the country, it generates the responsibility of
gathering data on the subject. Adequacy of the modern Management Information Systems in
MDAs at the Federal Level is stronger than the state counterpart. This is because annual
publication reports by NDE offers a good foundation for information gathering and data
accumulation. The reasons for this performance among MDAs at the federal level are
connected to the adherence to the organizational mandates; competition for excellence
among MDAs at the federal level, besides availability of funds for information management.
205. Gaps that must be bridged to make PMIS effective
• The computerization of work processes in MDAs must be spread to all sections of
the service apart from Accounts and Secretarial activities that have now been
computerized.
• Information sharing and networking among departments within an MDA should
be purposefully designed and intensified to engender development of sound
database for activities of every MDA.
• The internet and intranet services should be installed and used to facilitate access
to information within and among MDAs.
• Data tracking mechanism for deriving quantitative information from qualitative
information should be well developed and workers should be trained on its
application.
206. Mitigating Measures
1) The problems of governance and possibility of corruption can be checked by proper
monitoring of the government agents that are charged with the responsibilities which are
susceptible to corruption. Another means of curbing corruption is to provide sufficient
incentives to the agents such that the avenues for corrupt practices become unattractive to
the agents.
2) On the governance problem that is connected to untimely release of budgeted funds for
programme implementation, this simply calls for discipline allocation of funds such that

Social Protection Status Report for Nigeria
85 of155
every aspects of the budget is given attention as when due. Assignment of funds should
be based on fund inflows, every MDA should be allocated fund during the monthly
allocation meeting.
3) The corrupt practice at selection point could be addressed by the introduction of
biometric capturing and the use of unified central registration of beneficiaries. These
means shall also remove the possibility of payments to the wrong person and the
possibility of a beneficiary participating in more than one programme.
4.6. Concluding Remarks on Governance Issues in Nigeria
207. Highlights of governance and mistakes surrounding social protection programmes
in various States of Nigeria and federal level has been documented in this section. The
programmes are set to address the problems of poverty and unemployment in various states.
In the course of solving these problems, an array of interventions were implemented which
include skill development and public workfare programs, conditional cash transfers and
poverty alleviation programs.
208. Administration of these operational social protection programmes in the country
has been decentralized. Most programs operate at LGAs, State and Federal levels. The targets
for each programme varies but include men and women from vulnerable households,
unemployed youths pregnant mothers, babies and school age children up to junior secondary
education. The target groups are selected based on the rules of law governing each programs.
Selection criteria are community based in most cases or pre-set criteria most especially of
federal programmes. Beneficiaries are selected by independent or collaborative efforts of
Ward, communities, other stakeholders and Local Government Officials. In few programs,
selection of beneficiaries is from data base. Qualified and eligible beneficiaries who
participated in the programs receive their benefits either through banks or by cash.
209. The governance in social protection programs across states is limited by weak
Monitoring and Evaluation (M&E) and Management Information System (MIS). This is due
to low level of computerization; hence administrative activities are not integrated or are yet
to be incorporated online. In most cases, communications are through dialogues, use of
media, bills and text messages.
210. Some errors and corruption are observed in the programs such include, political
interference on selection of beneficiaries, payment errors, and presence of ghost
beneficiaries, mismanagement and irregular release of funds. Adequate measures are yet to
be employed to completely put such errors and corruption to a halt.

Social Protection Status Report for Nigeria
86 of155
211. There is evidence of program monitoring by some organizations and
implementing bodies, however, there is no uniform blue print on monitoring and evaluating
success of programs.
212. Based on the reports, it is recommended that;
1) Awareness is created to the general public on selection procedures to check political
interference.
2) A central data base is established and used to select beneficiaries into different SP
programmes.
3) A coordinated computerized and networking of the work-system in programs is
established
4) A clear harmonization of institutional functions, definition of organizational structures
and design of work-flow charts are necessary.
5) A clear procedure of monitoring and evaluating the success of programmes be put in
place.

Social Protection Status Report for Nigeria
87 of155
5. Gaps and Challenges in the Social Protection Sector
213. Social protection is not new to Nigeria rather; a coordinated system of social
protection programs that delivers services effectively to the poor and vulnerable and creates
fiscal space is novice. The present state of social protection programs is fragmented and ad
hoc; the programs are extremely small, and coverage is estimated to be only a tiny fraction of
the poor. This low coverage is a result of a combination of constraints, including political,
financial, and capacity limitations. In addition, the value of transfers is low, which inhibits
the extent to which social protection interventions can reduce poverty and inequality, and
create opportunities for the poor and vulnerable. Most challenging is the fact that the social
protection programs in Nigeria lack effective targeting, operation management and
monitoring and evaluation. Robust solutions to these basic yet complex challenges offer
Nigeria a viable way forward.
Limited Coverage
214. One of the key concerns is the limited coverage and reach of existing programs.
While the majority of Nigerians live in poverty, most social protection programs – including
the federally-led MDG-DRG safety nets In Care of the People (COPE) and Maternal and
Child Healthcare (MCH) – reach only a few hundred to a few thousand households. In fact,
the benefits structure provides limited incentives, especially in the pension scheme,
conditional cash transfers (CCT), National Health Insurance Scheme (NHIS), and School
Feeding Program. Only the Community-Based Health Insurance Scheme (CBHIS) has the
explicit goal of reaching 100 percent of the poor (in the informal sector). This may be due to
its presidential mandate to achieve universal health insurance coverage and access to
healthcare for all Nigerians by 2015 (NHIS, 2008). But, it has been officially acknowledged
that there are enormous financial difficulties in extending such a scheme to the magnitude of
informal workers and Nigerians living in poverty.
215. Table 24 provides figures on the coverage of several social protection programs in
Nigeria.

Social Protection Status Report for Nigeria
88 of155
Table 24: Coverage of Some Social Protection Programs
Program Projected Coverage Actual Coverage
(Number of Households / Percent of Poor)
COPE 22,000 households/less than 0.001% of poor
households nationally*
Currently not available
CCT Girls’
Education
Kano – scaling up to all eligible girls in LGAs
where CCT is implemented
12,000 girls, Kano/0.002% of the poor
(9.2 million population; poverty
incidence approx. 60%)
7,000 girls, Katsina / 0.001% of the poor
(6 million population; poverty incidence
approx. 70%)
MCH 851,198 women and girls as of June 2010
(Phase 1: 615,101, Phase 2: 236,097)/less than
0.01% of the poor (assumption 75 million
poor; poverty incidence54%)
CBHIS 100% informal sector workers (when fully
rolled out, expected to cover 112 million
Nigerians in informal sector)**
Currently unavailable
Source: Holmes et al. (2012).
Note: *Dijkstra et al. (2011), **PATHS2 (2010).
Poor Targeting and Goals Setting
216. Nigeria’s social protection programs also remain focused on a narrow set of
risks and target groups, and have undefined targeting mechanisms. For example in the
case of COPE, while it has multiple objectives (health, education, and investment), its design
does not take into account the needs of households (especially if they are labor-constrained).
Many of the other interventions have no clear targets, goals, or benchmarks against which
their performance could be measured and monitored. In the rare cases where targets exist,
their broad definition allows the elite and the non-poor to receive benefits. This targeting
problem can be further attributed to the absence of any overall framework on social
protection devised with the consensus of all stakeholders including the government,
development partners, civil society, and the private sector.
217. Even within the MDG-driven social protection agenda, productivity-enhancing
instruments have received little attention. Although some programs are designed to be gender
and child sensitive (as shown in (Box and Table 25) no concerted approach has been applied
to promote shared growth through reduction of inequities.

Social Protection Status Report for Nigeria
89 of155
Box 4: Child Protection and Social Protection
In order to address the key social and economic drivers of child violence, exploitation, abuse, and neglect,
efforts need to be concentrated in at least five broad areas:
i. Strengthening awareness of and enforcement of protection-related legislative and policy frameworks
ii. Supporting more effective inter-agency and inter-sectoral coordination, including state-specific
initiatives for building capacity in the effective planning, financing, delivery, coordination, and
monitoring and evaluation of programs
iii. Strengthening information systems and knowledge sharing in order to increase the evidence base on
child protection vulnerabilities, underlying drivers, and the impact of formal and informal responses
iv. Investing awareness raising, preventive activities, and response services to address child protection
vulnerabilities in a partnership between public service providers (e.g., schools, health facilities, and the
police), the justice system, civil society actors (including traditional and religious leaders), and the
private sector
v. Promoting synergies between what are generally small-scale child protection initiatives and broader
social protection and poverty reduction programs (including cash transfers, social health insurance,
school fee waivers, and public works schemes) in order both to enhance the reach of child protection
interventions and to tackle more effectively the multi-dimensionality of children’s vulnerabilities
Table 25: Child-sensitive Approach to Social Protection
Child-sensitive Approach Addressed in
Programming?
Examples
Reduction in household income poverty Limited COPE cash transfer (government)
Support to access basic services (education
and health)
Limited CCTs (health and education), free healthcare
for pregnant women and children under 5
CBHI, support to OVC (NGOs)
Child and maternal nutrition Limited HIV-related nutrition programs (NGOs)
Supporting families’ childcare role Limited Cash transfers
Reducing child labor No
Increasing household access to income or
employment
Limited Some state-level employment schemes,
agricultural inputs/subsidies
Preparing adolescents for future livelihood Limited Some youth employment and training schemes
Preventing and responding to abuse and
exploitation
Limited Laws in place (e.g., CRC) but poor
implementation
Addressing gender inequality Limited CCTs (girls’ education)
Responsiveness to children’s perspective No
Source: Holmes et al. (2012).
Financial Resources
218. Funding is a major challenge in implementation of social protection
programs. The operators of social protection programs indicated that funding is a major
constraint, militating against the achievement of program goals. An examination of the
budgets of these organizations indicates that they have been declining over time and that this
might have adversely affected their performance. Since most of the agencies and institutions

Social Protection Status Report for Nigeria
90 of155
depend on government financing, it was evident that no mechanism has been put in place to
ensure the sustainability of the programs. In addition, financing that the various levels of
government allocate to social expenditure is low. The creation of appropriately financed and
designed large-scale social transfer schemes would benefit millions of people living in
poverty, but affordability is a key concern and Nigeria is already highly dependent on foreign
aid (Holmqvis, 2012).
Political Commitment
219. The political commitment to protecting poor and vulnerable families is very
low. Well-targeted programs (e.g., AIDS widows with children) garner limited political
support and thus are allocated a small budget at the state and even at the federal level. In
contrast, a more broadly and ineffectively targeted program, like one that targets all
vulnerable families, tends to elicit greater political support and a larger budget. That being
said, most of the well-resourced social protection programmes are supported by development
partners, civil societies or private sector organization – with relatively low counterpart
contributions by the federal or state government. The eventual close of this support combined
with lack of government ownership raises grave concerns of sustainability.
Service Delivery and Governance
220. Most of the social protection programs have no measurable indicators, targets, or
benchmarks with which to monitor the progress of the interventions. Nor can their impact –
either through objective measures or the subjective perceptions of beneficiaries – be
measured for lack of mechanisms and systems. To compound matters, all of the agencies
seem to be working independently irrespective of the other agencies involved in social
protection and among the agencies in the social protection sector, coordination is scant.
221. In the public sector, in spite of recent reforms, there are still indications of
overlaps in the functions and activities of the various social protection/poverty alleviation
agencies (e.g., the many agencies involved in microfinance activities). Furthermore, the
governance structure of some of the agencies inhibits their ability to fulfill their
responsibility. For example, while the Bank of Agriculture is able to provide micro-credit for
the moderately poor, it lacks the capability to provide these services to the very poor. On the
other hand, the focus of NAPEP has shifted toward interventions from its original mandate of
coordination and M&E functions.

Social Protection Status Report for Nigeria
91 of155
6 Policy Implications and Recommendations
6.1. Policy Implications
222. Nigeria has reached a threshold in the global economy that necessitates a cohesive
society to undergird its potential economic growth, and the provision of effective social
protection to the poor and vulnerable is a direct and simple way of sharing the benefits of
growth among all Nigerians. This is especially true among those who are unable to contribute
productively to the economy, such as, children, the elderly, and the disabled as well as those
at risk of shocks. In addition, today’s relatively high proportion of poor and vulnerable
families requires new approaches and thinking. Rather than being an exception, the design
and implementation of social protection programs will have to shift in focus to pro-poor
growth and shared prosperity. Where the will of the government to fund and build the in-
country capacity is lagging (i.e., state and local governments responsible for implementing
programs at the grassroots level), the sustainability of programs supported by international
development agencies is jeopardized. Stakeholder involvement is, therefore, vital to the
robust dialogue on social protection policies and programs, and the only way to ensure this is
to develop a fully articulated policy document for poverty alleviation in Nigeria.
223. Within the framework of this policy document, priorities have to be set based on
what resources are available and what is institutionally feasible. Three areas need to be
emphasized in relation to the poor – opportunity, empowerment, and security‒and they must
complement one another. To create more opportunity, private investment needs to be
encouraged, and international markets have to be expanded. There is the need to build up the
assets of poor households and to address the inequality of assets across gender, ethnic, racial,
and social divides. More and better infrastructure is needed in rural areas, as well as more
and better access to information.
6.2. Recommendations
224. As a way of guaranteeing the security of the poor, it will be necessary to design
national systems to prevent civil conflicts and to help poor people manage risk. The analysis
of the status of social protection in Nigeria points to some major policy implications as
follows:

Social Protection Status Report for Nigeria
92 of155
a. Develop an overarching social protection policy framework that assigns clear
institutional roles and responsibilities and that guides the design and implementation of
social protection initiatives at the federal and state levels
225. A comprehensive and strategic social protection framework is needed in Nigeria.
The framework should recognize the federal nature of the country by taking the state and
local governments into consideration and clarifying the institutional roles and responsibilities
of all key stakeholders. The framework should designate an institution to coordinate, oversee,
and guide social protection policy at the federal level, while also being accountable and
responsive to the needs of the states. This is crucial because of the current lack of
coordination in the sector and the overlap of functions between the National Planning
Commission (NPC), and the MDGs office. This agency will also be responsible for
mobilizing both domestic and international funding for poverty reduction in Nigeria.
226. There must be constant monitoring and evaluation of all poverty alleviation
programs to ensure that they are on track to achieving their objectives. As of now, there are
no appropriate mechanisms for tracking of financial flows into the programs or for measuring
their outcomes or impact. These are major gaps that are hindering the fight against poverty in
Nigeria.
227. The effectiveness of the governance and institutional framework for poverty
reduction should also be monitored from time to time, and the role that the Budget Office
plays in coordinating the Federal Ministry of Finance (FMF), NPC, and MDG needs to be
streamlined. These three ministries, departments, and agencies all have mandates related to
poverty reduction, which currently results in both overlaps of and gaps in efforts. This would
not be the case if Nigeria had a comprehensive social protection framework overseen by one
designated institution.
b. Support and generate political commitment for social protection at the federal and state
levels
228. The implementation and success of social protection programs will depend on
strong political commitment from all levels of government in Nigeria. This will require not
only legislation but also active pressure from NGOs and civil society organizations. At
present, social protection does not appear to be a priority for the federal government,
although a number of state governments have demonstrated political and financial
commitment to cash transfers. It is important to understand that, for social protection to
become a significant instrument of poverty reduction, the federal and state governments must
be fully involved in implementing major, long-term programs of assistance. This is an area
where donors can help by ensuring that their support is coordinated with the priorities of the
government as laid out in the framework. This can only happen if there is political support
for the evolution and public financing of long-term social protection programs. Getting the

Social Protection Status Report for Nigeria
93 of155
politics right may be as important, or even more important, than getting the initial technical
design of programs right.
c. Allocate and realign the resources needed to scale up social protection programs
229. A conscious effort should be made to increase the number of poor individuals and
households covered by social protection in Nigeria. While this will clearly require a
substantial financial commitment, as this report has discovered, many options are available
for increasing the fiscal space to scale up pro-poor social protection initiatives. A realignment
of resources for optimal utilization is also required. Result-based financing approach is
imperative. While development partners can help in financing some of the initial scaling-up
efforts, recent trends in donor funding toward the short term, bring into question program
sustainability (Nino-Zarazua et al., 2010). It is therefore imperative that the government not
only take ownership of the financial and governance implications of this long-term expansion
of coverage but also build the requisite capacity to facilitate a smooth transition and fiscal
space. Any discussion of whether Nigeria can afford social protection must be balanced by
an examination of the costs of not providing effective social protection. These include long-
term restrictions on the development of human capital that will constrain economic growth
and development. Pockets of social protection activities already are springing up around the
country, especially in the area of social assistance. There is thus the need to find a way to
scale up social protection coverage in the country, especially where there is evidence of
positive results, without relying on uncertain and unsustainable donor funding. There is also
the need to integrate the various social protection interventions especially around a
coordinating platform. The current arrangement in Youth Employment and Social Support
Operation can assist in this regard because of existence of central coordinating bodies both at
the state and federal levels. This might also serve as the platform for obtaining a single
registry of all poor and vulnerable households from which interventions based on their own
eligibility criteria can select beneficiaries.
d. Increase investment in service delivery for the poor
230. There is a huge challenge in ensuring adequate financing for delivery capacity in
the social sector and especially for social protection services. One of the reviewed papers,
Hagen-Zanker and Holmes (2012), identified considerable fiscal space in the Nigerian budget
to fund social protection. However, the creation of fiscal space for social protection should
not come at the expense of other social sectors if the impact of social protection on human
development is to be maximized. Early Child Assistance Program such as Nutrition, School
feeding, conditional cash transfers, School Materials Subsidy Program, Public workfare,
Elderly Pensions Scheme etc are examples of good service delivery interventions for the poor
and vulnerable.

Social Protection Status Report for Nigeria
94 of155
231. Therefore, donors and domestic social protection advocates need to strengthen
their engagement with the Nigerian government to support the argument for increased pro-
poor expenditure in general. Hagen-Zanker and Tavakoli (2011) argue that the greatest scope
for increasing fiscal space for pro-poor social protection is by: (i) increasing the mobilization
of domestic resources; (ii) allocating an increased proportion of overseas aid to social
protection programs; and (iii) improving public expenditure management. It is important to
explore options for the Sovereign Wealth Fund (SWF) to be used to finance public works
programs and other social protection programs. The proceeds from partial subsidy removal
should be reallocated under the SURE-P in such a way as to give social protection at least
50% of the funds. Besides, having a social protection policy framework backed by law will
ensure financial sustainability. The temporary nature of the MDG Office suggests the need
for a permanent body to coordinate social protection interventions. Added to this, there can
be some percentage (about 2.5%) of federally generated revenue on the first line of charge
just as are ecological funds, sovereign wealth fund and the DRG funds. Indeed a consolidated
account for social protection can be evolved. This should be through public private
partnership with certain percentage of tax for corporate bodies allocated to social protection
as obtained in the tertiary education fund.
232. For purpose of clarity, a SWF is a state-owned investment fund composed of
financial assets such as stocks, property, bonds, precious metals or other financial
instruments. Essentially, it is a state-owned pool of money invested in various assets. The
purpose of a SWF is to channel a nation’s budgetary surplus back into the country through
investments. The essence of the Nigerian SWF is to invest excess oil revenues to generate
revenue for future generations and also to act as a buffer for the economy against the risk of
oil-price fluctuations. However, as good as the sovereign wealth is, the actual beneficiaries
may long have gone before the funds matured due to poor human capital development and
umeployment which make them vulnerable. Thus, taking a little of this sovereign fund into
the social protection consolidated account will assist in helping the vulnerable develop their
human capital.

Social Protection Status Report for Nigeria
95 of155
e. Integrate an equity focus into the design and implementation of programs
233. It is vital that social protection programs take equity into consideration from the
time of inception. Equity refers to not only economic inequalities (e.g., access to labor
market opportunities) but also social inequalities related to gender, age, ethnic, or
geographical location. Sharing growth resources in Nigeria is clearly an antidote to the
current social, ethnic and political tension in the Country. Appropriate targeting mechanism
to reduce leakage and wastage of resources is key. As part of the improvement in targeting, a
dynamic single register of poor and vulnerable households as part of the Management
Information System of a Social protection Platform will help to increase the equity and
inclusion focus of social protection interventions.
f. Strengthen the governance features of social protection programs
234. Good governance is synonymous with accountability and transparency. Robust
social protection and labor systems require adequate capacity for monitoring and evaluation,
including not only formal monitoring and evaluation but also participatory monitoring and
evaluation. The key area for governance focus will include: clearly defined rules of the
interventions bordering on legislation, regulation and operation guidelines; clearly defined
roles and responsibilities of different actors involved; and controls and accountability to
ensure right benefits get to the right person at the right time. This in effect will help check the
Errors, Fraud and Corruption inherent in most of the social protection interventions. Once
these are in place, the M&E can function properly based on well defined indicators for
inputs, activities, output, outcome and impact along the result chain. A strong MIS that is
fully computerised will complement good M&E and facilitate communication.
6.3. Recommendations for Future Research
There is a need to understand the drivers of change in social protection in the different
states and local governments of Nigeria both from a quantitative and a political
economy point of view. This is likely to vary greatly given the widely differing degrees
of commitment to social protection among the various levels of government.
Considerable investments must be made in the collection of data at the state and local
level to make it possible to conduct poverty and vulnerability profiling, particularly social
vulnerability profiling, disaggregated by age, sex, wealth, and ethnicity.
There is also a need to gather evidence on the benefits of social protection in terms of
reducing poverty, supporting economic growth, and contributing to social stability
through reduction in inequality.
A good monitoring and evaluation system is needed to ensure the efficiency and
effectiveness of the various social protection programs. This should not just involve
Social Protection Status Report for Nigeria
96 of155
formal monitoring and evaluation (M&E) but also participatory M&E to give
beneficiaries and non-beneficiaries a say in the evaluation of programs that have a direct
impact on their lives. An M&E plan is needed that encourages the use of best practices in
the design of M&E indicators and impact measures disaggregated by sex and age. It
might be necessary for the government to ask for support from its development partners
to fund the development of a common M&E framework to allow for comparisons
between programs or states and to enable the aggregation of information up to the state
and national level.
A proper structured fiscal space and governance study is also ideal to be able to
determine actual situstion of things in social protection interventions.
Social Protection Status Report for Nigeria
97 of155
References
Adepoju A., S. Yusuf, B. Omonona, and F. Okumadewa (2011).“Vulnerability Profile of Rural
Households in Southwest Nigeria,” Journal of Agricultural Science 3(1):128-139.
Ahmed, A., A. Quisumbing, M. Nasreen, J. Hoddinott, and E. Bryan (2009).Comparing Food
and Cash Transfers to the Ultra Poor in Bangladesh, Research Monograph 163. Washington DC:
International Food Policy Research Institute (IFPRI).
Alayande, B. (2004). Determinants of Vulnerability to Poverty in Nigeria: A Probit Analysis.
Washington DC and Abuja: World Bank and (Nigerian) National Planning Commission.
Aminu,A. (2012).Report of Study Visit to Oyo State. Abuja: World Bank Country Office.
———(2011a).Report of the Study Visit to Bauchi State.Abuja: World Bank Country Office.
———(2011b). Pre-Mission Study Visit Report on Kwara State Youth Employment and Social
Support Programmes.Abjua: World Bank Country Office.
———(2011c).Report of the Youth Employment and Social Support Programs in Ondo
State.Abuja: World Bank Country Office.
AngoAbdullahi Committee (2000).A Review of Poverty Alleviation Programmes and Institution
in Nigeria. Committee Report Submitted to the Presidency. Abuja.
Anonymous (undated) Governance and Political Economy Analysis on Social safety Nets in
Nigeria Draft Report Bauchi State
Anonymous (undated) Governance and Political Economy Analysis on Social safety Nets in
Nigeria Draft Report Cross River State
Anonymous (undated) Governance and Political Economy Analysis on Social safety Nets in
Nigeria Draft Report Federal
Anonymous (undated) Governance and Political Economy Analysis on Social safety Nets in
Nigeria Draft Report Kwara State
Anonymous (undated) Governance and Political Economy Analysis on Social safety Nets in
Nigeria Draft Report Oyo State
Anyikwa, N. (2012). Report of Visit to Abia State for Assessment of Youth Empowerment and
Social Safety Net Programs, May 28- 31.Abuja: World Bank Country Office.
——— (2011a).Report of Visit to Cross River State for Assessment of Youth Empowerment and
Social Safety Net Programs.Abuja: World Bank Country Office.

Social Protection Status Report for Nigeria
98 of155
——— (2011b). Report of Visit to Enugu State on Assessment of Youth Empowerment and
Social Safety Net Programs, 29th November and 3rd December. Abuja: World Bank Country
Office.
Barrientos, A., and D. Hulme (2008).Social Protection for the Poor and Poorest in Developing
Countries: Reflections on a Quiet Revolution.BWPI Working Paper 30. Manchester: Brooks
World Poverty Institute.
Basset. L, Giannozzi. S, Pop. L and Ringold. D (2012): Rules, Roles and Controls; Governance
in Social Protection with an Application to Social Assistance. Background Paper for the World
Bank 2012–2022 Social Protection and Labour Strategy
Betcherman, G., K. Olivas, and A. Dar(2004).Impacts of Active Labor Market Programs: New
Evidence from Evaluations with Particular Attention to Developing and Transition
Countries.Social Protection Discussion Paper Series No. 0402.Washington DC: World Bank.
Bitrán, R., and U. Giedion (2003).Waivers and Exemptions for Health Services in Developing
Countries.Social Protection Discussion Paper Series No. 308.Washington DC: World Bank.
Cafiero, C., and R. Vakis (2006). Risk and Vulnerability Considerations in Poverty Analysis:
Recent Advances and Future Directions.Washington DC: World Bank.
Central Bank of Nigeria (CBN) Statistical Bulletin (2013)
Datta, D., A. Ejakait, and K. Scriven (2009).Cash Transfers through Mobile Phones: An
Innovative Emergency Response in Kenya.ALNAP Innovations Case Study 1.London:Active
Learning Network for Accountability and Performance in Humanitarian Action.
De Coninck, J., and E. Drani(2009).Social Protection is Centuries Old! Culture and Social
Protection for the Very Poor in Uganda: Evidence and Policy Implications.Working Paper No.
140. Manchester:Chronic Poverty Research Centre.
Dercon, S. (2011).Social Protection, Efficiency and Growth.CSAE Working Paper WPS/2011
17. Oxford, England: Center for the Study of African Economies.
Dev, S. Mahendra (2009). Rising Food Prices and Financial Crisis in India: Impact on Women
and Children and Ways for Tackling the Problem. New York: UNICEF.
Devereux, S., R. Al-Hassan, A.Dorward, B. Guenther, C. Poulton, and R.Sabates-Wheeler
(2008). Linking Social Protection and Support to Small Farmer Development.Rome: Food and
Agricultural Organisation of the United Nations (FAO).
Dijkstra, G., B. Akanji, C.Hiddink, S. Sangarabalan, and F. de Mevius (2011). Mutual Interests –
Mutual Benefits: Evaluation of the 2005 Debt Relief Agreement between the Paris Club and
Nigeria, Summary Report. Rotterdam and Oxform: Ecorys and Oxford Policy Management.
Eboh, E., O. Ujah,and E. Amaechina (2006). Do Government Fertiliser Subsidies Benefit Rural
Poor Farmers in Nigeria? Making Sense Out of Existing Data. PEP Research Network General
Meeting. Addis Ababa, June 18-22.

Social Protection Status Report for Nigeria
99 of155
European Report on Development (2010).Social Protection for Inclusive Development – A New
Perspective in EU Cooperation with Africa. Florence: European University Institute.
Gentilini, U (2007). Cash and Food Transfer: A Primer Note. Occasional Paper No. 18. Rome:
World Food Organization.
GSDRC (2011).Understanding Social Protection. GSDRC Topic Guide, Birmingham, Accessed
on 19/08/2011 through http://www.gsdrc.org/go/topic-guides/social-protection
Habtom, G., and P. Ruys(2006).“Traditional Risk-Sharing Arrangements and Informal Social
Insurance in Eritrea,”Health Policy(80)1: 218-235.
Hagen-Zanker, J., and R. Holmes (2012). Social Protection in Nigeria: Synthesis Report. London
and Abuja: Overseas Development Institute and UNICEF.
Hagen-anker J. and Tavakoli H. (2012): An Analysis of Fiscal Space for Social Protection in
Nigeria ODI February
Hagen-Zanker, J., and H.Tavakoli (2011).Fiscal Space for Social Protection in Nigeria.ODI
Project Briefing No. 63.London: Overseas Development Institute.
Handley, G. (2009) ‘Fiscal Space for Strengthened Social Protection’. Report commissioned by
UNICEF West and Central Africa Office. London: ODI.
Heitzmann, K., R. Canagarajah, and P. Siegel (2002).Guidelines for Assessing the Sources of
Risk and Vulnerability.World Bank Social Protection Discussion Paper No. 0218. Washington
DC: World Bank.
Heller P. S. (2005), Understanding Fiscal Space.IMF Policy Discussion Papers 05/4. Washington
DC: International Monetary Fund.
Holmes, R., and B. Akinrimisi, with J. Morgan and R. Buck (2012). Social Protection in Nigeria:
Mapping Programmes and Their Effectiveness. London and Abuja: Overseas Development
Instituteand UNICEF.
Holmes, R., M. Samson, W. Magoronga, and B. Akinrimisi with J. Morgan (2012b).The
Potential for Cash Transfers in Nigeria.London and Abuja: Overseas Development Institute and
UNICEF.
Holmes, R., B.Akinrimisi, J. Morgan, and R. Buck (2011).Social Protection in Nigeria, Mapping
Programmes and Their Effectiveness. London:Overseas Development Institute.
Holmes, R., J. Farrington, T.Rahman, and R. Slater (2008). Extreme Poverty in Bangladesh:
Protecting and Promoting Rural Livelihoods.London: Overseas Development Institute.
Holmes, R., and R. Slater (2007). Conditional Cash Transfers: What Implications for Equality
and Social Cohesion? The Experience of Oportunidades in Mexico. London: Overseas
Development Institute.
Holmqvis, G. (2012).“External Financing of Social Protection: Opportunities and
Risks,”Development Policy Review 30 (1): 5-27.

Social Protection Status Report for Nigeria
100 of155
Holzmann, R., and R. Hinz (2005). Old Age Income Support in the 21st Century. Washington
DC: World Bank.
Holzmann, R., and S. Jorgensen (1999).“Social Protection as Social Risk Management:
Conceptual Underpinnings for the Social Protection Sector Strategy Paper,” Journal
ofInternational Development 11:1005-1027.
Howell, F. (2001).“Social Assistance - Theoretical Background.”In Social Protection in Asia and
the Pacific, ed. I. Ortiz. Manila: Asian Development Bank.
International Fund for Agricultural Development(2005).Achieving the Millennium Development
Goals: Rural Investment and Enabling Policy.IFAD Panel Discussion Paper for IFAD Governing
Council. Rome: IFAD.
International Labour Organization (ILO) (2012): The Strategy of the ILO: Social Security for
All: Building Social Protection Floors and Comprehensive Social Security Systems/ ILO Social
Secirity Department- Geneva, 2012, iv. 80p
International Monetary Fund (IMF) (2011): Nigeria: 2010 Article IV Consultation-Staff Report;
Debt Sustainability Analysis Annex; Public Information Notice on the Executive Board
Discussion; and Statement by the Executive Director for Nigeria.IMF Country Report No. 11/57
International Monetary Fund (IMF) (2012): Nigeria: 2011 Article IV Consultation. IMF Country
Report No. 12/194
International Monetary Fund (IMF) (2014): Nigeria: 2013 Article IV Consultation-Staff Report:
Press Release and Statement by the Executive Director for Nigeria. IMF Country Report No.
14/103
Jones, N., E. Presler-Marshall, N. Cooke, and B. Akinrimisi(2012).Promoting Synergies between
Child Protection and Social Protection in Nigeria.London and Abuja: Overseas Development
Institute and UNICEF.
Kaufmann, D., Aart, K and Maasimo, M. (2010): The Worldwide Governance Indicators;
Methodological and Analytical Issues (mimeo). World Bank Policy Research Working Paper
No.5430. Washington D.C.
Kannegiesser, L. (2009). National Health Insurance Scheme to Boost Generics Market in
Nigeria, Downloaded from http://www.frost.com/prod/servlet/market-insight-
top.pag?Src=RSS&docid=155485216 on 15/12/2012
Komives, K., J. Halpern, V. Foster, Q. Wodon, and R. Abdullah (2007). Utility Subsidies as
Social Transfers: An Empirical Evaluation of Targeting Performance, Development Policy
Review 25(6):659-679.
Kozel, V., P. Fallavier, and R. Badiani (2008).Risk and Vulnerability Analysis in World Bank
Analytic Work: FY2000-FY2007. Social Protection Discussion Paper No. 44780. Washington
DC: World Bank.

Social Protection Status Report for Nigeria
101 of155
Lund, F. (2009). “Social Protection and the Informal Economy: Linkages and Good Practices for
Poverty Reduction and Empowerment.”In Promoting Pro-Poor Growth: Social Protection.
Paris: Organization for Economic Cooperation and Development, pp.69-88.
McCord, A. (2004). Policy Expectations and Programme Reality: The Poverty Reduction and
Labour Market Impact of Two Public Works Programmes in South Africa. ESAU Working
Paper No. 8. London: Overseas Development Institute.
McCord, A., and J. Farrington (2008). Digging Holes and Filling Them in Again? How Far do
Public Works Enhance Livelihoods? Natural Resource Perspectives No. 120.London: Overseas
Development Institute.
Mesa-Lago, C. (2008). Social Insurance (Pensions and Health), Labour Markets and Coverage in
Latin America. Social Policy and Development Programme Paper No. 36. Washington DC:
World Bank.
Munro, L. (2008). Risks, Rights and Needs: Compatible or Contradictory Bases for Social
Protection. In A. Barrientos and D. Hulme (eds.), Social Protection for the Poor and Poorest:
Concepts, Policies and Politics. London: Palgrave.
National Bureau of Statistics(2012).Nigeria Poverty Profile Report 2010.Abuja:NBS.
——— (2011).Annual Socio-Economic Report. Abuja: NBS.
——— (2009). Annual Abstract of Statistics: Men and Women in Nigeria. Abuja: NBS.
National Directorate of Employment (2013).Annual Report of National Directorate of
Employment. Abuja: NDE.
National Directorate of Employment (2012).Annual Report of National Directorate of
Employment. Abuja: NDE.
National Health Insurance Scheme (2008). Blue Print for the Implementation of Community
Based Social Health Insurance Programme in Nigeria.Abuja: NHIS.
National Pension Commission (2008).Highlights of the Contributory Pension Scheme in Nigeria,
Abuja. Abuja: NPC.
——— (2004).National Economic Empowerment and Development Strategy. Abuja: NPC.
National Working Committee on Social Security (2009).National Social Security Policy for
Inclusiveness, Solidarity and Sustainable Peace and Prosperity‘. Draft, Abuja: NWCSS.
Niño-Zarazúa, M. (2011).The Impact of the Food, Financial and Fuel (3F) Crises on Women and
Children in Nigeria. London: Overseas Development Institute.
Niño-Zarazúa, M., A.Barrientos, D.Hulme, and S. Hickey (2010).Social Protection in Sub-
Saharan Africa: Will the Green Shoots Blossom?BWPI Working Paper 116. Manchester:
University of Manchester, Brooks World Poverty Institute.

Social Protection Status Report for Nigeria
102 of155
Nzongola-Ntalaja, G (2002): “UNDP role in promoting good governance”, Seminar for the
International Guests at the Congress of the Labour Party of Norway, Oslo
http://www.undp.org/oslocentre/pub.htm
Nzongola-Ntalaja, G (2003): “Gouvernance et developpement”, Conférencepréparée à
l’intention d’un groupe de politicienshaïtiens en visited’études en Norvège à l’invitation du
gouvernementnorvégienet de l’Institutd’EtudesInternationalesAppliquées, Oslo
http://www.undp.org/oslocentre/pub.htm
Ogunsola, B. (2012).Situation Report of the National Housing Fund (NHF). Paper presented at
the Mortgage Banking Association of Nigeria Housing and Finance Conference/Exhibition,
Global Homes, London.
Okogu B.E. (2012). Presentation of the 2012 budget Budget office of the Federation, Abuja April
16
Okunmadewa, F., and J. Elder (2003). Nigeria: Risk and Vulnerability Assessment.Washington
DC: World Bank.
OlaniyanO., and J. Edgerton (2007).Pilot Application of NAPEP’s Participatory Monitoring and
Evaluation (PM&E) System in 2006/7, mimeo. Abuja: World Bank Country Office.
Olaniyan, O., and N.Olasehinde (2010).Situation Analysis of Social Protection in Nigeria Health
Policy Training and Research Programme (HPTRP).Working Paper 2011/4.Ibadan: University of
Ibadan.
Olaniyan, O., O. Oyeranti, A.Bankole, and O. Oni (2003).Evaluation of Risk Management
Agencies in Nigeria.Washington DC and Abuja: World Bank and (Nigerian) National Planning
Commission.
Olaniyan, O., O. Oni, and A. Adepoju (2012).Welfare Costs of Risks and Risk Management
Options in Nigeria.Abuja: World Bank Country Office.
Olaniyan, O., S. Yusuf, and O. Oni (2004).An Evaluation ofSocial Protection Strategy For
Nigeria: Policy Note, Technical Report Submitted to the National Planning Commission, Abuja,
Nigeria, July, in Selected Papers for the 2005 Nigeria Economic Society Conference Lagos:
Nigeria Economic Society.
Oni, O. (2008).“Farming Households’ Vulnerability to Risk in the Northern Region of Oyo
State, Nigeria,”Journal of Social Science 17(3):201-210.
Oni O., and S. Yusuf (2008).Determinants of Expected Poverty among Rural Households in
Nigeria. AERC Research Paper 183, September 2008.Nairobi: African Economic Research
Consortium.
Ostry J. D., Ghosh A. R., Kim J. I., and Qureshi, M. S. (2010): Fiscal Space: IMF Staff Position
Note. SPN/10/11

Social Protection Status Report for Nigeria
103 of155
OyekaleT.,and S. Yusuf (2010). “Multi Dimensional Poverty of Shock Exposed Households and
Coping Mechanisms in Rural Nigeria,”The Social Sciences 5(3):254-263.
Palacios, R., and O. Sluchynsky (2006). Social Pensions Part 1: Their Role in the Overall
Pension System.Social Protection Discussion Paper No. 0601.Washington: World Bank.
PATHS2 (2010). Quarter Ten Report PATHS2/2/QTR/02 October–December 2010. Abuja:
PATHS2.
Preliminary Report on National MSME Collaborative Survey (2010).
Rubio, M (2011): Measuring Governance and Service Delivery in Safety Net Programs;
S P Discussion Paper September.NO. 1119
Samuels, F., C. Blake, and B. Akinrimisi (2012).HIV Vulnerabilities and the Potential for
Strengthening Social Protection Responses in the Context of HIV in Nigeria.London and Abuja:
Overseas Development Instituteand UNICEF.
Schubert, B., and M. Huijbregts (2006). The Malawi Social Cash Transfer Pilot Scheme:
Preliminary Lessons Learned. New York: UNICEF.
Shepherd, A., R. Marcus, and A. Barrientos (2004). Policy Paper on Social Protection, Paper
Preparedfor UK Department for International Development (DFID), mimeo, London:Overseas
Development Institute.
Slater, R., J. Farrington, and R. Holmes (2008).A Conceptual Framework for Understanding the
Role of Cash Transfers in Social Protection. ODI Project Briefing, London: Overseas
Development Institute.
Soares, S. (2007). Conditional Cash Transfers in Brazil, Chile and Mexico: Implications for
Inequality.Working Paper No. 35.New York: International Poverty Center.
Social Protection Advisory Group (2004).Social Protection Strategy for Nigeria.Abuja: SPAG.
Soyibo, A., and G. Mwabu (2011).Shaping Social Protection in Africa: National Transfer
Accounts for Kenya, Mozambique, Nigeria, Senegal and South Africa Technical report
Submitted to the International Development Research Centre Ottawa, Canada.
Soyibo, A.,O.Olaniyan, and A. Lawanson (2011).Population Aging and Social Protection in
Nigeria.Paper presented at the National Transfer Accounts Conference on Intergenerational
Approaches to Social and Economic Policy, Belo Horizonte, Brazil, 5-12, December 2011.
Stolk, V.C and Tesliuc, D.E (2010): Toolkit on Tackling Error, Fraud and Corruption in Social
Protection Programs; SP DISCUSSION PAPER, NO. 1002
Subbarao, K. (2003). Systemic Shocks and Social Protection: Role and Effectiveness of Public
Works Programs. Social Protection Discussion Paper Series No. 0302, Washington DC: World
Bank.
Social Protection Status Report for Nigeria
104 of155
Tesliuc, E., and K. Lindert (2002). Vulnerability:A Quantitative and Qualitative
Assessment.Guatemala Poverty Assessment Program. Washington DC:World Bank.
UNICEF (2009): Fiscal Space for Strengthened Social Protection in West and Central Africa: A
Regional Thematic Report 2 Study. UNICEF/WCARO/2009
United Nations (2000).Enhancing Social Protection and Reducing Vulnerability in a Globalizing
World. Report of the Secretary General to the Thirty-ninth Session E/CN.5/2001/2. Washington
DC: United Nations Economic and Social Council.
United Nations Department of Economic and Social Affairs (UNDESA, 2007): Public
Governance Indicators; A Literature Review. ST/ESA/PAD/SER.E/100
Universal Basic Education Commission (2013). Website Ubeconline.com/about Ube @ html
Van Ginneken, W. (2003).Extending Social Security: Policies for Developing Countries.ESS
Paper 13. Geneva: International Labor Organization.
Wohlmuth K., R. Alabi, and P. Burger (2008).New Growth and Poverty Alleviation Strategies
for Africa: International and Regional Perspectives. LIT VerlagMünster.
World Bank (2012).Managing Risk, Promoting Growth:Developing Systems for Social
Protection in Africa. The World Bank’s Africa Social Protection Strategy2012–2022.
Washington DC.
——— (2010). World Development Indicators.Washington DC: World Bank.
---------- (2013) Where Has All the Growth Gone?: A Poverty Update for Nigeria, Draft PREM
World Bank.
WWW.harambefarmland.com(2013)Agri News.
Yusuf S.A. (2014) Stocktaking of Existing Social Safety Net Programmes in Nigeria Prepared
for the Federal Ministry of Finance Abuja. March
Yusuf, S. (2012a). Assessment of Youth Empowerment and Social Safety Net Programs in Ekiti
State Abuja: World Bank Country Office.
——— (2012b).Assessment of Youth Empowerment and Social Safety Net Programs in Niger
State Abuja: World Bank Country Office.
——— (2011).Report of the Pre-Mission Field Visit to Osun State Youth Empowerment
Scheme (OYES).Abuja: World Bank Country Office.
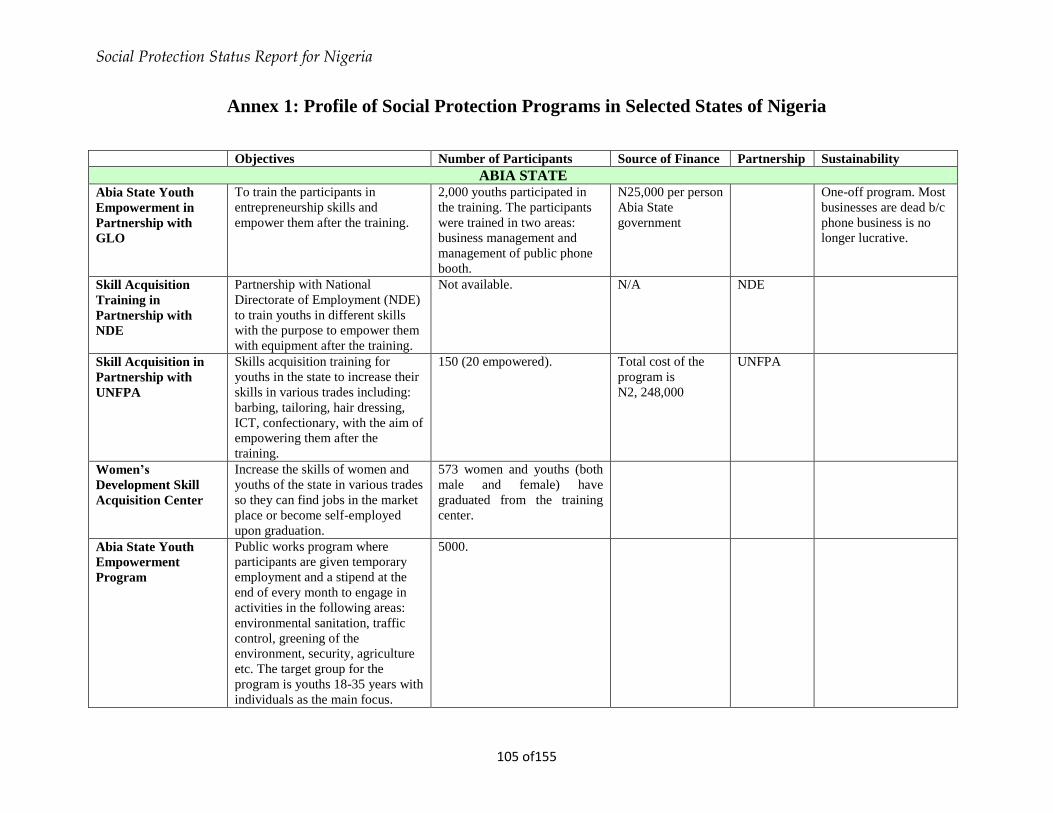
Social Protection Status Report for Nigeria
105 of155
Annex 1: Profile of Social Protection Programs in Selected States of Nigeria
Objectives Number of Participants Source of Finance Partnership Sustainability
ABIA STATE
Abia State Youth
Empowerment in
Partnership with
GLO
To train the participants in
entrepreneurship skills and
empower them after the training.
2,000 youths participated in
the training. The participants
were trained in two areas:
business management and
management of public phone
booth.
N25,000 per person
Abia State
government
One-off program. Most
businesses are dead b/c
phone business is no
longer lucrative.
Skill Acquisition
Training in
Partnership with
NDE
Partnership with National
Directorate of Employment (NDE)
to train youths in different skills
with the purpose to empower them
with equipment after the training.
Not available. N/A NDE
Skill Acquisition in
Partnership with
UNFPA
Skills acquisition training for
youths in the state to increase their
skills in various trades including:
barbing, tailoring, hair dressing,
ICT, confectionary, with the aim of
empowering them after the
training.
150 (20 empowered). Total cost of the
program is
N2, 248,000
UNFPA
Women’s
Development Skill
Acquisition Center
Increase the skills of women and
youths of the state in various trades
so they can find jobs in the market
place or become self-employed
upon graduation.
573 women and youths (both
male and female) have
graduated from the training
center.
Abia State Youth
Empowerment
Program
Public works program where
participants are given temporary
employment and a stipend at the
end of every month to engage in
activities in the following areas:
environmental sanitation, traffic
control, greening of the
environment, security, agriculture
etc. The target group for the
program is youths 18-35 years with
individuals as the main focus.
5000.

Social Protection Status Report for Nigeria
106 of155
Observations on the Abia State Youth Empowerment Program
The Abia State Youth Empowerment Program is laudable and has the capacity to engage poor unskilled and semi-skilled youths from extremely poor
households in the state if well articulated. As it stands, the program neither seems to have a clearly defined purpose or mission nor defined eligibility criteria
that target the poor and unemployed youths in the state. The only criterion used in selecting beneficiaries is nomination by stakeholders in the state, which is not
an objective means of selecting beneficiaries to programs of this nature. There is no documented framework for the Youth Empowerment Program, though it
has not fully evolved. At the moment, the focus of the program is on security. The other aspects of the program - environmental sanitation, greening of the
environment and agriculture, are yet to take off. It is necessary to expedite action on these aspects of the program to meaningfully engage the youths effectively.
There is no defined exit strategy in the program yet, though there is the thinking that the youths will be trained in different skills before the expiration program.
BAUCHI STATE
Bauchi State
Commission for
Youth and Women
Rehabilitation and
Development
(BACYWORD)
Capacity building and extra mural
studies.
4,821 students State government
Bauchi State
Conditional Cash
Transfer (CCT)
Program
5,995 families@5,000 naira
per family
MDGs
Bauchi State Poverty
Alleviation Program
Training in different skills. Since 2003, 6,577 individuals
of which 5,337 males and
1,240 females. 4,789 were
from rural areas while 1,788
were from urban areas.
CROSS RIVER STATE
(a) Conditional Cash
Transfer (CCT)
The CCT has conditions/co-
responsibility for the benefiting
households as follows: Households
must ensure that their children are
enrolled in primary and secondary
schools; they must ensure 80%
school attendance; and they must
also ensure school completion by
their children.
Total number of beneficiaries:
5,880(2,940 in 2009 and 2,940
in 2010).
Youth Empowerment
Initiative for
Unemployed
Graduates
The goal of the project is to train
1,000 unemployed graduates in
ICT professionals and
entrepreneurs across the 18 LGAs
of Cross River State. The specific
objectives of the project include:
Total -270

Social Protection Status Report for Nigeria
107 of155
train 270 unemployed graduates in
the first tranche with employable
ICT and entrepreneurial skills
within the next twelve months.
Project Sunny
Graduate Scheme
Produce self-employable youths,
create programs that can create
business opportunities for
unemployed youths in the State
especially in ICT, agriculture and
tourism, and to assist those in
business to scale up what they are
doing so they can become
employers of labor.
26 graduates have benefitted
from the program in the first
tranche.
EKITI STATE
Youth
Empowerment: Ekiti
State Volunteer
Corps Scheme (Ekiti
Project Volunteers)
Total number of beneficiaries
of the EPV corps scheme to
date is 4,776. Volunteer’s
monthly allowances are
remitted to banks of their
choice on a monthly basis
after clearance had been
issued by office of primary
assignment.
Skills Acquisition and
Entrepreneurship
Scheme
Conditional Cash
Transfer: Ekiti State
Street Sweepers and
Facility Managers
Social Security
Scheme for the
Elderly
10,084 persons registered as
beneficiaries from a total of
52,167 whose data were
captured.
The mission observed the following
• Availability of Database: The database being queried by the JCEA for its activities is robust. This is a good development as most of the development
efforts rely on inadequate or in some instance lack of data.
• Neglect of Public Training Institutions: Public training institutions are largely neglected in terms of funding and rehabilitation. This has led to the
collapse of many of these institutions. However, if rehabilitated and properly funded, the institutions can contribute significantly to training and
empowerment of youths in the state.

Social Protection Status Report for Nigeria
108 of155
• Monitoring and Evaluation is manual: The M&E system is still manual and will require improvement for it to function optimally.
• Delay in payment of allowances to Ekiti Project Volunteers (EPV): The beneficiaries of EPV were not paid as indicated for the months of October
and November. This can dampen the morale of these young men and women.
• Enabling Law being institutionalised: It is a welcome development that the state is thinking of institutionalising social security for the elderly. This
must also be extended to other safety nets such as youth empowerment and conditional cash transfer to ensure sustainability of the programs. Besides,
this will assist in getting an operational manual with which each of the schemes can work.
• Individual versus household beneficiaries: It was noticed that in most of the schemes, individuals constituted the target. This may, however, lead to
more than one member in a household benefitting from the state support.
ENUGU STATE
Conditional Cash
Transfer (CCT) In
Care of the People
(COPE)
Youth Empowerment
Program
(a)Adani Songhai
Farm Initiative
(Green City)
Coal City Taxi
Scheme
KWARA STATE
Youth Integrated
Training Farm
Center
The Farm Centre started in August 2005 with three basic objectives. These include training young people to become successful
commercial farmers; creating a generation of youth that would derive wealth from the land; and changing the perception that farming
is only for the poorly educated and resource poor in the society.
Youth Empowerment
Program
There is no documented framework for the State’s Youth Empowerment Program. The program is expected to employ 2,000 youth
(unemployed) out of the applicants who are in the region of 30,000. The recruitment of 2,000 youth is regarded as the first phase and
the program.
Small- and Medium-
Scale Enterprises
(SME) Program
The Senior Special Assistant (SSA), who pilots the affairs of this program, was recently appointed and was in the process of
articulating the visions, missions, and strategies of the government with respect to SMEs at the time of my visit. The SSA undertook a
tour with me to the Farm Centre at Malete to explore the extent to which the Centre’s activities can be enhanced under the SME
framework. The post-training empowerment program for Malete graduates and the need for training on entrepreneurship are some of
the likely proposals to be considered by the SME program.
NIGER STATE

Social Protection Status Report for Nigeria
109 of155
Vocational Skill
Acquisition
The vocational skill acquisition was to train 1,500 youths between 2009 and 2011. It was proposed by the State’s Ministry of Youths
Development and implemented in collaboration with private and public agencies; the training consultants (privately owned and
contracted); also involved are the government established National Directorate of Employment (NDE) and the National Agency for
Science and Engineering Infrastructure, Federal Scientific equipment Institute, Niger State.
Graduate
Employment Scheme
The Graduate Employment Scheme was initiated in 2008 by the Office of the Head of Service, Niger State. The objective is to train
unemployed youths with National Certificate of Education and Degree Certificate in methodology of teaching and also to provide
them with civil education for absorption into the state civil service and other sectors of the economy.
Talba Skill
Acquisition &
Vocational Training
Program
The program was initiated and approved in the fourth quarter 2011 by Niger State Executive Council via conclusion N0 C22 (2011)
4.1-4.1.9 of November17, 2011.The Talbaskill Acquisition Scheme was proposed by the State’s Ministry of Youths & Development
and implemented in collaboration with private and public agencies; the training consultants (privately owned and contracted);
Standard86 Nigeria Limited; also involved are the government established National Directorate of Employment (NDE) and the
National Agency for Science and Engineering Infrastructure.
Conditional Cash
Transfer (CCT)
Project
The preliminary office set-up and operationalization of instruments, including the development of the Project Implementation Manual
and the payments system, were concluded before August 2009.The program has two basic components: Basic Income Guarantee
(BIG) and Poverty Reduction Accelerator Investment (PRAI).
Social Welfare
Service Reformation
of Juveniles
(Correctional
Institution)
The program started in 1976 with the establishment of a Remand home in Kotangora, which was followed by that of Minna and Bida
in the year 1981 and 1998 respectively, due to the increasing rate of social vices among young persons in the state.The program is
funded through budgetary provision by the state government at N7,500.00 per month per beneficiary for six months (the maximum
period of stay ina correctional institution).
Care for the Aged
This program was established by the native authority in 1935 and was handed over to the local government in 1972.The state
government took over the program from the Local Government for the care and welfare of the aged in it 1986. This program is funded
through budgetary provision by the state government.
Care for the Pauper
Patients
This program was established in 1976 to alleviate the sufferings of indigent patients admitted to some major general hospitals in the
states (Minna, Bida, Suleja, Kontagora, Mokwa, New Wushe,andWushishi). This program is funded through budgetary provision by
the state government, as well as support by philanthropist and individuals. Each Unit is provided N50,000.00 per month
(N3,000:00/patient), totaling N1,620,000.00 per annum. To date, a total of N10,950,000 has been expended on caring for pauper
patients.
Skills Empowerment
for the Blind
A program to engage the blind and other forms of the physically challenged was first introduced in 1962 at Bida Blind Centre to help
make themself-reliant/productive and increase the life and security of the citizenry. There are currently five such institutions:
Ordinary/Advanced Blind Centre Bida (1962); Ordinary Blind Centre Ibeto (1989); Ordinary Female Blind Center Minna (1999); and
Spinal Cord Injuries Association Center (1987)). They are boarding institutions. This program is funded through budgetary provision
by the state government. Each trainee is cared and fed @ N7,500 per month. Beneficiaries are the blind persons and admission is
through LGAs, which are expected to provide pocket money as well as employment.
• Care for the
Mentally Challenged
• Care for the
Abandoned Children
• Provision of Life
and Vocational Skill

Social Protection Status Report for Nigeria
110 of155
Centers for Women
• Provision of
Microcredit
Facilities to
Registered Women’s
Cooperative Groups
OSUN
Osun Youth
Empowerment
Scheme (OYES)
OYES is a product of deliberate and well-planned program thatis includein the governor’s campaign brochure tagged, “My Pact with
the People of Osun State.”
20,000 people were finally selected, representing 1 in every 15 applicants. The successful applicants were to be deployed in six main
areas of Osun state:sheriff’s corps, Osunparamedics, traffic marshals, sanitation czars, public work brigade, and green gang.
OYO STATE
Youth Empowerment
Scheme of Oyo State
(YES-O)
The program started on July 18, 2011 when eligible applicants were asked to register online. The selected applicants were
matriculated on December 1,2011. The first batch of 3,400 employed youth, called cadets, started a two-week orientation program on
January30, 2012.
Oyo State Job
Creation and Poverty
Alleviation Program
There are four different sub-programs under the state’s Job Creation and Poverty Alleviation Program. These are graduate taxi
operators, mobile phone operators, skill acquisition program and KekeAjumose (tricycle transport operators).
Global Fund Project
Program
The program was introduced in 2009to alleviate the plight of orphans and vulnerable children (OVC) and to provide care and support
for them in the areas of education and nutrition.
Micro-Credit and
Widowhood Loan
Scheme
The program was set up in 2002 to alleviate the plight of indigent widows who could not pay their children’s school fees after the
demise of their husbands.
Conditional Cash
Transfer Programs
The two conditional cash transfer (CCT) programs in the state are still at the planning phase. However, the one proposed in the
Ministry of Health could be said to have progressed more than the one proposed.
Abiyamo Project
(Safe Motherhood
Program)
The program started in October 2011. A baseline survey was conducted in January 2012 to gather relevant data on the potential
beneficiaries. The program is meant to reduce to the barest minimum the incidence of maternal death and also to enhance child
survival with full involvement and support of fathers/husbands. The basic objectives of AbiyamoProject include creating awareness
within communities about safe motherhood issues, encouraging antenatal care attendance and healthy facility for delivery.
Education for the
Vulnerable Children
The program is proposed to commence in 2012. It is meant to assist children who have lost one or all their parents to attend school.
The assistance will become necessary for children whose surviving parents/guardians lack the wherewithal to ensure their attendance
in the school.
ONDO STATE
Public Works and
Skills for Job
The program started on December 21,2009. It focuses on unemployed youth and adult. The first and second batches of unemployed
beneficiaries were first taken through a series of training in physical fitness, public works, and entrepreneurial development. After the
training, they were deployed to control traffic (under Ministry of Transport), sweep the streets (under Waste Management Authority),
plant trees (under Ministry of Environment), and control crowd.

Social Protection Status Report for Nigeria
111 of155
Wealth Creation
Agency (WECA)
The Agency was set up in 2010. Its predecessor was the State’s Accelerated Poverty Alleviation Agency (APAA). WECA was meant
to engage the youth in agriculture in the short term, empower them in the medium term,and create wealth for them in the long run.
The basic agricultural activities of the Agency are crop production (arable farming), fishery.
Ondo State Micro-
Credit Agency
The Agency was established in 2001 and obtained legal status in May 2002. Its basic objectives are provision of easy access to credit,
creation of wealth, boosting domestic production, generation of employment, and meeting the millennium development goals
especially with respect to reduction in extreme poverty and hunger.
Conditional Cash
Transfer
The program was at the planning stage as at the time of the consultant’s visit. It was gathered that efforts were made to set up three
committees to oversee the implementation of CCT in the state on May 10,2012. See the Appendix for the composition of each of the
committees.

Social Protection Status Report for Nigeria
112 of155
ANNEX 2: SUMMARY OF GOVERNANCE STRUCTURE ACROSS SELECTED STATES
AND FEDERAL GOVERNMENT SOCIAL PROTECTION ACTIVITIES
Key Item Bauchi State Cross River State Oyo State Kwara State FCT
Targeting and
selection of
Beneficiaries
The poor and vulnerable
households are the target
Criteria for targeting
beneficiaries vary by
programmes.
Poverty and vulnerability
criteria were employed by
implementation committee in
various communities to identify
the targets. A proxy means test
is applied to verify and establish
accuracy.
Public workfare and skill for job
beneficiaries selectionswere
carried out by Ward Level
Stakeholder Committee in
collaboration with the
commission and verified by
Local Government Stakeholder
Committees
Beneficiaries are distributed
equally by size to Local
Government Areas
CCT Beneficiaries selection
was through the use of
Community Implementation
Committees(CIC) using criteria
and conditions specified in the
State CCT Operational Manual
Unemployed youths from
poor households are the
target.
Recruitment of
beneficiaries into
programmes is based on
response to advertisements
of vacancies.
MSWCD and MWA
recently adopted the use of
unified biometric captured
register to conduct
selection for programmes
in CCTs
Target group are Youths
A community based approach
is adopted.
The Agency for Youth
Development selected
beneficiaries under YES-O
with the assistance of Zonal
Officers through Community
Development Associations in
all State wards.
Targets include unemployed
graduates, semi-skilled,
unskilled and vulnerable
youths within 18 and 35
years
A Community Based
selection procedure was
employed.
KWABES Corp Members in
16 LGAs, Liason Officers in
the LGAs and Ward
Development Associations
were involved in the
Selection of beneficiaries
Selection was made based
on qualification, LG spread
and gender adhering to rules,
regulations and pre-set
criteria
Targets include the poor
and vulnerable people.
MDAs are done at State
levels.
Selection of beneficiaries
for NAPEP and MDGs
CCT is based on pre-set
criteria for core poor
households such as; -
i) Households with
children under the age of
5years to access free
healthcare and
immunization.
ii)Households with
children of primary and
secondary school age to
make 70% attendance at
school
iii) Households headed by
HIV/AID or VVF Patient
iv) Child headed
households
Selection of beneficiaries
for NDE training scheme
and GIS of CSWYE of
FMF are based on
qualifications and on
presentation of proof of
evidence.

Social Protection Status Report for Nigeria
113 of155
Beneficiaries for Poverty
Alleviation Programme of the
Ministry of Co-operatives and
Poverty Alleviation are
identified and screened by a
committee in each LGA at ward
level.
The Committee members
include District Head, Ward
Head, LGA Officials and Staff
of the Ministry.
Equal access to program was
determined by location and
community of residence and
involving intermediary agents at
community level to identify and
monitor beneficiaries
GIS beneficiaries were
selected from existing data
base
MDA Beneficiaries were
selected a fair
representation of Federal
character, within the state
and LGAs.
Selection for each
programme is usually at
the inception of the
program.
Key Item Bauchi Cross River State Oyo State Kwara State FCT
Payment
System and
Payment
delays
Beneficiaries of Skills
for Jobs
programmereceive their
monthly stipends by cash
upon presentation of
their identity card issued
during enrolment.
CCT beneficiaries were
paid through bank.
The State, LG civil
society organization
Community Leaders and
Community
Implementation
Committees monitor the
payment of stipends to
CCT beneficiaries
Beneficiaries of CCTs
and Skills for Jobs are
paid through banking
system
Some MDAs in PW
make payments of
stipends via bank and
cash-paying systems
Beneficiaries receive
their monthly stipends
through banking
system.
Payment are based on
attendance records of
beneficiaries
There were complaints
of delay in the payment
of stipends
Participants in the
Beautician Scheme
receives a monthly
stipend of N10,000
each.
Operators in the Waste
Management receive
N7,500 monthly
Stipends are paid by
respective contractors
through beneficiaries’
bank account.
Each beneficiary
obtains a clearance
letter from their
employer, endorsed at
the KWABES office
Financial commitments
to beneficiaries at
federal level are made
through banks for
MDGs and NAPEP
CCTs programs.
NDE financial
commitments to
beneficiaries are
through banks.
Irregularities to MDGs
CCTs payments are
common.

Social Protection Status Report for Nigeria
114 of155
prior to payment.
Delays to payment were
traced to the
cumbersome demand of
banks from
beneficiaries

Social Protection Status Report for Nigeria
115 of155
Key Item Bauchi State Cross River State Oyo State Kwara State FCT
Assessment of
Procurement
Process
Audit Capacity
Strict adherence to the
fundamental principles of
procurement as articulated in
the process guidelines.
Contracts are advertised, the
Tender Evaluation Committee
analyse the pre-qualified
Contractors based on
guidelines. 3 contractors are
recommended to Due Process
Officer for preferred bidder to
be certified
Expenditure on the programmes
is subjected to routine internal
audit procedures which monitor
payments, quality of work done
and beneficiaries in the
programmes.
The Office of the Auditor-
General of the State usually
conduct annual statutory audit
Procurement process is
guided by State Due
Process and Price.
MDAs internally handle
procurements of item
within the limit of ₦5
million, while those
with greater valuation
are handled under a
central procurement
process.
Annual statutory audit is
usually conducted by
the Office of the
Auditor-General of the
State.
The programmes have a
high audit capacity
There was strict
adherence to the
fundamental principle
of procurement
Expenditure on the
programmes is
subjected to routine
internal audit
procedures
It monitors payment,
quality of work done
and beneficiaries in the
programmes.
Annual statutory audit is
conducted by the office
of the Auditor-General
of the State.
There was no breach of
State procurement law
or guidelines by
agencies implementing
Youth Employment
Programmes and
Conditional Cash
Transfers
Expenditure on the
programmes is
subjected to routine
internal audit
procedures which
monitor payments,
quality of works done
and beneficiaries in the
programmes.
Annual Statutory audit
is usually conducted by
the Office of the
Auditor-General of the
State.
Procurement process is
guided by the
Procurement Law of the
Federation.
NDE make the
procurement through
sourcing of consultants
and resource persons
and by purchases of
goods.
Audit Department of
MDAs are charged with
the responsibility of
confirming the
accounting records and
financial information
Monitoring and
Evaluation Department
of the respective MDAs
administer Project
Audit.
Key Item Bauchi State Cross River State Oyo State Kwara State FCT
Vulnerability to Unintentional errors encountered Susceptible errors in the Omission of Recorded errors in the Susceptible

Social Protection Status Report for Nigeria
116 of155
Error, Fraud
and Corruption
were;
i)Wrong amount of benefit payment
ii)Payments to ineligible applicants
Intentional errors intransfer
programme include;
i) False statement or distortion of
relevant information regarding
income or household composition
Pressure Points Errors include;
i)Political biases in the geographical
allocation of program quotas
ii) Administrative errors in
registration and payment processes,
clientelism
Common corrupt practise include
manipulation of beneficiary rosters
e.g diversion of funds to ghost
beneficiaries, bribes, collusion
between staff, claimants, risk of
patronage and misappropriation of
funds
programmes include;
i)Registration and selection
malpractices
ii)Unregulated cost of
administering SSNs
iii)Procure malpractices and
mismanagement
iv)Wasteful collaboration
v)Irregular release of
budgetary funds
vi)Indeterminacy of exit time
for some programs
beneficiaries in the
payment process
Multiple payment of
beneficiaries
Others include
Presence of potential
errors, fraud and
political interference in
the selection process.
skill development
programmes include
i)Bank mistakes
ii)Error in payment
process
iii)Double capturing
of beneficiary’s name
iv)Dual L.G capturing
of beneficiary.
Others include
i)Allegation of
diverted fish farming
funds meant for
trainees
ii)Risk of ghost
beneficiaries
iii)Political
interference on
selection of
beneficiaries
mistakes include
i)Wrong targeting
ii)Payment to
beneficiaries who
do not meet
criteria
YESSO
programme
witness late
release of budget
funds for MDAs
operation
Key Item Bauchi State Cross River State Oyo State Kwara State FCT
Programme
Monitoring
and
Evaluation
For Public Workfare and Skill Development
Programmes
The Directorate of Monitoring and Evaluation
monitors the utilization of resources for the
programme, projects and attendance of
beneficiaries
Monitoring and Evaluation Officers conduct
monthly M$E visit to organisations
Currently there are no record of any Youth
programmes evaluation
SSNs monitoring is
done by the Budget
Monitoring Units, the
implementing MDAs,
NGOs, CBOs and
Community/Opinion
leaders.
Monitoring Units
of Implementing
MDAs are responsible
Monitoring
mechanism
involves taking
attendance,
supervision by
Zonal Officers
CDAs, Youth
Organizations and
monthly
verification of
activities of the
Cadets.
The Ministry of
Environment and Forestry
undertakes the monitoring
and evaluation of projects
through its Planning,
Research and Statistics
Units and the Directorates
of Environment and
Forestry Services
Monitoring durations
include mid-years
The M$E at the Federal level
monitors NDE Skills for Jobs
program
CCT programmes by NAPEP and
MDGs are monitored from
selection through payments and
exit of programme. Reports from
the State M$E Units are
forwarded to Research, M$E
Department in the NAPEP
Headquarters in Abuja

Social Protection Status Report for Nigeria
117 of155
The CCT Unit of the MDGs office and
Project Support Unit headed by the
Permanent Secretary is responsible for
monitoring the compliance of CCT
beneficiary households with the
predetermined conditionalities
School Headmasters and Officers-in-Charge
of health facilities in affected communities
are involved in monitoring activities
No evaluation has been done on the program
as the programmeis new. No arrangement
made for robust M$E of CCT programme.
for monitoring Public
Workfare Programmes.
MEDA and NGOs
collaborate to monitor
Skills for Jobs
Programmes
monitoring, monthly
meeting and periodic visit
to sites.
Monitoring activities for
skill development program
include periodic head
count, issuance of
clearance letter before
monthly stipend is paid.
The monitoring activity is
carried out by the
KWABES monitoring and
evaluation team
MDGs programme of CCT is
monitored at all State offices of
MDGs and by monitoring
officials at headquarters in Abuja
occasionally.
Local Government Field
Officials- Agric. Extension
Officers and Social Welfare
Officers monitor social protection
programmes
NGOs and CBO at State level
play a major role by offering
assistance in programme
monitoring.
Key Item Bauchi State Cross River State Oyo State Kwara State FCT
Existing
Management
Information
Systems(MIS)
The programmes have separate registries
of beneficiaries.
The BACYWORD has a database of
unemployed and eligible youth and
women in the state
BACYWORD has a new MIS for Skills
for Jobs and Public Workfare
Programmes yet to be placed online
CCT enrolment has been incorporated
into a web-oriented MIS. The system
was used to generate list of household
beneficiaries
There is low level MIS
adoption among MDAs
and CCTs
MIS adoption for Skills for
Jobs programmes is
reflective of private sector
orientation(MEDA)
NGOs operated with
dysfunctional computer
units.
There is a unified
registry for
beneficiaries
MIS is manually
operated under
the Skills for Jobs
KWABES uses its online
portal to register
beneficiaries and
disseminate information
Social media is also used
as tools toget feedback
from the public.
MIS of the Clean and
Green Program me is
coordinated in the
Planning, Research and
Statistics Unit
NDE Skill Development
Programmes has MIS
adaptable to modern MIS
NDE has its annual reports
been published and contains
organized set of information
-- data on activities of NDE
and performance of each
programme
CCTs of NAPEP have more
information structure and
dataset than the MDGs
office.
Key Item Bauchi State Cross River
State
Oyo State Kwara State FCT
Communication Existence of adequate consultation and dialogue with citizens, AYD KWABES means of

Social Protection Status Report for Nigeria
118 of155
Strategy CSO, Private Sectors and other actors to inform them, involve
them, collaborate with them and empower them with relevant
information.
Common information and communication strategy includes the use
of channels such as traditional leaders, face-to-face, radio,
notice/information board, town criers, churches, mosques,
handbills, field visits, community meetings, age groups, television
etc.
Implementation strategies of CCT Programmes were disseminated
in local dialects and publicized using media, posters and fliers
communicates
with stakeholders
through social
media, letters,
posters and
handbills
Short messages
are sent using
mobile phones.
communication with
Stakeholders include
dialogue/meetings,
correspondence and media.
Electronic mails are sent
through the internet and
mobile phones.
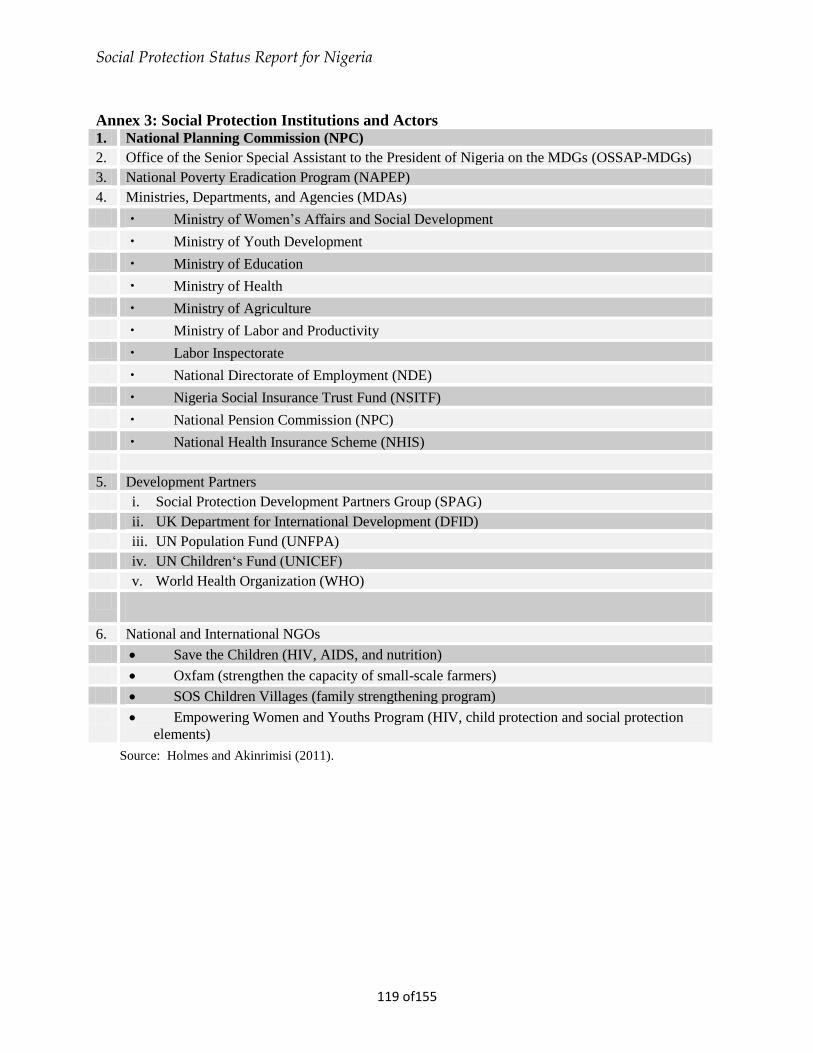
Social Protection Status Report for Nigeria
119 of155
Annex 3: Social Protection Institutions and Actors 1. National Planning Commission (NPC)
2. Office of the Senior Special Assistant to the President of Nigeria on the MDGs (OSSAP-MDGs)
3. National Poverty Eradication Program (NAPEP)
4. Ministries, Departments, and Agencies (MDAs)
• Ministry of Women’s Affairs and Social Development
• Ministry of Youth Development
• Ministry of Education
• Ministry of Health
• Ministry of Agriculture
• Ministry of Labor and Productivity
• Labor Inspectorate
• National Directorate of Employment (NDE)
• Nigeria Social Insurance Trust Fund (NSITF)
• National Pension Commission (NPC)
• National Health Insurance Scheme (NHIS)
5. Development Partners
i. Social Protection Development Partners Group (SPAG)
ii. UK Department for International Development (DFID)
iii. UN Population Fund (UNFPA)
iv. UN Children‘s Fund (UNICEF)
v. World Health Organization (WHO)
6. National and International NGOs
Save the Children (HIV, AIDS, and nutrition)
Oxfam (strengthen the capacity of small-scale farmers)
SOS Children Villages (family strengthening program)
Empowering Women and Youths Program (HIV, child protection and social protection
elements)
Source: Holmes and Akinrimisi (2011).

Social Protection Status Report for Nigeria
120 of155
Annex 4: Review of Relevant Literature
Definitions and Conceptual Understanding of Social Protection Worldwide
1. The need for social protection has been rigorously debated in the literature in recent times
in the context of risk as key determinants of poverty, wealth, and development in developing
countries. While risk is an unpredictable change in the economy that causes a decline in well-
being, vulnerability is the risk of being in poverty or falling into deeper poverty in the future
(Heitzmannet al., 2002). Cafiero and Vakis (2006) revealed that vulnerability can be viewed
from two main angles. In the first, vulnerability is the condition of being at risk of experiencing
any potentially harmful event, while the second regards it as the possibility of becoming or
remaining materially poor in the future. There is a very rich and extensive literature on risk and
vulnerability, including but not limited to Tesliuc and Lindert (2002), Olaniyanet al.
(2003),Cafiero and Vakis (2006), and Dev (2009).
2. Kozelet al.(2008) consolidated risk and vulnerability analysis together and had the
following unique features:
It focuses explicitly on poor and other vulnerable groups who are generally seen to be
more exposed to uninsured risk, more likely to suffer shocks, and less able to manage
these effectively than the average individual or household.
The poor consist both of those who are always poor (at any point in time) and of those
who move in and out of poverty. Accordingly, a static estimate of poverty (measured at a
specific point in time) is likely to underestimate those who are at risk of falling into
poverty (at some other point in time). This report looked at poverty explicitly as a
dynamic process. It focused on vulnerability as a forward-looking concept, capturing the
possibility that an individual will have a level of welfare (as measured by, for example,
consumption) below some benchmark (e.g.,the poverty line) at a given time in the future.
It examines the links between risk and shocks on the one hand and welfare and poverty
on the other. It identifies the most important downside risks as being potential
fluctuations in the circumstances of a household that affect its income and/or welfare. In
particular, risk refers to states of the world that an individual or household faces, coupled
with the likelihood that each of these states will occur. It defines shocks as the realization
of these different states of the world, such as the occurrence of an earthquake, trade
fluctuations, or the death of a household member. In other words, shocks connote the
events that produce vulnerability, which consequently increases the probability of people
sinking into poverty.
Given risk profiles, a risk and vulnerability analysis identifies ex ante and ex post risk
management strategies that can be used by individuals, households, and communities to

Social Protection Status Report for Nigeria
121 of155
protect their welfare, as well as policy measures to promote the effective management of
risk.
3. Recent literature has emphasized social protection policies and programs as a way of
dealing with these risks, shocks, and vulnerability. There is a wealth of literature on social
protection in developing nations, the vast majority of which has focused on the design, impact, or
type of programs that exist. A closer review of the social protection literature revealsfour
common types: social assistance, social insurance, labor market interventions, and community-
based or “informal” social protection. Barrientos and Hulme (2008) simply categorized those
who need social protection into the following three groups:
Weak and Unable: Those who are prevented from earning a living through disability,
long-term sickness, youth, or old age.
Able but Excluded: Those who are healthy and capable of earning an acceptable
livelihood but who cannot do so, either because they lack skills, capital, or other assets or
because they are excluded from the economy in some way.
Able but Vulnerable: Those whose living is at risk of a sudden collapse.
4. There is a consensus among scholars and development workers that social protection is
important given the understanding that poverty is multi-dimensional and persistent in time and
across generations. However, the literature is still fraught with disagreements about definitions.
While some authors have focused on the role of social protection, which is to lift the constraints
to human and economic development posed by social risk, others described it within the context
of ensuring the satisfaction of basic needs. Some others described it within the context of
implementing a rights-based approach to human development. These differences arise from
competing views of what social protection seeks to achieve (Munro, 2008).
5. These arguments have shaped how development partners define what social protection
actually means. For example, the World Bank defines social protection as social risk
management and proposes policies that seek “to assist individuals, households, and communities
in better managing income risks” (Holzmann and Jorgensen, 1999). This contrasts with the
perspective of the International Labor Organization (ILO), which is rooted in human rights.
Therefore, the ILO defines social protection as “entitlement to benefits that society provides to
individuals and households – through public and collective measures – to protect against low or
declining living standards arising out of a number of basic risks and needs” (van Ginneken,
2003).
6. The UK’s DFID defines social protection as a sub-set of public actions that help address
risk, vulnerability, and chronic poverty. This approach is accepted as cardinal by many policy-
makers both as a conceptual approach and as a concrete set of policies. As a conceptual
approach, it revolves around the needs of groups and individuals to live a fulfilling life, the role
of the state in facilitating this, and the vulnerabilities of particular groups or individuals that
prevent them from achieving this. As a set of policies, it consists of interventions that address

Social Protection Status Report for Nigeria
122 of155
vulnerabilities and any factors that hinder a group or individual's capacity to enjoy a fulfilling
life (GSDRC, 2011). Specifically, social protection is primarily concerned with those who are
vulnerable or at risk in some way19 and seeks to transfer assets to these vulnerable groups.
7. Furthermore, the European Report on Development (ERD, 2010) defines social
protection as “a specific set of actions to address the vulnerability of people’s lives through
social insurance, offering protection against risk and adversity throughout life; through social
assistance, offering payments and in-kind transfers to support and enable the poor, and through
inclusion efforts that enhance the capability of the marginalized to access social insurance and
assistance.” This definition is in line with that of the United Nations, which describes social
protection as “a set of public and private policies and programs undertaken by societies in
response to various contingencies to offset the absence or substantial reduction of income from
work; to provide assistance to families with children as well as provide people with basic
healthcare and housing” (United Nations, 2000).
8. Social protection can therefore be summarized as an effective response to poverty and
vulnerability in developing countries and an essential component of economic and social
development strategies (Barrientos and Hulme, 2008). However, there is also a consensus in the
literature that well-designed social protection may contribute to growth. Dercon (2011) has
argued that social transfers and other social assistance can offer the poor the productive assets
that they need to engage productively in the economy and that will enable them to graduate from
dependence. Public works programs can not only perform this function but also build relevant
public goods and infrastructure in local communities, thus contributing to growth.In addition,
well-designed social insurance can plug gaps in private insurance markets and complement
community-based systems.
9. While in the past, social protection was restricted to supporting people in managing and
mitigating shocks and heightened vulnerability, in the last two decades it has been expanded to
encompass four types of interventions: protective (recovery from shocks), preventive (mitigating
risks in order to avoid shocks), promotive (promoting opportunities), and transformative
(focusing on underlying structural inequalities that give rise to vulnerability) (Oni, 2008 and Oni
and Yusuf, 2008).
10. A close review of the social protection literature reveals four common types of programs:
social assistance, social insurance, emergency relief, and a range of other policies designed to
assist particular poor or vulnerable groups, including labor market quotas, employment support
(public works), price supports and subsidies, microfinance, and land reform. Although, social
protection has traditionally focused on short-term protection from the impact of shocks (e.g.,
floods, drought, unemployment, or death of a breadwinner) and on insurance for formal sector
workers, the need to support equitable growth means that it must also include longer-term
preventive and promotive perspectives. These approaches highlight the structural causes of
19 These include children, women, the elderly, the disabled, the displaced, the unemployed, and the sick.

Social Protection Status Report for Nigeria
123 of155
chronic poverty and attempt to address the social, economic, and political barriers faced by
vulnerable people as they try to rise out of poverty (Shepherd et al., 2004).
11. Social assistance refers to government and non-governmental action to transfer resources
to people whose vulnerability warrants some form of entitlement. It aims to reduce poverty and
develop the capabilities of the most vulnerable, thus increasing social and economic participation
and equality of opportunity. As articulated by Howell (2001), it covers cash transfers, social
pensions, public works programs, and in-kind transfers. When aligning these social protection
types with the most relevant target group, social assistance is most appropriate for those “weak
and unable” people who cannot earn their own living and cannot afford to contribute to insurance
or participate in other targeted programs. Social insurance and emergency relief are suitable for
individuals who are able but vulnerable, while specific programs, such as land reform and labor
market quotas, are effective in helping those who are able but excluded to overcome the barriers
that have alienated them from a growing economy.
12. As discussed by Holmes et al. (2008), there is the need to distinguish between core social
protection and complementary interventions. Core social protection includes interventions such
as asset transfers, income transfers, and public works; while complementary interventions
include micro-credit services, social development and skills training, and market enterprise
programs (Holmes et al., 2008). The elements of protection enable households to meet their basic
needs, and these include cash and in-kind transfers, which can also reduce seasonal hunger. The
elements of prevention aim to break the vicious cycles that can trap households during shocks
and stresses. This includes income support so that households do not have to resort to selling
their productive assets to smooth their income following a shock or to pay for major family
events. Such negative coping strategies can undermine households’ future productivity and
livelihoods. The “promotion” element involves providing cash transfers that households can
invest in production or transferring productive assets such as agricultural input transfer, thus
boosting incomes and improving livelihoods. More broadly, the transformative element gives
people a greater voice in decision-making, as well as access to institutions (e.g., markets) and
information from which they were previously excluded.
13. In conclusion, it becomes imperative from the above-reviewed literature that a better
understanding of Nigeria’s social protection status can be guaranteed only if its constituent
programs are assessed as regards whether they are achieving their objectives and improving the
welfare of the people of Nigeria.

Social Protection Status Report for Nigeria
124 of155
Social Protection Approach
Type Poverty-focused Social
Protection Intervention
Types of Instruments
Protective Social assistance Cash transfers, food transfers, fee waivers for social
services, school subsidies, school feeding
Preventive Social insurance Health insurance, premium waivers, subsidized risk-
pooling mechanisms
Promotive Productive transfers,
subsidies, and work
Agricultural input transfers, fertilizer subsidies, asset
transfers, public works programs
Transformative Social equity measures Equal rights/social justice legislation, affirmative
action policies, asset protection
Source Olaniyan et. al. 2012
Complementary Pro-Poor Measures and Programs
Complementary Social Services Health, education, social welfare, child protection
Complementary Economic Services Financial inclusion, agricultural extension, infrastructure, markets,
microcredit, microfinance
Source : Olaniyan et. al. 2012
Messages on Social Protection Systems
14. Going by the various definitions and understandings of social protection by development
agencies and countries worldwide, there is a need to provide clear understanding of how social
protection system can be institutionalized in Nigeria and other African countries. This involves
planning ahead to evolve Social Protection strategies for Nigeria and other African countries in
the next ten years.
15. The following are the key messages, according to World Bank(2012), that are imperative
for institutionalizing social protection in any country, though most especially Nigeria, which is
the main concern of this study:
1. Social protection is a powerful way to fight poverty and promote growth.
2. Social protection reduces inequality and promotes social stability.
3. Safety nets, an instrument of social protection, are a critical part of a government’s
capacity to respond to shocks.
4. Countries like Nigeria can realize significant benefits by creating an integrated social
protection and labor system.
5. Social protection is affordable in low-income countries and also in Nigeria despite tight
budget.

Social Protection Status Report for Nigeria
125 of155
6. The social protection strategy will be implemented by leveraging partnerships,
knowledge, and financing instruments of the World Bank and other development
agencies.
16. Otherkey messages, per the World Bank (2012), include:
Social Protection is needed more than ever in Africa and especially Nigeria. This is so
since despite modest gains of social protection strategies in Nigeria, rates of chronic
poverty remain high and millions of people are vulnerable to a range of well-known risks,
which are increasingly exacerbated by new sources of vulnerability such as climate
change.
Social Protection will contribute to development outcomes of countries such as Nigeria in
the following ways:
Social protection programs have an immediate and direct impact on chronic
poverty, by providing poor households with resources to meet their basic
consumption needs, protect assets, and achieve better health, nutrition, and
education outcomes.
Social protection programs build the productive assets of households and expand
their income-earning opportunities by building their labor market skills and
enabling them to invest tin their assets and human capital.
Social protection encourages local economic development by improving labor
market functioning, stimulating local markets through cash transfers, and creating
community infrastructure.
Social protection contributes to broad economic growth by boosting aggregate
demand and facilitating difficult economic reforms, through the provision of
support to populations that are negatively affected by such reforms.
Social protection systems, programs and policies help individuals and societies to
build resilience to risks, achieve equity, and avail of opportunities. Thus it promotes
economic growth through three functions.
Resilience through insuring against the effects of drops in well-being from a range
of shocks.
Equity through protecting against destitution and promoting equality of opportunity.
Opportunity through promoting better health, nutrition, education, and skills
development and helping men and women secure better jobs.
Finally, social protection can increase social cohesion and reduce inequality.
17. In order to promote a social protection system that will guarantee the above-stated
contributions to Nigerians social life, the Africa Social Protection Strategy outlines the vision for
the World Bank’s work in social protection over the next decade. Its main objectives are to

Social Protection Status Report for Nigeria
126 of155
strengthen social protection systems in order to reduce vulnerability and poverty by helping poor
citizens to:
i. Manage risk and respond to shocks
ii. Build their productive assets and increase their access to basic services
iii. Engage in productive income-earning opportunities.
18. Other key messages to achieving sustainable social protection system as pointed out by
the World Bank (2012) include:
Building a social protection system is made up of public policies and programs and
private and informal social protection mechanisms that deliver the resilience, equity, and
opportunity functions of social protection to reduce poverty and contribute to inclusive
economic growth.
Social protection systems evolve according to a country’s characteristics, including its
political economy and institutional capacity.
Social protection systems are shaped by the political economy.
19. Finally, to guarantee a stronger social protection and labor system for Africa, most
especially Nigeria, the following according to the World Bank (2012) are the fundamental
approaches/actions/messages:
The first of these approaches involves defining a long-term vision and a coherent set of
policies.
The second set of actions that governments can take to improve the functioning of their
social protection systems is integrating, harmonizing, and consolidating their social
protection programs.
A third set of actions is to adopt common administrative systems for all social protection
programs.

Social Protection Status Report for Nigeria
127 of155
Annex 5: Financing Social Protection in Nigeria
1. Clearly, very little is spent on social protection in Nigeria. This is partly because there are
few programs in the country. This is a key issue because despite Nigeria’s relative wealth, it
spends less on social protection than many other African countries. One study (Hagen-Zanker
and Tavakoli, 2011) has revealed that the fiscal space for social protection can be increased by
increasing the efficiency of government expenditure but this will depend on political
commitment.
Expenditure on Social Assistance in Nigeria (Excluding Civil Servant Schemes), 2005-2010
Source: Olaniyan et al 2012

Social Protection Status Report for Nigeria
128 of155
Expenditure on Social Assistance as Percentage of Government Expenditures in Selected African Countries (Excluding Civil Servant Schemes)
Source: Olaniyan et. al. 2012
What Is Fiscal Space?
An analysis of fiscal space looks at whether there is room in the budget for a government to provide
greater resources for a particular sector (e.g., social protection) without prejudice to the sustainability of
its financial position. It considers the following mechanisms:
• Mobilization of domestic revenues
• Increased discretionary expenditure through debt cancellation or increased borrowing
• Reallocation of expenditure between sectors
• Larger aid flows
• Improved financial management of expenditure
• Increased political commitment to support an expansion in social protection provision
Source: Heller (2005).
2. Information on the scope for fiscal space for social protection in Nigeria, based on
measures and recommendations, is presented in the table below.

Social Protection Status Report for Nigeria
129 of155
Scope for Fiscal Space for Social Protection
Mechanism/Measure Recommendations
Mobilization of
domestic revenues
There is scope to increase fiscal space through strong expected future growth as well as
through robust and more stable revenues. This will come from contributions from
Nigeria’s sovereign wealth fund (SWF) and improvements in tax administration and
compliance. The SWF is currently earmarked for non-recurrent expenditure, but if
innovative approaches to public works programs are pursued, it may be a potential source
of funding for these social protection activities.
Reallocation of funds
between sectors (cut
lower priority
expenditures to make
room for more desirable
ones)
There may be scope to reallocate the funding previously earmarked for the oil subsidy to
new social protection activities. In addition, there may be scope for reallocating resources
from regressive civil servant schemes to more progressive provision, although this may be
politically difficult to achieve. However, analysis of discretionary and non-discretionary
expenditure suggests there may be increasingly less scope for funding to be allocated to
social protection activities as discretionary expenditure is falling as a percentage of total
expenditure. It is hard to make a judgment on the potential for reallocating funding across
sectors and activities without having a detailed understanding of the government’s
priorities, programs, and activities. It is recommended that a public expenditure review be
carried out for this purpose.
Increase discretionary
expenditure through
debt cancellation and/or
increased borrowing
Debt cancellation is not an option. Also, given Nigeria’s history of high debt levels (as a
percentage of GDP), borrowing to fund future recurrent liabilities and long-term social
protection investments should only be pursued with care.
Increase aid It is difficult to judge whether overseas development aid (ODA) will increase over the
next few years. Beyond debt relief, ODA support to Nigeria has historically been quite
stable. Nigeria’s ownership of significant natural resources and its human development
improvements (albeit slow) suggest that increases in ODA levels are unlikely. In addition,
ODA to social protection in Nigeria has historically been very low. However, with CCT
pilots, a recent increase in development partner interest in social protection and the global
trends towards social protection programming suggest that there may be potential for
more ODA for social protection (even if overall ODA is unchanged), which would
increase the fiscal space for social protection spending.
Improve financial
management of
expenditure
There is scope to increase fiscal space by increasing the efficiency of government
expenditure. This will take time to achieve, and the exact savings from such
improvements will be difficult to quantify and hence to translate into exact measures of
increases in social protection funding. The ongoing effort to strengthen the efficiency and
effectiveness of spending is important not only for social protection allocations but also
for outcomes.
Political commitment to
support an expansion in
social protection
provision
Social protection is slowly being recognized as a policy instrument in Nigeria but is not
currently a high priority for the federal government, as reflected by its limited budget. The
commitment to social protection among the states varies significantly, though some states
are showing an interest in and channeling financial resources topro-poor social spending
in general and, increasingly, social protection in particular. In terms of future
development, social protection needs to build on these successes and leverage the political
will that exists at the state level. Development partners should present the Nigerian
government with the rationale for expanding social protection and the costs and benefits
of doing so.

Social Protection Status Report for Nigeria
130 of155
Annex 6: NIGERIA Poverty Numbers2003-04 and 2009-10
Poverty Headcount Variation Poverty Gap Poverty Severity
2003/04 2009/10 2003/04 2009/10 2003/04 2009/10
National 48.48 45.72 2.75 18.23 16.64 9.22 8.26
Rural 57.31 52.43 4.88 21.94 19.68 11.14 9.94
Urban 37.09 33.83 3.26 13.44 11.25 6.76 5.27
North Central 56.83 48.43 8.39 25.06 17.92 14.46 8.84
North East 59.19 59.41 -0.22 21.88 22.95 10.68 11.84
North West 56.20 57.52 -1.32 20.73 22.28 10.10 11.45
South East 29.20 38.58 -9.38 8.64 13.37 3.79 6.47
South South 42.74 36.51 6.24 14.83 12.53 6.90 5.97
South West 41.12 30.26 10.86 15.96 9.11 8.37 4.02
Abia 27.08 30.45 -3.37 8.09 8.98 3.56 3.90
Adamawa 63.29 64.51 -1.22 26.21 28.45 13.86 16.05
AkwaIbom 38.20 33.46 4.74 13.33 10.99 6.51 5.14
Anambra 22.78 30.05 -7.26 5.59 7.52 2.09 2.81
Bauchi 75.05 65.31 9.75 28.76 23.92 14.08 11.65
Bayelsa 27.72 28.77 -1.06 9.28 7.06 4.55 2.58
Benue 45.27 61.33 -16.06 14.45 25.34 6.70 13.51
Borno 41.29 42.78 -1.48 13.20 11.75 5.61 4.78
Cross-river 50.10 43.18 6.92 18.56 16.51 9.01 8.43
Delta 54.22 41.80 12.42 18.67 15.74 8.09 7.88
Ebonyi 43.99 71.17 -27.18 15.13 33.25 7.38 19.02
Edo 38.34 42.74 -4.40 11.55 13.95 4.82 6.16
Ekiti 43.27 40.21 3.07 13.58 14.16 5.92 6.77
Enugu 32.12 47.65 -15.53 8.70 17.88 3.71 8.84
Gombe 56.23 73.52 -17.29 20.81 35.41 10.52 20.55
Imo 29.36 28.04 1.32 9.64 8.03 4.39 3.32
Jigawa 87.37 77.92 9.45 42.88 39.23 24.79 24.32
Kaduna 35.17 45.50 -10.33 9.29 15.14 3.77 6.73
Kano 40.20 55.56 -15.35 12.78 22.85 5.40 12.08
Katsina 56.48 57.19 -0.71 18.05 18.45 7.70 8.20
Kebbi 78.63 50.10 28.53 31.00 15.95 15.12 7.04
Kogi 86.81 54.14 32.66 53.57 21.28 36.45 10.83
Kwara 82.98 51.89 31.09 45.87 18.01 29.27 8.00
Lagos 60.25 22.69 37.57 29.68 4.74 17.66 1.51
Nassarawa 46.38 55.38 -9.00 14.27 19.04 5.93 8.28
Niger 44.30 28.94 15.36 13.75 8.51 5.86 3.78
Ogun 32.74 40.48 -7.73 10.71 14.15 4.55 6.89
Ondo 46.30 40.49 5.81 14.69 13.59 6.51 6.67
Osun 26.42 22.96 3.46 7.37 7.03 3.19 3.00
Oyo 21.11 29.69 -8.58 4.99 9.21 1.76 4.02
Plateau 50.81 53.77 -2.96 19.27 20.92 10.03 11.10

Social Protection Status Report for Nigeria
131 of155
Poverty Headcount Variation Poverty Gap Poverty Severity
2003/04 2009/10 2003/04 2009/10 2003/04 2009/10
Rivers 39.96 29.76 10.20 14.50 9.92 7.09 4.72
Sokoto 62.54 71.52 -8.98 22.60 29.08 10.90 14.79
Taraba 45.09 47.41 -2.32 13.78 15.47 5.68 6.59
Yobe 71.61 67.98 3.63 27.17 28.43 13.86 15.48
Zamfara 67.32 50.90 16.41 26.33 16.93 13.26 7.83
FCT Abuja 35.72 30.89 4.82 12.45 9.20 5.68 3.50
Source:2013 World Bank PREM – Draft Poverty Assessment report - Nigeria
Authors calculations based on NLSS 2003/04 and HNLSS 2009/10

Social Protection Status Report for Nigeria
132 of155
Annex 7: Tables on Nigeria’s Fiscal Space for Social Protection
Table 1: Mobilization of Domestic Resources (2007-2014)
GDP & Natural Revenue (Nigeria Consolidated Government) (N'billion)
Actual Values Projections
2007 2008 2009 2010 2011 2012 2013 2014
Total Revenue 5926 8063 5003 6883 11285 10393 8938 10469
Nominal GDP 20657.3 24296.3 24794.2 33984.8 37409.9 40544.1 42396.8
GDP Growth Rate 6.40 6.00 7.00 8.40 6.90 6.60 6.30
Oil Revenue 4564 6535 3192 4809 8834 7581 5794 6854
Non-Oil Revenue 1362 1529 1811 2074 2451 2812 3144 3615
Import and Excise Duties 241 281 298 309 422 475 502 548
Companies Income tax 327 417 568 657 717 849 1012 1189
Value Added Tax 302 405 468 563 649 710 859 1024
Others (Education tax &
Custom levies)
92 129 201 166 236 306 243 216
Federal Government
Independent Revenue
243 115 73 154 182 207 241 326
State & LGs Independent
revenue
158 182 204 225 245 265 288 312
Sources: CBN Statistical bulletin 2013, IMF country report (2011(pg 24),2014(pg 27))

Social Protection Status Report for Nigeria
133 of155
Table 3: Revenue as percentage of GDP (consolidated)
2007 2008 2009 2010 2011 2012 2013 2014
Actual Values Projections
Total Revenue 11.1 12.3 6.4 20 29.9 25.3 20 21.1
Oil Revenue 8.5 10.3 4.3 14 23.4 7.1 12.9 13.8
Non-Oil Revenue 2.6 2 2.1 2 2.1 2.1 2.2 7.3
Import and Excise Duties 0.5 0.5 0.5 0.4 0.4 0.4 0.3
Companies Income tax 0.7 0.8 1.1 1 1 1 1.2
Table 2: Nigeria Government Operations (2007-2014) (N'billion)
Actual Values Projections
2007 2008 2009 2010 2011 2012 2013 2014
Total Revenue 2311 3029 1614 2181 2838 2763 3046 3533
GDP Growth Rate 6.4 6 7 8.4 6.9 6.6 6.4 7.3
Oil Revenue 1767 2539 1079 1506 2045 1851 1993 2269
Non-Oil Revenue 544 490 535 675 794 912 1053 1264
Import and Excise Duties 109 127 134 139 190 214 226 247
Companies Income tax 152 194 264 306 334 394 471 553
Value Added Tax 41 54 63 76 87 95 115 138
Federal Government
Independent Revenue
243 115 73 154 182 207 241 326
Sources:IMF country report (2011 (pg 22), 2014 (pg 26))

Social Protection Status Report for Nigeria
134 of155
Value Added Tax 0.2 0.2 0.3 0.2 0.3 0.3 0.3
Federal Government
Independent Revenue
1.2 0.5 0.3 0.4 0.4 0.4 0.4
Sources:IMF country report (2011 (pg23), 2014 pg(28))
Table 4: Public Sector Debt and Debt Servicing
2007 2008 2009 2010 2011 2012 2013 2014
Public (Domestic) Sector debt
(N'billion)
2170 2320 3228 4552 5623 6537.5 7119
External debt ($billion) 431 523 591 690 897 1027 1387
Debt Service 214 381 252 416 527 679 828
Public Sector debt (% of GDP) 10.5 9.6 13 13.4 17.4 16.1 16.8
Debt service-revenue 3.61 4.72 5.04 6.04 4.66 6.53 9.26
Source: CBN Statistical Bulletin 2013
Table 5: Percentage growth in Revenue Earnings (Consolidated)
2007 2008 2009 2010 2011 2012 2013 2014
Total Revenue 36 -38 38 64 -8 -16 17
Oil Revenue 43 -51 51 84 -14 -24 18
Non-Oil Revenue 12 18 15 18 15 12 15
Import and Excise Duties 17 6 4 37 13 6 9
Companies Income tax 28 36 16 9 18 19 18
Value Added Tax 34 16 20 15 9 21 19
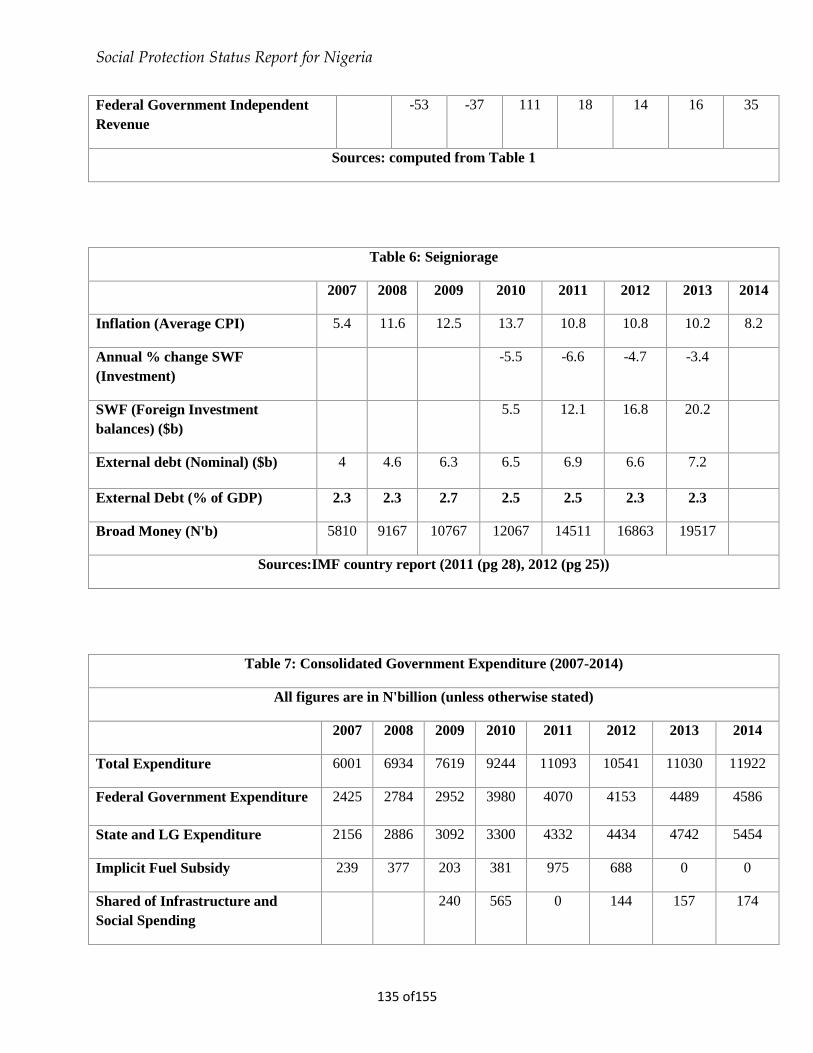
Social Protection Status Report for Nigeria
135 of155
Federal Government Independent
Revenue
-53 -37 111 18 14 16 35
Sources: computed from Table 1
Table 6: Seigniorage
2007 2008 2009 2010 2011 2012 2013 2014
Inflation (Average CPI) 5.4 11.6 12.5 13.7 10.8 10.8 10.2 8.2
Annual % change SWF
(Investment)
-5.5 -6.6 -4.7 -3.4
SWF (Foreign Investment
balances) ($b)
5.5 12.1 16.8 20.2
External debt (Nominal) ($b) 4 4.6 6.3 6.5 6.9 6.6 7.2
External Debt (% of GDP) 2.3 2.3 2.7 2.5 2.5 2.3 2.3
Broad Money (N'b) 5810 9167 10767 12067 14511 16863 19517
Sources:IMF country report (2011 (pg 28), 2012 (pg 25))
Table 7: Consolidated Government Expenditure (2007-2014)
All figures are in N'billion (unless otherwise stated)
2007 2008 2009 2010 2011 2012 2013 2014
Total Expenditure 6001 6934 7619 9244 11093 10541 11030 11922
Federal Government Expenditure 2425 2784 2952 3980 4070 4153 4489 4586
State and LG Expenditure 2156 2886 3092 3300 4332 4434 4742 5454
Implicit Fuel Subsidy 239 377 203 381 975 688 0 0
Shared of Infrastructure and
Social Spending
240 565 0 144 157 174

Social Protection Status Report for Nigeria
136 of155
Foreign financed capital spending 59 43 81 170 273 150 297 311
Sources: IMF country report (2011 (pg 24), 2014 (pg 27))
Table 8: Allocation of Spending between sectors
Consolidated Sectoral Expenditure (N'billion)
2007 2008 2009 2010 2011 2012 2013 2014
Education 241.3 255.3 244.1 261.9 391.5 406.4
Health 130.1 146.9 136.6 147.7 261.5 229.1
Agriculture 77 156.2 113.5 102.4 110.8 91.1
Defence 99.3 130.3 89.3 229.7 311.2 319.7
Internal Security 147.1 280.2 306.2 299.7 347.2 417.8
Discretionary 1180 1181 1222 1816 1349 1334 1482 1520
Non-discretionary 1246 1605 1730 2164 2721 2819 3000 3066
Sources: CBN Statistical Bulletin 2013, IMF Country report 2014 (pg 26)
Table 9: Discretionary and Non-discretionary Spending as a percentage of GDP
2007 2008 2009 2010 2011 2012 2013 2014
Discretionary 5.7 4.8 4.8 5.3 3.6 3.2 3.3 3.1
Non-discretionary 6 6.5 6.9 6.3 7.2 6.8 6.8 6.2
Sources: computed from Tables 1 and 8

Social Protection Status Report for Nigeria
137 of155
Table 10: Budget Allocation by functional classification, 2005 to 2009
Functions 2005 budget 2006 budget 2007 budget 2008 budget 2009 budget
N'Million % N'Million % N'Million % N'Million % N'Million %
General Public Services 303485 19.36 558245 28.82 539060 23.34 605586 24.75 879163 28.56
Defence 116524 7.43 101452 5.24 138407 5.99 151941 6.21 223022 7.25
Public Order and Safety 165022 10.53 191417 9.88 202703 8.78 390780 15.97 431516 14.02
Economic Affairs 274148 17.49 408632 21.09 471343 20.41 397649 16.25 752083 24.44
Environmental Protection 3696 0.24 6055 0.31 5693 0.25 4242 0.17 15341 0.5
Housing and Community
amenities
122160 7.79 32928 1.7 228847 9.91 81573 3.33 8057 0.26
Health 61544 3.93 106924 5.52 126219 5.47 138180 5.65 154567 5.02
Recreation, Culture and
Religion
22549 1.44 28909 1.49 37287 1.61 30005 1.23 33216 1.08
Education 137509 8.77 200555 10.35 224500 9.72 266451 10.89 282862 9.19
Social Protection 4889 0.31 12626 0.65 9096 0.39 8432 0.34 14346 0.47
Others (Debt Repayment) 355723 22.7 289500 14.94 326000 14.12 372000 15.21 283650 9.22
Source: Jessica Hagen-Zanker and Heidi Tavakoti (2012): An analysis of fiscal space for social protection
in Nigeria

Social Protection Status Report for Nigeria
138 of155