
FINAL DRAFT
109
University of Asia and Pacific School of Economics Research Seminar I: Industry Analysis MOTION PICTURE INDUSTRY: An Analysis of the Explanatory Power of Brand-Related Variables and Word-of-Mouth to Industry Performance Submitted by: Camu, John Harmon M. Quintos, JosetteAlbertine S. Salcedo, Althea Mae M. Tuason, Rige Gabriel N. 0
-
Upload
independent -
Category
Documents
-
view
1 -
download
0
Transcript of FINAL DRAFT

University of Asia and PacificSchool of EconomicsResearch Seminar I:Industry Analysis
MOTION PICTURE INDUSTRY: An Analysis of the Explanatory Power of Brand-Related Variables
and Word-of-Mouth to Industry Performance
Submitted by:
Camu, John Harmon M.Quintos, JosetteAlbertine S.
Salcedo, Althea Mae M.Tuason, Rige Gabriel N.
0

Mentor:Ms. Jovi Dacanay
October 21 2013
Table of ContentsOVERVIEW 2Chapter 1: The Motion Picture Industry 2
Industry Definition 3Product and Services 3Product Process 3History of the Philippine Motion Picture Industry 3Philippine Motion Picture Industry and the Macroeconomy3Linkages to the Rest of the Economy 3
Chapter 2: Industry Condition 4Factors Affecting Demand 5Factors Affecting Supply 6Regulatory Policy Framework 6
Chapter 3: Industry Structure 4Industry Players 3Market Structure 3Market Share 3
Chapter 4: Porter’s Five Forces Analysis 4Intensity of Rivalry 3Threat to Entry 3Pressures from Substitutes 3Bargaining Power of Suppliers 3Bargaining Power of Buyers 3
Chapter 5: Industry Conduct 4Pricing Policies 3Advertising/Promotions 3Production/Marketing Strategies 3
Chapter 6: Industry Performance and Prospects 3Factor Analysis 3
1

Regression without the Word-of Mouth Variable 3 Star Power 3
Coopetition 3Regression with the Word-of Mouth Variable 3
First Week Sales 3Second Week Sales 3Overall Gross Revenue 3
Industry Revenue 3
Analysis of Results 3
Chapter 7: SWOT Analysis 3
Chapter 8: Conclusions and Recommendations 3
BIBLIOGRAPHY 3
APPENDICES
INTRODUCTIONMovies are considered “experience goods”, wherein
production/distribution companies distribute the finished filmsto exhibition outfits for consumers to watch before making asound judgment regarding the content and quality of a movie.Consumers play a vital role in the performance of a motionpicture since a positive word-of-mouth is proven to affect thebehavior of moviegoers. Word of mouth initiates from informedconsumers who are familiar with brand-related variables such asstar power and coproduction between companies that influence themto watch a film. Thus, revenues generated in the first week arehighly due to the informed consumers who consider the explanatoryvariables of star power and coproduction. After the first week,gross revenues are then influenced by another significantexplanatory variable in word of mouth which considers thepercentage increase in revenues from week one to week two, alongwith the number of screens in week two compared to week one.Gross revenue are therefore further explained, particularly bythe three explanatory variables mentioned: star power,coproduction and word of mouth phenomenon.
STATEMENT OF THE PROBLEM
2

Given the numerous issues and problems confronting thePhilippine motion picture industry. In this study, theresearchers aim to answer: In spite of the losses in some major firms, how dothe major players sustain their market dominance?
Sub-problems:1. How does word-of-mouth and star power affect the players’
performance?2. How necessary are these factors to gross revenues?3. What benefits can be derived upon determining the strength
of each variable in explaining gross revenues?
OBJECTIVES
1. To analyze the effects of star power and word-of-mouth in explaining industry revenues2. To assess which strategy should be highly prioritized to maintain market dominance3. To formulate recommendations for the sustainability of the local film industry
THEORETICAL FRAMEWORK
The framework which will be used in the analysis revolvesaround the economic concept of signaling. Since movies areexperienced goods, individuals can only formulate their judgmentsabout the film by actually watching them in cinemas. According tothe signaling theory, first-week moviegoers tend to base theirjudgments whether to watch a film or not through brand-relatedvariables and movie attributes and not on the quality of themovie itself. These brand-related variables include the power ofthe lead stars to influence the moviegoers through their largefan-base and even through promotions. Other movie attributeswhich influence the signal of moviegoers to watch a film includethe genre, the ratings, the director, and the reputation of theproducer. The behavior of 2nd week moviegoers are different in asense that the decision-making process is dependent on thebehavior of moviegoers in the 1st week of a film’s screening.This is called the word-of-mouth phenomenon, more formally knownas the theory of information cascades. Based on the Specific Model
3
which parallels the theory of information cascades, moviegoersmay have a high or low signal in the first week and these signalswill generally cause individuals to watch a movie. However, inthe third week, when Consumer A (1st week) and Consumer B (2nd
week) both have high signals, Consumer C (3rd week), even with alow signal will reject his opinion about a movie given a highsignal coming from the two consumers. These also work vice versaas the dominance of low-signals in the first two weeks cannegatively affect the decision of the moviegoer in the 3rd weekas he may reject his private high signals due to the dominance oflow signals from the first two weeks. In this study, theresearchers will examine the demand for the industry asrepresented by gross revenues and ticket sales given thedifferent determinants which can affect movie demand.
EMPIRICAL METHODOLOGY AND CONCEPTUAL FRAMEWORK
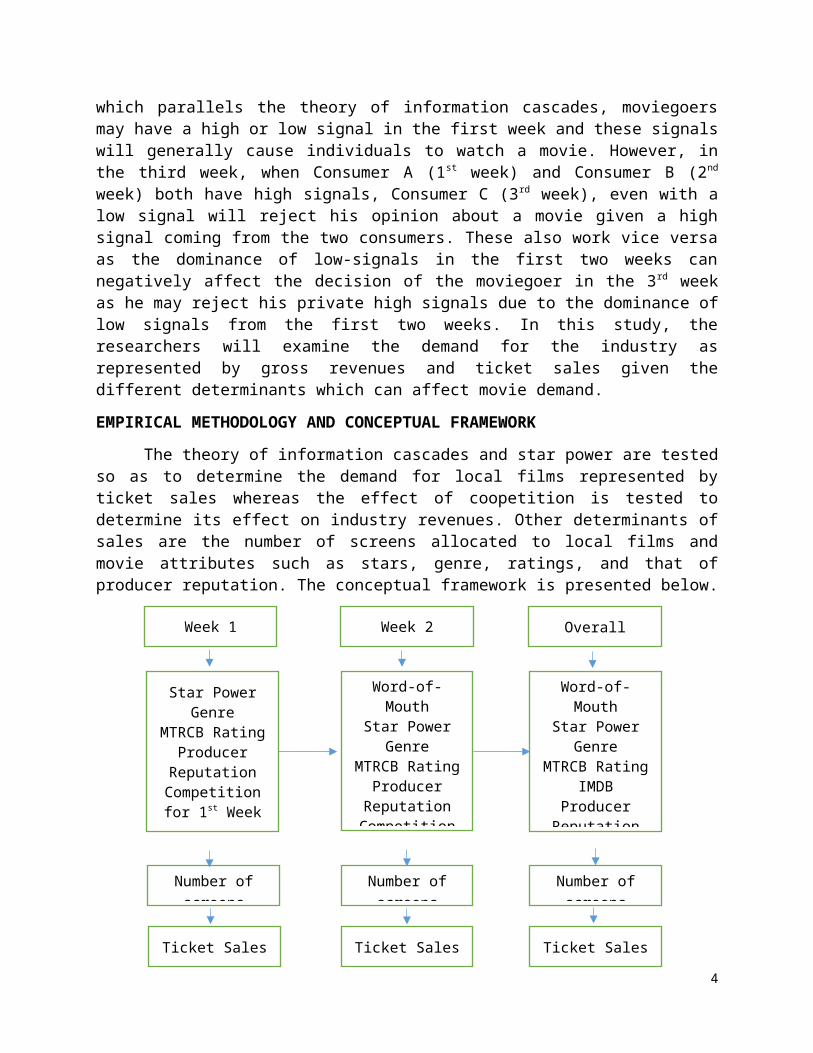
The theory of information cascades and star power are testedso as to determine the demand for local films represented byticket sales whereas the effect of coopetition is tested todetermine its effect on industry revenues. Other determinants ofsales are the number of screens allocated to local films andmovie attributes such as stars, genre, ratings, and that ofproducer reputation. The conceptual framework is presented below.
4
Week 1 Week 2
Star PowerGenre
MTRCB RatingProducerReputationCompetitionfor 1st Week
Overall
Number ofscreens
Ticket Sales
Word-of-Mouth
Star PowerGenre
MTRCB RatingProducerReputationCompetition
Number ofscreens
Ticket Sales
Word-of-Mouth
Star PowerGenre
MTRCB RatingIMDB
ProducerReputation
Number ofscreens
Ticket Sales

CHAPTER 1: THE MOTION PICTURE INDUSTRY
I. Industry Background
A. Industry Definition
The 1994 Philippine Standard Industry Classification (PSIC)classifies the motion picture activities, along with publishingactivities, radio and television broadcasting and programmingactivities, telecommunication activities and informationtechnology activities under the Other Community, Social, and PersonalActivities (Section O). The motion picture industry, in particular, isunder the Recreational, Cultural and Sporting Activities1.
The 2009 PSIC categorizes the motion picture industry underSection J: Information and Communication. This section includesthe production and distribution of information and culturalproducts, the provision of the means to transmit or distributethese products, as well as data or communications, informationtechnology activities and the processing of data and otherinformation service activities. Publishing includes theacquisition of copyrights to content (information products) andmaking this content available to the public by engaging in (or
1 Philippine Standard Industrial Classification, “Other Community, Social, andPersonal Activities,” www.bles.dole.gov.ph/beams/index.php/catalog/41/download/285(Retrieved July 2013)
5
arranging for) the reproduction and distribution of this contentin various forms. All the feasible forms of publishing (in print,electronic or audio form, on the internet, as multimedia productssuch as CD-ROM reference books, etc.) are included in thissection.2
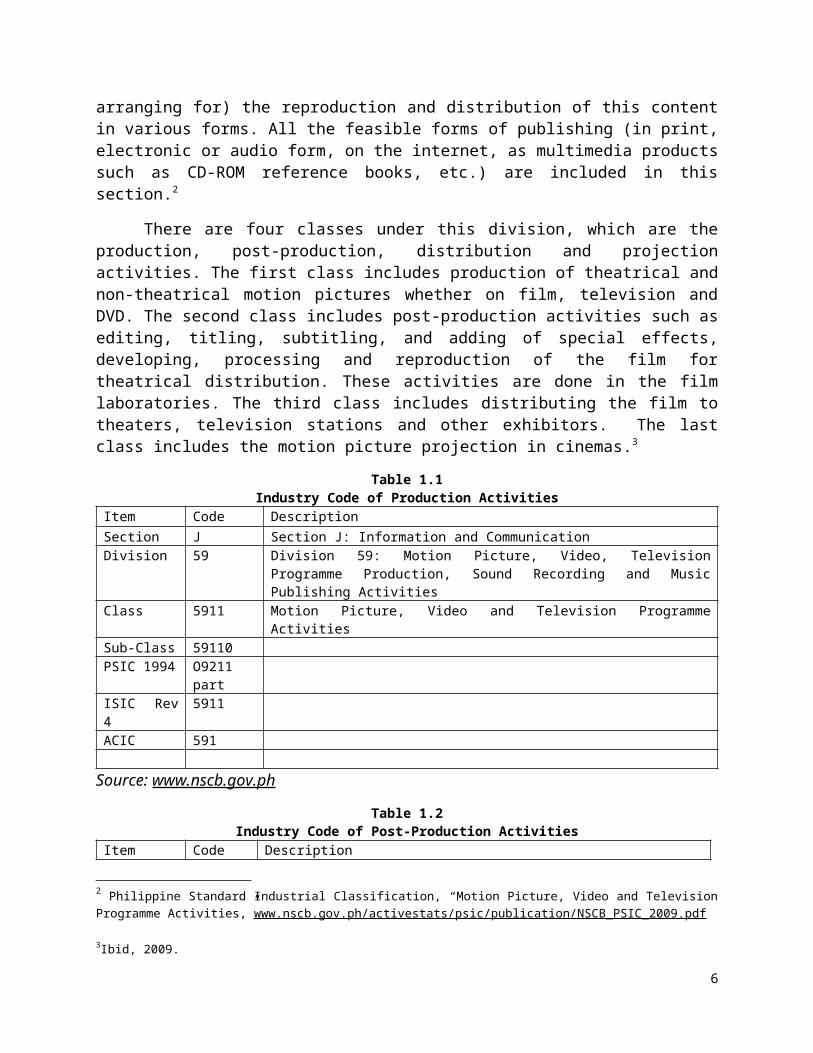
There are four classes under this division, which are theproduction, post-production, distribution and projectionactivities. The first class includes production of theatrical andnon-theatrical motion pictures whether on film, television andDVD. The second class includes post-production activities such asediting, titling, subtitling, and adding of special effects,developing, processing and reproduction of the film fortheatrical distribution. These activities are done in the filmlaboratories. The third class includes distributing the film totheaters, television stations and other exhibitors. The lastclass includes the motion picture projection in cinemas.3
Table 1.1Industry Code of Production Activities
Item Code DescriptionSection J Section J: Information and CommunicationDivision 59 Division 59: Motion Picture, Video, Television
Programme Production, Sound Recording and MusicPublishing Activities
Class 5911 Motion Picture, Video and Television ProgrammeActivities
Sub-Class 59110PSIC 1994 O9211
partISIC Rev4
5911
ACIC 591
Source: www.nscb.gov.ph
Table 1.2Industry Code of Post-Production Activities
Item Code Description
2 Philippine Standard Industrial Classification, “Motion Picture, Video and TelevisionProgramme Activities,”www.nscb.gov.ph/activestats/psic/publication/NSCB_PSIC_2009.pdf
3Ibid, 2009.
6

Section J Section J: Information and CommunicationDivision 59 Division 59: Motion Picture, Video, Television
Programme Production, Sound Recording and MusicPublishing Activities
Class 5912 Motion Picture, Video and Television Programme Post-Production Activities
Sub-Class 59120PSIC 1994 O92112ISIC Rev4
5912
ACIC 591Source: www.nscb.gov.ph
Table 1.3Industry Description of Distribution Activities
Item Code DescriptionSection J Section J: Information and CommunicationDivision 59 Division 59: Motion Picture, Video, Television
Programme Production, Sound Recording and MusicPublishing Activities
Class 5913 Motion Picture, Video and Television ProgrammeDistribution Activities
Sub-Class 59130PSIC 1994 O921113ISIC Rev4
5913
ACIC 591
Source: www.nscb.gov.ph
Table 1.4Industry Description of Motion Picture Projection Activities
Item Code Description
Section J Section J: Information and CommunicationDivision 59 Division 59: Motion Picture, Video, Television
Programme Production, Sound Recording and MusicPublishing Activities
Class 5914 Motion Picture Projection Activities
7

Sub-Class 59140PSIC 1994 O92120ISIC Rev4
5914
ACIC 591Source: www.nscb.gov.ph
B. Product and Services
Films are considered the products of the motion pictureindustry. Films are produced by recording images from the worldwith cameras, or by creating images using animation techniques orspecial effects. 4
These films are classified into different genres for easierevaluation and comparison. All films have at least one majorgenre, although there are a number of films that are consideredcrossbreeds or hybrids with three or four overlapping genres(or sub-genres) that identify them. Suspense-thriller,biographical, romance, and fantasy are few examples of sub-genres. The following are the main film genres: 5
1. Action: This type of film usually involves physical stunts,chases, fights and rescues. Oftentimes, it is two-dimensional, meaning there are heroes (protagonists)battling against villains (antagonists).
2. Comedy: Plots are typically light designed to amuse and makethe watchers laugh. It may be done by exaggerating languageand action. Various forms of comedy such as spoofs,parodies, slapstick, romantic comedy and cark satiricalcomedy (black comedy).6
3. Drama / Other: along with a serious tone and mood, realisticcharacters, settings and situations also characterize it.
4JehoshuaEliashberg, Anita Elberse and Mark Leenders, “The Motion Picture Industry:Critical Issues in Practice, Current Research & New Research Directions,”www.hbs.edu/faculty/Pages/download.aspx?name=05-059.pdf(accessed July 2013)
5 Tim Dirks, “Main Film Genres,” http://www.filmsite.org/genres.html (accessed July2013)6Adapted from film genre descrption used by Fee, Edward. “The Costs of Outside EquityControl: Evidence from Motion Picture Financing.” (Journal of Business, 2002, vol. 75,no.4)
8
This does not focus on special effects and other genres suchas comedy or action. Instead, it emphasizes plot andcharacter development and interaction.
a. Romance: stories that center on a the positive andnegative sides love between two or more characters
b. Documentaries: stories that develop on a true story andare narrated in the presence of factual figures andplaces explained by an expert on a certain field
c. Historical: these films revive the past through the useof old-fashioned costumes and plots that bring topresent the world lived by one’s ancestors
C. Product Process
Producing a film is a sophisticated process that requires acomplete specification of the conditions, materials, personnelneeded to produce a film. The stages for production can bedivided into three main stages: (1) Preproduction (2) Productionand (3) Post Production. Each stage is sequentially in order,unable to proceed to the next until the earlier stages have beensignificantly completed. The output of this production stages arethen distributed and exhibited; (4) Distribution and (5)Exhbition
1. PREPRODUCTION
The preparation for every element in the filming processtakes place in the preproduction stage. The producer and directorare the central figures when it comes to organizing thepreproduction stage. Schedules would be set to organize the orderin which each process of the preproduction tasks of the directorand producer will be planned and carried out.7
2. PRODUCTION
“The start of production is the moment when the score hasbeen written, the musicians are assembled, and the conductorraises the baton. The ship has been constructed, the crew hasbeen chosen, and the captain pulls up the anchor”.8 Production is
7 Ibid, 418 Ibid 225
9
also called ‘principal photography’ which is the period when thefirst unit completes photography.
3. POSTPRODUCTION
Much of what the audience perceives on the screen is createdduring the postproduction process, when the raw materialaccumulated during the shoot is transformed into a product9. Itinvolves the editing of sequences and images, as well as thesound that will be used for producing the final product. It isalso in this stage that finishing touches are executed in filmlaboratories.
4. DISTRIBUTION
Entering into the right theaters and territories are crucialto the film’s critical and financial success. A distributor mustknow that a character-driven film without major celebrity talentin the cast may need to be released in a few key territories atsites known to attract the right kind of audience. Filmdistributors are mainly responsible for getting the film intotheatrical release in movie or cinema theaters10. Distribution inthis industry’s sense is the interaction with its two main groupsof customers: exhibitors and its audiences. It encompasses thephysical distribution of the prints to the theaters or cinema aswell as the marketing activities in each of the markets in whichit is released11.
There is also a subset of film distributors that deals withnontheatrical distribution such as licensing to television,airlines, video, and the internet. These are normally handledbetween the production entity and television networks orsyndication companies. There are separate distributors for videoand other forms of electronic distribution. Since distributioncovers all these as well as film advertising, a distributor
9 Ibid, 253 10Yager F. and Yager J. Career Opportunities in the Film Industry.(NY: Ferguson, 2009), 19211 Eliashberg, Jehoshua, Anita Elberse, and Mark A.A.M Leenders. "The Motion
Picture Industry:Critical Issues in Practice, Current Research & New Researh Directions " HBS. (2009),
18-19.www.hbs.edu/faculty/Publication%20Files/05-059.pdf (accessed July 6, 2013).
10
should also work with various staff and agents and must knowmedia.
They use a variety of strategies to get people to buytickets to their movies such as holding advance screenings forkey journalists or opinion leaders to creating elaborate contentsopen to the public to see a movie prior to normal screenings.When television advertising is involved, commercials have to bemade. It is a tricky business wherein trailers are made withoutgiving too much or too less but just enough to entice peopleabout the movie12. All in all, distributors have many factors toconsider, including whether the release date is right, thebehavior of their target market, what competition will be at thattime, and the best way to market this particular movie.
5. EXHIBITION
Exhibition will refer to activities performed by theaterchains and individual theater sites13. Theater chains havevirtually taken over the exhibition business, and they have theirown buyers and bookers who attend screenings prior to a film’srelease. Theater owners should know which movie to exhibit thatinterest its market. Their location must be strategic enough thatit is where there are enough people and basically, there is easyaccess by driving which is explained by the relationship betweentheater characteristics which are price and quality, the distanceconsumers have to travel to theater, and their demand formovies14. They are also responsible for tracking box officereceipts meaning they have to keep the books as up-to-date aspossible. In addition to this, they often have to makeconcessions with distributors to get blockbusters which they willhave to agree on the less desirable film in exchange for beingallowed to show which movie will fill their theater. Aside fromadvertising and marketing, theatrical exhibition is also one ofthe major factors in persuading the public what they want to see.12Yager F. and Yager J. Career Opportunities in the Film Industry.(NY: Ferguson, 2009), 20413 Eliashberg, Jehoshua, Anita Elberse, and Mark A.A.M Leenders. "The Motion
Picture Industry:Critical Issues in Practice, Current Research & New Researh Directions " HBS. (2009),
31-34.www.hbs.edu/faculty/Publication%20Files/05-059.pdf (accessed July 6, 2013).14 Ibid
11

At the same time, it also influences the growth and decline ofexhibition industry because prior and during theatrical release:there is a combination of advertising, media attention and word-of-mouth communication.
D. Historical Background of the Film Industry
Prior to the existence of Philippine cinema, theater hadalready been embedded in the country’s national culture giventhat in early societies, ritual practitioners already had thehabit of performing their dance dramas through imitative communaldance, all of which aim to the assurance of the Earth’sfertility, to the proper regulation of seasons and elements, andto the grant of augmentations in harvest and in warfareactivities15.
By the turn of the 19th century, zarzuelas and vaudevillesbecame prominent as Filipinos from all over the country greatlyparticipated both as actors and audiences in this type ofperformance arts. The former was characterized as a traditional,satirical-themed Spanish one-act opera while the latter was astage show of variety of acts wherein actors engage themselves indancing, singing, and comedy to passionately prove their art ofentertainment16.
During the 19th century, motion picture was introduced inthe country via the efforts of Spain. Silent films arrived inthe Philippines. There were no stable audiences for the filmsthat time. The change happened just when the Americans made afilm that illustrated the execution of Dr. Jose Rizal. Filipinos’sense of nationalism rose, leading to the production of the FirstFilipino film entitled “DalagangBukid”, which was helmed by JoseNepomuceno, the Father of Philippine Movies. The zarzuela-basedfilm set the tone for the emerging popularity of Philippine
15Arsenio Bautista, “History of Philippine Cinema,” National Commission for Culture and the Arts(2011), 1-3,
http://www.ncca.gov.ph/about-culture-and-arts/articles-on-c-n-a/article.php?i=115&igm=1 (accessed July 7, 2013)
16Ibid, 2011.
12

literature-related themes and was released in September 25,191917.
During the 1930s and the 1940s, Julian Manansala, the Fatherof Nationalistic Film, produced and directed Patria Amore. The saidfilm helped in establishing the market for Filipino films. Filmartists and producers strayed from the guidelines and commentedon socio-political issues, using contemporary or historicalmatter.
The industry was put under a command during the Japaneseinvasion in the early years of the 1940s. Crimes and punishmentturned widespread during the three-year occupation of theJapanese. Instead of releasing Hollywood movies, the Japanesedominated the market with the influx of films coming from theirregion. Philippines served as an important market for Japanesefilms.
From 1919 to 1940s, the trends of Philippine films can bedeciphered by analyzing the popularity of genres that time.Specifically, they are dramas and zarzuelas. Soon enough, actionmovies began to be the norm. From the stratification consideredbefore which is religion, the basis soon became Philippineliterature. The industry still managed to compete despite thearrival of Hollywood movies. It was evident then that the habitof moviegoing was already headstand in the country that time18.
To date, the decades of the 1950s and the 1970s areconsidered the Golden Ages of Philippine Cinema as it was inthese periods wherein Filipinos films had been consideredundisputed leaders in the continent’s film scene and had alsogarnered international recognitions from different award-givingbodies across the world such as the Cambodian, Berlin, and AsianAwards19. The period of 1950s mirrored the rebuilding and
17NadiTofighian, The Role of Jose Nepomuceno in the Philippine Society (2005), 9-14, http://su.diva-portal.org/smash/get/diva2:200615/FULLTEXT01.pdf (Accessed July 8, 2013)18 Nick Deocampo, Film: American Influence on Philippine Cinema (Manila: Anvil Publications, Inc.,2011)19Arsenio Bautista, “History of Philippine Cinema”, National Commission for Culture and the Arts(2005), 1-3,http://www.ncca.gov.ph/about-culture-and-arts/articles-on-c-n-a/article.php?i=115&igm=1 (accessed July 7, 2013)
13

dominance of cinemas20. This decade was considered the “First GoldenAge of Philippine Cinema” due to the discovery of new cinematictechniques which increased the awareness of both local andinternational markets21. In terms of output, the film industrywas able to produce at an average of 350 films a year. Theestablishment of the First Golden Age can be explained throughthe emergence of studio systems in the country. The Big Fourwhich monopolized the industry that time were the LVN Pictures,Sampaguita Pictures, Premiere Productions, and LebranInternational22. In this decade, local films started to bringhome recognitions from internationally-acclaimed festivals.
During the 1960s, the industry suffered decline due tolabor-management conflicts and the increasing demands for foreignfilms that dominantly consisted of action and sex films. Thelatter were characterized as “bomba pictures”. They wereattributed with such title because they explicitly show sexscenes and were just shown in provinces or small-scale filmdistributors in order to attract the film audience23.
The Second Golden Age was achieved in the period of 1976-1986 under the Marcos administration wherein young filmmakersdebuted and made a mark in the industry in the persons of Lino deBrocka, Eddie Romero, Mario O’ Hara, Ishmael Bernal. There wasalso the rise of independent film companies such as LEAProductions, Regal Films, Viva Films, Seiko Films and a lotmore24. In this period, a regulatory board was established toensure the public of the proper censorship of films. This wascalled the Board of Censors of Motion Pictures (BCMP), which isequivalent to MTRCB at present. The collapse of the studiomovement paved the way for the rise of independent film outfitsand new product designers, writers, and editors25.
20Anonymous.“History of Philippine Cinema”.Philippine Journeys (n.d.),http://www.aenet.org/family/filmhistory.htm (Accessed July 8, 2013) 21Ibid, n.d.22 Joseph Palis, Cinema Archipelago: A Geography of Philippine Film and the Postnational Imaginary (ChapelHill: University of North Carolina, 2008), 115-119.23 Joseph Palis, Cinema Archipelago: A Geography of Philippine Film and the Postnational Imaginary (ChapelHill: University of North Carolina, 2008), 116.24Ibid, 117.25Ibid, 117.
14

In the 1980s, the decade when the former president FerdinandMarcos was subjected to People Power, film producers anddirectors incorporated in their movies the hardships, cruelty,and tyranny experienced by the people because of the Martial Law.In 1985, two movie governing bodies were created to help theindustry. These are the Movie and Television Review andClassification Board (MTRCB) and the Videogram Regulatory Board(now known as the Optical Media Board) that primarily aimed tocombat piracy26.
From 1990s and up to the present, there seems to be arepetition of genres, plots, styles and characterizations. Theproducers seem to be more profit-oriented. But still, we arestill recognized today in different international film festivals,such as the Cannes Film Festival27.
“Digital computer technology has brought us to the nextdecisive historical and discursive caesura. We are in thebackslash.”28These digital cinemas open new market opportunitiesfor the industry. According to the Executive Director of the FilmDevelopment Council of the Philippines, the shift to digitalfilmmaking has provided the country a better chance to give amore quality film and more quantity of films produced becauseseveral digital effects can now be altered using technology.Furthermore, the film experts believe that the cinema “will beinvigorated by the fresh blood injected into it by the digitalfilmmakers”29.
E. Industry and the Macro Economy
1. Contribution to GDP
The National Statistics Coordination Board (NSCB) hadrecently revealed that on the average, Metro Manila Film Festival(MMFF) entries generate more or less half-a-billion pesos, an
26ArunaVasudev, LatikaPadgaonkar, and RashmiDoraiswamy, Being and Becoming the Cinemas of Asia(New Delhi: Mac Millan, 2002)27Anonymous.“History of Philippine Cinema”.Philippine Journeys (n.d.),http://www.aenet.org/family/filmhistory.htm (Accessed July 8, 2013)28 Kristen Daly, How Digital and Computer Technologies are Changing Cinema. (2008), 1.29 Joseph Palis, Cinema Archipelago: A Geography of Philippine Film and the Postnational Imaginary (ChapelHill: University of North Carolina, 2008), 139.
15

amount constituting 10% of the combined local and internationalrevenues of motion pictures screened in the country and one-thirdof the total domestic gross of local movies. Despite having fewernational releases, on the average, a local film earns twice asmuch as foreign films.
As regards the contribution to the Gross Domestic Product(GDP) in 2011, the total revenues from both local and foreignmovies constitute 0.06% of the total GDP (0.016% coming fromlocal films and 0.046% coming from the foreign films)30. It isalso shown below that for two years, during the year 2008 until2010, the industry’s GDP contribution is slowly increasing.During the year 2009 and 2010, local films’ contribution wasstagnant but there was an increase in the foreign films’contribution which resulted to a 1.6% increase in 2010. For 2010and 2011, overall contribution of both the local and foreignfilms was stagnant. Even though the local films’ contributionincreased from 0.014 of 2010 to 0.016 of 2011 or a 12.5%increase, there was still a decrease in foreign films’contribution to GDP of 0.048 of 2010 to 0.046 of 2011 or a 12.5%decrease which resulted to the same overall contribution of theindustry to GDP of 2010.
Year Gross revenue Average revenue
Local Foreign Total Local Foreign Total Local Foreign Local Foreign Total Local Foreign2008 20 150 170 1.133 3.358 4.491 56.6 22.4 7,720,903 0.015 0.043 0.058 5,739,592 0.02 0.0592009 20 141 161 1.119 3.806 4.925 55.9 27 8,026,143 0.014 0.047 0.061 5,993,427 0.019 0.0642010 18 131 149 1.297 4.29 5.587 67.3 32.7 9,003,480 0.014 0.048 0.062 6,442,033 0.02 0.0672011 23 129 152 1.547 4.48 6.027 6.3 34.7 9,734,783 0.016 0.016 0.032 7,142,606 0.022 0.063
Number of films with reported gross revenue
Gross Domestic Product (GDP) in current prices
Percentage share of gross revenue to GDP
Household Final Consumption
Expenditure (HFCI) in current prices
Percentage share of gross revenue to HFCE
Source: National Statistical Coordination Board (NSCB)Figure 1.5
Contribution of Movie Industry to GDP
2. Contribution to Employment
According to the latest statistics provided by the NationalStatistics Office for the year 2009, the distribution ofemployment reached 87, 438 for the overall community, social, and30 Dr. Romulo Virola, “Now Showing: Panday, Nag-Shake, Rattle, and Roll”, StatisticallySpeaking (February 13, 2012),http://www.nscb.gov.ph/headlines/StatsSpeak/2012/021312_rav_mpg.asp
16

personal service activities establishments, 95.2% (83,271) werepaid while 4.8% (4,167) were working owners and unpaid workers.Out of these statistics, only an estimate of 18,000 (20.7%)employees is classified under motion picture, radio, televisionand other related activities portion31.
Source: National Statistical Coordination Board (NSCB)Figure 1.6
Contribution of Film Industry to Employment
Employees belonging to Sporting & other recreational activities garnered the highest number of workers per establishment at 35.5 or 40.6%, the statistics say. Ranked secondare from other services activities industry with 31.4 or 35.9%. Followed by Motion picture, radio, television & other
31 National Statistics Office, “2009 Annual Survey of Philippine Business and Industry(ASBPI) – Other Community, Social, and Personal Service Activities for allEstablishments: Final Results”, Social and Personal Services Activities (February 6, 2012),http://www.census.gov.ph/content/2009-annual-survey-philippine-business-and-industry-aspbi-other-community-social-and-0
17
62%
1%1%
13%
23%
Percent Distribution of Other Community, Social and Personal Service Activities Establishments for All
Employment Sizes by Industry Group: Philippines, 2009Other service actvitiesNews agency activitiesLibrary & archives, museums and other cultural activitiesSewage & refuse disposal, sanitation and similar activites
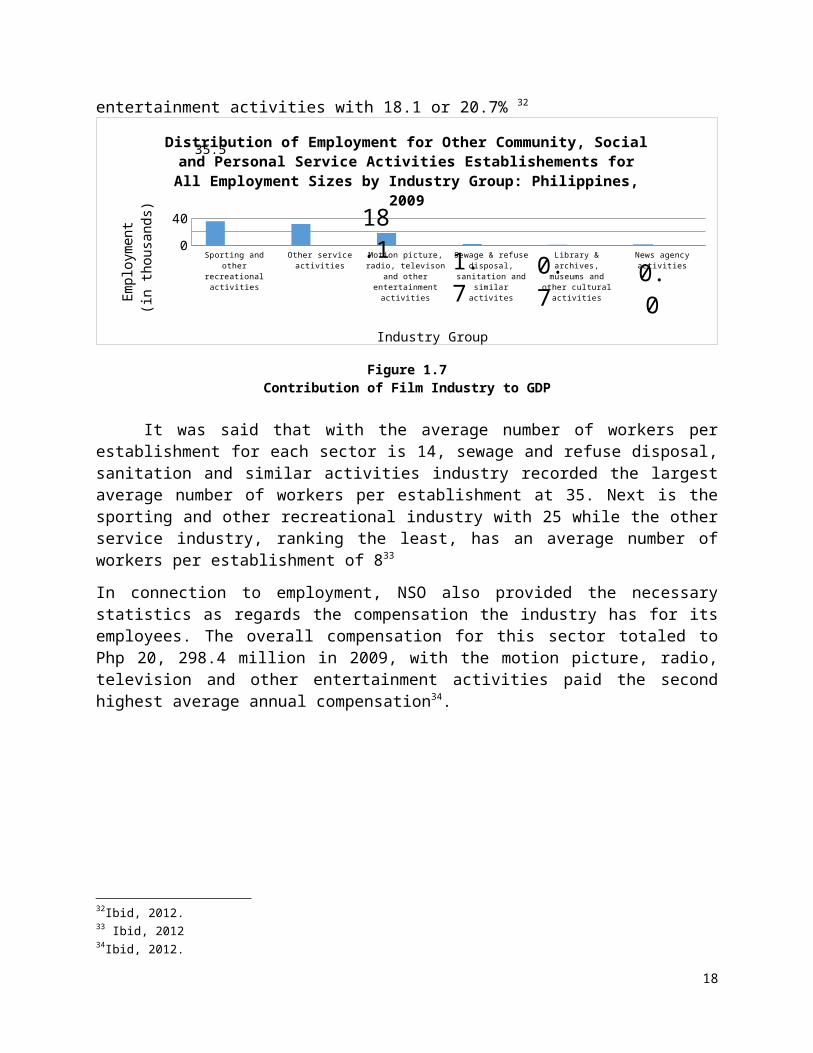
entertainment activities with 18.1 or 20.7% 32
Sporting and other
recreational activities
Other service activities
Motion picture, radio, televison
and other entertainment activities
Sewage & refuse disposal,
sanitation and similar
activites
Library & archives,
museums and other cultural
activities
News agency activities
0
40
35.5Distribution of Employment for Other Community, Social and Personal Service Activities Establishements for All Employment Sizes by Industry Group: Philippines,
2009
Industry Group
Employment
(in thousands) 18
.1 1.7
0.7
0.0
Figure 1.7Contribution of Film Industry to GDP
It was said that with the average number of workers perestablishment for each sector is 14, sewage and refuse disposal,sanitation and similar activities industry recorded the largestaverage number of workers per establishment at 35. Next is thesporting and other recreational industry with 25 while the otherservice industry, ranking the least, has an average number ofworkers per establishment of 833
In connection to employment, NSO also provided the necessarystatistics as regards the compensation the industry has for itsemployees. The overall compensation for this sector totaled toPhp 20, 298.4 million in 2009, with the motion picture, radio,television and other entertainment activities paid the secondhighest average annual compensation34.
32Ibid, 2012.33 Ibid, 201234Ibid, 2012.
18

Other community, social and
personal service activities
News agency activities
Motion picture, radio, televison
& other entrtainment activites
Sporting and other
recreational actvities
Sewage & refuse disposal
sanitation and similar
activities
Library & archives,
museums and other cultural
activities
0
1000
2000
3000 2203.6
Average Annual Compensation per Paid Employee for Other Community, Social and Personal Service Activities
Establishements for All Employment Sizes by Industry Group: Philippines, 2009
Industry Group
Aver
age
Annu
al
Comp
ensa
tion
per
Paid
Em
ploy
ee (
in t
hoou
sand
Pe
sos 36
1.3
90.0
Figure 1.8Contribution of Film Industry to Compensation (GDP)
For the total Revenue earned by the sector in the same yearwhich amounted to Php 125, 176.6 million, motion picture, radio,television and other entertainment activities generated thesecond largest revenue of Php 43, 738.3 million or 34.9%. Whilethe cost excluding compensation paid to employees totaled Php 63,125.4 million, 46.5% of which or the biggest cost amounting toPhp 29, 342.5 million were disbursed by the same industrygroup35.
Sporting and other recreational actvities
Motion picture, radio, televison & other entrtainment
activites
Other service activities
Sewage & refuse disposal sanitation
and similar activities
News agency activities
Library & archives, museums and other cultural activities
0.0040,000.0080,000.00 67767
43738.39921.6 2610.8 599.6 540.3
24787.1 29342.56620.3 1872.2
87.641.6
Distribution of Revenue and Cost for Other Community, Social and Personal Service Activities Establishements
for All Employment Sizes by Industry Group: Philippines, 2009
Revenue CostIndustry Group
Reve
nue an
d Co
st
(in
millio
n Pe
sos)
Figure 1.9Distribution of Revenue and Cost to Industry Groups
35 Ibid, 2012
19
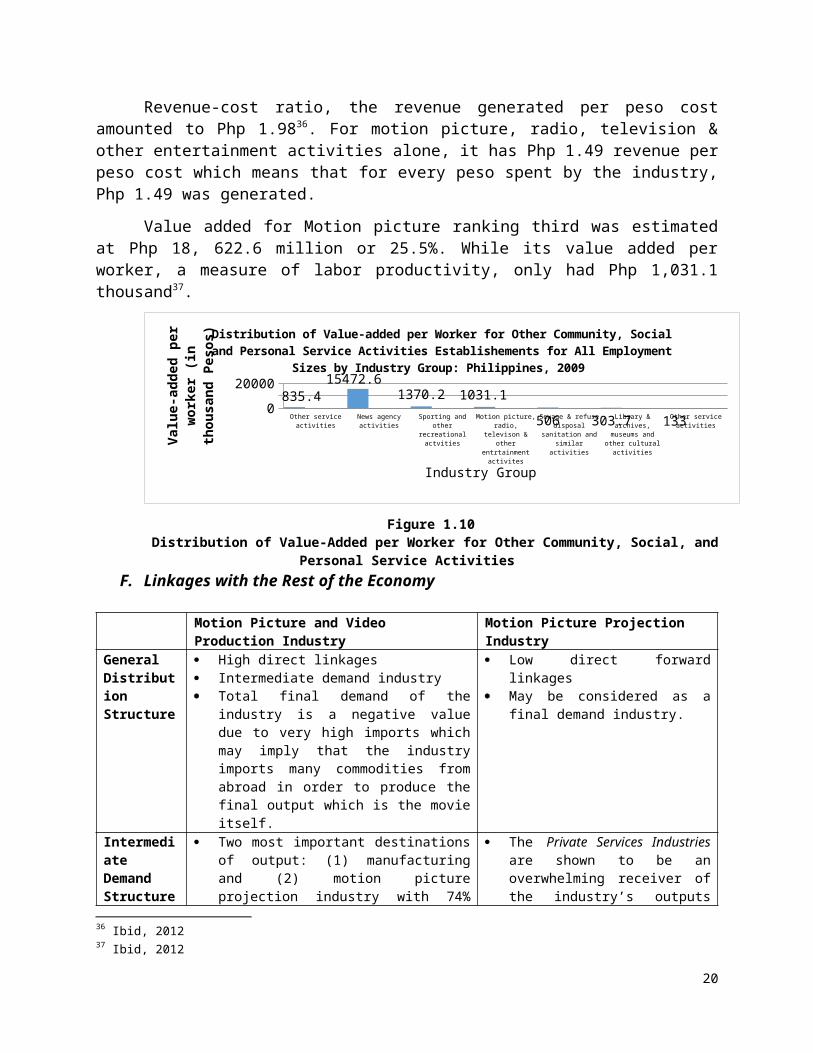
Revenue-cost ratio, the revenue generated per peso costamounted to Php 1.9836. For motion picture, radio, television &other entertainment activities alone, it has Php 1.49 revenue perpeso cost which means that for every peso spent by the industry,Php 1.49 was generated.
Value added for Motion picture ranking third was estimatedat Php 18, 622.6 million or 25.5%. While its value added perworker, a measure of labor productivity, only had Php 1,031.1thousand37.
Other service activities
News agency activities
Sporting and other
recreational actvities
Motion picture, radio,
televison & other
entrtainment activites
Sewage & refuse disposal
sanitation and similar
activities
Library & archives, museums and
other cultural activities
Other service activities
020000
835.415472.6
1370.2 1031.1506 303.7 133
Distribution of Value-added per Worker for Other Community, Social and Personal Service Activities Establishements for All Employment
Sizes by Industry Group: Philippines, 2009
Industry Group
Valu
e-ad
ded
per
work
er (in
thou
sand
Pes
os)
Figure 1.10 Distribution of Value-Added per Worker for Other Community, Social, and
Personal Service ActivitiesF. Linkages with the Rest of the Economy
Motion Picture and Video Production Industry
Motion Picture Projection Industry
General Distribution Structure
High direct linkages Intermediate demand industry Total final demand of the
industry is a negative valuedue to very high imports whichmay imply that the industryimports many commodities fromabroad in order to produce thefinal output which is the movieitself.
Low direct forwardlinkages
May be considered as afinal demand industry.
Intermediate Demand Structure
Two most important destinationsof output: (1) manufacturingand (2) motion pictureprojection industry with 74%
The Private Services Industriesare shown to be anoverwhelming receiver ofthe industry’s outputs
36 Ibid, 201237 Ibid, 2012
20
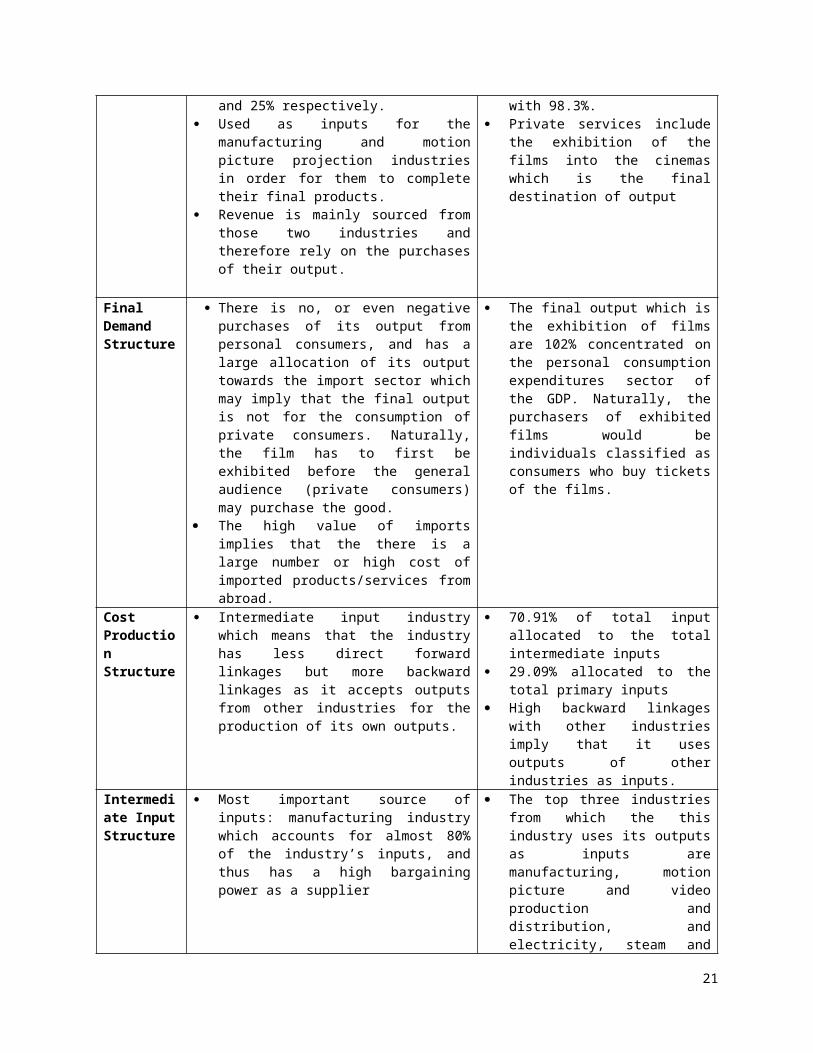
and 25% respectively. Used as inputs for the
manufacturing and motionpicture projection industriesin order for them to completetheir final products.
Revenue is mainly sourced fromthose two industries andtherefore rely on the purchasesof their output.
with 98.3%. Private services include
the exhibition of thefilms into the cinemaswhich is the finaldestination of output
Final Demand Structure
There is no, or even negativepurchases of its output frompersonal consumers, and has alarge allocation of its outputtowards the import sector whichmay imply that the final outputis not for the consumption ofprivate consumers. Naturally,the film has to first beexhibited before the generalaudience (private consumers)may purchase the good.
The high value of importsimplies that the there is alarge number or high cost ofimported products/services fromabroad.
The final output which isthe exhibition of filmsare 102% concentrated onthe personal consumptionexpenditures sector ofthe GDP. Naturally, thepurchasers of exhibitedfilms would beindividuals classified asconsumers who buy ticketsof the films.
Cost Production Structure
Intermediate input industrywhich means that the industryhas less direct forwardlinkages but more backwardlinkages as it accepts outputsfrom other industries for theproduction of its own outputs.
70.91% of total inputallocated to the totalintermediate inputs
29.09% allocated to thetotal primary inputs
High backward linkageswith other industriesimply that it usesoutputs of otherindustries as inputs.
Intermediate InputStructure
Most important source ofinputs: manufacturing industrywhich accounts for almost 80%of the industry’s inputs, andthus has a high bargainingpower as a supplier
The top three industriesfrom which the thisindustry uses its outputsas inputs aremanufacturing, motionpicture and videoproduction anddistribution, andelectricity, steam and
21
water with 34%, 32% and18% respectively.
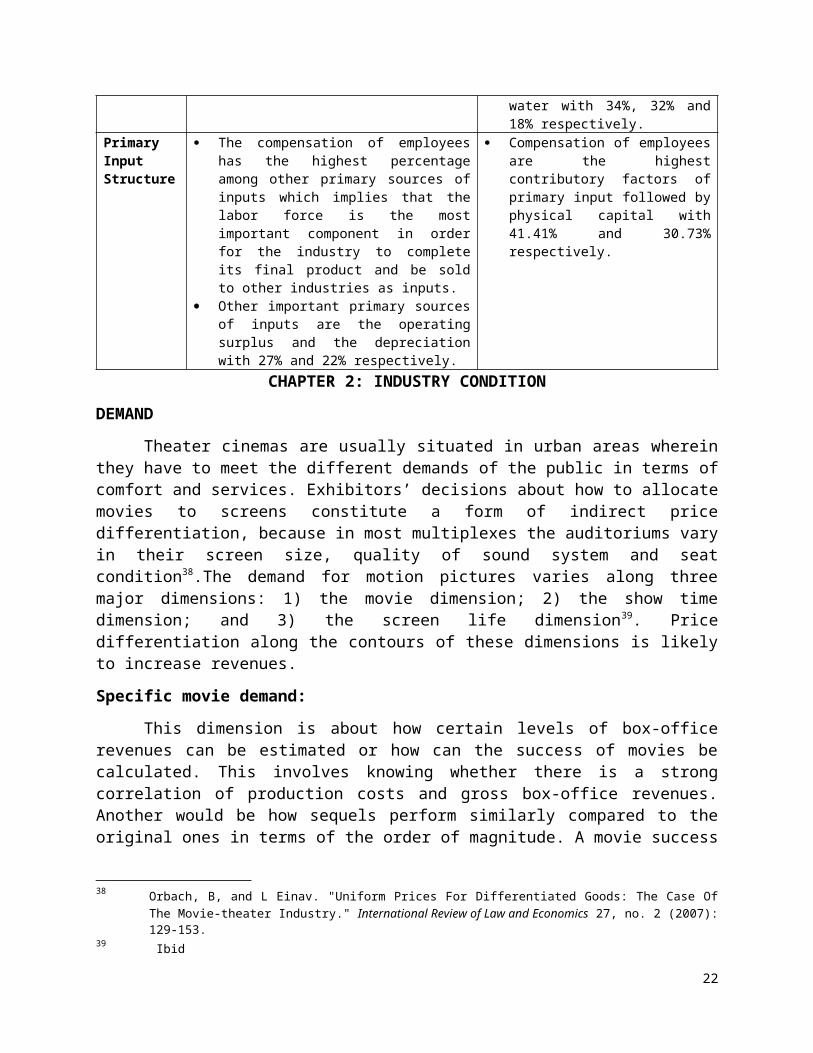
Primary Input Structure
The compensation of employeeshas the highest percentageamong other primary sources ofinputs which implies that thelabor force is the mostimportant component in orderfor the industry to completeits final product and be soldto other industries as inputs.
Other important primary sourcesof inputs are the operatingsurplus and the depreciationwith 27% and 22% respectively.
Compensation of employeesare the highestcontributory factors ofprimary input followed byphysical capital with41.41% and 30.73%respectively.
CHAPTER 2: INDUSTRY CONDITION
DEMAND
Theater cinemas are usually situated in urban areas whereinthey have to meet the different demands of the public in terms ofcomfort and services. Exhibitors’ decisions about how to allocatemovies to screens constitute a form of indirect pricedifferentiation, because in most multiplexes the auditoriums varyin their screen size, quality of sound system and seatcondition38.The demand for motion pictures varies along threemajor dimensions: 1) the movie dimension; 2) the show timedimension; and 3) the screen life dimension39. Pricedifferentiation along the contours of these dimensions is likelyto increase revenues.
Specific movie demand:
This dimension is about how certain levels of box-officerevenues can be estimated or how can the success of movies becalculated. This involves knowing whether there is a strongcorrelation of production costs and gross box-office revenues.Another would be how sequels perform similarly compared to theoriginal ones in terms of the order of magnitude. A movie success
38 Orbach, B, and L Einav. "Uniform Prices For Differentiated Goods: The Case OfThe Movie-theater Industry." International Review of Law and Economics 27, no. 2 (2007):129-153.
39 Ibid
22

is also revealed after the first weekend on the screens40. In thePhilippine setting, such dimension can be divided among thefollowing prevailing demand determinants according to consumerbehavior
A. Star PowerMovie success can also be based on the actors who are in the
film41. As said in the first parts of this paper, distributorshandle how the film will be advertised to people with theconsideration of the proper timing when they can take advantageof the actors’ fame.This is also true for producers as they arethe ones who chose the actors. Moviegoers tend to watch a film iftheir favorite stars play a role in the film42. It becomes sortof fan-based.
B. Technology: Digital Animations and EffectsAdvances in digital technology have the capacity to change
the pre-production, production and post-production stages inmaking a film43. More and more of the producers nowadays shift tosuch process of filmmaking because it can influence thepreferences of moviegoers.
C. Word-of-MouthMoviegoers can be classified into two, the informed and
uninformed. The informed are those consumers who have first-handinformation regarding the film that is why they decide to watchthe film. In contrast, the uninformed are those who are persuadedto watch a film primarily because of the feedback they hear fromother people who have already watched the film. In this case,they reject their private opinion instead. They are driven by thepublic who watch the film. This constitutes the theory of information40 Ibid41 Eliashberg, Jehoshua, Anita Elberse, and Mark A.A.M Leenders. "The Motion
Picture Industry:Critical Issues in Practice, Current Research & New Research Directions " HBS. (2009),
16.42Yager F. and Yager J. Career Opportunities in the Film Industry.(NY: Ferguson, 2009), 20443 Eliashberg, Jehoshua, Anita Elberse, and Mark A.A.M Leenders. "The Motion
Picture Industry:Critical Issues in Practice, Current Research & New Research Directions " HBS.
(2009), 16.www.hbs.edu/faculty/Publication%20Files/05-059.pdf (accessed August 4, 2013).
23
cascades. It states that the consumption of a movie is subjectiveand the demand is dependent on whether or not the moviegoers areinfluenced by other factors, such as advertisements andpromotions. Herd Theory, on the other hand, is somewhat similarto informational cascades. The only difference is that in theherd theory, one does not totally reject his private opinionregarding a movie44
D. DirectorThe tendency for people to watch the film is based on how
well the director can make an excellent film45. Just like whymovie sequels are generally produced, they want to outperform theoriginal or either continues a legacy. Thus when a certain filmhits the top list or a high rating in the box office, the wholeproduction team especially the director gets the credit.
E. GenreMost films produced today are those that accumulate greater
profits such as comedies, romantic comedies, romance and teen-oriented drama. As what is reflected on box-office receipts,romantic comedies are at high ranks, as well as comedies46.
F. Age RatingsThose movies that receive a general patronage or PG-13 earn
well. However, movies who are rated R-13 do not earn as muchbecause there are only selected moviegoers who can watch thefilm. Usually, in the Philippine scenario, when a child wants towatch a movie, the entire family goes as well47.
G. Critics’ Review
44 King, M. The Dynamics of Informational Cascades of Local Films in Theaters: A Demand Study. MasteralThesis.University of Asia and the Pacific. May 2004.
45 Santos, A. (2008). Pre-Release Indicators of Box Office Performance: A Study on the Pre-Consumption Behavior for Movies. Masteral Thesis. University of Asia and the Pacific. May 2008.
46Philippines Box Office.Box Office Mojo International. (2013). http://boxofficemojo.com/intl/philippines/?yr=2013&wk=26&p=.htm (Accessed August
13, 2013)47 Ibid.
24

A critic’s review about a film provides crucial informationfor moviegoers in the movie market. Critics make an impact on themoviegoer’s film selection that may influence the first weekendbox office performance of a certain film since reviews are mostoften published before the movie is released or immediately afterthe release48.
H. Market Power of DistributorA distributor is also in charge of advertising a certain
film that will thus influence a moviegoer to either watch or notto watch the movie. They say that if the distributor has alreadyestablished a name in the industry, moviegoers expect a qualityand enticing film from these movie outfits. Advertising andpromotions from movie distributors may serve as an indicator of abox-office success.
Show-time demand:Basically this dimension is about the patterns of the number
of moviegoers or the attendance patterns during the week andacross seasons. According to Orbach and Einav, these patterns arepredictable: approximately 3.5 times of the number of moviegoerson an average week day (Monday, Tuesday, Wednesday and Thursday)are the number of moviegoers on an average weekend day (Friday,Saturday and Sunday). This kind of basis of pattern suggests thatthe demand for movies on weekdays may be more elastic than thedemand on weekends. The pattern could also be applied to movieattendance during the different seasons: that there are moremoviegoers during summer and holidays than ordinary days or therest of the year49. If a movie is shown in a peak season, such asa Valentine’s Day, in summer, and in the yuletide season, it hasa large probability that moviegoers would patronize the film.
Release dates thus affect how the movie will perform in thebox-office. “A movie that fails to open strongly often loses the48 Jeon, J, and L Jiao."The Influence Effect of Critics Reviews on Foreign and
Domestic Movies."Economics in Trinity College of Duke University.https://econ.duke.edu/uploads/media_items/jeon-and-jiao-honors-thesis1.original.pdf (accessed August 13, 2013).
49Orbach, B, and L Einav. "Uniform Prices For Differentiated Goods: The Case Of TheMovie-theater Industry." International
Review of Law and Economics 27, no. 2 (2007): 129-153.
25

attention of the media, audiences, and exhibitors. Timing theopening carefully is therefore crucial.”50
Aside from the season when will the film be shown, oneshould also take into account the power of influence of theforeign competitors. If, for example, a film would be of rival toHarry Potter or Spiderman 3, local film distributors should notrelease the movie on the same playdate of the said movie or evennear the date of release.
Another would be as mentioned above wherein distributorswill want to take advantage on how famous the actor is. Adistributor would not want to release a movie when the cast in itis not in a good position to be in public. Some distributors mayalso want to take advantage on the fact that a certain cast isinfamous.
Demand over the movie’s screen life:With the movies’ screen life, the demand for movies
diminishes. As said above, a movie’s success will be determinedduring the first week. However, in the next weeks, the number ofmoviegoers will decrease thus; the demand for such movie in thecinemas also decreases. Successful movies have a longer screenlives than those of less popular movies as the demand decreasesin a slower rate over time.
SUPPLY
Suppliers’ Bargaining Power
A. Star Power and CoopetitionActors and actresses are necessary and integral when it
comes to producing a film of any sort. The story of the filmusually revolves around the character and thus, the character isresponsible for the progression of the story. “One suppliersegment that could be stronger than the rest is the actors
50 Eliashberg, Jehoshua, Anita Elberse, and Mark A.A.M Leenders. "The MotionPicture Industry:Critical Issues in Practice, Current Research & New Research Directions " HBS.(2009), 9.www.hbs.edu/faculty/Publication%20Files/05-059.pdf (accessed August 4, 2013).
26

performing in the company’s production”.51 The actor knows thathe can influence movie audiences/viewers and thus generate morerevenues for the film through high ticket sales. This allows thebargaining power of the actors to be very high, where they maynegotiate the contracts regarding wages and other incentives. Thefact that the producers bank on star actors when they want theirfilm to sell immediately increases the bargaining power of thesupplier (actor). The producers will adjust according to thedemands of the actors in order for him to star in a film.
B. Crew Indicated earlier in the “production process” section of the
paper; the producer hires the key crew personnel, and withcareful selection to ensure that the director is surrounded bythe best creative team. The fact that the crew key personnel haveto undergo interviews and auditions means that the producer anddirector have the luxury of having options. Thus, in this case,the bargaining power of the crew is low because their assurancein being part of the film production process is uncertain, letalone their wage negotiation.
C. Location Owner. (leaser) An alternative to shooting a film in a studio is to actually
shoot in locations that fit the environment within the script.Usually, the location the director wants to shoot in is not freeaccessible, and may belong to an owner. The leaser has theincentive of setting the price for the lease to which will berecorded in the contract. Price and all other conditions that thetenant or leaser includes in the contract will be final once theproducer consents. The producer can still negotiate the finalprice, but only during the negotiation period. In this case, thesupplier (leaser) has a high bargaining power in the sense thatthey are independent on the producer, and the production team. Ifthe conditions proposed by the leaser are not agreed upon by theproducer, the location owner will not sign the lease for the51“Bargaining Power of Suppliers”. Last Modified July 22, 2013. Accessed August 3,2013.
http://webcache.googleusercontent.com/search?q=cache:aefzb2ngzskJ:www.smo.dk/disney-assignment/porters-five-forces/bargaining-power-of-suppliers/+bargaining+power+of+actors+in+film+industry&cd=2&hl=en&ct=clnk&gl=ph
27

location to be used for shooting. The production team can alwaysrent another location for shooting, but if the location isspecific and unique, the bargaining power of the location owneris very high
. D. Investors
“When considering an investment in movies or film, financialadvisors insist the standard rule applies: never invest more thanyou can afford to lose. That goes double for the film industry,says Vogel”52. Schwarts mentions that for every one success boxoffice movie, twelve others fail. Thus the profitable movies areone in every twelve movies released. Alongside that, films thatselect star power actors to boost ticket sales also have thetendency for low returns on investment. After all the revenuesgenerated, the actors demand (in the contact) that they get paidfirst, which leaves the remainder (small or large) for thereturns on investment.
In this case, where investors’ returns are subject to therevenues generated by the movie, implies the high risk in gainingprofit. This shows that their bargaining power on their ROI isnot very strong in the sense that there is no certainty of whatthey will receive. Though they may negotiate in the contract withthe producers the rate in which they will be paid back, there isno certainty that the movie will generate enough revenues to doso.Cost Structure
The movie production and distribution industry, as well asthe movie projection industry, has 16 different costs thatinfluence the overall level of net income. These costs includethe following: (1) materials and supplies purchased (2) fuels,lubricants, oils, and greases purchased (3) electricity and waterpurchased (4) industrial services done by others (5) non-industrial services done by others (6) interest expense (7) goodspurchased for resale (8) indirect taxes (9) research andexperimental development (10) environmental protection expense
52Schwartz, S. “Investing in the Big Screen can be a profitable story”. (October,2010). Accessed August 4, 2013.http://www.cnbc.com/id/39342145
28

(11) royalty fee (12) franchise fee (13) bad and doubtful debts(14) depreciation of fixed assets and (16) other costs.
Below is the table representing the total cost structure ofthe entire motion picture industry based on the 2008 Annual Survey ofPhilippine Business and Industry.
Table 3.8Cost Structure
PSIC Code (1) (2) (3) (4) (5) (6) (7) (8) (9)Motion Pictureand VideoProduction
556777
18215
42313 234609
1145242
14244
43600
24499 5258
MotionPicture,Audio, andVideoProjection
210385
3847 227805
58762 1553333
- 11610
338892
-
PSIC Code (10) (11) (12) (13) (14) (15) TotalMotion Pictureand VideoProduction
- - - 30575 67932 18741
2202006
MotionPicture,Audio, andVideoProjection
64 - 459 36 183364 27237
2633547
REGULATORY POLICY FRAMEWORK
One of the factors currently affecting the profitability ofthe Philippine film industry is the excessive taxation of bothlocal and foreign movies screened in theaters53. The Philippinemovie industry, at present, shoulders about nine different kindsof taxes, duties and fees: cultural tax, amusement tax,withholding tax, municipal tax, value added tax, excise orspecific tax on positive prints, customs duties on films,corporate income tax and the MTRCB screening fee. In Quezon City,
53 Angara, J. “An Act Reviewing the Philippine Movie Industry by Providing Incentives to the Proprietors, Lessees,Operators of
Theaters and Cinemas”, 5th Cong., 1stsess, H.B. 404,http://www.congress.gov.ph/download/basic_15/HB00404.pdf (Accessed August 13,2013)
29
however as the entertainment capital of the Philippines,implements the reduction tax on locally produced films from 50 to30 percent.54
Additionally, the level of taxation depends on the film’sgrading by the Cinema Evaluation Board. Film that is graded ‘A’will be exempted from any taxation, whereas a graded ‘B’ filmwill have to pay 35% of the original 30% amusement tax that willbe collected.55
The Movie and Television Review and Classification Board(MTRCB) is a government arm in charge of classifying film asRestricted, General Viewership, or Parental Guidance. The MTRCBis in charge of classifying whether films are appropriate for thegeneral public, ensuring that no obscenity, such as rated X filmsare released and accessed by minors.56
Therefore, directors and production companies have toregulate the content of their film projects in order for MTRCB torate their films appropriate to a larger market. However, thereare controversies regarding the decision making of MTRCB inprohibiting and allowing the so called “objectionable scenes”.The MTRCB is more lax and lenient to foreign films in terms ofconsideration for the “objectionable scenes whereas they arestricter for local films.57.
One of the troublesome factors that usually plague the filmindustry in terms of generating higher profits is the issue ofpiracy, which is the illegal and unauthorized sale of acopyrighted film. Various government agencies such as theVideogram Regulatory Board (VRB), the National TelecommunicationsCommission (NTC) are combating and trying to reduce piracy.58
There are several bills pending for the strengthening of those
54 Ibid, 155Guillice-Felleo, L. “Implementing the Rules and Regulations of R.A. No. 9167”, (September 5, 2003).
http://www.lawphil.net/statutes/repacts/ra2002/ra_9167irr_2002.html (AccessedAugust 13, 2013).56Garcia, L and Masigan, C. “An In-depth study on the film industry in thePhilippines”. (August 17, 2001). dirp4.pids.gov.ph/ris/taps/tapspp0103.pdf. (AccessedAugust 12, 2013). 3357 Ibid, 3358 Ibid, 34
30

agencies’ power to combat piracy, and therefore enable the filmindustry to realize all their profits.
Quotas on the number of foreign films to be screened in thecountry are a unique case in the Philippines compared to otherSoutheast Asian countries. Since the 1960s, efforts to placequotas on imports have failed regularly in the PhilippineCongress. 59 One way for the film industry in the Philippines togrow is to screen a larger number of locally produced films, andminimized foreign imported films. There have been proposals suchas Bong Revilla’s statement of “show only one Hollywood movie amonth”.60 However, is can be observed that up until today,Hollywood films usually dominate the cinemas, outnumbering thenumber of locally produced films.
CHAPTER 3: INDUSTRY STRUCTURE
A. Industry Players
1. GMA Network Films, Inc.
It was established by GMA Network, Inc in 1995 and wasformerly known as “Cinemax Films”. Its studio partners are Regal59 Ibid, 1360 Vera, N. “Bong Revilla: “show only one Hollywood movie a month”. (January 3, 2010)
http://criticafterdark.blogspot.com/2010/01/bong-revilla-show-only-one-hollywood.html (Accessed August 12, 2013)
31
Entertainment, Viva Films and APT Entertainment. It wanted toproduce one film per month but only managed to produce eight last2012 and so far the most it has ever done. Among its popularfilms are Muro Ami, Deathrow, and Jose Rizal61
2. ABS-CBN Film Productions, Inc (Star Cinema)
This film studio was established by ABS-CBN Corporations in1993 and is popularly known by its trade name, Star Cinema. Itsfilms are known for a broad high-quality and value-laden filmswith different genres and themes. With a pristine track record ofthese films, it has maintained its dominance in the filmindustry. Its top grossing films include the following: It Takes aMan and a Woman, No Other Woman, and The Mistress62.
3. Viva Films
The production company was established in 1980 by the VivaEntertainment Group. Viva Films was also known for its qualityand diverse genres. The company partnered with Star Cinema, GMAFilms, On-Q 28 Productions, RGUTZ Production, MVP Films and itwill start co-producing films this year, 2013 with Regal Films.Some of its popular films are P.S I Love You, It Takes a Man and a Womanand A Secret Affair63.
4. Regal Entertainment, Inc
The production firm was established by Lily Monteverde in1962 which has also produced various genres. Some of its producedfilms include Scorpio Nights, Shake, Rattle and Roll and Relasyon.
5. OctoArts Films
The company was founded during the 1980s by Orly R. Ilacad.Among its partners are APT Entertainment, M-zet productions, ImusProductions, GMA Films, Lagarvista Entertainment, Star Cinema and
61 GMA Network, GMA Network History, (2013), http://www.wattpad.com/10908764-gma-network-history-gma-films-history#.UdpRUDuomuI62 Box Office Mojo, Philippines Yearly Box Office, (2013),http://boxofficemojo.com/intl/philippines/yearly/63 Viva Entertainment Management, Viva Films: When and How it Started, October 21, 2011,http://viva.com.ph/index.php?option=com_content&view=article&id=2980:viva-films-how-it-all-started&catid=1:news&Itemid=2 (Accessed July 8, 2013)
32
Quantum films. Some of its films include EntengKabisote filmseries, My House Husband: Ikaw Na! andPak! Pak! My Dr. Kwak!
B. Market Structure
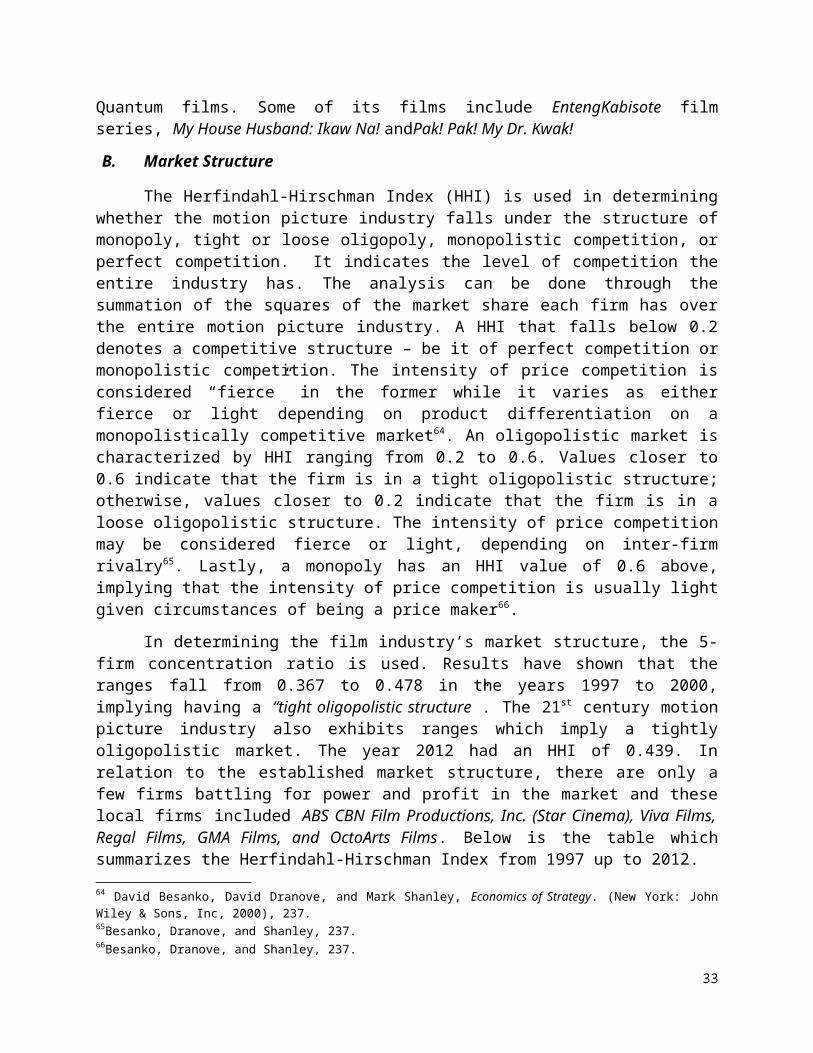
The Herfindahl-Hirschman Index (HHI) is used in determiningwhether the motion picture industry falls under the structure ofmonopoly, tight or loose oligopoly, monopolistic competition, orperfect competition. It indicates the level of competition theentire industry has. The analysis can be done through thesummation of the squares of the market share each firm has overthe entire motion picture industry. A HHI that falls below 0.2denotes a competitive structure – be it of perfect competition ormonopolistic competition. The intensity of price competition isconsidered “fierce” in the former while it varies as eitherfierce or light depending on product differentiation on amonopolistically competitive market64. An oligopolistic market ischaracterized by HHI ranging from 0.2 to 0.6. Values closer to0.6 indicate that the firm is in a tight oligopolistic structure;otherwise, values closer to 0.2 indicate that the firm is in aloose oligopolistic structure. The intensity of price competitionmay be considered fierce or light, depending on inter-firmrivalry65. Lastly, a monopoly has an HHI value of 0.6 above,implying that the intensity of price competition is usually lightgiven circumstances of being a price maker66.
In determining the film industry’s market structure, the 5-firm concentration ratio is used. Results have shown that theranges fall from 0.367 to 0.478 in the years 1997 to 2000,implying having a “tight oligopolistic structure”. The 21st century motionpicture industry also exhibits ranges which imply a tightlyoligopolistic market. The year 2012 had an HHI of 0.439. Inrelation to the established market structure, there are only afew firms battling for power and profit in the market and theselocal firms included ABS CBN Film Productions, Inc. (Star Cinema), Viva Films,Regal Films, GMA Films, and OctoArts Films. Below is the table whichsummarizes the Herfindahl-Hirschman Index from 1997 up to 2012.64 David Besanko, David Dranove, and Mark Shanley, Economics of Strategy. (New York: JohnWiley & Sons, Inc, 2000), 237.65Besanko, Dranove, and Shanley, 237.66Besanko, Dranove, and Shanley, 237.
33
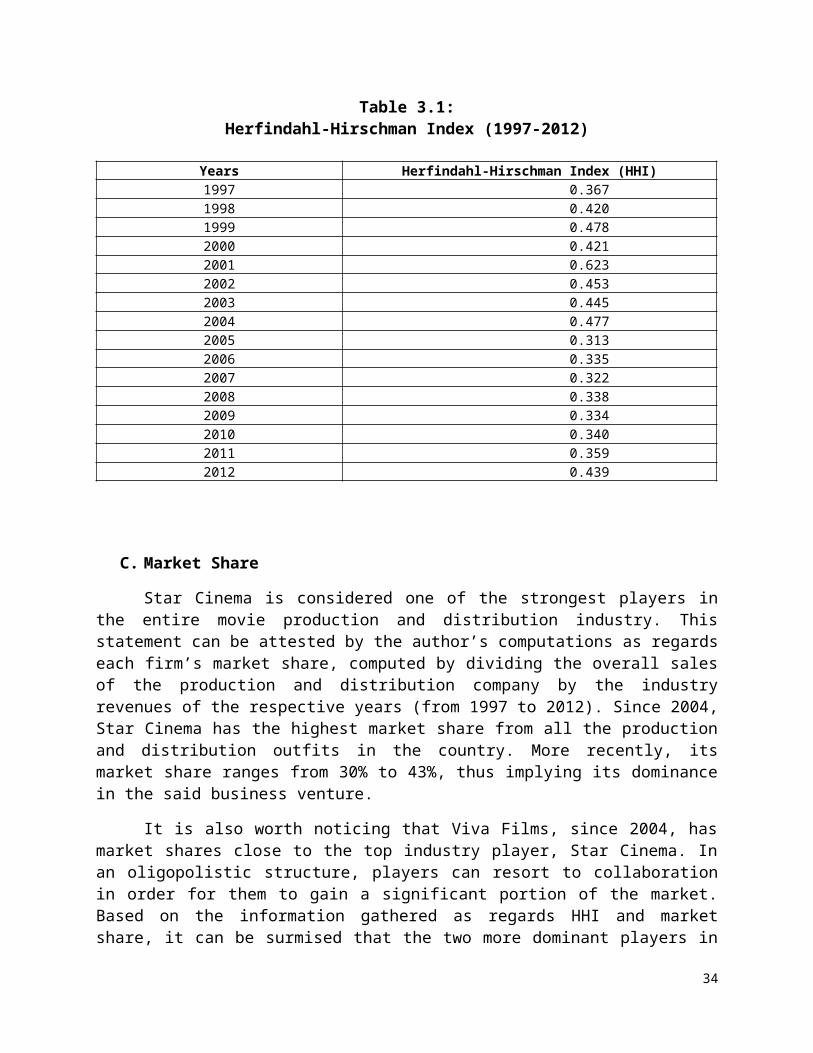
Table 3.1:Herfindahl-Hirschman Index (1997-2012)
Years Herfindahl-Hirschman Index (HHI)1997 0.367 1998 0.420 1999 0.478 2000 0.421 2001 0.623 2002 0.453 2003 0.445 2004 0.477 2005 0.313 2006 0.335 2007 0.322 2008 0.338 2009 0.334 2010 0.340 2011 0.359 2012 0.439
C. Market Share
Star Cinema is considered one of the strongest players inthe entire movie production and distribution industry. Thisstatement can be attested by the author’s computations as regardseach firm’s market share, computed by dividing the overall salesof the production and distribution company by the industryrevenues of the respective years (from 1997 to 2012). Since 2004,Star Cinema has the highest market share from all the productionand distribution outfits in the country. More recently, itsmarket share ranges from 30% to 43%, thus implying its dominancein the said business venture.
It is also worth noticing that Viva Films, since 2004, hasmarket shares close to the top industry player, Star Cinema. Inan oligopolistic structure, players can resort to collaborationin order for them to gain a significant portion of the market.Based on the information gathered as regards HHI and marketshare, it can be surmised that the two more dominant players in
34
the industry are undergoing cooperation so that the two of themcan have a hold on the industry. This is done in the process offilm collaboration, when two production outfits share the costsof producing a movie, so as to increase the chances of gainingrevenues with minimal costs. In economic terms, this is calledcoopetition.
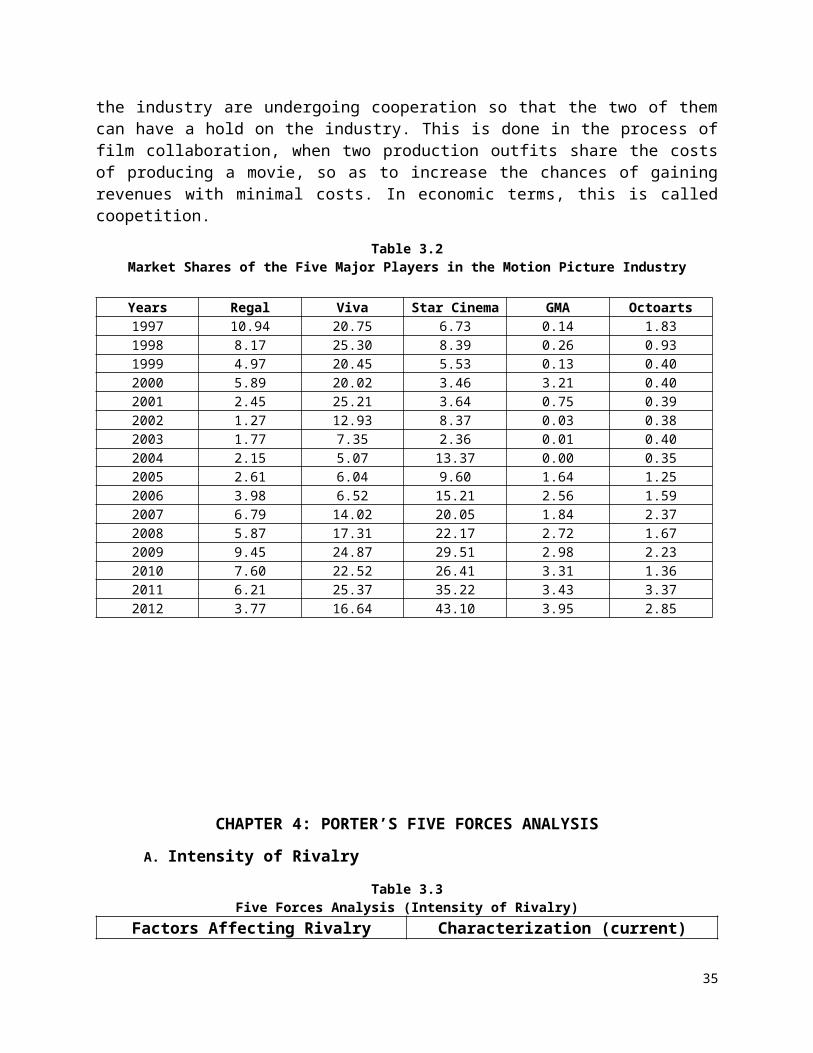
Table 3.2Market Shares of the Five Major Players in the Motion Picture Industry
Years Regal Viva Star Cinema GMA Octoarts1997 10.94 20.75 6.73 0.14 1.831998 8.17 25.30 8.39 0.26 0.931999 4.97 20.45 5.53 0.13 0.402000 5.89 20.02 3.46 3.21 0.402001 2.45 25.21 3.64 0.75 0.392002 1.27 12.93 8.37 0.03 0.382003 1.77 7.35 2.36 0.01 0.402004 2.15 5.07 13.37 0.00 0.352005 2.61 6.04 9.60 1.64 1.252006 3.98 6.52 15.21 2.56 1.592007 6.79 14.02 20.05 1.84 2.372008 5.87 17.31 22.17 2.72 1.672009 9.45 24.87 29.51 2.98 2.232010 7.60 22.52 26.41 3.31 1.362011 6.21 25.37 35.22 3.43 3.372012 3.77 16.64 43.10 3.95 2.85
CHAPTER 4: PORTER’S FIVE FORCES ANALYSIS
A. Intensity of Rivalry
Table 3.3Five Forces Analysis (Intensity of Rivalry)
Factors Affecting Rivalry Characterization (current)
35

Among Existing CompetitorsDegree of Seller Concentration HighRate of Industry Growth ModerateSignificant cost differencesamong firms
Moderate
Excess Capacity YesCost structure of firms:sensitivity of costs tocapacity utilization
High
Degree of productdifferentiation among sellers?Cross-price elasticities ofdemand among competitors inindustry?
Low
Buyer’s costs of switchingfrom one competitor to another
Low
Are prices and terms of salestransactions observable
Low
Can firms adjust pricesquickly?
Low
Large and/or infrequent salesorders
Moderate
Use of “facilitatingpractices” (price leadership,advance announcements of pricechanges)
High
History of “Cooperative”pricing
High
Strength of exit barriers HighHigh industry price elasticityof demand
Low
Seller concentration can be measured by observing the marketshare of top production and distribution companies (sellers). Ifat most two companies exhibit a large value of market share, itmay be inferred that the selling of the products is highlyconcentrated towards those two industries. The market share ofthe top five producer/distributor companies in the film industry
36

is highly concentrated to two companies at a large varyingdegree. The market share of the top two companies are Star Cinemaand Viva Films with 43.1% and 16.64% respectively. The next threecompanies exhibit relatively low market shared with GMA owning3.95%, Regal with 3.77% and Octoarts with 2.85%. The fact thatonly two companies pose double digits of market share upholds thestatement that the supplier concentration of the industry ishigh. Additionally, it may also be regarded that the market shareis highly concentrated to Star cinema despite Viva’s double digitmarket share due to the large 27% disparity in market share.
The growth rate of the industry is exhibited by the growthrate in revenues which stands currently at 1.184 in the year2012. The cost difference among firms is considered moderate dueto the fact that they produce the same final products, which arefilms. The only difference may be attributed to the process andintermediary circumstances different production companies partakein to produce a film, such as the wages of actors employed maydiffer for the different production companies.
The 2008 Annual Census of Establishments portrays totalcompensation to be P255,994,000 and total revenue atP3,000,750,000. Thus by calculation, the ratio of totalcompensation is 0.085 which implies that 8.5% of revenues areused to pay the employees of the industry. This value isconsiderably small when considering actors being part of the 8.5%of total compensation. The film industry banks on star power asits main driver for gaining revenues and thus should cover adominant portion of total compensation and total revenue. Thisimplies that the stars of films possess a high bargaining powerwhich can eventually affect the costs of the production companiesin means involving salaries that causes firms’ sensitivity tocosts to become high.
The degree of product differentiation is considered low dueto the fact that all production and distribution companiesproduce and manage the same final product which is the movieitself. On the other hand, the buyer’s cost (exhibitors) ofswitching from one competitor to another is considered low. Thefact that a written contract concerning the terms of opening dayand the duration of the film exhibited in cinemas are pointed out
37

in condition that the film generates the standard number ofticket sales. If not, the exhibitor may pull out the film fromits cinemas, which implies that the bargaining powers ofexhibitors are high.
Moreover, the prices and terms of sales transactions are notconsidered to be observable.Firms cannot adjust prices quicklybecause the production companies sell their final products at themarket price. From that analysis, we can infer that the industryis cannot have market dominance by being price-driven. Instead,firm players can resort to being quantity-driven to possibly gaina larger market share. Since film players can only be quantity-dependent and the costs of producing a film are high, the mostfeasible way is for coopetition to happen. Coopetition is definedas a form of strategic alliance between firms which can lead tomarket expansion and the formation of business relationships. Inthe case of the movie industry, production outfits share costs ofa film, as well as their respective contract stars, with the viewthat it can generate more profit, thus benefitting both of them.Given the power of brand-related variables and the sharing ofstars that goes with it, there is a greater probability ofincreasing revenues and even profit given minimal costs ofproduction.
Meanwhile, the size of sales orders of the productioncompanies are considered to be moderate. From 2008-2013,production companies produce at least two films in the same monthof the same year. Usually, only one film is produced per monthwhen considering Star Cinema, while other production companies donot produce films on a regular basis.
The instances when there were two movies produced by aproduction company in the same month in a year are: “Who’s ThatGirl?” and “Catch me… I’m in Love” (Viva Films, March 2011); “WorkingGirls” and “Babe, I Love You” (Viva Films, April 2011); “Every BreathYou Take” and “Born to Love You” (Star Cinema, May 2012); “WayBack Home” and “Wedding Tayo, Wedding Hindi” (Star Cinema, August 2011);“Sa Iyo Lamang” and “I Do”(Star Cinema, September 2011); “This Guys InLove With You Mare” and “Suddenly It’s Magic” (Star Cinema, October 2012).
38
The industry price of elasticity is considered low whichimplies inelasticity of the production/distribution companies’products to buyers (exhibitors). Despite the relatively highprices of the films distributed, the exhibitors will stillpurchase the films due to the few substitutes it can consider toreplace movies in their cinemas.
The strength of exit barriers is high due to the fact thatit would be costly to stop shooting a film after having incurredexpenses in the procedure of preproduction and/or productionstage. Thus, firms strive to complete producing a movie whenexpenses have already been incurred in order to prevent losses. Amore feasible strategy is for film players to collaborate so asto reduce their costs. Given the high costs of production, thereshould be an assurance of a greater return for the company.Therefore, it is safer to cut production costs into two or threethrough collaboration, while at the same time gaining morerevenues given the power of the stars to influence their audiencein watching their respective films.
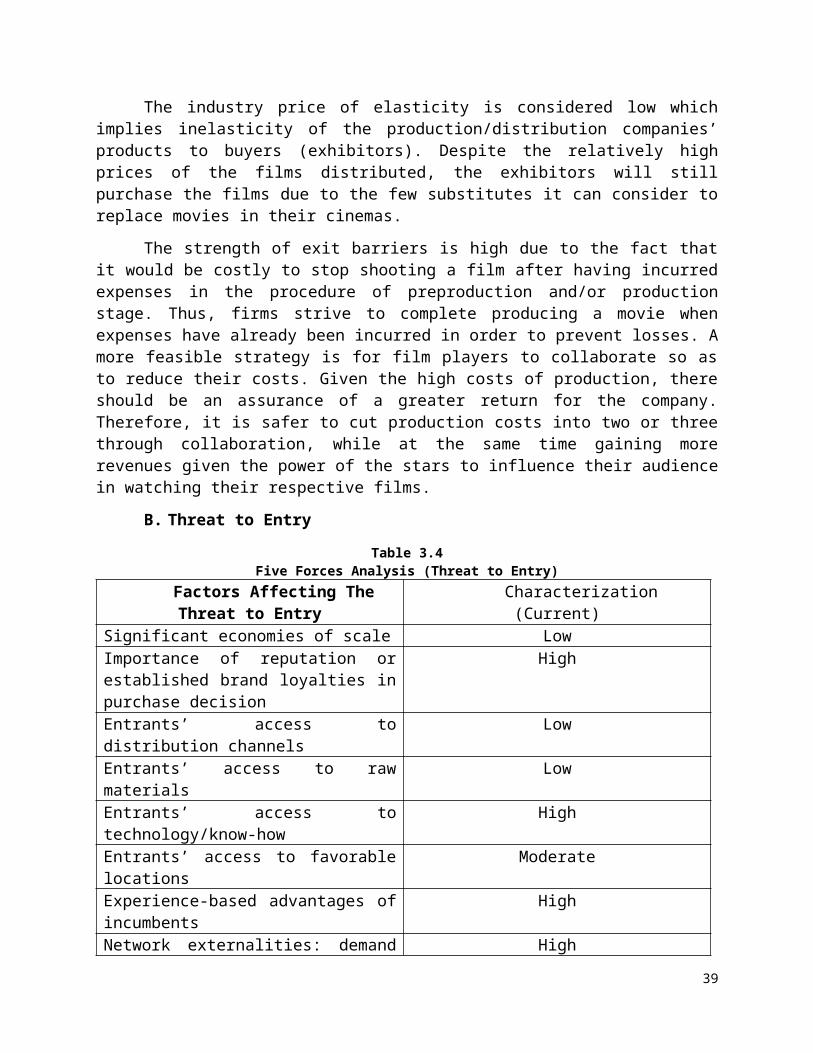
B. Threat to Entry
Table 3.4Five Forces Analysis (Threat to Entry)
Factors Affecting TheThreat to Entry
Characterization(Current)
Significant economies of scale LowImportance of reputation orestablished brand loyalties inpurchase decision
High
Entrants’ access todistribution channels
Low
Entrants’ access to rawmaterials
Low
Entrants’ access totechnology/know-how
High
Entrants’ access to favorablelocations
Moderate
Experience-based advantages ofincumbents
High
Network externalities: demand High
39
side advantages to incumbentsfrom large installed baseGovernment protection ofincumbents
Low
Perception of entrants aboutexpected retaliation ofincumbents/reputations ofincumbents for “toughness”
Low
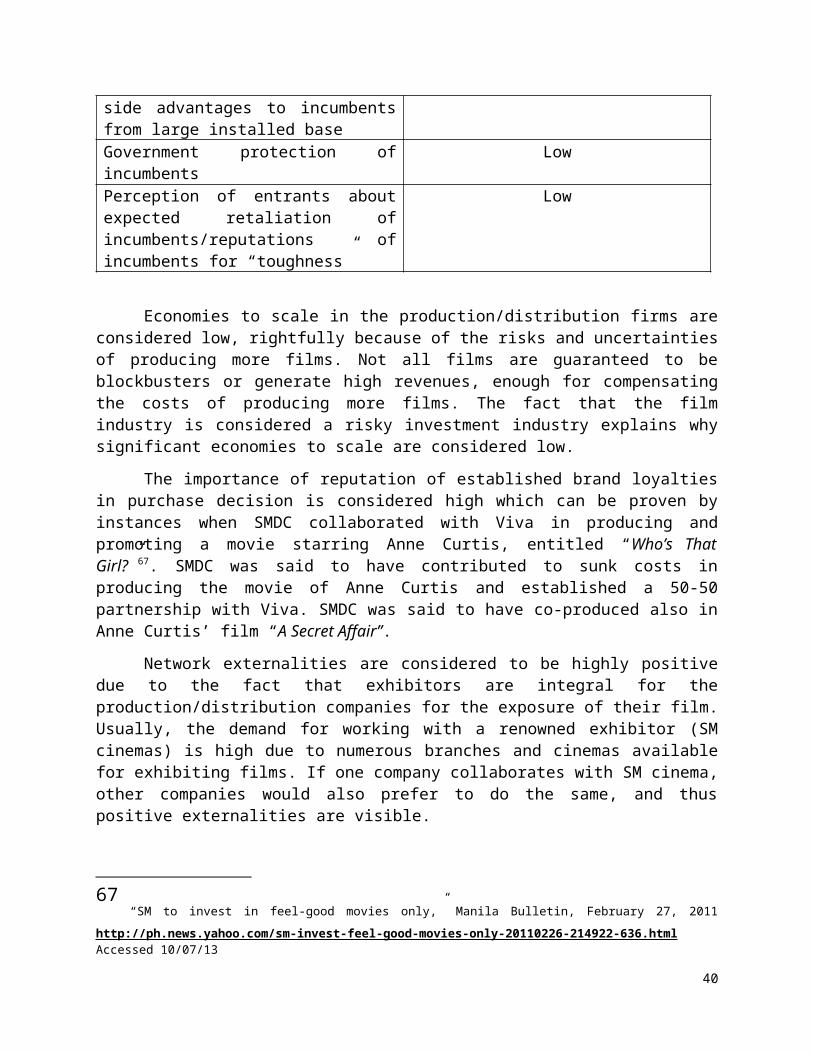
Economies to scale in the production/distribution firms areconsidered low, rightfully because of the risks and uncertaintiesof producing more films. Not all films are guaranteed to beblockbusters or generate high revenues, enough for compensatingthe costs of producing more films. The fact that the filmindustry is considered a risky investment industry explains whysignificant economies to scale are considered low.
The importance of reputation of established brand loyaltiesin purchase decision is considered high which can be proven byinstances when SMDC collaborated with Viva in producing andpromoting a movie starring Anne Curtis, entitled “Who’s ThatGirl?”67. SMDC was said to have contributed to sunk costs inproducing the movie of Anne Curtis and established a 50-50partnership with Viva. SMDC was said to have co-produced also inAnne Curtis’ film “A Secret Affair”.
Network externalities are considered to be highly positivedue to the fact that exhibitors are integral for theproduction/distribution companies for the exposure of their film.Usually, the demand for working with a renowned exhibitor (SMcinemas) is high due to numerous branches and cinemas availablefor exhibiting films. If one company collaborates with SM cinema,other companies would also prefer to do the same, and thuspositive externalities are visible.
67 “SM to invest in feel-good movies only,” Manila Bulletin, February 27, 2011
http://ph.news.yahoo.com/sm-invest-feel-good-movies-only-20110226-214922-636.htmlAccessed 10/07/13
40

The government protection of incumbents is considered to below, primarily because of the large sum of taxes imposed on thecompanies. The Philippine movie industry at present shouldersnine different kinds of taxes68. Government protection slightlyexists only for companies that produces a film with an A gradewhich would exempt the company from paying an amusement tax fee.
The reputation for incumbents such as the fiveproduction/distribution companies is not known for retaliation or“toughness”. The fact that collaboration and coopetition is nowthe norm for higher profits to be generated inclines companies tocoproduce, and thus mutually benefit each other. Therefore thereare low perceptions on retaliation or toughness towards theincumbent companies.
C. Pressures from Substitutes
Table 3.5Five Forces Analysis (Pressure from Substitutes)
Factors Affecting orReflecting Pressure From
Substitute
Characterization(Current)
Availability of closesubstitutes
High
Price-value characteristics ofsubstitutes
High
Price elasticity of industrydemand
Low
Availability of closecomplements
High
Price-value characteristics ofcomplements
High
There are other forms of media and entertainment which canbe presented and easily accessible by the market. Examples suchas the internet and television play a large role of closesubstitutes to films in cinemas. Many people engage indownloading or even accessing pirated movies through the internetwhich reduces the potential revenues for the film industry.68 Angara, J. “Explanatory Note”
41

Additionally, people can access their televisions and view movieswithout having to incur an expense or leaving their homes andthus the high availability of close substitutes.
The price elasticity of demand can be considered as low dueto the fact that exhibitors (buyers) obtain the films onlythrough the production/distribution companies. The price set bythe production/distribution companies on the films will beaccording to the market price which the exhibitors will accept.
Complements to films in cinemas include food and drinks suchas popcorn and soda. The availability of those complements isusually readily available in stalls stationed near the cinemas.Thus, there is a high availability of close complements.
D. Bargaining Power of Suppliers
Table 3.6Five Forces Analysis (Bargaining Power of Suppliers)
Factors Affecting OrReflecting Power Of Input
Suppliers
Characterization(Current)
Is supplier industry moreconcentrated than industry itsells to?
Moderate
Do firms in industry purchaserelatively small volumesrelative to other customers ofsupplier? Is typical firm’spurchase volume small relativeto sales of typical supplier?
Large
Few substitutes for supplier’sinputs
Yes
Do firms in industry makerelationship-specificinvestments to supporttransactions with specificsuppliers?
Yes
Do suppliers pose crediblethreat of forward integrationinto the product market?
Low
42
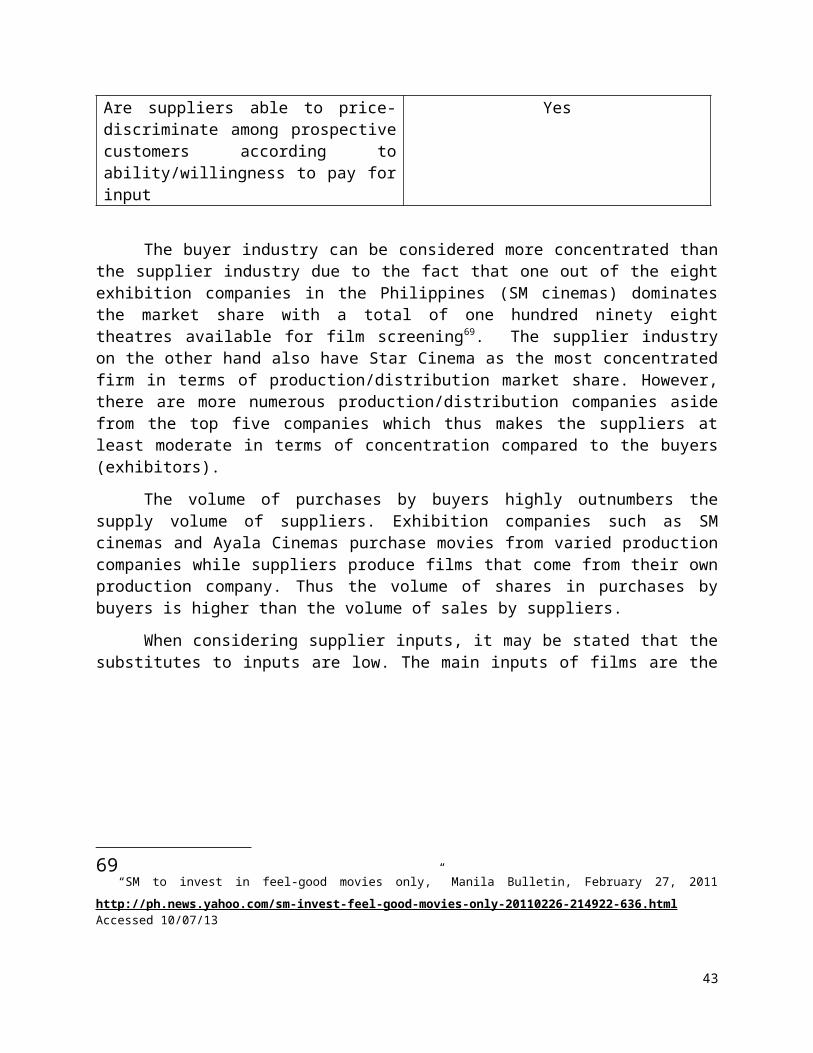
Are suppliers able to price-discriminate among prospectivecustomers according toability/willingness to pay forinput
Yes
The buyer industry can be considered more concentrated thanthe supplier industry due to the fact that one out of the eightexhibition companies in the Philippines (SM cinemas) dominatesthe market share with a total of one hundred ninety eighttheatres available for film screening69. The supplier industryon the other hand also have Star Cinema as the most concentratedfirm in terms of production/distribution market share. However,there are more numerous production/distribution companies asidefrom the top five companies which thus makes the suppliers atleast moderate in terms of concentration compared to the buyers(exhibitors).
The volume of purchases by buyers highly outnumbers thesupply volume of suppliers. Exhibition companies such as SMcinemas and Ayala Cinemas purchase movies from varied productioncompanies while suppliers produce films that come from their ownproduction company. Thus the volume of shares in purchases bybuyers is higher than the volume of sales by suppliers.
When considering supplier inputs, it may be stated that thesubstitutes to inputs are low. The main inputs of films are the
69“SM to invest in feel-good movies only,” Manila Bulletin, February 27, 2011
http://ph.news.yahoo.com/sm-invest-feel-good-movies-only-20110226-214922-636.htmlAccessed 10/07/13
43
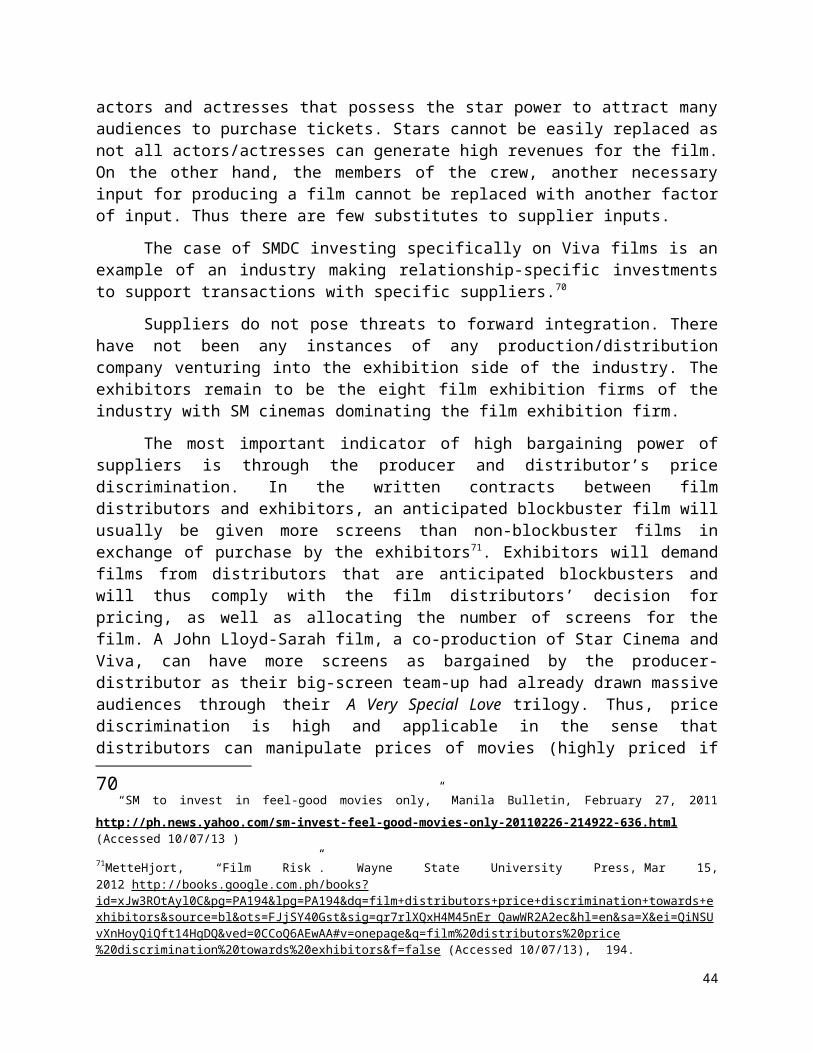
actors and actresses that possess the star power to attract manyaudiences to purchase tickets. Stars cannot be easily replaced asnot all actors/actresses can generate high revenues for the film.On the other hand, the members of the crew, another necessaryinput for producing a film cannot be replaced with another factorof input. Thus there are few substitutes to supplier inputs.
The case of SMDC investing specifically on Viva films is anexample of an industry making relationship-specific investmentsto support transactions with specific suppliers.70
Suppliers do not pose threats to forward integration. Therehave not been any instances of any production/distributioncompany venturing into the exhibition side of the industry. Theexhibitors remain to be the eight film exhibition firms of theindustry with SM cinemas dominating the film exhibition firm.
The most important indicator of high bargaining power ofsuppliers is through the producer and distributor’s pricediscrimination. In the written contracts between filmdistributors and exhibitors, an anticipated blockbuster film willusually be given more screens than non-blockbuster films inexchange of purchase by the exhibitors71. Exhibitors will demandfilms from distributors that are anticipated blockbusters andwill thus comply with the film distributors’ decision forpricing, as well as allocating the number of screens for thefilm. A John Lloyd-Sarah film, a co-production of Star Cinema andViva, can have more screens as bargained by the producer-distributor as their big-screen team-up had already drawn massiveaudiences through their A Very Special Love trilogy. Thus, pricediscrimination is high and applicable in the sense thatdistributors can manipulate prices of movies (highly priced if
70“SM to invest in feel-good movies only,” Manila Bulletin, February 27, 2011
http://ph.news.yahoo.com/sm-invest-feel-good-movies-only-20110226-214922-636.html(Accessed 10/07/13 )71MetteHjort, “Film Risk”. Wayne State University Press, Mar 15,2012 http://books.google.com.ph/books?id=xJw3ROtAyl0C&pg=PA194&lpg=PA194&dq=film+distributors+price+discrimination+towards+exhibitors&source=bl&ots=FJjSY40Gst&sig=qr7rlXQxH4M45nEr_QawWR2A2ec&hl=en&sa=X&ei=QiNSUvXnHoyQiQft14HgDQ&ved=0CCoQ6AEwAA#v=onepage&q=film%20distributors%20price%20discrimination%20towards%20exhibitors&f=false (Accessed 10/07/13), 194.
44

anticipated blockbuster; a lower price if it is not anticipatedto be a blockbuster.
E. Bargaining Power of Buyers
Table 3.7Five Forces Analysis (Bargaining Power of Buyers)
Factors Reflecting Power OfBuyers
Characterization(Current)
Is buyers’ industry moreconcentrated than the industryit purchased from?
High
Do buyers purchase in largevolumes? Does a buyer’spurchase volume represent alarge fraction of the typicalseller’s sales revenue
Moderate
Can buyers find substitutesfor industry’s product?
High
Do firms in industry makerelationship-specificinvestments to supporttransactions with specificbuyers
Yes
Is price elasticity of demandof buyer’s product high orlow?
Low
Do buyers pose credible threatof backward integration?
Moderate
Does product representsignificant fraction of costin buyer’s business?
High
Are prices in the marketnegotiated between buyers andsellers on each individualtransaction, or do sellerspost a “take it or leave it”price that applies to alltransactions?
Low
45
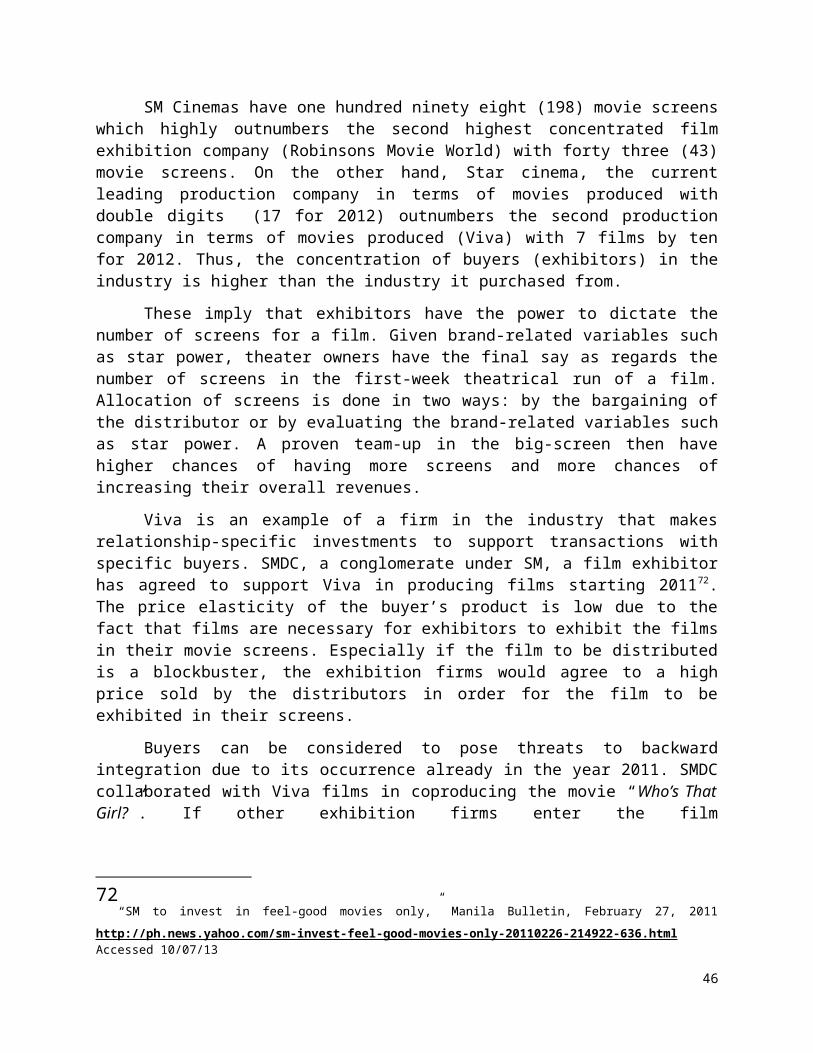
SM Cinemas have one hundred ninety eight (198) movie screenswhich highly outnumbers the second highest concentrated filmexhibition company (Robinsons Movie World) with forty three (43)movie screens. On the other hand, Star cinema, the currentleading production company in terms of movies produced withdouble digits (17 for 2012) outnumbers the second productioncompany in terms of movies produced (Viva) with 7 films by tenfor 2012. Thus, the concentration of buyers (exhibitors) in theindustry is higher than the industry it purchased from.
These imply that exhibitors have the power to dictate thenumber of screens for a film. Given brand-related variables suchas star power, theater owners have the final say as regards thenumber of screens in the first-week theatrical run of a film.Allocation of screens is done in two ways: by the bargaining ofthe distributor or by evaluating the brand-related variables suchas star power. A proven team-up in the big-screen then havehigher chances of having more screens and more chances ofincreasing their overall revenues.
Viva is an example of a firm in the industry that makesrelationship-specific investments to support transactions withspecific buyers. SMDC, a conglomerate under SM, a film exhibitorhas agreed to support Viva in producing films starting 201172.The price elasticity of the buyer’s product is low due to thefact that films are necessary for exhibitors to exhibit the filmsin their movie screens. Especially if the film to be distributedis a blockbuster, the exhibition firms would agree to a highprice sold by the distributors in order for the film to beexhibited in their screens.
Buyers can be considered to pose threats to backwardintegration due to its occurrence already in the year 2011. SMDCcollaborated with Viva films in coproducing the movie “Who’s ThatGirl?”. If other exhibition firms enter the film
72“SM to invest in feel-good movies only,” Manila Bulletin, February 27, 2011
http://ph.news.yahoo.com/sm-invest-feel-good-movies-only-20110226-214922-636.htmlAccessed 10/07/13
46
production/distribution market, then it is possible for amonopoly in the entire film industry to occur with one companydominating both production/distribution and the exhibitionindustry. However, the recent phenomena of SMDC venturing intothe production industry were in collaboration and not a soleendeavor. Thus the threat is currently considered as moderate.
The product represents a significant fraction of cost inbuyer’s business particularly because exhibitors require films tobe distributed to them, and purchased by them in order to exhibitfilms in their movie screens. If the film is an anticipatedblockbuster, then the fraction of cost increases due to a higherpricing decision by distributors.
Prices in particular are determined by the distributors incollaboration with the producers on how much exhibitors shouldpay to purchase the film for exhibition in their cinema moviescreens. Rather than negotiating prices, terms of agreement inthe exhibition contract such as the percentage of ticket salesreceived by the production/distribution firms and the exhibitionfirm.73 Thus negotiations regarding the prices between buyers andsellers are low.
73 Dave Roos, “How Booking Agents Work”.http://entertainment.howstuffworks.com/booking-agent2.htm Accessed 10/07/13
47
CHAPTER 5: INDUSTRY CONDUCT
Pricing Policies:
The determination of cinema prices are legally prepared byexhibitors but are also closely monitored by distributors74. Thisis because the revenues are shared by not only the exhibitorsduring the exhibiting but also by distributors as well asproducers.
Movie theaters do not offer different prices for differentfilms showing at the same time75. It also remains the same pricethroughout its specific length to be showed in theaters which
74 Eliashberg, Jehoshua, Anita Elberse, and Mark A.A.M Leenders. "The MotionPicture Industry:
Critical Issues in Practice, Current Research & New Researh Directions " HBS. (2009)www.hbs.edu/faculty/Publication%20Files/05-059.pdf (accessed August 2, 2013).75 Derek Thomson "Why Do All Movie Tickets Cost the Same? The Atlantic” News and
analysis on politics, business, culture, technology, national, international,and life http://www.theatlantic.com/business/archive/2012/01/why-do-all-movie-tickets-cost-the-same/250762/ (accessed August 2, 2013).
48

makes the basis of selling more cinema tickets are in the lengthof runs and displays on more screens or in larger venues76. Therehas been always one price charged for all movies. One-price-tickets have been the tradition of cinemas, when everybody wouldput a penny in a peep show machine. Around 1910, movie pricesvaried according to their length, stars and popularity. By 1940s,exhibitors would have the rights to each movie within a certainlocation. One-price-tickets started when Paramount anti-trustcase broke up monopolies between producers and distributors thatled to multiplexes. The need to rely on fewer and more expensivemovies led towards this one-ticket-price. This system is auniform practice for all the exhibitors until today77.
Different theories gathered to explain the said system allboils down to how consumers react to prices when it comes tocinemas. First, cutting prices after a successfully openingweekend would allow lesser moviegoers on the first week thusletting revenues go down78. Of course, consumers would want tospend less for a good that if they would know that prices willeventually go down, they would want to wait for the succeedingweeks. Second, price is a sign of quality79. Some consumers basetheir consumption on goods solely on prices. They think that themore expensive it is the more it has been researched on thus, agrade A quality. If exhibitors or cinema theaters show a movie Aless than Php 200, while movie B over Php 200, then moviegoerswould assume that movie B is better than movie A—thus more wouldwant to watch movie B. Movies also received grades ranging from Ato C which corresponded with the prices at these cinema theaters.The creation of multiplexes led to this such that some movies arebeing showed with better facilities. Since theaters vary, this iswhere exhibitors practice price discrimination wherein a grade Amovie is shown in a renovated theater thus with better
76Pascal Courty “An Economic Guide to Ticket Pricing in the Entertainment Industry”London Business School.http://harbaugh.uoregon.edu/Readings/Ticket%20pricing/LER.pdf(accesed August 2, 2013). 77 Derek Thomson "Why Do All Movie Tickets Cost the Same? The Atlantic” News andanalysis on politics, business, culture, technology, national, international, and lifehttp://www.theatlantic.com/business/archive/2012/01/why-do-all-movie-tickets-cost-the-same/250762/ (accessed August 2, 2013).78 Ibid79 Ibid
49

technology, while a lower grade movie are usually in oldertheaters with smaller screens. Price discrimination also offersmore opportunities for other movies to attract more moviegoers80. Ticket prices also depend on the presence of othercinemas or other exhibitors nearby allowing moviegoers choose aspecific cinema81.
Advertising/ Promotions:
A subset of film distribution is advertising and promotionsas explained in the supply chain of chapter 1 of this paper.Advertising and promotions from movie distributors may serve asan indicator of a box-office success. If teasers and trailers areshown more often, the greater is the chance of making it to thebox-office. Advertisements generally help the movie to be thesubject of news articles, as well as the talks of the commonpeople. Excitement grows in the minds and hearts of people sincethey would want to know the reasons behind the teasers andtrailers. These create either a positive or negative word-of-mouth, wherein people would disseminate the information they haveof a certain movie, particularly, the positive or negativeattributes of it. Even film specialists affirm that goodadvertising and promotions result to informational cascades andherd behavior82. Promotions would be better if a mother networkback-ups a certain movie project. Every commercial break, ateaser of a movie may be viewed for the public. Thus, the publicwould know more of the movie, and they could decide whether towatch that film or not.
As what is observed in the present scenario, months beforethe release of a Hollywood film, trailers are released so thatthe consumers can make evaluation of the expected flow of storyin a movie. Thus, consumers will be subjected to their owncuriosity. Generally, trailers are released 30 days before therelease. There are different types of release strategies:80 Ibid81 Eliashberg, Jehoshua, Anita Elberse, and Mark A.A.M Leenders. "The Motion
Picture Industry:Critical Issues in Practice, Current Research & New Researh Directions " HBS. (2009)www.hbs.edu/faculty/Publication%20Files/05-059.pdf (accessed August 2, 2013).82 G Pasadilla and A LantinCan the Philippines Follow Bollywood?.Philippine Institute ofDevelopment Studies Manila: (2005)
50
exclusive release is a non-commercial premiere of a movie inselected few locations only; saturation booking is a film that ispremiered in the widest and largest possible number of theatresas possible; limited release comprises of films that are set tobe released in major cities only; plat forming refers to thedistribution of films in “gradually widening markets and theatresso that it slowly builds its reputation and momentum throughreviews and words-of-mouth”.83 In the case of our Filipinomovies, trailers are released two to three weeks before itsrelease in the market. The differences briefly explain thephenomena in the country84 .
Convention-like events such as festivals offer opportunitiesto get attention especially for independent film producer85. Afilm festival is more than just the screening of films but thereare launch parties and press conferences as well as educationalseminars and awards with judges and prizes. It is also a way toorganize in one event and location not only those who want to seenew and unique films but also those who are involved in themoviemaking process such as directors, producers, and seasonedand emerging talent86
Production/ Marketing Strategy:
Partnerships in the film industry include coopetition andbeing affiliated with a studio. Financing is also seen as lessproblematic if the producer is affiliated with a studio. Bysigning a studio contract, a producer usually gives up a widerange of rights that has something to do with sequels, spin-offs,merchandising, and other opportunities, however they may be ableto increase the chances of securing bank loans or tapping intothe studio’s own capital and securing favorable distribution andexhibition deals for the series of movies. At the same time,studios are also growing more dependent on companies that areable to tap into overseas subsidies and tax incentives—efficient83Corrigan, T. & White, P.The Film Experience. USA: MacMillan Publishing Ltd (2009). 84 G Pasadilla and A LantinCan the Philippines Follow Bollywood?.Philippine Institute ofDevelopment Studies Manila: (2005)85Mamer, B. Film Production Technique: Creating the Accomplished Image. (CA: Wadsworth CengageLearning, 2009), 11886Yager F. and Yager J. Career Opportunities in the Film Industry.(NY: Ferguson, 2009), 204
51

portfolio management strategies may help to secure productplacements, which can also help reduce costs and thereby risks87.
Under coopetition, the process of film collaboration whentwo production outfits share the costs of producing a movie so asto increase the chances of gaining revenues with minimal costs,they also share their respective contract talents who haveattained a significant stature or fame in the industry. In theyears following the market trend, stars usually increase theirmarket value, as well as their power to influence the audience.Since actors and actresses are contract talents of a specificfilm production outfit, there is a need for players to cooperate,to share stars with a high market value, in order to producefilms which are blockbuster in nature.
Coopetition and sharing of stars is exemplified if we seeexamples of contract stars of different film production outfits.John Lloyd Cruz is a contract talent of Star Cinema, whereasSarah Geronimo belongs to Viva. Before they can be a tandem in amovie, both Star Cinema and Viva Films need to co-produce andshare the costs of the film if a potential blockbuster is highlyexpected with the two stars’ team-up in the big screen. Below arethe movies that were coproduced and their corresponding grossrevenues and ranks out of the 68 movies analyzed in this paper:
Movie ProductionOutfits
Rank (68movies)
GrossRevenues
It Takes A Man And A Woman Viva and Star 1st 401.03No Other Woman Viva and Star 2nd 278.42You Changed My Life (w/ Viva) Viva and Star 4th 225.62Catch Me…I'm In Love Viva and Star 13th 120.21Here Comes The Bride Star and OctoArts 16th 117.16Babe, I Love You Viva and Star 19th 96.19You to Me Are Everything GMA and Regal 20th 93.82When Love Begins Viva and Star 21st 91.27Pak! Pak! My Dr. KwakKwak Star and OctoArts 28th 77.05In Your Eyes GMA and Viva 32nd 63.59
87 Eliashberg, Jehoshua, Anita Elberse, and Mark A.A.M Leenders. "The MotionPicture Industry:
Critical Issues in Practice, Current Research & New Researh Directions " HBS. (2009)www.hbs.edu/faculty/Publication%20Files/05-059.pdf (accessed August 2, 2013).
52

Temptation Island GMA and Regal 33rd 62.78One True Love GMA and Regal 37th 58.8When I Met U GMA and Regal 39th 58.66Wedding Tayo, Wedding Hindi Star and OctoArts 51st 37.46Working Girls Viva and Star 53rd 31.99Patient X GMA and Viva 60th 24.49
CHAPTER 6: INDUSTRY PERFORMANCE AND PROSPECTS
There are only five major production and distributionoutfits in the current Philippine motion picture industry.Despite their market share of more than 70%, there are two firmsnamely, Viva Films and Regal Films that have incurred an averagenet loss instead of net profits (See Appendix _). Given thiscircumstance, the question is, how do these major firms maintaintheir market dominance?
This chapter contains the significant results gathered fromtwo methods namely, factor analysis and regression. Factoranalysis is used to see which variables are highly correlated.Artist-producer and producer-producer relationships thatfrequently work together are obtained here. The results from thismethod are used in regression models to determine which factorshave a significant explanatory power in explaining the dependentvariable, gross revenue. The presentation of data will follow thestructure of the conceptual framework below. Factors affectingfirst week revenues include brand-related variables consisting ofgenre, rating and producer reputation but mainly driven by starpower.88 By the second week, word-of mouth already takes effectand proves that it is an essential determinant of gross revenue.In the end, the results will show what technique or strategythese firms may engage in over the years and will determine thepositive implications of the strategy that will sustain theirmarket dominance.
Figure 6.1: Conceptual Framework
88 Source mo on star power or kung anumang study yung kay mis.d
53
Word-of-Mouth
Star PowerGenre
MTRCB RatingIMDB
Producer
Word-of-Mouth
Star PowerGenre
MTRCB RatingProducerReputation
OverallWeek 2
Star PowerGenre
MTRCB RatingProducerReputationCompetitionfor 1st Week
Week 1
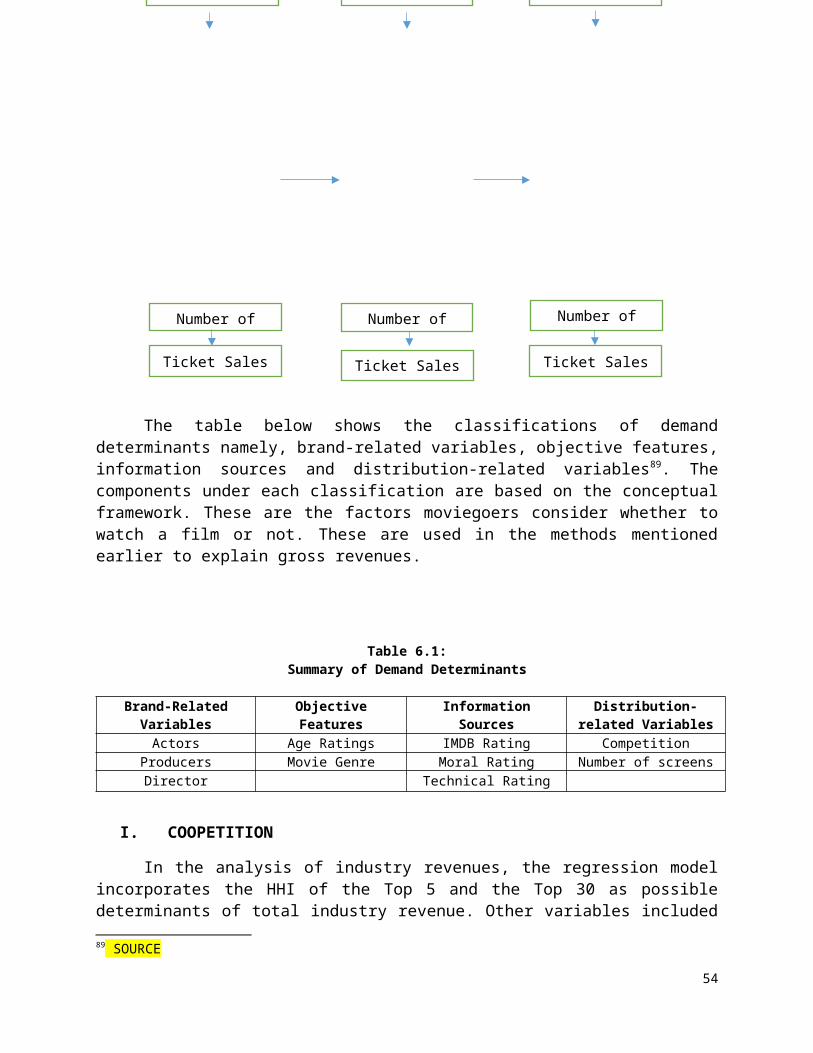
The table below shows the classifications of demanddeterminants namely, brand-related variables, objective features,information sources and distribution-related variables89. Thecomponents under each classification are based on the conceptualframework. These are the factors moviegoers consider whether towatch a film or not. These are used in the methods mentionedearlier to explain gross revenues.
Table 6.1: Summary of Demand Determinants
Brand-RelatedVariables
ObjectiveFeatures
InformationSources
Distribution-related Variables
Actors Age Ratings IMDB Rating CompetitionProducers Movie Genre Moral Rating Number of screensDirector Technical Rating
I. COOPETITION
In the analysis of industry revenues, the regression modelincorporates the HHI of the Top 5 and the Top 30 as possibledeterminants of total industry revenue. Other variables included89 SOURCE
54
Ticket Sales
Word-of-Mouth
Star PowerGenre
MTRCB RatingIMDB
Producer
Word-of-Mouth
Star PowerGenre
MTRCB RatingProducerReputation
Star PowerGenre
MTRCB RatingProducerReputationCompetitionfor 1st Week
Number of Number ofscreens
Ticket Sales
Number of
Ticket Sales

in the analysis of industry revenues from 1996 to 2010 includethe average movie projection revenue (per film), the averageindustry compensation (per film) and the average sales of StarCinema and Viva Films (per film). The table below summarizes thevariables used in the analysis of the regression model forindustry revenues.
Table 6.2:Description and Code of Variables for Industry Revenues
Variables Description CodeHHI Top 30 Represents the summation
of the market shares ofthe average 30 firm
players
HHITOP30
HHI Top 5 Represents the summationof market shares of thetop five industry movie
production anddistribution players
HHITOP5
Average MovieProjectionRevenue (per
film)
Represents the averageprojection sales per film
released
INDMOVPROJVALUEADDED/VOLUMETOP5
AverageIndustry
Compensation(per film)
Represents the averageindustry compensation per
film released.
INDUSTRYPDCOMP/VOLUMETOP5
Average Salesof Star
Cinema andViva Films(per film)
Represents the averagerevenues generated by thetop two film production
companies
SALESTOP2/VOLUMETOP2
Results show that HHITOP5 and the average compensation perfilm are highly significant in explaining the total industryrevenue (refer to Table 6.3). These are consistent with theresults of the Pairwise Granger Causality Test, a process whichdetermines the relationship between variables with a specific lagperiod. Some variables then, may have a high explanatory power indetermining industry revenues only after a year, two years, orthree years depending on the lag period stated.
The Granger Causality Test suggests that average industrycompensation significantly explains industry revenues only after
55
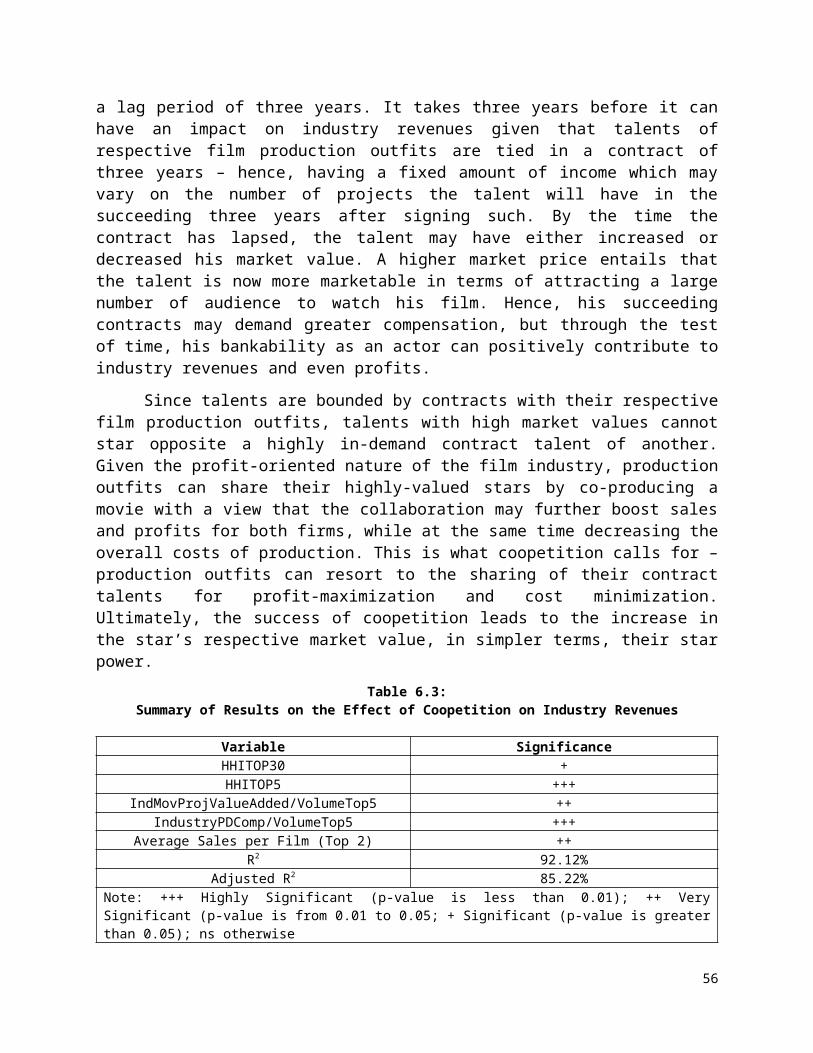
a lag period of three years. It takes three years before it canhave an impact on industry revenues given that talents ofrespective film production outfits are tied in a contract ofthree years – hence, having a fixed amount of income which mayvary on the number of projects the talent will have in thesucceeding three years after signing such. By the time thecontract has lapsed, the talent may have either increased ordecreased his market value. A higher market price entails thatthe talent is now more marketable in terms of attracting a largenumber of audience to watch his film. Hence, his succeedingcontracts may demand greater compensation, but through the testof time, his bankability as an actor can positively contribute toindustry revenues and even profits.
Since talents are bounded by contracts with their respectivefilm production outfits, talents with high market values cannotstar opposite a highly in-demand contract talent of another.Given the profit-oriented nature of the film industry, productionoutfits can share their highly-valued stars by co-producing amovie with a view that the collaboration may further boost salesand profits for both firms, while at the same time decreasing theoverall costs of production. This is what coopetition calls for –production outfits can resort to the sharing of their contracttalents for profit-maximization and cost minimization.Ultimately, the success of coopetition leads to the increase inthe star’s respective market value, in simpler terms, their starpower.
Table 6.3: Summary of Results on the Effect of Coopetition on Industry Revenues
Variable SignificanceHHITOP30 +HHITOP5 +++
IndMovProjValueAdded/VolumeTop5 ++IndustryPDComp/VolumeTop5 +++
Average Sales per Film (Top 2) ++R2 92.12%
Adjusted R2 85.22%Note: +++ Highly Significant (p-value is less than 0.01); ++ VerySignificant (p-value is from 0.01 to 0.05; + Significant (p-value is greaterthan 0.05); ns otherwise
56

The local film industry is dominated by collaboration amongfirms, in the likes of Star Cinema and Viva Films, as well asthat of GMA Films and Regal Films. Films, under the co-productionof Star Cinema and Viva, have produced most of the movies in theTop 10 Highest-Grossing Local Films of all Time. These films are presented ina table below:
Table 6.4: List of Highest-Grossing Films Co-Produced by Star Cinema and Viva
Movie Year Gross Revenue (in millionpesos)
1. It Takes a Man and a Woman 2013 401.032. Sisterakas 2012 391.013. The Unkabogable Praybeyt
Benjamin2011 331.61
4. No Other Woman 2011 278.395. This Guys In Love With You Mare 2012 249.096. You Changed My Life 2009 225.217. A Very Special Love 2008 179.25
Source: Box Office Mojo (Philippines)
Moreover, the Granger Causality Test suggests that HHITOP5is highly significant in explaining industry revenues in thesense that the interaction among these outfits characterize theiroverall market share and eventually HHI. Results show that StarCinema and Viva Films, are not prime movers; in fact, theirreaction is dependent on the performance of the Regal, GMA, andOctoArts. The assertion of dominant firms cannot also serve as afirm basis of industry revenues, given that the average profit ofViva and Regal is negative based on the data gathered on theirfinancial statements from 1996 to 2010. Their negative profitsimply that at certain points from 1996 to 2010, Viva and Regalneeded to co-produce and share their contract talents with morestable firms -- Star Cinema, GMA, and OctoArts. In the process ofcoopetition, production costs are cut, and the chances of earningincreases, although it can be really small nominally speaking.Hence, the presence of the five firms in their entiretycharacterizes the overall industry revenues.
57
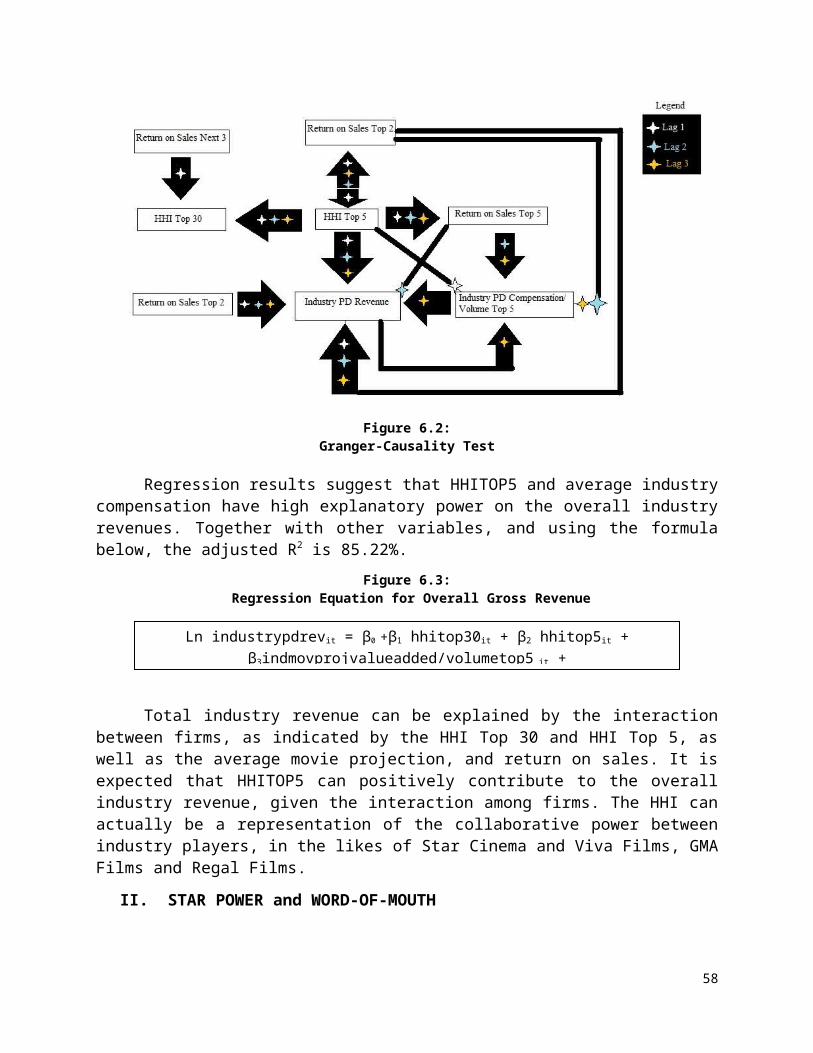
Figure 6.2: Granger-Causality Test
Regression results suggest that HHITOP5 and average industrycompensation have high explanatory power on the overall industryrevenues. Together with other variables, and using the formulabelow, the adjusted R2 is 85.22%.
Figure 6.3: Regression Equation for Overall Gross Revenue
Total industry revenue can be explained by the interactionbetween firms, as indicated by the HHI Top 30 and HHI Top 5, aswell as the average movie projection, and return on sales. It isexpected that HHITOP5 can positively contribute to the overallindustry revenue, given the interaction among firms. The HHI canactually be a representation of the collaborative power betweenindustry players, in the likes of Star Cinema and Viva Films, GMAFilms and Regal Films.
II. STAR POWER and WORD-OF-MOUTH
58
Ln industrypdrevit = β0 +β1 hhitop30it + β2 hhitop5it +β3indmovprojvalueadded/volumetop5 it +

Apart from coopetition, it is also important to note theeffect and significance of star power to overall gross revenueson its own before going into its contribution to a film’s weeklysales along with other factors.
Table 6.5: Summary of Results on the Effect of Star Power on Overall Gross Revenues
Variable SignificanceJohn +++Sarah +++Anne +++Angel +Bea +
Dingdong +Marian NSToni NSAi Ai NSR2 59.59%
Adjusted R2 52.50%Note: +++ Highly Significant (p-value is less than 0.01); ++ VerySignificant (p-value is from 0.01 to 0.05; + Significant (p-value is greaterthan 0.05); ns otherwise
A. First Week Sales Table 6.6:
Description and Code of Variables for First Week SalesVariables Description CodeStar Power Veteran: Sharon Cuneta,
Maricel Soriano, Aga Muhlach, Vilma SantosRising Stars: John Lloyd Cruz,Bea Alonzo, Sarah Geronimo, Angel Locsin, Toni Gonzaga, Dingdong Dantes, Marian RiveraQuality indicators, indicator of a film’s strength in drawing a good number of audience
John, Sarah, Bea, Angel,Toni, Anne, Dingdong, Marian(1 is assigned when films have stars and 0 when otherwise)
Genre Target Market Comedy, Drama, Romantic,Horror (1 is assigned when a film falls in a particular category and 0 when otherwise)
59
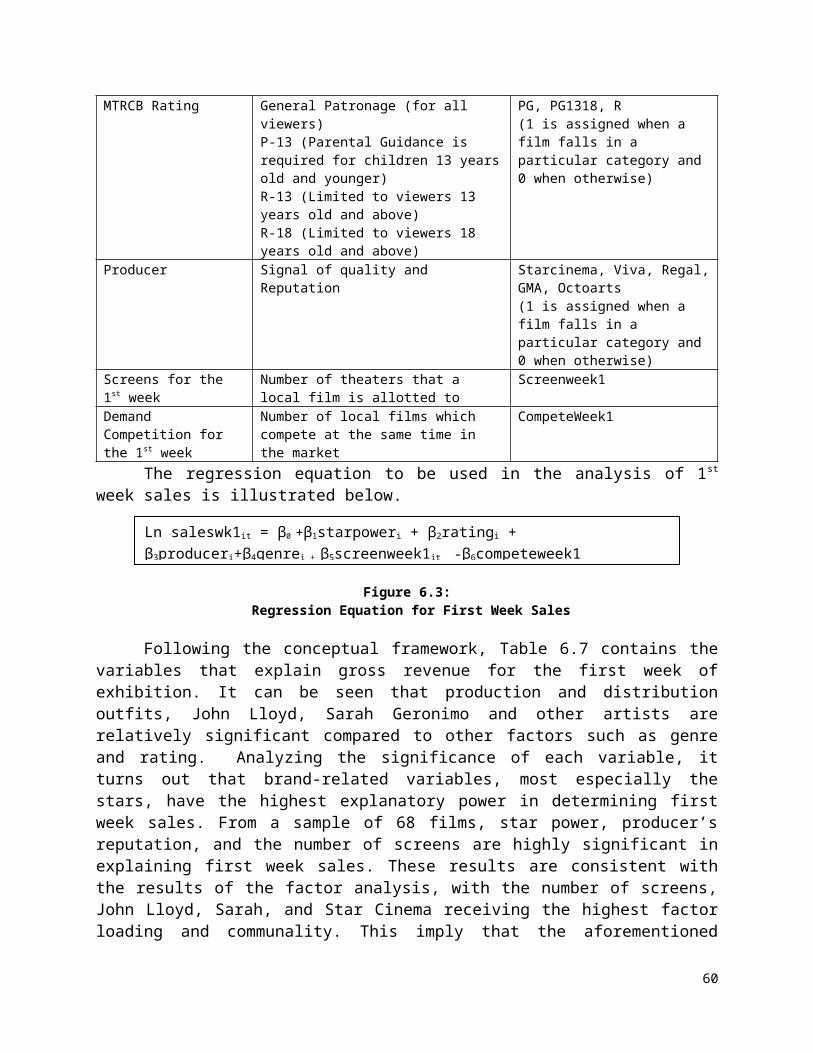
MTRCB Rating General Patronage (for all viewers)P-13 (Parental Guidance is required for children 13 yearsold and younger)R-13 (Limited to viewers 13 years old and above)R-18 (Limited to viewers 18 years old and above)
PG, PG1318, R(1 is assigned when a film falls in a particular category and 0 when otherwise)
Producer Signal of quality and Reputation
Starcinema, Viva, Regal,GMA, Octoarts(1 is assigned when a film falls in a particular category and 0 when otherwise)
Screens for the 1st week
Number of theaters that a local film is allotted to
Screenweek1
Demand Competition for the 1st week
Number of local films which compete at the same time in the market
CompeteWeek1
The regression equation to be used in the analysis of 1st
week sales is illustrated below.
Figure 6.3: Regression Equation for First Week Sales
Following the conceptual framework, Table 6.7 contains thevariables that explain gross revenue for the first week ofexhibition. It can be seen that production and distributionoutfits, John Lloyd, Sarah Geronimo and other artists arerelatively significant compared to other factors such as genreand rating. Analyzing the significance of each variable, itturns out that brand-related variables, most especially thestars, have the highest explanatory power in determining firstweek sales. From a sample of 68 films, star power, producer’sreputation, and the number of screens are highly significant inexplaining first week sales. These results are consistent withthe results of the factor analysis, with the number of screens,John Lloyd, Sarah, and Star Cinema receiving the highest factorloading and communality. This imply that the aforementioned
60
Ln saleswk1it = β0 +β1starpoweri + β2ratingi + β3produceri+β4genrei + β5screenweek1it -β6competeweek1
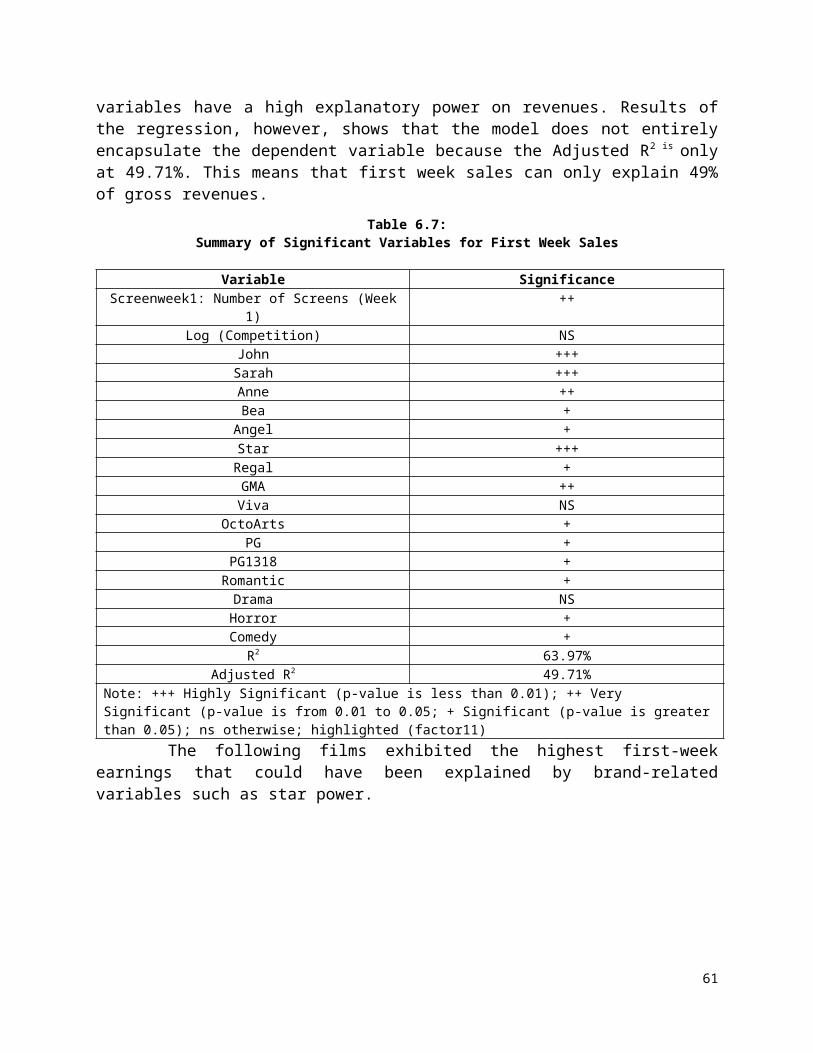
variables have a high explanatory power on revenues. Results ofthe regression, however, shows that the model does not entirelyencapsulate the dependent variable because the Adjusted R2 is onlyat 49.71%. This means that first week sales can only explain 49%of gross revenues.
Table 6.7: Summary of Significant Variables for First Week Sales
Variable SignificanceScreenweek1: Number of Screens (Week
1)++
Log (Competition) NSJohn +++Sarah +++Anne ++Bea +Angel +Star +++Regal +GMA ++Viva NS
OctoArts +PG +
PG1318 +Romantic +Drama NSHorror +Comedy +
R2 63.97%Adjusted R2 49.71%
Note: +++ Highly Significant (p-value is less than 0.01); ++ Very Significant (p-value is from 0.01 to 0.05; + Significant (p-value is greaterthan 0.05); ns otherwise; highlighted (factor11)
The following films exhibited the highest first-weekearnings that could have been explained by brand-relatedvariables such as star power.
61
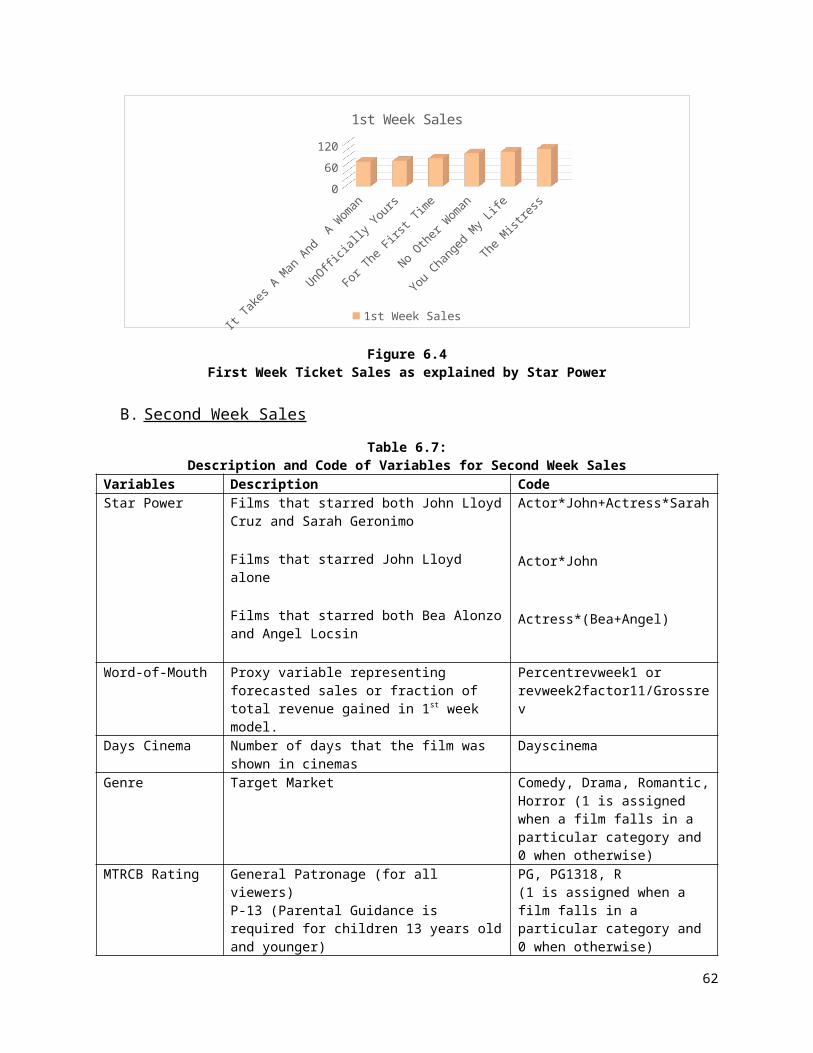
060120
1st Week Sales
1st Week Sales
Figure 6.4First Week Ticket Sales as explained by Star Power
B. Second Week Sales Table 6.7:
Description and Code of Variables for Second Week SalesVariables Description CodeStar Power Films that starred both John Lloyd
Cruz and Sarah Geronimo
Films that starred John Lloyd alone
Films that starred both Bea Alonzoand Angel Locsin
Actor*John+Actress*Sarah
Actor*John
Actress*(Bea+Angel)
Word-of-Mouth Proxy variable representing forecasted sales or fraction of total revenue gained in 1st week model.
Percentrevweek1 or revweek2factor11/Grossrev
Days Cinema Number of days that the film was shown in cinemas
Dayscinema
Genre Target Market Comedy, Drama, Romantic,Horror (1 is assigned when a film falls in a particular category and 0 when otherwise)
MTRCB Rating General Patronage (for all viewers)P-13 (Parental Guidance is required for children 13 years oldand younger)
PG, PG1318, R(1 is assigned when a film falls in a particular category and 0 when otherwise)
62
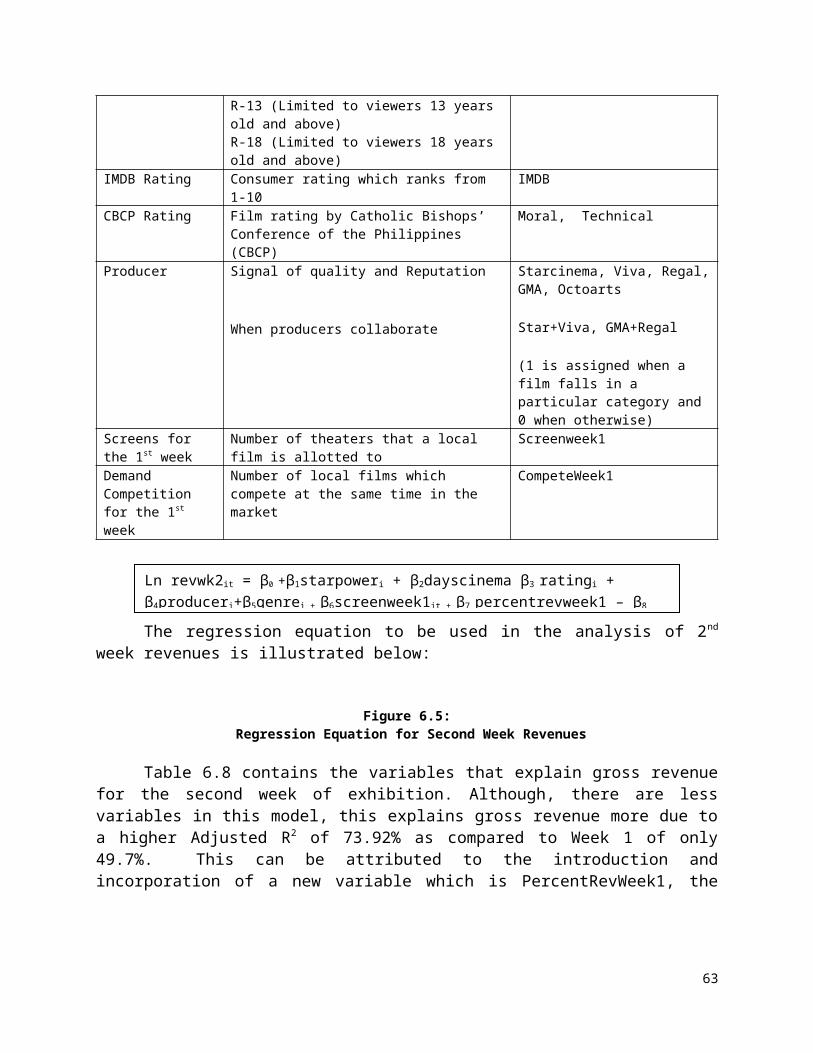
R-13 (Limited to viewers 13 years old and above)R-18 (Limited to viewers 18 years old and above)
IMDB Rating Consumer rating which ranks from 1-10
IMDB
CBCP Rating Film rating by Catholic Bishops’ Conference of the Philippines (CBCP)
Moral, Technical
Producer Signal of quality and Reputation
When producers collaborate
Starcinema, Viva, Regal,GMA, Octoarts
Star+Viva, GMA+Regal
(1 is assigned when a film falls in a particular category and 0 when otherwise)
Screens for the 1st week
Number of theaters that a local film is allotted to
Screenweek1
Demand Competition for the 1st week
Number of local films which compete at the same time in the market
CompeteWeek1
The regression equation to be used in the analysis of 2nd
week revenues is illustrated below:
Figure 6.5: Regression Equation for Second Week Revenues
Table 6.8 contains the variables that explain gross revenuefor the second week of exhibition. Although, there are lessvariables in this model, this explains gross revenue more due toa higher Adjusted R2 of 73.92% as compared to Week 1 of only49.7%. This can be attributed to the introduction andincorporation of a new variable which is PercentRevWeek1, the
63
Ln revwk2it = β0 +β1starpoweri + β2dayscinema β3 ratingi + β4produceri+β5genrei + β6screenweek1it + β7 percentrevweek1 – β8

proxy for Word-of Mouth. Indeed, the effect of informationcascades is at its peak during the second week.90
An explanation for the second week sales is the signalingeffect of demand determinants causing information cascades. Whenthe signals are strong enough, it may result to follow thesesignals whether or not it coincides with their personalsignals.91 Viewer feedback or response is not the onlymanifestation of word-of-mouth but in this case, the increase ordecrease in the number of screens in Week 2 and the number ofdays a film is shown, which ultimately affects gross revenues.Moreover, since information cascades can either be caused bypositive or negative externalities, individuals would want tofind out for themselves what the film is about and formulatetheir own judgment about it after watching it. Since movies areexperience goods, every person has a unique experience and hashis own perception on a film. Those who do not watch in the firstweek will be influenced by brand-related variables and enticethem to watch to experience the film themselves. Thus, there willalways be an increase in ticket sales as long as word-of-mouth ispresent.
Table 6.8: Summary of Results for Second Week Sales
Variable SignificanceDays Cinema +++
PercentRevWeek1 (proxy for Word-of-mouth)
++
Screenweek1: Number of screens +++IMDB +Star +Viva ++GMA +Regal NS
OctoArts NSActor*John + Actress*Sarah +++
R2 78.20%Adjusted R2 73.92%
Note: +++ Highly Significant (p-value is less than 0.01); ++ VerySignificant (p-value is from 0.01 to 0.05; + Significant (p-value is greater
90 INFORMATION CASCADES LALA91 ibid
64
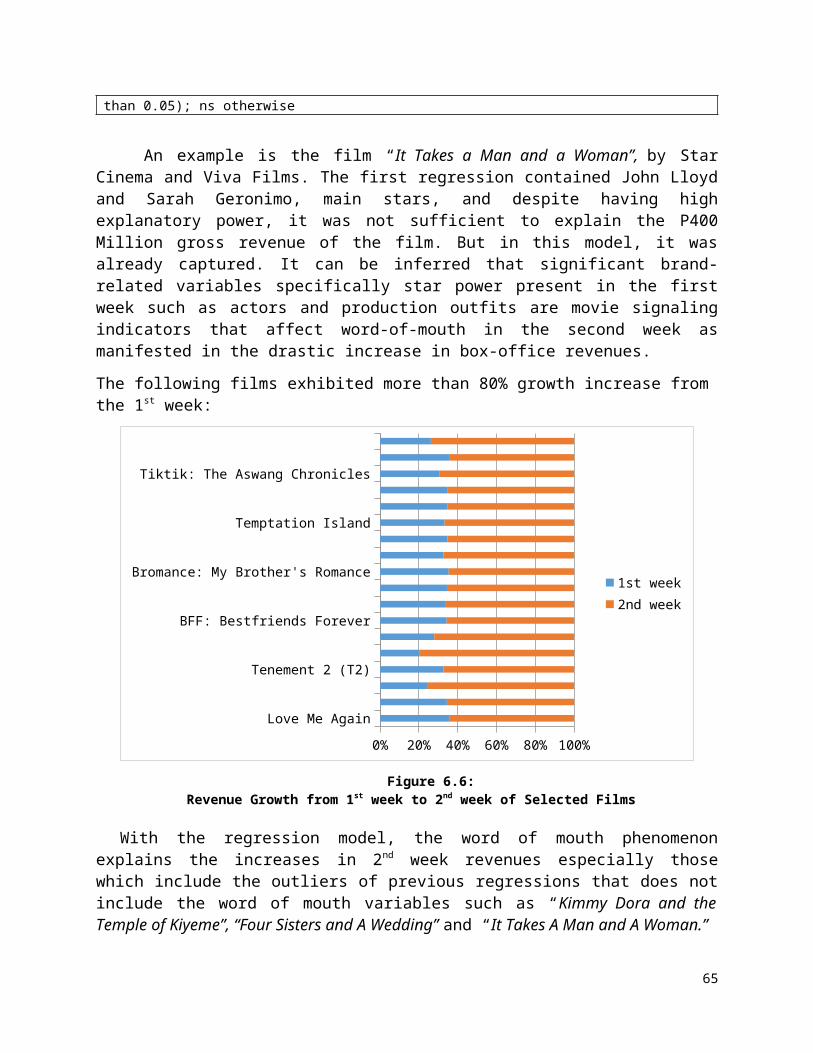
than 0.05); ns otherwise
An example is the film “It Takes a Man and a Woman”, by StarCinema and Viva Films. The first regression contained John Lloydand Sarah Geronimo, main stars, and despite having highexplanatory power, it was not sufficient to explain the P400Million gross revenue of the film. But in this model, it wasalready captured. It can be inferred that significant brand-related variables specifically star power present in the firstweek such as actors and production outfits are movie signalingindicators that affect word-of-mouth in the second week asmanifested in the drastic increase in box-office revenues.
The following films exhibited more than 80% growth increase from the 1st week:
Love Me Again
Tenement 2 (T2)
BFF: Bestfriends Forever
Bromance: My Brother's Romance
Temptation Island
Tiktik: The Aswang Chronicles
0% 20% 40% 60% 80% 100%
1st week2nd week
Figure 6.6: Revenue Growth from 1st week to 2nd week of Selected Films
With the regression model, the word of mouth phenomenonexplains the increases in 2nd week revenues especially thosewhich include the outliers of previous regressions that does notinclude the word of mouth variables such as “Kimmy Dora and theTemple of Kiyeme”, “Four Sisters and A Wedding” and “It Takes A Man and A Woman.”
65
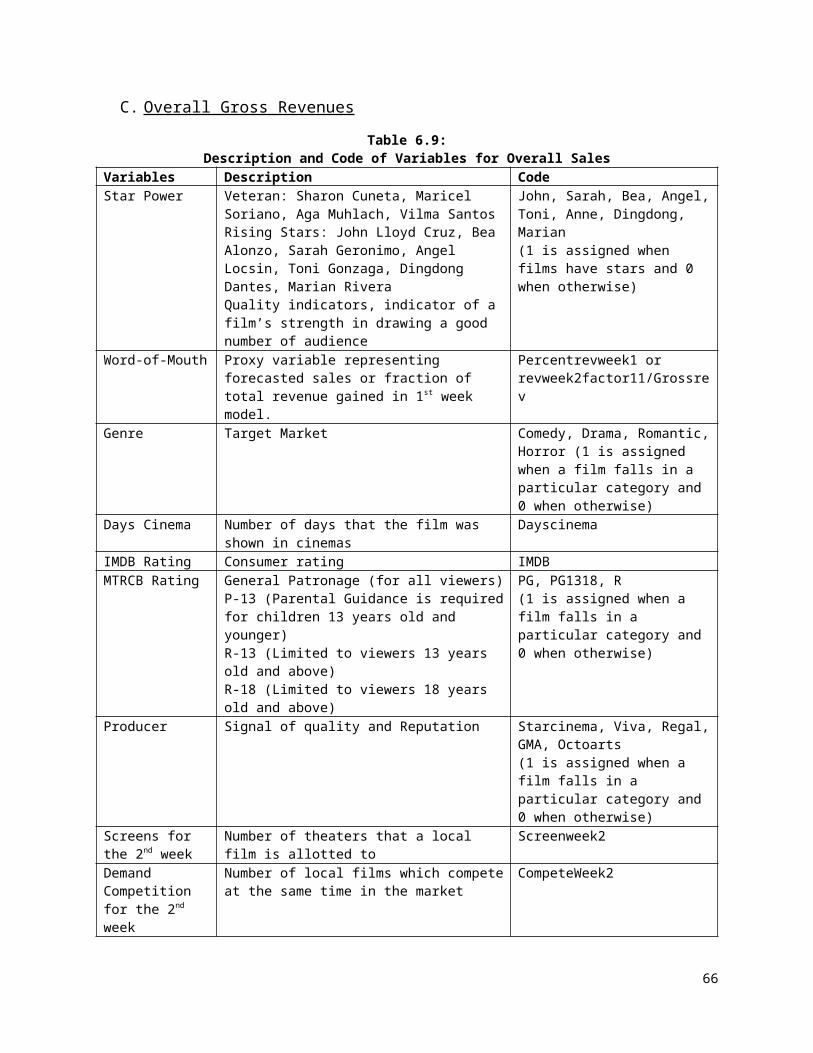
C. Overall Gross Revenues Table 6.9:
Description and Code of Variables for Overall SalesVariables Description CodeStar Power Veteran: Sharon Cuneta, Maricel
Soriano, Aga Muhlach, Vilma SantosRising Stars: John Lloyd Cruz, Bea Alonzo, Sarah Geronimo, Angel Locsin, Toni Gonzaga, Dingdong Dantes, Marian RiveraQuality indicators, indicator of a film’s strength in drawing a good number of audience
John, Sarah, Bea, Angel,Toni, Anne, Dingdong, Marian(1 is assigned when films have stars and 0 when otherwise)
Word-of-Mouth Proxy variable representing forecasted sales or fraction of total revenue gained in 1st week model.
Percentrevweek1 or revweek2factor11/Grossrev
Genre Target Market Comedy, Drama, Romantic,Horror (1 is assigned when a film falls in a particular category and 0 when otherwise)
Days Cinema Number of days that the film was shown in cinemas
Dayscinema
IMDB Rating Consumer rating IMDBMTRCB Rating General Patronage (for all viewers)
P-13 (Parental Guidance is requiredfor children 13 years old and younger)R-13 (Limited to viewers 13 years old and above)R-18 (Limited to viewers 18 years old and above)
PG, PG1318, R(1 is assigned when a film falls in a particular category and 0 when otherwise)
Producer Signal of quality and Reputation Starcinema, Viva, Regal,GMA, Octoarts(1 is assigned when a film falls in a particular category and 0 when otherwise)
Screens for the 2nd week
Number of theaters that a local film is allotted to
Screenweek2
Demand Competition for the 2nd week
Number of local films which competeat the same time in the market
CompeteWeek2
66

The regression equation used in the analysis of overallgross revenues of selected films is illustrated below:
Figure 6.7: Regression Equation for Overall Gross Revenue
By incorporating the effects of sales in Week 1 and Week 2,the summary of the regression model below captures, 86.36% ofgross revenue. The variables that significantly explain grossrevenues are the following, number of days shown, word-of-mouth,number of screens, Star Cinema and the artists, John Lloyd Cruzand Sarah Geronimo, in particular. These factors have to beconsidered if producers/distributors want to generate revenues.
Table 6.10: Summary of Results for Overall Gross Revenues
Variable SignificanceDays Cinema +++
Word-of-mouth:Revweek2Factor11/Grossrev
+++
Screenweek2: Number of screens +++IMDB +Star +++Viva ++GMA +Regal ++
OctoArts +Actor*John + Actress*Sarah +++
R2 88.60%Adjusted R2 86.36%
Note: +++ Highly Significant (p-value is less than 0.01); ++ VerySignificant (p-value is from 0.01 to 0.05; + Significant (p-value is greaterthan 0.05); ns otherwise
67
Ln grossrevit = β0 +β1starpoweri + β2dayscinema β3 ratingi + β4produceri+β5genrei + β6screenweek2it + β7
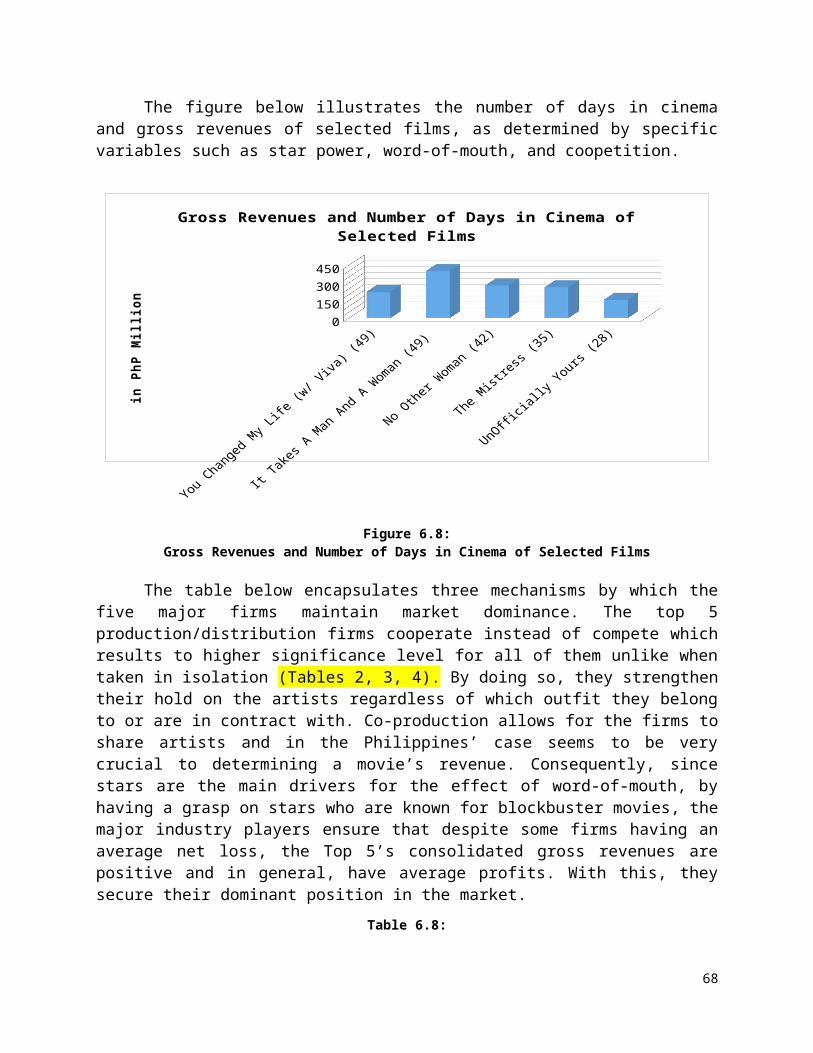
The figure below illustrates the number of days in cinemaand gross revenues of selected films, as determined by specificvariables such as star power, word-of-mouth, and coopetition.
0150300450
Gross Revenues and Number of Days in Cinema of Selected Films
in P
hP M
illi
on
Figure 6.8: Gross Revenues and Number of Days in Cinema of Selected Films
The table below encapsulates three mechanisms by which thefive major firms maintain market dominance. The top 5production/distribution firms cooperate instead of compete whichresults to higher significance level for all of them unlike whentaken in isolation (Tables 2, 3, 4). By doing so, they strengthentheir hold on the artists regardless of which outfit they belongto or are in contract with. Co-production allows for the firms toshare artists and in the Philippines’ case seems to be verycrucial to determining a movie’s revenue. Consequently, sincestars are the main drivers for the effect of word-of-mouth, byhaving a grasp on stars who are known for blockbuster movies, themajor industry players ensure that despite some firms having anaverage net loss, the Top 5’s consolidated gross revenues arepositive and in general, have average profits. With this, theysecure their dominant position in the market.
Table 6.8:
68
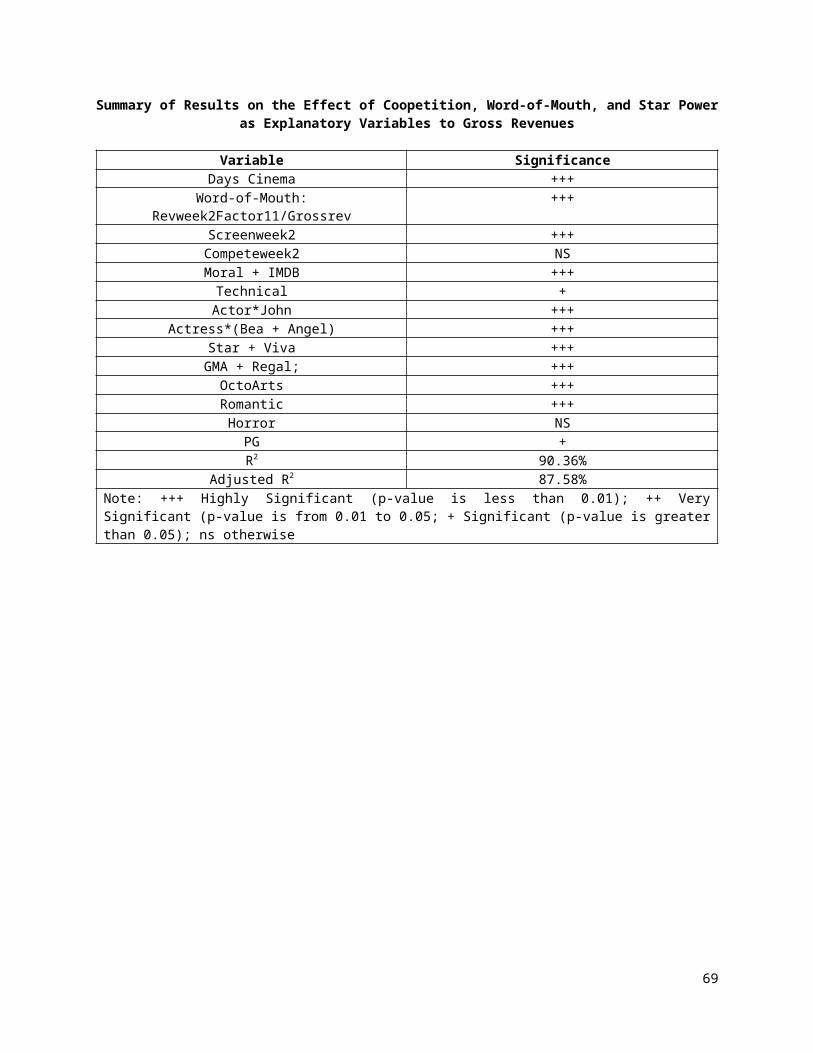
Summary of Results on the Effect of Coopetition, Word-of-Mouth, and Star Poweras Explanatory Variables to Gross Revenues
Variable SignificanceDays Cinema +++
Word-of-Mouth:Revweek2Factor11/Grossrev
+++
Screenweek2 +++Competeweek2 NSMoral + IMDB +++Technical +Actor*John +++
Actress*(Bea + Angel) +++Star + Viva +++GMA + Regal; +++OctoArts +++Romantic +++Horror NSPG +R2 90.36%
Adjusted R2 87.58%Note: +++ Highly Significant (p-value is less than 0.01); ++ VerySignificant (p-value is from 0.01 to 0.05; + Significant (p-value is greaterthan 0.05); ns otherwise
69
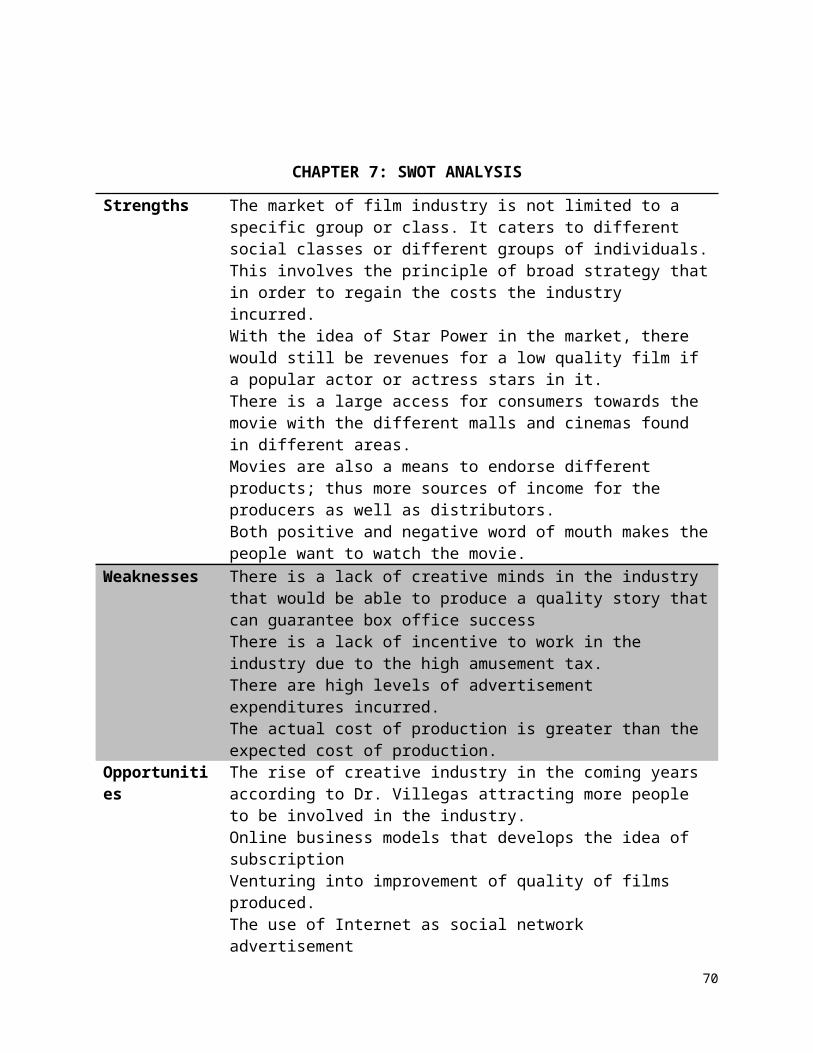
CHAPTER 7: SWOT ANALYSIS
Strengths The market of film industry is not limited to a specific group or class. It caters to different social classes or different groups of individuals.This involves the principle of broad strategy thatin order to regain the costs the industry incurred. With the idea of Star Power in the market, there would still be revenues for a low quality film if a popular actor or actress stars in it. There is a large access for consumers towards the movie with the different malls and cinemas found in different areas. Movies are also a means to endorse different products; thus more sources of income for the producers as well as distributors.Both positive and negative word of mouth makes thepeople want to watch the movie.
Weaknesses There is a lack of creative minds in the industry that would be able to produce a quality story thatcan guarantee box office success There is a lack of incentive to work in the industry due to the high amusement tax.There are high levels of advertisement expenditures incurred.The actual cost of production is greater than the expected cost of production.
Opportunities
The rise of creative industry in the coming years according to Dr. Villegas attracting more people to be involved in the industry. Online business models that develops the idea of subscriptionVenturing into improvement of quality of films produced.The use of Internet as social network advertisement
70

Threats The use of Internet to download pirated movies—Piracy Preference to download and pirate foreign films watch movie download
CHAPTER 8: CONCLUSIONS AND RECOMMENDATIONS
According to Dr. Bernardo Villegas, in the next ten years,there will be a higher demand for creative industries due to therise of multidisciplinary research dialogues among individuals.He believes in the premise that creativity is already embedded inthe Filipino character; hence, developing such may contribute topossible large employment opportunities in these sectors. Inspite of the prevalence of such optimism, he asserts that“economic development occurs in cycles revolving around a seriesof innovations. The innovator is the key to a rise in incomeafter a period of relative stagnation.” Industries expecting toboom in the next decades comprise of fashion, music,entertainment, animation, filmmaking, graphic design,storytelling, culinary arts, wood carving, furniture making, andarchitecture. In line with this statement, the researcherspropose the use of a step-by-step framework as a response to theexpected boom in the creative industries in the next few years.
71
The primary constraint involves then the sustainability of theentire motion picture industry.
According to the analysis in the Porter’s five forces inrelation to factors affecting the threat to entry, the governmentprotection of incumbent industries is currently low. Hightaxation on the film industry is a significant barrier for moreentries to the film production and distribution industry. Thefact that the production of a movie normally accumulates costshigher than its initial production budget implemented does nothelp the industry’s cost especially if the government protectionof incumbent firms remains low. For the filmmaking industry tosuccessfully maximize its productivity as it approaches theperiod for high demand, it would be supportive if the number oftaxes imposed were reduced at present so as to speed up thegrowth of the film industry.
At the present, dominant players in the industry choose thepath of being profit-oriented – releasing films patterned in acertain formula with greater probability of success. Forinstance, in the last five years, Star Cinema has alreadyproduced three films starring John Lloyd Cruz and Sarah Geronimo,all of which follow the original love story of the lovers. Thesefilms are released in 2008, 2009, and 2013, respectively. Its2009 movie, ‘You Changed My Life’ can be analyzed using the firstregression seen in the model which greatly stresses out theimportance of star power. However, its 2013 movie, ‘It Takes A Manand A Woman’ as calculated in the different regressions can onlybe captured in the model with the word of mouth incorporated inthe regression equation. The forecasted revenues expected for themovie was exceeded by almost half its amount by the actualrevenues gained at P401 million. The researchers suggest that afurther study be done on the variables that were explained in thesection of Factor Analysis and Part 1 Regression model of thispaper—evaluating the herding behavior.
Next, the role of the audience is limited in the encodingprocess as formulae have already been fixed by the management.Usually, audience participation is called for by testingprojections in each movie where stars and directors have alreadyproven their box-office power. Once a “romantic formula” has been
72

accepted widely by the public, there is much greater assurancethat the plot of future films only revolve around the sameconcepts and story lines. In the Philippine film industry, theboom of ‘No Other Woman’ paved the way for adult-oriented films inthe likes of ‘A Secret Affair’, ‘The Mistress’, and ‘My Neighbors’ Wife’. To avoidisolation from other reviews, production and distributioncompanies must consider the weight of both positive and negativereviews from critics as this would entail greater diversificationof offered products that can in turn fully maximize consumerbehavior. The researchers would want industry practitioners tohave a striking balance as regards the usage of establishedformulae to increase the possibility of widening profit margins.Other experimentations may possibly lead to wider profit margins.Doing such can open opportunities to increase the quantity offuture exports and with that, the country may experience aninflux of award-winning and critically-acclaimed projects in thefuture.
If the planning stage has already been successfullyestablished, practitioners in the industry can now take a look atan alternative market which caters to avid moviegoers who preferto watch movies in their respective households. To experience agood and strictly preferred than low-to-medium quality Internetdownloads, individuals can open a market for possiblesubscriptions of high-quality local and foreign films distributedin the country.
Given the goal of providing a sustainable environment forthe industry, researchers have identified three key solutions toaddress the short-sightedness of the motion picture industry.First, the Philippines can follow the procedures currently aidingthe Korean film market. The government, through its aim topropagate Hallyu, provide incentives for locally produced firms inKorea. Taxes have been reduced at a much lowered rate. Whathappens in the Philippines is the total opposite, given thattaxes are gradually killing the industry through expensiveamusement taxes, cultural taxes, value-added taxes and otherforms of taxes.
Second, to reduce production costs, dominant players in theindustry can actually resort to the production of films with
73

branded content as well as study the backward integration thatcould explain the outlier, ‘A Secret Affair’ as explained in Part 1Regression: Factor 1 Equation whether it could be more profitablefor both the industry players and different outfits. Anotherwould be to focus on the strong appeal to the country’s tourism.These can be done by establishing contracts between a specificdistributor of a product and a film production outfit. Instead ofspending millions of pesos for advertisement places in betweencommercials of the programs of rival networks, the latter mayonly ask for a certain ‘lower’ amount of money under thecondition that production costs will be divided among selectedparties as a compensation for the total amount of time allocatedfor advertising and promotions of the product in specificsegments of the film. This also holds true for agreements betweenthe firm and the local government units in the use of touristdestinations as one of a film’s strategic shooting location.Featuring such locations can increase the overall level ofindustry employment in the long-run. In exchange for such, aspecific amount will come from government funds that then reducesthe overall level of production costs.
Lastly, given that some of the stars have exclusivecontracts with their respective managements, the researchersthink that co-production is still the best way to generategreater profits. It empowers independent film makers to producequality films which can be distributed commercially. Despite sucharrangements, every producer should know the distribution processso as to avoid misunderstandings that can damage relationshipsbetween production and distribution outfits. It enables firms toproject which combination of artists when put together in a filmcan project higher revenues with a minimum possible coststructure.
74

Appendix A: Aggregated Input-Ouput MatrixCRTCC 234 235 #1-33 34-42234 Motion picture and video
production and distribution
12529.1653
1192047.57 0 0
235 Motion picture projection
9195.46473
867.273304 0 0
1-33 Agriculture, Fishery, and Forestry 0 0
50470083.9
43524.5154
34-42Mining and Quarrying 0 0 0
398415.81
43-176Manufacturing
1206423.73
1260411.9
88355345
6294098.83
177Construction 0 0
990495.984
484447.223
178-180 Electricity, Steam, and Water
42831.5451
704376.98
6480362.26
2061787.36
181-197Tranportation
10752.724
11629.5498
2821864.23
512777.397
198 wholesale and retail trade
20047.0466
66998.1945
5275301.02
233037.65
199 Repairs of motor vehicles and personal and household goods
1582.95083
156.575862
129805.669
34001.2338
200-204Finance
2224.31397
6366.38946
5718328.04
664537.363
205-206 Real Estate and Ownership of Dwellings
26179.3804
90927.2396
309234.323
55516.2954
207-209 Government Services 0 0 0 0210-233, 236-240 Private Services
184871.175
377238.347
10384246.2
2861778.24
TII Total Intermediate Inputs
1516637.49
3711020.02
170935067
13643921.9
CECompensation
546163.019
630558.557
181603589
5037885.56
DEPNDepreciation
320032.29
467933.191
43006668.2
1599109.54
IT-S Indirect Taxes-Subsidies
165790.467
300856.353
16241517.3
1278910.82
OVAOperating Surplus
393042.965
123211.016
274958059
16227776
TPITotal Primary Inputs
1425028.74
1522559.12
515809833
24143681.9
TITotal Inputs
2941666.24
5233579.14
686744900
37787603.9
75

CRTCC 177 178-180 181-197 198 199 200-204 205-206 207-209234 0 0 0 0 0 0 0 0235 0 0 0 0 0 0 0 01-33 14838.190
38336.002
428256446.
0291416848
6.8 0 0 03310951
.8534-42 7553154.1
891328369
8.222111.8
0175007990
.44 0 0138894.
02616898.9
49743-176 81424452.
722113878
1.91707591
231081047
893954406
.342110448
0.6 68190514697807
2.3177
1739583248569.
798558892.
768151824.
319 01031294
.9 25096191107696
8.5178-180 695295.00
171499534
2.22240973
.142183879
.991652781
.864499345
.25434121.
4175434935
.67181-197 26405769.
062026162
.711297873
2.29052388
8238880.
8991754314
5.6952056.
9059248764
.41198 3529497.5
53849239
.113146105
.48 0837962.
758253503.
606270351.
8831629195
.21199 25261.948
4657577.2
0872042747
.69 0215054.
697120044.
74444469.8
205406459.
678200-204 4679114.9
04364765.
5411619564
6.72698582
4.8214178.
39656955.8
939169861
.131338646
3.3205-206
19698004824.19
9134675777
.544861492
.1814036.8
3239206054
.02241621.
692 3794000207-209 0 0 0 0 0 0 0 0210-233, 236-240
5981497.23
4422955.25
22558438.6
12079683.2
516312.866
49670115.1
9960843.58
27054089.2
TII 134018263.8
60392252.1
235434995
264067859
7643614.65
103484940
30540890.5
122336799
CE 70365920.44
23822554
67808756.2
136618814
4373127.98
41992085.6 7247605
303784515
DEPN 20856799.8
30717510
95180838.2
45529801.1
3767941.27
11264034
5341440.85
14667000
IT-S 3937388.015 6157474
7036433.71
8427829.83
208034.245
16541546
3769112.4 1216000
OVA 60181752.74
75614357
108629595
331793392
1088185.59
127287738
243861430 0
TPI155341861
136311895
278655623
522369837
9437289.08
197085404
260219588
319667515
TI 289360124.8
196704147
514090617
786437696
17080903.7
300570344
290760478
442004314
CRTCC TID PCE GGCE GFCF CS E M TFD TO234
4751230.82
2360306.3 0 0 0
174843.21
-4344714
.1
-1809564
.62941666
.2235
611839.241
4697207.3 0 0 0
45658.745
-121126.
114621739
.95233579
.11-33
450687737
195304295 0
28438089
17219717
29441974
-3434691
42360571
626867449
0034-42 18938721
52598092
.90 0 523326
.535688841
.4-
1604098-
15159963778760
4
76
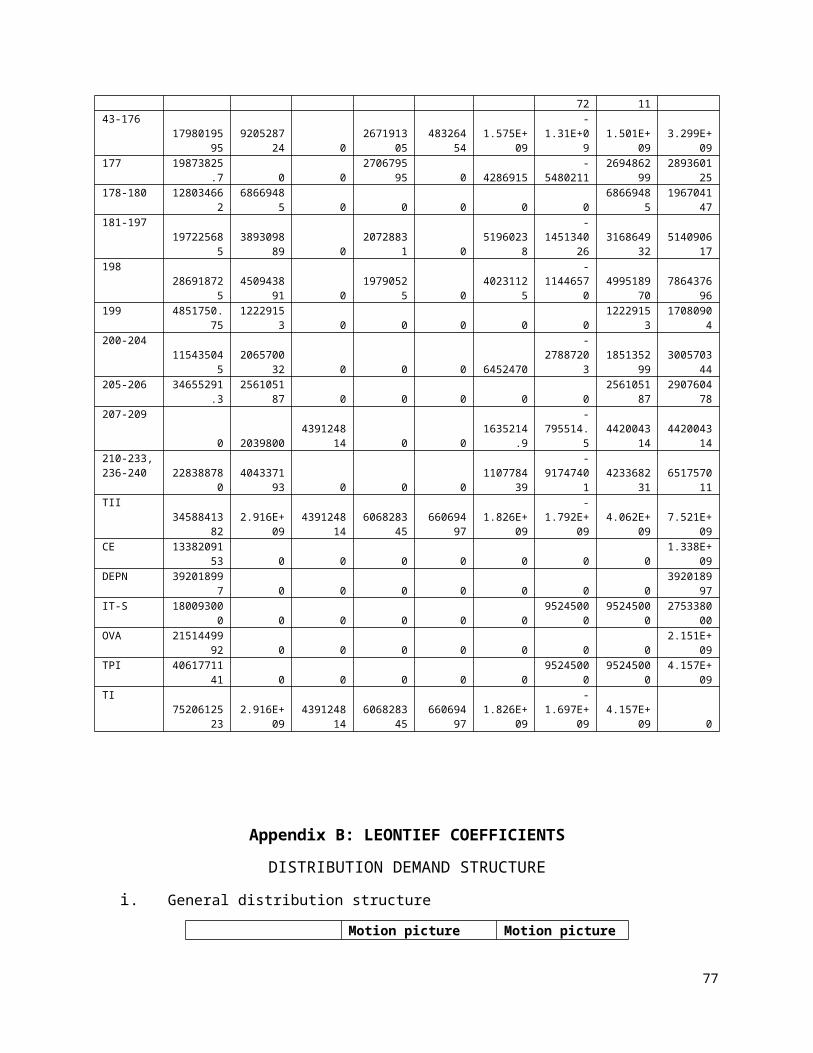
72 1143-176
1798019595
920528724 0
267191305
48326454
1.575E+09
-1.31E+0
91.501E+
093.299E+
09177 19873825
.7 0 02706795
95 0 4286915-
54802112694862
992893601
25178-180 12803466
26866948
5 0 0 0 0 06866948
51967041
47181-197
197225685
389309889 0
20728831 0
51960238
-1451340
263168649
325140906
17198
286918725
450943891 0
19790525 0
40231125
-1144657
04995189
707864376
96199 4851750.
751222915
3 0 0 0 0 01222915
31708090
4200-204
115435045
206570032 0 0 0 6452470
-2788720
31851352
993005703
44205-206 34655291
.32561051
87 0 0 0 0 02561051
872907604
78207-209
0 20398004391248
14 0 01635214
.9
-795514.
54420043
144420043
14210-233,236-240 22838878
04043371
93 0 0 01107784
39
-9174740
14233682
316517570
11TII
3458841382
2.916E+09
439124814
606828345
66069497
1.826E+09
-1.792E+
094.062E+
097.521E+
09CE 13382091
53 0 0 0 0 0 0 01.338E+
09DEPN 39201899
7 0 0 0 0 0 0 03920189
97IT-S 18009300
0 0 0 0 0 09524500
09524500
02753380
00OVA 21514499
92 0 0 0 0 0 0 02.151E+
09TPI 40617711
41 0 0 0 0 09524500
09524500
04.157E+
09TI
7520612523
2.916E+09
439124814
606828345
66069497
1.826E+09
-1.697E+
094.157E+
09 0
Appendix B: LEONTIEF COEFFICIENTS
DISTRIBUTION DEMAND STRUCTURE
i. General distribution structure
Motion picture Motion picture
77
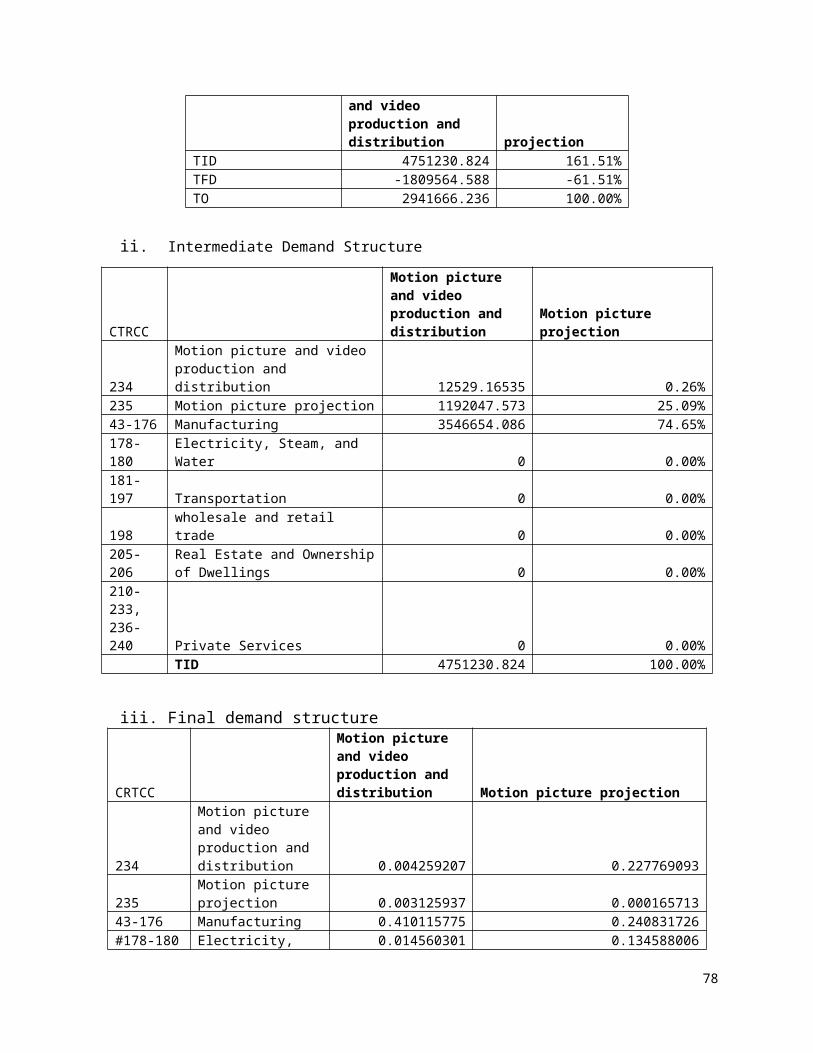
and video production and distribution projection
TID 4751230.824 161.51%TFD -1809564.588 -61.51%TO 2941666.236 100.00%
ii. Intermediate Demand Structure
CTRCC
Motion picture and video production and distribution
Motion picture projection
234
Motion picture and video production and distribution 12529.16535 0.26%
235 Motion picture projection 1192047.573 25.09%43-176 Manufacturing 3546654.086 74.65%178-180
Electricity, Steam, and Water 0 0.00%
181-197 Transportation 0 0.00%
198wholesale and retail trade 0 0.00%
205-206
Real Estate and Ownershipof Dwellings 0 0.00%
210-233, 236-240 Private Services 0 0.00% TID 4751230.824 100.00%
iii. Final demand structure
CRTCC
Motion picture and video production and distribution Motion picture projection
234
Motion picture and video production and distribution 0.004259207 0.227769093
235Motion picture projection 0.003125937 0.000165713
43-176 Manufacturing 0.410115775 0.240831726#178-180 Electricity, 0.014560301 0.134588006
78

Steam, and Water
181-197 Tranportation 0.003655317 0.002222103
198wholesale and retail trade 0.006814861 0.012801602
205-206
Real Estate and Ownership of Dwellings 0.008899507 0.017373816
210-233,236-240
Private Services 0.062845734 0.072080375
total excluding(govtserv, finance, repairs, construction) 0.514276641 0.707832433
Motion picture and video production and distribution
Motion picture projection
PCE 2360306.261 -130.44%GGCE 0 GFCF 0 CS 0 E 174843.2072 -9.66%M -4344714.057 240.10%TFD -1809564.588 100.00%
iv. Cost production structure
Motion picture and video production and distribution
Motion picture projection
Total Intermediate Inputs 1516637.495 51.56%Total Primary Inputs 1425028.741 48.44%Total Inputs 2941666.236 100.00%
v. Intermediate Input Structure
79
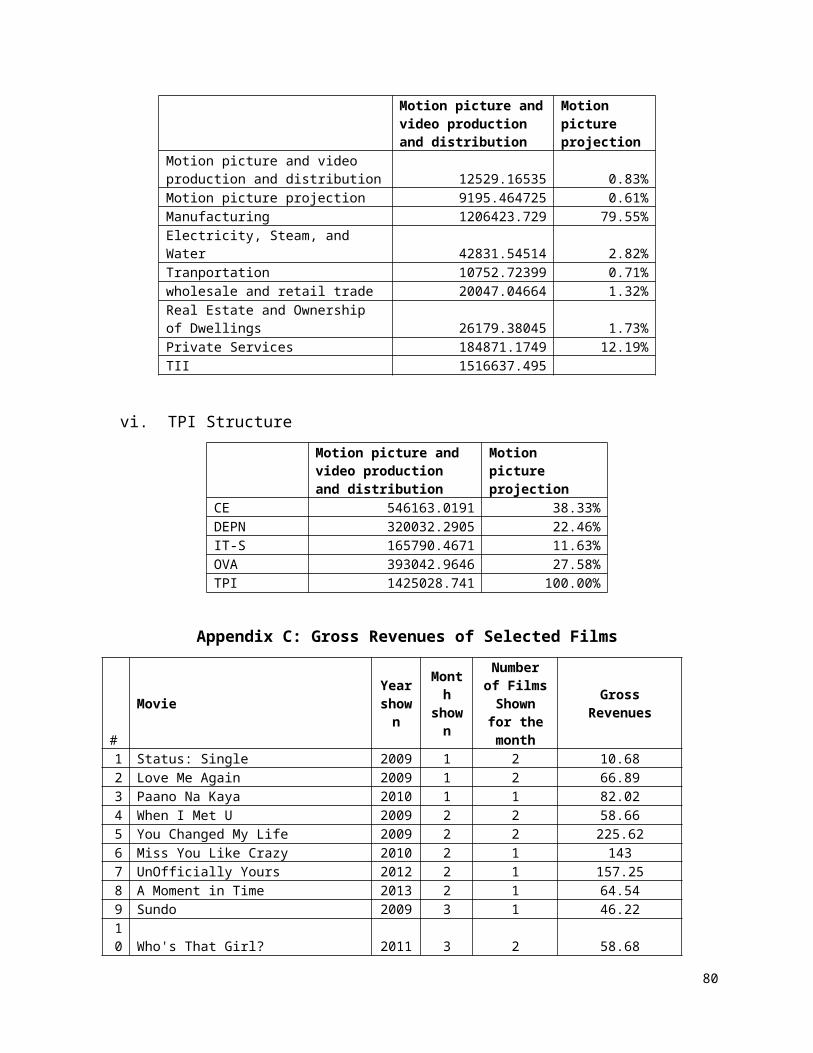
Motion picture andvideo production and distribution
Motion picture projection
Motion picture and video production and distribution 12529.16535 0.83%Motion picture projection 9195.464725 0.61%Manufacturing 1206423.729 79.55%Electricity, Steam, and Water 42831.54514 2.82%Tranportation 10752.72399 0.71%wholesale and retail trade 20047.04664 1.32%Real Estate and Ownership of Dwellings 26179.38045 1.73%Private Services 184871.1749 12.19%TII 1516637.495
vi. TPI Structure
Motion picture and video production and distribution
Motion picture projection
CE 546163.0191 38.33%DEPN 320032.2905 22.46%IT-S 165790.4671 11.63%OVA 393042.9646 27.58%TPI 1425028.741 100.00%
Appendix C: Gross Revenues of Selected Films
#
MovieYearshown
Month
shown
Numberof FilmsShownfor themonth
GrossRevenues
1 Status: Single 2009 1 2 10.682 Love Me Again 2009 1 2 66.893 Paano Na Kaya 2010 1 1 82.024 When I Met U 2009 2 2 58.665 You Changed My Life 2009 2 2 225.626 Miss You Like Crazy 2010 2 1 1437 UnOfficially Yours 2012 2 1 157.258 A Moment in Time 2013 2 1 64.549 Sundo 2009 3 1 46.2210 Who's That Girl? 2011 3 2 58.68
80
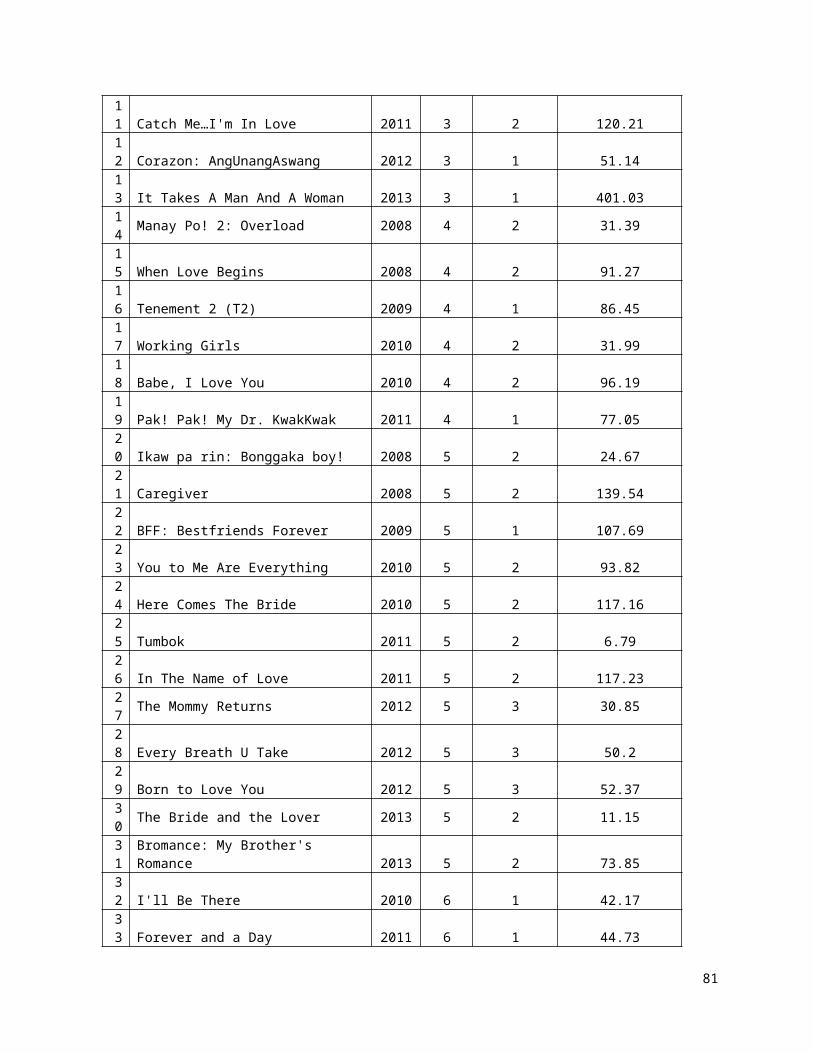
11 Catch Me…I'm In Love 2011 3 2 120.2112 Corazon: AngUnangAswang 2012 3 1 51.1413 It Takes A Man And A Woman 2013 3 1 401.0314 Manay Po! 2: Overload 2008 4 2 31.39
15 When Love Begins 2008 4 2 91.2716 Tenement 2 (T2) 2009 4 1 86.4517 Working Girls 2010 4 2 31.9918 Babe, I Love You 2010 4 2 96.1919 Pak! Pak! My Dr. KwakKwak 2011 4 1 77.0520 Ikaw pa rin: Bonggaka boy! 2008 5 2 24.6721 Caregiver 2008 5 2 139.5422 BFF: Bestfriends Forever 2009 5 1 107.6923 You to Me Are Everything 2010 5 2 93.8224 Here Comes The Bride 2010 5 2 117.1625 Tumbok 2011 5 2 6.7926 In The Name of Love 2011 5 2 117.2327 The Mommy Returns 2012 5 3 30.85
28 Every Breath U Take 2012 5 3 50.229 Born to Love You 2012 5 3 52.3730 The Bride and the Lover 2013 5 2 11.15
31
Bromance: My Brother's Romance 2013 5 2 73.85
32 I'll Be There 2010 6 1 42.1733 Forever and a Day 2011 6 1 44.73
81
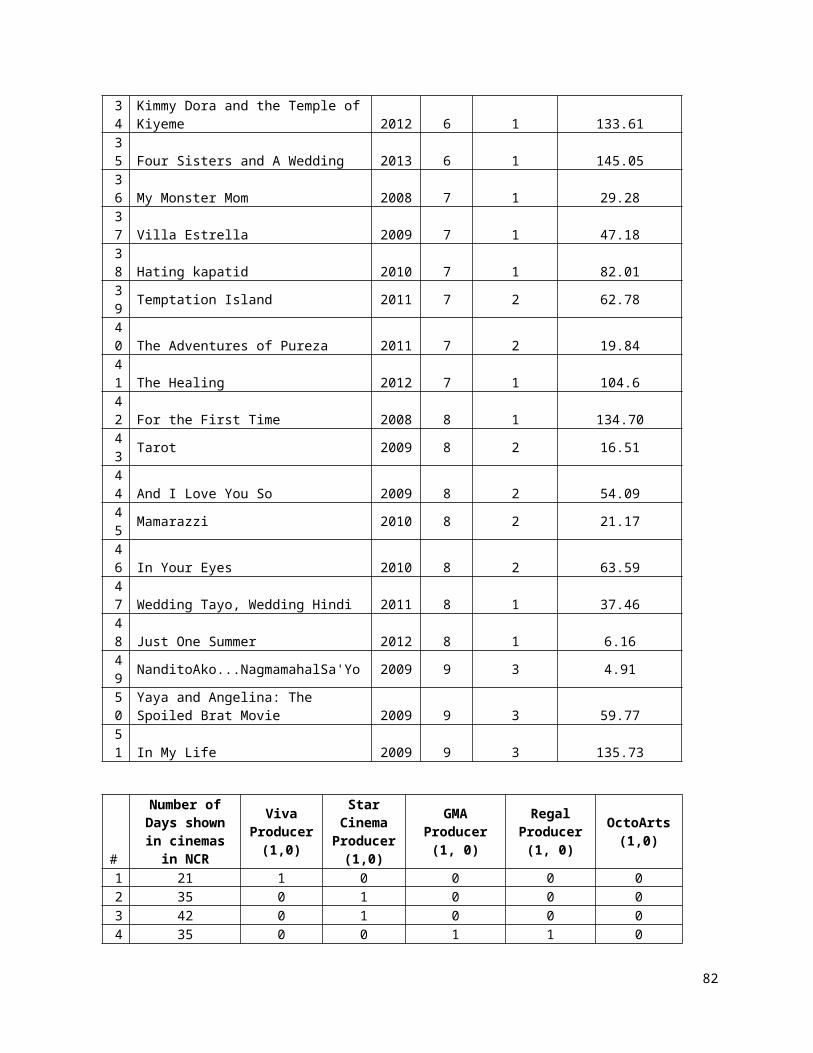
34
Kimmy Dora and the Temple ofKiyeme 2012 6 1 133.61
35 Four Sisters and A Wedding 2013 6 1 145.0536 My Monster Mom 2008 7 1 29.2837 Villa Estrella 2009 7 1 47.1838 Hating kapatid 2010 7 1 82.0139 Temptation Island 2011 7 2 62.78
40 The Adventures of Pureza 2011 7 2 19.8441 The Healing 2012 7 1 104.642 For the First Time 2008 8 1 134.7043 Tarot 2009 8 2 16.51
44 And I Love You So 2009 8 2 54.0945 Mamarazzi 2010 8 2 21.17
46 In Your Eyes 2010 8 2 63.5947 Wedding Tayo, Wedding Hindi 2011 8 1 37.4648 Just One Summer 2012 8 1 6.1649 NanditoAko...NagmamahalSa'Yo 2009 9 3 4.91
50
Yaya and Angelina: The Spoiled Brat Movie 2009 9 3 59.77
51 In My Life 2009 9 3 135.73
#
Number ofDays shownin cinemasin NCR
VivaProducer(1,0)
StarCinemaProducer(1,0)
GMAProducer(1, 0)
RegalProducer(1, 0)
OctoArts(1,0)
1 21 1 0 0 0 02 35 0 1 0 0 03 42 0 1 0 0 04 35 0 0 1 1 0
82

5 49 1 1 0 0 06 42 0 1 0 0 07 28 0 1 0 0 08 28 0 1 0 0 09 35 0 0 1 0 010 35 1 0 0 0 011 35 1 1 0 0 012 35 0 1 0 0 013 49 1 1 0 0 014 28 0 0 0 1 015 42 1 1 0 0 016 35 0 1 0 0 017 21 1 0 1 0 018 35 1 1 0 0 019 28 0 1 0 0 120 14 1 0 0 0 021 35 0 1 0 0 022 35 0 1 0 0 023 35 0 0 1 1 024 42 0 1 0 0 125 21 1 0 0 0 026 35 0 1 0 0 027 7 0 0 0 1 028 21 0 1 0 0 029 35 0 1 0 0 03 7 0 0 0 1 0
83

031 28 0 1 0 0 032 35 0 1 0 0 033 28 0 1 0 0 034 42 0 1 0 0 035 21 0 1 0 0 036 21 0 0 1 0 037 28 0 1 0 0 038 35 1 0 0 0 039 28 0 0 1 1 040 28 0 1 0 0 041 28 0 1 0 0 042 42 0 1 0 0 043 21 0 0 0 1 044 35 0 1 0 0 045 35 0 0 0 1 046 42 1 0 1 0 047 28 0 1 0 0 148 7 0 0 1 0 049 21 0 0 0 1 050 42 0 0 1 0 051 42 0 1 0 0 0
84
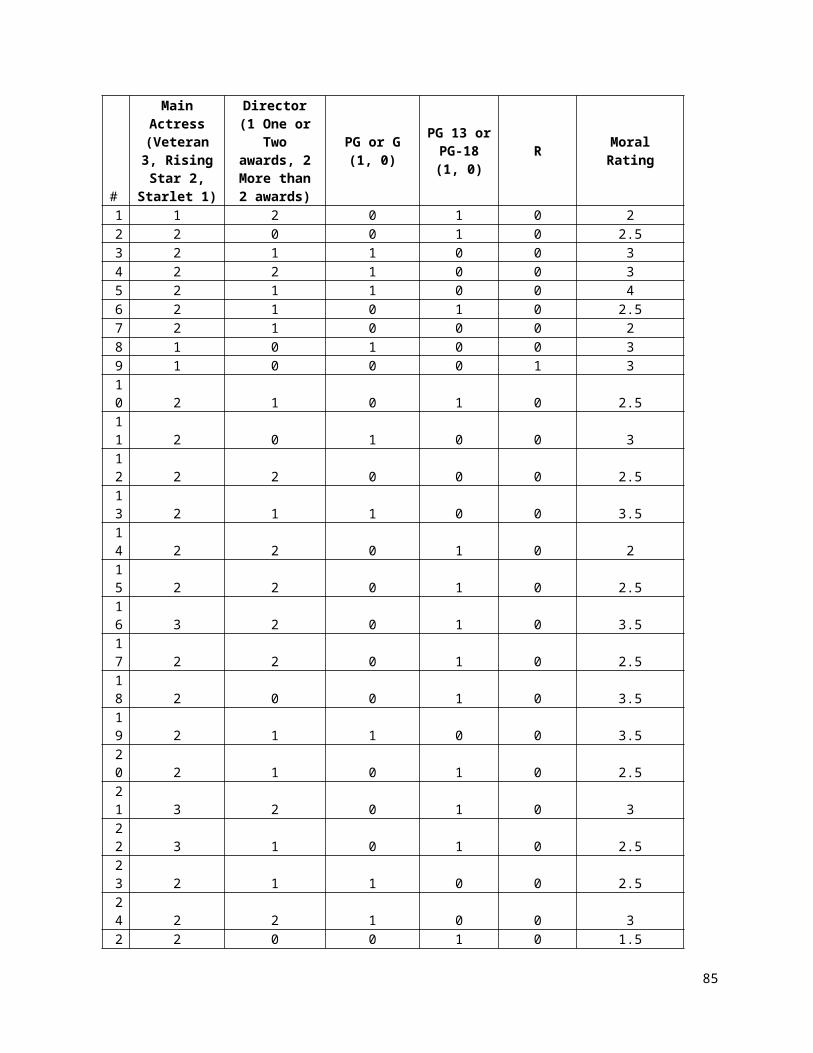
#
MainActress(Veteran3, RisingStar 2,
Starlet 1)
Director(1 One or
Twoawards, 2More than2 awards)
PG or G(1, 0)
PG 13 orPG-18(1, 0)
R MoralRating
1 1 2 0 1 0 22 2 0 0 1 0 2.53 2 1 1 0 0 34 2 2 1 0 0 35 2 1 1 0 0 46 2 1 0 1 0 2.57 2 1 0 0 0 28 1 0 1 0 0 39 1 0 0 0 1 310 2 1 0 1 0 2.511 2 0 1 0 0 312 2 2 0 0 0 2.513 2 1 1 0 0 3.514 2 2 0 1 0 215 2 2 0 1 0 2.516 3 2 0 1 0 3.517 2 2 0 1 0 2.518 2 0 0 1 0 3.519 2 1 1 0 0 3.520 2 1 0 1 0 2.521 3 2 0 1 0 322 3 1 0 1 0 2.523 2 1 1 0 0 2.524 2 2 1 0 0 32 2 0 0 1 0 1.5
85

526 2 2 0 1 0 2.527 2 2 0 1 0 2.528 2 0 0 1 0 2.529 1 0 0 1 0 3.530 2 2 0 0 0 231 2 1 0 1 0 332 2 2 0 1 0 333 2 1 1 0 0 434 2 1 0 1 0 2.535 2 1 0 1 0 336 2 0 1 0 0 2.537 2 0 0 1 0 2.538 2 1 1 0 0 339 2 2 0 1 0 240 1 1 0 1 0 2.541 3 2 0 0 0 242 2 1 0 1 0 343 2 2 0 1 0 344 2 0 0 1 0 345 2 2 1 0 0 246 2 0 0 1 0 247 2 2 0 1 0 3.54 1 0 0 1 0 2.5
86

849 1 2 1 0 0 350 2 0 1 0 0 2.551 2 2 0 1 0 2.5
#
IMDBrating
Comedy(1, 0)
Drama(1, 0)
Horror/Suspense(1, 0)
Action(1, 0)
Romantic(1, 0)
JohnLloyd(1, 0)
AnneCurtis(1, 0)
1 6.2 1 0 0 0 1 0 02 5.4 0 0 0 0 1 0 03 6.1 0 1 0 0 1 0 04 5.1 1 0 0 0 1 0 05 6.9 1 0 0 0 1 1 06 5.9 0 0 0 0 1 1 07 6.6 0 0 0 0 1 1 08 6.1 0 0 0 0 1 0 09 6.1 0 0 1 0 0 0 010 6.3 1 0 0 0 0 0 111 6.7 1 0 0 0 1 0 012 6.1 0 0 1 0 0 0 013 7.4 1 0 0 0 1 1 014 6.1 1 0 0 0 0 0 015 4.6 0 0 0 0 1 0 116 6.4 0 0 1 0 0 0 017 5 1 0 0 0 0 0 018 6.6 0 0 0 0 1 0 119 6.3 1 0 0 0 0 0 020 6.6 1 0 0 0 1 0 021 6.9 0 1 0 0 0 0 022 5.6 1 0 0 0 0 0 023 7.4 1 0 0 0 1 0 024 6.5 1 0 0 0 0 0 025 4.7 0 0 1 0 0 0 026 6.8 0 1 0 0 1 0 027 6.2 1 0 0 0 0 0 028 7 1 0 0 0 1 0 029 6.5 1 0 0 0 1 0 030 3.3 1 1 0 0 0 0 031 6.3 1 0 0 0 0 0 032 4.7 0 1 0 0 0 0 033 7.2 0 0 0 0 1 0 0
87

34 6.5 1 0 0 0 0 0 035 7.7 0 0 0 0 0 0 036 5 1 0 0 0 0 0 037 5.9 0 0 1 0 0 0 038 6.4 1 0 0 0 1 0 039 6 1 0 0 0 0 0 040 4.8 1 0 0 0 0 0 041 7.4 0 0 1 0 0 0 042 6.8 0 0 0 0 1 0 043 7 0 1 1 0 0 0 044 6.3 0 1 0 0 1 0 045 6.9 1 0 0 0 0 0 046 5.3 0 1 0 0 1 0 147 6.8 1 0 0 0 0 0 048 7.5 0 1 0 0 1 0 049 5.4 0 1 0 0 1 0 050 6.1 1 0 0 0 0 0 051 6.9 0 1 0 0 0 1 0
#
BeaAlonzo
(1.0)
AngelLocsin
(1,0)
DingDong(1,0)
Marian
Rivera
(1,0)
KimChiu(1,0)
SarahGeronimo
(1,0)
ToniGonzag
a(1,0)
1 0 0 0 0 0 0 02 0 1 0 0 0 0 03 0 0 0 0 1 0 04 0 0 0 0 0 0 05 0 0 0 0 0 1 06 1 0 0 0 0 0 07 0 1 0 0 0 0 08 0 0 0 0 0 0 09 0 0 0 0 0 0 010 0 0 0 0 0 0 011 0 0 0 0 0 1 012 0 0 0 0 0 0 013 0 0 0 0 0 1 014 0 0 0 0 0 0 015 0 0 0 0 0 0 0
88

16 0 0 0 0 0 0 017 0 0 0 0 0 0 018 0 0 0 0 0 0 019 1 0 0 0 0 0 020 0 0 0 0 0 0 021 0 0 0 0 0 0 022 0 0 0 0 0 0 023 0 0 1 1 0 0 024 0 0 0 0 0 0 025 0 0 0 0 0 0 026 0 1 0 0 0 0 027 0 0 0 0 0 0 028 0 0 0 0 0 0 029 0 0 0 0 0 0 030 0 0 0 0 0 0 031 0 0 0 0 0 0 032 0 0 0 0 0 0 033 0 0 0 0 0 0 034 0 0 0 0 0 0 035 1 1 0 0 0 0 136 0 0 0 0 0 0 037 0 0 0 0 0 0 038 0 0 0 0 0 1 0
89
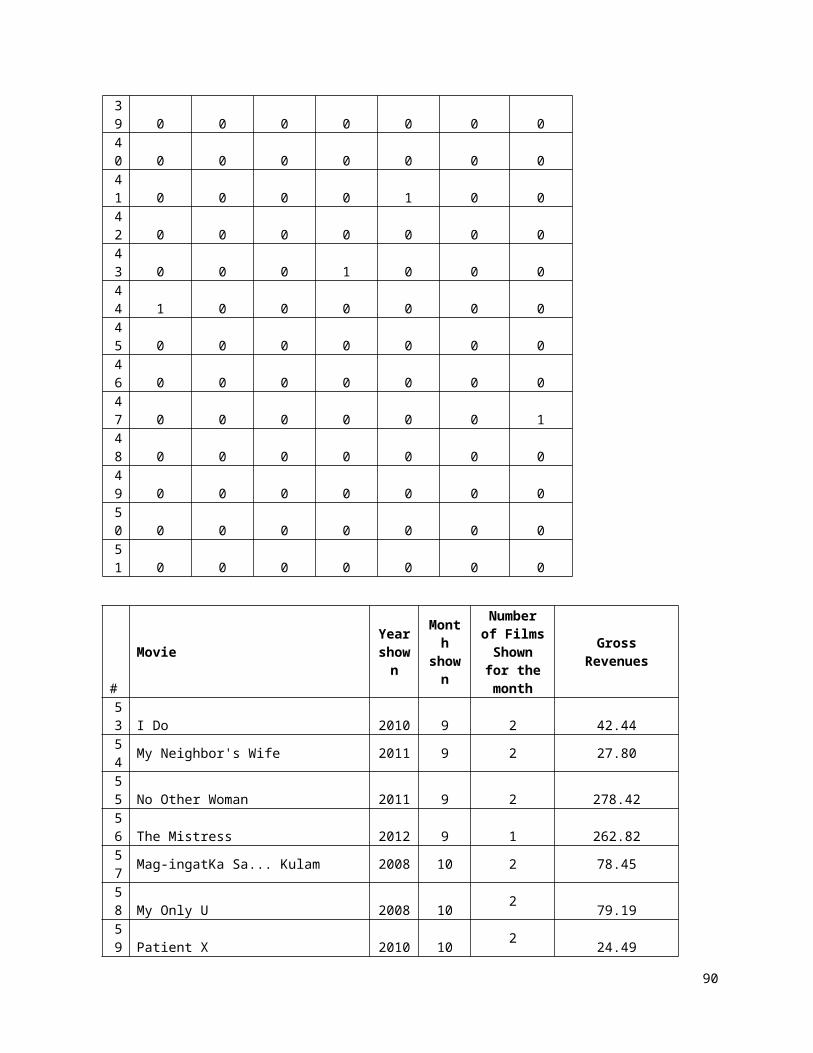
39 0 0 0 0 0 0 040 0 0 0 0 0 0 041 0 0 0 0 1 0 042 0 0 0 0 0 0 043 0 0 0 1 0 0 044 1 0 0 0 0 0 045 0 0 0 0 0 0 046 0 0 0 0 0 0 047 0 0 0 0 0 0 148 0 0 0 0 0 0 049 0 0 0 0 0 0 050 0 0 0 0 0 0 051 0 0 0 0 0 0 0
#
MovieYearshown
Month
shown
Numberof FilmsShownfor themonth
GrossRevenues
53 I Do 2010 9 2 42.4454 My Neighbor's Wife 2011 9 2 27.80
55 No Other Woman 2011 9 2 278.4256 The Mistress 2012 9 1 262.8257 Mag-ingatKa Sa... Kulam 2008 10 2 78.45
58 My Only U 2008 10 2 79.1959 Patient X 2010 10 2 24.49
90
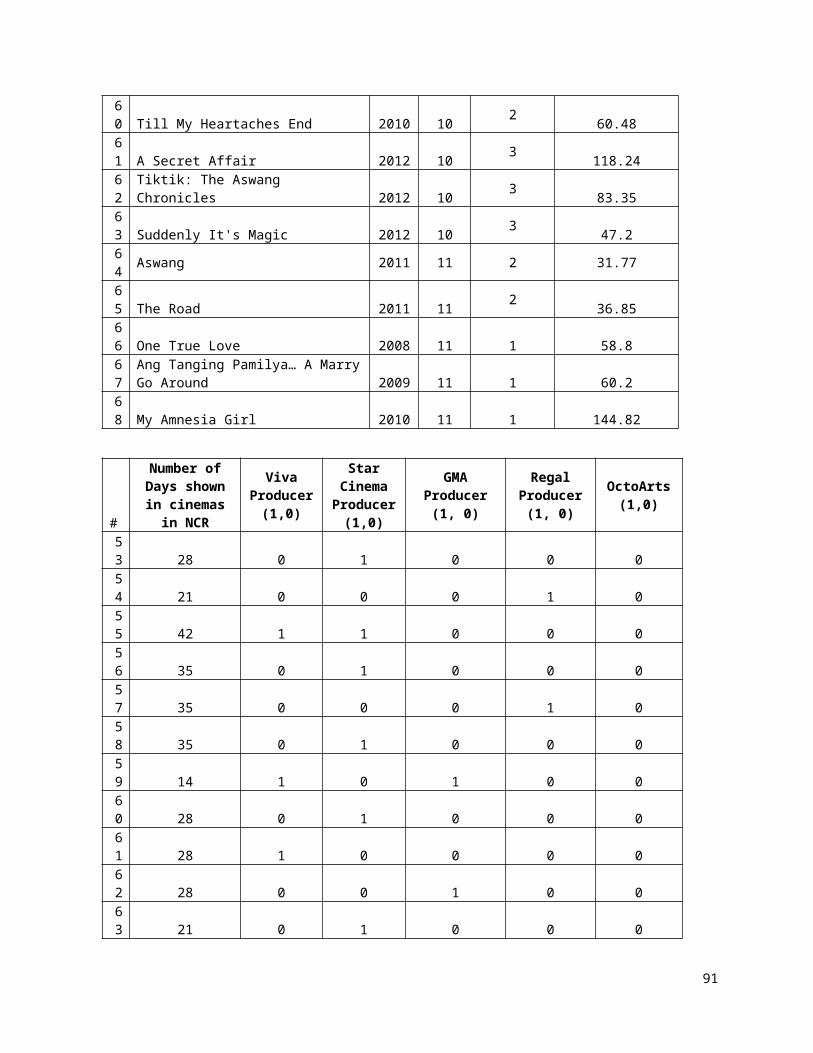
60 Till My Heartaches End 2010 10 2 60.4861 A Secret Affair 2012 10 3 118.2462
Tiktik: The Aswang Chronicles 2012 10 3 83.35
63 Suddenly It's Magic 2012 10 3 47.264 Aswang 2011 11 2 31.77
65 The Road 2011 11 2 36.8566 One True Love 2008 11 1 58.867
Ang Tanging Pamilya… A MarryGo Around 2009 11 1 60.2
68 My Amnesia Girl 2010 11 1 144.82
#
Number ofDays shownin cinemasin NCR
VivaProducer(1,0)
StarCinemaProducer(1,0)
GMAProducer(1, 0)
RegalProducer(1, 0)
OctoArts(1,0)
53 28 0 1 0 0 054 21 0 0 0 1 055 42 1 1 0 0 056 35 0 1 0 0 057 35 0 0 0 1 058 35 0 1 0 0 059 14 1 0 1 0 060 28 0 1 0 0 061 28 1 0 0 0 062 28 0 0 1 0 063 21 0 1 0 0 0
91

64 21 0 0 0 1 065
28 0 0 1 0 0
66
35 0 0 1 1 0
67
42 0 1 0 0 0
68
35 0 1 0 0 0
#
Main Actress(Veteran 3,
Rising Star 2,Starlet 1)
Director (1One or Two
awards, 2 Morethan 2 awards)
PG or G(1, 0)
PG 13or PG-18 (1,
0)
R MoralRating
53 2 2 1 0 0 2.554 2 2 0 0 0 2.555 2 1 0 0 0 356 2 2 0 0 0 2.557 2 2 0 1 0 358 2 1 1 0 0 359 2 2 0 0 0 1.560 2 2 0 1 0 361 2 1 0 0 0 1.562 2 1 0 1 0 2.563 2 0 1 0 0 364 2 2 0 1 0 2.565 2 2 0 0 1 366 2 0 0 1 0 367 2 1 1 0 0 268 2 1 1 0 0 2.5
#
IMDBrating
Comedy(1, 0)
Drama(1, 0)
Horror/Suspense(1, 0)
Action(1, 0)
Romantic(1, 0)
JohnLloyd(1, 0)
AnneCurtis(1, 0)
53 6.1 1 0 0 0 1 0 054 6.7 0 1 0 0 0 0 055 5.7 0 1 0 0 0 0 156 4.2 0 1 0 0 0 1 057 6.8 0 1 1 0 0 0 058 6.8 1 0 0 0 1 0 059 4.8 0 0 1 0 0 0 060 5.6 0 1 0 0 1 0 0
92

61 5.5 0 1 0 0 0 0 162 6.1 0 0 1 0 0 0 063 4.2 1 1 0 0 0 0 064 5 0 0 1 1 0 0 065 5.4 0 0 1 0 0 0 066 6.4 0 0 0 0 1 0 067 5.8 1 0 0 0 0 0 068 5.6 1 0 0 0 1 1 0
#
BeaAlonzo(1.0)
AngelLocsin(1,0)
DingDong(1,0)
MarianRivera(1,0)
Kim Chiu(1,0)
SarahGeronimo(1,0)
ToniGonzaga(1,0)
53 0 0 0 0 0 0 054 0 0 0 0 0 0 055 0 0 0 0 0 0 056 1 0 0 0 0 0 057 0 0 0 0 0 0 058 0 0 0 0 0 0 159 0 0 0 0 0 0 060 0 0 0 0 1 0 061 0 0 0 0 0 0 062 0 0 1 0 0 0 063 0 0 0 0 0 0 064 0 0 0 0 0 0 065 0 0 0 0 0 0 066 0 0 1 1 0 0 067 0 0 0 0 0 0 168 0 0 0 0 0 0 1
93

Appendix D: Financial Highlights of Industry Players
Years
SalesRegal
Sales
Viva
SalesStarCine
ma
SalesGMA
SalesOcto
ProfitsRegal
ProfitsViva
ProfitsStar
1990 48634 6100
9 504 1384
1991 55222 6796
9 326 2431
1992
53621.30056
74907 8418 264.1287
565 1212
1993 52067 8605
3 24279 214 1325
1994 69845 1215
81 21532 463 1371
1995
99332.02548
266306 79726 13536 1485.477
085 2825 13044
1996
141267.8257
256780 109882 0 20269 4765.965
811 37185 8208
1997 200908 3810
98 123633 2616 33534 15291 4195 7970
1998 157921 4890
02 162130 5049 17986 6983 12212 5939
1999 102315 4211
87 113843 2766 8233 3179 -11963 2756
2000 129268 4395
62 75936 70501 8774.661707 273 -98441 258
2001 59174 6090
37 87854 18080 9351.960169 528 37814 15307
2002 33384 3410
67 220833 804 9967.239983 74 -158341 -98739
2003
46642.01064
194051 62207 319 10623 195.6910
374 -153832 -2679
2004
65165.26351
153781 405472 49 10623 517.4997
585 -37389 54995
2005
91044.77936
210558 334435 56999 43658 1368.514
386 55953 54453
94
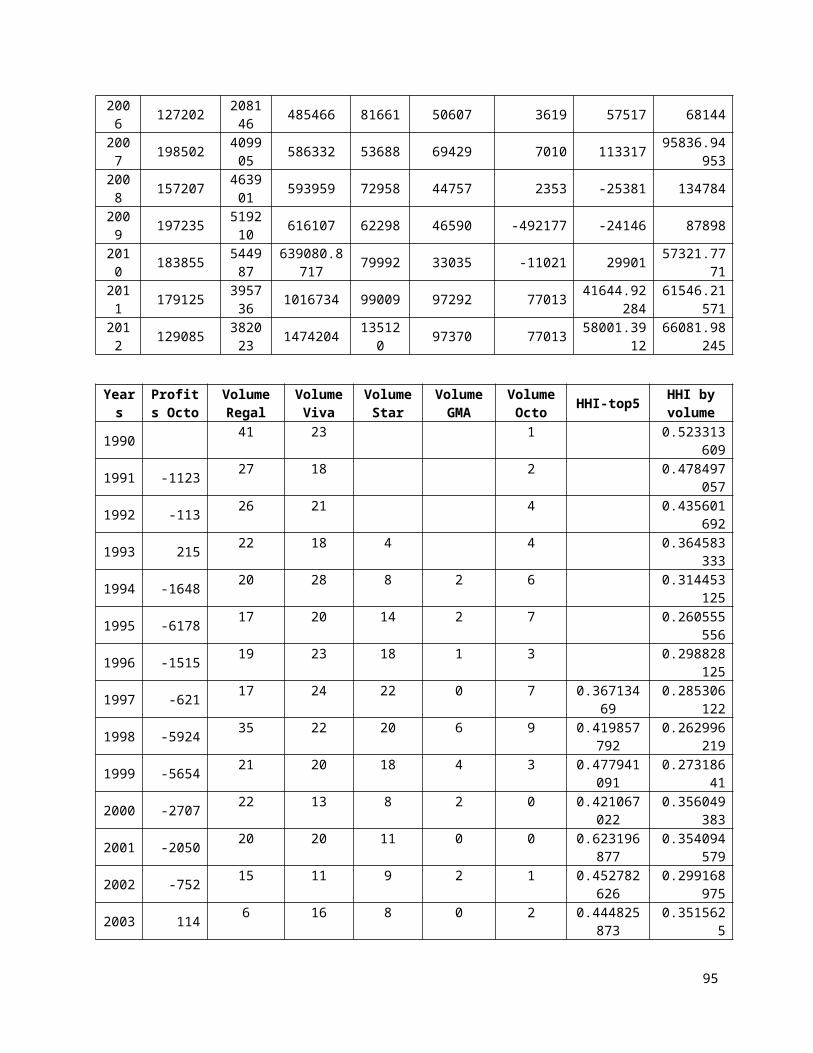
2006 127202 2081
46 485466 81661 50607 3619 57517 68144
2007 198502 4099
05 586332 53688 69429 7010 113317 95836.94953
2008 157207 4639
01 593959 72958 44757 2353 -25381 134784
2009 197235 5192
10 616107 62298 46590 -492177 -24146 87898
2010 183855 5449
87639080.8
717 79992 33035 -11021 29901 57321.7771
2011 179125 3957
36 1016734 99009 97292 77013 41644.92284
61546.21571
2012 129085 3820
23 1474204 135120 97370 77013 58001.39
1266081.98
245
Years
Profits Octo
VolumeRegal
VolumeViva
VolumeStar
VolumeGMA
VolumeOcto HHI-top5 HHI by
volume
1990 41 23 1 0.523313609
1991 -1123 27 18 2 0.478497057
1992 -113 26 21 4 0.435601692
1993 215 22 18 4 4 0.364583333
1994 -1648 20 28 8 2 6 0.314453125
1995 -6178 17 20 14 2 7 0.260555556
1996 -1515 19 23 18 1 3 0.298828125
1997 -621 17 24 22 0 7 0.36713469
0.285306122
1998 -5924 35 22 20 6 9 0.419857792
0.262996219
1999 -5654 21 20 18 4 3 0.477941091
0.27318641
2000 -2707 22 13 8 2 0 0.421067022
0.356049383
2001 -2050 20 20 11 0 0 0.623196877
0.354094579
2002 -752 15 11 9 2 1 0.452782626
0.299168975
2003 114 6 16 8 0 2 0.444825873
0.3515625
95
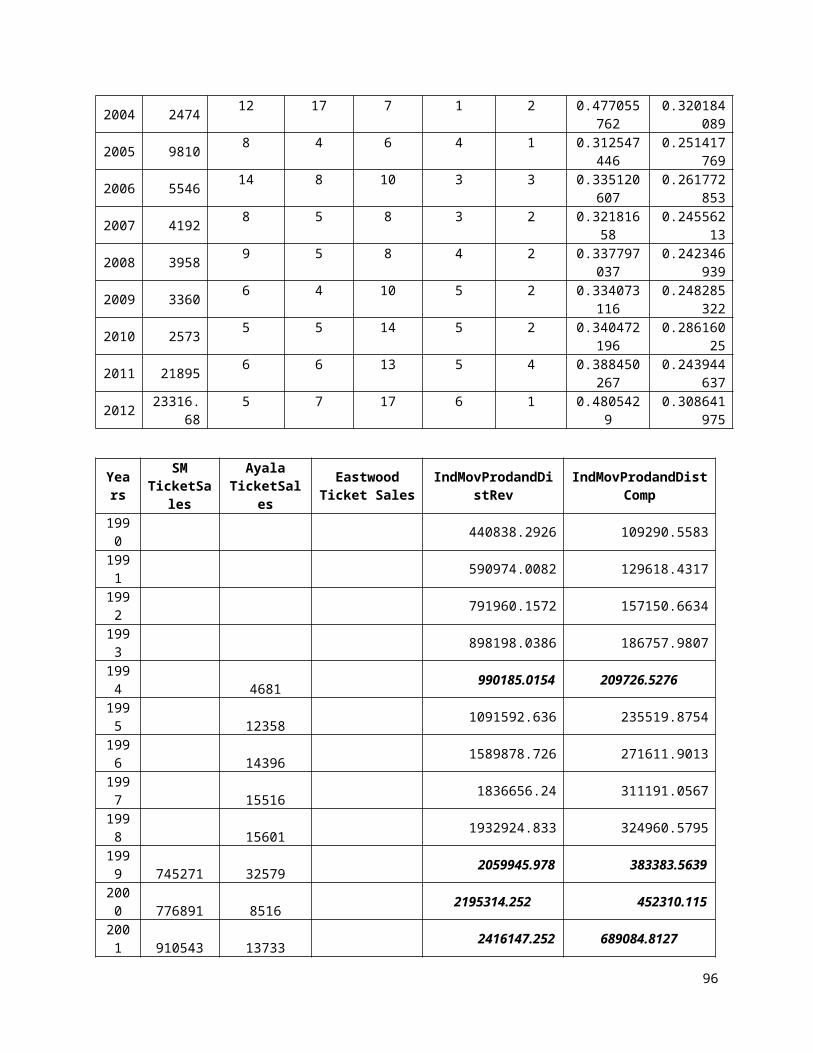
2004 2474 12 17 7 1 2 0.477055762
0.320184089
2005 9810 8 4 6 4 1 0.312547446
0.251417769
2006 5546 14 8 10 3 3 0.335120607
0.261772853
2007 4192 8 5 8 3 2 0.32181658
0.24556213
2008 3958 9 5 8 4 2 0.337797037
0.242346939
2009 3360 6 4 10 5 2 0.334073116
0.248285322
2010 2573 5 5 14 5 2 0.340472196
0.28616025
2011 21895 6 6 13 5 4 0.388450267
0.243944637
2012 23316.68
5 7 17 6 1 0.4805429
0.308641975
Years
SMTicketSa
les
AyalaTicketSal
es
EastwoodTicket Sales
IndMovProdandDistRev
IndMovProdandDistComp
1990 440838.2926 109290.5583
1991 590974.0082 129618.4317
1992 791960.1572 157150.6634
1993 898198.0386 186757.9807
1994 4681 990185.0154 209726.5276
1995 12358 1091592.636 235519.8754
1996 14396 1589878.726 271611.9013
1997 15516 1836656.24 311191.0567
1998 15601 1932924.833 324960.5795
1999 745271 32579 2059945.978 383383.5639
2000 776891 8516 2195314.252 452310.115
2001 910543 13733 2416147.252 689084.8127
96
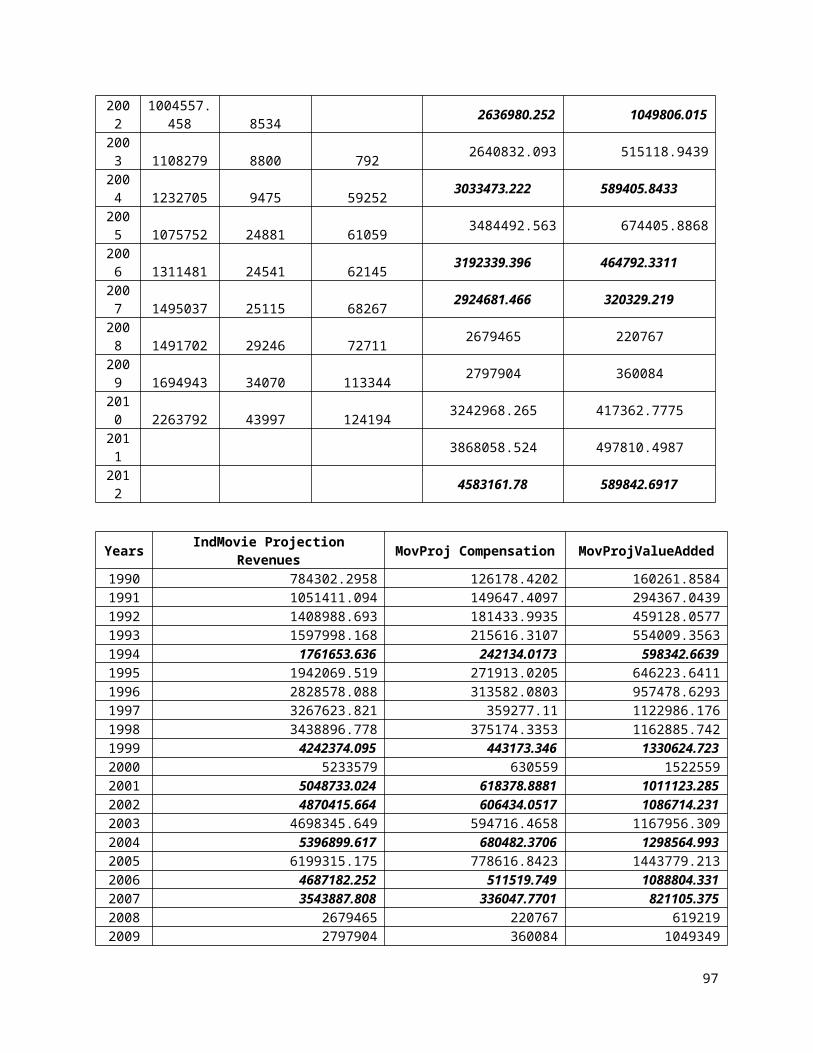
2002
1004557.458 8534 2636980.252 1049806.015
2003 1108279 8800 792 2640832.093 515118.9439
2004 1232705 9475 59252 3033473.222 589405.8433
2005 1075752 24881 61059 3484492.563 674405.8868
2006 1311481 24541 62145 3192339.396 464792.3311
2007 1495037 25115 68267 2924681.466 320329.219
2008 1491702 29246 72711 2679465 220767
2009 1694943 34070 113344 2797904 360084
2010 2263792 43997 124194 3242968.265 417362.7775
2011 3868058.524 497810.4987
2012 4583161.78 589842.6917
Years IndMovie ProjectionRevenues MovProj Compensation MovProjValueAdded
1990 784302.2958 126178.4202 160261.85841991 1051411.094 149647.4097 294367.04391992 1408988.693 181433.9935 459128.05771993 1597998.168 215616.3107 554009.35631994 1761653.636 242134.0173 598342.66391995 1942069.519 271913.0205 646223.64111996 2828578.088 313582.0803 957478.62931997 3267623.821 359277.11 1122986.1761998 3438896.778 375174.3353 1162885.7421999 4242374.095 443173.346 1330624.7232000 5233579 630559 15225592001 5048733.024 618378.8881 1011123.2852002 4870415.664 606434.0517 1086714.2312003 4698345.649 594716.4658 1167956.3092004 5396899.617 680482.3706 1298564.9932005 6199315.175 778616.8423 1443779.2132006 4687182.252 511519.749 1088804.3312007 3543887.808 336047.7701 821105.3752008 2679465 220767 6192192009 2797904 360084 1049349
97

2010 3242968.265 417362.7775 1216269.5742011 3868058.524 497810.4987 1450708.5822012 4583161.78 589842.6917 1718906.807
Appendix E: Results of Factor Analysis - Communality ofQuantitative and Qualitative Variables
Sorted Rotated Factor Loadings and Communalities
Variable Factor1 Factor2 Factor3 Factor4 Factor5Gross Revenues 0.849 0.063 -0.061 -0.180 -0.021Number of Days shown in cinemas 0.651 -0.058 -0.101 -0.217 -0.016John Lloyd (1, 0) 0.625 0.056 -0.049 0.057 -0.072Sarah Geronimo (1,0) 0.582 0.108 -0.327 -0.138 -0.089Star Cinema Producer (1,0) 0.510 0.471 0.103 0.163 -0.243Moral Rating 0.427 0.154 -0.114 0.222 -0.092IMDB rating 0.366 -0.070 0.065 0.232 -0.082Ding Dong (1,0) 0.081 -0.750 0.050 0.084 -0.050GMA Producer (1, 0) -0.277 -0.686 -0.080 -0.113 -0.026Marian Rivera (1,0) 0.078 -0.666 0.026 0.144 0.023Technical Rating 0.247 0.412 0.221 0.170 0.298PG 13 or PG-18 (1, 0) -0.112 0.029 0.903 0.011 -0.031PG or G (1, 0) 0.138 -0.016 -0.895 0.120 -0.200Anne Curtis (1, 0) -0.004 0.025 0.107 -0.806 -0.063Viva Producer (1,0) 0.138 0.096 -0.040 -0.801 -0.102Romantic (1, 0) 0.232 -0.050 -0.131 -0.032 -0.669Director (1 One or Two awards, -0.012 0.157 0.029 0.163 0.558Main Actress (Veteran 3, Rising 0.279 0.032 0.115 -0.038 0.447Month shown -0.206 -0.178 -0.072 0.001 0.379Angel Locsin (1,0) 0.119 0.060 0.217 0.191 -0.341R, R13 or R16 -0.020 -0.019 -0.114 -0.164 0.289Year shown 0.064 0.218 0.010 0.113 -0.141Toni Gonzaga (1,0) 0.044 0.054 -0.076 0.124 -0.024Ai Ai (1,0) -0.055 0.005 0.046 -0.088 0.066OctoArts (1,0) 0.032 0.154 -0.113 0.128 0.115Drama (1, 0) -0.061 0.185 0.047 -0.043 0.137Main Actor (Veteran 3, Rising S 0.222 -0.028 -0.045 -0.034 0.050Comedy (1, 0) 0.001 0.050 -0.282 0.051 -0.033Horror/Suspense/Action (1, 0) -0.173 -0.169 0.101 0.057 0.447Regal Producer (1, 0) -0.227 -0.375 -0.092 0.292 0.320Number of Films Shown for the m -0.280 0.029 0.014 -0.188 0.069Kim Chiu (1,0) 0.005 0.128 -0.069 0.087 0.010Bea Alonzo (1.0) 0.201 0.130 0.140 0.170 -0.033
Variance 3.1038 2.3075 2.0842 1.9180 1.9069% Var 0.094 0.070 0.063 0.058 0.058
98

Variable Factor6 Factor7 Factor8 Factor9 Factor10Gross Revenues 0.139 -0.035 -0.104 -0.011 -0.000Number of Days shown in cinemas -0.257 -0.202 -0.202 -0.172 0.000John Lloyd (1, 0) 0.190 0.035 -0.028 0.075 -0.000Sarah Geronimo (1,0) -0.087 0.197 0.478 0.161 0.000Star Cinema Producer (1,0) -0.044 -0.365 -0.264 -0.311 -0.000Moral Rating -0.354 0.047 -0.050 -0.152 0.000IMDB rating -0.194 0.037 0.070 -0.036 0.000Ding Dong (1,0) -0.089 0.030 -0.055 0.023 0.000GMA Producer (1, 0) 0.054 0.019 0.190 -0.071 -0.000Marian Rivera (1,0) -0.116 0.167 -0.119 0.096 0.000Technical Rating 0.026 0.100 -0.158 -0.117 0.000PG 13 or PG-18 (1, 0) -0.392 0.040 0.050 0.109 0.000PG or G (1, 0) -0.272 -0.194 0.022 0.112 -0.000Anne Curtis (1, 0) 0.015 0.066 -0.285 0.029 -0.000Viva Producer (1,0) -0.005 0.181 0.360 0.145 -0.000Romantic (1, 0) -0.172 0.207 -0.018 0.043 0.000Director (1 One or Two awards, 0.092 0.123 -0.107 0.154 -0.000Main Actress (Veteran 3, Rising -0.113 -0.189 -0.110 -0.130 0.000Month shown -0.069 -0.018 -0.303 -0.083 0.000Angel Locsin (1,0) 0.212 0.032 -0.076 -0.072 -0.000R, R13 or R16 0.867 0.185 -0.095 -0.285 0.000Year shown 0.460 0.029 0.037 0.064 -0.000Toni Gonzaga (1,0) -0.027 -0.467 -0.067 -0.003 -0.000Ai Ai (1,0) -0.027 -0.378 0.074 0.082 -0.000OctoArts (1,0) -0.060 -0.324 -0.005 0.014 -0.000Drama (1, 0) -0.014 0.457 -0.536 -0.033 0.000Main Actor (Veteran 3, Rising S 0.023 0.026 -0.416 0.006 -0.000Comedy (1, 0) -0.045 -0.480 0.306 0.624 -0.000Horror/Suspense/Action (1, 0) 0.060 0.199 0.295 -0.506 0.000Regal Producer (1, 0) -0.025 0.363 -0.122 0.471 0.000Number of Films Shown for the m -0.096 0.207 -0.167 0.385 0.000Kim Chiu (1,0) -0.002 0.087 -0.100 -0.288 0.000Bea Alonzo (1.0) 0.031 -0.048 -0.195 -0.096 -0.000
Variance 1.6321 1.5941 1.5240 1.5129 0.0000% Var 0.049 0.048 0.046 0.046 0.000
Variable CommunalityGross Revenues 0.792Number of Days shown in cinemas 0.661John Lloyd (1, 0) 0.448Sarah Geronimo (1,0) 0.786Star Cinema Producer (1,0) 0.879
99
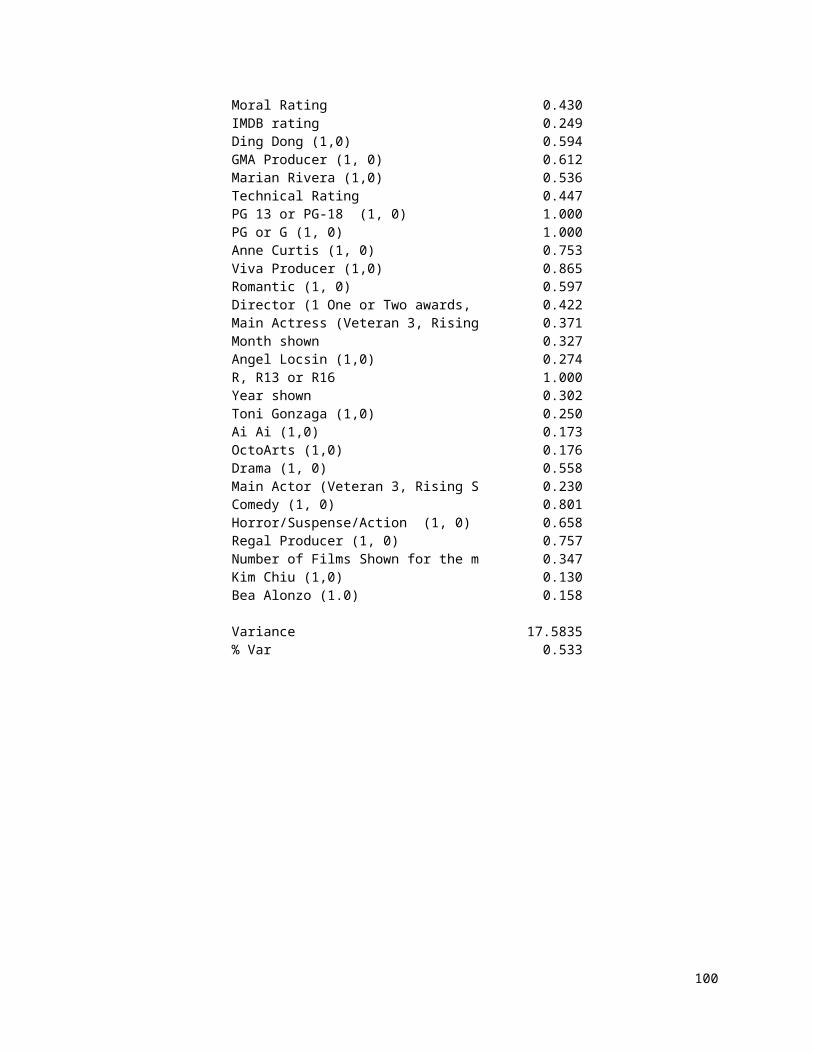
Moral Rating 0.430IMDB rating 0.249Ding Dong (1,0) 0.594GMA Producer (1, 0) 0.612Marian Rivera (1,0) 0.536Technical Rating 0.447PG 13 or PG-18 (1, 0) 1.000PG or G (1, 0) 1.000Anne Curtis (1, 0) 0.753Viva Producer (1,0) 0.865Romantic (1, 0) 0.597Director (1 One or Two awards, 0.422Main Actress (Veteran 3, Rising 0.371Month shown 0.327Angel Locsin (1,0) 0.274R, R13 or R16 1.000Year shown 0.302Toni Gonzaga (1,0) 0.250Ai Ai (1,0) 0.173OctoArts (1,0) 0.176Drama (1, 0) 0.558Main Actor (Veteran 3, Rising S 0.230Comedy (1, 0) 0.801Horror/Suspense/Action (1, 0) 0.658Regal Producer (1, 0) 0.757Number of Films Shown for the m 0.347Kim Chiu (1,0) 0.130Bea Alonzo (1.0) 0.158
Variance 17.5835% Var 0.533
100
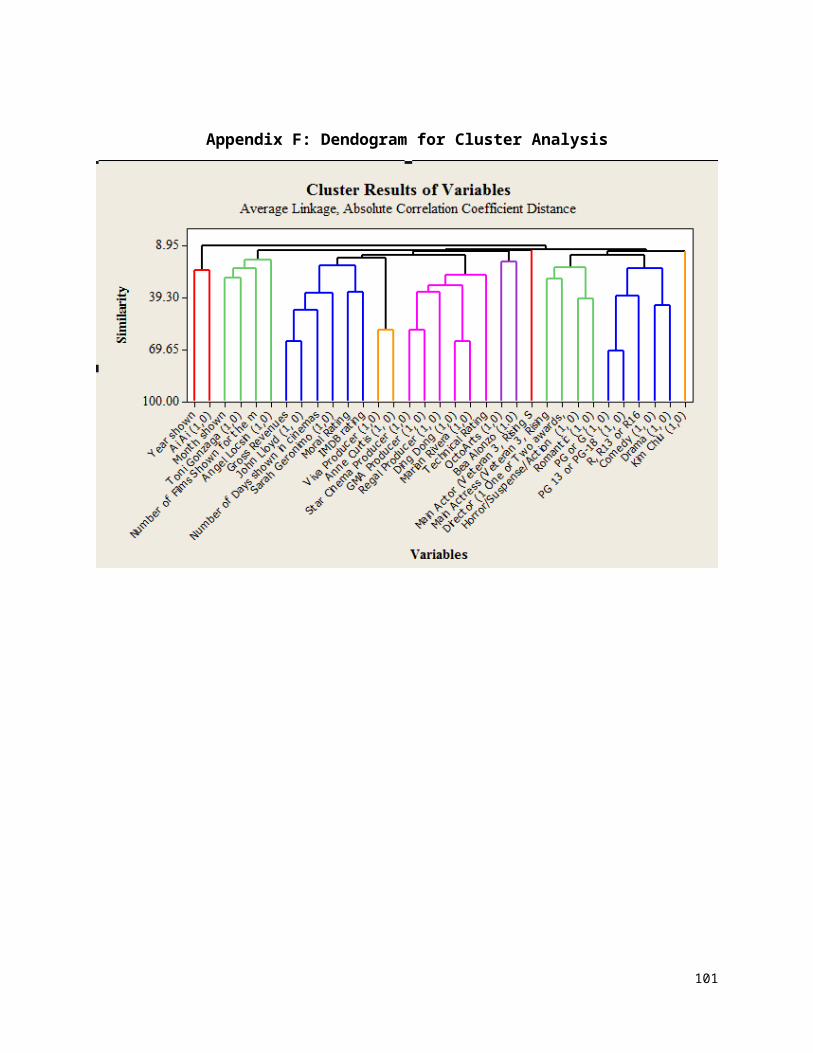
Appendix F: Dendogram for Cluster Analysis
101

References:
ABSCBNnews, “Brillante Mendoza in History Channel documentary,” ABSCBNNews.Com, March 1, 2013, Friday, http://www.abs-cbnnews.com/lifestyle/01/03/13/brillante-mendoza-history-channel-documentary (Accessed July 8, 2013)
Angara, J. “An Act Reviewing the Philippine Movie Industry by Providing Incentives to the Proprietors, Lessees, Operators of Theaters and Cinemas”, 5th Cong.,1stsess, H.B. 404, http://www.congress.gov.ph/download/basic_15/HB00404.pdf (Accessed August 13, 2013)
Anonymous, “Is the Curtain Finally Falling”, PhilNews, 2005, http://www.philnews.com/2005/wa.html (Accessed July 8, 2013)
Anonymous.“History of Philippine Cinema”.Philippine Journeys (n.d.), http://www.aenet.org/family/filmhistory.htm (Accessed July
8, 2013)
Barry Linetsky, “Think Like an Iconoclast: The Principles of WaltDisney’s Success”.
http://www.tspg-consulting.com/printpages/DIsney_Iconoclast.pdf (Accessed September 27, 2013)
“Bargaining Power of Suppliers”. Last Modified July 22, 2013. Accessed August 3, 2013.http://webcache.googleusercontent.com/search?q=cache:aefzb2ngzskJ:www.smo.dk/disney-assignment/porters-five-forces/bargaining-power-of-suppliers/+bargaining+power+of+actors+in+film+industry&cd=2&hl=en&ct=clnk&gl=ph
102

Baskett M, The Attractive Empire: Transnational Film Culture in Imperial Japan (Honolulu: University of Honolulu, 2008)
Bautista A, “History of Philippine Cinema”, National Commission for Culture and the Arts
(2005)
Besanko D, Dranove D, and Shanley M, Economics of Strategy. (NewYork: John Wiley & Sons,
Inc, 2000)
Box Office Mojo, Philippines Yearly Box Office, (2013), http://boxofficemojo.com/intl/philippines/yearly/
"Competition Policy and Film Distribution."OECD Policy Roundtables. www.oecd.org/regreform/sectors/1920038.pdf (accessed August 4, 2013).
Corrigan, T. & White, P.The Film Experience. USA: MacMillan Publishing Ltd (2009).
Courty P. “An Economic Guide to Ticket Pricing in theEntertainment Industry” London Business
School.http://harbaugh.uoregon.edu/Readings/Ticket%20pricing/LER.pdf (accesed
August 2, 2013).
Critical Issues in Practice, Current Research & New Researh Directions " HBS. (2009) www.hbs.edu/faculty/Publication%20Files/05-059.pdf (accessed August 2, 2013).
Dacanay, J.C., M.T. King-Calvo, A.A. Santos (2010) ―InformationCascades as Social
Learning: The Case of Box-Office Ticket Sales in the Philippines, Proceedings of the
European Conference on Knowledge Management; 2010.(http://search.ebscohost.com/login.aspx?direct=true&db=lxh&AN=53491612&site=ehost -live)
103
Dafilmschool.“Role of an Actor in Film making” (December 2011).Accessed August 3, 2013.
http://dafilmschool.wordpress.com/2011/12/09/role-of-an-actor-in-film-making/
Daly K, How Digital and Computer Technologies are Changing Cinema. (2008)
Deocampo N, Film: American Influence on Philippine Cinema (Manila: Anvil Publications, Inc.,
2011)
Dirks T, “Main Film Genres,” http://www.filmsite.org/genres.html (accessed July 2013)
Eliashberg, J, Elberse, A and Leenders M, “The Motion PictureIndustry: Critical Issues in
Practice, Current Research & New Research Directions,” www.hbs.edu/faculty/Pages/download.aspx?name=05-059.pdf(accessedJuly 2013)
Finney, A. “Value Chain Restructuring hin the Global Film Industry”. (June, 2010). http://ec.europa.eu/culture/media/media-content/documents/about/contributions/44.pdf (Accessed August 10, 2013)
Garcia, L and Masigan, C. “An In-depth study on the film industryin the Philippines”. (August 17, 2001). dirp4.pids.gov.ph/ris/taps/tapspp0103.pdf. (Accessed August 12, 2013)
GMA Network, GMA Network History, (2013), http://www.wattpad.com/10908764-gma-network-history-gma-films-history#.UdpRUDuomuI
Gonzales, I. “The economics of Philippine cinema”. (September, 2012). Accessed August 3, 2013.http://www.press.uchicago.edu/books/turabian/turabian_citationguide.html
104

Guillice-Felleo, L. “Implementing the Rules and Regulations of R.A. No. 9167”, (September 5, 2003). http://www.lawphil.net/statutes/repacts/ra2002/ra_9167irr_2002.html (Accessed August 13, 2013).
Hjort M, “Film Risk”. Wayne State University Press, Mar 15, 2012 http://books.google.com.ph/books?id=xJw3ROtAyl0C&pg=PA194&lpg=PA194&dq=film+distributors+price+discrimination+towards+exhibitors&source=bl&ots=FJjSY40Gst&sig=qr7rlXQxH4M45nEr_QawWR2A2ec&hl=en&sa=X&ei=QiNSUvXnHoyQiQft14HgDQ&ved=0CCoQ6AEwAA#v=onepage&q=film%20distributors%20price%20discrimination%20towards%20exhibitors&f=false (Accessed 10/07/13)
Irving K. and Rea P. Producing and Directing the short film and video (fourth edition.(Oxford: Focal Press/ Elsevier, 2010)
Jeon, J, and L Jiao."The Influence Effect of Critics Reviews on Foreign and Domestic Movies."Economics in Trinity College ofDuke University.
https://econ.duke.edu/uploads/media_items/jeon-and-jiao-honors-thesis1.original.pdf (accessed August 13, 2013).
King, M. The Dynamics of Informational Cascades of Local Films in Theaters: A Demand Study. MasteralThesis.University of Asia and the Pacific. May 2004.
Litwak, M. “Entertainment Law Resources”. (2003). http://www.marklitwak.com/articles/film/literary_material.html
(Accessed July 30, 2013)
“Main Film Genres,” http://www.mvrop.org/cms/lib03/CA01922720/Centricity/Domain/60/FEIST-Film_genres.pdf (accessed July 2013)
Mamer, B. Film Production Technique: Creating the Accomplished Image. (CA: Wadsworth Cengage Learning, 2009)
105

NadiTofighian, The Role of Jose Nepomuceno in the Philippine Society (2005), 9-14, http://su.diva-portal.org/smash/get/diva2:200615/FULLTEXT01.pdf (Accessed July 8, 2013)
National Statistics Office, “2009 Annual Survey of Philippine Business and Industry (ASBPI) – Other Community, Social, andPersonal Service Activities for all Establishments: Final Results”, Social and Personal Services Activities (February 6, 2012), http://www.census.gov.ph/content/2009-annual-survey-philippine-business-and-industry-aspbi-other-community-social-and-0
Orbach, B, and L Einav. "Uniform Prices For Differentiated Goods:The Case Of The Movie-theater Industry." International Review of Law and Economics 27, no. 2 (2007)
Palis J, Cinema Archipelago: A Geography of Philippine Film and the Postnational Imaginary (Chapel Hill: University of North Carolina, 2008)
Pasadilla G and LantinA.Can the Philippines Follow Bollywood?.Philippine Institute of Development Studies Manila: (2005)
Philippine Standard Industrial Classification, “Motion Picture,Video and Television ProgrammeActivities,”www.nscb.gov.ph/activestats/ psic /publication/NSC B_ PSIC _2009.pdf
Philippine Standard Industrial Classification, “Other Community,Social, and Personal Activities,”www.bles.dole.gov.ph/beams/index.php/catalog/41/download/285(Retrieved July 2013)
Philippines Box Office.Box Office Mojo International. (2011) http://boxofficemojo.com/intl/philippines/?yr=2011&wk=12&p=.htm (Accessed August 13, 2013)
Philippines Box Office.Box Office Mojo International. (2013). http://boxofficemojo.com/intl/philippines/?yr=2013&wk=26&p=.htm (Accessed August 13, 2013)
106
Pine J and Gilmore J, “Welcome to the Experience Economy”.http://rushkolnik.ru/tw_files/4995/d-4994348/7z-docs/4.pdf(Accessed September 24, 2013)
Roos D, “How Booking Agents Work”. http://entertainment.howstuffworks.com/booking-agent2.htm (Accessed October 7, 2013)
Santos, A. (2008). Pre-Release Indicators of Box Office Performance: A Study onthe Pre-Consumption Behavior for Movies. MasteralThesis.University of Asia and the Pacific. May 2008.
Schwartz, S. “Investing in the Big Screen can be a profitable story”. (October, 2010). Accessed August 4, 2013.http://www.cnbc.com/id/39342145
Starmometer. (2013). Highest-Grossing Filipino Films of All Time – ‘It Takes A ManAnd A Woman’ is 1st to Cross the 400M mark. Retrieved http://www.starmometer.com/2013/06/14/highest-grossing-filipino-films-of-all-time-it-takes-a-man-and-a-woman-is-1st-to-cross-the-p400-m-mark/#IQMCTVroWjqQMq2l.99 (Accessed August 13, 2013)
“Signing a Lease”.Tenantunion.Last Modified (n.d.).Accessed August 3, 2013.http://www.tenantunion.uiuc.edu/lease.html
“SM to invest in feel-good movies only,” Manila Bulletin, February 27, 2011
http://ph.news.yahoo.com/sm-invest-feel-good-movies-only-20110226-214922-636.html (Accessed October 7, 2013)
Thomson D. "Why Do All Movie Tickets Cost the Same? The Atlantic”News and analysis on politics, business, culture, technology, national, international, and life http://www.theatlantic.com/business/archive/2012/01/why-do-all-movie-tickets-cost-the-same/250762/ (accessed August 2, 2013).
107

Vera, N. “Bong Revilla: “show only one Hollywood movie a month”. (January 3, 2010) http://criticafterdark.blogspot.com/2010/01/bong-revilla-show-only-one-hollywood.html (Accessed August 12, 2013)
Vertido, C. "Film Industry in the Philippines." (1988), 1-2. AMIC Seminar on Asian Films
Virola R., “Now Showing: Panday, Nag-Shake, Rattle, and Roll”, Statistically Speaking (February 13, 2012),
http://www.nscb.gov.ph/headlines/StatsSpeak/2012/021312_rav_mpg.aspdr.ntu.edu.sg/bitstream/handle/10220/642/AMIC_1988_01_06.pdf?sequence=1 (accessed July 8,2013).
Viva Entertainment Management, Viva Films: When and How it Started, October 21, 2011, http://viva.com.ph/index.php?option=com_content&view=article&id=2980:viva-film. (AccessedAugust 2, 2013)
Vogel H. Entertainment Industry Economics (8th edition).(New York: Cambridge University Press, 2011).
Walmsley B, Key Issues in the Arts and Entertainment Industry(Oxford: Goodfellow Publishers, 2011)www.hbs.edu/faculty/Publication%20Files/05-059.pdf (accessedAugust 4, 2013).
Yager F. and Yager J. Career Opportunities in the Film Industry.(NY: Ferguson, 2009)
108