Rwanda-Social-Protection-System-Development-Policy ...
73
Document of The World Bank Report No: ICR00004727 IMPLEMENTATION COMPLETION AND RESULTS REPORT (IDA‐55800) ON THREE CREDITS IN THE AMOUNT OF SDR MILLION 47.9 MILLION (US$70 MILLION EQUIVALENT) ‐ FIRST OPERATION SDR MILLION 67.7 MILLION (US$95 MILLION EQUIVALENT) ‐ SECOND OPERATION SDR MILLION 68.2 MILLION (US$95 MILLION EQUIVALENT) ‐ THIRD OPERATION TO THE REPUBLIC OF RWANDA FOR A SOCIAL PROTECTION SYSTEM DEVELOPMENT POLICY OPERATION SERIES March 28, 2019 Social Protection and Jobs Global Practice Africa Region Public Disclosure Authorized Public Disclosure Authorized Public Disclosure Authorized Public Disclosure Authorized
-
Upload
khangminh22 -
Category
Documents
-
view
0 -
download
0
Transcript of Rwanda-Social-Protection-System-Development-Policy ...

Document of
The World Bank
Report No: ICR00004727
IMPLEMENTATION COMPLETION AND RESULTS REPORT (IDA‐55800)
ON
THREE CREDITS
IN THE AMOUNT OF
SDR MILLION 47.9 MILLION (US$70 MILLION EQUIVALENT) ‐ FIRST OPERATION
SDR MILLION 67.7 MILLION (US$95 MILLION EQUIVALENT) ‐ SECOND OPERATION
SDR MILLION 68.2 MILLION (US$95 MILLION EQUIVALENT) ‐ THIRD OPERATION
TO THE
REPUBLIC OF RWANDA
FOR A
SOCIAL PROTECTION SYSTEM
DEVELOPMENT POLICY OPERATION SERIES
March 28, 2019
Social Protection and Jobs Global Practice Africa Region
Pub
lic D
iscl
osur
e A
utho
rized
Pub
lic D
iscl
osur
e A
utho
rized
Pub
lic D
iscl
osur
e A
utho
rized
Pub
lic D
iscl
osur
e A
utho
rized

CURRENCY EQUIVALENTS (Exchange Rate Effective as of December 31, 2018)
Currency Unit = Rwandan Franc (FRW)US$1 = RWF 900US$1 = SDR 0.72
FISCAL YEAR
July 1 – June 30
ABBREVIATIONS AND ACRONYMS
CLS Community Living Standards CLSG Community Living Standards Grant CPS Country Partnership Strategy DFID U.K. Department for International Development DPF Developing Policy Financing DPL Development Policy Lending DPO Development Policy Operation DS Direct Support ECD Early Childhood Development EDPRS Economic Development and Poverty Reduction Strategy EICV Integrated Household Living Conditions Survey ePW Expanded PW EU European Union FARG Genocide Survivors Assistance Fund FS Financial Services GDP Gross Domestic Product GNI Gross National Income GoR Government of Rwanda IMF International Monetary Fund IPF Investment Project Financing iSP‐MIS Integrated Social Protection Management Information System IT Information Technology JSR Joint Sector Review LODA Local Administrative Entities Development Agency M&E Monitoring and Evaluation MIGEPROF Ministry of Gender and Family Planning MINALOC Ministry of Local Government MINECOFIN Ministry of Finance and Economic Planning MINISANTE Ministry of Health MIS Management Information System MOU Memorandum of Understanding NIDA National Identification Agency NISR National Institute of Statistics of Rwanda NSDS Nutrition Sensitive Direct Support NSPR National Social Protection Registry

NSPS National Social Protection Strategy PDO Program Development Objective PSI Policy Support Instrument PW Public Works RDRC Rwanda Demobilization and Reintegration Commission SP Social Protection SPS Social Protection System SPSWG Social Protection Sector Working Group SSPP Strengthening Social Protection Project SSPS Support to Social Protection System UNICEF United Nations Children’s Fund VUP Vision 2020 Umurenge Program
Senior Global Practice Director: Michal J. Rutkowski
Practice Manager: Robert S. Chase
Project Team Leader: Laura Rawlings
ICR Team Leader: Alex Kamurase
ICR Primary Authors: Suzana Abbott and Alex Kamurase

Page 1 of 73
Rwanda Social Protection System Development Policy Operation Series
(SPS‐1: P151279, SPS‐2: P155024 and SPS‐3: P158698)
Table of Contents DATASHEET ................................................................................................................................................... ii
1. PROJECT CONTEXT, DEVELOPMENT OBJECTIVES AND DESIGN............................................................ 2
1.1 Context at Appraisal ........................................................................................................................ 2
1.2 Original Program Development Objectives (PDO) and Key Indicators ......................................... 5
1.3 Revised PDO and Key Indicators, and Reasons/justification ......................................................... 5
1.4 Original Policy Areas Supported by the Program ........................................................................... 6
1.5 Revised Policy Areas ........................................................................................................................ 7
1.6 Other significant changes ................................................................................................................ 8
2. KEY FACTORS AFFECTING IMPLEMENTATION AND OUTCOMES .......................................................... 8
2.1 Program Performance ..................................................................................................................... 8
2.2 Major Factors Affecting Implementation ..................................................................................... 10
2.3 Monitoring and Evaluation (M&E) Design, Implementation, and Utilization ............................. 13
2.4 Expected Next Phase/Follow‐up Operation ................................................................................. 14
3. ASSESSMENT OF OUTCOMES .............................................................................................................. 15
3.1 Relevance of Objectives, Design, and Implementation ............................................................... 15
3.2 Achievement of Program Development Objectives .................................................................... 16
3.3 Justification of overall outcome rating ......................................................................................... 22
3.4 Overarching Themes, Other Outcomes and Impacts ................................................................... 22
4. ASSESSMENT OF RISK TO DEVELOPMENT OUTCOME ........................................................................ 24
5. ASSESSMENT OF BANK AND BORROWER PERFORMANCE ................................................................ 25
5.1 Bank Performance ......................................................................................................................... 25
5.2 Borrower Performance .................................................................................................................. 26
6. LESSONS LEARNED ............................................................................................................................... 27
7. COMMENTS ON ISSUES RAISED BY BORROWER/IMPLEMENTING AGENCIES/PARTNERS ............... 29
ANNEX 1: BANK LENDING AND IMPLEMENTATION SUPPORT/SUPERVISION PROCESSES ...................... 30
ANNEX 2: SUMMARY OF PROGRAM AND BENEFICIARY SURVEY RESULTS ............................................. 33
ANNEX 3: POLICY MATRIX FOR THE SPS DPL OPERATIONS ...................................................................... 37
ANNEX 4: STAKEHOLDER WORKSHOP REPORT AND RESULTS ................................................................. 41

Page 2 of 73
ANNEX 5: FINAL RESULTS FRAMEWORK ................................................................................................... 47
ANNEX 6: SUMMARY OF BORROWER'S ICR AND/OR COMMENTS ON DRAFT ICR .................................. 49
Chapter 1: Background ............................................................................................................................... 49
Chapter 2: Assessment of Progress ............................................................................................................. 49
2.1. Pillar #1: Efficiency of the Social Protection System .................................................................. 49
2.2. Pillar #2: Accountability and Transparency ................................................................................... 50
2.2.1. Policy Action 2: Accountability and transparency enhanced through improved SP budget reporting and dissemination and strengthened citizens' engagement. ................................................. 50
2.3. Pillar #3: Coverage of Poor and Vulnerable .................................................................................. 51
2.3.1. Policy Action 3: VUP coverage expanded with attention to appropriate design, notably poverty and child-sensitive elements. ................................................................................................. 51
Chapter 3: Key challenges and conclusion ................................................................................................. 54
o Delayed in implementation of Public Works program ............................................................... 54
o Number of days worked by households ...................................................................................... 54
o Timeliness of VUP beneficiary payments ................................................................................... 54
Source: LODA annual reports (2015/16-2017/18) ............................................................................. 55
Chapter 4: Policy reforms, Stakeholder Coordination and Partnership ...................................................... 55
ANNEX 7: LIST OF SUPPORTING DOCUMENTS .......................................................................................... 58
MAP ............................................................................................................................................................ 59

Page 1 of 73

The World Bank (P155024)
ii
DATASHEET
A. BASIC INFORMATION
Program 1
Country Rwanda Program Name: Social Protection System Support
Program ID: P151279 L/C/TF Number(s) IDA‐55800
ICR Date: 03/27/2019 ICR Type: 03/27/2019
Financing Instrument: DPL Borrower MINECOFIN
Original Total Commitment USD 70.00M Disbursed Amount USD 66.24M
Implementing Agencies:
Cofinanciers and Other External Partners:
Program 2
Country Rwanda Program Name: Third Social Protection System Support (SPS‐3)
Program ID: P158698 L/C/TF Number(s) IDA‐55800,IDA‐59100
ICR Date: 03/27/2019 ICR Type: 03/27/2019
Financing Instrument: DPL Borrower REPUBLIC OF RWANDA
Original Total Commitment USD 95.00M Disbursed Amount USD 91.40M
Implementing Agencies:
Cofinanciers and Other External Partners:
Program 3
Country Rwanda Program Name: Second Social Protection System DPO (SPS‐2)
Program ID: P155024 L/C/TF Number(s) IDA‐55800,IDA‐57460
ICR Date: 03/27/2019 ICR Type: 03/27/2019
Financing Instrument: DPL Borrower MINISTRY OF FINANCE AND ECONOMIC PLANNIN
Original Total Commitment USD 95.00M Disbursed Amount USD 93.96M
Implementing Agencies:
Cofinanciers and Other External Partners:
B. KEY DATES
Social Protection System Support P151279
Process Date Process Original Date Revised / Actual Date(s)
Concept Review: 10/30/2014 Effectiveness:
Appraisal: 12/02/2014 Restructuring(s):
Approval: 01/22/2015 Mid‐term Review:

The World Bank (P155024)
iii
Closing: 03/31/2016 03/31/2016
Third Social Protection System Support (SPS‐3) P158698
Process Date Process Original Date Revised / Actual Date(s)
Concept Review: 06/06/2016 Effectiveness: 12/31/2017
Appraisal: 09/13/2016 Restructuring(s):
Approval: 10/31/2016 Mid‐term Review:
Closing: 12/31/2017 12/31/2017
Second Social Protection System DPO (SPS‐2) P155024
Process Date Process Original Date Revised / Actual Date(s)
Concept Review: 06/02/2015 Effectiveness:
Appraisal: 10/13/2015 Restructuring(s):
Approval: 12/01/2015 Mid‐term Review:
Closing: 09/30/2016 09/30/2016
C. RATINGS SUMMARY
C.1 Performance Rating by ICR
Overall Program Rating
Outcomes Satisfactory
Risk to Development Outcome Low or Negligible
Bank Performance Satisfactory
Borrower Performance Satisfactory
C.2 Detailed Ratings of Bank and Borrower Performance (by ICR)
Overall Program Rating
Bank Ratings Borrower Ratings
Quality at Entry Satisfactory Government: Satisfactory
Quality of Supervision: Satisfactory Implementing Agency/Agencies:
Satisfactory
Overall Bank Performance Satisfactory Overall Borrower Performance
Satisfactory
C.3 Quality at Entry and Implementation Performance Indicators
Social Protection System Support P151279
Implementation Performance
Indicators QAG Assessments (if any) Rating
Potential Problem Program at any time (Yes/No):
No Quality at Entry (QEA) None
Problem Program at any time (Yes/No):
No Quality of Supervision (QSA)
None
DO rating before Closing/Inactive status
Third Social Protection System Support (SPS‐3) P158698

The World Bank (P155024)
iv
Implementation Performance
Indicators QAG Assessments (if any) Rating
Potential Problem Program at any time (Yes/No):
No Quality at Entry (QEA) None
Problem Program at any time (Yes/No):
No Quality of Supervision (QSA)
None
DO rating before Closing/Inactive status
Second Social Protection System DPO (SPS‐2) P155024
Implementation Performance
Indicators QAG Assessments (if any) Rating
Potential Problem Program at any time (Yes/No):
No Quality at Entry (QEA) None
Problem Program at any time (Yes/No):
No Quality of Supervision (QSA)
None
DO rating before Closing/Inactive status
D. SECTOR AND THEME CODES
Social Protection System Support P151279 Original Actual
Major Sector
Social Protection
Public Administration ‐ Social Protection 44 44
Social Protection 56 56
Major Theme/Theme/Sub Theme
Human Development and Gender 4 4
Gender 4 4
Social Development and Protection 97 97
Social Inclusion 19 19
Indigenous People and Ethnic Minorities 3 3
Other Excluded Groups 3 3
Participation and Civic Engagement 13 13
Social Protection 78 78
Social Safety Nets 13 13
Social protection delivery systems 65 65
Third Social Protection System Support (SPS‐3) P158698 Original Actual
Major Sector
Social Protection
Social Protection 100 100
Major Theme/Theme/Sub Theme

The World Bank (P155024)
v
Social Development and Protection 97 97
Social Protection 78 78
Social Safety Nets 13 13
Social protection delivery systems 65 65
Second Social Protection System DPO (SPS‐2) P155024 Original Actual
Major Sector
Social Protection
Social Protection 100 100
Major Theme/Theme/Sub Theme
Human Development and Gender 4 4
Gender 4 4
Social Development and Protection 97 97
Social Inclusion 19 19
Participation and Civic Engagement 13 13
Social Protection 78 78
Social protection delivery systems 65 65
E. BANK STAFF
Social Protection System Support P151279
Positions At ICR At Approval
Vice President: Hafez M. H. Ghanem Makhtar Diop
Country Director: Carlos Felipe Jaramillo Diarietou Gaye
Practice Manager/Manager: Robert S. Chase Manuel Salazar
Task Team Leader: Laura B. Rawlings Laura B. Rawlings
ICR Team Leader: Alex Kamurase
ICR Primary Author: Suzana Nagele de Campos Abbott
Alex Kamurase
Third Social Protection System Support (SPS‐3) P158698
Positions At ICR At Approval
Vice President: Hafez M. H. Ghanem Makhtar Diop
Country Director: Carlos Felipe Jaramillo Diarietou Gaye
Practice Manager/Manager: Robert S. Chase Dena Ringold
Task Team Leader: Laura B. Rawlings Laura B. Rawlings
ICR Team Leader: Alex Kamurase
ICR Primary Author: Suzana Nagele de Campos Abbott
Alex Kamurase
Second Social Protection System DPO (SPS‐2) P155024
Positions At ICR At Approval
Vice President: Hafez M. H. Ghanem Makhtar Diop
Country Director: Carlos Felipe Jaramillo Diarietou Gaye
Practice Manager/Manager: Robert S. Chase Dena Ringold

The World Bank (P155024)
vi
Task Team Leader: Laura B. Rawlings Laura B. Rawlings
ICR Team Leader: Alex Kamurase
ICR Primary Author: Suzana Nagele de Campos Abbott
Alex Kamurase
F. RESULTS FRAMEWORK ANALYSIS Program Development Objectives (from Program Document)
The Program Development Objective of the Social Protection System Support Program was to "support the Government of Rwanda to improve the efficiency, accountability and coverage of its social protection system"
Revised Program Development Objectives (as approved by original approving authority) There Program Development Objective as defined in the Program Document for SPS-1 was maintained in subsequent SPS-2 and SPS-3 Program Documents and thus never changed.
Indicator(s)
Social Protection System Support P151279
Indicator Baseline Value
Original Target Values (from approval
documents)
Formally Revised Target Values
Actual Value Achieved at Completion or Target Years
Third Social Protection System Support (SPS‐3) P158698
Indicator Baseline Value
Original Target Values (from approval
documents)
Formally Revised Target Values
Actual Value Achieved at Completion or Target Years
Second Social Protection System DPO (SPS‐2) P155024
Indicator Baseline Value
Original Target Values (from approval
documents)
Formally Revised Target Values
Actual Value Achieved at Completion or Target Years
Indicator 1: % of individuals over 16 years in the Ubudehe database matched to a national ID
Value quantitative or Qualitative
25
60 90
Date achieved 06/30/2014 06/29/2018 06/29/2018
Comments (incl. % achievement)
The source of information are simulations from the Ubudehe database. The database has been positioned as an important source of data for targeting several basic services beyond the safety nets. This prioritization made performance on this target exceeded.

The World Bank (P155024)
vii
Indicator 2: Number of core SP programs linked o the iSP‐MIS
Value quantitative or Qualitative
0
0 2
Date achieved 06/30/2014 06/29/2018 06/29/2018
Comments (incl. % achievement)
The source of information is the technical committee responsible for the integrated SP management information system under the auspices of the SP Sector Working Group. The iSP‐MIS located in LODA is now functional and linked
Indicator 3: % of targeted local government staff trained on SP program eligibility.
Value quantitative or Qualitative
0
70 98.6
Date achieved 06/30/2014 06/29/2018 06/29/2018
Comments (incl. % achievement)
Source of information is MINALOC administrative and programs data. Regular training and periodic orientation for new staff has now become a norm in the SP sector. LODA being a semi‐autonomous agency also has more flexibility to get related financing.
Indicator 4: % of districts reviewing SP budget during accountability day events per year.
Value quantitative or Qualitative
0
60 85
Date achieved 06/30/2014 06/29/2018 06/29/2018
Comments (incl. % achievement)
The source of information are reports from Districts which are aggregated by the Ministry of Local Government to give the overall performance. Monitoring for this indicator is done in collaboration with Ministry of Finance who lead budgetary processes.
Indicator 5: % of primary appeals that have been resolved at first instance at sector levels within two weeks in VPU
Value quantitative or Qualitative
80
80 80
Date achieved 06/30/2014 06/29/2018 06/29/2018

The World Bank (P155024)
viii
Comments (incl. % achievement)
The source of information is LODA/VUP routine monitoring and MIS. A GRM module has been included in the LODA MIS to simplify GRM. Due to enhanced citizens engagement and thus awareness, grievances increased initially but have stabilized over time.
Indicator 6: % of geographical sectors covered by the VUP in the poorest 30% of districts; for (a) Direct Support (DS); and (b) Public Works (PW).
Value quantitative or Qualitative
DS: 54 PW: 42
DS: 86 PW: 80
DS:100 PW: 66
Date achieved 06/30/2014 06/29/2018 06/29/2018
Comments (incl. % achievement)
During implementation of the SPS, government made a strong commitment to roll out coverage of DS countrywide reaching 100% of sectors. PW coverage equally increased but not as much as DS.
Indicator 7: VUP coverage by geographical sector and households for (a) Direct Support and (b) Public Works.
Value quantitative or Qualitative
DS: Sectors ‐ 180 Households ‐ 43,671 Female Headed ‐ 66% PW: Sectors ‐ 150 Households ‐ 89,011 Female Headed ‐ 46%
DS: Sectors ‐ 395 Households ‐ 96,000 Female Headed ‐ 66% PW: Sectors ‐ 240 Households ‐ 89,011 Female Headed ‐ 46%
DS: Sectors ‐ 416 Households ‐ 94,912 Female Headed ‐ 68.9% PW: Sectors ‐ 244 Households ‐ 134,993 Female Headed ‐ 50.7%
Date achieved 06/30/2014 06/29/2018 06/29/2018
Comments (incl. % achievement)
In addition to impressive end target coverage numbers for DS and PW against the baseline, targets for female headed households were exceeded in both cases.
G. RATINGS OF PROJECT PERFORMANCE IN ISRs

The World Bank (P155024)
ix
H. RESTRUCTURING (IF ANY)

The World Bank (P131558)
1

The World Bank (P131558)
2
1. PROJECT CONTEXT, DEVELOPMENT OBJECTIVES AND DESIGN
1.1 Context at Appraisal
1. This Implementation Completion and Results Report (ICR) is a review of the performance of the three‐part series of Social Protection System (SPS) Development Policy Operations (DPOs): SPS‐1 for SDR 47.9 million (US$70 million equivalent); SPS‐2 for SDR 67.7 million (US$95 million equivalent); and SPS‐3 for SDR 68.2 million (US$95 million equivalent), which were approved by the World Bank Board in FY15 (January 22, 2015), FY16 (December 1, 2015), and FY17 (October 21, 2016), respectively.
2. At the time of appraisal of SPS‐1, the Government of Rwanda (the Government or GoR) had demonstrated unwavering commitment to poverty reduction. Rwanda had emphasized the importance of building an effective SPS to boost resilience to shocks, ensure equity for the poor, and strengthen opportunity through increased human capital development and access to productive employment. The GoR had witnessed impressive progress under its first‐generation Economic Development and Poverty Reduction Strategy (EDPRS‐1), with an average economic growth of 8 percent over five years (2008–2012) and reductions in rates of poverty and extreme poverty of 11.8 percentage points and 11.7 percentage points, respectively, over the same period. The second‐generation EDPRS (EDPRS‐2) had been approved in May 2013 to address medium‐ and long‐term development challenges, including poverty and growth. The GoR’s priority to social protection (SP) as a main vehicle for achieving its poverty reduction objectives was reflected in its adoption, in 2013, of a revised National Social Protection Strategy (NSPS‐2) that was aligned to the EDPRS‐2. NSPS‐2 outlined a strategic framework toward achieving SP outcomes, the overall objective being to “establish an SP system that can tackle poverty, inequality and vulnerability, and improve access to essential services and social insurance.” The priority areas identified in NSPS‐2 and its corresponding Implementation Plan included (a) increasing coverage of extreme poor and vulnerable; (b) addressing child poverty and vulnerability; (c) ensuring that the SPS has sustainable impact on extreme poverty; (d) ensuring effective, efficient, and harmonized SP delivery; (e) improving measurement and visibility of SP results and impact; and (f) improving sector response to climate‐related risks. The GoR’s commitment was also reflected in its strong financial commitment to the sector: social assistance expenditures had grown steadily over the previous five years, and at 2.5–3.0 percent of public expenditures, they were well above the average for other low‐income countries.1
3. With the support of the World Bank and other development partners, the GoR had, in about six short years, established the foundation of an SPS that was increasingly institutionally mature, central to its poverty reduction objectives, and reaching a growing number of poor and vulnerable families. In the first phase of the program (2009–2011), supported by development partners and the World Bank’s Community Living Standards (CLS) programmatic DPO series,2 the Government introduced a strong social safety net program with the creation of the Vision 2020 Umurenge Program (VUP) based on some of the global best practices for social safety nets. The flagship VUP, under the Community Living Standards Grant (CLSG), was piloted in the first 30 poorest sectors,3 one in each of the country’s 30 districts, and currently provides direct support (DS) transfers, public works (PW), and financial services (FS) to poor and vulnerable households. In this first phase, the GoR crafted an appropriate wage policy for the VUP PW 1 Government of Rwanda, Ministry of Finance and Economic Development, Directorate of National Budget, Budget Reports (2011–2015). 2 World Bank, Community Living Standards Financing, Program Documents (2009, 2010, and 2011). 3 Government of Rwanda, Vision 2020 Umurenge Program Document (2008); World Bank, Community Living Standards Financing, Program Documents (2009, 2010, and 2011).

The World Bank (P131558)
3
designed not to have distortionary effects on the labor market for similar unskilled employment opportunities, a basic community targeting approach (Ubudehe), a payment architecture, a budget, and institutional framework for the VUP.
4. From earlier piloting of the VUP in 30 geographical sectors, the second phase, which counted upon continued support by development partners and the World Bank’s Support to the Social Protection System (SSPS) programmatic DPO series4, helped expand the VUP’s PW program from 90 to 240 geographical sectors (out of a total of 416 sectors) and coverage from 176,000 to 218,000 households, and introduced DS cash transfers for destitute households and FS microcredit loans. In addition, Rwanda began to move from a series of ad hoc programs focused on the needs of post‐genocide reintegration to consolidation and establishment of a harmonized SPS. The SP sector was also strengthened through the establishment of subsystems to support effective services delivery, including geographical and household poverty targeting, a nascent mechanism for appeals and complaints, a management information system (MIS) for monitoring implementation, and links with disaster response.
5. Despite impressive achievements from sustained commitment to social protection, Rwanda continued to face important challenges in reducing poverty. It remained one of the poorest countries in the world with a gross national income (GNI) per capita of US$644 (2013) and high levels of vulnerability, notably among children and people living in rural areas as well as those living in disaster prone areas. An approximate 44.5 percent of the population still lived below the poverty line, and 24 percent lived in extreme poverty. Poverty remained high among households with many children, and child malnutrition continued to affect 44 percent of children under five. More than 90 percent of the poor lived in rural areas, and over 80 percent of the Rwandans were employed in agriculture. The poorest Rwandans were agricultural laborers, although household agricultural production that more than doubled between 2001 and 2011 was a key driver of poverty reduction. There was a need to ensure extension of the coverage of SP programs to poor households, to maximize the poverty impact of SP programs, and to ensure that opportunities existed for families benefitting from social protection to build pathways to graduate from the programs and move out of poverty.
6. The SPS DPO series sought to continue the successful programmatic approach to strengthening Rwanda’s social protection system, focusing on support for a set of policy reforms that deepened core areas of the SP system and introduced a set of second‐generation reforms that were consistent with the degree of development of the sector. While the earlier series had been successful, there were still numerous issues and challenges remaining, to have in place an efficient, accountable, transparent and effective SP system. The DPO objectives, prior actions and triggers aimed to contribute to addressing these remaining challenges: (i) improve the efficiency of the SP system by focusing on core areas of administration and program harmonization to deepen needed reforms, especially in the Ubudehe registry and MIS tools used in the nuts‐and‐bolts management of the sector, and in boosting harmonization across programs to improve efficiency through addressing program overlaps, streamlining registry of beneficiaries for different interventions provided by different agencies and better coordinating income generating programs; (ii) deepen the focus on accountability and transparency and in line with the Government and CPS focus on accountable governance, bringing a core focus to budgetary transparency and citizens’ engagement, and (iii) continue the focus on the ambitious expansion of coverage, notably of
4 World Bank, Support to the Social Protection System, Program Documents (2012, 2013, and 2014).

The World Bank (P131558)
4
the VUP, emphasizing coverage of the poor and vulnerable, given the need to improve poverty targeting and to ensure protection that is both gender‐sensitive and conducive to child development. .
7. At the time of appraisal of the first SPS, three policy areas were selected as priorities to address the challenges in Rwanda’s SP system. First, to improve the system’s efficiency, it required administrative inter‐operability across program beneficiary registry databases to manage social programs efficiently, notably to identify the poor, address coverage duplication and gaps and promote synergies across programs. Further, although there had been progress in designing the SP MIS, the MIS systems of each of the main SP programs were unable to communicate with each other, making it impossible to manage beneficiaries across programs and throughout their life, or to track payments, grievances and redress and monitor and report efficiently on results. Finally, there was still considerable overlap and duplication between FARG and VUP direct support beneficiaries that would generate efficiency gains through harmonization.
8. With respect to accountability and transparency, the social protection sector did not count upon a consolidated social protection budget to inform effective management and support fiscal transparency and accountability in the sector. More simplified and transparent budget information coupled with information on budget allocation and execution across SP programs that was easily accessible to stakeholders was required to improve transparency and accountability and facilitate bottom‐up budget consultation with more visibility of the SP sector. Also, while an appeals and complaints mechanism had been established, there was still considerable lack of knowledge of the different programs and requirements, and an enabling environment was needed for citizens to participate in decision making processes in program activities and in the monitoring of the implementation of agreed actions, so that the program grievances redress mechanism (GRM) would draw from a well‐informed citizenry and beneficiaries. For this, the Government needed to increase staffing at the local government levels and train them to promote citizens’ engagement, sensitizing the communities about the key social protection programs and the roles of different stakeholders.
9. Lastly, the Government still faced a considerable challenge in increasing coverage of its SP system in line with national goals. The flagship VPU program still only reached about half of the country geographically, and in addition to increased resources, improvements in coverage required enhanced targeting so that a larger share of the available resources would reach the extreme poor and vulnerable. Also, the Government needed to address core challenges with respect to the labor intensity and predictability of public works to ensure that the VUP public works program could meet its safety net objectives.
10. All of Rwanda’s macroeconomic fundamentals were solid at appraisal and the choice of a programmatic DPO instrument was consistent with Rwanda’s strong macro‐fiscal framework. Rwanda’s macroeconomic policy framework was expected to remain adequate, given prudent macroeconomic policy management and the GoR’s continuing efforts to strengthen the macroeconomic policy framework. The International Monetary Fund (IMF) had successfully completed the second review in 2014 under the three‐year Policy Support Instrument (PSI) and the Article IV Consultation. The near‐ and medium‐term economic outlook was positive, with the economy expected to grow by about 6 percent in 2014, up from 4.7 percent in 2013. The IMF/World Bank Debt Sustainability Analysis carried out in November 2014 concluded that Rwanda remained a low risk of debt distress, with external debt in the public sector remaining at about 24 percent of gross domestic product (GDP), domestic debt at about 7 percent of GDP, and a debt profile that was expected to improve further over time. The balance of payments depended

The World Bank (P131558)
5
on aid inflows in the near term but was expected to improve in the medium term based on increasing exports of goods and services as the export base expanded and diversified. Monetary and exchange rate risks were considered low, and monetary policy was conducive to an environment of low inflation supporting the GoR’s economic growth objectives. Finally, fiscal policy was expected to sustain the domestic revenue mobilization efforts. The tax‐to‐GDP ratio was projected to increase from 14.9 percent in FY2013/14 to 17.4 percent in FY2017/18 through implementation of revenue mobilization policies. Consequently, the share of grants in total revenues was projected to decline form 35.4 percent to 15.0 percent during the same period. Expenditures were also expected to decline from 30.2 percent of GDP in FY2013/14 to 26.3 percent in FY2017/18, supported by the GoR’s efforts to reprioritize expenditures in a context of uncertainty from aid flows. With this, the overall deficit (including grants) was expected to decline marginally from 4.0 percent of GDP in FY2013/14 to 3.7 percent in FY2017/18. Domestic resource mobilization and subsequent smaller budget deficits were likely to lead to less external financing needs.
11. The level of financial support under the SPS DPO series was consistent with the Government’s financial commitment to the sector and envisaged in the macroeconomic outlook supported by the IMF’s PSI. The budget for implementing NSPS‐2 priorities was estimated at US$522 million over five years, or an average of about US$104.5 million annually. Overall, SP spending was expected to increase by 24 percent in the medium term. Nevertheless, the upgrading of Rwanda’s social assistance programs and extension of coverage supported by the SPS DPO series were considered fiscally responsible, even considering the Government’s ambitious goals.
1.2 Original Program Development Objectives (PDO) and Key Indicators
12. The PDO of the SPS DPO series was to support the Government of Rwanda to improve the efficiency, accountability and coverage of its SP system.
13. The key indicators selected to measure progress toward the PDO were the following:
(i) % of individuals over 16 years old in the Ubudehe database matched to a national ID
(ii) Number of SP MIS modules developed
(iii) % of targeted local government staff trained on SP Program eligibility
(iv) % of districts reviewing SP budget during accountability day events (per year)
(v) % of primary appeals that have been resolved at first instance at sector levels within two
weeks in VUP sectors
(vi) % of geographical sectors covered by VUP in the poorest 30% of districts for (a) direct
support (DS) and (b) public works (PW)
(vii) VUP coverage of geographical sectors and households for (a) direct support (DS) and (b) public works (PW)
1.3 Revised PDO and Key Indicators, and Reasons/justification
14. The PDO was maintained throughout the DPO series. The key indicators were also not revised in substance although in some cases baseline data and end targets were adjusted in SPS‐2. Specifically, for

The World Bank (P131558)
6
Key Indicator (vii) above, the end target for DS sectors was increased from 360 to 395 sectors; the baseline for DS households was revised from 61,981 to 43,671 and the end target from 96,000 to 90,000 households; the baseline for PW sectors was adjusted from 180 to 150 sectors (the end target was not modified); and the baseline for PW households was revised from 104,400 to 89,011 households (the end target was not modified). These revisions were maintained in the SPS‐3 Program Document. In addition, the wording for Key Indicator (ii) above was slightly revised under SPS‐3 as ‘Number of core SP programs linked to the Integrated Social Protection Management Information System (iSP‐MIS). This revision was introduced to better reflect the advances in the evolution of the MIS.
1.4 Original Policy Areas Supported by the Program
15. Incorporating the lessons learned from previous engagements in the sector, findings of an impact evaluation and other analytical work, the SPS DPO series was designed to address areas that needed strengthening and introduce second generation reforms, focusing on increased efficiency and value for money, strengthened accountability and transparency, and expanded coverage of poor and vulnerable populations. Specifically, the SPS DPO sought to: (i) strengthen tools to improve the management and service delivery of social protection programs, notably the social protection management information system (MIS) and the Ubudehe household registry classification system which was used by a number of agencies ; (ii) improve the harmonization and efficiency of programs within the SP system, notably the two largest programs—VUP and the Genocide Survivors Assistance Fund (FARG)—by ensuring that there will be no overlap in direct support benefits ; (iii) respond to strong focus in Rwanda on enhancing productivity by focusing on harmonizing and strengthening income‐generation programs targeted to poor households; (iv) introduce new accountability and transparency elements in line with the GoR’s accountable governance focus and in coordination with the increased devolution of responsibilities to local government entities, and (v) support reforms in the area of child‐sensitive social protection that were central to GoR policy commitments in both SP and early childhood development (ECD), with an eye toward longer‐term graduation from poverty and social assistance.
16. The SPS Program supported three main policy areas (pillars) that aimed to (a) improve the efficiency of the SPS by focusing on core areas of administration and program harmonization to deepen needed reforms, especially in the Ubudehe registry and MIS tools used in the nuts‐and‐bolts management of the sector, and boosting harmonization across programs to improve efficiency through addressing program overlaps and better coordinating income generating programs; (b) deepen the focus on accountability and transparency and in line with the GoR and CPS focus on accountable governance, bringing a core focus to budgetary transparency and citizens’ engagement; and (c) continue to focus on the ambitious expansion of coverage, notably of the VUP, emphasizing coverage of the poor and vulnerable, given the need to improve poverty targeting and to ensure protection that is both gender sensitive and conducive to child development. These pillars were selected to address the main challenges the SP sector was facing, as described in paragraph 8 above.
Policy Area 1: Efficiency of the Social Protection System
17. Pillar 1 aimed to improve the administrative efficiency of the SPS and help generate value for money by improving both administrative systems and program harmonization. Program‐supported reforms would lead to the following achievements, which were considered central to improving efficiency: (a) a reformed Ubudehe system and database for identifying and registering poor and vulnerable households to improve interoperability across SP and other poverty‐targeted program databases; (b) a

The World Bank (P131558)
7
comprehensive, improved MIS (iSP‐MIS), including links between the Ubudehe database, program registries, and the national ID database; and (c) increased harmonization across SP programs, addressing duplication of benefits in the main SP programs and ensuring rationalization in the use of income‐generating programs to support graduation from poverty and social assistance.
Policy Area 2: Accountability and Transparency
18. Extensive fiscal and program decentralization was planned, with commensurate responsibilities for Rwanda’s 30 districts and 416 sectors as determined under Rwanda’s decentralization policy (May 2000 as amended to date). New local government staff would be on the front lines for deepening citizen participation and engaging civil society organizations, elements that would be critical to encouraging program and fiduciary accountability and transparency. This decentralization would be coupled with ongoing financial management reforms in the Ministry of Finance affecting Rwanda’s SP budget. The reforms under Pillar 2 were designed to support this extensive decentralization and benefit from ongoing public financial management reforms through (a) improved transparency and accountability in SP budget reporting and discussion and (b) strengthened citizens’ engagement that would encourage increased awareness for financial literacy and participation by beneficiaries and the broader citizenry in SP decisions affecting their communities.
Policy Area 3: Coverage of the Poor and Vulnerable 19. Reforms under Pillar 3 were designed to ensure that not only Rwanda’s SP coverage expanded in line with national targets but also the expanded coverage was responsive to the needs of the poor and vulnerable households. The stronger focus on poverty and vulnerability implied that coverage was (a) well targeted to poor areas and households, given needed improvements in poverty targeting; (b) more gender and child sensitive, with a push for building a stronger link between SP and ECD as envisaged in key policy directives aimed at addressing the severe child development deficit in Rwanda, including the 38 percent rate of malnutrition among children under five; and (c) more labor intensive in PW, where reforms to ensure the efficiency of SP spending with respect to its short‐term safety net objectives for poor households were direly needed. The specific policy reforms that would be supported under Pillar 3 were (a) improved design of the VUP with respect to testing improvements in poverty targeting and introducing gender and child sensitivity of SP programs to promote child development and (b) expanded policy role for social protection in ECD.
1.5 Revised Policy Areas
20. The policy areas were not revised per se. However, the specific areas of support under Policy Area 3 were subdivided from the original two into four areas of support. In the SPS‐1 and SPS‐2 Program Documents, two areas of support were described under Policy Area 3: (a) Expanded coverage of the VUP in line with national targets and (b) Improved design of VUP with respect to testing improvement in poverty targeting and improving the gender and child sensitivity of SP programs to promote child development. In the SPS‐3 Program Document, these areas of support were divided into the following four: (a) Expanded coverage of VUP in line with national targets, (b) Improved design of VUP with respect to testing and improvement in poverty targeting, (c) Reform to the flagship VUP program to ensure better alignment with needs of poor and vulnerable populations, and (d) Improving the gender and child sensitivity of SP programs to promote child development and expanded policy role for social protection in ECD.

The World Bank (P131558)
8
21. In addition, the SPS‐3 Program Document presented rephrasing of some prior actions and the addition of a new Prior Action 6 (MINALOC to approve the revised VUP). In substance, all prior actions remained unchanged from the initial design of the SPS series, but the precise wording of the prior actions and the addition of a new one were made to strengthen them due to greater than contemplated progress on the program’s implementation. The final wording of prior actions and policy and institutional actions across the SPS DPO series are presented in annex 2.
1.6 Other significant changes
22. There were no additional significant changes in design, scope or scale, implementation arrangements or schedule and funding allocations from what was anticipated in all the three DPO series. However, in line with the government ambitious goals for eradication of extreme poverty, expanded public works and minimum package for graduation initiatives were introduced to facilitate caregiving mothers to participate in public works programs, and create innovations for accelerating poverty reduction.
2. KEY FACTORS AFFECTING IMPLEMENTATION AND OUTCOMES
2.1 Program Performance
23. The SPS Program was designed as a series of three single‐tranche DPOs with the Program Document for the first operation describing the entire reform program. All three operations were financed by IDA Credits, but the amount of the subsequent two operations had not been defined when the first operation was approved. Nevertheless, the operations were expected to be approved yearly, in 2014/15, 2015/16, and 2016/17. A summary of the operations’ key financing data, prior actions, and policy and institutional actions is provided in tables 1 and 2.
Table 1. Summary Key Financing Data for the SPS DPOs
Operation No.
Amount (SDR, millions)
Amount (US$ Million Equivalent)
% Disbursed Board Approval Date
SPS‐1 P151279
47.9 70.0 100 January 22, 2015
SPS‐2 P155024
67.7 95.0 100 December 1, 2015
SPS‐3 P158698
68.2 95.0 100 October 31, 2016
Total 183.8 260.0
Table 2. Summary Prior Actions for SPS‐1 and Policy and Institutional Actions for SPS‐2 and SPS‐3 DPOs
Prior Actions from Legal Agreement/ Program Document Status
SPS‐1
1. MINALOC to adopt roadmap for updating of the Ubudehe national household poverty database
Completed
2. Short‐, medium‐, and long‐term SP MIS objectives approved by the MINALO convened SP MIS Technical Committee
Completed

The World Bank (P131558)
9
Prior Actions from Legal Agreement/ Program Document Status
3. MINALOC to issue policy guidelines to decentralized entities as to which benefic to allocate to households eligible for more than one social protection program, with no duplicate benefit from FARG and VUP DS
Completed
4. MINECOFIN to produce consolidated Social Protection budget identifying the social protection programs
Completed
5. Cabinet to approve revised structure for expanded staffing at district and sector local government levels
Completed
6. MINALOC and MINECOFIN to approve plan and budget for expansion of VUP in FY15
Completed
7. MINALOC to adopt procedures to enhance community participation in Ubudehe household classification process and launch testing of poverty scorecard
Completed
8. MINALOC to conduct policy study and identify policy options for improving gender and child sensitivity of SP programs
Completed
SPS‐2
1. LODA to sign an MOU with National ID Agency (NIDA) including technical specifications for interface between Ubudehe and NIDA databases
Completed
2. MINALOC to finalize, validate, and adopt MIS technical system specifications and costed roadmap
Completed
3. MINALOC to develop and adopt policy guidelines for a minimum package to support graduation, including harmonizing income‐generating activities across selected SP programs
Completed
4. MINALOC and MINECOFIN to document, publish and discuss the SP consolidated budget allocation and execution through primary dissemination channels
Completed
5. MINALOC to develop and implement a curriculum for targeted district and sector local government staff to strengthen citizens’ engagement in the delivery of social protection programs
Completed
6. MINALOC and MINECOFIN to approve plan and budget for expansion of VUP in FY16
Completed
7. MINALOC to adopt plan for selected option(s) for improved gender and child sensitivity of SP programs
Completed
SPS‐3
1. LODA to ensure that the updated Ubudehe national household poverty database is operational, including a fully functional interface with the NIDA database
Completed
2. MINALOC to (i) establish the structure of the National Social Protection Registry (NSPR); (ii) design a web‐based graphical user interface for communication across programs; and (iii) develop protocols on staffing, and roles and responsibilities for use and maintenance of the iSP‐MIS
Completed
3. MINALOC to implement a pilot of the minimum package for graduation in 30 sectors, including harmonizing income‐generating activities across selected SP programs
Completed

The World Bank (P131558)
10
Prior Actions from Legal Agreement/ Program Document Status
4. MINALOC to implement and monitor a citizen appeals and complaints system, including web‐based and SMS platforms
Completed
5. MINALOC and MINECOFIN to approve plan and budget for expansion of VUP in FY17
Completed
6. MINALOC to approve the approve the revised VUP program Completed
7. Cabinet to approve National Early Childhood Development (ECD) policy Completed
Note: MINECOFIN = Ministry of Finance and Economic Planning; MOU = Memorandum of Understanding.
2.2 Major Factors Affecting Implementation
24. The ICRs for the earlier DPO series, namely, the CLSG Program and the SSPS Program, both of which provided earlier support to Rwanda’s SP sector, stated that the following factors affected those programs’ implementation: (a) strong government commitment, (b) the programs’ design as a component of an integrated World Bank strategy, (c) beneficiary involvement, (d) the macroeconomic environment in which they were implemented, and (e) continued donor support. The same factors were present and affected positively the implementation of the SPS Program. In addition, the SPS Program was affected positively by continuity in World Bank support over time and the systematic incorporation of lessons learned under previous programs in the design of the SPS Program.
25. Strong government commitment. Since the establishment of the VUP in 2009, the GoR has continued to show sustained and unwavering commitment to poverty reduction as per the priorities in its National Social Protection Strategy (NSPS) 2013–2018, including to (a) increase coverage of the extreme poor and vulnerable; (b) address child poverty and vulnerability in the poorest households; (c) ensure a sustainable impact of the SPS on extreme poverty; (d) establish a more efficient, effective, and harmonized SPS; and (e) improve the measurement and visibility of SP results and impacts. It has also maintained continued commitment to EDPRS‐2 (2013–2018) that addresses medium‐ and longer‐term development challenges. The Government’s strong commitment is reflected in its financial commitments to social protection in general and the VUP (Table 3). As shown in Table 3, year‐on‐year allocations and actual expenditures on the core social assistance programs have been increasing over the last nine years. Compared to the 2009/10 actual expenditure of US$48 million, the total expenditures increased to US$120 million in 2017/18. Although this increment may not be as significant if compared with the increase in GDP during the same time, this year on year allocation nonetheless show a strong commitment to the sector which can be improved over time.

The World Bank (P131558)
11
Table 3. Consolidated Budget Execution for the Main SP Programs for FY10–FY18
SOCIAL PROTECTION GOVERNMENT FINANCING
Government SP Financing2009/10 (actual)
2010/11 (actual)
2011/12 (actual)
2012/13 (actual)
2013/14 (actual)
2014/15 (actual)
2015/16 (Actual)
2016/17 (Budget)
2016/17 (Actual)
2017/18 (Proj.) 2017/18 (Actual)
Main SP Programs in US$ in US$ in US$ in US $ in US $ in US $ in US $ in US $
1. LODA 16,541,353 18,045,113 22,957,625 32,130,552 44,257,978 50,248,919 50,603,804 45,951,066 34,441,952 45,832,361 40,379,831
VUP 16,541,353 18,045,113 22,957,625 32,130,552 36,746,758 39,936,966 40,698,379 38,223,229 26,900,653 37,469,121 32,706,187
UBUDEHE - - - - 4,701,153 7,024,266 6,342,495 5,034,613 4,691,173 4,935,285 4,321,362
NUTRITION - - - - 2,810,067 3,287,687 3,562,930 2,693,224 2,850,126 3,427,955 3,352,283
2. FARG 23,934,371 28,360,922 31,811,598 34,229,221 36,990,864 37,750,409 38,924,607 39,196,361 36,222,760 36,399,986 36,399,986
3. RDRC 5,559,783 2,869,209 5,975,555 5,871,153 5,649,130 3,847,483 10,846,556 7,299,497 6,078,876 7,128,581 5,224,169
4. 1. MINALOC - SP interventions in decentralised entities
2,264,054 1,808,370 2,649,560 2,519,583 1,846,424 2,081,663 2,020,237 1,809,764 1,809,764 1,739,274 1,739,274
4.2. MINALOC - SP (Central) - - - - 301,905 170,199 131,401 158,339 69,039 164,449 619,353
Other SP Programs
5. NCPD - - - 722,911 1,392,065 491,012 952,275 896,447 872,974 697,843 697,843
6. NCC - - - 670,439 2,435,199 4,274,701 4,344,575 4,794,581 4,272,411 2,702,756 2,702,756
7.1. MINAGRI GIRINKA - - - 1,661,593 2,249,932 1,539,800 2,358,908 1,258,653 2,149,364 1,659,315 1,659,315
7.2. MINAGRI NUTRITION - - - - 2,199,550 2,819,267 3,902,610 1,875,426 1,875,426 4,014,097 5,029,863
8. MIGEPROF - - - 1,686,339 2,982,831 2,149,683 2,643,128 3,082,116 2,403,701 3,285,441 1,495,976
9. POOLING RISK 4,137,799 6,919,829 9,220,519 7,539,018 5,652,534 5,652,534 5,431,010 16,164,917
10. MIDMAR - - - - 1,589,912 1,021,215 6,588,469 6,699,581 1,946,537 5,789,022 4,323,270
11.NRS - - - - - - - - - 2,715,715 2,715,715
Total GoR Financing 48,299,561 51,083,614 63,394,338 83,629,590 108,815,618 115,614,871 130,855,586 118,674,366 97,795,340 117,559,850 119,152,268
Notes :
5) The data provided for 2017/18 and 2018/19 are projections from 2016/17 budget and MTEF.
1) Exchange rates applied: 665Rwf from 2009/10 to 2012/13; 666.5 RWF in 2013/14; 689RWF for 2014/15FY, 709.5 RWF for 2015/16FY, 794.5RWF for 2016/17FY, ) f f f g g f p
reported information on components externally funded whose execution is done outside IFMIS system
3) For 2013/14, the provided data are based on revised budget for 2013/14 whereas the SSPS‐3 data were based original budget for 2013/14.4) For consistence with data published last year, budget amount for 2015/16 is the amount as it was in the original budget while actuals are base on the Revised
budget

The World Bank (P131558)
12
26. Integrated IDA strategy ‐ continuity in support with a focus on lessons learned. Since the earliest phases, IDA assistance in support of Rwanda’s social protection and poverty reduction efforts has been integrated, comprehensive, sustained, and well‐coordinated with other development partners. Following the CLSG and the subsequent SSPS, the SPS and each of the individual operations in the SPS and in each of the earlier series have been adjusted and adapted to actual implementation experience and to reflect lessons while never losing track of the next steps on the agenda toward a fully functioning social safety net. World Bank support has been complemented by operations financed in other sectors (for example, agriculture), especially by non‐lending technical assistance, including both analytical work and hands‐on capacity‐building support. Analytical work included studies on VUP targeting and poverty survey, SP public expenditure reviews, a Social Safety Net Assessment (2012), and, more importantly, the 2014 VUP impact evaluation.
27. The 2014 VUP impact evaluation concluded that the VUP DS and PW can have positive impacts on household well‐being by enabling them to meet immediate needs and accumulate livestock, but these impacts were less pronounced for PW than for DS beneficiaries and might not be sustained. The findings suggested that stronger impacts of the VUP could be expected if (a) timeliness and predictability of DS and PW payments were improved; (b) coverage of PW were extended to a higher proportion of eligible households; (c) PW were better adapted to the needs of labor‐constrained households by providing more accessible job types and providing higher transfers for a sustained period by offering a higher number of days of work; (d) DS targeting criteria were expanded or a separate program designed to include more vulnerable households, specifically those with limited labor and caring responsibilities; and (e) links to key services and information on entitlements were strengthened for vulnerable and marginalized households. These recommendations for improving the VUP’s impacts provided input to the SPS Program’s design.
28. Beneficiary involvement and poverty targeting. The Ubudehe community support system, which is anchored on traditional values dating precolonial Rwanda, was revived in post‐genocide Rwanda and further developed to unite and mobilize communities in identifying the most vulnerable and their needs and to inform priority setting and selection of activities to address those vulnerabilities. Ubudehe is recognized as playing an important role in community engagement in the setting of priorities for poverty reduction and in mobilizing local support, notably at the grassroots level, for building resilience and addressing vulnerability. The original Ubudehe household classification process, formalized in 2011, assigned each household a score from 1 (poorest) to 6 (wealthiest) based on a community‐led qualitative criterion. Community‐level poverty maps were produced, a countrywide Ubudehe electronic database was developed, and the Ubudehe classifications were being used by the VUP as a criterion for income support through PW and DS, and by other social programs as a criterion for program eligibility as well.
29. In 2014, the Cabinet approved a revision to the Ubudehe structure, reducing it from six categories to four, since the first two categories were largely similar, and updating the criteria for assignment to each category. The new Ubudehe categorization was implemented in two phases by MINALOC in partnership with local governments and technical ministries. Starting in 2015, a pilot was first implemented in five districts, one district per province and one from Kigali City, and the rollout phase was conducted in the remaining 25 districts. Lessons learned from the pilot phase fed into the design of the rollout phase. Two independent categorization methods were used to classify the households: (a) a community‐based categorization where households were categorized by community appreciation and (b) a response‐based categorization where households were categorized through the administration of a structured questionnaire with data provided by the head of the household. The results of the response‐based categorization were then sent back to the communities and widely disseminated, allowing households the

The World Bank (P131558)
13
right to appeal. Almost 40 percent of households appealed their categorization, and the results were returned to the communities for validation. The 2015 Ubudehe categorization included about 2.4 million households across the country and classified them as follows: (a) Category 1 ‐ 16 percent of households; (b) Category 2 ‐ 29.8 percent of households; (c) Category 3 ‐ 53.7 percent of households; and (d) Category 4 ‐ 0.5 percent of households.
30. Macroeconomic environment. Rwanda’s macroeconomic management was considered satisfactory at the time each of the SPS operations were prepared, and the main identified risk (that the country’s short‐ to medium‐term outlook was vulnerable to external shocks given its trade imbalances and concentrated export items) was rated Moderate. Rwanda’s macroeconomic framework was stable through implementation of the SPS series despite a minor slowdown in growth in early 2017. Following 6 percent growth in 2016, annualized growth in the first quarter of 2017 fell to 4.2 percent due mainly to a combination of drought, weak export prices, and drop‐in construction activities following the completion of large investment projects in 2016. Growth bottomed out at an annual 3.4 percent from mid‐2016 to mid‐2017, before recovering to an annualized level of 6.1 percent in the second half of 2017 in view of improved export performance, favorable weather and revitalized agriculture, and a resumption of growth in private consumption.
31. Donor coordination. Rwanda’s SP sector is financed and supported by donors and the Government under in a coordinated manner through the SPWG. The SPS DPO continued to count upon a robust program of technical assistance and support provided by development partners, notably the United Kingdom’s Department for International Development (DfID), the United Nations Children’s Fund (UNICEF), European Union (EU) and the World Bank, all coordinated by a well‐functioning government‐development partner Sector Working Group (SPWG). The SPS was prepared and implemented in an environment of continued effective coordination with these development partners, under the framework of the SPWG. The SPWG, which has now been in existence for about ten years, continued its established practice of conducting bi‐annual Joint Sector Reviews, one retrospective and the other prospective of future, and provided an effective forum for discussing policy perspectives and implementation issues as the opportunity arose. The World Bank participated regularly in the SPWG, providing implementation support, hands‐on technical/advisory services, and support to preparation of the follow‐on project. Given sustained support by Rwanda’s donors, SPWG has provided a rolling forum in which financial and technical assistance by development partners are prepared, implemented, reviewed, and adjusted to future priorities.
2.3 Monitoring and Evaluation (M&E) Design, Implementation, and Utilization
32. Design. The Policy Matrix and Results Framework for SPS‐1 presented prior actions and triggers for each of the three operations as well as seven key outcome indicators (along with baselines and targets) and identified the agencies that would be responsible for reporting. The Policy Matrix and Results Framework, including the key indicators, were reviewed and revised as needed during preparation of each of the subsequent operation in the SPS Program. The Key Outcome Indicators selected to measure efficiency were very output based, but the indicators were selected recognizing that it would be difficult to collect outcome data measuring efficiency improvements in the three short years of the SPS program’s duration. Further, the SPSWG provides an overall framework for monitoring, which is formalized in the semiannual JSRs that assess performance on policy, outputs, and outcomes and make recommendations for the following six‐month period. The VUP is monitored routinely by LODA.

The World Bank (P131558)
14
33. The SPS DPO series also helped develop the instruments to support strengthened M&E. The program’s Pillar 1, Area (ii), iSP‐MIS, including links between the updated Ubudehe database, program registries, and the national ID database, supported policy actions and triggers to put in place an information system for the management of program data to support program harmonization. The iSP‐MIS was expected to help MINALOC monitor and evaluate its SP programs and ensure coordination and complementarity with other SP programs. The design envisaged a fully operational, comprehensive information technology architecture (comprising a range of autonomous but interconnected program‐level MIS) that automates program operations (targeting, payments, grievance management, and so on) and supports more effective cross‐sectoral M&E and coordination and harmonization of service delivery.
34. Implementation and utilization. Routine monitoring information on the VUP, compiled by LODA, fed into semiannual SPSWG reviews and evaluations. Further, consistent with its emphasis on results, the National Statistics Institute of Rwanda implements a nationally representative Integrated Household Living Conditions Survey (EICV) every three years. The Government has used the data from the EICV for impact evaluation. Following an oversample of VUP beneficiaries under EICV4 (2015), EICV5 (2018) has re‐interviewed a VUP pre‐program baseline and a matched control to evaluate the impacts of VUP over time using difference‐in‐difference estimates. The findings of this and other recent evaluations, which have relied on monitoring information to guide the design of each subsequent phase of the Government’s SP program, are described in section 3.4 (a).
2.4 Expected Next Phase/Follow‐up Operation
35. In view of the Government’s continuing commitment and priority to its SP sector and need for financial and technical support, the World Bank approved an SDR 56.7 million (US$80 million equivalent) Investment Project Financing (IPF) IDA Credit to provide continued support for improving the effectiveness of Rwanda’s SPS, notably the VUP, for targeted vulnerable groups. The Strengthening Social Protection Project (SSPP), approved on December 18, 2017, addresses some challenges identified with the program, including issues of self‐exclusion of moderately labor‐constrained households, lack of knowledge on available services, inability to accumulate assets, and unintended negative impacts on the care and nutrition of young children. It aims to address these challenges and improve effectiveness by (a) increasing the overall number of beneficiary households receiving income protection; (b) increasing the guaranteed minimum number of days of work for PW, thereby effectively increasing the size of transfers households receive; (c) expanding eligibility criteria to include more labor‐constrained households under DS; (d) introducing expanded PW (ePW) to provide more accessible jobs to those ineligible for DS but with some labor constraints, which will allow more households with limited labor capacity to access benefits; and (e) increasing the frequency and timeliness of payments, which will increase the reliability of income support. The new ePW component was designed to address the needs of moderately labor‐constrained households caring for children, by offering a more flexible year‐round work schedule that is more compatible with daily wage work and caring responsibilities. The new types of PW will include home‐based childcare work, whereby ePW participants will be employed to care for the children of other extremely poor households while parents work elsewhere. Given the Government’s priority to investing in children’s development and in jump‐starting an integrated program to combat chronic malnutrition, a program of community‐based parenting training and supervision for the childcare‐focused ePW is being developed in close coordination with the Ministry of Gender and Family Promotion (MIGEPROF) and the Ministry of Health (MINISANTE).
The World Bank (P131558)
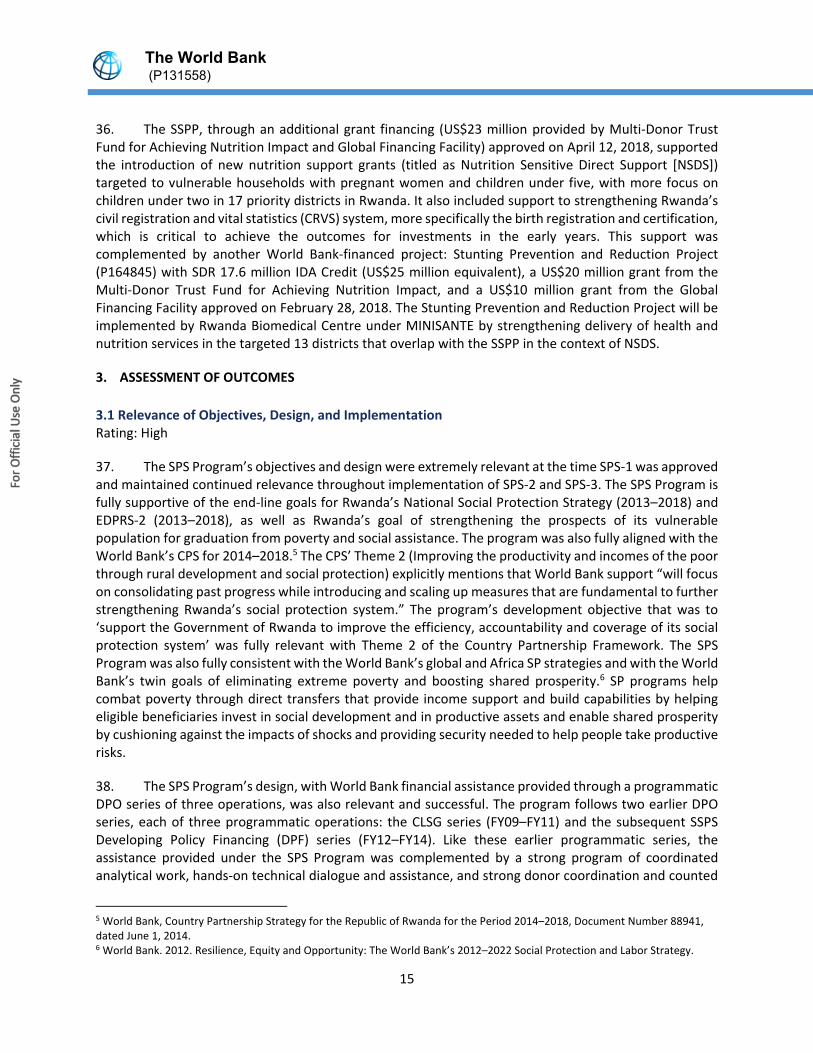
15
36. The SSPP, through an additional grant financing (US$23 million provided by Multi‐Donor Trust Fund for Achieving Nutrition Impact and Global Financing Facility) approved on April 12, 2018, supported the introduction of new nutrition support grants (titled as Nutrition Sensitive Direct Support [NSDS]) targeted to vulnerable households with pregnant women and children under five, with more focus on children under two in 17 priority districts in Rwanda. It also included support to strengthening Rwanda’s civil registration and vital statistics (CRVS) system, more specifically the birth registration and certification, which is critical to achieve the outcomes for investments in the early years. This support was complemented by another World Bank‐financed project: Stunting Prevention and Reduction Project (P164845) with SDR 17.6 million IDA Credit (US$25 million equivalent), a US$20 million grant from the Multi‐Donor Trust Fund for Achieving Nutrition Impact, and a US$10 million grant from the Global Financing Facility approved on February 28, 2018. The Stunting Prevention and Reduction Project will be implemented by Rwanda Biomedical Centre under MINISANTE by strengthening delivery of health and nutrition services in the targeted 13 districts that overlap with the SSPP in the context of NSDS.
3. ASSESSMENT OF OUTCOMES
3.1 Relevance of Objectives, Design, and Implementation Rating: High
37. The SPS Program’s objectives and design were extremely relevant at the time SPS‐1 was approved and maintained continued relevance throughout implementation of SPS‐2 and SPS‐3. The SPS Program is fully supportive of the end‐line goals for Rwanda’s National Social Protection Strategy (2013–2018) and EDPRS‐2 (2013–2018), as well as Rwanda’s goal of strengthening the prospects of its vulnerable population for graduation from poverty and social assistance. The program was also fully aligned with the World Bank’s CPS for 2014–2018.5 The CPS’ Theme 2 (Improving the productivity and incomes of the poor through rural development and social protection) explicitly mentions that World Bank support “will focus on consolidating past progress while introducing and scaling up measures that are fundamental to further strengthening Rwanda’s social protection system.” The program’s development objective that was to ‘support the Government of Rwanda to improve the efficiency, accountability and coverage of its social protection system’ was fully relevant with Theme 2 of the Country Partnership Framework. The SPS Program was also fully consistent with the World Bank’s global and Africa SP strategies and with the World Bank’s twin goals of eliminating extreme poverty and boosting shared prosperity.6 SP programs help combat poverty through direct transfers that provide income support and build capabilities by helping eligible beneficiaries invest in social development and in productive assets and enable shared prosperity by cushioning against the impacts of shocks and providing security needed to help people take productive risks.
38. The SPS Program’s design, with World Bank financial assistance provided through a programmatic DPO series of three operations, was also relevant and successful. The program follows two earlier DPO series, each of three programmatic operations: the CLSG series (FY09–FY11) and the subsequent SSPS Developing Policy Financing (DPF) series (FY12–FY14). Like these earlier programmatic series, the assistance provided under the SPS Program was complemented by a strong program of coordinated analytical work, hands‐on technical dialogue and assistance, and strong donor coordination and counted
5 World Bank, Country Partnership Strategy for the Republic of Rwanda for the Period 2014–2018, Document Number 88941, dated June 1, 2014. 6 World Bank. 2012. Resilience, Equity and Opportunity: The World Bank’s 2012–2022 Social Protection and Labor Strategy.

The World Bank (P131558)
16
upon strong government commitment and ownership, all of which made the DPO instrument even more powerful. The World Bank’s Independent Evaluation Group’s Rwanda Country Program Evaluation FY09–FY17 (2018) states as a lesson that “Continuous World Bank DPF support for the SP system over a decade represents an innovative approach that could bring meaningful lessons for the region and beyond.”
3.2 Achievement of Program Development Objectives
39. The SPS Program was successful in supporting the GoR’s continued efforts to improve efficiency, accountability and coverage of the social protection system. It provided continuity to the earlier World Bank‐supported efforts, in coordination with technical advisory services provided by both the World Bank and Rwanda’s donor partners. Progress toward the key results indicators over the SPS DPO series’ implementation is presented in annex 5, the program’s final Policy Matrix is presented in annex 3, and the results in each of the series’ three policy areas are described as follows.
Policy Area 1: Efficiency of the Social Protection System
Key Indicators
(i) % of individuals over 16 years old in the Ubudehe database matched to a national ID (baseline: 25%; end target: 60%)
(ii) Number of SP MIS modules developed (baseline: 0; end target: 2)
(iii) % of targeted local government staff trained on SP program eligibility (baseline 0%; end target 70%)
40. With support under the SPS Program and from donor partners, the Government has improved the efficiency of its SP system. This has been achieved through reforms and actions that have resulted in (a) a reformed Ubudehe system and database for identifying and registering poor and vulnerable households to improve interoperability across SP and other poverty‐targeted program databases; (b) a fully functioning, comprehensive iSP‐MIS, including links between the Ubudehe database, agency program registries, and the national ID database, and (c) increased harmonization across SP programs, providing a platform for a streamlined tracking of the different agency benefit of similar nature with an objective of progressively eliminating duplication of benefits in the main SP programs and ensuring rationalization in the use of income‐generating programs to support graduation from poverty and social assistance. At completion, 90 percent of individuals over 16 years old in the Ubudehe database were matched to a national ID, exceeding the indicator target of 60 percent.
41. MINALOC has updated the Ubudehe national household poverty database that is linked to the national ID, a revised classification scheme, and an updated community targeting process. The Ubudehe poverty database has a fully functional interface with the database of Rwanda’s NIDA that has issued national identification numbers and associated cards to 90 percent of the population above 16 years, thereby serving as a national population register. The web service linking the Ubudehe and NIDA systems is up and running, including secure transmission of data across the two systems. A formal agreement signed by both LODA, responsible for Ubudehe database and the iSP‐MIS, and NIDA ensure that updates in the foundational ID database will inform the Ubudehe database and iSP‐MIS on an ongoing basis, substantially improving MINALOC and other agencies’ capacity to manage their programs and beneficiary registries. Under this agreement, protocols and responsibilities for follow‐up on inconsistencies and

The World Bank (P131558)
17
missing IDs as well as protocols on roles and responsibilities to ensure quality of the data and restrict access to only specific users have been finalized. The SP program will be enhanced, and efficiencies will be gained by strengthening eligibility, including by addressing inclusion and exclusion errors and helping to prevent and eliminate those that are deceased and the other noneligible beneficiaries.
42. With support under the SPS program, Rwanda now counts upon a fully operational SP MIS to improve SP program delivery. The comprehensive information system, the iSP‐MIS, comprising a range of autonomous but interconnected agency/program‐level MISs, automates program operations and reporting (targeting, payments, grievance management, financial management, and so on) and supports more effective cross‐sectoral planning, monitoring and evaluation, coordination and harmonization of service delivery. In the medium to long run, the iSP‐MIS will contribute to improved targeting, coverage, harmonization, and monitoring of service delivery and payments; reduced costs in consolidating data from several manual databases; and enhanced accountability and program management, including the ability to harmonize SP interventions to facilitate graduation from poverty.
43. At completion, the iSP‐MIS currently serves as a registry for populations eligible for SP services with links to the Ubudehe database (social registry) and other programs‐specific registries as well as the national identification database, exceeding the indicator target for development of two MIS modules. This matching is currently ensuring that the main SP agencies (VUP, FARG and RDRC) can verify all their eligible beneficiaries of 16+ years, and ensures that beneficiaries who are eligible, but lack identity documentation are easily detected and enrolled. The inter‐operability between the social registry and the ID database has become critical to facilitating SP sector‐wide programming as well as programming for the main agencies and facilitates budgetary planning and reporting. Comprehensive systems assessments are envisaged to reveal concrete efficiency gains and course correct on the technical aspects of the systems if, any, but anecdotal evidence suggest that the functionality of the systems and the latter’s capacity to provide just‐in‐time data about beneficiaries and for service providers has greatly improved as a result.
44. The Government has increased harmonization across SP programs. A government policy directive has eliminated the possibility of a beneficiary receiving duplicate benefits from Rwanda’s two largest programs in the SP sector—the FARG (genocide survivors fund) and the VUP—thus enhancing the likeliness that previous problems related to double‐dipping would be avoided moving forward. The GoR has also introduced policy reforms for harmonizing income‐generating activities across selected SP programs as part of a graduation package and launched a three‐year pilot of the Minimum Package for Graduation in 30 geographical sectors. The graduation package, targeted initially at beneficiaries of the VUP PW with labor capacity and to a lesser extent to VUP and FARG DS beneficiaries, provides beneficiaries with a minimum number of days of PW (defined annually, currently 72 days), health insurance, timely payments, and three years of continuous engagement in PW. The graduation package has also a built‐in referral system that ensures that beneficiaries have access to a wide range of social benefits, tailored to their specific circumstances. An ongoing pilot is to be evaluated at its conclusion to determine the final graduation package and to scale up the initiative to other sectors drawing from good practice lessons.
45. To further improve efficiency, the Government expanded local government staffing with an emphasis on those working on SP programs both at central and local government levels and delivered targeted programs on SP program eligibility. Consistent with enhanced decentralization and the role of MINALOC as the lead agency for local development and social protection, staffing at the local government

The World Bank (P131558)
18
level has been expanded substantially, with an emphasis on those working on SP programs such that staff responsible for social protection are now present not only at the district but also at the sector and cell levels which are the lowest administrative entities within a district local government. MINALOC prepared a curriculum and implemented training for upgrading the skills of local government staff to improve their own and citizens’ understanding of and engagement in a range of activities and programs, including SP programs. The training was focused on local government staff’s roles and responsibilities in implementing the VUP and included modules on principles of social protection and the VUP, targeting, safety nets, exit and graduation guidelines and strategies to enhance graduation, communication, accountability, appeals and complaints, budgeting and finance, and so on. By completion, 98.6 percent (2,253 out of 2,283) local staff had received training on SP program eligibility, exceeding the end target of 70 percent countrywide.
Policy Area 2: Deepening the Focus on Accountability and Transparency
Key Indicators
(iv) % of districts reviewing SP budget during accountability day events (per year) (baseline: 0; end target: 60%)
(v) % of primary appeals that have been resolved at first instance at sector levels within two weeks in VUP sectors (baseline: 80%; end target: >80%)
46. The GoR has also successfully deepened the SP system’s focus on accountability and transparency, including by strengthening citizens’ engagement. Social protection has been formally established as a sector—the GoR officially defined the program composition of the SP sector, and MINECOFIN regularly produces a consolidated SP budget allocation and execution for the main SP programs (Table 3). This consolidated budget information includes information on the SP programs that is linked to the Government’s Chart of Accounts, and for both national‐ and district‐level budgets. This sectoral information is now accessible to the public through primary dissemination channels, including MINALOC’s website, JSRs, Sector Working Groups, and district and sector levels public accountability days. Efforts to strengthen citizens’ engagement were centered on a substantial expansion of local government staffing with accompanying capacity building to engage citizens more closely and the introduction of core tools to support citizens’ improved engagement.
47. To further improve accountability, MINALOC rolled out a grievances redress mechanism (GRM) commonly called an appeals and complaints mechanism for LODA‐administered social assistance programs and is monitoring its implementation in all operational sectors. In addition to the toll‐free number that had been introduced earlier for appeals and complaints, the mechanism now includes a telephone‐based SMS system and a web‐based system to help citizens lodge complaints on SP programs (notably VUP DS, PW, and FS, as well as the Ubudehe program) and raise different issues on other programs coordinated by LODA, countrywide. The systems are configured to provide feedback on complaints through SMS or by logging into the system online and allow LODA to view, monitor, and repot on the status of complaints received, actions taken, and complaints resolved, together with timeliness of addressing complaints. Through this improved and expanded GRM, complaints and appeals can also be logged through the traditional GRM book at the local administration offices (cell, sector and by escalation to districts) and analysis of data on grievances management shows that beneficiaries still preferred this traditional (otherwise called informal) mechanism for logging complaints and appeals. The table below

The World Bank (P131558)
19
provides a summary of complaints and appeals that were received and acted up on through the improved and expanded GRM system.
Complaints and appeals under the VUP program from FY14 to FY18
Complaints and appeals 2014/15 2015/16 2016/17 2017/18
Primary 2,172 2,162 2,189 1,507
Formal 343 341 73 254
Total [primary+formal] 2,515 2,262 2,262 1,761
Resolved in 2 weeks at sector level 2,392 2,393 2,329 1,500
Resolved after two weeks 123 120 104 265
Cases decided in favor of complainants/appellants
1,896 [75%]
1,865 [82%] 1,880 [83%] 1,196 [68%]
Source: LODA, monitoring and evaluation program data, FY14‐18
48. The above data indicates that the GRM system is functioning. The cases which are resolved at the sector level and in favor of complainants and appellants range between 68% and 83% which suggests that the GRM is contributing positively to reducing errors of exclusion. But most importantly, the reforms supported by the SPS under this pillar, and specifically in terms of promoting transparency, accountability and participation have been successful in creating lasting awareness among the beneficiaries on their rights and responsibilities and their grievances are being addressed by the service providers. It would imperative to even ascertain to which extent the grievances expressed are being viewed as feedback that can be used to make improvements in the program delivery systems. This kind of data will be corrected as part of enhancing innovations in this policy area under the SPS, particularly given the work being advanced by the IPF which followed this DPO series. By completion, 85 percent of districts were reviewing budget during accountability day events yearly, exceeding the target of 60 percent, and 84 percent of primary appeals were resolved at first instance at sector levels within two weeks in VUP sectors, exceeding the target of 80 percent.
Policy Area 3: Expanding Coverage, Emphasizing Coverage of the Poor and Vulnerable
Key Indicators
(vi) % of geographical sectors covered by VUP in the poorest 30% of districts for (a) direct support (DS); and (b) public works (PW) ((a) DS baseline 54%; end target: 86%; (b) PW baseline 42%; end target 80%)
(vii) VUP coverage of geographical sectors and households for (a) direct support (DS); and (b) public works (PW) (DS (i) Sectors ‐ baseline: 240 sectors; end target 360 sectors; (ii) households ‐ baseline: 61,981 households; % Female Headed Households (FHH): 66%; end target: 90,000 households; FHH 66%; PW (i) Sectors ‐ baseline: 180 sectors; end target: 240

The World Bank (P131558)
20
sectors; (ii) households ‐ baseline: 104,400 households; %FHH: 46%; end target: 130,000 households; %FHH: 48%
49. Under the SPS Program, the GoR has also expanded coverage of its flagship VUP program, emphasizing the poor and vulnerable.7 From FY14 to FY16, coverage of the VUP DS was increased from 240 to all of Rwanda’s 416 sectors (against a target of 395) and coverage of PW from 150 to 244 sectors (against a target of 240). It is important to note that the DS countrywide coverage does not include all the poor and vulnerable but rather those eligible for support under the DS component of the VUP. This scale‐up was made possible by sustained and predictable budget commitments by the GoR (a prior action under each of the SPS operations), accompanied by both improvements in the operational aspects of poverty targeting, especially in PW programs where the errors of inclusion and exclusion are more prevalent than in the DS grants and in continued efforts to improve the labor intensity of PW. In addition to exceeding targets for sector coverage of both DS and PW, upon completion, the SPS Program had substantially achieved targets for both the number of households and the percentage of FHHs under both DS and PW programs. DS households increased from 43,671 in FY2013/14 to 96,078 in FY2016/17, dropping to 94,912 households in FY2017/18, against a target of 96,000 households. Of these, 68.9 percent of households were headed by females, against a target of 66 percent. Coverage of PW was similarly expanded, increasing from 89,011 households in FY2013/14 to 134,993 in FY2017/18, against a target of 130,000; of these, the percentage of FHHs increased from 46 percent to 50.7 percent during the same period, against a target of 48 percent.
50. The GoR also improved the effectiveness of poverty targeting within elements of its SP system by restructuring the Ubudehe poverty classification system and through modifications in its geographical targeting. The new Ubudehe update includes reforms to the community‐based classification of poor households as well as the introduction of a new 13‐question set of criteria developed through national consultations to aid in socioeconomic classification. The Ubudehe community‐based mapping and registration exercise previously classified poverty ratings from 1 (the poorest of the poor) to 6 (the ‘money rich’), with the bottom two Ubudehe categories eligible for social assistance. With support under the SPS series, the GoR reduced the number of Ubudehe categories from six to four, with the first category being prioritized for certain SP services. A new set of criteria and indicators to guide the categorization of households into the four new categories were developed through a national consultative process. The shift from six categories to four is expected to help minimize the risk of exclusion as the six categories were very broad and it was increasingly difficult to differentiate minor differences in social and economic status and hence category ranking. It has also created more awareness about the appeal process and has allowed more investigation into household welfare assessment. Finally, the move to four Ubudehe categories has allowed the Government to modify the naming of categories to simple numbers, thereby addressing the use of names that has stigmatized communities in the past. The scale‐up of the VUP was complemented by reforms in geographical targeting—rather than adding one new sector in each district every year, scale‐up was determined by poverty levels within a district (based on EICV data), with the VUP rollout prioritizing geographical sectors within the poorest districts. This adjustment made it easier to identify and target the poorest districts on a larger scale. By completion, efforts to improve the
7 According to the SPS‐3 Program Document, focus on the poor and vulnerable implied that coverage was (a) well targeted to poor areas and households, given needed improvement in poverty targeting; (b) more gender and child sensitive, with a push for building a stronger link between SP and ECD as envisaged in key policy directives aimed at addressing the severe child development deficit in Rwanda, including the 38 percent rate of malnutrition among children under five; and (c) more labor‐intensive in public works, an area of needed reform to ensure the efficiency of social protection spending with respect to its short‐term safety net objectives for poor households.

The World Bank (P131558)
21
effectiveness of targeting had resulted in better coverage among both DS and PW households, but issues related to targeting of PW households to the poorest continued to require greater attention. For DS, the percentage of geographical sectors covered by the VUP in the poorest 30 percent of districts increased from 54 percent in FY2013/14 to 100 percent in FY2017/18 (against a target of 95 percent). For PW, the corresponding figures were 42 percent and 66 percent during the same periods (against a target of 80 percent). The failure to achieve the end of target for PW on this sub‐indicator was due to factors related to adequacy of financial commitments coupled with the capacity for multi‐year planning for PW subprojects.
51. The VUP was expanded and reformed to ensure better alignment with needs of poor and vulnerable populations. Although this had not been contemplated when the SPS Program was designed, the GoR advanced a revision to the flagship VUP to better meet the needs of target beneficiaries and work efficiently toward graduation from poverty. The Program Document for SPS‐3 therefore incorporated a new prior action to reflect approval of the revised VUP. Specifically, the revised VUP introduced modifications to (a) improve the relevance, efficiency, and effectiveness of the VUP safety net component; (b) accelerate sustainable graduation from extreme poverty; and (c) enhance capacity for program management.
52. To improve the relevance, efficiency, and effectiveness of the VUP safety net component, the revised VUP (a) made changes to geographic targeting and budget allocation between VUP sectors to improve the VUP’s responsiveness to better respond to geographic variations in poverty; (b) revised eligibility criteria and targeting procedures for the various subcomponents to align the VUP with the revised Ubudehe classification system and reduce exclusion of the most vulnerable households; (c) introduced nutrition support services and an ePW scheme to increase the accessibility of VUP PW to moderately labor‐constrained households, particularly FHHs with young children, while providing more regular and reliable employment, thereby making the SP more gender, nutrition, and child sensitive as further detailed below; (d) revised VUP PW guidelines to guarantee a minimum number of days’ employment per year for participating households; (e) strengthened budgeting and financial management procedures to improve the VUP’s ability to respond to shocks; and (f) established partnerships with Umurenge Savings and Credit Cooperatives for the delivery of regular, reliable, and accessible payments to VUP beneficiaries.
53. To accelerate sustainable graduation from extreme poverty, the revised VUP (a) introduced an asset transfers scheme, (b) introduced a formal skills development subcomponent for technical and vocational skills training for extremely poor households that want to engage in commercial agriculture or initiate off‐farm microenterprise, (c) established proximity advisory services (known as a ‘caseworker’ mechanism) and implemented a high‐quality public communications strategy to increase VUP beneficiaries’ awareness of their rights and responsibilities and access to information, (d) expanded the VUP FS subcomponent to include provision of microcredit and financial education and facilitated access to business development services and support to access relevant insurance products such as crop and livestock insurance, and (e) enhanced coordination of the VUP with other government and nongovernmental programs and services. Finally, to enhance capacity for program management and M&E, the revised VUP (a) embedded the VUP within newly established local government structures; (b) strengthened capacity for national program management and oversight; (c) strengthened the VUP M&E framework and systems; and (d) introduced a high‐quality, automated VUP MIS, linked to the SP sector iSP‐MIS, as well as the Ubudehe MIS.

The World Bank (P131558)
22
54. The SPS series supported improving gender and child sensitivity of Rwanda’s SP programs, allowing for an expanded role for social protection in ECD. In line with its mandate under the NSPS, MINALOC developed and piloted several options to increase the gender and child sensitivity of SP programs, specifically by reforming the VUP’s PW subcomponent. MINALOC engaged a wide range of stakeholders from the Government, civil society, and development partners in a series of workshops to develop the options, with support from UNICEF, the Rapid Social Response Trust fund, and a grant from the Early Learning Partnership Program carried out in collaboration with the Harvard School of Public Health and Partners in Health. MINALOC has been developing and implementing the initial pilots with support from UNICEF. The pilots include (a) providing VUP PW opportunities that are more gender sensitive, particularly less labor‐intensive (less physically demanding) opportunities for pregnant and lactating women, including flexible road maintenance, employment in home/community‐based ECD centers, and employment as support workers in formal early childhood centers; (b) establishing mobile creches or childcare services at PW sites to ensure the safety of children when the caregivers are working, thus making PW more accessible to mothers; and (c) linking VUP beneficiaries to other programs, notably ECD programs and services delivered through the Ministry of Gender and Family Promotion and the National Commission for Children, including home visits, center‐based support, and community‐based services as well as nutrition programs. Rwanda’s Cabinet, in May 2016, adopted a new Early Childhood Development Policy that includes a focus on social protection, underscoring the importance of SP programs in supporting the new policy and of the need for cross‐sectoral collaboration for delivering results. The ECD policy has evolved into a national ECD program.
3.3 Justification of overall outcome rating
Rating: Satisfactory
55. The team’s assessment is that overall, the SPS DPO series was successful in (i) increasing coverage of the program for both direct support cash transfers and public works; (ii) upgrading and integrating management information systems for better beneficiary monitoring and program management and (iii) introducing more comprehensive accountability and transparency mechanisms for the beneficiaries and other stakeholders. These improvements in the sector and of the VUP flagship has made it the SP system a strong foundation for delivery benefits to the poor and vulnerable and enhanced inter‐operability of systems, thus allowing linkages with other basic services.
3.4 Overarching Themes, Other Outcomes and Impacts
(a) Poverty Impacts, Gender Aspects, and Social Development
56. The program’s objective to improve the efficiency, accountability, and coverage of its social protection system was designed with the goal of addressing consumption needs of the poor and vulnerable and contributing to reduction of poverty and inequality. The recently concluded EICV5 (NISR 2017) revealed that poverty fell only very slightly from 39.1 percent to 38.2 percent between 2013/14 and 2016/17. Similarly, extreme poverty fell only from 16.3 percent to 16 percent during the same period. This result may well be a response to the slowdown in economic activity in late 2016 and early 2017. EICV5 also notes that the low efficiency in poverty reduction was due to prolonged droughts that were experienced during the period, underlining that existence of the VUP was an important mitigation against what could have been wore off adverse effects due to the drought‐induced shocks and vulnerabilities. A VUP Panel Survey was included in EICV5 to provide reliable estimates on changes in living conditions of

The World Bank (P131558)
23
VUP beneficiaries between EICV4 and EICV5. The EICV5 sample includes 1,493 households identified as VUP beneficiaries at the time of EICV4.
57. The preliminary findings present a mixed picture in terms of the VUP’s contribution to improvement in households’ living conditions, with DS having a much higher impact. A change in the poverty in the VUP Panel between 2014 and 2017 indicates that poverty fell from 48.8 percent to 38.8 percent in DS households, while in PW household poverty increased from 69.2 percent to 80.9 percent over the same period. Similarly, extreme poverty was reduced from 24.1 percent to 17.4 percent in DS households while it increased from 42 percent to 55 percent in PW households over the same period.
58. A recent VUP Mixed Methods Impact Evaluation indicates that the VUP is having a positive impact on the well‐being of households, with many respondents feeling that they can now ‘survive’, with positive trends for DS beneficiary households where consumption levels increased by 14 percent and poverty was reduced by 9.7 percent.8 In fact, the report indicates that the increase in consumption for DS household beneficiaries was very large and statistically significant with intake of higher‐quality food items including protein, dairy, vegetables, fruits, and legumes. Further, the results show an increase in investments in income‐generating assets or activities such as buying small livestock, hiring others to cultivate their plots, and accumulating small assets and savings. Income from the VUP has been instrumental in households’ immediate response to shocks (especially health shocks) rather than helping them build resilience for the future. The key challenges highlighted were a household’s composition (elderly, gender) and the number of dependents, including whether any were disabled, since these factors affect the ability to work; the composition of household expenditures (for example, food, health, education); and the time to manage the household and care work and income‐generating activities.
59. Overall, the evaluations and studies show that the VUP has a positive effect to the beneficiaries in terms of consumption smoothing and accumulation of assets both at the household and community levels. The evidence indicates that the VUP’s impacts on a household’s standards of living are higher for households who have been on the program for a longer time, as this longer period enables households to plan and invest their incomes in productive assets.
(b) Institutional Change/Strengthening
60. As a programmatic Development Policy Lending (DPL), the operation did not provide specific technical assistance aimed at institutional change/strengthening. Nevertheless, the policy actions supported by the program required parallel technical assistance for their implementation. This technical assistance was provided by Rwanda’s donors within the framework of the Government’s NSPS‐2 and by the World Bank under numerous analytical studies, including a Poverty Assessment, and hands‐on technical advisory support provided in the context of preparation of the follow‐on SSPP. The most notable institutional impacts are (a) the formal establishment of social protection as a sector with a consolidated SP budget allocation and execution for the main SP programs, (b) an improved Ubudehe poverty categorization system and process and more effective geographical targeting, (c) a fully functioning iSP‐MIS with modules linking beneficiary data to other SP systems, (d) a new Early Childhood Development Policy that includes a focus on social protection, and (e) expanded staffing at the local government level, with an emphasis on those working on SP programs trained on roles and responsibilities in implementing the VUP. The expansion in coverage of the VUP and the breadth of programs, for example, through
8 DFID, VUP Mixed Methods Impact Evaluation, 2018.

The World Bank (P131558)
24
introduction of the nutrition support grants and ePW, created space and rationale for creation of new structures in LODA—a national technical assistance team devoted to SP implementation has been constituted under the existing single Project Implementation Unit with consultants focused on the innovations in the VUP. This has led to a better‐capacitated LODA/VUP and will have trickle‐down benefits for the implementers at the district levels.
(c) Other Unintended Outcomes and Impacts
61. There are a couple of unintended outcomes that can be attributed to the SPS DPO series. Upgrading inter‐operability of the MISs, Ubudehe social registry and the ID database is creating an important platform for generation data that is usable by several other basic social services programs and this is expected to benefit the convergence agenda by the government in addressing some of the poverty and development challenges that require a multisectoral engagement. Furthermore, promotion of transparency and accountability motivates the poor to participate in the budget planning processes ‐ which will have benefits for SP budgeting, but also on the rest of the programs that concern the poor and vulnerable e.g. health and education
3.5 Summary of Findings of Beneficiary Survey and/or Stakeholder Workshops
62. An informal summary of the Consultation Workshop held on February 11, 2019, attended by the Government, donors, and World Bank representatives is provided in annex 3. Overall, reforms supported by the SPS DPO series were successful in helping the GoR expand coverage of the poor and vulnerable. EICV5 suggests that with the current programs, impacts could be stronger if coverage of all components of the VUP was implemented to scale. Despite the reduced efficiency in poverty reduction rates during the period of the reform, living conditions for all the VUP beneficiary categories improved between EICV4 and EICV5. The VUP transfers are seen as having been an important caution against shocks when most parts of the country were hit by prolonged droughts. A consolidated summary of recent evaluations on the VUP and social protection is provided in annex 2.
4. ASSESSMENT OF RISK TO DEVELOPMENT OUTCOME Ratings: Negligible to Low
63. Risk to development outcome is considered Negligible to Low. Rwanda has in place a fully functioning SPS that is increasingly institutionally mature and central to poverty reduction approaches, with a national coverage of the flagship VUP in several of its components and with a rollout plan for full coverage of other components. Supported by Rwanda’s donor partners, the institutions responsible for social protection and local government coordination, MINALOC and LODA, have gained considerable experience since the VUP was first established. The Government has demonstrated consistently strong political and financial commitment to this system over the years. Social protection as a priority is grounded in the Government’s strategic priorities and policy documents. Social protection is an integral part of the Government’s EDPRS, and its key priorities are outlined in NSPS‐2 that is valid through 2018. Following consultations among a wide range of stakeholders, the Government has already begun consultations on the new NSPS (2018–2024) that will provide continuity to NSPS‐2. The new policy is expected to build upon experience and successes during the earlier phases, while pushing the boundaries of the SPS to the next level, where the links with other priorities that affect poverty will be developed and cemented (for example, ECD, disaster risk management). The Government’s political commitment has been coupled with financial commitments (Table 3). The main risk to development outcome that would affect the pace of

The World Bank (P131558)
25
expansion rather than sustainability of the VUP as a program relates to possible decreases in donor financing in the future. The World Bank has approved an SDR 56.7 million (US$80 million equivalent) follow‐on IPF that aims to continue improving coverage, adequacy, and effectiveness of the VUP through 2021. As shown in Table 3, Government financial commitment to the main SP programs has been increasing gradually over and above the World Bank support. This is further affirmed by the allocation of US$6 million to the SSPP IPF that is currently under implementation.
5. ASSESSMENT OF BANK AND BORROWER PERFORMANCE
5.1 Bank Performance
(a) Bank Performance in Ensuring Quality at Entry Ratings: Satisfactory
64. The World Bank’s support to the Government’s EDPRS and NSPS continues to provide an excellent example of sustained commitment to a lower‐middle‐income client over time. The World Bank support was essential in providing seamless continuity, both in terms of periodic timing, with the three operations approved at a yearly interval or less, and in terms of adjusting and adapting policies and priorities, in each subsequent phase of each subsequent DPF to reflect experience, findings of analytical studies, and emerging priorities. The choice of the DPF instrument was appropriate, especially in view of the extensive amount of supporting technical assistance provided by Rwanda’s donor partners within the framework of the well‐functioning SPSWG. The SPS Results Framework was realistic, reflecting policy priorities of the Government’s SP agenda, defined in coordination with donor partners.
(b) Quality of Supervision Ratings: Satisfactory
65. The World Bank’s supervision was strong, timely, results focused, and aligned with the Government’s priorities and the assistance provided by Rwanda’s development partners. Regular supervision was provided by country office‐based staff who facilitated the World Bank’s hands‐on advisory support and coordination with the Government and donors. As a programmatic DPO, supervision and preparation of each of the program’s subsequent phases provided a continuum, whereby preparation, implementation support, lessons of experience, analytical studies, and evaluations, both by the World Bank and donor partners, would feed into the design of subsequent phases, adjusted as needed. More importantly, the implementation support provided within the context of the SPS Program seamlessly fed into the preparation of the SSP IPF.
66. Implementation of all policy and institutional actions was achieved timely and subsequent follow‐up on how the reforms trickled down to the levels of implementation through the results framework was completed. Implementation support missions by the World Bank teams for previous phases of the DPO were weaved into the lending processes for the following operations and for the third/final DPO. Implementation support was combined with the lending processes for the new IPF operation. For all the three DPOs, implementation support included following and providing advisory and technical assistance to ensure continuity of the policy actions and continuous monitoring of the performance indicators for the core data included in the Results Framework as well as the additional data that have been used to complement the analysis in this ICR. The establishment of the iSP‐MIS at LODA, the main implementing agency, and the increase in staffing over time also made implementation very relevant both as designed and in practice. Successful delivery of the three DPOs in a record timely manner every year attested to

The World Bank (P131558)
26
the fact that implementation of the policy and institutional actions was done successfully for the entire series of DPOs.
(c) Justification of Rating for Overall Bank Performance Ratings: Satisfactory
67. The policy dialogue, technical appraisal and analytical underpinnings that constituted the appraisal stage were strong and generated relevant motivation at each phase of the three DPOFs. This well appreciated due diligence was sustained through implementation and most of the reforms supported have become important innovations for moving forward the SPJ sector in Rwanda, for example those related to systems, targeting, budgetary planning and programming and transparency and accountability. The quality and timelines of technical assistance provided by the Bank showed a strong sense of proactiveness which was highly appreciated by the government during the ICR in‐country workshop. All these are evidence of satisfaction by the client and other stakeholders which truly culminates into a Satisfactory rating for the overall Bank performance.
5.2 Borrower Performance
(a) Government Performance Ratings: Satisfactory
68. The Government’s commitment to social protection and consequently to the SPS Program continued unwavering through preparation and implementation of each of the DPOs. The Government continued to prioritize its push for results, and its continued focus on M&E and developing the appropriate systems and instrument to support this helped create a virtuous cycle of implementation, review, analysis, and adjustment that has characterized its performance over the years. Its active role in providing an effective forum for donor coordination has continued to help maximize the impact of its own and external donor assistance.
(b) Implementing Agency or Agencies Performance Ratings: Satisfactory
69. MINALOC implementation in the areas of policy formulation and oversight and LODA’s in the implementation of SP policy have both provided strong and effective support to the SPS’ implementation. With continued support from donor partners over the years, both institutions have worked effectively with external assistance to become more effective institutions, increasingly capable of discharging their assigned functions independently. The systems and processes put in place throughout the VUP rollout (for example, the iSP‐MIS, the Appeals Mechanism), improved budget execution and reporting procedures, and collaboration with other government entities (for example, National Institute of Statistics and others) have all served to cement both of these institutions as fundamental pillars in Rwanda’s well‐functioning SPS.
(c) Justification of Rating for Overall Borrower Performance Ratings: Satisfactory
70. Overall borrower performance was demonstrated through continued government leadership and commitment to the sector and the SPS program, displayed in medium‐ and long‐term programs for the sector and in mainstreaming the reforms supported by the SPS DPOs into the Government’s broader SP agenda. Satisfactory borrower performance was also demonstrated in the way the agreed policy actions

The World Bank (P131558)
27
were implemented and their relevance was maintained and, in its commitment, to monitor and evaluate the program continuously.
6. LESSONS LEARNED 71. Many Lessons were learned from the SPS DPO series implementation over a period of close to 10 years. The selected ones, which are deemed most relevant at this stage of SP in Rwanda, are summarized in the following paragraphs.
72. A commitment to a national vision, goals, and targets with a strong accountability mechanism remains the overarching and important factor that has shaped the evolution of Rwanda’s social safety net system. It remains one of the most important lessons as documented in the previous two ICRs for the first and second DPO series. The GoR’s sustained policy and financial commitment to social protection has been supported by the World Bank’s continued presence in the sector for over a decade now and strong alignment with a core set of development partners. This factor has meant that the Government and development partners have maximized their various competitive advantages in converging at sustaining growth in the sector. Government‐led policies to guide sector investments have been developed and updated every three to five years and new or revised policies systemically draw on lessons from implementation. This commitment and assurance at the political and leadership levels has enabled steady expansion in the flagship program and its growth in terms of depth and breadth such that the VUP has not only expanded in coverage by household and geography, but it has also evolved in terms of the nature of interventions.
73. Accountability and transparency are important for the quality of continued sector growth and although related lessons from SPS implementation have informed SSPP design, implementation of accountability and transparency interventions need to be fast tracked so that their role as a right to the beneficiaries and a broader accountability mechanism are both promoted and their contribution to program objectives ascertained. Accountability and transparency were initially reflected in implementation of an appeals and complaints mechanism under the SSPS and later expanded to cover budget transparency. Drawing on Rwanda’s excellent home‐grown initiatives, this area is being expanded to enable introduction of broader accountability initiatives such as social accountability and citizen engagement tools that would be implemented systematically to generate complementary evaluation information from the demand side. Implementation of these tools will ensure that beneficiaries’ and other stakeholders’ perceptions are mainstreamed into project planning and implementation and that their participation in decision making helps ensure the project truly reflects needs of their development challenges.
74. Service delivery tools continue to be foundational elements of an SPS, and although the evolution in Rwanda’s SP systems has made headway, there are opportunities to make more advancement to bring in more efficiency gains. There is thus a need for continual support and strengthening of the delivery tools and systems given the pace of technological change and the evolution of SP sector. For example, digital payments; more efficient functionality of the grievances redress mechanism; introduction of citizen and community score cards at the start, middle, and end of the program; and enhancing of interoperability of different programs’ MISs are areas that are slated for more improvements. These, once fully achieved, have potential to bring in more efficiency benefits to the VUP and its sister SP programs.

The World Bank (P131558)
28
75. Earlier efforts to link social protection and disaster risk management need to be revived and operationalized given recent experiences with droughts and their impacts on the poor and vulnerable with possibility to reverse the other positive impacts of development programs. Under the SSPS, policy actions for introducing systemic links between social protection and disaster risk management were introduced and policy guidelines developed and adopted, which if implemented meticulously would enable the SP system to scale up in periods of disasters. Droughts experienced during the SPS period are attributed to the inefficient poverty impacts among other factors. Although the Ministry for Emergency Management is well mandated to respond to shocks and does a good job overall, operational links between SP response and disaster risk management would enable realization of synergies that can result in better impacts among the poor and vulnerable. Moving forward, more deliberate efforts to make this policy more operationally functional will make the SP system more adaptive and thus able to address the needs of the poor segments among Rwandans both in stable and shock‐prone periods.
76. Transitioning from the DPO to IPF after three series of DPOs spanning about 10 years came timely, and the IPF is playing a critical role in capacity building to take implementation to another level. The programmatic nature of the DPO series (and the sequence of DPOs in support of Rwanda’s social protection sector) allowed for the flexibility needed to constantly refine, adjust and adapt the program to implementation experience, and newly identified priorities and challenges, like what would be achieved through a project restructuring for an investment lending instrument. But, with the DPOs, intensive specific capacity building at the delivery levels was not addressed specifically given that there would not be adequate earmarked funds to serve the purpose. This issue is being better addressed with the IPF more flexibly. An institutional capacity assessment was undertaken as part of the project design, and specific needs‐based capacity‐building activities are integrated into the project implementation plans, an arrangement that allows continuous capacity building based on specific needs. The IPF will thus help provide resources for building capacities and delivery systems at the points of service delivery, complementing earlier efforts by the DPOs to build broad policy and implementation capacity. But Rwanda is currently addressing several other multisectoral challenges requiring multisectoral reform agendas, for example spanning human development, human capital, stunting et al. For these new initiatives to become entrenched at the policy and implementation levels, convergence at both levels will be needed which may call for multisectoral interventions at both levels.
77. Maintaining a healthy coordination mechanism is a cornerstone to the growth of the SP sector. Implementation of the SPS series benefited from a relatively well‐functioning coordination mechanisms within the SP sector. Specifically, the SPSWG and Technical Working Groups provided convenient platforms to discuss envisaged reforms in the sector and to review the sector both forward and backward looking to subsequently inform the implementation. Also, the donor coordination mechanism facilitated by LODA as the implementation agency improved transparency, data sharing, and trust among key partners in the sector, which helped avoid duplications and hence achieve efficient use of resources. In addition, the coordination mechanism has served as an important platform for knowledge sharing and often for determining needs for technical assistance as well as mobilizing such assistance from partners with ease.
78. Program design and staff capacity are critical investments. Various assessments under the DPO series had pointed to the importance of both program design and institutional capacity. MINALOC and LODA have played central roles in the establishment and implementation of the SP sector but will need to continue to invest in reviewing design elements based on evidence from implementation and programs performance, as well as invest heavily in staffing and capacity building, especially given growing

The World Bank (P131558)
29
decentralization. Lessons point to the importance of improving program design before expansion, as well as proper staff capacity to implement large‐scale programs.
7. COMMENTS ON ISSUES RAISED BY BORROWER/IMPLEMENTING AGENCIES/PARTNERS
(a) Borrower/Implementing agencies
79. The draft of the ICR was shared with the GoR key institutions namely: the Ministry of Finance, Ministry of Local Government and Local Administrative Entities Development Agency. The government counterparts submitted written feedback which was overall in concurrence with the ICR in substance and form. The main comments provided and how they have been addressed in the ICR are summarized below:
a. Ensuring accuracy of references to government policies and strategies. The SPS DPO series spanned several updates and changes in government policy and strategies some of which were related to the policy and institutional actions. Correct references have been reflected in this final version of the ICR based on government feedback.
b. Changes that are significant which happened during SPS implementation. The changes relate to introduction of expanded public works and minimum package for graduation both of which were introduced during implementation of SPS to facilitate eligible mothers with caring responsibilities to participate in PW and contribute to accelerating reduction of extreme poverty respectively. These have been reflected in section 1.6 of this ICR.
(b) Cofinanciers
Not Applicable
(c) Other partners and stakeholders
Not Applicable

The World Bank (P131558)
30
ANNEX 1: BANK LENDING AND IMPLEMENTATION SUPPORT/SUPERVISION PROCESSES
(a) Task Team members
Names Title Unit Responsibility/
Specialty
Laura Rawlings Lead Social Protection Specialist
GSP01 Task Team Leader
Enagnon Ernest Eric Adda
Senior Financial Management Specialist
GGOAE Team member
Denise Brain Program Assistant GSP01 Team Member
Tom Bundervot Senior Economist GPV01 Team member
Kevin Carey Practice Manager GMTM1 Team member
Yoichiro Ishihara Senior Economist SACBT Team member
Leif Jensen Senior Economist GMTA3 Team member
Maiada Mahmoud Abdel Fattah Kassem
Finance Officer WFACS Team member
Marjorie Mpundu Senior Operations Officer AFRVP Team Member
Stephen Mukaindo Counsel Team member
Dimitrie Mukanyiligira Program Assistant AFMRW Team member
Michael Munavu Senior Social Protection Specialist
GSP01 Team member
Toru Nishiuchi Economist OPSCE Team member

The World Bank (P131558)
31
Team member
Maria laura Sanchez‐Puerta
Program Leader MNCO3 Team member
James Tumwine Human Development Specialist
GSP01 Team member
Briana Wilson Senior Social Protection Specialist
GSP03 Team Member
Colin Andrews Senior Social Protection Specialist
GSP01 Team member
Aline Coudouel Lead Economist GSP06 Team member
Veronica Silva Villalobos Senior Social Protection Specialist
GSP04 Team member
Joseph Atick Consultant GDD12 Team member
Faly Dialo Finance Officer WFACS Team member
Winston Percy Onipede Cole
Lead Financial Management Specialist
GGOES Team member
Yoseph Deresa Senior Social Protection Specialist
GSP01 Team Member
Peter Isabirye Senior Operations Officer AFCE2 Team member
Valence Kimenyi Economist Team member
Jane Wangui Kiringai Consultant Team member
Annika Kjellgren, Consultant GSP01 Team member
Toni Koleva Senior Operations Officer GSP01 Team member
Lilian Brenda Namutebi Financial Management Specialist
Team member

The World Bank (P131558)
32
Chem Mete Practice Manager GSP03 Team Member
Iffath Sharif Practice Manager GSP08 Team member
Mulugeta Dinka Senior Procurement Specialist
GGOPA Team Member
(b) Staff Time and Cost
Stage of Project Cycle
Staff Time and Cost (Bank Budget Only)
No. of staff weeks USD Thousands (including travel and
consultant costs)
Lending FY17
Total: 46.78 130,923.22
Supervision/ICR FY17
Total: 29.47 167,724.84

The World Bank (P131558)
33
ANNEX 2: SUMMARY OF PROGRAM AND BENEFICIARY SURVEY RESULTS
Introduction
1. Over the period of the implementation of the Social Protection Strategy (2013–2018), significant achievements have been realized in the SP sector. Indeed, considerable effort has been invested in generating a robust evidence base on poverty, vulnerability, resilience, and nutrition that has informed policy development. Anecdotal evidences suggest that the VUP, one of the main SP programs in Rwanda, helps stabilize assets, incomes, and capabilities in the face of a wide range of life‐cycle, economic, and environmental shocks, thereby enabling households to take economic risks, make investments, and accumulate wealth in form of assets over time. The VUP is therefore instrumental in improving household resilience and self‐reliance among lower‐income households in particular. This annex presents excerpts from efforts made during the period of implementation of the SPS DPL to make advances in building improved evidence through the EICV and VUP Mixed Methods Impact Evaluation for the sector and partly for the VUP.
Summary Evidence of the VUP’s Contribution to Poverty and Extreme Poverty Reduction
2. The report of the recent concluded EICV5 (NISR 2017) indicated that poverty and extreme poverty reduced very slightly between 2013/14 and 2016/17 from 39.1 percent to 38.2 percent and 16.3 percent to 16.0 percent, respectively. This slow growth was largely attributed to shocks experienced in 2016/17.
3. To better understand VUP contribution to changes in household welfare, a VUP Panel Survey was included in EICV5 to provide reliable estimates on changes in living conditions of VUP beneficiaries between EICV4 and EICV5. Indeed, the EICV4 Poverty Trends Report (2014) and EICV5 (2017) show that poverty has declined at a much slower rate in urban areas than in rural areas since 2010/11, suggesting a growing need for SP interventions to respond effectively to urban poverty.
4. Further analysis of the poverty report indicates that DS beneficiaries are mostly female headed households (FHHs) (70 percent) and citizens over 60 years old (83.7 percent) or household heads with a visible disability (48.6%).
5. In terms of households’ exposure to shocks, the report indicates that FHHs are more vulnerable to shocks than those headed by men. About 17 percent of households headed by females were in the lowest quintile compared to 16 percent of those headed by males.
6. Overall, the EICV5 social protection and VUP thematic report indicates mixed results in terms of VUP contribution to improvement in household living conditions and should therefore be interpreted with caution. For example, improvement in household living conditions was most felt by DS beneficiaries compared to the PW beneficiaries.
7. Data from EICV4 also suggest that targeting of the poorest by VUP Classic PW has been rather challenging with only 35 percent of VUP PW beneficiaries being from poorest two quantiles (World Bank 2017). This implies exclusion of extremely poor labor‐constrained households (particularly FHHs) from VUP PW.

The World Bank (P131558)
34
8. Besides the abovementioned challenge, the EICV5 report indicated delayed payment as a cause for concern where over 58.1 percent of DS and 73.3 percent of PW beneficiaries’ payments were delayed with respect to high level norms that the program has committed to regarding timely payments.
9. In‐depth analysis of these challenges should be carried out to ascertain the implications of PW and delayed payment and assess their impact on poverty and extreme poverty reduction to better inform policy decisions.
10. This evidence generated from EICV4 (2014) and EICV5 (2017) on the VUP and its impact on poverty and extreme poverty reduction is also confirmed by the VUP Mixed Methods Impact Evaluation conducted by DFID (2018) and World Bank (2015).
11. The VUP Mixed Methods report (DFID 2018) indicates that the VUP is having a positive impact on the well‐being of households, with many respondents feeling they can now ‘survive’, with positive trends for DS beneficiary households where consumption levels increased by 14 percent and poverty reduced by 9.7 percent. In fact, the report indicated that the increase in consumption for DS household beneficiaries was very large and statistically significant with intake of higher‐quality food items including protein, dairy, vegetables, fruits, and legumes.
12. The results also show increase in investments in income‐generating assets or activities such as buying small livestock and hiring others to cultivate their plots, and beneficiaries were able to accumulate small assets and savings. In terms of household resilience to shocks, the VUP had a small contribution to large‐scale shocks (weather‐related shocks, health‐related shocks) and beneficiaries responded by spending their income on buying seeds, small repairs to houses, minor medical and related expenditure, implying that income from the VUP was used for “immediate” response to shocks rather than building resilience for the future. However, response to shocks was also influenced by the timeliness of payments and timing of PW though ePW and DS payments are available throughout the year.
13. The key challenges highlighted by the evaluation are household composition, individual characteristics associated with limiting program outcomes include single‐headed households (often elderly and/or women) and households with a higher number of dependents, elderly, and disabled. These factors affect ability to work, as well as household expenditure (for example, food, health, education, and related expenses, or expenses associated with disability or ill health) and the time available to manage the household and care work and income‐generating activities.
14. The report further indicates that the value of VUP transfers in relation to purchasing power and living costs was widely considered ‘not enough’, which limits investment in assets and so on, especially for people with disability. In addition, the evaluation indicates that the nature and type of work was a challenge for ePW beneficiaries such that the length of time taken to get to the worksite, especially for the single‐headed households—most often women—with dependents, given their other household and caring responsibilities, and the unpredictability of payment made some households prefer daily wage work to VUP PW, even though the former is lower paid.
15. The anecdote evidence presented above is consistent with the evaluation findings of the Mixed Method Study (World Bank 2015) on the welfare trajectories of VUP beneficiaries. According to Renate et al. (September 2015), the respondents who had benefited from a longer period of financial support from

The World Bank (P131558)
35
the VUP were able to use the money for improvement of their material well‐being such as building houses, buying land, buying cattle, investing in small businesses, and planning better for their future.
16. Households benefitting for only a short period had often spent their funds on immediate needs such as food, clothes, school fees, and housing repairs and improvements and did not have additional funds to invest in assets or income‐generating activities. Particularly in the case of PW beneficiaries, the short‐term nature of works and participation, in combination with delayed or outstanding payments, kept many respondents from improving their material well‐being. Similarly, for DS beneficiaries, respondents who had benefited from the support for a longer period had made greater improvements than those who had only been enrolled for a short time. For DS households characterized by their limited labor supply, the VUP provided an important ongoing source of protection, even when they had been successful in improving the household asset base.
Conclusion and Recommendations
17. The evidences generated from these evaluations and studies show that the VUP can make contribution toward improvements in living conditions of the poor especially through accumulation of assets both at household and community levels and therefore helping the poor the build more resilience with possibility for more impacts in the long run. The evidence generated indicates that the VUP’s impacts on households’ standards of living are high for households who have been on the program for a longer time than those benefiting on short periods of time. Being on the program for a longer period enabled households to plan and invest their incomes in productive assets. Evidence also suggests that the VUP program has been instrumental in households’ response to shocks, especially health shocks.
18. However, the evidence points to aspects of program implementation that require in‐depth analysis to understand how these constrainers affect VUP contribution to poverty and extreme poverty reduction. In addition, evidence indicates that households’ resilience to shocks is low, especially for FHHs.
Improvements in the timeliness and predictability of payment. Timeliness of payments is indicated as an overarching challenge in VUP implementation and its implication on poverty reduction resonates across all the studies and findings. It is imperative that mechanisms to ensure timely disbursement and delivery of funds are put in place so that beneficiaries are able to plan and budget for their incomes.
The length of time in the VUP is an important factor, with longer exposure improving outcomes. For improvement of material well‐being and possible graduation from poverty to take place, households appear to require support over a longer period to allow them to move from covering their immediate needs to making longer‐term investments and enabling them to build more effective resilience to shocks.
The household composition. Single‐ and female‐headed households appeared more vulnerable along a number of dimensions such as participation in ePW, in part due to their labor mobility, which is limited by their caregiving responsibilities.
Rural versus urban context. The EICV5 report revealed that the VUP is more concentrated in rural areas compared to urban areas, which implies that the VUP has less impact on urban

The World Bank (P131558)
36
poverty, which calls for greater focus in terms of improving targeting policies and instruments for the VUP to address urban poverty.
Increase of poverty in PW‐participating households. In‐depth analysis should be carried out to ascertain the implications of PW and its contribution to poverty and extreme poverty reduction to better inform policy decisions.
Low coverage. Low coverage of the VUP underestimates the VUP contribution to poverty reduction at a national scale, as well as low coverage in urban areas.
Targeting. Evidence shows that there are still areas of improvement around targeting with much emphasis placed on intra‐household poverty dynamics, household vulnerabilities, and shocks.

The World Bank (P131558)
37
ANNEX 3: POLICY MATRIX FOR THE SPS DPL OPERATIONS
Prior Actions and Triggers Results (Baseline June 2013, Target
June 2018) Prior Actions under SPS‐1 (completed)
Policy Actions under SPS‐2 (completed)
Policy Actions under SPS‐3 (completed)
Pillar 1: Efficiency of the Social Protection System Efficiency improved through reformed Ubudehe system and database, improved iSP‐MIS, and increased harmonization across social protection programs
1. MINALOC to adopt roadmap for updating of the Ubudehe national household poverty database
1. LODA to sign an MOU with National ID Agency (NIDA) including technical specifications for interface between Ubudehe and NIDA databases
1. LODA to ensure that the updated Ubudehe national household poverty database is operational, including a fully functional interface with the NIDA
database9 (Edited)
(i) % of individuals over 16 in the Ubudehe database matched to a national ID (baseline: 25%; end target: 60%)
Source: Analysis of the Ubudehe database (ii) Number of core SP programs linked to the iSP‐MIS.10 (baseline: 0; end target:2)
2. Short‐, medium‐, and long‐term MIS objectives approved by the MINALOC convened MIS Technical Committee
2. MINALOC to finalize, validate, and adopt MIS technical system specifications and costed roadmap
2. MINALOC to (i) establish structure of the National Social Protection Registry (NSPR); (ii) design a web‐based graphical user interface for communication across programs; and (iii) develop protocols on staffing, and roles and responsibilities for
use and maintenance of the iSP‐MIS 11
(Edited)
9 This policy action was edited slightly from the SPS‐1 matrix, from “MINALOC to ensure that the interface between the Ubudehe and NIDA databases is fully functional” to recognize that the Ubudehe poverty database has been fully updated and is operational, including the interface with the NIDA national ID database. 10 The four core SP programs (VUP, FARG, RDRC, and MINALOC Decentralized) are described in section 3. This indicator has been updated from “Number of MIS modules developed” to more accurately reflect how the iSP‐MIS will function: some new modules will be developed but some will also be simply upgraded to communicate with the new iSP‐MIS. The more important result is the ability of the system to function through linking programs. The target remains the same. 11 This policy action was edited slightly from the SPS‐1 matrix, from “MINALOC to develop priority MIS modules and issue protocols on roles and responsibilities for use and maintenance of the MIS” to better reflect the evolution of the MIS. The priority modules language was clarified to mean core SP programs and included as a results indicator, following OPCS guidance.

The World Bank (P131558)
38
Prior Actions and Triggers Results (Baseline June 2013, Target
June 2018) Prior Actions under SPS‐1 (completed)
Policy Actions under SPS‐2 (completed)
Policy Actions under SPS‐3 (completed)
3. MINALOC to issue policy guidelines to decentralized entities as to which benefit to allocate to households eligible for more than one social protection program, with no duplicate benefit from FARG and VUP DS
3. MINALOC to develop and adopt policy guidelines for a minimum package to support graduation, including harmonizing income‐generating activities across selected SP programs
3. MINALOC to implement a pilot of the minimum package for graduation in 30 sectors, including harmonizing income‐generating activities across selected SP
programs12 (Edited)
Source: iSP‐MIS Technical Committee (iii) % of targeted local government staff trained on SP program eligibility (baseline: 0; end target: 70%)
Source: MINALOC
Pillar 2: Accountability and Transparency Accountability and transparency enhanced through improved SP budget reporting and dissemination and strengthened citizens' engagement
4. MINECOFIN to produce consolidated Social Protection budget identifying the social protection programs
4. MINALOC and MINECOFIN to document, publish and discuss the SP consolidated budget allocation and execution through primary dissemination channels
(iv) % of districts reviewing SP budget during accountability day events (per year) (baseline: 0; end target: 60%)
Source: Reporting from the Districts
(v) % of primary appeals that have been resolved at first instance at sector levels within two weeks in VUP Sectors (baseline: 80%; end target: >80%)
Source: LODA VUP routine monitoring
5. Cabinet to approve revised structure for expanded staffing at district and sector local government levels
5. MINALOC to develop and implement a curriculum for targeted district and sector local government staff to strengthen citizens’ engagement in the delivery of social protection programs
4. MINALOC to implement and monitor a citizen appeals and complaints system, including web‐based and SMS platforms
12 This policy action was edited slightly from the SPS‐1 matrix, from” MINALOC to implement policy guidelines for harmonizing income‐generating activities across selected SP programs” to provide specificity on how the policy action was being implemented.

The World Bank (P131558)
39
Prior Actions and Triggers Results (Baseline June 2013, Target
June 2018) Prior Actions under SPS‐1 (completed)
Policy Actions under SPS‐2 (completed)
Policy Actions under SPS‐3 (completed)
Pillar 3: Coverage of Poor and Vulnerable VUP coverage expanded with attention to appropriate design, notably poverty and child‐sensitive elements
6. MINALOC and MINECOFIN to approve plan and budget for expansion of VUP in FY15
6. MINALOC and MINECOFIN to approve plan and budget for expansion of VUP in FY16
5. MINALOC and MINECOFIN to approve plan and budget for expansion of VUP in FY17
(vi) % of geographical sectors covered by VUP in the poorest 30% of districts: for (a) Direct Support; and (b)
Public Works13 (a) DS baseline: 54%; end target: 86% (b) PW baseline: 42%; end target: 80%
Source: LODA VUP routine monitoring
(vii) VUP coverage by geographical sector and households for (a) Direct
7. MINALOC to adopt procedures to enhance community participation in Ubudehe household classification process and launch testing of poverty scorecard
6. MINALOC to approve the revised VUP
program15 (New)
8. MINALOC to conduct policy study and identify policy options for improving gender and child sensitivity of SP programs
7. MINALOC to adopt plan for selected option(s) for improved gender and child sensitivity of SP programs
7. Cabinet to approve National Early Childhood Development (ECD) policy
(Revised)16
13 Districts are ranked according to a poverty index and the VUP is prioritizing program expansion in the poorest districts. 15 Please see discussion in section IV regarding this new policy action 16 This policy action was introduced as a substitute for the SPS‐1 prior action “MINALOC to incorporate plan and budget for expansion in FY17 of gender and child sensitive SP programs” to have a strong policy action with Cabinet approval within the policy matrix, in line with the focus of the DPO instrument. In addition, Policy Actions 5 and 6 incorporate the substance of the earlier SPS‐1 text for this policy action.

The World Bank (P131558)
40
Prior Actions and Triggers Results (Baseline June 2013, Target
June 2018) Prior Actions under SPS‐1 (completed)
Policy Actions under SPS‐2 (completed)
Policy Actions under SPS‐3 (completed)
Support and (b) Public
Works14 Direct Support (i) Sectors ‐ baseline: 180 sectors; end target: 395 sectors; (ii) households ‐ baseline: 43,671 households; % Female Headed Households (FHH): 66%; end target: 90,000 households; FHH: 66% Public Works (i) Sectors ‐ baseline: 150 sectors; end target: 240 sectors; (ii) households ‐ baseline: 89,011 households; % FHH: 46%; end target: 130,000 households; % FHH: 48%;
Source: LODA VUP routine monitoring
14 There are 416 sectors in Rwanda. All baselines for SPS‐2 use June 2013 data, but in SPS‐1 indicator (vii) used June 2014 data.

The World Bank (P131558)
41
ANNEX 4: STAKEHOLDER WORKSHOP REPORT AND RESULTS
WORKSHOP FOR THE ICR OF THE SPS DPO Series
Introduction
1. A workshop was jointly convened by the World Bank and the Government of Rwanda (GoR) to deliberate on completion and results from implementation of the reform program that was supported by the SPS DPO from 2014 to 2018. The Workshop was held at the World Bank, Rwanda Country Office on February 11, 2019 from 10:00am to 1:00pm.
2. The SPS DPO constituted three operations (SPS‐1, SPS‐2, and SPS‐3) with a total funding envelope of US$260 million. All the funds were disbursed within the same approval financial year. Table 4.1 provides a snapshot of key information about the three operations that constituted the SPS DPL.
Table 4.1. Key Information about the SPS DPL
No. DPL in Series Project
Identification Number
Approval Date
Closing Date
Amount of Funding (SDR)
Amount of Funding (US$)
1 First SPS DPO P151279 January 22, 2015
March 31, 2016
47,900,000 US$70,000,000
2 Second SPS DPO P155024 December 1, 2015
September 30, 2016
67,700,000 US$95,000,000
3 Third SPS DPO P158698 October 31, 2016
December 31, 2017
68,200,000 US$95,000,000
Total Funding 183,800,000 US$260,000,000
Source: Program Documents, World Bank (2015, 2016); World Bank Portal (2019).
3. The workshop brought together GoR officials from MINALOC, MINECOFIN, and LODA, as well as development partners, including the World Bank team (annex 1 provides the list of participants).
4. Alex Kamurase, the ICR Team Leader and Senior Social Protection Specialist, made a presentation on behalf of the World Bank team highlighting key findings and emerging issues for discussion to finalize the ICR. The objective was to seek participants’ feedback in the form of inputs and comments as well as collect additional information from all partners to enhance the storyline on the achievements of the reform and their sustainability.
5. It was noted that the SPS DPL series followed a successful implementation of two other DPL series during 2009/10 and 2014/15, both of which were evaluated and their respective ICRs rated Satisfactory. It was also reiterated that the workshop presented an opportunity for the Government and stakeholders to provide inputs and contribute to the finalization of the ICR before a formal review meeting and submission to World Bank management by March 31, 2019. The section that follows provides the main highlights from the consultative workshop in terms of issues discussed and the feedback provided.

The World Bank (P131558)
42
Excerpts from Discussions
6. Policy and institutional actions. Noting that all prior actions during SPS‐1 and the subsequent policy actions implemented with the support of SPS‐2 and SPS‐3 under the three main pillars were achieved successfully and that successful completion of related policy and institutional actions was the basis for appraisal, presentation to the Board, and approval, the focus on this topic was more to ensure that participants were reminded of the reform agenda supported by the DPL, how it relates to the results expected, and the implications for the sector currently. Efforts were also made to remind participants of the backward‐looking reform evolution. The reform program supported by the SPS was found to be as relevant at appraisal as at completion, noting that the DPL support has helped advance the sector in the three pillars of support: (a) efficiency of the social protection system, (b) accountability and transparency, and (c) coverage of the poor and vulnerable.
7. Results indicators. The SPS DPL supported reforms in three main areas outlined in the preceding paragraph. The key results indicators across the three reform areas were presented and discussed and it was noted that most of the indicators were achieved or exceeded. Two of the indicators in Pillar 2 of the reform program, namely, accountability and transparency, nonetheless presented data gaps, that required additional work to update, aggregate, and determine the end of DPL actual achievements. Government counterparts assured that they would update data values as soon as possible and submit them in two weeks from the time of the workshop. The main indicators on which additional data are required are (a) % of districts reviewing SP budget during accountability day events (per year) and (b) % of primary appeals that have been resolved at first instance at sector levels within two weeks in VUP sectors. An updated populated Results Framework was also developed during the mission and will be completed once data values on the two indicators are shared by the Government.
8. For the indicator “% districts reviewing SP budget during accountability day events (per year),” it was discussed that information would be sourced from public accountability day reports and agendas to ascertain whether during budget discussions at the district level, the SP budget was presented and discussed and in how many districts under each DPL series. MINECOFIN committed to work with MINALOC and LODA to provide data by February 22, 2019.
9. Regarding the indicator “primary appeals that have been resolved at first instance at sector levels within two weeks in VUP Sectors,” the content and data sources were extensively discussed, and it was pointed out that this indicator has a significant bearing on the rating of the ICR and lack of data could compromise the ICR performance rating. It was noted that using the LODA MIS a lot of data are being collected per year on grievances management and the issue would be to only perform a backward review of grievances data and classify grievances management for the main VUP components. Excel sheets for the data used during 2012/13–2014/15 were shared with government counterparts. It was agreed that LODA would provide the data by February 22, 2019, to enable the completion of the ICR.
10. Key questions on which the team sought feedback. The following questions were presented to the participants to get their views and inputs as a better reflection of related information would help enhance the quality of the ICR. A summary of feedback on each of the questions is provided below the questions.

The World Bank (P131558)
43
(a) What is the effect of moving from a six‐category ranking system for Ubudehe socioeconomic classification to a four‐category ranking to the overall poverty reduction agenda? Is this already in effect? Are there any indicators to reflect the effect of change, if any?
The shift from six categories helped the Government in minimizing the risk of exclusion as the six categories were very broad and it was increasingly difficult to differentiate minor differences in social economic status, hence affecting category ranking.
The revision of categories from six to four also created more awareness about the appeals process and has allowed more investigation into household welfare assessment.
Lessons learned from the review of the Ubudehe categories from six to four have strengthened the upcoming Ubudehe review where both community and score card methodology will be used. For example, previous reviews revealed that some parameters such as education and community health insurance that were and are provided by Government to some households were not a true reflection of household welfare categorization.
It was highlighted that with the six categories, there was no IT system to facilitate and monitor households’ welfare and mobility; however, with the introduction of four categories and the establishment of the web‐based IT systems, it is easy to track household mobility from one district or sector to another as well as the welfare status in real time.
Another positive impact of moving from six to four categories was the changing of naming that stigmatized communities; however, with the four categories, it has now been corrected and categories have been assigned numbers, and this has addressed the issue of stigma caused by use of names in the past.
This new categorization is now facilitated by a strong MIS that contains information that can be retrieved from the household registry.
(b) The EICV5 outcomes have been released and there was marginal poverty reduction relative to the period under EICV4. Are there other evaluations that were conducted during the period of the SPS1, SPS2, and SPS3 from which we can draw to tell the story of the SPS DPL series impact? Particularly, did the changes to the PW program make them more gender and child friendly? Have the different options piloted under Pillar 3 (with different modification to PW) been evaluated or reviewed? Is there any data to substantiate how many women participated in the new programs offered? Is there any feedback from those that did participate in form of beneficiary assessment or otherwise?
In response to this question, the Government pointed out that there have been several studies, assessments, and evaluations that have been conducted on the VUP and that they will provide a link to access those studies. The ICR team will review the link for all the other evaluations and include a summary of the main ones that pertain to the VUP

The World Bank (P131558)
44
and social protection, particularly where they resonate with the reforms supported under the SPS DPL.
(c) What was the impact of the modifications in targeting under the VUP rollout plan from geographical targeting so that rather than adding one new sector in each district in each year, scale‐up is determined by poverty levels within a district based on EICV data? Are there any indicators to substantiate such changes?
The impact is that poorer households are better reached at scale than when geographical targeting was used. The use of EICV data to identify the poorest districts and use of Ubudehe data to identify which sectors had the most population in extreme poverty greatly improved poverty targeting.
Information about donor partner’s assistance, by donor, type of assistance, duration and areas of support, and any other useful information on donor partnership in social protection during FY2013/14, FY2014/15, FY2015/16, and FY2016/17? Donors shared insights about their support during the SPS DPL. The meeting agreed that it would be more efficient for the World Bank team to provide a template in which all donors could provide a summary of such information. A matrix was subsequently developed and furnished with the key donors. We anticipate that they will provide the information before the formal ICR review will be held or thereafter and if done, a summary table will be included in annex or integrated in this workshop report.
(d) Is there any early indication of the effect of the pilot in rolling out the minimum package for graduation (MPG) in 30 sectors? Has this pilot been evaluated and what are the plans for rolling it out?
Since the start of the pilot of the MPG in 30 sectors in 2016/17, some lessons have been learned and the following were the responses from the participants:
The implementation of MPG informed the households profiling exercise, which has currently been done for all households in Ubudehe Category 1 and plans are under way to conduct it to households in Ubudehe Categories 2 and 3. The data collected from profiling have enhanced the planning and budgeting process.
The piloting of the livestock as an asset transfer during the start of implementation of the MPG has provided lessons on how asset transfers require cross‐sectoral coordination such as LODA working with MINAGRI in defining the specifications of the livestock to be purchased but also putting in place a full package such as up‐front training, livestock medicine, and strong monitoring
The implementation of the MPG has led to the elaboration of the draft graduation strategy, which has resulted in the development of the multisectoral action plans and strengthened coordination in addressing extreme poverty through a multisectoral approach.

The World Bank (P131558)
45
(e) What would be the overall views on SP sector reforms? Are more reforms needed? Have those been implemented
The sectoral reforms have allowed more engagement and dialogue between civil society organizations and the Government and enhanced accountability mechanisms.
The reforms should ensure that programs and projects that are designed are more results oriented.
The reforms should start addressing different vulnerabilities and intra‐household dynamics as well understanding the needs of the communities through citizen engagement, rather than solely relying on Ubudehe targeting as some households in higher categories sometimes experience similar challenges as those in Category 1 but are excluded from the programs.
Conclusions and Recommendations
11. After all the discussions and the deliberation of the workshop, the following key next steps were presented to ensure that the critical timelines to get information are adhered to.
Regarding the reporting the iSP‐MIS, it was concluded that the report shall capture the developments that LODA monitoring and evaluation information system (MEIS) has achieved as it already captures data on most of the core SP programs such as the RDRC and FARG. This was because LODA MEIS is already connected to the FARG and RDRC, which was also part of the design of the iSP‐MIS.
Since LODA MEIS is able to retrieve data from other systems, MINALOC shall assess the systems requirements for it to play its oversight role and mandate and agencies to develop a dashboard. It was recommended that the Government will discuss how it would like to move the iSP‐MIS agenda forward based on the LODA MEIS development.
Next Steps
Complete populating of key results and complementary indicators by Friday February 22, 2019.
The Government to provide its assessment of the ICR by March 15, 2019, which will be annex 4 to the main report.
A report on the summary of stakeholders’ workshop will be produced by the ICR mission team by February 22, 2019, which shall form annex 3 to the main ICR.
Finalization of the ICR, formal review meeting, and submission to the World Bank management by March 21, 2019.

The World Bank (P131558)
46
Table 4.2. List of Participants at the SPS DPO series ICR Workshop
No. Name Title Institution and Department
1 Godfrey KAYIGANA Social Protection Specialist MINALOC ‐ Community Development and Social Affairs
2 Olivier RUHAMYAMBUGA
Corporate Planning Specialist MINALOC ‐ Planning, M&E
3 Zachee IYAMUREMYE Director, Budget Policy Formulation and Reforms
MINECOFIN ‐ National Budget
4 Maletela Tuoane Nkhasi
Sr. Health Specialist Global Financing Facility/World Bank
5 Iftikhar Malik Sr. Social Protection Specialist and Task Team Leader
World Bank
6 Germain GATABAZI IT MIS Specialist LODA‐SPIU
7 Jean Claude MUGABO ICT Specialist MINALOC‐ICT
8 Gerald MUGABE External Finance Specialist MINECOFIN ‐ External Finance Division
9 Hugo Brousset Social Protection Specialist World Bank
10 Silas UDAHEMUKA Human Development Specialist World Bank
11 Vincent GAHAMANYI Social Protection Specialist UNICEF
12 Eugene UWIMANA M&E, Learning Specialist LODA‐SPIU
13 Esperance UWICYEZA SSPP Coordinator LODA‐SPIU
14 Justine Gatsinzi Division Manager LODA ‐ Social Protection Division
15 Saidi Sibomana Division Manager, LODA‐LDPP and M&E
16 Alex Kamurase Sr. Social Protection Specialist and ICR Task Team Leader
World Bank
17 Crispus Ayebare Consultant World Bank

The World Bank (P131558)
47
ANNEX 5: FINAL RESULTS FRAMEWORK
Pillars/Indicators Baseline FY2013/14
End FY2014/15
End FY2015/16
End FY2016/17
End FY2017/18
Pillar 1: Efficiency of the Social Protection System Efficiency improved through reformed Ubudehe system and database, improved iSP‐MIS, and increased harmonization across social protection programs
(i) % of individuals over 16 in the Ubudehe database matched to a national ID (baseline: 25%; end target: 60%) Source: Analysis of the Ubudehe database
25 52 63 82 90
(ii) Number of core SP programs linked to the iSP‐MIS. (baseline: 0; end target:2) Source: iSP‐MIS Technical Committee
0 0 0 2 2
(iii) % of targeted local government staff trained on SP program eligibility (baseline: 0; end target: 70%) Source: MINALOC and LODA
0 2,157 (100%) 4,430 (100%) 1,466/1,496 (97.9%)
2,253/2,283 (98.6%)
Pillar 2: Accountability and Transparency Accountability and transparency enhanced through improved SP budget reporting and dissemination and strengthened citizens' engagement
(iv) % of districts reviewing SP budget during accountability day events (per year) (baseline: 0; end target: 60%) Source: Reporting from the Districts
0 50 60 70 85
(v) % of primary appeals that have been resolved at first instance at sector levels within two weeks in VUP Sectors (baseline: 80% end target: >80%) Source: LODA/VUP routine monitoring
80 95 95 95 84

The World Bank (P131558)
48
Pillars/Indicators Baseline FY2013/14
End FY2014/15
End FY2015/16
End FY2016/17
End FY2017/18
Pillar 3: Coverage of Poor and Vulnerable VUP coverage expanded with attention to appropriate design, notably poverty and child‐sensitive elements
(vi) % of geographical sectors covered by VUP in the poorest 30% of districts:17 for (a) Direct Support; and (b) Public Works18 (a) DS baseline: 54%; end target: 95% (b) PW baseline: 42%; end target: 80% Source: LODA VUP routine monitoring
DS: 54 PW: 42
DS: 79 PW: 53.7
DS: 100 PW: 59.7
DS: 100 PW: 66
DS: 100 PW: 66
(vii) VUP coverage by geographical sector and households for (a) Direct Support and (b) Public Works
Direct Support (i) Sectors ‐ baseline: 180 sectors; end target: 395 sectors; (ii) households ‐ baseline: 43,671 households; % Female Headed Households (FHH): 66%; end target: 96,000 households; FHH: 66%
DS: 180 HH: 43,671 (FHH: 66%)
DS: 330 HH: 84,354 (FHH:54.5%)
DS: 416 HH: 85,899 (FHH: 67.7%)
DS: 416 HH: 96,078 (FHH: 71.2%)
DS: 416 HH: 94,912 (FHH: 68.9%)
Public Works (i) Sectors ‐ baseline: 150 sectors; end target: 240 sectors; (ii) households ‐ baseline: 89,011 households; % FHH: 46%; end target: 130,000 households; % FHH: 48% Source: LODA VUP routine monitoring
PW: 150 HH: 89,011 (FHH: 46%)
PW: 180 HH: 111,923 (FHH: 47.4%)
PW: 210 HHs: 103,584 (FHH 49.9%)
PW: 240 HH: 128,656 (FHH: 52.7%)
PW: 244 HH: 134,993 (FHH: 50.7%)
17 Poorest 30 percent districts as of 2013/14 were Bugesera, Nyamagabe, Gisagara, Nyaruguru, Karongi, Ngororero, Nyamasheke, Gicumbi, Gakenke, and Ruhango, composed of 149 sectors. 18 Between FY2014/15 and FY2015/16, PW scale‐up plan was scaling up one poorest sector in each district; however, the VUP targeting policy changed and targeting was based on the poorest sectors and households based on Ubudehe data at the sector level. It should also be noted that in FY2015/16, districts withdrew PW from first cohort sectors.

The World Bank (P131558)
49
ANNEX 6: SUMMARY OF BORROWER'S ICR AND/OR COMMENTS ON DRAFT ICR
Chapter 1: Background The Government of Rwanda has implemented Social Protection strategies and polices as embedded in the Economic Development and Poverty Reduction Strategies (EDPRS) I&II. The second generation EDPRS II (2013-2018) re-confirmed the importance of social protection to the socio-economic development and placed it under the Rural Development thematic pillar of EDPRS II; and the associated National Social Protection Strategy (2013-2018) delivered a significant expansion of coverage and effectiveness. Over this period, the social protection sector made critical contributions to the delivery of key national development targets (e.g. reducing extreme poverty and inequality) as well as contribution to the commitments under the Millennium Development Goals. In particular, the Social Protection Systems 3, which was implemented during the course of EDPRS II contributed towards the government ambitious agenda of scaling up and strengthening the effectiveness of SP programs, including VUP. During the period of 2015 to 2017, building on the achievements of the previous years, sustained growth was registered, even though, poverty and extreme poverty declined slowly compared to the period between 2011-2014. Though this growth was registered at national level and sector level contribution was instrumental in contributing to the overall growth targets. According to EICV5, poverty and extreme poverty reduced from 39.1% to 38.2% and from 16.3% to 16% respectively (NISR,2017). Even though the rate of reduction looks to be insignificant, living conditions of the poor households improved. According to EICV5 report, the social protections contribution and specifically VUP, the report indicated that VUP reached 4% of the households in Rwanda. Of this coverage, VUP public works covered 1.9% of the households, Direct support 1.3% and financial services 1.1% (EICV5). This coverage is based on the targeting policy of VUP where extremely poor households are identified based on district poverty ranking and Ubudehe data is used to select the poorest sectors and households at sector level. Accordingly, 5.3% coverage of the case load is in rural areas against 0.3% coverage of households in urban areas. This may imply that poverty or for that case extreme poverty is more concentrated in rural areas, partly due to using ubudehe data as a proxy for extreme poverty.
Chapter 2: Assessment of Progress 2.1. Pillar #1: Efficiency of the Social Protection System 2.1.1. Policy Action 1: Efficiency improved through reformed Ubudehe system and database,
improved iSP-MIS and increased harmonization across social protection programs: The Ubudehe database (Ubudehe management information system) was developed and operationalized and is interfaced to the NIDA database and 90% of individuals over 16 years in Ubudehe data base were successfully matched to national ID. This has improved the advocacy for SP beneficiaries who lack IDs. In order to strengthen SP management information system, a policy decision was taken to first enhance and strengthen individual agency MIS. Based on this decision, LODA, RDRC and FARG MIS were enhanced or strengthened.

The World Bank (P131558)
50
To continue improvements around harmonization of income generating activities across selected SP programs, a minimum package for graduation was launched in FY2015/16 in 30 sectors. It was implemented in VUP sectors, where beneficiaries were selected from VUP, FARG and RDRC. Since its inception from 2015-2018, the minimum package for graduation (MPG) programme has benefited a total number of 19,489 households, who are composed of 18,027 under VUP (13,132 PW and 4,895 DS) and 1,365 are from FARG DS and RDRC DS respectively. The female headed household represent 55% while male headed household represent 45%. The composition of the targeted beneficiaries was as follows: PW beneficiaries make up 67.4 %; 25.12% VUP DS; 7% FARG DS and 0.5% RDRC DS of all the program beneficiaries. A process evaluation is underway to determine how its implementation can be improved. In order to strengthen performance, build knowledge and understanding of SP programs and systems, in partnership with different stakeholder, trainings were provided to LG staffs in different areas such as trainings on social protection policy and implementation principles, MPG, Financial compliance, VUP implementation modalities, memorandum accounts, VUP MEIS just to mention a few. The beneficiaries included Vice Mayors, Directors of SDU, District budget officers, Director of Finance, Division Manager Corporate Services trainings, Sector executive Secretaries and Social Protection officers. In total, more than 10,306 local government staffs were given SP related induction or repeated trainings over the period of FY2015/16 to FY2017/18. 2.2. Pillar #2: Accountability and Transparency
2.2.1. Policy Action 2: Accountability and transparency enhanced through improved SP budget reporting and dissemination and strengthened citizens' engagement.
Over the years, there have been improvement in terms of planning and budgeting, where by bottom up planning and budgeting and the role of citizen in contributing to this process has improved. Every year as part of the planning and budgeting, a budget call circular, communities are consulted on the priorities at the village level where priorities are consolidated at each administrative levels. The second BCC issued provides budget ceilings where each district is presented with its ceiling among which the priorities are budgeted for. Before the priorities and budgets are presented to the District Sector Council for presentation, a public accountability day is convened where all the district priorities and budgets are presented to representatives from the communities, civil society organizations and other stakeholders. From FY2015/16 to FY2017/18, over 85% of the Districts The SP budget is also part of the presentation made before the public accountability day participants reviewed their budgets including SP budgets during public accountability days and the engagement has continued to improve. In order to improve efficiencies of SP programs and promote accountability and transparency, the sectors have been able to receive and resolve complaints from the communities on VUP within 2 weeks, more than 80% of issues raised have been resolved.

The World Bank (P131558)
51
2.3. Pillar #3: Coverage of Poor and Vulnerable
2.3.1. Policy Action 3: VUP coverage expanded with attention to appropriate design, notably poverty and child-sensitive elements.
Geographical coverage of VUP in the poorest Districts and Sectors. Over the period of implementation of SPS 3 from 2015/16 to 2016/17, VUP coverage increased significantly and currently implemented in 416 sectors for direct support, public works in 244 sectors, financial services in 270 sectors, while new initiatives such as expanded public works and minimum package from graduation which were introduced in 2015/16 were piloted and implemented in 30 sectors respectively. The number of households and individuals benefiting from SP programs19 increased from 189, 483 HHs in 2015/16, to 227,477 HHs in 2016/17 and 242,849 HHs in 2017/18. Of these programs, 96% are VUP beneficiaries.
o VUP Direct Support Coverage Direct Support (DS) is implemented in 416 Sectors nationwide. From FY2015/16 to 2017/18, direct support implemented has evolved to address emerging issues due to the evidence that has been generated over the period. It can be recalled that from 2015/16, a deliberate policy decision was made to change the targeting policy for VUP, where VUP would only target households in category 1, as opposed to households in category 1&2. This was done to align it with the revision of Ubudehe categories in 2015/16, from 6 to 4 categories. Another notable reform with regard to DS, is the review of the DS targeting policy, where in 2015/16, DS was scaled up massively to cover all sectors in the country and in FY2016/17 and FY2017/18, the targeting criteria was adjusted to include one worker households in Ubudehe category 1, to include a person with severe disability. These reforms to DS have attempted to address the issues of DS being more inclusive and responsive to the needs of single worker households with caring responsibilities which is in line with the SDGs commitments of leaving no one behind. The table 1 below presents the achievements performance against direct support key performance indicators.
Table 1: Beneficiaries of VUP DS component
Item 2014-15 2015-16 2016/17 2017/18 No of sectors receiving transfers 330 416 416 416 Number of HH who benefited 84,354 85,899 95,906 94,912
o No of female headed HHs 55,211 58,192 68,248 65,381
o No of males headed HHs 29,143 27,707 27,658 29,531
Average amount paid per HH 132,909 133,787 113,308 135,574.5
Source: LODA annual reports (2015/16-2017/18)

The World Bank (P131558)
52
According to the table 1 above, from 2015/16, the number of DS beneficiaries continued to raise and the amount paid also increased. The number of households benefitting from DS increased over the years, except in FY2017/18, when it fell slightly. However, the average amount paid to DS beneficiaries over the years was able to take them above the extreme poverty line (Rwf 105,000) as set by NISR.
o VUP Public Works coverage Public works is a labor intensive community-based works designed to provide temporary employment in order to ensure that participating households receive enough money to address their basic needs hence, while also contributing to the building of the community asset development projects that generate employment to the local population in the poorest sectors. Public works implementation has also evolved over the course of implementation with policy reforms informed by evidences generated from implementation, reviews and assessments. One of the key assessment was conducted in 2015/16 to address the exclusion issues where households eligible for PW were self-excluded. This prompted a study to understand the underlying causes of this exclusion and one of the key findings was due to distance to the project work sites, delayed payments but also caring responsibilities. This led to the introduction of the expanded public works component to address some of this issues, while also address the gender gap in the implementation of the public works programme.
The PW projects progress and key performance indicators are presented in the table below.
Table 2: Key performance indicators for Public Work from FY2014/15-2017/18
Item 2014-15 2015-16 2016-2017 2017-2018 Number of sectors covered 188 210 240 244 Number of HHs who benefited 111,923 103,584 128,656 134,993
Number of female HHs 53,033 51,766 67,878 65,504 Number of males HHs 58,890 51,818 60,778 66,489
Average days worked per HH 48 67 66 75 Average amount paid per HH 53,717 77,906 77,874 97,237 Average wage rate 1,125 1,165 1,178 1,297 Labour intensity 62% 67% 85% 79%
Source: LODA annual reports (2014/15-2017/18) From table 2 above, it is evident that even though PW has not scaled up so much in the last 3 years, the number of households covered has increased to 134,993 households, with more participation from female headed households (50.7%) compared to the male headed households (49.3%). The average annual works days have also improved, but not significantly, noting also that they have not achieved the annual targets in the previous 2 financial years except in 2017/18 when the target of 72 works days was exceeded. The reports further indicate that on average,
19 VUP (DS, PW), FARG, RDRC

The World Bank (P131558)
53
female headed households worked 81 days compared to male headed households who worked for 69 days. The labour intensity of public works also increased over time implying that more funds were paid to beneficiaries, though it decreased slightly in FY2017/18. Key areas that require particular attention include geographical coverage, average days worked and the labour intensity as this would significantly improve most of the public works indicators. That said, improved planning and early execution of public works projects are the key catalysts for the above to be achieved.
o Expanded Public Works (ePW) coverage Expanded Public Works (ePW) is a multi-year, year-round, flexible (working hours) Public Works to provide accessible and appropriate employment opportunities to moderately labour-constrained households. The program mainly targets extremely poor households with caring responsibilities/ low labour capacity from households in Ubudehe category 1 with no more than one worker.
The programme was conceptualized in 2015/16 and actual implementation commenced in 30 ddistricts in 2016/17, starting at small scale (limited number of scale), with one sector per District targeted and plans to scale up ePW to additional 50 sectors in FY2017/18 were drawn.
In FY2017/18, ePW was implemented in 80 sectors across the districts. According to ePW design, ePW beneficiaries should receive RwF 10,000 per months, and RwF 120,000 per year. The table below summarizes shows the performance over the FY2016/17 and 2017/18.
Table 3: Expanded Public Works key Performance Indicators (2016/17-2017/18)
Source: LODA annual report (2016/17-2017/18) By the end June of the 2017/2018 FY, the management information system was used to register all the projects and beneficiary payments. According to the report, during the implementation period presented in the table above, as the sectors and beneficiaries numbers increased, there is also a significant presence of female participation where more than 71% are female headed households across the years, implying that the programme is gender and child sensitive. Though the programme is responsive to the child and gender programming, its contribution to reduction of extreme poverty is still insignificant due to the low levels of coverage in terms of sectors and
EPW Indicators Actual Performance
FY2016/17 FY2017/18
No of sectors covered 30 80 Number of HHs employed
o Number of female headed HHs o Number of male headed HHs
2,757 o 1,969 o 788
13,003 o 9,332 o 3,671
Average amount paid per beneficiary HH 43,901 107,445 Average wage rate 1000 1,091
Labour intensity 96% 82%

The World Bank (P131558)
54
beneficiaries. Another noticeable challenge during this implementation phase is the number of months’ wages paid out which is still below the required 12 months. To improve the effectiveness of ePW, there is need for improved planning, early mobilization of projects and identification of beneficiaries as well as improve the regularity of payments. Chapter 3: Key challenges and conclusion
o Delayed in implementation of Public Works program Delayed implementation is one of the major issues that complicates the public works implementation cycle, and reduces its intended impact on extreme poor household. The justification for low completion rate of PW is attributed to planning and implementation cycle where there are registered delays at different levels of implementation. It is important that capacity is extended to across the implementation cycle to ensure that PW are implemented on time for them to have a positive impact on beneficiary households.
o Number of days worked by households The number of days worked by a beneficiary household determine the amount the household can get and take the household take the household above the extreme poverty or above the poverty line. Over the years, it has been very difficult to achieve this target due to a number of issues such as delayed implementation, non-completion of projects and cancellation of projects.
o Timeliness of VUP beneficiary payments
The timeliness of payment and regularity of payment is one of the benchmarks of a social safety net programme and very important indicator that VUP programme has ascribed to so that VUP beneficiaries are able to plan and budget for their incomes.
The timeliness of payment indicator was based on the VUP payment principles as defined in the VUP DS implementation guidelines which stated that:
Direct Support should be paid within 2 weeks of the end of the period being paid
Public Works payments to be made after every 10 working days with payment to be made within 2 weeks of the end of the period being paid;
However, the payment principles have evolved and changed due to address emerging issues and adopt to new tools such as timeliness functionality in MEIS.
The table below shows the timeliness of payments for direct support and direct support from FY2015/16.
Table 4: Summary of timeliness of VUP- PW & DS Payments, based on a sample of sector reports
Component FY2015/16 FY2016/17 FY2017/18

The World Bank (P131558)
55
Public Works
o Beneficiaries paid on time PW (%) 46% 35% 78%
o Beneficiaries paid late PW (%) 54% 65% 22%
Direct Support
o DS beneficiaries paid on time (%) 52% 35% 79%
o DS beneficiaries paid late (%) 48% 65% 21%
Expanded Public Works20
o EPW beneficiaries paid on time (%) - - 81%
o EPW beneficiaries paid late (%) - - 19%
Source: LODA annual reports (2015/16-2017/18)
According to information displayed in the table 4 above, timeliness of payment indicator didn’t not progress as planned from FY2015/16 and FY2016/17. This was partly due to the implementation challenges faced by VUP, such as absence of high quality data to be used, incompleteness of data, delayed entry of data to facilitate analysis as well as changing the implementation principles around timeliness of payments. However, since FY2017/18, significant progress was realised due to different mechanisms including awareness raising, reducing the cash flow layers and the systems such as MEIS.
3.4 Summary challenges in the implementation of minimum package for graduation (2015/16-2017/18: Some of the key challenges identified during implementation include: o Procurement delays affected late transfer of assets to beneficiaries. o The distribution of assets (small livestock) in non-conducive environments led to
depletion of assets in some areas.
Chapter 4: Policy reforms, Stakeholder Coordination and Partnership Some of the key policy reforms since 2015/16 to 2017/18 include the following: Vision 2020 Umurenge Program document: In FY2015/16, the VUP program was revised
to align it to the EDPRSII as well as address and respond to new and emerging challenges such malnutrition and the role of VUP in implementing the graduation strategy to accelerate the eradication of extreme poverty.
Expanded Public Works: Expanded public works (ePW) was also introduced in 2015/16, and currently targets single worker households with caring responsibilities, with flexible, year round public works

The World Bank (P131558)
56
Minimum package for graduation: MPG was introduced and started implementation towards the end of FY2015/16, with the development of policy guidelines and implementation tools. This program was initiated as a pilot to accelerate extreme poverty reduction.
Government partnership with Civil Society organization: In a bid to strengthen public accountability and citizen engagement, the government through LODA, RAB and RGB in collaboration in collaboration with CSOs identified 8 pilot Districts21 and local CSOs to implement a joint partnership framework in 2017.
Studies, Reviews and Research: During the period from FY2015/16, the sector built a strong evidence base, through planned evidences, research and studies. Notable among many are the following:
o Following up on the VUP panel data in EICV4, the social protection sector working with the NISR, was able to build in a VUP panel data for EICV5 to be able to assess the change in the standards of living for VUP beneficiaries over time.
o Mixed Methods Evaluation (WB, 2015): The WB supported the mixed methods evaluation “a dialogue on welfare trajectories of VUP beneficiaries: Identifying Individual Level Drivers and Obstacles for Change and the key findings indicated that: The length of time in VUP is an important factor, with longer exposure improving
outcomes The household context characterized by single and female headed households
appeared more vulnerable is therefore a determining factor The timing and predictability of the VUP payments impacts households’ ability
to use VUP as an effective risk management instrument o DFID Annual Review: DFID carried out its annual review of Social Protection Support
to the Poorest Districts in Rwanda in September 2017, the programme had scored an “A – likely to completely meet its objectives” in the review. The programme has achieved this score in every year of its operation.
o World Bank Investment Project Financing: MINALOC and LODA engaged with the World Bank in the preparation of the programme design for submission to the WB Board in December 2017. The project worth US$ 80 million is under implementation from FY2018-19 to FY2020-2021. Another related project is nutrition sensitive direct support (NSDS) which is worth $ USD 23 mn that targets pregnant mothers and children under 2 years.
E-Payment Systems Development: LODA worked with consultants engaged by Access to Finance Rwanda to produce a Feasibility Study on the opportunities of digitizing social protection payments through VUP. During this financial year the report was accepted by Access to Finance Rwanda (AFR) who then committed to finance development and piloting a system for DS and PW payments through the mobile money platform.
20 The MEIS functionality for EPW was not available until FY2017/18 21 Nyamagabe; Nyaruguru; Gakenke; Ngororero; Rutsiro, Muhanga and Ngoma

The World Bank (P131558)
57
Conclusion The support through strengthening social protection systems has facilitated policy dialogue and the evidences generated through the WB support, contributed to achieving of the government strategy of scaling up VUP to reach more sectors and beneficiaries, strengthening harmonization through aligning development partners support to government budget, management information systems and strengthening coordination across the sector. However, the report also highlights a number of issues, which are critical to improving the standards of living for the poor and extremely poor households. Some of these challenges such as coverage, timeliness of payments, budget gap, targeting, are being addressed through different mechanism as stated in the social protection strategic plan (2018/19-2024) and other policy documents.

The World Bank (P131558)
58
ANNEX 7: LIST OF SUPPORTING DOCUMENTS
World Bank, First SPS DPO, Program Document (December 19, 2014)
World Bank, Second SPS DPO, Program Document (November 2, 2015)
World Bank, Third SPS DPO, Program Document (October 3, 2016)
Government of Rwanda, National Institute of Statistics of Rwanda, EICV5 Main Indicators Report (2017)
Government of Rwanda and Department for International Development ‐ UK, Local Development Entities Agency, Vision 2020 Umurenge Program, Mixed Methods Evaluation (2018)
Government of Rwanda and World Bank, Mixed Method Study, A Dialogue on the Welfare Trajectories of VUP Beneficiaries: Identifying Individual Level Drivers and Obstacles for Change, (2015)
Government of Rwanda, National Budget Execution Reports (FY14–FY18)
Government of Rwanda, National Budget Organic Law (FY14–FY18)
Government of Rwanda, Local Administrative Entities Development Agency, Vision 2020 Umurenge Routine Monitoring Data (2014–2018)
Government of Rwanda, Local Administrative Entities Development Agency, Vision 2020 Umurenge, Grievances Redress Mechanisms Reports (2014–2018)
Government of Rwanda, National Institute of Statistics of Rwanda, EICV5 Poverty Profile Report (2017)
Independent Evaluation Group, Country Program Evaluation, Rwanda (2018)
Government of Rwanda, Ministry of Local Government, Social Protection Sector, Joint Sector Review Reports (2014‐2018)
World Bank, SPL Systems in Rwanda (P150643): Output Summary (June 2016)

The World Bank (P131558)
59
MAP