Rainfed upland rice production on a derived savannah soil in West Africa

Rice Production in Rwanda _ NGANGO Jules _ Bachelor's Dissertation, NUR _ +250783254304 Document Transcript
NATIONAL UNIVERSITY OF RWANDA FACULTY OF AGRICULTURE DEPARTMENT OF AGRICULTURAL ECONOMICS AND AGRIBUSINESS ACADEMIC YEAR: 2011-2012 THE PROMOTION OF RICE PRODUCTION ASA SOLUTION TO THE LOWER LEVELS OF SAVING AND INCOME IN THE RURAL AREAS OF RWANDA. CASE STUDY: KOAIRWA COOPERATIVE STUDYPERIOD: 2007-2011 A dissertation submitted Agriculture as a to partial the faculty of fulfillment of requirements for the award of the Bachelor’s degree with honours in Agricultural Economics and Agribusiness. By NGANGO Jules SUPERVISOR: Mr. HABIMANA Kizito, Msc Huye, June 2012
i DECLARATION I, NGANGO Jules, hereby declare that, the workpresented in this dissertation entitled « THE PROMOTION OF RICE PRODUCTION AS A SOLUTION TO THE LOWER LEVELS OF SAVING AND INCOME IN THE RURAL AREAS OF RWANDA: Case Study of KOAIRWA Cooperative» is my original work and has never been presented elsewhere for any academic award. All consulted references have been systematically presented in references.Signature: ......................... NGANGO Jules Date: .................................
ii DEDICATION I dedicate this Dissertation to: Almighty God,My parents, My entire family, And Friends.
iii ACKNOWLEDGEMENT I am greatly indebted to Mr. HABIMANA Kizito for undertaking the tasks of supervising this work, his willingness, guidance and assistance to identify in thisresearch. I gained a tremendous amount of knowledge under his supervision. I am deeply indebted to the Government of Rwanda for providing funds for my studies. A special word ofappreciation goes out to the National University of Rwanda through the faculty of Agriculture; I admire your advices, knowledge provided, favorable learning environment and cooperation during my studies at University. Special thanks go to the entire management of KOAIRWA for providing the required information. Without the cooperation and involvement of the farmers at Rwasave marshland, this work

would have gone nowhere. You have taught me a lot about rice. Thank you also for embracing new things. Your patiencein answering my numerous questions and willingness to work with me on the field is well appreciated. I express again mygratitude and thanks to my father MUGEMANGANGO André and my mother NYIRABAGABE Jacqueline for your love, your encouragement, advices and support during my studies. Special recognition also goes to my sisters MUKAMUGEMA Alice, MUGEMA Julie and MUKANGANGO Juliette for their encouragement and support. Finally, I am grateful to all my colleagues and all students of the faculty of agriculture for their moral support during the four years of my studies at National University of Rwanda. May God bless you all!
iv LIST OF SYMBOLS, ABBREVIATIONS AND ACRONYMS BC : Before Christ CIP : Crop Intensification Program CODERVAM : Cooperative de Developement Rizicole des Vallees du Mutara et al. : et ses collaborateurs FAO : Food and Agriculture Organization GDP : Gross Domestic Product Ha : Hectare IFAD : International Fund for Agricultural Development IRRI : International Rice Research Institute ISAR : Institutdes Sciences Agronomiques du Rwanda Kg : Kilogram KOAIRWA : Koperative y’Abahinzi b’Igishanga cya Rwasave MINAGRI : Ministry of Agriculture and Animal Resources MINECOFIN : Ministry of Finance and Economic Planning NRDS : National Rice Development Strategies OLS : Ordinary Least Squares RADA : Rwanda Agriculture Development Authority RSSP : RuralSector Support Project Rwf : Rwandan francs SACCO : Saving and Credit Cooperatives SPSS : Statistical Package for Social Sciences T : tonne UCORIRWA % : Union des Coopératives Rizicoles au Rwanda : Percent
v TABLE OF CONTENTS DECLARATION.................................................................................................................. i DEDICATION .................................................................................................................... ii ACKNOWLEDGEMENT .................................................................................................. iii

LIST OF SYMBOLS, ABBREVIATIONS AND ACRONYMS ......................................... iv TABLE OF CONTENTS..................................................................................................... v LIST OF TABLES ............................................................................................................. ix LIST OF FIGURES ............................................................................................................. x ABSTRACT ....................................................................................................................... xi CHAPTER I. GENERAL INTRODUCTION ...................................................................... 1 1.1. BACKGROUND OF THE STUDY .......................................................................... 1 1.2. PROBLEM STATEMENT........................................................................................ 2 1.3. RESEARCH QUESTIONS ....................................................................................... 4 1.4. HYPOTHESES ......................................................................................................... 4 1.5. OBJECTIVES OF THE STUDY ............................................................................... 4 1.5.1. General Objective ............................................................................................... 4 1.5.2. Specific objectives .............................................................................................. 4 1.6. SCOPE OF THE STUDY.......................................................................................... 5 1.7. SIGNIFICANCE OF THE STUDY ........................................................................... 5 1.8. ORGANISATION OF THE STUDY ........................................................................ 5 CHAPTER II: LITERATURE

REVIEW ............................................................................. 6 2.1. INTRODUCTION..................................................................................................... 6 2.2.DEFINITIONS OF KEY CONCEPTS ...................................................................... 6 2.2.1. Rice .................................................................................................................... 6
vi 2.2.2. Production .......................................................................................................... 7 2.2.3. Income ................................................................................................................ 7 2.2.4. Saving ................................................................................................................ 7 2.3. OVERVIEW OF RICE INDUSTRY ......................................................................... 8 2.3.1. Global Rice Industry ........................................................................................... 8 2.3.2. The Rwandan Rice Industry ................................................................................ 9 2.4. IMPORTANCE OF RICE PRODUCTION ............................................................. 10 2.4.1. Importance of Rice in the world ........................................................................ 10 2.4.2. Importance of Rice to the Rwandan Economy ................................................... 10 2.5. RICE PRODUCTION IN RWANDA ...................................................................... 12 2.5.1. Rice growing schemes in Rwanda ..................................................................... 12 2.5.2. Rice Production trends .....................................................

................................. 14 2.6. RICE MARKETING IN RWANDA........................................................................ 15 2.6.1. Paddy processing in Rwanda ............................................................................. 15 2.6.2. Rice supply channels in Rwanda ....................................................................... 16 2.7. CONSTRAINTS FOR THE DEVELOPMENT OF THE RICE SECTOR IN RWANDA ..................................................................................................................... 18 2.7.1. Constraints related to rice production ................................................................ 18 2.7.2. Constraints related to marketing of rice ............................................................. 20 2.8. STRATEGIES OF PROMOTING RICE PRODUCTION IN RWANDA ................ 20 CHAPTER III: METHODOLOGY .................................................................................... 23 3.1. INTRODUCTION................................................................................................... 23 3.2. RESEARCH DESIGN ............................................................................................ 23 3.3. PROCESS OF THE STUDY ................................................................................... 23 3.4. THE TYPE OF THE STUDY ................................................................................. 24
vii 3.5. STUDY POPULATION .......................................................................................... 24 3.6. SAMPLE SIZE ....................................................................................................... 24 3.7. SOURCE OF DATA ............................................................................................... 25 3.8. METHODS OF DATA COLLECTION .................................................
................. 25 3.8.1. Questionnaire .................................................................................................... 25 3.8.2. Observation ...................................................................................................... 25 3.9. DATA ANALYSIS ................................................................................................. 25 CHAPTER IV: DISCUSSION OF THE FINDINGS ......................................................... 26 4.1. INTRODUCTION................................................................................................... 26 4.2. PRESENTATION OF THE STUDY AREA ........................................................... 26 4.2.1. Localization ...................................................................................................... 26 4.2.2. Historical perspective of KOAIRWA ................................................................ 26 4.2.3. Objectives of KOAIRWA ................................................................................. 27 4.2.4. Mission statement ofKOAIRWA ..................................................................... 27 4.2.5. The administrative organization of KOAIRWA ................................................ 27 4.2.6. KOAIRWA rice production and commercialization ..........................................27 4.3. ANALYSIS AND INTERPRETATION OF THE FINDINGS ................................ 29 4.3.1. Demographic Characteristics of Respondents ....................................................... 29 4.3.1.1. Distribution of Respondents by sex ................................................................ 29 4.3.1.2. Distribution of Respondents by age ................................................................ 29 4.3.1.3. Distribution of Respondents by marital status................................................. 30

4.3.1.4. Education ....................................................................................................... 31 4.3.1.5. Family size .................................................................................................... 32 4.3.2. Reasons of Farmers to join KOAIRWA ................................................................ 33 4.3.3. Annual Income of Farmers before joining KOAIRWA ......................................... 33
viii 4.3.4. Rice Production and Marketing ............................................................................ 34 4.3.4.1. Field size under ricecultivation...................................................................... 34 4.3.4.2. Rice production in Rwasavemarshland .......................................................... 35 4.3.4.3. Relationship between rice production and land size ........................................ 35 4.3.4.4. Annual income from sales .............................................................................. 37 4.3.4.5. Saving ............................................................................................................ 37 4.3.4.6. Economic advantages of growing rice ............................................................ 40 4.3.5. Constraints of Rice Production in Rwasave Marshland ......................................... 41 4.3.6. Strategies of Promoting Rice in Rwasave Marshland ............................................ 41 CHAPTER V: SUMMARY OF THE FINDINGS, GENERAL CONCLUSION AND RECOMMENDATIONS ................................................................................................... 43 5.1. SUMMARY OF THE FINDINGS .......................................................................... 43 5.2. GENERAL CONCLUSION .................................................................................... 44 5.3. RECOMMENDATIONS ........................................................................................ 44

REFERENCES .................................................................................................................. 46 APPENDIX ....................................................................................................................... 49 APPENDIX 1: “QUESTIONNAIRE FOR SURVEY” ....................................................... 50
ix LIST OF TABLES Table 1: Top 10 rice producers by country in 2009 (paddy production in tons) .................... 9 Table 2: Area, average yield, rice production and night temperatures for each rice scheme. 12 Table 3: Rice Production Trends in Rwanda, 2000-2009.................................................... 14 Table 4: Total Milled Rice Production ('000 t) ................................................................... 15 Table 5: KOAIRWA rice production and commercialization ............................................. 28 Table 6: Age group of respondents in Rwasave marshland ................................................. 30 Table 7: Family size of respondents in Rwasave marshland ............................................... 32Table 8: Annual income before joining KOAIRWA .......................................................... 34 Table 9: Quantity of rice produced by KOAIRWA farmers in 2011 ................................... 35 Table10: OLS estimates of rice production in Rwasave marshland ................................... 36 Table 11: Monthly level of saving after joining KOAIRWA .............................................. 38 Table 12: The use of loan for those who have taken it ........................................................ 40
x LIST OF FIGURES Figure 1: Map of Rwanda showing the major Rice growing areas. ..................................... 13Figure 2: Sequence of postharvest operations..................................................................... 16 Figure 3: Rice marketing channels in Rwanda .....................................................
.............. 17 Figure 4: Distribution of Respondents by sex ..................................................................... 29 Figure 5: Marital status of respondent ................................................................................ 31 Figure 6: Education levelof respondents ........................................................................... 32 Figure 7: Respondents’ views on the reasons of joining KOAIRWA ................................. 33 Figure 8: Size of land under rice cultivation ....................................................................... 35 Figure 9: Annual income (Rwf) from sales in 2011 ............................................................ 37 Figure 10: Members of KOAIRWA who have bank account.............................................. 38 Figure 11: Members of KOAIRWA who have taken a loan in the last five years ............... 39 Figure 12: Economic advantages of growing rice ............................................................... 40
xi ABSTRACT Rice consumption in Rwanda is on the rise due tothe increase in urbanization and population growth. Much of the rapidly growing demand for rice in Rwanda will be met from increased rice production in irrigated marshland, whichcovers about 1.2 % of the total arable land. Therefore, riceproduction in Rwanda should be promoted through various strategies such as extension of cultivable area of marshlands, construction and maintenance of the water supplysystems to permit exploitation of the cultivable areas through the two growing seasons. This study has examined thepromotion of rice production as a solution to the lower levels of saving and income in the rural areas of Rwanda. Case study of KOAIRWA Cooperative with study period: 2007-2011. The study was mainly based on data from 65 members of KOAIRWA located in Huye District, Southern Province. The study had two main specific objectives: To analyze the constraints of rice production in Rwanda and to identify the
strategies of promoting rice production in Rwanda in general. The researcher adopted quantitative and qualitativemethods of data collection through selfadministered questionnaire, interview guides and library search. Findingsfrom the study seem to indicate that rice production has contributed significantly to the increase of income for farmers through the sale of their production, thus the sale of rice production has contributed to the food security of the Rwandan population living in Huye District. Furthermore,the establishment of KOAIRWA has contributed a lot to the promotion of welfare of the members such as the increase of income, the improvement of savings, and access to health services and the payment of school fees of their children. After analyzing and interpreting the data, recommendations and suggestions on what to be implemented by the government and the farmers’ cooperative of rice were highlighted in order to increase the levels of saving and income in the rural areas of Rwanda.
1 CHAPTER I. GENERAL INTRODUCTION 1.1. BACKGROUND OF THE STUDY In many developing countries, agriculture is still a major source of employment and income. Rwanda's economy is mainly based on agriculture. In 2005, approximately 90 percent of the economically active population was employed in agriculture and a large part of the farmers had an average size of their land less than 1 hectare per household. Despite government efforts to encourage migrationof labor out of agriculture to relieve pressure on the country’s severely constrained land resources, agriculture remains by far the main source of employment. The agricultural sector currently accounts for about 42 percent of GDP in real terms, (Michael Morris et al., 2008). Agriculture is the most important sector in the economy of Rwanda in terms of contribution to GDP, employment, and foreign exchange earnings. Agriculture’s contribution to growth is even larger when strong multiplier effects are taken into account. Agriculture also contributes significantly to national food self-sufficiency, as over 90 percent of all food consumed in the country is domestically produced, (Michael Morris et al., 2008). The rural incomes

come mainly from the sale of food crops, livestock and cash crops. Unfortunately, it is clear that these last two decades, agricultural production remained insufficient to meet the needs of the growing population and inducing food insecurity and increasing poverty levels especially in ruralareas where there is hard to find non-agricultural work, (FAO, Country Information). It is in this case that the government of Rwanda through MINAGRI identified rice production as a significant component of the agricultural sector in Rwanda that has high potential to drive economic growth, (IFAD, 2009). Rice was introduced in Rwanda in the 1950s with simple trials being made by the Chinese, through their mission known as “Formose”, in the regions of Bugaramain Cyangugu and Kabuye. By 1967, significant progress had been made which resulted in the development of several rice schemes across the country. In 1988, ISAR has initiated a coordinated rice
2 research program to improve rice quality. Since then, ricehas become one of the major food crops grown in Rwanda, (J.N. Jagwe et al., 2003). In Rwanda, rice is cultivated mainly in the valley swamps, referred to as marshlands. Theyare highly conducive for growing rice crop. In some marshlands, rice is the only crop that thrives well and produces better yield than any other traditional crops during rainy season, (Kathiresan, 2010). The production of rice has been given a high priority and so the government isseeking to increase productivity from the flood prone valleybottoms that are conducive for rice growing. It has also been observed that rice is capable of giving very high yields of over 7T per Ha per growth cycle, which is far above the yield from any other crops that can be planted in marshlands. Therefore, rice production is considered the most profitable enterprise and provides a viable alternate for millions of resource-poor rural farm families in Rwanda,(J.N. Jagwe et al., 2003). 1.2. PROBLEM STATEMENT Since the 1980s, Rwanda has been unable to meet its domestic food needs from national production. The food deficit has been filled in by commercial imports and to a large extent food aid, (J.N. Jagwe et al., 2003). Despite the steep rice

production increase, the country currently imports about 30 % of the rice from countries such as Tanzania, India, Vietnam, Pakistan and Thailand (IFAD, 2009).Thus there is anurgent need to improve the total crop productivity. Furthermore Rice produced in Rwanda is largely sold in unorganized rural markets, whereas the mainstream urban markets largely sell imported rice. This is mainly because the locally produced rice grains suffer higher breakages upon milling, (MINAGRI, 2011). According to MINECOFIN, the causes of these problems are due to the fact that Rwandan agriculture is largely for subsistence characterized by low productivity, low quality, low value and low skills. The problem of low production and productivity is due to continued
3 land degradation by erosion, insufficient exploitation of marshlands and insufficient use of agricultural inputs. The problem is also due to poor marketing of locally produced rice. In year 2000, as part of its strategy for growth and poverty reduction, the Government of Rwanda set a goal to increase per capita income from US$ 230 to US$ 900 and halvethe incidence of poverty by 2020. One of the principal sources of growth in the short to medium term was the agriculture sector, (Michael Morris et al., 2008). In order to create a more self-reliant food balance in the country, the government has developed a strategy to a number of food crops, which include maize, beans, rice, passion fruits and sweet potatoes. The reason for focusing on these crops is that they are crops which offer better trade and value addedprospects than the traditional food staples, (J.N. Jagwe et al., 2003). Rice is one of the major staple crops in Rwanda being targeted and to be promoted. It is used as cash crop and food crop. Rice crop has become increasingly important in Rwanda and has recently been targeted by the Ministry of Agriculture in its fight for food security, household incomes and the enhancement of nutritional standards. The importance of promoting rice production is to improve economic development and must clearly be exploited. The strong presence of farmers’ cooperatives enables farmers to collectively access the inputs such as seeds and natural

resources. There is an urgent need to expand the capacity ofextension system to enable efficient transfer of technologies on production, soil and water management, pest and disease management, harvesting, post harvest handling and storage of rice in marshlands. Public private partnerships in extension services can accelerate the dissemination of on-farm technologies to farmers. Such endeavours shall increase productivity levels in rice growing schemes, (MINAGRI, 2011). Therefore, the aim of the study is to know whether the promotion of rice production islikely to be the best strategy to improve levels of saving and income for small farmers. In order to contribute towardseconomic development and poverty reduction through the promotion of rice production, I have undertaken the researchwork entitled “the promotion
4 of rice production as a solution to the lower levels of saving and income in the rural areas of Rwanda.” 1.3. RESEARCH QUESTIONS 1. What are the strategies of promoting rice production in Rwanda? 2. What are the constraints of rice production in Rwanda? 3. What are the effects of rice production on levels of saving and income in the rural areasof Rwanda? 1.4. HYPOTHESES 1. There are various strategies of promoting rice production in Rwanda such as extension of cultivable area of marshlands, construction and maintenance of the water supply systems to permit exploitation of the cultivable areas, etc. 2. Rice production encounters variousconstraints such as insufficient availability of water in rice fields, insufficient use of agricultural inputs, poor post harvest. 3. Rice production contributes to the improvement of levels of saving and income for the members of KOAIRWA Cooperative. 1.5. OBJECTIVES OF THE STUDY 1.5.1. General Objective The general objective of this study is to analyze the contribution of rice production on levels of saving and income in the rural areas of Rwanda. 1.5.2. Specific objectives 1. To identify the strategies of promoting rice production in Rwanda in general. 2. To analyze the constraints of rice production in Rwanda. 3. To investigate the role of KOAIRWA cooperative in the
improvement of levels of saving and income of rice farmers in Rwasave marshland, Huye district.
5 4. To investigate the challenges being faced by rice farmers in Rwasave marshland; suggest solutions and recommendations to challenges. 1.6. SCOPE OF THE STUDY Due to limited time and financial means, this research will be concerned with rice farmers of KOAIRWA cooperative in Rwasave marshland, Huye district as a representative sample of all rice farmers in Rwanda. This will help to collect more data from field and to obtain reliable results. Study period (2007-2011) will be taken in this research. 1.7. SIGNIFICANCE OF THE STUDY This study will represent findingsreflecting the contribution of rice production on levels of saving and income in the rural areas and the role of cooperatives in improving levels of saving and income of rice farmers in Rwanda. This is valuable to rural dwellers, policymakers and donor community in determining and implementing policy that promote rice production in all available marshland thus developing rural economy. 1.8. ORGANISATION OF THE STUDY This study is divided into five chapters: The first chapter is the general introduction; it gives the background of the study, the statement of the problem, research questions, hypotheses, and objectives of the study, scope of the study and the significance of the study. The second chapter is the literature review, which describes generally the major concepts of the topic and other work related to the study. It gives an overview of rice production in general and the Rwandan rice in particular. The third chapter is entitled “Methodology”, it presents methods and techniques used in data collection, process of the study and the sample size. The fourth chapterfocuses on data analysis interpretation of the results; it shows the findings of this work and the suggestions comparatively to the previous works. The last chapter is conclusion and recommendations.
6 CHAPTER II: LITERATURE REVIEW 2.1. INTRODUCTION This chapter reviews key issues of the existing literature on thetopic under study. The study will relate findings of other scholars on the relationship between rice production and
levels of saving and income in the rural areas of Rwanda. Most aspects to be looked at in this chapter are: definitions of key concepts and different theories about them, background to rice production in Rwanda and elsewhere,the performance of rice production and contribution to farmers’ income, importance of rice production and strategies of promoting rice production in Rwanda, constraints of rice production in Rwanda. 2.2. DEFINITIONS OF KEY CONCEPTS 2.2.1. Rice Rice (oryza sativa) is the cereal crops which are grown purposely for food (consumption) but sometimes it can be grown for sale. It is the most important cereal crop in the developing world and is the staple food of over half the world’s population. It is generally considered a semi aquatic annual grass plant, (Oelke et al., 1997). Rice has many uses and it is used to make various dishes, from the main course to the desserts. Rice has been cultivated for such countless ages that its origin must always be a matter for conjecture. Botanists base their evidence of the origin of rice on the habitats ofthe wild species, (Grist, 1986). It is believed that since 10 000 BC, rice was grown in china and southern eastern Asiaand that it is where rice originated. The first crops were observed in China (Hemu Du region) around 5000 BC. They later appeared in Cambodia, Vietnam and Southern India. Fromthere, derived species Japonica and Indica expanded to otherAsian countries such as Korea, Japan, Myanmar, Pakistan, Sri-Lanka, Philippines and Indonesia, (Grist, 1986).
7 2.2.2. Production Business dictionary defines production as the processes and methods employed to transform tangible inputs (raw materials, semi finished goods, or subassemblies) and intangible inputs (ideas, information, knowledge) into goods or services. Production is the processof the creation of goods and services aimed at satisfying the wants of individuals (private wants) or groups (public wants), (Bagumire, 2005). 2.2.3. Income One approach sees income as a reward that the owners of fixed factors of production receive as a result of allowing their land, capital and labor to take part in production. The other seesincome as the flow of resources that households receive that

may be spent on consumption and on saving, (FAO, 2004). According to Mc Connell Brue (2002), income is a flow of dollars (or purchasing power) per unit of time derived from the use of human or property resources. Michael Parkin et al. (1939), define income as “the amount received by households in payment for the services of factors of production.” 2.2.4. Saving According to Richard et al. (1991:68), economists define saving as “the part of after-tax income which is not consumed.” Hence, households have two choices with their disposable income either to consume or to save. Christopher, Pass et al. (1988:484), state that,“saving is the proportion of a person’s (personal saving), company’s or institution’s (retained profits) income that isnot spent on current consumption.” They say, saving is typically placed on deposit with bank, saving society, etc, or used to acquire financial and physical assets such as shares or plant. In his study, William (1989:4), it is generally argued that, saving may be thought of as current period resources or productions that are not consumed in thecurrent period but rather are made available for future consumption.
8 Mc Connell Brue (2002), define saving as “the disposable income not spent for consumer goods; equal to disposable income minus personal consumption expenditure.” 2.3. OVERVIEW OF RICE INDUSTRY 2.3.1. Global Rice Industry Rice is one of the most important staple foods in the world. Ricehas become the second most important cereal in the world after wheat in terms of production, due to a recent decline in maize production, (Jones, 1995). It is widely cultivated throughout the tropics; and where flood controls are effective as in South-east Asia, production is high. Over 50percent of the world’s population depends on rice for about 80 percent of their food requirements. About 95 percent of the global output of rice is produced and consumed in developing countries, (Van Nguu Nguyen, 2000). Rice is grownon about 158 million hectares. It is especially important inAsia where approximately 90% of the world’s rice is grown. The annual global production is about 678 million tons of paddy rice, of which 90% of the total was produced by Asian

farmers, with two countries, the People’s Republic of China (including Taiwan) and India, producing 55% of the total crop, (FAOSTAT, 2011). Today, there are 111 countries in theworld producing rice, these include Asians countries, most countries in west Africa, some countries in central and EastAfrica, most of central American countries, Australia and a few states in the United States of America, (Choudhury, 2005). Top ten rice producer’s countries in the world (Table1).
9 Table 1: Top 10 rice producers by country in 2009 (paddy production in tons) 1. China 196,681,170 2. India 133,700,000 3. Indonesia 64,398,900 4. Bangladesh 47,724,0005. Viet Nam 38,950,200 6. Myanmar 32,682,000 7. Thailand 32,116,100 8. Philippines 16,266,400 9. Brazil 12,651,100 10. Japan 10,590,000 Source: FAOSTAT, 2011 2.3.2. The Rwandan Rice Industry Rice production has become a significant component of the agricultural sector in Rwanda. Conforming to Rwandan geographic conditions, rice is grown mostly in inland valley swamps referred to as marshlands. Ithas emerged as the most suitable crop for the marshlands andinland valleys in recent years. Owing to support by the Ministry of Agriculture and Animal Resources (MINAGRI), the area under rice cultivation in Rwanda rose from 3 549 ha in the year 2000 to currently about 12 000 ha, all of which is irrigated. Subsequently, rice production in Rwanda has increased to about 55 000 t in 2007.
10 It is a profitable enterprise as far as the utilization of scarce cultivated marshlands and labor is concerned, (IFAD, 2009). In Rwanda, rice is mainly cultivated by resource-poor smallholders who grow the crop through farmer-cooperative schemes set up by the Government. The 12 000 ha is cultivated by about 62 000 farmers operating under 55 cooperatives, with an average of 0.2 ha per household. The domestic rice consumption and hence the demand for milled rice grains has also risen substantially. Despite the steep production increase, the country currently imports about 30%of the rice it consumes from countries such as Tanzania, India, Vietnam and Thailand. Thus there is an urgent need toimprove the total crop productivity, (IFAD, 2009). 2.4.

IMPORTANCE OF RICE PRODUCTION 2.4.1. Importance of Rice in the world Rice is the most important crop to millions of small farmers who grow it on millions of hectares throughoutthe world, and to the many landless workers who derive income from working on these farms. It contributes to globalefforts directed at poverty alleviation. Rice provides 20 % of global human per capita energy and 15 % of per capita protein. Although, rice protein ranks high in nutritional quality among cereals, protein content is modest. It also provides minerals, vitamins, and fiber, although all constituents except carbohydrates are reduced by milling (IRRI, 1993). Rice is one of the most important starchy foods of the world, especially in the orient. The de-oiled bran is an excellent poultry and stock feed (Kipps, 1970). 2.4.2. Importance of Rice to the Rwandan Economy Rice production is considered the most profitable enterprise as regards the utilization of the hydro-agricultural investments laid out. It has also been observed that rice iscapable of giving very high yields of over 7 T per Ha per growth cycle, which is far above the yield from any other crops that can be planted in marshlands, (J.N. Jagwe et al.,2003).
11 According to J.N. Jagwe et al., (2003), Rice as a food commodity is steadily growing in demand and consumption is mainly institutional or urban. Rice requires less energy to cook than most of the other staples such as beans, banana and potatoes hence preferred by many urban dwellers. Other desirable features of rice include its ease of storage, handling and shelf life. Those features have made rice a popular choice of food in schools, homes, restaurants, and public ceremonies in Rwanda. When processed, rice gives off several useful by-products, which can be utilized in the animal feed industry, therefore also supporting the development of the livestock sector, which holds a key position in the support of the livelihood of the population especially by the protein supplement as well as household income. In addition to the reasons cited above for promotingrice production, another major importance of growing rice isto reduce the amount of foreign currency spent on the

imports of rice. Prospects for increasing rice production inRwanda have attracted great attention from government and donors. The government of Rwanda has secured funding from multilateral and bilateral agencies to finance various projects in the rice sub-sector that aim to revitalize rice production to meet the high local demand in Rwanda and to position the crop as a major competitive export commodity inthe region, (J.N. Jagwe at al., 2003). The reasons forwardedby government for prioritizing rice production in Rwanda arethat; Rice will offer an efficient utilization of the abundant natural resource (marshland). Rice will increaseemployment for the abundant labour force. Rice will improve incomes to stakeholders in the rice sub sector. Rice will provide sustainable food security. Rice will improve the balance of trade position through exporting rather than importing rice. Rice production is a factor of monetization of the rural economy as almost the total production is easily commercialized, generating income for producers and other stakeholders.
12 Rice is easily conservable, marketable, transportable hence the post harvest losses are minimal and the value ofthe crop is maximized. 2.5. RICE PRODUCTION IN RWANDA 2.5.1.Rice growing schemes in Rwanda At present, the rice growing schemes of Rwanda are eight: Bugarama, Ngenda, Butare, Kabuye, Muvumba, Mukunguri, Rwamagana, Cyunuzi. The following table (2) shows the surface, average yield (t/ha),total production and night temperatures accordingly to the rice growing schemes cited above. Table 2: Area, average yield, rice production and night temperatures for each rice scheme. Zone area (ha) average yield (t/ha) production (t) Night temperature (0 c ) Bugarama 1200 6.4 7600 15-20 Muvumba 460 5.0 2300 10-15 Rwamagana 729 4.6 3353 < 10 Ngenda 385 4.5 1732 10-15 Cyunuzi 250 4.0 1000 ---- Butare 2017 3.7 7463 10-15 Mukunguri 300 1.8 540 < 10 Kabuye 172 1.8 310 10-15 Total 5513 24598 Source: UCORIRWA, 2003 These rice schemes cover nearly 5500 hectares of mainly marshland and were designed to meet the food needs of the growing urban population.

13 The rest of the rice is produced on out grower fields andthese presently cover about 1500 hectares and this makes thetotal production area countrywide to be about 7000 hectares.In Bugarama, the People’s Republic of Korea participated in the Rice development program and in Butare, the American government through ACDI / VOCA has contributed financially towards the construction of hydro agricultural infrastructure of some of the rice schemes managed by CODERVAM, (J.N. Jagwe et al., 2003). Figure 1: Map of Rwandashowing the major Rice growing areas. Kagitumba - Muvumba Ntende Kayonza Kanyonyomba Muhazi Cyimpima Gitinga Bishya Mukunguri Kajevuba Gashara Shyogwe Cyarubare Rusuri Mbazi Agasasa Cyili Rwasave Source: MINAGRI, 2011 Mwambu
14 2.5.2. Rice Production trends Having acknowledged the potential of rice production in marshlands and the trends inconsumer demand, the Government of Rwanda declared rice as apriority crop in 2002. Government of Rwanda has since invested tremendous amount of resources through several highprofile development projects for the rice sector in the country, (MINAGRI, 2011). As a result, the total domestic rice production has increased from 11,654 tons in 2000 to about 111,076 tons in 2009 (Table 3). Such a significant increase in rice production was contributed by the several initiatives taken by MINAGRI in marshland reclamation and facilitation of inputs to farmers. Table 3: Rice Production Trends in Rwanda, 2000-2009 Year Paddy production (tons) Area Harvested (Ha) Yield (T/Ha) 2000 11654 4266 2.7 2001 15610 5090 3.1 2002 20976 6423 3.3 2003 27891 7607 3.7 2004 46191 12167 3.8 2005 62194 13922 4.5 2006 62932 14034 4.5 2007 62000 15005 4.1 2008 82000 18455 4.4 2009 111076 14433 7.7 Source: FAOSTAT, 2011
15 Despite the registered increase in rice production, the production is still very low compared to rice production in neighboring countries that are in the East African Community(EAC) as shown in table 4 below. Table 4: Total Milled Rice Production ('000 t) Decade Rwanda Burundi Kenya Uganda Tanzania EAC 1970s 1.85 4.44 24.56 12.4 184.05 227.3 1980s 4.64 15.41 30.19 17.29 329.54 397.07 1990s 6.53 29.75 31.58 54.47 446.29 568.62 2000s 213.03 199 475 1394 7646 9927.03

Source: MINAGRI, 2011 2.6. RICE MARKETING IN RWANDA 2.6.1. Paddy processing in Rwanda The original design for the rice schemes in Rwanda was to vertically integrate all the processes of rice production right from production until thefinal product ready for utilization by the consumer. All processes used in paddy processing until the distribution tothe consumer are shown in figure 2.
16 Figure 2: Sequence of postharvest operations. Paddy purchased from Cleaning By-products Drying Grading Storage Milling Distribution Parboiling Source: CHANDLER, 1979 Most of the processing units do act as intermediaries between theproducers and the consumers. They do purchase paddy from thefarmers, mill it and sort it and then sell the milled rice to consumers. Other by-products from the milling process arethe broken grain, the husks and the bran. The bran is usually sold to animal feed manufacturers. The processing ofrice is made easy if the grain is well dried and uniform in size. In cases where the grain size is not uniform, high broken grain incidences are experienced and the milling recovery rate lowers, (J.N. Jagwe et al., 2003). 2.6.2. Ricesupply channels in Rwanda In Rwanda, rice is mainly grown through the farmer cooperative schemes set up by the government. However, some of the population that is not under the membership of the cooperative scheme may also engage in rice growing. These have been referred to as out growers in figure 3.
17 Figure 3: Rice marketing channels in Rwanda Out growers Rice cooperative schemes Wholesalers Small-scale processors Imports Urban & Rural Retailers Consumers Individual households Schools & Colleges Hospitals Prisons Hotels& Restaurants STRATEGIES OF PROMOTING RICE PRODUCTION IN RWANDA2.7. KEY: Major channel Minor channel Source: J.N. Jagwe, 2003 Rice produced under the farmer cooperative schemes is centrally processed and the final product is mainly sold directly to consumers. This is the main rice-marketing channel. Other channels involve rice from the cooperative scheme being sold to wholesalers who sell it to retailers and finally to consumers.

18 The rice out growers sell their produce mainly to small-scale processors. The rice is processed and then sold to retailers and consumers in the nearby area. It is a common practice for out growers to pay a small fee to the small-scale processors to process their produce, which is later consumed domestically at a household level, (J.N. Jagwe et al., 2003). 2.7. CONSTRAINTS FOR THE DEVELOPMENT OF THE RICESECTOR IN RWANDA 2.7.1. Constraints related to rice production Despite the notable increase in yields, various challenges and constraints appear to hinder the maximum productivity potential of rice in Rwandan marshlands, (IFAD,2009). Adverse climate (droughts, flooding), poor soil, pest, weeds, inappropriate modern varieties, and lack of suitable modern technologies are the major causes of low productivity (Kayiranga, 2006). According to J.N. Jagwe et al., 2003, The Ministry of Agriculture (MINAGRI) in 2003, has reported that according to managers of several rice schemes which account for most of rice production in Rwanda,the limiting constraints to rice production are: The most important disease in most rice growing areas in Rwanda is Rice blast caused by P. Oyzae. It is common in Cyili and attacks the Yunyine4 variety when grown for more than 3 consecutive seasons on a large scale. This disease is capable of causing 80% loss in terms of yield. Other diseases include Sheath brown rot caused by Pseudomonas fuscovaginae and this is found in areas above 1,500M such asCyili, Rwamagana and Kabuye. The other disease is fungal caused by Sarocladium oryzae and is common in Bugarama. Most of the rice producers countrywide do complain about thestalked-eyed fly (Diopsis thoracica) whose larvae eat ricetillers causing them to dry out. Insecticides such as Sumithion and karate are recommended for use to control thispest.
19 The equitable distribution of water is a major constraint amongst rice growers, particularly during the dry season and for farmers whose fields are located at the lower end of a marshland. Deterioration and destruction of the drainage and irrigation infrastructure. This has resulted into the silting of canals, deterioration of water

catchments points and destruction of leveled plots set up which lead to poor water control. The untimely access to good quality seeds has also been reported to limit farmers’ ability to start the season on time and obtain the high yields possible. There is a very limited research aimed at improving performance of rice in terms of yield, disease and pest tolerance and good grain characteristics. This result from inadequate human, technical and financial resources. Insufficient use of agricultural inputs, both interms of quality and quantity, resulted into the degeneration of the input supply chain at a national and local level. Lack of knowledge on input usage and the high cost of inputs especially inorganic fertilizers, came out as the reasons for low or no input usage in Rice production in Rwanda. Most of the Chinese varieties that have been grown over the last 30 years are less superior to the newly introduced and the imported varieties such as Basmati and the Pakistan varieties. The newly introduced and important varieties have better desired qualitative such as a good aroma, long grain, easier to cook and most are tolerant to the notorious rice blast disease. In the absence of a strong extension network, rice growers in Rwanda mostly learn the production techniques from each other and through self trial and error. Poor organization of producers to take charge of input supply, field management as well as maintenance of the various infrastructures for production, handling, processing and marketing.
20 2.7.2. Constraints related to marketing of rice There is lack of adequate infrastructure including drying areas, threshers, huskers and stores which make it difficult to carry out the post harvest management of the crop. This results in losses in terms of quantity as well as quality ofthe produce hence less competitively on the market, (MINAGRI, 2005). Rice produced in Rwanda is largely sold in unorganized rural markets, whereas the mainstream urban markets largely sell imported rice. This is mainly because the locally produced rice grains suffer higher breakages upon milling. The implication of this low quality is that
lower farm gate prices are offered for the locally produced rice hence making the enterprise less profitable, (MINAGRI, 2011). For instance, the high post harvest losses (quantity and quality) of harvested grains can severely limit the profitability and marketability of locally produced rice. Most of the rice producers are price takers rather than setters and this is due to their urgent liquidity needs therefore they are usually offered the lowest farm gate prices for their produce. This greatly reduces the profitability of the enterprise, (J.N. Jagwe et al., 2003). Most of the rice growers and other stakeholders along the rice value chain are constrained by the credit availability.This results in the lack of investment capital which limits the involvement of the private sector, (MINAGRI, 2011). 2.8.STRATEGIES OF PROMOTING RICE PRODUCTION IN RWANDA Through a number of high profile agricultural development projects, the Ministry of Agriculture and Animal Resources (MINAGRI) has revamped and rendered several marshlands to farmers for rice cultivation. The government has also facilitated the delivery of inputs such as seeds, fertilizers and pesticides, (Kathiresan, 2010).
21 In order to promote rice production in Rwanda, the National Rice Development Strategies (NRDS) lay emphasis on the following approaches: Facilitation of research for development of rice value chain. Expansion and diversification of land area under rice cultivation by reclaiming new marshland areas that have the potential forrice production. Improvement in productivity of small holder farms through efficient distribution and use of inputs. Establishment of new- and rehabilitation/maintenance of old infrastructures in marshlands. Construction and/or maintenance of the water supply systems to permit exploitation of the cultivable areas through the two growing seasons. Enhancement of quality and competitiveness of locally produced grains in domestic and regional markets by introducing technologies and raising the awareness on handling of paddy grains at harvesting, drying, winnowing and storage phases by the producers. Creation of favorable environments for the

sustenance of rice sub-sector through effective policy andregulatory frameworks. Improving the knowledge on water useefficiency through training and by enabling efficient organization of irrigation water user associations in marshlands will increase land and crop productivity especially during the dry season. Provision of subsidies tofarmers’ cooperatives to acquire seed, fertilizer and other inputs. By setting rice as a priority crop, the government of Rwanda has sensitized the importance of the development of rice sector amongst farmers, local administrative authorities, research and developmental agencies in the country, non-governmental organizations and developmental partners. The government has helped farmers set up rice cooperatives in all rice production areas. The government treats cooperatives as ‘delivery nodes’ of various inputs and services meant for the development of rice sector, (Kathiresan, 2010).
22 There is an urgent need to expand the capacity of extension system to enable efficient transfer of technologies on production, soil and water management, pest and disease management, harvesting, post harvest handling and storage of rice in marshlands. To increase the efficiency of reaching out to the farmers, the government provides the technical and financial provisions also to the local district authorities and non-governmental organizations. Public private partnerships in extension services can also accelerate the dissemination of on-farm technologies to farmers, (MINAGRI, 2011). Rwanda AgricultureDevelopment Authority (RADA) is responsible for introducing and promoting technologies on rice production and post harvest processing amongst rice growers. The research functions are largely carried out by a specialized rice unitof ISAR through various regional and international collaborations. Crop Intensification Program (CIP) is a flagship program of MINAGRI that focuses on the intensification of rice crop. CIP aims to significantly increase total production of rice in the country by raising productivity in small holder farms. It intends to accomplishthis goal by facilitating access to inputs (seeds and

fertilizers), consolidation of land use, proximity extensionservices and post harvest handling and storage, (Kathiresan,2010). The consistency and efficiency of farm operations such as land preparation, crop management; harvesting and post harvest handling can be improved through appropriate mechanization. Profitable mechanization options need to be identified for rice production in marshlands and disseminated. Furthermore, private entrepreneurship in provision of mechanization services and sourcing of machineries and implements need to be encouraged. Training of rural artisans, mechanics, technicians and engineers on the usage and maintenance of farm machineries will improve the adoption of mechanization in rice sector, (MINAGRI, 2011). Improved access to finance through diversified loan schemes and increased rural banking facilities and services that are targeted to farmers, cooperatives, agro-dealers, service providers and traders in marshlands will speed up the transfer of socio economic benefits from increased rice production, (MINAGRI, 2011).
23 CHAPTER III: METHODOLOGY 3.1. INTRODUCTION This chapter
presents the methodological approach, the data collection techniques and the entire process that will be used to conduct the study. It shows the methods that the researcher will use to collect and analyze the data, the selection of the respondents, and it further spells out how the information was obtained from respondents, analyzed and interpreted to enable the researcher to draw logical conclusions. Kenneth D. Bailley (1978: 83) defines the methodology as the set of methods and principles that are used when studying a particular kind of work. A method composes all intellectual process in orderly system or arrangements that enable a researcher to reach an aspect of knowledge by using various techniques. Methodological research is controlled by investigation of the theoretical and applied aspects of measurement, mathematics and statistics, and way of obtaining and analyzing data, (Kerlinger, Fred N., 1964). 3.2. RESEARCH DESIGN Christensen(1991: 269); defines research design as an outline, a plan

or a strategy specifying the procedures to be used in investigating the research problem. It is simply the framework or plan of the study used as a guide in collectingand analyzing data. For the purpose of the current study thesurvey method was adopted. 3.3. PROCESS OF THE STUDY This study will involve both qualitative and quantitative data. The qualitative data are subjective in nature. Numerical data analysis and statistical tests are objective in nature and deal with measuring phenomena. For this study, computation of percentages, frequencies and hypotheses testing will be done.
24 3.4. THE TYPE OF THE STUDY Survey research was chosen dueto the fact that this is an exploratory analytical study on the assessment of the importance of rice production on levels of saving and income of rice farmers in Rwanda. Analytical study is defined as an investigation that seeks to explain in details the phenomenon. An exploratory research on the other hand, is a study conducted to investigate a new phenomenon or “old” phenomenon examined for a different perspective. 3.5. STUDY POPULATION The population under study is the members of KOAIRWA Cooperative. KOAIRWA Cooperative has 1179 members with 503 women and 676 men, this is a big population that is the reason a sampling method was used. 3.6. SAMPLE SIZE According to Dagnelie (1980), without using any mathematic formula, we can confirm that the precision of results obtained from surveys by questionnaire. The study will be conducted on a sample of 65 farmers. The choice of sample size from 1179 farmers was guided by sample size calculator by Raosoft.Inc (online software that calculates the sample size). By taking margin of error of 10%, confidence level of90% (level of significance is 10%) and the population size of 1179 farmers. Raosoft sample size calculator has given the recommended sample size of 65 farmers. Where: The margin of error is the amount of error that I can tolerate. The level of significance is the amount of uncertainty I can tolerate.
25 3.7. SOURCE OF DATA The researcher used both primary and secondary data to carry out the study. Primary data refers

to the information collected specifically for the purpose ofthe investigation at hand. This was obtained from selected respondents through individual interviews at field. The respondents mainly were the members of KOAIRWA selected as they were seen have much information on rice production. Secondary data on the other hand is the information not gathered for the immediate study at hand but some purpose. The source of secondary data includes library books, articles, journals, published annual reports, and other researches that have been done before. 3.8. METHODS OF DATA COLLECTION 3.8.1. Questionnaire The information was obtainedthrough a structured questionnaire. The questionnaire contained both close-ended and open-ended questions. The questionnaires were filled by the researcher as many rural farmers do not know how to read and write. 3.8.2. Observation The observation is a method that most commonly involves sight or visual data collection, and could also include data collection via other senses, such as hearing, touch, or smell. The use of this method does not preclude simultaneous use of other data gathering techniques. The researcher used this method by scrutinizing the way respondents answered questions and attempted to deduce some information from answers provided. 3.9. DATA ANALYSIS This technique helped to quantify the data from research and to represent them as tables or graphics which give a good imageto readers. The Microsoft word, Microsoft Excel programs andSPSS 16.0 Program for windows were used in data treatment and then the interpretations and conclusions.
26 CHAPTER IV: DISCUSSION OF THE FINDINGS 4.1. INTRODUCTION This chapter presents and discusses the major findings of the study and then interpretations. This was in due regarding to the objectives of the study. Responses were collected from the number of sample size and it was believedto be representative enough to allow for generalization to the place. In the presentation of the finding, statistical tables and percentages were used to summarize the data. The data was collected from 65 respondents. The researcher himself collected the data manually. Various findings were derived from the data collected in relation from the study
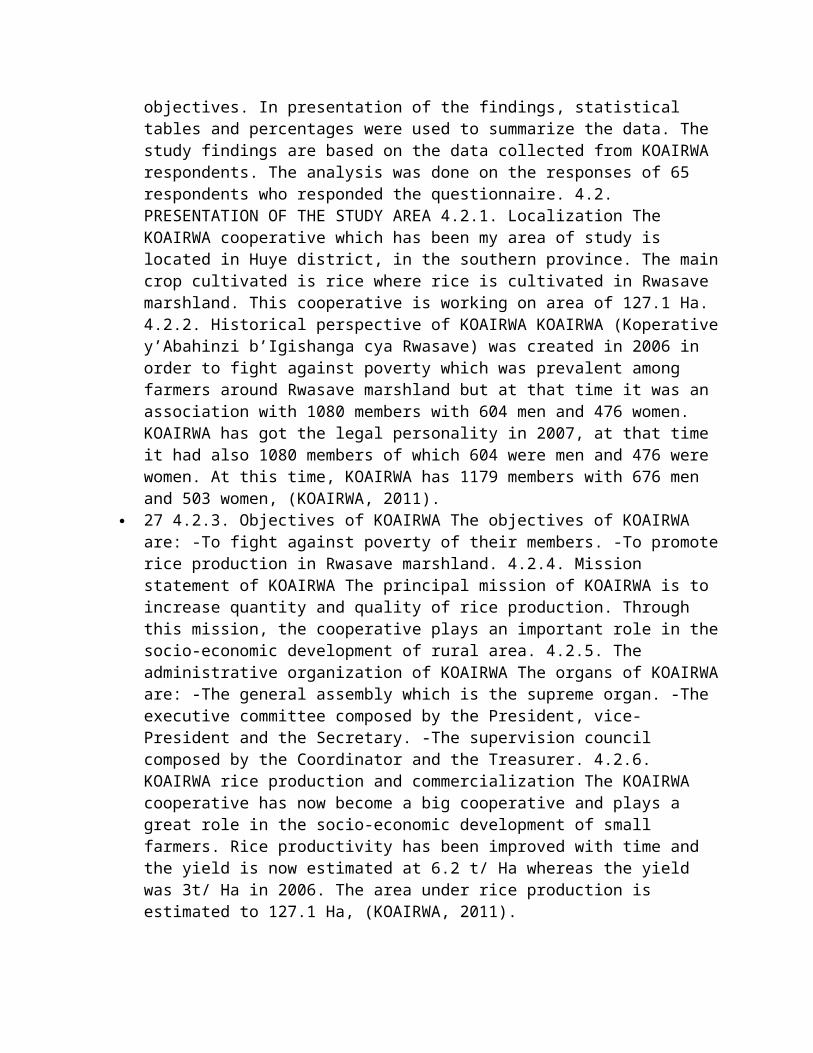
objectives. In presentation of the findings, statistical tables and percentages were used to summarize the data. The study findings are based on the data collected from KOAIRWA respondents. The analysis was done on the responses of 65 respondents who responded the questionnaire. 4.2. PRESENTATION OF THE STUDY AREA 4.2.1. Localization The KOAIRWA cooperative which has been my area of study is located in Huye district, in the southern province. The maincrop cultivated is rice where rice is cultivated in Rwasave marshland. This cooperative is working on area of 127.1 Ha. 4.2.2. Historical perspective of KOAIRWA KOAIRWA (Koperativey’Abahinzi b’Igishanga cya Rwasave) was created in 2006 in order to fight against poverty which was prevalent among farmers around Rwasave marshland but at that time it was an association with 1080 members with 604 men and 476 women. KOAIRWA has got the legal personality in 2007, at that time it had also 1080 members of which 604 were men and 476 were women. At this time, KOAIRWA has 1179 members with 676 men and 503 women, (KOAIRWA, 2011).
27 4.2.3. Objectives of KOAIRWA The objectives of KOAIRWA are: -To fight against poverty of their members. -To promoterice production in Rwasave marshland. 4.2.4. Mission statement of KOAIRWA The principal mission of KOAIRWA is to increase quantity and quality of rice production. Through this mission, the cooperative plays an important role in thesocio-economic development of rural area. 4.2.5. The administrative organization of KOAIRWA The organs of KOAIRWAare: -The general assembly which is the supreme organ. -The executive committee composed by the President, vice-President and the Secretary. -The supervision council composed by the Coordinator and the Treasurer. 4.2.6. KOAIRWA rice production and commercialization The KOAIRWA cooperative has now become a big cooperative and plays a great role in the socio-economic development of small farmers. Rice productivity has been improved with time and the yield is now estimated at 6.2 t/ Ha whereas the yield was 3t/ Ha in 2006. The area under rice production is estimated to 127.1 Ha, (KOAIRWA, 2011).
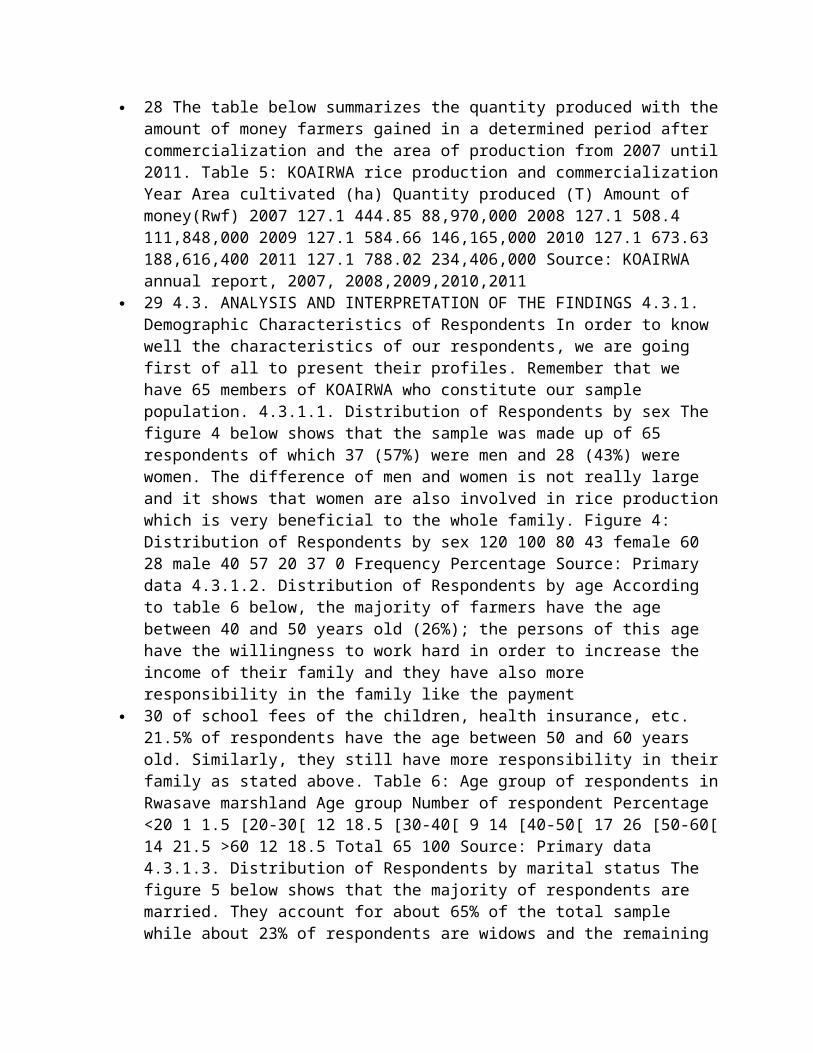
28 The table below summarizes the quantity produced with theamount of money farmers gained in a determined period after commercialization and the area of production from 2007 until2011. Table 5: KOAIRWA rice production and commercializationYear Area cultivated (ha) Quantity produced (T) Amount of money(Rwf) 2007 127.1 444.85 88,970,000 2008 127.1 508.4 111,848,000 2009 127.1 584.66 146,165,000 2010 127.1 673.63 188,616,400 2011 127.1 788.02 234,406,000 Source: KOAIRWA annual report, 2007, 2008,2009,2010,2011
29 4.3. ANALYSIS AND INTERPRETATION OF THE FINDINGS 4.3.1. Demographic Characteristics of Respondents In order to know well the characteristics of our respondents, we are going first of all to present their profiles. Remember that we have 65 members of KOAIRWA who constitute our sample population. 4.3.1.1. Distribution of Respondents by sex The figure 4 below shows that the sample was made up of 65 respondents of which 37 (57%) were men and 28 (43%) were women. The difference of men and women is not really large and it shows that women are also involved in rice productionwhich is very beneficial to the whole family. Figure 4: Distribution of Respondents by sex 120 100 80 43 female 60 28 male 40 57 20 37 0 Frequency Percentage Source: Primary data 4.3.1.2. Distribution of Respondents by age According to table 6 below, the majority of farmers have the age between 40 and 50 years old (26%); the persons of this age have the willingness to work hard in order to increase the income of their family and they have also more responsibility in the family like the payment
30 of school fees of the children, health insurance, etc. 21.5% of respondents have the age between 50 and 60 years old. Similarly, they still have more responsibility in theirfamily as stated above. Table 6: Age group of respondents inRwasave marshland Age group Number of respondent Percentage <20 1 1.5 [20-30[ 12 18.5 [30-40[ 9 14 [40-50[ 17 26 [50-60[14 21.5 >60 12 18.5 Total 65 100 Source: Primary data 4.3.1.3. Distribution of Respondents by marital status The figure 5 below shows that the majority of respondents are married. They account for about 65% of the total sample while about 23% of respondents are widows and the remaining

12% of respondents are single. Therefore the main demographical profile of respondents is married.
31 Figure 5: Marital status of respondent 70 65 60 50 42 40 Frequency 30 Percentage 23 20 15 12 10 8 0 Single Married Widow Source: Primary data 4.3.1.4. Education The figure 6 below shows that 85 % of farmers surveyed have attended the primary school and 9% did not attend the school, and few of them (6 %) have attended secondary school. This suggests that the majority of rice growers in Rwasave marshland have the primary school education while others are illiterate; this becomes a very big obstacle for the adoption of new technologies on rice crop management.
32 Figure 6: Education level of respondents 90 85 80 70 60 55 50 Frequency 40 Percentage 30 20 10 6 9 4 6 0 illiteracy Primary school Secondary school Source: Primary data 4.3.1.5. Family size The results from this study showed thatthe average size of a family of respondents is estimated at five members for each household. The families who have the minimum size are those with one member, these are mostly single persons. The largest family has ten members (Table 7). Table 7: Family size of respondents in Rwasave marshlandFamily size Minimum Maximum Mean 1 10 5.26 Source: Primary data
33 4.3.2. Reasons of Farmers to join KOAIRWA During the survey, the respondents claimed various factors that have pushed them to take decision of joining KOAIRWA. Figure 7 shows clearly the major reasons of joining KOAIRWA where 27 respondents (41.5%) have decided to join the cooperative forthe purpose of accessing to agricultural inputs such as fertilizers and pesticides. 26.2% of respondents decided to join the cooperative to access to the market because the cooperative provide a reliable and dependable market. 24.6% of respondents have decided to join the cooperative to get access to the financial services whereas 7.7% of respondentsdecided to join this cooperative to get access to farm extension services. Figure 7: Respondents’ views on the reasons of joining KOAIRWA 41.5 45 40 35 30 27 25 16 20 26.224.6 17 Frequency Percentage 15 10 5 7.7 5 0 Access to inputs Access to financial services Access to the market

Access to farm extension services Source: Primary data 4.3.3. Annual Income of Farmers before joining KOAIRWA According to table 8, the results from this study showed that 33 respondents (50.8%) said that their annual income before joining KOAIRWA was only between 20000 and 50000 Rwf,19 respondents (29.2%) could only get the amount of money between 0 and 20000 Rwandan francs which is very little, 10 respondents (15.4%) could gain between 50000 and 80000 Rwandan francs and only 3 respondents (4.6%) could have the amount of money between 80000 and 100000 Rwandan francs.
34 It is very important to mention that no respondent can gain hundred thousand Rwandan francs and more, the results show clearly that the annual income of farmers before joining KOAIRWA was very low and consequently they could notpay themselves the health insurance of the whole family and the school fees of their children. Table 8: Annual income before joining KOAIRWA Annual income Frequency Percentage 0-20000Rwf 19 29.2 20000-50000Rwf 33 50.8 50000-80000Rwf 10 15.4 80000-100000Rwf 3 4.6 Total 65 100 Source: Primary data4.3.4. Rice Production and Marketing 4.3.4.1. Field size under rice cultivation The figure 8 below shows that the area under rice cultivation for each household in Rwasave marshland is very small. This study has reported an average field size of 7.7 Ares (770 m2) per household, and the household who has the smallest field size, has 3 Ares (300 m2) and the one with the largest field size has 30 Ares (0.3Ha) for each household. This suggests that in Rwasave marshland, farmers cultivate rice in plots where the size per plot is estimated at 5 Ares but there are exceptions of plots with 4 Ares and 3Ares which is the minimum one.
35 Figure 8: Size of land under rice cultivation Farm size in ares 35 30 25 20 15 30 Farm size in ares 10 5 7.7 3 0 Minimum Mean Maximum Source: Primary data 4.3.4.2. Rice production in Rwasave marshland The results from this study showed that the average quantity of rice produced by each farmer in 2011 for two growing seasons was estimated to 425.3Kg. The lowest quantity produced in 2011 was 100Kg while the highest quantity encountered was 1500Kg (Table 9).Table 9: Quantity of rice produced by KOAIRWA farmers in

2011 Rice production (Kg) Minimum Maximum Mean 100 1500 425.3 Source: Primary data 4.3.4.3. Relationship between rice production and land size The table 10 illustrates an empirical analysis of the relationship rice production and size of land cultivated.
36 Table 10: OLS estimates of rice production in Rwasave marshland Coefficients Unstandardized Standardized 95% Confidence Interval Coefficients Coefficients for B Lower Model B (Constant) Std. Error Beta Farm size in Ares 52.290 2.879 .916 Sig. Bound Upper Bound .863 22.300 25.830 t .391 -29.317 73.918 18.164 .000 46.538 58.043 Dependent Variable:Rice production (kg)in 2011 Model Summary Adjusted Model R .916 R Std. Error of the R Square Square Estimate .840 106.610 .837 Source: Primary data iYi= 22.3 + 52.29xi + r2= 0.84 Where Yi= Rice production (Kg) Xi= Farm size in Ares (000m2) i= Error term The simple regression analysis gives a positive effect of farm size on rice production. There wasan estimated increase of 52.29Kg in average rice production resulting from 1 Are (100m2) increase in the size of the land cultivated. The r2 value of 0.84 means that about 84 percent of the variation in rice production is explained by land size. Since r2 can at most be 1, the observed r2 suggests that the sample regression line ts the data very fiwell.
37 The coefficient of correlation of 0.916 shows that the two variables, rice production and farm size, are highly positively correlated. 4.3.4.4. Annual income from sales According to figure 9, the results from this study showed that farmers earn higher income from the sales of their riceproduction than the income they gained before starting to cultivate rice. This result from the fact that farmers gained on average 127371Rwf in 2011 from the sales of rice production whereas there was no farmer who could gain 100000Rwf and more annually before joining KOAIRWA. Figure 9: Annual income (Rwf) from sales in 2011 Annual income(Rwf)in 2011 500000 450000 400000 350000 300000 250000 200000 150000 100000 50000 0 450000 127371 30000 Minimum Mean Maximum Source: Primary data 4.3.4.5. Saving a) Bank accountThe figure 10 below shows that a hundred percent of

respondents have a bank account. This suggests that during the survey, all members KOAIRWA have agreed that they have abank account in SACCO UMURENGE and it is where they are paidafter supplying their production to the cooperative.
38 Figure 10: Members of KOAIRWA who have bank account 100 100 80 65 Yes 60 No 40 20 0 0 0 Frequency Percentage Source:Primary data b) Level of saving The table 11 below shows that 90.8% of respondents said that they can now save each month the amount of money between 0 and 5000 Rwandan francs and only 9.2% of respondents can now save each month the amount of money between 5000 and 15000 Rwandan francs. It isvery important to mention that no respondent can save 15000Rwf and more. This level of saving suggests that farmers can pay themselves the health insurance of the wholefamily. Table 11: Monthly level of saving after joining KOAIRWA Monthly saving Frequency Percentage 0-5000Rwf 59 90.8 5000-15000Rwf 6 9.2 15000Rwf and more 0 0 Total 65 100 Source: Primary data
39 c) Loan taking The figure 11 below illustrates the numberof KOAIRWA members who have taken a loan and those who have not taken the loan in the last five years. This figure showsthat only 12.3% of respondents have taken a loan during the last five years whereas the remaining 87.7% of respondents have not taken any loan during the last five years. The logic behind this is that most farmers rely on their cooperative as a source loan and they have said that the management of cooperative does not give the loan easily for the reasons of lack of money. Figure 11: Members of KOAIRWA who have taken a loan in the last five years 87.7 90 80 70 60 50 40 30 20 10 0 57 Yes No 8 Frequency 12.3 Percentage Source: Primary data d) The use of loans The table 12 below shows that 87.5% of respondents, who have taken the loan during the last five years, use it for the investment in rice production whereas the remaining 12.5% use it for consumption. This suggests that few farmers, who have taken the loan in the last five years, have mostly used the investment in rice production.
40 Table 12: The use of loan for those who have taken it Useof loans Frequency Percentage Consumption 1 12.5 Investment

7 87.5 Total 8 100 Source: Primary data 4.3.4.6. Economic advantages of growing rice The figure 12 below shows that about 84.6% of respondents have gained enough income from rice production, 9.2% of respondents said that rice production has improved their level of saving and 6.2% of respondents have agreed that rice production can be taken asa facility of getting credit. According to this study, rice production has a major importance to the economic development of KOAIRWA members. Figure 12: Economic advantages of growing rice 84.6 90 80 70 60 55 50 Frequency 40 Percentage 30 20 6 10 9.2 4 6.2 0 Gain enough income Source: Primary data Be able to save Facility of getting credit
41 4.3.5. Constraints of Rice Production in Rwasave Marshland Rice growers from Rwasave marshland were requestedduring the survey to reveal various constraints faced at production and marketing of rice in their marshland. The major constraints identified by farmers were as follow: Farmers are not paid at time for their production delivered to the cooperative and this has been reported to limit farmers’ ability to start the season on time. Small area for paddy drying and inadequate storage facilities. Lack of factory for paddy processing. The inequitable distribution of water among rice fields, particularly duringthe dry season and for farmers whose fields are located atthe lower end of the marshland, this is also related to poormaintenance of the water supply infrastructures. Inadequatemarket and the low price for the paddy rice. The cooperative does not give credit easily to their members andthis causes the problem of poor investment. Lack of assistance by the cooperative in paddy processing particularly in rice milling. High cost of inputs like fertilizers and labor. 4.3.6. Strategies of Promoting Ricein Rwasave Marshland During the survey, rice growers in Rwasave marshland have proposed various strategies that their cooperative should put in action in order to overcome those constraints they usually face in the production and marketing of rice. The major strategies proposed by farmers were as follow: The management of cooperative should pay at

time their members after the delivery of the production. Furthermore they should give them better prices.
42 The cooperative should seek ways to enlarge area for paddy drying and build new storage facilities. The cooperative should work with different donors and financial institutions in order to get money for building a factory of paddy processing. The cooperative in partnership with RSSP should emphasize the maintenance of the water supply systems to permit exploitation of the whole marshland through the two growing seasons. The cooperative should assist their members by giving them credit when needed.
43 CHAPTER V: SUMMARY OF THE FINDINGS, GENERAL CONCLUSION AND RECOMMENDATIONS 5.1. SUMMARY OF THE FINDINGS This study has examined the promotion of rice production as a solution to the lower levels of saving and income in the rural areas of Rwanda. The study was mainly based on data from 65 members of KOAIRWA located in Huye District, Southern Province. Farmers have decided to join the cooperative of rice production (KOAIRWA) to get access to inputs, in order to increase their rice productivity. This study has shown that the rice production has contributed significantly to the increase of annual income of farmers compared to the income they gained before starting to cultivate rice. The level of saving has been improved resulting from the fact that all farmers have a bank account. Farmers have found various economic advantages from growing rice such as; the increase of income, the increase of savings, the facility ofgetting credit and hence the economic development of farmers. Although farmers have clearly improved their level of saving and income, they still face various constraints intheir production and marketing such as inequitable distribution of water among rice fields, small area for paddy drying and inadequate storage facilities; lack of factory for paddy processing; inadequate market and the low price for the paddy rice; the untimely payment of farmers; lack of credits for farmers, etc. Farmers have suggested some strategies to overcome those constraints such as the maintenance and construction of water supply systems enlargement of areas for paddy drying and the building of

new performing storage facilities; the building of factory for paddy processing; the payment at time in order to start the season on time; facilitation to get credit easily, etc.
44 5.2. GENERAL CONCLUSION The aim of this study was to identify the contribution of rice production on levels of saving and income of farmers in Rwasave marshland, Huye District. It was found that rice productivity in Rwasave hasincreased from 3t/Ha in 2006 to 6.2t/Ha in 2011 and most of this increment was due to inputs access and more extension services from their cooperative. Furthermore, rice production has contributed significantly to the increase of income for farmers through the sale of their production, thus the sale of rice production has contributed to the foodsecurity of the Rwandan population living in Huye District. Although KOAIRWA was created to fight against poverty which was prevalent among farmers around Rwasave marshland, this cooperative has managed to achieve its set objective. In this regard, KOAIRWA has played an important role in the improvement of levels of saving of their members because theresults from the study have shown that all members have a bank account and with their levels of saving, they have beenable to pay themselves the school fees of their children andthe health insurance of the whole family. Therefore, rice production in Rwasave marshland through the organization of farmers in KOAIRWA cooperative has contributed significantlyto poverty reduction and socioeconomic development of farmers. 5.3. RECOMMENDATIONS The following recommendations were made in order to promote rice production in Rwanda in general: Due to scarce land resource, the government of Rwanda through MINAGRI should put more and more effort in rice production because it is expected to give high yield per unit area and it generates more income to rural farmers,and also it provides a sustainable food security. Traditional farmers should be encouraged to adopt modern crop production and management practices including efficient use of improved crop varieties and fertilizers as well as pesticides for the purpose of improving their productivity.

45 There is a need to enhance the quality and competitiveness of locally produced gains in domestic and regional markets by introducing technologies and raising theawareness on handling of paddy grains at harvesting, drying and storage phases by the producers. RSSP should expand thecapacity of extension system to enable efficient transfer of technologies on production, soil and water management, pest and disease management, harvesting, post harvest handling and storage of rice in marshlands. Farmers should be encouraged to take loans in different financial institutions instead of relying on small credits rarely given by their cooperatives because credits will help them to increase their investment and then speed up the transfer of socioeconomic benefits from rice production.
46 REFERENCES A. TEXTBOOKS A.Kathiresan, 2010. Mapping of Poverty Reduction Strategy Papers (PRSPs), sector strategie and policies related to rice development in Rwanda. 7-9p. Chandler Robert F., 1979. Rice in the tropics: A guide of development of national programs, USA. West view press. Inc.Colorado. Choudhury I., 2005. Environmental status Evaluation of agroecosystem of South 24 Paraganas Districts,West Bengal using remote sensing and GIS Techniques, Nadia, West Bengal, India. Christensen, Larry B., 1991. Experimental methodology. 269p. Dagnelie P., 1980. Théories et méthodes statistiques. II. Applications agronomiques. Gembloux, Belgique : Les Presses agronomiques de Gembloux, 463 p. Grist D.H., 1986. Rice 6th Edition. Longman, London and New York. J.N.Jagwe, G. Okoboi, P. Hakizimana, J. Tuyisinge, and M. Rucibigango, 2003. Marketing Survey of theRice sub-sector in Rwanda. 8-12p. Jones, R.A.D., I.C. Mahapatra and S.A. Raymundo, 1995. Rice research in Sierra Leone. Kenneth D. Bailley, 1978. Methods of social research,83p. Kerlinger, Fred N., 1964. Foundations of behavioral research; educational and psychological inquiry, 700p. KippsM.S., 1970. Production of field crops 6th Edition, McGraw-Hill, New York. Wigginton. 335-346p. Mc Connell Brue, 2002. Macroeconomics.
47 Michael Morris, Liz Drake, Kene Ezemenari and Xinshen Diao, 2008. Promoting sustainable pro-poor growth in Rwandan
agriculture. 1-2p. Michael Parkin, Robin Bade, 1939. Macroeconomics. Oelke E.A, RA Porter, AW Grombacher, and PB Addis, 1997. Wildrice-new interest in an old crop cereal foods world 42. 234-247p. Pass, Christopher; Lowes, Bryan and Robinson, Andrew (1988). Business and Macroeconomics. Richard G., Andy Lipsey (1991). Economics, 7th Edition HarperCollins publishers Inc.New York. William H., Branson, 1989. Macroeconomics: theory and policy. B. DISSERTATIONS, REPORTS AND JOURNALS AMIS RWANDA, 2010. National Rice Production Program (period 2006-2016) Eugène Bagumire, 2005.The impact of rice cultivation on rural livelihoods. Case study of rice production in Muvumba District. FAO, 2006. Handbook on rural households’ livelihood and well-being FAO,2002. The development and use of integrated crop management for rice production IFAD, January 2009. Making Rice a Cash Cow in Rwanda. IRRI, 1993. International rice research Institute. P.O.Box 933, 1099 Manila, Philipines. ISAR, 2003.Presentation of ISAR Rice research program, Rubona. Kayiranga Didace, 2006. The effect of land factors and management practices on rice yields. Case study in Cyili inland valley, Gikongo Ditrict, Rwanda, Thesis Rubona. 5-17p. MINAGRI, 2005. National Rice Production Program (period2006-2016).
48 MINAGRI, 2009. Strategic Plan for the Transformation of Agriculture in Rwanda –Phase II MINAGRI, 2011. National RiceDevelopment Strategy (period 2011-2018). RADA, 2008. Increasing Rice Productivity through Integrated Input Management. 5-20p. Sendege Norbert, 2011. Rice Production inRwanda. UCORIRWA, 2004. Etude diagnostique des coopératives et associations rizicoles. Rapport final, Kigali. Van Nguu Nguyen, 2000. FAO Rice Information Volume 2 C. ELECTRONIC SOURCES FAOSTAT, 2011. FAO Statistics online databases on www.fao.org http://www.faostat.fao.org www.raosoft.com/samplesize.html www.fao.org/cms/world/rwanda/CountryInformation http://www.fao.org/docrep/meeting/004/ac346e/ac346e00.htm. www.businessdictionary.com/definition/production.htm www.amis.minagri.gov.rw
49 APPENDIX

50 APPENDIX 1: “QUESTIONNAIRE FOR SURVEY” Questionnaire No Name of interviewer Date of interview Cell Sector District Province I. INTERVIEWEE IDENTIFICATION 1. Sex: Male Female 2. Age: …………. 3. Marital status: Single Married Widow 4. Education level: Illiterate (No education) Primary school Secondary school University
51 5. Number of people in your family: ………… II. Rice production and marketing 1. What is the size of your farm under rice cultivation? 0 – 0.5 ha 3 – 4 ha 0.5 – 1 ha 4 – 5ha 1 – 2 ha above 5 ha 2 – 3 ha 2. How long you have been a rice farmer? 1= less than 5 years; 2= 6–10 years; 3= 11–15 years; 4= 16–20 years; 5= Over 20 years 3. When did you joinKOAIRWA? ………………………………………………………… 4. Were you growing rice before joining KOAIRWA? 1=yes; 2=no 5. Why did you decide tobecome a member of KOAIRWA? 1=Access to inputs (Fertilizers and Pesticides); 2=Access to financial services; 3=Access tothe market; 4=Access to farm extension services Other, specify ………………………………………………………………………………. 6. What was your annual income before joining KOAIRWA? 0-20000Rwf 20000-50000Rwf 50000-80000Rwf 80000-100000Rwf 100000 and above
52 7. Quantity of rice produced and sold from 2007 to 2011 Year Quantity harvested Quantity sold Market price/ kg Annual income from sales 2007 2008 2009 2010 2011 8. Do you have a bank account or an account in any financial institution? 1=yes; 2=no 9. Did you take a loan? Source of money (Borrowed Amount borrowed in 2010 Amount borrowed in 2011 from) 10. What was the use of your loan? 1=consumption;2=investment; 3=income generating activities Other, specify ……………………………………………………………………………
53 11. How is your level of saving after joining the cooperative? (Monthly) 0-5000Rwf 5001-15000Rwf 15001-30000Rwf 30001 and above 12. What are the benefits of growing rice? 1=Gain enough income; 2=be able to save; 3=Facility of getting credit Other, specify …………………………………………………………………………… 13. Where do you sell your produce? 1=KOAIRWA Cooperative; 2=local market; 3=Middlemen Other, specify ……………………………………………………………………………… 14. How do youtransport your rice production to your market (place of selling)? 1=by head; 2=Bike; 3=Pick up Other specify

……………………………………………………………………………… 15. How does the cooperative assist you to improve rice productivity? 1=Access to credit;2=offering farm extension services; 3=Provision of input (Fertilizers or Pesticides); 4=Access to the maintenance of the water supply systems to permit exploitation of the cultivable areas through the two growing seasons.
54 16. What are the constraints do you face in rice production? ………………………………… ………………………………………………………………………………………………… ………………………………………………………………………………………………… 17. What are the strategies to put in place in order to overcome those constraints? ……………………………………………………………………………………………....... …………………………………………………………………………………………………
Copyright © 2022 FDOKUMEN