Soil-Quality Indicators for Predicting Sustainable Organic Rice Production
23
This article was downloaded by: [Louisiana State University] On: 26 September 2012, At: 08:26 Publisher: Taylor & Francis Informa Ltd Registered in England and Wales Registered Number: 1072954 Registered office: Mortimer House, 37-41 Mortimer Street, London W1T 3JH, UK Communications in Soil Science and Plant Analysis Publication details, including instructions for authors and subscription information: http://www.tandfonline.com/loi/lcss20 Soil-Quality Indicators for Predicting Sustainable Organic Rice Production Chunchara Thuithaisong a , Preeda Parkpian a , Oleg V. Shipin a , Rajendra P. Shrestha b , Kunnika Naklang c , Ron D. DeLaune d & Aroon Jugsujinda d a Environmental Engineering and Management Program, School of Environment, Resources, and Development, Asian Institute of Technology (AIT), Klong Luang, Pathumthani, Thailand b Natural Resources Management Program, School of Environment, Resources, and Development, Asian Institute of Technology (AIT), Klong Luang, Thailand c Surin Rice Research Center, Surin, Thailand d Department of Oceanography and Coastal Science, School of Coast and Environment, Louisiana State University, Baton Rouge, Louisiana, USA Version of record first published: 07 Mar 2011. To cite this article: Chunchara Thuithaisong, Preeda Parkpian, Oleg V. Shipin, Rajendra P. Shrestha, Kunnika Naklang, Ron D. DeLaune & Aroon Jugsujinda (2011): Soil-Quality Indicators for Predicting Sustainable Organic Rice Production, Communications in Soil Science and Plant Analysis, 42:5, 548-568 To link to this article: http://dx.doi.org/10.1080/00103624.2011.546930 PLEASE SCROLL DOWN FOR ARTICLE Full terms and conditions of use: http://www.tandfonline.com/page/terms-and-conditions This article may be used for research, teaching, and private study purposes. Any substantial or systematic reproduction, redistribution, reselling, loan, sub-licensing, systematic supply, or distribution in any form to anyone is expressly forbidden. The publisher does not give any warranty express or implied or make any representation that the contents will be complete or accurate or up to date. The accuracy of any instructions, formulae, and drug doses should be independently verified with primary sources. The publisher shall not be liable for any loss, actions, claims, proceedings,
-
Upload
independent -
Category
Documents
-
view
2 -
download
0
Transcript of Soil-Quality Indicators for Predicting Sustainable Organic Rice Production
This article was downloaded by: [Louisiana State University]On: 26 September 2012, At: 08:26Publisher: Taylor & FrancisInforma Ltd Registered in England and Wales Registered Number: 1072954 Registeredoffice: Mortimer House, 37-41 Mortimer Street, London W1T 3JH, UK
Communications in Soil Science andPlant AnalysisPublication details, including instructions for authors andsubscription information:http://www.tandfonline.com/loi/lcss20
Soil-Quality Indicators for PredictingSustainable Organic Rice ProductionChunchara Thuithaisong a , Preeda Parkpian a , Oleg V. Shipin a ,Rajendra P. Shrestha b , Kunnika Naklang c , Ron D. DeLaune d &Aroon Jugsujinda da Environmental Engineering and Management Program, Schoolof Environment, Resources, and Development, Asian Institute ofTechnology (AIT), Klong Luang, Pathumthani, Thailandb Natural Resources Management Program, School of Environment,Resources, and Development, Asian Institute of Technology (AIT),Klong Luang, Thailandc Surin Rice Research Center, Surin, Thailandd Department of Oceanography and Coastal Science, School ofCoast and Environment, Louisiana State University, Baton Rouge,Louisiana, USA
Version of record first published: 07 Mar 2011.
To cite this article: Chunchara Thuithaisong, Preeda Parkpian, Oleg V. Shipin, Rajendra P. Shrestha,Kunnika Naklang, Ron D. DeLaune & Aroon Jugsujinda (2011): Soil-Quality Indicators for PredictingSustainable Organic Rice Production, Communications in Soil Science and Plant Analysis, 42:5, 548-568
To link to this article: http://dx.doi.org/10.1080/00103624.2011.546930
PLEASE SCROLL DOWN FOR ARTICLE
Full terms and conditions of use: http://www.tandfonline.com/page/terms-and-conditions
This article may be used for research, teaching, and private study purposes. Anysubstantial or systematic reproduction, redistribution, reselling, loan, sub-licensing,systematic supply, or distribution in any form to anyone is expressly forbidden.
The publisher does not give any warranty express or implied or make any representationthat the contents will be complete or accurate or up to date. The accuracy of anyinstructions, formulae, and drug doses should be independently verified with primarysources. The publisher shall not be liable for any loss, actions, claims, proceedings,

demand, or costs or damages whatsoever or howsoever caused arising directly orindirectly in connection with or arising out of the use of this material.
Dow
nloa
ded
by [
Lou
isia
na S
tate
Uni
vers
ity]
at 0
8:26
26
Sept
embe
r 20
12

Communications in Soil Science and Plant Analysis, 42:548–568, 2011Copyright © Taylor & Francis Group, LLCISSN: 0010-3624 print / 1532-2416 onlineDOI: 10.1080/00103624.2011.546930
Soil-Quality Indicators for Predicting SustainableOrganic Rice Production
CHUNCHARA THUITHAISONG,1 PREEDA PARKPIAN,1
OLEG V. SHIPIN,1 RAJENDRA P. SHRESTHA,2
KUNNIKA NAKLANG,3 RON D. DELAUNE,4
AND AROON JUGSUJINDA4
1Environmental Engineering and Management Program, School of Environment,Resources, and Development, Asian Institute of Technology (AIT), Klong Luang,Pathumthani, Thailand2Natural Resources Management Program, School of Environment, Resources,and Development, Asian Institute of Technology (AIT), Klong Luang, Thailand3Surin Rice Research Center, Surin, Thailand4Department of Oceanography and Coastal Science, School of Coast andEnvironment, Louisiana State University, Baton Rouge, Louisiana, USA
Soil physical, chemical, and biological properties in a rice field located at the SurinRice Research Center, Thailand, were evaluated as indicators for predicting organicrice (Kao Dok Mali 105 variety) production and yield. Four treatments under differ-ent management practices were studied. They included (1) conventional farming (CF)receiving chemical fertilizer application; (2) organic plot receiving green manure (GM)addition; (3) organic plot receiving rice straw (RS) addition; and (4) control plot (CT)without any external plant nutrient source. Soil quality in the four treatments wasassessed based upon selected physical, chemical, and biological parameters. Key find-ings are as follows: cation exchange capacity (CEC), electrical conductivity (EC), pH,soil organic matter (SOM), and essential macronutrients [nitrogen (N), phosphorus (P),and potassium (K)] were low in all plots. Soil biological properties including potentialN mineralization (PMN), soil basal respiration (BR), microbial biomass carbon (MBC)and microbial biomass N (MBN) in all treatments were also low. Principal compo-nent analysis (PCA), using 15 soil properties, showed significant differences amongfarm management practices. Soil chemical and biological properties best related tosoil quality included P, N, and SOM (for chemical properties) and MBC, MBN, andBR (for biological properties). Based on significant relationships between yield (r >0.75) and the soil properties (r > 0.55), selected soil biological (MBC, MBN, andBR) and chemical (TOP [total organic phosphorus], TK [total potassium], TN [totalnitrogen], SOC [soil organic carbon], and SOM) properties were determined to besuitable soil-quality indicators, respectively. A soil-quality indicator for predicting riceyield was computed using multiple regression analyses. The regression model (Y =−1.685 + 0.333 (MBN) + 0.640 (TK) − 0.282 (SOC), r2
adjusted = 0.962) was usedfor predicting yield. Grain yield of rice (RMSE = 0.046 t ha−1, D index = 0.45) wasobtained using this regression model.
Received 14 July 2009; accepted 12 January 2010.Address correspondence to Aroon Jugsujinda, Department of Oceanography and Coastal
Science, School of Coast and Environment, Louisiana State University, Baton Rouge, Louisiana70803-7511, USA. E-mail: [email protected]
548
Dow
nloa
ded
by [
Lou
isia
na S
tate
Uni
vers
ity]
at 0
8:26
26
Sept
embe
r 20
12

Soil-Quality Indicators for Predicting Rice Yield 549
Keywords Organic rice farming, principal component analysis, regression model,soil-quality indicators, rice yield
Introduction
Rice (Oryza sativa L.) is a major food crop grown under various moisture and floodingregimes. Most of the world’s rice is grown in Asia, which represents 90% of the globalrice-growing area (IRRI 1997). The leading producers of rice are China, India, Indonesia,Vietnam, and Thailand. Five countries, Thailand, Vietnam, India, Pakistan, and China,account for almost 75% of rice export. Thailand and Vietnam account for nearly half ofall rice exports (Dobermann and Fairhurst 2000; USDA 2005; USDA 2008).
Despite currently being the world’s largest exporter of rice, rice production in Thailandis a result of extensive area of rice production rather than high yield per hectacre. Thepotential for increased rice yield per hectacre is very limited. Rice yields in Thailand haveincreased little in recent years because 75% of rice area is produced on poor-quality soilswithout irrigation (i.e., rainfed systems). Drought, flooding, and low-fertility soils severelyrestrict the ability to increase yield even though farmers have access to improved varietiesand fertilizer (Cassman 1999). Fertilizer is the most important practice for increasing riceyield (Chen 2006). Fertilizer applications such as chemical, organic, and biofertilizers canhave either positive or negative impact on soil quality. Agricultural management practicesalso impact both yield and soil quality (Chen 2006; Dick 1992; Schjonning, Elmholt, andChristensen 2004).
To conserve soil fertility and improve soil quality, organic farming has been emergedas an alternative production practice. Organic farming represents a vital new scientificapproach in the implementation of an environmentally sound agriculture production prac-tice (UNCTAD and WTO 2006). The practice relies on crop rotations and use of cropresidues, animal manures, legumes, green manures, organic farm wastes, and crop residueas natural fertilizer sources for supplying plant nutrients for both crop production and main-tenance of soil quality (Jivraj and Savaliya 2004; Lampkin 1994). This is a rapidly growingpractice in many countries (approximately 110 countries) including Australia, Argentina,countries in Europe and North America, and developing countries, including Thailand. Thepopularity of organic farming in Thailand has resulted from three emerging trends. The firstis an increasing public awareness for healthy living. Organic foods are seen as the safestoption as they are perceived as having low or zero contamination from agrochemicals. Thesecond trend is the interest in development of sustainable agriculture by the farming sector.The third trend is the increased awareness for environmental protection and conservation,including the broader impact of agriculture on the environment caused by use of agro-chemicals (UNCTAD/WTO 2006). At present, organic farming is promoted by the Thaigovernment. The land area devoted to organic farming increased by more than 19,500 habetween 2001 to 2005 (>900%) (Green Net/Earth Net Foundation 2005). Currently, thepredominant organic farm product in Thailand is rice (especially “Jasmine rice” from thenortheast region).
Because many issues associated with maintaining sustainability crop production arerelated to soil chemical, physical, and biological properties assessment, soil quality is a pri-mary indicator for measuring sustainability of an agriculture system. Soil quality is definedas “the capacity of a specific soil to function, within natural or managed ecosystem bound-aries, to sustain plant and animal productivity, maintain or enhance water and air quality,and support human health and habitation” (Karlen et al. 1997). Soil quality as a measureof the capacity for crop production can be quantified by indicators based on soil physical,chemical, and biological properties. Measuring change in key soil-quality parameters over
Dow
nloa
ded
by [
Lou
isia
na S
tate
Uni
vers
ity]
at 0
8:26
26
Sept
embe
r 20
12

550 C. Thuithaisong et al.
a period of time allows for determining changes in soil quality as influenced by differentagricultural management practices. Thus, the determination of soil quality is a primaryindicator of sustainable organic rice farming. For organic rice cultivation, green manurecrop and legume can be used for the improvement of soil fertility (Choi, Goh, and Lee2004). Soil-quality assessment must be based on relevant soil-quality indicators. No singleindicator can be used to quantify all aspects of soil quality. The complexity of soil qualitycan only be assessed if the physical, chemical, and biological components are evaluatedsimultaneously (Johansson and Stenberg 2000).
To develop soil indicators for the evaluation of soil quality as related to crop produc-tion, we used an approach that involved identifying a set of soil indicators from differentrice farming practices. The interrelationships between soil properties and rice yield for var-ious farming practices were evaluated based on statistical analysis of soil properties andrice yield. Such correlation matrices can be used to study the relation among variables orindicators. Multivariate analysis is a collective term used for a number of statistical tech-niques for determining complex environment interactions. A commonly used technique isthe principal component analysis (PCA) (Johansson and Stenberg 2000). This study wasaimed at identifying selected soil properties (physical, chemical, and biological) for use asa suitable indicator of soil quality to predict grain yield in organically grown rice.
Materials and Methods
Study Site
The study was conducted at the Surin Rice Research Center, located in Korat Plateau,Muang District, Surin Province, Thailand (latitude 14◦ 55′ N and longitude 103◦ 25′ E)(Figure 1). The soil at the study site belongs to the Roi Et series, which is widely distributedand used for rice production in northeast Thailand. The soil is an acidic, clay loam or sandyloam soil to a depth of 0–17 cm with low fertility level for rice production (Vachrotayanand Takai 1983).
Experimental Design
The experimental design consisted of four treatment plots with an individual area of0.16 ha. The treatments included (1) conventional farming (CF), receiving chemical fer-tilizer (16–16–8) at a recommended rate of 232 kg ha−1, (2) organic treatment, receivingSesbania rostrata as green manure (GM) prior to rice planting, consisting of leaves ofSesbania at rate of 6,250 kg ha−1 followed by plowing into the soil, (3) organic treatment,receiving rice straw mulch (RS) applied at rate of 3,125 kg ha−1, and (4) control plot (CT), atreatment that did not have any external source of plant nutrients. The experimental designwas a 4 × 3 × 2 factorial design with three seasonal periods (May, October, and December)and two soil depths (0–10 cm and 10–20 cm). All plots were demonstration plots grown inrice (Oryza sativa, KDML 105 variety) under single-cropping, rainfed, lowland conditionsfor the past 11 years.
Soil Sampling and Laboratory Analysis
Both topsoil (0–10 cm deep) and subsoil (10–20 cm deep) were sampled from the fourplots. Each treatment were sampled three times in 2007; the first sampling was prior tothe growing of rice (May), the second sampling was at maximum tillering stage of rice
Dow
nloa
ded
by [
Lou
isia
na S
tate
Uni
vers
ity]
at 0
8:26
26
Sept
embe
r 20
12

Soil-Quality Indicators for Predicting Rice Yield 551
Figure 1. Location of study area in Surin province, Thailand, adapted from Wikimedia CommonsContributors (2008).
growth, and the third sampling was immediately following rice harvest. Based on the ran-dom sampling design, six sites from each plot were sampled. The topsoil from sites 1 and 2was combined into one sample. Sampling sites 3 and 4, as well as sites 5 and 6, were alsocombined. Subsoil samples were sampled and combined in a manner similar to topsoilsampling. Collected soil samples at different times of year were split into two groups; onegroup (air-dried and sieved) was used for further chemical and physical analysis, and theother group (fresh soil) was used for biological analysis. The two groups of soil sampleswere stored under laboratory condition until analysis.
Bulk density (Culley 1993) and particle-size distribution (Hillel 1988) were deter-mined only from samples collected in May. Other soil properties analyzed included pH,
Dow
nloa
ded
by [
Lou
isia
na S
tate
Uni
vers
ity]
at 0
8:26
26
Sept
embe
r 20
12

552 C. Thuithaisong et al.
electrical conductivity (EC), soil organic matter (Walkley and Black 1934), total nitrogen(N) using the Kjeldahl procedure (Bremner and Mulvaney 1982), and cation exchangecapacity (CEC) determination by extracting the soil with neutral one normal ammoniumacetate following by steam distillation (Chapman 1965).
Biological soil properties analyzed included microbial biomass carbon (MBC) andmicrobial biomass N (MBN). These measurements were conducted from a group of freshlycollected soil samples. Both MBC and MBN were measured by fumigation–extractionmethod (Voroney, Winter, and Beyeart 1993). Individual soil sample was extracted with0.5 M K2SO4 and ethanol-free chloroform. Microbial biomass carbon and MBN were thendetermined using a Shimadzu TOC-500 (Shimadzu, Tokyo Japan) analyzer. The k fac-tors used for converting extractable carbon (C) and N to MBC and MBN are 0.25 for kEC
and 0.18 for kEN, where EC and EN represent extractable C and N respectively. Resultswere expressed as micrograms of soil MBC and MBN per gram of soil (μg g−1). PotentialN mineralization (PMN) was also measured by the anaerobic incubation method adaptedfrom Keeney (1982). Determination of PMN was performed in triplicate and differencebetween the amount of ammonium (NH4)–N released from the sample after incubationand the amount released by the nonincubated sample was considered as potential N min-eralization. Soil basal respiration (BR) was measured using a titration method (Andersonand Domsch 1978).
Statistical Analysis
All of physical, chemical, and biological data collected was evaluated by analysis of vari-ance (ANOVA) and principal component analysis (PCA). Least significant differences(0.05) were used in determining differences among the four treatments. Likewise, soilparameters measurement were correlated with rice yield (2007) using multiple linearregression analysis. To identify soil-quality indicators, we used Pearson correlation coeffi-cients for determining the eligible dependent variables. The PCA was employed as a datareduction tool to select the most appropriate indicators based on the input variables of soilproperties. Only the PCs with given values greater than 1 were considered for identifyingthe minimum data set (MDS). Within each PC, indicators receiving weighed loading valueswithin 10% of the highest weighted loading values were selected for the MDS. To validatethe PCA model of selecting minimum variables, multiple linear regressions was employed.The analyses were performed by using soil properties as independent variables against riceyields as dependent variables.
Model evaluation required various statistical criteria such as coefficient of determina-tion (r2). This is a measure of the correlation between the predicted and observed valuesin a regression analysis. It is calculated as the square of the correlation coefficient, r, andvaries between 0 and 1. Root mean square error (RMSE) is the best measure because itsummarizes the mean difference in the units of observed and predicted values, and the Dindex is descriptive of both relative and bounded measurements (Willmott 1982; Willmottet al. 1985). In this study, weight of RMSE (Endo, Mishima, and Kohyama 2009; Idowuet al. 2008) and the index of agreement (D index) (Alagarswamy et al. 2006; Timsinaand Humphreys 2006) is validated. To evaluate the performance of the models, the resultsreported in this study were used in predicting models 1 and 2, using rice soil data for 2006.A model reproduces experimental data perfectly when r2 is close to 1, RMSE < 0.05, andD index is close to 1. These parameters were calculated as follows:
RMSE =[
N−1N∑
i=1
(Pi − Oi)2
]0.5
Dow
nloa
ded
by [
Lou
isia
na S
tate
Uni
vers
ity]
at 0
8:26
26
Sept
embe
r 20
12

Soil-Quality Indicators for Predicting Rice Yield 553
Normalised (relative) RMSE =RMSE
Oavg
D index = 1 −
⎡⎢⎢⎢⎣
N∑i=1
(Pi − Oi)2
N∑i=1
((Pi − Oavg
) + (Oi − Oavg
))2
⎤⎥⎥⎥⎦ , 0 ≤ D index ≤ 1
where Pi and Oi are the predicted and observed values and Oavg is the mean observed valueover several replicates. N is number of observations. Oavg has an associated standard devi-ation, which is often ignored in model evaluations, and any difference between simulationsand observations is attributed solely to model inadequacies.
Results and Discussions
Rice Soil Fertility
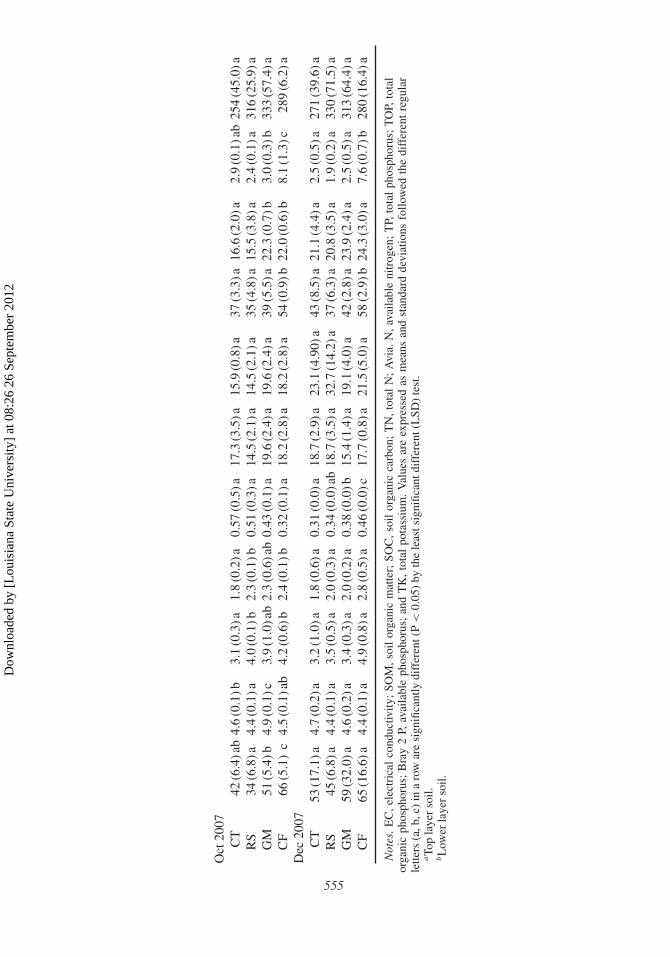
Selected physical and chemical properties of the rice soil in the demonstration plots at SurinRice Research Center were first reviewed by Vachrotayan and Takai (1983). Bulk densitywas quite high (1.50–1.58 g cm−3) for all plots. High bulk density for this soil (Roi Et soilseries) was attributed to the high sand content. The percentages of sand, silt, and clay con-tent were in the ranges of 52–59%, 25–33%, and 14–19%, respectively. The soil texturewas loam and sandy loam. The CEC of soil was quite low (3.1–3.8 meq 100g−1), sug-gesting low nutrient retention capacity, which limits the amount of soil nutrients for plantgrowth. Because of inherently low CEC, all four plots, regardless of cultural practices, hada low soil CEC (Tansiri and Saifak 1999). The results suggested that organic farming withrice straw and green manure at the rate applied by farmers for more than 10 years did notincrease CEC of this soil. In our study (2007), soil samples were again taken at three peri-ods from all four demonstration plots, and soil chemical analysis included 11 variables.One sampling was taken in May prior to growing season, one was taken in October (mid-season), and one was taken in December following harvest. Effects of different agriculturalpractices on paddy soil chemical properties are summarized and presented in Table 1.
Electrical conductivity of soil in the four plots was very low (34–92 μS cm−1). Suchvalue would have no adverse effect on rice growth and soil microorganisms (USDA 1999).Soil pH (4.3–5.0) in all plots indicated strongly acidic condition as shown by the pH mea-sured in air-dry soil samples collected in May 2007. Soil organic matter content (SOM) insoil samples from the four plots was also extremely low, ranging from 3.1–16.3 g kg−1,an amount equivalent to 0.31–1.63%. Essential macronutrients such as N, phosphorus (P),and potassium (K) in both total and plant bioavailable soil fractions were also low, even inthe plots receiving chemical fertilizer (CF). The application of rice straw and green manureover a 10-year period as an additional organic material supply to the soil improved SOMcontent in the RS and GM plots but the improved values were still less than adequate forpaddy soils (≥20 g kg−1). Slow responses in soil improvement in the two treatments usedin organic rice farming in Thailand and elsewhere (southeast Asia) is attributed to tropicalclimatic conditions (high temperature and rainfall), which promote rapid decomposition ofadded organic materials.
Dow
nloa
ded
by [
Lou
isia
na S
tate
Uni
vers
ity]
at 0
8:26
26
Sept
embe
r 20
12

Tabl
e1
Eff
ecto
fdi
ffer
entf
arm
ing
man
agem
entp
ract
ices
onpa
ddy
soil
chem
ical
prop
ertie
s
Para
met
erE
C(μ
Scm
−1)
pHSO
M(g
kg−1
)SO
C(g
kg−1
)T
N(g
kg−1
)
NH
4-N
(mg
kg−1
)N
O3-N
(mg
kg−1
)T
P(m
gkg
−1)
TO
P(m
gkg
−1)
Bra
y2
P(
mg
kg−1
)T
K(m
gkg
−1)
Top
laye
rso
il(0
–10
cm)a
May
2007
CT
62(6
.3)a
4.6
(0.1
)a9.
9(2
.5)a
5.8
(1.5
)a0.
05(0
.0)a
31.3
(8.9
)a30
.9(3
.6)a
52(6
.0)a
21.3
(4.2
)a2.
9(0
.8)a
285
(16.
4)a
RS
78(2
7.5)
a4.
8(0
.4)a
12.7
(5.0
)a7.
4(2
.9)a
0.28
(0.3
)a41
.0(1
7.4)
a33
.3(9
.3)a
42(3
.5)a
24.0
(6.3
)ab
3.9
(1.3
)a33
5(1
9.1)
bG
M81
(6.0
)a4.
7(0
.1)a
13.0
(2.5
)a7.
5(1
.5)a
0.09
(0.0
)a41
.8(8
.9)a
39.7
(2.7
)a63
(6.1
)b33
.7(3
.2)b
c5.
9(1
.0)b
351
(28.
4)b
CF
85(5
.8)b
4.7
(0.9
)a16
.3(1
.8)a
9.4
(1.0
)a0.
26(0
.2)a
53.5
(6.2
)a39
.7(5
.4)a
91(5
.3)c
38.0
(6.6
)c17
.6(6
.6)c
316
(21.
7)ab
Oct
2007
CT
43(7
.0)a
4.4
(0.1
)a3.
9(0
.6)a
2.3
(0.4
)a0.
43(0
.1)a
17.3
(1.6
)a16
.3(2
.9)a
44(8
.0)a
20.1
(4.1
)a4.
4(3
.4)a
284
(9.9
)aR
S37
(2.0
)a4.
3(0
.0)a
5.4
(0.6
)b3.
1(0
.4)b
0.54
(0.1
)a17
.7(2
.9)a
21.0
(0.0
)a44
(1.5
)a26
.1(2
.2)b
2.8
(0.1
)a33
4(4
0.9)
aG
M54
(3.8
)b4.
7(0
.1)b
5.3
(0.5
)b3.
1(0
.3)b
0.53
(0.1
)a19
.1(5
.3)a
20.5
(3.5
)a44
(6.3
)a28
.3(1
.5)b
4.6
(0.5
)a32
1(4
8.2)
aC
F62
(6.2
)b4.
4(0
.1)a
6.8
(1.0
)c4.
0(0
.6)c
0.47
(0.0
)a14
.5(0
.8)a
21.5
(4.5
)a64
(6.4
)b28
.0(1
.2)b
9.0
(3.6
)b27
7(4
3.1)
aD
ec20
07C
T68
(10.
8)a
4.3
(0.1
)a3.
8(0
.6)a
2.2
(0.4
)a0.
31(0
.1)a
17.7
(2.9
)a27
.5(8
.0)a
46(3
.8)b
23.3
(6.8
)a2.
2(0
.4)a
265
(13.
4)a
RS
52(4
.9)a
4.4
(0.1
)a4.
7(1
.8)a
b2.
7(1
.1)a
b0.
40(0
.1)a
16.3
(3.2
)a34
.1(1
8.7)
a39
(5.3
)a24
.8(5
.7)a
1.9
(0.6
)a30
1(3
1.6)
aG
M66
(16.
2)a
4.6
(0.2
)a3.
7(0
.2)a
2.1
(0.1
)a0.
40(0
.1)a
13.5
(2.9
)a22
.4(8
.5)a
39(1
.0)a
26.0
(4.0
)a2.
8(0
.6)a
278
(13.
9)a
CF
92(2
5.7)
a4.
3(0
.1)a
6.4
(0.1
)b3.
7(0
.1)b
0.43
(0.1
)a15
.9(0
.8)a
29.4
(4.9
)a61
(2.8
)c30
.0(8
.1)a
13.4
(2.0
)b25
5(3
7.6)
aL
ower
laye
rso
il(1
0–20
cm)b
May
2007
CT
62(1
0.9)
a4.
6(0
.3)a
9.9
(3.6
)a5.
7(2
.1)a
0.05
(0.0
)a31
.0(1
2.8)
a36
.8(7
.6)a
54(9
.3)a
24.3
(3.5
)a3.
2(0
.9)a
342
(86.
8)a
RS
55(1
0.9)
a4.
8(0
.4)a
11.1
(2.2
)a6.
4(1
.3)a
0.16
(0.1
)ab
35.4
(7.6
)a36
.2(2
.7)a
38(7
.1)a
23.7
(1.5
)a3.
0(0
.3)a
358
(75.
7)a
GM
61(9
.8)a
5.0
(0.2
)a10
.4(3
.0)a
6.0
(1.8
)a0.
13(1
.0)a
b33
.0(1
0.6)
a34
.4(7
.)a
53(1
0.1)
a27
.0(5
.3)a
3.3
(1.5
)ab
318
(17.
0)a
CF
73(1
5.7)
a4.
7(0
.2)a
13.7
(1.6
)a7.
9(0
.9)a
0.39
(0.3
)b44
.3(5
.5)a
33.9
(7.1
)a78
(9.3
)b31
.3(4
.6)a
13.6
(1.7
)b31
9(2
8.9)
a
554
Dow
nloa
ded
by [
Lou
isia
na S
tate
Uni
vers
ity]
at 0
8:26
26
Sept
embe
r 20
12
Oct
2007
CT
42(6
.4)a
b4.
6(0
.1)b
3.1
(0.3
)a1.
8(0
.2)a
0.57
(0.5
)a17
.3(3
.5)a
15.9
(0.8
)a37
(3.3
)a16
.6(2
.0)a
2.9
(0.1
)ab
254
(45.
0)a
RS
34(6
.8)a
4.4
(0.1
)a4.
0(0
.1)b
2.3
(0.1
)b0.
51(0
.3)a
14.5
(2.1
)a14
.5(2
.1)a
35(4
.8)a
15.5
(3.8
)a2.
4(0
.1)a
316
(25.
9)a
GM
51(5
.4)b
4.9
(0.1
)c3.
9(1
.0)a
b2.
3(0
.6)a
b0.
43(0
.1)a
19.6
(2.4
)a19
.6(2
.4)a
39(5
.5)a
22.3
(0.7
)b3.
0(0
.3)b
333
(57.
4)a
CF
66(5
.1)
c4.
5(0
.1)a
b4.
2(0
.6)b
2.4
(0.1
)b0.
32(0
.1)a
18.2
(2.8
)a18
.2(2
.8)a
54(0
.9)b
22.0
(0.6
)b8.
1(1
.3)c
289
(6.2
)aD
ec20
07C
T53
(17.
1)a
4.7
(0.2
)a3.
2(1
.0)a
1.8
(0.6
)a0.
31(0
.0)a
18.7
(2.9
)a23
.1(4
.90)
a43
(8.5
)a21
.1(4
.4)a
2.5
(0.5
)a27
1(3
9.6)
aR
S45
(6.8
)a4.
4(0
.1)a
3.5
(0.5
)a2.
0(0
.3)a
0.34
(0.0
)ab
18.7
(3.5
)a32
.7(1
4.2)
a37
(6.3
)a20
.8(3
.5)a
1.9
(0.2
)a33
0(7
1.5)
aG
M59
(32.
0)a
4.6
(0.2
)a3.
4(0
.3)a
2.0
(0.2
)a0.
38(0
.0)b
15.4
(1.4
)a19
.1(4
.0)a
42(2
.8)a
23.9
(2.4
)a2.
5(0
.5)a
313
(64.
4)a
CF
65(1
6.6)
a4.
4(0
.1)a
4.9
(0.8
)a2.
8(0
.5)a
0.46
(0.0
)c17
.7(0
.8)a
21.5
(5.0
)a58
(2.9
)b24
.3(3
.0)a
7.6
(0.7
)b28
0(1
6.4)
a
Not
es.
EC
,ele
ctri
cal
cond
uctiv
ity;
SOM
,soi
lor
gani
cm
atte
r;SO
C,s
oil
orga
nic
carb
on;
TN
,tot
alN
;A
via.
N,a
vaila
ble
nitr
ogen
;T
P,to
tal
phos
phor
us;
TO
P,to
tal
orga
nic
phos
phor
us;
Bra
y2
P,av
aila
ble
phos
phor
us;
and
TK
,to
tal
pota
ssiu
m.
Val
ues
are
expr
esse
das
mea
nsan
dst
anda
rdde
viat
ions
follo
wed
the
diff
eren
tre
gula
rle
tters
(a,b
,c)
ina
row
are
sign
ifica
ntly
diff
eren
t(P
<0.
05)
byth
ele
asts
igni
fican
tdif
fere
nt(L
SD)
test
.aTo
pla
yer
soil.
bL
ower
laye
rso
il.
555
Dow
nloa
ded
by [
Lou
isia
na S
tate
Uni
vers
ity]
at 0
8:26
26
Sept
embe
r 20
12

556 C. Thuithaisong et al.
0.0
0.5
1.0
1.5
2.0
2.5
3.0
3.5
4.0
CT RS GM CF
Ric
e yi
eld
(t h
a–1)
a
a
ab
b
Figure 2. Different agricultural practices that affected rice grain yield in 2007.
0.0
0.5
1.0
1.5
2.0
2.5
3.0
3.5
4.0
4.5
5.0
1995 1996 1997 1998 1999 2000 2001 2002 2003 2004 2005 2006 2007Year
Yie
ld (
t ha–1
)
CT RS GM CF
Figure 3. Rice yield in four treatment from 1996 to 2007.
Based upon chemical properties of the soil samples collected before the growing sea-son, all the plots had extremely low soil fertility. Major plant nutrients such as N, P, and Kare required to increase rice yield beyond the current level shown in Figures 2 and 3. Soiltests for available N, Bray 2 P, and SOM of all plots indicated nutrient deficiencies. Currentagricultural management practices for more than a decade in RS, GM, and CF treatmentsdid not increase nutrient reserve in the soil sufficient to support rice production of a fol-lowing crop. Thus application of fertilizers either organic or inorganic form is necessary tosupport rice production.
Soil biological properties including PMN, BR, MBC, and MBN activity in all thetreatments were low (Figures 4–7). It appeared that in the upper soil layer (0–10 cm) thebiological activities, such as PMN, BR, MBC, and MBN, were greater than in the lowersoil layer (10–20 cm). Microbial activities were fully functional in May during the rainyseason and decreased when approaching dry season in October and afterward.
The measured BR values [2–24 mg carbon dioxide (CO2)–C kg−1 d−1] as illustrated inFigure 4 were low during the monitoring period from the wet to dry seasons. Values werevery low in October samples (2.6 mg CO2-C kg−1 d−1), increased slightly in December(5.9 mg CO2-C kg−1 d−1), and reached a peak again in May (16.6 mg CO2-C kg−1 d−1).These results can be compared to guideline value of 19 mg CO2-C kg−1 d−1 (USDA 1999).
Dow
nloa
ded
by [
Lou
isia
na S
tate
Uni
vers
ity]
at 0
8:26
26
Sept
embe
r 20
12

Soil-Quality Indicators for Predicting Rice Yield 557
0
5
10
15
20
25
30
May Oct Dec May Oct Dec
0 –10 cm 10–20 cm
BR
(m
g C
O2-
C k
g–1 d
ay–1
)
CT RS GM CF
Figure 4. Basal respiration (BR) as influenced by soil depth and different sampling times.
0
5
10
15
20
25
May Oct Dec May Oct Dec
0 –10 cm 10–20 cm
PMN
(m
g N
H4-
N k
g–1)
CT RS GM CF
Figure 5. Potentially mineralizable nitrogen (PMN) as influenced by soil depth and differentsampling times.
The BR values in the GM plot and CF plot were not significantly different (P > 0.05)but were significantly different (P < 0.05) when compared to the CT plot and RS plot(Figure 4). This suggests that treatments receiving CF or GM showed better conditions(availability of C, N, and other substrates) for the growth of microorganisms in the rootzone. These phenomena was clearly evident in the upper soil layer, where there was anabundance of microorganisms as compared to low in the deeper soil profile.
Microbial respiration or basal respiration is the total production of CO2 through themetabolic processes of all living organisms present in the soil. A high level of microbialrespiration is indicated by the loss or decomposition of organic C and high rate of nutrientcycling within the soil (Parkin, Doran, and Vizcaino 1996). According to classification forsoil respiration, the BR values were low (<19 mg CO2-C kg−1 d−1). This indicates thatthe paddy soils are low in available organic matter, which results in low biological activity(USDA 1999).
Dow
nloa
ded
by [
Lou
isia
na S
tate
Uni
vers
ity]
at 0
8:26
26
Sept
embe
r 20
12

558 C. Thuithaisong et al.
0.0
0.5
1.0
1.5
2.0
2.5
May Oct Dec May Oct Dec
0 –10 cm 10–20 cm
MB
C (m
g kg
–1)
CT RS GM CF
Figure 6. Microbial biomass carbon (MBC) as influenced by soil depth and different samplingtimes.
0.0
0.1
0.2
0.3
0.4
0.5
0.6
0.7
May Oct Dec May Oct Dec
0 –10 cm 10–20 cm
MB
N (
g kg
–1)
CT RS GM CF
Figure 7. Microbial biomass nitrogen (MBN) as influenced by soil depth and different samplingtimes.
Soil respiration can, to some extent, reflect the release of nutrients such as N, S, P, andmicronutrients found in SOM that become bioavailable to plants. The poor soil fertility inpart was also supported by the low SOM.
The observed potentially mineralizable N (PMN) values ranged between 7.04 and8.75 mg ammonium (NH4)-N kg−1. However, in the organic plots (RS and GM), the PMN,MBN, and MBC were not significantly different (P > 0.05) from the CF plot (Figure 5).The PMN values in all of the treatments studied were extremely low. Canali et al. (2002)indicated that the PMN value in conventional farming was greater than in the organic farm-ing, with values of 34.1 and 39.0 mg kg−1, respectively. Our findings do not support theirresults. This may be attributed to the extremely low indigenous SOM in all of the treatments(<1.00%).
Microbial biomass carbon (MBC) in the GM plot (0.100–2.170 g kg−1) and CFplot (0.076–2.052 g kg−1) were not significantly different (P > 0.05), but they weresignificantly higher (P < 0.05) than values in the CT and RS plots (Figure 6). Stark
Dow
nloa
ded
by [
Lou
isia
na S
tate
Uni
vers
ity]
at 0
8:26
26
Sept
embe
r 20
12
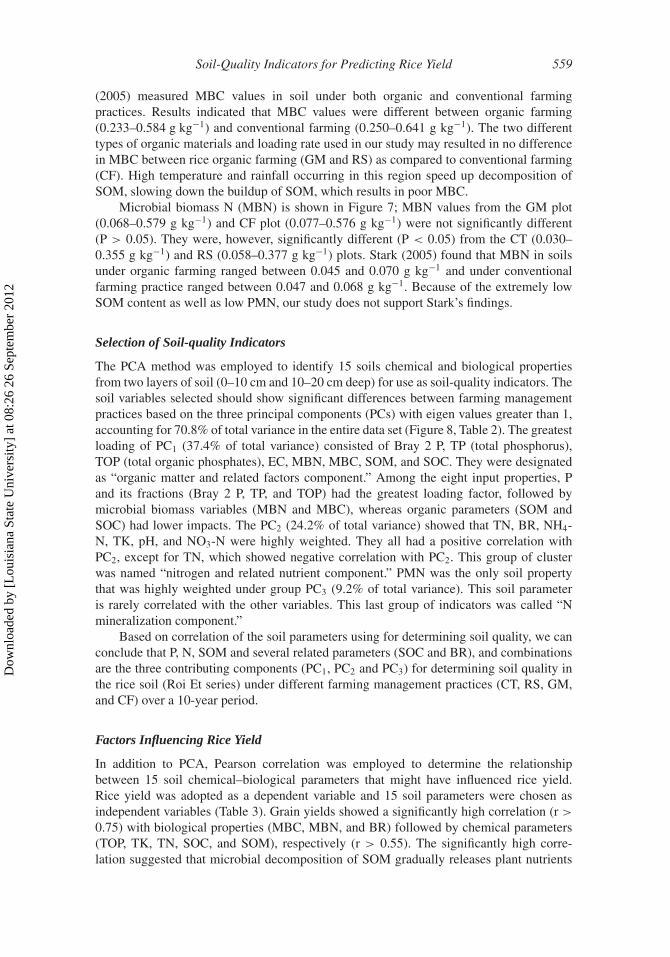
Soil-Quality Indicators for Predicting Rice Yield 559
(2005) measured MBC values in soil under both organic and conventional farmingpractices. Results indicated that MBC values were different between organic farming(0.233–0.584 g kg−1) and conventional farming (0.250–0.641 g kg−1). The two differenttypes of organic materials and loading rate used in our study may resulted in no differencein MBC between rice organic farming (GM and RS) as compared to conventional farming(CF). High temperature and rainfall occurring in this region speed up decomposition ofSOM, slowing down the buildup of SOM, which results in poor MBC.
Microbial biomass N (MBN) is shown in Figure 7; MBN values from the GM plot(0.068–0.579 g kg−1) and CF plot (0.077–0.576 g kg−1) were not significantly different(P > 0.05). They were, however, significantly different (P < 0.05) from the CT (0.030–0.355 g kg−1) and RS (0.058–0.377 g kg−1) plots. Stark (2005) found that MBN in soilsunder organic farming ranged between 0.045 and 0.070 g kg−1 and under conventionalfarming practice ranged between 0.047 and 0.068 g kg−1. Because of the extremely lowSOM content as well as low PMN, our study does not support Stark’s findings.
Selection of Soil-quality Indicators
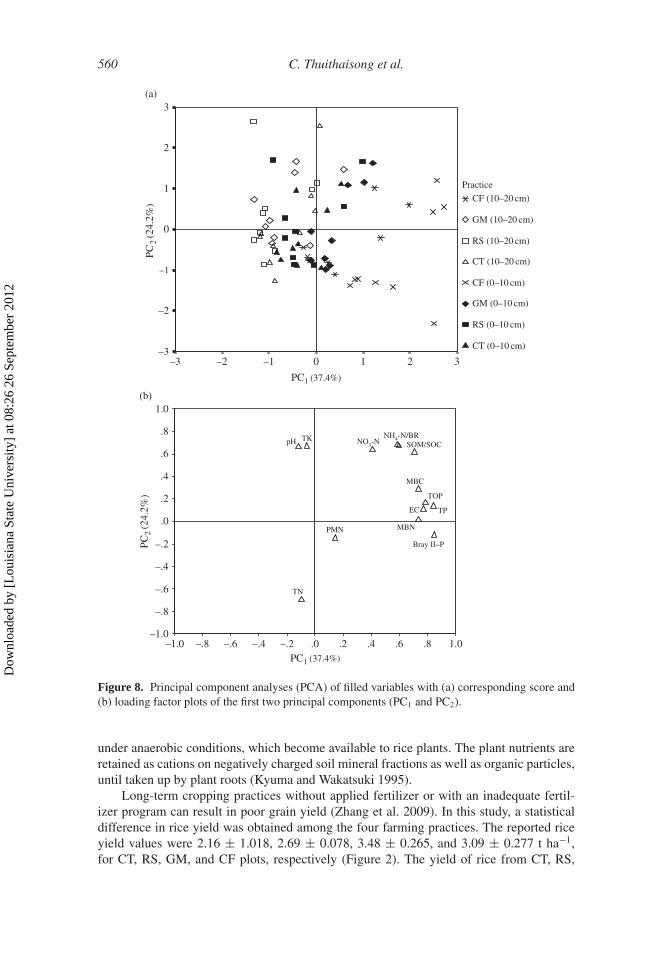
The PCA method was employed to identify 15 soils chemical and biological propertiesfrom two layers of soil (0–10 cm and 10–20 cm deep) for use as soil-quality indicators. Thesoil variables selected should show significant differences between farming managementpractices based on the three principal components (PCs) with eigen values greater than 1,accounting for 70.8% of total variance in the entire data set (Figure 8, Table 2). The greatestloading of PC1 (37.4% of total variance) consisted of Bray 2 P, TP (total phosphorus),TOP (total organic phosphates), EC, MBN, MBC, SOM, and SOC. They were designatedas “organic matter and related factors component.” Among the eight input properties, Pand its fractions (Bray 2 P, TP, and TOP) had the greatest loading factor, followed bymicrobial biomass variables (MBN and MBC), whereas organic parameters (SOM andSOC) had lower impacts. The PC2 (24.2% of total variance) showed that TN, BR, NH4-N, TK, pH, and NO3-N were highly weighted. They all had a positive correlation withPC2, except for TN, which showed negative correlation with PC2. This group of clusterwas named “nitrogen and related nutrient component.” PMN was the only soil propertythat was highly weighted under group PC3 (9.2% of total variance). This soil parameteris rarely correlated with the other variables. This last group of indicators was called “Nmineralization component.”
Based on correlation of the soil parameters using for determining soil quality, we canconclude that P, N, SOM and several related parameters (SOC and BR), and combinationsare the three contributing components (PC1, PC2 and PC3) for determining soil quality inthe rice soil (Roi Et series) under different farming management practices (CT, RS, GM,and CF) over a 10-year period.
Factors Influencing Rice Yield
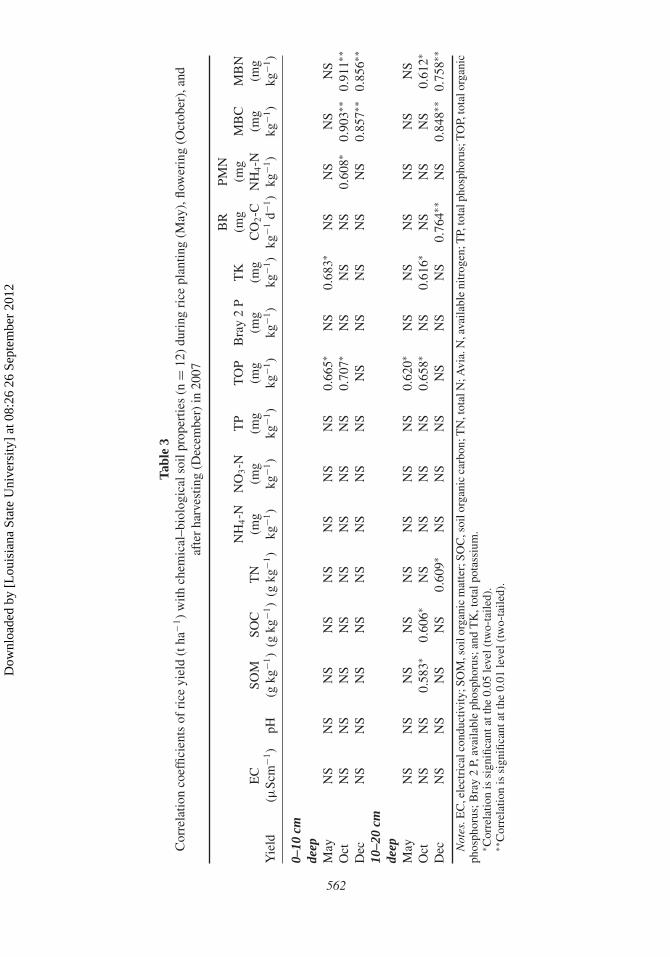
In addition to PCA, Pearson correlation was employed to determine the relationshipbetween 15 soil chemical–biological parameters that might have influenced rice yield.Rice yield was adopted as a dependent variable and 15 soil parameters were chosen asindependent variables (Table 3). Grain yields showed a significantly high correlation (r >
0.75) with biological properties (MBC, MBN, and BR) followed by chemical parameters(TOP, TK, TN, SOC, and SOM), respectively (r > 0.55). The significantly high corre-lation suggested that microbial decomposition of SOM gradually releases plant nutrients
Dow
nloa
ded
by [
Lou
isia
na S
tate
Uni
vers
ity]
at 0
8:26
26
Sept
embe
r 20
12
560 C. Thuithaisong et al.
3210–1–2–3
3
2
1
0
–1
–2
–3
Practice
CF (10–20 cm)
GM (10–20 cm)
RS (10–20 cm)
CT (10–20 cm)
CF (0–10 cm)
GM (0–10 cm)
RS (0–10 cm)
CT (0–10 cm)
PC1 (37.4%)
PC 2
(24.
2%)
(a)
PC1 (37.4%)
1.0.8.6.4.2.0–.2–.4–.6–.8–1.0
1.0(b)
.8
.6
.4
.2
.0
–.2
–.4
–.6
–.8
–1.0
PC2
(24.
2%)
Bray II–P
TP
MBN
MBC
TOP
PMN
SOM/SOCNO3-NNH4-N/BR
pH TK
TN
EC
Figure 8. Principal component analyses (PCA) of filled variables with (a) corresponding score and(b) loading factor plots of the first two principal components (PC1 and PC2).
under anaerobic conditions, which become available to rice plants. The plant nutrients areretained as cations on negatively charged soil mineral fractions as well as organic particles,until taken up by plant roots (Kyuma and Wakatsuki 1995).
Long-term cropping practices without applied fertilizer or with an inadequate fertil-izer program can result in poor grain yield (Zhang et al. 2009). In this study, a statisticaldifference in rice yield was obtained among the four farming practices. The reported riceyield values were 2.16 ± 1.018, 2.69 ± 0.078, 3.48 ± 0.265, and 3.09 ± 0.277 t ha−1,for CT, RS, GM, and CF plots, respectively (Figure 2). The yield of rice from CT, RS,
Dow
nloa
ded
by [
Lou
isia
na S
tate
Uni
vers
ity]
at 0
8:26
26
Sept
embe
r 20
12

Soil-Quality Indicators for Predicting Rice Yield 561
Table 2Results of principal components analysis of soil quality indicators from
different farming management practices (0–10 and 10–20 cm deep)
Principal component
Soil properties PC1 PC2 PC3
Eigen value 5.614 3.627 1.380Percentage of
variance (%)37.4 24.2 9.2
Cumulativepercentage (%)
37.4 61.6 70.8
Eigen vectorBray 2 P 0.845 −0.124 −0.031TP 0.843 0.134 −0.038TOP 0.781 0.163 0.284EC 0.770 0.110 −0.303MBN 0.736 0.013 0.257MBC 0.735 0.287 0.048SOM 0.704 0.616 0.132SOC 0.704 0.616 0.133TN −0.100 −0.694 0.294BR 0.587 0.682 −0.167NH4-N 0.596 0.673 0.022TK −0.062 0.668 0.424pH −0.118 0.661 −0.031NO3-N 0.406 0.640 −0.157PMN 0.141 −0.149 0.884
Boldface factor loadings are considered highly weighted.
GM, and CF plots over the past 10 years are illustrated in Figure 3. The results indicatedthat rice yield in GM plot was greatest over the 10-year period. Organic farming may havesignificantly greater soil N mineralization rate when compared with conventional farmingsystems receiving high inputs of synthetic N fertilizer. Cereal grain yields including rice areoften lower in organic than in conventional production practice. Problems associated withsynchronizing crop demand for N with N mineralization can explain part of this yield gap(Watson et al. 2002). This apparently is not the case for organic rice farming at Surin RiceResearch Center, Thailand. Recent data by Dawson, Huggins, and Jones (2008) showedthat the low-input organic agricultural production systems present unique environmentalconditions. The crop plant adapted to low N conditions still produced adequate grainyield.
Nutrient status of soils is often poor in rainfed lowland rice, and crop response toapplied nutrients is often unreliable. A study involving nutrient requirements in rainfedlowland rice in south and southeast Asia at 78 locations across India, Bangladesh, Thailand,Indonesia, and the Philippines during 1995–1997 identified N as the most limiting nutri-ent in irrigated rice systems (Wade et al. 1999). In rainfed lowland rice in central Java,Indonesia, N and K significantly influenced rice yields (Boling et al. 2004).
Dow
nloa
ded
by [
Lou
isia
na S
tate
Uni
vers
ity]
at 0
8:26
26
Sept
embe
r 20
12
Tabl
e3
Cor
rela
tion
coef
ficie
nts
ofri
ceyi
eld
(tha
−1)
with
chem
ical
–bio
logi
cals
oilp
rope
rtie
s(n
=12
)du
ring
rice
plan
ting
(May
),flo
wer
ing
(Oct
ober
),an
daf
ter
harv
estin
g(D
ecem
ber)
in20
07
Yie
ldE
C(μ
Scm
−1)
pHSO
M(g
kg−1
)SO
C(g
kg−1
)T
N(g
kg−1
)
NH
4-N
(mg
kg−1
)
NO
3-N
(mg
kg−1
)
TP
(mg
kg−1
)
TO
P(m
gkg
−1)
Bra
y2
P(m
gkg
−1)
TK
(mg
kg−1
)
BR
(mg
CO
2-C
kg−1
d−1)
PMN
(mg
NH
4-N
kg−1
)
MB
C(m
gkg
−1)
MB
N(m
gkg
−1)
0–10
cmde
epM
ayN
SN
SN
SN
SN
SN
SN
SN
S0.
665∗
NS
0.68
3∗N
SN
SN
SN
SO
ctN
SN
SN
SN
SN
SN
SN
SN
S0.
707∗
NS
NS
NS
0.60
8∗0.
903∗∗
0.91
1∗∗D
ecN
SN
SN
SN
SN
SN
SN
SN
SN
SN
SN
SN
SN
S0.
857∗∗
0.85
6∗∗10
–20
cmde
epM
ayN
SN
SN
SN
SN
SN
SN
SN
S0.
620∗
NS
NS
NS
NS
NS
NS
Oct
NS
NS
0.58
3∗0.
606∗
NS
NS
NS
NS
0.65
8∗N
S0.
616∗
NS
NS
NS
0.61
2∗D
ecN
SN
SN
SN
S0.
609∗
NS
NS
NS
NS
NS
NS
0.76
4∗∗N
S0.
848∗∗
0.75
8∗∗
Not
es.E
C,e
lect
rica
lcon
duct
ivity
;SO
M,s
oilo
rgan
icm
atte
r;SO
C,s
oilo
rgan
icca
rbon
;TN
,tot
alN
;Avi
a.N
,ava
ilabl
eni
trog
en;T
P,to
talp
hosp
horu
s;T
OP,
tota
lorg
anic
phos
phor
us;B
ray
2P,
avai
labl
eph
osph
orus
;and
TK
,tot
alpo
tass
ium
.∗ C
orre
latio
nis
sign
ifica
ntat
the
0.05
leve
l(tw
o-ta
iled)
.∗∗
Cor
rela
tion
issi
gnifi
cant
atth
e0.
01le
vel(
two-
taile
d).
562
Dow
nloa
ded
by [
Lou
isia
na S
tate
Uni
vers
ity]
at 0
8:26
26
Sept
embe
r 20
12

Soil-Quality Indicators for Predicting Rice Yield 563
Prediction of Rice Yield using Multiple Linear Regression and Validation Models
Multiple stepwise linear regression models were conducted using the soil chemical–biological parameters that could influence rice yield. Rice yield was the dependent variableand 15 soil parameters variables were the independent variables. To see the change in riceyield in response to changes in the independent variables, stepwise multiple regressionswere performed using the following formula:
Y = a + b1X1 + b2X2 + b3X3 . . . + b15X15
where Y is rice yield, a is intercept on the Y axis (constant), b is the regression coefficient—magnitude of change in Y for a unit change in X (the slope of line coefficients), X1 to X15
are independent variables (EC, pH, SOM, SOC, TN, NH4-N, TP, TOP, Bray 2 P, TK, MBC,BR, PMN, MBN, and NO3-N, respectively).
The selected equation (model 1) using multiple lineal regressions based on chemicaland biological properties of soil samples in May, October, and December 2007 was
Y = 1.675 + 0.420 (MBN), r2adjusted = 0.640 (1)
Results show that rice yield was significantly correlated with microbial biomass N(MBN) (r = 0.821). The value of adjusted r2 (0.640) implied the model’s goodness of fitfor the population.
Model 2 was selected for soil samples collected in October 2007, and the regressionequation was
Y = −1.685 + 0.333 (MBN) + 0.640 (TK) − 0.282 (SOC), r2adjusted = 0.962 (2)
Results show that rice yield was significantly correlated with TK and MBN and neg-atively correlated with SOC. The r value was 0.986, and the adjusted r2 was expressed as0.962.
Overall, MBN appeared to be the dominant factor in predicting soil quality and riceyield. Other important factors were TK and SOC. Zhang et al. (2009) reported that bothwheat and corn grain yields were significantly correlated with SOC, total and available N,and P. However, the relationships were stronger with total N (r = 0.50–0.60) than withavailable N (r = 0.26–0.30), indicating the importance of maintaining adequate soil totalN levels as an agricultural practice. Soil biological (MBC, MBN, PMN) and chemical(SOC, TN, CEC) properties are highly sensitive to environmental stress and thus can beused to assess soil quality for management and production practices (Bending et al. 2004;Lima et al. 2009; Stark 2005). Based on the results reported by Benintende et al. (2008),biological variables (MBC, MBN) were shown to be sensitive variables for use in evalu-ating soil rotations effects and could be used as soil-quality indicators once the thresholdvalues were determined for specific conditions. These variables were closely correlatedwith SOM and/or TN contents of the soils.
Two regression models from this study were computed using the soil sample datafor 2006. A coefficient of determination (R2), RMSE, and D index were computed fordetermining the efficacy of these regression models. Comparison between models 1 and2 showed model 2 to perform better than model 1; for example, the r2 value of model 2(0.472) was greater than for model 1 (r2 = 0.253). RMSEs of models 1 and 2 were 0.089t ha−1 and 0.046 t ha−1, the predictive confidences were 91.1% and 95.4%, normalized
Dow
nloa
ded
by [
Lou
isia
na S
tate
Uni
vers
ity]
at 0
8:26
26
Sept
embe
r 20
12

564 C. Thuithaisong et al.
Table 4Comparison of performance measures of the regression models 1 and 2 from rice soil
samples for 2006
Regressionmodela
Oavg
(t ha−1)Pavg
(t ha−1) N R2RMSE(t ha−1)
RMSEnormalized
(%) D index
Model 1 0.9992 1.270 12 0.253 0.089 8.9 0.00Model 2 0.9992 1.031 12 0.472 0.046 4.6 0.45
aModel 1: Y = 1.675 + 0.420 (MBN); model 2: Y = −1.685 + 0.333 (MBN) + 0.640 (TK) −0.282(SOC).
Notes. Oavg, average of values measured in rice field for 2006; Pavg, average of the values estimatedby regression model; N, observation number; R2, determination coefficient; RMSE, root mean squareerror: D index, index of agreement.
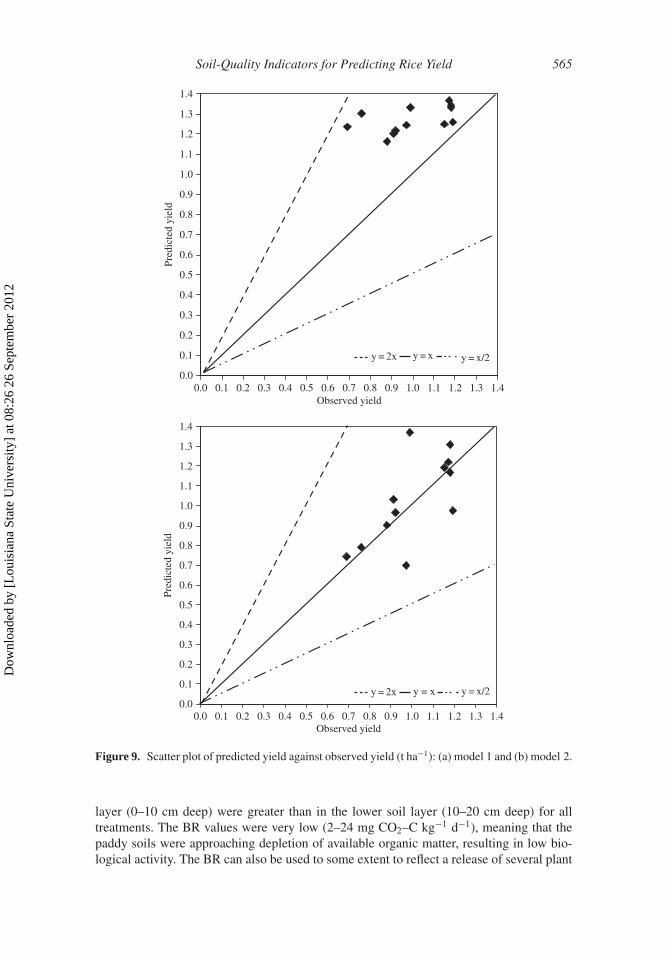
RMSEs were 8.9% and 4.6%, and D index values were 0 and 0.45, respectively (Table4). In Fujian Province, China, where weather conditions such as typhoons, floods, anddroughts threaten rice production, Ji et al. (2007), using an artificial neural network (ANN),predicted rice grain yield models showed r2 and RMSE of 0.87 and 891, respectively.The results showed the ANN models were superior for accurately predicting rice yieldsunder typical Fujian climatic condition. Xiong et al. (2008) evaluated the CERES (cropenvironment resource synthesis) rice model using rice yields for plot scale experimen-tal sites and/or observed yield data for the region. Result suggested that the CERES ricemodel can simulate a site-specific rice production with good performance in China with aRMSE of 0.991 t ha−1 and relative (normalized) RMSE of 14.9% for yield across China.In the tropic region, Matthews et al. (2000) reported fairly good prediction of grain yieldusing process-based crop/soil model MERES (methane emissions from rice ecosystems)with a RMSE of 1.1 t ha−1 at Los Banos, Philippines, and Hangzhou, China, except forthree treatments with midseason drainage in the dry season at Los Banos. The scatter plot(Figure 9), using results based on models 1 and 2 from this study, did not over- or underes-timated observed values. Statistical analyses indicated that model 2 consistently producedmore accurate yield predictions than model 1. Based on the literature and scatter plotdata (Figure 9), model 2 was proposed and recommended by this study for predicting riceyield.
This operational model, even though quite site specific for the Surin province’s ricefield in Thailand, can perhaps be used to predict rice yield in southeast Asian countries andother regions with similar environment.
Conclusions
Physical soil properties including soil texture were not different among the plots studied.The soils were loam and sandy loam. Bulk density (1.50–1.58 g cm−1) had no direct effecton rice growth. The percentages of sand, silt, and clay contents were 52–59%, 25–33%, and14–19%, respectively. Soil CEC (0.93–3.8 meq 100 g−1) was low. The soils were nonsalinewith a very low EC value of the four plots (34–92 μS cm−1). Soil pH, SOM, and essentialmacronutrients (N, P, and K) in all plots were also low.
Soil biological properties including PMN, BR, MBC, and MBN from all of the siteswere low. The biological activities such as PMN, BR, MBC, and MBN in the upper soil
Dow
nloa
ded
by [
Lou
isia
na S
tate
Uni
vers
ity]
at 0
8:26
26
Sept
embe
r 20
12
Soil-Quality Indicators for Predicting Rice Yield 565
0.0
0.1
0.2
0.3
0.4
0.5
0.6
0.7
0.8
0.9
1.0
1.1
1.2
1.3
1.4
0.0 0.1 0.2 0.3 0.4 0.5 0.6 0.7 0.8 0.9 1.0 1.1 1.2 1.3 1.4Observed yield
Pred
icte
d yi
eld
0.0 0.1 0.2 0.3 0.4 0.5 0.6 0.7 0.8 0.9 1.0 1.1 1.2 1.3 1.4Observed yield
0.0
0.1
0.2
0.3
0.4
0.5
0.6
0.7
0.8
0.9
1.0
1.1
1.2
1.3
1.4
Pred
icte
d yi
eld
y = 2x y = x/2 y = x
y = 2x y = x/2y = x
Figure 9. Scatter plot of predicted yield against observed yield (t ha−1): (a) model 1 and (b) model 2.
layer (0–10 cm deep) were greater than in the lower soil layer (10–20 cm deep) for alltreatments. The BR values were very low (2–24 mg CO2–C kg−1 d−1), meaning that thepaddy soils were approaching depletion of available organic matter, resulting in low bio-logical activity. The BR can also be used to some extent to reflect a release of several plant
Dow
nloa
ded
by [
Lou
isia
na S
tate
Uni
vers
ity]
at 0
8:26
26
Sept
embe
r 20
12

566 C. Thuithaisong et al.
nutrients such as N, S, P, and micronutrients contained in SOM into plant-bioavailableforms. So, poor soil fertility in our paddy soils was in part supported by low SOM. ThePMN values (7.04–8.75 mg NH4-N kg−1) from four plots were very low. The MBC andMBN values from GM and plot were not significantly different (P > 0.05). There werepoor MBC (0.037–2.170 g kg−1) and MBN (0.030–0.579 g kg−1) levels in all plots.
Based on the PCA method, 15 soil parameters were shown to be significantly differentamong the farming systems studied. Results show that soil quality was related to predomi-nately P, N, and SOM for soil chemical parameters and MBC, MBN, and BR for biologicalparameters. Because of a strong relationship between grain yield of rice and the soil prop-erties mentioned, it can be concluded that grain yield had high correlation (r > 0.75) withbiological properties (MBC, MBN, and BR) and chemical properties (TOP, TK, TN, SOC,and SOM) (r > 0.55). A combination of soil-quality indicators was analyzed by multipleregressions and fit with a regression model for predicting the rice yield (Y = −1.685 +0.333 (MBN) + 0.640 (TK) −0.282 (SOC), r2
adjusted = 0.962). The results showed goodprediction of grain yield using the following equation (RMSE = 0.046 t ha−1, D index =0.45): Y = −1.685 + 0.333 (MBN) + 0.640 (TK) −0.282 (SOC).
Acknowledgment
This research was funded by the Thailand Research Fund (TRF)/National Center forGenetic Engineering and Biotechnology (BIOTEC) Special Program for BiodiversityResearch and Training (BRT) and the Environmental Engineering and Management(EEM), Asian Institute of Technology (AIT), Thailand.
References
Alagarswamy, G., K. J. Boote, L. H. Allen, and J. W. Jones. 2006. Evaluating the CROPGRO-soybean model ability to simulate photosynthesis response to carbon dioxide levels. AgronomyJournal 98:34–42.
Anderson, T. H., and K. H. Domsch. 1978. A physiological method for the quantitative measurementof microbial biomass in soils. Soil Biology and Biochemistry 10:215–221.
Bending, G. D, M. K Tuner, F. Rayns, M. C. Marx, and M. Wood. 2004. Microbial and biochemicalsoil quality indicators and their potential for differentiating areas under contrasting agriculturalmanagement regimes. Soil Biology and Biochemistry 36 (11): 1785–1792.
Benintende, S. M., M. C. Benintende, M. A. Sterren, and J. J. De Battista. 2008. Soil microbiologicalindicators of soil quality in four rice rotations systems. Ecological Indicators 8:704–708.
Boling A., T. P. Tuong, S. Y. Jatmiko, and M. A. Burac. 2004. Yield constraints of rainfed lowlandrice in central Java, Indonesia. Field Crops Research 90 (2–3): 351–360.
Bremner, J. M., and C. S. Mulvaney. 1982. Nitrogen—Total. In Methods of soil analysis, part 2:Chemical and microbiological properties, ed. A. L. Page, R. H. Miller, and D. R. Keeney,595–641. Madison, Wisc.: American Society of Agronomy.
Canali, S., A. Trinchera, E. Di Bartoblomeo, L. Nisini, A. Benedetti, and F. Intrigiolo. 2002. Soilfertility comparison among organic and conventional manage citrus orchards in Sicily. Paperpresented at the 17th WCSS conference, Bangkok, Thailand, 14–21 August.
Cassman, K. G. 1999. Ecological intensification of cereal production systems: Yield potential,soil quality, and precision agriculture. Paper presented at the National Academy of SciencesColloquium on the Plants and Population: Is There Time?, Irvine, California, 2–6 December.
Chapman, H. D. 1965. Cation exchange capacity. In Method of soil analysis, part 2: Chemical andmicrobiological properties, ed. C. A. Black, D. D. Evan, L. E. Ensminger, J. L. White, F. E.Clark, and R. C. Dinauer, 891–901. Madison, Wisc.: American Society of Agronomy.
Dow
nloa
ded
by [
Lou
isia
na S
tate
Uni
vers
ity]
at 0
8:26
26
Sept
embe
r 20
12

Soil-Quality Indicators for Predicting Rice Yield 567
Chen, J.-H. 2006. The combined use of chemical and organic fertilizers and/or biofertilizer forcrop growth and soil fertility. Paper presented at the International Workshop on SustainedManagement of the Soil–Rhizosphere System for Efficient Crop Production and Fertilizer Use,Bangkok, Thailand, 16–20 October.
Choi, D. H., H. G. Goh, and Y. J. Lee. 2004. The modern technique for organic rice cultivation inKorea. Paper presented at the Benign Environment and Safe Food, 6th IFOAM-Asia ScientificConference, Yangpyung, Korea, 7–11 September.
Culley, J. L. B. 1993. Density and compressibility. In Soil sampling and methods of analysis, ed.M. R. Carted, 529–539. Boca Raton, Fl.: Lewis Publishers.
Dawson, J. C., D. R. Huggins, and S. S. Jones. 2008. Characterizing nitrogen use efficiency in naturaland agricultural ecosystems to improve the performance of cereal crops in low-input and organicagricultural systems. Field Crops Research 107:89–101.
Dick, R. P. 1992. A review: Long-term effects of agricultural systems on soils biochemical andmicrobial parameters. Agriculture, Ecosystems and Environment 40:25–36.
Dobermann, A., and T. H. Fairhurst. 2000. Rice: Nutrient disorders and nutrient management.Los Baños and Singapore: International Rice Research Institute (IRRI), Potash and PhosphateInstitute (PPI).
Endo, A., S. Mishima, and K. Kohyama. 2009. Modeling nitrate leaching on a cropped Andosol.Nutrient Cycling in Agroecosystems 85(1):41–61.
Green Net and Earth Net Foundation. 2005. Organic agriculture situation in Thailand 2005.Bangkok, Thailand.
Hillel, D. 1988. Environmental soil physics. San Diego, Calif.: Academic Press.Idowu, O. J., H. M. van Es, G. S. Abawi, D. W. Wolfe, J. I. Ball, B. K. Gugino, B. N. Moebius, R. R.
Schindelbeck, and A.V. Bilgili. 2008. Farmer-oriented assessment of soil quality using field,laboratory, and VNIR spectroscopy methods. Plant and Soil 307:243–253.
IRRI (International Rice Research Institute). 1997. Rice almanac, 2nd ed. Los Baños, Phillippines:IRRI.
Ji, B., Y. Sun, S. Yang, and J. Wan. 2007. Artificial neural networks for rice yield prediction inmountainous regions. Journal of Agricultural Science 145:249–261.
Jivraj, S. V., and N. V. Savaliya. 2004. Organic farming: A holistic approach for safe food and sustain-able agriculture. Paper presented at the Benign Environment and Safe Food, 6th IFOAM-AsiaScientific Conference, Yangpyung, Korea, 7–11 September.
Johansson, M., and B. Stenberg. 2000. Multivariate techniques for presentation, interpretation, andevaluation of soil quality data. In Soil stresses, quality, and care, ed. S. Elmholt, B. Stenberg,A. Gronlund, and V. Nuutinen, 63–72. Tjele: Danish Institute of Agricultural Science.
Karlen, D. L., M. J. Mausbach, J. W. Doran, R. G. Cline, R. F. Harris, and G. E. Schuman. 1997. Soilquality: A concept, definition, and framework for evaluation. Soil Science Society of AmericaJournal 61:4–10.
Keeney, D. R. 1982. Nitrogen availability indices. In Methods of soil analysis, part 2: Chemical andmicrobiological properties, ed. A. L. Page, R. H. Miller, and D. R. Keeney, 711–734. Madison,Wisc.: American Society of Agronomy.
Kyuma, K., and T. Wakatsuki. 1995. Ecological and economic sustainability of paddy rice system inAsia. In Agriculture and environment: Bridging food production and environmental protectionin developing countries, ed. A. S. R. Juo and R. D. Freed, 139–159. Madison, Wisc.: AmericanSociety of Agronomy.
Lampkin, N. 1994. Organic farming. Ipswich, UK: Farming Press.Lima, A. C. R., W. B. Hoogmoed, E. A. Pauletto, and L. F. S. Pinto. 2009. Management systems in
irrigated rice affect physical and chemical soil properties. Soil Tillage Research 103:92–97.Matthews, R. B., R. Wassmann, J. W. Knox, and L.V. Buendia. 2000. Using a crop/soil simulation
model and GIS techniques to assess methane emissions from rice fields in Asia, IV: Upscalingto national levels. Nutrient Cycling in Agroecosystems 58 (1–3): 1385–1314.
Dow
nloa
ded
by [
Lou
isia
na S
tate
Uni
vers
ity]
at 0
8:26
26
Sept
embe
r 20
12

568 C. Thuithaisong et al.
Parkin, T. B., J. W. Doran, and E. F. Vizcaino. 1996. Field and laboratory tests of soil respiration. InMethods for assessing soil quality, ed. J. W. Doran, and A. J. Jones, 231–246. Madison, Wisc.:SSSA.
Schjonning, P., S. Elmholt, and B. T. Christensen. 2004. Managing soil quality challenges in modernagriculture. Wallingford, UK: CABI Publishing.
Stark, C. 2005. Effects of long- and short-term crop management on soil biological properties andnitrogen dynamics. PhD dissertation, Canterbury, New Zealand: Lincoln University.
Tansiri, B., and K. Saifak. 1999. Qualitative land evaluations. Bangkok, Thailand: LandDevelopment Department.
Timsina, J., and E. Humphreys. 2006. Performance of CERES-rice and CERES-wheat models inrice–wheat systems: A review. Agricultural Systems 90:5–31.
UNCTAD and WTO. 2006. Strengthening the export capacity of Thailand’s organic agriculture.Geneva, Switzerland: UNCTAD/WTO.
USDA. 1999. Soil quality test kit guide: Soil quality test kit, section II: Background and interpretiveguide for individual tests. Washington, D.C.: Department of Agriculture.
USDA. 2005. USDA rice baseline. Available at http://www.ers.usda.gov/Briefing/rice/2005baseline.htm.
USDA. 2008. USDA rice baseline. Available at http://www.ers.usda.gov/Briefing/rice/2008baseline/htm.
Vachrotayan, S., and Y. Takai. 1983. Paddy nitrogen economy: Comparative ecological studyon nitrogen economy of paddy soil between tropical and temperate regions. Tokyo, Japan:University of Agriculture Press.
Voroney, R. P., J. P. Winter, and R. P. Beyeart. 1993. Soil microbial biomass C and N. In Soil samplingand methods of analysis, ed. M. R. Carter, 277–286. Boca Raton, Fl.: Canadian Society of SoilScience.
Wade, L. J., S. T. Amarante, A. Olea, D. Harnpichitvitaya, K. Naklang, A. Wihardjaka, S. S. Sengar,M. A. Mazid, G. Singh, and C. G. McLaren. 1999. Nutrient requirements in rainfed lowlandrice. Field Crops Research 64:91–107.
Walkley, A., and I. A. Black. 1934. An examination of the degtijaieff method for determining soilorganic matter and a proposed modification of the chromic acid titration method. Soil Science37:29–37.
Watson, C. A., D. Atkinson, P. Gosling, L. R. Jackson, and F. W. Rayns. 2002. Managing soil fertilityin organic farming systems. Soil Use Management 18 (S1): 239–247.
Wikimedia Commons Contributors. 2008. A blank map of Thailand with the provinces outlined.Available at http://commons.wikimedia.org/wiki/File:BlankMap_Thailand.png.
Willmott, C. J. 1982. Some comments on the evaluation of model performance. Bulletin of theAmerican Meteorological Society 63:1309–1313.
Willmott, C. J., S. G. Ackleson, R. E. Davis, J. J. Feddema, K. M. Klink, D. R. Legates, J. O’Donnell,and C. M. Rowe. 1985. Statistics for the evaluation and comparison of models. Journal ofGeophysical Research 90:8995–9005.
Xiong, W., I. Holman, D. Conway, E. Lin, and Y. Li. 2008. A crop model cross calibration for use inregional climate impacts studies. Ecological Modelling 213(3–4): 365–380.
Zhang, W., M. Xu, B. Wang, and X. Wang. 2009. Soil organic carbon, total nitrogen, and grainyields under long-term fertilizations in the upland red soil of southern China. Nutrient Cyclingin Agroecosystems 84(1): 59–69.
Dow
nloa
ded
by [
Lou
isia
na S
tate
Uni
vers
ity]
at 0
8:26
26
Sept
embe
r 20
12