HORTICULTURE POSTHARVEST PRACTICES IN RWANDA
23
HORTICULTURE POSTHARVEST PRACTICES IN RWANDA 2019
-
Upload
khangminh22 -
Category
Documents
-
view
2 -
download
0
Transcript of HORTICULTURE POSTHARVEST PRACTICES IN RWANDA
HORTICULTURE POSTHARVEST PRACTICES IN RWANDA
2019

2 | P a g e
HORTICULTURE POSTHARVEST PRACTICES IN RWANDA August 2019
This publication is made possible by the generous support of the American people through the United States Agency for International Development (USAID). The contents are the responsibility of the Horticulture Innovation Lab’s Reducing Postharvest Losses in Rwanda project and do not necessarily reflect the views of USAID or the United States Government.
Agribusiness Associates Started by Mr. Gurbinder Singh Gill, Agribusiness Associates is an international development consulting firm focusing on overcoming the biggest challenges in the agricultural sector. The firm has special expertise in offering comprehensive solutions to the agribusiness sector for enterprise development. ABA has worked in public-private partnerships, seed industry, technology adoption, capacity building and providing strategic advisory services. Agribusiness Associates is the lead implementing partner for the ‘Reducing Postharvest Losses in Rwanda’ project.
Acknowledgements Our gratitude goes to the Ministry of Rwanda Agriculture and Animal Resources for facilitating its institutions, Rwanda Agriculture Board (RAB) and National Agriculture Export Development Board (NAEB) to participate in the implementation of this project. Also, thanks to the University of Rwanda (UR) for their close collaboration to make the project successful.
We thank Dr. Elizabeth Mitcham and Erin McGuire of Horticultural Innovation Lab for their thoughtful guidance.
We thank, Dr. Bertha Mjawa and Rashmi Ekka for leading the design of the study along with the project team.
Our appreciation goes to the following contributors for their efforts: Christine Mukantwali, Eric Kabayiza, Hilda Vasanthakaalam, Serge Ndayitabi, Jean-Paul Hategekimana, Gerardine Nyirahaganyamunsi, Solange Musanase, Vincent Gasasira, Aloys Hakizimana, Sharon Cyatengwa, Alfred Nsigaye, and Jean-Claude Nyamatsi.
Rashmi Kiran Ekka is acknowledged for her editing and compilation of the report. Serge Ndayitabi is gratefully acknowledged for coordinating all aspects of this report and for his support to the project.
Any remaining errors and omissions are the responsibility of the contributors of the report.
3 | P a g e
Contents Executive summary........................................................................................................................................... 5
1. Introduction ............................................................................................................................................... 6
2. DATA ANALYSIS AND INTERPRETATION OF STUDY FINDINGS ....................................... 7
2.1 Farmer Demographics .......................................................................................................................... 7
Distribution of farmers interviewed by location ............................................................................... 7
Distribution of interviewed farmers by gender ................................................................................. 8
Distribution of Farmers by Family Status ............................................................................................ 9
2.2 Description of crops grown by interviewed farmers .................................................................... 9
Distribution of Crops ........................................................................................................................... 10
Distribution of Produce Sold by Farmers to Different Market Actors..................................... 11
2.3 Sales ....................................................................................................................................................... 12
Length between Harvest and Sales .................................................................................................... 12
Quality of Harvest ................................................................................................................................. 13
Grading the harvested crops before sale ......................................................................................... 14
Price of crops and grading practices ................................................................................................. 16
2.4. Farmers Practice: Crop Sales vs Home Consumption (Fresh, Processed or Stored) ....... 17
2.5. Predominant defects that lower price of crops .......................................................................... 18
Types of defects ..................................................................................................................................... 18
2.6. Postharvest Extension and When to Harvest ............................................................................. 20
Source of knowledge to determine when to harvest ................................................................... 21
2.9. Investment Capacity of farmer ....................................................................................................... 22
Share of Farmers having current loan for farming ......................................................................... 22

4 | P a g e
List of Figures Figure 1: Gender distribution of respondents in all three regions ........................................................ 8 Figure 2: Family type in all three regions ..................................................................................................... 9 Figure 3: Distribution of crops - North .................................................................................................... 10 Figure 4: Distribution of crops - East ........................................................................................................ 10 Figure 5: Distribution of crops - South ..................................................................................................... 11 Figure 6: Distribution of Produce Sold by Farmers to Different Market Actors ............................ 11 Figure 7: Harvest by Quality - North ........................................................................................................ 13 Figure 8: Harvest by Quality - East ............................................................................................................ 14 Figure 9: Harvest by Quality - South ......................................................................................................... 14 Figure 10: Grading practice - North .......................................................................................................... 15 Figure 11: Grading practice - East .............................................................................................................. 15 Figure 12: Grading practice - South ........................................................................................................... 16 Figure 13: Farmer perspective - Is price affected by grading? .............................................................. 16 Figure 14: Crop Sales vs Home Consumption - North ........................................................................ 17 Figure 15: Crop Sales vs Home Consumption - East ............................................................................ 17 Figure 16: Crops Sales vs Home Consumption - South ....................................................................... 18 Figure 17: Defects lowering prices of crops in North (1) .................................................................... 18 Figure 18: Defects lowering prices of crops in North (2) .................................................................... 19 Figure 19: Defects lowering prices of crops in East............................................................................... 19 Figure 20: Defects lowering prices of crops in South ........................................................................... 20 Figure 21: Received training on Postharvest Management Prior to Project Intervention............. 21 Figure 22: Source of Knowledge to determine post-harvest period ................................................. 21 Figure 23: Farmers access to finance ......................................................................................................... 22 Figure 24: Loan by purpose ......................................................................................................................... 23 Figure 25: Loan for investment in postharvest solutions ............ Error! Bookmark not defined.
List of Tables Table 1: Number of Respondents in the North ........................................................................................ 7 Table 2: Number of Respondents in the East ............................................................................................ 7 Table 3: Number of Respondents in the South ......................................................................................... 8 Table 4: Duration between Harvest and Sales - North ........................................................................ 12 Table 5: Duration between Harvest and Sales - East ............................................................................ 13 Table 6: Duration between Harvest and Sales - South ......................................................................... 13
5 | P a g e
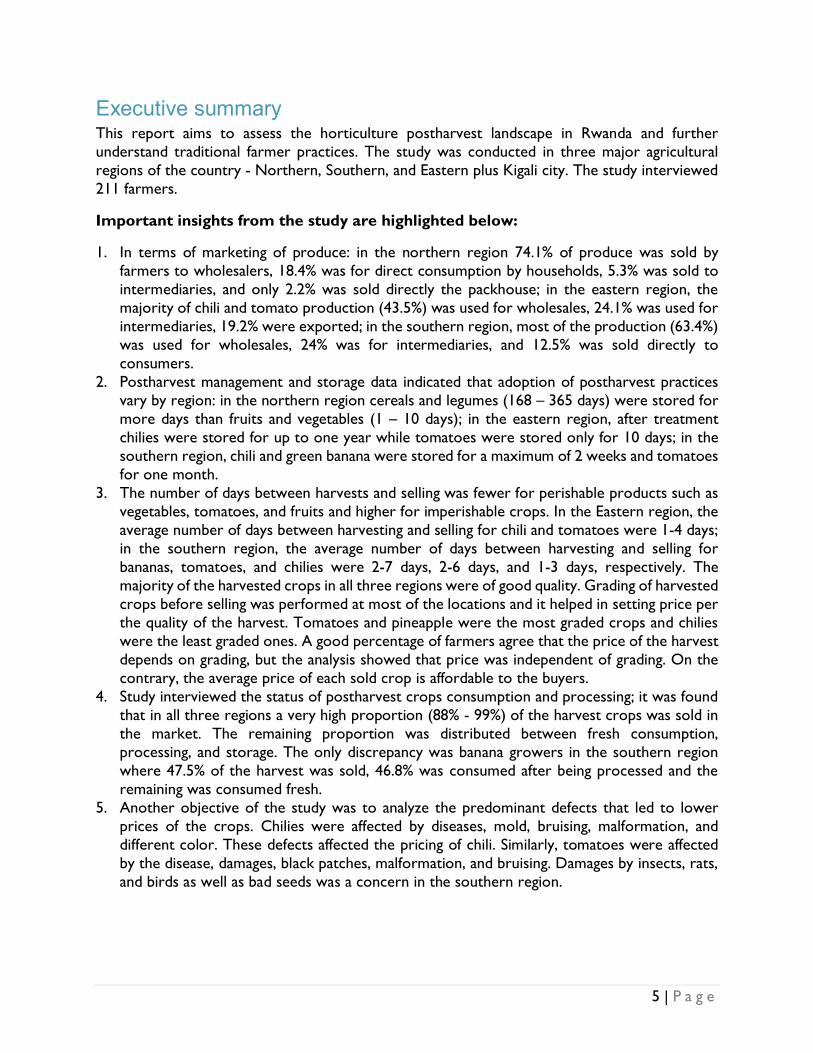
Executive summary This report aims to assess the horticulture postharvest landscape in Rwanda and further understand traditional farmer practices. The study was conducted in three major agricultural regions of the country - Northern, Southern, and Eastern plus Kigali city. The study interviewed 211 farmers.
Important insights from the study are highlighted below:
1. In terms of marketing of produce: in the northern region 74.1% of produce was sold by farmers to wholesalers, 18.4% was for direct consumption by households, 5.3% was sold to intermediaries, and only 2.2% was sold directly the packhouse; in the eastern region, the majority of chili and tomato production (43.5%) was used for wholesales, 24.1% was used for intermediaries, 19.2% were exported; in the southern region, most of the production (63.4%) was used for wholesales, 24% was for intermediaries, and 12.5% was sold directly to consumers.
2. Postharvest management and storage data indicated that adoption of postharvest practices vary by region: in the northern region cereals and legumes (168 – 365 days) were stored for more days than fruits and vegetables (1 – 10 days); in the eastern region, after treatment chilies were stored for up to one year while tomatoes were stored only for 10 days; in the southern region, chili and green banana were stored for a maximum of 2 weeks and tomatoes for one month.
3. The number of days between harvests and selling was fewer for perishable products such as vegetables, tomatoes, and fruits and higher for imperishable crops. In the Eastern region, the average number of days between harvesting and selling for chili and tomatoes were 1-4 days; in the southern region, the average number of days between harvesting and selling for bananas, tomatoes, and chilies were 2-7 days, 2-6 days, and 1-3 days, respectively. The majority of the harvested crops in all three regions were of good quality. Grading of harvested crops before selling was performed at most of the locations and it helped in setting price per the quality of the harvest. Tomatoes and pineapple were the most graded crops and chilies were the least graded ones. A good percentage of farmers agree that the price of the harvest depends on grading, but the analysis showed that price was independent of grading. On the contrary, the average price of each sold crop is affordable to the buyers.
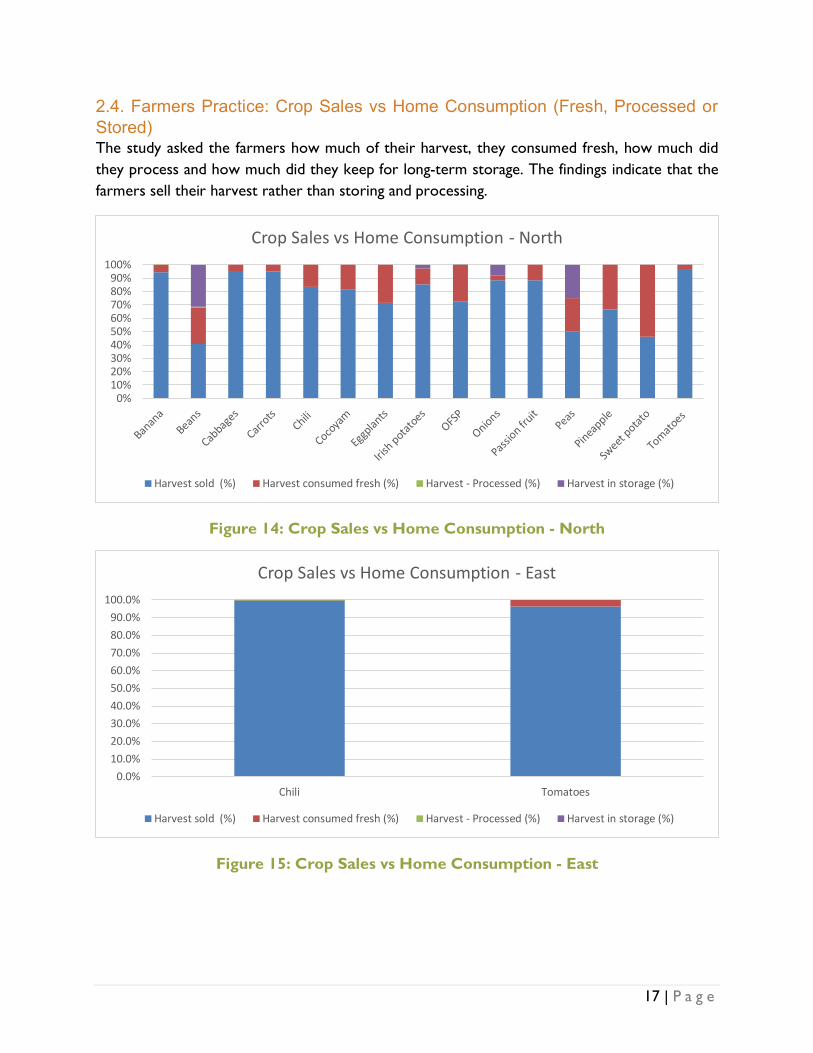
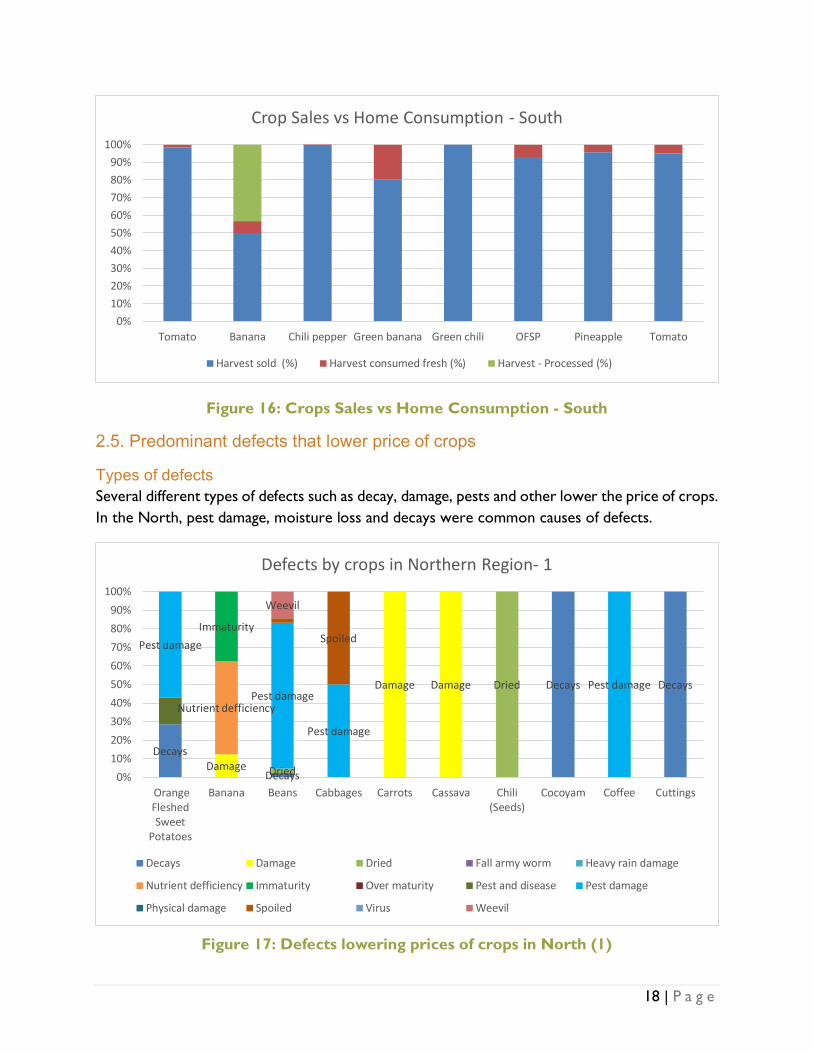
4. Study interviewed the status of postharvest crops consumption and processing; it was found that in all three regions a very high proportion (88% - 99%) of the harvest crops was sold in the market. The remaining proportion was distributed between fresh consumption, processing, and storage. The only discrepancy was banana growers in the southern region where 47.5% of the harvest was sold, 46.8% was consumed after being processed and the remaining was consumed fresh.
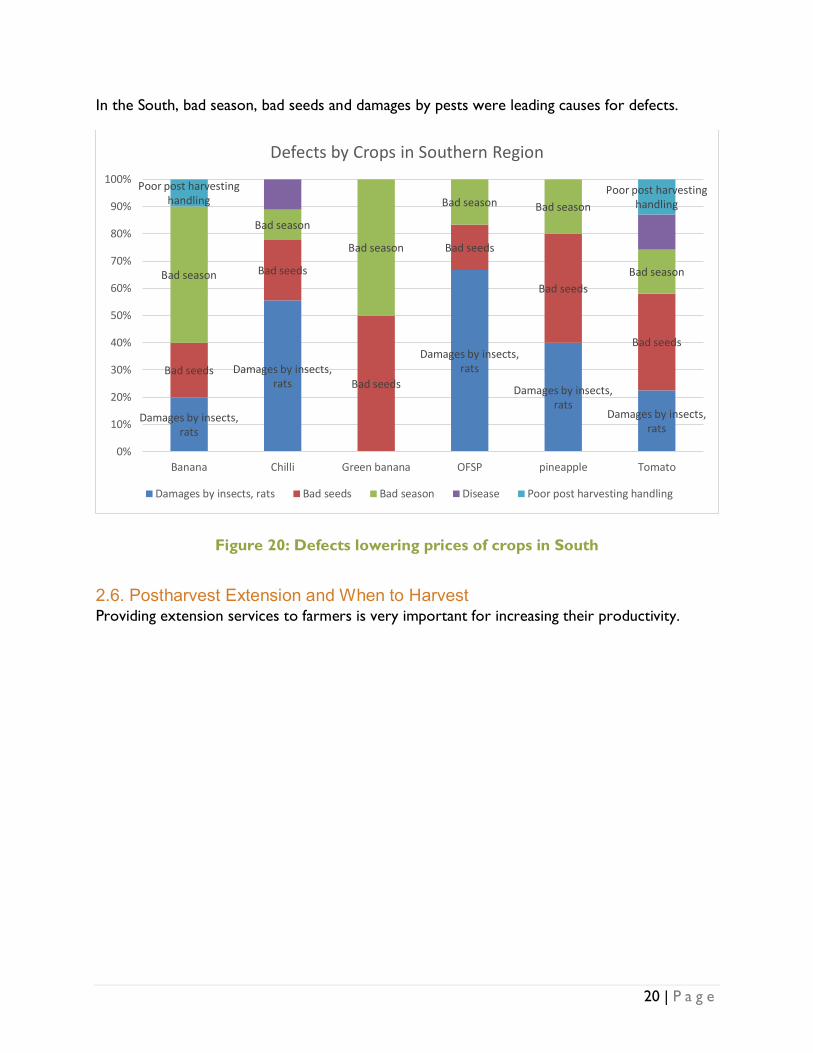
5. Another objective of the study was to analyze the predominant defects that led to lower prices of the crops. Chilies were affected by diseases, mold, bruising, malformation, and different color. These defects affected the pricing of chili. Similarly, tomatoes were affected by the disease, damages, black patches, malformation, and bruising. Damages by insects, rats, and birds as well as bad seeds was a concern in the southern region.

6 | P a g e
1. Introduction In Rwanda, agriculture serves as the backbone of the economy and is crucial to its growth and reduction in poverty. The agriculture sector accounts for 39% of gross domestic production, 80% of employment and 63% of foreign exchange earnings (World Bank, Rwanda, 2014). Various estimates say that up to 40% of food is lost in the postharvest stage. While simple approaches exist to reduce postharvest losses such as improved handling of horticultural crops, there is no one isolated intervention that will prove effective at mitigating this issue. Postharvest management is a system-based challenge and requires an integrated innovation strategy that incorporates technological and financial innovations, capacity building across the value chain, enhanced market access and other elements to achieve impact at scale (Global Knowledge Initiative, 2014).
About ‘Reducing Postharvest Losses in Rwanda’ Project
The study was conducted by the ‘Reducing Postharvest Losses in Rwanda’ Project. Funded by Feed the Future Horticultural Innovation Lab, the Reducing Postharvest Losses in Rwanda project worked under the guidance of the Ministry of Agriculture and Animal Resources in Rwanda with implementing partners, Agribusiness Associates, Rwanda Agriculture and Animal Resources Board, National Agriculture Export Development Board and University of Rwanda – College of Agriculture and Veterinary Medicine. Our postharvest technical assistance partner is Postharvest Education Foundation.
The primary goal of the project is to increase food security in Rwanda, by reducing postharvest losses in horticulture. The specific project objectives are:
Objective 1: Gain understanding of post-harvest losses, constraints and opportunities in the four identified horticultural crop value chains
Objective 2: Determine the benefits of introducing improved postharvest practices and technologies in partnership with three institutions
Objective 3: Build entrepreneurial capacity in stakeholders across the value chain
The project identified postharvest losses and constraints in four key horticultural crops – tomatoes, green chilies, orange-fleshed sweet potatoes and green bananas. This study is the next step in further understanding the practices of farmers. The study was conducted in three regions such as Northern, southern and Eastern plus Kigali City, the individual farmers and cooperatives of farmers were interviewed. The analysis of findings is given by region.
7 | P a g e
2. DATA ANALYSIS AND INTERPRETATION OF STUDY FINDINGS
2.1 Farmer Demographics
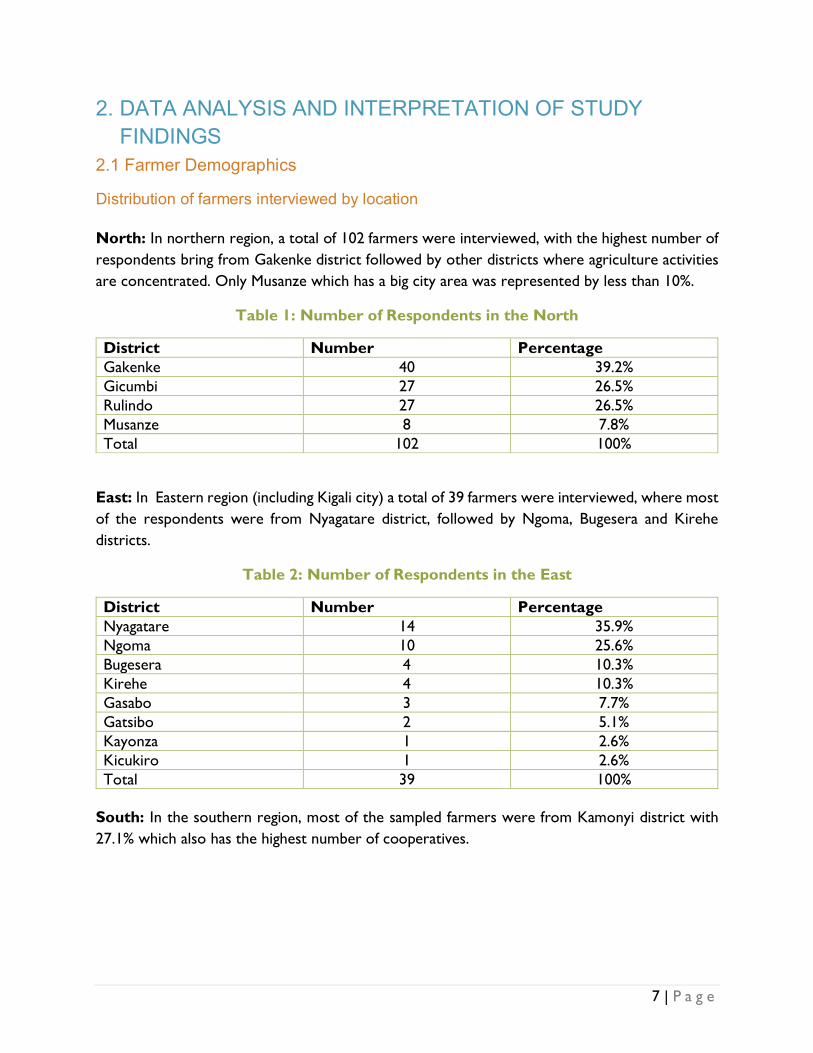
Distribution of farmers interviewed by location North: In northern region, a total of 102 farmers were interviewed, with the highest number of respondents bring from Gakenke district followed by other districts where agriculture activities are concentrated. Only Musanze which has a big city area was represented by less than 10%.
Table 1: Number of Respondents in the North
District Number Percentage Gakenke 40 39.2% Gicumbi 27 26.5% Rulindo 27 26.5% Musanze 8 7.8% Total 102 100%
East: In Eastern region (including Kigali city) a total of 39 farmers were interviewed, where most of the respondents were from Nyagatare district, followed by Ngoma, Bugesera and Kirehe districts.
Table 2: Number of Respondents in the East
District Number Percentage Nyagatare 14 35.9% Ngoma 10 25.6% Bugesera 4 10.3% Kirehe 4 10.3% Gasabo 3 7.7% Gatsibo 2 5.1% Kayonza 1 2.6% Kicukiro 1 2.6% Total 39 100%
South: In the southern region, most of the sampled farmers were from Kamonyi district with 27.1% which also has the highest number of cooperatives.
8 | P a g e
Table 3: Number of Respondents in the South
District Number Percentage Kamonyi 19 27.1% Huye 10 14.3% Muhanda 9 12.9% Nyanz 9 12.9% Nyaruguru 8 11.4% Ruhango 8 11.4% Gisagara 6 8.6% Nyamagabe 1 1.4% Total 70 100%
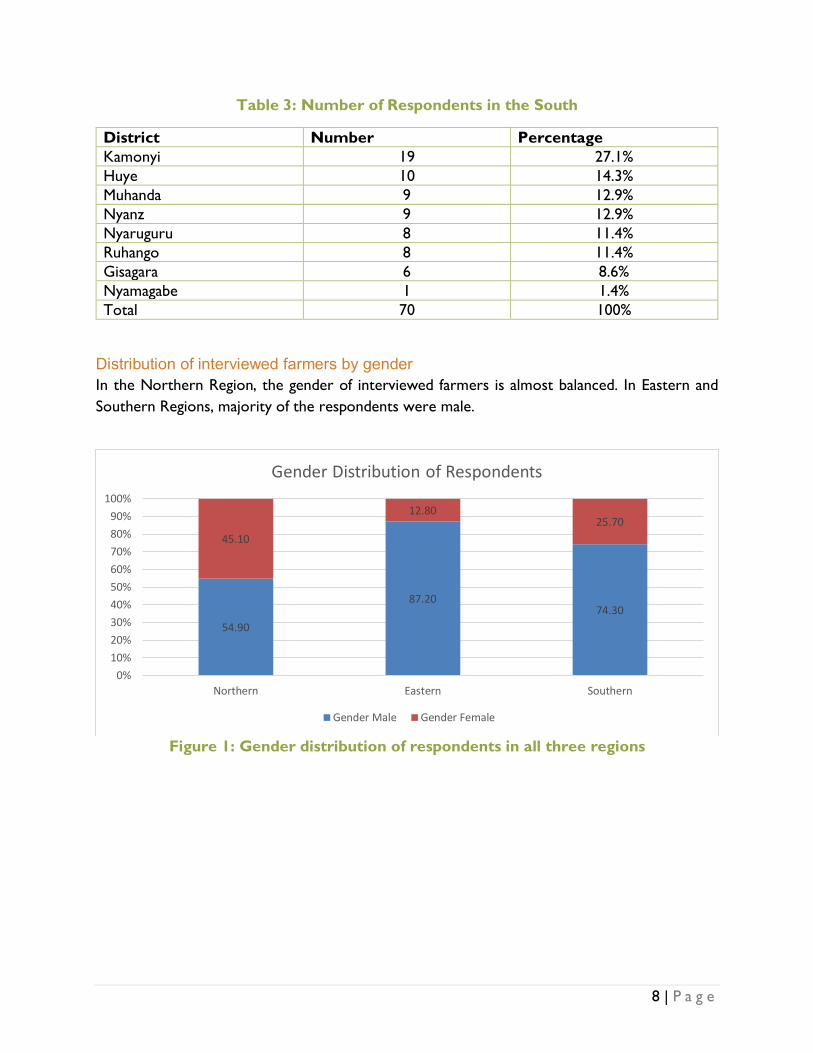
Distribution of interviewed farmers by gender In the Northern Region, the gender of interviewed farmers is almost balanced. In Eastern and Southern Regions, majority of the respondents were male.
Figure 1: Gender distribution of respondents in all three regions
54.90
87.2074.30
45.10
12.8025.70
0%10%20%30%40%50%60%70%80%90%
100%
Northern Eastern Southern
Gender Distribution of Respondents
Gender Male Gender Female

9 | P a g e
Distribution of Farmers by Family Status Regarding family status, in the Northern Region most respondents live in extended family. On the other hand, in Southern and Eastern Regions most respondents live in nuclear family.
Figure 2: Family type in all three regions
2.2 Description of crops grown by interviewed farmers
In the Northern Region, findings indicate that the predominant crops grown in the northern region of Rwanda are beans, maize, green banana, tomatoes and orange fleshed sweet potatoes.
14.71
89.7472.86
85.29
10.2627.14
0%10%20%30%40%50%60%70%80%90%
100%
Northern Eastern Southern
Family Type
Nuclear Extended

10 | P a g e
Distribution of Crops
Figure 3: Distribution of crops - North
In the Eastern Region, the findings indicate that the predominant crops grown by the interviewed farmers are tomatoes and chilies.
Figure 4: Distribution of crops - East
19.2%18.8%
16.4%12.0%
11.6%6.2%
4.5%2.1%
1.4%1.0%
0.7%0.7%0.7%0.7%0.7%0.7%
0.3%0.3%0.3%0.3%0.3%0.3%0.3%0.3%
BeansMaize
BananaTomatoes
Orange Fleshed Sweet PotatoesIrish potato
Sweet PotatoesCabbages
OnionsPineapple CuttingsCassava
CocoyamGreen BananaPassion fruits
WheatCarrots
ChiliCoffee
CuttingsEggplant
PeaseSugar CaneVegetables
Percentage Distribution of Crops in Northern Region
56.443.6
Percentage Distribution of Crops in eastern region
Chilli Tomatoes
11 | P a g e
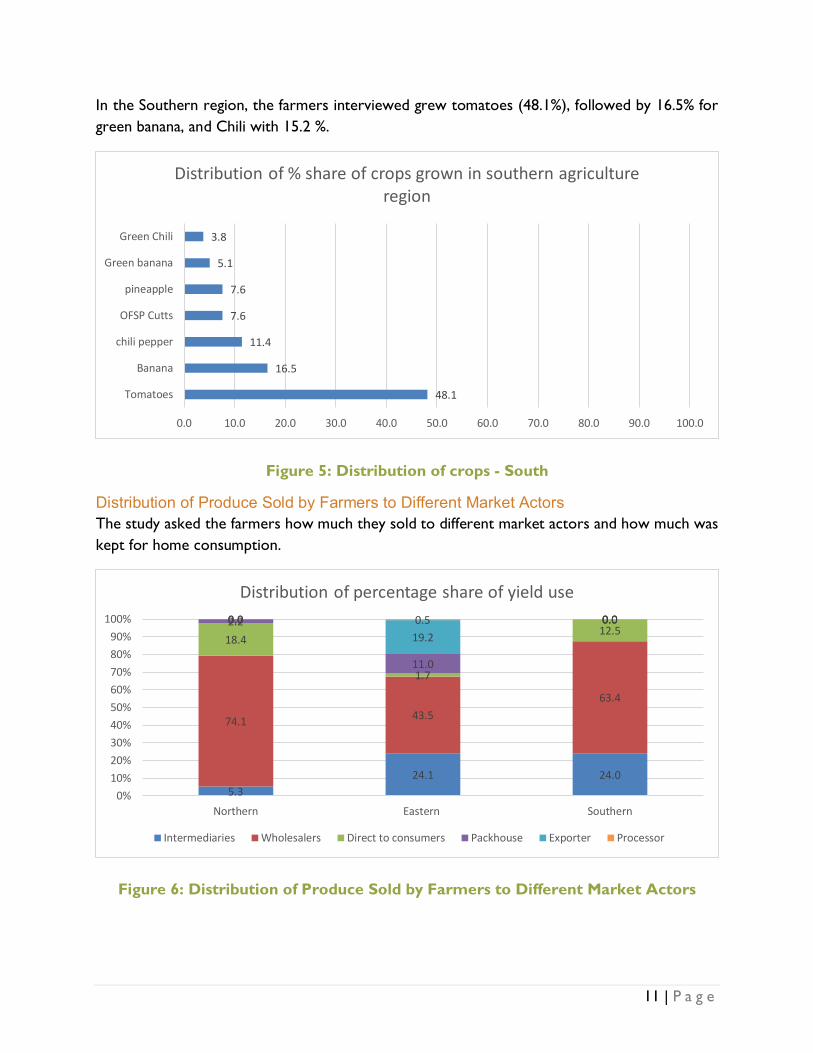
In the Southern region, the farmers interviewed grew tomatoes (48.1%), followed by 16.5% for green banana, and Chili with 15.2 %.
Figure 5: Distribution of crops - South
Distribution of Produce Sold by Farmers to Different Market Actors The study asked the farmers how much they sold to different market actors and how much was kept for home consumption.
Figure 6: Distribution of Produce Sold by Farmers to Different Market Actors
48.1
16.5
11.4
7.6
7.6
5.1
3.8
0.0 10.0 20.0 30.0 40.0 50.0 60.0 70.0 80.0 90.0 100.0
Tomatoes
Banana
chili pepper
OFSP Cutts
pineapple
Green banana
Green Chili
Distribution of % share of crops grown in southern agriculture region
5.324.1 24.0
74.1 43.563.4
18.4
1.7
12.52.2
11.0
0.00.019.2
0.00.0 0.5 0.0
0%10%20%30%40%50%60%70%80%90%
100%
Northern Eastern Southern
Distribution of percentage share of yield use
Intermediaries Wholesalers Direct to consumers Packhouse Exporter Processor
12 | P a g e
The figure above illustrates that in the Northern region, 74.1% of reported yield was sold to wholesalers, 18.4% was used for direct consumption by households, 5.3% was sold to intermediaries and only 2.2 % was sold to pack houses.
In the Eastern region, the majority of chili and tomatoes production were sold to wholesales at 43.5%. 24.1% of the production were sold to intermediaries and 19.2% was exported.
In the southern region, most of the production was sold to wholesales at 63.4% while 24.0% of the production was used for intermediaries and 12.5% of them were sold directly to consumers.
2.3 Sales
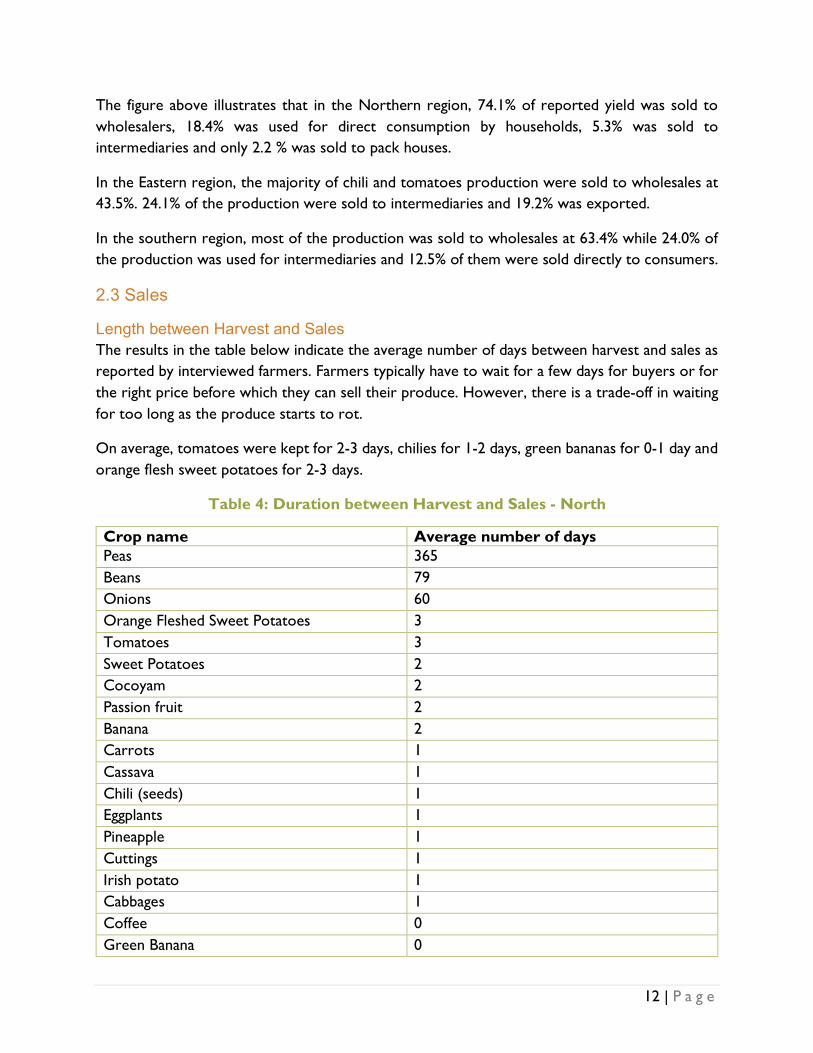
Length between Harvest and Sales The results in the table below indicate the average number of days between harvest and sales as reported by interviewed farmers. Farmers typically have to wait for a few days for buyers or for the right price before which they can sell their produce. However, there is a trade-off in waiting for too long as the produce starts to rot.
On average, tomatoes were kept for 2-3 days, chilies for 1-2 days, green bananas for 0-1 day and orange flesh sweet potatoes for 2-3 days.
Table 4: Duration between Harvest and Sales - North
Crop name Average number of days Peas 365 Beans 79 Onions 60 Orange Fleshed Sweet Potatoes 3 Tomatoes 3 Sweet Potatoes 2 Cocoyam 2 Passion fruit 2 Banana 2 Carrots 1 Cassava 1 Chili (seeds) 1 Eggplants 1 Pineapple 1 Cuttings 1 Irish potato 1 Cabbages 1 Coffee 0 Green Banana 0
13 | P a g e
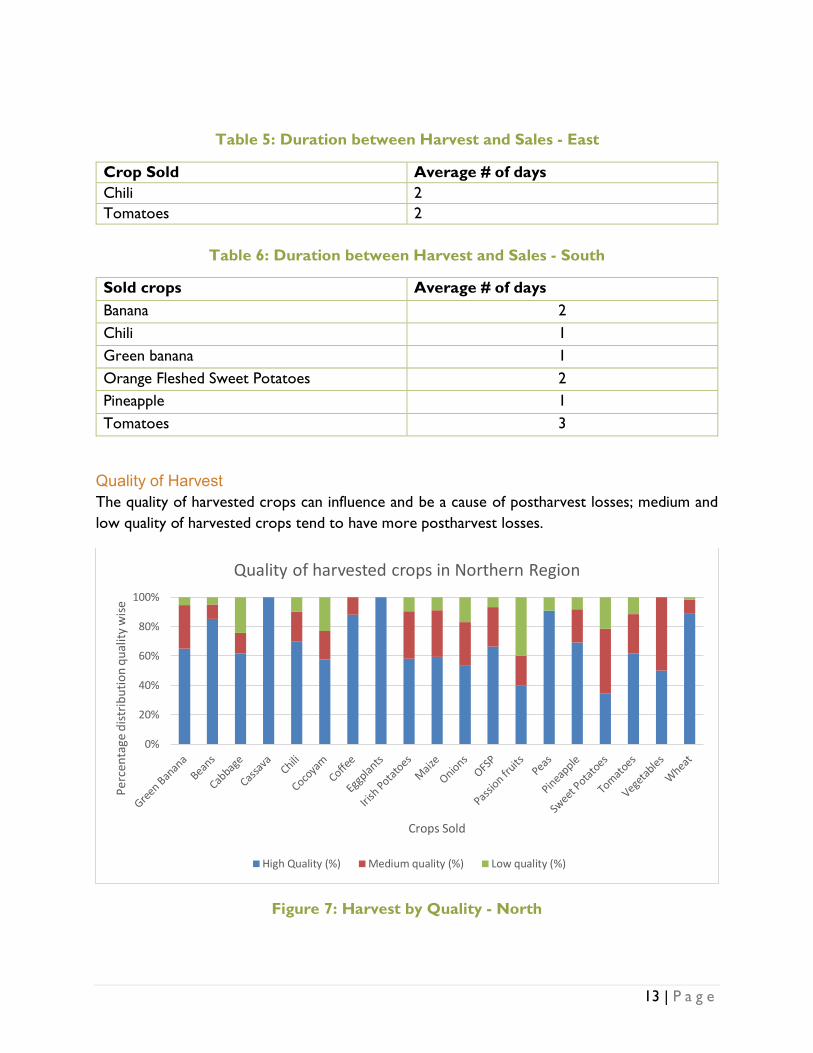
Table 5: Duration between Harvest and Sales - East
Crop Sold Average # of days Chili 2 Tomatoes 2
Table 6: Duration between Harvest and Sales - South
Sold crops Average # of days Banana 2 Chili 1 Green banana 1 Orange Fleshed Sweet Potatoes 2 Pineapple 1 Tomatoes 3
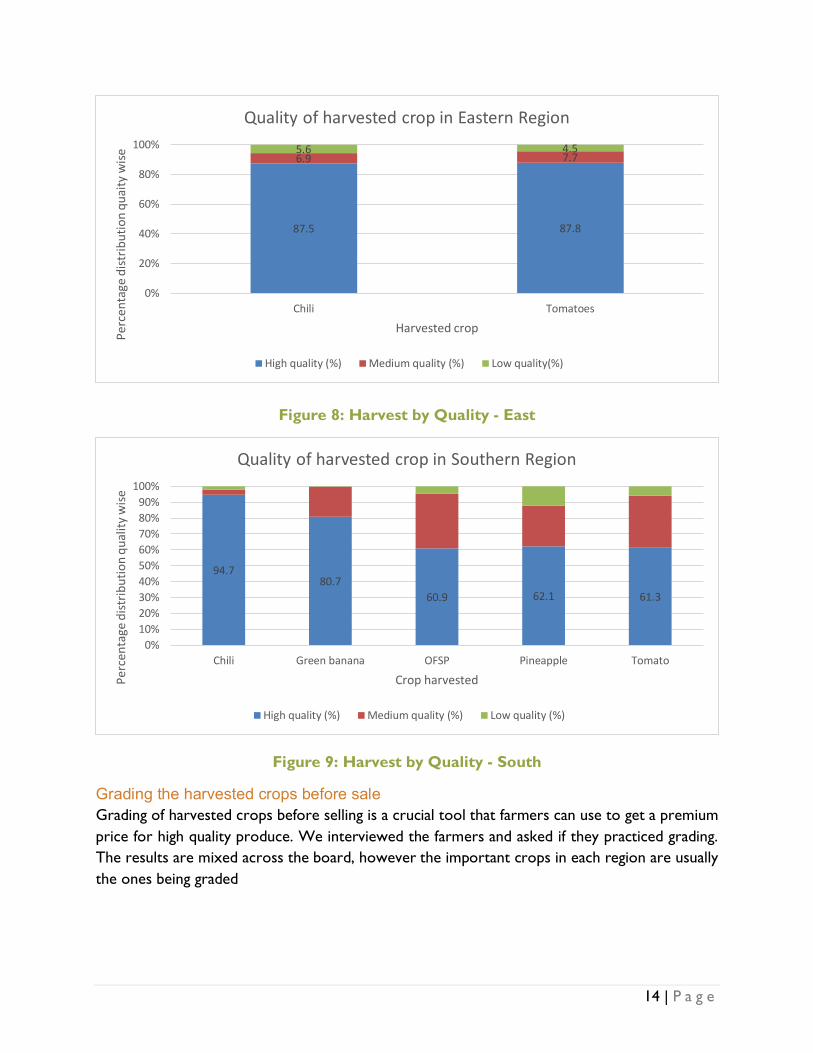
Quality of Harvest The quality of harvested crops can influence and be a cause of postharvest losses; medium and low quality of harvested crops tend to have more postharvest losses.
Figure 7: Harvest by Quality - North
0%
20%
40%
60%
80%
100%
Perc
enta
ge d
istrib
utio
n qu
ality
wise
Crops Sold
Quality of harvested crops in Northern Region
High Quality (%) Medium quality (%) Low quality (%)
14 | P a g e
Figure 8: Harvest by Quality - East
Figure 9: Harvest by Quality - South
Grading the harvested crops before sale Grading of harvested crops before selling is a crucial tool that farmers can use to get a premium price for high quality produce. We interviewed the farmers and asked if they practiced grading. The results are mixed across the board, however the important crops in each region are usually the ones being graded
87.5 87.8
6.9 7.75.6 4.5
0%
20%
40%
60%
80%
100%
Chili Tomatoes
Perc
enta
ge d
istrib
utio
n qu
aity
wise
Harvested crop
Quality of harvested crop in Eastern Region
High quality (%) Medium quality (%) Low quality(%)
94.780.7
60.9 62.1 61.3
0%10%20%30%40%50%60%70%80%90%
100%
Chili Green banana OFSP Pineapple Tomato
Perc
enta
ge d
istrib
utio
n qu
ality
wise
Crop harvested
Quality of harvested crop in Southern Region
High quality (%) Medium quality (%) Low quality (%)

15 | P a g e
Figure 10: Grading practice - North
In the northern region, grading of harvested crops ranges between 40% to 100% as illustrated in the above figure. However, in crops such as bananas and sweet potatoes there are high percentages of farmers (40-50%) not grading their harvested crops.
Figure 11: Grading practice - East
Figure above shows that 94% of tomatoes growers do grading before selling while only 6% did not grade. On the contrary, for chili only 14% grade before selling while the remaining percentage (86%) did not grade their produce.
88
40
100 100 100
5077
0%
20%
40%
60%
80%
100%
Orange FleshedSweet Potatoes
Banana Beans Irish Potatoes Maize Sweet Potatoes Tomatoes
Percentage share of grading practice before selling in Northern Region
No Grading Grading
86
6
14
94
0%
20%
40%
60%
80%
100%
chilli tomato
Percentage share of grading practice before selling in Eastern Region
No Yes
16 | P a g e
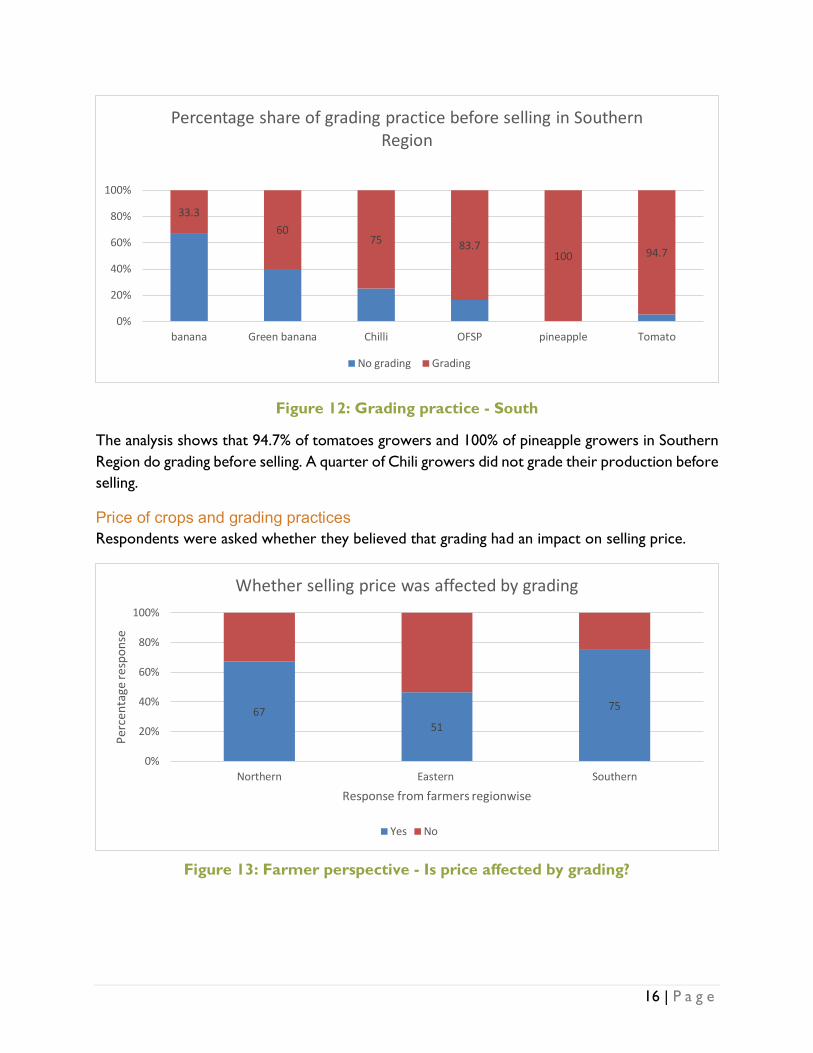
Figure 12: Grading practice - South
The analysis shows that 94.7% of tomatoes growers and 100% of pineapple growers in Southern Region do grading before selling. A quarter of Chili growers did not grade their production before selling.
Price of crops and grading practices Respondents were asked whether they believed that grading had an impact on selling price.
Figure 13: Farmer perspective - Is price affected by grading?
33.360
75 83.7100 94.7
0%
20%
40%
60%
80%
100%
banana Green banana Chilli OFSP pineapple Tomato
Percentage share of grading practice before selling in Southern Region
No grading Grading
6751
75
0%
20%
40%
60%
80%
100%
Northern Eastern Southern
Perc
enta
ge re
spon
se
Response from farmers regionwise
Whether selling price was affected by grading
Yes No
17 | P a g e
2.4. Farmers Practice: Crop Sales vs Home Consumption (Fresh, Processed or Stored) The study asked the farmers how much of their harvest, they consumed fresh, how much did they process and how much did they keep for long-term storage. The findings indicate that the farmers sell their harvest rather than storing and processing.
Figure 14: Crop Sales vs Home Consumption - North
Figure 15: Crop Sales vs Home Consumption - East
0%10%20%30%40%50%60%70%80%90%
100%
Crop Sales vs Home Consumption - North
Harvest sold (%) Harvest consumed fresh (%) Harvest - Processed (%) Harvest in storage (%)
0.0%10.0%20.0%30.0%40.0%50.0%60.0%70.0%80.0%90.0%
100.0%
Chili Tomatoes
Crop Sales vs Home Consumption - East
Harvest sold (%) Harvest consumed fresh (%) Harvest - Processed (%) Harvest in storage (%)
18 | P a g e
Figure 16: Crops Sales vs Home Consumption - South
2.5. Predominant defects that lower price of crops
Types of defects Several different types of defects such as decay, damage, pests and other lower the price of crops. In the North, pest damage, moisture loss and decays were common causes of defects.
Figure 17: Defects lowering prices of crops in North (1)
0%10%20%30%40%50%60%70%80%90%
100%
Tomato Banana Chili pepper Green banana Green chili OFSP Pineapple Tomato
Crop Sales vs Home Consumption - South
Harvest sold (%) Harvest consumed fresh (%) Harvest - Processed (%)
Decays
Decays
Decays Decays
Damage
Damage Damage
Dried
Dried
Nutrient defficiency
ImmaturityPest damage
Pest damage
Pest damage
Pest damage
Spoiled
Weevil
0%10%20%30%40%50%60%70%80%90%
100%
OrangeFleshedSweet
Potatoes
Banana Beans Cabbages Carrots Cassava Chili(Seeds)
Cocoyam Coffee Cuttings
Defects by crops in Northern Region- 1
Decays Damage Dried Fall army worm Heavy rain damage
Nutrient defficiency Immaturity Over maturity Pest and disease Pest damage
Physical damage Spoiled Virus Weevil
19 | P a g e
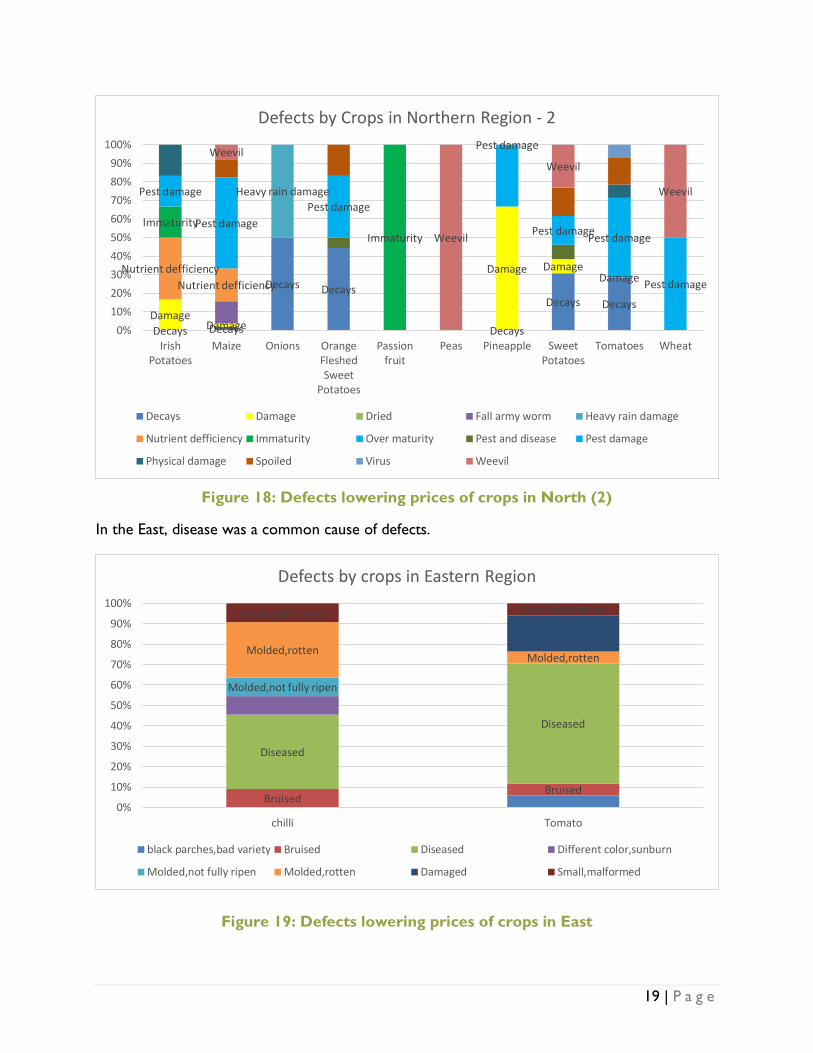
Figure 18: Defects lowering prices of crops in North (2)
In the East, disease was a common cause of defects.
Figure 19: Defects lowering prices of crops in East
Decays Decays
Decays Decays
Decays
Decays DecaysDamage
Damage
Damage Damage Damage
Heavy rain damage
Nutrient defficiencyNutrient defficiency
ImmaturityImmaturity
Pest damage
Pest damagePest damage
Pest damage
Pest damagePest damage
Pest damage
Weevil
Weevil
Weevil
Weevil
0%10%20%30%40%50%60%70%80%90%
100%
IrishPotatoes
Maize Onions OrangeFleshedSweet
Potatoes
Passionfruit
Peas Pineapple SweetPotatoes
Tomatoes Wheat
Defects by Crops in Northern Region - 2
Decays Damage Dried Fall army worm Heavy rain damage
Nutrient defficiency Immaturity Over maturity Pest and disease Pest damage
Physical damage Spoiled Virus Weevil
BruisedBruised
Diseased
Diseased
Molded,not fully ripen
Molded,rotten Molded,rotten
Small,malformed Small,malformed
0%
10%
20%
30%
40%
50%
60%
70%
80%
90%
100%
chilli Tomato
Defects by crops in Eastern Region
black parches,bad variety Bruised Diseased Different color,sunburn
Molded,not fully ripen Molded,rotten Damaged Small,malformed
20 | P a g e
In the South, bad season, bad seeds and damages by pests were leading causes for defects.
Figure 20: Defects lowering prices of crops in South
2.6. Postharvest Extension and When to Harvest Providing extension services to farmers is very important for increasing their productivity.
Damages by insects, rats
Damages by insects, rats
Damages by insects, rats
Damages by insects, rats
Damages by insects, rats
Bad seeds
Bad seeds
Bad seeds
Bad seeds
Bad seeds
Bad seeds
Bad season
Bad season
Bad season
Bad season Bad season
Bad season
Poor post harvesting handling
Poor post harvesting handling
0%
10%
20%
30%
40%
50%
60%
70%
80%
90%
100%
Banana Chilli Green banana OFSP pineapple Tomato
Defects by Crops in Southern Region
Damages by insects, rats Bad seeds Bad season Disease Poor post harvesting handling
21 | P a g e
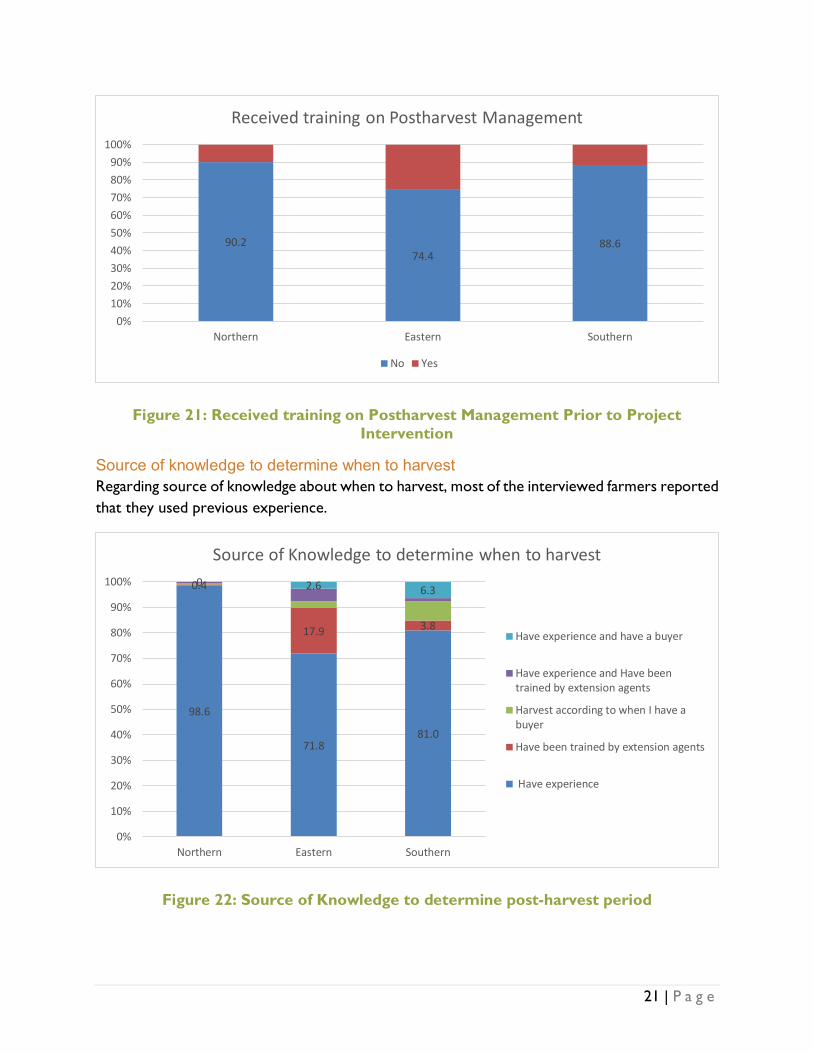
Figure 21: Received training on Postharvest Management Prior to Project Intervention
Source of knowledge to determine when to harvest Regarding source of knowledge about when to harvest, most of the interviewed farmers reported that they used previous experience.
Figure 22: Source of Knowledge to determine post-harvest period
90.274.4
88.6
0%10%20%30%40%50%60%70%80%90%
100%
Northern Eastern Southern
Received training on Postharvest Management
No Yes
98.6
71.881.0
0.4
17.9 3.8
0 2.6 6.3
0%
10%
20%
30%
40%
50%
60%
70%
80%
90%
100%
Northern Eastern Southern
Source of Knowledge to determine when to harvest
Have experience and have a buyer
Have experience and Have beentrained by extension agents
Harvest according to when I have abuyer
Have been trained by extension agents
Have experience
22 | P a g e
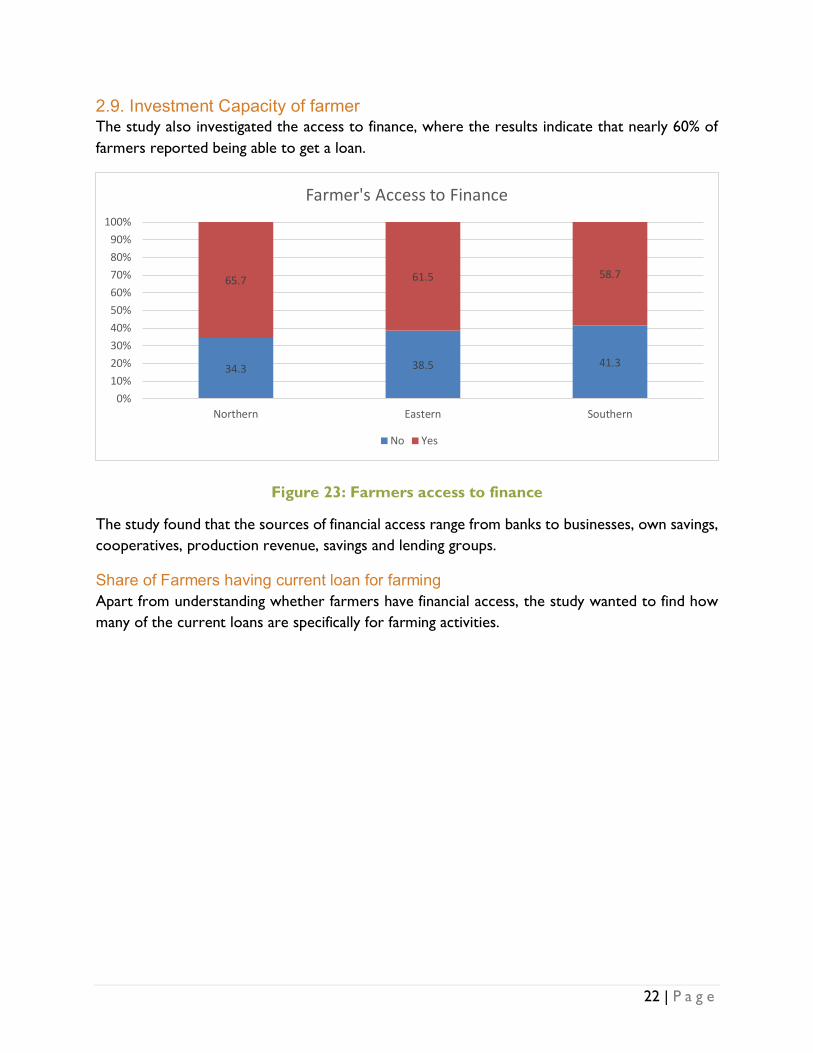
2.9. Investment Capacity of farmer The study also investigated the access to finance, where the results indicate that nearly 60% of farmers reported being able to get a loan.
Figure 23: Farmers access to finance
The study found that the sources of financial access range from banks to businesses, own savings, cooperatives, production revenue, savings and lending groups.
Share of Farmers having current loan for farming Apart from understanding whether farmers have financial access, the study wanted to find how many of the current loans are specifically for farming activities.
34.3 38.5 41.3
65.7 61.5 58.7
0%10%20%30%40%50%60%70%80%90%
100%
Northern Eastern Southern
Farmer's Access to Finance
No Yes

23 | P a g e
Figure 24: Loan for Farming
25.510.3
21.3
74.589.7
78.7
0%10%20%30%40%50%60%70%80%90%
100%
Northern Eastern Southern
Current Loan is for farming purposes
Yes No