phd-thesis-dtyordanovphd.pdf - Departement Natuurkunde en ...
Upload
khangminh22Category
view
1download
0
Agriculture and Horticulturein Flanders 2009
Pocket Agricultural Indicators
Flemish Government Department of Agriculture and Fisheries
EN
CoverEngFR.indd 1CoverEngFR.indd 1 09-03-2010 14:29:0009-03-2010 14:29:00

Agriculture and Horticulturein Flanders 2009
Pocket Agricultural Indicators
Flemish Government Department of Agriculture and Fisheries
EN
CoverEngFR.indd 1CoverEngFR.indd 1 09-03-2010 14:29:0009-03-2010 14:29:00

1
Foreword
Dear reader,
The purpose of this Department of Agriculture and Fisheries publication is to
concisely outline the situation of Flemish agriculture on the basis of the most
recently available key fi gures. Reliable and up-to-date fi gures are useful, even
essential, for conducting a constructive and substantiated debate and taking
goal-oriented action.
Based on approximately 60 indicators, the pocketbook guides you through
the current situation and recent developments in the Flemish agricultural
sector. Flemish agriculture is fi rst placed in a European context. The report
then continues with the economic importance of the primary sector and the
agribusiness complex in Flanders, going through the impact of agriculture on
society and the environment and then follows with an outline of the structure
of Flemish agriculture and its businesses. Agricultural policy has an important
infl uence on Flemish agriculture, and more generally the rural areas. This
infl uence is illustrated with a few indicators.
The many fi gures, tables and diagrams show that the agricultural sector,
embedded in the agri-foodstuff s complex, in Flanders is an important pillar of
the economy, but more than that, that it is an important cornerstone of Flemish
society.
Pocket Agricultural Indicators, with its extensive list of indicators and brief
explanatory descriptions, is an extremely useful instrument for all those interested
in Flemish agriculture.
Kris PeetersMinister-President of the Flemish Government
Flemish Minister of the Economy, Foreign Policy, Agriculture and Rural Policy
Land-enTuinbouw09_EN.indd 1Land-enTuinbouw09_EN.indd 1 09-03-2010 15:18:4909-03-2010 15:18:49

2
Land-enTuinbouw09_EN.indd 2Land-enTuinbouw09_EN.indd 2 09-03-2010 15:18:5009-03-2010 15:18:50

3
Introduction
Agriculture and Horticulture in Flanders 2009. Pocket Agricultural Indicators presents
the Flemish agricultural and horticultural sector using many diagrams, maps and
tables.
In the pocketbook, Flemish agriculture is fi rst and foremost placed in a European
perspective and compared to the agricultural sector of our neighbouring
countries. Then the economic indicators are considered: the fi nal production value,
operating income, family working income, agricultural trade. The social indicators
concern employment and the level of education of farmers. The environmental
indicators pay attention to water and energy consumption, the soil equilibrium
and greenhouse gas emissions. Then the structural indicators are discussed. They
concern the number of businesses, the agricultural area and livestock. A number
of detailed maps show the structure of agriculture in Flanders. The chapter on
agricultural policy contains fi gures on direct payments and rural development
support. A list of abbreviations and references completes the report.
This publication contains the most recently available fi gures from various
databases within the Flemish government (diff erent sections of the Agriculture
and Fisheries Policy Area, Research Centre of the Flemish Government, Flemish
Environment Company) and outside it (Eurostat, Federal Public Service Economy
- Directorate-General Statistics and Economic Information).
Interested readers can always consult other (Dutch-language) publications
of the Department of Agriculture and Fisheries on the website
www.vlaanderen.be/landbouw
Land-enTuinbouw09_EN.indd 3Land-enTuinbouw09_EN.indd 3 09-03-2010 15:18:5109-03-2010 15:18:51

4
Contents
Foreword
Introduction
Contents
Flemish agriculture in a European perspectiveGeneral characteristics . . . . . . . . . . . . . . . . . . . . . . . . . . . . . . . . . . . . . . . . . . . . . . . . . . . . . . . . . . . . . 6Economic characteristics . . . . . . . . . . . . . . . . . . . . . . . . . . . . . . . . . . . . . . . . . . . . . . . . . . . . . . . . . . 7Business-economic indicators . . . . . . . . . . . . . . . . . . . . . . . . . . . . . . . . . . . . . . . . . . . . . . . . . . . . 8Agricultural prices . . . . . . . . . . . . . . . . . . . . . . . . . . . . . . . . . . . . . . . . . . . . . . . . . . . . . . . . . . . . . . . . . . 9Structure of agricultural businesses . . . . . . . . . . . . . . . . . . . . . . . . . . . . . . . . . . . . . . . . . . . . . 10Agricultural production . . . . . . . . . . . . . . . . . . . . . . . . . . . . . . . . . . . . . . . . . . . . . . . . . . . . . . . . . . . . 11Yields . . . . . . . . . . . . . . . . . . . . . . . . . . . . . . . . . . . . . . . . . . . . . . . . . . . . . . . . . . . . . . . . . . . . . . . . . . . . . . . . . . 12
Agriculture in the economic contextFinal production value . . . . . . . . . . . . . . . . . . . . . . . . . . . . . . . . . . . . . . . . . . . . . . . . . . . . . . . . . . . . . 13
arable farming . . . . . . . . . . . . . . . . . . . . . . . . . . . . . . . . . . . . . . . . . . . . . . . . . . . . . . . . . . . . . . . . . . . . 14horticulture . . . . . . . . . . . . . . . . . . . . . . . . . . . . . . . . . . . . . . . . . . . . . . . . . . . . . . . . . . . . . . . . . . . . . . . . 15livestock . . . . . . . . . . . . . . . . . . . . . . . . . . . . . . . . . . . . . . . . . . . . . . . . . . . . . . . . . . . . . . . . . . . . . . . . . . . 16
Net added value . . . . . . . . . . . . . . . . . . . . . . . . . . . . . . . . . . . . . . . . . . . . . . . . . . . . . . . . . . . . . . . . . . . . 17Family working income in agricultural businesses . . . . . . . . . . . . . . . . . . . . . . . . . . . 18Breakdown of operating income per sector . . . . . . . . . . . . . . . . . . . . . . . . . . . . . . . . . . . 19Working income per AWU in horticultural businesses . . . . . . . . . . . . . . . . . . . . . . . 20Breakdown of operating income per secto . . . . . . . . . . . . . . . . . . . . . . . . . . . . . . . . . . . . 21Arable product prices . . . . . . . . . . . . . . . . . . . . . . . . . . . . . . . . . . . . . . . . . . . . . . . . . . . . . . . . . . . . . . 22Horticultural product prices . . . . . . . . . . . . . . . . . . . . . . . . . . . . . . . . . . . . . . . . . . . . . . . . . . . . . . 23Animal product prices . . . . . . . . . . . . . . . . . . . . . . . . . . . . . . . . . . . . . . . . . . . . . . . . . . . . . . . . . . . . . 24Yield and output from arable crops . . . . . . . . . . . . . . . . . . . . . . . . . . . . . . . . . . . . . . . . . . . . . 25Yield and output from dairy and pig farming . . . . . . . . . . . . . . . . . . . . . . . . . . . . . . . . . 26Number of producers with diversification activities in agriculture . . . . . . . . 27Economic climate index for agriculture . . . . . . . . . . . . . . . . . . . . . . . . . . . . . . . . . . . . . . . . 28Development of Belgian agricultural trade . . . . . . . . . . . . . . . . . . . . . . . . . . . . . . . . . . . . 29Breakdown of Belgian agricultural trade into components . . . . . . . . . . . . . . . . . 30Import and export of agricultural products by the EU member states . . . 31Home consumption of fresh agri-foodstuff products . . . . . . . . . . . . . . . . . . . . . . . . 32Development of the number of businesses in the agribusiness complex 33Turnover of businesses in the agribusiness complex . . . . . . . . . . . . . . . . . . . . . . . . 34Added value of the agribusiness complex . . . . . . . . . . . . . . . . . . . . . . . . . . . . . . . . . . . . . 35
Social aspects of agricultureEmployment in the agricultural sector . . . . . . . . . . . . . . . . . . . . . . . . . . . . . . . . . . . . . . . . . 36Employment in the agribusiness complex . . . . . . . . . . . . . . . . . . . . . . . . . . . . . . . . . . . . . 37Succession in agricultural businesses . . . . . . . . . . . . . . . . . . . . . . . . . . . . . . . . . . . . . . . . . . . 38Occupational accidents . . . . . . . . . . . . . . . . . . . . . . . . . . . . . . . . . . . . . . . . . . . . . . . . . . . . . . . . . . . 39Marital status of the business manager . . . . . . . . . . . . . . . . . . . . . . . . . . . . . . . . . . . . . . . . . 40
Agricultural education . . . . . . . . . . . . . . . . . . . . . . . . . . . . . . . . . . . . . . . . . . . . . . . . . . . . . . . . . . . . . 41
Impact of agriculture on the environmentEco-efficiency of agriculture . . . . . . . . . . . . . . . . . . . . . . . . . . . . . . . . . . . . . . . . . . . . . . . . . . . . . . 42Net nitrogen production from agriculture per municipality . . . . . . . . . . . . . . . . 43Net phosphate production from agriculture per municipality . . . . . . . . . . . . . 44
Land-enTuinbouw09_EN.indd 4Land-enTuinbouw09_EN.indd 4 09-03-2010 15:18:5209-03-2010 15:18:52

5
Soil equilibrium of agriculture . . . . . . . . . . . . . . . . . . . . . . . . . . . . . . . . . . . . . . . . . . . . . . . . . . . . 45Nitrogen and phosphate surplus in the soil equilibrium of agriculture . . 46Pressure on water life from crop protection products in agriculture . . . . . . 47Pesticide usage in agriculture per type . . . . . . . . . . . . . . . . . . . . . . . . . . . . . . . . . . . . . . . . . 48Energy consumption in agriculture per fuel type . . . . . . . . . . . . . . . . . . . . . . . . . . . . . 49Energy consumption in agriculture per subsector . . . . . . . . . . . . . . . . . . . . . . . . . . . 50Water consumption in agriculture per water source and subsector . . . . . . 51Ammonia emissions in agriculture . . . . . . . . . . . . . . . . . . . . . . . . . . . . . . . . . . . . . . . . . . . . . . 52Emission of greenhouse gases by agriculture . . . . . . . . . . . . . . . . . . . . . . . . . . . . . . . . . 53
Structural characteristics of agricultureDevelopment of agricultural area . . . . . . . . . . . . . . . . . . . . . . . . . . . . . . . . . . . . . . . . . . . . . . . . 54Share of agricultural land per municipality . . . . . . . . . . . . . . . . . . . . . . . . . . . . . . . . . . . . 56Number and average area of agricultural businesses . . . . . . . . . . . . . . . . . . . . . . . . 58Breakdown of agricultural businesses according to business size . . . . . . . . . 59Breakdown of businesses according to production orientation . . . . . . . . . . . 60Age profile of the business manager . . . . . . . . . . . . . . . . . . . . . . . . . . . . . . . . . . . . . . . . . . . . 61Number of start-up businesses . . . . . . . . . . . . . . . . . . . . . . . . . . . . . . . . . . . . . . . . . . . . . . . . . . . 62Livestock numbers per business . . . . . . . . . . . . . . . . . . . . . . . . . . . . . . . . . . . . . . . . . . . . . . . . . 63Development of livestock numbers . . . . . . . . . . . . . . . . . . . . . . . . . . . . . . . . . . . . . . . . . . . . . 64Flemish agriculture mapped
Arable farming . . . . . . . . . . . . . . . . . . . . . . . . . . . . . . . . . . . . . . . . . . . . . . . . . . . . . . . . . . . . . . . . . . . . 66Fruit . . . . . . . . . . . . . . . . . . . . . . . . . . . . . . . . . . . . . . . . . . . . . . . . . . . . . . . . . . . . . . . . . . . . . . . . . . . . . . . . 68Vegetables . . . . . . . . . . . . . . . . . . . . . . . . . . . . . . . . . . . . . . . . . . . . . . . . . . . . . . . . . . . . . . . . . . . . . . . . . 70Ornamental plant cultivation . . . . . . . . . . . . . . . . . . . . . . . . . . . . . . . . . . . . . . . . . . . . . . . . . . 72Dairy cows . . . . . . . . . . . . . . . . . . . . . . . . . . . . . . . . . . . . . . . . . . . . . . . . . . . . . . . . . . . . . . . . . . . . . . . . 74Beef cattle . . . . . . . . . . . . . . . . . . . . . . . . . . . . . . . . . . . . . . . . . . . . . . . . . . . . . . . . . . . . . . . . . . . . . . . . . 76Breeding . . . . . . . . . . . . . . . . . . . . . . . . . . . . . . . . . . . . . . . . . . . . . . . . . . . . . . . . . . . . . . . . . . . . . . . . . . . 78Agriculture characterisation map . . . . . . . . . . . . . . . . . . . . . . . . . . . . . . . . . . . . . . . . . . . . . . 80
Agricultural policy in FlandersPaid direct payments from Pillar I . . . . . . . . . . . . . . . . . . . . . . . . . . . . . . . . . . . . . . . . . . . . . . . . 82
breakdown according to value . . . . . . . . . . . . . . . . . . . . . . . . . . . . . . . . . . . . . . . . . . . . . . . . . 83breakdown according to business manager age . . . . . . . . . . . . . . . . . . . . . . . . . . . . . 84
Pillar I: direct support per municipality . . . . . . . . . . . . . . . . . . . . . . . . . . . . . . . . . . . . . . . . . 85Pillar I: average direct support per applicant and per municipality . . . . . . . . 86Rural policy: expenditure per financial year . . . . . . . . . . . . . . . . . . . . . . . . . . . . . . . . . . . . 87Rural policy: planned expenditure 2007-2013 . . . . . . . . . . . . . . . . . . . . . . . . . . . . . . . . 88Rural policy: area of agri-environmental measures . . . . . . . . . . . . . . . . . . . . . . . . . . . 89Rural policy: investment support . . . . . . . . . . . . . . . . . . . . . . . . . . . . . . . . . . . . . . . . . . . . . . . . 90Organic agriculture: number of businesses, area and hectare support . . . 91Agriculture research and development budget . . . . . . . . . . . . . . . . . . . . . . . . . . . . . . 93
Abbreviations
Bibliography
Colophon
Land-enTuinbouw09_EN.indd 5Land-enTuinbouw09_EN.indd 5 09-03-2010 15:18:5309-03-2010 15:18:53

6
General characteristics of agriculture in the European member states (2007,2008)
unit
EU-2
7Be
lgiu
mFl
ande
rsDe
nmar
kGe
rman
ySp
ain
Fran
ceIta
lyth
e Ne
ther
land
sth
e Uni
ted
King
dom
tota
l are
a km
24,
325,
257
30,5
2813
,522
43,0
9835
7,11
550
5,36
554
9,08
730
1,32
337
,354
244,
101
tota
l pop
ulat
ion
1,00
0 in
habi
tant
s49
5,09
010
,585
6,11
75,
447
82,3
1544
,475
63,3
9259
,131
16,3
5860
,817
GDP/
inha
bita
ntEU
R24
,900
29,4
0029
,485
*29
,900
28,6
0026
,200
27,2
0025
,200
32,6
0029
,700
infl a
tion
%2.
41.
8-
1.7
2.3
2.8
1.6
21.
62.
3
empl
oym
ent
1,00
0 pe
ople
219,
129
4,38
02,
528
2,80
438
,210
20,3
5625
,642
23,2
228,
464
29,1
18
bala
nce o
f tra
dem
illio
n EU
R-1
36,2
27-1
4,12
8-
2,52
557
,255
-43,
535
11,3
07-1
1,05
0-7
9,77
6-5
0,10
9
tota
l agr
icultu
ral a
rea
1,00
0 ha
182,
264
1,37
062
22,
695
16,9
5424
,991
29,4
1414
,490
1,88
616
,761
cere
als
%33
.326
.425
.755
.641
.526
.832
.827
.912
.919
.5
whe
at%
14.5
15.4
11.9
23.6
19.0
8.3
18.7
15.8
8.3
12.4
suga
r bee
ts
%1.
04.
73.
61.
32.
20.
21.
20.
43.
80.
7
pota
toes
%1.
24.
66.
11.
51.
50.
30.
50.
58.
10.
9
orga
nic a
gricu
lture
%4.
72.
42.
45.
25.
14.
02.
09.
02.
54.
1
lives
tock
1,00
0 un
its
catt
le89
,042
2,57
11,
273
1,54
512
,707
6,58
519
,124
6,57
73,
820
10,0
78
pigs
160,
046
6,24
85,
890
13,1
7027
,113
26,0
6114
,968
9,27
311
,710
4,67
4
layi
ng h
ens
389,
097
8,95
77,
525
2,99
547
,513
46,8
2145
,537
47,2
5029
,960
35,2
03
dairy
cow
s24
,176
524
294
551
4,08
790
33,
759
1,83
91,
490
1,97
8
* Es
timat
e
Sour
ce: A
gric
ultu
re a
nd F
ishe
ries P
olic
y Ar
ea b
ased
on
Inte
gra
and
Cert
isys
Land-enTuinbouw09_EN.indd 6Land-enTuinbouw09_EN.indd 6 09-03-2010 15:18:5409-03-2010 15:18:54

7
Economic characteristics of agriculture in the European member states (2007)
unit
EU-2
7Be
lgiu
mFl
ande
rsDe
nmar
kGe
rman
ySp
ain
Fran
ceIta
lyth
e Ne
ther
land
sth
e Uni
ted
King
dom
num
ber o
f bus
ines
ses
1,00
013
,700
4832
4537
01,
044
527
1,67
977
300
area
per
bus
ines
sha
13.3
28.5
19.5
60.4
45.8
23.9
55.8
8.6
24.6
55.9
empl
oym
ent
1,00
0 pe
ople
26,6
6989
6385
915
2,12
51,
060
3,17
422
465
1
mal
e1,
000
peop
le15
,461
5940
6157
81,
463
722
1,91
814
443
8
fem
ale
1,00
0 pe
ople
11,2
0830
2224
337
663
338
1,25
680
213
fam
ily em
ploy
men
t1,
000
peop
le24
,827
7552
6474
81,
915
633
3,05
715
051
1
shar
e of t
otal
empl
oym
ent
%5.
61.
82.
23.
02.
24.
53.
44.
03.
11.
4
use o
f inp
uts i
n ag
ricul
ture
mill
ion
EUR
202,
294
4,80
56,
583
30,3
5517
,589
37,3
2319
,152
14,1
8814
,654
gros
s add
ed va
lue a
gricu
lture
mill
ion
EUR
153,
516
2,35
21,
652
2,57
415
,008
23,1
1829
,217
25,2
138,
828
8,19
9
shar
e of a
gricu
lture
in G
DP
%1.
20.
70.
91.
10.
62.
21.
51.
61.
60.
4
prod
uctio
n va
lue a
gri s
ecto
rm
illio
n EU
R35
5,81
07,
355
9,15
845
,363
40,7
0866
,540
44,3
6523
,015
22,8
53
food
pric
e infl
atio
n%
3.5
3.9
4.5
2.9
3.7
1.4
2.9
1.6
4.5
shar
e of f
ood,
drin
k and
toba
cco i
n to
tal
hous
ehol
d ex
pend
iture
%16
.215
.615
.214
.614
.416
.616
.417
.313
.812
.7
Sour
ce: E
uros
tat,
FPS
Econ
omy
- Dire
ctor
ate-
Gen
eral
Sta
tistic
s and
Eco
nom
ic In
form
atio
n, N
atio
nal B
ank
of B
elgi
um
Land-enTuinbouw09_EN.indd 7Land-enTuinbouw09_EN.indd 7 09-03-2010 15:18:5509-03-2010 15:18:55

8
Business-economic indicators of agriculture in European member states (2007)
unit
EU-2
5Be
lgiu
mDe
nmar
kGe
rman
ySp
ain
Fran
ceIta
lyth
e Ne
ther
land
sth
e Uni
ted
King
dom
net a
dded
valu
e/bu
sines
sEU
R29
,708
78,2
5486
,968
69,7
9426
,656
51,5
7429
,514
112,
397
80,5
95
net a
dded
valu
e per
agric
ultu
ral w
ork u
nit
EUR/
AWU
18,2
8941
,571
59,4
643,
179
2,03
427
,168
21,8
8344
,867
33,9
55
prod
uctiv
ity1.
141.
250.
971.
011.
671.
021.
521.
130.
95
shar
e of d
irect
pay
men
ts P
illar
I in
inco
me
%16
.010
.111
.215
.613
.418
.010
.34.
918
.5
shar
e of p
aid
labo
ur%
22.8
16.7
39.9
36.3
18.9
26.6
18.8
39.1
41.9
shar
e of u
npai
d la
bour
%77
.283
.260
.163
.781
.173
.481
.260
.958
.1
solv
ency
*%
15.0
28.0
50.0
18.0
2.0
37.0
1.0
36.0
12.0
liqui
dity
**%
5.41
119.
024.
342.
2416
5.3
2.94
105.
12.
922.
26
retu
rn on
asse
ts **
*%
9.9
17.3
6.1
9.6
11.3
16.2
9.4
7.1
7.0
* ra
tio b
etw
een
long
- and
med
ium
-ter
m d
ebt a
nd w
orki
ng c
apita
l **
ra
tio b
etw
een
curre
nt a
sset
s (no
n-br
eede
rs, s
tock
s and
oth
er c
apita
l) an
d sh
ort-
term
deb
t**
* ra
tio b
etw
een
net a
dded
val
ue a
nd fi
xed
and
curre
nt a
sset
s
Sour
ce: D
G A
gri E
U FA
DN
Land-enTuinbouw09_EN.indd 8Land-enTuinbouw09_EN.indd 8 09-03-2010 15:18:5609-03-2010 15:18:56

9
Agricultural prices in the European member states (2007)
unit
Belg
ium
Denm
ark
Spai
nth
e Ne
ther
land
sth
e Uni
ted
King
dom
calv
esEU
R/10
0 kg
l+iv
e w
eigh
t16
1.0
193.
823
6.3
cere
als
EUR/
100
kg16
.520
.419
.016
.119
.1
pota
toes
EUR/
100
kg10
.623
.424
.017
.920
.8
suga
r bee
tsEU
R/to
nne
33.2
32.0
36.9
pigs
EUR/
100
kg li
ve w
eigh
t99
.979
.210
5.7
93.3
112.
5
pigl
ets
EUR/
100
kg li
ve w
eigh
t12
1.8
186.
915
7.0
133.
125
6.7
mea
t chi
cken
sEU
R/10
0 kg
live
wei
ght
85.8
56.9
108.
879
.3
eggs
EUR/
100
units
4.6
5.6
7.7
6.1
5.2
milk
EUR/
100
kg33
.839
.035
.434
.629
.3
Sour
ce: E
uros
tat
Land-enTuinbouw09_EN.indd 9Land-enTuinbouw09_EN.indd 9 09-03-2010 16:48:1609-03-2010 16:48:16
10
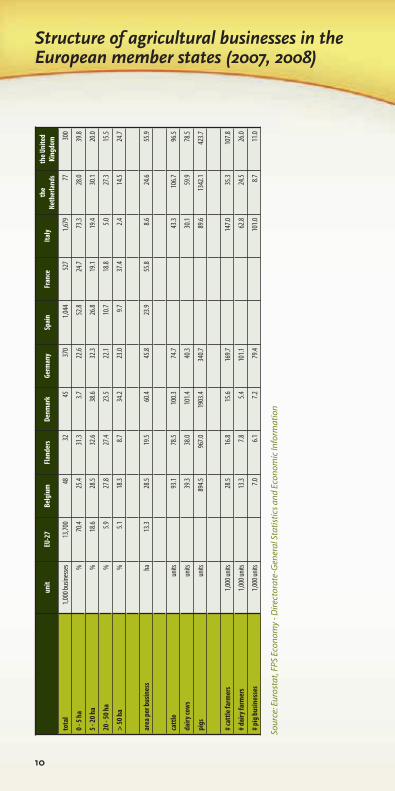
Structure of agricultural businesses in the European member states (2007, 2008)
unit
EU-2
7Be
lgiu
mFl
ande
rsDe
nmar
kGe
rman
ySp
ain
Fran
ceIta
lyth
e Ne
ther
land
sth
e Uni
ted
King
dom
tota
l1,
000
busi
ness
es13
,700
4832
4537
01,
044
527
1,67
977
300
0 - 5
ha%
70.4
25.4
31.3
3.7
22.6
52.8
24.7
73.3
28.0
39.8
5 - 20
ha
%18
.628
.532
.638
.632
.326
.819
.119
.430
.120
.0
20 - 5
0 ha
%5.
927
.827
.423
.522
.110
.718
.85.
027
.315
.5
> 50
ha
%5.
118
.38.
734
.223
.09.
737
.42.
414
.524
.7
area
per
bus
ines
sha
13.3
28.5
19.5
60.4
45.8
23.9
55.8
8.6
24.6
55.9
catt
leun
its93
.178
.510
0.3
74.7
43.3
106.
796
.5
dairy
cow
sun
its39
.338
.010
1.4
40.3
30.1
59.9
78.5
pigs
units
894.
596
7.0
1903
.434
0.7
89.6
1342
.142
3.7
# cat
tle fa
rmer
s1,
000
units
28.5
16.8
15.6
169.
714
7.0
35.3
107.
8
# dai
ry fa
rmer
s1,
000
units
13.3
7.8
5.4
101.
162
.824
.526
.0
# pig
bus
ines
ses
1,00
0 un
its7.
06.
17.
279
.410
1.0
8.7
11.0
Sour
ce: E
uros
tat,
FPS
Econ
omy
- Dire
ctor
ate-
Gen
eral
Sta
tistic
s and
Eco
nom
ic In
form
atio
n
Land-enTuinbouw09_EN.indd 10Land-enTuinbouw09_EN.indd 10 09-03-2010 15:18:5809-03-2010 15:18:58

11
Agricultural production in the European member states (2007)
shar
e of t
otal
EU pr
oduc
tion
unit
EU-2
7Be
lgiu
mDe
nmar
kGe
rman
ySp
ain
Fran
ceIta
lyth
e Ne
ther
land
sth
e Uni
ted
King
dom
whe
at%
1.4
4.7
16.7
5.9
30.0
7.2
0.8
8.2
suga
r bee
ts%
4.9
2.4
19.6
5.5
23.2
6.5
5.9
6.9
fresh
frui
t%
1.7
0.1
3.8
29.9
13.0
20.7
2.4
2.9
fresh
vege
tabl
es%
2.7
0.5
6.9
21.1
10.7
18.7
7.2
5.3
seed
s%
2.7
7.4
3.2
0.7
12.4
20.8
35.4
7.2
milk
%2.
03.
019
.75.
715
.28.
98.
08.
3
catt
le%
4.0
1.1
10.5
7.9
27.1
11.3
5.6
11.1
pigs
%4.
48.
117
.416
.09.
68.
06.
93.
6
eggs
%1.
61.
27.
814
.411
.513
.35.
88.
3
chick
ens
%2.
11.
19.
611
.418
.713
.54.
411
.1
pota
toes
%3.
51.
413
.65.
710
.96.
311
.78.
9
tota
l%
2.1
2.6
13.1
11.4
18.7
12.5
6.6
6.3
prod
uctio
n va
lue
mill
ion
EUR
355,
080
7,35
59,
158
45,3
6340
,708
66,5
4044
,365
23,0
1522
,853
crop
sm
illio
n EU
R18
9,69
13,
320
3,63
723
,284
24,5
6938
,153
26,1
2611
,672
8,51
5
cere
als
mill
ion
EUR
46,2
9343
71,
888
7,12
84,
374
11,1
284,
032
266
2,79
1
anim
al p
rodu
cts
mill
ion
EUR
141,
177
3,95
54,
976
20,3
7914
,410
23,4
1914
,402
9,00
612
,177
catt
lem
illio
n EU
R27
,043
1,09
630
33,
088
2,04
56,
906
3,24
11,
539
3,18
1
milk
mill
ion
EUR
48,1
9897
61,
481
9,55
82,
764
7,37
94,
308
3,89
14,
051
pigs
mill
ion
EUR
29,5
971,
340
2,40
05,
183
4,74
92,
843
2,37
92,
050
1,08
4
poul
try &
eggs
mill
ion
EUR
23,0
2244
326
52,
096
2,85
83,
808
3,11
01,
118
2,37
5
Sour
ce: E
uros
tat
Land-enTuinbouw09_EN.indd 11Land-enTuinbouw09_EN.indd 11 09-03-2010 15:18:5909-03-2010 15:18:59

12
Yields in the European member states (2007, 2008)
unit
EU-2
7Be
lgiu
mDe
nmar
kGe
rman
ySp
ain
Fran
ceIta
lyth
e Ne
ther
land
sth
e Uni
ted
King
dom
cere
als
100
kg/h
a78
.365
.669
.738
.464
.349
.172
.173
.5
suga
rto
nnes
/ha
10.7
9.7
9.5
10.0
12.0
7.8
10.4
appl
es10
0 kg
/ha
410.
533
6.9
367.
241
6.8
162.
3
pear
s10
0 kg
/ha
344.
923
7.6
206.
835
6.4
tom
atoe
s10
0 kg
/ha
4,25
2.7
2,13
6.5
672.
352
1.0
4,43
3.7
4,07
3.9
caul
ifl ow
er an
d br
occo
li10
0 kg
/ha
194.
023
1.3
183.
719
4.7
142.
511
2.4
pota
toes
100
kg/h
a46
9.5
394.
242
3.5
282.
045
3.8
256.
843
7.9
414.
2
aver
age c
arca
ss w
eigh
t adu
lt ca
ttle
kg32
0.8
440.
426
2.7
336.
827
3.8
377.
432
0.0
309.
733
6.7
aver
age c
arca
ss w
eigh
t cal
ves
kg14
3.6
166.
917
3.7
128.
215
7.3
136.
614
6.5
157.
729
.3
aver
age c
arca
ss w
eigh
t pig
skg
88.6
94.7
84.3
93.5
83.4
88.7
117.
990
.977
.9
milk
kg/c
ow6,
139.
35,
613.
28,
382.
26,
949.
07,
011.
66,
485.
05,
915.
87,
468.
77,
108.
7
eggs
kg/l
ayin
g he
n17
.918
.926
.016
.419
.720
.915
.721
.217
.4
Sour
ce: E
uros
tat
Land-enTuinbouw09_EN.indd 12Land-enTuinbouw09_EN.indd 12 09-03-2010 15:18:5909-03-2010 15:18:59

13
Final production value
(Flanders, million EUR, 2000-2008)
0
1,000
2,000
3,000
4,000
5,000
6,000
2000 2001 2002 2003 2004 2005 2006 2007
arable farming horticulture livestock total
2008
Source: Department of Agriculture and Fisheries
The fi nal production value of Flemish agriculture and horticulture is EUR 4.5 to 5 billion and presented a slight increasing trend between 2000 and 2008. It should be noted that the compensating amounts under the CAP reforms (operating subsidies, nurse cow premium, etc.) are not included in the production values.
The year 2008 was characterised by the highest turnover of the last nine years. Both livestock and horticulture achieved their highest values. Arable farming did less well after the peak year of 2007.
Flanders has a share of approximately 75% of the national fi nal production value. Save for a number of arable farming products, Flanders clearly accounts for more than half of the most important products. For pigs, vegetables, fruit and ornamental plants, the share is even more than 90%.
In 2008, the fi nal production value was broken down as follows: 8.5% from arable farming, 32.1% from horticulture and 59.4% from livestock. The three products that contribute the most to the turnover in Flanders are: pork, vegetables and dairy products.
Development of fi nal production value of Flemish agriculture and horticulture, million EUR
2000 2001 2002 2003 2004 2005 2006 2007* 2008*
fi nal production
value4,689 4,811 4,527 4,600 4,481 4,493 4,682 4,968 4,976
arable farming 386 473 418 467 434 413 432 504 424
horticulture 1,389 1,359 1,389 1,506 1,341 1,449 1,532 1,588 1,597
livestock 2,913 2,979 2,720 2,627 2,706 2,632 2,718 2,875 2,955
*: provisional fi gures
Land-enTuinbouw09_EN.indd 13Land-enTuinbouw09_EN.indd 13 09-03-2010 15:19:0009-03-2010 15:19:00

14
Final production value arable farming
(Flanders, %, 2008)
potatoes50%
sugar beets11%
other17%
cereals22%
Source: Department of Agriculture and Fisheries
The value of arable farming products was EUR 424 million in 2008. Cereals, potatoes and sugar beets are the main products. Together they account for 83%.
The production value of cereals presents a rising trend. The advance of grain maize cultivation is certainly a part of this. The year 2007 was a very good year for the cereal sector due to high price quotations. The poor harvest within and outside Europe, the extremely low stocks worldwide and increasing demand were at the basis of this.
The potato sector is characterised by large variations in production value. The size of the harvest, the quality of the potatoes and the potato prices are after all highly seasonal. Contracts are concluded in order to limit price fl uctuations somewhat: 40 to 50% of Flemish potatoes are grown under contract.
With regard to sugar beets, the production value has decreased sharply since 2005, which is due to falling prices and productions. The MTR reform has led to a substantial fall in price support. The guaranteed price for white sugar has fallen by 36% over four years (starting from 2006/07), resulting in falling prices for sugar beets. Due to the introduction of the quota, the production of sugar beets has been cut back sharply.
Final production value of Flemish arable farming, million EUR
2000 2001 2002 2003 2004 2005 2006 2007* 2008*
arable farming
products386 473 418 467 434 413 432 504 424
cereals 64 49 56 78 70 69 93 138 95
potatoes 172 272 205 218 186 191 203 209 210
sugar beets 107 113 113 119 113 96 71 66 45
other 44 39 44 52 65 56 65 91 74
*: provisional fi gures
Land-enTuinbouw09_EN.indd 14Land-enTuinbouw09_EN.indd 14 09-03-2010 15:19:0109-03-2010 15:19:01

15
Final production value horticulture
(Flanders, %, +)
fruit27%
non-edible crops32%
vegetables41%
Source: Department of Agriculture and Fisheries
Vegetables make up 41% of the production value of horticulture. Of this, 46.5% came from open-air production in 2008, with leek, chicory and caulifl ower being the three main crops. Sheltered vegetable cultivation accounted for the remaining 53.5%. In this subsector, tomatoes, mushrooms and lettuce are the three main products.
Fruit cultivation is good for 27% of horticultural production value. Apples and pears are the main products and account for 73% of this. The value of apple production consistently exceeded that of pears until 2003, but due to an increasing switch from apple to pear production, pears now hold fi rst place with regard to production value. In 2007 and 2008, the sales fi gures in fruit production were signifi cantly higher.
Although ornamental plant cultivation only accounts for 12% of horticultural area, ornamental plant cultivation is responsible for 32% of the total value of horticultural production. The value of ornamental plant cultivation showed a clear rising trend between 2000 and 2008. Both fl ower and tree cultivation products recorded an increase in value.
Final production value of Flemish horticulture, million EUR
2000 2001 2002 2003 2004 2005 2006 2007* 2008*
horticultural
products1,389 1,359 1,389 1,506 1,341 1,449 1,532 1,588 1,597
vegetables 692 708 683 740 570 577 657 631 649
sheltered crops 381 391 381 434 307 335 358 350 347
in open air 311 318 301 306 263 243 300 281 302
fruit 287 268 297 328 303 345 350 428 439
apples 109 94 102 104 87 98 123 142 148
pears 75 73 84 92 104 133 113 162 173
non-edible crops 410 383 409 437 467 526 524 529 508
*: provisional fi gures
Land-enTuinbouw09_EN.indd 15Land-enTuinbouw09_EN.indd 15 09-03-2010 15:19:0209-03-2010 15:19:02

16
Final production value livestock
(Flanders, %, 2008)
pigs44%
cattle20%
other1%
eggs5%
milk21%
poultry9%
Source: Department of Agriculture and Fisheries
The pig sector contributes by far the most to the production value of livestock. With regard to its development, there were relatively low sales fi gures between 2003 and 2007. This was due to the falling trend in production quantities and the low prices over a number of years (especially in 2003 and 2007). 2008 was characterised by a clear recovery of prices, such that the production value was higher.
Dairy products are the second most important product in the livestock sector. Due to falling milk prices as a result of the further cutback of price support, the production value fell continually between 2001 and 2007. A shortage on the world dairy market in 2007 ensured a strong price increase and, coupled with this, a higher production value. However, in 2008, the dairy market had to contend with persistent price pressure due to an oversupply on the world market.
Beef completes the top three livestock products. After the crisis year of 2001 (as a result of BSE), the production value remained at a low level until 2005. Since 2006, the production value has been at a clearly higher level due to better prices.
Final production value of Flemish livestock, million EUR
2000 2001 2002 2003 2004 2005 2006 2007* 2008*
livestock products 2,913 2,979 2,720 2,627 2,706 2,632 2,718 2,875 2,955
animals 2,202 2,234 2,030 1,915 2,048 2,002 2,072 2,073 2,196
cattle 546 339 449 493 496 491 566 586 579
pigs 1,386 1,599 1,314 1,168 1,299 1,255 1,280 1,216 1,332
poultry 241 273 244 234 232 231 207 248 260
animal products 711 744 691 712 658 629 646 802 760
milk and milkderivatives
573 612 562 553 544 519 515 658 626
eggs 138 132 129 159 114 110 131 144 134
*: provisional fi gures
Land-enTuinbouw09_EN.indd 16Land-enTuinbouw09_EN.indd 16 09-03-2010 15:19:0309-03-2010 15:19:03

17
Net added value
(Flanders, million EUR, 2000-2008)
NAV
/LU
(EU
R)
2,000
1,500
1,000
500
0
40,000
30,000
20,000
10,000
02000 2001 2002 2003 2004 2005 2006 2007 2008
NAV NAV/LU
NAV
(mill
ion
EUR)
Source: Department of Agriculture and Fisheries
The net added value (NAV) was exceptionally low in 2008. Due to a continual fall in the number of labour units (LU), the net added value per labour unit presented a growing trend until 2007. In 2008, this indicator also fell sharply. The greatly increased costs that could not be passed on through the sales lay at the basis of this. The strong increase in fodder prices is notable. Fodder accounts for 48% of total intermediate consumption. The sharp increase in fodder prices was mainly a result of the positive price trends on the cereal markets. Energy prices also continued to increase in 2008. As a result of this, and also because of the increasing demand for synthetic fertilizers in countries outside Europe, fertilizer prices also increased.
The net subsidies have increased markedly over the last ten years. This is attributable to the reform of the common sugar and milk policy. The intervention prices for dairy products (as of 2004) and sugar (as of 2006) were adjusted downwards and partly compensated for with direct payments.
Production account of Flemish agriculture and horticulture, million EUR
2000 2005 2006 2007* 2008*
fi nal production 4,689 4,493 4,682 4,968 4,976
intermediate consumption 2,945 2,964 3,050 3,322 3,783
odder and straw 1,477 1,362 1,400 1,597 1,812
fertilizers 136 129 144 160 251
energy 327 380 406 402 491
gross added value 1,744 1,529 1,632 1,646 1,192
depreciation 402 436 446 475 498
subsidies - taxes 176 240 279 300 305
net added value (NAV) 1,518 1,333 1,464 1,471 999
number of labour units (LU) 51,849 47,384 45,769 44,537 43,691
NAV per LU (EUR) 29,272 28,135 31,997 33,022 22,875
*: provisional fi gures
Land-enTuinbouw09_EN.indd 17Land-enTuinbouw09_EN.indd 17 09-03-2010 15:19:0409-03-2010 15:19:04

18
Family working income in agricultural businesses
(Flanders, 2001-2007, in EUR/FAWU)
Family working income per FAWU Comparable income
40,000
30,000
20,000
10,000
02001 2002 2003 2004 2005 2006 2007
Source: Department of Agriculture and Fisheries
The family working income is obtained by deducting the total costs from the total revenue, excluding the fi ctitious cost of wages attributed to family agricultural work units (FAWU). If we express this family working income per family agricultural work unit, it indicates what annual wage the farmer and his family receive for their labour.The comparable income corresponds to the average gross salary of a full-time employed wage earner. Job-seekers are not included in the calculation of this average.
On average for all agricultural businesses with a professional nature, the family working income per family agricultural work unit is EUR 25,623, which corresponds to 67.3% of the comparable income. Family working income in 2006 was the highest over the period concerned.The working income in 2007 was lower than in 2006 due to the greatly increased costs that could not be off set by lower increases in revenue. Variable costs increased strongly in particular. Fodder, pesticides and seeds were the most notable increases. The increase in revenue was due to the good prices for milk and arable farming products, but was reduced by the low prices for pigs.
Land-enTuinbouw09_EN.indd 18Land-enTuinbouw09_EN.indd 18 09-03-2010 15:19:0509-03-2010 15:19:05

19
Breakdown of operating income per sector
(Flanders, 2007, % per FAWU with regard to Flemish average)
pigs
beef cattle
highly specialiseddairy cows
arable farming
-40% -30% -20% -10% 0% 10% 20% 30% 40% 50% 60% 70%
Source: Department of Agriculture and Fisheries
The operating income is the remuneration that a business receives for the family labour and entrepreneurship, and the remuneration for the contribution of capital by the owner. In order to be able to compare businesses with one another, this indicator is expressed per family agricultural work unit (FAWU).
The average operating income per FAWU in a Flemish agricultural business was EUR 32,559/FAWU in 2007. Behind this average income lies a highly heterogeneous spread. There are large income diff erences between the sectors. In 2007, dairy cows and the arable farming sector had the strongest results, while the pig sector and cattle sector did less well.
The strong result that the dairy sector had was due to the high milk prices in 2007. A growing imbalance between supply and demand on the world market ensured that the price for milk fat and milk protein rose strongly, which resulted in high milk prices for the farmer.
In 2007, the arable farming sector was able to profi t from exceptionally high cereal prices. Extreme weather conditions ensured poor harvests worldwide. The huge demand for wheat pushed the prices markedly higher, partly due to the low worldwide stocks.
The low pig price and the high cost of fodder ensured a very low income for pig businesses. In the cattle sector, the high fodder cost lay at the basis of the lower income.
Land-enTuinbouw09_EN.indd 19Land-enTuinbouw09_EN.indd 19 09-03-2010 15:19:0609-03-2010 15:19:06

20
Working income per AWU in horticultural businesses
(Flanders, 2001-2007, in EUR/FAWU)
Source: Department of Agriculture and Fisheries
The working income is obtained by deducting the total costs from the total revenue, excluding the fi ctitious cost of wages attributed to family agricultural work units (FAWU) and the actual labour cost paid. If we express this working income per agricultural work unit (AWU), this indicates what annual wage the business activities yield.
The comparable income corresponds to the average gross salary of a full-time employed wage earner. Job-seekers are not included in the calculation of this average.
The working income per agricultural work unit followed a rising line over the last few years. In 2007, it was EUR 29,827, which was 79% of the comparable income. The working income per AWU achieved its highest level over the period concerned in 2007. The higher working income was primarily caused by the good prices received for apples and pears. Open-air vegetable crops also achieved good results. Greenhouse crops had to contend with rising energy costs over the last few years, although in 2007, this eff ect was tempered due to the mild winter.
working income per AWU comparable income
40,000
30,000
20,000
10,000
02001 2002 2003 2004 2005 2006 2007
Land-enTuinbouw09_EN.indd 20Land-enTuinbouw09_EN.indd 20 09-03-2010 15:19:0709-03-2010 15:19:07

21
Breakdown of operating income per sector
(Flanders, 2007, % per FAWU with respect to the Flemish average)
Source: Department of Agriculture and Fisheries
The operating income is the remuneration that a business receives for the family labour and entrepreneurship, and the remuneration for the contribution of capital by the owner. In order to be able to compare businesses to one another, this indicator is expressed per family agricultural work unit (FAWU).
The average operating income per FAWU in a Flemish horticultural business was EUR 40,486 in 2007. However, there was a large spread between the diff erent specialisations. In 2007, the operating income for the fruit sector was exceptionally good, while cut fl owers produced weak results. Greenhouse vegetables also scored weakly.
Due to the poor harvests abroad, the demand for Flemish fruit was high, which resulted in high prices for apples and pears. Cut-fl ower businesses received good prices for their products, but had to contend with much higher costs. Among the greenhouse vegetables, lettuce in particular had to contend with lower prices.
mushrooms
strawberries
greenhouse vegetables
open-air vegetables
potted plants
azaleas
cut flowers
fruit
-90%-70%
-50%-30%
-10% 10% 30% 50% 70% 90%110%
130%
Land-enTuinbouw09_EN.indd 21Land-enTuinbouw09_EN.indd 21 09-03-2010 15:19:0809-03-2010 15:19:08

22
Arable product prices
(Flanders, EUR, 1998-2008)
Source: Department of Agriculture and Fisheries, BIRB, CBB
The cereal price is aff ected by the common market price policy in the cereal sector. Due to the gradual reduction of price support for cereals and the introduction of hectare support, the market mechanism is increasingly aff ecting the price-making process, such that the price fl uctuations are also becoming greater. The price in 2008 fell after a year of extremely high prices, which was attributable to a poor harvest within and outside Europe, the extremely low stocks and increased demand. The world cereal stocks increased again in 2008 due to greater harvests, which ensured downward pressure on prices.
Just like the cereal price, the sugar price is strongly aff ected by the common market price policy. The diagram shows the development of sugar beets (16% sugar) that is sold within the quota. These prices remained reasonably stable until 2005/06 due to the unchanged price support. Since 2006/07, the MTR reform has led to a substantial reduction of the support. The guaranteed price for white sugar fell by 36% over four years, resulting in falling prices for sugar beets.The payments for beets produced outside the quota that are not transferred to a subsequent season are counted as industrial sugar. The price of this industrial sugar varies per business and depends on the contracts that the sugar businesses have entered into with their buyers.
The average season price for potatoes on the free market fl uctuates strongly. The market price depends on supply and demand. Potatoes for consumption are not subject to a common market price regulation. The prices on the free market in 2008/09 were somewhat higher than in 2007/08. The potato harvest fell sharply as a result of the smaller area and lower yields. Contracts are concluded in order to absorb the fl uctuations on the free market. Approximately 40 to 50% of Flemish potatoes are grown under contract.
wheat fodder potatoes sugar beets (quota price)
EUR/
100
kg
60
40
20
0
1998/991999/00
2000/012001/02
2002/032003/04
2004/052005/06
2006/072007/08
2008/09
Land-enTuinbouw09_EN.indd 22Land-enTuinbouw09_EN.indd 22 09-03-2010 15:19:0909-03-2010 15:19:09

23
Horticultural product prices
(Flanders, EUR, 1998-2008)
Source: FPS Economy - Directorate-General Statistics and Economic Information
In 2008, the prices of many open-air vegetables fell with respect to 2007. The lack of wintry weather in early 2008 ensured an oversupply of leaf crops, which led to very low prices. The gloomy summer of 2008 did not help the prices either.
The prices on the leek market were somewhat better than in 2007, but the price remained below par due to an imbalance between supply and demand.
The chicory market, which has been in a structural crisis for years, again had to contend with a strong price decrease. After a small upward fl icker in 2006, the sales of chicory went downhill again in 2007 and 2008. The poor prices in 2008 persisted for months. Some improvement was only seen during the autumn.
The greenhouse products too often did less well in 2008 than in 2007. Tomato prices fell by 7%. In the month of August, the prices fell to an all-time low. The poor summer and the large supply at home and abroad were certainly a part of this.
In the fruit sector, the main types of fruit experienced a price increase. For apples, this increase was attributable to the good price-making forces in the 2007/08 apple season, which was the result of a low apple harvest in the new EU member states and Russia. In 2008/09, the price came under pressure. Exports decreased as a result of the fi nancial crisis, resulting in lower exchange rates. Countries such as Russia and the Ukraine primarily imported apples from Poland. The Polish harvest was also extensive.
The prices of pears were very good in 2008/09. The European harvests were the lowest in the last ten years, which resulted in better price-making forces.
leek chicory tomatoes apples pears
1.2
0.8
0.4
0.0
0.8
0.6
0.4
0.2
0.0
vege
tabl
es (E
UR/
kg)
frui
t (EU
R/kg
)
1998 1999 2000 2001 2002 2003 2004 2005 2006 2007 2008
Land-enTuinbouw09_EN.indd 23Land-enTuinbouw09_EN.indd 23 09-03-2010 15:19:1009-03-2010 15:19:10

24
Animal product prices
(Flanders, EUR, 1998-2008)
Source: Department of Agriculture and Fisheries, VEVA, BIRB, Deinze, BCZ and Kruishoutem
The average price of live adult cattle rose by 3.5% in 2008. The rise was primarily due to better price-making forces in the lower quality classes. Thus the price for cows (50% quality) rose by 17%, while the price for double-muscle bulls stabilised (+0.6%).
Pig prices gradually recovered in 2008 after a year of very low prices. The market-support measures (introduction of refunds and support for private storage) and a slight fall in European supply contributed to better prices. The pig prices in the diagram come from the BIRB (“low-fat pigs” category) up to 2005, and as of 2006 from VEVA.
The dairy sector was characterised by a sharp drop in prices after the excellent dairy prices of 2007. Due to the rising stocks of dairy products across the world and the lagging international demand, the dairy market had to contend with persistent price pressure in 2008.
In 2008, poultry meat experienced a slight price improvement (+1.7% with respect to 2007). Consumption in Europe fell markedly in 2006 after the outbreak of avian fl u in a number of European countries. In northwest Europe, many consumers switched to eating pork or beef. Poultry meat exports to countries outside the European Union also fell because they closed their borders to European poultry meat out of fear of the avian fl u virus. Poultry prices were thus negatively infl uenced by this in 2006. Due to the absence of new outbreaks, consumption and exports outside the European Union grew, resulting in a positive eff ect on prices.
Prices on the egg market only fell slightly in 2008 (-1.4% with respect to 2007) due to a good balance between supply and demand.
adult cattle (EUR/100 kg) pigs (EUR/100 kg)roasting chickens (EUR/100 kg) milk (EUR/100 L) eggs (EUR/1,000 units)
1998 1999 2000 2001 2002 2003 2004 2005 2006 2007 2008
anim
al p
rices
anim
al p
rodu
ct p
rices
300
200
100
0
60
40
20
0
Land-enTuinbouw09_EN.indd 24Land-enTuinbouw09_EN.indd 24 09-03-2010 15:19:1109-03-2010 15:19:11

25
Yield and output from arable crops
Yield from wheat, sugar beets and store potatoes(Flanders, 2000-2008, 2000 = 100%)
Source: FPS Economy - Directorate-General Statistics and Economic Information, own calculations
Wheat (74,390 ha), sugar beets (22,218 ha) and store potatoes (27,510 ha) are the three main arable crops and together account for 63% of the total arable farming area. Fodder crops are not included in this area.
The above diagram indicates that the yields from the diff erent crops diff er sharply from year to year. A good wheat harvest often seems to coincide with a good sugar beet harvest. The potato yields do not follow this line and fl uctuate more sharply. Harvest outputs are highly dependent on weather conditions. Thus, 2007 was characterised by a low output for wheat, due to a dry spring and a wet summer that impeded the harvest. The wet weather in August 2006 ensured that the potato harvest was diffi cult and resulted in low yields.
Yields for wheat, sugar beets and store potatoes, kg/ha, 2000-2008
2000 2001 2002 2003 2004 2005 2006 2007 2008
wheat 7,940 7,780 8,290 8,820 9,140 8,550 8,412 7,780 8,806
sugar beets 66,460 58,520 66,170 70,020 71,350 68,080 67,700 67,810 69,700
store potatoes 45,480 42,800 50,110 43,740 52,010 45,150 40,842 49,667 48,322
wheat sugar beets store potatoes
120%
110%
100%
90%
80%2000 2001 2002 2003 2004 2005 2006 2007 2008
Land-enTuinbouw09_EN.indd 25Land-enTuinbouw09_EN.indd 25 09-03-2010 15:19:1209-03-2010 15:19:12

26
Yield and output from dairy farms and pig farms
Milk production per cow and per business(Flanders, 2001-2007, reference year 2001)
Source: Department of Agriculture and Fisheries based on the Agriculture Monitoring Network
The dairy businesses have realised a substantial production increase every year. This production increase was partly realised through a higher milk yield per dairy cow, but primarily as a result of a greater number of milked cows per business. This is partly attributable to the increase of the quota under the MTR.
Pig breeders are scoring technically better. The number of litters per sow is increasing annually and is now 2.2 litters per sow. The number of piglets raised per sow is increasing year by year. Since 2001, 3.2 more piglets per sow have been raised. During fattening, a growth of 629 g per day can be realised. In 2007, pigs were sold at an average of 110 kg.
Yield and output from dairy farms and pig farms, 2001-2007
2001 2002 2003 2005 2006 2007
milk yield per cow (litres) 6,091 6,056 6,496 6,612 6,744 6,993
total milk production per business (litres) 308,895 297,327 293,715 318,872 343,016 383,558
number of piglets raised per sow 18.0 18.5 19.1 19.9 20.2 21.2
number of litters per sow 2.11 2.13 2.16 2.16 2.20 2.19
meat pig growth per day (g) 610 610 629
fodder conversion meat pigs
(kg concentrate/kg growth) 2.98 3.00 2.98
milk yield per cow milk production per business
130%
120%
110%
100%
90%2001 2002 2003 2005 2006 2007
Land-enTuinbouw09_EN.indd 26Land-enTuinbouw09_EN.indd 26 09-03-2010 15:19:1309-03-2010 15:19:13

27
Number of producers with diversifi cation activities in agriculture
(Flanders, 2007-2008)
activity 2007 2008
social-tourism activities 447 482
environment, nature and landscape 2,002 2,428
outsourcing of production factors 378 317
production and sales (estimate) 1,150 1,150
total number of processors 3,977 4,377
Source: Department of Agriculture and Fisheries
Diversifi cation in agriculture means additional activities, other than production, from which the farmer derives extra income. A farmer can diversify by participating in conservation and environmental protection, by opening up his operation to outsiders or certain target groups (care farms, farm tourism) and by doing processing and/or traditional activities in his business.
The fi gures are an estimate of the number of individual farmers that diversifi ed in one way or another in 2008. Flanders had 4,377 farmers that had at least one diversifi cation activity. In 2008, there were 2,428 individual farmers in Flanders that had an ongoing management agreement relating to conservation (combating erosion, species protection, buff er zone management, small landscape elements, botanic management, nature management agreement). In comparison to 2007, this is an increase of more than 400 producers. The greatest increases were in the number of approved agreements for botanical management and maintaining small landscape elements.
According to the Steunpunt Groene Zorg, there were 399 active care farms, 54% more than last year. The Department of Agriculture and Fisheries counted 320 care farmers who had submitted an application for subsidies. Only at the end of 2009, for the payment application, will it be known how many of them are eff ective. VLAM used to keep an inventory of the number of farmstead producers, but it has since no longer been kept up to date. According to estimates, there are 1,150 farmstead producers, 336 of which are registered with Fermweb and 230 labelled as an “approved farm product sales point”. In particular, the number of producers that participate in environmental and nature conservation increased sharply in comparison to last year.
Land-enTuinbouw09_EN.indd 27Land-enTuinbouw09_EN.indd 27 09-03-2010 15:19:1309-03-2010 15:19:13

28
Economic climate index for agriculture
(Flanders, index: range from -100 to +100)
Source: Department of Agriculture and Fisheries
The six-monthly economic climate barometer has been developed to gain an understanding of economic fl uctuations, business confi dence and planned investments in the Flemish agricultural and horticultural sector. As expected, the economic climate index of autumn 2009 fell further below the zero line. The fall in agricultural prices and the economic crisis are weighing down on the agricultural sector. This trend could already be seen in autumn 2008.
The indices of most subsectors are also moving downwards, further below the zero line. The sector with the most negative index is the dairy sector (-35), which is to be expected given the very low milk prices, the imports of cheaper milk and the weak export position due to the strong euro. Ornamental plant cultivation (-27), which supplies more of a luxury product and is thus more sensitive to economic crises, and open-air vegetables (-23) ended very negatively. Arable farming (-20) followed the general economic climate index the closest. Open-air fruit cultivation (-15) also fell below the zero line as a result of the low apple prices. Pig farming (-13) moved away from its positive index in the previous survey. Nevertheless, it should be noted that the future expectations of pig farmers are generally positive, which would suggest that the worst is over. Greenhouse fruit and vegetables (-10) are somewhat more optimistic than the rest, probably due to the fall in energy costs and the slight rise of vegetable prices after the severe winter. The expectations indicate that demand and the prices will fall in the future. The index for the beef cattle sector (-6) is experiencing a status-quo, which is in line with the beef prices that recovered slightly after reaching a low point.
15
10
5
0
-5
-10
-15
-20
-25
index 2007 spring 2007 autumn 2008 spring 2008 autumn 2009 spring
agricultural economic climate index
7
10
0,5
-9
-22
Land-enTuinbouw09_EN.indd 28Land-enTuinbouw09_EN.indd 28 09-03-2010 15:19:1409-03-2010 15:19:14

29
Development of Belgian agricultural trade
(Belgium, 2003-2008, in billion EUR)
Source: Department of Agriculture and Fisheries, based on Eurostat
The total Belgian trade in agricultural products shows a positive trade balance. Both imports and exports are increasing signifi cantly. In contrast to the general trend in foreign trade, the agricultural trade surplus increased by 5.5% in 2008. It is now EUR 3.5 billion. In 2008, total exports came to EUR 34.1 billion, while imports of agricultural products were EUR 30.6 billion. As a comparison: EUR 30.1 billion of agricultural products were exported and EUR 26.7 billion were imported in 2007.
The share of imports and exports of agricultural products in total Belgian trade is 9.6% and 10.6% respectively, which indicates the not to be underestimated importance of the agricultural sector for Belgian exports. Figures from the National Bank of Belgium show that Flanders is responsible for 82% of national imports and 83% of national exports of agricultural products.
The EU member states are the most important agricultural trading partners, even more so than in total Belgian trade. 73% of imported agricultural products come from the EU and 84% of exported agricultural products go to EU member states. Within the EU, the neighbouring countries in particular are of great importance. Almost 62% of agricultural imports come from the Netherlands, Germany, Luxembourg, France and the United Kingdom. These fi ve, with 67%, are also the largest sales markets for Belgian agricultural products. The United Kingdom and Germany contribute the most to the Belgian trade surplus in agricultural products, with a positive balance of EUR 2 billion and EUR 1.6 billion respectively. In the EU, Belgium only has an agricultural product trade defi cit with the Netherlands (EUR -613 million) and, to a lesser extent, with Lithuania (EUR -37 million).
40
35
30
25
20
15
10
5
0Imports Exports Balance
200320042005200620072008
Land-enTuinbouw09_EN.indd 29Land-enTuinbouw09_EN.indd 29 09-03-2010 15:19:1509-03-2010 15:19:15

30
Breakdown of Belgian agricultural trade into components
(Belgium, 2008, billion EUR)
Source: Department of Agriculture and Fisheries, based on Eurostat
Arable farming products represent by far the greatest import and export values in Belgian agricultural trade. Belgium imports EUR 10.9 billion of arable farming products and exports EUR 11.1 billion. Products such as rape, soya, coff ee, cocoa and oil-yielding by-products are imported in bulk from non-EU countries. Cereal products are the most important export product, especially due to confectionery products, malt, wheat meal and pasta.
Belgium realises a trade surplus in animal and agri-industrial products in particular (each for EUR 1.8 billion). Dairy products represent 48% of the import value and 39% of the export value of animal products. The most important export product in this category is, however, fresh pork, followed by veal and beef, poultry and dairy preparations. Fertilizers form the most important product in the trade of agri-industrial products. Belgium exports nitrogenous and composite fertilizers in particular, and imports potassium-containing fertilizers. Belgium is also an export country for pesticides and agricultural equipment.
Only in the category of other agricultural and fi shery products does Belgium have a trade defi cit (EUR 680 million). The trade defi cit is primarily due to the negative balance with our neighbouring countries, France and the Netherlands. Belgium imports large quantities of wine, alcohol, soft drinks and water from France. Belgium imports a great deal of animal feed and shellfi sh from the Netherlands.
The trade surplus in horticultural products (EUR 299 million) is largely due to the export of frozen vegetables, fruit juices, fresh pears and tomatoes, primarily to EU member states. Subtropical fruit is imported on a large scale from countries outside the EU.
40
35
30
25
20
15
10
5
0
-5imports exports balance
arable farming products animal productshorticultural products other agricultural and fishery productsagri-industrial products
Land-enTuinbouw09_EN.indd 30Land-enTuinbouw09_EN.indd 30 09-03-2010 15:19:1609-03-2010 15:19:16

31
Import and export of agricultural products by EU member states
(EU member states, 2008, in billion EUR)
Source: Department of Agriculture and Fisheries, based on Eurostat
Belgium accounts for 7.7% of agricultural imports and 9% of agricultural exports of the European Union. It occupies sixth and fourth place respectively. Belgium is even the second largest exporter of agri-industrial products. The high fi gures for Belgium indicate that our country has a very open economy that thrives off the import, export and transit of products. The ports play an important role here.
In total, all EU member states import a total value of EUR 399 billion of agricultural products. The total export value is EUR 381 billion. Germany records the largest import and export values. For imports, the top three are completed with France and the United Kingdom, and for exports the Netherlands and France are in second and third place. The twelve new member states are still less important with regard to foreign agricultural trade. They represent 10.9% of the import value and 10.1% of the export value in the EU.
Belgium has the fourth largest agricultural trade surplus of all EU member states. Only the Netherlands, France and Denmark do better. The defi cit in European agricultural trade is primarily due to the United Kingdom, Italy, Sweden, Portugal, Germany and Greece. Among the new member states, only Poland and Lithuania have a trade surplus.
Arable farming products represent the highest value for both imports and exports, ahead of animal products and other agricultural and fi shery products. In the total trade of EU member states, agricultural trade accounts for around 9.5% of the import and export values.
70
60
50
40
30
20
10
0
Ger
man
y
Fran
ce
the
Net
herla
nds
the
Uni
ted
King
dom
Italy
Belg
ium
Spai
n
Den
mar
k
Pola
nd
Aust
ria
Swed
en
Import Export
Land-enTuinbouw09_EN.indd 31Land-enTuinbouw09_EN.indd 31 09-03-2010 15:19:1709-03-2010 15:19:17

32
Home consumption of fresh agri-foodstuff products
(Flanders, index: 2000 = 100%)
Source: Gfk Panel Services Benelux, VLAM
The home consumption of fresh agri-foodstuff products is determined each year through a random sample survey, representative of the population. The home consumption of most fresh agri-foodstuff products is below the level of 2000. The home consumption of cheese has undergone a rising trend over the last few years, but now appears to be stagnating, while bread consumption presents the reverse picture, and after years of falling is now beginning to rise again. This is primarily explained by the Fleming scaling back his consumption outside the home and consuming more prebaked bread. An end gradually seems to be coming to the fall in the consumption of drinking milk, which is primarily due to the shift from white drinking milk to “new” milk drinks with added value (milk drinks, soya drinks, drinking yoghurt) that have smaller packaging. The fall in fresh fi sh consumption is attributable to the decrease in the consumption of shellfi sh (including mussels). The home consumption of poultry and game has increased strongly over the last two years and is entirely due to the consumption of chicken. The consumption of fresh fruit saw a slight fall, which is entirely attributable to citrus fruits. The consumption of fresh vegetables on the other hand increased strongly in 2008 (among all types of vegetables) and is at the same level as in 2000.
Home consumption of fresh agri-foodstuff products in Flanders, in kg per capita
2000 2001 2002 2003 2004 2005 2006 2007 2008
drinking milk* 64.3 57.1 59.3 58.3 57.2 54.5 54.8 53.7 53.5
cheese 9.8 9.8 10.2 9.9 10.4 10.7 10.6 10.8 10.8
potatoes 43.3 41.3 39.4 38.1 37.5 38.4 36.9 38.0 39.1
bread 106.8 100.7 99.6 92.5 90.6 87.4 81.9 83.2 86.6
fruit 89.3 84.8 86.6 85.0 86.7 85.4 82.7 85.6 84.5
vegetables 60.4 59.7 61.2 60.4 63.6 62.4 56.0 57.5 60.1
meat 34.3 30.0 32.3 30.3 30.3 29.8 28.3 29.6 30.1
poultry & game 12.5 12.1 12.6 11.6 11.9 13.0 11.8 12.8 13.4
eggs** 89.2 83.9 82.8 79.6 78.3 82.5 88.7 86.6 86.8
fi sh 7.4 6.4 6.6 7.6 7.6 7.3 6.1 6.9 6.7
* litres ** units
120%
110%
100%
90%
80%
70%2000 2001 2002 2003 2004 2005 2006 2007 2008
drinking milkvegetables
cheesemeat
potatoespoultry & game
breadeggs
fruitfish
Land-enTuinbouw09_EN.indd 32Land-enTuinbouw09_EN.indd 32 09-03-2010 15:19:1809-03-2010 15:19:18

33
Development of the number of businesses in the agribusiness complex
(Flanders, 2003-2007)
2003 2004 2005 2006 2007
Flanders 49,061 47,850 46,663 45,429 43,471
agriculture and horticulture 36,577 35,486 34,410 33,272 31,984
excl. agriculture and horticulture 12,484 12,364 12,253 12,157 11,487
food 5,790 5,683 5,622 5,542 5,196
ABC related wholesale and trade mediation 4,121 4,038 3,942 3,876 3,466
other ABC sectors 2,573 2,643 2,689 2,739 2,825
Source: FPS Economy - Directorate-General Statistics and Economic Information, FPS Finance
The structure and dynamics of the agricultural and horticultural sector is increasingly determined by the relationship with the rest of the chain, as production is being increasingly integrated with the activities and products of the sectors before and after. Agribusiness complex generally means “the directly and indirectly related economic activities connected to the production, processing and sale of an agricultural product, including the supply and service businesses related to agricultural production”.
The number of agricultural and horticultural businesses is continuing to fall in Flanders and was 31,984 units (-3.9%) in 2007. The number of businesses in the Flemish ABC chain is experiencing an annual decrease. However, in 2007, this fall was stronger than usual. Based on the VAT declarations, we come to 11,487 agri-foodstuff s businesses (excl. agricultural and horticultural businesses). Both the deteriorating economy in the last quarter and the falling number of agricultural businesses has played a role here. The number of businesses in the food industry in particular has fallen sharply, with a decrease of 6.2%. In wholesale and trade intermediaries, we can observe a fall of 10.6%. The share of Flemish businesses in the Belgian agri-foodstuff s complex is approximately 63%.
Land-enTuinbouw09_EN.indd 33Land-enTuinbouw09_EN.indd 33 09-03-2010 15:19:1909-03-2010 15:19:19

34
Turnover of businesses in the agribusiness complex
(Flanders, 2007, in %)
Source: Department of Agriculture and Fisheries based on FPS Economy
In 2007, the turnover of ABC businesses rose from EUR 46.5 billion to EUR 49 billion. This is an increase of 5.5%. The turnover in the processing sector fell slightly (-2%). Nevertheless, this sector makes up more than half of the total turnover in the ABC chain with an amount of EUR 25 billion in 2007. The decrease in this category is due to the slight fall in turnover in the manufacture of food and drinks from EUR 15.6 to EUR 15.2 billion. The turnover in the manufacture of tobacco products has halved. The importance of this sector is decreasing year after year: the number of tobacco growers has fallen from around 200 businesses to approximately 70 businesses in about fi ve years. This fall is primarily due to the disengagement of support. Other sectors in the ABC chain, such as mass distribution and “producers and related services”1, saw their turnover rise by 13.3% and 9% respectively. In the agricultural sector, the fi gures of the FPS Economy only show a fall in turnover for cattle farmers. The other sectors only make a limited contribution to the total turnover.
1 These are only the producers subject to VAT.
manufactureof foodstuffs
and drinks52.20%
agriculture + servicesrelated to agriculture
21.22%
wholesale andtrade intermediaries
in foodstuffs19.41%
manufactureof textiles
3.29%
manufacture ofmachines for
agriculture andhorticulture
2.10%manufacture of
tobacco products0.95%
veterinary services0.64%
manufacture ofchemical products
for agriculture0.20%
Land-enTuinbouw09_EN.indd 34Land-enTuinbouw09_EN.indd 34 09-03-2010 15:19:2009-03-2010 15:19:20

35
Added value of the agribusiness complex
(Flanders, 2004-2007, in thousand EUR)
Source: Department of Agriculture and Fisheries based on Belfi rst
The added value of the Flemish agribusiness complex was EUR 6.2 billion in 2007, 3.7 billion of which was realised by the processing industry. This sector is very broad and includes the production of meat products, dairy products, fruit and vegetable canning, animal feed, bread and confectionery, etc. The “agriculture and horticulture” sector realised an added value of EUR 702 million. There are many services in this category that are related to agriculture and horticulture, such as landscape architecture and gardening, open space planning and fl orists. The added value for this group has grown by 48% over fi ve years. The third most important group is agricultural trade with EUR 595 million. With respect to previous years, the total added value rose by 5.3%. The rising added value also contains an infl ationary component. The “other ABC sectors” category comprises activities that are related to agriculture, but which have nothing to do with food production, such as veterinary services, textile production, tobacco, production of fertilizers and pesticides, machines for agriculture and forestry. Taken overall, this category has remained rather stable over the years and is EUR 1.1 billion on average.
1,400
1,200
1,000
800
600
400
200
0
3,800
3,600
3,400
3,2002003 2004 2005 2006 2007
agriculture and horticulture wholesale and trade intermediariesother ABC sectors foodstuffs (right axis)
Land-enTuinbouw09_EN.indd 35Land-enTuinbouw09_EN.indd 35 09-03-2010 15:19:2109-03-2010 15:19:21

3636
Employment in the agricultural sector
(Flanders, 2008, in %)
Source: FPS Economy - Directorate-General Statistics and Economic InformationAccording to the May 2008 survey, 60,563 people are regularly employed in Flemish agricultural and horticultural businesses. In line with the declining trend in the number of businesses, this number has been continually falling (-16% with respect to 2001).
Converted into agricultural work units (at least 38 hours per week or 20 days per month) and taking irregular employees into account, this means 46,000 work units or 1.50 per business in 2008. 33% of these workers are employed in specialised horticultural businesses.
This employment is predominantly family based, but the share of family agricultural work units has fallen slightly. The share of males in the total number of regular employees is stable at 65%.
Employment in the agricultural and horticultural sector, 2001-2008
2001 2005 2006 2007 2008
number of regularly employed people 72,066 66,950 64,983 62,511 60,563
number of agricultural work units 53,107 49,717 48,114 46,783 46,000
number of regularly employed people 100% 100% 100% 100% 100%
family 86% 84% 83% 83% 82%
non-family 14% 16% 17% 17% 18%
number of regularly employed people 100% 100% 100% 100% 100%
male 65% 65% 65% 65% 65%
female 35% 35% 35% 35% 35%
horticulture33%
mixed business19%
milk production13%
beef production10%
arable farming10%granivores
8%
mixed cattle4%
other grazinganimals
3%
Land-enTuinbouw09_EN.indd 36Land-enTuinbouw09_EN.indd 36 09-03-2010 15:19:2209-03-2010 15:19:22

3737
Employment in the agribusiness complex(
Flanders, 1995-2007, number of employees)
Source: National Offi ce of Social Security
Employment in the agri-foodstuff s complex includes full-time and part-time employees in Flanders and Belgium. Between 1995 and 2007, the number of employees in the agribusiness complex in Flanders fell from 111,841 to 102,678 people. This is a fall of 8.9%. This is a larger fall than for Belgium as a whole (-4.2%). Sectors that make a large contribution to employment are province-related. In the province of Antwerp, horticulture, bread and confectionery and the production of soft drinks make up 47% of total employment in agri-foodstuff s. In West-Flanders, the processing and canning businesses are active. Together with fi bre processing (fl ax) and the manufacture of machines, they account for a third of all employees in the province of West-Flanders.
In Flemish-Brabant, beer production in particular stands out and represents 26% of the total employment in this province. In Limburg, the horticultural industry (and fruit cultivation in particular), bread and confectionery, and the maintenance of parks and gardens are sources for 34% of the employment. In East-Flanders, employment in horticulture (tree nurseries, ornamental plants) is important (8%), but bread and confectionery (14%) and the “manufacture of cotton-like fabrics” (12%) also scores well.
160,000
140,000
120,000
100,000
80,0001995 1996 1997 1998 1999 2000 2001 2002 2003 2004 2005 2006 2007
Flanders Belgium
Land-enTuinbouw09_EN.indd 37Land-enTuinbouw09_EN.indd 37 09-03-2010 15:19:2309-03-2010 15:19:23
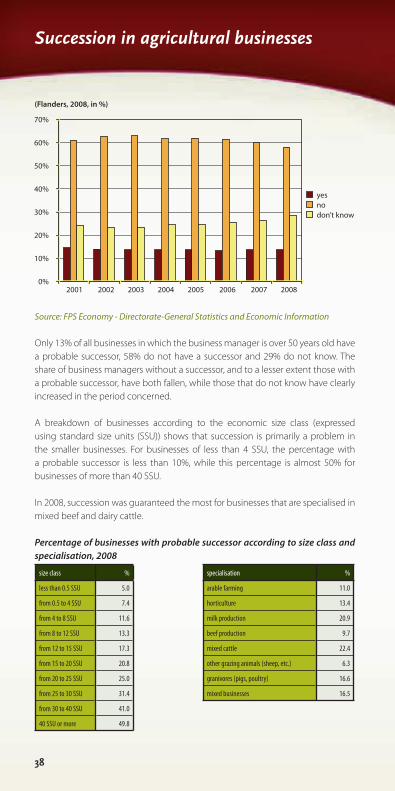
3838
Succession in agricultural businesses
(Flanders, 2008, in %)
Source: FPS Economy - Directorate-General Statistics and Economic Information
Only 13% of all businesses in which the business manager is over 50 years old have a probable successor, 58% do not have a successor and 29% do not know. The share of business managers without a successor, and to a lesser extent those with a probable successor, have both fallen, while those that do not know have clearly increased in the period concerned.
A breakdown of businesses according to the economic size class (expressed using standard size units (SSU)) shows that succession is primarily a problem in the smaller businesses. For businesses of less than 4 SSU, the percentage with a probable successor is less than 10%, while this percentage is almost 50% for businesses of more than 40 SSU.
In 2008, succession was guaranteed the most for businesses that are specialised in mixed beef and dairy cattle.
Percentage of businesses with probable successor according to size class and specialisation, 2008
size class % specialisation %
less than 0.5 SSU 5.0 arable farming 11.0
from 0.5 to 4 SSU 7.4 horticulture 13.4
from 4 to 8 SSU 11.6 milk production 20.9
from 8 to 12 SSU 13.3 beef production 9.7
from 12 to 15 SSU 17.3 mixed cattle 22.4
from 15 to 20 SSU 20.8 other grazing animals (sheep, etc.) 6.3
from 20 to 25 SSU 25.0 granivores (pigs, poultry) 16.6
from 25 to 30 SSU 31.4 mixed businesses 16.5
from 30 to 40 SSU 41.0
40 SSU or more 49.8
70%
60%
50%
40%
30%
20%
10%
0%2001 2002 2003 2004 2005 2006 2007 2008
yesnodon’t know
Land-enTuinbouw09_EN.indd 38Land-enTuinbouw09_EN.indd 38 09-03-2010 15:19:2409-03-2010 15:19:24

3939
Occupational accidents in agriculture, hunting and related services
(Flanders, 2005-2007, number)
Source: Industrial Accidents Fund
In 2007, there were 1,537 occupational accidents in agriculture, hunting and related services. This is an increase of almost 3% compared to the year before. A good third of accidents had consequences for the victim. 832 resulted in temporary incapacity for the victim and together accounted for 972 days of incapacity. In 178 cases, the accident resulted in permanent incapacity. In 2007, two victims regrettably died.
Almost 88% of the victims of these occupational accidents were male, while a good 61% of victims were between 25 and 50 years old. It should be noted that more than a quarter of the victims were under 15 and the two fatalities were in this category.
Of the 1,012 accidents with consequences (incapacity or fatality), 399 were attributable to agriculture, while the rest were attributable to services relating to agriculture and livestock farming (excluding veterinary services), the construction and maintenance of gardens and parks. Within agriculture, 30% of accidents were in vegetable cultivation, 18% in fl ower cultivation and 14% for tree nurseries, fruit cultivation and livestock farming.
Number of occupational accidents in agriculture, hunting and related services
2007 2006
without
conse-
quence
tem-
porary
inca-
pacity
perma-
nent
inca-
pacity fatal total
without
conse-
quence
tem-
porary
inca-
pacity
perma-
nent
inca-
pacity fatal total
agriculture, hunting
and related services525 832 178 2 1.537 498 822 173 0 1.493
of which
female 76 93 18 0 187 74 99 23 0 196
male 449 739 160 2 1.350 424 723 150 0 1.297
15-24 years 140 221 32 2 395 131 239 28 0 398
25-49 years 316 509 119 0 944 312 505 118 0 935
50 years and older 69 102 27 0 198 55 78 27 0 160
900
800
700
600
500
400
300
200
100
0
without consequencetemporary incapacitypermanent incapacityfatal
2007 2006 2005
Land-enTuinbouw09_EN.indd 39Land-enTuinbouw09_EN.indd 39 09-03-2010 15:19:2509-03-2010 15:19:25

4040
Marital status of the business manager
(Flanders, 2008, in %)
Source: FPS Economy - Directorate-General Statistics and Economic Information
The above diagram shows the marital status of the business managers who are not legal entities. Approximately 77% of business managers are married. In 2001, this was almost 80%. The number of married people has indeed fallen more (-27%) than the other categories and more than the total number of business managers (-25%). The number of divorced business managers has increased (+15%), such that their share has risen.
A further breakdown of the fi gures into age categories shows that the proportion of married people is clearly lower among the younger business managers.
Marital status of the business manager, 2001-2008
development 2001 2002 2003 2004 2005 2006 2007 2008
unmarried 5,183 5,022 4,865 4,737 4,633 4,531 4,344 4,231
married 29,659 28,362 27,156 26,123 25,085 23,970 22,830 21,623
widow(er) 1,591 1,531 1,481 1,451 1,424 1,390 1,328 1,240
divorced 765 772 793 804 834 866 882 876
per age category married divorced unmarried widow(er) total
under 30 42% 1% 57% 1% 100%
30 - 39 70% 3% 27% 0% 100%
40 - 49 80% 4% 15% 1% 100%
50 - 64 82% 4% 11% 3% 100%
65 and older 73% 1% 12% 14% 100%
total 77% 3% 15% 4% 100%
married77.31%
single15.13%
widow(er)4.43%
divorced3.13%
Land-enTuinbouw09_EN.indd 40Land-enTuinbouw09_EN.indd 40 09-03-2010 15:19:2609-03-2010 15:19:26

4141
Agricultural education
(Flanders, 2005, in %)
Source: FPS Economy - Directorate-General Statistics and Economic Information
Up until 2005, business managers in agricultural and horticultural businesses were questioned about their level of education. On average for the whole of Flanders, the breakdown of business managers in 2005 was as follows: 54% practical experience only, 23% basic agricultural education and 23% full agricultural education (at university or higher institute).
The businesses have been broken down in the diagram according to their economic size. It has been done on the basis of standard size units (SSU). This shows that small businesses are primarily managed by managers with practical experience only. The larger the business, the more the managers have been through higher education.
Among the start-ups, the majority have a higher secondary agricultural education qualifi cation. A quarter of start-ups have been through higher education. This is shown by a breakdown according to the level of education of the start-ups that have applied for and obtained VLIF support (Vlaams Landbouwinvesteringsfonds - Flemish Agricultural Investment Fund).
Agricultural education of agricultural start-ups with VLIF support, 2008
%
higher secondary agricultural training 32%
certifi cate for establishing a business or equivalent 29%
higher education 24%
higher vocational secondary agricultural training 12%
B-course or equivalent 1%
other 3%
total 100%
Source: Agriculture and Fisheries Agency
100
90
80
70
60
50
40
30
20
10
0Less
than 0,5SSU
From 0,5to 4SSU
From 4to 8SSU
From 8to 12SSU
From 12to 15SSU
From 15to 20SSU
From 20to 25SSU
From 25to 30SSU
From 30to 40SSU
40 SSUor more
full agricultural education basic agricultural education practical experience only
Land-enTuinbouw09_EN.indd 41Land-enTuinbouw09_EN.indd 41 09-03-2010 15:19:2709-03-2010 15:19:27

424242
Eco-effi ciency of agriculture
(Flanders, 2000-2007, index (2000=100))
* The gross added value has been calculated at market prices (i.e. excluding product-related subsidies) and calculated back to 1990 values.
Source: Environmental report based on ILVO, Department of Agriculture and Fisheries, Eurostat, FPS Economy, KULeuven, Vito, VLM, VMM, UGhent
A comparison of the development of the environmental pressure from agriculture to the gross added value of agriculture gives an indication of the eco-effi ciency of the sector. For 2007, the gross added value of the agricultural sector is estimated to be EUR 2.3 billion, against EUR 2.9 billion in 2000. This fall of 23% is the result of increasing production prices on the one hand and falling sales prices and shrinking production on the other. Over the period 2000-2007, the environmental pressure of agriculture clearly decreased, except for the erosion sensitivity of land usage and, in the last few years, pesticides.
In the period 2000-2007, both the acidifying (-28%) and fertilizing emissions (-67%) fell substantially. This fall is due to the fertilizer policy and the economic climate, which can be seen in shrinking livestock numbers. The fertilizer policy has reduced the use of synthetic fertilizers, the application of low-emission techniques, a lower nutrient content for fodder and increasing manure processing. The shrinking livestock numbers explains the decrease in greenhouse gas emissions (-13%) and fi ne dust emissions (-10%). The erosion sensitivity of land usage rose by 4% between 2000 and 2007 due to the choice of more erosion-sensitive crops such as maize and potatoes. The pressure on water life due to crop protection had fallen in 2003 by 44% with respect to 2000. This large decrease can be attributed to a ban on the use of the most polluting pesticides. In 2004 and 2005, however, there was a slight increase. The increasing use of just a few agents such as fl ufenoxuron, fenoxycarb and aclonifen is attenuating the generally favourable eff ects of the product policy. More up-to-date fi gures are unavailable to evaluate the crop protection policy.
110
100
90
80
70
60
50
40
302000 2001 2002 2003 2004 2005 2006 2007
gross added value *
erosion sensitivity land usage
fine dust emissions (PM 2.5)
greenhouse gas emissions
acidifying emissions
pressure due to crop protection
fertilizing emissions
Land-enTuinbouw09_EN.indd 42Land-enTuinbouw09_EN.indd 42 09-03-2010 15:19:2709-03-2010 15:19:27

434343
Net nitrogen production from agriculture per municipality
(Flanders 2007, kg N)
Source: Flemish Land Agency, NGI-AGIV
The actual nitrogen production in 2007 is estimated to be 153.5 million kg, 79.9 million kg of which is from cattle (50%), 58.8 million kg from pigs (38%), 15.6 million kg from poultry (10%) and 2.8 million kg from other animals (2%). The net nitrogen production was 122 million kg in 2007.The decrease with respect to 2006 is primarily due to the new excretion standards for cattle, good for 82% of the total decrease of actual nitrogen production. Pigs and poultry make a smaller contribution of 8% and 9% respectively to the decrease of actual nitrogen production. This is due to the unchanged balance types and a relatively smaller number of businesses that use the fl at-rate manure excretion system.
Net nitrogen production per municipality in kg N
KeyNet nitrogen production in kg N
=15,00015,001 - 75,000
1:850,000
75,001 - 200,000200,001 - 500,000
500,001 - 1,000,0001,000,001 - 1,500,000
1,500,001 - 2,000,000> 2,000,000
Land-enTuinbouw09_EN.indd 43Land-enTuinbouw09_EN.indd 43 09-03-2010 15:19:2909-03-2010 15:19:29

444444
Net phosphate production from agriculture per municipality
(Flanders 2007, kg P2O5)
Source: Flemish Land Agency, NGI-AGIV
Phosphate production in 2007 is estimated to be 61 million kg. The decrease in phosphate production is less than that observed for nitrogen and was 1.6% with regard to 2006.45% of phosphate production comes from cattle, 42% from pigs, 11% from poultry and 2% from other animals. Actual phosphate production rose by 1.1 million kg in 2007 with respect to 2006. Comparisons with the previous year are not possible because of changed excretion standards.
Net phosphate production per municipality in kg P2O5
KeyNet phosphate production in kg P2O5
=1,0001,001 - 50,000
1:850,000
50,001 - 150,000150,001 - 500,000
500,001 - 750,000750,001 - 1,000,000
> 1,000,000
Land-enTuinbouw09_EN.indd 44Land-enTuinbouw09_EN.indd 44 09-03-2010 15:19:3109-03-2010 15:19:31

454545
Soil equilibrium of agriculture
(Flanders, 2007, kg per ha)
Source: Environmental report based on ILVO
The input side of the soil equilibrium of agriculture consists of the quantities of nutrients (plant nutrients nitrogen and phosphorus) that go into the agricultural soil (manure, atmospheric deposition, biological nitrogen fi xation, seeds). The output side consists of the quantities that leave the agricultural soil: nutrients absorbed by plants, ammonia emissions from the soil and manure and other emissions into the environment that pass through the agricultural soil. This last fl ow is the surplus in the soil equilibrium and is an indicator of the loss of nutrients from the agricultural soil into the environment.
mineralfertilizers
60.8 1.2
animal manureinput**
135.3 20.5
residual substances
2.0 0.7
seeds andplant material
0.9 0.2
atmosphericdeposition*
24.6 /
biologicalN-fixation
4.6 /
ammoniaemissions
33.4 /
surplus in thesoil equilibrium
53.2 1.7
key
N P
cropproduction
39.3 7.1
fodderproduction
102.3 13.7
* provisional figure** animal manure input = animal manure production + manure import - manure export - manure processing
NUTRIENT METABOLISM IN AGRICULTURAL SOIL
Land-enTuinbouw09_EN.indd 45Land-enTuinbouw09_EN.indd 45 09-03-2010 15:19:3409-03-2010 15:19:34

464646
Nitrogen and phosphorus surplus in the soil equilibrium of agriculture
(Flanders, 1990-2007, million kg)
Source: Environmental report based on ILVO, VLM, VMM
With respect to 1990, the nitrogen surplus fell by 68% and the phosphorus surplus by 95%. This is due to the decrease in livestock numbers, the greatly reduced artifi cial fertilizer usage, increased manure processing, increased fodder effi ciency and the increase in crop removal due to productivity increases.
In 2007, the surplus was 53 million kg N or 80 kg N/ha, excluding ammonia emissions. The gap with respect to the MINA objective for 2010 (70 kg N/ha) is 6.6 million kg N or 10 kg N/ha. For phosphorus, the surplus is 2.6 kg P/ha or 1.7 million kg P in 2007 and the indicative objective for 2010 of 3.6 kg P/ha has been achieved. With respect to abroad, Flanders still has to contend with a large surplus.
Nitrogen and phosphorus in the soil equilibrium of agriculture
N surplus P surplus
unit kg N/ha kg P/ha
1990 247 55.9
1995 189 38.0
1996 178 36.7
1997 161 32.9
1998 163 32.4
1999 144 30.2
2000 149 21.1
2001 121 15.2
2002 114 13.6
2003 96 8.9
2004 95 6.9
2005 90 6.6
2006 94 7.0
2007 80 2.6
300
250
200
150
100
50
01990 1996 1998 2000 2002 2004 2006
N surplus
N objective 2010
P surplus
P objective 2010
Land-enTuinbouw09_EN.indd 46Land-enTuinbouw09_EN.indd 46 09-03-2010 15:19:3509-03-2010 15:19:35

474747
Pressure on water life due to crop protection products in agriculture
(Flanders, 1990-2005, 1990 = 100%)
Source: Environmental report based on UGhent, research group crop protection and FPS Environment
The total pressure on water life from the agricultural use of crop protection products fell by 42% between 1990 and 2005. This fall can be explained fi rstly by the agricultural sector limiting the use of crop protection products. In the period 1990-2005, they fell by 19%. Secondly, over the last few years, the federal government has prohibited many of the most harmful products. As a result, a good half of the decrease in the sum of the annual spread equivalents (Seq) was realised from 2001 to 2002. As an objective, the Flemish Environment Company set a 50% reduction by 2005 in the MINA plan 2003-2007. This was almost achieved in 2005.
The environmental pressure from crop protection products can by shown by the annual spread equivalents per crop protection product. This indicator provides, in addition to the volume of active substances, a picture of the environmental burden for water organisms. In this, the annual emissions (usage) of the products concerned are weighted for their (eco)toxicity (in this case for water organisms) and the time spent in the environment.
Index and share of the pressure on water life from crop protection products in the sum of the annual spread equivalents, 1990=100
Unit 1990 1995 2000 2001 2002 2003 2004 2005
Seq arable farming 39.20 23.78 35.49 34.29 10.15 12.11 13.17 15.21
Seq horticulture 60.80 54.57 46.47 48.12 39.67 34.13 38.31 42.28
Seq total agriculture 100.00 78.35 81.96 82.42 49.82 46.23 51.48 57.49
2005 objective 50.00 50.00 50.00 50.00 50.00 50.00 50.00 50.00
120%
100%
80%
60%
40%
20%
0% 1990 1995 1996 1997 1998 1999 2000 2001 2002 2003 2004 2005
Seq arable farming
Seq horticulture
Seq total agriculture
2005 objective
Land-enTuinbouw09_EN.indd 47Land-enTuinbouw09_EN.indd 47 09-03-2010 15:19:3609-03-2010 15:19:36

484848
Pesticide usage in agriculture per type
(Flanders, 2007, in %)
Source: Department of Agriculture and Fisheries and FPS Economy
After extrapolating the results of the Agriculture Monitoring Network (AMN) of the Department of Agriculture and Fisheries to the Farm Structure Survey, the total use of chemical pesticides by the whole of Flemish professional agriculture, including poultry, came to 3.3 million kg active substances in 2007. Almost half of this belonged to the fungicides group. These pesticides against fungi are fairly quick to biodegrade. The herbicides or weed killers account for a 30% share. Depending on the nature of their action, they are rather persistent. The insecticides (including acaricides) only account for 10% of the active substances, but they are often very diffi cult to break down and highly toxic for water organisms. The “other” group contains, for example, growth regulators, soil decontaminants, additives, repellents and preservatives.
The most persistent and toxic products have already been prohibited by law. The purpose of many other measures such as biological protection, inspection of spraying equipment, etc., is to reduce the use of chemical pesticides. The AMN series of fi gures is still too small (since 2005) to make absolute judgements about the use of pesticides in agriculture, but the amount of kg active substances is rising. However, it has to be noted here that the quantity of active substances is not really a suitable indicator for the toxicity. Prohibited products (e.g. Atrazine) are often replaced by less toxic alternatives with more eff ective active substances. Furthermore, the usage is highly crop dependent. Thus fruit, potatoes and maize are sprayed more often. A small expansion of the area of these crops has a big impact on total usage.
Use of pesticides in Flemish professional agriculture, 2007, in kg active substances
2007
fungicides 1,570,444
herbicides 967,076
insecticides 332,975
other 392,409
total 3,262,905
fungicides48%
herbicides30%
insecticides10%
other12%
Land-enTuinbouw09_EN.indd 48Land-enTuinbouw09_EN.indd 48 09-03-2010 15:19:3709-03-2010 15:19:37

494949
Energy consumption in agriculture per fuel type
(Flanders, 2007)
Source: Department of Agriculture and Fisheries and VITO
Since 2007, the VITO energy assessment for the Flemish agricultural sector has been calculated by using the results of the Agriculture Monitoring Network of the Department of Agriculture and Fisheries. According to this new calculation method, the energy consumption in 2007 was 29.7 Petajoules (PJ). Of this, 2.7 PJ or 9% is self-produced. Light fuel oil is the most common energy medium. Together with heavy fuel oil, petrol and LPG, these oil products account for 62%. Natural gas accounts for 18%, electricity 10% and coal 5%. Biomass and heat represent only 3% and 1% respectively, but it is expected that they will increase in importance in the future.
Including the changes to the method used, the total energy consumption in agriculture has fallen by 20% over 10 years. The large decrease in the number of agricultural businesses, and the shrinkage of the agricultural area and livestock coupled to it, is certainly a major reason for this. Furthermore, there has been a shift from oil products to natural gas, particularly in greenhouse horticulture.
Energy consumption in agriculture per fuel type, in Terajoules, 2007
2007
electricity 3,083
natural gas 5,456
LPG/propane/butane 42
petrol 103
light fuel oil 13,084
heavy fuel oil 5,232
coal 1,479
biomass 800
heat 393
total 29,672
Light fuel oil45%
heavy fuel oil18%
natural gas18%
electricity10%
coal5%
biomass3%
heat1%
LPG/propane/butane0%
petrol0%
Land-enTuinbouw09_EN.indd 49Land-enTuinbouw09_EN.indd 49 09-03-2010 15:19:3809-03-2010 15:19:38

505050
Energy consumption in agriculture per subsector
(Flanders, 2007)
Source: Department of Agriculture and Fisheries and VITO
Within the agricultural sector, total greenhouse horticulture (greenhouse vegetables and fruit + ornamental plants) is the biggest consumer of energy with 16.4 Petajoules (PJ) or a share of 55%. This energy is primarily used for heating the greenhouses. Greenhouse horticulture has been able to save energy by switching to natural gas, and in the future CHP will become increasingly established. The “other businesses” subsector also accounts for a high share (14%) of energy consumption, but that is because this group comprises many businesses. In the pigs sector (7%), the energy is mainly for heating the sties. In the dairy subsector, the milking machines, the milk cooling tanks and tractors use a great deal of energy. Off shore fi shing accounts for 7%. Consumption in forestry and green areas is minimal with respect to the whole agricultural sector. These fi gures exclude lubricants, but contracting is included. This was calculated to be 1.8 PJ or 6%. In dairy and arable farming in particular, contractors are often used for growing fodder and arable crops.
Energy consumption in agriculture per sector, 2007, Terajoules
2007
arable farming 911
open-air vegetables 653
open-air fruit 556
greenhouse fruit & vegetables 11,471
ornamental plants 4,902
dairy 1,717
beef 792
pig farming 2,159
other agricultural and
horticultural businesses
4,190
off shore fi shing 2,220
forestry 95
green areas 6
total agricultural sector 29,672
greenhouse fruit & vegetable
39%
ornamental plants17%
other business14%
offshore fishing7%
pig farming7%
dairy6%
beef cattle3%
arable farming3%
open-air fruit2%
open-air vegetables2%
green areas0%
forestry0%
Land-enTuinbouw09_EN.indd 50Land-enTuinbouw09_EN.indd 50 09-03-2010 15:19:3909-03-2010 15:19:39

515151
Water consumption in agriculture per water source and subsector
(Flanders, 2007)
Source: Department of Agriculture and Fisheries and FPS Economy
After extrapolating the results of the Agricultural Monitoring Network (AMN) to the Farm Structure Survey, the total water consumption in Flemish professional agriculture, including poultry, came to 47.4 million m3 in 2007. Most water is pumped up by the businesses themselves: 16% from shallow and 42% from deep groundwater. Somewhat more than a quarter is rainwater collected via greenhouses or buildings. The share of surface water is low (4%), because the business or fi eld must be near a stream or river of adequate water quality to be able to use it. Only 11% of the total water is taken from the public water company. Almost half of the businesses do not use any mains water at all. Greenhouse horticulture is the largest water consumer, but it mainly uses rainwater collected via the greenhouses. The dairy sector also needs a lot of water for the animals and rinsing the milking machines.
From an environmental point of view, rainwater is preferred, followed by surface water, groundwater and lastly mains water. When choosing the water source, the desired water quality is of course decisive. The quantity of “alternative water” can be defi ned as the total rainwater, half of the shallow groundwater and 80% of the surface water. Thus in 2007, according to the AMN, 17.8 million m3 or 37% of the total water consumption in agriculture was collected in an alternative way, with greenhouse horticulture in the lead.
Water consumption in Flemish professional agriculture, 2007, in m3
water source 2007
mains water 5 423 457
shallow groundwater 7 738 461
deep groundwater 19 740 288
rainwater 12 577 565
surface water 1 988 118
arable farming 656 308
total 47 467 889
of which alternative water 18,037,290
deep groundwater43%
rainwater26%
shallowground water
16%
mains water11%
surface water4%
other24%
greenhouse fruit and vegetables
19%
ornamentalplant cultivation
18%dairy15%
pigs14%
beef cattle5%
open-air fruit1%
open-air vegetable3%
arable farming1%
sector 2007
open-air vegetables 1 450 475
open-air fruit 441 795
greenhouse fruit and vegetables 8 846 128
ornamental plant cultivation 8 359 575
dairy 7 339 233
beef 2 180 193
pigs 6 804 245
other 11 389 937
total 47 467 889
Land-enTuinbouw09_EN.indd 51Land-enTuinbouw09_EN.indd 51 09-03-2010 15:19:4009-03-2010 15:19:40

525252
Ammonia emissions in agriculture
(Flanders, 1990-2007, million kg NH3)
Source: Environmental report, VMM
In the period 1990-2007, ammonia emissions from agriculture fell markedly. The emissions were 40.7 million kg NH3 in 2007. This is a fall of 56% with respect to 1990. Since the European nitrate directive came into eff ect in 1991, Flanders has systematically taken measures to curtail animal manure production and to reduce the harmful eff ects. The greatest decrease in ammonia emissions occurred in 2000 (-32% with regard to 1999) with the second manure action plan, which required the low-emission application of manure. The falling trend continued after 2000, for example, due to the reduction of livestock, which contributed to approximately a third of this fall. As a result of the decreasing use of synthetic fertilizers, the corresponding ammonia emissions also decreased.
Agriculture is the largest source of acidifying emissions in Flanders (31% in 2007). This is primarily due to ammonia emissions from agriculture. Indeed, 93% of Flemish ammonia emissions come from agriculture. 94% of these ammonia emissions come from animal manure.
1990 1995 1996 1997 1998 1999 2000 2001 2002 2003 2004 2005 2006 2007
100
90
80
70
60
50
40
30
20
10
0
synthetic fertilizer
manure processing
grazing
manure storage
animal muck-spreading
Land-enTuinbouw09_EN.indd 52Land-enTuinbouw09_EN.indd 52 09-03-2010 15:19:4109-03-2010 15:19:41

535353
Emission of greenhouse gases by agriculture
(Flanders, 2000-2007, million kg CO2 equivalents)
Source: Environmental report based on VMM, VITO Energy Assessment Flanders
In 2007, the total emissions of greenhouse gases from agriculture were 8,843 ktonne CO2 equivalents, a fall of 17% with regard to 1990 and 13% with regard to 2000. For comparison: total emissions of greenhouse gases in Flanders decreased by 6% over the same period. Therefore, the agricultural sector is more than doing its fair share to reduce emissions.
The share of agriculture in total Flemish greenhouse gas emissions is 11%. The relatively large share of agriculture is due to the fact that 56% of Flemish N2O emissions come from agriculture, largely directly from the soil. Moreover, 76% of Flemish CH4 emissions come from agriculture. As the greenhouse eff ects of N2O (laughing gas) and CH4 (methane) are respectively 310 and 21 times greater than CO2, agriculture accounts for a greater share of total greenhouse gas emissions than the economic size and energy consumption of the sector would suggest.
12,000
10,000
8,000
6,000
4,000
2,000
0 1990 1995 2000 2001 2002 2003 2004 2005 2006 2007
CO2
CH4
N2O
total
Land-enTuinbouw09_EN.indd 53Land-enTuinbouw09_EN.indd 53 09-03-2010 15:19:4209-03-2010 15:19:42

54
Development of agricultural area
(Flanders, 2000-2008, in ha)
2000 2005 2006 2007 2008
total area agricultural land 636,876 629,684 625,207 623,786 623,698
meadows, pastures and fodder crops 383,600 369,881 364,618 362,745 373,161
of which: meadows and pastures 241,313 226,314 222,847 219,863 216,646
feed maize 136,174 137,898 135,713 136,532 149,655
arable farming 197,511 202,700 202,858 204,798 197,867
of which: cereals * 107,371 116,032 119,003 121,002 129,672
sugar beets 33,925 32,747 30,968 31,268 22,218
potatoes 42,444 38,960 40,717 41,031 36,752
horticulture 47,901 49,072 50,255 49,599 49,154
of which: vegetables 25,884 26,911 28,299 27,816 27,313
fruit 15,992 16,060 15,773 15,652 15,897
other 6,025 6,101 6,183 6,131 5,945
other uses 7,864 8,031 7,475 6,644 3,516
of which: fallow 6,051 7,976 7,440 6,612 3,488
* including dry harvested grain maize
Source: FPS Economy - Directorate-General Statistics and Economic Information
In 2008, agriculture occupied a total area of 623,698 ha. This area presents a slightly falling trend. Of the total area of agricultural land, the fodder crops account for the largest share (59.8%), which underscores the importance of livestock farming in Flanders. Approximately half of Flemish businesses keep cattle. Arable farming is good for 31.7% of the total available area, two-thirds of which is intended for cereal cultivation. Almost 8% of the available area is horticultural land, a good half of which is intended for vegetable cultivation.
The large decrease in sugar beets area in 2008 is notable. This is due to the introduction of the Belgian sugar quota under the European restructuring of the sugar sector. The area of feed maize and cereals is expanding fast as a result of this as well. For cereals, the rise is mainly due to grain maize production.
34% of the area of cultivated agricultural land is operated by the owner. This percentage is inversely proportional to the size of the business.
Provisional results for 2009 show that, with respect to 2008, the cultivated area is continuing its falling trend (-0.8%). While the area of cereals grown for grain increased strongly in 2008, a decline (-5.1%) is estimated for 2009, primarily for the winter wheat and grain maize crops. The area of sugar beets fell further, but is less pronounced than in 2008 (-5.2%). The reduction of the area for sugar beets and cereals is largely in the favour of potato crops, which, after a sharp fall in 2008, expanded again strongly (+12.2%).
Land-enTuinbouw09_EN.indd 54Land-enTuinbouw09_EN.indd 54 09-03-2010 15:19:4309-03-2010 15:19:43

55
Land-enTuinbouw09_EN.indd 55Land-enTuinbouw09_EN.indd 55 09-03-2010 15:19:4409-03-2010 15:19:44

56
Share of agricultural land per municipality
(Flanders, 2007, percentage with respect to the total area of the municipality)
Lége
nde
Agric
ultu
ral a
rea
with
rega
rd to
tota
l mun
icip
al a
rea
< 20
%
40
- 60
%
>
80%
(max
. 91%
)
prov
inci
al b
ound
arie
s
20 -
40%
60 -
80%
mun
icip
al b
ound
arie
s
Sour
ce: D
epar
tmen
t of A
gric
ultu
re a
nd F
ishe
ries b
ased
on
data
from
ALV
, NG
I-AG
IV
050
12.5
25
kilo
mèt
res
Land-enTuinbouw09_EN.indd 56Land-enTuinbouw09_EN.indd 56 09-03-2010 15:19:4509-03-2010 15:19:45

57
Farm
ers
who
wan
t to
rec
eive
sub
sidie
s an
d/or
ar
e su
bjec
t to
the
man
ure
bank
dec
lara
tion
are
requ
ired
to d
ecla
re th
eir p
arce
ls to
the
Agen
cy fo
r Ag
ricul
ture
and
Fish
erie
s (A
LV)
each
yea
r. U
sing
the
data
fro
m t
his
“one
-off
parc
el r
egist
ratio
n”
(ALV
, 200
7), t
he to
tal a
rea
of a
gric
ultu
ral a
rea
with
re
spec
t to
the
tota
l are
a of
the
mun
icip
ality
can
be
indi
cate
d on
the
map
. In
2007
, 693
,690
ha
wer
e de
clar
ed b
y fa
rmer
s.
Ther
e ar
e 30
mun
icip
aliti
es in
whi
ch th
e ag
ricul
tura
l ar
ea is
less
tha
n 20
% o
f th
e to
tal a
rea.
The
y ar
e lo
cate
d in
the
prov
ince
s of
Ant
wer
p, L
imbu
rg a
nd
Flem
ish-B
raba
nt a
nd t
hey
are
mai
nly
urba
n ar
eas
and
thei
r sub
urbs
.
Mun
icip
aliti
es
with
a
rela
tivel
y hi
gh
shar
e of
ag
ricul
tura
l ar
ea (
60-8
0%)
are
loca
ted
in W
est-
Flan
ders
, the
Fle
mish
Ard
enne
s, th
e Pa
jott
enla
nd,
east
ern
Flem
ish-B
raba
nt,
sout
hern
Lim
burg
and
no
rthe
rn C
ampi
ne.
Mor
e th
an 8
0% o
f th
e ar
ea i
n 14
mun
icip
aliti
es
cons
ists
of a
gric
ultu
ral l
and.
Tw
elve
mun
icip
aliti
es
are
loca
ted
in W
est-F
land
ers,
11 o
f w
hich
are
ad
jace
nt m
unic
ipal
ities
in
the
sout
hwes
t of
the
pr
ovin
ce. T
he o
ther
tw
o m
unic
ipal
ities
(Ass
ened
e an
d Si
nt-L
aure
ins)
are
loca
ted
in t
he E
ast-F
lem
ish
pold
ers.
Logi
cally
, the
larg
est c
ities
in th
e pr
ovin
ces (
Brug
es,
Roes
elar
e, K
ortr
ijk a
nd O
sten
d in
Wes
t-Fla
nder
s; G
hent
an
d Aa
lst
in
East
-Fla
nder
s; Le
uven
in
Fl
emish
-Bra
bant
; An
twer
p in
Ant
wer
p pr
ovin
ce;
and
Has
selt
and
Gen
k in
Lim
burg
) ha
ve a
low
er
perc
enta
ge o
f ag
ricul
tura
l la
nd t
han
the
othe
r m
unic
ipal
ities
in th
e pr
ovin
ce.
Land-enTuinbouw09_EN.indd 57Land-enTuinbouw09_EN.indd 57 09-03-2010 15:19:4809-03-2010 15:19:48
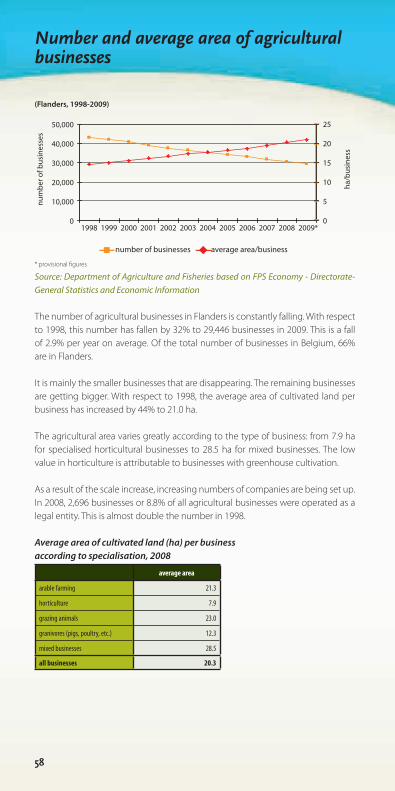
58
Number and average area of agricultural businesses
(Flanders, 1998-2009)
* provisional fi gures
Source: Department of Agriculture and Fisheries based on FPS Economy - Directorate-General Statistics and Economic Information
The number of agricultural businesses in Flanders is constantly falling. With respect to 1998, this number has fallen by 32% to 29,446 businesses in 2009. This is a fall of 2.9% per year on average. Of the total number of businesses in Belgium, 66% are in Flanders.
It is mainly the smaller businesses that are disappearing. The remaining businesses are getting bigger. With respect to 1998, the average area of cultivated land per business has increased by 44% to 21.0 ha.
The agricultural area varies greatly according to the type of business: from 7.9 ha for specialised horticultural businesses to 28.5 ha for mixed businesses. The low value in horticulture is attributable to businesses with greenhouse cultivation.
As a result of the scale increase, increasing numbers of companies are being set up. In 2008, 2,696 businesses or 8.8% of all agricultural businesses were operated as a legal entity. This is almost double the number in 1998.
Average area of cultivated land (ha) per business according to specialisation, 2008
average area
arable farming 21.3
horticulture 7.9
grazing animals 23.0
granivores (pigs, poultry, etc.) 12.3
mixed businesses 28.5
all businesses 20.3
ha/b
usin
ess
num
ber o
f bus
ines
ses
50,000
40,000
30,000
20,000
10,000
01998 1999 2000 2001 2002 2003 2004 2005 2006 2007 2008 2009*
25
20
15
10
5
0
number of businesses average area/business
Land-enTuinbouw09_EN.indd 58Land-enTuinbouw09_EN.indd 58 09-03-2010 15:19:4909-03-2010 15:19:49

59
Breakdown of agricultural businesses according to business size
(Flanders, 2001-2008)
Source: FPS Economy - Directorate-General Statistics and Economic Information
44% of businesses in Flanders operate on an area of less than 10 ha. The strong development of (greenhouse) horticulture and intensive cattle farming are certainly a part of this.
However, the agricultural area is becoming greater. The number of businesses with less than 30 ha is constantly falling. Since 2004, the number of businesses with an area between 30 and 50 ha has fallen. This is while the number of businesses with an area greater than 50 ha is continually rising.
Breakdown of businesses according to agricultural area, 2008
number of businesses %
0 - 10 ha 13,590 44.3%
10 - 20 ha 5,593 18.2%
20 - 30 ha 3,964 12.9%
30 - 50 ha 4,664 15.2%
> 50 ha 2,855 9.3%
total 30,666 100.0%
busi
ness
are
a
number of businesses
> 50 ha
30 - 50 ha
20 - 30 ha
10 - 20 ha
< 10 ha
0 5,000 10,000 15,000 20,000 25,000
2001 2002 2003 2004 2005 2006 2007 2008
Land-enTuinbouw09_EN.indd 59Land-enTuinbouw09_EN.indd 59 09-03-2010 15:19:5009-03-2010 15:19:50

60
Breakdown of businesses according to production orientation
(Flanders, 2008)
Source: FPS Economy - Directorate-General Statistics and Economic Information
The production orientation of a business is determined by the relative shares of the various types of production (arable farming, horticulture, etc.) in the total gross balance of the business.
80% of all businesses are specialised in a certain production orientation. Farmers of grazing animals, and more specifi cally cattle, form by far the largest group. 32% of all businesses are specialised cattle businesses. Horticultural and arable farming businesses occupy second and third position. Within horticulture, vegetable production forms the main activity of most businesses.
Mixed businesses (20%) primarily concern businesses that combine arable farming and grazing animals.Breakdown of businesses per production orientation, Flanders, 2008
businesses specialised in number of businesses
arable farming 4,990
horticulture 5,161
vegetables 2,274
fruit 1,731
ornamental plant cultivation 989
other horticulture 167
grazing animals 11,759
milk production 3,901
beef production 4,580
mixed cattle 1,338
other grazing animals 1,940
granivores 2,718
pigs 2,403
poultry 295
mixed breeding businesses 20
mixed businesses 6,038
total 30,666
mixed business20%
horticulture17%
arable farming16%
cattle15%
milk production13%
granivores9%
other grazing animals
6%
mixed cattle4%
Land-enTuinbouw09_EN.indd 60Land-enTuinbouw09_EN.indd 60 09-03-2010 15:19:5109-03-2010 15:19:51

61
Age profi le of the business manager
(Flanders, 2008)
Source: FPS Economy - Directorate-General Statistics and Economic Information and Department of Agriculture and Fisheries
The average age of the business managers of professional agricultural businesses was 49 years in 2008 and has risen continually over the last few years.
The age pyramid shows that the base is very small. Only 2.6% of businesses had a business manager under the age of 30 in 2008, while 7.5% were over 65. Most business managers were between the ages of 45 and 50 years.
With respect to 10 years ago, the base of the pyramid has clearly shrunk. The age categories up to 35-40 have decreased sharply. The medium range and the 65 and older category is increasing in size.
Development of the average age of business managers
1995 2000 2005 2006 2007 2008
average age 46.04 46.46 48.09 48.33 48.74 49.00
65 and older
from 60 to 65
from 55 to 60
from 50 to 55
from 45 to 50
from 40 to 45
from 35 to 40
from 30 to 35
from 25 to 30
under 25
0% 5% 10% 15% 20% 25%
20081998
Land-enTuinbouw09_EN.indd 61Land-enTuinbouw09_EN.indd 61 09-03-2010 15:19:5209-03-2010 15:19:52

62
Number of start-up businesses
(Flanders, 1998-2008)
Source: FPS Economy - Directorate-General Statistics and Economic Information
The FPS Economy annually asks business managers whether the management of the business has been taken over in the last 12 months. From 2001 to 2004, this question was only put to natural persons, such that the diagram only includes data for businesses for which the agricultural holder is a natural person. In 2008, the management changed in 1.5% of businesses compared to the previous year. This proportion reached a low point in 2005. 1998, 2001 and 2007 were years with a high proportion. This percentage is higher for companies because quite a few companies have been formed in the last ten years. In 2008, the management changed in 4% of companies.
Under certain conditions, a young farmer who sets himself up in an existing business can obtain start-up support. In 2008, 190 applications for start-up support were approved. The total support is EUR 9.9 million (EUR 52,107 per business) and is used to help fi nance EUR 34.1 million (EUR 179,688 per business) of subsidisable start-up costs. Here too we see a reduction in 2008 after the peak year of 2007. The average subsidisable amount and the average amount of support continue to rise.
2005 2006 2007 2008
Number of new business managers: 494 608 700 529
agricultural holder = natural person 393 483 547 414
agricultural holder = legal entity 101 125 153 115
Total number of businesses 34,410 33,272 31,984 30,666
agricultural holder = natural person 31,976 30,757 29,384 27,970
agricultural holder = legal entity 2,434 2,515 2,600 2,696
Number of approved applications for subsidisation of start-up costs (new cases) 196 204 322 190
Average subsidisable amount of start-up costs (EUR/business) 166,392 168,293 168,789 179,688
Average amount of support (EUR/business) 49,000 49,931 50,088 52,107
Source: Agriculture and Fisheries Policy Area, FPS Economy - Directorate-General Statistics and Economic Information
1000
800
600
400
200
0
3%
2%
1%
0%1998 1999 2000 2001 2002 2003 2004 2005 2006 2007 2008
number of new business managers share of new business managers
Land-enTuinbouw09_EN.indd 62Land-enTuinbouw09_EN.indd 62 09-03-2010 15:19:5309-03-2010 15:19:53

63
Average livestock numbers per business
(Flanders, 2001-2008)
Average livestock numbers
2001 2005 2006 2007 2008
number of cattle per cattle business 85 91 95 97 100
number of pigs per pig business 1,298 1,424 1,457 1,517 1,576
number of chickens per poultry business 32,507 34,472 36,624 39,003 38,162
Breakdown of businesses per size class 2008
Cattle%
businesses%
animals Pigs%
businesses% animals Chickens
% businesses
% animals
1 to 9 9.7 0.6 1 to 250 3.8 0.4 1 to 10,000 13.8 1.7
10 to 25 13.3 2.1 250 to 500 8.2 2.0 10,000 to 30,000 30.6 15.2
25 to 50 14.7 5.4 500 to 750 10.7 4.2 30,000 to 50,000 30.2 30.9
50 to 75 13.0 8.1 750 to 1,000 10.4 5.8 50,000 to 70,000 15.3 22.3
75 to 100 13.5 11.7 1,000 to 1,500 23.1 18.1 70,000 and more 10.1 29.8
100 to 150 17.7 21.5 1,500 to 2,000 16.8 18.3 all chicken businesses 100.0 100.0
150 and more 18.2 50.7 2,000 to 2,500 13.4 18.9
all cattle businesses 100.0 100.0 2,500 and more 13.7 32.2
all pig businesses 100.0 100.0
Source: FPS Economy - Directorate-General Statistics and Economic Information
The livestock numbers only relate to specialised cattle, pig and poultry businesses. The average numbers of livestock per business are continuing to rise. Only the poultry businesses had lower average livestock numbers in 2008 than in 2007.
Although there are still many businesses with a limited number of animals, these businesses only represent a low percentage of the total livestock numbers. Of the cattle businesses, most have more than 150 cattle; together they represent more than half of the livestock numbers. In the pigs sector, a third of animals are kept in businesses with 2,500 animals and more, but most businesses have 1,000 to 1,500 animals. In chicken businesses, the middle category (30,000 to 50,000 chickens) is strongly represented, both with regard to number of businesses and number of animals.
Land-enTuinbouw09_EN.indd 63Land-enTuinbouw09_EN.indd 63 09-03-2010 15:19:5409-03-2010 15:19:54
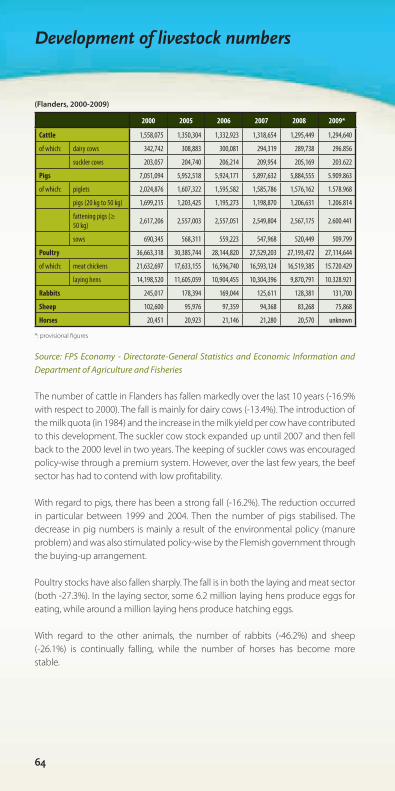
64
Development of livestock numbers
(Flanders, 2000-2009)
2000 2005 2006 2007 2008 2009*
Cattle 1,558,075 1,350,304 1,332,923 1,318,654 1,295,449 1,294,640
of which: dairy cows 342,742 308,883 300,081 294,319 289,738 296.856
suckler cows 203,057 204,740 206,214 209,954 205,169 203.622
Pigs 7,051,094 5,952,518 5,924,171 5,897,632 5,884,555 5.909.863
of which: piglets 2,024,876 1,607,322 1,595,582 1,585,786 1,576,162 1.578.968
pigs (20 kg to 50 kg) 1,699,215 1,203,425 1,195,273 1,198,870 1,206,631 1.206.814
fattening pigs (≥
50 kg) 2,617,206 2,557,003 2,557,051 2,549,804 2,567,175 2.600.441
sows 690,345 568,311 559,223 547,968 520,449 509.799
Poultry 36,663,318 30,385,744 28,144,820 27,529,203 27,193,472 27,114,644
of which: meat chickens 21,632,697 17,633,155 16,596,740 16,593,124 16,519,385 15.720.429
laying hens 14,198,520 11,605,059 10,904,455 10,304,396 9,870,791 10.328.921
Rabbits 245,017 178,394 169,044 125,611 128,381 131,700
Sheep 102,600 95,976 97,359 94,368 83,268 75,868
Horses 20,451 20,923 21,146 21,280 20,570 unknown
*: provisional fi gures
Source: FPS Economy - Directorate-General Statistics and Economic Information and Department of Agriculture and Fisheries
The number of cattle in Flanders has fallen markedly over the last 10 years (-16.9% with respect to 2000). The fall is mainly for dairy cows (-13.4%). The introduction of the milk quota (in 1984) and the increase in the milk yield per cow have contributed to this development. The suckler cow stock expanded up until 2007 and then fell back to the 2000 level in two years. The keeping of suckler cows was encouraged policy-wise through a premium system. However, over the last few years, the beef sector has had to contend with low profi tability.
With regard to pigs, there has been a strong fall (-16.2%). The reduction occurred in particular between 1999 and 2004. Then the number of pigs stabilised. The decrease in pig numbers is mainly a result of the environmental policy (manure problem) and was also stimulated policy-wise by the Flemish government through the buying-up arrangement.
Poultry stocks have also fallen sharply. The fall is in both the laying and meat sector (both -27.3%). In the laying sector, some 6.2 million laying hens produce eggs for eating, while around a million laying hens produce hatching eggs.
With regard to the other animals, the number of rabbits (-46.2%) and sheep (-26.1%) is continually falling, while the number of horses has become more stable.
Land-enTuinbouw09_EN.indd 64Land-enTuinbouw09_EN.indd 64 09-03-2010 15:19:5509-03-2010 15:19:55

65
Land-enTuinbouw09_EN.indd 65Land-enTuinbouw09_EN.indd 65 09-03-2010 15:19:5609-03-2010 15:19:56

66
Flemish agriculture mapped:Arable farming
(Flanders, 2007)
Key
% (o
ther
) spe
cial
ised
ara
ble
busi
ness
es o
f the
tota
l num
ber o
f bus
ines
ses
in th
e m
unic
ipal
ity >
20%
% a
rabl
e SO
of t
otal
mun
icip
ality
SO
0%
10
- 20
%
>
40%
< 10
%
20
- 40
%
Sour
ce: D
epar
tmen
t of A
gric
ultu
re a
nd F
ishe
ries,
NG
I-AG
IV
050
12.5
kilo
met
res
Land-enTuinbouw09_EN.indd 66Land-enTuinbouw09_EN.indd 66 09-03-2010 15:19:5609-03-2010 15:19:56

67
The
map
sho
ws
the
stan
dard
out
put2 (
SO)
of
arab
le fa
rmin
g w
ith re
spec
t to
the
tota
l SO
in th
e m
unic
ipal
ity. T
he m
unic
ipal
ities
with
mor
e th
an
20%
(oth
er) s
peci
alise
d ar
able
farm
ing
busin
esse
s ar
e in
dica
ted
with
hat
chin
g.
The
map
sho
ws
that
the
mun
icip
aliti
es w
here
the
SO o
f ara
ble
farm
ing
mak
es u
p m
ore
than
10%
of
the
tota
l SO
of t
he m
unic
ipal
ity a
re, a
s ex
pect
ed,
loca
ted
on th
e ric
h so
ils o
f Fla
nder
s: th
e sa
ndy l
oam
an
d lo
am s
oils
and
the
pold
ers.
The
mun
icip
aliti
es
whe
re t
he a
rabl
e fa
rmin
g se
ctor
is
impo
rtan
t (>
40%
) fo
r th
e to
tal S
O o
f th
e m
unic
ipal
ity a
re
prim
arily
loca
ted
to th
e ea
st o
f Bru
ssel
s.
2 The
sta
ndar
d ou
tput
is th
e fi n
anci
al v
alue
of t
he y
ield
that
cor
resp
onds
to th
e av
erag
e sit
uatio
n ov
er a
num
ber o
f yea
rs in
a c
erta
in re
gion
(Fla
nder
s) fo
r ea
ch o
f the
agr
icul
tura
l pro
duct
s.
Land-enTuinbouw09_EN.indd 67Land-enTuinbouw09_EN.indd 67 09-03-2010 15:20:0009-03-2010 15:20:00

68
Flemish agriculture mapped:Fruit
(Flanders, 2007)
Key
% s
peci
alis
ed fr
uit b
usin
esse
s of
the
tota
l num
ber o
f bus
ines
ses
in th
e m
unic
ipal
ity
% fr
uit S
O o
f tot
al m
unic
ipal
ity S
O
0%
10
- 20
%
>
40%
(max
. 94%
)
auct
ion
hous
es
< 10
%
20
- 40
%
fr
uit p
roce
ssin
g (ja
ms,
juic
es, c
anne
d, e
tc.)
froz
en in
dust
ry
Sour
ce: D
epar
tmen
t of A
gric
ultu
re a
nd F
ishe
ries,
NG
I-AG
IV
050
12.5
kilo
met
res
Land-enTuinbouw09_EN.indd 68Land-enTuinbouw09_EN.indd 68 09-03-2010 15:20:0109-03-2010 15:20:01

69
The
map
cle
arly
sho
ws
the
fruit
regi
ons
base
d on
the
rel
ativ
e sh
are
of t
he S
O o
f fru
it an
d th
e re
lativ
e sh
are
of s
peci
alise
d fru
it bu
sines
ses.
Ther
e is
a la
rge
conc
entr
atio
n in
the
Tiel
t-Win
ge, H
oese
lt,
Sint
-Tru
iden
tr
iang
le.
Sint
-Gill
is-W
aas,
Beve
ren
and
Zwijn
drec
ht (a
pple
s, pe
ars)
, Ove
rijse
(gra
pes)
, Ro
osda
al a
nd a
few
mun
icip
aliti
es a
roun
d th
e ty
pica
l fru
it re
gion
hav
e a
reas
onab
ly la
rge
num
ber
of s
peci
alise
d fru
it bu
sines
ses
and/
or a
reas
onab
ly
larg
e sh
are
of to
tal S
O.
Up
until
the
mid
-19th
Cen
tury
, app
le c
ultiv
atio
n (fr
eque
ntly
a
side
activ
ity)
was
sp
read
ac
ross
th
e en
tire
coun
try.
In t
he s
econ
d ha
lf of
the
19th
Ce
ntur
y, th
e go
vern
men
t or
gani
sed
cour
ses
to
stim
ulat
e fru
it cu
ltiva
tion.
Hor
ticul
tura
l sc
hool
s
wer
e se
t up
and
fru
it cu
ltiva
tion
deve
lope
d in
to
a su
cces
sful
act
ivity
. H
aspe
ngou
w b
ecam
e th
e ce
ntre
. Af
ter
1900
, fru
it cu
ltiva
tion
expa
nded
su
bsta
ntia
lly;
inst
ead
of
bein
g a
side
activ
ity,
culti
vatio
n w
as in
crea
singl
y do
ne o
n a
com
mer
cial
ba
sis. In
add
ition
to H
aspe
ngou
w, t
he M
eetje
sland
, Pa
jott
enla
nd a
nd L
and
van
Her
ve b
ecam
e fru
it cu
ltiva
tion
cent
res.
In a
dditi
on t
o su
pply
ing
the
fresh
fru
it m
arke
t, fru
it w
as a
lso g
row
n un
der
cont
ract
fo
r th
e pr
oduc
tion
of
syru
p or
fru
it pr
eser
vativ
es.
The
com
mer
cial
isatio
n of
th
e Jo
nago
ld a
pple
as
of t
he 1
970s
con
trib
uted
to
a gr
eate
r reg
iona
l spr
ead.
The
1950
s m
arke
d th
e br
eakt
hrou
gh o
f th
e id
ea
of a
uctio
ns. T
he m
ap s
how
s th
at t
here
is a
cle
ar
geog
raph
ical
lin
k w
ith t
he s
ales
cha
nnel
s. Th
e la
rges
t fru
it au
ctio
ns a
re: t
he B
elgi
sche
Fru
itvei
ling,
Ve
iling
Bo
rglo
on,
Veili
ng
Has
peng
ouw
, Ve
iling
H
oogs
trat
en a
nd P
rofru
co.
Land-enTuinbouw09_EN.indd 69Land-enTuinbouw09_EN.indd 69 09-03-2010 15:20:0409-03-2010 15:20:04

70
Flemish agriculture mapped:Vegetables including strawberries
(Flanders, 2007)
050
12.5
Key
% s
peci
alis
ed v
eget
able
bus
ines
ses
of th
e to
tal n
umbe
r of b
usin
esse
s in
the
mun
icip
ality
% v
eget
able
SO
of t
otal
mun
icip
ality
SO
0%
10
- 20
%
>
40%
auct
ion
hous
es
< 10
%
20
- 40
%
gr
ower
ass
ocia
tions
for p
rodu
cts
inte
nded
for p
roce
ssin
g
vege
tabl
e pr
oces
sing
indu
stry
froz
en in
dust
rySo
urce
: Dep
artm
ent o
f Agr
icul
ture
and
Fis
herie
s, N
GI-A
GIV
kilo
met
res
Land-enTuinbouw09_EN.indd 70Land-enTuinbouw09_EN.indd 70 09-03-2010 15:20:0509-03-2010 15:20:05

71
The
map
sho
ws
the
SO o
f the
veg
etab
les
sect
or,
incl
udin
g m
elon
s, st
raw
berr
ies a
nd m
ushr
oom
s, as
a
perc
enta
ge o
f the
tot
al S
O o
f the
mun
icip
ality
. Th
e m
unic
ipal
ities
with
mor
e th
an 2
0% sp
ecia
lised
ve
geta
ble
busin
esse
s ar
e in
dica
ted
with
hat
chin
g.
Conc
entr
ated
reg
ions
are
the
reg
ions
of
Sint
-Ka
telij
ne-W
aver
, Ro
esel
are
and
Hoo
gstr
aten
. Cu
rrent
ly, i
n th
e re
gion
aro
und
Mec
hele
n, q
uite
a
lot o
f veg
etab
les a
re g
row
n in
gre
enho
uses
. In
the
regi
on a
roun
d Ro
esel
are,
veg
etab
les
are
mai
nly
grow
n in
the
open
air
for t
he fr
ozen
food
indu
stry
. Th
is is
mai
nly
cont
ract
gro
win
g. A
s the
map
show
s, th
ere
is a
stro
ng li
nk w
ith th
e lo
catio
n of
the
froze
n fo
od i
ndus
try,
whi
ch i
s al
mos
t en
tirel
y in
Wes
t-Fl
ande
rs. T
he t
wo
larg
est
grow
er a
ssoc
iatio
ns fo
r
the
proc
essin
g in
dust
ry, V
egra
s (fro
zen
vege
tabl
es)
and
Ingr
o (in
dust
rial v
eget
able
s), a
re b
oth
loca
ted
in th
e vi
cini
ty o
f Roe
sela
re.
The
vege
tabl
es
are
mai
nly
trad
ed
thro
ugh
auct
ions
. The
re is
a c
lear
link
bet
wee
n re
gion
s with
ve
geta
ble
culti
vatio
n an
d th
e la
rges
t ve
geta
ble
auct
ions
. The
Mec
helse
Vei
ling
(Mec
hele
n Au
ctio
n - t
he la
rges
t coo
pera
tive
auct
ion
hous
e in
Eur
ope)
in
Sin
t-Kat
elijn
e-W
aver
mai
nly
trad
es t
omat
oes,
lett
uce,
pa
prik
a/pe
pper
s an
d cu
cum
bers
. Th
e Ka
mpe
nhou
t au
ctio
n (d
ivisi
on o
f BRA
VA in
Zel
lik)
mai
nly
trad
es c
hico
ry,
tom
atoe
s, as
para
gus
and
orga
nic
prod
ucts
. The
REO
auc
tion
in R
oese
lare
is
impo
rtan
t fo
r th
e tr
ade
of o
pen-
air
vege
tabl
es
and
stra
wbe
rrie
s. Th
e H
oogs
trat
en a
uctio
n m
ainl
y tr
ades
str
awbe
rrie
s an
d gr
eenh
ouse
veg
etab
les
(tom
atoe
s, pa
prik
a/pe
pper
s and
cuc
umbe
rs).
Com
mer
cial
veg
etab
le c
ultiv
atio
n ar
ose
afte
r th
e cr
isis
at t
he e
nd o
f th
e 19
th C
entu
ry. V
eget
able
cu
ltiva
tion
enab
led
a liv
ing
inco
me
to
be
gene
rate
d fro
m a
smal
l plo
t of l
and.
The
Mec
hele
n re
gion
gre
w in
to th
e ve
geta
ble
culti
vatio
n ce
ntre
be
fore
190
0. F
lem
ish h
ortic
ultu
ral
farm
ers
only
pr
oduc
ed l
uxur
y pr
oduc
ts s
uch
as c
hico
ry a
nd
caul
ifl ow
er th
at w
ere
sold
far o
utsid
e th
e na
tiona
l bo
rder
s. As
of
1890
, the
food
indu
stry
aro
se a
nd
vege
tabl
e pr
oces
sing
busin
esse
s em
erge
d. T
he
mai
n on
es a
re sh
own
on th
e m
ap.
Land-enTuinbouw09_EN.indd 71Land-enTuinbouw09_EN.indd 71 09-03-2010 15:20:0909-03-2010 15:20:09

72
Flemish agriculture mapped: Ornamental plant cultivation, including tree nurseries
(Flanders, 2007)
050
12.5
Key
% s
peci
alis
ed o
rnam
enta
l pla
nt c
ultiv
atio
n bu
sine
sses
of t
he to
tal n
umbe
r of b
usin
esse
s in
the
mun
icip
ality
% o
rnam
enta
l pla
nt c
ultiv
atio
n SO
of t
otal
mun
icip
ality
SO
0%
10
- 20
%
>
40%
(max
. 85%
)
< 10
%
20
- 40
%
Sour
ce: D
epar
tmen
t of A
gric
ultu
re a
nd F
ishe
ries,
NG
I-AG
IV
kilo
met
res
Land-enTuinbouw09_EN.indd 72Land-enTuinbouw09_EN.indd 72 09-03-2010 15:20:1009-03-2010 15:20:10

73
The
map
show
s the
SO
of t
he “fl
ow
ers,
orna
men
tal
plan
ts a
nd tr
ee n
urse
ries”
sect
or a
s a p
erce
ntag
e of
th
e to
tal S
O o
f the
mun
icip
ality
. The
mun
icip
aliti
es
with
mor
e th
an 2
0% s
peci
alise
d or
nam
enta
l pla
nt
busin
esse
s ar
e in
dica
ted
with
hat
chin
g. P
otte
d pl
ants
are
mai
nly
grow
n in
the
reg
ion
arou
nd
Loch
risti,
Des
telb
erge
n, M
erel
beke
and
Mel
le. I
n th
e re
gion
aro
und
Wet
tere
n, O
oste
rzel
e, L
aarn
e,
Wic
hele
n an
d Le
de,
this
is m
ainl
y or
nam
enta
l tre
es. T
he c
ut-fl
ower
sect
or is
mor
e in
the
dire
ctio
n of
Bru
ssel
s. Ar
boric
ultu
re i
s m
ainl
y ar
ound
the
re
gion
of
Mal
dege
m, W
aars
choo
t an
d Ev
erge
m.
To a
les
ser
exte
nt,
orna
men
tal
plan
t cu
ltiva
tion
is do
ne i
n a
few
mun
icip
aliti
es o
f th
e Ca
mpi
ne
and
the
Zand
stre
ek a
roun
d An
twer
p. W
e al
so
see
that
mun
icip
aliti
es w
ith a
reas
onab
le s
hare
of
the
tota
l SO
(>
10%
) ar
e pr
imar
ily lo
cate
d in
the
urba
n re
gion
s of
Bru
ges,
Kort
rijk,
Ghe
nt, B
russ
els,
Antw
erp,
Tur
nhou
t, H
asse
lt an
d G
enk.
Thi
s is
prob
ably
due
to th
e sa
les o
ppor
tuni
ties.
Orn
amen
tal
plan
t cu
ltiva
tion
aros
e in
Fla
nder
s w
hen
the
mid
dle
clas
ses
and
nobi
lity
saw
ill
ustr
atio
ns o
f unk
now
n pl
ants
with
str
ange
and
sp
lend
id fl
ower
s in
ric
hly
illus
trat
ed fl
ower
boo
ks
publ
ished
abr
oad,
and
wan
ted
to o
wn
thes
e. Th
ese
exot
ic p
lant
s w
ere
mai
nly
impo
rted
to
Engl
and
from
the
ove
rsea
s re
gion
s an
d th
en c
ultiv
ated
. A
Ghe
nt h
ortic
ultu
ralis
t ha
d a
colle
ctio
n of
pla
nts
brou
ght
over
fro
m E
ngla
nd i
n 17
74 i
n or
der
to
culti
vate
the
m i
n gr
eenh
ouse
s an
d or
ange
ries.
Indu
stria
l de
velo
pmen
ts
in
the
19th
Ce
ntur
y en
able
d ex
otic
pla
nts t
o be
gro
wn
on a
larg
er sc
ale
for a
wid
er m
arke
t. A
fl our
ishin
g or
nam
enta
l pla
nt
indu
stry
aro
se in
Ghe
nt a
nd th
e su
rroun
ding
are
as.
This
deve
lopm
ent w
as, a
mon
g ot
hers
, due
to th
e m
any
activ
ities
of t
he R
oyal
Soc
iety
of A
gric
ultu
re
and
Bota
ny in
Ghe
nt, b
ette
r kno
wn
unde
r the
nam
e of
the
exhi
bitio
ns it
org
anise
s, th
e G
ents
e Fl
oral
iën.
Ex
perim
ents
wer
e do
ne o
n th
e cu
ltiva
tion
of
fl ow
ers a
nd p
lant
s in
the
gard
en o
f Roz
elaa
r Cas
tle
in L
ochr
isti.
Char
les V
uylst
eke
gain
ed in
tern
atio
nal
fam
e by
cros
s-br
eedi
ng o
rchi
ds an
d pa
rtic
ipat
ing
in
inte
rnat
iona
l exh
ibiti
ons.
He
shar
ed h
is kn
owle
dge
with
his
colle
ague
s an
d in
spire
d th
em to
sta
rt u
p a
busin
ess.
Thus
47
orna
men
tal p
lant
bus
ines
ses
wer
e op
erat
ing
in L
ochr
isti a
t th
e en
d of
the
19th
Ce
ntur
y. Th
e la
rges
t Be
lgia
n di
strib
utio
n bu
sines
s fo
r pot
ted
plan
ts is
also
loca
ted
in L
ochr
isti.
Land-enTuinbouw09_EN.indd 73Land-enTuinbouw09_EN.indd 73 09-03-2010 15:20:1309-03-2010 15:20:13

74
Flemish agriculture mapped:Dairy farming
(Flanders, 2007)
050
12.5
Key
% s
peci
alis
ed d
airy
bus
ines
ses
of th
e to
tal n
umbe
r of b
usin
esse
s in
the
mun
icip
ality
% d
airy
SO
of t
otal
mun
icip
ality
SO
0%
10
- 20
%
>
40%
(max
. 74%
)
larg
e m
ilk c
olle
ctor
s
< 10
%
20
- 40
%
di
visi
ons
of la
rge
milk
col
lect
ors
Sour
ce: D
epar
tmen
t of A
gric
ultu
re a
nd F
ishe
ries,
NG
I-AG
IV
kilo
met
res
Mik
ka
Vare
co
Cam
pina
Inex
NV
Fabr
elac
Bonm
ilch
St.-J
ozef
Oly
mpi
a N
V
Post
elre
NV
Deb
ergh
NV
Cam
pina
Aal
ter
De
Krie
kela
arho
eve
Biom
elk
Vlaa
nder
en
Mel
kerij
St.
Clem
ens
Stee
gro
Dia
ry B
elgi
um
Mel
kinr
icht
ing
Her
czl &
Gol
d
Verm
eers
ch N
V
Milc
obel
- Be
lgom
ilk K
allo
Land-enTuinbouw09_EN.indd 74Land-enTuinbouw09_EN.indd 74 09-03-2010 15:20:1409-03-2010 15:20:14

75
The
map
sho
ws
the
rela
tive
shar
e of
the
SO
of
dairy
farm
ing
and
youn
g st
ock.
All
mun
icip
aliti
es
with
mor
e th
an 2
0% s
peci
alise
d da
iry f
arm
s ar
e in
dica
ted
with
hat
chin
g. T
he la
rge
milk
col
lect
ors
(bus
ines
ses
that
col
lect
mor
e th
an 1
00,0
00 li
tres
per
perio
d) a
re a
lso s
how
n. T
he m
ap s
how
s th
at
dairy
cat
tle a
re k
ept
in a
lmos
t al
l m
unic
ipal
ities
. Th
e Fl
emish
Ard
enne
s, th
e M
eetje
sland
, N
orth
Li
mbu
rg, V
oere
n an
d An
twer
p Ca
mpi
ne a
re z
ones
w
here
dai
ry fa
rmin
g m
akes
up
mor
e th
an 2
0% o
f th
e to
tal S
O o
f the
mun
icip
ality
.
Afte
r the
cris
is at
the
end
of th
e 19
th C
entu
ry, d
airy
fa
rmin
g de
velo
ped
furt
her
on p
oor
soils
whe
re
an e
xten
sive
area
of g
rass
land
was
ava
ilabl
e. A
fter
the
Seco
nd W
orld
War
, Eu
rope
wan
ted
to b
e
self-
suffi
cien
t co
ncer
ning
foo
d an
d pr
oduc
tion
stro
ngly
inc
reas
ed,
whi
ch l
ed t
o th
e so
-cal
led
butt
er m
ount
ains
and
milk
lake
s. Th
e co
sts
wer
e so
hig
h th
at m
easu
res
had
to b
e ta
ken.
The
milk
qu
ota
was
intro
duce
d in
198
4. T
his
led
to a
sha
rp
decr
ease
(-4
0%)
in t
he n
umbe
r of
dai
ry c
ows
in
Flan
ders
.
To p
roce
ss th
e m
ilk, t
he fa
rmer
s gro
uped
toge
ther
un
der
the
impe
tus
of t
he B
oere
nbon
d (F
arm
ers’
Uni
on) a
nd jo
int c
oope
rativ
e da
iries
aro
se. M
anua
l an
d st
eam
-driv
en d
airie
s pu
shed
asid
e th
e ho
me
proc
essin
g of
milk
as
of t
he l
ate
19th
Cen
tury
. Ev
ery
villa
ge o
r ham
let h
ad it
s ow
n da
iry. A
roun
d 19
40,
the
dairi
es p
roce
ssed
app
roxi
mat
ely
half
of t
he t
otal
milk
pro
duct
ion.
The
sm
all s
cale
and
rath
er
unpl
anne
d sp
read
of
da
iries
an
d da
iry
busin
esse
s w
as
cons
ider
ed
to
be
incr
easin
gly
econ
omic
ally
in
effi c
ient
, an
d af
ter
1945
on
ly
the
larg
e pr
ofes
siona
l bu
sines
ses
rem
aine
d. I
n th
e m
eant
ime,
the
tra
nspo
rt n
etw
ork
has
also
im
prov
ed a
nd t
he b
usin
esse
s no
w h
ave
cool
ing
tank
s su
ch t
hat
the
geog
raph
ic li
nk b
etw
een
the
dairi
es a
nd th
e ty
pica
l dai
ry fa
rmin
g re
gion
s is
no
long
er c
lear
.
Land-enTuinbouw09_EN.indd 75Land-enTuinbouw09_EN.indd 75 09-03-2010 15:20:1809-03-2010 15:20:18

76
Flemish agriculture mapped:Beef cattle
(Flanders, 2007)
050
12.5
Key
% s
peci
alis
ed b
eef c
attle
bus
ines
ses
of th
e to
tal n
umbe
r of b
usin
esse
s in
the
mun
icip
ality
% b
eef c
attle
SO
of t
otal
mun
icip
ality
SO
0%
10
- 20
%
>
40%
(max
. 74%
)
< 10
%
20
- 40
%
la
rge
abat
toirs
for c
attle
(10
larg
est a
ccor
ding
to tu
rnov
er, s
ee T
rend
s)
Sour
ce: D
epar
tmen
t of A
gric
ultu
re a
nd F
ishe
ries,
NG
I-AG
IV
kilo
met
res
M. R
ycka
ert
Slac
hthu
is G
eel
Etn.
Adr
iaen
s N
V
Slac
hthu
is G
enk
NV
Slac
hthu
is V
anlo
mm
el
Flan
ders
Mea
t Gro
up L
AR
NV
Vanh
oorn
wed
er M
arce
lEE
G S
lach
thui
s M
eche
len
Slac
hthu
is V
erbi
st Iz
egem
M. R
ycka
ert
Slac
hthu
is G
eel
Etn.
Adr
iaen
s N
V
Slac
hthu
is G
enk
NV
Slac
hthu
is V
anlo
mm
el
Flan
ders
Mea
t Gro
up L
AR
NV
Vanh
oorn
wed
er M
arce
lEE
G S
lach
thui
s M
eche
len
Slac
hthu
is V
erbi
st Iz
egem
Land-enTuinbouw09_EN.indd 76Land-enTuinbouw09_EN.indd 76 09-03-2010 15:20:1909-03-2010 15:20:19

77
Beef
cat
tle a
re ra
ised
in th
e m
ajor
ity o
f mun
icip
ali-
ties,
but i
ts im
port
ance
is o
nly
high
in a
few
mun
ic-
ipal
ities
: the
eco
nom
ic im
port
ance
of b
eef c
attle
fa
rmin
g is
less
than
10%
in 6
2% o
f mun
icip
aliti
es.
This
is sh
own
by th
e m
ap, w
hich
show
s the
rela
tive
shar
e of
the
SO
for
beef
cat
tle a
nd y
oung
sto
ck.
Nev
erth
eles
s, th
ere
are
100
mun
icip
aliti
es w
ith
mor
e th
an 2
0% s
peci
alise
d be
ef c
attle
bus
ines
ses.
Beef
cat
tle m
ainl
y oc
cur i
n th
e Ca
mpi
ne, i
n no
rth-
ern
Wes
t-Fla
nder
s, th
e Pa
jott
enla
nd, t
he F
lem
ish
Arde
nnes
and
Cen
tral
-Lim
burg
. Vea
l cal
f fa
rmer
s ar
e lo
cate
d ar
ound
Kas
terle
e.
Und
er
pres
sure
fro
m
chea
p Am
eric
an
grai
n,
Flem
ish f
arm
ers
cut
back
on
arab
le f
arm
ing
at
the
end
of th
e 19
th C
entu
ry a
nd li
vest
ock
farm
ing
beca
me
a se
ctor
in
its o
wn
right
. D
ue t
o th
e in
crea
sing
affl u
ence
aro
und
1900
, mea
t arr
ived
on
the
tabl
e of
the
com
mon
man
. Man
y sm
all “
catt
le
farm
ers”
kept
som
e ca
ttle
on
a pi
ece
of la
nd w
ith a
st
able
and
bro
ught
mea
t and
but
ter t
o th
e m
arke
t. Th
e fo
cus w
as o
n du
al-p
urpo
se c
ows (
Belg
ian
Blue
Be
ef, W
est-F
lem
ish R
ed C
ow) t
hat p
erfo
rmed
wel
l w
ith re
gard
to m
ilk a
nd m
eat.
Alon
gsid
e Eu
rope
an
inte
grat
ion
and
the
agric
ultu
ral p
olic
y th
at le
d to
ov
erpr
oduc
tion
and
regu
latio
n, ra
tiona
lisat
ion
and
mec
hani
satio
n al
so le
d to
a d
eclin
e in
the
num
ber
of b
eef c
attle
farm
ers
on t
he o
ne h
and
and
scal
e in
crea
ses o
n th
e ot
her. T
he a
gric
ultu
ral p
olic
y (m
ilk
quot
a, s
uckl
er c
ow s
ubsid
ies)
may
hav
e ca
used
a
shift
from
dai
ry fa
rmin
g to
bee
f cat
tle fa
rmin
g.
The
ten
larg
est a
batt
oirs
for c
attle
are
also
sho
wn
on t
he m
ap. A
s th
e ec
onom
ic im
port
ance
of t
he
sect
or is
not
ver
y hi
gh in
mos
t mun
icip
aliti
es, t
here
is
no c
lear
link
with
the
abat
toirs
.
Land-enTuinbouw09_EN.indd 77Land-enTuinbouw09_EN.indd 77 09-03-2010 15:20:2309-03-2010 15:20:23

78
Flemish agriculture mapped:Breeding
(Flanders, 2007)
050
12.5
25
Key
% s
peci
alis
ed b
reed
ing
stat
ions
of t
he to
tal n
umbe
r of b
usin
esse
s in
the
mun
icip
ality
> 2
0%
% b
reed
ing
SO o
f tot
al m
unic
ipal
ity S
O
0%
10
- 20
%
>
40%
(max
. 69%
)
Mix
ed fe
ed p
rodu
cers
(in
the
sect
or to
p 10
0, s
ee T
rend
s)
< 10
%
20
- 40
%
Pi
g ab
atto
irs (1
0 la
rges
t acc
ordi
ng to
turn
over
, see
Tre
nds)
Poul
try
abat
toirs
(10
larg
est a
ccor
ding
to tu
rnov
er, s
ee T
rend
s)So
urce
: Dep
artm
ent o
f Agr
icul
ture
and
Fis
herie
s, N
GI-A
GIV
kilo
met
res
•
Land-enTuinbouw09_EN.indd 78Land-enTuinbouw09_EN.indd 78 09-03-2010 15:20:2409-03-2010 15:20:24

79
In th
e abo
ve m
ap, w
hich
show
s the
SO fo
r gra
nivo
res
with
reg
ard
to t
he t
otal
SO
and
the
num
ber
of
mun
icip
aliti
es w
ith m
ore
than
20%
spe
cial
ised
bree
ding
com
pani
es. T
he ty
pica
l bre
edin
g re
gion
s of
Fl
ande
rs
can
be
clea
rly
reco
gnise
d:
Wes
t-Fl
ande
rs,
the
Mee
tjesla
nd,
Waa
sland
, th
e N
orth
Ca
mpi
ne a
nd N
orth
Lim
burg
. The
re is
alm
ost
no
bree
ding
in th
e An
twer
p - B
russ
els a
xis.
Pig
farm
ing
is pa
rtic
ular
ly im
port
ant,
with
the
shar
e of
pou
ltry
farm
ing
and
rabb
it fa
rmin
g in
the
tot
al v
alue
of
agric
ultu
re a
nd h
ortic
ultu
re b
eing
fairl
y lim
ited
in
the
mun
icip
aliti
es.
The
map
also
sho
ws
the
mos
t im
port
ant
mix
ed-
feed
pr
oduc
ers
acco
rdin
g to
tu
rnov
er.
The
mix
ed-fe
ed
prod
ucer
s ar
e st
rate
gica
lly
loca
ted
alon
g ca
nals
and
port
s to
ens
ure
the
tran
spor
t of
(co
ncen
trat
ed)
feed
pur
chas
ed o
n th
e w
orld
m
arke
t (e.
g. g
rain
from
nor
ther
n Fr
ance
, soy
a fro
m
Braz
il, et
c.).
As t
he m
ap s
how
s, th
ere
is a
larg
e co
ncen
trat
ion
of m
ixed
-feed
pro
duce
rs i
n W
est-
Flan
ders
. Thi
s is c
lear
ly li
nked
to th
e im
port
ance
of
the
anim
al se
ctor
in th
is pr
ovin
ce.
The
larg
est
abat
toirs
for p
igs
are
also
gen
eral
ly in
th
e m
ost i
mpo
rtan
t bre
edin
g re
gion
s.
Poul
try
farm
ing
is pa
rtic
ular
ly i
mpo
rtan
t in
the
Tu
rnho
ut re
gion
, in
the
vici
nity
of M
aase
ik a
nd to
a
less
er e
xten
t in
the
Aal
ter-K
ruish
oute
m r
egio
n.
Conc
entr
atio
n in
the
pou
ltry
sect
or is
hig
h: f
ew
but
very
larg
e bu
sines
ses.
In a
dditi
on, t
he m
ixed
-fe
ed in
dust
ry a
nd t
he a
batt
oir s
ecto
r are
stro
ngly
in
tert
win
ed.
Land-enTuinbouw09_EN.indd 79Land-enTuinbouw09_EN.indd 79 09-03-2010 15:20:2809-03-2010 15:20:28

80
Flemish agriculture mapped:Agriculture characterisation map
(Flanders, 2007)
050
12.5
2
5
Key
spec
ialis
atio
n br
eedi
ng
sp
ecia
lisat
ion
orna
men
tal p
lant
cul
tivat
ion
incl
. tre
e nu
rser
ies
arab
le fa
rmin
g - b
eef c
attle
prev
ailin
g da
iry c
attle
culti
vatio
n - v
eget
able
s
spec
ialis
atio
n fr
uit
vege
tabl
es -
beef
cat
tle
sp
ecia
lisat
ion
vege
tabl
es in
cl. s
traw
berr
ies
br
eedi
ng -
beef
cat
tle
urba
nise
d
orna
men
tal p
lant
cul
tivat
ion
- bee
f cat
tle
br
eedi
ng -
dairy
cat
tle
Sour
ce: D
epar
tmen
t of A
gric
ultu
re a
nd F
ishe
ries,
NG
I-AG
IV
kilo
met
res
Land-enTuinbouw09_EN.indd 80Land-enTuinbouw09_EN.indd 80 09-03-2010 15:20:2909-03-2010 15:20:29

81
The
map
sho
ws
the
resu
lt of
a c
lass
ifi ca
tion
of
mun
icip
aliti
es w
ith a
sim
ilar a
gric
ultu
ral a
ctiv
ity. 2
7 m
unic
ipal
ities
wer
e ru
led
out b
efor
ehan
d be
caus
e th
ey a
re to
o hi
ghly
urb
anise
d or
indu
stria
lised
and
th
us h
ave
few
agr
icul
tura
l bus
ines
ses o
r act
ivity
on
thei
r ter
ritor
y.
The
agric
ultu
ral
activ
ity o
f a
mun
icip
ality
was
de
term
ined
fro
m t
he d
ata
of t
he 2
007
Farm
St
ruct
ure
Surv
ey o
f the
FPS
Eco
nom
y an
d is
base
d on
tw
o pr
ofi le
s: th
e di
strib
utio
n of
the
num
ber
of
busin
esse
s ov
er
a nu
mbe
r of
pr
oduc
tion
orie
ntat
ions
on
the
one
hand
, and
the
dist
ribut
ion
of t
he e
cono
mic
dim
ensio
n (S
O”2
004”
) ov
er a
nu
mbe
r of s
ecto
rs o
n th
e ot
her. T
he m
unic
ipal
ities
ar
e cl
uste
red
toge
ther
acc
ordi
ng t
o a
grea
ter
or
less
er s
imila
rity
of th
eir p
rofi l
es. T
he m
odel
has
an
expl
anat
ory
qual
ity o
f 70%
The
mun
icip
aliti
es h
ave
been
div
ided
int
o 11
gr
oups
, fou
r of w
hich
are
spe
cial
ised
orie
ntat
ions
(b
reed
ing,
ve
geta
bles
, or
nam
enta
l pl
ants
, fru
it),
one
dom
inan
t or
ient
atio
n (d
airy
) an
d six
co
mbi
ned
type
s. Th
e ty
pica
l re
gion
s ar
e id
entifi
abl
e: f
ruit
arou
nd S
int-T
ruid
en; v
eget
able
s ar
ound
Si
nt-K
atel
ijne-
Wav
er,
Roes
elar
e an
d H
oogs
trat
en;
orna
men
tal
plan
ts a
roun
d G
hent
; an
d br
eedi
ng in
Wes
t-Fla
nder
s, th
e M
eetje
sland
, th
e La
nd v
an W
aas a
nd th
e Ca
mpi
ne. D
airy
occ
urs
in th
e Fl
emish
Ard
enne
s and
the
Pajo
tten
land
, and
in
the
Cam
pine
in
com
bina
tion
with
bre
edin
g.
Beef
cat
tle o
ccur
s in
the
reg
ion
arou
nd B
ruge
s, so
uthe
rn W
est
and
East
-Fla
nder
s, an
d in
Fle
mish
-Br
aban
t an
d So
uth-
Lim
burg
in c
ombi
natio
n w
ith
arab
le fa
rmin
g.
The
loca
tions
of
th
e re
gion
al
conc
entr
atio
ns
and
spec
ialis
atio
ns
gene
rally
ha
ve
a hi
stor
ical
ba
ckgr
ound
. Th
us
the
loca
tions
of
th
e m
unic
ipal
ities
with
a b
reed
ing
typo
logy
are
(par
tly)
expl
aine
d by
the
loc
atio
ns o
f th
e m
ixed
-feed
in
dust
ry a
nd t
he a
batt
oirs
, and
the
mun
icip
aliti
es
with
a v
eget
able
or f
ruit
typo
logy
are
also
loca
ted
arou
nd t
he a
uctio
n ho
uses
and
der
ived
indu
stry
. Ar
able
farm
ing
and
dairy
and
bee
f cat
tle fa
rmin
g ar
e pr
imar
ily e
xpla
ined
by
soil-
phys
ical
fac
tors
: ar
able
farm
ing
on ri
ch s
oils
and
lives
tock
farm
ing
on o
ther
soi
ls. O
rnam
enta
l pl
ant
culti
vatio
n is
hist
oric
ally
con
cent
rate
d ar
ound
Ghe
nt.
Furt
her i
nfor
mat
ion
on th
is m
ap m
ater
ial c
an b
e fo
und
in th
e re
port
“De
land
bouw
activ
iteit
in V
laam
se g
emee
nten
, pro
eve
van
typo
logi
e” (A
gric
ultu
ral a
ctiv
ity
in F
lem
ish m
unic
ipal
ities
, exa
min
atio
n of
typo
logy
), lo
cate
d on
the
web
site
ww
w.v
laan
dere
n.be
/land
bouw
/stu
dies
Land-enTuinbouw09_EN.indd 81Land-enTuinbouw09_EN.indd 81 09-03-2010 15:20:3209-03-2010 15:20:32

82
Paid direct payments from Pillar I
(Flanders, 2007)
number of businesses support (EUR) support/business
(EUR) share of support
(%)
allowance rights 24,266 222,233,659 9,185 84.6
suckler cow premium 6,596 29,564,193 4,482 11.3
slaughter premium calves 274 5,699,841 20,802 2.2
other coupled premium 290 689,222 2,377 0.3
extra payment 24,325 4,449,363 183 1.7
total Pillar I 24,384 262,636,277 10,771 100.0
Source: Agency for Agriculture and Fisheries on 13/08/2008
In 2007, slightly more than EUR 262.5 million of direct support was paid to farmers in Flanders. The allowance rights make up a good EUR 222 million, almost 85% of the total direct support of Pillar I. The suckler cow premium (EUR 29.5 million) is good for slightly more than 11% of the total and the slaughter premium calves (EUR 5.7 million) around 2%. The other coupled premiums (premium for protein-containing crops, the premium for nuts, the premium for energy crops, and the premium for sowing seed) have a smaller share (0.3% or EUR 0.7 million). Finally, there is an extra payment of around EUR 4.4 million which corresponds to a share of 1.7%. The extra payment concerns the modulation exemption.
The data are based on the 2007 total application (2007 season) to the Agency for Agriculture and Fisheries (ALV). The data were extracted on 13 August 2008.
Land-enTuinbouw09_EN.indd 82Land-enTuinbouw09_EN.indd 82 09-03-2010 15:20:3309-03-2010 15:20:33

83
Paid direct payments from Pillar I: breakdown according to value
(Flanders, 2007, in %)
Source: Agency for Agriculture and Fisheries on 13/08/2008
The diagram shows the percentage of businesses and the percentage support per size category of the total support expressed in euros. In general, the smaller sizes receive a relatively smaller share of the support. For the larger size categories, the reverse applies: a smaller percentage of businesses represent a higher percentage of support. Almost 7.5% of businesses receive less than EUR 500 of support. Together they received barely 0.2% of the total support. The largest number of businesses (36%) are in the EUR 501-5,000 category, but represent only 7.5% of total support. On the other hand, in the EUR 12,501-25,000 category, 21% of businesses receive 35% of the total support. Relatively few businesses, fi nally, belong to the EUR 25,001-50,000 (9.5%) and over EUR 50,000 (1.5%) categories, but they receive a high percentage of the support with 29% and 9.5% respectively.
The data are based on the 2007 total application (2007 season) to the Agency for Agriculture and Fisheries (ALV). The data were extracted on 13 August 2008.
share of pillar I direct support number of businesses
40
30
20
10
0 1-500 501-5,000 5,001-12,500 12,501-25,000 25,001-50,000 >50,000
Land-enTuinbouw09_EN.indd 83Land-enTuinbouw09_EN.indd 83 09-03-2010 15:20:3409-03-2010 15:20:34

84
Paid direct payments from Pillar I: break-down according to business manager age
(Flanders, 2007, in %)
Source: Agency for Agriculture and Fisheries on 13/08/2008
The diagram shows the percentage of businesses and the percentage of the total support that they represent per age category. The younger age categories and the companies receive a relatively higher percentage of the support; the older ones, and especially those of 65 years or older, receive a relatively lower percentage. Young farmers (< 35 years) only make up 7.5% of the number of farmers, but with 12.5%, receive a relatively higher percentage of the support. The average support is the highest there with EUR 17,623 per business. With 6.5% of business managers, companies represent 9% of the total support. The number of business managers in the age categories 35-44 years, 45-54 years, 55-64 years and 65 years and older fl uctuates around 20%. The business managers between 35-44 years and 45-54 years receive a relatively higher percentage of support with 29%. The business managers between 55 and 64 years, however, only receive 16% of the total support. For those of 65 years and older, which nevertheless represents a substantial group of the businesses, it is only 6%. The average support per business is the lowest there with EUR 3,381 per business. They are probably smaller farms in general, often winding down.
The data are based on the 2007 total application (2007 season) to the Agency for Agriculture and Fisheries (ALV). The data were extracted on 13 August 2008.
share of value rights number of businesses
40
30
20
10
018 - 34 years
35 - 44 years
45 - 54 years
55 - 64 years
>= 65 company
Land-enTuinbouw09_EN.indd 84Land-enTuinbouw09_EN.indd 84 09-03-2010 15:20:3509-03-2010 15:20:35
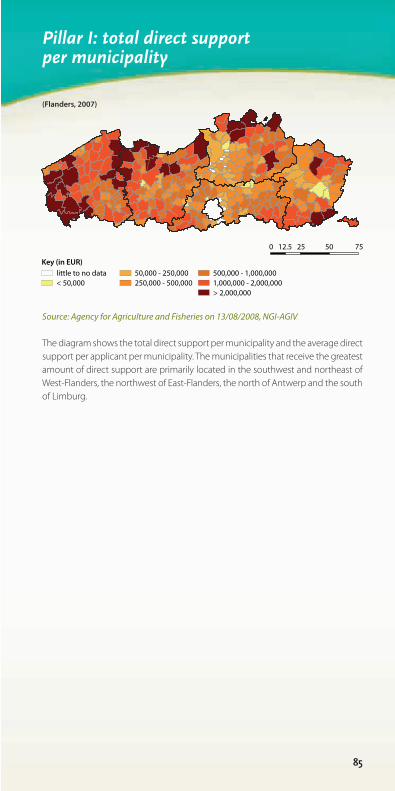
85
Pillar I: total direct support per municipality
(Flanders, 2007)
Source: Agency for Agriculture and Fisheries on 13/08/2008, NGI-AGIV
The diagram shows the total direct support per municipality and the average direct support per applicant per municipality. The municipalities that receive the greatest amount of direct support are primarily located in the southwest and northeast of West-Flanders, the northwest of East-Flanders, the north of Antwerp and the south of Limburg.
Key (in EUR)little to no data< 50,000
50,000 - 250,000250,000 - 500,000
500,000 - 1,000,0001,000,000 - 2,000,000> 2,000,000
0 12.5 25 50 75
Land-enTuinbouw09_EN.indd 85Land-enTuinbouw09_EN.indd 85 09-03-2010 15:20:3609-03-2010 15:20:36

86
Pillar I: average direct support per applicant and per municipality
(Flanders, 2007)
Source: Agency for Agriculture and Fisheries on 13/08/2008, NGI-AGIV
The municipalities with the highest average support per farmer are concentrated in the northwest and southwest of West-Flanders, the north and northeast of Antwerp, and the south of Flemish-Brabant and Limburg (along the language border). In the municipalities between Brussels and Leuven, the number of data is limited, which is also shown by the fact that the total direct support per municipality is low. The regions with a high average support more or less correspond to the traditional arable regions, and the regions with a substantial dairy and beef farming activity. It is notable that the average support per farmer is generally lower in regions where horticulture and pig farming are important activities.
The data are based on the 2007 total application (2007 season) to the Agency for Agriculture and Fisheries (ALV). The data were extracted on 13 August 2008. This concerns the support paid to applicants with a production unit in Flanders and with land in Flanders or in Wallonia. The analysis is based on the postcode of the applicant’s correspondence address registered with the Agriculture and Fisheries Agency. It is thus possible that a number of sites for which support is paid are located in another municipality.
Key (in EUR)little to no data< 5,000
5,000 - 7,5007,500 - 10,000
10,000 - 12,50012,500 -15,000> 15,000
0 12.5 25 50 75
Land-enTuinbouw09_EN.indd 86Land-enTuinbouw09_EN.indd 86 09-03-2010 15:20:4009-03-2010 15:20:40

87
Rural policy: expenditure per fi nancial year
(Flanders, 2000-2008, million EUR)
Source: Department of Agriculture and Fisheries
In order to obtain an overview of expenditure, the expenditure for the fi rst Rural Development Programme (PDPO I, 2000-2006) was subdivided according to the names of the measures that apply to the new programme (PDPO II, 2007-2013). The greatest expenditure was realised in the last year of the previous programme. That the expenditure of the fi rst two years of the new programme is not at the same level is fi rstly due to the “increase of the added value of agricultural products” measure, subsidies for agri-foodstuff s businesses, for which the approved applications of the fi rst call in 2008 would only be paid in 2009, and is secondly due to the fact that most payments for approved projects will be made for the region-oriented operation of axis 3 and the LEADER axis in 2009 and later.
year
120
100
80
60
40
20
02000 2001 2002 2003 2004 2005 2006 2007 2008
local group operation (LEADER)
agricultural education
start-up of young farmers
business advice systems for farmers and
horticulturalists, incl. environmental module and
business management advice
investments in agricultural business
(incl. diversification)
increase of the added value of agricultural
& forestry products
support for cooperation in the development &
sales of agricultural products of an innovative nature
infrastructure development
compensating payments for problem areas
agri-environmental measures
forestation of agricultural land,
non-productive investments, other forestry
provisions of care & activation of care applicants in
agricultural and horticultural businesses
stimulation of tourism activities
basic facilities for the economy and rural development
village centre modernisation and development
maintenance and upgrading of rural heritage
intermediary services
VLIF transitional measures
Land-enTuinbouw09_EN.indd 87Land-enTuinbouw09_EN.indd 87 09-03-2010 15:20:4409-03-2010 15:20:44

88
Rural policy: planned expenditure 2007-2013
(Flanders, 2007-2013, EUR)
Axis Measure Budget (Flemish + European)
Axis 1 agricultural education and sustainable agriculture awareness projects 37,561,693
start-up young farmers 48,035,867
business advice systems for farmers and horticulturists 18,976,540
investments in agricultural businesses 282,737,974
increase of the added value of agricultural and forestry products 28,874,403
infrastructure development 373,280
participation by farmers in food quality regulations 32,099,273
information and fostering sales of Flemish products accredited as PDO/PGI/TSG 382,387
total Axis 1 449,041,417
Axis 2 compensating payments outside Natura 2000 5,246,536
compensating payments within Natura 2000 4,430,410
agri-environmental measures 171,575,480
development measures by farmers under the Water Framework Directive 1,092,932
forestation of agricultural land 4,682,340
non-productive investments in forests 4,133,118
total axis 2 191,160,816
Axis 3 investments relating to diversifi cation of agricultural activities 21,674,061
stimulation of tourism activities 4,466,817
basic facilities for the economy and rural population 5,232,230
village centre modernisation and development 9,516,850
maintenance and upgrading of rural heritage 14,153,637
intermediary services 971,520
total axis 3 56,015,114
Axis 4 Leader 41,277,197
technical assistance 8,980,828
total government support 746,475,372
Source: Department of Agriculture and Fisheries
The above table of planned expenditures is the one that applied in 2009. The extra budget released for the new objectives of the Health Check and the recovery plan have not yet been incorporated into it. The expenditure at the end of 2008 was 29.5% of the planned 2007-2013 budget that applied in 2008, and 26.4% of the planned 2007-2013 budget that applied in 2009.
Land-enTuinbouw09_EN.indd 88Land-enTuinbouw09_EN.indd 88 09-03-2010 15:20:4509-03-2010 15:20:45

89
Rural policy: area of agri-environmental measures
(Flanders, 2000-2008, hectare)
Source: Department of Agriculture and Fisheries
The total area of agri-environmental measures fell by 6,747 ha in 2008 with regard to 20073. In total the area of agri-environmental measures decreased by 8,176 ha in the fi rst two years of PDPO II. This is primarily due to the “winter planting” sunset measure, and secondly to the “water MA”. The area of the following agri-environmental measures clearly fell in 2008 with regard to 2007: “winter planting” (-6%), “water MA” (-8%) and “nature MA” (-13%). The area of the following agri-environmental measures clearly increased in 2008 with regard to 2007: “Buff er zone MA” (+6%), “ornamental plants” (+5%), “standard tree orchards” (+18%), “Papilionaceae” (+13%) and erosion MA (+9%). In absolute numbers, the increase in “Papilionaceae (protein-containing crops)” is particularly notable: an increase of 1,706 ha with regard to 2006, 721 ha of which was in the last year. The area of the following agri-environmental measures fell slightly: “species protection MA” (-0.5%) and “organic agriculture hectare support” (-1%), “botanic management MA” (-2%) and “mechanical weed control” (-4%).
3 This fi gure does not include the area of small landscape elements because a link with the plots has not been possible since 2008. The data up to 2007 did not indicate the area of small landscape elements, but the area of the plots to which they were linked.
140.000
120.000
100.000
80.000
60.000
40.000
20.000
02000 2001 2002 2003 2004 2005 2006 2007 2008
erosion MAPapilionaceaeintegrated pome hectare supportorganic agriculture hectare supportorganic pig supportstandard fruit tree subsidywater MAnature MAbotanic management MAbuffer zone management MAspecies protection MAornamental plant cultivationmechanical weed controlwinter planting
Land-enTuinbouw09_EN.indd 89Land-enTuinbouw09_EN.indd 89 09-03-2010 15:20:4609-03-2010 15:20:46

90
Rural policy: investment support
(Flanders, 2001-2008, number, EUR 1,000)
Source: Department of Agriculture and Fisheries
The number of approved investment applications and the government support granted in 2008 was again at the level of 2006. The peak in 2007 was the result of the large number of applications in 2006, the last year of the fi rst period of the rural development programme. In addition to the investment support, farmers can also obtain a subsidy to start up in agriculture and diversify from the Flemish Agricultural Investment Fund (Vlaams landbouwinvesteringsfonds - VLIF). In 2008, the government support granted for these purposes was EUR 8.0 and EUR 4.1 million respectively.
Government support granted per business type, EUR 1,000
2001 2002 2003 2004 2005 2006 2007 2008
arable farming 469 645 406 1,034 641 577 765 629
horticulture 22,779 21,504 14,929 13,854 14,955 13,009 17,466 22,180
fruit cultivation 1,986 1,613 2,033 2,242 2,950 3,183 3,735 3,548
crop combinations in mixed businesses 9,190 11,296 9,100 9,263 11,620 17,028 20,966 12,994
dairy farming 6,109 5,688 6,172 4,826 5,121 6,628 8,609 7,144
young stock and beef cattle 1,119 1,365 1,904 1,622 1,086 781 1,304 1,080
pigs 377 873 744 777 2,693 5,945 8,537 5,329
poultry 127 265 234 343 360 1,132 748 844
other livestock (including combinations) 0 2,723 3,161 2,578 3,642 5,956 7,840 4,572
other (not incorporated elsewhere) 411 0 11 0 19 21 0 0
total 42,567 45,972 38,694 36,538 43,088 54,260 69,970 58,320
4,500
4,000
3,500
3,000
2,500
2,000
1,500
1,000
500
0
80,000
70,000
60,000
50,000
40,000
30,000
20,000
10,000
0
approved applications government support granted
num
ber o
f app
rove
d ap
plic
atio
ns
gove
rnm
ent s
uppo
rt g
rant
ed (E
UR
1,00
0)
2001 2002 2003 2004 2005 2006 2007 2008
Land-enTuinbouw09_EN.indd 90Land-enTuinbouw09_EN.indd 90 09-03-2010 15:20:4709-03-2010 15:20:47

91
Organic agriculture: number of businesses, area and hectare support
(Flanders, 1994-2008)
Source: Agriculture and Fisheries Policy Area based on Integra and Certisys
The number of organic businesses remained the same in 2008 and was 230 business units. 56 of these were in East-Flanders. As many businesses exit the sector as new ones enter. 0.75% of agricultural businesses are organic. The area in Flanders was 3,492 hectares in 2008, 10.5% of which was being converted. Compared to 2007, the total area fell by 0.1%. The diagram also indicates the area for which the producers applied for and obtained support in 2008 (2,600 ha in 2008). EUR 700,455 of hectare support was paid out. This relates to the applications of 2007.
Number of certifi ed producers and area, Flanders, 2008
number of businesses under supervision
area being converted (ha) organic area (ha) total area (ha)
West-Flanders 53 62.1 548.1 610.1
East-Flanders 56 107.1 654.4 761.5
Limburg 27 43.7 490.1 533.8
Antwerp 49 98.7 774.7 873.4
Flemish-Brabant 45 54.8 658.7 713.5
total 230 366 3,126 3,492
4,500
4,000
3,500
3,000
2,500
2,000
1,500
1,000
500
0
800,000
700,000
600,000
500,000
400,000
300,000
200,000
100,000
01994 1995 1996 1997 1998 1999 2000 2001 2002 2003 2004 2005 2006 2007 2008
year
area with ha support total organic area under supervision hectare support number of businesses
area
(ha)
hect
are
supp
ort (
€)
Land-enTuinbouw09_EN.indd 91Land-enTuinbouw09_EN.indd 91 09-03-2010 15:20:4809-03-2010 15:20:48

92
Agricultural research and development budget
(Flanders, 2009, million EUR)
R&Dcredit
S&T-credit
Total SPcredit
ILVO 9.895 8.583 18.478
ILVO donations 0.994 1.300 2.294
ILVO personnel costs, operating costs, investment costs 8.901 7.283 16.184
other 5.467 0.672 6.139
subsidies to agricultural and horticultural practical centres, to agricultural
chambers, agricultural comics, horticultural associations, warning services
and subsidies in the interest of agriculture and horticulture
2.375 0.083 2.458
subsidies to stimulate organic agriculture (partly with EU co-fi nancing) 0.100 0.000 0.100
subsidy to the EVA Flanders Agricultural and Marketing Board (VLAM) 0.000 0.589 0.589
expenses relating to the rural development programme for the Agriculture
and Fisheries Policy Area (EU co-fi nancing)0.104 0.000 0.104
miscellaneous expenses to strengthen the research and innovation
potential in the Agriculture and Fisheries Policy Area 0.311 0.000 0.311
donation to the Flemish Agricultural Investment Fund (Vlaams Landbouw-
investeringsfonds - VLIF)2.577 0.000 2.577
Economy, Science and Innovation
subsidies to scientifi c and technical research with an agricultural purpose
(IWT-Flanders)9.602 0.000 9.602
total 24.964 9.255 34.219
Source: credit lines of the 2009 budget, Agriculture and Fisheries and Economy policy domain and Science and Innovation policy domain, EWI research guide
The budget for agricultural research and development mainly comes from the credit lines of the Agriculture and Fisheries Policy Area and the Economy, Science and Innovation policy domain. The above table only shows the part of the budget credit actually intended for scientifi c policy. In this credit, a further distinction is made between credit for research and development and credit for scientifi c and technological services.The donations to the Institute for Agricultural and Fisheries Research (Instituut voor Landbouw- en Visserijonderzoek - ILVO) are, among others, intended for the data collection and advisory roles required by the EU in support of the EC Fisheries Policy (EU co-fi nancing), for research and development into more sustainable agricultural systems, for logistical and operational support of quality control in the vegetables sector and for fi nancing PhD grants.The ILVO does research into the following subjects: sustainable vegetable production, innovative agriculture, fi sheries and product processing; quality animal farming; sustainable exploitation of marine resources; agriculture and fi sheries in a changing climate; agriculture in the natural environment; agriculture and fi sheries for safe and high-quality food; dynamic rural region; competitive agricultural systems.The subsidies for scientifi c and technical research with an agricultural purpose are the budgets of the IWT Agricultural Research Programme.
Land-enTuinbouw09_EN.indd 92Land-enTuinbouw09_EN.indd 92 09-03-2010 15:20:4909-03-2010 15:20:49

93
List of abbreviations
ABC = Agribusiness Complex
ABS = Algemeen Boerensyndicaat (General Farmers’ Union)
ADLO = Afdeling Duurzame Landbouwontwikkeling (Sustainable Agricultural Development Division)
ADSEI = Algemene Directie Statistiek en Economisch Informatie (Directorate-General Statistics and Economic Information)
AF = Agriculture and Fisheries
AGIV = Agentschap voor Geografi sche Informatie Vlaanderen (Agency for Geographical Information Flanders)
ALV = Agentschap voor Landbouw en Visserij (Agency for Agriculture and Fisheries)
AMN = Landbouwmonitoringsnetwerk (Agriculture Monitoring Network)
AMS = Afdeling Monitoring en Studie (Division for Agricultural Policy Analysis)
AWU = Agricultural Work Unit
BCZ = Belgische Confederatie van de Zuivelindustrie (Belgian Confederation of the Dairy Industry)
Belfirst = Financial Reports and Statistics on Belgian and Luxembourg Companies
BEMEFA = Beroepsvereniging van de Mengvoederfabrikanten (Trade Association of Mixed-Feed Producers)
BIRB = Belgisch Interventie- en Restitutiebureau (Belgian Intervention and Refund Agency) BSE = Bovine Spongiform Encephalopathy (= mad cow disease)
CAP = Common Agricultural Policy
CBB = Confederatie van de Belgische Bietenplanters (Confederation of Belgian Beet Growers)
CHP = combined heat and power
DG = Directorate-General
EU = European Union
EWI = Economie, Wetenschap en Innovatie (Economy, Science and Innovation)
FADN = Farm Accountancy Data Network
FAVV = Federaal Agentschap voor de Veiligheid van de voedselketen (Federal Agency for the Safety of the Food Chain)
FAWU = Family agricultural work unit
FEBEV = Federatie Belgisch Vlees (Federation of Belgian Meat)
FPS = Federal Public Service
GDP = gross domestic product
ILVO = Instituut voor Landbouw- en Visserijonderzoek (Institute for Agricultural and Fisheries Research)
INGRO = Telersvereniging Industriegroenten (Industrial Vegetables Growers Association)
Land-enTuinbouw09_EN.indd 93Land-enTuinbouw09_EN.indd 93 09-03-2010 15:20:5009-03-2010 15:20:50

94
IWT = Instituut voor de aanmoediging van innovatie door Wetenschap en Technologie (Institute to stimulate innovation through Science and Technology)
LEADER = Liaisons Entre Actions de Développement de l’Economie Rurale (Links between actions for the development of the rural community)
LNE = Leefmilieu, Natuur en Energie (Environment, Nature and Energy)
LPG = Liquefi ed Petroleum Gas
LU = Labour Unit
MA = management agreement
MINA = Milieu- en Natuurraad (Board of the Environment and Nature)
MTR = Mid-term Review
NGI = Belgian National Geographic Institute
NAV = Net Added Value
PDO = Protected Designations of Origin
PDPO = Programmeringsdocument Plattelandsontwikkeling (Rural Development Programming Document)
PGI = Protected Geographic Indication
PM = particulate matter
R&D = Research and Development
REO = Roeselare En Omstreken Veiling (Roeselare and Environs Auction)
SO = Standard Output
SP = science policy
SSU = Standard Size Unit
S&T = Science and Technology
TSG = Traditional Specialities Guaranteed
VAC = Vlaams Agrarisch Centrum (Flemish Agricultural Centre)
VAT = Value Added Tax
Vegras = Vegetable Growers Association
VEVA = Vereniging voor Varkenshouders (Association of Pig Farmers)
VITO = Vlaamse Instelling voor Technologisch Onderzoek (Flemish Institute of Technological Research)
VLAM = Vlaams Centrum voor Agri- en Visserijmarketing (Flanders Agricultural and Marketing Board)
VLIF = Vlaams Landbouwinvesteringsfonds (Flemish Agricultural Investment Fund)
VLM = Vlaamse Landmaatschappij (Flemish Land Company)
VMM = Vlaamse Milieumaatschappij (Flemish Environment Company)
Land-enTuinbouw09_EN.indd 94Land-enTuinbouw09_EN.indd 94 09-03-2010 15:20:5109-03-2010 15:20:51

95
Bibliography
Bas L., Lenders S. & Van Gijseghem D. (2009) De Vlaamse Landbouwconjunctuurindex - Resultaten enquête voorjaar 2009, Agriculture and Fisheries Policy Area, Division for Agricultural Policy Analysis, Brussels.
Bernaerts E., Coulier T. & Demuynck E. (2009) Rentabiliteitsrapport Land- en tuinbouw 2007, Department of Agriculture and Fisheries, Division for Agricultural Policy Analysis, Brussels.
Bernaerts E., Demuynck E. & Platteau J. (2008) Productierekening van de Vlaamse land- en tuinbouw 2008, Agriculture and Fisheries Policy Area, Division for Agricultural Policy Analysis, Brussels.
Danckaert S., Lenders S. & Oeyen A. (2009) De landbouw activiteit in Vlaamse gemeenten, proeve van typologie, Agriculture and Fisheries Policy Area, Division for Agricultural Policy Analysis, Brussels.
Deuninck J. (2009) Analyse van de rechtstreekse steun uit Pijler I aan de landbouwer: campagne 2007, Agriculture and Fisheries Policy Area, Division for Agricultural Policy Analysis, Brussels.
European Union, Directorate-General Agriculture and Rural Development (2009), Agriculture in the European Union, Statistical and Economic Information 2008.
Eurostathttp://epp.eurostat.ec.europa.eu/portal/page/portal/eurostat/home
FPS Economy - Directorate-General Statistics and Economic Information, Mei-enquêtes, various volumes, Brussels.
FPS Economy - Directorate-General Statistics and Economic Information, Raming van de productie van de landbouwteelten, various harvest years, Brussels.
Fonds voor Arbeidsongevallen (FAO - Occupational Accidents Fund)http://www.fao.fgov.be/
IDEA Consult, UGhent, Belconsulting and VUB by order of the Department of Agriculture and Fisheries (2008) Ex post evaluatie van het Vlaams plattelandsontwikkelingsprogramma 2000-2006, Agriculture and Fisheries Policy Area, Division for Agricultural Policy Analysis, Brussels.
Lenders S., D’hooghe J., Van Gijseghem D. & Overloop S. (2008) Milieudruk in de landbouw op basis van gegevens van het Landbouwmonitoringsnetwerk 2005, Agriculture and Fisheries Policy Area, Division for Agricultural Policy Analysis, Brussels.
Land-enTuinbouw09_EN.indd 95Land-enTuinbouw09_EN.indd 95 09-03-2010 15:20:5209-03-2010 15:20:52

96
Messely L., Lenders S. & Carels K. (2008) Water in de Vlaamse land- en tuinbouw, Department of Agriculture and Fisheries, Division for Agricultural Policy Analysis, Brussels.
Meul, M., Nevens, F. & Hofman, G. (2006) Indicatoren voor duurzaam watergebruik op Vlaamse land- en tuinbouwbedrijven, Steunpunt Duurzame Landbouw (Policy Research Centre for Sustainable Agriculture).
Platteau J., Van Bogaert T. & Van Gijseghem D. (reds.) (2008) Landbouwrapport 2008, Department of Agriculture and Fisheries, Brussels.
Van Bogaert T., Janssens J., Platteau J. & Samborski V. (2009) Agrohandelsrapport 2008, Agriculture and Fisheries Policy Area, Division for Agricultural Policy Analysis, Brussels.
Van Dingenen K., Wautelet A., Vermeire B. & Gellynck X. (2008) Analyserapport voor het agribusinesscomplex in Vlaanderen, Department of Agriculture and Fisheries, Division for Agricultural Policy Analysis, Brussels.
Van Huylenbroeck G., Reymen D., Vandermeulen V., Van Dingenen K., Verspecht A. & Vuylsteke A. (2007) Toestandsrapport voor verbrede landbouw. Analyse van de beschikbare informatie inzake de verschillende groepen verbrede landbouwactiviteiten, Ghent University, Idea Consult, Brussels.
Van Steertegem M. (fi nal ed.) (2009) MIRA-T 2008 Indicatorrapport, Milieurapport Vlaanderen, Flemish Environment Company. www.milieurapport.be
Van Zeebroeck M., Carels K., Samborski V. & Danckaert S. (2009) Vlaams Programma voor Plattelandsontwikkeling 2007-2013, Jaarverslag 2008, Agriculture and Fisheries Policy Area, Division for Agricultural Policy Analysis, Brussels.
Vlaams landbouwinvesteringsfonds (2009) Activiteitenverslag 2008, Agriculture and Fisheries Policy Area, Agency for Agriculture and Fisheries, Structure and Investments Division, Brussels.
Vlaamse Landmaatschappij (Flemish Land Company)www.vlm.be
Land-enTuinbouw09_EN.indd 96Land-enTuinbouw09_EN.indd 96 09-03-2010 15:20:5209-03-2010 15:20:52

Colophon
Agriculture and Horticulture in Flanders 2009.Pocket Agricultural Indicators
Editorial staff: Jonathan Platteau, Tom Van Bogaert
Design and printing: Pen Vosselaar
Visual material: Agriculture and Fisheries Policy Area
Copywriting number: D/2009/3241/419
Publisher: Jules Van Lieff eringe
Secretary-General
Department of Agriculture and Fisheries
Department of Agriculture and FisheriesDivision for Agricultural Policy AnalysisKoning Albert II - laan 35, bus 401030 Brussels
E-mail: [email protected]: www.vlaanderen.be/landbouwTel: +32 2 552 7820Fax: +32 2 552 7821
The reproduction and/or use of the data are allowed provided that the source is expressly stated:Platteau J. & Van Bogaert T. (eds.) (2009) Agriculture and Horticulture in Flanders 2009. Pocket Agricultural Indicators, Department of Agriculture and Fisheries, Brussels.
Agriculture and Horticulture in Flanders 2009. Pocket Agricultural Indicators is also available on www.vlaanderen.be/landbouw (Section Beleid – Beleidsvoorbereidende studies)
www.vlaanderen.be/landbouw
Flemish GovernmentDepartment of Agriculture and Fisheries
CoverEngFR.indd 2CoverEngFR.indd 2 09-03-2010 14:29:0609-03-2010 14:29:06
Copyright © 2022 FDOKUMEN