FLOW BEHAVIOR OF GUAVA PUREE AS A FUNCTION OF TEMPERATURE AND CONCENTRATION
15
FLOW BEHAVIOR OF GUAVA PUREE AS A FUNCTION OF TEMPERATURE AND CONCENTRATION ALFRED0 A. VITAL1 Instituto de Tecnologia de Alimentos, Caixa Postal 139 13.100 Campinas, SP, Brazil AND M. A. RAO Institute of Food Science and NYS Agricultural Experiment Station Cor- nell University Geneva, N Y 14456 (Manuscript received October 2, 1981; in final form April 14, 1982) ABSTRACT Flow behavior of guava puree was determined with a tube viscometer. The puree samples (9.8- 16.0’ Brix) exhibited shear-thinning behavior. The flow behavior index of the power law model was nearly constant for all the samples over a temperature range of 25-60’C; its mean value was 0.43 with a standard deviation of 0.031. The apparent viscosity decreased with in- crease in temperature and the activation energy offlow was found to be 3.7 kcallg mole. The apparent viscosity increased as the concentration of the purees was increased; the increase was proportional to concentration raised to a power of 2.7. The Mizrahi-Berk model described well the flow data of the purees. The magnitude of the shear rate exponent was about 0.48, indicating that the purees were suspensions in shear-thinning media. INTRODUCTION The flow behavior of fluid foods is important in quality control, correlation with sensory properties, and engineering calculations re- lated to the handling of the foods. For example, the applicable rheological models must be known for the calculation of pressure drop in flow lines. The effect of temperature on the flow behavior must be known in the design of continuous sterilizers (Guariguata et al. 1979; Simpson and Williams 1974). The effect of temperature and con- centration on apparent viscosity will be useful in applications such as the concentration of fluid foods. Journcil ot Texture Studtes 13 (1982) 275-289. All Rights Reserued. 0 Copwight 1982 bv Food & Nutrition Press, Inc., W’estport. Connecticut. 275
-
Upload
independent -
Category
Documents
-
view
2 -
download
0
Transcript of FLOW BEHAVIOR OF GUAVA PUREE AS A FUNCTION OF TEMPERATURE AND CONCENTRATION

FLOW BEHAVIOR OF GUAVA PUREE AS A FUNCTION OF TEMPERATURE
AND CONCENTRATION
ALFRED0 A. VITAL1 Instituto de Tecnologia de Alimentos, Caixa Postal 139
13.100 Campinas, SP, Brazil
A N D
M . A. RAO Institute of Food Science and NYS Agricultural Experiment Station Cor-
nell University Geneva, N Y 14456
(Manuscript received October 2, 1981; in final form April 14, 1982)
ABSTRACT
Flow behavior of guava puree was determined with a tube viscometer. The puree samples (9.8- 16.0’ Brix) exhibited shear-thinning behavior. The flow behavior index of the power law model was nearly constant for all the samples over a temperature range of 25-60’C; its mean value was 0.43 with a standard deviation of 0.031. The apparent viscosity decreased with in- crease in temperature and the activation energy offlow was found to be 3.7 kcallg mole. The apparent viscosity increased as the concentration of the purees was increased; the increase was proportional to concentration raised to a power of 2.7. The Mizrahi-Berk model described well the flow data of the purees. The magnitude of the shear rate exponent was about 0.48, indicating that the purees were suspensions in shear- thinning media.
INTRODUCTION
The flow behavior of fluid foods is important in quality control, correlation with sensory properties, and engineering calculations re- lated to the handling of the foods. For example, the applicable rheological models must be known for the calculation of pressure drop in flow lines. The effect of temperature on the flow behavior must be known in the design of continuous sterilizers (Guariguata et al. 1979; Simpson and Williams 1974). The effect of temperature and con- centration on apparent viscosity will be useful in applications such as the concentration of fluid foods.
Journcil ot Texture Studtes 13 (1982) 275-289. All Rights Reserued. 0 Copwight 1982 bv Food & Nutrition Press, Inc., W’estport. Connecticut. 275

276 ALFRED0 A. VITAL1 and M. A. RAO
Reviews on the rheology of fluid foods (Holdsworth 197 1 ; Jimenez and Duran 1979; Rao 1977a) indicate that relatively few studies have been conducted on tropical fruit purees. In the case of guava puree, the studies (Brekke et al. 1978; Garcia et al. 1974; Rao et al. 1974) have been conducted a t either one temperature or one concentration.
Tube viscometers have been used in a number of studies (Brekke et al. 1978; Charm 1960; Rao et al. 1974; Saravacos 1968) on the flow behavior of pureed foods. They are relatively inexpensive and can provide reliable rheological data. However, they must be constructed such that pressure losses due to fittings and developing flow are eliminated (Rao et al. 1974; Rao 1977b).
The major objectives of the present study were: (1) to determine the flow properties of guava puree as a function of temperature and concentration by means of a well designed tube viscometer, and (2) to determine the applicability of the simple power law model, Casson model, and the Mizrahi-Berk model. Whereas the applicability of the simple power law and Casson models has been studied for a number of foods (Rao 1977b), the applicability of the Mizrahi-Berk model has been studied only for concentrated orange juice (Mizrahi and Berk 1970).
MATERIALS AND METHODS
Experimental
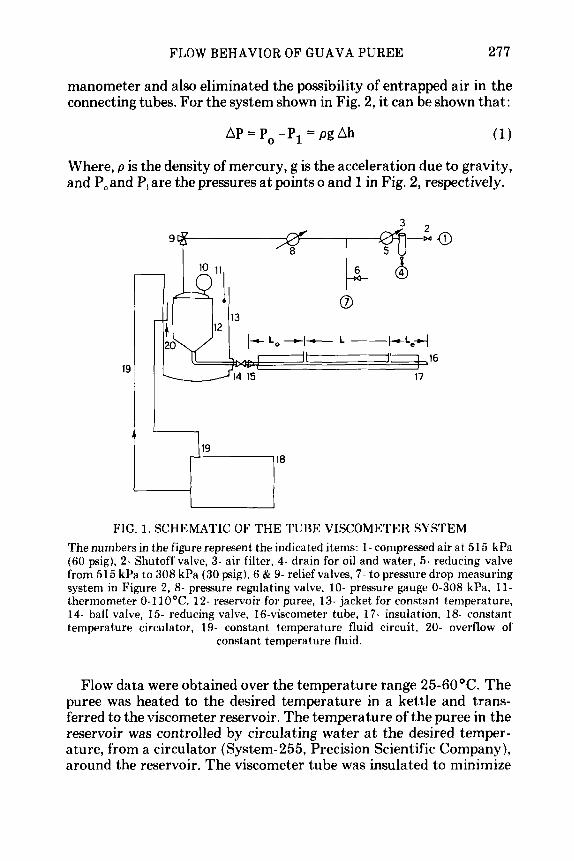
Figure 1 is a schematic representation of the tube viscometer system employed. The sample of puree contained in a large reservoir (17.2 liter capacity) was allowed to flow through the 0.49 cm diameter viscometer tube a t different flow rates. An entrance length (L, ) of 74.0 cm was provided to allow for fully developed flow. The pressure drop ( A P ) over a fixed length (L) 63.5 cm of the tube was measured for each volumetric flow rate (Q) of the puree. Different volumetric flow rates were obtained by employing different pressures in the res- ervoir. The procedures were similar to those employed in earlier studies (Brekke et al. 1978; Rao et nl. 1974; Saravacos 1968).
The pressure drop was measured with a mercury manometer sys- tem. In this system (Fig. 2), laboratory compressed air was employed to equalize the puree levels in the two vertical tubes and the pressure drop due to flow over the length L resulted in a difference in the levels of mercury ( A h ) in the U-tube manometer. This arrangement pre- vented the puree from coming in contact with the mercury in the
FLOW BEHAVIOR OF GUAVA PUREE 277
manometer and also eliminated the possibility of entrapped air in the connecting tubes. For the system shown in Fig. 2, it can be shown that:
A P = P , -PI =pgAh (1)
Where, p is the density of mercury, g is the acceleration due to gravity, and P,and P, are the pressures at points o and 1 in Fig. 2, respectively.
FIG. 1. SCHEMATIC O F T H E TUBE VISCOMETER SYSTEM The numbers in the figure represent the indicated items: 1- compressed air a t 51 5 kPa (60 psig), 2- Shutoff valve, 3- air filter, 4- drain for oil and water, 5- reducing valve from 515 kPa to 308 kPa (30 psig), 6 & 9- relief valves, 7- to pressure drop measuring system in Figure 2, 8- pressure regulating valve, 10- pressure gauge 0-308 kPa, 11- thermometer 0-1 10°C, 12- reservoir for puree, 13- jacket for constant temperature, 14- ball valve, 15- reducing valve, 16-viscometer tube, 17- insulation, 18- constant temperature circulator, 19- constant temperature fluid circuit, 20- overflow of
constant temperature fluid.
Flow data were obtained over the temperature range 25-60°C. The puree was heated to the desired temperature in a kettle and trans- ferred to the viscometer reservoir. The temperature of the puree in the reservoir was controlled by circulating water a t the desired temper- ature, from a circulator (System-255, Precision Scientific Company), around the reservoir. The viscometer tube was insulated to minimize

278 ALFRED0 A. VITAL1 and M. A. RAO
heat losses and in most experiments the temperature of the puree at the end of the tube was within 0.5'C of that in the reservoir; in a few experiments a t high temperatures the difference in the temperature was about 1 'C.
FIG. 2. MERCURY MANOMETER SYSTEM FOR MEASURING THE PRESSURE DIFFERENCE DUE TO FLOW
The numbers in the figures refer to the indicated items: 1 - reducing valves 0- 308 kPa (30 psig), 2- flasks to transmit pressures and collect accidental flow of puree, and
7- compressed air system in Figure 1.
Pasteurized guava puree (9.8' Brix) made from a single lot of fruit was obtained from a local processor. The fruit known locally as 'ver- melha' is of an indeterminate variety and it is cultivated for com- mercial use near Jundiai in the State of Sao Paulo. The puree was made by cooking washed fruit for 10 min a t 100°C in a continuous cooker (Therma-screw). The resulting mass was passed through a depulper equipped with a 1.5 mm screen to remove seeds and other large particles, and through a finisher with 0.5 mm screen to remove fibers and pieces of skin. The puree was heated to 90'C in a kettle and sealed in 18 kg cans. Higher puree concentrations (up to 16' Brix) were prepared by concentrating the 9.8' Brix puree in a scraper equipped vacuum kettle (Groen, Dover Corp.) a t about 45'C.

FLOW BEHAVIOR OF GUAVA PUREE 279
The density of each sample was determined from its weight in a 500 ml graduated cylinder whose actual volume was determined with distilled water a t 20'C. Total solids, pectin content and degree of methoxylation in the 9.8' Brix puree were determined using the methods described by Horwitz (1975) and Owens et al. (1952), re- spectively. The proportion of suspended pulp in 9.8' Brix puree was determined after diluting the puree with an equal volume of water. About 1Og of the diluted sample was centrifuged for 15 min a t 3,000 X g. The supernatant liquid was decanted and the weight of the wet pulp was determined. Table 1 contains the results of the above analysis.
Table 1 . Physical and chemical characteristics of unconcentrated guava puree
Soluhle solids 9.8'Brix Total solids 10.4% ' Suspended solids 30.0% ' Pectin 0.5 Degree of methoxylation 28.3%
Calculation of Shear Stress and Shear Rate
The shear stress 7, was calculated from the relation:
D AP =- rw 4L
where D = diameter of tube:
The shear rate was calculated by first determining the slope of the plot: log (32Q/rD3) vs. log 7, by linear regression analysis. The slope (n) was used to estimate the true shear rate (9 ) from the pseudo-shear rate ( 32Q/rD3 ) by means of the Weissenberg-Rabinowitch-Mooney equation for power law fluids:
+ = - 3n+l __ 32Q 4n nD3 (3)

280 ALFRED0 A. VITAL1 and M. A. RAO
The justification for using these methods can be found in a number of texts (e.g., Brodkey 1967; Van Wazer et al. 1963).
Flow Models for the Purees The simple power law model (Eq. 4) has been used extensively to
characterize the flow behavior of fluid foods (Holdsworth 1971; Rao 1977a). For this reason, the applicability of this model to guava purees was studied.
7 = Kj" (4)
Where: T is the shear stress (N/m2), $ is the shear rate (s-' ), K is the consistency index (N.s"/m2), and n is the flow behavior index (di- mensionless). The Casson model (Eq. 5 ) has been employed to deter- mine the yield stress of chocolate and other foods (Rao 1977a). Its applicability to guava purees was studied to determine the magnitudes of the Casson yield stress (7, = K2J. Linear regression methods were used to determine the parameters of the simple power law and Casson models.
The applicability of the Mizrahi-Berk model (Eq. 6) to the flow data was studied using a nonlinear regression program (Niebergall et al. 1971).
The parameters KoM, K,, and m in Eq. (6) were determined em- ploying the results from the power law and Casson models as initial estimates in the computer program. All the computations were per- formed on a Prime 400 digital computer.
RESULTS AND DISCUSSION
Applicability of Power Law Model The power law model (Eq. 4) described well the shear rate-shear
stress data on all the puree samples. The magnitudes of the correlation coefficients were between 0.986 and 0.999. Figure 3 illustrates the applicability of the power law model to one set of data; it also illus- trates the very high shear rates obtained with the viscometer, a

FLOW BEHAVIOR OF GUAVA PUREE 28 1
characteristic of tube and capillary viscometers (Rao 1977b). The magnitude of the flow behavior index (FI) was nearly constant for all the puree samples; its mean value was 0.43 with a standard deviation of 0.031. Because the magnitude of FI of the purees was less than 1.0, the purees were shear-thinning (pseudoplastic) fluids.
100
G U A V A PUREE
12 " B R I X , 30°C
G U A V A PUREE
12 " B R I X , 30°C
r = 0.999 1 10 1
10 lo3 4 lo3
SHEAR RATE, s-'
FIG. 3. APPLICABILITY OF POWER LAW MODEL TO FLOW DATA ON A 12' BRIX PUREE AT 30°C
The virtual invariance of the magnitude of FI has been found in other fruit purees. For pear puree of 18.3-45.8% solids content and between 32-82OC, a mean FI value of 0.466 with a standard deviation of 0.014 was found (Harper and Lebermann 1962). For peach puree of 15.4-24.9% solids content and between 4.5-6OoC, a mean FI value of 0.360 with a standard deviation of 0.059 was found (Watson 1968).
Effect of Temperature and Concentration on Apparent Viscosity
by the Arrhenius relationship (Rao 1977a): The effect of temperature on the apparent viscosity can be described
Where, 9, is the apparent viscosity a t a specific shear rate, 9 , is a constant, E, is the activation energy of flow, R is the gas constant, and

282 ALFRED0 A. VITAL1 and M. A. RAO
T is the absolute temperature. Harper and El Sahrigi (1965) and Rao et al. (1981) found that apparent viscosity and concentration can be correlated by a log-log (power type) relationship. And therefore, the effects of temperature and concentration on apparent viscosity can be combined into a single equation:
(8)
The apparent viscosity of the purees a t a shear rate of 100 s“ was
qa = a exp (E,IRT)C@
Where Q and f l are constants, and C is the concentration in ‘Brix.
calculated using the power law parameters by means of the equation:
Employing this apparent viscosity, the concentration of the purees in ‘Brix, and temperature in O K , the magnitudes of the parameters a, and f l were estimated by multiple linear regression analysis of the logarithmic form of Eq. (8). These magnitudes as well as those for other pureed foods are in Table 2; the magnitudes for pear puree and concentrated passion fruit juice were calculated by the authors from the published data.
Table 2 shows that as the suspended solids are increased the mag- nitude of E, decreases. In general, the magnitudes of E,for concen- trated fruit juices will be higher than those for fruit and vegetable purees because the juices are depectinized and filtered prior to con- centration and thus have lower suspended solids. This can be seen in Table 2 by comparing the magnitudes of E, for tomato concentrates (Harper and El Sahrigi 1965, Rao et al. 1981) with that for concen- trated passion fruit juice (Vitali et al. 1974). The higher magnitude of E, for passion fruit juice relative to that for guava puree is due to the finer pulp in the former resulting from homogenization of the con- centrates (Vitali et al. 1974). These trends can be observed also in the data of Saravacos (1970) on 50’ Brix “cloudy”, and depectinized and filtered apple juice; the magnitude of E, for the former was 6.1 kcal/g mole and for the latter it was 8.4 kcal/g mole.
Effect of Temperature and Concentration on Consistency Index
Because FI was practically constant, an equation relating the con- sistency index to temperature and concentration will permit the cal- culation of apparent viscosity, by means of Eq. (9), as a function of shear rate. The effect of temperature and concentration on the con- sistency index, K, was determined in a manner similar to that for

Tab
le 2
. Mag
nitu
des o
f m
ean
valu
es o
f fl
ow b
ehav
ior
inde
x, a
nd p
aram
eter
s re
lati
ng a
ppar
ent v
isco
sity
to
tem
pera
ture
and
co
ncen
trat
ion
for
frui
t an
d ve
geta
ble
pure
es (
Eq.
8)
Con
cent
rati
on
Ran
ge
Mea
n V
alue
Ed
Prod
uct
('Bri
x)
ofn
a
(kca
l/gr
noie
) @
r R
efer
ence
Gua
va p
uree
9.
8- 16
.0
0.43
5.
46
10.'
3.7
2.7
0.98
5 Pr
esen
t stu
dy
Pear
pur
ee
18.3
-45.
8 0.
47
9.77
10.'
2.6
2.8
0.99
5 H
arpe
r an
d
VF6
tom
ato
pure
e 5.
8-30
.0
0.43
3.
06 x
1W5
2.0
2.1
0.99
4 H
arpe
r an
d
Nov
a to
mat
o pu
ree
5.6-
36.0
0.
26
1.30
x 2.
2 2.
6 0.
994
Rao
et a
l. (
1981
) Pa
ssio
n fr
uit j
uice
15
.6-3
3.4
0.45
-0.8
8 5.
90 x
10.
' 3.
8 3.1
0.99
9 V
itali
et a
l. (1
974)
'App
aren
t vis
cosi
ty s
stin
iate
tl a
t a
shea
r ra
te o
f' 1
00
s.'
. IJn
its
of' a
ppar
ent
visc
osit
y ar
e P
a.s
Leb
erm
ann
(196
2)
El S
ahri
gi (
1965
)
to
00
W

284 ALFRED0 A. VITAL1 and M. A. RAO
apparent viscosity. The magnitudes of the concentration exponent and the activation energy of flow were determined to be 3.0 and 3.7 kcal/g mole, respectively. The correlation coefficient for the regression was 0.969. One can determine the apparent viscosity a t any shear rate, concentration, and temperature from the relationship:
(10)
Magnitudes of apparent viscosity (at 100s.') calculated using Eq. (10) were within 10% of the experimental values for 20 out of the 29 tests and between 10% and 20% for the rest. Using Eq. (8) and the appropriate coefficients, the calculated apparent viscosity were within 10% of the experimental values for 23 out of the 29 tests and between 10% and 20% for the rest. For the convenience of including the effect of shear rate, Eq. (10) is slightly less precise than Eq. (8). It is em- phasized that these equations are valid only for the range of experi- mental variables employed in the study.
qa = 3.64 x 10 - 6 C3.0 exp (3,670/RT)/j.0-58
Applicability of Casson and Mizrahi-Berk Models The yield value or yield stress is a desirable characteristic of jams,
jellies, and other foods prepared from fruit products. For this reason it is desirable to study the applicability of flow models with a yield term in them.
The Casson model (Eq. 5) described the flow data well with the correlation coefficients ranging between 0.968 and 0.997. These magnitudes are slightly lower than those for the simple power law (Eq. 4). Figure 4 illustrates the fit of Casson model to the experimental data of one run.
The Casson model has been derived for a system of interacting particles in a Newtonian fluid. The guava purees contained pectin (Table 1 ) and hence they were made up of suspended solids in non- Newtonian media. A recent study on tomato concentrates (Rao et al. 1981) showed that the Casson model does not fit flow data at low shear rates, typically below 1 s-I. In the present study, the shear rates were well above 1 s-' and the Casson model fits these data reasonably well.
The Mizrahi-Berk (M-B) model (Eq. 6) has been derived in a manner similar to the Casson model except that the suspended solids are assumed to be in a shear-thinning (pseudoplastic) medium (Miz- rahi and Berk 1972). The applicability of the M-B model to flow data on orange juice has been well demonstrated (Mizrahi and Berk 1970, 1972) but its applicability to other foods has not been demonstrated.

FLOW BEHAVIOR OF GUAVA PUREE 28 5
12
10
6
6
2 -
0
Y 0
- 13
11
9
7
5
- 3
- 1
- M - 8 MODEL, r = 0 986, m = 0 481 -
1 -
- - I I I I I I I I I I
; ;; . , .B, Y
H b , . ,
4 , ,
15 14 - CASSON MODEL. I ‘ = 0.985
FIG. 4. APPLICABILlTY OF CASSON AND MIZRAHI-BERK MODELS TO FLOW DATA ON 12’ BRIX PUREE A T 3OoC
Mizrahi and Firstenberg (1975) found that the sum of the squares of the difference between the experimental and predicted values of TO
were lower when the magnitude of the exponent m was lower than 0.5 than when m was greater than 0.5. This observation is in agreement with the derivation of the model which allows for a maximum value of 0.5 for m in the case of suspensions in Newtonian media and m less than 0.5 in the case of suspensions in shear-thinning media. Because of the dissolved pectin, guava purees are suspensions in a pseudoplastic medium.
For the guava purees, initial values of m of 0.48 were found to be satisfactory in the nonlinear regression analysis program. Further, in agreement with the results of Mizrahi and Firstenberg (1975) the sum of the squares of the difference between the experimental and pre- dicted 7”’ values were lower than when m was assigned magnitudes higher than 0.5. For example, the magnitudes of the sum of the squares of the difference for test # 12 were 0.380 and 2.46 for values of m of 0.48 and 0.84, respectively.
To facilitate comparison of the M-B model with the Casson model, the f i t of M-B model is also shown in Fig. 4 and the improvement in the fit is slight. Again, the lack of experimental data below a shear rate of about 100 s-’did not permit evaluation of the true capabilities of the M-B model. Further, the relatively few data points in each test ((10)

286 ALFRED0 A. VITAL1 and M. A. RAO
did not permit the accurate evaluation of the model's parameters by means of nonlinear regression analysis.
In spite of the limitations cited above, the M-B model well describes the flow data on the purees. The magnitude of the parameter m for all the purees was about 0.480. Over the limited range of concentration employed and a t a temperature of 31 f 1 O C , the parameter K,, in- creased linearly with concentration (Fig. 5). Mizrahi and Firstenberg (1975) also observed a similar relationship for orange juice for fixed values of the relative viscosity of the serum; serum was defined as the supernatant of a 11 OBrix sample that was centrifuged. In this study, the relative viscosity of the puree serum was not varied. The magni- tude of the parameter KM a t 31 1 l0C appears to increase exponen- tially with concentration (Fig. 6). However, additional work is re- quired to verify this preliminary finding. Equations 11 and 12 de- scribe the relationship between 'Brix on one hand and KO, and K, on the other, respectively:
KO, = 0.54 + 0.29 "Brix
K, = 5.51 x exp (0.25 "Brix)
9 10 11 12 13 14 15 16
"BRIX
FIG. 5. VARIATION OF T H E PARAMETER K $,M WITH CONCEN'I'RATION OF T H E I'IJREES

FLOW BEHAVIOR OF GUAVA PUREE 287
0.03 I I I I I I 9 10 11 12 13 14 IS 16
" B R I X
FIG. 6. VARIATION OF T H E PARAMETER K WITH CONCENTRATION OF T H E P U R E E S
CONCLUDING REMARKS
The simple power law, Casson, and Mizrahi-Berk models described the flow behavior of guava purees. The effect of temperature and concentration on the apparent viscosity of the purees can be described by a single equation (Eq. 8). The activation energy of flow for the puree was about the same as for passion fruit juice deduced from the data of Vitali et al. (1974) and the exponent on concentration was about the same in magnitude as for pear puree (Harper and Leber- mann 1962) and Nova tomato concentrates (Rao et al. 1981). The consistency index of the power law model also could be related to temperature and concentration by an analogous equation. The Mizrahi-Berk model (Eq. 6 ) described the flow data well and the magnitude of the exponent m was about 0.48. This magnitude being less than 0.5 is consistent with the concept that the purees are sus- pensions in a pseudoplastic medium.

288 A L F R E D 0 A. VITAL1 and M. A. RAO
ACKNOWLEDGMENTS
A fellowship from the Conselho Nacional de Desenvolvimento Cientifico e Tecnologico ( to AAV) and a research grant from the Commission for Educational Exchange between Brazil and the U.S.A. (Fulbright Commission) ( to MAR) a re gratefully acknowledged. Denise C.P. Jardim and Tulio C. Flora helped in the experimental portion of this study. B. Giovanetti contributed t o many stimulating discussions.
REFERENCES
BREKKE, J. E., MYERS, A. E. and AQUINO, C. R. N. 1978. Viscometric behavior of guava purees and concentrates. J. Food Sci. 43, 272-273.
BRODKEY, R. S. 1967. The Phenomena of Fluid Motions. Addison- Wesley, Reading, Mass.
CHARM, S. E. 1960. Viscometry of non-Newtonian food materials. Food Res. 25, 351-362.
GARCIA, R., RIVERA, J . and ROLZ, C. 1974. Rheological properties of some tropical fruit products and their enzymic clarification. Proc. 4th Int. Congress Food Sci. Technol. 2,18-26.
GUARIGUATA, C., BARREIRO, J. A. and GUARIGUATA, G. 1979. Analysis of continuous sterilization processes for Bingham Plastic fluids in laminar flow. J. Food Sci. 44, 905-910.
HARPER, J. C. and EL SAHRIGI, A. F. 1965. Viscometric behavior of tomato concentrates. J. Food Sci. 30, 470-476.
HARPER, J. C. and LEBERMANN, K. W. 1962. Rheological behavior of pear purees. Proc. 1st Int. Congress Food Sci. Technol. 1, 719-728.
HOLDSWORTH, S. D. 1971. Applicability of rheological models to the in- terpretation of flow and processing behaviour of fluid food products. J. Texture Studies 2, 393-418.
HORWITZ, W. 1975. Official Methods of Analysis of the Association of Official Analytical Chemists, 12th Ed., Washington DC.
JIMENEZ, G. and DURAN, L. 1979. Propriedades reologicas de produtos derivados de frutas y de tomate. Revision bibliografica. Rev. Agroquimica y Tec. de Alimentos 19, 203-216.
MIZRAHI, S. and BERK, Z. 1970. Flow behaviour of concentrated orange juice. J . Texture Studies 1, 342-355.
MIZRAHI, S. and BERK, Z. 1972. Flow behaviour of concentrated orange juice: mathematical treatment. J. Texture Studies 3, 69-79.
MIZRAHI, S. and FIRSTENBERG, R. 1975. Effect of orange juice com- Dosition on flow behaviour of six-fold concentrate. J. Texture Studies 6, 523-532.
NIEBERGALL, P. J., SCHNAARE, R. L. and SUGITA, E. T. 1971. Non- linear regression applied to non-Newtonian flow. J. Pharmaceutical Sci. 60, 1393-1402.
FLOW BEHAVIOR OF GUAVA P U R E E 289
OWENS, H . S. et a!. 1952. Methods used a t Western Regional Research Laboratory for extraction and analysis of pectic materials. Rept. AIC-340, USDA Western Regional Laboratories, A1 bany, CA.
RAO, M. A. 1977a. Rheology of liquid foods - a review. J. Texture Studies 8, 135- 168.
RAO, M. A. 197713. Measurement of flow properties of fluid foods - devel- opments, limitations, and interpretation of phenomena. J. Texture Studies 8, 257-282.
RAO, M. A . , OTOYA PALOMINO, L. N. and BERNHARDT, L. W. 1974. Flow properties of tropical fruit purees. J. Food Sci. 39, 160-161.
RAO, M. A., BOURNE, M. C. and COOLEY, H. J. 1981. Flow properties of tomato concentrates. J. Texture Studies 12, 521-528.
SARAVACOS, G. D. 1968. Tube viscometry of fruit purees and juices. Food Technol. 22, 1585-1588.
SARAVACOS, G. D. 1970. Effect of temperature on viscosity of fruit juices and purees. J. Food Sci. 35, 122-1 25.
SIMPSON, S. G. and WILLIAMS, M. C. 1974. An analysis of high tem- perature/short time sterilization during laminar flow. J. Food Sci. 39, 1047-1054.
VAN WAZER, J. R., LYONS, J. W., KIM, K. Y. and COLWELL, R. E. 1963. Viscosity and Flow Measurement. Interscience, New York.
VITALI, A. A., ROIG, S. M. and RAO, M. A. 1974. Viscosity behavior or concentrated passion fruit juice. Confructa 19, 201-206.
WATSON, E. L. 1968. Rheological behavior of apricot purees and concen- trates. Can. Agr. Eng. 10, 8-10.