
Concentration Dependent Transformation of Pyrogallarene to ...
21
1 Supporting information for: The Inherent Structural Instability: Concentration Dependent Transformation of Pyrogallarene to Pyrogallarene Lactones Elina Kalenius,* N. Kodiah Beyeh, J. Jänis, and Kari Rissanen* Table of Contents 1. Experimental .............................................................................................. 2 2. Mass spectrometric data ............................................................................. 4 2.1 Relative abundance of 1 as a function of stock solution aging time .... 4 2.2 Profile spectra measured from 10uM solutions ..................................... 5 2.3 Relative intensity of 1and fragments as a function of stock solution aging time ................................................................................................... 6 2.4 Composition, theoretical and experimental mass values and mass accuracies of ions ........................................................................................ 7 2.5 CID dissociation of 2 and 3. ................................................................. 8 2.6 CID fragmentation pathways for ions 2 and 3. ..................................... 9 2.7 Composition, theoretical and experimental mass values and mass accuracies of the CID fragments from 2.. ................................................. 10 2.8 Composition, theoretical and experimental mass values and mass accuracies of the CID fragments from 3.. ................................................. 11 3. NMR Experiments: 1 H NMR in DMSO, 1 H 1 H COSY and 1 H 1 H NOESY NMR in CD 3 OD........................................................................................... 12 4. IR Spectra ................................................................................................ 16 5. DFT Optimizations .................................................................................. 17 6. References................................................................................................ 20 Supplementary Material (ESI) for Chemical Communications This journal is (c) The Royal Society of Chemistry 2011
-
Upload
khangminh22 -
Category
Documents
-
view
1 -
download
0
Transcript of Concentration Dependent Transformation of Pyrogallarene to ...
1
Supporting information for:
The Inherent Structural Instability: Concentration Dependent Transformation of Pyrogallarene to Pyrogallarene Lactones
Elina Kalenius,* N. Kodiah Beyeh, J. Jänis, and Kari Rissanen*
Table of Contents
1. Experimental .............................................................................................. 2
2. Mass spectrometric data ............................................................................. 4
2.1 Relative abundance of 1 as a function of stock solution aging time .... 4
2.2 Profile spectra measured from 10uM solutions ..................................... 5
2.3 Relative intensity of 1and fragments as a function of stock solution aging time ................................................................................................... 6
2.4 Composition, theoretical and experimental mass values and mass accuracies of ions ........................................................................................ 7
2.5 CID dissociation of 2 and 3. ................................................................. 8
2.6 CID fragmentation pathways for ions 2 and 3. ..................................... 9
2.7 Composition, theoretical and experimental mass values and mass accuracies of the CID fragments from 2.. ................................................. 10
2.8 Composition, theoretical and experimental mass values and mass accuracies of the CID fragments from 3.. ................................................. 11
3. NMR Experiments: 1H NMR in DMSO, 1H1H COSY and 1H1H NOESY NMR in CD3OD ........................................................................................... 12
4. IR Spectra ................................................................................................ 16
5. DFT Optimizations .................................................................................. 17
6. References ................................................................................................ 20
Supplementary Material (ESI) for Chemical CommunicationsThis journal is (c) The Royal Society of Chemistry 2011

2
1. Experimental
The synthesis and characterization of pyrogallarene 1 have been reported earlier.1 The pyrogallarene 1 was dissolved in methanol or acetonitrile. The final samples were prepared in MeOH.
The exact mass measurements, profile spectra measurements and H/D exchange reactions were performed by using an APEX Qe Fourier transform ion cyclotron resonance (FT-ICR) mass spectrometer equipped with 4.7 T superconducting magnet, Infinity® ICR cell, AP2 electrospray ion source and pre-cell quadrupole interface. The measurements and data handling were accomplished with Bruker XMASS software, version 6.0.2. The mass spectra were externally calibrated with an ES tuning mix (Hewlett Packard, Palo Alto, CA). The composition of the ions was confirmed by comparing the experimental monoisotopic m/z values and isotopic patterns with the theoretical values calculated on the basis of natural abundances. For accurate mass experiments for CID fragments the precursor ions were isolated, activated (cc-trap 15 to 35 V) and allowed to collide with Ar background gas in the pre-quadrupole. After that the ions were detected in the ICR cell. The compositions of the fragment ions were confirmed by accurate mass measurements with mass accuracy from -0.4 ppm to -6.4 ppm.
In H/D exchange ion-molecule reactions deuterated methanol (MeOD) was selected as a reagent and introduced to the ICR cell from a separate volume through an adjustable needle valve. MeOD gas flow, from volume to cell, was set to keep the cell pressure at elevated state of 5·10–8 Torr. The precursor ions were isolated in the ICR cell by using correlated harmonic excitation fields2 and single frequency excitation shots were used to obtain monoisotopic isolation of the precursor ion. Isolated ions were allowed to react with MeOD by ranging the pumping delay times from 30 to 300 s. Sixteen scans were collected when reaction delays were 60 s or less, six scans when reaction delays were longer than 60 s and two scans when reaction delay was 300 s. The variation in the number of scans did not influence the information gathered from the resulting spectra.
The MSn CID for dissociation route determination was performed by using Bruker Esquire 3000 plus QIT mass spectrometer (Bruker Daltonik, Bremen Germany) equipped with an ESI source. The sample was introduced to the ion source at a flow rate of 150 L h-1. N2 (LC-MS-NGM 11 nitrogen generator, Bruker Daltonik) was used as a nebulizing (3 psi) and counter-current (2 L min-1) drying gas. He (grade 5.6, AGA Espoo, Finland) was used as the buffer/collision gas. The fragmentation amplitudes from 0.30 to 0.70 were used. The Instrument was controlled and the data were processed by using a Bruker Daltonics Compass 1.1 for Esquire/HCT. Each spectrum was an average of spectra collected within 1 min, each of these containing 24 individual scans that were averaged before being sent from the instrument to data system.
The 1H NMR spectra were recorded by using Bruker Avance DRX 500 FT NMR spectrometer operating at 500 MHz. Measurements were done in CD3OD and DMSO-d6 at 30 ºC. For the experiment, a 5µM MeOH solution of compound 1 was prepared (10 mg in 3L) and left to stand for 2h. The MeOH was then evaporated and the residue was dried. The sample was dissolved in 0.6 mL CD3OD and the 1H NMR was measured. The sampled NMR tube was left to stand at room temperature and the 1H NMR was again measured after 7 days and 25 days respectively.
Supplementary Material (ESI) for Chemical CommunicationsThis journal is (c) The Royal Society of Chemistry 2011

3
For the measurement of IR spectra 20 µM and 2.5mM solutions of 1 were prepared in MeOH. After aging time, the solvent was evaporated and the spectra were recorded in KBr tablets by using Bruker Vertex 70 FT-IR spectrometer. The spectra were processed by using OPUS 6.5 sofware. The optimizations of 1 and the decomposition products were carried out using Gaussian 09,3 and hybrid density functional B3LYP/6-311G(d,p). The energy minimum was confirmed by the frequency calculations (only real frequencies were obtained).
Supplementary Material (ESI) for Chemical CommunicationsThis journal is (c) The Royal Society of Chemistry 2011
4
2. Mass Spectrometric Data
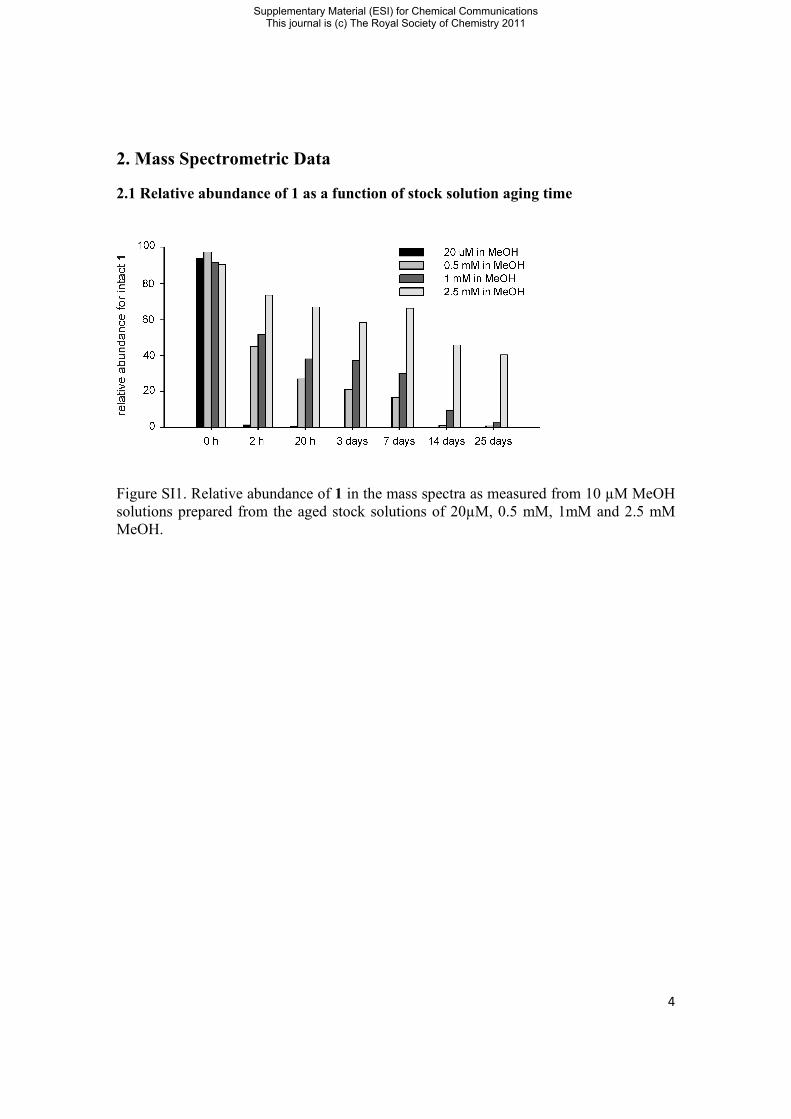
2.1 Relative abundance of 1 as a function of stock solution aging time
Figure SI1. Relative abundance of 1 in the mass spectra as measured from 10 µM MeOH solutions prepared from the aged stock solutions of 20µM, 0.5 mM, 1mM and 2.5 mM MeOH.
Supplementary Material (ESI) for Chemical CommunicationsThis journal is (c) The Royal Society of Chemistry 2011
5
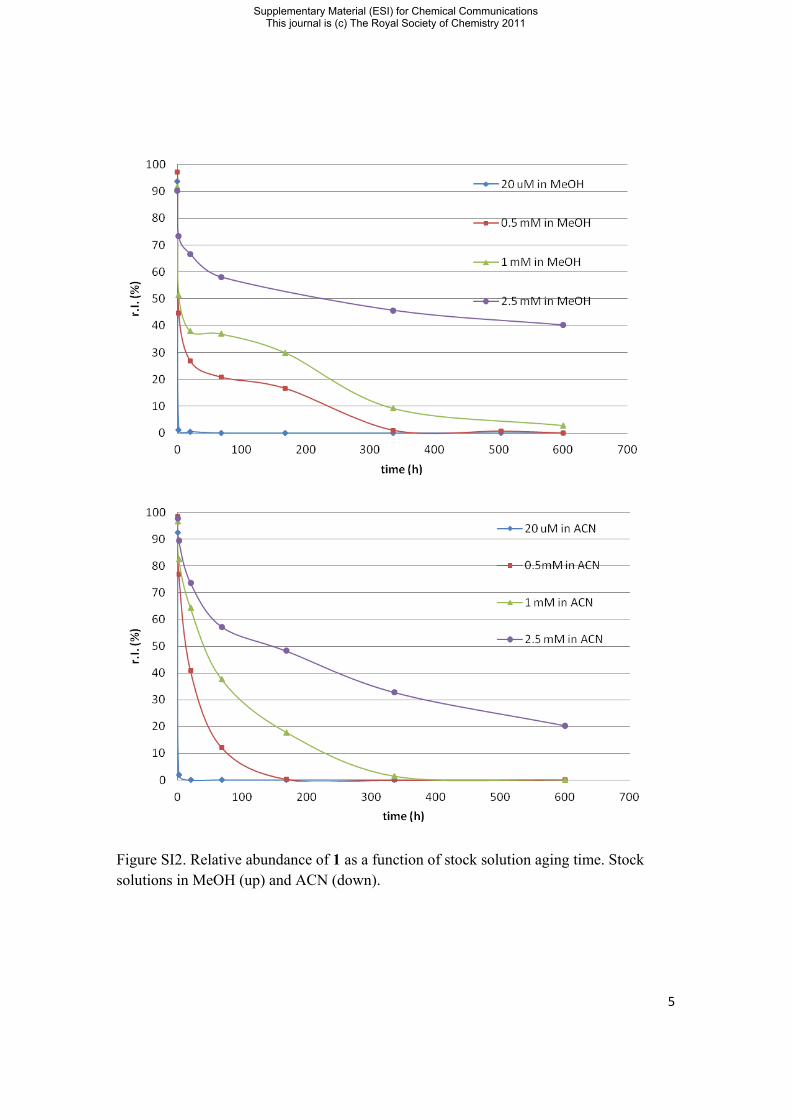
Figure SI2. Relative abundance of 1 as a function of stock solution aging time. Stock solutions in MeOH (up) and ACN (down).
Supplementary Material (ESI) for Chemical CommunicationsThis journal is (c) The Royal Society of Chemistry 2011
6
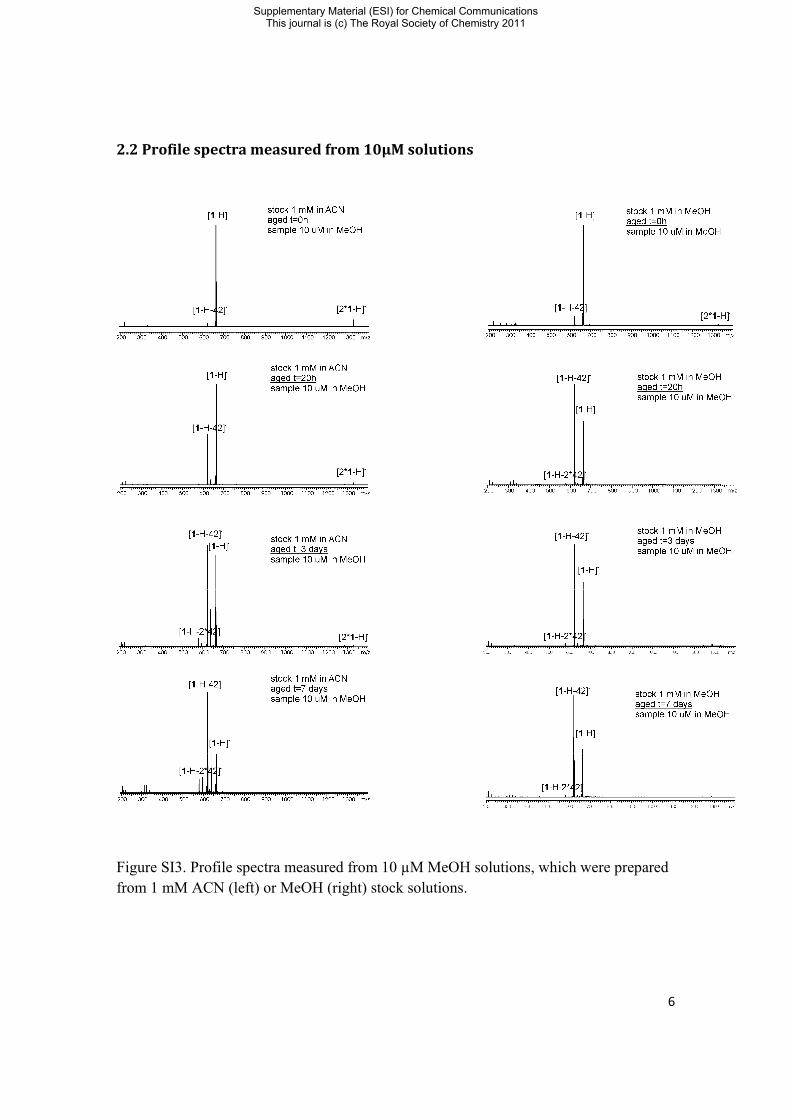
2.2 Profile spectra measured from 10µM solutions
Figure SI3. Profile spectra measured from 10 µM MeOH solutions, which were prepared from 1 mM ACN (left) or MeOH (right) stock solutions.
Supplementary Material (ESI) for Chemical CommunicationsThis journal is (c) The Royal Society of Chemistry 2011
7
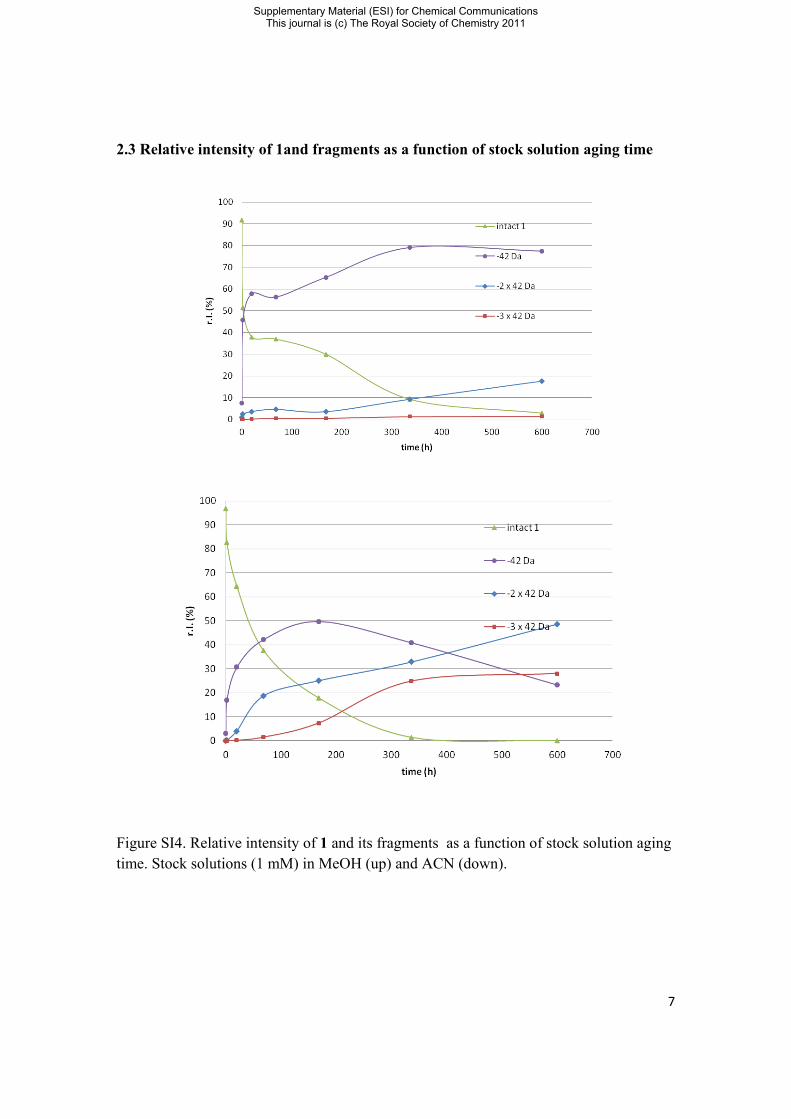
2.3 Relative intensity of 1and fragments as a function of stock solution aging time
Figure SI4. Relative intensity of 1 and its fragments as a function of stock solution aging time. Stock solutions (1 mM) in MeOH (up) and ACN (down).
Supplementary Material (ESI) for Chemical CommunicationsThis journal is (c) The Royal Society of Chemistry 2011
8
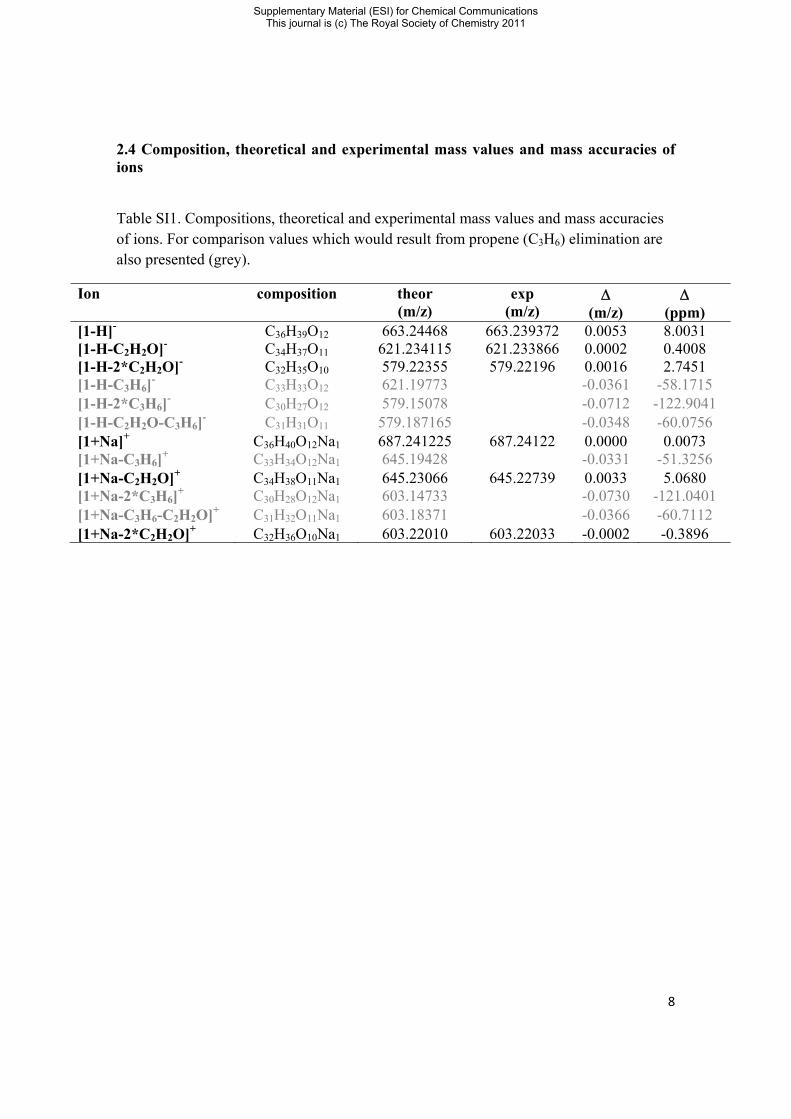
2.4 Composition, theoretical and experimental mass values and mass accuracies of ions
Table SI1. Compositions, theoretical and experimental mass values and mass accuracies of ions. For comparison values which would result from propene (C3H6) elimination are also presented (grey).
Ion composition theor (m/z)
exp (m/z)
(m/z)
(ppm)
[1-H]- C36H39O12 663.24468 663.239372 0.0053 8.0031[1-H-C2H2O]- C34H37O11 621.234115 621.233866 0.0002 0.4008[1-H-2*C2H2O]- C32H35O10 579.22355 579.22196 0.0016 2.7451[1-H-C3H6]
- C33H33O12 621.19773 -0.0361 -58.1715[1-H-2*C3H6]
- C30H27O12 579.15078 -0.0712 -122.9041[1-H-C2H2O-C3H6]
- C31H31O11 579.187165 -0.0348 -60.0756[1+Na]+ C36H40O12Na1 687.241225 687.24122 0.0000 0.0073[1+Na-C3H6]
+ C33H34O12Na1 645.19428 -0.0331 -51.3256[1+Na-C2H2O]+ C34H38O11Na1 645.23066 645.22739 0.0033 5.0680[1+Na-2*C3H6]
+ C30H28O12Na1 603.14733 -0.0730 -121.0401[1+Na-C3H6-C2H2O]+ C31H32O11Na1 603.18371 -0.0366 -60.7112[1+Na-2*C2H2O]+ C32H36O10Na1 603.22010 603.22033 -0.0002 -0.3896
Supplementary Material (ESI) for Chemical CommunicationsThis journal is (c) The Royal Society of Chemistry 2011
9
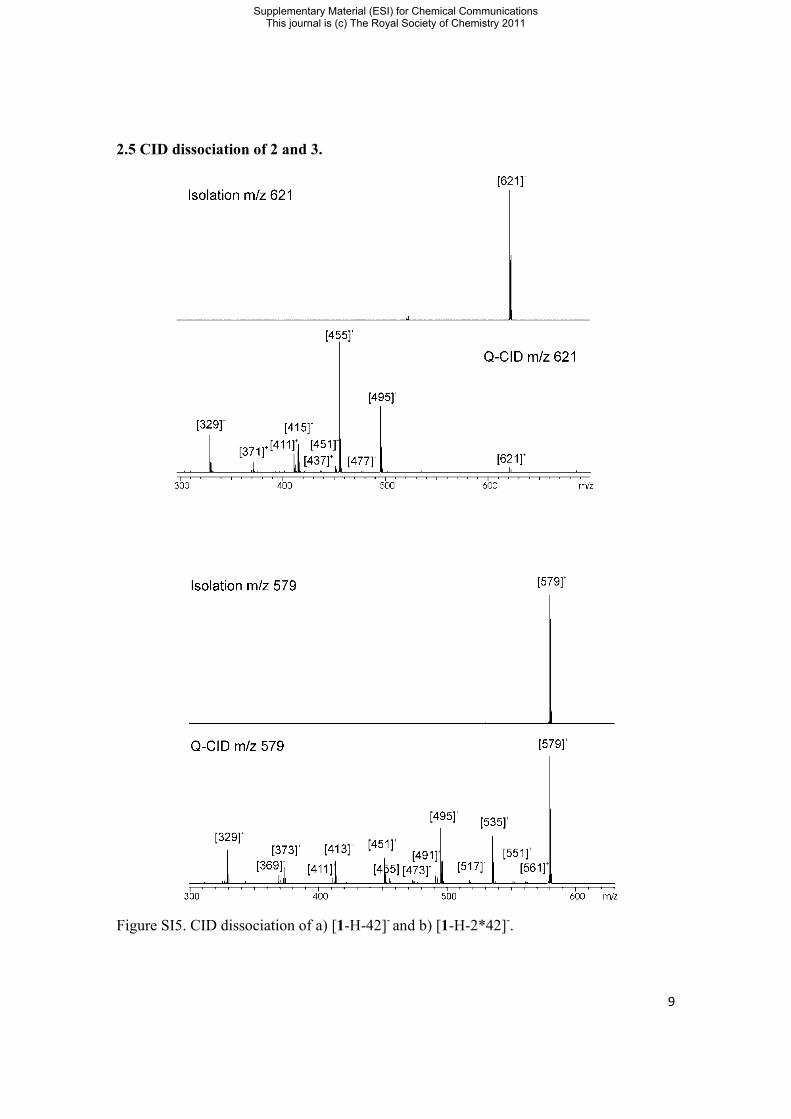
2.5 CID dissociation of 2 and 3.
Figure SI5. CID dissociation of a) [1-H-42]- and b) [1-H-2*42]-.
Supplementary Material (ESI) for Chemical CommunicationsThis journal is (c) The Royal Society of Chemistry 2011
10
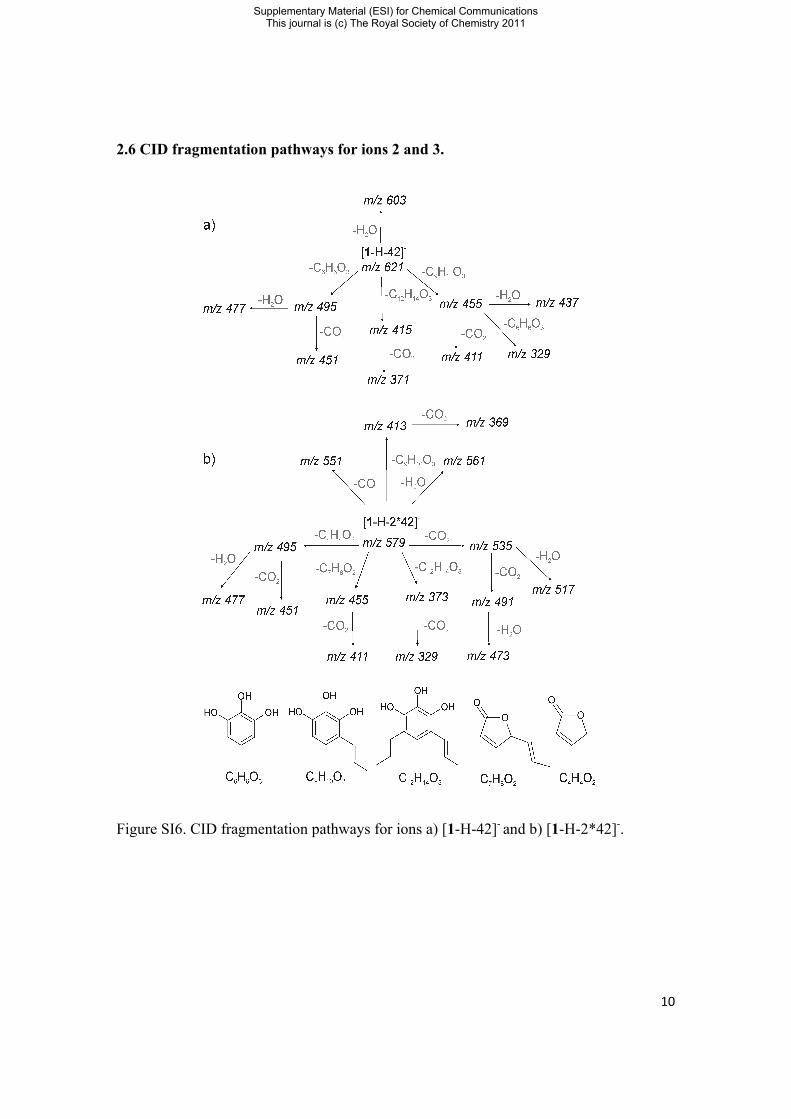
2.6 CID fragmentation pathways for ions 2 and 3.
Figure SI6. CID fragmentation pathways for ions a) [1-H-42]- and b) [1-H-2*42]-.
Supplementary Material (ESI) for Chemical CommunicationsThis journal is (c) The Royal Society of Chemistry 2011
11
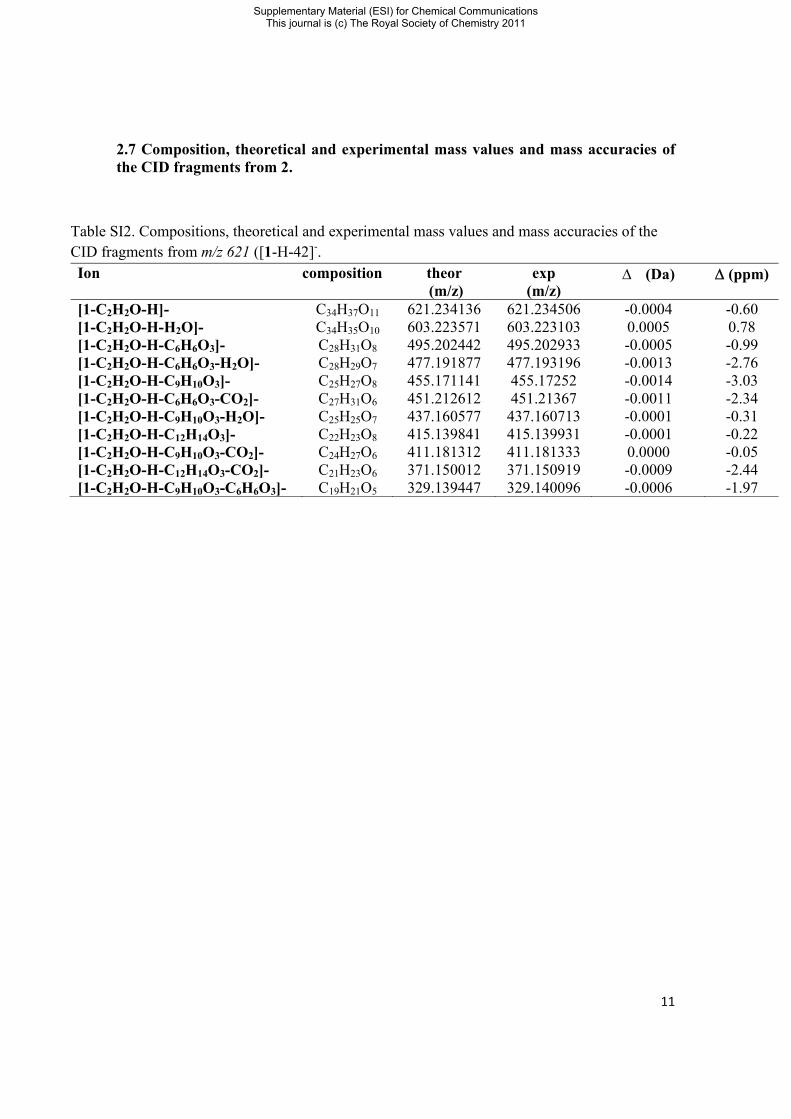
2.7 Composition, theoretical and experimental mass values and mass accuracies of the CID fragments from 2.
Table SI2. Compositions, theoretical and experimental mass values and mass accuracies of the CID fragments from m/z 621 ([1-H-42]-. Ion composition theor
(m/z)exp
(m/z) (Da) (ppm)
[1-C2H2O-H]- C34H37O11 621.234136 621.234506 -0.0004 -0.60[1-C2H2O-H-H2O]- C34H35O10 603.223571 603.223103 0.0005 0.78[1-C2H2O-H-C6H6O3]- C28H31O8 495.202442 495.202933 -0.0005 -0.99[1-C2H2O-H-C6H6O3-H2O]- C28H29O7 477.191877 477.193196 -0.0013 -2.76[1-C2H2O-H-C9H10O3]- C25H27O8 455.171141 455.17252 -0.0014 -3.03[1-C2H2O-H-C6H6O3-CO2]- C27H31O6 451.212612 451.21367 -0.0011 -2.34[1-C2H2O-H-C9H10O3-H2O]- C25H25O7 437.160577 437.160713 -0.0001 -0.31[1-C2H2O-H-C12H14O3]- C22H23O8 415.139841 415.139931 -0.0001 -0.22[1-C2H2O-H-C9H10O3-CO2]- C24H27O6 411.181312 411.181333 0.0000 -0.05[1-C2H2O-H-C12H14O3-CO2]- C21H23O6 371.150012 371.150919 -0.0009 -2.44[1-C2H2O-H-C9H10O3-C6H6O3]- C19H21O5 329.139447 329.140096 -0.0006 -1.97
Supplementary Material (ESI) for Chemical CommunicationsThis journal is (c) The Royal Society of Chemistry 2011
12
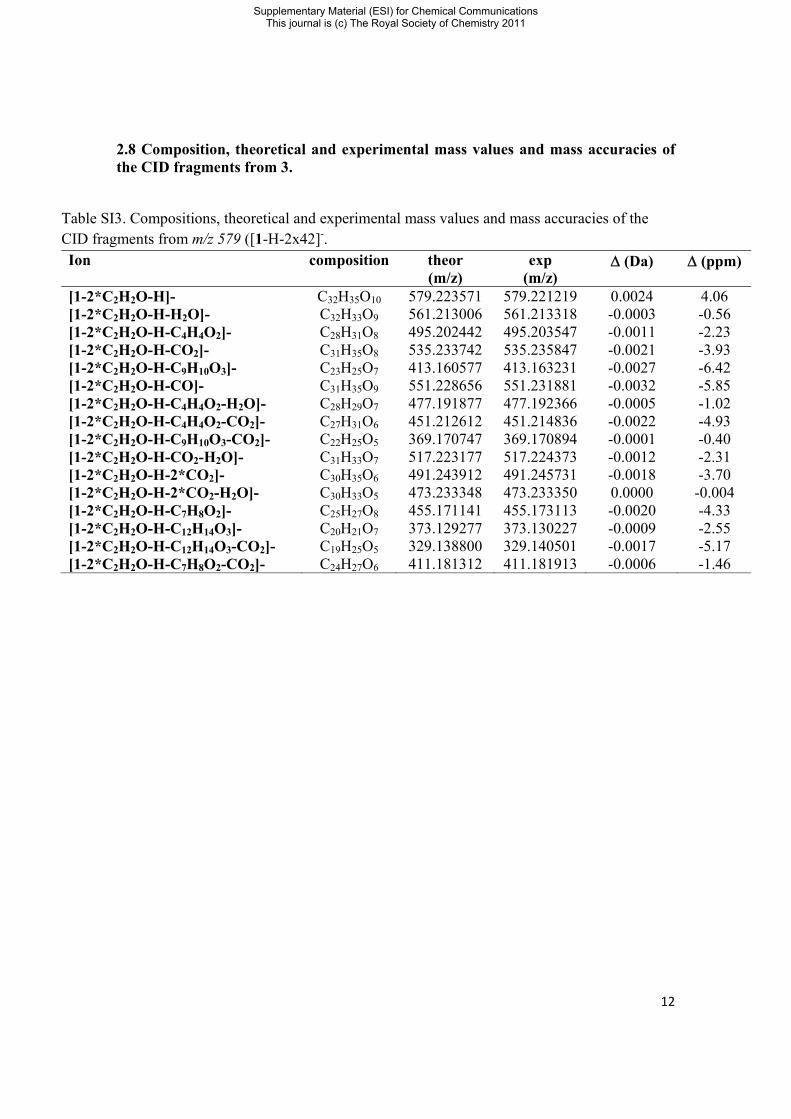
2.8 Composition, theoretical and experimental mass values and mass accuracies of the CID fragments from 3.
Table SI3. Compositions, theoretical and experimental mass values and mass accuracies of the CID fragments from m/z 579 ([1-H-2x42]-. Ion composition theor
(m/z)exp
(m/z) (Da) (ppm)
[1-2*C2H2O-H]- C32H35O10 579.223571 579.221219 0.0024 4.06[1-2*C2H2O-H-H2O]- C32H33O9 561.213006 561.213318 -0.0003 -0.56[1-2*C2H2O-H-C4H4O2]- C28H31O8 495.202442 495.203547 -0.0011 -2.23[1-2*C2H2O-H-CO2]- C31H35O8 535.233742 535.235847 -0.0021 -3.93[1-2*C2H2O-H-C9H10O3]- C23H25O7 413.160577 413.163231 -0.0027 -6.42[1-2*C2H2O-H-CO]- C31H35O9 551.228656 551.231881 -0.0032 -5.85[1-2*C2H2O-H-C4H4O2-H2O]- C28H29O7 477.191877 477.192366 -0.0005 -1.02[1-2*C2H2O-H-C4H4O2-CO2]- C27H31O6 451.212612 451.214836 -0.0022 -4.93 [1-2*C2H2O-H-C9H10O3-CO2]- C22H25O5 369.170747 369.170894 -0.0001 -0.40 [1-2*C2H2O-H-CO2-H2O]- C31H33O7 517.223177 517.224373 -0.0012 -2.31 [1-2*C2H2O-H-2*CO2]- C30H35O6 491.243912 491.245731 -0.0018 -3.70 [1-2*C2H2O-H-2*CO2-H2O]- C30H33O5 473.233348 473.233350 0.0000 -0.004 [1-2*C2H2O-H-C7H8O2]- C25H27O8 455.171141 455.173113 -0.0020 -4.33 [1-2*C2H2O-H-C12H14O3]- C20H21O7 373.129277 373.130227 -0.0009 -2.55 [1-2*C2H2O-H-C12H14O3-CO2]- C19H25O5 329.138800 329.140501 -0.0017 -5.17 [1-2*C2H2O-H-C7H8O2-CO2]- C24H27O6 411.181312 411.181913 -0.0006 -1.46
Supplementary Material (ESI) for Chemical CommunicationsThis journal is (c) The Royal Society of Chemistry 2011
13
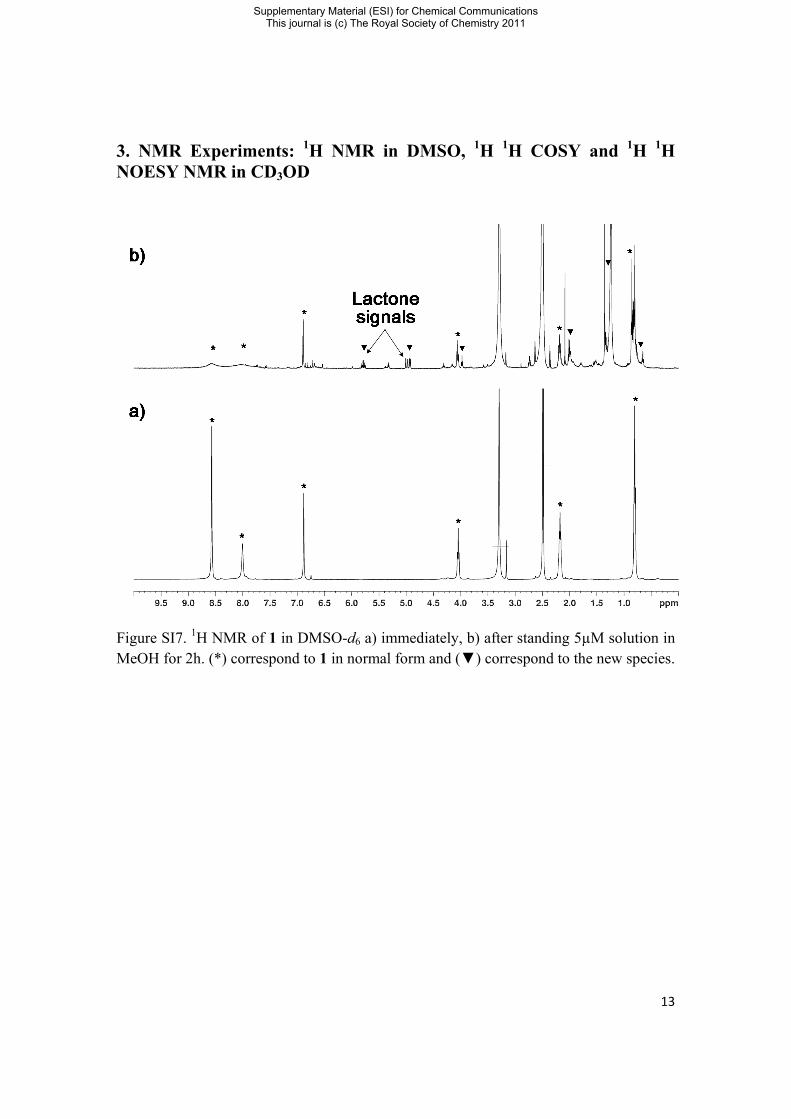
3. NMR Experiments: 1H NMR in DMSO, 1H 1H COSY and 1H 1H NOESY NMR in CD3OD
Figure SI7. 1H NMR of 1 in DMSO-d6 a) immediately, b) after standing 5µM solution in MeOH for 2h. (*) correspond to 1 in normal form and (▼) correspond to the new species.
Supplementary Material (ESI) for Chemical CommunicationsThis journal is (c) The Royal Society of Chemistry 2011
14
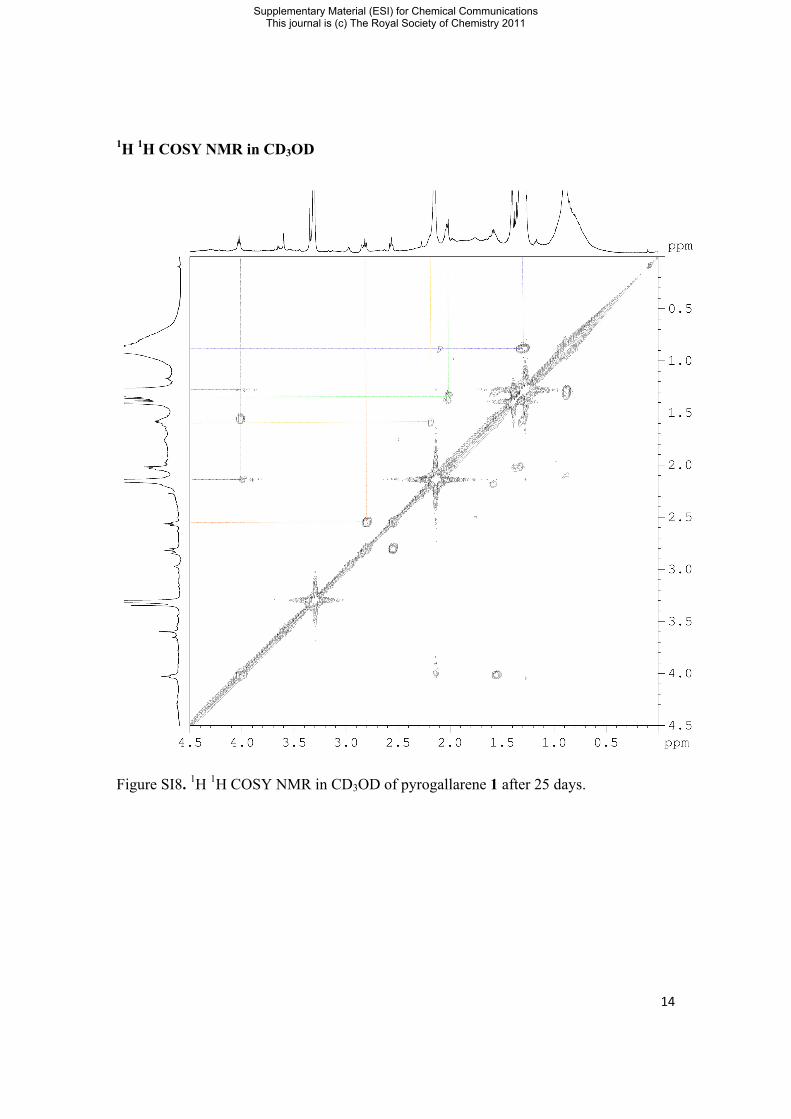
1H 1H COSY NMR in CD3OD
Figure SI8. 1H 1H COSY NMR in CD3OD of pyrogallarene 1 after 25 days.
Supplementary Material (ESI) for Chemical CommunicationsThis journal is (c) The Royal Society of Chemistry 2011
15
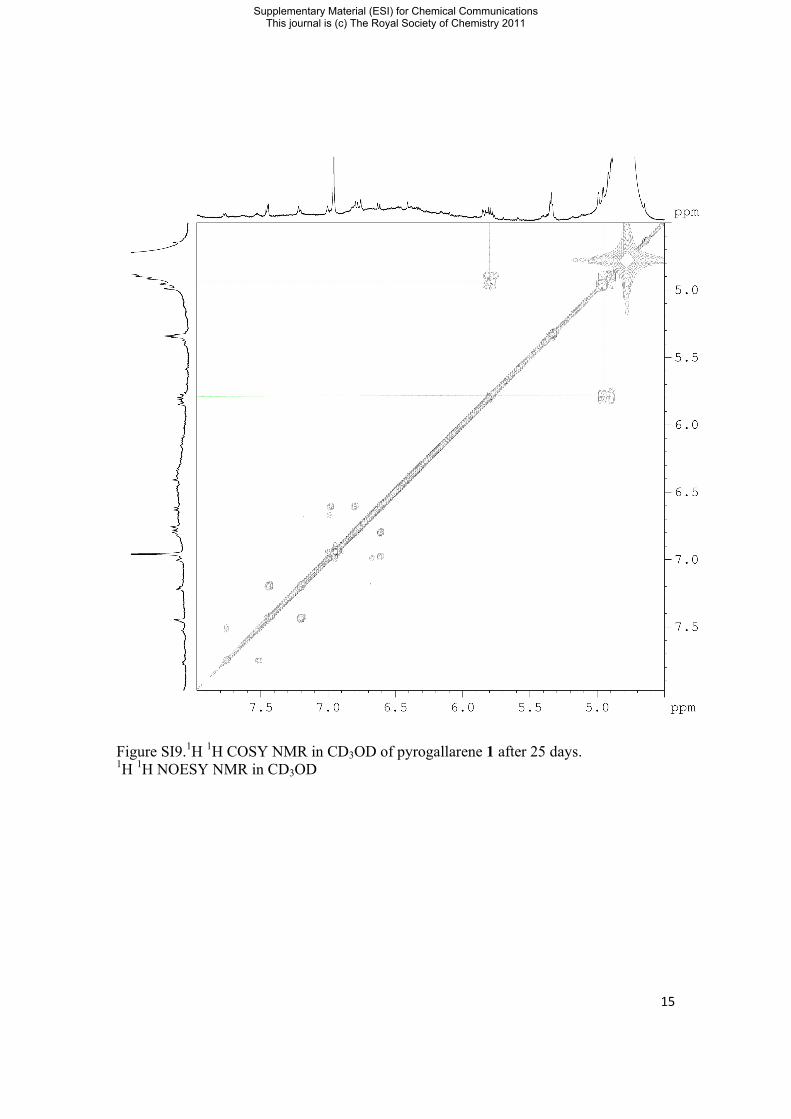
Figure SI9.1H 1H COSY NMR in CD3OD of pyrogallarene 1 after 25 days. 1H 1H NOESY NMR in CD3OD
Supplementary Material (ESI) for Chemical CommunicationsThis journal is (c) The Royal Society of Chemistry 2011
16
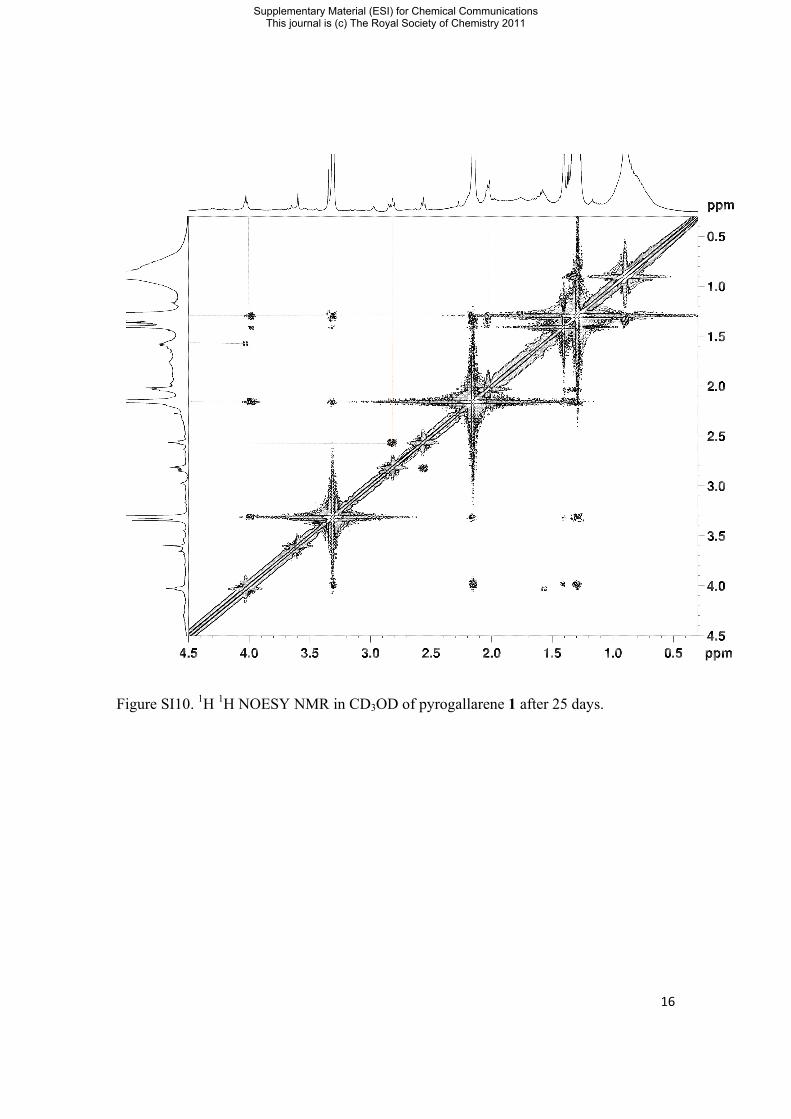
Figure SI10. 1H 1H NOESY NMR in CD3OD of pyrogallarene 1 after 25 days.
Supplementary Material (ESI) for Chemical CommunicationsThis journal is (c) The Royal Society of Chemistry 2011
17
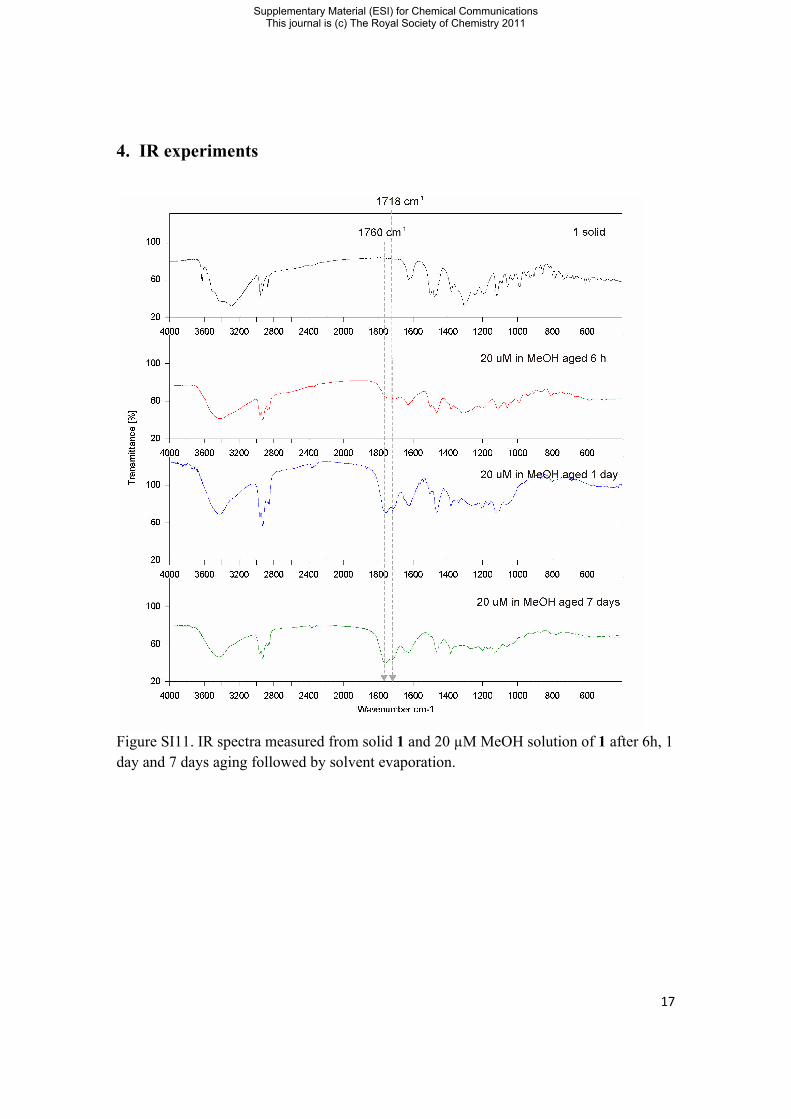
4. IR experiments
Figure SI11. IR spectra measured from solid 1 and 20 µM MeOH solution of 1 after 6h, 1 day and 7 days aging followed by solvent evaporation.
Supplementary Material (ESI) for Chemical CommunicationsThis journal is (c) The Royal Society of Chemistry 2011
18
5. DFT Optimizations
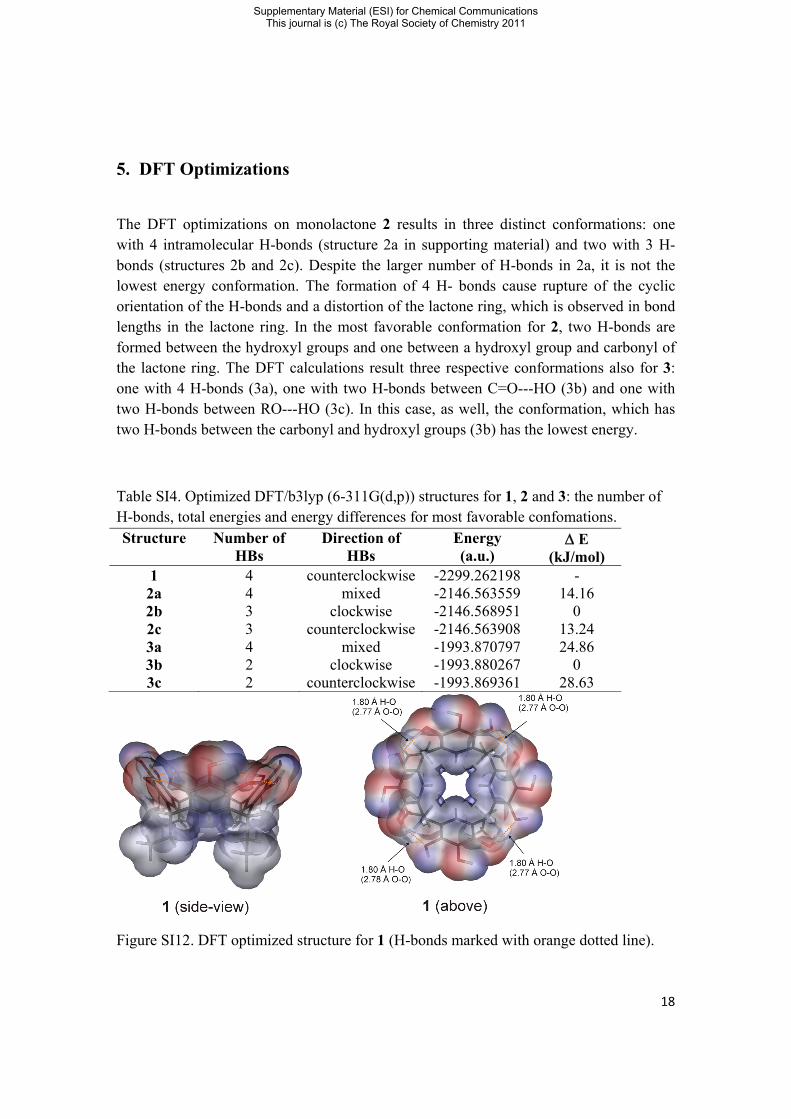
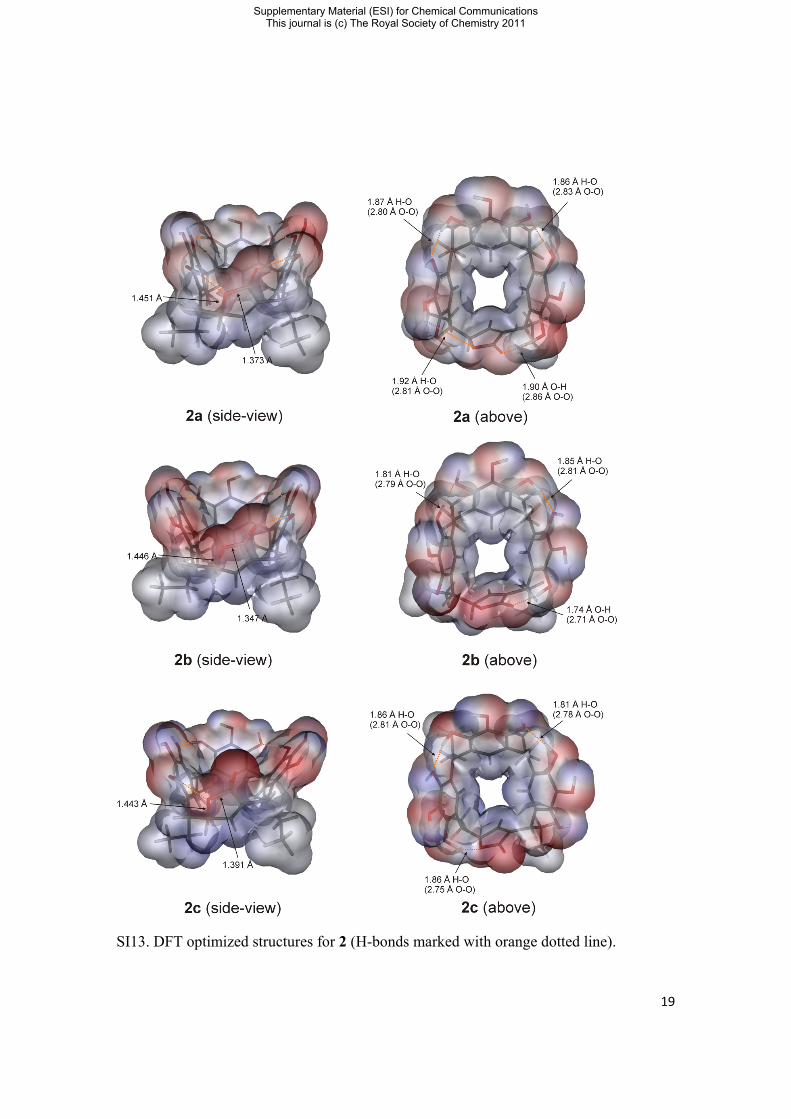
The DFT optimizations on monolactone 2 results in three distinct conformations: one with 4 intramolecular H-bonds (structure 2a in supporting material) and two with 3 H-bonds (structures 2b and 2c). Despite the larger number of H-bonds in 2a, it is not the lowest energy conformation. The formation of 4 H- bonds cause rupture of the cyclic orientation of the H-bonds and a distortion of the lactone ring, which is observed in bond lengths in the lactone ring. In the most favorable conformation for 2, two H-bonds are formed between the hydroxyl groups and one between a hydroxyl group and carbonyl of the lactone ring. The DFT calculations result three respective conformations also for 3: one with 4 H-bonds (3a), one with two H-bonds between C=O---HO (3b) and one with two H-bonds between RO---HO (3c). In this case, as well, the conformation, which has two H-bonds between the carbonyl and hydroxyl groups (3b) has the lowest energy.
Table SI4. Optimized DFT/b3lyp (6-311G(d,p)) structures for 1, 2 and 3: the number of H-bonds, total energies and energy differences for most favorable confomations. Structure Number of
HBs Direction of
HBs Energy (a.u.)
E (kJ/mol)
1 4 counterclockwise -2299.262198 - 2a 4 mixed -2146.563559 14.16 2b 3 clockwise -2146.568951 0 2c 3 counterclockwise -2146.563908 13.24 3a 4 mixed -1993.870797 24.86 3b 2 clockwise -1993.880267 0 3c 2 counterclockwise -1993.869361 28.63
Figure SI12. DFT optimized structure for 1 (H-bonds marked with orange dotted line).
Supplementary Material (ESI) for Chemical CommunicationsThis journal is (c) The Royal Society of Chemistry 2011
19
SI13. DFT optimized structures for 2 (H-bonds marked with orange dotted line).
Supplementary Material (ESI) for Chemical CommunicationsThis journal is (c) The Royal Society of Chemistry 2011

20
Figure SI14. DFT optimized structures for 3 (H-bonds marked with orange dotted line).
Supplementary Material (ESI) for Chemical CommunicationsThis journal is (c) The Royal Society of Chemistry 2011
21
6. References
[1] P. Timmerman, W. Verboom, D. Reinhoudt, Tetrahedron 1996, 52, 2663‐2704.
[2] L. J. de Koning, N. M. M. Nibbering, S. L. Van Orden, F. H. Laukien, Int. J. Mass Spectrom. Ion Processes, 1997, 8, 906‐915.
[3] Gaussian 09, Revision A.02, M. J. Frisch, G. W. Trucks, H. B. Schlegel, G. E. Scuseria, M. A. Robb, J. R. Cheeseman, G. Scalmani, V. Barone, B. Mennucci, G. A. Petersson, H. Nakatsuji, M. Caricato, X. Li, H. P. Hratchian, A. F. Izmaylov, J. Bloino, G. Zheng, J. L. Sonnenberg, M. Hada, M. Ehara, K. Toyota, R. Fukuda, J. Hasegawa, M. Ishida, T. Nakajima, Y. Honda, O. Kitao, H. Nakai, T. Vreven, J. A. Montgomery, Jr., J. E. Peralta, F. Ogliaro, M. Bearpark, J. J. Heyd, E. Brothers, K. N. Kudin, V. N. Staroverov, R. Kobayashi, J. Normand, K. Raghavachari, A. Rendell, J. C. Burant, S. S. Iyengar, J. Tomasi, M. Cossi, N. Rega, J. M. Millam, M. Klene, J. E. Knox, J. B. Cross, V. Bakken, C. Adamo, J. Jaramillo, R. Gomperts, R. E. Stratmann, O. Yazyev, A. J. Austin, R. Cammi, C. Pomelli, J. W. Ochterski, R. L. Martin, K. Morokuma, V. G. Zakrzewski, G. A. Voth, P. Salvador, J. J. Dannenberg, S. Dapprich, A. D. Daniels, O. Farkas, J. B. Foresman, J. V. Ortiz, J. Cioslowski, D. J. Fox, Gaussian, Inc., Wallingford CT, 2009.
Supplementary Material (ESI) for Chemical CommunicationsThis journal is (c) The Royal Society of Chemistry 2011