Study on non-catalytic and catalytic reactivity of Biodiesel and ...
177
HAL Id: tel-03144621 https://tel.archives-ouvertes.fr/tel-03144621 Submitted on 17 Feb 2021 HAL is a multi-disciplinary open access archive for the deposit and dissemination of sci- entific research documents, whether they are pub- lished or not. The documents may come from teaching and research institutions in France or abroad, or from public or private research centers. L’archive ouverte pluridisciplinaire HAL, est destinée au dépôt et à la diffusion de documents scientifiques de niveau recherche, publiés ou non, émanant des établissements d’enseignement et de recherche français ou étrangers, des laboratoires publics ou privés. Study on non-catalytic and catalytic reactivity of Biodiesel and model soot Hailong Zhang To cite this version: Hailong Zhang. Study on non-catalytic and catalytic reactivity of Biodiesel and model soot. Catalysis. Sorbonne Université; Sichuan University, 2019. English. NNT: 2019SORUS438. tel-03144621
-
Upload
khangminh22 -
Category
Documents
-
view
0 -
download
0
Transcript of Study on non-catalytic and catalytic reactivity of Biodiesel and ...

HAL Id: tel-03144621https://tel.archives-ouvertes.fr/tel-03144621
Submitted on 17 Feb 2021
HAL is a multi-disciplinary open accessarchive for the deposit and dissemination of sci-entific research documents, whether they are pub-lished or not. The documents may come fromteaching and research institutions in France orabroad, or from public or private research centers.
L’archive ouverte pluridisciplinaire HAL, estdestinée au dépôt et à la diffusion de documentsscientifiques de niveau recherche, publiés ou non,émanant des établissements d’enseignement et derecherche français ou étrangers, des laboratoirespublics ou privés.
Study on non-catalytic and catalytic reactivity ofBiodiesel and model soot
Hailong Zhang
To cite this version:Hailong Zhang. Study on non-catalytic and catalytic reactivity of Biodiesel and model soot. Catalysis.Sorbonne Université; Sichuan University, 2019. English. �NNT : 2019SORUS438�. �tel-03144621�

Sorbonne Université École doctorale SMAER (ED 391), Sciences Mécaniques Acoustique Électronique Robotique
Programme Doctoral Génie des Procédés, Institut Jean Le Rond d’Alembert
Sichuan University School of Chemical Engineering
Study on non-catalytic and catalytic reactivity of
Biodiesel and model soot
Etude sur la réactivité catalytique et non catalytique du biodiesel et de suies
modèles
生物柴油和模型碳烟的非催化与催化活性研究
By Mr. Hailong ZHANG
Doctoral thesis in Chemical Engineering - Chemical Technology
Supervised by Prof. Patrick DA COSTA and Prof. Yaoqiang CHEN
Presented in public on 27 May 2019
The scientific committee :
Mrs. Valérie TSCHAMBER, Full Professor, Université de Haute-Alsace, Reviewer
Mr. Zhen ZHAO, Full Professor, China University of petroleum, Reviewer
Mrs. Maria Elena GALVEZ, Associate Professor, Sorbonne Université, Examinator
Mr. Wei CHU, Full Professor, Sichuan University, Examinator
Mr. Yaoqiang CHEN, Full Professor, Sichuan University, Supervisor
Mr. Patrick DA COSTA, Full Professor, Sorbonne Université, Supervisor

Dédicace

I
Remerciements
I sincerely thank China and the China Scholarship Council for my scholarship in
Sorbonne Universités, France.
Firstly, I thank Prof. Patrick DA COSTA and Prof. Yaoqiang CHEN for their careful
guidance on my Ph. D work. Prof. Patrick DA COSTA and Prof. Yaoqiang CHEN
have profound knowledge, rigorous working attitude and unique insights into their
research fields. Their attitude and spirit of research that I learned from them will have
a positive impact in my future work and my whole life. Here, I would like to express
my sincere respect and sincere thanks to Prof. Patrick DA COSTA and Prof. Yaoqiang
CHEN.
I would like to thank Prof. Maria Elena GALVEZ for great help in my research. Also,
I would like to thank my reviewers Prof. Valérie TSCHAMBER and Prof. Zhen
ZHAO. Meanwhile, I would like to thank the members of my jury, Prof. Wei CHU,
Prof. Zhen ZHAO, Prof. Valérie TSCHAMBER, Prof. Maria Elena GALVEZ, Prof.
Patrick DA COSTA and Prof. Yaoqiang CHEN for willing to participate in my
defense.
I would like to appreciate the members of the research group, Hongrui LIU, Yiquan
XIE, Armando IZQUIERDO, Sandrine DUONG, Johnny ABBOUD, Ophélie
PEREIRA, Chao SUN, Ye WANG, Mira IBRAHIM, Dominik Wierzbicki, Katarzyna
Świrk, Maria MIKHAIL and my colleagues in China, Shanshan LI, Peng YAO,
Jishuang HE, Wei HU, I need thank all of you give me a lot of help both in research
and life.
Then, I would like to thank all professors, researchers, engineers, technicians and
administrators in Institut Jean le Rond d’Alembert. Prof. Stéphane ZALESKI, Prof.
Philippe GUIBERT, Prof. Guillaume LEGROS, Alexis MATYNIA, Evelyne
MIGNON, Anne MARCHAL, Renaud JALAIN, Jean-François KRAWCZYNSKI,

II
Jean-Marie CITERNE, Jérôme BONNETY, Hugo DUTILLEUL, Christian
OLLIVON, Dominique BUSQUET, Jȇrome PÉQUIN, and Frédéric SEGRETAIN.
Thank all of you for your help on my doctoral work.
In the end, I would like to thank my friends for giving me a lot of help in my life and
encouragement in my work. Thanks to my family for giving me the best love and
great support in all aspects.
III
Sommaire
Remerciements ................................................................................................................ I
Sommaire ..................................................................................................................... III
1. Introduction ................................................................................................................ 1
1.1 Overview .............................................................................................................. 1
1.2 Objectives of Ph.D. work ..................................................................................... 5
2. Literature review on soot emission control ................................................................ 7
2.1 Diesel exhaust emissions, environment pollution and health impact .................. 7
2.2 Diesel Particulate filter (DPF) ........................................................................... 11
2.2.1 DPF filtration ............................................................................................... 11
2.2.2 DPF regeneration ......................................................................................... 13
2.3 Soot structure ..................................................................................................... 16
2.4 Catalyst materials ............................................................................................... 19
2.4.1 Precious metal catalysts ............................................................................... 20
2.4.2 Ce-based mixed oxide catalyst..................................................................... 22
2.5 Soot oxidation reaction mechanism ................................................................... 24
3. Materials and experimental methods ....................................................................... 27
3.1 List of materials ................................................................................................. 27
3.1.1 Materials for soot preparation ..................................................................... 27
3.1.2 Materials for catalyst preparation ............................................................... 27
3.2 Physicochemical characterization ...................................................................... 27
3.2.1 Brunauer-Emmett-Teller (BET) .................................................................. 27
3.2.2 Laser Granulometry .................................................................................... 27
3.2.3 X-Ray Diffraction (XRD) ........................................................................... 28
3.2.4 Temperature-Programmed Reduction (TPR) .............................................. 28
3.2.4.1 H2-TPR ................................................................................................. 28
3.2.4.2 Soot-TPR.............................................................................................. 29
3.2.5 Temperature-Programmed Desorption (TPD) ............................................ 29
3.2.5.1 NOx-TPD coupled to MS ..................................................................... 29
3.2.5.2 NOx-TPD coupled to IR ....................................................................... 29
3.2.6 Thermal Gravimetric Analysis (TGA) ........................................................ 30
3.2.7 Transmission Electron Microscope (TEM) ................................................ 30
3.2.8 Raman Spectroscopy (Raman) .................................................................... 30
3.2.9 Diffuse Reflectance Infrared Fourier Transform Spectra (DRIFTS) .......... 31
3.2.10 X-ray Photoelectron Spectra (XPS) .......................................................... 31
3.3 Reactivity evaluation by TPOs .......................................................................... 31
3.2.1 Soot oxidation reactivity .............................................................................. 31
3.3.2 NO oxidation reactivity (NO-TPO) ............................................................. 33
3.4 Isothermal experiment ....................................................................................... 34
4. MnOx-CeO2 mixed oxides as the catalyst for NO-assisted soot oxidation: The key
role of NO adsorption/desorption on catalytic activity ................................................ 37
4.1 Introduction ........................................................................................................ 37

IV
4.2 Materials preparation ......................................................................................... 39
4.3 Physicochemical properties ............................................................................... 40
4.3.1 DRIFTS tests ............................................................................................... 40
4.3.2 XPS analysis ............................................................................................... 41
4.3.3 Raman analysis ........................................................................................... 44
4.3.4 TPD analysis with IR and MS .................................................................... 44
4.3.4 Soot-TPR tests coupled to MS .................................................................... 46
4.4 Soot oxidation activity ....................................................................................... 47
4.4.1 Soot-TPO .................................................................................................... 47
4.4.2 Isothermal reaction at 400 °C ..................................................................... 50
4.5 Summary ............................................................................................................ 52
5. Structure-reactivity study of model and Biodiesel soot in model DPF regeneration
conditions ..................................................................................................................... 53
5.1 Introduction ........................................................................................................ 53
5.2 Materials preparation ......................................................................................... 56
5.2.1 Soot samples preparation ............................................................................ 56
5.2.2 Catalyst preparation .................................................................................... 57
5.3 Physicochemical properties of soot ................................................................... 57
5.3.1 Laser granulometry ..................................................................................... 57
5.3.2 HRTEM analysis ......................................................................................... 59
5.3.3 XRD analysis .............................................................................................. 61
5.3.4 Raman spectra analysis ............................................................................... 63
5.4 Soot oxidation activity analysis by TPOs .......................................................... 65
5.4.1 Non-catalytic soot oxidation ....................................................................... 65
5.4.1.1 TPOs in 9% b.v. O2/Ar ........................................................................ 65
5.4.1.2 TPOs in 400 ppmv NO2 + 9% b.v. O2 in Ar ........................................ 67
5.4.2 Catalytic soot oxidation .............................................................................. 69
5.4.2.1 TPOs in 9% b.v. O2/Ar ........................................................................ 69
5.4.1.2 TPOs in 400 ppmv NO/NO2 + 9% b.v. O2 in Ar ................................. 70
5.4.3 Effect of soot-catalyst contact ..................................................................... 74
5.5 Structure and reactivity correlation .................................................................... 77
5.6 Summary ............................................................................................................ 81
6. Structure, surface and reactivity of activated carbon: From model soot to Bio Diesel
soot ............................................................................................................................... 83
6.1 Introduction ........................................................................................................ 83
6.2 Materials preparation ......................................................................................... 85
6.2.1 Soot samples preparation ............................................................................ 85
6.2.1 Catalyst preparation .................................................................................... 86
6.3 Reactivity analysis ............................................................................................. 86
6.3.1 TPO tests in O2............................................................................................ 86
6.3.2 TPO tests in NO + O2 ................................................................................. 90
6.3.3 Isothermal reaction rate at 350 °C .............................................................. 92
6.4 Physicochemical properties of soot ................................................................... 95
6.4.1 Laser granulometry ..................................................................................... 95

V
6.4.2 BET analysis ............................................................................................... 96
6.4.3 Raman analysis ........................................................................................... 97
6.4.4 HRTEM analysis ....................................................................................... 102
6.4.5 XPS analysis ............................................................................................. 104
6.4.6 DRIFTS analysis ....................................................................................... 107
6.5 Correlation of structural and surface properties to reactivity .......................... 109
6.6 Summary .......................................................................................................... 113
7. Effect of Biodiesel impurities (K, Na, P) on noncatalytic and catalytic activities of
soot in model DPF regeneration conditions ............................................................... 114
7.1 Introduction ...................................................................................................... 114
7.2 Materials preparation ....................................................................................... 116
7.2.1 Soot samples preparation .......................................................................... 116
7.2.2 Catalyst preparation .................................................................................. 116
7.3 Reactivity tests by TPOs .................................................................................. 117
7.3.1 Soot oxidation under noncatalytic regeneration conditions ...................... 117
7.3.1.1 Soot-TPOs in 9% b.v. O2/Ar + 5% H2O ............................................ 117
7.3.1.2 Soot-TPOs in 400 ppm NO2 + 9% b.v. O2/Ar + 5% H2O .................. 118
7.3.2 Soot oxidation under catalytic regeneration conditions ............................ 119
7.3.2.1 Soot-TPOs in 9% b.v. O2/Ar + 5% H2O ............................................ 119
7.3.2.2 Soot-TPOs in 400 ppm NO + 9% b.v. O2/Ar + 5% H2O ................... 120
7.3.2.2 Soot-TPOs in 400 ppm NO2 + 9% b.v. O2/Ar + 5% H2O .................. 122
7.4 Physicochemical properties ............................................................................. 123
7.4.1 Raman analysis ......................................................................................... 123
7.4.2 BET analysis ............................................................................................. 126
7.4.3 HRTEM analysis ....................................................................................... 127
7.4.4 XPS analysis ............................................................................................. 128
7.5 Summary .......................................................................................................... 131
8. Conclusion ............................................................................................................. 133
Reference ................................................................................................................... 136
Table des illustrations ................................................................................................ 160
Table des tableax........................................................................................................ 165
Annexes...................................................................................................................... 166
Annex. 1 Abbreviations and symbols .................................................................... 166
Abstract ...................................................................................................................... 168
Résumé ....................................................................................................................... 169

Chapter I. Introduction
1
1. Introduction
1.1 Overview
Diesel engines have extensive usage compared to gasoline engines due to their
improved fuel economy, energy efficiency, high durability and reliability. They can
also effectively reduce CO2 emissions. Thus, Diesel engines as the power source of
commercial transport have been widely employed in trucks, cars, buses, trains and
ships as well as off-road industrial vehicles. However, the high emissions of Diesel
exhaust pollutants such as NOx and particulate matter (PM) have become a severe
environmental problem worldwide, and the pollutants have a potential threat to human
health. In order to protect the environment and improve human health level, many
countries in the world have paid much attention to Diesel emission control. Thus, in
Europe, North America and China, the government has enacted restrictive legislation
to limit the pollutants emissions.
To comply with the restrictive standards, soot particulate emission from Diesel
vehicles exhaust and control technology have attracted much attention in recent years.
The most effective method to reduce soot particulate emissions is to apply wall-flow
Diesel particulate filter (DPF) in exhaust post-treatment system. As soot particles pass
through the filter, they are intercepted and collected in the wall-flow substrates by
physical filtration and then burned by chemical method. The regeneration of DPF has
two ways: active regeneration and passive regeneration. Active regeneration can be
periodically applied to DPF by burning soot with O2 at higher temperatures (>
550 °C). Its serious problem is higher regeneration temperature and energy supply.
However, passive regeneration can allow the oxidation of soot particulates to occur
at the low exhaust temperature through a catalytic reaction process. It can provide a
more effective regeneration and reduce the cost of vehicle operator and engine
management.
Precious metal catalysts and ceria-based oxides materials have been widely studied

Chapter I. Introduction
2
and applied in DPF passive regeneration and show an excellent performance in
decreasing soot oxidation temperature. Small amounts of NO in Diesel exhaust gas
can be effectively oxidized into NO2 on the precious metal catalysts especially
platinum catalysts, the NO2 will promote the oxidation of soot under a temperature
range of 200-450 °C. However, precious metals as rare resource are very expensive.
Furthermore, the optimization of modern engine combustion technology has
decreased the concentration of NOx in exhaust gas. These would limit the application
of precious metal catalysts. On the other hand, Ce-based mixed oxides have strong
oxygen storage capacity and redox ability, they are able to transfer O2 into active
oxygen species and then oxidize NO and soot at low temperatures, showing high
catalytic performance. Due to relatively low cost of Ce-based catalyst, it is promising
to be a commercial catalyst for DPF passive regeneration. Therefore, in my PhD work,
MnOx-CeO2 mixed oxides as catalyst was used to evaluate the catalytic oxidation
reaction of soot.
Many studies reported that the use of Biofuel/Biodiesel induces significantly lower
soot deposits in DPF, which might decrease the need of active regeneration and thus
the fuel consumption. So Biodiesel as a new energy has also become a focus of soot
emission control. It would be a trend of energy market for Diesel vehicles. Based on
this case, the effect of the use of Biodiesel on DPF active regeneration and passive
regeneration should be studied in details, including soot nanostructure, soot surface
property, soot noncatalytic and catalytic oxidation reactivity as well as impact of
Biodiesel impurities, and so on. Thus these are also main works in my PhD research.
In this research, the structure and reactivity of model soot and real Biodiesel soot
were studied and compared to look for suitable model soot used for correct
experimental simulation.
The thesis presents 7 chapters. The first three chapters include the general
introduction, research background and materials characterizations and soot reactivity
tests, respectively. The fourth, fifth, sixth and seventh chapter present the main
experimental results, including structure-reactivity study of model and Biodiesel soot,

Chapter I. Introduction
3
NO adsorption/desorption influence on MnOx-CeO2 catalyst, Biodiesel soot activation
study and impact of Biodiesel impurities on soot reactivity. The last chapter is a
summary of the PhD works.
The first chapter introduces the general content of various chapters and the PhD
research objectives and experimental methods, it is a general introduction of the
thesis.
The second chapter is a literature review of the research background. The first part
describes Diesel exhaust emissions, environment pollution and health impacts. It
illustrates that Diesel exhaust emissions, especially NOx and particulate matter (PM)
emissions, severely affect air environment and human health. The second part
introduces Diesel particulate filter (DPF), including DPF filtration process and DPF
regeneration and illustrates that it is the most effective way to control PM emissions.
The third part is to introduce soot structure that shows an important role in soot
oxidation reactions. The soot structure can be characterized through TEM, Raman and
XRD methods. The fourth part mainly introduces the precious metal Pt catalysts and
Ce-based mixed oxide catalysts. The fifth part presents the reaction mechanisms for
soot oxidation with O2 and/or NO2. It also illustrates that the reaction mechanisms are
different under different reaction conditions and catalyst systems.
The third chapter introduces the main experimental methods, including different
characterizations such as Laser Granulometry, BET, XRD, HRTEM, Raman, TGA,
Temperature-Programmed Reduction (TPR), Temperature-Programmed Desorption
(TPD), Diffuse Reflectance Infrared Fourier Transform Spectra (DRIFTS), X-ray
Photoelectron Spectra (XPS) and reactivity evaluation of soot by TPO method. Their
experimental equipment and operating conditions are also described. Moreover, the
calculation equations of some characterization parameters and soot oxidation rate are
also introduced. Some materials used for soot and catalyst preparation are presented
in this chapter.

Chapter I. Introduction
4
The fourth chapter mainly focuses on the effect of NO adsorption/desorption on
catalytic performance of MnOx-CeO2 catalyst for soot oxidation. Firstly, materials
preparation method is described, MnOx-CeO2 mixed oxides are prepared through
co-precipitation and then high-temperature calcination. The mixed oxides are treated
in 600 ppm NO/10% O2/N2 at 350 °C for 30 min to obtain NO-adsorbed sample. The
next part is the characterization of NO-adsorbed MnOx-CeO2 catalyst by DRIFTS,
XPS, Raman, NOx-TPD and Soot-TPR, and the effect of NO adsorption and
desorption on physicochemical property of the catalyst is analyzed. In final, the soot
oxidation activity is evaluated by TPO method and isothermal reactions and we also
compares the catalytic reactivity of soot before and after the exposure of catalyst in
NO. This chapter also discusses the reason why the presence of NO promotes soot
oxidation reactions.
The work in chapter 5 mainly focuses on the study on structure and reactivity of
model and Biodiesel soot samples. In the materials preparation, the real Biodiesel soot
samples are obtained in an engine bench equipped with a Euro VI post-treatment
system containing DOC and DPF, the model soot samples are prepared through the
combustion of model fuels in an steady co-flow laminar diffusion flame burner.
MnOx-CeO2 mixed oxides are also prepared by a co-precipitation and used to evaluate
the catalytic reactivity of soot. In the characterizations, the physicochemical
properties of Biodiesel and model soot samples are analyzed through laser
granulometry, HR-TEM, XRD, Raman. In soot oxidation activity measurement, the
non-catalytic and catalytic reactivity of Biodiesel and model soot samples are tested
through temperature-programmed oxidation (TPO) method under model DPF
regeneration conditions. Finally, the correlation of soot oxidation reactivity with the
structure is also presented in this chapter.
In chapter 6, the activated Biodiesel and Printex U soot samples are prepared by
temperature-programmed oxidation (TPO) with rising the temperature from 25 °C up
to 500 or 600 °C. The aim of this work is to investigate the impact of activation
process on the structure, surface and reactivity of soot. The structural property of

Chapter I. Introduction
5
activated soot is analyzed by BET, Laser granulometry, HRTEM and Raman and the
surface property is studied by DRIFTS and XPS. The oxidation reactivity of soot
samples is evaluated through TPO method and isothermal experiments. In final, the
factors that affect the reactivity of the activated soot samples are discussed based on
the physicochemical characterizations.
In chapter 7, the study mainly focuses on the effect of Biodiesel impurities such as K,
Na and P on the noncatalytic and catalytic reactivity of soot under model DPF
regeneration conditions. A real engine soot is used for this experiment and these
Biodiesel impurities are doped into this soot by a saturated impregnation method.
Then the reactivity of the doped soot samples is measured by TPO method under
different reaction conditions, and this research also presents different activity effects
of K, Na and P doping. The physicochemical properties of the doped soot are
characterized by BET, Raman, HRTEM and XPS and correlated to their reactivity.
The last part is a summary of all works and the perspectives for future study on
Biodiesel/Diesel soot oxidation. The main results of the experimental chapters
including chapter 4, chapter 5, chapter 6, chapter 7 are presented, which would
contribute to the further study on DPF active regeneration and passive regeneration.
In addition, based on these conclusions, some suggestions are provided for further
research on soot particulate combustion.
1.2 Objectives of Ph.D. work
My PhD research mainly focuses on the structure, surface and reactivity of Biodiesel
soot as well as the effect of NO adsorption/desorption on the catalytic performance of
MnOx-CeO2 mixed oxides. The related work is as follows:
(1) Real Biodiesel soot and model soot were prepared through a real engine bench and
a laminar burner, respectively. Printex U model soot that is often used for
experimental study was also considered as a comparison. This work investigated and

Chapter I. Introduction
6
compared their non-catalytic and catalytic reactivities and structural properties by a
series of characterizations and TPO measurements. Furthermore, the relationship
between the structure and the reactivity was also analyzed.
(2) The previous work (1) revealed that the presence of NO apparently promoted the
catalytic reactivity of MnOx-CeO2 catalyst for soot oxidation. Thus, this work studied
the role of NO adsorption/desorption in MnOx-CeO2 catalyst on soot oxidation
activity. It was found that NO adsorption/desorption promoted low-temperature soot
oxidation reactivity. The result was further analyzed through a series of
characterizations such as DRIFTS, XPS, Raman, NOx-TPD, Soot-TPR, TPD-MS, and
so on.
(3) The activated/oxidized Biodiesel soot and Printex U model soot were prepared by
TPO method, and then their non-catalytic and catalytic reactivities were studied. TPO
gave an evidence that the activated Printex U exhibited more apparent promotion on
the reactivity than the activated Biodiesel soot. A series of characterizations such as
XPS, HRTEM, DRIFTS, Raman were tested to analyze the structure and surface of
the activated soot samples.
(4) A real Biodiesel soot was impregnated by an aqueous solution of NaNO3, KNO3
or NH4H2PO4. Then the non-catalytic and catalytic reactivities of the doped soot
samples were evaluated through TPO method under model exhaust gas conditions.
The results confirmed the impact of Biodiesel impurities on the reactivity. The
physico-chemical properties of the doped soot were also analyzed by BET, Raman,
HRTEM and XPS.
Chapter II. Literature review on soot emission control
7
2. Literature review on soot emission control
2.1 Diesel exhaust emissions, environment pollution and health
impact
With the fast development of social economy and continuous progress of
industrialization, the rapid increase of motor vehicles has led to the severe air
pollution and climate impact due to high emissions of vehicle exhaust gas [1-10].
Transport has become a larger source of urban air pollution, which arouses a serious
public health problem in many cities of the developing world. It has been reported
that air pollution in developing countries account for tens of thousands of excess
deaths and billions of dollars in medical costs and loses productivity every year [5,11].
The World Health Organization (WTO) estimated that air pollution arouses the death
of around 2.4 million people each year [12]. Nowadays, pollution control and
environmental protection have become important subjects and are widely concerned
by many countries. In order to prevent air pollution and pollutant emissions, many
agencies and organizations (EPA, OECD, IPCC, IEA, EEA, etc.) were established
worldwide [4,13-17]. These organizations reported that around the 20-30% of
pollutant emissions originates from transport. To control pollutant emissions, they
have made several legal arrangements, created several model structures, developed
control systems and organized the structure of traffic.
Compared with gasoline engines, Diesel engines have lower operating costs, high
energy efficiency, high durability and reliability and thus are widely employed in
trucks, buses, trains, ships and off-road industrial vehicles. However, the emissions of
pollutants from Diesel exhaust gas have resulted in significant environmental
pollution and health problems. In fact, according to ideal thermodynamic equilibrium,
the complete combustion of diesel fuel would only produce CO2 and H2O in
combustion chambers of engine [18]. But many factors such as the air-fuel ratio,
air-fuel concentration, ignition timing, turbulence in the combustion chamber,
combustion form and temperature lead to the generation of harmful products during

Chapter II. Literature review on soot emission control
8
fuel combustion [19]. As shown in Figure 2-1, the most significant harmful products
in Diesel exhaust gas are CO, HC, NOx and PM. Pollutant emissions occupy around
1% in the Diesel exhaust gas, NOx and PM emissions have the highest proportion of
Diesel pollutant emissions [19-22]. Due to the lean combustion condition of Diesel
engines, the concentration of CO and HC is minimal. Besides, the emission of SO2
depends on the specifications and quality of fuel. In this section, the four main
pollutant emissions (CO, HC, NOx, PM) are introduced, their impacts on environment
and health are also illustrated.
Figure 2-1. The compositions of Diesel exhaust gas [19].
(1) Carbon monoxide (CO) emissions
The incomplete combustion process of fuel in Diesel engines results in CO emissions.
Diesel engines are lean combustion engines which have a high air-fuel ratio (λ > 1),
so the formation of CO is minimal. Carbon monoxide is an odorless and colorless gas.
In humans, CO in the air is inhaled by the lungs and transmitted into the bloodstream.
It binds to hemoglobin and decreases its capacity to transfer oxygen. Higher CO
concentration in the air would lead to asphyxiation, thus affecting the function of
different organs and resulting in impaired concentration, slow reflexes, and confusion
[10,19,23-25].

Chapter II. Literature review on soot emission control
9
(2) Hydrocarbon (HC) emissions
Hydrocarbon emissions consist of unburned fuels resulting from insufficient
temperature which occurs near the cylinder wall. At this point, the temperature of
air-fuel mixture is apparently lower than the center of the cylinder [26,27]. These HC
species include alkanes, alkenes, aromatics, and so on. In Diesel engines, the fuel type,
engine adjustment, and design can affect the emissions of hydrocarbons [19]. Besides,
HC emissions in the exhaust gas depend on irregular operating conditions [28,29]. the
hydrocarbon emissions affect environment and human health. They can react with the
other pollutants in air to form ground-level ozone. About 50% of the vehicle exhaust
emissions are contributed to form ozone. Hydrocarbons are toxic with the potential to
respiratory tract irritation and cause cancer [7,30].
(3) Nitrogen oxides (NOx) emissions
It is well known that the fuel in Diesel engines is ignited by highly compressed hot air.
Air is mainly composed of oxygen and nitrogen, it is drawn into the combustion
chamber and mixed with fuel, the combustion of fuel releases a large amount of heat.
When the temperature reaches more than 1600 °C in the cylinders, it can cause the
reaction between nitrogen and oxygen and thereby lead to generate NOx emissions
[19]. The amount of NOx emissions is related to the maximum temperature in the
cylinder, oxygen concentrations and residence time. Most of the emitted NOx is
formed early in the combustion process due to the highest flame temperature [19].
Nitrogen oxides (NOx) include nitrogen oxide (NO) and nitrogen dioxide (NO2), and
NO generally constitutes 85-95% of NOx. The two pollutants are distinctively
different. NO is a colorless and odorless gas, while NO2 is a reddish brown gas with
pungent odor [31,32].
Nitrogen oxides emissions from Diesel exhaust gas are responsible for environmental
pollution and health hazard. It was reported that NOx emissions result in the
acidification, ozone formation, nutrient enrichment and smog formation, which have

Chapter II. Literature review on soot emission control
10
become important issues in many major cities worldwide [33]. In the atmosphere,
NOx would react with other pollutants to form tropospheric ozone (the main
component of photochemical smog) and other toxic pollutants. Besides, NO and NO2
are considered to be toxic, but NO2 has five times greater toxicity than NO and it is
also a direct concern of human lung disease. NO2 can irritate the lungs and decrease
resistance to respiratory infection (such as influenza). NOx emissions are favorable for
forming acid rain, which will affect both terrestrial and aquatic ecosystems. Nitrogen
dioxide and airborne nitrate are also the components of pollutant haze that may
decrease visibility [9,34].
(4) Particulate matter (PM) emissions
The combustion process in Diesel engines also causes a large number of particulate
matter (PM) emissions, these particulates mainly result from the agglomeration of fine
particles which include unburned fuel and lube oil, ash, sulfates and water [26,34].
The diameter size of Diesel particulates is generally in a range of 15-40 nm, and the
size of most of PM (> 90%) is less than 1 µm in diameter [19]. PM emissions are
related to many factors, including combustion process, fuel and lube oil quality,
exhaust gas cooling, etc. [35]. In general, the amount of Diesel particulate matter
emissions are 6-10 times higher than that of Gasoline particulate matter emissions.
Diesel particulate matter is composed of three main components: soot, soluble organic
fraction (SOF) and inorganic ash [34,36-39]. More than 50% of particulate matter is
soot (carbon black), the SOF components are often adsorbed and/or condensed on the
surface of soot.
Many researchers have reported that Diesel particulate matter emissions apparently
affect environment and human health [19,40-43]. In many major cities, a large
number of PM emissions have led to low visibility, which severely affects people’s
production and life. Furthermore, the fine particles emitted to air also result in a
change of the climate. Besides, fine particulate matters containing toxic components
such as polycyclic aromatic hydrocarbons (PAHs) may cause lung damage and
Chapter II. Literature review on soot emission control
11
respiratory problems and even cancers when they go into human body through the
respiration [8,17,44].
2.2 Diesel Particulate filter (DPF)
In order to control Diesel exhaust pollutant emissions and protect environment and
human health, the exhaust post-treatment system has been designed and widely
employed in Diesel vehicles. The pollutant control system mainly includes Diesel
oxidation catalyst (DOC), Diesel particulate filter (DPF) and selective catalytic
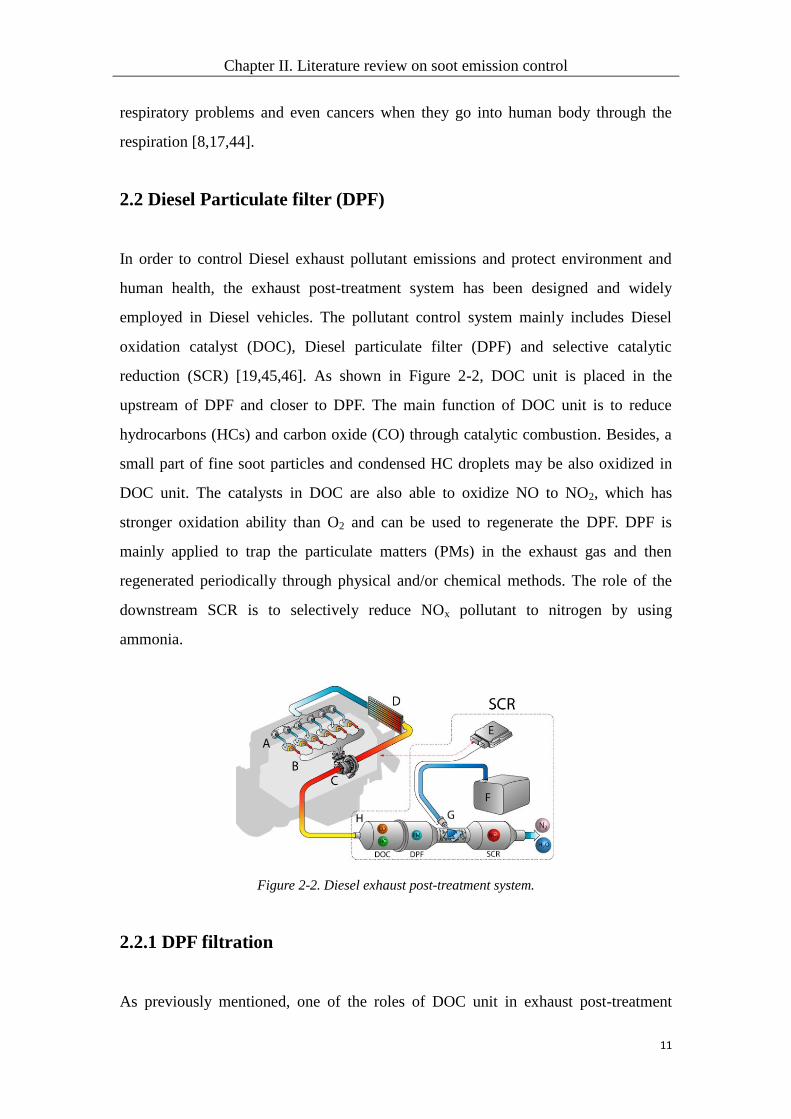
reduction (SCR) [19,45,46]. As shown in Figure 2-2, DOC unit is placed in the
upstream of DPF and closer to DPF. The main function of DOC unit is to reduce
hydrocarbons (HCs) and carbon oxide (CO) through catalytic combustion. Besides, a
small part of fine soot particles and condensed HC droplets may be also oxidized in
DOC unit. The catalysts in DOC are also able to oxidize NO to NO2, which has
stronger oxidation ability than O2 and can be used to regenerate the DPF. DPF is
mainly applied to trap the particulate matters (PMs) in the exhaust gas and then
regenerated periodically through physical and/or chemical methods. The role of the
downstream SCR is to selectively reduce NOx pollutant to nitrogen by using
ammonia.
Figure 2-2. Diesel exhaust post-treatment system.
2.2.1 DPF filtration
As previously mentioned, one of the roles of DOC unit in exhaust post-treatment

Chapter II. Literature review on soot emission control
12
system is to oxidize soluble organic fractions (SOFs) of Diesel exhaust PM. As a
result, particulate matter emissions would be reduced to a lower level. The
introduction of DPF to the post-treatment system greatly improves the efficiency of
PM emission control, and it becomes the best choice to fulfil Euro 6 standard.
DPF has been applied in Diesel PM emission control since 2000. Ceramic wall-flow
filters show the highest filtration efficiency (> 95%) and then received the most
attention [19,47-49]. DPF is usually made of cordierite (2MgO-2Al2O3-5SiO2) or
silicon carbide (SiC) honeycomb monolithic structure, with the channels being
blocked at alternate ends [19,50]. Thus, the exhaust gas containing PM is forced
through the porous channel walls (Figure 2-3) and the PM are trapped on the substrate
walls by a physical process or diffused into the pore walls where they adhere.
Figure 2-3. Wall-flow filter of PM from diesel exhaust [19].
When the exhaust gas is forced to pass through the wall-flow substrates, the PM are
retained on the porous channel walls. In this filtration process, there are two PM
filtration mechanisms: deep bed filtration and cake bed filtration. Deep bed filtration
often occurs at the initial stage of filtration. The PM with smaller size than filter pore
size are forced by flow inertia and concentration gradients into wall pores. They are
deposited in the wall pores by diffusion and flow line interception as exhaust gas
passes through the channel walls [51]. An example of deep filtration can be seen in
Figure 2-4. With the deep bed filtration, the pore size in wall substrates becomes

Chapter II. Literature review on soot emission control
13
smaller and smaller, so that the PM cannot penetrate through the wall pores and cake
bed filtration takes place. The PM deposition occurs on the surface of wall-flow
substrates, so cake bed filtration is also called surface filtration. The formation of a
“cake” layer is favorable for improving the filtration efficiency, thus cake bed
filtration is very important, especially, at high PM emission rates [51].
Figure 2-4. Soot deep bed and cake filtration on DPF wall-flow substrates [51].
2.2.2 DPF regeneration
As the filter becomes increasingly saturated with soot, more PM are deposited on the
surface of channel walls and result in the formation of PM cake layers. Consequently,
excessive saturation of PM filtration leads to pore-plugging phenomena and builds up
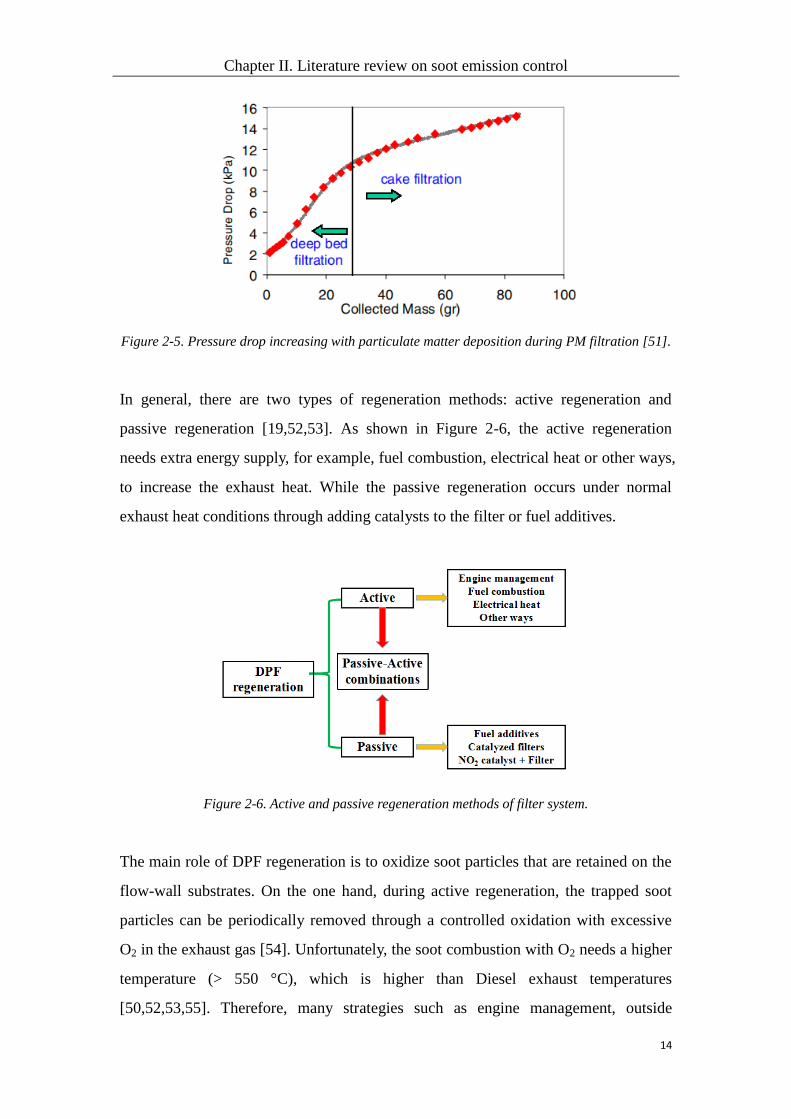
a backpressure, thereby pressure drop increasing (see Figure 2-5), which is negative
for Diesel engine operation because of increasing fuel consumption, causing engine
failure and high stress in the filter. In order to prevent the negative effects, the DPF
has to be continuously or periodically regenerated by burning the collected PM.
Chapter II. Literature review on soot emission control
14
Figure 2-5. Pressure drop increasing with particulate matter deposition during PM filtration [51].
In general, there are two types of regeneration methods: active regeneration and
passive regeneration [19,52,53]. As shown in Figure 2-6, the active regeneration
needs extra energy supply, for example, fuel combustion, electrical heat or other ways,
to increase the exhaust heat. While the passive regeneration occurs under normal
exhaust heat conditions through adding catalysts to the filter or fuel additives.
Figure 2-6. Active and passive regeneration methods of filter system.
The main role of DPF regeneration is to oxidize soot particles that are retained on the
flow-wall substrates. On the one hand, during active regeneration, the trapped soot
particles can be periodically removed through a controlled oxidation with excessive
O2 in the exhaust gas [54]. Unfortunately, the soot combustion with O2 needs a higher
temperature (> 550 °C), which is higher than Diesel exhaust temperatures
[50,52,53,55]. Therefore, many strategies such as engine management, outside
Chapter II. Literature review on soot emission control
15
sources heat and fuel injection are used to increase the exhaust temperature. However,
the higher regeneration temperature arouses high fuel consumption and large amount
of energy supply and thereby increases the cost of post-treatment system.
On the other hand, unlike the active regeneration, passive regeneration takes place at
real exhaust gas temperatures, it does not need external heat sources or additional fuel
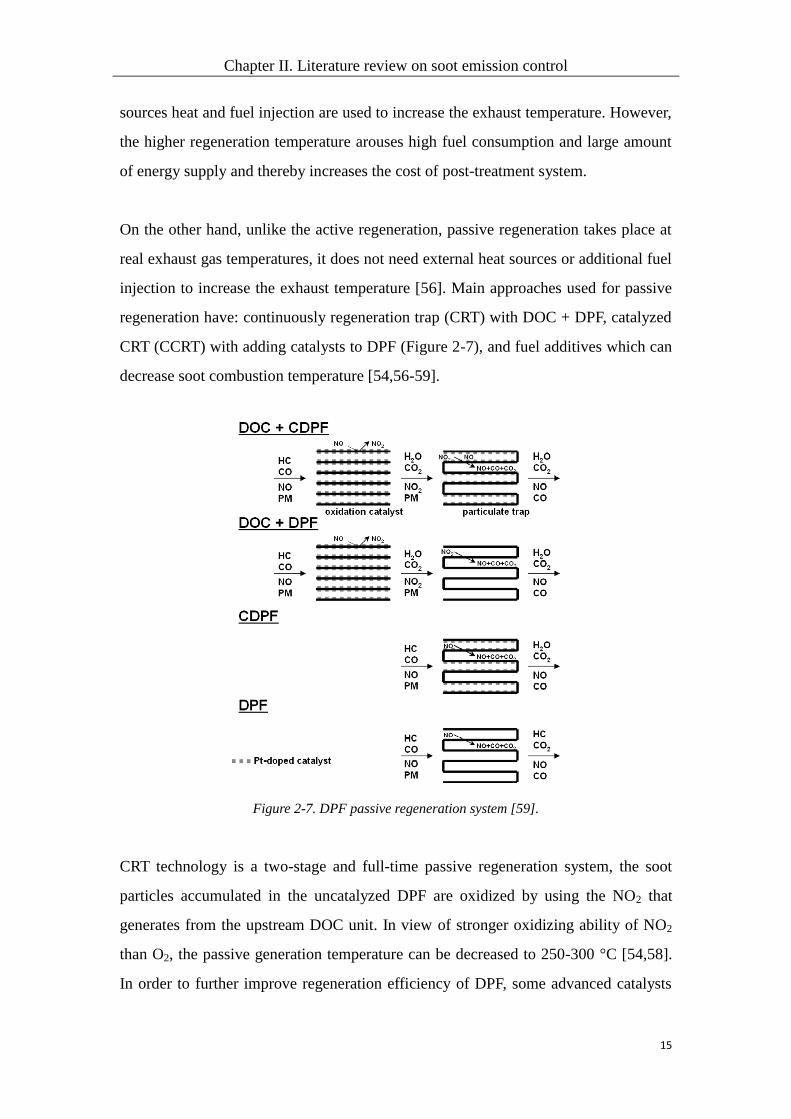
injection to increase the exhaust temperature [56]. Main approaches used for passive
regeneration have: continuously regeneration trap (CRT) with DOC + DPF, catalyzed
CRT (CCRT) with adding catalysts to DPF (Figure 2-7), and fuel additives which can
decrease soot combustion temperature [54,56-59].
Figure 2-7. DPF passive regeneration system [59].
CRT technology is a two-stage and full-time passive regeneration system, the soot
particles accumulated in the uncatalyzed DPF are oxidized by using the NO2 that
generates from the upstream DOC unit. In view of stronger oxidizing ability of NO2
than O2, the passive generation temperature can be decreased to 250-300 °C [54,58].
In order to further improve regeneration efficiency of DPF, some advanced catalysts
Chapter II. Literature review on soot emission control
16
are coated onto the filter surface. NO2 is reduced by soot particles into NO, which can
be reoxidized to NO2 on the catalysts. The increase of NO2 concentration can not only
increase the oxidation rate of soot but also enhance the fast SCR reaction [54,58]. It
was reported that ceria-based materials that are coated onto DPF are able to generate a
large number of active oxygen species under excessive O2, these active oxygen
species can also effectively decrease the soot oxidation temperature [60].
Another method of passive regeneration is dosing a very small amount of fuel
additives such as cerium, iron or platinum into the fuel on-board [61]. The fuel
combustion in the engine results in the formation of small metallic oxide particles,
they afterwards are trapped by the DPF. These metallic oxides are also able to
decrease the soot combustion temperature [54,62].
2.3 Soot structure
Soot particulates are the main component of particulate matter from Diesel exhaust
gas. In general, the soot particulates are collected on DPF channel wall and then
removed through soot combustion. The regeneration efficiency of DPF and oxidative
activity of soot are related to the structural property of soot particles [63-65]. Diesel
soot particles are generally composed of 10-30 nm sphere-like particles [66], which
aggregate in chain-like structures [67]. Each of the soot particles contains the carbon
nucleus, which are composed of graphitic carbons. The elemental carbon is arranged
in graphene sheets, which form the turbostratic particles with a wavy and
multi-layered structure [68].
In fact, the oxidation activity of soot particles depends on their chemical structure or
nanostructure (in particular the degree of graphitisation), and bulk properties such as
proposity, H/C ratio and inorganic impurities. These bulk properties also affect the
nanostructure of soot [69]. In general, the carbonaceous materials are mainly
composed of highly ordered graphite and disordered amorphous carbon. Graphite is a
form of pure carbon which consists of layers of hexagonally arranged carbon atoms in

Chapter II. Literature review on soot emission control
17
a plane. The interlayer spacing of graphite is 0.0335 nm [66,69] and the chemical
bonds within the carbon layers are covalent with sp2 hybridisation [70]. On the other
side, amorphous carbon is a form of carbon material without long-range crystalline
order. There are also different forms of carbon structures which exist in between
graphite and amorphous carbon. Graphitised carbons have more orderly stacked
crystalline layers and thus expose fewer active sites, while the disordered amorphous
carbons exist more active sites. It was reported that the disordered structure may
evolve to become more ordered structure at higher temperatures (≥ 700-1100 °C), this
process is called as graphitisation [68,71,72]. As shown in Figure 2-8. the isolated
basic structural units (BSUs) gradually tend to accumulation and then form layer-like
and ordered graphitised carbons.
Figure 2-8. Various steps of graphitisation [68].
Figure 2-9 shows the TEM images of Diesel soot particles, an onion-like turbostratic
structure can be clearly observed. From this TEM result, it is known that soot particle
is composed of relatively disordered amorphous carbon core and an external shell of
neatly arranged crystalline layers. The carbon core consists of 3-4 nm fine particles
and the external shell looks more disordered than carbon core [66,69,73]. Some
researchers also used X-ray diffraction (XRD) to study the structure of soot particles
[66,74]. As shown in Figure 2-10 [66], the XRD patterns of graphitised carbon
materials show four narrow bands, which can be identified in 002 (26.8°), 100 (42.3°),

Chapter II. Literature review on soot emission control
18
101 (44.5°) and 102 (54.9°) positions. For Diesel model soot Printex 90 and Printex
XE2, their XRD patterns only show two bands appearing at 24.9° and 43.6° of Printex
XE2 as well as 24.2° and 43.4° of Printex 90. The graphitisation of soot particles can
be evaluated by the full width at half maximum (FWHM) and crystallite size [66]. For
example, in Figure 2-10, the crystalline size of Diesel model soot is 2-4 nm and that
of graphitised carbon is around 250 nm, this illustrates that Diesel model soot has
lower degree of graphitization [66].
Figure 2-9. Structure of soot particles characterized by TEM [73]
Figure 2-10. X-ray diffractograms of graphite, Printex 90, and Printex XE2 [66].
Raman is also usually used to characterized the nanostructural features of soot
particles, much information on the nanostructure of soot has been reported through
Raman characterization [63,66,68,74-81], which provides a better understanding of
soot structure. As shown in Figure 2-11, the Raman spectra of soot can be

Chapter II. Literature review on soot emission control
19
characterized as two bands: G band and D band, which represent the content of
graphitised carbon and non-graphitised carbon, respectively [68,73,75]. The degree of
graphitisation of soot is generally related to the intensity and the full width at half
maximum (FWHM) of G band at 1580 cm-1
. The D band as defect band is divided
into D1, D2, D3 and D4, which appear at 1350, 1620, 1500 and 1200 cm-1
,
respectively. D1 band and D3 band are separately related to the disordered graphite
and amorphous and molecular carbons. The full width at half maximum (FWHM) of
D1 and the relative intensity of D3 are considered to be important parameters, since
they can provide more information on the structure of graphite-like carbon and
amorphous carbon [63,75].
Figure 2-11. Raman spectrum of untreated EURO VI soot [73].
2.4 Catalyst materials
An important role of the catalysts coated on DPF channel-wall substrates is to
decrease the temperature of soot oxidation, as a result, the DPF passive generation
occurs under real exhaust temperatures, which apparently decreases the cost of energy
consumption resulting from active generation. With the development of passive
generation technology, many catalysts have been widely studied and applied in soot
oxidation, which include alkali metal or alkaline-earth metal catalysts, perovskite-type
catalysts, precious metal catalysts and ceria-based mixed oxide catalysts. The latter
two have excellent NO oxidation ability into NO2, redox ability, structural and

Chapter II. Literature review on soot emission control
20
textural property and high thermal stability, thus they are extensively applied in DPF
passive regeneration. In this thesis, the precious metal catalysts and ceria-based mixed
oxide catalysts are mainly introduced as follows.
2.4.1 Precious metal catalysts
Precious metal catalysts are usually used for DPF passive regeneration and received
much attention in catalytic field for DPF passive regeneration. Precious metal
catalysts consist of two main parts: active components and support oxides. The former
mainly refers to Pt, Pd, Rh and Au, and the latter includes CeO2, CeO2-ZrO2, SiO2,
TiO2, Al2O3, etc. materials with vesicular structure and high thermal stability. In the
previous section, it is mentioned that a role of DOC is to oxidize NO in Diesel
exhaust gas into NO2 and then NO2 is used for DPF passive regeneration, this process
is called as CRT technology [82]. Some precious metal catalysts are coated onto the
DPF substrate and can further oxidize NO from NO2 reduction by soot into NO2, thus
increasing NO2 concentration. This is favourable for the improvement of DPF passive
regeneration efficiency [83,84].
Among all the precious metal catalysts, Pt catalysts show the best catalytic
performance for NO oxidation into NO2 and thus are often applied in Diesel exhaust
post-treatment system. Certainly, the excellent performance of Pt catalysts is not only
related to active Pt atoms but also to the dispersion, particle size and chemical state of
Pt [84-87]. For the Pt catalysts, the physicochemical performance of active
component Pt highly depends on the properties of the support, for example, surface
area, thermal stability, and the interaction between Pt and the support, etc. [85,86,88].
The thermal sintering of the support oxides at higher temperatures would lead to the
decrease of surface area and Pt dispersion, aggregation of Pt atoms and Pt particle
growth, and thereby a loss of catalytic activity [88]. Moreover, the activity of Pt
catalyst is affected by the composition of exhaust gas. For example, SO2 in exhaust
gas is absorbed on Pt atoms and then oxidized into SO3, which reacts with H2O that
presents in exhaust gas into sulfuric acid, and the reaction between sulfuric acid and

Chapter II. Literature review on soot emission control
21
some metallic ash forms sulfate. These sulfuric acid and sulfates then cover the
surface of Pt atoms, leading to the deactivation of Pt [88]. Thus, Pt catalysts are
generally applied in the exhaust gas system with low content of sulfur or without
sulfur.
In general, thermal stability and sulfur resistance of Pt catalysts are important factors
in actual application and many researchers have done a lot of works to improve the
performance of the catalysts. There are two methods to optimize the precious metal
catalysts and improve their catalytic performances, one is the optimization of the
active component to improve the sulfur resistance, thermal stability and the dispersion
of Pt. The other one is the optimization of the support oxides to better the structural
and textual properties, thermal stability and the interaction between Pt and the support,
and so on. For example, it was reported that the introduction of Rh into Pt catalysts
can decrease the formation of SO3 on Pt surface and thereby improve the sulfur
resistance of Pt catalysts [89]. It was also found that the addition of La, Y, Ce, etc. into
active components or support oxides would greatly improve the dispersion of Pt and
the thermal stability of the catalysts [90-92].
In Oi-Uchisawa’s studies [85], the researchers studied the effect of different support
oxides, which include TiO2, ZrO2, SiO2, Al2O3 and their mixed oxides, on soot
oxidation performance of Pt catalysts. It was found that the Pt catalyst with TiO2-SiO2
support showed the highest activity. Then Pt/TiO2-SiO2 catalyst was pretreated in SO2
gas flow, it still showed the best activity, which illustrates higher sulfur resistance of
the catalyst. They also studied the effect of different reaction gases on soot oxidation
activity [83], it was confirmed an apparent role of Pt on oxidizing NO to NO2 and
revealed that the presence of NO visibly enhanced the activity of the catalysts for soot
oxidation. The authors also studied the mechanism for soot oxidation under the
reaction gas with a small amount of SO2 and H2O. They thought that the presence of
SO2 and H2O enhanced the decomposition of anhydride species as COx precursors. In
another work [84], it was found that the precursors of Pt is also an important factor
that affects soot oxidation activity of Pt catalysts.

Chapter II. Literature review on soot emission control
22
Jeguirim et al. [93] studied and compared the soot-NO2 and soot-O2 reactions over
Pt/Al2O3 catalyst, they found that the presence of Pt catalyst had no apparent
influence on C-NO2 and C-O2 reactions. While Pt catalyst showed visible catalytic
activity under NO2 + O2 mixture. The authors suggested that the NO generating from
NO2 reduction by soot could be reoxidized into NO2 on the Pt catalyst and thus
promote catalytic activity. They also proposed C + NO2 + O2 cooperative reaction and
thought that the presence of Pt catalyst increased the rate of the cooperative reaction.
Liu et al. [94] studied the impact of the sulfurization of Pt/Al2O3 catalyst on its soot
oxidation activity through doping a small amount of H2SO4 into Pt/Al2O3 catalyst.
The result was found that the catalyst showed better activity in the presence of NO,
which would be ascribed to the interaction between Pt and sulfates. The authors
discussed three reasons: (i) the formation of sulfates prevented the oxidation of Pt
under high concentration of O2, which benefits the oxidation of NO into NO2 over the
Pt; (ii) the sulfurization of the support oxides could inhibit the adsorption of NOx on
the surface of the support, thus there are more NO2 react with soot particles; (iii) the
presence of sulfates would promote the decomposition of surface oxygenated
complexes (SOCs) into COx.
However, the use of precious metal catalysts results in a high cost due to the
expensive precious metals. Moreover, in the SO2-containing exhaust gas, the presence
of Pt catalysts would promote the formation of sulfates and increase their emissions.
Therefore, many researchers have also been studying the catalysts with lower content
of precious metals or without precious metals.
2.4.2 Ce-based mixed oxide catalyst
Ce-based mixed oxide catalyst is mainly composed of CeO2 oxides and transition
metal oxides such as MnOx, Co2O3, NiO, CuO, ZrO2, La2O3 and Y2O3. Rare-earth
metal CeO2 oxides as cheaper materials have been confirmed to have excellent redox

Chapter II. Literature review on soot emission control
23
ability and oxygen storage/release capacity and thus received much attention. In order
to further improve the thermal stability, oxygen storage/release capacity and structural
and textual properties, those transition metals are often doped into CeO2 oxides to
form Ce-based mixed oxides, thereby improving the catalytic activity. Besides, the
interaction between CeO2 and transition metal oxides can also enhance the redox
ability and oxygen storage capacity of the catalysts.
Atribak et al. [95] studied a series of Ce-Zr mixed oxide catalysts with different Ce/Zr
ratios and found that NO could be effectively oxidized into NO2 by the active oxygen
species presented in CeZrO2 catalysts. They also confirmed that the catalytic activity
of the catalyst is apparently related to the concentration of NO2, and the production of
NO2 depends on the content of CeO2 in the mixed oxides, higher content of CeO2
would cause the production of more NO2. In another work [96], they studied the
thermal stability of CeO2 and CeZrO2 catalysts and found that CeZrO2 catalyst
showed higher thermal stability after calcination at 1000 °C. Subsequently, the
authors added Y into CeZrO2 and found that there was no apparent effect on soot
oxidation activity, this is because ZrO2 in Ce-Zr mixed oxides plays an important role
on increasing thermal stability [97].
Krishna et al. [86] studied the impact of La, Pr, Y, Sm four rare-earth elements on the
catalytic activity of CeO2 catalyst under NO + O2 mixture. It was found that Pr- and
La-modified CeO2 catalysts showed higher activity, which should be attributed to
their increased surface area and redox ability. Besides, they also found that the lattice
oxygen in CeO2 took part in the oxidation reaction of NO into NO2. The authors also
impregnated 2.5 wt% Pt into these Ce-based mixed oxides, the experimental results
showed that the presence of Pt greatly improved the redox property of the catalysts,
and thereby soot oxidation activity and CO2 selectivity. Some researchers studied the
effect of Nd on physicochemical property and catalytic performances of Ce-Zr mixed
oxide catalysts [98]. It was found the addition of Nd promoted the soot oxidation
activity of the catalysts. This is because the addition of Nd into Ce-Zr mixed oxides
increased the oxygen vacancies and redox ability as well as thermal stability.
Chapter II. Literature review on soot emission control
24
Furthermore, the presence of Nd enhanced the formation of unstable nitrites on the
surface of the catalysts under NO, thus improving NO2 production.
Wu and Liu et al. [99-101] studied the catalytic performance of MnOx-CeO2 mixed
oxides during soot oxidation. It was confirmed the mixed oxides showed better
catalytic performance under both NO + O2 and O2, which should be ascribed to their
strong redox ability, oxygen storage capacity and low-temperature NOx storage
capacity as well as high oxidation ability of NO into NO2. It was also found that Mnx+
could enter into CeO2 lattice and form Mn-Ce solid solution, thereby increasing the
amount of oxygen defects. The authors thought that the interaction between MnOx
and CeO2 could inhibit crystalline growth of the oxides and increase surface area. It
was also revealed that under NO, the formation and decomposition of surface nitrates
and NO2 production on the Mn-Ce catalyst are very important in promoting soot
oxidation reactions. In some works [102,103], Mn-Ce mixed oxides were modified by
adding Ba. As a result, the modified catalyst showed higher NOx storage in the form
of surface nitrates and thereby produced more NO2 at higher temperatures due to the
decomposition of surface nitrates, thus improving soot oxidation activity. Some
authors studied that the effect of the introduction of Al2O3 on the catalytic activity and
thermal stability of Mn-Ce mixed oxides [104]. The result was found that the
introduction of Al2O3 increased surface area of the mixed oxides and the dispersion of
active species. Thus, Mn-Ce-Al mixed oxide catalyst exhibited higher activity and
thermal stability after aging at high temperatures.
2.5 Soot oxidation reaction mechanism
For the mechanism of soot oxidation reaction, it might be extremely complex in view
of a fact for the solid-solid-gas reaction under different contact and gas phase
conditions. In our previous work [105], it was reported that the soot oxidation over
Pt/MnOx-CeO2 under tight contact occurred at lower temperatures (250-450 °C) and
showed a higher reaction rate in comparison with that under loose contact. The results
should be ascribed to the accelerated oxidation mechanism of soot under tight contact.
Chapter II. Literature review on soot emission control
25
In Jeguirim’s works [106,107], it has been reported that the carbon-oxygen complexes
(-C(O)) such as carboxylates and phenols could form by the chemisorption of O2
presented in reaction gas on the carbon surface at 300-400 °C. Based on the literature
[108,109], the tight contact between CeO2 catalyst and soot can provide more contact
sites on the interface between soot and the catalyst and more active oxygen species
(O*) easily reach carbon surface to further oxidize -C(O) into CO2. Furthermore, the
formation of -C(O) complexes is easier under tight contact due to the involvement of
more active oxygen generated from CeO2. These facts might determine lower
oxidation temperatures and enhanced oxidation rate of soot under tight contact. The
reaction mechanism for the interaction of carbon and oxygen would be proposed as
follows:
C + O2 → -C(O)
C + O* → -C(O)
-C(O) → CO
-C(O) + O2 → CO2
-C(O) + O* → CO2
On the other hand, NO2 plays an important role during soot oxidation due to its
stronger oxidation ability than O2. According to the publications [83,105-107,110],
NO2 can directly attack the carbon surface and the attack would first produce the
surface -C(O) species, these -C(O) species then further react with NO2 to form
-C(O-NO2) intermediate complex. In fact, the -C(O) complexes can not decompose at
a significant rate below 400 °C [111]. The -C(O) complexes need to be destabilized by
NO2 attack at low temperatures and then decompose into CO and NO2. Thus, the
authors proposed the following mechanism for C-NO2 reactions:
C + NO2 → -C(O) + NO
-C(O) + NO2 → -C(O-NO2)
-C(O-NO2) → CO + NO2
-C(O-NO2) → CO2 + NO

Chapter II. Literature review on soot emission control
26
In fact, in the C-NO2-O2 reaction system, the two reactions (C + O2/O* and C + NO2)
mentioned above should be cooperative but not isolated during soot oxidation. The
cooperative reaction may be schematically presented as follows [105]:
C + O2 + O* + NO2 → CO + CO2 + NO + NO2
Moreover, in Ce-based catalyst system, under NOx + O2 mixture, the formation and
decomposition of surface nitrites and nitrates play an important role on the promotion
of soot oxidation reactions. In Setiabudi’s study [112], as shown in Figure 2-12, it was
found that the formation and desorption of active oxygen, especially super-oxygen
species (-O2-), originating from NO2 chemisorptions and the decomposition of surface
nitrates (such as bidentate and bridging nitrates) might accelerate the CeO2 catalyzed
soot oxidation. Setiabudi et al. thought that the gas-phase NO2 could be adsorbed to
the oxygen vacant sites of CeO2 and then form cerium nitrates, their decomposition
would lead to the production of peroxide or super-oxide species.
Figure 2-12. Reaction scheme showing oxygen transfer from NO2 to CeO2 [112].

Chapter III. Materials and experimental methods
27
3. Materials and experimental methods
3.1 List of materials
3.1.1 Materials for soot preparation
Aref model fuel
Methydecanoate (C11H22O2)
Methyl ester (Biodiesel fuel)
Standard Euro VI fuel (EN 590)
Degussa Printex U soot
3.1.2 Materials for catalyst preparation
Ce(NO3)3·6H2O (solid, 95% pure)
Mn(NO3)2 (liquid, 50 wt.%)
Polyvinyl alcohol (PVA)
Polyethylene glycol (PEG)
NH3H2O
(NH4)2CO3
3.2 Physicochemical characterization
3.2.1 Brunauer-Emmett-Teller (BET)
The textural characterization was conducted by N2 adsorption at -196 °C in a
BelSorb-Mini II (BEL-Japan) device. The BJH method was used for the calculation of
the specific surface area and mean pore size.
3.2.2 Laser Granulometry
Chapter III. Materials and experimental methods
28
FRITSCH laser particle sizer (ANALYSETTE 22 Nano Tec) was used to measure the
particle size distributions of soot under wet dispersion in which water was used as a
suitable liquid. Before each measurement, the aggregated soot sample was well
dispersed into individual particles by a close circulatory system and an integrated
ultrasonic generator.
3.2.3 X-Ray Diffraction (XRD)
The X-ray diffraction was performed on PANalytical-Empyrean diffractometer (Japan
Science) with CuKα radiation (λ = 0.154056 nm) to obtain some information about
internal lattice parameters of soot. The X-ray tube was operated at 40 kV and 40 mA.
The XRD patterns of samples were recorded in the range of 10° ≤ 2θ ≤ 90° with
a scanning step size of 0.02°. The stacking thickness of crystallites (D) and the
crystalline length (L) as crystallite dimensions of soot samples can be calculated by
applying the Scherrer equation to the bands 002 and 100, respectively, where K and K'
are the shape factors and β002 and β100 are the full widths at half maximum of the
bands.
89.0,cos 002002
KK
D
1.84',cos
'
100100
KK
L
3.2.4 Temperature-Programmed Reduction (TPR)
3.2.4.1 H2-TPR
The hydrogen temperature-programmed reduction (H2-TPR) profiles were obtained
using a BELCAT-M (BEL-Japan) apparatus, equipped with a TCD. The materials
were outgassed and activated at 400 °C for 1 h in Ar, then cooled down to room
temperature and reduced until 700 °C in 5 vol.% H2/Ar at a heating rate of 8 °C/min.
Chapter III. Materials and experimental methods
29
3.2.4.2 Soot-TPR
30 mg of soot-catalyst mixture in tight contact was used for soot
temperature-programmed reduction (soot-TPR). The sample was heated from 80 to
650 °C at a ramp rate of 5 °C/min in a pure Ar flow (100 ml/min). The consumption
signals (COx concentration) of soot were monitored by a MS (mass spectrometry)
detector (Figure 3-2).
3.2.5 Temperature-Programmed Desorption (TPD)
3.2.5.1 NOx-TPD coupled to MS
The catalyst (50 mg) was outgassed at 450 °C under O2/Ar flow for 30 min to clean
the surface and then cooled down to 350 °C. NO and NO2 adsorptions in the catalyst
were separately performed in a U-shaped quartz reactor by the exposure in 400 ppm
NO/9% O2/Ar and 400 ppm NO2/9% O2/Ar for 1 h. After that, the sample was kept at
80 °C in pure Ar flow for 1 h for proper degassing. The desorption profiles of NOx
and O2 were obtained by heating the sample from 80 to 550 °C at 10 °C/min in Ar
flow (100 ml/min). The concentrations of desorption species were calculated by the
m/z = 30 (NO), 32 (O2) and 46 (NO2) on a mass spectrometer (MS) (Figure 3-2).
3.2.5.2 NOx-TPD coupled to IR
The prepared MnOx-CeO2 mixed oxides were treated at 350 °C for 30 min in 600 ppm
NO/10% O2/N2, and then cooled down to 100 °C, the gas mixture was replaced by
pure N2 and the sample was maintained for 1 h to remove the weakly adsorbed NOx
species. The NOx (NO and NO2) temperature-programmed desorption (NOx-TPD)
tests were carried out in a fixed-bed reactor. 50 mg of pretreated sample was heated to
650 °C from 100 °C at a heating rate of 10 °C/min in N2 or 10% O2/N2 flow with a
flow rate of 500 ml/min. The concentration of NOx desorbed from the catalyst was

Chapter III. Materials and experimental methods
30
recorded on an IR detector.
3.2.6 Thermal Gravimetric Analysis (TGA)
The SOFs content of soot samples was evaluated by means of thermogravimetric
oxidation in a SDT Q600 apparatus (TA Instruments), under air flow, heating from
ambient temperature to 800 °C at a rate of 10 °C/min.
The soot oxidation reactivity of the catalysts was also measured through means of
thermogravimetric oxidation in a HCT-2 apparatus, in 10% O2/N2 flow (50 ml/min),
heating from ambient temperature to 700 °C at a rate of 10 °C/min.
3.2.7 Transmission Electron Microscope (TEM)
High-resolution transmission electron microscopy (HR-TEM) (JEOL JEM 100CX)
with a point resolution of 0.3 nm was utilized for an analysis of the internal structure
of soot particles. The high-resolution images were acquired under 500,000
magnification. The carbon fringes lengths of different soot samples were also
measured and analyzed by a software Image J in this work. The carbon fringe length
distribution (f(x)) of soot was obtained by the following:
02
1)(
2
2
2
)(
,x
exf
where µ is the mean value of fringe lengths, σ is the standard deviation and σ2 is the
variance.
3.2.8 Raman Spectroscopy (Raman)
Raman spectra of soot were obtained on a micro-Raman system (Horiba Jobin Yvon
HR 800 UV) with an exciting source of 532 nm. The output power of 0.1 mW was
chosen in the scanning range of 800-2000 cm-1
. The spectrometer includes a grating

Chapter III. Materials and experimental methods
31
with 600 grooves mm-1
and a CCD detector with 50× magnification objective lens.
3.2.9 Diffuse Reflectance Infrared Fourier Transform Spectra
(DRIFTS)
Diffuse reflectance infrared Fourier transform spectra (DRIFTS) of soot were
measured by using a Nicolet 6700 spectrometer with a DTGS detector and a high
temperature cell. Soot sample was diluted by KBr at a soot/KBr ratio of 1/40, then the
mixture was placed in a reaction cell and pretreated at 100 °C in pure N2 for 10 min.
After that, the IR spectra were recorded.
The diffuse reflectance infrared Fourier transform spectra (DRIFTS) of catalyst were
measured by using the same equipment. MnOx-CeO2 powder sample was diluted by
KBr and placed in a reaction cell and then pretreated at 500 °C in pure N2, the
background spectra were recorded at 250, 350 and 450 °C. The sample was finally
exposed in 600 ppm NO/10% O2/N2 at each temperature for 30 min for DRIFTS
measurements.
3.2.10 X-ray Photoelectron Spectra (XPS)
XPS measurement was conducted on an AXIS Ultra DLD spectrometer (Kratos,
England) by using AlKα radiation as the excitation source (300 W). All binding
energies (B.E.) were referenced to carbon C 1s line at 284.6 eV.
3.3 Reactivity evaluation by TPOs
3.3.1 Soot oxidation reactivity
The catalyzed and non-catalyzed oxidation activities of soot samples were studied by
temperature program oxidation (TPO) tests under different reaction gases: 9% b.v.
O2/Ar, 400 ppmv NO + 9% b.v. O2 in Ar, 400 ppmv NO2 + 9% b.v. O2 in Ar. It is well

Chapter III. Materials and experimental methods
32
known that one of important functions of Diesel oxidation catalyst (DOC) placed the
up-stream of DPF is to convert NO into NO2 and assist the DPF passive regeneration.
Thus, NO2 as reaction gas was added into gas mixtures in order to simulate real DPF
regeneration conditions.
Soot-TPOs were performed in a U-shaped quartz reactor (internal diameter 8 mm)
with a porous frit as reaction bed (Figure 3-1). Each sample was placed in the reactor
and heated by a thermally isolated furnace at a ramp rate of 10 °C. As shown in
Figure 3-1, the reaction temperature was monitored by K-type thermocouple located
in a thermowell in the reaction bed. The temperature program was controlled by a
heating controller (Ɛ’EUROTHERM 2404). All gas flows were controlled with the
mass flow meters (Brooks 5850S and Brooks Delta II). The gas mixtures passed
through the reactor at a total flow rate of 15 Nl/h (GHSV ≈ 100,000 h-1
).
Concentrations of CO and CO2 (ppmv) in the outlet were measured by a Siemens
Ultramat6 analyzer (Figure 3-2).
Soot and MnOx-CeO2 catalyst powder were mixed by a spatula in an agate mortar for
2 min with a weight ratio of 1/10 (2.0 mg/20 mg) to obtain so-called loose-contact
mixtures [105,109,113]. In order to compare the soot oxidation activity in different
contact cases, the tight-contact and pressure-contact samples with same soot/catalyst
ratio were prepared via using a pestle grinding for 2 min and loading about 60 bar
pressure in a pneumatic press, respectively [105,113]. Tight contact was used in this
work to study the intrinsic activity of soot catalytic combustion. In fact, in real
catalytic wall-flow DPF, the formation of soot cake during soot filtration can lead to
the increase of flow pressure, which promotes the interface contact between soot and
catalyst. Base this case, pressure contact was selected to evaluate the catalytic
reactivity of soot. To minimize the impact of hot spots, the soot-catalyst mixtures (22
mg) were diluted with 80 mg SiC pellets. In the obtained soot-TPO curves, Ti and Tm
separately represent the ignition temperature at which the COx (CO + CO2)
concentration reaches 100 ppm and the temperature of maximal soot oxidation rate.
T5% and T50% separately represent the temperatures at which 5% and 50% of soot

Chapter III. Materials and experimental methods
33
conversion.
For each experiment, based on the reaction C(soot) + (1 + x)/2O2 → xCO2 + (1-x)CO,
the specific reaction rates were normalized to initial soot mass (2.0 mg) or the catalyst
quality (20 mg) and thus calculated by the following:
inisootM
COCO
specmV
DXXV
,
3
2
3600
10)(
(Eq. a)
.
2
3600
)(
catM
COCO
specmV
DXXV
(Eq. b)
Where Vspec: the specific reaction rate in mmolsoot/s/gsoot,ini (Eq. a) or µmolsoot/s/gcat.
(Eq. b),
XCO and XCO2: molar fractions of CO and CO2 in ppmv,
D: flow rate (15 Nl/h),
VM: molar volume (22.4 L/mol),
msoot,ini and mcat.: initial quality of soot (0.002 g) and mass of catalyst (0.02 g).
Moreover, the selectivity of CO2 (SCO2) in soot oxidation reaction was obtained
through the following equation:
%1002
2
2
COCO
CO
COXX
XS
3.3.2 NO oxidation reactivity (NO-TPO)
The NO temperature-programmed oxidation (NO-TPO) tests were conducted in a
fixed-bed reactor. The reaction gases including 600 ppm NO, 10% O2, N2 were fed to
the fixed-bed reactor at a flow rate of 500 ml/min. 50 mg of MnOx-CeO2 sample was
firstly mixed with 200 mg SiC powder and the mixture was then used in NO-TPO test.
In order to a comparison, the mixture of 50 mg catalyst and 5 mg soot was also used

Chapter III. Materials and experimental methods
34
for NO-TPO under same conditions. The reactor temperature was heated to 650 °C at
a heating rate of 10 °C/min. The effluent gases were detected on an infrared (IR)
spectrometer (Thermo scientific).
3.4 Isothermal experiment
Isothermal experiments of soot oxidation were conducted at 350 °C or 400 °C under
9% b.v. O2/Ar and 400 ppm NOx/9% b.v. O2/Ar, respectively, to obtain the specific
reaction rate of soot. There is no apparent increase in soot conversion at 350-400 °C,
thus soot oxidation reaction is in a relatively stable state. High space velocity and
mixing SiC powder effectively inhibit the mass and heat transfer, and thereby soot
oxidation reaction can be mostly controlled by the chemical kinetics [114,115]. After
isothermal reaction for 1800 s, The “initial soot oxidation rate” at the starting of
isothermal reaction and the “final soot oxidation rate” at the end were recorded.

Chapter III. Materials and experimental methods
35
Figure 3-1. The physical profile of TPO equipment.

Chapter III. Materials and experimental methods
36
Figure 3-2. The physical profiles of exhaust gas detectors.

Chapter IV. MnOx-CeO2 mixed oxides as the catalyst for NO-assisted soot oxidation:
The key role of NO adsorption/desorption on catalytic activity
37
4. MnOx-CeO2 mixed oxides as the catalyst for
NO-assisted soot oxidation: The key role of NO
adsorption/desorption on catalytic activity
4.1 Introduction
In order to avoid the emission of soot from diesel vehicles and serious air pollution,
one effective method is to trap the soot by a Diesel Particulate Filter (DPF) and then
to burn soot at lower temperatures by a catalytic technology [116-118]. MnOx-CeO2
mixed oxides as a cheap and effective candidate for diesel soot oxidation have been
widely studied because of their high redox properties and oxygen storage capacity
[92,119,120]. Moreover, higher NOx storage capacity and better oxidation ability of
NO to NO2 make the soot oxidation reaction easier [92,118].
NO-assisted soot oxidation reactions are complex since they involve two main
oxidants: NO2 and oxygen, both oxidants playing a dominant role during soot
oxidation. It is well known that NO2 has a stronger oxidation ability than O2, and it
often plays a key oxidizing role in Pt catalyst system. For example, in Pt/Al2O3
catalyst system, the NO in exhaust gas can be oxidized into NO2 on Pt active sites,
and soot oxidation activity greatly depends on the production of NO2 [87,94]. It has
been reported that there are two fundamental reactions during soot oxidation in the
presence of NO2 and O2: the direct and cooperative reactions [106,107,121]. The
direct oxidation reactions (Eqs. (1) and (2)) are triggered when O2 or NO2 reaches the
carbon surface along with the C-NO2-O2 cooperative reactions (Eqs. (3) and (4)). For
the cooperative reactions, firstly, the soot reacts with O2 and forms -C(O) complexes
(Eq. (5)), then the presence of NO2 would lead to the the formation of intermediate
nitro-oxygenated species (-C(ONO2)) (Eq. (6)), and their decomposition finally
produces CO and CO2 (Eqs. (7) and (8)) [100,106,110,122]. However, for Ce-based
oxygen storage materials, the generation of active oxygen species (O*) and NOx
storage play an important role during soot oxidation and thus make the case of soot
oxidation different with that of Pt/Al2O3 [92,105,123]. Except for the cooperative C +

Chapter IV. MnOx-CeO2 mixed oxides as the catalyst for NO-assisted soot oxidation:
The key role of NO adsorption/desorption on catalytic activity
38
NO2 + O2 reactions, the oxidizing role of active oxygen from Ce-based oxides would
make soot oxidation reaction easier, because the presence of active oxygen effectively
enhances the formation and oxidation of -C(O) complexes (Eq. (9)) and thus the
cooperative reaction (Eq. (10)).
C + NO2 → COx + NO Eq. (1)
C + O2 → COx Eq. (2)
C + NO2 + O2 → CO2 + NO Eq. (3)
C + NO2 + O2 → CO + NO2 Eq. (4)
C + O2 → -C(O) Eq. (5)
-C(O) + NO2 → -C(ONO2) Eq.(6)
-C(ONO2) → CO + NO2 Eq. (7)
-C(ONO2) → CO2 + NO Eq. (8)
C + O* → CO + CO2 Eq. (9)
C + O2 + O* + NO2 → CO + CO2 + NO + NO2 Eq. (10)
It has been reported that the low-temperature (20-50 °C) adsorption of NO on CeO2
and CeO2/ZrO2 could promote the formation of surface O2- species and vacant site (□)
of Ce3+
[124]. Atribak et al. [95] proposed that NO could be adsorbed in oxygen
vacancies (□) of ceria and then formed transient species (NO-) (Eq. (11)), these
species were oxidized into nitrites and nitrates by an active oxygen transfer process in
ceria, which also led to the formation of Ce3+
(Eqs. (12) and (13)). Setiabudi et al.
[112] reported that CeO2-accelerated soot oxidation reaction under NO + O2 was
because the decomposition of surface nitrates led to the generation of surface
peroxides (-O2-) as more active oxygen species (Eq. (14)). It was also confirmed that
the decomposition of the nitrates formed on Ce-based catalysts led to the desorption
of oxygen and NOx [95,112]. In the previous work [105], it was found that nitrates
decomposition on Pt/MnOx-CeO2 catalyst greatly enhanced oxygen desorption.
Ce3+
-□ + NO → Ce4+
-NO- Eq. (11)
Ce4+
-NO- + Ce
4+-O* → Ce
4+-NO2
- + Ce
3+-□ Eq. (12)
Chapter IV. MnOx-CeO2 mixed oxides as the catalyst for NO-assisted soot oxidation:
The key role of NO adsorption/desorption on catalytic activity
39
Ce4+
-NO2- + Ce
4+-O* → Ce
4+-NO3
- + Ce
3+-□ Eq. (13)
Ce4+
-NO3- → Ce
4+-O2
- + NO Eq. (14)
In Wu’s works [100], the effect of adsorbed NOx species (surface nitrates) on soot
oxidation activity over MnOx-CeO2 was investigated. The authors thought that the
high promotion of NO on soot oxidation activity was mainly attributed to the role of
NO2 from nitrate decomposition and NO catalytic oxidation. However, in our
previous works [105], we analyzed the emissions of all products during NOx-assisted
soot oxidation over Pt/MnOx-CeO2 and found that the oxygen, which results from the
catalyst and NO desorption, also showed an apparent role in promoting soot oxidation.
In fact, the adsorption/desorption performances of NO in MnOx-CeO2 mixed oxides
exist in NOx-assisted soot oxidation process. Thus a question remains: what are the
effects of NO adsorption/desorption on the surface properties of MnOx-CeO2 catalyst
and soot oxidation activity?
The main goal of this work is to investigate the influence of NO adsorption on surface
properties of MnOx-CeO2 catalyst, including surface nitrates formation and
decomposition, surface element content and state, active oxygen species and oxygen
vacancies. Furthermore, we also studied the effects of NO desorption on oxygen
desorption property and the oxygen availability of MnOx-CeO2 catalyst. The
isothermal method was also used to evaluate the soot oxidation rate at 400 °C.
4.2 Materials preparation
MnOx-CeO2 mixed oxides (CM) (Mn/Ce = 1/4 (mol/mol)) as the catalyst were
prepared via a co-precipitation method as previously reported [105]. Ce(NO3)3·6H2O
(solid, 95% pure) and Mn(NO3)2 (liquid, 50 wt.%) as the precursors were firstly
dissolved in deionized water, then adding the dispersants PVA (polyvinyl alcohol) and
PEG (polyethylene glycol) into the mixed solution. Finally, the mixture solution was
mixed with the precipitant (pH > 9.0) consisting of NH3∙H2O and (NH4)2CO3
(chemical reagents, Beijing). The obtained precipitates were filtered and dried by a

Chapter IV. MnOx-CeO2 mixed oxides as the catalyst for NO-assisted soot oxidation:
The key role of NO adsorption/desorption on catalytic activity
40
spraying apparatus, then calcined in static air at 500 °C for 3 h in a muffle furnace.
The prepared sample was treated at 350 °C for 30 min in 600 ppm NO/10% O2/N2,
and then cooled down to 100 °C, the gas mixture was replaced by pure N2 and the
sample was maintained for 1 h to remove the weakly adsorbed NOx species. The
NO-adsorbed sample was labeled as CM-NO.
Printex U (Degussa) carbon was used as the model soot in soot oxidation activity
measurement.
4.3 Physicochemical properties
4.3.1 DRIFTS tests
Figure 4-1 shows in situ DRIFTS of CM after the adsorption of NO, the strong NOx
storage capacity can be seen here. According to the literature [100,105,112,125], the
bands of monodentate nitrates appear at 1040, 1237, 1290, 1440 and 1510 cm-1
and
those of bidentate nitrates can be seen at 1040, 1270, 1310, 1540 and 1580 cm-1
. And
ionic nitrates (1030, 1280, 1380 cm-1
), chelating nitrites (1205 cm-1
), nitro compounds
(1410 cm-1
) and a N2O4 compound (1750 cm-1
) are also observed in Figure 4-1. It can
be noticed that at lower temperatures (250 and 350 °C) the NOx is stored as various
NO-adsorbed species, but at higher temperature (450 °C) most of NO adsorbed
species are decomposed except for ionic nitrates. This illustrates ionic nitrates are
more stable than others at high temperatures [126].
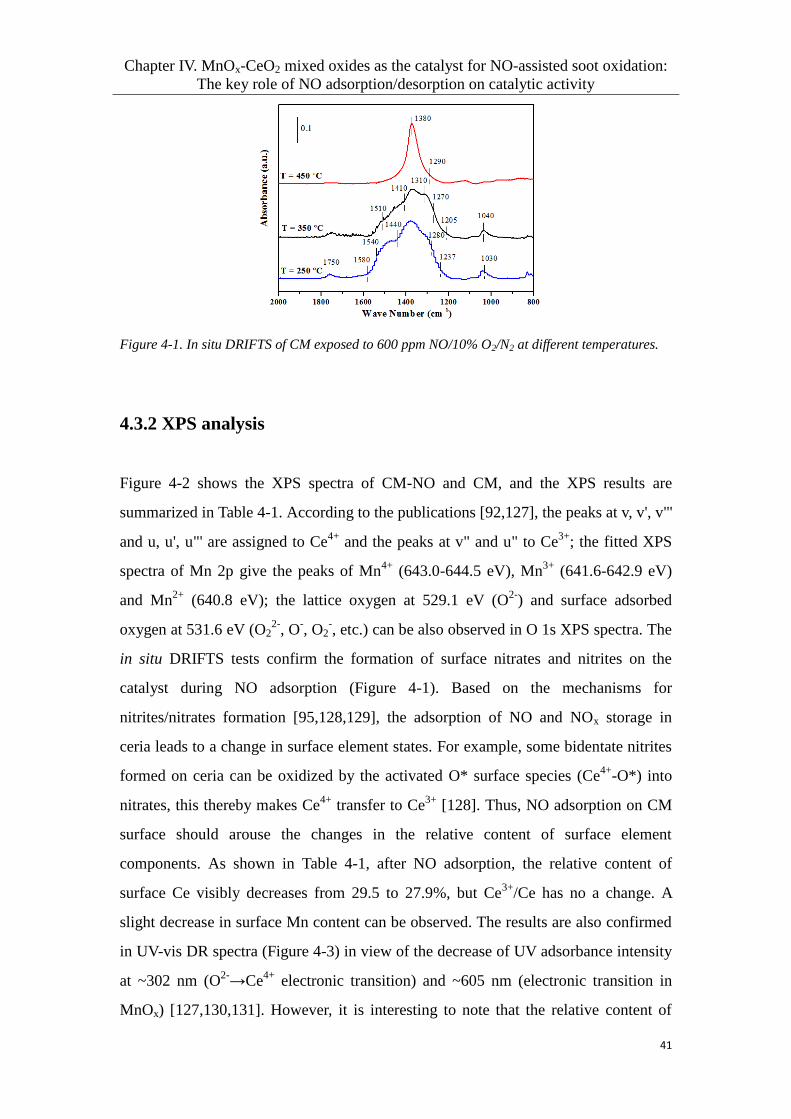
Chapter IV. MnOx-CeO2 mixed oxides as the catalyst for NO-assisted soot oxidation:
The key role of NO adsorption/desorption on catalytic activity
41
Figure 4-1. In situ DRIFTS of CM exposed to 600 ppm NO/10% O2/N2 at different temperatures.
4.3.2 XPS analysis
Figure 4-2 shows the XPS spectra of CM-NO and CM, and the XPS results are
summarized in Table 4-1. According to the publications [92,127], the peaks at v, v', v"'
and u, u', u"' are assigned to Ce4+
and the peaks at v" and u" to Ce3+
; the fitted XPS
spectra of Mn 2p give the peaks of Mn4+
(643.0-644.5 eV), Mn3+
(641.6-642.9 eV)
and Mn2+
(640.8 eV); the lattice oxygen at 529.1 eV (O2-
) and surface adsorbed
oxygen at 531.6 eV (O22-
, O-, O2
-, etc.) can be also observed in O 1s XPS spectra. The
in situ DRIFTS tests confirm the formation of surface nitrates and nitrites on the
catalyst during NO adsorption (Figure 4-1). Based on the mechanisms for
nitrites/nitrates formation [95,128,129], the adsorption of NO and NOx storage in
ceria leads to a change in surface element states. For example, some bidentate nitrites
formed on ceria can be oxidized by the activated O* surface species (Ce4+
-O*) into
nitrates, this thereby makes Ce4+
transfer to Ce3+
[128]. Thus, NO adsorption on CM
surface should arouse the changes in the relative content of surface element
components. As shown in Table 4-1, after NO adsorption, the relative content of
surface Ce visibly decreases from 29.5 to 27.9%, but Ce3+
/Ce has no a change. A
slight decrease in surface Mn content can be observed. The results are also confirmed
in UV-vis DR spectra (Figure 4-3) in view of the decrease of UV adsorbance intensity
at ~302 nm (O2-
→Ce4+
electronic transition) and ~605 nm (electronic transition in
MnOx) [127,130,131]. However, it is interesting to note that the relative content of
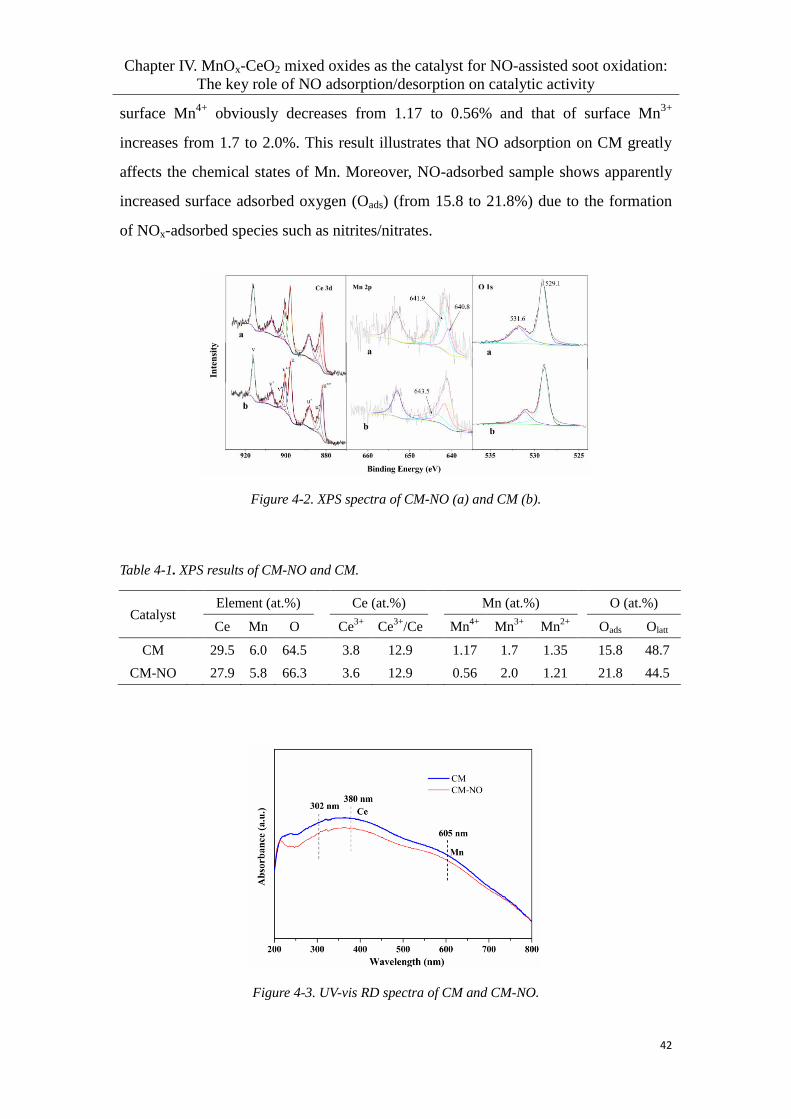
Chapter IV. MnOx-CeO2 mixed oxides as the catalyst for NO-assisted soot oxidation:
The key role of NO adsorption/desorption on catalytic activity
42
surface Mn4+
obviously decreases from 1.17 to 0.56% and that of surface Mn3+
increases from 1.7 to 2.0%. This result illustrates that NO adsorption on CM greatly
affects the chemical states of Mn. Moreover, NO-adsorbed sample shows apparently
increased surface adsorbed oxygen (Oads) (from 15.8 to 21.8%) due to the formation
of NOx-adsorbed species such as nitrites/nitrates.
Figure 4-2. XPS spectra of CM-NO (a) and CM (b).
Table 4-1. XPS results of CM-NO and CM.
Catalyst Element (at.%) Ce (at.%) Mn (at.%) O (at.%)
Ce Mn O Ce3+
Ce3+
/Ce Mn4+
Mn3+
Mn2+
Oads Olatt
CM 29.5 6.0 64.5 3.8 12.9 1.17 1.7 1.35 15.8 48.7
CM-NO 27.9 5.8 66.3 3.6 12.9 0.56 2.0 1.21 21.8 44.5
Figure 4-3. UV-vis RD spectra of CM and CM-NO.

Chapter IV. MnOx-CeO2 mixed oxides as the catalyst for NO-assisted soot oxidation:
The key role of NO adsorption/desorption on catalytic activity
43
Figure 4-4. XRD pattern of MnOx-CeO2 mixed oxides.
Thus, based on the changes in the chemical states of Mn and Ce, the possible
pathways leading to the formation of nitrites/nitrates can be mentioned, as suggested
by Eq. (11) and Eqs. (15)-(19). Firstly, the NO molecules absorbed on active sites
(Ce4+
-O*) are oxidized into NO2 and then stored at the form of nitrites, and those
absorbed in the vacancies (Ce3+
-□) form transient species (NO-) by the electron
transfer process and then are oxidized by CeO2/MnO2 to nitrites [95,112]. The
formation of many nitrates (Figure 4-1) on CM should be the oxidation of these
nitrites by active oxygen (O*). It has been confirmed that MnOx-CeO2 mixed oxides
show fluorite-like structure and decreased lattice constant (0.5392 nm) compared to
pure CeO2 (0.5418 nm) (Figure 4-4) [92,132]. Furthermore, their lower wavenumber
of F2g model (455 cm-1
) than that of pure CeO2 (463 cm-1
) illustrates the formation of
Mn-Ce solid solution (see Figure 4-3) [132]. In fact, on the surface of Mn-Ce solid
solution, Ce-O and Mn-O adjacent sites are present. Thus, the labile oxygen in MnOx
phase can take part in the transformations of Ce4+
-NO- to Ce
4+-NO2
- and Ce
4+-NO2
- to
Ce4+
-NO3- and Ce
3+ -□ can be oxidized by the active oxygen in MnOx phase (Eq. (20)).
A great decrease in Mn4+
content for CM-NO sample might be ascribed to its stronger
oxidizing role than Ce4+
during nitrites/nitrates formation.
Ce4+
-O* + NO → Ce4+
-NO2- Eq. (15)
Ce3+
-□ + NO → Ce4+
-NO-
Eq.(11)
Ce4+
-NO- + Ce
4+-O* → Ce
4+-NO2
- + Ce
3+ -□ Eq. (16)
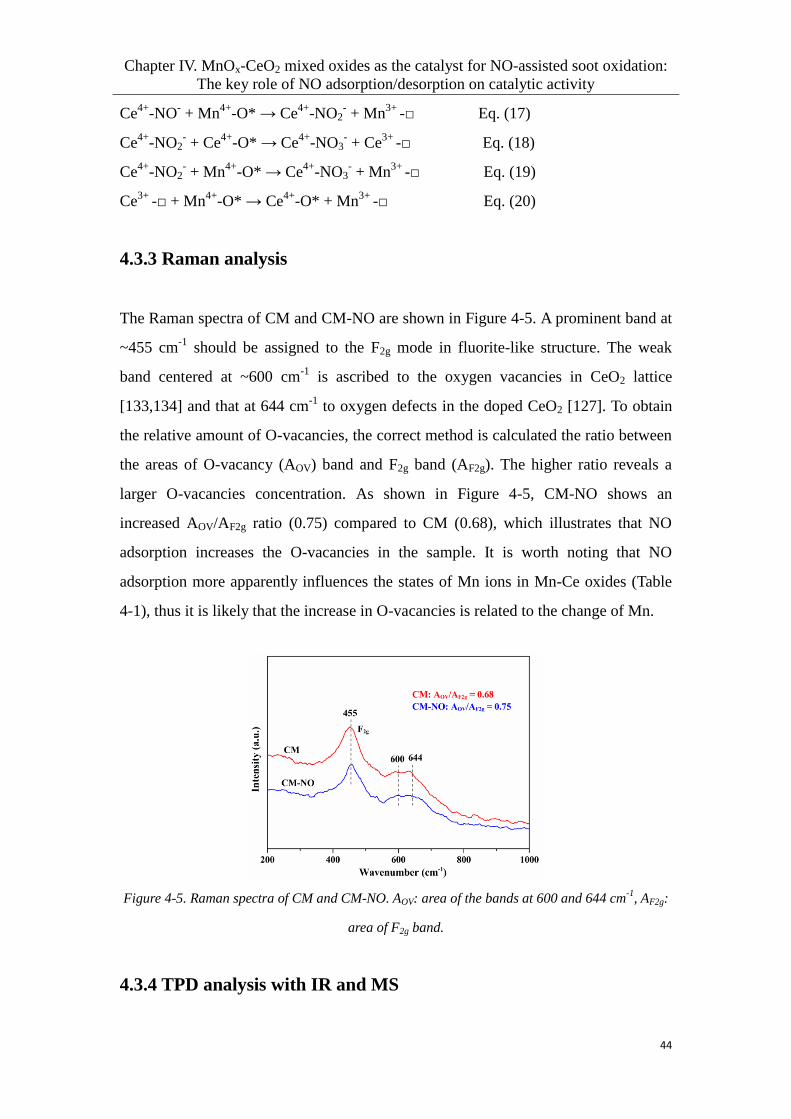
Chapter IV. MnOx-CeO2 mixed oxides as the catalyst for NO-assisted soot oxidation:
The key role of NO adsorption/desorption on catalytic activity
44
Ce4+
-NO- + Mn
4+-O* → Ce
4+-NO2
- + Mn
3+ -□ Eq. (17)
Ce4+
-NO2- + Ce
4+-O* → Ce
4+-NO3
- + Ce
3+ -□ Eq. (18)
Ce4+
-NO2- + Mn
4+-O* → Ce
4+-NO3
- + Mn
3+ -□ Eq. (19)
Ce3+
-□ + Mn4+
-O* → Ce4+
-O* + Mn3+
-□ Eq. (20)
4.3.3 Raman analysis
The Raman spectra of CM and CM-NO are shown in Figure 4-5. A prominent band at
~455 cm-1
should be assigned to the F2g mode in fluorite-like structure. The weak
band centered at ~600 cm-1
is ascribed to the oxygen vacancies in CeO2 lattice
[133,134] and that at 644 cm-1
to oxygen defects in the doped CeO2 [127]. To obtain
the relative amount of O-vacancies, the correct method is calculated the ratio between
the areas of O-vacancy (AOV) band and F2g band (AF2g). The higher ratio reveals a
larger O-vacancies concentration. As shown in Figure 4-5, CM-NO shows an
increased AOV/AF2g ratio (0.75) compared to CM (0.68), which illustrates that NO
adsorption increases the O-vacancies in the sample. It is worth noting that NO
adsorption more apparently influences the states of Mn ions in Mn-Ce oxides (Table
4-1), thus it is likely that the increase in O-vacancies is related to the change of Mn.
Figure 4-5. Raman spectra of CM and CM-NO. AOV: area of the bands at 600 and 644 cm-1
, AF2g:
area of F2g band.
4.3.4 TPD analysis with IR and MS

Chapter IV. MnOx-CeO2 mixed oxides as the catalyst for NO-assisted soot oxidation:
The key role of NO adsorption/desorption on catalytic activity
45
Figure 4-6. (a) NO- and (b) NO2-TPD profiles of CM-NO sample in N2 and 10% O2/N2.
The NOx desorption experiments of CM-NO sample were carried out by means of
TPD with an IR detector in N2 and 10% O2/N2, respectively, to investigate the
desorption cases of NO and NO2 and the results are shown in Figure 4-6. In the case
of NO-TPD (Figure 6-4a), the desorption profile in N2 flow shows a larger NO
desorption peak than that in 10% O2/N2, this illustrates that NO-TPD in N2 is more
favorable for the desorption of NO. In the other case of NO2-TPD (Figure 6-4b), a
contrary result compared to NO-TPD can be seen, the NO2-TPD profile in 10% O2/N2
exhibits more apparent NO2 desorption peak than that in N2. This may be because the
desorbed NO2 is more easily decomposed into NO in N2 due to thermal control of the
balance reaction: NO2 ↔ NO + 1/2O2 at high temperatures. However, the
decomposition of NO2 is not easy at low temperatures (< 400 °C), the production of a
large amount of NO should be mainly based on the decomposition of nitrates (Eq.
(21)) [112]. Thus the increase in NO2 desorption in the presence of O2 more likely
results from the oxidation of the produced NO over the catalyst.
Ce(NO3)4 → CeO2 + 4NO + 3O2 Eq. (21)
TPD-MS profiles were also obtained by heating the samples CM and CM-NO at
5 °C/min under pure Ar flow. It can be observed in Figure 4-7 that NO-adsorbed CM
shows a stronger NO desorption (> 200 ppm) and a smaller NO2 emission (< 20 ppm)
during TPD experiment. This illustrates that NO is the main product in the
decomposition of NOx-adsorbed species. It has to be noted that the O2 desorption

Chapter IV. MnOx-CeO2 mixed oxides as the catalyst for NO-assisted soot oxidation:
The key role of NO adsorption/desorption on catalytic activity
46
profile of CM-NO shows a much lager amount of O2 during NO desorption. However,
for the blank sample (CM), there is no apparent O2 desorption (< 20 ppm). The results
indicate that the NO adsorption/desorption enhances the yield of oxygen species in the
CM catalyst and further confirm that nitrates decomposition follows Eq. (21). Based
on the literature [112], the decomposition of nitrates would lead to the production of
cerium peroxides and super-oxides (Ce-O2-), the emission of partial O2 should be
attributed to their decomposition.
Figure 4-7. Mass spectrometry of NO, NO2 and O2 emissions during TPD tests of CM (blank) and
CM-NO. The sample was heated from 50 to 500 °C at 5 °C/min in pure Ar flow (100 ml/min).
4.3.5 Soot-TPR tests coupled to MS
To know the real reduction ability of CM and CM-NO used for soot oxidation,
soot-TPR was conducted in pure Ar flow based on carbon-catalyst redox reactions. As
shown in Figure 4-8, it can be seen that the TPR profiles (COx) show some continuous
reduction peaks. According to the publications [135,136], the peak at about 200 °C
should be ascribed to the reduction of the outer layer and that at 250-600 °C might be
assigned to the reduction of the second outer layer. By comparison, CM-NO shows
larger soot consumption and decreased reduction temperatures. This illustrates that the
NO adsorption/desorption enhances the redox property of CM. As revealed in the
previous results, NO adsorption arouses the changes in Ce/Mn valence states and
increases the oxygen vacancies, which would improve oxygen storage capacity and

Chapter IV. MnOx-CeO2 mixed oxides as the catalyst for NO-assisted soot oxidation:
The key role of NO adsorption/desorption on catalytic activity
47
mobility of oxygen in CM. Besides, NO desorption greatly promotes the generation of
surface oxygen species. These should play a crucial role on promoting the redox
property of CM.
Figure 4-8. Soot-TPR results of CM (dash line) and CM-NO (solid line) with NO and O2 emissions.
The mass of soot-catalyst mixture was 30 mg, the sample was heated from 80 to 650 °C at a ramp
rate of 5 °C/min in pure Ar flow (100 ml/min).
Moreover, it should be noticed in Figure 4-8 that the desorption of O2 can hardly be
observed during soot-TPR, while the previous TPD results show an obvious O2
desorption of CM-NO. This reveals the consumption of surface oxygen species in
soot-catalyst redox reactions and thus confirms a key role of oxygen in NO-assisted
soot oxidation reactions.
4.4 Soot oxidation activity
4.4.1 Soot-TPO
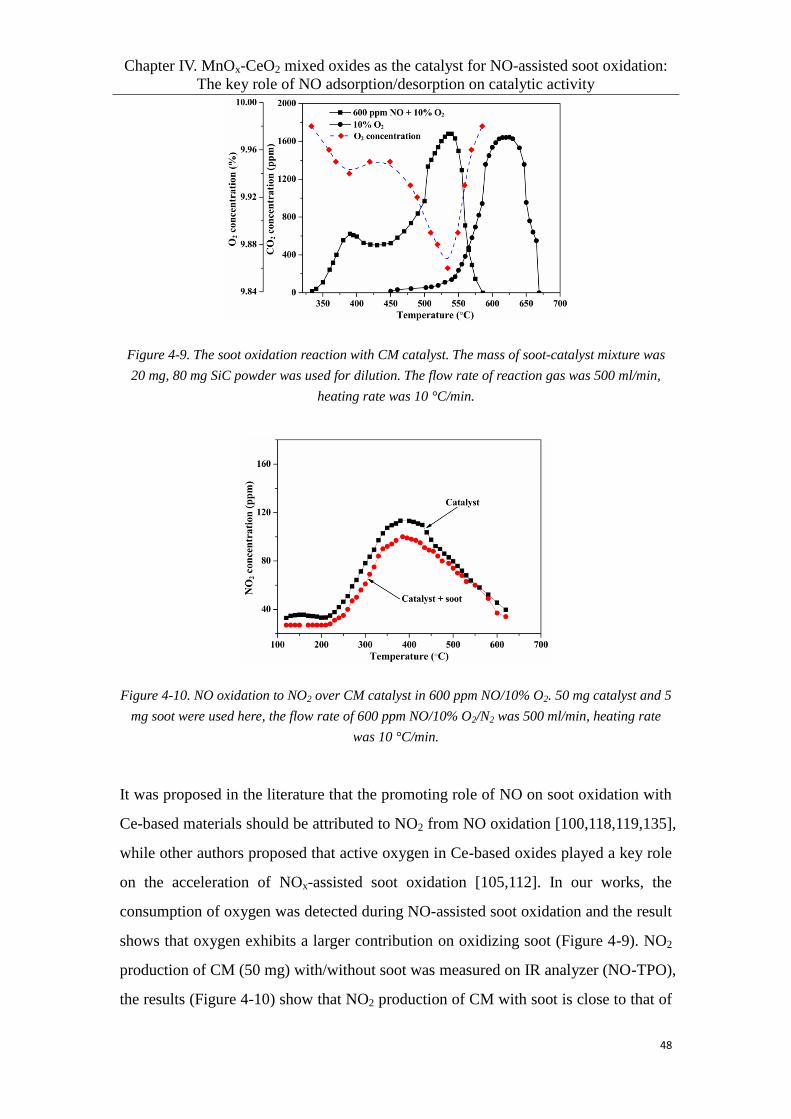
Chapter IV. MnOx-CeO2 mixed oxides as the catalyst for NO-assisted soot oxidation:
The key role of NO adsorption/desorption on catalytic activity
48
Figure 4-9. The soot oxidation reaction with CM catalyst. The mass of soot-catalyst mixture was
20 mg, 80 mg SiC powder was used for dilution. The flow rate of reaction gas was 500 ml/min,
heating rate was 10 °C/min.
Figure 4-10. NO oxidation to NO2 over CM catalyst in 600 ppm NO/10% O2. 50 mg catalyst and 5
mg soot were used here, the flow rate of 600 ppm NO/10% O2/N2 was 500 ml/min, heating rate
was 10 °C/min.
It was proposed in the literature that the promoting role of NO on soot oxidation with
Ce-based materials should be attributed to NO2 from NO oxidation [100,118,119,135],
while other authors proposed that active oxygen in Ce-based oxides played a key role
on the acceleration of NOx-assisted soot oxidation [105,112]. In our works, the
consumption of oxygen was detected during NO-assisted soot oxidation and the result
shows that oxygen exhibits a larger contribution on oxidizing soot (Figure 4-9). NO2
production of CM (50 mg) with/without soot was measured on IR analyzer (NO-TPO),
the results (Figure 4-10) show that NO2 production of CM with soot is close to that of

Chapter IV. MnOx-CeO2 mixed oxides as the catalyst for NO-assisted soot oxidation:
The key role of NO adsorption/desorption on catalytic activity
49
bare CM. This seems to illustrate that the consumption of NO2 is not apparent during
soot oxidation.
Figure 4-11. Soot oxidation activities of CM and CM-NO in 10% O2/N2. The mass of soot-catalyst
mixture was 20 mg, 80 mg SiC powder was used for dilution. The flow rate of reaction gas was
500 ml/min, heating rate was 10 °C/min.
To compare soot oxidation activities of CM and CM-NO, the soot-TPO was
conducted in 10% O2 and the results are shown in Figure 4-11. By comparison with
CM, CM-NO shows an apparently accelerated soot oxidation activity at 350-550 °C.
The TG tests (Figure 4-12) can also evidence this point. The previous results (Figure
4-6) have revealed that NO desorption of CM-NO effectively promotes the desorption
of oxygen, which may be an important factor that promotes the low-temperature
activity. In Wu’s work [100], the Mn-Ce mixed oxides were pretreated in NO + O2 at
350 °C and then used for TPO test in O2, the same results can be observed. The
authors thought that the promotion on soot oxidation activity should be ascribed to the
nitrate-derived NO2. However, in the present work, the production of NO2 is very
little during NOx desorption (Figure 4-6), thus the oxidizing role of NO2 is very weak.
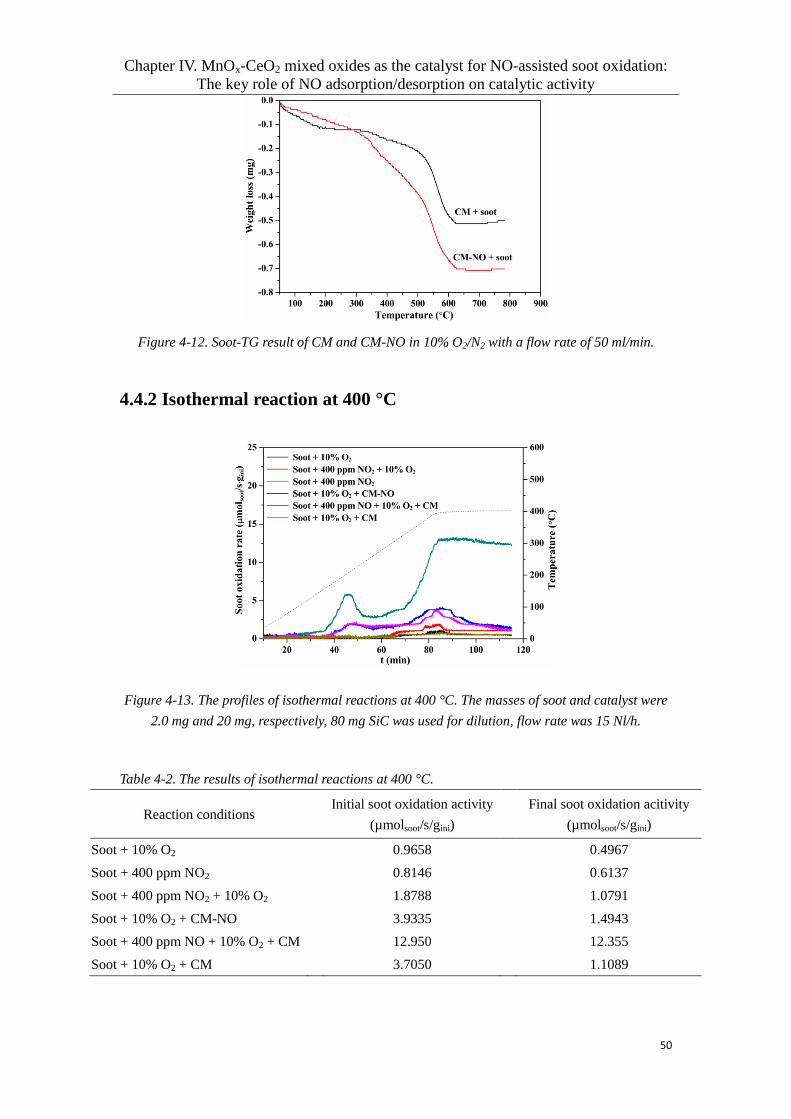
Chapter IV. MnOx-CeO2 mixed oxides as the catalyst for NO-assisted soot oxidation:
The key role of NO adsorption/desorption on catalytic activity
50
Figure 4-12. Soot-TG result of CM and CM-NO in 10% O2/N2 with a flow rate of 50 ml/min.
4.4.2 Isothermal reaction at 400 °C
Figure 4-13. The profiles of isothermal reactions at 400 °C. The masses of soot and catalyst were
2.0 mg and 20 mg, respectively, 80 mg SiC was used for dilution, flow rate was 15 Nl/h.
Table 4-2. The results of isothermal reactions at 400 °C.
Reaction conditions Initial soot oxidation activity
(µmolsoot/s/gini)
Final soot oxidation acitivity
(µmolsoot/s/gini)
Soot + 10% O2 0.9658 0.4967
Soot + 400 ppm NO2 0.8146 0.6137
Soot + 400 ppm NO2 + 10% O2 1.8788 1.0791
Soot + 10% O2 + CM-NO 3.9335 1.4943
Soot + 400 ppm NO + 10% O2 + CM 12.950 12.355
Soot + 10% O2 + CM 3.7050 1.1089

Chapter IV. MnOx-CeO2 mixed oxides as the catalyst for NO-assisted soot oxidation:
The key role of NO adsorption/desorption on catalytic activity
51
Figure 4-13 and Table 4-2 illustrate the oxidation performances of soot under
isothermal conditions at 400 °C. In the absence of the catalyst, the oxidation reactions
of soot show lower reaction rate in both the presence and absence of NO2. It can be
seen in Table 4-2 that the oxidation rate under 10% O2 and 400 ppm NO2 is lower
than that under 400 ppm NO2 + 10% O2 and only 400 ppm NO2 in reaction gas cannot
show a high soot oxidation rate. This fact indicates a cooperative oxidation reaction of
NO2 and O2. Generally, the chemisorption of O2 on the surface of soot leads to the
formation of -C(O) complexes (Eq. (5)), then the NO2 reacts with -C(O) complexes
and forms nitro-oxygenated species (-C(ONO2)) (Eq. (6)), their decomposition
thereby produces gas-phase CO and CO2 (Eqs. (22) and (23)) [100,105,106]. This
cooperative reaction also confirms an importance of oxygen during soot oxidation.
C + O2 → -C(O) Eq. (5)
-C(O) + NO2 → -C(ONO2) Eq. (6)
-C(ONO2) → CO + NO2 Eq. (22)
-C(ONO2) → CO2 + NO Eq. (23)
On the other hand, in the case of catalytic reactions, it can be observed that in 10% O2,
the soot oxidation rate has a greater increase in both the initial and final soot oxidation
activities compared to non-catalytic reaction. This is because CM catalyst provides
many active oxygen species (O*) and thus greatly enhances soot oxidation rate (Eqs.
(24) and (25)). For the pretreated sample CM-NO, it shows larger soot oxidation rate
than CM sample in 10% O2. In the previous sections, it has been proved that the
adsorption/desorption of NO in the catalyst promotes the formation of oxygen
vacancies and the desorption of active oxygen. This should be an important role on
promoting soot oxidation rate for C + O2 and C + NO2 + O2 reactions. When adding
400 ppm NO into 10% O2, the catalytic reaction rate apparently increases to a higher
value (12.355-12.950 µmolsoot/s/gini). The result should be attributed not only to the
adsorption/desorption of NO but to a cooperative oxidizing role of NO2 and oxygen
species (O2/O*) (Eq. (10)).

Chapter IV. MnOx-CeO2 mixed oxides as the catalyst for NO-assisted soot oxidation:
The key role of NO adsorption/desorption on catalytic activity
52
C + O* → -C(O) Eq. (24)
-C(O) + O*/O2 → CO + CO2 Eq. (25)
C + O2 + O* + NO2 → CO + CO2 + NO + NO2 Eq. (10)
4.5 Summary
NO adsorption on Mn-Ce mixed oxides leads to the formation of various adsorbed
species (especially nitrates), which arouses a visible change in chemical states of
surface Ce and Mn ions and thereby increases the oxygen vacancies. More interesting,
TPD-MS indicates that NO desorption effectively enhances the generation of surface
oxygen species and NO is main product during nitrates decomposition. Soot-TPR-MS
confirms that NO adsorption/desorption improves the availability of oxygen during
soot-catalyst redox reactions. Isothermal experiments reveal that the
adsorption/desorption of NO promotes soot oxidation rate, this is mainly ascribed to
the role of active oxygen and a cooperative C + NO2 + O2 reaction.

Chapter V. Structure-reactivity study of model and Biodiesel soot in model DPF
regeneration conditions
53
5. Structure-reactivity study of model and Biodiesel
soot in model DPF regeneration conditions
5.1 Introduction
It is well known nowadays that Diesel engines have high power output and improved
fuel economy, reasons why they are widely used by car and truck manufacturers.
Moreover, Diesel engines can play an important role on the reduction of
anthropogenic CO2 emissions [137]. However, the excessive amount of soot particles
emitted to the environment remain a significant issue, due to their potential threat to
human health [116,137-139]. Accordingly, the new Euro VI emission normative
contains more stringent emission limits regarding soot (particulate matter), in order to
protect the environment and human health [140,141].
Consequently, soot emission control has become a subject of major concern for both
scientists and automobile makers. On one hand, the application of Biodiesel and
Biodiesel blends in diesel engines is known to play a positive role on reducing
pollutant emissions, especially soot [142-144]. Therefore, commercial Diesel fuels
already contain small amounts of Biodiesel, and the aim is to increase its content in
future blends. On the other hand, the regeneration efficiency of the DPF (Diesel
Particulate Filter) can see a great development through the use of highly performing
advanced catalysts for soot oxidation [118,145].
Previous studies have proved that adding oxygenated hydrocarbons (such as ethers,
alcohols, methyl esters, methyldecanoate) into the surrogate fuels can effectively
decrease the sooting tendencies during fuel combustion [63,143,146,147]. Indeed, the
formation of combustion intermediates promoting soot generation is inhibited, while
the presence of radical species (-O and -OH) favors soot combustion rather than its
formation [148,149]. Seong and Boehman studied the impact of oxygenate additives
on the formation and oxidation activity of soot particles, they found that the presence
of oxygenate additives in fuels enhanced the formation of oxygenated soot and

Chapter V. Structure-reactivity study of model and Biodiesel soot in model DPF
regeneration conditions
54
thereby increased soot oxidative reactivity [149]. Song et al. [150] found that the use
of Biodiesel in fuels led to the incorporation of oxygen into soot particles and thus
improved soot oxidative reactivity.
Furthermore, many studies have revealed that soot oxidation activity is related to the
structural features of soot particles and soot structure generally depends on the type
and origin of fuels [64,151,152]. Different oxygenate additives in fuels can affect the
nature of fuels and combustion cases and thereby govern the structure of soot particles
[63,146]. It has been reported that ester components in Biodiesel have a larger impact
on the structure and oxidative reactivity of soot [147]. The authors confirmed that the
presence of shorter alkyl chains of methyl esters in Biodiesel led to the formation of
the soot particles with lower structural order and thus increased soot oxidation
reactivity. They also found that the increase in carbon chain length inhibited the
reactivity of soot. Moreover, It was also reported that soot oxidative reactivity is in
fact dependent on the nanostructure especially the degree of graphitization [69].
Graphene layers in soot are a form of pure carbon and arranged by carbon atoms in a
plane with higher order. This chemical structure can decrease the reactivity of soot
due to its an apparent influence on number and location of active sites exposed on
carbon surfaces [69,152,153]. However, amorphous carbon with lower crystalline
order has many exposed edge sites and defects, showing lower degree of
graphitization, and thus leads to a higher soot oxidation reactivity [69,153].
The use of catalytic DPFs placed the downstream of DOC (Diesel Oxidation Catalyst)
has been applied to soot emission control and can play an important role on the
enhancement in soot oxidative reactivity [145,154]. The use of advanced catalysts
(e.g., [85,100,118,155,156]) coated on DPF can visibly decrease the temperature of
soot combustion based on the reactions Eqs. (1) and (2). Moreover, the NO2 contained
in the exhaust gases can more easily oxidize soot at low temperatures in the range of
250-400 °C due to its stronger oxidizing strength in comparison to O2 [94,157].
However, the reaction rate of Eq. (1) greatly depends on the amount of NO2, thus it is
difficult to achieve an optimal usage of NO2 during continuous regeneration of DPF

Chapter V. Structure-reactivity study of model and Biodiesel soot in model DPF
regeneration conditions
55
because of lower NOx emissions in modern engine combustion modes [82,158].
Ce-based catalysts have been paid special attention for the past few years as they can
provide a mass of active oxygen species (O*) for low-temperature soot oxidation and
as a result increase the availability of O2 in exhaust gas [105,159].
C + NO2 → COx + NO Eq. (1)
C + O* → COx Eq. (2)
MnOx-CeO2 mixed oxides are a relatively cheap and a convenient candidate for soot
oxidation, they possess excellent oxygen storage capacity and redox ability and have
shown to highly promote soot reactivity towards oxidation [100,105,118]. Moreover,
it has been proved that MnOx-CeO2 mixed oxides have high oxidation activity of NO
into NO2 and better NOx storage ability at low temperatures, which is favorable for
the oxidizing role of NO2 [160,161]. Besides, MnOx-CeO2 mixed oxides can release a
large amount of active oxygen species that can directly oxidize soot and thus
apparently improve the catalytic activity for soot oxidation [105].
Many researchers often use carbon blacks (such as Printex-U) as Diesel soot
surrogates, in order to study its reactivity. However, the soot from a real Diesel engine
may considerably differ from such carbon blacks, in terms of nanostructure and
reactivity. In this work, real soot samples were prepared by burning Biodiesel
surrogates in a real Diesel engine whereas the model soot samples were obtained
through burning the surrogate fuels in a co-flow diffusion burner [63]. MnOx-CeO2
mixed oxides were used as catalyst in order to investigate the catalytic oxidation of
the different soot samples. The originality of this work indeed the use of Biodiesel
surrogates in a burner and the comparison of the structure and reactivity of the soots
generated to the soot obtained in an engine bench. All the materials have been also
compared to a Printex-U carbon black. The structural features of the soot samples
were characterized by laser granulometry, high-resolution transmission electron
microscopy (HR-TEM), XRD and Raman spectroscopy. Their catalytic and
non-catalytic oxidation were assessed by means of temperature-programmed
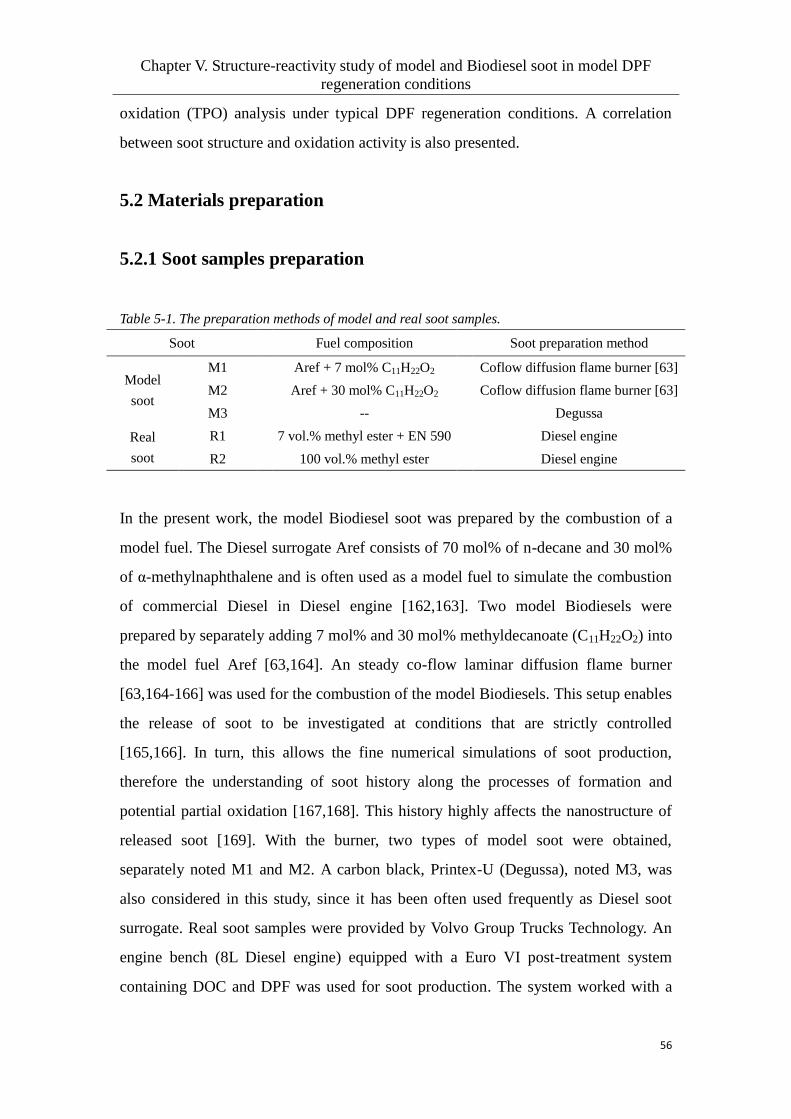
Chapter V. Structure-reactivity study of model and Biodiesel soot in model DPF
regeneration conditions
56
oxidation (TPO) analysis under typical DPF regeneration conditions. A correlation
between soot structure and oxidation activity is also presented.
5.2 Materials preparation
5.2.1 Soot samples preparation
Table 5-1. The preparation methods of model and real soot samples.
Soot Fuel composition Soot preparation method
Model
soot
M1 Aref + 7 mol% C11H22O2 Coflow diffusion flame burner [63]
M2 Aref + 30 mol% C11H22O2 Coflow diffusion flame burner [63]
M3 -- Degussa
Real
soot
R1 7 vol.% methyl ester + EN 590 Diesel engine
R2 100 vol.% methyl ester Diesel engine
In the present work, the model Biodiesel soot was prepared by the combustion of a
model fuel. The Diesel surrogate Aref consists of 70 mol% of n-decane and 30 mol%
of α-methylnaphthalene and is often used as a model fuel to simulate the combustion
of commercial Diesel in Diesel engine [162,163]. Two model Biodiesels were
prepared by separately adding 7 mol% and 30 mol% methyldecanoate (C11H22O2) into
the model fuel Aref [63,164]. An steady co-flow laminar diffusion flame burner
[63,164-166] was used for the combustion of the model Biodiesels. This setup enables
the release of soot to be investigated at conditions that are strictly controlled
[165,166]. In turn, this allows the fine numerical simulations of soot production,
therefore the understanding of soot history along the processes of formation and
potential partial oxidation [167,168]. This history highly affects the nanostructure of
released soot [169]. With the burner, two types of model soot were obtained,
separately noted M1 and M2. A carbon black, Printex-U (Degussa), noted M3, was
also considered in this study, since it has been often used frequently as Diesel soot
surrogate. Real soot samples were provided by Volvo Group Trucks Technology. An
engine bench (8L Diesel engine) equipped with a Euro VI post-treatment system
containing DOC and DPF was used for soot production. The system worked with a
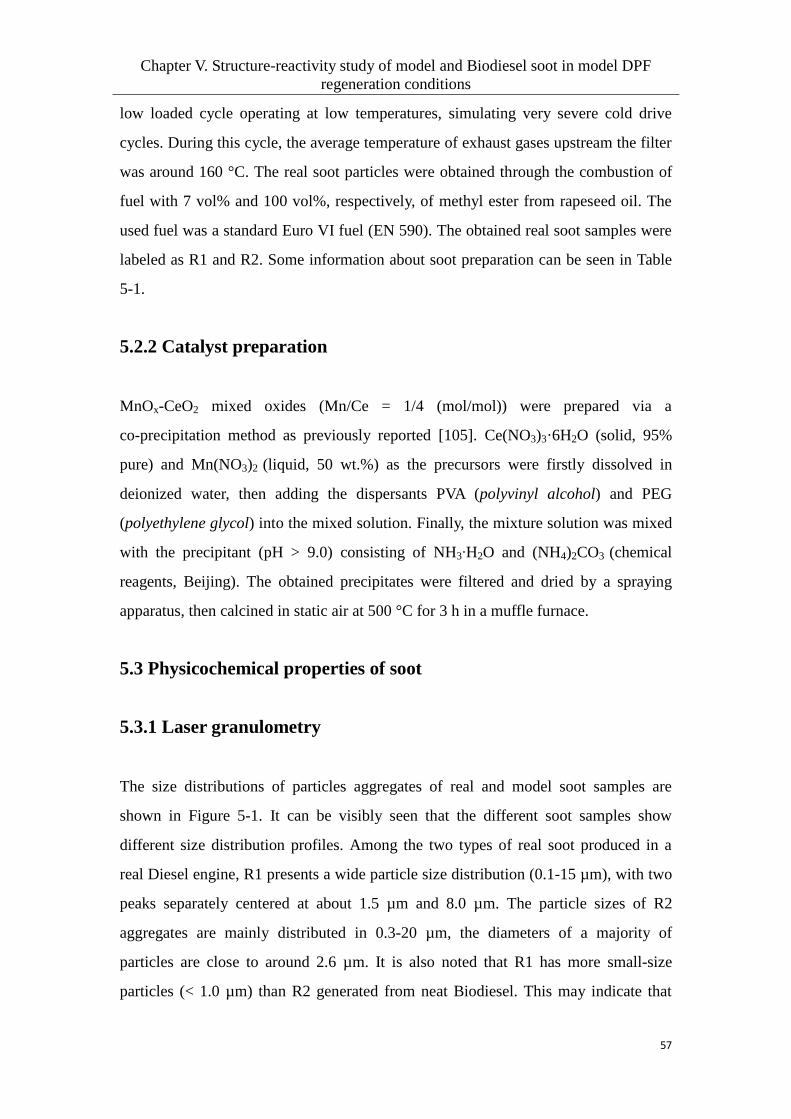
Chapter V. Structure-reactivity study of model and Biodiesel soot in model DPF
regeneration conditions
57
low loaded cycle operating at low temperatures, simulating very severe cold drive
cycles. During this cycle, the average temperature of exhaust gases upstream the filter
was around 160 °C. The real soot particles were obtained through the combustion of
fuel with 7 vol% and 100 vol%, respectively, of methyl ester from rapeseed oil. The
used fuel was a standard Euro VI fuel (EN 590). The obtained real soot samples were
labeled as R1 and R2. Some information about soot preparation can be seen in Table
5-1.
5.2.2 Catalyst preparation
MnOx-CeO2 mixed oxides (Mn/Ce = 1/4 (mol/mol)) were prepared via a
co-precipitation method as previously reported [105]. Ce(NO3)3·6H2O (solid, 95%
pure) and Mn(NO3)2 (liquid, 50 wt.%) as the precursors were firstly dissolved in
deionized water, then adding the dispersants PVA (polyvinyl alcohol) and PEG
(polyethylene glycol) into the mixed solution. Finally, the mixture solution was mixed
with the precipitant (pH > 9.0) consisting of NH3∙H2O and (NH4)2CO3 (chemical
reagents, Beijing). The obtained precipitates were filtered and dried by a spraying
apparatus, then calcined in static air at 500 °C for 3 h in a muffle furnace.
5.3 Physicochemical properties of soot
5.3.1 Laser granulometry
The size distributions of particles aggregates of real and model soot samples are
shown in Figure 5-1. It can be visibly seen that the different soot samples show
different size distribution profiles. Among the two types of real soot produced in a
real Diesel engine, R1 presents a wide particle size distribution (0.1-15 µm), with two
peaks separately centered at about 1.5 µm and 8.0 µm. The particle sizes of R2
aggregates are mainly distributed in 0.3-20 µm, the diameters of a majority of
particles are close to around 2.6 µm. It is also noted that R1 has more small-size
particles (< 1.0 µm) than R2 generated from neat Biodiesel. This may indicate that
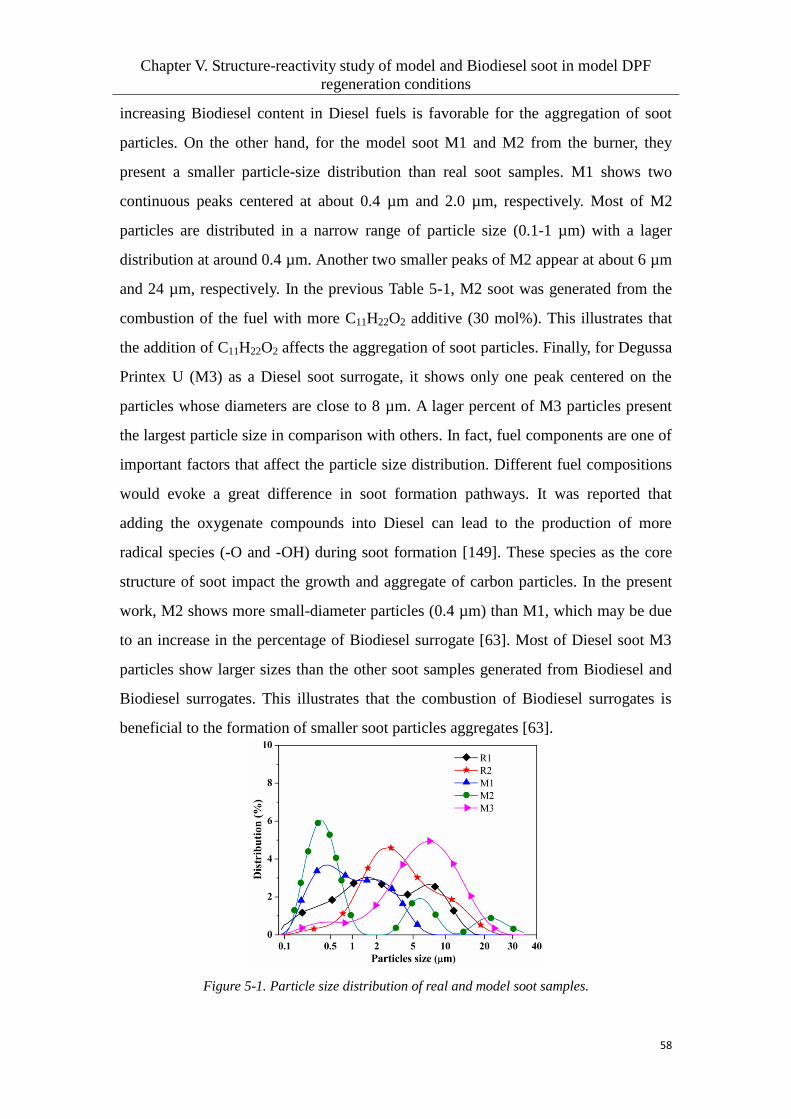
Chapter V. Structure-reactivity study of model and Biodiesel soot in model DPF
regeneration conditions
58
increasing Biodiesel content in Diesel fuels is favorable for the aggregation of soot
particles. On the other hand, for the model soot M1 and M2 from the burner, they
present a smaller particle-size distribution than real soot samples. M1 shows two
continuous peaks centered at about 0.4 µm and 2.0 µm, respectively. Most of M2
particles are distributed in a narrow range of particle size (0.1-1 µm) with a lager
distribution at around 0.4 µm. Another two smaller peaks of M2 appear at about 6 µm
and 24 µm, respectively. In the previous Table 5-1, M2 soot was generated from the
combustion of the fuel with more C11H22O2 additive (30 mol%). This illustrates that
the addition of C11H22O2 affects the aggregation of soot particles. Finally, for Degussa
Printex U (M3) as a Diesel soot surrogate, it shows only one peak centered on the
particles whose diameters are close to 8 µm. A lager percent of M3 particles present
the largest particle size in comparison with others. In fact, fuel components are one of
important factors that affect the particle size distribution. Different fuel compositions
would evoke a great difference in soot formation pathways. It was reported that
adding the oxygenate compounds into Diesel can lead to the production of more
radical species (-O and -OH) during soot formation [149]. These species as the core
structure of soot impact the growth and aggregate of carbon particles. In the present
work, M2 shows more small-diameter particles (0.4 µm) than M1, which may be due
to an increase in the percentage of Biodiesel surrogate [63]. Most of Diesel soot M3
particles show larger sizes than the other soot samples generated from Biodiesel and
Biodiesel surrogates. This illustrates that the combustion of Biodiesel surrogates is
beneficial to the formation of smaller soot particles aggregates [63].
Figure 5-1. Particle size distribution of real and model soot samples.
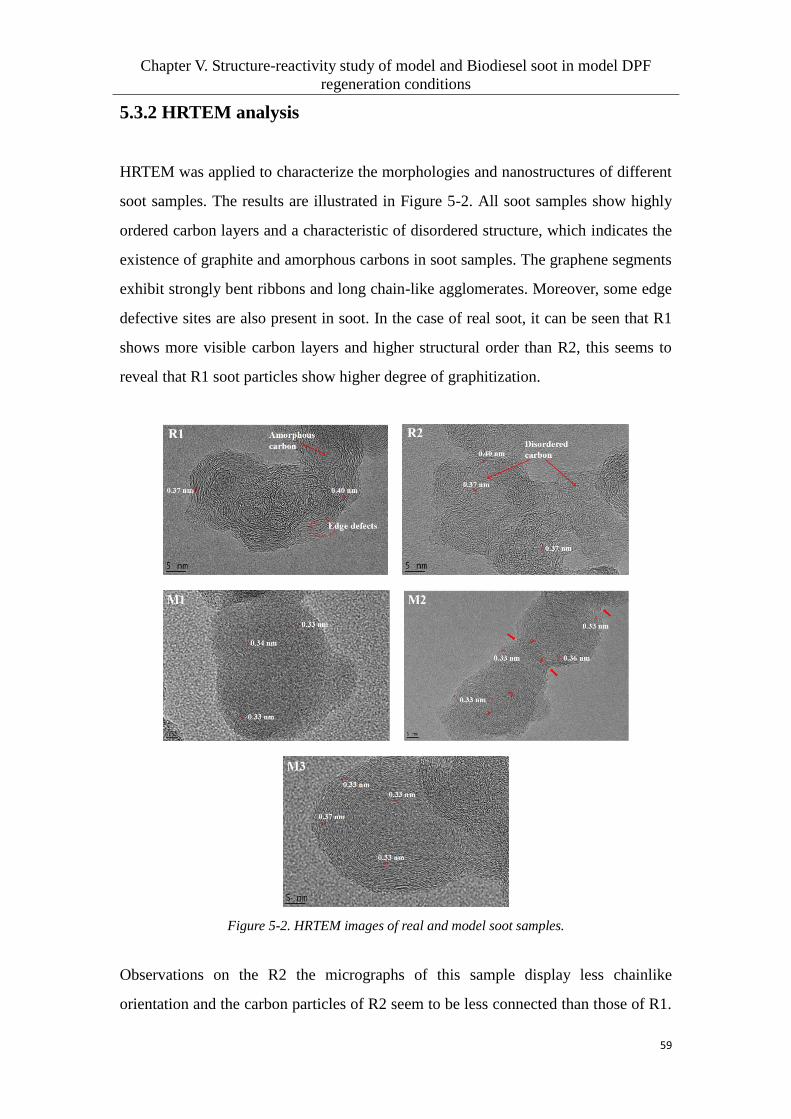
Chapter V. Structure-reactivity study of model and Biodiesel soot in model DPF
regeneration conditions
59
5.3.2 HRTEM analysis
HRTEM was applied to characterize the morphologies and nanostructures of different
soot samples. The results are illustrated in Figure 5-2. All soot samples show highly
ordered carbon layers and a characteristic of disordered structure, which indicates the
existence of graphite and amorphous carbons in soot samples. The graphene segments
exhibit strongly bent ribbons and long chain-like agglomerates. Moreover, some edge
defective sites are also present in soot. In the case of real soot, it can be seen that R1
shows more visible carbon layers and higher structural order than R2, this seems to
reveal that R1 soot particles show higher degree of graphitization.
Figure 5-2. HRTEM images of real and model soot samples.
Observations on the R2 the micrographs of this sample display less chainlike
orientation and the carbon particles of R2 seem to be less connected than those of R1.

Chapter V. Structure-reactivity study of model and Biodiesel soot in model DPF
regeneration conditions
60
In the case of model soot, they seem to appear more compact stacked crystallites in
comparison with real soot. A blurry and highly disordered surface can be observed on
the M1 soot. M2 and M3 exhibit more obvious carbon layers than M1, revealing their
higher order. The morphology of M2 illustrates that the agglomerates of small
nano-particles are happening, this leads to an intersection of different chainlike
orientations. On the surface of M3, the fullerenoid nano-particles with an onion-like
structure can be seen and the carbon particles are “tighter” connected than M1 and M2.
Furthermore, M3 has a larger number of parallel stacked graphene layers. This fact
points to highest graphitic order in M3 carbon-black in comparison to the other two
model soot samples. In addition, the interlayer spacing was measured by TEM images.
It is found that the real soot samples show larger interlayer spacings (3.7-4.0 nm) than
model ones (3.3-3.7 nm). This result also shows that model carbon particles have
more compact graphene layers than real carbon particles.
Figure 5-3. Carbon fringe length distributions of real and model soot samples.
Based on the HRTEM results, the carbon fringe lengths of real and model soot
samples were measured by the software Image J and their distributions were obtained.
As shown in Figure 5-3, for the real soot, R1 and R2 show a similar shape of fringe
length distribution profiles. The distribution profile of R2 shifts towards lower fringe
length values, with a decreased mean fringe length (about 1.6 nm) compared to R1. It
has been reported that larger fringe length of the ordered carbon layers indicates
higher degree of carbon graphitization and lower proportion of reactive edge atoms
[152,153]. Thus, R2 presents higher disordered nano-structure and more reactive edge

Chapter V. Structure-reactivity study of model and Biodiesel soot in model DPF
regeneration conditions
61
atoms than R1. On the other side, M1 and M2, which are the soot generated from
surrogate Diesel with oxygenated additives, show narrower fringes length distribution
(1.5-2.8 nm) and M2 has a lower mean fringe length than M1. M3 carbon-black
presents a wider distribution (1.2-3.2 nm) with a higher mean value of fringe lengths.
Thus, the degree of graphitization in graphene segments for model soot samples may
follow the order: M3 > M1 > M2.
Besides, nano-particle sizes of real and model soot samples were measured by TEM
images and the particle-size distribution and mean nano-particle size are separately
shown in Figure 5-4a and Figure 5-4b. For the real soot R1 and R2, R1 has a very
wide distribution of particle sizes (< 13 nm and 15-25 nm) and the sizes of a half of
nano-particles are centered on 19-21 nm (25%) and 23-25 nm (25%). R2 shows a
narrow particle-size distribution and most of nano-particles (about 80%) are centered
on 17-21 nm. Figure 5-4b also illustrates that R2 presents smaller mean nano-particle
size (18.97 nm) than R1 (20.92 nm). In the case of model soot, it can be observed in
Figure 5-4a that most of M1 soot particles show smaller sizes (13-19 nm) and the
nano-particle sizes of M2 and M3 apparently shift towards higher values (17-25 nm
and 23-27 nm, respectively). Thus the mean nano-particle size of model soot follows
the order: M1 (17.94 nm) < M2 (19.67 nm) < M3 (25.44 nm).
Figure 5-4. Nano-particles sizes of real and model soot samples. (a) particles size distribution and
(b) mean nanoparticle size.
5.3.3 XRD analysis
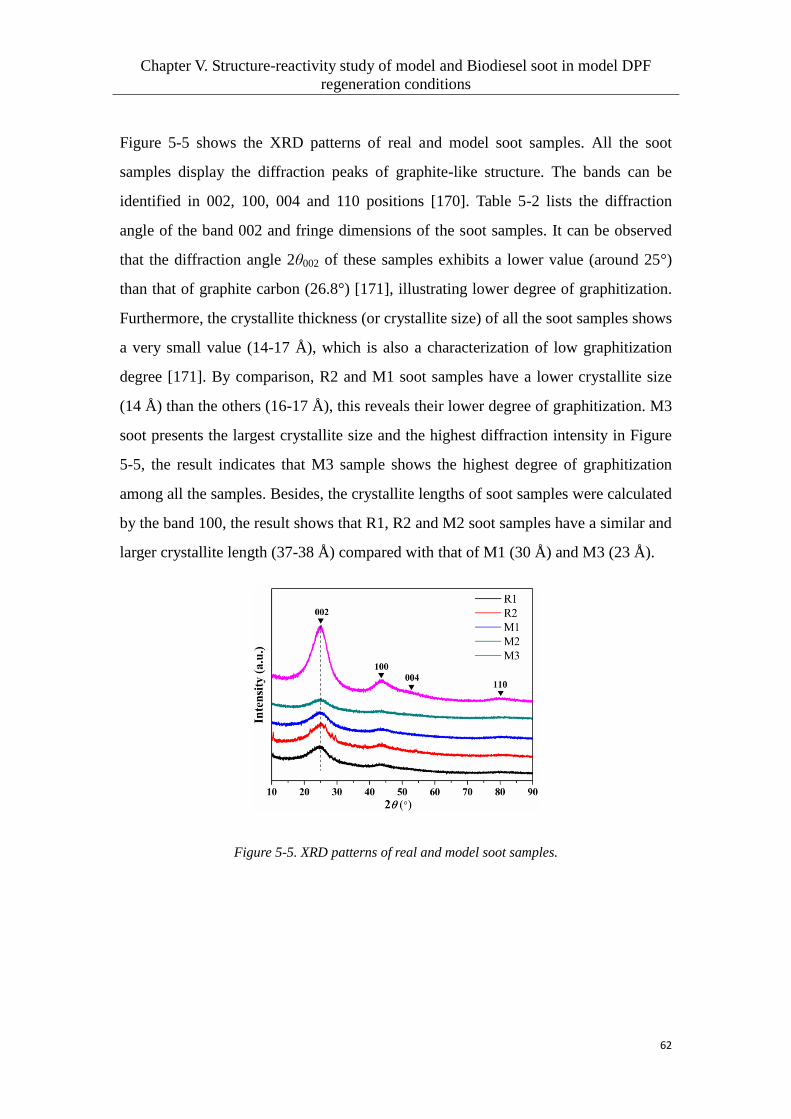
Chapter V. Structure-reactivity study of model and Biodiesel soot in model DPF
regeneration conditions
62
Figure 5-5 shows the XRD patterns of real and model soot samples. All the soot
samples display the diffraction peaks of graphite-like structure. The bands can be
identified in 002, 100, 004 and 110 positions [170]. Table 5-2 lists the diffraction
angle of the band 002 and fringe dimensions of the soot samples. It can be observed
that the diffraction angle 2θ002 of these samples exhibits a lower value (around 25°)
than that of graphite carbon (26.8°) [171], illustrating lower degree of graphitization.
Furthermore, the crystallite thickness (or crystallite size) of all the soot samples shows
a very small value (14-17 Å), which is also a characterization of low graphitization
degree [171]. By comparison, R2 and M1 soot samples have a lower crystallite size
(14 Å) than the others (16-17 Å), this reveals their lower degree of graphitization. M3
soot presents the largest crystallite size and the highest diffraction intensity in Figure
5-5, the result indicates that M3 sample shows the highest degree of graphitization
among all the samples. Besides, the crystallite lengths of soot samples were calculated
by the band 100, the result shows that R1, R2 and M2 soot samples have a similar and
larger crystallite length (37-38 Å) compared with that of M1 (30 Å) and M3 (23 Å).
Figure 5-5. XRD patterns of real and model soot samples.

Chapter V. Structure-reactivity study of model and Biodiesel soot in model DPF
regeneration conditions
63
Table 5-2. Diffraction angle of the band 002 and crystallite dimensions of the soot samples.
Soot Diffraction angle
2θ002 (°)
Crystallite thickness
D (Å)
Crystallite length
L (Å)
R1 24.6 16 37
R2 25.0 14 38
M1 24.9 14 30
M2 25.1 16 38
M3 24.8 17 23
5.3.4 Raman spectra analysis
Figure 5-6 shows the Raman spectrum of real soot R1 and the result is analyzed by a
curve fitting method (as an example of a typical Raman spectra obtained for these
materials). The other samples show similar Raman curves (no shown). It can be
observed that the Raman spectrum of R1 consists of four Lorentzian-shaped bands (G',
D1, D2, D4) at around 1587, 1342, 1620 and 1232 cm-1
, respectively, and a
Gaussian-shaped band D3 at around 1512 cm-1
[63,171]. The G band should be
assigned to an ideal graphitic structure and the entire D band (including D1, D2, D3
and D4) is ascribed to the defective structure of carbon [63]. D1 band with the largest
intensity implies the presence of disordered graphitic carbon and D3 band represents
the amorphous carbon. In Raman spectra, the structural defects in carbonaceous
materials depend on the intensity ratio of D and G bands (ID/IG). It has been reported
that the ratio of ID/IG increases with the order for amorphous and disordered carbon
with smaller crystallite size (< 2 nm) and decreases with the increase of order for
graphitic carbon with larger crystallite size (> 2 nm) [172,173]. Based on the previous
XRD results, the crystallite sizes of all soot samples are less than 2 nm. Thus, a higher
ID/IG ratio indicates an increase in the structural order [63,170].
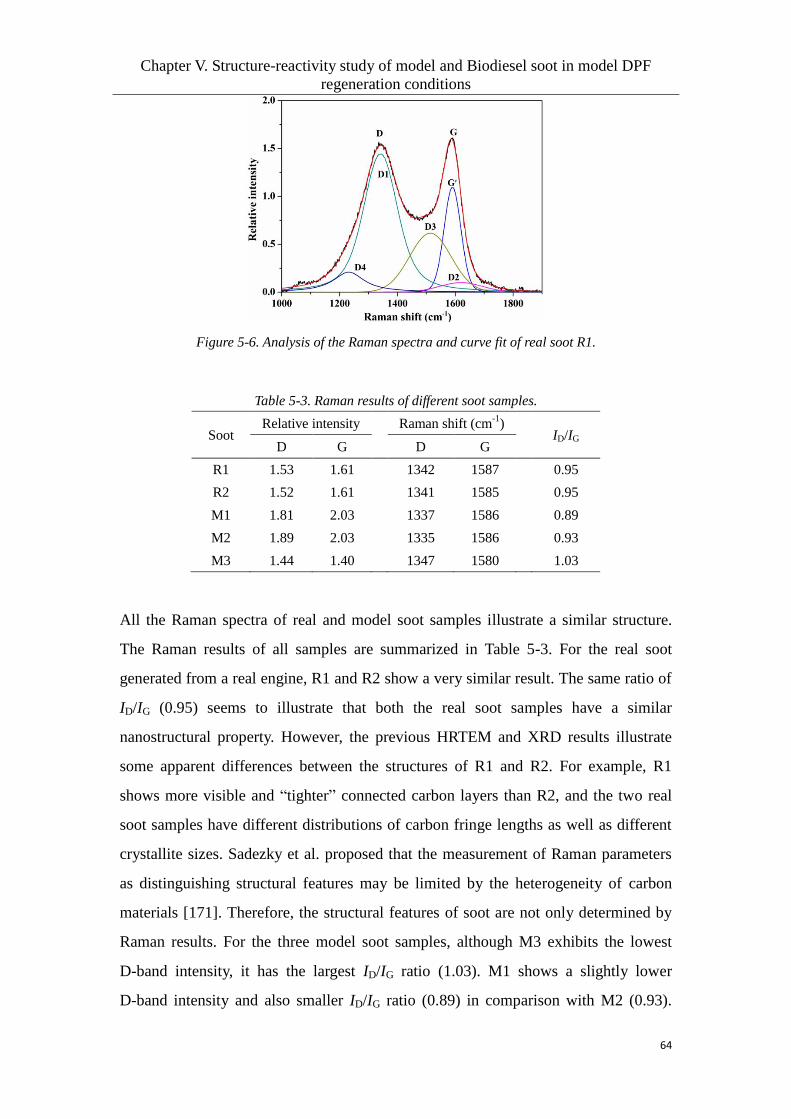
Chapter V. Structure-reactivity study of model and Biodiesel soot in model DPF
regeneration conditions
64
Figure 5-6. Analysis of the Raman spectra and curve fit of real soot R1.
Table 5-3. Raman results of different soot samples.
Soot Relative intensity Raman shift (cm
-1)
ID/IG D G D G
R1 1.53 1.61 1342 1587 0.95
R2 1.52 1.61 1341 1585 0.95
M1 1.81 2.03 1337 1586 0.89
M2 1.89 2.03 1335 1586 0.93
M3 1.44 1.40 1347 1580 1.03
All the Raman spectra of real and model soot samples illustrate a similar structure.
The Raman results of all samples are summarized in Table 5-3. For the real soot
generated from a real engine, R1 and R2 show a very similar result. The same ratio of
ID/IG (0.95) seems to illustrate that both the real soot samples have a similar
nanostructural property. However, the previous HRTEM and XRD results illustrate
some apparent differences between the structures of R1 and R2. For example, R1
shows more visible and “tighter” connected carbon layers than R2, and the two real
soot samples have different distributions of carbon fringe lengths as well as different
crystallite sizes. Sadezky et al. proposed that the measurement of Raman parameters
as distinguishing structural features may be limited by the heterogeneity of carbon
materials [171]. Therefore, the structural features of soot are not only determined by
Raman results. For the three model soot samples, although M3 exhibits the lowest
D-band intensity, it has the largest ID/IG ratio (1.03). M1 shows a slightly lower
D-band intensity and also smaller ID/IG ratio (0.89) in comparison with M2 (0.93).
Chapter V. Structure-reactivity study of model and Biodiesel soot in model DPF
regeneration conditions
65
Concerning model soots, these results point to increasing structural order as follows:
M3 > M2 > M1. A lower ID/IG ratio of soot samples also illustrates that there is higher
amorphous and disordered carbon concentration in soot. Moreover, it was reported
that the graphitic G-peak of the ideal graphite structures occurs at around 1580 cm-1
and an increase of the distance of G band from 1580 cm-1
indicates a less graphitic
structure [63]. It can be noted that the G band of M3 is at around 1580 cm-1
and does
not shift to higher wavenumber compared with the others, this also illustrates a higher
degree of graphitization of M3.
5.4 Soot oxidation activity analysis by TPOs
5.4.1 Non-catalytic soot oxidation
The non-catalytic oxidation of real and model soot samples was assessed in 9% b.v.
O2 and 400 ppmv NO2 + 9% b.v. O2, respectively. The oxidation reactivity and CO2
selectivity of different types of soot are compared and the promoting role of NO2
during soot oxidation is also discussed here.
5.4.1.1 TPOs in 9% b.v. O2/Ar
Figure 5-7 and Table 5-4 illustrate the oxidative performances of the different soot
samples under 9% O2/Ar. It can be observed in Figure 5-7a that the oxidation
reactions of all the soot samples occur at more than 450 °C and M3 shows the largest
soot oxidation rate at peak temperature (Tm). As shown in Table 5-4, for the real soot

Chapter V. Structure-reactivity study of model and Biodiesel soot in model DPF
regeneration conditions
66
Figure 5-7. TPO profiles under 9% b.v. O2 of different soot samples. (a) soot oxidative reactivity;
(b) CO production; (c) CO2 selectivity. Initial quality of soot was 0.002 g, 80 mg SiC powder was
used for dilution, heating rate was 10 °C/min, total flow rate was 15 Nl/h.
Table 5-4. TPO results in 9% b.v. O2 and 400 ppmv NO2 + 9% b.v. O2.
Soot 9% O2 400 ppm NO2 + 9% O2
Ti/°Ca Tm/°C
b SCO2/%
c Ti/°C
a Tm/°C
b SCO2/%
c
R1 523 670 56 503 667 51
R2 505 656 69 477 654 65
M1 503 650 49 497 648 35
M2 515 658 47 515 664 35
M3 535 673 64 531 669 50
aIgnition temperature at which COx concentration reaches 100 ppm.
bThe temperature of maximal soot oxidation rate.
cWhich is the CO2 selectivity at Tm.
samples that were prepared in a real engine, R2 has lower Ti and Tm values and thus
shows better oxidative reactivity than R1. The reactivities of model soot samples

Chapter V. Structure-reactivity study of model and Biodiesel soot in model DPF
regeneration conditions
67
follow the order: M1 > M2 > M3. Figure 5-7b displays the production of CO during
soot combustion. It is noted that the real soot R1 and R2 have lower CO emissions
than model soot and thereby show a relatively higher CO2 selectivity (Figure 5-7c). In
the real soot samples R2 exhibits higher CO2 selectivity compared to R1. A slight
lower CO2 selectivity than M1 can be found in M2. M3 shows the highest CO2
selectivity among model soot, but it has a more serious CO emission. Moreover, by
comparison, with the increase of soot oxidation rate (500-670 °C), the model soot
shows a decreased CO2 selectivity and the real soot shows a relatively stable result.
Figure 5-8. TPO profiles under 400 ppmv NO2 + 9% b.v. O2 of different soot samples. (a) soot
oxidative reactivity; (b) CO2 selectivity.
5.4.1.2 TPOs in 400 ppmv NO2 + 9% b.v. O2 in Ar
Figure 5-8 shows the soot conversion profiles under NO2 + O2 and CO2 selectivity
and Table 5-4 lists the TPO results. All the TPO profiles seem to be similar with those
under O2 (Figure 5-7a). As shown in Table 5-4, by comparison with the results under
O2 the model soot exhibits very similar Ti and Tm values and the real soot also has
close Tm values. However, a visible decrease in Ti can be observed for the real soot.
This result reveals that NO2 promotes the oxidation of real soot at ignition
temperatures. An apparent promotion of NO2 at Tm cannot be seen, which is due to the
decomposition of NO2 into NO at high temperatures [95]. Moreover, CO2 selectivity
of model soot slightly decreases after adding NO2 into reaction gas and that of real
soot has almost no changes compared to the results under only O2.
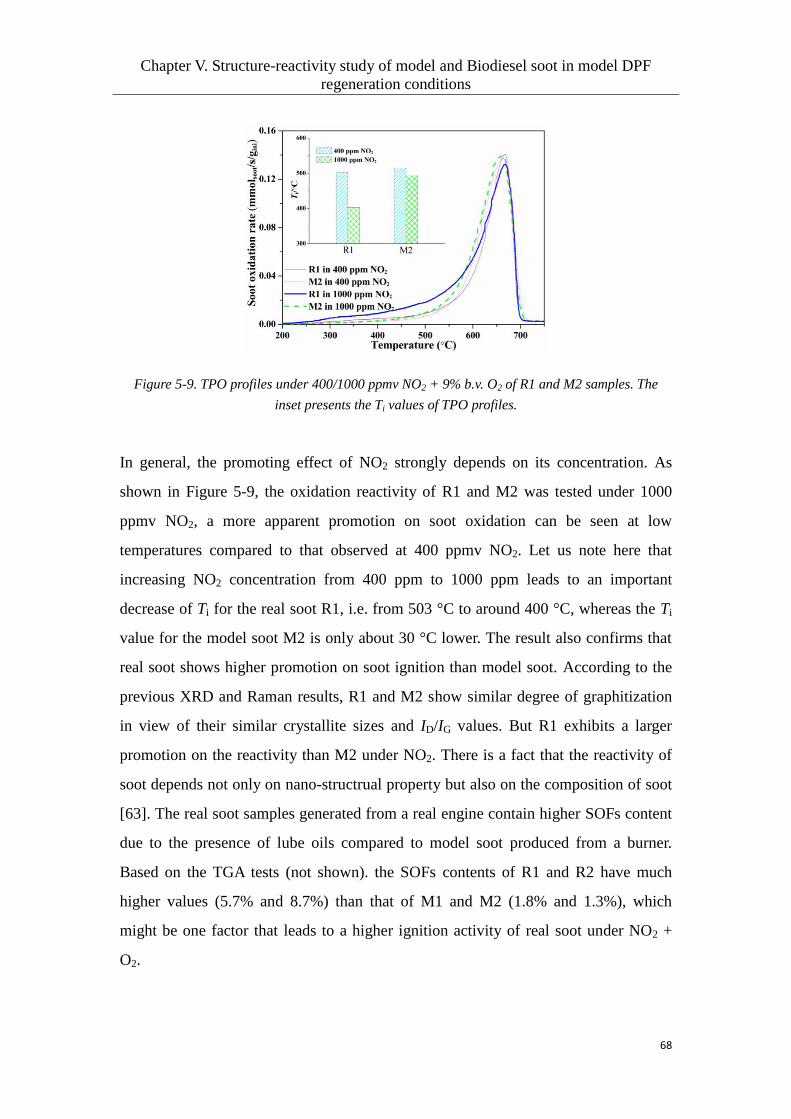
Chapter V. Structure-reactivity study of model and Biodiesel soot in model DPF
regeneration conditions
68
Figure 5-9. TPO profiles under 400/1000 ppmv NO2 + 9% b.v. O2 of R1 and M2 samples. The
inset presents the Ti values of TPO profiles.
In general, the promoting effect of NO2 strongly depends on its concentration. As
shown in Figure 5-9, the oxidation reactivity of R1 and M2 was tested under 1000
ppmv NO2, a more apparent promotion on soot oxidation can be seen at low
temperatures compared to that observed at 400 ppmv NO2. Let us note here that
increasing NO2 concentration from 400 ppm to 1000 ppm leads to an important
decrease of Ti for the real soot R1, i.e. from 503 °C to around 400 °C, whereas the Ti
value for the model soot M2 is only about 30 °C lower. The result also confirms that
real soot shows higher promotion on soot ignition than model soot. According to the
previous XRD and Raman results, R1 and M2 show similar degree of graphitization
in view of their similar crystallite sizes and ID/IG values. But R1 exhibits a larger
promotion on the reactivity than M2 under NO2. There is a fact that the reactivity of
soot depends not only on nano-structrual property but also on the composition of soot
[63]. The real soot samples generated from a real engine contain higher SOFs content
due to the presence of lube oils compared to model soot produced from a burner.
Based on the TGA tests (not shown). the SOFs contents of R1 and R2 have much
higher values (5.7% and 8.7%) than that of M1 and M2 (1.8% and 1.3%), which
might be one factor that leads to a higher ignition activity of real soot under NO2 +
O2.

Chapter V. Structure-reactivity study of model and Biodiesel soot in model DPF
regeneration conditions
69
5.4.2 Catalytic soot oxidation
The catalytic oxidation reactivity of real and model soot was investigated in 9% b.v.
O2, 400 ppmv NO + 9% b.v. O2 and 400 ppmv NO2 + 9% b.v. O2, respectively. The
promoting roles of NO and NO2 on catalytic reactivity are compared here. Besides,
the contact between catalyst and soot is moreover considered.
5.4.2.1 TPOs in 9% b.v. O2/Ar
Figure 5-10. TPO profiles under 9% b.v. O2 of different soot samples with the catalyst. 2.0 mg soot
and 20.0 mg catalyst were mixed by loose contact.
Table 5-5. TPO results in 9% b.v. O2, 400 ppmv NO + 9% b.v. O2 and 400 ppmv NO2 + 9% b.v.
O2.
Soot O2 NO + O2
NO2 + O2
Ti/°Ca Tm/°C
b Ti/°C
a Tm/°C
b Ti/°C
a Tm/°C
b
R1 493 665 346 540 401 554
R2 440 649 311 563 358 601
M1 480 623 348 556 -- --
M2 490 630 371 574 377 600
M3 506 636 386 590 380 605
aIgnition temperature at which COx concentration reaches 100 ppm.
bThe temperature of maximal soot oxidation rate.
Figure 5-10 and Table 5-5 summarize the results of the catalytic oxidation of the
different real and model soot samples under O2. All of them show high CO2
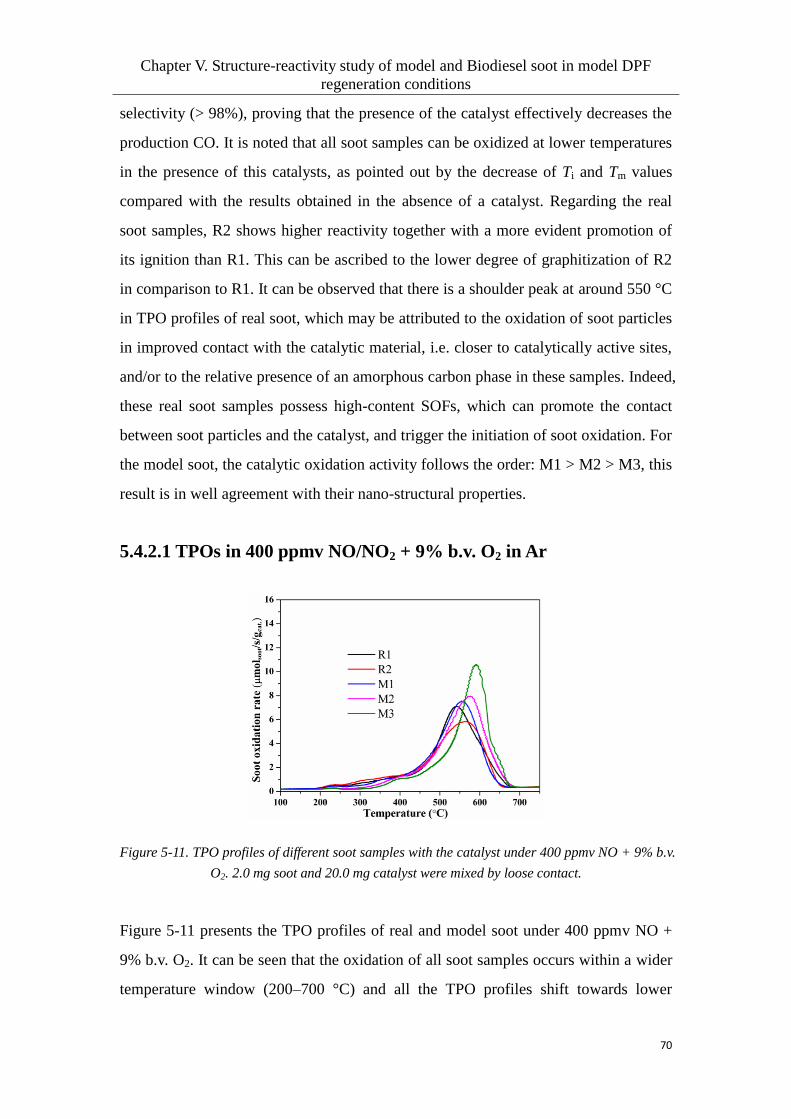
Chapter V. Structure-reactivity study of model and Biodiesel soot in model DPF
regeneration conditions
70
selectivity (> 98%), proving that the presence of the catalyst effectively decreases the
production CO. It is noted that all soot samples can be oxidized at lower temperatures
in the presence of this catalysts, as pointed out by the decrease of Ti and Tm values
compared with the results obtained in the absence of a catalyst. Regarding the real
soot samples, R2 shows higher reactivity together with a more evident promotion of
its ignition than R1. This can be ascribed to the lower degree of graphitization of R2
in comparison to R1. It can be observed that there is a shoulder peak at around 550 °C
in TPO profiles of real soot, which may be attributed to the oxidation of soot particles
in improved contact with the catalytic material, i.e. closer to catalytically active sites,
and/or to the relative presence of an amorphous carbon phase in these samples. Indeed,
these real soot samples possess high-content SOFs, which can promote the contact
between soot particles and the catalyst, and trigger the initiation of soot oxidation. For
the model soot, the catalytic oxidation activity follows the order: M1 > M2 > M3, this
result is in well agreement with their nano-structural properties.
5.4.2.1 TPOs in 400 ppmv NO/NO2 + 9% b.v. O2 in Ar
Figure 5-11. TPO profiles of different soot samples with the catalyst under 400 ppmv NO + 9% b.v.
O2. 2.0 mg soot and 20.0 mg catalyst were mixed by loose contact.
Figure 5-11 presents the TPO profiles of real and model soot under 400 ppmv NO +
9% b.v. O2. It can be seen that the oxidation of all soot samples occurs within a wider
temperature window (200–700 °C) and all the TPO profiles shift towards lower

Chapter V. Structure-reactivity study of model and Biodiesel soot in model DPF
regeneration conditions
71
temperatures in comparison with the results in only O2. As shown in Table 5-5, after
adding NO into O2, Ti and Tm values of all the soot samples greatly decrease to
311–386 °C and 540–590 °C, respectively. This apparently shows the strong
promoting role of NO during soot oxidation. Additionally, for real soot, it can be
observed that R2 generated from neat Biodiesel has lower Ti value and higher Tm
value than R1. At the sight of the results of the HRTEM, XRD and Raman
characterization of these materials we concluded that R2 contains more amorphous
and disordered carbon particles that are thereby more prompt to oxidation thus leading
lower ignition temperature under NO + O2 than for R1. However, thought R1
possesses a higher degree of graphitization it shows lower Tm value (540 °C) than R2
(563 °C), what illustrates that nano-structure of soot is just one of factors that impacts
soot oxidation reactivity, but may not be the only one. For the model soot generated in
the burner, their catalytic activity order is very similar to that observed in O2, M1
shows the best reactivity and M3 displays the worst one. The result is consistent with
their nano-structural properties. This also indicates that the catalytic reactivity of
model soot produced in the burner depends more strongly on their nano-structural
properties than the real soots produced in an engine bench.
Figure 5-12. TPO profiles of different soot samples with the catalyst under 400 ppmv NO2 + 9%
b.v. O2. 2.0 mg soot and 20.0 mg catalyst (S/C = 1/10) were mixed by loose contact.
Figure 5-12 and Table 5-5 show the catalytic oxidation activities of real and model
soot samples under 400 ppmv NO2 + 9% b.v. O2. The Tm values of all soot samples

Chapter V. Structure-reactivity study of model and Biodiesel soot in model DPF
regeneration conditions
72
move to higher temperatures compared to the results obtained in NO + O2, even the Ti
of real soot visibly shifts towards higher values. This fact confirms that, in the
presence of a catalyst, NO2 promotes soot oxidation to a lower extent than NO.
Figure 5-13. Ti versus Tm for catalytic oxidation of soot.
In summary, the presence of MnOx-CeO2 catalyst effectively enhances the oxidation
reactivity of the soots in O2 and NOx + O2. It has been reported that Mn-Ce mixed
oxides are excellent oxygen storage materials, they can transfer O2 in gas phase into
active species Ocat.* and then provide these active oxygen species for soot oxidation,
thus promoting soot oxidation activity [100,105,118,160,161]. The temperatures Ti
and Tm measured during the different catalytic oxidation experiments are plotted
together in Figure 5-13. The results further evidence that the addition of NO/NO2
greatly promotes the soot oxidation activity, and more interestingly, NO shows higher
promotion than NO2. Some researchers thought that the promoting role of NO should
be ascribed to the production of NO2 [100,160]. Certainly, NO2 has rather higher
oxidation ability than O2 and is able to oxidize soot at lower temperatures. However,
as shown in the previous section (5.4.1.2), low-temperature promotion of NO2
strongly depends on its concentration. Furthermore, in the absence of catalyst, the
addition of NO2 cannot make the whole TPO profiles shift to lower temperatures. The
NO2 production in the presence of the MnOx-CeO2 catalyst (20 mg) was tested in 400
ppmv NO + 9% b.v. O2, yielding only very small amounts of NO2 (< 50 ppm) (results
not shown). This relatively low amounts cannot be apparently responsible for the

Chapter V. Structure-reactivity study of model and Biodiesel soot in model DPF
regeneration conditions
73
enhancement of the oxidation of soot by NO2. In fact, the presence of NOx makes soot
oxidation reactions more complex. In this work, the promotion of NOx on catalytic
soot oxidation might be attributed to the following two reasons: the desorption
capacity of oxygen in the catalyst and the co-operative reactions involving active
oxygen and NO2.
Figure 5-14. Ar-TPD results of the samples separately pretreated in 400 ppm NO/9% O2/Ar (solid
line), 400 ppm NO2/9% O2/Ar (dash line) and 9% O2/Ar (red line) at 350 °C.
Based on the previous works [105,125], it is well known that the adsorption of NO
and NO2 on Mn-Ce catalyst leads to the formation of various nitrate species. An
important fact has been confirmed that the decomposition of these nitrates not only
causes the generation of NOx but, simultaneously, increases the desorption capacity of
oxygen [82,105,112]. In order to prove this point in this work, the Mn-Ce
catalyst-soot mixture was pretreated either in NO and NO2 and then analyzed by
means of temperature programmed desorption (TPD). The results obtained are
presented in Figure 5-14. The NOx-pretreated samples show a visibly increased
desorption of oxygen compared to the non-pretreated sample. This may be a key
factor leading to soot oxidation promotion in the presence of NOx. In addition,
NO-pretreated sample has larger desorption capacity of oxygen than the
NO2-pretreated sample, which is a reasonable evidence to explain the larger
promoting role of NO than NO2 during soot oxidation. Moreover, it can be also
observed that the main product of nitrates decomposition is NO rather than NO2. Thus,
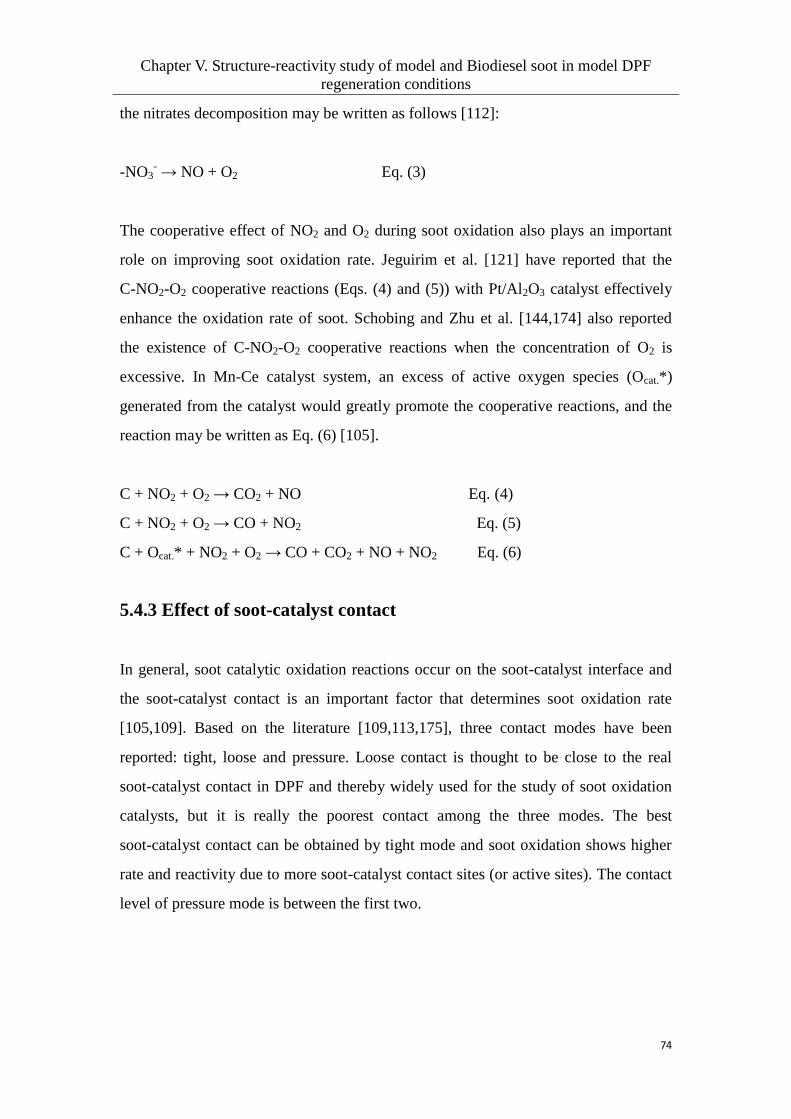
Chapter V. Structure-reactivity study of model and Biodiesel soot in model DPF
regeneration conditions
74
the nitrates decomposition may be written as follows [112]:
-NO3- → NO + O2 Eq. (3)
The cooperative effect of NO2 and O2 during soot oxidation also plays an important
role on improving soot oxidation rate. Jeguirim et al. [121] have reported that the
C-NO2-O2 cooperative reactions (Eqs. (4) and (5)) with Pt/Al2O3 catalyst effectively
enhance the oxidation rate of soot. Schobing and Zhu et al. [144,174] also reported
the existence of C-NO2-O2 cooperative reactions when the concentration of O2 is
excessive. In Mn-Ce catalyst system, an excess of active oxygen species (Ocat.*)
generated from the catalyst would greatly promote the cooperative reactions, and the
reaction may be written as Eq. (6) [105].
C + NO2 + O2 → CO2 + NO Eq. (4)
C + NO2 + O2 → CO + NO2 Eq. (5)
C + Ocat.* + NO2 + O2 → CO + CO2 + NO + NO2 Eq. (6)
5.4.3 Effect of soot-catalyst contact
In general, soot catalytic oxidation reactions occur on the soot-catalyst interface and
the soot-catalyst contact is an important factor that determines soot oxidation rate
[105,109]. Based on the literature [109,113,175], three contact modes have been
reported: tight, loose and pressure. Loose contact is thought to be close to the real
soot-catalyst contact in DPF and thereby widely used for the study of soot oxidation
catalysts, but it is really the poorest contact among the three modes. The best
soot-catalyst contact can be obtained by tight mode and soot oxidation shows higher
rate and reactivity due to more soot-catalyst contact sites (or active sites). The contact
level of pressure mode is between the first two.

Chapter V. Structure-reactivity study of model and Biodiesel soot in model DPF
regeneration conditions
75
Figure 5-15. Catalytic activities of different soot particles in 9 b.v.% O2 under tight contact (a)
and pressure contact (b).
Figure 5-16. Catalytic activities of real soot R1 and R2 in NO + O2 (a) and NO2 + O2 (b) under
tight/pressure contact.
Table 5-6. Ignition temperatures (Ti) of R1 and R2 under different contacts.
Reaction gas R1 R2 R1 R2 R1 R2
Tight/°C Pressure/°C Loose/°C
O2 216 209 321 323 493 440
NO + O2 215 205 321 290 346 311
NO2 + O2 215 205 324 313 401 358
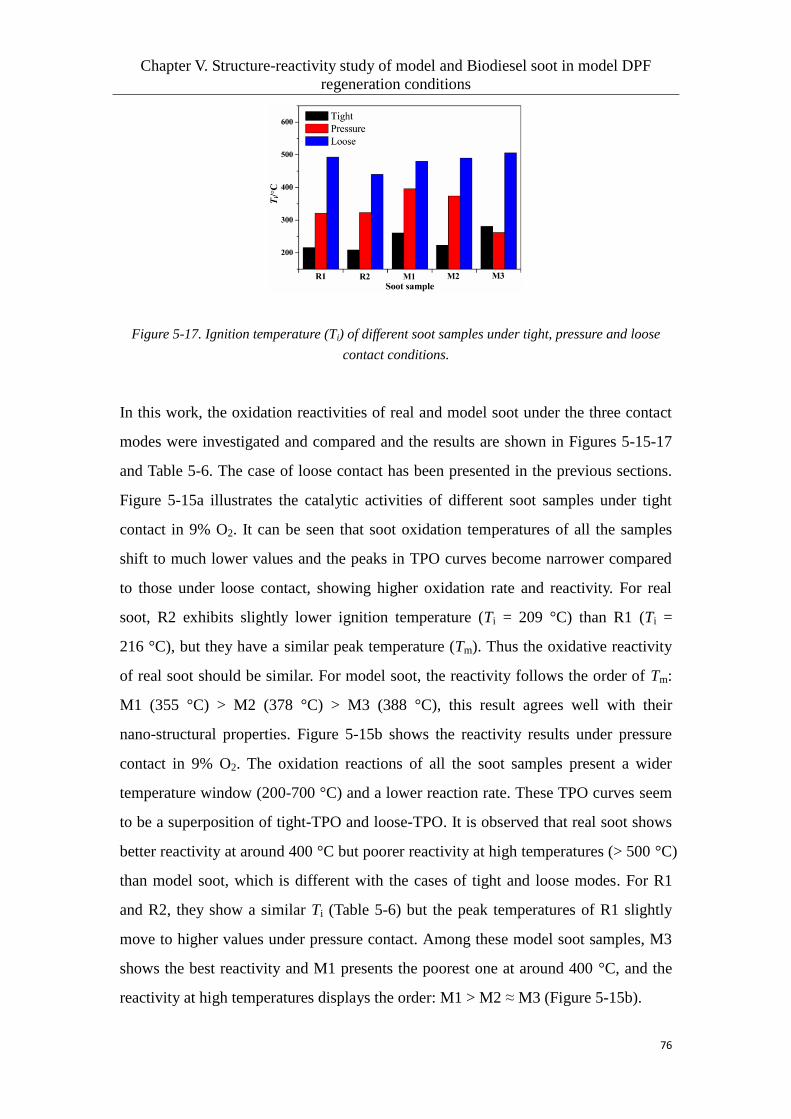
Chapter V. Structure-reactivity study of model and Biodiesel soot in model DPF
regeneration conditions
76
Figure 5-17. Ignition temperature (Ti) of different soot samples under tight, pressure and loose
contact conditions.
In this work, the oxidation reactivities of real and model soot under the three contact
modes were investigated and compared and the results are shown in Figures 5-15-17
and Table 5-6. The case of loose contact has been presented in the previous sections.
Figure 5-15a illustrates the catalytic activities of different soot samples under tight
contact in 9% O2. It can be seen that soot oxidation temperatures of all the samples
shift to much lower values and the peaks in TPO curves become narrower compared
to those under loose contact, showing higher oxidation rate and reactivity. For real
soot, R2 exhibits slightly lower ignition temperature (Ti = 209 °C) than R1 (Ti =
216 °C), but they have a similar peak temperature (Tm). Thus the oxidative reactivity
of real soot should be similar. For model soot, the reactivity follows the order of Tm:
M1 (355 °C) > M2 (378 °C) > M3 (388 °C), this result agrees well with their
nano-structural properties. Figure 5-15b shows the reactivity results under pressure
contact in 9% O2. The oxidation reactions of all the soot samples present a wider
temperature window (200-700 °C) and a lower reaction rate. These TPO curves seem
to be a superposition of tight-TPO and loose-TPO. It is observed that real soot shows
better reactivity at around 400 °C but poorer reactivity at high temperatures (> 500 °C)
than model soot, which is different with the cases of tight and loose modes. For R1
and R2, they show a similar Ti (Table 5-6) but the peak temperatures of R1 slightly
move to higher values under pressure contact. Among these model soot samples, M3
shows the best reactivity and M1 presents the poorest one at around 400 °C, and the
reactivity at high temperatures displays the order: M1 > M2 ≈ M3 (Figure 5-15b).
Chapter V. Structure-reactivity study of model and Biodiesel soot in model DPF
regeneration conditions
77
Figure 5-16 shows the catalytic activities of real soot samples under tight and pressure
modes in NOx + O2. It can be observed that the TPO profiles is similar with those in
O2 (Figure 5-15). In the previous results under loose contact, it has been confirmed
that the addition of NO/NO2 can effectively promote the catalytic oxidation of soot.
However, under tight contact, as shown in Table 5-6, this promoting role of NO/NO2
cannot be seen in view of their similar Ti values compared with that in O2. For the
pressure mode, R1 exhibits a similar result in different reaction gases, but R2 presents
a visible promotion in NO/NO2 + O2. This may indicate that the oxidation of R2 is
more easily promoted by NO/NO2 than that of R1. Table 5-6 also illustrates that the
promoting role of NO/NO2 would become weaker in a better contact and the
reactivity under the three contact modes follows the order: tight > pressure > loose.
These facts confirm that soot-catalyst contact is an important factor that affects soot
oxidation activity. This point is also revealed in Figure 5-17. For example, R2 exhibits
an apparently lower Ti value than R1 under loose contact, but their Ti values are very
similar under tight and pressure conditions. For model soot, under loose contact the Ti
value follows this order: M1 < M2 < M3, however, a different result is found under
tight and pressure contact conditions.
5.5 Structure and reactivity correlation
Previous works linked the soot oxidation activity to the nanostructure and it was
found that the reactivity of soot is closely related to its nanostructure. Lapuerta and
Sadezky [170,171] used XRD and Raman to illustrate the differences in the structure,
i,e. length scale and carbon fringe as well as the concentration of amorphous carbon,
of different types of soot generated under various conditions. Some researchers
studied the relationship between nanostructural properties and the oxidation reactivity
of soot and they found that the reactivity of soot strongly depends on its nanostructure
and high degree of graphitization of the graphene segments affects the oxidation
activity of soot particles [63,64,152]. Knauer et al. [176] also confirmed a strong
dependency of soot oxidation activity on the nanostructure by Raman and HRTEM

Chapter V. Structure-reactivity study of model and Biodiesel soot in model DPF
regeneration conditions
78
measurements.
In the present work, the oxidation reactivity of soot was measured by TPO under
different reaction gases and shows differences in Ti and Tm when various types of soot
generated from a real engine and a burner. The structural properties of soot were
characterized by laser granulometry, HRTEM, XRD and Raman and exhibit different
features in the particle and crystallite sizes, particle morphology and the degree of
graphitization. In order to connect the soot reactivity with the soot structure, the
initiation temperature Ti which represents the reactivity is used to analyze the
relationship between the both.
Figure 5-18 presents the correlation of the reactivity of real and model soot with the
structural features. The mean values of nanoparticle sizes, crystallite sizes and
particles aggregate sizes were obtained by HRTEM, XRD and laser granulometry,
respectively, and the relationship between these dimensions and the reactivity are
summarized in Figure 5-18a. In the case of real soot, R2 soot generated from the
combustion of neat Biofuel (methyl ester) shows lower mean crystallite and
nanoparticle sizes (14 Å and 18.97 nm) than R1 soot (16 Å and 20.92 nm) from the
combustion of a fuel blend (7% methyl ester). It is also observed that R2 has higher
oxidation reactivity than R1 both with and without catalyst under only O2 or NO + O2.
Similarly, for the model soot, the crystallite and nanoparticle sizes follow the order:
M1 < M2 < M3, which well agrees with their reactivity order. These results indicate
that the catalytic and non-catalytic oxidation reactivities are closely related to the
nanostructure of soot. Moreover, it is also seen in Figure 5-18a that R2 shows larger
mean size of soot particles aggregates and presents better oxidation reactivity than R1.
However, the model soot sample with larger soot particles aggregates presents poorer
reactivity. These soot samples except R2 have an order of the reactivity under only O2:
M1 >M2 > R1 > M3, which is consistent with the change in particles aggregate size.
This shows that smaller particles aggregate is favorable for the oxidation of soot
because it might benefit the exposition to oxygen [170] and a better contact between
soot particles and the catalyst. In addition, it should be noted that M2 shows a similar

Chapter V. Structure-reactivity study of model and Biodiesel soot in model DPF
regeneration conditions
79
catalytic reactivity in O2 but apparently poorer reactivity in NO + O2 compared with
R1. The result illustrates that the oxidation reactivity of soot is related not only to the
structure but to the reaction conditions.
Figure 5-18. Correlation of the non-catalytic and catalytic reactivities of real and model soot with
the structural parameters including mean nanoparticle size (a), mean crystallite size (a), mean
soot aggregate size (a), mean carbon fringe length (b) and ID/IG ratio (b).
Figure 5-18b presents the correlation of oxidation reactivity with mean carbon fringe
length and ID/IG. It has been reported that smaller fringe length of the ordered carbon
layers indicates a higher proportion of reactive edge atoms in soot [152,153]. For the
real soot, it can be observed that R2 exhibits smaller fringe length (1.64 nm) than R1
(1.87 nm), thus showing a better oxidation reactivity. However, for model soot, the
carbon fringe length follows the order: M2 (2.06 nm) < M1 (2.17 nm) ≈ M3 (2.16
nm), which cannot well correlate with the reactivity. In Raman spectra, the structural
defects in carbonaceous materials are related to the ratio between the intensities of D

Chapter V. Structure-reactivity study of model and Biodiesel soot in model DPF
regeneration conditions
80
band and G band (ID/IG), a higher ID/IG value indicates a higher degree of
graphitization. Therefore, the model soot presents this order in the degree of
graphitization: M1 < M2 < M3, this is well linked to their oxidation reactivity. But the
real soot samples R1 and R2 show a very similar ID/IG ratio, which cannot be
connected with the reactivity. In fact, the nanostructure of soot is not the only factor
that determines the oxidation reactivity. Ye et al. [177] studied the oxidation reactivity
of Biodiesel soot samples generated from a diesel engine and found that there is no
correlation between the reactivity and the nanostructure analyzed by Raman. Many
researchers have reported the other factors that influence the soot reactivity such as
ash content and composition [179-180] as well as oxygen content in soot [100].
Besides, in this study, the particle morphology of soot also plays an important role in
affecting soot oxidation reactivity. This result has been found in the previous works
[177,181]. Figure 5-18a has confirmed that the correlation between nanoparticle and
soot aggregates sizes and the oxidation reactivity. On the other hand, in the previous
HRTEM images, it can be observed that R2 soot presents less chainlike orientation
and “looser” connected carbon particles than R1, which seems to show higher
disorder of R2. Thus, R2 has a better oxidation reactivity than R1. The morphology of
the model soot also presents various features and can be linked to the reactivity. For
example, M1 soot shows a blurry and highly disordered surface, M2 and M3 exhibit
more obvious carbon layers than M1, and M3 has the largest number of parallel
stacked graphene layers. By comparison with the reactivity, it indicates that the blurry
and less carbon layers, revealing higher disordered surface, are connected with higher
reactivity of M1 and M3 with more graphene layers displays lower reactivity. These
results all prove a visible relationship between soot reactivity and particle morphology.
This study provides valuable findings on the soot oxidation rate and the parameters
influencing it, which could contribute to develop accurate soot models that are
required for robust regeneration strategies. The use of 100% biofuel induces
significantly lower soot deposits in DPF that being correctly estimated (adapted
biofuel soot models) might reduce the need of active regenerations and therefore the
fuel consumption and the catalyst ageing. Therefore, the understanding of how the

Chapter V. Structure-reactivity study of model and Biodiesel soot in model DPF
regeneration conditions
81
fuel type and engine operation affects the particle morphology and its reactivity are
crucial for optimizing the DPF regeneration strategy.
For the development of new coating formulations, the selection of model soot to be
used in synthetic gas benches shall be taken with care, as it was shown in that study
the risk of having different behaviors for example for the carbon-black Printex often
reported in literature. The catalyst evaluation studies shall therefore take into account
the use of burner and real engine soot samples as well as realistic operating conditions
in terms of gas composition and soot/catalyst contact in order to perform an accurate
benchmark.
5.6 Summary
In this work, real soot generated in a real Diesel engine and the model soot generated
in a burner were studied using laser granulometry, HRTEM, XRD and Raman, as
characterization techniques. A MnOx-CeO2 catalyst was used for the measurement of
catalytic reactivity. The results of the temperature programmed oxidation (TPO)
experiments point to increased oxidation reactivity for the real soot generated with
100% Biodiesel than the one obtained using the 7% Biodiesel mixture. The
carbon-black Printex U soot showed the poorest reactivity of the series, whereas the
reactivity of the soot prepared from the 7% oxygenated in the laminar flame burner
was higher than the one observed for the model soot generated from the 30%
oxygenated addictivated fuel. Characterizations illustrate that the real and model soot
samples show different nanostructure and morphology features. The reactivity of soot
was found to be closely related to its nanoparticle size, crystallite size, particles
aggregates and the degree of graphitization. The oxidation reactivity of soot in the
presence of the MnOx-CeO2 catalyst depended not only on its nanostructure but also
on the reactant gas composition, as well as soot-catalyst contact. Furthermore, it was
found that the presence of NOx cannot affect the reactivity of soot under tight contact,
whereas NOx can clearly enhance the reactivity under loose contact. Thus, the
promotion of NOx on catalytic activity depends on the contact between soot and the

Chapter V. Structure-reactivity study of model and Biodiesel soot in model DPF
regeneration conditions
82
catalytic DPF.
Chapter VI. Structure, surface and reactivity of activated carbon: From model soot to
Bio Diesel soot
83
6. Structure, surface and reactivity of activated
carbon: From model soot to Bio Diesel soot
6.1 Introduction
The high efficiency and durability of diesel engines have motivated their wide
applications in passenger cars and heavy-duty trucks in the world. However, the high
emission of fine soot nanoparticles for example PM2.5 has caused serious public health
and environment pollution [182-184]. These fine soot particles as an important
fraction of aerosols present in the air around urban area with big influences on the
climate, biosphere and citizen health [185-187]. Nowadays, the emissions of diesel
soot particles are limited all around world [188-190]. For example, the emissions of
particulate matters from cars and heavy-duty vehicles are limited to 4.5 mg/km and 10
mg/kWh, respectively [188-190]. Thus, the soot removal technology has become an
important topic of improving environment level and protecting human health. Diesel
particulate filter (DPF) used as an exhaust after-treatment unit has been confirmed to
be an effective way to remove soot emission [191-193]. Of course, the regeneration
(active or passive regeneration) of the filter unit is crucial to controlling soot emission.
The soot is oxidized periodically by O2 at higher temperatures during active
regeneration and also oxidized continuously over the catalysts by active oxygen and
NO2 during passive regeneration [94,187,125,194,195]. The regeneration efficiency
strongly depends on the reactivity of soot, because the combustion of high-activity
soot occurs at lower temperatures with small energy demand [187]. Many studies also
confirmed that the reactivity of soot is related to the soot nanostructure [170,196],
soot morphology [196,197], fuels [164,170,198], catalyst materials
[93,94,125,194,195,199] and engine operation conditions [200,201].
The main composition of soot is carbon (> 80 wt.%) with a particle of soluble organic
fraction (SOF) and ash [171,202,203]. The formation steps can be performed in diesel
engines through nucleation, nanoparticles aggregation and surface growth
mechanisms [171,204]. The primary soot particles are composed of ordered and
Chapter VI. Structure, surface and reactivity of activated carbon: From model soot to
Bio Diesel soot
84
amorphous carbons. The ordered carbon surface shows a graphite-like structure with
higher crystalline order and the amorphous carbon presents lower degree of
graphitization with many active edge sites and defects [69,152,205]. The different
structural features of soot determine its physical and chemical properties and thereby
its reactivity [69,205-207].
Boehman et al. [208] reported that the disordered carbon with more amorphous
structure had more defects and thus exhibited higher reactivity. Knauer et al. [196]
studied the relationship between soot structure and reactivity by Raman
microspectroscopy and high-resolution transmission electron microscopy (HRTEM),
it was found that the higher reactivity of soot was attributed to a higher degree of
disorder and a higher content of molecular carbon. It was also reported that the
reactivity of soot would be dependant on its primary particle size characterized by
TEM [170]. On the other side, Seong and Boehman found that the presence of
oxygenated additives in fuels enhanced the formation of oxygenated soot and thereby
increased the oxidative reactivity of soot [149]. Song et al. [150] illustrated that the
use of Biodiesel fuels would increase the content of oxygen in soot particles and thus
improved soot reactivity.
Moreover, the catalytic materials on the catalyzed DPF also play an important role on
determining soot reactivity. Bueno-López et al. [209] found that active oxygen from
ceria lattice is able to oxidize soot particulates at lower temperatures. It was also
reported that MnOx-CeO2 mixed oxides could exhibit a higher catalytic activity for
soot oxidation, this is due to the presence of a great quantity of active oxygen
[105,210]. Many authors studied ceria-zirconia mixed oxides for soot oxidation and
revealed that the reactivity of soot depends on oxygen vacancies, oxygen storage
capacity (OSC) and redox ability of the catalysts [195,156,158,211,212]. The
oxidative reactivity of soot can be also increased by precious metal Pt catalysts such
as Pt/Al2O3 and Pt/SiO2 as they have a strong ability to oxidize NO to NO2 which is
able to oxidize soot at lower temperatures [83,93,94].

Chapter VI. Structure, surface and reactivity of activated carbon: From model soot to
Bio Diesel soot
85
In Knauer’s work [196], the authors prepared the oxidized soot through an oxidation
process in a temperature range from 25 to 600 °C and studied the differences in
nanostructure between raw and oxidized/activated soot samples, they found the
changes in chemical homogeneity and structural order in different soot samples are
different during soot oxidation at increasing temperatures. In real exhaust
aftertreatment system, soot particles which were generated from diesel engine follow
thermal gas-flow and go through DOC unit, where the soot particulates experience a
partial oxidation or an activating process. Besides, for the catalytic soot oxidation, the
reactivity of soot is only ascribed to the role of catalysts, which may not be a full
understanding of soot oxidation. During soot activation in DOC or catalytic oxidation
in DPF, the changes in structure and surface property of soot itself should be also an
important aspect for understanding soot oxidation. Thus, the present work presents
results on activated soot presented in temperature-programmed oxidation (TPO) and
mainly studied the changes in nanostructure and surface properties of the activated
soot by BET, Raman spectra, HRTEM, diffuse reflectance infrared Fourier transform
spectra (DRIFTS) and XPS as well as linked them to their noncatalytic/catalytic
reactivity. The originality of this work is to use the real Bio Diesel soot obtained in an
engine bench and study its activation influence on oxidation reactivity, with being
compared to Printex U model soot which is usually used for experimental model.
6.2 Materials preparation
6.2.1 Soot samples preparation
The oxidized/activated soot samples were prepared by Temperature Programmed
Oxidation (TPO) method under 9% b.v. O2/Ar (250 ml/min). A carbon black
(Printex-U) from Degussa as a representative of model soot and biodiesel derived soot
B7 and B100, which separately generated from the burning of 7% biodiesel-diesel
blends and 100% biodiesel in a real diesel engine [159], were used for this study. As
shown in Figure 6-1, when soot-TPO was performed till 500 °C (about 3-10%
conversion) and 600 °C (about 20-30% conversion), respectively, the
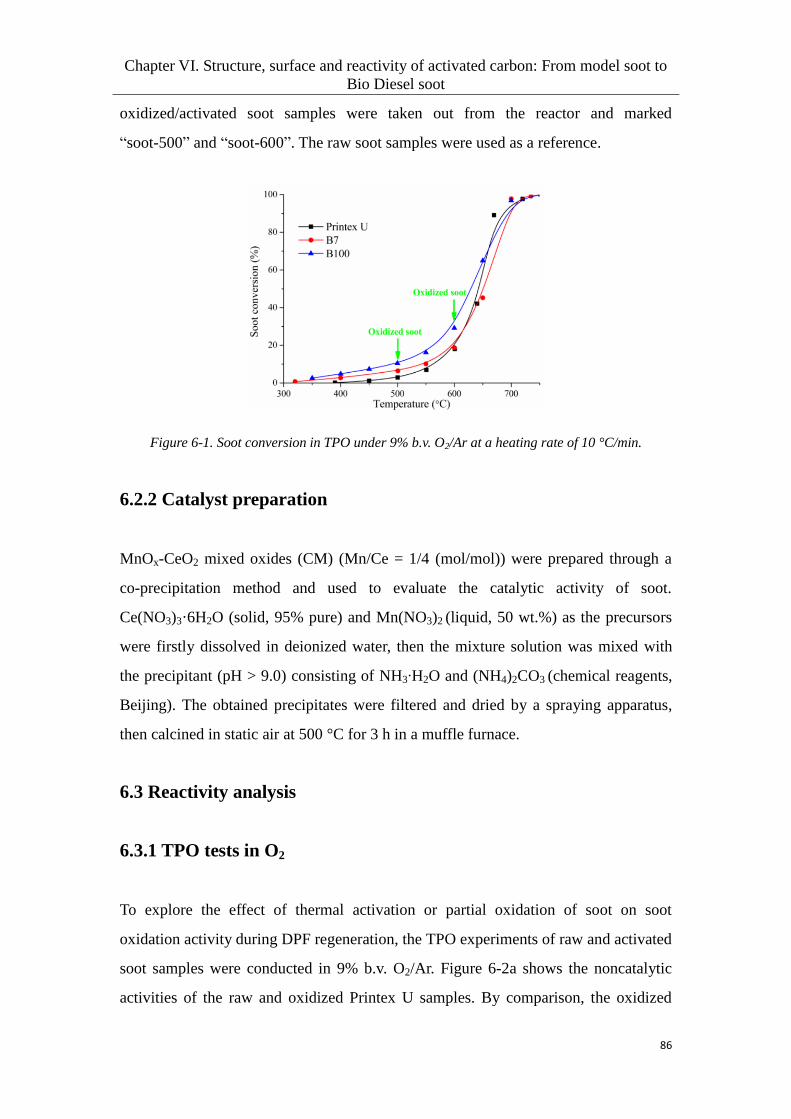
Chapter VI. Structure, surface and reactivity of activated carbon: From model soot to
Bio Diesel soot
86
oxidized/activated soot samples were taken out from the reactor and marked
“soot-500” and “soot-600”. The raw soot samples were used as a reference.
Figure 6-1. Soot conversion in TPO under 9% b.v. O2/Ar at a heating rate of 10 °C/min.
6.2.2 Catalyst preparation
MnOx-CeO2 mixed oxides (CM) (Mn/Ce = 1/4 (mol/mol)) were prepared through a
co-precipitation method and used to evaluate the catalytic activity of soot.
Ce(NO3)3·6H2O (solid, 95% pure) and Mn(NO3)2 (liquid, 50 wt.%) as the precursors
were firstly dissolved in deionized water, then the mixture solution was mixed with
the precipitant (pH > 9.0) consisting of NH3∙H2O and (NH4)2CO3 (chemical reagents,
Beijing). The obtained precipitates were filtered and dried by a spraying apparatus,
then calcined in static air at 500 °C for 3 h in a muffle furnace.
6.3 Reactivity analysis
6.3.1 TPO tests in O2
To explore the effect of thermal activation or partial oxidation of soot on soot
oxidation activity during DPF regeneration, the TPO experiments of raw and activated
soot samples were conducted in 9% b.v. O2/Ar. Figure 6-2a shows the noncatalytic
activities of the raw and oxidized Printex U samples. By comparison, the oxidized
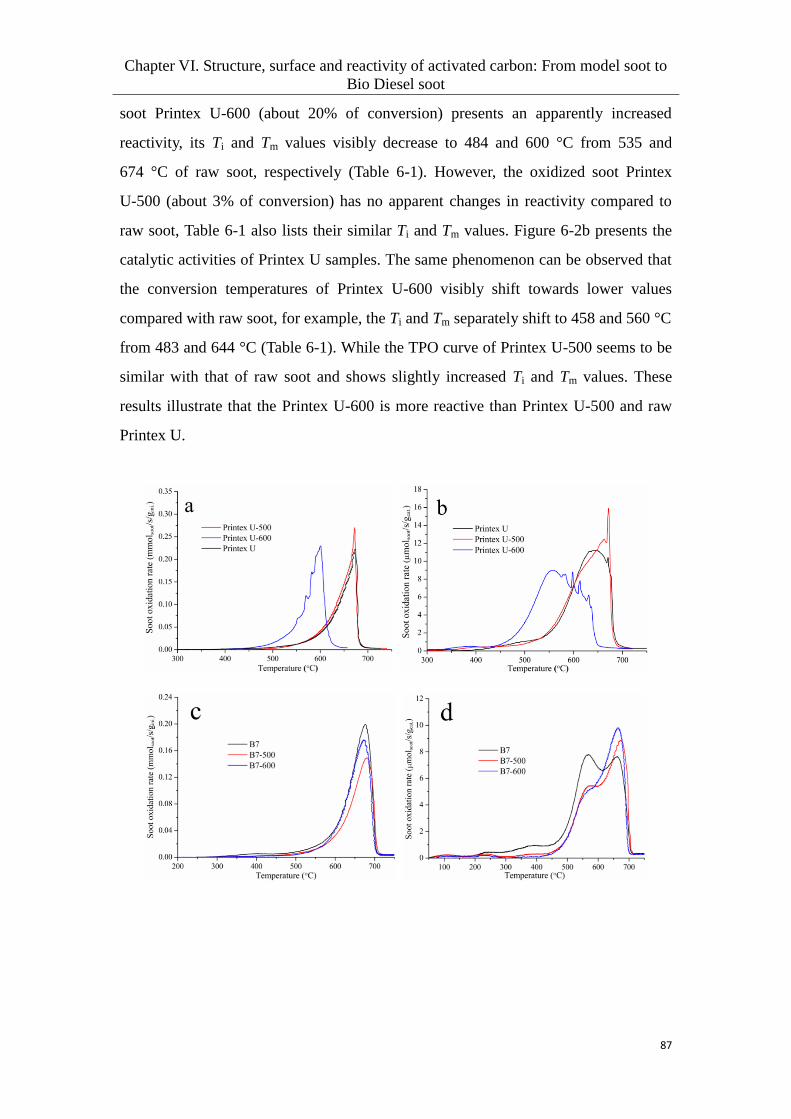
Chapter VI. Structure, surface and reactivity of activated carbon: From model soot to
Bio Diesel soot
87
soot Printex U-600 (about 20% of conversion) presents an apparently increased
reactivity, its Ti and Tm values visibly decrease to 484 and 600 °C from 535 and
674 °C of raw soot, respectively (Table 6-1). However, the oxidized soot Printex
U-500 (about 3% of conversion) has no apparent changes in reactivity compared to
raw soot, Table 6-1 also lists their similar Ti and Tm values. Figure 6-2b presents the
catalytic activities of Printex U samples. The same phenomenon can be observed that
the conversion temperatures of Printex U-600 visibly shift towards lower values
compared with raw soot, for example, the Ti and Tm separately shift to 458 and 560 °C
from 483 and 644 °C (Table 6-1). While the TPO curve of Printex U-500 seems to be
similar with that of raw soot and shows slightly increased Ti and Tm values. These
results illustrate that the Printex U-600 is more reactive than Printex U-500 and raw
Printex U.
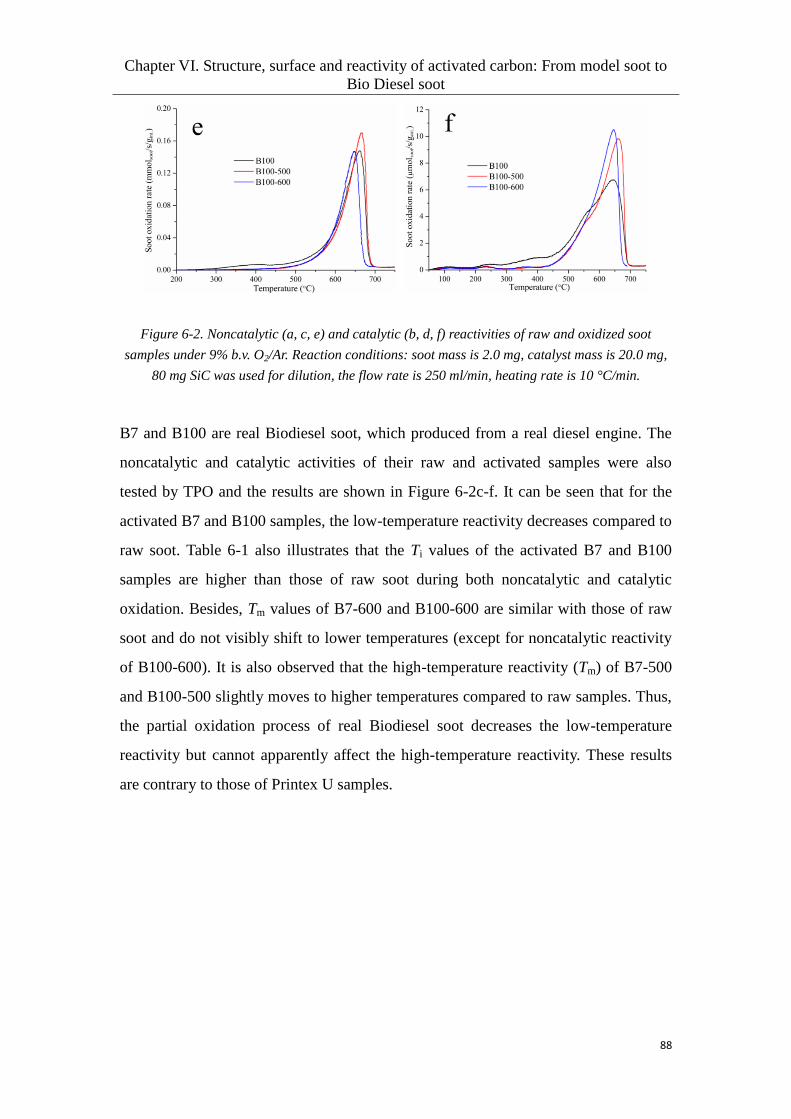
Chapter VI. Structure, surface and reactivity of activated carbon: From model soot to
Bio Diesel soot
88
Figure 6-2. Noncatalytic (a, c, e) and catalytic (b, d, f) reactivities of raw and oxidized soot
samples under 9% b.v. O2/Ar. Reaction conditions: soot mass is 2.0 mg, catalyst mass is 20.0 mg,
80 mg SiC was used for dilution, the flow rate is 250 ml/min, heating rate is 10 °C/min.
B7 and B100 are real Biodiesel soot, which produced from a real diesel engine. The
noncatalytic and catalytic activities of their raw and activated samples were also
tested by TPO and the results are shown in Figure 6-2c-f. It can be seen that for the
activated B7 and B100 samples, the low-temperature reactivity decreases compared to
raw soot. Table 6-1 also illustrates that the Ti values of the activated B7 and B100
samples are higher than those of raw soot during both noncatalytic and catalytic
oxidation. Besides, Tm values of B7-600 and B100-600 are similar with those of raw
soot and do not visibly shift to lower temperatures (except for noncatalytic reactivity
of B100-600). It is also observed that the high-temperature reactivity (Tm) of B7-500
and B100-500 slightly moves to higher temperatures compared to raw samples. Thus,
the partial oxidation process of real Biodiesel soot decreases the low-temperature
reactivity but cannot apparently affect the high-temperature reactivity. These results
are contrary to those of Printex U samples.

Chapter VI. Structure, surface and reactivity of activated carbon: From model soot to
Bio Diesel soot
89
Table 6-1. Ti and Tm values of TPOs with different soot samples.
Samples In O2 In NO + O2
Ti/°C Tm/°C Ti/°C Tm/°C
Printex U 535a/483
b 674
a/644
b 412
b 609
b
Printex U-500 540/508 672/662 382 580
Printex U-600 484/458 600/560 338 490
B7 511/379 676/662 370 556
B7-500 534/479 681/673 378 553
B7-600 540/483 672/664 374 543
B100 490/414 662/644 339 565
B100-500 527/480 667/662 404 590
B100-600 528/477 647/646 382 561
aThe values were obtained without catalyst.
bThe values were obtained with catalyst.
In order to confirm the influence of the activation step on the reactivity of soot, the
raw soot samples were firstly oxidized in O2/Ar through TPO step from 25 to 600 °C,
then the oxidized soot was cooled down to 25 °C and the second TPO was performed
to obtain the total soot conversion profile. As shown in Figure 6-3. For Printex U soot
(Figure 6-3a), the soot oxidation temperatures for the second TPO curve visibly shift
to lower values relative to the first TPO, which reveals a promoting role of the
activation step on soot oxidation. For B7 and B100 samples (Figure 6-3b, c), it can be
clearly observed that the second TPO profile presents a decreased low-temperature
reactivity (< 600 °C) compared with the first TPO. These results above are in good
agreement with those presented in Figure 6-2.
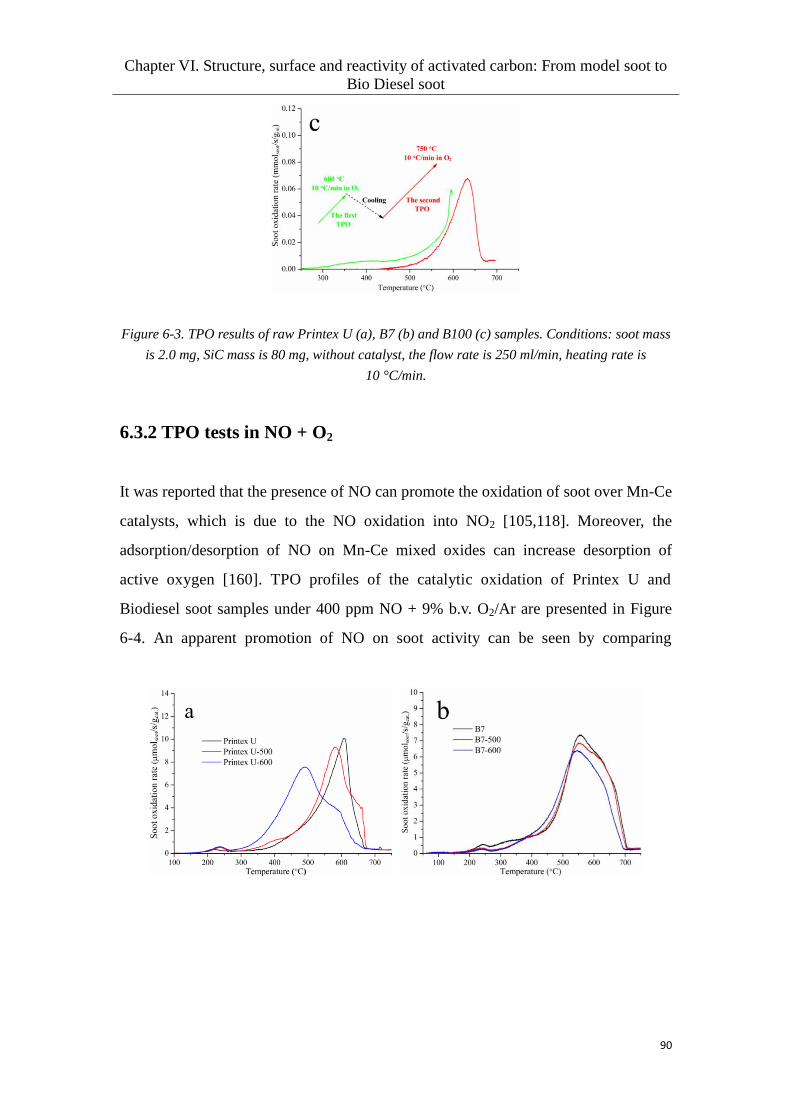
Chapter VI. Structure, surface and reactivity of activated carbon: From model soot to
Bio Diesel soot
90
Figure 6-3. TPO results of raw Printex U (a), B7 (b) and B100 (c) samples. Conditions: soot mass
is 2.0 mg, SiC mass is 80 mg, without catalyst, the flow rate is 250 ml/min, heating rate is
10 °C/min.
6.3.2 TPO tests in NO + O2
It was reported that the presence of NO can promote the oxidation of soot over Mn-Ce
catalysts, which is due to the NO oxidation into NO2 [105,118]. Moreover, the
adsorption/desorption of NO on Mn-Ce mixed oxides can increase desorption of
active oxygen [160]. TPO profiles of the catalytic oxidation of Printex U and
Biodiesel soot samples under 400 ppm NO + 9% b.v. O2/Ar are presented in Figure
6-4. An apparent promotion of NO on soot activity can be seen by comparing

Chapter VI. Structure, surface and reactivity of activated carbon: From model soot to
Bio Diesel soot
91
Figure 6-4. Catalytic reactivities of Printex U (a), B7 (b) and B100 (c) samples under 400 ppm
NO + 9% O2/Ar. Reaction conditions: soot mass is 2.0 mg, catalyst mass is 20.0 mg, 80 mg SiC
was used for dilution, the flow rate is 250 ml/min, heating rate is 10 °C/min.
the TPO profiles in Figure 6-4 and Figure 6-2. In the case of Printex U, In comparison
with raw soot, the oxidized samples especially for Printex U-600 show increased
reactivity. It can be noted in Table 6-1 that the Ti and Tm of Printex U-500 slightly
shift to lower values but those of Printex U-600 display a larger shift to lower
temperatures. For the previous TPO with catalyst under O2 (Figure 6-2b), Printex
U-500 presents a similar TPO curve with the raw soot, and the Ti and Tm of Printex
U-600 decrease by 25 and 84 °C, respectively, relative to those of raw Printex U.
However, in NO + O2 (Figure 6-4a), Printex U-500 exhibits a slight enhancement on
soot oxidation activity and the Ti and Tm of Printex U-600 separately decrease by 74
and 119 °C compared to those of raw soot. The fact illustrates that the reactivity of the
activated Printex U soot is more easily promoted in NO + O2. In the case of B7 and
B100, it can be clearly seen that the low-temperature reactivity of oxidized soot
samples decreases at about 200-350 °C. The results are also confirmed in Figure 6-2.
For B7 soot, the high-temperature reactivities of raw B7 and B7-500 samples are
almost similar in view of the close Tm values (556 and 553 °C), and that of B7-600
shows a slight promotion. For B100 soot, the Tm value of B100-500 shifts towards
higher temperature (590 °C) and that of B100-600 (561 °C) is similar compared with
raw soot (565 °C).
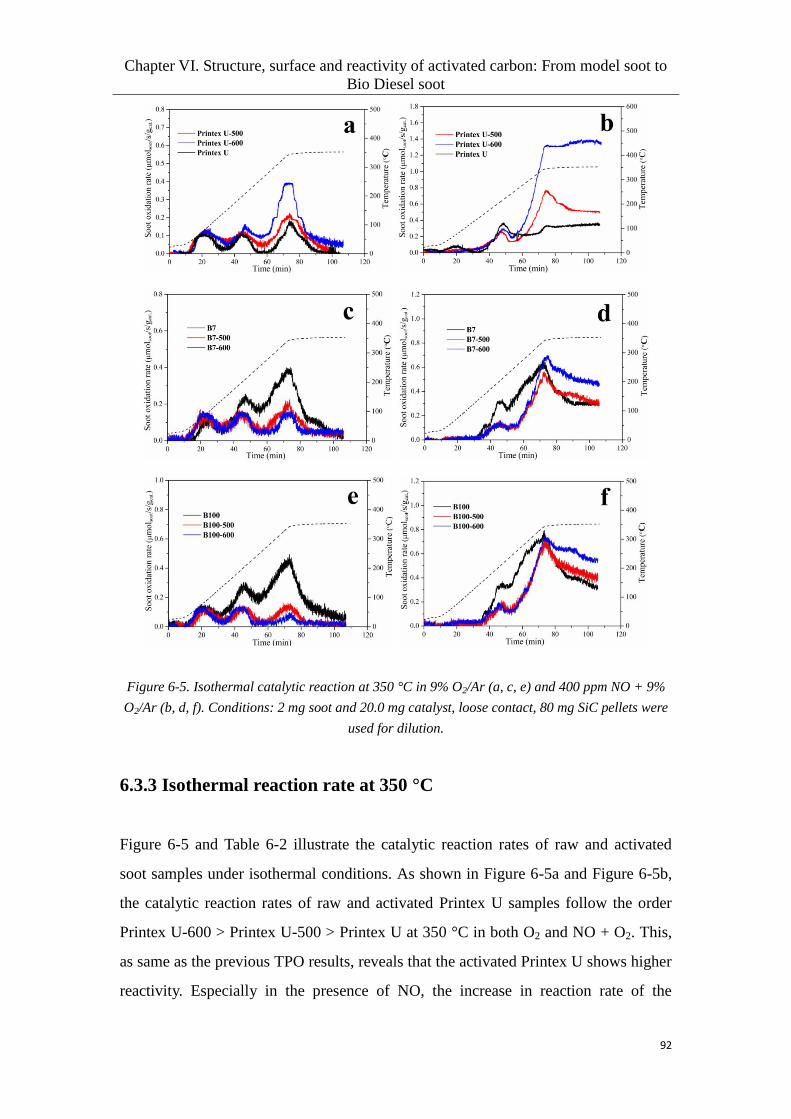
Chapter VI. Structure, surface and reactivity of activated carbon: From model soot to
Bio Diesel soot
92
Figure 6-5. Isothermal catalytic reaction at 350 °C in 9% O2/Ar (a, c, e) and 400 ppm NO + 9%
O2/Ar (b, d, f). Conditions: 2 mg soot and 20.0 mg catalyst, loose contact, 80 mg SiC pellets were
used for dilution.
6.3.3 Isothermal reaction rate at 350 °C
Figure 6-5 and Table 6-2 illustrate the catalytic reaction rates of raw and activated
soot samples under isothermal conditions. As shown in Figure 6-5a and Figure 6-5b,
the catalytic reaction rates of raw and activated Printex U samples follow the order
Printex U-600 > Printex U-500 > Printex U at 350 °C in both O2 and NO + O2. This,
as same as the previous TPO results, reveals that the activated Printex U shows higher
reactivity. Especially in the presence of NO, the increase in reaction rate of the
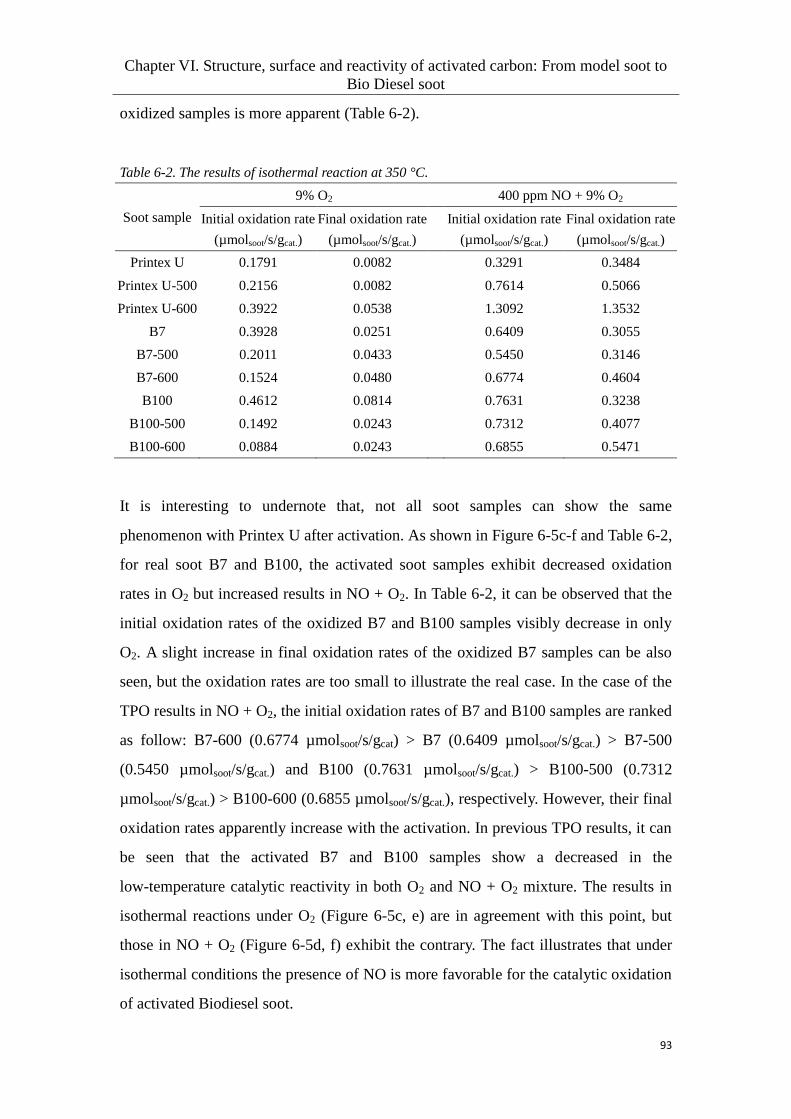
Chapter VI. Structure, surface and reactivity of activated carbon: From model soot to
Bio Diesel soot
93
oxidized samples is more apparent (Table 6-2).
Table 6-2. The results of isothermal reaction at 350 °C.
Soot sample
9% O2 400 ppm NO + 9% O2
Initial oxidation rate
(µmolsoot/s/gcat.)
Final oxidation rate
(µmolsoot/s/gcat.)
Initial oxidation rate
(µmolsoot/s/gcat.)
Final oxidation rate
(µmolsoot/s/gcat.)
Printex U 0.1791 0.0082 0.3291 0.3484
Printex U-500 0.2156 0.0082 0.7614 0.5066
Printex U-600 0.3922 0.0538 1.3092 1.3532
B7 0.3928 0.0251 0.6409 0.3055
B7-500 0.2011 0.0433 0.5450 0.3146
B7-600 0.1524 0.0480 0.6774 0.4604
B100 0.4612 0.0814 0.7631 0.3238
B100-500 0.1492 0.0243 0.7312 0.4077
B100-600 0.0884 0.0243 0.6855 0.5471
It is interesting to undernote that, not all soot samples can show the same
phenomenon with Printex U after activation. As shown in Figure 6-5c-f and Table 6-2,
for real soot B7 and B100, the activated soot samples exhibit decreased oxidation
rates in O2 but increased results in NO + O2. In Table 6-2, it can be observed that the
initial oxidation rates of the oxidized B7 and B100 samples visibly decrease in only
O2. A slight increase in final oxidation rates of the oxidized B7 samples can be also
seen, but the oxidation rates are too small to illustrate the real case. In the case of the
TPO results in NO + O2, the initial oxidation rates of B7 and B100 samples are ranked
as follow: B7-600 (0.6774 µmolsoot/s/gcat) > B7 (0.6409 µmolsoot/s/gcat.) > B7-500
(0.5450 µmolsoot/s/gcat.) and B100 (0.7631 µmolsoot/s/gcat.) > B100-500 (0.7312
µmolsoot/s/gcat.) > B100-600 (0.6855 µmolsoot/s/gcat.), respectively. However, their final
oxidation rates apparently increase with the activation. In previous TPO results, it can
be seen that the activated B7 and B100 samples show a decreased in the
low-temperature catalytic reactivity in both O2 and NO + O2 mixture. The results in
isothermal reactions under O2 (Figure 6-5c, e) are in agreement with this point, but
those in NO + O2 (Figure 6-5d, f) exhibit the contrary. The fact illustrates that under
isothermal conditions the presence of NO is more favorable for the catalytic oxidation
of activated Biodiesel soot.
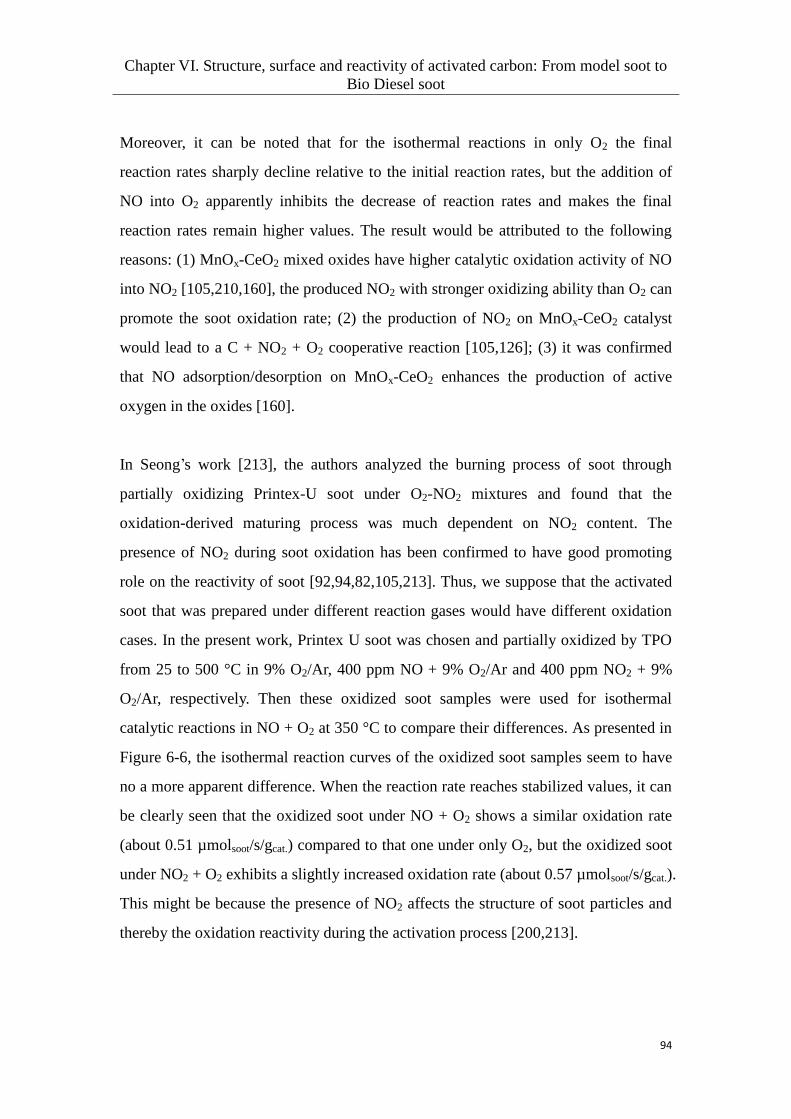
Chapter VI. Structure, surface and reactivity of activated carbon: From model soot to
Bio Diesel soot
94
Moreover, it can be noted that for the isothermal reactions in only O2 the final
reaction rates sharply decline relative to the initial reaction rates, but the addition of
NO into O2 apparently inhibits the decrease of reaction rates and makes the final
reaction rates remain higher values. The result would be attributed to the following
reasons: (1) MnOx-CeO2 mixed oxides have higher catalytic oxidation activity of NO
into NO2 [105,210,160], the produced NO2 with stronger oxidizing ability than O2 can
promote the soot oxidation rate; (2) the production of NO2 on MnOx-CeO2 catalyst
would lead to a C + NO2 + O2 cooperative reaction [105,126]; (3) it was confirmed
that NO adsorption/desorption on MnOx-CeO2 enhances the production of active
oxygen in the oxides [160].
In Seong’s work [213], the authors analyzed the burning process of soot through
partially oxidizing Printex-U soot under O2-NO2 mixtures and found that the
oxidation-derived maturing process was much dependent on NO2 content. The
presence of NO2 during soot oxidation has been confirmed to have good promoting
role on the reactivity of soot [92,94,82,105,213]. Thus, we suppose that the activated
soot that was prepared under different reaction gases would have different oxidation
cases. In the present work, Printex U soot was chosen and partially oxidized by TPO
from 25 to 500 °C in 9% O2/Ar, 400 ppm NO + 9% O2/Ar and 400 ppm NO2 + 9%
O2/Ar, respectively. Then these oxidized soot samples were used for isothermal
catalytic reactions in NO + O2 at 350 °C to compare their differences. As presented in
Figure 6-6, the isothermal reaction curves of the oxidized soot samples seem to have
no a more apparent difference. When the reaction rate reaches stabilized values, it can
be clearly seen that the oxidized soot under NO + O2 shows a similar oxidation rate
(about 0.51 µmolsoot/s/gcat.) compared to that one under only O2, but the oxidized soot
under NO2 + O2 exhibits a slightly increased oxidation rate (about 0.57 µmolsoot/s/gcat.).
This might be because the presence of NO2 affects the structure of soot particles and
thereby the oxidation reactivity during the activation process [200,213].
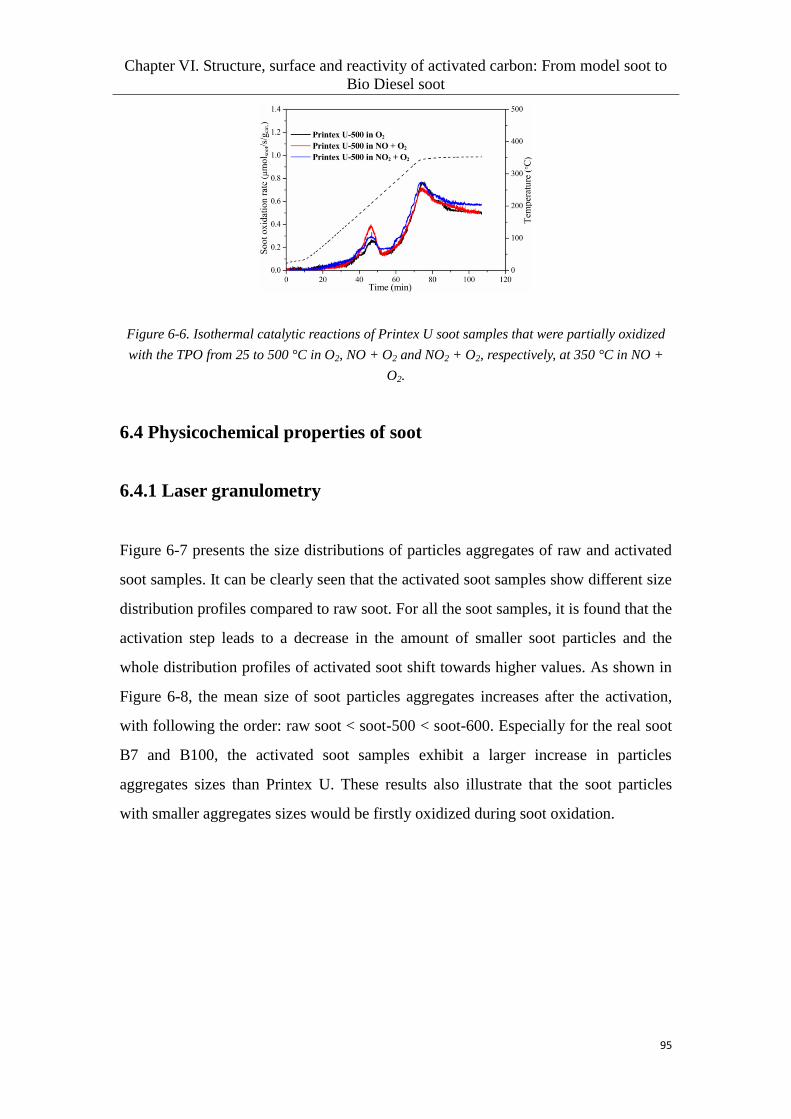
Chapter VI. Structure, surface and reactivity of activated carbon: From model soot to
Bio Diesel soot
95
Figure 6-6. Isothermal catalytic reactions of Printex U soot samples that were partially oxidized
with the TPO from 25 to 500 °C in O2, NO + O2 and NO2 + O2, respectively, at 350 °C in NO +
O2.
6.4 Physicochemical properties of soot
6.4.1 Laser granulometry
Figure 6-7 presents the size distributions of particles aggregates of raw and activated
soot samples. It can be clearly seen that the activated soot samples show different size
distribution profiles compared to raw soot. For all the soot samples, it is found that the
activation step leads to a decrease in the amount of smaller soot particles and the
whole distribution profiles of activated soot shift towards higher values. As shown in
Figure 6-8, the mean size of soot particles aggregates increases after the activation,
with following the order: raw soot < soot-500 < soot-600. Especially for the real soot
B7 and B100, the activated soot samples exhibit a larger increase in particles
aggregates sizes than Printex U. These results also illustrate that the soot particles
with smaller aggregates sizes would be firstly oxidized during soot oxidation.

Chapter VI. Structure, surface and reactivity of activated carbon: From model soot to
Bio Diesel soot
96
Figure 6-7. Particles aggregates size distribution of Printex U (a), B100 (b) and B7 (c) samples.
Figure 6-8. Mean size of particles aggregates of different soot samples.
6.4.2 BET analysis
Table 6-3 lists the values of surface area (SBET), mean pore size (R) and pore volume
(Vp) of raw and activated soot samples. Partial oxidation of raw soot significant

Chapter VI. Structure, surface and reactivity of activated carbon: From model soot to
Bio Diesel soot
97
increases surface area and decreases mean pore size. This illustrates that the activation
process led to a modification of textural property of soot. For Printex U samples,
Printex U-500 (at about 3% partial oxidation) shows a slight increase in SBET and R,
while Printex U-600 (at about 20% partial oxidation) has a sharp increase in SBET and
decrease in R. The pore volume (Vp) of Printex U also exhibits an increased trend with
the activation. For real Biodiesel soot B7 and B100, a similar change in SBET and R
with Printex U can be observed after activation, but one different point is that the Vp
of activated soot decreases (for example B7-600 and B100-500). The sharp decrease
of mean pore size for the activated soot indicates an apparent increase in the amount
of smaller pores and a disappearance of large pores. It is speculated that the initial
soot oxidation may occur in larger pores.
Table 6-3. Textual properties of raw and activated soot samples
Soot sample SBET (m2/g)
a
Mean pore size R
(nm)a
Pore volume Vp
(ml/g)a
Printex U 97.8 18.94 0.90
Printex U-500 111.8 19.07 1.05
Printex U-600 321.3 1.21 1.30
B100 124.1 39.01 1.26
B100-500 154.9 1.64 0.92
B100-600 217.1 1.21 1.29
B7 231.6 25.55 2.73
B7-600 296.2 1.21 1.91
awhich was calculated by BJH method.
6.4.3 Raman analysis
The Raman spectra of raw and activated soot samples were measured to analyze the
microstructural features and the results are presented in Figures 6-9, 6-10 and Table
6-4. Figure 6-10 presents the Raman analysis of Printex U samples (as an example).
The Raman spectra of these soot are characterized by two overlapping peaks, which
appear at around 1580 cm-1
(G peak) and 1350 cm-1
(D peak), respectively
[63,171,196]. The D peak is generally related to defect sites or disordered carbon and

Chapter VI. Structure, surface and reactivity of activated carbon: From model soot to
Bio Diesel soot
98
G peak involves the ordered carbon. As shown in Figure 6-9, in comparison with
untreated raw soot, which has more separated D and G peaks, the Raman spectra for
activated samples show more strongly overlapping peaks, this might imply an
increase in the content of molecular carbon for the activated soot [196]. Moreover, in
Figure 6-9, it is also observed that raw soot samples exhibit broad Raman signals in
the range of about 2300-3200 cm-1
, these should be ascribed to second-order bands
Figure 6-9. Raman spectra of raw and partially oxidized Printex U (a), B7 (b) and B100 (c)
samples.
due to (2*D) overtones and (D + G) combinations of graphitic lattice vibration modes
[171]. The second-order signals become less pronounced after activation treatment for
Printex U soot (Figure 6-9a), but the visible decrease in the second-order signals
cannot be seen for the activated B7 and B100 soot (Figure 6-9b and c). The result may
illustrate that Printex U soot becomes more disordered than B7 and B100 soot after
activation.

Chapter VI. Structure, surface and reactivity of activated carbon: From model soot to
Bio Diesel soot
99
Figure 6-10. Analysis of the Raman spectra and curve fits of raw Printex U (a), Printex U-500 (b)
and Printex U-600 (c).
Table 6-4. Raman results of soot samples.
Sample FWHMD1/cm-1
FWHMD2/cm-1
FWHMG/cm-1
ID1/IG ID2/IG ID3/IG AD1/AG AD3/AG
Printex U 174 47 70 1.04 0.87 0.90 2.7 0.75
Printex U-500 182 57 81 1.04 0.97 0.98 3.1 1.09
Printex U-600 179 51 81 1.03 0.97 0.97 3.3 0.97
B7 153 42 70 1.01 0.30 0.42 2.3 0.39
B7-500 149 39 67 1.07 0.37 0.44 2.6 0.44
B7-600 151 47 71 1.10 0.42 0.43 2.6 0.42
B100 154 37 61 0.98 0.38 0.47 2.3 0.42
B100-500 145 31 63 1.10 0.41 0.51 2.4 0.51
B100-600 166 31 65 1.09 0.34 0.49 2.4 0.56
Figure 6-10 clearly illustrates the Raman spectrum of soot consists of four
Lorentzian-shaped bands (G, D1, D2, D4) at around 1580, 1350, 1620 and 1200 cm-1
,
respectively, and a Gaussian-shaped band D3 at about 1500 cm-1
[62,196]. It has been
reported that D1 band is associated with disordered graphitic lattice and D3 band is

Chapter VI. Structure, surface and reactivity of activated carbon: From model soot to
Bio Diesel soot
100
related to amorphous carbon or molecular carbon, thus D1 FWHM (full width at half
maximum) and D3 band intensity as important parameters can provide some
information about chemical structure of graphite-like and amorphous carbon
[170,196]. Many earlier works have also reported the FWHM of G and D bands and
the D/G band intensity ratios (ID/IG) can correlate with degree of graphitization of
carbonaceous materials [214-219]. The authors thought that an increase in G and D
band FWHM and ID/IG values indicates a decrease in order. It was also published that
the ratios between D bands and G band areas (AD/AG) are related to the structural
defects in graphene layers [170]. Since it is unclear which of these parameters should
be used for Raman analysis, most of parameters are used here for comparison.
Table 6-4 lists spectroscopic parameters of different soot samples. For Printex U soot,
it can be observed that the partially oxidized soot samples (Printex U-500 and -600)
exhibit an increased spectroscopic parameters including D and G band FWHM, ID/IG
and AD/AG. This result illustrates that the activated soot has higher disorder and more
structural defects. Among these parameters, D1 band FWHM and AD1/AG values of
the activated soot samples increase with the activation, but their ID1/IG values are very
similar with that of raw soot. Here D1 FWHM should be more important parameter
for analyzing carbon structure. The relative intensity of D3 band (ID3/IG) is associated
with amorphous carbon or molecular carbon. The increase of ID3/IG value of the
oxidized soot samples indicates an increase in molecular carbon. However, by
comparison, the two oxidized Printex U samples (Printex U-500 and -600) show
similar spectroscopic parameters, which seems to imply their similar structural
features.
In the previous work [159], it has been proposed that the noncatalytic and catalytic
reactivities of soot are correlated to their structural properties. In the present work, the
previous TPOs results have confirmed that the activated Printex U samples show
improved reactivity compared to raw sample, this well agrees with the Raman results.
Nonetheless, the similar Raman results of the two oxidized samples cannot explain
much higher reactivity of Printex U-600 than the other one. This may illustrate that

Chapter VI. Structure, surface and reactivity of activated carbon: From model soot to
Bio Diesel soot
101
the reactivity of soot cannot be only ascribed to the structure but also to particle
morphology [159,220], ash content and composition [178,221] as well as oxygen
content [149].
On the other hand, in the case of real soot B7 and B100, it can be seen in Table 6-4
that they have different structural features after activation compared with Printex U.
For B7 soot, as listed in Table 6-4, the activated soot B7-500 (3-10% soot conversion)
shows slightly decreased FWHM values, which appears to imply an increase in order.
However, the ID/IG and AD/AG exhibit increased values, this seems to reveal an inverse
result. It has been reported that D band FWHM and ID/IG have no significant
correlation with each other [171]. Thus, it is difficult to well analyze the nanostructure
of soot by Raman measurement and it may need more evidences to illustrate the
nanostructural features. For B7-600 (20-30% soot conversion), D1 and G band
FWHM values as well as ID3/IG ratio are very similar with those of raw B7 sample.
But other parameters especially for D2 band FWHM and ID2/IG exhibit an increased
tend. It was reported that the ID2/IG ratio and the D2 band FWHM should be inversely
proportional to the thickness of graphitic domains in soot [171,216]. Therefore, the
increase in D2 band FWHM and ID2/IG might indicate the decrease of graphitic
carbon.
For B100 soot, it can be seen in Table 6-4 that B100-500 sample (3-10% soot
conversion) shows apparently decreased D1 and D2 bands FWHM but increased G
band FWHM, ID/IG and AD/AG values relative to raw soot. Generally, the intensity of
G band, D1 and G band FWHM as well as ID1/IG are related to the graphitic order. The
decrease in D1 band FWHM seems to reveal an increase in graphitic order. However,
the G band FWHM and ID1/IG increase, this inversely indicates a decrease in order.
Additionally, ID3/IG as important parameter is often used to evaluate the amorphous
carbon content of soot. The increase of ID3/IG implies an increase in amorphous
carbon content. Plus the increased tend of AD1/AG and AD3/AG, these results may
illustrate an increase in disorder for B100-500. In the case of B100-600, it can be
observed in Table 6-4 that D1 and G band FWHM as well as AD3/AG exhibit higher

Chapter VI. Structure, surface and reactivity of activated carbon: From model soot to
Bio Diesel soot
102
values than both B100 and B100-500 samples, and ID1/IG, ID3/IG and AD1/AG show
very close values with those of B100-500. The result illustrates B100-600 has a lower
order compared to the raw and B100-500 samples in spite of the decreased D2
parameters.
6.4.4 HRTEM analysis
Figure 6-11. HRTEM images of Printex U (a, b), Printex U-500 (c) and Printex U-600 (d).
In order to better observe the structural changes of the activated soot samples, the
morphology and nanostructural property of Printex U and B100 soot samples were
characterized by HRTEM, and the results are shown in Figure 6-11 and Figure 6-12.
In the case of Printex U soot, as shown in Figure 6-11a, the soot sample has
turbostratic patterns and an onion-like structure, the “tight” fringe layers

Chapter VI. Structure, surface and reactivity of activated carbon: From model soot to
Bio Diesel soot
103
concentrically surround nucleus where the disordered carbon structure is observed.
The raw Printex U also has a larger number of parallel stacked graphene layers with a
larger thickness (19.5 nm) (Figure 6-11b). This reveals a higher order for raw Printex
U. Moreover, some edge defective sites are also observed in Figure 6-11a. After the
soot being partially oxidized, a decreased fringe-layer thickness can be clearly seen in
`
Figure 6-12. HRTEM images of B100 (a, b), B100-500 (c) and B100-600 (d).
Figure 6-11c and d (11.5 nm for Printex U-500 and 7.3 nm for Printex U-600). The
result illustrates that the partial oxidation of Printex U decreases the degree of
graphitization and Printex U-600 exhibits more apparent result. Besides, in
comparison, it can be observed that the activated soot samples have an increased area
of highly disordered carbon particles on the center. For example, for Printex U-600,
the fringe patterns on the center become less noticeable, this is due to the oxidation of
less-ordered nuclei through diffused oxygen into porous particles [222]. Thus, it is

Chapter VI. Structure, surface and reactivity of activated carbon: From model soot to
Bio Diesel soot
104
also confirmed that Printex U experienced an internal burning-out process during
partial oxidation under O2 [200,213].
In the case of B100 sample as real biodiesel soot, it exhibits different structural and
morphology changes after oxidation treatment compared with Printex U. As shown in
Figure 6-12a and b, the raw soot displays less obvious fringe layers and thinner
carbon-layers thickness (about 5-10 nm) than raw Printex U soot. A less chainlike
orientation and looser fringe layers are also observed in Figure 6-12b. These results
seem to illustrate that the real biodiesel soot has higher disorder and lower degree of
graphitization than Printex U, which is also found in the previous work [159]. After
partial oxidation, the activated soot samples (B100-500 and B100-600) all show
unclear fringe layers. This might confirm that the partially oxidized samples become
more disordered. In comparison in Figure 6-12c, the edge of the B100-500 soot
particle shows vaguer fringe layers than the area inside. Some void areas on the outer
surface of primary particle are also found in Figure 6-12d. Therefore, B100 soot
tended to oxidize through an external burning process during oxidation treatment
[213].
Moreover, 50 soot particles were used for nanoparticles size analysis for each sample
and nanoparticle-size distribution was presented in Figure 6-13. With the soot being
oxidized partially, the nanoparticles sizes of Printex U and B100 tend to decrease.
Thus, the activated soot presents an smaller mean particle size than raw soot. This
observation has been already reported in Al-Ourashi’s work [200].
Figure 6-13. Nanoparticles size distribution of soot samples.
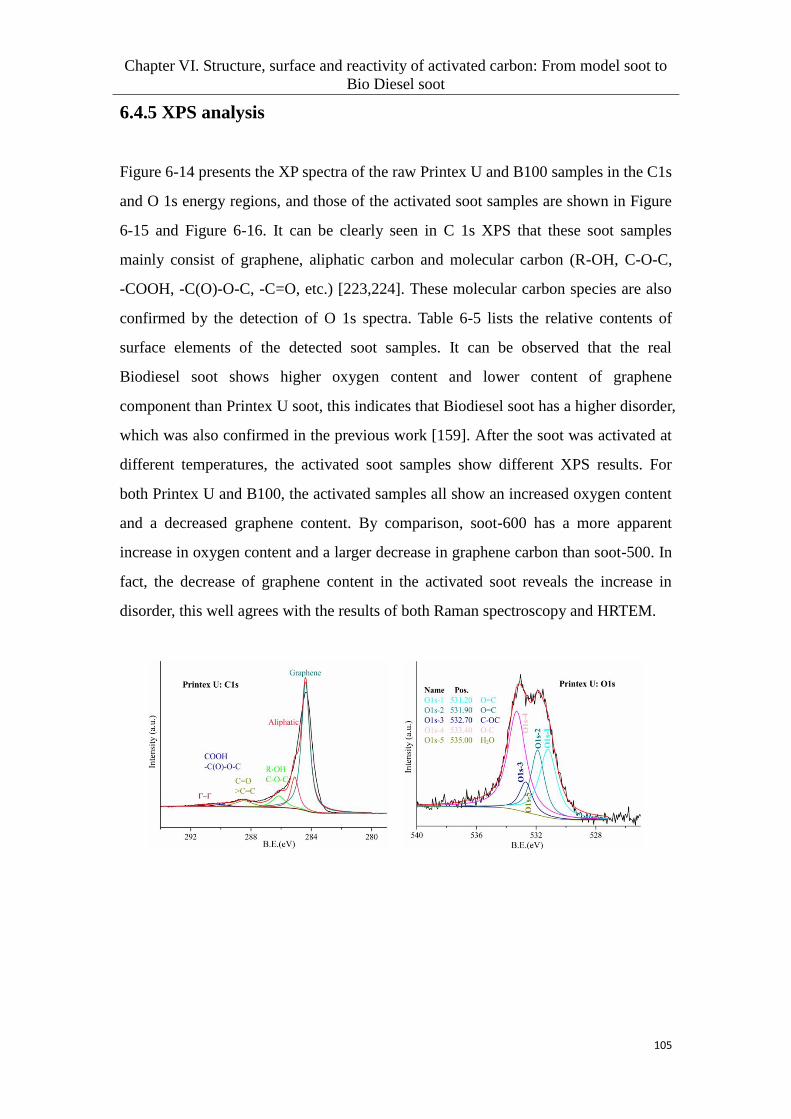
Chapter VI. Structure, surface and reactivity of activated carbon: From model soot to
Bio Diesel soot
105
6.4.5 XPS analysis
Figure 6-14 presents the XP spectra of the raw Printex U and B100 samples in the C1s
and O 1s energy regions, and those of the activated soot samples are shown in Figure
6-15 and Figure 6-16. It can be clearly seen in C 1s XPS that these soot samples
mainly consist of graphene, aliphatic carbon and molecular carbon (R-OH, C-O-C,
-COOH, -C(O)-O-C, -C=O, etc.) [223,224]. These molecular carbon species are also
confirmed by the detection of O 1s spectra. Table 6-5 lists the relative contents of
surface elements of the detected soot samples. It can be observed that the real
Biodiesel soot shows higher oxygen content and lower content of graphene
component than Printex U soot, this indicates that Biodiesel soot has a higher disorder,
which was also confirmed in the previous work [159]. After the soot was activated at
different temperatures, the activated soot samples show different XPS results. For
both Printex U and B100, the activated samples all show an increased oxygen content
and a decreased graphene content. By comparison, soot-600 has a more apparent
increase in oxygen content and a larger decrease in graphene carbon than soot-500. In
fact, the decrease of graphene content in the activated soot reveals the increase in
disorder, this well agrees with the results of both Raman spectroscopy and HRTEM.
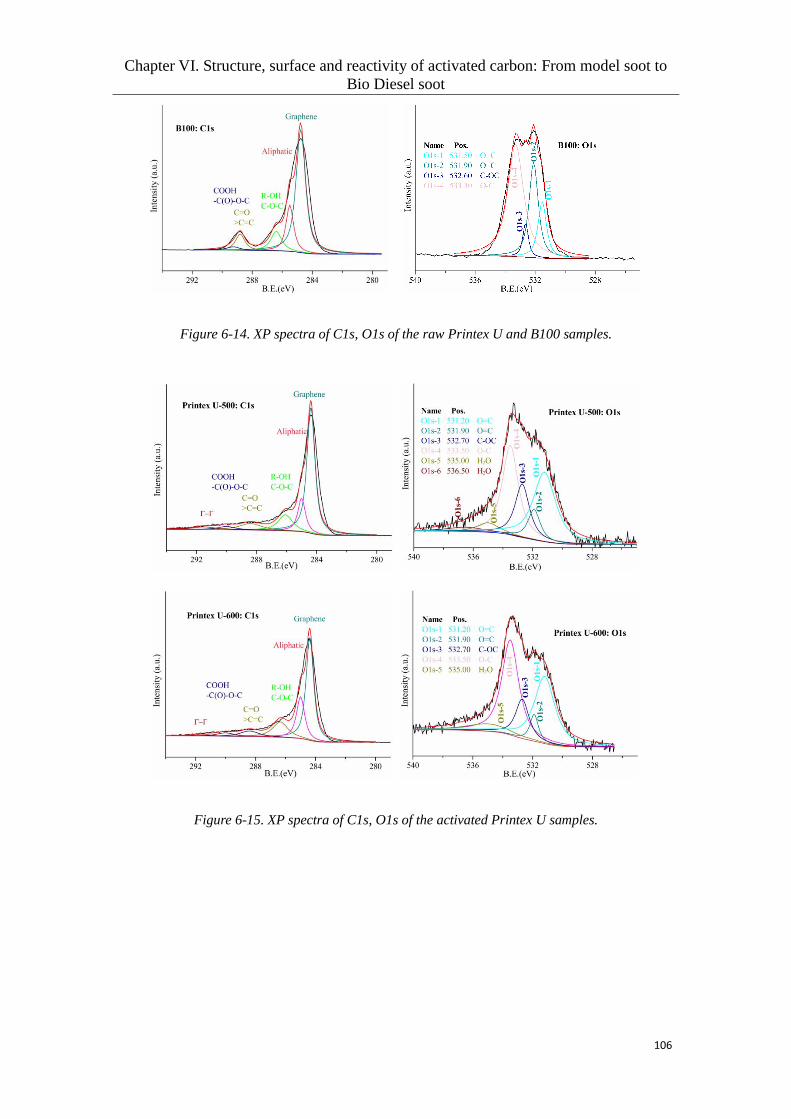
Chapter VI. Structure, surface and reactivity of activated carbon: From model soot to
Bio Diesel soot
106
Figure 6-14. XP spectra of C1s, O1s of the raw Printex U and B100 samples.
Figure 6-15. XP spectra of C1s, O1s of the activated Printex U samples.
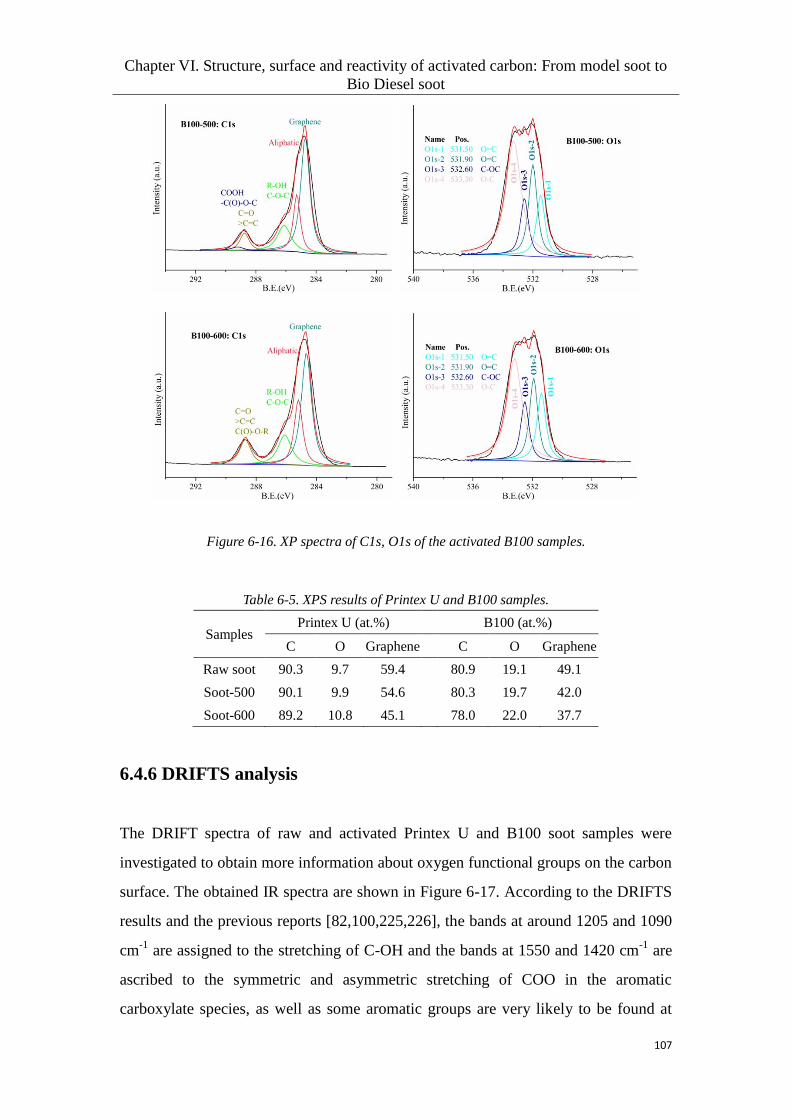
Chapter VI. Structure, surface and reactivity of activated carbon: From model soot to
Bio Diesel soot
107
Figure 6-16. XP spectra of C1s, O1s of the activated B100 samples.
Table 6-5. XPS results of Printex U and B100 samples.
Samples Printex U (at.%) B100 (at.%)
C O Graphene C O Graphene
Raw soot 90.3 9.7 59.4 80.9 19.1 49.1
Soot-500 90.1 9.9 54.6 80.3 19.7 42.0
Soot-600 89.2 10.8 45.1 78.0 22.0 37.7
6.4.6 DRIFTS analysis
The DRIFT spectra of raw and activated Printex U and B100 soot samples were
investigated to obtain more information about oxygen functional groups on the carbon
surface. The obtained IR spectra are shown in Figure 6-17. According to the DRIFTS
results and the previous reports [82,100,225,226], the bands at around 1205 and 1090
cm-1
are assigned to the stretching of C-OH and the bands at 1550 and 1420 cm-1
are
ascribed to the symmetric and asymmetric stretching of COO in the aromatic
carboxylate species, as well as some aromatic groups are very likely to be found at
Chapter VI. Structure, surface and reactivity of activated carbon: From model soot to
Bio Diesel soot
108
around 1515 cm-1
. The stretching of C=O in lactones and carboxylic anhydrides can
be observed at 1745 cm-1
as well as that in quinone and ceto-enol groups at 1610 cm-1
.
The weak band at around 1250 cm-1
may be associated with C-O stretching. It was
reported that the formation of some surface oxygen complexes (SOCs) could be
confirmed at 1730-1750 cm-1
(carboxylic anhydrides and lactones), 1595 and 1615
cm-1
(quinone and ceto-enol groups) as well as 1255 cm-1
(ethers and phenols) [100].
Moreover, in another publication [197], it was reported that the band at 1726 cm-1
is
ascribed to the vibration of C=O in aromatic ester groups and the band at 1595 cm-1
can be attributed to the stretching vibration of conjugated C=C bonds or the bending
mode of H2O. The apparent absorption bands between 1726 and 1615 cm-1
are
difficult to assign in details. The bending vibration of C-H is also found at about 1460,
1395 and 1390 cm-1
[197,225]. The band at 1600 cm-1
could be attributed to the
presence of H2O and the bands at 1300-1000 cm-1
are assigned to C-O vibrations
[197].
As shown in Figure 6-17, the real Biodiesel soot B100 exhibits more surface oxygen
functional components than Printex U soot in view of much stronger absorption
signals, especially for the surface components (such as aromatic groups) appearing at
1600-1400 cm-1
. This result would give a better explanation for the XPS result that
B100 soot exhibits higher oxygen content and lower carbon content than Printex U. In
Figure 6-17a, it can be seen that the IR result of Printex U-500 seems to be same with
that of raw Printex U, but an apparent change can be observed for Printex U-600 with
an increased absorbance signal. This illustrates that the contents of surface functional
groups, for example, aromatic groups (1550, 1515, 1460 and 1420 cm-1
), C-H (1460,
1395 and 1390 cm-1
) and C=O (1750-1726 cm-1
), visibly increase on the surface of
Printex U-600. It is also noted that the C=C components of Printex U-600 obviously
decrease compared to raw and Printex U-500 soot. The previous XPS results reveal
that Printex U-600 shows more apparent changes in oxygen and graphene contents
than Printex U-500, relative to raw soot. The IR results here would be a reasonable
explanation for this point. Besides, in Figure 6-17b, it can be observed that the raw
and activated B100 samples show a similar shape of IR absorbance profiles.
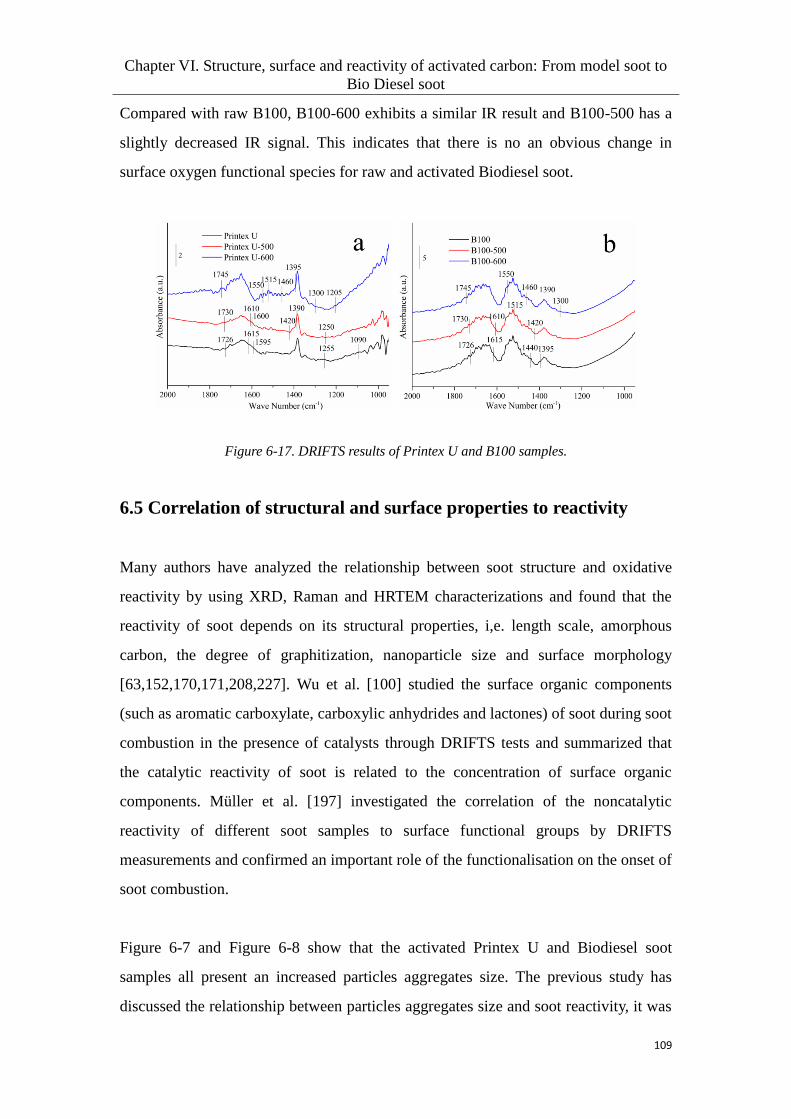
Chapter VI. Structure, surface and reactivity of activated carbon: From model soot to
Bio Diesel soot
109
Compared with raw B100, B100-600 exhibits a similar IR result and B100-500 has a
slightly decreased IR signal. This indicates that there is no an obvious change in
surface oxygen functional species for raw and activated Biodiesel soot.
Figure 6-17. DRIFTS results of Printex U and B100 samples.
6.5 Correlation of structural and surface properties to reactivity
Many authors have analyzed the relationship between soot structure and oxidative
reactivity by using XRD, Raman and HRTEM characterizations and found that the
reactivity of soot depends on its structural properties, i,e. length scale, amorphous
carbon, the degree of graphitization, nanoparticle size and surface morphology
[63,152,170,171,208,227]. Wu et al. [100] studied the surface organic components
(such as aromatic carboxylate, carboxylic anhydrides and lactones) of soot during soot
combustion in the presence of catalysts through DRIFTS tests and summarized that
the catalytic reactivity of soot is related to the concentration of surface organic
components. Müller et al. [197] investigated the correlation of the noncatalytic
reactivity of different soot samples to surface functional groups by DRIFTS
measurements and confirmed an important role of the functionalisation on the onset of
soot combustion.
Figure 6-7 and Figure 6-8 show that the activated Printex U and Biodiesel soot
samples all present an increased particles aggregates size. The previous study has
discussed the relationship between particles aggregates size and soot reactivity, it was

Chapter VI. Structure, surface and reactivity of activated carbon: From model soot to
Bio Diesel soot
110
found that smaller particles aggregates are more reactive than larger ones [159]. The
result in the present work cannot illustrate this point. For example, the activated soot
Printex U-600 exhibits the best reactivity in both O2 and NO + O2, but its mean
particles aggregates size is the largest one. This might indicate that smaller soot
particles aggregates have been oxidized during the activation. In the case of Biodiesel
soot samples, the activated soot shows a decreased low-temperature reactivity (Figure
6-3), this may be ascribed to the loss of smaller particles aggregates.
It was reported that high surface area of soot could promote the oxidative reactivity
[224]. The previous BET results reveal that the activated soot samples show higher
surface area than raw soot. The increased surface area apparently enhances the
reactivity of the activated Printex U soot, however, it cannot that of the activated
Biodiesel soot.
Raman spectroscopy is an important method to study the nanostructural features of
soot and D1 band FWHM and the relative intensity of D3 band (ID3/IG) were reported
to be the main parameters to evaluate soot structure [170,196]. Thus, Figure 6-18
presents the correlation of the reactivities (Tm) of Printex U and B100 samples with
structural features. For Printex U samples, as shown in Figure 6-18, the activated soot
samples show similar and higher D1 band FWHM and ID3/IG ratios, revealing their
similar and increased disorder structure. However, the noncatalytic and catalytic
reactivities of soot in O2 follow the order: Printex U-600 > Printex U-500 ≈ Printex U
and the catalytic reactivity in NO + O2 follows the order: Printex U-600 > Printex
U-500 > Printex U. This result can not be well correlated to Raman parameters.
Besides, in previous HRTEM results, it can be observed that the degree of
graphitization changes with the order: Printex U-600 < Printex U-500 < Printex U.
The content of graphene carbon on the surface of Printex U samples also follows this
order (Figure 6-19). The results can well agree with the catalytic reactivity in NO +
O2. On the other hand, Figure 6-19 shows that the order of surface oxygen content of
Printex U samples is Printex U-600 (10.8%) > Printex U-500 (9.9%) ≈ Printex U
(9.7%). The previous DRIFTS results also reveal that Printex U and Printex U-500
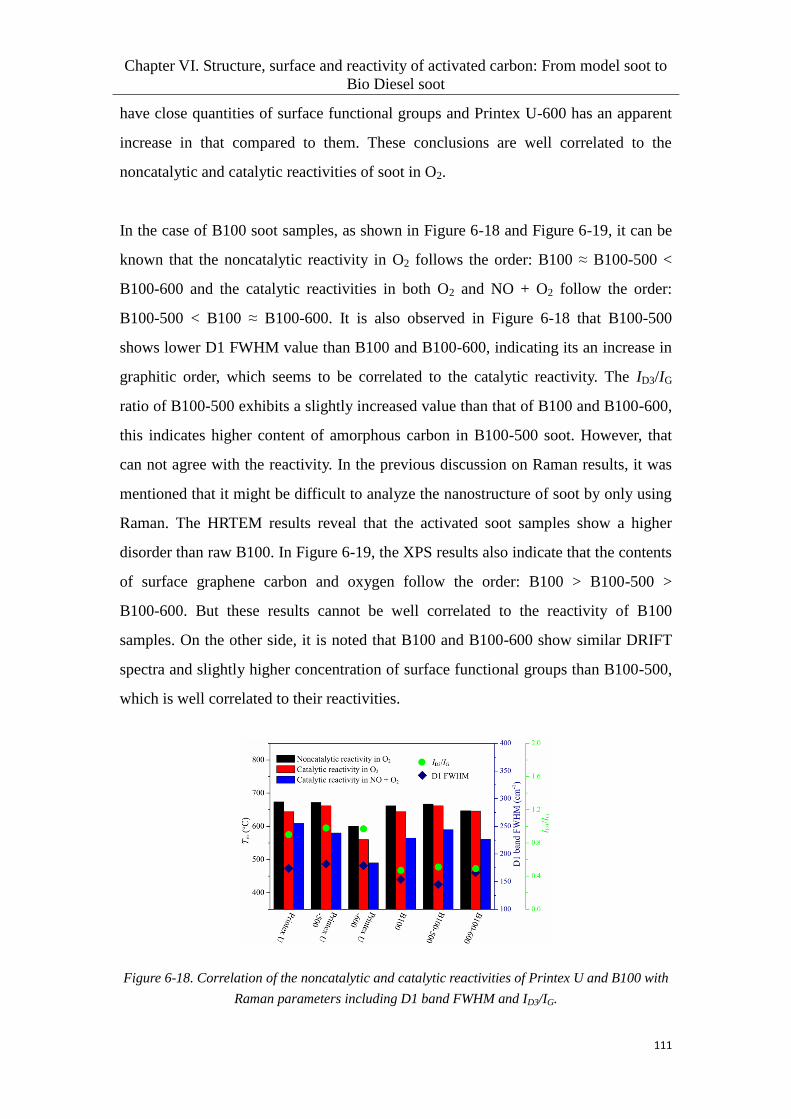
Chapter VI. Structure, surface and reactivity of activated carbon: From model soot to
Bio Diesel soot
111
have close quantities of surface functional groups and Printex U-600 has an apparent
increase in that compared to them. These conclusions are well correlated to the
noncatalytic and catalytic reactivities of soot in O2.
In the case of B100 soot samples, as shown in Figure 6-18 and Figure 6-19, it can be
known that the noncatalytic reactivity in O2 follows the order: B100 ≈ B100-500 <
B100-600 and the catalytic reactivities in both O2 and NO + O2 follow the order:
B100-500 < B100 ≈ B100-600. It is also observed in Figure 6-18 that B100-500
shows lower D1 FWHM value than B100 and B100-600, indicating its an increase in
graphitic order, which seems to be correlated to the catalytic reactivity. The ID3/IG
ratio of B100-500 exhibits a slightly increased value than that of B100 and B100-600,
this indicates higher content of amorphous carbon in B100-500 soot. However, that
can not agree with the reactivity. In the previous discussion on Raman results, it was
mentioned that it might be difficult to analyze the nanostructure of soot by only using
Raman. The HRTEM results reveal that the activated soot samples show a higher
disorder than raw B100. In Figure 6-19, the XPS results also indicate that the contents
of surface graphene carbon and oxygen follow the order: B100 > B100-500 >
B100-600. But these results cannot be well correlated to the reactivity of B100
samples. On the other side, it is noted that B100 and B100-600 show similar DRIFT
spectra and slightly higher concentration of surface functional groups than B100-500,
which is well correlated to their reactivities.
Figure 6-18. Correlation of the noncatalytic and catalytic reactivities of Printex U and B100 with
Raman parameters including D1 band FWHM and ID3/IG.
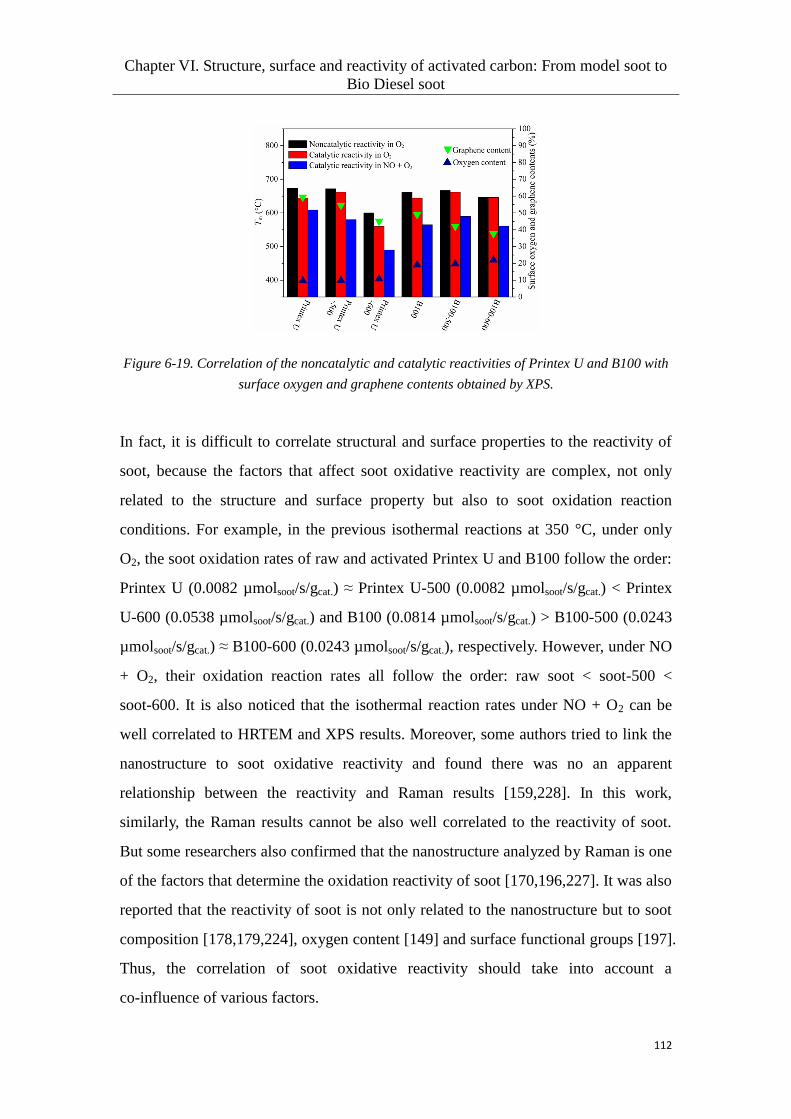
Chapter VI. Structure, surface and reactivity of activated carbon: From model soot to
Bio Diesel soot
112
Figure 6-19. Correlation of the noncatalytic and catalytic reactivities of Printex U and B100 with
surface oxygen and graphene contents obtained by XPS.
In fact, it is difficult to correlate structural and surface properties to the reactivity of
soot, because the factors that affect soot oxidative reactivity are complex, not only
related to the structure and surface property but also to soot oxidation reaction
conditions. For example, in the previous isothermal reactions at 350 °C, under only
O2, the soot oxidation rates of raw and activated Printex U and B100 follow the order:
Printex U (0.0082 µmolsoot/s/gcat.) ≈ Printex U-500 (0.0082 µmolsoot/s/gcat.) < Printex
U-600 (0.0538 µmolsoot/s/gcat.) and B100 (0.0814 µmolsoot/s/gcat.) > B100-500 (0.0243
µmolsoot/s/gcat.) ≈ B100-600 (0.0243 µmolsoot/s/gcat.), respectively. However, under NO
+ O2, their oxidation reaction rates all follow the order: raw soot < soot-500 <
soot-600. It is also noticed that the isothermal reaction rates under NO + O2 can be
well correlated to HRTEM and XPS results. Moreover, some authors tried to link the
nanostructure to soot oxidative reactivity and found there was no an apparent
relationship between the reactivity and Raman results [159,228]. In this work,
similarly, the Raman results cannot be also well correlated to the reactivity of soot.
But some researchers also confirmed that the nanostructure analyzed by Raman is one
of the factors that determine the oxidation reactivity of soot [170,196,227]. It was also
reported that the reactivity of soot is not only related to the nanostructure but to soot
composition [178,179,224], oxygen content [149] and surface functional groups [197].
Thus, the correlation of soot oxidative reactivity should take into account a
co-influence of various factors.

Chapter VI. Structure, surface and reactivity of activated carbon: From model soot to
Bio Diesel soot
113
Besides, this study gives valuable findings on the changes in the structure, surface and
noncatalytic/catalytic reactivity of the activated Printex U model and real Biodiesel
soot. In comparison, the two types of soot samples show different features. However,
many researchers often use Printex U model to investigate the oxidative reactivity of
Diesel soot, this might not be a better route to understand the combustion of real
engine soot samples. In actual exhaust gas, higher temperature and oxygen
concentration would promote the activation of soot before the exhaust gas going
through the DPF. Furthermore, the activation of soot might also occur during soot
deposition and DPF regeneration processes. These should be considered in
experimental models and studies. This study also gives some useful information on
the development and selection of model soot in order to carry out an accurate
evaluation of soot oxidation and thus further optimize the DPF regeneration.
6.6 Summary
In the present study, we studied and compared the structure, surface and reactivity of
Printex U model and real Biodiesel soot samples through a series of characterizations
and TPO measurements. Laser granulometry and BET separately revealed increased
particles aggregates size and surface area of the activated soot samples. Raman results
confirmed an increased disorder of the activated Printex U soot but could not clearly
illustrate the changes in nanostructure of the activated Biodiesel soot. HRTEM
showed different morphology of activated soot and different oxidation routes between
Printex U and Biodiesel soot. XPS confirmed that the activation of soot increased
surface oxygen content and decreased graphene carbon. DRIFTS indicated that the
activated Printex U had a visible increase in surface functional groups, while this
could not be observed in B100. TPO gave an evidence that the activated Printex U
exhibited more apparent promotion on the reactivity than the activated Biodiesel soot.
Furthermore, the activated Printex U displayed closer correlation of the reactivity to
nanostructure and surface than real Biodiesel soot.
Chapter VII. Effect of Biodiesel impurities (K, Na, P) on noncatalytic and catalytic
activities of soot in model DPF regeneration conditions
114
7. Effect of Biodiesel impurities (K, Na, P) on
noncatalytic and catalytic activities of soot in model
DPF regeneration conditions
7.1 Introduction
Operation of diesel engines as lean burn engines can provide the user with good fuel
economy due to their significant advantages in terms of high thermal efficiency and
durability. Besides, high air/fuel ratios in their operation effectively reduce the
emissions of gas phase hydrocarbons and carbon monoxide. However, severe
emission problems relate to particulate matter (PM), in particular, carbon
nanoparticles have caused serious environment pollution and human health influences
[116,229-232]. Thus, many countries and regions have drawn up more restrictive
legislation such as Euro VI emission standard to limit PM emissions [192,233].
In order to comply with the restrictive legislation, many researchers and vehicle
manufacturers have been looking for an effective method to reduce PM emissions.
They thought that the use of Biodiesel as a renewable fuel can apparently decrease the
emissions of carbon particulates and greenhouse gases (GHG) and thereby proposed
to replace conventional Diesel by Biodiesel [234,235]. Biodiesel is a synthetic
Diesel-like fuel and can be attained from natural sources such as vegetables and
animal fats through transesterification of triglycerides [234,236]. In comparison with
Diesel, Biodiesel has higher oxygen content, which would decrease the sooting
tendency during fuel combustion and thereby soot deposit in the Diesel Particulate
Filter (DPF) [149,237-240]. Its combustion also results in the formation of
oxygenated soot with more amorphous structure, thus improving soot oxidative
reactivity [63,159,241,242].
However, Biodiesel has been characterized to have some inorganic impurities like
alkali metals, phosphorus, etc., these impurities would deposit in the whole vehicle
exhaust system during the combustion of large amount of Biodiesel [234,243,244].
Chapter VII. Effect of Biodiesel impurities (K, Na, P) on noncatalytic and catalytic
activities of soot in model DPF regeneration conditions
115
Some inorganic elements may interact with the catalysts and soot particles, thereby
influencing their physicochemical properties and reactivity. It has been reported that
in Diesel Oxidation Catalyst (DOC) and Selective Catalytic Reduction (SCR) systems,
the presence of these impurities led to the loss of active sites and deactivation of
catalysts [244,245]. It was also found that in DPF, these impurities as ash exist on the
monolith wall and also in the soot composition, thereby affecting the passive and
active regeneration of DPF [244,246,247].
Many studies have confirmed that the presence of alkali metals in the catalysts has a
positive impact on soot oxidation activity [248-254]. It was reported that the K-doped
catalysts showed apparently improved catalytic activity during soot oxidation, the
researchers thought that the presence of potassium decreased the activation energy of
soot oxidation reactions and thereby increased the reactivity [249,250]. Gross et al.
[251] studied the soot oxidation activity of ceria catalysts doped by different KNO3
contents (4-14 wt%) and found a great enhancement of soot oxidation, they thought
that high mobility of K improved the contact between soot particulates and catalyst
and thus increased the availability of active sites in the catalyst. Aneggi et al. [252]
studied the effect of Na, K, Rn and Cs alkali metals on soot oxidation activity of ceria,
the result was found that all the elements showed an enhanced activity. Moreover, the
intrinsic activity of some alkali metals was also studied through their impregnation on
alumina support or directly on carbon black. It was reported that Na, K and Cs have a
catalytic impact on carbon oxidation under air and Cs and K even show better
reactivity than Pt noble metal [253,254]. However, a few reports illustrate that the
presence of phosphorus inhibits soot oxidation activity under O2 [255-257]. Schobing
et al. found that phosphorus has a beneficial effect on C-NO2 reaction, particularly in
presence of water [224]. Thus, the presence of these impurities in Biodiesel would
affect the soot reactivity and catalytic activity and thereby the regeneration of DPF.
Surprisingly, the impact of inorganic elements on non-catalytic and catalytic
reactivities of soot in presence of NOx (NO and NO2) in the feed gas is rarely reported
in the literature.

Chapter VII. Effect of Biodiesel impurities (K, Na, P) on noncatalytic and catalytic
activities of soot in model DPF regeneration conditions
116
Many studies reported that MnOx-CeO2 mixed oxides, as a relatively cheap candidate
for soot oxidation, have excellent oxygen storage and redox ability and thus show a
high promotion in soot oxidation activity [100,105,118]. Moreover, MnOx-CeO2
mixed oxides can not only oxidize NO to NO2 and storage NOx at lower temperatures
but also release a large amount of active oxygen species during soot combustion
[105,119].
The aim of the present work is to study the impact of the presence of Biodiesel
impurities on the DPF non-catalytic and catalytic regeneration under model DPF
regeneration conditions. A real soot B7, which generated from the combustion of 7%
Biodiesel-diesel blends, was used in this work. The soot was doped by 0.5-2 wt% of
inorganic elements (Na, K, P) to obtain the impurity-deposited soot samples. In order
to evaluate the influence of Na, K and P elements on catalytic oxidation activity of
soot, MnOx-CeO2 catalyst was prepared through a co-precipitation method and used
in the reactivity measurement.
7.2 Materials preparation
7.2.1 Soot samples preparation
Real Biodiesel soot sample was provided by Volvo Group Truck Technology. An
engine bench (8L Diesel engine) equipped with a Euro VI post-treatment system
containing DOC and DPF was used for soot production. The real soot sample was
obtained through the combustion of fuels blend with 7 vol% of methyl ester from
rapeseed oil and 93 vol% of standard Euro VI fuel (EN 590). The obtained real soot
sample was labeled as B7.
Soot doping was performed through a saturated impregnation method, the real soot
sample B7 was impregnated by an aqueous solution of NaNO3, KNO3 or NH4H2PO4.
Then the final samples with 0.5 wt%, 1.0 wt% and 2.0 wt% inorganic elements were
dried at 120 °C for a day and calcined in a muffle furnace at 350 °C for 2 h. The

Chapter VII. Effect of Biodiesel impurities (K, Na, P) on noncatalytic and catalytic
activities of soot in model DPF regeneration conditions
117
undoped soot was also calcined at the same temperature for 2 h and used for a
reference. It was noted 350B7.
7.2.2 Catalyst preparation
MnOx-CeO2 mixed oxides (Mn/Ce = 1/4 (mol/mol)) were prepared through a
co-precipitation method. Ce(NO3)3·6H2O (solid, 95% pure) and Mn(NO3)2 (liquid, 50
wt.%) as the precursors were firstly dissolved in deionized water, then adding the
dispersants PVA (polyvinyl alcohol) and PEG (polyethylene glycol) into the mixed
solution. Finally, the mixture solution was mixed with the precipitant (pH > 9.0)
consisting of NH3∙H2O and (NH4)2CO3 (chemical reagents, Beijing). The obtained
precipitates were filtered and dried by a spraying apparatus, then calcined in static air
at 500 °C for 3 h in a muffle furnace.
7.3 Reactivity tests by TPOs
7.3.1 Soot oxidation under noncatalytic regeneration conditions
7.3.1.1 Soot-TPOs in 9% b.v. O2/Ar + 5% H2O
Figure 7-1. TPO profiles of the doped B7 soot samples under 9% b.v. O2/Ar + 5% H2O. (a)
K/Na-doped samples; (b) P-doped samples.
Figure 7-1 shows the TPO profiles of the B7 soot samples doped by K, Na and P with

Chapter VII. Effect of Biodiesel impurities (K, Na, P) on noncatalytic and catalytic
activities of soot in model DPF regeneration conditions
118
different concentrations under 9% b.v. O2/Ar + 5% H2O. It was found that the
oxidative reactivity of B7 soot is apparently influenced by the presence of K, Na and P.
As shown in Figure 7-1a, the ignition of K/Na-doped samples takes place at lower
temperatures compared to that of the undoped soot. The temperatures of the
maximum soot oxidation rate visibly shift towards lower values after K and Na
doping. With the doping amount of K and Na increasing from 0.5% to 2%, the
oxidative reactivity of B7 trends to a better result. The promoting role of alkali metals
on carbon oxidation by O2 was also confirmed in the literature [224,253,254].
However, an opposite behavior of phosphorus can be seen in Figure 7-1b, it illustrates
that the presence of P impurity in soot inhibits the oxidative reactivity and the deposit
of higher content of P leads to a worse reactivity. This result is similar to the previous
studies [224,256,257]. The following Figure 7-3 shows the temperatures at 5% or
50% conversion of different soot samples, it was found under the same conditions, the
reactivity follows the order: 1% Na/B7 > 1% K/B7 > 350B7 > 1% P/B7.
7.3.1.2 Soot-TPOs in 400 ppm NO2 + 9% b.v. O2/Ar + 5% H2O
Figure 7-2. TPO profiles of the doped soot samples under 400 ppm NO2 + 9% b.v. O2/Ar + 5%
H2O.
Figure 7-2 shows the TPO profiles of the doped soot samples under 400 ppm NO2 +
9% b.v. O2/Ar + 5% H2O. The results seem to be similar with Figure 7-1. It was also
found that the presence of Na and K promotes the soot oxidation and 1% of element
concentration exhibits higher promotion than the 0.5%. However, for 0.5% K/B7

Chapter VII. Effect of Biodiesel impurities (K, Na, P) on noncatalytic and catalytic
activities of soot in model DPF regeneration conditions
119
sample, the ignition of soot occurs at higher temperature compared with that of
undoped soot. In Figure 7-3a, it is also observed that 1% K/B7 sample shows higher
T5% value than 350B7. It may be explained that partial NO2 was stored in K/B7 in the
form of nitrate and/or nitrite under 5% H2O, thus decreasing C-NO2 oxidation
reaction at low temperatures. On the other hand, for the P-doped samples, it can be
observed in Figure 7-2 that 0.5% P/B7 sample seems to exhibit a slightly increased
reactivity compared to 350B7. It was also noted in Figure 7-3a that 1% P/B7 has a
lower T5% (358 °C) than 350B7 (372 °C). The results reveal that the presence of P
also enhances the reactivity of soot under NO2 + O2 + H2O, which was confirmed in
Schobing’s work [224]. But the peak temperature (Tm) of 1% P/B7 visibly moves to
higher value relative to that of 350B7, their T50% values also present the same result
(Figure 7-3b). This indicates that P element inhibits high-temperature reactivity of
soot. Figure 7-3 illustrates the impact of different inorganic elements on soot
oxidation reactivity in the presence of NO2. T5% and T50% are as follows: 1% K/B7 >
350B7 > 1% P/B7 > 1% Na/B7 and 1% P/B7 > 350B7 > 1% K/B7 > 1% Na/B7,
respectively.
Figure 7-3. Temperature at which 5% of conversion (T5%) (a) and 50% of conversion (T50%) (b) of
the 1 wt% doped soot samples.
In addition, it can be seen in Figure 7-3a that the presence of NO2 apparently
decreases the T5% values of soot samples, revealing the promoting role of NO2 on soot
oxidation at lower temperatures. While, as shown in Figure 7-3b, the promotion of
NO2 becomes weak at higher temperatures (T50%), this is because thermal
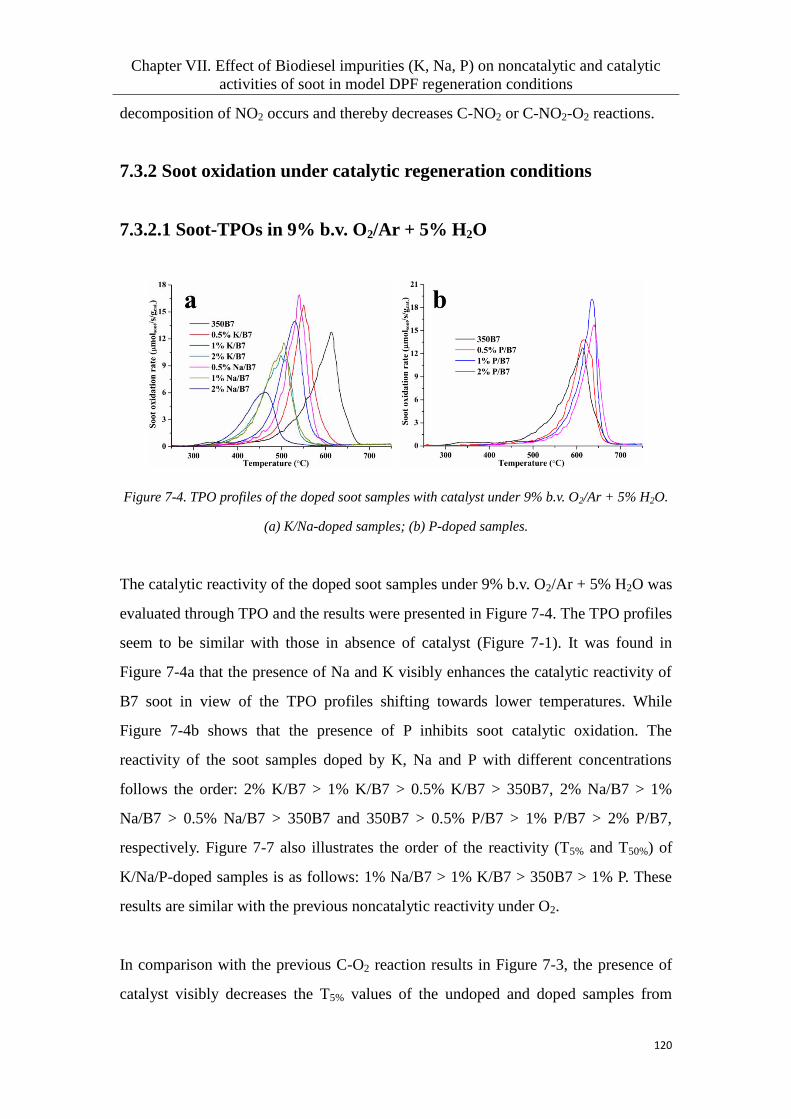
Chapter VII. Effect of Biodiesel impurities (K, Na, P) on noncatalytic and catalytic
activities of soot in model DPF regeneration conditions
120
decomposition of NO2 occurs and thereby decreases C-NO2 or C-NO2-O2 reactions.
7.3.2 Soot oxidation under catalytic regeneration conditions
7.3.2.1 Soot-TPOs in 9% b.v. O2/Ar + 5% H2O
Figure 7-4. TPO profiles of the doped soot samples with catalyst under 9% b.v. O2/Ar + 5% H2O.
(a) K/Na-doped samples; (b) P-doped samples.
The catalytic reactivity of the doped soot samples under 9% b.v. O2/Ar + 5% H2O was
evaluated through TPO and the results were presented in Figure 7-4. The TPO profiles
seem to be similar with those in absence of catalyst (Figure 7-1). It was found in
Figure 7-4a that the presence of Na and K visibly enhances the catalytic reactivity of
B7 soot in view of the TPO profiles shifting towards lower temperatures. While
Figure 7-4b shows that the presence of P inhibits soot catalytic oxidation. The
reactivity of the soot samples doped by K, Na and P with different concentrations
follows the order: 2% K/B7 > 1% K/B7 > 0.5% K/B7 > 350B7, 2% Na/B7 > 1%
Na/B7 > 0.5% Na/B7 > 350B7 and 350B7 > 0.5% P/B7 > 1% P/B7 > 2% P/B7,
respectively. Figure 7-7 also illustrates the order of the reactivity (T5% and T50%) of
K/Na/P-doped samples is as follows: 1% Na/B7 > 1% K/B7 > 350B7 > 1% P. These
results are similar with the previous noncatalytic reactivity under O2.
In comparison with the previous C-O2 reaction results in Figure 7-3, the presence of
catalyst visibly decreases the T5% values of the undoped and doped samples from

Chapter VII. Effect of Biodiesel impurities (K, Na, P) on noncatalytic and catalytic
activities of soot in model DPF regeneration conditions
121
412-542 °C to 382-492 °C. While there is no an apparent difference in T50% between
with and without catalyst. This indicates that the presence of catalyst effectively
promotes the ignition of soot.
7.3.2.2 Soot-TPOs in 400 ppm NO + 9% b.v. O2/Ar + 5% H2O
Figure 7-5. TPO profiles of the doped soot samples with catalyst under 400 ppm NO + 9% b.v.
O2/Ar + 5% H2O. (a) Na-doped samples; (b) K-doped samples; (c) P-doped samples.
Figure 7-5 presents the TPO profiles of the doped soot samples with catalyst under
400 ppm NO + 9% b.v. O2/Ar + 5% H2O. It was found that the soot oxidation
reactions of all samples take place within a wider temperature window (200-700 °C)
and the ignition of soot samples apparently shifts to lower temperatures compared to
the results in O2. Especially in Figure 7-5a and b, it can be seen that all the TPO
profiles move towards lower temperatures, which shows a strong promoting role of
NO on soot catalytic oxidation, this has been confirmed in the previous studies
[105,119,159]. However, in Figure 7-5c, the presence of phosphorus does not make

Chapter VII. Effect of Biodiesel impurities (K, Na, P) on noncatalytic and catalytic
activities of soot in model DPF regeneration conditions
122
the peak temperature (Tm) obviously shift towards lower temperatures after adding
NO into reaction gas. This indicates that the presence of P weakens the promotion of
NO on high-temperature activity.
Figures 7-5a and b show that the presence of Na and K promotes the NO-assisted
catalytic oxidation activity of soot except for 0.5% K-doped sample exhibiting a
similar reactivity with undoped sample. Higher content of Na or K in soot leads to an
increased reactivity. On the contrary, Figure 7-5c reveals that the presence of P
apparently inhibits the catalytic reactivity of soot. As same as shown in Figure 7-4b,
the deposit of more phosphorus in soot results in a larger decrease in the reactivity. In
Figure 7-7, it was found that T5% and T50% under NO + O2 + H2O separately follow
the order: 1% K/B7 > 1% Na/B7 > 1% P/B7 > 350B7 and 1% Na/B7 > 1% K/B7 >
350B7 > 1% P/B7. It is noted that during the ignition of soot, K-doped sample shows
higher oxidative reactivity than Na-doped one and P-doped sample also exhibits a
promoted reactivity. This is different with the result in O2. It illustrates that the impact
of inorganic impurities on soot catalytic oxidation also depends on the composition of
reaction gas.
7.3.2.3 Soot-TPOs in 400 ppm NO2 + 9% b.v. O2/Ar + 5% H2O
Figure 7-6. TPO profiles of the doped soot samples with catalyst under 400 ppm NO2 + 9% b.v.
O2/Ar + 5% H2O.
The catalytic reactivity of the doped soot samples was also evaluated by TPO under
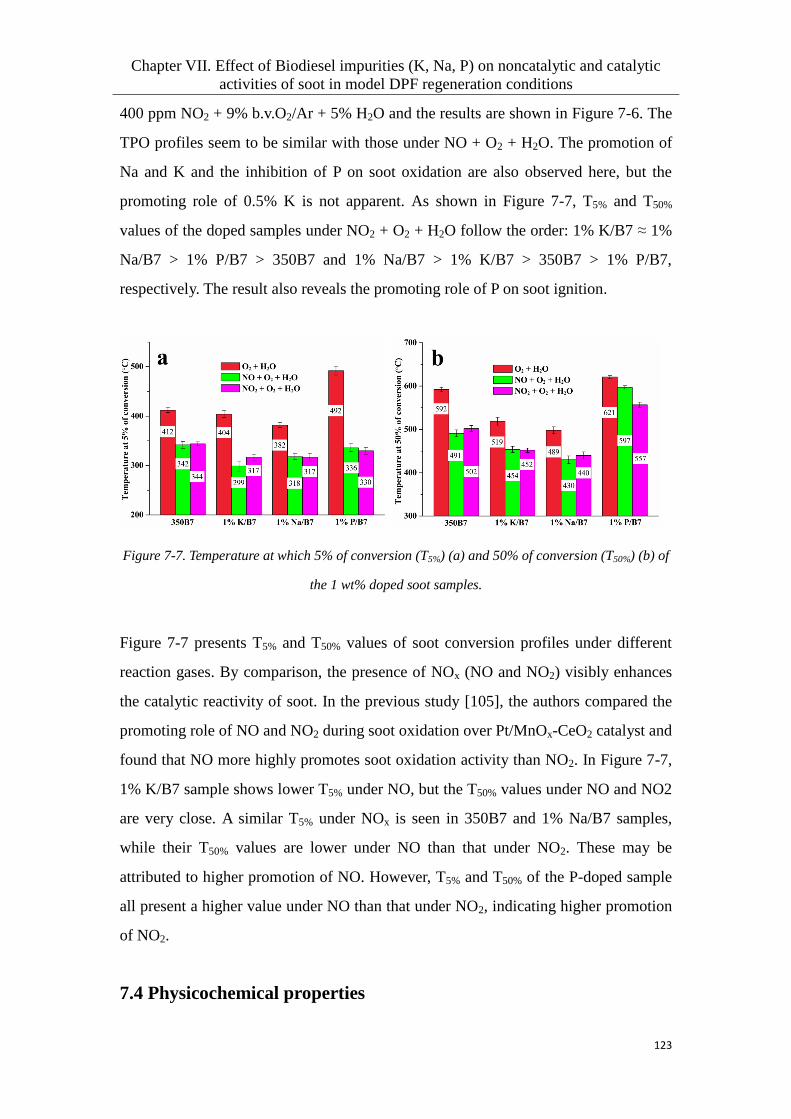
Chapter VII. Effect of Biodiesel impurities (K, Na, P) on noncatalytic and catalytic
activities of soot in model DPF regeneration conditions
123
400 ppm NO2 + 9% b.v.O2/Ar + 5% H2O and the results are shown in Figure 7-6. The
TPO profiles seem to be similar with those under NO + O2 + H2O. The promotion of
Na and K and the inhibition of P on soot oxidation are also observed here, but the
promoting role of 0.5% K is not apparent. As shown in Figure 7-7, T5% and T50%
values of the doped samples under NO2 + O2 + H2O follow the order: 1% K/B7 ≈ 1%
Na/B7 > 1% P/B7 > 350B7 and 1% Na/B7 > 1% K/B7 > 350B7 > 1% P/B7,
respectively. The result also reveals the promoting role of P on soot ignition.
Figure 7-7. Temperature at which 5% of conversion (T5%) (a) and 50% of conversion (T50%) (b) of
the 1 wt% doped soot samples.
Figure 7-7 presents T5% and T50% values of soot conversion profiles under different
reaction gases. By comparison, the presence of NOx (NO and NO2) visibly enhances
the catalytic reactivity of soot. In the previous study [105], the authors compared the
promoting role of NO and NO2 during soot oxidation over Pt/MnOx-CeO2 catalyst and
found that NO more highly promotes soot oxidation activity than NO2. In Figure 7-7,
1% K/B7 sample shows lower T5% under NO, but the T50% values under NO and NO2
are very close. A similar T5% under NOx is seen in 350B7 and 1% Na/B7 samples,
while their T50% values are lower under NO than that under NO2. These may be
attributed to higher promotion of NO. However, T5% and T50% of the P-doped sample
all present a higher value under NO than that under NO2, indicating higher promotion
of NO2.
7.4 Physicochemical properties
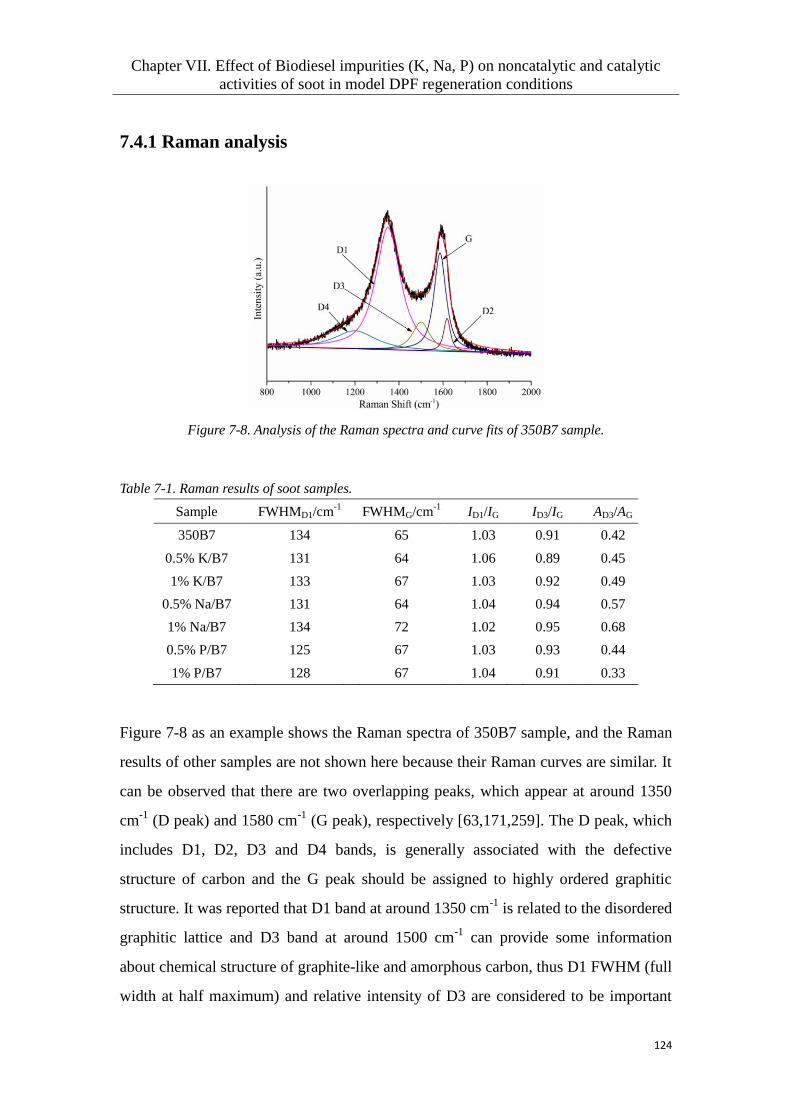
Chapter VII. Effect of Biodiesel impurities (K, Na, P) on noncatalytic and catalytic
activities of soot in model DPF regeneration conditions
124
7.4.1 Raman analysis
Figure 7-8. Analysis of the Raman spectra and curve fits of 350B7 sample.
Table 7-1. Raman results of soot samples.
Sample FWHMD1/cm-1
FWHMG/cm-1
ID1/IG ID3/IG AD3/AG
350B7 134 65 1.03 0.91 0.42
0.5% K/B7 131 64 1.06 0.89 0.45
1% K/B7 133 67 1.03 0.92 0.49
0.5% Na/B7 131 64 1.04 0.94 0.57
1% Na/B7 134 72 1.02 0.95 0.68
0.5% P/B7 125 67 1.03 0.93 0.44
1% P/B7 128 67 1.04 0.91 0.33
Figure 7-8 as an example shows the Raman spectra of 350B7 sample, and the Raman
results of other samples are not shown here because their Raman curves are similar. It
can be observed that there are two overlapping peaks, which appear at around 1350
cm-1
(D peak) and 1580 cm-1
(G peak), respectively [63,171,259]. The D peak, which
includes D1, D2, D3 and D4 bands, is generally associated with the defective
structure of carbon and the G peak should be assigned to highly ordered graphitic
structure. It was reported that D1 band at around 1350 cm-1
is related to the disordered
graphitic lattice and D3 band at around 1500 cm-1
can provide some information
about chemical structure of graphite-like and amorphous carbon, thus D1 FWHM (full
width at half maximum) and relative intensity of D3 are considered to be important
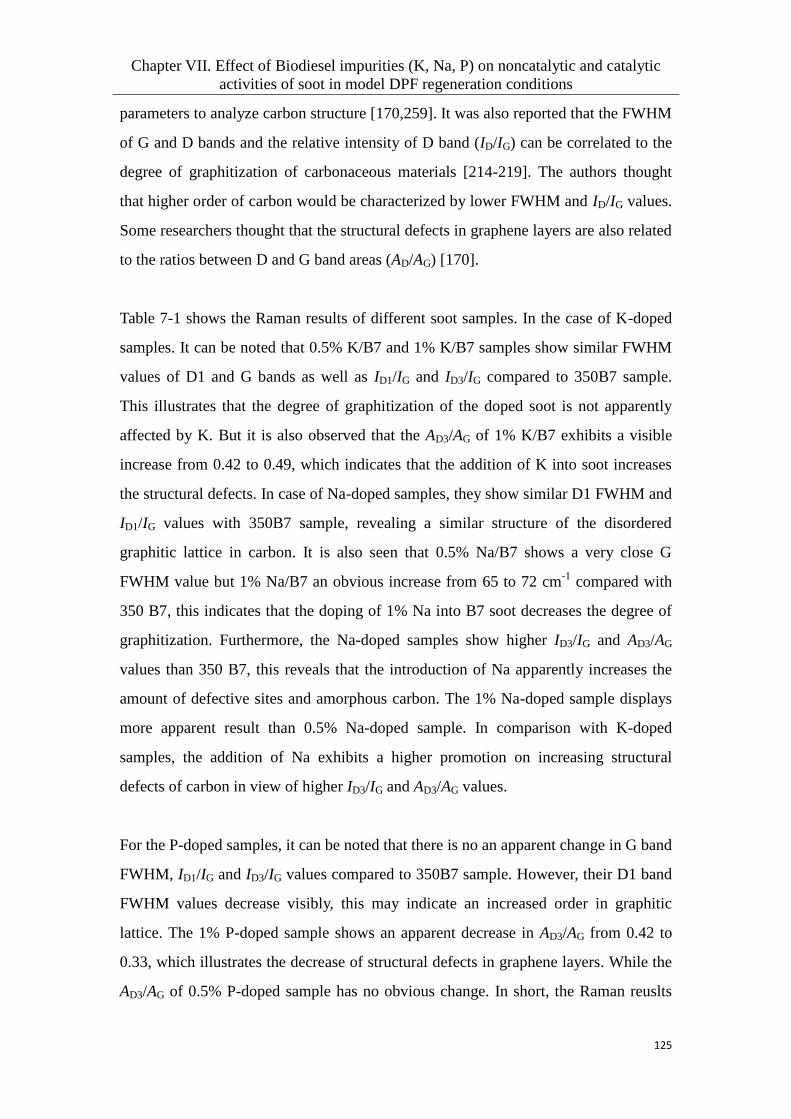
Chapter VII. Effect of Biodiesel impurities (K, Na, P) on noncatalytic and catalytic
activities of soot in model DPF regeneration conditions
125
parameters to analyze carbon structure [170,259]. It was also reported that the FWHM
of G and D bands and the relative intensity of D band (ID/IG) can be correlated to the
degree of graphitization of carbonaceous materials [214-219]. The authors thought
that higher order of carbon would be characterized by lower FWHM and ID/IG values.
Some researchers thought that the structural defects in graphene layers are also related
to the ratios between D and G band areas (AD/AG) [170].
Table 7-1 shows the Raman results of different soot samples. In the case of K-doped
samples. It can be noted that 0.5% K/B7 and 1% K/B7 samples show similar FWHM
values of D1 and G bands as well as ID1/IG and ID3/IG compared to 350B7 sample.
This illustrates that the degree of graphitization of the doped soot is not apparently
affected by K. But it is also observed that the AD3/AG of 1% K/B7 exhibits a visible
increase from 0.42 to 0.49, which indicates that the addition of K into soot increases
the structural defects. In case of Na-doped samples, they show similar D1 FWHM and
ID1/IG values with 350B7 sample, revealing a similar structure of the disordered
graphitic lattice in carbon. It is also seen that 0.5% Na/B7 shows a very close G
FWHM value but 1% Na/B7 an obvious increase from 65 to 72 cm-1
compared with
350 B7, this indicates that the doping of 1% Na into B7 soot decreases the degree of
graphitization. Furthermore, the Na-doped samples show higher ID3/IG and AD3/AG
values than 350 B7, this reveals that the introduction of Na apparently increases the
amount of defective sites and amorphous carbon. The 1% Na-doped sample displays
more apparent result than 0.5% Na-doped sample. In comparison with K-doped
samples, the addition of Na exhibits a higher promotion on increasing structural
defects of carbon in view of higher ID3/IG and AD3/AG values.
For the P-doped samples, it can be noted that there is no an apparent change in G band
FWHM, ID1/IG and ID3/IG values compared to 350B7 sample. However, their D1 band
FWHM values decrease visibly, this may indicate an increased order in graphitic
lattice. The 1% P-doped sample shows an apparent decrease in AD3/AG from 0.42 to
0.33, which illustrates the decrease of structural defects in graphene layers. While the
AD3/AG of 0.5% P-doped sample has no obvious change. In short, the Raman reuslts

Chapter VII. Effect of Biodiesel impurities (K, Na, P) on noncatalytic and catalytic
activities of soot in model DPF regeneration conditions
126
indicate that the introduction of P into soot causes a decreased trend of structural
defects in carbonaceous materials.
In the previous reactivity results, K- and Na-doped soot samples all show an improved
reactivity under both noncatalytic and catalytic conditions. This should be attributed
to their increased structural defects. The presence of Na in soot exhibits larger
promotion on the reactivity than that of K, this is because Na-doped soot presents
more structural defects than K-doped soot. However, P-doped samples show a
decreased reactivity compared to 350B7, which should be related to the decreased
trend of their structural defects.
7.4.2 BET analysis
Table 7-2. specific surface area (SBET), microporous pore volume (Vmicro) and mesoporous pore
volume (Vmeso) of doped B7 soot samples.
The values of surface area (SBET), micropore surface area, mesopore surface area,
micropore volume (Vmicro) and mesopore volume (Vmeso) are listed in Table 7-2.
Impregnation of B7 soot by K, Na and P significantly decreases the surface area and
mesopore volume but increases micropore volume. This should be attributed to
physical blocking of surface sites in pores. It can be noted that the addition of 0.5% K
into soot leads to a sharp decrease in surface area but that of 1% K a slight decrease
compared to 350B7 sample. It was reported that the impregnation of soot with alkali
metals would result in a modification of the bulk carbonaceous structure through the
Sample SBET
(m2/g)
Microporous SBET
(m2/g)
Mesoporous SBET
(m2/g)
Vmicro
(cm3/g)
Vmeso
(cm3/g)
350B7 345 358 259 6.6 × 10⁻³
1.63
0.5% K/B7 198 202 135 1.4 × 10⁻²
0.34
1% K/B7 337 354 249 1.7 × 10⁻²
0.64
0.5% Na/B7 286 323 188 1.7 × 10⁻²
0.49
1% Na/B7 238 262 108 8.4 × 10⁻²
0.17
0.5% P/B7 289 308 206 8.0 × 10⁻²
0.54
1% P/B7 237 282 105 9.4 × 10⁻²
0.16

Chapter VII. Effect of Biodiesel impurities (K, Na, P) on noncatalytic and catalytic
activities of soot in model DPF regeneration conditions
127
insertion of the metals in the structure and thereby increase BET surface area and
micropore volume [224]. This role of alkali metals might exist in the 1% K-doped
soot sample, as a result, it shows much higher surface area than 0.5% K-doped soot
sample. On the other side, for Na- and P-doped samples, their surface areas apparently
decrease with the increase of the doping amount (from 0.5% to 1%).
However, the surface area and pore volume cannot be well correlated to the reactivity
of the doped soot samples. For example, the introduction of Na and K greatly
promotes the reactivity, but the doped samples present a decreased surface area. The
result might illustrate that the reactivity of the doped soot samples do not depend on
their surface area.
7.4.3 HRTEM analysis
Figure 7-9. HRTEM images of different soot samples.
The morphology of different soot samples (including 350B7, 1% K/B7, 1% Na/B7
and 1% P/B7) was characterized through HRTEM, and the results are shown in Figure
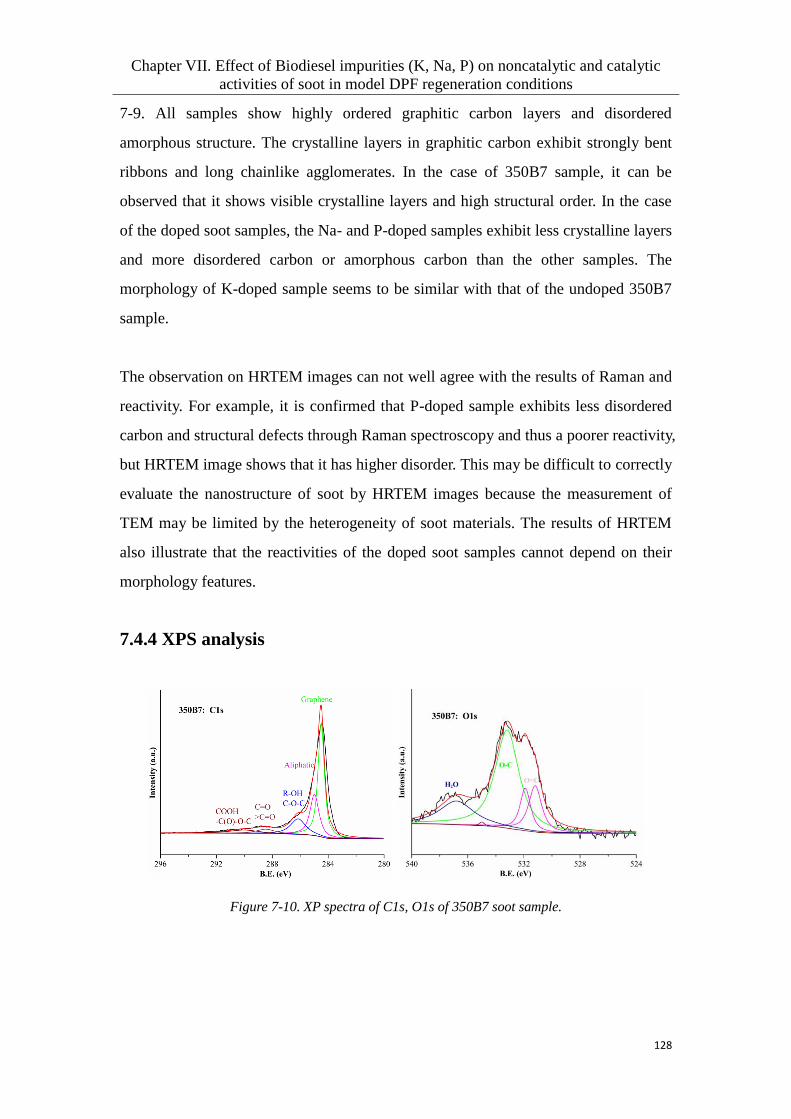
Chapter VII. Effect of Biodiesel impurities (K, Na, P) on noncatalytic and catalytic
activities of soot in model DPF regeneration conditions
128
7-9. All samples show highly ordered graphitic carbon layers and disordered
amorphous structure. The crystalline layers in graphitic carbon exhibit strongly bent
ribbons and long chainlike agglomerates. In the case of 350B7 sample, it can be
observed that it shows visible crystalline layers and high structural order. In the case
of the doped soot samples, the Na- and P-doped samples exhibit less crystalline layers
and more disordered carbon or amorphous carbon than the other samples. The
morphology of K-doped sample seems to be similar with that of the undoped 350B7
sample.
The observation on HRTEM images can not well agree with the results of Raman and
reactivity. For example, it is confirmed that P-doped sample exhibits less disordered
carbon and structural defects through Raman spectroscopy and thus a poorer reactivity,
but HRTEM image shows that it has higher disorder. This may be difficult to correctly
evaluate the nanostructure of soot by HRTEM images because the measurement of
TEM may be limited by the heterogeneity of soot materials. The results of HRTEM
also illustrate that the reactivities of the doped soot samples cannot depend on their
morphology features.
7.4.4 XPS analysis
Figure 7-10. XP spectra of C1s, O1s of 350B7 soot sample.
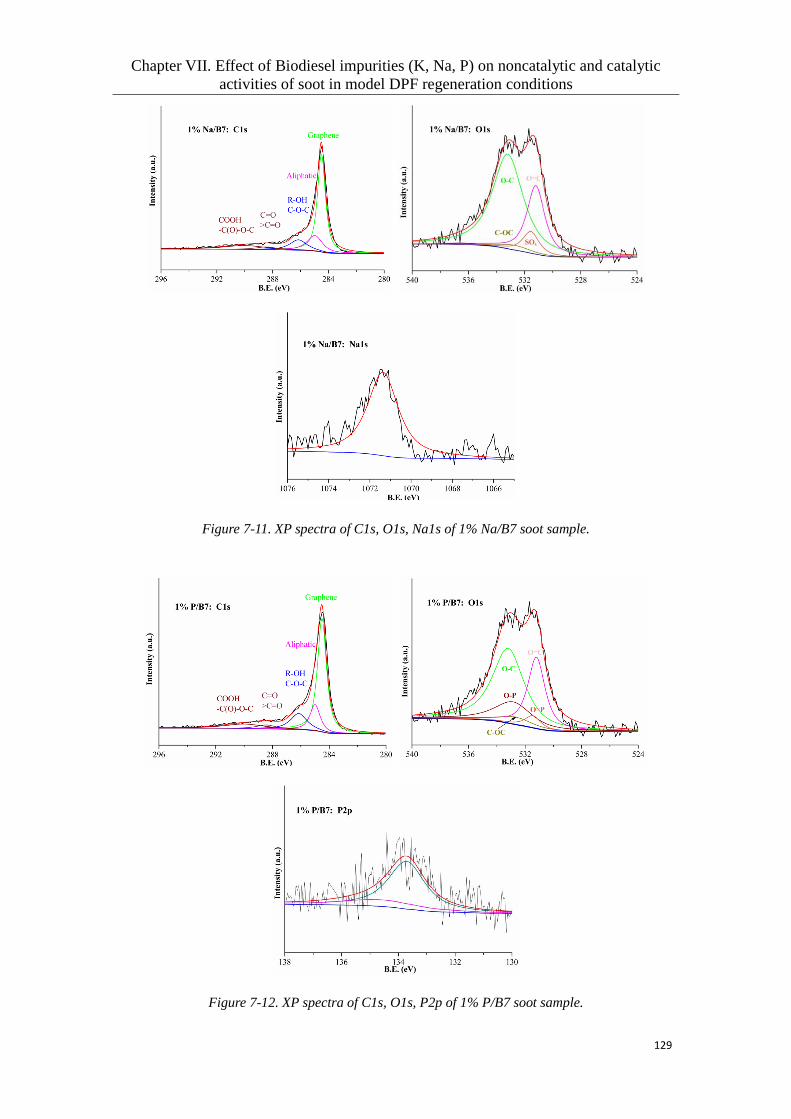
Chapter VII. Effect of Biodiesel impurities (K, Na, P) on noncatalytic and catalytic
activities of soot in model DPF regeneration conditions
129
Figure 7-11. XP spectra of C1s, O1s, Na1s of 1% Na/B7 soot sample.
Figure 7-12. XP spectra of C1s, O1s, P2p of 1% P/B7 soot sample.
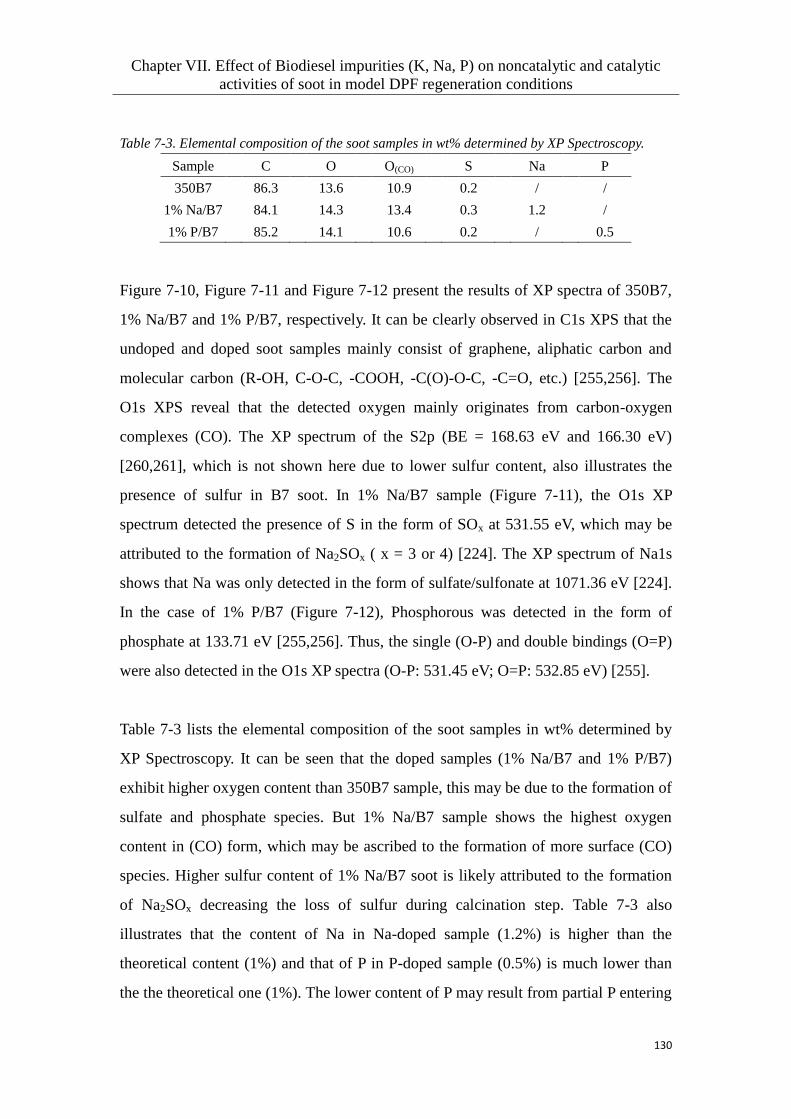
Chapter VII. Effect of Biodiesel impurities (K, Na, P) on noncatalytic and catalytic
activities of soot in model DPF regeneration conditions
130
Table 7-3. Elemental composition of the soot samples in wt% determined by XP Spectroscopy.
Sample C O O(CO) S Na P
350B7 86.3 13.6 10.9 0.2 / /
1% Na/B7 84.1 14.3 13.4 0.3 1.2 /
1% P/B7 85.2 14.1 10.6 0.2 / 0.5
Figure 7-10, Figure 7-11 and Figure 7-12 present the results of XP spectra of 350B7,
1% Na/B7 and 1% P/B7, respectively. It can be clearly observed in C1s XPS that the
undoped and doped soot samples mainly consist of graphene, aliphatic carbon and
molecular carbon (R-OH, C-O-C, -COOH, -C(O)-O-C, -C=O, etc.) [255,256]. The
O1s XPS reveal that the detected oxygen mainly originates from carbon-oxygen
complexes (CO). The XP spectrum of the S2p (BE = 168.63 eV and 166.30 eV)
[260,261], which is not shown here due to lower sulfur content, also illustrates the
presence of sulfur in B7 soot. In 1% Na/B7 sample (Figure 7-11), the O1s XP
spectrum detected the presence of S in the form of SOx at 531.55 eV, which may be
attributed to the formation of Na2SOx ( x = 3 or 4) [224]. The XP spectrum of Na1s
shows that Na was only detected in the form of sulfate/sulfonate at 1071.36 eV [224].
In the case of 1% P/B7 (Figure 7-12), Phosphorous was detected in the form of
phosphate at 133.71 eV [255,256]. Thus, the single (O-P) and double bindings (O=P)
were also detected in the O1s XP spectra (O-P: 531.45 eV; O=P: 532.85 eV) [255].
Table 7-3 lists the elemental composition of the soot samples in wt% determined by
XP Spectroscopy. It can be seen that the doped samples (1% Na/B7 and 1% P/B7)
exhibit higher oxygen content than 350B7 sample, this may be due to the formation of
sulfate and phosphate species. But 1% Na/B7 sample shows the highest oxygen
content in (CO) form, which may be ascribed to the formation of more surface (CO)
species. Higher sulfur content of 1% Na/B7 soot is likely attributed to the formation
of Na2SOx decreasing the loss of sulfur during calcination step. Table 7-3 also
illustrates that the content of Na in Na-doped sample (1.2%) is higher than the
theoretical content (1%) and that of P in P-doped sample (0.5%) is much lower than
the the theoretical one (1%). The lower content of P may result from partial P entering
Chapter VII. Effect of Biodiesel impurities (K, Na, P) on noncatalytic and catalytic
activities of soot in model DPF regeneration conditions
131
into the bulk structure of carbon and forming C-O-PO3 or (CO)3-P species [224].
The previous TPO results reveal the Na-doped soot sample shows higher noncatalytic
and catalytic reactivity under both O2 and NOx + O2 than 350B7 and P-doped soot
sample. The XPS results confirm that 1% Na/B7 shows higher oxygen content
(14.3%), especially that in (CO) form (13.4%), than 350B7 and 1% P/B7. This might
be one of factors that promote soot oxidation reactivity. Besides, the P-doped sample
shows a similar oxygen content with 350B7 sample, however, this cannot explain an
obvious inhibition of P on soot oxidation reactivity. The result also illustrates that the
oxygen content on the carbon surface is not only one factor that depends on the
reactivity of soot. The previous Raman results reveal that 1% P/B7 exhibits an
increase in structural order and thus a decreased reactivity, this indicates that the
reactivity of soot is also related to the structure.
On the other side, other factors may also determine the reactivity of soot. For example,
the presence of K or Na in soot could play a role of catalyst to decrease the activation
energy of soot oxidation, thus improving the reactivity [250,253,254]. Moreover, K
also promotes the contact between catalyst and soot due to its high mobility and
thereby the catalytic reactivity [251].
7.5 summary
A real Biodiesel soot was impregnated by Na, K and P through a saturated
impregnation method. The research mainly focuses on the impact of Biodiesel
impurities on the noncatalytic and catalytic reactivity of soot under model DPF
regeneration conditions. TPO measurements confirmed that the introduction of Na
and K enhanced the noncatalytic and catalytic reactivity of soot under both O2 and
NOx + O2 and Na-doped sample showed better results. The presence of P in soot
inhibited the the noncatalytic and catalytic reactivity in view of the increased T50%
value, but it promoted the ignition of soot under NOx + O2 mixture. The
characterizations revealed that the soot doped with Na and K exhibited increased

Chapter VII. Effect of Biodiesel impurities (K, Na, P) on noncatalytic and catalytic
activities of soot in model DPF regeneration conditions
132
structural defects and P led to a decrease in disordered structure. They also indicated
that the reactivity of the doped soot is related not only to surface oxygen content and
structure but also to the other factors such as the catalytic role of Na and K. HRTEM
and BET results revealed that the reactivity of the doped soot samples could not be
well correlated to their morphology and surface area.

Chapter VIII. Conclusions
133
8. Conclusions
In the chapter 4, the experiment studied the role of NO adsorption/desorption on soot
oxidation activity of MnOx-CeO2 catalyst under NO + O2 mixture. The
physical-chemical properties of the NO-adsorbed MnOx-CeO2 catalyst were
characterized through DRIFTS, XPS, Raman spectroscopy, TPD with IR and MS,
Soot-TPR coupled to MS. The catalytic activity of the catalyst was evaluated by TPO
and isothermal reaction. DRIFTS results confirmed that NOx were stored in the forms
of nitrites, nitrates, nitro compounds and N2O4. XPS and Raman results revealed that
NO adsorption on the surface of the catalyst led to the change in the surface Ce/Mn
states and the increase of oxygen vacancies, respectively. TPD experiments indicated
that the decomposition of nitrates would lead to the production of a large amount of
NO and super-oxides (Ce-O2-). TPR confirmed a key role of oxygen in NO-assisted
soot oxidation reactions. The activity measurement also revealed that the
adsorption/desorption of NO promoted the low-temperature soot oxidation activity.
This promotion is related to the increase of oxygen vacancies and the desorption of
active oxygen from surface nitrate decomposition.
The work presented in chapter 5 aims to investigate and compare the non-catalytic
and catalytic reactivities of real and model soot samples through
temperature-programmed oxidation (TPO). Such reactivity was furthermore
correlated with soot structural properties, determined by laser granulometry, XRD,
Raman and HRTEM. Biodiesel soot samples were obtained through the combustion of
different fuels in a real Diesel engine, whereas model soot samples were produced in a
laminar burner. TPO evidenced that the soot generated with 100% Biodiesel (methyl
ester) was more reactive than real soot generated with 7% Biodiesel (7% methyl ester).
The model soot from the diesel surrogate (Aref) containing 7% oxygenate additive
(C11H22O2) exhibited higher reactivity than the model soot containing 30% additive,
whereas the model soot (Degussa Printex U) showed the poorest reactivity of this
series. The presence of NO2 more apparently promoted the non-catalytic reaction of
real soot. In the presence of the MnOx-CeO2 catalyst, soot reactivity depended both on

Chapter VIII. Conclusions
134
reactant gas composition and on soot-catalyst contact, following the order: NO + O2 >
NO2 + O2 > O2 and tight > pressure > loose, respectively.
In the chapter 6, the experiment focused on the structure, surface and reactivity of the
activated Printex U model and real Biodiesel soot samples through BET, Raman,
HRTEM, XPS, DRIFTS and temperature-programmed oxidation (TPO). TPO
evidenced that the activated Printex U soot was more reactive than the activated
Biodiesel soot (B7 and B100) generated from a real Diesel engine under both O2 and
NO + O2 mixture. BET displayed an increased surface area and a decreased pore size
of activated soot. Raman and HRTEM revealed that the activated soot showed an
increased disorder. The morphology features also confirmed different combustion
processes of Printex U and B100. XPS illustrated that the activation decreased surface
graphene carbon and increased oxygen content. DRIFTS indicated that the activation
did not increase the concentration of surface functional groups of B100 but increased
that of Printex U. It was proved that the reactivity of activated Printex U samples is
more dependent on structural and surface properties compared with that of the
activated Biodiesel soot samples.
These studies in chapters 5 and 6 provided valuable findings on the soot oxidation rate
and the parameters influencing it, which could contribute to develop accurate soot
models that are required for robust regeneration strategies. The use of 100% biofuel
induces significantly lower soot deposits in DPF that being correctly estimated
(adapted biofuel soot models) might reduce the need of active regenerations and
therefore the fuel consumption and the catalyst ageing. Therefore, the understanding
of how the fuel type and engine operation affects the particle morphology and its
reactivity are crucial for optimizing the DPF regeneration strategy. For the
development of new coating formulations, the selection of model soot to be used in
synthetic gas benches shall be taken with care, as it was shown in that study the risk
of having different behaviors for example for the carbon-black Printex U often
reported in literature. The catalyst evaluation studies shall therefore take into account
the use of burner and real engine soot samples as well as realistic operating conditions
Chapter VIII. Conclusions
135
in terms of gas composition and soot/catalyst contact in order to perform an accurate
benchmark.
The experiments in chapter 7 mainly studied the impact of Biodiesel impurities on the
noncatalytic and catalytic reactivity of soot under model DPF regeneration conditions.
A real Biodiesel soot was impregnated by Na, K and P through a saturated
impregnation method. TPO measurements confirmed that the introduction of Na and
K enhanced the noncatalytic and catalytic reactivity of soot under both O2 and NOx +
O2 and Na-doped sample showed better results. The presence of P in soot inhibited the
the noncatalytic and catalytic reactivity in view of the increased T50% value, but it
promoted the ignition of soot under NOx + O2 mixture. The characterizations revealed
that the soot doped with Na and K exhibited increased structural defects and P led to a
decrease in disordered structure. They also indicated that the reactivity of the doped
soot could be related not only to surface oxygen content and structure but also to the
other factors such as the catalytic role of Na and K as well as the soot-catalyst contact.
136
Reference
[1] Venkataraman S V, Iniyan S, Goic R. A review of climate change, mitigation and
adaptation. Renewable and Sustainable Energy Reviews. 2012; 16: 878-897.
[2] Lindley A A, McCulloch A. Regulating to reduce emissions of fluorinated
greenhouse gases. Journal of Fluorine Chemistry. 2005; 126: 1457-1462.
[3] Lloyd A C, Cackette T A. Diesel engines: environmental impact and control.
Journal of the Air & Waste Management Association. 2001; 51: 809-847.
[4] International Energy Agency (IEA). CO2 Emissions From Fuel Combustion
Highlights. France, 2012.
[5] Faiz A, Weaver C S, Walsh P W. Air pollution from motor vehicles: standards and
texhnologies for controlling emissions. The World Bank, Washington, 1996.
[6] Dhariwal H C. Control of blowby emissions and lubricating oil consumption in
I.C. engines. Energy Conversion and Management. 1997; 38: 1267-1274.
[7] Krzyzanowski M, Kuna-Dibbert B, Schneider J. Health effects of transport-related
air pollution. WHO, Denmark, 2005.
[8] Englert N. Fine particles and human health—a review of epidemiological studies.
Toxicology Letters. 2004; 149: 235-242.
[9] Hoeft I, Steude K, Wrage N, Veldkamp E. Response of nitrogen oxide emissions
to grazer species and plant species composition in temperate agricultural grassland.
Agriculture, Ecosystems & Environment. 2012; 151: 34-43.
[10] Kampa M, Castanas E. Human health effects of air pollution. Environmental
Pollution. 2008; 151: 362-367.
[11] Sivaloganathan S. Case report: death from diesel fumes. Journal of Clinical
Forensic Medicine. 1998; 5: 138-139.
[12] World Health Organization. Estimated deaths & DALYs attributable to selected
environmental risk factors, by WHO member state. Department of Public Health &
Environnment, 2007.
[13] Organisation for Economic Co-Operation and Develeopment (OECD),
Environmental outlook to 2050—climate change chapter, 2011.
[14] Environmental Protection Agency (EPA), Climate change indicators in the
United States. EPA, Washington, 2012.
137
[15] European Environment Agency (EEA), Annual European Union greenhouse gas
inventory 1990-2000 and inventory report 2012. Copenhagen, 2012.
[16] Intergovernmental Panel on Climate Change (IPCC), Climate change 2007:
synthesis report. Valencia, Spain, 2007.
[17] Organisation for Economic Co-Operation and Develeopment (OECD), Strategies
to reduce greenhouse gas emissions from road transport: analytical methods. OECD,
Paris, 2002.
[18] Prasad R, Bella V R. A review on diesel soot emission, its effect and control.
Bulletin of Chemical Reaction Engineering & Catalysis. 2010; 5(2): 69-86.
[19] Reşitoğlu İ A, Altinişik K, Keskin A. The pollutant emissions from diesel-engine
vehicles and exhaust aftertreatment systems. Clean Technologies and Environmental
Policy. 2015; 17: 15-27.
[20] Khair M K, Majewski W A. Diesel Emissions and Their Control. SAE,
2006-12-01.
[21] Johnson T V. Review of diesel emissions and control. International Journal of
Engine Research. 2009; 10(5): 275-285.
[22] Johnson T. Review of Diesel Emissions and Control. SAE International Journal
of Fuels and Lubricants. 2010; 3(1): 16-29.
[23] Raub J A. Health effects of exposure to ambient carbon monoxide. Chemosphere:
global change. Science 1999; 1:331-351.
[24] Walsh M P. Mobile source related air pollution: effects on health and the
environment. Encyclopedia of Environ Health 2011; 3: 803-809.
[25] Strauss S, Wasil J R, Earnest G S. Carbon monoxide emissions from marine
outboard engines. SAE, 2004-32-0011.
[26] Demers D, Walters G. Guide to exhaust emission control options. BAeSAME,
Bristol, 1999.
[27] Correa S M, Arbilla G. Carbonly emissions in diesel and biodiesel exhauts.
Atmospheric Environment. 2008; 42: 769-775.
[28] Payri F, Bermudez V R, Tormos B, Linares W G. Hydrocarbon emissions
speciation in diesel and biodiesel exhausts. Atmospheric Environment. 2009; 43:
1273-1279.
138
[29] Zheng M, Mulenga M C, Reader G T, Wang M, Ting D S, Tjong J. Biodiesel
engine performance and emissions in low temperature combustion. Fuel. 2008; 87:
714-722.
[30] Diaz-Sanchez D. The role of diesel exhaust particles and their associated
polyaromatic hydrocarbons in the induction of allergic airway disease. Allergy. 1997;
52: 52-56.
[31] Chong J J, Tsolakis A, Gill S S, Theinnoi K, Golunski S E. Enhancing the
NO2/NOx ratio in compression ignition engines by hydrogen and reformate
combustion, for improved aftertreatment performance. International Journal of
Hydrogen Energy. 2010; 35: 8723-8732.
[32] Hoekman S K, Robbins C. Review of the effects of biodiesel on NOx emissions.
Fuel Processing Technology. 2012; 96: 237-249.
[33] Grewe V, Dahlmann K, Matthes S, Steinbrecht W. Attributing ozone to NOx
emissions: implications for climate mitigation measures. Atmospheric Environment.
2012; 59: 102-107.
[34] Maricq M M. Chemical characterization of particulate emissions from diesel
engines: a review. Journal of Aerosol Science. 2007; 38: 1079-1118.
[35] Burtscher H. Physical characterization of particulate emissions from diesel
engines: a review. Journal of Aerosol Science. 2005; 36: 896-932.
[36] Ogyu K, Ohno K, Hong S, Komori T. Ash storage capacity enhancement of
diesel particulate filter. SAE Transactions, 2004, 113: 466-473.
[37] Sappok A. Rodriguez R, Wong V. Characteristics and Effects of Lubricant
Additive Chemistry on Ash Properties Impacting Diesel Particulate Filter Service Life.
SAE International Journal of Fuels and Lubricants, 2010, 3(1): 705-722.
[38] Kain J. Retrofit Overview. Connecticut Diesel Emissions Control Technologies
Forum. August 17, 2005.
[39] Liati A, Spiteri A, Eggenschwiler P D, Vogel-Schäuble N. Microscopic
investigation of soot and ash particulate matter derived from biofuel and diesel:
implications for the reactivity of soot. Journal of Nanoparticle Research, 2012, 14:
1224-1241.
[40] Cheng Y, Lee S C, Gao Y, Cui L, Deng W J, Cao J J, Shen Z X, Sun J. Real-time
139
measurements of PM2.5, PM10-2.5, and BC in an urban street canyon. Particuology,
2015, 20: 134-140.
[41] Cohen A J, Anderson H R, Ostro B, Pandey K D, Krzyzanowski M, Künzli N, et
al. Urban air pollution. Chapter 17.
[42] Walker A R, Controlling particulate emissions from diesel vehicles. Top Catalysis,
2004, 28: 165-170.
[43] Zhang J J, Hu W, Wei F, Wu G, Korn L R, Chapman R S. Children’s respiratory
morbidity prevalence in relation to air pollution in four Chinese cities. Environmental
Health Perspectives, 2002, 110: 961-967.
[44] Michael R A, Kleinman M T. Incidence and apparent health significance of brief
airborne particle excursions. Aerosol Science and Technology. 2000; 32: 93-105.
[45] Williams A, McCormick R, Luecke J, Brezny R, Geisselmann A, Voss K, et al.
Impact of Biodiesel Impurities on the Performance and Durability of DOC, DPF and
SCR Technologies. SAE International Journal of Fuels and Lubricants, 2011; 4(1):
110-124.
[46] Naseri M, Chatterjee S, Castagnola M, Chen H, Fedeyko J, Hess H, Li J.
Development of SCR on Diesel Particulate Filter System for Heavy Duty
Applications. SAE International Journal of Engines, 2011; 4(1): 1798-1809.
[47] Grossale A, Nova I, Tronconi E, Chatterjee D, Weibel M. NH3-NO/NO2 SCR for
Diesel Exhausts Aftertreatment: Reactivity, Mechanism and Kinetic Modelling of
Commercial Fe- and Cu-Promoted Zeolite Catalysts. Topics in Catalysis. 2009; 52:
1837-1841.
[48] Biswas S, Verma V, Schauer J J, Sioutas C. Chemical speciation of PM emissions
from heavy-duty diesel vehicles equipped with diesel particulate filter (DPF) and
selective catalytic reduction (SCR) retrofits. Atmospheric Environment. 2009; 43:
1917-1925.
[49] Koltsakis G, Haralampous O, Depcik C, et al. Catalyzed diesel particulate filter
modeling. Reviews in Chemical Engineering. 2013; 29(1): 1-61.
[50] Song X, Johnson J H, Naber J D. A review of the literature of selective catalytic
reduction catalysts integrated into diesel particulate filters. International Journal of
Engine Research. 2015; 16: 738-749.

140
[51] Masoudi M, Konstandopoulos A G, Nikitidis M S, Skaperdas E, Zarvalis D,
Kladopoulou E, et al. Validation of a model and development of a simulator for
predicting the pressure drop of diesel particulate filters, SAE International, 2001.
[52] Premchand K. Development of a 1-D Catalyzed Diesel Particulate Filter Model
for Simulation of the Performance and the Oxidation of Particulate Matter and
Nitrogen Oxides Using Passive Oxidation and Active Regeneration Engine
Experimental Data. Dissertation, Michigan Technological University, 2013.
https://digitalcommons.mtu.edu/etds/672.
[53] Chen K, Martirosyan K S, Luss D. Temperature gradients within a soot layer
during DPF regeneration. Chemical Engineering Science. 2011; 66: 2968-2973.
[54] Guan B, Zhan R, Lin H, Huang Z. Review of the state-of-the-art of exhaust
particulate filter technology in internal combustion engines. Journal of environmental
management. 2015; 154: 225-258.
[55] Jeguirim M, Tschamber V, Brilhac J F, Ehrburger P. Oxidation mechanism of
carbon black by NO2: effect of water vapour. Fuel. 2005; 84: 1949-1956.
[56] https://www.fstcorporation.com/basics-of-dpf-operation.html.
[57] Stanmore B R, Tschamber V, Brilhac J F. Oxidation of carbon by NOx, with
particular reference to NO2 and N2O. Fuel. 2008; 87: 131-146.
[58] Maunula T, Matilainen P, Louhelainen M, Juvonen P, Kinnunen T. Catalyzed
particulate filters for mobile diesel applications, SAE International, 2007.
[59] Schejbal M, Štěpánek J, Marek M, Kočí P, Kubíček M. Modelling of soot
oxidation by NO2 in various types of diesel particulate filters. Fuel, 2010, 89(9):
2365-2375.
[60] Harada K, Yamada H, Okamoto K, Takami A. Development of High
Performance Catalyzed DPF with New Soot Burning Mechanism. Catalysis Survey
from Asia. 2010; 14: 176-184.
[61] Rocher L, Seguelong T, Harle V, Lallemand M, Pudlarz M, Macduff M. New
generation fuel borne catalyst for reliable DPF operation in globally diverse fuels,
SAE International, 2011.
[62] Granger P, Parvulescu I V, Kaliaguine S, Preillier W. Perovskites and Related
Mixed Oxides: Concepts and Applications. Wiley-VCH, 2015.
141
[63] Abboud J, Schobing J, Legros G, Bonnety J, Tschamber V, Brillard A, et al.
Impacts of oxygenated compounds concentration on sooting propensities and soot
oxidative reactivity: Application to Diesel and Biodiesel surrogates. Fuel, 2017; 193:
241-253.
[64] Boehman A L, Song J, Alam M. Impact of biodiesel blending on diesel soot and
the regeneration of particulate filters. Energy Fuels, 2005; 19: 1857-1864.
[65] Vander Wal R L, Tomasek A J. Soot oxidation: dependence upon initial
nanostructure. Combustion and Flame, 2003; 134: 1-9.
[66] Sadezky A, Muckenhuber H, Grothe H, Niessner R, Poschl U. Raman
microspectroscopy of soot and related carbonaceous materials: Spectral analysis and
structural information. Carbon, 2005; 43: 1731-1742.
[67] Darcy P. Modélisation du fonctionnement d’un filtre à particules catalysé. PhD
thesis, Université Pierre et Marie Curie (Paris VI), 2005.
[68] Leistner K. Etude expérimentale et modélisation de l’oxydation catalysée de
suies Diesel. PhD thesis, Université Pierre et Marie Curie (Paris VI), 2012.
[69] Alfè M, Apicella B, Barbella R, Rouzaud J N, Tregrossi A, Ciajolo A.
Structure-property relationship in nanostructures of young and mature soot in
premixed flames. Proceedings of the Combustion Institute. 2009; 32: 697-704.
[70] Fitzer E, Kochling K H, Boehm H, Marsh H. Recommended terminology for the
description of carbon as a solid. Pure and Applied Chemistry, 1995; 3: 473-506.
[71] Laurendeau N M. Heterogeneous kinetics of coal char gasification and
combustion. Progress in Energy and Combustion Science, 1978; 4: 221-270.
[72] Jones J M, Jones D H. Modelling the competition between annealing and
oxidation in the carbon-oxygen reaction. Letters to the Editor/Carbon, 2007; 45:
668-689.
[73] Ruiz M, Villoria R G, Millera A, Alzueta M, Bilbao R. In-fluence of the
temperature on the properties of the soot formed from C2H2 pyrolysis. Chemical
Engineering Journal. 2007; 127: 1-9.
[74] Lapuerta M, Oliva F, Agudelo J R, Boehman A L. Effect of fuel on the soot
nanostructure and consequences on leading and regeneration of diesel particulate filter.
Combustion and Flame, 2012; 159: 844-853.
142
[75] Knauer M, Schuster M E, Su D S, Schlögl R, Niessner R, Ivleva N P. Soot
structure and reactivity analysis by Raman microspectroscopy,
Temperature-Programmed Oxidation and High-resolution transmission electron
microscopy. Journal of Physical Chemistry A, 2009; 113: 13871-13880.
[76] Wang Y, Alsmeyer D C, McCreery R L. Raman spectroscopy of carbon materials:
structural basis of observed spectra. Chemistry of Materials, 1990; 2: 557-563.
[77] Cuesta A, Dhamelincourt P, Laureyns J, Martinez-Alonso A, Tascon J M D.
Raman microprobe studies on carbon materials. Carbon, 1994; 32: 1523-1532.
[78] Sze S K, Siddique N, Sloan J J, Escribano R. Raman spectroscopic
characterisation of carbonaceous aerosol. Atmospheric Environment, 2001; 35:
561-568.
[79] Jawhari T, Roid A, Casado J. Raman spectroscopic characterisation of some
commercially available carbon black materials. Carbon, 1995; 33: 1561-1565.
[80] Dippel B, Jander H, Heintzenberg J. NIR FT Raman spectroscopic study of flame
soot. Physical Chemistry Chemical Physics, 1999; 1: 4707-4712.
[81] Nakamura K, Fujitsuka M, Kitajima M. Disorder-induced line broadening in
first-order Raman scattering from graphite. Physical Review B, 1990; 41:
12260-12263.
[82] Setiabudi A, Makkee M, Moulijn J A. The role of NO2 and O2 in the accelerated
combustion of soot in diesel exhaust gases. Applied Catalysis B, 2004; 50: 185-194.
[83] Oi-Uchisaw J. Obuchi A, Ogata A, et al. Effect of feed gas composition on the
rate of carbon oxidation with Pt/SiO2 and the oxidation mechanism. Applied Catalysis
B, 1999, 21: 9-17.
[84] Oi-Uchisawa J, Obuchi A, Zhao Z, et al. Carbon oxidation with platinum
supported catalysts. Applied Catalysis B: Environmental, 1998, 18: L183-L187.
[85] Oi-Uchisawa J, Wang S, Nanba T, et al. Improvement of Pt catalyst for soot
oxidation using mixed oxide as a support. Applied Catalysis B: Environmental, 2003,
44: 207-215.
[86] Krishna K, Bueno-López A, Makkee M, Moulijn J A. Potential rare-earth
modified CeO2 catalysts for soot oxidation part II: Characterisation and catalytic
activity with NO + O2. Applied Catalysis B, 2007, 75: 201-209.
143
[87] Liu S, Wu X D, Weng D, Ran R. NOx-Assisted Soot Oxidation on Pt−Mg/Al2O3
Catalysts: Magnesium Precursor, Pt Particle Size, and Pt-Mg Interaction. Industrial
and Engineering Chemistry Research, 2012; 51, 2271−2279.
[88] Liu S, Wu X D, Weng D, Li M, Lee H R. Combined promoting effects of
platinum and MnOx-CeO2 supported on alumina on NOx-assisted soot oxidation:
thermal stability and sulfur resistance, Chemical Engineering Journal. 2012; 203:
25-35.
[89] Subonen S, Valden M, Hietikko M, et al. Effect of Ce-Zr mixed oxides on the
chemical state of Rh in alumina supported automotive exhaust catalysts studied by
XPS and XRD. Applied Catalysis A: General, 2001; 218: 151-160.
[90] Bueno-López A, Krishna K, van der Linden B, Mul G, Moulijn J A, Makkee M.
On the mechanism of model diesel soot-O2 reaction catalysed by Pt-containing
La3+
-doped CeO2 A TAP study with isotopic O2. Catalysis Today, 2007; 121: 237-245.
[91] Bonilla S H, Carvalho J G A, Almeida C M V B, Giannetti B F, Zinola C F.
Platinum surface modification with cerium species and the effect against the methanol
anodic reaction. Journal of Electroanalytical Chemistry, 2008; 617: 203-210.
[92] Zhang H L, Zhu Y, Wang S D, Zhao M, Gong M C, Chen Y Q. Activity and
thermal stability of Pt/Ce0.64Mn0.16R0.2Ox (R = Al, Zr, La, or Y) for soot and NO
oxidation. Fuel Processing Technology, 2015; 137: 38-47.
[93] Jeguirim M, Tschamber V, Ehrburger P. Catalytic effect of platinum on the
kinetics of carbon oxidation by NO2 and O2. Applied Catalysis B. 2007; 76: 235-240.
[94] Liu S, Wu X D, Weng D, Li M, Fan J. Sulfation of Pt/Al2O3 catalyst for soot
oxidation: High utilization of NO2 and oxidation of surface oxygenated complexes.
Applied Catalysis B. 2013; 138-139: 199-211.
[95] Atribak I, Azambre B, Bueno-López A, et al. Effect of NOx
adsorption/desorption over ceria-zirconia catalysts on the catalytic combustion of
model soot. Applied Catalysis B, 2009; 92: 126-137.
[96] Atribak I, Bueno-López A , García-García A. Thermally stable ceria-zirconia
catalysts for soot oxidation by O2. Catalysis Communications, 2008; 9: 250-255.
[97] Atribak I, Bueno-López A , García-García A. Role of yttrium loading in the
physico-chemical properties and soot combustion activity of ceria and ceria–zirconia

144
catalysts. Journal of Molecular Catalysis A: Chemical, 2009; 300: 103-110.
[98] Hernández-Giménez A M, Xavier L P, Bueno-López A. Improving ceria-zirconia
soot combustion catalysts by neodymium doping. Applied Catalysis A, 2013; 462-463:
100-106.
[99] Wu X D, Liu S, Weng D, Lin F. Textural-structural properties and soot oxidation
activity of MnOx-CeO2 mixed oxides. Catalysis Communication, 2011; 12: 345-348.
[100] Wu X D, Lin F, Xu H B, Weng D. Effects of adsorbed and gaseous NOx species
on catalytic oxidation of diesel soot with MnOx-CeO2 mixed oxides. Applied
Catalysis B, 2010; 96: 101-109.
[101] Liang Q, Wu X D, Weng D, Xu H B. Oxygen activation on Cu/Mn-Ce mixed
oxides and the role in diesel soot oxidation. Catalysis Today, 2008; 139: 113-118.
[102] Wu X D, Liu S, Lin F, Weng D. Nitrate storage behavior of Ba/MnOx-CeO2
catalyst and its activity for soot oxidation with heat transfer limitations. Journal of
Hazardous Materials, 2010; 181: 722-728.
[103] Wu X D, Lin F, Wang L, Weng D, Zhou Z. Preparation methods and thermal
stability of Ba-Mn-Ce oxide catalyst for NOx-assisted soot oxidation. Journal of
Environmental Sciences, 2011; 23(7): 1205-1210.
[104] Lin F, Wu X D, Liu S, Weng D, Huang Y. Preparation of MnOx-CeO2-Al2O3
mixed oxides for NOx-assisted soot oxidation: Activity, structure and thermal stability.
Chemical Engineering Journal. 2013; 226: 105-112.
[105] Zhang H L, Yuan S D, Wang J L, Gong M C, Chen Y Q. Effects of contact
model and NOx on soot oxidation activity over Pt/MnOx-CeO2 and the reaction
mechanisms. Chemical Engineering Journal. 2017; 327: 1066-1076.
[106] Jeguirim M, Tschamber V, Villani K, Brilhac J F, Martens J A. Mechanistic
study of carbon oxidation with NO2 and O2 in the presence of a Ru/Na-Y catalyst.
Chemical Engineering Technology. 2009; 32: 830-834.
[107] Jeguirim M, Tschamber V, Brilhac J F. Kinetics and mechanism of the oxidation
of carbon by NO2 in the presence of water vapor, International Journal of Chemical
Kinetics. 2009; 41: 236-244.
[108] Zouaoui N, Issa M, Kehrli D, Jeguirim M. CeO2 catalytic activity for soot
oxidation under NO/O2 in loose and tight contact. Catalysis Today. 2012; 189: 65-69.

145
[109] Hensgen L, Stöwe K. Soot-catalyst contact studies in combustion processes
using nano-scaled ceria as test material. Catalysis Today. 2011; 159: 100-107.
[110] Tschamber V, Jeguirim M, Villani K, Martens J, Ehrburger P. Comparison of the
activity of Ru and Pt catalysts for the oxidation of carbon by NO2. Applied Catalysis
B. 2007; 72: 299-303.
[111] Marsh H, Kuo K, in: Marsh H (Ed.). Introduction to Carbon Science,
Butterworths, London, 1989 (Chapter 4).
[112] Setiabudi A,. Chen J L, Mul G, Makkee M, Moulijin J A. CeO2 catalysed soot
oxidation The role of active oxygen to accelerate the oxidation conversition. Applied
Catalysis B. 2004; 51: 9-19.
[113] Bensaid S, Russo N, Fino D. CeO2 catalysts with fibrous morphology for soot
oxidation: The importance of the soot-catalyst contact conditions, Catalysis Today.
2013; 216: 57-63.
[114] Yamazaki K, Kayama T, Dong F, Shinjoh H. A mechanism study on soot
oxidation over CeO2-Ag catalyst with ‘rice-ball’ morphology. Journal of Catalysis.
2011; 282: 289-298.
[115] Liu S, Wu XD, Liu W, Chen WM, Ran R, Li M, et al. Soot oxidation over CeO2
and Ag/CeO2: Factors determining the catalyst activity and stability during reaction.
Journal of Catalysis. 2016; 337: 188-198.
[116] Quiros D C, Yoon S, Dwyer H A, Collins J F, Zhu Y F, Huai T. Measuring
particulate matter emissions during parked active diesel particulate filter regeneration
of heavy-duty diesel trucks. Journal of Aerosol Science, 2014, 73: 48-62.
[117] Obeid E, Lizarraga L, Tsampas M N, Cordier A, Boréave A, Steil M C, et al.
Continuously regenerating Diesel Particulate Filters based on ionically conducting
ceramics. Journal of Catalysis, 2014, 309: 87-96.
[118] Lin F, Wu X D, Liu S, Weng D, Huang Y Y. Preparation of MnOx-CeOx-Al2O3
mixed oxides for NOx-assisted soot oxidation: Activity, structure and thermal stability.
Chemical Engineering Journal, 2013, 226: 105-112.
[119] Liu S, Wu X D, Weng D, Li M, Lee H R. Combined promoting effects of
platinum and MnOx-CeO2 supported on alumina on NOx-assisted soot oxidation:
Thermal stability and sulfur resistance. Chemical Engineering Journal, 2012, 203:

146
25-35.
[120] He H, Lin X T, Li S J, Wu Z, Gao J H, Wu J L, et al. The key surface species
and oxygen vacancies in MnOx(0.4)-CeO2 toward repeated soot oxidation. Applied
Catalysis B, 2018, 223: 134-142.
[121] Jeguirim M, Tschamber V, Brilhac J F. Kinetics of catalyzed and non-catalyzed
soot oxidation with nitrogen dioxide under regeneration particle trap conditions.
Journal of Chemical Technology & Biotechnology, 2009, 84: 770-776.
[122] Jeguirim M, Tschamber V, Brilhac J F, Ehrburger P J. Interaction mechanism of
NO2 with carbon black: effect of surface oxygen complexes. Journal of Analytical and
Applied Pyrolysis, 2004, 72: 171-181.
[123] Azambre B, Collura S, Darcy P, Trichard J M, Costa P D, García-García A,
Bueno-López A. Effects of a Pt/Ce0.68Zr0.32O2 catalyst and NO2 on the kinetics of
diesel soot oxidation from thermogravimetric analyses. Fuel Processing Technology,
2011, 92: 363-371.
[124] Il’ichev A N, Shibanova M D, Ukharskii A A, Kuli-zade A M, Korchak V N.
Mechanism of the formation of O2- radical anions on CeO2 and (0.5-10)%CeO2/ZrO2
during the adsorption of an NO-O2 mixture. Kinetics and Catalysis, 2005, 46:
387-395.
[125] Zhang H L, Hou Z Y, Zhu Y, Wang J L, Chen Y Q. Sulfur deactivation
mechanism of Pt/MnOx-CeO2 for soot oxidation: Surface property study. Applied
Surface Science, 2017, 396: 560-565.
[126] Zhang H L, Li S S, Lin Q J, Feng X, Chen Y Q, Wang J L. Study on
hydrothermal deactivation of Pt/MnOx-CeO2 for NOx-assisted soot oxidation: redox
property, surface nitrates and oxygen vacancies. Environmental Science and Pollution
Research, 2018, 25: 16061-16070.
[127] Venkataswamy P, Jampaiah D, Rao K N, Reddy B M. Nonostructured
Ce0.7Mn0.3O2-δ and Ce0.7Fe0.3O2-δ solid solutions for diesel soot oxidation. Applied
Catalysis A, 2014, 488: 1-10.
[128] Martínez-Arias A, Soria J, Conesa J C, Seoane X L, Arcoya A, Cataluña R. NO
reaction at surface oxygen vacancies generated in cerium oxide. Journal of the
Chemical Society, Faraday Transactions, 1995, 91: 1679-1687.

147
[129] Gil B, Mierzyńska K, Szczerbińska M, Datka J. Basic sites in zeolites followed
by IR studies of NO+. Applied Catalysis A, 2007, 319: 64-71.
[130] Xia C H, Hu C G, Chen P, Wan B Y, He X S, Tian Y S. Magnetic properties and
photoadsorption of the Mn-doped CeO2 nanorods. Materials Research Bulletin, 2010,
45: 794-798.
[131] Murugan B, Ramaswamy A V. Chemical states and redox properties of
Mn/CeO2-TiO2 nanocomposites prepared by solution combustion route. The Journal
of Physical Chemistry C, 2008, 112: 20429-20442.
[132] Zhang H L, Wang J L, Cao Y, Wang Y J, Gong M C, Chen Y Q. Effect of Y on
improving the thermal stability of MnOx-CeO2 catalysts for diesel soot oxidation.
Chinese Journal of Catalysis, 2015, 36: 1333-1341.
[133] Andriopoulou C, Trimpalis A, Petallidou K C, Sgoura A, Efstathiou A M,
Boghosian S. Structural and redox properties of Ce1-xZrxO2-δ and Ce0.8Zr0.15RE0.05O2-δ
(RE: La, Nd, Pr, Y) solids studied by high temperature in situ Raman spectroscopy.
The Journal of Physical Chemistry C, 2017, 121: 7931-7943.
[134] Taniguchi T, Watanabe T, Sugiyama N, Subramani A K, Wagata H, Matsushita
N, Yoshimura M. Identifying defect in ceria-based nanocrystals by UV resonance
Raman spectroscopy. The Journal of Physical Chemistry C, 2009, 113: 19789-19793.
[135] Porsin A V, Alikin E A, Bukhtiyarov V I. A low-temperature method for
measuring oxygen storage capacity of ceria-containing oxides. Catalysis Science &
Technology, 2016, 6: 5891-5898.
[136] Wei Y C, Liu J, Zhao Z, Duan A J, Jiang G Y. The catalysts of
three-dimensionally ordered macroporous Ce1-xZrxO2-supported gold nanoparticles
for soot combustion: The metal-support interaction. Journal of Catalysis, 2012, 287:
13-29.
[137] Hayashi H, Kubo S. Computer simulation study on filtration of soot particles in
Diesel particulate filter. Computers & Mathematics with Applications, 2008, 55:
1450-1460.
[138] Bensaid S, Marchisio D L, Fino D, Saracco G, Specchia V. Modelling of diesel
particulate filtration in wall-flow traps. Chemical Engineering Journal, 2009, 154:
211-218.

148
[139] Yamamodo K, Nakamura M. Simulation on flow and heat transfer in diesel
particulate filter. Journal of Heat Transfer, 2011, 133: doi:10.1115/1.4003448.
[140] Direction générale des Infrastructures, des Transports et de la Mer-Des
véhicules aux normes pour réduire la pollution de l’air., 2011.
[141] Mokhri M A, Abdullah N R, Abdullah S A, Kasalong S, Mamat R. Soot
filtration recent simulation analysis in Diesel particulate filter (DPF). Procedia
Engineering, 2012, 41: 1750-1755.
[142] Agarwal A K, Gupta T, Shukla P C, Dhar A. Particulate emissions from
biodiesel fuelled CI engines. Energy Conversion and Management, 2015, 94: 311-30.
[143] Xue J, Grift T E, Hansen A C. Effect of biodiesel on engine performances and
emissions. Renew. Sustain. Energy Reviews, 2011, 15: 1098-1116.
[144] Schobing J, Tschamber V, Brillard A, Leyssens G. Impact of Biodiesel
impurities on carbon oxidation in passive regeneration conditions: Influence of the
alkali metals. Applied Catalysis B, 2018, 226: 596-607.
[145] Palma V, Ciambelli P, Meloni E, Sin A. Catalytic DPF microwave assisted
active regeneration. Fuel, 2015,140: 50-61.
[146] Mcenally C S, Pfefferle L D. Sooting tendencies of oxygenated hydrocarbons in
laboratory-scale flames. Environmental Science & Technology, 2011, 45: 2498-2503.
[147] Barrientos E, Maricq M, Boehman A, Anderson J. Impact of ester structures on
the soot characteristics and soot oxidative reactivity of biodiesel. SAE Technical
Paper, 2015.
[148] Dmitriev A M, Knyazkov D A, Bolshova T A, Shmakov A G, Korobeinichev O
P. The effect of methyl pentanoate addition on the structure of premixed fuel-rich
n-heptane/toluene flame at atmospheric pressure. Combustion and Flame, 2015, 162:
1964-1975.
[149] Seong H J, Boehman A L. Studies of soot oxidative reactivity using a diffusion
flame burner. Combustion and Flame, 2012, 159: 1864-1875.
[150] Song J, Alam M, Boehman A L. Impact of alternative fuels on soot properties
and DPF regeneration. Combustion Science and Technology, 2007, 179: 1991-2037.
[151] Vander Wal R L, Bryg V M, Hays M D. Fingerprinting soot (towards source
identification): physical structure and chemical composition. Journal of Aerosol

149
Science, 2010, 41: 108-117.
[152] Vander Wal R L, Tomasek A J. Soot oxidation: dependence upon initial
nanostructure. Combustion and Flame, 2003, 134: 1-9.
[153] Ishiguro T, Suzuki N, Fujitani Y, Morimoto H. Microstructural changes of
Diesel soot during oxidation. Combustion and Flame, 1991, 85: 1-6.
[154] Beatrice C, Iorio S D, Guido C, Napolitano P. Detailed characterization of
particulate emissions of an automotive catalyzed DPF using actual regeneration
strategies. Experimental Thermal and Fluid Science, 2012, 39: 45-53.
[155] Muroyama H, Hano S, Matsui T, Eguchi K. Catalytic soot combustion over
CeO2-based oxides. Catalysis Today, 2010, 153: 133-135.
[156] Zhu L, Yu J J, Wang X Z. Oxidation treatment of diesel soot particulate on
CexZr1-xO2. Journal of Hazardous Material, 2007, 140: 205-210.
[157] Schejbal M, Štěpánek J, Marek M, Kočí P, Kubíček M. Modelling of soot
oxidation by NO2 in various types of diesel particulate filters. Fuel, 2010, 89:
2365-2375.
[158] Zhang H L, Wang J L, Zhang Y H, Jiao Y, Ren C J, Gong M C, Chen Y Q. A
study on H2-TPR of Pt/Ce0.27Zr0.73O2 and Pt/Ce0.27Zr0.70La0.03Ox for soot oxidation.
Applied Surface Science, 2016, 377: 48-55.
[159] Atribak I, López-Suárez F E, Bueno-López A, García-García A. New insights
into the performance of ceria-zirconia mixed oxides as soot combustion catalysts.
Identification of the role of “active oxygen” production. Catalysis Today, 2011, 176:
404-408.
[160] Liu S, Wu X D, Weng D, Li M, Lee H R. Combined promoting effects of
platinum and MnOx-CeO2 supported on alumina on NOx-assisted soot oxidation:
Thermal stability and sulfur resistance. Chemical Engineering Journal, 2012, 203,
25-35.
[161] Tikhomirov K, Kröcher O, Elsener M, Wokaun A. MnOx-CeO2 mixed oxides
for the low-temperature oxidation of diesel soot. Applied Catalysis B, 2006, 64:
72-78.
[162] Lemaire R, Faccinetto A, Therssen E, Ziskind M, Focsa C, Desgroux P.
Experimental comparison of soot formation in turbulent flames of Diesel and
150
surrogate Diesel fuels. Proceedings of the Combustion Institute, 2009, 32: 737-744.
[163] Ramirez H P, Hadj-Ali K, Diévart P, Dayma G, Togbé C, Moréac G. Oxidation
of commercial and surrogate bio-Diesel fuels (B30) in a jet-stirred reactor at elevated
pressure: experimental and modeling kinetic study. Proceedings of the Combustion
Institute, 2011, 33: 375-382.
[164] Abboud J, Schobing J, Legros G, Matynia A, Bonnety J, Tschamber V, et al.
Impacts of ester’s carbon chain length and concentration on sooting propensities and
soot oxidative reactivity: Application to Diesel and Biodiesel surrogates. Fuel, 2018,
222: 588-598.
[165] Kashif M, Bonnety J, Guibert P, Legros G. Sooting tendencies of primary
reference fuels in atmospheric laminar diffusion flames burning into vitiated air.
Combustion and Flame, 2014, 161: 1575-1586.
[166] Kashif M, Bonnety J, Matynia A, Costa P D, Legros G. Sooting propensities of
some gasoline surrogate fuels: Combined effects of fuel blending and air vitiation.
Combustion and Flame, 2015, 161: 1840–1847.
[167] Consalvi J L, Liu F, Contreras J, Kashif M, Legros G, Shuai S, et al. Numerical
study of soot formation in laminar coflow diffusion flames of methane doped with
primary reference fuels. Combustion and Flame, 2015, 162: 1153-1163.
[168] Consalvi J L, Liu F, Kashif M, Legros G. Numerical study of soot formation in
laminar coflow methane/air diffusion flames doped by n-heptane/toluene and
iso-octane/toluene blends. Combustion and Flame, 2017, 180: 167-174.
[169] Kelesidis G A, Goudeli E, Pratsinis S E. Flame synthesis of functional
nanostructured materials and devices: Surface growth and aggregation. Proceedings of
the Combustion Institute, 2017, 36: 29-50.
[170] Lapuerta M, Oliva F, Agudelo J R, Boehman A L. Effect of fuel on the soot
nanostructure and consequences on loading and regeneration of diesel particulate filter.
Combustion and Flame, 2012, 159: 844-853.
[171] Sadezky A, Muckenhuber H, Grothe H, Niessner R, Pöschl U. Raman
microspectroscopy of soot and related carbonaceous materials: spectral analysis and
structural information. Carbon, 2005, 43: 1731-1742.
[172] Ferrari A C, Robertson J. Interpretation of Raman spectra of disordered and
151
amorphous carbon. Physical Review B, 2000, 61: 14095-14107.
[173] Ess M N, Bladt H, Mühlbauer W, seher S I, Zöllner C, Lorenz S, et al.
Reactivity and structure of soot generated at varying biofuel content and engine
operating parameters. Combustion and Flame, 2016, 163: 157-169.
[174] Zhu L, Wang X. Improving Ce0.5Zr0.5O2 soot combustion catalyst by KNO3
loading. Reaction Kinetics, Mechanisms and Catalysis, 2014, 112: 383-395.
[175] Aneggi E, Divins N J, de Leitenburg C, Llorca J, Trovarelli A. The formation of
nanodomains of Ce6O11 in ceria catalyzed soot combustion. Journal of Catalysis, 2014,
312: 191-194.
[176] Knauer M, Carrara M, Rothe D, Niessner R, Ivleva N P. Changes in structure
and reactivity of soot during oxidation and gasification by oxygen, studied by
microRaman spectroscopy and temperature programmed oxidation. Aerosol Science
and Technology, 2009, 43: 1-8.
[177] Ye P, Sun C, Lapuerta M, Agudelo J, Vander Wal R, Boehman A L, et al. Impact
of rail pressure and biodiesel fueling on the particulate morphology and soot
nanostructures from a common-rail turbocharged direct injection diesel engine.
International Journal of Engineering Research, 2014, doi:
10.1177/1468087414564229.
[178] Bladt H, Ivleva N P, Niessner R. Internally mixed multicomponent soot: impact
of different salts on soot structure and thermo-chemical properties. Journal of Aerosol
Science, 2014, 70: 26-35.
[179] Bladt H, Schmid J, Kireeva E D, Popovicheva O B, Perseantseva N M,
Timofeev M A, et al. Impact of Fe content in laboratory-produced soot aerosol on its
composition, structure, and thermo-chemical properties. Aerosol Science and
Technology, 2012, 46: 1337-1348.
[180] Schmid J, Grob B, Niessner R, Ivleva N P. Multiwavelength Raman
microspectroscopy for rapid prediction of soot oxidation reactivity. Analytical
Chemistry, 2011, 83: 1173-1179.
[181] Lu T, Cheung C S, Huang Z. Size-resolved volatility, morphology,
nanostructure, and oxidation characteristics of diesel particulate. Energy Fuels, 2012,
26: 6168-6176.

152
[182] Reşitoğlu I A, Altinişik K, Keskin A. The pollutant emissions from
diesel-engine vehicles and exhaust aftertreatment systems. Clean Technologies and
Environmental Policy. 2015; 17: 15-27.
[183] Twigg M V. Progress and future challenges in controlling automotive exhaust
gas emissions. Applied Catalysis B. 2007; 70: 2-15.
[184] Giechaskiel B, Alföldy B, Drossinos Y. A metric for health effects studies of
diesel exhaust particles. Journal of Aerosol Science. 2009; 40: 639-651.
[185] Carslaw K S, Boucher O, Spracklen D V, Mann G W, Rae J G, Woodward S, et
al. A review of natural aerosol interactions and feedbacks within the earth system.
Atmospheric Chemistry and Physics. 2010; 10: 1701-1737.
[186] Mahowald N, Ward D S, Kloster S, Flanner M G, Heald C L, Heavens N G, et al.
Aerosol impacts on climate and biogeochemistry. Annual Review of Environment and
Resources. 2011; 36: 45-74.
[187] Niessner R. The many faces of soot: characterization of soot nanoparticles
produced by engines. Angewandte Chemie International Edition. 2014; 53:
12366-12379.
[188] European Parliament. Regulation (EC) No 715/2007 of the European
Parliament and the Council of 20 June 2007 on type approval of motor vehicles with
respect to emissions from light passenger and commercial vehicles (Euro 5 and Euro
6) and on access to vehicle repair and maintenance information, O.J. L171/1 (2007).
[189] European Commission. Commission Regulation No 582/2011 of 25 May 2011
implementing and amending Regulation (EC) No 595/2009 of the European
Parliament and of the Council with respect to emissions from heavy duty vehicles
(Euro VI) and amending Annexes I and III to Directive 2007/46/EC of the European
Parliament and of the Council, O.J. L167/1 (2011).
[190] European Commission. Commission Regulation (EU) No 459/2012 of 29 May
2012 amending Regulation (EC) No 715/2007 of the European Parliament and of the
Council and Commission Regulation (EC) No 692/2008 as regards emissions from
light passenger and commercial vehicles (Euro 6), O.J. L142/16 (2012).
[191] Bensaid S, Marchisio D L, Fino D. Numerical simulation of soot filtration and
combustion within diesel particulate filters. Chemical Engineering Science 2010; 65:
153
357-363.
[192] Mokhri M A, Abdullah N R, Abdullah S A, Kasalong S, Mamat R. Soot
filtration recent simulation analysis in diesel particulate filter (DPF). Procedia
Engineering. 2012; 41: 1750-1755.
[193] Caliskan H, Mori K. Environmental, enviroeconomic and enhanced
thermodynamic analyses of a diesel engine with diesel oxidation catalyst (DOC) and
diesel particulate filter (DPF) after treatment systems. Energy. 2017; 128: 128-144.
[194] Leistner K, Nicolle A, Costa P D. Impact of the catalyst/soot ratio on diesel soot
oxidation pathways. Energy Fuels. 2012; 26: 6091-6097.
[195] Zhang H L, Hu W, Zhou C X, Liu H R, Yao P, Wang J L, et al. A new
understanding of CeO2-ZrO2 catalysts calcinated at different temperatures: Reduction
property and soot-O2 reaction. Applied Catalysis A. 2018; 563: 204-215.
[196] Knauer M, Schuster M E, Su D S, Schlögl R, Niessner R, Ivleva N P. Soot
structure and reactivity analysis by Raman microspectroscopy,
Temperature-Programmed Oxidation and High-resolution transmission electron
microscopy. The Journal of Physical Chemistry A. 2009; 113: 13871-13880.
[197] Müller J O, Su D S, Jentoft R E, Kröhnert J, Jentoft F C, Schlögl R.
Morphology-controlled reactivity of carbonaceous materials towards oxidation.
Catalysis Today. 2005; 102-103: 259-265.
[198] Lamharess N, Starck L, Millet C N, Costa P D. Effect of biofuels on catalyzed
diesel particulate filter regeneration. Topics in Catalysis. 2013; 56: 462-466.
[199] Hansen B B, Jensen A D, Jensen P A. Performance of diesel particulate filter
catalysts in the presence of biodiesel ash species. Fuel. 2013; 106: 234-240.
[200] Al-Qurashi K, Boehman A L. Impact of exhaust gas recirculation (EGR) on the
oxidative reactivity of diesel engine soot. Combustion and Flame. 2008; 155:
675-695.
[201] Yehliu K, Armas O, Vander Wal R L, Boehman A L. Impact of engine operating
modes and combustion phasing on the reactivity of diesel soot. Combustion and
Flame. 2013; 160: 682-691.
[202] Hori S, Sato T, Narusawa K. Effects of diesel fuel composition on SOF and
PAH exhaust emissions. JSAE Review 1997; 18: 255-261.

154
[203] Kain J. Connecticut diesel emissions control technologies forum, Retrofit
Overview. August 17, 2005.
[204] Setten B, Makkee M, Moulijn J A. Science and technology of catalytic diesel
particulate filters. Catalysis Review. 2001; 43: 489-564.
[205] Ishiguro T, Suzuki N, Fujitani Y, Morimoto H. Microstructural changes of
Diesel soot during oxidation. Combustion and Flame. 1991; 85: 1-6.
[206] Yehliu K, Vander Wal R L, Armas O, Boehman A L. Impact of fuel formulation
on the nanostructure and reactivity of diesel soot. Combustion and Flame 2012; 159:
3597-3606.
[207] Barrientos E J, Maricq M M, Boehman A L, Andersson J E. Impact of ester
structures on the soot characteristics and soot oxidative reactivity of biodiesel. SAE
Technical Paper 2015-01-1080 (2015).
[208] Boehman A L, Song J, Alam M. Impact of biodiesel blending on diesel soot and
the regeneration of particulate filters. Energy Fuels. 2005; 19: 1857-1864.
[209] Bueno-López A, Krishna K, Makkee M, Moulijn J A. Enhanced soot oxidation
by lattice oxygen via La3+
-doped CeO2. Journal of Catalysis. 2005; 230: 237-248.
[210] Tikhomirov K, Kröcher O, Elsener M, Wokaun A. MnOx-CeO2 mixed oxides
for the low-temperature oxidation of diesel soot. Applied Catalysis B. 2006; 64:
72-78.
[211] Aneggi E, Leitenburg C, Trovarelli A. On the role of lattice/surface oxygen in
ceria-zirconia catalysts for diesel soot combustion. Catalysis Today. 2012; 181:
108-115.
[212] Atribak I, Bueno-López A, García-García A. Role of yttrium loading in the
physico-chemical properties and soot combustion activity of ceria and ceria-zirconia
catalysts. Journal of Molecular Catalysis A: Chemical. 2009; 300: 103-110.
[213] Seong H, Choi S. Oxidation-derived maturing process of soot, dependent on
O2-NO2 mixtures and temperatures. Carbon 2015;93:1068-1076.
[214] Wang Y, Alsmeyer D C, McCreery R L. Raman spectroscopy of carbon
materials: structural basis of observed spectra. Chemistry of Materials.
1990;2:557-563.
[215] Cuesta A, Dhamelincourt P, Laureyns J, Martinez-Alonso A, Tascon JMD.

155
Raman microprobe studies on carbon materials. Carbon 1994;32:1523-1532.
[216] Sze S K, Siddique N, Sloan J J, Escribano R. Raman spectroscopic
characterisation of carbonaceous aerosol. Atmospheric Environment. 2001; 35:
561-568.
[217] Jawhari T, Roid A, Casado J. Raman spectroscopic characterisation of some
commercially available carbon black materials. Carbon. 1995;33:1561-1565.
[218] Dippel B, Jander H, Heintzenberg J. NIR FT Raman spectroscopic study of
flame soot. Physical Chemistry Chemical Physics. 1999; 1: 4707-4712.
[219] Nakamura K, Fujitsuka M, Kitajima M. Disorder-induced line broadening in
first-order Raman scattering from graphite. Physical Review. B 1990; 41:
12260-12263.
[220] Lu T, Cheung C S, Huang Z. Size-resolved volatility, morphology,
nanostructure, and oxidation characteristics of diesel particulate. Energy Fuels
2012;26:6168-6176.
[221] Schmid J, Grob B, Niessner R, Ivleva N P. Multiwavelength Raman
microspectroscopy for rapid prediction of soot oxidation reactivity. Analytical
Chemistry. 2011; 83: 1173-1179.
[222] Ishiguro T, Takatori Y, Akihama K. Microstructure of diesel soot particles
probed by electron microscopy: first observation of inner core and outer shell.
Combustion and Flame 1997;108:231-234.
[223] Valero-Romero M J, García-Mateos F J, Rodríguez-Mirasol J, Cordero T. Role
of surface phosphorus complexes on the oxidation of porous carbons. Fuel Processing
Technology. 2017;157:116-126.
[224] Schobing J, Tschamber V, Brillard A, Leyssens G. Impact of biodiesel
impurities on carbon oxidation in passive regeneration conditions: Influence of the
alkali metals. Applied Catalysis B. 2018:226:596-607.
[225] Escribano V S, López E F, Gallardo-Amores J M, Del C, Martínez H, Pistarino
C, et al. A study of a ceria-zirconia-supported manganese oxide catalyst for
combustion of Diesel soot particles. Combustion and Flame. 2008;153:97-104.
[226] Figueiredo J L, Pereira M F R, Freitas M M A, Órfăo J J M. Modification of the
surface chemistry of activated carbons. Carbon. 1999;37:1379-1389.
156
[227] Knauer M, Carrara M, Rothe D, Niessner R, Ivleva N P. Changes in structure
and reactivity of soot during oxidation and gasification by oxygen, studied by
microRaman spectroscopy and temperature programmed oxidation. Aerosol Science
and Technology. 2009;43:1-8.
[228] Ye P, Sun C X, Lapuerta M, Agudelo J, Vander Wal R, Boehman A L, Toops T J,
Daw S. Impact of rail pressure and biodiesel fueling on the particulate morphology
and soot nanostructures from a common-rail turbocharged direct injection diesel
engine. International Journal of Engine Research. 2016;17:193–208.
[229] Twigg M V. Progress and future challenges in controlling automotive exhaust
gas emissions. Applied Catalysis B. 2007; 70: 2-15.
[230] Fornasiero P, Montini T, Graziani M, Zilio S, Succi M. Development of
functionalized Fe-Al-Cr alloy fibers as innovative catalytic oxidation devices.
Catalysis Today. 2008; 137: 475-482.
[231] Twigg M V. Catalytic control of emissions from cars. Catalysis Today. 2012;
163: 33-41.
[232] Valavanidis A, Fiotakis K, Vlahogianni T, Bakeas E B, Triantafillaki S,
Paraskevopoulou V, et al. Characterization of atmospheric particulates, particle-bound
transition metals and polycyclic aromatic hydrocarbons of urban air in the centre of
Athens (Greece). Chemosphere. 2006; 65: 760-768.
[233] Direction générale des Infrastructures, des Transports et de la Mer-Des
véhicules aux normes pour réduire la pollution de l’air., (2011).
[234] Agarwal A K, Gupta T, Shukla P C, Dhar A. Particulate emissions from
biodiesel fuelled CI engines. Energy Conversion and Management. 2015; 94:
311-330.
[235] Xue J, Grift T E, Hansen A C. Effect of biodiesel on engine performances and
emissions. Renewable & Sustainable Energy Reviews. 2011; 15: 1098-1116.
[236] Schuchardt U, Sercheli R, Vargas R M. Transesterification of vegetable oils: a
review. Journal of the Brazilian Chemical Society. 1998; 9: 199-210.
[237] Schalla R L, McDonald G E. Variation in smoking tendency. Journal of
Industrial and Engineering Chemistry. 1953; 45: 1497-1500.
[238] Lemaire R, Lapalme D, Seers P. Analysis of the sooting propensity of C-4 and

157
C-5 oxygenates: comparison of sooting indexes issued from laser-based experiments
and group additivity approaches. Combustion and Flame. 2015;162:3140-3155.
[239] Dmitriev A M, Knyazkov D A, Bolshova T A, Shmakov A G, Korobeinichev O
P. The effect of methyl pentanoate addition on the structure of premixed fuel-rich
n-heptane/toluene flame at atmospheric pressure. Combustion and Flame.
2015;162:1964-1975.
[240] McEnally C S, Pfefferle L D. Sooting tendencies of oxygenated hydrocarbons
in laboratory-scale flames. Environmental Science & Technology.
2011;45:2498-2503.
[241] Song J, Alam M, Boehman A L, Kim U. Examination of the oxidation behavior
of biodiesel soot. Combustion Flame. 2006; 146: 589-604.
[242] Lamharess N, Millet C N, Starck L, Jeudy E, Lavy J, Costa P D. Catalysed
diesel particulate filter: Study of the reactivity of soot arising from biodiesel
combustion. Catalysis Today. 2011; 176: 219-224.
[243] Shukla P C, Gupta T, Labhsetwar N K, Agarwal A K. Trace metals and ions in
particulates emitted by biodiesel fuelled engine. Fuel. 2017; 188: 603-609.
[244] Brookshear D W, Nguyen K, Toops T J, Bunting B G, Rohr W F, Howe J.
Investigation of the effects of biodiesel-based Na on emissions control components.
Catalysis Today. 2012; 184: 205-218.
[245] Schobing J, Tschamber V, Brilhac J F, Auclaire A, Vonarb R. Investigation of
the Impact of Calcium, Zinc and Phosphorus on DeNOx. Topics in Catalysis. 2016; 59:
1013-1019.
[246] Liati A, Spiteri A, Eggenschwiler D P, Vogel-Schäuble N, Microscopic
investigation of soot and ash particulate matter derived from biofuel and diesel:
implications for the reactivity of soot. Journal of Nanoparticle Research. 2012;
https://doi.org/10.1007/s11051-012-1224-7.
[247] Liati A, Eggenschwiler D P, Gubler M E, Schreiber D, Aguirre M. Investigation
of diesel ash particulate matter: A scanning electron microscope and transmission
electron microscope study. Atmospheric Environment. 2012; 49: 391-402.
[248] Löpez Suárez F E, Bueno-López A, Illán-Gómez M J, Ura B, Trawczynski J.
Study of the uncatalyzed and catalyzed combustion of diesel and biodiesel soot.
158
Catalysis Today. 2011; 176: 182-186.
[249] Jiménez R, García X, Cellier C, Ruiz P, Gordon A L. Soot combustion with
K/MgO as catalyst. Applied Catalysis A. 2006; 297: 125-134.
[250] Jiménez R, García X, Cellier C, Ruiz P, Gordon A L. Soot combustion with
K/MgO as catalyst: II. Effect of K-precursor. Applied Catalysis A. 2006; 314: 81-88.
[251] Gross M S, Ulla M A, Querini C A. Catalytic oxidation of diesel soot: New
characterization and kinetic evidence related to the reaction mechanism on K/CeO2
catalyst. Applied Catalysis A. 2009; 360: 81-88.
[252] Aneggi E, de Leitenburg C, Dolcetti G, Trovarelli A. Diesel soot combustion
activity of ceria promoted with alkali metals. Catalysis Today. 2008; 136: 3-10.
[253] Matarrese R, Castoldi L, Lietti L, Forzatti P. Soot combustion: Reactivity of
alkaline and alkaline earth metal oxides in full contact with soot. Catalysis Today.
2008; 136: 11-17.
[254] Castoldi L, Matarrese R, Lietti L, Forzatti P. Intrinsic reactivity of alkaline and
alkaline earth metal oxide catalysts for oxidation of soot. Applied Catalysis B. 2009;
90: 278-285.
[255] Valero-Romero M J, García-Mateos F J, Rodríguez-Mirasol J, Cordero T. Role
of surface phosphorus complexes on the oxidation of porous carbons. Fuel Processing
Technology. 2017; 157: 116-126.
[256] Wu X, Radovic L R. Inhibition of catalytic oxidation of carbon/carbon
composites by phosphorus. Carbon. 2006; 44: 141-151.
[257] Wu X, Radovic L R. Catalytic oxidation of carbon/carbon composite materials
in the presence of potassium and calcium acetates. Carbon. 2005, 43: 333-344.
[258] Tikhomirov K, Kröcher O, Elsener M, Wokaun A. MnOx-CeO2 mixed oxides
for the low-temperature oxidation of diesel soot. Applied Catalysis B. 2006; 64:
72-78.
[259] Knauer M, Schuster M E, Su D S, Schlögl R, Niessner R, Ivleva N P. Soot
structure and reactivity analysis by Raman microspectroscopy,
Temperature-Programmed Oxidation and High-resolution transmission electron
microscopy. Journal of Physical Chemistry A 2009;113:13871-13880.
[260] Wagner C D, Naumkin A V, Kraut-Vass A, Allison J W, Powell C J, Rumble J R

159
J. NIST X-ray Photoelectron Spectroscopy (XPS) Database, Version 3.5. 2003.
[261] Puziy A M, Poddubnaya O I, Socha R P, Gurgul J, Wisniewski M. XPS and
NMR studies of phosphoric acid activated carbons. Carbon, 2008; 46: 2113-2123.

160
Table des illustrations
Figure 2-1. The compositions of Diesel exhaust gas [19]..............................................8
Figure 2-2. Diesel exhaust post-treatment system........................................................11
Figure 2-3. Wall-flow filter of PM from diesel exhaust [19].......................................12
Figure 2-4. Soot deep bed and cake filtration on DPF wall-flow substrates [51]........13
Figure 2-5. Pressure drop increasing with particulate matter deposition during PM
filtration[51].................................................................................................................14
Figure 2-6. Active and passive regeneration methods of filter system........................14
Figure 2-7. DPF passive regeneration system [59]......................................................15
Figure 2-8. Various steps of graphitisation [68]...........................................................17
Figure 2-9. Structure of soot particles characterized by TEM [73]..............................18
Figure 2-10. X-ray diffractograms of graphite, Printex 90, and Printex XE2 [66]......18
Figure 2-11. Raman spectrum of untreated EURO VI soot [73]..................................19
Figure 2-12. Reaction scheme showing oxygen transfer from NO2 to CeO2 [112].....26
Figure 3-1. The physical profile of TPO equipment....................................................35
Figure 3-2. The physical profiles of exhaust gas detectors..........................................36
Figure 4-1. In situ DRIFTS of CM exposed to 600 ppm NO/10% O2/N2 at different
temperatures.................................................................................................................41
Figure 4-2. XPS spectra of CM-NO (a) and CM (b)....................................................42
Figure 4-3. UV-vis RD spectra of CM and CM-NO....................................................42
Figure 4-4. XRD pattern of MnOx-CeO2 mixed oxides...............................................43
Figure 4-5. Raman spectra of CM and CM-NO. AOV: area of the bands at 600 and 644
cm-1
, AF2g: area of F2g band..........................................................................................44
Figure 4-6. (a) NO- and (b) NO2-TPD profiles of CM-NO sample in N2 and 10%
O2/N2............................................................................................................................45
Figure 4-7. Mass spectrometry of NO, NO2 and O2 emissions during TPD tests of CM
(blank) and CM-NO. The sample was heated from 50 to 500 °C at 5 °C/min in pure
Ar flow (100 ml/min)...................................................................................................46
Figure 4-8. Soot-TPR results of CM (dash line) and CM-NO (solid line) with NO and
O2 emissions. The mass of soot-catalyst mixture was 30 mg, the sample was heated
from 80 to 650 °C at a ramp rate of 5 °C/min in pure Ar flow (100 ml/min)..............47

161
Figure 4-9. The soot oxidation reaction with CM catalyst. The mass of soot-catalyst
mixture was 20 mg, 80 mg SiC powder was used for dilution. The flow rate of
reaction gas was 500 ml/min, heating rate was 10 °C/min..........................................48
Figure 4-10. NO oxidation to NO2 over CM catalyst in 600 ppm NO/10% O2. 50 mg
catalyst and 5 mg soot were used here, the flow rate of 600 ppm NO/10% O2/N2 was
500 ml/min, heating rate was 10 °C/min......................................................................48
Figure 4-11. Soot oxidation activities of CM and CM-NO in 10% O2/N2. The mass of
soot-catalyst mixture was 20 mg, 80 mg SiC powder was used for dilution. The flow
rate of reaction gas was 500 ml/min, heating rate was 10 °C/min...............................49
Figure 4-12. Soot-TG result of CM and CM-NO in 10% O2/N2 with a flow rate of 50
ml/min..........................................................................................................................50
Figure 4-13. The profiles of isothermal reactions at 400 °C. The masses of soot and
catalyst were 2.0 mg and 20 mg, respectively, 80 mg SiC was used for dilution, flow
rate was 15 Nl/h............................................................................................................50
Figure 5-1. Particle size distribution of real and model soot samples..........................58
Figure 5-2. HRTEM images of real and model soot samples......................................59
Figure 5-3. Carbon fringe length distributions of real and model soot samples..........60
Figure 5-4. Nano-particles sizes of real and model soot samples. (a) particles size
distribution and (b) mean nanoparticle size.................................................................61
Figure 5-5. XRD patterns of real and model soot samples..........................................62
Figure 5-6. Analysis of the Raman spectra and curve fit of real soot R1.....................64
Figure 5-7. TPO profiles under 9% b.v. O2 of different soot samples. (a) soot
oxidative reactivity; (b) CO production; (c) CO2 selectivity. Initial quality of soot was
0.002 g, 80 mg SiC powder was used for dilution, heating rate was 10 °C/min, total
flow rate was 15 Nl/h....................................................................................... ...........66
Figure 5-8. TPO profiles under 400 ppmv NO2 + 9% b.v. O2 of different soot samples.
(a) soot oxidative reactivity; (b) CO2 selectivity..........................................................67
Figure 5-9. TPO profiles under 400/1000 ppmv NO2 + 9% b.v. O2 of R1 and M2
samples. The inset presents the Ti values of TPO profiles...........................................68
Figure 5-10. TPO profiles under 9% b.v. O2 of different soot samples with the catalyst.
2.0 mg soot and 20.0 mg catalyst were mixed by loose contact..................................69
162
Figure 5-11. TPO profiles of different soot samples with the catalyst under 400 ppmv
NO + 9% b.v. O2. 2.0 mg soot and 20.0 mg catalyst were mixed by loose contact.....70
Figure 5-12. TPO profiles of different soot samples with the catalyst under 400 ppmv
NO2 + 9% b.v. O2. 2.0 mg soot and 20.0 mg catalyst (S/C = 1/10) were mixed by
loose contact.................................................................................................................71
Figure 5-13. Ti versus Tm for catalytic oxidation of soot............................................72
Figure 5-14. Ar-TPD results of the samples separately pretreated in 400 ppm NO/9%
O2/Ar (solid line), 400 ppm NO2/9% O2/Ar (dash line) and 9% O2/Ar (red line) at
350 °C...........................................................................................................................73
Figure 5-15. Catalytic activities of different soot particles in 9 b.v.% O2 under tight
contact (a) and pressure contact (b)..............................................................................75
Figure 5-16. Catalytic activities of real soot R1 and R2 in NO + O2 (a) and NO2 + O2
(b) under tight/pressure contact....................................................................................75
Figure 5-17. Ignition temperature (Ti) of different soot samples under tight, pressure
and loose contact conditions........................................................................................76
Figure 5-18. Correlation of the non-catalytic and catalytic reactivities of real and
model soot with the structural parameters including mean nanoparticle size (a), mean
crystallite size (a), mean soot aggregate size (a), mean carbon fringe length (b) and
ID/IG ratio (b)................................................................................................................79
Figure 6-1. Soot conversion in TPO under 9% b.v. O2/Ar at a heating rate of
10 °C/min.....................................................................................................................86
Figure 6-2. Noncatalytic (a, c, e) and catalytic (b, d, f) reactivities of raw and oxidized
soot samples under 9% b.v. O2/Ar. Reaction conditions: soot mass is 2.0 mg, catalyst
mass is 20.0 mg, 80 mg SiC was used for dilution, the flow rate is 250 ml/min,
heating rate is 10 °C/min..............................................................................................88
Figure 6-3. TPO results of raw Printex U (a), B7 (b) and B100 (c) samples.
Conditions: soot mass is 2.0 mg, SiC mass is 80 mg, without catalyst, the flow rate is
250 ml/min, heating rate is 10 °C/min.........................................................................90
Figure 6-4. Catalytic reactivities of Printex U (a), B7 (b) and B100 (c) samples under
400 ppm NO + 9% O2/Ar. Reaction conditions: soot mass is 2.0 mg, catalyst mass is
20.0 mg, 80 mg SiC was used for dilution, the flow rate is 250 ml/min, heating rate is
163
10 °C/min.....................................................................................................................91
Figure 6-5. Isothermal catalytic reaction at 350 °C in 9% O2/Ar (a, c, e) and 400 ppm
NO + 9% O2/Ar (b, d, f). Conditions: 2 mg soot and 20.0 mg catalyst, loose contact,
80 mg SiC pellets were used for dilution.....................................................................92
Figure 6-6. Isothermal catalytic reactions of Printex U soot samples that were partially
oxidized with the TPO from 25 to 500 °C in O2, NO + O2 and NO2 + O2, respectively,
at 350 °C in NO + O2...................................................................................................95
Figure 6-7. Particles aggregates size distribution of Printex U (a), B100 (b) and B7 (c)
samples.........................................................................................................................96
Figure 6-8. Mean size of particles aggregates of different soot samples.....................96
Figure 6-9. Raman spectra of raw and partially oxidized Printex U (a), B7 (b) and
B100 (c) samples..........................................................................................................98
Figure 6-10. Analysis of the Raman spectra and curve fits of raw Printex U (a),
Printex U-500 (b) and Printex U-600 (c)......................................................................99
Figure 6-11. HRTEM images of Printex U (a, b), Printex U-500 (c) and Printex U-600
(d)...............................................................................................................................102
Figure 6-12. HRTEM images of B100 (a, b), B100-500 (c) and B100-600 (d).........103
Figure 6-13. Nanoparticles size distribution of soot samples....................................104
Figure 6-14. XP spectra of C1s, O1s of the raw Printex U and B100 samples..........106
Figure 6-15. XP spectra of C1s, O1s of the activated Printex U samples..................106
Figure 6-16. XP spectra of C1s, O1s of the activated B100 samples.........................107
Figure 6-17. DRIFTS results of Printex U and B100 samples...................................109
Figure 6-18. Correlation of the noncatalytic and catalytic reactivities of Printex U and
B100 with Raman parameters including D1 band FWHM and ID3/IG........................111
Figure 6-19. Correlation of the noncatalytic and catalytic reactivities of Printex U and
B100 with surface oxygen and graphene contents obtained by XPS.........................112
Figure 7-1. TPO profiles of the doped B7 soot samples under 9% b.v. O2/Ar + 5%
H2O. (a) K/Na-doped samples; (b) P-doped samples.................................................117
Figure 7-2. TPO profiles of the doped soot samples under 400 ppm NO2 + 9% b.v.
O2/Ar + 5% H2O.........................................................................................................118
Figure 7-3. Temperature at which 5% of conversion (T5%) (a) and 50% of conversion

164
(T50%) (b) of the 1 wt% doped soot samples...............................................................119
Figure 7-4. TPO profiles of the doped soot samples with catalyst under 9% b.v. O2/Ar
+ 5% H2O. (a) K/Na-doped samples; (b) P-doped samples.......................................120
Figure 7-5. TPO profiles of the doped soot samples with catalyst under 400 ppm NO
+ 9% b.v. O2/Ar + 5% H2O. (a) Na-doped samples; (b) K-doped samples; (c) P-doped
samples.......................................................................................................................121
Figure 7-6. TPO profiles of the doped soot samples with catalyst under 400 ppm NO2
+ 9% b.v. O2/Ar + 5% H2O........................................................................................122
Figure 7-7. Temperature at which 5% of conversion (T5%) (a) and 50% of conversion
(T50%) (b) of the 1 wt% doped soot samples..............................................................123
Figure 7-8. Analysis of the Raman spectra and curve fits of 350B7 sample.............124
Figure 7-9. HRTEM images of different soot samples..............................................127
Figure 7-10. XP spectra of C1s, O1s of 350B7 soot sample......................................128
Figure 7-11. XP spectra of C1s, O1s, Na1s of 1% Na/B7 soot sample......................129
Figure 7-12. XP spectra of C1s, O1s, P2p of 1% P/B7 soot sample..........................129
165
Table des tableax
Table 4-1. XPS results of CM-NO and CM.................................................................42
Table 4-2. The results of isothermal reactions at 400 °C.............................................50
Table 5-1. The preparation methods of model and real soot samples..........................56
Table 5-2. Diffraction angle of the band 002 and crystallite dimensions of the soot
samples.........................................................................................................................63
Table 5-3. Raman results of different soot samples.....................................................64
Table 5-4. TPO results in 9% b.v. O2 and 400 ppmv NO2 + 9% b.v. O2......................66
Table 5-5. TPO results in 9% b.v. O2, 400 ppmv NO + 9% b.v. O2 and 400 ppmv NO2
+ 9% b.v. O2.................................................................................................................69
Table 5-6. Ignition temperatures (Ti) of R1 and R2 under different contacts..............75
Table 6-1. Ti and Tm values of TPOs with different soot samples..............................89
Table 6-2. The results of isothermal reaction at 350 °C...............................................93
Table 6-3. Textual properties of raw and activated soot samples.................................97
Table 6-4. Raman results of soot samples....................................................................99
Table 6-6. XPS results of Printex U and B100 samples.............................................107
Table 7-1. Raman results of soot samples..................................................................124
Table 7-2. specific surface area (SBET), microporous pore volume (Vmicro) and
mesoporous pore volume (Vmeso) of doped B7 soot samples..................................126
Table 7-3. Elemental composition of the soot samples in wt% determined by XP
Spectroscopy...............................................................................................................130
Table Annexes 1-1. List of abbreviations and explanations.......................................166
Table Annexes 1-2. List of symbols and explanations...............................................167
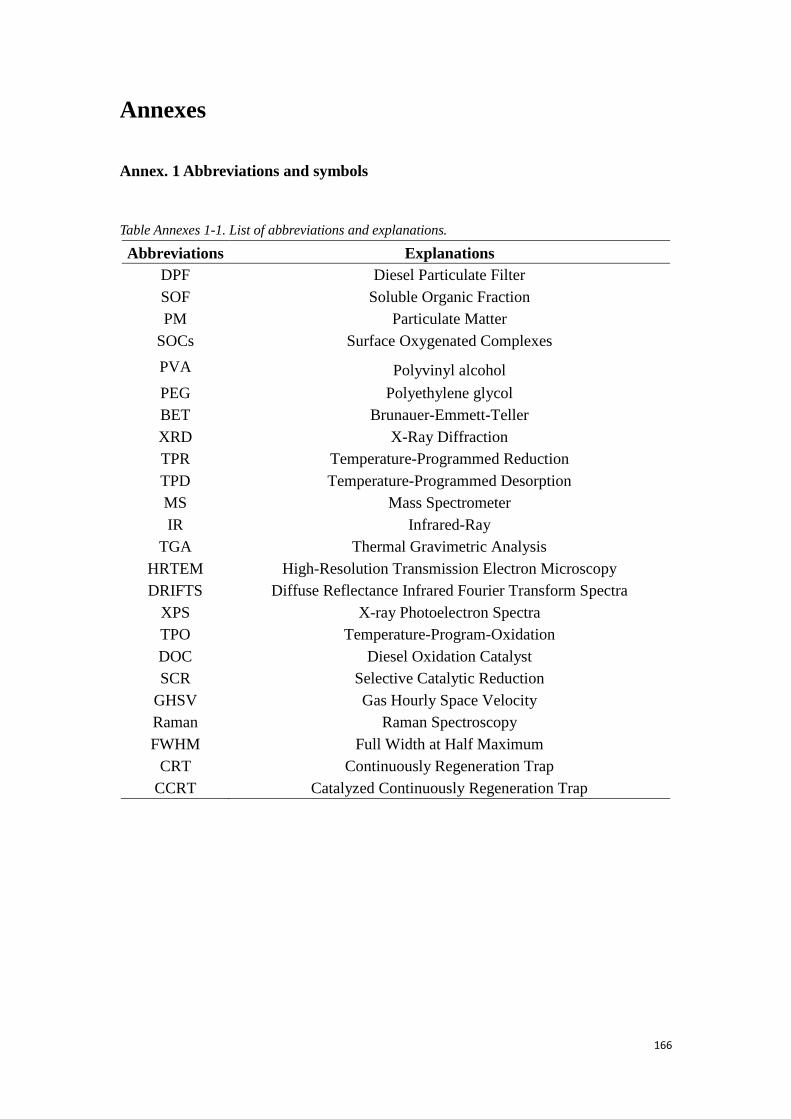
166
Annexes
Annex. 1 Abbreviations and symbols
Table Annexes 1-1. List of abbreviations and explanations.
Abbreviations Explanations
DPF Diesel Particulate Filter
SOF Soluble Organic Fraction
PM Particulate Matter
SOCs Surface Oxygenated Complexes
PVA Polyvinyl alcohol
PEG Polyethylene glycol
BET Brunauer-Emmett-Teller
XRD X-Ray Diffraction
TPR Temperature-Programmed Reduction
TPD Temperature-Programmed Desorption
MS Mass Spectrometer
IR Infrared-Ray
TGA Thermal Gravimetric Analysis
HRTEM High-Resolution Transmission Electron Microscopy
DRIFTS Diffuse Reflectance Infrared Fourier Transform Spectra
XPS X-ray Photoelectron Spectra
TPO Temperature-Program-Oxidation
DOC Diesel Oxidation Catalyst
SCR Selective Catalytic Reduction
GHSV Gas Hourly Space Velocity
Raman Raman Spectroscopy
FWHM Full Width at Half Maximum
CRT Continuously Regeneration Trap
CCRT Catalyzed Continuously Regeneration Trap

167
Table Annexes 1-2. List of symbols and explanations
Symbols Explanations
-C(O) Carbon-Oxygen Complexes
O* Active Oxygen
-O2- Super-Oxygen Species
D Thickness of Crystallites
L Crystalline Length
K, K' Shape Factors in XRD
β002, β100 Full Widths at Half Maximum of 100 and 002 Bands in XRD
m/z Proton Number/Charge Number Ratio
f(x) Carbon Fringe Length Distribution
µ Mean Value of Fringe Lengths
σ Standard Deviation
σ2 Variance
B.E. Binding Energies
Ti Ignition Temperature
Tm Temperature of Maximal Soot Oxidation Rate
T5% Temperatures at which 5% of Soot Conversion
T50% Temperatures at which 50% of Soot Conversion
XCO Molar Fractions of CO in ppmv
XCO2 Molar Fractions of CO2 in ppmv
VM Molar Volume
msoot,ini. Initial Quality of Soot
mcat. Initial Quality of Catalyst
SCO2 Selectivity of CO2
CM MnOx-CeO2
CM-NO NO-adsorbed MnOx-CeO2
Ce3+ -□ Oxygen Vacancy
AOV Area of O-Vacancy
AF2g Area of F2g Band
M1, M2, M3 Model Soot
R1, R2 Real Engine Soot
ID/IG ID/IG Ratio
B7 The Soot From the Burning of 7% Biodiesel-Diesel Blends
B100 The Soot From the Burning of 100% Biodiesel
SBET Specific Surface Area
R Mean Pore Size
Vp Pore Volume
350B7 B7 Soot Calcined at 350
1% K/B7 1 wt% K doped into B7 Soot
1% Na/B7 1 wt% Na doped into B7 Soot
1% P/B7 1 wt% P doped into B7 Soot
168
Abstract
Diesel has been widely applied in the vehicle field due to its high efficiency,
durability and low costs. However, the high emissions of particulate matter (PM) from
Diesel exhaust gas have led to severe environmental pollution and human health
threat. DPF aftertreatment system that combines the catalytic reactions is considered
to be an efficient solution to meet the restrictive emission standards. MnOx-CeO2
mixed oxides have high redox ability and oxygen storage capacity, thus they as
promising catalysts have been widely studied and employed in soot oxidation
reactions. In the present research, it was found that NO adsorption/desorption on
MnOx-CeO2 catalyst promoted the low-temperature reactivity of soot due to the
changes in the surface Ce/Mn states and an increase of oxygen vacancies. Moreover,
the active oxygen species generated from nitrates decomposition played an important
role during the promoted soot oxidation. It was revealed that non-catalytic and
catalytic reactivities of real Biodiesel and model soot samples were furthermore
correlated with soot structural properties. In the presence of the MnOx-CeO2 catalyst,
soot reactivity also depended both on reactant gas composition and on soot-catalyst
contact. Besides, the activation of soot under O2 showed a positive role on its
structural and surface properties and thereby enhanced its reactivity. In the end, a real
Biodiesel soot was impregnated by Na, K or P, reactivity results evidenced that alkali
metals Na and K exhibited a positive effect on soot oxidation but phosphorus showed
an inhibition under both O2 and NOx + O2.
Keywords: Biodiesel soot, Model soot, Catalytic reactivity, Nanostructure;
MnOx-CeO2

169
Résumé
Le diesel a été largement utilisé dans le secteur automobile en raison de son efficacité
élevée, de sa durabilité et de ses faibles coûts. Cependant, les émissions de particules
provenant des gaz d'échappement diesel ont entraîné une grave pollution de
l'environnement et une menace pour la santé humaine. Le système de post-traitement
« filtre à particules » en combinant des réactions catalytiques est aujourd’hui
considéré comme une solution efficace pour respecter les normes. Les matériaux de
type oxydes mixtes MnOx-CeO2 ont une capacité rédox et une capacité de stockage
d’oxygène élevée. Ils ont été largement étudiés et utilisés comme catalyseurs
prometteurs dans les réactions d’oxydation des suies. Dans cette étude, il a été
constaté que l'adsorption/désorption de NO sur le catalyseur MnOx-CeO2 favorisait la
réactivité à basse température de la suie en raison des modifications des états Ce/Mn
en surface et d'une augmentation des lacunes d'oxygène. De plus, les espèces
d'oxygène actif générées par la décomposition des nitrates jouent un rôle important
lors de l'oxydation favorisée de la suie. Nous avons montré que les réactivités non
catalytiques et catalytiques de biodiesel réel et d'échantillons de suie modèles étaient
en outre corrélées aux propriétés structurelles de la suie. En présence de MnOx-CeO2,
la réactivité de la suie dépend aussi bien de la composition du gaz réactif que du
contact catalyseur/suie. En outre, l'activation de la suie sous O2 joue un rôle positif sur
ses propriétés structurelles et de surface et améliore ainsi sa réactivité. Finalement,
une véritable suie de biodiesel a été imprégnée par Na, K ou P, les résultats de
réactivité ont montré que les métaux alcalins, Na et K, avaient un effet positif sur
l’oxydation de la suie, mais que le phosphore présentait lui une inhibition.
Mots clés: Suie de biodiesel, Suie modèle, Réactivité catalytique, Nanostructure;
MnOx-CeO2.