Temperature profile of catalyst bed during oxidative steam reforming of methane over Pt-Ni...
10
Temperature profile of catalyst bed during oxidative steam reforming of methane over Pt-Ni bimetallic catalysts Baitao Li a , Shigeru Kado a , Yuya Mukainakano a , Mohammad Nurunnabi a , Toshihiro Miyao b , Shuichi Naito b , Kimio Kunimori a , Keiichi Tomishige a, * a Institute of Materials Science, University of Tsukuba, 1-1-1 Tennodai, Tsukuba, Ibaraki 305-8573, Japan b Department of Applied Chemistry, Faculty of Engineering, Kanagawa University, 3-27-1, Rokkakubashi, Kanagawa-ku, Yokohama, Kanagawa 221-8686, Japan Received 20 October 2005; received in revised form 30 January 2006; accepted 7 February 2006 Available online 9 March 2006 Abstract The catalyst bed temperature during oxidative reforming of methane (CH 4 /H 2 O/O 2 /Ar = 40/30/20/10) at 1123 K and atmospheric pressure was investigated by infrared thermography over g-Al 2 O 3 supported bimetallic Pt-Ni catalysts prepared by different impregnation methods: co- impregnation and sequential impregnation. The thermographical results clearly demonstrated that the catalyst bed temperature was strongly dependent on the preparation method. The bimetallic catalyst prepared from the sequential impregnation method exhibited much higher resistance to hot spot formation in oxidative reforming of methane. Temperature programmed reduction (TPR) with H 2 revealed that the addition of Pt by a sequential impregnation method greatly promoted the reduction of Ni species; furthermore, infrared spectra of CO adsorption suggests that the surface composition of Pt on the catalyst prepared by the sequential method is much higher than that for the catalyst prepared by the co- impregnation method. The surface enrichment of Pt is responsible for the effective overlap between the combustion and reforming zones, and this can enhance the inhibition of hot spot formation. # 2006 Elsevier B.V. All rights reserved. Keywords: Oxidative steam reforming of methane; Pt; Ni; Bimetallic catalyst; Thermograph; Hot spot 1. Introduction In recent years, there has been much interest in the production of hydrogen for highly efficient generation of electricity using fuel cells, where one of the candidates for the hydrogen source is the natural gas composed mainly of methane [1]. At the same time, much attention has been paid to the production of synthesis gas by natural gas reforming which is related to gas to liquid (GTL) technology [2,3]. Steam reforming of methane (Eq. (1)) and other light hydrocarbons is the primary and most important commercial method of synthesis gas production [3–5]. Because of its endothermic nature, external energy cost is necessary. CH 4 þ H 2 O ! CO þ 3H 2 ðDH 298 K ¼þ206 kJ=molÞ (1) In the conventional process, the heat is supplied from the outside the reactor wall by methane combustion, which makes the efficiency of the production process influenced by the heat supplying method. On the other hand, it is well-known that an internal heat supply is more energy-efficient than an external heat supplying system. A famous internal heat supplying system for natural gas reforming is the autothermal reforming process (called ATR), which has been developed by Haldor Topsoe [6,7]. The ATR process consists of the non-catalytic partial oxidation (Eq. (2)), combustion of methane (Eq. (3)), and catalytic reforming of methane (Eq. (1)). CH 4 þ 1 2 O 2 ! CO þ 2H 2 ðDH 298 K ¼36 kJ=molÞ (2) CH 4 þ 2O 2 ! CO 2 þ 2H 2 O ðDH 298 K ¼803 kJ=molÞ (3) One of the important points in ATR is to inhibit the contact of the reforming catalysts with oxygen which causes the sintering of support materials and the aggregation of metal particles. Such results are connected to catalyst deactivation www.elsevier.com/locate/apcata Applied Catalysis A: General 304 (2006) 62–71 * Corresponding author. Tel.: +81 29 853 5030; fax: +81 29 853 5030. E-mail address: [email protected] (K. Tomishige). 0926-860X/$ – see front matter # 2006 Elsevier B.V. All rights reserved. doi:10.1016/j.apcata.2006.02.025
-
Upload
independent -
Category
Documents
-
view
1 -
download
0
Transcript of Temperature profile of catalyst bed during oxidative steam reforming of methane over Pt-Ni...
Temperature profile of catalyst bed during oxidative steam
reforming of methane over Pt-Ni bimetallic catalysts
Baitao Li a, Shigeru Kado a, Yuya Mukainakano a, Mohammad Nurunnabi a,Toshihiro Miyao b, Shuichi Naito b, Kimio Kunimori a, Keiichi Tomishige a,*
a Institute of Materials Science, University of Tsukuba, 1-1-1 Tennodai, Tsukuba, Ibaraki 305-8573, Japanb Department of Applied Chemistry, Faculty of Engineering, Kanagawa University, 3-27-1, Rokkakubashi,
Kanagawa-ku, Yokohama, Kanagawa 221-8686, Japan
Received 20 October 2005; received in revised form 30 January 2006; accepted 7 February 2006
Available online 9 March 2006
Abstract
The catalyst bed temperature during oxidative reforming of methane (CH4/H2O/O2/Ar = 40/30/20/10) at 1123 K and atmospheric pressure was
investigated by infrared thermography over g-Al2O3 supported bimetallic Pt-Ni catalysts prepared by different impregnation methods: co-
impregnation and sequential impregnation. The thermographical results clearly demonstrated that the catalyst bed temperature was strongly
dependent on the preparation method. The bimetallic catalyst prepared from the sequential impregnation method exhibited much higher resistance
to hot spot formation in oxidative reforming of methane. Temperature programmed reduction (TPR) with H2 revealed that the addition of Pt by a
sequential impregnation method greatly promoted the reduction of Ni species; furthermore, infrared spectra of CO adsorption suggests that the
surface composition of Pt on the catalyst prepared by the sequential method is much higher than that for the catalyst prepared by the co-
impregnation method. The surface enrichment of Pt is responsible for the effective overlap between the combustion and reforming zones, and this
can enhance the inhibition of hot spot formation.
# 2006 Elsevier B.V. All rights reserved.
Keywords: Oxidative steam reforming of methane; Pt; Ni; Bimetallic catalyst; Thermograph; Hot spot
www.elsevier.com/locate/apcata
Applied Catalysis A: General 304 (2006) 62–71
1. Introduction
In recent years, there has been much interest in the
production of hydrogen for highly efficient generation of
electricity using fuel cells, where one of the candidates for the
hydrogen source is the natural gas composed mainly of
methane [1]. At the same time, much attention has been paid to
the production of synthesis gas by natural gas reforming which
is related to gas to liquid (GTL) technology [2,3].
Steam reforming of methane (Eq. (1)) and other light
hydrocarbons is the primary and most important commercial
method of synthesis gas production [3–5]. Because of its
endothermic nature, external energy cost is necessary.
CH4 þ H2O!COþ 3H2 ðDH�298 K ¼ þ206 kJ=molÞ (1)
* Corresponding author. Tel.: +81 29 853 5030; fax: +81 29 853 5030.
E-mail address: [email protected] (K. Tomishige).
0926-860X/$ – see front matter # 2006 Elsevier B.V. All rights reserved.
doi:10.1016/j.apcata.2006.02.025
In the conventional process, the heat is supplied from the
outside the reactor wall by methane combustion, which makes
the efficiency of the production process influenced by the heat
supplying method. On the other hand, it is well-known that an
internal heat supply is more energy-efficient than an external
heat supplying system. A famous internal heat supplying
system for natural gas reforming is the autothermal reforming
process (called ATR), which has been developed by Haldor
Topsoe [6,7]. The ATR process consists of the non-catalytic
partial oxidation (Eq. (2)), combustion of methane (Eq. (3)),
and catalytic reforming of methane (Eq. (1)).
CH4 þ 12O2!COþ 2H2 ðDH�298 K ¼ �36 kJ=molÞ (2)
CH4 þ 2O2!CO2 þ 2H2O ðDH�298 K ¼ �803 kJ=molÞ (3)
One of the important points in ATR is to inhibit the contact
of the reforming catalysts with oxygen which causes the
sintering of support materials and the aggregation of metal
particles. Such results are connected to catalyst deactivation
B. Li et al. / Applied Catalysis A: General 304 (2006) 62–71 63
and the large temperature gradient in the catalyst bed [8,9].
Catalytic partial oxidation of methane, shown in Eq. (2), has
advantages such as mild exothermicity, high conversion, high
selectivity, suitable H2/CO ratio and very short residence time
[10–12]. However, even a low conversion to CO generates a
large amount of heat, which leads to the hot spot formation, as
reported previously [13,14]. Oxidative steam reforming of
methane, which is a combination of a catalytic combustion and/
or partial oxidation reaction with reforming reaction, is an
effective and economic internal heat supply process [15–17].
Since the combustion reaction proceeds more rapidly than the
reforming reaction, in the usual cases it occurs near the
catalyst bed inlet where the temperature becomes very high
within a very small thickness; especially when Ni catalyst is
utilized, it can easily be oxidized in the presence of oxygen
and can lose its reforming activity [18–20]. On the other
hand, in the catalyst bed after oxygen is consumed, Ni
species can maintain the metallic state and contribute to the
reforming reaction. This will reasonably result in a very large
temperature gradient because the exothermic and the
endothermic regions are separated [21–23]. Recently, our
group used an infrared thermograph to monitor the surface
temperature and found that Rh and Pt catalysts exhibited
flatter temperature profiles in oxidative steam reforming of
methane reaction than Ni and Pd catalysts [24,25]. This
phenomenon is due to the overlap of the combustion zone with
the reforming zone.
In this research, the oxidative steam reforming of methane
was investigated by infrared thermography over monometallic
Ni and Pt catalysts and over bimetallic Pt-Ni catalysts prepared
by two methods: co-impregnation method and sequential
impregnation method. Various characterization techniques
were applied to determine the surface structures of these
catalysts. The relationship between the catalyst structure and
the bed temperature is discussed in detail.
2. Experimental
2.1. Catalyst preparation
g-Al2O3 support was prepared by calcining commercially
available JRC-ALO-1 (Catalysis Society of Japan,
SBET = 143 m2/g, grain size of 2–3 mm) at 1123 K in the air
for 3 h. The support thus obtained had a specific surface area
of 110 m2/g. Then it was crushed and sieved to particle
sizes between 180 and 250 mm before the impregnation with
the metal components. Supported monometallic Ni and Pt
catalysts were prepared by a wet impregnation method using
Ni(NO3)2�6H2O (Wako Pure Chemical Industries, Ltd., 99.9%)
or H2PtCl6�6H2O (Soekawa Chemical Co., Ltd., 99.9%),
respectively. After removal of the solvent by the evaporation at
353 K, the resulting product was dried in an oven at 383 K
overnight. Subsequently, the sample was calcined at 773 K in
the air for 3 h. Bimetallic Pt-Ni catalysts were prepared by
two methods. One is the sequential (two-step) impregnation
method. The calcined monometallic nickel catalyst was
reduced at 1123 K for 0.5 h under H2 flow, followed by the
impregnation of Pt using the precursor of Pt(C5H7O2)2�H2O
(Soekawa Chemical Co., Ltd., 99.9%) acetone solution. After
the removal of the acetone solvent, the catalyst was dried at
383 K overnight and next calcined in air at 573 K for 3 h.
The catalyst thus prepared is denoted as Pt/Ni/Al2O3. The other
is the co-impregnation method; here the aqueous solution
mixture of Ni(NO3)2�6H2O and H2PtCl6�6H2O was used a
precursor. After co-impregnation, the calcination procedure
was the same as that of monometallic catalyst. This catalyst
thus obtained is denoted as Pt + Ni/Al2O3. The value in
parentheses represents the weight percent of metallic compo-
nents in the catalyst.
2.2. Activity test and thermographical observation
Methane reforming catalytic reaction was conducted under
atmospheric pressure in a continuous fixed-bed quartz reactor
(i.d. 4 mm). Details are explained in our previous report [26].
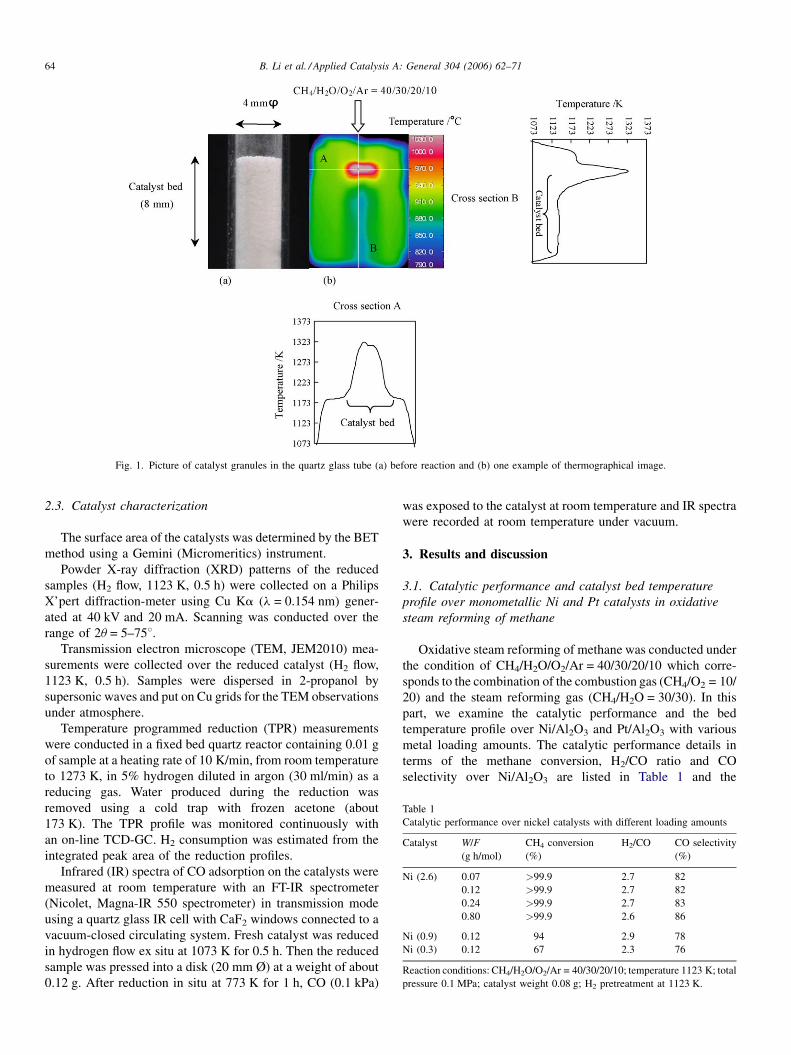
Pictures of catalyst granules with 180–250 mm diameter in the
reactor and one example of a thermographical image are
illustrated in Fig. 1. The quartz reactor had an axial thermowell
(i.d. 1.5 mm) containing a chromel–alumel thermocouple
located at the outlet of the catalyst bed that was used for the
temperature control. An electronic furnace was connected with
this thermo-controller; it had a window (15 mm � 18 mm) for
the observation of the temperature profile of catalyst granules.
The temperature profile was measured with infrared thermo-
graph equipment (TH31, NEC San-ei Instruments Ltd.). As
shown in Fig. 1, the radial temperature gradient was rather flat in
the A cross section, indicating that the gas flowing condition is
close to the plug flow. Therefore, we only show the temperature
profile along the B cross section in Section 3. The catalyst
(0.08 g) was reduced in the hydrogen flow (30 ml/min, 100% H2)
at 1123 K for 0.5 h in the reactor prior to every activity test. After
the reduction, the feed gases with partial pressure ratio CH4/H2O/
O2/Ar = 40/30/20/10 were introduced to the catalyst bed at
various contact times W/F (W (g) = catalyst weight, F (mol/
h) = total flow rate of gases). CH4, O2, Ar and H2 (Takachiho
Trading Co., Ltd.) were research grade and they were used
without further purification. Steam was obtained by vaporizing
distilled water supplied by a feeding pump (MT2111, Moleh
Ltd.). An iced water trap was located at the reactor exit to remove
the steam contained in the effluent gas. The effluent gas was
collected from the sampling port using a micro-syringe and then
analyzed by gas chromatography (Shimadzu GC-14A). This
instrument was equipped with a flame ionization detector (FID)
and a thermal conductivity detector (TCD). The concentrations
of CO, CO2 and CH4 were determined on an FID-GC equipped
with a methanator, using a stainless steel column packed with
Gaskuropack 54; the concentration of H2 was determined by
TCD-GC using a stainless steel column packed with molecular
sieve 13X.
The activity test of methane combustion was performed using
air containing 2% CH4 as the reactant gas (W/F = 0.40 g h/mol)
with 0.09 g catalyst. The measurement was carried out from 523
to 1123 K at the temperature intervals of 50 K. The analysis
method was the same as that described above.
B. Li et al. / Applied Catalysis A: General 304 (2006) 62–7164
Fig. 1. Picture of catalyst granules in the quartz glass tube (a) before reaction and (b) one example of thermographical image.
Table 1
Catalytic performance over nickel catalysts with different loading amounts
Catalyst W/F
(g h/mol)
CH4 conversion
(%)
H2/CO CO selectivity
(%)
Ni (2.6) 0.07 >99.9 2.7 82
0.12 >99.9 2.7 82
0.24 >99.9 2.7 83
0.80 >99.9 2.6 86
Ni (0.9) 0.12 94 2.9 78
Ni (0.3) 0.12 67 2.3 76
Reaction conditions: CH4/H2O/O2/Ar = 40/30/20/10; temperature 1123 K; total
pressure 0.1 MPa; catalyst weight 0.08 g; H2 pretreatment at 1123 K.
2.3. Catalyst characterization
The surface area of the catalysts was determined by the BET
method using a Gemini (Micromeritics) instrument.
Powder X-ray diffraction (XRD) patterns of the reduced
samples (H2 flow, 1123 K, 0.5 h) were collected on a Philips
X’pert diffraction-meter using Cu Ka (l = 0.154 nm) gener-
ated at 40 kV and 20 mA. Scanning was conducted over the
range of 2u = 5–758.Transmission electron microscope (TEM, JEM2010) mea-
surements were collected over the reduced catalyst (H2 flow,
1123 K, 0.5 h). Samples were dispersed in 2-propanol by
supersonic waves and put on Cu grids for the TEM observations
under atmosphere.
Temperature programmed reduction (TPR) measurements
were conducted in a fixed bed quartz reactor containing 0.01 g
of sample at a heating rate of 10 K/min, from room temperature
to 1273 K, in 5% hydrogen diluted in argon (30 ml/min) as a
reducing gas. Water produced during the reduction was
removed using a cold trap with frozen acetone (about
173 K). The TPR profile was monitored continuously with
an on-line TCD-GC. H2 consumption was estimated from the
integrated peak area of the reduction profiles.
Infrared (IR) spectra of CO adsorption on the catalysts were
measured at room temperature with an FT-IR spectrometer
(Nicolet, Magna-IR 550 spectrometer) in transmission mode
using a quartz glass IR cell with CaF2 windows connected to a
vacuum-closed circulating system. Fresh catalyst was reduced
in hydrogen flow ex situ at 1073 K for 0.5 h. Then the reduced
sample was pressed into a disk (20 mm Ø) at a weight of about
0.12 g. After reduction in situ at 773 K for 1 h, CO (0.1 kPa)
was exposed to the catalyst at room temperature and IR spectra
were recorded at room temperature under vacuum.
3. Results and discussion
3.1. Catalytic performance and catalyst bed temperature
profile over monometallic Ni and Pt catalysts in oxidative
steam reforming of methane
Oxidative steam reforming of methane was conducted under
the condition of CH4/H2O/O2/Ar = 40/30/20/10 which corre-
sponds to the combination of the combustion gas (CH4/O2 = 10/
20) and the steam reforming gas (CH4/H2O = 30/30). In this
part, we examine the catalytic performance and the bed
temperature profile over Ni/Al2O3 and Pt/Al2O3 with various
metal loading amounts. The catalytic performance details in
terms of the methane conversion, H2/CO ratio and CO
selectivity over Ni/Al2O3 are listed in Table 1 and the
B. Li et al. / Applied Catalysis A: General 304 (2006) 62–71 65
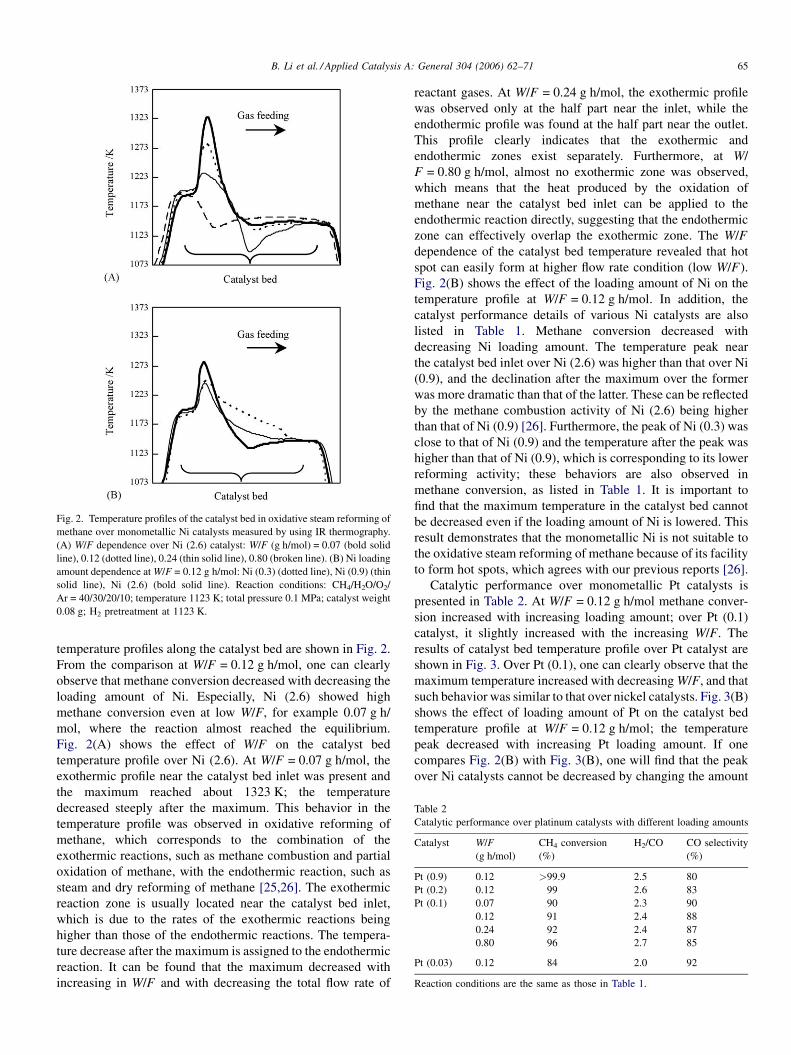
Fig. 2. Temperature profiles of the catalyst bed in oxidative steam reforming of
methane over monometallic Ni catalysts measured by using IR thermography.
(A) W/F dependence over Ni (2.6) catalyst: W/F (g h/mol) = 0.07 (bold solid
line), 0.12 (dotted line), 0.24 (thin solid line), 0.80 (broken line). (B) Ni loading
amount dependence at W/F = 0.12 g h/mol: Ni (0.3) (dotted line), Ni (0.9) (thin
solid line), Ni (2.6) (bold solid line). Reaction conditions: CH4/H2O/O2/
Ar = 40/30/20/10; temperature 1123 K; total pressure 0.1 MPa; catalyst weight
0.08 g; H2 pretreatment at 1123 K.
Table 2
Catalytic performance over platinum catalysts with different loading amounts
Catalyst W/F
(g h/mol)
CH4 conversion
(%)
H2/CO CO selectivity
(%)
Pt (0.9) 0.12 >99.9 2.5 80
Pt (0.2) 0.12 99 2.6 83
Pt (0.1) 0.07 90 2.3 90
0.12 91 2.4 88
0.24 92 2.4 87
0.80 96 2.7 85
Pt (0.03) 0.12 84 2.0 92
Reaction conditions are the same as those in Table 1.
temperature profiles along the catalyst bed are shown in Fig. 2.
From the comparison at W/F = 0.12 g h/mol, one can clearly
observe that methane conversion decreased with decreasing the
loading amount of Ni. Especially, Ni (2.6) showed high
methane conversion even at low W/F, for example 0.07 g h/
mol, where the reaction almost reached the equilibrium.
Fig. 2(A) shows the effect of W/F on the catalyst bed
temperature profile over Ni (2.6). At W/F = 0.07 g h/mol, the
exothermic profile near the catalyst bed inlet was present and
the maximum reached about 1323 K; the temperature
decreased steeply after the maximum. This behavior in the
temperature profile was observed in oxidative reforming of
methane, which corresponds to the combination of the
exothermic reactions, such as methane combustion and partial
oxidation of methane, with the endothermic reaction, such as
steam and dry reforming of methane [25,26]. The exothermic
reaction zone is usually located near the catalyst bed inlet,
which is due to the rates of the exothermic reactions being
higher than those of the endothermic reactions. The tempera-
ture decrease after the maximum is assigned to the endothermic
reaction. It can be found that the maximum decreased with
increasing in W/F and with decreasing the total flow rate of
reactant gases. At W/F = 0.24 g h/mol, the exothermic profile
was observed only at the half part near the inlet, while the
endothermic profile was found at the half part near the outlet.
This profile clearly indicates that the exothermic and
endothermic zones exist separately. Furthermore, at W/
F = 0.80 g h/mol, almost no exothermic zone was observed,
which means that the heat produced by the oxidation of
methane near the catalyst bed inlet can be applied to the
endothermic reaction directly, suggesting that the endothermic
zone can effectively overlap the exothermic zone. The W/F
dependence of the catalyst bed temperature revealed that hot
spot can easily form at higher flow rate condition (low W/F).
Fig. 2(B) shows the effect of the loading amount of Ni on the
temperature profile at W/F = 0.12 g h/mol. In addition, the
catalyst performance details of various Ni catalysts are also
listed in Table 1. Methane conversion decreased with
decreasing Ni loading amount. The temperature peak near
the catalyst bed inlet over Ni (2.6) was higher than that over Ni
(0.9), and the declination after the maximum over the former
was more dramatic than that of the latter. These can be reflected
by the methane combustion activity of Ni (2.6) being higher
than that of Ni (0.9) [26]. Furthermore, the peak of Ni (0.3) was
close to that of Ni (0.9) and the temperature after the peak was
higher than that of Ni (0.9), which is corresponding to its lower
reforming activity; these behaviors are also observed in
methane conversion, as listed in Table 1. It is important to
find that the maximum temperature in the catalyst bed cannot
be decreased even if the loading amount of Ni is lowered. This
result demonstrates that the monometallic Ni is not suitable to
the oxidative steam reforming of methane because of its facility
to form hot spots, which agrees with our previous reports [26].
Catalytic performance over monometallic Pt catalysts is
presented in Table 2. At W/F = 0.12 g h/mol methane conver-
sion increased with increasing loading amount; over Pt (0.1)
catalyst, it slightly increased with the increasing W/F. The
results of catalyst bed temperature profile over Pt catalyst are
shown in Fig. 3. Over Pt (0.1), one can clearly observe that the
maximum temperature increased with decreasing W/F, and that
such behavior was similar to that over nickel catalysts. Fig. 3(B)
shows the effect of loading amount of Pt on the catalyst bed
temperature profile at W/F = 0.12 g h/mol; the temperature
peak decreased with increasing Pt loading amount. If one
compares Fig. 2(B) with Fig. 3(B), one will find that the peak
over Ni catalysts cannot be decreased by changing the amount
B. Li et al. / Applied Catalysis A: General 304 (2006) 62–7166
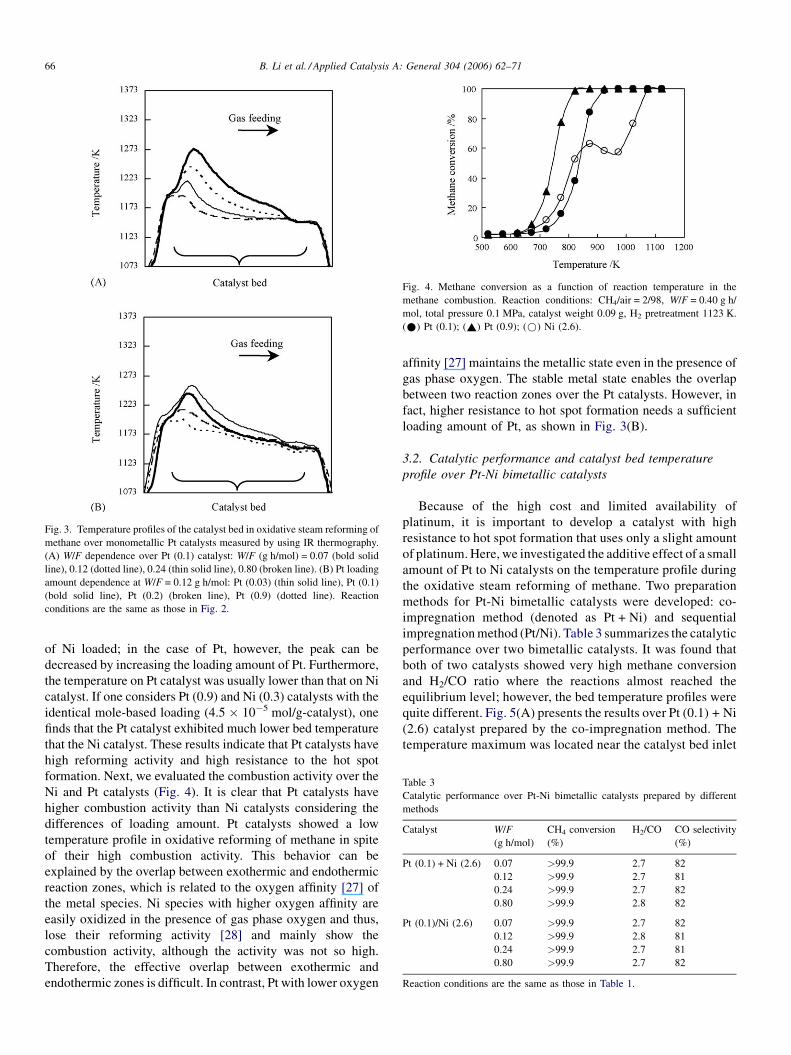
Fig. 3. Temperature profiles of the catalyst bed in oxidative steam reforming of
methane over monometallic Pt catalysts measured by using IR thermography.
(A) W/F dependence over Pt (0.1) catalyst: W/F (g h/mol) = 0.07 (bold solid
line), 0.12 (dotted line), 0.24 (thin solid line), 0.80 (broken line). (B) Pt loading
amount dependence at W/F = 0.12 g h/mol: Pt (0.03) (thin solid line), Pt (0.1)
(bold solid line), Pt (0.2) (broken line), Pt (0.9) (dotted line). Reaction
conditions are the same as those in Fig. 2.
Fig. 4. Methane conversion as a function of reaction temperature in the
methane combustion. Reaction conditions: CH4/air = 2/98, W/F = 0.40 g h/
mol, total pressure 0.1 MPa, catalyst weight 0.09 g, H2 pretreatment 1123 K.
(*) Pt (0.1); (~) Pt (0.9); (*) Ni (2.6).
Table 3
Catalytic performance over Pt-Ni bimetallic catalysts prepared by different
methods
Catalyst W/F
(g h/mol)
CH4 conversion
(%)
H2/CO CO selectivity
(%)
Pt (0.1) + Ni (2.6) 0.07 >99.9 2.7 82
0.12 >99.9 2.7 81
0.24 >99.9 2.7 82
0.80 >99.9 2.8 82
Pt (0.1)/Ni (2.6) 0.07 >99.9 2.7 82
0.12 >99.9 2.8 81
0.24 >99.9 2.7 81
0.80 >99.9 2.7 82
Reaction conditions are the same as those in Table 1.
of Ni loaded; in the case of Pt, however, the peak can be
decreased by increasing the loading amount of Pt. Furthermore,
the temperature on Pt catalyst was usually lower than that on Ni
catalyst. If one considers Pt (0.9) and Ni (0.3) catalysts with the
identical mole-based loading (4.5 � 10�5 mol/g-catalyst), one
finds that the Pt catalyst exhibited much lower bed temperature
that the Ni catalyst. These results indicate that Pt catalysts have
high reforming activity and high resistance to the hot spot
formation. Next, we evaluated the combustion activity over the
Ni and Pt catalysts (Fig. 4). It is clear that Pt catalysts have
higher combustion activity than Ni catalysts considering the
differences of loading amount. Pt catalysts showed a low
temperature profile in oxidative reforming of methane in spite
of their high combustion activity. This behavior can be
explained by the overlap between exothermic and endothermic
reaction zones, which is related to the oxygen affinity [27] of
the metal species. Ni species with higher oxygen affinity are
easily oxidized in the presence of gas phase oxygen and thus,
lose their reforming activity [28] and mainly show the
combustion activity, although the activity was not so high.
Therefore, the effective overlap between exothermic and
endothermic zones is difficult. In contrast, Pt with lower oxygen
affinity [27] maintains the metallic state even in the presence of
gas phase oxygen. The stable metal state enables the overlap
between two reaction zones over the Pt catalysts. However, in
fact, higher resistance to hot spot formation needs a sufficient
loading amount of Pt, as shown in Fig. 3(B).
3.2. Catalytic performance and catalyst bed temperature
profile over Pt-Ni bimetallic catalysts
Because of the high cost and limited availability of
platinum, it is important to develop a catalyst with high
resistance to hot spot formation that uses only a slight amount
of platinum. Here, we investigated the additive effect of a small
amount of Pt to Ni catalysts on the temperature profile during
the oxidative steam reforming of methane. Two preparation
methods for Pt-Ni bimetallic catalysts were developed: co-
impregnation method (denoted as Pt + Ni) and sequential
impregnation method (Pt/Ni). Table 3 summarizes the catalytic
performance over two bimetallic catalysts. It was found that
both of two catalysts showed very high methane conversion
and H2/CO ratio where the reactions almost reached the
equilibrium level; however, the bed temperature profiles were
quite different. Fig. 5(A) presents the results over Pt (0.1) + Ni
(2.6) catalyst prepared by the co-impregnation method. The
temperature maximum was located near the catalyst bed inlet
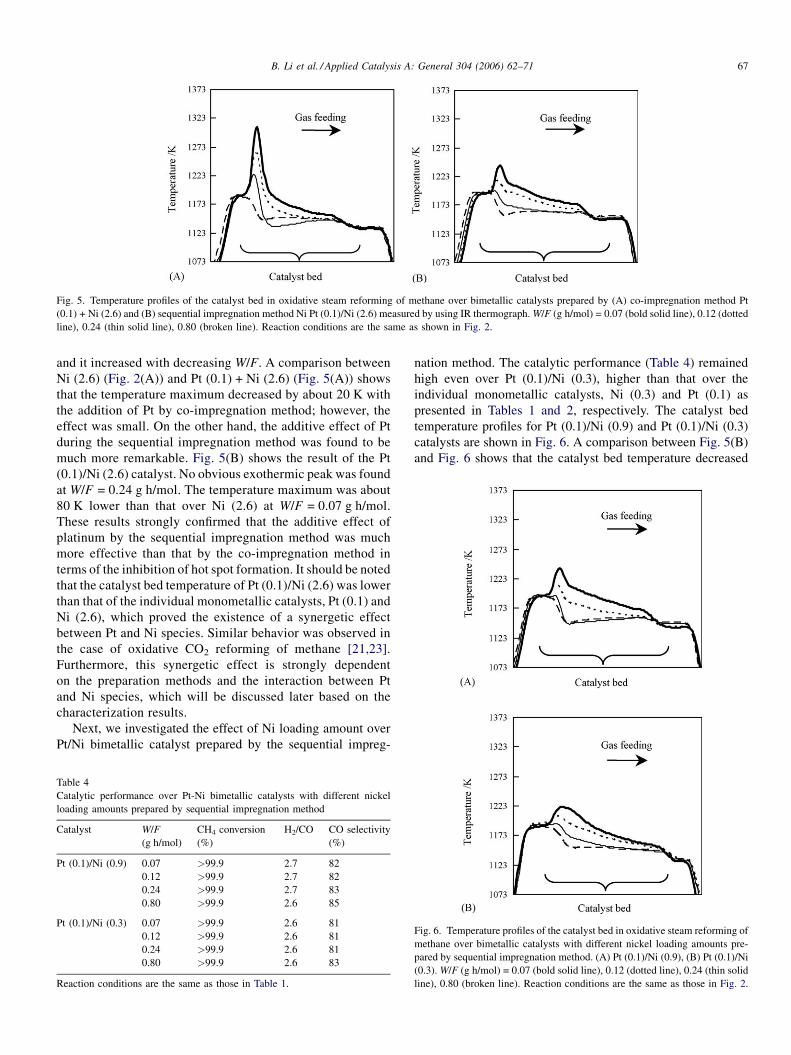
B. Li et al. / Applied Catalysis A: General 304 (2006) 62–71 67
Fig. 5. Temperature profiles of the catalyst bed in oxidative steam reforming of methane over bimetallic catalysts prepared by (A) co-impregnation method Pt
(0.1) + Ni (2.6) and (B) sequential impregnation method Ni Pt (0.1)/Ni (2.6) measured by using IR thermograph. W/F (g h/mol) = 0.07 (bold solid line), 0.12 (dotted
line), 0.24 (thin solid line), 0.80 (broken line). Reaction conditions are the same as shown in Fig. 2.
and it increased with decreasing W/F. A comparison between
Ni (2.6) (Fig. 2(A)) and Pt (0.1) + Ni (2.6) (Fig. 5(A)) shows
that the temperature maximum decreased by about 20 K with
the addition of Pt by co-impregnation method; however, the
effect was small. On the other hand, the additive effect of Pt
during the sequential impregnation method was found to be
much more remarkable. Fig. 5(B) shows the result of the Pt
(0.1)/Ni (2.6) catalyst. No obvious exothermic peak was found
at W/F = 0.24 g h/mol. The temperature maximum was about
80 K lower than that over Ni (2.6) at W/F = 0.07 g h/mol.
These results strongly confirmed that the additive effect of
platinum by the sequential impregnation method was much
more effective than that by the co-impregnation method in
terms of the inhibition of hot spot formation. It should be noted
that the catalyst bed temperature of Pt (0.1)/Ni (2.6) was lower
than that of the individual monometallic catalysts, Pt (0.1) and
Ni (2.6), which proved the existence of a synergetic effect
between Pt and Ni species. Similar behavior was observed in
the case of oxidative CO2 reforming of methane [21,23].
Furthermore, this synergetic effect is strongly dependent
on the preparation methods and the interaction between Pt
and Ni species, which will be discussed later based on the
characterization results.
Next, we investigated the effect of Ni loading amount over
Pt/Ni bimetallic catalyst prepared by the sequential impreg-
Table 4
Catalytic performance over Pt-Ni bimetallic catalysts with different nickel
loading amounts prepared by sequential impregnation method
Catalyst W/F
(g h/mol)
CH4 conversion
(%)
H2/CO CO selectivity
(%)
Pt (0.1)/Ni (0.9) 0.07 >99.9 2.7 82
0.12 >99.9 2.7 82
0.24 >99.9 2.7 83
0.80 >99.9 2.6 85
Pt (0.1)/Ni (0.3) 0.07 >99.9 2.6 81
0.12 >99.9 2.6 81
0.24 >99.9 2.6 81
0.80 >99.9 2.6 83
Reaction conditions are the same as those in Table 1.
nation method. The catalytic performance (Table 4) remained
high even over Pt (0.1)/Ni (0.3), higher than that over the
individual monometallic catalysts, Ni (0.3) and Pt (0.1) as
presented in Tables 1 and 2, respectively. The catalyst bed
temperature profiles for Pt (0.1)/Ni (0.9) and Pt (0.1)/Ni (0.3)
catalysts are shown in Fig. 6. A comparison between Fig. 5(B)
and Fig. 6 shows that the catalyst bed temperature decreased
Fig. 6. Temperature profiles of the catalyst bed in oxidative steam reforming of
methane over bimetallic catalysts with different nickel loading amounts pre-
pared by sequential impregnation method. (A) Pt (0.1)/Ni (0.9), (B) Pt (0.1)/Ni
(0.3). W/F (g h/mol) = 0.07 (bold solid line), 0.12 (dotted line), 0.24 (thin solid
line), 0.80 (broken line). Reaction conditions are the same as those in Fig. 2.
B. Li et al. / Applied Catalysis A: General 304 (2006) 62–7168
Table 5
Catalyst properties of monometallic and bimetallic catalysts
Catalyst BET surface areaa (m2/g-catalyst) Particle size of Nia (nm) Metal dispersionb (%) Reduction degreec (%)
XRDd TEMe
Pt (0.1) 109 – – – –
Ni (2.6) 104 5.2 � 0.6 4.8 � 0.4 19 102
Pt (0.1) + Ni (2.6) 101 5.6 � 0.6 4.5 � 0.4 17 96
Pt (0.1)/Ni (2.6) 104 4.8 � 0.6 5.0 � 0.4 20 104
a Reduced in H2 flow at 1123 K, 0.5 h.b Determined by XRD results [34].c Determined from TPR results.d Evaluated by Ni(2 0 0) at 51.88 [32]. Calculated from Scherrer equation, using the half-width at half-height of the peak [33].e Calculated according to Ref. [34]. Mean diameter ðdsÞ ¼
Pnid
3i =P
nid2i , in which ni is the number of particles having a characteristic diameter di (within a given
diameter range).
significantly with decreasing Ni loading amount. An important
and meaningful temperature profile was observed over Pt (0.1)/
Ni (0.3), which gave a comparable temperature profile to that of
Pt (0.2) (Fig. 3(B)) at W/F = 0.12 g h/mol. This tendency
suggests that bimetallic catalyst with lower nickel loading
prepared by sequential method is a good substitute for a Pt
catalyst with higher metal component content.
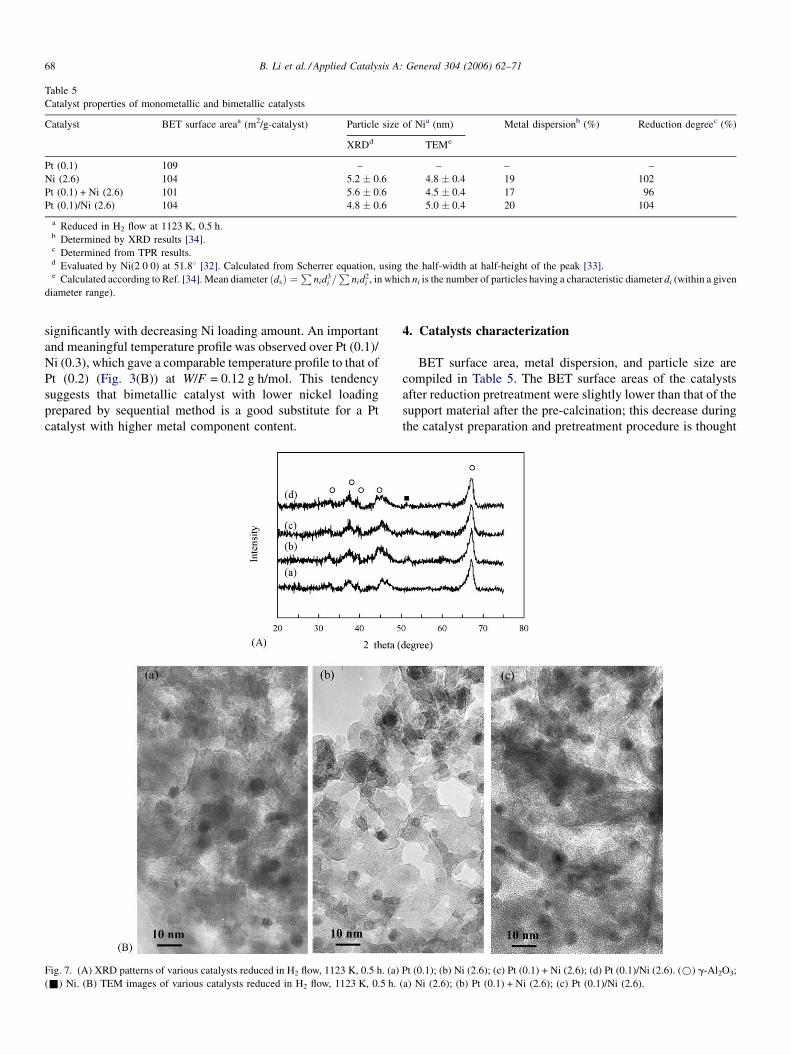
Fig. 7. (A) XRD patterns of various catalysts reduced in H2 flow, 1123 K, 0.5 h. (a)
(&) Ni. (B) TEM images of various catalysts reduced in H2 flow, 1123 K, 0.5 h.
4. Catalysts characterization
BET surface area, metal dispersion, and particle size are
compiled in Table 5. The BET surface areas of the catalysts
after reduction pretreatment were slightly lower than that of the
support material after the pre-calcination; this decrease during
the catalyst preparation and pretreatment procedure is thought
Pt (0.1); (b) Ni (2.6); (c) Pt (0.1) + Ni (2.6); (d) Pt (0.1)/Ni (2.6). (*) g-Al2O3;
(a) Ni (2.6); (b) Pt (0.1) + Ni (2.6); (c) Pt (0.1)/Ni (2.6).
B. Li et al. / Applied Catalysis A: General 304 (2006) 62–71 69
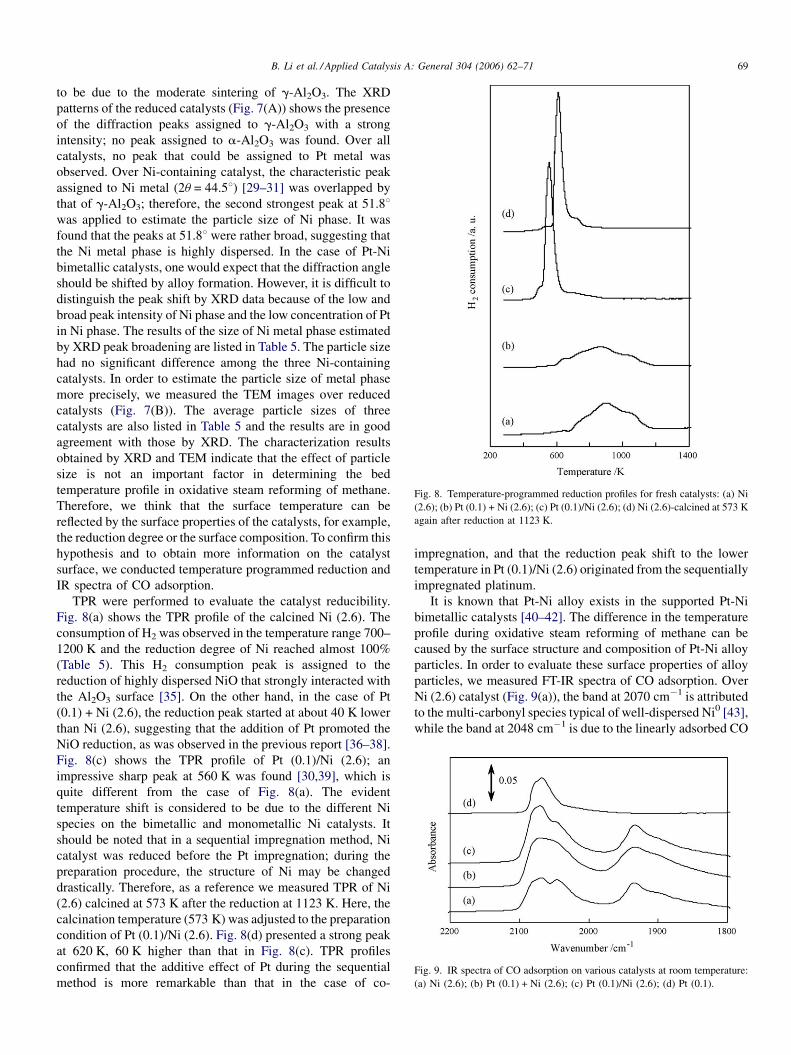
Fig. 8. Temperature-programmed reduction profiles for fresh catalysts: (a) Ni
(2.6); (b) Pt (0.1) + Ni (2.6); (c) Pt (0.1)/Ni (2.6); (d) Ni (2.6)-calcined at 573 K
again after reduction at 1123 K.
Fig. 9. IR spectra of CO adsorption on various catalysts at room temperature:
(a) Ni (2.6); (b) Pt (0.1) + Ni (2.6); (c) Pt (0.1)/Ni (2.6); (d) Pt (0.1).
to be due to the moderate sintering of g-Al2O3. The XRD
patterns of the reduced catalysts (Fig. 7(A)) shows the presence
of the diffraction peaks assigned to g-Al2O3 with a strong
intensity; no peak assigned to a-Al2O3 was found. Over all
catalysts, no peak that could be assigned to Pt metal was
observed. Over Ni-containing catalyst, the characteristic peak
assigned to Ni metal (2u = 44.58) [29–31] was overlapped by
that of g-Al2O3; therefore, the second strongest peak at 51.88was applied to estimate the particle size of Ni phase. It was
found that the peaks at 51.88 were rather broad, suggesting that
the Ni metal phase is highly dispersed. In the case of Pt-Ni
bimetallic catalysts, one would expect that the diffraction angle
should be shifted by alloy formation. However, it is difficult to
distinguish the peak shift by XRD data because of the low and
broad peak intensity of Ni phase and the low concentration of Pt
in Ni phase. The results of the size of Ni metal phase estimated
by XRD peak broadening are listed in Table 5. The particle size
had no significant difference among the three Ni-containing
catalysts. In order to estimate the particle size of metal phase
more precisely, we measured the TEM images over reduced
catalysts (Fig. 7(B)). The average particle sizes of three
catalysts are also listed in Table 5 and the results are in good
agreement with those by XRD. The characterization results
obtained by XRD and TEM indicate that the effect of particle
size is not an important factor in determining the bed
temperature profile in oxidative steam reforming of methane.
Therefore, we think that the surface temperature can be
reflected by the surface properties of the catalysts, for example,
the reduction degree or the surface composition. To confirm this
hypothesis and to obtain more information on the catalyst
surface, we conducted temperature programmed reduction and
IR spectra of CO adsorption.
TPR were performed to evaluate the catalyst reducibility.
Fig. 8(a) shows the TPR profile of the calcined Ni (2.6). The
consumption of H2 was observed in the temperature range 700–
1200 K and the reduction degree of Ni reached almost 100%
(Table 5). This H2 consumption peak is assigned to the
reduction of highly dispersed NiO that strongly interacted with
the Al2O3 surface [35]. On the other hand, in the case of Pt
(0.1) + Ni (2.6), the reduction peak started at about 40 K lower
than Ni (2.6), suggesting that the addition of Pt promoted the
NiO reduction, as was observed in the previous report [36–38].
Fig. 8(c) shows the TPR profile of Pt (0.1)/Ni (2.6); an
impressive sharp peak at 560 K was found [30,39], which is
quite different from the case of Fig. 8(a). The evident
temperature shift is considered to be due to the different Ni
species on the bimetallic and monometallic Ni catalysts. It
should be noted that in a sequential impregnation method, Ni
catalyst was reduced before the Pt impregnation; during the
preparation procedure, the structure of Ni may be changed
drastically. Therefore, as a reference we measured TPR of Ni
(2.6) calcined at 573 K after the reduction at 1123 K. Here, the
calcination temperature (573 K) was adjusted to the preparation
condition of Pt (0.1)/Ni (2.6). Fig. 8(d) presented a strong peak
at 620 K, 60 K higher than that in Fig. 8(c). TPR profiles
confirmed that the additive effect of Pt during the sequential
method is more remarkable than that in the case of co-
impregnation, and that the reduction peak shift to the lower
temperature in Pt (0.1)/Ni (2.6) originated from the sequentially
impregnated platinum.
It is known that Pt-Ni alloy exists in the supported Pt-Ni
bimetallic catalysts [40–42]. The difference in the temperature
profile during oxidative steam reforming of methane can be
caused by the surface structure and composition of Pt-Ni alloy
particles. In order to evaluate these surface properties of alloy
particles, we measured FT-IR spectra of CO adsorption. Over
Ni (2.6) catalyst (Fig. 9(a)), the band at 2070 cm�1 is attributed
to the multi-carbonyl species typical of well-dispersed Ni0 [43],
while the band at 2048 cm�1 is due to the linearly adsorbed CO
B. Li et al. / Applied Catalysis A: General 304 (2006) 62–7170
[43,44]. The band at the lower frequency, i.e., 1930 cm�1, is
assigned to the bridged adsorbed CO [45]. For the mono-
metallic platinum catalyst (Fig. 9(d)), only one band was
observed at 2070 cm�1; this is assigned to linear CO [46–48].
We found that the band of the linear CO on Pt has almost the
same position as that of multi-carbonyl species of Ni.
Therefore, the relative intensity of the band was taken into
account for the peak assignment in the bimetal catalysts. In the
case of Pt (0.1) + Ni (2.6) catalyst (Fig. 9(b)), two broad bands
at 2070 and 2048 cm�1 were observed at the same intensity,
which was similar to the spectrum of Ni (2.6). On the other
hand, over Pt (0.1)/Ni (2.6) catalyst (Fig. 9(c)), the intensity of
the 2070 cm�1 band was much higher than that of the
2048 cm�1 band, suggesting that a significant amount of Pt
atoms are located on the catalyst prepared by the sequential
impregnation method. The similarity of Pt (0.1) + Ni (2.6) and
Ni (2.6) indicates that the ratio of Pt on the surface in Pt
(0.1) + Ni (2.6) is much lower than that in Pt (0.1)/Ni (2.6). This
means that the sequential impregnation method is more
effective than the co-impregnation method in terms of the
surface modification, even with a small amount of Pt.
A surface segregation phenomenon of Pt atoms was often
found in Pt-Ni alloy [49–51]. However, this effect is not so
significant on the catalyst prepared by the co-impregnation
method, due to the very low composition of Pt to Ni (molar ratio
Pt/Ni = 1/100). In contrast, the surface concentration of Pt is
enhanced by the sequential impregnation method, although the
average composition of Pt to Ni was just the same as that for the
co-impregnation method. The effect of preparation methods
can be explained on the basis of the TPR profiles. From the TPR
profile of Pt (0.1) + Ni (2.6) (Fig. 8(b)), one can deduce that Ni
interacted with Al2O3 support surface and that the Ni species is
reduced slowly even in the presence of Pt. Since the reducibility
of Pt is high, Ni species is gradually reduced after the reduction
of Pt, suggesting that Pt species can be covered with reduced Ni
species. This would induce the low composition of surface Pt.
In contrast, the TPR profile of Ni species without Pt (Fig. 8(d))
gave a sharp peak at much lower temperature than that of Ni
(2.6), suggesting that NiO formed on the surface and that the
interaction between NiO species and the support surface was
rather weak. The sharp peak at much lower temperature in Pt
(0.1)/Ni (2.6) (Fig. 8(c)) showed that the introduction of Pt
promoted the reduction of this NiO species, and that NiO
particles were reduced directly to Ni metal particles, thus
inhibiting the mixing of Pt with Ni species and leading to the
high surface composition of Pt. Further investigations are
necessary for the structural analysis of the Pt-Ni bimetallic
catalysts; however, we can conclude that the addition of Pt to
Ni/Al2O3 catalysts by the sequential impregnation method is
very effective for the inhibition of the hot spot formation in
oxidative reforming of methane and that the preparation
methodology ensured the surface enrichment of Pt.
5. Conclusions
(1) In the oxidative steam reforming of methane (CH4/H2O/O2/
Ar = 40/30/20/10), Ni catalysts showed the presence of an
exothermic reaction at the catalyst bed inlet; the
endothermic reaction zone and the exothermic zone are
present separately, exhibiting a large temperature gradient
in the catalyst bed. The maximum of the bed temperature
cannot be decreased by the decrease of Ni loading amount.
(2) M
onometallic Pt catalyst gave a much smaller temperaturegradient than Ni catalysts, attributable to the overlap
between the endothermic and exothermic reaction zones.
The inhibition of hot spots is dependent on the loading
amount of Pt, and the catalyst with a small amount of Pt did
not have a significant effect.
(3) T
he addition of small amount of Pt to Ni/Al2O3 waseffective for the inhibition of hot spot formation. The two
bimetallic Pt-Ni catalysts investigated showed different
temperature profiles. The effect of adding small amounts of
Pt to Ni/Al2O3 was strongly dependent on the preparation
method and the addition by a sequential impregnation
method had a more remarkable effect than that by a co-
impregnation method.
(4) C
haracterizations of monometallic and bimetallic catalystsby means of XRD, TEM, TPR and FT-IR of CO adsorption
suggest that the introduction of Pt by a sequential
impregnation leads to the efficient surface modification
even with a small amount of Pt, showing the high Pt surface
composition.
Acknowledgement
This study was supported by the Industrial Technology
Research Grant Program (05A43002C) from the New Energy
and Industrial Technology Development Organization (NEDO)
of Japan.
References
[1] J.R. Rostrup-Nielsen, Catal. Rev. Sci. Eng. 46 (2004) 247.
[2] J.R. Rostrup-Nielsen, J. Sehested, J.K. Norskov, Adv. Catal. 47 (2002) 65.
[3] J.R. Rostrup-Nielsen, Catalysis: Science and Technology, vol. 5,
Springer-Verlag, New York, 1984.
[4] K. Aasberg-Petersen, J.-H. Bak Hansen, T.S. Christensen, I. Dybkjaer, P.
Seier Christensen, C. Stub Nielsen, S.E.L. Winter Madsen, J.R. Rostrup-
Nielsen, Appl. Catal. A 221 (2001) 379.
[5] M.C.J. Bradford, M.A. Vannice, Catal. Rev. Sci. Eng. 41 (1999) 1.
[6] J.R. Rostrup-Nielsen, Sekiyu Gakkaishi 40 (1997) 366.
[7] J.R. Rostrup-Nielsen, Catal. Today 71 (2002) 243.
[8] A.M. O‘Connor, J.R.H. Ross, Catal. Today 46 (1998) 203.
[9] D. Dissanayake, M.P. Rosynek, J.H. Lunsford, J. Phys. Chem. 97 (1993)
3644.
[10] Y.H. Hu, E. Ruckenstein, Adv. Catal. 48 (2004) 297.
[11] D.A. Hickman, L.D. Schmidt, Science 259 (1993) 343.
[12] D.A. Hickman, L.D. Schmidt, AIChE J. 39 (1993) 1164.
[13] A.M. De Groote, G.F. Froment, Appl. Catal. A: Gen. 138 (1996) 245.
[14] F. Basile, G. Fornasari, F. Trifiro, A. Vaccari, Catal. Today 64 (2001)
21.
[15] K. Takehira, T. Shishido, P. Wang, T. Kosaka, K. Takaki, J. Catal. 221
(2004) 43.
[16] B. Li, R. Watanabe, K. Maruyama, M. Nurunnabi, K. Kunimori, K.
Tomishige, Catal. Today 104 (2005) 7.
[17] K. Nagaoka, A. Jentys, J.A. Lercher, J. Catal. 229 (2005) 185.
[18] D. Dissanayake, M.P. Rosynek, K.C.C. Kharas, J.H. Lunsford, J. Catal.
132 (1991) 117.
B. Li et al. / Applied Catalysis A: General 304 (2006) 62–71 71
[19] B. Li, K. Maruyama, M. Nurunnabi, K. Kunimori, K. Tomishige, Ind. Eng.
Chem. Res. 44 (2005) 485.
[20] K. Tomishige, Y. Matsuo, M. Asadullah, Y. Yoshinaga, Y. Sekine, K.
Fujimoto, ACS Sym. Ser. 809 (2002) 303.
[21] K. Tomishige, S. Kanazawa, M. Sato, K. Ikushima, K. Kunimori, Catal.
Lett. 84 (2002) 69.
[22] K. Tomishige, M. Nurunnabi, K. Maruyama, K. Kunimori, Fuel Process.
Technol. 85 (2004) 1103.
[23] K. Tomishige, S. Kanazawa, S. Ito, K. Kunimori, Appl. Catal. A 244
(2003) 71.
[24] B. Li, K. Maruyama, M. Nurunnabi, K. Kunimori, K. Tomishige, Appl.
Catal. A 275 (2004) 71.
[25] K. Tomishige, S. Kanazawa, K. Suzuki, M. Asadullah, M. Sato, K.
Ikushima, K. Kunimori, Appl. Catal. A 233 (2002) 35.
[26] B. Li, R. Watanabe, K. Maruyama, M. Nurunnabi, K. Kunimori, K.
Tomishige, Appl. Catal. A 290 (2005) 36.
[27] T.B. Reed, Free Energy Formation of Binary Compounds, MIT Press,
Cambridge, 1971.
[28] O. Yamazaki, K. Tomishige, K. Fujimoto, Appl. Catal. A 136 (1996) 49.
[29] J.H. Lee, E.G. Lee, O.S. Joo, K.D. Jung, Appl. Catal. A 269 (2004) 1.
[30] Y.-J. Chu, Z.-B. Wei, S.-W. Yang, C. Li, Q. Xin, E.-Z. Min, Appl. Catal. A
176 (1999) 17.
[31] J.-C. Zhang, Y.-H. Wang, R.-Y. Ma, D.-Y. Wu, Appl. Catal. A 243 (2003)
251.
[32] H.-Z. Hou, O. Yokota, T. Tanaka, T. Yashima, Catal. Lett. 89 (2003) 121.
[33] H.P. Klug, L.E. Alexander, X-ray Diffraction Procedure, Wiley, New
York, 1974.
[34] D.G. Mustard, C.H. Bartholomew, J. Catal. 67 (1981) 186.
[35] J. Wang, L. Dong, Y.-H. Hu, G.-S. Zheng, Z. Hu, Y. Chen, J. Solid State
Chem. 157 (2001) 274.
[36] Y.-G. Chen, O. Yamazaki, K. Tomishige, K. Fujimoto, Catal. Lett. 39
(1999) 91.
[37] M. Nurunnabi, B. Li, K. Kunimori, K. Suzuki, K.-I. Fujimoto, K.
Tomishige, Appl. Catal. A 292 (2005) 272.
[38] M. Nurunnabi, B. Li, K. Kunimori, K. Suzuki, K.-I. Fujimoto, K.
Tomishige, Catal. Lett. 103 (2005) 277.
[39] S.-B. Wang, G.-Q. Lu, Appl. Catal. A 169 (1998) 271.
[40] Y.-G. Chen, K. Tomishige, K. Yokoyama, K. Fujimoto, Appl. Catal. A 165
(1997) 335.
[41] H. Yang, C. Coutanceau, J.M. Leger, N. Alonso-Vante, C. Lamy, J.
Electroanal. Chem. 576 (2005) 305.
[42] S. Mukerjee, S. Srinivasan, M.P. Soriaga, J. McBreen, J. Electrochem.
Soc. 142 (1995) 1409.
[43] G. Poncelet, M.A. Centeno, R. Molina, Appl. Catal. A 288 (2005) 232.
[44] C. Hu, Y. Chen, P. Li, H. Min, Y. Chen, A. Tian, J. Mol. Catal. A 110
(1996) 163.
[45] T. Ueckert, R. Lamber, N.I. Jaeger, U. Schubert, Appl. Catal. A 155 (1997)
75.
[46] X. Li, X. You, P. Ying, J. Xiao, C. Li, Top. Catal. 25 (2003) 63.
[47] E.L. Jablonski, A.A. Castro, O.A. Scelza, S.R. de Miguel, Appl. Catal. A
183 (1999) 189.
[48] D. Liu, G.-H. Que, Z.-X. Wang, Z.-F. Yan, Catal. Today 68 (2001) 155.
[49] K. Haug, M. Lin, N.J. Lonergan, J. Phys. Chem. B 109 (2005) 14557.
[50] G.F. Wang, M.A. Van Hove, P.N. Ross, M.I. Baskes, J. Chem. Phys. 122
(2005) 024706.
[51] T. Jacob, B.V. Merinov, W.A. Goddard, Chem. Phys. Lett. 385 (2004) 374.