Pakistan Reforming Provincial Finances in the Context of ...
170
Report No. 21362-PAK Pakistan Reforming Provincial Finances in the Context of Devolution An Eight PointAgenda November 10, 2000 Poverty Reduction and Economic Management Unit South AsiaRegion Documentof the World Bank Public Disclosure Authorized Public Disclosure Authorized Public Disclosure Authorized Public Disclosure Authorized
-
Upload
khangminh22 -
Category
Documents
-
view
1 -
download
0
Transcript of Pakistan Reforming Provincial Finances in the Context of ...

Report No. 21362-PAK
PakistanReforming Provincial Financesin the Context of DevolutionAn Eight Point Agenda
November 10, 2000
Poverty Reduction and Economic Management UnitSouth Asia Region
Document of the World Bank
Pub
lic D
iscl
osur
e A
utho
rized
Pub
lic D
iscl
osur
e A
utho
rized
Pub
lic D
iscl
osur
e A
utho
rized
Pub
lic D
iscl
osur
e A
utho
rized

CURRENCY EQUIVALENTS
Currency Unit US$ 1 = Pakistan Rupees (Rs) at Official Exchange Rate= 25.895 1992/93= 30.164 1993/94= 30.852 1994/95= 33.563 1995/96= 38.994 1996/97= 43.196i 1997/98= 46.74:5 1998/99= J51.885 1999/00 at Floating Inter-Bank Exchange Rate
FISCALYEAR (FY)July 1 - June 30
Vice President: Mieko NishimizuCountry Director: John W. WallSector Director: Roberto ZaghaTeam Leader: Williarn ByrdTask Leader: Hanid Mukhtar

LIST OF ACRONYMS
ACR Annual Confidential ReportADP Annual Development ProgramAG Auditor GeneralAIT Agricultural Income TaxARV Annual Rental ValueAWB Area Water BoardBFP Budget Framework PaperBOR Boards of RevenueCDL Cash Development LoanDAO District Accounts Offico,rDC District CouncilDDO Drawing and Disbursing OfficerDG Director GeneralDG District governmentDPC District Planning CommitteeE&T Excise and Taxation DepartmentETO Excise and Taxation OfficterFO Farmer OrganizationFPA Foreign Project AssistanceGDP Gross Domestic ProductGP Gratuity and Provident FundGST General Sales TaxKDA Karachi Development AuthorityKMC Karachi Municipal CorporationKWSB Karachi Water Supply BoardLBs Local BodiesLGO Local Government OrdinanceMCL Metropolitan Corporation of LahoreMOF Ministry of FinanceMPC Metropolitan Planning CommitteeMPED Ministry of Planning and Economic DevelopmentMTBF Medium-Term Budget FrameworkMVT Motor Vehicle TaxNBP National Bank of PakistanNDP National Drainage ProgramNFC National Finance CommissionNGO Non-Governmental OrganizationNWFP North West Frontier ProvinceO&M Operation and Maintenance

PHED Public Health Engineering DepartmentPIDA Provincial Irfigation and Drainage AuthorityPID Provincial Irrigation DepartmentPIPRA Project for Improvement of Financial Reporting and AuditingPTA Parents Teachers AssociationRPFB Rolling Plan and Forward BudgetSAP Social Action ProgramSBP State Bank of PakistanSMC School Management CommitteeSNEs Schedule of New ExpendituresTPV Third Party ValidationUC Union CouncilsUIPT Urban Immovable Property TaxULB Urban Loxal BodyVAT Value Added TaxWAPDA Water arad Power Development AuthorityWASA Water and Sanitation Authority

ABSTRACT
Public finances in Pakistan have been characterized by unsustainably high fiscaldeficits; poor revenue mobilization; a persistent trend of centralization; massive verticalimbalances between the federal and provincial governments; skewed, problematicexpenditure structure; weakfinancial management; the atrophy of local governments; andlack of accountability. Recently the government has announced a bold and potentially path-breaking devolution initiative to address some of these problems by establishing strong,accountable local governments.
Focussing on the provinces, their financial health, and the delivery of infrastructureand public services, this report puts forward specific recommendations for reform in thefollowing eight areas:
(1) adjustingfederal-provincialfiscal relations to reduce verticalfiscal imbalances;
(2) improving the effectiveness ofpublic services through devolution;
(3) reprioritizing provincial expenditures in favor of critical non-wa e operationsand maintenance (O&M) and reducing the dominant share of establishment costs(salaries, benefits and pensions),
(4) improving expenditure programming and management;
(5) restructuring the provincial civil services;
(6) mobilizing more provincial revenue by streamlining the tax structure andrationalizing user charges ofprovincial services;
(7) strengtheningfinancial management; and
(8) developing a more systematic approach to provincial debt management.

ACKNOWLEDGEMENTS
This report is based on the findings of a World Bank mission that visited Karachi duringApril 12-17, 199, Lahore during April 18-24, 1999 and Islamabad during April 26-29, 1999.The mission consisted of Hanid Mukhtar, (task leader), William Byrd (team leader), ShahnazKazi, and Shaheen Malik (all of the World Bank); and Martin Johnson, Mohammad HanifMalik, Musleh-ud-din, and John Short (consultants). The report was processed by Shams urRehman and Abdul Qadir. Peer reviewers for this report were Hafiz A. Pasha, Steven BenjaminWebb, and Gunnar Eskeland. Useful comments on the report were provided by the PeerReviewers and other participants in a review meeting held on May 1, 2000. The study wasconducted under the overall guidance of Roberto Zagha (Sector Director, SASPR), and SadiqAhmed and John Wall (successively Country Director for Pakistan and Afghanistan). Financialsupport from the Department for International Development (DFID) of the UK, which fundedthe contributions of Messrs. Short and Johnson, is gratefully acknowledged.
This report would not have been possible without the strong support and cooperationof the Government of Pakistan and Governments of Punjab and Sindh. The assistance ofprovincial government agencies in particular, in interacting closely with the mission andproviding the information required to prepare this report, is greatly appreciated.

TABLE OF CONTENTS
Executive Summary .................................................................... i-xiv
Chapter 1 Trends in Provincial Finances ................................................................. 1Introduction 1Historical Background 3Provincial Revenue: Composition and Trends 5Composition and Trends in Provincial Expenditure 8Provincial Debt and Contingent Liabilities 9Expenditure Issues in Selected Sectors 12
Chapter 2 Adjusting Intergovernmental Fiscal Relations ......... 19Distribution of Functional Responsibilities among Different Levels of Government 19Implications of Overcentralization 21Distribution of Taxation Powers Among Different Levels of Government 23Revenue Transfers 24Development Loans 27Options for Reforming Intergovernmental Fiscal Relations 29
Chapter 3 Mobilizing Adequate Provincial Revenue ................................................ 33The Structure of Provincial Taxes 33Provincial User Charges 37Provincial Tax Administration 39Recommendations for Tax Rationalization and Enhancing Revenue Mobilization 40
Chapter 4 Improving Provindal Expenditure Management and Govemance ............ 48Short-Term and Input Focus 48Procedural Inadequacies 50Structural Disconnect between Policy, Planning and Budgeting 52Inadequate Inter-Governmental Coordination 54Ineffective Decisionmaking 55Problems in Financial Management 56Recommnendations for Budgetary Reform 61
Chapter 5 Strengthening Local Government Finances ............................................. 65Background and Existing Situation 66Toward Effective Accountable Local Governments: The New Devolution Plan 72Options for Improving Local Government Finances in the Context of Devolution 78
Matrix: Options for Reform ................... 85-89
AnnexesA Proceedings of the Workshop on Reforming Provincial Finances
in the Context of Devolution 1B The Distribution of Powers and Functions in Federal Systems:
A Comparative Overview 12C Areas of Taxation Authority of Each Level of Government 14D Provincial Revenue Punjab and Sindh 1998/99 Budget 16E Provincial Taxes Punjab and Sindh 19F Medium-Term Budget Framework: Key Features and Potential Benefits 21G The Property Tax 26
Statistical Appendix

List of Tables
1.1 Pakistan: Fiscal Framework, 1995/1996-1999/2000 21.2 Composition of Provinces' Own Revenue 61.3 Wage Cost of the Provincial Governments, 1990/91 - 1995/96 81.4 Structure of Government Employment 91.5 Composition and Trends in Provincial Debt 102.1 Pakistan: Vertical Fiscal Imbalances 232.2 Evolution of Revenue Sharing Arrangements between the Federal and
Provincial Governments 273.1 The Structure of Provincial Revenue 333.2 Indices of Provincial Tax Buoyancy 343.3 Composition of Provincial revenue Punjab and Sindh, 1998/99 Budget 353.4 Indexes of Fiscal Effort by the Provinces 373.5 Suggested and Actual Cost Recovery Rates of Provincially Delivered Services 424.1 Budgeted, Revised and Actual Revenues from Federal Tax Assignments,
Provincial Government of Punjab 1997/98 545.1 Actual Allocation of Functions Between Local Councils, Specialized
Agencies and Provincial Line Departments 675.2 Local Government Responsibilities by level of Government in Pakistan:
Legislative, Actual and Suggested 73
List of Boxes
1.1 Third Party Validation 151.2 Decentralization of Health Services in Punjab 161.3 Community Involvement in Primary Education 172.1 The Conceptual Framework for Assigning Functions in a Federal System 202.2 Mechanisms for Revenue Sharing Between Federal and Provincial Governments 252.3 A Critique of Revenue Sharing Mechanisms 262.4 The 1997 NFC Award 283.1 Water Charges and Cost Recovery of Irrigation Water 393.2 Agriculture Income Tax (AIT) in Punjab 433.3 Sub-National Value Added Taxation in Pakistan 464.1 MTBF Experience in Uganda and Tanzania 494.2 Overcrowding of the Development Program in Punjab 534.3 Current Approaches to Budgetary Reform in the Punjab Government 625.1 Local Octroi and Export Tax 695.2 The Indian Panchayat System 74
List of Figures
1.1 Trends in Provincial Finances 31.2 Changing Composition of Provincial Revenue 52.1 Legislative Responsibility and Actual Allocation of Functions among
various Levels of Government 225.1 Proposed Local Government Structure 76

EXECUTIVE SUMMARY
1. Over the last decade, Pakistan has been facing a serious development crisis.Economic growth has slowed down, industrial investment has fallen, school enrollment rateshave declined, health indicators are low, and despite some declines in fertility and populationgrowth rates, poverty rates may have increased. Social indicators have stagnated at levelssignificantly worse than in other countries at comparable levels of development. Theseproblems are in large part attributable to the failure of national policies to produce asustainable high GDP growth rate of at least 6-8% per year, which Pakistan should haveachieved, but they also reflect the inability of the provincial and local governments to provideessential public services of reasonable quality to the population, especially basic socialservices. Weak governance and the poor state of public finances are two key factors behindthis failure of the public sector. Both issues are at the top of the present government's reformagenda. The government has announced a bold reform program; taken some concretemeasures to combat corruption and improve governance within government departments andinstitutions; initiated reform processes to strengthen the public sector and public sectorinstitutions; and articulated a strong poverty reduction strategy. The provinces also haveinitiated some significant financial reforms; nevertheless, the process of fortification of publicfinances through better resource mobilization and expenditure management has only justbegun.
2. Public finances in Pakistan have been characterized by unsustainably high fiscaldeficits; poor revenue mobilization; a persistent trend of centralization; massive verticalimbalances between federal and provincial governments (i.e. very large gaps betweenprovincial governments' expenditures and own revenues, which have to be made up by meansof fiscal transfers from the federal government); skewed and problematic expenditurestructure; weak expenditure and financial management; lack of accountability of the publicsector to communities and stakeholders; and the atrophy of local governments. Furthermore,due to the neglect of longstanding structural problems and poor revenue mobilization by thefederal government, provincial finances have been deteriorating, and during the past twoyears the provinces have been facing a fiscal crisis. This crisis has adversely affectedprovincial spending - even on high-priority initiatives in the social sectors - and raisesconcerns about the stability of overall national finances. Although the short-term fiscalposition of the provinces looks better based on the 2000/01 budget targets, this improvementis entirely dependent on the performance of federal tax collections in relation to the ambitiousrevenue target. Moreover, most of the long-term structural problems remain.
3. Recently the government has announced a bold and potentially path-breakingdevolution initiative to address problems plaguing public finances by establishing strong,accountable elected local governments. For the government's devolution initiative to besuccessful, however, the provinces will need to restore their financial health and generatesufficient resources to adequately fund local governments, as no system of taxation willenable all local governments to be entirely self-reliant from a resource perspective.
i
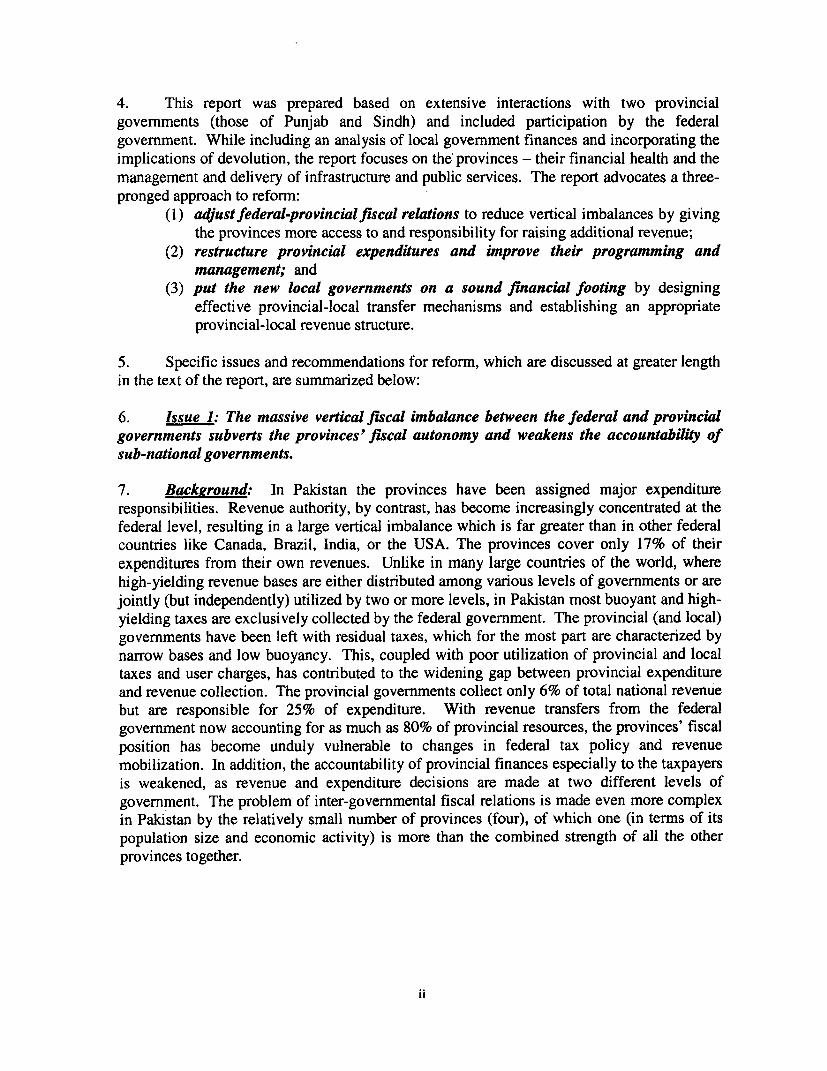
4. This report was prepared based on extensive interactions with two provincialgovernments (those of Punjab and Sindh) and included participation by the federalgovernment. While including an analysis of local government finances and incorporating theimplications of devolution, the report focuses on the provinces - their financial health and themanagement and delivery of infrastructure and public services. The report advocates a three-pronged approach to reform:
(1) adjustfederal-provincialfiscal relations to reduce vertical imbalances by givingthe provinces more access to and responsibility for raising additional revenue;
(2) restructure provincial expenditures and improve their programming andmanagement; and
(3) put the new local governments on a sound financial footing by designingeffective provincial-local transfer mechanisms and establishing an appropriateprovincial-local revenue structure.
5. Specific issues and recommendations for reform, which are discussed at greater lengthin the text of the report, are summarized below:
6. Issue 1: The massive vertical fiscal imbalance between the federal and provincialgovernments subverts the provinces' fiscal autonomy and weakens the accountability ofsub-national governments.
7. Background: In Pakistan the provinces have been assigned major expenditureresponsibilities. Revenue authority, by contrast, has become increasingly concentrated at thefederal level, resulting in a large vertical imbalance which is far greater than in other federalcountries like Canada, Brazil, India, or the USA. The provinces cover only 17% of theirexpenditures from their own revenues. Unlike in many large countries of the world, wherehigh-yielding revenue bases are either distributed among various levels of governments or arejointly (but independently) utilized by two or more levels, in Pakistan most buoyant and high-yielding taxes are exclusively collected by the federal government. The provincial (and local)governments have been left with residual taxes, which for the most part are characterized bynarrow bases and low buoyancy. This, coupled with poor utilization of provincial and localtaxes and user charges, has contributed to the widening gap between provincial expenditureand revenue collection. The provincial governments collect only 6% of total national revenuebut are responsible for 25% of expenditure. With revenue transfers from the federalgovernment now accounting for as much as 80% of provincial resources, the provinces' fiscalposition has become unduly vulnerable to changes in federal tax policy and revenuemobilization. In addition, the accountability of provincial finances especially to the taxpayersis weakened, as revenue and expenditure decisions are made at two different levels ofgovernment. The problem of inter-governmental fiscal relations is made even more complexin Pakistan by the relatively small number of provinces (four), of which one (in terms of itspopulation size and economic activity) is more than the combined strength of all the otherprovinces together.
..

8. Recommendations for Reform: Expand the provincial revenue base by:* Consider allowing the provinces to share selected federal taxes (such as personal
income tax and possibly GST) through levying "add-ons" on the federal taxes,with federal collection but provincial responsibility for use of resources and, atleast over time, for setting supplementary rates, along with rationalization offederal tax rates to avoid over-utilization of tax bases, and appropriate adjustmentof general revenue sharing rates.
* Vacating by the federal government of tax bases which under the Constitution areassigned to the provinces, for example capital value taxes on provincial bases.
* Sharing the revenue from energy resource taxes (which constitutionally belong tothe provinces) on the basis of the divisible-pool formula, or devolving these taxesto the provincial governments, rather than the federal government collecting thesetaxes and transferring their receipts to the provincial governments.
* Assigning specific-purpose excise duties (e.g. on cigarettes and tobacco) to theprovincial governments, or letting the provinces share these bases with the federalgovernment.
* Correcting horizontal imbalances which may be generated as a result of revenuedevolution by means of well-designed fiscal equalization grants from the federalgovernment to economically weaker provinces.
9. Issue 2: The persistent trend of centralization in Pakistan has severely weakenedlocal governments, leaving them without capacity, resources, or accountability structures toeffectively deliver and manage public services.
10. Backrround: The Constitution of Pakistan does not fully recognize local bodies as aseparate and autonomous level of government. Their effectiveness and even their existencehas remained uncertain and dependent on the whims of provincial politicians. Lack ofadequate capacity at the local level has been used as a pretext to provincialize key functionswhich were constitutionally assigned to local governments. This resulted in further erosion oftheir roles and capacity. Weak and often dysfunctional local governments have increased theprovincial governments' burden of delivering public services and developing and maintaininglocal infrastructure, which they are ill-positioned to do.
11. As a consequence of centralization, local government finances have atrophied. Whileon the surface local bodies in Pakistan until recently have been largely self-financing, withsome of them generating small (although declining) surpluses, there is considerable variation infinancial strength among local bodies, with serious doubts about the financial viability of mostnon-urban local councils. Where there are surpluses they are somewhat illusory, as localgovernments' budgets do not include a number of payment obligations as well as deferredliabilities like civil service pension commitments. Local governments are also running intosignificant arrears on utility charges. In addition, local bodies have become divested of many oftheir service provision responsibilities, so their financial self-reliance has not been associatedwith effective fulfillment of local government roles and responsibilities. While the eliminationof octroi and local export taxes in 1999/00 was a very good move in terms of reducingimpediments to the private sector, 60% of the local governments' revenue base was abruptly
iii

removed. Although the revenue loss is being offset in the short run by a special transfer fromthe federal government, this does not constitute a sustainable solution over the longer run.
12. The bold devolution initiative recently announced by the federal government aims atstrengthening local governments and represents a promising effort to decentralize thegovernment structure and service management in a comprehensive manner. The devolutionplan has been carefully thought out and is well-articulated, particularly with respect to politicalstructure and processes, accountability checks and balances, and administrative structures.Effective implementation of such an ambitious, potentially path-breaking plan will be a majorchallenge. More work is needed to develop the fiscal and financial management aspects oflocal government as well as to build up administrative, political, and societal capacity to makedevolution work. If effectively implemented, devolution will have major implications forprovincial finances, administration, and management processes. By enhancing accountabilityto, and participation of, beneficiaries in service management, the devolution initiative has greatpotential to enhance the efficiency and effectiveness of public services. On the other hand,there are risks that, if not carefully designed and well implemented, devolution could lead tocontinuing overcentralization with even greater duplication, inadvertent expansion of the publicsector, elite capture of local governments, breaking down of sub-national personnelmanagement, or interruptions in service delivery, among other risks.
13. Recommendations for Reform: As envisaged in the devolution plan, develop localgovernments into a fully functional third tier of government, with primnary responsibilityfor delivery of localy-oriented public services. Consistent with this approach, localgovernments could be provided with some kind of Constitutional cover. Such a legal changeneeds to be accompanied by concrete steps to reverse past centralization by devolvinggovernment authority and functions to the local governments. In the context of thegovernment's devolution initiative, local governments should be strengthened by:
- Providing the local governments with adequate financial resources throughappropriate transfer mechanisms from the priovinces, with incentives for soundfinancial performance. As in other counties, local governments in Pakistancannot be expected to generate sufficient resources on their own to adequatelyfund all or most of their expanded expenditure responsibilities. They will need torely on substantial transfers from the provincial governments, whose design andimplementation will have important ramifications for efficiency (incentives) andequity (level and quality of public services provided by different localities). Whileinternational experience suggests that transfers should be formula-based ratherthan ad-hoc and to a large extent tied to non-negotiable, transparent criteria (e.g.population), a portion should be designed to ensure accepted minimum standardsfor provision of key public services (such as elementary education and basic publichealth services). The fiscal transfer mechanism should also provide incentives forsound financial management and accountability at the local level. As called for bythe new devolution plan, establishment of Provincial Finance Commissions todetermine appropriate revenue sharing between the local and provincialgovernments is an important step in this direction.
iv
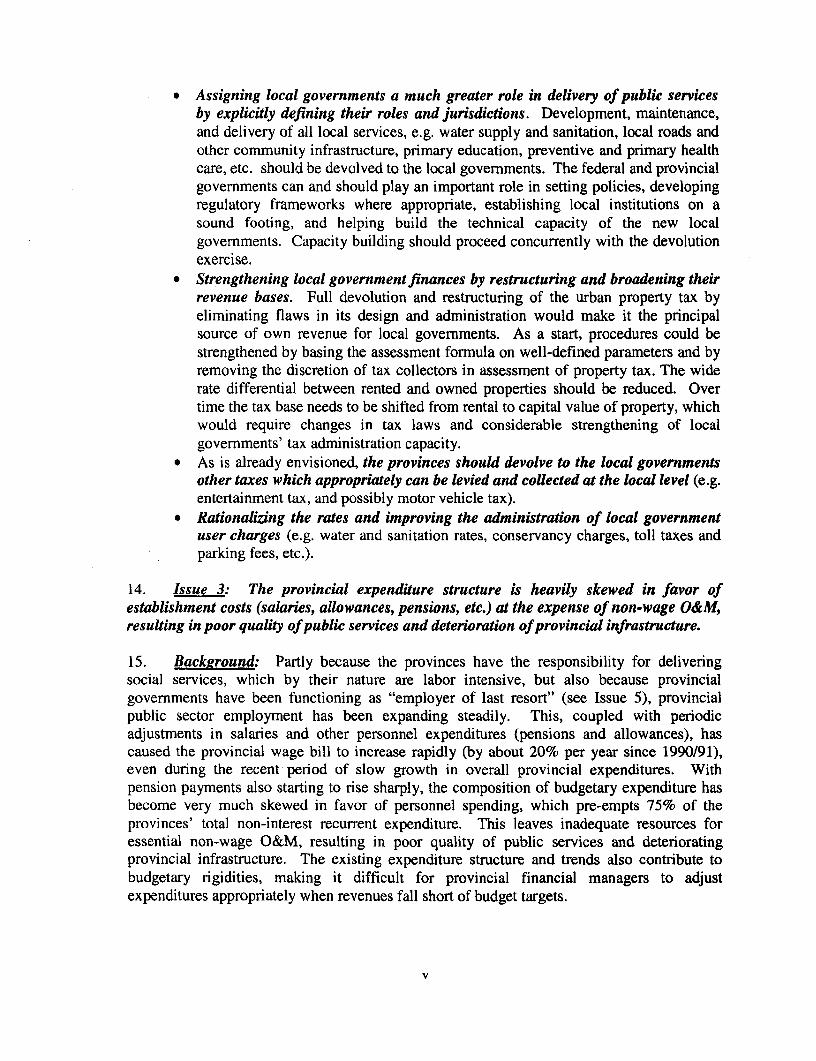
* Assigning local governments a much greater role in delivery of public servicesby explicitly defining their roles and jurisdictions. Development, maintenance,and delivery of all local services, e.g. water supply and sanitation, local roads andother community infrastructure, primary education, preventive and primary healthcare, etc. should be devolved to the local governments. The federal and provincialgovernments can and should play an important role in setting policies, developingregulatory frameworks where appropriate, establishing local institutions on asound footing, and helping build the technical capacity of the new localgovernments. Capacity building should proceed concurrently with the devolutionexercise.
* Strengthening local government finances by restructuring and broadening theirrevenue bases. Full devolution and restructuring of the urban property tax byeliminating flaws in its design and administration would make it the principalsource of own revenue for local governments. As a start, procedures could bestrengthened by basing the assessment formula on well-defined parameters and byremoving the discretion of tax collectors in assessment of property tax. The widerate differential between rented and owned properties should be reduced. Overtime the tax base needs to be shifted from rental to capital value of property, whichwould require changes in tax laws and considerable strengthening of localgovernments' tax administration capacity.
* As is already envisioned, the provinces should devolve to the local governmentsother taxes which appropriately can be levied and collected at the local level (e.g.entertainment tax, and possibly motor vehicle tax).
* Rationalizing the rates and improving the administration of local governmentuser charges (e.g. water and sanitation rates, conservancy charges, toll taxes andparking fees, etc.).
14. Issue 3: The provincial expenditure structure is heavily skewed in favor ofestablishment costs (salaries, allowances, pensions, etc.) at the expense of non-wage O&M,resulting in poor quality of public services and deterioration of provincial infrastructure.
15. Background: Partly because the provinces have the responsibility for deliveringsocial services, which by their nature are labor intensive, but also because provincialgovernments have been functioning as "employer of last resort" (see Issue 5), provincialpublic sector employment has been expanding steadily. This, coupled with periodicadjustments in salaries and other personnel expenditures (pensions and allowances), hascaused the provincial wage bill to increase rapidly (by about 20% per year since 1990/91),even during the recent period of slow growth in overall provincial expenditures. Withpension payments also starting to rise sharply, the composition of budgetary expenditure hasbecome very much skewed in favor of personnel spending, which pre-empts 75% of theprovinces' total non-interest recurrent expenditure. This leaves inadequate resources foressential non-wage O&M, resulting in poor quality of public services and deterioratingprovincial infrastructure. The existing expenditure structure and trends also contribute tobudgetary rigidities, making it difficult for provincial financial managers to adjustexpenditures appropriately when revenues fall short of budget targets.
v
16. Recommendations for Reformn: Functional reviews should be conducted for allprovincial public sector entities (including government departments, autonomous bodies,public enterprises, etc.) to assess their objectives, roles, and staffing needs and to determinethe scope for shifting some (or all) of their activities to the private sector. These reviewsshould fully incorporate the implications of devolutior. Based on these reviews, phasedrestructuring of staffing and expenditures should be iniliated. It is critically important thatthese functional reviews be led by experts from outside the government. Moreover, effective,sustainabke expenditure programming and management systems need to be put in place tosupport expenditure restructuring and prevent re-emergence of skewed expenditure structuresin the future (see Issue 4). In the short run, the underfunding of O&M budgets should becorrected by providing higher allocations for critical O&M (e.g. for medicines, books andschool materials, irrigation, road network, etc.)
17. Issue 4: Provincial expenditure planning, programming, and budgeting have ashort-term and input focus, the budgeting processes are obsolete and no longer make sense,and the artificial distinction between the recurrent and development budgets leads tosuboptimal resource allocation decisions and inefficient expenditures.
18. Background: The weaknesses of provincial expenditure programming, budgeting andmanagement stem from flaws and weaknesses in budgetary processes; ineffective monitoringand evaluation; and poor governance. Budgeting processes in Pakistan have remained more orless unchanged since colonial times and are not in tune with present-day realities. Theseprocesses have an almost exclusive input focus, with peiformance judged mainly in terms ofspending the allocated budget. In addition, there is a very short-term approach to budgetarydecisionmaking which fails to take into account longer-term costs and benefits, thus injectinga bias in favor of "quick fixes" and short-term policy instruments. The provinces' budgetaryprocesses are also marred by significant procedural inadequacies and rigidities. For example,the incremental budgeting approach, under which different criteria are used to evaluate"permanent" and "new" recurrent expenditures, effectively exempts the bulk of the recurrentbudget (i.e. permanent spending items) from any evaluation regarding its consistency withgovernment policies and changes in priorities. Incremental budgeting is one of the reasonsbehind the large build-up of provincial government arrears on dues to public utilities,especially WAPDA, which constitutes a significant short-term threat to the stability ofprovincial finances (also see Issue 8). Moreover, there is an artificial and unwarranteddistinction between the development and recurrent budgets, with development expendituresconsidered to be superior in quality to recurrent expenditures. This "pro-development" biashas led to rapid expansion of provincial infrastructure, generating increasingly large demandson the current budget for O&M. The overexpansion of ?provincial infrastructure and publicservice delivery systems in relation to provincial fiscal capacity has exacerbated theunderfunding of non-wage O&M, resulting in deterioration of infrastructure and poor qualityof provincial services.
vi

19. Recommendations for Reform: Build up necessary provincial capacity and withinone year put in place a Medium-Term Budget Framework (MTBF) to guide the annualbudgetary process. An MTBF is based on multi-year projections of resource availability,adopts a comprehensive sector- and program-oriented approach to allocating public sectorresources, integrates budgeting and management of development and recurrent expenditures,and takes an outcome- and output-oriented focus as opposed to the present input bias. Punjabprovince has already made a start in this direction by initiating some sensible budgetaryreforms. These reforms need to be expanded and made sustainable through strengthening ofprovincial budgetary processes and institutions, including:
* Developing improved macroeconomic analysis and revenue forecastingcapabilities.
* Establishing a system of incentives to promote financial discipline withindepartments and in the provincial governments as a whole (see Issue 7). Thelatter will require greater self-discipline on the part of the federal government inimposing a "hard budget constraint" on the provinces.
* Instituting a system of sectoral expenditure analyses, which could assist inrestructuring expenditures toward strategic priorities.
* Restructuning budget classification and reporting systems so as to permit a moretransparent relationship between public expenditures and associated outputs andoutcomes.
* Eliminating the compartmentalization of budgeting of development and recurrentexpenditures and adopting an integrated program and sectoral approach.
20. Issue 5: The large size, inadequate skills, weak management, and poor incentivesand motivation of the provincial civil services constitute a fundamental problem adverselyaffecting the delivery of public services.
21. Backeround: The provincial governments have large establishments in relation toboth the quantity and quality of public services being delivered and available fiscal resources.This is mainly because the government, and to a large extent the society, have lost sight of theappropriate role of the state. Specifically, the role of the provincial governments has becomeassociated mainly with expanding and continuing direct provision of employment by thepublic sector, to the detriment of effective and efficient delivery of quality public services.Correspondingly, an increasingly large portion of provincial expenditure budgets is beingdevoted to personnel spending, leaving inadequate resources for high-priority non-wageexpenditures (see Issue 3).
22. The bulk of provincial employees are concentrated in the lower skill levels, whichcontributes to the low productivity and ineffectiveness of the public sector, along with poormanagement, weak accountability, and inadequate incentives and motivation. Moreover, thepublic sector at the provincial level has become involved in commercial activities, which incertain areas has crowded out the private sector and more generally has caused anunnecessary drain on already scarce public resources. The provinces also have increasinglytaken over functions and activities previously handled by local governments, furtheroverburdening the provincial governments and weakening the local bodies.
vii

23. Since the early 1990s, some progress has been made in changing the role ofgovernment, in particular through privatization and comrnercialization of public enterprises,and telecommunication sectors, and the recently announced devolution initiative promises toconsiderably enhance the roles and autonomy of local governments. Nevertheless, thisprocess of change has only just begun, and moving away from a public sector employment-oriented to a developmental and private sector-oriented approach will be a major challenge.Not being in a position to bear the large up-front cost of severance packages for theiremployees, the provincial governments have been trying to deal with their excessive staffingby banning fresh recruitment and reducing the size of their civil services through naturalattrition.
24. Recommendations for Reform: Based on the functional reviews of public sectorentities mentioned earlier and a much needed baseline survey (or census) of provincial civilservants, a vision needs to be developed of the future size, structure, roles, incentives, andmanagement of the provincial civil services, taking ,fully into account the profoundimplications of devolution. Concrete steps can then be taken to restructure individualagencies (e.g. tax administration, police, autonomous bodies, etc.) in line with the reformvision. The government should continue with right-siz:ing by keeping in place existingrecruitment bans and reducing employment through natural attrition, while improving skillmix through extremely selective recruitments. In the rnedium term, the provincial civilservices need to be reformed so that they become leaner and more effective, equipped withthe needed skills, facing an appropriate incentive structure, and better organized andmanaged, with their cost in line with provincial objectives and available fiscal resources.This will require major changes in administrative structure, service rules, personnelmanagement, compensation, and accountability mechanisms, among other aspects. Sincenatural attrition alone will be too slow to meet the needs of civil service restructuring, theprovinces should consider devising appropriate severance packages for reducing redundantpublic sector employment, consistent with their resource position and staffing requirements.Most fundamentally, the provincial (and local) civil services must become much more openand accountable to the public for service delivery.
25. Issue 6: Existing provincial taxes and user charges are inefficient and inequitable,and incapable of generating substantial, buoyant revenues to meet a significant part ofprovincial expenditure needs.
26. Backrround: The main weaknesses of the provincial tax structure are its narrow base,reliance on numerous low-yield tax instruments, lack of political will to collect key provincialtaxes (e.g. agricultural income tax), the administrative and other complexities of taxing someprovincial revenue bases, and weak tax administration marred by governance problems. Whilethe provinces have imposed a large number of taxes and o;ther levies, the yield from most ofthem has been minimal. The plethora of taxes has resulted in lack of transparency and highadministrative costs, as scarce resources are allocated to pursue what can only be termed asnuisance taxes. Moreover, economic activity has been hincdered and distorted; the tax systemhas become excessively complex; tax compliance has been discouraged; and corruption isfacilitated. These problems are compounded by the levying of federal, provincial and localtaxes (such as octroi) on the same tax base, which raises tax rates to levels that are likely to
viii

encourage non-compliance as well as generating serious disincentives to economic activity. Inaddition, provincial taxation has an exclusive revenue focus and is not based on sound taxpolicy. Little or no importance is given to equity or efficiency considerations when new taxesare imposed or rates of existing taxes are increased. The element of stability that is desirable inany tax system also is missing, as such changes are frequent and ad-hoc.
27. Moreover, the provinces have not adequately employed user charges for public servicesas instruments to regulate demand and enhance provincial revenue. Cost recovery rates forprovincial services are woefully low. Although this is understandable in the case of basic socialservices, which generate potentially large social benefits, cost recovery rates for secondary andtertiary level social services also are very low, as is also the case for most economic andcommunity services, such as irrigation and water supply. Flaws in the design andimplementation of these charges allow subsidized services to be consumed mainly by relativelyaffluent segments. Moreover, institutional incentives for collection of user charges are weakbecause they are not retained by the service providing departments and instead form part ofgeneral revenue.
28. Despite an elaborate network, provincial tax administration is weak and bifurcated intwo separate departments - the Excise and Taxation Department and Provincial Board ofRevenue. Moreover, most taxes are regulated by an obsolete legal framework which wasdevised prior to independence and has only been modestly adjusted since then to meetimmediate needs.
29. Recommendations for Reform: As already initiated by the provinces, reduce thenumber of taxes and rationalize rates, and devolve some taxes to the local level (see Issue 2).In order to simplify and rationalize the provincial tax structure, the many small taxes should beconsolidated into a limited number of taxes that effectively generate revenue at a reasonablecost, while eliminating taxes which have only "nuisance" value. In addition, the provinces haveto make concerted efforts to raise additional revenue from the several relatively broad-basedtaxes and user charges assigned to them. Specifically, the provincial governments should:
Enhance the potential and yield of agricultural income tax (AIT) by expandingthe base of the land-based farm tax in the short run and over time transformingAIT into a tax which is closer in character to an income tax. Punjab province inits 2000/01 budget reduced the exemption limit for its land-based tax from 12.5acres to five acres and also introduced an income-based tax for larger farmers albeitwith a high exemption limit and a low rate structure. These were very positivesteps, although the reduction in the exemption limit for land-based tax unfortunatelywas subsequently reversed. NWFP, by contrast, has had a zero exemption limit forits land-based agricultural income tax for the past several years.) the governmentappears to be taking a two-pronged approach of (1) mobilizing additional revenue inthe short run by expanding the base of the existing land-based agricultural tax, forexample by setting a zero or very small exemption limit, while (2) graduallyimposing regular income tax on larger farmers over the medium term. This strategyis a very good one in the Pakistan context, but in order to work the exemption limitfor the land-based portion needs to be as low as possible (preferably zero), and therate structure and exemption limit for the income-based tax should be identical or at
ix

least similar to those for the regular non-agricultural income tax. It is roughlyestimated that effectively implementing this strategy can increase provincial revenueby as much as Rs 10 billion (about Rs 2 billion from removing the presentexemption limits for the land-based tax, and Rs 8 billion from imposing regularincome tax on farms of 50 acres or more).
* Increase reliance on user charges wherever appropriate and feasible.Rationalization of user charges would better regulate the demand for provincialservices (e.g. irrigation, roads, professional and university education, tertiary healthcare, etc.) and could also increase provincial revenues.
* Strengthen provincial tax administrahion and plug leakages of revenue.Significant revenue gains could be realized by strengthening the provincial taxadministration, by merging the two revenue collecting departments into one; bybetter liaison with the federal Central Board of Revenue; through improvedautomation and computerization in key areas of provincial taxes (e.g. land andproperty records); and through enhanced training of and improved incentives for taxofficials.
30. Issue 7: The provinces'financial management has been inadequate, mainly due toweak national and provincial institutions, worsening governance problems, lack ofaccountability, and political interference.
31. Back,round: A basic problem is that financial management in the provinces has tendedto be associated with financial controls narrowly construLed. Moreover, financial rules arefrequently by-passed and circumvented in response to pressures to ensure that projects andprograms are funded, irrespective of resource availability or prioritization. The provincialADPs contain projects which have been undertaken without having obtained the requiredapprovals - a direct (and apparently longstanding) contravention of established procedures.Institutions responsible for managing the provinces' finances and maintaining financialdiscipline have neither the technical capacity nor the motivation to undertake this importantwork. Furthermore, incessant interference in financial and related matters by politicians, lack oftransparency in financial management, weak capacity of financial institutions, and weakaccountability have all contributed heavily to weakening of 1fnancial management.
32. Recommendations for Reform: Reinvigorate and strengthen institutions offinancialmanagement through a coherent program including, among other elements, well-designedcivil service reforms, better incentive and motivation structures, and insulation of financialmanagement insttions from political pressures by clearljy defining the roles of politicians inexpenditure planning, budgeting and management. This would require strengthening theinstitutions concerned (including independent, timely auditing); prompt reconciliation ofaccounts; reformiing accounting definitions and practices; developing useful, up-to-datedatabases and monitoring for key fiscal information such as establishment size and costs,program expenditures, etc; establishment of a better system of financial accounting, reportingand auditing through improvements in professional ski]ls and technology; separation ofaccounts and audit functions; clarifying and delineating the role of politicians in expenditureplanning, budgeting, and management, including limits on such political involvement;improving incentives for sound financial management in the civil service; and meaningful
x

external accountability and safeguards against abuses. Gains could also be made decentralizingthe management of provincial services to the district or even facility level as part of thedevolution initiative; increased community participation can also enhance the accountability andthe effectiveness of public expenditures. In this regard, community involvement in primaryeducation through School Management Committees and Parent Teachers Associations andgiving autonomy to larger hospitals in Punjab are steps in the right direction. There is, a need toexpand the scope of such initiatives, consistent with the devolution program and on the basis oflessons learnt.
33. Issue 8: The provinces have a sizable debt burden (mostly to the federalgovernment) and potentially much larger contingent liabilities on account of numerousautonomous bodies and unfunded pension liabilities of civil servants. Moreover, over theyears, the provinces have been accumulating a large stock of deferred liabilities, mainly in theform unpaid utility bills. These problems if not addressed will pose a serious threat toprovincial finances in the future.
34. Background: The provincial governments in the past have not carefully managedtheir debt. Given the fragility of their finances and the large and growing interest burden,more serious, concerted and immediate debt management efforts are needed to stop provincialdebt from becoming a serious problem in the future. Besides financial debt, which is owedmainly to the federal government, the provinces have substantial contingent liabilities, mostlyin the form of unfunded pension liabilities (pension payments are made out of the recurrentbudget) and debt guarantees and workers' compensation obligations of provincial autonomousbodies. Moreover, Pakistan has perhaps a unique system of undiscounted up-frontcommutation of a very large portion of individual pensions. Due to rapid growth in provincialemployment, pension payments have recently started to increase sharply, and if not addressedin the near future they will become a major threat to provincial finances. Provincial deferredpayments have also been increasing mainly due to negligence of the provinces in makingprompt payment of their utility bills. Although strongly disputed by provinces, payments dueto WAPDA alone on account of unpaid electricity bills run into billion of rupees and pose amajor short-term threat to provincial finances.
35. Recommendations for Reform: There is an urgent need for the provinces to getaccurate information on the size, nature and terms of their public debt, on their autonomousbodies and staffing, and on contingent liabilities. For improved management of their publicdebt, the provinces need to establish a debt management system which is fully integratedwith the federal system. This would help the provinces to minimize the cost and levels oftheir debt and would also assist them in determining the size and terms of new projectborrowing which would be consistent with provincial priorities and debt carrying capacity.The envisioned functional reviews of autonomous bodies (Issue 3) should recommendprivatization, closure, restructuring, merger with local governments, etc. as appropriate, andadvise on strategies for putting these recommendations into effect. The provinces shouldconsider establishing professionally managed pension funds, and changing the practice ofundiscounted commutation of pensions, at least for new employees. Significant progress hasbeen made in resolving the issue of outstanding payments to WAPDA. A first step towardspreventing reoccurrence of this problem would be to meter all provincial governments'
xi

facilities and to disconnect all facilities where connections had been established withoutlawful authority. Moreover, WAPDA should be given the authority to disconnect all facilitieswhich fail to clear their electricity dues within a specified time period (which is mutuallyagreed between WAPDA and provincial governments).
36. Conclusions: The poor and deteriorating state of provincial finances has been a majorconstraint hampering effective service delivery and more generally poverty reduction andeconomic growth in Pakistan. In addition, the fragility of provincial finances has contributedto overall fiscal instability and has hampered efforts to put the country's public finances on asound, sustainable footing. With the government's strong focus on restoring economicgrowth, alleviating poverty, and improving the quality of life, reform of provincial and localgovernment finances will be critical for the success of these initiatives. The requiredsubstantial strengthening of provincial finances will include addressing longstandingstructural fiscal problems, substantially reducing vertical imbalances, restructuring andrevitalizing provincial and local institutions, and developing sound and effective localgovernments on a sustainable basis. Some steps have already been taken or announced in thisdirection, which need to be expanded, put in a consistent framework and effectivelyimplemented. The recommendations put forward in this report are intended to support thegovernment's efforts to pursue its reform objectives.
37. Further Dialogue on Reforming Provincial Finances: In order to solicit views ofand comments from the federal and provincial governments on this report, a workshop onReforming Provincial Finances in the Context of Devolution was held in Islamabad onSeptember 17-18, 2000, which was attended by key officials of the federal and threeprovincial governments, including the finance ministers. '(The proceedings of the workshopare presented in Annex A.) The key agreements reached in the workshop are presentedbelow:
* The workshop recognized that in the context of the overall fiscal problems facedby Pakistan, the present state of provincial finances is unsatisfactory and requiresmajor improvements.
* The workshop agreed that redefining the role of government is essential forsuccessful reform of provincial finances. Roles of government should be clarifiedacross different levels of government, and each level should define a set of coreactivities that it can and should perforrn effectively, and other roles should bedevolved to lower levels of government or shifted to the private sector. Thoseactivities which should be handled by the private sector but with public fundingalso should be identified.
* There is a need to improve inter-governmental fiscal relations through more activeinclusion of the provinces in national decision-making and building of trust andconfidence between the two levels of governrent, and by devising a mutuallyagreeable revenue transfer mechanism.
* The workshop felt that provincial planning and budgeting is adversely affected byuncertainties regarding transfers of federal resources to the provinces. Stepsshould therefore be taken to remove uncertainties regarding provincial resourceavailability, and also to address the problem of seasonal fluctuations in federaltransfers.
xii
* Provincial revenue generation is inadequate and needs to be enhanced. In thisregard, the recent tax reforms undertaken by the provinces may have somenegative revenue implications in the short run but would strengthen the provincialtax structure in the medium to long term. Steps should be taken to consolidate,expand and sustain these reforms.
* The workshop agreed that the provinces have not adequately utilized user chargesas a source of additional revenue and for regulating demand for services. Theprovinces should enhance their reliance on user charges by increasing andrationalizing the rates of these charges on economic and higher-level socialservices.
* Provincial expenditures have increased to levels which cannot be supported withthe present levels of provincial revenue resources. Moreover, the effectivenessand productivity of expenditures in many cases is very low. Significantimprovements in the quality of provincial expenditure management are required.
* Provincial civil services are large in relation to provincial revenue resources andrelative to the quantity and quality of services being delivered. Most provincialemployees have low levels of skills and productivity. Reforms are needed to makethe provincial civil services lean and effective in the context of devolution.
- The poor state of the accounting system is one of the main reasons for poorfinancial management. Efforts are already underway to improve provincialaccounts by better and timely reconciliation of accounts between the DistrictAccount Officers (DAOs) and Drawing and Disbursement Officers (DDOs).Substantial improvements in the accounting system would require significantrestructuring of district accounts offices and sustained commitment to improvingthe reporting system.
3 Political factors and inadequate planning have led to the inclusion of a very largenumber of projects in the provincial development programs. The existing level offiscal resources available for development activities is inadequate to completeeven a fraction of these projects. The workshop supported the exercise undertakenby the provincial governments to restructure their development programs.
* There is a need to build up necessary provincial capacity and to put in place aMedium-Term Budget Framework, which would adopt a comprehensive sector-and program-oriented approach, integrate budgeting and management ofdevelopment and recurrent expenditures, and take an output- and outcome-orientedfocus as opposed to the present input bias.
* The workshop also agreed that poor governance is the root cause of all theproblems underlying present weaknesses in provincial finances. Urgent actionsare required to eliminate corruption and promote good governance.
* Lack of fiscal transparency has hindered provincial planning and budgeting andhas eroded accountability in public finances. In order to improve provincialbudgeting and accountability to the public, key budgetary information should bedisseminated to all public sector entities and to the general public.
* The workshop agreed that devolution will bring major changes which will haveimportant implications for the provinces. The roles of the provinces will change ina major way, and the size of the provincial establishments will be reduced asfunctions are transferred to the districts. The political and administrative
xiii

components of devolution are moving ahead rapidly, but the fiscal and financialaspects of devolution need a great deal of design and implementation work. It wasagreed that this work is of high priority, ard would benefit from professionalexpertise being applied to these aspects as well as more generally to changemanagement.
* There was also an agreement to hold meetings between the federal and provincialfinance ministers on a quarterly basis to discuss and resolve issues pertaining toprovincial finances.
38. An area where consensus was not achieved was the suggested sharing of federalrevenue bases by the provinces. While the workshop agreed with the report'srecommendation to expand the provincial tax base, the proposal for the provinces to levysupplementary rates on federal GST, together with required adjustments in federal rates, wasconsidered by many participants to be very difficult to implement in the current Pakistancontext, as such an arrangement would create inter-jurisdictional problems in taximplementation. The workshop, however, agreed to the possibility of levying supplementaryrates on federal personal income tax. Further consideration and analysis of these issues wassuggested.
xiv
CHAPTER 1. TRENDS IN PROVINCIAL FINANCES
INTRODUCTION
1.1 In Pakistan, the provinces comprise the key intermediate tier in the governmenthierarchy. At present, they are predominantly responsible for the delivery of important publicservices like education, health, law and order, agriculture, irrigation, etc., and thereforepotentially, together with local governments, can play a major role in reducing poverty andimproving social indicators in the country. Besides, the provinces assist both the federal andthe local governments in performing their functions. In contrast with their very extensiveexpenditure functions, the provinces have only limited revenue generating capacity. Allmajor and most of the more buoyant taxes are in the federal domain, and the revenueresources available to the provinces have been eroded over time or have been grossly under-utilized, mainly due to political considerations. As a result the vertical fiscal imbalancebetween the federal and provincial governments has become extraordinarily large byinternational standards (see Table 2.1 and the discussion in Chapter 2). The provincestherefore have come to rely primarily on revenue transfers from the federal government tomeet their expenditure requirements. This over-dependence on federal transfers impedesprovincial autonomy in fiscal decisionmaking and also contributes to lack of accountability tothe stakeholders.
1.2 During the past two years the provinces have been facing an acute fiscal crisis, whichis attributable to persistent shortfalls in federal revenues and also to neglect of longstandinggovernance and structural problems which have plagued provincial finances for decades. Thefundamental fiscal problem is that Pakistan as a whole has been unable to raise enoughrevenue to meet the expenditure needs of all levels of government (see Table 1.1), and anyrevenue sharing formula between the federal and provincial governments can improve thefinances of one level of government only at the expense of the other. Due to poor revenueeffort, the federal government has been borrowing heavily, both domestically and abroad, tofill the growing gap between public expenditure and revenue. The resulting sharp increases ininterest payments, along with very high levels of defense expenditure, have led to an everworsening fiscal situation. Recognizing that the fiscal deficit was unsustainable, thegovernment in the early 1990s embarked on a stabilization and fiscal reform program, whichcalled for a drastic reduction in the fiscal deficit through enhancement of revenue andcurtailment of expenditure. However, aggregate revenue continuously failed to keep pacewith targets and the growing expenditure needs of provincial governments, so revenue sharinghas increasingly become a source of friction. Shortfalls in federal revenue collections havehad a serious advcrse effect on the composition of provincial spending.
1.3 Although the 1997 NFC Award made a positive change in the structure of federaltransfers by including almost all major federal taxes in the pool of divisible taxes (see Chapter2 for details), reductions instituted by the federal government in rates of sales tax and customsduties, along with poor collection of federal taxes, led to a sharp decline in transferablerevenue. This caused an unprecedented squeeze on provincial expenditures, adverselyaffecting even high-priority activities (e.g. the Social Action Program). The structural
I

rigidities of provincial expenditures meant that there was an even greater reduction in alreadymeager non-wage operation and maintenance (O&M) alloc;ations, with an unfavorable impacton the productivity of provincial expenditures. Provincial debt to the State Bank of Pakistan(particularly that of Sindh and Balochistan) increased sharply.
Table 1.1: Pakistan - Fiscal Framework, 1995/96-1999/2000
(Percent of GDP)Revised Budget
Actuals Estimates Estimates1995/96 1996/9 1997/98 1998/99 1999/2000
FEDERAL GOVERNMENTTotal Revenue 11.6 10.3 11.4 11.3 10.7
Tax (net) 8.1 7.2 8.2 8.8 7.5Tax (gross) 13.7 12.5 12.6 12.8 12.1Provincial Share -5.7 -5.4 -4.5 -4.0 -4.6
Non-tax (net) 3.6 3.1 3.1 2.5 3.2Interest Income from Provinces 1.1 1.0 1.0 0.8 0.8Others 2.3 1.8 2.1 1.7 2.2
Total Expenditure 17.9 16.6 18.4 16.8 16.7Current 14.5 14.0 161 14.5 14.7
Grants to Provinces 0.1 0.1 0.3 0.3 0.7Defense 5.6 5.2 5.0 4.7 4.3Interest payments 6.0 5.9 7.2 7.0 6.8Others 2.8 2.8 3.7 2.3 2.9
Development c/ 3.4 2.5 2.3 2.4 2.0Fiscal deficit -6.2 -6.3 -7.0 -5.4 -6.0
PROVINCIAL GOVERNMENTSTotal Revenue 6.7 6.4 5.5 5.2 6.5
Federal Transfers 5.7 5.4 4.2 4.0 4.6Own Tax Revenue 0.5 0.6 0.6 0.7 0.7Own Non-Tax Revenue 0.5 0.5 0.8 0.5 1.2
Of which: Grants from Fed. Govt. 0.1 0.1 0.3 0.3 0.7Total Expenditure 7.7 6.5 6.3 5.9 5.7
Current 6.3 5.4 5.2 5.0 4.8Ofwhich: Interestto the Fed. Govt. 1.1 1.0 1.0 0.8 0.8
Development 1.3 1.0 1.1 1.0 0.9Fiscal deficit -0.9 0.0 -o. 7 -0.7 0.7
Memo Items (Consolidated Accounts):Total Revenue 17.2 15.6 15.7 15.4 15.6
Tax 14.3 13.1 12.9 13.5 12.8Non-Tax 2.9 2.5 2.8 1.9 2.8
Total Expenditure 24.4 22.0 23.4 21.6 20.9Current 19.7 18.4 20.1 18.2 18.0Development 4.7 3.6 3.4 3.3 2.9
Fiscal Deficit -7.2 -6.3 -7.7 -6.1 -5.3Source: Federal andprovincial governments' Finance Accounts, various issues.
1.4 In contrast with the poor performance on the rev-nue side, provincial expenditureresponsibilities have increased substantially over time. The most important factor behind therapid growth of provincial expenditures has been the continuous expansion of employment inthe provincial civil services, which has caused the provincial wage bill to increase at a rapidrate. Moreover, provincial governments have been taking over some of the localgovernments' functions, and they have been striving to increase allocations for basic socialservices to improve social indicators. The fiscal problems of the provinces have been furthercompounded by high inflation, the adverse law and order situation, the federal government'sdecision that the provinces should finance part of their development budgets from their ownresources, and the increasing debt servicing liabilities of the provinces. With provincial
2
revenue resources not keeping pace with expenditure growth, fiscal stress on the provinceshas been increasing.
HISTORICAL BACKGROUND
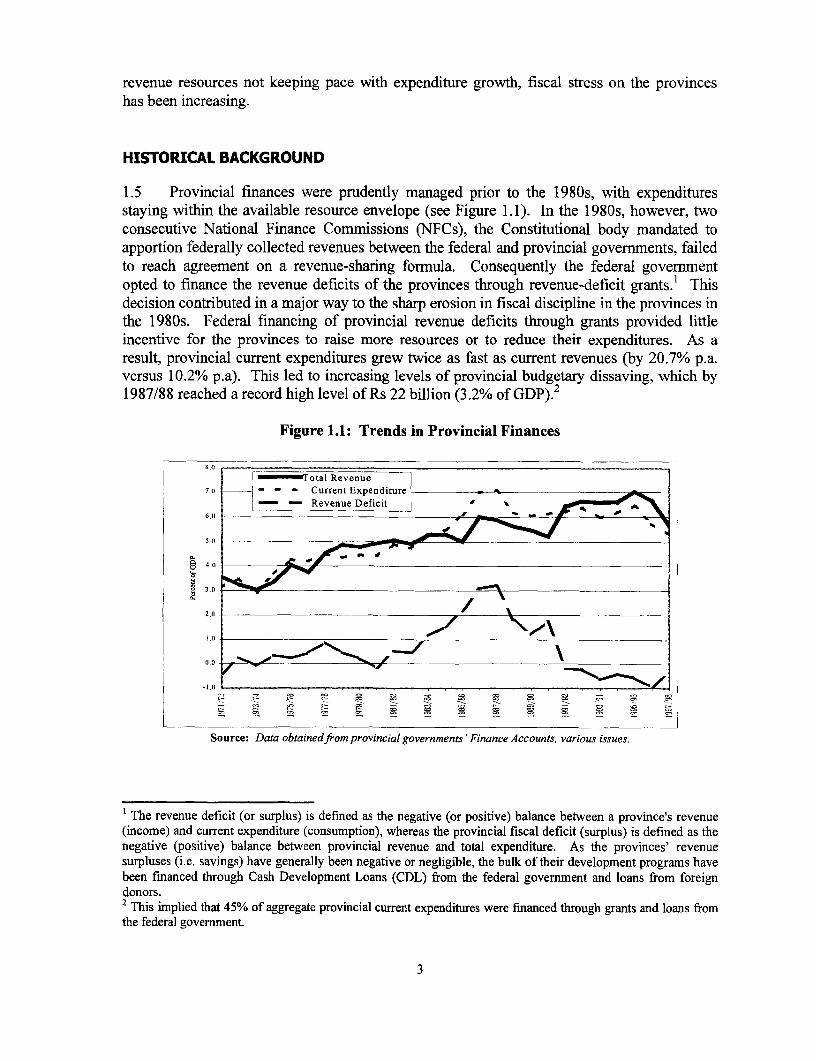
1.5 Provincial finances were prudently managed prior to the 1980s, with expendituresstaying within the available resource envelope (see Figure 1.1). In the 1980s, however, twoconsecutive National Finance Commissions (NFCs), the Constitutional body mandated toapportion federally collected revenues between the federal and provincial governments, failedto reach agreement on a revenue-sharing formula. Consequently the federal governmentopted to finance the revenue deficits of the provinces through revenue-deficit grants.' Thisdecision contributed in a major way to the sharp erosion in fiscal discipline in the provinces inthe 1980s. Federal financing of provincial revenue deficits through grants provided littleincentive for the provinces to raise more resources or to reduce their expenditures. As aresult, provincial current expenditures grew twice as fast as current revenues (by 20.7% p.a.versus 10.2% p.a). This led to increasing levels of provincial budgetary dissaving, which by1987/88 reached a record high level of Rs 22 billion (3.2% of GDP).2
Figure 1.1: Trends in Provincial Finances
-7Tot.al Revenue|7il - - - Current Expenditure
- -Revenue Deficit v6,,
2.0
.1.(1 ' . . , . - . C-- _ ... _, . C Ca -. .... ..... , - , ,lC
Source: Data obtainedfrom provincial governments ' Finance Accounts, various issues.
The revenue deficit (or surplus) is defined as the negative (or positive) balance between a province's revenue(income) and current expenditure (consumption), whereas the provincial fiscal deficit (surplus) is defined as thenegative (positive) balance between provincial revenue and total expenditure. As the provinces' revenuesurpluses (i.e. savings) have generally been negative or negligible, the bulk of their development programs havebeen financed through Cash Development Loans (CDL) from the federal government and loans from foreigndonors.2 This implied that 45% of aggregate provincial current expenditures were financed through grants and loans fromthe federal government.
3

1.6 Rapidly increasing current expenditure coupled with growing provincial developmentoutlays (which recorded about a five-fold increase during this period and were generallyfinanced by loans from the federal government) resulted in high and growing provincial fiscaldeficits. By 1987/88, the aggregate provincial deficit amounted to 5.5% of GDP andconstituted 64% of the consolidated fiscal deficit of the federal and provincial governments,aggravating the country's overall fiscal imbalance. Fearing a complete fiscal breakdown, thefederal government then imposed ceilings on total federal transfers to the provinces. Thisarrested the sharp escalation in provincial current expendilures, which fell from 7.1% of GDPin 1987/88 to 6.2% in the following year. It did not, however, induce the provinces tomobilize more revenues.
1.7 The 1991 NFC Award, which was implemented starting from the 1991/92 budget,abolished non-obligatory federal grants but at the same time included some additional revenuesources (e.g. excise duty on tobacco and tobacco manufactures and sugar) in the divisible pooland provided gas surcharges and royalty on gas and oil as straight transfers to the provinces.3Moreover, the 80% provincial share in revenue from fast-growing taxes (income and salestaxes) was retained, which caused revenue transfers to provinces to be more buoyant thanoverall federal revenue. The 1991 NFC Award was instrurnental in raising provincial revenuesharply by as much as 70% in the first year of the Award. This helped the provincialgovernments to convert their 1990/91 revenue deficit (before federal revenue deficit grants) ofRs 17.9 billion into a surplus of about Rs 2.5 billion in 1991/92. Moreover, this turnaroundwas achieved in a situation where provincial expenditure responsibilities were expanding dueto initiation of the Social Action Program (SAP) in 1990/91.
1.8 However, this new-found financial prosperity of the provinces was not prudentlyutilized. Significant increases were made in the salaries of civil servants and the provincesopted for large-scale recruitment into the civil service, especially Sindh. Provincialdevelopment expenditures also grew rapidly. Nevertheles3, the provinces not only generatedsignificant revenue surpluses to finance a large portion of their development programs, butthese surpluses grew at a rapid rate and by 1996/97 reached Rs 23 billion (more than theaggregate provincial development program for that year).
1.9 The revenue-sharing arrangement under the 1991 NFC Award turned out to beunsustainable, as larger revenue transfers to the provinces increased fiscal stress at the federallevel. Responding to this problem, the 1997 NFC expanded the divisible pool to include allfederally collected taxes (except the petroleum surcharge) and correspondingly lowered theshare of the provinces in the divisible pool. With slow-growing customs and excise dutiesnow included in the divisible pool, the overall buoyancy of provincial revenue receiptsdeclined. Moreover, immediately after the announcement of the NFC Award, the federalgovernment lowered rates of sales tax and import tariffs, thereby reducing tax transfers to theprovinces. As federal revenues fell short of the budget targets by substantial margins, theprovinces experienced a fiscal crisis of unprecedented magnitude during 1997/98 and1998/99, leading to a major squeeze on provincial spending which adversely affected evenhigh-priority expenditures.
3The provinces were also given revenue from hydel profits from the federal electricity utility (WAPDA), whichprimarily accrue to NWFP.
4
1.10 Based on the 2000/01 budget targets, the fiscal position of the provinces lookssomewhat better, which reflects planned expansion of the base of the GST, as well as efforts todocument the economy. Whether a significant improvement in the provinces' fiscal positionwill actually be achieved, however, will depend on the performance of tax collection in relationto the ambitious revenue target, which is uncertain in the light of past revenue shortfalls.
PROVINCIAL REVENUE: COMPOSION AND TRENDS
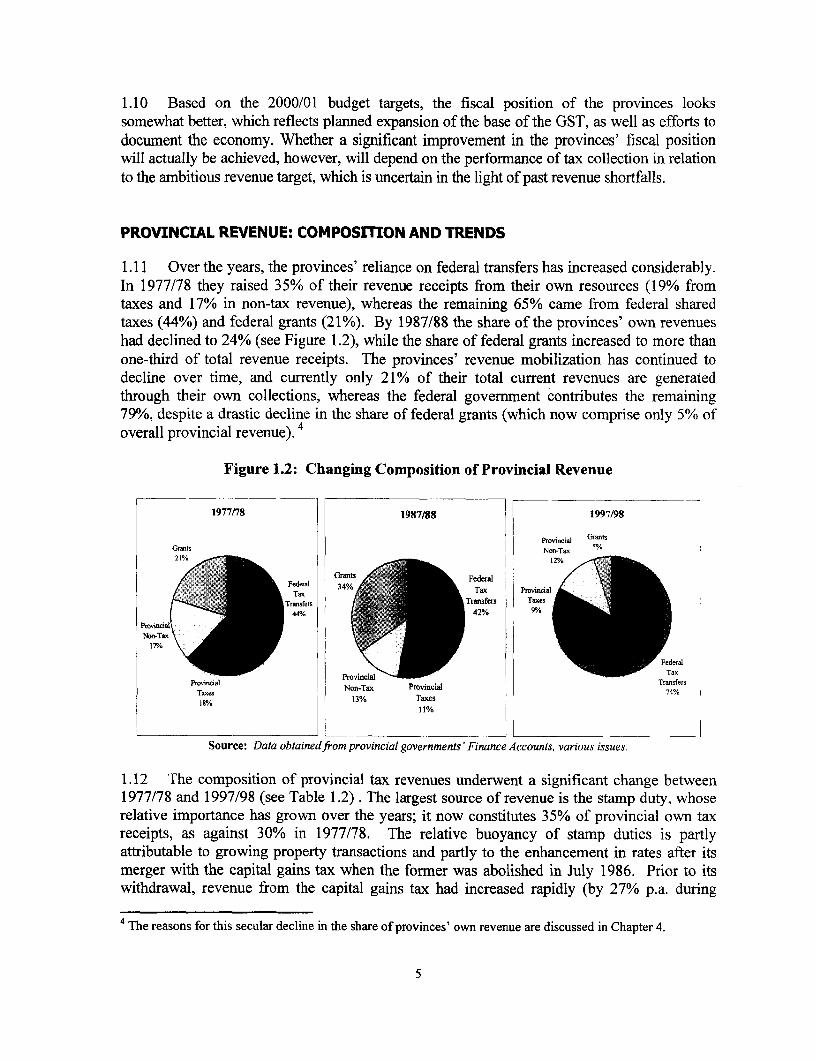
1.11 Over the years, the provinces' reliance on federal transfers has increased considerably.In 1977/78 they raised 35% of their revenue receipts from their own resources (19% fromtaxes and 17% in non-tax revenue), whereas the remaining 65% came from federal sharedtaxes (44%) and federal grants (21%). By 1987/88 the share of the provinces' own revenueshad declined to 24% (see Figure 1.2), while the share of federal grants increased to more thanone-third of total revenue receipts. The provinces' revenue mobilization has continued todecline over time, and currently only 21% of their total current revenues are generatedthrough their own collections, whereas the federal government contributes the remaining79%, despite a drastic decline in the share of federal grants (which now comprise only 5% ofoverall provincial revenue).4
Figure 1.2: Changing Composition of Provincial Revenue
1977178 1987/88 1997198
Provicial GrantsGrants Non-Tax21% 12%
Grants340 FederalTan 34% Tax Provincial
- Trmsfes Transfers Taxes 1441% 42% 9/
ProSincialNon-Ta
17% '
*1Federal
1.12 The ciapositionlof Prrvincial tt.PoiTeaxe o a Poica Transfers
i5n,M 13% Taxes % I
11%
Source: Data obtained from provincial governments 'Finance.Accounts, various issues.
1.12 The composition of provincial tax revenues underwent a significant change between1977/78 and 1997/98 (see Table 1.2) . The largest source of revenue is the stamp duty, whoserelative importance has grown over the years; it now constitutes 35% of provincial own taxreceipts, as against 30% in 1977/78. The relative buoyancy of stamp duties is partlyattributable to growing property transactions and partly to the enhancement in rates after itsmerger with the capital gains tax when the former was abolished in July 1986. Prior to itswithdrawal, revenue from the capital gains tax had increased rapidly (by 27% p.a. during
4 The reasons for this secular decline in the share of provinces' own revenue are discussed in Chapter 4.
5

1977/78-1985/86, as its administration was strengthened to check tax evasion.5 The secondbiggest source of revenue is the motor vehicle tax (MVT), which also witnessed a rise in itsshare of total provincial tax revenues (from 13% in 1997/78 to 15% in 1997/98) as a result ofsome administrative measures and rate increases.
1.13 The urban immovable property tax which accounted for 14% of provincial tax revenuein 1997/98, has shown the highest rate of increase (21% p.a.) over the last 20 years, but thishealthy growth rate conceals severe fluctuations as the provinces experimented with differentdefinitions of the tax base and different assessment and collection procedures. At presentelectricity duties contribute another 7-8% of the provinces' tax receipts, whereas land revenue,has lost most of its significance due to the federal government's imposition of Ushr (anIslamic levy on agricultural product, proceeds of which do not form part of provincialrevenues) in 1983/84. As Ushr payers are exempted frorn levy of land revenue, the receiptspresently recorded under land revenue are largely revenues from collection of local rates,development cess, mutation fees, etc.
Table 1.2: Composition of Provinces' Own Revenue(Percent)
1977/78 1982/83 1987/88 1990/91 1991/92 1992/93 1993/94 1994/95 1995/96 1996/97 1997/98
Provincial Tax Revenue 100.0 100.0 100.0 100.0 100.0 1(10.0 100.0 100.0 100.0 100.0 100.0Direct taxes 15.5 20.8 20.6 19.6 22.4 24.9 25.6 22.1 22.4 27.0 30.0
Urban immovable 3.1 3.6 5.3 1.8 4.3 8.2 8.6 5.2 4.4 9.9 14.0Property tax
Agriculture income tax 0.5 0.0 0.0 0.0 0.0 0.0 0.0 0.0 0.0 1.1 4.8Registration fee 3.9 4.2 4.5 4.1 3.7 3.3 2.9 3.0 3.3 2.7 2.7Land revenue (tax) 8.0 7.3 8.9 11.8 12.6 11.8 12.4 12.1 13.0 11.7 6.5Capital gains tax 0.0 4.0 0.3 0.1 0.1 0.0 0.0 0.0 0.0 0.0 0.0Taxes on profession, 0.0 1.6 1.6 1.8 1.7 1.6 1.6 1.8 1.8 1.6 2.0Trades and callings
Indirect taxes 84.5 79.2 79.4 80.4 77.6 ,5.1 74.4 77.9 77.6 73.0 70.0Motor vehicle tax 12.5 15.9 19.0 20.4 18.1 18.8 16.9 17.5 14.4 13.9 15.3Stamp duties 30.1 23.2 37.2 42.1 41.2 37.7 39.0 36.5 36.3 32.0 34.6Entertainment tax 0.0 7.5 4.7 4.0 3.0 2.6 2.9 2.4 1.7 1.9 1.9Electricity duties 5.3 4.5 7.3 1.3 2.4 4.5 3.5 9.3 10.4 8.8 2.6Hotel tax 0.0 0.6 0.9 1.9 1.0 1.2 1.1 2.0 1.3 1.3 1.4Provincial excises 5.0 3.1 3.7 5.5 5.9 6.5 7.5 5.4 7.1 6.8 6.6Education cess 0.0 0.8 0.8 0.6 0.5 0.2 0.3 0.2 0.8 0.0 1.7Cotton cess 3.6 3.9 5.1 4.1 5.0 3.1 3.0 2.6 3.2 2.2 2.2Other 28.0 19.6 0.7 0.6 0.5 0.2 0.4 1.9 2.4 6.2 3.6
Provincial Non-Tax Revenue 100.0 100.0 100.0 100.0 100.0 110.0 100.0 100.0 100.0 100.0 100.0User Charges 33.4 31.9 16.6 25.6 28.9 22.9 27.5 26.4 29.7 32.6 24.4Grants 54.9 46.1 73.3 59.0 13.0 22.5 19.7 15.2 10.5 10.9 28.8Others 11.7 22.0 10.1 15.4 58.1 54.6 52.8 58.4 59.9 56.5 46.8
Source: Provincial governments'Finance Accounts, various issues.
1.14 Growth in receipts from provincial excise duties also was low during the 1980s, asrestrictions were imposed on alcohol consumption, a primaly source of excise revenue, in 1976.During the 1977/88-1987/88 period, revenues from provincial excises grew by only 8.4% p.a.However, with expansion of the tax base by bringing provincial services (catering, restaurants,marriage halls, etc.) into the tax net, the yield from provincial excise duties has improved
5 During the period in which it was levied (1972/73 - 1984/85), the capital gains tax showed the highest buoyancyarnong all provincial taxes, and its discontinuation resulted in an annual revenue loss of over Rs 200 million.
6

considerably; between 1987/88 and 1997/98 they grew at about 19% p.a. and now contribute6.6% of provincial tax revenues, as against 5% in 1997/78 and 3.1% in 1982/83.
1.15 In terms of their revenue yield, all other provincial taxes are of little importance.Moreover, the revenue contributions of many of them have been declining over time. Thesharpest fall has been in the entertainment tax, whose share in tax revenues dropped from7.5% in 1977/78 to less than 2.0% in 1997/98, due to a persistent recession in the filmindustry and show business and the ban on horse racing since 1977 (which caused a loss inrevenues from taxes on betting and gambling). The tax on professions and callings on averagecontributes about 2% and the hotel tax about 1.5% to provincial own tax revenues. With theexception of the cotton cess (2.2% of provincial tax revenues),6 all other minor taxes havenegligible revenue yields.
1.16 The provinces' non-tax revenues consist of receipts from interest, dividends, civiladministration, user charges, proceeds from sale of goods, and non-development grants from thefederal government. Until 1990/91, federal grants were the dorninant component of provincialnon-tax revenue, contributing as much as 73% of these receipts in 1987/88. With thediscontinuation of non-obligatory grants in 1991/92, however, the share of federal grants inprovincial non-tax revenue dropped sharply to only 13%. The 1991 NFC Award, whichdiscontinued non-obligatory federal grants, assigned profits from hydel generation to theprovinces, the revenues from which more than made up for the loss of revenue from federalgrants.
1.17 Despite growing by more than 20% p.a. over the last two decades, interest receiptsrealized from loans and advances to non-financial institutions, local bodies, commercialdepartments, and government servants constitute only 5.5% of total non-tax collections.Receipts from civil administration departments (i.e. general administration and law and order)contribute another 4.5%, including pension and gratuity contributions, court and police fees andfines, service payments, sale proceeds of unclaimed properties and products produced in jails,and examination fees realized by the Public Services Commission.
1.18 User charges account for almost 29% of total non-tax receipts. The most significant isirrigation water charges, which yield 8.5% of total non-tax revenues, while other economicservices (agriculture, industry, transport and communication, etc.) contribute another 6.2%.Receipts from other user charges have been rather modest. Education receipts primarily accruefrom fees at the secondary level, as primary education is free and fees for colleges, universities,and technical and commercial institutes have an insignificant revenue yield. Health sectorreceipts are derived mainly from hospital charges, as medical college fees and receipts from saleof medicines are small.
6 This revenue accrues mainly in Punjab.7 Although the non-obligatory grants were discretionary in nature, they benefited all the provinces. Hydelprofits, which are transferred directly by WAPDA and treated by the provinces as non-tax revenue, accruemainly to NWFP.
7

COMPOSMON AND TRENDS IN PROVINCIAL EXPENDITURE
1.19 As mentioned earlier, the provinces have primary responsibility for provision of socialservices, agricultural services, irrigation, rural development, and maintenance of law andorder. Correspondingly, provincial expenditures are concentrated in these key sectors.However, servicing of provincial debt and the growing provincial civil service establishmentare claiming a rising proportion of the provinces' limited resources. Interest payments and thewage bill together constitute 70% of total provincial current expenditure, preventing adequateallocations for operation and maintenance (O&M) of provincial physical infrastructure andpublic services. The provincial expenditure structure has also contributed to seriousbudgetary rigidities, making it difficult for provincial financial managers to adjustexpenditures appropriately when revenues fall short of budget targets. A fall in provincialrevenue receipts generally translates into higher levels of provincial indebtedness to thefederal government or to the State Bank of Pakistan, further exacerbating the vulnerability ofprovincial finances.
1.20 Over the last two decades, provincial expenditures have grown at an average rate of14% p.a. in nominal terms, with current expenditure increasing considerably faster (16% p.a.)than development spending (10%). When the federal goveinment fuilly covered the provincialgovernments' fiscal deficits during 1980/81-1987/88, a sharp escalation in expenditure (at20% p.a.) was observed. Due to worsening fiscal stress in recent years, expenditure growthhas subsided considerably, registering an increase of only 10% p.a. during the 1987/88-1997/98 period (as compared with 19% p.a. during 1977/78-1987/88). A sharp decelerationin development spending contributed greatly to this slowdown.
1.21 In contrast, the provincial salary bill has continued to increase at a relatively rapidpace, even during years when overall expenditure growth slowed down (see Table 1.3). Withprovincial revenue stagnating in recent years, this is one of the key trends behind the fiscalcrisis faced by the provinces. The continuing increase in the provincial wage bill isattributable to the following factors: (i) substantial growth in civil service employment inrecent years, despite recruitment bans imposed by all provincial governments; (ii) revision ofbasic salaries, translating into increases of about 20% p.a. in 1991 and 1994; (iii) automaticincreases in basic salary due to annual increments; and (iv) increases in some allowances.
Table 1.3: Wage Cost of the Provincial Governments, 1990/91-1995/96
(Rs million)
Avg. Annual1990/91 1991/92 1992/93 1993/94 1994/95 1995/96 Growth (%)
Provincial 26:849 36,034 41,346 47,134 55,199 66,184 19.8Punjab 13,933 18,760 22,292 25,361 28,149 34,502 19.9Sindh 6,935 9,331 10,237 11,824 15,076 17,096 19.8NWFP 3,936 5,191 5,630 6,304 7,737 9,530 19.3Balochistan 2,045 2,753 3,188 3,644 4,236 5,057 19.8
Source: Provincial governments' unpublished data.
8
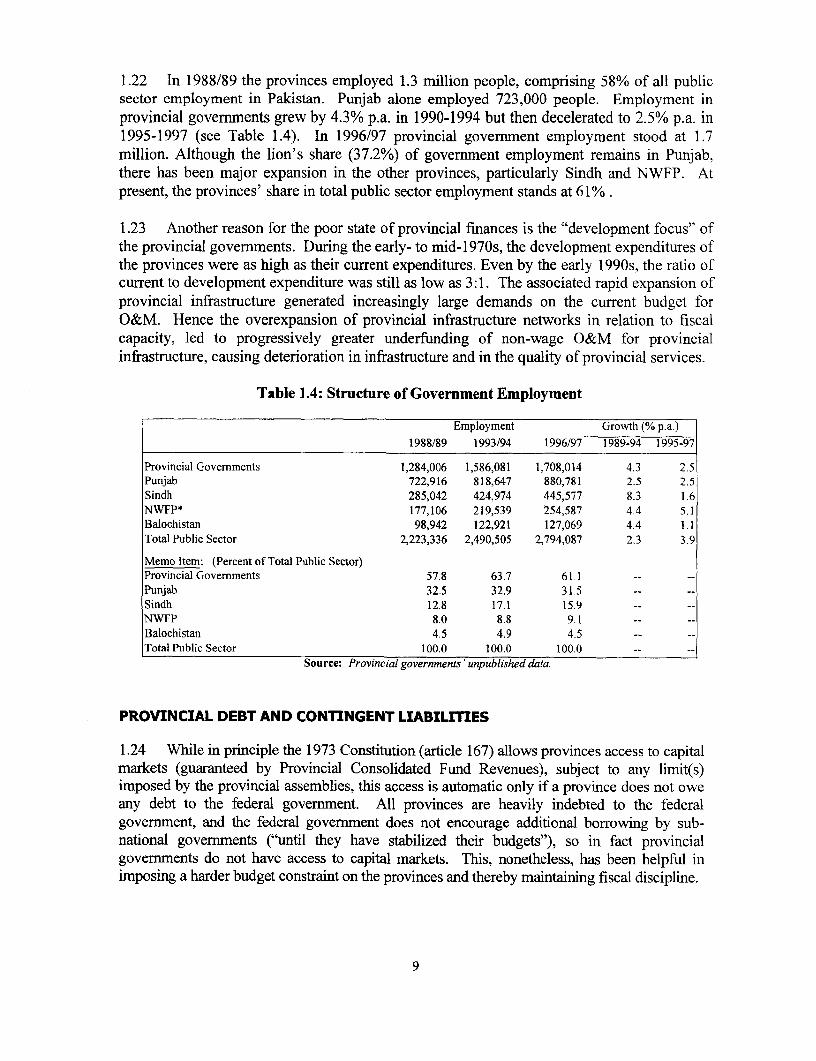
1.22 In 1988/89 the provinces employed 1.3 million people, comprising 58% of all publicsector employment in Pakistan. Punjab alone employed 723,000 people. Employment inprovincial governments grew by 4.3% p.a. in 1990-1994 but then decelerated to 2.5% p.a. in1995-1997 (see Table 1.4). In 1996/97 provincial government employment stood at 1.7million. Although the lion's share (37.2%) of government employment remains in Punjab,there has been major expansion in the other provinces, particularly Sindh and NWFP. Atpresent, the provinces' share in total public sector employment stands at 61%.
1.23 Another reason for the poor state of provincial finances is the "development focus" ofthe provincial governments. During the early- to mid-1970s, the development expenditures ofthe provinces were as high as their current expenditures. Even by the early 1990s, the ratio ofcurrent to development expenditure was still as low as 3:1. The associated rapid expansion ofprovincial infrastructure generated increasingly large demands on the current budget forO&M. Hence the overexpansion of provincial infrastructure networks in relation to fiscalcapacity, led to progressively greater underfunding of non-wage O&M for provincialinfrastructure, causing deterioration in infrastructure and in the quality of provincial services.
Table 1.4: Structure of Government Employment
Employment Growth (% p.a.)
1988/89 1993/94 1996/97 1989-94 1995-97
Provincial Governments 1,284,006 1,586,081 1,708,014 4.3 2.5Punjab 722,916 818,647 880,781 2.5 2.5Sindh 285,042 424,974 445,577 8.3 1.6NWFP* 177,106 219,539 254,587 4.4 5.1Balochistan 98,942 122,921 127,069 4.4 1.1Total Public Sector 2,223,336 2,490,505 2,794,087 2.3 3.9
Memo Item: (Percent of Total Public Sector)Provincial Governments 57.8 63.7 61,1Punjab 32.5 32.9 31.5 -- --
Sindh 12.8 17.1 15.9 -- --
NWFP 8.0 8.8 9.1 -- --
Balochistan 4.5 4.9 4.5 -- --
Total Public Sector 100.0 100.0 100.0 -- --
Source: Provincial governments' unpublished data
PROVINCIAL DEBT AND CONTINGENT LIABILITIES
1.24 While in principle the 1973 Constitution (article 167) allows provinces access to capitalmarkets (guaranteed by Provincial Consolidated Fund Revenues), subject to any limit(s)imposed by the provincial assemblies, this access is automatic only if a province does not oweany debt to the federal government. All provinces are heavily indebted to the federalgovernment, and the federal government does not encourage additional borrowing by sub-national governments ("until they have stabilized their budgets"), so in fact provincialgovernments do not have access to capital markets. This, nonetheless, has been helpful inimposing a harder budget constraint on the provinces and thereby maintaining fiscal discipline.
9

1.25 Although when measured by standard indebtedness indicators, the provinces do nothave a substantial debt burden, their debt, mainly to the federal government, is high,particularly in view of the provinces' weak finances. In 1984/85 the total debt of the provincesamounted to Rs 42 billion (8.9% of GDP and 225% of provincial revenue receipts), withPunjab owing half of the total. Market loans accounted for only Rs 2.2 billion of provincialdebt. Another Rs 3 billion was raised by the provincial governments as "floating debt".8 Theremaining amount of Rs 36.8 billion was owed to the federal government for its cashdevelopment loans (CDL) and onlending of foreign loans (see Table 1.5). With the provincesaccumulating debt at a rate of 12% p.a., by 1997/98 provincial debt had increased to Rs 172billion,9 with CDL-related debt amounting to Rs 133 billion and foreign loans contributinganother Rs 24 billion. Moreover, the provinces also have significant contingent liabilities in theform of unfunded future pension obligations and Gratuity and Provident (GP) Fund.
Table 1.5: Composition and Trends in Provincial Debt(Percent)
1984/85 1990/91 1991/92 1992/93 : 993/94 1994/95 1995/96 1996/97 1997/98
Total DebtAsapercentofGDP 8.9 9.1 8.7 8.9 8.1 7.3 6.9 6.2 6.3Asapercentofprovincial revenue 224.9 207.9 135.9 134.5 123.2 111.2 98.1 92.4 111.5As a percent of Total Debt:Domestic Debt (Permanent) 5.2 3.3 2.9 2.3 2.6 2.4 1.6 1.4 1.5Domestic Debt (from Federal Govt.) 85.9 92.1 92.4 91.5 90.7 87.4 86.3 83.1 77.1Foreign Debt 1.9 2.7 2.5 2.4 3.4 6.3 7.8 10.9 14.3Floating Debt 7.0 1.9 2.2 3.8 3.4 3.9 4.3 4.6 7.1
Source: Provincial governments' Finance Accounts, and budget White Papers, various issues.
1.26 With provincial revenue increasing at a somewhat faster rate than the growth ofprovincial debt, the provinces' debt-carrying capacity has improved, with the debt-to-revenueratio, although still at a high level of 112%/'o, falling to about hialf of its 1984/85 level. However,with the federal government raising interest charges on CDL from 10% p.a. to 18% p.a. overtime,10 provincial interest payments to have increased by 15% p.a. and still account for 23% ofprovincial recurrent expenditure (the same level as in 1987/88).
1.27 The "floating debt" of the provincial governments n-early doubled to Rs 12.3 billion in1997/98 (from Rs 6.9 billion in 1996/97). This was a result of the 1997 NFC provision thatprovinces are permitted to borrow from the State Bank of Pakistan to meet short-term cash flowneeds, which inadvertently encouraged fiscal mismanagement in the provinces by allowing theprovincial governments to finance their revenue deficits through borrowing.
This includes advances to the provincial governments for ways and means, cash credit accommodation, andspecial-purpose bonds/debentures issued by the provincial governments (with the federal government'sapproval).9 But the debt-to-GDP ratio fell to 6.3%.'° As interest on federal loans is significantly higher than market rates, the provinces in effect are subsidizing thefederal government. Moreover, the State Bank of Pakistan (SBP) charges an annual interest rate of about 10% on theways and means advances to the provinces (as long as a province remains within the SBP specified limit for theseadvances) and 14% on the amount in excess of this limit, whereas no interest is paid on provincial cash balancesdeposited with SBP. The debt related to GP Funds carries an even higher interest charge (22%).
10

1.28 Despite the improvement in the debt-carrying capacity of the provinces, their debtremains at a very high level particularly in relation to their expenditure structures, and there isno room for the provinces to be complacent about the debt problem. Along with a high
degree of fiscal prudence, better debt management practices are required, not only to decrease
the burden of provincial debt and reduce debt servicing expenditures, but also to enhance theprovinces' creditworthiness for the future.
1.29 Moreover, the provincial governments also have significant contingent liabilities,mainly in the form of unfunded pension liabilities, and through the large number of provincialautonomous bodies, public enterprises, and other organizations. Pensions of the provincialgovernments (as is the case for the federal and local governments) are totally unfunded, withthe partial exception of NWFP which has established a pension fund albeit with very limitedresources. Moreover, Pakistan has a unique system of undiscounted commutation of 50% oftotal pension, which results in a significant up-front cost to the government for every retiringemployee." Given the relatively young age structure of provincial establishments, pension
costs, which are paid out of current revenues, have not yet gone completely out of control.However, the massive increase in provincial government employment in the early 1970s hasrecently started to push up pension costs to worrisome levels.'2 Given the large size ofprovincial establishments, rising pension costs present the greatest risk to provincial financesin the future, and the time to take remedial actions is now. The NWFP government hasalready instituted a provincial pension fund by making some allocations from its currentbudget for this fund. The Punjab government is also planning to establish such a fund startingfrom the 2000/01 budget. However, given the fiscal difficulties of the provincialgovernments, it is unlikely that these pension funds could be allocated funds commensuratewith the growing future pension liabilities. The complexity of the problem warrants aseparate and comprehensive study to fully analyze all aspects and options available to thegovernment on this issue, as the problem has the potential of reaching crisis proportionswithin the next 5-10 years.
1.30 The other major source of provincial contingent liabilities is the large number ofautonomous bodies established by the provincial governments. For example, the Punjabgovernment operates 125 autonomous bodies (of which six are now defunct or about to beclosed), with total employment of more than 100,000. Not only do these autonomous bodiesget significant funds from the provinces' recurrent budgets (mostly as grants-in-aid) and theirdevelopment budgets (mainly as cash development loans), they also impose additionalburdens on provincial resources through borrowings from the provincial governments.Currently, total outstanding loans of the autonomous bodies and local bodies to the Punjabgovernment amount to Rs 35 billion (about 2% of GDP), and almost all of them are non-performing assets. There is constant pressure on the provincial government to write-off theseloans.
11 Along with up-front payment of 50% of the expected amount of lifetime pension as commutation, anadditional 25% of the commuted amount is paid as gratuity (which is also treated in the government accounts asa pension payment).12 For example, the pension payments of the Punjab government increased from Rs 1.7 billion in 1990/91 to Rs 8billion in 1999/00.
11

1.31 As almost all borrowings of the autonomous bodies (other than those from theprovincial government) are guaranteed by the provincial government, they also imposesignificant contingent liabilities on the provinces. At present, total borrowing by Punjab'sautonomous bodies from the banking system are estimated at about Rs 6 billion, with thePunjab Road Transport Corporation (Rs 1.8 billion) and Punjab Cooperative Bank (Rs 2.4billion) being the largest borrowers. Another contingent liability of the provincialgovernment arises from the current and future pension benefits of employees of theautonomous bodies, which in the case of Punjab are estirnated at about Rs 500 million perannum. However, in the event of closure of most of these autonomous bodies andcorrespondingly wholesale (early) retirement of their employees, provincial pension paymentson this account would be much higher in the short run.
1.32 The provincial governments are trying, with some degree of success, to privatize allautonomous bodies with commercial functions (e.g. PRTC). This process at present is ad hoc,however, and needs to be formalized through functional r-eviews of these bodies (see para.4.5). Moreover, with the planned devolution of authority and responsibilities to localgovernments, some of these autonomous bodies (especial]y development authorities) wouldbecome defunct or would be merged with the local governments. However, transfer of theautonomous bodies to the local governments without needed financial and administrativerestructuring of these bodies could cause major financial problems for the local governments.
1.33 To summarize, the provinces' debt and associated interest burden are continuing togrow rapidly. Serious, concerted and immediate debt management efforts are needed to stopprovincial debt from becoming a major problem in the future. Besides this financial debt,which is owed mainly to the federal government, the provinces have substantial contingentliabilities, mostly on account of unfunded pension schemes and debt guarantees and workers'compensation obligations of provincial autonomous bodies. Past rapid provincial publicsector employment growth has started to impact on provincial pension payments in a big way.It is therefore imperative that the provinces tackle pension issue. Establishment ofprofessionally managed pension funds in the provinces should be considered, and the existingpractice of undiscounted commutation of pension needs 1o be changed, at least for newlyrecruited employees.
EXPENDITURE ISSUES IN SELECTED SECTORS
1.34 Agriculture: In Pakistan the government has playecl an active role in the developmentof agriculture, and most agricultural expenditures are funcled out of the provincial budgets.After an initial period of rising yields in the 1960s which coincided with the green revolution,however, public investment in agriculture has failed to boost productivity. This is partlybecause the provincial governments have often failed to allocate adequate resources to crucialareas (such as research and extension), despite their long-term plans for continuing spendingin these areas.'3 Moreover, inappropriate input mix has rendered the spending which occursineffective. Public outlays on agriculture are dominated by salary expenditure, with little
13 Overall provincial expenditure on agriculture has increased by only about 7% p.a. in nominal terms over thelast decade; its share in total expenditure has declined from 5.6% in 1997/98 to 4.3% in 1997/98.
12
money left for operations and maintenance. For example, staff salaries constitute about 85-90% of current expenditure on agricultural research and extension, leaving inadequate fundsfor research equipment and travel. Moreover, the provincial governments have misallocatedscarce public resources by funding activities that could have been equally well performed bythe private sector. Such government activities not only promote inefficient use of resources,but also crowd out the private sector.
1.35 Agricultural research and extension are generally recognized to have most of theattributes of public goods. While some agricultural extension in Pakistan is being undertakenby private firms dealing in farm chemicals, and there is potential for private sector researchand extension in the seed sector, basic research on agricultural technologies will necessarilycontinue to be funded by the public sector. The focus of extension services should shift awayfrom introducing "new" fertilizer-seed technologies to helping farmers better manageresources. The private sector can be a partner in performing this role but is not expected toreplace the public sector entirely. Therefore public spending on agricultural research andextension should continue but in a more focused manner. Moreover, because of their publicgood nature, there is also a strong rationale for continued (and perhaps increased) publicsector funding of plant protection activities, especially against locusts and some plant diseases(e.g. cotton leaf curl virus). In these areas of continuing public sector involvement, it iscrucial to improve the mix of inputs (in particular by adequately funding critical non-wageO&M) and more generally improve the effectiveness of public spending.
1.36 Social Sectors: As mentioned earlier, the provinces have the main responsibility forprovision of social services. Until the mid-1980s, however, provincial spending on socialsectors amounted to only 25% of aggregate provincial expenditure. This changed in the early1990s, when spending on social sectors increased substantially, mainly due to initiation of theSocial Action Program (SAP) in 1991/92. This represents a concerted effort by thegovernment to improve the country's social indicators by sharply increasing spending on andimproving the delivery of basic social services - elementary education, basic public health,family planning, and rural water supply and sanitation. As a result, the provincialgovernments presently spend more than one-third of their total expenditure on social services,with education alone claiming 26%.
1.37 Given the rigid structure of the provincial budgets as mentioned earlier, higherallocations for the SAP sectors in a period of fiscal squeeze have implied slower growth innon-SAP expenditures (including non-SAP social sectors), especially non-wage O&M. Inother words, increased spending on SAP has been achieved at least partly by running downphysical (and non-SAP social) infrastructure. This gives rise to doubts about thesustainability of higher allocations for SAP in the future, if the provincial resource position isnot improved significantly.
1.38 Unfortunately, the increases in public spending on basic social services have notachieved their intended impact. While the bulk of SAP resources have been expended onbasic education, this has not been reflected in commensurate improvements in school
13

enrollment rates, which have fallen short of planned targets.14 Furthermore, evidence suggeststhat the poor are benefiting least from primary schooling services.15
1.39 Moreover, mainly due to the poor quality of public services, there is (according toPIHS data) continuing reliance on private care for treatnient of minor ailments. In 1996/97,treatment of children for diarrheas was sought from private practitioners in 60% of the casesand from government hospitals in 8%, whereas BHUs were used for treatment in only 2% ofthe cases. Only 36% of women in rural areas practicing family planning obtained servicesfrom government hospitals, 12% from government famnily planning clinics, and 5% fromgovernment health workers. Among public facilities, hcispitals have tended to be the mainsource of health services, even for outpatient care, while utilization of primary health serviceshas remained low. As a result of this poor utilization of public health facilities, their unit costis many times that of comparable private sector facilities.
1.40 The limited impact of increased spending on basic social services underscores the lowefficiency with which available resources are utilized. The effectiveness of expenditures hasbeen undermnined by persistent institutional weaknesses, poor governance, and inadequatemanagement and organizational capacity of service delivery departments and agencies.Governance problems, particularly those related to personmel, have been a critical constraint,including absenteeism, hiring of staff on other than merit grounds, frequent transfers, andmaldistribution of staff to the disadvantage of rural areas. The recent army survey of schoolsin Punjab found 6,800 teachers absent from schools and 2,000 non-functioning schools.Maldistribution of staff is partly due to the widespread practice of loaning and detailment,whereby staff may work in urban areas while they continue to retain their positions and drawtheir salaries from rural facilities. In Sindh an estimated 14,000 teachers need to be re-located, while 18,000 teachers have been fired in Balochistan and about 4,000 in Punjab dueto irregularities in recruitment processes and lack of professional qualifications. Thesedifficulties to a large extent stem from corruption and political interference in personnelmanagement. Political patronage as well as limited administrative authority undermine theability of lower-level managers to link rewards and punishment to performance. Poor staffperformance is also a reflection of the systemic problem of low pay and weak motivation toperform, which is related broader issues of civil service reform.
1.41 In order to enhance the effectiveness of public expenditures and improve theperformance of the social sectors, the provinces need to: (].) achieve adequate minimum levelsof spending; (ii) build the institutional capacity to better design and implement programs; (iii)develop and fund a phased program to expand key activities in line with improvedinstitutional capacity; (iv) establish better governance mechanisms (see Box 1.1 for anexample); (v) in line with the government's devolution plan (see chapter 5) decentralizeservice delivery systems to lower levels of administration as appropriate (see Box 1.2 for a
14 Although there has been an increase in the gross primary enrollment rate (GER) for girls, overall enrollmentrates have fallen, mainly due to a declining trend in boys' primary GER, which decreased at an annual rate of 1.3percentage points between 1991 and 1996/97.'5 Pakistan Integrated Household Survey (PIHS) data for 1995/96 and 1996/97 indicate that the GER of boys andgirls belonging to households in the lowest expenditure quintile has declined in both rural and urban areas of allprovinces, with the sole exception of rural NWFP.
14
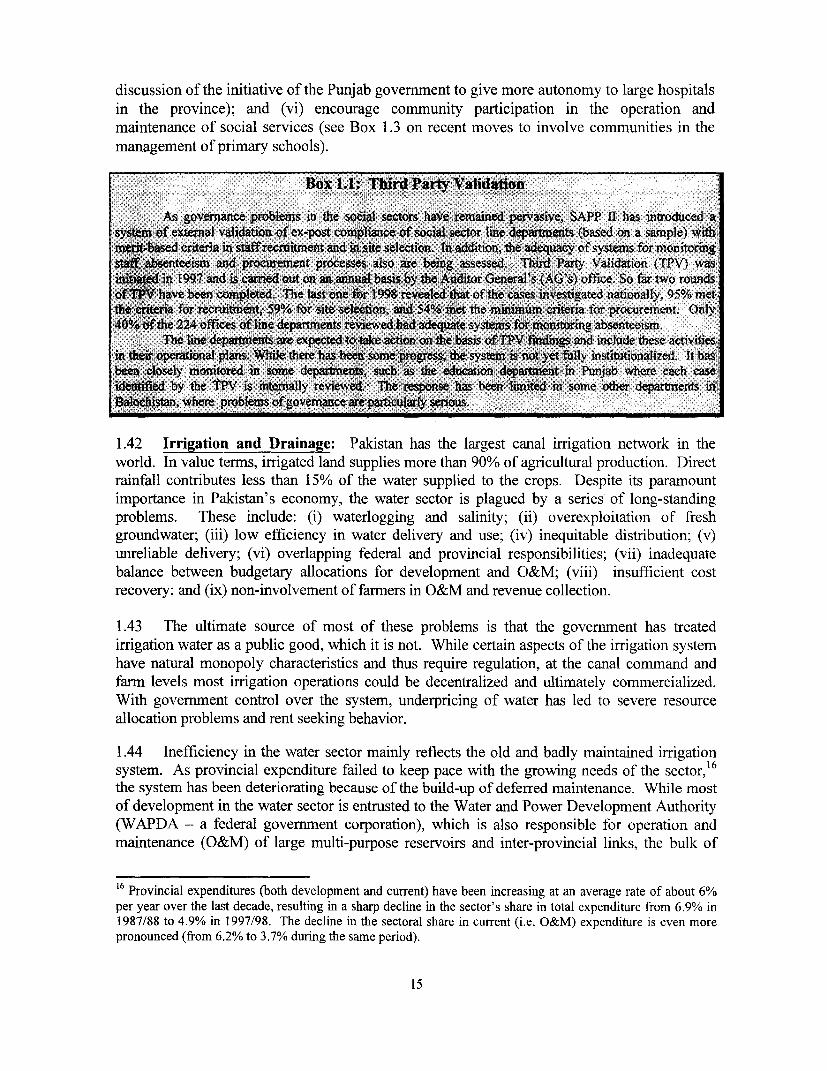
discussion of the initiative of the Punjab government to give more autonomy to large hospitalsin the province); and (vi) encourage community participation in the operation andmaintenance of social services (see Box 1.3 on recent moves to involve communities in the
management of primary schools).
Box 1.1: Third Party Validation
As govemance probtems in the social sectors have remaied pervasive, SAPP II has introduced asystem of external validation of ex-post compliance of social sector line departments (based on a sample) withmert-based criteria in staffrecruitnent and i site selection. In addition, the adequacy of systems for monitoringstan absenteeism and procurement processs also are being assessed. Third Party Validation (TPV) wasini iat~din 1997 and is camded out on an annual basis by the Auditor General's (AG's) office. So far two roundsofT#Vhave been completed. The last one fbr 1998 revealed that of the cases investigated natonally, 95% mettheXcrita for recruitment, % for site seltion, and 54% etn the minimum critria for procurement. Only40% of the 224 offces of lini deparments reviewed had adquate systens for monioring absenteeism.
The line depstments are expected to take actin on the basis of TPV findins and include these activitiesin opeaOnal plans. Wile there has been some progess, the system is not yet fully insfitutionalized. It hasbeen closely monttored in some departments, such as the education departent in Punjab where each caseidenified by the TPV is internally reviewed. Th response has been limited in some other deparmeents in
Balochist where problems of goverance are pariecularly serious.
1.42 Irrigation and Drainage: Pakistan has the largest canal irrigation network in theworld. In value terms, irrigated land supplies more than 90% of agricultural production. Direct
rainfall contributes less than 15% of the water supplied to the crops. Despite its paramountimportance in Pakistan's economy, the water sector is plagued by a series of long-standingproblems. These include: (i) waterlogging and salinity; (ii) overexploitation of freshgroundwater; (iii) low efficiency in water delivery and use; (iv) inequitable distribution; (v)
unreliable delivery; (vi) overlapping federal and provincial responsibilities; (vii) inadequatebalance between budgetary allocations for development and O&M; (viii) insufficient costrecovery; and (ix) non-involvement of farmers in O&M and revenue collection.
1.43 The ultimate source of most of these problems is that the government has treated
irrigation water as a public good, which it is not. While certain aspects of the irrigation systemhave natural monopoly characteristics and thus require regulation, at the canal command and
farm levels most irrigation operations could be decentralized and ultimately commercialized.With government control over the system, underpricing of water has led to severe resource
allocation problems and rent seeking behavior.
1.44 Inefficiency in the water sector mainly reflects the old and badly maintained irrigationsystem. As provincial expenditure failed to keep pace with the growing needs of the sector,16
the system has been deteriorating because of the build-up of deferred maintenance. While mostof development in the water sector is entrusted to the Water and Power Development Authority(WAPDA - a federal government corporation), which is also responsible for operation and
maintenance (O&M) of large multi-purpose reservoirs and inter-provincial links, the bulk of
16 Provincial expenditures (both development and current) have been increasing at an average rate of about 6%per year over the last decade, resulting in a sharp decline in the sector's share in total expenditure from 6.9% in1987/88 to 4.9% in 1997/98. The decline in the sectoral share in current (i.e. O&M) expenditure is even morepronounced (from 6.2% to 3.7% during the same period).
15

O&M of the canal network system is left to the provincial irrigation departments (PIDs), whichhave neither the institutional capacity nor the financial resources to undertake such a majorresponsibility. Despite periodic increases in O&M allocations, the allocated funds have fallenshort of assessed needs by as much as one-quarter. Inadequacy of O&M allocations is largelyan outcome of the poor recovery of irrigation costs from users. Water charges, which areintended to fully cover O&M costs, are not even linked to Cl&M needs. While PIDs in Punjaband NWFP assess these charges, the revenue is collected by the provincial Boards of Revenue(BORs) and forms part of general-purpose provincial revenue. In Sindh and Balochistan, BORsassess as well as collect water charges. Despite significant increases in rates of water chargesover the last five years, the gap between O&M requirements and recoveries has remainedsubstantial.
0'; ~~BX>J.:;;0 DecetrDaliatonof elthSeiiesnujab: ::i
bai.4Th drspitalslge otr~sub-setrvie suffers fromW ai varieikubrty ofpDlmiiarto thoe facedbthfie iriatinasysemen Cofumntindou se&epagses. aro th sunlndaa ~sysem high topogaph,atndlanck of nauraldg srandcpent and lu-srack ofrainageresulf in wareterlogsivg and sav inied tof
p~irriatedsareas ndwt thei qflooity dfusrvinges. Honsoita seasice Thiost hasbl serice onlyafce the
sector ecnd ovm t itir prfohaes crg ticalo pulaion but als d buildinl sup atifor a
teon c peforn gvem entc as enedgt e performnce om the dleda inagi suistei act is tohreable,
and lac of mnagerialsufc and si~ca utb-surfagoedranmgen resuitl1 winhb i ofterlrgg ing and alintyo
essential for sustained agricultural development.
16

Box 1.3: Community r!o olmnCi Pioii*jA ;
In the education sector, sigificant efforts have been made to prorote comunity involvement int ent of primary schools through f of School Man P!Rt C6J*ittees or Parent Teac
A 'ons in all provinces. The SMs o As were offi n in - l* OrigaIly hmew ! Compmie head tecwher, other tea&ier a(re redhr
anda 8 veote plests m aofor Ashasbeen eosiueto provi4tefg of
The envisaged role of SMCs is tod}*ie r ropoutsimsmall repairs and maitenance of s ls. .iI govaratentss
ti= ize procurement. of schoot co0 4rp th and e 1ep -& psinvolved with this task. Alt res o to SM Vbegun toke lce {f
* Teased to 28,000 SMCs in Punjab i,fer non-selary fS d PTAs accounts hasf yet to emerge: anPy prov la
The limited capacit of SMCs andPTAs to iA these ftutc6ons has also been an imp.c . Special cells have been establishdplanned i te dpan d o ton of all provinces exc
tit dealwth capacity building And otr issir related t6 SMCs. While, has been intated i mnany cases wih the assisance-o£'4GOs, onlyGasunted. er f group have been rai
Field-based assessments have raised questions aboute, rep capacity and saiabio~ies. groups. in adion a large number of SMCs ad As wnon-fiona t a ib6ir oted that even the tained groups have itile idea of their ctns byond school maitenaucNeycitheless, overaIl results have been encouring, and all provinces are m ttempts to strenen Sori -s. Enhancing the role of SMCs and PTAs in management of primary siho;lgespecially in redci**Oisin, promoting enrollments and other educna dte i envged.
.:4
1.46 The medium-term policy direction for the irrigation and drainage sector is embodiedin the National Drainage Program (NDP). The main features of the new strategy are: (i)redefining the roles of the public and private sectors; (ii) moving toward decentralization byestablishing autonomous Provincial Irrigation and Drainage Authorities (PIDAs) andautonomous Area Water Boards (AWBs) to operate, maintain, and manage water distribution;(iii) fostering viable Farmer Organizations at the distributory canal level to carry out O&M,distribute water in accordance with water rights, monitor groundwater use, undertake on-farmdrainage development, and collect water delivery and drainage charges; and (iv) initiatingpilot projects for phased implementation of the above strategy. By giving the autonomousPIDAs, AWBs and FOs a greater role in O&M of the irrigation network, the new policy willminimize the direct role of provincial governments in the irrigation and drainage sector overthe medium term. In the short run, however, while the PIDAs would gain the right to collectwater charges (and drainage cess) to be utilized for O&M of the sector, in light of theimmense needs of the sector, provincial budgets will have to continue to provide significantallocations for rehabilitation of the irrigation network until the PIDAs become completelyself-financing. 17
1.47 Provincial Infrastructure: Pakistan has adequate road network coverage for adeveloping country, most of the road infrastructure, especially in the provincial domain, is inpoor condition. About half the length of paved roads is considered to be in poor condition,while the ratio is much higher for unpaved roads. As a result, road users face much highereconomic and operating costs than would have been the case if the roads were well
17 The Punjab government estimates a net revenue loss of Rs 300 million per year from the new irrigation policy.
17

maintained. Moreover, the poor condition of roads discourages usage of modern road haulageequipment, which could help in reducing transport costs.
1.48 The main reason behind inadequate road maintenance is inadequate allocations forO&M. For budgetary purposes, the provincial authorities calculate the O&M requirements ofthe provincial road network as a fixed percentage of the length of the network. The fixedpercentage, or the yardstick, is based on estimated costs cf a number of key items (e.g. labor,bitumen, fuel, etc.). The provincial yardsticks are based on only a few variables, however, sotheir ability to fully adjust to changes in O&M costs is limited. Although the vardsticks arerevised periodically, delays are often significant. In recent years prices have been rising at amuch faster rate, so the inertia in revising the yardstick Las caused budgetary allocations forO&M of the road network to fall increasingly short of requirements. Finally, in times offiscal squeeze the release of funds usually falls significantly short of the allocated budget,thereby accentuating the inadequacies of O&M budgets. Overall, there has been a furtherbuild-up of the road maintenance backlog, which at present is estimated at 30-50% of the roadnetwork length in the provinces.
1.49 The problems created by underfunding are exacerbated by low technical skills andstandards of provincial C&W departments (responsible for construction and maintenance ofprovincial roads). Poor quality control measures, widespr,-ad corruption and waste, and weakimplementation capacity of these departments have also contributed to the low standard ofmaintenance of provincial road networks.
1.50 Although provincial standards call for resurfacing of roads to take place every three tofive years, due to inadequate implementation capacity of provincial agencies and insufficientftnding, the actual frequency is six to ten years. Deferring of routine O&M results in costescalation and higher claims on future budgetary resources, which given the tight fiscalsituation of the provinces and the large claims on their resources, will likely be even moredifficult to accommodate in the future.
1.51 It is therefore essential that: (i) the effectiveness of allocated O&M funds be enhancedthrough better planning, improved implementation and cutting down waste and leakage ofresources through improved monitoring and better expendAture management practices; (ii) theyardstick system be phased out and replaced with a systern of assessing O&M needs throughactual field measurements, which can provide a better har.dle on area and site specific O&Mrequirements; (iii) a better balance be achieved between expansion of the road network andthe available O&M funds, which requires effective prioritization of development projects andadopting an integrated program approach to road sector expenditure (with, in particular,integrated programming and budgeting of development and current expenditures); and (iv) theresource constraints faced by the road sector be loosened by innovative resource mobilizationtechniques (e.g. establishing provincial road and/or infrastructure funds).
18
CHAPTER 2. AWUSTING INTER-GOVERNMENTALFISCAL RELATIONS
2.1 Besides being one of the most contentious and widely debated areas of publicfinances, intergovernrnental fiscal relations in Pakistan are a very important factordetermining the soundness and effectiveness of provincial as well as national finances. Thesystem of intergovernmental fiscal relationships specifies the functional (i.e. expenditure)responsibilities of each level of government and also defines the degree of control overresources of each level by identifying the taxation authority of each tier of government andstipulating arrangements for revenue transfers from one level of government to another. Thestrengths and weaknesses of this system have a major impact on sub-national finances.
2.2 Many of the current problems provincial finances in Pakistan have their roots ininappropriate design or practice of intergovernmental fiscal relations. For example, theassignrent of the main broad-based and buoyant taxes to the federal government results in avery large vertical fiscal imbalance (i.e. a large positive gap between the expenditures andown revenues of the provinces) and thereby in excessive dependence by the provinces onfederal revenue transfers to meet their expenditure needs. Moreover, overcentralization oftaxation authority at the federal level, along with other factors, has weakened theaccountability of the tax system (especially to taxpayers) and is partly responsible for theexisting culture of tax avoidance. It is also, to a great extent, responsible for the taking overof more and more provincial and/or local government functions by higher-level governments,which has seriously compromised the efficiency of public expenditures.
2.3 The problem of inter-governmental fiscal relations is made even more complex inPakistan by the relatively small number of provinces (four), of which one is larger (in terms ofits population size and economic activity) than the combined strength of all three otherprovinces together. This structure leads to complicated political dynamics which make it verydifficult for the federal government to effectively impose a "hard budget constraint" on theprovinces and refrain from ad-hoc interventions in provincial matters. This underminesprovincial autonomy, softens the provinces' resource constraints, and weaken their incentivesfor sound financial management.
DISTRIBUTION OF FUNCTIONAL RESPONSIBILMESAMONG DIFFERENT LEVELS OF GOVERNMENT
2.4 The Constitution of Pakistan specifies the areas of expenditure responsibility andtaxation authority of the federal and provincial governments. The Constitution also acceptsthat these assignments will lead to vertical fiscal imbalances between these two levels ofgovernment, which are to be resolved through revenue sharing. Under the Constitution, theNational Finance Commission is supposed to be instituted at regular intervals to developappropriate revenue sharing arrangements.
19

2.5 Through the Federal Legislative List' and Concurrent List,2 the Constitution hasspecified the distribution of functions (regulatory and servizie delivery) between the federal andprovincial governments. The former indicates the functions to be performed by the federalgovernment, while the latter specifies the functions which can be undertaken by the federalgovernment or by the provincial governnments (or jointly by both levels). The Constitution issilent on the remaining functions and assumes that these residual functions are to be performedby the provincial (or local) governments. The Constitutional distribution of functions inPakistan is generally in accordance with the general principles of fiscal assignment (see Box2.1) and compares favorably with that of other well-established federal systems (for a detailedinternational comparison see Annex B).
2.6 Local governients in Pakistan do not have any distinct Constitutional status. They havebeen established by the provincial govenrnients, and their powers are deterined by provincialstatutesf, which specify the allocation of residual functions to the local goveratnents (seeChapter 5 for a detailed discussion of local gover yment finances).
' Contained in the fourth schedule, article 70(4) of the constitution.2 Also contained in the fourth schedule.3The currently operative ordinances are the Local Govemraent Ordinarlce of 1979 in Punjab, sineu and NWFPand of 1980 in salochistans
20

2.7 Constitutional and provincial legislative provisions aside, the Constitution also allowsthat, under certain circumstances, higher-level governments can take over the functions oflower-level governments. Based on this last provision, there has been a trend in Pakistan ofhigher levels of government playing a dominant role in areas of shared responsibility. Hencethe actual distribution of functions has diverged significantly from the legislative distribution, inthe direction of centralization. The Constitutional and provincial legislative responsibilities andtheir actual assumption by various levels of government are summarized in Figure 2.1.
IMPLICATIONS OF OVERCENTRALIZATION
2.8 In Pakistan, the overcentralization of administrative functions beyond the provisions ofthe Constitution and provincial statutes is often defended on the grounds of superiorinstitutional capacity at higher levels of government and the corresponding relativeeffectiveness of service delivery at these levels. However, the overcentralization ofadministrative functions has the following adverse implications for public sector management inPakistan:
(a) Highly Centralized Decisionmaking: In areas of concurrent responsibility, thehigher level of government has often adopted a dominant role. Decisions on mostlarge development projects, even those initiated by provincial governments, requirefederal approval. Similarly, as most local functions have been taken over by theprovincial governments, local governments have been effectively excluded fromparticipation in major policy decisions regarding local services.
(b) Impairment of Public Sector Accountability: Separation of taxing and spendingdecisions at the provincial and local levels compromises accountability, as citizens donot know with any precision who is responsible for what services. The level ofgovernment raising most of the revenues, i.e. the federal government, may be blamedfor provincial-local service delivery problems. Accountability is further weakened dueto lack of clarity regarding the roles of different levels of government in areas of sharedresponsibility.
(c) Lack of Fiscal Discipline: Overcentralization, by distancing beneficiaries of manypublic services from the levels of government responsible for provision and funding,along with the lack of an appropriate institutional framework to force governments at alllevels to face the financial consequences of their decisions, has given rise to weak fiscaldiscipline despite centralized controls.
(d) Weakening of Local Governments: Pakistan started with a well-thought out andwell-organized local government structure. During the 1950s and 1960s, localgovernments were a reasonably vibrant part of the public sector and delivered mostlocal public services. During the 1970s and 1980s, important local functions, such asprimary education and basic public health, were shifted upward to the provincialgovernments, who now dominate the provision of local services. As a result thesignificance of local bodies has been diminished, leading to weakening of
21

accountability that has further diminished their effectiveness. Moreover, by creatingattached agencies of their own (development authorities, WASAs, KWSB, etc.), theprovincial governments have pre-empted the ftnctions of urban local bodies indelivering local services like land development, water supply and sanitation.
Figure 2.1: Legislative Responsibility and Actual Allocation of Functionsamong Various Levels of Government
Rsn it jfi gg;!fi,;;;;5000.Service FunctionsDefenseExternal AffairsPosts and TelegraphsTelephonesRadio and TVCurrencyForeign ExchangeForeign AidInstitutes for ResearchNuclear Energy
Fet1G4(o nimct ni000 t $0f000 Q 0 Ports and AerodromesShippingAir ServiceStock Exchanges de G ver .aNational HighwaysGeological SurveysMeteorological SurveysCensusesRailwaysMineral Oil & Natural Gas
Lindustries
Population PlanningCurricutum Development
Syllabus PlanningG~~a~mtse~ts bf Tourism
Social WelfareVocational/Technical Training & Proncial
LEmployment Exchanges oructHistorical Sites and MonumentsLaw and OrderJusticeTertiary Health Care and HospitalsHighways
4mW Coverrncut5 Urban TransportSecondary and Higher Education*Agricultural ExtensionFertilizer and Seeds Distribution rvcilGeunmtIrrigation* "
-Land Reclamation"*PrimiaryEducationCurative HealthPreventive Health** *Water Supply Drainage & SewerageLand DevelopmentFarm-to-Market Roads
L~c$ Govenments cIRural DevelopmentLink Roads IIntra-Urban Roads 0Street Lighting Loa ocnetGarbage Collection IFire Fightingj
LParks and Playgrounds
a/ According to Federal Legislative List; b/ According to Concurrent Legislative List; c/ According to LGOs;University Education is funded by the federal government through the University Grants Commission (UGC),but administratively controlled by the provincial govermnents.Development of irrigation and SCARP projects is a federal subject.
22
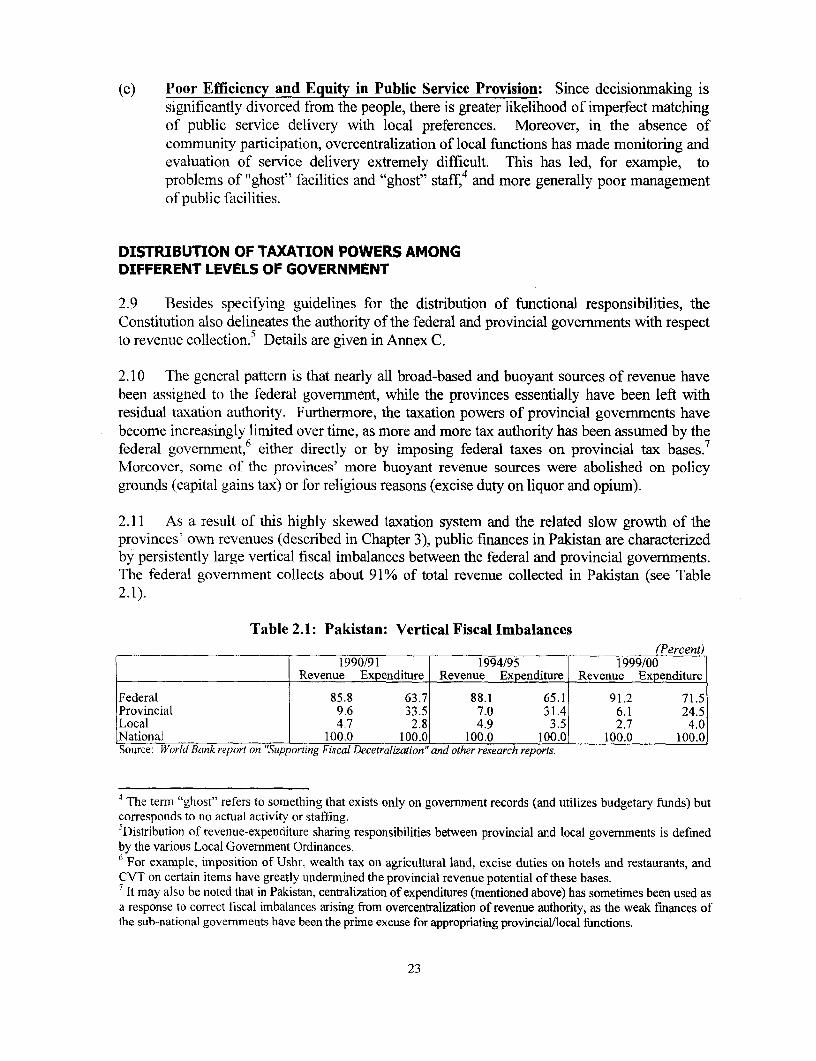
(e) Poor Efficiency and Equity in Public Service Provision: Since decisionmaking issignificantly divorced from the people, there is greater likelihood of imperfect matchingof public service delivery with local preferences. Moreover, in the absence ofcommunity participation, overcentralization of local functions has made monitoring andevaluation of service delivery extremely difficult. This has led, for example, toproblems of "ghost" facilities and "ghost" staff,4 and more generally poor managementof public facilities.
DISTRIBUTION OF TAXATION POWERS AMONGDIFFERENT LEVELS OF GOVERNMENT
2.9 Besides specifying guidelines for the distribution of functional responsibilities, theConstitution also delineates the authority of the federal and provincial governments with respectto revenue collection.5 Details are given in Annex C.
2.10 The general pattern is that nearly all broad-based and buoyant sources of revenue havebeen assigned to the federal government, while the provinces essentially have been left withresidual taxation authority. Furthermore, the taxation powers of provincial governments havebecome increasingly limited over time, as more and more tax authority has been assumed by thefederal government,6 either directly or by imposing federal taxes on provincial tax bases.7
Moreover, some of the provinces' more buoyant revenue sources were abolished on policygrounds (capital gains tax) or for religious reasons (excise duty on liquor and opium).
2.11 As a result of this highly skewed taxation system and the related slow growth of theprovinces' own revenues (described in Chapter 3), public finances in Pakistan are characterizedby persistently large vertical fiscal imbalances between the federal and provincial governrments.The federal government collects about 91% of total revenue collected in Pakistan (see Table2.1).
Table 2.1: Pakistan: Vertical Fiscal Imbalances(Percent)
1990/91 1994/95 1999/00Revenue Expenditure Revenue Expenditure Revenue Expenditure
Federal 85.8 63.7 88.1 65.1 91.2 71.5Provincial 9.6 33.5 7.0 31.4 6.1 24.5Local 4.7 2.8 4.9 3.5 2.7 4.0National 100.0 100.0 100.0 100.0 100.0 100.0Source: World Bank report on "Supporting Fiscal Decetralization" and other research reports.
4The term "ghost" refers to something that exists only on government records (and utilizes budgetary funds) butcorresponds to no actual activity or staffing.5 Distribution of revenue-expenditure sharing responsibilities between provincial and local governments is definedby the various Local Government Ordinances.6 For example, imposition of Ushr. wealth tax on agricultural land, excise duties on hotels and restaurants, andCVT on certain items have greatly undermined the provincial revenue potential of these bases.7 It may also be noted that in Pakistan, centralization of expenditures (mentioned above) has sometimes been used asa response to correct fiscal imbalances arising from overcentralization of revenue authority, as the weak finances ofthe sub-national governments have been the prime excuse for appropriating provincial/local functions.
23

On the other hand, despite a substantial increase in federal expenditure caused by a sharpescalation in interest payments, the federal government accounts for only 72% of aggregatenational expenditure. The provinces, by contrast, collect only 6% of total national revenue butaccount for nearly a quarter of total expenditures. This trassive vertical fiscal imbalance is fargreater than in other large federal countries such as Canada, Brazil, the USA, and India.
2.12 The vertical imbalance in resources and responsibilities is recognized in theConstitution, which has provided a forum, the National Finance Commission (NFC), to help thefederal and provincial governments to come up with apprepriate revenue sharing arrangements.These allow for both sharing of tax and non-tax revenues and tax devolution. Under the currentNFC Award, the federal governmnent retains 73% of the revenue it collects and distributes theremaining 27% among the provinces.8 The NFCs so far have focussed on determining theappropriate level of revenue transfers from the federal government to provincial governrmentsto meet the current expenditure needs of each level of government. Tax devolution hasgenerally remained an unexplored option (for details of the revenue sharing mechanisms inPakistan and a critique of them see Boxes 2.2 and 2.3, respectively). The Constitutionimposes a strict condition that the NFC Award is to be made only through a consensusbetween the federation (federal government) and all federating units (provinces).9
REVENUE TRANSFERS
2.13 As mentioned above, transfers of funds through the NFC Awards have become thedominant source of revenue for the provincial governmenlts, at present accounting for about80% of provincial revenue receipts. They are dictated mo:re by immediate revenue needs thanby long-term equity and fiscal policy considerations, however. For example, in order to helpthe provincial governments sharply increase allocations f:)r social services in the interest ofimproving the country's social indicators, the 1991 NFC Award made significant increases inthe provinces' share in federally collected taxes, but at the same time the provinces were deniedall forms of discretionary grants and were required to fund part of their development programsfrom their own resources. However, the provinces were assigned a greater share in morebuoyant taxes (sales and income taxes), whereas the fedoral government retained exclusiverights to falling customs revenues. As a result, the Award not only led to larger verticalimbalances but also provided a strong disincentive for the federal government againstimplementing tax and tariff reforms required to streamline the tax structure and eliminate theprevailing anti-export bias in the system. (The evolution of revenue-sharing arrangementsbetween the federal and provincial governments is presented in Table 2.2.)
B According to the 1997 NFC Award, the provinces get 37.5% sharn of revenues from taxes included in thedivisible pool. However, federal government deducts 5% of gross revenue as collection charges for most ofthese taxes (for income tax, the deduction is at 6%). Similarly, revenue from straight transfers are transferred tothe provincial governments after a 2% deduction for collection charges. Moreover, some of the federal taxrevenues (e.g. development surcharge of petroleum) and most non-tax revenues are not shared with theprovinces.
It was for this reason that no Award could be agreed in the two NFCs constituted in 1979 and 1984. Hence theNFC Award of 1974 continued to remain in effect until 1991, despite significant changes in revenue andexpenditure patterns at federal and provincial levels.
24
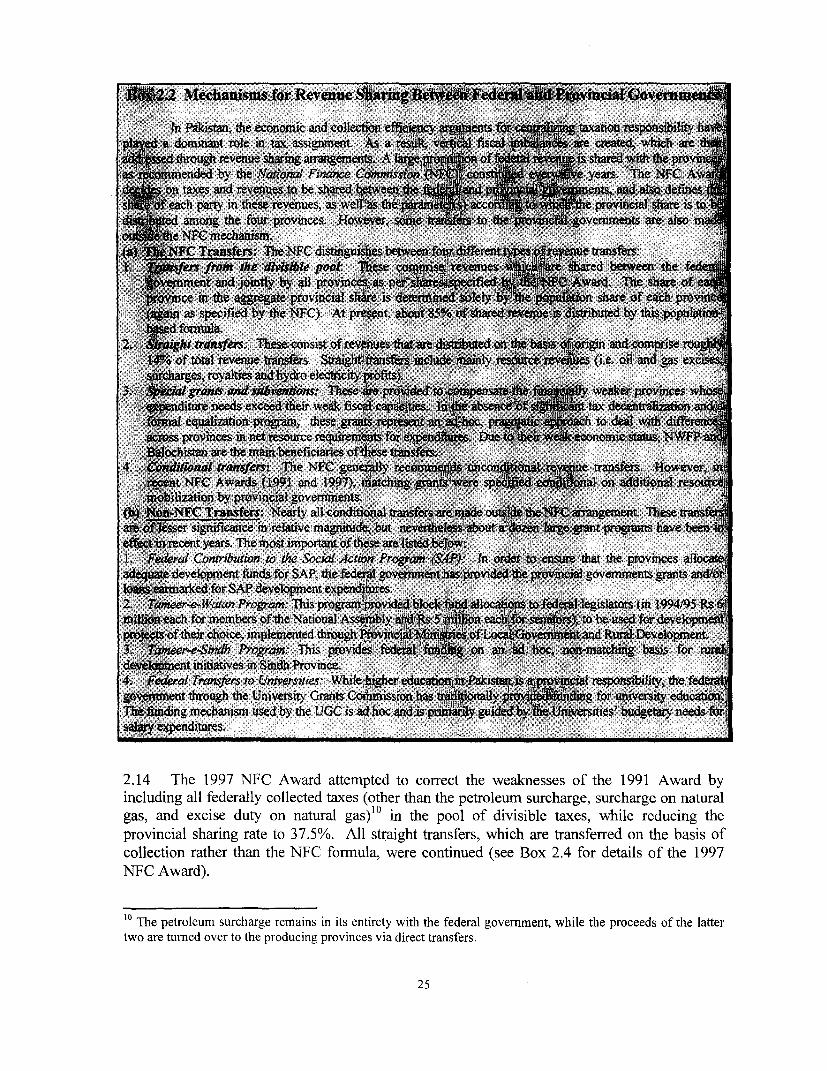
- .2 Mechanisms'for RevenueSiiie _
In Pakistan, the economic and collection,.a domiD ant role in tax assignment As.
throug revenu sOaringangret.A aeofsshedwhtepended by the National Fin e years. The Ataxes and revetues,to beshrdteet nsas4fls
each party in these rvne,a e~te cepoica hr stamong the four provinces. Howevers t overnmet ae alsoN Ee C mechnsm. ------ : ..-
(W*Z1N Ct Ts Tkers: r he NFC distinguishes beiweenfdifferet1 ereoue tansfes:i, >e~-fifm the dMvble pool: Res betwem
t and jointly by all provines p Ae efc in the -aggregae provinca sire isi sehare o each pr
.(agin as specfied the NFC). At prst, about 85%- r*ibuted b his pop
2. *f trasfers: These consist of revenues thataare ditrhted on t basis and ,comprise o~, i of total revenue transfers. Staightnsf incld inIy r (i.e. oil and gas cxc
.a rcharges, royalties anidhydroelecticity--- -3 *te~*I *ra1t~ and tn subventios These : p Iided tk
:iture needs exceed their weak fiscapl . 11equalization program, these grant" %1 hOW
Wmross provinces in net resoure requirem&ts for De ci-a-ochistan are the main beneficiaries ofOiese tin -;,
4_. C#4itional .tnsfers: The NFC ;na` ir transrs. However,, .. t N.E Awards (1991 and 199o7),n atchingl .-;m6ilbaion by provincial governmient-s.:
(b~ ,$~ni-NFC Transfers: Nearly all coitional transe ar de o te Ndangement These narflesser significance in reltive magnitud but hl out ae lgt progms have beene~ect recent years. The most importt f de arelied 1 . -Federa Contribution to he social Action PrOgr e(SA:m- In or sw, that the provinces allo
development funds for SAP the feda govanntas . prov al goverments grants and/r,lonu earmarked for SAP development expendjt-res.2. mWaan ProWam. This program vAm totedg legislators (in 1994/95 R million each for members of the National Ass"Inbly 4 S for se to be used for developm6d,pr1ts Ff their choice, implemented through -invincjal ~in1 of Governix*t and Rurfrevelopment r| 3. 'Theer-e,Sind Program: This provides fd on ann -matching basis for, nwfodeveopment initiatives in Sindh Province.4. Fe-eral Trarsfers to UInhveiies: Whie higherd Pat reosib ty, he fedgovement through the University Grants co ission Uas fo university du
fding mechanism used by te UGC is ad hoc and is pri y guidhy` £e Uiveities' budtay needs fisaa e cxpenditturs.
2.14 The 1997 NFC Award attempted to correct the weaknesses of the 1991 Award byincluding all federally collected taxes (other than the petroleum surcharge, surcharge on naturalgas, and excise duty on natural gas)'0 in the pool of divisible taxes, while reducing theprovincial sharing rate to 37.5%. All straight transfers, which are transferred on the basis ofcollection rather than the NFC formula, were continued (see Box 2.4 for details of the 1997NFC Award).
1' The petroleum surcharge remains in its entirety with the federal govemment, while the proceeds of the lattertwo are turned over to the producing provinces via direct transfers.
25

hi~kax fk4lBe,ta 2.3: An CrtiqMt~
Ii in,. i vihceg e w o thnpb~ e6~ shr iest nn rvse ihotheirsz,pplto e
2ra.15r onVh the s Nle c Aie rdoo projectd t transfpear oR 17. bi uindtteprovin4eas durinc997tic ansm R 20wver bil lttive forn l has99 due toreuctifons inmpr tarifr tos andlowrngopsinc~ o reovd aes the raexstn ecansm vhels porcletos,teaonstenseTdwrsubtaniaoflrsouress thn apeithose pasronected ~bvitheNFC As al result ith poimpics thate f an
uiprecedentAoed ficomprqehenze redu -hring 19 t7/98 anda~ be8/9 v In orderto im olmpentsiate tex
poiia nironment
::n mitaton .hs incWlude.to o FOtnftfre X ba ie
prov Whincesalbe onelyAwartia rojected ths r eotsn , tefeder goiveioneto toe providca
the provinces with concessional development loans, wbich carry an interest rate of about halfthat of normal Cash aievelopment Loans.
26

Table 2.2: Evolution of Revenue Sharing Arrangements betweenthe Federal and Provincial Governments
(Percent)Niemeye Raisman NFC NFC NFC NFC NFC NFC
Award Award Award Award Award Award Award Award1937 1951 1962 1964 1970 1974 1991 1996
Income Tax 50 50 50 65 80 80 80 37.5Wealth Tax 0 0 0 0 0 0 0 37.5Capital Value Tax 0 0 0 0 0 0 0 37.5Sales Tax 0 50* 60 65 80 80 80 37.5Central Excise Duty On: _I__ _ ___
Tea & Beetlenuts 50 60 65 80Tobacco 0 50 60 65 80 0 80 37.5Jute and Cotton 62.5 62.5 100 65 80 80 80 37.5Sugar 0 0 0 0 0 0 80 37.5
Natural Gas** 0 0 0 0 0 100 100 100Others 0 0 0 0 0 0 0 37.5
Export Duty on Cotton 0 0 0 0 0 80 80Import Duties 0 0 0 0 0 0 0 37.5Estate and Succession Duty on Agri. 100 100 100Duties on Capital Value of Immovable 100 100 100 --
Surcharge on Natural Gas** 0 0 0 100 100Royalty on Natural Gas** 0 0 100 100 100Royalty on Crude Oil** - -- 0 0 0 100 100* 50% of collection in each province was given to that province, and in addition, 50% of collection in Karachi was shared byPunjab, Bahawalpur, and other administrative units.* * Straight transfer, i.e. distributed entirely to the provinces on the basis of collection rather than the population-based formulaNote: In addition to the revenue heads specified above, the 1991 (and 1997) NFC Award provided for transfer of profits fromhydro electricity from WAPDA to the provinces on the basis of location of generation stations.
Source: Ministry of Finance, Government of Pakistan, Explanatory Memorandum on Budget.
DEVELOPMENT LOANS
2.16 In addition to funding several federally sponsored schemes in the provinces, the federalgovernment also finances the provincial Annual Development Programs (ADPs) through CashDevelopment Loans (CDLs)'1 and development grants. With the exception of a short periodafter the 1991 NFC Award when the provinces were able to cover part of their developmentbudgets from their revenue surpluses, the provinces have been relying entirely on developmentassistance from the federal government for financing their development programs. Over timethe composition of federal development assistance has undergone a marked change, with theshare of grants in total development assistance declining to only a small fraction (except forSAP-related grants during 1992/93-1996/97). As rupee loans provided by the federalgovernment usually carry an interest rate of about 16%, this has aggravated the provincial debtservicing burden." The problem is further compounded by the fact that social services
" In theory the distribution among provinces of these CDLs is based on a fixed criterion as determined by the 1974NFC, under which 10% of the ADP is equally divided between NWFP and Balochistan and the remaining 90% isallocated on the basis of population shares among all provinces. In recent years, however, an element of discretionhas crept into the distribution of CDLs.12 With lowering of rates on government's financial instruments, interest rate on CDL was recently lowered to14%. However, with the projected increase in federal revenue transfers, no CDL is expected to be given to theprovinces in 2000/01.
27
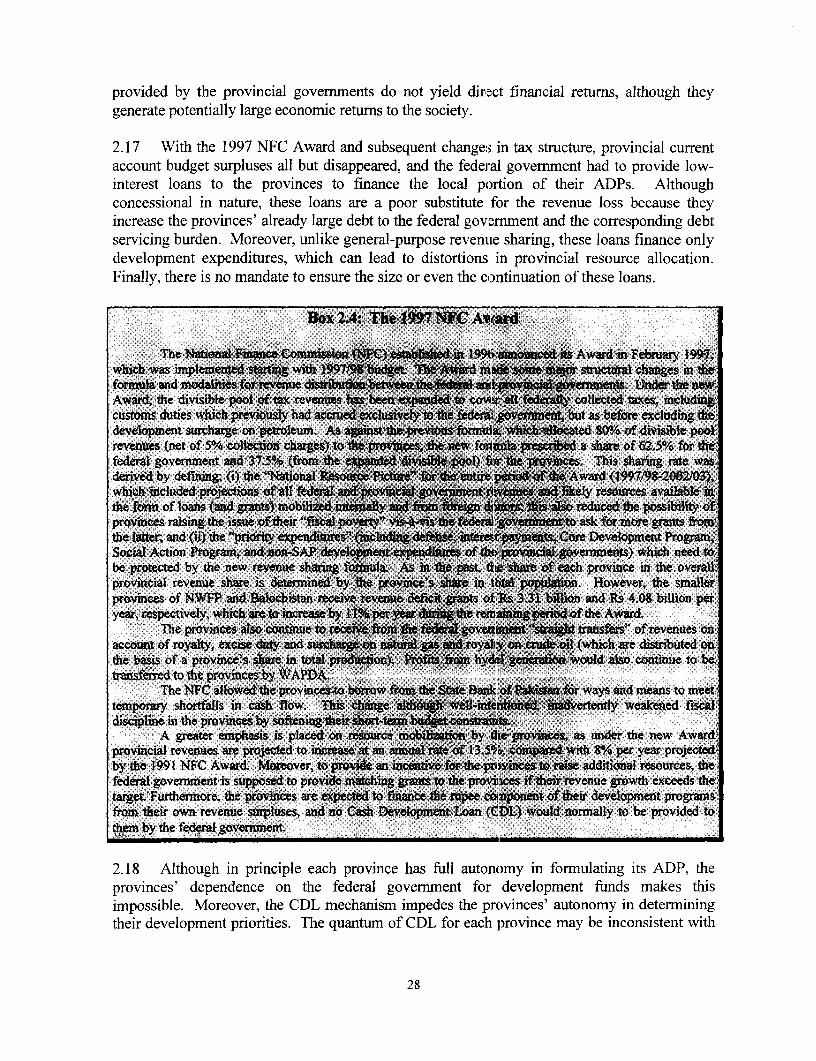
provided by the provincial governments do not yield direct financial returns, although theygenerate potentially large economic returns to the society.
2.17 With the 1997 NFC Award and subsequent changes in tax structure, provincial currentaccount budget surpluses all but disappeared, and the federal government had to provide low-interest loans to the provinces to finance the local portion of their ADPs. Althoughconcessional in nature, these loans are a poor substitute for the revenue loss because theyincrease the provinces' already large debt to the federal government and the corresponding debtservicing burden. Moreover, unlike general-purpose revenue sharing, these loans finance onlydevelopment expenditures, which can lead to distortions in provincial resource allocation.Finally, there is no mandate to ensure the size or even the continuation of these loans.
W%~~~~~~~~~~~~~~~~~~~~~~~~~~t
2.18 Although in principle each province has full autonomy in formulating its ADP, theprovinces' dependence on the federal goverment for development furds makes thisimpossible. Moreover, the CDL mechanism impedes the provinces' autonomy in determiningtheir development priorities. The quantum of CDL for each province may be inconsistent with
28

the need for counterpart funds for donor-assisted projects, as CDL is transferred on thepopulation-based fornula while donor assistance is passed on as per terms of loan or creditagreements and project implementation. Finally, the financing of provincial ADPs depends onthe fiscal strength or weakness of the federal government and is vulnerable to overall budgetarycuts and pressures to expend resources on politically-motivated federal programns.
OPTIONS FOR REFORMING INTERGOVERNMENTAL FISCAL RELATIONS
2.19 Properly designed intergovernmental transfers can enhance fiscal accountability, fosterregional equity, provide adequate incentives for revenue mobilization by different levels ofgovernment, and promote fiscal harmonization. In Pakistan, the disconnect between taxingand spending responsibilities under present arrangements has weakened fiscal accountability,especially at sub-national levels. There are no easy answers to these and other problems offiscal federalism in Pakistan. Some policy options in key areas of reform are outlined below:
(a) Review the Roles of Government: It is of paramount importance to carefully evaluatethe role of government, with a basic objective of equitable and efficient provision ofpublic goods and services. All avenues need to be explored to disengage the federaland provincial governments from functions which the private sector and non-governmental organizations (NGOs) can perform equally well (or better). Someprogress in this direction has already been made, with the federal government largelyexiting from production sectors, and attempts are being made to privatize state-ownedfinancial institutions and energy-related corporations. Similarly, progress has also beenmade by the provincial governments in privatizing some activities. However, the pacehas been slow and there is a need to accelerate it. There is a need to put the privatizationprocess into a more systematic perspective through functional reviews (see para. 4.5) ofall govemrnment agencies, departments, autonomous bodies and enterprises.
(b) To the Extent Feasible and Appropriate, Induct the Private Sector and NGOs intoAreas of Pubic Service Delivery: While the provision of basic social services (due totheir positive redistributive impact and positive externalities) should remain afundamental public sector responsibility, the scope for greater private sectorinvolvement to assist the public sector in the delivery of social services is substantialand should be actively pursued. This would not only develop healthy competitionbetween the private and public sectors, but also would conserve scarce public resourcesand augment the quantity and improve the quality of services.
(c) Each Level of Government should Vacate Domains of Other Levels: Clarificationof the roles of each level of government should have as a major objective eliminationof overlapping functions of different levels of government and specificallyreducing the role of federal and provincial government(s) in areas that are eitherprovincial or local responsibilities or where central involvement can hinderlower-level governments from developing appropriate solutions. This, however,does not imply that the federal government should abdicate or even curtail itssupervisory role, which is essential in any federal system and needs to be non-intrusive and non-impinging on sub-national autonomy, and provide incentives (and
29

direction) for the sub-national governments to meet (or maintain) national standardsand fiscal discipline. Functions where the role of the federal government needs to bereduced include: planning and development (especially regarding provincialdevelopment programs), irrigation, tourism, justice, transport and communications,population control, curriculum development, syllabus planning, and establishingcenters of excellence'3 . Such a reassignment of responsibilities should have a positiveeffect on the federal government's budgetary flexibility and reduce the federal deficit.Similarly, provincial governments do not have the capacity to oversee, monitor,and manage the performance of vast networks of services like primary educationand basic health, as well as localized urban services. Therefore the provincialgovernments should devolve responsibilities to local governments in areas likeland development, urban and rural water supply and sanitation, irrigation,drainage, primary and secondary education, basic health, preventive care andlocal roads. For all these services, the provincial oversight role and assistance withrespect to technical and financial matters needs to be strengthened.
(d) Strengthen Local Governments for Improved Delivery of Public Services:Provincial governments have increasingly adopted an intrusive and unhelpful role inlocal government. Local governments have been denied an opportunity to succeed andinstead their roles have been taken over by provincial governments. Arresting this trendwould help restore public confidence in the public sector. There may therefore be aneed to provide local government with Constittutional cover as a separate andautonomous level of government (see Chapter 5). The provincial governments canplay an important role in helping develop the technical capacity of local bodies. This canbe undertaken concurrently with devolution of responsibilities to the local level.
(e) Devolve Suitable Taxes to Sub-National Levels: Regarding tax and revenue sharing,reassignment of some revenue responsibilities, through tax devolution, tax basesharing and tax abatement, is needed to reduce vertical fiscal imbalances andreliance on general revenue sharing. This is important because unconditional grantsand revenue sharing separate taxation and spending responsibilities and thereby impairaccountability to stakeholders. General revenue sharing should be relied on only to theextent that decentralization of fiscal responsibility fails to achieve the desired results.The following options may form a basis for tax devolution:
. The federal government may retain exclusive responsibility for taxation ofinternational trade and corporate income. Moreover, the federal government wouldhave primary responsibility for taxing personal income and General Sales Tax (GST),but giving the provinces an option to impose a supplementary rate over and above thefederal rate, which would be collected by the federal governnent but transferred tothe provinces on the basis of collection.
* Although sales tax on services is Constitutionally a provincial subject, due to weakprovincial tax administration instituting an autlonomous, provincially-collected
These are elite institutions of higher learning which are high cost and waters mainly to the needs and demandsof affluent groups.
30

GST on services would not be desirable at present. Hence a more promisingoption would be to integrate services into the existing federal GST under a taxrental agreement from the provinces to the federal government. In other words,the federal government should levy and collect the tax and then transfer therevenue to the provinces as straight or divisible-pool transfers (after retainingcollection costs).
* While most federal excise duties are likely to be subsumed in the GST on services,control over specific purpose excise duties (e.g. on tobacco and tobaccomanufactures, etc.) may be given to the provinces.
* Energy taxes may either be devolved to the provincial governments or be consideredfor inclusion in a general revenue sharing pool to be distributed on a per-capita and/orneed basis. Alternatively, such revenues may accrue only to the federal governmentbut for the purpose of providing fiscal equalization grants to the provinces. Theassignment of hydel profits to the province of location of the facilities should bereassessed, as it underrnines the financial condition and autonomy of the nationalpower enterprise (WAPDA).
* The urban immovable property tax should over time be devolved to the localgovernments, which would set its rate and define the tax base according to localneeds and conditions, and also would become responsible for assessment and taxcollection.
* The revenue from Motor Vehicle and Entertainment taxes should be shared betweenprovincial and local governments and the possibility should be explored to allowlocal governmnents to share the bases of these taxes by levying supplementary rates.
(t) Review Non-Tax Revenue Transfers: Transfers of non-tax revenues whichundermine the autonomy of sub-national governments may be replaced by conditionalgrants which promote the federal government's objectives of enhanced fiscal effort,fiscal harmonization, uniform standards, and regional equity.
* Good public expenditure management practice dictates against the direct allocationof resources to political representatives for uses that circumvent ADP discipline.The system of allocations therefore should be discontinued and should not berevived in any form.
. In addition, to the extent that in practice politicians directly influence othercomponents of the ADP, this also is not compatible with good public expendituremanagement practice. Hence interference by politicians in decisions and spendingon particular public investment projects should be stopped and channeled througha formal process, so that local priorities are accommodated in the budgetaryprocess without opening it to governance problems and violating fiscal discipline.
31
* The apparent capability of the federal government to override existing proceduresat the provincial level also is not consistent with good public expendituremanagement practice. The Tameer-i-Sindh program is an example where, at theinitiative of a previous Prime Minister, a range of development projects wereundertaken with initial funding from the federal government. The financial burdenof the program has now effectively become a responsibility of the government ofSindh, even though the projects concerned by-passed the regular procedures of theprovincial government.
32

CHAPTER 3. MOBILIZING ADEQUATE PROVINCIAL REVENUE
3.1 As mentioned in Chapter 1, the provinces rely excessively heavily on revenuetransfers from the federal government to meet their expenditure obligations. Moreover, sincethe mid-1 980s the financing of provincial expenditure has changed significantly incomposition, and the provinces have become almost wholly dependent on formula-basedtransfers from the federal government's divisible pool under the NFC Award (see Table 3.1).At present, federal transfers (excluding federal grants and hydroelectricity profits fromWAPDA, which according to the provincial budget classification are treated as non-taxrevenues of the provinces) account for 72% of provincial revenue resources. Excludingfederal grants and hydro electricity profits from WAPDA, which constitute another 8% ofprovincial revenue resources, the provinces contribute a mere 20% of total provincial receipts,from their own tax (12%) and non-tax (8%) revenues.
Table 3.1: The Structure of Provincial Revenue
1984/85Punjab Sindh NWFP Balochistan Total
Federal Tax Assignments 45.9% 61.6% 32.7% 60.8% 47.7%
Provincial Taxes 14.0% 23.7% 6.2% 2.8% 13.3%
Non Tax (mcl. Grants) 40.1% 14.7% 61.1% 36.4% 39.1%
O/w Grants 23.9% 0.0% 52.2% 29.5% 25.3%
Total 100.0% 100.0% 100.0% 100.0% 100.0%
1990/91
Punjab Sindh NWFP Balochistan Total
Federal Tax Assignments 65.0% 75.6% 44.4% 59.4% 62.9%
Provincial Taxes 12.3% 12.7% 3.6% 1.8% 9.9%
Non Tax (mcl. Grants) 22.7% 11.6% 52.0% 38.8% 27.2%
O/w Grants 9.9% 0.0% 43.0% 34.9% 16.0%
Total 100.0% 100.0% 100.0% 100.0% 100.0%
1998/99 (R)
Punjab Sindh NWFP Balochistan Total
Federal Tax Assignments 76.7% 77.0% 52.2% 69.0% 72.00%Provincial Taxes 14.6% 14.5% 5.0% 1.7% 11.70%
Non Tax (mcl. Grants) 8.7% 8.5% 32.8% 29.3% 16.30%
O/w Grants 0.0% 0.0% 13.20% 27.1% 4.90%
Total 100.0% 100.0% 100.0% 100.0% 100.00%Source: Provincial budget documents.
THE STRUCTURE OF PROVINCIAL TAXES
3.2 The present provincial tax system is inefficient and inequitable. It is incapable ofgenerating enough resources to meet the provinces' growing expenditure needs. While theprovinces have generally been assigned non-buoyant and narrow-based taxes, lack of politicalwill to collect key provincial taxes, the economic and political complexities of taxingprovincial revenue bases, and weak tax administration capacity have prevented the provinces
33

from realizing the full revenue potential of the several mcore buoyant and potentially broadertax bases assigned to them. Agricultural income, consumption of services, and capital gainson physical assets are the three potentially important tax bases available to the provincesunder the Constitution, but no tax is imposed on the latter two bases (other than some stampduties), and the revenue yield from agricultural income tax is only a fraction of its potential. '
3.3 Rather than concentrating on broad-based taxes, the provinces have imposed a largenumber of taxes and other levies, most of which have only meager yields.2 The wide array oftaxes or levies increases administrative costs, renders the tax structure highly complex,increases compliance costs to the taxpayers, and in some cases inhibits economic activity.
3.4 Unlike in other large federal countries, where high-yielding revenue bases are eitherindividually distributed among various levels of governmrent or are jointly (but independently)utilized by two or more levels of government, in Pakistan the Constitution assigns all majortaxes with the highest revenue potential (other than the three discussed above) exclusively tothe federal government. The provincial (and local) governments are left for the most partwith only residual taxes, which have narrow tax bases and low buoyancy (see Table 3.2).Strikingly, instead of broadening the provinces' tax base, the federal government over timeabolished a few provincial taxes including the capital gains tax, which despite its structuralweaknesses and massive evasion, generated significant revenues and, if effectivelyadministered, would have had high revenue potential and buoyancy.
Table 3.2: Indices of Provincial Tax Buoyancy
|Year Punjab Sindh |NWFP Balochistan
1995/96 0.58- 1.49 0.84 1.58
1996/97 1.26 1.64 0.99 0.84
1997/98 0.42 -1.04j 1.09 0.83
Average 0.76 1.06 0.94 1.16
Source: World Bank estimates.
3.5 Provincial taxes can be broadly classified into five types of direct taxes, eight indirecttaxes, and a few minor levies or cesses (for details of these taxes see Annex D). Currently,indirect taxes contribute 70% of provincial own tax receipts, of which about one-third is raisedfrom stamp duties and another 14% from the motor vehicle tax. Direct taxes consist of thenewly-levied agricultural income tax, land revenue, urban inmmovable property tax, registrationfees, and the tax on trade, professions, and callings. The forner two taxes raise almost 22% ofprovincial tax revenues, the latter three only about 8%.
The difficulties of taxing agricultural incomes are well known. Among others, the key problem in implementingan agricultural income tax is the determination of gross output, cost of inputs (including family labor), prices, andthe element of home consumption. A land-based presumptive tax has therefore been devised by all provinces, butat present with very small revenue yields.
2 Moreover, the provinces also levy some non-budgetary taxes, like the labor-related cesses, sugarcanedevelopment cess, etc., the revenues from which are generally earmarked and do not accrue to the provincialconsolidated fund. Although small in revenue yields, these taxes are costly in terms of their incidence andadministration and there is significant scope for improving their struc-ure and accountability. Some of thesetaxes could be abolished.
34

3.6 Annex E shows the structure of provincial taxes in Punjab and Sindh. The moststriking features include:
* The large number and variety of taxes levied.* The large number of different taxes in each category.* The tiny revenue yields from some categories of taxes.. The confusion between taxes and administrative fees (e.g. stamp duties, land
registration, mutation fees) or charges for services (such as rent).* Some fees are not fees but rather taxes (e.g. cotton and paddy husking fees).
3.7 As taxes, administrative fees, and service charges play different roles in fiscal andsectoral policies, a first step toward analyzing and streamlining the provincial tax structure isto correctly classify each revenue item according to its type and end use. To isolate the truetax collection of Punjab and Sindh (excluding user charges and administrative fees), theprovincial "taxes" in Annex E are reallocated to administrative fees and taxes. The result ofthis exercise is shown in Table 3.3, which presents the complete revenue position of these twomajor provinces (1998/99 budget estimates). The table shows that some 17% of what isconsidered tax collection in Punjab (or 2.2% of total revenue) is from administrative fees,while the comparable figure for Sindh is 10% (1.4% of total revenue). Although theseadministrative fees contribute to provincial revenue, they are not taxes and should beseparated from tax revenues in the same way as user charges are.
Table 3.3: Composition of Provincial Revenue of Punjab and Sindh,1998/99 Budget
Punjab -o% Sindh %Rs millions Share Rs millions Share
Federal Transfers 70,815,23 78.88% 35,881,129 80.50%Revenue Assignments 68,475,366 76.27% 2,7,541,57 61.79%Straight Transfers (including electricity profits) 2,339,869 2.61% 8,339,552 18.71%
Total Provincial Fees and Taxes 11,268,266 12.550/ 5,767,647 12.94%Provincial Fees shown as Taxes 1,961,479 2.18% 605,345 1.36%Provincial Taxes in the form of Taxes 9,306,78, 10.37% 5,162,302 11.58%Non Tax Receipts 6,884,625 7.67% 2,274,618 5.10%Total Provincial Receipts 18,152,891 20.22% 8,042,265 18.04%Miscellaneous Transfers 811,661 0.90% 650,000 1.46%Total Revenue Receipts 89,779,78 100.00% 44,573,39 100. 00%Capital Receipts 30,647,240 12,646,758 1Total Receipts 1 120,427,027 1 = 57,220,1521
Source: Provincial budget documents.
3.8 Aside from these classification problems, the provincial tax system faces a plethora ofissues relating to both tax policy and tax effort:
(a) Lack of Sound Fiscal Policy: The provincial tax structure is not based on sound taxdesign. The tax system at present has an exclusive revenue focus. Taxes are imposedonly when growing expenditure needs leave no other avenue for the government but toimpose new taxes or raise rates of existing taxes. Little or no importance is given tothe incidence, equity, or efficiency of these taxes.
35

(b) Complexity of Tax Structure due to the Large Number of Taxes: The myriad oftaxes clouds the transparency of the tax system and adds to administrative costs, asscarce resources are allocated to pursue what can only be termed as nuisance taxes.The tax structure also inhibits economic activity, increases complexity, reduces taxcompliance and encourages corruption.
(c) Over-Utilization of Limited Tax Bases: The combination of taxes of the federalgovernment, provincial governments and local bodies (such as octroi) on the same baseraises tax rates to levels that are likely to encoiurage non-compliance as well asgenerating serious disincentives to economic activity. Moreover, overreliance by theprovincial governments on stamp duties to raise revenue has increased the effective taxrates to a level where they have become a deterrent i:o documented economic activity.
(d) Improper Design of Provincial Taxes: Many taxes, particularly stamp duties, arelevied directly on economic activity (e.g. administration bonds, agreements or MOUs,articles of associations, etc.) and inputs (e.g. bills of lading and exchange, conveyanceand transfers, etc.) rather than on income, thereby creating further disincentives toproduction and economic activity.
(e) Disconnect and Instability of Tax and Economic Policies: The element of stabilitythat is desirable in any tax system is missing. The provinces frequently raise tax ratesin order to increase revenue, apparently without due consideration of the economic oradministrative impact. Other changes also are frequent, further undermining thestability of the provincial tax system.
(f) Ad-hoc Nature of Provincial Taxes: The taxation system is at times confused andincoherent. The imposition of a one-time tax on luxury vehicles in the Punjab FinanceAct 1997, with retrospective effect from June ] 994, is a clear indication of theconfused nature of tax policy and tax administration.3 In a Court dismissal of appealsagainst the tax, it was reported that "luxury vehicles fall outside the necessities of lifeand should be discouraged like other items in the interest of austerity, economicdevelopment and a just socio-economic order. Precious foreign exchange should notbe wasted on luxury goods."4 In this instance, applying an excise tax would be moreappropriate, but making it retrospective compromise-s principles of sound taxation.
(g) Weak Fiscal Effort: As mentioned earlier, provincial tax effort has been lacking.This is partly an outcome of the evolution of intergovernmental fiscal relationships inPakistan, but also of weak tax administration in the provinces (see below). Anunderlying factor behind both of these problems is the weak political will of theprovincial governments to raise sufficient revenues from their own sources. Table 3.4,which presents indexes of tax effort for all provinces, clearly indicates that except forPunjab, tax effort in all other province has been significantly below potential.Moreover, tax effort in all of the provinces appears to have declined over time. Theincreasingly lax fiscal effort of the provinces in the 1990s has been largely due to the
3 The justification for the tax may be questioned in terms of incentives and changes in broader economic policy.4 Dawn (newspaper), April 17, 1999
36

"windfall" received by the provinces from the 1991 NFC Award, and represents amyopic and imprudent approach to long-run fiscal management.
Table 3.4: Indexes of Fiscal Effort by the Provinces
~PIOVINCES 9mIStamp Duties
Punjab 1.46 1.56 1.69 1.50 1.43 1.16Sindh 0.56 0.48 0.35 0.55 0.61 0.86NWFP 0.72 0.55 0.39 0.51 0.68 0.99Balochistan 0.34 0.23 0.18 0.23 0.21 0.25
Motor Vehicle Tax-CommercialPuniab 1.03 1.00 1.07 1.02 0.96 1.16Sindh ~~0.88 0.95 0.87 1.01 1.16 0.89X <0 NWFP0 - 1.10 1.04 1.11 1.07 0.97 0.85Balochistan 1.10 1.13 0.81 0.68 0.75 0.62
Motor Vehicle Tax-Private{Punjab 1.21 1.20 1.14 1.19 1.02 0.97lSindh 0.89 0.90 0.97 0.92 1.10 1.15XNWFP 0.93 0.93 0.88 0.92 0.79 0.75Balochistan 0.76 0.75 0.70 0.74 0.64 0.64
Land RevenuePuniab 1.41 1.39 1.37 1.40 1.42 1.42Sindh 0.26 0.22 0.22 0.24 0.19 0.23NWFP 0.65 0.91 0.77 0.71 0.67 0.57Balochistan 0.25 0.13 0.57 0.24 0.18 0.19
Electricitv DutyPuniab 0.91 1.36 0.66 0.92 1.15 0.91Sindh 0.83 0.53 2.03 1.04 0.57 1.21NWFP 1.99 0.53 0.61 1.56 1.35 1.19Balochistan 0.39 0.16 0.24 0.08 0.32 0.27
Tax On Transfer Of Property _ _
Punjab -1.15 .17 I.21 1.18 1.33 0.94Sindh 0.99 0.95 0.87 0.90 0.70 1.21NWFP 0.22 0.34 0.37 0.41 0.45 0.42Balochistan 0.97 0.76 0.87 0.86 0.68 0.92
Urban Immovable Property Tax .Puniab 1.13 1.11 1.16 1.34 1.33 1.32Sindh 0.85 0.91 0.87 0.55 0.60 0.63NWFP 0.64 0.55 0.44 0.58 0.54 0.46Balochistan 1.76 1.69 1.70 2.10 1.92 1.84
Tax On Profession, Trade & CallinfsPuniab 0.80 0.81 0.78 0.82 0.73 0.65Sindh 1.88 1.86 1.81 1.73 1.90 2.03NWFP 0.00 0.00 0.24 0.23 0.20 0.21Balochistan 0.04 0.07 0.05 0.06 0.05 0.04
Overall IndexPunjab 1.25 1.36 1.36 1.30 1.29 1.15Sindh 0.69 0.61 0.63 0.68 0.69 0.89______ NWFP 2 0.94 0.69 0.64 0.82 0.81 0.85Balochistan j 0.63 0.52 0.47 0.43 0.43 0.43
Note: Index offiscal effort is defined as actual revenue from a tax divided by potential revenue.Potential revenue is calculated by multiplying the average tax rate(for all provinces)with the assessed tax base of the respective province.
Source: Estimates by the Social Policy Development Centre, Karachi, 1997.
PROVINCIAL USER CHARGES
3.9 Besides levying a large number of taxes, the provincial governments also collectrevenue from fees and other user charges for services they render as well as other provincial
37
levies.5 At present, non-tax revenues comprise 40% of total revenue receipts from theprovinces' own sources.
3.10 For social and political reasons, the revenue potential of provincial user charges hasnever been adequately exploited, and as a result cost recovery for these services has beenextremely poor. The large expenditures on operation and maintenance for provincial servicestherefore have to be funded from general-purpose revenue, aggravating provincial fiscal stressand, by divorcing the consumption of services from payment for their delivery, weakeningfiscal accountability and encouraging tax avoidance and tax evasion.
3.11 By their very nature, certain provincial services like general administration and law andorder provide benefits to all citizens of the province. As users cannot be segregated for thepurpose of levying charges, these services have to be funded from general-purpose revenues.On the other hand, social services like education and health, community services like watersupply and sanitation, and economic services (agricultural research and extension, irrigation,etc.) are provided at different levels to different sets of consumers. As basic social servicesgenerate potentially large social benefits, very low user charges are appropriate. However, costrecovery rates for secondary and tertiary level social services also are very low, as is also thecase for most publicly provided economic services.6 As a result, most provincial services aresubsidized. Partly because of flaws in design and partly because affluent segments are in aposition to capture these subsidized services, the intended results of low user charges are notrealized. Moreover, incentives for collection of user charges are weak because they are notretained by service providing departments and instead form the part of general purpose revenue.
3.12 User charges at present constitute only 13% of the provinces' own revenues, and thecost recovery ratio is only 9%. While low cost recovery is expected for basic social serviceslike elementary education and primary health services, considering that the provinces alsoprovide secondary and tertiary levels of these services, cost recovery rates of only 3% and 4%,respectively, are not justified. Hence charges for economic- and higher-level for the educationand health sectors social services should be enhanced commensurate with the amount andquality of services consumed (see para 3.23 below). The equity and externality considerationsof levying these charges could be addressed by varying rates for different groups of consumersand by level of services, or through some other mechanism. This would not only generateadditional revenue, which should be allowed to be retained by the service providing departnent,but would also help regulate demand.
3.13 Irrigation is a good example of these issues. With a series of rate adjustments, the costrecovery ratio in the irrigation sector has risen to about 40%, but this is still much too low giventhat irrigation water is more like a private good than a public good. Further efforts are required
5 These include fines and penalties, sale of government assets (timber, firewood, charcoal, etc.) tolls on bridges,roads and barrages, interest on loans to local bodies and provincial government employees, dividends frominvestment in financial and non-financial instruments, etc.6 Enhancing user-charges for social services raises strong equity concerns, especially for health services, wherelow rates of user charges, in the absence of any health insurance scheme, are essential to provide access toservice to low income groups. Nevertheless, as bulk of the subsidy generated through low rates accrue to moreaffluent groups, there perhaps is need to address the equity concerr.s through better designed , targeted andimplemented subsidy schemes.
38
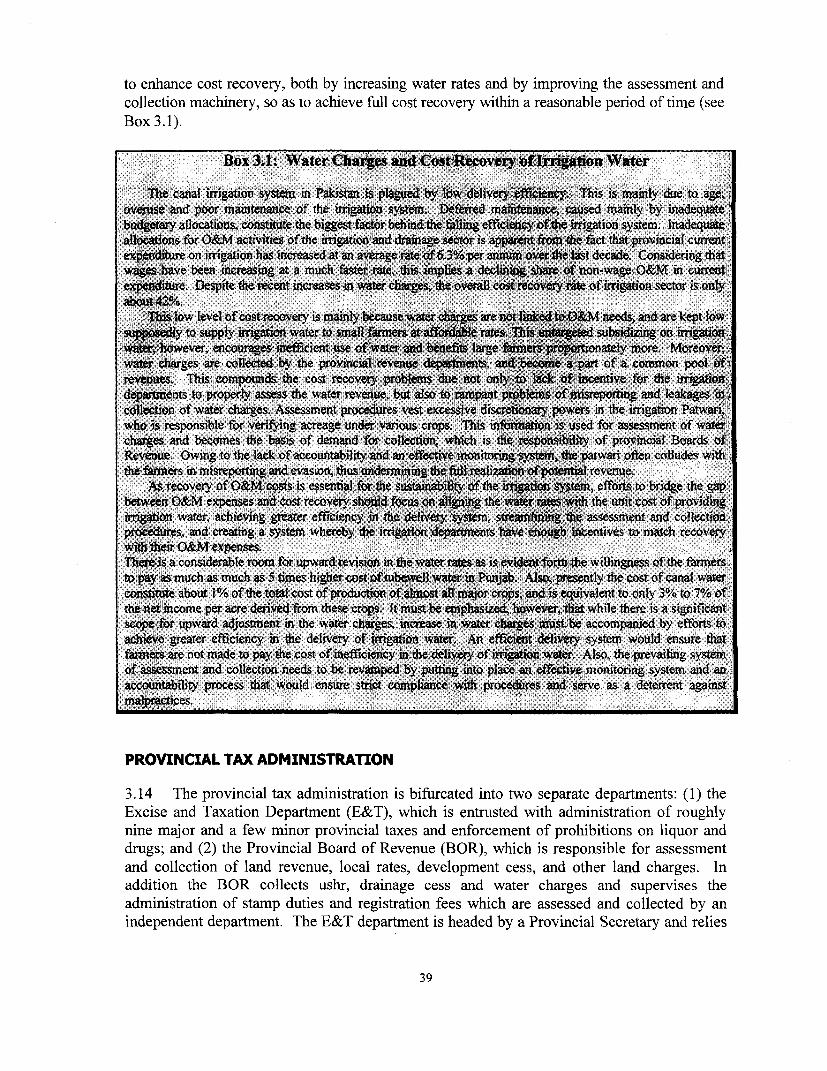
to enhance cost recovery, both by increasing water rates and by improving the assessment andcollection machinery, so as to achieve fIll cost recovery within a reasonable period of time (seeBox 3.1).
Box 3.1: Water Chazts and CostRecovery4f Irition Water
The canal irrigation system in Pakistan is plagued by''1iw elivery efflienc'y Tbis is mainly due to age,overuse and poor mainteratce of the irrigation system. eferred maitance, caused mainly by inadequtebudgetay alloations, constitute the biggest faor behind te flling efficiency ofthe irrigation system. Inadequateallocations for O&M activities of the irriation and drainge sector is appautnt fiom te fact at provincial cunrtexp tureon irrigation has increasedat an averaerted 6.3%0per annum over the lst decade. Considering thatwages have been incresing at a much faster ;ie, this implies a declining share of non-wage O&M in currentexpeniture. Despite the recent inreases in water chages, Xt overal costrcvery rate of irrigation setor is onlyabout-42%/..
This low level of cost recovery is mainly becse, water cha4es are not linked to O&M needs, and are kept lowsu4~tedly to supply irrigatioi water to smallarmersat affobe rates. This subs-o iwater, however, encourages inefficient use of water and bneis: lage tiers onatel more. Moreoverwater charges are coleted by the provincial revenue departments, and ca part of a common pool of.revenues. This compounds the cost recovery probims dtuer not only to La* of incentive for the iiationdeparments to properly assess the water revenue, but also to, rnamat plemis of misreporting and leakages Jicolleion of water charges. Assessment procedures vest excessive discretionary powers in the irigation Patw4 who is responsible for verifying acreage under various crps. This informaton is used for assessment of watercharges and becones the basis of demand for collecion, which is the resposbiy of provincial Boards ofRevenue. Owing to the lack of accourtability and an effective monitoring system he patwari often colludes withthe fainers in misreporting and evasion, thus undermiing the fullrealizatin ofpotetial revenie.
As recovery of O&M costs is essenti for the sustability of the irigaton systn, efforts to bridge the gapabetween O&M expenses and cost recovery shoWd focus onaignin the water res with the unit cost of providingirigon water, achieving greater efficieny in: the delivery Y i in the assessment and collectionpro~ures, and creating a system wherby the irrigain deprmets have eough incentives to match recoverywith their O&M expenses.The is a considerable room for upward revision in the water rates as is evident form the willingness of the fanrers-to pay as much as much as 5 times higher cost of tubewell war in Punjab. Also, prestly the cost of canal waterconsute about 1% of the total cost of production of almost allmiaor crops, and is eqivalent to only 3% to 7% ofthe net income per acre derivedfrom these crops, It must be emphasized, owever, tbat while there is a significantscope fbr upward adjustment in the water charges, increase in water chauges must be accompanied by efforts toachieve greater efficiency in the delivery of irigation water, An efficient deliery system would ensure thatfames are not made to pay the cost of inefficiecy in the delvery of irrigation water. Also, the prevailing systemof assessment and collection,needs to be revamped by putting into place an effecve monitoring system and anaccountability process that would ensure stict compliance with procedures and serve as a deterrent against.ma ices.
PROVINCIAL TAX ADMINISTRATION
3.14 The provincial tax administration is bifurcated into two separate departments: (1) theExcise and Taxation Department (E&T), which is entrusted with administration of roughlynine major and a few minor provincial taxes and enforcement of prohibitions on liquor anddrugs; and (2) the Provincial Board of Revenue (BOR), which is responsible for assessmentand collection of land revenue, local rates, development cess, and other land charges. Inaddition the BOR collects ushr, drainage cess and water charges and supervises theadministration of stamp duties and registration fees which are assessed and collected by anindependent department. The E&T department is headed by a Provincial Secretary and relies
39
on an affiliated department - headed by the Director General (DG) E&T - for theadministration and collection of taxes. Separate and independent from the E&T, there is anelaborate revenue administration managed by the BOR.
3.15 Despite an elaborate network, provincial tax administration is weak. Most of the taxesare regulated by an obsolete legal framework which was devised prior to independence andhas been only slightly modified to respond to immediate exigencies. The land and propertyrecords and assessment schedules are outdated and inaccessible to the general public, whohave to rely on the discretion of the lowest revenue official (Excise and Taxation Officer -ETO - or Patwari) to determine their tax liability. These persons for the most part lackformal training and apparently in many cases use their discretionary powers to engage incorrupt practices. Provincial tax officials in general are poorly trained and have lowmotivation. Although there is an intricate supervisory network above the lowest revenuestaff, actual supervision is very weak, records are either nonexistent or faulty, and there is noattempt to verify the information supplied by the revenue official or taxpayer. The districtadministration, which is supposed to play a critical role in supervising and overseeing therevenue administration and attending to public grievances, has other competing demandsgiven the wide functions entrusted to it.
3.16 Computerization of land records has not taken place,7 and all records are maintainedmanually. This creates great scope for errors and conceal:ment of tax records, giving rise toopportunities for corruption. Malpractices are widespread, and the combination ofconsiderable powers with low remuneration and lack of supervision among revenueadministrators constitutes a strong inducement for corruption. The efficiency and objectivity ofthe revenue administration has been further undermined by political pressures exerted at thelocal level. While collection efficiency is extremely low, administration cost as a ratio torevenue collected has been increasing over time. This is especially true of BOR, where due torapid increases in administrative costs and falling revenue from land-based taxes, the ratio ofcollection costs to tax receipts has increased sharply.
RECOMMENDATIONS FOR RATIONALIZATION ANDENHANCING REVENUE MOBILIZATION
3.17 The following recommendations highlight the structural changes in the provincial taxstructure that are needed, as there cannot be any quick fixes in their absence.
3.18 In order to streamline the provincial revenue system, a sound and effectiveprovincial fiscal policy should be devised, which should be consistent with national fiscalpolicy while suiting the prevailing provincial economic coniditions. A much better approachis to integrate federal and provincial fiscal policies, which would not only remove thepossibility of any two policies being mutually inconsistent, but would also lead to a moreeven distribution of tax burden.
7 There is a pilot project for computerizing land records in 51 villages ir. Punjab, however.
40

3.19 The first requirement in formulating such a policy is to base it on realism. At present,provincial expenditures do not seem to correspond either to the provincial fiscal base or to
requirements. Moreover, as mentioned above immediate expenditure needs (not based on any
objective criteria and lacking effective prioritization) have to a large extent determined thetaxation structure in Pakistan. As a result ambitious revenue targets have been imposed onthe provinces' tax collection departments, without due regard to the capacity of the provincesto collect in the absence of a major reform of the entire tax system. The policy response tooverall shortfalls in revenues (including in the federal divisible pool) has focused onextracting more revenues from an already over-stretched tax system.
3.20 For provincial governments to have a significant degree of autonomy andaccountability, they should be made responsible for raising a substantial portion of their totalrevenues rather than relying primarily on transfers of federal taxes from the federalgovernment. The standard prescriptions emanating from the theory of tax assignment to
different levels of government suggest that some of the more buoyant and high-yielding taxescould be transferred to the provincial governments, or they should be allowed to share federalbases by levying supplementary rates (over and above the federal rates), consistent with theobjectives of the overall integrated fiscal policy. In this regard, provincial sharing of incometax, excise duties (especially in areas which are constitutionally assigned to the provinces),and especially GST bases may be considered (see also Chapter 2).
3.21 Given the present nature of provincial taxes and levies, it is improbable that anysignificant revenue could be raised by increases in the numbers or rates of existingprovincial taxes. On the contrary, such measures may undermine economic activity bydistorting incentives, as well as exacerbating inconvenience and rent-seeking. Also, asalready proposed, the element of revenue that is collected from administrative fees anduser charges needs to be isolated from taxes. There is a need to reclassify taxes accordingto their functions and objectives before a serious restructuring of the tax system is engaged in.
3.22 In order to maximize the revenue potential of provincial taxes, there is an overridingneed to simplify the tax system at the provincial level by: (i) consolidating the many smalltaxes into a limited number of relatively high-yielding, non-distortionary and buoyantprovincial taxes; and (ii) eliminating taxes which have only "nuisance" value. Theprovinces in their 2000/01 budgets have taken major steps in this direction, by consolidatingand reducing the number of provincial taxes by around half or more. The resulting improvedtax structure should provide a better foundation for rapid growth of provincial revenues in thefuture.
3.23 Serious consideration should be given to consolidating taxes on services into eitherone provincial level tax, or better still into the GST. The revenue needs of the provincescould then be met by making adequate adjustments in other broad-based taxes (e.g. GST) andensuring that these changes are reflected in the NFC transfers.
3.24 As already suggested, user charges and administrative fees should be enhancedand rationalized, both for improved cost recovery and also to help regulate demand for theseservices. Given Pakistan's unsatisfactory social indicators, low ability and (perhaps)
41

willingness to pay for economic, community and social services, especially in the rural andpoor urban areas, enhancement of user charges needs to be undertaken with care. Table 3.5provides some tentative suggestions for rationalization of user charges (in terms of improvingcost recovery) for some key provincial services. These suggested improvements in costrecovery rates would generate estimated additional revenue of Rs 16 billion from user charges(equivalent to 10% of present overall revenue receipts of th1e provinces).
Table 3.5: Suggested and Actual Cost Recovery Rates for ProvinciallyDelivered Services
Sug ested Rates (%) Present Rates (%Urban Rru~al Average Actual
Education_
Primary _ 0 1.5 0.1Secondary 10 5 6 0.9
University/College 25 25 19.2
Professional/Technical 30 30 2.2Others 30 15 20 8.1
Health
Immunization 5 0.9Out Patient & Ward 00 1.3Room 25 25 25 6.2Surgery 30 30 30 17.5Mother & Child 10! 5 6 0.7
Public Health* 50 25 30 25.5
Large Small Average Present|Agriculture 52 26 32 10.6Extension 50 25 30 3.5Plant Protection 50 25 30 17.3Seeds 50 25 30 12.5Agricultural Machinery 60 30 35 25.3Others 60 30 35 9.6
Irrigation 100 75 80 42.1Forestry 100 70 80 21.3Fisheries 70 35 40 11.5Industry & Mineral Resources 100 60 75 67.2,Transport & Communications 60 30 40 22.6
3.25 Specific options for streamlining and restructuring provincial taxes include thefollowing:
(a) The imposition of Agricultural Income Tax (AIT') is a significant development, but itmay take some time to generate substantial revenues because of the difficulties inassessing actual income from agricultural activities (see Box 3.2 for the structure onAIT in Punjab). A land-based presumptive tax, as adopted by three of the fourprovinces, appears to be a good starting point. Nevertheless, the differential treatmentof agriculture and other sectors for the purpose cf income taxation would remain amajor anomaly in the tax structure. Thus over the longer term, agricultural incomeshould not be differentiated from other souirces of income for income taxpurposes.8 In the interim period, the provinces should make strong efforts to improveassessment and collection of agricultural tax. There are several possible options and
8 The new government had stated that from the 2000/01 budget onward, for taxation purposes agriculturalincome would be treated the same way as income from other sources.
42
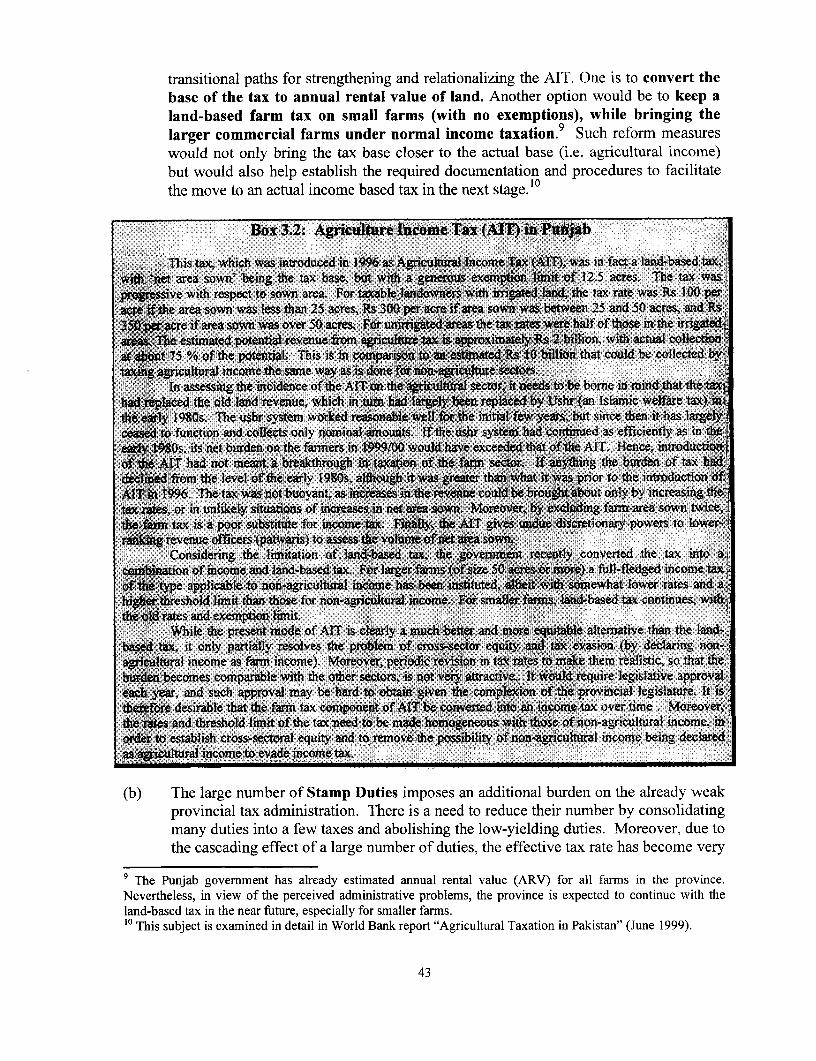
transitional paths for strengthening and relationalizing the AIT. One is to convert thebase of the tax to annual rental value of land. Another option would be to keep aland-based farm tax on small farms (with no exemptions), while bringing thelarger commercial farms under normal income taxation.9 Such reform measureswould not only bring the tax base closer to the actual base (i.e. agricultural income)but would also help establish the required documentation and procedures to facilitatethe move to an actual income based tax in the next stage.'0
Box 3.2: Agriculture 1nkome Tax (AIl) in Puijab
This tax which was introduced in 6 as Aricultural Income TaX (AlT), was in fact a land-based tax, Iwidtf,net area sown' being the tax base, but with a- gn exempon Jimit of 12.5 acres. The tax was;prnressive with respect to sown area. For taxable lmdowners with irrigated a4 the tax rate was Rs 100 perace if the area sown was less than 25 acres, Rs 300 per acre if area sown was between 25 and 50 acres and PR* 3per a if area sown was over 50 acres. For unirrigated areas the tax rtes were half of those in the irigate4area~ AThe estimated potential xevenueom agri-culture taxs a Rs 2 iion wiactual collection'ati.m 75 % of the potetial. This is in conipmIs.n to a,estated Rs sO billion that could be collected by,tanricultural income the same way as Is done frw non-eakr sectrs.
In assessing the incdence of the AIT on the it sector, it to be borne in mindthatthe .-h.a&replac the old land revenue, which in turn had largely been replaced by Ushr (an Islamic welfe tax) it1weaffy 1980s. The ushr system worked reasonable well Xor te initial few years, but since ten i has lare.ceased function and collects only nominal amounts. If thie ushr systerb; h ued as efficiently as in theeady 1980s, its net burden on the fanners in 1999100 would have.exceedethat of the AlT, Hence, introductiot3of h AIT had not meant a breakth in detax-atio f the farm secor If anythng the burden of tax TidXdelied from the level of the early 1980s, althou i was Veater th#i tit was prior to the introduction oAIT in 1996. The tax was not bwyant, as inceases in thie revenue couldbe ibout only by increasing thtax ntes, or in unlikely situations of increasesin net amreasown. Moreover, by excluding farm area sown twice,
theWm tax is a poor substitute for income tax. Finaly theALT gives undue discretionary powers to lower-rMliifig revenue officers (patwaris) to assess evolmiof et area sown.
Considering the limitation of land-based tax, the government recently converted the tax into aicombination of income and land-based tax. PFor larger fims (of size 50 more) a full-fledged income taxofhe type applicable to non-agriculturl income has been initued, albeit withsomewhat lower rates and ahigberibreshold limit ta those for non-aicultural income. For smalesr fams, lamx-based tax continues, with'theold rates and exemption lhmit.
While the present mode of AIT is clearly a much better and mTore equitable alternative than te land-based tax, it only partially resolves the problem of cross-ector equity and,tax evasion (by declaring non-Xagruu income as farm income). Moreover, periodic rvison in tax rates t ak them realistic, so that theburden'becomes comparable with the other sectors, is not very atracve. It would require legislative approvaleachyear, and such approa may be hard to obtain given the complexion of the provincial legislature. It istet6 desirable that the farm tax component of ALT be converted into an iicome tax over time . Moreover>,.the rates and threshold limit of the tax need to be made homogeneous with othse of non-agricultural income, inorder to establish cross-sectral equity and to remove the possibility of non-agriculiural income being declaredasaultural income to evade income tax.
(b) The large number of Stamp Duties imposes an additional burden on the already weakprovincial tax administration. There is a need to reduce their number by consolidatingmany duties into a few taxes and abolishing the low-yielding duties. Moreover, due tothe cascading effect of a large number of duties, the effective tax rate has become very
9 The Punjab government has already estimated annual rental value (ARV) for all farms in the province.Nevertheless, in view of the perceived administrative problems, the province is expected to continue with theland-based tax in the near future, especially for smaller farms.'0 This subject is examined in detail in World Bank report "Agricultural Taxation in Pakistan" (June 1999).
43

high, which not only encourages tax evasion and avoidance but also stifles economicactivity. A more rational tax structure for these duties needs to be put in place. In themedium term, subsuming stamp duties in the sales tax on services (like otherprovincial taxes) could be considered.
(c) Motor Vehicle Taxes should be consolidated into a few rates based on type of vehicleand size of engine. Given the local nature of the tax, it should be devolved to the localgovernments.
(d) Provincial Excise Duties on alcohol should be converted from specific to ad valoremrates in order to capture the impact of inflation. Licenses would remain as adjustablespecific fees, but treated as a user charge.
(e) In order to develop a more efficient inter-governmental fiscal set-up, it may beadvisable to devolve as many federal excises as possible to the provincialgovernments. Given the weak tax administration of the provinces, the federalgovernment may have to assume responsibility for collecting these taxes on theprovinces' behalf during a transitional period, while the provincial tax administrationis being strengthened to take up this responsibility.
(f) The Urban Immovable Property Tax would be retained as the main localgovernment tax, with reduction of exemptions, removal of the distinction betweenowner-occupied and rented properties, and shifting the basis of valuation to capitalvalue. Like the motor vehicle tax, this tax also may be devolved to the localgovernment (or at least the revenue from the tax shared with local governments overtime.
(g) All other provincial taxes may be abolished and subsumed under the extension of GSTto the services sector or consolidated into a few heads. Any administrative charges forservices rendered would still be levied. If it is considered necessary to ensure thelegality of a document, stamp duty could be retairLed, but charged at a realistic ratereflecting the cost of the service and not as a tax.
3.26 The concentration of provincial tax generating capacity in a limited number ofrevenue-yielding taxes plus the extension of GST to services will allow the Excise andTaxation (E&T) Department and the Board of Revenue (BOR) to administer these taxes moreeffectively, which will increase their yields. Existing staff currently allocated to collectingredundant taxes (along with an adequate operations budget) could be reassigned to theadministration of the remaining taxes so as to ensure that the administrative principlesoutlined above can be achieved.
3.27 Significant revenue is lost due to weak provincial tax administration at present. Henceimprovements in tax administration are perhaps the most cost-effective way to increaseprovincial revenue resources in the short run. In the short run, provincial the governmentsshould concentrate on improving the capacity and efficiency of the BOR and E&Tdepartments by improving the overall level of motivation of their staff through instituting a
44

better incentive system coupled with an effective training program, and throughcomputerization of land and tax records. The two revenue collection agencies should berestructured and merged into a single, autonomous entity in each province, responsible forcollection all provincial taxes. This would not only eliminate duplication of efforts, but willalso help in better assessment of taxes through use of a common database.
3.28 The Constitution of Pakistan assigns taxes on services to the provinces, but it is notenvisaged that the extension of GST to services will be administered at the provincial level.The GST is a value added type tax, so refunds have to be made for taxes paid on inputs. GSTon services cannot be separated from GST on goods, as there will be refunds on non-serviceinputs for the creation of services, just as there will be refunds on service inputs for themanufacture of goods. Moreover, as noted earlier the provincial tax administrations are weakand would be unable to effectively collect a relatively sophisticated tax like GST. For GST towork efficiently under these circumstances, its administration should be unified. However, inkeeping with the Constitution's provisions, the distribution of revenue collected from GST onservices can be allocated to the provinces after deduction of a reasonable collection charge(see Box 3.3).
3.29 The treatment of taxation on services highlights an important issue of provincialfinances. The tax base of the provinces is narrow, and this is reflected in the fact that some80% of provincial revenues are federally collected (and then transferred to the provinces viathe NFC mechanism). This is not surprising given that the taxes administered at the federallevel of government are those with the widest tax base. These are also the taxes where it iseasiest both from an administrative and policy perspective to adjust tax rates to meet resourcerequirements for expenditure programs.
3.30 This leads to the conclusion that attempts to address the provincial revenue shortfall(after expenditures are rationalized) should not be limited to rationalizing and improving thecollection of existing provincial taxes. As discussed in Chapter 2, over the longer run variousoptions need to be explored for reducing the disconnect between the provinces' limited taxbases and their very heavy expenditure responsibilities, through an appropriate form of fiscaldevolution.
3.31 As suggested in Chapter 2 in the context of tax devolution, provinces could decide tolevy supplementary rates on GST (on both goods and services) over and above the(rationalized) federal rates, while collection would remain a federal responsibility. Such"add-ons" by the provinces on a federally-collected tax like the GST could be implemented ina phased manner. For example, in the early stages the supplementary rate charged by theprovinces could be limited by the federal government to a stipulated, fairly narrow range toensure that rates do not vary substantially across provinces, or even the supplementary ratecould be fixed for a time. Such restrictions could be subsequently eased as implementation offiscal devolution progresses.
45
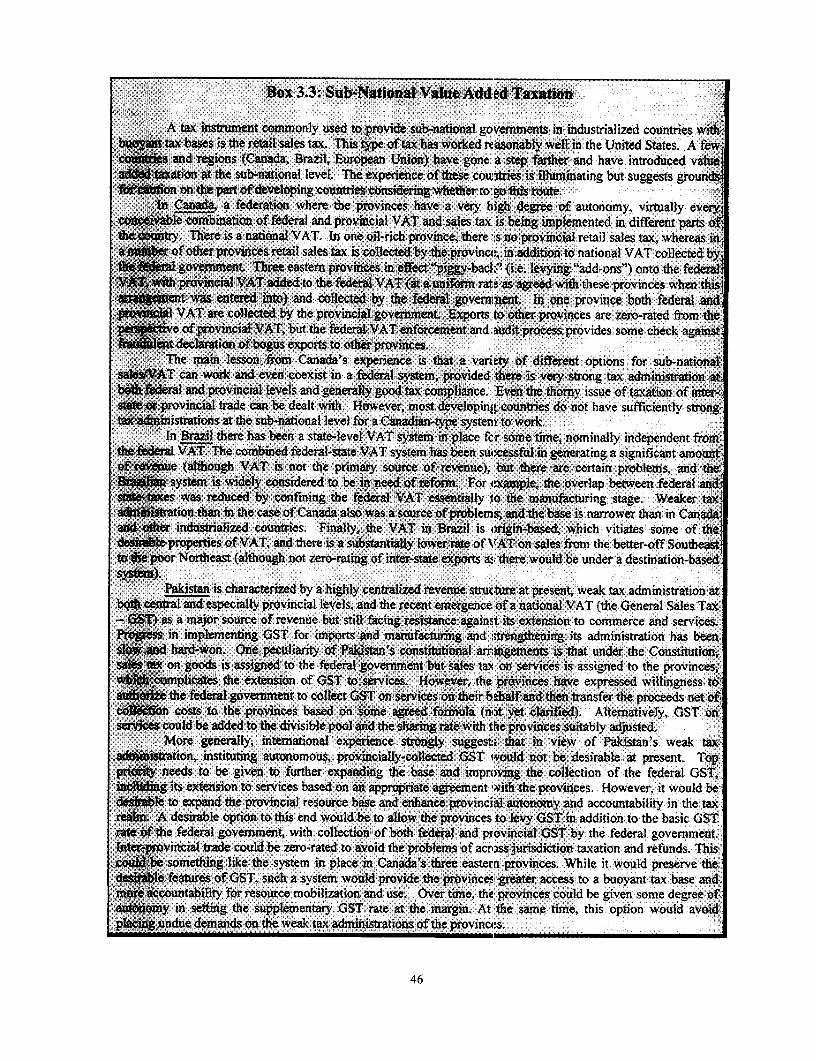
instumet cmmoly ued o povie su-naionl gvernent inindstralized countries wtilaxbass i te rtai slestax Tis ypeoftaxhaswokedrEaonblyw~Winthe Unite States.Afe
an reg 2,ionsX (Cnaa Brz. European0e Union hav gone3, a ste fate an ha. inrdue vai
on ~t~ferelop j gouteosiputi~du
b~~~~~~~~~~~~~~~~~~~~~pin for sub- >ata .tof ote prvics eti saes tax is ~olceb h~rvi tne, in aditiotonational VAT colleced by
wKfi~~~~~~~~~~~~~~~~~~~u& ' dst
,0t,2w~ en9a:'Wjl, B tere hlate) andcletdb h kT0fedrlgvrni0nt. n nepo incebthfderl nd
3 3wOt Wng~~~~~~~~~sr wea W s - 5 a ta
VX0;4ATUS are0 cojid ythe prvnal governnyent: Exports-.'i toASi ote provincs.0 ar eortdfo h
e of provincial VAT, ut thederaliment gand d it procespvidssomecheck(the G againstededl S i W artgatttion of bogus exportsolto otherprovinc ie§gs. st-Gi s i to ce aines
can rkand even coexist iS n a federal stem, uprode .e v so tax federat onGad provinial levels andcountilgplithe thoryisueotaation fter e
.,.ipoinil rd ca bei dealt ith Hoevr,W mos deeoig contie do no hs ave pEsfiently ston
rA* s t t subnational levelforaCanadiantypesystedtto wonoto the basic GST
VAT. The con*ined ~ ~ ~ ~ ~ ~ ~ th federal-ttVAsytmhsbesuesfingeriga sgnivecnt moun
_ Fmbig iSizeto-ied to;-id44s Of avss ~taxation and rfunds. Tbiissystem is widie considered plbe, in explaG the vie it w ederal a
46

3.32 Implementation of all of the above recommendations would improve the structure ofprovincial taxes (and user charges) and their revenue potential over the medium term. In theshort run, however, these changes, along with the devolution of certain provincial taxes to (andsharing the revenue of others with) the local governments, would probably leave the level ofprovincial revenue unchanged. Therefore, in the short run the provinces would need to continueto rely heavily on federal revenue transfers to meet their expenditure needs. Higher revenuetransfers to the provinces would come from sharing the presently unshared taxes (e.g. surchargeon petroleum) and conversion of federal excise duties on services into GST (with the entirerevenue from these taxes transferred to the provinces, which would then be shared with localgovernments). This reassignment of tax revenues is likely to increase provincial revenue receiptsby about 15% (about Rs 23 billion), while at the same time it would more than double therevenue of local governments (increasing them by Rs 13 billion). Such short-term adjustmentsshould not, however, be considered a substitute for the major tax devolution proposed to addressthe severe vertical fiscal imbalances that plague Pakistan's system of intergovernmental fiscalrelations.
47
CHAPTER 4. IMPROVING PROVINCIAL EXPENDITUREMANAGEMENT AND GOVERNANCE
4.1 Budgeting and expenditure management processes at the provincial as well as thefederal level have failed to deliver public services in an effective and efficient manner. Thiscan be attributed to a number of problems which have remained unaddressed for decades.Moreover, the deteriorating fiscal situation of the provinces has adversely affected servicedelivery, as a result of the shrinking level of resources and the inability of the budget processto make needed structural adjustments in a timely manner. In the absence of improvements inprovincial budgeting and expenditure management, these problems will continue and worsenover time.
4.2 The weaknesses of the budgeting process mainly stem from (a) its short-run and inputfocus, with hardly any attention given to "outputs" of the process or to medium-termexpenditure liabilities or resource availability; (b) procedural bottlenecks, which make thebudgeting process extremely rigid and inhibit appropriate prioritization; (c) the absence ofeffective links between policy-making, planning, and budgeting institutions and processes; (d)weak and inappropriate institutional arrangements and mechanisms; (e) ineffective anddiffused decisionmaking; and (f) political intervention, lack of transparency, and insufficientaccountability.
SHORT-TERM AND INPUT FOCUS
4.3 Unlike in a number of developing countries which have adopted program budgetingbased on a Medium-Term Budget Framework (see Box 4.1 for a discussion of Uganda andTanzania), the budgetary process in Pakistan continues to have an almost exclusive inputfocus, with performance judged mainly in terms of spending the allocated budget. Moreover,this approach to budgetary decisionmaking is oriented toward the short run and fails to takeinto account longer-term costs and benefits. This inappropriate focus of the budgetaryprocess is a manifestation of the fact that the government (and to a very large extent, thesociety) has lost sight of the appropriate role of the public sector. The role of the provincialgovernments has become mainly associated with direct provision of employment, to thedetriment of effective and efficient delivery of public services. As a result, employment in theprovincial civil services has increased rapidly over the lasi: two decades. Although from aninternational perspective the size of public employment in relation to the total population inPakistan has remained relatively low, the government establishment appears oversized inrelation to the size of the economy, the resources available to the public sector, and the leveland especially quality of public services delivered.
4.4 The crux of the issue is that an increasingly large proportion of provincial expenditurebudgets is being devoted to personnel spending, and few resources are left for high-prioritynon-wage requirements. Both the provincial governments and to a large extent communitiesappear to view government mainly as "employer of first anc last resort." As a result, althoughthe provincial wage bills are protected, insufficient funds are left for O&M of existing publicinfrastructure and services. This has led to a sub-optimal rmix of wage and non-wage inputs,resulting in lesser quantity and poorer quality of services provided. The clear prescription toimprove outputs in such circumstances is to shift resources from wage to non-wage inputs byadjusting the size of the provincial civil service.
48

Box 4.1: MTBF Experience in Uganda and Tainania
Since the early 1990s, the Govenment of Ugada has been progressively introducing a medium-termbudge framework. The process involves close collaboration between Minsty of Finarce (MOF), which is incharge of the prepaation of the anmual budget, and the. Ministy of Planning: and Economic Development(PED)., which is responsible for medium-term budget plaing. The i-ti MtF reforms were introducedwith the 1992/93 budget and focused on strengthening the macro framework for the budget and makingirovements in fiscal forecasting in order to provide more robust paramters for budget setting. By the time ofthe 1995/96 budget, it was felt that sufficient progress had been made to allow the setting of three year resourceframeworks for each sectoral program covering both recurrent and development expenditures. This involves aserie,of sector review meetingS held between MOFA/PED and the line ministries, These meetings seek tosdy shifts in expenditure patterns that are implied by government policy objectives and strategies or are
necssary to improve the delivery of public services. After the completion of the sector review meetings, theMOP/MPED puts together a Budget Framework Paper (BFP) which:* Ouies th ree-year ffamew or the public expendte program;* Set- forth the main expediture policy issues; and* Proposes recurrent and development resource ceilings: fr each of the principal sector programs for the
coming three-year period, consistent with the macro fiamework.-Once prepared the BFP is considered for apprvW by the cabinet, and after its approval it provides the
framework for the subsequent detailed budgetprepation exercie.| Uganda's MTEF is to be further strengthened by (i) insitutionalizing the two-stage budgeting procs
that ha been introduced with the BFP; (ii) inculcating a stronger outcome focus to the MTBF; (iii) bringing all39 district budgets within the MTBF; and (iv) introducing a common program framework to be lied to bothdevelopment and recurrent budgets as a prelude to eventual integration of the two budgets.
Although considerable progress has been made with the intoduction of the MTBF, a number ofdifficuties have been encountered. These include: (i) the unwillingness of the stakeholders to considerrationaization of their progrms; (ii) the limited detail of the sector review submissions required from the linem= isries; (iii) delays experienced in finalizing the BPP and getting Cabie agreement to the resource ceilings;and; ( diffculties in holding line ministry budgetsto the resoure ceigs.
Tanzania has also endeavored to introduce an MO7F, in the fom of a Rolling Plan and ForwardBudget (RPFB), since the early i990s. This has involved cooperaion between the Planning Conmission and theM-inty of Finance and has superseded the previous systemof Five Year Plans. The exercise has had limited:success so far,
On the positive side:* The RPEB provided a succinct, coherent, and widely available statement of the government of Tanzania's
macroeconomic and sctor policies. It played a sigifant part in m6di6fing prevailing perceptions aboutthe role of government and of planning i a marketeconomy.
* There was considerable progress in developing consisnt fiscal prcjections based on a model shared by thecetal resource agencies ofgovernment
* Ther was also some progress in pnming and consolidating the excessive number of development projects.On the other hand:
* Adequate political involvement in the exercise was not achieved, contributing.to failure to adhere either to,the macro targets or to the sector allocations put forward in e RPFB.
* Te Forward Budget proJections remained an academic exerise. Th urgency of annual budget preparationcontinually led to focus on the next yeaes budget at the expens of medium-tenn prQjections, and failure toadhere even to the annual expenditure target robbed the proecions for later years of credibility.
* For similar reasons, the intended integration between recent and development budgets was not achieved.(However, the governmeat has recently assigned responsibility for both recwrent and development budgetsto the Ministry of Finance.)
The Tanzanian experience demonstrates the importae of politic commitment to the MTBF, and alsothat of the sequencing of decisions. High-level political agreement on strategy and on broad expenditure targetsneeds to precede annual budget preparation if the strategic framework for budgets is to be taken seriously. Andthe government must demonstrate the determination and ability to enforce expenditure controls.
49
4.5 An important initial step in this direction would be to collect and compile complete andaccurate information on provincial employment through baseline surveys and/or censuses, whichwould determine the size, composition, and skill mix of staff in each provincial governmentdepartment, agency, public enterprise and autonomous bedy. This has to be followed byprofessional functional reviews of all provincial public sector entities, which would not onlyassess their objectives, roles, and staffing needs, but would also deternine the scope for shiftingsome (or all) of their activities to the private sector or devolving them to the local governments.The implications of the government's devolution initiative (see Chapter 5) would need to be fullytaken into account in these reviews. It is of critical importance that these reviews be led byexperts outside the government but with full support and cooperation of high-ranking officials.More generally, and building on the reviews, the provinces need to develop a vision of the futuresize, structure, roles, incentives and management of the provincial civil services. Based on thisvision, phased restructuring of staffing and expenditures should be initiated, perhaps byfocussing on key agencies whose improved functionning i:, most critical for the progress ofreforms and for better governance (e.g. tax administration, police, basic social service providers,judiciary).
PROCEDURAL INADEQUACIES
4.6 Budgetary processes in Pakistan are marred by procedural inadequacies and rigidities,which affect both the recurrent and development budgets. These include:
(a) Structural Rigidities: Existing budgetary processes and practices exacerbate structuralrigidities. For example, when budgeting, spending is bifurcated into "permanent" and"-new" expenditures, subject to different budgeting processes and leaving no scope for amore general assessment of both the priorities and the funding requirements of currentactivities. About 90% of the current budget is "permanent" and is generally formulatedon an incremental basis. Consequently there is no incentive for a line department to scaleback or close down a "permanent" activity that is no longer of high priority. This is sobecause the net outcome of stopping any particular "permanent" expenditure activitywould be a straightforward loss of resources to the department. The result is protectionof the existing structure of activities irrespective of their efficiency or the associatedoutputs.
The "new" expenditures (i.e. the Schedule of New Expenditures - SNEs) in principle aresomewhat better examined for relative priorities, bur: in practice this is diluted by theincessant political pressure to shift completed schemes from the development to therecurrent budget. The provincial budgets therefore neither adequately reflect nor arecapable of quickly adapting to changes in government priorities.
Moreover, as the budgets formulated in this manner are inconsistent with changes in unitcosts of providing services or operating provincial and local infrastructure, the allocationsmade through this incremental budgeting process are usually inconsistent with fundingneeds, as the emphasis of annual increments in allocations is to protect the wage bill, thusexacerbating shortfalls in non-wage allocations. T his problem may also be partlyresponsible for the building up of provincial deferred liabilities, especially to WAPDA.
50
(b) Outdated Yardsticks: A large number of expenditure yardsticks exist at the provinciallevel which, in principle, permit the calculation and application of unit costs in planningexpenditure activities in the budget. In practice, these yardsticks are updated infrequentlyand, in the interim, are adjusted only according to the projected increase in "permanent"expenditures, irrespective of actual changes in the underlying costs of inputs. To theextent that prices of particular inputs are increasing faster than the percentage increaseallocated to "permanent" expenditures, O&M allocations will become increasinglyinadequate.
(c) Budgeting for Vacant Posts: It is normal practice for the provincial governments tomake full budgetary provision for the public service establishment, including unfilledvacant positions. Under normal circumstances this would not be considered unusual,although some ex-post adjustments in spending may be needed depending on actualrecruitment. Currently, however, a recruitment ban is in force in the provinces.Nevertheless, the provincial budgets continue to include provisions for all vacancies. Infact, it has become normal practice to use the allocation for vacancies as an informalbuffer in the provincial budgets to help offset revenue shortfalls or overspending in otherexpenditure categories. This undermines the transparency of the budgeting process andthe credibility of budget allocations.
(d) Weaknesses in Preparation and Budgeting of the Development Program: In principle,the provincial Annual Development Program (ADP) is conceived and formulated in a"bottom-up" manner according to provincial priorities as identified by line departments(but consistent with national priorities and within a hard resource constraint established bythe federal government). In practice, however, project initiation for a substantialcomponent of the ADP is not determined by provincial priorities, and the aggregate size ofthe provincial development budget bears little relation to available resources. The netoutcome is a series of projects, and associated development budget activities, which areinadequately funded, poorly prioritized, and not well-linked to overall or sectoraldevelopment strategy.
Moreover, as in the case of the recurrent budget, the guidelines for preparation of thedevelopment budget are essentially incremental. The planning department generallyspecifies a given percentage increase in the overall development budget, which in theoryprovides scope for inter-sectoral adjustments. In practice, however, these guidelines areinterpreted by the line departments to apply to each sector and sub-sector, allowing littlescope for re-prioritizing between sectors.
For most of their fiscal history, the provinces have relied heavily on cash developmentloans (CDL) provided by the federal government and project assistance from the donorsto finance the bulk of their development spending. CDL is apportioned on the basis ofpopulation shares and is used to finance local schemes as well as the counterpart fundingrequirements of donor-assisted projects. Donor assistance is made available to theprovinces on the same terms and conditions as provided by the donors. The differentcriteria used in allocating local and foreign development funds to the provinces can resultin a mis-match between donors' (expected) disbursements and the counterpart fundsavailable to execute donor-assisted projects, leading to poor implementation of these
51

projects, lower foreign aid disbursements, and correspondingly reduced effectiveness ofdonor funding.
STRUCTURAL DISCONNECT BETWEEN POLICY, PLANN:[NG, AND BUDGETING
4.7 At present there is a very sharp and unwarranted distinction between development andcurrent expenditures in all budgetary processes. Line departments can increase their claims onscarce budgetary resources by initiating as many development projects as they can get approved,irrespective of their own implementation capacity and expected future resource availability. Theprovincial expenditure budgets thus have become heavily biased in favor of asset creation asopposed to asset maintenance and service delivery. The disconnect in preparation of therecurrent and development budgets is related to the provinces' inability to link policies, planningand budgeting, which are undertaken independently by different players in the government.Whereas policy making remains fundamentally the responsibility of the politicians, planning isdone by the planning departments and is confined mainly to public investment activities, usuallynot closely related to the budgeting of the aggregate size of the development program (which isthe responsibility of the finance departments). As discussed earlier, budgeting of recurrentexpenditures is handled separately from the development budget and is overseen by the financedepartment.
4.8 In the initial stages, the development program is prepared with little knowledge orconsideration of the resources that would be available to finance it. As a consequence, thedevelopment budget tends to be over-programmed and substantially in excess of the likelyresources available. It therefore has to be compressed, usually arbitrarily, to fit into the resourceconstraint, leading to overcrowding of development programs, with a large "throw-forward" (i.e.claim on future development resources) of on-going projects (see Box 4.2). This is usually doneby spreading resources thinly over a large portfolio of projects, thereby delaying completion,which raises their costs and erodes their economic and social returns. Moreover, the preparation ofdevelopment budgets does not take into consideration the impact on future current expenditures,required to operate and maintain the assets created. Although at the decision point for goingahead with a project, information on recurrent cost implications is recorded on the PC-1proforma, in practice this information is rarely used to assess the sustainability of the project anddetermine whether it should be approved or rejected.
4.9 In this regard, the role of the donor community in the budget process often has beensomewhat problematic. First, through their project interventions they have sometimesinadvertently promoted a culture whereby new development expenditure is given priority overadequate O&M spending. Second, until recently donor missions paid only limited attention tothe prevailing fiscal situation and the broader public expenditure management process in theprovinces and their impact on the implementation and sustainability of projects. The result is thecreation of critical masses of support for projects (also related to associated benefits andperquisites) without taking into account the resource context and relative priorities.
52
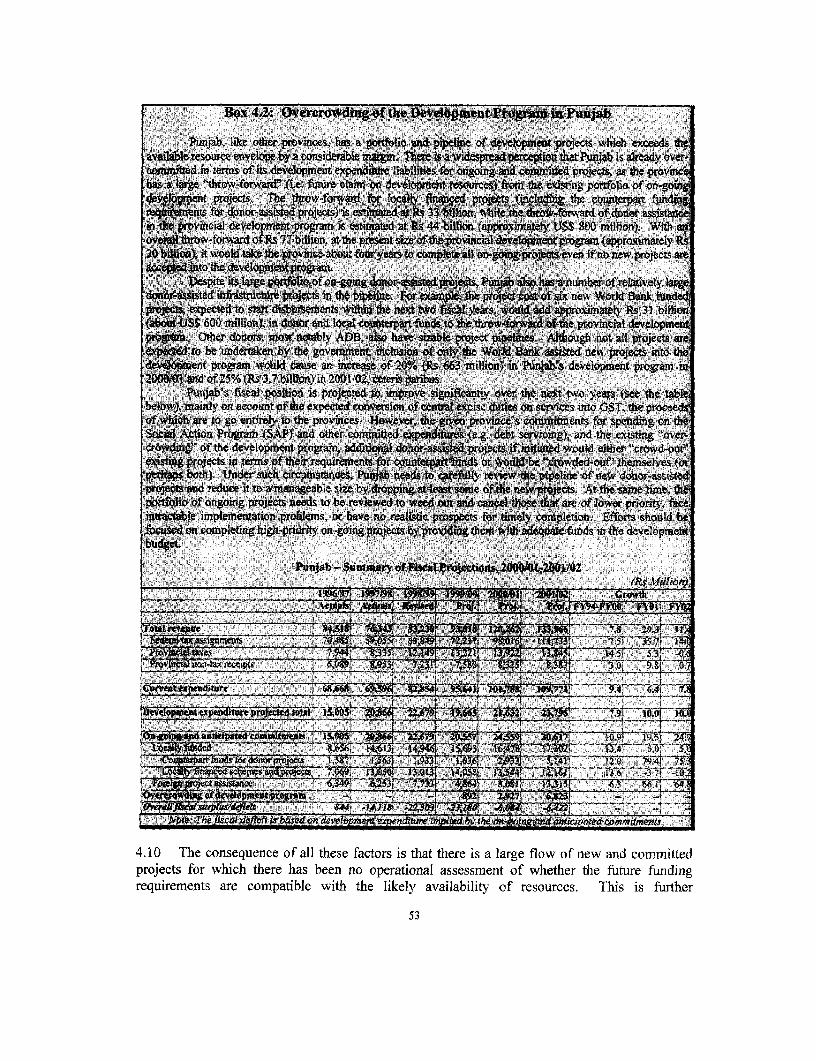
Box 4 ,-: OvercrOWI3gz,*tlt. P'':b
Punjab, like other p has a poOt,lio and- pipline of d**pinent prJetS which etSsavaille resouce envelope y a coidberain.T aw pr p ptth Pun is already over
* mntreited in} terms of its developmem eXptn*re liabilities for ongoing vid comittd protts, as he provhas; large "throw4frwad" (i0-. fture laim on &Velom r-oc) frothe exsting portblio of on
projects. he 0hrow-forard, r loqll fin proOM (100Iud the cot,ntrpart,eqinenrs fior aonor-astd preCUs)Iis estim0e *s I3 bx whilether rard of donor assisMin. the ~ryincial , edevelopme progam is esi at Rs 44 biln (approxim4ely U$ s00 mqflion). Withfove l1tubw-forward of R 77 bllion, atthe pr6sent si Uoft incial or (ap R20 - )d itwould take ,the e povinc about four years tomplete on-g6, ee ven if non projects ar- ito th deveJpmeniproa.. ,, , ,- -,
.. espite iar ge -pooli Ofon-goin eets, -P.p ah la aan umber of relayvelad strictnre pr*ecrs ttt ppiri -tPor- iex new World Bank-
prjcs, eetedt stat iureents wihnte next two 1l;i: ear.wolsdd aprximay Rs 31 blli(abot*IIS$ 600 milui;oti) win oon lan,l foun ds to e r4 o provimcial dewer-ProsnOter donos, n notablyAD, h bel Altough knot all poects
W to be undertiln by the government; msie U. e Wor a ssitd new projecs intonent prgram would cause an increase:of 20% (I 63uiioi Pt s development progam
20(l and of 25% Rs 3.7 blion n 2001/2,1W, .er .s pbsPunjA's fisxal position is proected to im e siiit ovr the ext two ye (see the tab
belov)r, mainly on account of th expected mvesitmn ofcenitilexcise dties on.services into GT te procof h are to go entirely to the provinces. Howevr, te i . j m ts for spen on *ocial Ad'ion Program (SAP) and other committed xp (e.g. debt sevi;g, and the exstig 'over-
- t of the development program,i addiionail 4ossid pros if i;i would eier 'crowd-utcts im ters of their requirements for cuuetpa s or would b "cwded-o themselves (
peh, both. Unde sic nitnesX, Puje netoc ly review th ipelie of new donorassisteprjeetsand redce itto amanageable size b roppi atlaome of 'he new projects. At te same time,pIorfio of onging projecs needs to be reviewed to weed eut and canel those taare of lower pront fai%radabJe implemeatation problems, or have no realiic pr pletion. Efort should b
:sd on completing hish-priodriy -oing pjectsbyprodig tm w equate funds in the developnen
-a, -N .SIAM Projeati2l001O
1wxe pottdtw ." P -6 w - - -f - -: - ilfN Tefscsat7, i dM' x t_ ____ _______ _ _5___ _ ;O .. . '-. _
4.10 The consequence of all these factors is that there is a large flow of new and commrittedprojects for which there has been no operational assessment of whether the future fundingrequirements are compatible with the likely availability of resources. This is further
53

compounded by the fact that revenue forecasting looks no 1,Farther ahead than one year. Thecombination of these two factors leads to overextended and cvercrowded provincial investmentprograms, an excessive amount of work in progress, and delayed project completions withassociated cost increases, as well as shortfalls in downstream O&M funding.
INADEQUATE INTER-GOVERNMENTAL COORDINATION
4.11 Lack of coordination both within provincial governments and especially across differenttiers of government constitutes another major impediment to an effective budgeting process. Themore important of these include the following:
(a) Lack of Revenue Projections: The failure of provincial governments to producemeaningful medium-term revenue projections partly reflects the lack of any provision inthe existing procedures for estimating the resource envelope beyond one year ahead. Moreimportant, the provinces have effectively abdicated their responsibility for estimating futurerevenues from federal transfers. Mainly for strategic reasons, they simply assume that theprojections originally made for the current NFC revenue sharing arrangement will continueto hold throughout the lifetime of the arrangement. Ihey fear that if accurate revenueprojections during a time of fiscal crisis result in a reduclion in provincial expenditures, thismay be used as a justification by the federal government to adjust the next NFC revenuesharing formula in its favor. While preparing their respective budgets, the provinces takethe federal government's projections of current-year revenue transfers at face value. Inother words, no projection at all is made by the provincial governments for some 80% oftheir total resources.
This represents a major flaw in the provincial budget process, as is illustrated in Table 4.1.The table shows that actual federal tax transfers to Punjab province in 1997/98 fell morethan 10% short of those "projected" by the federal government for the year. Without moreaccurate forecasts of federal revenues, it will be very difficult to formulate meaningfulprovincial budgets. Under the current institutional relationship between the federal andprovincial governments, there is a serious disincentive to accurately project provincialrevenues and to adjust the structure of expenditures accordingly.
Table 4.1: Budgeted, Revised and Actual Revenues from Federal TaxAssignments, Provincial Government of Punjab 1997/98
(Rs millions)Budgeted Revised Actual
Revenue from shared tax transfers 66,012 61,935 58,992Percentage of amount budgeted 100% 94% 89%
Source: World Bank and Provincial Government of Punjab Finance Accounts 199 7/98
(b) At-Source Deductions: Although an outcome of the general deterioration of the fiscalsituation in recent years, the practice of at-source deductions for payment of utility andother charges is a powerful disincentive to the preparation of realistic budgets andappropriate use of resources. The problem is compounded by the fact that metering ofindividual consumers within the provincial governments (especially electricityconsumption) to a large extent appears not to take place. As a result of these two factors,excessive utility consumption is effectively guaranteed by a "first call" on the resources
54

of the provincial governments. Although in principle a given office, agency ordepartment is allocated a budget line for such consumption, this allocation has nomeaning. De facto consumption simply goes ahead in excess of the budget allocation, tobe paid ultimately via at-source deduction from the divisible pool. This has led to asituation of great uncertainty with regard to resource availability for the provinces (net ofat-source deductions), allocation of resources within the provincial budgets, and theprovinces' overall net fiscal position.
Moreover, the provincial governments cogently argue that the practice of at-sourcededuction for electricity consumption has facilitated serious over-billing of the provincesby WAPDA. While WAPDA claims that the Sindh govemrnent owes WAPDA Rs 12billion in unpaid electricity bills, the provincial government considers that WAPDA hadbeen over-billing the provincial government and contends that WAPDA should refundabout Rs 6 billion to the Sindh government. Similarly, according to WAPDA the Punjabgovernment owed WAPDA Rs 3.8 billion as of April 1999. However, the Punjabgovernment considers that WAPDA has been overbilling the provincial government andin addition has not been transferring the revenues from electricity duty which it collectson behalf of the provincial government. For these reasons, Punjab considers thatWAPDA owes Rs 5 billion to the provincial government.
INEFFECTIVE DECISIONMAKING
4.12 Planning in Pakistan is a top-bottom process. While the provincial governments areasked to provide inputs into the Five Year Plans, Plan priorities are generally set by the federalgovernment. Even in annual planning, the sectoral and project-wise priorities reflected in theprovincial ADP are somewhat distorted because of pressures from the federal government toinclude certain projects and programs in the ADP, which may not conform to provincialpriorities. For example, the hard currency made available through donor funds for ADP projectsis routed through and retained by the federal government. The equivalent local currency is thenpassed on to the respective provincial government(s). Considerable pressure is put on provincialgovernments to propose development projects that have the greatest possibility of receivingdonor support, in order to expand the federal government's access to much-needed foreignexchange. In this context, the role of donors in the provincial budgetary process has sometimesbeen problematic.
4.13 In addition to the explicit obligation under the development budget guidelines toadequately fund foreign-aided projects (irrespective of priorities), provincial governments alsoexperience pressure at the stage of initiating new foreign aided projects. The nature of theprovincial government bureaucracy and political structure is such that it is frequently possible togenerate a critical mass of support for a foreign-aided project within the relevant line department,without due regard to its funding implications or relative priority. This could occur as a result ofvarious incentives associated with donor-funded projects (e.g. provision of project vehicles,computers, opportunities for travel, expansion in employment, etc.), or simply a desire on thepart of departments to expand their access to resources in order to achieve departmentalobjectives. Once the line department is convinced of the "benefits" of a project, it may bepossible to generate the requisite political support for the project to override any prioritizationconcerns of the Planning and Development Department and budgetary concerns of the Finance
55

Department. As a result, the provincial ADPs may contain a portfolio of donor-supportedprojects that does not necessarily correspond to provincial priorities and whose completion andsubsequent O&M requirements exceed the financial resources that can reasonably be expected tobe available to the provinces.
4.14 Donors can mitigate their potentially negative influence by, first, explicitly recognizingthe issue and ensuring that donor missions are fully briefed accordingly. In addition, muchcloser relationships need to be established with both the Plarning and Development Departmentand the Finance Department during the early stages of project identification and preparation.The purpose would be to ensure that the donor becomes fully aware of the views and concerns ofthese agencies with regard to the relative priority of a given project within the overall ADP andits budgetary implications, before the project gains momentum which would be very difficult toreverse.
4.15 It is becoming increasingly recognized that the productivity of donor support depends toa large extent on appropriate allocation and use of government budgetary resources. Thus afundamental means of making donor assistance more effiective is to bring in good publicexpenditure management practices. Once public expenditure management is improved, it makessense to provide donor resources (with appropriate accountability and safeguards) in asunconstrained a manner as possible. This in part explains the increased use of program aid andpolicy-based assistance in the delivery of donor support to developing countries.
PROBLEMS IN FINANCIAL MANAGEMENT
4.16 Although well-defined functions and responsibilities are assigned to various individualsand institutions, financial management in Pakistan, especially in the provinces, has remainedweak. This is partly because financial management in the provinces has tended to be associatedwith financial controls, and partly because the financial rules are frequently by-passed andcircumvented. Furthermore, interference in finance-related matters by political leaders, lack oftransparency in financial management, weak capacity of financial institutions and weakaccountability have all contributed to weakening of financial management. Financial controlsare needed to impose a hard budget constraint, but excessive pre-occupation on the part ofprovincial finance departments and accountant generals' offices with financial controls maybecome an obstacle to smooth and efficient government functioning.
4.17 By-Passing of Procedures: Regular procedures are frequently by-passed in response to"pressures" to ensure that projects and programs are funded, irrespective of resource availabilityor prioritization. The provincial ADPs contain projects which have been initiated without havingobtained the required approvals - a direct (and apparently established) contravention ofestablished procedures. Similarly, while the budget procedures clearly stipulate that onlyapproved projects should be considered for ADP financing, the development programs of everyprovince contain a significant number of unapproved projects.
4.18 Weak Financial Institutions: Institutions responsible for managing the provinces'finances and maintaining financial discipline have neither the technical capacity nor themotivation to undertake these important tasks. The finance departments play a pivotal role infinancial management. Although they usually attract high-quality bureaucrats, the technical
56

skills required for modem public sector financial management are generally lacking, especiallyamong mid-level officials. The situation is even worse in the Accountant General's and treasuryoffices, which are essential components of financial management and control. Although theDistrict Accounts Officers (DAOs) as representatives of the AG's office and the treasuryofficers play the most important role in disbursement and control of provincial expenditures, theyusually lack basic training. Moreover, coordination between the financial managementinstitutions and provincial line departments is less than adequate. While the financedepartments, due to their central coordinating role, are often in a position to give helpful adviceon financial matters to the line departments, they generally refrain from doing so.
4.19 There are also serious problems with the timeliness and reconciliation of provincial fiscaldata. There are some significant discrepancies between the federal and provincial governmentdata on financial flows between the two levels of government, mainly because some transactionsare treated as "net" by the provinces, while the federal government treat them as "gross" flows.The problem lingers on due to lack of an established inter-govemmental institutional frameworkfor reconciling data, and it is compounded by accounting weaknesses at the provincial level. Asper rules, the DAOs and treasury officers are to submit a monthly account of receipts andexpenditures (and of deposits) to the Accountant General's office by the fifth of the followingmonth. The Accountant General's Office then consolidates and compiles these Civil Accountsand submits them to the Finance Department by fifteenth of the month following the month forwhich the accounts pertain. While these data could provide important information for thefinance departments for improving fiscal monitoring, their usefulness is compromised by lack ofconcern of the Principal Accounting Officers (PAOs) of the line departments for their accountingresponsibilities, which provides disincentive for regular reconciliation of data between theDrawing and Disbursing Officers (DDOs) of the line departments and the DAOs.1 Similarly,delayed communication of expenditure information (to the AG's office) by the National Bank(NBP) and State Bank of Pakistan (SBP) further aggravates the problem.
4.20 Increasing and inappropriate use of Personal Ledger Accounts (PLAs) is another factoradding to data reconciliation problems. The PLAs were created mainly to accelerate the pace ofdisbursements for development projects. However, the amounts transferred to a PLA are bookedas expenditure by the AG's office, even when no actual transaction has taken place. As all PLAslapse at the end of each fiscal year, adjustments are made to end-June civil accounts (final) byaccommodating surrenders of excess amounts back to the finance departments (if any). Untilsuch adjustments are made, the expenditure shown by the civil accounts would be higher than theexpenditure actually incurred.
4.21 Nevertheless, the most serious problem with the AG's data on expenditures is that not alldevelopment expenditure is officially recorded in the public accounts. This situation arises fromarrangements reached with donors, which allow project entities to send SOEs directly to donorsfor reimbursements. Although expenditure reports are sent to the Economic Affairs Division(EAD), these expenditures are never fully recorded in the AG's accounts. This results in under-estimation of development expenditure and leads to a significant discrepancy between provincialfiscal deficits (as calculated using AG's data) and available financing (as obtained from themonetary survey).
In Punjab, for example, about 35% of DDOs fail to reconcile their accounts with those of DAOs.
57

4.22 Political Interference: A key issue with regard to public expenditure management inPakistan concerns the role of politicians. Politicians have an integral role in public expendituredecisionmaking, which should mainly involve establishment of the policy agenda based onwhich expenditures are prioritized. The political level also should be involved in making finaldecisions on broad expenditure allocations consistent with such priorities and based on analysisand advice from line departrnents. Finally, the provincial assemblies have a mandated role inmonitoring the utilization of budgetary resources and associated outcomes (e.g. via the PublicAccounts Committees).2 Unfortunately, while not adequately taking on these mandatedresponsibilities, politicians in Pakistan have become involved in public expenditure managementin other, counterproductive ways.
4.23 A perennial issue in the allocation of budgetary resources, especially in a large countrywith a dispersed population, is how to respond to needs and relative priorities at the local level.In Pakistan there has been no effective institutional arrangement to address this issue, whichappears in practice to have been dealt with through inforrnal interventions by local politicalrepresentatives. This informal mechanism operates through expression of priorities by a localcommunity to their political representative, who then tries to directly influence the distribution ofbudgetary resources accordingly. While it may be a useful source for project identification, thereare obvious and significant problems with this approach:
(a) This informal role of politicians in the budgetary process is not accommodated (and is notintended to be accommodated) within the established fornal procedures.
(b) There is no way of ensuring that all available information is applied to any decision topromote or support a given project or expenditure activity.
(c) Whatever mechanisms are employed to identify and appraise projects in this informalprocess, they are unlikely to be either objective or transparent. Hence there can be abreakdown in accountability.
(d) It is likely that within the community a certain group will enjoy relatively greaterpatronage with a local representative, distorting local priorities.
(e) The relative claim on resources from a given community is likely to depend more on thepolitical power of the local representative than on inter-locality priorities.
(f) There will undoubtedly be instances where the true rmotivation for intervention in thebudgetary process is not to serve the local community. In fact, these informal politicalinterventions provide a ready-made vehicle for self-serving actions by politicians.
4.24 Moreover, the informal role of politicians in public expenditure decisionmakingundermines both the technical soundness of the process ancl its accountability. In order tofacilitate and accommodate local priorities within the budgetary processes, appropriatedecentralization is needed. Decentralization does not mean abdication of fiscal and policyresponsibility by provincial governments. Instead, the focus would be on establishrment of
2 This system has broken down, however, as the Public Accounts Committees (PACs) fail to meet regularly to keepthe system current. Delays of two years or more between incurring of exienditures and the PAC's taking up therelated audit reports for discussion are quite common.
58

provincial policies and provision of the requisite budgetary resources at the provincial or locallevel, with responsibility for service delivery being managed by an appropriate tier of localgovernment. With regard to education, for example, this would involve transfer of the existingapparatus (schools, establishment, etc.) and the corresponding budgetary resources for deliveryof primary education to the district level. Similar actions would also be taken with regard toother basic services (e.g. public health facilities, water and sanitation).
4.25 Transparency: Details of the provincial budget are prepared by the finance departmentand submitted to the Provincial Assembly (via the Provincial Cabinet) for approval. TheProvincial Assembly is empowered to make reductions in expenditure allocations and changes inrevenue proposals, but it does not have the authority to increase the resources devoted to thebudget.3 There is currently no procedure for updating the budget documents in accordance withchanges made by the Provincial Assembly. Seemingly to avoid having to reproduce the entirebudget documentation, the original details of the budget, as presented to the ProvincialAssembly, are retained in the final budget documents. Any changes are reflected in the relevantbudget heads and are subsequently communicated to the Accountant General's office. Thisobscures the final budget allocations from the public, which cannot easily ascertain the actual(i.e. approved) allocation for any sector or activity. Also, the Accountant General does notprepare the finance accounts in the same detail as the budget is prepared and subsequentlysubmitted to the Provincial Assembly. Finally, the classification of both revenues andexpenditures and budgetary terminology remain difficult for an ordinary person to comprehend,frequently leading to confusion and misunderstanding among the public.
4.26 The transparency of the development program is compromised by its presentation in thebudget. The ADP document focuses only on the locally financed portion of the program. Whileforeign project assistance (FPA) for each donor-assisted project (along with the name of thedonor) is supposed to be listed in the ADP document, at times this is not done. Moreover, evenwhen FPA is listed in the plan document, it is not aggregated to give a complete sectoral oraggregate picture of the provincial development program. Transparency is further eroded byincluding a number of block allocations (e.g. allocations for district development funds, priorityprogram, etc.) in the ADP, without any sectoral or program-wise breakdown.
4.27 Accountability Issues: The accountability procedures with regard to provincialgovernment expenditures are summarized below:
(a) For most expenditures, the relevant Drawing and Disbursement Officer (DDO) prepares abill and checks whether the purpose of the expenditure accords with the budget head towhich it is being charged, and whether sufficient resources are available under that head.If these criteria are met and there has been no instruction by the finance department toapply any informal "checks" on expenditure, the bill is presented to the State Bank ofPakistan (SBP), or to the National Bank of Pakistan (NBP) which uses its branch networkto act as an agent for the SBP, where payment is made.
The authority to enhance budgetary spending is not vested with the executive. The fmance department approvesincreased allocations on the basis of need, and the Provincial Assembly (as a fait accompli) approves thissupplementary expenditure along with the next year's budget. Moreover, in recent years inadequate time has beengiven to the Provincial Assembly to debate all aspects of the budget.
59

(b) All transactions for expenditures under this process (and expenditures under relatedprocedures such as Personal Ledger Accounts4 ), plus all transactions relating to receiptsfrom tax payments etc., are summarized on a daily basis by the respective branch of theNBP or SBP and forwarded to the appropriate District Accounts Officer (DAO). Thecivil accounts are compiled each month on the basis cf this information and forwarded tothe head office of the Accountant General (in principle by around the fifth of thefollowing month in the case of Sindh). The Accountant General then compiles theaccounts of all DAOs and Treasury Offices ancd forwards these to the FinanceDepartment (by the fifteenth of the following month for Sindh).
4.28 With some relatively minor caveats,5 the accountability procedures of the system appearto be sound. They are neither overly cumbersome (given the circumstances of Pakistan) nor dothey exhibit obvious flaws. Nevertheless, accountability is a very serious problem, for thefollowing reasons:
(a) There is no separation of functions between the Accountant General and Auditor General.The Accountant General's office for each province operates under the authority of theAuditor General. It is an attached department of the Federal Ministry of Finance with thestatus of a federal government agency. The Auditor General therefore has ultimateresponsibility for preparing and keeping the accounts of each of the four provinces andfor auditing the same accounts, a clear conflict of interest.
(b) The payment of wages and salaries is an accountability black hole. Payrolls ofemployees in grades 16 to 22 are computerized, but only for the metropolitan cities. Thiscomprises a relatively small percentage of total salary payments. The scope for ghostemployees and related abuses for the non-computerized component of the payroll issignificant. In the absence of recent civil service census information (and the concurrentestablishment of appropriate accountability checks',, there is also scope for ghostemployees and related abuses in the computerized component of the payroll.
(c) A penalty system exists for misdemeanors in the public service (e.g. unauthorizedexpenditures and misuse or theft of resources). A range of sanctions are applicable,
4Personal Ledger Accounts (PLAs) are opened with either SBP or NBP to facilitate regular payments for certainactivities. A block of funds is released to a PLA to cover a range of expenditures. Checks can be drawn on thisaccount by the competent officer without prior reference to the DAO, as long as adequate funds remain in theaccount. The pre-audit function of the DAO is by-passed in the interest of expediency of payments. PLAs are usedrelatively infrequently and are subject to the same process of regular post-transaction accounting as for otherexpenditures.
5 For example, in both Sindh and Punjab the DAOs and district treasuries have been combined into one office. Theexception is in Karachi and Lahore, where the respective Treasury Office continues to function separately from theDAO. This is justified with regard to its non-payment functions (e.g. issuinig of stamps etc.) but is not justified withregard to the payments function, whereby requests for expenditures have to be routed through both the respectiveTreasury Office and the DAO's office before sanction for payment is obtained. This is because the sanction forpayment that the Accountant General's office provides (in Lahore and Kamachi) is sufficient both to trigger releaseof funds from the SBP/NBP and for the process of accountability. The current arrangement was appropriate whenthe treasury acted as a payments office per se (i.e. as a treasury). Since it no longer has this function, the routing ofpayment bills through this office is superfluous and acts only to delay the processing of payments.
60
including dismissal. The procedures for exercising such sanctions, however, areinordinately cumbersome and lengthy, with the result that they are ineffective.6
(d) Although dismissal of staff through regular procedures appears to be virtuallyunachievable, anecdotal evidence suggests that informal intervention from politicians atleast in some cases can result in swift dismissal or transfer (and also in appointmentswhich circumvent procedures) - with adverse implications for accountability and morale.
(e) Recruitment into the provincial civil services frequently has been politicized and notmerit based. Promotions have tended to be seniority-based, with only limited relationshipto performance. The system of Annual Confidential Reports (ACRs) is a mechanical,nonparticipatory process of performance evaluation, with considerable scope for bias.
(f) Procedures for recruitment under contract (e.g. advertising, appointment by merit, etc.)have often been by-passed, with decisions subject to political influence.
(g) The lack of computerization of the accounts system makes the accounting process subjectto considerable error given the sheer volume of data that has to be contended with (e.g.only eight of the 34 DAOs in Punjab have computers).
RECOMMENDATIONS FOR BUDGETARY REFORM
4.29 The discussion and analysis in this chapter amply demonstrates that the provincialbudgetary process is out of tune with modem-day realities and is marred by a host of problems.In view of the fiscal problems faced by the provincial governments, there is an urgent need forreforms. Archaic and irrelevant budgetary processes need to be done away with, and a Medium-Term Budget Framework (MTBF) type of approach to provincial planning and budgeting shouldbe instituted. Such an approach would be based on multi-year projection of resource availabilityand an outcome-oriented program approach to expenditure allocations, and its specific featuresshould be suitably designed to fit the situation in Pakistan. (A description of a standard MTBF isgiven in Annex F.) Punjab has already made a start in this direction by initiating some sensiblebudgetary reforms (see Box 4.3). However, the success of these reforms will depend not only onthe govermnent's efforts to tackle and remove various impediments (see below) which are likelyto thwart any reform effort, but also on the strength of political will for real change and theleadership's efforts to this end. There is also a need to coordinate reform efforts by the provinceswith similar reforms by the federal government. And the budgetary practices of the localgovernments emerging from the devolution process need to be put on a sound footing.
6 In contrast to the lack of timeliness of such sanctions, staff can be transferred to different departments and differentareas of the country at relatively short notice. Transfers are regarded informally within the public service as aneffective power of sanction, although this method is not used officially for this purpose. Instead, it increases thescope for breakdowns in accountability by virtue of the power that the authority to transfer bestows.
61

The PNj~ab govrmn scnieiganme t ugtr1ri esrsitouigpormbsdbudgetin and output-bae ugtn.Terfr praht aehsbe oehtpeeel novn dhoc ~additions to the regua ugtismtest iedprmnsrte hnawoeaerassmnprocesses proceue,adititonlageets
reanange Itheirbuetso
oetIvs ofthe dOvt ealmevt npriua,ti ugtrsitmn a iln~ o
an
* t cfuttbren puspose of iaVh deparment
theisl aoll exsigln tw obe mape o h nwfucosF peritpyal pR formancet emaue
Tb 191/M43 bune forderc tonction the bew appfrchtd ito buagetin g ~and 3uli eo~a expndtremnaeen
mesne tho suporocsso adin suppl eadrment whaMBs e istortcted t mo~easr esicue) Initheactingcvity srevanc? ednand esne aaeen eo?Ti oudicue mn
tber tins, thefollowui ix o inpsutes?ubseouentily ioenmn empil ov9 meafu t sherc n touldb reduced throughattiin,enthich require to
zeo-naidnudeing" o uvprtll byn examplesh rerim rents, coupld itehl very eective restruitme ntline
seancioning tof acoryteqirebdg psubtssions th t e bai fgvmet pioritiesad h mmdaeged
*o th rotie ias e departments
4 an A paoryater n rnapthe nd approred c to budeti ng reewansod m becopnducturedo manage calnudictsi, the pential governmentnis ien t t departa nmers utosh anluds bdiesgub
i) Abnifihing creundnt sevaceand porsitonnesaaetn.efr:Ti oldicue mn
eerisrin seos cad e dead-cadrses " ptsiT tosethv t are fld btafonneeds. The evier the ultmeante wl va cantiu p tshou be aidheremb slrymtheprvin
santrdctionin of aefuntoa(ired anst outu)n nnint the bassdgoernet prsioriatiesnd sythem. ismeiate needst
this wdoultd becnitnt wihapter1 and ,ounctiongerban reviws sould bhe onduct for allproveinciaol
orgbnicecoaettiona (clasiiain uitymdifigoed. etdprmnt,atnmu bde,pbi*Tenetabrishen,tc. tof asss thforobecastivoel, ~broinal vnes, and expenditurees. Ths reiewsshulde
Th 199200bugt f h Pnjbgo met are afis se*i tisdreti2

fully incorporate the implications of devolution. Based on these reviews, phasedrestructuring of staffing and expenditures should be initiated.
* In the light of these functional reviews and a much needed baseline survey (or census) ofprovincial civil servants, the provinces need to develop a vision of the future size, structure,roles, incentives and management of the provincial civil service, taking fully into account thepotentially profound implications of devolution. Concrete steps can be taken with respect toindividual agencies (e.g. tax administration, police, autonomous bodies, etc.) in line with thereform vision.
* Induct highly skilled professionals into the civil service (preferably on contract basis) byimproving the incentives structure.
ii) Implementing budgetary reforms: These may require:* Removing the distinction between "permanent", "continuing" and "new" expenditures and
the differing approach to the preparation of budgets for each type of expenditure.* Moving toward integrated budgeting of recurrent and development expenditures.* Establishing a reliable mechanism in the provincial governments for the projection of
revenues (and expenditures) over the medium term. This will require training and capacity-building in the provincial finance departments to build the economic skills and tools requiredto carry out this work effectively. It will also require a change in the institutionalarrangements between the Federal Government and the provincial governments with regardto cooperation and sharing of policy and technical information (e.g. timely information onCBR collections; timely information on policy changes; and the anticipated revenue andexpenditure impact of these changes.)
* Taking measures to reduce the disconnect between the recurrent and development budgets byusing information contained in projects' PC-1 forms at inception to determine whether therecurrent budget can support the project.
* Ensuring that O&M requirements are adequately covered. This may be achieved partly byensuring that yardsticks for determination of unit costs are appropriately designed andregularly updated.
* Changing the procedures for budgeting and billing and payment for utilities in a mannerwhich promotes efficient use of resources. This implies, in particular, metering of electricityconsumption by all provincial facilities as soon as possible and doing away with at-sourcedeductions for utility payments. Blanket authority should be given to public utilities todisconnect all defaulting public facilities (except emergency services, which should be welldefined). In addition, the dispute over the WAPDA payments issue needs to be resolved in atimely and fair manner.
iii) Strengthening expenditure management and monitoring:* Establishing and enforcing a system of requiring a-priori legislative (or at least Cabinet)
approvals for supplementary grants.* Effectively separating the auditing and accounts functions of the Pakistan Audit Department.* Making Principal Accounting Officers (PAOs) of provincial line departments responsible for
timely delivery of monthly financial, information to the accounts offices or treasuries; andfull and timely reconciliation of DDOs accounts with those complied by the DAOs orTreasury Officers.
63

* Reactivating the pre-1987 requirement of sharing with the DAO the monthly information onbank balances and transfers of funds which the district branches of NBP convey to theirheadquarters in Karachi.
* Limiting the use of PLAs to only a few special cases.* Improving the accounting procedures for donor reimbursements.* Ensuring that provincial line departments give due importance to the review and early
settlement of audit observations made by the departmental audits.* Improving the present mid-year review process so as to make allocations more consistent
with changes in priorities and to make expenditure mDre productive by reallocating fundsfrom slow-moving and low-return to more productive arid high-priority activities.
iv) Enhancing the transparency of the budget and budgetary processes and procedures:* Better dissemination of relevant information to and increased involvement of line
departments in the budgetary process; and increasing the accessibility of budgetaryinformation to civil society by providing more understandable budget overviews (e.g.improved White Papers) and by making all budget documents available to the citizens (atcost price).
* Expenditure financed from foreign project assistance should be explicitly incorporated intothe provincial development programs to present an integrated development budget.
- The non-budgetary programs of provincial autonomous bodies should be presented either aspart of integrated provincial development programs or as separate section of the developmentbudget.
4.31 Options for further developing and improving the NTEBF over the medium term include:i) Adapting the MTBF to incorporate a program approach to expenditure allocation for each
sector by eliminating the artificial distinction between budgeting development and non-development expenditures.
ii) Extending the MTBF approach to the local governments (perhaps in simplified form) toencourage a programmatic, results-oriented approach to budgeting and financialmanagement.
iii) Developing and implementing more comprehensive civil service reforms.iv) Preparing appropriate and affordable severance packages to reduce redundant employment in
ciVil service.v) Ensuring quick and effective disposal of provincial audit reports by the provincial Public
Accounts Committees.vi) Implementing the improved system of financial reporting and audited through the PIFRA
project.
64

CHAPTER 5. STRENGTHENING LOCAL GOVERNMENT FINANCES
5.1 As noted earlier in this report, the delivery of local public services in Pakistan has beenadversely affected by progressive centralization during the past several decades. As they lostcontrol over key services such as elementary education, urban water supply, and landdevelopment, as well as corresponding fiscal resources, local governments have atrophied.Lacking Constitutional protection, their existence and functioning have become entirelydependent on provincial decisions. In recent years, political local governments have been inabeyance (i.e. dissolved by provincial decrees), and their administrations have been supervisedby the provincial governments. These trends have contributed to the reduced effectiveness ofPakistan's public sector. The large distance (geographical and hierarchical) betweenbeneficiaries of local public services and the management and funding of such services hasdrastically weakened the incentives and accountability of service providers and decisionmakers.The result is absenteeism, underutilization of public sector service facilities, deterioration ofinfrastructure, inappropriate mix of inputs (e.g. wage versus non-wage), corruption, poor qualityof services, and exit by much of the population to private sector providers.
5.2 The present government publicly highlighted the issue of overcentralization as soon as itcame into power and stressed that devolution would be one of the cornerstones of its reformprogram. A detailed devolution proposal, prepared by the National Reconstruction Bureau(NRB), was made available to the public in May 20C0. The devolution plan clearly specifiesthe multi-level political structure and election processes. The administrative structure also isspelled out. Perhaps most important, the plan explicitly takes into account the need for checksand balances, effective accountability mechanisms, and citizen/community/beneficiaryparticipation to make local government work. In certain other areas, the devolution plan has notyet been specified in concrete terms. These include most notably (1) the fiscal transfermechanisms between provincial and local governments; (2) local governments' revenue base;(3) the implications of devolution for provincial administrative structures and staffing; and (4)details of local government functional responsibilities for social and economic services.
5.3 By bringing decisionmaking, management, and financing related to local public servicesmuch closer to beneficiaries, devolution carries great potential for better service delivery andaccountability. There are also risks, however. If the devolution plan is not soundly designedand effectively carried out, it could lead at one extreme to continuing centralizeddecisionmaking, with additional costs and duplication of functions at the local level. At anotherextreme, inadequate or ineffective checks and balances and lack of popular participation couldopen the way for capture of local governments by entrenched elites. There could also beinterruptions in service delivery (even in relation to current low levels and quality), andcontinuing failure to make progress toward national objectives for poverty reduction, improvingsocial indicators, etc. These risks highlight the need to make devolution work well.
65

BACKGROUND AND EXISTING SITUATION
5.4 Legal Basis and Structure. The Constitution of Pakistan does not fully recognize localgovernments as a separate tier of government with their own powers and functions. They areessentially viewed as extensions of the provincial governments, having been created byprovincial legislation, through which some functions have been delegated to them. Thisinstitutional arrangement has not only affected the evolution of local governments in Pakistanbut has also influenced the fiscal structure and related distribution of authority for revenuemobilization and expenditure obligations among different levels of government. As a result ofcentralization, the provinces have to shoulder a heavy responsibility for delivering local publicservices to a large population through provincial departments. Consequently, many provincialdepartments have grown to a size that is substantially larger than optimal from the perspectiveof efficient and effective management.
5.5 The existing legislation governing the organizational structure, management and fiscalpowers of local bodies (LBs) is contained in the LocaL Government Ordinances (LGOs)promulgated by the provincial legislatures. These laws divide LBs into two broad categories,rural and urban, based on their geographical location. The councils in rural areas have beenfurther subdivided into Union and District councils (whose areas of operations are based onexisting administrative boundaries determined by land revernue records), whereas those in urbanareas are differentiated and classified according to the population of the area under theirjurisdiction. The LGOs identify the regulatory and service delivery functions of the LBs in twoseparate lists. The first contains compulsory functions which the local councils are expected toperform, while the second includes functions which these agencies may or may not perform. 1
5.6 The local government structure, especially in urban areas, has been fragmented andcomplicated by the existence of a number of specialized provincial government agencies, whichare responsible for various local functions. The most notable examples are the urbanDevelopment Authorities (DAs) and Water Supply anc, Sanitation Agencies (WASAs).Moreover, Commissioner and Deputy Commissioners, the key administrative officers at thelocal level, are federal government employees reporting to the provincial government. Thispattern has resulted in a high degree of de facto centralization even when local governments arenot dissolved. Still another factor which adversely affected the development of localgovernments has been the extensive involvement of elected representatives of the federal andprovincial assemblies in local decision-making on develcpment schemes, recruitment andtransfers, site selection. Table 5.1 provides a typical division of functional responsibilitiesbetween local and provincial governments.
5.7 While in principle the LGOs specify a large number of areas where LBs can exerciseautonomy, in practice local councils are controlled by the provincial (and federal) governmentsthrough various mechanisms. The regulatory instruments available to the provincialgovernment include approval of projects,2 budgets and taxation proposals of LBs, and
' These latter functions are either performed by local govemments or tby provincial governments, or jointly byboth.2 Each local council is required to forward its approved Annual Works Program to the respective provincialgovemment.
66

appointment or transfer of their key personnel. In addition, there are legislative provisionsranging from supervision and inspection of the LBs to their outright dissolution by theprovincial governments (a frequent occurrence). In the rural areas, administrative control overLBs is still vested with the district bureaucracy. This is partly because the administrativemachinery of local governments does not report to a political authority at the local level, andchecks and balances instead of being internal to local governments are being exercised throughthe provincial bureaucracy (at district level). Moreover, local councils are required to complywith lengthy and cumbersome consultative mechanisms before they can revise tax rates.
Table 5.1: Actual Allocation of Functions Between Local Councils,Specialized Agencies and Provincial Line Departments
. W........... ........ ............... . ........ ........ .............. ........... ...... .................... .. ...... . .. -. ... . ................. - .. . ... .. . .............. . .. . .... ..... ........ .. . .............. .... .. .. ... ...... . . .. . . . . . . .... .. .. . . .. .... . . .... .... . . ......Key to acronyms used
.CWD = Communications and Works Department LGRDD = Local Government and Rural Development Department
.ED Education Department PHED = Public Health Engineering DepartmentHD Health Department PPHD = Physical Planning and Housing DepartmentLC - Local Council SA Specialized Agency (Development Authority/WASA etc.)............................ .............. .............. ..................................... ...... . .. ..... ........ ... ............... .-..-.-. .-..............- . ................ ... .........-....t...
Large Intermediate Small Rurial,Service Function Cities Cities Towns AreasWater Supply and Sewerage Development SA PHED/LC PHED PHED/LGRDD
Maintenance SA LC LC PHED/LGRDD/LC
Drainage Development SA/LC PHED/LC PHED/LC PHED/LCMaintenance LC LC LC PHED/LC
Roads Development LC/SA LC LC CWD/LCMaintenance LC LC LC CWD/LC
Garbage Collection Development LC LC LCMaintenance LC LC LC
Primary Education Development ED/LC ED ED EDMaintenance ED/LC ED ED ED
Curative Health (Incl. Veterinary) Development HD/LC HD HD HDMaintenance HD/LC HD HD HD
Preventive Health Development LC LC HD/LC HD/LCMaintenance LC LC HD/LC HD/LC
Street Lighting Development LC LC LCMaintenance LC LC LC
Fire Fighting Development LC LC
Maintenance LC LC
Parks and Playgrounds Development LC/SA LC
Maintenance LC/SA LC
Libraries Development LC
Maintenance LC
Land Development Development SA PPHD
Maintenance LC LC
Source: Based on information contained in the World Bank report "Supporting Fiscal Decentralization inPakistan"
67
5.8 Administrative authority in rural areas is heavily concentrated at the District Council(DC) level, while the lower-tier Union Councils (UC) have very limited responsibilities.Because of their size (on average a district contains about 900,000 persons, in Punjab 1.3million),3 the DCs are very large from the perspective of carrying out many local functions. Infact, the DCs are of a size comparable to that of regional governments in a number of countries.As such, they may be better suited for planning and coorcination functions than for delivery ofmany grass-roots services. The size of Union Councils (averaging about 16,000 persons), on theother hand, compares more favourably with that of local governments in many other countries.
5.9 Local Government Finances. Local governments in Pakistan until recently havebeen funding most of their expenditures from their own resources. There is considerablevariation in financial strength across LBs, however, with Urban Local bodies (ULBs), or localcouncils sharing borders with large urban centers, having sizeable financial surpluses in somecases. There are serious doubts about the financial viability of the rest of the local councils.In aggregate, the surpluses of local councils have been relatively small and have declined overtime from around 3-5% of their expenditures in the mid-1980s to around 1% in the first halfof the 1990s. Even the nominal surpluses declared by some local bodies exist largely onpaper, as local government budgets do not reflect their payment arrears on various dues anddeferred liabilities like pension obligations. Local governments are running large arrears withutility service providers, especially WAPDA, and in the case of local councils in Punjab, thereare also some arrears on their debt servicing obligations.4 Moreover, while preserving theiraccess to local revenues until recently, local bodies have lost many of their service provisionresponsibilities, which have been taken over by the provincial governments. Even in themajor urban centers, where institutional capacity exists at the local government level, manyservices are now provided by the provincial governmenits or their agencies (e.g. KWSB,WASA, KDA, etc.). This has led to unclear demarcation of responsibilities among differentlevels of governnent, poor coordination between different agencies providing public services,and considerable overlapping of functions between the provincial and local governments,resulting in inefficient allocation and use of resources.
5.10 Local Revenues. Until recently, revenue collection by local governments exceededthat of the provincial governments. Their contribution to aggregate (national) revenues hasbeen in excess of 6%, compared with around 5% by provincial governments. Localgovernments have received grants-in-aid from the provincial governments, but in the pastthese comprised only a minor component of LBs' revenue receipts.5
5.11 Local governments have been heavily dependent on one or two taxes, principally octroi- a local tax on inward transportation of goods - and loczl export tax mainly on agricultural
3 These are very large populations under one local government by zny standards especially when the unioncouncils have minimal or negligible responsibilities. In western Canada, rural districts typically serve only 20,000people.According to figures compiled for Punjab, local councils have a total outstanding debt of about Rs 300 million
to the provincial government, most of which is in default.5 In Punjab, these grants constituted around 1% of the total receipts of urban local councils and 4% in the case ofDistrict Councils during the first half of the 1980s, 3-5% and 10% respectively during the latter half of the1980s, and 2% and 3% respectively thereafter. According to the LGRRD in Sindh, no development grants orloans had been extended to local councils during the previous six or seven years.
68
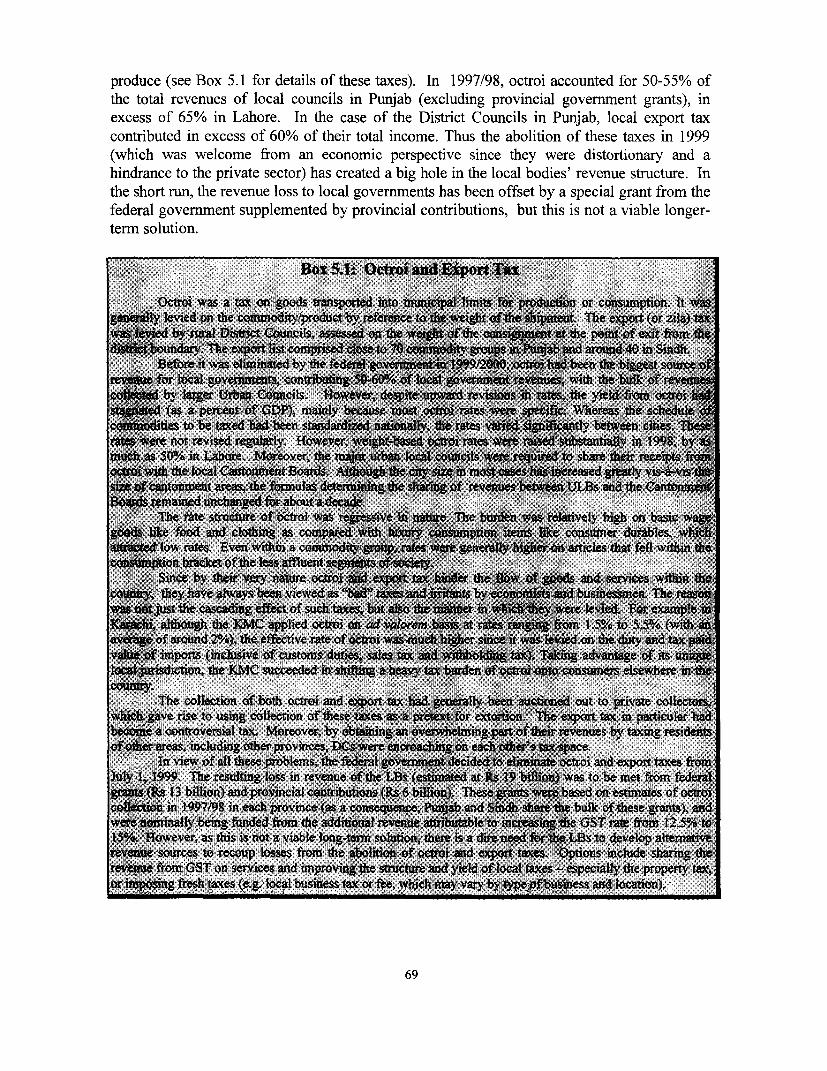
produce (see Box 5.1 for details of these taxes). In 1997/98, octroi accounted for 50-55% ofthe total revenues of local councils in Punjab (excluding provincial government grants), inexcess of 65% in Lahore. In the case of the District Councils in Punjab, local export taxcontributed in excess of 60% of their total income. Thus the abolition of these taxes in 1999(which was welcome from an economic perspective since they were distortionary and ahindrance to the private sector) has created a big hole in the local bodies' revenue structure. Inthe short run, the revenue loss to local governments has been offset by a special grant from thefederal government supplemented by provincial contributions, but this is not a viable longer-term solution.
Box 5.1 -wd A-- .. . . .x- ..-
Octroi was a tax on good trasported into - limits `for or cnddption. It avastly. levd on th commoditylproductJ by, rit fht. The exprt (or zila) MW
dbyrrallisrls on4i we of te e V i Pto fekitfomAO*export compis arm g. ro as 40 indSih '
. .. '-,"twas; w, ed by .,fedralgJbr WV,local gvr t con % j=*by l .gerUrban Concils. Howex t de in rate. mthe yield ooctn( 3as; a percent of ObIP), mainly b~use mo* oefroz xates w0 Wheres ffie s
ties to be ta6ed had been standardi~ed~ th~rtesybeweeni- =i 3
raes were not revised reguhaty. However, or- rates *,e ustiy in Xnt3as 50% in Labore. Wowver, the % u1061i wer* 0aP share Aes
si~ cantonmentareas,, thefrnulas ddW Aiesauo evebtUBstdhCn:VMama ed.3 fdi.3about a. d: "
The rate structumeof 6ctroi was 'Psvin Te r jwas reltivel h o bscgoe lilke fod and ascs lothings coSinsumr es, i
low rate. Even wihn a bwativel fell witgn tic
Since by their very nature otro.i, ekt l Of and svcitm i tkl4COt1~% --they have always been viewecs "*lcii 4 by,a- ae we> ut the cacdn ffc of sc axebtalso in i *re levie 1'orexaip4Kar- hi, although the IMC applied octroi on( ad vak*~em ~b~sat i WOon the to =d (with an
avpo aon % ), the effective rateofotri was mnuch. er su1ce it w ieid on the ut andta iiximports (inhisve o custom duti sale t- da- its n4
the KMC succeeded ir shing a heavyt. Ybuden f m ct *r coners elsewhee in *Fcou1Xry
The collection of both octroi and eprt tax hadwl Wan auctioned oUt to private collectoMrwhicl gave rise to using colleeion of these xes as a pretext r exorio n lie 6port tax in particular ba7
a controversial ta-. Moreover, by tng aivoVerwhelmin pofiIe nues yt residentsof'oth-t areas, inchlding other provinces,)cs won e4ih ax e.
In view of all theseprobems, tie fe&ial gove m"Itciledfto iminateo6troi and export taxes fr o .1The resulti lss in reventu ihe ed ( at Rs 19 bllto bw met form fedea
1.S s 3 bilfion) and provincial contributimon ( 6 bi t. These ra based on estimates of octroiinwech province (as a onue, Pu and Sh&d shate the bulk of ese grants), and.
w- nominally being funded from the Addi-ral reeto it GSTe om 12.5% to'I% However, as this is not a viable long-tern solbtio theri a dire need frthe LBs to develop altenative
sources to recoup losses from e abolition Of octoli and export taxvs. Options inchde sharing the3reveu from GST on seves and ifprovig the srte a6 yield oal t - espeily the property t
.poe fries taxes (e. locl busiess tax or whih Ma vary by y a cai.. . .- .3 . S.3..... ;4;.193 ... ; : '" t':-'6
69
5.12 Other main contributors to LBs' revenues include taxes on physical assets andtransactions in real estate. The Urban Immovable Preperty Tax (UIPT) remains the mostunder-utilized local government tax. At present the tax is levied and collected by theprovincial governments, which then pass on 85% of the revenue to the local governments.The UIPT presently contributes barely 3%-5% of the total revenue of local governments,while for metropolitan and municipal corporations in Punjab the share is a mere 2%. (Fordetails on the structure and weaknesses of the property tax, see Annex G.) With the abolitionof octroi and export taxes, UIPT is the only local tax having the potential to be a majorsource of revenue for the local governments. In order to strengthen their revenue base, the taxshould be fully devolved to the local governments in a phased manned, starting with largerurban municipalities. The Punjab government has alreacly made a good start in this directionby devolving the tax in two localities to the local governments.
5.13 The bulk of the receipts of UCs is derived from revenue transfers from DistrictCouncils (DC). Twenty per cent of the local rate,6 which comprises 8%-10% of the revenueof DCs, is distributed among Union Councils within the jurisdiction of each respective DC.Fifty per cent of this amount is distributed on the basis of population and the balance isdivided equally among all UCs.
5.14 Although local governments have limited fiscal powers, even those granted to themunder the LGOs have not been fully exploited. A combination of limited fiscal effort andheavy dependence on taxes with specific rates has led to stagnation or decline in localgovernment revenues as a ratio to GDP. The wide array of taxes of LBs has added to thecomplexity of the tax structure while pushing up collection costs. Moreover, although yieldsfrom existing taxes can be increased through base expan1sion and better tax administration,weak implementation capacity prevents local govornments from achieving majorimprovements in these areas. Furthermore, not enough effort has gone into resourcemobilization through exploitation of user charges for locally provided services.
5.15 There is also the issue that higher levels of government have encroached on the fiscalpowers of lower levels, pre-empting the productive and buoyant revenue-generating taxes thatshould, in principle, be levied by lower levels of government. The professional callings andentertainment taxes and the motor vehicle tax are notable examples of potentially good localtax sources pre-empted by the provincial governments. These taxes fall within the fiscaldomain of both levels of government but are monopolized by the provincial governments.Quite a few municipal corporations also collect some taxes on behalf of the provincialgovernments, such as education cess, which is levied at the rate of 5% on octroi collections.However, these receipts are not shared with the respective local councils, which also manageschools.
5.16 Local Expenditures. The share of local governments in total expenditures by alllevels of government has fluctuated around a low level of 4%. General administration absorbs8-22% of the total expenditure of urban local councils in Punjab. Education spending takes up10-19%, sanitation 15-19% (in excess of 30% in the Metropolitan Corporation Lahore), waterand drainage 15-20%, and roads and street lights 15-25%.
6A tax irnposed on land under cultivation, it is pitched at a rather low rate, especially in Sindh.
70
5.17 Like the provincial governments, local governments also suffer from overstaffing, butapparently to a smaller extent. The share of wages in total expenditures is about 45-50% formetropolitan corporations, whereas the corresponding figure is 60% in the rest of the localcouncils in Sindh (and only marginally lower in Punjab). These proportions comparefavorably with the 70% share of salaries in the non-interest current expenditures of provincialgovernments. Nevertheless, local governments too have limited flexibility in managing theirexpenditures. Urban Local Bodies, in particular, are hostage to their oversizedestablishments, which are likely to constitute an obstacle to efforts to improve budgetarymanagement practices and procedures. As in the case of the provincial governments,structural rigidities associated with the wage bill and related payments (like pensionliabilities) leave inadequate resources for other critical operational expenditures, creating animbalance between wage and non-wage inputs and compromising the effectiveness of localexpenditures.
5.18 Unlike the ULBs, which are required to provide primary education services, water,and sewerage and solid waste disposal facilities, the DCs are essentially focused onconstruction and maintenance of farm-to-market link roads, veterinary hospitals, civildispensaries, and in some places water supply schemes. Hence DCs have much smallerestablishments, with salaries absorbing only 20%-25% of their total expenditure. As aconsequence, the fiscal health of rural local governments is considerably better, and some ofthe rural DCs generate revenue surpluses.
5.19 There is also a structural disconnect between allocations for capital expenditure andO&M in the budgets of local governments. The recurrent expenditure implications of localdevelopment programs are not appropriately factored into the expenditure projections of localgovernments for subsequent years. The artificial distinction between "development" and"non-development" spending has contributed to the deterioration in the productivity andeffectiveness of expenditures by distorting their composition. Part of the problem stems fromthe political and administrative culture that is strongly biased in favor of "development" andglorifies capital programs, creating, assets whose O&M is not affordable. This problem iscommon to all levels of government.
5.20 The Case for Devolution. As demonstrated in earlier discussion, the presentoperational structure of government in Pakistan is substantially more centralized than wasenvisaged by the Constitution and the LGOs. It is also obvious that the political andadministrative machineries of the federal and provincial governments have failed to deliverpublic services of desired quality, especially at the grass-roots level. A major factor behindthis failure is that excessive distance from the beneficiaries has contributed to a situationwhere the provision of services is significantly at variance with local and community needs.Devolution could therefore increase efficiency in the provision of services through costreductions and/or enhancements in the quality of service. This is particularly true in the caseof services which are not characterized by significant economies of scale, and the coverage ofwhich is essentially limited to small jurisdictions. Improved efficiency at the local level mayresult from the greater ability of LBs to organize inputs from beneficiaries in cash or in kindof labor, land and materials through community involvement at all stages of project execution
71

and management. The stronger accountability and better access to information implicit inlocal management may also improve the quality of service provision. However, theseefficiency gains depend critically on the administrative capacity of LBs. While capacityurgently needs to be strengthened, in any case functions and services which are based onrelatively simple technology, are labor-intensive, and serve relatively small jurisdictions canand should be handed over to LBs in the immediate future, concurrently with capacitybuilding efforts. Based on broad principles (and inte:rnational experience) of assigningfunctional responsibilities to different levels of governments, recommendations can be madeon functions which could be devolved to the local governmnents in short- and medium-run. Acomparison of these recommendations with the legislative and actual assignment of functionalresponsibilities of various tiers of governments is shown in Table 5.2.7
5.21 It is also important to formalize the status of the local governments as an effectivethird tier of the government by providing them with some kind of constitutional cover throughnecessary amendments in the Constitution.8 In this regard, Pakistan can learn a great dealfrom the Indian experience, which made constitutional amendments in 1992 in this regard(see Box 5.2). However, as is evident from the case of Iridia, giving Constitutional cover tothe local governments is only a necessary (and not a sufficient) condition for making them aneffective arm of the government. Wholesale reforms in local governments, capacity building,adjustments in the provincial governments' roles and functions, and more generally greaterparticipation and monitoring by civil society are required to make the vision of effective localgovernments with improved service delivery a reality.
TOWARD EFFECTIVE, ACCOUNTABLE LOCAL GOVERNMENT: THE NEWDEVOLUTION PLAN
5.22 On March 23, 2000, the federal government announced a bold devolution plan, whichis intended to create a system of inter-related local governments at the district (zila), sub-district (tehsil) and union levels. A more detailed version of the plan was presented in Mayfor public debate, and the final plan was presented in August. The devolution plan presents agreat opportunity for decentralizing the government structure and service management,enhancing the efficiency and effectiveness of key public services by bringing theirmanagement closer to the people, creating potential for much greater beneficiary participationand monitoring, and improving responsiveness to needs and strengthening accountability tothe public. A summary of the main features of the devolution plan is given below.
7 For a detailed breakdown of which functions should be devolved to different local governments, seeStrengthening Fiscal Decentralization, World Bank report No. 15092, 1996.' While local governments in Pakistan and India evolved more or less from the same background, India has madeamendments in the Constitution to protect local governments, while in Pakistan the LBs continue to have anuncertain existence, dependent entirely on the discretion of provincial governments.
72

Table 5.2: Local Government Responsibilities by Level of Government in Pakistan: Legislative, Actual and Suggested.Metropolitan/Municipal Union Council\
Provincial Government Corporation Municipal Committee Towvn Committee District Govemmenit Village Council
Legislative Actual Suggested Legislative Actual Suggested Legislative Actual Suggested Legislative Actual Suggested Legislative Actual Suggested Legislative Actual SuggestedFire Fighting - - D, M D, M D, M D, M D, M D,M D,M M Dm,Ms _
PrimaryEducation D,M DM D, M D,M M Dm, Ms D,M D'*,M* Dm,Ms D,M - Dm,MGarmage Collection U _ , D, M D, M D,M D,M D, M D,M D,M D,M D, M D,M - Dm,Ms D,MM _ DlMP'arks &Playgrounds - D , M D - , M Ds, M s D, M D,M D,M D,M D,M D, M DIM D, M D, M Dl M M
Street Lighting : D M D, M D,M D,M D,M D,M D,M Ds,Ms D,M Dl, Ml
Traffic Control DD, M M D *,M D,M Dm,Mm D,MM D m , Mm D, M _
Libraries _ D, M D, M D, M D, M D, M D, M D, M _ Ds,Ms D,M _
Veterinary Medicine D', M' - _ D, M D, M' Ds, Ms
Preventive Health D', M' D, M D, MM DM D,M DM m D,M Dm,Ms D,M Dm,Ms D,M Dm, MmLand Development\2 - D D,M M Dm, Ms D, M Dm, Mm D, M _ Dm, Mm - . _ _
Link & Farn to Market Roads D,M D, M D' Dm,Ms D, M D, M D, M D,EM D', M' Dm, Ms D, M D,M' DlMm D,-M -Dl, MWater Supply & Sanitation D, M D,M Dm, Ms D, M M Dm, M D,M M Dm, M D-M M* DI, Ms D, M DlMlHealth Centers & Dispensaries\2 D, M D,M D', M' Dm,Ms D, M Dm,Ms D,M ]Dl,Mm D,M D',M' DI, Mm D, M - DI,M Secondary Education \2 _ D-,M D¶, M ' M -, Dsn, MMm D, M _ m,Msn D,M DMm MUrban Transport\2 D, M D', M* D,M Dm, Mm
Police Protection D', M D,M D*, -M* D'm,Mm D*, M' D*m, M'm Dm, M* D' M'
\1 The function may be left to the private sector in larger municipalities.\2 Participation of private sector should be encouraged.0= Full Responsibility for Development.D*= Partial Responsibility for Development.M = Full Responsibility for Maintenance.M* = Partial Responsibility for Maintenance.Ds = Assuming Development Responsibility in the Short-Run (next three years).Dm = Assuming Development Responsibility in the Medium-Run (next three to eight years).Dl = Assuming Development Responsibility in the Long-Run (next eight to fifteen years).Ms = Assuming Maintenance Responsibility in the Short-Run (next three years).Mm = Assuming Maintenance Responsibility in the Medium-Run (next three to eight years).Ml = Assuming Maintenance Responsibility in the Long-Run (next eight to fifteen years).
73

Box :T Indi"Pl t ytSt;m
In 1992 India took a major step to set lc govermn p g Consi Sbo ral local governme ic tati ye iean t
0t;0 00;0The mandatory rviins of tes medmns werenccroae<in EeSttelee Panhyalt aMunicipal legislationsT amended Sta lvelasidor the tbs nf athe-rPaRfLe.' local government s at t iadis e f mral setmnts a
v e FfideVU>p_iei.
T nde of muiciJpalitisforurbnsret0tleme intseendrihien poUtit6fpong fucios t eco3ic ase t4Mi-eevr hs mnment s also la*r< y don thet psroeucaregs ftlfoal e dio's; ioling h stablishmel:n:tXf
Sta>erleton Commission, Scon stitu fnnc ans dt inentirict aComttees (OPCsan Metropolitanor suPlnning Committe (Ps)
1s f)[ ̂n:y~doe nt_do a
n simpotanti s povisinin the amndeCtitution is thai evtiy t hmat ando eaveryaMnicisolle of avyeas; ii eiir4 sins tibhelith
iuoilnths TeCostittion mae asecfc rvii o threree nt4 in fwneadotr dt0isavnt
bg o rder torimpart greate p atioloaf sctions oofw lo unities which have been outideategor andet dsretionincestu Panchayats o al deerinig their ttrelao0,
Ckeep tiong ffor lon pros as wa s the c searer asbndthone ayoreX"ing the Constiti of dteciic exp; ditrectaesonsties or I
powerdistributP n hy aMn lt C in tsScdSede of thee litprsceeds#ParxcliayataMipalities titxesc ow1er athori,ty as iti, a cne necessary too enabl thfn c deteiniitutions or aog e d on n ited by,pfor
de nchaytonopwes tod MunichayatsanMuipite.T&ontttotusm ansherrgtvef
States in respcofaideto ter P hefunayatsiand aiicipedinespnesi sof of the ::t San ni;duti0es, othol and ees a hould ib prai ed taieand t S an
bo Despite the cognisznthDat cover- dlopmen relatin in te d cunt r veben mark p4sm w eak ness es. aefedtobing a stamitesyto th relations,te
rCosi tonstitug anp infioritesimal g up of ahFinaneC snevery Se, g orh paosnepr wnof their recurrentexpendioture. Panchgespand Municiplt ,an aking reommnatrions1a teovemmentsr revenue, Sare a nd-hoe, dischetson at e nd icipalities o th ne poeeds oadtotration of local tanes is unsat he and- I to e relo thedetms whiahare sfill &the thes, ds, tol an fres whc may be asn to or approriatd by
*j::. theX,0. grants-in:aid to the a y ad Ms fm th o so e n of te S* nyotermasretht oldimroeth fnace f hePacaytsan Mncialtis

5.23 To promote a sense of participation in governance and local decision making withinthe general population, village councils and citizen community boards will also beconstituted.
5.24 Planned structure of the new local governments. Figure 5.1 illustrates the proposedlocal government structure under the devolution plan. The cornerstone of the localgovernment structure is the district (zila) government, which will comprise a mayor (zilanazim),9 who will be the executive head of the district, a deputy mayor (naib zila nazim),who would also be the speaker of the zila council (or district parliament), a zila council andthe district administration.
5.25 Directly elected nazims of all union councils in a district (see below) will be membersof the zila council. The number of general seats in the zila council will therefore varydepending on the number of unions in the district. In addition to the general seats, the zilacouncil will have 33% seats reserved for women, 5% for workers and peasants, and 5% forminorities.10 These reserved seats will be filled through indirect elections, with the unioncouncilors of the district serving as the electoral college. Similarly, the union councilors ofthe district will elect the zila nazim and naib zila nazim (as joint candidates)." 1
5.26 The zila council will be authorized to levy taxes according to the list of district taxesto be given in the Local Government Ordinance 2000 (not yet promulgated); raise or lowerexisting taxes and make by-laws, rules and procedures applicable to local governments. Theprovincial assembly, however, will have the power to set aside a resolution of the zila council(or an order of the zila nazim) by a simple majority.12 The zila council will also approvedistrict annual development plans and budgets presented by the district administration andmonitor the district administration through a system of specialized committees.
5.27 The district administration will be coordinated by a District Coordination Officer(DCO), while the District Police Officer (DPO) would be responsible for law enforcement atthe district level. Both of these officers will appointed by the provincial government.However, the zila nazim can ask for transfer of a DCO and/or a DPO, with which theprovincial chief secretary has to comply within a week. The rest of the district administrationwill consist of a maximum of eleven groups of district offices (each headed by an ExecutiveDistrict Officer (EDO)), to undertake functions related to: (i) Finance and Planning; (ii) CivilWorks and Services; (iii) Agriculture; (iv) Health; (v) Education; (vi) Literacy; (vii)Community Development; (viii) Information Technology; (ix) Revenue and Taxation; (x)Law; and (xi) Magistracy. There will also be an internal audit office under the zila nazim.
9 The zila nazim will not be a member of the zila council.10 In a district where the population of the minorities is in excess of 10% of the total population, reserved seatsfor minority communities will be allocated in the manner prescribed by the provincial government." The zila nazim and naib zila nazim will be required to have academic qualification of at leastmatriculation/secondary school certificate, or equivalent.12 Subject to the confirmation of the provincial governor.
75

Figure 5.1: Local Governmenit Plan 2000
The District Government......................... . . ............. ..... ......Citizen Community .Boards; comnnittees forHospitals, Basic Health Units, Zila Nazim / Naib Nazim Disi rict / Zila CouncilSchools, Colleges, Thana, (elected indirectly by all union Directly elected UJnion Nazims will constitute the ZilaInfrastructure, Transport and councilors in the district; will Council, and the District Naib Nazim will be theIrrigation; will have official contest as joint candidates) Speaker.recognition. Will work closely If clear 50% majority not secured, General seats = no. of unions in the districtwith Union Monitoring . will hold run-offelections Reserved seats (additional): women =33% Zila Motasib /Committees. workers/peasants 5% Ombudsman
.......................................... minorities"* = 5% SelectedandAll Union Councilors of the district will be the electoral appointed by Zilacollege for the reserved seats. Zila council will monitor Council.District Administation by forming specializedMonitoring Comniittees for each functional office at thedistrict level plus Ethics, Justice and Sports
Committees.
r ------- _-.-District Administration District Police
Comprising District Coordination Officer ( Civil servant BS- District Police Officer (DPO) will be appointed........ ............................... 20) and Executive District Officers heading each office. by the provincial goverament. Would report
District Public Safety District Officers will head sub-offices and Deputy District directly to the Zila Nazim.Commission; Officers will overlook specific functions at the Tehsil level.Cnminal Justice Co- Departments: Coordination, Human Resource Management andordination Committee Civil Defence; Finance and Planning; Works and Services;Police Complaints Agriculture; Health; Education; Literacy; CommunityAuthority. Development; Information Technology; Revenue; Law; and
..................................... .... _ M agistracy.
The Tehsil Government
'Tehsil Nazim Tehsil CouncilNaib Nazim Will comprise Naib Union Nazims of all
r ---------- (Elect d by all the union unions in the tehsil.co icilors of the tehsil.) General seats = no. of unions in the
l____ ____ _____ ____ ____ _____ ____ _____ ____ ____ __________ _________ _tehsilThe Union Level Government - Reserved seats (additional)~ 33% for
Tehsil Administration women. 5% workers/peasantsTeh:;il Municipal 5% minorities"
Union Nazim / Offi :er + All union colLcilors of the tehsil will beNaib Nazim * 4 Tehsil Officers the electoral college for the reserved
Elected as joint Union Council seats.candidates by direct The entire union councilballot. Union Nazim will be directly elected.and Naib Nazim will Total seats: 21 (includingbecome members of Nazim and Naib Nazim)district and tehsil General seats: 12council, respectively. (4 reserved for women)
Workers/peasants: 6 seats Union Guards Villaee Council(2 reserved for women). (with local law & Chairman and members elected tsrougiMinorities: I reserved order direct elections.
Union seat** responsibilities). The village, for the first time, will beAdministration Union council will form Funded and recognized as a municipal entity.
specific Monitoring recruited by the
Comnmittees. Union Council,C with the approval
of DPO.
* Should have minimum academic qualification of matriculation/secondary school certificate.* * If the population of minorities is greater than 10% of the total population of the constituency direct
elections will be heldfor these seats and only minorities will be eligible to vote.
76
5.28 Immediately below the district government would be tehsil governments, whichwould be constituted on a similar pattern to that of the district government, with some minordifferences. Directly elected naib nazims of all union councils in the district will also bemembers of the tehsil council. The tehsil nazim and naib tehsil nazim would also be electedby indirect elections through the electoral college of union councilors. Under the nazim therewill be a Tehsil Municipal Officer (TMO) who will be the coordination officer of the tehsiladministration, which would comprise four Tehsil Officers (TOs), one each for (i) Finance,Budget and Accounts (ii) Municipal Standards and Co-ordination (iii) Land Use Control (iv)Rural-Urban Planning.
5.29 In political terms, the union government is perhaps the most important component ofthe new local government structure, as it is the only level which is constituted through directelections. The union councils and the union nazims and naib union nazims will be electeddirectly through adult suffrage, with the voting age lowered from 21 to 18 to encouragegreater participation. The total number of seats in a union council will be 21. It will comprise12 general seats, of which four will be reserved for women. There will be six
seats for workers and peasants, of which two will be reserved for women. The remaining threeseats will be those of the union nazim, the naib union nazim, and one reserved seat forminorities.
5.30 Under the executive control of each union nazim, there would be a maximum of threesecretaries (Secretary Union Committees, Secretary Municipal Functions and SecretaryCommunity Development) to assist him in discharging his functions. The union council willensure that the municipal needs of villages, which for the first time are being recognized asmunicipal entities, are met adequately, either by developing local capacity or through liaisonwith the Tehsil Officer Municipal Standards and Co-ordination.
5.31 The new local governments have been given considerable autonomy and powers, andthe role of provincial governments in regulating and supervising these governments has beensignificantly reduced. Unlike in the past, when the provincial governments had unfetteredauthority to dismiss local governments, the new plan gives the provincial Chief Minister theright to dismiss ("recall") only the zila nazim. Even this has to be ratified by the provincialassembly (by simple majority) and confirmed by the provincial governor. For the lowerlevels of government, the right to dismiss the nazim rests only with the immediately highergovernment.
5.32 Although quite precise on the subjects of elections and the local political structure andproviding some detail on local administration, the devolution plan does not yet includespecifics on the local revenue base, the fiscal transfer mechanism between provincial andlocal levels, the local government civil service structure and specific assignment of functionalresponsibilities. The revenue base of local governments is an issue of some concern, as untilrecently more than 60% of local government revenue was mobilized from octroi and zila
77
taxes, which were abolished in the 1999/00 budget. T'his has left a large hole in localgovernments finances, which has been temporarily filled through special grants from thefederal and provincial governments. However, this is only a stopgap measure, which needs tobe replaced in part by an augmented local revenue base. Some of the options in this regardare mentioned below.
OPTIONS FOR IMPROVING LOCAL GOVERNMENT F:INANCESIN THE CONTEXT OF DEVOLUTION
5.33 As mentioned above, the devolution plan is not yet completely specified andoperationalized, and there are some important gaps. Areas where it is still incomplete andneeds further work include the fiscal transfer mechanisms under which the new localgovernments will be provided resources from higher levels of government; the localgovernments' own resource base; assignment and delineation of functional responsibilities,implications for the provincial administrations, etc. Extensive work will be needed in comingmonths to fully develop and operationalize the devolution plan and come up with a moredetailed blueprint for implementation. There are a number of important issues relating to thedesign and implementation aspect of the plan, which will need to addressed in order toimprove and operationalize the devolution initiative to be. These include:
(a) Appropriate assignment of functional responsibiilities. The devolution plan, bydelineating the administrative structure and listing the departments of DistrictGovernments, broadly indicates an assignment of functional responsibilities. However,more thought and work are required to specify the roles of local governments moreprecisely and clearly demarcate them from those of the provincial governments. Foractivities deemed to be best suited for local management or delivery, it is important thatlocal government autonomy (vis-a-vis higher levels of government) and accountability (tolocal beneficiaries and citizens) be ensured.
In the case of primary education, local provision is the normal pattern in internationalexperience. Within medical services, basic health units and rural health centers cater tosmall jurisdictions and therefore could be devolved to the local level. Devolution of basicsocial services to local governments nevertheless gives rise to some potential risks, whichneed to be addressed. Spending on primary education and health services has strongdistributional implications, but the local governments are relatively ill positioned to pursuedistributional objectives, especially across districts. In order to promote redistributionalobjectives, higher level governments would continue to play a role in financing theseservices through revenue transfers, which could be conditioned on meeting minimumnational or regional standards.'3 Management of schools and health centers, including staffrecruitment, nevertheless should be a local responsibility. This should build on thedecentralization initiatives already underway, e.g. Parenits Teachers Associations (PTAs) orSchool Management Committees (SMCs), and autonomy for larger hospitals in Punjab.
13 Given the cost implications of devolution and the weak finances of LBs, the provincial government role infinancing primary (and secondary) education and basic health most likely would remain large for the foreseeablefuture.
78

As far as farm-to-market roads are concerned, local responsibility would be a logicalextension of the role currently being played by DCs in Pakistan. The bulk of thedevelopment activity of such councils consists of construction of link roads in rural areas.Therefore the motivation and capability to take on responsibility for development andmaintenance of farm-to-market roads should exist, subject to availability of resources.
Development of water supply, sewerage and drainage facilities has largely been localized inthe large cities. Elsewhere, the provincial Public Health Engineering Department (PHED) isprimarily responsible for this function. Given the relative complexity of technology andeconomies of scale in engineering functions, there is a case for preserving the status quo inthe smaller cities. However, since maintenance of facilities is a local council responsibility,it is essential that local councils be involved in project design, approval and execution rightfrom the initial stages. In rural areas, decentralization is called for in view of the greatersimplicity of technology involved. Schemes based on relatively simple technology (gravityflow systems, conmunity hand pumps, etc.) can be handed over to district or unioncouncils. Here again, arrangements will have to be made to cover the burden of O&Mcosts.
In order to effectively fulfill these new and expanded responsibilities, local governmentswill need to develop and augment their capacity. Even though existing capacity at theprovincial level may be transferred to the local governments, a great deal of work will beneeded in this area in order to ensure the success and sustainability of devolution. Whilecapacity building is extremely important, experience suggests that it goes hand-in-hand withdevolution, and that holding up the latter on grounds of inadequate local capacity is notconducive to the development of effective local capacity over time. The federal andprovincial governments can and should play an important role in this context.
(b) Strengthening local governments' revenue base through reforming and rationalizingthe structure of local taxes and user charges. The large number of local taxes, rates andfees, each following its own pattern, has made the structure complex and unwieldy toadminister. Moreover, a host of minor taxes have only nuisance value, generate littlerevenue at high administrative cost, and provide rent-seeking opportunities to thoseadministering them. Hence the local tax structure needs to be streamlined, not only toimprove its equity and efficiency properties but also to raise revenue yields. A number oflocal taxes and levies- should be eliminated or consolidated to improve their managementand administration. Such tax restructuring may lead to some revenue losses in the shortrun, however. Together with the major loss in revenue from elimination of octroi andexport taxes and expanded expenditure responsibilities resulting from assignment ofadditional functions to LBs, this could put local finances under considerable pressure.The bulk of the shortfall would need to be addressed through improved tax-sharingarrangements (as discussed above), while the remainder should be managed byrestructuring the main local taxes and levies and through better collection. Below aresome suggestions in this regard.
79

* Restructuring the property tax: At present, property tax liability is calculated on thebasis of annual rental value (ARV).' In order to enhance the long-term yield of thistax, there is an urgent need to expand the tax base and to improve the coverage ratio,thereby enhancing horizontal and vertical equity. Owner-occupied properties arecurrently taxed rather lightly.'5 Moreover, the property tax formula, based on rentalvalues per room, is unable to bring developed vacant plots of land into the tax net.Hence a shift to a capital value basis will not only extend the coverage of property taxto Katchi Abadis (informal settlements) and vacant plots of land, it will also eliminatethe artificial distinction in the value of properties cn the basis of ownership.'6 Giventhe weak institutional capacity of ULBs, it will take time to move to a fullyoperational capital value system, so phased implementation will be necessary.
In the short run, the focus should be on improving the structure, expanding the base,and strengthening administration of the urban property tax. In the transitional period,a proxy can be employed to estimate property values. For example, both land andbuildings could be valued in the manner proposed below to arrive at an estimatedcapital value, which then could be converted into an annual value by taking a fixedpercentage (say 5%) of this effective capital value. The value of the land could beestimated on the basis of the area-wise land valuation lists prepared by the office ofthe Deputy Commissioner for registration of property transfers. As for buildings andstructures on the land, these could be valued on the basis of the schedule of ratesprepared by the Communication and Works Department for buildings with differentqualities of construction.17 To obtain a more reasonable estimate of the value ofbuildings, the estimated cost can be depreciated on the basis of age and normal life.
These changes would result in a substantial enhancement of property tax liability forowner-occupied properties, particularly large-sized properties. Whereas owner-occupiers would lose, properties rented out would gain. This development most likelywould increase the availability of property for rental, thereby enhancing economicactivity, and encourage development of smaller properties. But if for political, equityor other reasons, self-occupied properties need to be taxed lightly relative to rentedproperties, this could be addressed by allowing owner-occupied properties asubstantial rebate of, say, 50%, on the assessed tax.18
14 Since the Constitution empowers only the federal government to impose tax(es) on capital values, anappropriate methodology for urban property tax needs to be devised so as to avoid any breach of this provision." This is partly on the ground that these properties are also liable to wealth tax, a federal government tax onproperties constructed on plots of 1,000 square yards and above and on apartments with covered area of morethan 2,500 square feet. There is also a Punjab Government tax on houses constructed on plots of 2,000 squareyards and above. Moreover, in the case of owner occupiers, financial charges on housing loans (or the servicingcost of investment in homes) are inadmissible charges against other income for income tax purposes.16 However, the Constitution empowers only the federal government to impose tax(es) on capital values, anappropriate methodology for urban property tax needs to be devised so as to avoid any breach of thisconstitutional provision.
7 The Government of Punjab is pilot-testing a variation of this recommendation by indexing land values to therespective DC valuation table in new rating areas in Lahore, Multan, Rawalpindi and Faisalabad.18 Under a World Bank funded pilot project, a fresh survey and valuation assessment has been planned for twoareas in Karachi - the commercial center of the city (I.I. Chundrigar Road) and a residential area colonized bythe well-to-do (Clifton). It should be noted, however, that if property values after this exercise reflect market
80
e Increasing the yield of taxes on transfers of property: The tax rate for transfer ofproperty tax is significantly variable, not only across municipalities but also acrossprovinces. It is higher in NWFP, Punjab and Balochistan (ranging between 2-3%)compared to Sindh where it is only 1%. Scope exists, therefore, for enhancement ofthe rate in Sindh to bring it in line with other provinces.
a Sharing federal and/or provincial revenue bases through levying of local surchargeson federal and/or provincial taxes:(i) Local surcharge on federal excise on gasoline: In Pakistan, energy taxes have
mostly been in the federal domain. While taxes on natural gas (and excise dutyon POL products) are shared with the provincial governments, the petroleumsurcharge has not been shared with either provincial or local governments. Sinceboth provincial and local governments responsible for maintaining roads in theirjurisdiction, there is a justification for either sharing the petroleum surcharge withlower tiers of govermnent or letting local governments impose a surcharge on theexcise duty levied by the federal government. This is common in other countrieslike Thailand (Bangkok). It could act as a proxy for a user charge on roadtransport and limit congestion. In addition, it would be progressive in incidencegiven the highly concentrated patterns of automobile ownership and transportexpenditure.
(ii) Surcharge on sales tax on cement: Another possible candidate for levy of a localsurcharge is the sales tax on cement. This surcharge can be justified on thegrounds that cement is used for construction of residential, commercial andindustrial properties. These properties, once constructed, place an additionaldemand on municipal services. So this surcharge essentially acts as a proxy forvalorization (development) charges.
(iii) Surcharge on agricultural income tax: Rural councils may consider levying asupplementary rate on the provincial agricultural income tax. In addition toraising significant revenues for rural LBs, this may enhance the politicalacceptability of the agricultural income tax, as part of the revenues would beavailable to the localities in which they are generated.
E Improving cost recovery for local services: Like the provincial governments, localgovernments also suffer from poor cost recovery on the services they deliver. Localuser charges too need to be rationalized, and the objective should be to recover thebulk of the operational cost of service delivery through these charges.(i) Enhancing water rates: Water rates, especially in the intermediate cities, are
either flat rate charges or are based on the area of a property. Since the rates arefixed, there is no buoyancy in revenue unless water rates are increased, whichshould be done regularly and as a matter of priority. In the absence of periodicrate increases, water rate revenues as a percentage of the recurrent costs of water
rates, the high rates of tax (currently 20-30%) will have to be lowered, while the structure will need to berationalized by withdrawing exemptions and by bringing Katchi Abadis and vacant plots of land into the tax net.Once properties reflect their market-based capital values, tax rates of 20% and above will be difficult to justifyand sustain and in any case would be unnecessary for revenue needs.
81

supply have declined over time. At present, only about 50% of the recurrent costof urban water supply is recovered through water rates, which is far too low.
(ii) Increasing cost recovery for other services: )While the growing urban populationhas increased demand for municipal services, the fiscal state of the municipalgovernments has constrained the provision and quality of local services. Localgovernments therefore need to recover a much higher proportion of costs wherepossible. Possible candidates for much higher cost recovery include conservancy,drainage and lighting rates, which currently are either not levied at all or arelevied only in large metropolitan areas.
* Improving procedures for renting out local governments' assets: At present rents onmunicipal commercial properties are only 1/4 - 1/3 of actual market rents. This hasencouraged sub-letting of municipal shops. To bring income from rents close tomarket levels, it is suggested that leases for municipal commercial properties beauctioned out on the basis of bids, and that all rental contracts should includeautomatic periodic rent escalation clauses which are implemented.
* Revising rates on local licenses andfees: Rates for most licenses and fees levied bythe local councils have remained the same over the past decade or so. It is thereforerecommended that rates for major licenses and fees, such as fees on slaughter houses,registration and markets, etc., should be increased. Simultaneously, some of thesmaller fees, the revenue contribution of which is negligible, could be phased out.Prospects for involving the private sector in issuance of licenses and collection of feesalso should be explored.
(c) Fiscal transfer mechanisms. Even with strong efforts to augment local revenuemobilization, for the foreseeable future local govern-ments in Pakistan (as elsewhere in theworld) will be dependent on revenue transfers from higher levels of government to cover alarge part of their expenditures. According to the devolution plan, revenue transfers fromprovincial to local governments are to take place ander Provincial Finance Awards,recommended by Provincial Finance Commissions to be established by each province, ina transparent and predictable manner. This system is intended to be similar to the NationalFinance Commission which determines fiscal transfe.is from the center to the provincesbased on a population-related formula. However, Cietails with regard to the revenue-sharing arrangements and how they will be determined in the case of the ProvincialFinance Awards remain to be clarified. Nevertheless, given the commonality of thepresent fiscal powers of the local and provincial governments, which the latter have pre-empted, as well as the local nature of some of the taxes collected by higher levels ofgovernments, it would be appropriate to share taxes which fall within the fiscal powers ofboth local and provincial governments. Also, any tax collected for a function performedby both levels of government could be made part of the revenue-sharing pool between thetwo levels of government. Specific suggestions in this regard are:
Sharing the revenue of GST on services: By its naiure, GST on services comes closestto the recently-abolished local taxes on transportation of goods and services (octroiand export taxes). Hence one option would be for the revenue from GST on services
82

to be shared between the provincial and local governments, with the share of the latterapportioned among various LBs on collection basis. This to a large extent couldrecoup the revenue losses incurred by LBs on account of elimination of octroi (andexport tax).
Devolving some provincial taxes to the local level: Of the provincially collected taxes,Motor Vehicle Tax (MVT) should either be completely devolved to the LBs or at leastlocal governments should get a significant share of revenues from this tax. Revenuesfrom MVT are meant to cover costs of road maintenance. Since local governments areresponsible for maintenance of intra-city roads while responsibility for maintenance ofinter-city roads rests with the provincial government, the case for sharing of MVTrevenues is very strong. Revenue from MVT accruing to the local councils could bedistributed among local councils in part on the basis of population, in part on the basisof collection. Sharing on the basis of population should be considered because carowners in smaller cities have a tendency to register their cars in Karachi (in view of themarket premium), even though these cars subsequently are utilized elsewhere.Similarly, a case for devolution or sharing of the entertainment tax and tax onprofessions and callings can be made, on the grounds that these fall within the fiscalpowers of both levels of governments but have been pre-empted by the provincialgovernments. In fact, these taxes are collected by the local authorities in thecantonment areas. Therefore, sharing of say, 50% of these taxes on the basis ofcollection would be justified. Finally, allowing the local governments to share in theAgricultural Income Tax by means of a local add-on, while maintaining unifiedcollection at the provincial level, should be considered.
a Provincial financing of additional functions devolved to the local governments: ifadditional functions are to be transferred to local councils, this must be accompaniedby grants or revenue shares equivalent to the present levels of expenditure on thesefunctions by the government transferring the responsibilities. This is critical becauseit will take time to develop an adequate local revenue base through additional taxsharing or revenue transfers and additional resource mobilization measures at the locallevel. During the period in which local resource mobilization capabilities are beingbuilt up, provincial budgets will need to continue to fund social services like primaryeducation and primary health care, and subsidize O&M for rural water supplyschemes, if these are transferred to the local governments.
Establishing conditional andfiscal-base equalization grants: It will be desirable tohave an appropriate balance between unconditional and conditional transfers. Thiswould help ensure fiscal stability by enforcing a hard budget constraint on the localgovernments at the margin. Moreover, by conditioning these transfers on achievementor maintenance of minimum national or regional standards, suitable conditionaltransfers would provide incentives for sound financial performance, good servicedelivery and achievement of national or regional objectives. Finally, as mentionedabove, local governments have varied revenue bases and therefore wide variation infiscal capacity. The Provincial Finance Commission in each province would have to
83

carefully evaluate the fiscal capacity of each local government and support financiallyweaker local bodies with well designed fiscal base equalization grants.
(d) Personnel Management and Implications for provinces. The extent to which thebenefits of decentralization can be realized will depend on a number of factors, one ofwhich is how the provincial government structure, establishment and finances areadjusted. There are potential risks in this area. At one extreme, devolution might bestifled if the provincial bureaucracy remains pretty much as it is, with bureaucratsnominally deputed to local governments but still reporting to their superiors in provincialdepartments, and with personnel management, career development, etc. remainingcentralized. On the other hand, wholesale transfer of provincial employees to localgovernments is likely to face strong resistance fromi employees' groups and, in theabsence of any other actions, could burden the local governments with huge liabilities andthreaten their viability. Moreover, if the devolution exercise would lead to passing downof expenditure functions to local governments without commensurate transfer ofresources, it would exacerbate the fiscal problems of ]ocal governments. This suggeststhat necessary restructuring of the provincial establishment and finances should not awaitfull implementation of the devolution initiative.
In addition there are issues related to personnel management in terms of the status andincentive orientation of the transferred employees. Given the objectives of devolution, itwould be desirable for the service delivery, supervisory, and management personnelrelated to provision of local public services covered by the devolution plan to beeffectively employees of the local governments. Provision could be made for mobilityacross districts of well-trained, highly skilled staff and those with potential foradvancement, but nevertheless their reporting relationships and personnel managementwould be with the local government, as is normally the case in most federal systemsoutside South Asia. If there are major legal constraints to changing the formal status ofprovincial civil servants to that of local government ernployees, then existing provincialstaff transferred to local governments could retain their provincial status in a legal sense,but with all important aspects of their management (including personnel management)handled at the local government level. This would have the advantage that redundant,inadequately skilled, or poorly performing employees could be returned by the localgovernments to their provincial cadres. Employees newly recruited by local governmentswould be local civil servants and fully the responsibility of the government that hiresthem.
84

Matrix: Options for Reform
Objective Possible Short-Term Measures Medium-Term OptionsI. Adjusting Intergovernmental Fiscal Relations
Reverse the persisted trend of * Eliminate most discretionary transfers, including federally * Complete process of disengagement of higher levels ofcentralization over the past several financed special provincial programs (e.g. tameer-i-watan, government from areas of responsibility of lower levels.decades and bring the actual assignment tameer-i-Sindh, etc.) by merging them with the normal * Stabilize the assignment of functional responsibilities forof functional responsibilities and public development programs of the provinces. efficient, accountable delivery of public services resist anyexpenditure decision making between * Initiate process of disengagement of higher levels of tendencies toward recentralization, which is probably bestthe federal and provincial govermments government from the areas of responsibility of lower levels. accomplished by having well-functioning successful, andinto line with the spirit and provisions of The federal government could disengage itself from accountable local governments.the constitution. Enhance the functional population planning, irrigation, tourism development,responsibilities of the local governments lower levels of the justice system, transport andas part of the governments devolution communications, curriculum development, centers ofinitiative. excellence, etc. Provincial governments could move away
from land development, urban and rural water supply,drainage and sanitation, primary education, preventivehealth, and local roads.
2. Enhance the autonomy and * Federal/provincial governments should vacate * Consider devolving some of the more broad-based taxesaccountability of lower levels of provincial/local tax bases. The federal government could to the provincial governments, e.g. specific purpose excisegovernment through appropriate tax stop levying capital value tax on properties and motor duties; collection of provincial energy taxes; wage taxes;devolution. vehicles. Provincial governments should withdraw taxes etc.
on inter-provincial trade and on local government tax * Devolve local taxes to local governments, includingbases. property tax, motor vehicle taxes, and entertainment taxes.
* Allow provincial/local governments to share infederal/provincial tax bases through levying ofsupplementary rates at their discretion onfederal/provincial taxes (e.g. on GST, personal and
_________________________________________ corporate income taxes, central excises, energy taxes).3. Make fiscal transfers less discretionary * Remove the existing uncertainty with respect to federal * Incorporate all federal taxes (including the petroleum
and more in line with the needs and transfers through improved revenue projections, better surcharge) into the divisible pool.objectives of the provincial and federal collection of federal taxes, and ensuring timely transfers of * Consider redesigning the present NFC grants (to thegovernments by improving the revenues to the provincial governments. smaller provinces) as a formula-based system of fiscalefficiency, stability and equity of these * Devise mechanisms to alleviate provincial cash flow capacity equalization transfers.transfers. problems caused by seasonality in federal revenue * Discontinue remaining discretionary transfers by
collection. converting them into formula-based transfers andincorporating them into the NFC Award .
85
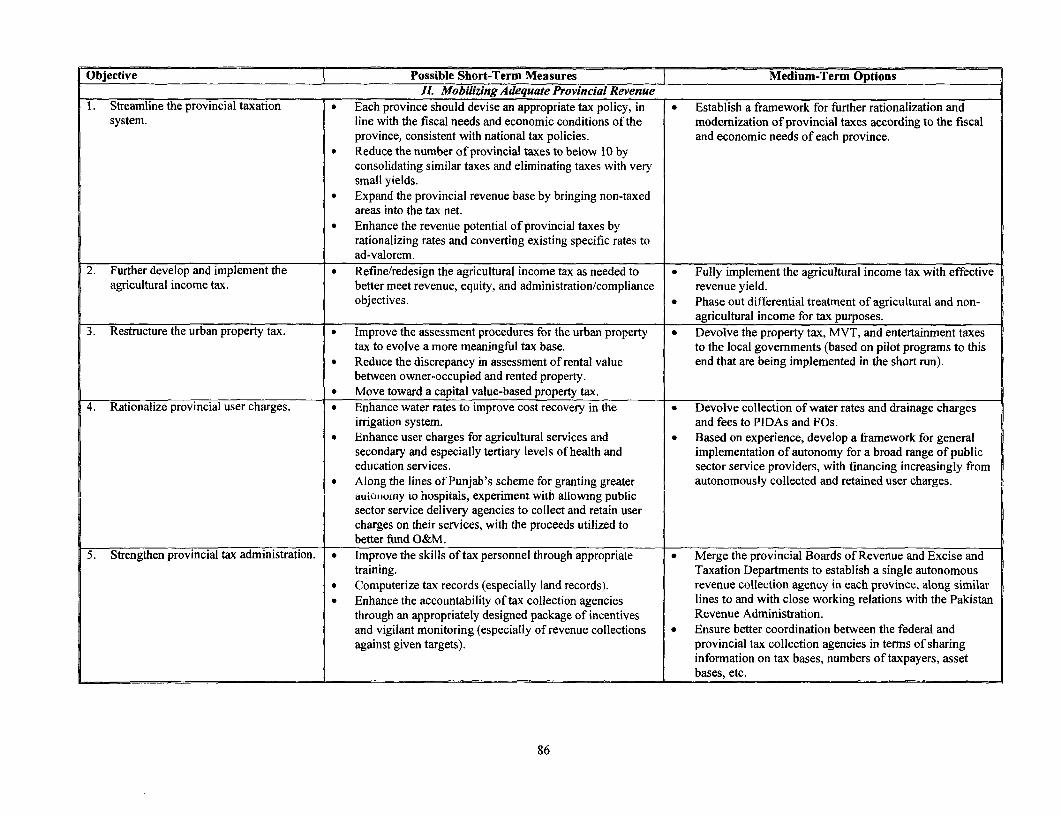
| Objective - { Possible Short-Term Measures Medium-Term OptionsII. Mobilizing Adequate Provincial Revenue
1. Streamline the provincial taxation * Each province should devise an appropriate tax policy, in * Establish a framework for further rationalization andsystem. line with the fiscal needs and economic conditions of the modernization of provincial taxes according to the fiscal
province, consistent with national tax policies. and economic needs of each province.* Reduce the number of provincial taxes to below 10 by
consolidating similar taxes and eliminating taxes with verysmall yields.
* Expand the provincial revenue base by bringing non-taxedareas into the tax net.
* Enhance the revenue potential of provincial taxes byrationalizing rates and converting existing specific rates toad-valorem.
2. Further develop and implement the * Refine/redesign the agricultural income tax as needed to * Fully implement the agricultural income tax with effectiveagricultural income tax. better meet revenue, equity, and administration/compliance revenue yield.
objectives. * Phase out differential treatment of agricultural and non-agricultural income for tax purposes.
3. Restructure the urban property tax. * Improve the assessment procedures for the urban property * Devolve the property tax, MVT, and entertainment taxestax to evolve a more meaningful tax base. to the local governments (based on pilot programs to this
* Reduce the discrepancy in assessment of rental value end that are being implemented in the short run).between owner-occupied and rented property.
* Move toward a capital value-based property tax.4. Rationalize provincial user charges. * Enhance water rates to improve cost recovery in the * Devolve collection of water rates and drainage charges
irrigation system. and fees to PIDAs and FOs.* Enhance user charges for agricultural services and * Based on experience, develop a framework for general
secondary and especially tertiary levels of health and implementation of autonomy for a broad range of publiceducation services. sector service providers, with financing increasingly from
* Along the lines of Punjab's scheme for granting greater autonomously collected and retained user charges.auiunolnuiy io hospitais, experiment with allowing publicsector service delivery agencies to collect and retain usercharges on their services, with the proceeds utilized tobetter fund O&M.
5. Strengthen provincial tax administration. * Improve the skills of tax personnel through appropriate * Merge the provincial Boards of Revenue and Excise andtraining. Taxation Departments to establish a single autonomous
* Computerize tax records (especially land records). revenue collection agency in each province, along similar* Enhance the accountability of tax collection agencies lines to and with close working relations with the Pakistan
through an appropriately designed package of incentives Revenue Administration.and vigilant monitoring (especially of revenue collections * Ensure better coordination between the federal andagainst given targets). provincial tax collection agencies in terms of sharing
information on tax bases, numbers of taxpayers, assetbases, etc.
86

Objective Possible Short-Term Measures Medium-Term OptionsIII. Strengthening Provincial Expenditure Management and Governance
1. Reform the budgetary process to * Adopt a Medium-Term Budget Framework (MTBF) at the * Fully implement the MTBF and institute outcome-improve the allocation of provincial provincial level, based on multi-year projections of oriented and program-based budgeting.resources to better serve development resource availability and outcome-oriented sector- andobjectives on a sustainable basis. program-based expenditure allocations, with hard budget
constraints and integration of budgeting of developmentand recurrent expenditures.
* Establish a system of provincial debt management, whichcovers debt to the federal government (CDL and foreignloans), provincial market borrowing, State Bank overdrafts,and contingent liabilities.
2. Reform the provincial civil services so * Undertake baseline surveys/censuses to assess the size, * Implement restructuring of provincial public sectorthat they become leaner and more composition and skill mix of public sector employment in entities based on reviews and broader reform program.effective, equipped with the needed each government department, agency, public enterprise and * Develop and implement more comprehensive reforms ofskills, facing an appropriate incentive autonomous body. provincial civil services.structure, and better organized and * Conduct functional reviews of all provincial public sector * Devise appropriate severance packages for reducingmanaged, and whose cost is in line with entities to assess their objectives, roles and staffing needs, redundant employment in the civil service, consistent withprovincial objectives and available fiscal and the scope for shifting activities to the private sector, the resource position of the provinces.resources. devolving some entities to local governments,
commercialization and/or closure.* Reduce provincial government employment through
attrition coupled with extremely selective recruitment toimprove skill mix.
* Induct highly-skilled professionals into the provincial civilservices (preferably on contract basis).
3. Improve the allocation of expenditures * Enhance non-wage O&M allocations for key services like * In line with the MTBF, establish a program approach foracross broad economic categories irrigation, primary health care, primary education, expenditure allocations for each sector by eliminating the(capital versus recurrent, wage versus provincial roads, etc. compartmentalization between development and non-non-wage) so as to create fiscal space for * Induct local communities more generally into financing and development expenditures, so that sustainablehigh-priority activities. managing operation, repairs and maintenance of public infrastructure and service network sizes (and related
services and infrastructure. O&M) determine public investment and staffing levelsrather than vice versa.
4. Devolve management authority for * The initiative of giving autonomy to larger hospitals in * Expand management decentralization to the facility level,certain services to the facility level and Punjab should be built upon by developing a better based on experience.to communities. regulatory framework which addresses equity concerns. * Based on experience with their functioning, SMCs/PTAs
* Strengthen School Management Committees (SMCs) and to be handed over management of the entire school-levelPTAs and as to devolve management of primary schools recurrent budget, including teacher salaries.and their O&M expenses to these SMCs. * Develop the community-based irrigation system by
* Expand the initiative of handing over O&M strengthening and empowering Farmer Associations (FOs)management for rural water supply and drainage and Provincial Irrigation Development Authoritiesschemes to local communities for all such schemes. (PIDAs), under the National Drainage Program.
87

Objective Possible Short-Term Measures Medium-Term Options5. Improve provincial financial * The budgetary process should be made more transparent * Fully implement the improved system of financial
management through enhanced through better dissemination of relevant information to and reporting and auditing supported by PIFRA project.transparency and accountability. increased involvement of line departments. * Improve the effectiveness of the auditing system by
* Increase the accessibility of budgetary information to civil revitalizing the public accounts committees of thesociety by providing more understandable budget provincial assemblies with accelerated and effectiveoverviews (e.g. improved White Papers), and by making all disposal of audit reports.budget documents available to citizens (at cost price). * Ensure adequate legislative involvement in setting overall
* Enhance the transparency of provincial development and medium-term budgetary priorities and policiesprograms by incorporating expenditures financed from through review/discussion of MTBF and budgetforeign project assistance and non-budgetary development documents by the Provincial Assemblies.programs of provincial autonomous bodies.
* Effectively separate audit and accounts functions with fullindependence of audit and provincialization of the accountsfunctions for provincial governments.
* Ensure full and timely reconciliation of monthly accountsprepared by DAOs/Treasury Officers with those of DDOsof the line departments.
* Ensure timely actions by line departments to review andsettle audit observations raised by the departmental auditconducted by the audit department.
* Establish ad-hoc public accounts committees during thecurrent suspension/inactivity of the provincial assemblies.
6. Enhance the stability and predictability * Meter electricity consumption by all provincial and local * Effectively put into practice and enforce disconnection ofof provincial budgeting for utility bills. government departments/agencies. nonpaying government customers for metered
* Institute a fair and effective system for payment of consumption of electricity and other utilities.government utility bills (and arrears), which is acceptableto all concerned nartiecI Give public utilities authority to disconnect service for non-payment of bills (except emergency services).
* Review budgetary process and calculation methods forutility charges, and make appropriate modifications toensure adequate budget allocations.
88

Objective Possible Short-Term Measures Medium-Term OptionsIV. Strengthening Local Government Finances
1. Improve service delivery and enhance * Refine and further develop and improve the government's * Complete implementation of devolution to all urban andaccountability through devolution of new devolution plan through a careful review of its fiscal rural local governments.authority, responsibility, and finances to and administrative implications, building communityelected, accountable local governments. involvement in key local services like primary education
and rural water supply and sanitation; and by providingsafeguards against elite capture of local/districtgovernments.
* Based on their financial and administrative strength, urbanlocal councils should become involved in the developmentand provision of key local services like primary educationand preventive and basic heath care.
* Devolve development and management of urbaninfrastructure to local governments (e.g. urban water supplyand sanitation, urban roads, etc.)
* Implement the devolution plan in a phased manner, startingwith large urban municipalities.
2. Institute effective tax- and revenue- * Establish Provincial Finance Commissions under * Devolve the administration of local taxes (e.g. propertysharing arrangements between provincial appropriate legislative arrangements, to make tax, MVT, entertainment tax etc.) to local governments,and local governments. recommendations on tax and revenue sharing with local based on pilot programs in the short run.
governments.* Revenues from all taxes which are levied on local bases or
fall within the fiscal powers of both the provincial and localgovernments (e.g. property tax, motor vehicle tax,entertainment tax and tax on professions and callings. GSTon services, etc.) should be shared between the provincialand local governments on mutually agreed formulas.
3. Reform and rationalize local taxes. * Restructure the property tax to eliminate problems with the * Consider allowing local governments to share bases oftax base by moving toward a capital value assessment of some federal and provincial taxes (e.g. central excise dutythe tax, and improve tax assessment procedures, especially on gasoline, sales tax on cement, agricultural income tax,addressing the problem that owner-occupied properties are etc.) by levying local surcharges or supplementary ratescurrently assessed at a much lower rate than rented on these taxes.property.
* Sindh province should enhance the rates of transfer ofproperty tax receipts to local governments to bring this topar with the other provinces.
* Improve cost recovery for local services by rationalizingand improving collection of user charges.
4. Make the local governments a separate * Consider providing appropriate legislative cover to local * Consider enacting a Constitutional amendment to theand autonomous tier of government. governments, which would provide them an autonomous same end.
status with well-defined functional responsibilities andtaxation authority.
89

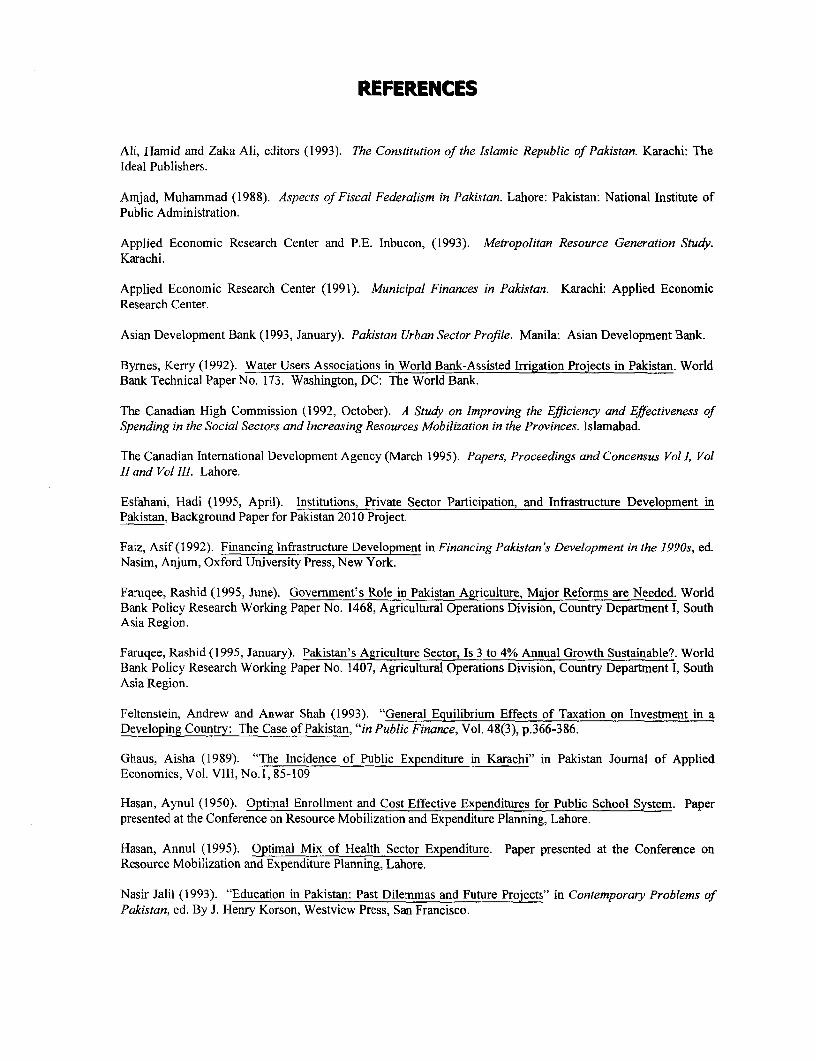
REFERENCES
Ali, Hamid and Zaka Ali, editors (1993). The Constitution of the Islamic Republic of Pakistan. Karachi: TheIdeal Publishers.
Amjad, Muhammad (1988). Aspects of Fiscal Federalism in Pakistan. Lahore: Pakistan: National Institute ofPublic Administration.
Applied Economic Research Center and P.E. Inbucon, (1993). Metropolitan Resource Generation Study.Karachi.
Applied Economic Research Center (1991). Municipal Finances in Pakistan. Karachi: Applied EconomicResearch Center.
Asian Development Bank (1993, January). Pakistan Urban Sector Profile. Manila: Asian Development Bank.
Byrnes, Kerry (1992). Water Users Associations in World Bank-Assisted Irrigation Projects in Pakistan. WorldBank Technical Paper No. 173. Washington, DC: The World Bank.
The Canadian High Commission (1992, October). A Study on Improving the Efficiency and Effectiveness ofSpending in the Social Sectors and Increasing Resources Mobilization in the Provinces. Islamabad.
The Canadian International Development Agency (March 1995). Papers, Proceedings and Concensus Vol I, Vol11 and Vol 11. Lahore.
Esfahani, Hadi (1995, April). Institutions, Private Sector Participation, and Infrastructure Development inPakistan, Background Paper for Pakistan 2010 Project.
Faiz, Asif (1992). Financing Infrastructure Development in Financing Pakistan's Development in the 1990s, ed.Nasim, Anjum, Oxford University Press, New York.
Faruqee, Rashid (1995, June). Government's Role in Pakistan Agriculture, Major Reformns are Needed. WorldBank Policy Research Working Paper No. 1468, Agricultural Operations Division, Country Department I, SouthAsia Region.
Faruqee, Rashid (1995, January). Pakistan's Agriculture Sector, Is 3 to 4% Annual Growth Sustainable?. WorldBank Policy Research Working Paper No. 1407, Agricultural Operations Division, Country Departrnent I, SouthAsia Region.
Feltenstein, Andrew and Anwar Shah (1993). "General Equilibrium Effects of Taxation on Investment in aDeveloping Country: The Case of Pakistan, "in Public Finance, Vol.48(3), p.3 66 -38 6 .
Ghaus, Aisha (1989). "The Incidence of Public Expenditure in Karachi" in Pakistan Journal of AppliedEconomics, Vol. VIII, No.1,85-109
Hasan, Aynul (1950). Optimal Enrollment and Cost Effective Expenditures for Public School System. Paperpresented at the Conference on Resource Mobilization and Expenditure Planning, Lahore.
Hasan, Annul (1995). Optimal Mix of Health Sector Expenditure. Paper presented at the Conference onResource Mobilization and Expenditure Planning, Lahore.
Nasir Jalil (1993). "Education in Pakistan: Past Dilemmas and Future Projects" in Contemporary Problems ofPakistan, ed. By J. Henry Korson, Westview Press, San Francisco.

NWFP, The Government of, The NWFP Working Group (1998). Report on Reconciliation Between WAPDAand NWFP. Peshawar.
Pasha, Hafiz and Michael McGarry (1989). Rural Water Supply and Sanitation in Pakistan, Lessons fromExperience. World Bank Technical Paper No. 105. Washington, DC: World Bank.
Pasha, Hafeez, et al. (1991). Local Government Administration Vol .and Vol. 11. Karachi: Applied EconomicsResearch Centre.
Pasha, Hafeez and Aisha Ghaus (1990). Provincial Finances. Karachi: Applied Economics Research Centre.
Pakistan, Government of (1994, January). Good Governance, Report on the Task Force on Social Contract.
Pakistan, Government of (1991). Report of the National Finance Commission, 1990. National FinanceCommission Secretariat.
Pakistan, Government of (1991). Report of the National Finance Commission, 1996. National FinanceCommission Secretariat.
Pakistan, Government of (1988, March). Report of the National Comrmission on Agriculture.
Social Policy Development Centre, (1999). Social Development in Pakistan (1999).
World Bank (December 1998). A Framework for Civil Service Rejorm in Pakistan. Report No. 18386-Pak.Washington, D.C. South Asia Country Department I.
World Bank (October 1996). Public Expenditure Review: Reform Iss;ues and Options. Report No. 18432-Pak.Washington, D.C. Poverty Reduction and Economic Management, South Asia Region.
World Bank (November 1996). Supporting Fiscal Decentralization in Pakistan. Report No. Pak-15092.Washington, D.C. South Asia Country Department I.
World Bank (1995b, April). Pakistan Poverty Assessment. Report No. 14397-PAK, (Yellow Cover), CountryOperations Division, Country Departrnent I, South Asia Region.
World Bank (1991, June). Pakistan Local Government Finance Sector Review. Report No. 9759-PAK,Infrastructure Division, Country Department I, Europe, Middle East and North Africa Regional Office.
World Bank (1991, April). Pakistan Rural Water Supply and Sanitation Project. Staff Appraisal Report No.8345-PAK, Country Department I, Europe, Middle East and North Africa Regional Office.
World Bank (1990, June). Pakistan Transport Sector Project. Staff Appraisal Report No. 8611 -PAK, CountryDepartmnent I, Europe, Middle East and North Africa Regional Office.
World Bank User\\StreetTalk\Unit Disk@SASPKBNO1 @WORLDBANK\TEAMS\ECONOMIC\HANID\PFS\pfs-report-I 11-10-00(final).doc11/13/2000 4:27 PM
ii

ANNEXES


ANNEX A
PROCEEDINGS OF THE WORKSHOP ONREFORMING PROVINCIAL FINANCES IN THE CONTEXT OF DEVOLUTION
Islamabad, September 17-18, 2000
SUNDA Y, SEPTEMBER 17,2000
Opening SessionChairman: Mr. Farid Rahman, Finance Minister, NWFP
In his opening remarks, Mr. Mueen Afzal, Secretary General, Ministry of Finance, highlightedthe progress made by the government on its macroeconomic reform agenda. He indicated that thestabilization part of the reform program is doing well; growth has picked up; inflation is expected toremain low, exports have started showing some buoyancy; etc. He nevertheless expressed concernabout the debt overhang, which remains a big problem. On structural reforms, he referred to progressmade in bringing agricultural prices closer to market prices, and reforms in the oil and gas and powersectors are continuing, but more needs to be done in the energy and banking sectors. He also pointedto slow progress in poverty reduction and improving social indicators. He nevertheless emphasizedthat poverty reduction is very high on the government's priority list, notably as reflected by theIntegrated Rural-Urban Development Program (IRUDP), initiation of the food support program, andestablishment of the Micro-Credit Bank and Pakistan Poverty Alleviation Fund. Mr. Afzal alsohighlighted the government's initiatives on enhancing public sector accountability and governance.
In his opening statement, Mr. John Wall, Country Director for Pakistan and Afghanistan,World Bank Islamabad Office, stated that the government's inability to raise resources in line withexpenditure needs is the fundamental problem behind most of economic and social problems of thecountry. Insufficient resources allocated to the social sectors, most of which are utilized in payingsalaries of the large public sector establishment, results in poor quality of these services. Under itsdevolution initiative, the government is now adding a third tier of government, which would beresponsible for delivery of basic services. The fear is that the mismatch between federal andprovincial resources and expenditures may get translated into a similar mismatch between the twolower tiers of government. The solution lies in raising more revenues and producing and deliveringservices in a more efficient and cost effective way.
Session I: Recent Provincial Reform Initiatives and Future PlansChairman: Mr. Mueen Afzal, Secretary General, Ministry of Finance
The Finance Ministers of Punjab, NWFP and Sindh highlighted key issues and constraintsfaced by the provinces in the area of provincial finances and briefed the workshop on their respectivereform initiatives. Brief summaries of presentations by each finance minister:
I

Presentation by Mr. Shahid Kardar, Finance Minister, Punjab
Mr. Kardar stated that the existing level and quality of services delivered by the provincialgovernment is unsatisfactory. The issue is more the quality cf services delivered than the resourcesexpanded. He also highlighted the fiscal and structural reforms undertaken by the province. Theseinclude:
* Rationalizing the tax structure by reducing the number of taxes from 33 to eight.* Improvement in the structure of the Agricultural Inicome Tax by imposing a full-fledged
income tax for farmers with large land holdings.* Restructuring of the Urban Property Tax by converting its base from rental to capital
value, reducing the rate discrepancy between owned and rented property, and reducingand rationalizing exemptions. Moreover, the property tax has been devolved to localgovernments in two localities of Lahore on a pilot basis.
* Restructuring of the provincial development program by weeding out a large number ofslow-moving projects, thereby reducing the throw-forward of the development programfrom Rs 38 billion to Rs 28 billion.
Mr. Kardar stated that at present intergovernmental fiscal relations have some flaws.* Revenue sharing mechanisms are defective, and the fairness of the revenue sharing
formula is in doubt.* There is a lack of sub-national participation in national decisionmaking.* Constitutional amendments are needed to change the structure of energy surcharges.* The interest rates charged by the federal government on development loans to the
provinces need to be reexamined, as this has been unfair to the provincial governments.
In the context of devolution, Mr. Kardar indicated that the financial strength of localgovernments would be key to improved delivery of public services. The provincial governmentshave to devise fair and innovative means to help the local governments in their tasks. For example,the provinces may consider direct funding of schools operated by local governments. The Punjabgovernment has already formulated a list of 17 indicators (which would be shortened to six or sevenindicators) to determine the backwardness of districts for the purpose of fiscal equalization grants tothe local governments.
According to Mr. Kardar, better expenditure management is essential for improvements inprovincial finances. At present, most of the provincial government's expenditure is pre-empted bysalaries and pensions. Hence there is a need to re-examine the roles of provincial governments andencourage the private sector to take up some provincial responsibilities, even if this meanstransferring some service delivery functions to the private sector with public sector financing.Integrating the budgeting of development and recurrent expenditures and strengthening theprovincial accounting system are two high-priority areas for irmproved expenditure management.
Presentation by Mr. Farid Rahman, Finance Minister, NWFP
Mr. Rahman highlighted the problems of provincial finances, which range from flaws inintergovernrmental fiscal relations to the increasing provincial debt burden, from provincialliabilities due to the wheat subsidy to cash flow problems. He felt that tax reforms, devolution andrightsizing the government are three main areas needing attention. He highlighted actionstaken/being considered by the provincial government in each of these areas:
2

Tax reforms:* Reduction in provincial taxes from 17 to nine.* Improvement in the structure and elasticity of Property Tax. In this regard, the
provincial government has undertaken a census to classify properties.* At the moment there is a land-based Agricultural Income Tax with no exemption limit.
However, the government is seriously thinking of introducing a full income tax.* Computerization of motor vehicle tax.* The government is in the process of rationalizing irrigation water rates (which may be
increased by as much as 25%).* Improving the collection of provincial license fees by allowing payment through banks
rather than the Deputy Commissioner's Offices.
Devolution and Administrative reforms* In the context of devolution, the provincial government is considering administrative
reforms to right-size the government. However, as per the provincial government'sestimates, the new devolution plan would increase overall public sector employment.
* The provincial government is planning to merge all four works-related departments intoone.
* Functional reviews of provincial departments and autonomous bodies have beeninitiated, and a number of provincial departments and autonomous bodies are in theprocess of being closed. The resulting surplus manpower has to be absorbed, either bythe district governments or through some kind of severance package, for which theprovincial government has no resources at present.
* An exercise is underway to determine the revenue potential and assets and liabilities ofeach district.
On other areas of provincial finances, the minister cited actions taken by the government torestructure its development program, which have halved the throw-forward of the developmentprogram, and mobilization of additional resources (including funds of auqaf and other departments)for primary education.
Presentation by Mr. Abdul Hafeez Shaikh, Finance Minister, Sindh
Mr. Shaikh expressed concern that the impact of the government's reform program has notbeen as visible as had been hoped, despite serious efforts during the last 9-10 months. He was alsoconcerned about the lack of economic activity in Sindh province and indicated that a more focussedapproach (by selecting a lirnited number of reforms) is needed to make an impact. He noted the sizeand pervasiveness of government in economic activity. Emphasizing the need to reexamine the roleof government, he felt that the leadership has to come from the federal government. He alsomentioned that the shortcomings of inter-governmental fiscal relations have had a major negativeimpact on provincial finances. Not only has the shortfall in revenue transfers caused cash flow andfiscal difficulties for the province, but this has also led to uncertainty which makes planning andbudgeting very difficult.
On institutional reforms, Mr. Shaikh mentioned the establishment of the province's EconomicRevival Committee and Fiscal Monitoring Committee as key steps taken by the government to revivethe provincial economy and improve provincial expenditure management. He also referred to the
3

major restructuring of the provincial development program, which is aimed at reducing the number ofprojects by dropping non-performing schemes; safe-guarding high-priority and donor-assistedprojects; completing schemes by providing more resources to fast moving schemes; and protectinghorizontal equity across districts.
During the general discussion, issues were raised about the problems of monitoring andevaluation of federally funded provincial programs, e.g. the Poverty Alleviation Program. It was feltthat innovative ways need to be considered to get communities involved in monitoring. Onesuggestion was to enhance the transparency of provincial development programs by postinginformation on the web site of the provincial governments. During discussion of the issue of thewheat subsidy, a representative of the federal government indicated that there would have no problemif the subsidy is eliminated. On the matter of reducing the size of the government establishment, itwas suggested that the provincial governments should consider mandatory/voluntary retirement forsurplus staff without needed skills after 15 years of service.
MONDA Y, SEPTEMBER 18,2000
Session II: Presentation of Provincial Finances Study Recomnamendations andDiscussion of Provincial Expenditure ManagementChairman: Mr. Abdul Hafeez Shaikh, Minister Finance, Sindh
Mr. Shaukat Aziz, Federal Finance Minister, emphasized the progess made on thegovernment's reform agenda but conceded that the country's foreign exchange cash flow situation hasdeteriorated. In the context of poor tax collections and a culture of nonpayment, the government isusing innovative means like the tax survey and documentation drive to raise additional revenues. Heindicated that the tax survey has been quite successful. He also said that the government is quitewilling to improve incentives for the tax administration and strengthen its management to make it intoa more effective and business-friendly entity. Mr. Aziz also aJmitted that progress on privatizationhas been slow, but the regulatory system is now in place and prcgress will be faster from now on. Healso suggested that devolution would have a major impact.
The present government is committed to financial sector reforms through privatization ofbanks. The Securities and Exchange Commnission (SECP) has been strengthened, and stockexchanges have been automated. The insurance laws have been amended, and the sector is now beingregulated by the SECP in a more professional way instead of by the Commerce Ministry.
The Finance Minister concluded his presentation by asking the donor community to becomemore actively engaged with the government in policy discussions. The revival of the IMF programis very important in the short run. After agreement with the IMF, other multilateral donors like theWorld Bank and Asian Development Bank would also extend fresh assistance. Some bilateraldonors are also waiting for an agreement between the government and the Fund.
4
Summary of Provincial Finances Study Recommendations(Mr. Hanid Mukhtar, Senior Economist, World Bank Islamabad Office)
Mr. Mukhtar presented a summary of the main issues in provincial finances and the keyrecommendations of the World Bank's Provincial Finances Study. These include:
* Issue: Weaknesses of inter-governmental fiscal relations have led to large vertical fiscalimbalances, creating disincentives against better financial management and pooraccountability of the fiscal system to general public.Recommendation: Expand the provincial revenue base by allowing provinces to levysupplementary rates on federal taxes (e.g. personal income taxes and general sales tax),and correcting the resulting horizontal imbalances by means of well-designed fiscalequalization grants.
* Issue: The large size, inadequate skills, weak management and poor incentives andmotivation of the provincial civil services adversely affect delivery of public services.Moreover, the chronic mismatch between wage and non-wage expenditures leads toinadequate maintenance and poor quality of public services and provincial infrastructure.Recommendations: Functional reviews of all public sector entities to assess theirobjectives, roles and staffing needs, and to determine the possibility of shifting some (orall) of their activities to the private sector. Continued right sizing of provincial civilservices through attrition. Over the longer term, devise appropriate, affordable severancepackages.
* Issue: The short-term and input focus of the budgeting process and archaic budgetingprocedures lead to sub-optimal allocation of budgetary resources.Recommendation: Build necessary provincial capacity and put in place a Medium-Term Budget Framework (MTBF). This would adopt a comprehensive sector- andprogram-oriented approach to allocating public sector resources, integrate budgeting andmanagement of development and recurrent expenditures, and take an output and/oroutcome-oriented focus as opposed to the present input bias.
* Issue: Provincial taxes and user charges as presently structured and collected areincapable of generating substantial, buoyant revenues.Recommendations: Simplify the provincial tax structure by reducing the number oftaxes and rationalizing rates; enhance the potential and yield of agricultural income tax(AIT) through converting it from a land-based farm tax into a tax which is closer incharacter to an income tax; increase reliance on user charges wherever appropriate andfeasible; and strengthen provincial tax administration and plug leakages of revenue.
* Issue: Weak national and provincial institutions and poor governance have contributedto the erosion of provincial financial management.Recommendation: Reinvigorate and strengthen institutions of financial managementthrough a coherent program including, among other elements, well-designed civilservice reforns, better incentive and motivation structures, and insulation of financialmanagement institutions from political pressures by clearly defining the roles ofpoliticians in expenditure planning, budgeting and management.
5

* Issue: Their sizeable debt burden and large contingent, implicit, and deferred liabilitiesadd to the fragility and vulnerability of provincial finances.Recommendation: Establish provincial debt management systems which closely linkedwith the federal system; privatize, close, restructare and merge provincial departmentsand autonomous bodies; and change the procedu:res for budgeting, billing and paymentfor utilities in a manner which promotes efficient use of resources.
* Issue: Overcentralization of state functions and weakening of local governments haveadversely affected the quality and delivery of local public services.Recommendation: Operationalize and implement the devolution plan; develop localgovernments into a fully functional third tier of government by providing them withappropriate Constitutional cover; and provide them with adequate financial resourcesthrough appropriate transfer mechanisms from the provinces, with incentives for soundfinancial performance.
Provincial Budgeting and Expenditure Management(Mr. Mohammad Akram Malik, Finance Secretary, Punjab)
Mr. Malik discussed some issues related to provincial expenditure management. He madethe following main points:
* The budget making process does not involve all stakeholders.* The line item approach currently used in government budgets has made budgets very
rigid. To inject flexibility, budgets should be allocated to departments, and they shouldhave the authority to decide on composition and make changes during the year, ifdeemed necessary.
* Fifteen years back, politicians who got elected to the National and Provincial Assemblieshad a background of serving in local governments. (Mr. Malik was referring to the 1985non-party elections.) These legislators carried local interests to the new assemblies atthe provincial and national levels and concentrated on lobbying for funds fordevelopment schemes located in their constituencies instead of paying attention tolegislative work. This led to the inclusion of MPAs' and MNAs' programs in publicsector development programs, which became a source of corruption. Can thegovernment put in place some mechanisms to prevent a repeat of this experience?
* The countryside of Punjab is a graveyard of 8-10,000 development schemes, which arenot being completed or maintained.
* Punjab has already started moving in the direction of performance budgeting.
Session III: Intergovernmental Fiscal RelationsChairman. Mr. Shahid Kardar, Finance Minister Punjab
Presentation on Key Issues of Fiscal Federalism in the Pakistan Context(Mr. Younis Khan, Secretary, Ministry of Finance)
Mr. Khan stated that fiscal federalism is a sensitive subject and has to be reviewed in thepolitical and historical perspective. He mentioned that from late 1 970s until the early 1 990s there wasno NFC Award, which resulted in some ad hoc decisions, that had a profound impact on provincialfinancial management and finances. The most important was the federal government's decision tofinance the provincial fiscal deficits through federal grants, which provided a strong disincentive for
6

prudent financial management by the provincial governments. As result, provincial expenditureincreased exponentially while provincial resource mobilization declined. He also mentioned thatvertical imbalances exist in all federal systems, as tax assignment has to take into account collectionefficiency, which in developing countries lies with the central government. He criticized the presentmode of federal transfers, which, according to him, has led to slackening of revenue efforts by theprovinces. He recommended that the next NFC should consider imposing expenditure reductiontargets for the provinces. Also, the provinces need to better utilize their existing revenue resources,especially property taxes and user charges, and the provincial governments should stop being theemployer of first and last resort.
Provincial Perspective on Fiscal Federalism in the Pakistan Context(Dr. Mutawakkil Kazi, Additional Chief Secretary, Planning & Development, Sindh)
Dr. Kazi made the following main points:* Despite the government's preference for development expenditure as opposed to current
expenditure, the Development Program has declined from 14% of GDP in the 1970s to2.7% of GDP at present.
* There is a lot of waste in government expenditure. An item of stationery purchased ongovernment account costs something like 3-4 times more than when it is purchased onpersonal account.
* Projects should not be considered completed as soon as the civil works finished. Projectcompletion occurs only when a project has been made operational.
Points made during the subsequent discussion included the following:* The main focus should be on making the broad-based General Sales Tax fully
operational. Now is not the time to consider piggy-backing with supplementary rates byprovinces.
* About 46% of government employees are illiterate. How can they be retrained?* The natural attrition rate of 2-2.5% annually will not be sufficient to reduce the size of
public sector employment to an optimal level.X The unified salary scales for government employees constitute a major hurdle in the way
of providing appropriate incentives for officers assigned greater responsibilities.. Provincial governments have been unwilling to take over the levy and collection of
motor vehicle tax, as this would need to be accompanied by corresponding fiscalaccountability.Availability of loans through CDL has encouraged excessive development expenditurein the past.While piggybacking by the provinces on income tax may be okay, piggybacking on GSTwould raise issues of inter-jurisdictional trade. Although solutions like zero-rating inter-provincial trade may exist, these would be overly complicated and cumbersome in thePakistan context.Transfers from the federal divisible pool are very uncertain and are not according to theprojections made at the beginning of the year. These transfers tend to be very low in thebeginning of the year and then rise sharply in the last quarter, whereas the provincialgovernments' expenditures are evenly spread over the year. This makes it very difficultfor the provinces to plan their expenditures.
7

* Provincial governments are not involved in the federal government's budgetary decisionshaving implications for provinces. Moreover, trust and consultation between the federaland provincial governments has eroded over the years.
Winding up the session's discussion, John Wall said that federal-provincial fiscal relationsare a sensitive subject, and there is no one perfect way of handling them. There are many ways ofdistributing fiscal resources between federating units. Pakistan uses population as a basis fortransfers.
SESSION IV: Implications of Devolution for Provincial FinancesChairman: Mr. Farid Rahman, Finance Minister, GovernmenIt of NWFP
Presentation on Implication of D)evolution(Mr. William Byrd, Lead Economist World Bank, Islamabad Office)
Mr. Byrd stated that the government's new devolution plan is a bold initiative which, byshifting responsibility for key public services to the local governments, is expected to improveaccountability for service delivery and thereby the quality of services.
He pointed out that although the devolution plan is fully articulated and detailed in the areasof political and to a lesser extent administrative devolution., it remains incomplete in other areassuch as fiscal transfer mechanisms, local government revenue structure, and the impact ofdevolution on the provincial governrments. He noted a number of risks associated with thedevolution initiative, including the risk of elite capture and resistance by vested interests (provincialbureaucracy, contractors, some politicians). He also mentioned capacity constraints, in terms of theskills and quality of local government staff, and a possible overdependence on communitymonitoring institutions which would take time to develop.
Concerning the impact of devolution on the provinces, Mr. Byrd stated that with devolutionmany of the expenditure responsibilities of the provinces will be transferred to the local level, whichwould imply devising appropriate revenue transfer mechanisms to provide adequate resources to thedistrict governmnents. The devolution will also imply that a large proportion of provincial civilservants would be working for the local governments. The role of the provincial governments willtherefore change from the present centralized and detail-oriented management to one of settingpolicy frameworks, quality assurance, regulation, and supporting capacity building/change withappropriate fiscal incentives.
Mr. Byrd outlined two options regarding the pace of devolution gradual and rapid. Theformer goes for minimal real change to start with. The local government is cobbled together out ofthe existing provincial departments, and local governments develop capacity gradually and set upchecks and balances over time. This approach poses minimum risk of disruption and resistancefrom vested interests, although it could burden local governments with existing institutionalstructures and overstaffing. In contrast, the rapid approach calls for quick wholesale change basedon a well-designed provincial-local transfer mechanism. The rapid approach has more potential tobring about real change in the short run. However, resistance from vested interests is likely to begreater, and if the devolution package is not complete this approach would likely fail.
8

In the subsequent general discussion, participants expressed the following concerns:* At this time there is some confusion with respect to what is being devolved and what this
implies in terms of management, finances, capacity, and the needed administrativearrangements. There is also need for a vision of decentralization between the federalgovernment and the provinces.
* Fear was expressed that the present inefficiencies of the provincial government may gettransferred to the local level through the devolution exercise; for example, 34 replicas ofthe Punjab govermnent the way it operates now will certainly not be a desirableoutcome.
* The Provincial Finance Award will be more complicated than the National FinanceAward, as the pie will need to be divided in many more pieces.
The Finance Minister, Mr. Shaukat Aziz, made the following points at the end of thesession's discussion:* The devolution plan is definitely being implemented. Elections for selected local
governments will be held in December.* On operational matters, such as project decisionmaking, district governments will be in
the driving seat, although the districts may subcontract delivery of some services toprovincial governments, at least in the initial phase.
• The direct role of provinces in expenditure decision-making and management willdecrease sharply, and their role will more focused on areas like research, policy makingand advice, regulation, establishing service standards, curriculum development, etc.
Mr. John Wall indicated that Pakistan is not the first country to embark on the path ofdevolution, and that many lessons may be learned from the experience of other countries. He assuredthe government of the World Bank's support to the devolution initiative.
Session V: The Way ForwardChairman: Mr. Shaukat Aziz, Federal Finance Minister
Summary of Main Recommendations from Sessions 1-4(Mr. Mueen Afzal, Secretary General Finance)
Mr. Afzal presented the main conclusions of the workshop, which are as follows:
Areas of Agreement* The workshop recognized that in the context of the overall fiscal problems faced by
Pakistan, the present state of provincial finances is unsatisfactory and requires majorimprovements.
* The workshop agreed that redefining the role of government is essential for successfulreform of provincial finances. Roles of government should be clarified across differentlevels of government, and each level should define a set of core activities that it can andshould perform effectively, and other roles should be devolved to lower levels ofgovernment or shifted to the private sector. Those activities which should be handled bythe private sector but with public funding also should be identified.
* There is a need to improve inter-governmental fiscal relations through more activeinclusion of the provinces in national decision-making and building of trust and
9

confidence between the two levels of government, and by devising a mutually agreeablerevenue transfer mechanism.
* The workshop felt that provincial planning and budgeting is adversely affected byuncertainties regarding transfers of federal resources to the provinces. Steps shouldtherefore be taken to remove uncertainties regardir,g provincial resource availability, andalso to address the problem of seasonal fluctuations in federal transfers.
* Provincial revenue generation is inadequate and needs to be enhanced. In this regard,the recent tax reforms undertaken by the provinces may have some negative revenueimplications in the short run but would strengthen the provincial tax structure in themedium to long term. Steps should be taken to consolidate, expand and sustain thesereforms.
* The workshop agreed that the provinces have not adequately utilized user charges as asource of additional revenue and for regulating demand for services. The provincesshould enhance their reliance on user charges by increasing and rationalizing the rates ofthese charges on economic and higher-level social services.
* Provincial expenditures have increased to levels which cannot be supported with thepresent levels of provincial revenue resources. Moreover, the effectiveness andproductivity of expenditures in many cases is very low. Significant improvements in thequality of provincial expenditure management are required.
- Provincial civil services are large in relation to provincial revenue resources and relativeto the quantity and quality of services being delivered. Most provincial employees havelow levels of skills and productivity. Reforms are needed to make the provincial civilservices lean and effective in the context of devolulion.
* The poor state of the accounting system is one o:- the main reasons for poor financialmanagement. Efforts are already underway to improve provincial accounts by better andtimely reconciliation of accounts between the District Account Officers (DAOs) andDrawing and Disbursement Officers (DDOs). Substantial improvements in theaccounting system would require significant restructuring of district accounts offices andsustained commitment to improving the reporting system.
* Political factors and inadequate planning have led to the inclusion of a very largenumber of projects in the provincial development programs. The existing level of fiscalresources available for development activities is inadequate to complete even a fractionof these projects. The workshop supported the eKercise undertaken by the provincialgovernments to restructure their development programs.
* There is a need to build up necessary provincial capacity and to put in place a Medium-Term Budget Framework, which would adopt a comprehensive sector- and program-oriented approach, integrate budgeting and management of development and recurrentexpenditures, and take an output- and outcome-oriented focus as opposed to the presentinput bias.
* The workshop also agreed that poor governance is the root cause of all the problemsunderlying present weaknesses in provincial finances. Urgent actions are required toeliminate corruption and promote good governance.
* Lack of fiscal transparency has hindered provincial planning and budgeting and haseroded accountability in public finances. In order to improve provincial budgeting andaccountability to the public, key budgetary information should be disseminated to allpublic sector entities and to the general public.
* The workshop agreed that devolution will bring major changes which will haveimportant implications for the provinces. The roles of the provinces will change in a
10

major way, and the size of the provincial establishments will be reduced as functions aretransferred to the districts. The political and administrative components of devolutionare moving ahead rapidly, but the fiscal and financial aspects of devolution need a greatdeal of design and implementation work. It was agreed that this work is of high priority,and would benefit from professional expertise being applied to these aspects as well asmore generally to change management.
. There was also an agreement to hold meetings between the federal and provincialfinance ministers on a quarterly basis to discuss and resolve issues pertaining toprovincial finances.
Area where consensus was not achieved* While the workshop agreed with the report's recommendation to expand the provincial tax
base, the proposal for the provinces to levy supplementary rates on federal GST, togetherwith required adjustments in federal rates, was considered by many participants to be verydifficult to implement in the current Pakistan context, as such an arrangement would createinter-jurisdictional problems in tax implementation. The workshop, however, agreed to thepossibility of levying supplementary rates on federal personal income tax. Furtherconsideration and analysis of these issues was suggested.
Concluding Statements
From the World Bank side, Mr. Roberto Zagha, Sector Director, Poverty Reduction andEconomic Management, World Bank South Asia Region, concluded that strengthening of sub-national finances is a necessary step to achieve desired improvements in service delivery systems inPakistan. This would require wide ranging reforms, including civil service reforms, budgetaryreforms, expenditure management reforms, etc. He mentioned that the present initiative of thegovernment to devolve state functions and authority to the district level is a revolutionary decision.However, a prerequisite to make this initiative a success is that the federal and provincialgovernments have a consensus of opinion on this initiative. He also emphasized the need forinstitutionalizing workshops such as this one, so that the federal and provincial finance ministerscan have a regular exchange of views on fiscal issues.
From the government side, Mr. Shaukat Aziz stated that the present state of provincialfinance is not satisfactory and needs urgent and major changes. The upcoming devolution exerciseis likely to have a strong impact on structures of government at all three levels, which necessitatesconsiderable strengthening of sub-national finances. He appreciated the suggestion of regularmeetings between the federal and provincial finance ministers, and proposed that these meetings beheld on a quarterly basis at different locations. In order to give focus to fiscal reforms, Mr. Azizrecommended that, as a start, each province should select three to four reform actions on the basisof their priority. Progress on these reform actions would be discussed in each meeting of financeministers. He also urged the donors to be more engaged than they had been in the past, as they canhelp the government on issues like devolution, financial management, budgetary reforms, civilservice reforms, etc. He hoped that with enhanced efforts from each level of government and helpfrom the donors, the present government would be able to leave office in two years with a muchbetter functioning fiscal system.
11

ANNEX B
THE DISTRIBUTION OF POWERS AND FUNCTIONS IN FEDERAL SYSTEMS:A COMPARATIVE OVERVIEW
_Canada Llnited States Switzerland Australia Germany Austria India Pakistan Malaysia Nigeria Rhodesia West Indies(1867) (1789) (18481 (1901) (1949) (1929) (1950) (1962) (1963) (1989) (1953) (1957)
BASIC FEATtURES _Residual Power F S S S S S F S S FS S S
Enumeration of State Powers Yes No No No Yes Yes Yes No Yes No No NoDelegation of Legislative Authority No No No Yes No No Yes Yes Yes No Yes Yes
SCOPE OF POWERSFinance and Fiscal Relations
TaxationC Customs/Fxcise F F/C F F F F F/FS F F2 F FS CS... Corporate FS C F C Ct F F F F c FS CPersonal Income FS C FS C Ct 1: FS FS F C FS CF
.. Sales FS C F C ct F FS F F2C FS
Equalization F F FS CDebt and Borrowing
Public D)ebt of the Federation F F. F F F F F F F F... Foreign Borrowing FS FS FS C FS F F FS F F ES FC
... Domestic Borrowing FS FS FS C FS FS FS FS F FS FCIN I ERNAXI IONAI. RELATIONS
... Defense [2 FS F FS F F F F F F 1 F... Treaty Implementation Ft F F F FS F' I 2 F2 F2S F' C F'C FC
... Citizenship F F F' F FCt FSt F F Fa F FC CImmigration (into federation) C C C C Ct F F F Fa F FC F
... Immigration (between regions) Ct F Ca C C C
FUNCTIONING OF ECONOMIC UNION"Trade and Commerce"
External Trade F F F F Ct 12 F F 1: FInter-state Trade F F F C 1- 1F Fa F F C
Intra-state Trade F F F C F F Fa F C CCurrency S S S SC Fa S FS SBanking F F F F F F F F F F F C
Bankruptcy FS' C F C Ct F F FS F F rc c
Insurance F FS C F C F FFS FS FS C F F FS Fa F FS C
12

Canada United States Switzerland Australia Germany Austria India Pakistan Malaysia Nigeria Rhodesia West Indies(1867) (1789) (1848) (1901) (1949) (1929) (1950) (1962) (1963) (1989) (1953) (1957)
Transportation and Communications FCt F.. Roads and Bridges S FS FS FS Ct FS FS FS FS FS FC
... Railways FS FS F FS FCt F F F Fa F F... Air F F F FS F F F F F F C
... Telecommunications FS FS F C F F F F F F F C... Postal Services F F F C F F F F F F F C... Broadcasting F F C FCt F F F F FS C C
Agriculture C S FS SC Ct Ft SC S SC2 CS FaCaSFisheries FS S FS Ct FS FS FS FS CS
Mineral Resources FS S S F FS S FS FNuclear Energy F FS F C C F F F F F C
SOCIAL AFFAIRSEducation and Research
... Primary and Secondary Education S S CtS S S FS CS CS Fa SC FS... Post-secondary Education S FS FCtS FS Ct* F FCS S Fa FC F F... Research and Development FS Ct FS Ct FS FCS FS Fa C C F
Health Services F... Hospitals SF SF S FS Ct Ct S FS Fa C C
... Public Health and Sanitation S S Ct S FS S SC FC C CLabor and Social Services Ct F
... Unemployment Insurance F FS Ct C Ct F S Fa... Income Security FS FC C Ct F CS Fa FS F... Social Services SF SF Ct C S CS C C FS S
... Pensions Cs C Ct C F C FS FaS FS FS FSLaw and Security
... Civil Law S S F FS Ct FS* C FaS CS CS C... Criminal Law F S F S Ct FS* C F FC C
... Organization of Courts FS FS S FS Ct F FS FS Fa FS FCS FSIntemal Security (police) FS FS S SF CtS FS FS S F FS FCS S
Prisons FS FS S S F S F F
Other Matters FLanguage FS S FS FS FCCulture FS Ct C FC
Aboriginal Affairs F F C FS FS FaEnvironment FS FS Ct FS Ct FS FS
Municipal Affairs S S S S S S S FaS S
LEGEND:F = federal powerS = state (province/canton/land) powerC = concurrent power (federal paramountcy except where denoted Csa = asymmetrical application of powerst = federal legislation in this field administered by statesNote: italics denote de facto distribution of powers and functions
Source: Herperger, D. Distribution Of Poivers and Functions in Federal Systems, Minister of Supply and Services Canada, 199 1.
13

ANNEX C
AREAS OF TAXATION AUTHORITY OF EACH LEVEL OF GOVERNMENT
The 1973 Constitution of Pakistan specifies the following as areas of taxing responsibility forthe federal government:
(a) customs duties, including export duties;(b) excise duties, including duties on salt but excluding daties on alcoholic liquors, opium and
other narcotics;(c) duties in respect to succession of property;(d) estate duty in respect to property;(e) income taxes other than on agricultural income;(f) corporation tax;(g) taxes on sales and purchase of goods imported, exported, produced, manufactured or
consumed;(h) taxes on the capital value of assets, not including taxes on capital gains on immovable
property;(i) taxes on mineral oil, natural gas and mineral for use in generation of nuclear energy;(j) taxes and duties on production capacity of any plant, machinery, undertaking, establishment or
installation in lieu of any or more of them; and(k) terninal taxes on goods or passengers carried by railway, sea or air and taxes on their fares
and freights.
All other forms of taxes fall under the purview of the provincial governments. The provincialgovernments then allocate some of these to the local governments on the basis of the LocalGovernment Ordinances (LGOs). Taxes retained by the provincial governments under the LGOsinclude:
(1) tax on agricultural income;(2) capital gains tax on immovable property;(3) excise duties on alcoholic liquors, opium and other narcotics;(4) tax on professions, trades, callings or employment;(5) tax on immovable property;(6) land revenue;(7) motor vehicle taxes;(8) stamp duties;(9) entertainment taxes; and(10) taxes on purchase and sale of services (excluding railway, sea or air; transport).
The fiscal powers delegated to the local governments by the LGOs include the followingtaxation powers:
(1) octroi;(2) tax on annual rental value of buildings and land (except in Sindh);(3) tax on cinemas and cinema tickets;
14

(4) entertainment tax on dramatic and theatrical shows;(5) tax on the transfer of immovable property;(6) fees for licenses, sanctions and permissions;(7) market fees;(8) rates on services like water supply, drainage, lighting etc;(9) fees at fairs, agricultural shows, etc;(10) fees for specific services;(11) tax for export of goods and animals;(12) tolls on roads and bridges;(13) tax for the construction or maintenance of any work of public utility;(14) taxes on vehicles other than motor vehicles;(15) tax on professions, trades, callings and employment;(16) tax on advertisements;(17) school fees;(18) fees on sale of cattle at cattle fairs;(19) tax on the annual rental value of buildings and land;(20) tax on lands not subject to local rate;(21) tax on hearths;(22) tax on births, marriages and feasts;(23) tax on animals;(24) conservancy rate;(25) fees for erecting buildings;(26) fees for slaughtering animals;(27) community tax on adult males for public work of general utility;(28) surcharge on taxes levied by the federal and/or provincial governments; and(29) any other tax levied by the government.
15

ANNEX D
PROVINCIAL REVENUE PUNJAB AND SIPIDH 1998/99 BUDGET
Punjab SindhRs millions Rs millions
Provincial Tax Receipts 11,268.266 5,767.647Agriculture Income 1,633.000 600.000Sale Proceeds of Medicinal Opium 8.000
Direct Taxes (on Income and Wealth)Property and Wealth TaxLand Revenue 1,373.713 130.000Ordinary Collection 37.,760Malkana 1.135 14.,419Recovery of survey and settlement charges 0.195Fees for Consolidation of Holdings 2.043Fines and Forfeitures 1.700Rent of Agricultural Land 143.722Timi Grazing dues 0.026Collection fees on recovery of arrears 13.600 241Rent from Shops etc. 17.025 88.119Revenue talbana 0.063Mutation Fee 1,158.983 42.591Copying and Inspection fee of Padwaris' records 19.295Copying fees of produce statements 0.200 0.002Acreage rate 0.030Examination Fees 6.171Recovery of overpayments 0.600 0.115Payments for services rendered 1.120 0.239Others 8.000 34.438Refunds -88.119Capital Gains Tax 0.182Registration 186.680 252.440Fees for registering documents 182.480 237.298Fees for copying registered documents 3.600 0.322Others 10.000 14.820Refunds -9.400Urban Immovable Property Tax 285.000 112.455Ordinary Collection 1,477.084 699.090On luxury houses 22.700DeductionsRefunds -1.270Shares of net proceeds assigned to local authorities -1,207.839 -586.636Exemption on self occupied up to 5 marlas -5.675Betterment Tax 8.563Betterment Tax 15.487Shares of net proceeds assigned to local authorities -6.925Tax on professions, trade and callings 381.067 180.000
16
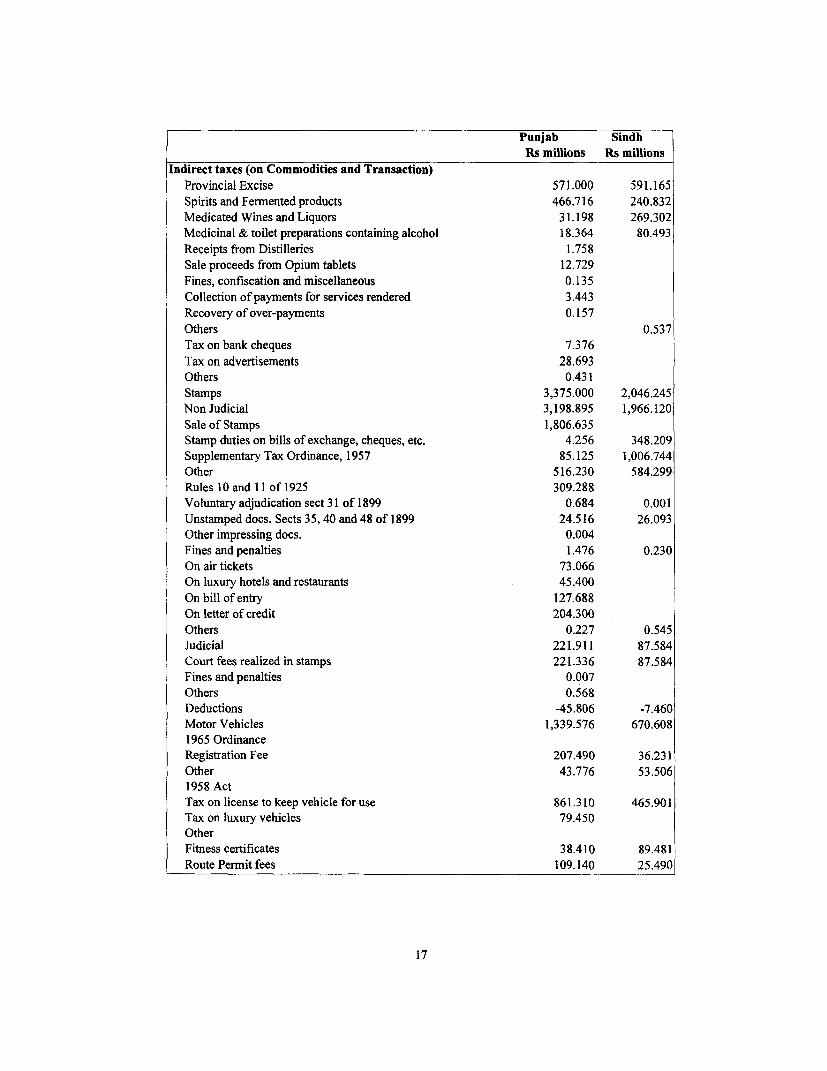
Punjab SindhRs millions Rs millions
Indirect taxes (on Commodities and Transaction)Provincial Excise 571.000 591.165Spirits and Fermented products 466.716 240.832
Medicated Wines and Liquors 31.198 269.302
Medicinal & toilet preparations containing alcohol 18.364 80.493
Receipts from Distilleries 1.758Sale proceeds from Opium tablets 12.729
Fines, confiscation and miscellaneous 0.135Collection of payments for services rendered 3.443Recovery of over-payments 0.157
Others 0.537
Tax on bank cheques 7.376
Tax on advertisements 28.693Others 0.431Stamps 3,375.000 2,046.245
Non Judicial 3,198.895 1,966.120
Sale of Stamps 1,806.635Stamp duties on bills of exchange, cheques, etc. 4.256 348.209Supplementary Tax Ordinance, 1957 85.125 1,006.744
Other 516.230 584.299
Rules 10 and 11 of 1925 309.288Voluntary adjudication sect 31 of 1899 0.684 0.001
Unstamped docs. Sects 35, 40 and 48 of 1899 24.516 26.093Other impressing docs. 0.004Fines and penalties 1.476 0.230
On air tickets 73.066On luxury hotels and restaurants 45.400
On bill of entry 127.688On letter of credit 204.300Others 0.227 0.545Judicial 221.911 87.584Court fees realized in stamps 221.336 87.584
Fines and penalties 0.007Others 0.568Deductions -45.806 -7.460Motor Vehicles 1,339.576 670.6081965 OrdinanceRegistration Fee 207.490 36.231
Other 43.776 53.5061958 ActTax on license to keep vehicle for use 861.310 465.901Tax on luxury vehicles 79.450OtherFitness certificates 38.410 89.481Route Permit fees 109.140 25.490
17
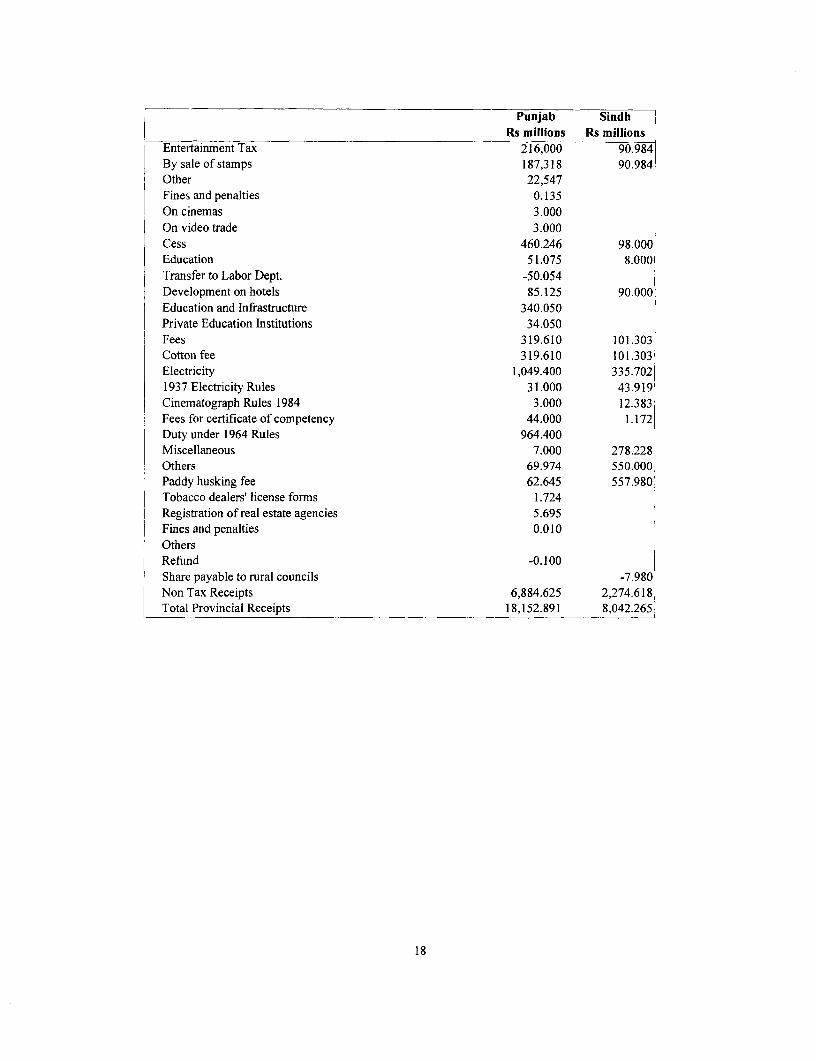
Punjab SindhRs millions Rs millions
Entertainment Tax 216,000 90.984By sale ofstamps 187,318 90.984Other 22,547Fines and penalties 0.135On cinemas 3.000On video trade 3.000Cess 460.246 98.000Education 51.075 8.000Transfer to Labor Dept. -50.054Development on hotels 85.125 90.000Education and Infrastructure 340.050Private Education Institutions 34.050Fees 319.610 101.303Cotton fee 319.610 101.303Electricity 1,049.400 335.7021937 Electricity Rules 31.000 43.919Cinematograph Rules 1984 3.000 12.383Fees for certificate of competency 44.000 1.172Duty under 1964 Rules 964.400Miscellaneous 7.000 278.228Others 69.974 550.000Paddy husking fee 62.645 557.980Tobacco dealers' license forms 1.724Registration of real estate agencies 5.695Fines and penalties 0.010OthersRefund -0.100Share payable to rural councils -7.980Non Tax Receipts 6,884.625 2,274.618Total Provincial Receipts 18,152.891 8,042.265
18

ANNEX E
PROVINCIAL TAXES PUNJAB AND SINDH
Punjab % Sindh %Rs million Share Rs million Share
Agriculture Income 1,633.000 17.5% 600.000 11.6%Capital Gains Tax 0.0% 0.182 0.0%Urban Immovable Property Tax 285.000 3.1% 112.455 2.2%Ordinary Collection 1,477.084 15.9% 699.090 13.5%On luxury houses 22.700 0.2% 0.0%Refunds -1.270 0.0% 0.0%Shares of net proceeds assigned to local authorities -1,207.839 -13.0% -586.636 -11.4%Exemption on self occupied up to 5 marlas -5.675 -0.1% 0.0%Betterment Tax 0 0.0% 8.563 0.2%Betterment Tax 0.0% 15.487 0.3%Shares of net proceeds assigned to local authorities 0.0% -6.925 -0.1%Tax on professions, trade and callings 381.067 4.1% 180.000 3.5%Excise Taxes 571.000 6.1% 591.165 11.5%Spirits and Fermented products 466.716 5.0% 240.832 4.7%Medicated Wines and Liquors 31.198 0.3% 269.302 5.2%Medicinal and toilet preparations containing alcohol 18.364 0.2% 80.493 1.6%Receipts from Distilleries 1.758 0.0% 0.0%Sale proceeds from Opium tablets 12.729 0.1% 0.0%Fines, confiscation and miscellaneous 0.135 0.0% 0.0%Collection of payments for services rendered 3.443 0.0% 0.0%Recovery of over-payments 0.157 0.0% 0.0%Tax on bank cheques 7.376 0.1% 0.0%Tax on advertisements 28.693 0.3% 0.0%Others 0.43 1 0.0% 0.537 0.0%Stamp Duties 3,173.464 34.1% 1,939.482 37.6%Sale of Stamps 1,806.635 19.4% 0.0%Stamp duties on bills of exchange, cheques, etc. 4.256 0.0% 348.209 6.7%Supplementary Tax Ordinance, 1957 85.125 0.9% 1,006.744 19.5%Other 516.230 5.5% 584.299 11.3%Rules 10 and 11 of 1925 309.288 3.3% 0.0%Fines and penalties 1.476 0.0% 0.230 0.0%On air tickets 73.066 0.8% 0.0%On luxury hotels and restaurants 45.400 0.5% 0.0%On bill of entry 127.688 1.4% 0.0%On letter of credit 204.300 2.2% 0.0%Motor Vehicles 1,192.026 12.8% 555.638 10.8%1965 Registration Fee 207.490 2.2% 36.231 0.7%1965 Other 43.776 0.5% 53.506 1.0%1958 Tax on license to keep vehicle for use 861.310 9.3% 465.901 9.0%Tax on luxury vehicles 79.450 0.9% 0.0%Entertainment Tax 216.000 2.3% 90.984 1.8%By sale of stamps 187.318 2.0% 90.984 1.8%Other 22.547 0.2% 0.0%
19
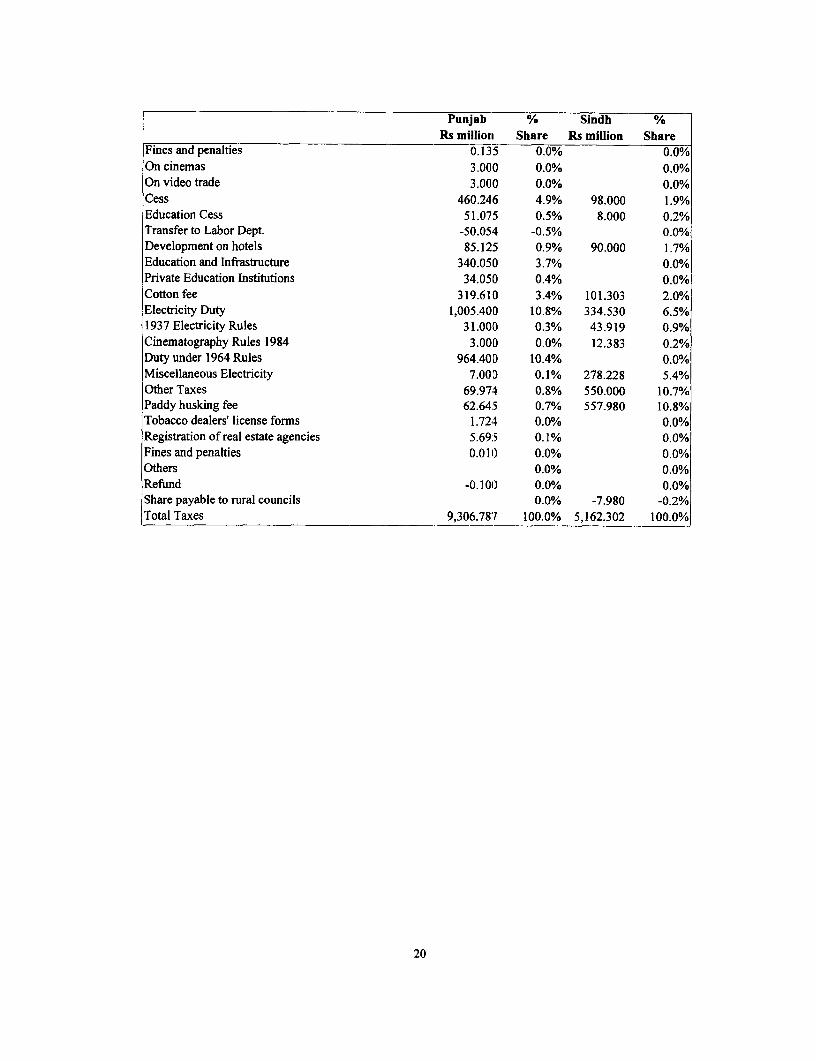
Punjab % Sindh %Rs million Share Rs million Share
Fines and penalties 0.135 0.0% 0.0%On cinemas 3.000 0.0% 0.0%On video trade 3.000 0.0% 0.0%Cess 460.246 4.9% 98.000 1.9%Education Cess 51.075 0.5% 8.000 0.2%Transfer to Labor Dept. -50.054 -0.5% 0.0%Development on hotels 85.125 0.9% 90.000 1.7%Education and Infrastructure 340.050 3.7% 0.0%Private Education Institutions 34.050 0.4% 0.0%Cotton fee 319.610 3.4% 101.303 2.0%Electricity Duty 1,005.400 10.8% 334.530 6.5%1937 Electricity Rules 31.000 0.3% 43.919 0.9%Cinematography Rules 1984 3.000 0.0% 12.383 0.2%Duty under 1964 Rules 964.400 10.4% 0.0%Miscellaneous Electricity 7.00D 0.1% 278.228 5.4%Other Taxes 69.974 0.8% 550.000 10.7%Paddy husking fee 62.64.5 0.7% 557.980 10.8%Tobacco dealers' license forms 1.724 0.0% 0.0%Registration of real estate agencies 5.69.5 0.1% 0.0%Fines and penalties 0.011) 0.0% 0.0%Others 0.0% 0.0%Refund -0.101) 0.0% 0.0%Share payable to rural councils 0.0% -7.980 -0.2%Total Taxes 9,306.787 100.0% 5,162.302 100.0%
20

ANNEX F
MEDIUM-TERM BUDGET FRAMEWORK:KEY FEATURES AND POTENTIAL BENEFITS
It is widely recognized among countries engaged in budget reform that the traditionalapproach to preparing budgets on a year-to-year basis, with a strict distinction between recurrentand "development" expenditures, is incapable of delivering good outcomes on a sustainable basis.Recent budget reform efforts in a number of countries have therefore been entered on the concept ofa Medium-Term Budget Framework (MTBF).
The MTBF approach aims at enhancing the application of existing budget tools andimproving their effectiveness by arranging them within a new framework which takes a multi-yearplanning perspective and focuses attention on the outputs and outcomes of the budget rather thanthe inputs. The overall objective of MTBF-based budget reform is to improve the quality andsustainability of government service provision in the light of declared national, provincial andsectoral priorities and within the context of a stable macroeconomic framework. Irrespective ofwhether all aspects of a typical MTBF are adopted at the same time, budget reforns which aim toimplement (or consolidate) any of the key component features are in themselves desirable.
THE FIVE MAIN FEATURES OF AN MTBF APPROACH
1. Use of a Multi-Year Planning Framework
Chief characteristic of the MTBF is that it is a "rolling" approach, in the sense thatexpenditures and revenues are estimated and projected over a period of more than one year,typically three to five years. Thus (for an MTBF based on a rolling three-year period), the estimatesfor the first year would be sufficiently detailed to determine specific expenditure allocations forbudget implementation in that year. In addition, an outline of the cost of implementing sectorpolicies (and the various additional elements of public expenditure) would be provided for thefollowing two years, along with an estimate of anticipated resource mobilization (domestic andexternal) over the same period to ascertain consistency with the projected expenditures. During thefollowing year, the process would be repeated, with the previous "year two" becoming the new"year one" (for which detailed allocations would be made), the previous "year three" becoming thenew "year two", and so on.
The importance of a multi-year framework for budget planning is that it establishes greatercertainty and predictability with regard to resource availability over the planning period. Thismechanism allows for an estimate of global resources (domestic and external) to be "allocated" foreach of the sectors over a multi-year period according to inter- and intra-sectoral priorities.
There are two key benefits that result from this process. First, giving sectors or departmentssufficient information on the resources expected to be available to them in following years betterenables them to implement sector expenditure policies as planned and in a sustainable fashion.Second, where departments or sectors intend to engage in policy change through a major re-orientation of expenditures, the greater certainty and predictability of a rolling approach greatly
21
facilitates this. An MTBF based on a firm political commitment to a defined structure of sectoralallocations provides a sound basis for managing budgetary changes over the medium termn.
2. Strengthening of Revenue Forecasting and Macroeconomic Planning Capabilities
A central component of the MTBF is accurate and timely estimation of the resourceenvelope - the domestic revenues and external grants and loans expected to be available to thebudget over the rolling period. Whereas the current approach of the provincial governments is toestimate revenues for the coming budget year alone, an MTBF approach would derive detailedestimates for the forthcoming budget year along with projected estimates for the subsequent twoyears. This component of an MTBF underpins the whole process, as accurate and timelyinformation on resources is essential to ensure that rolling budget plans can be funded.
Projections of domestic resources would be based on: (i) an estimation of the performanceof the macroeconomy (the macro framework); (ii) an estimation of the performance of the local(provincial) economy; (iii) assumptions on the future perfonnance of the macroeconomy and thelocal economy (e.g. expected growth in GDP, etc.) based on economic analysis where this isfeasible (e.g. through the use of a macroeconomic model); (iv) the implications of anticipated policychanges (e.g. lowering of extemal tariffs); and (v) efficiency gains in tax administration.
Projections of available external resources would be based on pledges and commitmentsfrom the international community, as determined through the process of establishing the ADP.However, it is important that the typical delays involved in the initiation, negotiation, andsubsequent disbursement of external financing be taken into account.
3. The Use of Sectoral Expenditure Analysis and Related InstitutionalMechanisms to Restructure Expenditures Toward Strategic Priorities
Under the MTBF, a key objective is to maximize the benefits from public expendituresthrough: (i) reviewing and evaluating the services that are currently funded through publicexpenditures; (ii) determining the services that should be produced according to the objectives ofeach department; (iii) determining an appropriate mix of inputs (e.g. wage and non-wage) toachieve desired objectives; (iv) determining the cost of implementing the programs and activitiesthat would be required to achieve the objectives; and (v) prioritizing departmental/sectoral programsand activities such that objectives can be best achieved within the available resources.
Implementation of this component of budget planning would involve a major departure fromcurrent practice in the provincial governments of Pakistan. The current budget process is based onan implicit assumption that the vast majority of departmental activities, as inherited from previousyears' budgets, are both adequate and optimal. Some 90% of provincial recurrent budgetexpenditure is treated as "permanent", irrespective of whether the corresponding activities meet themost urgent needs in an efficient manner. Under an MTBF, provincial budgets would require a re-analysis and re-justification of all activities - existing and planned. This is sometimes referred to aszero-based budgeting.
The MTBF approach would therefore include implementation of sector reviews (including,where appropriate, review of mission statements for departments). The aim of these would be tofacilitate the design of sector strategies. The reviews and sectcr strategies would also be important
22
in determining the amount of external assistance required over an MTBF period and in helping tosecure access to such resources through the ADP formulation process.
4. Restructuring of Budget Classification and Reporting Systems to PermitExpenditures to be More Transparently Related to Outputs and Outcomes
Budget planning and implementation in the provincial governments has been focused on themanagement of inputs, to the neglect of the outputs these resources are meant to deliver. Ifexpenditures are to be restructured to meet strategic national priorities more effectively, it isessential to re-focus budgets away from the management of inputs and toward the achievement ofoutputs. A crucial step to this end involves a modification of the budget classification structure, withthe ultimate aim of introducing a functional dimension.'
This would be very important to promote a program- and activity-based approach tobudgeting, as it allows programs and activities to be much better defined in budget documents thanan organizational and economic classification allows. It also enables programs and activities to bedefined across departments where more than one department has an input/responsibility. This is notpossible with the current classification system of the provincial governments, thereby making it allbut impossible for decision-makers at cabinet level to digest information on the competing claims ofexpenditure programs (and associated opportunity costs).
In addition, application of program- and activity-based budgeting requires budget allocationsto be linked with performance indicators (e.g. outputs, such as the ratio of trained teachers to pupils,and outcomes, such as changes in the literacy rate). Many budgets - including the provincialgovernment budgets in Pakistan - tend to focus primarily on inputs and give limited information onactivities, outputs and outcomes. Such input-based budgeting puts considerable emphasis oncontrolling expenditure so that it is utilized only for the inputs for which it has been authorizedthrough the budget. To have sufficient information against which to judge different expenditureoptions (and the respective performance of different expenditure allocations), it is necessary to beable to define the activities that are funded through the budget and to analyze the associated outputsthat they generate and resulting policy outcomes.
In the absence of a functional dimension to the classification structure, the organizationalstructure may, in some cases, approximate the required definition of activities. This would be thecase in education for example, where the organizational structure is likely to approximate thefunctions of primary, secondary and tertiary education fairly well (although the respectivedefinitions may be obscured somewhat, for example, by the treatment of expenditures onadministration). In most cases, however, the organizational structure will be insufficient to defineactivities and programs (especially where they cut across departments).
Reform of the classification structure therefore is an important and integral step both in re-focusing the budget toward outputs and outcomes and in facilitating the definition of performancemeasures with which to monitor budget implementation.
1 This implies including in the Charter of Accounts the classification of functions (i.e. outputs) which these expenditureare supposed to perform. This is an objective of the PIFRA project.
23

5. Integration of the Recurrent and Development Budgets
Serious problems in public expenditure management arise from the separation of theprogramming and management of the recurrent and capital (or development) budgets. Wheredevelopment budgets are largely aid-financed and comprise a wider range of development activitiesthan would normally be included in a pure capital investment budget, these problems can be wide-ranging and detrimental to sound budget management. The provincial governments in Pakistan areno exception to this pattern. There is a sharp separation, in terms of procedures and administrativeresponsibilities, between the programming and management of the recurrent budget, on the onehand, and the development budget and the Annual Development Program (ADP), on the other. Thissystem suffers from a number of inadequacies:
* The separate programming of the development and recurrent budgets often createsinconsistencies and contradictions in expenditure priorities.
* Development budget projects are often embarked upon without reference to the futurerecurrent resource requirements to run them (for exaample, new school facilities may beconstructed without assessing the future availability of trained teachers, and funding fortheir salaries, instruction materials, and school maintenance funds).
- Development budgets typically contain a number of projects that are recurrent in nature,potentially leading to duplication of funding with the recurrent budget andinconsistencies in the application of public service norms relating to salaries, allowancesand other recurrent costs.
- Development projects are often donor-driven and therefore correspond to donors'perception of priorities rather than to a national definition of needs and priorities.
- The poor links between resource requirements and resource availability create atendency to embark on new projects at the cost of not completing on-going projects.
One of the aims of an MTBF approach is to improve the linkages between the recurrentbudget and the development budget in order to address the above problems. In particular, an MTBFapproach will lead to integrated planning of the two components of the budget so that resources areallocated more effectively to priority activities and proper provitsion is made for the recurrent costsof investments. This process can be greatly facilitated by information from sector reviews, whichidentify the resource requirements for priority activities and programs, regardless of whether thenature of the expenditure involved is recurrent or capital. This can help ensure that capitalexpenditures are fully consistent with the future resource requixements for completing projects andsubsequently operating and maintaining the facilities and service networks created. In sum, anMTBF would aim to have a unified budget comprising both recurrent and capital components.
POTENTIAL BENEFITS OF AN MTBF.APPROACH
The MTBF provides a framework for budget reform to facilitate a more effective andefficient allocation of resources to achieve the government's strategic objectives. While it will takesome time to implement in full, significant improvements are achievable even in the short run. Thekey benefits of an MTBF approach can be summarized as follows:
24

* greater certainty over the level of available resources, permitting clear-cut decisions overwhat can and cannot be funded and hence a stronger guarantee to sector departments offunds being made available in line with budgets;
* enhanced participation and "ownership" among line departments in the budget processas a result of its improved predictability and consistency;
* improved management of the overall resources available to the budget, implying bothenhanced allocations to priority sectors and more efficient management of funds;
* greater consistency between macroeconomic performance, policy formulation, andpublic expenditure;
* a better-defined and more detailed budget calendar, fully respected by all spendingagencies and central ministries;
* greater transparency of budgetary allocations and procedures and increased clarity on theexpected outcomes of public expenditure;
* improvement in the quality and efficiency of service delivery by refocusing the attentionof departments on the outputs and planned outcomes of expenditures;
* integrated planning and programming of the recurrent and development budgets, withthe ultimate aim of unifying them into one budget with recurrent and capitalcomponents; and
* explicit inclusion of all development resources (both internal and external) in the budgetprocess.
25
ANNEX G
THE PROPERTY TAX'
The Urban Immovable Property Tax (UIPT - commonly called the Property Tax) is a proxytax for user charges for provision of services, including solid waste disposal and maintenance ofinfrastructure like roads and parks. The tax is essentially a provincially administered tax, whoserevenues are shared with local bodies. While the local governments can request extension in rating(or taxed) areas under their jurisdiction, the provincial Excise and Taxation departments areresponsible for assessment and collection of tax at provincially determined rates. The provincialgovernment retains a total of 19.25% of gross collections (5% as collection charges and 15% of theremaining 95% as their share in revenue), while the remaining 80.75% of revenue is transferred tothe ULBs on the basis of collections. As described in Chapter 5, the contribution of the urbanimmovable property tax to the total revenue of local governments in urban areas has rangedbetween 3-5% in recent years, having declined from 8-10% before the early 1990s.
The structure of this tax is such that only constructed properties become liable for UIPT.Moreover, liberal exemptions and lighter taxation of owner-occupied properties have eroded the taxbase. Nevertheless, a combination of tax restructuring and phased withdrawal of some exemptionsin Punjab (and partially in Sindh)l has broadened the base and has narrowed of the gap between thevaluations of self-occupied and rented properties (from a factor of 1:10 to 1:6 in the Punjab).
Exemptions have been granted on the basis of ownership (government, widows, orphans,retired government servants) or size of property (plot size or constructed area - parcels of land witharea less than 100 square yards), and a standard exemption limit or threshold level of propertyvalues (ARV). As a result of these exemptions, only 55-60% of properties are actually assessed fortax.2
WEAKNESSES IN EXISTING STRUCTURE OF PROPERTY TAX
In addition to the generous exemptions, the proper,ty tax suffers from a number ofweaknesses, some of which are discussed below:
(1) In Sindh the tax structure has become unnecessarily complex because of multiple taxes onthe same property. There is a property tax, and on top of it there is a betterment tax plus asurcharge and an additional surcharge.
(2) Physical survey of properties was last conducted in Karachi in 1968, and even newproperties are being valued at rates last determined in 1 977/78. As a result, even within thecity, the Cantonment Board is valuing similar properties with a two-fold difference in ratesfor property tax purposes. Partly because of irregular assessments of property values andpartly because of the formula used by the provincial Excise and Taxation Departments toassess property values for tax purposes, the system currently in place in Karachi merely
'For example, removal of the three-year exemption for newly constructed owvner-occupied properties.2 For instance, in Karachi out of one million properties in the registers of the Excise and Taxation Department, around600,000 are liable for tax.
26

captures 5-10% of the market value of the properties. As a result, collections of property taxfrom existing properties have fallen dramatically in real terms.
(3) Since the rates used by the provincial governments of Sindh and Punjab for valuing self-occupied properties are in terms of nominal rupees per bedroom or per square foot, thebuoyancy and elasticity of the property tax are greatly reduced.
(4) Although the occupants of a property in a particular locality have access to the same level ofservices, the existing tax structure discriminates heavily against rented properties. Theassessed rental values of self-occupied properties for determining tax liability aresubstantially lower than those for rented properties with similar status in terms of plot sizeand physical condition.
(5) Outdated assessment procedures create large anomalies in the tax structure. For example, thebuilt-in bias in the assessment system of Punjab taxes old properties at disproportionatelylow rates.
(6) There is little difference in the prescribed rates for valuing properties between differentareas, despite large differentials in their market values. For instance, whereas the marketvalue of properties in the Clifton area of Karachi is (on average) almost four times that ofproperties in Nazimabad, the difference in the assessed (average) annual rental values isonly 7%.
(7) The per bedroom rates for self-occupied properties also are inequitable. The prescribedrates are regressive in their incidence, being biased in favor of large, independent, owner-occupied properties in localities colonized by the more privileged segments of thepopulation. As the size of a property rises there is a fall in the rate of increase in propertytax. Moreover, this trend worsens for properties in better physical condition. In Karachi, forinstance, with an increase in property area e.g. from 200 square yards to 1,000 square yards,the annual rental value increases by only 2 to 3.5 times. In Nazimabad, as against a 218%increase in area, the ARV rises by only 50%. Moreover, for each subsequent slab theregressivity of the tax rate structure increases. Similarly, tax rates applicable to apartmentsare based on covered area, and the locality in which apartments are located is not taken intoaccount.
(8) The pro-rich bias in the structure of property tax runs throughout the law. For example,legislation in Punjab exempts from property tax properties belonging to widows and orphanswith the following characteristics: (1) commercial properties with GARV < Rs 12,000; and(2) residential house, whether self-occupied or rented. Widows and orphans from moreprivileged backgrounds are likely to qualify for tax exemption under the second criterion, asthey would be owners of residential property in the more affluent localities, whereas widowsand orphans from the middle classes are more likely to own commercial properties fallingunder category (a), and are liable to property tax if the Gross ARV exceeds a mere Rs12,000.
(9) Prime commercial centers pay only nominal property tax, simply because the rates fordetermining the Annual Rental Value of commercial properties have been derived on the
27
basis of imputed monthly rental changes. The rates, however, fail to take into considerationthe "Pugree" (goodwill or key money) that these comrnercial properties attract.
(10) Currently only 15-20% of regularized Katchi Abadis in Karachi and Lahore fall within theproperty tax net.
(11) The property tax assessment procedure also introduces a distortion into the structure ofwater tariffs. In Karachi, outdated valuations also affect the conservancy and the fire rates.Charges for water in the case of unmetered connections are linked to the ARV assessed bythe Excise and Taxation Department. Given infrequent valuations, this acts as a drag on theyield from user charges for these services.
(12) Generally, new rating areas are not notified at the sane pace at which metropolitan limitsare extended. However, the Excise and Taxation Departrnent in Punjab has recently notifiednew rating areas for property tax purposes by extending existing municipal limits to theboundaries prescribed for LDA.
(13) Widespread collusion between tax collectors and taxpayers also keeps the yield fromproperty tax low.
(14) The incentive for the provincial governments to exploit the full revenue potential of a robustand buoyant instrument like property tax is weak because they are only entitled to a 15%share in the revenues while having to bear the entire political fall-out of this sensitive andemotive tax. As a result, the revenue generating potential of the property tax remains largelyunrealized. The only incentive features of relevance to provincial governments includepolicy improvement, their share of 15% in the revenue from property tax, and the cash flowadvantages of holding on to property tax proceeds for some time before transferring them tolocal governments.
(15) Although property tax collections are to be passed on to the local bodies, the latter complainthat transfers from the provincial government are not regular. Reconciliations have not beencarried out between the two tiers of governnent on property tax collections from differentrating areas. Such a state of affairs raises a question about whether property tax levy andcollection should not rest with the local councils. The Government of Punjab has taken amajor step in this direction by giving the Metropolitan Corporation of Lahore (MCL) themandate to levy and collect property tax in two zones of the city. The results of this effortwill enable the government to assess both the capacity of MCL and the potential forimproving the efficiency of collection by empowering local councils to levy and collectproperty tax.
28

STATISTICAL ANNEX

Table 1A: All Provinces - Current Revenues(Rs Million)
1987/88 1988/89 1989/90 1990/91 199.1/92 1992/93 1993/94 1994/95 1995196 1996/97 1997/98Actual Actual Actual Actual Actual Actual Actual Actual Actual Actual Actual
TOTAL REVENUE RECEIPTS 39,669 43,289 46,676 53,298 77,879 89,009 103,799 124,247 150,454 163,769 155,305TAXREVENUE 21,075 28,651 35,951 38,808 64,378 72,025 87,481 106,104 132,061 145,518 128,517Federal tax assignments 16,585 23,858 30,705 33,527 57,986 65,088 80,105 96,777 120,446 131,577 114,635Income and corporation tax 9,232 10,207 11,885 14,312 19,417 25,462 32,216 40,660 53,584 62,879 32,753Sales tax 6,053 10,610 14,740 15,200 16,340 18,224 24,396 32,541 37,925 42,560 18,797Others 1,300 3,041 4,080 4,015 22,229 21,402 23,493 23,576 28,937 26,138 63,085Customs 0 1,786 2,755 2,614 1,546 380 331 20 0 0 26,550Excise duty & Royalty on Natural Gas 1,300 1,255 1,325 1,401 1,346 1,921 2,370 3,239 4,777 5,523 6,395Surcharge on Natural Gas/petro./ferti. 0 0 0 0 7,398 7,710 8,747 8,055 9,399 5,365 6,236Other Federal Excise Duties 0 0 0 0 1 1,440 11,391 12,045 12,252 14,761 15,250 22,434Gift tax\Wealth\CVT 0 0 0 0 0 0 0 10 0 0 1,470
Provincial taxes 4,489 4,793 5,245 5,282 6,391 6,937 7,377 9,327 11,615 13,941 13,883Direct taxes 924 1,084 1,226 1,035 1,432 1,731 1,885 2,065 2,602 3,758 4,147Urban immovable property tax 239 336 307 95 275 569 635 484 505 1,377 1,191Agriculture income tax 0 0 0 0 0 0 0 0 1 150 781Registration fee 200 196 225 215 236 230 212 282 382 380 379Landrevenue(tax) 398 469 574 623 8:07 816 917 1,131 1,504 1,628 1,521Capital gains tax 12 6 5 4 4 2 2 2 1 2 1
Taxesonprofes. tradesandcallings 74 77 115 98 110 114 118 165 209 220 274Indirect taxes 3,565 3,709 4,019 4,247 4,559 5,207 5,492 7,263 9,013 10,183 9,736Motor vehicle tax 855 891 981 1,077 1,157 1,305 1,246 1,637 1,668 1,931 2,124Stamp duties 1,671 1,778 2,053 2,222 2,634 2,618 2,876 3,405 4,213 4,463 4,815Entertainment tax 210 210 221 210 193 182 211 228 198 262 268Electricityduties 328 297 210 67 153 314 257 871 1,211 1,224 358Hotel tax 40 46 45 102 63 84 82 190 147 182 196Provincial excises 165 198 225 289 377 452 550 502 825 949 920Education cess 38 34 26 33 31 17 22 17 98 5 243Cotton cess 230 221 226 216 319 217 218 238 369 304 306Other 29 35 32 30 34 17 29 175 284 863 505
NON-TAXRECEIPTS 18,594 14,638 10,725 14,489 13,592 16,984 16,318 18,143 18,392 18,251 26,787
Interest 214 297 111 147 2.32 133 190 335 403 99 1,480Dividends 13 10 19 24 20 42 176 14 22 42 54Civil Administration Receipts 503 520 499 603 8:53 937 1,021 1,117 1,315 1,180 1,214
General Administration 93 129 128 136 111 203 219 223 283 202 210Law and Order 410 391 371 466 672 735 802 894 1,032 979 1,004
User Charges 3,114 3,124 3,409 3,823 9,3t6 10,587 9,610 12,249 12,006 11,956 11,983Community Services 285 257 300 424 515 511 516 658 668 714 870
Works 238 249 191 125 234 395 343 420 435 354 320Public Health 47 39 50 52 "II 95 86 112 101 128 143
Social Services 576 711 754 895 98:9 874 1,160 1,052 1,190 1,566 1,605Education 299 411 401 599 641 520 783 615 713 1,018 1,018Health 123 138 145 151 1i9 200 223 249 273 373 402Others 153 161 208 145 HtO 154 154 188 205 176 185
Economic Services 2,230 2,035 2,190 2,386 2,352 2,505 2,806 3,080 3,596 3,676 4,054Irrigation (largely water charges) 1,121 1,002 985 1,149 976 956 1,221 1,292 1,806 1,986 2,276Others 1,109 1,033 1,205 1,237 1,416 1,550 1,585 1,788 1,790 1,691 1,779
Others 23 121 164 117 5,420 6,696 5,127 7,459 6,552 6,000 5,454Exciseduty on minerals 23 121 156 117 270 556 95 112 13 0 12Physical, Planning and Housing 0 0 8 0 0 0 0 0 0 0 0Electricity Profits from WAPDA 0 0 0 0 5,150 6,140 5,032 7,347 6,539 6,000 5,442
Grants 13,628 9,712 5,498 8,548 1,762 3,821 3,216 2,761 1,929 1,982 7,724Federal Govemment 13,628 9,712 3,650 8,548 1,762 3,821 3,216 2,761 1,929 1,982 7,724Foreign 0 1 0 0 1 0 0 0 0 0 0
Others 1,121 974 1,190 1,345 1,31) 1,463 2,105 1,667 2,718 2,992 4,332Source: Provincial current receipts table.
1
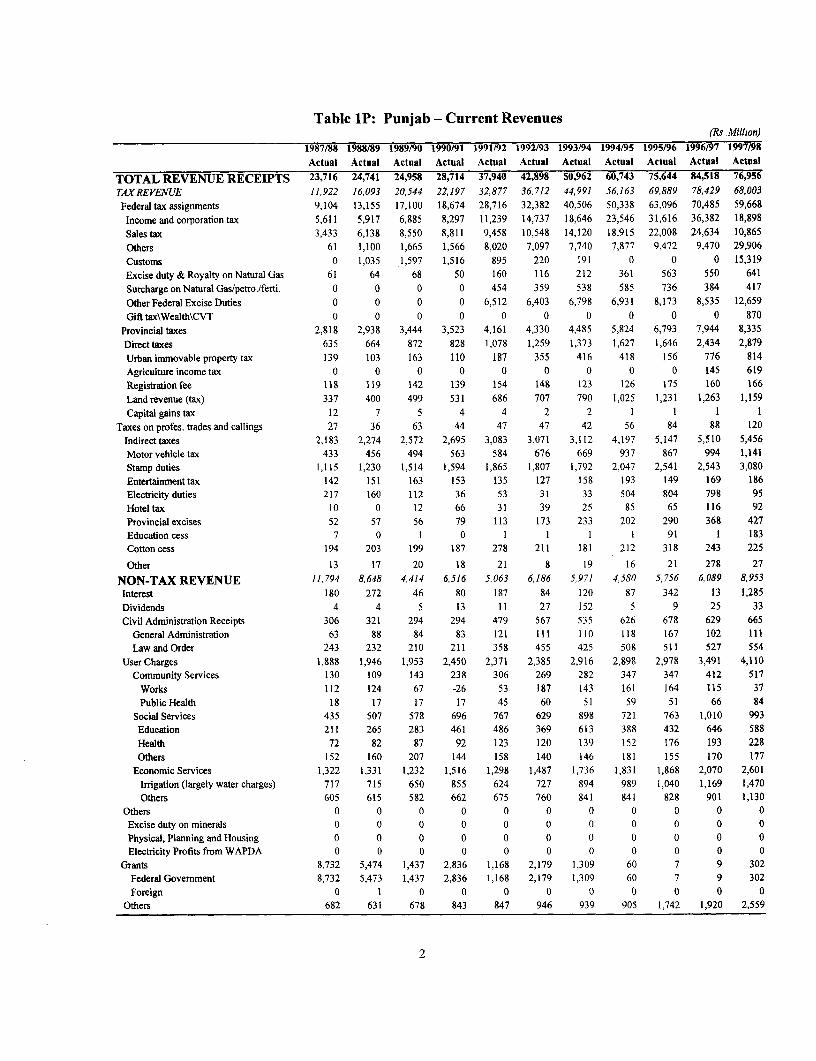
Table IP: Punjab - Current Revenues(Rs .Million)
1987/88 1988/89 1989/90 1990/91 1991/92 1992/93 1993/94 1994/95 1995/96 1996/97 1997/98Actual Actual Actual Actual Actual Actual Actual Actual Actual Actual Actual
TOTAL REVENUE RECEIPTS 23,716 24,741 24,958 28,714 37,940 42,898 50,962 60,743 75,644 84,518 76,956TAXPREVENUE 11,922 16,093 20,544 22,197 32,877 36,712 44,991 56,163 69,889 78,429 68,003
Federal tax assignments 9,104 13,155 17,100 18,674 28,716 32,382 40,506 50,338 63,096 70,485 59,668
Income and corporation tax 5,611 5,917 6,885 8,297 11,239 14,737 18,646 23,546 31,616 36,382 18,898
Salestax 3,433 6,138 8,550 8,811 9,458 10,548 14,120 18,915 22,008 24,634 10,865
Others 61 1,100 1,665 1,566 8,020 7,097 7,740 7,877 9,472 9,470 29,906
Customs 0 1,035 1,597 1,516 895 220 191 0 0 0 15,319
Exciseduty&RoyaltyonNaturalGas 61 64 68 50 160 116 212 361 563 550 641
Surcharge on Natural Gas/petro./ferti. 0 0 0 0 454 359 538 585 736 384 417
OtherFederal Excise Duties 0 0 0 0 6,512 6,403 6,798 6,931 8,173 8,535 12,659
Gift tax\Wealth\CVT 0 0 0 0 0 0 0 0 0 0 870
Provincial taxes 2,818 2,938 3,444 3,523 4,161 4,330 4,485 5,824 6,793 7,944 8,335
Direct taxes 635 664 872 828 1,078 1,259 1,373 1,627 1,646 2,434 2,879
Urbanimmovablepropertytax 139 103 163 110 187 355 416 418 156 776 814
Agriculture income tax 0 0 0 0 0 0 0 0 0 145 619
Registration fee 118 119 142 139 154 148 123 126 175 160 166
Land revenue (tax) 337 400 499 531 686 707 790 1,025 1,231 1,263 1,159Capital gains tax 12 7 5 4 4 2 2 1 1 1 1
Taxes on profes. trades and callings 27 36 63 44 47 47 42 56 84 88 120Indirecttaxes 2,183 2,274 2,572 2,695 3,083 3,071 3,112 4,197 5,147 5,510 5,456
Motor vehicle tax 433 456 494 563 584 676 669 937 867 994 1,141Stamp duties 1,115 1,230 1,514 1,594 1,865 1,807 1,792 2,047 2,541 2,543 3,080
Entertainment tax 142 151 163 153 135 127 158 193 149 169 186
Electricity duties 217 160 112 36 53 31 33 504 804 798 95
Hoteltax 10 0 12 66 31 39 25 85 65 116 92
Provincial excises 52 57 56 79 113 173 233 202 290 368 427Education cess 7 0 1 0 1 1 1 1 91 1 183Cottoncess 194 203 199 187 278 211 181 212 318 243 225
Other 13 17 20 18 21 8 19 16 21 278 27
NON-TAX REVENUE 11,794 8,648 4,414 6,516 5,063 6,186 5,971 4,580 5,756 6,089 8,953Interest 180 272 46 80 187 84 120 87 342 13 1,285
Dividends 4 4 5 13 11 27 152 5 9 25 33
Civil Administration Receipts 306 321 294 294 479 567 535 626 678 629 665
General Administration 63 88 84 83 121 111 110 118 167 102 111Law and Order 243 232 210 211 358 455 425 508 511 527 554
User Charges 1,888 1,946 1,953 2,450 2,371 2,385 2,916 2,898 2,978 3,491 4,110Community Services 130 109 143 238 306 269 282 347 347 412 517
Works 112 124 67 -26 53 187 143 161 164 115 37
Public Health 18 17 17 17 45 60 51 59 51 66 84
Social Services 435 507 578 696 767 629 898 721 763 1,010 993Education 211 265 283 461 486 369 613 388 432 646 588
Health 72 82 87 92 123 120 139 152 176 193 228
Others 152 160 207 144 158 140 146 181 155 170 177Economic Services 1,322 1,331 1,232 1,516 1,298 1,487 1,736 1,831 1,868 2,070 2,601
Irrigation (largely water charges) 717 715 650 855 624 727 894 989 1,040 1,169 1,470
Others 605 615 582 662 675 760 841 841 828 901 1,130Others 0 0 0 0 0 0 0 0 0 0 0Excise dutyon minerals 0 0 0 0 0 0 0 0 0 0 0
Physical, Planning and Housing 0 0 0 0 0 0 0 0 0 0 0
Electricity Profits from WAPDA 0 0 0 0 0 0 0 0 0 0 0Grants 8,732 5,474 1,437 2,836 1,168 2,179 1,309 60 7 9 302
Federal Government 8,732 5,473 1,437 2,836 1,168 2,179 1,309 60 7 9 302Foreign 0 1 0 0 0 0 0 0 0 0 0
Others 682 631 678 843 847 946 939 905 1,742 1,920 2,559
2

Table IS: Sindh - Curreni Revenues(Rs .Milion)
1987/88 1988/89 1989/90 1990/91 1991/92 1992/93 1993/94 1994/95 1995/96 1996/97 1997/98Actual Actual Actual Actual Actual Actual Actual Actual Actual Actual Actual
TOTAL REVENUE RECEIPTS 6,116 7,970 9,480 10,467 18,147 21,334 26,389 32,083 38,427 41,272 37,760TAXREVENEUE 5,029 6,998 8,482 9,249 16,536 18,397 22,903 27,523 34,630 38,879 34,948Federal tax assignments 3,746 5,530 7,150 7,916 14,982 16,410 20,685 24,797 30,801 34,027 30,532Income and corporation tax 2,011 2,382 2,777 3,340 4,520 5,927 7,500 9,471 11,677 14,655 7,650Sales tax 1,455 2,483 3,438 3,548 3,1i04 4,243 5,679 7,608 8,754 9,908 4,370Others 280 664 935 1,028 6,658 6,240 7,506 7,718 10,370 9,464 18,512Customs 417 643 610 -60 88 77 0 0 0 6,161Excise duty & Royalty on Natural Gas 280 247 292 418 679 679 869 1,357 2,182 2,689 3,109Surcharge on Natural Gas/petro.lferti. 0 0 0 0 2,629 2,432 3,372 3,175 4,105 2,650 3,097Other Federal Excise Duties 0 0 0 0 2,990 3,041 3,188 3,186 4,082 4,125 5,848Gift tax\Wealth\CVT 297
Provincial taxes 1,284 1,468 1,332 1,333 1,654 1,987 2,217 2,727 3,829 4,852 4,416Direct taxes 225 356 280 117 229 359 399 291 696 974 920Urban immovable propertytax 78 219 127 -31 64 185 196 4 312 526 305Agriculture income tax 0 0 0 0 0 0 0 0 0 0 110Registration fee 75 69 66 63 56 68 80 138 192 208 196Land revenue (tax) 26 28 34 33 39 41 52 48 76 116 166Capital gains tax 0 -1 0 0 0 0 0 0 0 0 0
Taxes on profes. trades and callings 47 41 52 51 59 64 72 101 116 123 142Indirect taxes 1,058 1,112 1,053 1,216 1,426 1,628 1,818 2,435 3,133 3,878 3,497Motor vehicle tax 253 255 284 318 344 400 334 438 486 562 570Stamp duties 473 463 439 510 639 675 949 1,130 1,478 1,733 1,580Entertainment tax 60 52 50 50 48 43 44 26 40 84 72Electricityduties 64 112 22 27 :I 174 71 252 267 284 244Hotel tax 29 39 31 34 29 42 53 101 74 58 75Provincial excises 106 132 164 206 2'5 264 301 289 475 518 431Education cess 31 33 26 33 0 16 21 16 7 3 6Cotton cess 36 18 27 30 40 7 37 26 50 61 81Other 7 7 10 9 9 6 8 156 257 574 437
NON-TAXREVENUE 1,087 972 998 1,218 1,51J 2,937 3,487 4,560 3,796 2,394 2,811Interest 3 2 3 3 2 3 3 221 3 3 83Dividends 0 0 1 1 2 2 1 1 4 3 3Civil Administration Receipts 127 119 119 218 244 225 305 322 435 386 355
General Administration 10 16 17 25 29 38 37 40 42 49 45LawandOrder 117 103 102 193 215 186 269 281 393 337 310
User Charges 704 624 686 690 962 1,119 748 826 1,156 1,167 1,188Community Services 60 57 56 76 87 91 102 141 130 130 145
Works 48 51 45 64 83 88 99 132 117 120 134PublicHealth 12 6 11 12 4 4 4 9 14 9 11
Social Services 99 124 129 145 153 170 183 236 290 272 282Education 69 91 95 111 1Z2 124 131 172 196 202 201Health 31 33 34 34 315 46 49 60 46 65 76Others 0 0 0 1 1 1 3 4 48 4 5
Economic Services 522 322 345 351 4465 301 368 337 723 766 749Irrigation (largely water charges) 346 214 239 228 279 156 235 200 582 617 622Others 177 108 106 123 167 146 133 137 141 149 126
Others 23 121 156 117 270 556 95 112 13 0 12Excise duty on minerals 23 121 156 117 270 556 95 112 13 0 12Physical, Planning and Housing 0 0 0 0 0 0 0 0 0 0 0Electricity Profits from WAPDA 0 0 0 0 0 0 0 0 0 0 0
Grants 0 0 0 0 (0 1,320 1,559 2,689 1,490 260 0Federal Government 0 0 0 0 0 1,320 1,559 2,689 1,490 260 0Foreign 0 0 0 0 C0 0 0 0 0 0 0
Others 252 227 189 307 301 269 870 502 709 574 1,182
3

Table IN: NWFP - Current Revenues(Rs Million)
1987/88 1988/89 1989/90 1990/91 1991/92 1992/93 1993/94 1994/95 1995/96 1996/97 1997/98Actual Actual Actual Actual Actual Actual Actual Actual Actual Actual Actual
TOTAL REVENUE RECEIPTS 6,205 6,586 7,297 9,680 13,393 15,330 16,167 20,810 23,089 24,700 25,016TAX REVENUE 2,301 3,325 4,289 4,645 6,874 7,852 9,724 12,092 15,122 17,034 14,416Federal tax assignments 1,989 3,031 3,934 4,301 6,444 7,366 9,189 11,465 14,345 16,134 13,554Income and corporation tax 1,154 1,367 1,593 1,916 2,629 3,448 4,362 5,508 7,396 8,511 4,419Sales tax 835 1,425 1,972 2,035 2,212 2,468 3,303 4,425 5,148 5,763 2,542Others 0 239 369 350 1,603 1,451 1,524 1,532 1,801 1,861 6,594Customs 0 239 369 350 209 51 45 0 0 0 3,584Excise duty & Royalty on Natural Gas 0 0 0 0 0 0 0 0 0 0 0Surcharge on Natural Gas/petro./ferti. 0 0 0 0 0 0 0 0 0 0 0Other Federal Excise Duties 0 0 0 0 1,393 1,399 1,479 1,522 1,801 1,861 2,807Gift tax\Wealth\CVT 0 0 0 0 0 0 0 10 0 0 203
Provincial taxes 312 295 355 344 430 486 535 626 777 900 862Direct taxes 51 49 54 72 87 82 86 116 221 303 291Urban immovable property tax 17 8 9 8 14 15 12 51 21 56 54Agriculture income tax 0 0 0 0 0 0 0 0 1 5 42Registration fee 4 4 11 7 10 7 5 11 8 5 7Land revenue (tax) 30 37 34 55 60 58 65 47 183 228 177Capital gainstax 0 0 0 0 0 0 0 0 0 0 0
Taxes on profes. trades and callings 0 0 0 2 3 3 4 7 8 8 11Indirect taxes 261 246 301 272 343 403 449 511 556 597 570Motorvehicletax 135 133 141 155 165 171 184 184 221 281 312Stampduties 70 69 82 102 103 117 104 204 169 149 116Entertainment tax 3 4 5 5 5 5 5 5 5 4 7Electricity duties 46 19 64 1 60 100 146 106 140 142 7Hotel tax 0 7 3 3 3 3 4 4 8 8 29Provincial excises 4 4 4 4 4 5 5 6 9 9 12Education cess 0 0 0 0 0 0 0 0 0 1 54Cotton cess 0 0 0 0 0 0 0 0 0 0 0Other 3 10 2 2 2 1 1 1 4 3 34
NON-TAXUREVENUE 3,903 3,261 3,008 5,035 6,519 7,478 6,443 8,719 7,967 7,666 10,600Interest 25 19 62 64 38 45 67 27 57 82 112Dividends I 1 12 5 6 7 13 3 3 13 10Civil Administration Receipts 55 65 67 77 102 121 147 135 154 132 152
General Administration 18 25 25 27 30 52 71 63 72 47 52Law and Order 37 40 41 50 72 70 76 72 82 85 101
User Charges 388 410 569 559 5,829 6,929 5,786 8,290 7,583 7,141 6,484Community Services 69 80 85 95 107 133 121 137 173 164 197
Works 52 65 68 75 86 112 93 107 140 114 149Public Health 18 15 17 20 21 21 28 30 33 51 48
Social Services 33 37 39 40 46 65 59 80 118 264 304Education 16 16 18 18 21 23 26 47 75 159 217Health 17 20 21 22 25 29 29 32 41 104 86Others 0 0 0 0 1 13 4 2 2 1 2
Economic Services 285 293 445 424 525 591 574 726 753 713 540Irrigation (largely water charges) 38 50 60 50 51 53 71 77 123 148 144Others 247 243 385 374 474 538 503 649 630 564 396
Others 0 0 0 0 5,150 6,140 5,032 7,347 6,539 6,000 5,442Excise duty on minerals 0 0 0 0 0 0 0 0 0 0 0Physical, Planning and Housing 0 0 0 0 0 0 0 0 0 0 0Electricity Profits from WAPDA 0 0 0 0 5,150 6,140 5,032 7,347 6,539 6,000 5,442
Grants 3,283 2,675 2,213 4,165 414 205 217 12 5 5 3,338Federal Govemment 3,283 2,675 2,213 4,165 414 205 217 12 5 5 3,338Foreign 0 0 0 0 0 0 0 0 0 0 0
Others 151 91 85 165 130 170 212 252 165 293 504
4
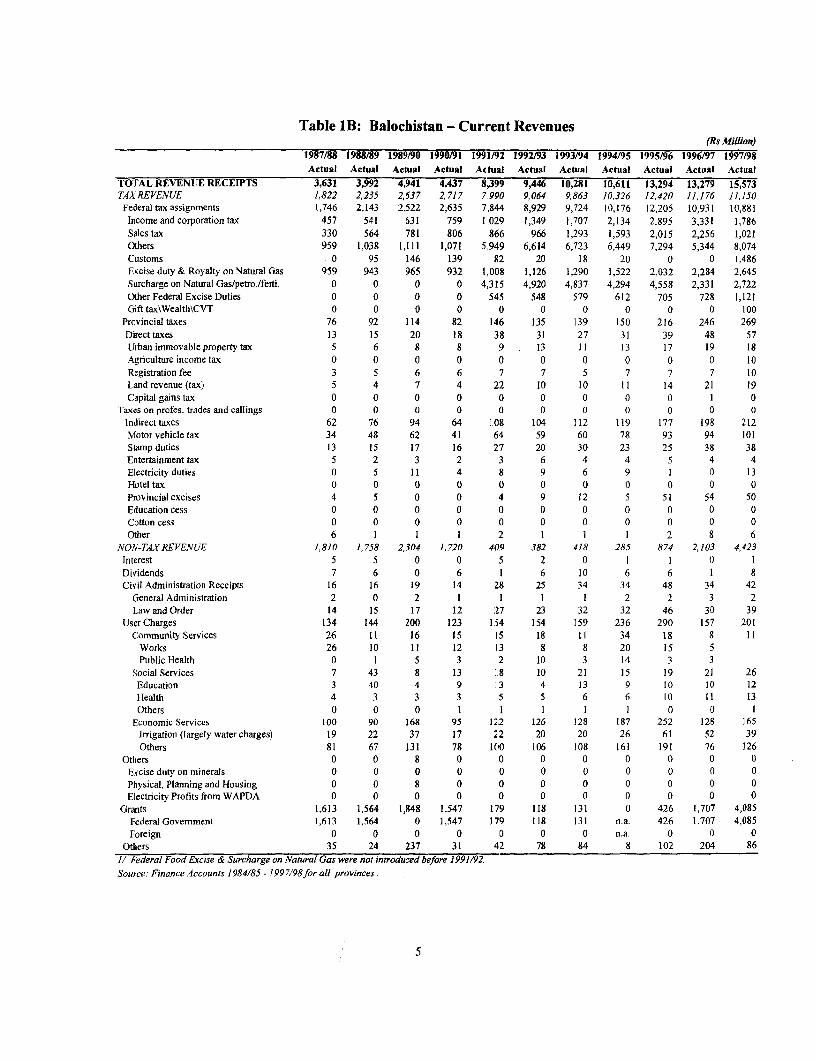
Table 1B: Balochistan - Current Revenues(Rs Million)
1987/88 1988/89 1989/90 1990/91 1991/92 1992/93 1993/94 1994/95 1995/96 1996/97 1997/98Actual Actual Actual Actual Actual Actual Actual Actual Actual Actual Actual
TOTAL REVENUE RECEIPTS 3,631 3,992 4,941 4,437 8,399 9,446 10,281 10,611 13,294 13,279 15,573TAX REVENUE 1,822 2,235 2,637 2,717 7990 9,064 9,863 10,326 12,420 11,176 11,150Federal tax assignments 1,746 2,143 2,522 2,635 7,844 8,929 9,724 10,176 12,205 10,931 10,881Income and corporation tax 457 541 631 759 1,029 1,349 1,707 2,134 2,895 3,331 1,786Sales tax 330 564 781 806 866 966 1,293 1,593 2,015 2,256 1,021Others 959 1,038 1,111 1,071 5.949 6,614 6,723 6,449 7,294 5,344 8,074Customs 0 95 146 139 82 20 18 20 0 0 1,486Excise duty & Royalty on Natural Gas 959 943 965 932 1,008 1,126 1,290 1,522 2,032 2,284 2,645Surcharge on Natural Gas/petro./ferti. 0 0 0 0 4,315 4,920 4,837 4,294 4,558 2,331 2,722Other Federal Excise Duties 0 0 0 0 545 548 579 612 705 728 1,121Gift tax\Wcalth\CVT 0 0 0 0 0 0 0 0 0 0 100
Provincial taxes 76 92 114 82 146 135 139 150 216 246 269Direct taxes 13 15 20 18 38 31 27 31 39 48 57Urbanimmovablepropertytax 5 6 8 8 9 13 11 13 17 19 18Agriculture income tax 0 0 0 0 0 D 0 0 0 0 10Registration fee 3 5 6 6 7 7 5 7 7 7 10Land revenue (tax) 5 4 7 4 22 10 10 11 14 21 19Capital gains tax 0 0 0 0 0 0 0 0 0 1 0
Taxes on profes. trades and callings 0 0 0 0 0 D 0 0 0 0 0Indirecttaxes 62 76 94 64 :.08 104 112 119 177 198 212Motorvehicle tax 34 48 62 41 64 59 60 78 93 94 101Stamp duties 13 15 17 16 27 20 30 23 25 38 38Entertainment tax 5 2 3 2 3 6 4 4 5 4 4Electricity duties 0 5 11 4 8 9 6 9 1 0 13Hotel tax 0 0 0 0 0 0 0 0 0 0 0Provincial excises 4 5 0 0 4 9 12 5 51 54 50Education cess 0 0 0 0 0 0 0 0 0 0 0Cottoncess 0 0 0 0 0 0 0 0 0 0 0Other 6 1 1 1 2 1 1 1 2 8 6
NON-TAXREVENUE 1,810 1,758 2,304 1,720 409 382 418 285 874 2,103 4,423Interest 5 5 0 0 5 2 0 1 1 0 1Dividends 7 6 0 6 1 6 10 6 6 1 8Civil Administration Receipts 16 16 19 14 28 25 34 34 48 34 42
General Administration 2 0 2 1 1 1 1 2 2 3 2Law and Order 14 15 17 12 27 23 32 32 46 30 39
UserCharges 134 144 200 123 154 154 159 236 290 157 201CommunityServices 26 11 16 is 15 I1 11 34 18 8 11
Works 26 10 I1 12 13 8 8 20 15 5Public Health 0 1 5 3 2 10 3 14 3 3
Social Services 7 43 8 13 :.8 10 21 15 19 21 26Education 3 40 4 9 3 4 13 9 10 10 12Health 4 3 3 3 5 5 6 6 10 11 13Others 0 0 0 1 1 1 I 1 0 0 1
Economic Services 100 90 168 95 122 126 128 187 252 128 165Irrigation (largely water charges) 19 22 37 17 i2 20 20 26 61 52 39Others 81 67 131 78 1(0 106 108 161 191 76 126
Others 0 0 8 0 0 D 0 0 0 0 0Excisedutyon minerals 0 0 0 0 0 0 0 0 0 0 0Physical, Planning and Housing 0 0 8 0 0 0 0 0 0 0 0Electricity Profits from WAPDA 0 0 0 0 0 0 0 0 0 0 0
Grants 1,613 1,564 1,848 1,547 179 118 131 0 426 1,707 4,085Federal Govemment 1,613 1,564 0 1,547 179 118 131 n.a. 426 1,707 4,085Foreign 0 0 0 0 0 0 0 n.a. 0 0 0
Others 35 24 237 31 42 78 84 8 102 204 861/ Federal Food Excise & Surcharge on Natural Gas were not introduced before 1991/92.
Source: Finance Accounts 1984/85 - 1997/98for all provinces.
5

Table 2A: AUl Provinces Total Expenditures(Rs Million)
1987/88 1988/89 1989/90 1990/91 1991/92 1992/93 1993/94 1994/95 1995/96 1996/97 1997/98Actual Actual Actual Actual Actual Actual Actual Actual Actual Actual Actual
TOTAL EXPENDITURES 62,988 62,796 69,638 84,909 101,346 109,115 114,554 146,630 167,969 158,466 166,827General Administration 4,577 6,012 5,284 5,927 7,644 9,449 9,513 17,083 29,134 25,407 18,972Law & order 4,245 4,583 4,610 6,401 8,366 9,047 10,425 12,683 13,512 13,603 15,003Defense - - - -Social services 16,285 16,954 18,819 24,026 29,438 32,183 36,462 44,732 49,207 49,533 57,384
Education 11,771 12,381 13,417 17,241 21,435 23,272 27,294 33,115 36,688 36,990 43,323Primnary 5,176 5,751 6,342 8,321 10,613 11,462 13,295 15,946 18,229 19,004 23,404Secondary 2,982 3,241 3,318 4,387 5,015 5,628 6,820 8,462 10,077 10,367 11,643University and College Education 1,335 1,302 1,393 1,704 1,702 2,167 2,447 2,654 3,334 3,274 3,722Professional & Technical Edu & Teachers Tmg 862 851 955 1,257 1,431 1,789 1,620 1,572 1,633 1,728 1,796Others 1,416 1,236 1,410 1,572 2,675 2,226 3,112 4,481 3,417 2,618 2,758
Health 3,554 3,695 4,063 5,002 6,075 6,535 7,686 9,232 9,949 9,989 11,502General Hospitals & Clinics 2,934 3,045 3,283 4,137 5,020 5,355 6,189 7,188 7,933 7,914 9,414Mother & Child 25 27 30 33 35 34 40 46 67 50 62Other Facilities & Preventive Measures 192 217 192 223 277 294 290 408 396 436 487other 402 407 557 608 743 853 1,168 1,590 1,553 1,589 1,619
Population 1 5 36 62 76 113 209 540 875 375 241Other Social Services 1/ 959 878 1,303 1,739 1,879 2,301 1,330 1,897 1,695 2,179 2,318
Economic Services 10,328 10,422 12,325 15,169 18,910 16,802 14,633 20,206 22,547 19,825 18,316Agriculture 3,544 3,565 3,933 4,200 5,113 5,296 5,630 6,715 7,026 6,375 7,192Irrigation 4,365 4,618 4,611 5,856 6,810 6,680 5,758 8,296 10,023 8,621 8,231Industries and mineral resources 408 437 468 486 524 547 618 661 613 554 474Other Economic Services 2/ 2,011 1,801 3,313 4,627 6,462 4,279 2,627 4,534 4,886 4,276 2,419
Community services 11,196 11,146 12,491 13,211 14,633 16,252 15,461 21,062 21,478 15,080 19,001Works (Administration civil) 513 497 589 671 938 1,014 1,131 1,634 1,520 1,537 2,180Highways, Roads & Bridges & Building & 8,306 8,214 9,461 9,855 10,375 10,413 9,497 13,830 13,384 8,397 10,405
Struct.WaterSupplyandSanitation 831 1,063 1,152 1,347 1,811 2,414 2,616 2,710 3,189 2,158 2,652Public Health Engineering 1.099 1,123 909 1,109 1,195 1,349 1,258 2,088 3,068 2,709 3,510Broadcasting - - - - - - - - - - -Urban Town Planning & Regulator Services 282 70 87 44 17 13 24 30 29 6 4Scientific Research and Survey - - - - - - - - - 3 15Other Community Services 3/ 842 733 792 186 298 1,050 940 770 287 270 234
Subsidies 3,643 1,085 1,959 1,840 1,494 1,367 1,130 1.999 2,801 4,085 2,815Interest payments 10,832 11,181 12,930 15,684 18,681 21,658 25,596 25,671 27,403 30,004 33,348Grants 1,310 1,204 985 2,533 2,152 2,281 1,289 3,028 1,459 378 1.059Unallocable 574 209 235 118 32 76 51 124 430 550 930
Note: Footnotes on Provincial Tables.Source: Provincial Tables.
6

Table 2P: Punjab: Total Expenditures( Rs Million)
1987/88 1988/89 1989/90 1990/91 1991/92 1992/93 1993/94 1994/95 1995/96 1996/97 1997/98Actual Actual Actual Actual Actual Actual Actual Actual Actual Actual Actual
TOTAL EXPENDITURES 33,807 30,735 34,800 43,643 48,444 52,593 52,211 68,087 80,095 77,331 82,089
General Administration 2,275 2,680 2,606 2,947 3,735 4,667 4,724 8,142 14,667 11,877 9,544
Law & order 2,239 2,183 2,169 3,342 3,709 4,225 4,646 5,491 5,965 6,328 7,041
Defense
Social services 8,550 8,941 9,795 12,935 14,753 16,172 18,183 22,539 24,913 25,365 29,857
Education 6,140 6,546 7,101 9,579 11,049 12,093 13,963 17,049 19,144 19,281 22,921Primary 2,865 3,220 3,507 4,789 5,932 6,146 7,283 9,140 10,433 10,331 13,389
Secondary 1,574 1,691 1,719 2,460 2,682 2,917 3,494 4,207 4,807 4,911 5,255University & College Education 768 731 718 947 763 1,225 1,322 1,462 1,748 1,801 1,948Professional & Technical Edu & Teachers Tmg 531 524 591 825 848 1,138 1,016 792 875 935 914Others 403 380 566 558 823 667 847 1,446 1,281 1,303 1,414
Health 1,848 1,902 2,033 2,538 2,884 3,157 3,608 4,391 4,636 4,666 5,634General Hospitals & Clinics 1,535 1,598 1,694 2,187 2,451 2,709 3,048 3,661 3,952 4,020 4,736Mother&Child 11 12 17 17 14 16 17 20 38 20 27
OtierFacilities&Preventive Measures 10 10 10 11 11 11 13 17 32 17 26Other 292 282 312 324 409 420 530 692 615 609 844
Population - - - - - - 75 391 492
OtherSocial Services I/ 562 494 661 817 820 923 536 708 641 1,418 1,303Economic Services 5,953 5,454 6,509 8,701 10,035 8,519 6,010 9,123 10,579 9,547 9,371
Agriculture 1,962 1,749 1,785 2,218 2,399 2,766 2,600 3,276 3,409 3,369 3,910
Irrigation 2,484 2,511 2,352 3,163 3,326 3,108 2,520 3,541 4,849 4,878 4,074Industries and mineral resources 189 176 199 197 192 194 195 238 226 226 125OtherEconomicServices2/ 1,318 1,019 2,173 3,123 4,117 2,451 695 2,068 2,096 1,074 1,261
Community services 5,657 5,309 6,218 5,832 5,717 6,988 6,390 9,319 9,677 8,375 10,228
Works (Administration civil) 49 49 52 54 63 69 80 109 103 !09 !43Hiehway. Roads & Bridges & Bu'.lding& 4,3;7 3,970 4,976 4,499 4,185 5,054 4,747 6,968 6,246 5,315 6,432
Struct.Water Supply and Sanitation - - - - - - - - - -
Public Health Engineering 1,099 1,123 909 1,107 1,192 1,348 1,255 2,088 3,068 2,709 3,510Broadcasting - - - - - - - - - -
Urban Town Planning & Regulator Services - -
Scientific Research and Su,pvey - - - - - - - - - 3 3
OtherCommunityServices 152 167 281 171 277 517 309 154 259 240 138Subsidies 2,306 24 659 582 908 541 46 505 1,153 1,502 1,133
Interest payments 5,628 5,613 6,367 7,955 9,130 10,520 11,945 12,467 12,951 13,669 13,966
Grants & Others 659 345 266 1,274 449 931 236 499 184 302 866
Unallocable 540 186 212 76 7 30 31 1 5 366 84
I/ Includes Natural Calamities and Religious Affairs.
2/ Includes Land Reclamation, Rural Development, Transport & Communication, Other Economic Services & Unallocable.
3/I ncludes Works Urban and Rural, and Scientific Research.
Source: Government of the Punjab, Finance Accounts - 1987/88 to 1997/98
7

Table 2S: Sindh: Total Expenditures(Rs MUlion)
1987/88 1988/89 1989190 1990191 1991/92 1992/93 1993/94 1994/95 1995/96 1996/97 1997/98Actual Actual Actual Actual Actual Actual Actual Actual Actual Actual Actual
TOTAL EXPENDITURES 13,969 14,888 15,810 19,844 25,038 26,585 30,395 40,265 45,198 42,491 43,577
General Administration 1,189 1,235 1,302 1,465 2,036 2,345 2,339 5,865 10,160 9,981 4,883
Law & order 1,017 1,306 1,254 1,657 2,676 2,563 3,510 4,378 4,635 4,433 4,851
DefenseSocial services 3,424 3,616 4,109 5,137 6,989 7,621 8,212 10,596 11,548 11,584 13,553
Education 2,599 2,774 3,020 3,787 5,128 5,490 6,264 8,246 8,794 8,873 10,317Primary 1,188 1,319 1,440 1,857 2,453 2,758 3,353 3,984 4,408 4,581 5,503Secondary 661 780 824 1,017 1,154 1,373 1,615 1,859 2,430 2,440 2,727University& College Education 357 348 370 416 511 596 636 610 917 905 978Professional & Technical Edu & Teachers Tmg 186 163 200 245 355 296 317 437 452 436 430Others 207 164 186 252 655 467 342 1,356 587 511 679
Health 692 718 858 1,158 1,590 1,449 1,719 2,010 2,242 2,246 2,678General Hospitals & Clinics 561 576 708 952 1,338 1,213 1,477 1,591 1,819 1,848 2,237Mother & Child 5 6 5 6 8 2 6 - - - -Other Facilities& Preventive Measures 98 109 117 135 178 175 162 267 235 289 301Other 28 28 28 65 67 58 74 152 188 110 221
Population - - - - - - - 199 178 -
Other Social Services 1/ 133 123 231 192 271 683 229 341 313 285 558Economic Services 2,233 2,427 2,499 2,847 3,408 3,244 3,740 5,009 4,893 3,661 4,331
Agriculture 596 605 649 725 1,098 888 963 1,081 1,273 1,076 1,091Irrigation 1,166 1,293 1,274 1,428 1,621 1,602 1,697 2,831 2,986 2,027 2,538Industries andmineral resources 117 147 120 140 140 118 175 243 153 154 154Other Economic Services 2/ 354 381 456 554 549 636 904 854 481 404 548
Community services 2,864 3,047 3,034 3,709 4,314 3,949 3,952 5,314 5,267 3,002 4,143
Works (Administration civil) 147 166 170 200 264 288 322 391 469 447 483Highways, Roads & Bridges & Building & 2,035 2,325 2,362 2,961 3,418 2,893 2,752 3,868 3,736 1,825 2,888
Struct.Water Supply and Sanitation 395 484 410 498 607 750 852 995 1,029 717 754Public Health EngineeringBroadcasting - - - - - - - - - - -Urban Town Planning & Regulator Services 282 70 87 44 15 11 20 30 26 4 4Scientific Research and Survey - - - - - - - - - - -
Other Community Services 3/ 682 556 503 7 10 7 5 29 7 10 14Subsidies 524 61 276 583 112 326 463 304 248 1,383 132
Interest payments 2,386 2,536 2,981 3,600 4,512 5,364 7,172 6,366 7,009 8,208 10,682
Grants 298 636 330 805 968 1,131 989 2,311 1,018 65 169
Unallocable 34 23 23 41 24 42 19 123 425 176 834
I/Includes Natural Calamities and Religious Affairs.2/ A substantial amount on the suspense account is included under this head
3/ Includes land reclamation, stationery & printing and rural development etc
Source: Government of the Sindh, Finance Accounts - 1987/88 to 1997/98.
8

Table 2N: NWFP: Total Expenditures(Rs Mlllion)
1987/88 1988/89 1989/90 1990/91 1991/92 1992/93 1993/94 1994/95 1995/96 1996/97 1997/98Actual Actual Actual Actual Actual Actual Actual Actual Actual Actual Actual
TOTAL EXPENDITURES 10,339 10,492 12,409 13,932 17,683 18,735 19,350 23,824 26,937 25,415 25,655General Administration 710 783 876 904 1,137 1,398 1,428 1,959 2,720 2,346 2,471Law & order 581 617 659 820 1,179 1,248 1,310 1,634 1,705 1,649 1,850Defense - - - - - - - - - - -
Social services 3,013 2,834 3,223 4,124 4,982 5,707 5,958 7,024 7,903 8,190 8,897Education 2,303 2,165 2,257 2,712 3,421 3,982 4,334 5,044 5,738 6,244 6,645
Primary 763 857 959 1,210 1,556 1,723 1,738 2,078 2,456 3,172 3,170Secondary 576 567 615 715 907 1,013 1,370 1,736 2,043 2,051 2,360University & College Education 162 149 166 191 235 250 274 326 405 355 389Professional &TechnicalEdu&TeachersTTmg 137 128 137 152 190 226 227 266 224 278 313Others 664 464 380 445 533 770 725 638 611 389 412
Health 625 614 678 812 996 1,206 1,328 1,601 1,730 1,601 1,815General Hospitals &Clinics 525 516 568 667 820 959 1,077 1,319 1,482 1,326 1,511Mother & Child 5 6 3 4 5 5 6 7 9 9 10Other Facilities & Preventive Measures 39 32 36 45 43 55 59 67 65 64 75Other 55 60 70 96 127 187 186 208 174 203 219
Population 1 0 36 43 49 75 78 96 112 134 241OtherSocialServices I/ 85 55 253 556 516 443 218 282 323 211 195
Economic Services 1,213 1,317 1,905 1,981 3,130 2,635 2,727 3,388 4,425 4,289 2,515Agriculture 503 604 857 699 911 893 975 1,024 1,144 897 916Irrigation 446 475 566 753 899 871 900 1,006 1,170 659 1,031Industries and mineral resources 42 44 87 85 102 125 126 82 139 85 103Other Economic Services 2/ 221 194 394 444 1,218 746 777 1,2?6 1,972 2,648 466
Commu-ity sswvixcs 1,900 1,773 1,972 2,234 2,674 3,070 2,754 3,862 3,780 1,984 2,181Works (Administration civil) 130 137 150 173 229 246 271 322 350 343 386Highways, Roads & Bridges & Building & 1,484 1,365 1,480 1,631 1,856 1,942 1,805 2,763 2,305 714 687
Struct.Water Supply and Sanitation 285 271 342 428 586 883 677 776 1,125 927 1,107Public Health Engineering - - - 2 2 - - - - - -Broadcasting - - - - - - - - -
Urban Town Planning & Regulator ServicesScientific Research and SurveyOther Community Services 0 0 0 0 1 0 0 0 (0) - -
Subsidies 575 762 789 510 250 400 550 940 850 1,200 1,550Interest payments 1,995 2,183 2,595 2,903 3,597 4,057 4,559 4,799 5,297 5,740 6,155Grants&Others 352 223 389 455 735 219 64 218 257 11 25Unallocable 0 0 0 0 0 0 0 0 0 8 12
1/ Includes Natural Calamities and Religious Affairs.Source: Government of North-West Frontier Province, Finance Accounts - 1987/88 to 1997/97.
9

Table 2B: Balochistan: Total Expenditures(Rs Milion)
1987/88 1988/89 1989/90 1990/91 1991/92 1992/93 1993/94 1994/95 1995/96 1996/97 1997/91/
Actual Actual Actual Actual Actual Actual Actual Actual Actual Actual BudgetTOTAL EXPENDITURES 4,872 6,681 6,619 7,490 10,181 11,202 12,598 14,453 15,739 13,228 15,506
GeneralAdministration2/ 404 1,313 500 611 736 1,039 1,021 1,116 1,588 1,203 2,074
Law & order 407 477 528 582 802 1,011 960 1,180 1,207 1,194 1,261
DefenseSocial services 1,298 1,563 1,691 1,831 2,714 2,683 4,110 4,573 4,843 4,395 5,077
Education 729 896 1,039 1,163 1,838 1,708 2,733 2,776 3,013 2,592 3,440Primary 360 355 436 466 672 836 921 743 933 921 1,341Secondary 171 203 160 195 271 325 341 659 797 964 1,300University & College Education 48 74 139 151 194 97 214 256 263 213 407Professional & Technical Edu & Teachers Trng 9 35 27 34 37 129 59 76 82 78 138Others 142 228 278 318 664 322 1,198 1,041 937 416 254
Health 389 461 494 494 605 723 1,031 1,231 1,340 1,475 1,375General Hospitals & Clinics 313 355 314 331 412 473 586 617 680 720 931Mother & Child 4 3 5 6 8 10 10 19 20 21 25Other Facilities & Preventive Measures 45 66 29 33 45 53 56 56 64 67 85Other 27 37 147 124 141 188 377 538 576 668 335
Population - 4 - 18 26 38 57 52 72 63 -
Other Social Services 180 206 157 174 271 252 346 566 419 264 262Economic Services 929 1,224 1,411 1,640 2,337 2,404 2,156 2,686 2,650 2,329 2,099
Agriculture 482 607 642 558 705 749 1,092 1,334 1,199 1,034 1,275Irrigation 270 340 420 513 963 1,099 641 918 1,018 1,057 588Industries and mineral resources 59 70 60 64 91 109 122 98 95 89 92Other Economic Services 118 207 290 506 578 446 301 336 338 149 143
Community services 775 1,017 1,267 1,436 1,928 2,244 2,366 2,567 2,755 1,719 2,450
Works (Administration civil) 187 145 217 244 382 411 458 812 598 639 1,168Highways, Roads & Bridges & Building & 429 555 643 763 917 524 193 230 1,097 545 397
Struct.WaterSupply and Sanitation 151 309 399 422 619 781 1,086 939 1,035 514 791Public Health EngineeringBroadcastingUrban Town Planning & Regulator Services - - - - I 1 4 - 4 2 -
Scientific Research and Survey - - - - - - - - - - 12Other Community Services 8 9 8 7 9 526 625 586 20 21 82
Subsidies 237 237 234 164 224 100 70 250 550 - -
Interest payments 823 850 987 1,226 1,442 1,717 1,920 2,039 2,146 2,388 2,545
Grants - - - - - - - -
Unallocable (0 0 0 0 0 4 0 -
1/ Break down of Capital Development Expenditures is not available.2/For 1988/89 includes Superannuation and Pension amounting to Rs. 1034.6 Mil.Source: Government of Balochistan, Finance Accounts - 1987/88 to 1997/98.
10

Table 3A: Provincial Aggregate -- Current Expenditures(Rs Million)
1987/88 1988/89 1989/90 1990/91 1991/92 1992/93 1993/94 1994/95 1995/96 1996/97 1997/98Actual Actual Actual Actual Actual Actual Actual Actual Actual Actual Actual
CURRENT EXPENDITURES 47,727 47,537 51,603 62,630 75,347 85,951 93,901 116,361 138,528 140,604 144,267General Administration 4,554 5,860 5,178 5,738 7,546 9,305 9,387 16,948 28,958 25,263 18,851Law & order 4,218 4,328 4,545 6,301 8,287 8,991 10,397 12,645 13,473 13,582 14,986Defense - - - - - - - - - - -Social services 14,932 15,626 17,061 21,988 26,399 29,609 32,811 40,385 44,848 46,059 52,748
Education 11,130 11,835 12,596 16,515 19,939 22,082 25,419 31,475 35,102 35,815 41,038Primary 5,055 5,703 6,298 8,261 10,537 11,263 13,165 15,760 18,111 18,230 21,666Secondary 2,805 3,079 3,235 4,302 4,884 5,564 6,789 8,328 10,005 10,349 11,545University & College Education 1,318 1,272 1,373 1,687 1,688 2,154 2,428 2,629 3,298 3,257 3,636Professional & Technical Edu & Teachers Trg 783 776 814 1,159 1,282 1,482 1,492 1,461 1,518 1,701 1,733Others 1,169 1,005 877 1,106 1,548 1,618 1,545 3,297 2,171 2,279 2,458
Health 3,081 3,177 3,539 4,436 5,336 5,837 6,415 7,756 8,601 8,777 10,230General Hospitals & Clinics 2,549 2,666 2,981 3,814 4,533 5,009 5,453 6,551 7,268 7,405 8,669Mother & Child 21 21 25 27 27 32 34 46 67 50 62Other Facilities & Preventive Measures 133 123 131 154 196 202 185 249 297 412 457Other 378 367 402 442 580 595 742 909 969 910 1,043
Population 1 0 - - - - I I 1 2 2Other Social Services 720 613 926 1,037 1,124 1,689 977 1,153 1,145 1,466 1,477
Economic Services 6,277 6,460 6,551 7,670 8,866 9,442 9,873 12,429 14,390 15,515 13,565Agriculture 2,382 2,503 2,612 3,130 3,735 3,961 4,389 5,159 5,641 5,551 6,155Irrigation 2,942 3,053 3,053 3,278 3,704 4,032 3,834 4,914 5,977 6,091 5,408Industries and mineral resources 339 323 283 383 411 446 444 496 534 501 427OtherEconomicServices 615 581 603 879 1,016 1,003 1,205 1,860 2,238 3,372 1,574
Community services 2,585 2.485 3 00R nlQ9 3,710 4,8QQ^ ,7°9 5,674 6,052 5,66i 7,349
Works (Administration civil) 513 497 588 669 933 1,009 1,130 1,403 1,517 1,537 2,180Highways, Roads & Bridges & Building & Struct. 1,708 1,548 1,991 1,846 2,108 2,904 2,533 3,060 2,933 2,678 3,235Water Supply and Sanitation 250 304 311 383 525 694 792 798 902 766 1,164Public Health Engineering 55 53 44 79 76 212 243 288 396 403 587BroadcastingUrban Town Planning & Regulator Services 7 5 3 1 4 6 15 30 17 4 3Scientific Research and Survey - - - - - - - - - 3 3
Other Community Services 52 78 70 41 63 64 75 96 287 269 176Subsidies 3,617 1,077 1,951 1,820 1,454 1,358 1,083 1,994 2,748 4,077 2,812Interest payments 10,832 11,181 12,930 15,684 18,681 21,658 25,281 25,671 27,403 30,004 33,348Grants 160 319 178 301 379 630 235 501 231 122 575Unallocable 553 203 202 110 28 71 48 114 425 321 35
Note: Footnotes on Provincial Tables.
Source: Provincial Tables.
11

Table 3P: Punjab -- Current Expenditures(Rs Million)
1987/88 1988/89 1989/90 1990/91 1991/92 1992/93 1993/94 1994/95 1995/96 1996/97 1997/98Actual Actual Actual Actual Actual Actual Actual Actual Actual Actual Actual
CURRENT EXPENDITURES 25,631 23,964 25,997 32,834 37,093 42,659 45,769 56,418 68,290 68,668 69,596
General Administration 2,272 2,672 2,593 2,839 3,700 4,625 4,708 8,122 14,626 11,854 9,530
Law & order 2,239 2,183 2,169 3,342 3,709 4,225 4,646 5,491 5,965 6,328 7,027
DefenseSocial services 7,979 8,404 9,027 12,425 13,674 15,361 17,305 21,222 23,373 24,209 27,213
Education 5,921 6,369 6,697 9,422 10,511 11,611 13,683 16,750 18,661 19,062 21,513Primary 2,857 3,213 3,507 4,789 5,909 6,013 7,234 9,013 10,434 10,246 12,150Secondary 1,494 1,637 1,667 2,408 2,588 2,901 3,474 4,194 4,806 4,904 5,250University&CollegeEducation 768 731 718 938 761 1,214 1,315 1,452 1,741 1,798 1,936Professional & Technical Edu & Teachers Trng 480 487 492 771 761 894 929 750 835 935 914Others 321 301 313 516 493 590 732 1,341 845 1,179 1,264
Health 1,576 1,639 1,769 2,298 2,506 2,931 3,078 3,892 4,123 4,168 4,837General Hospitals & Clinics 1,263 1,338 1,444 1,959 2,086 2,494 2,525 3,230 3,469 3,562 4,102Mother & Child 11 12 17 17 14 16 17 20 38 20 27OtherFacilities & Preventive Measures 10 10 10 11 11 11 13 12 27 17 26Other 292 279 298 312 395 410 523 630 589 569 682
PopulationOther Social Services 1/ 482 396 560 705 657 819 544 580 589 979 862
Economic Services 3,624 3,558 3,479 4,160 4,461 4,951 4,890 5,872 7,323 7,862 7,013
Agriculture 1,365 1,411 1,423 1,732 1,848 2,103 2,270 2,718 2,927 2,989 3,286Irrigation 1,830 1,798 1,750 1,966 2,067 2,323 2,127 2,603 3,796 4,254 2,977Industries and mineral resources 168 172 121 190 181 192 195 237 224 224 125OtherEconomicServices 2/ 261 177 184 271 366 333 298 313 377 395 624
Community services 1,019 1,106 1,431 1,262 1,413 2,167 2,109 2,584 2,806 2,841 3,327
Works (Administration civil) 49 49 52 54 63 69 80 109 103 109 143Highways, Roads & Bridges & Building & Struct. 875 935 1,278 1,104 1,232 1,841 1,729 2,128 2,047 2,086 2,454Water Supply and Sanitation - - - - - - - - - - -Public Health Engineering 55 53 44 77 74 212 243 288 396 403 587BroadcastingUrban Town Planning & Regulator Services - -Scientific Research and Survey - - - - - - - - - 3 3OtherCommunity Services 3/ 40 69 57 27 43 45 57 59 259 239 138
Subsidies 2,281 17 652 562 868 532 - 500 1,100 1,500 1,131
Interest payments 5,628 5,613 6,366 7,955 9,130 10.520 11,945 12,467 12,951 13,669 13,966
Grants 69 232 86 220 134 248 137 160 145 88 390Unallocable 519 180 193 69 4 30 29 0 0 317 0
1/ Includes Natural Calamities and Religious Affairs.
2/ Includes Land Reclamation, Rural Development, Transport & Communication, and Other Economic Services
3/I ncludes Works Urban and Rural, and Scientific Research.Source: Government of the Punjab, Finance Accounts - 1984/85 to 1997/98
12
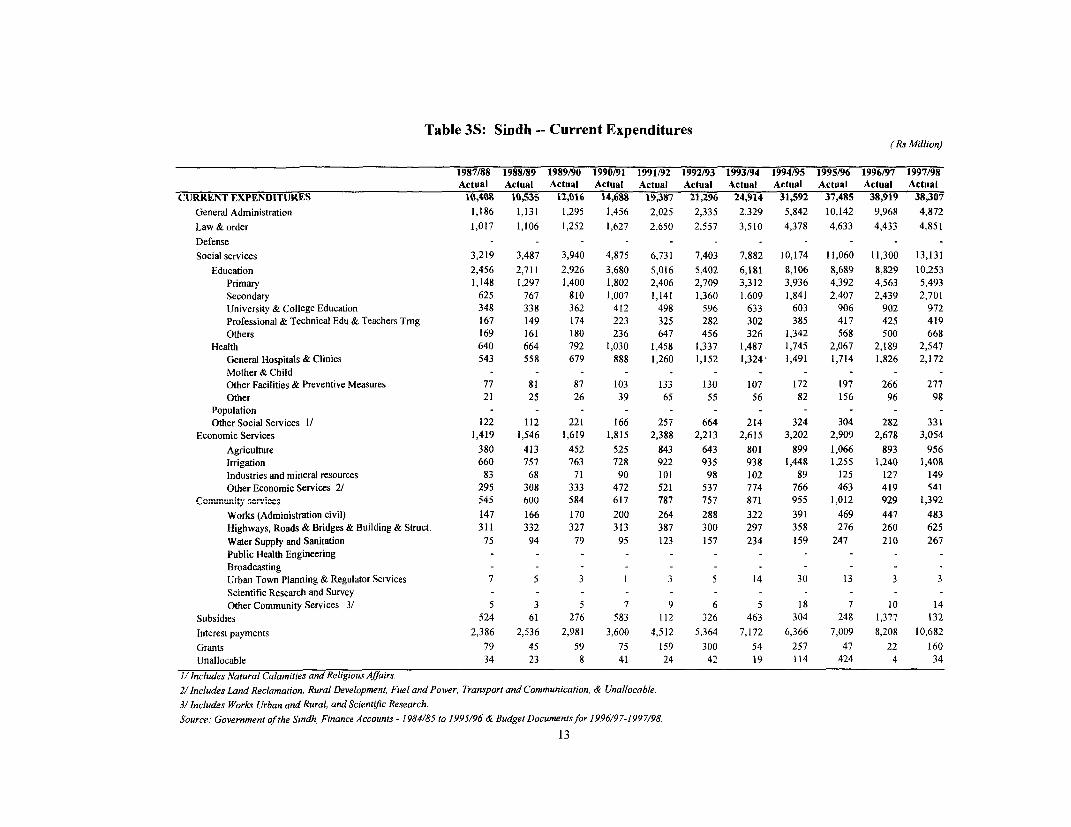
Table 3S: Sindh -- Current Expenditures(Rs Million)
1987/88 1988/89 1989/90 1990/91 1991/92 1992/93 1993/94 1994/95 1995/96 1996/97 1997/98Actual Actual Actual Actual Actual Actual Actual Actual Actual Actual Actual
CURRENT EXPENDITURES 101,408 10,535 12,016 14,688 19,387 21,296 24,914 31,592 37,485 38,919 38,307General Administration 1,186 1,131 1,295 1,456 2,025 2,335 2,329 5,842 10,142 9,968 4,872Law & order 1,017 1,106 1,252 1,627 2,650 2,557 3,510 4,378 4,633 4,433 4,851DefenseSocial services 3,219 3,487 3,940 4,875 6,731 7,403 7,882 10,174 11,060 11,300 13,131
Education 2,456 2,711 2,926 3,680 5,016 5,402 6,181 8,106 8,689 8,829 10,253Primary 1,148 1,297 1,400 1,802 2,406 2,709 3,312 3,936 4,392 4,563 5,493Secondary 625 767 810 1,007 1,141 1,360 1,609 1,841 2,407 2,439 2,701University & College Education 348 338 362 412 498 596 633 603 906 902 972Professional & Technical Edu&TeachersTTmg 167 149 174 223 325 282 302 385 417 425 419Others 169 161 180 236 647 456 326 1,342 568 500 668
Health 640 664 792 1,030 1,458 1,337 1,487 1,745 2,067 2,189 2,547General Hospitals &Clinics 543 558 679 888 1,260 1,152 1,324 1,491 1,714 1,826 2,172Mother & ChildOther Facilities & Preventive Measures 77 81 87 103 133 130 107 172 197 266 277Other 21 25 26 39 65 55 56 82 156 96 98
PopulationOtherSocialServices 1/ 122 112 221 166 257 664 214 324 304 282 331
Economic Services 1,419 1,546 1,619 1,815 2,388 2,213 2,615 3,202 2,909 2,678 3,054Agriculture 380 413 452 525 843 643 801 899 1,066 893 956Irrigation 660 757 763 728 922 935 938 1,448 1,255 1,240 1,408Industries and mineral resources 83 68 71 90 101 98 102 89 125 127 149Other Economic Services 2/ 295 308 333 472 521 537 774 766 463 419 S41
c =ni.y.e. ---ccs 545 60U 584 617 787 757 871 955 1,012 929 1,392Works (Administration civil) 147 166 170 200 264 288 322 391 469 447 483Highways, Roads & Bridges & Building & Struct. 311 332 327 313 387 300 297 358 276 260 625Water Supply and Sanitation 75 94 79 95 123 157 234 159 247 210 267Public Health Engineering - - - - - - - - - - -BroadcastingUrban Town Planning & Regulator Services 7 5 3 1 3 5 14 30 13 3 3Scientific Research and Survey - - - - - - - - - -Other Community Services 3/ 5 3 5 7 9 6 5 18 7 10 14
Subsidies 524 61 276 583 112 326 463 304 248 1,377 132Interest payments 2,386 2,536 2,981 3,600 4,512 5,364 7,172 6,366 7,009 8,208 10,682Grants 79 45 59 75 159 300 54 257 47 22 160Unallocable 34 23 8 41 24 42 19 114 424 4 34
I/Includes Natural Calamities and ReligiousAffairs.2/Includes Land Reclamation, Rural Development, Fuel and Pover, Transport and Communication, & Unallocable.3/Includes Works Urban and Rural, and Scientific Research.Source: Government of the Sindh, Finance Accounts - 1984/85 to 1995/96 & Budget Documentsfor 1996/97-1997/98.
13
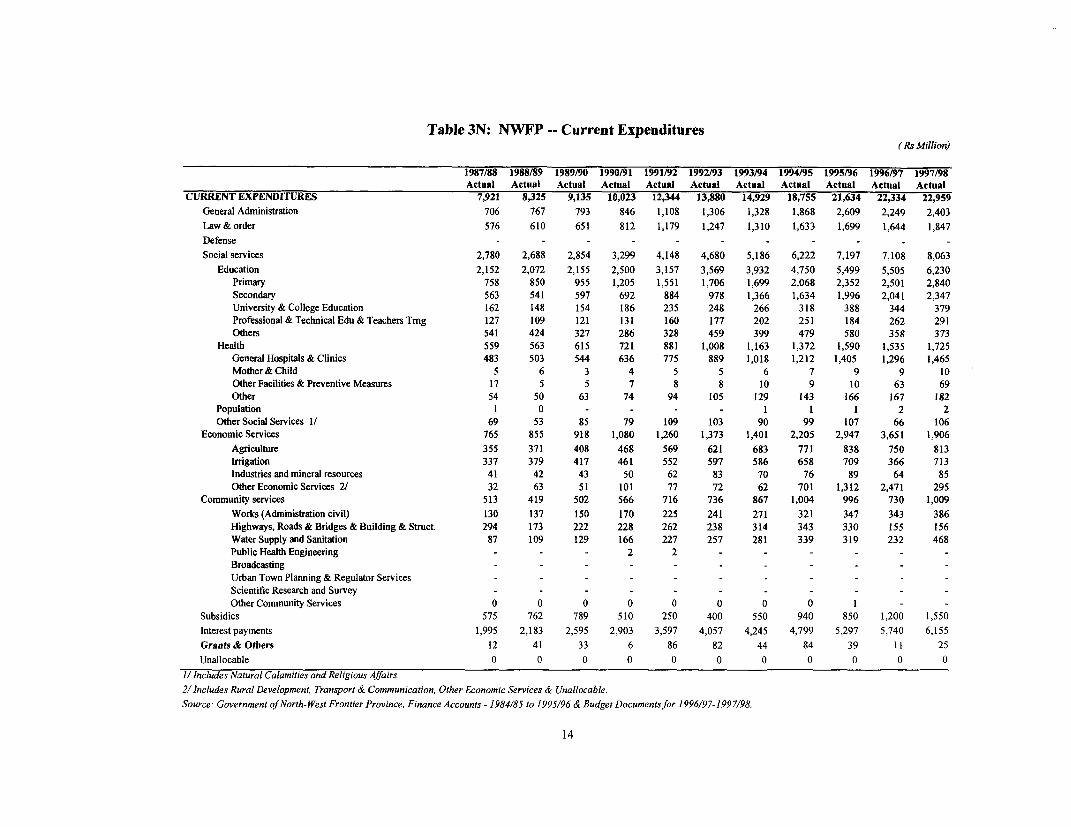
Table 3N: NWFP -- Current Expenditures(Rs Million)
1987/88 1988/89 1989/90 1990/91 1991/92 1992/93 1993/94 1994/95 1995/96 1996/97 1997/98Actual Actual Actual Actual Actual Actual Actual Actual Actual Actual Actual
CURRENT EXPENDITURES 7,921 8,325 9,135 10,023 12,344 13,880 14,929 18,755 21,634 22,334 22,959
General Administration 706 767 793 846 1,108 1,306 1,328 1,868 2,609 2,249 2,403
Law & order 576 610 651 812 1,179 1,247 1,310 1,633 1,699 1,644 1,847
DefenseSocial services 2,780 2,688 2,854 3,299 4,148 4,680 5,186 6,222 7,197 7,108 8,063
Education 2,152 2,072 2,155 2,500 3,157 3,569 3,932 4,750 5,499 5,505 6,230
Primary 758 850 955 1,205 1,551 1,706 1,699 2,068 2,352 2,501 2,840
Secondary 563 541 597 692 884 978 1,366 1,634 1,996 2,041 2,347
University & College Education 162 148 154 186 235 248 266 318 388 344 379
Professional & Technical Edu & Teachers Tmg 127 109 121 131 160 177 202 251 184 262 291
Others 541 424 327 286 328 459 399 479 580 358 373
Health 559 563 615 721 881 1,008 1,163 1,372 1,590 1,535 1,725
General Hospitals & Clinics 483 503 544 636 775 889 1,018 1,212 1,405 1,296 1,465
Mother & Child 5 6 3 4 5 5 6 7 9 9 10
Other Facilities & Preventive Measures 17 5 5 7 8 8 10 9 10 63 69
Other 54 50 63 74 94 105 129 143 166 167 182
Population 1 0 - - - - I 1 1 2 2
Other Social Services 1/ 69 53 85 79 109 103 90 99 107 66 106
Economic Services 765 855 918 1,080 1,260 1,373 1,401 2,205 2,947 3,651 1,906
Agriculture 355 371 408 468 569 621 683 771 838 750 813
Irrigation 337 379 417 461 552 597 586 658 709 366 713
Industries and mineral resources 41 42 43 50 62 83 70 76 89 64 85
OtherEconomicServices 2/ 32 63 51 101 77 72 62 701 1,312 2,471 295
Community services 513 419 502 566 716 736 867 1,004 996 730 1,009
Works (Administration civil) 130 137 150 170 225 241 271 321 347 343 386
Highways, Roads & Bridges & Building & Struct. 294 173 222 228 262 238 314 343 330 155 156
Water Supply and Sanitation 87 109 129 166 227 257 281 339 319 232 468
Public Health Engineering - - - 2 2 - - - - - -
BroadcastingUrban Town Planning & Regulator Services - - - - - - - - - - -
Scientific Research and Survey - - - - - - - - -
Other Community Services 0 0 0 0 0 0 0 0 1 - -
Subsidies 575 762 789 510 250 400 550 940 850 1,200 1,550
Interest payments 1,995 2,183 2,595 2,903 3,597 4,057 4,245 4,799 5,297 5,740 6,155
Grants & Others 12 41 33 6 86 82 44 84 39 11 25
Unallocable 0 0 0 0 0 0 0 0 0 0 0
1/ Includes Natural Calamities and Religious Affairs.
2/ Includes Rural Development, Transport & Communication, Other Economic Services & Unallocable.
Source: Government of North-West Frontier Province, Finance Accounts - 1984/85 to 1995/96 & Budget Documentsfor 1996/97-1997/98.
14

Table 3B: Balochistan -- Current Expenditures(Rs Million)
1987/88 1988/89 1989/90 1990/91 1991/92 1992/93 1993/94 1994/95 1995/96 1996/97 1997/98Actual Actual Actual Actual Actual Actual Actual Actual Actual Actual Budget
CURRENT EXPENDITURES 3,768 4,714 4,456 5,084 6,522 8,116 8,289 9,596 11,120 10,683 13,406General Administration I/ 391 1,290 496 597 713 1,039 1,021 1,116 1,581 1,192 2,046Law & order 386 429 473 520 748 963 932 1,143 1,176 1,178 1,261DefenseSocial services 954 1,046 1,240 1,388 1,846 2,164 2,439 2,767 3,219 3,441 4,341Education 601 683 818 914 1,254 1,500 1,623 1,869 2,253 2,418 3,042Primary 292 343 436 466 672 836 921 743 933 921 1,183Secondary 123 135 160 195 271 325 341 659 797 964 1,248University & College Education 40 54 139 151 194 97 214 256 263 213 350Professional & Technical Edu & Teachers Tmg 9 32 27 34 37 129 59 76 82 78 109Others 138 119 56 68 80 114 88 134 177 242 153
Health 306 311 362 387 490 561 687 747 821 885 1,122GeneralHospitals&Clinics 261 268 314 331 412 473 586 617 680 720 931Mother & Child 4 3 5 6 8 10 10 19 20 21 25Other Facilities & Preventive Measures 30 27 29 33 45 53 56 56 64 67 85Other 12 12 15 17 26 26 34 54 57 77 81
PopulationOther Social Services 2/ 46 53 60 87 101 103 128 151 145 139 177
Economic Services 470 501 535 615 757 905 967 1,150 1,210 1,324 1,591Agriculture 281 308 329 404 475 594 635 771 810 919 1,100Irrigation 114 119 123 123 163 178 183 205 217 231 310Industries and mineral resources 3/ 48 41 48 53 67 73 78 94 95 86 68OtherEconomicServices4/ 27 33 35 36 52 61 71 80 87 88 113
Communitv services 508 360 491 574 794 i,229 942 i,i3i 1,23: 1,161 1,621Works 187 145 217 244 382 411 458 582 598 639 1,168Highways, Roads & Bridges 227 108 164 201 226 524 193 230 280 177 -
Water Supply and Sanitation 88 102 102 122 175 280 277 300 336 324 429Public Health Engineering - - - - - - - - - - -
BroadcastingUrban Town Planning & Regulator Services - - - - I 1 2 - 4 2
Scientific Research and Survey - - - - - - - -
Others 6 6 8 7 9 13 13 19 20 20 23Subsidies 237 237 234 164 224 100 70 250 550 - -
Interest payments 823 850 987 1,226 1,442 1,717 1,920 2,039 2,146 2,388 2,545GrantsUnallocables
I/For 1988/89 includes Superannuation and Pension amounting to Rs. 1034.6 Mil.2/ Includes Natural Calamities and Religious Affairs.
3/Includes Stationary & Printing.4/Includes Rural Development.Source: Government of Balochistan, Finance Accounts - 1984/85 to 1995/96 & Budget Documentsfor 1996/97-1997/98.
15

Table 4A: Provincial Aggregate -- Development Expenditures(Rs Million)
1987/88 1988/89 1989/90 190/91 1991/92 1992/93 1993/94 1994/95 1995/96 1996/97 1997/98Actual Actual Actual Actual Actual Actual Actual Actual Actual Revised Budget
DEVELOPMENT EXPENDITURES 15,261 15,258 18,034 22,279 26,000 23,164 20,652 30,269 29,440 17,861 22,560General Administration 23 152 106 189 98 144 126 135 176 144 121Law & order 27 254 65 99 79 56 28 38 39 21 17Defense 0 0 0 0 0 0 0 0 0 0 0Social services 1,353 1,328 1,758 2,038 3,040 2,575 3,651 4,347 4,359 3,474 4,636
Education 641 545 822 726 1,496 1,190 1,875 1,640 1,586 1,175 2,285Primary 120 48 44 60 75 199 130 185 118 774 1,738Secondary 177 162 83 85 131 64 30 134 72 18 97University& CollegeEducation 17 30 20 18 14 13 19 25 35 17 86Professional & Technical Edu & Teachers Tmg 79 74 141 98 149 306 128 110 115 27 63Others 247 231 532 466 1,127 608 1,567 1,185 1,246 339 300
Health 473 518 524 566 739 698 1,271 1,476 1,348 1,212 1,272General Hospitals & Clinics 385 378 302 324 488 346 736 637 665 509 746Mother & Child 5 6 5 6 8 2 6 0 0 0 0OtherFacilities& Preventive Measures 59 94 61 70 81 92 104 158 99 24 31Other 24 40 155 167 163 258 425 680 584 679 576
Population 0 4 36 62 76 113 208 539 874 374 239Other Social Services 239 265 377 702 755 612 353 744 550 713 841
Economic Services 4,051 3,963 5,774 7,499 10,044 7,360 4,760 7,777 8,158 4,310 4,751Agriculture 1,163 1,062 1,321 1,071 1,378 1,335 1,241 1,556 1,384 824 1,037Irrigation 1,423 1,565 1,558 2,578 3,105 2,648 1,923 3,382 4,046 2,530 2,822Industriesandmineralresources 69 115 185 103 114 101 174 165 79 53 47Other Economic Services 1,396 1,220 2,710 3,748 5,446 3,276 1,422 2,674 2,648 904 845
Community services 8,611 8,662 9,484 10,192 10,923 11,363 10,671 15,388 15,426 9,419 11,652Works (Administration civil) 0 0 0 3 5 5 1 231 3 0 0Highways, Roads & Bridges & Building & Struct. 6,598 6,666 7,470 8,009 8,268 7,509 6,964 10,770 10,451 5,719 7,170Water Supply and Sanitation 581 759 841 964 1,286 1,721 1,824 1,912 2,288 1,393 1,488Public Health Engineering 1,043 1,071 865 1,030 1,119 1,137 1,015 1,800 2,672 2,306 2,923Broadcasting 0 0 0 0 0 0 0 0 0 0 0Urban Town Planning & Regulator Services 275 65 84 42 12 6 9 0 13 1 1Scientific Research and Survey 0 0 0 0 0 0 0 0 0 0 12OtherCommunity Services 790 654 722 145 236 986 864 674 0 1 58
Subsidies 25 7 7 20 40 9 46 5 53 7 2Interest payments 0 0 0 0 0 0 315 0 0 0 0Grants 1,150 886 807 2,233 1,772 1,652 1,054 2,527 1,229 257 485Unallocable 21 6 33 8 4 5 3 10 5 229 895
Note: Footnotes on Provincial Tables.Source: Provincial Tables.
16

Table 4P: Punjab -- Development Expenditures(Rs Million)
19871/88 1988/89 1989190 1990/91 1991/92 1992/93 1993/94 1994/95 1995/96 1996/97 1997/98Actual Actual Actual Actual Actual Actual Actual Actual Actual Actual Actual
DEVELOPMENT EXPENDITURES 8,176 6,771 8,804 10,809 11,351 9,934 6,442 11,669 11,805 8,663 12,493
General Administration 3 8 12 108 35 42 16 20 41 23 14
Law & order 0 0 0 0 0 0 0 0 0 0 14
Defense 0 0 0 0 0 0 0 0 0 0 0
Social services 571 537 768 509 1,079 811 878 1.317 1,541 1,156 2,644
Education 220 176 404 157 538 482 281 298 483 219 1,407
Primary 7 7 0 0 23 133 50 128 -1 85 1,239Secondary 80 54 52 52 95 17 20 13 1 7 5
University & College Education I 0 1 9 2 11 8 10 7 3 13
Professional & Technical Edu & Teachers Tmg 50 37 99 54 88 243 88 42 40 0 0
Others 82 78 253 42 331 77 115 105 436 124 150
Health 272 263 263 240 378 225 531 499 514 498 797General Hospitals & Clinics 272 260 249 228 365 215 523 431 482 458 634Mother & Child 0 0 0 0 0 0 0 0 0 0 0Other Facilities & Preventive Measures 0 0 0 0 0 0 0 5 5 0 0
Other 0 3 14 11 14 10 7 62 26 39 162Population 0 0 0 0 0 0 75 391 492 0 0
OtherSocial Services 79 98 101 112 163 104 -8 129 52 440 440Economic Services 2,329 1,896 3,030 4,541 5,574 3,568 1,120 3,251 3,256 1,685 2,358
Agriculture 597 338 362 486 552 663 330 558 482 380 624
Irrigation 653 713 601 1,197 1,260 785 393 938 1,053 624 1,096
Industries and mineral resources 21 3 78 7 12 2 0 1 2 2 0
OtheT Economic Services 1;0s7 RA4 !,989 2,852 35 2,11 97 1,7355 i,7i9 680 63/
Community services 4,637 4,203 4,787 4,570 4,304 4,821 4,281 6,735 6,871 5,534 6,901
Works (Administration civil) 0 0 0 0 0 0 0 0 0 0 0Highways, Roads & Bridges & Building & Struct 3,482 3,034 3,699 3,395 2,953 3,213 3,018 4,840 4,199 3,228 3,978
Water Supply and Sanitation 0 0 0 0 0 0 0 0 0 0 0Public Health Engineering 1,043 1,071 865 1,030 1,118 1,136 1,011 1,800 2,672 2,306 2,923
Broadcasting 0 0 0 0 0 0 0 0 0 0 0Urban Town Planning & Regulator Services 0 0 0 0 0 0 0 0 0 0 0
Scientific Research and Survey 0 0 0 0 0 0 0 0 0 0 0
Other Community Services 112 99 223 144 233 472 252 95 0 0 0Subsidies 25 8 7 20 40 9 46 5 53 2 2
Interest payments 0 0 0 0 0 0 0 0 0 0 0
Grants 590 112 180 1,053 316 683 98 339 39 213 476
Unallocable 21 6 19 8 3 0 2 1 5 49 84
Source: Government ofthe Punjab, Finance Accounts - 1987188 to 1997/98.
17

Table 4S: Sindh -- Development Expenditures(Rs Million)
1987188 1988/89 1989/90 1990/91 1991/92 1992/93 1993/94 1994/95 1995/96 1996/97 1997/98Actual Actual Actual Actual Actual Actual Actual Actual Actual Actual Actual
DEVELOPMENT EXPENDITURES 3,561 4,352 3,795 5,156 5,651 5,289 5,481 8,674 7,713 3,572 5,270General Administration 3 104 7 9 11 10 10 23 18 13 12
Law & order 0 200 2 30 26 6 0 0 2 0 0
Defense 0 0 0 0 0 0 0 0 0 0 0
Social services 205 129 170 261 258 218 330 422 487 283 422
Education 143 63 94 107 111 87 83 140 105 44 64Primary 40 23 40 55 47 49 41 48 16 18 10Secondary 37 13 13 10 14 12 6 19 23 1 27University & College Education 9 10 8 4 12 0 4 7 11 3 6Professional&TechnicalEdu&TeachersTTmg 19 14 26 23 31 14 15 53 35 11 11Others 38 3 6 15 8 12 16 14 19 11 10
Health 51 55 66 128 133 113 232 265 175 58 131General Hospitals & Clinics 18 18 28 64 78 61 153 100 105 22 65Mother & Child 5 6 5 6 8 2 6 0 0 0 0Other Facilities & Preventive Measures 21 27 30 32 45 45 55 96 38 23 23Other 7 3 2 26 2 4 18 70 32 13 123
Population 0 0 0 0 0 0 0 0 199 178 0OtherSocialServices 11 11 11 26 15 19 15 17 9 3 226
Economic Services 815 881 880 1,032 1,020 1,031 1,125 1,807 1,983 983 1,277
Agriculture 216 193 197 200 255 245 162 182 207 182 135Irrigation 505 536 511 700 699 667 759 1,383 1,731 787 1,130Industries and mineral resources 35 79 50 50 38 20 74 154 28 27 5OtherEconomicServices 59 73 123 83 27 98 130 88 18 -14 7
Community services 2,319 2,447 2,450 3,093 3,527 3,192 3,080 4,359 4,255 2,073 2,751
Works (Administration civil) 0 0 0 0 0 0 0 0 0 0 0Highways, Roads & Bridges & Building & Struct. 1,724 1,993 2,035 2,648 3,030 2,593 2,455 3,510 3,460 1,565 2,263Water Supply and Sanitation 320 390 331 403 483 593 618 837 782 507 487Public Health Engineering 0 0 0 0 0 0 0 0 0 0 0Broadcasting 0 0 0 0 0 0 0 0 0 0 0Urban Town Planning & Regulator Services 275 65 84 42 12 6 7 0 13 1 1Scientific Research and Survey 0 0 0 0 0 0 0 0 0 0 0Other Community Services 676 553 498 0 1 0 0 12 0 0 0
Subsidies 0 0 0 0 0 0 0 0 0 6 0
Interest payments 0 0 0 0 0 0 0 0 0 0 0
Grants 220 591 271 730 808 831 935 2,054 971 43 9
Unallocable 0 0 14 0 0 1 0 9 0 171 800
Source: Government of the Sindh, Finance Accounts - 1984/85 to 1997/98-1997/98.
18

Table 4N: NWFP -- Development Expenditures(Rs Million)
1987/88 1988/89 1989/90 1990/91 1991/92 1992/93 1993/94 1994/95 1995/96 1996/97 1997/98Actual Actual Actual Actual Actual Actual Actual Actual Actual Actual Budget
DEVELOPMENT EXPENDITURES 2,418 2,167 3,273 3,909 5,339 4,855 4,421 5,070 5,303 3,082 2,697General Administration 4 16 83 58 29 93 100 92 110 97 67Law& order 5 7 8 8 0 1 0 1 6 5 3Defense 0 0 0 0 0 0 0 0 0 0 0Social services 233 146 369 825 834 1,027 772 802 706 1,081 834
Education 151 93 102 212 264 413 402 295 239 738 415Primary 5 6 4 5 5 17 39 10 103 671 330Secondary 14 26 18 23 23 35 4 103 47 10 13University& College Education 0 1 12 5 0 2 8 8 17 11 10Professional & Technical Edu & Teachers Trg 10 20 16 21 31 49 25 16 40 16 23Others 123 40 52 159 205 311 326 159 31 31 40
Health 67 50 63 92 114 198 165 228 140 66 90General Hospitals & Clinics 43 13 25 32 45 70 59 107 78 29 46Mother & Child 0 0 0 0 0 0 0 0 0 0 0Other Facilities & Preventive Measures 23 28 31 38 36 47 49 57 55 1 7Other I 9 8 22 33 82 57 65 7 36 37
Population 0 0 36 43 49 75 77 95 112 132 239OtherSocial Services 15 3 168 477 407 340 128 183 216 144 90
Economic Services 448 462 987 901 1,870 1,262 1,326 1,183 1,478 638 609Agriculture 148 233 450 231 341 271 292 253 307 147 103Irrigation 108 95 149 292 347 275 313 349 461 293 317Industries and mineral resources 2 2 45 35 40 42 56 7 50 21 18Other Fcnnnmir._ervices 19C 132 344 343 1,141 674 665 575 660 177 171
Community services 1,388 1,354 1,470 1,668 1,958 2,334 1,887 2,858 2,784 1,253 1,171Works (Administration civil) 0 0 0 3 5 5 I 1 3 0 0Highways, Roads & Bridges & Building & Struct. 1,190 1,192 1,257 1,404 1,594 1,704 1,490 2,420 1,975 558 532Water Supply and Sanitation 198 162 213 262 359 626 396 437 807 695 640Public Health Engineering 0 0 0 0 0 0 0 0 0 0 0Broadcasting 0 0 0 0 0 0 0 0 0 0 0UTban Town Planning & Regulator Services 0 0 0 0 0 0 0 0 0 0 0Scientific Research and Survey 0 0 0 0 0 0 0 0 0 0 0Other Community Services 0 0 0 0 1 0 0 0 -I 0 0
Subsidies 0 0 0 0 0 0 0 0 0 0 0Interest payments 0 0 0 0 0 0 315 0 0 0 0Grants & Others 340 182 356 449 648 137 21 134 218 0 0Unallocable 0 0 0 0 0 0 0 0 0 8 12
Source: Government of North-West Frontier Province, Finance Accounts - 1987/88 -1997/98.
19

Table 4B: Balochistan -- Development Expenditures(RrsMUlion)
1987/88 1988/89 1989/90 1990/91 1991/92 1992/93 1993/94 1994/95 1995/96 1996/97 1997/98
Actual Actual Actual Actual Actual Actual Actual Actual Actual Revised Budget
DEVELOPMENT EXPENDITURES 1,105 1,967 2,163 2,406 3,659 3,086 4,309 4,857 4,619 2,545 2,100
General Administration 13 24 5 14 23 0 0 0 7 12 28
Law & order 21 48 55 62 53 48 28 37 31 16 0
Defense 0 0 0 0 0 0 0 0 0 0 0
Social services 344 516 450 443 868 519 1,671 1,806 1,624 954 736
Education 128 213 222 249 583 208 1,110 907 760 174 398
Primary 68 12 0 0 0 0 0 0 0 0 159
Secondary 48 69 0 0 0 0 0 0 0 0 52
University & College Education 8 20 0 0 0 0 0 0 0 0 58
Professional & Technical Edu & Teachers Tmg 0 3 0 0 0 0 0 0 0 0 29
Others 4 109 222 249 583 208 1,110 907 760 174 100
Health 83 151 132 107 114 162 343 484 519 591 254
General Hospitals & Clinics 52 87 0 0 0 0 0 0 0 0 0
Mother & Child 0 0 0 0 0 0 0 0 0 0 0
Other Facilities & Preventive Measures 15 39 0 0 0 0 0 0 0 0 0
Other 16 25 132 107 114 162 343 484 519 591 254
Population 0 4 0 18 26 38 57 52 72 63 0
Other Social Services 134 152 97 87 170 149 218 415 274 126 84
Economic Services 459 723 876 1,025 1,580 1,499 1,189 1,536 1,441 1,005 507
Agriculture 202 299 313 154 230 156 457 563 389 115 175
Irrigation 156 221 296 390 800 921 458 713 801 826 278
Industries and mineral resources 11 30 12 11 23 37 44 4 0 3 24
OtherEconomic Services 91 174 255 470 526 385 230 256 251 61 30
Community services 267 657 776 862 1,134 1,015 1,423 1,436 1,517 559 829
Works (Administration civil) 0 0 0 0 0 0 0 230 0 0 0
Highways, Roads & Bridges & Building & Struct. 202 447 479 562 691 0 0 0 817 368 397
Water Supply and Sanitation 63 207 297 300 444 502 809 639 699 190 362
Public Health Engineering 0 0 0 0 0 0 0 0 0 0 0
Broadcasting 0 0 0 0 0 0 0 0 0 0 0
Urban Town Planning & Regulator Services 0 0 0 0 0 0 2 0 0 0 0
Scientific Research and Survey 0 0 0 0 0 0 0 0 0 0 12
Other Community Services 2 3 0 0 0 513 612 567 0 0 58
Subsidies 0 0 0 0 0 0 0 0 0 0 0
Interest payments 0 0 0 0 0 0 0 0 0 0 0
Grants 0 0 0 0 0 0 0 0 0 0 0
Unallocable 0 0 0 0 0 4 0 0 0 0 0
Source: Government of Balochistan, Finance Accounts - 1987/88 -1997/98.
20
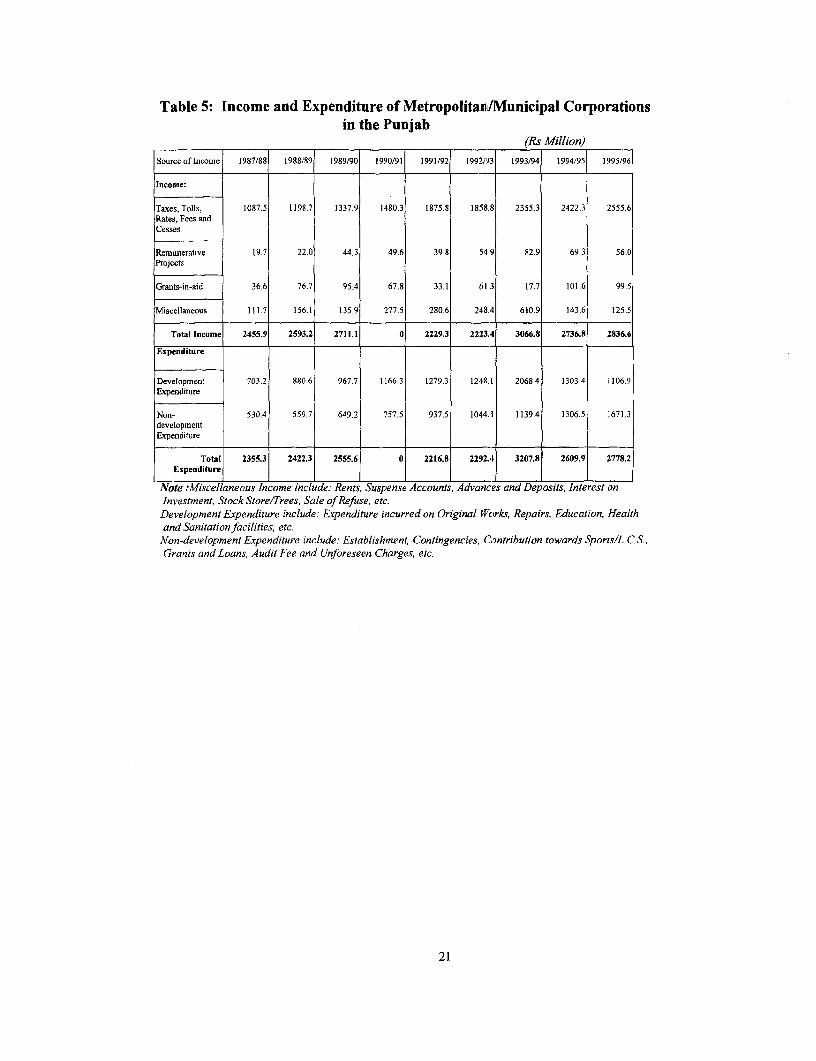
Table 5: Income and Expenditure of MetropolitaEl/Municipal Corporationsin the Punjab
(Rs Million)
Source of Income 1987/88 1988/89 1989/90 1990/91 1991/92 1992/'3 1993/94 1994/95 1995/96
Income:
Taxes, Tolls, 1087.5 1198.7 1337.9 1480.3 1875.8 1858.8 2355.3 2422.3 2555.6Rates, Fees andCesses
Remunerative 19.7 22.0 44.3 49.6 39.8 54.9 82.9 69.3 56.0Projects
Grants-in-aid 36.6 76.7 95.4 67.8 33.1 613 17.7 101.6 99.5
Miscellaneous 111.7 156.1 135.9 277.5 280.6 248 4 610.9 143.6 125.5
Total Income 2455.9 2593.2 2711.1 0 2229.3 2223.4 3066.8 2736.8 2836.6
Expenditure
Development 703.2 880.6 967.7 1166.3 1279.3 1248.1 2068.4 1303.4 1106.9Expenditure
Non- 530.4 559,7 649.2 757.5 937.5 1044.1 1139.4 1306.5 1671.3developmentExpenditure
Total 2355.3 2422.3 2555.6 0 2216.8 2292.4 3207.8 2609.9 2778.2Expenditure
Note .Miscellaneous Income include: Rents, Suspense Accounts, Advances and Deposits, Interest onInvestment, Stock Store/Trees, Sale of Refuse, etc.
Development Expenditure include: Expenditure incurred on Original Works, Repairs, Education, Healthand Sanitation facilities, etc.Von-development Expenditure include: Establishment, Contingencies, Cantribution towards Sports/L. CS,Grants and Loans, Audit Fee and Unforeseen Charges, etc.
21
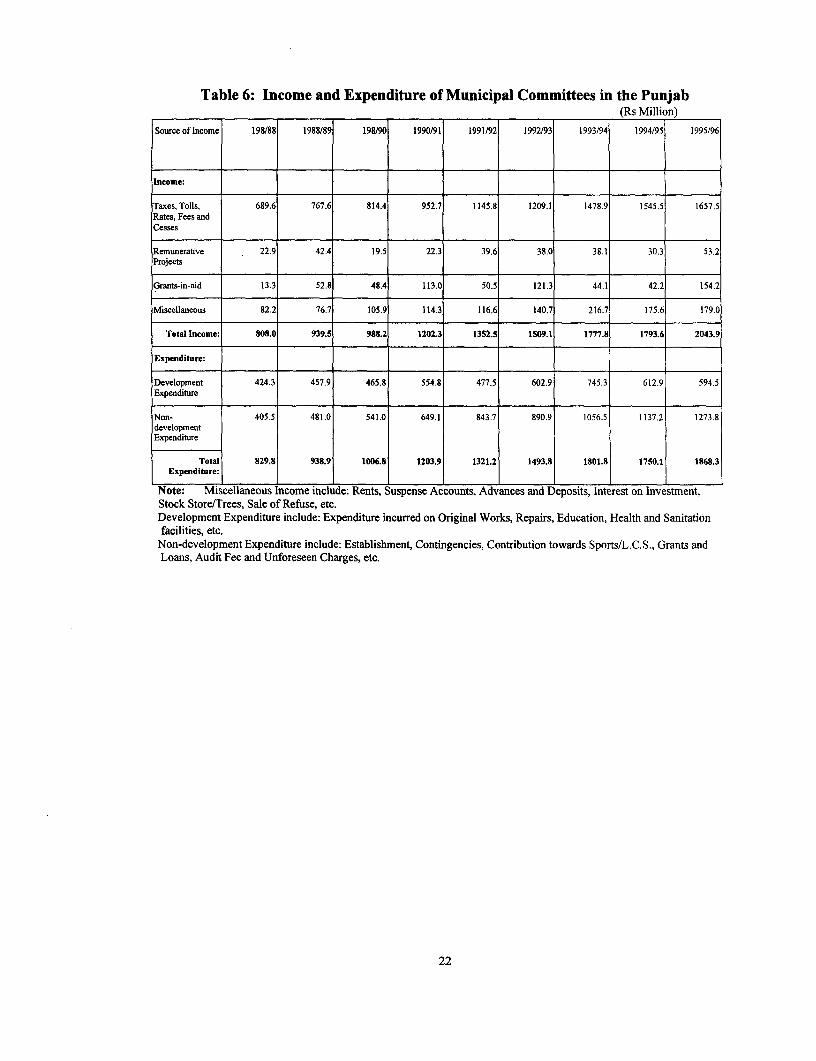
Table 6: Income and Expenditure of Municipal Committees in the Punjab(Rs Million)
Source of Income 198/88 1988/89 198/90 1990/91 1991/92 1992/93 1993/94 1994/95 1995/96
Income:
Taxes, Tolls, 689.6 767.6 814.4 952.7 1145.8 1209.1 1478.9 1545.5 1657.5Rates, Fees andCesses
Remunerative 22.9 42.4 19.5 22.3 39.6 38.0| 38.1 30.3 53.2Projects
Grants-in-aid 13.3 52.8 48.4 113.0 50.5 121.3 44.1 42.2 154.2
Miscellaneous 82.2 76.7 105.9 114.3 116.6 140.7 216.7 175.6 179.0
Total Income: 808.0 939.5 988.2 1202.3 1352.5 1509.1 1777.8 1793.6 2043.9
Expenditure:
Development 424.3 457.9 465.8 554.8 477.5 602.9 745.3 612.9 594.5Expenditure
Non- 405.5 481.0 541.0 649.1 843.7 890.9 1056.5 1137.2 1273.8developmentExpenditure
Total 829.8 938.9 1006.8 1203.9 1321.2 1493.8 1801.8 1750.1 1868.3Expenditure:
Note: Miscellaneous Income include: Rents, Suspense Accounts, Advances and Deposits, Interest on Investment,Stock Store/Trees, Sale of Refuse, etc.Development Expenditure include: Expenditure incurred on Original Works, Repairs, Education, Health and Sanitationfacilities, etc.
Non-development Expenditure include: Establishment, Contingencies, Contribution towards Sports/L.C. S., Grants andLoans, Audit Fee and Unforeseen Charges, etc.
22
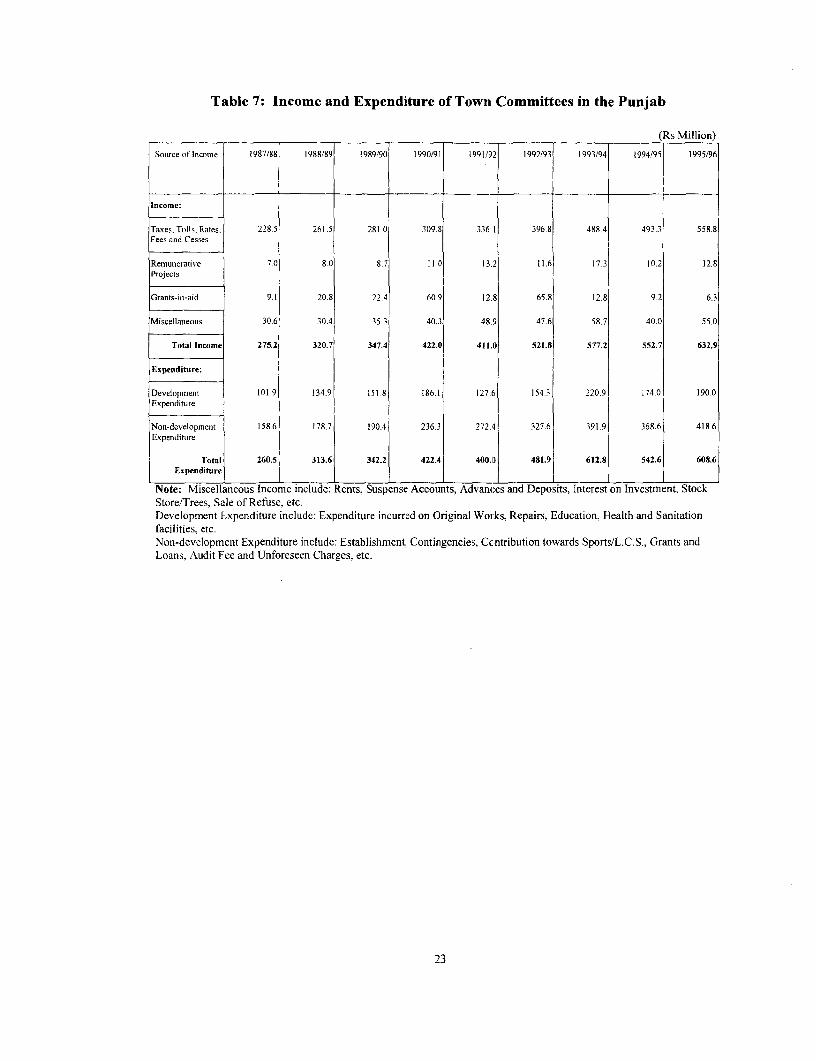
Table 7: Income and Expenditure of TowIn Committees in the Punjab
(Rs Million)
Source of Income 1987/88 1988/89 1989/90 1990/91 1991/32 1992/93 1993/94 1994/95 1995/96
Income:
Taxes, Tolls, Rates, 228.5 261.5 281.0 309.8 336.1 396.8 488.4 493.3 558.8Fees and Cesses
Remunieratixe 7.0 8.0 8.7 11.0 13.2 11.6 17.3 10.2 12.8Projects
Grants-iu-aid 9.1 20.8 22.4 60.9 12.8 65.8 12.8 9.2 6.3
Miscellanieous 30.6 30.4 35.3 40.3 48.9 47.6 58.7 40.0 55.0
Total Income 275.2 320.7 347.4 422.0 411.0 521.8 577.2 552.7 632.9
Expenditure:
Developmenit 101.9 134.9 151.8 186.1 127.6 154.3 220.9 174.0 190 0Expenditure
Non-development 158.6 178.7 190.4 236.3 272.4 327.6 391.9 368.6 418.6Expendituire
Total 260.5 313.6 342.2 422.4 400.8 481.9 612.8 542.6 608.6Expenditure _ l
Note: Miscellaneous Income include: Rents, Suspense Accounts, Advances and Deposits, Interest on Investment, StockStore/Trees, Sale of Refuse, etc.Development Expenditure include: Expenditure incurred on Original Wotks, Repairs, Education, Health and Sanitationfacilities, etc.Non-development Expenditure include: Establishment, Contingencies, Ccntribution towards Sports/L.C. S., Grants andLoans. Audit Fee and Unforeseen Charges, etc.
23

Table 8: Income and Expenditure of District Councils in the Punjab
(Rs Million)
Source of Income 1985/86 1986/87 1987/88 1988/89 1989/90 1990/91 1991/92 1992/93 1993/94
Income:
Taxes, Tolls, Rates, 512.6 576.5 726.1 856.6 951.1 1227.9 1502.3 1862.0 2334.0Fees and Cesses
Remunerative 8.6 28.3 20.1 14.6 21.4 16.1 18.9 11.9 15.6Projects
Grants-mn-aid 46.8 45.0 48.1 105.0 101.3 152.2 631 114 6 35.4
Miscellaneous 101.4 87.5 107.8 97.0 222.2 184.1 161.7 168.5 261.0
Total Income 669.4 737.3 902.1 1073.2 1296.0 1560.3 1746.0 2157.0 2646.0
Expenditure:
Development 372.1 472 5 429.5 634.8 953.3 1033.3 1113.0 1269.0 1680.5Expenditure
Non-development 245.2 266.1 332.6 367.0 411.8 466.3 591.4 827.1 1035.1Expenditure
Total 617.3 738.6 762.1 1001.8 1365.1 1499.6 1704.4 2096.1 2715.6Expenditure
Note: Miscellaneous Income include: Rents, Suspense Accounts, Advances and Deposits, Interest on Investment, StockStore/Trees, Sale of Refuse, etc.Development Expenditure include: Expenditure incurred on Original Works, Repairs, Education, Health and Sanitationfacilities, etc.Non-development Expenditure include: Establishment, Contingencies, Contribution towards Sports/L.C.S., Grants andLoans, Audit Fee and Unforeseen Charges, etc.
24
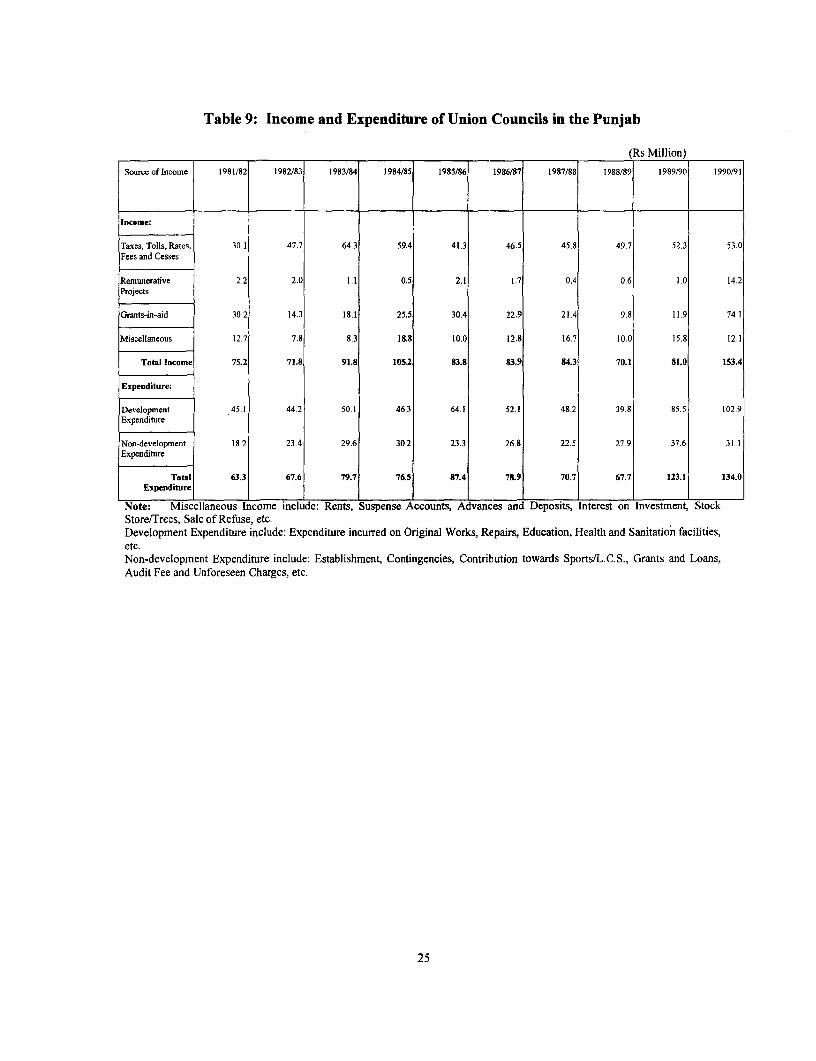
Table 9: Income and Expenditure of Union Councils in the Punjab
(Rs Million)
Source of Income 1981182 1982/83 1983/84 1984/85 1985/86 1986/87 1987/88 1988/89 1989/90 1990/91
Income:
Taxes, Tolls, Rates, 30.1 47.| 64.3 59.4 41.3 46.5 45.8 49.7 52.3 53.0Fees and Cesses
Remunerative 2.2 2.0 1.1 0.5 2.1 1.7 0.4 0.6 1.0 14.2Projects
Grants-in-aid 30.2 14.3 18.1 25.5 30.4 22.9 21.4 9.8 11.9 74.1
Miscellaneous 12.7 7.8 8.3 18.8 10.0 12.8 16.7 10.0 15.8 12.1
Total Income 75.2 71.8 91.8 105.2 83.8 83.9 84.3 70.1 81.0 153.4
Expenditure:
Development 45.1 44.2 50.1 463 64.1 52.1 48.2 39.8 85.5 102.9Expenditure
Non-development 18.2 23.4 29.6 302 23.3 26.8 22.5 27.9 37.6 31.1Expenditure
Total 63.3 67.6 79.7 76.5 87.4 78.9 70.7 67.7 123.1 134.0Expenditure
Note: Miscellaneous Income include: Rents, Suspense Accounts, Advances and Deposits, Interest on Investment, StockStore/Trees, Sale of Refuse, etc.Development Expenditure include: Expenditure incurred on Original Works, Rcpairs, Education, Health and Sanitation facilities,etc.Non-development Expenditure include: Establishment, Contingencies, Contribution towards Sports/L.C.S., Grants and Loans,Audit Fee and Unforeseen Charges, etc.
25