State Finances - AG AP
124
Report of the Comptroller and Auditor General of India State Finances for the year ended March 2012 on Government of Andhra Pradesh Report No. 1
-
Upload
khangminh22 -
Category
Documents
-
view
3 -
download
0
Transcript of State Finances - AG AP
Report of the Comptroller and Auditor General of India
State Financesfor the year ended March 2012
on
Government of Andhra PradeshReport No. 1


Report of the Comptroller and Auditor General of India
on
State Finances
for the year ended March 2012
Government of Andhra Pradesh Report No.1

Reference to
Paragraph Page
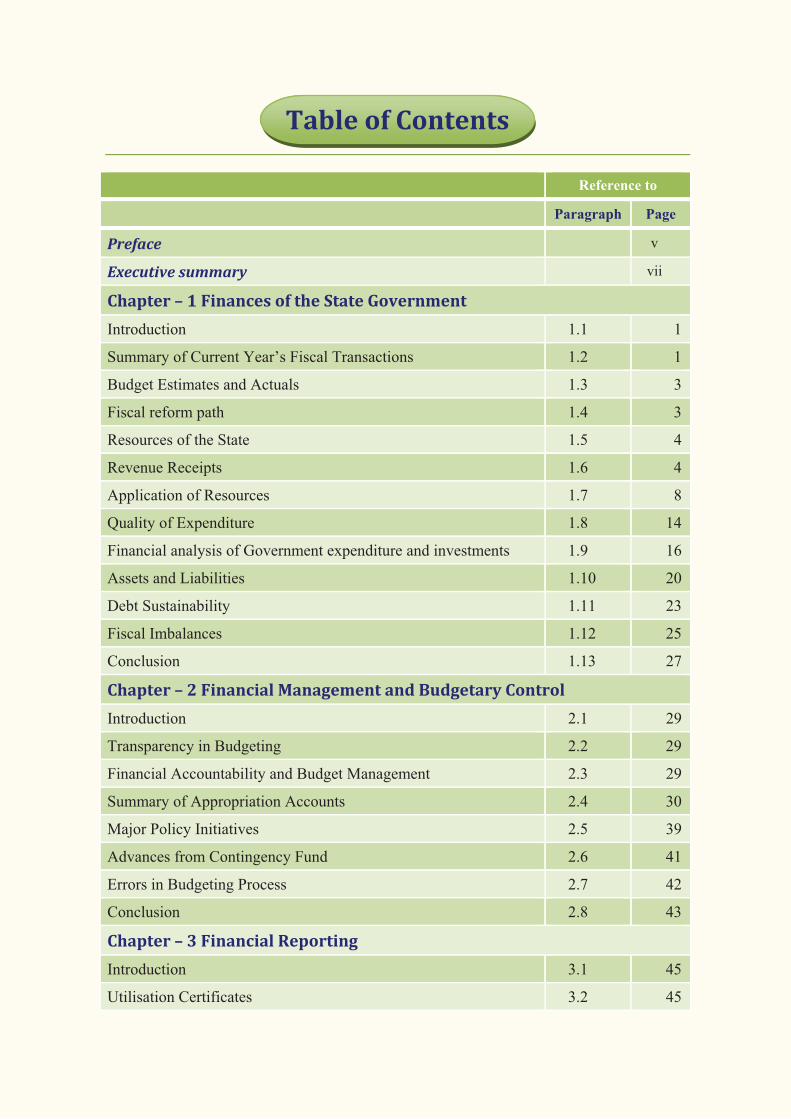
Preface v
Executive summary vii
Chapter – 1 Finances of the State Government
Introduction 1.1 1
Summary of Current Year’s Fiscal Transactions 1.2 1
Budget Estimates and Actuals 1.3 3
Fiscal reform path 1.4 3
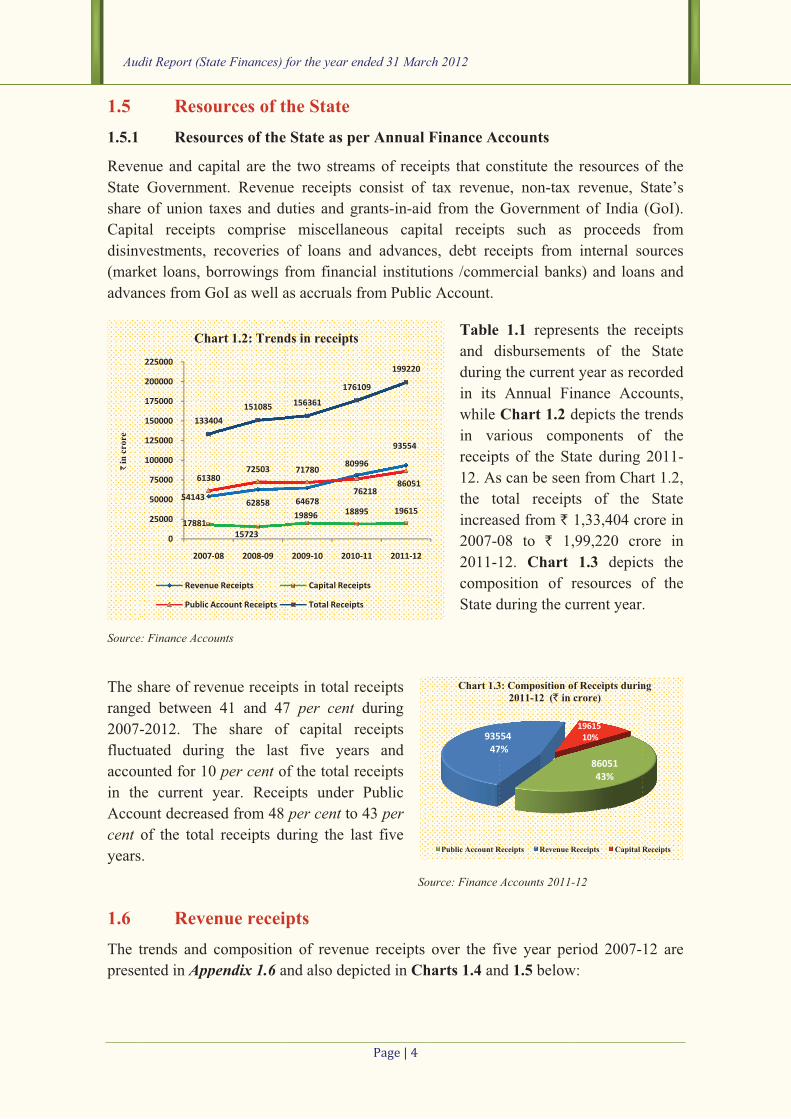
Resources of the State 1.5 4
Revenue Receipts 1.6 4
Application of Resources 1.7 8
Quality of Expenditure 1.8 14
Financial analysis of Government expenditure and investments 1.9 16
Assets and Liabilities 1.10 20
Debt Sustainability 1.11 23
Fiscal Imbalances 1.12 25
Conclusion 1.13 27
Chapter – 2 Financial Management and Budgetary Control
Introduction 2.1 29
Transparency in Budgeting 2.2 29
Financial Accountability and Budget Management 2.3 29
Summary of Appropriation Accounts 2.4 30
Major Policy Initiatives 2.5 39
Advances from Contingency Fund 2.6 41
Errors in Budgeting Process 2.7 42
Conclusion 2.8 43
Chapter – 3 Financial Reporting
Introduction 3.1 45
Utilisation Certificates 3.2 45
Table of Contents

����������
Reference to
Paragraph Page
Submission of accounts/Audit Reports of Autonomous bodies 3.3 45
Un-reconciled expenditure and receipts 3.4 46
Functioning of Treasuries 3.5 46
Irregular parking of funds 3.6 46
Personal Deposit Accounts 3.7 47
Parking of funds outside Government account 3.8 50
Pendency of Detailed Contingent bills 3.9 50
Outstanding balances under Major Suspense Account - 8658 3.10 51
Operation of Omnibus Minor Head -800 3.11 54
Implementation of Indian Government Accounting Standards (IGAS)
3.12 54
Conclusion 3.13 55
�����������
Appendices
Reference to
Paragraph Page
1.1 Andhra Pradesh State Profile 57
1.2 Structure of Government accounts and layout of Finance
Accounts 1.1 58
1.3 Abstract of Receipts and Disbursements in 2011-12 1.2 59
1.4 Actual vis-à-vis Budget Estimates 2011-12 1.3 63
1.5 Fiscal Responsibility and Budget Management Act, 2005 1.4 64
1.6 Time Series Data on State Government Finances 1.6 &1.10.2
65
1.7 Funds transferred directly to State implementing agencies 1.6.4 68
1.8 List of Incomplete Irrigation Projects 1.9.1 69
1.9 Summarised Financial Position of the Government of Andhra
Pradesh as on 31 March 2012 1.10.1 72
2.1 Statement of Grants/Appropriations where saving was more than
` 100 crore each and more than 20 per cent of the total
provision
2.4.1 74
2.2 Excess over provision of previous years requiring regularisation 2.4.5 75
2.3 Cases where Supplementary provision proved unnecessary by
` one crore or more in each case 2.4.6 76
2.4 Unnecessary re-appropriation of funds
(more than ` 10 crore in each case) 2.4.7 78
2.5 Substantial surrenders made during the year 2.4.9 81
2.6 Surrenders (` 50 lakh or more in each case) in excess of actual
saving/excess 2.4.10 83
2.7 Statement of various grants/appropriations in which saving
occurred but no part of which was surrendered 2.4.11 84
2.8 Details of saving of ` 5 crore and above not surrendered 2.4.11 85
2.9 Cases of surrender of funds in excess of ` 10 crore on 30 and 31
March 2012 2.4.11 86
2.10 Statement showing non-incorporation of correction slips 2.7.1 88
2.11 Detailed Head 530-major works appearing under Revenue
section 2.7.7 89
2.12 Detailed Head 270-Minor works appearing under Capital section 2.7.8 89
2.13 Detailed Head 310-Grants-in-aid appearing under Capital
section 2.7.8 89
3.1 Year-wise position of outstanding UCs as of 31 March 2012 3.2 90

���������
Reference to
Paragraph Page
3.2 Statement showing submission of accounts and status of audit of autonomous bodies
3.3 91
3.3 Statement of Bodies and Authorities whose accounts have not been received
3.3 93
3.4 Un-reconciled expenditure (` 500 crore and above cases only) 3.4 96
3.5 Excess payment of pension/family pension 3.5 97
3.6 Variation in the figures of receipts & expenditure 3.7 97
3.7 Statement showing Department-wise details of pending DC bills at the end of 2011-12
3.9 98
4.1 Glossary of terms -- 100
4.2 Acronyms and abbreviations -- 103

��������
This Report has been prepared for submission to the Governor under Article 151
of the Constitution.
Chapters 1 and 2 of this Report respectively contain Audit observations on matters
arising from examination of Finance Accounts and Appropriation Accounts of the
State Government for the year ended 31 March 2012. Chapter 3 on ‘Financial
Reporting’ provides an overview and status of the State Government’s compliance
with various financial rules, procedures and directives during the current year.
The Report containing the findings of performance audit and audit of transactions
in various departments and observations arising out of audit of Statutory
Corporations, Boards and Government Companies and the Report containing
observations on Revenue Receipts are presented separately.
Preface


Executive Summary
1 Background Government of Andhra Pradesh enacted the “Fiscal Responsibility and Budget
Management (FRBM) Act” in October 2005, setting out a reform agenda through a fiscal
correction path in the medium term with the long-term goal of securing growth stability
for the State economy. The State Government’s commitment to carry forward these
reforms is reflected in policy initiatives announced in the subsequent budgets. While the
benefits of FRBM legislation have been realized to a large extent in terms of reduction in
major deficit indicators etc., the State Government’s switchover to VAT, introduction of
New Pension Scheme, ceiling on Government guarantees and a host of other institutional
and sectoral reform measures are expected to facilitate building up the ‘fiscal space’
needed for improving the quality of public expenditure and promote fiscal stability.
2 The Report Based on the audited accounts of the Government of Andhra Pradesh for the year ended
March 2012, this report provides an analytical review of the finances of the State
Government. The report is structured in three Chapters.
Chapter 1 is based on audit of Finance Accounts and makes an assessment of the
Government’s fiscal position as on 31 March 2012. It provides an insight into trends,
among others, in State Government’s resources and their application, developmental
expenditure, borrowing pattern, sustainability of debt etc., besides a brief account of
central transfers – both to the State Government, and to the implementing agencies
through off-budget route. It also assesses the adequacy of the State’s fiscal priorities.
Chapter 2 is based on audit of Appropriation Accounts and reviews the allocative
priorities of the State Government and the manner in which the allocated resources were
managed by the service delivery departments.
Chapter 3 gives an overview of the State Government’s compliance with various
reporting requirements and financial rules. The report also has an appendage of additional
data collated from several sources in support of the findings.
3 Audit findings and recommendations
3.1 Fiscal consolidation Government of Andhra Pradesh has been achieving the fiscal reform targets every year in
the post FRBM legislation period. The State registered revenue surplus for the 6th
consecutive year during 2011-12, and fiscal deficit, despite a marginal increase over the
previous year, was well within the ceiling prescribed by the FRBM Act. The total
liabilities as a percentage of GSDP stood at 22.27 per cent at the end of the current year,
against a ceiling of 29.60 per cent prescribed in FRBM Act for the year 2011-12.
Audit Report (State Finances) for the year ended 31 March 2012
�����������
In line with the FRBM Act, the State Government established Sinking Fund for reduction/
avoidance of debt and Guarantee Redemption Fund and has been contributing to these
funds at the rates prescribed by the RBI. However, adverse balances existed under debt
head (` 3,732 crore), due to wrong booking of assistance to various SPVs as repayment of
the latter’s debt, which led to understatement of revenue expenditure and thereby,
affected the fiscal indicators of the State.
Recommendation: Government needs to take a closer look at the factors that affect its fiscal indicators and ensure that proper accounting treatment is given to various transactions, especially those relating to its debt.
Revenue receipts registered a growth of over 15.50 per cent during the current year
(` 12,558 crore) over the previous year, due to growth in own tax and non tax revenue by
` 9,119 crore. Revenue expenditure increased by 15.13 per cent (`11,881 crore) over the
previous year, due to increase in both plan and non-plan expenditure. The increase in
revenue expenditure is attributable to interest payments and increased assistance to local
bodies in education.
While capital expenditure increased by 23 per cent and its ratio to total expenditure has
also increased significantly to 18.43 per cent from 12.28 per cent during previous year, it
was not up to the level envisaged in the Macro Economic Framework Statement for the
year. Capital works/projects in irrigation and roads sectors were not completed on time,
which led to cost escalation on these projects without achieving the desired benefits. The
investment blocked in such incomplete works/projects as of March 2012 was ` 49,516
crore (previous year ` 46,330 crore).
Recommendation: Government needs to prepare an action plan to complete all the projects in the pipeline for several years, especially those relating to irrigation, within a specified timeframe, so that the envisaged benefits accrue to the targeted beneficiaries. Also, Government should prioritize the areas that need capital expenditure, especially in socio-economic sectors.
Although the State Government accorded adequate fiscal priority to development
expenditure during 2011-12, it did not ensure that allocated funds were fully utilized for
the intended purpose. Funds earmarked for specific social sector activities were not
always released on time/ not released at all, thereby negating the objective of allocating
these funds. State outlay on education in particular, was way behind (13.80 per cent) that
of the General Category States (17.18 per cent). Further, the share of capital expenditure
in Social Sector (12.58 per cent of aggregate expenditure) was also lower in the State,
compared to the General Category States (13.71 per cent).
Recommendation: Government needs to re-prioritize the outlay in respect of social sector and ensure that funds are released based on approved outlays and spent for the purpose sanctioned. Greater fiscal priority needs to be accorded to education and health sectors. Besides, capital expenditure needs to be increased to create adequate asset back up for increasing liabilities.

Executive Summary
���������
Government had not estimated the yearly pension liabilities on actuarial basis for the
ensuing years, as stipulated in the FRBM Act. The State Government’s progressive
liability with regard to its share in the Contributory Provident Fund scheme as of 31
March 2012 was ` 894 crore, which has not been transferred to the Fund Manager, as
required by the Pension Fund Regulatory Authority. In fact, during the current year,
Government provided ` 100 crore less in the budget, as compared to the contribution of
the employees during the year.
Recommendation: Government should review its budgetary allocation for pension and provide for its liability on this account on the basis of actuarial valuation. Further, it should transfer the accumulated fund amount immediately to the Fund Manager.
Return on investment in Companies/Statutory Corporations continued to be poor and the
rate of return on investment was 0.85 per cent during 2011-12, while the rate of interest
paid by the Government during the year was 7.40 per cent. The accounts of several of these companies/corporations have been in arrears and up to the year of accounts
finalized, the accumulated losses of 11 entities alone amounted to ` 5,979 crore, with AP
State Housing Corporation (` 3,554 crore) and APSRTC (` 1,984 crore) leading the list.
The current level of recovery of loan is abysmal, with the gap between disbursement
(` 4,983 crore) and recovery (` 164 crore) widening. In fact, confirmation of balances on
loan amount of ` 17,337 crore was yet to be received from the entities, which were the
recipients of these loans.
Recommendation: The losses of State Public Undertakings (PSUs) are attributable to a large extent to deficiencies in project implementation and operational and financial management. The State Government needs to draw up a roadmap for closure of loss making PSUs in non-commercial areas, in keeping with the recommendation of the 13th Finance Commission. Government also needs to follow up with the recipient entities to confirm the loan amount balances with them and pursue for repayment of both principal and interest in a time bound manner.
(Chapter 1)
3.2 Financial Management and Budgetary Control As with 2010-11, there were several lacunae in the budgetary processes of the State
Government. There were errors in budgeting, several misclassifications continued to
exist, lumpsum provisions were made without clarity of purpose (only to be surrendered
later), excess expenditure over allocation, expenditure without budget provision etc.
Financial rules were flouted by several departments by drawing funds in excess of
requirement, resorting to re-appropriations without proper explanations and expending
without provision of funds. Persistent savings in certain Grants and huge savings of over
` 500 crore and over 20 per cent of budgetary provision in certain other Grants, indicate
inaccurate budgetary assumptions.
Saving of about one sixth of the budgetary allocation and non-utilisation of funds
allocated for various developmental programmes raises serious questions about the

Audit Report (State Finances) for the year ended 31 March 2012
��������
budget formulation exercise. While this could show a healthy picture as far as fiscal
indicators are concerned, it has had an adverse impact on implementation of various
policy initiatives announced/taken up by the Government.
Recommendation: Government should ensure that budgeting process is more transparent and result oriented. Basic assumptions in budgetary formulation have to be more accurate and efforts should be made by all the departments to submit realistic budget estimates, keeping in view the past trends in receipts and expenditure in order to avoid large scale saving/excess, re-appropriations and surrenders at the fag end of the year.
(Chapter 2)
3.3 Financial reporting Several State Government departments were not compliant with the applicable rules and
regulations, especially those relating to compilation and submission of accounts for audit
and reporting utilization of funds placed at their disposal for implementation of various
socio-economic developmental schemes. Internal controls were not functioning as
envisaged, as evidenced from non-reconciliation of receipts and expenditure with those
booked by the Principal Accountant General (A&E), irregular and unauthorized parking
of funds in various deposits outside Government accounts, non-adjustment of advances
drawn on AC bills with the relevant DC bills for prolonged periods etc. Adequate
attention was not given by the Government to ensure that relevant vouchers/missing
documents were provided by the concerned authorities to adjust the amounts held in
suspense heads. Operation of over one lakh Personal Deposit (PD) accounts and locking up of about ` 23,483 crore in these accounts, affected the transparency of Government accounts. Classifying large amounts and important items of expenditure
like ‘subsidies’ under omnibus Minor Head 800 affected transparency in financial
reporting.
Recommendation: Government needs to strengthen financial management and reporting, especially in areas such as timely compilation of accounts by Government undertakings and bodies, adjustment of funds drawn through AC bills and correct classification of expenditure at the Minor Head level. Government should initiate stringent measures to streamline the system of PD Accounts and ensure that these are operated in a transparent manner in accordance with the letter and spirit of the relevant instructions and rules.
(Chapter 3)
Chapter 1 Finances of the State Government
Profile of Andhra Pradesh ndhra Pradesh is the fourth largest State in India in terms of geographical area of
2.75 lakh sq. km. with a population of 8.47 crore as per the 2011 census. The
State has shown marginally higher economic growth in the past decade, as the
compound annual growth rate of its Gross State Domestic Product (GSDP) for the period
2002-03 to 2011-12 has been 16.71 per cent, as compared to 14.46 per cent in General
Category States1. During this period, its population also grew by 9.72 per cent against
13.90 per cent in General Category States. Consequently, the compound annual growth
rate of per capita income of the State (15.52 per cent) has been higher than that of the
General Category States (13.09 per cent) in the current decade. Key socio-economic
parameters of the State viz., population Below Poverty Line (15.8 per cent), Infant
Mortality Rate (46 per 1000 live births) and Life Expectancy at birth (64.4 years) are
better than the All India average. Also, inequality of income distribution, as reflected
through the Gini2 co-efficient was marginally lower in the State in rural areas (0.29) than
the national average, but approximately the same in urban areas (0.37) as the All India
position (Appendix 1.1). Over half of the State’s GSDP accrues from the Services Sector.
1.1 Introduction This chapter provides a broad perspective of the finances of the Government of Andhra
Pradesh during the current year and analyses critical changes in the major fiscal
aggregates relative to the previous year, keeping in view the overall trends during the last
five years. This analysis was made based on the Finance Accounts and the information
obtained from the State Government. The structure of Government Accounts and the
layout of Finance Accounts are given in Appendix 1.2.
1.2 Summary of current year’s fiscal transactions Table 1.1 presents the summary of State Government’s fiscal transactions during the
current year (2011-12) vis-à-vis the previous year, while Appendix 1.3 provides the
details of receipts and disbursements as well as overall fiscal position during the current
year.
1 States other than the 11 states termed as Special Category States (Arunachal Pradesh, Assam, Jammu & Kashmir, Himachal Pradesh, Manipur, Meghalaya, Mizoram, Nagaland, Sikkim, Tripura and Uttarakhand)
2 It is a measure of inequality of income distribution where zero refers to perfect equality and one refers to perfect inequality
A

Aud
SectionRevenu
Tax Rev
Non-tax
Share Taxes/DGrants f
SectionMisc. C
Recove
and Adv
Public D
Conting
Public
Receipt
Openin
Balance
Total Source:
Signifyear a
Ex
Ex
&
P
Ca
dit Report (Sta
Rec
n A - Revenue
ue Receipts
venue
x Revenue
of UnionDuties from GOI
n B – Capital &Capital Receipts
eries of Loan
vances
Debt Receipts
gency Fund
Accoun
ts
ng Cash
e
: Finance Acco
ficant changare given be
Revenue
Receipts
Revenue
xpenditure
Capital
xpenditure
Loans
& Advances
Public Debt
ash Balance
ate Finances) f
ceipts
2010-11
Total
80,996
45,139
10,720
n 15,237
9,900
& Others s ---
s 173
18,722
---
nt 76,218
h 5,983
1,82,092 unts; * ` 164.9
ges in the felow:
• Increased by
• Own tax reve
• Increased by
• Plan expendi
• Non-plan exp
• Increased by
• Recoveries d
• Disbursemen
• Receipts incr
• Repayment d
• Increased by
for the year e
Table 1.1
2011-12
Total
93,554 ReEx
53,284 Ge
11,694 So
17,751 Ec
10,825 GrCo
--- Ca
164* Lo
Ad
19,450 Re
Pu
2 Co
86,051 Pu
Di
8,830 Cl
ba
2,08,051 To92 crore rounde
fiscal positi
15.50 per centenue increased b
15.13 per centiture increased b
penditure increa
23.37 per cent
ecreased by 5.2
nts increased by
reased by 3.88 pdecreased by 14
5.57 per cent
nded 31 Marc
���������
Summary o
evenue xpenditure eneral Services
ocial Services
conomic Service
rants-in-aid aontributions
apital Outlay
oans
dvances disburs
epayment
ublic Debt
ontingency Fun
ublic Acco
isbursements
losing C
alance
otal ed-off to ` 164 c
ion of the S
by 18.04 per ce
by 20.12 per ceased by 13.46 p
t
20 per centy 50.32 per cent
per cent4.21 per cent
ch 2012
of balances
Disbu
2010-11
Total
78,534
26,708
32,314
es 19,346
and 166
11,123
and
sed
3,315
of 7,881
nd 2
ount 72,407
Cash 8,830
1,82,092crore for balan
State during
ent
entper cent
t
ursements
1
Non-Plan
4 66,751
8 29,722
4 21,287
6 15,527
6 215
3 35
5 222
1 ---
2 ---
7 ---
0 ---
2 67,008 ncing purpose
g 2011-12 o
State achievedsurplus consecu2011-12fiscal deat 2.27GSDP current to 2.08 2010-11within per centAct andFinance
(` i
2011-12
Plan T
23,664
152
16,730
6,782
---
13,687
4,761
6,761
---
82,848
9,322
1,41,043 2,
over the pre
Governd re
for the utive year d2. Althdeficit was h7 per cen
during year com
per cent d1, it was the ceilingt fixed by Fd the Thire Commissi
n crore)
Total
90,415
29,874
38,017
22,309
215
13,722
4,983
6,761
---
82,848
9,322
08,051
evious
nment evenue
sixth during hough higher nt of
the mpared during
well g of 3 FRBM teenth ion.

1.3 Budge
Appen
Source:
Reven
of Wa
Urban
Intere
paym
by `
previo
defici
estima
1.4 State
Comm
Act, 2
GSDP
given
1999-
by the
curren
-2
1
3
5
7
9
11
` `in
cro
re
Budget estimate
ndix 1.4.
: Budget in Brie
nue expend
ater Supply
n Developm
est payment
ments, in real
886 crore.
ous year, bu
its were also
ates.
FiscaGovernme
mission (TF
2005 (amen
P for the y
n in Append-2000 to 20
e Central St
nt prices hav
25000
-5000
15000
35000
55000
75000
95000
15000
73264
2
71
Chart 1
get estimaes and actu
ef and Finance
iture was le
and Sanitat
ment (28.52
ts (7.66 perl terms, ther
. Capital ex
ut was less t
o less by 12
al reform nt, in com
FC), enacted
nded in 201
ear 2011-12
dix 1.5. Due
004-2005 ba
tatistics Off
ve undergon
27731
100995 97
1035
22519
93554
1.1: Budget E
BE
ates and auals for key
Accounts 2011
ess than the
tion (46.02 pper cent),
r cent). Th
re was an in
xpenditure
than the bud
2.50 per cen
path mpliance wit
d the Fiscal
1), limiting
2. A Summ
e to the chan
ased on new
fice, New D
ne a change
7170
1143717855
90415
105611
Estimates vis
E Actuals
���������
actuals y fiscal pa
1-12
budget esti
per cent), DIrrigation a
ough there
ncrease in in
had increa
dget estima
nt and 21.46
th the reco
l Responsib
g its total ou
mary of FR
nge in the b
w series of N
Delhi, the ca
e over the fi
3826
-17602
3722
3138
-154
s-à-vis actua
Chapter 1-
arameters a
T
v
e
a
A
t
a
t
e
R
e
7
ci
s
o
imates (6.95
District Adm
and Flood C
was a savi
nterest paym
ased during
ates (23.15 p6 per cent r
ommendatio
bility and Bu
utstanding l
RBM Act, 2
base year fo
National Ac
alculation of
ive year per
-6164401
-4840
als
Finances of th
are given in
There wer
variations b
estimates
almost all
Although bo
tax revenue
an increase
these have
estimated
Revenue
expenditure
7.37 per cecent respec
in decreas
surplus by
over the bud
5 per cent) ministration
Control (19
ing in prov
ments over
g 2011-12
per cent). Frespectively
ons of the
udget Mana
liabilities to
2005 as am
or calculatio
ccounts Sta
f and comm
riod 2007-12
he State Gove
n Chart 1.
re conside
between b
and actual
the param
oth tax and
e have regis
during the
e not met
quan
receipts
e decreased
ent and 6.9
ctively, resu
se in rev
17.98 perdget estimat
mainly in r
n (33.33 per.04 per cen
vision for in
the previou
compared
Fiscal and pr
y, over the b
Twelfth Fi
agement (F
o 29.6 per cended in 2
on of GSDP
atistics intro
ments on GS
2.
ernment
1 and
erable
udget
ls in
meters.
d non-
stered
year,
t the
ntum.
and
d by
5 per ulting
venue
r cent tes.
respect
r cent), nt) and
nterest
us year
to the
rimary
budget
inance
RBM)
cent of
011 is
P from
oduced
SDP at
Aud
1.5 1.5.1
Reven
State
share
Capit
disinv
(mark
advan
Source:
The s
range
2007-
fluctu
accou
in the
Accou
cent o
years.
1.6 The t
presen
`in
cro
re
dit Report (Sta
ResouResou
nue and cap
Governme
of union ta
al receipts
vestments, r
ket loans, b
nces from G
: Finance Acco
share of rev
d between
-2012. The
uated durin
unted for 10
e current y
unt decreas
of the total
.
Revetrends and c
nted in App
54143
17881
6138
13340
0
25000
50000
75000
100000
125000
150000
175000
200000
225000
2007-
Cha
Revenu
Public A
ate Finances) f
urces of turces of the
pital are the
nt. Revenu
axes and du
s comprise
recoveries
orrowings f
GoI as well a
unts
enue receip
41 and 47
e share of
ng the last
0 per cent oyear. Recei
ed from 48
receipts du
nue receicomposition
pendix 1.6 a
62858
15723
8072503
04
151085
-08 2008-09
art 1.2: Trend
e Receipts
Account Receipts
for the year e
the Statee State as pe
e two stream
ue receipts
uties and g
miscellan
of loans an
from financ
as accruals f
pts in total r
7 per centf capital r
t five yea
of the total r
ipts under
per cent touring the la
pts n of revenu
and also dep
64678
809
19896 188
71780
7
156361
176
2009-10 2010
ds in receipts
Capital Recei
Total Receipt
nded 31 Marc
������� �
er Annual
ms of recei
consist of
grants-in-aid
neous capit
nd advance
cial instituti
from Public
receipts
during
receipts
ars and
receipts
Public
o 43 per ast five
So
ue receipts
picted in Ch
996
93554
895 19615
7621886051
109
199220
0-11 2011-12
s
ipts
ts
ch 2012
Finance Ac
ipts that co
tax revenu
d from the
tal receipts
es, debt rec
ions /comm
c Account.
Table and d
during
in its
while
in va
receipt
12. As
the to
increas
2007-0
2011-1
compo
State d
ource: Finance A
over the fi
harts 1.4 an
93547
Chart 1.3
Public Account R
ccounts
onstitute the
ue, non-tax
Governmen
s such as
ceipts from
mercial bank
1.1 repres
disbursemen
g the current
Annual Fi
Chart 1.2 d
arious com
ts of the St
s can be see
otal receipt
sed from ` 08 to ` 1
12. Chart osition of r
during the c
Accounts 2011-
ive year pe
nd 1.5 below
5547%
3: Composition o2011-12 (` in
Receipts Revenue R
e resources
revenue, S
nt of India
proceeds
m internal so
ks) and loan
sents the re
nts of the
t year as rec
inance Acc
depicts the
mponents o
tate during
en from Cha
ts of the
1,33,404 cr
,99,220 cro
1.3 depic
resources o
urrent year.
-12
eriod 2007-
w:
8605143%
1961510%
of Receipts durincrore)
Receipts Capital R
of the
State’s
(GoI).
from
ources
ns and
eceipts
State
corded
counts,
trends
of the
2011-
art 1.2,
State
rore in
ore in
ts the
of the
.
12 are
ng
Receipts

Source:
The r
can b
over t
The g
lower
(3.75
(` 97
own
` 9,11
` 652
assess
are gi
Tax R
Non-
Source:
Actua
Gover
share
includ
has ar
The tr
100
200
300
400
500
600
700
800
900
1000
`in
cro
re
: Finance Acco
rate of grow
e seen from
the last five
growth rate
r than the g
per cent) i,194 crore)
tax and no
19 crore ov
2 crore. T
sments mad
iven in Tab
Revenue
Tax Revenue
13th Finance Co
al realizatio
rnment, wa
of Interest
ding ` 5,726
risen out of
rends in rev
54143
35858
11184
71010
000
000
000
000
000
000
000
000
000
000
2007-08
Chart 1.4: T
Revenue ReceipCentral Tax Tr
ounts
wth of reven
m Table 1.3 years, exce
of revenue
growth rate
in revenue
made in M
on tax reve
er the previ
he actual
de by 13th Fi
le 1.2 below
Table
Assess
e
ommission recom
n of tax and
as higher tha
t receipts i
6 crore from
book adjus
venue receip
62858 64678
43041 42979
11802 12141
8015 9558
2008-09 2009-10
Trends in Reven
ptsransfers
nue receipts
3, although
ept during 2
e (15.50 peduring 201
(` 93,554 c
Macro Econ
enue (` 64,
ious year, bu
receipts un
inance Com
w:
1.2: Revenu
sment by 13th
Commissio
52,505
7,239
mmendations; Fin
d non tax r
an the asses
in non tax
m irrigation
tment.
pts relative t
80996
935
55859
649
15237 177
9900 108
2010-11 201
nue Receipts
State Own RevenGrants-in-aid
���������
Sourc
s has been f
own tax rev
2009-10.
er cent) dur
10-11. Ther
crore) realiz
nomic Fram
,978 crore)
ut was lowe
nder State’
mmission an
ue receipts v
h Finance on
nance Accounts 2
evenue, tho
ssment mad
revenue in
projects, w
to GSDP ar
554
978
751
825
1-12
nue
1
1
1
1
1
2
`in
cro
re
Chapter 1-
ce: Finance Acc
fluctuating
venue has b
ring the cu
re was also
zed during
mework Stat
during the
er than the p
s tax and
nd the State
vis-à-vis asse
ProjectioGovernm
53
12
2011-12 and ME
ough lower
de by the 13
n the curren
which is only
re presented
0
20000
40000
60000
80000
100000
120000
140000
160000
180000
200000
2007-08
54143
35858
111847101
Chart 1.5: C
Revenue Receipts Stat
Finances of th
counts
during the
been increas
urrent year
a shortfall
the year ov
tement (ME
e current y
projection m
non tax r
Governmen
essment
ons by State ent in MEFS
3,399
2,231
EFS tabled in Leg
than the pr
3th Finance C
nt year wa
y a notional
d in Table 1
2008-09 2009-1
62858 6467
43041 4297
11802 12148015 9558
Composition of R
te Own Revenue Centr
he State Gove
last five ye
sing in real
was signifi
of ` 3,640
ver the proj
EFS). The S
year increas
made in ME
revenue vis
nt during 20
(` in
S Act
53,
11,
gislature during
rojection ma
Commission
as ` 6,279
l revenue, s
.3.
10 2010-11 20
880996 9
9
55859
61
15237
1
8
9900
1
Revenue Receipt
ral Tax Transfers Gra
ernment
ears as
terms
icantly
0 crore
jection
State’s
sed by
EFS by
s-à-vis
011-12
n crore)
tuals
284
694
2011-12
ade by
n. The
crore,
since it
011-12
93554
64978
1775110825
s
ants-in-aid
Audit Report (State Finances) for the year ended 31 March 2012
���������
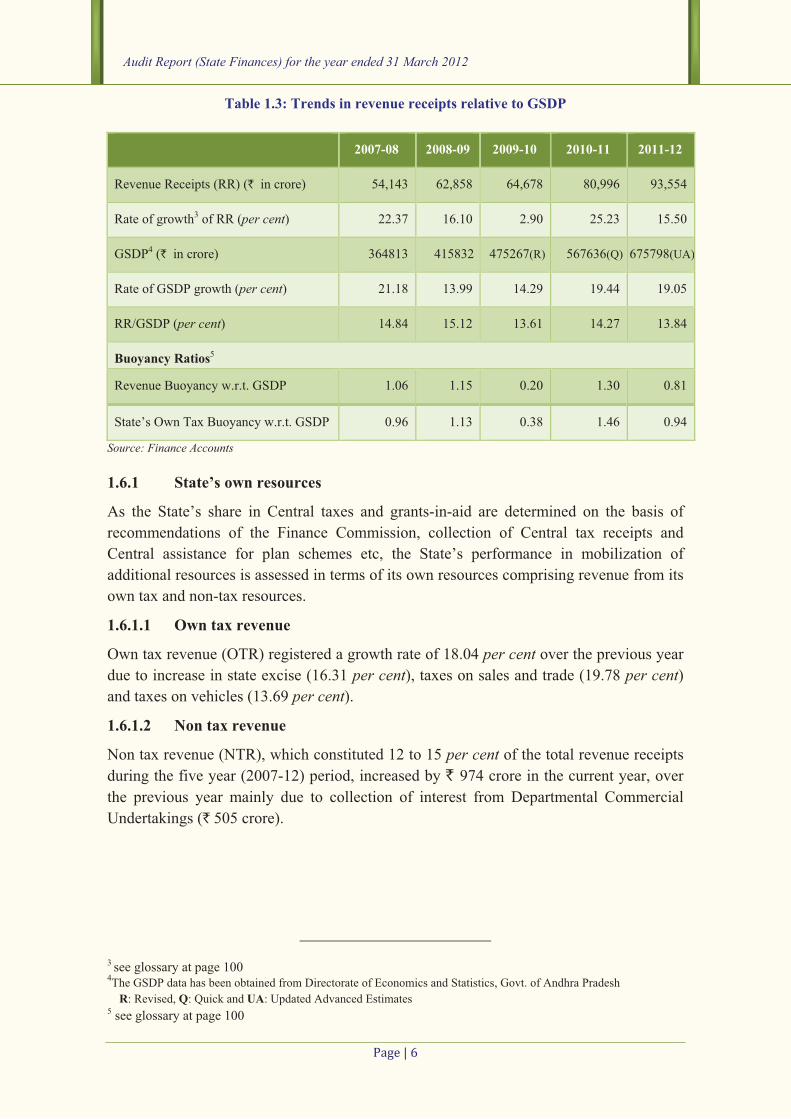
Table 1.3: Trends in revenue receipts relative to GSDP
Source: Finance Accounts
1.6.1 State’s own resources
As the State’s share in Central taxes and grants-in-aid are determined on the basis of
recommendations of the Finance Commission, collection of Central tax receipts and
Central assistance for plan schemes etc, the State’s performance in mobilization of
additional resources is assessed in terms of its own resources comprising revenue from its
own tax and non-tax resources.
1.6.1.1 Own tax revenue
Own tax revenue (OTR) registered a growth rate of 18.04 per cent over the previous year
due to increase in state excise (16.31 per cent), taxes on sales and trade (19.78 per cent) and taxes on vehicles (13.69 per cent).
1.6.1.2 Non tax revenue
Non tax revenue (NTR), which constituted 12 to 15 per cent of the total revenue receipts
during the five year (2007-12) period, increased by ` 974 crore in the current year, over
the previous year mainly due to collection of interest from Departmental Commercial
Undertakings (` 505 crore).
3 see glossary at page 100 4The GSDP data has been obtained from Directorate of Economics and Statistics, Govt. of Andhra Pradesh
R: Revised, Q: Quick and UA: Updated Advanced Estimates 5 see glossary at page 100
2007-08 2008-09 2009-10 2010-11 2011-12
Revenue Receipts (RR) (` in crore) 54,143 62,858 64,678 80,996 93,554
Rate of growth3 of RR (per cent) 22.37 16.10 2.90 25.23 15.50
GSDP4 (` in crore) 364813 415832 475267(R) 567636(Q) 675798(UA)
Rate of GSDP growth (per cent) 21.18 13.99 14.29 19.44 19.05
RR/GSDP (per cent) 14.84 15.12 13.61 14.27 13.84
Buoyancy Ratios5
Revenue Buoyancy w.r.t. GSDP 1.06 1.15 0.20 1.30 0.81
State’s Own Tax Buoyancy w.r.t. GSDP 0.96 1.13 0.38 1.46 0.94

Chapter 1- Finances of the State Government
���������
1.6.2 Cost of Collection
The cost of collection of major State tax revenue is given below in Table 1.4
Table 1.4: Cost of collection of revenue (` in crore)
Head of revenue Year Gross collection
Expenditure on
collection
Cost of collection
(%)
All India Average
(%) Taxes on sales, trade etc, 2009-10 23,640 216 0.91 0.96
2010-11 29,145 262 0.90 0.752011-12* 34,910 283 0.81 --
State Excise 2009-10 5,848 201 3.43 3.642010-11 8,265 234 2.83 3.052011-12 9,612 264 2.75 --
Taxes on Vehicles 2009-10 1,995 65 3.26 3.072010-11 2,626 85 3.24 3.712011-12 2,986 100 3.35 --
Stamp Duty and Registration fee 2009-10 2,639 88 3.33 2.472010-11 3,834 95 2.48 1.602011-12 4,385 102 2.33 --
Source: Finance Accounts *NOTE: All India Average for the year 2011-12 is not yet available
The cost of collection has been fluctuating over the last three years. As compared to
previous year, the percentage of expenditure on collection of taxes gradually decreased in
all heads of revenue, except taxes on vehicles.
1.6.3 Central tax transfers
There was an increase in Central tax transfers by 16.49 per cent from ` 15,237 crore in
2010-11 to ` 17,751 crore in 2011-12. The increase was mainly on account of share of net
proceeds under customs (15.52 per cent) and service tax (39.45 per cent).
1.6.4 Funds transferred to State Implementing Agencies outside the State budget
GoI has been transferring sizeable quantum of funds directly to the State implementing
agencies for the implementation of various schemes/programmes in social and economic
sectors recognized as critical. As these funds are not routed through the State budget/State
treasury System, the Finance Accounts do not capture the flow of these funds and to that
extent, State’s receipts and expenditure as well as other fiscal variables/parameters
derived from them are underestimated. To present a holistic picture about the availability
of aggregate resources, the extent of funds directly transferred by the GoI to State
implementing agencies6 of cases more than ` 10 crore is given in Appendix 1.7.
6 State Implementing Agencies include any Organization/Institution including Non-Governmental Organization, which is authorized by the State Government to receive funds from the GoI for implementing specific programmes in the State, such as State Implementation Society for SSA and State Health Mission for NRHM etc.

Aud
Durin
agenc
State
route
requir
There
availa
impor
agenc
will b
has to
1.7 We h
social
the St
1.7.1
CharThe c
‘expe
Source:
Reven
13.37
Educa
(` 1,0
(` 886
20
40
60
80
100
120
`in
cro
re
dit Report (Sta
ng the curre
cies concern
budget. Fu
run the ris
rements of t
e is no sing
able on the
rtant schem
cies and pro
be difficult
o put in plac
Applhave analyse
l sector, to
tate level on
Grow
t 1.6 presen
composition
nditure by a
: Finance Acco
nue expend
per cent o
ation, Sport
046 crore),
6 crore), So
69678
53984
40083
12774
29200
0000
0000
0000
0000
0000
0000
2007-08
Chart 1.6: Tot
Total Expenditur
Non Plan Revenu
Loans and Advan
ate Finances) f
nt year, Go
ning variou
unds flowin
k of poor o
transparenc
gle agency
e amount s
mes. Unless
oper docume
to monitor
ce an approp
ication ofed the alloc
see the eff
n this expen
wth and co
nts the tren
n of total e
activities’ is
unts
diture increa
of GSDP. T
ts, Art and c
Crop Husb
ocial Securit
75635 7
61854 6
42862
4
103671
3414 159
2008-09 2
tal expenditure:
re
ue Expenditure
nces
for the year e
oI transferre
us Central S
ng directly
oversight an
y and escap
monitoring
spent in an
s uniform
entation is m
the end us
priate mech
f resourcecation of ex
fect of ongo
nditure. Our
mposition
ds in total e
expenditure
s depicted in
ased by ` 1
There was
culture (` 2,
bandry (` 9
ty and Welf
78831
92972
63448
78534
48006
58833
13793 11123
90 3315
009-10 2010-11
Trends and com
Revenue Ex
Capital Exp
nded 31 Marc
���������
ed ` 9,807 c
Schemes/pro
to the impl
nd inhibit F
pe accountab
g the use o
ny particul
accounting
maintained
se of these
hanism to en
es xpenditure f
oing fiscal c
findings ar
n of expend
expenditure
e both in t
n Charts 1.
1,881 crore
significant
,332 crore),
949 crore),
fare (` 690
109120
90415
66751
13722
4983
1 2011-12
mposition
xpenditure
penditure
ch 2012
crore direct
ogrammes,
lementing a
Fiscal Resp
bility.
of these fu
lar year on
g practices
with timely
direct trans
nsure proper
for develop
correction a
re given bel
diture
e over a per
erms of ‘e
.7 and 1.8 re
Total ex
increase
crore (
previous
mainly d
advance
expendi
capital e
During t
of the
from r
balance
total exp
projecte
crore).
e over the p
increase in
, Welfare of
interest pay
crore) and P
ly to the St
without rou
agencies th
onsibility L
unds and no
n major fla
are follow
y reporting
sfers. The S
r accounting
pmental acti
and consoli
ow:
riod of five
conomic cl
espectively
xpenditure (
ed in 2011-
17.37 per s year (`due to incre
es (` 1,668
ture (` 11
expenditure
the current
total expen
revenue re
from borro
penditure w
ed in the bu
previous yea
n revenue e
f SCs and S
yment and
Power (` 65
tate implem
uting throug
hrough off-b
Legislation
o data is r
agship and
wed by all
of expendit
State Gover
g for these f
ivities, espe
idation proc
years (200
lassification
.
(` 1,09,120
-12 by ` 1
cent) ove
` 92,972
ease in loan
8 crore), re
1,881 crore
e (` 2,599 c
year, 86 penditure wa
eceipts and
owed funds
was less tha
udget (` 1,1
ar and const
expenditure
Ts and othe
servicing o
59 crore).
menting
gh the
budget
(FRL)
readily
other
these
ture, it
rnment
funds.
ecially
cess at
07-12).
n’ and
crore)
16,148
er the
crore)
ns and
evenue
e) and
crore).
er cent as met
d the
s. The
an that
15,025
tituted
under
er BCs
of debt

In th
qualit
an im
expen
cent expen
curren
scope
and a
growt
need
reven
growt
Capit
previo
increa
(` 48
(`18,7
Loans
the pr
disbur
during
Source:
1.7.2
Comm
intere
and C
Perc
enta
ge
e context
ty of expen
mportant iss
nditure acco
of the
nditure, whi
nt consum
e for invest
asset creatio
th prospects
to identify
nue expendi
th and welfa
al expenditu
ous year (`ase was mai
0 crore). Ca
798 crore) m
s and advan
revious yea
rsement of
g the five ye
: Finance Acco
Comm
mitted expe
est payment
Chart 1.9 pr
0
20
40
60
80
100
2007
26
27.
42
4.
0
Cha
General Service
Loan and Adva
of State fi
diture has a
sue. Current
ounts for aro
State’s
ich is in th
mption, lea
tment in in
on. Since th
s of the Stat
unwarrant
iture, which
are implicat
ure (` 13,7
` 11,123 cro
inly on maj
apital expen
made in ME
nces disburs
ar and cons
loans and
ear period 2
unts
mitted Exp
enditure of t
ts, expenditu
resent the tr
-08 2008-09
.13 24.84
.1933.49
.13 36.75
.19 4.51
0.36 0.4
art 1.8: Trends b
es So
ance Gr
inances, the
always been
tly, revenue
ound 83 peraggregate
he nature o
aving little
nfrastructure
his impede
te, there is a
ted items o
h have low
tions.
22 crore) du
ore) and co
or and med
nditure at 2
EFS for 201
sed during
stituted 4.5
advances i
2007-12.
penditure
the State G
ure on salar
rends in the
9 2009-10
4 27.25
9 33.48
5 37.14
2.02
41 0.11
by Activities of to
ocial Services
rants-in-aid
���������
e
n
e
r e
f
e
e
s
a
f
w
Source: Fin
uring 2011-
onstituted 12
dium irrigati
.03 per cen1-12.
the current
57 percent in total exp
Government
ries and wa
expenditure
1
Perc
enta
ge
C
Rev
2010-11
28.84
35.41
32
3.57
0.18
otal expenditure
Econ
Chapter 1-
nance Accounts
-12 increase
2.58 per ceion (` 1,147
nt of GSDP
t year increa
of the total
penditure w
on revenue
ages, pensio
e on these c
0
20
40
60
80
100
2007-08
77.48
18.33
4.19
Chart 1.7: Trends
venue Expenditure
2011-12
27.45
35.6
32.18
4.57
0.2
e
nomic Services
Finances of th
s
ed by ` 2,5
ent of total
7 crore) and
was less th
ased by 50
l expenditu
was between
TrendThe s
servic
expen
by 1.3
2011-
previo
was a
share
and ec
in tota
0.19 pper ce
e account m
ons and sub
components
2008-09 2009-10
81.78 80.4
13.71 17.504.51 2.02
s in components o
e Capital Expend
he State Gove
599 crore ov
expenditure
d minor irri
han the proj
.31 per cenure. The sh
n 2 to 5 pe
ds by Activshare of g
es in
nditure dec
39 per cent d12 over
ous year.
an increase
of social se
conomic se
al expenditu
per cent and
ent respectiv
mainly cons
bsidies. Tabs during 200
0 2010-11 201
48 84.47 8
0 11.96 1
2 3.57
of total expendit
diture Loans an
ernment
ver the
e. The
igation
jection
nt over
hare of
er cent
vities: general
total
reased
during
the
There
in the
ervices
ervices
ure by
d 0.18 vely.
ists of
ble 1.5
07-12.
11-12
82.85
12.584.57
ture
nd Advances

Aud
Compo
commexpen
Salarie
Wages
which
(i) Non
(ii) Pla
Interes
payme
Pensio
Subsid
Total
Source: grants-in
Comm
consti
1.7.2.1
Expen
during
12.49
year.
budge
more
MEFS
(` 26
assess
Comm
Durin
on sal
expen
pensio
the
recom
Finan
1.7.2.Altho
during
cent)
dit Report (Sta
ponents of mitted nditure
20
es* &
s, of 13
n-Plan
an**
st
nts
ns
dies
29
Finance Accountn-aid and work ch
mitted expe
ituted 84 pe
1 Salaries
nditure on
g the curren
9 per cent It was, how
et estimates
than the p
S of S
6,573 crore)
sments ma
mission (`ng the curre
lary was 40
nditure, ne
on paymen
ceiling o
mmended
nce Commis
.2 Intereough the sha
g the curren
over the p
ate Finances) f
Table 1
007-08 20
,243(24)
14
12,171
1,072
7,589
5,092
3,918
9,842(54) 34
ts Figures in pare
harged establishm
nditure on
er cent of N
and wage
salaries an
nt year incr
over the
wever, less
s by 1.52 pprojections
State Gov
); and more
de in 13th
` 15,735
ent year, exp
0 per cent oet of inte
nt, which w
of 35 pby the
ssion.
est paymenare of intere
nt year, ther
previous yea
for the year e
1.5: Compon
008-09 2
4,539(23) 17
12,883
1,656
8,057
5,518
6,213
4,327(55)
enthesis indicate
ment. **Plan head
salaries and
NPRE during
es
nd wages
reased by
previous
than the
per cent; made in
vernment
e than the
Finance
crore).
penditure
f revenue
rest and
was above
per cent Twelfth
ts est payment
re was an in
ar mainly i
nded 31 Marc
���������
nents of com
009-10 2
7,721(27) 23
15,706
2,015
8,914
6,339
6,056
39,030 49
percentage of Re
also includes the
d wages, pe
g 2011-12.
Source: Finan
ts in revenu
ncrease in i
in interest o
0
10
20
30
40
50
60
70
80
90
100
20
In p
er c
ent
Char
Salaries a
Subsidies
ch 2012
mmitted expe
010-11
Bes
3,844(29) 27
21,128
2,716
9,675
9,609
6,543
9,671(61) 55,
evenue Expenditu
salaries and wag
ensions, inte
ce Accounts
ue expenditu
interest pay
on Internal
007-08 2008-09
33.05 33.92
18.93 18.8
12.7 12.87
9.77 14.5
25.55 19.91
rt 1.9: Share of cdu
and Wages In
s O
enditure
20
Budget stimates
A
7,237(28) 26
24,155
3,082
11,437
9,693
7,313
,680( 57) 55
ure.* It also includ
ges paid under CS
erest payme
ure was stea
ments by `debt (` 88
2009-10 2
2 36.91
18.57
7 13.2
12.62
1 18.7
committed expenuring 2007-12
nterest payments
Others in NPRE
(` in011-12
Actuals Perva
6,823(30)
23,828
2,995
10,561
11,110
7,313
5,807(62)
des the salaries p
SS.
ents and sub
ady at 12 pe` 886 crore
85 crore). I
2010-11 2011-12
40.53 40.18
16.44 15.82
16.33 16.64
11.12 10.96
15.58 16.40
nditure in NPRE
s Pensions
n crore)
rcentage ariation
-1.52
-1.35
-2.82
7.66
14.62
0.00
0.23
aid out of
bsidies
er cent (9 per
It was,
2
8
2
4
6
0
E
Chapter 1- Finances of the State Government
����������
however, lower than the projection made in MEFS (` 10,790 crore) and was also lower
than the assessment made in the 13th Finance Commission (` 11,025 crore). The major
source of borrowings during the year was market loans (` 15,500 crore) at interest rates
ranging from 8.47 to 9.25 per cent.
1.7.2.3 Pensions The expenditure on pension and other retirement benefits to State Government pensioners
during the year was ` 11,110 crore, and constituted 12 per cent of revenue receipts.
During this year, it increased by ` 1,501 crore over the previous year (` 9,609 crore) and
was more than the budget estimates (` 9,693 crore) and assessment made in the 13th
Finance Commission (` 8,527 crore). The Government had not estimated the yearly pension liabilities on actuarial basis for the ensuing years, as stipulated in the FRBM Act.
Contributory Pension Scheme
State Government introduced a Contributory Pension Scheme for employees recruited on
or after 01 September 2004. As per the guidelines, it is mandatory for every employee to
contribute monthly 10 per cent of basic pay and dearness allowance from his/her salary
and equal contribution will be made by the Government. The contribution details and
corresponding amounts shall be transferred to the central record keeping agency i.e.
National Securities Depository Limited (NSDL) and to the fund managers appointed by
New Pension Scheme (NPS) Trust, respectively. Government entered into agreements
with NSDL on 21 November 2008 and NPS Trust on 15 September 2009. During the
current year, employees contribution to the scheme was ` 226.64 crore and Government
contribution was ` 126.84 crore. The State Government’s progressive liability in this
regard, as per Finance Accounts as on 31 March 2012 was ` 894 crore (including
` 226.64 crore). Government is yet to transfer this amount to the fund manager.
As per 13th Finance Commission’s recommendation, the Government is required to
provide interest on contributions on par with the interest rate being paid for General
Provident Fund contributions until the transfer of accumulated balances to the designated
fund manager. Government replied (November 2012) that the interest would be calculated
and transferred to the individual accounts. Non-transferring of contributions to designated fund manager till date deprives the intended benefits envisaged in the scheme guidelines.
1.7.2.4 Subsidies The total expenditure on subsidies during the current year was ` 7,313 crore, of which,
subsidy on rice was ` 2,280 crore (31 per cent), subsidy on power was ` 4,300 crore (59
per cent) and other subsidies were ` 733 crore (10 per cent). While subsidies increased
by ` 770 crore (12 per cent) over the previous year, the amount was lower than the
projections made in the MEFS (` 10,724 crore).

Audit Report (State Finances) for the year ended 31 March 2012
����������
1.7.3 Financial Assistance to local bodies and other institutions
1.7.3.1 Introduction to Local Bodies and other Institutions
GoI enacted the 73rd and 74th Amendments to the Constitution, to empower the local self
governing institutions like the Panchayati Raj Institutions (PRIs) and Urban Local Bodies
(ULBs) to ensure a more participative governance structure in the country. The GoI
further entrusted the implementation of key socio-economic developmental programmes
to the PRIs and ULBs and devolved funds through successive Finance Commissions. The
States, in turn, were required to entrust these local bodies with such powers, functions and
responsibilities as to enable them to function as institutions of self-government and
implement schemes for economic development and social justice including those
enumerated in the Eleventh and Twelfth Schedules to the Constitution.
State Government enacted the Andhra Pradesh Panchayat Raj (APPR) Act in 1994 and
established a three-tier governance system at Village, Mandal and District levels. Further,
the Andhra Pradesh Municipal Corporations Act, 1994 was enacted to set up Municipal
Corporations in the State. The Municipalities are, however, governed by the
Andhra Pradesh Municipalities Act, 1965.
All the above mentioned Acts provided for conducting elections to the Local Bodies once
every five years. Elections to the PRIs and ULBs in the State were last conducted during
July-August 2006 and September 2005 respectively. Consequently, although GoI
sanctioned ` 1,044 crore towards basic and performance grants to local bodies, only ` 420
crore was released to the State.
1.7.3.2 Devolution of funds, functions and functionaries
The Eleventh Schedule of the 73rd Constitutional Amendment Act, 1992 listed 29 subjects
for devolution to strengthen the PRIs. During 2007-08, the State Government devolved
ten7 functions to PRIs.
The 74th Constitutional Amendment Act identified 18 functions for ULBs as incorporated
in Twelfth Schedule of the Constitution. All the functions mentioned in this Schedule,
except Fire Services, were devolved to the ULBs in the State.
1.7.3.3 Accounting Arrangement
The PRIs maintain accounts on cash basis. The Model accounting system was prescribed
by the GoI in consultation with the Comptroller and Auditor General of India. As per the
latest information furnished (February 2011) by the Commissioner of Panchayat Raj and
Rural Employment, the State Government issued (September 2010) orders for adopting
the format using PRIASoft (Panchayat Raj Institution Accounting Software) developed
7 (i) Agriculture and Agricultural extension (ii) Animal Husbandry, Dairy and Poultry (iii) Fisheries
(iv) Rural Development (v) Drinking water and Sanitation (RWS) (vi) Primary, Secondary and Adult
Education (vii) Health, Sanitation, PHC, Dispensaries, Family welfare (viii) Social Welfare,
(ix) Backward classes welfare, (x) Women and Child Development.

Chapter 1- Finances of the State Government
����������
by NIC. It was planned to implement it initially in Zilla Praja Parishads and subsequently
in Mandals and 475 Gram Panchayats, which are notified as e-panchayats.
Ministry of Urban Development and Poverty Alleviation, GoI and CAG had formulated
(December 2004) National Municipal Accounts Manual (NMAM) with double entry
system for greater transparency and control over finances and requested (May 2005) the
States to adopt the same with appropriate modifications to meet the State’s specific
requirements. Accordingly, a Steering Committee was constituted (May 2005) by State
Government, and the Andhra Pradesh Municipal Accounts Manual (APMAM) was
developed during 2006-07. The State Government issued orders in August 2007 for
adoption of APMAM in all the ULBs in the State. Similarly, the other manuals viz.,
Andhra Pradesh Municipal Budget Manual and Andhra Pradesh Municipal Asset Manual,
as approved by CAG were also accepted by the State for implementation (August 2007)
by the ULBs.
1.7.3.4 Audit of PRIs and ULBs
The Director, State Audit (DSA) is the statutory auditor for PRIs and ULBs under the
Andhra Pradesh State Audit Act, 1989 and is required to conduct audit of all the
22,927 PRIs and 124 ULBs annually. As per Section 11(2) of the Act, the Director is
required to prepare the Consolidated State Audit and Review Report and present it to the
State Legislature. The State Audit Department functions under the administrative control
of the Finance Secretary to Government of Andhra Pradesh. It has six Regional Offices,
22 District Offices, 156 Sub-offices and several resident offices.
1.7.3.5 Financial Assistance
The quantum of financial assistance provided by the State Government to local bodies
and other institutions by way of grants and loans during the current year, relative to the
previous four years, is presented in Table 1.6.
Table 1.6: Financial assistance to Local Bodies etc. (` in crore)
2007-08 2008-09 2009-10 2010-11 2011-12 Educational Institutions (Aided Schools,
Aided Colleges, Universities, etc.)
1,876 1,820 1,994 2,876 7,178
Municipal Corporations and Municipalities 2,699 4,105 3,142 3,671 3,361
Zilla Parishads and other PR Institutions 921 2,503 1,867 1,745 3,023
Development Agencies 3,715 11,791 7,481 8,363 11,341
Hospitals and Other Charitable Institutions 600 1,152 1,393 1,721 1,192
Autonomous Bodies -- -- -- -- 1,473
Co-operative Institutions -- -- -- -- 52
Other Institutions8 8,851 3,436 3,965 4,538 5390
Total 18,662 24,807 19,842 22,914 33,010Assistance as percentage of RE 34.57 40.11 31.27 29.18 36.50Source: Finance Accounts
8 Other institutions include institutions that received ad-hoc or one time grants during the year
Audit Report (State Finances) for the year ended 31 March 2012
�������� �
Financial assistance, including grants and loans, extended to local bodies and other
institutions in 2011-12 (` 33,010 crore) increased by ` 10,096 crore, which is 44.06 per cent increase over the previous year (` 22,914 crore) and constituted 37 per cent of
revenue expenditure. As can be seen from the above table, there was a quantum jump in
the financial assistance provided to PRIs, educational institutions and development
agencies. The plan, non-plan grants and loans given to local bodies and other institutions
in 2011-12 were ` 13,190 crore, ` 15,058 crore and ` 4,762 crore respectively. The major
schemes/recipients of grants during the year were INDIRAMMA pensions to old age
persons and widows (` 1,105 crore); interest subsidy on loans taken by DWCRA groups
(` 710 crore); NRHM (` 494 crore); Rajiv Vidya Mission (` 974 crore); Government
Residential Schools (` 400 crore); JNNURM (` 1,045 crore); Mid-day meals (` 697 crore)
and Post Matric Scholarships (` 277 crore).
1.8 Quality of Expenditure 1.8.1 Adequacy of public expenditure
The expenditure responsibilities relating to social sector and economic infrastructure
assigned to the State Governments are largely State subjects. Enhancing human
development levels requires the States to step up their expenditure on key social services
like education, health etc. Low fiscal priority (ratio of expenditure under a category to
aggregate expenditure) is attached to a particular sector, if it is below the respective
national average. Table 1.7 analyses the fiscal priority of the State Government with
regard to development expenditure, social expenditure and capital expenditure during
2011-12.
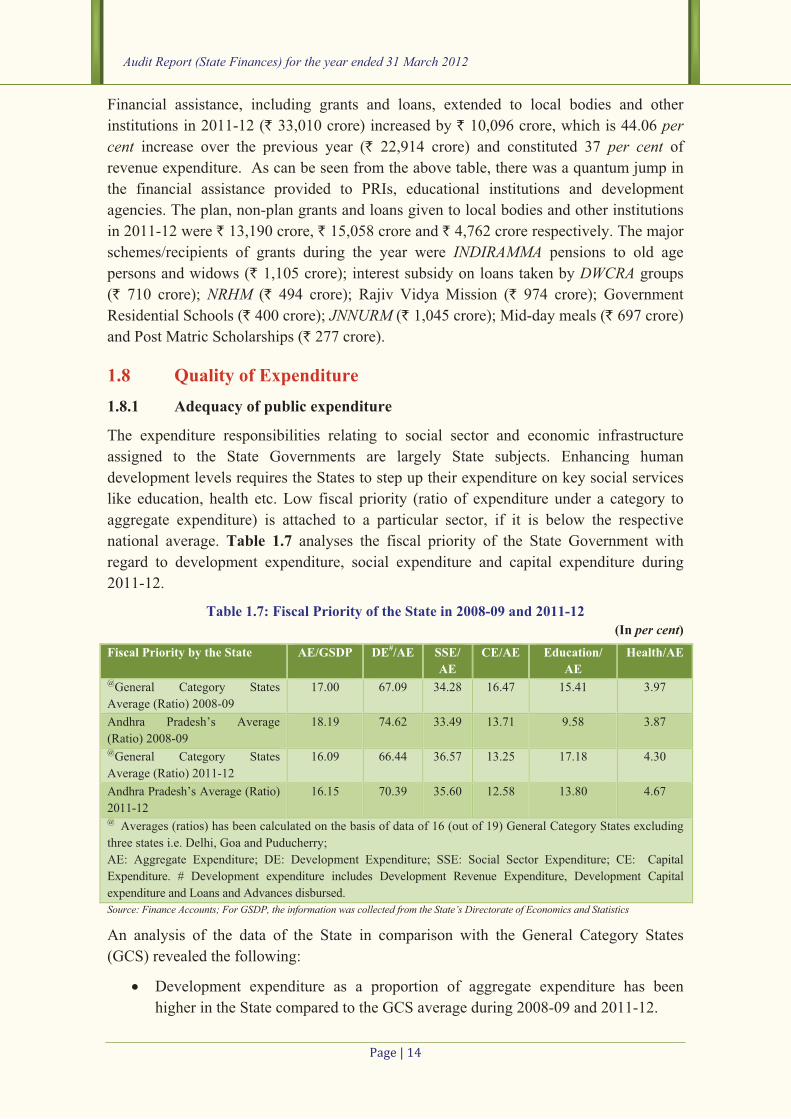
Table 1.7: Fiscal Priority of the State in 2008-09 and 2011-12 (In per cent)
Fiscal Priority by the State AE/GSDP DE#/AE SSE/ AE
CE/AE Education/ AE
Health/AE
@General Category States
Average (Ratio) 2008-09
17.00 67.09 34.28 16.47 15.41 3.97
Andhra Pradesh’s Average
(Ratio) 2008-09
18.19 74.62 33.49 13.71 9.58 3.87
@General Category States
Average (Ratio) 2011-12
16.09 66.44 36.57 13.25 17.18 4.30
Andhra Pradesh’s Average (Ratio)
2011-12
16.15 70.39 35.60 12.58 13.80 4.67
@ Averages (ratios) has been calculated on the basis of data of 16 (out of 19) General Category States excluding
three states i.e. Delhi, Goa and Puducherry;
AE: Aggregate Expenditure; DE: Development Expenditure; SSE: Social Sector Expenditure; CE: Capital
Expenditure. # Development expenditure includes Development Revenue Expenditure, Development Capital
expenditure and Loans and Advances disbursed.
Source: Finance Accounts; For GSDP, the information was collected from the State’s Directorate of Economics and Statistics
An analysis of the data of the State in comparison with the General Category States
(GCS) revealed the following:
� Development expenditure as a proportion of aggregate expenditure has been
higher in the State compared to the GCS average during 2008-09 and 2011-12.
�
�
Great
capita
liabili
1.8.2
In viein suexpengoodsefficieexpenoperaratio qualitrelativbudge
Source:
Durin
crore
9 See g10 See g
2007
-08
2008
-09
2009
-10
2010
-11
2011
-12
Yea
rs
DeveDeve
Expenditu
per cent) it compa
expenditu
cent), the
per cent).The share
compared
current ye
ter fiscal pr
al expenditu
ities.
Efficie
ew of the emuccessive pnditure ratios9. Apart frency of expnditure (andation and mof these coty of expenve to the eted and the
Finance Account
ng the curre
(24 per cen
glossary at pag
glossary at pa
3
0
2007
0820
0809
2009
1020
1011
2011
12
Chart
elopment Revenueelopment Loans an
ure of the S
and educati
ared more
ure on Soci
expenditure
e (13.71 ped to the GC
ear (12.58 p
riority need
ure needs to
ency of exp
mphasis onplans, it isonalisation rom improvpenditure usd/or GSDP
maintenance omponents tnditure. Chaggregate e
e previous y
ts
ent year, wh
nt), develop
ge 100
age 100
35564
42811
41970
51660
65951
60326
12738
10
1
20000 40000` in cro
1.10: Developme
e Expenditurend Advances
State on Soc
ion (9.58 pefavourably
ial Sector (
e on educati
er cent) of c
CS (16.47 pper cent).
ds to be ac
o be increas
penditure u
n public exps importantmeasures a
vising the ase is also re
P) and propof the existo total exphart 1.10expenditure
years.
hile the deve
pment loans
8
0308
13702
11015
1769
13638
2825
3321
1509
3213
60000 8ore
ent Expenditure
Development Cap
���������
cial Sector (
er cent), wa
with the
35.60 per cion (13.80 p
capital expe
per cent) d
ccorded to
sed to creat
use
penditure ont that the and focus oallocation toeflected inportion of ting social
penditure (apresents th
e of the St
elopment ca
s and advan
90
3
3808
4761
0000 100000
e
pital Expenditure
Chapter 1-
(33.49 per cs lower than
GCS durin
cent), in pa
per cent) wa
enditure ha
during 2008
education a
e adequate
n socio-ecoState Gov
on provisioowards devthe ratio ofrevenue e
and economand/or GSDhe trends intate during
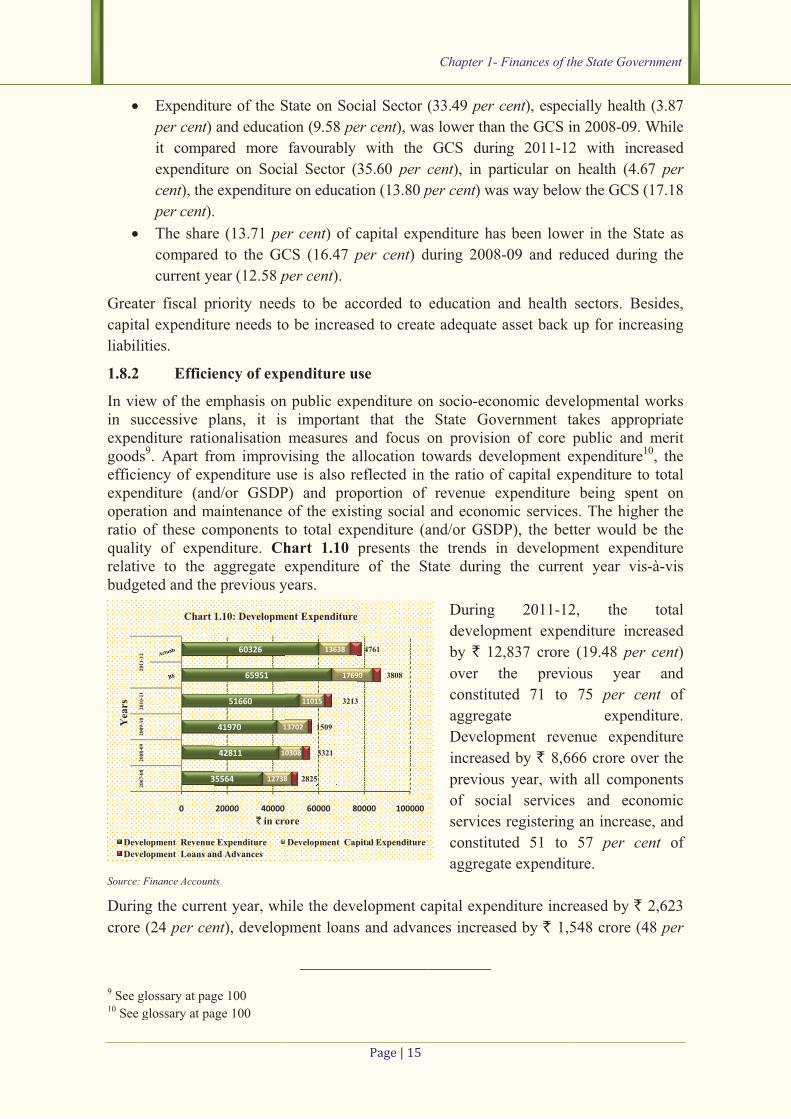
During
develop
by ` 12
over t
constitu
aggrega
Develop
increase
previous
of soci
services
constitu
aggrega
apital expen
nces increas
Finances of th
cent), espec
n the GCS i
ng 2011-12
articular on
as way below
s been low
8-09 and re
and health
asset back
nomic devevernment ton of core velopment ef capital expexpenditure mic service
DP), the betn developm
g the curren
2011-12
ment expen
2,837 crore
the previo
uted 71 to
ate
pment reve
ed by ` 8,6
s year, with
al services
s registering
uted 51 to
ate expenditu
nditure incr
sed by ` 1,5
he State Gove
cially health
in 2008-09.
2 with inc
health (4.6
w the GCS
er in the St
duced durin
sectors. Be
up for incr
elopmental takes appropublic and
expenditurependiture to
being spes. The hightter would bment expennt year vis
2, the
nditure incr
(19.48 perous year
75 per ceexpend
enue expen
66 crore ov
h all compo
s and eco
g an increas
57 per ceure.
reased by ` 548 crore (4
ernment
h (3.87 While
creased
67 per (17.18
tate as
ng the
esides,
easing
works opriate
merit 10, the o total ent on her the be the
nditure s-à-vis
total
reased
r cent) and
ent of
diture.
nditure
ver the
onents
onomic
se, and
ent of
2,623
48 per

Audit Report (State Finances) for the year ended 31 March 2012
����������
cent) over the previous year. The increase in developmental capital expenditure was
essentially in economic services (` 2,403 crore) under irrigation and flood control
(` 1,708 crore). During 2011-12, the share of social services and economic services
constituted 36 and 32 per cent of total expenditure respectively.
Table 1.8 provides the details of capital expenditure and the components of revenue
expenditure incurred on the maintenance of the selected social and economic services.
Table 1.8: Efficiency of expenditure use in selected social and economic services (In per cent)
Social/Economic Infrastructure
2010-11 2011-12
Ratio of CE to TE
In RE, the share of Ratio of CE to TE
In RE, the share of
S&W O&M S&W O&M
Social Services (SS) General Education 0.40 68.26 0.14 0.80 73.86 0.10
Health and Family Welfare 0.43 49.12 0.56 1.45 44.76 0.39
Water supply, Sanitation,
Housing & Urban Development
6.22 17.12 3.00 4.45 22.29 0.39
Total (SS) 1.85 38.02 0.46 2.13 39.59 0.16 Economic Services (ES) Agriculture & Allied Activities 1.02 31.62 0.60 1.81 24.37 1.99
Irrigation and Flood Control 58.16 4.86 9.46 61.00 5.87 11.41
Power & Energy 0.57 0.30 0.11 0.74 0.35 0.12
Transport 50.77 2.67 66.54 42.37 7.00 74.31
Total (ES) 34.97 12.60 6.81 36.47 12.19 10.21 Total (SS+ES) 12.28 18.75 1.87 18.43 29.46 3.88 TE: Total Expenditure; CE: Capital Expenditure; RE: Revenue Expenditure; S&W: Salaries and Wages; O&M:
Operation & Maintenance of respective sector.
Source: Finance Accounts
Although no specific norms were laid down for prioritization of capital expenditure in the
State’s FRBM Act, increase in capital expenditure during 2011-12 indicated impetus to
asset formation in the State. The percentage of expenditure in social sector under General
Education, Health and Family Welfare, Water supply, Sanitation constitutes 2.13 per cent only. Funds earmarked for specific social sector activities were not always released on
time/ not released at all, thereby negating the objective of allocating these funds as
discussed in Chapter-2. The operation and maintenance expenditure (` 2,495 crore) in
2011-12 constituted 2.76 per cent of revenue expenditure.
1.9 Financial analysis of Government expenditure and investments In the post-Fiscal Responsibility Legislation (FRL) framework, the State is expected to
keep its fiscal deficit (and borrowing) not only at low levels but also meet its capital
expenditure/investment (including loans and advances) requirements. In addition, in a
transition to complete dependence on market based resources, the State Government is
expected to initiate measures to earn adequate return on its investments and recover its

Chapter 1- Finances of the State Government
����������
cost of borrowed funds rather than bearing the same on its budget in the form of implicit
subsidy. This section presents the broad financial analysis of investments and other
capital expenditure undertaken by the Government during the current year vis-à-vis
previous years.
1.9.1 Incomplete Projects
Blocking of funds on incomplete projects/works impinge negatively on the quality of
expenditure. As per the information provided by the Government, 228 projects/works
which were due for completion by 31 March 2012, were not completed. The total amount of funds expended on these projects/works as of 31 March 2012 was ` 49,516 crore (previous year ` 46,330 crore) in respect of 228 projects/works (previous year 188 projects/works). Further, of the 228 incomplete projects/works, the original cost of
54 projects/works was revised upwards by the Government to ` 87,559 crore. Non-
completion of these projects/works within the stipulated period not only resulted in
increase in cost, but also deprived the State of the intended benefits for prolonged periods.
The department-wise position of incomplete projects, each costing above ` one crore and
due for completion are detailed in Table 1.9. The details of major and medium irrigation
projects are given in Appendix 1.8.
Table 1.9: Department-wise profile of incomplete projects/works (` in crore)
Nature of works No. of incomplete
Projects
Original cost
Revised total cost
of projects
Cost over run
Cumulative Expenditure
as on 31-03-2012
Irrigation and Command Area Development Department#
Irrigation Projects 72 57,670 86,512 20,142
(16 projects)
48,156
Roads and Bridges Department#
Roads and Bridges 42
645 751
59
(8 works)
441
Panchayat Raj and Rural Development Department*
Roads 99 252 296 --- 101
Rural Water Supply and Sanitation Department*
Water Supply & Sanitation 15 1,387 --- --- 818
Total 228 59,954 87,559 20,201 49,516
Source: #Departmental information; *Finance Accounts 2011-12
Test check of some of these projects in audit revealed that due to the prolonged processes
involved in land acquisition, finalizing the designs and drawings, approvals, tendering
etc. The projects took enormous time for completion and due to non-adherence to fixed
timelines in many cases, funds allocated for many capital works remained unspent during
the year.
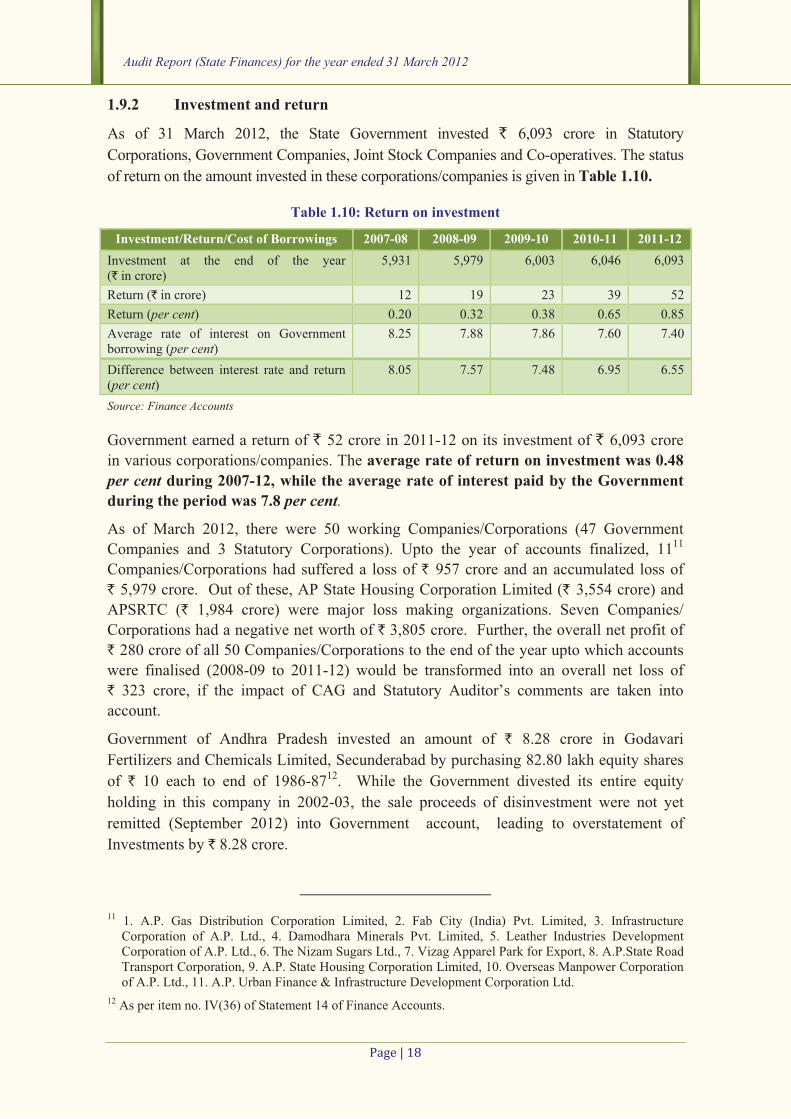
Audit Report (State Finances) for the year ended 31 March 2012
����������
1.9.2 Investment and return
As of 31 March 2012, the State Government invested ` 6,093 crore in Statutory
Corporations, Government Companies, Joint Stock Companies and Co-operatives. The status
of return on the amount invested in these corporations/companies is given in Table 1.10.
Table 1.10: Return on investment
Investment/Return/Cost of Borrowings 2007-08 2008-09 2009-10 2010-11 2011-12 Investment at the end of the year (` in crore)
5,931 5,979 6,003 6,046 6,093
Return (` in crore) 12 19 23 39 52
Return (per cent) 0.20 0.32 0.38 0.65 0.85
Average rate of interest on Government borrowing (per cent)
8.25 7.88 7.86 7.60 7.40
Difference between interest rate and return (per cent)
8.05 7.57 7.48 6.95 6.55
Source: Finance Accounts
Government earned a return of ` 52 crore in 2011-12 on its investment of ` 6,093 crore
in various corporations/companies. The average rate of return on investment was 0.48 per cent during 2007-12, while the average rate of interest paid by the Government during the period was 7.8 per cent.
As of March 2012, there were 50 working Companies/Corporations (47 Government
Companies and 3 Statutory Corporations). Upto the year of accounts finalized, 1111
Companies/Corporations had suffered a loss of ` 957 crore and an accumulated loss of
` 5,979 crore. Out of these, AP State Housing Corporation Limited (` 3,554 crore) and
APSRTC (` 1,984 crore) were major loss making organizations. Seven Companies/
Corporations had a negative net worth of ` 3,805 crore. Further, the overall net profit of
` 280 crore of all 50 Companies/Corporations to the end of the year upto which accounts
were finalised (2008-09 to 2011-12) would be transformed into an overall net loss of
` 323 crore, if the impact of CAG and Statutory Auditor’s comments are taken into
account.
Government of Andhra Pradesh invested an amount of ` 8.28 crore in Godavari
Fertilizers and Chemicals Limited, Secunderabad by purchasing 82.80 lakh equity shares
of ` 10 each to end of 1986-8712. While the Government divested its entire equity
holding in this company in 2002-03, the sale proceeds of disinvestment were not yet
remitted (September 2012) into Government account, leading to overstatement of
Investments by ` 8.28 crore.
11 1. A.P. Gas Distribution Corporation Limited, 2. Fab City (India) Pvt. Limited, 3. Infrastructure Corporation of A.P. Ltd., 4. Damodhara Minerals Pvt. Limited, 5. Leather Industries Development Corporation of A.P. Ltd., 6. The Nizam Sugars Ltd., 7. Vizag Apparel Park for Export, 8. A.P.State Road Transport Corporation, 9. A.P. State Housing Corporation Limited, 10. Overseas Manpower Corporation of A.P. Ltd., 11. A.P. Urban Finance & Infrastructure Development Corporation Ltd.
12 As per item no. IV(36) of Statement 14 of Finance Accounts.

Chapter 1- Finances of the State Government
����������
The massive investment in State level public enterprises in the form of equity capital
raised legitimate expectations of significant contributions by these enterprises to the State
exchequer. On the contrary, they have proved to be a drag on the finances of the State
Government with the average returns on investments continuing to be low.
1.9.3 Loans and advances by State Government
In addition to investments in Co-operative Societies, Corporations and Companies, the
State Government has also been providing loans and advances to many of these
institutions/organisations. Table 1.11 presents the outstanding loans and advances as of
31 March 2012, along with the status during the last four years.
Table 1.11: Average interest received on loans advanced by State Government (` in crore)
Quantum of Loans/Interest Receipts/ Cost of Borrowings
2007-08 2008-09 2009-10 2010-11 2011-12
BE Actual
Opening Balance 10,648 13,378 16,421 17,868 -- 21,011
Amount advanced during the year 2,921 3,413 1,590 3,315 3,808 4,983
Amount repaid during the year 191 370 143 172 235 165
Closing Balance 13,378 16,421 17,868 21,011 4,043 25,829
Of which, outstanding balance for
which terms and conditions have been
settled
NA NA NA NA NA NA
Net addition 2,730 3,043 1,447 3,142 3,573 4,818
Interest Receipts 44 21 32 60 -- 95
Interest receipts as percentage of
outstanding Loans and Advances
0.33 0.13 0.18 0.29 -- 0.37
Interest payments as per cent to
outstanding fiscal liabilities of the
State Government.
7.79 7.54 7.44 7.17 -- 7.02
Difference between interest receipts
and interest payments (per cent) (-)7.46 (-)7.41 (-)7.26 (-)6.88 -- 6.65
Source: Finance Accounts
Urban Development Authorities (` 1,201 crore) and State Housing Corporation (` 1,111
crore) were the major recipients of loans during the current year. At the end of 2011-12
recovery of ` 22,905 crore (` 17,557 crore (Principal) and ` 5,348 crore (Interest)) was
due from Municipalities, Local bodies, Panchayati Raj Institutions etc. Of these, the
recovery of ` 15,037 crore (Principal ` 10,372 crore and Interest ` 4,665 crore) was
outstanding for more than 3 years. Out of ` 2,201 crore outstanding against AP State
Electricity Board on the eve of its bifurcation in January 1999, loans amounting to ` 561
crore were overdue. The Government is yet to bifurcate the assets and liabilities between
the two companies. Therefore, it is not clear as to how the Government proposes to
recover the amount advanced to APSEB.
Despite constant pursuance by PAG (A&E), Government departments have not furnished
the complete details relating to investments and outstanding loans in their records as of 31

Audit Report (State Finances) for the year ended 31 March 2012
����������
March 2012. Consequently, this data was obtained from the limited information available
with the office of PAG (A&E). In fact, State Government is yet to obtain confirmation with regard to balances of loans advanced to the tune of ` 17,337 crore to various departments/organisations. The earliest loan for which confirmation of balances was
awaited relates to 1984-85. Housing (` 10,662 crore) and Loans to public sector and other
undertakings (` 981 crore) are the major departments yet to convey acceptance of the
balances as of 31 March 2012.
1.9.4 Cash balances and investment of Cash balances
During the current year, the State Government invested ` 3,486 crore in GoI Treasury
Bills as against ` 4,534 crore in the previous year. Table 1.12 depicts the cash balances
and investments made by the State Government out of these during the year.
Table 1.12: Cash balances and their investment (` in crore)
Particulars As on 1st April 2011
As on 31st March 2012
Increase/ Decrease
Cash Balances 8,830 9,322 492
Investments from Cash Balances (a to d) 4,534 3,486 -1,048
a. GoI Treasury Bills 4,534 3,486 -1,048
b. GoI Securities -- -- --
c. Other Securities -- -- --
d. Other Investments -- -- --
Fund-wise break-up of Investment from Earmarked
balances (a to c)
4,525 5,426 901
a. Sinking Fund 3,843 4,697 854
b. Guarantee Redemption Fund 668 715 47
c. Other Funds 14 14 --
Interest realized 451 578 127
Source: Finance Accounts 2011-12
The rate of interest earned on the investments from cash balances and investments from
earmarked balances worked out to 5.40 per cent and 7.18 per cent respectively during the
year 2011-12, against the average market borrowing rate of 7.40 per cent.
The State Government maintained the minimum daily cash balance of ` 3.32 crore with
RBI during the year without obtaining any advances. The cash balance of the State
increased by ` 492 crore (6 per cent) at the end of 2011-12 over the previous year. During
the current year, the Government has not resorted to ways and means advances or
overdrafts.
1.10 Assets and Liabilities 1.10.1 Growth and composition of assets and liabilities
In the existing Government accounting system, comprehensive accounting of fixed assets
like land and buildings owned by the Government is not done. However, Government

accou
of the
assets
2011.
GoI, r
outlay
The t
“liabi
and s
purpo
princi
1.10.2
The tr
comp
presen
Source:
The to
by ` 1.61 t
Total
at 22.
prescr
Gover
Redem
RBI.
13 Con
serv
Pub
Inte
unts do capt
e expenditu
s as on 31 M
While liab
receipts from
y and loans
otal liabilit
lities under
shall also i
ose vehicle
ipal and/or i
2 Fiscal
rends in out
osition of
nted in Cha
: Finance Acco
otal fiscal l
15,608 cro
times of rev
fiscal liabil
.27 per centribed in FR
rnment esta
mption Fun
nsolidated Fun
viced out of S
1058370%
Chart 1.11: Coliabilities (`
lic Account Liabili
ernal Debt
ture the fina
ure incurred
March 2012
bilities cons
m Public ac
and advanc
ies of the s
r the consol
nclude bor
s and othe
interest are
l liabilities
tstanding fi
fiscal liabil
arts 1.11 an
unts 2011-12
liabilities of
re (12 per venue receip
lities as def
t of GSDP
RBM Act f
ablished Sin
nd and has b
nd and Publi
State budget (`
274018%
38%
omposition of ou` in crore) as of M
ities Loan
ancial liabil
d. Appendix2, compared
sist mainly
ccount and
ces given by
state as defi
lidated Fund
rrowings by
er equivale
to be servic
scal liabiliti
lities durin
nd 1.12.
f the State a
cent) over
pts.
fined in FRB
at the end o
for the year
nking Fund
been contrib
ic Account L
` 2,050 crore)
09%
1726512%
tstanding fiscal March 2012
ns and Advances fr
���������
lities of the
x 1.9 gives
d with the c
of internal
Reserve Fu
y the State G
fined under
d of the Sta
y the publi
ent instrum
ced out of th
ies of the S
g the curre
Sourc
at the end o
the previou
BM Act wo
of current y
r 2011-12.
for reducti
buting to th
Liabilities (`
and outstandi
rom GOI Pu
Int
Chapter 1-
Governme
an abstrac
correspondi
l borrowing
unds, assets
Government
the FRBM
ate and the
ic sector un
ments includ
he State bud
tate are pre
ent year vis
ce: Finance Acc
of 2011-12
us year (` 1
rked out to
year, agains
In line wit
ion or avoid
hese funds a
1,50,512 cror
ing off budget
9492070%
Chart 1.12: Cliabilities
blic Account Liabi
ternal Debt
Finances of th
nt and the a
ct of such l
ing position
gs, loans an
comprise m
t and cash b
M Act of the
Public Acc
ndertakings
ding guara
dgets”.
esented in As-à-vis the
counts 2010-11
(` 1,50,512
1,34,905 cr
` 1,53,849
st a ceiling
th the FRBM
dance of de
at the rates
re), outstandin
t borrowings (
2449118%
Composition of o(` in crore) as of
ilities Loa
he State Gove
assets creat
liabilities an
n as on 31 M
nd advances
mainly the c
balances.
e State mea
count of the
s and the s
antees wher
Appendix 1.previous y
2 crore) incr
ore) and sto
crore13 and
of 29.60 peM Act, the
ebt and Gua
prescribed
ng guarantee
(` 1,287 crore
1549412%
outstanding fiscaf March 2011
ans and Advances f
ernment
ted out
nd the
March
s from
capital
ans the
e State
special
re the
6. The
year is
reased
ood at
d stood
er cent e State
arantee
by the
s to be
e).
al
from GOI

Audit Report (State Finances) for the year ended 31 March 2012
����������
1.10.3 Status of guarantees-contingent liabilities
Guarantees are liabilities contingent on the Consolidated Fund of the State in case of
default by the borrower for whom the guarantee has been extended. State Government in
its FRBM Act, committed to limit the amount of annual incremental risk weighted
guarantees to 90 per cent of the total revenue receipts in the year preceding the current
year, and constituted (January 2002) Guarantee Redemption Fund for discharging the
guarantees invoked. During the current year, ` 70 crore was contributed to the Fund and
the entire closing balance (` 715 crore) as on 31 March 2012 was invested in Government
securities.
As per Statement No.9 of the Finance Accounts, the maximum amount for which
guarantees were given by the State and outstanding guarantees for the last five years are
given in Table 1.13.
Table 1.13: Guarantees given by the Government of Andhra Pradesh
(` in crore)
Guarantees 2007-08 2008-09 2009-10 2010-11 2011-12
Maximum amount guaranteed 18,798 29,990 20,324 29,554 23,543
Outstanding amount of guarantees 14,502 15,239 13,135 12,290 12,286
Percentage of maximum amount
guaranteed to total revenue receipts
34.72 47.71 31.42 36.49 25.17
Source: Finance Accounts
The maximum amount guaranteed during the year (` 23,543 crore) to 37 entities is within
the norm prescribed by the FRBM Act., i.e. 90 per cent of the total revenue receipts
(` 72,896 crore) of the preceding year. The decrease in the maximum amount guaranteed
at the end of 2011-12 by ` 6,011 crore over the previous year was mainly in respect of
Power (` 448 crore), Urban Development and Housing (` 231 crore) and Co-operatives
(` 289 crore).
During the current year, the Government received ` 0.90 crore on account of guarantee
commission from Cooperatives and an amount of ` 14 crore is due from various other
organisations as guarantee commission.
1.10.4 Off budget borrowings
The borrowings of a State are governed under Article 293 of the Constitution of India. In
addition to the liabilities shown in Appendix 1.9, the State Government guaranteed loans
availed by Government Companies/Corporations. These Companies/Corporations
borrowed funds from the market/financial institutions for implementation of various State
plan programmes projected outside the State budget. Although the State Government
projects that funds for these programmes would be met out of the State budget, in reality,
the borrowings of many of these concerns ultimately turn out to be the liabilities of the
State Government and hence, constitute off-budget borrowings.
Out of the off-budget borrowings of ` 2,231 crore raised by APTRANSCO through
adjustment bonds, private placement and banks during the period 2001-09, the

Chapter 1- Finances of the State Government
����������
Government repaid ` 937 crore up to 2010-11. During the current year, Government has
not resorted to any off-budget borrowing but repaid ` 7 crore towards principal and ` 111
crore as interest of earlier years.
The total liabilities of State comprising fiscal liabilities (` 1,50,512 crore), off-budget
borrowings (` 1,287 crore) and outstanding guarantees including interest at the end of
March 2012 (` 12,286 crore) were ` 1,64,085 crore, which, as a ratio of GSDP, stood at
24.28 per cent i.e. less than the ceiling of 29.60 per cent prescribed in FRBM Act for the year 2011-12.
1.10.5 Adverse Balances
Adverse balances appearing in Finance Accounts distort the position of accounts
balances. Adverse balance (Minus balances) under Loan head indicates that the
repayment was more than the loans advanced by the Government. The adverse balances
appearing under the Loan account were mainly under 6003 (109-Loans from other
Institutions). Government departments that directly avail of institutional loans, have been
classifying such loan amounts as their receipts, while in respect of SPVs and
companies/corporations, these amounts do not enter Government accounts at all. Loan
repayments, however, are booked as debit under MH-6003-Internal debt in Government
accounts. This has resulted in adverse balance of ` 3,732 crore during 2011-12. These
balances were in respect of the departments of Agriculture and Cooperation, AP Road
Development Corporation, AP Power Finance Corporation Limited, and AP Transco
Bonds. Government of Andhra Pradesh has been wrongly booking the repayment of
principal on discharged bonds under 6003-Internal Debt. In respect of Special Purpose
Vehicles (SPV), such repayment by Government on their behalf amounts to assistance to
these undertakings and should have therefore, been classified under revenue expenditure.
Hence, the cumulative adverse balances in respect of loan repayments on behalf of SPVs
represent a cumulative understatement of revenue expenditure.
Government accepted the audit finding and stated (November 2012) that it is a legacy
issue which is being addressed.
1.11 Debt sustainability Apart from the magnitude of debt of the State Government, it is important to analyse
various indicators that determine the debt sustainability14 of the State. This section
assesses the sustainability of debt of the State Government in terms of debt stabilisation15,
sufficiency of non-debt receipts16, net availability of borrowed funds17, burden of interest
payments (measured by ratio of interest payments to revenue receipts) and maturity
profile of State Government securities. Table 1.14 analyses the debt sustainability of the
State according to these indicators during the five year period 2007-12.
14 See glossary at page 100 15 See glossary at page 100 16 See glossary at page 100 17 See glossary at page 100

Audit Report (State Finances) for the year ended 31 March 2012
�������� �
Table 1.14: Debt sustainability: Indicators and trends
Indicators of Debt Sustainability 2007-08 2008-09 2009-10 2010-11 2011-12 Debt Stabilisation (Quantum Spread +
Primary Deficit) (` in crore)
13,796 10,861 12,800 18,101 22,375
Debt-GSDP ratio 0.27 0.26 0.25 0.24 0.22
Sufficiency of Non-debt Receipts (Resource
Gap) (` in crore)
(-) 3,143 (-) 3,710 (-) 1,603 (+) 2,207 (-) 3,598
Net Availability of Borrowed Funds
(` in crore)
(-) 510 3,033 5,523 2,769 3,348
Debt Redemption (Principal+Interest)/Total Debt Receipts
1.130 0.840 0.850 0.915 0.853
Burden of Interest Payments
(IP/RR Ratio)
0.14 0.13 0.14 0.12 0.11
Source: Finance Accounts
The quantum spread together with primary deficit has been positive for the last five years,
resulting in decline in Debt/GSDP ratio from 0.27 in 2007-08 to 0.22 in 2011-12. These
trends indicate the tendency towards debt stabilization, which would eventually improve
the debt sustainability of the State. The resource gap has been negative in four out of the
five year period indicating that the incremental non-debt receipts were not sufficient to
meet the incremental primary expenditure and interest burden. Thus, the State needs to
step up its resource mobilisation as well as prune unproductive expenditure to maintain
debt stability. The net availability of borrowed funds was positive during the last five
years, indicating the availability of borrowed funds for purposes other than debt
repayment. The maturity profile of State debt is shown in Table 1.15.
Table 1.15: Maturity Profile of State Debt
(` in crore)
Maturity profile Amount Percentage
0 – 1 years 6,056 5.71
1 – 3 years 10,615 10.02
3 – 5 years 9,953 9.39
5 – 7 years 21,577 20.36
7 years and above 57,785 54.52
Total 1,05,986 100.00
To discharge its expenditure obligations,
the Government has to borrow further,
since fiscal surplus was not available in
any of the last five years. The significant
increase in market borrowings (` 42,883
crore) of the State Government in 2009-
10, 2010-11 and 2011-12 could lead to
large repayment obligation from the year
2018-19 onwards. The maturity profile of
outstanding stock of State Development
Loans (SDLs) as on 31 March 2012 shows
that 55 per cent of SDLs are in the
maturity bucket of 7 years and above.
Source: Finance Accounts 2011-12
It further indicates that the liability of the State to repay the debt would be ` 9,953 crore
during 2015-17 and ` 21,577 crore during 2017-19, which would put a strain on the
Government budget during that period. The State may have to borrow further to repay
these loans. A well thought out debt repayment strategy will have to be worked out by the
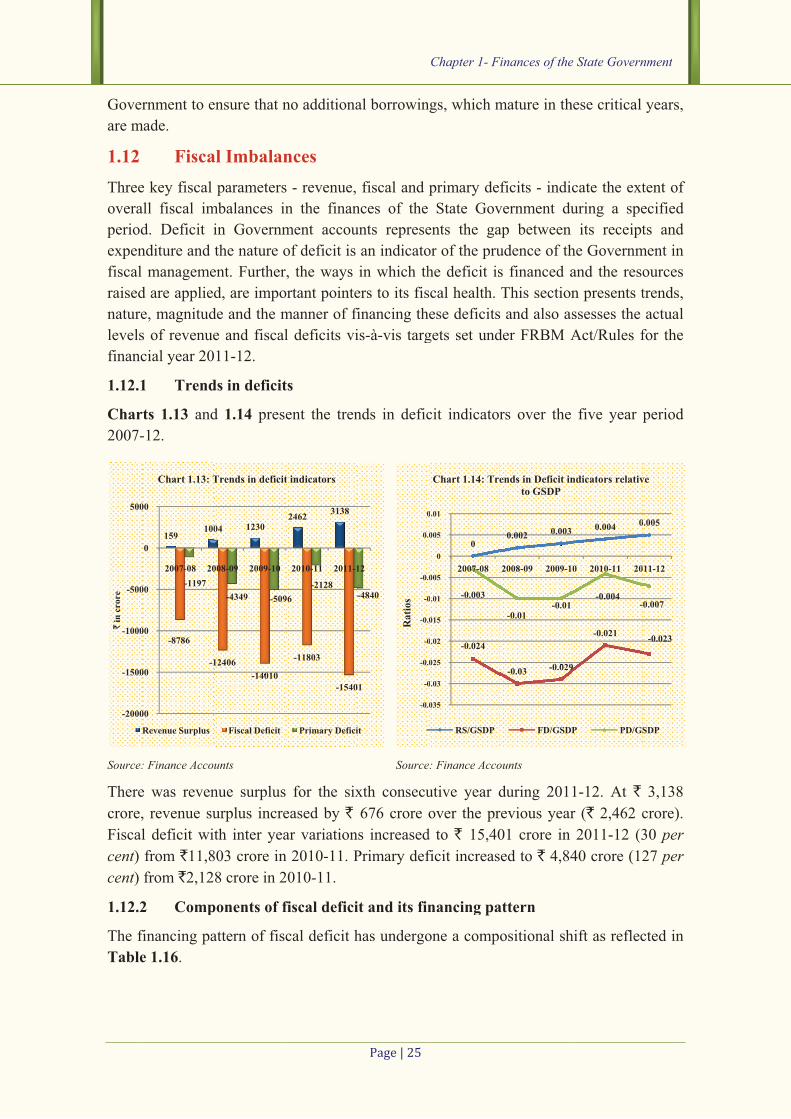
Gover
are m
1.12 Three
overa
period
expen
fiscal
raised
nature
levels
financ
1.12.1
Char2007-
Source:
There
crore,
Fiscal
cent) cent)
1.12.2
The f
Table
-2000
-1500
-1000
-500
500
`in
cro
re
R
rnment to e
made.
Fiscae key fiscal
all fiscal im
d. Deficit i
nditure and
manageme
d are applied
e, magnitud
s of revenue
cial year 20
1 Trend
ts 1.13 and
-12.
: Finance Acco
e was reven
, revenue su
l deficit wi
from `11,8
from `2,12
2 Comp
financing pa
e 1.16.
159100
-8786
-1
-1197
00
00
00
00
0
00
2007-08 20
Chart 1.13: T
Revenue Surplus
ensure that n
al Imbalanparameters
mbalances in
in Governm
the nature o
ent. Further
d, are impo
de and the m
e and fiscal
11-12.
ds in deficit
d 1.14 pres
unts
nue surplus
urplus incre
th inter yea
803 crore in
8 crore in 2
ponents of f
attern of fis
04 1230
12406-14010
-4349 -509
008-09 2009-10
Trends in deficit
Fiscal Deficit
no additiona
nces s - revenue,
n the finan
ment accou
of deficit is
r, the ways
ortant pointe
manner of fi
l deficits vi
ts
ent the tren
s for the six
eased by ` ar variation
n 2010-11. P
2010-11.
fiscal defici
cal deficit h
2462 3138
-11803
-1540
96-2128
2010-11 2011-1
t indicators
Primary Defici
���������
al borrowin
fiscal and
nces of the
unts represe
an indicato
in which th
ers to its fis
financing th
is-à-vis targ
nds in defic
Source
xth consecu
676 crore
ns increased
Primary def
it and its fin
has undergo
01
-4840
12
it
-0.
-0
-0.
-0
-0.
-0
-0.
0.
0
Rat
ios
Chapter 1-
ngs, which m
primary de
State Gov
ents the ga
or of the pru
he deficit is
scal health.
ese deficits
gets set und
cit indicator
e: Finance Acco
utive year d
over the pr
d to ` 15,40
ficit increas
nancing pa
one a compo
0
-0.024
-0.003
035
0.03
025
0.02
015
0.01
005
0
005
0.01
2007-08
Chart 1.14: Tre
RS/GSDP
Finances of th
mature in th
ficits - indi
vernment du
ap between
udence of th
s financed a
This section
s and also a
der FRBM A
rs over the
ounts
during 201
revious year
01 crore in
ed to ` 4,84
attern
ositional sh
0.002 0.003
-0.03 -0.029
-0.01-0.01
2008-09 2009-1
ends in Deficit into GSDP
FD/GSD
he State Gove
hese critical
cate the ext
uring a spe
its receipt
he Governm
and the reso
n presents t
ssesses the
Act/Rules f
five year p
1-12. At `
r (` 2,462 c
2011-12 (3
40 crore (12
hift as reflec
0.004 0
9
-0.021
-0.004-
0 2010-11 20
ndicators relativ
P PD/GS
ernment
years,
tent of
ecified
ts and
ment in
ources
trends,
actual
for the
period
3,138
crore).
30 per 27 per
cted in
0.005
-0.023
0.007
11-12
ve
SDP

Audit Report (State Finances) for the year ended 31 March 2012
����������
Table 1.16: Components of fiscal deficit and their financing pattern
(` in crore)
Sl. Particulars 2007-08 2008-09 2009-10 2010-11 2011-12
Receipts Disbursements Net
A Decomposition of Fiscal Deficit (1 to 3)
(-) 8,786 (-) 12,407 (-) 14,010 (-) 11,803 93,719 1,09,120 (-) 15,401
1. Revenue
Deficit/Surplus
159 1,004 1,230 2,462 93,553 90,415 3,138
2. Net Capital
Expenditure
(-) 6,216 (-) 10,367 (-) 13,793 (-) 11,123 0 13,722 (-) 13,722
3. Net Loans and
Advances
(-) 2,729 (-) 3,044 (-) 1,447 (-) 3,142 165 4,983 (-) 4,818
B Financing Pattern of Fiscal Deficit Market Borrowings 6,182 10,911 13,403 10,154 16,731* 5,813 10,918
Loans from GoI (-) 43 (-) 391 73 687 2,719 948 1,771
Small Savings, PF etc
(Cr)
940 570 961 1,603 3,376 2,156 1,220
Reserve Funds (Cr) 252 271 (-) 113 945 3,272 2,921 351
Deposits and Advances
(Cr)
3,416 (-) 1,812 (-) 1,437 1,703 42,963 41,617 1,346
Suspense and Misc. (Dr) (-) 2,828 4,405 (-) 1 (-) 2,200 1,23,420 1,23,083 337
Remittances (Cr) 943 (-) 1,621 1,435 (-) 1,351 17,524 17,427 97
Others (Contingency
Fund)
(-) 1 (-) 6 7 (-) 1 1.54 0.40 1#
Overall Surplus/Deficit (-)75 80 (-) 318 263 -- -- (-) 638
Source: Finance Accounts. *Includes borrowings from other institutions; #Difference is due to rounding off
There was an increase of fiscal deficit in the current year by ` 3,598 crore over the
previous year. At ` 15,500 crore during 2011-12, market borrowings were the main
source of financing fiscal deficit.
1.12.3 Quality of deficit/surplus
The ratio of revenue deficit to fiscal deficit and the decomposition of primary deficit into
primary revenue deficit18 and capital expenditure (including loans and advances) would
indicate the quality of deficit in the State finances. The ratio of revenue deficit to fiscal
deficit indicates the extent to which borrowed funds were used for current consumption.
Further, persistent high ratio of revenue deficit to fiscal deficit would indicate that the
asset base of the State was continuously shrinking and a part of the borrowings (fiscal
liabilities) are not backed by assets. The bifurcation of primary deficit (Table 1.17) would
indicate the extent to which the deficit has been on account of enhancement in capital
expenditure which may be desirable to improve the productive capacity of the State’s
economy.
18 See glossary at page 100
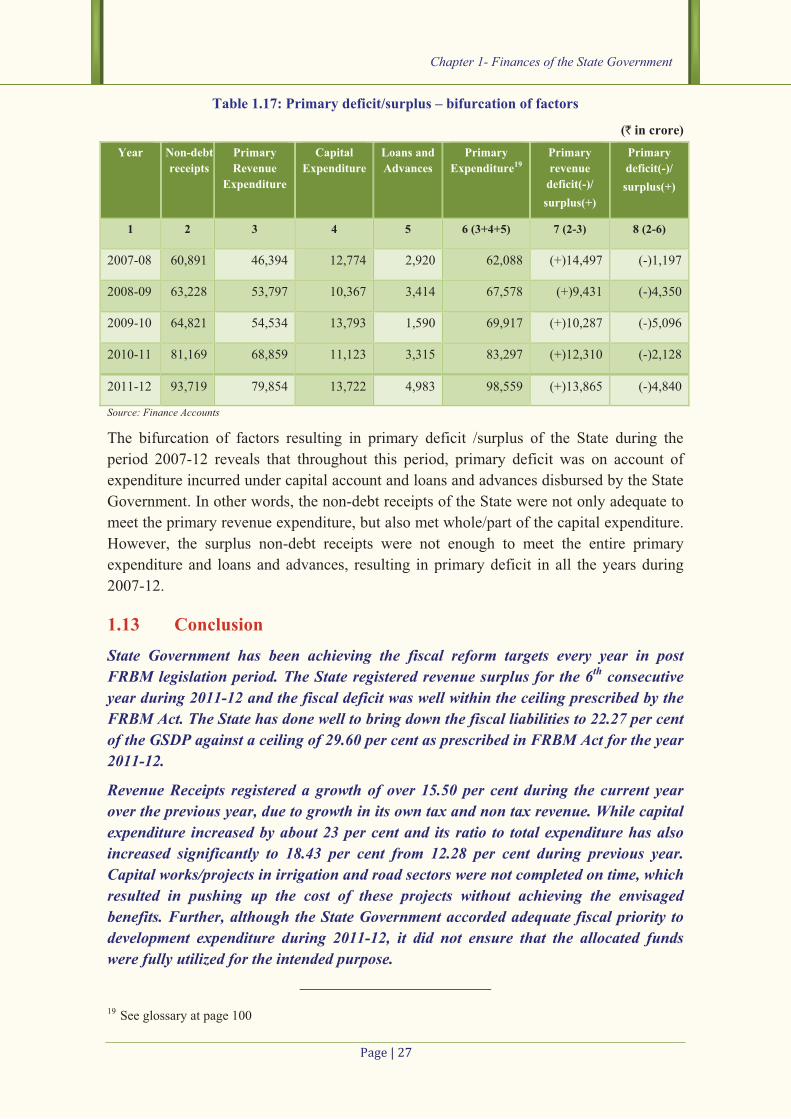
Chapter 1- Finances of the State Government
����������
Table 1.17: Primary deficit/surplus – bifurcation of factors
(` in crore) Year Non-debt
receipts Primary Revenue
Expenditure
Capital Expenditure
Loans and Advances
Primary Expenditure19
Primary revenue
deficit(-)/ surplus(+)
Primary deficit(-)/ surplus(+)
1 2 3 4 5 6 (3+4+5) 7 (2-3) 8 (2-6)
2007-08 60,891 46,394 12,774 2,920 62,088 (+)14,497 (-)1,197
2008-09 63,228 53,797 10,367 3,414 67,578 (+)9,431 (-)4,350
2009-10 64,821 54,534 13,793 1,590 69,917 (+)10,287 (-)5,096
2010-11 81,169 68,859 11,123 3,315 83,297 (+)12,310 (-)2,128
2011-12 93,719 79,854 13,722 4,983 98,559 (+)13,865 (-)4,840
Source: Finance Accounts
The bifurcation of factors resulting in primary deficit /surplus of the State during the
period 2007-12 reveals that throughout this period, primary deficit was on account of
expenditure incurred under capital account and loans and advances disbursed by the State
Government. In other words, the non-debt receipts of the State were not only adequate to
meet the primary revenue expenditure, but also met whole/part of the capital expenditure.
However, the surplus non-debt receipts were not enough to meet the entire primary
expenditure and loans and advances, resulting in primary deficit in all the years during
2007-12.
1.13 Conclusion State Government has been achieving the fiscal reform targets every year in post FRBM legislation period. The State registered revenue surplus for the 6th consecutive year during 2011-12 and the fiscal deficit was well within the ceiling prescribed by the FRBM Act. The State has done well to bring down the fiscal liabilities to 22.27 per cent of the GSDP against a ceiling of 29.60 per cent as prescribed in FRBM Act for the year 2011-12.
Revenue Receipts registered a growth of over 15.50 per cent during the current year over the previous year, due to growth in its own tax and non tax revenue. While capital expenditure increased by about 23 per cent and its ratio to total expenditure has also increased significantly to 18.43 per cent from 12.28 per cent during previous year. Capital works/projects in irrigation and road sectors were not completed on time, which resulted in pushing up the cost of these projects without achieving the envisaged benefits. Further, although the State Government accorded adequate fiscal priority to development expenditure during 2011-12, it did not ensure that the allocated funds were fully utilized for the intended purpose.
19 See glossary at page 100

Audit Report (State Finances) for the year ended 31 March 2012
����������
Return on investment in Companies/Statutory Corporations continued to be poor and the rate of return on investment was 0.85 per cent during 2011-12, while the rate of interest paid by the Government during the year was 7.40 per cent. The accounts of several of these companies/corporations have been in arrears and up to the year of accounts finalized, the accumulated losses of eleven entities alone amounted to ` 5,979 crore, with AP State Housing Corporation (` 3,554 crore) and APSRTC (` 1,984 crore) leading the list.
The current level of recovery of loan is abysmal with the gap between disbursement (` 4,983 crore) and recovery (` 164 crore) widening. In fact, confirmation of balances on loan amount of ` 17,337 crore was yet to be received from the entities, which were the recipients of these loans.
Existence of adverse balances under loan head (` 3,732 crore) understated the revenue expenditure position of the State in Finance accounts and affected the State fiscal indicators.
Chapter 2 Financial Management and Budgetary Control
2.1 Introduction Effective financial management ensures that decisions taken at the policy level are
implemented at the administrative level without wastage or diversion of funds and with
reasonable assurance relating to successful implementation of the policy at the ground
level. This Chapter reviews the allocative priorities of the State Government and
comments on the transparency and effectiveness of its budgetary processes.
2.2 Transparency in Budgeting 2.2.1 Budget cycle The Andhra Pradesh Financial Code (APFC) and the Andhra Pradesh Budget Manual
(APBM) lay down the procedure to be followed with regard to all matters concerning
finance and budget. Budget preparation in the State is guided by a budget calendar, which
is generally complied with. The exercise for preparation of budget estimates starts around
October for the next financial year. Our audit of various departments, however, revealed
that there was no central expenditure control mechanism in terms of submission of
monthly statements of expenditure to the Finance Department to ensure that there are no
deviations and surprises at the end of the year.
A bottom-up approach is prescribed to be followed in budget preparation as per the
APBM with the requirement of funds projected from the unit level and consolidated at the
district and finally the department level. There was, however, no evidence of compliance
with this requirement from the departments audited during the year. Audit of several
schemes/transactions of Government departments revealed that financial inputs were not
correlated with the corresponding physical outputs or outcome either at the unit/district or
department level and inadequate rigour is exercised in analysing and assessing the actual
requirement of funds. While the Government instituted the outcome budget mechanism
during the last few years, the departments do not report the extent of achievement of
projected outputs with the targets fixed for a year, while submitting budget proposals for
the succeeding year.
2.3 Financial accountability and budget management Appropriation Accounts are accounts of the expenditure of the Government for each
financial year, compared with the amounts of the grants voted and appropriations charged
for different purposes as specified in the schedules appended to the Appropriation Acts.
These Accounts depict the original budget estimates, supplementary grants, surrenders
and re-appropriations distinctly and indicate actual capital and revenue expenditure on
various specified services vis-à-vis those authorised by the Appropriation Acts.
Appropriation Accounts thus facilitate understanding of utilisation of funds and
monitoring of budgetary provisions and are, therefore, supplementary to Finance
Accounts.

Audit Report (State Finances) for the year ended 31 March 2012
����������
Audit of appropriations by the CAG seeks to ascertain whether the expenditure actually
incurred under various grants is within the authorisation given under the Appropriation
Act and that the expenditure required to be charged under the provisions of the
Constitution is so charged. It also ascertains whether the expenditure so incurred is in
conformity with the laws, relevant rules, regulations and instructions.
2.4 Summary of Appropriation Accounts The summarised position of actual expenditure during 2011-12 against 40 grants/appropriations is given below in Table 2.1.
Table 2.1: Summarised positions of actual expenditure vis-à-vis original/supplementary provisions
(` in crore)
Nature of expenditure
Original Supplementary Total Actual expenditure1
Saving(-)/ Excess(+)
Voted I Revenue 86,042.35 9,997.95 96,040.30 81,135.89 (-)14,904.41
II Capital 18,030.72 1,164.36 19,195.08 14,145.28 (-)5,049.80
III Loans
and
Advances
3,808.10 1,840.15 5,648.25 4,983.20 (-)665.05
Total Voted 1,07,881.17 13,002.46 1,20,883.63 1,00,264.37 (-)20,619.26
Charged IV Revenue 11,552.25 21.25 11,573.50 10,685.28 (-)888.22
V Capital 72.15 5.19 77.34 22.11 (-)55.23
VI Public
Debt
Repayment
9,709.75 --- 9,709.75 6,761.01 (-)2,948.74
Total Charged 21,334.15 26.44 21,360.59 17,468.40 (-)3,892.19
Grand Total 1,29,215.32 13,028.90 1,42,244.22 1,17,732.77 (-)24,511.45
Source: Appropriation Accounts 2011-12 Note: Detailed Contingent bills were not received as required under rules from Drawing and Disbursing Officers in support of ` 671 crore drawn on Abstract Contingent bills during 2011-12. In the absence of Detailed Contingent bills the genuineness of the expenditure could not be vouched.
The overall saving of ` 24,511 crore was the result of saving of ` 24,700 crore in 38
grants and 11 appropriations under Revenue Section, 26 grants and three appropriations
under Capital Section and 9 grants and one appropriation (Public Debt) under Loans
Section, offset by an excess of ` 189 crore in two grants2 and two appropriations3 under
Revenue Section, one grant4 under Capital Section and two grants5 under Loans Section.
These savings were 1.88 times the supplementary provision made during the year, which
indicated inaccurate budget estimation and inadequate monitoring of expenditure.
1 These are gross figures without taking into account the recoveries adjusted in accounts as reduction of expenditure
under revenue expenditure (` 1,406 crore) and capital expenditure (` 445 crore). 2 X-Home Administration(` 54.73 crore) and XXIV-Minority Welfare (` 31.16 crore). 3 XXIII-Backward Classes Welfare (` 912) and XXV-Women, Child and Disabled Welfare (` 51,238). 4 XVII-Municipal Administration and Urban Development (` 1.69 crore). 5 IX-Fiscal Administration, Planning, Surveys and Statistics (` 98.21 crore) and XV-Sports and Youth Services (` 2.79
crore).
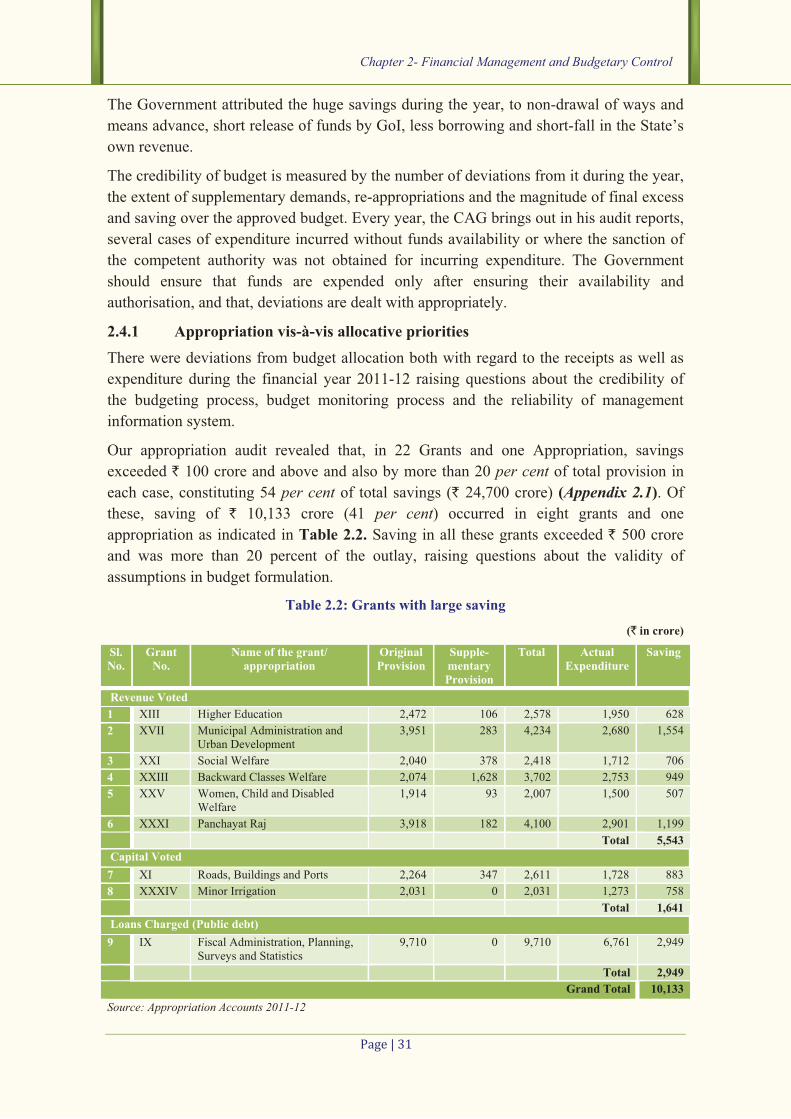
Chapter 2- Financial Management and Budgetary Control
����������
The Government attributed the huge savings during the year, to non-drawal of ways and
means advance, short release of funds by GoI, less borrowing and short-fall in the State’s
own revenue.
The credibility of budget is measured by the number of deviations from it during the year,
the extent of supplementary demands, re-appropriations and the magnitude of final excess
and saving over the approved budget. Every year, the CAG brings out in his audit reports,
several cases of expenditure incurred without funds availability or where the sanction of
the competent authority was not obtained for incurring expenditure. The Government
should ensure that funds are expended only after ensuring their availability and
authorisation, and that, deviations are dealt with appropriately.
2.4.1 Appropriation vis-à-vis allocative priorities There were deviations from budget allocation both with regard to the receipts as well as
expenditure during the financial year 2011-12 raising questions about the credibility of
the budgeting process, budget monitoring process and the reliability of management
information system.
Our appropriation audit revealed that, in 22 Grants and one Appropriation, savings
exceeded ` 100 crore and above and also by more than 20 per cent of total provision in
each case, constituting 54 per cent of total savings (` 24,700 crore) (Appendix 2.1). Of
these, saving of ` 10,133 crore (41 per cent) occurred in eight grants and one
appropriation as indicated in Table 2.2. Saving in all these grants exceeded ` 500 crore
and was more than 20 percent of the outlay, raising questions about the validity of
assumptions in budget formulation.
Table 2.2: Grants with large saving
(` in crore)
Sl. No.
Grant No.
Name of the grant/ appropriation
Original Provision
Supple-mentary Provision
Total Actual Expenditure
Saving
Revenue Voted 1 XIII Higher Education 2,472 106 2,578 1,950 628
2 XVII Municipal Administration and Urban Development
3,951 283 4,234 2,680 1,554
3 XXI Social Welfare 2,040 378 2,418 1,712 706
4 XXIII Backward Classes Welfare 2,074 1,628 3,702 2,753 949
5 XXV Women, Child and Disabled Welfare
1,914 93 2,007 1,500 507
6 XXXI Panchayat Raj 3,918 182 4,100 2,901 1,199
Total 5,543 Capital Voted 7 XI Roads, Buildings and Ports 2,264 347 2,611 1,728 883
8 XXXIV Minor Irrigation 2,031 0 2,031 1,273 758
Total 1,641 Loans Charged (Public debt) 9 IX Fiscal Administration, Planning,
Surveys and Statistics 9,710 0 9,710 6,761 2,949
Total 2,949 Grand Total 10,133
Source: Appropriation Accounts 2011-12

Audit Report (State Finances) for the year ended 31 March 2012
����������
Reasons for the large saving were attributed by the Government to the following factors:
Higher Education: Non-filling up of vacant posts, non-receipt of requisition from unit
offices for release of funds, non-receipt of UGC grants, not receiving continuation orders
in respect of contract appointees and lack of approvals from competent authority.
Municipal Administration and Urban Development: The saving was due to ‘non-receipt
of sanction orders’ and ‘slow progress of works’.
Social Welfare: Late release of Tuition fee and Post-Matriculation Scholarships by GoI,
non-filling up of retirement vacancies, slow progress of maintenance works and non
receipt of bills from concerned agencies.
Backward Classes Welfare: Non-release of Post Matriculation Scholarship funds by GoI
and postponement of expenditure relating to reimbursement of Tuition Fee to
Economically Backward Classes students to next financial year.
Women, Child and Disabled Welfare: ‘Postponement of maintenance works under
Integrated Child Development Services’, ‘late release of State share of Nutrition
Programme’ and ‘SABALA (Rajiv Gandhi Scheme for Empowerment of Adolescent
Girls) funds by GoI and consequent non-release of funds by the State Government’.
Panchayat Raj: Non-receipt of sanction orders & requisition for release of funds, late
approval of TFC works by High Powered Committee, slow progress of works and
postponement of maintenance works.
Roads, Buildings & Ports: Slow progress of works and non-receipt of sanction orders
from competent authorities.
Minor Irrigation: The saving was due to ‘slow progress of works’, ‘non-receipt of bills’
and ‘non-receipt of sanction orders from the Government’.
Fiscal Administration, Planning, Surveys and Statistics: Non-availment of Ways and
Means advance from RBI during 2011-12.
In addition to the above, though the percentage of saving was less than 20, huge saving of
more than ` 1,000 crore was noticed in three grants, as shown in the table below:
Table 2.3: Saving more than ` 1,000 crore (` in crore)
Sl No.
Grant No.
Name of the Grant Amount of saving
Reasons
1 XII School Education (Revenue Voted)
2,324 Non-filling up of vacant posts, non-receipt of funds from GoI and non-receipt of requisitions from units.
2 XXXIII Major and Medium Irrigation
(Capital Voted)
2,165 Non-receipt of administrative approvals from competent authority, slow progress in acquisition of land, slow progress of works, non-finalisation of compensation, non-filling up of vacant posts, postponement of certain maintenance works and non-receipt of bills from APTRANSCO.
3 XXXIII Major and Medium Irrigation
(Revenue Voted)
1,482 Postponement of maintenance works, non-receipt of bills, and non-receipt of administrative approvals.
Source: Appropriation Accounts 2011-12
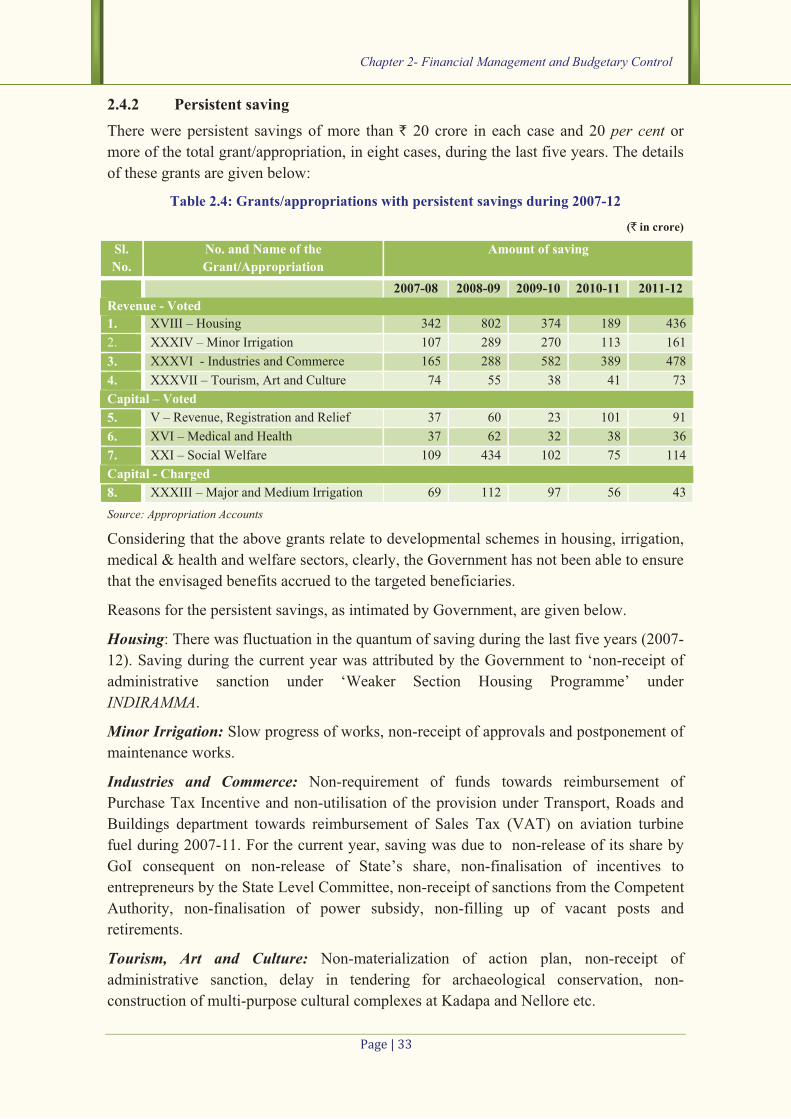
Chapter 2- Financial Management and Budgetary Control
����������
2.4.2 Persistent saving There were persistent savings of more than ` 20 crore in each case and 20 per cent or
more of the total grant/appropriation, in eight cases, during the last five years. The details
of these grants are given below:
Table 2.4: Grants/appropriations with persistent savings during 2007-12
(` in crore)
Sl. No.
No. and Name of the Grant/Appropriation
Amount of saving
2007-08 2008-09 2009-10 2010-11 2011-12 Revenue - Voted 1. XVIII – Housing 342 802 374 189 436
2. XXXIV – Minor Irrigation 107 289 270 113 161
3. XXXVI - Industries and Commerce 165 288 582 389 478
4. XXXVII – Tourism, Art and Culture 74 55 38 41 73
Capital – Voted 5. V – Revenue, Registration and Relief 37 60 23 101 91
6. XVI – Medical and Health 37 62 32 38 36
7. XXI – Social Welfare 109 434 102 75 114
Capital - Charged 8. XXXIII – Major and Medium Irrigation 69 112 97 56 43
Source: Appropriation Accounts
Considering that the above grants relate to developmental schemes in housing, irrigation,
medical & health and welfare sectors, clearly, the Government has not been able to ensure
that the envisaged benefits accrued to the targeted beneficiaries.
Reasons for the persistent savings, as intimated by Government, are given below.
Housing: There was fluctuation in the quantum of saving during the last five years (2007-
12). Saving during the current year was attributed by the Government to ‘non-receipt of
administrative sanction under ‘Weaker Section Housing Programme’ under
INDIRAMMA.
Minor Irrigation: Slow progress of works, non-receipt of approvals and postponement of
maintenance works.
Industries and Commerce: Non-requirement of funds towards reimbursement of
Purchase Tax Incentive and non-utilisation of the provision under Transport, Roads and
Buildings department towards reimbursement of Sales Tax (VAT) on aviation turbine
fuel during 2007-11. For the current year, saving was due to non-release of its share by
GoI consequent on non-release of State’s share, non-finalisation of incentives to
entrepreneurs by the State Level Committee, non-receipt of sanctions from the Competent
Authority, non-finalisation of power subsidy, non-filling up of vacant posts and
retirements.
Tourism, Art and Culture: Non-materialization of action plan, non-receipt of
administrative sanction, delay in tendering for archaeological conservation, non-
construction of multi-purpose cultural complexes at Kadapa and Nellore etc.

Audit Report (State Finances) for the year ended 31 March 2012
�������� �
Revenue, Registration and Relief: Non-construction of buildings, bridges, cyclone
shelters and roads and not taking up construction works under National Cyclone Risk
Mitigation Project, slow progress of works, non-receipt of sanctions/approvals for works
and non-filling up of vacant and outsourcing posts.
Medical and Health: Non-receipt of administrative orders, slow progress of works and
non-finalisation of agencies for taking up construction work.
Social Welfare: Non-receipt of funds by GoI, slow progress of works and non-agreement
by NABARD for sanction of works under RIDF under ‘Construction of buildings for
Integrated Hostels (HUDCO Loan).
Major and Medium Irrigation: (Capital Charged section) Specific reasons for savings
during 2007-12 were not intimated by the Government. Reasons for saving during the
current year was due to non-finalisation of land acquisition awards, court cases and late
receipt of administrative approvals for depositing amount in court.
2.4.3 Excess expenditure Excess expenditure over the budget provision was reduced from ` 842 crore in 2010-11
to ` 189 crore during 2011-12, which is encouraging. The excess occurred in five grants
and two appropriations during the year and requires regularisation under Article 205 of
the Constitution of India.
Expenditure exceeded the budget by ` 20 crore or more in each case amounting to ` 184
crore in three cases, as shown in table below.
Table 2.5: Excess expenditure
(` in crore)
Sl. Grant No.
Name of the Grant Total Grant Expenditure Excess expenditure
1. IX Fiscal Administration, Planning, Surveys and Statistics (LV)
124 222 98
2. X Home Administration (RV) 4,290 4,345 55
3. XXIV Minority Welfare (RV) 334 365 31
Total 4,748 4,932 184 Source: Appropriation Accounts 2011-12; RV- Revenue Voted; LV- Loans Voted
Excess under Home Administration was due to (i) payment of arrears of DA, Automatic
Advancement Scheme and other allowances, (ii) payment of remuneration to the
outsourced staff and (iii) payment of property tax on Government buildings and quarters.
2.4.4 Expenditure without Provision As per paragraph 20.3.1 of APBM, expenditure should not ordinarily be incurred on a
scheme/service without provision of funds. However, ` 326 crore was incurred in six
cases (` 10 crore and above in each case) during the year 2011-12 without budget
provision as detailed in Table 2.6.

Chapter 2- Financial Management and Budgetary Control
����������
Table 2.6: Expenditure without provision during 2011-12
(` in crore)
Sl. No. and Name of the Grant
Head of Account Expendi-ture
Reasons
1 IX-Fiscal Administration, Planning, Surveys and Statistics
2071-01-110-(09) 53 Payment of pension/family pension in revised pay scales and also payment of Dearness Relief from time to time
2 XI-Roads, Buildings and Ports
3054-04-797-(04) 198 Non-provision of funds in the budget for transfer of amount received from Central Government to Road Fund
3 XII - School Education
2202-01-789-(30) 23 Expenditure was incurred under ‘Nutritious Meals Programme’ under Elementary and Secondary education. Reasons for incurring expenditure without budget provision have not been intimated.
4 XII - School Education
2202-02-789-(13) 15
5 XVII – Municipal Administration and Urban Development
2217-80-001-(75) 25 Reasons for incurring expenditure under the sub-head ‘Lumpsum provision’ without budget provision were not intimated.
6 XXXII-Rural Development
2501-01-003-(25) 12 Expenditure was incurred towards matching state share in the new scheme ‘Mahila Kisan Shashaktikaran Pariyojana’ (MKSP)
Total 326
Source: Appropriation Accounts 2011-12
2.4.5 Excess expenditure over provision relating to previous years not regularised As per Article 205 of the Constitution of India, it is mandatory for a State Government to
get the excess over a grant/appropriation regularised by the State Legislature. Although
no time limit has been prescribed under the Article, regularisation of excess expenditure
is to be done after the completion of discussion of the Appropriation Accounts by the
Public Accounts Committee (PAC). However, excess expenditure over the allocation
amounting to ` 2,687 crore pertaining to the years 2004-11 was yet to be regularized as of
July 2012, as detailed in Appendix 2.2, due to non-furnishing of Explanatory Notes by the
concerned Administrative departments/Finance department. The year-wise amount of
excess expenditure pending regularisation is summarised in Table 2.7.
Table 2.7: Excess over provision relating to previous years requiring regularization
(` in crore)
Year Number of Amount of excess over provision
Status of Regularisation
Grants Appropriations 2004-05 5 1 15 Out of these 61 Grants and 18
Appropriations, Explanatory Notes for 18 Grants and 6 Appropriations were received and vetted by the PAG (GSSA) as of July 2012. Explanatory Notes for the remaining 43 Grants and 12 Appropriations are awaited from the Administrative Departments /Finance Department.
2005-06 10 3 586
2006-07 7 1 199
2007-08 7 3 201
2008-09 11 3 709
2009-10 10 2 110
2010-11 11 5 867
Total 61 18 2,687 Source: Summary to Appropriation Accounts from 2004-05 to 2010-11
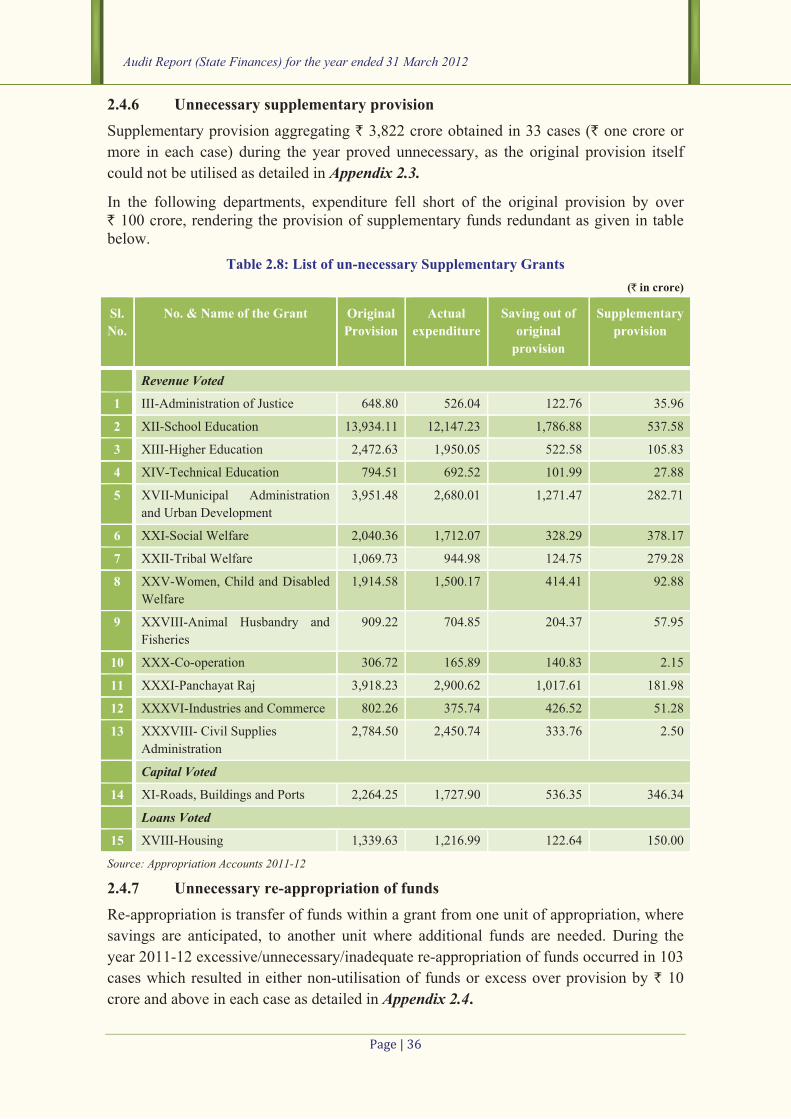
Audit Report (State Finances) for the year ended 31 March 2012
����������
2.4.6 Unnecessary supplementary provision Supplementary provision aggregating ` 3,822 crore obtained in 33 cases (` one crore or
more in each case) during the year proved unnecessary, as the original provision itself
could not be utilised as detailed in Appendix 2.3.
In the following departments, expenditure fell short of the original provision by over ` 100 crore, rendering the provision of supplementary funds redundant as given in table below.
Table 2.8: List of un-necessary Supplementary Grants (` in crore)
Sl. No.
No. & Name of the Grant Original Provision
Actual expenditure
Saving out of original
provision
Supplementary provision
Revenue Voted
1 III-Administration of Justice 648.80 526.04 122.76 35.96
2 XII-School Education 13,934.11 12,147.23 1,786.88 537.58
3 XIII-Higher Education 2,472.63 1,950.05 522.58 105.83
4 XIV-Technical Education 794.51 692.52 101.99 27.88
5 XVII-Municipal Administration
and Urban Development
3,951.48 2,680.01 1,271.47 282.71
6 XXI-Social Welfare 2,040.36 1,712.07 328.29 378.17
7 XXII-Tribal Welfare 1,069.73 944.98 124.75 279.28
8 XXV-Women, Child and Disabled
Welfare
1,914.58 1,500.17 414.41 92.88
9 XXVIII-Animal Husbandry and
Fisheries
909.22 704.85 204.37 57.95
10 XXX-Co-operation 306.72 165.89 140.83 2.15
11 XXXI-Panchayat Raj 3,918.23 2,900.62 1,017.61 181.98
12 XXXVI-Industries and Commerce 802.26 375.74 426.52 51.28
13 XXXVIII- Civil Supplies
Administration
2,784.50 2,450.74 333.76 2.50
Capital Voted
14 XI-Roads, Buildings and Ports 2,264.25 1,727.90 536.35 346.34
Loans Voted
15 XVIII-Housing 1,339.63 1,216.99 122.64 150.00
Source: Appropriation Accounts 2011-12
2.4.7 Unnecessary re-appropriation of funds Re-appropriation is transfer of funds within a grant from one unit of appropriation, where
savings are anticipated, to another unit where additional funds are needed. During the
year 2011-12 excessive/unnecessary/inadequate re-appropriation of funds occurred in 103
cases which resulted in either non-utilisation of funds or excess over provision by ` 10
crore and above in each case as detailed in Appendix 2.4.

Chapter 2- Financial Management and Budgetary Control
����������
2.4.8 Unexplained re-appropriations Paragraph 20.17.2 of APBM stipulates that reasons for the additional expenditure and
savings should be explained in the re-appropriation statement and vague expressions such
as “based on actual requirement/expenditure”, “savings are anticipated” “observance of
economy”, “original provision proved insufficient or excessive”, “based on progress of
actuals” etc., should be avoided. However, a scrutiny of re-appropriation orders issued by
the State Government revealed that, out of 13,248 items of re-appropriations made,
specific reasons were intimated only in respect of 6,940 (52 per cent) items. There was
also no consistency in the reasons cited for savings/additional expenditure by the
administrative departments concerned and the Finance department.
2.4.9 Substantial surrenders Funds in excess of ` 10 crore and also more than 50 per cent of total provision in each
case was surrendered in respect of 183 sub-heads. The savings were mainly due to (i)
non-availment of Ways and Means Advances from the RBI, (ii) non-release of funds for
administrative reasons, (iii) postponement and slow progress of work, (iv) non-receipt of
grants from GoI, (v) non-filling up of vacant posts, (vi) non-agreement for sanction of
works under RIDF6 by NABARD, (vii) non-receipt of administrative approvals and (viii)
non-finalisation of land acquisition awards.
Out of the total provision of ` 15,873 crore under 183 sub-heads, ` 13,362 crore (84 per cent) was surrendered, which included cent per cent surrenders (` 6,556 crore) under 62
sub-heads. Details of cases where the surrendered amount was more than ` 100 crore and
more than 90 per cent of the provision in each case are given in Appendix 2.5. The
Government could have assessed its requirement more realistically in these cases.
2.4.10 Lumpsum provision Paragraph 16.12 of the APBM stipulates that lumpsum provision should not as a rule be
made in the budget estimates. However, lumpsum provision of ` 1,205 crore was made in
the budget in violation of this stipulation and ` 1,130 crore (94 per cent) of this provision
remained unutilized at the end of the year. The details in this regard are tabulated below.
6 RIDF: Rural Infrastructure Development Fund; NABARD: National Bank for Agriculture and Rural
Development
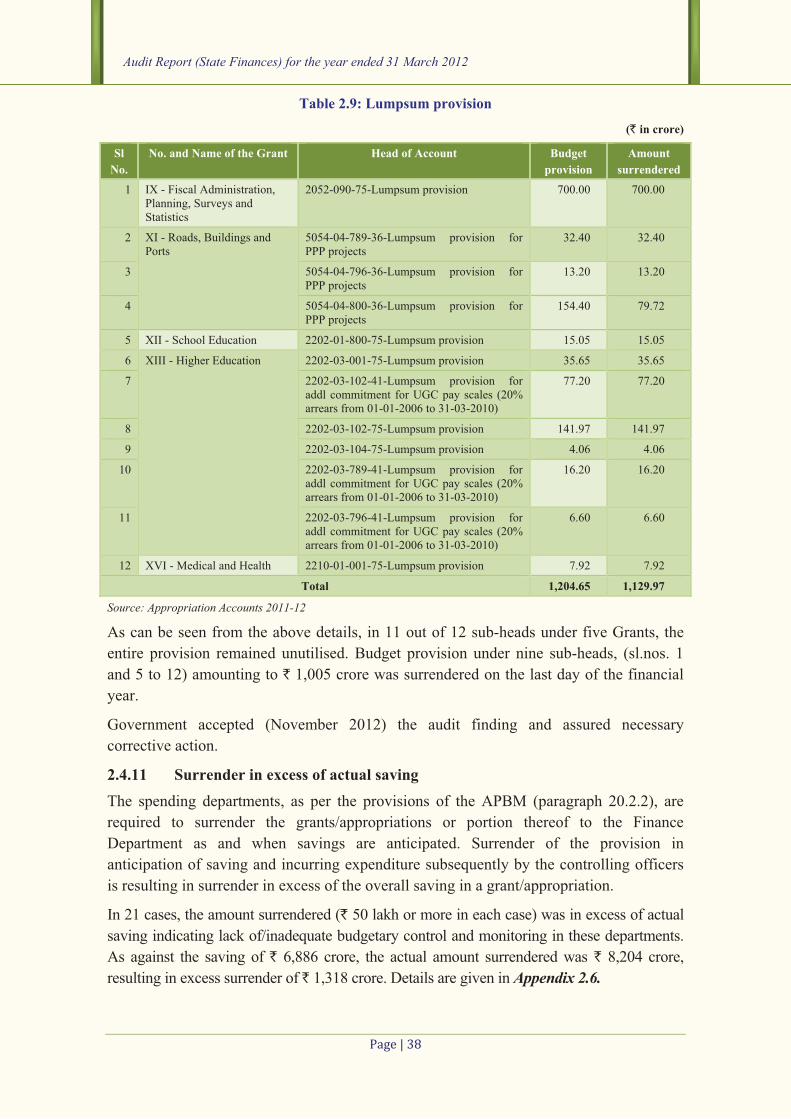
Audit Report (State Finances) for the year ended 31 March 2012
����������
Table 2.9: Lumpsum provision
(` in crore)
Sl No.
No. and Name of the Grant Head of Account Budget provision
Amount surrendered
1 IX - Fiscal Administration, Planning, Surveys and Statistics
2052-090-75-Lumpsum provision 700.00 700.00
2 XI - Roads, Buildings and Ports
5054-04-789-36-Lumpsum provision for PPP projects
32.40 32.40
3 5054-04-796-36-Lumpsum provision for PPP projects
13.20 13.20
4 5054-04-800-36-Lumpsum provision for PPP projects
154.40 79.72
5 XII - School Education 2202-01-800-75-Lumpsum provision 15.05 15.05
6 XIII - Higher Education 2202-03-001-75-Lumpsum provision 35.65 35.65
7 2202-03-102-41-Lumpsum provision for addl commitment for UGC pay scales (20% arrears from 01-01-2006 to 31-03-2010)
77.20 77.20
8 2202-03-102-75-Lumpsum provision 141.97 141.97
9 2202-03-104-75-Lumpsum provision 4.06 4.06
10 2202-03-789-41-Lumpsum provision for addl commitment for UGC pay scales (20% arrears from 01-01-2006 to 31-03-2010)
16.20 16.20
11 2202-03-796-41-Lumpsum provision for addl commitment for UGC pay scales (20% arrears from 01-01-2006 to 31-03-2010)
6.60 6.60
12 XVI - Medical and Health 2210-01-001-75-Lumpsum provision 7.92 7.92
Total 1,204.65 1,129.97
Source: Appropriation Accounts 2011-12
As can be seen from the above details, in 11 out of 12 sub-heads under five Grants, the
entire provision remained unutilised. Budget provision under nine sub-heads, (sl.nos. 1
and 5 to 12) amounting to ` 1,005 crore was surrendered on the last day of the financial
year.
Government accepted (November 2012) the audit finding and assured necessary
corrective action.
2.4.11 Surrender in excess of actual saving The spending departments, as per the provisions of the APBM (paragraph 20.2.2), are
required to surrender the grants/appropriations or portion thereof to the Finance
Department as and when savings are anticipated. Surrender of the provision in
anticipation of saving and incurring expenditure subsequently by the controlling officers
is resulting in surrender in excess of the overall saving in a grant/appropriation.
In 21 cases, the amount surrendered (` 50 lakh or more in each case) was in excess of actual
saving indicating lack of/inadequate budgetary control and monitoring in these departments.
As against the saving of ` 6,886 crore, the actual amount surrendered was ` 8,204 crore,
resulting in excess surrender of ` 1,318 crore. Details are given in Appendix 2.6.

Chapter 2- Financial Management and Budgetary Control
����������
2.4.12 Savings not surrendered
At the close of the year 2011-12, there were four grants and four appropriations in which
saving of ` 290 crore occurred but no part of it had been surrendered by the departments
concerned (Appendix 2.7).
Similarly, out of the saving of ` 12,762 crore under 30 grants/ appropriations, saving (` 5
crore and above in each case) amounting to ` 5,024 crore (20 per cent) of total saving
(` 24,700 crore) was not surrendered. Details are given in Appendix 2.8.
Besides, in 79 cases, ` 20,522 crore (83 per cent) of the total saving of ` 24,700 crore was
surrendered (in excess of ` 10 crore in each case), on the last two working days of March
2012 (Appendix 2.9) indicating inadequate financial control and poor capacity to spend.
2.4.13 Rush of expenditure Article 39 of the APFC requires that expenditure should be evenly distributed throughout
the year and no attempt should be made to prevent the lapse of an appropriation by any
undue rush of expenditure during March.
Contrary to these provisions,
while the expenditure during
the months from April 2011
to February 2012 was
between 5 and 9 per cent of
the total expenditure of `1,04,137 crore (both
revenue and capital
expenditure), expenditure in
the month of March 2012
alone constituted 19 per cent indicating rush of
expenditure at the end of the
financial year. Source: Monthly Civil Accounts prepared by PAG(A&E)
2.5 Major Policy Initiatives Some of the major policy initiatives/schemes outlined in the Budget speech/ annual plan
of the State Government during the year 2011-12 were scrutinized in audit on a test check
basis to verify if these pronouncements were implemented. Audit findings in this regard
are given below:
2.5.1 With a view to relieve the Weavers Cooperative Societies and weavers from
indebtedness, Government introduced the scheme “Assistance towards Loan
Waiver to Weavers” and allocated a sum of ` 200 crore in the Budget for the
year 2011-12. However, only an amount of ` 32.88 crore (16 per cent) was
released for the purpose during the year.
5499 53936501
8966 97227169 8518
7418 8192 82258863
19671
0
5000
10000
15000
20000
25000
`in
cro
re
Month-wise expenditure
Chart 2.1 Month-wise Expenditure

Audit Report (State Finances) for the year ended 31 March 2012
������� ��
2.5.2 “Rashtriya Madhyamika Siksha Abhiyan (RMSA)” is a centrally sponsored
scheme, with the funding pattern of 75:25 between the Central and State
Governments being implemented in the State with the objective to provide
access to secondary education for the age group of 14 to 18 years duly providing
necessary physical facilities, teaching and non-teaching staff for every secondary
school and financial assistance to the Government/Local body/ aided schools.
The State Government allocated ` 300 crore as state matching share during the
year 2011-12. Out of ` 322.05 crore (` 227.90 crore Central share and ` 94.15
crore State share) released, the expenditure incurred was only ` 225.52 crore.
Reasons for non-utilisation of funds to the extent of ` 96.53 crore were due to
non-approval of the Executive Committee of the State Project and the unutilised
funds (together with the earlier unspent balances) were kept as fixed sweep
deposits.
2.5.3 In order to ensure good quality education at secondary level, the scheme ‘Setting
up of Model Schools at Block level as benchmark of excellence’ was taken up as
a Centrally Sponsored Scheme on 75:25 cost share basis between Central and
State Governments and an amount of ` 200 crore was allocated as State share in
the Budget during the year 2011-12. Although, Central share of ` 412.09 crore
was released by GoI in July 2011, the corresponding State’s share of ` 137.36
crore was not released by the State. Further, out of the total Central share
released, only ` 6.33 crore was spent and ` 400 crore was kept as Fixed
Deposits.
2.5.4 Rajiv Gandhi Scheme for Empowerment of Adolescent Girls (RGSEAG)-
SABALA was introduced by GoI to enable self-development and empowerment
of adolescent girls in the age group of 11 to 18 years. Out of the Budget
allocation of ` 124.91 crore during the year 2011-12, only an amount of
` 20.25 crore (16 per cent) was expended.
2.5.5 GoI introduced (October 2010) a 100 per cent CSS “Indira Gandhi Matrutwa
Sahayog Yojana (IGMSY)”- a conditional maternity benefit scheme, with a view
to provide cash incentive directly to pregnant and lactating women. The scheme
was taken up in West Godavari and Nalgonda districts during 2011-12 and an
amount of ` 10.32 crore was released by GoI for the purpose. However, only
` 1.26 crore was utilized as of March 2012.
2.5.6 Government decided to introduce a Comprehensive Financial Management
System (CFMS) to provide a seamless interface with all the stakeholders with
regard to budgeting and accounting processes and an amount of ` 100 crore was
provided in the budget for the year the year 2011-12. However, only ` 1.65 crore
was incurred on the programme due to non-floating of RFP7 and non-
appointment of System Integrator during the year 2011-12.
7 RFP:- Request For Proposal

Chapter 2- Financial Management and Budgetary Control
������� ��
2.5.7 AP Road Sector Project was approved by GoI and World Bank for developing
and maintaining roads in the State under AP State Highway Project (APSHP) at
an estimated cost of ` 3,165 crore and an amount of ` 600 crore was provided in
the Budget 2011-12. A scrutiny of the relevant records revealed that only an
amount of ` 221.27 crore (48 per cent) was incurred as against the budget
allocation of ` 463.20 crore under the general component.
2.5.8 Government proposed to construct 2,93,000 houses under ‘INDIRAMMA’ rural
scheme and 50,000 houses under ‘INDIRAMMA’ urban scheme during 2011-12
and ` 571.25 crore (` 514.12 crore for Rural, ` 57.13 crore for Urban) was
allocated in the Budget. As against this, only an amount of ` 142.81 crore (Rural
` 128.53 crore and Urban ` 14.28 crore) was released by the Government
towards subsidy and expenditure was incurred to that extent.
2.5.9 Government provided ` 100 crore in the Budget as State’s share for ‘National
Rural Drinking Water Programme (NRDWP)’. However, no amount was
released during the year 2011-12.
2.5.10 Government initiated a new Employment Generation scheme and set up “Rajiv
Udyogasri Society (RUS)” with the objective of imparting necessary skills to the
candidates so as to enable them to get absorbed in the private establishment. An
amount of ` 40 crore was provided in the budget for the year 2011-12. However,
only ` 10 crore was released and expended. Government did not release funds
for the 2nd to 4th quarter (` 30 crore).
2.5.11 Government allocated ` 100 crore for ‘Assistance to Panchayat Raj Bodies for
Rural Sanitation’. Only ` 28 crore was expended on the scheme, and as against
the physical target of providing 9.28 lakh individual household latrines, the
achievement was only 0.91 lakh (9.8 per cent).
2.5.12 Against an allocation of ` 1,112 crore for providing ‘Mid Day Meals’ to poor
children, Government could spend only ` 673 crore (61 per cent) on the scheme
during the year.
2.6 Advances from Contingency Fund Contingency Fund (CF) of the State has been established under the Andhra Pradesh
Contingency Fund Act, 1957, in terms of provisions of Article 267(2) and 283(2) of the
Constitution of India. Advances from the CF are to be made only for meeting expenditure
of an unforeseen and emergent nature. The Fund is in the nature of an imprest with a
corpus of ` 50 crore.
During the year 2011-12, 73 sanctions aggregating ` 4.02 crore have been issued for
drawal from CF. An amount of ` 3.96 crore was met from these sanctions, of which,
` 3.75 crore was recouped to the Fund, leaving a balance of ` 21 lakh un-recouped. In
addition, ` 1.54 crore which remained un-recouped in 2010-11, was also re-couped in the
current year.

Audit Report (State Finances) for the year ended 31 March 2012
������� ��
Further, out of the ` 4.02 crore sanctioned from CF during 2011-12, ` 2.72 crore (68 per cent) pertains to decretal payments ordered by courts prior to 2011-12. A test check of
five of these sanctions (` 1.51 crore) revealed that, payment of the amounts ordered by
Hon’ble Courts (between September 2006 and July 2010) was postponed by the
Government till attachment of Government property or initiation of contempt proceedings
by the respective courts indicating that the payments were not in the nature of
unforeseen/emergent character and funds for these payments could have been provided in
the regular Annual Budget or the Supplementary Estimates.
2.7 Errors in budgeting process The following lapses/errors were observed in the process of budgeting by the State
Government:
2.7.1 Non-incorporation of correction slips: Though the omissions/errors in budget
process are being pointed out every year to the Finance department by the
PAG(A&E), corrections to List of Major and Minor Heads made by the Controller
General of Accounts from time to time are not being incorporated by the State
Government in the Budget Estimates for the years subsequent to the year of issue
of correction slips. Details in this regard are given in Appendix 2.10.
2.7.2 Operation of un-authorised Sub Major Head/Minor Heads: The Sub Major
Head 01 and all the Minor Heads operated there under below MH 2501-Special
Programme for Rural development are no longer in operation and were deleted in
2003. However the Sub Major Head 01 continued to be operated. Government
accepted (November 2012) the audit finding and assured necessary corrective
action.
2.7.3 Incorrect booking of Revenue: Under MH 0056-Jails specific Minor Head-102 is
provided for booking proceeds out of sale of jail manufacture. However, the entire
amount is being treated as “User Charges” collection and shown under MH 0056-
800-SH (02) Sale of jail manufacture-800 User charges. Similarly under MH
0051-Public Service Commission, entire examination fee is being treated as User
charges collection. Government replied that a policy decision has been taken to
allow Jails department and AP Public Service Commission to remit such receipts
as User charges.
2.7.4 Incorrect classification: Subsidies are being shown under Detailed Head 310-
Grants-in-aid instead of under 330-Subsidies. It was noticed that an amount of
` 4,300 crore was shown as 310-Grants-in-aid under MH 2801-05-800-SH (06)
Assistance to APTRANSCO for Agriculture and allied subsidy. Government
accepted (November 2012) the audit finding and assured necessary corrective
action.
2.7.5 The entire provision of ` 148 crore under ‘Loans to APTRANSCO for High
Voltage Distribution System (HVDS)’for the year 2011-12 was re-appropriated to
the head ‘Loans to APGENCO for Supercritical Thermal Power Station,
Krishnapatnam’. Further, the entire provision of ` one crore each during the years

Chapter 2- Financial Management and Budgetary Control
������� ��
2009-10 and 2010-11 respectively was also re-appropriated to APGENCO,
defeating the purpose for which funds were provided for in the budget.
2.7.6 Similarly, the entire provision of ` 330 crore under ‘Loans to APTRANSCO for
Krishnapatnam Thermal Power Project’ for the years 2010-11 and 2011-12 was
re-appropriated to the head ‘Loans to APGENCO for Supercritical Thermal Power
Station, Krishnapatnam’. Further, ` 150 crore provided under Loans to
APTRANSCO for Krishnapatnam Thermal Power Project was not utilized during
2009-10.
2.7.7 Misclassification in budget estimates: The Detailed head of account 530-Major
Works, which is supposed to be operated under Capital section, was classified in
Revenue section. An illustrative list of cases in this regard are detailed in
Appendix-2.11. Government accepted (November 2012) the audit finding and
assured necessary corrective action.
2.7.8 While the detailed heads 270-Minor Works and 310-Grants-in-aid are to be
operated under Revenue section, these were classified in Capital section under
Grants XI-Roads, Buildings and Ports, XVII-Municipal Administration & Urban
Development, XXXIII-Major and Medium Irrigation and XXXIV-Minor
Irrigation. An illustrative list of such cases are detailed in Appendix-2.12 & 2.13.
2.8 Conclusion As with 2010-11, there were several lacunae in the budgetary processes of the State Government. There were errors in budgeting, several misclassifications continued to exist, lumpsum provisions were made without clarity of purpose (only to be surrendered later), excess expenditure over allocation, expenditure without budget provision etc. Financial rules were flouted by several departments by resorting to re-appropriations without proper explanations and expending without provision of funds. Persistent savings in certain Grants and huge savings of over ` 500 crore and over 20 per cent of budgetary provision in certain other Grants, raise serious questions about budgetary assumptions.
Saving of about one sixth of the budgetary allocation and non-utilisation of the allocated funds for various developmental programmes raises serious questions about the budget formulation exercise. While this could show a healthy picture as far as fiscal indicators are concerned, it has had an adverse impact on implementation of various policy initiatives announced/taken up by the Government.


Chapter 3 Financial Reporting
3.1 Introduction Sound internal controls and compliance with rules and procedures contribute significantly
to good governance. These also ensure relevant, reliable and timely financial reporting
and thereby assist the State Government in meeting its basic stewardship responsibilities,
including strategic planning and appropriate decision making. This Chapter provides an
overview of the State Government’s compliance with various financial rules, procedures
and directives during the current year.
3.2 Utilisation Certificates Utilisation Certificates (UCs) should be furnished by the State Government to the GoI
with regard to the funds provided by the latter for implementation of various socio-
economic development programmes. State Government rules1 also provide for
submission of UCs by the departmental officers from the grantees where specific grants
are provided, and forwarding them to the PAG (A&E) after verification. 214 UCs
aggregating ` 85 crore in respect of grants released by the State Government during
1992-93 to 2011-2012, were outstanding as of 31 March 2012. The delay in this regard
ranged from one to 18 years, as summarized in Appendix 3.1.
3.3 Submission of accounts/Audit Reports of Autonomous bodies Several autonomous bodies have been set up by the State Government in the fields of
Medical Education, Tribal Welfare and Urban Development etc. The audit of accounts of
18 such bodies has been entrusted to the CAG of India. However, none of the 18 bodies
had rendered annual accounts up to date i.e. 2011-12. The delay (as of June 2012) in
submission of accounts for audit ranged from three to 99 months. Details of the period
upto which accounts were rendered and due are given in Appendix 3.2.
The State Government needs to take expeditious measures to ensure that these accounts
are compiled and submitted for audit within a fixed timeframe, so as to ensure that
financial irregularities, if any, do not go undetected.
Further, in order to identify the institutions which attract audit under sections 14 and 15 of
the Comptroller and Auditor General’s (Duties, Powers and Conditions of service) Act,
1971, the Government/Heads of the Department are required to furnish to Audit every
year detailed information about the financial assistance given to various institutions, the
purpose of assistance granted and the total expenditure of the institutions. However,
annual accounts of 358 such assisted bodies/authorities (total no. of accounts: 1983) due
up to 2011-12 were not submitted to audit as of June 2012. Details of these accounts are
given in Appendix 3.3. Government stated that instructions were issued to the
Autonomous Bodies/ Institutions to furnish accounts to PAG (G&SSA).
1 Note 1 below Article 211A(2) of APFC
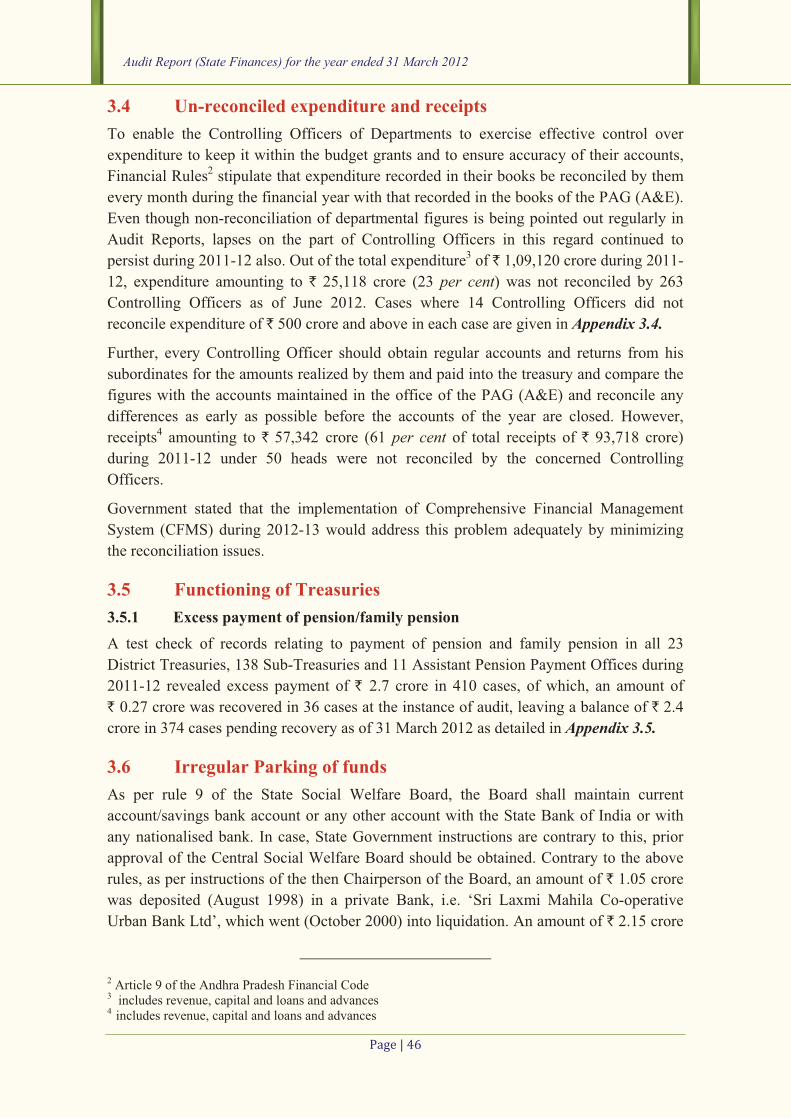
Audit Report (State Finances) for the year ended 31 March 2012
������� ��
3.4 Un-reconciled expenditure and receipts To enable the Controlling Officers of Departments to exercise effective control over
expenditure to keep it within the budget grants and to ensure accuracy of their accounts,
Financial Rules2 stipulate that expenditure recorded in their books be reconciled by them
every month during the financial year with that recorded in the books of the PAG (A&E).
Even though non-reconciliation of departmental figures is being pointed out regularly in
Audit Reports, lapses on the part of Controlling Officers in this regard continued to
persist during 2011-12 also. Out of the total expenditure3 of ` 1,09,120 crore during 2011-
12, expenditure amounting to ` 25,118 crore (23 per cent) was not reconciled by 263
Controlling Officers as of June 2012. Cases where 14 Controlling Officers did not
reconcile expenditure of ` 500 crore and above in each case are given in Appendix 3.4.
Further, every Controlling Officer should obtain regular accounts and returns from his
subordinates for the amounts realized by them and paid into the treasury and compare the
figures with the accounts maintained in the office of the PAG (A&E) and reconcile any
differences as early as possible before the accounts of the year are closed. However,
receipts4 amounting to ` 57,342 crore (61 per cent of total receipts of ` 93,718 crore)
during 2011-12 under 50 heads were not reconciled by the concerned Controlling
Officers.
Government stated that the implementation of Comprehensive Financial Management
System (CFMS) during 2012-13 would address this problem adequately by minimizing
the reconciliation issues.
3.5 Functioning of Treasuries 3.5.1 Excess payment of pension/family pension
A test check of records relating to payment of pension and family pension in all 23
District Treasuries, 138 Sub-Treasuries and 11 Assistant Pension Payment Offices during
2011-12 revealed excess payment of ` 2.7 crore in 410 cases, of which, an amount of
` 0.27 crore was recovered in 36 cases at the instance of audit, leaving a balance of ` 2.4
crore in 374 cases pending recovery as of 31 March 2012 as detailed in Appendix 3.5.
3.6 Irregular Parking of funds As per rule 9 of the State Social Welfare Board, the Board shall maintain current
account/savings bank account or any other account with the State Bank of India or with
any nationalised bank. In case, State Government instructions are contrary to this, prior
approval of the Central Social Welfare Board should be obtained. Contrary to the above
rules, as per instructions of the then Chairperson of the Board, an amount of ` 1.05 crore
was deposited (August 1998) in a private Bank, i.e. ‘Sri Laxmi Mahila Co-operative
Urban Bank Ltd’, which went (October 2000) into liquidation. An amount of ` 2.15 crore
2 Article 9 of the Andhra Pradesh Financial Code 3 includes revenue, capital and loans and advances 4 includes revenue, capital and loans and advances

Chapter 3- Financial Reporting
������� ��
(Principal: ` 0.59 crore and Interest: ` 1.56 crore) has been pending realization for more
than a decade.
3.7 Personal Deposit Accounts As per APFC5, PD Accounts are created for discharging the liabilities of the Government
arising out of special enactment, by debit to the Consolidated Fund, and, as per orders6 of
the State Government, funds released during a particular financial year shall lapse by 31
March of next financial year (lapsable deposits under category ‘C’). The administrators of
PD accounts are required to close such accounts and transfer the unspent balances back to
the Government account.
The provision for approval of the PAG (A&E) for opening of individual PD Accounts
was dispensed with by the State Government in 2005. Further, due to non-rendering of
administrator-wise PD accounts to the Office of the PAG (A&E), details of expenditure
out of the funds transferred, transfer of unspent balances to the Government Account and
a correlation of AC Bills with PD Accounts/Bank account could not be arrived at.
The District Treasury Officers (DTOs) reported to the PAG (A&E) that 90,573 PD
accounts were in operation with a closing balance of ` 22,272 crore as of 31 March 2012,
as summarised in Table 3.1 below:
Table: 3.1: Status of PD Accounts as on 31 March 2012 (` in crore)
Sl. No. Particulars No. of
PD Accounts Amount
1 PD Accounts existing at the beginning of the year 2011-12 90,188 21,738
2 PD Accounts opened during the year 2011-12 536 535
3 PD Accounts closed at the end of the year 2011-12 151 1
4 PD Accounts existing at the close of the year 2011-12 90,573 22,272
Source: Finance Accounts 2011-12
The opening balance of 2011-12 differed from the closing balance of 2010-11 by 4,355 PD accounts and ` 11,121 crore (increased), which had not been reconciled by
the respective departments. As reported by the DTOs, eleven out of the 23 District
Treasuries in the State have reconciled the balances in respect of 53,913 PD accounts (60
per cent of total no. of PD accounts) involving an amount of ` 14,917 crore (67 per cent of the total outstanding amount in PD accounts) as on 31 March 2012.
However, in response to an audit enquiry, the Director of Treasuries and Accounts (DTA)
intimated (July 2012) PAG (GSSA) about the existence of 1,16,638 PD accounts with a
closing balance of ` 23,483 crore available with them as on 31 March 2012 (excluding
minus balances). The huge variation in the number of PD accounts (26,065) and the amount of variation (` 1,211 crore) reported to PAG (A&E) and the figures reported to PAG (GSSA) needs reconciliation.
5 Article 271 (4) of Andhra Pradesh Financial Code 6 G.O.Ms.No.43, Finance and Planning (W&M) Department, dated 22-4-2000
Audit Report (State Finances) for the year ended 31 March 2012
������� ��
Government stated (November -2012) that the 536 accounts were not new accounts but
were only separate account numbers under the existing PD Administrators.
A test-check of records of a few PD account administrators revealed the following
irregularities:
� Commissioner of Civil Supplies (PD Account No.7) - An amount of ` 100 crore was
released (October 2009) by the Government from the Calamity Relief Fund for supply
of rice and kerosene to the flood affected victims in five7 districts, of which ` 61 crore
(61 per cent) was un-utilised and was lapsed by the DTO (Urban) Hyderabad to
Government account.
Further, GoI had released (July 2010) 13th Finance Commission Grant of ` 13 crore
(First instalment) as an incentive for issuing Unique Identification (UID) Numbers to
Below Poverty Line (BPL) residents under Unique Identification Programme by
UIDAI8. Though sanction orders were issued (December 2010) and funds drawn and
credited to the PD account in September 2011, they were lying unutilized as of July
2012.
An amount of ` 8 crore released (October 2008) towards procurement of rice to
welfare hostels was drawn (March 2009), but remained unutilized and was lapsed by
the DTO (Urban) Hyderabad to Government account in June 2011.
� Andhra Pradesh State Civil Supplies Corporation (PD Account No.75) - An amount
of ` 2,280 crore pertaining to rice subsidy was drawn (2011-12) from PD account and
was kept in bank contrary to Government orders9, dated November 2009, of which,
` 163 crore was diverted towards payment of LPG subsidy to three oil companies10.
Also, there was a huge variation in figures in respect of receipts and expenditure
between the books of PAG (A&E) and the administrator of PD accounts which needs
reconciliation. (Appendix 3.6.)
� Society for Elimination of Rural Poverty (SERP) (PD Account No.277) - Funds of
` 1,647 crore pertaining to various schemes viz., AABY, Pavala Vaddi, Pensions to
Aids patients, APRPRP etc., were drawn (2011-12) from the PD account and kept in
various banks. Separate PD account cash book as well as scheme-wise ledgers were
not maintained.
An amount of ` 10 crore was drawn (March 2012) by SERP from its PD account for
conducting BPL Census. The funds were however, lying un-utilised in its bank
account as of August 2012.
An amount of ` 9.79 crore meant for disbursement of pensions to AIDS patients was
drawn (2011-12) from the PD account by SERP and kept in its bank account. Of this
7 Guntur, Krishna, Kurnool, Mahbubnagar and Nalgonda 8 Unique Identification Authority of India 9 Circular Memo No. M2/17836/2009, dtd. 16 November 2009 10 Hindustan Petroleum Corporation Ltd., Bharat Petroleum Corporation Ltd., and Indian Oil Corporation Ltd.

Chapter 3- Financial Reporting
������� ��
amount, ` 0.45 crore was withdrawn. However, SERP could not furnish the
expenditure details to audit and the balance amount of ` 9.36 crore (including
interest) was lying un-utilised in the bank as of August 2012.
With regard to SERP also, there was a significant variation in the figures in respect of
receipts and expenditure between the books of PAG (A&E) and the administrator of
PD Accounts which needs reconciliation. (Appendix 3.6.)
� Social Benefit Management System(SBMS): An amount of ` 63.69 crore pertaining
to ‘SBMS scheme meant for disbursement of post-matric scholarships and Re-
imbursement of Tuition Fee & Maintenance Tuition Fee to SC, ST and disabled
students in the State during July 2008, was lying undisbursed in 29 PD accounts in
various Treasuries as of September 2012.
� Test audit revealed that 21 Government Corporations and other organisations had kept
an amount of ` 141 crore in various banks by withdrawing funds (December 2011 and
January 2012) from their respective PD accounts.
� As per rules11, an amount of ` 119 crore (lapsable deposits under category ‘C’) was
lapsable to Government during 2010-11. However, only an amount of ` 25 crore was
credited to Government, leaving a balance of ` 94 crore in PD account.
� Rupees ` 155 crore (lapsable deposits under category ‘C’) was lying unutilized in 336
in-operative PD accounts as of 31 March 2012. 1,053 PD accounts showed ‘zero’
balances, while 563 PD accounts had minus balances of ` 4,409 crore (as of August
2012). Minus balances could arise on account of opening multiple PD accounts by the
same Administrator and using funds pertaining to one account under another head, or
drawing more amount from the PD account than has been authorized.
� Further, despite specific Government orders prohibiting transfer of funds from PD
accounts to banks through self cheques, several PD account Administrators have
resorted to this procedure and transferred huge amounts from PD accounts to
commercial banks.
While the need for opening PD accounts cannot be disputed, Government needs to ensure that these are operated in a transparent manner in accordance with the letter and spirit of the relevant instructions and rules. Considering that almost 1/6th of the budget is locked away in these accounts across the State, and these are outside the purview of Government accounts, it is a matter of serious concern that PAG (A&E) is not kept informed about the opening of these accounts and their utilization and closing balances.
Government shared the concern of Audit and stated (November-2012) that a committee
had been set up to review the operation of PD accounts and assured that the entire system
would be streamlined soon.
11 G.O.Ms.No.43, Finance and Planning (W&M) Department, dated 22-4-2000

Audit Report (State Finances) for the year ended 31 March 2012
����������
3.8 Parking of funds outside Government account As per Government orders12, Heads of Departments should not withdraw any funds to be
kept in fixed deposits (while not restricting use of ‘flexi-interest’ schemes offered by
banks). However, test-check of records of a few GoI schemes on a sample basis revealed
such withdrawals as detailed below.
3.8.1 Electronically Deliverable Services (EDS) GoI released ` 18.58 crore (August and November 2007) to the Director, EDS for
establishing Common Service Centres (CSCs) in six zones under National e-Governance
Plan over a period of four years. However, as of August 2012, ` 24 crore (including
interest of ` 8 crore) was parked in fixed deposits with Indian Bank instead of utilizing
for the purpose for which the amount was sanctioned.
3.9 Pendency of Detailed Contingent bills Orders issued by the Government13 stipulate that amount drawn on Abstract Contingent
(AC) bills should be adjusted by submitting Detailed Contingent (DC) bills for the
expenditure incurred, to the PAG(A&E)/Pay and Accounts Officer, with supporting
vouchers, within one month of drawal of such amounts. However, despite flagging this
issue by the PAG (A&E) at regular intervals, as of 31 March 2012, DC bills were
submitted in respect of ` 1,838 crore against ` 3,124 crore drawn on AC bills (59 per cent). The year-wise details in this regard are given in Table 3.2.
Table 3.2: Amount drawn on Abstract Contingent Bills (` in crore)
Year AC bills drawn DC bills Submitted Percentage of amount adjusted/ accounted
for
DC bills pending
Number Amount Number Amount Number Amount
Upto 2006-07 79,378 635 58,549 462 73 20,829* 173* 2007-08 10,459 158 8,292 123 78 2,167 35 2008-09 7,383 158 5,674 139 88 1,709 19 2009-10 4,447 458 3,501 341 74 946 117 2010-11 3,158 774 2,366 503 65 792 271 2011-12 2,546 941 1,683 270 29 863 671
Total 1,07,371 3,124 80,065 1,838 59 27,306 1,286Source: Information from PAG(A&E)
* excludes 82,130 AC bills for ` 222 crore upto 2002-03 for which details are not available.
Note: 316 AC bills for ` 66 crore in respect of PAO (Hyderabad) for 2004-12 which is under reconciliation is not included.
Of the total outstanding amount of AC bills (` 1,286 crore), 67 per cent (` 866 crore)
pertains to Agriculture department alone. The department-wise details of AC bills for
which DC bills are pending are given in Appendix 3.7.
12 G.O.Ms.No. 113 Finance (Ways & Means) Department dated 10-05-2007 13 G.O.Ms.No.285 Finance (TFR-II) Department dated 15-10-2005

Chapter 3- Financial Reporting
����������
Illustrative cases noticed during test check are detailed below. In all these cases, the amounts drawn through AC bills were not adjusted through DC bills as of July 2012.
� Chief Commissioner of Land Administration(CCLA): Rupees one crore was drawn
on AC bill by the CCLA in February 2006 towards ‘repairs to old building and
construction of new building in the premises of CCLA office’ and a cheque was
issued in the name of Chief Executive, HABTECH, Hyderabad for execution of the
work.
� Andhra Pradesh Public Service Commission (APPSC): Two AC bills were drawn
(September & November 2011) for an amount of ` 5.44 lakh towards payment of hire
charges to APSRTC for delivery of confidential material for conduct of Group-I
Services Main examination and payment of honorarium to subject experts, for
selection of lecturers in Government Degree Colleges.
� Greater Hyderabad Municipal Corporation (GHMC): Seven AC bills involving
` 4.81 crore (2009-10) and two AC bills of ` 16 lakh (2010-11) were drawn for
‘conduct of General Elections to Parliament, Legislative Assembly and Legislative
Council’.
� Commissioner of Police, Hyderabad: Rupees 4.33 crore was drawn through five AC
bills (September & October 2011) towards ‘bandobust arrangements for Ganesh and
other festivals’ of which, DC bills were pending in respect of four AC bills amounting
to ` 4.11 crore.
� Commissioner of Technical Education: DC bill was not submitted as of July 2012 to
adjust the amount of ` 31 lakh drawn on AC bill during November 2004 for
‘organizing Pratibha Awards function’ in 2004.
� Joint Director of Agriculture: Seven AC bills for ` 40 crore were drawn (January
2010, January & June 2011) by JD Agriculture, Mahabubnagar and three AC bills for
` 61 crore were drawn (January & June 2011) by JD Agriculture, West Godavari
towards ‘input subsidy to small and marginal farmers whose agricultural crops were
damaged by more than 50 per cent’. Relevant DC bills were not submitted even as of
July 2012.
Government replied (November 2012) that sustained efforts were being made to settle the
AC bills and an amount of ` 419 crore drawn on AC bills was adjusted during the year
through relevant DC bills.
3.10 Outstanding balances under Suspense Account (Major Head 8658)
Suspense heads are operated in Government accounts to reflect transactions that cannot
be booked initially to their final heads of account for some reason or the other. These are
finally cleared by minus debit or minus credit when the amount is taken to its final head
of account. If the amounts under suspense heads remain unadjusted, the balances under
these heads get accumulated resulting in understatement of Government’s receipts and
payments. It is necessary to maintain the ledger pertaining to suspense heads detailed
head-wise.

Aud
The a
Finan
31st M
and,
Accou
State
dis-ag
Pairin
indep
result
level
Heads
Suspe
net ba
Source:
3.10.1This
gover
PAOs
minor
on be
been
by th
debit
` in
cro
re
dit Report (Sta
aggregate n
nce Account
March 2012
therefore, t
unt does no
Legislature
ggregating t
ng off of d
endent acc
ts in underst
in Finance A
s 101-PAO
ense-Centra
alances as g
: Finance Acco
1 Pay anminor hea
rnmental tra
s of the Un
r head repre
ehalf of ano
operated. C
e Accounts
is cleared b
0
500
1000
1500
2000
2500
3000
3500
4000
4500
ate Finances) f
net balance
ts of the Go
. The Finan
the real ma
ot get report
e. The corre
the debit an
ebits and c
ounts and
tatement of
Accounts. T
O Suspense
al Accounts
given in Fina
unts and Ledge
nd Accountad is oper
ansactions a
nion Territo
esent either
other Accou
Credit under
s Officer in
by ‘minus d
MH
101
MH
102
2007-08
93.2
2
187.
78
23.6
8
115.
25
C
for the year e
e under the
overnment
nce Account
agnitude of
ted in the an
ect balances
nd credit b
credits unde
adjusted by
f Suspense b
The position
e, 102-Sus
Office und
ance Accou
ers maintained b
ts Office –rated for
arising in th
ories and th
recoveries
unts Officer
r this head i
n whose boo
debit’ on re
MH
110
MH
101
MH
102
2008-
2235
.82
92.9
2
1897
.26
23.9
5
108.
63
hart 3.1: Ou
nded 31 Marc
���������
e Major He
of Andhra
ts reflect th
f the outsta
nnual accou
s under the
alances sep
er Suspense
y minus de
balances bo
n of Suspen
pense Acc
der Suspens
unts for the l
by PAG(A&E)
Suspense (the settlem
he books o
he Accoun
effected or
against wh
is cleared b
oks initial r
ceipt and re
MH
110
MH
101
-09 2
123.
34
1266
.39
108.
16
1144
.66
23.9
6
utstanding b
DR CR
ch 2012
ead “8658-
Pradesh wa
e net balanc
anding amo
unts of the G
se Suspens
parately und
e Accounts
ebits and m
th at Major
nse balances
count (Civi
se Account
last five yea
(Mh 101) ment of in
of PAOs un
ntants Gener
payments m
hom the min
by ‘minus cr
recovery w
ealization o
MH
102
MH
110
MH
101
2009-10
108.
16
130.
34
1365
.86
98.2
9
998.
99
balances und
R
Suspense A
as ` 250.18
ces under S
ounts unde
Governmen
e Heads ca
der various
is not pos
minus credit
r Head level
s (Debit/Cre
il) and 11
t (MH 8658
ars are prese
nter-departm
nder the Un
ral. Transa
made by an
nor head PA
redit’ when
was accounte
of cheque fr
MH
101
MH
102
MH
110
2010-11
106.
87 193.
32
1276
.71
24.1
2
112.
99
1255
.49
der Major H
Accounts”
8 crore (Dr)
Suspense acc
r these hea
nt presented
an be obtain
Suspense
ssible as the
ts respectiv
l and Minor
edit) Under
10-Reserve
8) along wi
ented below
mental and
nion Govern
ctions unde
Accounts O
AO Suspen
n cheque is
ed for. Sim
rom the Acc
MH
101
MH
102
2011-12
119.
16
239.
34
23.4
8
84.5
5
Head 8658
in the
as on
counts
ads of
to the
ned by
heads.
ey are
ely. It
r Head
Minor
Bank
ith the
w:
inter
nment,
er this
Officer
nse has
issued
milarly,
counts
MH
110
1549
.84
1553
.57
Chapter 3- Financial Reporting
����������
Officer on whose behalf payment was made. Outstanding debit balance under this head
means that payments have been made by the PAO on behalf of other PAO, which are yet
to be recovered. Outstanding credit balance under this head means that payments have
been received by the PAO on behalf of other PAO, which are yet to be paid.
The outstanding debit balance under this head was ` 119.16 crore and the credit balance
was ` 23.48 crore at the end of the year 2011-12. The outstanding debit balances were
mainly in respect of PAO, Central Pensions, New Delhi (` 18.22 crore), Interests of stock
warrants (` 18.74 crore) and PAO, Shipping and Transport, Bangalore (` 80.82 crore) and
the outstanding credit balances were mainly in respect of PAO, Department of Economic
Affairs, New Delhi (` 12.65 crore), Pay Roll Saving Scheme (` 1.69 crore) and PAO,
Shipping and Transport, New Delhi (` 8.41 crore). The debit balances under this head
were increased from ` 93.22 crore in 2007-08 to ` 119.16 crore in 2011-12 and a
marginal decrease is recorded in respect of credit balances from ` 23.68 crore in 2007-08
to ` 23.48 crore in 2011-12. The debit and credit balance under PAO Suspense and their
continuous accumulation indicates significant control deficiencies.
3.10.2 Suspense Account - Civil (Mh 102) The transactions which cannot be taken to final head of expenditure/receipt accounts for
want of certain information/documents (challans, vouchers etc.,) are at the first instance
booked under this suspense head. Receipts are credited and expenditure is debited to this
account and cleared on receipt of required information by minus credit and minus debit
respectively. Outstanding debit balance under this head means payment made could not
be debited to the final head of expenditure for want of certain particulars and outstanding
credit means receipts could not be credited to final receipt head of account for want of
details.
The outstanding balance under this minor head as on 31 March 2012 was ` 239.34 crore
(Dr) and ` 84.55 crore (Cr) indicating that an amount of ` 323.89 crore was required to be
adjusted in respect of receipts and expenditure separately duly taking to their respective
final heads of account. Major debit balances were outstanding in respect of FA&CAO,
South Central Railway (` 79.33 crore), unclassified suspense (` 50.92 crore), Remittances
in Treasuries in other accounting system (` 48.58 crore), whereas major credit balances
were outstanding in respect of Cheques drawn on treasuries in other accounts circles
(` 55.50 crore), Tungabhadra Project Suspense- Remittances (` 12.67 crore) and
Tungabhadra Project Suspense (` 7.18 crore) under this Minor Head.
3.10.3 Reserve Bank Suspense-Central Accounts Office (Mh-110) When transfer of huge balances between Central and State Governments take place on
account of sanction of loan, grants-in-aid etc., the minor head 110-Reserve Bank
Suspense-Central Accounts Office under Major Head-8658 is operated to record the
transaction before taking it to its final Head of Account. In case of sanction of loan to
State Government, on receipt of sanction from the PAO of the Ministry concerned, the
RBI issues Clearance Memo duly crediting Major Head-8658 Suspense-110 RBS, CAO
by debiting Major Head-8675- Reserve Bank Deposits. The Accountant General gives

Audit Report (State Finances) for the year ended 31 March 2012
�������� �
credit to final Head of Account 6004-Loans and Advances from Central Government,
duly clearing the suspense by minus credit after receiving the original sanction order from
the ministry concerned. A debit balance under this minor head would mean that
repayments of loan made have not yet been taken to its final head and a credit balance
under this account means loans received from GoI were not yet booked under the
concerned head.
The outstanding balances under this head as on 31 March 2012 were ` 1,549.84 crore
(Dr) and ` 1,553.57 crore (Cr). It indicates that an amount of ` 3,103.41 crore requires to
be adjusted in respect of both debits and credits under this account. However, the Finance
Accounts show a balance of ` 3.74 crore (Cr) which does not reflect the actual loans and
repayments position of the State. It is clearly evident from the above that the amount of
repayment of loans shown in Finance Accounts was understated by ` 1,549.84 crore and
the amount of loans received from the GoI was understated by ` 1,553.57 crore.
3.11 Operation of omnibus Minor Head 800 During the past two decades, the range and diversity of Government activity had
increased manifold, outpacing the number of available programme minor heads. The
omnibus Minor Head - 800 accommodates the expenditure which could not be classified
under the available programme minor heads.
During 2011-12, expenditure aggregating ` 14,165 crore, constituting 13.6 per cent of the total expenditure (` 1,04,137 crore), was classified under Minor Head 800-Other
Expenditure against more than 100 Major Heads under Revenue and Capital sections. The
largest instance of such classification was in respect of subsidy of ` 4,300 crore given by
the State Government to AP TRANSCO for free supply of power to farmers.
Similarly, revenue receipts aggregating ` 3,447 crore (3.68 per cent of total revenue
receipts of ` 93,554 crore) were classified under the omnibus Minor Head ‘800-Other
Receipts’ under 58 Major Heads. Classification of large amounts under the omnibus
Minor Head ‘800-Other Expenditure/Receipts’ affects transparency in financial reporting.
Government accepted (November 2012) the audit finding and assured necessary
corrective action.
3.12 Implementation of Indian Government Accounting Standards (IGAS)
3.12.1 Guarantees given by State Government IGAS-1 requires that sector-wise and class-wise disclosures on guarantees given by the
State Government should be incorporated in Finance Accounts from the year 2011-12
onwards. Although sector-wise details have been disclosed, class-wise details were not
incorporated in Finance Accounts of the State.
3.12.2 Accounting and Classification of Grants-in-aid As per IGAS-2, expenditure relating to Grants-in-aid should be classified as revenue
expenditure if it involves creation of assets, except in cases specifically authorized by the

Chapter 3- Financial Reporting
����������
President on the advice of the Comptroller and Auditor General of India. Contrary to this,
State Government made a provision of ` 220.24 crore in the budget with regard to Grants-in-
aid from GoI for creation of assets and classified the related expenditure of ` 25.69 crore
under capital section.
3.13 Conclusion Several State Government departments were not compliant with the applicable rules and regulations, especially those relating to compilation and submission of accounts for audit and reporting utilization of funds placed at their disposal for implementation of various socio-economic developmental schemes. Internal controls were not functioning as envisaged, as evidenced from non-reconciliation of receipts and expenditure with those booked by the Principal Accountant General (A&E), irregular and unauthorized parking of funds in various deposits outside Government accounts, non-adjustment of advances drawn on AC bills with the relevant DC bills for prolonged periods etc. Adequate attention was not given by the Government to ensure that relevant vouchers/missing documents were provided by the concerned authorities to adjust the amounts held in suspense heads. Operation of over one lakh PD accounts and locking up of about ` 23,483 crore in these accounts affected the transparency of Government accounts. Classifying large amounts and important items of expenditure like ‘subsidies’ under omnibus Minor Head-800 affected transparency in financial reporting.
Hyderabad The
(VANI SRIRAM) Principal Accountant General (G&SSA)
Andhra Pradesh
Countersigned
New Delhi The
(VINOD RAI) Comptroller and Auditor General of India
aao2report1
Text Box
21 November 2012
aao2report1
Text Box
26 November 2012


Appendices

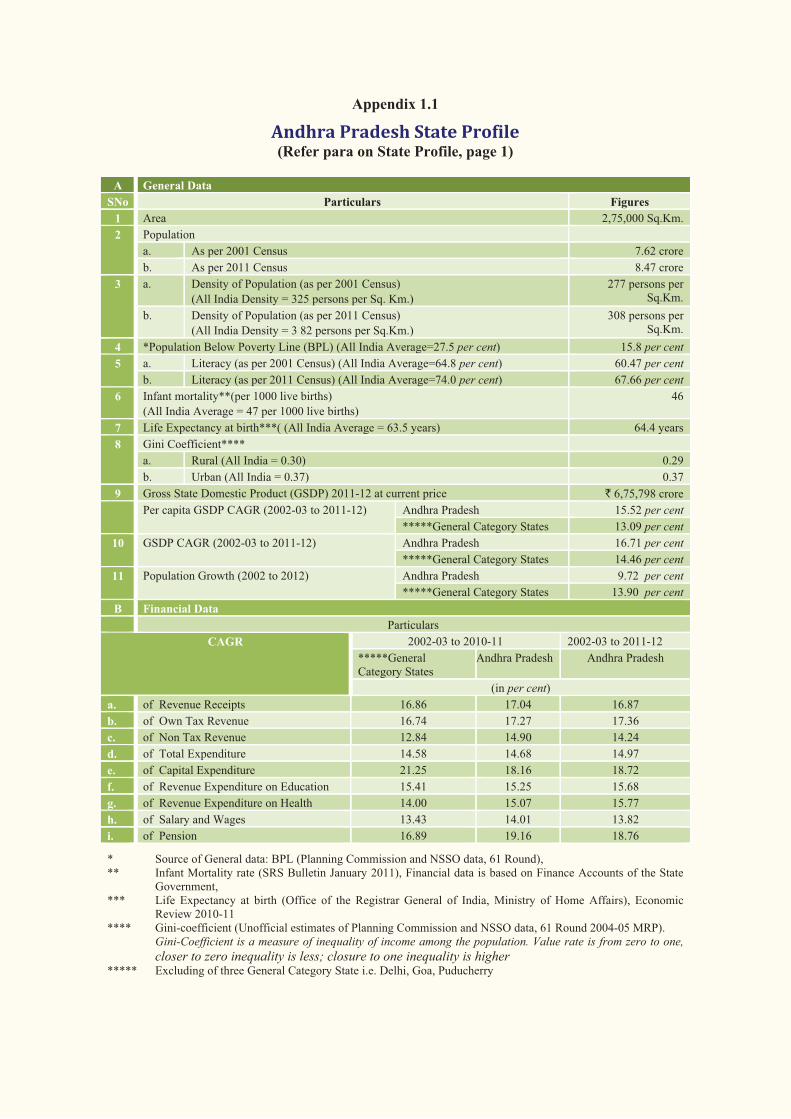
Appendix 1.1
Andhra Pradesh State Profile (Refer para on State Profile, page 1)
A General Data SNo Particulars Figures
1 Area 2,75,000 Sq.Km.
2 Population
a. As per 2001 Census 7.62 crore
b. As per 2011 Census 8.47 crore
3 a. Density of Population (as per 2001 Census)
(All India Density = 325 persons per Sq. Km.)
277 persons per Sq.Km.
b. Density of Population (as per 2011 Census)
(All India Density = 3 82 persons per Sq.Km.)
308 persons per Sq.Km.
4 *Population Below Poverty Line (BPL) (All India Average=27.5 per cent) 15.8 per cent 5 a. Literacy (as per 2001 Census) (All India Average=64.8 per cent) 60.47 per cent
b. Literacy (as per 2011 Census) (All India Average=74.0 per cent) 67.66 per cent 6 Infant mortality**(per 1000 live births)
(All India Average = 47 per 1000 live births)
46
7 Life Expectancy at birth***( (All India Average = 63.5 years) 64.4 years
8 Gini Coefficient****
a. Rural (All India = 0.30) 0.29
b. Urban (All India = 0.37) 0.37
9 Gross State Domestic Product (GSDP) 2011-12 at current price ` 6,75,798 crore
Per capita GSDP CAGR (2002-03 to 2011-12) Andhra Pradesh 15.52 per cent *****General Category States 13.09 per cent
10 GSDP CAGR (2002-03 to 2011-12) Andhra Pradesh 16.71 per cent *****General Category States 14.46 per cent
11 Population Growth (2002 to 2012) Andhra Pradesh 9.72 per cent *****General Category States 13.90 per cent
B Financial Data Particulars
CAGR 2002-03 to 2010-11 2002-03 to 2011-12
*****General Category States
Andhra Pradesh Andhra Pradesh
(in per cent) a. of Revenue Receipts 16.86 17.04 16.87
b. of Own Tax Revenue 16.74 17.27 17.36
c. of Non Tax Revenue 12.84 14.90 14.24
d. of Total Expenditure 14.58 14.68 14.97
e. of Capital Expenditure 21.25 18.16 18.72
f. of Revenue Expenditure on Education 15.41 15.25 15.68
g. of Revenue Expenditure on Health 14.00 15.07 15.77
h. of Salary and Wages 13.43 14.01 13.82
i. of Pension 16.89 19.16 18.76
* Source of General data: BPL (Planning Commission and NSSO data, 61 Round), ** Infant Mortality rate (SRS Bulletin January 2011), Financial data is based on Finance Accounts of the State
Government, *** Life Expectancy at birth (Office of the Registrar General of India, Ministry of Home Affairs), Economic
Review 2010-11 **** Gini-coefficient (Unofficial estimates of Planning Commission and NSSO data, 61 Round 2004-05 MRP).
Gini-Coefficient is a measure of inequality of income among the population. Value rate is from zero to one, closer to zero inequality is less; closure to one inequality is higher
***** Excluding of three General Category State i.e. Delhi, Goa, Puducherry

Audit Report (State Finances) for the year ended 31 March 2012
����������
Appendix 1.2
Structure of Government accounts and layout of Finance Accounts (Refer paragraph 1.1, page 1)
Structure of Government Accounts The accounts of the State Government are kept in three parts (i) Consolidated Fund, (ii) Contingency Fund and (iii) Public Account.
Part I: Consolidated Fund: All revenues received by the State Government, all loans raised by issue of treasury bills, internal and external loans and all moneys received by the Government in repayment of loans shall form one consolidated fund entitled ‘The Consolidated Fund of State’ established under Article 266(1) of the Constitution of India.
Part II: Contingency Fund: The Contingency Fund of the State established under Article 267 (2) of the Constitution is in the nature of an imprest placed at the disposal of the Governor to enable him to make advances to meet urgent unforeseen expenditure, pending authorisation by Legislature. Approval of the Legislature for such expenditure and for withdrawal of an equivalent amount from the Consolidated Fund is subsequently obtained, whereupon the advances from the Contingency Fund are recouped to the Fund.
Part III: Public Account: Receipts and disbursements in respect of certain transactions such as small savings, provident funds, reserve funds, deposits, suspense, remittances etc., which do not form part of the Consolidated Fund, are kept in the Public Account set up under Article 266 (2) of the Constitution and are not subject to vote by the State Legislature.
Layout of Finance Accounts Statement
No. Layout
1 Statement of financial position – Cumulative figures of assets and liabilities of the Government, as they stand at the end of the year.
2 Statement of receipts and disbursements showing all receipts and disbursements of the Government in respect of Consolidated Fund, Contingency Fund and Public Account during the year.
3 Statement of receipts (Consolidated Fund) – comprises revenue and capital receipts and receipts from borrowings by the Government consisting of loans from the GOI, other institutions, market loans raised by the Government and recoveries on account of loans and advances made by the Government.
4 Statement of expenditure (Consolidated Fund) – gives expenditure by function and also summarises expenditure by nature activity.
5 Statement of progressive capital expenditure by function.
6 Statement of borrowings and other liabilities of Government.
7 Statement of loans given by the Government – loans and advances are summarized sector and loanee group wise.
8 Statement of grants-in-aid given by the State Government., organized by grantee institutions group wise.
9 Statement of guarantees given by the Government for repayment of loans etc raised by the statutory corporations, local bodies and other institutions.
10 Statement of Voted and Charged expenditure of the Government during the year.
11 Detailed account of Revenue and Capital receipts by Minor Heads.
12 Detailed account of revenue expenditure by minor heads under non-plan, plan and centrally sponsored schemes separately.
13 Detailed capital expenditure incurred during and to the end of the year.
14 Details of investments of the State Government in statutory corporations, Government companies, other joint stock companies, cooperative banks and societies etc., up to the end of the year.
15 Detailed statement of borrowings and other liabilities by Minor Heads.
16 Detailed statement of loans and advances given by the Government.
17 Detailed statement on sources and application of funds for expenditure other than revenue account.
18 Detailed statement of Contingent Fund and Public Account transactions.
19 Detailed statement of investment out of reserve funds and earmarked funds.
Appendices In addition to the above 19 statements Finance Accounts also contain 13 appendices giving the details on salaries, subsidies, grants-in-aid – scheme-wise and institution –wise, details of externally aided projects, scheme-wise expenditure in respect of major Central Schemes and State Plan Schemes etc.

Appendices
����������
Appendix 1.3
Abstract of Receipts and Disbursements in 2011-12 (Refer paragraph 1.2; page 1)
(` in crore) Receipts Disbursements
2010-11 2011-12 2010-11 2011-12
Non-Plan
Plan Total
Section-A: Revenue 80996 I. Revenue
receipts 93554 78534 I. Revenue
expenditure 66751 23664 90415
45139 Tax revenue 53284 26708 General Services 29722 152 29874 32314 Social Services 21287 16730 3801710720 Non-tax
revenue 11694 12531 Education, Sports,
Art and Culture 11330 3604 14934
4134 Health and Family Welfare
3174 1852 5026
15237 State's share of Union Taxes
17751 3615 Water Supply, Sanitation, Housing and Urban Development
1021 2297 3318
4183 Non-Plan grants
3499 124 Information and Broadcasting
212 100 312
3318 Grants for State Plan Schemes
3957 4710 Welfare of Scheduled Castes, Scheduled Tribes and Other Backward Classes
1610 4146 5756
2399 Grants for Central and Centrally sponsored Plan Schemes
3369 190 Labour and Labour Welfare
156 108 264
6973 Social Welfare and Nutrition
3744 4623 8367
37 Others 40 40
19346 Economic Services 15527 6782 22309 2984 Agriculture and
allied Activities 1108 3081 4189
3639 Rural Development 2109 1571 3680
6529 Irrigation and Flood Control
6287 608 6895
3757 Energy 4400 16 4416
506 Industry and Minerals
144 326 470
1026 Transport 1190 449 1639
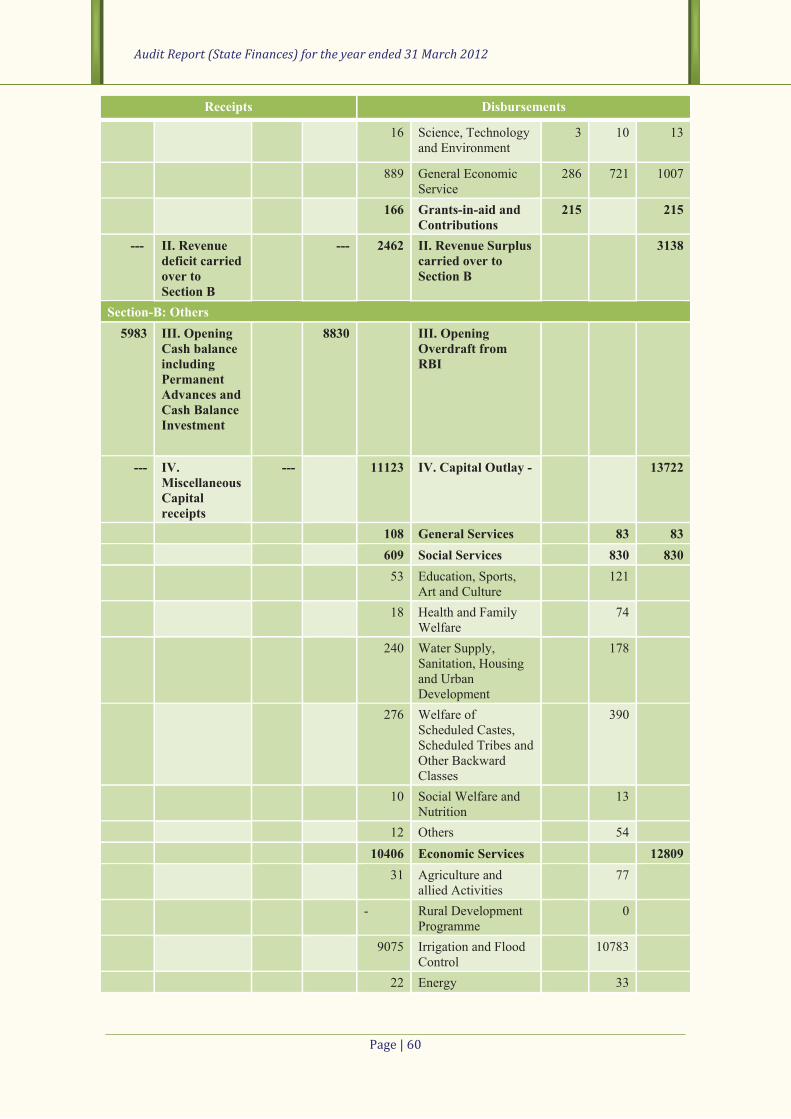
Audit Report (State Finances) for the year ended 31 March 2012
����������
Receipts Disbursements
16 Science, Technology and Environment
3 10 13
889 General Economic Service
286 721 1007
166 Grants-in-aid and Contributions
215 215
--- II. Revenue deficit carried over to Section B
--- 2462 II. Revenue Surplus carried over to Section B
3138
Section-B: Others 5983 III. Opening
Cash balance including Permanent Advances and Cash Balance Investment
8830 III. Opening Overdraft from RBI
--- IV. Miscellaneous Capital receipts
--- 11123 IV. Capital Outlay - 13722
108 General Services 83 83 609 Social Services 830 830 53 Education, Sports,
Art and Culture 121
18 Health and Family Welfare
74
240 Water Supply, Sanitation, Housing and Urban Development
178
276 Welfare of Scheduled Castes, Scheduled Tribes and Other Backward Classes
390
10 Social Welfare and Nutrition
13
12 Others 54 10406 Economic Services 12809 31 Agriculture and
allied Activities 77
- Rural Development Programme
0
9075 Irrigation and Flood Control
10783
22 Energy 33

Appendices
����������
Receipts Disbursements
13 Industry and Minerals
8
1058 Transport 1206
207 General Economic Services
702
173 V. Recoveries of Loans and Advances
164 3315 V. Loans and Advances disbursed
4983
21 From Power Projects
35 494 For Power Projects 1475
89 From Government Servants
93 102 To Government Servants
220
63 From others 36 2719 To Others 3288
2462 VI. Revenue surplus brought down
3138 VI. Revenue deficit brought down
18722 VII. Public Debt receipts
19450 7881 VII. Repayment of Public Debt
6761
16260 Internal Debt other than Ways and Means Advances and Overdraft
16731 6106 Internal debt other than Ways and Means Advances and Overdraft
5813
218 Net transactions of Ways and Means Advances including Overdraft
--- 218 Net transactions of Ways and Means Advances including Overdraft
2244 Loans and Advances from Central Government
2719
1557 Repayment of Loans and Advances to Central Government
948
--- VIII. Appropriation to Contingency Fund
--- - VIII. Appropriation to Contingency Fund
--- IX. Amount recouped to Contingency Fund
2 2 IX. Expenditure from Contingency Fund
76218 X. Public Account Receipt
86051 72407 X. Public Account disbursements
82848
3130 Small Savings and Provident Funds
3376 1527 Small Savings and Provident Funds
2156

Audit Report (State Finances) for the year ended 31 March 2012
����������
Receipts Disbursements
3017 Net Reserve Funds
2873 1221 Net Reserve Funds 1621
16433 Net Suspense and Miscellaneous
19315 16373 Net Suspense and Miscellaneous
20026
15030 Remittances 17524 16381 Remittances 17427
38608 Deposits and Advances
42963 36905 Deposits and Advances
41618
--- XI. Closing Overdraft from Reserve Bank of India
--- 8830 XI. Closing Cash Balance
9322
5 Cash in Treasuries and Local Remittances
5
-237 Deposits with Reserve Bank and other Banks
403
2 Departmental cash balance including permanent advances
2
9060 Cash balance investment and investment of earmarked funds
8912
184554 Total 211189 184554 Total 211189

Appendices
����������
Appendix 1.4
Actuals vis-à-vis Budget Estimates 2011-12 (Refer Paragraph 1.3; page 3)
(` in crore)
B.E. Actuals Increase(+)/ Decrease(-)
Increase(+)/Decrease(-)
(in %) (1) (2) (3) (4) (3-2) (5)
Revenue Receipts of which 100995 93554 -7441 -7.37Taxes on Sales, Trade etc 38306 34910 -3396 -8.87
State Excise 9014 9612 598 6.63
Taxes on immovable property other than agricultural lands
97 157 60 61.86
Taxes on vehicles 3434 2986 -448 -13.05
Stamps and Registration fees 4240 4385 145 3.42
Taxes on goods and Passengers 12 12 0 0.00
Land Revenue 146 141 -5 -3.42
Interest Receipts 7164 6279 -885 -12.35
Miscellaneous General Services 73 255 182 249.32
Non ferrous Mining and Metallurgical Industries
2994 2337 -657 -21.94
Revenue Expenditure 97170 90415 -6755 -6.95General Education 16281 14006 -2275 -13.97
Water Supply and Sanitation 728 393 -335 -46.02
Pension and Other Retirement Benefits 9693 11110 1417 14.62
Police 3671 3980 309 8.42
Welfare of Scheduled Castes, Scheduled Tribes and Other Backward Classes
5430 5756 326 6.00
Health and Family Welfare 5022 5025 3 0.06
Social Welfare and Nutrition 7655 8366 711 9.29
Roads and Bridges 1588 1506 -82 -5.16
Secretariat - Economic Services 614 666 52 8.47
Forestry and Wild Life 415 335 -80 -19.28
Rural Development 4099 3680 -419 -10.22
Urban Development 3341 2388 -953 -28.52
Irrigation and Flood Control 8517 6895 -1622 -19.04
District Administration 1218 812 -406 -33.33
Administration of Justice 722 597 -125 -17.31
Interest Payments 11437 10561 -876 -7.66
Power 4422 4407 -15 -0.34
Capital Receipts 0 0 0 0Capital Expenditure 17855 13722 -4133 -23.15Revenue Surplus(+)/Deficit(-) 3826 3138 -688 -17.98Fiscal deficit (-) -17602 -15402 -2200 -12.50Primary Surplus(+)/Deficit(-) -6164 -4841 -1323 -21.46
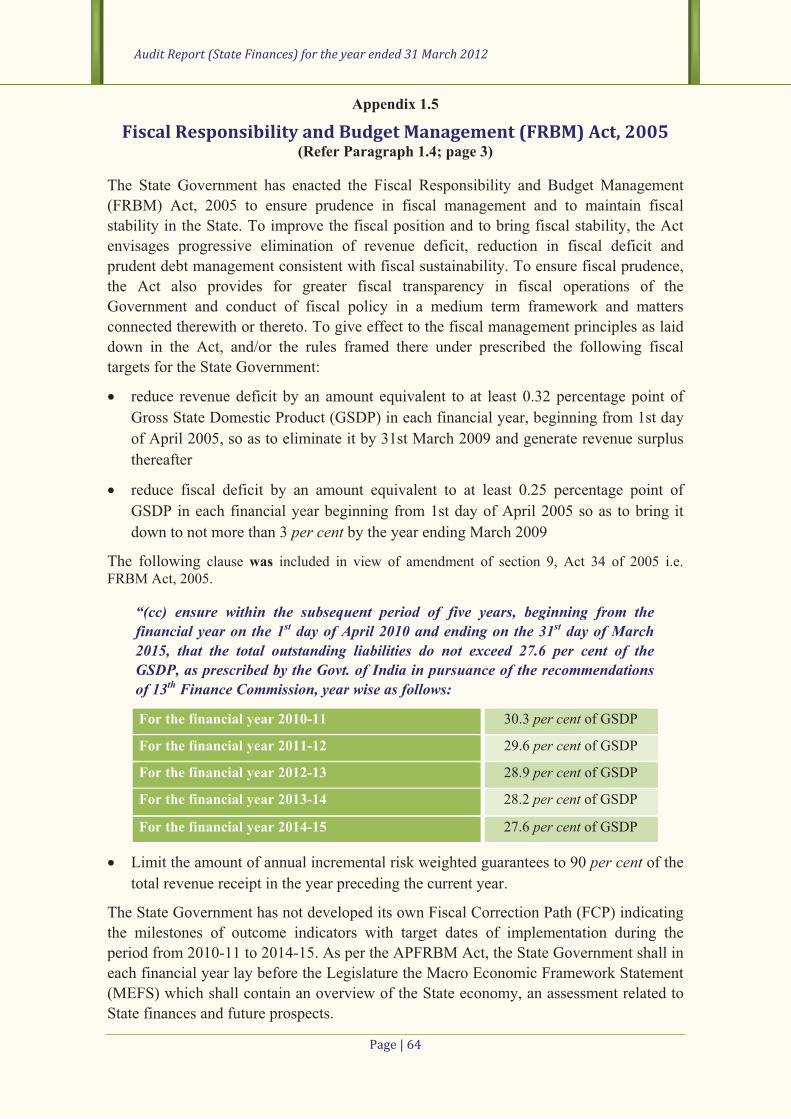
Audit Report (State Finances) for the year ended 31 March 2012
�������� �
Appendix 1.5
Fiscal Responsibility and Budget Management (FRBM) Act, 2005 (Refer Paragraph 1.4; page 3)
The State Government has enacted the Fiscal Responsibility and Budget Management
(FRBM) Act, 2005 to ensure prudence in fiscal management and to maintain fiscal
stability in the State. To improve the fiscal position and to bring fiscal stability, the Act
envisages progressive elimination of revenue deficit, reduction in fiscal deficit and
prudent debt management consistent with fiscal sustainability. To ensure fiscal prudence,
the Act also provides for greater fiscal transparency in fiscal operations of the
Government and conduct of fiscal policy in a medium term framework and matters
connected therewith or thereto. To give effect to the fiscal management principles as laid
down in the Act, and/or the rules framed there under prescribed the following fiscal
targets for the State Government:
� reduce revenue deficit by an amount equivalent to at least 0.32 percentage point of
Gross State Domestic Product (GSDP) in each financial year, beginning from 1st day
of April 2005, so as to eliminate it by 31st March 2009 and generate revenue surplus
thereafter
� reduce fiscal deficit by an amount equivalent to at least 0.25 percentage point of
GSDP in each financial year beginning from 1st day of April 2005 so as to bring it
down to not more than 3 per cent by the year ending March 2009
The following clause was included in view of amendment of section 9, Act 34 of 2005 i.e.
FRBM Act, 2005.
“(cc) ensure within the subsequent period of five years, beginning from the financial year on the 1st day of April 2010 and ending on the 31st day of March 2015, that the total outstanding liabilities do not exceed 27.6 per cent of the GSDP, as prescribed by the Govt. of India in pursuance of the recommendations of 13th Finance Commission, year wise as follows:
For the financial year 2010-11 30.3 per cent of GSDP
For the financial year 2011-12 29.6 per cent of GSDP
For the financial year 2012-13 28.9 per cent of GSDP
For the financial year 2013-14 28.2 per cent of GSDP
For the financial year 2014-15 27.6 per cent of GSDP
� Limit the amount of annual incremental risk weighted guarantees to 90 per cent of the
total revenue receipt in the year preceding the current year.
The State Government has not developed its own Fiscal Correction Path (FCP) indicating
the milestones of outcome indicators with target dates of implementation during the
period from 2010-11 to 2014-15. As per the APFRBM Act, the State Government shall in
each financial year lay before the Legislature the Macro Economic Framework Statement
(MEFS) which shall contain an overview of the State economy, an assessment related to
State finances and future prospects.

Appendices
����������
Appendix 1.6
Time Series Data on State Government Finances (Refer Paragraph 1.6 & 1.10.2; page 4 & 21)
(` in crore) 2007-08 2008-09 2009-10 2010-11 2011-12
Part A Receipts
1. Revenue Receipts 54143(89) 62858(99) 64678(100) 80996(100) 93554(100)
(i) Tax Revenue 28794(53) 33358(53) 35176(54) 45139(56) 53284(57)
Taxes on Sales, Trade, etc. 19026(66) 21852(66) 23640(67) 29145(65) 34910(66)
State Excise 4041(14) 5752(17) 5849(17) 8265(18) 9612(18)
Taxes on Vehicles 1604(6) 1801(5) 1995(6) 2626(6) 2987(6)
Stamps and Registration fees 3086(11) 2931(9) 2639(8) 3834(8) 4385(8)
Land Revenue 144 130 222(1) 171 141
Other Taxes 893(3) 892(3) 831(2) 1098(2) 1249(2)
(ii) Non Tax Revenue 7064(13) 9683(15) 7803(12) 10720(13) 11694(12)
(iii) State’s share in Union taxes and duties 11184(21) 11802(19) 12141(10) 15237(19) 17751(19)
(iv) Grants in aid from GOI 7101(13) 8015(13) 9558(15) 9900(12) 10825(12)
2. Misc. Capital Receipts 6558(11) --- --- --- ---
3. Recovery of loans and advances 191 370(1) 143(0) 173(0) 165(0)
4. Total revenue and Non-debt capital receipts (1+2+3)
60892(85) 63228(80) 64821(77) 81169(81) 93719(83)
5. Public Debt Receipts 11132(15) 15353(20) 19753(23) 18722(19) 19450(17)
Internal Debt (excluding Ways and Means Advances and Overdraft)
10223(92) 14956(97) 18185(92) 16260(87) 16731(86)
Net transactions under Ways and Means Advances and Overdraft
--- --- --- 218(1) ---
Loans and Advances from Government of India 909(8) 397(3) 1568(8) 2244(12) 2719(14)
6. Total Receipts in the Consolidated Fund (4+5)
72024(54) 78581(52) 84574(54) 99891(57) 113169(57)
7. Contingency Fund receipts --- 1 7(0) --- 2(0)
8. Public Account receipts 61380(46) 72503(48) 71780(46) 76218(42) 86051(43)
9. Total Receipts of Government (6+7+8) 133404 151085 156361 176109 199222
Part B. Expenditure/Disbursement
10. Revenue Expenditure 53984(77) 61854(82) 63448(80) 78534(84) 90415(83)
Plan 13901(26) 18993(31) 15442(24) 19701(25) 23664(26)
Non-plan 40083(72) 42861(69) 48006(76) 58833(75) 66751(74)
General Services (including interest payments) 18170(34) 18730(30) 21392(34) 26708(34) 29874(33)
Social Services 18660(35) 25004(40) 25757(41) 32314(41) 38017(42)
Economic Services 16904(31) 17807(29) 16213(25) 19346(25) 22309(25)
Grant in aid and contributions 249 313(1) 86(0) 166(0) 215(0)
11. Capital Expenditure 12774(18) 10367(14) 13793(17) 11123(12) 13722(13)
Plan 12866(100) 10611(102) 13955(101) 11120(100) 13687(100)
Non-plan (-)9 (-)244(-2) (-)162(-1) 3(0) 35(0)
General Services 36 59 92(1) 108(1) 83(1)
Social Services 284 324 639(4) 609(5) 830(6)
Economic Services 12454(98) 9984 13062(95) 10406(94) 12809(93)
12. Disbursement of Loans and Advances 2920(4) 3414 1590(2) 3315(4) 4983(6)
13. Total (10+11+12) 69678(93) 75635 78831(93) 92972 109120(94)
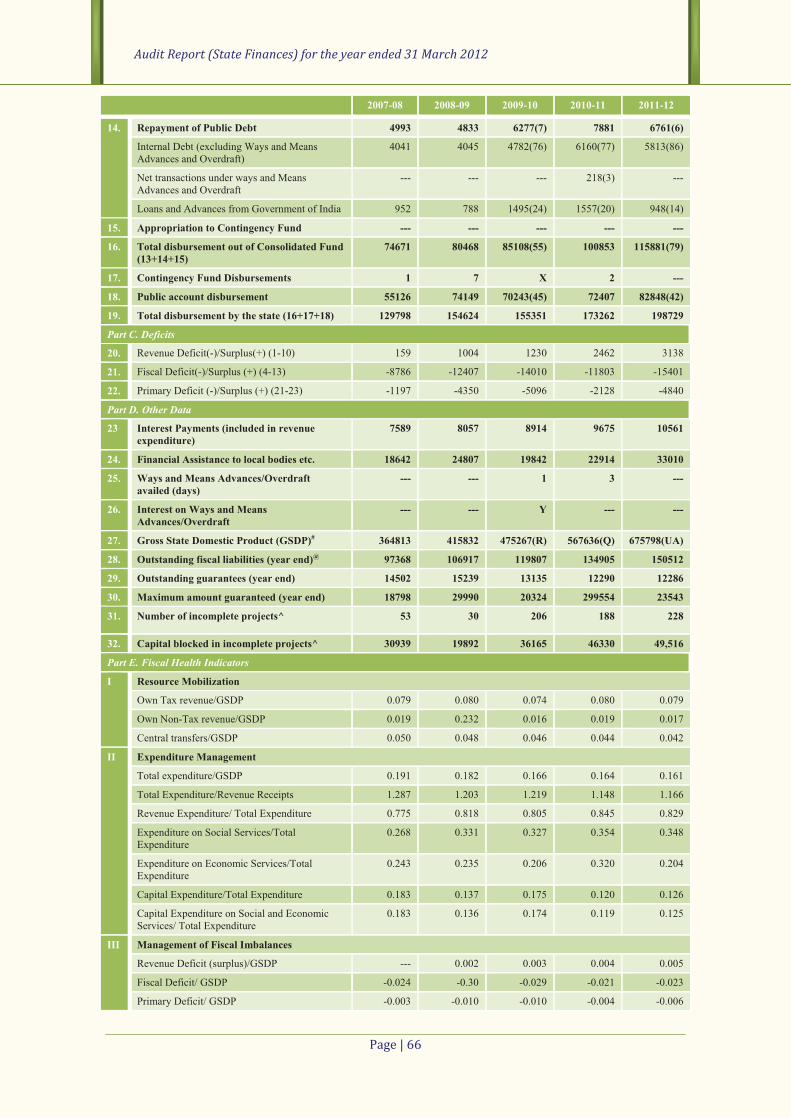
Audit Report (State Finances) for the year ended 31 March 2012
����������
2007-08 2008-09 2009-10 2010-11 2011-12
14. Repayment of Public Debt 4993 4833 6277(7) 7881 6761(6)
Internal Debt (excluding Ways and Means Advances and Overdraft)
4041 4045 4782(76) 6160(77) 5813(86)
Net transactions under ways and Means Advances and Overdraft
--- --- --- 218(3) ---
Loans and Advances from Government of India 952 788 1495(24) 1557(20) 948(14)
15. Appropriation to Contingency Fund --- --- --- --- ---
16. Total disbursement out of Consolidated Fund (13+14+15)
74671 80468 85108(55) 100853 115881(79)
17. Contingency Fund Disbursements 1 7 X 2 ---
18. Public account disbursement 55126 74149 70243(45) 72407 82848(42)
19. Total disbursement by the state (16+17+18) 129798 154624 155351 173262 198729
Part C. Deficits
20. Revenue Deficit(-)/Surplus(+) (1-10) 159 1004 1230 2462 3138
21. Fiscal Deficit(-)/Surplus (+) (4-13) -8786 -12407 -14010 -11803 -15401
22. Primary Deficit (-)/Surplus (+) (21-23) -1197 -4350 -5096 -2128 -4840
Part D. Other Data
23 Interest Payments (included in revenue expenditure)
7589 8057 8914 9675 10561
24. Financial Assistance to local bodies etc. 18642 24807 19842 22914 33010
25. Ways and Means Advances/Overdraft availed (days)
--- --- 1 3 ---
26. Interest on Ways and Means Advances/Overdraft
--- --- Y --- ---
27. Gross State Domestic Product (GSDP)# 364813 415832 475267(R) 567636(Q) 675798(UA)
28. Outstanding fiscal liabilities (year end)@ 97368 106917 119807 134905 150512
29. Outstanding guarantees (year end) 14502 15239 13135 12290 12286
30. Maximum amount guaranteed (year end) 18798 29990 20324 299554 23543
31. Number of incomplete projects^ 53 30 206 188 228
32. Capital blocked in incomplete projects^ 30939 19892 36165 46330 49,516
Part E. Fiscal Health Indicators
I Resource Mobilization
Own Tax revenue/GSDP 0.079 0.080 0.074 0.080 0.079
Own Non-Tax revenue/GSDP 0.019 0.232 0.016 0.019 0.017
Central transfers/GSDP 0.050 0.048 0.046 0.044 0.042
II Expenditure Management
Total expenditure/GSDP 0.191 0.182 0.166 0.164 0.161
Total Expenditure/Revenue Receipts 1.287 1.203 1.219 1.148 1.166
Revenue Expenditure/ Total Expenditure 0.775 0.818 0.805 0.845 0.829
Expenditure on Social Services/Total Expenditure
0.268 0.331 0.327 0.354 0.348
Expenditure on Economic Services/Total Expenditure
0.243 0.235 0.206 0.320 0.204
Capital Expenditure/Total Expenditure 0.183 0.137 0.175 0.120 0.126
Capital Expenditure on Social and Economic Services/ Total Expenditure
0.183 0.136 0.174 0.119 0.125
III Management of Fiscal Imbalances
Revenue Deficit (surplus)/GSDP --- 0.002 0.003 0.004 0.005
Fiscal Deficit/ GSDP -0.024 -0.30 -0.029 -0.021 -0.023
Primary Deficit/ GSDP -0.003 -0.010 -0.010 -0.004 -0.006

Appendices
����������
2007-08 2008-09 2009-10 2010-11 2011-12
Revenue deficit/Fiscal deficit -0.018 -0.081 -0.088 -0.208 -0.204
Primary revenue balance/ GSDP 0.040 0.023 0.022 0.022 0.021
IV Management Fiscal Liabilities
Fiscal liabilities/ GSDP 0.267 0.257 0.252 0.238 0.223
Fiscal liabilities/RR 1.798 1.701 1.852 1.666 1.609
Primary deficit vis-a-vis quantum spread 13796 10861 12800 18101 21608
Debt Redemption (Principal + Interest)/Total Debt Receipts
1.130 0.840 0.850 0.915 0.853
V Other Fiscal Health Indicators
Return on Investment 0.20 0.31 0.38 0.65 0.85
Balance from Current Revenue (` in crore) 8503 14625 10846 17048 20087
Financial Assets/Liabilities 0.83 0.86 0.92 0.94 0.97
Note: Figures in brackets represent percentages (rounded) to total of each sub-heading
X: ` 40.63 lakh; Y: ` 65,287
# The GSDP data for has been obtained from Directorate of Economics and Statistics, Govt. of Andhra Pradesh R: Revised, Q: Quick and UA: Updated Advanced Estimates
@ Nomenclature and its components were changed so as to show total liabilities of Government (i.e. Public debt and
other obligations) as per revised format of Chapter-I
^ The information is not exhaustive but is as furnished by the departmental authorities

Audit Report (State Finances) for the year ended 31 March 2012
����������
Appendix 1.7
Funds transferred directly to State implementing agencies (Refer paragraph 1.6.4; page 7)
(` in crore) Sl. No.
Name of the Scheme Implementing Agency Amount released during 2011-12
1 Sarva Siksha Abhiyan(SSA) RVMA 1,835
2 National rural Employment Guarantee Scheme APSREGS 1,478
3 Rural Housing-IAY DRDAs 892
4 National rural Health Mission (NRHM) SH&FWS, STBCS & SBCS 778
5 Pradhan Manthri Gram Sadak Yojaa (PMGSY) APSRRDA 607
6 National Rural Drinking Programme SWSM 463
7 Setting up of 6000 Model Schools at Block level as Benchmark of Excellence
AP Secondary Education Society 412
8 Rashtriya Madyamik Siksha Abhiyan RMSA(APSES) 328
9 Micro Irrigation APMIP 287
10 Integrated Watershed Management Programme (IWMP) State Level Nodal Agency 161
11 Economic Census District Collectors 154
12 National Aids Control Programme including STD control APSACS 110
13 Central Rural Sanitation Scheme SWSM 97
14 National Horticulture Mission APSHM 93
15 National Food Security Mission APSAM&ETI 89
16 Adult Education and Skill Development Scheme Director of Adult Edn., State Literacy Mission
65
17 AAJEEVIKA Society for Elimination of Rural Poverty
63
18 District Hospitals Medical Colleges @ Kurnool, Hyderabad and Vijayawada
38
19 Development and Strengthening of Infrastructure facilities for Production and Distribution of Quality Seeds
AP State Seeds Development Corporation Ltd
32
20 Panchayat Yuva Krida and Khel Abhiyan (PYKKA) AP Sports School 26
21 Swarna Jayanthi Shahari Rozgar Yojana (SJSRY) Commissioner and Director of Municipal Administration
24
22 Renewable Energy for Rural Applications for all villages NEDCAP 19
23 Crime and Criminal Tracking Network and System APS e-COPS 18
24 National Project of cattle and buffalo breeding APLSDA 17
25 Support to State Extension Programme for Extension Reforms
APSAM&ETI 17
26 National Afforestation Programme AP State Forest Development Agency 15
27 Provision for Urban Amenities in Rural Areas (PURA) DRDA, Warangal 14
28 Strengthening of Education among ST Girls in low literacy districts
Gurukulam (APTWREIS) 12
29 Live Stock Insurance AP Live Stock Development Agency 10
Total 8,154
Source: CPSMS (Central Plan Scheme Management System) of CGA Portal (cga.nic.in).
Data includes only items depicted in Finance Accounts 2011-12

Appendices
����������
Appendix 1.8
List of Incomplete Irrigation Projects (Refer paragraph 1.9.1; page 17)
(` in crore)
Sl. No.
Name of the Project Year of commence-
ment
Original cost
Revised cost
Expenditure to the end of March 2012
Cost over run
I. Major Irrigation
1 Vamsadhara Project Stage-II,
Phase-I
2002 123.94 209.00 132.74 0.00
2 Vamsadhara Project Stage-II,
Phase-II
2005 933.90 933.90 661.59 0.00
3 Thotapalli Barrage 2004 450.23 450.23 480.00 0.00
4 Gajapathi Nagaram 2010 76.99 76.99 0.00
5 Pushkaram LIS 2004 297.25 608.04 598.27 310.79
6 Tadipudi LIS 2004 296.80 526.14 438.24 229.34
7 Venkatanagaram LIS 2005 58.43 124.18 83.68 65.75
8 K.L.Rao Sagar-Pulichintala 2004 565.87 1281.00 946.27 343.18
9 Telugu Ganga 1983 637.00 8384.00 4122.38 7747.00
10 GNSS Phase-I (Pkg nos 1,2
FFC & Pkg 24 to 31
2005 1252.03 4690.45 3561.54 0.00
11 HNSS Phase-I 2005 1305.00 2774.00 2635.21 975.14
12 HNSS Phase-II 2005-06 1880.00 4076.00 3169.22 638.71
13 Gandikota LIS 2005 286.00 837.00 700.05 0.00
14 Gandikota Reservoir-CBR Lift
Schemes
2007 2059.00 2059.00 1356.27 0.00
15 Guru Raghavendra LIS 2005-06 129.01 129.01 154.71 0.00
16 SRBC (Gorakallu Br) Owk
reservoir &Pkg 36,37,38
2005 843.80 843.80 789.26 0.00
17 PABR Stage-II 2005 542.44 542.44 638.76 0.00
18 CBR Right Canal 2005 405.82 405.82 299.16 0.00
19 Mylavaram Modernisation 2006 151.01 151.01 141.45 0.00
20 Pulivendula Branch Canal 2005 141.43 297.43 192.12 156.00
21 Siidhapuram 2007 89.72 89.72 44.22 0.00
22 Kandula Obula Reddy
Gundlakamma Reservoir
2004 165.22 592.18 567.68 426.96
23 Sangam Barrage 2008 111.86 111.86 24.08 0.00
24 Nellore Barrage 2008 118.14 118.14 65.85 0.00
25 AMR SLBC Project-Lift
Scheme
1983 353.00 2166.98 1753.00 1168.00
26 Udayasamudram Lift Irrigation
Scheme
2008 699.00 699.00 0.00 0.00
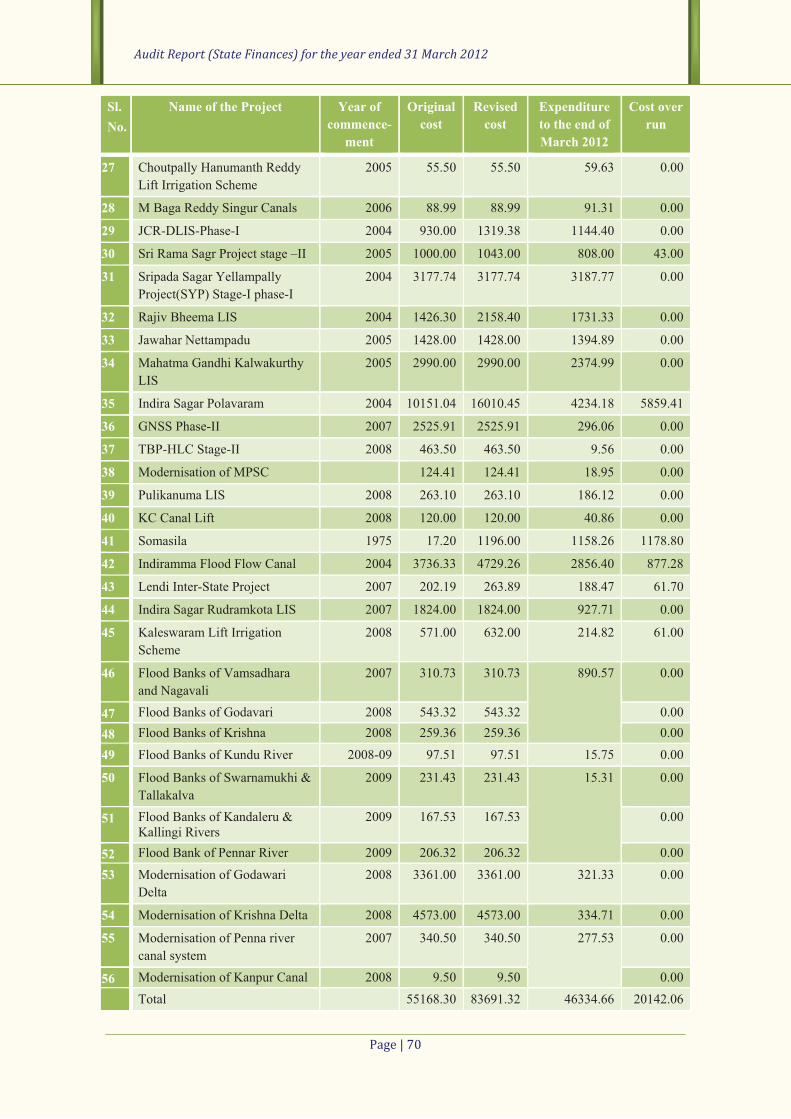
Audit Report (State Finances) for the year ended 31 March 2012
����������
Sl. No.
Name of the Project Year of commence-
ment
Original cost
Revised cost
Expenditure to the end of March 2012
Cost over run
27 Choutpally Hanumanth Reddy
Lift Irrigation Scheme
2005 55.50 55.50 59.63 0.00
28 M Baga Reddy Singur Canals 2006 88.99 88.99 91.31 0.00
29 JCR-DLIS-Phase-I 2004 930.00 1319.38 1144.40 0.00
30 Sri Rama Sagr Project stage –II 2005 1000.00 1043.00 808.00 43.00
31 Sripada Sagar Yellampally
Project(SYP) Stage-I phase-I
2004 3177.74 3177.74 3187.77 0.00
32 Rajiv Bheema LIS 2004 1426.30 2158.40 1731.33 0.00
33 Jawahar Nettampadu 2005 1428.00 1428.00 1394.89 0.00
34 Mahatma Gandhi Kalwakurthy
LIS
2005 2990.00 2990.00 2374.99 0.00
35 Indira Sagar Polavaram 2004 10151.04 16010.45 4234.18 5859.41
36 GNSS Phase-II 2007 2525.91 2525.91 296.06 0.00
37 TBP-HLC Stage-II 2008 463.50 463.50 9.56 0.00
38 Modernisation of MPSC 124.41 124.41 18.95 0.00
39 Pulikanuma LIS 2008 263.10 263.10 186.12 0.00
40 KC Canal Lift 2008 120.00 120.00 40.86 0.00
41 Somasila 1975 17.20 1196.00 1158.26 1178.80
42 Indiramma Flood Flow Canal 2004 3736.33 4729.26 2856.40 877.28
43 Lendi Inter-State Project 2007 202.19 263.89 188.47 61.70
44 Indira Sagar Rudramkota LIS 2007 1824.00 1824.00 927.71 0.00
45 Kaleswaram Lift Irrigation
Scheme
2008 571.00 632.00 214.82 61.00
46 Flood Banks of Vamsadhara
and Nagavali
2007 310.73 310.73 890.57 0.00
47 Flood Banks of Godavari 2008 543.32 543.32 0.00
48 Flood Banks of Krishna 2008 259.36 259.36 0.00
49 Flood Banks of Kundu River 2008-09 97.51 97.51 15.75 0.00
50 Flood Banks of Swarnamukhi &
Tallakalva
2009 231.43 231.43 15.31 0.00
51 Flood Banks of Kandaleru & Kallingi Rivers
2009 167.53 167.53 0.00
52 Flood Bank of Pennar River 2009 206.32 206.32 0.00
53 Modernisation of Godawari
Delta
2008 3361.00 3361.00 321.33 0.00
54 Modernisation of Krishna Delta 2008 4573.00 4573.00 334.71 0.00
55 Modernisation of Penna river
canal system
2007 340.50 340.50 277.53 0.00
56 Modernisation of Kanpur Canal 2008 9.50 9.50 0.00
Total 55168.30 83691.32 46334.66 20142.06
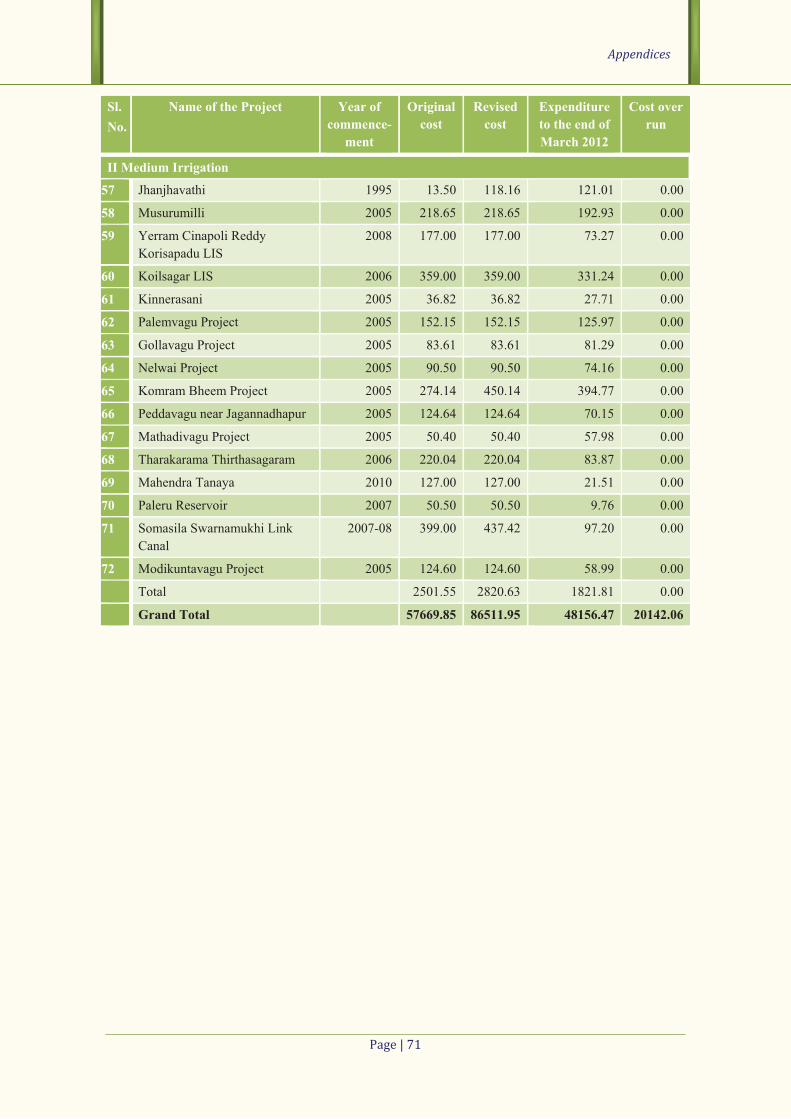
Appendices
����������
Sl. No.
Name of the Project Year of commence-
ment
Original cost
Revised cost
Expenditure to the end of March 2012
Cost over run
II Medium Irrigation
57 Jhanjhavathi 1995 13.50 118.16 121.01 0.00
58 Musurumilli 2005 218.65 218.65 192.93 0.00
59 Yerram Cinapoli Reddy
Korisapadu LIS
2008 177.00 177.00 73.27 0.00
60 Koilsagar LIS 2006 359.00 359.00 331.24 0.00
61 Kinnerasani 2005 36.82 36.82 27.71 0.00
62 Palemvagu Project 2005 152.15 152.15 125.97 0.00
63 Gollavagu Project 2005 83.61 83.61 81.29 0.00
64 Nelwai Project 2005 90.50 90.50 74.16 0.00
65 Komram Bheem Project 2005 274.14 450.14 394.77 0.00
66 Peddavagu near Jagannadhapur 2005 124.64 124.64 70.15 0.00
67 Mathadivagu Project 2005 50.40 50.40 57.98 0.00
68 Tharakarama Thirthasagaram 2006 220.04 220.04 83.87 0.00
69 Mahendra Tanaya 2010 127.00 127.00 21.51 0.00
70 Paleru Reservoir 2007 50.50 50.50 9.76 0.00
71 Somasila Swarnamukhi Link
Canal
2007-08 399.00 437.42 97.20 0.00
72 Modikuntavagu Project 2005 124.60 124.60 58.99 0.00
Total 2501.55 2820.63 1821.81 0.00
Grand Total 57669.85 86511.95 48156.47 20142.06

Audit Report (State Finances) for the year ended 31 March 2012
����������
Appendix 1.9
Summarised Financial position of the Government of Andhra Pradesh
as on 31 March 2012 (Refer Paragraph 1.10.1; page 20)
(` in crore)
As on 31 March 2011 Liabilities As on 31 March 2012
94919.92 Internal Debt 105837.71 61982.75 Market Loans bearing interest 75088.87 1.14 Market Loans not bearing interest 0.75 --- Market Loans Suspense --- 703.41 Loans from LIC 595.09 102.19 Loans from GIC 93.24 4621.42 Loans from NABARD 4859.9 64.5 Loans from other Institutions -1239.74 27444.51 Special sanction issued NSSF 26439.6 --- Ways and Means Advances --- Overdraft from Reserve Bank of India
15494.41 Loans and Advances from Central Government
17265.23
89.14 Pre 1984-85 Loans 8.73 15307.74 Non-Plan Loans 82 17.46 Loans for State Plan Schemes 17169.72 70.71 Loans for Central Plan Schemes 4.78 9.36 Loans for Centrally Sponsored Plan
Schemes ---
Other Ways and Means Advances --- 48.46 Contingency Fund 49.61
10035.23 Small Savings, Provident Funds, etc. 11255.5812579.35 Deposits 13927.116401.18 Reserve Funds 7652.81
572.65 Suspense and Miscellaneous Balances 270.19 Remittance Balances 367.16
140321.39 Total 156355.21As on 31March 2011 Assets As on 31 March 2012
102321.76 Gross Capital Outlay on Fixed Assets 116037.66 6046.03 Investments in shares of Companies,
Corporations, Cooperatives, etc. 6086.61
96275.73 Other Capital Outlay 109951.05 21010.76 Loans and Advances 25829.04
4100 Loans for Power Projects 5539.82 16687.47 Other Development Loans 19937.88 223.29 Loans to Government servants and
Miscellaneous loans 351.34
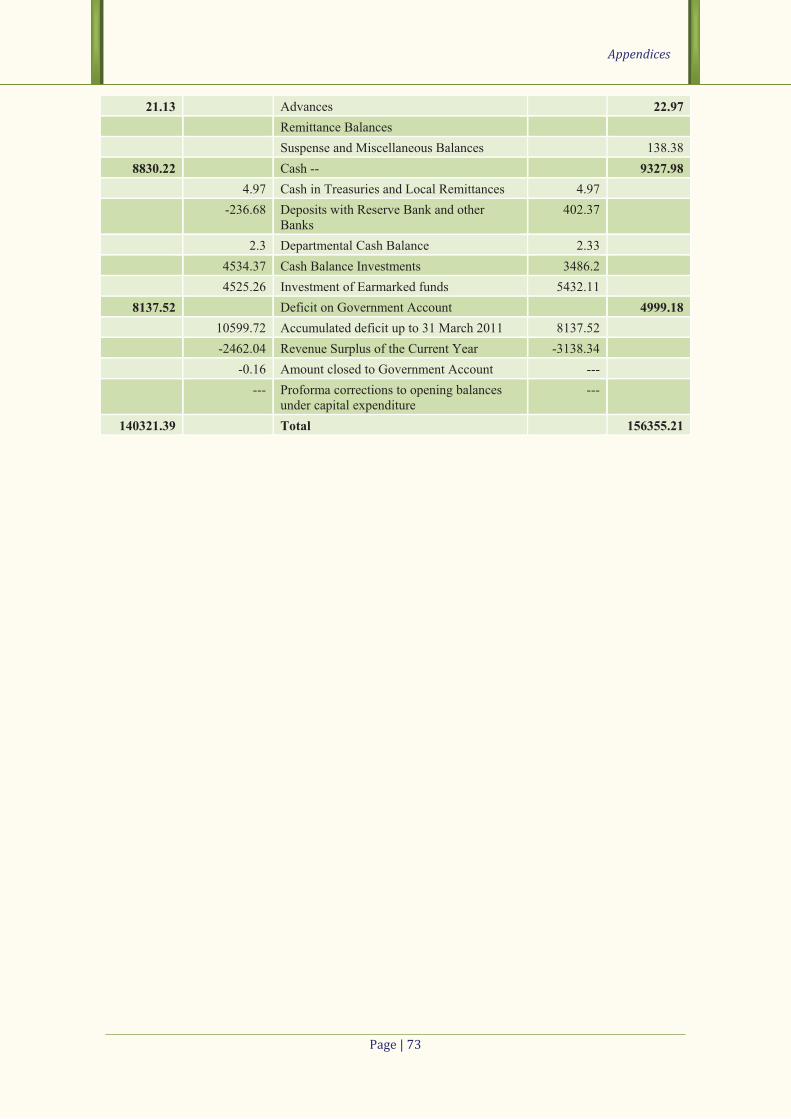
Appendices
����������
21.13 Advances 22.97 Remittance Balances Suspense and Miscellaneous Balances 138.38
8830.22 Cash -- 9327.98 4.97 Cash in Treasuries and Local Remittances 4.97 -236.68 Deposits with Reserve Bank and other
Banks 402.37
2.3 Departmental Cash Balance 2.33 4534.37 Cash Balance Investments 3486.2 4525.26 Investment of Earmarked funds 5432.11
8137.52 Deficit on Government Account 4999.18 10599.72 Accumulated deficit up to 31 March 2011 8137.52 -2462.04 Revenue Surplus of the Current Year -3138.34 -0.16 Amount closed to Government Account --- --- Proforma corrections to opening balances
under capital expenditure ---
140321.39 Total 156355.21
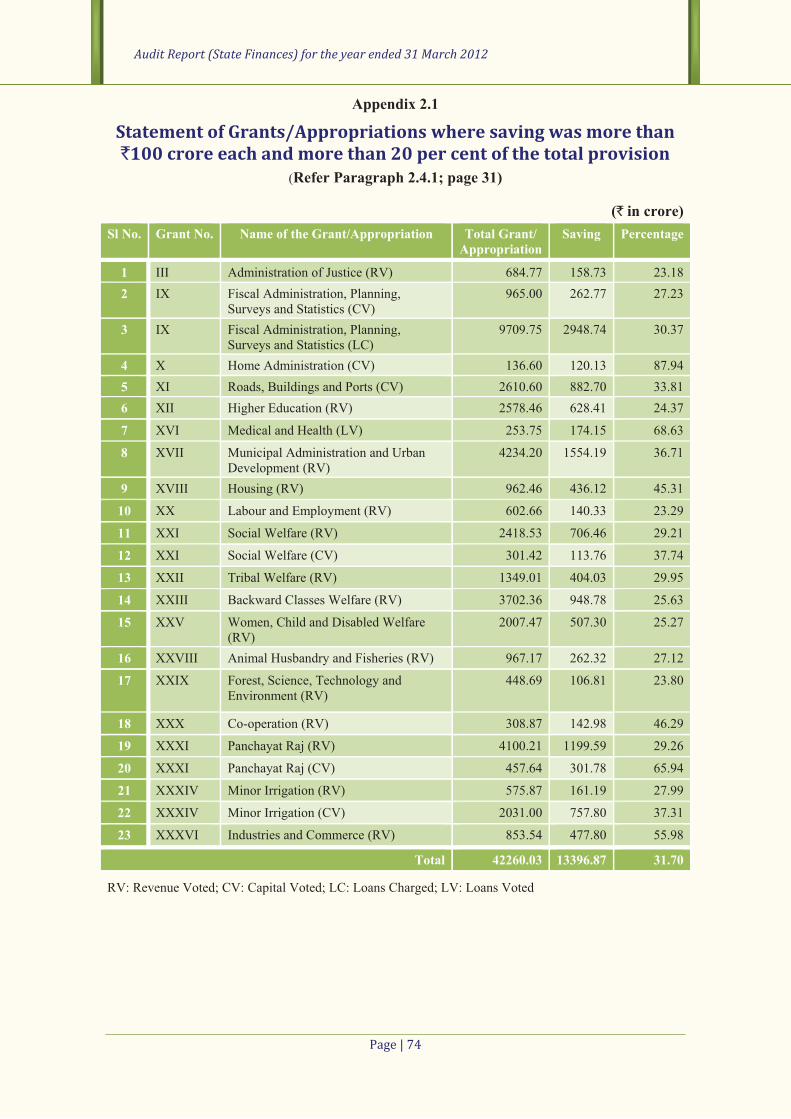
Audit Report (State Finances) for the year ended 31 March 2012
�������� �
Appendix 2.1
Statement of Grants/Appropriations where saving was more than `100 crore each and more than 20 per cent of the total provision
(Refer Paragraph 2.4.1; page 31)
(` in crore) Sl No. Grant No. Name of the Grant/Appropriation Total Grant/
AppropriationSaving Percentage
1 III Administration of Justice (RV) 684.77 158.73 23.18
2 IX Fiscal Administration, Planning, Surveys and Statistics (CV)
965.00 262.77 27.23
3 IX Fiscal Administration, Planning, Surveys and Statistics (LC)
9709.75 2948.74 30.37
4 X Home Administration (CV) 136.60 120.13 87.94
5 XI Roads, Buildings and Ports (CV) 2610.60 882.70 33.81
6 XII Higher Education (RV) 2578.46 628.41 24.37
7 XVI Medical and Health (LV) 253.75 174.15 68.63
8 XVII Municipal Administration and Urban Development (RV)
4234.20 1554.19 36.71
9 XVIII Housing (RV) 962.46 436.12 45.31
10 XX Labour and Employment (RV) 602.66 140.33 23.29
11 XXI Social Welfare (RV) 2418.53 706.46 29.21
12 XXI Social Welfare (CV) 301.42 113.76 37.74
13 XXII Tribal Welfare (RV) 1349.01 404.03 29.95
14 XXIII Backward Classes Welfare (RV) 3702.36 948.78 25.63
15 XXV Women, Child and Disabled Welfare (RV)
2007.47 507.30 25.27
16 XXVIII Animal Husbandry and Fisheries (RV) 967.17 262.32 27.12
17 XXIX Forest, Science, Technology and Environment (RV)
448.69 106.81 23.80
18 XXX Co-operation (RV) 308.87 142.98 46.29
19 XXXI Panchayat Raj (RV) 4100.21 1199.59 29.26
20 XXXI Panchayat Raj (CV) 457.64 301.78 65.94
21 XXXIV Minor Irrigation (RV) 575.87 161.19 27.99
22 XXXIV Minor Irrigation (CV) 2031.00 757.80 37.31
23 XXXVI Industries and Commerce (RV) 853.54 477.80 55.98
Total 42260.03 13396.87 31.70
RV: Revenue Voted; CV: Capital Voted; LC: Loans Charged; LV: Loans Voted

Appendices
����������
Appendix 2.2
Excess over provision of previous years requiring regularisation (Refer paragraph 2.4.5; page 35)
(` in crore) Year Number of grants/
appropriations Grant/appropriation
numbers Amount
of excess
Stage of consideration by Public Accounts Committee
(PAC)
2004-05 5 Grants Revenue : VIII, XIX & XL Capital: XVI Loans: XXXVI
14.83
Out of these 61 Grants and 18 Appropriations, Explanatory Notes for 18 Grants and 6 Appropriations were received and vetted by the PAG (GSSA) as of July 2012. Explanatory Notes for the remaining 43 Grants and 12 Appropriations are awaited from the Administrative Departments/Finance Department for vetting by the PAG (GSSA)
1 Appropriation Revenue : XXXVI
2005-06 10 Grants Revenue : X, XI, XIX & XXXI Capital : VIII, XIII, XVII, XXXII & XXXIII Loans : XVII
585.82
3 Appropriations Revenue : II, XVI & XXVIII
2006-07 7 Grants Revenue : IX, X, XI & XIV Capital : XVII & XXIX Loans : XXVII
198.72
1 Appropriation Revenue : III
2007-08 7 Grants Revenue : X, XI & XXXII Capital : XVII, XXXIII & XXXV Loans : XXXVI
201.30
3 Appropriations Revenue : II, IV & XIV
2008-09 11 Grants Revenue : II,V, XI, XXIV, XXVI & XXXI Capital : XVII & XXXIX Loans : XIX, XXVII & XXXVI
709.24
3 Appropriations Revenue : II, III & XIII
2009-10 10 Grants Revenue : III, XIX Capital : IV, VII, X, XVII & XXIX Loans : XI, XVI & XVII
109.74
2 Appropriations Revenue : VII & XIII
2010-11 11 Grants Revenue : X, XXIV Capital : X, XVII, XXVII & XXXVI Loans : XI, XV, XVI, XVII & XXXV
867.54
5 Appropriations Revenue : IV, V, X & XVII Capital : XI
Total 2,687.19
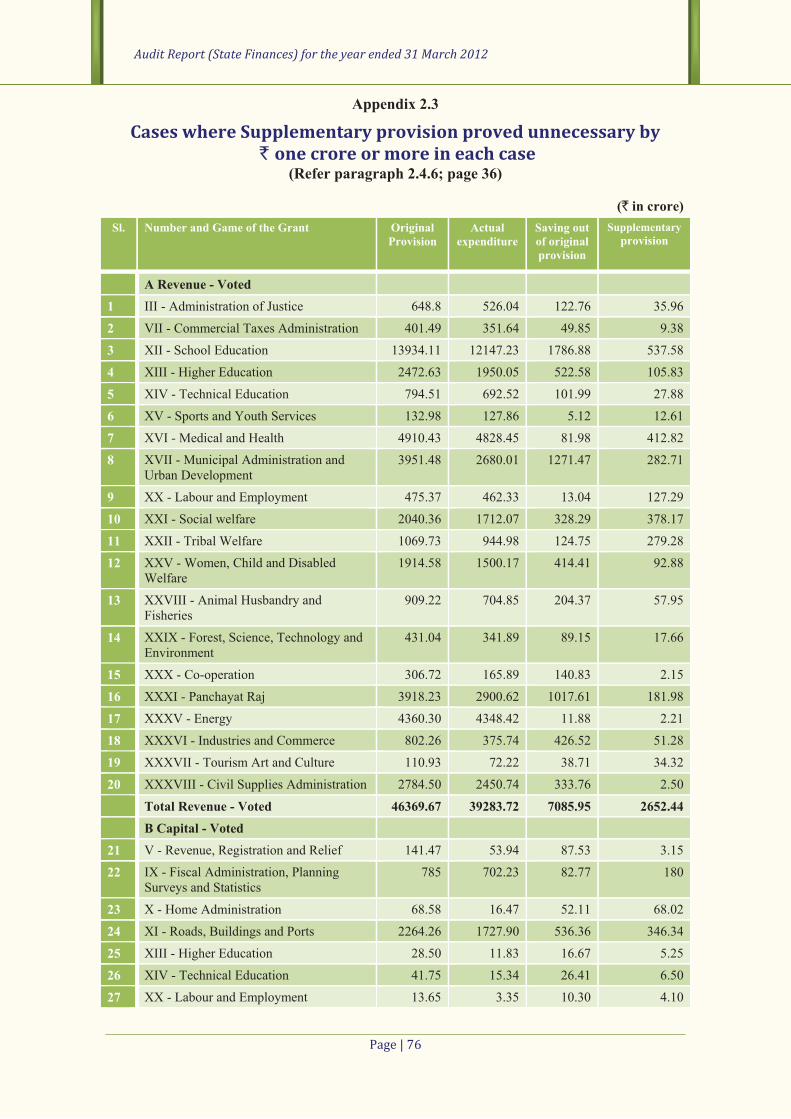
Audit Report (State Finances) for the year ended 31 March 2012
����������
Appendix 2.3
Cases where Supplementary provision proved unnecessary by ` one crore or more in each case
(Refer paragraph 2.4.6; page 36)
(` in crore) Sl.
Number and Game of the Grant Original
Provision Actual
expenditure Saving out of original provision
Supplementary provision
A Revenue - Voted 1 III - Administration of Justice 648.8 526.04 122.76 35.96
2 VII - Commercial Taxes Administration 401.49 351.64 49.85 9.38
3 XII - School Education 13934.11 12147.23 1786.88 537.58
4 XIII - Higher Education 2472.63 1950.05 522.58 105.83
5 XIV - Technical Education 794.51 692.52 101.99 27.88
6 XV - Sports and Youth Services 132.98 127.86 5.12 12.61
7 XVI - Medical and Health 4910.43 4828.45 81.98 412.82
8 XVII - Municipal Administration and Urban Development
3951.48 2680.01 1271.47 282.71
9 XX - Labour and Employment 475.37 462.33 13.04 127.29
10 XXI - Social welfare 2040.36 1712.07 328.29 378.17
11 XXII - Tribal Welfare 1069.73 944.98 124.75 279.28
12 XXV - Women, Child and Disabled Welfare
1914.58 1500.17 414.41 92.88
13 XXVIII - Animal Husbandry and Fisheries
909.22 704.85 204.37 57.95
14 XXIX - Forest, Science, Technology and Environment
431.04 341.89 89.15 17.66
15 XXX - Co-operation 306.72 165.89 140.83 2.15
16 XXXI - Panchayat Raj 3918.23 2900.62 1017.61 181.98
17 XXXV - Energy 4360.30 4348.42 11.88 2.21
18 XXXVI - Industries and Commerce 802.26 375.74 426.52 51.28
19 XXXVII - Tourism Art and Culture 110.93 72.22 38.71 34.32
20 XXXVIII - Civil Supplies Administration 2784.50 2450.74 333.76 2.50
Total Revenue - Voted 46369.67 39283.72 7085.95 2652.44 B Capital - Voted
21 V - Revenue, Registration and Relief 141.47 53.94 87.53 3.15
22 IX - Fiscal Administration, Planning Surveys and Statistics
785 702.23 82.77 180
23 X - Home Administration 68.58 16.47 52.11 68.02
24 XI - Roads, Buildings and Ports 2264.26 1727.90 536.36 346.34
25 XIII - Higher Education 28.50 11.83 16.67 5.25
26 XIV - Technical Education 41.75 15.34 26.41 6.50
27 XX - Labour and Employment 13.65 3.35 10.30 4.10
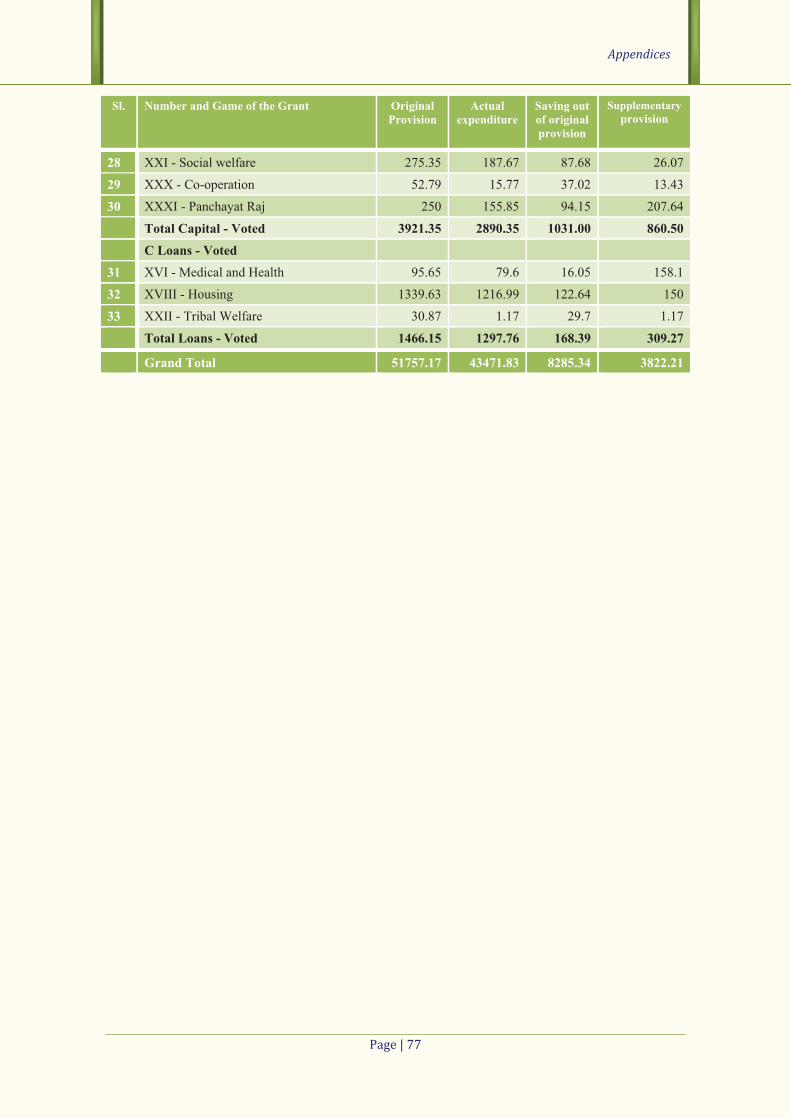
Appendices
����������
Sl.
Number and Game of the Grant Original Provision
Actual expenditure
Saving out of original provision
Supplementary provision
28 XXI - Social welfare 275.35 187.67 87.68 26.07
29 XXX - Co-operation 52.79 15.77 37.02 13.43
30 XXXI - Panchayat Raj 250 155.85 94.15 207.64
Total Capital - Voted 3921.35 2890.35 1031.00 860.50 C Loans - Voted
31 XVI - Medical and Health 95.65 79.6 16.05 158.1
32 XVIII - Housing 1339.63 1216.99 122.64 150
33 XXII - Tribal Welfare 30.87 1.17 29.7 1.17
Total Loans - Voted 1466.15 1297.76 168.39 309.27
Grand Total 51757.17 43471.83 8285.34 3822.21

Audit Report (State Finances) for the year ended 31 March 2012
����������
Appendix 2.4
Unnecessary re-appropriation of funds (more than ` 10 crore in each case)
(Refer paragraph 2.4.7; page 36)
(` in crore) Sl. No.
Grant No.
Description Head of Account Re-appropria-
tion
Final Excess (+)/Saving(-)
1 III Administration of Justice 2014-00-105-(04) -32.50 -37.30
2 IV General Administration and Elections 2015-00-103-(04) -0.57 -24.63
3 IV General Administration and Elections 2015-00-104-(04) -0.10 -10.25
4 V Revenue, Registration and Relief 2053-00-093-(03) -8.35 -13.53
5 V Revenue, Registration and Relief 2053-00-094-(06) -0.04 -254.76
6 V Revenue, Registration and Relief 2053-00-094-(12) -11.67 -119.50
7 IX Fiscal Administration, Planning, Surveys and Statistics
2054-00-098-(03) -0.34 -11.23
8 X Home Administration 4055-00-800-(05) -0.17 -18.14
9 XI Roads, Buildings and Ports 5054-04-800-(37) -1.85 -10.26
10 XI Roads, Buildings and Ports 5054-80-001-(04) -103.82 -33.93
11 XVI Medical and Health 2211-00-789-(09) -39.88 -12.70
12 XVI Medical and Health 6210-01-190-(04) -22.00 -124.00
13 XVII Municipal Administration and Urban Development
2217-80-191-(73) -598.17 -115.80
14 XVII Municipal Administration and Urban Development
2217-80-789-(73) -125.52 -0.24
15 XVIII Housing 6216-03-190-(04) -122.64 -150.00
16 XIX Information and Public Relations 2220-60-101-(13) -0.03 -50.14
17 XIX Information and Public Relations 2220-60-101-(14) -0.65 -35.96
18 XXI Social Welfare 2225-01-277-(05) -218.30 -150.25
19 XXII Tribal Welfare 2225-02-102-(04) -47.15 -10.61
20 XXIII Backward Classes Welfare 2225-03-277-(07) -32.05 -50.71
21 XXIII Backward Classes Welfare 2225-03-277-(08) -288.63 -159.44
22 XXIII Backward Classes Welfare 2225-03-277-(24) -166.85 -50.00
23 XXIII Backward Classes Welfare 4225-03-277-(74) -11.64 -12.34
24 XXXI Panchayat Raj 2515-00-196-(06) -41.20 -12.28
25 XXXI Panchayat Raj 4215-01-102-(29) -157.59 -72.99
26 XXXI Panchayat Raj 4215-01-789-(29) -32.88 -21.87
27 XXXIII Major Irrigation 2700-01-113 -0.13 -17.19
28 XXXIII Major Irrigation 2700-01-116 -0.10 -405.68
29 XXXIII Major Irrigation 2700-80-001-(02) -2.02 -19.98
30 XXXIII Major Irrigation 2700-01-800-(14) -8.46 -26.88
31 XXXIII Major Irrigation 2700-01-800-(19) -27.78 -60.78
32 XXXIII Major Irrigation 2701-03-109 -0.01 -30.31
33 XXXIII Major Irrigation 2701-03-174 -0.01 -10.69
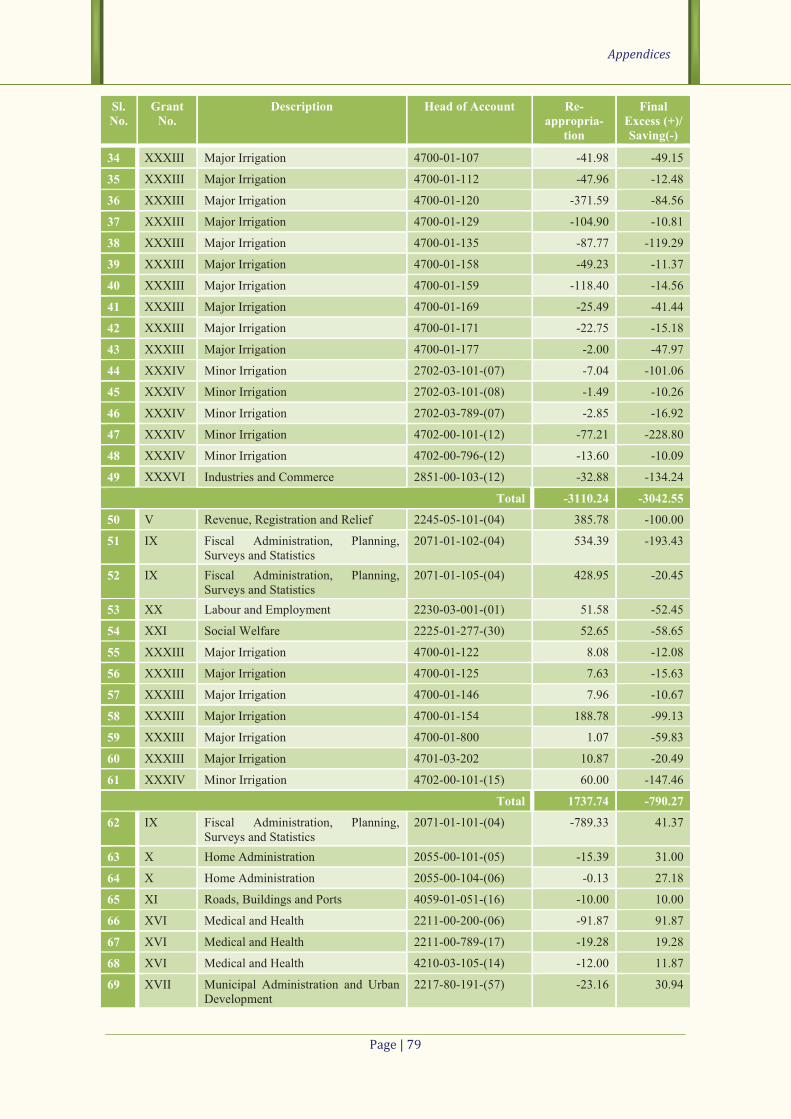
Appendices
����������
Sl. No.
Grant No.
Description Head of Account Re-appropria-
tion
Final Excess (+)/Saving(-)
34 XXXIII Major Irrigation 4700-01-107 -41.98 -49.15
35 XXXIII Major Irrigation 4700-01-112 -47.96 -12.48
36 XXXIII Major Irrigation 4700-01-120 -371.59 -84.56
37 XXXIII Major Irrigation 4700-01-129 -104.90 -10.81
38 XXXIII Major Irrigation 4700-01-135 -87.77 -119.29
39 XXXIII Major Irrigation 4700-01-158 -49.23 -11.37
40 XXXIII Major Irrigation 4700-01-159 -118.40 -14.56
41 XXXIII Major Irrigation 4700-01-169 -25.49 -41.44
42 XXXIII Major Irrigation 4700-01-171 -22.75 -15.18
43 XXXIII Major Irrigation 4700-01-177 -2.00 -47.97
44 XXXIV Minor Irrigation 2702-03-101-(07) -7.04 -101.06
45 XXXIV Minor Irrigation 2702-03-101-(08) -1.49 -10.26
46 XXXIV Minor Irrigation 2702-03-789-(07) -2.85 -16.92
47 XXXIV Minor Irrigation 4702-00-101-(12) -77.21 -228.80
48 XXXIV Minor Irrigation 4702-00-796-(12) -13.60 -10.09
49 XXXVI Industries and Commerce 2851-00-103-(12) -32.88 -134.24
Total -3110.24 -3042.55
50 V Revenue, Registration and Relief 2245-05-101-(04) 385.78 -100.00
51 IX Fiscal Administration, Planning, Surveys and Statistics
2071-01-102-(04) 534.39 -193.43
52 IX Fiscal Administration, Planning, Surveys and Statistics
2071-01-105-(04) 428.95 -20.45
53 XX Labour and Employment 2230-03-001-(01) 51.58 -52.45
54 XXI Social Welfare 2225-01-277-(30) 52.65 -58.65
55 XXXIII Major Irrigation 4700-01-122 8.08 -12.08
56 XXXIII Major Irrigation 4700-01-125 7.63 -15.63
57 XXXIII Major Irrigation 4700-01-146 7.96 -10.67
58 XXXIII Major Irrigation 4700-01-154 188.78 -99.13
59 XXXIII Major Irrigation 4700-01-800 1.07 -59.83
60 XXXIII Major Irrigation 4701-03-202 10.87 -20.49
61 XXXIV Minor Irrigation 4702-00-101-(15) 60.00 -147.46
Total 1737.74 -790.27
62 IX Fiscal Administration, Planning, Surveys and Statistics
2071-01-101-(04) -789.33 41.37
63 X Home Administration 2055-00-101-(05) -15.39 31.00
64 X Home Administration 2055-00-104-(06) -0.13 27.18
65 XI Roads, Buildings and Ports 4059-01-051-(16) -10.00 10.00
66 XVI Medical and Health 2211-00-200-(06) -91.87 91.87
67 XVI Medical and Health 2211-00-789-(17) -19.28 19.28
68 XVI Medical and Health 4210-03-105-(14) -12.00 11.87
69 XVII Municipal Administration and Urban Development
2217-80-191-(57) -23.16 30.94
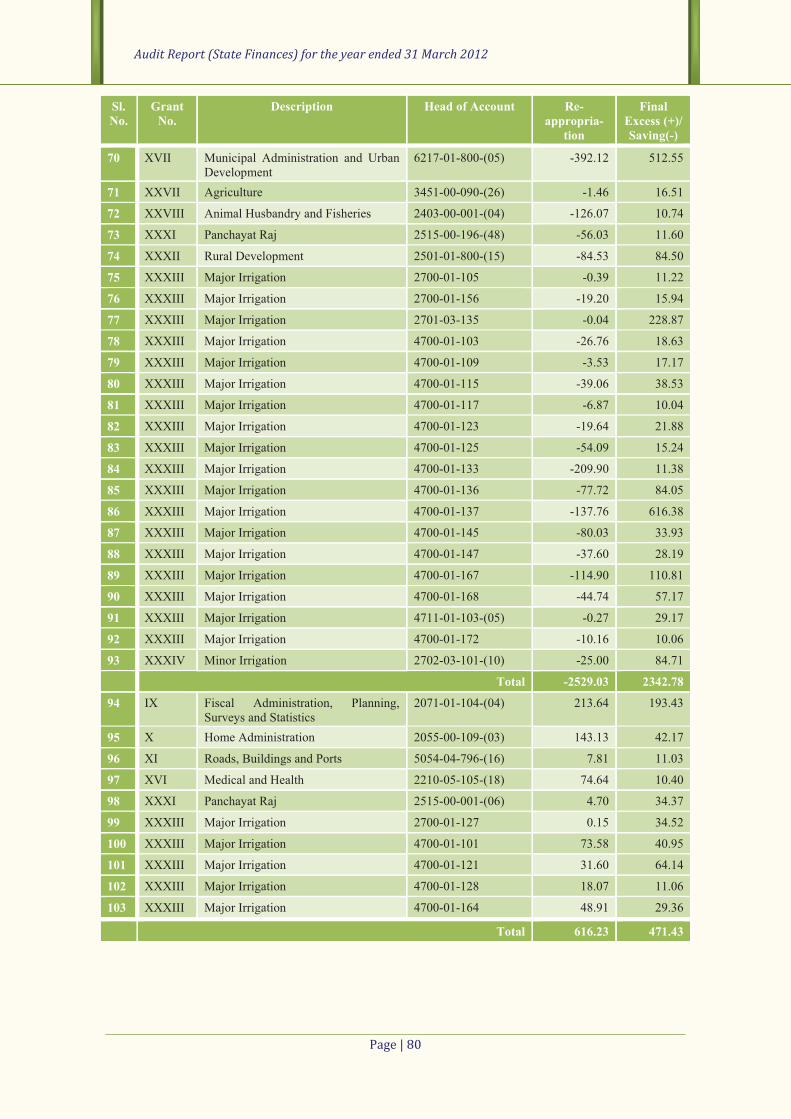
Audit Report (State Finances) for the year ended 31 March 2012
����������
Sl. No.
Grant No.
Description Head of Account Re-appropria-
tion
Final Excess (+)/Saving(-)
70 XVII Municipal Administration and Urban Development
6217-01-800-(05) -392.12 512.55
71 XXVII Agriculture 3451-00-090-(26) -1.46 16.51
72 XXVIII Animal Husbandry and Fisheries 2403-00-001-(04) -126.07 10.74
73 XXXI Panchayat Raj 2515-00-196-(48) -56.03 11.60
74 XXXII Rural Development 2501-01-800-(15) -84.53 84.50
75 XXXIII Major Irrigation 2700-01-105 -0.39 11.22
76 XXXIII Major Irrigation 2700-01-156 -19.20 15.94
77 XXXIII Major Irrigation 2701-03-135 -0.04 228.87
78 XXXIII Major Irrigation 4700-01-103 -26.76 18.63
79 XXXIII Major Irrigation 4700-01-109 -3.53 17.17
80 XXXIII Major Irrigation 4700-01-115 -39.06 38.53
81 XXXIII Major Irrigation 4700-01-117 -6.87 10.04
82 XXXIII Major Irrigation 4700-01-123 -19.64 21.88
83 XXXIII Major Irrigation 4700-01-125 -54.09 15.24
84 XXXIII Major Irrigation 4700-01-133 -209.90 11.38
85 XXXIII Major Irrigation 4700-01-136 -77.72 84.05
86 XXXIII Major Irrigation 4700-01-137 -137.76 616.38
87 XXXIII Major Irrigation 4700-01-145 -80.03 33.93
88 XXXIII Major Irrigation 4700-01-147 -37.60 28.19
89 XXXIII Major Irrigation 4700-01-167 -114.90 110.81
90 XXXIII Major Irrigation 4700-01-168 -44.74 57.17
91 XXXIII Major Irrigation 4711-01-103-(05) -0.27 29.17
92 XXXIII Major Irrigation 4700-01-172 -10.16 10.06
93 XXXIV Minor Irrigation 2702-03-101-(10) -25.00 84.71
Total -2529.03 2342.78
94 IX Fiscal Administration, Planning, Surveys and Statistics
2071-01-104-(04) 213.64 193.43
95 X Home Administration 2055-00-109-(03) 143.13 42.17
96 XI Roads, Buildings and Ports 5054-04-796-(16) 7.81 11.03
97 XVI Medical and Health 2210-05-105-(18) 74.64 10.40
98 XXXI Panchayat Raj 2515-00-001-(06) 4.70 34.37
99 XXXIII Major Irrigation 2700-01-127 0.15 34.52
100 XXXIII Major Irrigation 4700-01-101 73.58 40.95
101 XXXIII Major Irrigation 4700-01-121 31.60 64.14
102 XXXIII Major Irrigation 4700-01-128 18.07 11.06
103 XXXIII Major Irrigation 4700-01-164 48.91 29.36
Total 616.23 471.43

Appendices
����������
Appendix 2.5
Substantial surrenders made during the year (Refer paragraph 2.4.9; page 37)
(` in crore) Sl
No. Number and Title of grant Name of the scheme
(Head of Account) Budget
Provision Amount of surrender
Percentage to Budget provision
1 IX-Fiscal Administration, Planning, Surveys and Statistics
Ways and Means Advances from the Reserve Bank of India
MH 6003-00-110-(05)
3000.00 3000.00 100.00
Surrender of entire provision was stated to be due to non-utilisation of Ways & Means Advances from RBI during 2011-12
2 IX-Fiscal Administration, Planning, Surveys and Statistics
Lumpsum Provision MH 2052-00-090-(75)
700.00 700.00 100.00
Specific reasons for surrender of the entire provision were not intimated
3 XXXV-Energy Loans to APTRANSCO for Krishnapatnam Thermal Power Project MH 6801-00-205-(12)
250.80 250.80 100.00
Surrender of entire provision was stated to be due to payment of loans to APGENCO for Super Critical Thermal Power Station, Krishnapatnam
4 XXXIII-Major & Medium Irrigation
Assistance to Andhra Pradesh Water Resource Development Corporation for maintenance of Irrigation Projects
MH 2700-80-800-(21)
250.00 250.00 100.00
Surrender of entire provision was stated to be due to non-release of funds for Administrative reasons
5 XXXIII-Major & Medium Irrigation
Dummugudem Nagarjunasagar Tail Pond Project
MH 4700-01-170
200.00 200.00 100.00
Surrender of entire provision was stated to be due to postponement of works, slow progress of works, non-finalisation of LA awards, non-receipt of Administrative approvals by Competent authorities and litigations involved in Land Acquisitions
6 XII-School Education Rashtriya Madhyamika Siksha Abhiyan MH 2202-02-109-(07)
194.09 185.68 95.67
Reasons for surrender of provision was stated to be due to non-receipt of funds from GOI

Audit Report (State Finances) for the year ended 31 March 2012
����������
Sl No.
Number and Title of grant Name of the scheme (Head of Account)
Budget Provision
Amount of surrender
Percentage to Budget provision
7 XII-School Education Teaching grants to Municipalities MH 2202-01-103-(04)
179.58 165.96 92.42
Reasons for surrender of provision was stated to be due to non-filling up of vacant posts
8 XII-School Education Setting up of Model Schools (RMSA) MH 2202-02-109-08)
154.40 154.40 100.00
Surrender of entire provision was stated to be due to non-receipt of funds from GOI
9 XXI-Social Welfare Construction of Buildings for Integrated Hostels (HUDCO Loan) MH 4225-01-277-(33)
150.00 150.00 100.00
Surrender of entire provision was stated to be due to non-agreement for sanction of works under RIDF by NABARD
10 XIII-Higher Education Lumpsum Provision MH 2202-03-102-(75)
141.97 141.97 100.00
Specific reasons for surrender of the entire provision were not intimated
11 XII-School Education ICT in 4031 Schools MH 2202-02-800-(17)
139.02 139.02 100.00
Surrender of entire provision was stated to be due to non-receipt of funds from GOI
12 XXXV-Energy Loans to APTRANSCO for High Voltage Distribution System (HVDS) MH 6801-00-205-(07)
112.48 112.48 100.00
Surrender of entire provision was stated to be due to payment of loans to APGENCO for Super Critical Thermal Power Station, Krishnapatnam
13 XXXIII-Major & Medium Irrigation
Resettlement and Rehabilitation MH 4700-80-800-(49)
100.00 100.00 100.00
Surrender of entire provision was stated to be for making payments of R&R for Gundlakamma Reservoir Project, Polavaram Project, GNSS Project and Pulichintala Project, compensation under Musurumalli Project, R&R benefits to the PDFs for providing amentities to R&R colonies of priority villages under Musurumalli Project, R&R benefits to the Bhupathi Palem Reservoir Project and non-finalisation of compensation to be paid
Total 5572.34 5550.31 99.60

Appendices
����������
Appendix 2.6
Surrenders (` 50 lakh or more in each case) in excess of actual saving/excess
(Refer paragraph 2.4.11; page 38) (` in crore)
Sl. No.
Number and Name of the grant/appropriation
Total grant/ appropriation
Excess(+)/ Savings(-)
Amount surrendered
Amount surrendered in
excess
Revenue - Voted 1 I-State Legislature 94.91 (-)11.89 14.86 2.97
2 VI-Excise Administration 366.49 (-)99.2 99.84 0.64
3 X-Home Administration 4289.81 (+)54.73 43.34 43.34
4 XI-Roads, Buildings and Ports 1806.30 (-)53.54 142.51 88.97
5 XII-School Education 14471.69 (-)2324.46 2327.58 3.12
6 XIV-Technical Education 822.39 (-)129.87 130.54 0.67
7 XV-Sports and Youth Services 145.59 (-)17.73 18.84 1.11
8 XVI-Medical and Health 5323.24 (-)494.79 591.22 96.43
9 XXIV-Minority Welfare 334.17 (+)31.16 5.00 5.00
10 XXV-Women, Child and Disabled Welfare
2007.47 (-)507.30 513.23 5.93
11 XXVIII-Animal Husbandry and Fisheries
967.17 (-)262.32 281.42 19.10
12 XXIX-Forest, Science, Technology and Environment
448.69 (-)106.81 114.23 7.42
13 XXXVIII-Civil Supplies Administration
2787.00 (-)336.26 337.51 1.25
14 XXXIX-Information Technology and Communications
71.82 (-)14.10 14.95 0.85
Revenue - Charged 15 I-State Legislature 3.63 (-)1.97 2.85 0.88
16 IV-General Administration and Elections
36.84 (-)5.40 7.04 1.64
Capital Voted 17 IV-General Administration
and Elections 15.00 (-)10.51 11.13 0.62
18 XVI-Medical and Health 109.80 (-)35.63 39.42 3.79
19 XXII-Tribal Welfare 276.02 (-)78.94 79.45 0.51
20 XXXIII-Major and Medium Irrigation
11671.48 (-)2165.26 2686.32 521.06
Loans Voted 21 XVII-Municipal
Administration and Urban Development
1656.53 (-)230.37 742.92 512.55
Total 47706.04 (-) 6886.351 8204.20 1317.85
1 Excludes sr.No. 3 (` 54.73 crore) & 9 (` 31.16 crore) being final excess

Audit Report (State Finances) for the year ended 31 March 2012
�������� �
Appendix 2.7
Statement of various grants/appropriations in which saving occurred but no part of which was surrendered
(Refer paragraph 2.4.12; page 38)
(` in crore) Sl No. Grant No. Name of the grant/appropriation Saving
I-Grants 1 IX Fiscal Administration, Planning, Surveys and Statistics (CV) 262.77
2 XI Roads, Buildings and Ports (LV) 0.81
3 XXIV Minority Welfare (CV) 5.00
4 XXVI Administration of Religious Endowments (RV) 8.71
Total 277.29
II - Appropriations 5 III Administration of Justice (RC) 0.15
6 XI Roads, Buildings and Ports (CC) 1.71
7 XXXIV Minor Irrigation (CC) 10.53
8 XXXVI Industries and Commerce (RC) 0.04
Total 12.43
Grand Total 289.72
RV: Revenue Voted; RC: Revenue Charged; CV: Capital Voted; CC: Capital Charged; LV: Loans Voted
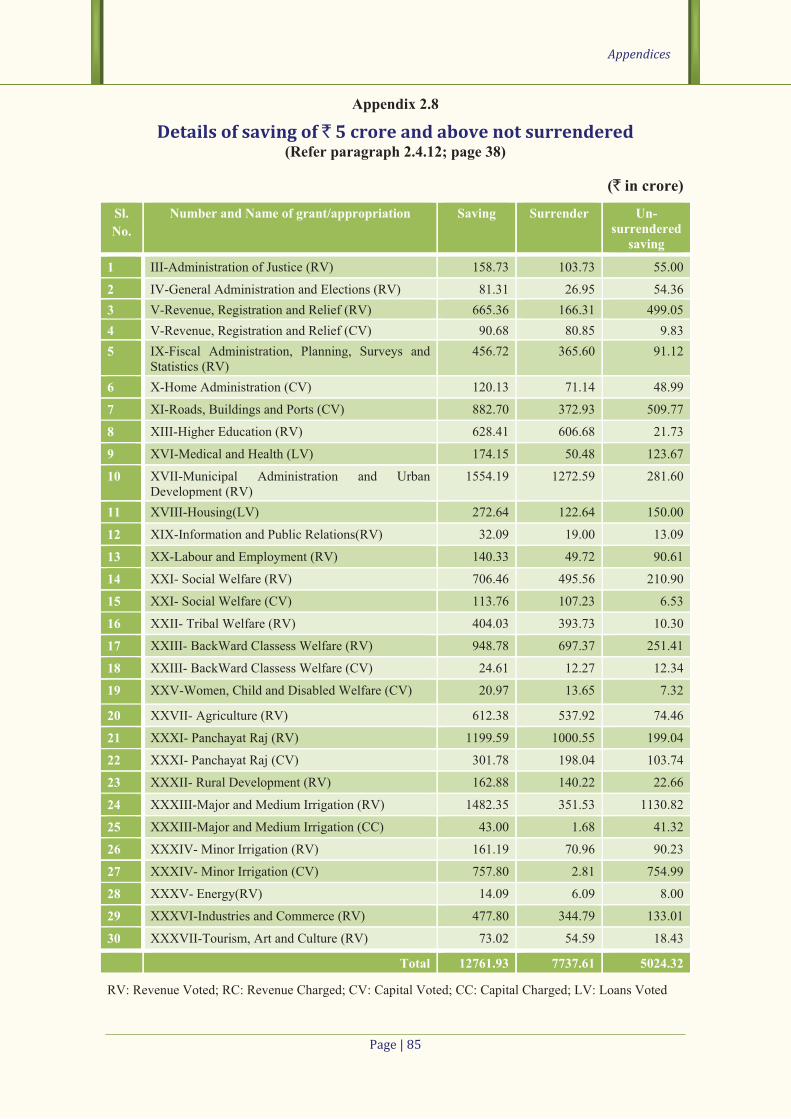
Appendices
����������
Appendix 2.8
Details of saving of ` 5 crore and above not surrendered (Refer paragraph 2.4.12; page 38)
(` in crore)
Sl. No.
Number and Name of grant/appropriation Saving Surrender Un-surrendered
saving
1 III-Administration of Justice (RV) 158.73 103.73 55.00
2 IV-General Administration and Elections (RV) 81.31 26.95 54.36
3 V-Revenue, Registration and Relief (RV) 665.36 166.31 499.05
4 V-Revenue, Registration and Relief (CV) 90.68 80.85 9.83
5 IX-Fiscal Administration, Planning, Surveys and Statistics (RV)
456.72 365.60 91.12
6 X-Home Administration (CV) 120.13 71.14 48.99
7 XI-Roads, Buildings and Ports (CV) 882.70 372.93 509.77
8 XIII-Higher Education (RV) 628.41 606.68 21.73
9 XVI-Medical and Health (LV) 174.15 50.48 123.67
10 XVII-Municipal Administration and Urban Development (RV)
1554.19 1272.59 281.60
11 XVIII-Housing(LV) 272.64 122.64 150.00
12 XIX-Information and Public Relations(RV) 32.09 19.00 13.09
13 XX-Labour and Employment (RV) 140.33 49.72 90.61
14 XXI- Social Welfare (RV) 706.46 495.56 210.90
15 XXI- Social Welfare (CV) 113.76 107.23 6.53
16 XXII- Tribal Welfare (RV) 404.03 393.73 10.30
17 XXIII- BackWard Classess Welfare (RV) 948.78 697.37 251.41
18 XXIII- BackWard Classess Welfare (CV) 24.61 12.27 12.34
19 XXV-Women, Child and Disabled Welfare (CV) 20.97 13.65 7.32
20 XXVII- Agriculture (RV) 612.38 537.92 74.46
21 XXXI- Panchayat Raj (RV) 1199.59 1000.55 199.04
22 XXXI- Panchayat Raj (CV) 301.78 198.04 103.74
23 XXXII- Rural Development (RV) 162.88 140.22 22.66
24 XXXIII-Major and Medium Irrigation (RV) 1482.35 351.53 1130.82
25 XXXIII-Major and Medium Irrigation (CC) 43.00 1.68 41.32
26 XXXIV- Minor Irrigation (RV) 161.19 70.96 90.23
27 XXXIV- Minor Irrigation (CV) 757.80 2.81 754.99
28 XXXV- Energy(RV) 14.09 6.09 8.00
29 XXXVI-Industries and Commerce (RV) 477.80 344.79 133.01
30 XXXVII-Tourism, Art and Culture (RV) 73.02 54.59 18.43
Total 12761.93 7737.61 5024.32
RV: Revenue Voted; RC: Revenue Charged; CV: Capital Voted; CC: Capital Charged; LV: Loans Voted

Audit Report (State Finances) for the year ended 31 March 2012
����������
Appendix 2.9
Cases of surrender of funds in excess of ` 10 crore on 30 and 31 March 2012 (Refer paragraph 2.4.12; page 38)
(` in crore) Sl
No. Grant No. Major Head Amount of
surrender
1 I 2011 State Legislature 14.86
2 III 2014 Administration of Justice 103.73
3 IV 2014 Administration of Justice 17.27
4 IV 4070 Capital outlay on other Administrative Services 11.13
5 V 2029 Land Revenue 81.56
6 V 2030 Stamps and Registration 46.56
7 V 2053District Administration 29.94
8 V 4250 Capital outlay on Other Social Services 80.62
9 VI 2039 State Excise 99.84
10 VII 2040 Taxes on Sales, Trade etc. 56.81
11 VIII 2041 Taxes on Vehicles 21.48
12 IX 2047 Other Fiscal Services 87.26
13 IX 2048 Appropriation for Reduction or Avoidance of Debt 11.88
14 IX 2049 Interest Payments (Charged) 875.70
15 IX 2052 Secretariat General Services 227.72
16 IX 2054 Treasury and Accounts Administration 38.74
17 IX 6003 Internal Debt of the State Government (Charged) 2948.74
18 X 2055 Police 30.15
19 X 4055 Capital outlay on Police 71.14
20 X 6216 Loans for Housing 15.21
21 XI 2059 Public Works 49.66
22 XI 3054 Roads and Bridges 90.09
23 XI 5054 Capital outlay on Roads and bridges 295.38
24 XI 4059 Capital outlay on Public Works 55.00
25 XI 4202 Capital outlay on Education, Sports, Art and Culture 22.54
26 XII 2202 General Education 1129.09
27 XII 2059 Public Works 1198.45
28 XII 4202 Capital outlay on Education ,Sports, Art and Culture 19.68
29 XIII 2059 Public Works 320.46
30 XIII 2202 General Education 284.95
31 XIII 4202 capital outlay on Education, Sports, Art and Culture 20.50
32 XIV 2203 Technical Education 126.04
33 XIV 4202 Capital outlay on Education, Sports, Art and Culture 32.91
34 XV 2204 Sports and Youth Services 18.84
35 XVI 2059 Public Works 415.28
36 XVI 2210 Medical and Public Health 175.94
37 XVI 4210 Capital out lay on Medical and Public Health 37.92
38 XVI 6210 Loans for Medical and Public Health 50.48
39 XVII 2215 Water supply and Sanitation 1272.59

Appendices
����������
Sl No.
Grant No. Major Head Amount of surrender
40 XVII 6215 Loans for Water supply and Sanitation 742.92
41 XVIII 2216 Housing 435.89
42 XVIII 6216 Loans for Housing 122.64
43 XIX 2220 Information and Publicity 19.00
44 XX 2059 Public Works 49.72
45 XX 4250 Capital outlay on Other Social Services 12.62
46 XXI 2059 Public Works 495.56
47 XXI 4225 Capital outlay on Welfare of Scheduled Castes. Scheduled Tribes and Other Backward Classes
107.23
48 XXII 2059 Public Works 393.73
49 XXII 4225 Capital outlay on Welfare of Scheduled Castes. Scheduled Tribes and Other Backward Classes
79.45
50 XXII 6225 Loans for Welfare of Scheduled Castes. Scheduled Tribes and Other Backward Classes
30.63
51 XXIII 2059 Public Works 697.37
52 XXIII 4225 Capital outlay on Welfare of Scheduled Castes. Scheduled Tribes and Other Backward Classes
12.27
53 XXV 2059 Public Works 513.23
54 XXV 4235 Capital outlay on Social Security and Welfare 13.65
55 XXVII 2059 Public Works 472.48
56 XXVII 2401 Crop Husbandry 59.38
57 XXVIII 2059 Public Works 193.65
58 XXVIII 2403 Animal Husbandry 67.77
59 XXVIII 4405 Capital outlay on Fisheries 11.75
60 XXIX 2059 Public Works 114.19
61 XXX 2425 Co-operation 142.36
62 XXX 4425 Capital outlay on Co-operation 50.00
63 XXXI 2215 Water supply and Sanitation 275.49
64 XXXI 2515 Other Rural Development Programmes 725.06
65 XXXI 4215 Capital outlay on Water Supply and Sanitation 198.04
66 XXXII 2235 Social Security and Welfare 136.67
67 XXXIII 2700 Major Irrigation 345.17
68 XXXIII 4700 Capital outlay on Major Irrigation 2615.36
69 XXXIII 4701 Capital outlay on Medium Irrigation 44.49
70 XXXIV 2702 Minor Irrigation 70.96
71 XXXVI 2059 Public Works 175.69
72 XXXVI 2851 Village and Small Industries 68.14
73 XXXVI 2852 Industries 97.41
74 XXXVI 4851 Capital outlay on Village and Small Industries 10.29
75 XXXVI 6851 Loans for Village and Small Industries 22.28
76 XXXVI 6860 Loans for Consumer Industries 16.90
77 XXXVII 2205 Art and Culture 54.59
78 XXXVIII 2236 Nutrition 327.10
79 XXXIX 3451 Secretariat Economic Services 14.95
Total 20522.22
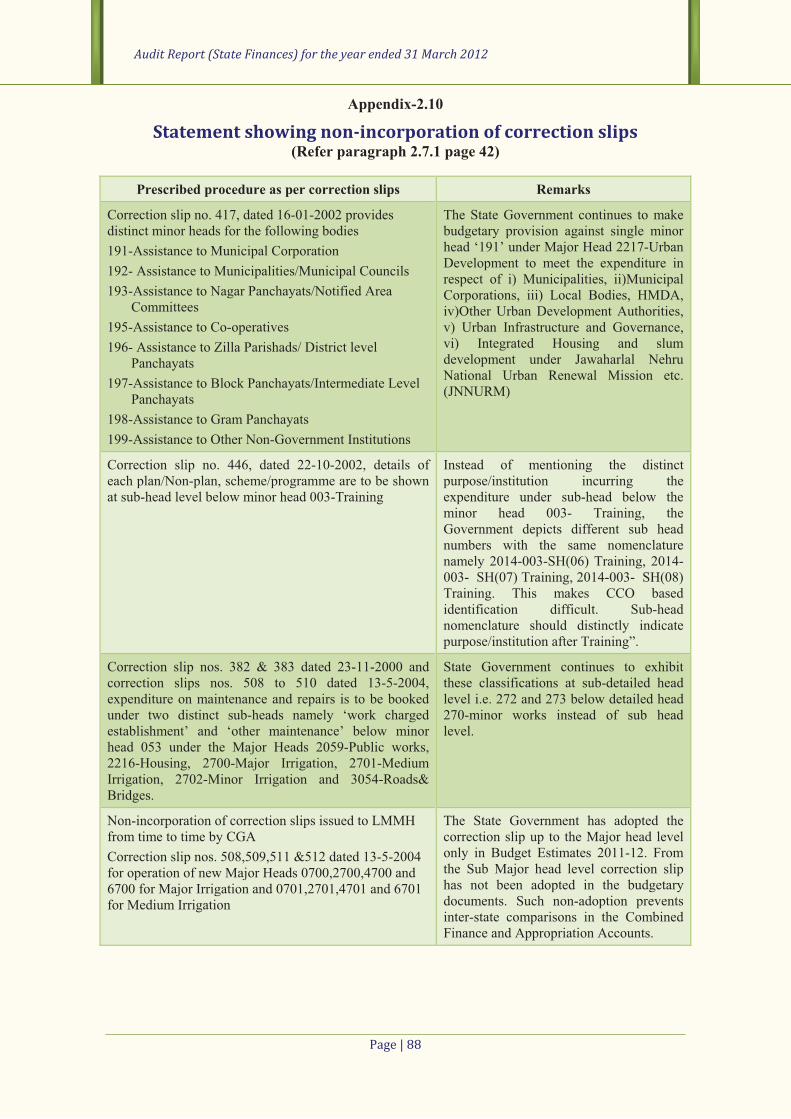
Audit Report (State Finances) for the year ended 31 March 2012
����������
Appendix-2.10
Statement showing non-incorporation of correction slips (Refer paragraph 2.7.1 page 42)
Prescribed procedure as per correction slips Remarks
Correction slip no. 417, dated 16-01-2002 provides distinct minor heads for the following bodies
191-Assistance to Municipal Corporation 192- Assistance to Municipalities/Municipal Councils
193-Assistance to Nagar Panchayats/Notified Area Committees
195-Assistance to Co-operatives
196- Assistance to Zilla Parishads/ District level Panchayats
197-Assistance to Block Panchayats/Intermediate Level Panchayats
198-Assistance to Gram Panchayats
199-Assistance to Other Non-Government Institutions
The State Government continues to make budgetary provision against single minor head ‘191’ under Major Head 2217-Urban Development to meet the expenditure in respect of i) Municipalities, ii)Municipal Corporations, iii) Local Bodies, HMDA, iv)Other Urban Development Authorities, v) Urban Infrastructure and Governance, vi) Integrated Housing and slum development under Jawaharlal Nehru National Urban Renewal Mission etc. (JNNURM)
Correction slip no. 446, dated 22-10-2002, details of each plan/Non-plan, scheme/programme are to be shown at sub-head level below minor head 003-Training
Instead of mentioning the distinct purpose/institution incurring the expenditure under sub-head below the minor head 003- Training, the Government depicts different sub head numbers with the same nomenclature namely 2014-003-SH(06) Training, 2014-003- SH(07) Training, 2014-003- SH(08) Training. This makes CCO based identification difficult. Sub-head nomenclature should distinctly indicate purpose/institution after Training”.
Correction slip nos. 382 & 383 dated 23-11-2000 and correction slips nos. 508 to 510 dated 13-5-2004, expenditure on maintenance and repairs is to be booked under two distinct sub-heads namely ‘work charged establishment’ and ‘other maintenance’ below minor head 053 under the Major Heads 2059-Public works, 2216-Housing, 2700-Major Irrigation, 2701-Medium Irrigation, 2702-Minor Irrigation and 3054-Roads& Bridges.
State Government continues to exhibit these classifications at sub-detailed head level i.e. 272 and 273 below detailed head 270-minor works instead of sub head level.
Non-incorporation of correction slips issued to LMMH from time to time by CGA
Correction slip nos. 508,509,511 &512 dated 13-5-2004 for operation of new Major Heads 0700,2700,4700 and 6700 for Major Irrigation and 0701,2701,4701 and 6701 for Medium Irrigation
The State Government has adopted the correction slip up to the Major head level only in Budget Estimates 2011-12. From the Sub Major head level correction slip has not been adopted in the budgetary documents. Such non-adoption prevents inter-state comparisons in the Combined Finance and Appropriation Accounts.

Appendices
����������
Appendix-2.11
Detailed Head 530-major works appearing under Revenue section (Refer paragraph 2.7.7; page 43)
(` in crore) Grant Number Classification Budget
XI-Roads, Buildings & Ports 3054-80-001-03-530 NV 0.22
3054-80-001-03-530 NC 0.61
XXXIII-Major & Medium Irrigation 2705-00-103-11-08-530 0.01
2700-80-001-11-02-530 0.08
2700-80-800-03-19-530 100.00
2700-80-800-03-19-530 3.00
XXXIV-Minor Irrigation 2702-01-796-03-10-530 12.00
2702-02-001-11-01-530 5.00
2702-02-005-03-05-530 4.00
2702-03-101-03-10-530 93.00
Appendix-2.12
Detailed Head 270-Minor works appearing under Capital section (Refer paragraph 2.7.8; page 43)
(` in crore) Grant No. Classification Budget
XXXIII-Major & Medium Irrigation 4700 - 1 - 125 - 11 - 26 - 270 70.00
4700 - 1 - 166 - 11 - 27 - 270 37.93
4700 - 1 - 157 - 11 - 27 - 270 16.00
4700 - 1 - 129 - 11 - 26 - 270 12.90
4700 - 1 - 159 - 21 - 26 - 270 10.00
4700 - 1 - 144 - 11 - 26 - 270 10.00
Appendix-2.13
Detailed Head 310-Grants-in-aid appearing under Capital section (Refer paragraph 2.7.8; page 43)
(` in crore) Grant No. Classification Budget
XI-Roads, Buildings and Ports 5054 - 80 - 001 - 11 - 01 - 310 @
5054 - 80 - 001 - 11 - 03 - 310 #
XVII-Municipal Administration and Urban Development
4215 - 01 - 101 - 11 - 05 - 310 *
XXXIII- Major and Medium Irrigation 4700 - 80 - 800 - 11 - 04 - 310 1.50
4700 - 01 - 129 - 03 - 34 - 310 10.00
4700 - 01 - 129 - 03 - 37 - 310 1.80
XXXIV – Minor Irrigation 4702 - 00 - 101 - 11 - 12 - 310 0.01
@` 35,000; #` 45,000; *` 10,000

Audit Report (State Finances) for the year ended 31 March 2012
����������
Appendix 3.1
Year-wise position of outstanding UCs as of 31 March 2012 (Refer paragraph 3.2; page 45)
(` in crore) Department Year Number of
UCs outstanding
Amount
Director of School Education 1992-93 3 1.55
Labour & Employment 1993-94 4 0.46
1994-95 5 0.65
1995-96 2 0.49
1996-97 6 0.60
Municipal Administration & Urban Development
2010-11 7 1.04
2011-12 187 80.41
Total 214 85.20

Appendices
����������
Appendix 3.2
Statement showing submission of accounts and status of audit of autonomous bodies
(Refer paragraph 3.3; page 45)
Sl. No.
Name of body/authority
Period of entrustment
Year up to which
accounts were
rendered
Period upto
which Separate
Audit Report
was issued
Placement of SAR in
the Legislature
Comments
Urban Development Authorities
1 AP Vaidya Vidhana Parishad
2009-10 2005-06 2005-06 2004-05 Approved Accounts from 2006-12 were not provided for audit.
2 Hyderabad Metropolitan Development Authority
2010-11 onwards
2008-09 2002-03 2000-01 While accounts were given upto 2008-09 supporting vouchers were not provided. Hence audit could not be taken up.
3 Visakhapatnam Urban Development Authority
2010-11 onwards
2010-11 2008-09 2001-02 Audit under progress for 2009-10 & 2010-11
4 Tirupati Urban Development Authority
2010-11 onwards
2010-11 2008-09 2001-02 SAR for 2009-10 is under finalisation. Audit being taken up for 2010-11.
5 Kakatiya Urban Development Authority
2010-11
onwards
2006-07 2006-07 1998-99 Approved Accounts from 2007-12 were not provided for audit.
6 Vijayawada-Guntur-Tenali-Mangalagiri-Urban Development Authority
2012-13 2008-09 2008-09 2000-01 Approved Accounts from 2009-12 were not provided for audit.
7 Sri Satya Sai Urban Development Authority
2008-09 2002-03 -- -- Records not produced due to fire accident.
8 Hyderabad Metropolitan Water Supply & Sewerage Board
2010-11 onwards
2005-06 2005-06 Not required as per bye laws of the
Board
Approved Accounts from 2006-12 were not provided for audit.
Integrated Tribal Development Agencies
9 ITDA, Bhadrachalam
2011-12 2010-11 2009-10 Not required as per bye
laws
Approved accounts for 2010-11 were not provided for audit.

Audit Report (State Finances) for the year ended 31 March 2012
����������
Sl. No.
Name of body/authority
Period of entrustment
Year up to which
accounts were
rendered
Period upto
which Separate
Audit Report
was issued
Placement of SAR in
the Legislature
Comments
10 ITDA, Seethampet 2011-12 2008-09 2008-09 -do- Approved Accounts from 2009-12 were not provided for audit.
11 ITDA, Srisailam 2011-12 2006-07 2006-07 -do- Approved Accounts from 2007-12 were not provided for audit.
12 ITDA, Parvathipuram
2011-12 2008-09 2008-09 -do- Approved Accounts from 2009-12 were not provided for audit.
13 ITDA, Paderu 2011-12 2009-10 2009-10 -do- Approved Accounts from 2010-12 were not provided for audit.
14 ITDA, Rampachodavaram
2011-12 2006-07 2006-07 -do- Approved Accounts from 2007-12 were not provided for audit.
15 ITDA, K.R. Puram 2011-12 2010-11 2009-10 -do- Approved accounts from 2010-11 were not provided for audit.
16 ITDA, Utnoor 2011-12 2008-09 2007-08 -do- Approved accounts for 2008-09 received recently and currently being audited.
17 ITDA, Nellore 2011-12 2009-10 2009-10 -do- Approved Accounts from 2010-12 were not provided for audit.
18 ITDA, Eturunagaram
2011-12 2006-07 2006-07 -do- Approved Accounts from 2007-12 were not provided for audit.

Appendices
����������
Appendix 3.3 Statement of Bodies and Authorities whose accounts
have not been received (Refer paragraph 3.3; page 45)
Sl No.
Name of the body/ Authority No. of bodies/
authorities
Years for which accounts had not been
received
No. of annual accounts in
arrears as of June 2012
Higher Education 1 Universities 11 2004-05 to 2011-12 24
2 Aided colleges 121 1993-94 to 2011-12 914
3 AP State Council of Higher Education
1 2009-10 to 2011-12 3
4 Societies 7 1999-2000 to 2011-12 36
School Education 5 Zilla Grandhalaya Samsthas 22 1997-98 to 2011-12 149
6 Zilla Saksharatha Samities 23 1997-98 to 2011-12 228
Health Medical and Family Welfare 7 AP AIDS Control Society 1 2010-11 to 2011-12 2
8 AP Health Medical Housing and Infrastructure Development Corporation
1 2011-12 1
9 AP Medicinal and Aromatic Plants Board
1 2009-10 to 2011-12 3
10 AP State TB Society 1 2011-12 1
11 AP Vaidya Vidhana Parishad 1 2006-07 to 2011-12 6
12 AP Yogadhyayana Parishad 1 2006-07 to 2011-12 6
13 Hyderabad Akshara Jyothi Samithi, Hyderabad
1 2006-07 to 2011-12 6
14 Indian Institute of Health and Family Welfare
1 2009-10 to 2011-12 3
15 MNJ Institute of Oncology 1 2010-11 to 2011-12 2
16 Nizam’s Institute of Medical Sciences
1 2007-08 to 2011-12 5
17 NTR University of Health Sciences 1 2010-11 to 2011-12 2
18 Sri Venkateswara Institute of Medical Sciences
1 2011-12 1
19 State Blindness Control Society, Hyderabad
1 2006-07 to 2011-12 6
20 State TB Office 1 2003-04 to 2011-12 9
Municipal Administration and Urban Development 21 QQUDA 1 2010-11 to 2011-12 2
Backward Classes Welfare 22 BC Finance Corporation,
Hyderabad 1 2004-05 to 2011-12 8
23 AP Study Circle, Anantapur 1 1997-98 to 2011-12 15
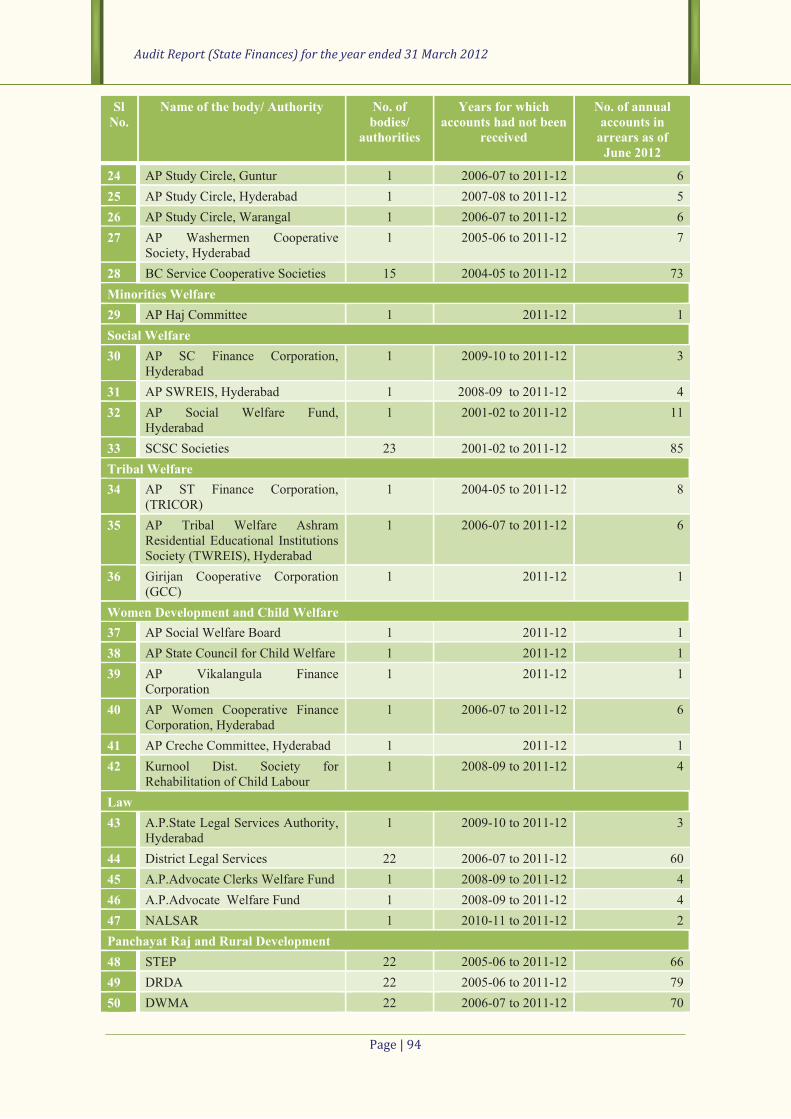
Audit Report (State Finances) for the year ended 31 March 2012
�������� �
Sl No.
Name of the body/ Authority No. of bodies/
authorities
Years for which accounts had not been
received
No. of annual accounts in
arrears as of June 2012
24 AP Study Circle, Guntur 1 2006-07 to 2011-12 6
25 AP Study Circle, Hyderabad 1 2007-08 to 2011-12 5
26 AP Study Circle, Warangal 1 2006-07 to 2011-12 6
27 AP Washermen Cooperative Society, Hyderabad
1 2005-06 to 2011-12 7
28 BC Service Cooperative Societies 15 2004-05 to 2011-12 73
Minorities Welfare 29 AP Haj Committee 1 2011-12 1
Social Welfare 30 AP SC Finance Corporation,
Hyderabad 1 2009-10 to 2011-12 3
31 AP SWREIS, Hyderabad 1 2008-09 to 2011-12 4
32 AP Social Welfare Fund, Hyderabad
1 2001-02 to 2011-12 11
33 SCSC Societies 23 2001-02 to 2011-12 85
Tribal Welfare 34 AP ST Finance Corporation,
(TRICOR) 1 2004-05 to 2011-12 8
35 AP Tribal Welfare Ashram Residential Educational Institutions Society (TWREIS), Hyderabad
1 2006-07 to 2011-12 6
36 Girijan Cooperative Corporation (GCC)
1 2011-12 1
Women Development and Child Welfare 37 AP Social Welfare Board 1 2011-12 1
38 AP State Council for Child Welfare 1 2011-12 1
39 AP Vikalangula Finance Corporation
1 2011-12 1
40 AP Women Cooperative Finance Corporation, Hyderabad
1 2006-07 to 2011-12 6
41 AP Creche Committee, Hyderabad 1 2011-12 1
42 Kurnool Dist. Society for Rehabilitation of Child Labour
1 2008-09 to 2011-12 4
Law 43 A.P.State Legal Services Authority,
Hyderabad 1 2009-10 to 2011-12 3
44 District Legal Services 22 2006-07 to 2011-12 60
45 A.P.Advocate Clerks Welfare Fund 1 2008-09 to 2011-12 4
46 A.P.Advocate Welfare Fund 1 2008-09 to 2011-12 4
47 NALSAR 1 2010-11 to 2011-12 2
Panchayat Raj and Rural Development 48 STEP 22 2005-06 to 2011-12 66
49 DRDA 22 2005-06 to 2011-12 79
50 DWMA 22 2006-07 to 2011-12 70

Appendices
����������
Sl No.
Name of the body/ Authority No. of bodies/
authorities
Years for which accounts had not been
received
No. of annual accounts in
arrears as of June 2012
51 Society for Eradication of Rural Poverty (SERP)
1 2008-09 to 2011-12 4
Labour Employment, Training and Factories 52 Rajiv Udyogsri Society 1 2009-10 to 2011-12 3
53 AP Building & other construction workers Welfare Board, Hyderabad
1 2009-10 to 2011-12 3
Youth Advancement, Tourism and Culture 54 Dr. Y.S.R. Institute and Hospitality
Management 1 2009-10 to 2011-12 3
55 Ravindra Bharathi 1 2005-06 to 2011-12 7
56 Sports Authority of Andhra Pradesh 1 2009-10 to 2011-12 3
Revenue 57 AP Disaster Mitigation Society 1 2010 to 2011-12 2
Environment Forests, Science and Technology 58 AP State Remote Sensing
Application Centre 1 2009-10 to 2011-12 3
Planning 59 Centre for Economic and Social
Studies 1 2007-08 to 2011-12 5
Total 358 1,983

Audit Report (State Finances) for the year ended 31 March 2012
����������
Appendix 3.4
Un-reconciled expenditure (` 500 crore and above cases only) (Refer paragraph 3.4; page 46)
(` in crore)
Sl. No.
Department/Controlling Officer Amount not reconciled
1 Director General & Inspector General of Police,
(MH 2055-Police)
3,003
2 Municipal Administration and Urban Development, Secretariat
(MH 2217- Urban Development)
2,105
3 Power Projects
(MH 6801- Loans for Power Projects)
1,475
4 Director General & Inspector General of Police
(MH 6216-Loans for Housing)
1,268
5 Municipal Administration and Urban Development, Secretariat Department
(MH 6217-Loans for Urban Development)
1,201
6 Finance,
(MH 2049 – Interest payments)
827
7 Chief Engineer, FMC (SRSP) & SYP, LMD Colony, Karimnagar
(MH 4700- Capital Outlay on Major Irrigation)
808
8 Engineer-in-Chief Roads
(MH 3054-Roads and Bridges)
713
9 Planning Department, Secretariat
(MH 5475- Capital Outlay on other General Economic Services)
702
10 Chief Engineer, (PROJ), Ongole
(MH 4700- Capital Outlay on Major Irrigation)
690
11 Chief Engineer, Indira Sagar Polavaram Project
(MH 4700- Capital Outlay on Major Irrigation)
655
12 Chief Engineer, DR.B.R.Ambedkar Pranahita-Chevella SS
(MH 4700- Capital Outlay on Major Irrigation)
604
13 Registrar of High Court
(MH 2014-Administration of Justice)
520
14 Chief Engineer, Minor Irrigation
(MH 4702- Capital Outlay on Minor Irrigation)
507
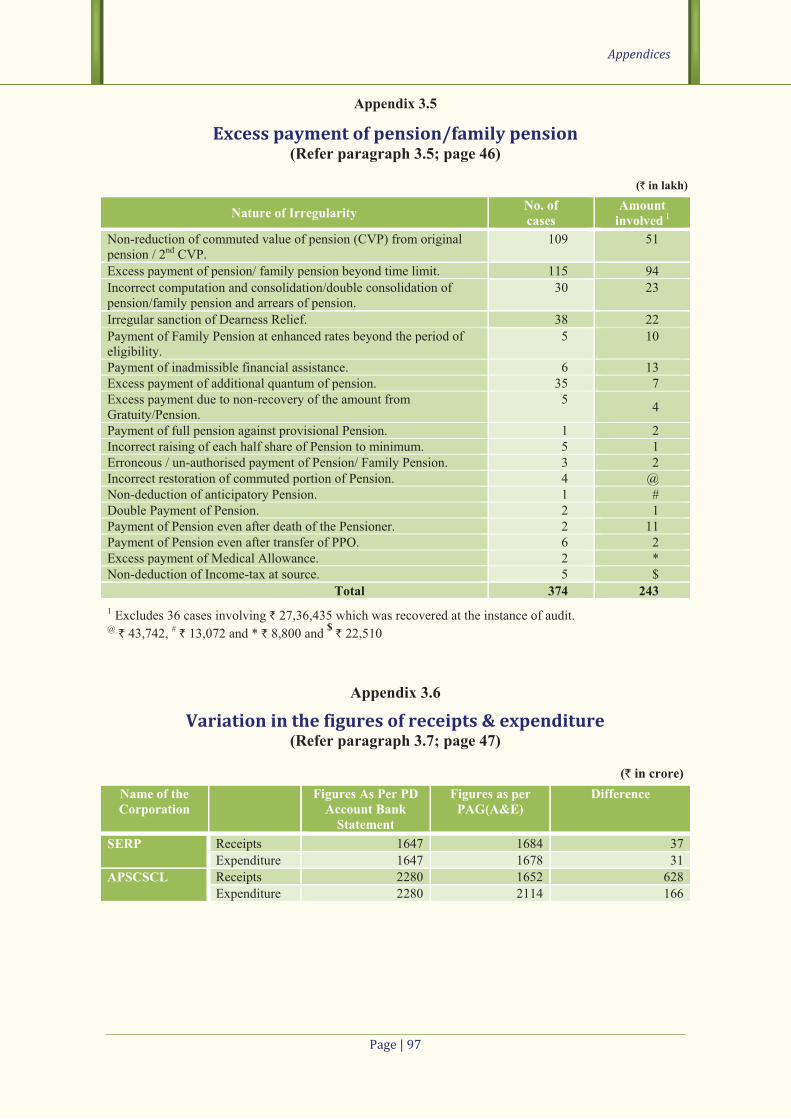
Appendices
����������
Appendix 3.5
Excess payment of pension/family pension (Refer paragraph 3.5; page 46)
(` in lakh)
Nature of Irregularity No. of cases
Amount involved 1
Non-reduction of commuted value of pension (CVP) from original pension / 2nd CVP.
109 51
Excess payment of pension/ family pension beyond time limit. 115 94
Incorrect computation and consolidation/double consolidation of pension/family pension and arrears of pension.
30 23
Irregular sanction of Dearness Relief. 38 22
Payment of Family Pension at enhanced rates beyond the period of eligibility.
5 10
Payment of inadmissible financial assistance. 6 13
Excess payment of additional quantum of pension. 35 7
Excess payment due to non-recovery of the amount from Gratuity/Pension.
5 4
Payment of full pension against provisional Pension. 1 2
Incorrect raising of each half share of Pension to minimum. 5 1
Erroneous / un-authorised payment of Pension/ Family Pension. 3 2
Incorrect restoration of commuted portion of Pension. 4 @
Non-deduction of anticipatory Pension. 1 #
Double Payment of Pension. 2 1
Payment of Pension even after death of the Pensioner. 2 11
Payment of Pension even after transfer of PPO. 6 2
Excess payment of Medical Allowance. 2 *
Non-deduction of Income-tax at source. 5 $ Total 374 243
1 Excludes 36 cases involving ` 27,36,435 which was recovered at the instance of audit. @ ` 43,742, # ` 13,072 and * ` 8,800 and
$ ` 22,510
Appendix 3.6
Variation in the figures of receipts & expenditure (Refer paragraph 3.7; page 47)
(` in crore) Name of the Corporation
Figures As Per PD Account Bank
Statement
Figures as per PAG(A&E)
Difference
SERP Receipts 1647 1684 37
Expenditure 1647 1678 31
APSCSCL Receipts 2280 1652 628
Expenditure 2280 2114 166

Audit Report (State Finances) for the year ended 31 March 2012
����������
Appendix 3.7
Statement showing Department-wise details of pending DC bills at the end of 2011-12
(Refer paragraph 3.9; page 50)
(` in crore)
Sl. No
Department No. of Bills
Amount
1 Agriculture
299 865.58
2 Revenue, Registration and Relief
3,791 278.27
3 School Education
552 47.78
4 Panchayat Raj & Rural Development
74 28.96
5 Medical and Health
21,583 23.14
6 Fiscal Administration, Planning, Surveys and Statistics
281 15.62
7 Major and Medium Irrigation
1 10.00
8 Home Administration
145 5.41
9 Animal Husbandry
19 3.78
10 Sports and Youth Services
343 3.67
11 Commercial Taxes Administration
11 0.94
12 Administration of Justice
22 0.73
13 Industries and Commerce
10 0.67
14 Labour and Employment
27 0.24
15 Tourism, Art and Culture
4 0.21
16 Civil Supplies Administration
9 0.19
17 Higher Education
8 0.17
18 Energy, Forest
4 0.17
19 Municipal Administration and Urban Development
11 0.12
20 Women, Child and Disabled Welfare
11 0.10
21 General Administration and Elections
11 0.06
22 Social Welfare
17 0.05
23 Transport Administration
2 0.04
24 Roads, Buildings and Ports
19 0.02
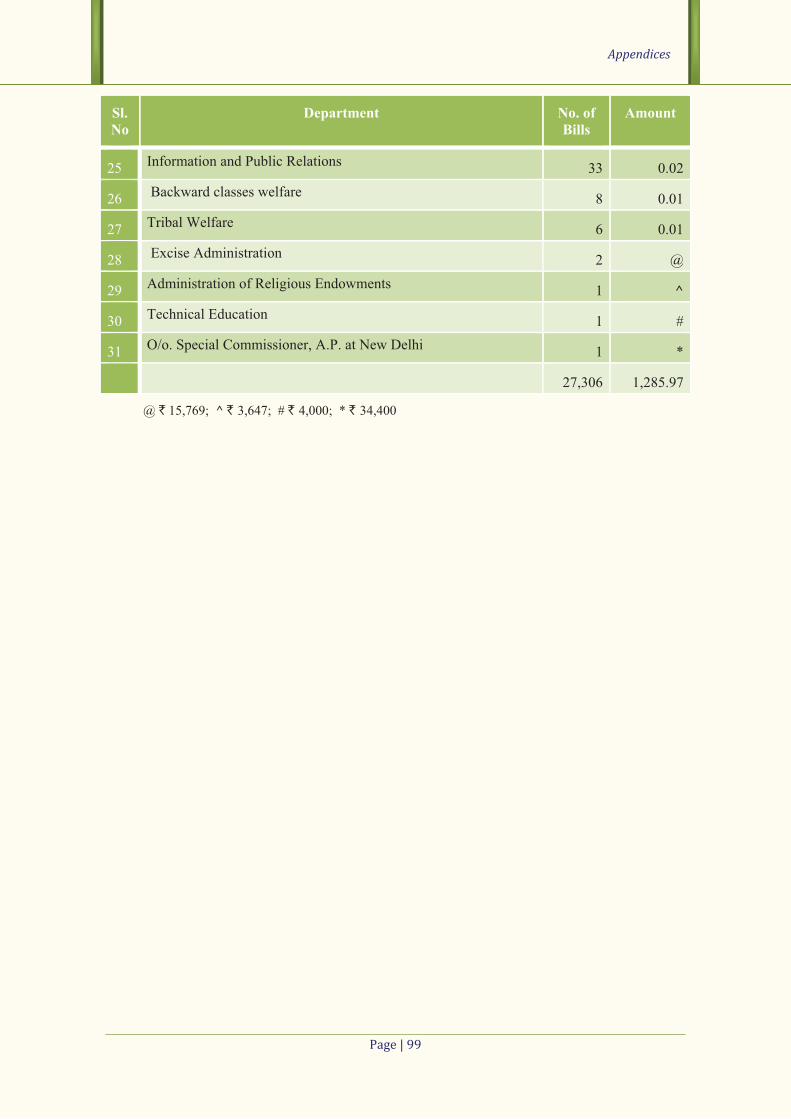
Appendices
����������
Sl. No
Department No. of Bills
Amount
25 Information and Public Relations
33 0.02
26 Backward classes welfare
8 0.01
27 Tribal Welfare
6 0.01
28 Excise Administration
2 @
29 Administration of Religious Endowments
1 ^
30 Technical Education
1 #
31 O/o. Special Commissioner, A.P. at New Delhi
1 *
27,306 1,285.97
@ ` 15,769; ^ ` 3,647; # ` 4,000; * ` 34,400

Audit Report (State Finances) for the year ended 31 March 2012
�����������
Appendix 4.1
Glossary of terms
Terms Basis of calculation
Average interest paid by
the State
Interest payment/[(Amount of previous year’s Fiscal Liabilities + Current
year’s Fiscal liabilities)/2] * 100
Balance from Current
Revenue (BCR)
Revenue Receipts minus all Plant grants and Non-plan Revenue Expenditure
excluding expenditure recorded under the major head 2048 – Appropriation
for reduction or avoidance of debt
Buoyancy of a parameter Rate of Growth of parameter/GSDP Growth Rate
Buoyancy of a parameter
(X) with respect to another
parameter(Y)
Rate of Growth of parameter(X)/ Rate of Growth of parameter(Y)
Development Expenditure Social Services + Economic Services
Fiscal Deficit Revenue Expenditure + Capital Expenditure + Net Loans and Advances –
Revenue Receipts – Miscellaneous Capital Receipts
Interest received as per
cent to Loans Outstanding
Interest Received/[(opening balance + Closing balance of Loans and
Advances)/2] * 100
Interest spread GSDP growth rate – Average Interest Rate
Primary Deficit Primary deficit defined as the fiscal deficit net of interest payments indicates
the extent of deficit which is an outcome of the fiscal transactions of the
State’s during the course of the year (Fiscal Deficit – Interest payments)
Quantum spread Debt stock * Interest spread
Rate of growth (ROG) [(Current year Amount/Previous year Amount)-1] * 100
Revenue Deficit Revenue Receipt – Revenue Expenditure
Terms Description
Absorptive capacity Absorptive capacity in this case refers to the ability of a State to implement a
developmental scheme in such a way that with given resources, there is
maximum benefit to the people. This is usually achieved when the design of
schemes are well planned with careful risk mitigation strategy in place,
administrative costs are low, operation, maintenance, monitoring and control
mechanisms are in place etc so that the State is able to effectively achieve
targeted outcomes.
Average interest rate Average interest rate is defined as the percentage of interest payment made
to, average financial liabilities of the State during the year i.e. (sum of
opening and closing balances of fiscal liabilities/2) X 100
Buoyancy ratio Buoyancy ratio indicates the elasticity or degree of responsiveness of a fiscal
variable with respect to a given change in the base variable. For instance,
revenue buoyancy at 0.6 implies that revenue receipts tend to increase by 0.6
percentage points, if the GSDP increases by one per cent
GSDP GSDP is defined as the total income of the State or the market value of goods
and services produced using labour and all other factors of production at
current prices

Appendices
�����������
Debt consolidation and
Relief Facility
In pursuance of the recommendations of the Twelfth Finance Commission
(TFC) for fiscal consolidation and elimination of revenue deficit of the
States, Government of India formulated a scheme “The States’ Debt
Consolidation and Relief Facility (DCRF) (2005-06 to 2009-10)” under
which general debt relief is provided by consolidating and rescheduling at
substantially reduced rates of interest the Central loans granted to States of
enacting the FRBM Act and debt waiver is granted on fiscal performance,
linked to the reduction of revenue deficits of States
Development expenditure The analysis of the expenditure data is disaggregated into development and
non-development expenditure. All expenditure relating to Revenue Account,
Capital Outlay and Loans and Advances are categorized into social services,
economic services and general services. Broadly, the social and economic
services constitute development expenditure, while expenditure on general
services is treated as non-development expenditure.
Debt sustainability The debt sustainability is defined as the ability of the State to maintain a
constant debt-GSDP ratio over a period of time and also embodies the
concern about the ability to service its debt. Sustainability of debt therefore
also refers to sufficiency of liquid assets to meet current or committed
obligations and the capacity to keep balance between costs of additional
borrowings with returns from such borrowings. It means that rise in fiscal
deficit should match with the increase in capacity to service the debt.
Debt stabilization A necessary condition for stability States that if the rate of growth of
economy exceeds the interest rate or cost of public borrowings, the debt-
GSDP ratio is likely to be stable provided primary balances are either zero or
positive or are moderately negative. Given the rate spread (GSDP growth
rate- interest rate) and quantum spread (Debt*rate spread), debt sustainability
condition states that if quantum spread together with primary deficit is zero,
debt-GSDP ratio would be constant or debt would be constant or debt would
stabilize eventually. On the other hand, if primary deficit together with
quantum spread turns out to be negative, debt-GSDP ratio would be rising
and in case it is positive, debt-GSDP ratio would eventually be falling.
Merit goods Core public goods are which all citizens enjoy in common in the sense that
each individual’s consumption of such good leads to no subtractions from
any other individual’s consumption of that good, et. Enforcement of law and
order, security and protection of our rights; pollution free air and other
environmental goods and road infrastructure etc. Merit goods are
commodities that the public sector provides free or at categorized rates
because an individual or society should have them on the basis of some
concept of need rather than ability and willingness to pay the government
and therefore wishes to encourage their consumption. The examples of such
goods include the provision of free or subsidized food for the poor to support
nutrition, the delivery of health services to improve quality of life and reduce
morbidity, providing basic education to all, drinking water and sanitation etc.
Net availability of
Borrowed funds
Defined as the ratio of the debt redemption (Principal + Interest Payments) to
total debt receipts and indicates the extent to which the debt receipts are used
in debt redemption indicating the net availability of borrowed funds.
Primary revenue deficit Primary revenue deficit defined as gap between non interest revenue
expenditure o the State and its non-debt receipts indicates the extent to which
the non-debt receipts of the State are able to meet the primary expenditure
incurred under revenue account.

Audit Report (State Finances) for the year ended 31 March 2012
�����������
Primary expenditure Primary expenditure of the State, defined as the total expenditure net of the
interest payments, indicates the expenditure incurred on the transactions
undertaken during the year.
Sufficiency of non-debt
receipts
Adequacy of incremental non-debt receipts of the State to cover the
incremental interest liabilities and incremental primary expenditure. The
debt sustainability could be significantly facilitated if the incremental non-
debt receipts could meet the incremental interest burden and the incremental
primary expenditure. Non debt receipts = incremental growth of revenue
receipts – Incremental growth of interest payments – Incremental primary
revenue expenditure.

Appendices
�����������
Appendix 4.2
Acronyms and abbreviations
Acronym Full form
AABY : Aam Admi Bhima Yojana
AC Bills : Abstract Contingent Bills
AE : Aggregate Expenditure
AIDS : Acquired Immuno Deficiency Syndrome
APFRBM Act : Andhra Pradesh Fiscal Responsibility and Budget Management
APGENCO : Andhra Pradesh Generation Corporation
APLSDA : Andhra Pradesh Live Stock Development Agency
APSAM&ETI : State Agricultural Management and Extension Training Institute
APMIP : Andhra Pradesh Micro Irrigation Project
APRPRP : Andhra Pradesh Rural Poverty Reduction Project
APSACS : Andhra Pradesh State AIDS Control Society
APSCSCL : AP State Civil Supplies Corporation Limited
APS e-COPS : Andhra Pradesh Society for Electronic Computerisation of Police Services
APSHM : Andhra Pradesh State Horticulture Mission
APSREGS : Andhra Pradesh State Rural Employment Guarantee Scheme
APSWREIS : AP Social Welfare Residential Educational Institutions Society
APSRRDA : Andhra Pradesh State Rural Roads Development Agency
APSRTC : Andhra Pradesh State Road Transport Corporation
APTRANSCO : Transmission Corporation of Andhra Pradesh
BE : Budget Estimates
CAG : Comptroller and Auditor General of India
CAGR : Compound Annual Growth Rate
CB : Closing Balance
C&DA : Commissioner and Director of Agriculture
CE : Capital Expenditure
CF : Contingency Fund
CGA : Controller General of Accounts
CSS : Centrally Sponsored Schemes
DC Bills : Detailed Contingent Bills
DDs : Demand Drafts
DE : Development Expenditure
DRDA : District Rural Development Agency
DWCRA : Development of Women and Children in Rural Areas
DWMA : District Water Management Agency
FCP : Fiscal Correction Path
FD : Fiscal Deficit

Audit Report (State Finances) for the year ended 31 March 2012
��������� �
Acronym Full form
FPSS : Fiscal Policy Strategy Statement
FRL : Fiscal Responsibility Legislation
GOI : Government of India
GSDP : Gross State Domestic Product
HODs : Heads of Departments
IAY : Indira Awas Yojana
INDIRAMMA : Integrated Novel Development in Rural Areas and Modal Municipal
Areas
ITDA : Integrated Tribal Development Agency
JNNURM : Jawaharlal Nehru National Urban Renewal Mission
LPG : Liquefied Petroleum Gas
MEFS : Macro Economic Framework Statement
NALSAR : National Academy of Legal Studies and Research
NEDCAP : Non conventional Energy Development Corporation of Andhra Pradesh
NOAPS : National Old Age Pension Scheme
NPRE : Non-Plan Revenue Expenditure
NRDWP : National Rural Drinking Water Programme
NRHM : National Rural Health Mission
NSSF : National Small Savings Fund
NTR : Non-Tax Revenue
O&M : Operations and Maintenance
OTR : Own Tax Revenue
PAC : Public Accounts Committee
PD : Primary Deficit
PDA : Personal Deposit Account
PERT Chart : Programme/Project Evaluation and Review Technique
PF : Provident Fund
PPO : Pension Payment Order
PMS : Post Metric Scholarship
PRC : Pay Revision Commission
QQUDA : Quli Qutubshah Urban Development Authority
RBI : Reserve Bank of India
RD : Revenue Deficit
RDO : Revenue Divisional Officer
RE : Revenue Expenditure
RMSA : Rashtriya Madhyamik Shiksha Abhiyan
RR : Revenue Receipts
RVMA : Rajiv Vidya Mission Authority
S&W : Salaries and Wages
Appendices
�����������
Acronym Full form
SAAP : Sports Authority of Andhra Pradesh
SBCS : State Blindness Control Society
SCSCS : Scheduled Castes Service Co-operative Society
SDL : State Development Loan
SH&FWS : State Health and Family Welfare Society
SSA : Sarva Siksha Abhiyan
SSE : Social Sector Expenditure
STBCS : State TB Control Society
SWSM : State Water Supply Mission
TE : Total Expenditure
TFC : Twelfth Finance Commission
TRICOR : Tribal Cooperatives
UC : Utilisation Certificate
VAT : Value Added Tax
WMA : Ways and Means Advances


© COMPTROLLER AND AUDITOR GENERAL OF INDIA
www.cag.gov.in
www.agap.cag.gov.in