State Finances
60
16.1 Introduction In the late nineties, almost all states went through a difficult phase in respect of state finances. In a comparative perspective, however, Uttar Pradesh’s fiscal imbalance has been one of the worst. As already mentioned, the ratio of revenue to fiscal deficit in undivided Uttar Pradesh (Uttar Pradesh) was 74.76 per cent in 1998-99, which was the highest among the NSC states in that year. Thus, while the experience of growing fiscal imbalance during the nineties is shared by all states, Uttar Pradesh’s finances proved to be particularly vulnerable to the impact of rise in revenue expenditure claims on salaries, pensions and interest payments. With partitioning of the state, composition of resources and the expenditure have changed significantly. Therefore, in this study, the analysis of historical patterns relate to Uttar Pradesh as it actually existed, that is Uttar Pradesh until November 8, 2000, and reorganised Uttar Pradesh after that date. Projections have been done for the new Uttar Pradesh. The chapter is organised in the following manner: Section 16.2 presents an overview of state finances with respect to the effects of reorganisation of Uttar Pradesh, expenditure trends and deterioration of fiscal condition. Section 16.3 discusses the tax and non-tax revenue receipts. The growth of expenditures is discussed in Section 16.4. Section 16.5 deals with the fiscal management, performance of budget estimates and the last Section 16.6 discusses fiscal prospects in the state. 16.2 Overview of State Finances: Growing Fiscal Imbalance 16.2.1 Effects of Reorganisation of Uttar Pradesh The reorganisation of Uttar Pradesh, with the carving out of Uttaranchal in November 2000, has affected the two new states asymmetrically in terms of the fiscal implications. Chapter 16 State Finances U T T A R P R A D E S H The undivided Uttar Pradesh (Uttar Pradesh) was the most populous among Indian states with 16.7 per cent of the nation’s population in the 1991 Census. Even after the reorganisation in 2000 that carved out Uttaranchal, Uttar Pradesh (UP) is still the most populous among Indian states. According to the 2001 Census, Uttar Pradesh’s population accounted for nearly 16.4 per cent of the all-state population. The state also saw the largest volume of government expenditure (revenue and capital), which constituted 18.45 per cent of the gross state domestic product (GSDP) (comparable at factor cost and current market prices) in 2002-03. (This, however, constituted only 10.23 per cent of the all-state aggregate government expenditure in 2002-03.) While proximity to National Capital Territory of Delhi (NCT), Punjab and Haryana, may be economically and fiscally advantageous to Uttar Pradesh, its large size, high population density, large agricultural sector, narrow industrial base and relatively low literacy rate constrain the growth of its economy, and in turn, the health of state finances. In the context of state finances, the partitioning of the state has affected the two new states asymmetrically. Uttar Pradesh has the larger share of population (about 95 per cent) relative to the share in area (about 82 per cent). Its population density has become higher than earlier whereas Uttaranchal has a much lower population density. Uttar Pradesh has also lost out in terms of forest share and hydel energy sources. It has, however, a much larger share of industry and agriculture. These changes affect both tax and non-tax revenue resources. The expenditure profile is also asymmetrically affected. The Uttar Pradesh Reorganisation Act, 2000 delineated the criteria of distribution of revenues, authorisation of expenditure and apportionment of assets and liabilities. As per the notification of the Ministry of Finance, Government of India, 96.7 per cent
-
Upload
khangminh22 -
Category
Documents
-
view
0 -
download
0
Transcript of State Finances
16.1 Introduction
In the late nineties, almost all states went through adifficult phase in respect of state finances. In acomparative perspective, however, Uttar Pradesh’s fiscalimbalance has been one of the worst. As alreadymentioned, the ratio of revenue to fiscal deficit inundivided Uttar Pradesh (Uttar Pradesh) was 74.76 percent in 1998-99, which was the highest among the NSCstates in that year. Thus, while the experience of growingfiscal imbalance during the nineties is shared by all states,Uttar Pradesh’s finances proved to be particularlyvulnerable to the impact of rise in revenue expenditureclaims on salaries, pensions and interest payments.
With partitioning of the state, composition ofresources and the expenditure have changedsignificantly. Therefore, in this study, the analysis ofhistorical patterns relate to Uttar Pradesh as it actuallyexisted, that is Uttar Pradesh until November 8, 2000,and reorganised Uttar Pradesh after that date.Projections have been done for the new Uttar Pradesh.
The chapter is organised in the following manner:Section 16.2 presents an overview of state finances withrespect to the effects of reorganisation of Uttar Pradesh,expenditure trends and deterioration of fiscal condition.Section 16.3 discusses the tax and non-tax revenuereceipts. The growth of expenditures is discussed inSection 16.4. Section 16.5 deals with the fiscalmanagement, performance of budget estimates and thelast Section 16.6 discusses fiscal prospects in the state.
16.2 Overview of State Finances: GrowingFiscal Imbalance
16.2.1 Effects of Reorganisation of Uttar Pradesh
The reorganisation of Uttar Pradesh, with thecarving out of Uttaranchal in November 2000, hasaffected the two new states asymmetrically in terms ofthe fiscal implications.
Chapter 16
State Finances
UTTAR PRADESH
The undivided Uttar Pradesh (Uttar Pradesh) wasthe most populous among Indian states with 16.7 percent of the nation’s population in the 1991 Census.Even after the reorganisation in 2000 that carved outUttaranchal, Uttar Pradesh (UP) is still the mostpopulous among Indian states. According to the 2001Census, Uttar Pradesh’s population accounted for nearly16.4 per cent of the all-state population. The state alsosaw the largest volume of government expenditure(revenue and capital), which constituted 18.45 per centof the gross state domestic product (GSDP) (comparableat factor cost and current market prices) in 2002-03.(This, however, constituted only 10.23 per cent of theall-state aggregate government expenditure in 2002-03.)While proximity to National Capital Territory of Delhi(NCT), Punjab and Haryana, may be economically andfiscally advantageous to Uttar Pradesh, its large size,high population density, large agricultural sector,narrow industrial base and relatively low literacy rateconstrain the growth of its economy, and in turn, thehealth of state finances.
In the context of state finances, the partitioning ofthe state has affected the two new statesasymmetrically. Uttar Pradesh has the larger share ofpopulation (about 95 per cent) relative to the share inarea (about 82 per cent). Its population density hasbecome higher than earlier whereas Uttaranchal has amuch lower population density. Uttar Pradesh has alsolost out in terms of forest share and hydel energysources. It has, however, a much larger share ofindustry and agriculture. These changes affect both taxand non-tax revenue resources. The expenditure profileis also asymmetrically affected.
The Uttar Pradesh Reorganisation Act, 2000delineated the criteria of distribution of revenues,authorisation of expenditure and apportionment ofassets and liabilities. As per the notification of theMinistry of Finance, Government of India, 96.7 per cent

UTTAR PRADESH DEVELOPMENT REPORT—VOL. 2482
of the tax devolution to UUP was assigned to the newUttar Pradesh, and the rest, i.e., the 3.3 per cent toUttaranchal. This arrangement was necessitated due tothe fact that the Eleventh Finance Commission (EFC)had already submitted its report before the reorganisationtook place. The calamity relief fund was divided on thebasis of the geographical area of the two states. The totalof the cash balances in all treasuries of the state of UUPand the credit balance of the state with the Reserve Bankof India (RBI) and any other bank were divided betweenthe two states on the basis of their respective populationsize. According to provisions, tax arrears should becollected and distributed according to the location ofthe assessing authority. Loans should be realised onthe basis of the location of public sector enterprises.For the apportionment of liabilities, public debt as onNovember 5, 2000 has to be divided on per capita termsbetween the two states. The GPF and EPF balanceshave also to be divided on the basis of the number ofemployees in the two states, as allotted.
In this analysis, a review of State Finances over theperiod 1987-88 to 2004-05 BE is undertaken. Data onthe basis of actuals are available up to 2002-03. For2003-04, revised estimates and for 2004-05, Budgetestimates are available. GSDP has been compiled forUUP. In analysing fiscal trends up to 2002-03, thefollowing considerations qualify the overall review:
(i) GSDP has been estimated for UUP up toNovember 8, 2000, and for the new UttarPradesh beyond that.
(ii) Ratios to GSDP and other fiscal aggregatesrelate to the same entity, whether UUP orUttar Pradesh.
(iii) The year 2000-01 is the change over year.
(iv) Our analysis, in general, is up to 2002-03, forwhich accounts data are available. In all thetables, however, data for 2003-04 RE and 2004-05BE are also given. Salient features of changes inthese two years are also taken note of.
(v) The year 2003-04 RE requires separate attentionbecause of one-time provisions related to theelectricity sector both on the revenue side andcapital, side.
16.2.2 Fiscal Imbalance: Growing Deterioration
The finances of UUP show marked deterioration inrevenue and fiscal balance relative to GSDP towards the endof the nineties. The profile of fiscal imbalance afterbifurcation, after a brief period of improvement has started
deteriorating again. The quality of fiscal deficit has worsenedconsiderably over the years. Relative to other states, fiscalimbalance in Uttar Pradesh is among the largest.
The outstanding feature of UUP’s finances was themounting fiscal imbalance where the revenue surplus of0.66 per cent of GSDP in 1987-88 transformed into adeficit in 1988-89 reaching a peak of 5.31 per cent in1998-99. Up to 1998-99, the deteriorating fiscalsituation can clearly be divided into three phases: thefirst from 1987-88 to 1990-91, the second from 1991-92to 1995-96, and the last from 1996-97 to 1998-99. Theyear 1999-00 could possibly be seen, in this pattern, asthe beginning of another phase of improvement. In1999-00, it improved to 4.12 per cent of GSDP. Thefiscal deficit increased from 2.64 per cent of GSDP in1987-88 to a peak of 7.11 per cent in 1998-99. Itmarginally improved to 6.31 per cent in 1999-00. Infact, after the reorganisation of Uttar Pradesh, the trendtowards improvement was further strengthened until2003-04, when a sharp deterioration occurred.
The three phases mentioned above and the positionafter that in the profile of fiscal imbalance as shown byrevenue, fiscal, and primary deficit is shown in Figure16.1. In 1987-88, there was a revenue surplus of 0.65 percent of GSDP. It turned into a revenue deficit in thenext year which continued to rise up to 1990-91. In thesecond phase, although the revenue account remained indeficit, the position of fiscal deficit visibly improvedduring 1991-92 to 1995-96. Since 1996-97, the profile offiscal imbalance sharply deteriorated with the rise inrevenue as well as fiscal deficits. However, another phaseof improvement is visible from 1999-00 to 2004-05, withthe exception of 2003-04 RE, where the sharpdeterioration is due to the power sector adjustments asalready mentioned earlier.
FIGURE 16.1
Profile of Fiscal Imbalance
-0.64
1.36
3.36
5.36
7.36
9.36
11.36
1987
-88
1988
-89
1989
-90
1990
-91
1991
-92
1992
-93
1993
-94
1994
-95
1995
-96
1996
-97
1997
-98
1998
-99
1999
-00
2000
-01
2001
-02
2002
-03
2003
-04
RE
2004
-05
BE
Year
Per
Cen
t
Revenue Deficit Fical DeficitPrimary Deficit

Chapter 16 • STATE FINANCES 483
Further, the share of revenue deficit in fiscal deficit,which is indicative of the quality of fiscal deficit, hadalso sharply deteriorated. In 1990-91, nearly 40 per centof fiscal deficit was claimed by revenue deficit. Thisshare rose to nearly 75 per cent in 1998-99. After that,it has started to fall showing improvement in theutilisation of fiscal deficit, with 2003-04 RE being anexception. In 2003-04 RE the revenue deficit accountedfor nearly 98 per cent of fiscal deficit. This, however,was due to one-time adjustments in the electricitysector, as already mentioned. The dimensions of fiscalimbalance, based on some key fiscal indicators, aresummarised in Table 16.1. It appears that in both theearlier phases, fiscal deterioration started with salaryrevisions in tandem with the Fourth and Fifth CentralPay Commissions. In the late nineties, the deteriorationis sharper, combining the influence both of salaryrevision and interest payments which had risenfollowing the steadily rising fiscal deficit combined withthe rising cost of borrowing in the nineties.
As already mentioned, the ratio of revenue to fiscaldeficit in UUP was 74.76 per cent in 1998-99, whichwas the highest among the NSC states in that year.The rising share of the claims on salaries, pensions andinterest payments in revenue expenditure rendered thestate’s financial position vulnerable. The outstandingliabilities of the state government show an explosivegrowth since 1999-00. It rose from a level of 38.31 percent of GSDP in 1998-99 to 53.76 per cent in 2003-04RE.
16.2.3 State Finances: Core Trends
Relative to GSDP, every major component of revenuereceipts, i.e., own tax revenues, central transfers, andown non-tax revenues fell during 1987-88 to 1999-00.This was accompanied by an unhealthy structural shiftin expenditure; while interest payments, pensions andsalary expenditures rose sharply, capital expenditure fell.
Since fiscal imbalance is the outcome of changes inrevenue and expenditure profiles, we now look at thesein terms of relevant aggregates. From 1987-88 to 1998-99, the revenues of the state relative to GSDP declinedby about three percentage points from 13.3 to 10.4 percent. There has been an improvement since then. Therevenue receipts in 2003-04 RE and 2004-05 BE areestimated at 14.2 and 14.3 per cent of GSDP. If actuallyrealised, these would be the highest levels of revenueeffort seen since 1987-88. The relevant magnitudes aregiven in Table 16.2. This improvement has been mainlydue a rise in own tax revenues and also due to themarginal increase in transfers from the Centre.
TABLE 16.1
Fiscal Imbalance: The Key Indicators
1987-88 1988-89 1989-90 1990-91 1991-92 1992-93 1993-94 1994-95 1995-96
Revenue Deficit -0.66 1.32 1.97 1.98 1.00 1.28 1.34 1.99 2.06Fiscal Deficit 2.64 3.92 4.73 4.94 3.92 4.69 3.68 4.73 3.85Primary Deficit 0.83 2.15 2.75 2.85 1.56 2.11 1.23 1.66 0.93Revenue Deficit/Fiscal Deficit -24.86 33.55 41.53 40.04 25.54 27.34 36.29 42.02 53.43Outstanding Debt* 29.53 29.02 30.59 31.26 31.41 33.15 33.96 34.20 34.54
1996-97 1997-98 1998-99 1999-00 2000-01 2001-02 2002-03 2003-04 RE 2004-05 BE
Revenue Deficit 2.34 3.16 5.31 4.12 3.73 3.54 2.52 8.72 2.15Fiscal Deficit 4.38 5.17 7.11 6.31 5.87 5.51 4.68 8.93 4.04Primary Deficit 1.39 1.97 3.74 2.58 1.76 1.15 1.20 4.21 -0.42Revenue Deficit/Fiscal Deficit 53.38 61.03 74.76 65.35 63.42 64.25 53.88 97.67 53.15Outstanding Debt* 33.75 36.05 38.31 45.68 43.85 48.78 50.04 53.76 51.75
Source (Basic Data): Finance Accounts of Uttar Pradesh & Budget Document (2004-05) of Uttar Pradesh.
Note: * Includes Reserve Fund and Deposits.
FIGURE 16.2
Revenue Deficit as % to Fiscal Deficit
(Per Cent to GSDP)
-40.00-20.00
0.0020.0040.0060.0080.00
100.00120.00
1987
-88
1988
-89
1989
-90
1990
-91
1991
-92
1992
-93
1993
-94
1994
-95
1995
-96
1996
-97
1997
-98
1998
-99
1999
-00
2000
-01
2001
-02
2002
-03
2003
-04R
E
2004
-05
BE
Year
Per
Cen
t

UTTAR PRADESH DEVELOPMENT REPORT—VOL. 2484
During 1987-88 to 1998-99, the general fall inrevenue receipts was accompanied by a rise inexpenditure from 16.16 per cent of GSDP in 1987-88 to18.45 per cent in 1999-00. Within this margin ofincrease in the ratio of aggregate expenditure to GSDP,a large structural change needs to be highlighted. Thisrelates to committed expenditures like interestpayments, pensions and salaries, which increased, andcapital expenditure, and non-interest and non-pensionrevenue expenditures, which fell. Most of the increasewas due to only two components of expenditure,namely, interest payments and pensions, which wentup respectively by margins of 1.81 and 0.86 percentagepoints of GSDP between 1987-88 to 1999-00. On theother hand, capital expenditure became a casualty of theadjustment process, falling from 3.56 to 2.34 per centof GSDP over 1987-88 to 1999-00, a decline of 1.22
percentage points. In 2003-04 RE, the revenueexpenditure increased sharply from 16.1 per cent ofGSDP to 22.9 per cent. This was due partially to a risein interest payments from 3.5 percent of GSDP in 2002-2003 to 4.7 per cent in 2003-04 RE. Pension paymentsalso increased from 1.4 to 1.6 per cent of GSDPbetween these years. A larger part of the increase wasdue, however, to adjustments in the power sectorinvolving writing off and securitisation of debt inrespect of the power sector entities. Appendix A-16.5gives details of power sector restructuring in UttarPradesh.
The structural changes in the fiscal profile of UttarPradesh are summarised in Table 16.3 where acomparison is made in respect of selected fiscalaggregates, considered relative to GSDP, in 2004-05
TABLE 16.2
State Finance of Uttar Pradesh: An Overview
1987-88 1988-89 1989-90 1990-91 1991-92 1992-93 1993-94 1994-95 1995-96
Revenues 13.25 11.69 11.93 12.76 12.49 13.85 12.87 12.20 12.78
Own Tax Revenues 5.18 4.50 4.67 5.10 4.84 4.92 4.80 4.84 4.81
Own Non-tax Revenues 1.02 0.93 0.87 0.62 0.61 0.88 0.77 0.79 1.51
Share in Central Taxes 4.70 3.88 4.41 3.75 3.81 4.33 4.16 3.95 4.48
Grants 2.36 2.39 1.97 3.29 3.24 3.73 3.15 2.62 1.98
Contra Entries 0.63 0.61 0.69 0.63 0.89 0.92 1.23 1.08 0.60
Expenditures 16.16 16.00 16.73 18.29 16.67 18.63 16.69 17.76 16.76
Revenue Expenditure of which: 12.60 13.01 13.90 14.74 13.49 15.14 14.21 14.19 14.84
Interest Payment 1.81 1.77 1.99 2.09 2.37 2.58 2.45 3.06 2.92
Pension 0.31 0.33 0.33 0.37 0.41 0.60 0.49 0.49 0.64
Capital Expenditure (Net) of which: 3.56 2.99 2.84 3.55 3.18 3.50 2.48 3.57 1.93
Capital Outlay 2.76 2.03 1.85 1.90 0.99 1.61 1.10 1.11 0.99
Net Lending 0.53 0.57 0.91 1.07 1.93 1.80 1.24 1.63 0.80
1996-97 1997-98 1998-99 1999-00 2000-01 2001-02 2002-03 2003-04 RE 2004-05 BE
Revenues 11.55 11.76 10.39 11.99 13.41 13.31 13.52 14.21 14.32
Own Tax Revenues 4.64 4.78 4.83 5.34 6.78 5.48 6.29 6.03 6.26
Own Non-Tax Revenues 0.73 0.64 0.67 0.92 0.82 0.69 0.75 0.65 0.57
Share in Central Taxes 4.51 4.90 3.56 4.25 4.28 5.40 5.34 5.47 5.80
Grants 1.67 1.44 1.32 1.48 1.53 1.74 1.14 2.05 1.68
Contra Entries 0.24 0.24 0.23 0.22 0.25 0.26 0.19 0.17 0.15
Expenditures 16.10 17.15 17.96 18.45 19.45 19.01 18.31 28.80 18.61
Revenue Expenditure of which: 13.89 14.91 15.70 16.12 17.14 16.85 16.05 22.93 16.46
Interest Payment 2.99 3.20 3.37 3.72 4.12 4.36 3.48 4.72 4.46
Pension 0.66 0.72 1.09 1.17 1.19 1.27 1.36 1.56 1.61
Capital Expenditure (Net) of which: 2.21 2.24 2.26 2.34 2.31 2.16 2.27 5.87 2.15
Capital Outlay 1.06 1.14 1.28 1.44 1.80 1.88 1.87 5.20 1.90
Net Lending 0.99 0.88 0.51 0.75 0.34 0.09 0.29 -4.99 -0.01
Source (Basic Data): Finance Accounts of Uttar Pradesh and Budget Document (2004-05) of Uttar Pradesh.
(Per Cent to GSDP)

Chapter 16 • STATE FINANCES 485
BE and three benchmark years, viz., 1987-88, 1990-91and 1999-00. Except for non-tax revenues, theresultant structural changes are the same in the twocomparisons. Compared to 1990-91, the emergentpicture indicates that:
1. Own tax revenues declined over the years butreached the same level as in 1990-91.Throughout 2000-01 to 2004-05 BE (except2001-02), the tax-GSDP ratio remained abovesix per cent of GSDP. This represents asignificant improvement in Uttar Pradesh’s tax-GSDP ratio.
2. Own non-tax revenues increased by 0.30percentage points (although compared to 1987-1988, this shows a fall of 0.10 percentagepoints); own non-tax revenue fell as apercentage of GSDP in recent years afterreaching a peak in 2001-02.
3. Central transfers fell by 1.31 percentage points.
4. Interest payment increased by 1.63 percentagepoints during 1990-91, and 1999-00 andcontinued to rise reaching a level of 4.5 percent in 2004-05 BE.
5. Pensions increased by 0.80 percentage pointsduring 1990-91 to 1999-00, and have continuedto rise as a percentage of GSDP.
6. Capital expenditure fell by 1.22 percentage pointsbetween 1990-91 and 1999-00. In 2004-05 BEthese are estimated at 2.15 per cent of GSDP.
7. Revenue deficit increased by 2.14 percentagepoints in 1999-00 (by 4.78 percentage points ascompared to 1987-88).
8. Fiscal deficit increased by 1.37 percentagepoints in 1999-00 (3.67 w.r.t. 1987-88); it hascome down in recent years (except 2003-04)and was estimated at 4.0 per cent of GSDP in2004-05.
9. Outstanding debt rose by 14.41 percentagepoints between 1990-91 to 1999-00. It hascontinued to rise since then.
Since 1999-00 and up to 2002-03, one notablechange is the improvement in own tax revenues at 6.3per cent of GSDP. On the side of expenditure, in totalexpenditures, no significant change is noticeable.Although interest payments fell in 2002-03, these areestimated to rise again in 2004-05.
Thus, the profile of the major fiscal aggregates over1987-88/1990-91 to 1998-99 reveals falling: (i) own taxrevenues; (ii) non-tax revenues; (iii) capital expendituresrelative to GSDP, accompanied by rising; (iv) interestpayments; (v) pensions; (vi) revenue deficit; (vii) fiscaldeficit; and (viii) outstanding debt. The picture since1999-00 shows improvement in own revenues, butexpenditures still show a rising trend. As a result,there is no improvement in fiscal imbalance. TheEleventh Finance Commission (EFC) had placed UttarPradesh among the five fiscally most vulnerable NSCstates. This picture has not changed for the better inrecent years. The superimposition of cyclical phases on
TABLE 16.3
Fiscal Profile of Uttar Pradesh: Summary of Structural Changes (During 1999-2000 to 2002-03)
1987-88 1990-91 1999-00 1999-00 Minus 2002-03 2002-03 Minus
1987-88 1990-91 1999-00
Own Tax 5.18 5.10 5.34 0.17 0.25 6.29 0.95Revenues
Own Non- 1.02 0.62 0.92 -0.10 0.30 0.75 -0.16tax Revenues
Central Transfers 7.06 7.04 5.73 -1.33 -1.31 6.47 0.74
Interest Payment 1.81 2.09 3.72 1.92 1.63 3.48 -0.25
Capital 3.56 3.55 2.34 -1.23 -1.22 2.27 -0.07Expenditure
Revenue Deficit -0.66 1.98 4.12 4.78 2.14 2.52 -1.60
Fiscal Deficit 2.64 4.94 6.31 3.67 1.37 4.68 -1.63
Outstanding Debt* 29.53 31.26 45.68 16.15 14.41 50.04 4.37
Source (Basic Data): Finance Accounts of Uttar Pradesh and Budget Document (2004-05) of Uttar Pradesh.
Note: *Includes Reserve Fund and Deposits.
(Percentage Points w.r.t. GSDP)

UTTAR PRADESH DEVELOPMENT REPORT—VOL. 2486
long-term deterioration path may be attributed to one-time shocks of salary revisions twice (connected withFourth and Fifth Central Pay Commission Reports).The deterioration became sharper in the latter part ofthe nineties because of a rise in nominal interest rates.The long-term deterioration occurred because of higherinterest payments, higher pension liabilities, anddecline in the share of central transfers. We nowexamine the central problem in Uttar Pradesh’s statefinances, namely, the rise in debt and other liabilities.
16.2.4 Debt and Contingent Liabilities
Borrowing at ever-increasing costs, and using mostof it for current expenditures, led to high andunsustainable debt for UUP.
The effective interest rate obtained by dividinginterest payment by the outstanding liabilities at the endof the previous year shows the average cost ofborrowing. The cost of borrowing has steadily increasedfor the state until 1999-00. After that with a fall innominal interest rates in general and also partly due tothe debt swap scheme, there has been a decline in theaverage cost of borrowing. In more recent years, thedebt-swap extended by the Central government has alsohelped Uttar Pradesh with a reduction in its effectiveinterest rate. Table 16.4 shows that effective interest raterose from 8.61 per cent in 1987-88 to 13.48 per cent in1999-00. It has fallen since and was estimated to be
10.06 per cent in 2003-04 RE. However, going by the2004-05 BE, the effective interest rate will be as high as13.73 per cent. The fall in interest rates occurred in thecase of market borrowing as well as on central loans.The sharp increases in the interest rates in 1996-97 and1997-98, when the average cost of borrowing had become14.05 per cent and 15.69 per cent, are especially notable.
For many years, a double damage to UUP statefinances was caused due to the high cost borrowingand the use of these borrowings mostly for currentexpenditures. As shown in Table 16.2, a growingproportion of fiscal deficit has been used for financingrevenue deficit, and correspondingly, a lower and lowerproportion of borrowed resources became available forcapital outlay and lending. The changing compositionof fiscal deficit is shown in Table 16.5.
We have noted in Table 16.3 that the debt-GSDPratio of UUP rose from 29.53 per cent in 1987-88 to45.68 per cent in 1999-00. It rose further to 53.76 percent of GSDP by 2003-04 RE. As an undivided state, ithad the fifth highest debt-GSDP ratio among the NSCstates after Orissa (37.79 per cent), Punjab (34.58 percent), Goa (34.21 per cent), and Bihar (33.14 per cent)at the end of 1998-99 as per the Eleventh FinanceCommission (EFC) report. The new Uttar Pradesh alsohas one of the highest debt-GSDP ratios among thegeneral category states.
TABLE 16.4
Effective Rate of Interest: Selected Debt Instruments
1987-88 1988-89 1989-90 1990-91 1991-92 1992-93 1993-94 1994-95 1995-96
Internal Debt of the State 11.83 10.72 10.33 9.20 11.08 10.14 5.37 15.95 11.03GovernmentMarket Borrowing 8.20 11.27 11.23 9.78 11.67 10.13 4.71 17.62 11.05Loans and Adv. from the 7.28 7.75 8.33 8.92 9.73 9.97 10.48 11.06 11.43Central GovernmentSmall Savings, Provident 10.47 9.87 10.29 11.99 10.76 11.52 10.69 11.17 11.18Funds, etc.Total 8.61 8.87 9.63 10.14 11.11 11.43 10.35 13.40 12.52
1996-97 1997-98 1998-99 1999-00 2000-01 2001-02 2002-03 2003-04 RE 2004-05 BE
Internal Debt of the 14.50 14.84 13.86 12.89 6.49 3.38 13.24 7.07 13.05State GovernmentMarket Borrowing 14.05 15.69 13.10 12.60 7.68 4.12 11.64 11.09 11.40Loans & Adv. from the 11.73 10.07 12.25 12.53 6.12 5.10 12.90 12.88 12.61Central GovernmentSmall Savings, Provident 11.55 20.44 12.48 11.29 5.62 5.01 8.76 8.74 14.86Funds, etc.Total 13.55 13.54 13.79 13.48 6.68 4.89 13.45 10.06 13.73
Source (Basic Data): Finance Accounts of Uttar Pradesh and Budget Document (2004-05) of Uttar Pradesh.

Chapter 16 • STATE FINANCES 487
TABLE 16.5
Composition of Fiscal Deficit: 1987-88 to 2004-05(Per Cent)
Years Capital Net Lending Revenue Total FiscalOutlay Deficit Deficit
1987-88 104.74 20.12 -24.86 100.001988-89 51.83 14.62 33.55 100.001989-90 39.16 19.31 41.53 100.001990-91 38.39 21.57 40.04 100.001991-92 25.16 49.29 25.54 100.001992-93 34.23 38.43 27.34 100.001993-94 29.98 33.73 36.29 100.001994-95 23.50 34.48 42.02 100.001995-96 25.78 20.79 53.43 100.001996-97 24.10 22.53 53.38 100.001997-98 22.01 16.95 61.03 100.001998-99 18.03 7.22 74.76 100.001999-00 22.83 11.83 65.35 100.002000-01 32.11 6.12 63.42 100.002001-02 35.87 1.62 64.25 100.002002-03 39.95 6.16 53.88 100.002003-04 RE 58.25 -55.92 97.67 100.00
2004-05 BE 47.04 -0.19 53.15 100.00
Source: Finance Accounts of Uttar Pradesh and Budget Document (2004-05) ofUttar Pradesh.
The change in the structure of public debt in UUPshowed a movement towards higher cost sources in thenineties away from borrowing from the centralgovernment and increasing dependence on marketborrowing and small savings and provident funds. Thestructure of liabilities as highlighted in Table 16.6shows a shift towards high cost market borrowing untilthe nineties. The recent lowering of interest rateswould help in easing out this burden, facilitated furtherby swapping high cost debt to the centre with newborrowing at a lower rate.
16.2.5 Decentralisation: Finances of Local Bodies
Effective decentralisation can help improve thequality of governance. GoUP should take urgent stepsto facilitate urban services and rural infrastructure.
Management of expenditure responsibilities could besignificantly improved by decentralising functions andfinancial activities to the local bodies. With the 73rdand 74th Amendments to the Constitution, themanagement of local body finances has become anintegral component of state finances. There are 59607Panchayati Raj Institutions (rural local bodies) and 689
TABLE 16.6
Structure of Outstanding Debt of the Central Government: 1987-88 to 2004-05(Per Cent)
1987-88 1988-89 1989-90 1990-91 1991-92 1992-93 1993-94 1994-95 1995-96
Internal Debt of the State Government 20.37 21.97 22.45 22.47 21.36 21.87 23.67 22.18 22.00
Market Borrowing 17.42 18.16 18.62 18.59 19.24 19.70 20.56 20.77 21.51
Ways and Means Advances 0.00 0.00 1.92 1.89 0.60 1.47 2.84 1.23 0.37
Others 2.84 3.72 1.84 1.94 1.42 0.61 0.18 0.15 0.10
Loans & Adv. from the Central 69.44 67.75 66.08 65.02 65.90 64.94 62.89 64.35 64.10Government
Small Savings, Provident Funds, etc. 10.19 10.28 11.47 12.50 12.74 13.19 13.44 13.47 13.90
Total 100.00 100.00 100.00 100.00 100.00 100.00 100.00 100.00 100.00
Other Obligations (including 18.98 18.85 20.17 20.63 21.31 22.20 21.25 22.97 23.67Reserve Funds and Deposits)
1996-97 1997-98 1998-99 1999-00 2000-01 2001-02 2002-03 2003-04 RE 2004-05 BE
Internal Debt of the State 23.40 22.49 23.95 32.73 36.55 41.95 46.00 56.82 59.53Government
Market Borrowing 21.60 21.55 21.47 19.21 21.90 22.16 23.34 0.00 0.00
Ways & Means Advances 1.25 0.00 1.17 3.42 0.09 1.06 -0.04 0.00 0.00
Others 0.52 0.92 1.29 10.09 14.54 18.72 22.70 0.00 0.00
Loans & Adv. from the Central 62.74 62.61 61.15 54.13 50.06 45.47 40.27 29.98 26.85Government
Small Savings, Provident Funds, etc. 13.86 14.90 14.90 13.14 13.39 12.58 13.73 13.20 13.62
Total 100.00 100.00 100.00 100.00 100.00 100.00 100.00 100.00 100.00
Other Obligations (including 24.54 24.24 22.48 18.94 23.03 23.73 22.63 23.22 22.20Reserve Funds and Deposits)
Source: Finance Accounts of Uttar Pradesh and Budget Document (2004-05) of Uttar Pradesh.
UTTAR PRADESH DEVELOPMENT REPORT—VOL. 2488
urban bodies, namely nagar palikas in Uttar Pradesh(Appendix A-16.16). Prior to the 73rd and 74thAmendments to the Constitution the state governmenthad been giving grants-in-aid to the third-tieradministrative units. The First State FinanceCommission set up in October 1994 reviewed theposition and reported that the system of passing onassistance through grants-in-aid was unsatisfactory.The Commission recommended that the local bodies begiven a regular share of taxes, duties, tolls and feeslevied by the state government, all pooled together. Theshare of urban local bodies was fixed at 7 per cent andthat of the Panchayati Raj Institutions at 3 per cent ofsuch pooled gross revenue. The inter se distributionamong them was to be on 80 per cent population and20 per cent area. The Commission also recommendedthat all outstanding loans and interest thereon shouldbe converted into grants.
The state government accepted the recommendationsbut stipulated that funds from taxes would be releasedtaking into account the performance profile of the localbodies. The recommendations of the First FinanceCommission were in force till March 2001. The SecondFinance Commission has also given its recommendationsnow.
The EFC made specific recommendations based upona formula of five variables with different weightsassigned (Appendix A-16.16). Based on these criteria,the EFC recommended grants-in-aid to be passed on tothe local bodies. At the same time, the EFC noted thatthe database as well as the maintenance of village levelrecords were not adequate and, therefore, earmarkedspecific funds amounting to Rs. 7184.47 lakhdistributed to the panchayats and municipalities as ‘firstcharge’ out of the grants recommended. Details aregiven in Appendix A-16.16.
16.2.6 Summary
The central problem in Uttar Pradesh’s statefinances is accumulation of liabilities relative to GSDP.This itself is the result of large primary deficits andincreasing interest payments. The accumulatedliabilities have resulted in a vicious circle, where fiscalimbalance and higher debt accumulations leads to largerfiscal imbalance. The Uttar Pradesh Governmentenacted a Fiscal Responsibility and Budget ManagementAct (FRBM) in 2004 with a view to controlling thegrowth in debt and eliminating revenue deficit. In thenext chapter, we consider in detail, the revenue profileof the state, tax and non-tax. Own revenue performance
is the key to effective reduction in fiscal imbalance andfor honouring the enacted FRBM.
While in this section, we provided an overview ofthe fiscal profile of UUP, some of the importantdeterminants of the deteriorating fiscal position will beconsidered in the subsequent sections. In the nextsection, we consider the tax and non-tax revenues ofUUP in greater detail.
16.3 Revenue Receipts: Tax and Non-tax
16.3.1 Tax Revenues: Recent Improvements
The buoyancy of own tax revenues is close to 1.Relative to other NSC states, the tax-GSDP ratio inUttar Pradesh shows scope for augmentation. However,with sales tax constituting the core of state taxes,there is a marked growth in revenues in the recentpast, following the introduction of uniform floor rates.Services and agriculture are under-taxed.
On the interstate ladder of tax-GSDP ratios a groupof 15 general category states, considering the averageover the period 2000-01 to 2002-03, Uttar Pradesh isthe fourth lowest in relative ranking with Orissa, Biharand West Bengal constituting the tail end. The growthrates year-wise and trend growth rate (TGR) of themain state taxes are shown in Table 16.7.
For the period prior to reorganisation, the TGR oftotal own tax revenues was 13.74 over 1987-88 to 1999-2000. There is also considerable volatility in the year-to-year growth in almost all taxes. The TGR for salestax is higher than the average TGR by a little less thanone percentage point. The TGRs of state excise dutiesand stamp duty and registration fees are also higherthan the TGR of aggregate own tax revenues. Incomparing growth rates in the period afterreorganisation, it should be noted that 2001-02 growthrates are negative due to the reorganisation of the stateand are not comparable with previous years or latteryears. The high growth rates in 2000-01 and 2002-2003are particularly noteworthy.
The structure of Uttar Pradesh’s economy has adirect bearing on its tax-GSDP ratio. With the shareof industry being below 20 per cent of GSDP in 1999-2000 (Appendix A-16.11), the tax base has beenuncomfortably narrow for commercial taxes. The shareof industry has fallen further in the subsequent years.The share of agriculture and allied activities was 35.8per cent in 1999-00. It has also fallen further to 31.6per cent by 2002-03. The share of the service sector

Chapter 16 • STATE FINANCES 489
has increased from about 43 per cent in 1993-94 tomore than 50 per cent in 2002-03. Both agricultureand services have remained under-taxed in UttarPradesh, as in most other states. Many agriculturalcommodities have enjoyed exemptions in sales tax.While the services represent a potential growth areafor taxation, its utilisation for a better tax yield woulddepend on how services are handled for taxation bythe central government and assignments are made tothe states under the amended Article 268A.
Table 16.8 gives the estimated buoyancies of majorcategories of tax revenues with respect to GSDP for twoperiods viz., 1987-88 to 1999-00 and 1987-88 to 2002-2003. For more recent years, annual buoyancies are alsogiven. The overall buoyancy of own tax revenues ismore than unity. Sales tax, stamp duty and registrationfees and state excise duties have buoyancies that aremarginally above unity. The central sales tax buoyancyis little less than one in 1987-88 to 2002-03. In thecase of other taxes, the buoyancies are rather low.
16.3.2 Own Tax Revenues
Sales tax predominates the profile of tax revenues,its relative importance has increased while that of stateexcise duties has gone down.
The structure of tax revenues has shifted towardssales tax due to the below unity buoyancies of othertaxes. There is a marginal improvement in the share ofstamp duties and registration fees during 2000-01 to2003-04 RE. Relative share of other taxes has gonedown substantially during the nineties. This trend hascontinued in the more recent years also (Table 16.9).
TABLE 16.7
Growth Rate of Tax Revenues
1988-89 1989-90 1990-91 1991-92 1992-93 1993-94 1994-95 1995-96 1996-97
State’s Own Tax Revenues 3.88 18.53 29.14 10.60 11.12 6.32 18.06 12.11 15.31
Sales Tax 14.27 22.67 25.65 12.98 6.45 6.34 21.23 13.87 17.07
State Excise Duties -31.55 24.80 71.70 -1.27 23.63 8.17 15.42 4.89 14.18
Taxes on Vehicles 75.74 -11.73 7.72 8.86 10.72 -4.34 9.71 16.10 11.22
Stamp Duty and 0.58 23.20 15.98 23.76 3.43 15.45 18.80 16.35 19.09Registration Fees
Other Taxes 23.70 1.32 4.08 10.68 20.88 -5.17 8.35 12.75 2.48
1997-98 1998-99 1999-00 2000-01 2001-02 2002-03 2003-04 RE 2004-05 BE TGR(1988-2000)
State’s Own Tax Revenues 10.97 13.03 18.85 30.50 -15.75 23.56 7.97 17.00 13.74
Sales Tax 13.30 13.28 14.39 19.99 0.73 15.59 6.69 18.41 14.56
State Excise Duties 6.14 16.18 30.34 5.28 -12.38 30.27 -0.20 17.65 14.36
Taxes on Vehicles 19.39 26.83 142.36 6.05 -7.37 23.02 -26.32 10.00 13.59
Stamp Duty and 9.25 7.93 14.13 7.83 12.56 45.43 7.28 14.98 14.62Registration Fees
Other Taxes 8.28 7.78 -15.95 332.04 -86.70 41.26 141.38 12.02 6.83
Source (Basic Data): Finance Accounts of Uttar Pradesh and Budget Document (2004-05) of Uttar Pradesh.
Note: TGR refers to trend growth rate for the period 1987-88 to 1999-00.
(Per Cent Per Annum)
TABLE 16.8
Buoyancy of State Taxes
W.r.t GSDP Annual Buoyancy
1987-88 to 1987-88 to 2001- 2002-1999-00 2002-03 02 03
Own Tax 1.011(36.01) 1.108(23.76) -3.74 3.13Sales Tax 1.091(55.86) 1.178(30.93) 0.63 3.41Central Sales Tax* 0.754(5.33) 0.994(6.041) -3.99 -13.20State Excise Duty 1.051(11.21) 1.093(15.15) -2.94 4.02Motor Vehicle Tax 0.979(5.66) 1.310(7.37) -1.75 3.06Stamp Duty and 1.072(38.54) 1.172(21.86) 2.98 6.03Registration FeeOther Taxes 0.525(12.52) 0.519(2.60) -20.57 5.48
Source (Basic Data): Finance Accounts of Uttar Pradesh.
Note: Figures within parentheses are t-values.
*Central Sales Tax was very low at Rs. 258 lakh for 2002-03. Thishas been excluded in the estimation of buoyancy.

UTTAR PRADESH DEVELOPMENT REPORT—VOL. 2490
The major problems in the case of sales taxes are:(i) levy of tax mostly at first point; (ii) extensiveevasion; (iii) undervaluation; (iv) problems related withconsignment transfers; (v) classification disputes; and(vi) multiplicity of tax rates. However, Uttar Pradesh,like other states, should also be embarking upon statelevel value added tax (VAT) replacing the existingcommercial taxes with effect from April 1, 2005. Withthe agreement among the states to eliminate incentives,reduce tax rates and implement the value added tax, thestate administration will have to gear up to exploit thefull potential of the state’s tax base. The major tasksahead include: (i) introduction of state level VAT;(ii) training of officials and dealers; (iii) coordinationwith other states introducing VAT; (iv) exhaustivecomputerisation; and (v) publicity.
The recently published White Paper on VATprepared on the basis of recommendations of theEmpowered Committee has suggested two core rates,viz., 4 and 12.5 per cent. Depending on the structure ofexemptions, and the number of commodities put underthe 4 and 12.5 per cent rates, the revenue impact ofVAT in Uttar Pradesh will be determined. The largerthe number of commodities placed under the higher
rate, particularly of high value added nature, the largerwould be the revenue benefit to the state. UttarPradesh should endeavour to develop such a structureover the medium term, where the exemptions and the 4per cent rate items are limited and most commoditiesare taxed at 12.5 per cent. A full-fledged informationsystem, encompassing trade flows among dealers andprocessing it for purposes of assessing proper taxliabilities and input tax rebates, needs to be established.
Experience in other states has shown that loweringof stamp duty rates can have a significant positiveimpact on tax revenue generated from this source,especially when accompanied by credible valuationprocedures of properties. In an earlier study, the UttarPradesh Resource Mobilisation and Taxation ReformsCommittee (1996) had observed that high rates ofstamp duty, complicated and non transparent system ofregistration, paucity of stamps, lack of rational andscientific system of valuation, requirement of largenumber of no objection certificates (NOCs) and absenceof efficient executive machinery are some of the reasonsfor extensive evasion and avoidance of stamp duty. Stateexcise duties are undoubtedly a potentially high-yielding source for larger revenue mobilisation.
TABLE 16.9
Structure of State’s Own Tax Revenues(Per cent)
1987-88 1988-89 1989-90 1990-91 1991-92 1992-93 1993-94 1994-95 1995-96
State’s Own Tax Revenues
Sales Tax (Excluding CST) 44.22 48.11 50.78 49.35 49.26 48.23 48.57 49.96 51.53
Central Sales Tax 3.75 4.66 3.84 3.79 5.03 3.77 3.45 3.45 2.72
State Excise Duties 24.85 16.37 17.24 22.92 20.46 22.76 23.16 22.64 21.19
Taxes on Vehicles 2.57 4.35 3.24 2.70 2.66 2.65 2.38 2.22 2.29
Stamp Duty and 12.59 12.19 12.67 11.38 12.73 11.85 12.87 12.95 13.44Registration Fees
Other Taxes 12.02 14.31 12.24 9.86 9.87 10.73 9.57 8.79 8.84
Total 100.00 100.00 100.00 100.00 100.00 100.00 100.00 100.00 100.00
1996-97 1997-98 1998-99 1999-00 2000-01 2001-02 2002-03 2003-04 RE 2004-05 BE
State’s Own Tax Revenues
Sales Tax (Excluding CST) 52.83 52.84 54.05 49.73 44.99 54.81 55.76 51.86 52.61
Central Sales Tax 2.25 3.39 2.30 4.51 4.88 4.82 0.02 3.26 3.18
State Excise Duties 20.98 20.06 20.62 22.62 18.25 18.98 20.01 18.49 18.60
Taxes on Vehicles 2.21 2.38 2.67 5.45 4.43 4.87 4.85 3.31 3.11
Stamp Duty and 13.88 13.66 13.04 12.53 10.35 13.83 16.28 16.17 15.89Registration Fees
Other Taxes 7.85 7.66 7.31 5.17 17.11 2.70 3.09 6.90 6.61
Total 100.00 100.00 100.00 100.00 100.00 100.00 100.00 100.00 100.00
Source (Basic Data): Finance Accounts of Uttar Pradesh and Budget Document (2004-05) of Uttar Pradesh.

Chapter 16 • STATE FINANCES 491
16.3.3 Non-tax Revenues: Overall Stagnationbut Some Recent Gains
Rate revisions led to gains in the royalties onminerals in recent years, but revenue from forestsdeclined sharply in relative terms. With most forestsfalling on the side of Uttaranchal, forestry would nomore be a significant source of non-tax revenue forUttar Pradesh.
There are four non-tax revenue sources, whichtogether account for 64 per cent of the total non-taxrevenues. These are: interest receipts, receipts from thegeneral services, receipts from education, sports, andculture in social services, and receipts from royaltiesfrom minerals in the category of economic services.Considered together, own non-tax revenues of UUPhave steadily fallen relative to GSDP, as alreadyindicated in Table 16.2. There is a relative fall in theratio even after the formation of a separate state.
Over 1987-88 to 1999-00, relating to UUP, interestreceipts grew at the TGR of 7.17 per cent and receiptsfrom education, sports, art and culture grew at theTGR of 14.9 per cent while revenues from major andmedium irrigation grew at a TGR of 7.72 per cent perannum (Table 16.10). After the formation of the newstate, the share of interest receipts in total non-taxrevenues has increased. Receipts from the generalservices showed a growth of above 7 per cent in 2002-2003, and mineral royalties including fees and rentsshowed a growth of above 41 per cent. In the case ofroyalties, this higher growth is the result of revision ofroyalty rates and payment of arrears. In fact, between1992-93 and 1993-94, and again between 1993-94 and1994-95, the amounts received had nearly doubled. Thistrend has continued in Uttar Pradesh.
The importance of forestry and wildlife, has comedown in Uttar Pradesh. Revenues from this source havecome down in absolute terms from Rs. 160.52 crore in1999-00 to about Rs. 86.27 crore in 2002-03. As aresult, the relative importance of this source in totalnon-tax revenues has gone down from 25.84 to 5.63 percent during 1987-88 to 2002-03. In the case of forestryand wildlife, revenues, just as in many other states,have stagnated after the Supreme Court decision linkingfelling of trees to scientific management of forests.Since most forests were in Uttaranchal, the remainingforests in Uttar Pradesh are likely to make only a smallcontribution to its non-tax revenues. The profile ofnon-tax revenues in terms of the relative shares of themajor sources and their respective growth rates aregiven in Table 16.10. It is also shown that the share of
interest receipts in non-tax revenues fell from 26.90 to8.71 per cent in 2002-03. Table 16.10 indicates that thelargest contribution to non-tax revenue is from theEconomic Services group. At the same time, SocialServices as a whole have recorded the highest trendgrowth rate (13.88 per cent) over the 13-year periodprior to reorganisation. The share of economic servicesin non-tax revenues has gone down in 2002-03 ascompared to 1999-00.
TABLE 16.10
Structure and Growth of Non-Tax Revenues
(in Per Cent)
Share TGR
1987- 1999- 2002- 1987-88 to88 00 03 1999-00
Interest Receipts 26.90 5.06 8.71 7.17Dividends and 0.91 0.36 0.51 5.45ProfitsGeneral Services 26.69 20.63 20.55 7.48Social Services 12.34 18.38 23.48 13.88of which:
Education, Sports, 5.39 8.51 16.67 14.89Art and CultureOthers 6.95 9.86 6.81 12.96
Economic Services 46.20 55.58 46.74 11.40of which:
Forestry and 25.86 9.93 5.63 3.68WildlifeMajor and 4.40 2.48 5.88 7.72Medium IrrigationMineral 1.09 11.14 16.94 41.06Concession Fees,Rents and RoyaltiesRoad and Bridges 1.99 1.50 1.17 9.05Others 12.86 30.52 17.11 10.55
Total Non-Tax 38983 161683 153156 12.76Revenue (Rs. Lakh)
Source (Basic Data): Finance Accounts of Uttar Pradesh.
Note: Interest receipts excludes contra entries in irrigation. Receipts fromlotteries are taken net of payments.
In the Economic Services group, while at thebeginning of the period, the sale of timber and otherforest produce contributed the largest share, by the endof 1993-94 the Mineral Concession Fees, Rents andRoyalties had become the largest contributor to non-taxrevenues. This may, in part, be due to certain discreterevisions in the royalty rates. In the Social Servicesgroup, Secondary Education has continued to be thelargest contributor in terms of fees collected.
Table 16.11 shows interest recoveries as percentageof loans and advances. Not only are the recovery rateslow, but these have also fallen over time. A similarpattern is indicated with reference to state government

UTTAR PRADESH DEVELOPMENT REPORT—VOL. 2492
TABLE 16.12
Revenue Expenditure and Receipts from General and Social Services(Rs. Crore)
Year General Services* Social Services
Expenditure Receipts Ratio of Receipt to Expenditure Receipts Ratio of ReceiptExpenditure (Per Cent) to Expenditure
(Per Cent)
1987-88 927.58 104.03 11.215 1766.48 48.12 2.7241988-89 1144.16 158.68 13.869 2200.11 39.80 1.8091989-90 1529.30 193.26 12.637 2905.25 89.47 3.0801990-91 1746.60 211.62 12.116 3392.91 69.71 2.0551991-92 2067.51 463.51 22.419 3441.38 94.43 2.7441992-93 2474.09 605.19 24.461 4047.64 153.25 3.7861993-94 2946.47 855.21 29.025 4053.08 64.29 1.5861994-95 3387.04 1034.10 30.531 4681.25 81.97 1.7511995-96 4099.84 1318.69 32.164 5499.08 101.55 1.8471996-97 3363.93 193.69 5.758 6374.19 142.54 2.2361997-98 4056.85 191.74 4.726 7501.42 166.03 2.2131998-99 4194.87 333.42 7.948 8882.30 221.77 2.4971999-00 4843.70 333.37 6.883 8677.02 297.13 3.4242000-01 5539.37 261.72 4.725 9217.96 325.63 3.5332001-02 5566.68 333.60 5.993 9336.59 283.24 3.0342002-03 5772.03 314.77 5.453 10308.04 359.63 3.4892003-04 RE 6374.42 413.53 6.487 11813.76 272.81 2.3092004-05 BE 7667.45 498.93 6.507 11574.73 180.85 1.562
Source (Basic Data): Finance Accounts of Uttar Pradesh and Budget Documents (2004-05) of Uttar Pradesh.
Note: *Excluding Interest Payments (2049) and Pension & Other Retirement Benefits (2071). These two together have increased from Rs. 814 crore in1987-88 to Rs. 15619.84 crore in 2004-05.
TABLE 16.11
Recovery of Interest on Loans and Advances and Dividend Returns on Equity Investments of theGovernment of Uttar Pradesh
(Rs. Crore)
Year Loans and Interest Receipts* Interest Receipts as % of Equity Invested Dividend Received Dividend as % ofAdvances Loans and Advances Equity Investment
1 2 3 4=3/2 5 6 7= 6/5in % in %
1987-88 4763.20 104.88 2.202 1083.15 0.77 0.071
1988-89 4967.09 23.81 0.479 1214.77 0.19 0.016
1989-90 5230.59 52.14 0.997 1376.38 0.02 0.002
1990-91 5709.90 56.46 0.989 1396.03 0.28 0.020
1991-92 6371.61 38.00 0.596 1427.34 0.45 0.031
1992-93 7769.85 103.40 1.331 1691.99 3.15 0.186
1993-94 9195.85 69.80 0.759 1711.16 2.66 0.156
1994-95 10263.79 138.73 1.352 1994.92 2.23 0.112
1995-96 11907.36 154.70 1.299 2027.94 0.23 0.011
1996-97 12817.95 150.41 1.173 2112.48 0.37 0.018
1997-98 14159.60 133.18 0.941 2367.87 0.05 0.002
1998-99 15444.01 56.25 0.364 2357.72 4.46 0.189
1999-00 17596.20 81.77 0.465 2413.59 5.05 0.209
2000-01 18218.86 66.53 0.365 3962.89 6.27 0.158
2001-02 18379.63 59.15 0.322 4033.27 6.24 0.155
2002-03 18964.83 133.45 0.704 9049.70 7.26 0.080
Source (Basic Data): Finance Accounts of Uttar Pradesh.
Note: *Interest receipts excludes contra entries.

Chapter 16 • STATE FINANCES 493
investments. State government investment in UUPmore than doubled between 1987-88 and 1999-00.There has also been an increase after the formation ofUttar Pradesh. The dividend receipts have beenextremely volatile up to 1997-98 but thereafter therehas been a steady increase. However the rates of returnon the equity invested, even in the best year (1999-00)is less than 0.2 per cent (it being less than 0.1 per centin most years between 1987-88 and 1998-99) indicatingan extremely low rate of return. The government ofUttar Pradesh has recently decided to control and abolishbudgetary support to state government undertakings.
An analysis of the revenue receipts relative tocurrent costs (revenue expenditure) in General (otherthan interest payments and pensions), Social andEconomic Services (Tables 16.12 and 16.13) reveals thatwhile there had been some improvement in this ratio inthe early nineties, the effort seems to have lost steamby the middle of the decade. In fact, for all the broadservices aggregates, this ratio had fallen to below 1987-1988 levels, showed some signs of recovery in 1999-00but thereafter the trend seems mixed.
It is thus clear that not only a significant portion ofcurrent costs remain unrecovered, but also the relevantpercentage of recovery has steadily come down over the
years, pointing out to the growth of expenditureswithout corresponding growth in non-tax revenues.This necessitates an examination of implicit subsidies,which is discussed in a later section (16.3.4).
16.3.4 Resource Transfers from the Centre:Debilitating Fall
Resource transfers from the Centre to UUP fellsignificantly both because transfers relative to GDP fellfor all states, and also the share of UUP in the transferto states fell during the nineties. There has been someimprovement in recent years.
As given earlier in Table 16.2, resource transfersfrom the Centre to Uttar Pradesh fell during the periodunder review. Table 16.14 shows that the share of UUPin total central transfers to states fell from 14.42 percent in 1987-88 to 12.30 per cent in 1998-99 after apeak in 1992-93 at 16.56 per cent. It marginallyincreased to 13.75 per cent in 1999-00. It reached 14per cent in 2001-02 but declined to below 13 per centin the subsequent year. In 2003-04 RE, it is estimatedto improve to 14.5 per cent. Disaggregation into thecomponents of central transfers reveals that thecontribution of share in central taxes has increasedwhile that of grants has declined. This is due to the
TABLE 16.13
Revenue Expenditure and Receipts on Economic Services(Rs. Crore)
Year Economic Services Total Services*
Expenditure Receipts Ratio of Receipt to Expenditure Receipts Ratio of ReceiptExpenditure (Per Cent) Expenditure (Per Cent)
1987-88 1513.98 180.10 11.896 4208.04 332.25 7.8961988-89 1904.34 253.20 13.296 5248.61 451.68 8.6061989-90 1966.73 258.04 13.120 6401.23 540.77 8.4481990-91 2762.80 192.22 6.957 7902.30 473.55 5.9931991-92 2711.14 222.59 8.247 8220.03 781.53 9.5081992-93 3411.20 341.24 10.004 9932.93 1099.68 11.0711993-94 3517.58 438.37 12.462 10517.13 1357.87 12.9111994-95 3503.74 390.47 11.144 11572.03 1506.54 13.0191995-96 3634.84 511.87 14.082 13233.76 1932.11 14.6001996-97 4216.14 495.66 11.756 13954.26 831.89 5.9621997-98 4276.24 443.14 10.363 15834.51 800.91 5.0581998-99 4820.77 481.41 9.986 17897.94 1036.60 5.7921999-00 5752.35 898.55 15.621 19273.07 1529.05 7.9342000-01 5572.03 822.69 14.765 20329.35 1410.04 6.9362001-02 5349.73 620.33 11.596 20253.00 1237.17 6.1092002-03 5883.21 715.84 12.167 21963.27 1390.23 6.3302003-04 RE 18878.24 736.17 3.900 37066.42 1422.51 3.8382004-05 BE 6461.62 728.53 11.275 25703.81 1408.31 5.479
Source (Basic Data): Finance Accounts of Uttar Pradesh and Budget Document (2004-05) of Uttar Pradesh.
Note: *Equals the sum of General [excluding Interest Payments (2049) and Pension & Other Retirement Benefits (2071)], Social and Economic Services.

UTTAR PRADESH DEVELOPMENT REPORT—VOL. 2494
fact that, while both shares in central taxes and centralgrants declined as a percentage of GSDP, the fall ingrants was steeper. While revenue augmentation willserve to restore Uttar Pradesh’s fiscal health,expenditure restructuring is also critically important asdiscussed in the next section.
16.4 Expenditures: Growth of CommittedExpenditures
16.4.1 Trends in Revenue Expenditures
Interest payments and pensions are growing muchfaster than GSDP and revenues. The share of economicservices in total revenue expenditure has fallen by morethan 10 percentage points during the nineties; and thatof social services, by a little more than 2 percentagepoints.
The structure of revenue expenditures hasundergone a significant change during 1987-88 to2002-03. In considering the expenditure trends, it isappropriate to consider the period up to 1999-00,while Uttar Pradesh was undivided as distinct fromthe period afterwards. As per the TGR estimated overthe period 1987-88 to 1999-00 (Table 16.15), interest
TABLE 16.14
Composition of Central Transfers(Per Cent)
1987-88 1988-89 1989-90 1990-91 1991-92 1992-93 1993-94 1994-95 1995-96
Central TransfersShare in Central Taxes 66.51 61.87 69.10 53.28 54.08 53.73 56.91 60.11 69.32Article 275(1) Grants 3.08 1.57 1.69 13.03 11.74 11.83 12.74 13.67 10.51Plan Grants 30.07 34.42 27.73 32.42 31.42 32.60 29.37 25.26 19.95Other Non-Plan Grants 0.34 2.14 1.48 1.26 2.76 1.84 0.98 0.96 0.21Total Grants 33.49 38.13 30.90 46.72 45.92 46.27 43.09 39.89 30.68Total Transfers (Rs. Crore) 2712 2882 3351 4371 5094 6369 6282 6626 7347Total Transfers/GSDP 7.06 6.27 6.39 7.04 7.04 8.06 7.30 6.57 6.46Share of Uttar Pradesh in all State 14.42 13.89 15.27 15.71 15.43 16.56 14.54 14.68 14.44Rev. Transfs.
1996-97 1997-98 1998-99 1999-00 2000-01 2001-02 2002-03 2003-04 RE 2004-05 BE
Central TransfersShare in Central Taxes 72.96 77.29 72.94 74.18 73.66 75.57 82.42 72.74 77.56Article 275(1) Grants 4.68 1.12 4.06 0.00 1.29 0.00 0.29 0.00 0.00Plan Grants 22.15 21.29 22.75 22.58 23.44 21.06 14.34 20.48 17.72Other Non-Plan Grants 0.22 0.30 0.26 3.24 1.61 3.36 2.95 6.78 4.72Total Grants 27.04 22.71 27.06 25.82 26.34 24.43 17.58 27.26 22.44Total Transfers (Rs. Crore) 8404 9281 7994 10082 10530 13475 13137 17205 19274Total Transfers/GSDP 6.18 6.34 4.88 5.73 5.82 7.14 6.47 7.53 7.48Share of Uttar Pradesh in all State 14.34 12.54 12.30 13.75 11.75 14.05 12.91 14.51 NARev. Transfs.
Source: Finance Accounts of Uttar Pradesh and Budget Document (2004-05) of Uttar Pradesh.
Indian Public Statistics 2003-04, Ministry of Finance, Department of Economic Affairs, Economic Division.
TABLE 16.15
Growth Profile of Revenue Expenditure:A Disaggregated Analysis
(Per Cent Per Annum)
Trend Growth Rates Annual Growth Rates1987-88 to 1999-00 2002-03*
General Services 18.64 -3.68Interest Payment 20.68 -14.12Pension 26.27 15.03Others 14.98 3.69Social Services 13.66 10.40Education 14.41 0.41Medical and Public 11.70 18.24HealthFamily Welfare 8.17 3.68Other Social Services 13.85 38.07Economic Services 10.65 13.07Irrigation 10.98 35.28Roads and Bridges 10.54 25.76Others 10.39 5.65C. & A. to Local Bodies 29.34 25.50Total Expenditure 15.19 3.99
Source: Finance Accounts of Uttar Pradesh and Budget Document (2004-05) ofUttar Pradesh.
Note: *Growth for 2001-02 is not relevant because the previous yearrelated to the old state for part of the year. Growth rate for 2003-2004 RE is also not comparable because of one-time adjustmentsin the power sector, both on the revenue and capital accounts.

Chapter 16 • STATE FINANCES 495
payments grew by about 21 per cent per annum,while pension payments grew by about 26 per centper annum on an average. Revenue expenditure oneducation grew by 14 per cent, while that on medicaland public health grew by about 12 per cent perannum. Expenditure on economic services grew at aTGR of about 11 per cent. The growth in expenditurewas thus dominated by the growth in interestpayments and pensions. There was a fall in thegrowth of interest payments after the bifurcation,because of a fall in the nominal interest rates. Thepre-emptive claims of committed expenditures of
TABLE 16.16
Changing Structure of Revenue Expenditure of Uttar Pradesh(Per Cent)
1987-88 1988-89 1989-90 1990-91 1991-92 1992-93 1993-94 1994-95 1995-96
General Services 34.94 34.19 35.81 34.22 37.80 37.42 38.53 42.76 46.06
Interest Payment 14.34 13.63 14.29 14.20 17.53 17.06 17.27 21.59 19.71
Pension 2.48 2.57 2.39 2.52 3.00 3.96 3.48 3.48 4.29
Others 18.12 18.00 19.13 17.50 17.26 16.40 17.78 17.69 22.07
Social Services 36.51 36.81 39.86 37.09 35.28 33.83 33.16 32.72 32.60
Education 19.78 21.26 25.57 22.99 20.62 20.95 19.29 20.04 20.05
Medical and Public Health 5.85 5.81 5.59 5.16 4.90 4.97 5.59 4.54 4.67
Family Welfare 2.16 1.98 1.80 1.63 1.49 1.20 1.96 1.73 1.29
Water Supply and Sanitation 2.22 2.31 1.98 2.22 1.73 1.48 1.58 1.58 1.52
Other Social Services 6.50 5.44 4.91 5.08 6.52 5.23 4.74 4.83 5.06
Economic Services 27.35 28.33 23.83 27.52 25.12 26.72 26.45 22.85 19.71
Irrigation 6.05 5.95 5.93 4.78 5.69 6.28 5.81 6.43 5.96
Roads and Bridges 2.10 2.46 1.71 2.14 2.09 1.66 2.43 1.89 1.57
Others 19.21 19.92 16.19 20.60 17.34 18.78 18.21 14.54 12.18
C. & A. to Local Bodies 1.20 0.67 0.51 1.16 1.80 2.03 1.85 1.66 1.62
Total Expenditure 100.00 100.00 100.00 100.00 100.00 100.00 100.00 100.00 100.00
1996-97 1997-98 1998-99 1999-00 2000-01 2001-02 2002-03 2003-04 RE 2004-05 BE
General Services 44.07 44.86 44.73 47.46 49.57 50.89 47.31 39.26 54.43
Interest Payment 21.51 21.47 21.46 23.11 24.38 25.86 21.43 20.42 26.82
Pension 4.74 4.82 6.95 7.27 7.08 7.52 8.35 6.77 9.68
Others 17.82 18.57 16.32 17.08 17.12 17.51 17.52 12.07 17.92
Social Services 33.76 34.34 34.56 30.60 30.15 29.37 31.29 22.38 27.05
Education 20.52 19.21 22.30 20.15 20.02 19.01 18.42 12.62 15.30
Medical and Public Health 4.57 5.03 3.96 3.72 3.74 3.43 3.92 3.07 3.89
Family Welfare 1.55 1.48 0.84 0.76 0.87 0.83 0.83 0.98 1.27
Water Supply & Sanitation 1.59 2.42 1.54 1.10 0.98 1.52 0.82 1.33 1.23
Other Social Services 5.54 6.20 5.92 4.87 4.54 4.57 7.31 4.38 5.37
Economic Services 20.59 17.97 17.31 18.90 16.73 15.54 16.90 35.29 14.34
Irrigation 5.86 4.79 4.11 2.72 2.88 2.73 3.55 1.29 1.66
Roads and Bridges 1.56 1.41 1.23 1.53 1.73 1.71 2.07 1.03 1.22
Others 13.18 11.77 11.97 14.64 12.12 11.10 11.28 32.97 11.46
C. & A. to Local Bodies 1.58 2.83 3.40 3.04 3.55 2.96 3.58 2.62 3.45
Total Expenditure 100.00 100.00 100.00 100.00 100.00 100.00 100.00 100.00 100.00
Source: Finance Accounts of Uttar Pradesh and Budget Documents.
interest payments and pensions is also clearlybrought out by the changes in the structure ofrevenue expenditure indicated in Table 16.16. Theshare of interest payment in total revenueexpenditure increased from about 14.2 per cent in1990-91 to more than 23 per cent in 1999-00, andthat of pensions increased from 2.52 per cent to morethan 7 per cent, during the same period.Correspondingly, the shares of social services andeconomic services have both gone down, the latter bya much larger margin of about 10 percentage points.

UTTAR PRADESH DEVELOPMENT REPORT—VOL. 2496
There is sharp increase in the ratio of interestpayment to total revenue expenditure in post-divisionyears. By 2001-02, it had increased to about 26 percent. After some decline, it is estimated at about 27 percent in 2004-05 BE. This together with a pensionpayment of 9.7 per cent, nearly 37 per cent of therevenue expenditure is claimed by interest paymentsand pensions only.
However, as shown in Figure 16.3, the ratio ofinterest payment to revenue deficit in Uttar Pradesh islower than that of a number of the NSC states. Figure16.4 shows plan expenditure as a percentage of planoutlay for Uttar Pradesh relative to other NSC states.Uttar Pradesh’s performance is shown to be worse thanstates like Andhra Pradesh, Tamil Nadu, West Bengaland Kerala but better than most other NSC states.
16.4.2 Capital Expenditures: Steady Fall
The burden of adjustment of falling revenue receiptsfell significantly on capital expenditures, which havesteadily declined relative to GSDP. Most of this declinewas in capital outlay.
In the pre-division years, capital expenditure as a percent of GSDP declined from 3.51 to 2.19 during 1987-1988 to 1999-00. Most of this decline was in capital
outlay that fell from 2.72 per cent of GSDP in 1987-88to 1.35 per cent in 1999-00 (Table 16.2). Table 16.17shows year-wise growth rates for different componentsof capital expenditure indicating considerable volatility.The TGRs over 1987-88 to 1999-00 show that thecapital outlays grew sluggishly as compared to theother components. In considering growth rates in thepost-division years, growth rates in 2003-04 RE jumpedup because of one time capital outlay as part of powersector restructuring. Even prior to that, capitalexpenditure shows volatile growth.
Table 16.18 shows changes in the composition ofcapital expenditure and highlights the fall in the share ofcapital outlay which declined from about 51.62 per centof total capital expenditure in 1987-88 to 42.67 per centin 1999-00. On the other hand, repayments continued toaccelerate claiming an increasing share of total capitalexpenditures and peaking in 1998-99 with a share of 63per cent in capital expenditure. This trend has beenfurther strengthened in the post-division years.
FIGURE 16.3
Interest Payment as % of Revenue Deficit: Uttar Pradeshin Comparison to NSC States
Wes
t B
enga
l
Utt
ar P
rade
sh
Tam
il N
adu
Raj
asth
an
Punj
ab
Ori
ssa
Mah
aras
htra
Mad
hya
Prad
esh
Ker
ala
Kar
nata
ka
Har
yana
Guj
arat
Goa
Bih
ar
And
hra
Prad
esh
Per
Cen
t
State
Source: Reserve Bank of India Bulletin, State Finances: A Study of Budgets,various years.
Source: Reserve Bank of India Bulletin, State finances: A Study of Budgets,various years.
20
40
60
80
100
120
140
160
FIGURE 16.4
Plan Expenditure as % to Plan Outlay: NSC States
Wes
t B
enga
l
Utt
ar P
rade
sh
Tam
il N
adu
Raj
asth
an
Punj
ab
Ori
ssa
Mah
aras
htra
Mad
hya
Prad
esh
Ker
ala
Kar
nata
ka
Har
yana
Guj
arat
Goa
Bih
ar
And
hra
Prad
esh
0
20
40
60
80
100
State
Per
Cen
t

Chapter 16 • STATE FINANCES 497
TABLE 16.18
Composition of Capital Expenditure(Per Cent)
1987-88 1988-89 1989-90 1990-91 1991-92 1992-93 1993-94 1994-95 1995-96
Capital Outlay 51.62 48.76 42.68 30.82 16.95 31.10 21.82 20.95 31.14
Loans and Advances 14.92 22.98 22.63 26.88 37.65 36.59 27.25 46.42 29.29
Repayment of Loans and 33.46 28.26 34.69 42.30 45.40 32.32 50.94 32.63 39.58Advances of which:
Central Loans 17.95 20.17 18.93 11.74 10.99 11.96 12.72 11.11 17.73
Internal Debt 15.51 8.09 15.75 30.55 34.41 20.36 38.22 21.52 21.84
Total 100.00 100.00 100.00 100.00 100.00 100.00 100.00 100.00 100.00
1996-97 1997-98 1998-99 1999-00 2000-01 2001-02 2002-03 2003-04 RE 2004-05 BE
Capital Outlay 35.99 33.22 21.05 42.67 52.49 50.62 37.76 55.04 43.51
Loans and Advances 39.30 32.10 16.08 26.54 14.76 7.49 8.00 7.04 5.70
Repayment of Loans and 24.72 34.68 62.87 30.80 32.75 41.89 54.23 37.92 50.80Advances of which:
Central Loans 18.81 17.42 10.04 18.90 24.57 20.40 36.20 31.93 37.70
Internal Debt 5.91 17.26 52.84 11.90 8.18 21.49 18.03 5.99 13.10
Total 100.00 100.00 100.00 100.00 100.00 100.00 100.00 100.00 100.00
Source: Finance Accounts of Uttar Pradesh and Budget Documents (2004-05) of Uttar Pradesh.
16.4.3 Plan Expenditure: High Revenue Intensity
High revenue intensity in plan expenditures of over65 per cent indicates that plan schemes have relativelylarge salary expenditure. At the same time, the share ofplan revenue expenditure has been falling in totalrevenue expenditure.
Trends in plan expenditure point out to twodisturbing features: (i) high and unacceptable revenue
TABLE 16.17
Growth of Capital Expenditure: A Disaggregated Analysis(Per Cent Per Annum)
1988-89 1989-90 1990-91 1991-92 1992-93 1993-94 1994-95 1995-96 1996-97
Capital Outlay -12.01 4.05 21.16 -39.39 77.98 -25.29 18.02 0.82 27.10
Loans and Advances 43.43 17.07 99.26 54.37 -5.72 -20.69 109.40 -57.20 47.56
Repayment of Loans and Advances -21.33 45.89 104.56 18.33 -30.95 67.87 -21.26 -17.73 -31.33
Capital Expenditure (Net of Rep.) 0.43 8.22 48.22 4.29 20.27 -22.80 68.77 -39.16 37.02
Total Capital Expenditure -6.85 18.86 67.76 10.23 -2.99 6.50 22.91 -32.17 9.97
1998-99 1999-00 2000-01 2001-02 2002-03 2003-04 RE 2004-05 BE TGR 1987-88to
1990-00
Capital Outlay 25.74 20.81 28.98 8.81 6.72 213.41 -58.87 7.29
Loans and Advances -0.62 -1.63 -41.70 -42.70 52.81 89.14 -57.90 12.73
Repayment of Loans and Advances 259.82 -70.80 11.50 44.29 85.20 50.33 -30.28 11.30
Capital Expenditure (Net of Rep.) 12.79 11.09 1.88 -2.49 12.66 191.68 -58.76 9.07
Total Capital Expenditure 98.45 -40.40 4.84 12.83 43.05 115.03 -47.96 10.31
Source (Basic Data): Finance Accounts of Uttar Pradesh and Budget Document (2004-05) of Uttar Pradesh.
intensity, and (ii) falling plan revenue expenditure asproportion of non-plan revenue expenditure (Figure16.5). In the post-division years, there has been a fallin the share of plan revenue expenditure to total planexpenditure. There has also been a fall in the ratio ofplan expenditure to non-plan revenue expenditure.Table 16.19 provides a profile of growth of plan andnon-plan revenue expenditures, as also plan capitaloutlay. The ratio of plan revenue expenditure to total

UTTAR PRADESH DEVELOPMENT REPORT—VOL. 2498
plan has also been indicated for the decade of thenineties and beyond. This ratio has been in the rangeof 62 to 72 per cent up to 1999-00. It may be recalledthat the desirable ratio is only 30 per cent in relationto which the grant–loan proportions of plan assistance
FIGURE 16.5
Trends in Plan Expenditure
Note: Series 1: Revenue Plan Expenditure as % of Total Plan Expenditure
Series 2: Plan Revenue Expenditure as % of Revenue Non-Plan Expenditure.
TABLE 16.19
Trends in Plan Expenditure in Uttar Pradesh(Rs. Crore)
Year Plan Revenue Non-Plan Revenue Plan Capital Total Plan Col. Plan Revenue Plan RevenueExpenditure Expenditure Outlay (2+4) Expenditure as Expenditure to
% of Total Plan Non-Plan Revenue (%)
(1) (2) (3) (4) (5) (6) (7)
1990-91 2267.03 7421.17 1035.65 3302.68 68.64 30.551991-92 1977.02 8422.18 809.67 2786.69 70.95 23.471992-93 2196.8 10493.94 1133.88 3330.68 65.96 20.931993-94 2285.72 10994.41 1000.44 3286.16 69.56 20.791994-95 2763.54 12660.12 1074.69 3838.23 72.00 21.831995-96 2524.44 15031.42 1168.39 3692.83 68.36 16.791996-97 3267.94 15939.76 1614.48 4882.42 66.93 20.501997-98 3262.62 18932.41 1455.64 4718.26 69.15 17.231998-99 3589.8 22485.05 2118.59 5708.39 62.89 15.971999-00 4090.39 24657.34 1976.44 6066.83 67.42 16.592000-01 3686.01 27346.6 2862.28 6548.29 56.29 13.482001-02 3564.66 28215.25 706.98 4271.64 83.45 12.632002-03 3574.82 29363.68 3361.38 6936.20 51.54 12.172003-04 RE 4627.49 48170.58 6041.25 10668.74 43.37 9.612004-05 BE 4364.69 38421.02 4725.52 9090.21 48.02 11.36TGR (1990-00) 7.835 14.206 9.728
Source: Reserve Bank of India Bulletin on State Finances (various issues).
were determined in the Gadgil Formula. In the post-division years, plan revenue intensity fell. It isestimated to be 48 per cent in 2004-05 BE. As such,there has been an improvement in the composition ofplan expenditure in the post-division years. The highrevenue-intensity only reflects the relatively large salaryexpenditures in the plan schemes. Table 16.19 alsoindicates that the TGR of plan revenue expenditure was7.84 per cent whereas that for non-plan revenueexpenditure was 14.21 per cent. It is because of themuch higher growth of the latter, that the ratio of planto non-plan revenue expenditure fell from 30.55 percent in 1990-91 to about 16 per cent in 1998-99. In1999-00, there was an improvement in this ratio, but itis still nearly 14 percentage points below that in 1990-1991.
16.4.4 Structure of Government Employment
Control on growth in number of governmentemployees will provide necessary reduction in growth ofcommitted expenditure that is needed for carrying fiscalcorrection required in the Fiscal Responsibility andBudget management Act (FRBMA).
Immediately prior to the bifurcation of the state,according to a statement brought out by the UttarPradesh Government, regarding approved posts and
0.0
1 0 .0
2 0 .0
3 0 .0
4 0 .0
5 0 .0
6 0 .0
7 0 .0
8 0 .0
9 0 .0
1990
-91
1991
-92
1992
-93
1993
-94
1994
-95
1995
-96
1996
-97
1997
-98
1998
-99
1999
-00
2000
-01
2001
-02
2002
-03
2003
-04
2004
-05
Y ear
Per
Cen
t
S e rie s1 Serie s2
Per
Cen
t
Year

Chapter 16 • STATE FINANCES 499
employees actually in position, as on April 1, 2000,there were 804480 approved posts and 687031 positionswere actually occupied. Table 16.20 below lists alldepartments where the number of approved positions ismore than 10000.
Table 16.20 indicates that in terms of actualemployees the highest percentage share is that of thehome department (police) followed by agriculture andallied activities, medical and public health, followed bythe revenue department. Irrigation also has a largeshare of about seven per cent. There is considerablevariation in the ratio of actual to approved employmentacross departments. The lowest of these ratios is forforestry and the highest is for the home department.
TABLE 16.20
Staff Strength in the Departments of StateGovernment as on April 1, 2000
Departments Approved Actuals Actuals Per Cent Per CentPer Cent Share in Share in
of Total TotalApproved Approved Number of
EmployeesActual
Home (Police) 187447 175619 93.690 23.30 25.56
Law and Justice 22810 20042 87.865 2.84 2.92
Revenue 78600 68207 86.777 9.77 9.93
Public Works 40386 35734 88.481 5.02 5.20
Education 37667 30135 80.004 4.68 4.39
Medical and 106965 89237 83.426 13.30 12.99Public Health
Agriculture and 145478 117948 81.076 18.08 17.17Allied Activities
Forestry 11797 8209 69.585 1.47 1.19
Irrigation 52841 45650 86.391 6.57 6.64
All Others 132286 104459 78.965 16.44 15.20
Total 804480 687031 85.401 100.00 100.00
Source (Basic Data): Uttar Pradesh Budget 2000-01, Volume 6.
A more recent data indicates that the total numberof approved posts, covering both gazetted and non-gazetted posts, as on April 1, 2003 in differentdepartments is 892839.
16.4.5 Subsidies as Unrecovered Costs
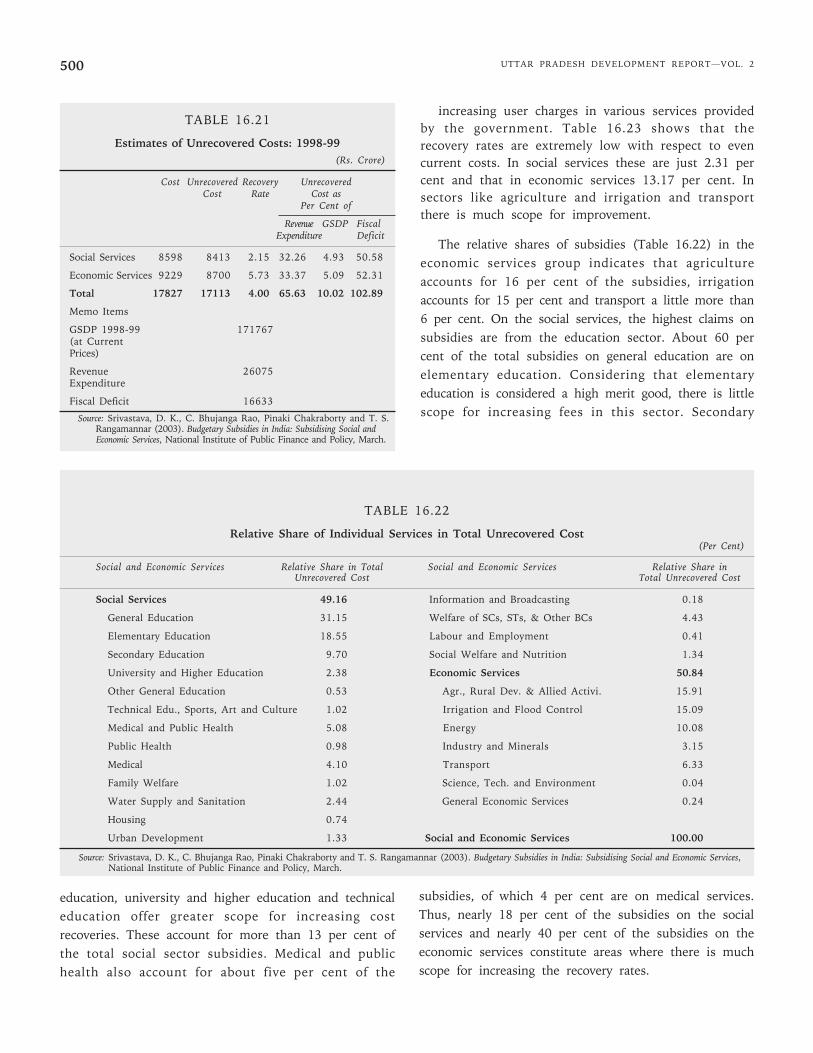
Cost recoveries are dismally low at 4 per cent ofestimated costs in social and economic services. Theestimated unrecovered costs amounted to 10 per cent of
GSDP in 1998-99. There is scope for increasing usercharges in various services provided by the government.
Although considerable subsidies are paid out, veryfew are shown explicitly in the state budget. In order toobtain an idea of unrecovered costs or implicit subsidies,we need to calculate the cost of providing services.
The state government provides an extensive range ofsocial and economic services, which are private in nature,some of which may have significant positive externalities,but the cost recoveries are dismally low. In calculating thecosts, a distinction is made between current costs andcapital costs. The current costs consist of the revenueexpenditure on a Major Head from which the followingitems are deducted: transfers to individuals and nettransfers to funds. The capital costs are annualised capitalcosts obtained by applying a depreciation rate along withthe effective cost of borrowing on capital assets indepartmental services and by applying the effective cost ofborrowing on accumulated equity investment and loansextended by the government. The methodology forestimating depreciation costs is given in Srivastava andAmar Nath (2001). An earlier NIPFP study, with 1993-94as the reference year, estimated that unrecovered costsamounted to 10.56 per cent of the GSDP for the state. Inthe present study, a similar estimate for 1998-99 showsunrecovered costs as a little less than 10 per cent per centof GSDP.
As shown in Table 16.21, the aggregate recovery rateis 4 per cent. The aggregate subsidies amount to a littlemore than Rs. 17100 crore which is 10 per cent ofGSDP and marginally less than 66 per cent of revenueexpenditure. This pertains to 1998-99 for which acomparative study of state level subsidies was done bythe NIPFP. Table 16.22 shows the relative share ofindividual services in total unrecovered costs. Thehighest share is in the education sector among thesocial services. In the economic services, agricultureand allied activities, irrigation and flood control, energyand transport are the main services responsible for thebulk of unrecovered costs.
A break-up of the total estimated subsidies indicatesthat more than 49 per cent of subsidies are in socialservices and 51 per cent in economic services. Therecovery rate in social services is 2.15 per cent whereasthat in the economic services was 5.73 per cent. Theserecovery rates are extremely low and indicate scope for
UTTAR PRADESH DEVELOPMENT REPORT—VOL. 2500
TABLE 16.21
Estimates of Unrecovered Costs: 1998-99(Rs. Crore)
Cost Unrecovered Recovery UnrecoveredCost Rate Cost as
Per Cent of
Revenue GSDP FiscalExpenditure Deficit
Social Services 8598 8413 2.15 32.26 4.93 50.58
Economic Services 9229 8700 5.73 33.37 5.09 52.31
Total 17827 17113 4.00 65.63 10.02 102.89
Memo Items
GSDP 1998-99 171767(at CurrentPrices)
Revenue 26075Expenditure
Fiscal Deficit 16633
TABLE 16.22
Relative Share of Individual Services in Total Unrecovered Cost(Per Cent)
Social and Economic Services Relative Share in Total Social and Economic Services Relative Share inUnrecovered Cost Total Unrecovered Cost
Social Services 49.16 Information and Broadcasting 0.18
General Education 31.15 Welfare of SCs, STs, & Other BCs 4.43
Elementary Education 18.55 Labour and Employment 0.41
Secondary Education 9.70 Social Welfare and Nutrition 1.34
University and Higher Education 2.38 Economic Services 50.84
Other General Education 0.53 Agr., Rural Dev. & Allied Activi. 15.91
Technical Edu., Sports, Art and Culture 1.02 Irrigation and Flood Control 15.09
Medical and Public Health 5.08 Energy 10.08
Public Health 0.98 Industry and Minerals 3.15
Medical 4.10 Transport 6.33
Family Welfare 1.02 Science, Tech. and Environment 0.04
Water Supply and Sanitation 2.44 General Economic Services 0.24
Housing 0.74
Urban Development 1.33 Social and Economic Services 100.00
increasing user charges in various services providedby the government. Table 16.23 shows that therecovery rates are extremely low with respect to evencurrent costs. In social services these are just 2.31 percent and that in economic services 13.17 per cent. Insectors like agriculture and irrigation and transportthere is much scope for improvement.
The relative shares of subsidies (Table 16.22) in theeconomic services group indicates that agricultureaccounts for 16 per cent of the subsidies, irrigationaccounts for 15 per cent and transport a little more than6 per cent. On the social services, the highest claims onsubsidies are from the education sector. About 60 percent of the total subsidies on general education are onelementary education. Considering that elementaryeducation is considered a high merit good, there is littlescope for increasing fees in this sector. Secondary
education, university and higher education and technicaleducation offer greater scope for increasing costrecoveries. These account for more than 13 per cent ofthe total social sector subsidies. Medical and publichealth also account for about five per cent of the
subsidies, of which 4 per cent are on medical services.Thus, nearly 18 per cent of the subsidies on the socialservices and nearly 40 per cent of the subsidies on theeconomic services constitute areas where there is muchscope for increasing the recovery rates.
Source: Srivastava, D. K., C. Bhujanga Rao, Pinaki Chakraborty and T. S. Rangamannar (2003). Budgetary Subsidies in India: Subsidising Social and Economic Services,National Institute of Public Finance and Policy, March.
Source: Srivastava, D. K., C. Bhujanga Rao, Pinaki Chakraborty and T. S. Rangamannar (2003). Budgetary Subsidies in India: Subsidising Social and Economic Services, National Institute of Public Finance and Policy, March.
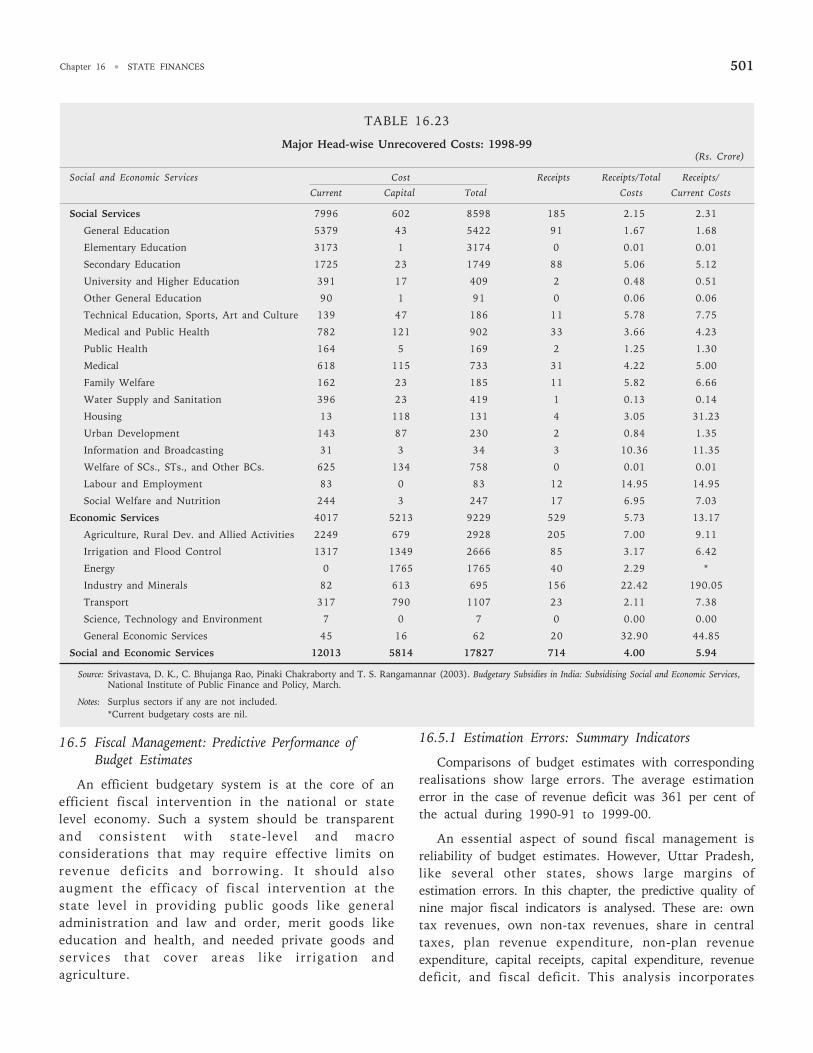
Chapter 16 • STATE FINANCES 501
TABLE 16.23
Major Head-wise Unrecovered Costs: 1998-99(Rs. Crore)
Social and Economic Services Cost Receipts Receipts/Total Receipts/
Current Capital Total Costs Current Costs
Social Services 7996 602 8598 185 2.15 2.31
General Education 5379 43 5422 91 1.67 1.68
Elementary Education 3173 1 3174 0 0.01 0.01
Secondary Education 1725 23 1749 88 5.06 5.12
University and Higher Education 391 17 409 2 0.48 0.51
Other General Education 90 1 91 0 0.06 0.06
Technical Education, Sports, Art and Culture 139 47 186 11 5.78 7.75
Medical and Public Health 782 121 902 33 3.66 4.23
Public Health 164 5 169 2 1.25 1.30
Medical 618 115 733 31 4.22 5.00
Family Welfare 162 23 185 11 5.82 6.66
Water Supply and Sanitation 396 23 419 1 0.13 0.14
Housing 13 118 131 4 3.05 31.23
Urban Development 143 87 230 2 0.84 1.35
Information and Broadcasting 31 3 34 3 10.36 11.35
Welfare of SCs., STs., and Other BCs. 625 134 758 0 0.01 0.01
Labour and Employment 83 0 83 12 14.95 14.95
Social Welfare and Nutrition 244 3 247 17 6.95 7.03
Economic Services 4017 5213 9229 529 5.73 13.17
Agriculture, Rural Dev. and Allied Activities 2249 679 2928 205 7.00 9.11
Irrigation and Flood Control 1317 1349 2666 85 3.17 6.42
Energy 0 1765 1765 40 2.29 *
Industry and Minerals 82 613 695 156 22.42 190.05
Transport 317 790 1107 23 2.11 7.38
Science, Technology and Environment 7 0 7 0 0.00 0.00
General Economic Services 45 16 62 20 32.90 44.85
Social and Economic Services 12013 5814 17827 714 4.00 5.94
Source: Srivastava, D. K., C. Bhujanga Rao, Pinaki Chakraborty and T. S. Rangamannar (2003). Budgetary Subsidies in India: Subsidising Social and Economic Services,National Institute of Public Finance and Policy, March.
Notes: Surplus sectors if any are not included.*Current budgetary costs are nil.
16.5 Fiscal Management: Predictive Performance ofBudget Estimates
An efficient budgetary system is at the core of anefficient fiscal intervention in the national or statelevel economy. Such a system should be transparentand consistent with state-level and macroconsiderations that may require effective limits onrevenue deficits and borrowing. It should alsoaugment the efficacy of fiscal intervention at thestate level in providing public goods like generaladministration and law and order, merit goods likeeducation and health, and needed private goods andservices that cover areas like irrigation andagriculture.
16.5.1 Estimation Errors: Summary Indicators
Comparisons of budget estimates with correspondingrealisations show large errors. The average estimationerror in the case of revenue deficit was 361 per cent ofthe actual during 1990-91 to 1999-00.
An essential aspect of sound fiscal management isreliability of budget estimates. However, Uttar Pradesh,like several other states, shows large margins ofestimation errors. In this chapter, the predictive quality ofnine major fiscal indicators is analysed. These are: owntax revenues, own non-tax revenues, share in centraltaxes, plan revenue expenditure, non-plan revenueexpenditure, capital receipts, capital expenditure, revenuedeficit, and fiscal deficit. This analysis incorporates

UTTAR PRADESH DEVELOPMENT REPORT—VOL. 2502
information up to 1999-00 for the calculation ofprediction errors. The latter years cannot be used becauseof non-comparability with the earlier years.
Often there are large divergences between budgetestimates, revised estimates and actuals. This is true ofcentral government as well as many state governments.Many a times, systematic biases of underestimation andoverestimation have been noted. Errors also creep inbecause of misprediction of the relevant economicprospects including that of GSDP growth as well asgrowth of central revenues. Improvement in thepredictive accuracy of budget estimates would makethese more reliable.
Two summary indicators are used to describepredictive accuracy on average over the period 1990-91 to1999-00. These are root mean square error (RMSQ) andTheil’s inequality coefficient (I). These are defined as:
RMSQ = [ (Pt – At)2/n]½
I = [ (Pt – At)2/ At2] ½
where P stands for budget estimates and A standsfor corresponding actuals.
Both indices use the square of the prediction errorimplying that overestimates and underestimates areconsidered equally bad. The Root Mean Square Error(RMSQ) shows the average size of the error, whetherpositive or negative, over the sample period. The ‘I’ co-efficient relates error to the actual level of realisations.The higher the magnitude of these summary statistics,the larger is the prediction error.
Table 16.24 gives the estimated values of thesesummary statistics describing prediction performanceover the nineties. Looking at the inequality coefficient,it would appear that the worst prediction is that of
revenue deficit, followed by fiscal deficit. The bestpredictions are those of tax revenues (own as well asshare in central taxes). The quality of estimating ownnon-tax revenues in relative terms is much worse.Details of estimates are given in Annexure A-16.13.
16.5.2 Analysis of Prediction Errors
There has generally been an underestimation ofrevenues on own tax and non-tax accounts up to 1996-97, and overestimation of non-plan expenditure up to1995-96. Some of these trends have been reversed inthe late nineties.
Cases where actuals turn out to be lower thanestimates are instances of overestimation. In thesecases, percentage errors would have a negative sign. Onthe other hand, cases where actuals are higher thancorresponding budget estimates, percentage errorswould appear with a positive sign. These are cases ofunderestimation. In comparative terms, estimation ofown non-tax revenue, plan revenue expenditure, capitalexpenditure and revenue deficit, suffer from large errorsin terms of deviations of actuals from budget estimatesas percentage of actuals. The direction of error inselected variables is summarised in Table 16.25 andAppendix A-16.13.
Predictability in the estimations of receipts andexpenditures, whether revenue or capital, has a salutaryeffect on the financial management of the government.Large deviations lead to inefficiencies in budgetmanagement and unnecessary recourse to ways andmeans advances.
TABLE 16.25
Observations on Nature of Errors
Own Tax Revenue Overestimation since 1997-98; inprevious years underestimation.
Own Non-tax Revenue Generally underestimation.Share in Central Taxes Generally underestimation.Plan Revenue Expenditure Almost always overestimated; large
margins of error after 1995-96.Non-plan Revenue Expenditure Overestimation in the early
nineties; underestimation in thelate nineties.
Capital Receipts Overestimation in the mid-nineties; underestimation inrecent years.
Capital Expenditure Almost always overestimation;performance generally less thanwhat is budgeted.
Revenue Deficit Large margins of error, especiallysince 1996-97.
Fiscal Deficit Well predicted in the mid-nineties;margins of error has increased inrecent years.
TABLE 16.24
Predictive Quality of Budget Estimates
Variable RMSQ I
Own Tax Revenue 55575.3 0.0928
Own Non-Tax Revenue 35599.3 0.2229
Share in Central Taxes 32776.3 0.0655
Plan Revenue Expenditure 77233.4 0.2531
Non-Plan Revenue Expenditure 78680.0 0.0497
Capital Receipts 163286.2 0.1998
Capital Expenditure 98587.4 0.5784
Revenue Deficit 58384.6 2.7639
Fiscal Deficit 117193.3 0.0783
Chapter 16 • STATE FINANCES 503
The methodology of budget estimation shouldchange. The general tendency to apply some growthfactor to all budgeted magnitudes should bediscontinued. The estimation methods should take intoaccount the interdependence among fiscal variables. Forexample, interest payments should be related tooutstanding debt stock. Pension expenditures need tobe determined by properly working out the number ofpensioners likely to join the pensioner stream in thebudget year, and the likely increase in average pension,etc.
16.5.3 Budgeting Reforms
The existing budget system in Uttar Pradesh suffersfrom certain inadequacies. Some of the importantdeficiencies include:
(i) poor predictive accuracy of the budget andrevised estimates;
(ii) lack of adequate framework for ensuringconsistency with desirable medium term fiscaltargets;
(iii) lack of capacity to undertake intra-yearadjustments;
(iv) lack of suitable procedures for evaluatingbudgetary outcomes and impact on the stateeconomy; and
(v) inadequate attention to accruals of claims andpayments as well on assets and liabilitiesincluding contingent liabilities.
In evaluating budgetary outcomes, the concept ofperformance budgeting takes budgetary analysis beyondexpenditures and attempts to link these to outputs andoutcomes. Under a performance budget, governmentaloperations are divided into functions, programmes andactivities. A function refers to: (i) major division ofwork of the government such as education, healthagriculture, etc., (ii) programmes refer to broadcategories within a function that identify projects oraccomplishments in respect of the budgets of afunction, (iii) activity consists of the collection ofhomogenous types of work in a programmes. Theprimary concern in a performing budget is to bring outend of objectives associated with the monetaryallocation in the budget. It relates the costs ofproviding a service and the results and accomplishmentin financial as well as physical terms. It would enhancethe quality and impact of government expenditures, ifperformance budgeting is undertaken, in the firstinstance, for departments that spend more than five per
cent of the total budget in a given year.
16.6 Fiscal Prospects
In this chapter, fiscal prospects for Uttar Pradesh areconsidered in the light of recent fiscal trends and thetargets stipulated in the FRBM of 2004. The TFCrecommendations would also have an important bearingon the state finances. The budget estimates for 2004-05provide the latest available set of budget numbers forUttar Pradesh. This may be used as the base year withsome adjustments. Nominal magnitudes are studiedrelative to GSDP at current prices.
16.6.1 Fiscal Responsibility Act andOther Reform Initiatives
The fiscal situation of the state calls for multi-dimensional reforms, augmenting tax revenues withdistortion-minimising tax reforms, reducing interestpayments, curbing growth of government employment,introducing a new strategy for handling pensionliabilities, revamping state level public enterprises,curbing contingent liabilities and bringing debt withinsustainable limits.
16.6.1.1 Fiscal Responsibility Act
The Government of Uttar Pradesh (GoUP) enactedan FRBM (Act Number 5 of 2004) in February of 2004.(Annexure A-16.18). The Act aims at ensuring fiscalstability and sustainability while enhancing the scopeof improving social and physical infrastructure as wellhuman development. It emphasises, for this purpose,the need for achieving revenue surplus, reduction infiscal deficit, and prudent management of debt. Itenvisages limits on fiscal and revenue deficits as well asgovernment guarantees. It also places emphasis on theneed for greater transparency and provides for a mediumterm fiscal framework. It specifically provides that theGoUP shall:
i. Reduce revenue deficit to zero by the end of2008-09.
ii. Reduce revenue deficit as percentage of GSDPin each financial year beginning April 1, 2004in a manner consistent with eliminatingrevenue deficit by 2008-09.
iii. Reduce fiscal deficit to not more than three percent of GSDP by the end of 2008-09.
iv. Reduce fiscal deficit as a percentage of GSDP ineach year beginning April 1, 2004 so as toachieve the target of reducing fiscal deficit to

UTTAR PRADESH DEVELOPMENT REPORT—VOL. 2504
no more than three per cent of GSDP by 2008-2009; and to ensure that within a period of 14financial years beginning from 2004-05, that isby 2017-18, the total liabilities of the stategovernment do not exceed 25 per cent of GSDPof that year.
The guarantees are also to be limited as provided byappropriate Rules framed under the Act or any othersuitable law or rule.
16.6.1.2 Other Recent Initiatives
The Government of Uttar Pradesh signed an MoUwith the Government of India for initiating fiscalreforms in 1999-00. It also embarked upon a medium-term fiscal policy and accountability strategy, whichwas placed before the legislature in March 2000.Following the creation of Uttaranchal, this policy wassubsequently amended and the new policy is calledMedium Term Fiscal Restructuring Policy (MTFRP).This was supplemented by two legislations for reformsin the power sector and the public sector. The mainsteps, which have been taken under these policyreforms may be listed as follows:
i. The Uttar Pradesh State Electricity RegulatoryCommission has been established. TheRegulatory Commission has undertaken periodictariff reviews.
ii. Trade Tax Act has been amended to checkunder-valuation of imported goods by thetraders.
iii. Computerisation in commercial taxadministration has been undertaken.
iv. Entry tax is also levied although only on thoseitems where trade tax is not levied.
v. Motor vehicles tax for life time levy on personalfour wheel vehicles has been converted fromspecific to ad valorem rates.
vi. Computerisation has been undertaken in theadministration of stamps and registrationduties.
vii. Certain user charges have been hiked upincluding power tariffs and higher and technicaleducation.
viii.Floor rates in the case of trade tax wereintroduced.
ix. Trade tax incentives for attracting newinvestments have been abolished.
x. On the expenditure side, leave encashmentfacility to class I and class II employees hasbeen withdrawn and foreign travels have beenbanned.
xi. Grants-in-aid to the secondary and highersecondary schools have been frozen at the 1998-1999 levels.
xii. A ban on new educational institutions forinclusion in the grant list was imposed.
xiii.Transfer of unspent money to personal ledgeraccounts has been stopped.
xiv.On the planning side, all departments havebeen asked to review existing schemes andscrap those schemes which are identified to beunproductive.
xv. The erstwhile Uttar Pradesh State ElectricityBoard was divided into three corporations, viz.,Uttar Pradesh Rajya Vidyut Utpadan Nigam Ltd.for thermal generation; Uttar Pradesh Jal VidyutNigam Ltd. for hydro generation; and UttarPradesh Power Corporation Limited fortransmission and distribution. There was afurther division of the distribution companiesfor catering to the needs of different zones andserving as profit centres.
xvi.Under the reform of public enterprises, aDivestment Commission was constituted.
In many respects, the existing programme initiativeswill have to be supplemented and strengthened. Theforemost objective of fiscal reforms should beconsidered as achieving the targets of Uttar Pradesh’sFRBMA. We have discussed below the importantdimensions and feasible policy action for these reforms.We have drawn up a medium term fiscal profile forUttar Pradesh’s finances that ensures not only theachievement of the FRBMA targets but also sufficientincrease in capital expenditure by the government aimedat strengthening infrastructure in the state, with aview to attracting investment and strengthening thegrowth pulse of the state economy.
16.6.2 Fiscal Reforms in the Medium-term
In this section, we examine the fiscal prospects forUttar Pradesh under a medium-term correction paththat is consistent with the targets of the FRBM ofUttar Pradesh up to 2008-09. An important input inthese projections would be the impact of therecommendations of the Twelfth Finance Commission
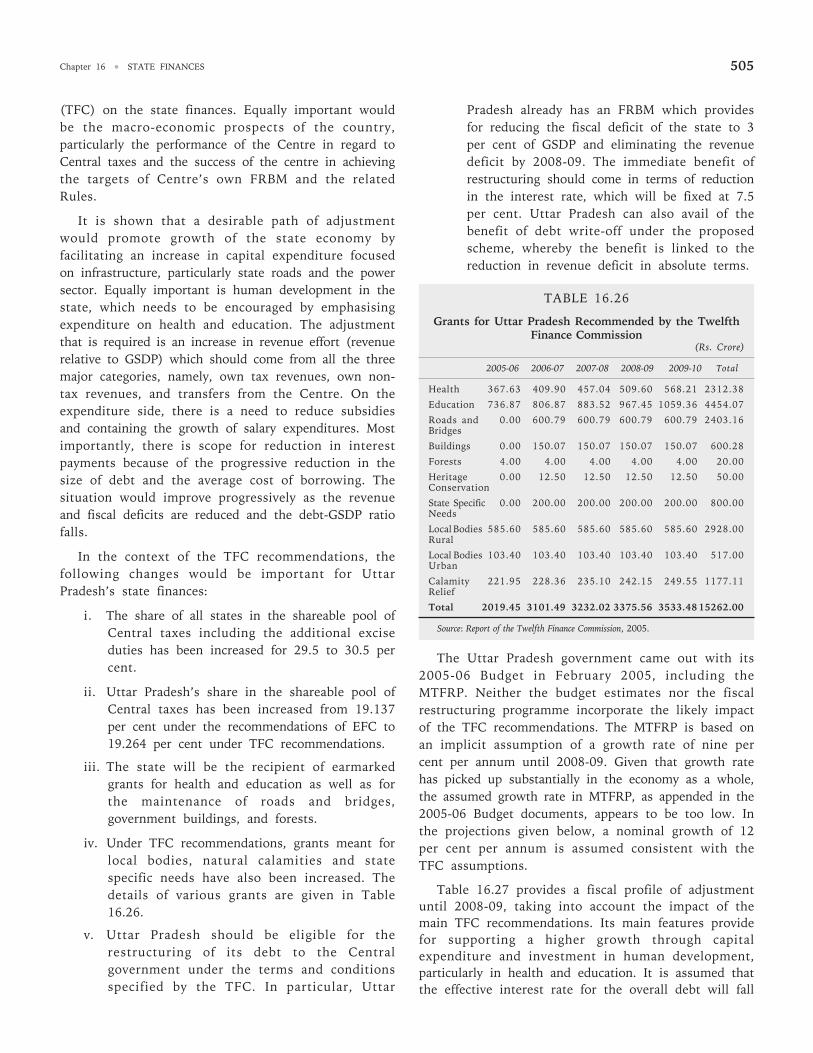
Chapter 16 • STATE FINANCES 505
(TFC) on the state finances. Equally important wouldbe the macro-economic prospects of the country,particularly the performance of the Centre in regard toCentral taxes and the success of the centre in achievingthe targets of Centre’s own FRBM and the relatedRules.
It is shown that a desirable path of adjustmentwould promote growth of the state economy byfacilitating an increase in capital expenditure focusedon infrastructure, particularly state roads and the powersector. Equally important is human development in thestate, which needs to be encouraged by emphasisingexpenditure on health and education. The adjustmentthat is required is an increase in revenue effort (revenuerelative to GSDP) which should come from all the threemajor categories, namely, own tax revenues, own non-tax revenues, and transfers from the Centre. On theexpenditure side, there is a need to reduce subsidiesand containing the growth of salary expenditures. Mostimportantly, there is scope for reduction in interestpayments because of the progressive reduction in thesize of debt and the average cost of borrowing. Thesituation would improve progressively as the revenueand fiscal deficits are reduced and the debt-GSDP ratiofalls.
In the context of the TFC recommendations, thefollowing changes would be important for UttarPradesh’s state finances:
i. The share of all states in the shareable pool ofCentral taxes including the additional exciseduties has been increased for 29.5 to 30.5 percent.
ii. Uttar Pradesh’s share in the shareable pool ofCentral taxes has been increased from 19.137per cent under the recommendations of EFC to19.264 per cent under TFC recommendations.
iii. The state will be the recipient of earmarkedgrants for health and education as well as forthe maintenance of roads and bridges,government buildings, and forests.
iv. Under TFC recommendations, grants meant forlocal bodies, natural calamities and statespecific needs have also been increased. Thedetails of various grants are given in Table16.26.
v. Uttar Pradesh should be eligible for therestructuring of its debt to the Centralgovernment under the terms and conditionsspecified by the TFC. In particular, Uttar
Pradesh already has an FRBM which providesfor reducing the fiscal deficit of the state to 3per cent of GSDP and eliminating the revenuedeficit by 2008-09. The immediate benefit ofrestructuring should come in terms of reductionin the interest rate, which will be fixed at 7.5per cent. Uttar Pradesh can also avail of thebenefit of debt write-off under the proposedscheme, whereby the benefit is linked to thereduction in revenue deficit in absolute terms.
TABLE 16.26
Grants for Uttar Pradesh Recommended by the TwelfthFinance Commission
(Rs. Crore)
2005-06 2006-07 2007-08 2008-09 2009-10 Total
Health 367.63 409.90 457.04 509.60 568.21 2312.38
Education 736.87 806.87 883.52 967.45 1059.36 4454.07
Roads and 0.00 600.79 600.79 600.79 600.79 2403.16Bridges
Buildings 0.00 150.07 150.07 150.07 150.07 600.28
Forests 4.00 4.00 4.00 4.00 4.00 20.00
Heritage 0.00 12.50 12.50 12.50 12.50 50.00Conservation
State Specific 0.00 200.00 200.00 200.00 200.00 800.00Needs
Local Bodies 585.60 585.60 585.60 585.60 585.60 2928.00Rural
Local Bodies 103.40 103.40 103.40 103.40 103.40 517.00Urban
Calamity 221.95 228.36 235.10 242.15 249.55 1177.11Relief
Total 2019.45 3101.49 3232.02 3375.56 3533.48 15262.00
Source: Report of the Twelfth Finance Commission, 2005.
The Uttar Pradesh government came out with its2005-06 Budget in February 2005, including theMTFRP. Neither the budget estimates nor the fiscalrestructuring programme incorporate the likely impactof the TFC recommendations. The MTFRP is based onan implicit assumption of a growth rate of nine percent per annum until 2008-09. Given that growth ratehas picked up substantially in the economy as a whole,the assumed growth rate in MTFRP, as appended in the2005-06 Budget documents, appears to be too low. Inthe projections given below, a nominal growth of 12per cent per annum is assumed consistent with theTFC assumptions.
Table 16.27 provides a fiscal profile of adjustmentuntil 2008-09, taking into account the impact of themain TFC recommendations. Its main features providefor supporting a higher growth through capitalexpenditure and investment in human development,particularly in health and education. It is assumed thatthe effective interest rate for the overall debt will fall

UTTAR PRADESH DEVELOPMENT REPORT—VOL. 2506
substantially in 2005-06 to 8.5 per cent and continue tofall gradually after that until it reaches a level of 7.5 percent in 2008-09. It is indicated that while capitalexpenditure and revenue expenditure on education andhealth should increase with respect to GSDP, othercomponents of revenue expenditures are projected to fallrelative to GSDP. Of particular importance is the fall ininterest payments by a margin of a little more than onepercentage point between 2004-05 and 2008-09.
TABLE: 16.27
Fiscal Adjustments in the Medium-term:A Suggested Path
(Per Cent to GSDP)
2004-05 2005-06 2006-07 2007-08 2008-09
Own Tax Revenues 6.66 6.94 7.09 7.24 7.40
Own Non-tax 0.91 0.85 0.88 0.90 0.92Revenues
Transfers from the 8.77 9.18 9.23 9.30 9.40Centre
Share in Central Taxes 6.69 6.68 6.83 6.99 7.18
Non-Plan Grants 0.52 1.08 1.00 0.93 0.87
Plan Grants 1.56 1.42 1.40 1.37 1.35
Total Grants 2.08 2.50 2.40 2.30 2.22
Total Revenue 16.34 16.98 17.19 17.44 17.72Receipts
Interest Payments 4.63 4.10 4.00 3.64 3.52
Pensions 1.69 1.57 1.57 1.57 1.57
Other General Services 3.05 3.44 3.28 3.14 3.00
Total General Services 9.37 9.11 8.85 8.35 8.09
Education 3.20 3.58 3.83 4.11 4.40
Health 0.74 0.86 1.00 1.16 1.34
Other Social Services 2.14 1.75 1.71 1.66 1.62
Total Social Services 6.08 6.19 6.54 6.92 7.36
Total Economic 3.16 2.90 2.36 2.08 1.53Services
C. & A. to Local 0.78 0.78 0.77 0.76 0.74Bodies
Total Revenue 19.39 18.98 18.53 18.11 17.72Expenditure
Capital Outlay 2.08 2.40 2.28 2.55 2.82
Loans and Advances 0.27 0.32 0.32 0.31 0.31
Total Capital 2.35 2.72 2.60 2.87 3.13Expenditures
Non-Debt Capital 0.28 0.14 0.13 0.13 0.13Receipts
Fiscal Deficit 5.82 5.14 3.80 3.40 3.00
Revenue Deficit 3.05 2.00 1.33 0.67 0.00
Primary Deficit 1.19 1.04 -0.20 -0.24 -0.52
Outstanding Liabilities 56.27 55.97 54.35 52.50 50.44
GSDP 100.00 100.00 100.00 100.00 100.00
Source (Basic Data): Uttar Pradesh Budget Documents, Report of TFC, andprojections.
The expenditure on education is projected toincrease from 3.2 per cent of GSDP in 2004-05 to 4.4per cent in 2008-09 and that on health from 0.74 percent to 1.34 per cent. Capital outlay is allowed toincrease by a margin of 0.74 percentage points duringthis period. These increases are consistent withreducing fiscal deficit from 5.8 per cent of GSDP in2004-05 to 3 per cent in 2008-09. The revenue deficit isreduced from 3 percent of GSDP in 2004-05 to 0 in2008-09. The ratio of outstanding liabilities includingreserve funds and deposits, which stand at 56.3 percent in 2004-05 will fall by a margin of 6 percentagepoints by 2008-09. This is mainly due to the emergenceof a primary surplus in 2006-07. It will, however, takeseveral more years for the debt-GSDP ratio to comedown to the levels recommended by the TFC.
16.6.3 Reforming State Finances:15-fold Reform Strategy
A 15-fold strategy of fiscal reforms relating to fiveareas of intervention is suggested for achieving UttarPradesh’s FRBMA targets and strengthening thegrowth pulse of the state economy.
Fiscal reforms are suggested with a view to servingthree primary objectives: (i) restoring revenue accountbalance and bringing debt and fiscal deficit tosustainable levels; (ii) increasing the productivity ofgovernment to serve growth and governance objectivesbetter; and (iii) reducing the structural vulnerability ofstate finances, keeping in view the long-term prospects.
Given the FRBMA, a five-part 15-points strategy offiscal reforms relating to five areas of fiscal managementis suggested as detailed below.
16.6.3.1 Objectives and Overall Strategies
• Fiscal support to growth through investment ininfrastructure and human development.
• Fiscal support to poverty alleviation throughdirect and indirect intervention.
16.6.3.2 Revenue Augmentation
• Implementation of VAT and rationalisation ofthe system of commodity taxation.
• Cost-related user charges for augmentation ofnon-tax revenues.
16.6.3.3 Expenditure Reforms
• Pension reforms.
• Salary and employment related reforms.

Chapter 16 • STATE FINANCES 507
• Subsidy reforms.
• Capital expenditure augmentation.
• New plan strategy.
• Improving efficacy of government expenditure.
16.6.3.4 Fiscal Discipline and Budget Management
• Rule-based control of revenue and fiscal deficitaccording to FRBMA.
• Debt-related reforms including curbing ofcontingenment liabilities.
• Budgeting reforms.
16.6.3.5 Public Sector Reforms
• Strengthening power sector reforms.
• Reforming other (SLPEs) includingdisinvestment.
These reforms are individually discussed below. Thebasic reform needed in each case is also summarised inTable 16.28 at the end of this section.
16.6.3.1 Objective and Overall Strategies
Fiscal Support to Growth through Investmentin Infrastructure and Human Development
State government has a critical role to play insectors like health and education as also in developingphysical infrastructure in sectors like roads, power andirrigation. It is investment in these sectors that willstrengthen growth and attract investment from outside.With higher growth, the revenues accruing to thegovernment will also increase. Expenditure has to berestructured such that capital expenditure is increasedbut focussed on the infrastructure, and revenueexpenditure can also be increased in sectors like healthand education. We recommend that the revenueexpenditure on health and education taken togethershould increase at least by 1 percentage point of GSDPtaking the revenue expenditure on these two sectors towell above 4.0 per cent of GSDP by 2008-09. Careshould be taken to emphasise augmentation of non-salary expenditure in these sectors. Additional supportto this sector should also come from an increase incapital expenditure.
Fiscal Support to Poverty Alleviation
Ranking among the higher poverty-incidence statesin rural and urban poverty, according to the povertyestimates provided by the Planning Commission for1999-00, Uttar Pradesh accounts for the largest number
of poor in the country: about 31 per cent of the totalnumber of rural and urban poor. This is far higher thanthe share of population of the combined state in totalpopulation. Apart from the benefits of growth onpoverty alleviation, direct fiscal intervention is neededthat may consist of state level employment generationschemes and capacity building in rural and urban areasthrough education and health.
16.6.3.2 Revenue Augmentation
Distortion Minimising Augmentation of Tax Revenues
Government should prepare for implementing VATwhich should be revenue-neutral in the short-run andrevenue-augmenting (with respect to GSDP) in thelonger run.
As already discussed, sales taxes constitute the coreof state taxes. With the introduction of uniform floorrates, and some reduction in exemptions, there hasbeen higher growth in sales taxes in recent years. Thefollowing key tasks now need to be addressed:
• Implementation of VAT replacing existing salestaxes.
• Determining the revenue impact of the proposedstructure of state VAT rates of 4 and 12.5 percent suggested by the Empowered Committee.
• Revamping tax administration throughsimplification of forms and procedures.
• Comprehensive computerisation of taxadministration.
After several rounds of discussion, the empoweredcommittee of Finance Ministers has finalised itsrecommendations regarding the implementation of statelevel VAT. Accordingly, a White Paper (excerpts atAppendix A-16.14) on State Level VAT has beenbrought suggesting two core rate categories of 4 percent and 12.5 per cent with some special rates. Statesare planning to embark upon this reformed regime andUttar Pradesh should also join this initiative withoutreservations.
The share of the industrial sector in Uttar Pradeshis only about 22 per cent and a large part of output(GSDP) comes from services. For a better coverage ofservices at the state level, appropriate changes arerequired, enabling the states to share in this potentiallylarge and growing tax base. Given the magnitude of theGSDP of the state economy, such changes would beespecially beneficial. The Government of India, vide aconstitutional amendment has placed taxation of
UTTAR PRADESH DEVELOPMENT REPORT—VOL. 2508
services under Article 268A. This has taken the sharingof service tax raised by the Central government outsideof the purview of recommendations of the FinanceCommission. It is also up to the Centre to assigncertain services for taxation by the states.
User Charges and Non-tax Revenues
Recoveries should be targeted relative to cost. In thefirst instance, targets can relate to current costs.
To garner additional revenues through non-taxsources, fees for a variety of general administrativeservices, and various user charges for publicly providedservices should be brought under a reform regime. Feesand user charges should be linked to input costs,particularly current costs, for which estimates shouldbe prepared for each department/service. Norms shouldbe determined on a case to case basis for services.Maximum attention should be paid to the removal ofinefficiencies in the system, which hike up the costs.Further, attention should be paid to the quality ofservices. With better quality, it is easier to persuade theusers to pay a higher portion of costs as user charges.
Most user charges require legislative/departmentalclearance for revision upwards. While input costscontinuously increase, upward revisions of user chargesare few and far between, giving rise to continuous risein the implicit subsidy and/or fall in the quality/quantity of publicly provided services. Mechanismsshould be put in place for automatic upward revision ofuser charges linked to an index of costs, which wouldneed to be prepared separately for different services.
The state government particularly needs to look intothe profile of user charges in relation to the costs ofproviding various general, social and economic services,particularly when the services are private in naturealthough publicly provided. Six areas need focusedattention: education, health, agriculture, irrigation,power, and transport. An autonomous body in thenature of a user charges commission should be set upto determine the principles according to which usercharges should be linked to costs. Such a regulatorybody is already functioning in the case of the powersector. This body should also protect the interests ofconsumers by monitoring quality of services andsuggesting ways and means for reducing inefficienciesin the governmental provision of private goods/services.
The GoUP needs to set up a User ChargesCommission which should look after the user chargesas well as other fees and tariffs except the electricitytariffs which are being looked after by the Uttar
Pradesh Electricity Regulatory Commission. The usercharges commission should be an autonomous body sothat it can examine both the costs of providing servicesand the quality of services and then fix the rates anduser charges accordingly. It should revise these chargesperiodically.
16.6.3.3 Expenditure Reforms
Pension Reforms
Pensions constitute an everincreasing fiscal liability.Pension reforms should be initiated to bring itsbudgetary costs under control.
In the context of pensions, new initiatives areneeded. First, a Funded Pension Scheme withcontributions from the employees, in the case of allnew employees, should be brought in place. Secondly,the formula for commutation of a portion of pensionentitlement should be revised taking into account thechange in the interest rate from the period when theformula was originally worked out. In this context, theinitiatives taken by the Central government and somestates like Madhya Pradesh should be reviewed foradoption. The feasibility of keeping provident funds in aseparate account should be examined. At present,transactions to and from provident funds to the budgetare merely accounting entries. A separate publicprovident fund for state government employees wouldlead to greater transparency in transactions. Pensionreforms would yield benefits only in the long-termperspective. These reforms however are needed to makestate finances less vulnerable to exogenous decisionsregarding pensions by making these self-sustaining.
Salary (Government Employment) Reforms
Salary related reforms, including reform ingovernment employment strategy, should constitute thecore of fiscal reform.
In order to contain the growth of salary bill, allposts that are presently vacant should be reviewed anda significant number of these should be abolished. Inaddition, a survey should identify department-wisesurplus staff. Further, only a fraction of positionsshould be filled-up on superannuation of employees.
Reforms in management of government employmentare critical to restoring Uttar Pradesh’s state financesto health. This reform should consist of not onlycurbing the growth of employment in the governmentsector but also its productive redeployment. AlthoughUttar Pradesh has experimented with identification ofsurplus staff earlier also, it should now take this issue

Chapter 16 • STATE FINANCES 509
up at a much larger scale. As a first step, Departmentof Administrative Reforms should identify surplus staffin consultation with the concerned Ministry/Department. These staff should be attached to theDepartment of Administrative Reforms or a newlycreated Department of Redeployment. Apart fromregular salary, no other expenditures need to beincurred on this staff because they will have no dutyother than waiting for redeployment. This should resultin immediate savings. The next step is the process ofredeployment. The Department of Redeployment shouldbe keeping elaborate biodata of all such attached staff.No fresh appointments should be made withoutreference to the Department of Redeployment. Moregenerally, all posts in the Tenth Plan should be filledup with such redeployable staff. Vacancies that arisedue to retirement of staff from non-plan or continuingplan schemes should also be filled from this pool. Therole of the Department of Redeployment and Training isexplained in Figure 16.6. The issue of growth in thenumber of government employees should be freshlyexamined after the adjustment period in Uttar Pradesh’sFRBMA, if the specified targets are successfully achieved.
Attempt should be made to arrange for adequateretraining of these staff so that their redeployabilityincreases. Those who are willing and able can also bedirected towards teaching and health administrationjobs.
Subsidy Reforms
Subsidy reforms should lead to reduction involumes, lower costs, greater transparency and bettertargeting.
Subsidy as a budgetary instrument of promotingsocial welfare has been overused, and sometimesabused, leading to inefficiencies. The cost of subsidieshas generally been underestimated because mostsubsidies are hidden or implicit. In state budgets, onlya very small fraction of subsidies is shown explicitly assubsidies. The state government should explicitly showits subsidies in the budget as much as possible, so thattheir volumes and continued validity may be discussedeach year in the legislature. Many subsidies arisebecause the government may be participating in theprovision of purely private goods where its presence isnot warranted either economically or technologically. Inthe few areas like health and education, wheresubsidies are justified because of large externalities,government should rationalise the subsidy structure, sothat subsidies are given more to the economicallypoorer sections. Subsidies should have a specific timespan, after which its utility should be reassessed, andthe duration revised; it should be withdrawn in stages.Subsidy reforms should be approached from both theexpenditure and revenue sides. On the expenditure side,reducing costs of providing services by reducing
Existing Employees
Vacancies in Non-Plan Post and Continuing Old Plan Posts
New Plan Positions
Regular Government Teaching Health Services Infrastructure
Department of Redeployment
Identified Surplus Training
FIGURE 16.6
Training and Redeployment

UTTAR PRADESH DEVELOPMENT REPORT—VOL. 2510
operational inefficiency could reduce subsidies withoutaffecting service levels. On the receipts side, one has totarget higher recovery rates by linking prices (usercharges) to costs. At first, these linkages may be fixedwith reference to current costs. Input-linked usercharges (already discussed), partial privatisation ofgeneration and distribution (in electricity), propermetering, setting up bodies for autonomous tariffrevisions in power and transport, fees for health andeducation, should lead to better cost recoveries, andlower implicit subsidies. The subsidy regime should belimited, transparent, and properly targeted.
New Plan Strategy
The planning strategy should emphasise not theplan size but its productivity. Projects should beselected on the basis of cost-benefit analysis; andpotential contribution to output and non-governmentemployment opportunities.
The planning strategy should be completelyoverhauled. As already noted, the revenue component ofplan expenditures has become unduly large. A large partof that relates to salary expenditures. Plans have becomescheme-based without a proper backing of cost-benefitanalysis. Schemes became employment-intensive andemployment generated only salary burdens withoutformation of productive assets and contribution tooutput. Salaries became exogenously driven andcompletely delinked to productivity. The consequencewas that the plan, which was meant to be the core ofdevelopment strategy, actually became a major fiscalliability. This adverse dynamics must be reversed by aparadigm shift in preparing a plan. The new plan mustconsist of a list of projects where each project is backedby a cost-benefit analysis and each project is ranked on ascale of contribution to output and contribution to non-government employment. The practice of determiningplan size first, and then finding projects or schemes forthe plan size as an after thought, must be reversed. Plansize should not be determined by the capacity of thestate to borrow. Rather, it should be determined by theselection of such projects as can produce a rate of returnhigher than the cost of borrowing.
Capital Expenditure Augmentation
Capital expenditure relative to GSDP should beaugmented, focusing on infrastructure, especially roadsand bridges, power, and information technology.
Capital expenditure relative to GSDP should beincreased by at least one percentage point of GSDP.This should be mainly on infrastructure capital outlay
covering power, roads and bridges and informationtechnology, especially communications and largebandwidth. Investment in infrastructure will lendsupport to higher GSDP growth.
16.6.3.4 Fiscal Discipline and Budget Management
Targeted Deficits
Management of deficits (revenue and fiscal) in annualbudgets should be according to predetermined medium-term targets as prescribed by Uttar Pradesh’s FRBMA.
The FRBMA has already prescribed targets for 2008-2009. It is essential to follow a path of annualadjustments so as to meet these targets. As fiscaldeficit is reduced along a targeted path, and as interestrates have already been lowered on central loans, smallsavings, provident funds, etc., and as the market ratesare also going down, it is expected that interestpayments relative to GSDP would go down. This wouldfacilitate adjustment for achieving FRBMA targets.
Management of Debt
A lowering of the debt-GDP ratio would helpachieve reduction in revenue deficits by reducinginterest payment liability.
The FRBMA has also provided for curbing theissuance of guarantees. Limits to guarantees should befixed relative to GSDP. Further, the debt-GSDP ratioshould be put on a path of successive reduction yearafter year until it reaches a sustainable level in thecontext of the achievable growth rate and the prevalentinterest rate. The high-cost debt incurred in the latenineties may be prematurely retired using freshborrowing at lower costs. The debt-swap scheme offeredby the Central government has been useful in thisregard. New borrowing agreements should provide for a‘put’ option or flexible interest rates.
Budgeting Reforms
Budgeting reforms would augment efficacy of fiscalintervention.
The state should undertake budgeting reforms witha view to imparting greater transparency and control.Important elements should include the following:
i. There is need to formulate a medium-term fiscalpolicy. This may be done in the context of theFRBMA. This medium-term policy should bepresented to legislature along with the budget.
ii. A separate schedule, indicating major head-wisenumber of employees, and salaries and

Chapter 16 • STATE FINANCES 511
allowances should be presented in the budgetalong with proposed reforms.
iii. Separate schedule on pensions and terminalbenefit outflows along with number ofpensioners. There should be an estimate of thelikely pension bill for the next five years.
iv. A major head-wise schedule of subsidies,making as many subsidies explicit as possible.
v. A schedule of year-wise and project-wiseoutstanding guarantees (this has been initiatedin Uttar Pradesh).
vi. Computerisation of budgeting methodology andprocedures should be undertaken; and quarterlyflows of receipts and expenditures also shouldbe announced and monitored.
vii. Statement on the deviations between actualsand budget estimates should be presented, andan analysis of factors explaining the deviationshould be undertaken leading to continuousimprovement in estimation methodology.
16.6.3.5 Public Sector Reforms
SLPE reform should be a contextual combination ofprivatisation (disinvestment/outright sale) along withminimising budgetary implications of managing thepower, transport and irrigation sectors whilstdeveloping them.
Power Sector Reforms
In 1998, the GoI enacted the Electricity RegulationCommissions Act to set up Electricity RegulationCommissions both at the Centre and in the states torationalise tariff, adopt transparency, promote efficiencyand ensure fair rate of return to investors. As a sequelto this the Uttar Pradesh Electricity Reforms Act, 1999was enacted. Accordingly, the Uttar Pradesh StateElectricity Board (UPSEB) was reorganised into threecorporations, viz., the Uttar Pradesh Power CorporationLtd. (UPPCL) as a principal successor to the UPSEB,the Uttar Pradesh Rajya Vidyut Utpadan Nigam Ltd.(UPRVUNL) and the Uttar Pradesh Jal Vidyut UtpadanNigam Ltd. (UPJVUNL).
The Expert Group headed by Shri MS Ahluwalia, inits report in May 2001 recommended, besides paring offthe dues after verification, a one-time settlement ofarrears through a scheme of writing off 50 per cent ofthe interest/surcharge arrears and securitising thebalance interest and principal in long-term bonds. Forfuture, SEBs will continue to get power facility from
CPSUs on prompt payment without the backlog ofarrears. The SEB’s have to enter into an agreement withCPSUs to ensure regular power purchases. In the July2001 report, the Committee recommended reforms,which involve huge investments for a ModifiedAccelerated Power Development Programme for theTenth Plan. The Economic Survey of the GoI for 2001-2002 reported that in 2000-01 a new plan schemeknown as the Accelerated Power DevelopmentProgramme (APDP) was initiated to promote financialassistance to states to undertake renovation andmodernisation programme of thermal and hydel powerstations. The Uttar Pradesh Government signed anMoU with the Central government in this regard. TheMoU is a joint commitment to undertake reforms in atime-bound manner. The Uttar Pradesh government, aspart of agreed restructuring has made adjustments inthe 2003-2004 Budget, which involved writing off debtas well as securitisation of some dues.
Since power is a key component of infrastructure,Uttar Pradesh must attract private sector players in allthree fields, viz., generation, transmission, anddistribution in the light of the new and recentlyannounced electricity policy by the Central government.The private sector can play an effective role at least inthe generation and distribution in the first instance.
Reforming Other SLPEs
Government should undertake a comprehensivedisinvestment programme in respect of SLPE’s otherthan power, particularly when these are unproductive.
Keeping in view the investments made by the stategovernment over the years in its SLPEs, their lacklustreperformance has become the biggest fiscal liability onstate finances. The government must initiatecomprehensive disinvestment and privatisationprogramme for SLPEs. Those that are beyondredemption and where there are no takers, should beclosed down. The interest of employees should beprotected by a VRS, which should largely be financed bysale of assets, including land, wherever feasible. ADisinvestment Committee under the Chief Ministershould be set up to expedite the process.
16.6.4 Monitoring Process of Reforms andMid-course Corrections
Once reforms decided upon and undertaken, amonitoring mechanism should be in place to a reviewtheir progress.
The progress of reforms needs to be monitored eachyear. As soon as deviations from the expected reform
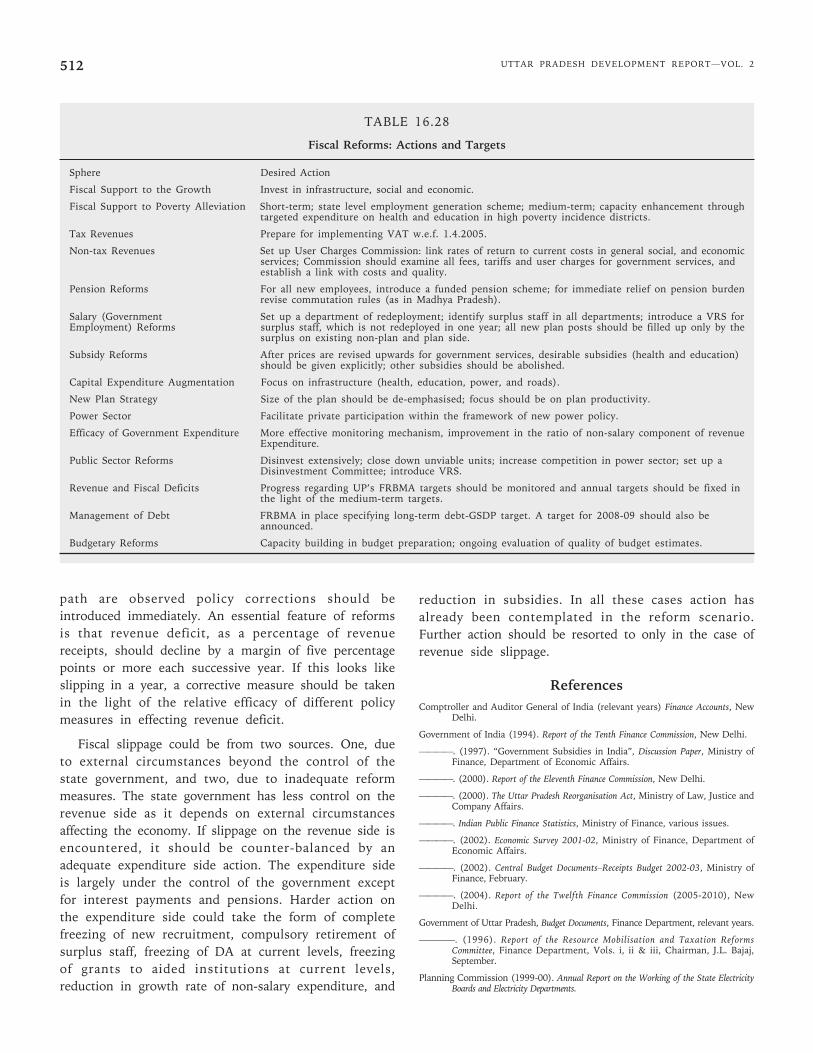
UTTAR PRADESH DEVELOPMENT REPORT—VOL. 2512
path are observed policy corrections should beintroduced immediately. An essential feature of reformsis that revenue deficit, as a percentage of revenuereceipts, should decline by a margin of five percentagepoints or more each successive year. If this looks likeslipping in a year, a corrective measure should be takenin the light of the relative efficacy of different policymeasures in effecting revenue deficit.
Fiscal slippage could be from two sources. One, dueto external circumstances beyond the control of thestate government, and two, due to inadequate reformmeasures. The state government has less control on therevenue side as it depends on external circumstancesaffecting the economy. If slippage on the revenue side isencountered, it should be counter-balanced by anadequate expenditure side action. The expenditure sideis largely under the control of the government exceptfor interest payments and pensions. Harder action onthe expenditure side could take the form of completefreezing of new recruitment, compulsory retirement ofsurplus staff, freezing of DA at current levels, freezingof grants to aided institutions at current levels,reduction in growth rate of non-salary expenditure, and
reduction in subsidies. In all these cases action hasalready been contemplated in the reform scenario.Further action should be resorted to only in the case ofrevenue side slippage.
ReferencesComptroller and Auditor General of India (relevant years) Finance Accounts, New
Delhi.
Government of India (1994). Report of the Tenth Finance Commission, New Delhi.
————. (1997). “Government Subsidies in India”, Discussion Paper, Ministry ofFinance, Department of Economic Affairs.
————. (2000). Report of the Eleventh Finance Commission, New Delhi.
————. (2000). The Uttar Pradesh Reorganisation Act, Ministry of Law, Justice andCompany Affairs.
————. Indian Public Finance Statistics, Ministry of Finance, various issues.
————. (2002). Economic Survey 2001-02, Ministry of Finance, Department ofEconomic Affairs.
————. (2002). Central Budget Documents–Receipts Budget 2002-03, Ministry ofFinance, February.
————. (2004). Report of the Twelfth Finance Commission (2005-2010), NewDelhi.
Government of Uttar Pradesh, Budget Documents, Finance Department, relevant years.
————. (1996). Report of the Resource Mobilisation and Taxation ReformsCommittee, Finance Department, Vols. i, ii & iii, Chairman, J.L. Bajaj,September.
Planning Commission (1999-00). Annual Report on the Working of the State ElectricityBoards and Electricity Departments.
TABLE 16.28
Fiscal Reforms: Actions and Targets
Sphere Desired Action
Fiscal Support to the Growth Invest in infrastructure, social and economic.
Fiscal Support to Poverty Alleviation Short-term; state level employment generation scheme; medium-term; capacity enhancement throughtargeted expenditure on health and education in high poverty incidence districts.
Tax Revenues Prepare for implementing VAT w.e.f. 1.4.2005.
Non-tax Revenues Set up User Charges Commission: link rates of return to current costs in general social, and economicservices; Commission should examine all fees, tariffs and user charges for government services, andestablish a link with costs and quality.
Pension Reforms For all new employees, introduce a funded pension scheme; for immediate relief on pension burdenrevise commutation rules (as in Madhya Pradesh).
Salary (Government Set up a department of redeployment; identify surplus staff in all departments; introduce a VRS forEmployment) Reforms surplus staff, which is not redeployed in one year; all new plan posts should be filled up only by the
surplus on existing non-plan and plan side.
Subsidy Reforms After prices are revised upwards for government services, desirable subsidies (health and education)should be given explicitly; other subsidies should be abolished.
Capital Expenditure Augmentation Focus on infrastructure (health, education, power, and roads).
New Plan Strategy Size of the plan should be de-emphasised; focus should be on plan productivity.
Power Sector Facilitate private participation within the framework of new power policy.
Efficacy of Government Expenditure More effective monitoring mechanism, improvement in the ratio of non-salary component of revenueExpenditure.
Public Sector Reforms Disinvest extensively; close down unviable units; increase competition in power sector; set up aDisinvestment Committee; introduce VRS.
Revenue and Fiscal Deficits Progress regarding UP’s FRBMA targets should be monitored and annual targets should be fixed inthe light of the medium-term targets.
Management of Debt FRBMA in place specifying long-term debt-GSDP target. A target for 2008-09 should also beannounced.
Budgetary Reforms Capacity building in budget preparation; ongoing evaluation of quality of budget estimates.

Chapter 16 • STATE FINANCES 513
Reserve Bank of India, “State Finances–A Study of Budgets”, RBI Bulletin, variousissues.
Srivastava, D. K., Tapas K. Sen, H. Mukhopadhyay, C. Bhujanga Rao and H. K.Amar Nath (1997). Government Subsidies in India, National Institute ofPublic Finance and Policy, New Delhi.
Srivastava, D. K., Saumen Chattopadhyay and T. S. Rangamannar (1999). Assam:State Fiscal Studies, National Institute of Public Finance and Policy, NewDelhi.
Srivastava, D. K., Saumen Chattopadhyay and Pratap Ranjan Jena (1999). Kerala:State Fiscal Studies, National Institute of Public Finance and Policy, NewDelhi.
Srivastava, D. K and H. K. Amar Nath (2001). Central Budgetary Subsidies in India,National Institute of Public Finance and Policy, New Delhi.
Srivastava, D. K and C. Bhujanga Rao (2001). “Subsidies: Issues and Approach”,presented at the World Bank and NIPFP Conference on India: Fiscal Policiesto Accelerate Economic Growth, May.
Srivastava, D. K., C. Bhujanga Rao, Mukesh Anand, Pinaki Chakraborty and T.S. Rangamannar (2001). Assam: Study of State Finances, National Instituteof Public Finance and Policy, New Delhi, March.
Srivastava, D. K., C. Bhujanga Rao, Pinaki Chakraborty and T. S. Rangamannar(2003). Budgetary Subsidies in India: Subsidising Social and Economic Services,National Institute of Public Finance and Policy, March.
Theil, H. (1966), Applied Econometric Forecasting, North Ireland, Netherlands.
Uttar Pradesh Electricity Reforms Act, 1999.
Uttar Pradesh Fiscal Responsibility and Budget Management Act, 2004.

UTTAR PRADESH DEVELOPMENT REPORT—VOL. 2514
APPENDIX A-16.1
Finances of Uttar Pradesh (Revenue Receipts): 1987-88 to 2004-05(Rs. Crore)
1987-88 1988-89 1989-90 1990-91 1991-92 1992-93 1993-94 1994-95 1995-96
Total Revenue Receipts (I+II+III) 5090.4 5373.0 6258.6 7918.7 9030.3 10949.4 11072.8 12302.7 14529.0
I. Total Tax Revenues (A+B) 3792.4 3848.8 4764.0 5490.9 6251.9 7308.1 7707.2 8861.2 10562.1
A. Own Tax Revenue 1988.7 2065.7 2448.6 3162.1 3497.4 3886.3 4132.0 4878.3 5468.9
Total Sales Tax 954.0 1090.2 1337.4 1680.4 1898.5 2021.0 2149.2 2605.4 2966.8
Sales Tax (Excluding CST) 879.4 993.9 1243.4 1560.4 1722.7 1874.5 2006.8 2437.2 2818.1
Central Sales tax 74.7 96.3 94.0 120.0 175.8 146.5 142.5 168.3 148.7
State Excise Duties 494.2 338.2 422.1 724.8 715.6 884.7 957.0 1104.6 1158.6
Taxes on Vehicles 51.1 89.8 79.3 85.4 93.0 103.0 98.5 108.1 125.5
Stamp Duty and Registration Fees 250.3 251.8 310.2 359.7 445.2 460.5 531.6 631.5 734.8
Other Taxes 239.0 295.7 299.6 311.8 345.1 417.2 395.6 428.6 483.3
B. Share in Central Taxes 1803.8 1783.1 2315.4 2328.8 2754.5 3421.8 3575.2 3982.9 5093.2
II. Non-tax Revenues 389.8 425.4 459.0 386.0 439.2 694.1 658.9 798.8 1713.2
Fiscal Services 0.0 0.0 0.0 0.0 0.0 0.7 0.0 0.0 0.1
Interest Receipts 104.9 23.8 52.1 56.5 38.0 103.4 69.8 138.7 154.7
Dividends and Profits 3.6 18.4 1.1 1.8 3.0 2.8 4.8 9.3 3.5
General Services 53.2 90.2 58.2 65.8 80.1 92.7 81.6 178.3 941.6
Social Services 48.1 39.8 89.5 69.7 94.4 153.3 64.3 82.0 101.6
Economic Services 180.1 253.2 258.0 192.2 223.6 341.2 438.4 390.5 511.9
III. Total Grants 908.1 1098.8 1035.6 2041.7 2339.2 2947.2 2706.7 2642.7 2253.7
Plan Grants 815.5 992.0 929.3 1417.1 1600.5 2076.4 1845.0 1673.5 1465.4
Non-Plan Grants 92.7 106.8 106.3 624.7 738.7 870.8 861.7 969.2 788.3
Adjusted Items as Contra Entries (a+b)
a. State Lotteries 50.9 68.5 135.1 145.8 383.4 512.5 773.6 855.9 377.1
b. Interest Earning from Irrigation 190.7 210.7 229.5 245.6 260.9 214.3 285.0 234.7 309.1
Unadjusted Revenue Receipts 5331.9 5652.2 6623.2 8310.1 9674.6 11676.2 12131.4 13393.2 15215.2
1996-97 1997-98 1998-99 1999-00 2000-01 2001-02* 2002-03 2003-04 RE 2004-05 BE
Total Revenue Receipts (I+II+III) 15700.0 17220.0 17007.0 21100.2 24284.7 25113.6 27439.3 32478.2 36876.7
I. Total Tax Revenues (A+B) 12437.5 14172.0 13740.4 16879.8 20025.5 20519.3 23598.7 26303.0 31081.3
A. Own Tax Revenue 6306.0 6998.0 7910.1 9401.1 12268.8 10336.0 12770.7 13788.3 16131.9
Total Sales Tax 3473.2 3934.9 4457.7 5099.2 6118.4 6163.1 7123.7 7600.4 9000.0
Sales Tax (Excluding CST) 3331.2 3697.9 4275.4 4675.2 5519.2 5664.7 7121.2 7150.4 8486.2
Central Sales Tax 142.0 237.1 182.3 424.1 599.2 498.4 2.6 450.0 513.8
State Excise Duties 1322.9 1404.1 1631.3 2126.3 2238.5 1961.4 2555.0 2550.0 3000.0
Taxes on Vehicles 139.5 166.6 211.3 512.1 543.1 503.0 618.8 456.0 501.6
Stamp Duty and Registration Fees 875.1 956.0 1031.8 1177.6 1269.8 1429.3 2078.7 2230.0 2564.0
Other Taxes 495.3 536.3 578.0 485.9 2099.1 279.2 394.4 951.9 1066.3
B. Share in Central Taxes 6131.5 7174.1 5830.3 7478.7 7756.6 10183.3 10828.0 12514.7 14949.4
II. Non-tax Revenues 989.9 940.6 1103.3 1616.8 1486.0 1302.7 1531.6 1484.5 1470.6
Fiscal Services 0.8 0.7 4.3 0.1 0.7 0.0 0.0 0.0 0.0
Interest Receipts 150.4 133.2 56.3 81.8 66.5 59.2 133.5 56.1 56.5
Dividends and Profits 6.8 5.8 6.2 5.9 8.7 6.4 7.8 5.9 5.9
General Services 193.7 191.7 333.4 333.4 261.7 333.6 314.8 413.5 498.9
Social Services 142.5 166.0 221.8 297.1 325.6 283.2 359.6 272.8 180.8
Economic Services 495.7 443.1 481.4 898.6 822.7 620.3 715.8 736.2 728.5
Contd. ...

Chapter 16 • STATE FINANCES 515
1987-88 1988-89 1989-90 1990-91 1991-92 1992-93 1993-94 1994-95 1995-96
III. Total Grants 2272.6 2107.4 2163.2 2603.6 2773.2 3291.5 2309.0 4690.7 4324.8
Plan Grants 1861.1 1975.6 1818.3 2276.4 2468.0 2838.1 1883.8 3524.4 3415.1
Non-Plan Grants 411.5 131.8 345.0 327.2 305.2 453.4 425.3 1166.3 909.6
Adjusted Items as Contra Entries (a+b)
a. State Lotteries 0.0 0.0 0.0 0.0 0.0 0.0 0.0 0.0 0.0
b. Interest Earning from Irrigation 328.6 351.2 371.7 394.9 0.0 0.0 0.0 0.0 0.0
Unadjusted Revenue Receipts 16028.6 17571.1 17378.7 21495.1 24743.3 25597.9 27821.2 32860.1 37258.6
Source: Finance Accounts of Uttar Pradesh and Budget Document (2004-05) of Uttar Pradesh.
Note: *Data pertains to divided Uttar Pradesh.
APPENDIX A-16.2
Structure of Central Revenue Transfers: 1987-88 to 2004-05(Rs. Crore)
1987-88 1988-89 1989-90 1990-91 1991-92 1992-93 1993-94 1994-95 1995-96
Total Transfers (I+II) 2711.9 2881.8 3351.0 4370.5 5093.8 6369.0 6281.9 6625.6 7346.9
I. Sharing of Central Taxes 1803.8 1783.1 2315.4 2328.8 2754.5 3421.8 3575.2 3982.9 5093.2
Income Tax other than 462.6 489.2 713.1 691.9 858.0 1157.6 1311.3 1439.0 2008.7Corporation Tax
Union Excise Duties 1324.2 1277.0 1587.9 1613.8 1873.4 2241.1 2240.8 2520.8 3025.3
Grants in Lieu of Tax on 17.0 17.0 14.4 23.2 23.2 23.2 23.2 23.2 59.2Railway Passenger Fare
II. Total Grants 908.1 1098.8 1035.6 2041.7 2339.2 2947.2 2706.7 2642.7 2253.7
Article 275(1) Grants 83.4 45.3 56.7 569.5 598.1 753.4 800.2 905.8 772.5
Plan Grants 815.5 992.0 929.3 1417.1 1600.5 2076.4 1845.0 1673.5 1465.4
Other Non-Plan Grants 9.3 61.5 49.6 55.1 140.6 117.4 61.5 63.4 15.8
1996-97 1997-98 1998-99 1999-00 2000-01 2001-02* 2002-03 2003-04 RE 2004-05 BE
Total Transfers (I+II) 8404.1 9281.5 7993.5 10082.5 10529.8 13474.9 13137.0 17205.3 19274.1
I. Sharing of Central Taxes 6131.5 7174.1 5830.3 7478.9 7756.6 10183.3 10828.0 12514.7 14949.4
Income Tax other than 2410.1 3761.0 2585.6 2948.2 @ @ @ @ @Corporation Tax
Union Excise Duties 3662.3 3353.9 3185.5 4530.7 @ @ @ @ @
Grants in Lieu of Tax on 59.2 59.2 59.2 0.0 @ @ @ @ @Railway Passenger Fare
II. Total Grants 2272.6 2107.4 2163.2 2603.6 2773.2 3291.5 2309.0 4690.7 4324.8
Article 275(1) Grants 393.3 103.7 324.3 0.3 135.8 0.3 37.5 0.0 0.0
Plan Grants 1861.1 1975.6 1818.3 2276.4 2468.0 2838.1 1883.8 3524.4 3415.1
Other Non-Plan Grants 18.2 28.1 20.7 326.9 169.4 453.1 387.8 1166.3 909.6
Source: Finance Accounts of Uttar Pradesh and Budget Document (2004-05) of Uttar Pradesh.
Notes: *Data pertains to divided Uttar Pradesh.
@ Due to the Constitution Amendment the tax specific transfers have been stopped.
...Contd. ...

UTTAR PRADESH DEVELOPMENT REPORT—VOL. 2516
APPENDIX A-16.3
Finances of Uttar Pradesh (Revenue Expenditure): 1987-88 to 2004-05(Rs. Crore)
1987-88 1988-89 1989-90 1990-91 1991-92 1992-93 1993-94 1994-95 1995-96
I. General Services 1690.5 2043.7 2610.2 3130.5 3687.6 4476.8 4709.5 6117.6 7771.0
Interest Payment 693.8 814.6 1041.9 1298.9 1710.3 2041.6 2111.1 3088.6 3324.9
Pension 120.0 153.4 174.1 230.9 293.1 473.6 425.5 497.8 723.4
Police 328.4 411.3 522.7 644.1 672.5 778.2 873.5 987.2 1101.1
Election 3.7 5.2 26.2 9.8 31.6 15.0 28.6 86.2 108.7
Others 544.6 659.3 845.4 946.8 980.1 1168.4 1270.7 1457.8 2513.0
II. Social Services 1766.5 2200.1 2905.2 3392.9 3441.4 4047.6 4053.1 4681.2 5499.1
Education 957.1 1270.7 1863.6 2103.1 2011.9 2507.0 2358.1 2866.4 3383.2
Medical and Public Health 282.9 347.3 407.8 472.0 478.5 594.8 683.5 650.2 787.1
Family Welfare 104.4 118.6 131.6 149.4 145.8 143.0 239.4 248.0 218.1
Water Supply and Sanitation 107.6 138.2 144.3 203.3 168.8 176.5 193.4 225.7 256.6
Other Social Services 314.5 325.2 358.1 465.1 636.5 626.3 578.8 691.0 854.1
III. Economic Services 1323.3 1693.6 1737.2 2517.2 2450.2 3196.9 3232.6 3269.0 3325.8
Irrigation 292.5 355.4 432.6 436.8 555.1 751.2 709.9 919.1 1004.9
Roads and Bridges 101.4 147.3 124.5 195.9 204.0 198.8 297.2 270.4 265.7
Others 929.4 1190.9 1180.1 1884.5 1691.1 2246.9 2225.5 2079.5 2055.2
IV. C. and A. to Local Bodies 58.1 40.1 36.8 106.3 175.7 242.7 226.4 237.5 273.8
Total Expenditure (I+II+III+IV) 4838.4 5977.6 7289.5 9146.9 9754.9 11964.0 12221.6 14305.4 16869.7
Adjusted Items as Contra Entries (a+b)
a. State Lotteries 50.9 68.5 135.1 145.8 383.4 512.5 773.6 855.9 377.1
b. Interest Earning from Irrigation 190.7 210.7 229.5 245.6 260.9 214.3 285.0 234.7 309.1
Unadjusted Revenue Expenditure 5079.9 6256.8 7654.0 9538.4 10399.2 12690.7 13280.1 15396.0 17555.9
1996-97 1997-98 1998-99 1999-00 2000-01 2001-02* 2002-032003-04 RE2004-05 BE
I. General Services 8319.4 9799.9 11497.7 13457.5 15155.2 16178.4 15582.7 20731.0 23287.3
Interest Payment 4061.0 4689.3 5516.6 6553.1 7452.6 8220.0 7059.5 10782.8 11476.6
Pension 894.4 1053.7 1786.3 2060.7 2163.3 2391.7 2751.1 3573.8 4143.3
Police 1291.9 1589.2 1623.9 1765.0 1997.6 1944.2 2039.1 2256.8 2366.6
Election 86.0 81.0 23.6 64.1 35.6 66.0 37.1 38.4 77.5
Others 1986.0 2386.6 2547.3 3014.5 3506.2 3556.5 3695.8 4079.2 5223.3
II. Social Services 6374.2 7501.4 8882.3 8677.0 9218.0 9336.6 10308.0 11813.8 11574.7
Education 3873.6 4196.1 5731.4 5712.3 6119.3 6042.4 6067.1 6661.4 6544.3
Medical and Public Health 862.6 1099.6 1018.0 1054.6 1143.1 1092.0 1291.2 1621.3 1663.2
Family Welfare 292.4 322.3 215.9 215.5 267.1 264.1 273.8 519.4 543.5
Water Supply and Sanitation 299.5 528.3 395.3 312.8 300.8 484.7 268.7 699.6 525.3
Other Social Services 1046.0 1355.2 1521.6 1381.7 1387.6 1453.4 2407.3 2312.1 2298.5
III. Economic Services 3887.6 3925.1 4449.0 5357.4 5113.4 4865.4 5501.3 18496.3 6079.7
Irrigation 1105.6 1045.3 1056.3 771.1 881.1 853.7 1154.9 675.0 705.7
Roads and Bridges 294.2 308.1 316.8 434.7 527.5 536.5 674.7 541.1 515.3
Others 2487.8 2571.7 3075.9 4151.6 3704.8 3475.2 3671.6 17280.2 4858.6
IV. C. and A. to Local Bodies 298.0 617.5 874.0 860.9 1084.6 927.9 1164.6 1375.1 1462.1
Total Expenditure (I+II+III+IV) 18879.2 21843.9 25703.1 28352.8 30571.2 31308.4 32556.6 52416.1 42403.8
Adjusted Items as Contra Entries (a+b)
a. State Lotteries 0.0 0.0 0.0 0.0 0.0 0.0 0.0 0.0 0.0
b. Interest Earning from Irrigation 328.6 351.2 371.7 394.9 0.0 0.0 0.0 0.0 0.0
Unadjusted Revenue Expenditure 19207.7 22195.0 26074.8 28747.7 31029.9 31792.7 32938.5 52798.1 42785.7
Source: Finance Accounts of Uttar Pradesh and Budget Document (2004-05) of Uttar Pradesh.
Note: *Data pertains to divided Uttar Pradesh.
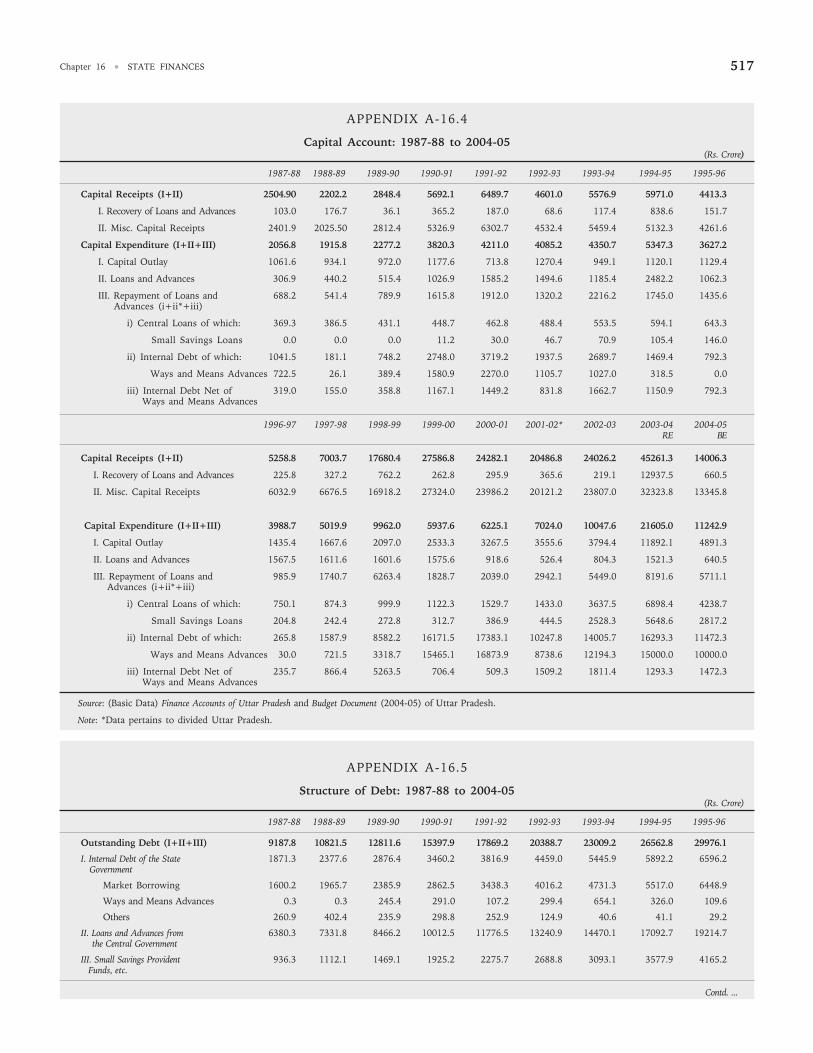
Chapter 16 • STATE FINANCES 517
APPENDIX A-16.4
Capital Account: 1987-88 to 2004-05(Rs. Crore)
1987-88 1988-89 1989-90 1990-91 1991-92 1992-93 1993-94 1994-95 1995-96
Capital Receipts (I+II) 2504.90 2202.2 2848.4 5692.1 6489.7 4601.0 5576.9 5971.0 4413.3
I. Recovery of Loans and Advances 103.0 176.7 36.1 365.2 187.0 68.6 117.4 838.6 151.7
II. Misc. Capital Receipts 2401.9 2025.50 2812.4 5326.9 6302.7 4532.4 5459.4 5132.3 4261.6
Capital Expenditure (I+II+III) 2056.8 1915.8 2277.2 3820.3 4211.0 4085.2 4350.7 5347.3 3627.2
I. Capital Outlay 1061.6 934.1 972.0 1177.6 713.8 1270.4 949.1 1120.1 1129.4
II. Loans and Advances 306.9 440.2 515.4 1026.9 1585.2 1494.6 1185.4 2482.2 1062.3
III. Repayment of Loans and 688.2 541.4 789.9 1615.8 1912.0 1320.2 2216.2 1745.0 1435.6 Advances (i+ii*+iii)
i) Central Loans of which: 369.3 386.5 431.1 448.7 462.8 488.4 553.5 594.1 643.3
Small Savings Loans 0.0 0.0 0.0 11.2 30.0 46.7 70.9 105.4 146.0
ii) Internal Debt of which: 1041.5 181.1 748.2 2748.0 3719.2 1937.5 2689.7 1469.4 792.3
Ways and Means Advances 722.5 26.1 389.4 1580.9 2270.0 1105.7 1027.0 318.5 0.0
iii) Internal Debt Net of 319.0 155.0 358.8 1167.1 1449.2 831.8 1662.7 1150.9 792.3 Ways and Means Advances
1996-97 1997-98 1998-99 1999-00 2000-01 2001-02* 2002-03 2003-04 2004-05RE BE
Capital Receipts (I+II) 5258.8 7003.7 17680.4 27586.8 24282.1 20486.8 24026.2 45261.3 14006.3
I. Recovery of Loans and Advances 225.8 327.2 762.2 262.8 295.9 365.6 219.1 12937.5 660.5
II. Misc. Capital Receipts 6032.9 6676.5 16918.2 27324.0 23986.2 20121.2 23807.0 32323.8 13345.8
Capital Expenditure (I+II+III) 3988.7 5019.9 9962.0 5937.6 6225.1 7024.0 10047.6 21605.0 11242.9
I. Capital Outlay 1435.4 1667.6 2097.0 2533.3 3267.5 3555.6 3794.4 11892.1 4891.3
II. Loans and Advances 1567.5 1611.6 1601.6 1575.6 918.6 526.4 804.3 1521.3 640.5
III. Repayment of Loans and 985.9 1740.7 6263.4 1828.7 2039.0 2942.1 5449.0 8191.6 5711.1 Advances (i+ii*+iii)
i) Central Loans of which: 750.1 874.3 999.9 1122.3 1529.7 1433.0 3637.5 6898.4 4238.7
Small Savings Loans 204.8 242.4 272.8 312.7 386.9 444.5 2528.3 5648.6 2817.2
ii) Internal Debt of which: 265.8 1587.9 8582.2 16171.5 17383.1 10247.8 14005.7 16293.3 11472.3
Ways and Means Advances 30.0 721.5 3318.7 15465.1 16873.9 8738.6 12194.3 15000.0 10000.0
iii) Internal Debt Net of 235.7 866.4 5263.5 706.4 509.3 1509.2 1811.4 1293.3 1472.3 Ways and Means Advances
Source: (Basic Data) Finance Accounts of Uttar Pradesh and Budget Document (2004-05) of Uttar Pradesh.
Note: *Data pertains to divided Uttar Pradesh.
APPENDIX A-16.5
Structure of Debt: 1987-88 to 2004-05(Rs. Crore)
1987-88 1988-89 1989-90 1990-91 1991-92 1992-93 1993-94 1994-95 1995-96
Outstanding Debt (I+II+III) 9187.8 10821.5 12811.6 15397.9 17869.2 20388.7 23009.2 26562.8 29976.1
I. Internal Debt of the State 1871.3 2377.6 2876.4 3460.2 3816.9 4459.0 5445.9 5892.2 6596.2 Government
Market Borrowing 1600.2 1965.7 2385.9 2862.5 3438.3 4016.2 4731.3 5517.0 6448.9
Ways and Means Advances 0.3 0.3 245.4 291.0 107.2 299.4 654.1 326.0 109.6
Others 260.9 402.4 235.9 298.8 252.9 124.9 40.6 41.1 29.2
II. Loans and Advances from 6380.3 7331.8 8466.2 10012.5 11776.5 13240.9 14470.1 17092.7 19214.7 the Central Government
III. Small Savings Provident 936.3 1112.1 1469.1 1925.2 2275.7 2688.8 3093.1 3577.9 4165.2 Funds, etc.
Contd. ...
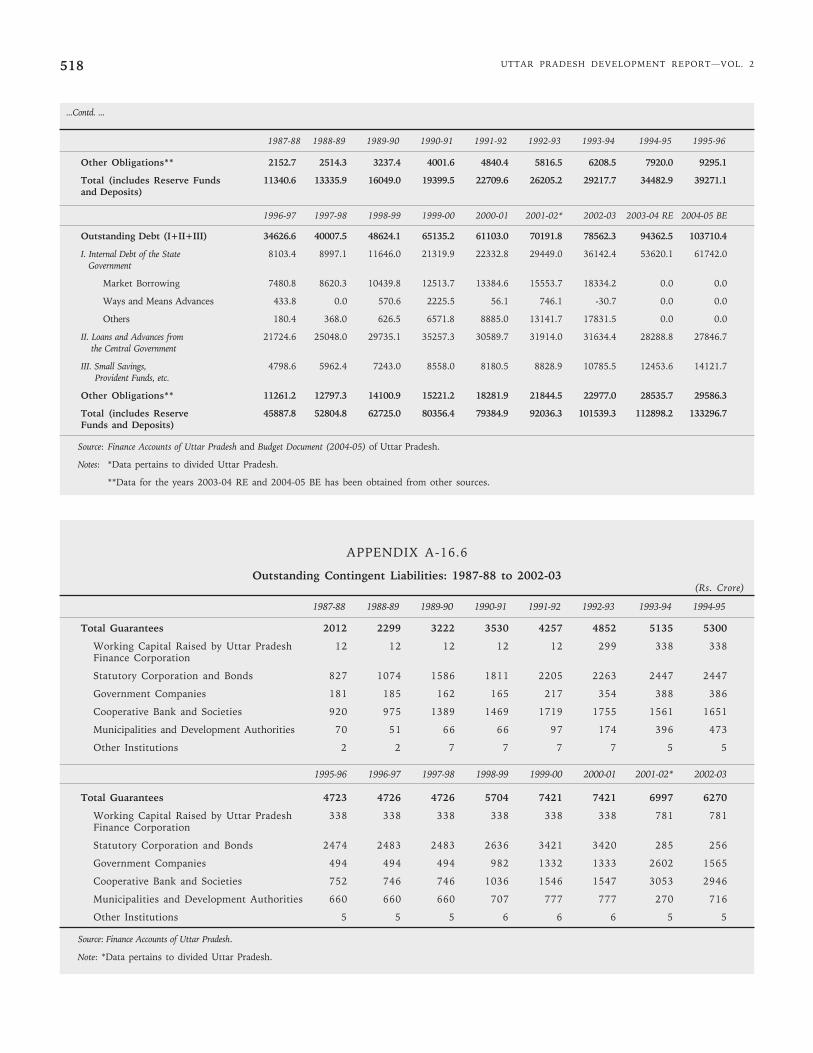
UTTAR PRADESH DEVELOPMENT REPORT—VOL. 2518
1987-88 1988-89 1989-90 1990-91 1991-92 1992-93 1993-94 1994-95 1995-96
Other Obligations** 2152.7 2514.3 3237.4 4001.6 4840.4 5816.5 6208.5 7920.0 9295.1
Total (includes Reserve Funds 11340.6 13335.9 16049.0 19399.5 22709.6 26205.2 29217.7 34482.9 39271.1and Deposits)
1996-97 1997-98 1998-99 1999-00 2000-01 2001-02* 2002-03 2003-04 RE 2004-05 BE
Outstanding Debt (I+II+III) 34626.6 40007.5 48624.1 65135.2 61103.0 70191.8 78562.3 94362.5 103710.4
I. Internal Debt of the State 8103.4 8997.1 11646.0 21319.9 22332.8 29449.0 36142.4 53620.1 61742.0 Government
Market Borrowing 7480.8 8620.3 10439.8 12513.7 13384.6 15553.7 18334.2 0.0 0.0
Ways and Means Advances 433.8 0.0 570.6 2225.5 56.1 746.1 -30.7 0.0 0.0
Others 180.4 368.0 626.5 6571.8 8885.0 13141.7 17831.5 0.0 0.0
II. Loans and Advances from 21724.6 25048.0 29735.1 35257.3 30589.7 31914.0 31634.4 28288.8 27846.7 the Central Government
III. Small Savings, 4798.6 5962.4 7243.0 8558.0 8180.5 8828.9 10785.5 12453.6 14121.7 Provident Funds, etc.
Other Obligations** 11261.2 12797.3 14100.9 15221.2 18281.9 21844.5 22977.0 28535.7 29586.3
Total (includes Reserve 45887.8 52804.8 62725.0 80356.4 79384.9 92036.3 101539.3 112898.2 133296.7Funds and Deposits)
Source: Finance Accounts of Uttar Pradesh and Budget Document (2004-05) of Uttar Pradesh.
Notes: *Data pertains to divided Uttar Pradesh.
**Data for the years 2003-04 RE and 2004-05 BE has been obtained from other sources.
APPENDIX A-16.6
Outstanding Contingent Liabilities: 1987-88 to 2002-03(Rs. Crore)
1987-88 1988-89 1989-90 1990-91 1991-92 1992-93 1993-94 1994-95
Total Guarantees 2012 2299 3222 3530 4257 4852 5135 5300
Working Capital Raised by Uttar Pradesh 12 12 12 12 12 299 338 338Finance Corporation
Statutory Corporation and Bonds 827 1074 1586 1811 2205 2263 2447 2447
Government Companies 181 185 162 165 217 354 388 386
Cooperative Bank and Societies 920 975 1389 1469 1719 1755 1561 1651
Municipalities and Development Authorities 70 51 66 66 97 174 396 473
Other Institutions 2 2 7 7 7 7 5 5
1995-96 1996-97 1997-98 1998-99 1999-00 2000-01 2001-02* 2002-03
Total Guarantees 4723 4726 4726 5704 7421 7421 6997 6270
Working Capital Raised by Uttar Pradesh 338 338 338 338 338 338 781 781Finance Corporation
Statutory Corporation and Bonds 2474 2483 2483 2636 3421 3420 285 256
Government Companies 494 494 494 982 1332 1333 2602 1565
Cooperative Bank and Societies 752 746 746 1036 1546 1547 3053 2946
Municipalities and Development Authorities 660 660 660 707 777 777 270 716
Other Institutions 5 5 5 6 6 6 5 5
Source: Finance Accounts of Uttar Pradesh.
Note: *Data pertains to divided Uttar Pradesh.
...Contd. ...

Chapter 16 • STATE FINANCES 519
APPENDIX A-16.7
Schedule of Salary and Wages of Employees in Uttar Pradesh(Rs. Lakh)
Department 2002-03 2003-04 RE
Non-Plan Plan Total Non-Plan Plan Total
Excise 1.13 2148.88 2150.01 0.00 2855.63 2855.63
Housing 6.01 1099.63 1105.64 0.00 1235.16 1235.16
Industry (Small Industries and Export Promotion) 11.36 2845.88 2857.24 15.13 3326.77 3341.90
Industry (Minerals and Metals) 0.00 624.13 624.13 0.00 733.24 733.24
Industry (Khadi and Village Industries) 0.00 6.56 6.56 0.00 10.70 10.70
Industry (Handlooms) 0.00 400.82 400.82 33.76 503.43 537.19
Industry (Stationary and Printing) 0.08 3117.07 3117.15 0.00 3171.52 3171.52
Energy 0.00 506.01 506.01 0.00 616.85 616.85
Agri. and Other (Floriculture and Silk Promotion) 24.80 3410.79 3435.59 36.26 3884.68 3920.94
Agri. and Allied (Agriculture) 1021.35 17051.06 18072.41 759.99 21713.24 22473.23
Agri. and Allied (Land Dev. and Water Resources) 3898.11 0.00 3898.11 1200.33 0.00 1200.33
Agri. and Allied (Rural Dev.) 45.68 28831.83 28877.51 32.77 33217.80 33250.57
Agr. and Allied (Panchayat Raj) 30.54 38295.86 38326.40 11.71 43411.66 43423.37
Agri. and Allied (Animal Husbandry) 40.78 12242.56 12283.34 124.19 13988.94 14113.13
Agri. and Allied (Dairy Dev.) 1.36 584.17 585.53 0.00 609.87 609.87
Agri. and Allied (Fisheries) 0.44 1162.30 1162.74 7.69 1412.43 1420.12
Agri. and Allied (Cooperation) 25.58 2269.87 2295.45 0.00 2831.17 2831.17
Labour (Training and other Exp.) 0.00 19.41 19.41 0.00 93.34 93.34
Labour (Public Service Commission) 0.00 609.66 609.66 0.00 707.06 707.06
Food and Provisions 0.00 7923.96 7923.96 0.00 9643.43 9643.43
Sports 0.00 472.72 472.72 0.00 528.85 528.85
Sugarcane Dev. (Sugarcane) 3.80 4050.71 4054.51 0.00 4654.74 4654.74
Sugarcane Dev. (Sugar Industry) 0.03 441.53 441.56 0.00 494.47 494.47
Home (Jails) 2.16 5895.18 5897.34 0.00 6540.39 6540.39
Home (Police) 75.21 180526.08 180601.29 0.00 198417.45 198417.45
Home (Civil Defence) 99.88 2521.14 2621.02 0.00 3120.42 3120.42
Home (Political Pension and Other Retirement Benefits) 7.27 1794.35 1801.62 0.00 2093.04 2093.04
Vigilance (Governor Secretariat) 0.00 174.48 174.48 0.00 223.30 223.30
Vigilance (Directorate of Rev. Sp. Inform. and Other Exp.) 0.00 51.18 51.18 0.00 67.80 67.80
Health (Medical, Education and Training) 13.21 4473.33 4486.54 47.55 6349.38 6396.93
Health (Allopathy) 198.38 50579.09 50777.47 526.35 60075.18 60601.53
Health (Ayurveda and Unani) 27.83 10129.39 10157.22 0.00 12511.34 12511.34
Health (Homeopathy) 1.52 4543.25 4544.77 0.00 5588.75 5588.75
Health (Family Welfare) 25192.66 0.00 25192.66 36739.74 2135.66 38875.40
Health (Public Health) 466.61 14273.84 14740.45 43.68 15128.19 15171.87
Urban Development 0.48 380.49 380.97 0.96 440.49 441.45
Civil Aviation 0.00 247.51 247.51 0.00 261.74 261.74
Language 0.00 7.37 7.37 0.00 8.38 8.38
Planning 40.67 2580.39 2621.06 33.90 3278.72 3312.62
Election 0.00 661.72 661.72 0.00 837.61 837.61
Judiciary 869.65 21804.03 22673.68 1831.50 28775.18 30606.68
Transport 0.12 2284.95 2285.07 0.00 2645.91 2645.91
Tourism 12.75 336.09 348.84 63.79 370.24 434.03
Environment 0.00 54.26 54.26 0.00 60.93 60.93
Administrative Reforms 0.00 130.17 130.17 0.00 96.81 96.81
Contd. ...

UTTAR PRADESH DEVELOPMENT REPORT—VOL. 2520
Department 2002-03 2003-04 RE
Non-Plan Plan Total Non-Plan Plan Total
Technical Education 45.50 2982.14 3027.64 95.89 3318.44 3414.33
Muslim Waqf 0.00 315.02 315.02 5.12 434.90 440.02
Women and Child Welfare 4190.07 1577.54 5767.61 4525.79 1767.28 6293.07
Revenue (District Admn.) 0.00 12842.04 12842.04 0.00 15302.52 15302.52
Revenue (Natural Calamities.) 0.00 2.09 2.09 0.00 2.77 2.77
Revenue (Revenue Council and other Exp.) 376.15 49374.68 49750.83 0.00 57748.13 57748.13
Public Works (Establishment) 0.00 35099.07 35099.07 59.53 40062.17 40121.70
Public Works (Directorate of Estate) 0.00 888.92 888.92 0.00 1049.19 1049.19
Forestry 0.35 9294.63 9294.98 0.00 10521.82 10521.82
Finance (Interest Payments and Servicing of Debt) 0.00 48.95 48.95 0.00 68.88 68.88
Finance (Treasury and Accounts Admn.) 0.00 3772.31 3772.31 0.00 4955.13 4955.13
Finance (State Lotteries) 0.00 54.99 54.99 0.00 54.53 54.53
Finance (Audit Accounts, Small Savings, etc.) 22.38 4360.54 4382.92 0.00 5421.11 5421.11
Finance (Group Insurance) 0.00 59.08 59.08 0.00 71.73 71.73
Vidhan Parishad Secretariat 0.00 445.31 445.31 0.00 556.28 556.28
Vidhan Sabha Secretariat 0.00 1038.09 1038.09 0.00 1085.13 1085.13
Education (Primary Education) 7.89 5310.66 5318.55 16.19 7104.10 7120.29
Education (Secondary) 89.51 21223.29 21312.80 254.41 23977.72 24232.13
Education (University and Higher Education) 30.06 3470.01 3500.07 120.22 4408.70 4528.92
Education (State Council and Education Training) 824.33 2134.27 2958.60 2363.38 1085.55 3448.93
Labour (Labour Welfare) 21.75 5893.40 5915.15 29.97 6557.93 6587.90
Labour (Employment Exchange) 44.23 5685.45 5729.68 24.50 7287.02 7311.52
Secretariat Admn. 6.34 9325.24 9331.58 10.24 10401.21 10411.45
Social Welfare (Disabled and BC Welfare) 2.50 469.22 471.72 8.35 571.58 579.93
Social Welfare (Social Welfare and SC Welfare) 23.22 2464.69 2487.91 0.00 2744.48 2744.48
Social Welfare (ST Welfare) 2.09 155.00 157.09 4.85 174.84 179.69
Vigilance 0.00 904.54 904.54 0.00 1082.86 1082.86
Social Welfare (Special Component Plan for SC’s) 0.00 0.00 0.00 84.74 0.00 84.74
General Administration 0.00 119.84 119.84 0.00 0.00 0.00
Public Enterprises 0.00 104.27 104.27 0.00 118.99 118.99
Information 0.40 1127.41 1127.81 0.02 1355.36 1355.38
Army Welfare 10.96 451.49 462.45 0.00 544.38 544.38
Institutional Fin. (Directorate) 0.00 119.06 119.06 0.00 149.12 149.12
Institutional Fin. (Commercial Taxes) 0.00 13337.44 13337.44 0.00 14925.14 14925.14
Institutional. Fin. (Entertainment and Betting) 0.00 587.66 587.66 0.00 677.65 677.65
Institutional Fin. (Stamps and Registration) 0.00 1475.14 1475.14 0.00 1758.47 1758.47
Cultural 0.07 444.61 444.68 1.91 501.21 503.12
Irrigation (Establishment) 7381.39 41678.47 49059.86 7393.13 52407.11 59800.24
Total 45198.64 670200.26 715398.90 56507.54 778925.32 835432.86
Source: Budget Document (2004-05) of Uttar Pradesh, Vol. 2, Part 1, February 2004.
...Contd. ...

Chapter 16 • STATE FINANCES 521
APPENDIX A16.8
Position of Loans Given by the State Government as on April 1, 2003(Rs. Crore)
Description of Loans@ Over Due as on 1.04.2002 Current Due (Year 2002-03) Total Payable Amount(Year 2002-03)
Principal Interest Principal Interest Col. 1+3 Col. 2+4Principal Interest
1 2 3 4 5 6
Corporations and Municipalities 314.89 174.92 23.75 21.99 338.64 196.91
Town Area Committees 0.36 0.82 0.36 0.82
Notified Area Committees 0.12 0.30 0.12 0.30
District Boards 1.11 2.12 1.11 2.12
Improvement Trust and Development Board 330.60 14.06 6.76 3.71 337.36 17.77
Join Stock Companies 0.55 1.39 0.55 1.39
Cooperatives 115.00 28.03 3.30 7.29 118.30 35.32
Miscellaneous 629.87 57.47 92.00 35.14 721.87 92.61
Rampur Rajya 0.02 0.02 0.02 0.02
Cooperative Institutions and Banks 666.91 88.15 200.70 38.67 867.60 126.82
State Electricity Boards * 0.00 0.00
Water Corporation/Water Board 370.75 325.62 74.74 7.40 445.50 333.02
Housing Development Board 52.60 318.10 68.84 52.60 386.93
Total 2482.78 1010.99 401.25 183.03 2884.02 1194.02
Description of Loans@ Returns to the Heads Over Due as on 1.04.2003(Year 2002-03)
Principal Interest Principal Interest
7 8 9 10
Corporations and Municipalities 0.44 0.06 338.20 196.85
Town Area Committees 0.36 0.82
Notified Area Committees 0.12 0.30
District Boards 1.11 2.12
Improvement Trust and Development Board 14.45 1.35 322.92 16.42
Join Stock Companies 0.55 1.39
Cooperatives 0.68 0.35 117.62 34.97
Miscellaneous 69.70 5.31 652.17 87.29
Rampur Rajya 0.02 0.02
Cooperative Institutions and Banks 17.82 15.26 849.78 111.57
State Electricity Boards *
Water Corporation/Water Board 0.20 0.04 445.30 332.97
Housing Development Board 15.78 4.24 36.83 382.70
Total 119.06 26.62 2764.96 1167.40
Source: Budget Document (2004-05), Vol. 2, Part 1.
Notes: *Pursuant to a notification dated January 14, 2000, the loans and recoveries have been rescheduled. Therefore, outstanding of earlier years are not shown.;@ in the description of loans notification, Uttaranchal part is also included.

UTTAR PRADESH DEVELOPMENT REPORT—VOL. 2522
APPENDIX A-16.9
Statement of Guarantees Extended by the State Government till 31st March, 2003(Rs. Crore)
Name of Department Maximum Amount of Amount of Unpaid Interest Paid AmountGuarantees Extended Guarantees as on 31st on Guarantees Involved
March 2003 Extended Guarantees
Bond Loan Total Bond Loan Total
Housing Department 176.66 676.36 853.03 47.26 46.36 93.62 50.87
Department of Industry 1364.62 336.51 1701.13 852.09 210.51 1062.60 485.28 67.94
Sugarcane Development Department 40.28 40.28 9.65 9.65 10.15 40.28
Industry (Sugar Industry) Department 147.30 147.30 548.59 548.59 64.80
Department of Cooperatives 4227.69 4227.69 199.67 199.67 1.19
Food and Supplies Department 2.50 2.50 2.02 2.02 0.19 2.02
Department of Energy 2533.33 2533.33 1196.15 1196.15 6.58
Department of Social Welfare 54.47 54.47 42.30 42.30
Department of Transport 172.17 172.17 106.92 106.92
Udyan and Khadya Prasanskaran Department 0.57 0.57 0.56 0.56 1.57
Department of Backward Classes Welfare 52.65 52.65 7.78 7.78 0.17
Minority and Muslim Waqf Department 59.70 59.70 59.70 59.70 0.69
Dairy Development Department 129.83 129.83 33.52 33.52 6.17
Department of Medical 5.00 5.00 3.44 3.44 6.52
Urban Employment and Eradication of 187.55 187.55 167.96 167.96 12.56Poverty Department
Department of Rural Development 340.20 340.20 65.09 65.09 16.64
Department of Urban Development 41.37 41.37 1.87 1.87 1.42
Total 1541.28 9007.48 10548.76 899.35 2702.08 3601.43 664.80 110.24
Source: Budget Document (2004-05), Vol. 2, Part 1 of Uttar Pradesh.
APPENDIX A-16.10
Statement of Arrears: Tax and Non-Tax(Rs. Crore)
Arrear Items Arrears at the Recoveries Made in Arrears as End of Previous 2002-03 against onFinancial Year as Col. 3/Amounts 1.04.2003 on 1.04.2002 Reduced in Appeal
or Written Off
Land Revenue 21.97 4.13 30.54
Land Revenue Tax 0.49 0.06 0.43
Irrigation Duty 84.75 23.17 116.12
(i) Agriculture Income Tax
(ii) L.L.H.T.
(iii) Tax on Large Holdings 0.08 0.08
Consolidation Duty 5.02 0.18 5.03
Commercial Tax 5883.21 2450.12 5496.36
Entertainment and Taji Tax 6.35 0.84 8.02
Receivables from Forest 11.55 1.51 11.21
Road Tax 4.10 3.03 4.13
Goods Tax 4.15 3.17 4.31
Contd. ...
Arrear Items Arrears at the Recoveries Made in Arrears as End of Previous 2002-03 against onFinancial Year as Col. 3/Amounts 1.04.2003 on 1.04.2002 Reduced in Appeal
or Written Off
Passenger Tax 7.83 5.33 8.65
Purchase Tax on Sugarcane
(i) By Sugar Mills+ 12.22 12.22
(ii) By Khandsari Units 0.40 0.04 0.37
Electricity Duty 15.04 0.09 39.38
Excise Duty 36.32 0.54 36.77
Sales Tax on Motor Vehicles 0.43 0.43
Land and House Tax+ 0.08 0.08
Profession Tax 2.97 2.97
C.D.F., Aligarh+ 0.05 0.05
Receivables under Animal 1.97 0.37 1.97Farms, etc.
Total 6098.9851 2492.5687 5779.1172
Source: Budget Document (2004-05), Vol. 2, Part 1 of Uttar Pradesh.
Note: +On account of lack of information, earlier year’s data isfurnished.
...Contd. ...

Chapter 16 • STATE FINANCES 523
APPENDIX A-16.11
Sectoral Composition of GSDP: Uttar Pradesh(Per Cent)
1993-94 1994-95 1995-96 1996-97 1997-98 1998-99 1999-00 2000-01 2001-02 2002-03
(At Current Prices)
Agriculture and Allied Activities 39.03 37.97 36.42 36.66 34.92 35.32 35.79 34.90 33.49 31.63
Agriculture 37.94 37.13 35.79 36.02 34.14 33.70 34.31 33.30 31.78 29.82
Forestry and Logging 0.63 0.42 0.24 0.30 0.44 1.26 1.11 1.21 1.32 1.40
Fishing 0.46 0.42 0.39 0.33 0.34 0.36 0.36 0.39 0.40 0.41
Industry 18.01 20.02 20.27 20.50 19.99 19.83 19.23 17.38 17.48 17.93
Mining and Quarrying 0.76 0.80 0.92 0.86 0.91 1.01 1.11 1.20 0.99 1.23
Manufacturing-Registered 7.99 9.67 9.09 10.67 8.91 8.37 8.04 7.33 7.59 7.26
Manufacturing-Unregistered 5.67 5.78 6.11 5.32 6.08 5.89 5.85 5.62 5.66 5.66
Electricity, Gas and Water Supply 3.59 3.77 4.15 3.65 4.09 4.56 4.22 3.23 3.24 3.78
Services 42.95 42.01 43.31 42.84 45.09 44.85 44.98 47.71 49.03 50.45
Construction 4.20 3.97 4.37 4.32 4.87 5.42 5.42 5.48 5.73 5.94
Railways 1.84 1.67 1.72 1.51 1.59 1.56 1.52 1.36 1.46 1.59
Transport by other Means 2.94 2.91 2.83 2.93 3.16 3.24 3.40 3.49 3.41 3.43
Communication 0.56 0.72 0.72 0.74 0.65 0.68 0.73 0.87 1.03 1.26
Trade, Hotels and Restaurants 13.51 13.79 14.18 14.77 15.00 13.80 13.23 14.80 14.93 15.28
Banking and Insurance 2.53 2.58 2.92 3.15 3.41 2.98 3.07 3.28 3.52 3.81
Real Estate, Ownership of Dwellings 6.85 6.29 5.98 5.38 5.38 5.36 5.69 6.23 6.40 6.68and Business Services
Public Administration 4.44 4.07 4.33 4.10 4.79 4.81 5.08 5.06 5.14 5.01
Other Services 6.08 6.01 6.24 5.94 6.25 7.00 6.84 7.14 7.41 7.45
GSDP at Current Prices (Rs. Crore) 80451 94019 106249 127778 137561 153853 165324 173669 188687 202904
(At 1993-94 Prices)
Agriculture and Allied Activities 39.03 37.97 37.21 36.74 34.93 35.10 36.17 35.54 34.95 32.38
Agriculture 37.94 37.10 36.45 35.90 33.88 33.17 34.27 33.57 32.96 30.28
Forestry and Logging 0.63 0.42 0.30 0.42 0.61 1.42 1.39 1.43 1.42 1.47
Fishing 0.46 0.46 0.46 0.42 0.45 0.51 0.50 0.55 0.57 0.63
Industry 18.01 19.98 20.08 21.20 20.61 19.95 18.80 18.43 18.57 19.13
Mining and Quarrying 0.76 0.80 0.92 0.93 0.95 0.98 1.07 1.03 0.93 1.24
Manufacturing-Registered 7.99 9.76 9.31 11.35 9.81 9.25 8.70 8.36 8.57 8.53
Manufacturing-Unregistered 5.67 5.72 6.13 5.54 6.39 6.12 5.96 5.85 5.94 6.25
Electricity, Gas and Water Supply 3.59 3.70 3.71 3.38 3.46 3.61 3.07 3.18 3.13 3.11
Services 42.95 42.05 42.72 42.07 44.46 44.95 45.02 46.03 46.48 48.49
Construction 4.20 3.98 4.44 4.19 4.89 5.40 5.40 5.74 6.05 6.50
Railways 1.84 1.64 1.70 1.59 1.68 1.79 1.76 1.74 1.77 1.87
Transport by other Means 2.94 2.95 2.94 2.94 3.18 3.16 3.28 3.42 3.32 3.44
Communication 0.56 0.73 0.79 0.85 0.78 0.84 1.00 1.28 1.51 1.87
Trade, Hotels and Restaurants 13.51 13.40 13.22 13.31 12.79 12.88 12.95 12.67 12.55 12.95
Banking and Insurance 2.53 2.61 2.61 3.34 4.17 3.58 3.56 3.77 3.74 3.86
Real Estate, Ownership of Dwellings 6.85 6.62 6.49 5.97 6.12 6.10 5.91 5.98 5.87 6.05and Business Services
Public Administration 4.44 4.05 4.29 4.03 4.74 4.61 4.80 4.79 4.84 4.87
Other Services 6.08 6.06 6.23 5.85 6.12 6.59 6.36 6.64 6.85 7.08
GSDP at 1993-94 Prices (Rs. Crore) 80451 85106 88244 97719 97634 100321 105833 107038 111673 111830
Source: Central Statistical Organisation, released on 30.11.2004.

UTTAR PRADESH DEVELOPMENT REPORT—VOL. 2524
APPENDIX A-16.12
Uttar Pradesh State Series from 1987-88 to 2004-05(Rs. Crore)
GSDP (Current Prices) 1987-88 1988-89 1989-90 1990-91 1991-92 1992-93 1993-94 1994-95 1995-96
Old Series Uttar Pradesh (1980-81 Base) 34352.42 41101.59 46925.52 55505.71 64677.23 70704.35 79481.20 90267.03 101518.56
Uttar Pradesh (1993-94 Base) 80451.08 94019.12 106249.46
Uttaranchal (1993-94 Base) 5582.44 6809.49 7448.54
Constructed Series* 38403.86 45949.01 52459.80 62051.91 72305.10 79043.04 86033.52 100828.61 113698.00
1996-97 1997-98 1998-99 1999-00 2000-01 2001-02 2002-03 2003-04 2004-05
Old Series Uttar Pradesh (1980-81 Base) 117975.06 129977.42
Uttar Pradesh (1993-94 Base) 127778.00 137560.73 153852.83 165324.21 173668.82 188687.08 202903.95
Uttaranchal (1993-94 Base) 8168.78 8917.94 9862.80 10600.66 12091.54 13011.56
Constructed Series* 135946.78 146478.67 163715.63 175924.87 181056.25 188687.08 202903.95 215861.90 235289.47
Source: GSDP data released by CSO.
Notes: Conversion factor was obtained by taking the ratio of new GSDP to old GSDP (average of 1993-94 to 1996-97). This works out to 1.117937 to arriveat GSDP of combined Uttar Pradesh for the year 2000-01, the GSDP of Uttaranchal was multiplied by (223/365) the number of days of undividedUttar Pradesh existed in the financial year plus the GSDP of Combined Uttar Pradesh. GSDP for 2003-04 and 2004-05 are projected based on the trendgrowth rate estimated for the period 1990-91 to 1999-00.
* Relates to Uttar Pradesh as it existed, i.e., UUP up to 8.11.2000 and Uttar Pradesh from 9.11.2000.
APPENDIX A-16.13
Predictive Performance of Budget Estimates
Budget estimates are compared with corresponding actuals forthe following nine variables: own tax revenues, own non-taxrevenues, share in central taxes, plan revenue expenditure, non-planrevenue expenditure, capital receipts, capital expenditure, revenuedeficit, and fiscal deficit.
Comparisons are made over the period 1990-91 to 1999-00.Last year revised estimates were used as given in the latest RBIBulletin on State Finances. Percentage error is calculated by taking
Table A-16.13.1
Own Tax Revenue(Rs. Lakh)
BE Actual % Error
(B) (A) (A-B)/A*100
1990-91 269966 316212 14.62
1991-92 317183 349738 9.31
1992-93 366507 388634 5.69
1993-94 447209 413201 -8.23
1994-95 460122 487831 5.68
1995-96 515546 546892 5.73
1996-97 606965 630597 3.75
1997-98 707591 699796 -1.11
1998-99 936949 791011 -18.45
1999-00 1045680 996957 -4.89
Avg. % error (1990-91 to 1999-00) 1.21
Avg. % error (1990-91 to 1994-95) 5.42
Avg. % error (1995-96 to 1999-00) -2.99
the estimation error, i.e., differences of actual from the budgetestimate as percentage of the actual. Average percentage error iscalculated with reference to the period 1990-91 to 1999-00, and thesub-periods, viz., 1990-91 to 1994-95, and 1995-96 to 1999-00.
For each table, there is a corresponding Figure. The horizontal
axis represents the line of perfect forecast. If error is zero, all points
will be on the horizontal axis. Excess of actual over budget estimate
(case of underestimation) is represented by points above the
horizontal axis. Correspondingly, cases of overestimation, are shown
by points below the axis.
Percentage Error: Own Tax Revenues
(Rs. Lakh)
Root Mean Sq. Prediction Error 55575.3
Theil’s Inequality Coefficient 0.0928
Figure A-16.13.1
-25.0
-20.0
-15.0
-10.0
-5.0
0.0
5.0
10.0
15.0
20.0
90-9
1
91-9
2
92-9
3
93-9
4
94-9
5
95-9
6
96-9
7
97-9
8
98-9
9
99-0
0

Chapter 16 • STATE FINANCES 525
Table A-16.13.2
Own Non-Tax Revenue
(Rs. Lakh)
BE Actual % Error(B) (A) (A-B)/A*100
1990-91 269966 316212 14.621990-91 80303 77747 -3.291991-92 87236 108348 19.491992-93 127553 142090 10.231993-94 131740 171750 23.301994-95 147820 188933 21.761995-96 181524 239941 24.351996-97 129741 131849 1.601997-98 157760 129171 -22.131998-99 212205 147506 -43.861999-00 179192 196459 8.79
Avg. % error (1990-91 to 1999-00) 4.022Avg. % error (1990-91 to 1994-95) 14.297Avg. % error (1995-96 to 1999-00) -6.252
Figure A-16.13.2
Percentage Error: Own Non-Tax Revenues
(Rs. Lakh)
Root Mean Sq. Prediction Error 35599.3
Theil’s Inequality Coefficient 0.2229
Table A-16.13.3
Share in Central Taxes
(Rs. Lakh)
BE Actual % Error(B) (A) (A-B)/A*100
1990-91 228839 230565 0.751991-92 250501 273136 8.291992-93 293441 339860 13.661993-94 359146 355207 -1.111994-95 388320 395976 1.931995-96 512073 503402 -1.721996-97 586485 607238 3.421997-98 646474 711491 9.141998-99 623557 577112 -8.051999-00 685912 719206 4.63
Avg. % error (1990-91 to 1999-00) 3.093Avg. % error (1990-91 to 1994-95) 4.704Avg. % error (1995-96 to 1999-00) 1.483
Figure A-16.13.3
Percentage Error: Share in Central Taxes
(Rs. Lakh)
Root Mean Sq. Prediction Error 32776.3
Theil’s Inequality Coefficient 0.0655
Source: RBI Bulletins; figures under 1999-00 actuals are revised estimates.
Table A-16.13.4
Plan Revenue Expenditure
(Rs. Lakh)
BE Actual % Error(B) (A) (A-B)/A*100
1990-91 228839 230565 0.751990-91 226703 211730 -7.071991-92 208281 197702 -5.351992-93 220352 219680 -0.311993-94 238007 228572 -4.131994-95 259379 276354 6.141995-96 320516 252444 -26.971996-97 406165 326794 -24.291997-98 495399 326262 -51.841998-99 487207 358980 -35.721999-00 459948 514292 10.57
Avg. % error (1990-91 to 1999-00) -13.90Avg. % error (1990-91 to 1994-95) -2.14Avg. % error (1995-96 to 1999-00) -25.65
Figure A-16.13.4
Percentage Error: Plan Revenue Expenditure
(Rs. Lakh)
Root Mean Sq. Prediction Error 77233.4
Theil’s Inequality Coefficient 0.2531
-60.0
-40.0
-20.0
0.0
20.0
40.0
-10.0
-5.0
0.0
5.0
10.0
15.0
-60.0
-50.0
-40.0
-30.0
-20.0
-10.0
0.0
10.0
20.0
90-9
1
91-9
2
92-9
3
93-9
4
94-9
5
95-9
6
96-9
7
97-9
8
98-9
9
99-0
0

UTTAR PRADESH DEVELOPMENT REPORT—VOL. 2526
Table A-16.13.5
Non-Plan Revenue Expenditure
(Rs. Lakh)
BE Actual % Error
(B) (A) (A-B)/A*100
1990-91 742117 742106 0.001991-92 821875 842218 2.421992-93 919916 1049394 12.341993-94 1079273 1099441 1.831994-95 1226941 1266012 3.091995-96 1483584 1503142 1.301996-97 1679542 1593976 -5.371997-98 2077440 1893241 -9.731998-99 2270138 2248505 -0.961999-00 2516240 2542554 1.03
Avg. % error (1990-91 to 1999-00) 0.595Avg. % error (1990-91 to 1994-95) 3.935
Avg. % error (1995-96 to 1999-00) -2.745
Figure A-16.13.5
Percentage Error: Non-Plan Revenues Expenditure
(Rs. Lakh)
Root Mean Sq. Prediction Error 78680.0
Theil’s Inequality Coefficient 0.0497
Table A-16.13.6
Capital Receipts(Rs. Lakh)
BE Actual % Error
(B) (A) (A-B)/A*100
1990-91 402056 388439 -3.511991-92 428020 389606 -9.861992-93 422047 467828 9.791993-94 458007 354174 -29.321994-95 491252 879613 44.151995-96 680923 638638 -6.621996-97 759718 701661 -8.271997-98 1041971 835726 -24.681998-99 1130144 1265531 10.701999-00 1247399 1435112 13.08
Avg. % error (1990-91 to 1999-00) -0.454Avg. % error (1990-91 to 1994-95) 2.251
Avg. % error (1995-96 to 1999-00) -3.159
Fgiure A-16.13.6
Percentage Error: Capital Receipts
(Rs. Lakh)
Root Mean Sq. Prediction Error 163286.2
Theil’s Inequality Coefficient 0.1998
Source (Basic Data): RBI Bulletins; figures under 1999-00 actuals are revisedestimates.
Table A-16.13.7
Capital Expenditure(Rs. Lakh)
BE Actual % Error
(B) (A) (A-B)/A*100
1990-91 62862 54187 -16.011991-92 63543 59768 -6.321992-93 56150 170966 67.161993-94 67426 28206 -139.051994-95 71573 276727 74.141995-96 30426 160932 81.091996-97 159188 160136 0.591997-98 255807 119989 -113.191998-99 261253 238100 -9.721999-00 168736 234164 27.94
Avg. % error (1990-91 to 1999-00) -3.34Avg. % error (1990-91 to 1994-95) -4.02
Avg. % error (1995-96 to 1999-00) -2.66
Figure A-16.13.7
Percentage Error: Capital Expenditure
(Rs. Lakh)
Root Mean Sq. Prediction Error 98587.4
Theil’s Inequality Coefficient 0.5784
-15.0
-10.0
-5.0
0.0
5.0
10.0
15.0
-40.0
-20.0
0.0
20.0
40.0
60.0
-200.0
-150.0
-100.0
-50.0
0.0
50.0
100.0
90-9
1
91-9
2
92-9
3
93-9
4
94-9
5
95-9
6
96-9
7
97-9
8
98-9
9
99-0
0
1

Chapter 16 • STATE FINANCES 527
APPENDIX A-16.14
Excerpts from the White Paper on State Level Value AddedTax by the Empowered Committee of Finance Ministers,
Dated January 17, 2005
Registration, Small Dealers and Composition Scheme
Registration of dealers with gross annual turnover above fivelakh rupees will be compulsory. There will be provision forvoluntary registration. All existing dealers will be automaticallyregistered under the VAT Act. A new dealer will be allowed 30 daystime from the date of liability to get registered.
Small dealers with gross annual turnover not exceeding five lakhrupees will not be liable to pay VAT. States will have flexibility tofix threshold limit within five lakh rupees.
Small dealers with annual gross turnover not exceeding Rs. 50
lakh who are otherwise liable to pay VAT, shall however have the
option for a composition scheme with payment of tax at a small
percentage of gross turnover. The dealers opting for this
composition scheme will not be entitled to input tax credit.
Tax Payer’s Identification Number (TIN)
The Tax Payer’s Identification Number will consist of 11 digit
numerals throughout the country. First two characters will represent
the State Code as used by the Union Ministry of Home Affairs. The
setup of the next nine characters may, however, be different in
different States.
Table A-16.13.8
Revenue Deficit(Rs. Lakh)
BE Actual % Error
(B) (A) (A-B)/A*100
1990-91 -16441 -6925 -137.421991-92 -12608 -5682 -121.891992-93 -35141 -18243 -92.631993-94 -26139 -19898 -31.361994-95 -33325 1789 1962.771995-96 105373 -19297 646.061996-97 83427 3936 -2019.591997-98 52700 3608 -1360.641998-99 91953 3562 -2481.501999-00 -39365 -56891 30.81
Avg. % error (1990-91 to 1999-00) -360.539
Avg. % error (1990-91 to 1994-95) 315.894
Avg. % error (1995-96 to 1999-00) -1036.973
Figure A-16.13.8
Percentage Error: Revenue Deficit
(Rs. Lakh)
Root Mean Sq. Prediction Error 58384.6
Theil’s Inequality Coefficient 2.7639
Table A-16.13.9
Fiscal Deficit(Rs. Lakh)
BE Actual % Error
(B) (A) (A-B)/A*100
1990-91 801174 831010 3.591991-92 881415 967461 8.891992-93 1004597 1167618 13.961993-94 1193719 1213142 1.601994-95 1289142 1339323 3.751995-96 1491185 1521521 1.991996-97 1597806 1602857 0.321997-98 1803205 1757111 -2.621998-99 2047970 1737869 -17.841999-00 2283107 2264549 -0.82
Avg. % error (1990-91 to 1999-00) 1.282
Avg. % error (1990-91 to 1994-95) 6.359
Avg. % error (1995-96 to 1999-00) -3.796
Figure A-16.13.9
Percentage Error: Fiscal Deficit
(Rs. Lakh)
Root Mean Sq. Prediction Error 117193.3
Theil’s Inequality Coefficient 0.0783
Source (Basic Data): RBI Bulletins; figures under 1999-00 actuals are revisedestimates.
-3000.0
-2000.0
-1000.0
0.0
1000.0
2000.0
3000.0
-20.0
-10.0
0.0
10.0
20.0

UTTAR PRADESH DEVELOPMENT REPORT—VOL. 2528
Return
Under VAT, simplified form of returns will be notified. Returnsare to be filed monthly/quarterly as specified in the State Acts/Rules, and will be accompanied with payment challans. Every returnfurnished by dealers will be scrutinised expeditiously withinprescribed time limit from the date of filing the return. If anytechnical mistake is detected on scrutiny, the dealer will be requiredto pay the deficit appropriately.
Procedure of Self-assessment of VAT Liability
The basic simplification in VAT is that VAT liability will beself-assessed by the dealers themselves in terms of submission ofreturns upon setting off the tax credit. Return forms as well asother procedures will be simple in all States. There will no longer becompulsory assessment at the end of each year as is existing now.If no specific notice is issued proposing departmental audit of thebooks of accounts of the dealer within the time limit specified inthe Act, the dealer will be deemed to have been self-assessed on thebasis of returns submitted by him.
Because of the importance of the concept of self-assessment inVAT, provision for ‘self-assessment’ will be stated in the VAT Billsof the states.
Coverage of Goods under VAT
In general, all the goods, including declared goods will becovered under VAT and will get the benefit of input tax credit.
The only few goods which will be outside VAT will be liquor,lottery tickets, petrol, diesel, aviation turbine fuel and other motorspirit since their prices are not fully market determined. These willcontinue to be taxed under the Sales Tax Act or any other State Actor even by making special provisions in the VAT Act itself, andwith uniform floor rates decided by the Empowered Committee.
VAT Rates and Classification of Commodities
Under the VAT system covering about 550 goods, there will beonly two basic VAT rates of four per cent and 12.5 per cent, plus aspecific category of tax-exempted goods and a special VAT rate ofone per cent only for gold and silver ornaments, etc. Thus themultiplicity of rates in the existing structure will be done away withunder the VAT system.
Under exempted category, there will be about 46 commoditiescomprising of natural and unprocessed products in unorganisedsector, items which are legally barred from taxation and itemswhich have social implications. Included in this exempted categoryis a set of maximum of 10 commodities flexibly chosen byindividual states from a list of goods (finalised by the Empowered
Committee) which are of local social importance, without any inter-state implication. The rest of the commodities in the list will becommon for all the states. Under 4 per cent VAT rate category,there will be the largest number of goods (about 270), common forall the states, comprising basic necessities such as medicines anddrugs, all agricultural and industrial inputs, capital goods anddeclared goods. The schedule of commodities will be attached tothe VAT Bill of every state. The remaining commodities, commonfor all the states, will fall under the general VAT rate of 12.5 percent.
In terms of decision of the Empowered Committee, VAT onAED items relating to sugar, textile and tobacco, because of initialorganisational difficulties, will not be imposed for one year after theintroduction of VAT, and till then the existing arrangement willcontinue. The position will be reviewed after one year.
It needs to be carefully noted that although introduction of VATmay, after a few years, lead to revenue growth, there may be a lossof revenue in some states in the initial years of transition. It is withthis in view that the Government of India had agreed to compensatefor 100 per cent of the loss in the first year, 75 per cent of the lossin the second year and 50 per cent of the loss in the third year ofintroduction of VAT, and the loss would be computed on the basisof an agreed formula. This position has not only been reaffirmed bythe Union Finance Minister in his Budget Speech of 2004-05, but aconcrete formula for this compensation has also now been workedout after interaction between the Union Finance Minister and theEmpowered Committee.
As mentioned earlier, there is also a need, after introduction ofVAT, for phasing out of Central Sales Tax (CST). However, thestates are now collecting nearly Rs. 15 thousand crore every yearfrom CST. There is accordingly a need of compensation from theGovernment of India for this loss of revenue as CST is phased out.Moreover, while CST is phased out, there is also a critical need forputting in place a regulatory framework in terms of TaxationInformation Exchange System to give a comprehensive picture ofinterstate trade of all commodities. As already mentioned, thisprocess of setting up of Taxation Information Exchange System hasalready been started by the Empowered Committee, and is expectedto be completed within one year. The position regarding CST willbe reviewed by the Empowered Committee during 2005-06, andsuitable decision on the phasing out of CST will be taken.
It is also essential to bring imports into the VAT chain. Becauseof the set-off, this will not result in any tax cascading effect, butwill only improve tax compliance. A proposal for VAT on imports,including the collection mechanism with adequate safeguards for theprotection of interest of landlocked states, is being discussed withthe Government of India.

Chapter 16 • STATE FINANCES 529
APPENDIX A-16.15
The States’ Fiscal Reforms Facility (2000-01 to 2004-05)(As Notified)
Background
The finances of state governments have shown considerabledeterioration in the decade starting 1990-91. A very high GrossFiscal Deficit (GFD) to GDP ratio has marked this period, for allthe states taken together. The debt of states has also gone up ashas the Revenue Deficit. The table below summarises the majortrends in states’ finances over this period:
A-16.15.1
Major Trends in State Finances
Indicator 1993- 1994- 1995- 1996- 1997- 1998- 1999-94 95 96 97 98 99 2000 (RE)
(1) (2) (3) (4) (5) (6) (7)
Revenue -0.53 -0.83 -0.88 -1.60 -1.50 -3.19 -3.57Deficit as% of GSDPGross Fiscal -2.80 -3.24 -3.15 -3.36 -3.58 -5.24 -5.78Deficit as% of GSDPRevenue Deficit 19.05 25.55 28.06 57.61 41.96 60.86 61.83as % of GFDDebt* as % 22.20 21.68 21.69 21.62 22.48 23.99 25.87of GSDPGuarantees** 6.78 6.72 7.30 8.79 10.23 11.52 13.80as % of GSDP
Source: Reserve Bank of India.
Notes: *Debt outstanding at the end of each year and includes internaldebt, loans from Centre and PF & small savings.
** Guarantees outstanding at the end of each year and pertains to17 major states.
GSDP state’s new series (1993-94=100) as applied except in caseof Jammu & Kashmir and Nagaland where old series is used(1980-81=100).
Fiscal reforms at state level have thus become an urgentcomponent of overall economic reforms. Restructuring of IndianPublic Finance requires the collective action of the Central and stategovernments. In recognition of this reality, one of the crucial termsof reference of the EFC was to review ‘the state of finances of theUnion and the States and suggest ways and means by which theGovernments collectively and severally may bring about arestructuring of the Public Finances so as to restore budgetarybalance and maintain macro-economic stability’.
The EFC Reports
The reports mainly deal with grants to states in the context ofrevenue deficit in the accounts of the states. In respect of revenuedeficit grants of states, the Commission’s recommendations in theirthree Reports are summarised below:
• In the Interim Report submitted on January 15, 2000, theCommission had recommended a lump sum provision of
Rs. 11000 crore in the Central Budget 2000-01 for revenuedeficit grants to states without giving state-wise breakup.
• In the Main Report submitted on July 7, 2000, theCommission recommended revenue deficit grants of Rs.35359 crore for 15 states during 2000-05. The remaining10 states were revenue surplus in the Commission’sassessment. The Commission was asked to draw up amonitorable fiscal reforms programme and to recommendhow to link the release of revenue deficit grants toprogress in implementing the programme.
• Since only 15 states were assessed to be in revenue deficit,the fiscal reforms programme should have normallycovered only the 15 states assessed to be in revenuedeficit. Instead, in the Supplementary Report submitted onAugust 30, 2000, the majority view in the Commissionhas recommended monitorable fiscal reforms programmefor all states. It has been recommended that 15 per centof the revenue deficit grants meant for 15 states during2000-05 and a matching contribution by Centralgovernment be credited into an Incentive Fund from whichfiscal performance based grants should be made availableto all 25 states. Release of performance based grants froman Incentive Fund to be set up by withholding 15 per centof the Rs. 35359 crore deficit grants for 15 states and anequal matching contribution by Government of India withyear-wise phasing as follows:
(Rs. Crore)
Year Withheld Portion Contribution of Total Fundof the Revenue the CentreDeficit Grants
2000-01 1523.06 598.48 2121.54
2001-02 1080.43 1041.11 2121.54
2002-03 994.64 1126.91 2121.55
2003-04 861.74 1259.81 2121.55
2004-05 843.99 1277.55 2121.54
Total 5303.86 5303.86 10607.72
• The Commission has also recommended that the grantsfor specific purposes like upgradation, special problemsand local bodies, which remain unutilised due to non-observance of conditionalities attached to the release ofthese grants may also be credited to the Incentive Fundduring 2004-05.
The important features of the scheme proposed by the EFC in theSupplementary Report are as follows:
i. Eighty-five per cent of the revenue deficit grantrecommended by the Commission and accepted by theGovernment of India may be released to the relevant states

UTTAR PRADESH DEVELOPMENT REPORT—VOL. 2530
without linking it to performance under the monitorablefiscal reforms programme. Only 15 per cent of therevenue deficit grant to which a state is entitled may bewithheld and linked with the progress in performance.
ii. The Incentive Fund should comprise of two parts. Thefirst part would comprise 15 per cent of the withheld partof the grants recommended to cover the deficit of thestates on non-plan revenue account. Depending on theperformance of a state in the implementation of themonitorable programme, the withheld amount would bereleased to it on a proportionate basis. The second part ofthe Fund would be created by contribution from theCentral government, equivalent to 15 per cent of therevenue deficit grants recommended by the Commission.
iii. The incentive component is recommended to be providedto all the states. The initial eligibility of the states hasbeen worked out on the basis of the population as per the1971 Census. The amount will be available to a state inproportion to the level of performance in theimplementation of the monitorable fiscal reformsprogramme for each year.
iv. If any state is unable to get the full amount initiallyearmarked for it in any year, such amount will not lapsebut will continue to be available in subsequent years to thesame state. During the first four years, no amount of thisFund earmarked for assistance/incentive to a state, wouldbe transferred to another state. However, if any state isnot able to draw the amount indicated on the basis of theperformance of the first four years, the amountundisbursed to a state would form part of the commonpool and would be distributed to the performing states inthe fifth year on a pro-rata basis in addition to theamounts to which they are initially entitled. The samewould apply to the undrawn amount of the withheldportion of the grants to cover non-plan revenue deficit.Every state, irrespective of the assessed deficit or not,would be entitled to get the assistance on a pro-rata basisrelated to performance from the additions to the Fund.This additional entitlement can go up to 100 per cent oftheir initial eligibility indicated for the state concerned.
v. The witheld amount of grants releasable in 2004-05 maybe released to the concerned assessed state on the basis ofa review of performance. In case any amount remainsunreleased to a state, it would be added to the Fund andwould be available to the remaining states. The balanceamount in the Fund at the end of 2005-06 will lapse tothe Central government.
vi. The Commission had recommended grants for specificpurposes like upgradation, special problems and local
bodies in the Main Report. There are certain specificconditionalities for releasing these grants. The progress inthe implementation of the identified schemes may bereviewed by the Monitoring Agency. If the Agency issatisfied that a state has not taken effective steps toimplement these in the first four years, and is not in aposition to utilise the amount either in full or in part, thesame may be added to the Incentive Fund in the fifth year.
vii. In addition to the incentives for better performance,Central government may also consider the fiscal reformsprogramme linked assistance by way of extended waysand means advance and additional open marketborrowings. The scope and dimension of such facilitiesshould be drawn up by the Central government bearing inmind the centre’s fiscal position and the macro-economicimplications of this facility. This facility should also beextended to all states linked to monitorable fiscal reformsprogramme drawn up for the state.
viii. The disbursements from the Incentive Fund as well as theutilisation of the grants recommended by the EFC in theMain Report will be subject to review by the TFC.
Fiscal Objectives Set by the EFC
Chapter 3 of the EFC’s Main Report lays down the broadparameter of fiscal correction in the state sector. Starting with thebase-year of 1999-2000, each state is expected to take effectivesteps for revenue augmentation and expenditure compression overthe five-year period so as to broadly achieve the following objectives:
• State GFD as an aggregate, to fall to 2.5 per cent ofGSDP.
• Revenue deficit of all states, in an aggregate, falling to zero.
• Interest payments, as a percentage of revenue receipts ofthe state sector as a whole—18 to 20 per cent.
In the Supplementary Report the EFC has also suggested thefollowing objectives:
i. Increases in wages and salaries should not exceed five percent or increase in the consumer price index whichever ishigher.
ii. Increase in interest payments (in absolute terms) may belimited to 10 per cent per year.
iii. Explicit subsidies to be brought down by 50 per cent overthe next five-year period with a view to eliminatesubsidies altogether by 2009-10.
Medium-term Fiscal Restructuring Policy
Given the broad contours of the fiscal objectives sketched above,the state governments should draw up a Medium-term Fiscal

Chapter 16 • STATE FINANCES 531
Restructuring Policy (MTFRP). The policy needs to dovetail timebound action points such as:
a. Fiscal Objectives and Reforms
• Widening the tax base.
• Increasing tax rates on a year to year basis.
• Pricing services such as irrigation, water charges, busfares, to an identified base, computing the subsidyelement and preparing a schedule to reduce the subsidyelement.
• Indexation of prices/user-charges to major input costssuch as POL, Dearness allowance, etc..
• Abolition of vacant posts in government except primaryschool teachers, health workers.
• New teachers to be appointed on contract basis as inRajasthan and Madhya Pradesh.
• Work charged establishment to be redeployed for newcapital works. Practice of engaging new work charge staffand daily wage workers to be stopped forthwith.
• Tapering off subventions to GIA Institutions. Registrationof new grants-in-aid institutions in secondary and highereducation to be phased out over five years.
b. Power Sector Reforms
Power sector reforms would aim at reducing the negativecontribution of the SEBs to states revenues. While the Ministry ofPower is separately working out a set of monitorable reformmilestones, the basic ingredients would include:
• Achieving an average tariff equal to the cost of powerwithin two years.
• Setting up of State Regulatory Electricity Commissions(SRECs).
• Implementing the awards of the SRECs.
• Unbundling of basic services—generation, transmissionand distribution or setting up separate profit centres.
• Reducing T&D losses by five per cent every year.
• Metering up to 11 KV sub-station level.
c. Public Sector Restructuring
The Public Sector Restructuring Component should have twobasic subsets. Each state should identify the need of continuingcertain activities within the state domain. This would be regardlessof whether the PSE is making profits or commercial losses. Primaryamong these would be PSEs that are in manufacturing activitiessuch as electronics. Wireless, textiles and tractors to cite a fewexamples. A road map for PSRP would be:
• identify PSEs with a view to determining the need forgovernment to continue as owners;
• for loss making PSES, a comprehensive VRS package tobe drawn-up;
• a time-bound road map for winding up such PSEs be laiddown;
• for commercially profitable PSES, government to decide—either through a High Powered Committee or otherwise—the extent of dilution in government share holding.Depending on the nature of PSE, government shareholding should be reduced to:
• Zero per cent-total privatisation.
• Twenry-six per cent giving shareholders rights in AGMsand EGMS.
• Forty-nine per cent where, despite privatisation,government would still exercise managerial control.
• Further infusion of government funds either by way ofequity or loans be phased out over five years to PSES,unless such PSEs are identified to be socially desirable.
d. Budgetary Reforms
The EFC has laid stress on certain modifications in the budgetmaking process of states, as well as the way in which data ispresented. Specifically the following issues should be laid down:
• A separate schedule in each state government budgetgiving the total expenditure on salaries and allowances.
• A separate schedule on pensions and terminal benefitoutflows.
• A scheme-wise, sector-wise schedule of subsidies(explicit) from the state budget.
• A schedule of year-wise and project-wise guaranteesoutstanding.
• Annexure II to this note captures the basic ingredients offiscal transparency. While this document will form a basicmonitoring input for monitoring the FRF, states mayconsider presenting this document as a part of the statebudget.
Monitoring of Fiscal Reform
Pursuant to the receipts of these guidelines, each state mustdraw up the Medium-Term Fiscal Reforms Programme (MTFRP).While flexibility in designing the MTFRP is broadly left to the statesthe following principles should form the minimum requirement ofeach state:
Releases from the incentive fund will be based on a singlemonitorable fiscal objective. Each state will be expected to achieve a

UTTAR PRADESH DEVELOPMENT REPORT—VOL. 2532
minimum improvement of five per cent in the revenue deficit(surplus) as a proportion of their revenue receipt each year till 2004-05. The base-year will be financial year 1999-2000.
Explanations
• If a state ‘A’ falls short of an improvement of five percent in year (t+l) compared to the previous year, t, thestate will not be eligible to draw upon its share from theIncentive Fund for that year. The amount of the Fund willbe carried over to the next year, (t+2);
• If in year (t+2) state ‘A’ shows an improvement of over10 per cent compared to the base-year ‘t’, the state shallbe entitled to its share of the Incentive Fund for the year(t+2) as well as the withheld portion of year (t+l);
• If, however, the improvement in year (t+2) is six per centcompared to year (t+l) the state shall be eligible for itsshare for the year (t+2) but not for the year (t+l). Thewithheld portion of year (t+l) will then be carried over toyear (t+3);
• Paragraphs 8.3 to 8.7 of the Supplementary Report of theEFC clarify the mechanism for releases from the IncentiveFund, which inter-alia also includes with-held portion ofthe revenue deficit grants to states, and also such otherdiscretionary releases to states as additional Open MarketBorrowings and extended ways and means that may beallotted to states in the duration of the scheme period;
• The revenue deficit should be clearly understood to beinclusive of:
• Contingent liabilities such as guarantees and lettersof comfort due in that year which would directlyconstitute a budget liabilities.
• Subsidies due to PSEs, whether or not the statepays such a subsidy upfront. Thus, a budget subsidypayable to the SEB will be ‘recognised’ as a revenueexpenditure, for purposes of computing the revenuedeficit.
• Financial year 2004-05 is the final year of the EFC Award.However, in the course of the year only the financialdetails of 2003-04 (RE) will be available thus, startingfrom base-year 1999-00, states may expect releases of theentire Incentive Fund if they achieve a 20 per centimprovement in revenue deficit (or surplus) as proportionof the revenue receipts. Details of improvement of eachState are given in Annexure I. It will be seen that by thefinancial year 2005-06 if the trend of the improvementcontinues, the states sector as a whole will come intorevenue balance.
States should draw up MTFRP as suggested above. Monitoringof the facility would be a joint exercise conducted on the basis of
components of the MTFRP and the improvement in revenue balancecaptured in the form given in Annexure II. This should form thebasis of a Memorandum of Understanding (MoU) entered intobetween each State and Ministry of Finance, as a preliminaryexercise.
Monitoring Committee
The States Fiscal Reform Facility and the MTFRP is essentiallythe states’ own programme. Considerable flexibility in designing thepolicy framework has been left to the initiative of the stategovernments. However, the state’s fiscal health is an importantcomponent of the country’s overall macroeconomic balance.Monitoring the programme is, to that extent, a collaborative exercisebetween the centre and the states. A committee comprising of:
i. Secretary (Expenditure) in the Ministry of Finance.
ii. Secretary, Planning Commission.
iii. Deputy Governor, Reserve Bank of India.
iv. Chief Economic Adviser, DEA, Ministry of Finance.
v. An outside Expert.
vi. The Chief Secretary of the state.
vii. The Finance Secretary of the state concerned.
will form the Monitoring Committee. Joint Secretary (PF-1) inthe Ministry of Finance will be the Member-Secretary of thisMonitoring Committee. The Fiscal Reform Unit in the FCD will bethe single window Secretariat for the Fiscal - Reform Programmeunder this scheme as well as any other supplementary facility thatmay be extended to states from time to time, including, inter-alia,facilities from multilateral lending agencies.
On receipt of these guidelines states may immediately embarkupon the exercise of drawing up the MTFRP, dovetailing the samewith improvements in the revenue balance before entering into anMoU with the Government of India.
APPENDIX A-16.16
Decentralisation in Uttar Pradesh: Fiscal Aspects
There are 59607 Panchayati Raj Institutions (rural local bodies)and 689 nigam palikas in Uttar Pradesh. Included in the 689 urbanlocal bodies called nigam palikas are:
A-16.16.1
Nigam Palikas in Uttar Pradesh
Nagar Nigams (Municipal Corporations) 11
Nagar Palika Parishads 226
Nagar Panchayats 452
689
Sources: 1. Eleventh Finance Commission.
2. First Finance Commission–Interim Report.

Chapter 16 • STATE FINANCES 533
Article 243(I) and 243(Y) inserted in the Constitution throughthe 73rd and 74th Amendment in 1992 enjoin on the Governor toset up a Finance Commission within two years and at every five-year internal. The First Finance Commission was constituted inOctober 1994 with a directive to study and review the financialposition of every third-tier administrative institution and recommenddistribution between them of the net proceeds of taxes, duties,tools and fees leviable by the state and prescribe the shares of eachgram/kshetra/zilla panchayats and urban local bodies. The Commissiongave an Interim Report in December 1995 and a Final Report inDecember 1996. The system of financial support to local bodieswas through grants-in-aid, which was unsatisfactory. Therefore, theCommission recommended discontinuance of the grants-in-aidsystem and substituted it with a regular share of taxes, duties, tollsand fees levied by the state government, all pooled together. Theshare of urban local bodies was fixed at seven per cent and of thepanchayati institutions at three per cent of such pooled gross taxrevenue. The inter se distribution among them should be 80 per centpopulation and 20 per cent area.
In respect of grants-in-aid, distinction has been drawn betweenplan and non-plan grants. The state government should pass on tothe local bodies plan schemes and along with them the financesrequired for executing them. In addition, the funds recommended bythe TFC amounting to Rs. 30.29 crore for the urban bodies andRs. 189.88 crore for the rural local bodies should be released tothem by way of matching aid.
In the final Report, the Commission has not reopened thedevolution formula. It however recommended the levy and collectionof property tax and the manner of computation of the tax. It alsorecommended that all loans granted and outstanding along withinterest thereon, should be converted into grants.
The state government accepted the recommendations given in theInterim Report with the stipulation that the funds would be releasedtaking into account the performance profile of these local bodies.
The EFC which under a specified term of reference contained inthe Presidential Order, examined the requirements of the localbodies, both rural and urban and made some wide-ranging andcomprehensive recommendation which have been accepted by bothPresident and Parliament. The specific recommendations regardinggrants have been desired by applying a formula of five variables withdifferent weights assigned to each of them. These are as follows.
A-16.16.2Criteria for Recommendation of Grants
(Per Cent)
1. Population (1991) 402. Area (1991) 203. Distance from highest per capita income 204. Revenue effort 105. Index of decentralisation 10
100
Source: Report of the Eleventh Finance Commission.
Adopting these criteria the Commission recommended grants tostates which they should pass on to the local bodies, rural and urban.
At the same time, the EFC has identified that the database aswell as the maintenance of village land seconds are not adequate.The EFC therefore recommended that funds should be earmarked as‘first charge’ out of the grants recommended for these basic needs.The grants recommended for Uttar Pradesh are shown below.
A-16.16.3
Share of Uttar Pradesh in the Allocation of Grants
Panchayats Municipalities Total Total
Percentage Amount Percentage Amount First AllocationShare of Grant Share of Grant Charge
Normal Area 16.489 26382.67 12.582 5032.64 - 31415.31
For Creation of 4754.95 54.56 4809.52Database
Maintenance -of Accounts in
Village Level 2344.80 - 2344.80
Intermediate 36.16 - 36.16
Grant Total 7135.91 54.56 7190.48 31415.31
Source: Eleventh Finance Commission Report.
Thus, out of a total sum of Rs. 31415.31 lakh of grant perannum, the amount earmarked for creation of database isRs. 4809.52 and for village/intermediate level is Rs. 2380.96 lakh.These amounts hold a priority in the total amount of grant.
The EFC reported that some states had not held elections. It isyet not clear as to how many areas have not elected theirrepresentatives in Uttar Pradesh. It is important to hold elections asotherwise the state might forfeit the statutory grants recommended.
It is a matter of satisfaction that the erstwhile grants-in-aidsystem has become tax-formula-based which ensures an automaticflow of revenues to the local bodies. This is precisely what wasconceived by the 73rd and 74th Amendment to the Constitution.
However, the State Finance Commission as also the stategovernment consider that the position of the local bodies in thestate are not up to the mark and that there is need for improvingtheir performance which cannot be examined by making fundsavailable alone. Under the Constitution, functions have to beallocated together with the funds made available for their soundperformance. The state government should identify areas whereperformance targets require to be determined and proceed to overseewhether the grants are being reached. From the preliminarydiscussions held it appeared that there is need to cover a lot ofground before the local bodies can be considered to be performingneeded. Also, it was pointed out that as much as 70 per cent of thefunds are consumed by salaries, thereby leaving very little for theperformance of the prescribed duties of the local bodies.
In fact, it is understood that on the plea of verification ofperformance, funds are withheld by the government resulting in

UTTAR PRADESH DEVELOPMENT REPORT—VOL. 2534
non-performance. While the performance of the urban bodies isconsidered to be good and satisfactory, that of the rural bodies isnot at all good. This would require, more than the funds and theirallocation, the selection of persons with commitment and who havethe will to perform. Property taxes are levied only in 42 out of the77 municipal corporations. This is very low. This should be leviedand collected as also the user charges for Jal Nigam and JalSansthan should be enforced.
Democratic decentralisation plan is going slow in the state. It isin the interests of economic development of the state that the localbodies should be encouraged to perform and their performancesreviewed and, if necessary, through a system of rewards for theperforming bodies. The state government should devise means togenerate an atmosphere of collective performance of the local bodiesall over the state in a well coordinated manner.
APPENDIX A-16.17
Uttar Pradesh Power Sector
Reforms in the power sector in the country have been on theanvil for over a decade. A specific direction was provided with theenactment of the Electricity Regulatory Commission Act, 1998 witha view to setting up of independent Electricity RegulatoryCommissions both at the Centre and in the states with the objectof rationalising tariff, ensure transparency, promote efficiency andensure fair returns to the investors.
The Uttar Pradesh Electricity Reforms Act, 1999 came intoforce on January 14, 2000 and the Uttar Pradesh ElectricityRegulatory Commission (UPERC) which was already set up under theCentral Act, was formally constituted under the State Act. The Actrequires the UPERC to determine the tariff for electricity wholesale,bulk, grid and retail and for the use of transmission facilities.
In terms of the Uttar Pradesh Electricity Reforms Act, 1999 andunder the rules made thereunder the Uttar Pradesh State ElectricityBoard (UPSEB) was reorganised into three corporations, viz.-
i. The Uttar Pradesh Power Corporation Limited (UPPCL)which is a principal successor to the UPSEB, entrustedwith transmission, distribution and retail supply.
ii. The Uttar Pradesh Rajya Vidyut Utpadan Nigam Limited(UPRVUNL) dealing with generation of thermal power.
iii. The Uttar Pradesh Jal Vidyut Utpadan Nigam Limited(UPJVUNL) concerned with hydroelectric generation.
The State Government is the owner of these corporations. Inaddition, corporate bodies for Kanpur and Noida were also set up.
The functioning of the UPERC has led to several startlingdisclosures of the working of the UPSEB. These related to non-availability of details of power consumption in rural areas, cost ofsupply of power to different classes of consumers, revenue from
billing departments and above all, details of expenditure. There werealso disclosures that the Transmission and Distribution (T&D)losses were generally overestimated because the Agriculturalconsumers were supplied unmetered power besides beingperpetrated through theft/pilferage with the connivance of staff.Distorted tariff structure and cross subsidisation have resulted in adecline in the growth rates in productive sectors of industry andagriculture and increased growth rates in the domestic sectors. TheCommission also stated that commercial loss was a euphemism fortheft and pilferage.
The UPPCL placed before the Commission proposals to raisethe tariff by about 48.4 per cent in 2000-01 to meet a gap ofRs. 3028 crore between the expenditure and receipts. The receiptsinclude a sum of Rs. 790 crore as subsidy, equity, etc. TheCommission had public hearings in some selected cities and towns.The public reaction to increase in tariff was clearly negative formany reasons, important among which are:
i. Low purchase of energy.
ii. No proposal for a differential tariff through time of daycriterion.
iii. A 10 per cent upward revision was made in January 1999.
iv. T&D bases should be controlled in which case there is noneed for rate revision.
v. The additional expenditure provision of 6 per cent forwage revision and 10 per cent for administrative purposes.
The Commission reviewed the revenue and expenditureestimates and revised the requirement for expenditure. TheCommission reviewed the tariff and recommended revisions on anaverage of 10.18 per cent. In 8 of the 12 months for which therevised tariff would be implemented, additional revenue of the orderof Rs. 427 crore would be available to the UPPCL. As the reworkedgap between revenue and expenditure amounted to Rs. 399 crore,the Commission recommended that the resultant surplus of Rs. 28crore be treated as Rate of Return on capital base.
The UPPCL implemented the revised tariff.
The State Electricity Boards are in substantial arrears to theCentral Public Sector Undertakings (CPSUs). As at the end ofFebruary 2001 they owed a sum of Rs. 41473 crore consisting ofRs. 25727 crore as principal and Rs. 18746 crore as interest/surcharge. Of the total sum, UPSEB’s share was Rs. 5170 crore or12 per cent of the total. The breakdown between principal andinterest is not available. The principal CPSUs were the NTPC, CoalIndia Limited, NHPC and NPC.
The Chief Ministers Conference held in March 2001 considered theneed for expediting power sector reforms. It was agreed that while thedues should be cleared, the SEBs would need to be restructured. It wasdecided to constitute an Expert Group to recommend.

Chapter 16 • STATE FINANCES 535
i. A one-time settlement of outstanding dues.
ii. A medium-term capital restructuring and reform of SEBs.
Accordingly, the Expert Group was constituted with ShriMontek Singh Ahluwalia as the Chairman. The Expert Group gavetwo separate reports on these two terms, in May 2001 forsettlement of dues and in July 2001 for restructuring of SEBs.
In the first Report, the Expert Group thought that while thesettlement of dues was important, the unviable situation of theSEBs should be addressed so that over dues would not arise again.The Group recommended settlement of outstanding dues with alinkage to a mechanism, which would ensure payment of currentdues in future. The Group’s recommended package contained thefollowing main features:
i. For states, which accept the package of recommendations,50 per cent of the interest/surcharge on delayed paymentswould be waived. The rest of the dues consisting of thefull principal and the balance of 50 per cent of interestaggregating to Rs. 33600 crore should be securitisedthrough bonds issued by the respective state governments.
ii. The bonds should be issued by the RBI through a tax-freeinterest rate of 8.5 per cent.
iii. The terms of the bond be structured to achieve amoratorium of 5 years on repayment of principal with theentire principal paid between the 6th and the 15th year.The bonds will be like those for market borrowings andwould be subject to lock-in restrictions that will allowrelease of only 10 per cent of the bonds in the secondarymarket each year.
iv. To encourage adherence to the scheme and to avoiddefaults, there will be a scheme of incentives offered bythe CPSUs such as cash incentives of two per cent of thevalue of the bond. The Group estimated that theseincentives add up to Rs. 6300 crore. In addition, theconforming states would get the benefit of APDP grantand supply of power.
v. The scheme would come into force after one half of thestates which have not less than Rs. 500 crore of billingper annum from CPSUs signify their acceptance.
As mentioned earlier the Expert Group gave its Second Reportfor restructuring the SEBs in July 2001. The main recommendationsare the following:
i. While cross-subsidies should be phased out gradually overa period of time, subsidies in pursuance of socialobjectives should be given in a transparent manner, andonly to the extent of reimbursement by the stategovernment.
ii. The reforms would require large resources—both by wayof investment financing as well as for meeting the
adjustment costs, and resources can be mobilised to asubstantial extent from the private sector provided anappropriate framework is created.
iii. For meeting investment needs, the Central Governmentshould assist state governments interested inimplementing an integrated programme of reform in thepower sector to access resources from multilateralfinancing institutions such as IBRD or the ADB. TheGroup estimated that it should be possible to obtainaround Rs. 50,000 crore from these institutions (i.e., US$2 billion per year) in the Tenth Plan period.
iv. The Group estimated a sum of Rs. 40,000 crore in theTenth Plan by way of Central assistance. This should beprovided through a Modified Accelerated PowerDevelopment Programme. The break up of the allocationis:
a. Rs. 15000 crore for bridging the current revenue gapby way of central assistance to the states againstreduction of T&D losses and improvement incollection efficiency.
b. Rs. 15000 crore on a matching basis for assisting thestates in meeting their pension liabilities as well asfor supporting VRS.
c. Rs. 10000 crore to assist the states in introducingopen access and allowing new generating stations tosell directly to bulk consumers in a competitiveenvironment. The assistance would be linked tocreation of framework for open access, and for actualwheeling of power on an open access basis during aperiod of three years.
As part of the ongoing reforms, the Expert Group headed by
Shri N.K. Singh gave a Report in December 2001 containing
recommendations for transitional mechanism and finance to make
state-specific suggestions which the Group considers is a complex
problem because the difficulties attendant to the process have to be
mitigated before the transition can succeed. The following are the
main observations in the Report:
i. The present APDP is basically aimed at financial
investment with support from financial institutions and
the budget. This structure should be reformed from an
investment window to a mechanism for supporting power
sector reforms linked to certain performance parameters.
ii. The Ministry of Power should devise State-specific
reforms. In the meantime 25 per cent of the specified
allocation of Central assistance under APDRP which is the
modified APDP should be released at the beginning of the
financial year 2002-03.

UTTAR PRADESH DEVELOPMENT REPORT—VOL. 2536
iii. The Empowered Committee of Chief Ministers set up
sometime ago should monitor the reforms and the
achievements towards the milestones.
The brief survey of the recent developments in the power
reforms shows that the onus of success rests primarily on the state
governments. Just as SEBs owe large sums of money to CPSU’s the
Central government agencies themselves are in arrears to the SEBs.
Their composition requires to be ascertained. The Ahluwalia
Committee recognised this fact and suggested settlement and
paring off the amounts due in both ends. As at the end of 1998-99
the SEBs were to receive revenue arrears amounting to Rs. 18,726
crore of which Uttar Pradesh’s share was Rs. 4827.5 crore
(Planning Commission Annual Report on the Working of the State
Electricity Boards and Electricity Departments, 1999-00).
In 2003-04 RE, the Uttar Pradesh Government provided
for writing off government loans to the SEBs amounting to
Rs. 12277.40 crore. In this year, an amount equal to Rs. 5541.09
crore was also provided as investment to State Electricity
Corporation and Uttar Pradesh State Generation Corporation as part
of the restructuring of the State Electricity Sector.
The reorganisation of power sector led to the creation of
following entities:
1. Uttar Pradesh Rajya Vidyut Utpadan Nigam (Uttar
Pradesh State Power Generation Corporation)
2. Uttar Pradesh Minor and Small Hydro Electric Corporation
3. Tehri Hydro Development Corporation
4. Uttar Pradesh Hydro Electricity Generation Corporation
(Uttar Pradesh Hydro Electric Utpadan Corporation)
The Government of India and Uttar Pradesh Government
announced a Memorandum of Understanding on January 25, 2000
for reforming the power sector. The MoU provided for establishing
distribution profit-centres. In November 2002, it was decided to
form four distribution companies called:
1. Paschimanchal Vidyut Vitran Nigam
2. Meerut Madhanchal Vidyut Vitran Nigam
3. Dakshinanchal Vidyut Vitran Nigam
4. Poorvanchal Vidyut Vitran Nigam
In the case of transmission and distribution a new company was
formed, viz., Uttar Pradesh Power Corporation Limited (UPPCL).
This has two subsidiary companies also, viz., Kanpur Electric Supply
Company Limited and Noida Power Company Limited. In August
2003, the distribution function of UPPCL was transferred to the
four independent distribution companies covering eastern, western,
southern, and central regions of the state.
APPENDIX A-16.18
The Uttar Pradesh Fiscal Responsibility and BudgetManagement Bill, 2004
A bill to provide for the responsibility of the State Governmentto ensure fiscal stability and sustainability, and to enhance the scopefor improving social and physical infrastructure and humandevelopment by achieving sufficient revenue surplus, reducing fiscaldeficit and removing impediments to the effective conduct of fiscalpolicy and prudent debt management through limits on stategovernment borrowings, government guarantees, debt and deficits,greater transparency in fiscal operations of the state government anduse of a medium-term fiscal framework and for matters connectedtherewith or incidental thereto.
It is hereby enacted in the 55th year of the Republic of India asfollows:
Short title and commencement:
1. (1) This Act may be called the Uttar Pradesh FiscalResponsibility and Budget Management Act, 2004.
(2) It shall come into force on such date as the StateGovernment may by notification, appoint.
2. In this Act, unless the context otherwise requires:
(a) ‘Annual budget’ means the annual Financial statement laidbefore both Houses of State Legislature under article 202of the Constitution.
(b) ‘Current year’ means the year preceding the year for whichbudget and Medium Term Fiscal Restructuring Policy arebeing presented.
(c) ‘Previous year’ means the year preceding the current year.
(d) ‘Revenue deficit’ means the difference between revenueexpenditure and revenue receipts.
(e) ‘Fiscal deficit’ means the excess of:
- total disbursements from the Consolidated Fund ofThe State (excluding repayment of debt) over totalreceipts into the Fund excluding the debt receiptsduring the financial year; or
- total expenditure from the Consolidated Fund ofthe State (including loans but excluding repaymentof debt) over own tax and non-tax revenue receipts,devolution and other grants from Government ofIndia to the state, and non-debt capital receiptsduring a financial year which represents theborrowing requirements, net of repayment of debt,
of the State Government during the financial year.
(f) ‘Fiscal indicators’ means the measures such as numerical
ceilings and proportions to gross state domestic product
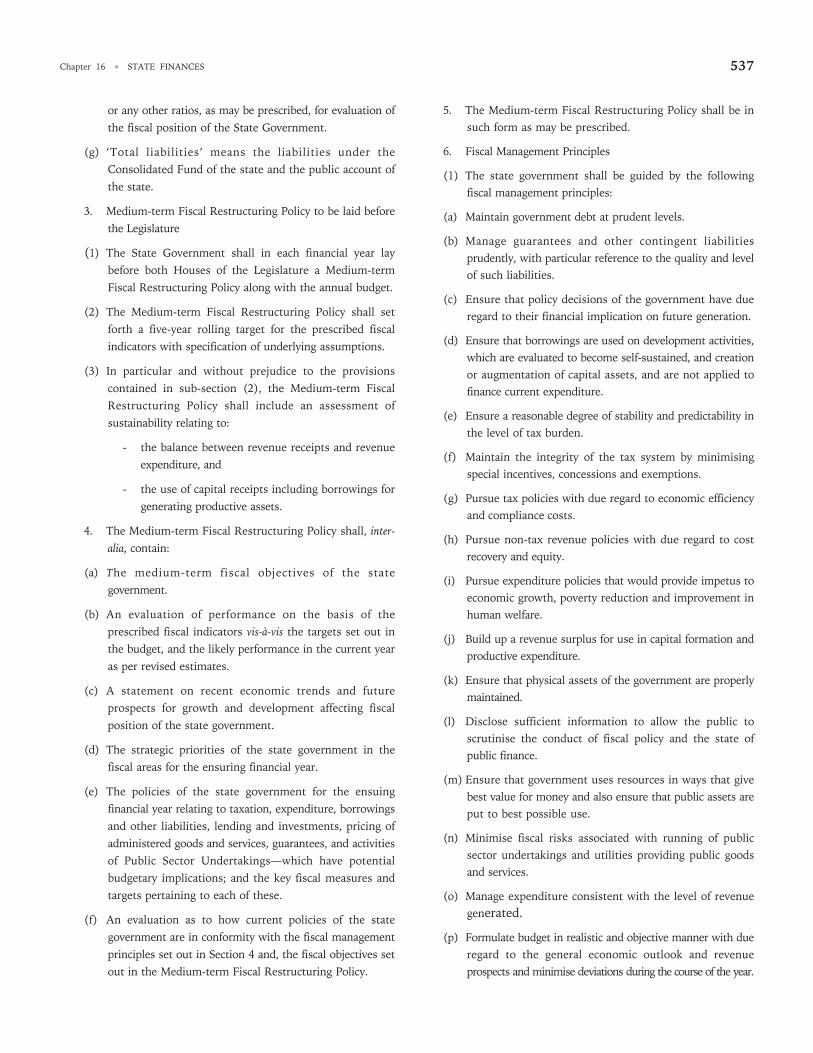
Chapter 16 • STATE FINANCES 537
or any other ratios, as may be prescribed, for evaluation ofthe fiscal position of the State Government.
(g) ‘Total liabilities’ means the liabilities under theConsolidated Fund of the state and the public account ofthe state.
3. Medium-term Fiscal Restructuring Policy to be laid beforethe Legislature
(1) The State Government shall in each financial year laybefore both Houses of the Legislature a Medium-termFiscal Restructuring Policy along with the annual budget.
(2) The Medium-term Fiscal Restructuring Policy shall setforth a five-year rolling target for the prescribed fiscalindicators with specification of underlying assumptions.
(3) In particular and without prejudice to the provisionscontained in sub-section (2), the Medium-term FiscalRestructuring Policy shall include an assessment ofsustainability relating to:
- the balance between revenue receipts and revenueexpenditure, and
- the use of capital receipts including borrowings forgenerating productive assets.
4. The Medium-term Fiscal Restructuring Policy shall, inter-
alia, contain:
(a) The medium-term fiscal objectives of the stategovernment.
(b) An evaluation of performance on the basis of theprescribed fiscal indicators vis-à-vis the targets set out inthe budget, and the likely performance in the current yearas per revised estimates.
(c) A statement on recent economic trends and futureprospects for growth and development affecting fiscalposition of the state government.
(d) The strategic priorities of the state government in thefiscal areas for the ensuring financial year.
(e) The policies of the state government for the ensuingfinancial year relating to taxation, expenditure, borrowingsand other liabilities, lending and investments, pricing ofadministered goods and services, guarantees, and activitiesof Public Sector Undertakings—which have potentialbudgetary implications; and the key fiscal measures andtargets pertaining to each of these.
(f) An evaluation as to how current policies of the stategovernment are in conformity with the fiscal managementprinciples set out in Section 4 and, the fiscal objectives setout in the Medium-term Fiscal Restructuring Policy.
5. The Medium-term Fiscal Restructuring Policy shall be insuch form as may be prescribed.
6. Fiscal Management Principles
(1) The state government shall be guided by the followingfiscal management principles:
(a) Maintain government debt at prudent levels.
(b) Manage guarantees and other contingent liabilitiesprudently, with particular reference to the quality and levelof such liabilities.
(c) Ensure that policy decisions of the government have dueregard to their financial implication on future generation.
(d) Ensure that borrowings are used on development activities,which are evaluated to become self-sustained, and creationor augmentation of capital assets, and are not applied tofinance current expenditure.
(e) Ensure a reasonable degree of stability and predictability inthe level of tax burden.
(f) Maintain the integrity of the tax system by minimisingspecial incentives, concessions and exemptions.
(g) Pursue tax policies with due regard to economic efficiencyand compliance costs.
(h) Pursue non-tax revenue policies with due regard to costrecovery and equity.
(i) Pursue expenditure policies that would provide impetus toeconomic growth, poverty reduction and improvement inhuman welfare.
(j) Build up a revenue surplus for use in capital formation andproductive expenditure.
(k) Ensure that physical assets of the government are properlymaintained.
(l) Disclose sufficient information to allow the public toscrutinise the conduct of fiscal policy and the state ofpublic finance.
(m) Ensure that government uses resources in ways that givebest value for money and also ensure that public assets areput to best possible use.
(n) Minimise fiscal risks associated with running of publicsector undertakings and utilities providing public goodsand services.
(o) Manage expenditure consistent with the level of revenuegenerated.
(p) Formulate budget in realistic and objective manner with dueregard to the general economic outlook and revenueprospects and minimise deviations during the course of the year.

UTTAR PRADESH DEVELOPMENT REPORT—VOL. 2538
(q) Ensure discharge of current liabilities in a timely manner.
(2) The State Government shall take appropriate measures toeliminate the revenue deficit and control the fiscal deficitat sustainable level and built up adequate revenue surplus.
(3) In particular, and without prejudice to the generality to theforegoing provisions the State Government shall:
(a) Reduce revenue deficit to nil within a period of fivefinancial years beginning from the initial financial year onthe 1st day of April 2004 and ending on the 31st day ofMarch, 2009.
(b) Reduce revenue deficit as percentage of gross statedomestic product, in each of the financial years beginningon the 1st day of April, 2004 in a manner consistent withthe goal set out in clause (a).
(c) Reduce fiscal deficit to not more than three per cent ofthe estimated Gross State Domestic Product within aperiod of five financial years beginning from the initialfinancial year on the 1st day of April, 2004 and ending onthe 31st day of March, 2009.
(d) Reduce fiscal deficit as percentage of gross state domesticProduct in each of the financial years beginning on the 1st
day of April, 2004 in a manner consistent with the goalset out in clause (c).
(e) Not to give guarantee for any amount exceeding the limitstipulated under any rule or law of the State Governmentexisting at the time of the coming into force of this Actor any rule or law to be made by the State Governmentsubsequent to coming into force of this Act.
(f) Ensure within a period of financial years, beginning fromthe initial financial year on the 1st day of April, 2004 andending on the 31st day of March, 2018; that the totalliabilities at the end of the last financial year, do notexceed 25 five per cent of the estimated gross statedomestic product for that year.
(4) Provided that revenue deficit and fiscal deficit may exceedthe limits specified under this sub-section due to groundor grounds of unforeseen demands on the finance of theState Government due to national security or naturalcalamity, subject to the condition that the excess beyondlimits arising due to natural calamities does not exceedthe actual fiscal cost that can be attributed to thecalamities.
Provided further that the ground or grounds specified inthe measures to first proviso shall be placed before boththe Houses of Legislature, as soon as possible, after itbecomes likely that such deficit amount may exceed theaforesaid limits, with an accompanying report stating thelikely extent of excess, and reasons thereof.
Measures for Fiscal Transparency
(1) The State Government shall take suitable measures toensure greater transparency in its fiscal operations inpublic interest and minimise as far as practicable, secrecyin the preparation of the annual budget.
(2) In particular, and without prejudice to the generality of theforegoing provision, the State Government shall, at thetime of presentation of the annual budget, disclose in astatement in the form as may be prescribed-
(a) The significant changes in the accounting standards,policies and practices affecting or likely to effect thecomputation of prescribed fiscal indicators.
(b) As far as practicable, and consistent with protection ofpublic interest, the contingent liabilities created by way ofguarantees; the actual liabilities arising out of borrowingsby public sector undertakings and Special Purpose Vehiclesand other equivalent instruments where liability forrepayment is on the State Government allocations andcommitments made by the state government havingpotential budgetary implications, including revenuedemand raised but not realised, tax expenditure; lossesincurred in providing public goods, and services throughpublic utilities and undertaking; liability in respect ofmajor works and contracts; and subsidy payments and theimpact of the same on the fiscal position of the stateincluding in relation to the targets referred to in sub-section (3) of Section 4.
Measures to Enforce Compliance
(1) The Annual Budget, and policies announced at the time ofthe budget, shall be consistent with the objectives andtargets specified in the Medium-Term Fiscal RestructuringPolicy for the coming and future years.
(2) The Minister in charge of the Department of Finance, shallreview, every half year, the trend in receipts and expenditurein relation to the budget, remedial measures to be taken toachieve the budget targets and place before both theHouses of Legislature the outcome of such reviews. Thereview report shall be in such from as may be prescribed.
(3) The review report shall explain:
(a) Any deviation or likely deviation in meeting theobligations cast on the state government under thisAct.
(b) Whether such deviation is substantial and relates tothe actual or the potential budgetary outcomes, andhow much of the deviation can be attributed togeneral economic environment and to policy changesby the state government.

Chapter 16 • STATE FINANCES 539
(c) The remedial measures the State Governmentproposes to take.
(4) Wherever there is a prospect of either shortfall in reviewor excess of expenditure over pre-specified levels for agiven year on account of any new policy decision of theState Government that affects either the state governmentor its public sector undertakings, state government, priorto taking such policy decision, shall take measures to fullyoffset the fiscal impact for the current and future years bycurtailing the sums authorised to be paid and applied fromand out of the Consolidated Fund of the state under anyAct to provide for the appropriation of such sums, or bytaking interim measures for revenue augmentation, or bytaking up a combination of both.
(5) Provided that nothing in this sub-section shall apply to theexpenditure charged on the Consolidated Fund of the stateunder clause (3) of Article 202 of the Constitution.
Provided further that, while adhering to the fiscal years,the state government will give priority to protectingcertain expenditure defined in the Medium-Term FiscalRestructuring Policy as ‘High Priority DevelopmentExpenditure’ (including, inter-alia) from curtailment ormay impose a recede or partial curtailment.
(6) Whenever one or more supplementary estimates arepresented to the House of Legislature, the stategovernment shall also present an accompanying statementindicating the corresponding curtailment of expenditureand/or augmentation of revenue to fully offset the fiscalimpact of the supplementary estimates in relation to thebudget targets of the current year and the Medium-TermFiscal Restructuring Policy objectives and targets for thefuture year.
7 (1) The state government may, by notification, make rules forcarrying out the provisions of this Act.
(2) In particular, and without prejudice to the generality of theforegoing powers, such rules may provide for all or any ofthe following matters, namely:
(a) The fiscal indicator to be prescribed for thepurpose and sub-section (2) of section 3 andclause (a) of sub-section (2) of section (5).
(b) The term of the Medium-term Fiscal RestructuringPolicy referred to sub-section (5) of section 3 andsub-section (2) of section.
(c) Any other matter which is required to be, or maybe prescribed.
(8) Protection of action taken in good faith: No suit forprosecution or other legal proceedings shall lie against theState Government or any officer of the State Governmentfor anything which is in good faith done or intended do bedone under this Act or the rules made thereunder.
(9) Application of other laws not barred Power to removedifficulties: The provisions of this Act shall be in additionto and not in derogation of the provisions of any otherlaw for the time being in force.
(1) If any difficulty arises in giving effect to theprovisions of this Act, the State Government may,by order published in the Gazette make suchprovisions not inconsistent with the provisions ofthis Act as it may deem necessary for removingthe difficulty.
(2) Provided that no order shall be made under thissection after the expiry of two years from thecommencement of this Act.
(3) Every order made under this section shall be laid assoon as may be after it is made, before each houseof the state legislature.

UTTAR PRADESH DEVELOPMENT REPORT—VOL. 2540