
Assessment of Municipal Finances of 15 Municipalities ... - PAS
Upload
khangminh22Category
view
2download
0
Finance and Economics Discussion Series Division of Research and Statistics
Division of Monetary Affairs Federal Reserve Board, Washington, D.C.
93
THE NATIONAL SURVEY OF SMALL BUSINESS FINANCES: DESCRIPTION AND PRELIMINARY EVALUATION
Brenda G. Cox, Gregory E. Elliehausen and John D. Wolken
November 1989
NOTE: Papers in the Finance and Economics Discussion Series ere preliminary materials circulated to stimulate discussionandcriticalcomment.Theanalysisandconclusionssettortharethoseoftheaumorsanddonotindicate concurrence by other members of the research staffs. by the Board of Governors, or by the Federal Ftase~e Banks. Upon request, single copies of the paperwill be provided. Referenms in publications to the Finance and Economics Discussion Series (other than acknowledgement by a writer that ha has access to such unpublished material) should be deared with the author to protect the tentative character of these papers.

THE NATIONAL SURVEY OF SMALL BUSINE!% FINANCES: DESCRIPTION AND PRELIMINARY EVALUATION
Brenda G. Cox Research Triangle Institute
Gregory E. Elliehausen Federal Reserve Board
John D. Wolken Federal Reserve Board
September 1989
This survey was funded by the Board of Governors of the Federal Reserve System and the Small Business Administration. The views expressed in this paper are those of the authors and do not necessarily reflect those of the Board of Governors of the Federal Reserve System, the Small Business Administration or Research Triangle Institute. We would like to thauk Charles Ou of the Small Business Administration and Frederick Yohn and members of the Financial Structure Section at the Board for advice during the development of the survey, RTI staff members involved in implementing the survey, and Gerhard Fries, Ronnie McWilliams, and Andrew Steinerman for research assistance in preparing the paper. An earlier version of this paper was presented at the 1989 JOINT STATISTICAL MEETINGS in Washington, DC.

Abstract The Board of Governors of the Federal Reserve System and the Small Business
AdministrationsponsoredtheNationalSurveyofSmallBusinessFinances(NSSBF)in1988. The NSSBF collected data from a national sample of 3,600 small business firms inventorying their use of transaction accomrts, other deposit and investment accounts, and credit services by source as well as obtaining a balance sheet, an income statement, and other characteristics of the business. A major concern of the study was to assess the degree to which small businesses rely on local commercial banks for credit, transactions, and deposit services. information that may have implications for public policy on mergers and deregulation in financial markets. The survey was intended, however, to serve a much broader purpose of providing basic data needed to address a wide range of issues in small business finance. This paper provides the first report of the purpose, content, and basic procedures used for the survey and presents a preliminary discussion of the coverage and overall response.
_ ii _
I. Introduction Small businesses account for about a third of employment and sales of US industry
and a majority of its growth (US Small Business Administration 1988b). Yet despite the importance of small businesses in our economy, relatively little is known about the financial position of small firms.
To obtain basic data on small businesses, the Board of Governors of the Federal Reserve System and the Small Business Administration sponsored the National Survey of Small Business Finances (NSSBF) in 1988. The NSSBF collected data from a national sample of 3,600 small business firms inventorying their use of transaction accounts. other deposit and investment accounts, and credit services by source as well as obtaining a balance sheet, an income statement, and other characteristics of the business. Interviewing was conducted by Research Triangle Institute (RR).
A major concern of the study was to assess the degree to which small businesses rely on local commercial banks for credit, transactions, and deposit services. This information may have implications for public policy on mergers and deregulation in financial markets. The survey was intended, however, to serve a much broader purpose of providing basic data needed to address a wide range of issues in small business finance.
The NSSBF is the fust attempt in several decades to collect comprehensive financial information from a nationahy representative sample of small businesses (Acs and Audretsch 1989). The dearth of experience in surveying small businesses was a problem at virtually all stages of the survey - from development of the sampling design and data collection procedures to data preparation. This paper provides the first report of the purpose, content, and basic procedures used for the survey and presents a pretiiinary discussion of the coverage and overall response.
II. Background and Objectives One of the regulatory functions of the Federal Reserve Board is-to-determine
whether proposed mergers or acquisitions of bank holding companies and of certain banks are anticompetitive. This task requires empirical delineation of the economic markets in which banking firms operate. Current analysis relies on research and court decisions that are more than two decades old. A major purpose of the NSSBF was to determine how banking markets should be delineated for small businesses. Data needed for this task also provide information about other issues associated with small business finances.
Bank Market DejXtion Historically. the financial system in the US has been characterized by legal
constraints that segmented markets along institutional lines. Thus, commercial banks provided business credit and checking services, credit unions provided consumer loans, and savings and loan associations provided mortgages. This market segmentation was recognized in the Supreme Court’s decision in the 1963 Philadelphia National Bank case which forms the basis for the current approach to bank market definition. Considering the evidence available at that time, the court concluded that because customers generally obtained multiple financial products from one place, only tirms offering the

-2-
full array of commercial bank products should be included in bank markets (in other words, commercial banking was a distinct and separate line of commerce). Furthermore, the court determined that banking markets were limited to small geographic areas because the bulk of banking business was conducted with local customers. Small businesses (and households) were considered to be constrained in their choice of financial product suppliers. Subsequent survey research conducted in conjunction with individual bank merger and acquisition cases supported the court’s decision, and in the 1974 Connecticut National Bank case, the Supreme Court reaffiied its earlier decision!
Sweeping regulatory changes, advances in technology, and financial innovations have occurred since the Connecticut decision. Most notable are the regulatory changes empowering savings institutions to offer traditional bank products (checking accounts, commercial loans, and consumer credit), the emergence of nondepository institutions (money market mutual funds) as competitors of depository institutions for household savings accounts, and technological changes (such as electronic fund transfer technol- ogy) reducing depository and nondepository institutions’ cost of delivering financial services to final users. These changes make the current approach to bank market definition appear increasingly antiquated. Critics argue that the provision of bank products takes place in a market that includes both tluifts and nondepository insti- tutions as well as banks. They also contend that the geographic market in which these firms operate has national, if not international, dimensions. While large businesses have access to a variety of sources of financial products in a national or international market, there is little information about the sources and geographic extent of small business financial dealings. Except for data collected in conjunction with individual bank merger applications, recent evidence is limited to two surveys conducted during 1981: a Federal Reserve Bank of Atlanta survey of small businesses in the Sixth Federal Reserve District (Whitehead 1982) and survey of small businesses in Ohio sponsored by the Federal Reserve Bankof-Cleveland (Watro1982). -
The need to study product and geographic markets dictated that NSSBF collect data along two dimensions (see Wolken 1984). Fit, to delineate geographic markets, the survey obtained information on the geographic location of suppliers of financial products relative to the small business. Second, the survey collected an inventory of tire different financial products that the firm obtained from each supplier to determine whether the business obtains services as a “cluster” from a single institution or purchases them separately from different institutions (in other words, whether banks compete in a single product market or in several separate product markets).
Other Survey Objectives The bank market definition problem is only one component of the study of how small
businesses finance their activities. In a modem economy, business firms invest in real assets to carry on production. Finance is concerned with the questions of how much the firm should invest and how it should obtain funds to pay for these investments.
1. For au extended discussion of the issues, see Federal Reserve Bank of Atlanta (1982).

-3-
important considerations for the small business are the cost and availability of credit
to finance-its operations. Motivated in part by concerns about the effects of monetary policy on credit
availability, the federal government sponsored several studies of small business financingaftertheSecondWorldWar(Bridge1948;BridgeandHolmes1950;McHugh1951: McHugh and Ciaccio 1955; Board of Governors 1958; Stockwell and Bytes 1961). These surveys showed that bank financing dominated all other sources of outside financing, supporting the view that availability of bank credit was an important determinant of small business investment. The majority of funds for investment, however, were obtained from owners. This suggests that a broader perspective than one focusing solely on banks is needed to understand small business finances. Unfortunately, most efforts to collect financial data from small businesses were abandoned after the 1950s.
Since these early studies, advances in economic theory have enhanced the ability of researchers to study business finances. Modigliani and Miller’s (1958) pathbreaking work, which demonstrated that the value of the fum is independent of its source of financing in a perfect capital market, motivated substantial theoretical analysis of the effects of market imperfections (such as differential tax rules, transactions costs, agency costs, and asymmetric information) on the cost and availability of alternative sources of financing (see Miller 1988; Weston 1989). These market imperfections may have a greater effect on smaller firms than on larger firms, providing a basis for empirical analysis of how the behavior of smaller firms differs from that of larger firms (Pettit and Singer 1985). However, adequate data are not available for this purpose. Existing surveys generally do not cover all sources of fmancing (Dennis 1985; Dennis and Dunkelberg 1988) or have limited or incomplete coverage of the small business population (Ando 1985; Combs, Pulver. and Shaffer 1979; Dennis 1985; Dennis and Dunkelberg 1988). A few sources provide summary statistics of data from prepared balance sheets (Internal Revenue Service .1988a, 1988b; USBureau of the Census 1987; Robert Morris Associates 1988). While these sources include all sources of financing, they provide little or no information o; the identity of tire sources of fmancing or on demographic characteristics of the firms.
The NSSBF collects a complete balance sheet and identifies the sources of financing to the fhm. It also collects information on the ownership and management characteristics of the fum, collateral and guarantor characteristics of the firm’s debts, and extent of use of cash services. This information permits empirical analysis of many of the basic questions on small business financing (Ou 1986; Pettit and Singer 1985).
2. Ou (1986) reviews previous surveys and other data sources on small business finances in greater detail.

KH. Sample Design The NSSBF collected data from two samples: a national sample of approximately
3,600 small businesses and a supplementary sample of roughly 400 fums having SBA- guaranteed loans. The procedures for the SBA sample were comparable to those used for the national sample. This discussion focuses on procedures used for the national sample.
Definition of the Target Population The target population for a survey is the entire set of elements about which
inferences will be made using the survey data (Cox and Cohen 1985). For the NSSBF, the target population was defmed to be ah nonfinancial and nonfat-m small business enterprises in the US in operation as of December 1987.
A fum was considered to be small if it had fewer than 500 full-time equivalent employees. This deftition is one commonly used by the Small Business Administration in its reports (see, for example, Small Business Administration 1984, 1986, 1988b): Large fums were excluded from the target population because they typically have access to a national market for financial services and thus generally are not a concern in bank antitrust cases. Moreover, a large amount of publicly available data already exist for large businesses.
Nonfmancial and nonfarm business was defined as all privately owned and for-profit businesses, excluding industry groups: (1) agriculture. forestry, and fishing; (2) finance and insurance underwriting; and (3) real estate investment trusts. Some industry groups (especially utilities, transportation, and educational services) contain both privately and publicly owned entities as well as for-profit and not-for- profit firms. Ineligible firms in these industry groups were identified in a screening interview, which is discussed in a later part of this paper.
These restrictions correspond to the deftitiorts for the nonfarm, noncorporate business and corporate notimancial sectors in the Federal Reserve Board’s flow of funds accounts (Board of Governors 1980). In addition to conforming with extant statistical programs, the restrictions eliminate from the target population several types of organizations that differ substantially from most businesses. The nature of financial firms’ business (financial intermediation) makes their behavior differ from that of other business firms. Moreover, detailed financial data are available for many financial fii. Publicly owned and not-for-profit firms are excluded because their peculiar objectives and environment give rise to different record keeping procedures than those used by for-profit firms. Agricultural firms, on the other hand, are often small and operate in rural markets where bank antitrust problems are likely to arise. However, adequate data are routinely collected for agriculmral firms (US Department of Agriculture 1988). and the existence of substantial federal programs for agriculture mitigates concerns about adverse effects on credit availability for this industry.
3. Total sales are also commonly used to measure the sire of a busimsses. Using total sales to defme the target population for NSSBF would have been impractical, however. See the discussion in the following text regarding alternative sampling frames.

-5
An enterprise was defined as an aggregation of all offices, branches, and subsidiary companies under common ownership andcontrol. An entetprisemay be a single, independent establishment or a company with multiple branches or subsidiaries. While production and sales occurs at the subsidiary or branch level of the firm, financial decisions typically are made at a higher level and encompass all branches and subsidiaries of the firm. This approach is similar to the Census Bureau methods for financial sweys of businesses (Federal Committee on Statistical Methodology 1988).
Firms that were no longer in business, bankrupt, or in business less than a month at the time of the interview were also ineligible for the survey. At the target date, the finances of such firms would not reflect those of a going concern.
Sampling Frame The sampling frame is a list or mechanism used to identify population elements for
sample selection purposes. The ideal frame is a list of all population members with sufficient data to identify and locate each member (Cox and Cohen 1985). Thus, the utility of a particular sampling frame also depends on the method chosen for data collection. Cost considerations led to the decision to use telephone data collection for the NSSBF. For this reason, availability of telephone numbers was a crucial consideration in selecting a sampling frame.
The sampling frame for the NSSBF was constructed from the December 1987 Dun’s Market Identifier @MI) file. The DMI file combines the old Dun and Bradstreet data file, which contained firms applying for credit or purchasing commercial insurance, and a business telephone listings file. The addition of firms from the telephone listings file reduced the coverage problem of the old program, although there is still some tmdercoverage of very new firms, firms with few employees, and sole proprietorships (Iannacchione, LaVange, and Duffer 1986). Nev;rtheless, the DMI file is believed to have good coverage of businesses with employees. The DMI frame has several desirable features as a sampling frame. Information on the Dh4l file includes the business address, telephone number. main office/branch status, standard industrial classification (SIC) code, and the name of the owner or principal executive officer. This information facilitates selection of the sample and establishment of contact with the appropriate person in the firm. Moreover, the DMI file is updated regularly, making its obsolescence rate compare favorably with other publicly available sampling frames.
To construct the sampling frame, all DMI records with ineligible SIC codes as well as records for branch offices and subsidiary companies were elimiited. The DIviI variable for employment was not used to eliminate large businesses because it was often missing and was not defined in terms of full-time equivslents. Instead, information collected in the screening interview was used to eliminate firms with more than 500 employees and not-for-profit or publicly owned firms.
4. The SBA estimates mat the DMl hle accounts for about 93 percent of private employment in the US (US Small Business Administration 1988b). Also see US Small Business Admidmtion (1988a) for discussion of DMI coverage issues.

-6-
Alternative Sampling Frames Several alternatives provide potentially better coverage than the DMI file. One
alternative is an area sampling based frame. Such a frame could be constructed by selecting a sample of geographic areas and listing all businesses located in these areas. Lu principle, such a sample frame would be comprehensive. However, it is sometimes difficult to recognize commercial structures. As a result, the coverage actually achieved would be less than comprehensive. Moreover, listing the individual business in an area is expensive, and information on SIC classification and main office/branch status are not available for eliminating study ineligibles.
The Bureau of Labor Statistics’ Employment and Wages (ES-202) file provides comprehensive coverage of firms that employ five or more persons and are active in the first quarter of the year. Telephone numbers are not available, and identification of the headquarters of the firm is difficult for firms that operate in more than one state because a main offke is designated for each state in which the firm has branches. Permission would r&d to be obtained from each state, and state confdentiality would apply to use of the data, which could cause problems.
LRS tax returns provide comprehensive coverage of the population of businesses. Tax returns themselves are timely, but the time required :o construct a sample frame from tax returns would introduce obsolescence problems. Also, tax returns do not provide telephone numbers. Tracing procedures would be required to obtain telephone numbers and identify firms that had gone out of business, but results would not be completely accurate. The main problem of a tax-based sample frame, however, is the severe confidentiality restrictions on data use, which would likely yield a low response rateP
Jn sum, area sampling-based and tax-based sample frames would not iu practice provide comprehensive coverage of the population of small businesses for this survey. The Dh4l file provides adequate but not comprehensive coverage, is probably at least as timely as the other sample frames, and contains information not rekiily available from the other frames that facilitates sample selection and interviewing.
5. For example, the IRS provided a 1980 sample frame for the high-income sample in the 1983 Survey of Consumer Finances (Avery and Elliehauseo 1988). Evidence suggests that business lists deteriorate at a rate of about 1 percent per month (Converse and Heeringa 1984). Thus, a similar delay in producing a tax-based sample frame might result in 15 to 20 percent obsolescence rate.
6. For the high-income sample of the 1983 Survey of Consumer F-s, the Comptroller of the Currency (which, like the IRS, is part of the Department of Treasury and can legally obtain tax data) sent potential participants a letter requesting participation in the survey. The Survey Research Center of the University of Michigan, the organization conducting the interviews, was allowed to contact only those individuals who notified the Comptroller that they were wilIing to participate. This procedure yielded a 9 percent response rate. Under the best circumstances, such procedures have yielded no better than a 30 percent xsponse rate (Avery and EUiehauseu, 1988).
-7-
Coverage of DMI SampIing Frame To evaluate coverage issues further, we compared frame counts for establishments on
the DMI file with statistics on business tax returns compiled by the Statistics of Income Division of the IRS (Internal Revenue Service 1988a, 1988b. 1987). Exact comparisons are not possible, but IRS statistics provide some basis for evaluating the DMI tile’s coverage of the universe of interest for this study.
Before discussing our findings, several conceptual differences between the IRS and DMl lists should be noted. First, the IRS unit of observation is the business tax return. Firms owning other fums have the option of filing consolidated returns for the enterprise or separate returns for each company. Hence, IRS statistics overstate the number of corporate and partnership enterprises. Next, IRS statistics include firms that were active at any time during the year, while the NSSBF includes only those firms that were in business at a specified point of time. Thus, IRS estimates of the population of businesses will be larger because they count firms that change ownership more than once and include fn-ms that went out of business before the reference date and firms that started operations after the reference date. ln addition, IRS estimates include fums with more then 500 emplo
7y ees. This is not a large number, however, and it
primarily affects the corporation total. With these caveats, we present some results of our preliminary work.
The DMI estimate for number of corporations is not much smaller than the IRS estimate.* Both data sources indicate that the majority of corporations were engaged in retail trade and services. The distribution of corporations by industry groups is also similar, although the DMI list contains proportionately somewhat fewer service and real estate firms and more manufacturing and trade fms than the IRS list. Hence, our preliminary work suggests that the DMI file’s coverage of corporations is good.
The DMI estimate of the number of proprietorships, on the other hand, is substantially lower than the IRS estimate. In both lists, proprietorships are more concentrated in the service and construction industries and less concentrated in manufacturing than either partnerships or corporations. The DMI list underrepresents proprietorships in all industry groups. The DMI tile contains a greater proportion of trade fums and a smaller proportion of services than the IRS list.
A large part of the coverage problem for proprietorships appears to arise from a lack of coverage of businesses without employees. Businesses without employees are mostly proprietorships. They are often part-time businesses and are not easily identified. These firms include, for example, individuals for whom part-time self- employment is a secondary occupation. Zero-employee firms are a large proportion of the
7. There is one tiuther discrepancy. These preliminaxy comparisons are based on the latest available published statistics - 1985 for corporatiorq 1984 for parme&@, and 1983 for proprietorships. The IRS totals for 1987 would be somewhat different from the numbers we used.
8. The Dhll file does not identify ownership form. We estimated the distribution of tirms by ownership form within industry groups using results from the NSSBF.

-8s
total number of businesses in the US, although they probably account for a small share of total revenues, assets, or employment. Other than tax return data, the most complete coverage of zero-employee fvms is from household surveys such as the Current Popula;ion Survey or the Survey of Consumer Finances, which provide data on self-employment.
The DMI file’s coverage of partnerships is not as good as its coverage of corporations but better than that of proprietorships. The most severe under-
coverage of parmerships is found in the real estate industry. Again, the undercoverage of partnerships may be associated with zero-employee firms.
Sample Selection To develop the sample design, frame counts were obtained for various reporting
domains. Reporting domains of interest for which DMI information was available include industry, Census region, urban/rural location, number of employees, and sales. The distribution of firms indicated that rural fnms would have to be oversampled to achieve approximately equal precision by urban/rural location. Similarly, larger firms would have to be oversampled to achieve equal precision across ah size groups of firms. Because one-third of all records had missing values, sales would be unsuitable for use in stratification. In contrast, only 12 percent of records had missing values for number of employees.
The sample frame was partitioned on the basis of Census region (Northeast, North Central, South, and West), urban/rural location (fms in MSAs are classified urban; all others are classified rural), and firm size ,(somall=1-49 employees, medium=50-99 employees, and large=100 or more employees). DMI frame counts for these strata and their allocated sample sizes are presented in Table 1.
The choice of strata and allocation of completed interviews to strata was based on consideration of three constraints:
(1) the size of the final sample should be 4,000 completed interviews; (2) domain estimates for small firms for each region and urban/rural location
should have approximately equal precision; and (3) domain estimates for medium and large fvms in urban and rural locations should
have approximately equal precision. The decision was to create 24 strata, allocating 400 completed interviews to small firms in each region by urban/rural location category, 200 completed interviews to medium fums in each urban/rural location category, and 200 completed interviews to large firms in each urban/rural location category. For medium and large firms, the completed interviews were allocated proportional to population size within each Census region to reduce the effect of unequal weighting. Simple random sampling was used to select fums from each stratum.
9. For further discussion of 8nns without employees, see US Small Business Administration 1983,1986, 1988a
10. As mentioned, the DMI file contains records in which the number of employees is missing. For purposes of sample selection, these firms were classified as small.

-9-
IV. Questionnaire Development The survey materials were developed in an iterative process involving four rounds
of cognitive testing, which sought to determine respondents’ understanding of questions and ability to provide answers, and one formal pretest. Exhibit 1 outlines the topics covered by the resulting NSSBF questionnaire. The NSSBF asked respondents to report a large amount of financial data. Most respondents would not be able to report the requested financial data accurately without consulting records. For this reason, the survey desi
R called for mailing worksheets listing the financial information to
respondents. The information on the worksheets was then to be collected in telephone interviews. The use of telephone interviews to collect the data was intended to achieve a higher response rate and better quality of information than is typically obtained in mail surveys. This section discusses the problems encountered in developing the questionnaire and data collection strategy.
Cognitive Testing As discussed earlier, the survey objectives involving public policy toward
commercial banks required collection of an inventory of financial services by source. The information could be obtained either by listing the sources of financial services and then asking about the financial products obtained at each institution or by taking an inventory of services and identifying the sources of each service. Testing results indicated that it was easier for respondents to identify the financial product first and then list the sources.
Analysts may want to group financial products in different ways. For example, it may be necessary to group loans by maturity for some purposes and by collateral for others. Thus, a high degree of disaggregation is desirable. While firms have a small number of some financial services (such as checking accounts and credit lines), they may have a large number of other types of financial services (for example, automobile lessors may have many motor vehicle loans). Testing indicated that higher levels of aggregation increased the complexity of the questionnaire, and respondents often had greater difficulty answering questions. Some aggregation, however, was necessary lo avoid extremely burdensome interviews for some respondents. The types of financial services most likely to cause problems - mortgages, motor vehicle loans, and equipment loans -- were categories that respondents had little trouble understanding and that tended to be relatively homogeneous. Hence, workable questions could be developed without sacrificing analytical flexibility.
11. Due to the complexity of the data collected, limitations and reliability of the data available on the sample frame, and tbe potential for sample frame obsolescence. several contacts were necessary prior to collecting the main questionnaire data l%e steps followed to collect the data were (l) draw sample firms from sampling frame; (2) screen linus by telephone to identify ineligibles and verify frame data (for example, address); (3) mail a package of materials, including a worksheet to prepare in advance of the intetiew to allow firms to assemble records. consult accountants, etc., and tinally (4) administer questionnaire. Each of these is discussed in greater detail below.

-lO-
Another problem was to develop a structure for collecting reasonably consistent financial data from all firms in the sample. Several obstacles were encountered. Accounting practices, developed for controlling the operations of business fii rather than reporting economic value, are not uniform. Larger firms tend to have greater coordination and monitoring needs and thus more complex records than smaller firms. Similarly. partnerships and corporations tend to have more sophisticated records than proprietorships. Federal tax returns provided a nearly common basis for reporting balance sheet items for partnerships and corporations. The worksheet and questionn$e identified the appropriate lines from the tax forms for each item requested. Proprietorships, however, do not normally prepare balance sheets. They had to be instructed how to construct a balance sheet.
The informal tests revealed that some questions were best answered by the firm’s accountant white others were best answered by an owner. Many owners, partners and stockholders as well as proprietors, did not understand accounting terms. Accountants, however, often did not know the meaning of terms defining financial services. Therefore, definitions were provided for all items on both the worksheet and the questionnaire.
Owners of small fums tended to describe personal finances even though they were instructed to report business finances only. This problem was especially severe for proprietors, who typically commingle their business and personal fmances. As a consequence, instructions were developed to provide guidance in separating business and personal finances.
Testing also revealed that respondents’ willingness to respond varied substantially for different types of questions. Few respondents were sensitive to questions about the general characteristics of firms. Interviewers encountered somewhat more resistance to questions about use of financial services. Few respondents refused to acknowledge use of different services or to identify the source from which it was obtained. Some respondents were willing to report sources but refused dollar amounts. Income statement and balance sheet questions encountered the most resistance. Many respondents refusing income and balance sheet questions viewed this information as confidential. Lack of understanding of accounting terms also contributed to respondents’ reluctance to answer these questions.
Some respondents were unwilling to report aggregate debts or cash holdings in a balance sheet, even though they had reported dollar amounts of individual debts and accounts. For the pretest and main study the questions were ordered based on this experience: questions about general characteristics of the fum were asked first, and then data concerning the sources of financial services were collected. The income statement and balance sheet were at the end. Thus, for some firms, partial balance sheet information could be constructed from responses to questions about financial service use, even when balance sheet questions were refused.
12. Respondents sometimes had to add two or more lines or to disaggregate items reported on a single line on the tax form.
-ll-
Pretest A formal pretest was conducted for small samples of fu-ms from the DMI and SBA
lists. Responses were obtained from 26 of 45 eligible respondents from the DMI sample. Thirteen of the firms refused. The remaining cases were partial interviews, which were not completed due to time constraints.
The pretest indicated the need to use experienced interviewers for the main study. The inexperienced interviewers had great difficulty in obtaining responses. Knowledge of accounting, on the other hand, was useful but not necessary for interviewers.
Respondents appeared to have few problems answering the financial service questions about their use of financial services, although dollar amounts reported on this part of the questionnaire often appeared to be estimates. Some respondents had difficulty with the income statement and balance sheet. Refusals and don’t know responses were also a problem for these cases. III many instances, accounting identities were not satisfted. Expert reviewers could sometimes discern the problem. however. Relationships between balance sheet items (the latter part of the questionnaire) and the financial services inventory (collected earlier in the interview) were useful in identifying where mistakes occurred.
A major problem in the pretest was that many respondents did not complete the worksheets. As a result, dollar amounts were often rounded and inaccurate. Several measures were taken for the main study to increase use of the worksheets. First, respondenis were contacted much sooner after the mailout packages were sent. This measure was intended to reduce the number of lost and discarded worksheets. Second, the worksheets were remailed to firms that lost, discarded or did not receive them and then recontacted respondents after remailing. Fiially, when interviewers discovered that respondents had not completed worksheets, respondents were encouraged to do so. and the interviews were rescheduled for a later date.
V. Implementation and Response Based upon the results of the four rounds of testing and pretest, a data collection
strategy evolved. The approach began with a short screening interview to determine study eligibility and to confii the mailing address. A lead letter package and worksheets were then mailed to the business. After a 10 day delay, the business was contacted by telephone and questionnaire data collected including worksheet responses. At the conclusion of the interview, the interviewer asked the respondent to mail the worksheet and the records he used in answering the questions. This section discusses the results of this data collection approach.
Screening Results Screening interviews of firms selected for participation were conducted to
determine eligibility and to correct inaccurate information on ownership, telephone number, and address. Because the eligibility rate was unknown. screening was scheduled in waves. Each wave was a random sample. Thus, estimates of eligibility from the early
waves could be used to select a sufficient number of fums in the fourth wave to yield the desired number of eligible firms.
A total of 8,017 firms from the DMI file were screened (Table 2). Of these firms, 5,280 firms (66 percent) were determined to be eligible, and an additional 267 firms (5 percent) indeterminable.
Virtually all of the ineligible firms can be classified into one of two categories. The first category, consisting of ineligible types of businesses, contained 969 firms (12.1 percent of screened firms). About 57 percent of these 969 firms were not-for- profit or publicly owned, 28 percent were not the main office of the firm, 9 percent had more than 500 employees, and 6 percent were subsidiary companies.
The second category contains firms that were no longer in business. About 17 percent of the sample was in this category: 921 firms where the owner or another knowledgeable person reported that the firm was out of business, and 452 firm which had no directory listing and could not be traced through calls to their top executive, the Better Business Bureau, the Chamber of Commerce, local libraries, and the telephone company.
Interviewing and Response After completion of screening, packages were mailed to respondents containing
letters from the Chairman of the Board of Governors of the Federal Reserve Alan Greenspan and RTI’s president urging participation in the survey. a question and answer pamphlet about the survey, and the worksheets. ,Ten days after packages were mailed, interviewers began telephoning respondents. i The pretest had indicated that most respondents could not complete the interview in one session, Initially we planned to have the interviewer ask the general questions about business characteristics first and then break off the interview if the respondent had not completed the worksheets. Early results, however, indicated that the bulk of the sample was very reluctant to respond or difficult to reach. In addition, not having completed the worksheets was clearly being used as a “put off’ technique by the respondents. To alleviate this problem, interviewers were instructed to allow a breakoff only when they were convinced the respondent intended to complete the worksheets. Otherwise, the interviewer would encourage respondents to get any records they had and continue the interview.
Obtaining response was a continuing problem throughout the interview process with two primary sources for the difficulty: (1) respondents did not want to respond to a survey that asked for such sensitive, confidential data and (2) establishing contact with the owner and finding an appropriate time for interview was often problematic. This difficulty in establishing contact and gaining cooperation was reflected in the number of contacts needed to complete screening and the interview.
An average of 4.3 calls were made for each business selected for screening with 3.1 calls made for completed screenings, 4.9 calls for nonrespondents, and 9.6 calls for unable to contact firms. For the interview itself, 11.6 calls were made on average for each sample business with 10.4 calls made for totally complete interviews, 20.3 calls for partial interviews, 10.9 calls for total nonrespocdents and 19.2 calls for unable- tocontact businesses.

-13-
Since obtaining response was so problematic for tis study, we set up four separate response status indicators for the interview: the first for Section I where business
characteristics were discussed, the second for Section II where financial services used by the firm were enumerated, the thiid for Sections ill-V where the income statement and balance sheet were obtained and the fourth for the questionnaire as a whole. For completed questionnaires and work in progress. we evaluated the individual section response status indicators by tabulating the frequency of missing data in the data base. When too large a percentage of the items in a completed section were missing, the respondent was telephoned to obtain the missing data. Data were obtained for
approximately 60 percent of these reopened cases. The data collection goal was to achieve a 75 percent response rate among study
eligibles. During the data collection process, it became clear that achieving this goal might not be possible. From the beginning days of the survey, respondents demonstrated great reluctance to participate in the study. As an example, during the fist week of data collection, interviewers averaged less than one completed interview per interviewer-day worked (an I-hour shift). In part this result was due to the lack of interviewer experience in questiomnCre administration. Various measures were taken to boost production including staff retraining, reassignment of personnel, changes in working hours, incentives, etc. Production increased markedly peaking at 3-4 completed interviews per interviewer-day. The bulk of time was spent in hying to establish contact with respondents and to convince them to participate. The interview itself averaged SO minutes in length.
Table 3 presents results of the data collection process. An interview was
considered complete if the respondent provided answers to the majority of the financial inventory questions in Section II. When ail possible nonresponse follow-up approaches had been exploited, we achieved a 71 percent response rate for the DMI survey. Of these respondents. 93 percent had completed all survey sections including the income statement and bsItice sheet sect5iis. -BEakoffs kere m&i%e@ent than ty@cAly~found in sampIe surveys, and they occurred at all points in the survey questionnaire. To illustrate, 24 percent of the nonrespondents stopped after having provided all Section I data on characteristics of their business.
Note that in spite of having screened for eligibility, we had 6 percent of the fielded DMI sample classified as ineligible. These swey ineligibles included ineligible business types (for example, farms) with incorrect SIC codes, subsidiary companies and large businesses not correctly identified in screening, and companies that had gone out of business since screening or were not truly in business. The latter source of ineligibility often was identified after the inteniew was nearly complete. ln recording income, the interviewer would encounter no sale-s and no expenses. Probing in these cases usually determined that the business had been actively pursued in the past but was now totally inactive.
Table 4 presents response rates by selected reporting domains. There was little difference in response rates by firm size. R71en firms were grouped by other criteria, however, some differences in response rates were found. Rural firms were more likely than urban fiis 10 complete interviews. By region, the resp@nse rate was lowest in the
northeast (68 percent) and highest in the south (74 percent). Among industry groups, response rates ranged from 68 percent in transportation, communication, and public utilities to 75 percent in mining and manufacturing and in wholesale trade industries.
Use of Worksheets Despite all efforts to encourage use of worksheets, only about 20 percent of
respondents reported having completed worksheets (table 5). We expected worksheets to be more useful to proprietorships than partnerships or corporations because proprietor- ships would not have prepared fmancial statements. We found the Oppite result: corporations were more likely than other organization forms to have completed the worksheets. Among the other groups examined, larger firms and manufacturers were more likely than smaller fums and firms in other industries to have completed worksheets. However, there were no apparent differences on worksheet use by Census region or urban/rural location.
Firms were more wilimg to use records than to complete worksheets. About 34 percent of respondents reported consulting records to answer questions about financial institution relationships, and 47-50 percent used records to answer the income statement and balance sheet questions. Corporations, larger fums, and manufacturers were more likely than other groups of firms to consult records.
In all groups, accounting records were the most commonly used records for questions about financial institution relationships. Use of accounting records increased with firm size. Nearly three-fifths of the records used by partnerships and corporations were accounting records. Nevertheless, a large proportion of records used in all groups was bank or tax records. In contrast, tax records were the most commonly used records for the income statement and balance sheet, probably because the worksheet and questionnaire indicated on which line of income tax forms each item could be found. FVoprietorships were more likely than other organization forms to use tax records for the iiicome statement. However, that was not true for the balance sheet. Tax records were less useful for this purpose because proprietorship tax forms do not include a balance sheet, although tax records contain some items (especially inventory and property) that appear on a balance sheet. For both the income statement and balance sheet, the use of tax records declined with firm size.
A few additional preliminary observations about responses and use of worksheets and records are worth mentioning. Most respondents had little difficulty in reporting about fmancial institution relationships. Dollar amounts were the most difficult questions in this section. Many estimated dollar amounts here but later consulted records to report income statement and balance sheet items. Small firms’ failure to use worksheets or records was troublesome, but most of these firms appeared to have simple finances. Major items appear to be reported, although dollar amotmts are often estimates. Items such as prepayments, deposits, and accrued expenses and taxes payable are likely to be underreported. However, these items tend to be relatively small amounts. We will be able to say a great deal more about thcsc issues in a future paper.

-15
VI. Conclusions This paper provides the frrst description of the purpose, content, and basic
procedures used for the National Survey of Small Business Finances and presents a preliminary discussion of the coverage and overall response of the survey.
A major concern of the study was to assess the degree to which small businesses rely on local commercial banks for credit, transactions, and deposit services. This information was expected to illuminate issues associated with public policy concerning banking mergers and deregulation in financial markets. The survey was intended, however, to serve a much broader purpose of providing basic data needed to address a wide range of issues in small business finance. Our initial analysis suggests that the survey goes a long way towards accomplishing these objectives.
The NSSBF collected data from a national sample of 3,600 small business firms inventorying their use of transaction accounts,.other deposit and investment accounts, and credit services by source as well as obtaining a balance sheet, an income statement, and other characteristics of the business. Corporations, partnerships, and sole proprietorships were included in the sample.
It appears that reasonably good coverage of firms with employees was obtained using the DMI fide for a sampling frame. Theoretically, the more comprehensive tax-based sample frames provide better coverage of the population of small businesses, but restrictions on their use make their actual coverage much worse than that obtained using the DMI file.
Firms were induced to cooperate on a voluntary survey requesting difftcult and confidential financial information. Substantially greater resources were required to obtain an interview than is normally required for a consumer survey. Only experienced and “natural” interviewers were able to achieve adequate yield rates. Substantial amounts of time were required to obtain interviews. The time required to complete an interview was dominated by the time spent to establish contact, to gain cooperation, and to resume contact following abre%koff. The total time spent for an iiitetew was more than three times the average administration time for the questionnaire.
Despite these difficulties, an acceptable overall response rate (nearly 70 percent) was obtained for the survey, which is comparable to those obtained for high quality business and consumer financial surveys. For completed interviews, item nonresponse does not appear to be a problem. Common knowledge questions had very low rates of missing data. Even for dollar amounts, missing data rates were low. However, the use of worksheets or records was lower than hoped. Reported dollar amounts were frequently estimated. At this time we cannot assess data quality. Future work will investigate data consistency, the extent of use of estimates, and the accuracy of reported data.

-16-
References
Acs, Zoltan J. and David B. Audretsch. ‘Editors’ Introduction.” Small Business Economics 1 (1989): l-6.
Ando, Faith H. “Access to Capital by Subcategories of Small Businesses.” Report prepared for the Small Business Administration under Contract No. SBA-6061-OA-82. Fort Washington, PA: JACA Corporation, 1985.
Avery, Robert B. and Gregory E. Elliehausen. “1983 Survey of Consumer Finances: Technical Manual and Codebook.” Washington, DC Board of Governors of the Federal Reserve System, Division of Research and Statistics, 1988.
Board of Governors of the Federal Reserve System. Financing Small Business. Report by the Federal Reserve System to the Committees on Banking and Currency and the Select CommitteesonSmallBusiness. Washington,DC USGovernment PrintingOffice, 1958.
Board of Governors of the Federal Reserve System. Introduction to Flow of Funds. Washington, DC: Board of Governors of the Federal Reserve System, 1980.
Bridge, Lawrence. “Capital Requirements of New Trade Firms.” Survey of Current Business 28 (December 1948): 18-24.
Bridge,LawrenceandLoisE.Holmes.“CapitalRequirementsofNewManufacturingFirms.” Survey of Current Business 30 (April 1950): 1 l-8.
Combs, Robert, G. Pulver, and Ron Shaffer. “Financing New Small Business In Wisconsin.” University of Wisconsin, Department of Agricultural Economics, 1979.
Converse, Muriel and Steven G. Heeringa. “An Evaluation of the Accuracy and Current Utility of the 1981 Master Establishment List (MEL).” Report prepared for the Small BusinessAdministrationunderContractNo.SBA-6067-GA-82. AnnArbor,MI Institute for Social Research, 1984.
Cox, Brenda G. and Steven B. Cohen. Methodological Issuesfor Health Care Surveys. New York: Marcel Dekker Inc.. 1985.
Dennis, William J., Jr. Credit, Banks and Small Businesses: 1980-1984. Washington, DC: National Federation of Small Businesses, 1985.
Dennis, William J., Jr, and William C. Dunkelberg. Credir, Banks and Small Business: The United States. Washington, DC: National Federation of Small Businesses, 1988.

-17-
Federal Committee on Statistical Methodology. “Quality in Establishment Surveys.” Statistical Policy Working Paper 15. Washington, DC: Office of Management and Budget, 1988.
Federal Reserve Bank of Atlanta. Economic Review 67 (April 1982).
McHugh, Laughlin F. “Financing Small Business in the Postwar Period.” Survey of Current Business 31 (November 1951): 17-24.
McHugh, Loughlin F. and Jack N. Ciaccio. “External Financing of Small- and Medium-Size Business.” Suntey ofcurrenr Business 35 (October 1955): 15-22.
Iannacchione, Vincent G., Lisa M. LaVange, and Allen P. Duffer. “The Pesticide Use Survey of Food Processors.” RTI Final Report No. RTI-3493~02-OlF. Research Triangle Park, NC: Research Triangle Institute, 1986.
Internal Revenue Service. Statistics of Income, 1985: Corporation Income Tar Returns. Washington, DC: US Government Printing Office, 1988a.
. Statistics of Income, 1984: Partnership Income Tax Returns. Washington, DC: US Government Printing Office, 1988b.
. Statistics of Income, 1983: Sole Proprietorship Income Tax Returns. Washington, DC: US Govermnent Printing Office, 1987.
Miller, Merton H. “The Modigliani-Miller Propositions After Thirty Years.” Journal of Economic Perspectives 2 (Fall 1988): 99-120.
Modigliani, France, and Met-ton H. Miller. “The Cost of Capital, Corporation Finance, and the Theory of Investment.” American Economic Review 48 (June 1958): 267-97.
Ou. Charles. “Small Business Financing: A Review of Data Collection Efforts.” Paper presented at the Eastern Finance Association Meeting, Nashville, TN, April 1986.
Pettit, R. Richardson and Ronald F. Singer. “Small Business Finance: A Research Agenda.” Financial Management 14 (Autumn 1985): 47-60.
Robert Morris Associates. Annual Statement Studies, 1987. Philadelphia, PA: Robert Morris Associates, 1988.
Stockwell, Eleanor J. and James C. Bymes. “Small Business Financing: Corporate Manufacturers.” Federal Reserve Bulletin 47 (January 1961): S-22.
-18
US Bureau of the Census. Quarrerly Financial Report for Manufacturing, Mining, and Trade Corporations. Fourth Quarter, 1987, Series QFR-87-4. Washington, DC: US Government Printing Offrce, 1987.
US Department of Agriculture. Financial Characrerisrics of US Farms, January 1.1988. Washington, DC: US Government Printing Office, 1988.
USSmallBusinessAdministration. IiandbookofSmallBusinessDara. Washington,DC:US Small Business Administration, 1983.
. Handbook of Small Business Dara, 1988. Washington, DC: US Government Printing Office, 1988a.
. The State of Small Business: A Repon of the President. Washington, DC: US Government Printing Office. 1984,1986,1988b.
Watro, Paul. “Financial Services and Small Businesses.” Economic Commentary, Federal Reserve Sank of Cleveland, January 11,1982.
Whitehead, David D. “The Sixth District Survey of Small Business Credit.” Economic Review, Federal Reserve Bank of Atlanta 67 (Apt-n 1982): 42-8.
Volken. John D. Geograpfric Market Defineation: A Review of the Literature. Staff Studies 14C. Washington, DC: Board of Governors of the Federal Reserve System, 1984.

-19-
Table 1
Sample Allocation Across Domains Defined by Census Region, Metropolitan Status, and Firm Size
Census Metropolitan Reaion status
Firm DMI Sample k
1 Count Size
Northeast Urban
North Central Urban
south
West
Northeast
North Central
south
West
!Jrban
Urban
Rural
Rural
Rural
Rural
Small 926,956 400 Medium 20,911 51
Large 19,741 56
Small 854,960 400 Medium 19932 47
J-=ge 17.215 48
Small 1,104,141 400 Medium 23,700 58 hge 19,921 56
SmaIi 913,040 400 Medium 18,037 44
hge 14,212 40
Small 167,650 400 Medillill 2,732 32 kge 2,441 35
Small 378,395 400 Medium 5,352 63 bge 4,112 59
Small 442.133 400 Medium 6,697 78 uge 5,793 83
Small 216,681 400 Medium 2,346 27
hge 1,568 23
1. Small=1 49 employees, medium=50-99 employees, large=1 00 or more employees.

-2o-
Exhibit 1
Structure of the NSSBF Questionnaire
I. Characteristics of the Firm A. Screening Information 3. SIC Code c. Organization Type
1. Proprietorships 2. Partnerships 3. Corporations
D. Location of Firm E. Reference Period (time period to which data apply)
II. Sources of Financial Services A. Use of Deposit Services
1. Checking Accounts 2. Savings Accounts
B. Use of Credit and Financing 1. Leases 2. Lines of Credit 3. Mortgages 4. Motor Vehicle Loans 5. Equipment Loans 6. Loans from Partners/Stockholders 7. Other Loans
8. Most Recent Loan from an Institution C. Use of Other Financial Services D. Relationships with Financial Institutions
1. Characteristics of Financial Institution 2. Location Used for Noncredit Services 3. Location Used for Credit Services
E. Other Financial Institutions F. Previous Relationships with Financial Institutions G. Shopping for Financial Services H. Solicitation by Fiiancial Institutions I. Use of Trade Credit J. SBA Borrowing Experience (SBA sample only)
III. Income and Expenses IV. Balance Sheet
A. Assets B. Liabilities and Equity C. Miscellaneous
V. Closing Remarks (Use of Records)

-21-
Table 2
Screening Results
Result DMI SBA
samule SamDle Total
Ineligible Completed screening,
ineligible business Confumed, no longer
in business No telephone listing,
unable to contact Other
Subtotal 2,348
Eligible Completed screening,
eligible business Partiai screening Language barrier Listed telephone number,
unable to contact RefUG3.l Other
Subtotal
Total 8,017 675 8,692
969
921
452 6
5.280 79 15
11 125 159
5,669
19
41
34 0
94
562 5.842 7 86 2 17
0 3 7
11 128 166
581 6,250
988
962
486 6
2,442

Table 3
Response Rates
DhfI
%UIlDk SBA
Samnle Total 1
1. Total firms 5,547 520 6.067
2. Ineligible firms 357 19 376
3. Eligible fums (l)-(2) 5,190 501 5,691
4. Interviews 3,679 404 4.083
a. All sections complete 3,397 390 3,787
b. All but balance sheet or income statement complete
282 14 296
5. Noninterviews 1511 97 1,608
6. Response rate 100*(4)/(3) 70.9% 80.6% 71.7%
1. Because of uncertainty about the eligibility rate, a larger than needed number of fums was screened. The sample for interviewing was then randomly selected from the larger screened sample of eligibile firms. Thus, the total number of firms in the final sample is smaller than the number of eligible fms in table 2.

-23-
Table 4
Response Rates by Reporting Domains: DMI Sample
Domain
Percent of Firms Reoortine Business Financial Balance
Characteristics Service Use Sheet Data
Censors Region Northeast North Central south West
75 68 62 79 72 67 81 74 68 76 69 65
MePopolitan Status ‘Jrban Rural
74 67 62 82 7.5 70
Firm Size 1-49 employees SO-99 employees 1 O-409 employees
78 71 66
80 74 68 77 71 64
Industry Mining, Manufacturing ConstIuction Transportation, Communica-
tion, Public Utilities Wholesale Trade Retail Trade Insurance, Real Estate Services
82 75 70 79 72 67
77 68 61 80 75 68 76 69 64 80 73 69 76 69 64
All Firms 78 71 66

-24
Table 5
Use of Worksheets and Records by Respondents
Domain
Percent Usine Records For Percent Financial Income Balance
Preparing Services Statement Sheet Worksheets Inventors Ouestions Ouestions
Organization Form Proprietorships Partnerships S Corporations Corporations
17 27 40 30 17 33 47 43 20 38 56 57 24 39 58 59
Firm Size l-4 employees 5-9 employees 10-49 employees 50-99 emp!oyees 100-499 employees
i5 26 41 34 22 34 51 49 24 42 56 57 29 46 66 66 27 51 71 72
Industry Mining, h4anufactming 30 47 64 64 construction 18 31 48 41 Transportation, Cornmuni-
cation, Public Utilities 16 42 58 53 Wholesale Trade 19 35 52 50 Retail Trade 18 31 48 44 Insurance, Real Rsttte 19 37 48 46 Services 21 31 45 42
All Firms 20 34 50 47
FINANCE AND ECONWICS DISCUSSION SERIES
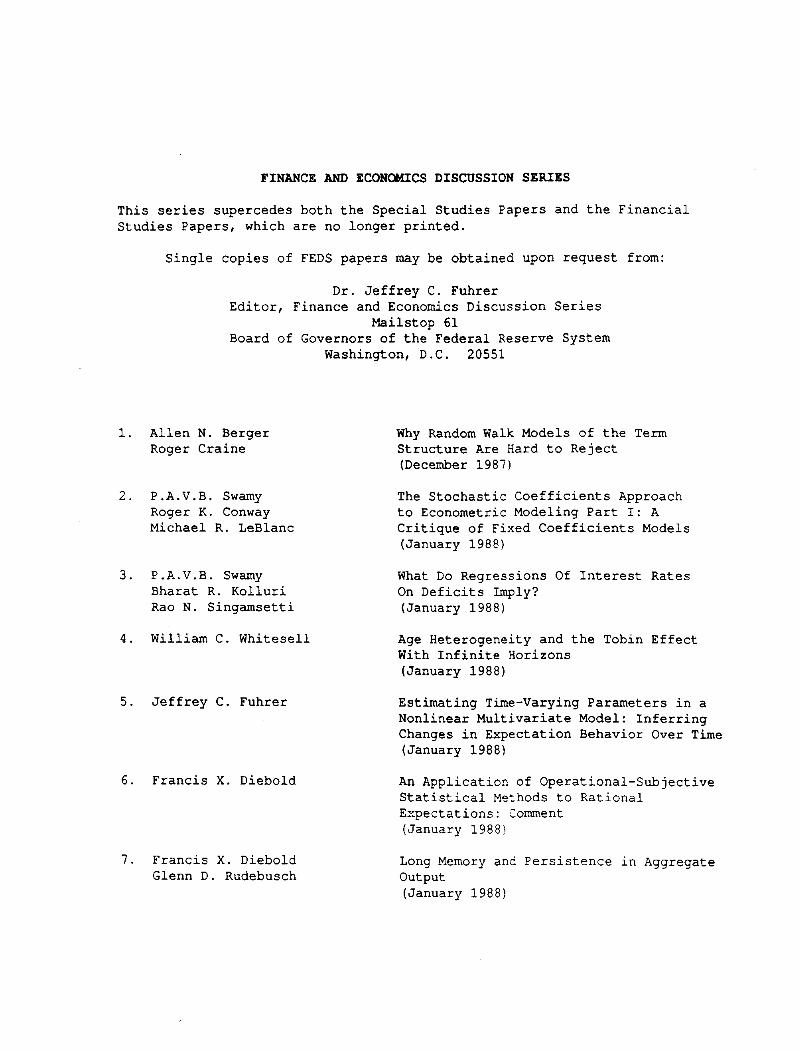
This series supercedes both the Special Studies Papers and the Financial Studies Papers, which are no longer printed.
Single copies of FEDS papers may be obtained upon request from:
Dr. Jeffrey C. Fuhrer Editor, Finance and Economics Discussion Series
Mailstop 61 Board of Governors of the Federal Reserve System
Washington, D.C. 20551
1. Allen N. Berger Roger Craine
2. P.A.V.B. Swamy Roger K. Conway Michael R. LeBlanc
3. P.A.V.B. Swamy Bharat R. Kolluri Rao N. Singamsetti
4. William C. Whitesell
5. Jeffrey C. Fuhrer
6. Francis X. Diebold
I. Francis X. Diebold Glenn D. Rudebusch
Why Random Walk Models of the Term Structure Are Hard to Reject (December 1987)
The Stochastic Coefficients Approach to Econometric Modeling Part I: A Critique of Fixed Coefficients Models (January 1988)
What Do Regressions Of Interest Rates On Deficits Imply? (January 1988)
Age Heterogeneity and the Tobin Effect With Infinite Horizons (January 1988)
Estimating Time-Varying Parameters in a Nonlinear Multivariate Model: Inferring Changes in Expectation Behavior Over Time (January 1988)
An Application of Operational-Subjective Statistical Methods to Rational Expectations: Comment (January 1988)
Long Memory ant Persistence in Aggregate output (January 1988)

I
-2-
8. Francis X. Diebold Steven A. Sharpe
9. Francis X. Diebold
10. Mark J. Warshawsky
11. James M. Nason
12. David D. VanHoose
13. David D. VanHoose
14. David D. VanHoose
15. P.A.V.B. Swamy George S. Tavlas
16. Kathleen A. Kuester
17. Richard J. Rosen
18. P.A.V.B. Swamy Peter von zur Muehlen
19. Francis X. Diebold
Post-Deregulation Deposit Rate Pricing: The Multivariate Dynamics (February 1988)
State Space Modeling of Time Series: A Review Essay (February 1988)
Aggregate Debt and Wealth: The Significance of the Bequest Motive (February 1988)
The Equity Premium and Time-Varying Risk Behavior (February 1988)
Discount Rate Policy and Alternative Federal Reserve Operating Procedures in a Rational Expectations Setting (February 1988)
Floating Rate Loan Contracts and Monetary Policy (February 1988)
Combination Monetary Policies in a Disaggregated Economy With Endogenous Wage Indexation (February 1988)
Modeling Buffer Stock Money -- An Appraisal (February 1988)
Asymptotic Consistency and Normality of Least Absolute Deviations Applied to Seemingly Unrelated Regression Systems (February 1988)
Research and Development with Asymmetric Firm Sizes (February 1988)
On a Problem in Identifying Linear Parametric Models (March 1988)
On the Solution of Dynamic Linear Rational Expectations Models (March 1988)

-3-
20. Richard J. Rosen Peter LLoyd-Davies Myron L. Kwast David B. Humphrey
21. David D. Van Hoose Christopher J. Waller
22. David D. Van Hoose
23. Allen N. Berger Timothy H. Hannan
24. Carol Corrado Jane Haltmaier
25. Jeffrey C. Fuhrer Mark A. Hooker
26. Sally M. Davies
21. Steven A. Sharpe
28. P.A.V.B. Swamy Peter von zur Muehlen
29. Sanders D. Korenman David Neumark
30. P.A.V.B. Swamy Roger K. Conway Michael R. Leblanc
31. Jeffrey C. Fuhrer
New Banking Powers: A Portfolio Analysis of Bank Investment in Real Estate (March 1988)
Optimal Monetary Policy and Alternative Wage Indexation Schemes in a Model With Interest-Sensitive Labor Supply (March 1988)
Price Smoothing, Intermediate Monetary Targeting, and Price Level Non-Trend- Stationarity (April 1988)
The Price-Concentration Relationship in Banking (April 1988)
The Use of High-Frequency Data in Model-Based Forecasting at the Federal Reserve Board (April 1988)
Learning About Monetary Regime Shifts in an Overlapping Wage Contract Model (April 1988)
Dynamic Price Competition and the Theory of Contestable Markets (April 1988)
A Theory Of Credit Rationing and the Maturity Structure of Debt (October 1988)
On A Problem in Identifying Linear Parametric Models (April 1988)
Does Marriage Really Make Men More Productive? (May 1988)
The Stochastic Coefficients Appproach to Econometric Modeling, Part II: Description and Motivation (June 1988)
"Animal Spirits" in Consumer Expectations: Filtering the Information

-4-
32. McKinley Blackburn David Neumark
33. Mark French
34. Allen N. Berger David B. Humphrey
35. Robert B. Avery Allen N. Berger
36. Robert B. Avery Allen N. Berger
31. J. Michael Woolley
38. Neil B. Murphy
39. Lawrence M. Benveniste Paul A. Spindt
40. Francis X. Diebold Glenn D. Rudebusch
in Consumer Survey Expectations (June 1988)
Efficiency Wages, Inter-Industry Wage Differentials, And The Returns To Ability (June 1988)
Efficiency and Equity of a Gasoline Tax Increase (July 1988)
Market Failure and Resource Use: Economic Incentives to use Different Payment Instruments (July 1988)
Risk-Based Capital and Off-Balance Sheet Activities (August 1988)
Replaced by FEDS #36.
Imperfect Information, Adverse Selection, and Interest Rate Sluggishness in the Pricing of Bank Credit Cards (September 1988)
Determinants of Household Check Writing: The impacts of the Use of Electronic Banking Services and Alternative Pricing of Checking Services (August 1988)
Bringing New Issues to Market: A Theory of Underwriting (August 1988)
Ex Ante Turning Point Forecasting with the Compcsite Leading Index (October 1988)

-5-
41. Francis X. Diebold
42. Francis X. Diebold Jong Im C. Jevons Lee
43. David D. VanHoose
44. John V. Duca David D. VanHoose
45. C.W.J. Granger Jeff Hallman
46. P.A.V.B. Swamy Roger K. Conway Michael R. LeBlanc
47. John V. Duca David D. VanHoose
48. William C. Whitesell
49. Francis X. Diebold Marc Nerlove
50. David Neumark P.A. Tinsley Suzanne Tosini
51. Allen N.Berger Gregory F. Udell
Random Walks Versus Fractional Integration: Power Comparisons of Scalar and Joint Tests of the Variance-Time Function (October 1988)
Conditional Heteroskedasticity in the Market Model (September 1988)
Borrowed Reserves Targeting and Nominal Income Smoothing (August 1988)
Loan Commitments and Optimal Monetary Policy (August 1988)
The Algebra of I(1) (November 1988)
The Stochastic Coefficients Approach to Econometric Modeling, Part III: Estimation, Stability Testing, and Prediction (November 1988)
Wage Indexation in a Multisector Economy (November 1988)
Deposit Pricing, Bank Market Structure, and Welfare with Cost-Minimizing Consumers (November 1988)
Unit Roots in Economic Time Series: A Selective Survey (November 1988)
After-Hours Stock Prices and Post-Crash Hangovers (November 1988)
Collateral, Loan Quality, and Bank Risk (December 1988)

-6-
52.
53.
54.
55.
56.
57.
58.
59.
60.
61.
62.
63.
64.
65.
David Neumark Steven A. Sharpe
Paul H. Kupiec
Paul A. Spindt Richard W. Stolz
P.A.V.B. Swamy George S. Tavlas
Jane T. Haltmaier
Francis X. Diebold Glenn D. Rudebusch
Mark J. Warshawsky
Allen N. Berger Timothy H. Hannan
Gregory E. Elliehausen Edward C. Lawrence
Matthew D. Gelfand David E. Lindsey
Paul H. Kupiec
Timothy H. Hannan
Timothy H. Hannan John D. Wolken
Robert B. Avery Allen N. Berger
Market Structure and the Nature of Price Rigidity: Evidence from the Market for Consumer Deposits (January 1989)
Initial Margin Requirements and Stock Returns Volatility: Another Look (February 1989)
Underpricing of Seasoned Issues: The Case of U.S. Treasury Bills (April 1989)
Forecasting Australian Monetary Aggregates (April 1989)
The Use of Survey Data in Forecasting Business Fixed Investment (April 1989)
IS Consumption Too Smooth? Long Memory and the Deaton Paradox. (April 1989)
The Adequacy of Funding of Private Defined Benefit Pension Plans. (April 1989)
Price Rigidity and Market Structure: Theory and Evidence from the Banking Industry (April 1989)
Discrimination in Consumer Lending (April 1989)
The Simple Microanalytics of Payments System Risk (April 1989)
A Survey of Exchange-Traded Basket Instruments (April 1989)
The Impact of Bank Regulatory Requirements on Large Corporate Lending (April 1989)
Returns to Bidders and Targets in the Acquisition Process: Evidence from the Banking Industry (April 1989)
Loan Commitments and Bank Risk Exposure (Revision of FEDS 136;

-l-
March 1989)
66. Jean Helwege
67. Kathleen A. Kuester James M. O'Brien
68. J. Nellie Liang John D. Wolken
69. Paul H. Kupiec
70. Steven A. Sharpe
71. Steven A. Sharpe
12. David A. Pierce Laura L. Bauer
13. Timothy H. Hannan John M. McDowell
74. Dean F. Amel J. Nellie Liang
15. Reva Krieger
76. Mark J. Warshawsky
11. P.A.V.B. Swamy Leonard A. Lupo John D. Sneed
78. Martin H. Wolfson
79. James E. Kennedy
Capital Structure, Bankruptcy costs, and Firm-Specific Human Capital (April 1989)
Bank Equity Values, Bank Risk, and the Implied Market Values of Banks' Assets and Liabilities (April 1989)
Systematic Risk, Market Structure and Entry Barriers (May 1989)
Microeconomic Sources of Beta Risk Instability (May 1989)
Asymmetric Information, Bank Lending, and Implicit Contracts: A Stylized Model of Customer Relationships (May 1989)
A Theory of Credit Rationing and the Maturity Structure of Debt (May 1989)
Tolerance-Width Groupings for Editing Banking Deposits Data: An Analysis of Variance of Variances (May 1989)
The Impact of Technology Adoption on Market Structure (May 1989)
. Dynamics of Market Concentration (June 1989)
Sectoral and Aggregate Shocks to Industrial Output in Germany, Japan, and Canada (June 1989)
Postretirement Health Benefit Plans: Costs and Liabilities for Private Employers (June 1989)
Coherent Methods of Estimating Technical Progress (June 1989)
The Causes of Financial Instability (June 1989)
The Effect of Bayesian Priors on the

80. Francis X. Diebold
81. Francis X. Diebold
82. Takeo Hoshi, Anil Corporate Structure, Liquidity and Kashyap, and David Investment: Evidence from Japanese Scharfstein Industrial Groups
83. Timothy H. Hannan
84. Sarah A. Hooker John F. Wilson
85. Allen N. Berger Kathleen A. Kuester James M. O'Brien
86. Takeo Hoshi Anil Kashyap David Scharfstein
87. Dean Amel Do Firms Differ Much? Luke Froeb (August 1989)
88. Robert A. Eisenbeis Myron L. Kwast
89.
90.
91.
92.
Jeffrey C. Fuhrer George R. Moore
Francis X. Diebold Glenn D. Rudebusch
Paul H. Kupiec Animal Spirits, Margin Requirements and Steve A. Sharpe Stock Price Volatility (Sept. 1989)
Reva F. Krieger
-8-
Moving-Average Representation of Vector Autoregressions (June 1989)
Forecast Combination and Encompassing: Reconciling Two Divergent Literatures (June 1989)
Nonparametric Exchange Rate Prediction? (June 1989)
Foundations of the Structure-Conduct- Performance Paradigm in Banking (June 1989)
A Reconciliation of Flow of Funds and Commerce Department Statistics on U.S. International Transactions and Foreign Investment Position (August 1989)
Some Red Flags Concerning Market Value Accounting (August 1989)
Bank Monitoring and Investment: Evidence from the Changing Structure of Japanese Corporate Banking Relationships (August 1989)
Are Real Estate Specializing Depositories Viable? The Evidence From Commercial Banks (August 1989)
Monetary Policy Rules and the Indicator Properties of Asset Prices (August 1989)
Forecasting Output with the Composite , Leading Inde::: An E:r Ante Analysis (Sept. 1989)
Real Exchange Rates, Sectoral Shifts, and Aggregate Unemployment (Sept. 1989)
. I

-9-
93. Brenda G. Cox The National Survey of Small Business Gregory E. Elliehausen Finances: Description and Preliminary John D. Wolken Evaluation (November 1989)
94. Jeffrey C. Fuhrer The Stability of Wicksell's Monetary George R. Moore Policy Rule (November 1989)
95. Paul H. Kupiec Futures Margins and Stock Price Volatility: Is There Any Link? (November 1989)
Copyright © 2022 FDOKUMEN