An Insider's Guide to How US University Finances Really Work
488
ANDREW C. COMRIE Like Nobody’s Business An Insider’s Guide to How US University Finances Really Work
-
Upload
khangminh22 -
Category
Documents
-
view
0 -
download
0
Transcript of An Insider's Guide to How US University Finances Really Work

www.openbookpublishers.com
ANDREW C. COMRIE
Like Nobody’s Business is a remarkable piece of work. The book describes all aspects of the enormously complicated business of higher educati on in terms of the fl ow and uti lizati on of resources—human but predominantly fi nancial. In doing so, the author addresses all the issues that are perennially discussed and contested in the popular media, in both governmental and nongovernmental policy forums, and in academic studies. This book simply provides a wealth of informati on on topics large and small, but especially on the chief foci of policy and controversy in American higher educati on.
— Roger Lewis Geiger, dis� nguished professor of educa� on at Pennsylvania State University
How do university fi nances really work?
From fl agship public research universi� es to small, private liberal arts colleges, there are few aspects of these ins� tu� ons associated with more confusion, myths or lack of understanding than how they fund themselves and func� on in the business of higher educa� on. Using simple, approachable explana� ons supported by clear illustra� ons, this book takes the reader on an engaging and enlightening tour of how the money fl ows. How does the university really pay for itself? Why do tui� on and fees rise so fast? Why do universi� es lose money on research? Do most dona� ons go to athle� cs?
Grounded in hard data, original analyses, and the prac� cal experience of a seasoned administrator, this book provides refreshingly clear answers and comprehensive insights for anyone on or off campus who is interested in the business of the university: how it earns its money, how it spends it, and how it all works.
As with all Open Book publica� ons, this en� re book is available to read for free on the publisher’s website. Printed and digital edi� ons, together with supplementary digital material, can also be found at www.openbookpublishers.com
Cover image: Photo by Tim Mossholder on Unsplash at htt ps://unsplash.com/photos/GmvH5v9l3K4Cover design: Anna Gatti
Like Nobody’s Business
AN
DREW
C. C
OM
RIE Like N
obody’s Busin
ess
OBP
An Insider’s Guide to How US University Finances Really Work
ANDREW C. COMRIE
Like Nobody’s Business
An Insider’s Guide to HowUS University Finances
Really WorkOPENACCESS
ebookebook and OA edi� ons
also available

LIKE NOBODY’S BUSINESS


Like Nobody’s Business
An Insider’s Guide to How US University Finances Really Work
Andrew C. Comrie

https://www.openbookpublishers.com
© 2021 Andrew C. Comrie
This work is licensed under a Creative Commons Attribution 4.0 International license (CC BY 4.0). This license allows you to share, copy, distribute and transmit the text; to adapt the text and to make commercial use of the text providing attribution is made to the authors (but not in any way that suggests that they endorse you or your use of the work). Attribution should include the following information:
Andrew C. Comrie, Like Nobody’s Business: An Insider’s Guide to How US University Finances Really Work. Cambridge, UK: Open Book Publishers, 2021, https://doi.org/10.11647/OBP.0240
Copyright and permissions for the reuse of many of the images included in this publication differ from the above. This information is provided in the captions and in the list of illustrations
In order to access detailed and updated information on the license, please visit, https://doi.org/10.11647/OBP.0240#copyright
Further details about CC BY licenses are available at https://creativecommons.org/licenses/by/4.0/
All external links were active at the time of publication unless otherwise stated and have been archived via the Internet Archive Wayback Machine at https://archive.org/web
Updated digital material and resources associated with this volume are available at https://doi.org/10.11647/OBP.0240#resources
Every effort has been made to identify and contact copyright holders and any omission or error will be corrected if notification is made to the publisher.
ISBN Paperback: 9781800641075ISBN Hardback: 9781800641082ISBN Digital (PDF): 9781800641099ISBN Digital ebook (epub): 9781800641105ISBN Digital ebook (mobi): 9781800641112ISBN XML: 9781800641129DOI: 10.11647/OBP.0240
Cover image: Photo by Tim Mossholder on Unsplash at https://unsplash.com/photos/GmvH5v9l3K4Cover design: Anna Gatti

To Lee


Contents
1. Introduction 11.1 Preface 11.2 Structure 71.3 Budgets don’t make decisions, people do 91.4 Notes on data 9
2. Institutional Revenues 132.1 How big is the university budget? 132.2 How big is the university by enrollment size and growth? 162.3 Are budgets growing or shrinking over time? 202.4 Where does the revenue come from? 212.5 How does the revenue mix differ by type of institution? 232.6 How much is tuition? 252.7 How fast has tuition increased, and why? 262.8 What is included in tuition and fee revenue? 272.9 How much revenue do institutions receive per student? 282.10 What are the trends in per-student revenues? 312.11 Why isn’t all revenue treated the same way? 322.12 Why worry about state appropriations and investment income if
tuition dominates?34
2.13 What is the revenue significance of out-of-state and international students?
35
3. Institutional Expenditures 393.1 Where does all the money go? 393.2 How does investment in major functions differ by type of
institution?41
3.3 What do institutions spend per student? 433.4 What are the trends in per-student spending? 443.5 What share of costs are covered by tuition versus subsidy? 453.6 Do out-of-state students subsidize in-state students? 473.7 Why do higher education costs rise so much? 503.8 What can be done to control costs in higher education? 543.9 Does the university make a profit? 56

Like Nobody's Businessviii
4. Public Funding: Grant Aid, Loans and Appropriations 594.1 How does public funding for higher education work? 594.2 How does aid add up on a per-student basis? 614.3 What proportion of students get state aid, and how much do they
get?64
4.4 How does public financial aid vary by institution? 654.5 What are the amounts and trends in student loans? 694.6 What is the history of state investment in higher education? 734.7 How have state appropriations changed by type of institution? 784.8 How much does each state spend per student? 804.9 Where has state spending gone instead of higher education? 824.10 When did tuition revenue overtake state revenue? 834.11 Do state funding cuts increase tuition? 854.12 Does performance funding work? 864.13 Can’t we simply privatize a public university? 874.14 How are universities funded in other countries? 90
5. Human Resources 935.1 What is the organizational structure? 935.2 How many employees are there? 955.3 How much are employees paid? 975.4 What is the size of the faculty? 985.5 How has faculty composition changed by rank? 1015.6 What is the proportion of part-time faculty members? 1035.7 How much do the faculty earn? 1055.8 What are the types of support staff and their salaries? 1085.9 Is administrative bloat a myth? 1105.10 How do we account for graduate assistants? 1125.11 How much do graduate assistants earn? 1135.12 How much are employee fringe benefits and costs? 115
6. Academic Affairs 1196.1 What does a college budget include? 1196.2 What is RCM or activity-based budgeting? 1236.3 What is the cost of producing a degree? 1266.4 How does the cost of degree production vary by discipline? 1276.5 Do the humanities cross-subsidize the STEM fields? 1286.6 How have popular majors shifted over time? 1306.7 What does it cost to run a graduate program? 1336.8 How much do the faculty earn by discipline? 1356.9 What are the financial implications of tenure? 1366.10 How do we account for faculty time and workload distribution? 1406.11 What is happening in online higher education? 1436.12 What is the budget role of international programs? 151

Contents ix
6.13 What are the trends in library expenditures? 1566.14 How much do we spend on information technology? 159
7. Student Affairs 1657.1 What are the numbers for recruiting and admissions? 1657.2 What are the academic and financial profiles of the incoming
class?168
7.3 How much aid are incoming students awarded by income level? 1717.4 How much aid goes to need versus merit? 1737.5 How is tuition discounting used? 1767.6 Why do students drop out and what proportion are retained? 1777.7 What are the patterns and trends in graduation rates? 1807.8 What are the trends in student services spending? 1847.9 What is the total cost of attendance with room, board, and books? 1857.10 How has affordability changed? 1897.11 How much debt do students have at graduation? 1917.12 What are the rates of student loan repayment? 1937.13 What is going on with textbook prices and spending? 195
8. Research 2018.1 What’s in the research budget, and how big is it? 2018.2 What are the trends in research expenditures? 2058.3 What is the research funding mix by discipline? 2088.4 Why do universities lose money on research? 2108.5 Which are costlier to support, graduate assistants or postdocs? 2148.6 How much does research compliance cost? 2168.7 How does the university earn money from technology transfer? 218
9. Public Service, Cooperative Extension, and Community Engagement 2239.1 Where’s the land grant money, and how does it fund cooperative
extension?223
9.2 What is the business model for performing arts centers? 2279.3 How are university museums paid for? 2309.4 How is a university press supported? 234
10. Facilities & Finance 24110.1 What do campus buildings cost? 24110.2 What are the trends in campus construction and deferred
maintenance?243
10.3 How much is the university’s “mortgage” and debt payment? 24510.4 How much is the campus energy and utility bill? 24810.5 Does the university have a rainy-day fund? 24910.6 Why isn’t parking free? 25210.7 Do public-private partnerships and outsourcing save money? 253

Like Nobody's Businessx
11. Health Sciences, Hospitals & Medical Schools 25711.1 How do hospital budgets compare to main campus budgets? 25711.2 How are medical schools funded? 25911.3 How much are medical school faculty salaries? 26211.4 What is the mix of health science research funding? 265
12. Athletics 26912.1 How big is the business of college sports? 26912.2 How important are subsidies and media revenues in athletics? 27412.3 Is the number of student athletes increasing? 27612.4 What are the trends in athletics spending and where does the
money go?278
12.5 Which sports make or lose money? 28012.6 Do all head coaches earn millions? 28212.7 Does athletic success benefit the university’s bottom line? 284
13. Fundraising 28713.1 How much do universities raise in gifts? 28713.2 Who is giving, and what are they supporting? 29013.3 How big are endowments and how much have they grown? 29313.4 How does a university endowment work? 29913.5 Are fossil fuel divestment and socially responsible investing
financially viable?303
13.6 How does the business of university fundraising work? 30713.7 What role do alumni donors and associations fill in fundraising? 313
14. Outcomes & Futures 31714.1 What are the financial benefits of a degree? 31714.2 Do university rankings have a financial impact? 32314.3 What is the economic impact of a university? 32914.4 Our business model: what is it and how do we manage it? 33214.5 Which schools are most at risk for closing, especially with
COVID-19?336
14.6 What are the long-term financial futures for higher education? 341

Contents xi
Epilogue 349Acknowledgements 351About the Author 357Appendices 359
Appendix A: Institutions in the Data Set 359Appendix B: Land Grant Institutions 390
References 395Figures 429Box Figures 449Tables 453Boxes 455Index 457


1. Introduction
1.1 Preface
Universities are fascinating institutions. For almost 1,000 years, these corporations of teachers and scholars have been searching for knowledge and transmitting it. In carrying out this mission, universities are “things of unruly paradox”1 that operate as the birthplace and battlefield of ideas, constantly enlightening, challenging, solving, confounding, serving, criticizing, creating, reasoning, and frustrating both themselves and their stakeholders. And yet, focusing on my initial term above, universities are corporations too. In fact, universitas, the Latin root of the word, literally means “corporation” as in a company or guild.2 It’s odd, then, as institutions built on the very notion of knowing, that the people in and associated with universities know so little about them as corporations in the business-oriented sense of the word. That’s the charge I’m taking on in this book: to explain how the business of the university works, to provide a grounding in what people want to know and ought to know about how money really flows in and around these vital institutions.
Contemporary universities are part of a global higher education enterprise that has seen unprecedented expansion for decades, growing and succeeding, as the idiom says, like nobody’s business. The breadth and complexity of how universities are funded and operated make them, in a managerial and practical sense, utterly unlike any other business either. Nowhere are these observations truer than for universities in the US. During the twentieth century individual states invested in their higher education systems, sometimes more and sometimes less, while elite private universities continued to flourish. Simultaneously, the GI Bill, Pell Grant program and unprecedented research investments at the federal level propelled US higher education into a position of world leadership. These factors, along with the significant
1 Ben Johnson, a past Chair of Emory University’s Board of Trustees, coined this redolent term when he said, “A great university is a thing of unruly paradox. It is a place of tranquil reflection and a testing place and indeed a battleground of outrageous ideas… It requires stability, yet is a catalyst for change. It teaches respect for boundaries, yet encourages pushing those boundaries. It is a place of self-conscious egalitarianism, yet a place of studied rank. It trains for the sacred, as well as the secular. It gleans from the past, to prepare for the future.” (Williams 2013)
2 The full Latin phrase describing an academic corporation is universitas magistrorum et scholarium, a “guild of masters and scholars” that had collective legal rights guaranteed by charter, was self-regulating, and determined the qualifications of its members (Wikipedia 2019b).
© Andrew C. Comrie, CC BY 4.0 https://doi.org/10.11647/OBP.0240.01

Like Nobody's Business2
absence of unifying central control by a national ministry of education (unlike many other countries), produced a large, diverse system of universities and colleges and, importantly, an intensely competitive academic marketplace in which they function. US universities are constantly competing for students, for faculty, for facilities, and for the resources to support them and further fuel their success, and generally do so as nonprofits in a business environment like no other. And, US universities have graduated, like no other, tens of millions of people, redefining the middle class to such an extent that a college degree has replaced a high school diploma as the ticket to career success. Finally, add to all this our cultural embrace of universities, their simultaneously elitist and egalitarian aims, their parts in the concurrent pursuit of individualistic American dreams and civic Jeffersonian ideals, their uneasily parallel functions as engines of both social reproduction and of social change, their depictions in movies and novels as variously idyllic or sophomoric, the unique role of college sports, the considerable financial support by alumni and donors, and our obsession with ranking them. In both senses of the phrase then—of a lot happening and of being unlike any other—it’s no wonder that the responsibility of running a US university has grown like nobody’s business.
There are three broad aspects of running (i.e., administrating) a university: (1) supporting the academic mission through teaching and research programs involving primarily the faculty and students, as well as outreach/community engagement; (2) leading and managing the people, as in any enterprise, and including here the extensive specialized faculty and staff, administrators, and other employees of the institution; and (3) generating and managing the money that pays for it all, from revenue generation to expense allocation, including budgeting, accounting, finance and, increasingly, the nature of the business model. For the faculty, staff, students, alumni, and community members, of these three broad aspects, arguably none is associated with more mystery, confusion, myth or general lack of understanding than the third: money, and the business of the university, the corporation, that it represents.
A significant part of the university spends its time worrying about the first point, academics, especially those in the departments, schools, colleges, centers and institutes. Because the academic mission is the raison d’être of the university, how the academic part of the university works is generally well-understood by those who labor in it. Regarding the second point, people: although the faculty generally eschews issues of administration and management, non-academic employees are typically in the majority by a substantial margin—leading and managing people is something that many of them do every day. Furthermore, while there is always room for more to be written and learned about the practical science and elusive art of leading and managing people, especially in academia, there is nonetheless a significant literature already established on how to do so.
Yet the third point, money, is at best only partially understood by the vast majority of those who work on or with a campus. The sheer range and complexity of university

1. Introduction 3
finances, when combined with the limited number of people on a campus with the expertise and institution-wide perspective to explain them means that, despite its vital role for the successful operation of the institution, this aspect of how a university works is poorly understood by many who need to know it better. Worse yet, there are serious misunderstandings and oversimplifications of university funding that are commonly held, both on campus and off, and which can lead to poorly-informed decisions and detrimental outcomes.
I’m not entirely sure why the ins and outs of university funding have ended up as such a mysterious topic, with connotations of secrets shared only by those in the know, but I hypothesize that it is the result of at least a few factors: university finances are inherently complicated; revenues have diversified faster than the general understanding thereof; and, administration has historically been a distraction from (and anathema to) academic pursuits. Taking each factor in turn, universities are complicated institutions and their finances reflect this fact.3 Ironically, public university budgets in all their detail are in fact public, but they are opaque to lay readers because of the necessary technical complexity required to appropriately reflect proper financial rules and institutional accounting practices. Next, university revenue has become far more diverse since the days of direct appropriations that covered most core costs. In public institutions, recent decades have seen a growth in fundraising that is starting to rival the privates, tuition is now a major revenue source, research funding is far larger from both government and private industry, and states have become minority shareholders in terms of the proportion of public university budgets that they fund. Tending to each source requires specialized expertise and experience beyond the realm of most university citizens. Furthermore, there is a longstanding social convention that faculty members don’t need or want to be distracted from their scholarly pursuits by the details of administration, which includes the realities of funding flows. Indeed, the role of administrator is often a derogatory stereotype, and faculty who take on administrative roles are half-jokingly said to have crossed over to “the dark side.” Likewise, some administrators can be tone deaf to faculty concerns. Much of that culture is understandable, if not constructive, and the blame for this state of affairs, as well as the responsibility to fix it, falls squarely on both sides. Still, an unfortunate side-effect of the oversimplified us-versus-them attitude is a naïve and sometimes misleading understanding of how the institution operates financially.
I can recall times as a junior faculty member when a senior colleague would opine that we were “paid to think” by society, sometimes with the added implication that teaching undergraduates was a necessary irritation. For most universities in the US, to the extent that such a self-absorbed view was ever even partially true, those days
3 William McRaven, a decorated military commander who served as chancellor of the University of Texas system, described the position of university president as “the toughest job in the nation” (Thomason 2018) because of the multifaceted competing political and financial challenges of running such a complicated organization.

Like Nobody's Business4
are long gone.4 While the end of the era of more-or-less full public funding for US higher education is still bemoaned by many on campus, it doesn’t alter the fact that the halcyon days of public funding for higher education began to recede as long ago as the 1970s and 1980s. This trend accelerated in the 1990s and became a stark reality with the Great Recession that arrived in late 2008. A business model based on increasing privatization and neoliberal precepts is simply the fact of life for a contemporary US campus, reflecting a substantial shift in higher education from a public good to a private good. While I personally don’t condone this shift, I am nonetheless a pragmatist: it is hard to argue against the reality that the success of a contemporary US university relies on it being able to function well in this economic environment.
Therefore, whether those of us in higher education like this situation or not,5 it is worth understanding how university funding works within institutions and across the higher education landscape. For example, at the microeconomic level, and as colleagues serving students and wanting to advance the university, it is essential that we better understand how and why we might increase funding for a program or initiative, or how we provide the necessary support services, or what the financial and academic trade-offs are among different approaches to delivering on the university’s academic mission. Further examples, at the macroeconomic level, include dealing with changes in college-going rates, federal funding, and the growth of online education. Perhaps because of the diversity of funding flows across a university, and how they intertwine to make these great institutions run, learning how it all works can be extremely valuable for many campus stakeholders. After all, as responsible members of the university community we should know how our institution works so that we can better enable the effective pursuit of knowledge and learning. This need has been made even more essential by the economic and financial effects of the COVID-19 pandemic on higher education.
This book is not a conventional text on higher education budgeting, finance or accounting, and I didn’t write it as a published scholarly expert on university funding—any expertise I have was learned on the job. There are some useful books out there that are by recognized scholars and/or are technical texts (Massy 2003; Weisbrod et al. 2008; Archibald and Feldman 2011; Kretovics 2011; Lombardi 2013; Serna and
4 Clark Kerr, who was chancellor of UC Berkeley and then president of the University of California system during the boom years of the 1950s and 1960s, captured this tension with a metaphor (Moore et al. 2013), “The cherished view of some academics that higher education started out on the Acropolis of scholarship and was desecrated by descent into the Agora of materialistic pursuits led by ungodly commercial interests and scheming public officials and venal academic leaders is just not true for the university systems that have developed at least since 1200 A.D. If anything, higher education started in the Agora, the market place, at the bottom of the hill and ascended to the Acropolis on top of the hill… Mostly it has lived in tension, at one and the same time at the bottom of the hill, at the top of the hill, and on many paths in between.”
5 In a recent essay, Adam Daniel and Chad Wellmon (2018) argue that higher education’s insatiable appetite for acquiring more roles and complexity will be its undoing. They coin the term “omniversity” to replace Clark Kerr’s “multiversity” and contend that the university’s varied commitments are pulling it apart.

1. Introduction 5
Weiler 2016; Barr and McClellan 2018; D.O. Smith 2019). There are also some excellent recent volumes that are broader in scope and that touch on selected topics in this book (Bok 2013; Clotfelter 2017; Brint 2019; Geiger 2019). All of the above are valuable references for the eager reader. My aim with this book is slightly different: I would like it to serve the kind of reader who is interested in getting a grasp of the essentials of university funding in an approachable form, one that can engage a relative novice while also informing those readers with more background knowledge, and to do so comprehensively with a heavy emphasis on data and visuals. Thus, my intended audience is broad and includes administrators, faculty, staff and students on campus as well as alumni, parents, fans, community members, the media, board members, policy makers and others who deal with higher education. While it can certainly be read from start to finish, this book is designed so that the reader can “dip in” to a specific topic of interest in modular form. I have written the book I wish I’d had when I first had to discover how money flows in a university, i.e., as a non-expert faculty member who became an administrator and had to figure it out bit by bit. Since then, in countless budget presentations I’ve made as a central administrator, I have learned that most stakeholders in the university community are eager to learn how the money works to enable the successful functioning of the institution and their part thereof. As the questions flow in those talks, as they inevitably do, many in the audience are fascinated as the shrouds of mystery are removed, prompting even more queries and explanations. I’ve attempted to collect all those questions, asked from an everyday perspective and, in answering them, illuminate how the business of the university works and fits together.
In my experience, there is no more effective way to achieve this understanding than to use real-life facts and figures on university funding along with clear, even pithy, explanations. Better yet, if one starts with simple questions asked by many on campus, the resulting answers lead to more questions and greater engagement, developing precisely the clarity we desire. So, this book will “follow the money” or, more precisely, follow the data about how money flows in a university.6 While those flows are often complicated, and sometimes complex (there’s a difference), gaining an understanding of the basics of how money flows in a university is not hard. It just needs to be explained in everyday language with a minimum of financial and accounting jargon, exposing myth and misunderstanding with appropriate data analyses, and illustrating how things truly work with factful charts and graphics (Nyhan and Reifler 2019).
It’s easy for a financial topic to seem boring to a non-specialist, just as I have found that science can seem boring to non-scientists in my academic work. I remember a book from my kids’ childhood called The Big Book of Why (Perritano 2010) that presented
6 The phrase “follow the money” was coined in the 1976 movie All the President’s Men to describe how to get to the bottom of financial dealings in the Watergate crisis. It has since been used widely in many contexts, sometimes without the negative connotation, as a verbal shorthand to understand how a process or organization really works. It’s used in that latter sense here.

Like Nobody's Business6
science nuggets in an appealing way to children, playing off intriguing (and sometimes impolite) questions and engaging graphics. A fine example of effective communication about business and economic issues to a non-specialist audience is Marketplace on public radio (Marketplace 2020)—it is engaging, literate and entertaining, and one of my favorite shows. As a comprehensive compendium for the non-expert there is no better model than Mark Bittman’s How to Cook Everything (Bittman 1998), another personal favorite. I’ve tried to incorporate a sense of those styles in this book to explain university funding to non-specialist readers. As a result, it is an introduction, a Frequently Asked Questions (FAQ) list, a chartbook, a pictorial guide at times, a quick-start user’s handbook rather than a dense technical manual or, to use academic analogs, a summary akin to Cliffs Notes or a 101-level course on how the money works in a contemporary US university.
At one point the working title of this book was Seeing the Elephant, a reference to the ancient parable of the blind men, each touching a different part of an elephant and who, when each was asked to describe the animal he was touching, provided a completely different interpretation because he could only sense the part and not the whole. The person touching the trunk thought it might be a snake, the one touching a leg suggested a tree trunk, the one touching the tail supposed it was a rope, and so on. It’s an apt metaphor for the widespread poor or partial understanding of how contemporary US university funding works and how limited views from different stakeholders are projected onto the whole. As I learned when looking up the phrase, it also has a relevant second connotation that dates to Civil War times, meaning to have experienced action in combat, to have seen what lies over the hill, or to have overcome an adversity. In all senses I’ve certainly “seen the elephant” in my experiences as a faculty member and senior administrator—I hope to share some of those insights with you in this book.
Box 1.1. Early University FundingThe first independent universities not established by religious authorities emerged during medieval times in Europe (although the first full-fledged university-like institutions with religious affiliations were Taxila around 800 BCE and then Nalanda in 427 CE, both in what is now India, and Al-Quaraouiyine in 859 CE, in Morocco). The independence of the European universities was born in part from a desire for academic freedom, and the institutions were formed as corporations of scholars and students with an organizational structure and an elected leadership. The price of autonomy was a different funding model: tuition and fees. Initially the students contributed a donation in place of paying outright tuition because knowledge was considered to be given by God and therefore not able to be sold. Unsurprisingly, students did not always make their donations. No doubt the early bursar’s office, formal salaries, and the need for financial aid followed soon after!

1. Introduction 7
This development of independently funded institutions also marked the emergence of market forces in higher education because work conditions and the course of study had to meet expectations. Needing little or no specialized physical infrastructure, it was relatively easy for faculty or students to move to a different city and establish or join another competing institution (The Editors of Encyclopedia Britannica 2016; University of Bologna 2018). For example, the University of Padua (est. 1222) was formed by a group that split off from the University of Bologna (est. 1088). Bologna is the oldest secular university and the Latin alma mater studiorum on its seal (Figure B1) means “nourishing mother of studies” (yes, the original alma mater), while Padua can boast Galileo Galilei as a former Chair of Mathematics (1592–1610) and both Nicolaus Copernicus and Elena Cornaro Piscopia, the first woman to receive a PhD, as alumni.
Figure B1. Seals of the universities of Bologna (left) and Padua (right) including the year that each was established. Sources: University of Bologna, Image by Malinion (2016), Wikimedia, Public Domain, https://upload.wikimedia.org/wikipedia/commons/d/d0/Seal_of_the_University_of_Bologna.svg, and University of Padua, Image by OMT5500 (2017), Wikimedia, Public Domain, https://upload.wikimedia.org/wikipedia/it/5/53/
Logo_Universit%C3%A0_Padova.svg.
1.2 Structure
The business of the university can be thought of as having six major functional elements (Figure 1.1). The foundation of university funding is students, the community and broader society. Together they support the core threefold academic mission pillars of teaching, research and public service. University business is coordinated by the administration, and it is in turn overseen by external groups such as the state or trustees (that represent the foundational broader community). The hierarchy of service is

Like Nobody's Business8
primarily to students and the broader community (the principal stakeholders served by the university) and then successively to the remaining layers, which can also influence each other. The hierarchy of management is the other way around, with universities chartered and presidents appointed by states and/or a board of regents/trustees. The organizational chart proceeds down through administration to employees in the academic functions. Money flows between and within these functional elements, often in complicated ways among the academic pillars, where individual employees and units often have overlapping responsibilities across all three academic mission areas.
Figure 1.1. Schematic of the six major functional elements of the university.
As we discuss the various parts that make up these major functional elements and how they work financially, you will see this overall structure represented throughout the book. The chapters don’t all correspond directly to the six-element structure because there is more detail to the functional organization in practice (skip ahead to Figure 5.1 if you’re interested) and I thus expand upon several areas with distinct funding characteristics. Following this introductory chapter, Chapters 2 and 3 focus on institutional revenues and expenditures and Chapter 4 covers public funding, with all three of these chapters connecting to the external elements at the top of Figure 1.1, as well as the foundational student and community elements at the base. The remaining chapters deal with internal components of the university, starting with Chapter 5 on the human resources of instructional and support staff. The next four chapters move on to the mission pillars: Chapter 6 focuses on academic affairs and Chapter 7 covers associated student affairs and support services, Chapter 8 covers research activities and Chapter 9 covers public service, including extension services. We shift to facilities and finance in Chapter 10, and then we consider the somewhat different funding models of the health sciences and hospitals in Chapter 11. Athletics is the topic of Chapter 12,
STUDENTS AND COMMUNITY
EDUCA
TION
RESEAR
CH
PUBLIC SER
VICE
UNIVERSITY ADMINISTRATION
GOVERNANCE(STATE AND/OR BOARD)
HIERA
RCHY OF SERV
ICE
HIERARCH
Y OF M
ANAG
EMEN
T

1. Introduction 9
and we circle back to community again in Chapter 13 to focus on fundraising. Chapter 14 concludes the book by examining outcomes and considering the future.
1.3 Budgets don’t make decisions, people do
It’s not too early to point out something fundamental, something that is easy to forget when discussing university funding: at all times we must ensure that decisions are made first on the basis of academic and societal priorities. Budgets are unquestionably a vital component of decision-making and they can enable or constrain activity, sometimes dramatically, but it is a mistake to let budgets be the core driver of decisions. Even when there is not enough money (which is most of the time, see Bowen’s Law in Section 3.7) the decision is more that the proposed activity cannot be prioritized over other competing priorities given the available resources. We should never lose sight of human agency in making money-related decisions about the business of the university—competing priorities are assessed and assigned to deliver on the mission of the university (i.e., ultimately, even if an individual decision is a smaller one).
Expressed another way, in a nonprofit enterprise such as most universities, the “bottom line” on the balance sheet is not dollars (by definition, that is held to zero). Our threefold bottom line is comprised of students graduated, knowledge discovered, and impact on the community. Universities are social enterprises operating under business constraints while, in contrast, companies are business enterprises operating under social constraints. Companies exist to make a profit. Universities exist to make graduates, knowledge, and societal impact (see Box 3.2).
The pursuit of financial resources to support those social goods consumes a substantial amount of time and effort for many on campus. Money is, quite literally, the means by which we carry out the business of the university, albeit a tool that works for us and not the other way around.
1.4 Notes on data
As I mentioned earlier, I employ data extensively to illustrate and explain concepts throughout this book. Most of the data I present can be found in openly accessible reports, online data warehouses, and books. It is all regular stuff for those who specialize in higher education institutional finance and data analytics. However, while much of the information appears individually in those places, this wide range of data is rarely pulled together in one place to tell a comprehensive overall story such as I lay out in the coming chapters.
A quick pedantic note: data are plural. I’m trained as a scientist and I served as a journal editor, and therefore I am compelled to say, “data are” rather than “data is” or “these data” rather than “this data” and so on. Data are like staff, or the faculty, a collective noun. Technically, the singular of data is datum, but that is too fussy even for

Like Nobody's Business10
me. I prefer data point, data element, etc., just as we would say staff member or faculty member (and not “a faculty” to refer to an individual person as I’ve sometimes heard in stifled horror!).
The largest and most comprehensive publicly accessible repository of higher education data is IPEDS, the Integrated Postsecondary Education Data System, run by the US Department of Education’s National Center for Education Statistics (US Department of Education 2020b), hereafter referenced as IPEDS (2020). It is a veritable trove of information where you can find many useful summaries as well as technical details just a few clicks into the data section. I have made extensive use of IPEDS’s financial and related data in this book. Where necessary for comparison, I have used the closest corresponding categories to allow for technical accounting differences applicable to public and private institutions, and known by their acronyms, GASB and FASB, respectively (US Department of Education 2018). I’ve augmented the IPEDS data with useful information from reports, academic papers, and statistical websites, and I cite specific data sources in each case.
Inflation adjustments were made using Consumer Price Index (CPI) data from the US Bureau of Labor Statistics (2018b) to convert financial trend data to constant dollars. As a technical detail, I utilized the standard CPI-Urban values for January to reflect the midpoint of each fiscal year.
There are literally thousands of colleges and universities in the US, each with its own set of data. In many analyses it is useful to draw on the overall average or a set of group averages as the clearest way to illustrate key patterns. Thus, I have selected a large cross-section of schools with varying characteristics that represent the range of institutions in the US, essentially all of the public and private nonprofit four-year institutions in the country. My selection criteria were as follows, using IPEDS (2020):
• US only
• Title IV participating (i.e., participating in federal financial aid programs)
• Control:
◦ Public, four-year or above
◦ Private nonprofit, four-year or above (i.e., excludes two-year and for-profit institutions)
• Carnegie Classification 2015
◦ Doctoral Universities: Highest Research Activity (R1)
◦ Doctoral Universities: Higher Research Activity (R2)
◦ Doctoral Universities: Moderate Research Activity (R3)
◦ Master’s Colleges & Universities: Larger Programs (M1)
◦ Master’s Colleges & Universities: Medium Programs (M2)
◦ Master’s Colleges & Universities: Small Programs (M3)

1. Introduction 11
◦ Baccalaureate Colleges: Arts & Sciences Focus (BAS)(i.e., excludes professional schools or colleges with special focus)
• Has full-time first-time undergraduates (i.e., not graduate-only)
• Branch campuses reporting separate financial information
• Valid data for common variables and years analyzed
The resulting data set covers most universities and four-year colleges across the nation and includes 468 public and 706 private institutions, for a total of 1174 in the data set. The Carnegie Classification (Indiana University Center for Postsecondary Research 2015) provides useful categories representing academic level, size and scope. I have collapsed the smaller Carnegie institution types into one group because their financial profiles are broadly similar, producing four categories: R1, R2, R3-M3 and BAS. I have selected only nonprofit institutions to keep the scope of the book consistent and because for-profit colleges, by definition, operate under a separate suite of financial and academic conditions. The set of selected institutions is summarized in Figure 1.2 and mapped in Figure 1.3. A listing of the institutions in the data set appears in Appendix A. This set is used throughout the book where possible, in order to make comparisons consistent and easy to understand.
Figure 1.2. Number of public and private institutions in each Carnegie category of the data set used for analysis. See text for details. Source: IPEDS (2020).
80 74
294
2034 28
434
210
0
50
100
150
200
250
300
350
400
450
500
R1 R2 R3‐M3 BAS
Num
ber o
f Institutions
Public Private

Like Nobody's Business12
Figure 1.3. All 1174 universities and colleges in the data set, showing location, Carnegie Classification, and public or private control. Alaska and Hawaii are not to scale. Source: IPEDS (2020).
R1 PublicR2 PublicR3‐M3 PublicBAS PublicR1 PrivateR2 PrivateR3‐M3 PrivateBAS Private

2. Institutional Revenues
2.1 How big is the university budget?
University budgets range from a few million dollars at small colleges to several billion dollars at the largest universities (Figure 2.1). Dealing with millions of dollars is unfamiliar to most people, let alone dealing with billions. Once we examine the details throughout the book you will be far better acquainted with what makes up these numbers and hopefully find them easier to grasp. Note that these revenue numbers are not the same as university endowments, which are more commonly reported in the media; we’ll cover those in Chapter 13.
Figure 2.1. Average total institutional budget (FY2017 non-hospital revenues) for the universities and colleges in the data set, by Carnegie classification and control. Source: IPEDS (2020).
These budget numbers are simply the total of what it takes to run the business of the university in a given year. Technically, the amounts in Figure 2.1 are revenues (money coming in) and not expenditures (what was spent to cover costs), but because we are
© Andrew C. Comrie, CC BY 4.0 https://doi.org/10.11647/OBP.0240.02
$‐
$500
$1,000
$1,500
$2,000
$2,500
$3,000
$3,500
R1 Public R2 Public R3‐M3 Public BAS Public R1 Private R2 Private R3‐M3 Private BAS Private
FY20
17 Reven
ues ($ Millions)

Like Nobody's Business14
dealing with nonprofits where we allocate essentially all income to expenditures, the two amounts are similar in practice unless the institution is in dire financial straits or receives windfall income. We’ll cover expenditures in Chapter 3.
For comparative consistency, Figure 2.1 excludes hospital revenues because some universities formally include a hospital in their reported budgets. Many universities with medical schools have affiliated hospitals run as independent corporations, even if the hospital name is university-related, and those hospital finances are reported independently. Either way, academic medical school finance and administration are distinct from those of a hospital, although they are often highly dependent thereon. We’ll examine hospitals, medical schools and health sciences in Chapter 11.
It’s clear from Figure 2.1 that the nation’s major research institutions can have truly large budgets that reflect their comprehensive scope as well as their sheer size. This holds true as we look across the categories to medium universities and to baccalaureate colleges, where the latter are focused on providing an educational environment that is purposely small, undergraduate-only, and liberal arts oriented. At this level of aggregation, the distinctions between public and private institutions are not especially remarkable, but as we get into more detail in later sections we’ll see some significant differences emerge.
Institutional size and budget are closely correlated, as plotted in Figure 2.2. Across types of institution, average budgets scale in an almost perfect linear relationship with the number of employees and scale almost as well in terms of student enrollment (especially if one considers public and private institutions separately). As a quick guide, if you don’t know the size of the budget for your own institution, you can approximate it by simple comparison to similarly sized institutions in these data. All institutions publish an annual financial statement or report, and you can always find the definitive number for your school in that document. Although the size of the institutional budget enables coarse comparisons such as those above, alone it doesn’t tell us much more than size itself. The interesting parts are what accounts for those revenues and the matching expenditures. The rest of the book covers all of that and more.

2. Institutional Revenues 15
Figure 2.2. FY2017 total non-hospital revenues compared to total FTE employees (upper) and twelve-month FTE student enrollment (lower) by Carnegie classification and control.
Source: IPEDS (2020).
R1 Public
R2 Public
R3-M3 PublicBAS Public
R1 Private
R2 Private
R3-M
3 Pr
ivat
eBA
S Priv
ate
$-
$500
$1,000
$1,500
$2,000
$2,500
$3,000
$3,500
0 2,000 4,000 6,000 8,000 10,000
FY20
17 R
even
ues (
$ M
illio
ns)
FY2017 Employees (FTE)
R1 Public
R2 Public
R3-M3 PublicBAS P
ublic
R1 Private
R2 Private
R3-M3 Private
BAS P
rivat
e
$-
$500
$1,000
$1,500
$2,000
$2,500
$3,000
$3,500
0 5,000 10,000 15,000 20,000 25,000 30,000 35,000
FY20
17 R
even
ues (
$ M
illio
ns)
FY2017 Enrollment (FTE)
R1 Public
R2 Public
R3-M3 PublicBAS Public
R1 Private
R2 Private
R3-M
3 Pr
ivat
eBA
S Priv
ate
$-
$500
$1,000
$1,500
$2,000
$2,500
$3,000
$3,500
0 2,000 4,000 6,000 8,000 10,000
FY20
17 R
even
ues (
$ M
illio
ns)
FY2017 Employees (FTE)
R1 Public
R2 Public
R3-M3 PublicBAS P
ublic
R1 Private
R2 Private
R3-M3 Private
BAS P
rivat
e
$-
$500
$1,000
$1,500
$2,000
$2,500
$3,000
$3,500
0 5,000 10,000 15,000 20,000 25,000 30,000 35,000
FY20
17 R
even
ues (
$ M
illio
ns)
FY2017 Enrollment (FTE)

Like Nobody's Business16
Box 2.1. Universities in the Fortune 500?How do the larger university enterprises compare to the size of companies, just for interest’s sake, given that they are different creatures? Fortune magazine publishes an annual listing of companies by revenue. The current threshold for number 500 is ~$5.4B and for number 1000 it is ~$1.8B (Fortune 2018). As a guide, recognizable names close to number 500 are Harley Davidson and Western Union, and close to number 1000 are Tribune Media and Vail Resorts. For FY2016 data, eight of the biggest public and private US R1 universities have total revenues (including hospitals) that would put them in the Fortune 500 (Figure B2). A further 41 R1 universities would be in the Fortune 1000. Using the chart-topper, Penn, its FY2016 total revenues were $9.5B, of which $5.3B were from its hospital. Just two of these eight, NYU and Johns Hopkins, do not include hospitals in their budgets, and if we exclude hospital revenues from the others, only these would squeak into the Fortune 500 at $5.6B and $5.5B respectively, with Stanford just missing the cut at $5.1B. Taking the comparison beyond revenues, the median number of employees for companies in positions 490–500 is 10,550 people, which is somewhat smaller than the median of 17,548 for these eight schools, likely because higher education and healthcare are relatively labor-intensive sectors.
Figure B2. The eight US universities with the highest revenues in FY2016 that exceeded the Fortune 500 threshold of $5.4B. Source: IPEDS (2020).
2.2 How big is the university by enrollment size and growth?
We acknowledged the obvious importance of student enrollments in the previous section on budget size, so let’s take a closer look. Enrollment is the most commonly cited measure of university size. As a metric, it is an excellent example of how variable
$‐ $1 $2 $3 $4 $5 $6 $7 $8 $9 $10
Johns Hopkins University
Pennsylvania State University‐Main Campus
New York University
Ohio State University‐Main Campus
Stanford University
University of Michigan‐Ann Arbor
University of California‐Los Angeles
University of Pennsylvania
FY2016 Revenue ($ Billions)
Non‐Hospital Hospital

2. Institutional Revenues 17
definitions are critically important (and infuriating to the uninitiated) because the truth is that there isn’t one correct answer to the question, “how many students are at your university?” The simplest metric would appear to be total headcount—all individuals registered as students—but even that’s complicated. Consider the following non-exhaustive list that can influence the answer, in which I’ve included the IPEDS Fall enrollment definition in parentheses for context (US Department of Education 2019b):
• What if some students are doing two degrees at the same time, do we count them twice? (no);
• What about students just taking the odd class who are non-degree seeking? (yes);
• And those who are only auditing classes? (no);
• There are many part-time students, should we use full-time equivalent (FTE) numbers instead? (no);
• Do we include online students? (yes);
• Include students at the main campus only or include those at branch campuses and off-campus locations? (domestic = yes, international = no);
• What about those taking remedial courses or English as a Second Language before they take regular college courses? (yes);
• Undergraduates only or are graduate students included too? (yes, count all);
• Do we count professionals registered for continuing professional education classes? (no).
As you can see, there are dozens of permutations that each lead to a different number for the “how many students” question. Thus, the right answer is that it depends on how the number will be used. For example, in Figure 2.2 in the previous section, I used FTE enrollment because it arguably aligns better with resource-related amounts like revenue. If we were interested in student-faculty ratios then some version of headcount would be better. There are still further details (e.g., which day of the semester to use as the census day) but at this point you get the idea as to why official enrollment numbers can be simultaneously accurate and yet different for one institution at any given time.1
The IPEDS enrollment headcount definition is designed for consistency and comparison across many institutions, and it is the basic metric of institutional size, so let’s take a closer look. Figure 2.3 shows total Fall enrollment broken out for undergraduate and graduate students for two individual years that are three decades
1 Similar challenges of multiple variable definitions apply to much of the financial data we’ll be looking at too. I’ll be sure to point out where definitions might make an important difference to how we interpret the data.

Like Nobody's Business18
apart, FY1987 and FY2017. The Carnegie classification is closely tied to size, and indeed we see a steady scaling by institution type from the large R1 schools to the small baccalaureates. Public institutions have higher average enrollments than private ones, category for category, and as it happens private schools have enrollments that are roughly the size of the next smaller category of public school (i.e., R1 privates are similar in size to R2 publics, and so on down).
Figure 2.3. FY1987 and FY2017 total Fall enrollment (i.e., headcount, including part-time and full-time) of undergraduate students and graduate and first professional (e.g., JD, MD)
students, averaged by Carnegie classification and control. Source: IPEDS (2020).
Figure 2.3 also shows that the average number and proportion of graduate students differs between public and private universities, especially at R1 and R2 institutions, which the bulk of them attend. The majority of them are master’s and doctoral (PhD) students but this group also includes what are known as first professional doctor’s degrees such as those in law (JD), medicine (MD), pharmacy (PharmD), veterinary medicine (DVM) and a number of other fields. The percentage of graduate students is about 25% and 20% at R1 and R2 publics respectively, while it is over 50% and about 35% at R1 and R2 privates respectively. There are several dimensions to those differences related to revenue and funding for graduate students that we will explore in parts of Chapters 5, 6 and 7.
Enrollments have grown at virtually every type of institution over the last three decades, as illustrated by absolute numbers in Figure 2.3 and by relative growth over time in Figure 2.4. Most types of school grew their total enrollment by 30–40% over that period (a little over 1% annual growth on average). Enrollment growth was alternately faster and slower by decade: fast in the late 1980s, slow in the 1990s, faster again in
R1 Public R2 Public R3‐M3 Public BAS Public R1 Private R2 Private R3‐M3 Private BAS Private0
5,000
10,000
15,000
20,000
25,000
30,000
35,000
40,000
Total Enrollm
ent
Grad & 1st Prof FY2017
Undergraduate FY2017
Grad & 1st Prof FY1987
Undergraduate FY1987

2. Institutional Revenues 19
the 2000s, and then slower in the 2010s. Enrollment growth is counter-cyclical with economic and unemployment conditions, although not across the board at all kinds of institution or across all demographic groups (Dellas and Sakellaris 2003; Schmidt 2018; Li et al. 2019); while it is widely observed and assumed, this general tendency for people to enroll in or return to university studies during tougher economic times or vice-versa when the economy and employment are strong is just that: a tendency, and not a hard and fast rule.
Figure 2.4. Growth in total enrollment (all undergraduate, graduate and first professional students) relative to FY1987, averaged by Carnegie classification and control. The vertical bar
indicates the onset of the Great Recession. Source: IPEDS (2020).
There are three types of institution whose enrollment growth trends stand out from the others. R3-M3 private schools grew in enrollment at double the typical rate (80% over the same period, about 2% annually), disproportionately in graduate students. This sector is dominated by a handful of schools with massive growth in online enrollments (see Section 6.11). The baccalaureate colleges make up the other two atypical trends. Private baccalaureate institutions have seen flat growth rates for fifteen or so years, while the small number of public baccalaureate schools have had declining growth over that period and have actually shrunk in absolute size by about 10% since the Great Recession.
As with basic budget sizes, basic enrollment numbers don’t tell us much more than size itself. Again, the interesting parts are what accounts for these enrollment patterns and what they mean for the business of the university. There’s plenty of that to come in the rest of the book, but for now we return to budgets.
0.9
1.0
1.1
1.2
1.3
1.4
1.5
1.6
1.7
1.8
1.9
Total Enrollm
ent G
rowth
R1 Public R2 Public R3‐M3 Public BAS PublicR1 Private R2 Private R3‐M3 Private BAS Private

Like Nobody's Business20
2.3 Are budgets growing or shrinking over time?
Budgets at four-year colleges and universities have grown steadily over time. Figure 2.5 illustrates how revenues have generally increased with occasional brief periods of decline during economic downturns. The effects of the Great Recession on revenues are especially noticeable in FY2009. Notice also that revenues tend to fluctuate more than expenditures although the trend is essentially the same for both—we’ll cover more detail on expenditures in Chapter 3. Even with economic fluctuations the broad increasing trend has been present for many decades (see Chapter 4).
Figure 2.5. Trends in revenues and expenses (current dollars not adjusted for inflation or enrollment) by fiscal year averaged across the four public and private institution types. The vertical
bar indicates the onset of the Great Recession. Source: IPEDS (2020).
The trend is sufficiently steep (4.4% per year for publics and 4.2% per year for privates in Figure 2.5) that it is twice the 2% general rate of inflation for this period (US Bureau of Labor Statistics 2018a), with the result that institutional budgets have essentially doubled over these fifteen years.2 For those of us that have worked on campuses since the early 2000s, it certainly doesn’t feel like our institutions now have twice as much money as we did back then—but despite the cognitive dissonance of this trend against the lived experience of multiple budget cuts, the data don’t lie! The brief and absolutely crucial explanation is that these trends are not adjusted for inflation or for increasing enrollments that together account for almost all of the trend (skip ahead to Section
2 Although they are beyond our scope here, it is interesting to note for context that recent revenue trends have been flat at four-year for-profit institutions. Furthermore, at two-year institutions, recent revenue trends prior to the pandemic were mixed across type: flat at publics, rising at privates, and falling at for-profits.
$‐
$100
$200
$300
$400
$500
$600
$700
$800
$900
$1,000
2002 2003 2004 2005 2006 2007 2008 2009 2010 2011 2012 2013 2014 2015 2016 2017
Amou
nt ($
Millions, not adjusted for inflatio
n)
Revenues (Public)Expenditures (Public)Revenues (Private)Expenditures (Private)

2. Institutional Revenues 21
2.10 to see how the adjusted revenue trends are essentially flat). Also, underlying costs have also been rising inexorably (we’ll see much more on these topics when we cover expenditures in Chapter 3 and public funding in Chapter 4).
You may be wondering why the revenue fluctuations are relatively large for the privates compared to the publics. That’s because a key source of revenue for each is driven by different fundamentals: the publics receive allocations from state revenue, which is based on taxes and thus responds to broad economic conditions, in contrast to the privates, which do not receive state allocations and instead rely on endowment and investment revenues that are closely tied to the comparatively higher volatility of the stock market. We’ll look at all the major sources of revenue in the next few sections, and endowments in Chapter 13.
2.4 Where does the revenue come from?
Universities and colleges generate revenues from many sources. The average revenue picture across all types of four-year colleges and universities is shown in Figure 2.6. The revenue mix changes depending on the type of institution, public or private and large or small (see Section 2.5 coming up next). However, looking at the broad public and private averages first is a straightforward way to get a feel for the basics before we delve into crucial differences between types of schools. Two data notes: (i) here and in other similar figures I’ve used the average across types of schools to better show the central tendency, instead of the simple overall average that would be skewed towards the more numerous smaller schools in the set; (ii) for comparability across institutions, I have omitted hospital revenues where applicable, per the discussion in previous sections.
Figure 2.6. Share of FY2017 non-hospital revenues averaged across types of public and private institutions. Source: IPEDS (2020).
Public Private
Tuition & Fees State Appropriations Investment Income Grants & Contracts Auxiliaries Gifts Other

Like Nobody's Business22
The most important take-home point in this section is that tuition and fees are the dominant source of revenue. While certain types of institutions have always relied heavily on tuition, as an across-the-board pattern in all sizes of public and private universities, this is a relatively recent development involving several factors (see the rest of this chapter). Note that Figure 2.6 shows net tuition and fee revenue after subtracting discounts (e.g., scholarships and fellowships paid with institutional funds). Gross tuition and fee revenue can sometimes include a third to half as much again beyond net revenue (see Section 2.8). Tuition revenue is important not only because of its size, but also because it can be spent broadly and used to pay salaries and operating expenses (see Section 2.11).
People new to university budgeting are often surprised to learn that state appropriations are nowadays a relatively small part of institutional revenues, because they imagine (reasonably enough) that a state would be the signature funding source for a state university. For medium and large publics in particular, that has not been the case for many decades, and as a result those institutions have diversified their revenue sources over time. State allocations are still a critical revenue source in most public institutions, however, because of their role as a primary funding source that enables the institution to leverage additional funds such as grants and philanthropy (see Chapters 8 and 13).
Investment income can be thought of as the private university counterpart to state income, serving as the signature revenue source for private colleges (as state revenue is for publics). While it is not typically the major source of revenue on a private campus, investment income is nonetheless a critical revenue source. One difference, as we’ve already seen in Section 2.3, is that investment income is relatively more volatile and private colleges must allow for that in their financial planning. For example, Figure 2.6 uses FY2017 data, a good year for investment income, but in FY2016 many private institutions experienced low or negative investment income. There is a popular impression that private colleges in general are awash in investment income proceeds from their substantial endowments. This is not the typical situation and the misconception likely stems from conditions found only at the wealthiest (and hence highly visible and influential) private institutions (see Chapter 13 for more on this topic).
Grants and contracts can form a sizable portion of overall revenues, especially at larger research-oriented institutions. The Federal Government is the dominant source of these funds, although state and local governments and private industry are also significant sources. An important distinction is that these sponsored projects almost always involve restricted funds, because the funds are obtained and can only be expended for the purposes of the project. By definition, then, they are not to be used for the everyday running of the institution, and instead they augment the activities of the university. See Chapter 8 for more detail on research funding including direct costs and indirect cost recovery (the much maligned and misunderstood “overhead”).

2. Institutional Revenues 23
Auxiliaries are units within the university that are largely or wholly self-funded through a direct cost-recovery mechanism. Examples of auxiliaries include residence halls, dining services, bookstores, parking, and sometimes the athletics department. This slice of the pie in Figure 2.6 is largely committed because the revenues are used directly to pay for the activity that generates them. Well-run auxiliaries can generate a modest margin for investment in other priorities.
Gifts have always been a critical component of the budget for the privates, and increasingly they are a vital source of revenue at the publics too. Gift revenues come from new gifts each year made to the institution or its foundation(s). Gift revenue is distinct from investment income earned on the endowment (that is built on gifts from prior years). Fundraising, gifts and endowments are covered in Chapter 13.
Finally, there are countless other activities that generate smaller portions of revenue that vary by institution. For simplicity, these are all lumped together in the “Other” category in Figure 2.6.
2.5 How does the revenue mix differ by type of institution?
A useful way to appreciate the differences in institutional revenue mix is to compare portfolios by type and control of the school. Figure 2.7 shows pie charts that break out the same FY2017 data used in the previous section, illustrating several significant distinctions between the categories of institutions. For the publics, both tuition and state funding comprise a progressively larger portion of overall revenue as one shifts from large to medium and smaller schools. Conversely, the portion of revenue from grants and contracts diminishes across the span from large to small campuses, especially at the privates. For smaller publics, almost two-thirds of their revenue comes from tuition and state appropriations in roughly equal proportions.
For the privates, there are several notable differences. Needless to say, there is no state funding. For R1 privates, if one substitutes investment income for state appropriation as a functional parallel, then the rest of the budget mix is not unlike the R1 publics. The relative role of investment income declines with type for the other privates, although it rises in importance at the baccalaureate colleges. Another distinction across all private institutions is that, as expected, gift revenues are clearly a bigger part of the budget than at the publics. For medium and small privates, grants and contracts (essentially research revenues) are a relatively smaller portion of the budget, even compared to their similarly-sized public counterparts.
The dominance of tuition as a revenue source for the medium and small privates is clear, where it can form half or more of the institution’s revenue. Many articles have been written in the popular and higher education press about small privates being overly tuition-dependent in an unforgiving market, leading to a precarious financial standing and the risk of closure in some cases (Seltzer 2018). In contrast, at elite private baccalaureate colleges the relative role of tuition can diminish to about one third of

Like Nobody's Business24
Figure 2.7. Share of FY2017 non-hospital revenues averaged by Carnegie classification and control. Source: IPEDS (2020).
R1 Public
R2 Public
R3-M3 Public
BAS Public
R1 Private
R2 Private
R3-M3 Private
BAS Private
Tuition & Fees
State Appropriations
Investment Income
Grants & Contracts
Auxiliaries
Gifts
Other

2. Institutional Revenues 25
revenues and investment income can instead make up a sizable portion of revenue, averaging about 25%.
Presidents and chancellors, and their senior leadership teams, are usually acutely aware of their institutional revenue profile. They typically pay a lot of attention to developing strategies that can sustain current sources of revenue and grow additional income streams to support the academic mission. This awareness and attention to the revenue portfolio holds across all types of institution, even though some must deal with the reality of a more narrowly constrained business model than others.
2.6 How much is tuition?
Before looking at the details of tuition and fee revenue, it is useful to start with published tuition rates (the “sticker price” using the car sales analogy) and explore the details from there. In Figure 2.8 I’ve shown these data for entering undergraduates in FY2018 including the out-of-state portion for the publics. Naturally, the overall totals as well as the breakout details all vary by institution. Fees in these data are those that all students are required to pay, which are also different from place to place and variously include fees for information technology, student health service, library, new students, activities, athletics, and so on. These fees exclude those that vary by degree program or individual course fees—the annual total for them will differ individually by student and term. Program fees can sometimes add substantially to the overall amount in professional programs (e.g., engineering) and can be significantly more than regular tuition for special graduate programs such as an executive MBA.
Figure 2.8. Published FY2018 annual undergraduate tuition and required fees by control and Carnegie classification, showing in-state tuition as well as combined additional tuition
and fees for out-of-state students for the public institutions. Source: IPEDS (2020).
$‐
$10,000
$20,000
$30,000
$40,000
$50,000
$60,000
R1 Public R2 Public R3‐M3 Public BAS Public R1 Private R2 Private R3‐M3 Private BAS Private
FY20
18 Pub
lishe
d Tu
ition
& Fees
Out‐of‐State
Fees
Tuition

Like Nobody's Business26
Still, most students pay less than the full published rate, so one cannot simply multiply a university’s enrollment by the posted tuition to obtain its realized tuition revenue. Financial aid, in the form of both need-based and non-need-based aid (sometimes called merit aid), is available to every student and is contingent on family income as well as individual academic preparation (see Sections 7.5, 7.10 and 7.11 for more about price, affordability and debt). In addition to discounting with aid, further factors in the tuition revenue mix include international students and, at the publics, the proportion of in-state and out-of-state students, as well as online students, those attending summer sessions, and the mix of part-time to full-time students (see Sections 3.6 and 6.11). It takes a lot of important and detailed accounting, almost constantly throughout the year, to figure all these details and arrive at the institutional tuition and fee revenue.
2.7 How fast has tuition increased, and why?
Annual increases in published tuition and fees routinely garner media attention, shaping public opinion on the perceived costs of higher education. Even after adjusting for inflation, tuition and fees at all types of institutions have been trending upward for many years, consistently so since the early 1980s (Figure 2.9). Over the last three decades, published tuition and fees have approximately tripled in real terms, with average annual rates of 3.9% for in-state and 3.5% for out-of-state students at the publics, and 2.9% at the privates.
Figure 2.9. Inflation-adjusted trends in published annual undergraduate tuition and required fees at public (in-state and out-of-state amounts) and private institutions, FY1964–2018, in 2016 dollars. Prior to FY1988, private institution data include for-profit institutions. The vertical bar indicates the onset of the Great Recession. Source: NCES Digest (National
Center for Education Statistics 2016) for pre-FY1988 data and IPEDS (2020).
$‐
$5,000
$10,000
$15,000
$20,000
$25,000
$30,000
$35,000
1964
1966
1968
1970
1972
1974
1976
1978
1980
1982
1984
1986
1988
1990
1992
1994
1996
1998
2000
2002
2004
2006
2008
2010
2012
2014
2016
2018
Tuition
& Req
uired Fees (in 20
16 Dollars)
PrivatePublic Out‐of‐StatePublic In‐State
2. Institutional Revenues 27
What is driving these increases? It is easy to jump to convenient conclusions and blame various supposed causes, such as administrative bloat, high faculty salaries, students demanding resort-like amenities, or reduced government support. In reality, it is not all these things, but instead a combination of fundamental economic forces that include some of these factors and some others—the core explanation on the causes of rising costs is in Section 3.7, with additional material in Chapter 4 on state funding, and in Section 7.5 on discounting.
2.8 What is included in tuition and fee revenue?
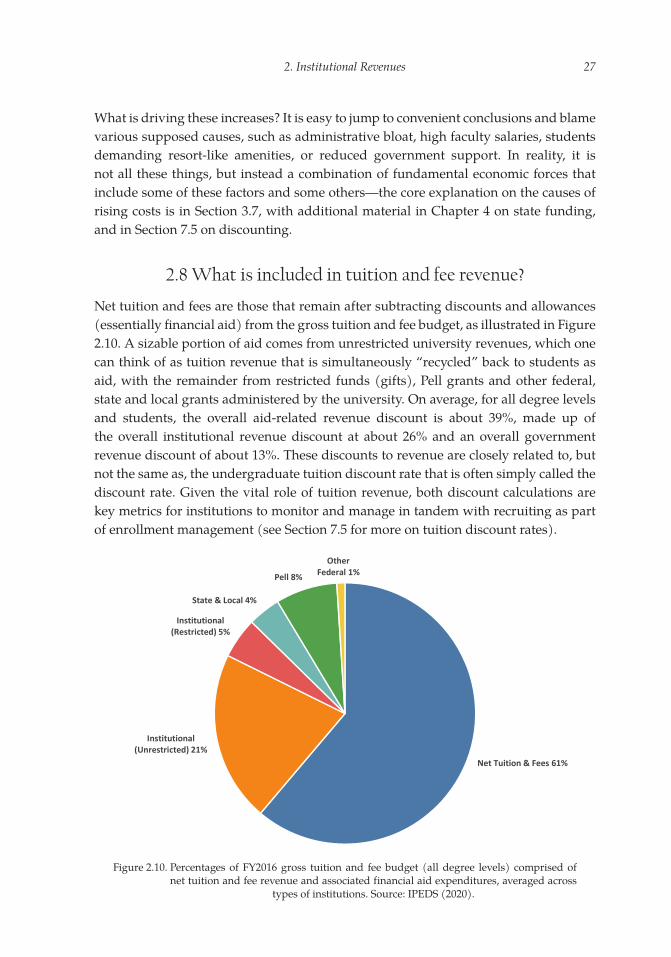
Net tuition and fees are those that remain after subtracting discounts and allowances (essentially financial aid) from the gross tuition and fee budget, as illustrated in Figure 2.10. A sizable portion of aid comes from unrestricted university revenues, which one can think of as tuition revenue that is simultaneously “recycled” back to students as aid, with the remainder from restricted funds (gifts), Pell grants and other federal, state and local grants administered by the university. On average, for all degree levels and students, the overall aid-related revenue discount is about 39%, made up of the overall institutional revenue discount at about 26% and an overall government revenue discount of about 13%. These discounts to revenue are closely related to, but not the same as, the undergraduate tuition discount rate that is often simply called the discount rate. Given the vital role of tuition revenue, both discount calculations are key metrics for institutions to monitor and manage in tandem with recruiting as part of enrollment management (see Section 7.5 for more on tuition discount rates).
Figure 2.10. Percentages of FY2016 gross tuition and fee budget (all degree levels) comprised of net tuition and fee revenue and associated financial aid expenditures, averaged across
types of institutions. Source: IPEDS (2020).
Net Tuition & Fees 61%
Institutional(Unrestricted) 21%
Institutional(Restricted) 5%
State & Local 4%
Pell 8%
OtherFederal 1%

Like Nobody's Business28
Figure 2.11 shows how aid discounts to revenue differ across types of institution. As one might expect, institutional aid is by far the dominant form of aid at the privates, averaging 44% at the small baccalaureate colleges and over 30% at other privates. At the publics the combined institutional aid is about 17%, but combined government aid plays a far larger role at public institutions. At the large publics, government aid is just under half of all aid, and at the smaller regional publics and public baccalaureate colleges it is over half of all financial aid, highlighting the critical role the smaller publics fulfil in affordability and access (see also Chapter 7). Unsurprisingly, institutions with higher tuition tend to discount at a higher rate and vice-versa, with correlations of 0.73 and 0.65 respectively for in-state and out-of-state, which leads one to how much revenue an institution spends per student (see Section 3.3). Nationwide, aid discounts have been trending higher in recent decades—see more on tuition discount rates in Section 7.5.
Figure 2.11. Average FY2016 aid discounts (for all degree levels) averaged by Carnegie classification and control. Unrestricted and restricted institutional aid comprise the total institutional aid; Pell grants and other federal, state and local grants comprise government aid.
Source: IPEDS (2020).
2.9 How much revenue do institutions receive per student?
As we saw earlier in Section 2.3, gross revenues to higher education have risen over time. Increasing enrollments at new and existing institutions (plus inflation) make up most of the trend in increasing revenues and expenditures and so, to gain a comparable understanding of budgets across institutions, we often express data in terms of amounts per student, combining full-time and pro-rated part-time enrollments into
0%
10%
20%
30%
40%
50%
60%
R1 Public R2 Public R3‐M3 Public BAS Public R1 Private R2 Private R3‐M3 Private BAS Private
FY20
16 Total Scholarship & Fellowship Discoun
t
Other Federal
Pell
State & Local
Institutional (Restricted)
Institutional (Unrestricted)

2. Institutional Revenues 29
FTE enrollment, including undergraduates as well as graduate and professional students.
Figure 2.12 illustrates FY2017 revenues per FTE student enrolled across types of institutions, now in dollars rather than in relative percentage terms as we introduced in the preceding sections. Note that these are core revenues that exclude auxiliaries, hospitals, and independent operations. The most obvious feature is that average revenues per FTE at private R1 universities dwarf all others. Revenues per FTE at private R2 universities and private baccalaureate colleges exceed revenues at all types of public institution on average (R3-M3 private institutions receive about the same as the smaller publics). At all types of institution, revenue components generally scale by size, even after the per-FTE adjustment, although there is a notable difference at the baccalaureate colleges that have relatively higher state appropriations at the publics and relatively higher investment returns at the privates.
Returning to the large revenues at R1 private universities, although they are prominent in name and reputation, these institutions have only half the enrollment of R1 publics on average (~17,000 versus ~32,000), which has the effect of increasing the per-FTE revenue amounts. Also, as we’ll see in the next section, investment returns are volatile from year to year and, particularly at R1 privates, they can range from the largest to the smallest (and even negative) component of the budget depending on the year. For example, the $63,000 in investment return per FTE at R1 privates in FY2017 was just $3,600 in FY2016.
Figure 2.12. FY2017 core revenues per full-time equivalent (FTE) student enrollment averaged by control and Carnegie classification. Source: IPEDS (2020).
$‐
$20,000
$40,000
$60,000
$80,000
$100,000
$120,000
$140,000
$160,000
$180,000
R1 Public R2 Public R3‐M3 Public BAS Public R1 Private R2 Private R3‐M3 Private BAS Private
FY20
17 Core Re
venu
es per FTE
Enrollm
ent
Other Core
Gifts
Grants & Contracts
Investment Return
State Appropriations
Tuition & Fees

Like Nobody's Business30
Figure 2.13. Trends in core revenues per FTE of student enrollment (2016 dollars) by fiscal year, averaged across public institutions (upper panel) and private institutions (lower panel). The vertical bar indicates the onset of the Great Recession. Gifts and investment return at public institutions were combined with other core revenue prior to FY2010; dashed lines indicate estimated amounts based on their FY2010 proportions. Investment return amounts below zero (losses) in FY2009 and FY2016 at private institutions are indicated
in italics within the chart. Source: IPEDS (2020).
$-
$5,000
$10,000
$15,000
$20,000
$25,000
$30,000
$35,000
$40,000
2006 2007 2008 2009 2010 2011 2012 2013 2014 2015 2016 2017
Core
Rev
enue
s per
FTE
Enro
llmen
t (Pu
blic;
201
6 Do
llars
)
Tuition & Fees
State Appropriations
Investment Return
Grants & Contracts
Gifts
Other Core
-$38,669 -$723 $-
$5,000
$10,000
$15,000
$20,000
$25,000
$30,000
$35,000
$40,000
2006 2007 2008 2009 2010 2011 2012 2013 2014 2015 2016 2017
Core
Rev
enue
s per
FTE
Enro
llmen
t (Pr
ivat
e; 2
016
Dolla
rs)
Tuition & Fees
Investment Return
Grants & Contracts
Gifts
Other Core

2. Institutional Revenues 31
2.10 What are the trends in per-student revenues?
We covered overall higher education trends in both revenues and expenditures earlier in Section 2.3 and in short, before adjusting for enrollment and inflation, they are upward. Now that we have discussed revenues on a per-student basis, we move on to revenue trends per student FTE adjusted for inflation (per Section 1.4). To aid clarity, I’ve shown the per-FTE core revenue trends in separate panels for public and private institutions (Figure 2.13), and just at that aggregated level because the patterns by Carnegie type across the years are generally consistent with the proportions in Figure 2.12 above.
Starting with the publics, over the last dozen years, tuition revenue has climbed from $6,628 to $8,797 per FTE, averaging 2.9% per year. State revenues dropped from almost $9,300 per FTE right before the recession to about $7,000 per FTE four to five years later with a $700 rebound since then. Grants and contracts are shown for completeness but obviously they are not directly related to student enrollment. Private gifts and investment income are both relatively small components at the publics; gifts increased from about $1,600 to $2,100 per FTE, while investment returns per FTE averaged under $1,000 but varied by hundreds of dollars from year to year. Significantly, total core revenues per FTE at public institutions (Figure 2.14) have decreased over the twelve years, from $35,893 to $33,436, an average reduction of -0.84% annually.
Figure 2.14. Trends in total core revenues per FTE of student enrollment (2016 dollars) by fiscal year, averaged across public institutions and private institutions. The vertical bar indicates
the onset of the Great Recession. Source: IPEDS (2020).
$‐
$10,000
$20,000
$30,000
$40,000
$50,000
$60,000
$70,000
$80,000
$90,000
2006 2007 2008 2009 2010 2011 2012 2013 2014 2015 2016 2017
Core Rev
enue
s per FTE
Enrollm
ent (20
16 Dollars)
Private
Public

Like Nobody's Business32
At the privates, the volatility in investment returns is the most notable feature (Figure 2.13). Over the last twelve years it has been nominally centered around $15,000 per FTE but has frequently been double or half that amount. The massive losses of FY2009 are clear, and even in “normal” years these revenues can be close to zero or as high as $30,000 per FTE. Managing institutional finances with this kind of volatility can be challenging, particularly at the private R1 universities where investment returns can approach half the overall budget. Financial officers must budget these revenues conservatively, estimating the level that produces a reasonably constant funding stream from year to year by keeping funds in reserve from the good years to cover the bad years. We’ll examine cash on hand and related financial issues in Chapter 10. Average tuition revenue increased from $18,760 to $21,503 per FTE, about 1.3% annually over the twelve years. Gifts rose from about $11,000 to about $12,000 over the period, averaging a 1.2% annual increase. It is crucial to note that total core revenues per FTE at private institutions (Figure 2.14) have been essentially flat (with high volatility) over the twelve years, as well as the post-recession years.
I want to reiterate just how important the trends are in Figure 2.14: in contrast to claims of rampant increases that use unadjusted numbers, on a per-student basis and adjusted for inflation, FY2006–2017 total core institutional revenues decreased at the publics and were flat at the privates.
2.11 Why isn’t all revenue treated the same way?
All money is green, as the saying goes, although at universities and other nonprofits the source of funds and their intended use lead to various shades of green with different associated allowable expenditures (Figure 2.15). This is what is meant by different “colors of money” in accounting slang on some campuses. We’ll leave the technicalities of fund accounting to the experts, but there are some relevant peculiarities that attentive campus citizens should be aware of. I’ve briefly mentioned the big ones already when introducing revenues: restricted and unrestricted funds.
Restricted funds, as the name implies, carry external stipulations limiting their use to specific types of expenditure. The largest sources of university restricted funds are expendable gifts and endowment income from gifts, as well as the direct cost portion of sponsored grants and contracts. Most donors designate their gifts for a specified purpose, such as a scholarship for women engineers or construction of a new biotech building. When the university accepts the donation, it obligates itself to spend the funds in accordance with the donor’s desires. Likewise, when the university is awarded a contract, such as a federal research grant from the National Institutes of Health, it is contractually obligated to spend the award only on the directly budgeted costs of that project (laboratory equipment, specialized labor, etc.).
Unrestricted funds, in contrast, can be used for most of the general expenses of running an institution, and their local names can vary, including general funds,

2. Institutional Revenues 33
Figure 2.15. Types of university revenue funds. Restricted funds are limited to externally stipulated uses. Unrestricted funds can be used for the general running of the institution. Some
unrestricted funds may be designated by the university for special purposes.
UNRESTRICTED FUNDS• Tuition & fees• Investment interest• State appropriations• Indirect cost recovery• Auxiliary income
RESTRICTED FUNDS• Gifts• Endowment
income• Direct costs on
grants
DESIGNATED FUNDS
GENERAL FUNDS
UNIVERSITY REVENUES
$
institutional funds, state funds, and more. The largest sources of unrestricted funds are tuition and fees, interest earned on investments, state appropriations, the indirect cost recovery portion of grants that covers institutional facilities and administration costs (see Chapter 8), and income from auxiliary units.
Even unrestricted funds have some notable fine-print exceptions. For example, in many states public universities cannot use them to purchase alcohol, such as for special events and receptions (a common work-around is to use unrestricted gift income instead, especially as such events often involve donor development). Another kind of exception is income from specially targeted fees, such as course fees to cover expendable supply and equipment costs (e.g., laboratory courses in chemistry)—such fees are often approved for a narrow purpose only, and the related expenditures are usually vetted on a regular basis. These fees, as well as various special funds such as parking surcharges for the “free” campus shuttle, are often known as designated funds. Designated funds originate as unrestricted funds, but the Board or President/Chancellor will designate them such that in practice they become restricted for most campus accounting purposes.
One further clarification on restricted endowment income versus unrestricted investment interest: the investments that produce unrestricted interest income originate from unrestricted institutional funds (e.g., money in the university’s bank accounts) and quasi-endowments (Board-designated institutional funds for investment) as well as undesignated gifts. At institutions with exceptionally large endowments, the unrestricted investment interest can be a major source of operating revenue. For

Like Nobody's Business34
example, unrestricted funds account for about 30% of Harvard’s total endowment (Harvard University 2018).
Box 2.2. Complicated Fund Sources and PitfallsRestricted, unrestricted, and designated funds complement each other within the overall university budget. It can get complicated, though. Professor Overachiever might be paid a base nine-month academic year salary from unrestricted funds (tuition and state allocation), a stipend as
the prestigious Eminent Alumnus Chair from restricted funds (endowment proceeds from a gift), plus a summer salary from both restricted funds (a research grant) and unrestricted funds (administrative stipend as department chair). Often these are just technical details that the department business manager can handle easily. But academic work is often more complex and intertwined than this tidy accounting world, which can trip up unsuspecting academics.
One example is spending on research grants where early results change the approach so that the project needs equipment that wasn’t listed or the population under study is changed to a more logical one that wasn’t anticipated in the grant. These shifts make perfect academic sense, but they are an accounting no-no unless formally approved by the granting agency. Another example might be a student awards committee that expands eligibility for a donor-endowed award because the rules have become outdated, but the chair forgets to first get the OK from the development office and donor.
2.12 Why worry about state appropriations and investment income if tuition dominates?
Despite the leading role of tuition revenue at essentially all US institutions nowadays, the two signature revenue sources of publics and privates—state appropriations and investment income respectively—are nonetheless each critical because of what we can spend them on. As unrestricted funds they are sizable sources of primary operating income. In many institutions, together with tuition, these revenues associated with the primary educational mission are the main way that we cover payroll and operations outside of the auxiliaries.
There are further implications: these two sources are linked to the psychology and culture of the institution. At the publics, decades ago (in the 1970s and 1980s), state appropriations averaged around 45% of institutional revenues and in some cases over 75% (National Center for Education Statistics 1991; IPEDS 2020). Even at their present diminished levels, however, state appropriations represent (through taxes) the investment of society at large in public higher education. At the privates, funds from the founder and other major donors literally made the origin and ongoing independence of the college possible. Faculty, staff, students, alumni and the community are often

2. Institutional Revenues 35
closely connected to the institutional philosophy that is exercised through these funds and changes to them are invariably newsworthy.
Another implication is leverage—as part of the primary activity revenue, these funds are necessary for the institution to obtain additional funding from other key revenue sources, such as gifts, or funding the research mission through grants and contracts (Figure 2.16). It is exceedingly difficult to succeed in sustaining a research enterprise on grant funds (so-called “soft” money) alone, and thus the primary funding for faculty and administrative staff furnished by tuition and signature revenues is key in enabling sustained external research support (and the associated quality and prestige). This primary activity revenue is a critical part of the research university’s business model (see Section 14.2) and a fundamental element in the unparalleled success of the US in research and graduate education since the mid-twentieth century (see Section 8.2).
Figure 2.16. Revenues broadly associated with primary activity (the educational mission) provide necessary leverage to enable other activities and their associated revenues. Revenue
segments are for R1 public institutions illustrated in Figure 2.7.
2.13 What is the revenue significance of out-of-state and international students?
At private institutions the distinction between in-state and out-of-state students doesn’t apply, at least in the revenue sense, and there is a uniform sticker price for all students. At public institutions, which are supported in part by tax proceeds, substantially lower pricing for in-state students is built into the pricing structure, often by statute or charter. These are known as resident students for tuition purposes, while out-of-state and international students are known as non-resident students. International students
LeveragedActivity Revenues
• Grants & Contracts• Auxiliaries• Gifts• Other
PrimaryActivity
Revenues
Tuition & Fees •State Appropriations •Investment Income •

Like Nobody's Business36
are typically billed at the non-resident rate although they pay slightly more at a few institutions (for more on international students, see Section 6.12).
As state funding for public higher education has diminished, non-resident students have come to play a role in tuition revenue at the publics that is far greater than their relative headcount. Detailed comparative data showing net tuition revenue from in-state and out-of-state students is not readily available, but we can easily examine enrollment data and show the revenue impact of non-resident students by inference. Figure 2.17 illustrates the relative proportions of in-state, out-of-state and international students across the types of schools in our set for first-time undergraduates. All types of private schools except the smaller regionals draw over half their incoming students from outside their home states, while at all types of public university the non-resident portion averages substantially lower with 15–27% being non-residents. As an individual counterexample, the University of Vermont has only 21% in-state first-timers, the lowest of all public universities (Vermont is among the public universities with the highest out-of-state tuition and fees, comparable to the University of California campuses)—clearly Vermont’s situation is atypical for the mix of tuition revenue (Despart 2015).
Figure 2.17. Fall 2016 first-time undergraduate enrollment percentage mix of in-state, out-of-state and international students at institutions, averaged by control and Carnegie
classification. Source: IPEDS (2020).
With some simple assumptions, we can calculate a back-of-the-envelope estimate of the net tuition revenue impact of out-of-state students at a public university, as summarized in Table 2.1. In line A we use the average in-state and out-of-state FY2018 published tuition and fees for the public universities in our example set. In line B
0%
10%
20%
30%
40%
50%
60%
70%
80%
90%
100%
R1 Public R2 Public R3‐M3 Public BAS Public R1 Private R2 Private R3‐M3 Private BAS Private
FY20
16 Fall First‐Time Und
ergrad
uate Enrollm
ent
International
Out‐of‐State
In‐State

2. Institutional Revenues 37
we assume an average 30% tuition discount across all students (in practice, in-state students often receive a higher percentage discount relative to out-of-state students, but we’ll keep it simple here and use an equal discount, just to be conservative). In line C we list the required fees, and in line D we obtain the tuition and fee revenue per student as the total of lines B and C. We assume an overall enrollment of 14,000 in line E (this number doesn’t matter in the end, but it helps keep the example understandable) with 75% as in-state students (this proportion does make a difference). We multiply the average revenue per student (line D) by enrollment (line E) to get the total net tuition and fee revenue for the institution in line F. Finally, in line G, we convert the two revenue totals into their percentages of the combined total.
Table 2.1. An illustrative estimate of the net tuition and fee revenue impact of in-state versus out-of-state students. See text for explanation.
Line Item In-State Out-of-StateA. Tuition $8,092 $21,195 B. Less 30% discount $5,664 $14,837 C. Fees $1,998 $2,329 D. Revenue per student $7,662 $17,166 E. Enrollment 10,500 3,500F. Net Tuition & Fee Revenue $80,455,200 $60,079,250 G. Percent 57% 43%
In this model, at 43%, the net tuition and fee revenue from out-of-state students is approaching half the total revenue although these students only comprise 25% of the total by headcount. If we vary the proportion of out-of-state students in the model, we can get a sense of their impact across typical public institutions: with 10% out-of-state students they generate 20% of the revenue, and with 30% out-of-state students we get close to a 50:50 revenue split. Thus, as a rough guide for a typical public institution, we can say that the net tuition and fee revenue portion from out-of-state students is 1.7 to 2 times their headcount proportion. On a per-student basis in our model, as line D shows, an out-of-state student pays more than double that of an in-state student. These numbers are clearly significant in the business model of public institutions, and like the discount rate this is also a key metric for these institutions to monitor and manage in tandem with recruiting as part of enrollment management (see Chapter 7). Note that we’ve also simply included undergraduate and graduate students together for data reasons, although the undergraduate numbers will dominate the calculation at almost every institution. See Section 3.6 for the flip-side of the in-state/out-of-state issue in expenditures.


3. Institutional Expenditures
3.1 Where does all the money go?
Higher education is a labor-intensive industry, so it’s no surprise that people, in the budgetary form of salaries, wages and benefits, are the single biggest category of expense for universities and colleges. More prosaically, meeting payroll is the biggest institutional bill each month.
Figure 3.1 shows the average mix of expenditures by nature of expense, one of two views of expenditures that we’ll examine. In this view, the proportions are remarkably similar across all types and sizes of our example institutions. It is easy to see that salaries and benefits combined make up over half of all expenditures. The remaining major natural expense categories are all under 10% of the total. Operation and maintenance of the physical plant (permanent built infrastructure), also known as O&M, is easy to cut in lean years but it inevitably accumulates into much larger costs over time,
© Andrew C. Comrie, CC BY 4.0 https://doi.org/10.11647/OBP.0240.03
Figure 3.1. Percentages of FY2017 non-hospital expenditures averaged across institution types, by nature of expense. Source: IPEDS (2020).
Salaries & Wages 43%
Employee Fringe Benefits 14%
Operations & Maintenance 8%
Depreciation 7%
Interest 2%
Other 26%

Like Nobody's Business40
which become even tougher to afford. Major equipment is accounted for through depreciation, spreading its cost over the expected useful lifespan rather than incurring it all in a single year. To use two everyday analogies, O&M is like maintenance on your house, while depreciation is like the annually decreasing value of your car. And, to complete the house analogy, interest in this case is what the institution pays on its debt (often in the form of bond financing to build buildings, see Section 10.3), which is like the mortgage payment on your house.
The other view of expenditures is by function of the expense, as illustrated in Figure 3.2, where the same dollars are instead tagged to the core mission and supporting activities of the university. On average across our example institutions, instruction is the single largest functional expenditure and it includes faculty salaries and benefits, office supplies, and the administration of academic departments. Research here includes the cost of research centers and institutes as well as restricted funds (see Section 2.11) for sponsored research projects. Accounting of public service includes separately budgeted activities such as cooperative extension services, public broadcasting, and public information offices. Following the three core mission areas are four vital categories that support and supplement the core missions, and which together play a sizable role in the expenditure budget. Academic support covers activities that support all three mission areas such as libraries, computing, museums, and deans’ offices. Student services incorporates recruitment, admissions, the registrar’s office, career center, financial aid administration, and student clubs. Institutional support consists of general administration, executive leadership, the legal office, financial services, public relations, and facility operations. Auxiliary
Figure 3.2. Percentages of FY2017 non-hospital expenditures averaged across institution types, by function of expense. Source: IPEDS (2020).
Instruction 36%
Research 8%
Public Service 3%Academic Support 10%
Student Services 10%
Institutional Support 14%
Scholarships & Grant Aid 3%
Auxiliary Enterprises 14%
Independent Operations 1% Other Expenses 2%

3. Institutional Expenditures 41
enterprises include residence halls, bookstores, and dining services (we’ve omitted hospitals to enable equivalent comparisons, as explained earlier). The remaining small categories comprise scholarship and grant aid expenses, independent operations, and other expenses.
These functional expenditure data highlight a point I made in Chapter 1, which is that universities are complicated institutions. Investing in the multiple interlocking and interdependent activities listed above is necessary for a thriving institution that carries out its mission well, and that’s why managing a university is a form of matrix management (cross-functional management, to be more precise, but that’s a story for another book). The university’s expenditure budget reflects this reality because in effect it is a matrix of the natural and functional views above (e.g., salaries, O&M, etc. within instruction, research and so on), only with hundreds of fine-scaled categories.
3.2 How does investment in major functions differ by type of institution?
There are some interesting patterns in the proportion of budget that types of institutions spend on major functional areas, the most notable being instruction and research. In Figure 3.3, perhaps the most remarkable pattern is the consistency in the proportion of budget invested in instruction—just over one third across all types of institutions. We can see that research expenditures shrink relative to instruction and other areas as one moves from the R1 schools to smaller institutions that do less research, just as one would expect. Expenditures on public service are, again as expected, a much larger portion of the budget at public institutions, especially the R1 & R2 publics (the groups that includes most of the land-grant institutions).
Academic support is a similar proportion across all types of school, but the portions of budget invested in student services show a relative increase at smaller schools with slightly greater portions at the privates. Private institutions expend relatively more on administration (institutional support) than do their public counterparts, with relatively higher portions at smaller public and private schools. Scholarships and grant aid are primarily a feature of public universities (as we’ve seen, private schools tend to discount relatively more instead). The portion of expenditures on auxiliaries is similar across all institutions. There are some notable differences in independent operations, with R1 private institutions far outweighing all others.
In Section 2.3 we saw that overall expenditures (and revenues) have trended upwards for years. Seeing the public-private differences in expenditures above and knowing that not only financial resources, but also enrollments differ across these schools, the logical comparison across institutions is to look at expenditures per student, which we cover in the next section.

Figure 3.3. Percentages of FY2017 non-hospital functional expenditures averaged by Carnegie classification and control. Source: IPEDS (2020).
R1 Public R1 Private
R2 Public R2 Private
R3-M3 Public R3-M3 Private
BAS Public BAS Private
Instruction
Research
Public Service
Academic Support
Student Services
Institutional Support
Scholarships & Grant Aid
Auxiliary Enterprises
Independent Operations
Other Expenses

3. Institutional Expenditures 43
3.3 What do institutions spend per student?
There are several ways to answer this question, and none of them is perfect because it is virtually impossible to untangle strictly student-related expenditures from other kinds, and because purposes often overlap. The simplest and least satisfactory approach is to take the entire budget of the institution and divide by the number of students, but at large research universities that would overestimate what was allocated to supporting students versus other activities. We could omit auxiliaries, independent operations, etc. and keep only the first six categories in Figure 3.2 and Figure 3.3, which is a version of the so-called Educational and General (E&G, or sometimes G&E) budget, but that still includes research and public service that could skew the comparisons. So, to focus in on educational and related spending only, we compute a version of the Education and Related (E&R) budget,1 which includes only expenditures on instruction, academic support, student services and institutional support.
As Figure 3.4 illustrates, the differences in E&R spending per FTE student across types of institutions appear to be dramatic, but (some) appearances can be deceiving. Starting with the publics, R1 universities appear to spend about one third to one half more per student than the medium and smaller publics. Recall from Section 3.1, however, that all faculty costs are accounted for under instruction expenditures, and yet at research universities faculty time is split between teaching, research and service (often 40:40:20 or similar at an R1) with a higher research expectation than elsewhere. There is no precise way to adjust for this in national data, but as a (very) rough estimate we can simply deduct 40% from the instruction column for the R1 universities to get a sense of more comparable numbers (given that this is a crude estimate, I have not shown a prorated adjustment for R2 or R3 schools, keeping with the simplest approach for now; we’ll return to this issue when we deal with research in Chapter 8). With the adjustment, instructional spending per student across the publics is around $10,000, with a little more spending per capita on support services at the bigger schools. After the R1 adjustment, all publics in our examples average in the $15,000 to $20,000 annual dollars per student range. Moving on to the privates, even after the adjustment the R1 private universities spend almost three times more per student than their public counterparts (over $60,000 per year). The R2 privates and baccalaureate colleges spend about double their public counterparts (about $37,000 per student per year). Interestingly, the R3-M3 privates spend about the same as their public counterparts (about $20,000)—this may be because this category includes some of the most financially-stressed and tuition-dependent institutions.
Overall, the main take-home point from this section is that many private institutions spend about twice as much or more per student than public institutions do (parallel
1 This is a simplified version of the Education and Related (E&R) budget suitable for calculation directly from IPEDS data. It is close, but not identical, to a detailed per-institution E&R calculation that accounts more precisely for small portions of some support costs.

Like Nobody's Business44
with their tuition which is also roughly double, see Section 2.8). We’ve known for several decades (Getz and Siegfried 1991) that the two principal reasons why spending per student differs across institutions are, first, differences in student to faculty ratios and, second, differences in part-time faculty and other instructional resources (see Chapters 5 and 6).
Figure 3.4. FY2017 Educational and Related (E&R) expenditures per full-time equivalent student averaged by control and Carnegie classification. See text for estimate of R1 instructional
spending without faculty research time. Source: IPEDS (2020).
3.4 What are the trends in per-student spending?
The trends in E&R and non-E&R expenditures as well as total expenditures are illustrated in Figure 3.5. I’ve only shown the overall averages across publics and privates because the patterns are broadly consistent by size of institution within those groups. At the publics the immediate adjustment to the recession and subsequent recovery involved a $3,000 (30%) drop in non-E&R spending per FTE, $2,000 of which was shifted to E&R spending with the remainder being cut, while at the privates the shifts were relatively subtle. At all institutions, since the recession, essentially all new expenditures have been invested into the educational mission (E&R). Over the dozen years following FY2004, inflation-adjusted E&R spending per student at public institutions shifted from 59% to 72% of the total, with most of that jump in FY2010 right after the start of the recession; the shift at the privates was relatively flat from 76% to 79%.
$‐
$10,000
$20,000
$30,000
$40,000
$50,000
$60,000
$70,000
$80,000
$90,000
R1 Public R2 Public R3‐M3 Public BAS Public R1 Private R2 Private R3‐M3 Private BAS Private
FY20
17 Edu
catio
nal &
Related
Expen
ditures p
er FTE
Enrollm
ent
Institutional Support
Student Services
Academic Support
Instruction
R1 Instruction (Est.)

3. Institutional Expenditures 45
Figure 3.5. Trends in Educational and Related (E&R), non-E&R and total expenditures per FTE of student enrollment (2016 dollars) averaged across public and private institutions. The
vertical bar indicates the onset of the Great Recession. Source: IPEDS (2020).
Following the recession onset, both publics and privates took six years to again equal or exceed 2009 amounts in their overall spending per FTE (Figure 3.5). Given the rhetoric of runaway expenses in higher education, and as I similarly noted for revenues, this is an immensely significant point to emphasize: when examined on a per-student basis and adjusted for inflation, from FY2004–2017 the average rate of increase in total institutional spending was 0.7% annually at the publics and 1% annually at the privates (see Section 3.7 for details on underlying cost increases).
3.5 What share of costs are covered by tuition versus subsidy?
How much of what universities invest in E&R spending is paid for by tuition revenue? Or, phrased the other way around, what portion of educational costs are subsidized by the institution? As we saw in Section 2.5, net tuition is the biggest slice of the revenue pie at all types of institutions. We can compare that revenue to expenditure on E&R costs to see what share it covers. Whatever is not covered by tuition is considered the institutional subsidy, which largely comes from state appropriations at the publics and from investment and other revenues at the privates.
Figure 3.6 illustrates the tuition/institutional subsidy split. Given what we know about tuition revenues, it isn’t surprising that the publics generally cover a smaller portion of E&R costs with tuition than do the privates, which rely more on tuition. There are noteworthy distinctions in the details that relate closely to their tuition revenue dependency (roughly following the tuition portion of revenue in Section
$‐
$10,000
$20,000
$30,000
$40,000
$50,000
$60,000
2004 2005 2006 2007 2008 2009 2010 2011 2012 2013 2014 2015 2016 2017
Average Expe
nditu
res p
er FTE
Enrollm
ent (20
16 Dollars)
Total (Public) E&R (Public) Non‐E&R (Public)
Total (Private) E&R (Private) Non‐E&R (Private)

Like Nobody's Business46
2.5). The R1 publics receive a higher tuition portion than do the R1 privates, but the other smaller publics have a lower tuition portion and thus greater subsidy than their private counterparts. The tuition dependency (and therefore enrollment dependency) of the R3-M3 privates is stark, with over 87% of E&R costs being covered by tuition. These data reveal how types of institutions have varying capacities to subsidize the cost of education on a percentage basis, but it is worth keeping in mind that the per-student amounts in dollars are still substantially larger at private institutions (see Section 3.3).
Figure 3.6. FY2016 Net tuition and fee revenue and remaining subsidy portions of Educational and Related (E&R) expenditures averaged by control and Carnegie classification. Source:
IPEDS (2020).
The trends in the portion of E&R costs covered by tuition were significantly upward for the publics pre-recession and have been more-or-less flat since then, while the trend for the privates has been relatively flat with a slight increase post-recession (Figure 3.7). At the publics, over the five years from FY2002–2006 the tuition portion of the split went from just over one third to almost half. There is a range by type of public institution: R1 publics have seen a steady increase continuing beyond the recession through FY2016, while public baccalaureate colleges experienced a decrease back to about 40%. The wavy shape of the overall curve for the publics results from the interplay between tuition and state revenues as economic conditions shift. Tuition can rise in good economic times (market forces) and bad (replacing losses in state funding) and state funding can rise in good times and fall in bad (tracking state tax revenue and often lagging by a year or more due to the budget cycle). While these forces induce year-to-year variability, the macro effect is unmistakable—a massive
0%
10%
20%
30%
40%
50%
60%
70%
80%
90%
100%
R1 Public R2 Public R3‐M3 Public BAS Public R1 Private R2 Private R3‐M3 Private BAS Private
FY20
16 Net Tuitio
n & Sub
sidy
Portio
n of E&R Expe
nditu
res
Subsidy
Net Tuition

3. Institutional Expenditures 47
shift to less state funding and more reliance on tuition to cover the cost of public higher education. We delve further into public funding for higher education in Chapter 4.
Figure 3.7. Trends in the net tuition and fee revenue portion of Educational and Related (E&R) expenditures averaged for public and private institutions (including the R1 and baccalaureate publics). The vertical bar indicates the onset of the Great Recession.
Source: IPEDS (2020).
3.6 Do out-of-state students subsidize in-state students?
Yes and no. We can combine some of our earlier analyses to explain why. First, as we saw in Section 2.13, out-of-state students can contribute as much as twice the per capita share of overall net tuition revenue compared to in-state students. So, in a narrow sense, yes, they contribute a higher proportion of net tuition revenue and that revenue is essential. Nonetheless, in the broader sense, the apparent subsidy is significantly diminished, because net tuition revenue covers only about half the full cost of providing a student’s education (see Section 3.5) at public universities. This is clear in Figure 3.8 where the tuition and subsidy portions of E&R costs are broken out. We can see that out-of-state students don’t “pay for” in-state students but their greater revenue contributions are an important partial offset that nonetheless still doesn’t cover the entire cost of education. Government aid, institutional aid and additional institutional subsidies cover a sizable portion of the costs for all students, both in-state and out-of-state.
30%
35%
40%
45%
50%
55%
60%
65%
70%
FY2002 FY2003 FY2004 FY2005 FY2006 FY2007 FY2008 FY2009 FY2010 FY2011 FY2012 FY2013 FY2014 FY2015 FY2016
Net Tuiiotn Portio
n of E&R Expe
nditu
res
All Private All Public
R1 Public BAS Public

Like Nobody's Business48
Figure 3.8. FY2016 breakout of net tuition and fee revenue (in-state and out-of-state) and subsidy portions (institutional and government aid plus other institutional subsidy) of Educational and Related (E&R) expenditures per FTE enrollment for public institutions
averaged by Carnegie classification. Source: IPEDS (2020).
$‐
$5,000
$10,000
$15,000
$20,000
$25,000
$30,000
R1 Public R2 Public R3‐M3 Public BAS Public
FY20
16 Bud
get C
ompo
nents o
f E&
R Expe
nditu
res p
er FTE
Other Institutional Subsidy
Government Discount
Institutional Discount
Out‐of‐State Net Tuition
In‐State Net Tuition
Figure 3.9. Student-oriented net price view of contribution to FY2016 total Educational and Related (E&R) costs per FTE enrollment for public institutions averaged by Carnegie classification. Net price is calculated using the assumptions of the model described in the text, including the same aid rate for in and out of state students. Source: IPEDS (2020).
$‐
$5,000
$10,000
$15,000
$20,000
$25,000
$30,000
R1 Public R2 Public R3‐M3 Public BAS Public
FY20
16 Net Pric
e & Sub
sidy
of E&
R Expe
nditu
res pe
r FTE
Subsidy
Out‐of‐State Net Price
In‐State Net Price

3. Institutional Expenditures 49
Instead of using the institutional budget picture we can also look at this from an individual student’s budgetary point of view. Figure 3.9 uses the assumptions of our simple out-of-state model (Table 2.1 in Section 2.13) to illustrate how the average tuition paid, even by out-of-state students, still does not cover the full cost of education. For our example, the average out-of-state student with 30% discount off sticker price through all forms of aid still only pays between 63% and 85% of the actual cost of education depending on the type of school. Likewise, in our model the average in-state student only pays 30% to 36% of the actual cost of education—this is by far the highest value for money in US university education. At about $8,000 per year to attend an R1 public (ranked among the best universities in the world) and just over $5,000 per year for a small public (that also provides an excellent education), over four years this investment is about the same as the cost of a new car and yet it will pay out many times that amount over the career of the graduate (see Section 14.1). Needless to say, in years and decades past, when state support for higher education was relatively higher and tuition lower in real terms, the value was even greater (see Chapter 4).
From the two figures referenced above one could infer, correctly, that institutions lose money on in-state students. It’s reasonable for states to want “their” in-state students to benefit from the state support relative to out-of-state students. However, in most states the per-FTE state appropriation falls well short of the cost of a degree (Chapter 4). So, between stipulated low in-state tuition rates and low state appropriations, there is indeed a marginal cost to a typical public institution taking on additional in-state students. As we’ve seen above, there is also a compensating marginal benefit to taking on additional out-of-state students.
Therefore, it is shortsighted for states to automatically assume that out-of-state students somehow “exclude” in-state students from attending—on the contrary, the extra margin from additional out-of-state students helps offset the greater unrecovered costs of in-state students. So long as the total number of in-state students served is greater than it would be without increasing out-of-state students, and so long as state allocations and in-state tuition underfund the cost of educating in-state students, for financial (and academic) reasons it is therefore good policy to expand the number of out-of-state students at a public institution if states want to serve more in-state students. Certainly, it is incumbent on the institution to maintain academic standards while doing so—doing this simply for budgetary reasons at the expense of institutional quality is financial (and academic) folly in the long run.
In deciding on the right mix of out-of-state to in-state students, institutional leaders must balance a commitment to educate in-state students with the reality that out-of-state students help to lower costs for in-state students. Even if absolute numbers of in-state students increase, a declining share of in-state students can be politically difficult. In practice, we see larger increases in out-of-state students in states with small

Like Nobody's Business50
populations, while states with larger college-bound populations are more easily able to achieve a balance between the two (Mitchell 2018).
3.7 Why do higher education costs rise so much?
We saw in Section 3.4 that higher education spending trends, when adjusted for inflation and considered on a per-student basis, have averaged under 1% annually for over a decade (while revenues remained flat or decreased). Yet, there are countless media articles about the soaring costs of college, and they’re not wrong either. The difference is in the definitions of price versus cost: to students and families, the “sticker price” as well as the net price paid after aid have indeed been increasing, while to institutions the underlying costs of doing business also rise relentlessly. We covered published tuition trends (price) in Section 2.7. We’ll focus on the underlying institutional costs in this section, and we’ll examine price and total cost of attendance from the student perspective in Chapter 7.
There are two overarching economic theories of cost in higher education: Baumol’s “cost disease” and Bowen’s “revenue theory” (Martin and Hill 2014).2 Baumol’s cost disease3 recognizes that labor-intensive personal services industries don’t increase their productivity with scale (Baumol and Bowen 1966; Baumol 2012; Helland and Tabarrok 2019). In performing arts, you need more string quartets doing more concerts to reach a bigger live audience, in healthcare, you need more nurses and doctors to serve more patients, and in higher education, you need more instructors to teach increasing numbers of students. These fixed proportions constrain productivity to remain constant and, with regular pressures to increase wages to cover growth and inflation in the broader economy, the result is a bias towards ever-increasing production costs. Contrast this to other industries such as manufacturing and agriculture, where the effects of automation, scale and going digital have increased productivity and kept costs down.4 At the beginning of this chapter we saw that labor and related expenses account for the largest portion of institutional expenditures, so Baumol’s cost disease is an important driver of overall costs in higher education.
2 Interestingly, Baumol and a different Bowen introduced both ideas together in a 1965 essay (Baumol and Bowen 1965). William Baumol was a leading economist who taught at NYU and Princeton. His co-author was one of his doctoral students, William Bowen, who went on to become president of Princeton and later of the Mellon Foundation. The Bowen in Bowen’s Law is Howard Bowen, also an economist, and he too served as a president, at Grinnell College, the University of Iowa, and Claremont Graduate University.
3 Baumol outlined the theory but credits his economist colleague Alice Vandermeulen from UCLA with coining the term “Baumol’s cost disease” (Baumol 2012).
4 One of the most accessible explanations of the Baumol effect, with data, is a recent report by Helland and Tabarrok (2019).

3. Institutional Expenditures 51
Bowen’s Law extends to all nonprofits, and it explains how marginal revenues are invested in excellence in a never-ending cycle. His revenue theory of cost is summarized as follows (Bowen 1980):
1. The dominant goals of institutions are educational excellence, prestige, and influence;
2. In quest of excellence, prestige, and influence, there is virtually no limit to the amount of money an institution could spend for seemingly fruitful educational ends;
3. Each institution raises all the money it can;
4. Each institution spends all it raises.
Taken together, these four rules lead toward ever increasing expenditures as universities compete for students and pursue prestige, such that higher prices lead to greater value that can lead again to higher prices in a circular process (Massy 2003). Also, a consequence familiar to many on campus is that when budget cuts or academic cost efficiency initiatives come along, they are almost invariably opposed because they are “cutting quality”—the precise product of Bowen’s Law.
Both theories operate simultaneously to drive higher education costs upwards. Empirical studies to test which one has the greater effect have come to differing conclusions. Although earlier analyses showed that cost disease dominates (Archibald and Feldman 2008), more recent work shows that Bowen effects are relatively larger than Baumol effects, and combined they explain 74% of cost changes at public institutions and 63% at private institutions (Martin and Hill 2014). I imagine that in practice the balance changes over time, but either way it’s clear that both forces lead to relatively higher costs for nonprofits that have constant productivity, such as colleges and universities.
The Baumol and Bowen theories have some corollary effects. One has been the evolution of increased production costs owing to a half-century shift in expectations by students and parents along with changing demographics and social policy (Thelin 2018). Decades ago, a smaller proportion of high-school graduates went on to college, and those that did were largely from middle- and upper-income families. Efforts to increase gender and ethnic diversity were in their infancy. While tuition was low compared to today, other costs such as books, board and lodging hindered access. There was little in the way of financial aid and banks would not issue loans to students without collateral. Later, the availability of Pell grants and federal loans greatly broadened access. Their portability also provided students with choice, leading to greater competition among colleges (Thelin 2018). Antiquated approaches to academic success were wasteful in human and financial terms: the infamous student orientation warning—look to your left, look to your right, only one of you will be here in four years—was not apocryphal. Institutions began to

Like Nobody's Business52
invest in retention and student success through academic advising, co-curricular activities, recreation centers, mental-health care and career services. Support services such as these, along with necessary but unfunded compliance mandates, form the bulk of what is pejoratively called administrative bloat (see Section 5.9 for more on that topic). The expansion of academic and student services has led to relatively larger increases in the number of employees and associated costs in this part of the higher education workforce (see Section 7.1), an unintended but nonetheless classic Baumol effect.
A further noteworthy effect is called the principal-agent problem, which results from asymmetric information and differential interests in the outcome between two contracted parties. For example, when you need to take your car for repairs you (a) don’t have proper information on successful outcomes (repair success rates) so you rely on reputation, and (b) the mechanic has an incentive to charge you for things you don’t need rather than acting in your best interests. We see examples of this problem every day, including between voters and politicians, shareholders and company management, and clients and lawyers (Wikipedia 2018). In higher education the principal-agent problem is related to Bowen’s Law in that, without explicit data and meaningful metrics of output quality, spending on quality is effectively spending on reputation that thereby contributes to the cost spiral (Martin 2009).
So, how big is the net effect of these factors on higher education costs? The Higher Education Price Index (HEPI) tracks inflation in key higher education costs going back to 1961, and it includes salaries and benefits for faculty, administrators, clerical and service staff, as well as utilities, supplies and materials, and miscellaneous services (Commonfund Institute 2017a). Not surprisingly, it mirrors university budgets and is dominated by labor costs. One can think of HEPI as the inflation rate for the goods and services that higher education institutions purchase, much as the CPI is the general inflation rate for those that consumers purchase. Both are shown in Figure 3.10, in their index form with a common base year for comparative purposes and in terms of their annual inflation rates. Over a bit more than a half-century, the two rates are highly correlated (r = 0.99) with the underlying costs of higher education clearly rising faster than general inflation. Looking at the annual inflation in each index, there have been alternating periods in which one exceeds the other, and over the entire period the HEPI inflation rate averages 0.65% above the CPI inflation rate. For the last decade this difference has been about 0.5%, which, as one might hypothesize, approaches the overall higher education spending per FTE growth rate mentioned at the beginning of this section. Finally, remember that we’ve been talking about costs. Price is covered in the sections on tuition (2.7) and discounting (7.5).

3. Institutional Expenditures 53
Figure 3.10. Trends in the Higher Education Price Index (HEPI) and Consumer Price Index (CPI) set equal to 1.0 in 1961 (upper panel) and trends in the annual inflation rate for each index (lower panel). Sources: Commonfund Institute (2017a) and BLS (US Bureau of
Labor Statistics 2018b).
0
2
4
6
8
10
12
1419
61
1963
1965
1967
1969
1971
1973
1975
1977
1979
1981
1983
1985
1987
1989
1991
1993
1995
1997
1999
2001
2003
2005
2007
2009
2011
2013
2015
2017
Inde
x Val
ue (1
961=
1.0)
HEPICPI
0%
2%
4%
6%
8%
10%
12%
14%
16%
1961
1963
1965
1967
1969
1971
1973
1975
1977
1979
1981
1983
1985
1987
1989
1991
1993
1995
1997
1999
2001
2003
2005
2007
2009
2011
2013
2015
2017
Annu
al In
flatio
n Ra
te
HEPICPI

Like Nobody's Business54
Box 3.1. Higher Education vs. Healthcare Cost IncreasesHigher education and healthcare both suffer from Baumol’s cost disease (see Section 3.7) in that they are labor-intensive sectors that don’t gain production efficiencies with increased scale. Decade-averaged indices of cost increases in each sector have been similar for the last three decades (Figure B3), 3% to 4% in the 1990s and 2000s and about 2% in the most recent decade.
Figure B3. Decade averages of annual percentage change in the Higher Education Price Index (HEPI) and inflation-adjusted National Healthcare Expenditures (NHE) per capita. Sources: Commonfund
Institute (2017a) and CMS (US Centers for Medicare & Medicaid Services 2018).
3.8 What can be done to control costs in higher education?
Many remedies have been suggested to counter the seemingly inexorable cost spiral in higher education. The ones most likely to be effective in the long run are those that address the root causes outlined in Section 3.7 rather than the symptoms (i.e., price), so policies to deal with the escalating costs of college should avoid price controls and focus on cost controls instead (National Commission on the Cost of Higher Education 1998).
Some examples of cost-reduction approaches are shown in Figure 3.11. Suggestions for operational efficiency that target Baumol’s cost disease range from prosaic cost-cutting to provocative change, such as outsourcing food services or rethinking athletics participation (Adams and Shannon 2006). Ideas for competing on outcomes aimed at minimizing the effects of Bowen’s Law focus on minimizing emphasis on reputation and prestige and instead providing meaningful data on instructional outcomes and incentivizing measured teaching quality and productivity (Martin and Gillen 2009).
0%
1%
2%
3%
4%
5%
6%
7%
8%
1960‐69 1970‐79 1980‐89 1990‐99 2000‐09 2010‐17
Annu
al Percentage Ch
ange
HEPI
NHE

3. Institutional Expenditures 55
Figu
re 3
.11.
Exa
mpl
es o
f cos
t-red
uctio
n ap
proa
ches
for h
ighe
r edu
catio
n ta
rget
ed a
t Bau
mol
effe
cts
(Ada
ms
and
Shan
non
2006
) an
d Bo
wen
ef
fect
s (M
artin
and
Gill
en 2
009)
.
COST‐RED
UCT
ION APP
ROAC
HES
$
COMPE
TING ON OUTCOMES
Target: B
owen
Effe
cts
•Re
duce uncertainty abo
ut college qua
lity
•Prov
ide da
ta on ou
tcom
es in
teaching
(e.g.,
learning
outcomes or skills achieved)
•Em
phasize value‐ad
ded ed
ucation pe
r dollar,
deem
phasize repu
tatio
n/prestig
e•
Reform
accreditatio
n•
Enab
le ra
ther th
an sup
press inn
ovation
•Expa
nd ra
ther th
an re
stric
t com
petition
•Ad
dress the principa
l‐agent problem
•Clearly
specify
fund
ing an
d staffin
g po
licies (e.g.,
teaching
load
s an
d stud
ent‐instructor ra
tios)
•Prov
ide meaningful d
ata on
teaching
qua
lity an
dprod
uctiv
ity, and
seriously incentivize them
•Re
form
institu
tiona
l governa
nce
•Ch
ange practices to
disclose all abo
ve points for
third
‐party sc
rutin
y
OPE
RATIONAL
EFFICIENCIES
Target: B
aumolEffects
•Ad
ministration
•Outsource non
‐core functio
ns (e
.g., dining
,bo
okstore)
•Stream
line de
cision
process (e
.g., RC
M)
•Limit legal &
regulatory exposure
•Create con
sortia (e
.g., insurance, purchasing)
•Ac
adem
ics
•Und
erstan
d prog
ram cost &
pric
ing
•Limit un
dersub
scrib
ed classes
•Leverage te
chno
logy, esp. o
nline
•Limit remed
iatio
n (high scho
ol alignm
ent)
•Re
view
research costs & produ
ctivity
•Athletics
•Justify
com
petitive level (e.g., D
iv. I, D
iv. II, etc.)
•Re
duce, rathe
r tha
n increase, num
ber o
f spo
rts for
Title
IX com
pliance

Like Nobody's Business56
Most institutions strive to be more productive and efficient in providing a quality education at a low price. There are few if any campuses that haven’t implemented operational efficiencies in recent decades, especially since the Great Recession, and one of the most widely-established trends has been the greater use of faculty not on the tenure-track to deliver instruction at lower cost (see Chapter 5). Many campuses have achieved some success in improving retention and graduation rates because of a focus on data, but progress in managing and marketing by outcomes metrics is generally far less advanced than for operational efficiencies. Overall, the most thoughtful suggestions for reducing costs, and those most likely to be adopted in practice, are those that improve quality and enhance competitiveness by creating higher value.
3.9 Does the university make a profit?
No. As nonprofit entities, it would seem self-evident that universities and colleges don’t make a profit (remember, I’ve specifically excluded for-profit institutions from our scope in this book and they are obviously set up to make a profit as their primary goal). And yet, with the myriad activities across a campus, there are inevitably unit-level or institutional surplus funds (or deficits) from year to year, often on purpose, although there are pitfalls if the surplus is too large (Bauman 2019). Informally, in a verbal shorthand, some might refer to such a surplus as a profit, but fortunately we have a precise and more appropriate term for use in the nonprofit sector: margin.
Why is a margin not a profit? They both have the connotation of “extra money left over” after subtracting costs from revenues, but if it isn’t saved for the next year then profit goes to shareholders as cash or to employees as a bonus. A nonprofit has no shareholders and its employees don’t get bonuses in a good year. Instead, nonprofits like universities have a social mission to benefit the public. Whether saved for later use or spent right away, at a nonprofit the margin is invested in the mission.
“No margin, no mission” is an adage that encapsulates the imperative for sound financial management of a nonprofit along with the necessity to grow funds for investing in improving and expanding the social mission. A university that is stagnant or under financial stress cannot do a decent job of serving its students or community. To do those things well, it must generate sufficient resources to deliver quality programs in addition to investing in adaptions and innovations to ensure its future success. In a nutshell, you can do more social good if you have a well-run institution with a margin that can help it continue to achieve and expand its mission (but beware of Bowen’s Law, see Section 3.7).

3. Institutional Expenditures 57
Box 3.2. The University’s Bottom Line(s)The so-called “bottom line” for a company is primarily to make a profit, whereas for a university the bottom line is social benefit in the form of educating students, discovering new knowledge, and serving the public. Profit is simple enough to define and measure in dollars. However, the three social bottom lines for universities are harder to define and measure, so we tend to use multiple metrics to monitor and manage them. Figure B4 illustrates the upward trends in two key examples of these non-monetary bottom lines, graduates and scholarly publications for the US. These are imperfect output metrics so, for example, the number of degrees conferred does not necessarily equate with quality of education and the number of scholarly articles published is a proxy for knowledge discovered. Universities can monitor their own versions of these and related metrics to track and manage outputs. More important perhaps, but often harder to track, are outcomes; for example, job placement and career path of graduates, or most influential publications and long-term benefits of basic discoveries.
Figure B4. Degrees conferred (bachelor’s, master’s and doctor’s) by postsecondary institutions per academic year and citable documents published in all subject areas in the SCOPUS database per calendar year, both for the United States. Sources: IPEDS (2020) and
SCImago (2018).
300,000
350,000
400,000
450,000
500,000
550,000
600,000
650,000
1,250,000
1,500,000
1,750,000
2,000,000
2,250,000
2,500,000
2,750,000
3,000,000
1996
1997
1998
1999
2000
2001
2002
2003
2004
2005
2006
2007
2008
2009
2010
2011
2012
2013
2014
2015
2016
2017
Citable Docum
ents
Degrees Con
ferred
Degrees Conferred
Citable Documents


4. Public Funding: Grant Aid, Loans and Appropriations
4.1 How does public funding for higher education work?
Public funding for higher education in the US, even just for public institutions, is relatively complicated as compared to many other countries where the national education ministry is the principal funder and overseer (see Section 4.14 later in this chapter). In the US, the states and some local governments fill most of this role (except for accreditation) for the public universities via appropriations. The Federal Government, rather than funding institutional budgets directly, supplies financial aid to students (depending on family income) who can use it to attend public or private institutions.1 Students and their families combine that aid with their own sometimes sizable contributions, and a portion of the combined amount flows to the institution as tuition, with the remainder used for living expenses. Many of these students will also receive substantial institutional aid from the university, as we saw in Chapter 3.
Figure 4.1 illustrates the four main players and the relative sizes of the flows between them for US public higher education. The two big public funding arrows are federal aid and state appropriations. The relative contributions of the Federal Government and the states have become more equal in recent decades, especially since the Great Recession. State spending used to dominate federal spending on higher education, but state funding declines occurred while the Federal Pell Grant Program expanded considerably (The Pew Charitable Trusts 2015). We’ll examine these two major funding sources below and in subsequent sections, but before doing that, let’s look briefly at the other arrows in the diagram.
1 The last decade saw a widening student aid scandal at for-profit colleges, where in many cases federal grants and loans accounted for over 90% of revenue, repeating a pattern that was seen in the past, such as with the GI Bill (Shireman 2017).
© Andrew C. Comrie, CC BY 4.0 https://doi.org/10.11647/OBP.0240.04
The institutional aid arrow looks narrower here than you might think from the pie charts of school types in Chapter 3—that’s because there are thousands of small four-year and two-year colleges in the overall higher education sector that sway the average to look more like their profile. Government grants and contracts made directly to the institutions are the other main flows in the diagram, and we’ll cover

Like Nobody's Business60
Figure 4.1. Public higher education funding flows with arrow thickness scaled to FY2012. State funding includes appropriations as well as grants and contracts for research. Federal and state flows represent aid to undergraduates. Federal grants to states include only higher education programs related to affordability. Land-grant appropriations and federally funded research projects are included as part of the funding from the Federal Government. Benefits from tax credits and deductions for higher education are not included. Source: redrafted from GAO (US Government Accountability Office 2014),
Public domain, https://www.gao.gov/products/GAO-15-151.
Public Colleges& Universities
Grants Grants
Grants,Contracts,Appropriations
Grants,Contracts,
Appropriations
InstitutionalStudent Aid
Tuition &Fees
Grants, Loans,Work Study
Students(& Families)
StateGovernment
FederalGovernment
those in more detail when we discuss Research in Chapter 8. For the private institution version of Figure 4.1, one could simply omit state appropriations to universities (keeping grants and contracts), thereby switching that arrow from broad to narrow, and the overall result would be approximately correct. It would be even closer to correct if one made the federal arrow to students somewhat narrower to reflect the smaller proportion of Pell Grant students attending private institutions. In terms of the budgets from which these expenditures come, federal spending on higher education is about 2% of all federal spending, while higher education averages about 9% of state spending (The Pew Charitable Trusts 2015).
To provide a relative sense of the public funding numbers, Figure 4.2 illustrates the major categories of aid and loan amounts for all undergraduate and graduate students. We see that federal grants exceed state and private grants while institutional grants top them all (as seen in Sections 2.8 and 3.6). In contrast, federal loans greatly exceed non-federal loans from banks, credit unions, private lenders, some states, and institutions. It is notable how small the Federal Work-Study Program is in comparison to the grant and loan programs, and at almost $1B (that’s Billion with a “B”) it also provides a scale reference for the staggeringly large numbers in the figure. All

4. Public Funding 61
these federal funds are accessed by the student who must submit a FAFSA (Free Application for Federal Student Aid) form that includes information on student and family income. And, just so it’s been said, grants do not need to be repaid and they lower the price paid, whereas loans do need to be repaid but they enable the costs to be spread out over time.
Figure 4.2. Student financial aid and loans for FY2017. Source: College Board (Baum et al. 2017).
4.2 How does aid add up on a per-student basis?
The total national investments in various forms of aid can be expressed in per-student FTE terms, making it easier to see the mix of aid for the average student. Figure 4.3 illustrates trends in aid mix separately for undergraduates and graduate students because their aid profiles are different. In the academic year 2016–17 (AY2017) undergraduates received an average of $14,400 mostly made up of federal grants and loans, proportionally about 2:1, with much smaller amounts from other federal sources and non-federal loans. In contrast, graduate students received about double that aid at $27,950 with the federal grant to loan proportion reversed at roughly 1:2. Put another way, federal grant aid per student was similar at roughly $9,000, but graduate students received almost four times more in loans than undergraduates ($17,710 versus $4,620). There are multiple reasons involved in that difference, including prior years as a student with loans and, in some cases, anticipated higher subsequent earnings from pricier professional programs potentially justifying a higher loan. We’ll take a closer look at student indebtedness in Section 7.11.
$0
$10,000
$20,000
$30,000
$40,000
$50,000
$60,000
Pell Grants
Veterans and
Military
Fed Supp
Edu
c Opp
Grants
Unsub
sidized Stafford
Subsidized
Stafford
ParentPLUS
GradP
LUS
Perkins Loan
s
Education Tax Be
nefits
Fede
ral W
ork‐Stud
y
Institu
tiona
l Grants
Private & Employer Grants
State Grants
NON‐FED
ERAL
LOAN
S
FEDERAL GRANTS FEDERAL LOANS FEDERAL OTHER NON‐FEDERAL GRANTS
FY20
17 Stude
nt Aid and
Loa
ns ($
Millions)

Like Nobody's Business62
Figure 4.3. Average federal aid and non-federal loans per FTE undergraduate (upper panel) and graduate student (lower panel) in 2016 dollars by academic year. The shaded vertical bar indicates the onset of the Great Recession. Source: College Board (Baum et al. 2017).
Looking at trends in Figure 4.3, federal grant aid (mostly Pell Grants) has essentially tripled in nearly three decades, with a rapid post-recession acceleration for undergraduate aid. The growth in federal loans for undergraduates paralleled grant aid but has declined substantially (by about one third) since the recession. Graduate federal loans grew dramatically (almost five-fold) in the 1990s and 2000s, before
$0
$2,000
$4,000
$6,000
$8,000
$10,000
$12,000
$14,000
$16,000
$18,000
$20,000
1991 1993 1995 1997 1999 2001 2003 2005 2007 2009 2011 2013 2015 2017
Aver
age A
id p
er F
TE U
nder
grad
uate
(201
6 Do
llars
)
Federal Grant AidFederal LoansNon-Federal LoansEducation Tax BenefitsFederal Work-Study
$0
$2,000
$4,000
$6,000
$8,000
$10,000
$12,000
$14,000
$16,000
$18,000
$20,000
1991 1993 1995 1997 1999 2001 2003 2005 2007 2009 2011 2013 2015 2017
Aver
age
Aid
per F
TE G
radu
ate
Stud
ent (
2016
Dol
lars
)
Federal Grant AidFederal LoansNon-Federal LoansEducation Tax BenefitsFederal Work-Study
$0
$2,000
$4,000
$6,000
$8,000
$10,000
$12,000
$14,000
$16,000
$18,000
$20,000
1991 1993 1995 1997 1999 2001 2003 2005 2007 2009 2011 2013 2015 2017
Aver
age A
id p
er F
TE U
nder
grad
uate
(201
6 Do
llars
)
Federal Grant AidFederal LoansNon-Federal LoansEducation Tax BenefitsFederal Work-Study
$0
$2,000
$4,000
$6,000
$8,000
$10,000
$12,000
$14,000
$16,000
$18,000
$20,000
1991 1993 1995 1997 1999 2001 2003 2005 2007 2009 2011 2013 2015 2017
Aver
age
Aid
per F
TE G
radu
ate
Stud
ent (
2016
Dol
lars
)
Federal Grant AidFederal LoansNon-Federal LoansEducation Tax BenefitsFederal Work-Study

4. Public Funding 63
dropping back a little. The grant to loan ratio for undergraduates was near 1:1 until after the Great Recession when federal and non-federal loans began a steady decrease. For graduate students, despite the overall upward trends and higher amounts, the 1:2 grant-to-loan ratio has been roughly consistent since the mid-1990s.
Virtually all states provide grant aid to selected students, although the average amounts per student FTE are a lot smaller, at about 10% of federal aid grants (but remember that states also make appropriations that are often large—we’ll examine them in subsequent sections). Figure 4.4 shows the average amount of state aid per student over time for all states, averaging $790 per student in AY2016, with a range from $0 in New Hampshire to $2,100 in South Carolina (Baum et al. 2017). Just as for the federal data above, the denominator here for the state data is all students, to enable direct comparison. Note therefore that the denominator is not limited to eligible in-state students, and thus dollar amounts averaged across only in-state students would be a bit higher. However, the trends and proportions are unaffected by this quirk. Think of these numbers as aid for the average student across all students. We’ll look at aid per awarded student in the next section.
Figure 4.4. State grant aid per FTE (in-state and out-of-state) undergraduate in 2015 dollars by academic year. The wider shaded bar indicates the onset of the Great Recession. Source:
College Board (Baum et al. 2017).
As with other aid and loans, a substantial part of these state aid amounts will flow to institutions via tuition (in addition to state appropriations for public universities). Be aware that, rather than using tax revenues, some states fund their aid programs through so-called tuition set-asides where all students contribute a small amount to the state aid pool. As we can see in Figure 4.4, the proportion of need-based awards
$0
$100
$200
$300
$400
$500
$600
$700
$800
$900
1991
1992
1993
1994
1995
1996
1997
1998
1999
2000
2001
2002
2003
2004
2005
2006
2007
2008
2009
2010
2011
2012
2013
2014
2015
2016
State Grant Aid per FTE
Und
ergrad
uate (2
015 Dollars)
Non‐Need‐Based
Need‐Based

Like Nobody's Business64
has held at about 75% since the turn of the millennium. The relative role of state aid has shrunk over time, with the twenty-five-year trends in Figure 4.3 and Figure 4.4 exhibiting a 4% annual average increase in federal grant aid per student compared to the overall state aid trend, which exhibits about a 2.5% annual average increase per student. In this chapter we are focused on the macro supply of public funding—we’ll examine the student perspective related to indebtedness and affordability in Chapter 7.
4.3 What proportion of students get state aid, and how much do they get?
Figure 4.5 is a scatterplot of FY2016 state grant aid by award amount and the percentage of students awarded, for all fifty states plus Puerto Rico and the District of Columbia, as well as the national averages. Figure 4.6 provides the matching percentages of need-based versus non-need-based aid. Note that graduate students are included in the data behind these figures, but their effect is negligible because over 98% of state aid goes to undergraduates (NASSGAP 2017). Overall, looking at both figures, the national average shows that just under 30% of students were awarded state aid of about $2,400
Figure 4.5. FY2016 average grant aid per award and percentage of enrolled FTE awarded by state, including the District of Columbia (DC), Puerto Rico (PR), and the national average
(USA). Source: NASSGAP (2017).
NE
PRUT
AL
MA
OR
RI
ME
MS
WI
SD
FLNV
NM
VT
MIOH
ND
KS
KY
CO
MN
MO
HIMT
NJ
OK
WV
MD
TN
NH
PA
AZ
NC
CT
USA
TXAK
VA
GA
AR
WY
DE
SC
IA
ID
IL
NY
LA
WA
IN CA
DC
0%
10%
20%
30%
40%
50%
60%
70%
80%
$‐ $1,000 $2,000 $3,000 $4,000 $5,000 $6,000 $7,000
FY20
16 Awards per FTE
Enrolled
FY2016 State Grant Aid per Award

4. Public Funding 65
in FY2016, about three-quarters of which was need-based. There are extremely wide ranges by state: Washington, DC awarded just 6% percent of students with large non-need-based grants of almost $7,000, Nebraska awarded over 70% of students an average award of just a few hundred dollars in mostly need-based aid, and Alabama awarded under 5% of students with less than $1,000 split about equally into need-based and non-need-based aid.
Figure 4.6. FY2016 average percentage of need-based and non-need-based state grant aid per award, including the District of Columbia (DC), Puerto Rico (PR), and the national average
(USA). Source: NASSGAP (2017).
In addition to the obvious implications for students, there are consequences for institutions resulting from this broad range in state aid for students. Depending on their home state, and all else being equal, institutions will increase or decrease institutional aid to offset lower or higher state aid respectively, for total costs to the student to remain similar. This effect is amplified because in high-aid states, that aid effectively supplements institutional tuition revenue, whereas not only do institutions in low-aid states not receive that aid revenue, but they also must subtract the compensating institutional aid from their relatively lower revenue.
4.4 How does public financial aid vary by institution?
In the previous sections on public financial aid we have looked nationally and at the states and, sure enough, aid plays out differently across various types of institutions too. Figure 4.7 plots aid per award versus percentage of students receiving awards,
0%
10%
20%
30%
40%
50%
60%
70%
80%
90%
100%
GA
NH DC SD AR LA SC UT
TN NM NV AK MT FL MS
WV AL KY ND
MO DE
OH
USA VA OK NE IA CO ID NY
MA CT MD WI
IN NJ
NC MI
MN VT PA IL CA OR
WA AZ HI
KS ME PR RI TX WY
FY20
16 Need‐Ba
sed & Non
‐Need‐Ba
sed State Aid
Non‐need‐basedNeed‐based

Like Nobody's Business66
Figure 4.7. FY2016 government grant aid to first-time full-time (FTFT) undergraduates by average amount per student awarded and by percentage of students awarded from federal (upper panel) and state and local sources (lower panel), averaged by Carnegie classification and control. Categories are differentiated by circle size and color for easier comparison.
Source: IPEDS (2020).
R1 PublicR2 Public
R3-M3 Public BAS Public
R1 Private
R2 Private
R3-M3 Private
BAS Private
0%
5%
10%
15%
20%
25%
30%
35%
40%
45%
50%
$3,000 $3,500 $4,000 $4,500 $5,000 $5,500 $6,000 $6,500
FY20
16 FT
FT U
nder
grad
s Aw
arde
d St
ate/
Loca
l Gra
nts
FY2016 Average State/Local Grant per FTFT Undergraduate
R1 Public
R2 Public
R3-M3 Public
BAS Public
R1 Private
R2 Private
R3-M3 Private
BAS Private
0%
5%
10%
15%
20%
25%
30%
35%
40%
45%
50%
$3,000 $3,500 $4,000 $4,500 $5,000 $5,500 $6,000 $6,500
FY20
16 FT
FT U
nder
grad
uate
s Aw
arde
d Fe
d. G
rant
s
FY2016 Average Fed. Grant per FTFT Undergraduate

4. Public Funding 67
averaged by category of institution. Government financial aid is primarily based on need and, because the mix of students with need varies by type of institution, we see the effect of that pattern in these data. Generally, students with greater need tend to enroll in relatively higher proportions at smaller rather than larger schools, and at publics more than privates, even though many schools go to great lengths to broaden the financial diversity of their student body and promote accessibility.
The two key patterns in federal aid in Figure 4.7 are firstly that students at private institutions receive higher aid awards than at the publics (likely to cover higher tuition) with a narrow award range close to $4,700 at the publics and, secondly, that, as expected, there is a greater proportion of students receiving federal aid at smaller regional schools, public and private. The state and local panel in Figure 4.7 shows a completely different pattern: the public-private contrast is evident in the higher percentage of students receiving aid at the publics (this is partly because many states do not provide aid to private institutions), which in this case also have the broader award range across different institution types compared to the privates. Looking across both sources of government financial aid, a similar percentage of students are awarded federal and state/local aid. However, federal aid awards are greater than state/local aid awards: the amount of federal aid per award is about $1,000 more than the state/local award at the publics, and roughly $1,500 more at the privates.
Figure 4.8 illustrates the trends in government grant aid for public and private institutions (the Carnegie groups track similarly to their relative positions in Figure 4.7, so I’ve plotted just public and private summary data to show the key trends and keep the charts legible). At both types of school, the percentage of students awarded federal grant aid gradually declined from the late 1990s until the recession and then jumped immediately post-recession to about 1.3 times the pre-recession level, before again commencing a gradual decline. Looking at the amount of federal aid awarded per student, there was a similar post-recession jump with sizable increases in award amounts before they dropped back down to the longer upward trend. Yet, the steep drops of over $1,000 immediately post-recession did not occur without consequence (especially when federal loans were flat at the same time, as we’ll see in the next section)—in partial compensation, institutional support rose during this period (as we saw in Chapter 3).
State aid trends are stark in their contrast, with the percentage of students receiving awards at the publics essentially flat since a period of rapid growth at the turn of the millennium, although state award amounts at those schools have steadily increased and almost doubled over the period in the chart. However, at the privates, the percentage of students receiving state aid awards has decreased steadily while award amounts have also decreased slightly. The net result, on an inflation-adjusted per student basis, has been a distinct shift in state aid dollars from private to public institutions over the last decade and a half.

Like Nobody's Business68
Figure 4.8. Trends in grant aid (by fiscal years in 2016 dollars) awarded to first-time full-time (FTFT) undergraduates by percentage of students awarded (upper panel) and by average amount per student receiving an award (lower panel) from federal and state and local
sources, averaged for public and private universities. Source: IPEDS (2020).
$1,000
$2,000
$3,000
$4,000
$5,000
$6,000
$7,000
1999 2000 2001 2002 2003 2004 2005 2006 2007 2008 2009 2010 2011 2012 2013 2014 2015 2016
Aver
age
Gran
t Aw
ard
per F
TFT
Unde
rgra
d (F
Y201
6 Do
llars
)
Federal (Public)State & Local (Public)Federal (Private)State & Local (Private)
0%
5%
10%
15%
20%
25%
30%
35%
40%
45%
50%
1999 2000 2001 2002 2003 2004 2005 2006 2007 2008 2009 2010 2011 2012 2013 2014 2015 2016
FTFT
Und
ergr
adua
tes A
war
ded
Gran
t Aid
Federal (Public)State & Local (Public)Federal (Private)State & Local (Private)

4. Public Funding 69
4.5 What are the amounts and trends in student loans?
Previously, in Section 4.2, we saw how student loan aid compared to grant aid across all students. How do student loans look when we examine them on a per-awarded student basis as we’ve just done for financial aid? Figure 4.9 illustrates student loans by award amount and percentage of students awarded, for all loans and for federal
Figure 4.9. FY2016 loan aid to first-time full-time (FTFT) undergraduates by average amount per student awarded and by percentage of students awarded from federal (upper panel) and all sources (lower panel), averaged by Carnegie classification and control. Categories are differentiated by circle size and color for easier comparison. Source: IPEDS (2020).
R1 Public
R2 PublicR3-M3 Public
BAS Public
R1 Private
R2 Private
R3-M3 Private
BAS Private
20%
30%
40%
50%
60%
70%
80%
$4,000 $5,000 $6,000 $7,000 $8,000 $9,000
FY20
16 FT
FT U
nder
grad
s Aw
arde
d Fe
dera
l Loa
n
FY2016 Average Federal Loan per FTFT Undergraduate
R1 Public
R2 PublicR3-M3 Public
BAS Public
R1 Private
R2 Private
R3-M3 Private
BAS Private
20%
30%
40%
50%
60%
70%
80%
$4,000 $5,000 $6,000 $7,000 $8,000 $9,000
FY20
16 FT
FT U
nder
grad
uate
s Aw
arde
d St
uden
t Loa
ns
FY2016 Average Student Loans per FTFT Undergraduate
R1 Public
R2 PublicR3-M3 Public
BAS Public
R1 Private
R2 Private
R3-M3 Private
BAS Private
20%
30%
40%
50%
60%
70%
80%
$4,000 $5,000 $6,000 $7,000 $8,000 $9,000
FY20
16 FT
FT U
nder
grad
s Aw
arde
d Fe
dera
l Loa
n
FY2016 Average Federal Loan per FTFT Undergraduate
R1 Public
R2 PublicR3-M3 Public
BAS Public
R1 Private
R2 Private
R3-M3 Private
BAS Private
20%
30%
40%
50%
60%
70%
80%
$4,000 $5,000 $6,000 $7,000 $8,000 $9,000
FY20
16 FT
FT U
nder
grad
uate
s Aw
arde
d St
uden
t Loa
ns
FY2016 Average Student Loans per FTFT Undergraduate

Like Nobody's Business70
loans (which account for the vast bulk of all loans) for first-time full-time students. The average federal loan amount is similar across all types of institutions, in a narrow range between $5,000 and $6,000 in FY2016. In contrast, the percentage of students with federal loans varies widely across types of institutions with roughly 40–60% across the publics and a remarkable range from about 25–70% across the privates. The R1 privates likely have low percentages of students with loans due to a high capacity to offer institutional aid and lower relative enrollments of financially needy students, as compared to the R3-M3 privates where most students are borrowing, likely because those institutions have a low capacity to offer institutional aid and have higher relative enrollments of financially needy students. As we saw in Chapter 2, these latter institutions are also those with the greatest tuition dependency—the student loan situation is yet another example of the serious challenges facing such schools.
There is an increment of about $1,000 to $3,000 above the federal amount when we consider all loans averaged across students with loans. Notice how carefully I phrased that—the data for remaining non-federal loans are distributed differently and these overall averages can be deceiving because “students with loans” includes those with just federal loans, those with just other loans, and those with both. The matching data for other non-federal loans are shown in Figure 4.10. Some first-time students are borrowing on average two to three times the amount of federal loans in other loans,
Figure 4.10. FY2016 other non-federal student loan aid to first-time full-time (FTFT) undergraduates by average amount per student awarded and by percentage of students awarded, averaged by Carnegie classification and control. Categories are differentiated by circle size and color for easier comparison. As a reference to highlight the different scales of these other loan data, the federal loan data from Figure 4.9 are plotted in the gray rectangle corresponding to the axis ranges used in that figure. Source: IPEDS (2020).
R1 PublicR2 PublicR3-M3 PublicBAS Public R1 Private
R2 PrivateR3-M3 PrivateBAS Private
0%
10%
20%
30%
40%
50%
60%
70%
80%
$4,000 $7,000 $10,000 $13,000 $16,000 $19,000
FY20
16 FT
FT U
nder
grad
s Aw
arde
d Ot
her L
oan
FY2016 Average Other Loan per FTFT Undergraduate

4. Public Funding 71
more at the privates than at the publics and as much as $18,000 at R2 private schools. Fortunately, only a small fraction of students takes out these large other loans, about 6% at the publics and about 10% at the privates (except R1 privates where it’s 4%).
That takes us back to the lower panel in Figure 4.9—it’s the small proportion of students with high other loans that raise the all-sources average above the federal amount. I’ve included the all-sources number because we have much longer trend data for this amount than for the subcategory amounts. Given the media hype about student loans (warranted hype when applied to the for-profit sector in particular), it is instructive to note that averaged across all types of institution, 53% of students have loans and for those who do, their loans average $7,228 in FY2016. For these students, that’s about $30,000 over four years of study. If we average that number across all students for the “average student debt”, it is about half: approximately $15,000. Unquestionably, we’d like that number to be as close to zero as possible, but this amount of debt for the average student compared to a lifetime of increased earnings is still an unbeatable deal. On the other hand, there is a tiny percentage of students who borrow immense amounts into the hundreds of thousands, many of whom will struggle with that debt for years or decades. We’ll return to student indebtedness in Section 7.11.
Trends in student loans by institution type generally track their relative positions in Figure 4.9 and Figure 4.10, so I’ve plotted summaries of the trends by public and private institution in Figure 4.11 to keep the charts uncluttered as I did for financial aid. At the publics, we see a flat percentage of students with loans in the mid-40% range that rises in the pre- and post-recession years and then levels off in the mid-50% range. At the privates there has been variability in the mid-50% range for a long time, and this dropped slightly post-recession. In the shorter period we have for the breakout data, we see almost identical patterns in the federal loan percentages and a decrease in other non-federal loans by as much as one third at the privates. The one pattern that is masked in these summary trends is the dramatic decrease in the percentage of students with loans at R1 privates, from 48% in FY1999 down to 28% in FY2016—as mentioned before, these institutions are best-positioned to use institutional aid in offsetting costs to students.
Moving on to loan amounts, most of the jump of about $2,000 across all student loans occurred from FY2007–FY2009 and they have been essentially flat since then (in real dollars adjusted for inflation). The loan amounts of federal loans have decreased slightly in recent years, but other non-federal loan amounts have continued a steep, steady increase of almost $3,000 since the recession for that small percentage of students who take out these loans. Clearly, with the amounts for federal loans staying relatively flat over that period, the market has stepped in for a certain category of student.
A final point on trends in student borrowing: the share who borrow and the amounts borrowed also vary by income level. Comparing changes from FY1996 to FY2016, both shares and amounts have risen, especially in the upper two quintiles (income greater than $69,000) where the share of bachelor’s degree completers borrowing doubled and the amounts more than doubled (Delisle 2019). High-income families borrow

Like Nobody's Business72
more than low-income families and they do so at rates that now approach those of low-income families. Importantly, though, for high-income families the loan amounts at graduation are a much smaller proportion of family income (less than half), while for the lower-income quintiles the amounts can be equivalent to double the annual income (Delisle 2019; Seltzer 2019a).
Figure 4.11. Trends in student loan aid (by fiscal years in 2016 dollars) awarded to first-time full-time (FTFT) undergraduates by percentage of students awarded (upper panel) and by average amount per student receiving an award (lower panel) from all, federal and other sources, averaged for public and private universities. Loan data broken out by
category are only available from FY2008 onwards. Source: IPEDS (2020).
0%
10%
20%
30%
40%
50%
60%
70%
1999 2000 2001 2002 2003 2004 2005 2006 2007 2008 2009 2010 2011 2012 2013 2014 2015 2016
FTFT
Und
ergr
adua
tes A
war
ded
Stud
ent L
oans
Student Loans (Public)Student Loans (Private)Federal Loans (Public)Federal Loans (Private)Other Loans (Public)Other Loans (Private)
$-
$2,000
$4,000
$6,000
$8,000
$10,000
$12,000
$14,000
$16,000
1999 2000 2001 2002 2003 2004 2005 2006 2007 2008 2009 2010 2011 2012 2013 2014 2015 2016
Aver
age
Loan
per
FTFT
Und
ergr
adua
te
Student Loans (Public)Student Loans (Private)Federal Loans (Public)Federal Loans (Private)Other Loans (Public)Other Loans (Private)

4. Public Funding 73
4.6 What is the history of state investment in higher education?
If there is a topic in higher education funding that gets as much press as tuition or student loans, it might be state appropriations. On public university campuses, state funding (or the lack thereof) has been the leading funding topic for decades. As a result, there is plenty of myth and misunderstanding on this subject. So, let’s shed some light by looking at the numbers, starting with the long view. By combining data from multiple sources, I have managed to assemble a unique almost century-long data set on state funding and associated variables, which we’ll examine in this section.
State investments in higher education take place in the context of broader economic conditions, illustrated in Figure 4.12. Important macroeconomic dynamics and policies undergird these trends—I’ll briefly review the major features, but I’ll leave further explanation to the economists. The classic national economic indicator is Gross Domestic Product (GDP), known as real GDP in its inflation-adjusted form. The historical trend in real GDP shows the Great Depression, a spending surge in World War II (WWII), the postwar expansion of the 1950s and 1960s, a slowdown in the 1970s followed by continued overall growth with expansion/recession every five to ten years through the 1980s, 1990s and early 2000s, and most recently the Great Recession that began in 2008–09 and lasted several years.
Figure 4.12. Historic trends in real (inflation-adjusted) GDP (calendar years) and all state expenditures (fiscal years, 2016 dollars). Sources: Bureau of Economic Analysis (2018a; 2018b).
Looking at the total expenditures of all the states (i.e., on everything, not just higher education, and adjusted for inflation) in Figure 4.12, not surprisingly we see the same broad growth over the century, but with some notable variations. State
$0.0
$0.5
$1.0
$1.5
$2.0
$2.5
$3.0
$3.5
$0
$3
$6
$9
$12
$15
$18
$21
1930
1933
1936
1939
1942
1945
1948
1951
1954
1957
1960
1963
1966
1969
1972
1975
1978
1981
1984
1987
1990
1993
1996
1999
2002
2005
2008
2011
2014
2017
All State Expen
ditures (Trillions of 2
016 Dollars)
Real GDP (Trillio
ns)
Real GDP
All State Expenditures

Like Nobody's Business74
spending expanded dramatically during the 1960s, slowed down in the 1970s and then decreased into the early 1980s recession. State budgets grew modestly in the late 1980s, slowed in the 1990s, and as they accelerated again in the early 2000s they also became more volatile. The Great Recession saw the largest and longest decrease in state spending and has been followed by a modest recovery with slower growth than in GDP.
State appropriations for public higher education (also inflation-adjusted and including four-year and two-year institutions) roughly track the general economic trends over the last century (Figure 4.13). Two broad eras are discernable: first, a relatively smooth and remarkably steep expansion that occurred without interruption from the postwar years until 1979 and, second, a subsequent period of great volatility through to the present, characterized by numerous surges and cuts in appropriations (the Great Recession being the largest). We’ll compare these state higher education expenditures to all state spending below, but first let’s include enrollment.
Figure 4.13. Historic trends in all state higher education appropriations (2016 dollars) and total enrollment in all public degree-granting postsecondary institutions (four-year and two-year). Sources for appropriations: Snyder (1993) for FY1930–1959, odd years interpolated from even years; Grapevine for FY1960–1999 (Illinois State University, Center for the Study of Education Policy 2018); SHEEO-SHEF (2017) for FY2000–2017. Sources for enrollment: Snyder (1993) for FY1930–1947, odd years interpolated from
even years; NCES (National Center for Education Statistics 2017) for FY1948–2017.
It turns out that state appropriations have broadly tracked student enrollment in public institutions over the last century (Figure 4.13), although again the story is in the fluctuations. For the enrollment data, while FTE enrollment would be more precise, it has a much shorter data record than total enrollment, which I’ve shown
0
3
6
9
12
15
18
$‐
$20
$40
$60
$80
$100
$120
1930
1933
1936
1939
1942
1945
1948
1951
1954
1957
1960
1963
1966
1969
1972
1975
1978
1981
1984
1987
1990
1993
1996
1999
2002
2005
2008
2011
2014
2017
Total Pub
lic Enrollm
ent (Millions)
State Ap
prop
riatio
ns (B
illions of 2
016 Dollars)
Enrollment (Public)
State Appropriations

4. Public Funding 75
instead—fortunately, their trend patterns are similar (and likewise, these enrollment data cover four-year and two-year institutions, matching the state funding). State funding variations don’t align directly with enrollment fluctuations for at least a couple of reasons. The main reason is that annual state higher education budgets are strongly influenced by political and economic forces that shape the entire state budget. The needs of, and political attitudes towards, higher education are of consequence in some years, but at other times alternate factors will dominate such as changes in tax revenue and spending on other rising costs like health. We’ll return to this topic in several ensuing sections. The other reason for state appropriation and enrollment fluctuations to be out of sync is that, while a little inconsistent, it’s not uncommon for enrollments to increase during economic downturns when jobs are harder to come by and people return to school to upgrade their education credentials.
Returning to enrollment trends, we can see the decrease in WWII followed by the increase associated with the GI Bill. Enrollments increased steadily from the early 1950s onwards, increasing even more steeply during the 1960s. This was when the baby boomers went to college, as well as many more women and people of color. The ideas of equality and access slowly made their way into policy during this time, some reflected in the recommendations of the 1947 Truman Commission (Gilbert and Heller 2010). At the national level there was a substantial expansion of federal aid. At the state level, community colleges also underwent huge growth in this period, opening at a rate of one per week in the late 1960s. After peaking in 1976, enrollments entered an era of approximately decade-long variations around a slower overall growth trend, which has continued through to the present day.
So, now that we’ve reviewed the context, what are the historical trends in state appropriations per student? Figure 4.14 illustrates the history of state investment per student in public higher education, using the same data as above including all postsecondary institutions (four-year and two-year) and adjusted for inflation. After some volatility before and during WWII, we see the characteristic steep postwar rise in state appropriations per student through the 1950s and 1960s into the mid-1970s, from about $3,500 to about $6,500. From that point onwards through to the late 2000s, per-student state appropriations went through a volatile period with several quasi-cyclical periods of 5–10% variations. The Great Recession was a signal event, with average state investment per student dropping from $6,722 in 2008 to $4,981 in 2012 (a 26% cut). This recent drop mirrors the one in the Great Depression of the 1930s and is about half the size of the postwar rise. For the record, that 2012 number was last seen in 1959! It has bounced back a little in the last few years, but contemporary state investment per student is the same as in the 1960s.

Like Nobody's Business76
Figure 4.14. Historic trend in all state higher education appropriations per student in all degree-granting postsecondary institutions (four-year and two-year), in 2016 dollars using total enrollment. Sources for appropriations: Snyder (1993) for FY1930–1959, odd years interpolated from even years; Grapevine for FY1960–1999 (Illinois State University, Center for the Study of Education Policy 2018); SHEEO-SHEF (2017) for FY2000–2017. Sources for enrollment: Snyder (1993) for FY1930–1947, odd years interpolated from
even years; NCES (National Center for Education Statistics 2017) for FY1948–2017.
Early in Chapter 2 we saw that our institutional budgets have doubled in the last fifteen years, and yet, as I mentioned, that fact didn’t align with the lived experience on campus. Now we see why—those increases went to inflation, and especially to enrollment growth. If we calculate the year-to-year percentage changes in state appropriations per student, the result is a chart that illustrates how state appropriations were felt by institutional budgets (Figure 4.15). The long, uninterrupted period of state funding increases from 1945 to 1979 is clear, followed by almost four decades of alternating increases and decreases.
$2,500
$3,000
$3,500
$4,000
$4,500
$5,000
$5,500
$6,000
$6,500
$7,000
$7,5001930
1933
1936
1939
1942
1945
1948
1951
1954
1957
1960
1963
1966
1969
1972
1975
1978
1981
1984
1987
1990
1993
1996
1999
2002
2005
2008
2011
2014
2017
State Ap
prop
riatio
ns per Stude
nt (2
016 Dollars, Total Enrolled)
We can do a related calculation and express state higher education appropriations in relation to the economy, or more specifically to overall state budgets. Those values are illustrated in Figure 4.16 as a percentage of GDP and as a percentage of overall state expenditures. The two measures show similar patterns, with the recognizable postwar growth through to the highpoint in 1975 for the GDP curve and to the early 1980s for the state budget curve. The post-1980s plunge, however, is stark and dramatic. Relative to the overall economy and to state budgets, state appropriations to higher education have dropped by almost half over the last three decades. States have not invested this small a percentage of their budgets (slightly over 3%) in higher education since the late 1950s.

4. Public Funding 77
Figure 4.15. Historic annual percentage change in all state higher education appropriations (2016 dollars). Sources: Snyder (1993) for FY1930–1959, odd years interpolated from even years; Grapevine for FY1960–1999 (Illinois State University, Center for the Study of
Education Policy 2018); SHEEO-SHEF (2017) for FY2000–2017.
-25%
-20%
-15%
-10%
-5%
0%
5%
10%
15%
20%
25%
1930
1933
1936
1939
1942
1945
1948
1951
1954
1957
1960
1963
1966
1969
1972
1975
1978
1981
1984
1987
1990
1993
1996
1999
2002
2005
2008
2011
2014
2017
Annu
al C
hang
e in
Infla
tion-
Adju
sted
Stat
e Ap
prop
riatio
ns
X
Figure 4.16. Historic trends in all state higher education appropriations as a percentage of real (inflation-adjusted) GDP and of all state expenditures (2016 dollars). Sources for appropriations: Snyder (1993) for FY1930–1959, odd years interpolated from even years; Grapevine for FY1960–1999 (Illinois State University, Center for the Study of Education Policy 2018); SHEEO-SHEF (2017) for FY2000–2017. Sources for state expenditures and
GDP: Bureau of Economic Analysis (2018a; 2018b).
1.0%
1.5%
2.0%
2.5%
3.0%
3.5%
4.0%
4.5%
5.0%
5.5%
6.0%
0.0%
0.1%
0.2%
0.3%
0.4%
0.5%
0.6%
0.7%
0.8%
0.9%
1.0%
1930
1933
1936
1939
1942
1945
1948
1951
1954
1957
1960
1963
1966
1969
1972
1975
1978
1981
1984
1987
1990
1993
1996
1999
2002
2005
2008
2011
2014
2017
State Highe
r Edu
catio
n Ap
prop
riatio
n Share of
All State Expen
ditures
State Highe
r Edu
catio
n Ap
prop
riatio
n Share of GDP
(infla
tion ad
justed
)
% of Real GDP% of State Expenditures

Like Nobody's Business78
Not surprisingly, many in public higher education view this as a travesty. Despite being a fundamental shift that has been underway for decades, universities were in denial and throughout the 1990s and the early 2000s they (we!) clung to hopes of a return to the halcyon days of long ago. Looking at the swings of recent decades in Figure 4.14, such hopes weren’t without reason, but the structural decline in state higher education spending seen in Figure 4.16 is the deeper trend. Only with the shock of the Great Recession did public higher education lift its head out of the sand and acknowledge that the old days of growth and high state investment were not coming back anytime soon.
There are plenty of questions about all of this. Depending on their political bent, policy advocates wring their hands about massive state defunding of higher education or about the upward spiraling costs of attending college. Others worry about the underlying shift in higher education from a public to a private good. Some believe that state legislatures “have it in” for higher education and will continue to cut, and yet others wonder where all those state expenditures have gone instead. We’ll return to those questions, but first we will take a closer look to see how this plays out across types of institutions and states.
4.7 How have state appropriations changed by type of institution?
Using a shorter data record, we can disaggregate the nationwide trends of the previous section and examine them for four-year schools by type of institution. Figure 4.17 shows the average state appropriations and enrollment across all the four-year public institutions in our data set. State appropriations (in 2016 dollars) had some large swings of 5–10% during the last thirty years, but have ended up essentially flat over that time, about $115M at the average institution. In contrast, average enrollments over the same period have grown by about 40%, currently about 15,000 students at the average institution. The one exception in enrollment trends is the group of 20 small public baccalaureate colleges—their enrollments (not shown) were mostly flat over this period, averaging about 2,200 until after the Great Recession; since then they have declined by almost 10% and were down to about 2,000 students at the average college in 2017, a worrying trend for those schools.
Figure 4.18 illustrates state appropriations per student (now as FTE rather than total enrollment that was necessary for the historical trends in the previous section) for the four Carnegie groups of public institutions. We see the same overall patterns with several pre-recession cycles followed by the post-recession decrease in per-FTE state funding. The R1 schools saw the largest absolute and relative decreases, about $4,000 per student or roughly one third. The R2 and R3-M3 schools saw decreases of around $1,500 per student, about 15–20%. The baccalaureates have seen fluctuations in per-student funding but have trended flat overall because of their post-recession enrollment declines mentioned above, which occurred concurrently with the decrease in funding. A recent study found that a 10% decrease in state appropriations at public

4. Public Funding 79
Figure 4.17. Trends in state appropriations and enrollment at public institutions, averaged within and then across the four Carnegie classification groups. Amounts are in 2016 dollars by fiscal year and twelve-month full-time equivalent enrollment by academic year. To provide long-term trends prior to 2004 (dashed line), twelve-month FTE enrollment is estimated from total Fall enrollment (full-time plus part-time) by using the average
2004–2006 ratio of the two for each Carnegie group. Source: IPEDS (2020).
10,000
11,000
12,000
13,000
14,000
15,000
16,000
$80
$90
$100
$110
$120
$130
$140
1987
1988
1989
1990
1991
1992
1993
1994
1995
1996
1997
1998
1999
2000
2001
2002
2003
2004
2005
2006
2007
2008
2009
2010
2011
2012
2013
2014
2015
2016
2017
FTE En
rollm
ent
State Ap
prop
riatio
ns (M
illions of FY2
016 Dollars)
State Appropriations
FTE Enrollment
Figure 4.18. Trends in state appropriations per student at public institutions, averaged by Carnegie classification. Amounts are in 2016 dollars per twelve-month full-time equivalent enrollment by fiscal and academic year. To provide long-term trends prior to 2004 (dashed lines), twelve-month FTE enrollment is estimated from total Fall enrollment (full-time plus part-time) by using the average 2004–2006 ratio of the two for each
Carnegie group. Source: IPEDS (2020).
$5,000
$6,000
$7,000
$8,000
$9,000
$10,000
$11,000
$12,000
$13,000
$14,000
1987
1988
1989
1990
1991
1992
1993
1994
1995
1996
1997
1998
1999
2000
2001
2002
2003
2004
2005
2006
2007
2008
2009
2010
2011
2012
2013
2014
2015
2016
2017
State Ap
prop
riatio
ns per FTE
Enrollm
ent (FY20
16 Dollars)
R1 Public
R2 Public
R3‐M3 Public
BAS Public

Like Nobody's Business80
research universities led to a 3.6% decrease in bachelor’s degrees awarded and a 7.2% decrease in PhD degrees completed; non-research publics had fewer alternative revenue sources that necessitated lower spending and higher in-state tuition (Bound et al. 2019).
We can compare these changes in state investment per student to total institutional spending on each student, using the E&R expenditures per FTE we examined in Section 3.4. Figure 4.19 shows state appropriations per FTE as a percentage of E&R expenditures per FTE for FY2006–2016 by Carnegie group for public institutions. There was a post-recession plunge from covering about 60% of education-related spending down to about 35% at most institutions, with the baccalaureate colleges showing much the same pattern but shifted about 5% higher. These dramatic changes represent a fundamental shift in society’s support of public higher education. More candidly, the states are no longer majority stakeholders in public higher education.
Figure 4.19. Recent trends in state appropriations per FTE enrolled at public institutions as a percentage of Education and Related (E&R) expenditures, averaged by Carnegie classification and based on amounts in 2016 dollars per twelve-month full-time
equivalent enrollment by fiscal and academic year. Source: IPEDS (2020).
4.8 How much does each state spend per student?
There is an extensive range in annual spending per student across the 50 states (see Figure 4.20), from about $3,000 in Vermont and New Hampshire to over $15,000 in Alaska, Wyoming, Illinois and Hawaii, with the US average slightly over $7,600 and the median slightly over $6,500 in FY2017. The reasons for the varying amounts are as different as the states themselves, depending variously on their revenues,
30%
35%
40%
45%
50%
55%
60%
65%
70%
2006 2007 2008 2009 2010 2011 2012 2013 2014 2015 2016
State Ap
prop
riatio
ns per FTE
as Share of E&R Expe
nditu
res
R1 Public
R2 Public
R3‐M3 Public
BAS Public

4. Public Funding 81
enrollments, policy environment, other demands on appropriations, etc. Note that these figures are for all postsecondary schools, two-year and four-year, and while the underlying data and analyses are similar to those in preceding sections, they are not identical.
Figure 4.20. FY2017 state and local funding for post-secondary education per student (upper panel) and ten-year change (FY2007–FY2017) in funding per student (lower panel), by state,
in 2017 dollars. Source: College Board (Ma et al. 2018).
The ten-year percentage change in state funding per student from FY2007–FY2017 spans the period preceding and following the recession (Figure 4.20). The percentages on the left axis are substantial—with a median of negative 12%, the majority of states are still considerably below their pre-recession investments in higher education, with Arizona (that also had increasing enrollments) and Louisiana down almost 40% over the decade. A handful of states’ investments are up over the decade, by 5–10%, with Montana at 13% and North Dakota at 53% (both with high oil revenues and low enrollments). The 56% increase for Illinois was a dramatic change aimed mostly at under-funded pensions (Ma et al. 2018), in contrast to the negative 23% for the five years FY2008–2013 in the heart of the recession (Weisman 2013). These data provide yet more evidence of how state higher education spending per student was slashed during the recession, and how it has not yet recovered (Mitchell et al. 2017).
$0
$3,000
$6,000
$9,000
$12,000
$15,000
$18,000
AK WY IL HI NY CT CA NE ND NM NC MA
MD ID GA ME US TX WA TN NJ NV MN AR KY OR FL IN UT DE RI SD MI
WI
MS KS IA VA MT
MO AL OK OH SC AZ LA WV PA CO VT NH
Stat
e &
Loca
l Fun
ding
per
FTE
-40%
-20%
0%
20%
40%
60%
IL ND MT CA NE HI NY OR SD WY
ME AK IN MD
MN TX AR CO US OH WA
MA
NM TN NC MS
WV ID CT UT GA MI
VA KS IA VT WI
KY RI SC DE NJ FL NH MO AL OK NV PA AZ LA
Chan
ge in
Fund
ing
per F
TEFY
2007
-FY2
017

Like Nobody's Business82
4.9 Where has state spending gone instead of higher education?
The largest expenditures in state budgets go to elementary and secondary education, followed by Medicaid, then higher education, and then corrections (Figure 4.21). Smaller amounts go to public assistance and transportation, with all other spending including, for example, budgets of state agencies. Higher education accounted for 9.7% of state general fund expenditures in FY2018—roughly one quarter of K-12 education spending and one half of Medicaid spending.
Figure 4.21. FY2018 general fund expenditures by category totaled for all states. Source: NASBO (2018).
With these proportions as context, the real story is in the trends (Figure 4.22). As we know from the preceding sections, state funding per FTE student has been in decline for some time, and we see that pattern when looking at higher education expenditures as a share of all state general fund expenditures, where it dropped from 15.5% in FY1987 to the 9.7% in FY2018 mentioned above. This systematic decrease can be viewed, perhaps simplistically, as part of a concerted policy to defund higher education. While there may be an argument to be made in that regard, the reality is more complicated: decreases in state support also reflect tough choices that states have had to make in reaction to compulsory Medicaid spending, escalating pension contributions, and wanting to sustain K–12 education (The Lincoln Project: Excellence and Access in Public Higher Education 2015). The main culprit is the rising cost of mandatory contributions to health services through Medicaid, which has increased 1.5 times since FY1987, from 8.1% to 20.2% of state general fund expenditures. Therefore, limiting the growth of healthcare costs is essential not only for healthcare reform but also for the public-higher-education landscape (Webber 2018). Interestingly, although
$‐
$50
$100
$150
$200
$250
$300
K‐12 Education Medicaid Higher Education Corrections Public Assistance Transportation All Other
FY20
18 State Gen
eral Fun
d Expe
nditu
res ($ Billion
s)

4. Public Funding 83
corrections are sometimes blamed for “receiving” the higher education dollars, the share spent on corrections has been essentially flat since the mid-1990s.
Figure 4.22. Trends in percentage share of state general fund expenditures for higher education, Medicaid and corrections, FY1987–2018. Source: NASBO (2018).
4.10 When did tuition revenue overtake state revenue?
In FY2010, for the first time, four-year public colleges and universities depended more on net tuition revenue than on state appropriations for funding support. We saw this in Section 4.7, where we broke out state appropriations as a share of E&R expenses by type of institution (Figure 4.19). Figure 4.23 illustrates state appropriations and net tuition revenue explicitly, where we can plainly see the FY2010 transition when the student share of educational cost first exceeded the state share. The two trends have diverged further since then, and in FY2016 the student share was almost 50% higher than the state share.
0%
5%
10%
15%
20%
25%
1987
1988
1989
1990
1991
1992
1993
1994
1995
1996
1997
1998
1999
2000
2001
2002
2003
2004
2005
2006
2007
2008
2009
2010
2011
2012
2013
2014
2015
2016
2017
2018
Share of State Gen
eal Fun
d Expe
nditu
res
Higher Education
Medicaid
Corrections
At the state level, for all postsecondary institutions (four-year and two-year), FY2017 marked the first time that over half of all states relied more on the student share than on the state share to fund public higher education (SHEEO-SHEF 2017). In other words, the median state share dropped below 50% for the first time in FY2017 (for the average it was FY2012). Figure 4.24 shows the FY2017 state share of public higher education funding relative to the student share on a state-by-state basis, with 28 states now below the 50% mark. As we’ve seen in related state comparisons, the states vary widely in per-FTE support of higher education, from 80% and more in California and Wyoming, to 21% and 13% respectively in New Hampshire and Vermont. Since the Great Recession, the state share has decreased in all but two

Like Nobody's Business84
Figure 4.23. Recent trends in state appropriations and net tuition revenue in 2016 dollars per FTE student at public institutions. Source: IPEDS (2020).
$‐
$2,000
$4,000
$6,000
$8,000
$10,000
$12,000
2002 2003 2004 2005 2006 2007 2008 2009 2010 2011 2012 2013 2014 2015 2016
Revenu
e Source per FTE
Enrolled
State Appropriation
Net Tuition Revenue
states (North Dakota and Wyoming) although most states’ relative ranking does not shift markedly from year to year (SHEEO-SHEF 2017).
Figure 4.24. FY2017 state higher education appropriations as a percentage share of combined educational revenues (state higher education appropriation per FTE plus net tuition
revenue per FTE). Source: SHEEO-SHEF (2017).
10%
20%
30%
40%
50%
60%
70%
80%
90%
WY CA NM HI
AK IL ID FL NC
NY
GA
NV TX NE
WA
MA UT
TN MO ND AR MD KY MS
WI
LA OK CT KS MT
ME
MN OR
OH RI NJ IN IA VA AZ WV SD SC AL MI
CO PA DE
NH VT
FY20
17 State Sha
re (A
ppropriatio
n % of E
ducatio
nal R
even
ue)

4. Public Funding 85
4.11 Do state funding cuts increase tuition?
Yes, cuts in state appropriations to public universities do increase tuition, but not in a 1:1 relationship. Figure 4.25 illustrates the relationship over three decades as annual percentage changes and, generally, tuition rises more when state appropriations fall and vice-versa (FYI, the correlation between these data series is a bit over 0.4). Given the analyses in previous sections this question may seem like a no-brainer, although in politically-tilted debates on state higher education funding the effect is claimed to range from near zero to 100% (Seltzer 2017). We know from previous sections that when state appropriations decrease, institutions take a variety of actions to decrease expenditures and increase other revenues (e.g., cutting labor costs, enrolling more out-of-state students if the institution has market access to them) while increasing tuition as a partial offset. Using advanced analyses to adjust for extraneous effects (e.g., state limitations on tuition increases, political bias in appropriations) rather than simple correlation, the pass-through rate has averaged about 26% since the late 1980s, although before 2000 it was about 10% and since then it has been 32% (Webber 2017). Multiple analyses have come to similar conclusions, that state funding cuts explain a significant and likely growing portion of tuition hikes and, furthermore, beyond the debate between advocates for greater support of higher education or advocates for restraint in government spending, the reactions of an institution to decreased state investment depend on its market position (Baum et al. 2018b).
Figure 4.25. Annual percentage change in inflation-adjusted published tuition and fees (in-state) and state appropriations per FTE student enrolled at public institutions, by fiscal year.
Source: IPEDS (2020).
‐15%
‐10%
‐5%
0%
5%
10%
15%
1989
1990
1991
1992
1993
1994
1995
1996
1997
1998
1999
2000
2001
2002
2003
2004
2005
2006
2007
2008
2009
2010
2011
2012
2013
2014
2015
2016
2017
Annu
al Percentage Ch
ange
Tuition & Fees (In‐State)
State Appropriation per FTE

Like Nobody's Business86
4.12 Does performance funding work?
No, but that may be okay. Let’s review some background before returning to this question. The appeal of performance funding, sometimes called performance-based funding or outcomes-based funding, is that it supposedly incentivizes public institutions to pursue improved student outcomes based on specified metrics (e.g., graduation rates). Historically, state higher education funding was made through block appropriations or based on enrollment. Tennessee adopted the first performance funding program in 1979, followed by several more states in the following years, growing to 21 states in 2001, but dropping to almost half that number in the subsequent decade before rising again (McLendon and Hearn 2013). The most recent total, which includes states with performance funding for both two-year and four-year schools, was as high as 35 states in 2015 and 29 states in FY2020, depending on how one counts (Li 2018; Rosinger et al. 2020). Many programs have been reformulated to add or subtract accountability measures and to address challenges such as year-to-year volatility and avoiding unintended consequences for student equity. Furthermore, designing these programs for mission-differentiated institutions and sustaining them over time has proven difficult in ever-changing fiscal and political environments (McLendon and Hearn 2013; Obergfell 2018). Beyond the inherent attractiveness of the targeted quality-assurance element, the accountability aspects of performance funding in the face of tight state budgets, rising tuition and greater attention to oversight would seem to ensure that it will be around for the foreseeable future (Obergfell 2018).
Performance funding programs vary a lot, even across the 21 states that currently have them for four-year institutions (Figure 4.26). In 5 states, 80% to 100% of the state appropriation is tied to performance funding while it is 10% or less of the state appropriation in about a dozen states. Depending on the state, these amounts are determined via 1 to 10 or more metrics that fall into typical categories, frequently including those related to degree completion as well as job placement, critical fields (e.g., STEM, health professions), equity and diversity measures, and other metrics such as financial efficiency (Li 2018). Thus in North Dakota, for example, 100% of the state allocation is determined solely by credits earned (a completion-related metric) versus, say, Florida, where metrics in all five categories (credits earned, undergraduate and graduate degrees awarded, time-to-degree, graduation rates, employment outcomes, critical fields, Pell Grant/low-income student rates, and instructional costs) determine 22% of the state appropriation (Li 2018).
Coming back to whether performance funding works as intended, most but not all empirical research studies have found that degree completions and graduation rates have not improved as a direct result of performance funding (Dougherty et al. 2014; Hillman 2016; Callahan et al. 2017; Hillman et al. 2018; Li 2018). There are several possible reasons for this: performance funding assumes that institutions will respond to the incentive, that the effect of performance dollars in the face of state divestment

4. Public Funding 87
Figure 4.26. The 21 states with performance funding for four-year public colleges and universities in FY2018, showing percentage share of state appropriations tied to performance funding and the mix of performance metric types (unweighted proportional count) within each share. Performance funding in Kansas, Oklahoma and Missouri applies to new state
appropriations only and no new funds were allocated in FY2018. Source: Li (2018).
0%
10%
20%
30%
40%
50%
60%
70%
80%
90%
100%
ND NV OH OR TN LA CO ME FL AR MT PA IN KY NM UT HI MI KS* OK* MO*
Share of State App
ropriatio
ns Tied to Perform
ance Fun
ding
& M
ix of P
erform
ance M
etric
Types
OtherEquityCritical FieldsLabor Market OutcomesCompletion
in higher education will be felt, and that the institution has the capacity to implement completion strategies above and beyond those already in place before the incentive. Additional confounding effects include the inverse cyclical relationship between enrollments and economic conditions, and that attention to completion, diversity, and other measures in higher education has been increasing independently of performance funding. Even if the evidence for an empirical link is weak, performance funding policies continue to enjoy political and foundation support (Fain 2015). While outcomes haven’t clearly shifted, some equity concerns such as shifts in low-income enrollment and funding disparities across different types of institutions have been raised (Rosinger et al. 2020). Performance funding has undoubtedly drawn campus and stakeholder attention to completion and other important outcome metrics, resulting in a silver lining of constructive changes in institutional practices such as developmental pre-college courses, accelerated programs, supplementary instruction, and tutoring (Li 2018).
4.13 Can’t we simply privatize a public university?
From time to time, especially after reductions in state support such as during the Great Recession, and often in tandem with frustrations about regulatory constraints, public campus leaders and others raise the idea of “going private.” Alas, the dream

Like Nobody's Business88
of complete autonomy with minimal budgetary impact doesn’t stand up to the cold facts of reality. There is no question that state disinvestment, coupled with increased tuition dependence, the necessity for fundraising, and more private sector partnerships, have led public universities (the R1 flagships in particular) to appear more like private institutions in those respects. However, the leap from there to total privatization is sufficiently far that virtually no institutions have done so, apart from a few that were set up with a special situation or independent funding from the start (Ebersole 2014).
There are at least a half-dozen financial reasons, and numerous non-financial reasons, as to why total privatization is impracticable (Chapter 10 covers several of these topics in more breadth):
• Annual Revenue Flow: We saw in Chapter 2 and in several earlier sections of this chapter that in some states, especially those with the lowest shares of state revenue on the right of Figure 4.24 such as Vermont, the low levels of state appropriations mean that total elimination of those funds from an institution’s budget could be a survivable event. For the average public institution, however, the state slice of the revenue pie is critical for at least two reasons: (i) it funds core activities that leverage others (see Section 2.12), thereby amplifying the loss, and (ii) the size of endowment necessary to replace it is out of reach in most cases. Consider a large university that receives $200M each year in state appropriations—it would need a new endowment of roughly $4B to supply a similar annual income stream. Yet, a smaller school that receives only $20M in annual state support could conceivably raise $400M to provide a similarly sized stream of annual endowment proceeds.
• Facilities: A major sticking point, buildings, grounds and other physical infrastructure are owned by the state and would have to be purchased, because states cannot give public property away to private entities. The biggest public campuses comprise hundreds of acres and hundreds of buildings that together would cost billions of dollars while smaller campuses would total in the hundreds of millions.
• Employee Benefits: Pensions, retirement plans, and healthcare contributions are handled differently across the states, and in those with large commitments to past or current employees the state is unlikely to assume those costs, so they would need to be covered by the privatized institution. These costs are hard to generalize but would likely be in the tens of millions of dollars annually at bigger institutions.
• Bonds and Ratings: Most campuses have debt payments on buildings, often funded directly or indirectly through bonds that were issued based on their being a public entity. Furthermore, the interest rate on any new bonds is

4. Public Funding 89
strongly influenced by the rating of the institution’s perceived future ability to pay for them. Again, these costs are hard to generalize, but could total a few percent of the annual institutional budget.
• Alumni and Donor Contributions: with a major identity change, an institution will need to consider the implications for income from philanthropic gifts. There would without doubt be a concerted effort to rally support for the evolving new identity, and to use it as a fundraising opportunity. Still, the privatization move would minimally raise questions about past donations that were made based on the institution having a public mission, and there may be current donors who decide to withdraw their support.
• Charter and Name: Public universities receive their charter and public mission, as well as their name, by constitution or law. A privatized institution could finesse a modified public service mission, but if a name change was required by the state it would have significant implications for marketing and branding, and therefore enrollment, all else being equal. Universities and colleges are built on reputation and brand, so a name change would be a serious business risk and would need both a comprehensive rebranding plan and a long-term marketing investment to mitigate potential losses.
The upshot of these considerable impediments is that institutions contemplating significant privatization are likely to maintain their core public status and instead select hybrid solutions that enable them to partially address their challenge. The state with perhaps the most notable examples of hybrid shifts in recent years is Oregon, whose major universities have evolved towards greater autonomy with new regulatory and financial structures while retaining their public status (Wang 2013). Complete privatization was subsequently suggested by a state task force as one option to cut a huge shortfall in the public pension system, although implementation seems unlikely for all the reasons discussed above (Lehman 2017).
Privatization is more often seen in less dramatic but wider-reaching ways. There are countless public-private partnerships across the US higher education landscape and virtually every campus has something of that sort that fits under a wider banner of privatization: typical examples include spinning off or subcontracting dining services, bookstores, conference centers, and parking, as well as some non-auxiliary services like online enrollment recruiting and collaborative research space with companies (see Section 10.7). There is a lively discussion surrounding this broader notion of privatization, ranging from support to condemnation, and an accompanying set of structural dynamics related to declining public support and a neoliberal economic environment (Berdahl 2000; Morphew and Eckel 2009; Tierney 2012; Lambert 2014; Newfield 2018).

Like Nobody's Business90
4.14 How are universities funded in other countries?
The higher education system in most countries is typically overseen by the national education ministry, often with substantial funding coming from the national government for public higher education. The US is unusual in having non-governmental regional accreditors provide oversight in place of the US Department of Education and, moreover, our public higher education institutions are funded and administrated primarily by the states with the Federal Government providing student aid and research investment. There is plenty of variation around the world and in some countries the states (or their equivalent) and cities may also fund public higher education. Many, but not all, countries also allow private institutions—globally, about 33% of higher education enrollment is at private institutions (Levy 2018). In some countries they are predominant, such as South Korea, Japan, and Brazil with between 70% and 80% enrollment in private higher education; India has the largest total private enrollments, with 58% of higher education enrollments being at private institutions (Levy 2018).
To understand public higher education funding internationally, it is useful to appreciate the other ways in which US higher education can be different. The tradition of going away to college is a part of US culture, but it is far less common in other countries where students typically attend an institution in their home city, which means that residence halls can have a decreased role. The whole concept of high-visibility college sports is American to the core—while there are club sports at many universities around the world, none of them have television contracts! Research is handled differently in some countries and may take place at government laboratories rather than on teaching-focused campuses. In most countries a smaller proportion of high school graduates goes on to university, and technical and vocational colleges play a relatively larger role. And, compared to the United States, tuition and fees at public institutions are generally lower (or even zero) in other countries.
It is hard to account for all these differences, but somewhat dated and limited national-level summary data enable some broad comparisons of investment in public higher education (combined for all levels of government in Figure 4.27). It is interesting that, in relative terms as a percentage of GDP, higher and lower income countries have similarly wide ranges in the amount they invest in higher education, and that the US ranks in the middle of high-income countries by this measure. The pattern changes when expressed in absolute dollars per student, and unsurprisingly it generally scales with the income level of the countries. Remarkably, the US also falls in the middle of the high-income countries by this measure of government spending on public higher education. Naturally, government spending is only part of the picture and it is worth noting that the US is among the countries with the highest household contribution to total higher education expenses (United Nations Children’s Fund [UNICEF] 2015).

4. Public Funding 91
Figure 4.27. Government expenditures on public higher education as a percentage of GDP and per student in US$, both for 2014 and grouped by World Bank country income classification. Sources:
UNESCO (2019) and The World Bank (2019)
$‐ $10,000 $20,000 $30,000 $40,000 $50,000
0.0% 0.5% 1.0% 1.5% 2.0% 2.5%
FinlandAustriaCanadaBelgiumEstoniaMalta
AustraliaUnited StatesSwitzerland
LithuaniaCyprusFrancePolandChileLatvia
South KoreaSloveniaIrelandSlovakia
SpainPortugal
IsraelCzechia
ItalyLuxembourg
Bermuda
NamibiaTurkeyMexico
ArgentinaColombiaBelarus
IranRomaniaMaldives
Kazakhstan
SenegalUkraineMoldovaHonduras
Côte d'IvoireEswatiniMongoliaIndonesia
LaosSri Lanka
GuatemalaEl Salvador
Armenia
TogoGuineaBeninMali
AfghanistanNepal
High
Upp
er M
iddle
Lower M
iddle
Low
Government Funding Per Tertiary Student ($US)
Government Expenditure on Tertiary Education (% of GDP)
% of GDP
US$ Per Student


5. Human Resources
5.1 What is the organizational structure?
Early in my career as a central administrator, I was chatting with a senior faculty member, excitedly describing the facilities, coordination and support services that my unit provided to campus. He wasn’t buying it, and his inner curmudgeon kicked in as he said, “Humph, I don’t need all this extra stuff that wastes money, I can teach my students with just a table and chairs on the lawn.” At the time I bit my tongue and didn’t retort that he might need a tree to provide shade and shelter, not to mention all the invisible background support required to enable his supposedly administration-free fantasy. I’ve thought about our conversation many times since then, and from it I’ve developed a useful visual metaphor of how the supporting services of a university (boringly known as administration) support the core activity of learning: I imagine a silhouette in the style of a Japanese woodblock print, containing a student and teacher at the focal point under a tree, with its branches reaching over them to provide shade and its roots extending below, invisible to them but vital nonetheless.
While that image may be sentimental (and probably more appealing to support staff than faculty members), there are indeed many visible and not-so-visible functions that are necessary to enable the effective operation of a contemporary university. In most universities, budgets and people are organized in a more-or-less standard structure of functional units, each one typically a vice-presidential division reporting to the president (Figure 5.1). Naturally, academic affairs are the raison d’être for the university and this area includes all the colleges, schools and departments from Anthropology to Zoology, as well as services directly supporting the faculty and academic programs such as libraries and online education. Student affairs include recruitment and admissions as well as many co-curricular aspects of student life such as clubs, health, and residence halls. The research office is well-known in many academic units because it is the source of startup funds to help faculty obtain external research support, but in addition to supporting research with funds and services it also has an extensive set of compliance functions (human subjects protection, data privacy, animal care, laboratory safety, financial conflict of interest management, and more). In many institutions the Provost oversees the academic, student and research areas. The finance and facilities division manages
© Andrew C. Comrie, CC BY 4.0 https://doi.org/10.11647/OBP.0240.05

Like Nobody's Business94
the institution’s money, major capital projects and physical facilities (buildings, grounds, utilities, etc.). If the university has a hospital or works closely with one, there is typically a division handling the health sciences and it may include academic health programs (e.g., medicine, nursing) if they are not under academic affairs. Large athletic programs can include a dozen or more men’s and women’s sports in addition to their staff overseeing operations. The advancement area typically includes alumni relations and the fundraising operation. Finally, there are numerous other smaller administrative offices—a few examples of those are included in Figure 5.1.
Figure 5.1. A generalized high-level functional organizational structure for a large research university, showing the major vice-presidential areas and selected subareas within each. These major divisions are the fundamental management, budget and employment units
of the institution.
As we saw in Chapter 3, employees and their benefits are the largest investment that a university makes every year. The human resources division often resides in the area overseeing business and financial operations, and its functions include employee recruitment and hiring, onboarding, compensation, payroll, training and compliance, and organizational development and effectiveness. The remaining sections in this chapter review the basic financial elements of the university’s human resources: the number and types of employees working on campus, their associated salaries and benefits, and related trends. In other words, in this chapter we’ll cover people and then in all the subsequent chapters of the book we will cover what they do, mirroring the organizational structure.
Academic Affairs
Arts & SciencesColleges
Professional Colleges
Libraries, Graduate College, etc.
International & Online
Student Affairs
Enrollment Management
Student Success
Student Life & Health
Residence Halls
Research
Sponsored Projects
Research Compliance
Tech Transfer
Finance & Facilities
Budget, Finance, & Payroll
Human Resources
Facilities
Information Technology
Health Sciences
Schools of Medicine,
Nursing, etc.
Hospital &Clinical
Athletics
Sports
Administration & Operations
Advance‐ment &
Fundraising
Alumni
Development
Other Adminis‐tration
President’s Office
General Counsel
Marketing & Communic‐
ations
Government Relations

5. Human Resources 95
5.2 How many employees are there?
The Carnegie classification is tied to institutional size, and thus it is no surprise to see a clear scaling by number of employees across those categories (Figure 5.2). At the broadest level it is useful to group staff into full-time and part-time, instructional (including faculty) and non-instructional, as well as medical and non-medical. Staff numbers and salaries in medical schools are sufficiently high that they can skew the summary data despite being present in less than 10% of institutions overall. Medical schools are clustered principally in R1 institutions, with R1 privates having a higher proportion and therefore more medical employees (almost one third of the total) on average than at R1 publics.
Figure 5.2. FY2018 employee headcount by full-time (FT) and part-time (PT) status as well as instructional and non-instructional position, for medical and non-medical staff, all
averaged by Carnegie classification and control. Source: IPEDS (2020).
Looking further at Figure 5.2, full-time employees make up 80% or more of the total at R1 and R2 schools and at private baccalaureate colleges, while that percentage is in the lower 70s at the smaller publics, and a little over 60% at the R3-M3 privates (parallel to their challenging financial position). Across almost all types of institution, non-instructional staff are in the majority, around three quarters of the total at the bigger schools and closer to one half at the smaller schools. Furthermore, non-instructional staff are mostly full-time (84% to 91% across types of schools). Among the instructional staff, part-time employees are more common. While part-time lecturers and instructors form less than one quarter of all instructional staff at R1 schools, their representation approaches and even exceeds half of all instructional staff at smaller institutions (see Section 5.6).
0
2,000
4,000
6,000
8,000
10,000
12,000
R1 Public R2 Public R3‐M3 Public BAS Public R1 Private R2 Private R3‐M3 Private BAS Private
Total Staff
Med PT Non‐Instr
Med PT Instr
Med FT Non‐Instr
Med FT Instr
Non‐Med PT Non‐Instr
Non‐Med PT Instr
Non‐Med FT Non‐Instr
Non‐Med FT Instr

Like Nobody's Business96
The total number of campus employees has been growing steadily (Figure 5.3) and is up 22% over the last sixteen years, although the COVID-19 pandemic has led to employee reductions (Bauman 2020). Within that overall growth, the number of full-time and part-time faculty has increased, as has the number of full-time support staff, although the number of part-time support staff has decreased slightly. The share of instructional to non-instructional staff has remained almost flat, with all instructional staff increasing slightly from 29% to 30% of total employees over this period.
Figure 5.3. Unadjusted trends in employee headcount by full-time and part-time status as well as instructional and non-instructional staff, averaged across all eight types of institution by
fiscal year. Source: IPEDS (2020).
To properly evaluate the trend in employee numbers, we must account for student enrollment growth. Once we make that adjustment, we see that the ratio of employees per 1000 students1 has remained essentially unchanged over the data period (Figure 5.4) at about 200 on average for non-instructional staff, and increasing slightly from about 80 to 85 for instructional staff. Overall then, the number of employees has simply scaled with enrollment growth over time. However, within that essentially flat trend there are noteworthy patterns in employee trends among the various types of institutions, which we will explore in the rest of this chapter.
1 The astute reader will notice that employees per 1000 students is simply the inverse of students per employee, a common metric often focused on the faculty as students per faculty member. I’ve used the former configuration in this chapter to keep the focus on adjusted employee trends.
0
500
1,000
1,500
2,000
2,500
3,000
3,500
4,000
2003 2004 2005 2006 2007 2008 2009 2010 2011 2012 2013 2014 2015 2016 2017 2018
Total Employ
ees
Part‐Time Non‐Instructional
Full‐Time Non‐Instructional
Part‐Time Instructional
Full‐Time Instructional

5. Human Resources 97
Figure 5.4. Trends in instructional and non-instructional staff adjusted by total fall student enrollment, expressed as staff per 1000 students, averaged across all eight types of
institution by fiscal year. Source: IPEDS (2020).
5.3 How much are employees paid?
Average FY2018 salaries for full-time non-medical staff are illustrated in Figure 5.5 with a comparison of instructional versus non-instructional salaries by type of institution, using the typical contract lengths of nine months for academic appointments and twelve months for other staff. Instructional staff (which includes the professorial faculty ranks as well as lecturers and instructors) are paid more than non-instructional staff on average, presumably because of national market forces related to specialization and advanced degree requirements. Instructional staff members are also paid relatively more at the bigger publics and privates. In general, the pay at private institutions is higher at comparable sizes of schools across instructional and non-instructional staff, again except for the R3-M3 privates where the pay is about the same as at the corresponding publics. The salary premium at private institutions averages 17% more for instructional staff and 14% more for non-instructional staff. For the average instructional staff salary, there is a notable difference of more than $35,000 per year between R1 publics and privates. Further details on faculty salaries are covered in Section 5.7.
150
160
170
180
190
200
210
220
60
70
80
90
100
110
120
130
2003 2004 2005 2006 2007 2008 2009 2010 2011 2012 2013 2014 2015 2016 2017 2018
Non
‐Instructiona
l Staff per 100
0 Stud
ents
Instructiona
l Staff per 100
0 Stud
ents
Non‐Instructional
Instructional

Like Nobody's Business98
Figure 5.5. FY2018 salaries of full-time non-medical staff, averaged by Carnegie classification and control. Annual amounts are for the typical contract period with instructional staff salaries equated to nine months and non-instructional salaries for twelve months.
Source: IPEDS (2020).
5.4 What is the size of the faculty?
As I noted previously, the Carnegie classification is closely related to overall institution size, and so we see the size of the instructional staff being largest at R1 universities and smallest at baccalaureate colleges (Figure 5.6). A quick technical note: the faculty can include non-instructional members (e.g., those focused on research), so the term instructional staff is more precise, although at the level we’re examining there isn’t much practical difference between the two and we can use the faculty as shorthand. Returning to Figure 5.6, at most types of institution there are roughly similar proportions of the three professorial ranks and fewer lecturers and instructors. However, at R1 schools there is a remarkable sliding proportion of headcounts by rank, with more full professors and successively fewer members of each lower rank. The reason for this stark difference is unclear but, given that this is an R1 phenomenon only, it is likely a function of higher research activity. The three professorial ranks total 78% of the total across all institutions, a remarkably consistent percentage that varies only by a few percentage points across institution types. Note that this observation is for full-time positions, and that there are higher proportions of part-time instructional positions at smaller schools as detailed in Section 5.6.
$‐
$20,000
$40,000
$60,000
$80,000
$100,000
$120,000
$140,000
$160,000
R1 Public R2 Public R3‐M3 Public BAS Public R1 Private R2 Private R3‐M3 Private BAS Private
Salary of Full‐T
ime Non
‐Med
ical Staff
Instructional (9 month)
Non‐Instructional (12 month)

5. Human Resources 99
Box 5.1. Faculty Titles: A Primer for the UninitiatedFaculty job titles can seem confusing to those unfamiliar with the practices of the academy. Ironically, for institutions that are such bastions of egalitarianism, the formal hierarchy of earned and ranked job titles and the implicit campus class structure they produce are remarkable. The basic structure is simple enough, with three faculty ranks for those who are tenured or on the tenure track (Figure B5). Professors are the most senior and, because “professor” is also a generic term for anyone teaching at a university, for precision we talk about Full Professors. Associate Professors are in the middle rank, and Assistant Professors are the most junior of these three. Typically, but not always, the upper two ranks have achieved tenure while Assistant Professors are working towards it (see Chapter 6 for more on tenure). Faculty members not on the tenure track, also known as the contingent faculty, have various job titles, the most common being lecturer and instructor for teaching, with various titles for researchers, librarians and other specialists. Their appointments may be multi-year, one-year, less than a year, by course or project, as well as full-time or part-time.
Where things get confusing is the plethora of modifiers. We have honorary titles such as Distinguished and Regents’ Professor, and endowed chair titles such as the John Smith Professor of XYZ. There are Professors of Practice (often practitioners whose primary job is not on campus, but sometimes core faculty by another name), and Clinical, Research and Teaching Professors, who may be tenure-track or contingent depending on the institution. Visiting Professors of various ranks may indeed be visiting for a semester or a few weeks every year, paid or unpaid, or may be local contingent faculty. Some individuals may have split appointments across multiple departments and others may have courtesy titles in cognate fields that variously might be called Joint or Dual Appointments. We also have titles such as Adjunct Professor, a poorly-defined term that may or may not signal contingent and/or part-time or class-by-class status. To cap things off, titles can be combined to obtain inscrutable ostentations such as the Jane Doe Distinguished Clinical Research Professor of Underwater Basket Weaving!
Figure B5. Simplified typology of faculty titles at US universities.
FACULTY TITLES
TENURED & TENURE‐TRACK
Professor (Full)Associate ProfessorAssistant ProfessorHONORARY
ROLE
SELECTED MODIFIERS
CORE POSITIONS
Distinguished, Regents’, etc.Named / Endowed Chair
Professor of PracticeResearch / Teaching / ClinicalVisiting, Adjunct, Joint, etc.
CONTINGENTFull‐Time orPart‐Time
Lecturer / InstructorResearcher, etc.

Like Nobody's Business100
Figure 5.6. FY2018 counts of full-time non-medical instructional staff, averaged by Carnegie classification and control. Source: IPEDS (2020).
There are several key differences among the trends in instructional staff size when we break the data out by type of institution (Figure 5.7). The first pattern to note is that the number of full-time faculty members per 1000 students (i.e., adjusted for enrollment
0
100
200
300
400
500
600
R1 Public R2 Public R3‐M3 Public BAS Public R1 Private R2 Private R3‐M3 Private BAS Private
Num
ber o
f Full‐T
ime Non
‐Med
ical In
structiona
l Staff
Full Professor Associate Professor Assistant Professor Lecturer Instructor
Figure 5.7. Trends in full-time instructional staff adjusted by total fall student enrollment per fiscal year, expressed as instructional staff per 1000 students, averaged by Carnegie
classification and control. Source: IPEDS (2020).
30
40
50
60
70
80
90
1985
1986
1987
1988
1989
1990
1991
1992
1993
1994
1995
1996
1997
1998
1999
2000
2001
2002
2003
2004
2005
2006
2007
2008
2009
2010
2011
2012
2013
2014
2015
2016
2017
2018
Full‐Time Instructiona
l Staff per 100
0 Stud
ents
R1 Public R2 Public R3‐M3 Public BAS Public
R1 Private R2 Private R3‐M3 Private BAS Private

5. Human Resources 101
growth over time) is generally lower at public institutions than privates. The second notable pattern is that the trend in adjusted faculty size has been flat for several decades at the larger publics and the R3-M3 privates, while it has been increasing relative to enrollment at the R1 and R2 privates, as well as both public and private baccalaureate colleges. Recall that at the latter small colleges, enrollments have been relatively flat and even decreasing, so some if not all of the increase in faculty ratio is attributable to a change in the denominator. Generally, though, after adjusting for enrollment growth the full-time faculty to student ratio at most publics has remained about the same size, while it has grown (albeit modestly) at an annualized rate of 0.5% to 0.8% at most privates.
5.5 How has faculty composition changed by rank?
The mix of faculty ranks relative to each other began shifting noticeably in the late 1990s (Figure 5.8). Looking across all institutions, the percentage of full professors declined from 35% two decades ago to 29% of the instructional faculty in recent years, while at the same time the percentage of lecturers and instructors rose from 5% to 13% and 9% respectively. The percentage of associate and assistant professors has remained relatively level by comparison, varying by a few percent at or above the 25% level. This is an interesting case in which the Great Recession that hit in FY2009 was not the initial force for change. Instead, the long economic expansion that had been underway since the postwar years ended with the recession of the early 1990s. This period saw increased unemployment and an extended real estate slump,
Figure 5.8. Trends in percentage share by rank of full-time instructional staff, averaged across all eight types of institution by fiscal year. Source: IPEDS (2020).
0%
5%
10%
15%
20%
25%
30%
35%
40%
1985
1986
1987
1988
1989
1990
1991
1992
1993
1994
1995
1996
1997
1998
1999
2000
2001
2002
2003
2004
2005
2006
2007
2008
2009
2010
2011
2012
2013
2014
2015
2016
2017
2018
Share of Full‐T
ime Instructiona
l Staff
Full ProfessorAssociate ProfessorAssistant ProfessorLecturerInstructor

Like Nobody's Business102
multiple years of state budget cuts at the publics and lower market returns for the privates, that together partly catalyzed universities to shift their hiring patterns. Two related elements were at play, the first simply being less money and the second being uncertainty about future funding, so that money freed up by retiring senior faculty members was more likely to be deployed in hiring non-tenure track faculty (i.e., those with shorter-term contracts and lower budgetary obligation) than in growing the junior ranks of the tenure-track faculty.
These broad patterns occurred in institutions of all types and sizes, but naturally there are some differences among them. The net change in percentage share of each rank is illustrated for our eight institution types in Figure 5.9. The decrease in the proportion of full professors occurred across all types of school, although it was less at the privates (except the R2 privates) and more at the publics (except the public baccalaureate colleges). Likewise, the growth in proportions of lecturers and instructors has been ubiquitous, although relatively more at larger universities and less at smaller schools where those proportions were slightly higher initially (except for private baccalaureate colleges, where the proportions of all ranks have shifted the least of any type over time). The overall trends of relatively fewer full professors and relatively more non-tenure track faculty do not appear to have ameliorated in recent years. Given that the relevant financial pressures on institutions have not diminished, these trends in the composition of the faculty will presumably continue for the foreseeable future.
Figure 5.9. FY1998–FY2018 change in percentage share by rank of full-time instructional staff, averaged by Carnegie classification and control. Source: IPEDS (2020).
‐10%
‐8%
‐6%
‐4%
‐2%
0%
2%
4%
6%
8%
10%
12%
R1 Public R2 Public R3‐M3 Public BAS Public R1 Private R2 Private R3‐M3 Private BAS Private
Share of Full‐T
ime Instructiona
l Staff Cha
nge 19
98‐2018
Full Professor Associate Professor Assistant Professor Lecturer Instructor

5. Human Resources 103
5.6 What is the proportion of part-time faculty members?
Part-time faculty members currently make up almost 60% of the faculty at private R3-M3 schools, a far greater proportion than at any other type of institution (Figure 5.10). The next largest percentage is 44% at the R3-M3 publics. These two categories together comprise almost two thirds of all institutions in our data set (see Figure 1.2 in Chapter 1) and thus part-time faculty form a substantial part of the overall faculty at most of the nation’s universities. In contrast, however, the share of part-time faculty at public and private R1 universities is 22%. These dissimilarities relate to the tuition-dominated revenue portfolios of the smaller teaching-oriented schools versus the diverse revenue streams at large research universities. Importantly, and not in Figure 5.10, R1 and R2 schools have graduate teaching assistants that partially offset their lower part-time faculty numbers. By necessity, financial pressures at teaching and tuition-dominated institutions will incentivize lowering the cost of education, most of which is labor cost (including support-staff labor, not only instructional labor). A revealing indicator in this regard is the number of credit hours taught by various types of faculty members (Geiger 2011), with part-timers among the highest when pro-rated. It follows that cost savings in instructional salaries and benefits from part-time appointments have been found across all types of institutions and over time (Hurlburt and McGarrah 2016a).
Figure 5.10. Trends in part-time instructional staff as a percentage share of total instructional staff, averaged by Carnegie classification and control per fiscal year. Complete data are unavailable for odd years FY1995–FY2015; those values are interpolated from
neighboring even years. Source: IPEDS (2020).
There have been widespread increases in the share of contingent (non-tenure track) faculty more generally, and part-time appointments in particular, that have been widely
15%
20%
25%
30%
35%
40%
45%
50%
55%
60%
65%
1994
1995
1996
1997
1998
1999
2000
2001
2002
2003
2004
2005
2006
2007
2008
2009
2010
2011
2012
2013
2014
2015
2016
2017
2018
Part‐Tim
e Faculty
as Pe
rcen
tage
of T
otal Faculty
R1 Public R2 Public R3‐M3 Public BAS PublicR1 Private R2 Private R3‐M3 Private BAS Private

Like Nobody's Business104
commented upon and studied (American Association of University Professors 2019a; Hurlburt and McGarrah 2016b). As with the non-tenure track faculty (see Section 5.5), significant trends in the relative share of part-time faculty were underway in the 1990s at all types of institution and their growth rivaled that of lecturers and instructors until roughly the turn of the millennium (Figure 5.10). Over the two decades since then, the proportion of part-time faculty has been relatively flat at the larger universities and at private baccalaureate colleges (and has decreased at R1 privates), with ongoing slower growth at the smaller publics.
We can look further back in time using broader data for all four-year and two-year postsecondary institutions to gain some perspective (Figure 5.11). The growth in the percentage of part-time faculty has three distinct periods, a steep rise in the 1970s, followed by slower and mostly steady growth for three decades from the 1980s through the 2000s (with some variability in the early 1990s that may relate to a change in data collection), and most recently an unprecedented decline since the 50% peak in FY2012. What is driving these patterns, in general and by institution type? The 1970s saw record enrollment growth (see Figure 4.13), much of which was absorbed at two-year community colleges, while investment returns from the market shrunk for the privates and state spending per student flattened and became more volatile for the publics. Higher education’s glory days of funding were over and one way that institutions coped was to hire an increasing share of part-time faculty members. The
Figure 5.11. Trends in part-time faculty as a percentage of total faculty across all degree-granting postsecondary institutions (four-year and two-year) and averaged for all institutions in Figure 5.10. Sources: NCES Digest (National Center for Education Statistics 2018c) and
IPEDS (2020).
15%
20%
25%
30%
35%
40%
45%
50%
55%
60%
65%
1970
1972
1974
1976
1978
1980
1982
1984
1986
1988
1990
1992
1994
1996
1998
2000
2002
2004
2006
2008
2010
2012
2014
2016
2018
Part‐Tim
e Faculty
as Sh
are of Total Faculty
4‐Year & 2‐Year4‐Year Only

5. Human Resources 105
financial pressure to keep costs down along with the year-to-year uncertainty have been present ever since, along with the further rise in part-time teaching positions. Those institutions that rely most heavily on tuition revenue have felt these forces the strongest, and they are the ones with the highest proportion of part-time faculty. We don’t see the recent declining trend in our four-year only dataset (Figure 5.11); it represents a shift only at two-year colleges where the entire faculty has shrunk by 18% from FY2012 to FY2018 (National Center for Education Statistics 2018b)!
5.7 How much do the faculty earn?
Salaries across the academic ranks increase as expected from junior to senior positions, with assistant professor salaries averaging 60% to 70% of full professor salaries and instructors being paid about 50% of what full professors receive on average, depending on institution type (Figure 5.12). These average data obscure the considerable salary differences across disciplines; we’ll cover those in Chapter 6. Overall, the highest salaries are paid at private institutions and pay across public institutions averages 14% below that at the privates. Private-public percentage differences in salary by rank and institution type are highlighted in Figure 5.13. The dichotomy between public and private salaries is strongest at R1 schools, especially for full professors at public R1 universities, who make 26% less that than their private counterparts. The private-public salary imbalance at the R1 and R2 institutions has worrying implications for the locus of top research talent and it fuels a brain-drain that could undermine the historic strength of the nation’s public research universities (see Chapter 8 on research). The
Figure 5.12. FY2018 nine-month equated salaries of full-time non-medical instructional staff, averaged by Carnegie classification and control. Source: IPEDS (2020).
$‐
$20,000
$40,000
$60,000
$80,000
$100,000
$120,000
$140,000
$160,000
$180,000
$200,000
R1 Public R2 Public R3‐M3 Public BAS Public R1 Private R2 Private R3‐M3 Private BAS Private
Faculty
Salary (Full‐T
ime, Non
‐Med
ical) FY2
018
Full Professor Associate Professor Assistant Professor Lecturer Instructor

Like Nobody's Business106
interesting exception is again the set of R3-M3 private institutions, which pay their professors about 8% less than their public colleagues while paying lecturers and instructors about the same as at the publics.
Figure 5.13. FY2018 percentage differences of nine-month equated salaries of full-time non-medical instructional staff at public institutions as compared to private institutions, averaged by
Carnegie classification. Source: IPEDS (2020).
Overall, the increase in private university faculty salaries as compared to their public colleagues has been attributed to the relatively higher tuition increases at the privates (Ehrenberg 2002). The growing salary ranges as one moves from smaller to larger institutions is primarily tied to the growing spread of state appropriations per student across the publics and a counterpart expanding spread in endowment per student levels across the privates (Ehrenberg 2002). Also, the same work controlled for other factors and holding them constant found that universities with the most growth in inflation-adjusted research expenditures per faculty member from institutional funds had the largest increase in their student-faculty ratio (Ehrenberg 2002).
In the decades before the Great Recession, inflation-adjusted faculty salaries at all ranks rose steadily except for a flatter period of a half-dozen years during and after the early 1990s recession (Figure 5.14). In contrast to more than a quarter-century of general salary growth leading up to FY2009, faculty salaries averaged by rank across all institutions have been flat for the decade since then. However, within that average austerity are some remarkable salary trends by institution type and rank, illustrated in Figure 5.15 as percentage changes from FY2009 to FY2018. At smaller schools, both public and private, all ranks saw decreases of between 2% and 8% in their inflation-adjusted salaries. The opposite occurred at R1 and R2 private institutions, where all
‐30%
‐25%
‐20%
‐15%
‐10%
‐5%
0%
5%
10%
15%
R1 R2 R3‐M3 BAS
Public‐Priv
ate Salary Differen
ce FY2
018
Full Professor Associate Professor Assistant Professor Lecturer Instructor

5. Human Resources 107
ranks received increases of 1.5% to 8%, while the trends were smaller and mixed across ranks at R1 and R2 publics.
Figure 5.14. Trends in average inflation-adjusted faculty salaries by rank, equated to a nine-month contract, averaged across institution type by Carnegie classification and control. Source:
IPEDS (2020).
Figure 5.15. FY2009–FY2018 percentage change in average inflation-adjusted faculty salaries by rank, equated to a nine-month contract. Source: IPEDS (2020).
$40,000
$50,000
$60,000
$70,000
$80,000
$90,000
$100,000
$110,000
$120,0001985
1986
1987
1988
1989
1990
1991
1992
1993
1994
1995
1996
1997
1998
1999
2000
2001
2002
2003
2004
2005
2006
2007
2008
2009
2010
2011
2012
2013
2014
2015
2016
2017
2018
Average Faculty
Salary (9‐M
onth Equ
ated
, in 20
16 Dollars)
Full Professor
Associate Professor
Assistant Professor
Lecturer
Instructor
‐10.0%
‐8.0%
‐6.0%
‐4.0%
‐2.0%
0.0%
2.0%
4.0%
6.0%
8.0%
10.0%
R1 Public R2 Public R3‐M3 Public BAS Public R1 Private R2 Private R3‐M3 Private BAS Private
Salary Cha
nge FY20
09‐FY2
018 (In
flatio
n‐Ad
justed
)
Full Professor Associate Professor Assistant Professor Lecturer Instructor

Like Nobody's Business108
The growth in salaries from FY1985–FY2009 averaged 31% for tenure-track faculty (34%, 28% and 31% respectively for full, associate and assistant professors) while it was slightly lower at 27% for non-tenure track faculty (25% and 29% respectively for lecturers and instructors). On the other hand, average full and associate professor salaries declined by about 2.5% from FY2009 to FY2018, while salaries for assistant professors, lecturers and instructors decreased less. by roughly 0.5% to 1%.
5.8 What are the types of support staff and their salaries?
As we saw in Section 5.2, most university employees are not on the instructional staff, and instead they work in many kinds of support positions. To provide a sense of the wide range of support staff positions on campus, the IPEDS non-instructional staff categories and some example occupations in each are listed in Table 5.1.
Table 5.1. Non-instructional support staff categories and selected examples of occupations and fields. Sources: IPEDS (2020) and US Bureau of Labor Statistics (2010).
Category Example Occupations & FieldsResearch Researchers (Non-Instructional) in all disciplinesPublic Service Agricultural Extension; Clinical Services; Continuing EducationLibrarians, Curators & Academic Support
Librarians; Curators; Archivists; Academic Affairs & Other Education Support (Non-Instructional)
Management Chief Executives; Vice Presidents; Executive Directors & Directors; Managers of Operations, Marketing, IT, Purchasing, Transportation, Human Resources, Food Service
Business & Finance Accountants; Auditors; Budget Analysts; Benefits Specialists; Compliance Officers; Financial Analysts; Fundraisers; Meeting & Event Planners
IT & Technical Computer Systems Analysts, Developers & Programmers; Architects; Engineers; Life, Physical & Social Scientists
Community, Legal, Arts & Sports
Community & Social Service; Legal; Arts, Design, Entertainment, Sports & Media
Healthcare Practice Physicians, Nurses, Therapists, Counselors, Pathologists, Veterinarians, Laboratory Technicians
Service Healthcare Support; Security; Food Preparation & Serving; Building & Grounds Cleaning & Maintenance
Sales Retail Workers, Cashiers, Sales Representatives, TelemarketersOffice & Administrative Support
Clerical Assistants; Records Clerks; Executive & Administrative Assistants; Postal Services; Receptionists
Natural Resources, Construction & Maintenance
Farming, Fishing & Forestry; Construction; Installation, Maintenance & Repair
Transportation & Production Bus, Car & Truck Drivers; Machine Operators; Carpenters; Painters

5. Human Resources 109
The number of non-instructional support staff in each of the major job categories is roughly consistent at public and private institutions (Figure 5.16). The biggest staff categories are office support, IT, management, business and service. Public institutions have slightly more staff on average across institution types. The larger research-focused institutions have relatively more staff in research, business/finance, and IT/technical roles than the smaller schools, which is what we might expect given their missions.
Figure 5.16. FY2018 counts of non-instructional support staff (full-time, non-medical) by type, averaged by Carnegie classification and control. Source: IPEDS (2020).
Support staff salaries are not available by rank or seniority except for those in management roles. As one would expect, managers earn more than regular staff members, with managers averaging over $100,000 per year and regular staff averaging in the $40,000 to $60,000 range (Figure 5.17). The higher-earning fields on average include research, IT/technical, and business/finance, while office support, sales, and service occupations are at the lower end. Unsurprisingly, public institutions pay staff less than the privates, averaging 7% lower across the board, and ranging from twice that difference between R1 schools to 2% less at R3-M3 private schools (likely indicative of the financial stress at those institutions that we’ve noted multiple times).
0
100
200
300
400
500
600
700
800
900
Office &
Administrative
Supp
ort
IT & Techn
ical
Man
agem
ent
Busine
ss & Finan
ce
Service
Commun
ity, Legal,
Arts & Spo
rts
Librarians, Curators &
Acad
emic Sup
port
Research
Natural Resou
rces,
Constructio
n &
Mainten
ance
Health
care Practice
Tran
sportatio
n &
Prod
uctio
n
Public Service
Sales
FY20
18 Non
‐Instructiona
l Sup
port Staff (FT, Non
‐Med
.) R1 PublicR2 PublicR3‐M3 PublicBAS PublicR1 PrivateR2 PrivateR3‐M3 PrivateBAS Private
IPEDS only began collecting detailed salary data for non-instructional employees in FY2013, so the trend data don’t yet provide much information beyond looking like those for instructional staff. Average inflation-adjusted support staff salaries increased about 3% from FY2014 to FY2015, and by small amounts in the other years.

Like Nobody's Business110
Figure 5.17. FY2018 twelve-month salaries for types of non-instructional support staff (full-time, non-medical), averaged by Carnegie classification and control. Source: IPEDS (2020).
$‐
$20,000
$40,000
$60,000
$80,000
$100,000
$120,000
$140,000
Man
agem
ent
Research
IT & Techn
ical
Busine
ss & Finan
ce
Public Service
Commun
ity, Legal,
Arts & Spo
rts
Health
care Practice
Librarians, Curators &
Acad
emic Sup
port
Natural Resou
rces,
Constructio
n &
Mainten
ance
Tran
sportatio
n &
Prod
uctio
n
Office &
Administrative
Supp
ort Sales
Service
FY20
18 Salaries o
f Sup
port Staff (F
ull‐T
ime, Non
‐Med
.) R1 Public
R2 Public
R3‐M3 Public
BAS Public
R1 Private
R2 Private
R3‐M3 Private
BAS Private
5.9 Is administrative bloat a myth?
If ever you hear the phrase “administrative bloat,” know that it works like chum in the water to get the sharks circling. This trope relies on the age-old mistrust the faculty has of administrators as misguided or even malicious instruments of corporatist power, and on the assumption that administrators have been proliferating for years, “wasting” money that could be used to hire more faculty members instead. In this particular context, an administrator is a well-paid individual in an academic managerial role such as a dean or vice provost, or a vice president in a non-academic administrative area like human resources or communications, i.e., higher administration. Rarely does the sense of the term extend to rank-and-file professional staff members carrying out their support roles in lower-level administration.
Administrative bloat in the sense above is a myth: higher administrators are not escalating relative to the faculty or students and have not done so for decades (Desrochers and Kirshstein 2014; Kelchen 2018). However, the relative numbers of professional support staff2 have indeed been rising. These trends are made plain by the data in Figure 5.18, which shows that the number of executive administrators per faculty member has remained constant at about 0.3, while the number of professional support staff per faculty member has increased by almost half (0.7 to 1.0) in nearly two decades.
2 Professional staff positions require at least a bachelor’s degree.

5. Human Resources 111
Figure 5.18. Trends in executive/managerial administrators and professional support staff per faculty member (all full time) averaged across all eight types of institution by fiscal year. Data categories changed in FY2013 and were aligned to the closest match. Source:
IPEDS (2020).
The fastest-growing professional staff segment has been student support services (see more about those spending trends in Section 7.8). These positions include advisors, counselors and other professionals who, in some cases, perform duties that otherwise the faculty would have to do. In other cases, they serve in roles that didn’t necessarily exist in prior decades and are now providing essential support that is expected by students and parents. This type of position has grown relative to other staff, which would at first glance appear to indicate “lower administration bloat,” but that’s not the whole story. Some other staff categories have shrunk over time, resulting in a relative balance in overall non-instructional staff proportions; recall from Figure 5.4 that the overall trends in all non-instructional staff have remained parallel to trends in instructional positions. So, while the two trends (flat higher administration and growing professional staff, especially in student services) might appear to be contradictory in relation to administrative bloat, they are not—the relative increase in professional staff is offset by relative decreases in other staff categories in relation to all instructional staff. What we have seen is simply a shift to a greater proportion of staff in the professional category relative to other staff positions, with all-staff totals remaining parallel to trend in instructional staff. Therefore, whether in its classic higher administration invocation or more broadly relating to non-instructional staff, administrative bloat is a false hypothesis that refuses to die. It is likewise a red herring in arguments about rising costs in higher education, which have structural causes as we saw in Section 3.7.
0.0
0.2
0.4
0.6
0.8
1.0
1.2
2002 2003 2004 2005 2006 2007 2008 2009 2010 2011 2012 2013 2014 2015 2016 2017 2018 2019
Employees p
er Faculty M
embe
r (Full Time)
Professional Support Staff
Executive Administrators

Like Nobody's Business112
5.10 How do we account for graduate assistants?
Graduate assistants are distinctive in an accounting sense because they are a special kind of student-employee hybrid. A graduate assistantship is a form of financial aid awarded only to selected students on a per-semester basis to enable them to attend graduate school (an assistantship is not like a regular job for which anyone can apply). Yet, graduate assistants clearly perform work in teaching or research, typically half-time or less. Graduate assistants are completely different to regular staff members attending a graduate program who may receive qualified tuition reduction as an employee benefit, and whose job does not depend on satisfactory academic performance in the program. The hybrid nature of a graduate assistantship simultaneously enables many students to attend graduate school while providing academic labor to their program, the latter having sometimes led to labor relations disputes and efforts to organize, most recently at elite private institutions (Kroeger et al. 2018).
Graduate assistants are, needless to say, found at schools with graduate programs, and those are primarily R1 and R2 institutions (Figure 5.19). The teaching/research assistant percentage split is 57:43 at R1 publics and close to that at R2 public and private schools, but the split at R1 privates is exactly the opposite way around (43:57) with more research than teaching assistants. The typical graduate assistantship is awarded to a full-time research doctoral student (or research master’s student) and rarely to graduate students in professional programs (e.g., EdD, MBA, MD) or part-time graduate students. Figure 5.19 also shows that the share of all full-time graduate students receiving assistantships
Figure 5.19. FY2018 total unadjusted counts of graduate assistants (teaching, research, other) as a share of full-time graduate student fall enrollment, averaged by Carnegie classification
and control. Source: IPEDS (2020).
0
1,000
2,000
3,000
4,000
5,000
6,000
7,000
8,000
R1 Public R2 Public R3‐M3 Public BAS Public R1 Private R2 Private R3‐M3 Private BAS Private
Num
ber o
f Gradu
ate Assistan
ts & Stude
nts (FY2
018)
Graduate Enrollment (Full‐Time)
Other Assistant
Research Assistant
Teaching Assistant

5. Human Resources 113
at public institutions is double the share at private institutions (43% versus 21%), which is due to a combination of factors at the privates: smaller undergraduate enrollments needing fewer teaching assistants, relatively larger graduate enrollments, especially in professional programs, and more self-paying graduate students.
Trends in the unadjusted counts of graduate assistants have been rising over the last decade and a half, by roughly 1% annually at the publics and about 3% at the privates. As with the instructional staff, we should adjust these totals to account for enrollment growth over time, and those adjusted trends are shown in Figure 5.20. Note also that these totals are for all graduate assistants, teaching, research and other; on average, teaching assistants are 53% and 40% of all graduate assistants at public and private universities respectively. Adjusted graduate assistant trends were rising until the mid-2000s at all four types of institution, after which they leveled off and even receded at the R1 publics. At the privates, the trend in graduate assistants increased in the early 2010s and rose to about 10% more than at the publics.
Figure 5.20. Trends in graduate assistant headcount adjusted by total fall student enrollment, expressed as graduate assistants per 1000 students, for public and private R1 and R2
institutions by fiscal year. Source: IPEDS (2020).
5.11 How much do graduate assistants earn?
Graduate assistantship stipend amounts are not collected comprehensively on a national basis in IPEDS (although it does count the number of graduate assistants). Instead, total assistantship dollar amounts (among many other variables) are collected every few years via sample (National Center for Education Statistics 2018a), but when the data are broken out by subset such as Carnegie classification, degree level, and so
0
10
20
30
40
50
60
70
80
90
2003 2004 2005 2006 2007 2008 2009 2010 2011 2012 2013 2014 2015 2016 2017 2018
Gradu
ate Assistan
ts per 100
0 Stud
ents
R1 Public R2 Public
R1 Private R2 Private

Like Nobody's Business114
on, they can be unreliable or unavailable because of small sample sizes. These data are also not specified by appointment level (half-time, quarter-time, etc.). Full-time research doctoral students are the most consistently comparable subgroup across institutions and categories to receive a half-time graduate assistantship, typically a nine-month or ten-month stipend for teaching and often for twelve months as a research assistant. Given the above constraints, these “most comparable” stipends are illustrated in Figure 5.21. Graduate assistantships across all fields are 30% lower at R1 publics compared to R1 privates, almost $18,000 versus nearly $26,000 (the difference is 9% at R2 schools). Dividing the data by major academic field, half-time nine-month stipends in STEM fields are higher than in others (about $21,000 versus about $16,000), and the public/private difference holds except in business-related majors. In the life sciences, graduate assistant stipends are often linked to the predoctoral amount stipulated annually by the National Institutes of Health, which at $23,376 for FY2016 (National Institutes of Health 2016) falls right between the average public and private half-time stipends for life and physical sciences. By the way, it is sometimes incorrectly assumed that, as teachers or researchers, graduate students are “cheaper” than their nearest staff counterparts: instructors or postdoctoral researchers (for more on this topic, see Section 8.5).
Figure 5.21. FY2016 half-time (0.5 FTE, non-summer) graduate assistantship amount for full-time, full-year research doctoral students averaged by Carnegie classification, academic field and control. Note that data for some categories are unreliable or unavailable because of small sample sizes. Source: NPSAS:16 (National Center for Education Statistics 2018a).
Trends in graduate assistantship stipends are hard to discern with much precision given the data issues mentioned above, but such as they are, the inflation-adjusted trends have generally been upwards (Figure 5.22). The annualized rate of increase for
$‐
$5,000
$10,000
$15,000
$20,000
$25,000
$30,000
R1 R2 Life &PhysicalSciences
Math/Engineering/ComputerScience
Social/BehavioralSciences
Education Business/Management
Humanities
Carnegie Classification Academic Field
Gradu
ate Assistan
tship Stipen
d (Doctoral, FY20
16)
Public Private

5. Human Resources 115
the NPSAS survey data is roughly 1.5%, which is interestingly slightly higher than that for the faculty. Amounts at the publics have been essentially flat since 2000 given the variability in the data, while at the privates they have been flat in the post-recession years. Inflation-adjusted NIH stipends have likewise been flat since the recession and are now a bit lower in real terms than they were in 2004 after they rose with the NIH budget-doubling between 1998 and 2003.
Figure 5.22. Trends in half-time (0.5 FTE, non-summer year) graduate assistantship amounts for full-time, full-year research doctoral students at public and private R1 and R2 institutions, and trend in the stipulated NIH pre-doctoral stipend amount for graduate research assistants (0.5 FTE, full-year), all by fiscal year in 2016 dollars. Sources: NPSAS:16 (National Center for Education Statistics 2018a) and NIH
(National Institutes of Health 2016; 2019).
5.12 How much are employee fringe benefits and costs?
Full-time university employees, whether academic or regular staff, have an associated set of fringe benefits and related costs that are paid by the institution in addition to an employee contribution. On average, as we saw in Figure 3.1, employee fringe benefits total an additional one third of salary costs. IPEDS stopped collecting detailed fringe benefit data after FY2011, but fortunately the set of benefits has remained essentially unchanged since then, so we can still usefully examine those data (Figure 5.23). In addition to major benefits like healthcare, retirement and social security, there are other items such as workers’ compensation, disability income protection, unemployment compensation, group life insurance and housing allowances. A signature benefit in higher education as compared to other sectors is a tuition plan for dependents. It
$‐
$5,000
$10,000
$15,000
$20,000
$25,000
$30,000
1975
1980
1983
1985
1989
1991
1994
1997
1998
1999
2000
2001
2002
2003
2004
2005
2006
2007
2008
2009
2010
2011
2012
2014
2015
2016
2017
2018
Gradu
ate Assistan
t Stip
ends (P
hD only, FY2
016 Do
llars)
NIH
NPSAS Public
NPSAS Private

Like Nobody's Business116
is a valuable benefit for many employees and is therefore an important incentive in attracting workers into higher education. The dollar value to the employee, and cost to the institution, can be significant, especially at private institutions with their higher tuition levels. Some benefits have a vesting period of several years before they are fully usable (e.g., retirement, tuition). Public institutions often participate in their state benefits program, which may include a pension system as well as a healthcare plan that is purchased on the open market.
Figure 5.23. Most recently available (FY2011) per-employee fringe benefit expenditures (equated nine-month contract) for public and private institutions, in 2016 dollars. Retirement plans are within five years of appointment; tuition and other items include restricted
and unrestricted expenditures. Source: IPEDS (2020).
The public-private dollar difference in employer benefit contributions in Figure 5.23 is likely due to the higher salaries at the privates; likewise, the higher salaries at R1 schools lead to relatively higher dollar contributions too. When expressed as a percentage of salary, this relationship can be inverted. For example, in FY2018 the average faculty retirement benefit as a percentage of salary was 11.7% at four-year publics versus 7.3% at non-religiously affiliated four-year privates (American Association of University Professors 2018).
Fringe benefit costs grow faster on average than any other costs in higher education, with an average annual increase of 3.9% over FY2007–FY2017 (Commonfund Institute 2017a); also, see the HEPI (Section 3.7), which indexes all higher education costs and averaged only 2.4% growth over the same period. The fast-rising cost of healthcare is a major component of the overall growth in fringe benefit costs, affecting not only universities and colleges but all employers. Healthcare premiums have doubled in the last twenty years (Figure 5.24): they rose rapidly in the early 2000s, from 5% to 13%
$‐
$2,000
$4,000
$6,000
$8,000
$10,000
$12,000
$14,000
$16,000
$18,000
$20,000
Health Retirement Social Security Other Tuition
Fringe
Ben
efit Expe
nditu
re per Employ
ee (in 201
6 Dollars)
Public Private

5. Human Resources 117
annually even after adjusting for inflation, but subsequently stabilized somewhat in the late 2000s and have remained mostly under 4% since then, again after adjusting for inflation. The employer contribution has remained in the mid-80% range for most of these two decades. However, one of the key ways that plans keep prices down is through deductibles. Both the number of high deductible health plans and the amount of the deductible has been rising, and since 2008 annual deductibles for covered workers have increased eight times as fast as wages (Kaiser Family Foundation 2018).
Figure 5.24. Worker and employer contributions to health insurance premiums (single coverage) and year-to-year percentage changes in total premiums, in 2016 dollars. Source: Kaiser
Family Foundation (2018).
Retirement benefits have been undergoing structural changes for some time. Defined benefit (traditional pension) plans are in retreat, while defined contribution (retirement investment) plans have been on the rise since pre-tax 401(k) plans were established in 1978. At public universities, with their state public pension plan links, 11% currently offer a pension plan only, 10% offer a defined contribution plan only, and 79% offer both kinds of plan, whereas at private universities only 1% are currently limited to a pension plan, 92% offer a defined contribution plan only, and 7% offer both (Sibson Consulting 2018). Overall, the average higher education employer contribution to defined contribution retirement plans is 8.7%, which is a valuable benefit at two to three times more than the typical corporate contribution (Sibson Consulting 2018).
Finally, universities variously offer a range of additional benefits to employees. Certainly, all offer paid and unpaid leave programs, but they differ in what they include, such as vacation time, sick leave, paid time off, extra holidays, short-term and long-term disability plans, parental leave, bereavement leave, military leave, and
0%
2%
4%
6%
8%
10%
12%
14%
16%
$‐
$1,000
$2,000
$3,000
$4,000
$5,000
$6,000
$7,000
$8,000
1999 2000 2001 2002 2003 2004 2005 2006 2007 2008 2009 2010 2011 2012 2013 2014 2015 2016 2017 2018
Annu
al Cha
nge in Total Premium
Contrib
ution to Health
Insurance Prem
ium (FY2
016 Dollars)
WorkerEmployerAnnual % Change

Like Nobody's Business118
sabbatical leave. About half of institutions offer employee assistance programs (Sibson Consulting 2018) and non-traditional benefits as well, such as financial consultation, clinical counseling sessions, legal consultation, stress management, group life insurance, professional development, wellness initiatives, access to campus fitness centers, as well as resource and referral services for substance abuse, elder care and childcare. These benefits can go a long way to creating a desirable workplace, and while their cost to the institution is not large in comparison to healthcare or retirement, they still need to be monitored and managed.

6. Academic Affairs
6.1 What does a college budget include?
Colleges are even more varied than the universities in which they exist. A broad Arts and Sciences college at an R1 university may contain two or three dozen departments with many hundreds of faculty members, while a small professional school (e.g., Nursing, Law) at the same university may have only two or three dozen full-time faculty members and no department structure. Furthermore, an entire M3 university or baccalaureate college may be the equivalent of a single college at an R1 institution.
I’ve created an example high-level annual college budget that could represent a modestly sized R1 college or a large college at a smaller institution (Table 6.1), in which the precise numbers are less important than the budget components that they illustrate. For professional schools, say in Law or the health professions, that have more financial autonomy and often no undergraduate program, it is simple enough to modify the estimates accordingly. Let’s examine the example in detail, starting on line 1 with the revenue section. I’ve specified undergraduate and graduate net tuition as if they were calculated in a responsibility centered management (RCM) or activity-based budget environment. As explained in Section 6.2, that approach is merely a way to allocate a share of revenue based on activity, and these two sources would simply be allocated from the central university budget in a traditional (incremental) budget environment. We’ll assume that the college teaches 25,000 undergraduate student credit hours (SCH) to all students, including general education and classes taken by students majoring in other colleges, a typical class being three credit hours per student. We’ll also assume that the college receives $300 per credit hour for a total of $7.5M. In addition, we’ll assume the college has 2,000 majors in its degree programs and that the college receives $1,250 per major for a total of $2.5M. These two amounts together make up the $10M undergraduate net tuition revenue (line 2). The university pools all tuition revenue and subtracts financial aid before allocating revenue to the colleges as a net amount. The calculation is similar for graduate programs; we’ll assume 7,000 graduate SCH at $300 too, which generates $2.1M, plus 1,200 graduate majors also at $1,250 that generates $1.5M. Those two amounts total $3.6M and although that number is already net of any central financial aid
© Andrew C. Comrie, CC BY 4.0 https://doi.org/10.11647/OBP.0240.06

Like Nobody's Business120
as for undergraduates, individual graduate programs often award tuition waivers as part of recruiting. We must subtract those locally-awarded waivers, which we’ll assume amount to $0.6M, leaving a net graduate revenue of $3M (line 3).
Table 6.1. Example annual college budget, showing major categories of revenues and expenditures, including shares of revenue and institutional costs. See text for explanations.
Line Item Detail Amount ($)1. Revenues2. Undergraduate Net Tuition Undergraduate revenue, net of central aid* 10,000,0003. Graduate Net Tuition Graduate revenue, net of central and local aid** 3,000,0004. Fees Program and course-specific fees 500,0005. Research (F&A) Indirect cost recovery from grants*** 1,000,0006. TOTAL Teaching & Research 14,500,0007. Institutional Allocation University revenues, e.g., state, investments 5,000,0008. Philanthropy Endowment income and gifts 1,000,0009. TOTAL REVENUES 20,500,00010. Expenditures11. Facilities Share 60,000 ft2 @ $25 per ft2 1,500,00012. Support Units Share 35% of Teaching & Research 5,075,00013. Central Investment Share 3% of Teaching & Research 435,00014. TOTAL Support Cost Share 7,010,00015. Salaries—Faculty 70 @ $80,000 per year average 5,600,00016. Salaries—Staff 15 @ $50,000 per year average 750,00017. Teaching Assistants 80 @ $30,000 per 0.5 FTE per year 2,400,00018. TOTAL Salaries 8,750,00019. Fringe Benefits 36% of Total Salaries 3,150,00020. TOTAL Personnel 11,900,00021. Operations Office supplies, lab equipment, travel, etc. 1,500,00022. TOTAL Operational Budget 13,400,00023. TOTAL EXPENDITURES 20,410,00024. Net Revenues-Expenditures 90,000
*Undergraduate activity: 25,000 student credit hours @ $300 = $7.5M; 2,000 majors @ $1,250 = $2.5M; total = $10M
**Graduate activity: 7,000 student credit hours @ $300 = $2.1M; 1,200 majors @ $1,250 = $1.5M; less $0.6M local aid (tuition waivers); total = $3M
***Research grant revenues: $1M of indirect cost recovery for use of facilities and administration @ 50% of $2M in direct grant costs; grant total = $3M

6. Academic Affairs 121
The college also receives fee income to cover special program and class-specific costs not covered by regular tuition that we’ll assume is $0.5M (line 4). For research income, the direct costs are restricted funds that are budgeted separately but indirect cost recovery contributes back to the regular budget. Thus, if we assume gross revenue from research grants of $3M, $2M of that would be direct costs involved in carrying out the research (researcher time, equipment, supplies) and $1M would reimburse the university for associated facilities and administration costs (space, accounting services, compliance, etc.) assuming a 50% indirect cost rate. The college receives the $1M as revenue here (line 5) but will use it to pay its share of those costs when we get to expenditures. All teaching and research revenues thus total $14.5M (line 6).
Most colleges require an institutional allocation beyond teaching and research revenue to cover all costs, assumed as $5M in this example (line 7). This amount would typically come from state appropriations and/or investment and endowment income depending on whether this was a public or private institution. The final revenue item is income from philanthropy, assumed to be $1M (line 8). These are restricted funds, but typically a portion is directed towards endowed chairs and program support; increasingly such funds effectively add to the operational budget. All revenues for our example college total $20.5M (line 9).
Moving on to the expenditures section (line 10), we’ll again specify the first few items in an RCM context. These support costs (lines 11, 12 and 13) reflect the college’s share of space and central administrative support units. In an incremental budget the college would not see these items and they would be subtracted from tuition and institutional revenues before allocations were made. The college’s share of all facilities costs (construction bond payments, maintenance, etc.) is computed as the share of space it uses, here assumed to be 60,000 net assignable square feet at an assumed rate of $25 per square foot for a total of $1.5M (line 11). The college’s share of all non-college support unit costs is slightly over $5M at an assumed rate of 35% (line 12). For simplicity I’ve used a simple flat rate based on total teaching and research revenues, but in practice this would likely be a combination of different rates on undergraduate, graduate and research activity. The college’s contribution to the central fund used for reinvestment back into the colleges is a little under $0.5M at an assumed rate of 3%, again levied as a flat rate on all teaching and research revenue for simplicity in this example (line 13). The college’s combined support cost share totals slightly over $7M (line 14).
Personnel costs include salaries and stipends and associated fringe benefits. Our example college has 70 FTE faculty members with an assumed average salary of $80,000 across a mix of all faculty ranks, for a total of $5.6M (line 15). There are 15 support staff at $50,000 average salary, totaling $0.75M (line 16). The stipends for 80 0.5 FTE graduate teaching assistants, at an assumed $30,000 each, come to $2.4M (line 17). Together, employee pay totals $8.75M (line 18) to which we add fringe benefits

Like Nobody's Business122
at an assumed rate of 36% to get a bit over $3M (line 19), with total personnel costs thus amounting to $11.9M (line 20). The fringe benefit rate is also a simplification for sake of example, as different position types may have different associated rates, and even more simplistically I’ve assumed that it includes tuition for graduate assistants here too. The final budget item covers all other costs of operations such as classroom and teaching materials, office supplies, equipment maintenance, travel and so on, and I’ve assumed a value of $1.5M for all operations (line 21). The total operational base budget combines personnel and operations costs for a total of $13.4M (line 22). When added to the support cost share, total expenditures slightly exceed $20.4M (line 23), leaving a small net remainder from overall revenue (line 24).
This example includes the major parts of a college budget and although it glosses over umpteen minor items, the main point is to provide a relative sense of the components and how they might interact. For instance, to add one additional assistant professor at $73,000 salary will require about $100,000 including benefits on a sustained annual basis. That expenditure is the equivalent of an additional 460 SCH (333 SCH plus a further 127 SCH to cover the combined 38% support cost share) and it assumes there is a spare office for the new person, otherwise the extra space and facilities cost will be $2,500 for a 100 square foot office. That 460 SCH represents 153 class seats using 3-credits per class, which at 30 credits per year is about 5 net new students. The point about them being net new is critical—if they simply move internally then that doesn’t produce new revenue for the institution. Alternatively, increasing the endowment by about $2M would produce revenue of about $100,000 annually, and it could be used to offset funds to retain some star professors through endowed chairs, thereby freeing up funds for a new assistant professor. Not surprisingly, there are multiple combinations and, in practice, there are many efforts going on simultaneously to grow revenue and control expenditures.
A final thought on academic unit budgets: because departments represent disciplines and fields, they are the fundamental organizational units. However, a generic example department budget isn’t especially useful because each department has a unique institutional context and a cost structure that varies by discipline. Still, one can think of a department budget as a smaller version of a college budget. A college such as the one in this example might have five or so departments, some small and some large, and the college budget would be allocated among them and the dean’s office. So, adjusting this budget and dividing everything by five or ten would provide a generic department budget. However, the challenge with smaller units like departments is that they individually have constrained revenue and expenditure portfolios; therefore, they may need to receive or supply cross-subsidies within the college, requiring careful judgment and management by the dean.

6. Academic Affairs 123
6.2 What is RCM or activity-based budgeting?
One of the biggest changes in university budgeting in recent decades has been the increasingly widespread adoption of a budget model that distributes responsibility for managing revenues and expenditures. Such an approach is known variously as Responsibility Center Management (RCM), Responsibility Centered Management, or more generally as Activity-Based Budgeting (ABB). Compared to the other prevalent model, incremental budgeting, RCM is a fundamentally different approach for major subunits of the university, particularly schools and colleges, to manage how they generate and spend resources. There are articles and whole books on RCM (Kosten and Lovell 2011; Curry et al. 2013) and its implementation, something I led at my institution, and from which I learned a great deal about many of the topics in this book. As with all the topics we are covering, I provide simply the essence of RCM here.
RCM adoptions are a response to the “hat-in-hand” approach of incremental budgeting. In that traditional model, units request an increase in their budgets for the following year, based on current needs and new initiatives, from central administration. Under RCM, the dean is given responsibility for all budgetary aspects of the college (hence the term ”Responsibility Center”), not only for generating the revenues but also for managing costs effectively. Neither of these is a feature of incremental budgeting. It is not surprising, then, that the rise in RCM budgeting has echoed the trend toward increasing tuition-dependency.
RCM has evolved over the last several decades, so that a recent RCM model can differ in key ways from older implementations (interestingly, with a greater role for central administration management) as institutions learn from each other and adapt the approach to suit their own situations. RCM’s roots lie in the budget models of some of the oldest private universities, where each school or college had an independent budget in the federation making up the university, with “every tub on its own bottom” (or ETOB) as the saying at Harvard goes. If ETOB is at one end of the spectrum and government agency-like central budget control is at the other, proponents of contemporary RCM aim for it to combine the best of both worlds somewhere in the middle. However, RCM evolved from the ETOB end of the spectrum (mostly at the privates) many decades ago. It has only seen broader implementation at the publics since the 1990s and into the 2000s and 2010s. Given its varied history, when a university is considering RCM as a new budget model, critiques may be raised based on perceptions of older ETOB-like models. For example, under classic ETOB a college could theoretically go out of business with little opportunity for intervention from the rest of the university. In contrast, contemporary RCM is built around the concept of subventions (cross-subsidies) in the institutional budget, such that academic priorities are supported by a shared mix of higher- and lower-revenue units and activities.
At the unit (college) level, the change in thinking relative to incremental budgeting is that the base budget no longer arrives automatically each year—if unit activity

Like Nobody's Business124
rises relative to others then the unit’s share of the overall budget rises too (and vice-versa!). Under either budget system, it is a convenient local fiction that a base budget is semi-permanent—as we’ve seen in many of the preceding sections, the institutional revenues behind those budgets have been changeable, but they aren’t consistently felt locally. Under RCM, colleges sense more closely both the opportunity and precariousness in institutional budgeting that before was largely the concern of senior central administration. Under incremental budgeting, the focus is typically more on academic priorities rather than their revenue or cost dimensions. These differences are at the heart of critiques of both systems.
Figure 6.1 illustrates RCM as compared to incremental budgeting, in a nutshell. Under RCM, colleges (responsibility centers) receive their share of campus revenues as well as their share of costs. Many of those institutional costs (e.g., space and facilities) are invisible to colleges under incremental budgeting, but under RCM the college sees the cost and is provided the (previously invisible) budget to pay for those costs. Notice that colleges likewise see and pay for the costs of central support units (student affairs, human resources, etc.) that were also previously invisible. The net effect of these changes on a college budget is zero in dollar terms, but significant in terms of perception.
Under the incremental model, a college that taught more (or less) than it did the previous year would not necessarily see the change in marginal revenue, whereas under RCM it would see the related revenue increase (or decrease) as well as the associated costs. In RCM, the revenue-generating activity of all colleges is tracked using simple metrics (e.g., total credit hours, enrolled majors, sponsored project revenue) and revenue is allocated by each college’s share of the total activity. Costs are allocated based on share of space occupied for facilities and via a proportional share of support unit costs. These costs are often called taxes, and one of the most important taxes is a contribution to a strategic investment fund that is managed centrally and is available to fund new initiatives.
It is worth underlining that RCM itself doesn’t “make” any decisions, it is merely another way of getting to a budget allocation. It provides latitude for central control and management through subventions and strategic investments while prioritizing a decentralized approach that ideally enables greater entrepreneurial activity by the units. Because the activity formulas and metrics are well-known, RCM proponents claim that it is more transparent and predictable than the incremental model. Still, a well-run incremental budget system with comparable levels of communication can be transparent and effective at stimulating innovation too. In practice, neither is perfect: both have many positive attributes as well as unintended consequences and perverse incentives that require active management for the system to work well.
RCM is structured to incentivize and optimize revenue generation and cost-effective practices. In doing so, it places increased authority and accountability on the deans and vice presidents. While RCM proper operates at the college level,

6. Academic Affairs 125
Figure 6.1. Schematic comparison of annual budgeting under an incremental process versus responsibility center management.
Incremental Budgeting
Annual Marginal Revenue Changes• Net Tuition• State Appropriation• Investment Income• Indirect Cost Recovery• Auxiliary Service Charges
Central Administration
Marginal Changes to Base Budgets
Colleges Facilities CostSupport Units
Responsibility Center Budgeting
Activity‐Based Allocations of Revenues &Costs plus Subventions
Colleges
Strategic Investment
Fund
Support Units & Central
Administration
Facilities Cost
All Annual Revenues & Costs• Net Tuition• State Appropriation• Investment Income• Indirect Cost Recovery• All Fees• Gifts
• Salaries & Wages• Employee Benefits• O&M of Plant• Depreciation• Interest on Debt• Other Costs
Auxiliaries
it relies upon clear communication between colleges and their departments for it to succeed—faculty must understand the within-college budget model so that they can connect their innovations and adaptations with college incentives. It is not unusual for communication to be oversimplified at this level, resulting in a “dollars for butts in seats” mentality that is hard to counteract. Furthermore, because universities are necessarily academically decentralized, many important decisions with financial implications are made at the department level. Yet, RCM is not designed to be a department funding mechanism—that model must be able to handle a relatively higher variance in subventions within and across departments because their budgets are not sufficiently diverse or large enough to absorb “noisy” fluctuations. Thus, the dean must balance academic priorities with budget trends while providing short-term budget stability. This is the reason that RCM is primarily used at larger universities, where the responsibility centers (colleges) have enough varied programs that they can manage year-to-year swings in the budgets across their internal units (departments).
While RCM is often implemented in response to the perceived shortcomings of incremental budgeting (e.g., no incentives to cut costs, dollars don’t necessarily follow teaching activity), RCM is not a panacea and it doesn’t print money. RCM can lead to an everyone-for-themselves attitude, with units competing over the size of their slice of the pie because they have less control over growing the whole pie (for example, colleges poaching enrollments from each other instead of attracting new students to the university). The core notion of a well-implemented RCM budget system is that it should incentivize rapid local responses to opportunities and challenges that together

Like Nobody's Business126
benefit the institution, by aligning the locus of revenue and cost decisions with the locus of academic decisions. In practice, as I’ve mentioned, both incremental and RCM approaches are messy and imperfect, requiring many complicated adjustments to fit them to a complicated institution. One thing both systems have in common: campus units will gripe about their budgets either way because there are winners and losers under both, and because there is never enough money to support and grow the size and quality of every campus program (see Bowen’s Law in Section 3.7).
6.3 What is the cost of producing a degree?
It turns out that this simple question is devilishly hard to answer accurately. The reason is that we don’t account for activities in a way that makes it easy to answer. We can indeed calculate useful institution-wide figures summed across all levels of degrees and all disciplines, but the minute we want to examine the cost of producing just bachelor’s degrees, PhD degrees, MD degrees, etc. or the cost of producing degrees in Economics, Engineering or English, we run into all kinds of issues. Let’s look at the institution-wide numbers first before unpacking them in the next couple of sections.
We discussed E&R (education and related) expenditures, the subset of all expenditures related to delivering and supporting instruction, in Chapter 3. In particular, we looked at E&R expenditures per student FTE in Sections 3.3 and 3.4, which is a useful way to compare investments per input. For investments per output we calculate E&R per degree awarded instead (Figure 6.2). By this measure of institutional cost of education per degree we see many of the same patterns as we did with the per-FTE calculation: the privates spend about twice as much per degree than do the publics, with the private baccalaureate and R1 institutions spending $150,000 to almost $250,000 per degree, as compared to other schools spending $60,000 to $100,000 per degree in recent years.
It’s tempting to mentally divide by four to obtain an annual cost, but it’s not that simple. These amounts include all levels of degrees, undergraduate, professional and graduate, each with a different typical time-to-degree. Many undergraduates don’t finish in four years (and others transfer away or don’t complete), master’s degrees take two years or less, a PhD can take six-plus years, and their relative proportions differ by institution. Therefore, the E&R cost per FTE metric analyzed in Chapter 3 is better suited to obtaining an annual amount. We can also see that research universities have a higher cost structure than the other institutions, an important part of that being the relative mix of faculty workload. Nevertheless, E&R spending per degree is widely used as a cost-of-production metric to benchmark output efficiency in an economic sense, and it is also useful to analyze trends. In the data underlying Figure 6.2, from FY1987–2009 the annualized growth rate in cost-per-degree across public institutions was 0.7% (aligning with labor cost, see Section 3.7) and a striking 3.1% across private institutions. Post-recession, from FY2009–2017 the two rates were both modest at 0.6% and 0.5% respectively.

6. Academic Affairs 127
Figure 6.2. Trends in Educational and Related (E&R) expenditures per total degrees awarded in 2016 dollars by fiscal year, averaged by Carnegie classification and control. Source:
IPEDS (2020).
$‐
$50,000
$100,000
$150,000
$200,000
$250,000
1987
1988
1989
1990
1991
1992
1993
1994
1995
1996
1997
1998
1999
2000
2001
2002
2003
2004
2005
2006
2007
2008
2009
2010
2011
2012
2013
2014
2015
2016
2017
E&R Expe
nditu
res p
er Degree Aw
arde
d (FY2
016 Dollars)
R1 PublicR2 PublicR3‐M3 PublicBAS PublicR1 PrivateR2 PrivateR3‐M3 PrivateBAS Private
6.4 How does the cost of degree production vary by discipline?
Systematic national data on discipline-specific costs are not widely available, in part because disaggregated department-level data on teaching workloads, salaries, etc. would risk revealing individual personal information. The National Study of Instructional Costs and Productivity, known as the Delaware Cost Study, was initiated by a consortium of institutions in the 1990s to collect such data voluntarily for internal benchmarking by participants, and it now includes hundreds of four-year public and private institutions (Higher Education Consortia 2019).
Fortunately, a recent study has provided the first wide-ranging analysis of program-level costs based on those data (Hemelt et al. 2018). The authors used sophisticated modeling to analyze the relative effects of class size, instructor salary, workload, and non-personnel expenses as key drivers of cost differences by discipline. For ease of understanding, I have converted the results from natural log form into percentage form, showing cost per SCH relative to English for 20 fields for each of the four drivers and as an overall net difference (Figure 6.3). There are wide ranges in the differences across fields, overall and in the component drivers, especially salary and class size. Note that average salary in a department is a function not only of the disciplinary market-based salary but also the mix of faculty types (tenure-track, contingent, teaching assistants). Also, the average class size in a department depends on the mix of lower-division undergraduate classes versus typically smaller upper-division and

Like Nobody's Business128
graduate classes. Departments that provide introductory or fundamental classes to students across the university, such as Mathematics or English, have a different average class size to those that focus more exclusively on professional or graduate education. Overall, engineering and nursing degrees are relatively costly (roughly double the cost of English degrees), while education and fine arts with small salary effects are still 30–40% more expensive because of class size. Business and accounting are interesting cases because, although salaries are relatively high, the effect of class size lowers their overall cost. At the other end of the scale, disciplines such as psychology, sociology, philosophy and mathematics are less costly primarily because of their average (mix of) class sizes. While faculty workload (class sections per faculty member per year) is a contributing factor in some disciplines, its overall effect is not large, while non-personnel costs (e.g., equipment) are relatively unimportant overall. The study found these results to hold across all institution types meaning, for example, that psychology is consistently less expensive than physics whether at an R1 public university or a private baccalaureate college (Hemelt et al. 2018).
Figure 6.3. Instructional expenditures per student credit hour (SCH) by field of study, expressed relative to English for four cost drivers and the net overall difference, using 2013–2015 data from the Delaware Cost Study. Data are converted to percentages from the original
modeled natural log cost differences. Source: Hemelt et al. (2018).
6.5 Do the humanities cross-subsidize the STEM fields?
This is a loaded question for two reasons, one because there are several layers of answer, and two, because it is an attention-grabbing ringer for the broader question of whether different fields cross-subsidize each other across the university. To the latter, yes,
‐60%
‐40%
‐20%
0%
20%
40%
60%
80%
100%
120%
Electrical Engineerin
g
Nursing
Mecha
nical Engineerin
g
Education
Fine
/Studio Arts
Busine
ss/M
anagem
ent
Compu
ter/Info Scien
ces
Accoun
ting
Physics
Chem
istry
Biology
English
Poli Sci/Governm
ent
Econ
omics
History
Comm/M
edia Studies
Psycho
logy
Sociolog
y
Philo
soph
y
Mathe
matics
Cost per SCH
(differen
ce from
Eng
lish)
Non‐PersonnelClass sizeWorkloadSalaryOverall Difference

6. Academic Affairs 129
unequivocally, cross-subsidies exist in almost every university and for good reason: not doing so would undermine academic priorities that enable students to select and combine classes from multiple fields and to change majors if necessary, without worrying about cost. There has nonetheless been a longstanding practice of adding what are essentially surcharges for some fields that are more expensive or where the market (i.e., anticipated future earnings such as for an MBA) will support a higher quality program. But importantly, cross-subsidies and surcharges at the department or program level are not the whole story as they still don’t cover the full cost: the bigger truth is that virtually all programs are subsidized.
Let’s return to the original question about humanities and STEM and use it as a worked example to understand the various layers of this answer (Table 6.2). Fundamentally, as we saw in Section 6.4, because many humanities fields (e.g., English, history, philosophy, and many languages) have modest salaries and can be offered effectively at a moderate class size, on average they are less expensive to operate than most science and technical fields (e.g., physics, engineering) that have relatively higher salaries, smaller classes and/or lower teaching loads (Figure 6.3). But recall that mathematics, the “M” in STEM, is among the least expensive disciplines to teach. Those direct instructional costs per SCH by discipline are approximated from the study mentioned previously (Hemelt et al. 2018) and they are the starting point in our example (Table 6.2, line 1). You’ll see that they range from $165 per SCH for mathematics to $400 per SCH for an engineering program, with an overall average of slightly under $240 per SCH. So, as a layer-one answer, the underlying direct instructional costs of the humanities are lower than in STEM on average, but it is important to keep in mind that the disciplines in each group have a mix of cost structures and the groups are not monolithic. Now we assume a net tuition amount of $350 per SCH (line 2), which as a guide is $10,500 per year based on
Table 6.2. Example of the layers of cross-subsidization across disciplines. Amounts are in dollars per student credit hour (SCH).
Line ItemHumanities STEM
English History Philosophy Physics Engineering Math1. Direct Instructional Cost (200) (190) (180) (285) (400) (165)2. Net Tuition 350 350 350 350 350 3503. Differential Tuition/Fees - - - - 50 -4. SUBTOTAL 150 160 170 65 - 1855. Indirect Support Cost (240) (240) (240) (240) (240) (240)6. OVERALL TOTAL (90) (80) (70) (175) (240) (55)

Like Nobody's Business130
a standard 30 SCH load for a full-time student, representative of a public institution. We also include differential tuition for the Engineering program at $50 per SCH (line 3), which equates to $1,500 per year on top of base tuition. Our initial subtotals (line 4) show the humanities disciplines generating positive margins of $150 to $170 per SCH, whereas physics generates $65 per SCH, engineering breaks even and generates zero, and math produces $185 per SCH. Many arguments about cross-subsidies will focus solely on the disciplinary cost data as a layer-one answer or will use these offset-by-revenue subtotals as a layer-two answer.
As I’ve intimated above and explained earlier in this chapter, our example so far is incomplete because it does not include all costs related to education. We mustn’t forget the indirect instruction-related costs of academic support, student support and institutional support, that together form the “R” in E&R (education and related) expenditures. From Chapter 3 and elsewhere we know that those are roughly equivalent to instructional costs, so we’ll include them as a flat rate of $240 per SCH across all disciplines (line 5). The resulting overall total (line 6) shows the fully-costed picture: all fields generate negative margins and they are all subsidized from other institutional funds (e.g., state funding at the publics or investment income at the privates). So, the layer-three answer to our question is that all fields “lose” money, humanities and STEM included, but the humanities are subsidized relatively less than STEM.
There are at least two implications of this conclusion. First, when a department proposes a new degree program that will add students and local revenue, remember that unless it is an unusually high tuition program with little to no financial aid (such as a professional program aimed at executives), odds are that it will still incur costs to the institution that need to be built into budget plans. Second, the impact of subsidies for all will be modulated by enrollments, such that low or high subsidy programs may in turn have high or low enrollments that can amplify or diminish their overall financial impact in total dollar terms. Oftentimes these effects can creep up on an institution as enrollments ebb and flow across the disciplines. We’ll examine those next.
6.6 How have popular majors shifted over time?
Student enrollments have more than doubled over the last half-century (Figure 4.13), though not all undergraduate majors have grown in matching proportions. Perhaps unsurprisingly given the digital revolution, from FY1971 to FY2016 library science shrank from 1,000 majors to less than one tenth of that number, while computer and information sciences grew almost 30-fold from about 2,000 to over 60,000. In relative terms, library science went from 0.1% of all majors to almost zero, while computer and information sciences grew from 0.3% to 3.4% of all majors, more than a tenfold relative increase (Figure 6.4).

6. Academic Affairs 131
Figure 6.4. Trends in percentages of all bachelor’s degrees awarded by field of study at postsecondary institutions, per academic year at five-year intervals. Source: NCES Digest (National
Center for Education Statistics 2018d).
These sorts of shifts can have significant financial and personnel implications for departments that shed or gain majors (and SCH) relative to others on campus. In the short term, annual fluctuations are often handled by adjusting class sizes or by increasing or decreasing the number of contingent faculty members and class sections. In the medium to longer term, as clear trends become evident, areas of persistent
0%
10%
20%
30%
40%
50%
60%
70%
80%
90%
100%
1971 1976 1981 1986 1991 1996 2001 2006 2011 2016
Bachelor's Degrees Awarde
d by
All Po
stsecond
ary Institu
tions
Agriculture & Natural Resources
Architecture & Related
Area, Ethnic, Cultural, Gender, & Group Studies
Biological & Biomedical Sciences
Business, Management & Marketing
Communication, Journalism, & Related
Communications Technologies
Computer & Information Sciences
Education
Engineering
Engineering Technologies
English Language & Literature/Letters
Family & Consumer Sciences/Human Sciences
Foreign Languages, Literatures, & Linguistics
Health Professions & Related
Homeland Sec., Law Enforcement, & Firefighting
Legal Professions & Studies
Liberal Arts, General Studies & Humanities
Library Science
Mathematics & Statistics
Military Technologies & Applied Sciences
Multi/Interdisciplinary Studies
Parks, Recreation, Leisure, & Fitness Studies
Philosophy & Religious Studies
Physical Sciences & Science Technologies
Precision Production
Psychology
Public Administration & Social Services
Social Sciences & History
Theology & Religious Vocations
Transportation & Materials Moving
Visual & Performing Arts

Like Nobody's Business132
absolute growth or decline will almost inevitably lead to a concomitant shift in the tenure-track faculty. In a decline, depending on the career demographics of the department in question, the adjustment to the underlying cost structure may happen expediently, via attrition of positions through retirements and individual job moves, or it may be delayed considerably.
Returning to Figure 6.4, let’s review the most dramatic shifts in sheer numbers of majors over the forty-five years. The two fields that have grown the most are business and health. Business, management and marketing added over 250,000 majors and the health professions added over 200,000 (most of that in the last decade), which represented relative increases in percentages of all majors of 5.6% (13.7–19.4%) and 8.9% (3.0–11.9%) respectively. Other growth fields in absolute terms include communication/journalism, psychology, biosciences, visual/performing arts, computer/information sciences, and engineering. Some of those, such as communication/journalism and computer/information sciences, increased their share of all majors by several percentage points, while others such as psychology and biosciences saw modest growth in their relative share of all majors.
The field that has shrunk more than any other is Education, with total enrollments dropping by half (from 176,307 to 87,147) between FY1971 and FY1986 and holding roughly constant since then, accounting for its 16.5% (21.0–4.5%) reduction in share of all majors over the half-century. English language and literature, much like education, lost about half of its enrollments in the 1970s (dropping from 63,914 to 31,922 from FY1971–FY1981) and although it recovered somewhat in the 1990s, it has dropped again in recent years. That’s a 5.4% (7.6–2.2%) drop in relative share of all undergraduate majors over the forty-five-year span. Although their enrollments are smaller, foreign languages, literatures and linguistics mirrored the decline/recover/decline-again pattern of English, and hundreds of foreign language programs have closed in recent years (Johnson 2019). Mathematics and statistics saw a similar decline and has recovered only in the last decade. With net flat enrollments over the half-century, both fields were crowded out by other growing fields and each saw their share shrink from about 3% to about 1% of all majors. One final interesting example is social sciences and history, which enrolls about 160,000, again net flat over time, but with a similar cycle to English, in that it has seen a substantial loss of 10.1% (18.5–8.4%) in relative share, second only to education.
Not only do these shifts illustrate the dynamics behind changing departmental fortunes within the university, but they also reflect broader vicissitudes in the academy and in society. There is no denying that students vote with their feet (as do parents with their dollars). Like it or not, those votes reflect diminished interest and support for majors in education, languages and literature alongside increased attention for business and health. We can and should vigorously debate those priorities and what they mean, as US higher education has done since the late 1800s and before. As we do so, it’s worth a reminder that ours is the system that, through the land-grant acts, inserted

6. Academic Affairs 133
a more practical education into the classical curriculum of the day. Furthermore, it is also the system that in the mid-twentieth century massively expanded access to higher education and thereby the purposes and people that it serves.
6.7 What does it cost to run a graduate program?
Graduate education is the jewel in the crown of US higher education. It has long been the envy of the world and remains so, despite rising competition from Europe and Asia. Several factors contributed to the ascent of US graduate schools: co-evolution with disciplinary specialization (especially in the sciences) during the twentieth century, the inclusion of advanced coursework rather than “dissertation only” degrees, unprecedented government research investment during the postwar years which fueled the rise of research universities including support for research assistants (RAs), and simultaneous massive growth in undergraduate enrollments which fueled support for teaching assistants (TAs). The US model, especially for the PhD, of a structured experience through advanced seminars and mentored apprentice-like research training, along with a part-time assistantship to support the student, was radically different from the lone scholar model prevalent in Europe. I could go on about the many other innovative attributes of US graduate education, but I’ll spare you that excursion and instead make my point about graduate programs and university business: while this approach undoubtedly enables the highest quality education, by paying one’s students to attend graduate school, educating them in very small classes and providing them with extended one-on-one training with renowned experts, it is an incredibly expensive (and on the face of it, utterly foolish) business model! How do we make it work?
It works by the mutual reinforcement of attracting the best faculty and the best graduate students who want to work on their scholarly topic together. Crucially, it’s also built around the teaching support required for the undergraduate operation and, in fields where sponsored projects are available, the competitive research grants that those faculty win. There is one other distinct model, the professional master’s degree, that teaches technical and/or executive content and that, because of desirability and anticipated future earnings, can charge market rates without assistantships and tuition waivers.
Let’s do some numbers. For a tuition/fee-driven professional program, things are straightforward enough that we don’t need a worked example; the program revenue must simply be enough to fund the costs of operating the program. For the PhD scenario, I’ll keep things simple and deal with program-level funding only, acknowledging that other institutional support costs are out there. In partial justification thereof, we’ll assume our scenario is taking place in an existing department with an active undergraduate program and the faculty already in place. At some point those faculty members, especially if this is a research university, will want to start a graduate

Like Nobody's Business134
program. With the large expenses of core infrastructure and salaries covered, so the thinking goes, the marginal costs of adding a few core graduate classes to augment classes already available in related fields is low.1 Question: OK, so what does it cost? Answer: about a million bucks a year. Never fails to get people’s attention.
Here’s the logic (Table 6.3), line by line, for the basic first-order (program level) annual costs of a PhD program. We’ll provide half-time assistantships at a going rate of $25,000 per year (line A). Each student’s tuition will need to be covered, either by paying it directly (typically via a research grant) or via an internal waiver (typical of teaching assistantships), plus an amount for benefits, and we’ll assume that to total $15,000 per year for a public university (line B). A doctoral program needs to meet minimum size or productivity requirements, which are often imposed by boards, for example an average of 3 graduates per year (line C). A minimum size is also necessary for academic reasons to enable a viable cohort for class sizes. If the program offers its classes on a two-year rotation, that means 6 students in a graduate seminar. Attrition is easily forgotten because, by definition, those students are no longer in the program (whether for academic or personal reasons), so we’ll add 1 per year for attrition (line D). Therefore, the program must plan to admit and support 4 students per year, and further support them for the duration of the program. We’ll assume the average time-to-degree in our example discipline is six years (line E). As an aside, one can infer that this must be a nominal five-year program as students rarely complete early and more often take longer, given the vagaries of their dissertation projects.
1 Permutations of this basic scenario were proposed to me several times per year when I was a graduate dean, which is when I developed this back-of-the-envelope approach to help the faculty hone (or abandon) their plans.
Table 6.3. Example of annual first-order costs of a modest PhD program (see text for explanation).
Line Item AmountA. Assistantship stipend (0.5 FTE) $25,000 B. Tuition & benefits $15,000 C. Minimum completions per year 3 D. Attritions per year 1 E. Average time to degree (years) 6 F. Program coordinator (0.5 FTE incl. benefits) $35,000 G. Operations $30,000H. CALCULATED TOTAL: (A + B) × (C + D) × E + F + G $1,025,000
The program thus has a steady state of 24 students, 4 per year for six years (slightly less if there is some early attrition, but we’ll ignore that for simplicity). The program

6. Academic Affairs 135
will need to add a staff member to coordinate admissions, exams, funding, etc.; a half-time position is enough for this modest-size program (line F). Finally, there are always operational costs (travel, computers and printers, etc.) so we’ll plug in a number for that (line G). As mentioned above, we will ignore other marginal costs such as foregone undergraduate teaching activity/faculty time, central support costs, and space. Adding it all up, we get a total of slightly over $1M per year (line H).
To succeed, the program must have the capacity to support twenty-plus students and some operations costs on a sustainable basis. The mix of TAs and RAs to achieve that varies from virtually 100% TA in the disciplines with little to no grant activity (e.g., humanities) to virtually 100% RA in grant-active disciplines (e.g., biosciences), and with many disciplines somewhere in between. For a 50:50 mix, 12 TAs would be derived from, say, 36 discussion or lab sections (at 3 per TA), each with 25 to 30 undergraduates, for 2 semesters, which is about 2,000 undergraduates or 6,000 SCH per year. The RAs would each be supported by grants with a minimum of, say, $100,000 in direct costs (the RA, principal investigator, other staff, equipment) plus indirect costs at 50%, totaling $150,000, which for 12 RAs approaches $2M per year in external grant support. These numbers reflect an active teaching and research operation. A graduate program with less than those levels of activity will need to obtain additional funds from the dean, who will cross-subsidize from other areas.
6.8 How much do the faculty earn by discipline?
In Section 5.7 we saw how overall faculty salaries were stratified from senior to junior rank and how they were generally stratified by size/type of institution. In Section 6.4 we saw how average faculty salaries by discipline were a key driver explaining differences in the cost of producing a degree across academic fields. To round out our coverage of salaries, Figure 6.5 illustrates average salaries of tenure-track faculty by rank across a set of 32 disciplinary fields. These data are collected by survey each year, with the FY2018 data representing 696 institutions and 162,818 full-time tenure-track faculty members (College and University Professional Association for Human Resources 2019). The emphasis here is on the variations across disciplines, which are determined by the market. The top end of the salary spectrum contains fields that compete, at least in part, with higher private-sector salaries such as law, business, engineering, computer/information science, architecture and the health professions. Note that medical school faculty, most of whom are practicing physicians, are not included in these data and their salaries are considerably larger than the others shown here (see also Chapter 11). In most arts and sciences disciplines, where there is little direct private-sector competition with academia, salaries across those fields fall in a compressed range of about $15,000 in each rank, or within roughly plus/minus 10% of the average. These ranges reflect moderate competitive forces in the disciplinary salary markets. In these sorts of fields, theology, the arts, languages and literature are at the lower end of the salary spectrum with social sciences and STEM fields in the middle ranges.

Like Nobody's Business136
Figure 6.5. FY2018 Tenured and tenure-track faculty salaries by discipline and faculty rank, sorted by the disciplinary three-rank average. Source: CUPA-HR (College and University
Professional Association for Human Resources 2019).
6.9 What are the financial implications of tenure?
This is another one of those fraught questions where the opinion-to-fact ratio runs high in discussions about the ills of higher education. Tenure is misunderstood by many, including those in the professoriate. To avoid confusion, let’s start with a definition and follow that with a few paragraphs of basic explanation:
Tenure is the granting of certain employment protections against arbitrary dismissal that, absent just cause for discharge, create the expectation of renewed appointment each year.
Employment contracts span a spectrum regarding the protections they contain. In jobs with low protections, employees work “at will” and they can be dismissed on the spot for no reason and without much, if any, due process. In jobs with medium protections, employees might receive a reason for dismissal and may have recourse to a review process and, assuming no egregious wrongdoing, they will receive notice of their employment and pay ending after several weeks. In jobs with high protections, such as those with tenure or union contracts, before dismissal there is an extensive review process that typically goes beyond the employee’s direct supervisor, there are established rules about what are and are not valid reasons for dismissal (“just cause”), and again assuming no egregious wrongdoing, the notice of employment and pay ending may range from weeks to months to the end of the contract year.
$50,000
$60,000
$70,000
$80,000
$90,000
$100,000
$110,000
$120,000
$130,000
$140,000
$150,000
Legal P
rofessions
& Studies
Busine
ss, M
anagem
ent, M
arke
ting
Engine
ering
Compu
ter & In
form
ations
Scien
ces
Architecture & Related
Services
Hea
lth Profession
s
Engine
ering Te
chno
logies
Multi/Interdisciplin
ary Stud
ies
Natural Resou
rces &
Con
servation
Area, Ethnic, Cult, Gen
der & Grp Stud
Tran
sportation
& M
aterial S
ervices
Agriculture &
Related
Scien
ces
Commun
ications
Techn
olog
ies
Public Adm
in &
Soc
ial S
ervice
Family
& Con
sumer/H
uman
Scien
ces
Social Scien
ces
Libe
ral A
rts, Gen
Stud & Hum
anities
Physical Scien
ces
Mathe
matics & Statistics
Biolog
ical &
Biomed
ical Scien
ces
Hom
elan
d Se
c, Law
Enfcm
nt, &
Fire
Psycho
logy
Educ
ation
Philo
soph
y & Religious
Studies
Commun
ication & Jou
rnalism
Parks, Rec, L
eisure &
Fitne
ss Studies
History
Foreign Lang
uage
s, Lit &
Lingu
istics
Library Scienc
e
English Lang
uage
& Lit/Letters
Visual &
Perform
ing Arts
Theo
logy
& Religious
Vocations
FY20
18 Salary
Professor
Associate Professor
Assistant Professor

6. Academic Affairs 137
A tenured appointment is preceded by a probationary period (typically five to seven years) on the tenure track. Although there are exceptions, assistant professors are usually on the tenure track and associate and full professors are usually tenured. An assistant professor must demonstrate sufficient quality and quantity of scholarly work to be granted tenure (and if denied will depart the institution or move into a non-tenure job). Most universities have annual and/or post-tenure review systems for ongoing assessment of productivity. Contrary to misconception, tenure is not a sinecure and just cause for dismissal includes poor job performance. Other just causes include things like violations of research integrity, serious violations of institutional rules (e.g., stealing, severe harassment), and moral turpitude.
Tenure exists primarily to protect its close relative, academic freedom, so that professors cannot be fired for teaching or doing research in their area of expertise that may be politically unpopular, undesirable to certain interests, or otherwise controversial. History has plenty of examples of this, such as Galileo’s imprisonment for being at odds with the Church by positing that the Earth revolved around the Sun, and prohibitions on teaching Darwin’s theory of evolution, as well as multiple contemporary calls for professors to resign or be fired because of their work on divisive issues (e.g., the politics of race and religion, or “unpatriotic” findings on terrorism). In my own research specialty, climate science, I have colleagues who have felt the pressure of the fossil-fuel industry and associated political forces for whom the scientific findings are an inconvenient truth.2 The American Association of University Professors (AAUP) is the keeper of the flame for academic freedom and tenure (American Association of University Professors 2019b; 2019c); its 1940 Statement of Principles on Academic Freedom and Tenure (American Association of University Professors 1940) is the definitive document on the subject and the AAUP website has further supporting material.
Returning now to the financial implications of tenure, it’s been said that the granting of tenure is a million-dollar decision. That’s because a professor, once tenured, might be expected to work another thirty years at the institution (or move to another, ensuring that the new position comes with tenure). The original statement must date back many decades, because at current associate and full professor salaries the long-term commitment of the institution is closer to three million dollars without including benefits. An interesting economic corollary of this implication is that, compared to positions they might obtain in the private sector, professors are willing to accept lower pay with tenure because of the implied long-run commitment and perceived lower risk of job loss. Much can be made (misguidedly) from the fact that tenure imposes large fixed costs on the institution and that universities need greater flexibility in how they allocate resources. This argument is specious because, and we’ve seen elements
2 The term is a good one, even without being enshrined as the title of Al Gore’s award-winning movie. Interestingly, the movie’s title was debated right up until its screening at Sundance (Armstrong et al. 2016).

Like Nobody's Business138
of this point in every chapter of this book so far, tenured professors make up a small proportion of the overall university budget. Let’s do those numbers to make it clear.
Although we examined faculty ranks and trends in Chapter 5, there we dealt with tenure status as implied from job titles. To look at tenure numbers explicitly, Figure 6.6 shows the share of faculty by tenure status. Although the patterns are generally similar to the earlier charts on faculty rank, there are some differences in the details here because we are including part-time faculty as well as non-instructional faculty (typically research faculty at the bigger schools). About half the faculty are on the tenure track or tenured, with a higher proportion at R1 than R2 schools, and lowest at the R3-M3 institutions; the share is largest at baccalaureate colleges, especially the privates. These proportions are unevenly affected by the share of part-time versus full-time contingent faculty that can exceed 60% and even 70% at medium and small institutions. Overall, by headcount, tenured faculty average under 40% of the total. If we compare the underlying numbers to total non-medical employees (back in Figure 5.2) the we find that the tenured faculty averages about 12% of the total. That means that 88% of the labor pool is “flexible” in an economic resource sense. Furthermore, we saw in Chapter 3 that labor expenditures average about two thirds of all expenditures, so there is even more flexibility of resource allocation in the overall budget. In short, despite looming large in a perception sense, tenure is not any more limiting in fact than many other parts of an institution’s financial commitments.
Figure 6.6. Share of non-medical faculty in instruction, research and public service by tenure status in FY2018. Tenured and tenure track faculty are shown as combined full-time and part-time appointments (less than 3% are part-time), while contingent faculty not on the tenure track are shown by full-time (FT) and part-time (PT) appointment. Source:
IPEDS (2020).
0%
10%
20%
30%
40%
50%
60%
70%
80%
90%
100%
R1 Public R2 Public R3‐M3 Public BAS Public R1 Private R2 Private R3‐M3 Private BAS Private
FY20
18 Faculty Ten
ure Status (N
on‐M
edical)
Contingent PTContingent FTTenure TrackTenured

6. Academic Affairs 139
Another oft-misunderstood financial aspect of tenure is what happens if there is no money. It is critically important to understand that tenure is an employment protection, and not the employment itself. Put more plainly, there is no money attached to tenure. If a university runs out of money, as has happened at some small colleges in recent years, that “financial exigency,” as it is known, is considered a just cause that can enable the dismissal of tenured faculty members. Now, a university that decides it wants to close one department can’t easily claim “Sorry, we don’t have enough money, we need to close your department and get rid of the tenured professors!” Apart from the institution likely being able to carry out more conventional budget cuts if this was just one department in question, the university would have to declare a financial exigency, a last-ditch kind of move (somewhat akin to restructuring to avoid bankruptcy in the for-profit world) that can have significant consequences for its bond rating and ability to borrow. But if it really is in dire straits, a university can indeed lay off tenured faculty. A related scenario applies to medical schools, where the faculty are basically funded from their clinical activity. If the hospital goes belly-up and cannot meet payroll, the university will likely have no alternative way to cover the sizable salaries of the medical school professors, tenured or not.
Box 6.1. Competition in Faculty Hiring is (Sort-Of) Like Professional Sports
The arcane ritual of hiring a professor can seem odd to those outside the academy. It helps to think of departments as a bit like professional sports teams. Disciplines are specialized fields that don’t generally compete across fields for faculty members, just as football doesn’t compete with basketball for players. Within each discipline, however, there is competition taking place across institutions and among the faculty in the
field: institutions compete for the “best” faculty members and faculty members compete for the “best” jobs. As with any other career, while salary and prestige certainly play into job changes, there are many other factors influencing when or why people change jobs (e.g., family, location, position “fit”). Faculty jobs differ from most others because, in all but the biggest cities, there is generally a maximum of one potentially suitable position in that specialty at the university or college in that town. If a town has one basketball team, then there is generally only one point-guard position that might become available. In either case, many people will try out for that one slot when there’s an opening. In a departure from the metaphor, tenure-track faculty hiring is largely done by the team (the whole department or a committee) and finalized by the department head and dean. When an offer is made, there may be a counteroffer by the person’s current department. Sometimes there are pre-emptive retention offers to dissuade someone from looking to move. For professors, the money is nowhere near as big as in professional sports, but the odds of landing a position are arguably better!

Like Nobody's Business140
6.10 How do we account for faculty time and workload distribution?
Faculty members are the keystone species in the ecosystem of university employees, the core individuals carrying out the academic mission. Even so, the mix of duties reflecting that mission is not uniform across faculty members, plus the academic year is inherently seasonal, so how do we account for what the faculty is paid to do? It turns out that descriptions of faculty workload and cadence, and associated lingo, follow some common conventions across the wide variety of US higher education institutions; differences from one institution to another are typically minor variations on the overall theme.
Let’s get a stone out of the faculty’s shoe right up front. There are those outside the academy who think that all the faculty do (or ought to do) is teach, by which they mean that faculty members should be in the classroom instructing all day, because that’s all that universities do, right? That’s as ridiculous as saying that lawyers must be in court all day or that, ahem, legislators are supposed to be in session all the time. Enough said.
Faculty members are “exempt” employees under the Fair Labor Standards Act (FLSA), meaning that they are exempt from overtime pay and the minimum wage. Exempt employees are not paid by the hour but instead receive a salary for the overall work they perform, typically in professional, administrative or executive positions. The faculty, like other members of the learned professions, meet the professional exemption test because their duties are primarily intellectual, require advanced knowledge in a field of learning, and regularly entail the use of discretion and judgment (US Department of Labor 2016; 2018).
Contrary to casual assumption among uninitiated faculty members, there is no presumption of a forty-hour work week precisely because they are exempt employees under the FLSA; one is paid to get the job done no matter how little or how much time it takes. Studies have consistently found that full-time faculty members work fifty to sixty-plus hours per week. As long ago as 1942 the median was fifty-eight hours (Charters 1942), in 1992 and again in 2004 the average for full-time faculty at four-year institutions was fifty-four hours (National Center for Education Statistics 1993; 2008; Cataldi et al. 2005), another study obtained an average of sixty-one hours at Boise State University (Ziker 2014), and University of Wisconsin-Madison reported an average of sixty-three hours per week (Blank 2015). Where cited across these sources, the variation across institution types, faculty ranks, and disciplines was consistently small, typically plus/minus a few hours.
The “hours worked” number therefore represents a faculty member’s 100% total effort, a denominator that is variable from person to person (and to head off a corollary rookie assumption to the one above, there is no connection between effort percentage and a forty-hour work week). The 100% is split among the three core academic mission

6. Academic Affairs 141
activities of teaching, research, and a range of other public/professional service duties such as administrative assignments, clinical activity, cooperative extension, university and professional review teams and committees, and peer-review or editorial service for scholarly journals. When referring to faculty workload, one properly means the mix of percentages across all these activities that add up to 100% overall, although it is sometimes used less precisely and confusingly as a contraction of faculty teaching workload (a.k.a. teaching load).
Most, but not all, faculty members are appointed to work an approximately nine-month academic year. Depending on whether a campus calendar is based on semesters or a quarter system, exactly how long those last, and local policies on expected pre-term preparation and post-exam grading periods, the appointment period may be as short as seven or eight months or extend to ten; in any case, the standard academic year does not include summer and the standard faculty member is technically unpaid for that time. There are plenty of exceptions to this general practice. At land-grant universities, professors in agriculture often have an association with Cooperative Extension and may therefore have twelve-month contracts. Likewise, medical school professors have associated clinical responsibilities and twelve-month appointments. Faculty members at research universities in disciplines where external grant funding is available have an incentive to augment their nine-month (i.e., three-quarter time) salaries up to the full twelve-month equivalent, as compensation for grant-specified research performed over the summer (and in short breaks depending on local policy). Grants can also be used to “buy out” teaching in a regular semester using an appropriate percentage of the individual’s salary. Department chairs and others doing part-time administration duties may also receive summer compensation for their duties if they are expected to work during that time.
You may have heard of faculty members doing outside consulting work. Any such activities must take place strictly outside of the effort and hours discussed above, and independently of the institution. Many universities have a contractual prohibition on full-time faculty members working for another entity, with a carve-out for consulting done as an individual. Best practices for such consulting include pre-approval by a supervisor to ensure that the faculty member has the time and flexibility to handle an outside commitment without negatively affecting primary faculty duties, and to cross-check potential conflicts of interest.
Statements of faculty workload distribution apply to the academic year and are often expressed as a string of three numbers representing teaching, research, and other service,3 totaling 100%.4 For example, a common distribution at R1 institutions is
3 Convention varies as to the order of the three numbers. The third is almost always service; however, teaching and research can be in either first or second place and they are sometimes ordered such that the bigger of the two comes first. It’s best to check.
4 The individual percentages are typically round numbers in multiples of 10, sometimes multiples of 5, and occasionally in some finer split. The general idea is that they are broad estimates of effort meant to provide a shorthand summary of a complex set of activities, often interrelated, rather than a precise accounting.

Like Nobody's Business142
40/40/20, whereas at an institution with lower research and higher teaching emphasis a 60/20/20 distribution would be more typical. Contingent faculty members with a teaching assignment might have an 80/0/20 distribution, while a research professor doing no teaching might have a 0/80/20 distribution. Often, new faculty members will be assigned a lower initial teaching load so that they may get up to speed in the first year or two. Survey data of faculty work time percentages illustrate the three-part average workload distributions across types of institutions with astonishing clarity (Figure 6.7). The other service component is almost unwavering at just over 20% across all types of school, with the share of teaching and research activity varying primarily with the missions of the schools and showing little distinction between public and private institutions.
Figure 6.7. Work time distribution of full-time faculty and instructional staff by level and control of institution. Source: NCES Digest/NSOPF:04 (National Center for Education
Statistics 2008).
Teaching can comprise many activities, some easier to count than others: large introductory undergraduate courses that may or may not have graduate teaching assistants; medium size upper-division classes with a heavy writing emphasis; small graduate seminars; multiple sections of the same class versus each class being different. There is more outside the classroom: class preparation; grading; advising; mentoring; curriculum coordination; and more. Useful metrics can include student credit hours, classroom hours, class size, student contact hours (the two previous metrics multiplied together), and of course, number of class sections. All these items are primarily about quantity, and none deal with quality (assessment of teaching and learning is a hugely important topic, but one for a different book). Many institutions
0%
10%
20%
30%
40%
50%
60%
70%
80%
90%
100%
ResearchPublic
ResearchPrivate
DoctoralPublic
DoctoralPrivate
ComprehensivePublic
ComprehensivePrivate
Liberal ArtsPrivate
Work Time Distribution
OtherResearchTeaching

6. Academic Affairs 143
have formulated local combinations of the above that strive for an equitable balance of teaching commitments, at least within disciplines or colleges.
Despite the minutiae, and much as for workload distribution, a simple lingua franca of teaching loads is widely used for shorthand purposes and it is based simply on classes (sections) taught by semester and year. For example, a professor at a research university might teach a 2-2 load, meaning two classes in the Fall and two in the Spring semester of a regular academic year, while a professor at a baccalaureate college might teach a 3-3 load with lower expectations for research. A 4-4 load is usually only carried by lecturers and instructors at a university, because their assignment is dominantly teaching (a 5-5 load is ordinarily only found at a community college). As an astute reader, you may have noticed that teaching one section seems to correspond to about 10% of effort but beware, “there be dragons”, as the edges of ancient maps used to proclaim, because both workload distribution and teaching load are highly generalized, and they gloss over details and customs that can be of great consequence locally.
Now that you know the jargon, you can decipher a comment like the following that you might easily hear at a faculty gathering: “I’m at fifty percent admin while I’m department chair. I’m glad the dean agreed to a one and one load, so I can keep my research going.”
6.11 What is happening in online higher education?
As with other sectors experiencing digital transformation, online higher education has seen its fair share of hype and myth, while evidence is emerging about significant changes that are under way. Let’s review the former before analyzing the latter.
• Money: Online technology was supposed to drive down the price of a degree by driving down the cost of production. Hopes for cheap (or virtually free) degrees, or inversely, institutional hopes for a windfall, have not materialized. Marketing, instructional support, and course development drive costs up while competition drives pricing down, and the upshot is that the typical institution charges near-standard tuition, often more with fees (Poulin and Strout 2017; Legon and Garrett 2018).
• Disruption: Clayton Christensen originated the theory of “disruptive innovation” and applied it to higher education (Christensen and Eyring 2011), and he followed that book with predictions that half of American universities would go bankrupt within a decade (Lederman 2017). It’s been almost a decade and nothing of that scale has happened. The core idea is that online technology fundamentally changes the business model for higher education, leading to the disruption seen in other sectors. While his timing and hyperbole were wrong, the jury is still out on his underlying ideas.

Like Nobody's Business144
• MOOCs: Massive Open Online Courses perhaps defined the high-water mark of online hype in higher education, circa 2012. Elite universities and others opened MOOCs to anyone for free but, pointedly, not for credit towards a degree. Millions registered for these classes in the US and around the world; exceedingly few (3–5%) completed them (Coffrin et al. 2014) and specialized interventions to raise completion have not had widespread success (Kizilcec et al. 2020), although MOOCs may yet find a limited role (Yang 2013; Hoxby 2014; Impey 2020).
• Access: The potential of online higher education to reach those who traditionally have not had access, domestically and internationally, still holds promise although there has not been much progress in online utilization by low-income and other under-served populations in the US, or by people in developing countries. But, and it is a big but, access to online higher education has been transformational for those already in the workforce and in the military (see below).
• Unbundling: Amid the disruption and MOOC fever, online was supposed to lead to the unbundling of degrees as the core credentialing vehicle. Degree programs and classes would be split into modules and via micro-credentialing (e.g., badges) could be used alone or assembled into certificates. There’s some of that in workplace training, but it’s not visible in online higher education where the fully-online degree is the core strategy (Legon and Garrett 2018).
• Poor Quality: In the early days the quality of teaching and content in online higher education carried a stigma. A side-benefit of the MOOC infatuation was the engagement of the elite institutions, which helped overcome perceptions of poor quality. Nowadays, even with the pandemic-related surge in online delivery, it is increasingly considered equivalent in quality to conventional higher education (and indeed better than a mediocre face-to-face lecture class).
• Luddites: In other sectors there were sentimentalists, such as those who could not imagine reading the newspaper on anything but paper (and a day late), or those who could not imagine losing the ambience and serendipity of the neighborhood bookstore. Let’s also not forget the spectacular strategic shortsightedness of Kodak not anticipating digital cameras or Blockbuster video stores not grasping the advent of Netflix and streaming. Nostalgia for the ivied groves of academe,5 along with uncritical denial of the advantages of online technologies, is not a viable strategy.
5 This evocative phrase was used by Mary McCarthy (1952) as the title of her academic novel, one of the first in the genre that has since grown to include dozens (Wikipedia 2019a). Selected gems include Jane Smiley’s Moo (1995), Straight Man by Richard Russo (1997), Disgrace by J.M Coetzee (1999) which helped him win a Nobel Prize, and Julie Schumacher’s Dear Committee Members (2014).

6. Academic Affairs 145
Online tools clearly add value to multiple aspects of teaching, learning and knowledge dissemination through multimedia materials, asynchronous and synchronous delivery, and perhaps most importantly in comparison to earlier distance technologies such as video courses, interactivity. Yet, face-to-face higher education, especially for eighteen- to twenty-two-year-olds in the US university context, has strong experiential and extra-curricular components that are not easily replicated online. The online debate, when considered coolly and without hype, is not an either/or discussion between these two alternatives; the smarter approach is to consider how mode meets market and mission. US universities are already diverse in their markets and missions (small elite private, large public research, regional comprehensive, technical or liberal arts focus, commuter or residential, applicants who are high school graduates or already in the workforce, etc.), and online approaches will have advantages and disadvantages particular to each context. In some cases, online approaches will complement and strengthen an institution’s business model, and in others they may indeed threaten that model. Savvy institutions are figuring out what is best for them and adjusting their courses accordingly. Some have implemented dramatic changes, others are steadily diversifying, and many others are still on the sidelines. Much of this has been accelerated by the flip to remote instruction during COVID-19, but it remains to be seen what mix institutions will return to post-pandemic.
It’s important to include data from outside the four-year nonprofit segment for context, because much of the early action in online higher education has been in for-profit institutions. All institutions with more than 10,000 fully-online enrollments in FY2019 are shown in Figure 6.8, which includes not only for-profits but also baccalaureate special-focus colleges and two-year institutions along with our usual set of four-year nonprofit institutions by type. Examining the set by sheer size of online enrollments, in FY2019 the University of Phoenix had 94,000 enrolled online, a shadow of the 470,000 it had in 2010. It is now the third-largest online school, with Western Governor’s University (WGU) leading the pack at over 120,000 and Southern New Hampshire University (SNHU) at 97,000, both R3-M3 private nonprofits that have risen quickly in recent years (McKenzie 2018b). Several other for-profits and privates follow them, and at position number seven we find the largest public online university, the University of Maryland University College (UMUC). As an example of an evolving public institution, UMUC has been around since 1947, primarily serving military members and working adults in the region; it recently announced plans for a name change and associated global expansion strategy (McKenzie 2019c). Other major publics with a sizable online presence are ASU and Penn State, as well as two that have acquired previously for-profit institutions that are now affiliated with the parent public nonprofit: Purdue and its purchase of Kaplan (Purdue University 2018), and the University of Arizona and its acquisition of Ashford (McKenzie 2020b). The rising role of the nonprofits versus the for-profits in recent years has been especially noticeable, with nonprofit status signaling quality against growing skepticism of the

Like Nobody's Business146
for-profit sector in the wake of student loan scandals and the enforcement of gainful-employment regulations (McKenzie 2018b). A related development has been the rise of online program management (OPM) companies to help colleges grow their online course offerings. Those contracts can cede extensive control and up to half the tuition revenue to the OPM, what a recent report calls a “deeply unsettling picture” (Hall and Dudley 2019).
Figure 6.8. All institutions with greater than 10,000 students in exclusively online (a.k.a. distance) enrollment for FY2019 (Fall 2018), by Carnegie classification and control, including private for-profit institutions, baccalaureate special-focus colleges, and two-year colleges.
Source: IPEDS (2020).
0 20,000 40,000 60,000 80,000 100,000 120,000
The University of Texas at Arlington
Florida International University
University of Central Florida
Arizona State University‐Skysong
University of Maryland Global Campus
Purdue University Global‐Davenport
Pennsylvania State University‐World Campus
Colorado State University‐Global Campus
Fort Hays State University
Thomas Edison State University
St Petersburg College
Lone Star College System
Eastern Gateway Community College
Ivy Tech Community College
Rio Salado College
Liberty University
Western Governors University
Southern New Hampshire University
Excelsior College
Brigham Young University‐Idaho
Independence University
Embry‐Riddle Aeronautical University‐Worldwide
Ultimate Medical Academy‐Clearwater
University of Phoenix‐Arizona
Grand Canyon University
Walden University
Capella University
Northcentral University
American Public University System
Ashford University
Colorado Technical University‐Colorado Springs
Columbia Southern University
DeVry University‐Illinois
Full Sail University
Chamberlain University‐Illinois
Strayer University‐Global Region
R1R3
‐M3
B‐ SF2‐Yr
R3‐M
3B‐SF
2‐Yr
R3‐M
3B‐SF
Public
Private
For‐Profit
Online Students Enrolled (FY2019)

6. Academic Affairs 147
Box 6.2. A Parable for Online Higher EducationWhile there is little question that change is afoot, it is not entirely clear in what ways online education will reshape universities. Think for a moment about the nature of adaptation to technological change in dramatic entertainment: just over a century ago, it was all about on-stage productions in a theater; with the advent of movies, some aspects of theater moved to the new technology and others remained on stage; television brought a new wave that did the same and in turn disrupted both the theater business and movie-going; and more recently, on-demand streaming video services have changed the game again. My point is not the technological change per se, it is that today we still have the live experience of stage theaters, the immersion of movie theaters (Figure B6), and the convenience of home viewing, with each adapted to its niche. Make no mistake, there were upheavals with each new technology, such as individual theaters closing or adapting to showing movies, or the rise and fall of drive-in movies, the demise of the big three television networks and the rise of cable, and now the shift from cable to online services. In this scenario, which I think is more apposite to higher education than the all-or-nothing examples like Blockbuster and Netflix, there is an evolutionary space for prior forms, especially those with an intrinsic experiential component. Crucially, the evolved niches are still competitive and require continual adaptation to remain relevant and financially viable.
Figure B6. This photograph from July 1, 2006 shows the County Theater in Doylestown, Pennsylvania, a glorious art deco building from 1938 that is still showing movies today. Source: Frederick (2006), Flickr, CC BY 2.0, https://www.flickr.com/photos/galfred/180834829.
Looking now across institutions by type, we can see that the schools with the largest online enrollments are unevenly spread across categories (Figure 6.8). This is partly

Like Nobody's Business148
because several of the R1 publics designate their online campus as a separate “branch” campus, which is why they show up in the R3-M3 category. Others have a brick and mortar campus identity but they are generally not flagship institutions (e.g., UT Arlington but not UT Austin) although some are large (e.g., University of Central Florida). Also, there is a growing set of schools in the 5,000 to 10,000 online enrollment range (not shown) that are making concerted efforts to grow, such as Georgia Tech, which is carving out a particular niche to become a market innovator (Schroeder 2019). The largest online R1 privates are likewise in that next group of several thousand enrollments, and all are elite names (e.g., Johns Hopkins, USC, and Harvard). There is a handful of R2 schools in this smaller-enrollment group as well and, as one might expect, almost no baccalaureate colleges have significant online enrollments. As we’ve seen, the action is in the R3-M3 category, where WGU, SNHU, and Liberty University are many times larger than most of the other nonprofits doing online education. The number of institutions with substantial online enrollments is still small enough to fit in one figure today, but online enrollments have increased for fourteen consecutive years, with growth in 2016 exceeding 7% across nonprofit institutions (Seaman et al. 2018). No doubt, the online pivot across higher education during the COVID-19 pandemic will add to this trend.
Returning to our regular set of schools, online enrollment data reveal distinct patterns when examined by sub-category (Figure 6.9). Exclusively online enrollments average 5–10% of total enrollments for most types of institutions; private baccalaureate
Figure 6.9. Exclusively online (distance) and blended online/face-to-face enrollment as a share of total enrollment, as well as shares of exclusively online enrollment by degree level and by location, averaged by Carnegie classification and control for FY2018 (Fall 2017). Source:
IPEDS (2020).
0%
10%
20%
30%
40%
50%
60%
70%
80%
90%
100%
R1 Public R2 Public R3‐M3 Public BAS Public R1 Private R2 Private R3‐M3 Private BAS Private
Online En
rollm
ent (FY20
18)
InternationalOut‐of‐StateIn‐StateGraduateUndergraduateBlended (of All)Online (of All)

6. Academic Affairs 149
colleges average just 1% and, as we’ve seen above, the R3-M3 privates have the highest share, averaging 26% of total enrollment. Thus today, at the most common type of institution in the nation, the same type that is most financially challenged and has the highest proportion of contingent faculty, over one quarter of all students are already completely online and effectively don’t set foot on campus.
An interesting development has been the rise in blended or hybrid courses, in which students take a mixture of face-to-face and online classes while attending an institution. These statistics are not typically included in counts of “online” students because the classes are taken by students who are campus-based. A student, typically an undergraduate, may opt to take the online version of a class because of scheduling around other classes or a part-time job, availability of open slots, preference for an instructor, degree requirements, etc.—in other words, for many of the same reasons they choose face-to-face classes. In Figure 6.9 we can see that students taking online classes in blended mode are more common at publics than privates, more than 20% of all enrolled students at R1, R2 and R3-M3 publics in a given semester. Because the individuals taking the classes change from one semester to the next, this means that the typical face-to-face undergraduate takes several online courses before graduating. Strikingly, while relatively commonplace, blended learning is not a core strategy at most institutions (Legon and Garrett 2018).
Returning to exclusively online enrollments, you may be surprised to see that graduate students make up a large share of the total, and they constitute the majority at most privates and R1 publics. It turns out that professional and technical graduate degrees for working adults wanting to upgrade their qualifications were one of the early success areas in online higher education; e.g., business, information technology, education, and healthcare were the most popular in 2016 (Silber and Chien 2016). Undergraduate enrollments have since followed and will probably dominate in the long run by sheer force of numbers. As expected, research-focused institutions have greater proportions of online graduate students while the R3-M3 schools and baccalaureate colleges have higher proportions of undergraduates.
The location of exclusively online students may also surprise you. At most types of institutions, the lion’s share of online students is located nearby, in-state. For undergraduates, the national median across all institutions is just 13 miles away, 130 miles on average (Campbell and Wescott 2019). Students from within the institution’s state make up over half of all online enrollments across most types of school. The exceptions are the R3-M3 privates (likely skewed by those few extremely large schools) and the R1 privates whose elite branding enables a national market. The share of online international students is small and averages just a few percent at most types of institutions, a counterintuitive pattern given the potential reach of online and the international nature of other internet technologies. Again, the R3-M3 schools are the exception with over 20% international online enrollments.
To round out our picture of the typical online student, the data show that age and occupation differ from the conventional fresh-from-high-school student. Across

Like Nobody's Business150
all postsecondary institutions (not just four-year nonprofit institutions) in FY2016, the percentage of undergraduates whose entire program was online (i.e., distance education) was under 4% for age groups under twenty-three years old, and more than 22% for age groups thirty years or older (Campbell and Wescott 2019). The same data set shows that for non-military undergraduates about 10% are enrolled in online-only programs, whereas for veterans and active duty military the figures are 20% and 33% respectively (Campbell and Wescott 2019). Lastly, for undergraduates not working, 7% are in online-only programs versus 22% for those who are working full time (Campbell and Wescott 2019).
Comprehensive financial data for online programs are not readily available, although we can certainly infer funding flows from the various types of enrollment data above. Further insights on the funding of online programs can be gained from a regular survey of chief online officers (Figure 6.10). About half of these respondents see online programs as net sources of revenue for the institution with almost one third seeing variation in cost/revenue balance across programs. Most programs charge standard tuition, many with additional fees (Legon and Garrett 2018). Standard tuition at private institutions is much higher than at the publics, and therefore the privates are less likely to charge higher online tuition than the publics, given competitive market pricing for high-demand and high-reward programs. The allocation of online revenues is seldom dedicated solely to supporting online activities; a combined-revenue-for-general-needs
Figure 6.10. Survey responses of chief online officers at public and private four-year institutions regarding net cost or revenue generation of online programs, tuition rates charged, and whether online budget allocations are dedicated to online, split between online, academic departments and the general institution, or combined with all revenue for general use. Categories do not total 100 because of omitted responses and/or multiple
rates at some institutions. Source: CHLOE 2 (Legon and Garrett 2018).
0%
10%
20%
30%
40%
50%
60%
70%
80%
90%
Net Cost Variation Net Revenue Lower Standard Higher Dedicated Split General
Cost/Revenue Tuition Budget Allocation
Chief O
nline Officers R
espo
nding
Public 4Y Private 4Y

6. Academic Affairs 151
model is the most common at private institutions, while public institutions use almost equally either a split model (between online, academic departments and general needs) or the combined revenue model.
A recent development is the formation of private companies and university spin-offs competing in the market for employer-provided tuition benefits (Fain 2019). Some of that market is for workers who have some college education but did not complete a degree, and another segment is the provision of customized online credential programs that are not full degrees. These intermediary online-brokering companies offer streamlined services to employees, matching them with education providers and managing their tuition reimbursement process, while receiving revenue for those services from the sponsoring employer. No doubt this new space will be developing rapidly as online education evolves.
6.12 What is the budget role of international programs?
International programs have the laudable educational goal of creating graduates who are globally informed. Not only do US students study abroad, experiencing life in a different culture first-hand; the world also studies in the US, bringing a valuable array of international perspectives stateside. In addition to generating cultural exchange, international programs also involve money and markets.
It is useful to appreciate that there are four (sometimes intentionally confused) logics at work in international student mobility (Usher 2019): the pilgrimage logic in which scholars gathered in centers of learning as an academic rite of passage (e.g., medieval times, or Americans to the UK or Germany in the late 1800s); the soft power logic of mutual bond-strengthening (e.g., the US Fulbright program, or the Erasmus program across Europe); the war-for-talent logic in which higher education serves as an international talent magnet for the host nation (e.g., the US since the 1950s); and, the pecuniary interest logic in which revenue from international students bolsters the bottom line of income-challenged public and private universities (e.g., the UK starting in the 1980s, Australia in the 2000s, and the US especially since the Great Recession). The four logics are not mutually exclusive and often the pecuniary interest logic is camouflaged in soft power or war-for-talent terms (Usher 2019).
Budgetarily, most of the action is with inbound international students (the preferred term, rather than foreign students). Their impact is analogous to that of out-of-state students, as we saw in Section 2.13, and growing numbers of universities are contracting with companies that recruit international students into so-called pathway programs with mixed success (Redden 2018). Figure 6.11 illustrates international undergraduate and graduate student enrollments as a share of total enrollment by type of institution for FY2018. International graduate students are disproportionately over-represented (about double the overall rate and reflecting the war-for-talent logic among others) and naturally they are found predominantly at R1 and R2 institutions;

Like Nobody's Business152
furthermore, note that graduate students make up half of all international students at R3-M3 privates. The highest proportions of international students are found at R1 private universities (over 20%) and at R1 publics and R2 privates (over 10%), with other types of schools averaging 6% international students or less.
Figure 6.11. FY2018 undergraduate and graduate international enrollment as a share of total enrollment, averaged by Carnegie classification and control. Source: IPEDS (2020).
Trends in international enrollments have been generally upward across all institution types for several decades (Figure 6.12), growing at approximately twice the rate of overall enrollments. International undergraduate enrollments grew modestly through the late 2000s and then surged dramatically following the Great Recession, presumably in part as an institutional revenue opportunity. International graduate student enrollments saw more consistent growth overall with periods of variability. The consequences of post-9/11 immigration rule changes can be observed as a multi-year downturn in international enrollment in the 2000s; likewise, the downturn in FY2017 and FY2018 appears to coincide with country-specific immigration bans and widely reported anti-immigration rhetoric. That downturn continued in FY2019, and in Fall 2020 the lockdowns and border closures due to the COVID-19 pandemic led to an estimated 43% plummet in new international enrollment (Fischer 2020). International enrollments have rebounded after other major international events (e.g., the 9/11 attacks in 2001), but it is not yet clear to what degree these numbers will rebound after the pandemic.
0%
5%
10%
15%
20%
25%
R1 Public R2 Public R3‐M3 Public BAS Public R1 Private R2 Private R3‐M3 Private BAS Private
Internationa
l Enrollm
ent S
hare of T
otal Enrollm
ent F
Y201
8
Graduate
Undergraduate
The total numbers of international students and their primary sources of funding are shown in Figure 6.13. International undergraduates are largely self-funded (with funding by their families or by their home governments or institutions) and only about 9% are funded by the host institution. This is critical from a revenue standpoint: we

6. Academic Affairs 153
Figure 6.12. Trends in undergraduate and graduate international enrollment by fiscal year, totaled across the eight institution types. Values for FY1986, FY1988 and FY1990 are interpolated from neighboring years. Shaded bars indicate the onset of major changes in immigration policy (FY2002 and FY 2017) and the Great Recession (FY2009). Source:
IPEDS (2020).
0
50,000
100,000
150,000
200,000
250,000
300,000
350,000
400,000
450,000
1985
1986
1987
1988
1989
1990
1991
1992
1993
1994
1995
1996
1997
1998
1999
2000
2001
2002
2003
2004
2005
2006
2007
2008
2009
2010
2011
2012
2013
2014
2015
2016
2017
2018
Internationa
l Enrollm
ent
Graduate
Undergraduate
can infer that most international undergraduates are paying near-full tuition (and at the publics, this would be at the out-of-state rate). The corresponding share is smaller for international graduate students because a greater proportion of them are funded by the host institution. This funding is typically via graduate assistantships, and we saw in Section 5.9 that those are split roughly 50:50 between research and teaching assistantships. While research assistants usually have their tuition paid by the grant from the funding agency, teaching assistant tuition is typically foregone institutional revenue. Therefore, about 15–20% of international graduate students are funded by the host institution directly. For completeness, Figure 6.13 shows that non-degree seeking students (e.g., visiting for a semester) at either level are a small proportion of the total; also shown are more than 200,000 international students who, after completing their full-time studies, stay on for Optional Practical Training, employment in their field that is directly supported by a salary from the employer and is time-limited (one year, longer in STEM fields).
More than half of all international students in the US were from just two countries in FY2019: China (34%) and India (18%), and they have supplied essentially all the dramatic post-recession growth in international enrollments (Figure 6.14). Enrollments from South Korea and Saudi Arabia, the next two leading countries of origin, have decreased in recent years; the trend for all remaining countries (not shown) was essentially flat from FY2000 to FY2014 followed by modest recent growth through

Like Nobody's Business154
Figure 6.13. All international higher education students in the US and their primary source of funding, FY2019. Source: IIE (Institute of International Education 2019).
0
50,000
100,000
150,000
200,000
250,000
300,000
350,000
400,000
450,000
500,000
Undergraduate Graduate Non‐Degree Seeking Optional Practical Training
Internationa
l Stude
nts & Prim
ary Fund
ing Source FY2
019
All Other SourcesCurrent EmploymentInternational Government or UniversityUS College or UniversityPersonal & Family
FY2018. The dominance of China and India in the portfolio means that any negative geopolitical or immigration issues between these countries and the US could have substantial financial consequences for tuition-dependent institutions. For example, if enrollments from those two countries returned to pre-recession levels, a drop of about 40% in total, a school with 5% international enrollment would see that drop to 3%, representing a 2% decrease in total enrollments and associated tuition revenue.
International programs have several other dimensions, including study abroad (i.e., outbound students), exchange (both directions), and international branch campuses. Because study abroad can entail a significant expense from the student and family perspective, US institutions tend to run their own programs on a cost-recovery or small margin basis rather than as a significant institutional net revenue source (although there are a few that specialize in study abroad, as well as numerous third-party operators). Over 330,000 US students study abroad each year, with Europe dominating the top destinations, which for FY2018 were, in order: UK, Italy, Spain, France, Germany, Ireland, China, Australia, Costa Rica, Japan, South Africa, and Mexico (Institute of International Education 2019).
Exchange programs are entirely different. Their philosophy is to avoid imposing additional costs on the student through a simple mechanism: bodies move, tuition stays put. Agreements are set up so that the students effectively switch seats with neutral institutional impact because they keep paying tuition at home, and the institutions ensure a reasonable balance over time. This is especially useful if pricing is lopsided when compared to the US (i.e., countries with centrally-funded education and low or no tuition, and low-income countries).

6. Academic Affairs 155
Figure 6.14. Recent trends in international higher education students studying in the US by leading countries of origin, FY2018. Source: IIE (Institute of International Education 2019).
0
50,000
100,000
150,000
200,000
250,000
300,000
350,000
400,000
2000 2001 2002 2003 2004 2005 2006 2007 2008 2009 2010 2011 2012 2013 2014 2015 2016 2017 2018 2019
Internationa
l Stude
nts in the US
ChinaIndiaSouth KoreaSaudi ArabiaCanadaVietnamTaiwanJapanMexicoBrazil
An international branch campus (IBC) is partly or fully owned by the providing university, which awards a degree in its name based on an academic program run substantively on-site in the host country. The most recent comprehensive study shows that IBCs have been opening at a rate of about 11 new campuses per year, worldwide, since 2006 (The OBHE and C-BERT at SUNY Albany 2016). Of the 249 in operation serving about 180,000 students, almost one third have home institutions in the US (78) followed by IBCs based in the UK (39), France (28), Russia (21) and Australia (15), per Garrett et al. (2016). The host countries with the most IBCs are China (32), United Arab Emirates (31), Singapore (12), Malaysia (12), and Qatar (11), with the growth seen in the Persian Gulf countries during the 1990s and 2000s now halted and China growing markedly instead (Garrett et al. 2016). Part ownership of IBCs is common, often in partnership with the host government, other educational institutions or private entities, with the rationales for the commitment including revenue, internationalization and status, and with concerns including financial sustainability, mission creep, reputational risk, and academic freedom issues (Garrett et al. 2016). The large initial capital investment in IBCs can sometimes be offset by the local government partner, but IBCs have operational costs and activities that rival a regular campus, including a set of support services (a part of their appeal in recreating the home campus experience abroad) as well as complying with financial, labor and other laws and regulations not only of the home country but also of the host country (Crist 2017). About 13% of all IBCs have closed over time, based on the most recent data (Cross-Border Education Research Team 2017). This is a high failure rate by higher education standards but a low failure rate in comparison to other sectors involving entrepreneurial startups; for

Like Nobody's Business156
example, 90% over three years in technology (Kinser and Lane 2016). Finally, blended models have emerged, such as a “microcampus” network that merges elements of in-person delivery with online education on a host campus (Redden 2017).
6.13 What are the trends in library expenditures?
University libraries are iconic institutions, often centrally located on campus, that represent both the repository and accessibility of knowledge at the heart of the academy. So much so that some are architectural treasures: the George Peabody Library at Johns Hopkins University, the Linderman Library at Lehigh University, the Suzzallo Library at the University of Washington, and the Geisel Library at the University of California in San Diego (yes, it is named for Dr. Seuss), to mention just a few.
Knowledge in the contemporary era is increasingly stored electronically and virtually, rather than physically on paper, and academic libraries are changing accordingly. The thousands of linear feet of shelf space (“the stacks”) that were devoted to local copies of broadly available periodicals and books are giving way to information commons, study rooms and even classrooms as the library provides support and access to specialized digital information sources from all over the world. Instead of the pre-digital model of purchasing resources once and keeping them forever, libraries now enter into licensing agreements with vendors to purchase access to virtual volumes. To be sure, established libraries will continue to maintain physical collections of special and unique items and even make them available to others digitally. Yet, the workaday set of scholarly journals and other frequently accessed items has been predominantly electronic for years. At smaller schools, 90% or more of serials collections are now electronic; R1 and R2 university libraries house collections of specialized non-digital subscriptions, so the electronic share is 60–80% (IPEDS 2020).
The mix of costs in library budgets is remarkably consistent across types of institutions, with 59% (plus/minus 5–10%) of expenditures going to personnel and operations and the other approximately 40% going to acquiring resource materials (Figure 6.15). Three quarters of the materials budget goes to ongoing subscriptions, the bulk of which are scholarly journals, while the other quarter is spent on one-time acquisitions, such as new books. The challenge for libraries is as follows: total library budgets have roughly kept pace with inflation (more so at bigger institutions and less so at smaller schools, within about 0.5%) but subscription costs have seen rampant increases for decades, well before the digital era.
The trend in subscription expenditures is clear in Figure 6.16, where ongoing subscription costs for research libraries have been increasing by 3.4% over inflation since the 1980s. This contrasts with expenditures for one-time acquisitions, which have remained flat in real terms. Comparable data for R1 libraries are overlaid in Figure 6.16 and, while the amounts are higher for private versus public institutions, the trends are the same. This state of affairs has come about due to monopolistic tendencies in

6. Academic Affairs 157
Figure 6.15. FY2017 share of library expenditures for personnel and other operations and for resource materials, including ongoing subscriptions (e.g., journals), one-time acquisitions (e.g., books), and other materials, averaged across institutional categories. Source: IPEDS (2020).
Personnel & Operations 59%
Ongoing Subscriptions 30%
One‐time Acquisitions 9%
Other Materials 2%
the for-profit journal market, in which journals are not interchangeable and are only available from one vendor. For highly-accessed journals, libraries have had limited negotiating room as continued subscriptions to those journals are vital to the success of the university’s researchers.
Figure 6.16. Trends in library expenditures for ongoing subscriptions (e.g., journals) and one-time acquisitions (e.g., books) for the median of Association of Research Libraries (ARL) and the average of R1 public and R1 private institutions respectively, by fiscal year in 2016 dollars. ARL data from FY2012 onward are adjusted to account for a survey methodology change. Note that R1 data are available only in even years before FY2014.
Sources: ARL (2016) and IPEDS (2020).
$‐
$2
$4
$6
$8
$10
$12
1986
1987
1988
1989
1990
1991
1992
1993
1994
1995
1996
1997
1998
1999
2000
2001
2002
2003
2004
2005
2006
2007
2008
2009
2010
2011
2012
2013
2014
2015
2016
2017
Library Re
source Expen
ditures ($ M
illions of FY2
016 Dollars)
ARL Ongoing
ARL One‐Time
R1 Public Ongoing
R1 Public One‐Time
R1 Private Ongoing
R1 Private One‐Time

Like Nobody's Business158
To make matters worse, the large commercial publishers market their journals in bundles, much like cable television providers bundle channels, in which many minor titles are packaged with those in highest demand. This practice became known as the “Big Deal” in which the price per title in a discounted bundle is significantly lower than the sum of the individual list prices, although Big Deal pricing has risen nonetheless.6 A recent study evaluated the cost-effectiveness of bundled subscription prices by comparing cost per citation from 19 nonprofit and 6 for-profit publishers (Bergstrom et al. 2014). As shown in Figure 6.17, the cost per citation from for-profit publishers is substantially higher than from the nonprofits, with big differences by institution type that reflect the differential willingness (necessity) of major research institutions to pay (Bergstrom et al. 2014). For R1 institutions, the bundle cost per citation averages roughly $1 from nonprofit publishers but about $6 across the major for-profit publishers. The range by publisher is large: about $2 for Elsevier, $3 for Springer, $5 for Wiley, and up to about $11 per citation for Taylor & Francis. At R2 institutions, the average for-profit rate is still more than double the nonprofits, and at master’s institutions it is about 50% more (Figure 6.17).
Figure 6.17. Average cost per citation for journal subscription bundles from 19 nonprofit and 6 for-profit publishers. Source: Bergstrom et al. (2014).
University libraries have not stood by idly, and through systems and consortia they have had some success in bargaining. The University of California system has taken a notably hard stance, keeping their increases from Elsevier to an average annual rate
6 The Scholarly Publishing and Academic Resources Coalition (SPARC) makes available a database of Big Deal journal subscriptions by university (SPARC 2019).
$‐
$1.00
$2.00
$3.00
$4.00
$5.00
$6.00
$7.00
R1 R2 M
Average Bu
ndle Cost P
er Cita
tion (200
9)
Nonprofit For‐Profit

6. Academic Affairs 159
of about 1.5% versus the initial 5% for the decade ending in 2013 (Bergstrom et al. 2014); nonetheless, negotiations reached a breaking point in 2019 when the UC system dropped its Big Deal with that publisher, garnering statements of support from other libraries that have done or are contemplating doing the same (McKenzie 2019b). Part of the desire in that negotiation was for a “read-and-publish” deal, which would combine the cost for accessing content behind a paywall with another cost structure known as open access. The UC System recently announced just such an open-access agreement in a landmark deal with Springer Nature (McKenzie 2020a).
Open access is a broad movement, supported by many but not all librarians and scholars, to make published research freely available to read. Under open access, there are two main models: in the “gold” model the author or funding agency pays an upfront processing and publication fee (which can amount to thousands of dollars), while in the “green” model a version of the article is made available for free after a delay period (e.g., six months or a year) but subscription remains for immediate access (Ellis 2019). Many US funding agencies now require the green model, and the major European funding agencies now require the gold model (Ellis 2019).
It is not clear what this will mean for library budgets in the long run. The indignation of scholars at having to pay unreasonable rates to either publish or read research that they produce (and that they peer-review for free as part of the publication process) will only diminish if they move away from for-profit publishers. Yet, many of their most prized journals are from those very publishers; Springer Nature recently announced optional open access processing charges of more than $11,000 per article (Else 2020). It remains to be seen whether the open access movement will succeed in keeping down the costs of accessing the latest knowledge (see Section 9.4 for more on open access).
6.14 How much do we spend on information technology?
Institutions spend about $1,000 per person on campus for information technology (IT). Figure 6.18 illustrates expenditures on central IT per institutional FTE (full-time equivalent students, faculty and staff), with average totals ranging from about $800 to $1,500 per year. Research institutions spend more than master’s institutions per FTE, and baccalaureate colleges (most of which are private) also spend relatively more. Over half of these amounts go towards personnel costs, about one third go to infrastructure and services on campus, and 2–6% goes to external providers (e.g., “cloud” services such as email or web servers hosted offsite). The total institutional investment in central IT can therefore total millions to tens of millions of dollars annually depending on the size of the institution, comparable to a mid-sized academic college. From FY2010 to FY 2016, inflation-adjusted central IT spending per FTE has grown at annualized rates of 0.3% at master’s institutions and 1–2% at research universities and baccalaureate colleges (Lang 2017).

Like Nobody's Business160
Figure 6.18. FY2016 central IT expenditures per institutional FTE (full-time equivalent students, faculty and staff) divided into primary spending categories of personnel compensation and fringe benefits, infrastructure and services provided in-house (e.g., hardware software, network cabling), and those provided through external entities (e.g., third party email and web services), by classification (research, master’s, or baccalaureate)
and control. Source: EDUCAUSE (Lang 2017).
The two main pressures on IT budgets are personnel and the technology itself. Stiff competition from the private sector in the salary market means that pay rates are higher and can rise faster for IT compensation versus other parts of the university, which can also lead to high turnover—it’s not unusual for individuals to spend just a few years in a position before moving to another. The endless treadmill of technology refresh and upgrades means that the IT enterprise has continuous short-term capital outlays. If the Chief Information Officer (CIO) is not provided with the resources to invest in updated networks and systems, as with all deferred maintenance, the institution will fall behind in its capabilities, leading to higher costs later when the inevitable upgrade turns into a crisis. Some system replacement costs are large enough that they need to be amortized over the life of the technology, such as the core enterprise resource planning (ERP) systems like the student information system or the finance and accounting system. An entire ERP replacement project is a massive undertaking in technical and implementation terms, and at a large university the cost can amount to many tens of millions of dollars, similar in financial scale to (and as critically important as) a new campus building.
Central IT expenditures account for about 4.75% of the total institutional budget at master’s universities and baccalaureate colleges, but at public and private research institutions that share is lower at about 3% and 3.75% respectively (Lang 2017). From FY2010 to FY2016 all these percentages remained essentially flat. The lower shares
$‐
$200
$400
$600
$800
$1,000
$1,200
$1,400
$1,600
$1,800
R Public M Public R Private M Private B All
Central IT Spen
ding
per In
stitu
tiona
l FTE
(FY2
016)
Other
External Providers
In‐House Infrastructure & Services
Ongoing Compensation & Fringe

6. Academic Affairs 161
at large research institutions occur because distributed (i.e., non-centralized) IT is more commonplace at those schools, partly reflecting the historical emergence of IT in multiple specialized units; 69% and 45% of public and private research universities respectively spend less than 75% of total IT expenditures centrally, while that share is only 9–30% at other types of institutions (Lang 2017). Institutions have difficulty tracking distributed IT expenses consistently, and therefore it is hard to establish reliable trends in centralized versus distributed IT expenditures (Brummund et al. 2015). Recent technological trends have been towards centralization (and outsourcing) of commodity IT services such as email and website hosting. One regular survey shows consistently increasing trends in the percentage of centralized versus distributed campus IT spending for over a decade across all types of institutions: for example, the share of central IT spending increased from around 40% to over 60% at larger public universities, and from about 60% to nearly 90% at smaller private four-year colleges (Green 2007–18).
You may be wondering why I’ve included IT in this chapter on academic affairs, rather than in the facilities section along with utilities like lights and water. Information technologies, in contrast to regular utilities, play a direct and strategic role in furthering the academic mission of the university. Some domains of IT are utility-like, such as basic internet service and, literally, dial tone for telephones. Other domains support the broader administration of the university (accounting, human resources, etc.). Still, IT software and services are critical to not only supporting but also advancing teaching and learning, student success, and research, which is why smart institutions view IT as integral to knowledge transfer and discovery. Figure 6.19 illustrates relative levels of central IT spending across the major IT functional domains including personnel, averaged across institution types because they are similar. While all the domains are essential, some are more visible than others:
• Administration of the IT enterprise includes activities related to the Office of the CIO such as management, planning, vendor contracts, and policy development, and it accounts for one quarter of expenditures;
• Information systems include the core enterprise resource planning (ERP) systems (student information, payroll and financial, procurement, human resources, grants and contract management, etc.);
• Enterprise infrastructure and services include data centers, servers, backup power supplies, web services, databases and more;
• IT support services serve all users such as desktop support, reference staff, departmental support, IT training, and multimedia production;
• The communications infrastructure includes all the physical elements of the network such as cable, wireless network, telephone and voicemail, video surveillance, and emergency notification systems along with communication services such as email, calendaring, and collaboration technologies;

Like Nobody's Business162
• Educational technology services cover the range of instructional software and support including learning management systems, e-portfolio, degree audit, classroom technology, online education platforms, and library systems and together they account for about 10% of central IT spending;
• Information security covers increasingly critical items such as identity management, access provisioning, authentication, intrusion detection and prevention, breach response, and information security training, with spending on IT security increasing one and a half times over the previous year (to 3% of the total);
• Finally, research computing services are not reflected in Figure 6.19 because they are only significant at the relatively small number of major research institutions, and they include high-performance computing (“supercomputers”), specialized networks (e.g., Internet2), and advanced visualization (EDUCAUSE 2020).
Figure 6.19. FY2016 functional domain area spending as a percentage of central IT spending, averaged across all types of four-year institutions. Source: EDUCAUSE (Lang 2017).
The various software systems and services vary widely in cost and, as might be expected in the dynamic IT environment, the relative spending on each also changes from year to year (Figure 6.20). Student, financial and human resources ERP systems are large and growing, and the vendors in this area include Oracle (Peoplesoft), Ellucian (Banner), Jenzabar and Workday (MarketWatch 2018). The biggest institutional investment in instructional technology is learning management systems (LMS). The LMS landscape has been consolidating since the late 1990s when the technology was first introduced,
Administration & Other 25%
Information Systems 18%
Enterprise Infrastructure 17%
IT Support Services 15%
Communications Infrastructure 12%
Educational Technology Services 10%
Information Security 3%

6. Academic Affairs 163
and over 90% of market share is now held by the big four: Canvas, Blackboard Learn, D2L Brightspace, and Moodle (Hill 2019). An LMS has become an essential tool in face-to-face and online education, although the related technology of adaptive (self-paced and personalized) learning tools has not yet gained wide adoption (Dimeo 2017). The other systems lower down the list in Figure 6.20 have seen flat or decreasing shares of expenditures, and they are generally low to medium in relative expense (the drop for analytics may be related to a definition change in the survey, as it was increasing steeply in prior years). Finally, plagiarism-detection software (e.g., Turnitin) was not listed on the survey, but it is another educational technology tool that is widely used (McMurtrie 2019).
Figure 6.20. FY2016 and FY2018 shares of annual expenditures for ERP, administrative and instructional software and services, averaged across all public and private four-year colleges and universities, sorted by growing (upper portion) or shrinking share (lower
portion). Source: Campus Computing Survey (Green 2007–2018).
0% 2% 4% 6% 8% 10% 12% 14% 16% 18% 20%
Student Information System
Finance & Accounting
Learning Management Systems
Human Resources (HR records and payroll)
Alumni, Advancement & Development
Human Resources (Recruitment)
Emergency Notification Services
ePortfolio services
Lecture Capture & Campus Video Management
Grants and Research Management
Library System Management
Customer Relationship Management (CRM)
Courseware/Digital Course Supplements
Analytics for Student Success / BI
Share of Software & Services Expenditures
2016
2018


7. Student Affairs
7.1 What are the numbers for recruiting and admissions?
As we’ve seen, most universities are tuition-dependent, especially the smaller non-elite institutions, and enrollment is their financial life-blood. Effective enrollment management is therefore critical to the survival and success of a campus. Enrollment management begins with recruiting and admissions, although nowadays it goes well beyond those activities. Done strategically, enrollment management is most effective when it (i) optimizes student success in the context of the institution (diversity, location, selectivity, size, etc.) and (ii) works in close collaboration with academic programs, all of which lead to improved retention and graduation rates, greater overall enrollment numbers, and consistent and predictable tuition revenues. That said, we’ll focus on recruitment and admissions in this section, and then progress to other aspects of the incoming class in subsequent sections.
Every university needs to shape its incoming class and doing so requires a set of marketing and recruitment activities that cost money. A recent survey provides some insights into these expenditure details (Ruffalo Noel Levitz 2018), although it is unfortunately quite narrow (N=126) and limited to small privates and a range of publics. The median cost to recruit a new undergraduate enrollee in 2017, including personnel costs, was $2,357 at small privates (middle tercile of total enrollment from 1,673 to 2,992 students) and $536 at public institutions (middle tercile of total enrollment from 8,683 to 17,144). Omitting personnel costs, those medians are $1,102 and $175 respectively (Ruffalo Noel Levitz 2018) with the primary scaling being the efficiency of larger incoming class size. Backing out those numbers, the typical size of a recruiting and admissions staff is 10 to 30 FTE at small privates and 30 to 50 FTE at midsize publics, with expenditures of $2M to $3M in either case on the mix of activities shown in Figure 7.1. Marketing is the largest expenditure in this area, followed by travel and events such as admissions fairs. These latter two reflect the key role of reaching college-bound students in high school, and the special influence of guidance counselors who rank visits from university representatives as their most useful source for helping students with college planning (Ruffalo Noel Levitz 2017b). Universities also purchase lists of prospective students from vendors such as the College Board and ACT, which, at 10% of the recruiting budget, cost well into the six-figure range. Unsurprisingly, digital marketing budgets are growing faster than any
© Andrew C. Comrie, CC BY 4.0 https://doi.org/10.11647/OBP.0240.07

Like Nobody's Business166
other part of the recruiting budget, with traditional marketing budgets mostly staying flat or decreasing (Ruffalo Noel Levitz 2018).
Figure 7.1. Share of FY2018 recruiting budget allocated to specific marketing and recruitment activities from a survey of 126 four-year institutions, including public institutions of all sizes and predominantly smaller private institutions. Source: RNL (Ruffalo Noel
Levitz 2018).
0% 5% 10% 15% 20%
Traditional Marketing
Admissions Travel
Admissions Events
Student Search (Purchased Lists)
Digital Marketing
Transfer Recruitment
International Recruitment
Share of Recruiting Budget
4Y Public
Small 4Y Private
Figure 7.2. Percentage of admitted applicants and subset of those who enrolled for FY2018, averaged by Carnegie classification and control. Source: IPEDS (2020).
0%
10%
20%
30%
40%
50%
60%
70%
80%
R1 Public R2 Public R3‐M3 Public BAS Public R1 Private R2 Private R3‐M3 Private BAS Private
Admitted
& Enrolled as Percentage of App
lican
ts (FY2
018)
Admitted
Enrolled

7. Student Affairs 167
The number of applicants ranges from thousands at the small colleges to tens of thousands at large universities. At most types of institutions, 50–70% of applicants are admitted on average (Figure 7.2). R1 institutions admit a lower percentage of applicants than R2 and smaller institutions across publics and privates, with the most notable being the R1 privates where the admissions rate averages only 18% of applicants. Naturally, the applicant populations differ across types of institution, so that selectivity is more stratified than it looks from these basic numbers (that’s coming up next). The subset of applicants who subsequently enroll is 16–20% (of the 50–70%) at the publics, likewise 10–13% of applicants at R2 and smaller privates, and just 6% of the 18% of admitted applicants at the R1 privates.
If we take these enrollment figures as a percentage of those admitted, we get a (widely over-used) metric known as the yield, the percentage of admissions that became enrollments (Figure 7.3). Purveyors of college rankings frequently use yield as a measure of selectivity, with a higher yield supposedly indicating a more selective institution. However, yield rates are so inconsistent as to render this approach utter nonsense. Indulge me, if you would: take a look at Figure 7.3, where we see that the R1 private universities average 34% yield, followed by all the publics in decreasing size order (30–26% yield), and then the other three types of private institution around 19–22% yield. If that wasn’t enough to demonstrate that yield is a poor index of selectivity, allow me to cite a handful of yield rates for individual institutions as a further indulgence: Harvard leads the R1 private schools at 83% yield, followed by Stanford, MIT, Chicago, Yale, etc., much as expected; things unravel from there, though, with the R1 public universities led by the University of Nebraska-Lincoln (51%), UC Berkeley and UW-Milwaukee tied for 7th place (44%), but with UW-Madison in 31st place (35%); institutions of different types also at 44% yield like UC Berkeley include the University of North Dakota, Northwestern State University of Louisiana, and Liberty University, to name just a few. With all due respect to my colleagues at these schools, I imagine they’d be among the first to agree that they are not as selective as Berkeley. So, yield is a terrible measure of selectivity, more inconsistent than not because it is a complex contextual combination of applicant pool, financial aid, reputation, competition, and more.1 OK, that was fun, but let’s get back to our regular programming.
1 By the way, cynical college applicants invented the concept of yield protection (a.k.a. Tufts syndrome), which alleges that, to bolster its rankings, a university will manipulate yield by rejecting or wait-listing highly qualified applicants who will surely be accepted to higher-prestige schools. Admissions officers deny its existence, but like any good conspiracy theory, it is conveniently appealing to those rejected by their safety schools in the admissions process (Pak 2015).
Recruiting and admissions staff build a class somewhat like an investment portfolio, balancing applicants across a range of academic preparation, in-state and out-of-state share at the publics, enrollment targets related to size and revenue, student demographics, and the mix of need-based and merit aid from the institution to hopefully increase academic readiness, diversity and revenue. While much of this activity is aimed at high school graduates, transfer students from other universities

Like Nobody's Business168
Figure 7.3. Yield, or percentage of admitted applicants that subsequently enrolled, for FY2018, averaged by Carnegie classification and control. Source: IPEDS (2020).
0%
5%
10%
15%
20%
25%
30%
35%
40%
R1 Public R2 Public R3‐M3 Public BAS Public R1 Private R2 Private R3‐M3 Private BAS Private
Yield (FY2
018)
and colleges are becoming an important component of the incoming class at many institutions too.
As potential future students are identified and move along the path from prospect to applicant to being admitted and matriculating, admissions staff members use several indicators to monitor and manage that path.2 At the start, these indicators include information requests, email open rates, and such, along with campus visits. A paid application fee is an early indicator of intent, and after the admission decision other similar indicators include housing deposits, orientation signup, and ultimately enrolling in courses. These are all going on simultaneously in the year or more before the student arrives, and the indicators are checked closely and regularly, with the incoming class being shaped continuously via tuning of admission and aid offers, in some cases right up until classes begin.
7.2 What are the academic and financial profiles of the incoming class?
Fortunately, we have a useful index of academic preparation in IPEDS, which collects information on standardized test scores. These tests, such as the SAT and ACT, which
2 A phenomenon known as summer melt is seen in this process, and it comes in two varieties: one is related to competition, in which students drop out of the process at one university in favor of another; the other relates to college-intending students, more typically from low-income backgrounds, who for various reasons including perceived financial issues or other unexpected obstacles, fail to make the transition to actually enrolling.

7. Student Affairs 169
assess what might be informally described as the “three Rs” (reading, writing, and arithmetic), offer a useful common benchmarking comparison across most applicants to undergraduate programs (as does the GRE for graduate school). These tests are validated to predict first-year college grades (ACT, Inc. 2017; The College Board 2018), not college success overall or future earnings and so on; validity here is used in the narrow, technical, psychometric sense of robust statistical association. They are not perfect and display differences across demographic subgroups, largely (but not completely) attributable to differential academic preparation (ACT, Inc. 2017). First-year grades and class-rank can be similar predictors of grades in entry-level courses, but they are not standardized. It’s the latter feature that makes standardized tests useful for benchmarking (comparison), which is how we’ll employ them here. Using scores expressed as score percentiles so we can compare across tests as well, Figure 7.4 illustrates the interquartile range (from the 25th to 75th percentile) of admitted applicants. The admitted applicants to R1 private institutions are remarkably well-prepared and the middle 50% of them occupy a narrow band between the 93rd and 99th score percentiles. The 25th percentile individuals in that group score similarly to the 75th percentile individuals at the R1 publics and R2 privates. A similar step jump occurs from the latter to R3-M3 privates, with private baccalaureate colleges overlapping these last two categories. There is relatively more overlap among the different types of public institution as compared to the privates, although the same step pattern across types is still clear. This test score/academic preparation distribution pattern is a critical part of the college rankings discussion, which we’ll cover in Section 14.2.
Figure 7.4. Range of 25th to 75th percentile values of standardized test scores of admitted applicants for FY2018, expressed as score percentiles for comparison, on the SAT Evidence-Based Reading and Writing (EBRW), SAT Mathematics, ACT Composite, ACT English and ACT Mathematics tests, averaged by Carnegie classification and control. Sources: IPEDS
(2020), The College Board (2018) and ACT (2019).
R1 Public R2 Public R3‐M3 Public BAS Public R1 Private R2 Private R3‐M3 Private BAS Private0%
10%
20%
30%
40%
50%
60%
70%
80%
90%
100%
25th to
75th Pe
rcen
tiles of Score Percentiles (FY20
18)
SAT EBRW SAT Math ACT Composite ACT English ACT Math

Like Nobody's Business170
The consistency of score percentiles within each type of institution across the various kinds of test is worth noting too. It’s encouraging to hypothesize that the greater overlap across public versus private institutions reflects the public university mission of greater accessibility and inclusion. Again, we are fortunate that IPEDS collects the necessary data to test that hypothesis, in this case income levels of first-time, full-time undergraduates, illustrated in Figure 7.5, where I’ve expressed them relative to the US average household income distribution. These data are just as illuminating as the standardized test data. Public universities are indeed much more representative of the national income distribution than the privates, and starkly so in some cases. In a result that you might not expect, the R1 public universities and public baccalaureate colleges are within just a few percent of the US population across all income bands. Lower- and upper-income bands are relatively over- and under-represented at R2 and R3-M3 publics by roughly 10% and 30% respectively. At R1 and R2 private institutions, incoming undergraduates in the income band of $110,000 or more are over-represented by 60–80%, those in the $30,000 to $75,000 band by 20–30%, and those in the lowest income band under $30,000 are 30–46% under-represented on average. The patterns are similar, but not as extreme, for the smaller private institutions. There is so much that can be said about these two sets of data in conjunction, but I’ll keep it brief. Of course, the privates by their nature are more expensive and will therefore have more students from wealthy backgrounds, especially the smaller tuition-dependent privates that are struggling for revenue. Still, the extent of the imbalance is nonetheless glaring,
Figure 7.5. FY2017 representation of first-time, full-time undergraduate degree-seeking students (including those awarded and not awarded aid) by family income level, expressed as percentage difference from the corresponding distributional share of the US average household income, averaged by Carnegie classification and control. Sources: IPEDS
(2020) and IPUMS (Flood et al. 2018).
‐60%
‐40%
‐20%
0%
20%
40%
60%
80%
100%
R1 Public R2 Public R3‐M3 Public BAS Public R1 Private R2 Private R3‐M3 Private BAS Private
Differen
tial R
epresentation of Stude
nts (From US Av
erage)
$0‐$30K $30K‐$48K $48K‐$75K $75K‐$110K >$110K

7. Student Affairs 171
particularly at relatively well-endowed R1 privates that often profess inclusion. A recent study found that students from families in the top 1% of the income distribution are 77 times more likely to attend an Ivy League college than those from families in the bottom income quintile (Chetty et al. 2017). Still, the fact that R1 publics can achieve a balanced mix of income bands while attracting well-prepared students demonstrates that it can be done.
7.3 How much aid are incoming students awarded by income level?
We looked at financial aid broadly in Chapters 3 and 4, and here we focus on aid awards stratified by student family income. Overall, we would expect relatively more students from less wealthy backgrounds to receive aid and to receive larger aid awards, ceteris paribus.3 The data show that these statements are indeed true. Figure 7.6 shows that over 90% of students with family income levels less than $75,000 receive financial aid at all types of university. At public institutions, the share is 70–80% in the $75,000 to $110,000 income band, while only 50–60% of students in the band greater than $110,000 receive aid. In contrast, at private institutions, virtually all students receive financial aid, over 90% in all income bands except for the uppermost band at R1 privates at
3 This Latin term is one of the few things I remember from my first-year economics course, and it means “all else being equal” or “other things remaining constant.” It is typically used in a context such as this where one is positing a fundamental relationship isolated from the influence of other variables.
Figure 7.6. FY2017 share of first-time, full-time undergraduate degree-seeking students awarded grant and scholarship aid by family income level, averaged by Carnegie classification
and control. Source: IPEDS (2020).
0%
10%
20%
30%
40%
50%
60%
70%
80%
90%
100%
R1 Public R2 Public R3‐M3 Public BAS Public R1 Private R2 Private R3‐M3 Private BAS Private
Stud
ents Awarde
d Aid by
Income Level
$0‐$30K $30K‐$48K $48K‐$75K $75K‐$110K >$110K

Like Nobody's Business172
82% (Figure 7.6). The main reason for the public-private difference is the much higher tuition and associated institutional aid at the privates.
We can see this in the amounts of financial aid versus price paid towards the total cost of attendance (Figure 7.7). Cost of attendance is the full cost upon which financial aid is awarded, and it includes tuition as well as accommodation, food, books, supplies, transportation, etc. Cost of attendance (largely tuition) is much higher at the privates, with aid levels in all income bands set correspondingly higher to reduce the net price paid closer to that at the publics. Students in the lowest income band pay $10,000 to $11,000 per year at all types of public institution and, notably, also at R1 privates; however, these students pay roughly double at the smaller privates. Students in the highest income band pay most of the cost of attendance at the publics, about 90% on average, ranging from $17,500 to $23,000. At the privates, students in the higher income band pay 60–70% of the cost of attendance, but the amounts are roughly double in dollar terms, ranging from about $27,000 to $43,000 annually. Despite the high aid amounts at the privates, the net price paid is generally higher and therefore, as you will recall from the previous section, private institutions have relatively fewer students in the low- and middle-income bands. Of course, $10,000 per year at the publics (or R1 privates) is still a lot of money for a low-income family, with serious implications for equity of access (Mugglestone et al. 2019). Financial aid for low- and middle-income students has generally tracked the institutional charges, but not living expenses (St. Amour 2020).
Figure 7.7. FY2017 amount of grant and scholarship aid and net price by family income level for first-time, full-time undergraduate degree-seeking students awarded Title IV aid, averaged by Carnegie classification and control. Amounts for public institutions are at
in-state rates. Source: IPEDS (2020).
R1 Public R2 Public R3‐M3 Public BAS Public R1 Private R2 Private R3‐M3 Private BAS Private $‐
$10,000
$20,000
$30,000
$40,000
$50,000
$60,000
$70,000
$80,000
Cost of A
tten
dance: Net Pric
e + Aid (FY2
017)
Aid 0‐30K Aid 30‐48K Aid 48‐75K Aid 75‐110K Aid >110K
Net Price 0‐30K Net Price 30‐48K Net Price 48‐75K Net Price 75‐110K Net Price >110K

7. Student Affairs 173
A related policy question surfaces from time to time: do state subsidies at public universities favor the wealthy? We have now seen all the evidence demonstrating that this is patently not the case, as a thorough study has clearly found (Delisle and Dancy 2016). The argument is that state funding for public universities provides an indirect subsidy, and because that subsidy is relatively higher per student at the larger prestigious state institutions that also spend more per student than smaller, less prestigious schools, and because students attending the bigger schools are more affluent, students from high-income families must be receiving a greater public subsidy than their low-income counterparts. That logic draws over-simplified conclusions from generic per-student funding rates and doesn’t consider who receives financial aid and thus the tuition paid by family income level (Delisle and Dancy 2016). We’ve seen in Section 7.2 that the R1 (or any other size) publics do not enroll predominantly high-income students. Plus, we’ve just seen that low-income students receive grant and scholarship aid that reduces their tuition paid at all types of public university, before accounting for federal and other aid. Additionally, affluent students are more likely to attend out-of-state schools where tuition is well above the cost of education and carries no subsidy (see Section 3.6). For these reasons, the indirect state subsidy for public universities does not favor the wealthy.
Returning our attention to all types of institution, once the financial aid dust settles, the typical student pays almost double to attend a private school. The income-scaling range from lowest to highest student family income level is consistent across public institutions, with students from the wealthiest backgrounds paying roughly twice what those from the poorest backgrounds pay; that factor diverges at the privates that include both broader (R1) and narrower (R3-M3) income-scaling ranges. Naturally, because these figures are all averages, individual students each receive aid and pay a net price that is more or less unique, based on their combination of academic preparedness, family income, and fit to the university’s overall portfolio for its incoming class. Up to this point we’ve ignored the type of aid awarded, so we’ll look at the split between need-based and merit aid next.
7.4 How much aid goes to need versus merit?
Institutional financial aid, as distinct from federal, state, and other forms of aid, is divided into need-based and merit (non-need based) components and, as the name implies, is controlled by the institution. As we saw in Section 2.8, institutional aid is a typically hidden portion of a university budget because, as a discounting device, it is subtracted from gross tuition revenue to obtain the commonly used net tuition revenue. Institutional aid of both types is vital at all universities, but especially at private institutions where it is the dominant form of aid (Figure 7.8). At the publics, total aid per student averages $10,000-$15,000 and institutional aid is 10–20% of that amount while at the privates, in contrast, institutional aid makes up 40–60% of the

Like Nobody's Business174
$20,000 to $30,000 total aid amount. The R3-M3 institutions award the lowest average proportion of institutional aid relative to other types within the public and private groups.
Figure 7.8. FY2016 undergraduate total aid amount partitioned into institutional and other aid, averaged by Carnegie classification and control. Source: NPSAS:16 (National Center for
Education Statistics 2018a).
Let’s take a brief detour to mention so-called need-blind admissions, where the notion is that the admission decision is made before, and independently of, the financial aid decision— “If you’re good enough to get in, you get in regardless of your financial situation, and we’ll figure out the money later.” The intent of the concept is to signal to prospective students of high ability that cost should not scare them away. Only a small number of the most elite schools can cover all need; most institutions do not have enough resources to meet the full financial need of all accepted students without including impractical loans in a need-blind offer. Therefore, most institutions are instead need-aware, and they do consider need in the admission decision. Importantly, this enables them to meet the financial need for all those who are accepted— “If you get in, we’ll make sure you can afford to attend.” Both terms are easy slogans but, outside of the most elite institutions, each has trade-offs and neither one is inherently better.
So, how do institutions split their investments in need-based versus merit aid? Figure 7.9 illustrates undergraduate institutional aid partitioned into need-based, merit and athletic scholarships (the latter are a non-academic subset of merit aid). At the R1 privates, over 75% of institutional aid goes toward financial need. Recall from Section 7.2 that essentially all students at these institutions are academic superstars, so
$‐
$5,000
$10,000
$15,000
$20,000
$25,000
$30,000
$35,000
R1 Public R2 Public R3‐M3 Public BAS Public R1 Private R2 Private R3‐M3 Private BAS Private
Aid Am
ount (FY2
016)
Other Aid
Institutional Aid

7. Student Affairs 175
merit is less of a differentiator than at other types of universities. The split is near half and half at private baccalaureate colleges and R1 publics, and around 30% need-based at the other types of institution.
Figure 7.9. FY2016 share of undergraduate institutional aid partitioned into need-based, merit, and athletic scholarships, averaged by Carnegie classification and control. Source: NPSAS:16
(National Center for Education Statistics 2018a).
It’s tempting to think that many institutions are, if you’ll pardon my bluntness, effectively “buying” meritorious students. While that isn’t entirely untrue, there is an additional psychology at work. For the same dollars, a school can make an offer seem more prestigious by framing all or part of the overall award as a merit scholarship. Most financial aid is “stackable” and that is certainly true of the institutional aid portion. Doesn’t it sound more appealing to be offered a presidential scholarship or an our-mascot-name-here award for your high-school achievements? Then, that merit award is topped up with a need-based award as necessary. Of course, this is all done in a competitive environment and schools, especially those that wish to project prestige, must be careful not to undermine perceptions of brand quality.
I’ve included the athletic scholarships here largely for comparison and as a teaser for Chapter 12, which deals with athletics. It’s interesting to see that at the publics, except for the baccalaureate colleges, 10–15% of institutional aid goes towards athletics scholarships; it’s about half that share at the privates, but their institutional aid budgets are about ten times bigger, thus netting out athletic scholarship spending at about five times the amount of the publics, which is considerably more than what it takes to cover any tuition differential. Let’s leave it at that until later.
0%
10%
20%
30%
40%
50%
60%
70%
80%
90%
100%
R1 Public R2 Public R3‐M3 Public BAS Public R1 Private R2 Private R3‐M3 Private BAS Private
Institu
tiona
l Aid (FY2
016)
Athletic
Merit
Need

Like Nobody's Business176
7.5 How is tuition discounting used?
The tuition discount rate, usually referred to as simply the “discount rate,” is derived by calculating the total amount of institutional grant aid (need plus merit) as a percentage of gross tuition and fee revenue. Essentially, it’s what the institution awards (in cash and waivers) as a share of what it would have collected had it charged full tuition and fees (a.k.a. “sticker price”) to every student, like this:
It’s literally the percentage discount off the sticker price, reflecting not only what the average student pays after institutional aid (not counting federal aid, loans, etc.) but also the complement to (and a key lever of) net tuition revenue. Note that this doesn’t include room and board, textbooks, etc., just tuition and fees. The version above is for the incoming undergraduate class, which tends to run a few percentage points higher than the discount rate that can be calculated similarly for undergraduates overall.
Enrollment managers have an extremely tough job to build a class of the desired quality, size, and diversity. On top of that, they have the weighty responsibility of controlling the discount rate elements that supply the institution’s net tuition revenue. It’s their version of optimizing the “iron triangle” (see Section 14.3): obtain the desired quantity at maximum quality and minimum cost. The unfortunate psychology of the college recruiting marketplace is that (i) higher sticker price is perceived to signal high quality and (ii) everyone expects a discount. Pricing and discount strategies have therefore evolved with the market, which has shifted from low-tuition/low-aid a generation ago to high-tuition/high-aid in recent decades.
That shift means higher discount rates, which are exactly what we see in the data (Figure 7.10). Two patterns are immediately clear: one, the trends are all upward, about 7 to 15 percentage points higher over the almost two decades of data depending on the type of institution; and two, the privates discount at almost double the rate of the publics. The current average discount at the publics is 23–34%, whereas it is 41–53% at the privates. Of course, the privates have much higher tuition, but the higher discount rates bring the average tuition paid comparatively closer to that at the publics, as we saw when looking at net price by income level in Figure 7.7 (although those numbers include all aid, not just institutional aid, but the general patterns are the same).4
4 The dependence of the discount rate on (the semi-arbitrary) sticker price is the subject of a recent critique, which notes that it is a flawed metric for following university finances (Levine 2019).
This is a good juncture for us to return briefly to “skyrocketing” tuition increases of 3–4% annually. We saw earlier that, after accounting for rising enrollment and inflation, net revenues and expenditures have been rising at 1% or less (see Sections 2.10 and 3.4). We also saw that the explanation for those latter increases over general inflation

7. Student Affairs 177
Figure 7.10. Trends in tuition discount rates for full-time first-time undergraduates, averaged by Carnegie classification and control. Values for public institutions are weighted to
account for proportions of in-state and out-of-state students. Source: IPEDS (2020).
0%
10%
20%
30%
40%
50%
60%
2000 2001 2002 2003 2004 2005 2006 2007 2008 2009 2010 2011 2012 2013 2014 2015 2016 2017
Discoun
t Rate
R1 Public R1 PrivateR2 Public R2 PrivateR3‐M3 Public R3‐M3 PrivateBAS Public BAS Private
were fundamental economic forces related to being in a labor-intensive industry and the continual pursuit of quality in a competitive marketplace (see Section 3.7). Still, after accounting for all of those (roughly 2% inflation and 1% labor and quality), where has the remaining approximately 0.5–1% of the annual sticker-price tuition increase gone? The answer is in the apparently irresistible shift to a high-tuition/high-aid model with the associated prestige and discounting that the marketplace has encouraged and supported.
7.6 Why do students drop out and what proportion are retained?
A retained student, and better yet a graduate (see the next section), is not only a successful outcome for the individual but is also more financially efficient and effective for the university. A retention costs three to five times less than a fresh recruit (Cuseo 2010), and improved retention rates lead directly to the success of the institution in graduating a greater proportion of its students. Attrition, the opposite of retention, arises when students drop out of higher education. If this occurs, state appropriations yield lower returns, students diminish their lifetime incomes, and universities lose revenue (Johnson 2012).

Like Nobody's Business178
Box 7.1. College Dropouts Get Mostly A’s and B’sContrary to popular misconception, inadequate academic preparation or performance are minor causes of students dropping out of four-year universities and colleges (Bound et al. 2010; Johnson 2012). Overwhelmingly, students drop out because of other life issues, and not because they are having academic problems (Figure B7). A major longitudinal study found that for students with unfinished degrees, 80% left in good standing, most of those with A and B grades, and with the majority departing in the first two years (Johnson 2012). Effective student-success support systems are expressly designed to address not only academic support, such as early warning and tutoring services, but also to assist to the degree possible with the many other reasons that students drop out, e.g.: by providing counseling services; by supplying financial advice and supplementary aid; and, if a student must leave, such as when a personal crisis hits, assisting with how to withdraw formally (rather than the student just leaving with default failing grades), which makes it easier to resume studies at a later date.
Figure B7. Reasons cited for leaving higher education by students in the 2003–04 cohort of the Beginning Postsecondary Students Longitudinal Study who had left without a degree by 2008–09. Note the relatively low frequency of academic problems. Source: Delta Cost
Project (Johnson 2012).
Ensuring the success of students involves a multidimensional set of activities across many aspects of administration and student life, many of them embedded within a student affairs division: recruiting, marketing, application, admissions, transfer, financial aid, orientation, registrar, residence halls, dining, tutoring, advising, student analytics, success interventions, student organizations, mental and physical health, career services, and graduation. The contemporary student affairs portfolio, and by extension the strategic enrollment management portfolio, embody the transition from the pre-1980s
0% 10% 20% 30% 40% 50% 60%
Personal reasons
Financial reasons
Other reasons
Family responsibilities
Dissatisfied with program
Academic problems
Scheduling problems
Finished desired classes
Military service
Reasons Cited for Leaving Without A Degree (Multiple Selections Permitted)
Left Year 1
Left Year 2‐3

7. Student Affairs 179
“weeding out” mentality to the “student success” approach over the last few decades. Naturally, to provide this support, student affairs expenditures and personnel have grown accordingly (see Section 7.8). The results of the change have been small but steady gains in retention and graduation rates despite counteracting forces such as increasing enrollments, rising student financial need, and lower state investment with attendant increases in student-faculty ratios at smaller public institutions (Bound et al. 2010).
First-year to second-year retention rates are highest at R1 institutions and decrease by Carnegie classification, with the highest rates in the mid-90% range at R1 privates, followed by R1 publics and R2 privates in the mid to high 80s, and the smaller publics and R3-M3 privates just over 70% (Figure 7.11). We look at retention/attrition from first to second year because it is typically the largest jump—subsequent years tend to have progressively smaller attrition rates. The primary reason for students leaving is not academic performance (see Box 7.1) but having to deal with other life issues. At the institutions with higher attrition, an important contributing factor is the lower income profile of students that reduces their resilience when inevitable challenges occur, such as having to care for a family member or work longer hours at a job because another family member lost income. The relative lack of financial security means that the other pressures of life place greater demands on a student’s time. As we’ll see in the next section, students who are not retained do not always drop out permanently; a sizable number of them transfer and graduate from a different institution, while others “stop out” instead and return to complete their studies later. We’ll also see that these behaviors are more prevalent at lower-retention institutions.
Figure 7.11. Full-time retention rate, defined as the percentage of the fall full-time first-time cohort from the prior year that re-enrolled at the same institution in the current year, for fiscal years 2005 and 2018, averaged by Carnegie classification and control.
Source: IPEDS (2020).
0%
10%
20%
30%
40%
50%
60%
70%
80%
90%
100%
R1 Public R2 Public R3‐M3 Public BAS Public R1 Private R2 Private R3‐M3 Private BAS Private
Full‐Time Re
tention Ra
te
FY2005 FY2018

Like Nobody's Business180
7.7 What are the patterns and trends in graduation rates?
The official federal graduation rate is, unfortunately, the source of much confusion and myth because non-specialists who quote it don’t realize how narrowly it is defined. The graduation rate required to be reported by law5 is the share of students completing their programs within 150% of the standard time (i.e., six years for a four-year bachelor’s degree) at, and here’s the kicker, the same institution where they started as full-time, first-time students. So, if you go out of state for college, decide you’d rather transfer closer to home and then complete your degree locally, you don’t count. If you take a year off for medical reasons and then finish your degree, you don’t count. If you struggle in your first year, go to community college for a semester to improve your grades, and then return and complete your degree, you don’t count. Consequently, it isn’t the percentage of students who graduated in six years as many people might imagine that number, it’s a considerably more conservative version thereof that assumes a standard single-institution continuous conveyor-belt model.
While the choice of such a model is understandable, it is most applicable at the kind of institutions for which it is typical: selective schools with primarily eighteen- to twenty-two-year-old students who are financially well-supported. It should be no surprise, then, that non-selective institutions catering to older and/or working students do not fare as well on this metric. Such institutions tend also to have higher proportions of students who are part-time, as well as those who are taking individual courses without the intention of completing a full credential (most notably at community colleges). Thus, the conventional graduation rate has a built-in bias that under-represents student success for types of schools and students with these latter types of completions.
Also, the regular graduation rate is “institution following” rather than “student following,” meaning that, strictly speaking, it can provide only the aggregate numbers of students attending, graduating or otherwise departing an institution. The regular graduation rate does not provide the graduation outcomes of students independently of institutions attended, including those that transferred, suspended and resumed their studies, or never completed a degree. Because of these concerns, calls for national student unit-record data are made from time to time, although they are often opposed due to privacy concerns (Kreighbaum 2017). Alternative non-government systems
5 There were no publicly available national data on graduation rates until the Student Right-to-Know and Campus Security Act of 1990 was passed. It was originally intended to inform student athletes about graduation rates at their prospective programs, which at the time were known to be lower than for all students (Cook and Pullaro 2010). One of the sponsors was US Senator Bill Bradley, a former college and professional basketball player (and Rhodes scholar). In addition to requiring graduation data to be published, the security part of the act similarly required disclosure of campus safety policies and statistics. That section was amended in 1998 and renamed the Jeanne Clery Disclosure of Campus Security Policy and Campus Statistics Act, known as the Clery Act, named for a student who was sexually assaulted and murdered in 1986 at Lehigh University. Her parents argued that, had they known of the many violent crimes on campus in previous years that had not been made public, she never would have attended (Nelson 2008).

7. Student Affairs 181
have developed in the higher education community instead, notably the National Student Clearinghouse (2019) and associated initiatives such as the VSA and SAM (Voluntary System of Accountability 2019; Student Achievement Measure 2019). One last bit of throat-clearing before we get to the numbers: graduation rates are not the same as attainment rates, which measure the percentage of the population with postsecondary degrees.6
Graduation rates are based on entering cohorts from six (or more) years earlier, with a standard method to define who is included or not, and from which completion rates for different times can be computed. In recent years, IPEDS has included additional numbers beyond just the cohort size and count of graduates, such as transfers, students still enrolled, and those not enrolled; these values for FY2018, which tracks the entering cohort from Fall 2011 (i.e., FY2012), are illustrated in Figure 7.12. Most students graduate in four years, a further share in five years, and a small share in six years, although these proportions vary by type of institution. Graduation rates are lower at the publics and higher at the privates. Average four-year graduation rates at private R1, R2 and baccalaureate schools exceed those at all public institutions, including the R1 publics that have a graduation rate close to the R3-M3-privates. The relative proportions of students completing in five or six years are lowest at all types of private institution; for example, students graduating on the “five-year plan” range from an additional 8–26% beyond the number who finish in four at the privates,
6 The US educational attainment rate reflecting the share of the population aged twenty-five and over with a bachelor’s degree or higher was 35% in 2018 and 4.6% in 1940 (US Census Bureau 2019a).
Figure 7.12. FY2018 rates (Fall 2011 entering cohort) for completion of bachelor’s or equivalent degrees in four years or less, five years, and six years, students still enrolled, known transfers out to another institution, and individuals no longer enrolled, averaged by
Carnegie classification and control. Source: IPEDS (2020).
0%
10%
20%
30%
40%
50%
60%
70%
80%
90%
100%
RR11 PPuubblliicc RR22 PPuubblliicc RR33‐‐MM33 PPuubblliicc BBAASS PPuubblliicc RR11 PPrriivvaattee RR22 PPrriivvaattee RR33‐‐MM33 PPrriivvaattee BBAASS PPrriivvaattee
Fall 20
11 Coh
ort G
radu
ation & Other Rates (F
Y201
8)
NNoott EEnnrroolllleedd
SSttiillll EEnnrroolllleedd
TTrraannssffeerr OOuutt
YYeeaarr 66
YYeeaarr 55
YYeeaarr ≤≤ 44

Like Nobody's Business182
while the corresponding range at the publics is 36–70%. Six-year full-time first-time graduation rates average 90% at R1 privates, in the 70s at private R2 and baccalaureate schools, and 61% at the R3-M3 privates. The R1 publics average a 74% full-time first-time graduation rate, with the subsequent types down the scale at 56%, 50% and 49% respectively.
But, as I discussed above, this is an undercount of the percentage of students who ultimately finish with a degree. While the portion of students still enrolled at the same institution where they started after six years is just a few percent of the original cohort, the share that were known to have transferred to another institution is sizable at most institutions, 13–18% overall at the medium and small publics and 13% at R3-M3 privates. What fraction of those go on to graduate? About two thirds to three quarters, it turns out, if we look at the Clearinghouse data (See Figure 7.13). An additional 8–10% of students transfer and graduate at a different four-year institution, and a further 2–3% graduate from a two-year institution. If we went beyond six years, several more percent would be added from those still enrolled. The Clearinghouse six-year graduation rates are in the mid-60% zone for students who started at publics and the mid-70s for those who started at privates. Lest we start slipping back into thinking that the smaller schools are somehow “worse” at graduating students than bigger or more selective institutions, or that their students are somehow “weaker” at their studies, this is a good time to repeat the information from the retention section on the reasons why students don’t finish their degrees: most students leave with As and Bs, and they leave to deal with other personal, financial and family issues that are more challenging to resolve for students with lower incomes. The proportion of students in these situations
Figure 7.13. Six-year outcomes by starting institution type for the Fall 2012 cohort based on National Student Clearinghouse data. Source: NSC Research Center (Shapiro et al. 2018).
0%
10%
20%
30%
40%
50%
60%
70%
80%
90%
100%
Four‐Year Public Four‐Year Private Nonprofit
Fall 20
12 Coh
ort S
ix‐Year O
Utcom
es
Not Enrolled (At Any Institution)Still Enrolled (At Any Institution)Completion at Different Institution (Two‐Year)Completion at Different Institution (Four‐Year)Completion at Same Institution

7. Student Affairs 183
is the leading reason for the differences in both retention and graduation rates across types of institution. Effective initiatives to improve graduation rates therefore must grapple with and address these underlying challenges.
Challenges notwithstanding, graduation rates have been on an improving trend for several decades. The reportable rate is available in IPEDS only from FY2005 to the present, so to extend the general trends further back in time, I’ve calculated a simple proxy metric using data that are available for a longer period, degrees awarded per (current) enrollment, and shown them both relative to starting values (See Figure 7.14). While they differ in their annual variability, the long-term trends are roughly linear, showing that graduation rates are about 15% higher today than three decades ago averaged across private institutions, and over 35% higher across public institutions. Similar trends are seen in attainment rates (the percentage of the population with a degree, as mentioned above), with a rise from 33.6% of people aged twenty-five to thirty-four years old in 1987 to 52.4% of that age cohort in 2017, a 56% increase (Garrett 2019). By either measure, these are dramatic improvements, even more so given that many of the challenges for students are non-academic in nature, and these trends constitute valuable evidence that parallel activities to increase student success (and access) have indeed paid off.
Figure 7.14. Trends in two bachelor’s degree graduation metrics, the six-year graduation rate for the total cohort (available since FY2005) and degrees awarded per enrolled student (available since FY1987), both expressed relative to their starting values to enable comparison, averaged by fiscal year across public and private institutions. Source:
IPEDS (2020).
0.9
1.0
1.1
1.2
1.3
1.4
1.5
1987
1988
1989
1990
1991
1992
1993
1994
1995
1996
1997
1998
1999
2000
2001
2002
2003
2004
2005
2006
2007
2008
2009
2010
2011
2012
2013
2014
2015
2016
2017
Chan
ge in
Gradu
ation Metric
(Relative to FY1
987)
Degrees Awarded per Enrollment (Public)
6‐Year Graduation Rate (Public)
Degrees Awarded per Enrollment (Private)
6‐Year Graduation Rate (Private)

Like Nobody's Business184
7.8 What are the trends in student services spending?
What are the investment trends in student services (and possibly in student success) that have coincided with improving retention and graduation rates? As discussed in Section 7.6, these activities include transactional student services activities (e.g., admissions, registrar, records) as well as success-oriented activities such as tutoring, developmental courses, counseling services, student organizations, special advising, as well as student performance monitoring, data analytics and intervention. In FY2017, institutions of all types spent about 40% of their student services budget on personnel (around 50% if fringe benefits are included) versus other operational costs such as recruiting, marketing, consultants, analytics services, etc. The trends in overall student services budgets have been strongly upward for several decades and are visible in a variety of metrics. Figure 7.15 illustrates these student services investment trends using expenditures per student FTE and share of the overall E&R budget. Over the last three decades, inflation-adjusted student services spending per FTE has doubled at the publics and tripled at the privates. In Chapter 3 we saw that overall E&R spending per FTE has been increasing over time, and if we calculate student services spending as a share of those amounts, we see that student services spending still increased relative to other E&R spending, from 9.3% to an 11.6% share at the publics (a 25% increase) and from 10.5% to a 14.9% share at the privates (a 42% increase). For comparison, trends in academic support spending (libraries, media services, academic administration and IT, as well as course and curriculum development) were about one half (public)
Figure 7.15. Trends in student services expenditures per student FTE (in 2016 dollars) and in the student services share of E&R expenditures averaged across public and private
institutions, by fiscal year. Source: IPEDS (2020).
9%
10%
11%
12%
13%
14%
15%
$‐
$1,000
$2,000
$3,000
$4,000
$5,000
$6,000
1987
1988
1989
1990
1991
1992
1993
1994
1995
1996
1997
1998
1999
2000
2001
2002
2003
2004
2005
2006
2007
2008
2009
2010
2011
2012
2013
2014
2015
2016
2017
Stud
ent S
ervices S
pend
ing as Sha
re of E
&R Bu
dget
Stud
ent S
ervices E
xpen
ditures p
er FTE
(201
6 Dollars)
$/FTE Private
$/FTE Public
%E&R Private
%E&R Public

7. Student Affairs 185
to one quarter (private) of these increases and for the last two of the three decades, essentially flat or decreasing shares of E&R spending.
Unfortunately, there are no easily available national figures on recruitment versus retention budgets and, based on relative costs of these activities (Cuseo 2010), we must assume that recruitment expenditures comprise a substantially larger portion. That means that much (but not all) of the growth in student services budgets has likely been in recruiting-related activities, which makes sense in a tuition-dependent environment. Still, while retention budget trends cannot be easily determined, there is little doubt that retention initiatives and activities are now widely practiced (Ruffalo Noel Levitz 2017a) and have seen an increase over time.
7.9 What is the total cost of attendance with room, board, and books?
The full cost, by which we strictly mean price, of attending university extends beyond tuition and fees (after subtracting aid) to include books and supplies, room and board, and other expenses. One can reasonably argue that individuals will incur room and board costs whether they are attending university or not—they would still be paying for rent and food if they were working a job instead—but, as a practical matter, students and parents want to know how much the entire experience will cost them.
The formalized way that institutions provide estimates of the total cost of attendance is stratified by a student’s lodging arrangement: on campus, off campus staying with family,
Figure 7.16. FY2017 share of first-time full-time students living on campus, off campus (not with family) and living with family. Source: IPEDS (2020).
0%
10%
20%
30%
40%
50%
60%
70%
80%
90%
100%
R1 Public R2 Public R3‐M3 Public BAS Public R1 Private R2 Private R3‐M3 Private BAS Private
Stud
ent Lod
ging
Arran
gemen
t (FY20
17)
On CampusOff CampusWith Family

Like Nobody's Business186
and off campus living independently (not with family). First-time full-time students stay predominantly on campus at all types of institutions and we see this proportion vary with the different missions and student bodies they serve (see Figure 7.16), averaging from 98% living on campus at R1 privates to 64% at R3-M3 publics. At many, but not all, schools the share of students living on campus (in residence halls) is highest in the first year and diminishes in the second and subsequent years as students seek to live off campus. In the first year, only 5–10% of students live off campus independently, whereas a notably higher share of first-year students live with family (2–26% depending on the type of institution).
Figure 7.17 shows that the average costs for living on campus or independently off campus do not differ much; naturally, students living with family typically will not incur any additional costs for lodging at home although their marginal food costs will still be a factor. The room/board split for on-campus students is roughly 60/40 (about $6,500 and $4,800 on average). Room and board costs are based on a student sharing a room with one other student and a specified number of meals per week (about 20), using institutional room and board charges for on-campus students and area market estimates for off-campus students. Other expenses averaging $3,000 to $4,000 include items such as laundry, transportation, entertainment, and furnishings; the average amount is slightly larger for off-campus students largely because of higher transportation costs. Books and supply costs can vary widely by program, and the average for students in programs without specialized requirements is currently estimated by institutions for financial aid purposes at about $1,200 per year. The institutional estimate definition is an important caveat as we’ll see in Section 7.11 about textbooks; spoiler alert, the book portion is only about half this total.
Figure 7.17. FY2017 non-tuition costs of attendance for the full academic year by lodging arrangement for first-time full-time students, averaged across all types of institution. Room and board charges are shown separately for on-campus students and are not provided for
students living with family. Source: IPEDS (2020).
Room
Board
$‐
$2,000
$4,000
$6,000
$8,000
$10,000
$12,000
On Campus Off Campus With Family On Campus Off Campus With Family Books &Supplies
Room & Board Other Expenses
Non
‐Tuitio
n Attend
ance Costs (FY2
017)

7. Student Affairs 187
Adding all these components to sticker-price tuition results in the total cost of attendance, illustrated in Figure 7.18 as amounts weighted by the mix of students living on campus, off campus and with family at each school. This is the gross (rather than net) amount and, because tuition is the largest component, we see the stratification across institution types familiar to us from earlier sections on tuition. The average net price paid after accounting for all grant and scholarship aid (federal, state, local, institutional), but not loans, is also illustrated in Figure 7.18. We examined net price by income level in Section 7.3 and here we see it split into in-state and out-of-state versions for the public institutions, which reveals an interesting pattern: the net price paid by out-of-state students at the publics is remarkably comparable to that for students at the privates, $25,000 to $35,000 annually, while it is significantly less ($13,000 to $16,000, about half as much) for in-state students at the publics. These are the actual average costs to students and families, and while they are not small and have grown over time, they are also not the headline-grabbing extreme amounts sometimes cited in the media. We’ll look at affordability of these costs in the next section.
Figure 7.18. FY2017 total cost of attendance and component costs of published tuition and required fees (left and right columns are in-state and out-of-state for public institutions), books and supplies, and weighted averages for room and board and other expenses (weighted by the mix of students staying on campus, off campus and with family), as well as net price (total cost after deducting total federal, state, local and institutional grant aid), for first-time full-time undergraduates for the full academic year. Total aid is the upper
portion of each column not covered by net price. Source: IPEDS (2020).
Talking of cost increases over time, though, let’s finish up this section with exactly that, the trends in inflation-adjusted component costs of attendance (Figure 7.19). Room charges have risen just a little slower relative to sticker-price tuition, both having grown more than 1.5 times over almost two decades. This is interesting because room
R1 Public R2 Public R3‐M3 Public BAS Public R1 Private R2 Private R3‐M3 Private BAS Private $‐
$10,000
$20,000
$30,000
$40,000
$50,000
$60,000
$70,000
Costs o
f Atten
dance & Net Pric
e (FY2
017)
Net PriceOther ExpensesRoom & BoardBooks & SuppliesTuition & Fees

Like Nobody's Business188
charges are part of the local housing market, with the implication that they cannot differ greatly from local market rental rates (to avoid over- or under-subscription). It turns out that inflation-adjusted median rents grew 1.4 times over this period (US Census Bureau 2019b), a similar amount to tuition and room rates (noting that these are broad national census data not tied to university-area markets). Meal charges grew less rapidly, about 1.3 times, although this increase is above the inflation-adjusted national average for food away from home of 1.1 times since FY2000 (US Bureau of Labor Statistics 2019a). In contrast, the inflation-adjusted costs of books and supplies as well as other expenses has remained essentially flat, increasing slightly before the recession and decreasing in recent years.
Figure 7.19. Trends in component costs of attendance expressed relative to their FY2000 amounts in inflation-adjusted dollars, averaged across all types of institutions (using in-state
amounts for publics). Source: IPEDS (2020).
The cost of food can become a budget trade-off for low income students, leading to a much greater prevalence of food insecurity in recent years. National data on food insecurity are not available, but a recent comprehensive government review estimates that more than 30% of all students are food insecure (Harris 2019), although other studies present much larger numbers and another recent study challenges these high figures (Smith 2019). Campuses have begun to address this issue by opening food pantries and making sure that students are aware of their eligibility for the Supplemental Nutrition Assistance Program (SNAP), widely known as food stamps (Harris 2019).
0.9
1.0
1.1
1.2
1.3
1.4
1.5
1.6
1.7
2000 2001 2002 2003 2004 2005 2006 2007 2008 2009 2010 2011 2012 2013 2014 2015 2016 2017 2018
Infla
tion‐Ad
justed
Cha
nge Re
lativ
e to FY2
000
Tuition & Fees (In‐State/Private)
Room
Board
Books & Supplies
Other Expenses

7. Student Affairs 189
7.10 How has affordability changed?
Affordability in our context is the net price relative to the ability to pay, which we can index to median family income for trend purposes. This makes sense because substantial portions of financial aid are tied to income-based need. Inflation-adjusted median family income was flat in the decade leading up to the Great Recession, dipped by almost 10% for several years thereafter, and only since FY2016 has it recovered to pre-recession levels near $70,000 per year (Figure 7.20). The median value doesn’t convey the underlying (and widely-documented) further separation in inflation-adjusted income inequality between the lower percentiles (flat trend) and upper percentiles (over 10% growth) of the income distribution since FY2000 (US Census Bureau 2018a). As it happens, median family income increased by about $5,000 over this period, and the net price for public and private institutions increased by roughly the same amount (Figure 7.20) with the familiar pre-recession rise, then fall, and rise again pattern.
Figure 7.20. Trends in median family income and in net price for four-year public and private institutions, by fiscal year (median family income is for the previous calendar year), in 2016 dollars. Sources: US Census Bureau (2018b) and College Board (Ma et al. 2018).
Looking at net price trends as a share of median family income accounts for shifts in timing and relative amounts (Figure 7.21), showing that the privates have held steady near 35% since rising in the early 2000s, while net price at the publics rose from 12% to about 20% of median family income through FY2013 and it has since remained at that level. Therefore, and this is a big deal because it is contrary to popular perception, university affordability relative to income has remained flat for at least the last seven years, twice that length at the privates.
$‐
$10,000
$20,000
$30,000
$40,000
$50,000
$60,000
$70,000
$80,000
2000 2001 2002 2003 2004 2005 2006 2007 2008 2009 2010 2011 2012 2013 2014 2015 2016 2017 2018
Net Pric
e & M
edian Family In
come (FY2
016 Dollars)
Net Price (4Y Private) Median Family Income
Net Price (4Y Public)

Like Nobody's Business190
Figure 7.21. Trends in net price as a share of median family income for four-year public and private institutions, by fiscal year (median family income is for the previous calendar year), in 2016 dollars. Sources: US Census Bureau (2018b) and College Board (Ma et al. 2018).
Box 7.2. How Free is Free College?The lexicon surrounding college affordability has become complicated in recent years, especially around what is meant by “free college” during elections. Here’s a handy guide (Kreighbaum 2019b; Mangan 2019):
• First Dollar: program funds applied before grant aid that can then be used for living costs (rare);
• Last Dollar: program funds applied after grant aid (most common);
• Last Dollar Plus: like Last Dollar, with extra program funds for living costs (rare);
• Tuition-Free: program funds cover only tuition;
• Debt Free: Tuition-Free with extra funds for living costs, thereby avoiding loans;
• Debt Cancellation: program funds applied to reduce or zero-out existing loans for all or for lower-income subgroups with loans.
Some of these options can be expensive, e.g., First Dollar. Yet others can be controversial too, such as Debt Cancellation, which is criticized as unfair by those who’ve just paid off their loans and/or those who worked more during college to avoid accumulating debt.
0%
5%
10%
15%
20%
25%
30%
35%
40%
2000 2001 2002 2003 2004 2005 2006 2007 2008 2009 2010 2011 2012 2013 2014 2015 2016 2017 2018
Net Pric
e as Sha
re of M
edian Family In
come (FY2
016 Dollars)
4Y Private
4Y Public

7. Student Affairs 191
You might be wondering if students, especially those from low-income families, can offset the net price and cost to families by working part-time during college. Decades ago, when net price was much lower relative to median family income, a part-time job was often an effective solution. Unfortunately, that is no longer the case. A recent study (Anthony et al. 2019) shows that at four-year institutions, a student working ten hours per week at the minimum wage would still be $6,550 short of the net price or, alternatively that the student would need to work twenty-six hours per week to offset the net price (with large differences in both of those figures across states). Unlike a generation or two ago, students and families must now bridge this affordability gap with savings or by incurring debt through loans.
7.11 How much debt do students have at graduation?
“As you walk across campus and see students moving between classes, remember that they and their families took out loans to pay our salaries.” I’ve made this point many times in campus meetings to underscore, even in the large public research university where I work, that we are a tuition-dependent institution and the extent to which we rely on and must serve our students. The reality of paying the net price (i.e., after aid) for attending university, while considerably lower than the sticker price, means that students must foot that remaining bill by working, by using their parents’ savings, and/or by borrowing the money. We looked at student loans for first-time full-time (FTFT) students in Section 4.5, and here’s a quick recap:
• Not all FTFT students have debt and the share who do ranges widely from about one quarter at R1 privates to almost three-quarters at R3-M3 privates, while the share is roughly half at other types of institutions;
• The average loan is just over $7,000 (plus/minus about $1,000 depending on type of school, in FY2016 dollars) for those FTFT students with loans;
• Most student loans are federal loans, but there is a small portion of students, 4–10%, with much larger other loans averaging $10,000 to $20,000 (by type of school);
• Four years at the average loan amount is about $30,000 of cumulative debt for students who have borrowed. I underline again that this kind of number is frequently misquoted and misperceived as the average debt of all students, but because only half of all students borrow, it follows that (if someone truly wants that figure) the average cumulative debt per graduating student is also half, about $15,000;
• The trend in the share of FTFT students borrowing has been relatively flat, increasing slightly after the recession and then decreasing in recent years;
• The amount borrowed has remained flat since the recession for federal and student loans, except strong increases for that small percentage with other types of loans.

Like Nobody's Business192
Now, instead of FTFT students, we’ll move to the completion of their studies and examine cumulative debt for students that earned undergraduate and graduate degrees. The share of degree recipients with debt and the amount of debt per individual are illustrated in Figure 7.22 (note that these data are from student NPSAS
Figure 7.22. FY2016 share of graduates with debt (upper) and average debt of those with debt (lower) by degree level, averaged by Carnegie classification and control. Professional practice degrees include the doctor degree in chiropractic, dentistry, law, medicine, optometry, pharmacy, podiatry, and veterinary medicine. Blanks indicate that minimum reporting standards were not met. Source: NPSAS 2016 (National Center for Education
Statistics 2018a).
0%
10%
20%
30%
40%
50%
60%
70%
80%
90%
R1
Publ
ic R
2 Pu
blic
R3-
M3
Publ
ic B
AS P
ublic
R1
Priv
ate
R2
Priv
ate
R3-
M3
Priv
ate
BAS
Priv
ate
R1
Publ
ic R
2 Pu
blic
R3-
M3
Publ
ic B
AS P
ublic
R1
Priv
ate
R2
Priv
ate
R3-
M3
Priv
ate
BAS
Priv
ate
R1
Publ
ic R
2 Pu
blic
R3-
M3
Publ
ic B
AS P
ublic
R1
Priv
ate
R2
Priv
ate
R3-
M3
Priv
ate
BAS
Priv
ate
R1
Publ
ic R
2 Pu
blic
R3-
M3
Publ
ic B
AS P
ublic
R1
Priv
ate
R2
Priv
ate
R3-
M3
Priv
ate
BAS
Priv
ate
Bachelor's Master's Doctor's Professional
Grad
uate
s With
Deb
t (FY
2016
)
$-
$20,000
$40,000
$60,000
$80,000
$100,000
$120,000
$140,000
$160,000
$180,000
R1
Publ
ic R
2 Pu
blic
R3-
M3
Publ
ic B
AS P
ublic
R1
Priv
ate
R2
Priv
ate
R3-
M3
Priv
ate
BAS
Priv
ate
R1
Publ
ic R
2 Pu
blic
R3-
M3
Publ
ic B
AS P
ublic
R1
Priv
ate
R2
Priv
ate
R3-
M3
Priv
ate
BAS
Priv
ate
R1
Publ
ic R
2 Pu
blic
R3-
M3
Publ
ic B
AS P
ublic
R1
Priv
ate
R2
Priv
ate
R3-
M3
Priv
ate
BAS
Priv
ate
R1
Publ
ic R
2 Pu
blic
R3-
M3
Publ
ic B
AS P
ublic
R1
Priv
ate
R2
Priv
ate
R3-
M3
Priv
ate
BAS
Priv
ate
Bachelor's Master's Doctor's Professional
Aver
age
Debt
of T
hose
With
Deb
t (FY
2016
)

7. Student Affairs 193
surveys and are not directly comparable to the institutional IPEDS data in Section 4.5). Starting with bachelor’s recipients, at most types of institution about 60–70% graduate with debt, although that share is 75% at R3-M3 privates and much lower, 43%, at R1 privates. The average debt amount for graduates with debt is quite similar across institution types, $26,000 to $29,000 at the publics and a few thousand more, $28,000 to $34,000, at the privates.
For master’s recipients, the share with debt is centered around 50% depending on type of school, but with a large public-private difference in the average debt amount, $32,000 to $45,000 at the publics and $44,000 to $68,000 at the privates. Bear in mind (i) that students may be awarded assistantships for master’s degrees in the arts and sciences, but financial aid is less common for professionally-oriented master’s degrees that can also be priced higher, and (ii) these debt amounts are accumulated in the two years or less that it takes to complete a master’s degree.
Students graduating with a Ph.D. or other research doctoral degree will take four to eight years (some requiring a master’s, some not, depending on field) and they are the most likely graduate degree level to be awarded assistantships and other aid. Thus, although the degree takes two to four times longer than a master’s, the share of Ph.D. graduates with debt is the lowest for all levels of degree (although it is concerning that this share at R3-M3 institutions is double that at R1 schools). Debt amounts for the generally smaller share of Ph.D. graduates with debt are more than for master’s graduates, but not as much as time-to-degree would imply.
Professional practice doctor’s degrees include the MD, JD, PharmD, DVM, etc.; 70% or more of these degree recipients have debt on average, and those individuals have the highest average debt amounts of all graduates, approaching $120,000 at the publics and $180,000 at the privates. This level of average debt is breathtaking for those who haven’t seen the numbers before. It also highlights the issue of repayment: the starting salary and future earnings of an MD graduate will likely make repayment feasible but starting salaries for veterinarians and several others in this category are under six figures—those individuals will struggle with their debt for many years. We’ll cover repayment in the next section.
7.12 What are the rates of student loan repayment?
Repayment rates have slowed in recent years, and they differ by who is paying. The repayment rate is the share of borrowers who are making progress paying down their loans (at least one dollar of the initial balance), measured within a given window (e.g., three, five or seven years) since they entered repayment. Borrowers may enter repayment in a different year than when they left the institution because of a six-month grace period, being granted a deferment for hardship, or for attending graduate school; repayment rates are reported for undergraduate debt (US Department of Education 2019a). Five-year repayment rates by institution type are shown in Figure 7.23 and,

Like Nobody's Business194
logically enough, they track the corresponding student/family income profiles (see Section 7.3). Repayment rates are lower for those who left the publics (60–75%) than the privates (68–88%), while they are highest for R1 school leavers and lowest for R3-M3 school leavers. For leavers from all types of institution, repayment rates have declined by 5–10% in recent years, especially for those borrowers who left the institution since the recession.
Figure 7.23. Five-year repayment rates on federal student loans by ending fiscal year for two-year averages (i.e., borrowers entering repayment in FY2006 and FY2007 comprise the FY2012 amount, and likewise those entering in FY2011 and FY2012 comprise the FY2017 amount), averaged by Carnegie classification and control. Repayment is defined as paying down at least one dollar of loan principal after five years. Source:
College Scorecard (US Department of Education 2019a).
Students who graduate are, as expected, better able to repay their student loans than those who do not complete their degrees (Figure 7.24), with non-completers repaying at rates that are 15–20% lower than completers at the same type of school. Similarly, students who are financially dependent on their families have a better repayment record than those who are financially independent without family resources (Figure 7.24), with a parallel difference of 10–20% between the two groups. Note that these data reflect whether a borrower has paid down at least $1 of the loan within five years; they do not reflect if the loan has been completely repaid or those individuals who begin repayment after five years.
0%
10%
20%
30%
40%
50%
60%
70%
80%
90%
100%
2012
2013
2014
2015
2016
2017
2012
2013
2014
2015
2016
2017
2012
2013
2014
2015
2016
2017
2012
2013
2014
2015
2016
2017
2012
2013
2014
2015
2016
2017
2012
2013
2014
2015
2016
2017
2012
2013
2014
2015
2016
2017
2012
2013
2014
2015
2016
2017
R1 Public R2 Public R3‐M3 Public BAS Public R1 Private R2 Private R3‐M3 Private BAS Private
Five
‐Year R
epaymen
t Rate (by En
ding
FY)
While we are not including for-profit institutions in our analyses, a lot of media attention has been devoted to their repayment rates, which are only about half of those at public and private four-year schools; two-year colleges are in-between (Baum et al. 2018a). Most national reports on student indebtedness and repayment include these

7. Student Affairs 195
Figure 7.24. Five-year repayment rates on federal student loans for the two-year averages of borrowers entering repayment in FY2011 and FY2012 (i.e., five years ending FY2017), by degree completion status and dependency status, averaged by Carnegie classification and control. Repayment is defined as paying down at least one dollar of loan principal
after five years. Source: College Scorecard (US Department of Education 2019a).
0%
10%
20%
30%
40%
50%
60%
70%
80%
90%
100%
R1 Public R2 Public R3‐M3 Public BAS Public R1 Private R2 Private R3‐M3 Private BAS Private
Five
‐Year R
epaymen
t Rate (End
ing FY20
17)
Completers Noncompleters Dependent Independent
other types of institutions where the statistics are quite dismaying. Loans to student’s parents through the Parent PLUS program have been a particular focus of attention, because those loans do not have the same protections as federal undergraduate loans like loan forgiveness and income-based repayment (Kreighbaum 2018; Looney and Lee 2018). As with undergraduates, the data show that large-balance graduate student borrowers attended for-profit schools that tend to have worse repayment outcomes (Lee and Looney 2018). Overall, the growth in borrowers acquiring high debt with low earnings prospects leads to unsustainable levels of indebtedness, that in turn lead to higher costs for the federal loan programs and for students.
7.13 What is going on with textbook prices and spending?
Like rising tuition, “skyrocketing” textbook prices generate considerable consternation that is further confounded by conflated questions and confusing data sources. Textbook prices (and consequent antipathy toward publishers) rather than other course materials have fueled the concerns and drawn most of the attention, so we’ll begin with them.
Two core questions: how much have textbook prices risen, and how much are students spending on them? Curiously, the answers are (i) a lot, and (ii) less and less. The best data on prices are literally part of the CPI (consumer price index): the

Like Nobody's Business196
educational books and supplies component goes back decades, while college textbooks as a subset thereof were broken out in FY2002. It turns out that they track closely, providing a fascinating trend pattern (Figure 7.25). After adjusting for inflation with the overall CPI exactly as we’ve done for other dollar trends, we see that new textbook prices were flat from the 1960s through the mid-1980s, then doubled in price over the next thirty years, and that trend has abated only in the last few years. The other data source for textbook prices is the National Association of College Stores (NACS); its surveys show comparable but slightly lower increases in inflation-adjusted new textbook prices and flat prices for used textbooks (Figure 7.25).
Figure 7.25. Inflation-adjusted price changes for educational books and supplies (relative to FY1967) and for college textbooks (relative to FY2002, starting at the matching value) from the consumer price index, and the price of new and used textbooks from college bookstore surveys (relative to FY2008, also starting at the matching value). Source: BLS
(US Bureau of Labor Statistics 2019b) and NACS (2019a).
While new textbook prices have climbed, students have been spending progressively less on their overall basket of textbooks and course materials. Three independent surveys all converge on approximately the same number, which after adjusting for inflation is currently about $500 per year, down from about $850 in FY2002 (Figure 7.26). Data for the last five years show that the mix of materials purchased has shifted too. Of the four types, the shares of new and rented textbooks have remained roughly flat, the used textbook share has shrunk, and the digital text share has grown to make up the difference (Figure 7.27). These are noisy survey responses and not national summary data, but this latter switch is nonetheless consistent with an important trend in textbook publishing: unlike paper books, digital textbooks cannot be resold, and students can only purchase them new. While a growing trend in online versus paper
0.80
1.00
1.20
1.40
1.60
1.80
2.00
2.20
1967
1969
1971
1973
1975
1977
1979
1981
1983
1985
1987
1989
1991
1993
1995
1997
1999
2001
2003
2005
2007
2009
2011
2013
2015
2017
2019
Infla
tion‐Ad
justed
Relative Price Ch
ange
Educational Books & Supplies (BLS)
College Textbooks (BLS)
New Textbooks (NACS)
Used Textbooks (NACS)

7. Student Affairs 197
texts is expected nowadays, this shift also happens to be a way for publishers to reclaim a portion of the used textbook market that otherwise does not accrue to them.
Figure 7.26. Student-reported spending on textbooks from three surveys, each averaged across all types of institution, by fiscal year in FY2016 dollars. Sources: Student Monitor/SM (Kestenbaum 2014; Business Wire 2018), NACS (2019b), and NPSAS 2016 (National
Center for Education Statistics 2018a).
Figure 7.27. Share of student-reported spending on types of textbooks by fiscal year. Source: Student Monitor (Business Wire 2018).
$‐
$100
$200
$300
$400
$500
$600
$700
$800
$900
2002 2003 2004 2005 2006 2007 2008 2009 2010 2011 2012 2013 2014 2015 2016 2017 2018 2019
Stud
ent S
pend
ing on
Cou
rse Materials (FY2
016 Dollars)
All Textbooks (SM)
Required Course Materials* (NACS)
*Weighting Change (NACS)
Textbooks & Other Required (NPSAS)
0%
10%
20%
30%
40%
50%
60%
2014 2015 2016 2017 2018
Share of Stude
nt Spe
nding on
Textboo
ks
New
Used
Rented
Digital

Like Nobody's Business198
The curious part of all this is that despite the decades-long increase in textbook prices, students are spending about 60% less on textbooks than they did just over a decade ago. Are they getting the same books for less using other means, or are they just opting out of buying them altogether? It appears to be a bit of both. We saw above that used textbook purchase amounts are down. The same survey shows that while renting expenditures are flat, the percentage of students renting has virtually doubled to about 40% over almost a decade (Business Wire 2018). About half of students responding purchased at least one new textbook; 39% of those bought it significantly cheaper than list price from a mix of sources, 61% from the campus bookstore, 41% from Amazon, and 21% from other bookstores and online retailers (Business Wire 2018). When it comes to all course materials of any type, not only new, 77% of students purchase from the campus bookstore, 42% from Amazon, and 25% from other sellers (NACS 2019b). Only 12% of students (Business Wire 2018) reported that one or more of their classes used an open educational resource (OER). OERs are public domain or freely usable materials, typically online, that include textbooks as well as course modules, videos, tests, etc. While almost half of all faculty members are now aware of OERs, only 13% of those teaching all courses and 22% of those teaching introductory courses require OERs (Seaman and Seaman 2018). About 30% of students do not buy or rent at least one of their required materials, and on average these students skip buying three required texts in one semester; price was cited by 30% as a reason for not acquiring the text, the other responses being that either the individual, the professor or others said it was not necessary (Hill 2015). What do students do without a text? Apparently, 57% just use class notes, 47% borrow from friends or the library, and 19% obtain material illegally (Hill 2015). Consistent with all the above, the number of books bought per student was down from 13 in 2001 to 8.5 in 2013 (Kestenbaum 2014).
In addition to required texts and course materials, students also need to purchase non-required (but practically necessary) technology such as a computer and other school supplies; the FY2019 average spending on these items was $527 (NACS 2019b), which is $496 in 2016 dollars for comparison to the textbook amounts. So, together, student-reported annual spending on books and other supplies total about $1,000 on average. That’s not too different from the roughly $1,200 amount for books and supplies listed in IPEDS that is subsequently republished by the College Board (Ma et al. 2018) and widely-cited by the media and interest groups. However, it’s worth repeating the easy-to-miss distinction between the source of these amounts that I flagged in Section 7.9: the underlying IPEDS amount does not come directly from student-reported amounts and instead is a broad estimate for financial aid purposes made by the institutions.
The vicious cycle of increasing textbook prices and purchase avoidance by students is reflected in campus bookstore sales figures. Campus stores are often owned and run by the institution or its student association, and they are sometimes contracted to a company (NACS 2019a). Although textbooks are just one part of college store sales

7. Student Affairs 199
(that also include stationery, logo items and apparel, and technology), overall total and per-student sales have declined almost 20% during the decade since the recession (Figure 7.28). About 22% of a textbook’s price goes to the bookstore, of which almost one quarter (6%) is profit after costs, which is a modest amount; about 11–15% of the price goes to author royalties, and the rest goes to the publisher to cover costs and generate a profit (Crockett 2013).
Figure 7.28. Recent trends in inflation-adjusted US college store sales and sales per postsecondary student (Fall enrollment), by fiscal year. Sources: NACS (2019a) and IPEDS (2020).
The textbook publishing industry, after the long run-up of price increases, now finds itself pressured by all the alternative options mentioned above as well as mergers, acquisitions and associated debt necessitated by a rapidly changing market. The recent merger announcement between Cengage and McGraw-Hill will rival the largest publisher, Pearson, with this consolidation resulting in a duopoly that will dominate market share (McKenzie 2019a). A new subscription-based model is emerging, aimed at institutions and departments, with content morphing from static textbook information to digital courseware that includes personalized, adaptive learning technology (McKenzie 2018a; Blumenstyk 2019b).
There is one other dimension to the college textbook business worth mentioning. Faculty-authored textbooks are sometimes assigned by those authors in their own courses, which can create an actual or perceived conflict of interest. Many universities and the AAUP have statements and policies on the necessity of avoiding such conflicts while enabling the material to be used. Remedies include an approval process, eliminating or donating (typically minor) royalties, and discounting the cost of the book (American Association of University Professors 2005; Quintana 2018).
$450
$475
$500
$525
$550
$575
$600
$9.0
$9.5
$10.0
$10.5
$11.0
$11.5
$12.0
2008 2009 2010 2011 2012 2013 2014 2015 2016 2017
Sales pe
r Postsecon
dary Stude
nt
Campu
s Boo
kstore Sales (F
Y201
6 $B
illions)
Bookstore Sales
Sales per Student


8. Research
8.1 What’s in the research budget, and how big is it?
Discovery, inquiry, the search for meaning, creative activity: all of these and more comprise the academic quest for original new knowledge that we include under the banner of research. Furthermore, like love, knowledge isn’t really knowledge until it is shared, and therefore research also includes communication of its outcomes through publication, presentation and performance. Research can be undertaken for the sake of knowledge and curiosity alone, as well as for broader application and problem-solving;1 it can be carried out by lone scholars and by large groups of researchers; and, most relevant to our purposes here, depending on the topic, it can be done at very little cost beyond time and expertise or it can require significant and sustained investment.
Many kinds of science and engineering research simply cannot be accomplished without research funding to cover the costs of equipment, supplies, specialized labor, and unique facilities. Faculty members and other researchers in these areas expend a lot of time and effort in the pursuit and acquisition of research funds to enable their research, much of it through intense national competition.2 Naturally, those who garner such support are judged as successful by their peers. Because money (and publications) can be counted easily, it was probably inevitable that these two metrics came to be used as convenient proxies for research productivity in promotion and tenure as well as in university rankings.3 Of course, research funds are not an end in
1 Vannevar Bush, who in 1945 delivered Science, the Endless Frontier (Bush 1945), the enormously influential report that ultimately led to the creation of the National Science Foundation and the unprecedented rise in research funding for US universities, made the unidimensional distinction between basic and applied research. Donald Stokes, in his book, Pasteur’s Quadrant (1997), transformed this view into two dimensions to explain use-inspired research. He contrasted the work of Niels Bohr (purely basic) and Thomas Edison (purely applied) with that of Louis Pasteur and the discovery of penicillin, an example of use-inspired research that simultaneously contributed to basic biological knowledge and solved a practical problem.
2 Two points on competitive research grants: (1) open competition adjudicated by rigorous peer review in the US research funding system is a driver of high overall quality, and (2) those faculty members and others who are outside the grant-active disciplines often don’t appreciate just how intense and time-consuming the competition can be, with funding rates under 20% in many fields.
3 I’ve often referred to this pair as “fame and fortune” when discussing research productivity with faculty colleagues. While they can be empty personal attributes, as Elvis Presley told us in his 1960 song of the same name, in this case they are a droll reminder of the necessity for research support and for communicating research findings.
© Andrew C. Comrie, CC BY 4.0 https://doi.org/10.11647/OBP.0240.08

Like Nobody's Business202
themselves. Still, at a successful research university they are vital, and they represent a sizable portion of the overall institutional budget.
We celebrate grants when they are awarded, and we’ll typically quote the entire award amount, “Professor Famous just received a $1M grant from the NIH to study a promising cancer treatment.” What this doesn’t say is that it might be a five-year grant at, say, $200,000 per year, and it might be split among several universities collaborating on the work.4 Also, research grants are not the only kind of grants and contracts coming in to the university—they fund instruction and public service too. These complications make it difficult to track research revenues alone, but more importantly they are quite uneven from year to year: large grants can arrive all in one award year or be unevenly spread over the multiple grant years they are intended to cover. And, you shouldn’t be shocked to learn that sometimes the money arrives late.
So, to avoid these issues, the convention is to track research expenditures instead. Research expenditures include not only expenditures on government agency-funded research grants that make up the biggest category, but they also include research funded by private sector, state and local, and institutional sources. The latter includes staff and facilities costs for research centers and institutes, the central research and/or sponsored programs office, research compliance, and so forth. Note that research expenditures do not account for faculty time allotted to research during the regular semesters (a potentially large number given that this may be as much as half of the faculty’s effort at an R1 school; see Section 6.10 on faculty effort), but faculty summer salaries paid on research grants are included in research expenditures.
To make the above distinctions plain, Figure 8.1 illustrates grant and contract revenues versus research expenditures by institution type. Several things are immediately apparent: the R1 schools are by far the dominant players in terms of sheer dollars of either kind; federal funds comprise the lion’s share; and, for the reasons cited above, research expenditure totals do not equate neatly to grant and contract revenue (although they are nonetheless closely related). At the beginning of Chapter 3 we observed that, across all university types, research expenditures comprise about 8% of the budget. At R1 institutions, those with the greatest focus on research, the budget share for research expenditures is about 20% and second only to instruction.
4 Professor Famous might be the lead principal investigator (PI), but she could be a co-principal investigator, a co-investigator, a subcontractor, etc., and her role may or may not correlate with the proposed budget share allocated to the work done by her individually or by her lab.
Which universities are the biggest players nationally? The go-to data source for research expenditures is the National Science Foundation (NSF) Higher Education Research and Development (HERD) survey, and the top 25 institutions are shown in Figure 8.2. These are, by definition, among the most prominent research institutions in the country (and the world). For most of them the dominant share of research expenditures is associated with health sciences and funding from the National Institutes of Health (NIH); see more on NSF and NIH funding later in this chapter. Note, for example, that the University of Texas MD Anderson Cancer Center is, on

8. Research 203
Figure 8.1. FY2017 revenues from all grants and contracts (research and non-research) by source, and expenditures on research from all sources (external and institutional), by Carnegie
classification and control. Source: IPEDS (2020).
R1 Public R2 Public R3‐M3 Public BAS Public R1 Private R2 Private R3‐M3 Private BAS Private $‐
$100
$200
$300
$400
$500
$600
All G
rant/Con
tract R
even
ues & Research Expe
nditu
res
($Millions, FY2
017)
Research Expenditures
Private Revenues
Local Revenues
State Revenues
Federal Revenues
Figure 8.2. FY2017 total research and development expenditures for the 25 highest-ranked institutions. Source: NSF HERD (National Science Foundation, National Center for
Science and Engineering Statistics 2018a).
$‐ $500 $1,000 $1,500 $2,000 $2,500
Johns Hopkins UniversityUniversity of Michigan, Ann Arbor
University of California, San FranciscoUniversity of Pennsylvania
University of Washington, SeattleUniversity of Wisconsin‐MadisonUniversity of California, San Diego
Duke UniversityHarvard UniversityStanford University
University of North Carolina at Chapel HillUniversity of California, Los Angeles
Cornell UniversityMassachusetts Institute of Technology
Yale UniversityUniversity of Pittsburgh, PittsburghUniversity of Minnesota, Twin Cities
New York UniversityTexas A&M University, College Station
Columbia University in the City of New YorkUniversity of Texas M.D. Anderson Cancer Center
The Ohio State UniversityPennsylvania State University & Hershey Medical Center
Georgia Institute of TechnologyUniversity of Florida
Research Expenditures ($Millions, FY2017)
Public
Private

Like Nobody's Business204
its own, ahead of the regular UT Austin campus (which is number 35). Counter to the health sciences point, Johns Hopkins University, at the top if the list, includes its Applied Physics Laboratory (APL), a huge research center with over 6,000 employees that receives funds from the Department of Defense (DoD) and NASA. Much like the point I made in Chapter 2 about university budgets sometimes including hospitals and sometimes not, the same goes here for hospitals as well as the units that carry out DoD-funded research and development—some of the latter are part of the university, like APL at Hopkins, and some are independent entities such as the MIT Lincoln Laboratory. Over half of Hopkins’ $2.6B research expenditures ($1.4B in FY2016) are associated with APL (National Science Foundation, National Center for Science and Engineering Statistics 2018a).
In addition to clarifying that the research expenditure totals are not always an apples-to-apples comparison, there are a couple of other issues related to research expenditures in general that are worth clearing up. First, while faculty members bring their unique and specialized expertise to bear on a research project, and they do the intellectual heavy lifting of applying for grants and carrying out the research, some novice faculty members are surprised to learn that the grant is not “theirs.” The funding agency awards the grant (or contract) to the institution (or its board) and the faculty member (in the role of principal investigator) carries out the work as an employee of the institution. Technically, if the faculty member cannot complete the work for some reason, the institution can substitute another suitable researcher to do so or return the remaining funding to the agency. In practice, and in most cases, should a faculty member move to another institution, most universities will work with the funding agency to enable the grant to follow the investigator. For its role, the institution handles the mostly invisible but nonetheless essential administration of the research including accounting, contracting, compliance processes, legal issues, etc. that are paid for through overhead charges (see Section 8.4).
The second issue is one of terminology and public perception. Research expenditures as a term makes sense in the context outlined in this section, vis-à-vis incoming grant awards, but it is easily confused by those outside the university. Consider, for example, that the latest research rankings are released, and our university proudly puts out a press release about how its research expenditures have risen. If not explicitly stated, there will be some commentators or politicians who are unaware that we really mean separately-funded revenues (most of which are externally-funded) when we say expenditures; so, in fact, when we say expenditures, we really mean income, the exact opposite. “There goes that university again,” they might say, “wasting our precious tuition or tax money.” Moral of the story: whenever you mention research expenditures outside of a research audience, always append a comment to the effect that they mostly reflect outside investment that the university has brought to the community. If you are talking with politicians or business people, you can further underline that most of those dollars are spent in the community on salaries, goods, services, and taxes (see also Section 14.3 on economic impact).

8. Research 205
8.2 What are the trends in research expenditures?
University research expenditures from all sources have increased steeply for over sixty years. Even after adjusting for inflation, research expenditures at all universities have been doubling every twenty years, with about 5–6% annualized growth (Figure 8.3). Each of the major meanders in this unprecedented expansion of research investment has a story that we can unpack by funding source. Figure 8.4 shows the relative share of this research funding trend by source. Note that the National Institutes of Health (NIH) are part of the Department of Health and Human Services (HHS) and, for our purposes of university research funding, HHS and NIH are synonymous. The predominance of federal funding is clear, and we can see the increase due to the 1960s space race, several decades with episodes of slowing and growth, the effects of the NIH budget-doubling in the early 2000s (naturally, expenditures lagged the 1998–2003 appropriation increases by a couple of years), the Great Recession, and immediately thereafter a brief spike from the stimulus.5 The federal share trends slowly downward for much of the record, not because federal spending has shrunk, but because institutional investments by universities have grown steadily as well, thereby increasing in share over time (it’s not shown in the figure, but if we exclude institutional investments, all external funding sources have maintained relatively steady shares
5 The American Recovery and Reinvestment Act of 2009 (ARRA) was an economic stimulus package enacted in response to the Great Recession. It included federal research funding increases of almost 25% focused in FY2009 and FY2010.
Figure 8.3. Trend in higher education research and development expenditures from all sources, in FY 2016 dollars by fiscal year. Source: NSF HERD (National Science Foundation,
National Center for Science and Engineering Statistics 2018a).
$‐
$10
$20
$30
$40
$50
$60
$70
$80
1953
1955
1957
1959
1961
1963
1965
1967
1969
1971
1973
1975
1977
1979
1981
1983
1985
1987
1989
1991
1993
1995
1997
1999
2001
2003
2005
2007
2009
2011
2013
2015
2017
Highe
r Edu
catio
n R&
D Exp
enditures ($Billion
s, FY2
016 Dollars)

Like Nobody's Business206
over time, with the federal share between 70% and 80%). The institutional investments comprise the university’s infrastructure to help carry out research, and as mentioned in the previous section they include staff and facilities costs for research centers and institutes, the central research and/or sponsored programs office, and research compliance (the expense of which has been increasingly borne by universities; see Section 8.6 on research compliance costs). By comparison, research funding from state and local governments, from private business, and from nonprofits and other sources has increased only modestly over time, with their shares each staying under 10% of total research expenditures.
Figure 8.4. Trends in shares of higher education research and development expenditures by source, in FY 2016 dollars by fiscal year. Source: NSF HERD (National Science Foundation,
National Center for Science and Engineering Statistics 2018a).
Figure 8.5 delves deeper into the federal portion of the research funding trend, illustrating financial support to universities by agency. Note that these are funding allocations and not expenditures, and thus the inflections in the trend lead those in the preceding figures by a couple of years. Again, the space race, NIH doubling, and the stimulus are quite clear. After its initial growth in the 1960s, federal research funding was flat through the 1970s in real terms, and then doubled in the two decades from the early 1980s to the early 2000s. Except for the stimulus, the inflation-adjusted trend in federal research funding to universities has been downward to flat in the last fifteen years. Despite this recent trend, the competition among universities for those resources continues unabated, as seen in the growth of institutional expenditures noted above and in diminished funding success rates for those faculty members and other researchers writing the proposals (see Box 8.1 on Research Grant Funding Success Rates).
0%
10%
20%
30%
40%
50%
60%
70%
80%
1953
1955
1957
1959
1961
1963
1965
1967
1969
1971
1973
1975
1977
1979
1981
1983
1985
1987
1989
1991
1993
1995
1997
1999
2001
2003
2005
2007
2009
2011
2013
2015
2017
Share of Highe
r Edu
catio
n R&
D Exp
enditures by
Sou
rce
Federal Government State & Local Government Institution Funds Business Other

8. Research 207
Figure 8.5. Trends in federal science and engineering research and development funding to universities by agency, in FY2016 dollars by fiscal year. Agency acronyms are for the Department of Health and Human Services (HHS, which includes the National Institutes of Health, NIH), the National Science Foundation (NSF), the Department of Defense (DOD), the Department of Energy (DOE), the National Aeronautics and Space Administration (NASA), and the US Department of Agriculture (USDA). Source: NSF Federal Support (National Science Foundation, National Center for Science and
Engineering Statistics 2018b).
Looking at the funding mix by agency in Figure 8.5, perhaps most the notable feature for the uninitiated is the relative size of NIH funding, about three times that of NSF and over half of all federal research funding to universities. Incidentally, this is why it is tough for a university without health sciences to rise into the top ranks of research university funding. DoD funding to universities is slightly less than that from NSF, followed by the Department of Energy, NASA, USDA, and other agencies that fund smaller amounts. The relative sizes of federal agency support amounts have waxed and waned over the decades, albeit dominated by NIH that moved from about 50% to about 60% of the total during its doubling phase. The DoD more than doubled its share of federal research funding from 7% in the 1970s to over 15% in the mid-1980s before declining again in the 1990s;6 NASA’s peak share was in the 1960s, as one might expect, but the USDA’s share has dropped from about 11% in the mid-1970s to just 3% of the total in FY2017.
6 Defense funding to universities is generally non-classified and non-military, and it covers the gamut one might expect from a large government organization, including not only technology but also health and biosciences, environment, economics, and game theory, to mention just a few examples. Many universities prohibit classified work on campus; some are affiliated with independent organizations for that purpose.
$‐
$5
$10
$15
$20
$25
$30
$35
$40
$45
1963
1965
1967
1969
1971
1973
1975
1977
1979
1981
1983
1985
1987
1989
1991
1993
1995
1997
1999
2001
2003
2005
2007
2009
2011
2013
2015
2017
Fede
ral R
&D Fun
ding
for U
niversities ($
Billion
s, FY2
016 Dollars)
Other
USDA
NASA
DOE
DOD
NSF
HHS (NIH)

Like Nobody's Business208
Box 8.1. Research Grant Funding Success RatesSuccess rates for competitive peer-reviewed research grants average about 20% nowadays, about half what they were a generation ago when today’s senior researchers were starting out (Figure B8). At NIH the number of proposals has quadrupled over a half-century while awards doubled, and at NSF applications almost doubled over a quarter-century while award counts stayed about the same. We know that the numbers of faculty and principal investigators (PIs) have increased at a far slower rate than proposals based on data from IPEDS (2020) and NSF (National Science Foundation, National Center for Science and Engineering Statistics 2018a), and thus proposals per person have also increased. Of course, grant budgets have increased over time to cover rising labor and other costs, so we have more PIs submitting more proposals per person, all vying for limited funding (Lauer 2018). The number of grant awards per PI has not changed markedly over time, they are not going disproportionately to the successful few, and the number of applications per PI does not correlate with the percentage of funded applications (Rockey 2011; 2012). Therefore, declining funding success rates are largely a problem of our own making, a symptom of intensified competition for research funding.
Figure B8. Overall research grant funding success rates at NIH and NSF (left) and associated proposal and award counts (right). NIH data show similar patterns for research project grants and all R01-equivalent grants, therefore they are combined here. Sources: NIH
(National Institutes of Health 2018) and NSF (National Science Foundation 2018).
8.3 What is the research funding mix by discipline?
Academic disciplines and fields differ enormously in their levels of extramural research funding. Not only do they differ in the level of support necessary to enable productive
0%
5%
10%
15%
20%
25%
30%
35%
40%
45%
50%
1970
1973
1976
1979
1982
1985
1988
1991
1994
1997
2000
2003
2006
2009
2012
2015
2018
Succ
ess R
ate
NIHNSF
0
10,000
20,000
30,000
40,000
50,000
60,000
70,000
80,000
90,000
100,000
1970
1973
1976
1979
1982
1985
1988
1991
1994
1997
2000
2003
2006
2009
2012
2015
2018
Num
ber o
f Pro
posa
ls &
Aw
ards
NIH ProposalsNSF ProposalsNIH AwardsNSF Awards

8. Research 209
research (labs, equipment, etc.) but they also differ in funding level accorded them by funding agencies (based on topic, strategic priority, history, etc.). Figure 8.6 illustrates federal research funding by field and by agency, grouped into several science subfields, engineering, and non-science and engineering fields.
Figure 8.6. FY2017 federal higher education research and development expenditures as shares (left) and total dollars (right), by agency and field. Source: NSF HERD (National Science
Foundation, National Center for Science and Engineering Statistics 2018a).
We saw the dominance of NIH funding in the previous section, and it is clearly visible here in the amounts for health sciences and biosciences. Unfortunately, these NSF
0% 20% 40% 60% 80% 100%
Health SciencesBiological & Biomedical Sciences
Agricultural SciencesLife Sciences, Other
Natural Resources & ConservationPhysics
ChemistryAstronomy & Astrophysics
Physical Sciences, OtherMaterials Science
Geological & Earth SciencesOcean Sciences & Marine Sciences
Atmospheric Science & MeteorologyGeosciences, Other
Computer & Information SciencesPsychology
Mathematics & StatisticsSciences, Other
Social Sciences, OtherSociology, Demography, & Population Studies
EconomicsPolitical Science & Government
AnthropologyElectrical, Electronic, & Communications
Engineering, OtherMechanical
Bioengineering & BiomedicalAerospace, Aeronautical, & Astronautical
CivilChemical
Metallurgical & MaterialsIndustrial & Manufacturing
EducationNon-Science & Engineering, Other
Social WorkBusiness Management & AdministrationCommunication & Comm. Technologies
HumanitiesLaw
Visual & Performing Arts
Life
Scie
nce
Phys
ical S
cienc
eEa
rth S
cienc
eOt
her S
cienc
eSo
cial S
cienc
eEn
gine
erin
gNo
n-S&
E
Share of Federal Higher Education R&DExpenditures (FY2017)
HHS (NIH) NSF DOD DOE NASA USDA Other
$- $2 $4 $6 $8 $10 $12Federal Higher Education R&D
Expenditures ($Billions, FY2017)

Like Nobody's Business210
Higher Education Research and Development (HERD) survey data do not distinguish between the many disciplines in these two large fields,7 which exaggerates their relative size. All other fields total roughly the same as the combined health sciences and biosciences funding levels. Among the other fields, the next largest are electrical engineering, computer science and physics, with most remaining fields receiving far smaller amounts of federal research funding.
Separately from whether disciplinary research funding levels are high or low, the mix of agency funding across fields varies by relevance of the topic to the agency, as expected (Figure 8.6). NIH funds are prominent in social work, psychology, bioengineering and several social sciences. The largest fields of support for the NSF are computer and information science, biosciences, physics, and electrical engineering. For the DoD, it’s not surprising that electrical and computer engineering is top, but health sciences is its second largest funding area, followed by computer and information science, mechanical and aerospace engineering, and the biosciences. The DoE’s funds go in large part to physics, as well as chemistry and several engineering fields. NASA funding is largest in astronomy, of course, but is also important in geological and atmospheric sciences, aerospace engineering, and physics. Unsurprisingly, USDA funding goes predominantly to agricultural sciences, biosciences and natural resources.
8.4 Why do universities lose money on research?
When Professor Famous brings in that $1M research grant it certainly supports more research but, counterintuitively, it costs the university money. For all the effort put into research as a major mission area of the university, and for all the grants awarded, most faculty members are shocked to hear that research actually loses money for the university. How can that be, and why do we keep doing it? The answer to the latter question is simple—the quest for knowledge is fundamental to the university mission and, especially for research universities, high levels of research are synonymous with quality, strong graduate programs, productivity and prestige. Like so many other things universities do, we cross-subsidize critical activities in research from other sources for the benefit of the whole institution.
To understand why the financial support of federal agencies, private foundations and others generally doesn’t cover the full cost of research, we need to examine what is known variously as overhead, facilities and administrative (F&A) costs, or indirect cost recovery (ICR). Let’s work through a simplified example research grant budget to help explain things (Table 8.1).
7 The health sciences include dentistry, clinical research, gerontology, medicine, mental health, nursing, optometry, pharmacy, public health, radiology, rehabilitation, veterinary medicine, and others. The biosciences include animal biology, biochemistry, biophysics, bioinformatics, biotechnology, plant biology, cellular biology, epidemiology, genetics, immunology, molecular medicine, neuroscience, pharmacology, toxicology, physiology, and more.

8. Research 211
Table 8.1. Example of a simple one-year research grant budget, showing major categories including direct and indirect costs. See text for explanations.
Line Item Detail Amount ($)1. Salaries2. Principal Investigator Dr. V. Famous, 1 month, summer 11,0003. Graduate Research Assistant 0.5 FTE, 9 months Fall & Spring 25,0004. Fringe Benefits5. Faculty @ 32% 3,5206. Graduate Assistants @ 11% 2,7507. Other Direct Costs8. Equipment (>$5K) Real-time rapid cycling PCR system 34,0009. Materials & Supplies Lab glassware, tools, chemicals, etc. 8,00010. Travel Conference registration, airfare, hotel, food 2,00011. Tuition Remission 2 semesters, in-state amount 12,00012. TOTAL DIRECT COSTS: 98,27013. Indirect Costs (F&A)14. Modified Total Direct Costs Excluding equipment & tuition: $52,27015. Indirect Cost Negotiated rate @ 50% of MTDC: $26,13516. TOTAL INDIRECT COSTS: 26,13517. TOTAL COST: Direct plus Indirect costs 124,405
Starting with the salary section (line 1), we have just the PI and a grad student (lines 2 and 3) on this proposal. In the fringe benefits section (line 4) we calculate those amounts at the applicable rates (lines 5 and 6). The section for other direct costs (line 7) includes equipment, supplies, travel, and tuition for the grad student (lines 8 through 11). Together, the total direct costs for this grant proposal are $98,270 (line 12).
Now, here’s where it gets interesting: so far, this is a bare bones budget for just the actual research activity and it does not include necessary supporting activities such as accounting, janitorial services, lab safety, regulatory reporting, space, utilities, hazardous waste disposal, internet services, and more. All of those are facilities and administrative (F&A) costs that also should be covered by the research sponsor. Rather than itemizing them for each grant, F&A costs are calculated using an overall rate that is negotiated with the Federal Government (and which universities often use for external grants with other sponsors too). In our example budget, we use a 50% F&A rate that is applied to something called MTDC or modified total direct costs (lines 14 and 15). MTDC includes all the allowable direct costs (according to federal regulations) that can be included in the base amount to which the rate is applied;

Like Nobody's Business212
items such as major equipment and tuition remission are excluded from that base. The total indirect costs (line 16) are added to the total direct costs (line 12) to obtain the overall proposed total grant cost of $124,405 (line 17). Note that our institutional F&A rate of 50% is not the same as the effective rate, which is a little over 26% in this example because of the M in MTDC—the modified costs can be quite a bit less than the total direct costs.
The F&A rate varies from institution to institution (typically 40–60%) and from year to year (typically fractions of a percent), and it is calculated using audited amounts that detail the myriad costs associated with research. A university proposes a fully-accounted rate (often with the help of consultants) to its cognizant federal agency (either the Office of Naval Research or the Department of Health and Human Services, which stand in for all federal agencies); that agency’s accountants go through the proposal and a final reimbursement rate is set. If you were paying attention in the previous sentence, you will have noticed that I said reimbursement—that’s because the university pays these indirect costs from institutional funds until it gets the money back from the sponsor. There are separate F&A rates established for sponsored instruction, special facilities, on or off campus, and so on; we’ll stick with research here to keep it simple.
A common misconception is that F&A rates somehow represent a margin or profit on research (the colloquial use of the term “overhead rates” may fuel that misunderstanding). Quite the opposite: they are, as their other name states, a means of indirect cost recovery, and for most institutions the negotiated rate is less than the full set of indirect costs. The administrative portion has been capped at 26% since 1991, although compliance and other administrative mandates have increased over time, moving more of the cost burden to universities (Council on Government Relations 2019). It is not unusual for the overall F&A differential between the proposed and negotiated rates to be on the order of 5%. So, in our example above, the negotiated rate is 50%, but the true indirect cost might be 55%, a difference of $2,600 in this case. Taken across all sponsored projects at an R1 university, that structural shortfall of a few percent can add up to millions of dollars annually.
Furthermore, many private foundations stipulate that they will only pay a greatly reduced F&A rate (often zero or 10%, sometimes 15% or 20%). The logic, explicit or implicit, is that they want to stretch their nonprofit philanthropic dollars, and/or that they like to see a cost-sharing contribution from the university. Certain foundations will allow some kinds of F&A costs to be listed as direct costs. On the other hand, some contracts with private companies can be fully costed so that the indirect costs are all included as direct costs. University sponsored project offices typically have policies and procedures to enable proposals that are in line with institutional and other regulations when the regular F&A approach is not applied.
While it is in the university’s best interests to recoup F&A costs to the full extent possible, historically this reimbursement logic has been poorly communicated to the

8. Research 213
faculty at many institutions. From a PI perspective, if a grant agency has a fixed pot of dollars available to fund projects, the higher the F&A amount, the less there is to fund the direct research costs. Even though winning proposals are selected on quality rather than price, keeping the price down in a grant competition is a deeply rooted instinct. At many institutions there is a steady stream of requests to the vice president or vice chancellor for research for F&A cost waivers on grant proposals, often with compelling arguments as to why a waiver is worth it to win the award. Each time, though, the financial decision is about shifting the costs from the individual project to the institution (i.e., all the other projects and revenue sources).
There is a further angle to how the funds returned to cover indirect costs are handled on campus: F&A recovery funds (that are a type of revenue, even if reimbursed) enter the institutional coffers as a different “color” of money to the funds that may actually pay for the various items making up F&A costs. These are unrestricted funds (see Section 2.11) and the practice on many campuses has been to return a portion of the F&A recovery to the college and/or department and sometimes the lab of the PI. The good intentions here are to incentivize further grant-getting and to provide local funds in the unit to cover many of the smaller costs in support of research. But those good intentions also help pave the road to hell, as the saying goes, by creating an implied sense that the funds somehow “belong” to the PI or to the local unit doing the research, contributing to the myth of margin or profit from grant awards.
Many sponsored projects are grants, but some come in the form of contracts. There are numerous technical differences between the two for government funders and in the private sector, most of which are not worth detailing here. But one form of contract, the fixed-price contract, is worth a mention in answering the overarching question of this section on why research loses money. For most research grants and contracts, if some portion of the grant activities cannot be carried out or amended to satisfy the original scope, the relevant funds and any others remaining at the end of the project must be returned to the sponsor (“use it or lose it”). However, a fixed-price contract is not bound by any alteration that lowers or increases the cost to the contractor (the university). This kind of contract carries high risk and can obligate the institution to unforeseen and unrecoverable costs, but for the savvy project director who budgets well and knows how to save a buck, the opportunity exists to perform the work for less than the agreed budget and for the institution to pocket the difference. The latter is an enticing prospect to some on campus; needless to say, the associated risks mean that special permissions are typically required.
We’ve now reviewed how research grants generally cost the university money in a net sense, because of F&A reimbursement shortfalls. You will recall from previous sections that the university also invests institutional funds in research infrastructure such as centers and institutes. The point is to advance research, after all, and not make money. Still, there is yet one more way in which universities make massive investments in underwriting research. At R1 and R2 institutions especially, a standard faculty

Like Nobody's Business214
member’s workload includes a large portion of their time for research and scholarship (see also Chapter 5). Thus, a truly complete description of the full costs of university research must include the tens of millions of dollars in salaries and fringe benefits necessary at research universities to support faculty research time during the academic year. Those funds must come from some source, and it’s not research-specific revenue like grants—it’s many of the other sources we reviewed in Chapter 2, including state appropriations or investment/endowment income at public or private institutions respectively.
Lest I give the impression that research is a burdensome cost to be paid, let me conclude this section with an acclamation of the vital importance of the research mission. To be sure, research is expensive, and it is important to be informed about what it really costs and the business model that pays for it all. That said, for the better part of seventy years, the US has tended a unique partnership between the government (as well as the private sector) and higher education that has produced the finest quality and quantity of research in history, by any measure. This system has produced more Nobel prizes, more life-saving and life-changing discoveries, more critical insights, than any other. Furthermore, research and graduate education are inextricably bound together in the quest for new knowledge, and their combination in the US has produced the best system of graduate education in the world. Certainly, there are costs to performing research, but its value far outweighs them.
8.5 Which are costlier to support, graduate assistants or postdocs?
One of the key elements of graduate education (see also Section 6.7) is the intimate link between it and research. Many graduate degrees, and the PhD in particular, in fact require the student to learn and demonstrate production of original and new knowledge (i.e., to do professional-level research). In practice, this educational model is a modern-day apprenticeship—in addition to advanced coursework, graduate students learn their craft by training with faculty members and other researchers for several years. The culture and practice of this critical element of graduate education varies considerably across the disciplines, and even across faculty advisors within individual graduate programs. In some disciplines (e.g., many in the humanities) the core day-to-day work is solo scholarship, while in others (especially in the sciences) the work necessitates working in small or large teams that are likely funded by a research grant. Either way, the student’s direct experience of the process of knowledge creation is key to advanced graduate education and, at universities, is also a critical component of the research enterprise.
Postdoctoral scholars are another important part of the research enterprise, and they are found most frequently across the sciences.8 Importantly, postdocs are
8 The biosciences have long had postdoc positions and over the last few decades many other sciences have followed suit. The role and nature of postdocs has expanded into the social sciences and even the

8. Research 215
simultaneously research staff employees (unless supported by independent fellowship funding) as well as being trainees (National Postdoctoral Association 2019). Ideally, postdocs bring their expertise to the lab that they join while they also learn additional fields and skills in the new setting. Thus, both postdoc positions and graduate assistantships have an educational component to their research role that distinguishes them from regular research technician and staff scientist jobs.
For a principal investigator deciding on the kinds of position on a research grant, questions arise as to the costs and benefits of graduate assistants versus postdocs. There are obviously important educational and research considerations that must be included in the decision, such as the need to support students in a graduate program, the specific expertise needed for the project, and so on. Still, this decision is often boiled down to hiring a less-experienced graduate assistant versus a more-experienced postdoc. In this simplified view, the graduate assistant will need to be trained but then will likely remain in the lab for a longer period, while the postdoc can get up to speed fast and will require less oversight, but will likely depart after a couple of years. The question is often oversimplified even further to ask whether graduate assistants or postdocs are more expensive to fund. There isn’t a single answer, because it depends on who is paying for the various associated costs, and that mix varies by institution.
Table 8.2 shows a comparison of basic costs for graduate research assistants at public and private institutions (separated because tuition can be so different) and postdocs. Line A details the cost of a twelve-month appointment for each, using the typical 0.5 FTE (half-time) rate for the graduate students and the full-time rate for postdocs. I’ve included fringe benefits at 20% in Line B, which is likely a higher rate than many institutions use but it’s a neutral term here because we’re assuming it is equivalent across positions for simplicity (both types of position can have lower fringe benefit costs than regular employees, but this can vary widely). If we stop the calculation here, Line C shows that graduate assistant costs are about 60–70% of postdoc costs. However, tuition is included with an assistantship at most institutions, so we add that amount in Line D. As we saw in Section 2.6, non-discounted tuition and fees are substantially higher at private institutions, and institutions will generally charge the grant sponsor for that amount. Thus, the fully-costed totals in Line E completely change the cost implications depending on the type of institution. Some institutions will charge tuition at a special rate, such as in-state only at some publics (as assumed here), or otherwise waived or discounted. Postdoc salaries and graduate stipends can be slightly higher at private institutions, but they do not make as significant a difference as tuition in this comparison.
humanities in recent years, with some in novel forms such as a teaching postdoc. I focus on the most common research-type postdoc in this section.

Like Nobody's Business216
Table 8.2. Example comparative annual costs of graduate research assistants (for public and private institutions) and postdoctoral scholars. Round-number estimates of tuition
are from Figure 2.8 with graduate and postdoc stipends rounded from FY2018 NIH rates (twelve-month).
Line Item Grad Research Assistant Postdoc(0.5 FTE; Public) (0.5 FTE; Private) (1.0 FTE)
A. Stipend (twelve-month)
24,000 29,000 48,500
B. Fringe Benefits @20% 4,800 5,800 8,800C. Subtotal $28,800 $34,800 $52,800D. Tuition 10,000 45,000 -E. TOTAL $38,800 $79,800 $52,800
As an aside, one can do a very similar set of calculations for graduate teaching assistants versus instructors. In that case, the department will typically pay the stipend and the college or institution will account for the tuition, so that the discussion is also about cost to whom. So, for all graduate assistantships, who pays tuition and how much are both determinative in assessing comparative costs. Returning to research assistants, principal investigators have certainly noticed the increased tuition in recent decades—anecdotal information suggests that principal investigators have shifted to employing postdocs instead of graduate research assistants, although that trend is hard to document explicitly.
8.6 How much does research compliance cost?
Many faculty members, especially those outside the life sciences and hi-tech fields that are subject to a greater range of compliance activities, know the Vice President (or Vice Chancellor) for Research (VPR) principally as (i) the person who invests institutional funds in support of research, such as for faculty startup funds or centers and institutes, and (ii) the person responsible for F&A rates and the sponsored projects office that processes grant proposals. However, the VPR is also responsible for making sure the university is in continual compliance with complex federal and state regulations that govern the conduct of research by faculty, staff and students. At an R1 university, research compliance functions include these areas:
• Human subjects research via the Institutional Review Board (IRB), often with multiple IRBs for clinical or social and behavioral sciences, plus health data privacy for the Health Insurance Portability and Accountability Act (HIPAA);
• Animal welfare for laboratory and other animals via the Institutional Animal Care & Use Committee (IACUC);

8. Research 217
• Laboratory safety, radiation safety, and biosafety (e.g., involving recombinant nucleic acid molecules, stem cells, or select agents/pathogens);
• Export compliance for high technology items and information deemed to be of a sensitive nature for national security;
• Conflict of Interest (COI) disclosure and management, both for individual researchers and for the institution;
• Responsible conduct of research promotion through training and ethics education;
• Research integrity and allegations of misconduct involving falsification or fabrication of data, plagiarism, or other kinds of unethical research conduct, overseen by a research integrity officer;
• Research data management, retention, and repository requirements;
• Financial oversight of sponsored grants and contracts, pre-award and post-award, including accounting, effort tracking, and subcontracting.
Regulations and policies are, of course, absolutely necessary for the appropriate and safe conduct of research, but over time the associated administrative burden and costs of unfunded mandates accumulate. While regulatory costs to universities are undoubtedly increasing over time as they are incurred over and above the 26% F&A administrative cap (see the trends in share of university research spending in Figure 8.4), there are surprisingly few studies that systematically detail the costs of research compliance. Broad surveys have consistently shown that faculty members spend 42% of their research time on meeting requirements rather than doing research itself (Schneider et al. 2014). The relative time commitment on each compliance responsibility is illustrated in Figure 8.7, and it is clear that faculty members working with animal or human subjects and clinical trials spend substantial time on compliance in those areas, while financial and personnel-related compliance is time-consuming for most faculty (given that those roles are ubiquitous across almost all projects). A study across 13 institutions of varying sizes found that research-related compliance costs ranged from 11–25% of research expenditures, with a negative scale effect such that the highest relative amounts were at institutions with the lowest research expenditures (i.e., there are economies of scale in handling research compliance costs); also, consistent with the discussion above, research institutions doing more biomedical research experienced higher associated compliance costs (Vanderbilt University 2015).

Like Nobody's Business218
Figure 8.7. Percent of faculty respondents reporting a substantial (some to very much) workload for those that experience the listed research compliance responsibility. Source: FDP
(Schneider et al. 2014).
8.7 How does the university earn money from technology transfer?
The Bayh-Dole Act of 1980 incentivized the development of economic benefits from government-funded research and subsequent patents, which had been stagnant prior to its enactment, by awarding universities and other recipients of federal research funding ownership of their intellectual property (IP or, simply, inventions) and the right to license it. In the decades since the act’s passage, research universities have grown sophisticated technology transfer and commercialization offices to develop and earn revenue from their inventions.9 This is an area where a relatively small number of blockbuster successes have led to fabulous financial rewards for a handful of universities. Some of these outliers have become household names (e.g., Warfarin, Gatorade, Google)10 while other lesser-known pharmaceuticals and engineering
9 University technology transfer, licensing and commercialization operations are often performed by an associated foundation or similar entity. I’ll refer to the parent university for consistency and clarity in this section.
10 Warfarin is a blood-thinning drug discovered in the 1930s at the University of Wisconsin, known widely today by its trade name, Coumadin. The research was funded by the Wisconsin Alumni Research Foundation (WARF), established in 1925 as the first university office for what would become known as technology transfer—its name was used as the first four letters of the new drug (Pirmohamed 2006). Gatorade was created in the 1960s at the University of Florida and named for its football team, the Gators. The University initially turned down the patent rights, but in 1973 it and the faculty inventor were part of a settlement that awarded annual royalties (Kays and Phillips–Han 2003). Google’s co-founders famously invented the PageRank algorithm while they were graduate students at Stanford. In the late 1990s they and the University patented the technology, which Google licensed for 1.8M shares in the company. Stanford sold its shares for $336M in 2005; if it had waited another week it would have received twice that amount (Krieger 2005).
0% 10% 20% 30% 40% 50% 60% 70% 80%
Animal Welfare / IACUCHuman Subjects / IRB
FinancesPersonnel
Clinical TrialsSubcontractsCross‐Cutting
Effort ReportingARRA / Stimulus
Intellectual PropertyGeneral Lab Safety & Security
Select AgentsBiosafety
Radiation SafetyChemical Safety
Health Data Privacy / HIPAAControlled Substances / Narcotics
Data SharingExport Controls
Recombinant DNAResponsible Conduct of Research for TraineesProtected Critical Infrastructure Information
Conflict of Interest
Percent Reporting Substantial Workload (For Those Experiencing Item)

8. Research 219
inventions have been similarly lucrative, earning their parent institutions tens to hundreds of millions of dollars annually (Merrill et al. 2016). However, the odds of that kind of windfall are like winning the lottery and cannot be relied upon to turn around a university’s finances—the FY2017 median gross license revenue for R1 universities was a comparatively modest $4.6M (AUTM 2020).
The majority of university technology transfer activity takes place at R1 institutions; activity at R2 schools, for the under half of those that report it, is typically 20% or less than at R1 schools depending on the metric and negligible at smaller schools (AUTM 2020). Licensing income is a widely-used financial metric in technology transfer. A university’s gross license revenue typically includes a set of annual payments from companies using its inventions. Occasionally, rather than annual payments, a university may sell all or part of a license depending on circumstances, such as when Northwestern sold portions of its Lyrica license to Pfizer for over $1.1B in 2008–2010 before the fibromyalgia pain-relief and epilepsy drug went off-patent (Tech Transfer Central 2011). Consequently, licensing income can be highly variable from year to year.
Figure 8.8 illustrates gross license income by quintiles across R1 institutions, averaged for public and private schools within each quintile for three years. Licensing revenue is exponentially larger in the upper quintiles, by a factor of about 100 between the top and bottom quintile, and it is relatively higher at private versus public universities. NYU, Columbia, the UC System and Northwestern are consistently among the very top earners (Merrill et al. 2016; DeVol et al. 2017) and they, like many of the most active schools, have a large presence in the health sciences and biotechnology.
Figure 8.8. Gross license income averaged for public and private institutions by quintile of all R1 institutions in FY2015, FY2016 and FY2017 (current dollars). Source: AUTM (2020).
$‐ $10 $20 $30 $40 $50 $60 $70 $80 $90 $100
Public
Private
Public
Private
Public
Private
Public
Private
Public
Private
Quintile
5Quintile
4Quintile
3Quintile
2Quintile
1
Gross License Income ($ Millions)
2017 Private 2017 Public
2016 Private 2016 Public
2015 Private 2015 Public

Like Nobody's Business220
Institutions spend their licensing dollars on covering the costs of technology transfer and on strategic investments such as internal funds for commercialization and patenting, research equipment and facilities, or endowing graduate fellowships. These revenues don’t flow only to the overall institution, they are typically shared with the department, individual lab and the inventors (faculty members, postdocs, and graduate students who were employed by the university at the time). Institutional rules regarding the ownership and licensing of IP (federally-funded or not) and its proceeds are set out in each university’s IP policy. Not all university IP is commercialized or held by the institution: some work is released to the public domain (research software code is a common example) while other IP is almost universally assigned to the individual, such as lecture content or books produced by the faculty.
Among the earliest steps as an idea transitions from research into something that might be commercialized is the requirement for new inventions to be disclosed to the university, an obligation of the Bayh-Dole Act. A subset of inventions is suitable for perfection into patents, which are the formal means by which inventions are made public and protected. Patent applications are filed (in the US and often internationally too, both at some expense) and a further subset of those pending patents is subsequently issued. Figure 8.9 shows trends in these three metrics increasing steadily over time as commercialization activities have expanded on campuses. Invention disclosures have more than doubled since the early 1990s and now average 200 per year. Patent applications have increased from about 25 per year to over 100 per year in the same period, with issued patents rising from about 20 to 60 per year. If a patent is infringed and the university litigates then large settlements can result, such as the $750M that Carnegie Mellon received in 2016 regarding its technology for data transfer accuracy in hard drives (Stempel 2016).
License agreements are made with established companies as well as with new start-up companies. A license option agreement is used when a company wants to evaluate the technology before licensing it. Many start-up companies are spun off from the university by the inventors (e.g., as with Google), usually with the assistance of the technology transfer office and sometimes via an associated small business incubator or accelerator. Figure 8.10 shows the rising trends in licenses and options, gross license income, and the number of start-up companies formed at R1 institutions. The increase in licenses and options is relatively smooth when compared to the more volatile annual figures for gross license income, as mentioned above. Universities saw a run-up in their inflation-adjusted licensing income before the Great Recession; since then these revenues have been comparatively flat despite the increases in underlying activity. The number of startups formed has also increased steeply, from about 2 per year in the mid-1990s to an average of 9 per year in FY2017.
In addition to licensing technology to a start-up company, a university may also take equity in a spinoff (i.e., a share of ownership). It’s often easier for a cash-strapped fledgling company to offer a share of its potential future success along with a reduced license payment, and this gives the university an incentive to keep initial license costs

8. Research 221
Figure 8.9. Invention disclosures, new patent applications and patents granted, averaged across R1 institutions by fiscal year. Source: AUTM (2020).
0
50
100
150
200
250
1991
1992
1993
1994
1995
1996
1997
1998
1999
2000
2001
2002
2003
2004
2005
2006
2007
2008
2009
2010
2011
2012
2013
2014
2015
2016
2017
Disclosures & Paten
ts
Invention Disclosures Received
New Patent Applications Filed
US Patents Issued
Figure 8.10. Total licenses and options, gross license income in FY2016 dollars and new start-up companies formed, averaged across R1 institutions by fiscal year. Source: AUTM (2020).
0
5
10
15
20
25
30
0
20
40
60
80
100
120
1991
1992
1993
1994
1995
1996
1997
1998
1999
2000
2001
2002
2003
2004
2005
2006
2007
2008
2009
2010
2011
2012
2013
2014
2015
2016
2017
Gross Licen
se In
come (FY2
016 $M
illions) &
Start‐Ups Formed
Total Licen
ses &
Options Issued
Gross License Income
Total Licenses & Options Issued
Start‐Ups Formed
down and advance the success of the company while retaining a stake if the company becomes successful.
While universities certainly have a self-interest in advancing technology transfer, it’s important to note that the growth in these programs has produced broader economic

Like Nobody's Business222
and health benefits from university research, just as the Bayh-Dole Act intended. Because university IP is protected, business and industry are prepared to make high-risk investments to turn discoveries into products, creating wealth and jobs in the process. Not all applaud these and associated industry partnerships: some critics take a dystopian view and charge that corporate priorities have undermined the role of the academy (Lazerson 2010; Perry and Katz 2018). Still, technology development at universities has become inextricably linked to their mission of public service because community and public investment in higher education is predicated in part on the expectation of innovation and economic development. Talking of public service, that’s the perfect segue to the next chapter.

9. Public Service, Cooperative Extension, and Community Engagement
9.1 Where’s the land grant money, and how does it fund cooperative extension?
Public service is the third of the three core university mission areas and, relative to teaching and research, it is the least funded. Public service goes by a variety of names, including outreach, community service, community engagement, extension services, and even social impact. The core idea is that a university should be connecting with its community through knowledge in ways that go beyond for-credit instruction and academic scholarship. While the Cooperative Extension Service is the quintessential example of public service in higher education, there are many other forms including performing arts, museums, public lectures, K-12 outreach programs, open libraries, and university presses. All of these have in common that they are principally supported by funds other than those from tuition or research. A few in this set have interesting business dimensions and we’ll examine them in subsequent sections; first, let’s look at the one that started them all, cooperative extension.
The Cooperative Extension Service is a national outreach program that was formalized by the Smith-Lever Act of 1914, mounted in partnership with the land-grant universities that were established with the proceeds from selling designated federal lands (See Box 9.1). Contemporary funding for cooperative extension is complicated: in addition to iterations of land grant acts over a century ago, some with funding and some without, there is associated legislation from 1967, 1972, 1994 and 2008 that added, amended and reorganized which institutions are included and the basis for how much funding they each receive. Some funds are equally allocated to the states, others are based on farm population or total population, and yet others are for specific kinds of land grant activity.
It’s called “cooperative” because the funding was originally split three ways in a cooperation among federal, state and local (county) governments, some requiring a match to the federal funds. These same three revenue sources are still important today, along with grants, contracts, fees and gifts. As a result, every university cooperative extension service has a different amount and mix of revenue (and incidentally there
© Andrew C. Comrie, CC BY 4.0 https://doi.org/10.11647/OBP.0240.09

Like Nobody's Business224
is no national database containing those data). Figure 9.1 illustrates an example university extension budget at a state land grant university. These are R1 or R2 institutions, and all of them are public with just a few exceptions. For this example, we assume a mid-range federal amount of $8M and we assume it is a quarter of the total budget of $32M, also a mid-range estimate. The state appropriation is typically the largest component, and for our example we’ve assumed a 40% share ($12.8M). County shares can be zero or substantial depending on the state, and we’ve assumed a 10% share ($3.2M). Rounding out the remaining 25% of revenue are other types of sources including one-time grants and gifts as well as any fee revenue. These latter sources and a portion of the appropriated federal, state and county funds are restricted funds for targeted projects, so perhaps one half to two thirds of the total budget can be used for unrestricted payroll and operations expenses. For a sense of scale, this unit might have a payroll of several hundred employees spread across the main campus and county extension offices; smaller states might have an extension budget of half or less this size and the biggest states have extension budgets more than double this size.
Figure 9.1. Example revenue sources budget for a typical cooperative extension service at a land grant university. Percentage ranges in parentheses are from APLU (Association of Public
& Land-Grant Universities 2019).
Recent trends in federal and state funding for cooperative extension are illustrated in Figure 9.2. The US Department of Agriculture (USDA) administers the relevant federal funds to the universities through the National Institute for Food and Agriculture (NIFA) via what were previously known as formula funds (now capacity grants), earmark funds (now special needs), and competitive funds that also include substantial research funding. Federal extension funds total about $550M annually, about two thirds
Federal (10‐50%)$8.0M 25%
State (20‐50%)$12.8M 40%
County (0‐20%)$3.2M 10%
Grants (5‐30%)$4.8M 15%
Fees, Gifts, etc. (5‐20%)$3.2M 10%
Cooperative ExtensionFY2018 Example Total Revenue: $32M

9. Public Service, Cooperative Extension, and Community Engagement 225
from formula/capacity mechanisms and one third from other mechanisms. While federal support has been roughly flat overall but highly variable (plus/minus 20% or more in several years), both in extension-only funding and in extension plus research (that has a longer record). In contrast, state support for extension underwent a major decline of about one third post-recession. The state to federal extension funding ratio has recently been about 67:33, but historically it was as low as 40:60 in the mid-1930s, about 60:40 in the postwar years through about 1980, and then it ascended to a high of 80:20 in the early 2000s (Wang 2014).
Figure 9.2. Recent trends in federal and state funding for cooperative extension, including funding mechanism (stacked columns) and total expenditures (extension plus research) at the National Institute of Food and Agriculture (NIFA), by fiscal year. Sources: NIFA
(National Institute of Food and Agriculture 2019a; 2019b).
Box 9.1. Land Grant UniversitiesIt’s hard to overstate the significance of land grant universities in US higher education’s rise to global preeminence during the twentieth century. The seeds sown in the 1862 Morrill Act, the Hatch Act in 1887, the second Morrill Act in 1890 and the 1914 Smith-Lever Act created the contemporary US university with its three-part mission of teaching, research and service. The first Morrill Act authorized a public university in every state and territory by providing federal land that was sold or put in trust to start the new institutions, 30,000 acres for each senator and representative. For example, New Hampshire received 150,000 acres, Arizona 60,000, and Wisconsin 240,000, the latter selling for $1.25 per acre (University of Wisconsin Madison 2018) and netting $300,000 or
0
0.2
0.4
0.6
0.8
1
1.2
1.4
1.6
1.8
2
2002 2003 2004 2005 2006 2007 2008 2009 2010 2011 2012 2013 2014 2015 2016 2017 2018
Extension Fund
ing ($ Billions, 201
6 Dollars)
Other ExtensionSmith‐Lever 3d (Earmark/Special Needs)1890s Institutions (Formula/Capacity)Smith‐Lever 3b&c (Formula/Capacity)State AppropriationsNIFA (Formula+Research)

Like Nobody's Business226
roughly $7M today. The act was passed during the Civil War; land prices were depressed, and the new colleges were underfunded from the start.
Antebellum institutions catered to the elite and taught the classical liberal arts and theology, with little emphasis on science and technology. The industrial revolution and democratic ideals stimulated education reform, and the push for higher education that taught practical subjects for the working classes is widely credited to an Illinois educator, Jonathan Baldwin Turner. Even so, Morrill’s language and the motives of Congress in authorizing the land-grant institutions were all about economic benefit and increasing wealth (Young 2000).
Initially, these “cow colleges” suffered from snobbery and quality issues as they began to teach “agriculture and the mechanical arts.” To provide the necessary new knowledge, the Hatch Act enabled the establishment of so-called experiment stations (research and demonstration farms) as well as funds for agricultural research based on state population size and the number of farms, and which required state matching funds. The second Morrill Act addressed two issues: it was primarily intended to correct the lack of federal funding for the system and it effectively created a second set of land-grant colleges in the Southern states. To obtain the 1890 funds those states had to avoid race-based admissions, which they could do by including separate colleges that served African Americans. Funding across institutions was not as equitable as the law intended and many of these schools essentially became teacher’s colleges (Young 2000). Furthermore, Hatch Act funds went only to 1862 institutions and not to 1890 colleges.
Extension work was already underway at both types of land-grant when the Smith-Lever Act formalized extension at the 1862 colleges in 1914, making it a cooperative service by requiring a state match. In the half-century that followed there were various
Figure B9. Land-grant universities and colleges in the three legislation-year funding groups. Note that these year groups do not necessarily correspond to year of establishment or authorization of land-grant status. Alaska and the Pacific and Caribbean island states and territories are not to scale. See Appendix B for a detailed listing. Sources: IPEDS
(2020) and National Institute of Food and Agriculture (2019c).
PR VIHI
FM
AS
AK
GU
1994
1890
1862
MP

9. Public Service, Cooperative Extension, and Community Engagement 227
additional laws passed to improve funding, further development, and provide financial aid (Association of Public & Land-Grant Universities 2012). In the late 1960s and 1970s, land-grant status was awarded (using appropriated endowments rather than land) to the District of Columbia and several Pacific and Caribbean island territories, with further Pacific island territories added in 1990 (Young 2000). A major addition to the land-grant system occurred in 1994, when Native American tribal colleges were added to the list with a $23M endowment (Young 2000). Today there are 57 1862s, 19 1890s, and 35 1994s, for a total of 111 land-grant universities and colleges, as illustrated in Figure B9 and listed in Appendix B (the three California institutions count as one because the University of California System is the designated land-grant institution).
As imperfect as the implementation of land-grant universities undoubtedly was, the seeds it planted nonetheless grew into dozens of saplings, leading to a large and unparalleled nationwide system of state universities that were founded on the integrated three-part mission. Especially after World War II, those saplings grew into large trees as they were fed by postwar economic growth, the GI Bill, and massive federal research investment, producing many of the best public universities in the world.
9.2 What is the business model for performing arts centers?
Most universities host a performing arts center that, apart from major athletics events, can otherwise be the most visible and visited element of the institution for community members. Campus performing arts venues are often major landmarks of their local cultural landscape, metaphorically and physically. Even in large cities, campus performing arts centers can be part of a vibrant, top-tier arts scene, while in smaller cities and towns they are frequently the leading arts presenter in the community. Bringing the creative and performing arts to the public is as important a public service role as bringing science to the community, especially because performing arts events engage many people who otherwise would be unconnected with the campus. However, public funding for the arts is low and campus performing arts centers must rely on other kinds of funding to carry out their public service mission.
Now, like many other parts of the public service and outreach mission, the performing arts are deeply connected to the teaching and research missions (research being creative activity in this case). If the university has academic programs in music, theatre or dance, those departments may have their own performance spaces, or they may work in a joint arrangement to use the main venue or the combined set of large and smaller venues. The distinction to be made is that, while student concerts, shows and recitals may (and should) be integrated into the programming of a campus performing arts center, to mount a regular season of professional artists the center needs to operate as a separately managed unit with goals and finances and a business model that are distinct from regular academic programs. Furthermore, the business of running an entertainment facility is unfamiliar to many in academic administration, with unique personnel issues, atypical procurement and bidding processes, special contracts, licensing, and large sums of money having to change hands fast (Henley 2016).

Like Nobody's Business228
It turns out that, of all the business models on a campus, the performing arts center arguably has the most gut-wrenching: every new season is an “if we build it, they will come” exercise in managed risk that puts a large portion of its budget on the line each year, often several years in advance. As a director or lead programmer for a performing arts center, here is your challenge: take half (or more) of your budget; spend it on contracts with a set of artists to create a season portfolio that balances cultural value, cost and anticipated audience; invest in marketing and fundraising; sell tickets; mount the shows successfully, and hope you break even. Rinse and repeat each year, hoping that you make a margin in more years than you incur a loss.
There’s a lot that goes into balancing cultural value, the cost of the act, and likely audience attendance. The acts that make money aren’t necessarily the ones that your (segmented) regular audience wants to see. Broadway blockbusters may fill the house and bring in new patrons, but they are expensive with large casts, sets and crew. There’s more donor support for classical music, ballet and opera but those audiences are often smaller. Exciting new artists emerge from contemporary genres, but it can be hard to sell tickets for lesser-known or avant-garde acts. A popular comedian will attract an audience and needs only a microphone and a spotlight. Aging rock-and-roll groups can bring yet another crowd. Yet, as the presenter, if you slide too far into commercial presenting to pay the bills you risk drifting from your core arts and culture focus and connection to the university, losing your audience and the financial backing of donors and organizations (and possibly the institution). In addition to curating and presenting a season yourself, you can also rent out your facility to third-party promoters of touring Broadway shows, comedy acts or pop groups. Less common, but in keeping with the university connection, you can also produce shows and/or commission new work.
A good executive director and her team will artfully blend all the above with the goal of creating deeper connections with different sectors of the community and the university, building value to drive participation and support (Webb 2016). The unit will do so with a limited financial support from the institution and be expected to generate most of its own revenue; it may report to a dean, vice president, provost or president, or it might be a separately incorporated entity; and, it may be required to provide campus units with facility usage below cost as well as block out times for graduations and other university events (Henley 2016; Brown 2017).
While there is a wide variety of organizational structures and programming arrangements across university performing arts centers, they have core business elements in common that are best illustrated with an example. I’ve provided a model of a typical performing arts center budget in Table 9.1 and in Figure 9.3 to make both detail and relative proportions easier to appreciate. Naturally, the overall budget will scale by the size of the center in each case, and the relative share of each item will shift with programming scope. The proportions presented in the example are based on results from an industry survey (Hager and Pollak 2002), and I’ve assumed dollar amounts that reflect a medium to large contemporary university performing arts center. Also, this is an annual operating budget and it doesn’t include major capital

9. Public Service, Cooperative Extension, and Community Engagement 229
and facilities activities, such as fundraising for a new performance hall or paying for major renovations.
Table 9.1. Example operating budget for a moderate to large university performing arts center. Note that major capital and facilities costs are excluded.
Line Item Amount ($)1. Revenues2. Ticket Sales 2,000,0003. Hall Rentals 1,000,0004. Gifts 1,000,0005. Institutional Support 1,000,0006. Grants 500,0007. Investment 300,0008. TOTAL Revenues 5,800,0009. Expenditures10. Artist salaries, fees, travel 2,400,00011. Management & General 1,500,00012. Stage & Production 700,00013. Marketing 700,00014. Fundraising 350,00015. TOTAL Expenditures 5,650,00016. NET Operating Margin 150,000
Figure 9.3. Shares of example revenue and expenditure budgets for a moderate to large university performing arts center. Note that major capital and facilities costs are excluded.
Artist salaries, fees,
& General
27%
Stage & Production
12%
Marketing12%
Fund-raising
6%
Management
43%travel
ExpendituresRevenues
Ticket Sales35%
Hall
Institutional Support
17%
Grants9%
Invest-ments
5%
Rentals17%
Gifts17%

Like Nobody's Business230
We start with revenue sources (line 1), where ticket sales are the single largest item (line 2). They may be rivaled or exceeded by rental revenues from, say, a Broadway promoter (line 3) or rentals may be a minor item, depending on the core business model. Gifts (line 4) are an essential part of the revenue stream, such as for show sponsorships and special programs for patrons or schools. Support from the university (line 5) can also vary substantially by institution, although for most it is a small but enabling and highly-leveraged part of the overall budget. Many centers will apply for grants to support young performers, special outreach, and other initiatives, but these are generally not large and are one-time restricted funds (line 6). Some performing arts centers may be fortunate to have an endowment from when they were established, and/or that they have diligently grown over time. Those investment returns (line 7), because they can be relied upon, are also enabling and leveraged. Looking at total revenues (line 8 and Figure 9.3), we can see that earned income is primarily from ticket sales and rentals and comprises roughly half of all income.
Moving to expenditures in the lower half of the budget (line 9), we see that paying the artists and associated costs (line 10) is the largest expense, approaching half the total and exceeding ticket sale revenue. Management (managers, front of house, accounting, security, etc.), staging and production (back of house including lighting, tech, stagehands, etc.), marketing and fundraising expenses all include labor and supplies; all these areas support the performances as well as operating the venue for other events (lines 11–14). The proportions of total expenditures (line 15 and Figure 9.3) are quite different to most other university unit budgets, where in-house labor costs make up the bulk of expenditures; here, the main budget dynamic is around artist costs and the large revenues from ticket sales required to offset them. Finally, this example has a small net operating margin (line 16), ideally for investment in future activities if it isn’t needed to cover past deficits.
A successful university performing arts center will manage this budget model adroitly, by sharing risk with partners, combining safer and riskier bets across the portfolio of acts and genres discussed earlier, and developing diverse income streams from fundraising and other sources. More importantly, a flourishing performing arts center brings cultural richness to the community, connects it with the campus, and adds broadly to the quality of life by making the city more attractive and livable.
9.3 How are university museums paid for?
Over one quarter of the nation’s art museums are located at colleges and universities (Association of Art Museum Directors 2019). While museums of art constitute the majority of campus museums, some institutions are home to museums of natural history, culture, archaeology, botany, zoology, minerals and more. The functions of a university museum are archival (de facto, they house collections of academically significant objects), scholarly (curatorial staff and faculty study the objects), educational (they are

9. Public Service, Cooperative Extension, and Community Engagement 231
resources for teaching students) and engaging (they serve the broader community). Importantly, they are not simply venues to go and see beautiful or interesting things with a consumer mindset. Ideally, these museums are a vital part of campus and community life, infusing and inspiring young and old with an appreciation of art and science (Cotter 2009). For donors, university museums provide the opportunity for their collections to be seen rather than overshadowed as they might be in major civic museums, and some smaller museums have found that universities can be valuable stabilizing partners (Kiley 2013; Grant 2019). While those in the trade proclaim that “Great Universities Have Great Museums” there are critics who think that campus museums may have gone too far with extravagant commissions and extraordinary exhibits (Urist 2016; The Association of Academic Museums and Galleries 2020).
Museums are typically started and continue to grow through donations (and bequests) to the collection from private or scholarly enthusiasts. The gift of a private art collection or the need to conserve a set of scientific specimens, if of sufficient cultural or academic value, enables the development of a museum while also creating the need to support the people, programs and facilities necessary to run it. Business models for university museums differ widely, but virtually all of them rely on some combination of direct support from the parent institution, endowment proceeds, and philanthropy for the bulk of their support.
Figure 9.4 illustrates the revenue mix for four example university museum budgets: a small museum ($1.5M annual budget) at a public institution; two medium museums ($4M budget), one at a public school and one at a private school; and, a large museum ($20M budget) at an elite private university. Comprehensive data on university museum budgets are not available, but fortunately some campus museums publish their financials in an annual report; these simplified examples are drawn broadly from those reports.1 Small museums are heavily dependent on their parent institutions, which supply about two-thirds of the revenue; gifts and membership are the next largest revenue category at about 20%, while endowment income, grants and earned income are relatively small. Earned income includes admissions, museum store and merchandise proceeds, space rentals, as well as restaurant and catering income (typically only found in larger museums). At medium-sized museums the university allocation comprises about half of the revenue (a bit more at the publics and a bit less at the privates) while endowment income might contribute 10–20% along with several percent each from grants and earned income. The biggest university museums are supported by large endowments and their endowment earnings can be well over half the revenue budget, even exceeding three quarters in some cases.
1 Acknowledgements to the David Owsley Museum of Art at Ball State University, the Stanley Museum of Art at the University of Iowa, the McClung Museum of Natural History & Culture at the University of Tennessee-Knoxville, the Jordan Schnitzer Museum of Art at the University of Oregon, the Spencer Museum of Art at the University of Kansas, the Block Museum of Art at Northwestern University, the Nasher Museum of Art at Duke University, the Princeton University Art Museum, and the Museum of Comparative Zoology at Harvard University.

Like Nobody's Business232
Figure 9.4. Revenue mix for four example university museum budgets. See text for details.
Small museums may see 15,000 to 50,000 visitors per year, while that number can exceed 100,000 at some medium-sized museums and rise over 200,000 at large museums. Virtually all university museums will have thousands of students visiting through classes as well as providing students with part-time paid internships and volunteer opportunities. Such positions serve a critical staffing as well as educational role and may include dozens of students at small museums and over 100 at larger ones. At smaller museums the regular staff may number from less than 10 to more than 20, with 30–40 at medium-sized museums and well over 100 staff at the largest museums.
It’s no surprise that payroll is the largest item in the expense budget of university museums—they are labor-intensive units just like the rest of the university. Curators, assistants, security attendants, conservators, IT staff, financial administrators and managers are all on the staff in addition to the many part-time assistants, not to mention volunteer docents. In Figure 9.5 we can see that personnel expenses range from just over half the budget at large museums to about two thirds at medium-sized museums (a bit more at the publics and a bit less at the privates) to almost three quarters at small museums. Non-personnel spending on collections-related items (exhibitions, acquisitions, education programs, and collections care and conservation) is the next biggest category at 20–30% of the budget, and about 60% of that portion goes to exhibitions. Non-personnel investments in revenue-generating activities such as fundraising development, marketing and communications comprise 4–5% of the budget. Non-personnel expenses in administration, information technology, security, facilities maintenance and other operations round out expenditures, scaling with museum size from 3–8% of the budget. An important note: these budgets exclude
UniversityAllocation
EndowmentEarnings
Gifts &Member-
ship
GrantsEarnedIncome
Public $4M
Private $4MPublic $1.5M $20MPrivate

9. Public Service, Cooperative Extension, and Community Engagement 233
utilities and building costs (an additional 10–20%) as these are often covered by the university.
Figure 9.5. Expenditure mix for four example university museum budgets. See text for details.
An illuminating metric used by some museum directors is direct revenue versus overall expenditure per visitor. Average direct revenue per visitor at university museums is low, no more than $2 or $3; many university museums are free to the public, although some special exhibitions may require a fee, and visitors may sometimes spend a little on merchandise. Average expenditure per visitor is many times that amount, in the $50 to $100 range. This is a crude way to reflect monetary value for something that is intrinsically non-financial, yet it underlines the level of commitment that university museums have towards their communities.
A section on university museum finances, particularly art museums, would be incomplete without mention of the ultimate taboo: selling valuable pieces of the collection to pay the bills. There isn’t a single museum that doesn’t endure challenging budgetary conditions from time to time, whether that is a budget cut from the parent university or a drop-off in philanthropic support. There are stories, not all apocryphal, of administrators, board members or politicians suggesting that the director could solve the museum’s financial woes by selling a prominent piece. Here’s one story:
I was invited for a dinner at the president’s house… the trustees are all kind of bantering around and one of them sort of grabbed me and said, “Well you could sell your Picasso and solve all your financial problems. That would be a good solution, wouldn’t it?” And I said, “Would you fire your only Nobel laureate to have a bunch of teaching assistants?” (Glesne 2012, 22)
PersonnelCollections& Programs
RevenueGener-
ation
Adminis-tra�on
Public $4M
Private $4MPublic $1.5M $20MPrivate

Like Nobody's Business234
The most notable recent example was the 2009 recession-induced attempt by Brandeis University to close its Rose Art Museum and sell off the collection. The decision was later reversed following an uproar from the broader art community, alumni and faculty members and an accompanying lawsuit (Shea 2011). The Brandeis case also illustrates two important points: (i) the university broke the trust placed in it to look after the donated items, and (ii) many such donations build in a failsafe that stipulates the piece or collection cannot be sold, or that it will revert to the donor if the institution does not have sufficient funds to care for it and share it with the public (Glesne 2012).
9.4 How is a university press supported?
This chapter is about the university’s public service mission and you may be wondering why a section on the university press fits here rather than, say, with libraries in the academic affairs chapter. While a university press is run by the university, it serves the broader academy (i.e., scholars at other universities) and to an extent the general public. Perhaps surprisingly, university presses have little direct connection to teaching and research on their own campuses, and instead they succeed and serve their role by publishing authors from many other institutions, often in specialty areas particular to each press. The imperative to spread knowledge beyond the confines of campus was recognized from the beginning: “It is one of the noblest duties of a university to advance knowledge, and to diffuse it not merely among those who can attend the daily lectures—but far and wide.” So proclaimed Daniel Coit Gilman, who founded Johns Hopkins University and who, just two years later in 1878, started what is now the oldest continually operating university press in the country (Givler 2002). He and many of his peers at other universities around that time also appreciated that specialized scholarly research would not see the light of day if left to the commercial presses (Givler 2002).
There are nearly 100 US university presses that both belong to the Association of University Presses and appear in our dataset of four-year colleges and universities (Figure 9.6). Except for a small number that publish through a consortium, these presses bear the moniker of the principal institution (rather than branch campuses) and serve as its scholarly publishing arm. The substantial majority are at R1 institutions, about 60% of which have a press. There are a handful at R2 schools, public and private, plus a further handful at the smaller private campuses.
As nonprofit entities, university presses benefit from non-commercial mailing rates and, importantly, their inventories are not subject to tax—nonetheless, they are subject to the other business challenges faced by all publishers (Givler 2002). The bulk of university press net revenue is generated from book sales, over three quarters on average, as seen in Figure 9.7. While book sales include a portfolio of activity such as edited volumes, textbooks, reprints, and translations, the quintessential university press book is the monograph: one that is written by one or more scholars and that is

9. Public Service, Cooperative Extension, and Community Engagement 235
Figure 9.6. Number of university presses and percentage of institutions with a university press, by Carnegie classification and control. Sources: Association of University Presses (2019)
and IPEDS (2020).
0%
10%
20%
30%
40%
50%
60%
0
10
20
30
40
50
60
R1 Public R2 Public R3‐M3 Public BAS Public R1 Private R2 Private R3‐M3 Private BAS Private
Institu
tions with
a University
Press
Num
ber o
f University
Presses
Number of Presses
% With a Press
Figure 9.7. FY2018 sources of university press funding. Source: AUP (Association of University Presses 2019).
$‐
$0.5
$1.0
$1.5
$2.0
$2.5
$3.0
$3.5
$4.0
Net Book Sales InstitutionalAllocation
Endowment Income Net Journals Activity Net Pub. Services &Misc
Grants & TitleSubsidies
FY20
18 Average
University
Press Fun
ding
by Source ($
Millions)
expected to be read predominantly by other scholars (Maron et al. 2016). Institutional allocations (i.e., university subsidies) average about 10% of press net income, with successively smaller shares from endowment income, journal publishing, other

Like Nobody's Business236
services, and grants and title subsidies (from authors and their institutions). Sales to university libraries have historically been a cornerstone of this market (although that is changing, as we saw in Section 6.13); while print and e-book sales dominate these revenues at most US university presses,2 it is worth noting that scholarly journals constitute nearly half or more of library sales at a few of the very largest university presses such as Chicago, Duke, and the University of California (Daniel et al. 2019).
2 Oxford University Press (OUP) and Cambridge University Press dominate the overall academic press landscape. In a recent study of US university library purchases, each of the two British presses has book sales that approach ten times those of the biggest US university presses. Together OUP and Cambridge book sales to US university libraries represent 77% of all US university press book sales combined and 11% of total book sales from all publishers to university libraries (Daniel et al. 2019).
It’s useful to understand university press expenditures by examining costs per monograph, which total nearly $30,000 in directly attributable expenses and over $40,000 when full costs are accounted for (Maron et al. 2016). Figure 9.8 shows a breakout of staff and non-staff costs per monograph for the five core press departments from acquisitions through editorial, production, design and marketing, as well as for other general and administrative costs. Acquisitions are the most expensive part of the process in labor and total cost terms. This is where the intellectual qualities of the press’s book list are shaped, and it includes author recruitment, topical expertise in selection, communication, and managing a thorough peer review process. Despite the switch to digital copy and the automation of some parts of production, the majority of expenditures in other parts of the process are also on labor. This is true even for general and administrative costs that include staff in accounting and information technology (Maron et al. 2016). Considering that monographs on obscure topics in small fields may sell only a few hundred copies and more popular titles might do more than a thousand (Berlatsky 2014; Barclay 2015; Straumsheim 2016), the margins are small overall. To ensure financial sustainability of their university presses, astute directors and editors are continually seeking the balance between their curatorial role and hoped-for prestige, the relevance and likely popularity of book topics, and the realities of their business model.
That business model is shifting too, with reductions in library purchases, multiple distribution models including print and electronic forms, and the advent of open access (Maron et al. 2016). In the latter, much wider readership is possible with a low or zero cost to the reader in electronic form and payment for print-on-demand as a conventional paper book; the difference is that the press must cover its costs via other funding sources (e.g., the author or the author’s institution, grants, crowdfunding, institutional support).
As we saw above, those costs amount to tens of thousands of dollars at conventional university presses—can they survive with such a high cost structure, and will university libraries and individuals continue to pay a premium for that model when lower-cost and alternative business models are becoming available? A quick online search reveals a convenient lower-end cost benchmark: the basic cost of self-publishing a book with

9. Public Service, Cooperative Extension, and Community Engagement 237
Figure 9.8. FY2014 average staff and non-staff costs per monograph by core department, as well as general and administrative (G&A) costs, other overhead costs, and in-kind costs (e.g., contributed staff time, author-paid fees and office space) at the press level. Source:
Ithaka S+R (Maron et al. 2016).
$0
$2,000
$4,000
$6,000
$8,000
$10,000
$12,000
$14,000
Acquisitions Manuscript Editorial Production Design Marketing Press‐Level
Costs p
er M
onog
raph
Department Non‐Staff In‐KindDepartment Staff Overhead G&A & Other OverheadDepartment Staff Direct
a quality of editing, cover design, formatting and marketing comparable to a press-produced book is on the order of $6,000 (Reedsy 2020). Most university press editors wouldn’t let me finish that last sentence without interjecting, rightly, that their presses offer far more than those basic services in the academic and production quality of their books (e.g., peer review, an established platform, the stamp of authority from a prestigious press, technical editing and production, targeted marketing). Still, the potential to expand reader access and lower cost structure by implementing business models that are not sales-based continues to drive the development of open access publishing in academia. Book production costs at presses created specifically to produce open access material are typically under $10,000, while they are $15,000 and more at existing presses that have started open access imprints and consortia (Willey 2019; Champion 2020; Luminos 2020; Penier et al. 2020). Such entities can lower their costs through labor savings due to technology and leaner approaches to, for example, acquisitions. It’s important to appreciate that open access books are not necessarily cheaper to produce—the different underlying business philosophy and necessary associated infrastructure are what distinguish it from sales-driven publication (Grimme and Watkinson 2020).3
3 Full disclosure: this book is published under an open access model. In this particular case, the born-open and born-digital approaches meant that including roughly 200 color figures did not greatly affect the sales or production costs. In contrast, many of the university presses that I approached shied away from that much color and the prohibitive cost. It seems anachronistic to be limited to the

Like Nobody's Business238
Open access is still evolving, and there are multiple business models in the ecosystem (Speicher et al. 2018) that are often combined in practice:
• Article/book processing charges: the dominant model, in which upfront fees are paid by the author (or the author’s institution) to offset a portion of the publishing costs, that vary considerably by publisher;
• Collaboration/coalition: organizations and institutions combine assets (e.g., technical skills, funding sources) to support open access;
• Community: some academic-led presses use volunteers from their intellectual community, not only for peer review, but also for editing and other tasks;
• Endowment: endowment income can support open access as well as regular publishing;
• Freemium: a model adapted from the software world, whereby an online version of the publication is provided for free while other formats (e.g., e-reader, regular print) are available for a charge;
• Grants: some foundations will support projects to make publications open access, or support open access costs within a research project;
• Institutional: the university may include support for open access as part of the institutional support for its university press;
• Library funding: libraries may participate in a contribution arrangement with publishers to ensure open access to certain kinds of publications, such as in the arts, humanities and social sciences;
• Sales revenues: the press may sell print copies and other formats while also running an open access imprint;
• Services revenues: in addition to their regular publishing activities, some presses offer publishing services to other institutions.
As can be seen, libraries are active in this space, as are academic and professional societies, and also academic-led presses. Interestingly, open access is in many ways further developed in Europe and the UK than in the US, and it continues to develop actively at presses both small and large on both sides of the Atlantic.
Shifting back to other business model issues, another concern is the university allocation, the most visible recent example being that of Stanford University Press, where the institution proposed and subsequently delayed eliminating the press’s $1.7M bridging allocation, relative to its $5M in book sales (Kafka 2019). Some on campus expressed dismay at the full financial sustainability argument, noting it isn’t applied to athletics, while the wider university press community were alarmed at
legacy of almost 600-year-old black and white printing technology as we enter the third decade of the twenty-first century.

9. Public Service, Cooperative Extension, and Community Engagement 239
the potential domino-effect of such a decision at a well-endowed institution (Jaschik 2019b). Yet further business model concerns for university presses include the decline in long-form reading, shifting scholarly modes of writing and communication, and of course the implications of the evolving digital revolution in print and online media.


10. Facilities & Finance
10.1 What do campus buildings cost?
It depends. Of course, there is no such thing as a typical campus building and they vary by size, purpose, intended lifespan, local labor and construction costs, as well as by the precise definition of cost. That said, numbers from $50M to $100M are not unusual for construction of a new medium-sized campus building with a few floors totaling, say, 100,000 square feet, while smaller buildings the size of large houses might cost just a few million dollars and massive laboratory complexes can cost hundreds of millions. Let’s dig in a little further.
It’s easy to focus only on direct construction costs (a.k.a. brick-and-mortar or hard costs paid to a contractor) and not on the total project cost, which also includes associated design costs, permit fees, local taxes, legal fees, cost of land, utility expansion/connection, roadway alterations, landscaping, interior furnishings and specialized equipment (some or all of which are counted as soft costs depending on the definition). Together, these other items add 20–50% on top of basic construction costs, as can be seen in Figure 10.1.
Figure 10.1. Hard costs (construction and construction contingency) and soft costs (“everything else”) per gross square foot for a variety of campus building types from a 2016 study.
Source: D’Angelo (2016).
© Andrew C. Comrie, CC BY 4.0 https://doi.org/10.11647/OBP.0240.10
$‐
$100
$200
$300
$400
$500
$600
$700
$800
$900
Labo
ratory ‐ New
Labo
ratory ‐ Fitout
Labo
ratory ‐ Re
novatio
n
Health
care ‐ Fitout
Stud
ent/Visitors Cen
ter
Office
Athletics
Classroo
m
Reside
nce Hall
Library
Cost (p
er sq
ft)
Soft Cost
Hard Cost
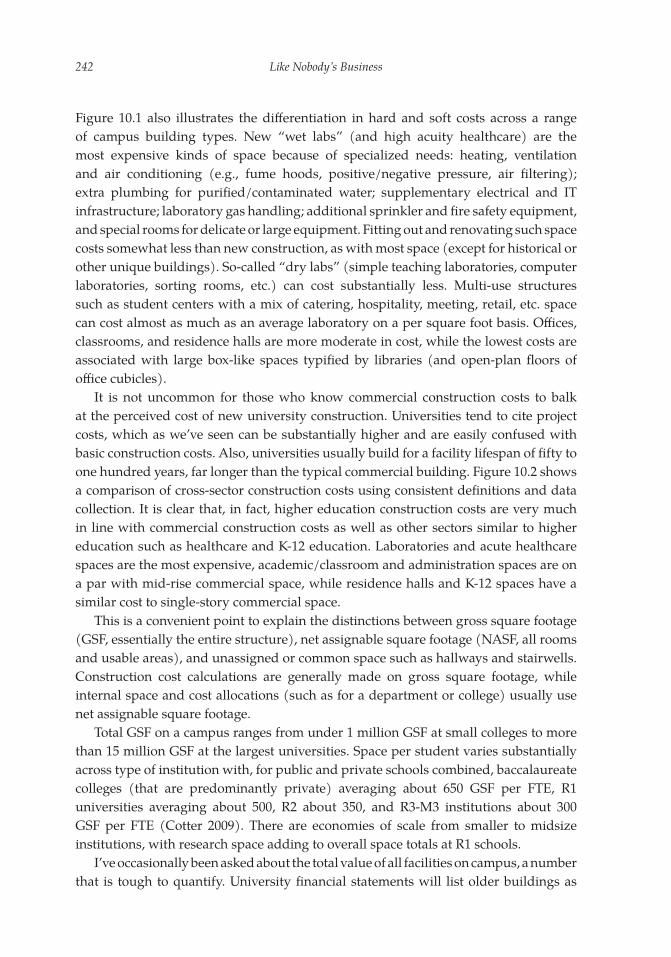
Like Nobody's Business242
Figure 10.1 also illustrates the differentiation in hard and soft costs across a range of campus building types. New “wet labs” (and high acuity healthcare) are the most expensive kinds of space because of specialized needs: heating, ventilation and air conditioning (e.g., fume hoods, positive/negative pressure, air filtering); extra plumbing for purified/contaminated water; supplementary electrical and IT infrastructure; laboratory gas handling; additional sprinkler and fire safety equipment, and special rooms for delicate or large equipment. Fitting out and renovating such space costs somewhat less than new construction, as with most space (except for historical or other unique buildings). So-called “dry labs” (simple teaching laboratories, computer laboratories, sorting rooms, etc.) can cost substantially less. Multi-use structures such as student centers with a mix of catering, hospitality, meeting, retail, etc. space can cost almost as much as an average laboratory on a per square foot basis. Offices, classrooms, and residence halls are more moderate in cost, while the lowest costs are associated with large box-like spaces typified by libraries (and open-plan floors of office cubicles).
It is not uncommon for those who know commercial construction costs to balk at the perceived cost of new university construction. Universities tend to cite project costs, which as we’ve seen can be substantially higher and are easily confused with basic construction costs. Also, universities usually build for a facility lifespan of fifty to one hundred years, far longer than the typical commercial building. Figure 10.2 shows a comparison of cross-sector construction costs using consistent definitions and data collection. It is clear that, in fact, higher education construction costs are very much in line with commercial construction costs as well as other sectors similar to higher education such as healthcare and K-12 education. Laboratories and acute healthcare spaces are the most expensive, academic/classroom and administration spaces are on a par with mid-rise commercial space, while residence halls and K-12 spaces have a similar cost to single-story commercial space.
This is a convenient point to explain the distinctions between gross square footage (GSF, essentially the entire structure), net assignable square footage (NASF, all rooms and usable areas), and unassigned or common space such as hallways and stairwells. Construction cost calculations are generally made on gross square footage, while internal space and cost allocations (such as for a department or college) usually use net assignable square footage.
Total GSF on a campus ranges from under 1 million GSF at small colleges to more than 15 million GSF at the largest universities. Space per student varies substantially across type of institution with, for public and private schools combined, baccalaureate colleges (that are predominantly private) averaging about 650 GSF per FTE, R1 universities averaging about 500, R2 about 350, and R3-M3 institutions about 300 GSF per FTE (Cotter 2009). There are economies of scale from smaller to midsize institutions, with research space adding to overall space totals at R1 schools.
I’ve occasionally been asked about the total value of all facilities on campus, a number that is tough to quantify. University financial statements will list older buildings as

10. Facilities & Finance 243
Figure 10.2. 2019 construction costs per square foot of gross floor area for selected sectors, calculated as the average of high and low values within the city limits of 20 US cities. Land, permits
and other soft costs are excluded. Source: Cumming Corporation (2019).
$0
$100
$200
$300
$400
$500
$600
$700
$800
$900
$1,000
Acad
emic/Classroom
Labo
ratory
Administration
Dormito
ry
Single Story
Mid‐Rise
High Rise
Acute Ca
re Facility
Med
ical Office Bu
ilding
Specialty
Clin
ic
Elem
entary Schoo
l
Middle Scho
ol
High Scho
ol
HIGHER EDUCATION COMMERCIAL / OFFICE HEALTHCARE PRIMARY & SECONDARYEDUCATION
2019
Con
struction Co
st (p
er sq ft)
depreciated assets, but that kind of book value doesn’t necessarily align with value for practical purposes (what a university might spend on functionally similar space) and it certainly isn’t the same as replacement value. In any case, the total value of all facilities naturally scales with the overall size of the institution, and the figures are clearly in the hundreds of millions on smaller campuses and in the several billions of dollars for large R1 schools.
10.2 What are the trends in campus construction and deferred maintenance?
As any homeowner knows, once a building is built it still needs regular maintenance, which will eventually involve major outlays as essential components age and need to be updated or replaced (e.g., roofs, mechanical systems, windows, interiors). And, just like at home, it’s easy for cash-strapped institutions to put off those costs for just another year or two, leading to a mounting and ever more expensive backlog of deferred maintenance projects.
Industry benchmarks suggest that institutional investments into maintenance of campus facilities should be 2–3% of total asset value, a target not met by most campuses (EAB 2017). For a $50M building of 100,000 GSF that’s about $1M to $1.5M per year, or about $10 to $15 per GSF. Of course, this guideline is not per building, but for the entire portfolio of campus facilities, some new and many older. The average deferred maintenance backlog in 2015 was $88 per GSF at private institutions and $108 per GSF

Like Nobody's Business244
at public institutions, both of which grew faster than the inflation rate since 2007 (EAB 2017).
Major maintenance expenses rise around twenty to thirty years after a building is built. Of course, there are few campuses with an even mix of building ages and fewer yet that have dutifully kept up a consistent maintenance schedule amid other budget pressures. On many campuses the result is that major maintenance costs tend to surge. Figure 10.3 illustrates the century-plus age profile of campus buildings as a share of national higher education GSF. On top of the overall growth trend, we see two big surges in construction: the 1960s and 1970s, and the 2000s into the 2010s. Each of these had, or will have, an echo in major maintenance costs a few decades later.
Figure 10.3. Building construction age as a share of total gross square footage (GSF) across US higher education. Source: Gordian (2018).
The first surge is easy to understand as a response to massive sustained enrollment growth during that time (as we saw in Section 4.6). The recent surge is a combination of pre-recession investments and response to post-recession enrollment growth, both taking place in an environment of intense competition for additional students. Paying for this recent wave of construction and the associated major maintenance will become extremely challenging in the next ten years, especially for institutions that have not managed to grow enrollments at the same time. The early signs of that challenge are clear in Figure 10.4, which shows the mismatched growth curves for space and enrollment across research, masters and baccalaureate institutions since 2007. The two rates are comparable at research schools, masters’ institutions saw the largest cumulative space growth along with weak post-recession enrollment growth, and baccalaureate colleges grew space while seeing several years of flat or negative
0%
2%
4%
6%
8%
10%
12%
1880
1885
1890
1895
1900
1905
1910
1915
1920
1925
1930
1935
1940
1945
1950
1955
1960
1965
1970
1975
1980
1985
1990
1995
2000
2005
2010
2015
Build
ing Co
nstructio
n Ag
e Share of GSF

10. Facilities & Finance 245
enrollment growth. These are troubling patterns for all but the research campuses. Not only will it be challenging to pay off the associated debt with modest or declining enrollment revenues, but also the major maintenance bills will start to hit in the coming decade, requiring additional debt if those schools don’t have adequate maintenance funding built into their budget plans.
Figure 10.4. Recent trends in rates of space expansion and enrollment growth across US higher education. Source: Gordian (2018).
10.3 How much is the university’s “mortgage” and debt payment?
Universities borrow money for large capital projects, much as homeowners obtain a mortgage to buy or build a house, enabling large one-time costs to be spread over many years. Mortgages are issued in the residential loan market by lending institutions based on the creditworthiness of the buyer and use of the property as collateral. In contrast, like other corporations, universities generally issue bonds to finance large capital projects. Direct borrowing from banks tends to be costlier and more restrictive than selling debt on the bond market. While bonds do not use collateral, universities are rated by independent agencies as to the likely reliability of the institution to repay them.
Unlike most homeowners with a single mortgage for a single home, universities typically have multiple bonds that cover many capital projects of various ages, some from years ago that are about to end and others that are more recent. Thus, a university’s overall debt portfolio can extend its interest payments several decades into the future, and the institution has to weigh any consideration of new debt against those obligations.
‐1%0%1%2%3%4%5%6%7%8%9%
10%11%12%13%14%15%16%17%18%
2007
2008
2009
2010
2011
2012
2013
2014
2015
2016
2017
2007
2008
2009
2010
2011
2012
2013
2014
2015
2016
2017
2007
2008
2009
2010
2011
2012
2013
2014
2015
2016
2017
Research Masters Baccalaureate
Growth (since 200
7)
Space GrowthEnrollment Growth

Like Nobody's Business246
So, just how big is university debt at any one time and how much are the interest payments? Figure 10.5 shows average debt by type of institution and the matching interest for FY2018. Both amounts scale with institution size, much as one would expect, with the annual interest across institutions in a consistent range of 3.5–4.5% of the total debt. Average debt is about $800M at R1 public institutions and over double that amount at R1 privates, almost $1.8B. The smallest institutions average less than $100M in debt, public and private. Debt service, the interest that universities pay on their bonds and other loans, averages about $35M annually at R1 public universities and over $60M annually at R1 privates, while it is under $5M annually at smaller colleges and universities. Making those bond payments is a financial priority for the institution because not doing so would make any future borrowing much more expensive. Thus, bond defaults are rare and they occur only if the institution is undergoing significant financial distress. For example, as universities lost all or part of their anticipated residence hall revenue in FY2020 due to COVID-19 effects, most will find ways to cover the revenue shortfall gap from other sources rather than defaulting on the related debt.
Figure 10.5. FY2018 institutional debt (left axis) and interest on debt (right axis, note narrower scale) by Carnegie classification and control. Source: IPEDS (2020).
Those annual interest payments account for 2–3.5% of the university budget depending on the type of institution, generally lower at public universities and higher at private institutions. Figure 10.6 illustrates the trend in debt service as a share of expenditures over three decades for public and private universities. While that share has remained in a narrow band for private institutions, at public institutions it almost doubled during the 2000s driven largely by non-R1 schools, in
$‐
$10
$20
$30
$40
$50
$60
$70
$80
$90
$100
$‐
$200
$400
$600
$800
$1,000
$1,200
$1,400
$1,600
$1,800
$2,000
R1 Public R2 Public R3‐M3 Public BAS Public R1 Private R2 Private R3‐M3 Private BAS Private
FY20
18 Interest on Deb
t ($ Millions)
FY20
18 Institu
tiona
l Deb
t ($ Millions)
Debt Interest

10. Facilities & Finance 247
synchrony with increasing enrollment growth across all institutions. Worryingly, for the small group of BAS public colleges, their enrollment growth subsequently flattened and then declined in the 2010s, meaning that they will be challenged to meet their debt obligations in the coming years if enrollments and revenues continue on their current path.
Figure 10.6. Trends in interest on institutional debt as a share of total non-hospital expenditures, averaged across Carnegie classifications for public and private institutions. Source:
IPEDS (2020).
The major rating agencies (Moody’s, Standard & Poor’s, and Fitch) rate the creditworthiness of higher education institutions. For example, Moody’s uses a scale of A (low risk), B (speculative, medium to high risk) and C (very high risk as well as near or in default), with nine subdivisions and three further modifiers for a total of 21 categories (Moody’s Investors Service 2020c). The range of ratings for four-year institutions is illustrated in Figure 10.7, which also shows that public institutions generally receive better ratings than private ones. Overall, the upper categories are typically dominated by elite private universities as well as major public universities or systems; remember also that the medium and smaller schools make up the majority of all institutions. To develop their ratings, the agencies examine multiple business-related metrics, including many covered in this book, to gain a comprehensive picture of each institution’s financial health. Agencies offer annual outlooks for the whole higher education sector, and in recent years they have varied between negative and stable, reflecting overall concerns about enrollment and net tuition revenue, state support, and endowment performance among other factors (Seltzer 2019e; 2020a).
0.0%
0.5%
1.0%
1.5%
2.0%
2.5%
3.0%
3.5%
1989
1990
1991
1992
1993
1994
1995
1996
1997
1998
1999
2000
2001
2002
2003
2004
2005
2006
2007
2008
2009
2010
2011
2012
2013
2014
2015
2016
2017
2018
Interest on Institu
tiona
l Deb
t Sha
re of T
otal Exp
enditures
Public
Private

Like Nobody's Business248
Figure 10.7. Moody’s credit rating distribution for 226 public and 256 private four-year institutions, as shares of each for December 2018. Source: Moody’s Investors Service (Shaffer 2019).
10.4 How much is the campus energy and utility bill?
The national average for the cost of utilities (natural gas, steam, electricity, water & sewer) in 2018 was about $2 per GSF (Gordian 2018). That translates into an annual utility bill of tens of millions at a large R1 university down to single-digit millions at smaller colleges. For example, FY2018 utility expenditures were $84M at UNC Chapel Hill (R1 public), $103M at Stanford (R1 private), $10M at Creighton (M1 private), $1.1M at Henderson State University (M2 public), as well as $3.5M at Goucher and $1M at Juniata which are both BAS privates (University of North Carolina at Chapel Hill 2019; Stanford University 2017; Creighton University 2018; Henderson State University 2018; Goucher College 2018; Juniata College 2018). Utility expenditures thus account for a few percent of the overall institutional budget.
Utility activity by type of utility also scales with campus size (i.e., GSF), as illustrated in Figure 10.8. Consumptive metrics (energy use, carbon footprint, electricity use and water use) are generally higher at large schools and they decrease with smaller type, such that BAS colleges consume at 30–50% of the rates at R1 universities. Across all institutions, natural gas comprises over 85% of all fossil fuel usage with emissions per GSF declining at about 2% per year (Sightlines 2014). Productive metrics (garbage and recycled waste) show the reverse pattern in Figure 10.8, with the highest rates at small campuses and the lowest rates at large campuses, dramatically so for recycling. The unusual water-use and recycling values for R2 institutions in particular may be a result of small sample size.
0%
5%
10%
15%
20%
25%
30%
Aaa Aa1 Aa2 Aa3 A1 A2 A3 Baa1 Baa2 Baa3 Ba1 Ba2 Ba3 B1 B2 B3 Caa1 Caa2 Caa3 Ca C
Share of In
stitu
tions by Moo
dy's Rating
Public Private

10. Facilities & Finance 249
Figure 10.8. FY2018 utility activity per 1,000 gross square feet (GSF), with the scale for each indexed to 1 for comparison, by Carnegie classification of 172 institutions. The R3-M3 values are a weighted combination based on response count. Sources: NACUBO (2019) and
APPA (2019).
10.5 Does the university have a rainy-day fund?
Yes. Institutions in sound financial shape keep cash on hand to cover unexpected revenue shortfalls or unforeseen emergency expenses (such as the financial impacts of COVID-19). You won’t typically find a specific fund to which money is allocated; rather, the institution will have cash accounts and cash equivalents (e.g., short-term investments) that can be liquidated almost immediately. There are many measures of liquidity, most of which reflect available cash relative to expenses, with variants depending on how those two figures are accounted for. One easy to understand example is “days cash on hand” that Moody’s uses in its ratings reports, and which is sometimes mentioned in a university’s annual financial report. It represents the number of days that the institution could cover operating expenses from cash. For example, starting with some public institutions, FY2017 days cash on hand was: 210 at Indiana (Moody’s Investors Service 2018a) and 68 at New Mexico (Moody’s Investors Service 2018d) that are both R1; 241 at Kent State, an R2 (Moody’s Investors Service 2019); 64 at Texas Southern (Hilltop Securities 2018), an R3; and 134 at Midwestern State (Hilltop Securities 2018), an M2. Examples from private institutions include: 620 at Vanderbilt (Moody’s Investors Service 2018f) and 954 at Notre Dame (Moody’s Investors Service 2018e) along with 187 at USC (Moody’s Investors Service 2020b), all R1 schools; 457 at Loyola University of Chicago (Moody’s Investors Service 2018b), an R2; 205 at Rollins College (Moody’s Investors Service 2018c), an M1; 534 at Kalamazoo
0.0
0.1
0.2
0.3
0.4
0.5
0.6
0.7
0.8
0.9
1.0
Energy Use(200 Million BTU)
Carbon Footprint(20 Metric Tons)
Electricity Use(20,000 kWh)
Water Use(40,000 Gallons)
Garbage(1 Metric Ton)
Recycled Waste(4 Metric Tons)
Utilities (Ind
exed
to 1) p
er 1,000
GSF
R1 R2 R3‐M3 BAS

Like Nobody's Business250
College (Moody’s Investors Service 2020a) and 644 at Lafayette College (Prager & Co. 2019), both BAS colleges.
From these examples we can see that while there are differences in liquidity across all schools, there is also a differentiation between public and private universities. Public institutions can typically cover a portion of a year while private institutions are
Figure 10.9. Trends in simple liquidity ratios averaged by Carnegie classification and control. Note that the vertical scale in the upper panel (Private) is 4X the lower panel (Public); see
text for details. Source: IPEDS (2020).
0.0
0.1
0.2
0.3
0.4
0.5
0.6
0.7
0.8
0.9
1.0
2002 2003 2004 2005 2006 2007 2008 2009 2010 2011 2012 2013 2014 2015 2016 2017 2018
Liqui
dity
Rat
io
R1 PublicR2 PublicR3-M3 PublicBAS Public
0.0
0.5
1.0
1.5
2.0
2.5
3.0
3.5
4.0
2002 2003 2004 2005 2006 2007 2008 2009 2010 2011 2012 2013 2014 2015 2016 2017 2018
Liqui
dity
Rat
io
R1 Private
R2 Private
R3-M3 Private
BAS Private
0.0
0.1
0.2
0.3
0.4
0.5
0.6
0.7
0.8
0.9
1.0
2002 2003 2004 2005 2006 2007 2008 2009 2010 2011 2012 2013 2014 2015 2016 2017 2018
Liqui
dity
Rat
io
R1 PublicR2 PublicR3-M3 PublicBAS Public
0.0
0.5
1.0
1.5
2.0
2.5
3.0
3.5
4.0
2002 2003 2004 2005 2006 2007 2008 2009 2010 2011 2012 2013 2014 2015 2016 2017 2018
Liqui
dity
Rat
io
R1 Private
R2 Private
R3-M3 Private
BAS Private

10. Facilities & Finance 251
usually able to cover hundreds of days and some even several years. The reason for the distinction is that private institutions typically keep a portion of their endowment as cash in addition to other operating cash reserves. This is not typically an option at public universities where an outside foundation holds the endowment and those funds are restricted. While endowment-related funds at a private university can fill a hole in the short run, if they are used, they will of course deplete the long-term resources of the institution. This public-private difference can be seen in Figure 10.9, which illustrates trends in simple liquidity ratios.
Unfortunately, while the data to calculate days cash on hand are readily found in individual university financial statements, sufficiently specific information to properly calculate days cash on hand for all schools is not publicly available, nor is it recorded in IPEDS. However, IPEDS does contain certain asset and liability data, from which simple liquidity ratios can be computed. In Section 1.4, I mentioned that we could generally handle technical accounting differences between public and private institutions in our comparisons, but this is one of the topics where those differences are marked. In the case of public universities, this simple IPEDS-based liquidity ratio is calculated as total current assets over total expenses, while for private universities it is calculated as total unrestricted net assets over total expenses. The numerator for the privates is a far broader quantity than that for the publics, which leads to two different scales as seen in Figure 10.9. Despite the resulting much higher ratios for privates versus publics, there are still some interesting differences among each group and some overall trends worth noting. At public universities, liquidity is similar across all sizes of institution except the group of small baccalaureate colleges that have lower cash reserves. Before the Great Recession there was variability in liquidity trends among the publics, but institutions made modest improvements to their liquidity post-recession. The privates, especially R1 universities and baccalaureate colleges, had distinct profiles pre-recession and they experienced dramatic reductions in liquidity as their endowments shrank. Interestingly, because endowments are relatively low at the smaller private research and master’s institutions the impact of the recession on their liquidity was comparatively muted. Post-recession, liquidity improved slightly across all types of private institution.
In fact, it was the recession that prompted far more attention to liquidity across all of higher education: some institutions had to borrow money to meet debt obligations because their investments were inaccessible, and the credit rating agencies cited liquidity concerns in numerous cases as they downgraded institutions (Kiley 2011). Of course, liquidity is just one of many indicators used to assess institutional financial health, and composite financial indices are made available by the US Department of Education and in rankings exercises published by the media (Coudriet and Schifrin 2019; Seltzer 2019d).

Like Nobody's Business252
10.6 Why isn’t parking free?
A university is a series of individual faculty entrepreneurs held together by a common grievance over parking. This much-repeated witticism is attributed to Clark Kerr, and like many good jokes it contains just enough truth to be amusing. Because thousands and even tens of thousands of people flow on and off a typical campus every day, there is never enough parking for all of them and it’s only natural that the tensions between convenience and congestion make for regular grumbles about parking and transportation. Chief among those are questions about why parking fees are so expensive, and why parking can’t be free. Companies don’t charge their employees or their customers for parking, as the argument goes, so why do universities do it? Besides this rhetoric being partially untrue (many businesses in urban downtown settings don’t have onsite parking and expect their employees and customers to figure out their own public or private transportation and parking needs), the bigger point is really about who pays.
We all know the economic truth that there is no such thing as a free lunch, so either the costs of providing parking or alternative transportation solutions are absorbed centrally and paid for by all whether they use the service or not, or they are paid by those who use the service. Individual faculty and staff members might consider parking fees a tax on wages while students may complain that it should be included in tuition; all have an interest in externalizing the cost away from the individual to the institution. On the other hand, many campuses have physical space constraints that severely limit parking availability, and even if they don’t, the university community still has an interest in reducing congestion and the physical costs of providing parking. Therefore, universities typically charge individuals for parking permits, often using a portion of parking fees to offset costs of other transit options such as free shuttles, bus passes, and the like.
Surface lots are the cheapest to construct although they are the least efficient use of space, while multi-level parking garage structures enable higher density parking but they can cost an order of magnitude more to build; both require additional maintenance. Construction cost estimates range from $2,000 to $3,500 per space for surface parking, and between $12,000 and $25,000 per space for a parking structure (UNC Charlotte 2019; Texas A&M University 2020). Operations and maintenance expenses include custodial, repairs, staffing, and security. A back-of-the-envelope calculation that spreads construction and financing costs out over thirty years (assuming the university issues a bond for the project) and includes an allowance for maintenance puts the annual cost at a few hundred dollars per surface space and $1,500-$3,000 per garage space, an amount that needs to be recovered from parking charges or other sources (such as tuition). Because the faculty and students are not all on campus all the time, typical annual parking charges can be less than these numbers if the university issues more permits than there are physical spaces—the hunting license analogy. As an indication

10. Facilities & Finance 253
of the seriousness and emotion attached to campus parking issues, it is interesting to note that at UC Berkeley the ultimate academic recognition is being awarded a special reserved parking spot for winning the Nobel Prize (Figure 10.10).
Figure 10.10. The ultimate academic accolade at UC Berkeley, winning a special reserved parking space along with the Nobel Prize. Source: De Comité (2017), Flickr, CC BY 2.0, https://
www.flickr.com/photos/fdecomite/34688401634.
10.7 Do public-private partnerships and outsourcing save money?
They can save money, but that should not be the sole reason that a university enters into a public-private partnership (P3) or similar form of privatizing or outsourcing. There are several important aspects of P3s that institutions should assess and manage to avoid non-financial (e.g., academic and reputational) as well as financial risks. We’ll cover those items below, but first let’s describe what we’re talking about. Outsourcing is a slightly older term that carries negative connotations for some. The P3 term is now widely used, although it is technically a misnomer for private universities that use these agreements as much as public institutions. Whatever we call them, the essence of such agreements is that the university contracts with a third party to deliver a service rather than the institution providing that service itself.
P3s are not new and universities have been contracting out functions such as food service, vending and bookstores for decades (Bushman and Dean 2005; Phipps and Merisotis 2005). These areas are not close to the core academic mission and can often be delivered more effectively by a company with specialty expertise and economies

Like Nobody's Business254
of scale. Since the late 2000s, however, higher education has seen strong increases in P3s for facilities construction and/or operation as well as those much closer to the core academic mission, such as student services and online program management. Table 10.1 shows the extensive range of functions and services that may be provided by private partners. Across the country, higher education P3 deals now total in the billions of dollars annually (EY-Parthenon 2017), with a growing literature that describes them (Leeds 2019).
P3 agreements differ depending on the level of control and risk for the company and the university, financial elements such as whether there are fixed payments or a revenue-sharing agreement, and timing. Depending on the needs of the institution the P3 could be a short-term contract or it might be a long-term partnership over many decades. A seemingly straightforward example might be a contract for janitorial services, where the university pays a certain amount to a company instead of hiring and managing its own janitorial staff. Clearly the university will want the costs to be lower, but it also has to consider how integrated it wants the “outside” staff to be and how the arrangement fits with union agreements. Furthermore, will the cost savings come from efficiencies or will the company workers be paid less than if they were university employees, and will they receive fewer benefits? These can be critical issues for a campus community.
A facilities example might involve the construction and operation of a residence hall, where the institution provides a ground lease to the company, which in turn fronts the cost of construction and receives a significant portion of the student housing revenues. From the company’s point of view, it can rely on the captive audience of students for a relatively reliable tenant income to recoup its investment, while the university gets a building financed and built quickly without having to borrow. Concerns abound: to list just a few, can the university ensure that the construction quality meet its usual standards, will maintenance problems be dealt with to the satisfaction of students and parents, and will the university or the company be handling student behavior and support issues? If such issues are anticipated and managed well, then the project can work well for all, but poor revenue or management arrangements can severely undermine the hoped-for benefits. Also, for capital projects, universities can typically borrow money (through bonding) at lower rates than commercial developers, so the premium paid for that aspect of the project must be offset by other benefits such as speed to completion, level of service, or risk avoidance.
A third example is online program management (OPM), which has received a lot of press over the last decade as higher education moved into online instruction. I mentioned OPMs briefly in Section 6.11 when discussing online programs, and it’s worth emphasizing again just how poorly structured many of these OPM deals have been for the universities (Hall and Dudley 2019). In their rush to get help recruiting online students and delivering instructional content, some institutions more-or-less sold their academic souls (Carey 2019), ceding over half the revenue and much of the

10. Facilities & Finance 255
academic control to the OPM partner. As universities gain more experience in the online space the nature of these deals will hopefully become more balanced. Nonetheless, in a recent survey of campus leaders the desire for OPM P3s came in second, right behind facilities and infrastructure P3s (Blumenstyk 2019a).
Table 10.1. Examples of institutional functions and services that may be provided through public-private partnerships.
Academic Affairs
Enrollment & Student Support
Campus Services
Information Technology
Facilities & Maintenance
Other Administration
Instructional Content
Course & Program Development
Instructional Design
Academic Advising
Online Program Management
International Student Recruiting
Career Services
Non-Credit Programs
Coaching & Mentoring
Enrollment Management
Student Health & Support
Financial Aid
Student Loans
Student Data Analytics
Food Service
Bookstore
Copy Center
Computer Store
Vending
Janitorial & Custodial
Laundry
Residence Hall Management
Recreation Center
Enterprise Systems
Information Systems Management
Document & Data Storage
Desktop Help
Instructional Technology
Student Housing
Academic Facilities
Sports Venues & Concessions
Hotel & Conference Center
Energy & Steam/Ice Supply
Parking
Transportation
Security
Mechanical & Electrical
Grounds
Office Equipment
Laboratory Support
Overall Facilities Management
Payroll
Human Resources
Legal Services
Debit & Credit Cards
Finance & Accounting
Marketing & Communications
Mailroom
Endowment Management
Development & Fundraising


11. Health Sciences, Hospitals & Medical Schools
11.1 How do hospital budgets compare to main campus budgets?
Some of the health sciences operate on a completely different financial basis to the rest of campus because of their reliance on clinical revenues. Nowhere is this truer than in medical schools, although it can also be a factor across nursing, pharmacy, dentistry, public health and veterinary medicine. We’ll get to medical school funding in the next section, but first, let’s get a feel for the basic numbers.
In earlier chapters I was careful to point out where hospital revenues or medical employees needed to be excluded from our campus comparisons. That’s because (i) most universities don’t have hospitals or medical schools, (ii) of those with medical schools, at more than half the hospital partner is an independent corporation rather than the hospital being incorporated within the university, and (iii) hospital budgets can be as big or bigger than the universities with which they are directly or indirectly affiliated. The Association of American Medical Colleges (AAMC) lists 155 accredited member medical schools in the United States (Association of American Medical Colleges 2020), 115 of which are spread across our comparison data set of nearly 1,200 four-year higher education institutions, as illustrated in Figure 11.1 (the rest are largely stand-alone specialty or for-profit schools). Of those, 45 (39%) report in-budget hospitals on IPEDS.1
1 Technically, IPEDS lists the Penn State College of Medicine separately for academic data, while the finances of Penn State Health are included in main campus financials. For Rutgers, IPEDS reflects the medical school and hospital on the New Brunswick campus plus two small hospitals at the Camden and Newark campuses although they don’t have separate medical schools.
© Andrew C. Comrie, CC BY 4.0 https://doi.org/10.11647/OBP.0240.11
Unsurprisingly, R1 universities are home to most medical schools and in-budget hospitals, with fewer of each down the size scale. We can get a sense of hospital budget sizes by breaking out the hospital and non-hospital (i.e., university) revenues for those institutions with in-budget hospitals, as shown in Figure 11.2. Three quarters of these hospitals are at R1 universities and their budgets average about 40% of the total budget or, put differently, hospital budgets approach the size of the regular university budget. Financially and organizationally, it’s like adding a second university to the main campus. There are no publicly-accessible comprehensive statistics on the budgets of

Like Nobody's Business258
Figure 11.1. FY2018 numbers of higher education institutions with medical schools and with hospitals included in the reported institutional budget, by Carnegie classification and
control. Source: IPEDS (2020).
0
5
10
15
20
25
30
35
40
45
50
R1 Public R2 Public R3‐M3 Public BAS Public R1 Private R2 Private R3‐M3 Private BAS Private
Institu
tions
Medical School Hospital In‐Budget
other independent teaching hospitals that work with the remaining medical schools, although from individual examples it is clear that they have not dissimilar financial scopes of in-budget hospitals and sometimes more.
Figure 11.2. FY2018 hospital and non-hospital portions of total institutional revenue for the 45 institutions reporting in-budget hospitals, by Carnegie classification and control.
Source: IPEDS (2020).
$‐
$1
$2
$3
$4
$5
$6
R1 Public R2 Public R3‐M3 Public BAS Public R1 Private R2 Private R3‐M3 Private BAS Private
FY20
18 Reven
ues ($ Billion
s)
Hospital
Non‐Hospital

11. Health Sciences, Hospitals & Medical Schools 259
11.2 How are medical schools funded?
Most medical schools don’t exist in financial isolation in the way that other campus professional schools do. Business schools, law schools, engineering programs and colleges of education all connect to their domains of professional practice to ensure that students can learn through hands-on experience, like medical schools, but none of those require the level of financial integration with clinical activities necessary to support a contemporary US medical school. Put more pointedly, with the exception of the few that focus exclusively on teaching medical students, medical schools rely overwhelmingly on clinical revenues to support themselves with tuition playing only a minor role.
How does that work? The necessary combination of medical education, research and clinical practice is enabled by organizational and financial elements of what is called an academic medical center, which is typically comprised of the medical school, its affiliated hospital (historically university-owned but also independent), and the faculty practice plan. Practice plans originated as organizations to handle clinical revenue collection and compensation for the faculty as practicing physicians, much like a group private practice. While this is still their core function nowadays, practice plans have evolved into organizations that also promote patient care, manage the various medical specialty practices, recruit and retain quality physicians, and ensure an adequate number and range of patients for research and teaching. These activities are aligned with the mission of the academic medical center.
The practice plan looks after the interests of faculty physicians, as distinct from those doctors and other health professionals without academic appointments who work directly for the hospital. Faculty practice plans are usually separately incorporated, meaning that the academic medical center is a three-way partnership between the university, the practice plan, and the hospital. Each brings something to the table: the university and medical school need clinically active professors and a means to compensate them from the practice plan, plus the physical and organizational infrastructure of the hospital; the hospital desires the prestige of being a specialized institution with renowned experts and the latest treatments; and, the practice plan needs them both while providing a vehicle for the academic and clinical activities of faculty physician scientists.
As you will have surmised by now, successful academic medical centers therefore involve the exchange of large sums of money among the three parts, in particular to support the medical school. The practice plan contributes substantial clinical income while the hospital contributes payments for medical services as well as additional investments into the teaching, research and clinical care missions. These latter investments, which are typically tens of millions of dollars annually, are known as “mission support” and they essentially provide a cross-subsidy of teaching and research.2 Figure 11.3 illustrates the critical role of practice plan and hospital revenues
2 Mission support funding has to be carefully structured to avoid kickback and ethics laws because the medical school’s physicians refer patients to the supporting hospital (Bulleit et al. 2017).

Like Nobody's Business260
for medical schools, in a roughly two thirds/one third split that together comprise 63% of the total support. Research grants and contracts are the other large source of medical school revenue, with federal and other sources accounting for a combined 22% of medical school revenue on average.
Figure 11.3. FY2018 shares of revenue sources supporting 141 US medical schools. Source: AAMC (Association of American Medical Colleges 2019b).
Figure 11.3 also shows that the remaining sources of medical school income are all much smaller, each making up just a few percent of the total. Support from state and local governments and from the parent institution (i.e., the university) and revenue from tuition and fees each average about 4% of the total although, as we’ll see next, these two categories differ across public and private institutions. Gifts, endowment income and other miscellaneous costs round out the revenue portfolio.
The average dollar amounts for each of these sources at public and private medical schools are illustrated in Figure 11.4. While the general profile is similar, the revenues supporting private medical schools are approximately double those at public universities. There are two noteworthy departures from this overall pattern though; public medical schools naturally receive relatively more via state and local government support, while private medical schools generate almost three times more in gift income on average.
Practice Plans 43%
Hospital Services and Investments 20%
Federal Research Grants and Contracts 14%
Other Grants and Contracts 8%
Government and Parent Institution 4%
Tuition and Fees 4%Gifts 2%
Endowment Income 2% Miscellaneous 4%
To appreciate the magnitude of total dollars required to fund a medical school, the level of funding is on the order of ten times the budget of a regular college at an R1 university. That contrast makes it instructive to return for a moment to the cross-subsidy of teaching and research by mission support and other funds. Tuition revenues are insufficient to cover the substantial infrastructure, operational and labor costs of the

11. Health Sciences, Hospitals & Medical Schools 261
Figure 11.4. FY2018 supporting revenue sources averaged across 85 public and 56 private US medical schools. Source: AAMC (Association of American Medical Colleges 2019b).
$‐
$100
$200
$300
$400
$500
$600
$700
Practic
e Plan
s
Hospital Services
and Inve
stmen
ts
Fede
ral R
esea
rch
Grants an
d Co
ntracts
Other Grants
and Co
ntracts
Governmen
t and
Parent In
stitu
tion
Tuition
and
Fee
s
Gifts
Endo
wmen
tIncome
Miscellane
ous
FY20
18 M
edical Schoo
l Reven
ues ($ M
illions)
Public Private
whole enterprise associated with educating medical students.3 At most major medical schools, the faculty will outnumber the students and they will be among the highest salaried professors in the university (see the next section). Thus, even from this limited example, and with perception of medical school tuition as high, it is clear that tuition alone will not come close to covering the institutional costs of education. Regarding research, remember that we saw in Section 8.4 how research actually loses money because facilities and administration costs are not fully recovered. This is especially true for medical schools because biomedical research support and compliance costs are among the highest across campus. We’ll examine health science research funding in Section 11.4.
As with general university funding, the relative roles of revenue sources have changed over time for medical schools. Figure 11.5 illustrates the trends in relative shares of clinical revenues (also known as medical services), state and institutional funding, and tuition and fees since FY1977. Tuition and fees have stayed consistent around 4–5% of budget over the entire period, and other sources have stayed flat or decreased slightly in share over time (not illustrated; FY2018 values were 14% federal research, 13% other income, and 2% other federal revenue). However, clinical income
3 Note that medical schools offer not only medical degrees but also training programs required for physicians to be able to practice, i.e., residencies and fellowships. Confusingly, these latter programs are known as Graduate Medical Education (GME). GME is funded largely by the Federal government through Medicare with small amounts from states and hospitals. Federal GME funding has essentially been capped since the Balanced Budget Act of 1997, creating a bottleneck for residency slots.

Like Nobody's Business262
rose from a 20–60% share of the budget over the last four decades. Because state funding stayed about the same over time in inflation-adjusted dollars, its relative share decreased from 30–5% of the total budget over the same period. Of course, the world of healthcare finance was completely different back then—Medicare and Medicaid started in the 1960s, and various successive forms of health insurance emerged over the decades too. Understanding the changes in the complex healthcare business would take a book of its own, but do recall that healthcare has many of the same underlying economic drivers of cost increases as higher education, as we saw in Section 3.7 and Box 3.1. Those costs are anticipated to grow faster than revenues in coming years, creating a vulnerability for medical schools that are dependent on clinical revenues and transfers from the other parts of the academic medical center (Guadagnolo 2018).
Figure 11.5. Trends in the shares of three revenue sources for US medical schools, FY1977 to FY2018. Source: AAMC (Association of American Medical Colleges 2019c).
11.3 How much are medical school faculty salaries?
Medical school professors are the highest compensated faculty members in the university, earning roughly three times more on average than their colleagues elsewhere on campus. Figure 11.6 illustrates total compensation by rank and medical specialty. Across all departments and specialties, assistant professors earn about $300,000 per year and full professors almost $400,000, while department chairs average $632,000. Across the departments, salaries in the basic medical sciences (i.e., those without a clinical component such as immunology, microbiology, and pharmacology) are the lowest, although they are comparable to some of the higher-earning disciplines in the
0%
10%
20%
30%
40%
50%
60%
70%
1977
1978
1979
1980
1981
1982
1983
1984
1985
1986
1987
1988
1989
1990
1991
1992
1993
1994
1995
1996
1997
1998
1999
2000
2001
2002
2003
2004
2005
2006
2007
2008
2009
2010
2011
2012
2013
2014
2015
2016
2017
2018
Share of M
edical Schoo
l Rev
enue
Medical Service
State, Local, & Parent Institution
Tuition and Fees

11. Health Sciences, Hospitals & Medical Schools 263
arts and sciences. Surgery is the highest-compensated set of medical specialties, where instructors earn $300,000 to $400,000 annually and the average chair of surgery makes almost $1M per year. The other specialties cover a broad range in between. Assistant professors earn 70–90% of full professor compensation across most specialties, whereas in the basic medical sciences that figure is just over 50%, reflecting the absence of clinical revenues and the structure seen elsewhere in the university.
Figure 11.6. FY2018 total compensation averages for medical school faculty members (MD or equivalent) by rank and sorted by decreasing department/specialty average. Source:
AAMC (Association of American Medical Colleges 2019a).
Why are medical school salaries so high? There are at least two factors at work: (i) as is true elsewhere in the university for fields that have a practice component with high market rates, such as computer science or accounting, that market drives the academic salaries higher; and (ii) medical professors are at the pinnacle of clinical care by virtue of their academic and technical expertise, thus they are the top earners in their profession overall (unlike computer science and accounting). If you are diagnosed with a hard-to-treat disease or you were in an awful accident, you will want to seek out the “top” medical expert in the necessary specialty—that doctor is in all likelihood a professor at a leading medical school. Likewise, many leading cancer centers, heart institutes, etc. are part of academic medical centers. Thus, the confluence of eminent technical expertise with elevated market rates, which in turn are enabled by the way the US healthcare system is set up, lead to the high compensation we see in US medical schools. In fact, at many of these universities, it’s not unusual to have a dozen or more individuals in the medical school earning more than the university president.
$‐
$100
$200
$300
$400
$500
$600
$700
$800
$900
$1,000
Ortho
paed
ic Surgery
Surgery
Radiolog
y
Diagnostic
Rad
iology
Dermatology
Otolaryngolog
y
Cardiology
Anesthesiology
OB/GYN
Oph
thalmology
Clinical Scien
ces
Emergency Med
icine
Med
icine
Pathology
Neu
rology
Psychiatry
Pediatric
s
Family M
edicine
Basic Sciences
FY20
18 Faculty Total Com
pensation ($ Tho
usan
ds) Chair Chief Professor Associate Professor Assistant Professor Instructor

Like Nobody's Business264
Box 11.1. Relative Value Units (RVUs)Clinical revenues are a key part of academic medicine. Medicare payments for medical services provided by physicians across the US are accounted for using a system that assigns relative value to each of more than 10,000 distinct services.
Relative value units (RVUs) largely reflect the total time necessary to perform the service (before, during the service, and after) as well as skill, complexity, judgment, etc. So, for example, the RVU to remove a foreign body from an eye is 0.49 while it is 1.95 to repair a minor eye wound, meaning that the latter is four times the work of the former (AAPC 2020b). This is known as the work RVU and it is used with two others in the Medicare payment formula, practice expense (PE) RVUs and malpractice (MP) RVUs; the average shares of each across all payments are 51%, 45% and 4% respectively (AAPC 2020a). There are geographic practice cost indices (GPCI) used to weight each kind of RVU as well as distinctions based on the place of service (e.g., a physician’s office versus a hospital). Medicare sets an annual per-RVU dollar conversion factor (CF), which has been close to $36 in recent years (AAPC 2020a), enabling the payment to be calculated as follows according to the US Centers for Medicare and Medicaid Services (2020):
Payment = [(RVUwork × GPCIwork) + (RVUPE × GPCIPE) + (RVUMP × GPCIMP)] × CF
Using the minor eye wound repair example, for a physician in Arizona doing the procedure in her office in 2020, the numbers look like this:
Payment = [(1.95 × 1.0) + (5.86 × 0.961) + (0.13 × 0.846)] × $36.0896 = $277.58
In San Francisco, because of two higher GPCI values reflecting the higher expenses of the area (1.076, 1.327, and 0.44 respectively), the Medicare payment for the same service would be $358.43. If the procedure was done at a hospital, where the physician does not have to incur the overhead costs, then the physician payment amounts are $140.59 in Arizona and $169.26 in San Francisco because the practice expense RVU decreases from 5.86 to 1.91.
While this sort of calculation is far from a perfect representation of the work involved, it certainly beats its simplistic predecessors such as number of patients seen. Of course, because of their key connection to revenue generation, RVUs are extensively used to measure physician productivity. Ask almost any doctor about this and you’ll hear plenty of criticism, including: it is imprecise because each case is different, no allowance is made for challenging cases, experienced physicians can handle complex cases more efficiently, the system can be manipulated, it incentivizes physicians to break procedures into parts, it doesn’t include patient satisfaction, and much more.
In academic settings, the pressures to deliver on RVUs are in direct tension with, and exclude consideration of, research and teaching. While that tension cannot be fully removed, it can be minimized if administrators and faculty design clear workload expectations and implement effective multidimensional and holistic evaluations.

11. Health Sciences, Hospitals & Medical Schools 265
11.4 What is the mix of health science research funding?
We saw in Chapter 8 that support from the National Institutes of Health (NIH) provides more than half of all university research funding. NIH funds virtually all federal health sciences research and we also saw that it spends about three times more than NSF, which covers all the other sciences and engineering. In addition, we saw how NIH funding doubled in the early 2000s via a program of increased appropriations by Congress. But to which diseases and conditions does NIH funding go, and to which universities?
Figure 11.7. Share and cumulative share of FY2019 NIH spending on specific diseases and conditions for the top 50 of 292 categories. Source: NIH (National Institutes of Health 2020b).
0%
10%
20%
30%
40%
50%
60%
70%
80%
0%
1%
2%
3%
4%
5%
6%
7%
8%
Clinical Research
Gen
etics
Preven
tion
Neu
rosciences
Biotechn
ology
Brain Disorde
rsCa
ncer
Beha
vioral & Social Scien
ceInfectious Diseases
Clinical Tria
ls & Sup
portive Ac
tivities
Rare Diseases
Bioe
ngineerin
gPe
diatric
Aging
Wom
en's Health
Hum
an Gen
ome
Neu
rode
gene
rativ
eHealth
Dispa
rities
Men
tal H
ealth
Minority
Health
HIV/A
IDS
Emerging
Infectious Diseases
Basic Be
havioral & Social Scien
ceSubstance Ab
use
Acqu
ired Co
gnitive Im
pairm
ent
Alzheimer's Disease/D
emen
tias
Cardiovascular
Biod
efen
seBiom
edical Im
aging
Immun
ization
Dem
entia
Health
Services
Alzheimer's Disease
Vaccine Re
lated
Digestiv
e Diseases
Stem
Cell R
esearch
Orpha
n Drug
Lung
Nutrition
Precision Med
icine
Drug Ab
use (NIDA Only)
Networking
& IT
R&D
Hem
atology
Patie
nt Safety
Heart Disease
Immun
othe
rapy
Obe
sity
Diabe
tes
Regene
rativ
e Med
icine
Men
tal Illn
ess
Cumulative Share
FY20
19 Sha
re of N
IH Spe
nding
As the plural in its name indicates, the NIH comprises over 20 major institutes and centers, organized largely around disease areas, through which most of its funding flows. Of the $39B total NIH budget in FY2019, more than 80% was awarded for extramural research. Over half the funding was awarded through just five institutes: the National Cancer Institute (16%); the National Institute of Allergy and Infectious Diseases (14%); the National Heart, Lung, and Blood Institute (9%); the National Institute on Aging (8%); and the National Institute of General Medical Sciences (7%).
While institute-level funding provides a broad sense of the fields supported, the NIH produces a list of how much is spent across almost 300 diseases and conditions. It specifically includes multiple counting of research projects because a particular project could be addressing several topics (e.g., the genetics of brain disorders in the elderly, which covers at least three areas). The top 50 funded categories are illustrated in Figure 11.7 and they provide a sense of the wide range of research funded by the NIH.

Like Nobody's Business266
Clearly, many studies involve clinical research, a theme that is associated with $16B in research funding at 6.6% of the total. Among the higher-funded diseases, cancer, infectious diseases and rare diseases all receive similar levels of support at around 2.5% of the total (about $6B) annually. Half of the funding goes to the first 18 diseases, and three quarters to the first 45.
Figure 11.8. FY2019 NIH funding awarded to higher education institutions, for the top 50 of 516 listed institutions. Data for multiple units on the same campus have been combined.
Source: NIH (National Institutes of Health 2020c).
$0 $100 $200 $300 $400 $500 $600 $700 $800
Johns Hopkins UniversityUniversity of California, San Francisco
University of MichiganUniversity of Pennsylvania
Duke UniversityUniversity of Pittsburgh
Columbia UniversityUniversity of Washington
Stanford UniversityWashington University
Univ of North Carolina, Chapel HillYale University
University of California, San DiegoUniversity of California, Los Angeles
Harvard UniversityIcahn School of Medicine at Mount Sinai
Northwestern UniversityEmory University
New York UniversityUniversity of Alabama, Birmingham
University of Wisconsin‐MadisonUniversity of Minnesota
Cornell UniversityUniversity of Southern California
Oregon Health & Science UniversityBaylor College of Medicine
University of Colorado, DenverUniversity of California, Davis
UT Southwestern Medical CenterUniversity of Chicago
Boston UniversityOhio State University
Indiana Univ‐Purdue Univ at IndianapolisUniversity of Utah
University of Maryland, BaltimoreUniversity of Florida
Case Western Reserve UniversityUniversity of Iowa
Albert Einstein College of MedicineUniversity of Texas MD Anderson Cancer Center
University of VirginiaUniversity of RochesterUniversity of Kentucky
University of California‐IrvineUniversity of Massachusetts Med Sch Worcester
University of MiamiUniversity of Arizona
University of California, BerkeleyUniversity of Illinois, Chicago
Medical University of South Carolina
FY2019 NIH Funding ($ Millions)
Public
Private

11. Health Sciences, Hospitals & Medical Schools 267
Looking down the list, each university will naturally have its own strengths across the spectrum of health research, with the highest-funded institutions being active across multiple areas. Those universities are ranked in Figure 11.8, which shows the top 50 institutions nationally. The first 23 on the list win half of all higher education NIH funding. That group includes 10 public universities and 13 private ones, and in the top 50 there are 29 publics and 21 privates. The amount of NIH research funding awarded to all higher education institutions exceeded $22B in FY2019, accounting for over half of the $39B total (National Institutes of Health 2020a; 2020c). It is important to note that more than 500 US higher education institutions receive NIH funding although there are only about 150 medical schools. Thus, many institutions are awarded support across a wider set of biomedically-related sciences and social sciences than just the clinically-oriented and basic medical science departments found in a medical school. Of higher education institutions receiving NIH funding in FY2019, the average was $43M and the median was just $3.6M. Thus, while NIH research support is concentrated at high-profile institutions with medical schools and extensive biomedical programs, the effects of NIH funding extend far more widely than just those institutions with medical schools.


12. Athletics
12.1 How big is the business of college sports?
Lucrative contracts, high visibility, and college rivalries cause much to be said about how the money works across the variety of sports and types of schools involved in intercollegiate athletics.1 The total athletics budget across all schools in our dataset2 exceeded $18B in FY2018 (Office of Postsecondary Education 2020). That’s about 4.2% of the $435B total non-hospital revenues for all of the nearly 1,200 institutions (IPEDS 2020). More interesting is that 57% of all athletics revenue is accounted for by just 124 of those institutions, the NCAA Football Bowl Subdivision (FBS) schools (see Box 12.1) with the highest-profile teams, celebrity coaches and rich sports media contracts (Office of Postsecondary Education 2020). Thus, it’s unsurprising that these prominent sports programs garner the lion’s share of headlines for game news and sports finances, especially in football and basketball. Some schools go so far as to privatize their athletics departments (Jarvis 2019), and some conferences may be looking to attract private equity investment (Bauer-Wolf 2019).
Let’s digress briefly to address a common question up front: do college sports provide an overall financial win to universities? No, they do not. With the exception of extraordinarily few schools in Division I of the NCAA that can cover virtually all their athletics costs, plus one or two rare rags-to-riches stories, university and college athletics programs are subsidized via student fees and institutional funds as part of a financially unsustainable “arms race” for greater standing (Cheslock and Knight 2015). We’ll delve into further details about athletics revenue sources, including subsidies, in Section 12.2.
Returning to the size of the athletics budget, Figure 12.1 illustrates the difference in revenues by type of institution (expenses essentially equal revenues, as they do elsewhere in the university). Apart from the obvious budget scaling by institution size, perhaps the most remarkable feature of these data is the anomaly of the R1 Private
1 The first intercollegiate sporting event was held in 1852, a four-mile rowing race known as the Harvard-Yale Regatta that marked the first of many US college sports rivalries and continues today.
2 IPEDS holds very little financial data on athletics programs, and several other data sets deal only with public institutions. Fortunately, the US Department of Education provides data from the Equity in Athletics Disclosure Act (EADA) that includes detailed information on the public and private institutions in our data set (Office of Postsecondary Education 2020).
© Andrew C. Comrie, CC BY 4.0 https://doi.org/10.11647/OBP.0240.12

Like Nobody's Business270
universities that, on average, spend far less on athletics ($47M) than their public counterparts ($89M). The “on average” aspect is important here, a direct consequence of the relatively few R1 Private universities participating in expensive top-tier football and basketball (see Box 12.1). If, instead of using the Carnegie classification, we stratify institutions by athletic subdivision (Figure 12.2), then the expected pattern emerges: FBS public schools have an average athletics budget of $80M while FBS private schools are at $92M. That 16% difference in public-private athletics budget in the FBS is relatively small compared to the more than 40% public-private difference in the rest of NCAA Division I and the Division II football schools. Remarkably, while the dollar amounts for public institutions are lower in NCAA Division III and still lower in the NAIA, private schools in the NAIA Division I spend three times more than their public counterparts, and twice as much in the NAIA Division II. For FBS institutions, the athletics department is roughly equivalent, budgetarily speaking, to a major academic college.
Figure 12.1. FY2018 total athletics revenues from all sports per institution, averaged by Carnegie classification and control. Source: EADA (Office of Postsecondary Education 2020).
$‐
$10
$20
$30
$40
$50
$60
$70
$80
$90
$100
R1 Public R2 Public R3‐M3 Public BAS Public R1 Private R2 Private R3‐M3 Private BAS Private
FY20
18 Reven
ues from All Sports ($
Millions)
What kind of investment in athletics are all these schools making relative to their overall institutional budgets? It turns out that it’s about 5% of overall non-hospital revenue for most Carnegie classifications, with a few exceptions: a little over 7% at public baccalaureate colleges and the R3-M3 Private universities, and just 1.5% for R1 Private universities (Office of Postsecondary Education 2020) due to a combination of a low numerator (smaller average budget because of lower FBS participation, mentioned above) and a high denominator (large institutional budgets). When stratified by subdivision there are some stark differences, however, as seen in Figure 12.3. In the

12. Athletics 271
Figure 12.2. FY2018 total athletics revenues per institution averaged by athletic association, division, subdivision and control. Source: EADA (Office of Postsecondary Education 2020).
$‐
$10
$20
$30
$40
$50
$60
$70
$80
$90
$100
Division IFBS
Division IFCS
Division Ino FB
Division IIwith FB
Division IIno FB
Division IIIwith FB
Division IIIno FB
Division I Division II
NCAA NAIA Other
FY20
18 Athletic
s Reven
ue ($
Millions)
Public Private
FBS, publics and privates aren’t too different in relative share of the institutional budget for athletics, but in the FCS the publics run athletics budgets at twice the share of the privates. That arrangement is flipped for NCAA Division I non-football schools and all schools in NCAA Division II, where the privates run athletics budgets that are
Figure 12.3. FY2018 total athletics revenue share of overall institutional non-hospital revenues by athletic association, division, subdivision and control. Source: EADA (Office of
Postsecondary Education 2020).
0%
2%
4%
6%
8%
10%
12%
Division IFBS
Division IFCS
Division Ino FB
Division IIwith FB
Division IIno FB
Division IIIwith FB
Division IIIno FB
Division I Division II
NCAA NAIA Other
FY20
18 Athletic
s Sha
re of Institition
al Non
‐Hospital R
even
ue Public Private

Like Nobody's Business272
two to three times the relative size of those at the publics. It’s even more the case in both divisions of the NAIA with athletics budgets at the private schools being three to five times larger in a relative sense.
All the above data focus on revenues flowing to the universities, but there is a bit more money to account for in the overall enterprise of college sports: the funds going to support the associations and conferences themselves. The associations and the individual conferences are separately incorporated nonprofit organizations, which also means that they each file a Form 990 summarizing their annual revenues (Schwencke et al. 2020). For FY2018, the NCAA’s budget was $1B, the budgets for the Power Five conferences ranged from $374M at the Big 12 to $759M at the Big Ten with the ACC, Pac-123 and SEC in between those, while the other conferences in Division I ranged between $28M and $78M. Not included here in the bigger college sports business are the media companies, logo wear manufacturers, etc. who pay the NCAA and its members but who also make a profit of their own.
Box 12.1. Athletic Associations, Divisions and ConferencesHere’s a quick guide to the structure of intercollegiate athletics for readers who are not sports fans; to be precise, that’s 44% of US adults who are not college football fans and 62% who are not college basketball fans (Jones 2017). Most institutions (95%) belong to one or more intercollegiate athletic associations (IPEDS 2020) that serve as the national sanctioning (i.e., quasi-regulatory) organizations. By far the largest and best-known is the National Collegiate Athletic Association (NCAA), although the National Association of Intercollegiate Athletics (NAIA) serves small colleges and universities, and there are others that serve community colleges, religious schools and some individual sports. It’s worth noting the distinction between the selective nature of individuals and teams playing sanctioned sports versus the non-selective recreational and intramural club sports that any student can join; we are talking about the former here, those that are under a formal campus athletics department with a budget, coaches, facilities and, in the higher tiers, scholarships for designated student athletes.
The larger associations have hierarchical divisions and subdivisions, many of which are further divided into leagues known as conferences; these are the groups of ten to fifteen teams among which the regular-season games are played. Figure B.10 illustrates where the various types of schools in our data set belong by association, division and subdivision. We can see that the NCAA has three divisions, each including subdivisions for programs with football and without football (because having a football program skews the resources available to other sports). Division I of the NCAA, in addition to a non-football subdivision, has two subdivisions for football, the Football Bowl Subdivision (FBS) that includes the major (i.e., most well-resourced) football schools and the Football Championship Subdivision (FCS) that includes the other Division I schools
3 The Pac-12 has two entities, the Pac-12 conference and the Pac-12 Networks, that had respective FY2018 revenues of $370M and $127M for a consolidated total of $497M.

12. Athletics 273
with football programs. The three NCAA Divisions are differentiated by regulations regarding number of sports fielded per school, the balance of teams for men and women, financial aid amounts and more. FBS schools have a higher scholarship requirement than FCS schools and they must average 15,000 people or more per home game.
Figure B.10. Athletic association, division and subdivision membership in FY2018, by Carnegie classification and control. Source: EADA (Office of Postsecondary Education 2020).
In the NCAA the top divisions are dominated by public institutions whereas Division III has a preponderance of smaller private schools (Figure B.10). Most R1 publics are in the FBS while R1 privates are spread throughout all three divisions. The FBS is largely comprised of R1 and R2 schools with some R3-M3 schools as well.
Within the FBS are ten conferences, with conference membership differing slightly for football versus basketball, as seen in Figure B.11. The FBS conferences are the Atlantic Coast Conference (ACC), Big Ten Conference (Big Ten), Conference USA (CUSA), Southeastern Conference (SEC), Mid-American Conference (MAC), Pacific-12 Conference (Pac-12), Sun Belt Conference (S-Belt), Mountain West Conference (MWC), American Athletic Conference (AAC), Big Twelve Conference (Big 12). The one independent FBS school for football is Notre Dame (it’s an ACC member in basketball).
Division IFBS
Division IFCS
Division Ino FB
Division IIwith FB
Division IIno FB
Division IIIwith FB
Division IIIno FB
Division I Division II
NCAA NAIA Other
0
20
40
60
80
100
120
140
160
180
FY20
18 Athletic
Associatio
n & Division Mem
bers
BAS PrivateR3‐M3 PrivateR2 PrivateR1 PrivateBAS PublicR3‐M3 PublicR2 PublicR1 Public
The dominance of public schools in the FBS is especially striking (Figure B.11) with only 16 privates among the total of 124 in our data set (13%).* One would think that the available resources at R1 Private schools in particular would enable them to spend more on top-tier football and basketball programs, but clearly that is a path that many have chosen not to follow. No doubt the age-old tension between athletics and academics is a part of that dynamic, along with a differential need for name exposure, focusing on an elite academic reputation, and understanding that FBS participation requires what is typically a significant and sustained “loss-leader” investment.

Like Nobody's Business274
Figure B.11. NCAA Division I FBS conference membership for football (FB) and basketball (BB) in FY2018, by Carnegie classification and control. Source: IPEDS (2020).
0
2
4
6
8
10
12
14
16
FB BB FB BB FB BB FB BB FB BB FB BB FB BB FB BB FB BB FB BB FB BB
ACC Big Ten CUSA SEC MAC Pac‐12 S‐Belt MWC AAC Big 12 Indep
FY20
18 NCA
A FB
S Co
nferen
ce M
embe
rs
R2 Private
R1 Private
R3‐M3 Public
R2 Public
R1 Public
———
* The FBS additionally incorporates a half-dozen schools including teams from the three military academies that are not in our data set (Army, Navy, and Air Force) and some schools that have multiple conference memberships across different sports.
12.2 How important are subsidies and media revenues in athletics?
With the exception of the Power Five conferences, which the NCAA calls the FBS Autonomy conferences,4 institutional funds and student fees contribute the majority of support for athletics programs in all divisions. Figure 12.4 shows that together they supply 70% of revenue even in the FCS, and about 90% in Divisions II and III. Philanthropic income is generally the other sizable source of revenue, about 5–13% in all but the Power Five. It’s worth noting that this funding mix is not unlike many academic departments. As we expect, the Power Five revenue portfolio is quite different, dominated by NCAA and conference income from media rights and bowl games, followed by gifts and endowment income as well as ticket sales. Institutional support comprises only about 5% of income for this group, about half the amount from royalties, licensing and advertising.
4 The Power Five conferences are the ACC, Big Ten, Big 12, Pac-12 and SEC. The NCAA grants them autonomy to create their own rules to benefit athletes, which includes allocating more resources. The remaining (non-autonomous) FBS conferences are sometimes called the Group of Five.

12. Athletics 275
Figure 12.4. FY2018 athletics revenue sources as a share of total athletic revenues by NCAA subdivision. Source NCAA (2019a).
The divergence between the Power Five and the other subdivisions is even more striking when we consider that these percentages apply to the dollar amounts in Figure 12.2. The median FY2018 revenue at a Power Five school was $123M versus $41M at the other FBS schools, and about $22M at FCS and non-football schools across the rest of Division I (NCAA 2019a). For a sense of comparison, the median FY2018 income from media rights/NCAA alone at Power Five schools was about $42M, the same as the entire revenue of the other FBS schools and double the entire revenue of an FCS school (NCAA 2019a).
Thus, institutional subsidies are the most important source of support for athletics programs at most universities. In the FBS, especially the Power Five, the business model is entirely different and can only be sustained because of the income streams associated with the high profile of its football and basketball programs. Ironically, the institutional investments required to compete at a middling level place a higher relative financial burden on the university than they do for the richest and highest-performing FBS programs. The pressures to participate in the cycle of increasing investments to improve performance are significant, whether from athletics boosters, wealthy donors, board members, politicians, or local sports media, and they lead to widespread aspirational athletics budgeting across US higher education.
As we’ve seen, the size of the subsidy at most schools is sufficiently large that, if it was cut from athletics, it could indeed be diverted to help support academics, as has happened occasionally (Keller 2010; Sokol 2020). However, at top-tier programs, this logic applies only to the relatively small subsidy and not to the generated income.
0%
10%
20%
30%
40%
50%
60%
70%
80%
90%
100%
FBSAutonomy
FBSNon‐Aut.
FCS No FB FB No FB FB No FB
Division I Division II Division III
FY20
18 Sha
re of R
even
ue
Other RevenuesGuaranteed RevenuesRoyalties & LicensingTicket SalesMedia Rights / NCAA & BowlsDonations & EndowmentStudent FeesInstitution & Government

Like Nobody's Business276
I have heard resolute colleagues on my campus (a Power Five school) suggest that the entire athletics budget be diverted to academics—that’s largely folly, of course, because most of the generated and gift revenue would evaporate without the high-profile teams.5
12.3 Is the number of student athletes increasing?
Before we move on to athletics spending, which is to say investments made ostensibly in the interests of student athletes (at least in part), it’s worth knowing how many athletes there are by type of school and any underlying trends. The average number of student athletes (who are all undergraduates by definition) at R1 and R2 institutions is about 500 to 700, and about 400 at smaller institutions (Office of Postsecondary Education 2020). From those numbers alone, we can infer that the percentage of students who are athletes is significantly higher at smaller schools. While absolute numbers of student athletes have increased steadily at all types of institution in recent decades (the numerator), overall student enrollments (the denominator) have generally increased too with the exception of baccalaureate institutions (as we saw in Section 2.2).
These and other dynamics have led to interesting patterns in student athletes as a share of all undergraduates, illustrated in Figure 12.5 and Figure 12.6. Public universities have lower percentages of student athletes than private universities, and bigger universities have lower shares of student athletes than do medium and small institutions. Thus, at R1 Public universities, student athletes average just a few percent of the student body, while at private baccalaureate colleges, nearly 30% of the student body are athletes (Figure 12.5). The trends diverge by size: larger universities (R1 and R2, public and private) have decreased their shares of student athletes on campus largely due to overall enrollments growing faster than athletics team slots. Many of these schools have fielded a large set of sports for men and women for some time, so they are closer to an upper bound. In contrast, medium to small institutions have all increased their shares of student athletes on campus (since at least the early 2000s when data began). This latter trend is especially noticeable when viewed by association and division (Figure 12.6). The NCAA Division I schools have not seen an increase in the percentage of student athletes on campus, while NCAA Divisions II and III as well as both divisions of the NAIA have seen higher percentages of student athletes. The growth is particularly pronounced in the NAIA where that share has virtually doubled in several categories. A recent study of athletics at small colleges that compete predominantly in lower division sports found that certain sports (e.g., women’s golf, women’s and men’s lacrosse) have grown rapidly, and that while women’s sports have grown faster than men’s, the number of men’s sports and participants have each
5 Athletics subsidies contribute to the historic tension between academic and athletic priorities. For the record, despite an admission advantage (Malekoff 2005) and lower GPAs (Rampell 2010), graduation rates for athletes are higher than for the broader student body (NCAA 2019b).

12. Athletics 277
increased too (Hearn et al. 2018). The authors make the case that expanding into desirable sports and growing the percentage of student athletes can expand appeal to prospective students, creating a potentially astute enrollment strategy for certain small colleges.
Figure 12.5. FY2003 and FY2018 student athletes as a share of all undergraduates by Carnegie classification and control. Source: EADA (Office of Postsecondary Education 2020).
Figure 12.6. FY2003 and FY2018 student athletes as a share of all undergraduates by athletic association, division, subdivision and control. Source: EADA (Office of Postsecondary
Education 2020).
0%
5%
10%
15%
20%
25%
30%
R1 Public R2 Public R3‐M3 Public BAS Public R1 Private R2 Private R3‐M3 Private BAS Private
Stud
ent A
thletes a
s Sha
re of A
ll Und
ergrad
uates
Public 2003 Public 2018 Private 2003 Private 2018
0%
5%
10%
15%
20%
25%
30%
35%
40%
45%
Division IFBS
Division IFCS
Division Ino FB
Division IIwith FB
Division IIno FB
Division IIIwith FB
Division IIIno FB
Division I Division II
NCAA NAIA Other
Stud
ent A
thletes a
s Sha
re of A
ll Und
ergrad
uates
Public 2003 Public 2018 Private 2003 Private 2018

Like Nobody's Business278
12.4 What are the trends in athletics spending and where does the money go?
Athletics expenditures at most types of schools are virtually the same as the revenues shown in Section 12.1, except that FBS schools average several million dollars (a few percent) less in annual expenditures. That margin may be used for reinvestment, carried forward to the next year, or (rarely) returned to the university. Whether it is truly a profit (in everyday terms; recall from Section 3.9 that technically it’s a margin in the nonprofit setting) depends on all costs being fully accounted—student financial aid is sometimes overlooked as a cost to the institution, as are regular facilities maintenance expenses. In general, though, total athletics expenditures look much like total revenues.
Because universities field different numbers of sports and various sized teams, athletics expenditures can be usefully scaled and compared as expenditures per athlete, much like university spending per student. Athletics expenditure levels are illustrated in Figure 12.7, including inflation-adjusted changes from FY2003 to FY2018 (the trends between those years are approximately linear in most cases). The amounts per subdivision generally scale as expected, with FY2018 expenditures per student well over six figures at FBS institutions6 and over $40,000 in the rest of NCAA Division I. Curiously, among the latter, the FCS programs spend slightly less than the non-football subdivision programs, perhaps because the large size of football squads increases the denominator relative to other sports. All lower divisions spend under $20,000 per athlete.
6 In FY2018, FBS schools per-athlete spending averaged almost $300,000 in basketball and almost $200,000 in football. The other FBS sports averaged about $50,000 per athlete and ranged between $10,000 (Sailing) and $120,000 (Ice Hockey) per athlete (Office of Postsecondary Education 2020).
The real story in Figure 12.7 is the growth. Almost all divisions have grown per-athlete expenditures by half over those sixteen years, with the FBS and NAIA Division II closer to double. In annualized growth terms, all divisions have expanded at least 2% above the rate of inflation with several above 3% and the same couple closer to 4%. These patterns highlight the expansion of athletics on a financial and a per capita basis at two to four times the analogous rate for university-wide expenditures (see Section 3.4). When FY2020 data become available, they are likely to show the dramatic effects of COVID-19 on athletics finances, nowhere more so than in the FBS: virtually no ticket revenue, canceled games and seasons, layoffs and furloughs, program cuts, and even elimination of smaller sports at some institutions (Uhler 2020).
While the size of athletics expenditures varies across subdivisions, in a relative sense the money goes to a consistent set of expenses more-or-less across the board. Figure 12.8 shows athletics expense categories as a share of total expenditures for the NCAA. Athletic scholarship aid is the only category with substantial differences across the subdivisions: in Division I it ranges from 13% of the total at FBS autonomy

12. Athletics 279
Figure 12.7. FY2003 and FY2018 total institutional athletics expenditures per student athlete averaged by athletic association, division, and subdivision. Source: EADA (Office of
Postsecondary Education 2020).
$‐
$20,000
$40,000
$60,000
$80,000
$100,000
$120,000
$140,000
Division IFBS
Division IFCS
Division Ino FB
Division IIwith FB
Division IIno FB
Division IIIwith FB
Division IIIno FB
Division I Division II
NCAA NAIA Other
Athletic Expen
ditures p
er Athlete (FY2
016 Dollars)
2003 2018
(Power Five) schools to a bit under 30% for the FCS and non-football subdivisions; in Division II, aid is about one third of the budget; and, in Division III there is virtually no aid by stipulation. If we omit financial aid then all NCAA subdivisions spend
Figure 12.8. FY2018 athletics expense categories as a share of total athletic expenses by NCAA subdivision. Source NCAA (2019a).
0%
10%
20%
30%
40%
50%
60%
70%
80%
90%
100%
FBSAutonomy
FBSNon‐Aut.
FCS No FB FB No FB FB No FB
Division I Division II Division III
FY20
18 Sha
re of E
xpen
ses
Other ExpensesMedical ExpensesGuarantee ExpensesRecruiting ExpensesGame & Travel ExpensesAdmin. Comp. & SeveranceFacility ExpensesCoach CompensationAthletic Student Aid

Like Nobody's Business280
their funds in a remarkably similar pattern (much as we see in Division III), over one quarter on coaches (see Section 12.6 below), about 20% each on facilities costs and on administrative compensation and severance packages, about 15% on game and travel expenses, and the remainder on all other costs. Clearly, other than the student aid component, it takes much the same mix of activities and resources to run an athletics department no matter if its teams are regularly on national television or competing in the lower divisions.
12.5 Which sports make or lose money?
The so-called “revenue sports” are football and men’s basketball in the NCAA Division I FBS. Only these two sports in that subdivision (and largely only those in the Power Five conferences) are able to attract enough television viewers and ticket-buying fans to create clear net revenue margins when averaged across the division. And when we look closely at net revenues, as we’ll do below, we’ll see that it’s really about football—perhaps surprisingly, basketball comes in a distant second on average. Those margins cross-subsidize all the other intercollegiate sports at the institution that are typically also competing heavily in Division I. Note that these two sports are not necessarily net revenue positive at all schools in the division, and likewise some other sports that are non-revenue positive on average across the division can be revenue sports at certain schools (e.g., ice hockey).
It bears repeating that, as we saw in Section 12.2, institutional subsidies and student fees account for half to 90% of the athletics budget from the FCS on down through the lower divisions. Therefore, those athletics programs all “lose” money in an overall sense. Of course, within their own (subsidized) budgets they generally balance total revenue with expenses as any other unit would. We’ll focus on the FBS in this section because it is where the generated net revenues are.
It is instructive to see the revenue and expenditure amounts for each sport, illustrated in Figure 12.9. We see that FBS football budgets are two to three times larger than basketball budgets, and basketball budgets are about ten times the size of any other sport. The effects of media revenues and ticket sales on football and basketball finances are thus dramatic. Furthermore, football is a men’s-only sport and over 80% of FBS basketball revenues are earned by the men’s team rather than the women’s team—about two thirds of the expenses are incurred by the men’s team (Office of Postsecondary Education 2020). As much as Title IX has led to greater gender parity in college sports, popular sports culture and fan preferences lag far behind, leading to the financial dominance of these two sports within FBS athletics programs. The net revenues make this plain: about $14M from football, $1M from basketball, and net losses of $0.5M or more in each of the other sports. Football clearly supplies the lion’s share of net revenues and it is remarkable that basketball net revenues are so low, especially given the sport’s high visibility and the comparative size of basketball budgets.

12. Athletics 281
Figure 12.9. FY2018 revenues, expenses and net revenue/loss by sport for all sports with over 1,000 participants in the NCAA Division I FBS. Source: EADA (Office of Postsecondary
Education 2020).
While the absolute dollar amounts provide a clear sense of scale across the various sports, it is also enlightening to examine them in relative terms. Figure 12.10 shows net revenue (revenue minus expenditure) for each sport expressed as a share of the
$(30)
$(20)
$(10)
$‐
$10
$20
$30
$40
Footba
ll
Basketba
ll
Swim
ming
Baseba
ll
Volleyball
Soccer
Golf
Lacrosse
Tenn
is
Softba
ll
Wrestlin
g
Rowing
All Track Com
bine
d
Gym
nastics
FY20
18 Reven
ues & Expen
ses (NCA
A D‐I FB
S; $ M
illions) Revenues
Expenses
Net
Figure 12.10. FY2018 net revenue/loss as a share of expenses by sport for all sports with over 1,000 participants in the NCAA Division I FBS. Source: EADA (Office of Postsecondary
Education 2020).
‐80%
‐60%
‐40%
‐20%
0%
20%
40%
60%
80%
Footba
ll
Basketba
ll
Swim
ming
Baseba
ll
Volleyball
Soccer
Golf
Lacrosse
Tenn
is
Softba
ll
Wrestlin
g
Rowing
All Track Com
bine
d
Gym
nastics
FY20
18 Net Reven
ue as S
hare of E
xpen
ses (NCA
A D‐I FB
S)

Like Nobody's Business282
spending in that sport, thus providing a relative index of net gain or loss by sport. FBS football produces a margin that is 60% more than its expenses, while basketball margins are less than 10% beyond expenses. Looking at Figure 12.10 we can see the relative gain/loss profile of sports across FBS schools quite plainly: many have net losses that require as much as half of their expenditures to be cross-subsidized, and as we’ve just seen, almost all of that comes from football.
12.6 Do all head coaches earn millions?
Outside of the NCAA Division I, which is to say at the majority of institutions, head coach salaries across all sports are unexceptional, averaging $45,000 (NAIA Division II) to $69,000 (NCAA Division II with football) in FY2018 (Office of Postsecondary Education 2020). Headline-grabbing seven-figure head coach salaries are largely a feature of NCAA Division I FBS football and basketball, especially in the Power Five conferences. Figure 12.11 illustrates overall head coach compensation for the revenue sports in the Power Five. At these eye-watering levels, football head coaches average $5M annually in the SEC and “only” $3M in the PAC-12. Those earnings are 25–65% higher than the men’s basketball head coaches that average just over $2M in the PAC-12 and near $3M in the other conferences. Base institutional salaries generally account for over 90% of the total pay, with 3–9% in bonuses and up to 6% from non-university athletically-related compensation (e.g., endorsements, consulting with apparel and equipment manufacturers, guest speaking, sports camps). These coaches are usually the highest compensated individuals at their institutions, earning more than the president and the rock-star surgeons. For some observers these numbers are obscene and for others they are the reality of the market, but all can agree that they are quite extraordinary.7
7 The contrast between the sky-high coaches’ salaries, athletics revenues, and the prohibition against student-athlete compensation has for years created rising pressure on the NCAA to permit athletes to profit from their name, image and likeness, a decision that it recently approved (Anderson 2020a). The highest-rated football recruits in the FBS generate $650,000 for their programs annually (Anderson 2020b). A recent study estimated that in the Power Five conferences, assuming wage structures from professional sports and a 50% share of revenue, that a starting quarterback should earn $2.4M annually, a wide receiver $1.3M, with the lowest-paid backups still earning over $100,000 annually (Garthwaite et al. 2020).
What about trends in head coach salaries? Figure 12.12 shows inflation-adjusted head coach salaries averaged for all sports by division since FY2003. FBS head coach salaries have risen dramatically, more than doubling over this period at an annualized rate of 5% above the rate of inflation. No doubt the football and basketball coaches’ compensation affect the average—major football coach salaries rose 9% from FY2018 to FY2019 (Lederman 2019)—but non-revenue coaches at Power Five schools have seen steep raises too (Berkowitz et al. 2019). FCS head coaches earn about the same in real terms now as they did in 2003, while head coaches in the non-football subdivision of NCAA Division I have grown at an annualized rate of 1.6% above inflation since then. Outside of NCAA Division I, head coach salaries have remained flat for over a decade—those coaches, who comprise the majority of head coaches nationally, are

12. Athletics 283
Figure 12.11. FY2019 football and men’s basketball head coach pay for the NCAA Division I FBS Power Five conferences, including base institutional salary, bonuses paid and athletically related compensation from non-university sources. Source: USA Today
(2020a; 2020b).
SEC Big Ten Big 12 ACC Pac‐12 $‐
$0.5
$1.0
$1.5
$2.0
$2.5
$3.0
$3.5
$4.0
$4.5
$5.0
FY20
19 Head Co
ach Pa
y ($ M
illions)
FB School FB Bonus FB Non‐SchoolBB School BB Bonus BB Non‐School
making relatively less today in real terms than they did in the early 2000s. As in other aspects of college athletics finances, in head coach compensation amounts and trends the contrasts between the top-tier and the rest are as conspicuous as ever.
Figure 12.12. Trends in inflation-adjusted average institutional head coach salary across all sports by athletic association, division, and subdivision. Source: EADA (Office of Postsecondary
Education 2020).
$‐
$50,000
$100,000
$150,000
$200,000
$250,000
$300,000
$350,000
$400,000
$450,000
$500,000
2003 2004 2005 2006 2007 2008 2009 2010 2011 2012 2013 2014 2015 2016 2017 2018
Average Head Co
ach Salary (FY2
016 Dollars per FTE)
NCAA Division I FBS NCAA Division I FCS NCAA Division I no FB NCAA Division II with FB NCAA Division II no FB NCAA Division III with FB NCAA Division III no FB NAIA Division I NAIA Division II

Like Nobody's Business284
12.7 Does athletic success benefit the university’s bottom line?
It happened on a windy and rainy Miami afternoon in 1984, the Friday after Thanksgiving, at the end of a nationally-televised football game between Boston College and defending national champions, the University of Miami. An improbable Hail Mary pass in the final second of the game by Doug Flutie,8 the Boston College quarterback, led to a classic victory and ensured that this now-legendary moment became enshrined in the annals of college sports. For two years following the win, Boston College experienced a rise in applications that many attributed to the school’s high-exposure success on the field. The post-game increase was alliteratively dubbed the Flutie Factor, or Flutie Effect. Ever since then, because most football seasons and virtually every basketball tournament produce compelling underdog stories,9 anecdotes surface regularly about the Flutie Factor working for other schools (Nowicki 2014; Wikipedia 2020).
The claimed benefits of this supposed phenomenon have broadened over the years to include not only the quantity of applications but also their quality, reputational rankings, merchandise sales, publicity value, philanthropic gifts, attendance growth, licensing royalties, and state appropriations as well as less tangible benefits including name recognition and institutional prominence. While increased game attendance, team merchandise sales and licensing royalties are unsurprising following high-profile athletic success, they benefit primarily the athletic department.
What about the more fundamental assertion embodied in the Flutie Factor, that athletics success benefits the wider university? It turns out that unequivocal answers to that question were elusive for many years, with studies of varying scope and sophistication producing mixed and even contradictory results. The two most comprehensive and econometrically advanced studies are both recent: a paper by Anderson (2017) and an article by Baumer and Zimbalist (2019). The latter authors provide an expert review of the literature covering 25 studies; those findings, the results of their own analyses, and two further recent papers (Eggers et al. 2019; D.R. Smith 2019), for a total of 28 altogether, are the basis for the relationships depicted in Figure 12.13. Nearly all of the studies focus on NCAA Division I, some more narrowly on the FBS, and the majority cover football although some incorporate men’s basketball; 16 of
8 After winning the Heisman Trophy and becoming the first to break the 10,000 yards passing barrier in a college career, Flutie went on to play professional football. He retired from the game in 2006 and became a sports broadcaster. Of the many articles on what became known as the Hail Flutie game, one of the most evocative was written for its 30th anniversary by Mark Brown (2014); it includes the obligatory video clip and many others in a lively summary of the game.
9 One of the most notable Cinderella stories is the rise of Gonzaga, a previously obscure small college in Spokane, Washington, that was in serious enrollment and financial decline during the 1990s. After bursting to prominence in the Elite Eight round of the 1999 NCAA Men’s basketball tournament, a series of major athletics gifts and continued strong performance vaulted the school’s national exposure and led to documented increases in enrollments and academic quality of applicants (O’Neil 2017).

12. Athletics 285
the studies focus on applicant quantity and quality, 11 on philanthropic giving, and 4 on state appropriations.
Figure 12.13. Summary of the strength of statistical relationships between athletic success and hypothesized benefits, based on review of 28 scholarly articles. See text for details.
None of the relationships are strong, and those with any effect favor football over basketball. The statistical link between athletic success and number of subsequent applicants is weak to moderate at best, with the size of the increase being just 0.5–1% in the most comprehensive studies and lasting one to three years; when studied, the additional applicants tended to be less academically prepared and originated in-state. That likely explains why the observed effect on admissions yield is extremely weak statistically and any effect is small (about 0.5%). The relationship between athletic success and a school’s SAT scores is likewise exceedingly weak, with an essentially meaningless impact of 0 to 8 points (a fraction of a percent). None of these applicant quantity or quality metrics has a direct financial benefit, and many schools have fixed incoming classes, but it could be argued that improvements in yield might make the institution slightly more selective and thus able to charge higher tuition.
Figure 12.13 also illustrates several metrics that are explicitly financial: gifts to the athletics program, gifts to the university excluding athletics, and state appropriations. Analyses of giving are plagued by incomplete data, but there may be a weak statistical link to athletic giving, with an impact of several hundred thousand dollars (perhaps 5–10%). There is no robust link between athletic success and broader university giving, nor is there a relationship to legislative appropriations to public institutions.
Overall, under expert scrutiny, it appears that the Flutie Factor is often exaggerated, and the limited effects found in the most thorough studies are small when they exist
Applicants
Admissions Yield
SAT Scores
Gifts to Athletics
Gifts to University
State Appropriations
None Weak Moderate Strong Very StrongStatistical Relationship to Athletic Success

Like Nobody's Business286
at all. Interestingly, the attribution of the enrollment bump at Boston College to the Flutie Factor was later discounted and was instead explained by a set of campus investments and enrollment growth in the years before and after Flutie’s eponymous pass (McDonald 2003). Despite the lackluster evidence, it’s a testament to the power of a great story that advocates and commentators continue to mention the Flutie Factor when discussions turn to the benefits of college athletics for the rest of campus.

13. Fundraising
13.1 How much do universities raise in gifts?
Philanthropic giving to universities is an essential part of their business model. This has always been true for private universities, and for most public institutions it has become increasingly true over the last several decades. Of course, the relative role of gifts and endowment income is far greater at the privates than the publics, as we saw back in Sections 2.4 and 2.5; combined, they account for 5–10% of the budget at public institutions and 20–40% of the budget at privates. Thus, it shouldn’t surprise us that education is the second largest charitable cause at 14% of all giving, second only to religion at 29%, and ahead of giving to human services and health at 13% and 9% respectively (Giving USA 2020).
The levels of giving to different types of institutions are illustrated in Figure 13.1, split into deciles to show the huge range of giving within each type of institution. Gift totals clearly scale with school size and as I just noted, size-for-size, private institutions
© Andrew C. Comrie, CC BY 4.0 https://doi.org/10.11647/OBP.0240.13
Figure 13.1. FY2018 gifts averaged per decile by Carnegie classification and control. Source: IPEDS (2020).
$‐
$200
$400
$600
$800
$1,000
$1,200
$1,400
R1 Public R2 Public R3‐M3 Public BAS Public R1 Private R2 Private R3‐M3 Private BAS Private
FY20
18 Gifts b
y Decile
($ M
illions)

Like Nobody's Business288
attract more than public ones. The sheer dollar amounts raised are astonishing—in FY2018 the top 10% of R1 publics attracted over $380M in new gifts, while the top decile of R1 privates raised nearly $1.3B, over three times more—and these averages are per-institution and they raise these amounts anew every year. The stark disparity in gift income within each type of school is even more dramatic. The bottom 10% of R1 publics attracted about $10M in new gifts in FY2018, while the bottom decile of R1 privates raised “only” $76M dollars. Across all types of institution, the lowest decile raises from 0.1–3% of the highest decile.
Gift amounts per student afford a more consistent comparison across institution types, and in Figure 13.2 we can see that FY2018 gifts per student at the publics amounted to no more than a few thousand dollars at most publics and under $10,000 in the topmost decile of each institution type. At the privates, the profile of R3-M3 privates, the lowest type, is similar to the R1 publics with all but the top decile under $5,000 per student in new gifts, while at the other privates the schools in the upper deciles raise many tens of thousands of dollars per student annually, peaking at more than $70,000 at the top 10% of R1 private universities. Private baccalaureate colleges stand out as receiving the second highest level of overall gift support per student. It’s worth noting that R1 universities attract sizable gifts for research and athletics beyond the mix at other institutions, which increases their general and per-student gift totals. Also, a reminder that we are looking just at new giving here and that endowment income is a separate but equally important source of philanthropically-derived support (endowments are covered in Sections 13.3 and 13.4).
Figure 13.2. FY2018 gifts per full-time equivalent student averaged per decile by Carnegie classification and control. Source: IPEDS (2020).
$‐
$10,000
$20,000
$30,000
$40,000
$50,000
$60,000
$70,000
$80,000
R1 Public R2 Public R3‐M3 Public BAS Public R1 Private R2 Private R3‐M3 Private BAS Private
FY20
18 Gifts p
er Stude
nt FTE
by Decile

13. Fundraising 289
Giving has tripled over the last three decades at most types of university, the exceptions being the two smallest types of private school (R3-M3 universities and baccalaureate colleges) as shown in Figure 13.3. The latter saw some growth in gift support during the late 1990s but their inflation-adjusted trends have otherwise been flat. Considering that the R3-M3 private schools have experienced slight enrollment growth over this period, their per-student gift support has actually declined by almost 40% (not shown) since its peak in 2000. The reason that we don’t see a similar pattern in the smaller publics, which have seen analogous enrollment patterns, is that virtually all publics initiated or expanded their development programs during this time. Many public institutions were starting from low levels of fundraising activity relative to the privates that already had active giving programs, and the publics thus had plenty of opportunity to grow (although their received gift totals are still substantially less than at the privates, as we saw above). Fundraising programs are still growing throughout the medium and small publics and it’s not yet clear when they will encounter similar limitations to further growth seen at the smaller privates. Still, at some point, they must because there is only so much giving capacity available for institutions with lower numbers of alumni and limited geographical spheres of influence.
Figure 13.3. Growth in inflation-adjusted total gifts averaged for the two smallest Carnegie classifications of private institution and for all other public and private institution types, by fiscal year. Values for 1997 and 1998 at private institutions are interpolated at the average rate of neighboring years; the average for other institutions is weighted by
the number in each type. Source: IPEDS (2020).
0.5
1.0
1.5
2.0
2.5
3.0
3.5
1987
1988
1989
1990
1991
1992
1993
1994
1995
1996
1997
1998
1999
2000
2001
2002
2003
2004
2005
2006
2007
2008
2009
2010
2011
2012
2013
2014
2015
2016
2017
2018
Growth in
Gifts (FY19
87 Base Ye
ar)
All Others
R3‐M3 Private
BAS Private

Like Nobody's Business290
13.2 Who is giving, and what are they supporting?
The mix of individuals and groups giving to higher education has shifted in recent decades, reflecting the changing face of philanthropy. Alumni have always been and will always be an important donor group, precisely because alumni have personal ties and emotional connections to their alma mater. As we can see in Figure 13.4, alumni donations are consistently among the top sources of giving to universities and colleges, although the preeminence of alumni giving changed after 2001 as philanthropic foundations took the top spot, part of the latter’s multi-decade increase in importance. At about the same time, and similarly to alumni giving, inflation-adjusted giving by non-alumni individuals and by corporations also flattened. The absolute and relative roles of giving by religious organizations has decreased consistently since the 1960s, to the point where those contributions have become sufficiently small to be included with other organizations since 2014. However, this is not the reason for the increase in giving by other organizations, which instead reflects an underlying change in the nature of philanthropy that is closely connected to the increase in importance of foundation giving.
Figure 13.4. Seven decades of voluntary support for degree-granting postsecondary institutions by source of gift, in FY2016 dollars. Sources: NCES (National Center for Education Statistics 2018e) and CASE (Council for Advancement and Support of Education 2020).
The growth in independent foundations parallels the affluence generated in the private sector, such as in technology and finance (e.g., Gates Foundation and Bloomberg Philanthropies), and the number of independent foundations grew by 40% from the early 2000s to the mid-2010s (Foundation Center 2020). That rise to some extent
$‐
$2
$4
$6
$8
$10
$12
$14
$16
$18
1950
1952
1954
1956
1958
1960
1962
1964
1966
1968
1970
1972
1974
1976
1978
1980
1982
1984
1986
1988
1990
1992
1994
1996
1998
2000
2002
2004
2006
2008
2010
2012
2014
2016
2018
2020
Voluntary Supp
ort b
y Source (FY2
016 $ Billion
s)
Alumni
Non‐Alumni Individuals
Corporations
Foundations
Religious Organizations
Other Organizations
Other (incl. Religious)

13. Fundraising 291
reflects a shift in structure of how individual wealth is given away more indirectly than before. Similarly, the growth in popularity of donor-advised funds is an example of how individual wealth is given away using a different structure, and these account for some of the recent rise in the other organization category seen in Figure 13.4. Donor-advised funds are managed by community foundations or charitable arms of investment companies (the latter having lately seen substantial growth). They enable a donor to place money in the fund and claim the charitable tax deduction right away while the fund subsequently gives the money to charitable causes (technically an independent decision by the fund, but in practice virtually always on the advice of the donor). Thus, the mechanisms by which individual wealth is donated have been changing, affecting the appearance of who is giving to higher education. Also, while major gifts and giving overall are on the rise, household giving rates are actually declining (Osili 2019).
Not all contributions from independent foundations are gifts. Many such foundations have extensive grant-making programs that support work in research, education and public outreach. For example, several of the largest foundations, including Mellon, Duke, Ford, Kellogg, and MacArthur, recently announced a $1.7B initiative in cultural inclusivity that will support nonprofit institutions in higher education, the arts and the humanities (Jaschik 2020). Most universities (and their foundations, if applicable) have established rules about what counts as a gift versus a grant or contract. The general rule of thumb is that the donor should not receive more than a thank you note for it to be a gift, versus a grant or contract where there are typically deliverables. Such rules are a defense against creative investigators and/or donors who wish to avoid paying the facilities and administration cost recovery charges for grants (see Chapter 8).
Now that we’ve seen where donations come from, let’s move our attention to the intended purposes of those gifts. Gift purposes are divided into two broad categories, current operations and capital, as illustrated in Figure 13.5. Gifts to current operations are those that are available directly for current spending on a wide variety of purposes. In contrast, gifts to capital purposes will last for many years (e.g., buildings, property and major equipment) or they will last in perpetuity (i.e., endowments) and are managed to produce income for annual expenditures. Gifts to research cover the whole range of scholarly pursuits from science to the humanities, while donations to academic divisions include those made to departments, schools and colleges but without other restrictions (such as a research topic or student scholarship). Unrestricted gifts, those without a purpose expressed by the donor, are far less common than they were a generation or two ago—unlike all other (restricted) gifts that can only be spent on their stipulated use, unrestricted gifts can be used however the institution deems best. Gifts to student financial aid include non-endowment contributions for scholarships (merit or need-based), student awards, and some athletic scholarships.

Like Nobody's Business292
Figure 13.5. FY2018 distribution of gifts to higher education institutions by purpose. Source: CASE (Council for Advancement and Support of Education 2019; 2020).
Speaking of athletics, let’s bust a persistent myth about giving to athletics versus academics: on average, athletics receives just 4% of gifts to the university for current operations. There’s a perception on many campuses that the lion’s share of giving goes to athletics, and while athletics gifts also go to endowments and facilities, the total athletic share pales in comparison to the academic share.1 There’s a related hypothesis that courting athletics donors somehow crowds out donors who otherwise might give to academics. Its flawed assumptions are that fundraising for an institution is a zero-sum game and that donors can be redirected to other causes. The bulk of athletics fundraising is directly linked to obtaining premium football and basketball tickets and associated privileges such as stadium clubs and parking privileges. Astute presidents and fundraisers know that it is not an either/or proposition and that, while there are benefits to greater exposure and the occasional major athletics donor can be persuaded to support the institution more broadly, donor passion and intent drive most giving decisions and these are largely separate sets of donors. The research literature on this effect is small, but the most thorough recent study found evidence for spillover benefits from athletic giving to academic giving rather than crowding out such donations (Koo and Dittmore 2014), although recall from Section 12.7 on the related Flutie Factor that the magnitude of these kinds of effects is small.
Returning to the distribution of gifts by purpose, a large share of donations goes to restricted endowments. These are the core gift funds that support student scholarships,
1 There are exceptions but they are rare. For example, even in the SEC, only LSU raises more gift funding for athletics than for academics; the other conference members typically raise twice as much money “for the classroom as for the locker room” (Allen 2016).
Research 17%
Academic Divisions 11%
Unrestricted 6%
Student Financial Aid 5%
Athletics 4%
Other Operations 14%
Endowment Restricted (Scholarships, Chairs, Etc.) 27%
Property, Buildings, & Equipment 12%
Endowment Unrestricted 2%Deferred Gifts 1%
Capital Purposes Current Operations

13. Fundraising 293
named chairs, centers and institutes for the long term. Making a gift to endow these purposes involves a challenging trade-off, as much for the donor as for the department chair or dean soliciting the gift: current needs are almost always pressing and a large contribution of cash in the short run can make a sizable impact immediately versus a smaller impact for the long run. For example, a $100,000 gift can benefit 20 needy students with scholarships of $5000 for one year, or it can provide a single $5,000 scholarship for just one student in perpetuity, taking twenty years to reach the same level of impact. Only after that time, at which point the donor may have passed on, does the lasting impact of an endowment manifest itself. Thus, endowments are about the long game and they are not necessarily the vehicle of choice when shorter-term goals are a priority.
Buildings are a particularly visible sign of large capital gifts. Depending on the building’s purpose, the gift might account for a substantial portion of the construction expenses or it might only cover a minor portion of the overall project cost. There may be other sources of funds for classroom or laboratory buildings that can be supplemented with gifts, while funds for performance halls or stadiums may not be given the same precedence for funding as academic buildings, meaning that a larger proportion of those dollars will need to be raised from private donations. Most universities have established policies on the gift amounts associated with naming buildings, centers, programs, etc. after donors (and of course buildings can be named without relation to a donation to honor a significant social figure such as a politician, civil rights leader, or former university president).2
13.3 How big are endowments and how much have they grown?
The basic concept of an endowment is simple: rather than spending a cash gift on current needs, invest the money for the long term and use the proceeds to provide funding in perpetuity. We’ll go through an illustrated example of how endowments work in the next section (Section 13.4), but first let’s clarify some language and get a sense of endowment size and growth across higher education.
We tend to talk about endowments like we talk about sheep, using the same word for the singular and the plural (as I just did in the previous paragraph). This can lead to unfortunate misperceptions both on campus and in public policy, especially the use of the singular to describe the entire university endowment. The resulting impression is that there is a single fund containing a vast hoard of cash that can be spent on whatever the university desires or used as a rainy-day account to avoid budget cuts in times of financial need. There is no single fund. University endowments are collections of
2 Names can be removed and naming gifts returned if warranted. For example, the names of controversial figures such as pro-slavery alumni at Yale (Thelin 2017) and Woodrow Wilson at Princeton (Princeton University 2020) have been removed from campus buildings, as was the name of donors to Tufts who were linked to the opioid crisis (Seltzer 2019b). The issue can go further: at the University of Alabama a donor seeking improper influence had his name removed from the Law School and his gift returned (Jaschik 2019c).

Like Nobody's Business294
hundreds or thousands of individual funds, each from a distinct original gift and almost all from different donors over time. So, technically, the university has endowments, plural, despite our confusing verbal shorthand that incorrectly implies a single institutional fund. Endowments are generally not fungible either and virtually all of them have legal restrictions on their purpose as a condition of the gift, as we saw in the previous section. Therefore, the university or its foundation cannot unilaterally spend the principal or earnings of an endowment intended for, say, student scholarships to instead pay for a new stadium or to cover salaries and prevent layoffs. This issue isn’t helped by the conspicuous size of total endowments at the wealthiest elite private universities, which have become sufficiently large that recent legislation imposed a tax on these otherwise tax-exempt organizations.3
Figure 13.6 shows the size of total institutional endowments, split into deciles as we did for gifts because of the unusually large range within each institution type. At R1 public universities the total endowment value is typically $0.5 to $1.5B although schools in the top decile average north of $6B each. Endowments at the other public institution types barely register on the chart: at R2 publics the median endowment is $190M (lowest and highest deciles averaging $22M and $732M respectively), while at the smaller publics the median is $20-$30M with their lowest deciles in the single-digit millions and the highest deciles at $150-$300M.
Figure 13.6. FY2018 endowments averaged per decile by Carnegie classification and control. Source: IPEDS (2020).
3 The 2017 Tax Cuts and Jobs Act imposed a 1.4% tax on private nonprofit higher education institutions with endowment assets greater than $500,000 per student and with at least 500 students enrolled. Less than a few dozen private schools meet these criteria, mostly R1 and BAS institutions.
$‐
$2
$4
$6
$8
$10
$12
$14
$16
$18
$20
$22
$24
$26
$28
$30
$32
R1 Public R2 Public R3‐M3 Public BAS Public R1 Private R2 Private R3‐M3 Private BAS Private
FY20
18 End
owmen
t by Decile
($ Billions)

13. Fundraising 295
Figure 13.6 also makes plain why the most well-endowed private institutions attract special attention—the handful of universities at the top of the pyramid have total endowment assets in the tens of billions of dollars (Harvard leads that list with about $40B). Endowments at the R1 privates are more typically in the single-digit billions, as are the wealthier R2 privates, although the latter are more typically in the hundreds of millions. While the richer R3-M3 privates have endowments in the hundreds of millions, there is a steep drop-off across these institutions and their endowments are more typically in the tens of millions. The private baccalaureate schools display a particularly wide range in endowments, as this group includes some unusually well-endowed elite colleges ($1.5B in the highest decile) as well as many less-wealthy schools (averaging just $11M in the lowest decile).
Returning to those universities with the largest endowments, the concentration of accumulated private giving is especially stark at the very top of the list, as shown in Figure 13.7. The top 2% of schools (23 of them) hold 50% of all university endowment wealth in the country. The first four on the list—Harvard, Yale, Stanford and Princeton—account for over 20%. Counterintuitively, the top 25 list includes 5 public universities: Texas A&M and the University of Michigan are in positions 7 and 8, ahead of large private schools such as Columbia and also the University of Southern California, the latter with an endowment close to those of two more publics, Virginia and Ohio State. Endowment size is determined by many things, including but not limited to the size of the founding endowment (at private institutions), the number of financially successful alumni (in turn a function of time), and the compounding effects of past success and prestige that help to further attract non-alumni donors as well.
Figure 13.7. Top 25 FY2018 university endowments and their cumulative share of all endowments in the data set. Amounts are for the main campus location and do not include branch
campuses reporting separately. Source: IPEDS (2020).
0%
10%
20%
30%
40%
50%
60%
$‐
$10
$20
$30
$40
$50
$60
Harvard
Yale
Stan
ford
Princeton
MIT
Penn
Texas A&
M
Michigan
Notre Dam
e
Columbia
Duk
e
Northwestern
Emory
Wash U
Chicago
Cornell
Virginia
Rice
USC
Dartm
outh
Ohio State
Vand
erbilt
Wisconsin
NYU
John
s Hop
kins
Cumulative Share of All En
dowmen
ts
FY20
18 End
owmen
t ($ Billion
s)
Private Public Cumulative Share

Like Nobody's Business296
The result for high-endowment institutions is that they have extraordinary resources to invest in their educational and research missions, all part of staying ahead in the competition (some would say arms race) to be the best. Assuming a 4.5% payout, every billion dollars of endowment provides $45M in revenue per year—that’s as much as a percentage or two of overall budgets at big universities such as the ones on the top 25 list, and they all receive several multiples of that number.
We can level the endowment playing field somewhat by examining endowment per student, just as we did for gift amounts. Figure 13.8 illustrates those distributions, again by decile as we did above for endowments. The same key observations apply here too: the especially wide range within each type of institution, and the large differences between public and private schools. The lowest deciles at medium and small institutions are just a few thousand dollars of endowment per student, while the highest deciles average in the hundreds of thousands, with the most well-endowed reaching $1M or more per student.
Figure 13.8. FY2018 endowment per full-time equivalent student averaged per decile by Carnegie classification and control. Source: IPEDS (2020).
The top 25 list for per-student endowments is illustrated in Figure 13.9 and, unsurprisingly, with only one exception (Soka University4 in the number 2 spot), it’s a who’s who of the most elite and long-established private schools in the nation.
4 Soka University of America is a small liberal arts college located in Orange County, CA, and it isn’t yet as well-known as the other schools on this list. It provides a secular education emphasizing human rights and interdisciplinary approaches, and was established in 2001 by a Japan-based worldwide Buddhist movement that contributed to its endowment (Soka University of America 2020). In FY2018, Soka’s endowment was $1.3B with an enrollment of 442 according to IPEDS (2020).
$‐
$0.2
$0.4
$0.6
$0.8
$1.0
$1.2
$1.4
$1.6
$1.8
$2.0
$2.2
R1 Public R2 Public R3‐M3 Public BAS Public R1 Private R2 Private R3‐M3 Private BAS Private
FY20
18 End
owmen
t per Stude
nt FTE
by Decile
($ M
illions)

13. Fundraising 297
No public institutions make this list;5 they are all private and virtually all are either R1 universities or baccalaureate colleges. The wealth concentration is slightly less pronounced for this metric than for endowments proper, but the institutions on this list are still home to over one third of all per-student endowment wealth. Using the same payout math as above, $1M of endowment per student equates to $45,000 of annual endowment income per student. Note that this is not what these institutions necessarily spend per student, but it is a relative guide to the level of resources available at the wealthiest institutions. Also, a reminder that research universities have endowments for research institutes as well as for graduate students, and the simple endowment per student metric does not account for these differences.
Figure 13.9. Top 25 FY2018 university endowments per full-time equivalent student and their cumulative share of all values in the data set, shaded by Carnegie classification (all are private institutions). Amounts are for the main campus location and do not include
branch campuses reporting separately. Source: IPEDS (2020).
To wrap up our tour of endowment wealth it’s worthwhile to also look at trends. Endowment values have increased steadily over the years, with the amounts for each type of institution showing the same basic pattern that more-or-less tracks the stock market, which is where the bulk of the funds are invested. A much more interesting trend, and one worth showing, is the relative growth of endowments per student that are illustrated in Figure 13.10 (the patterns are extremely similar to those for straight endowments, but the per-student values provide a more consistent comparison over time). What’s intriguing is that, over the three decades
5 The highest-ranked public institutions on the list are Virginia Military Institute and the University of Virginia at numbers 59 and 60 respectively, each with about $300,000 of endowment per student.
0%
5%
10%
15%
20%
25%
30%
35%
40%
$‐
$0.5
$1.0
$1.5
$2.0
$2.5
$3.0
$3.5
$4.0
Princeton
Soka U of A
merica
Yale
Stan
ford
Harvard
Pomon
a
MIT
Swarthmore
CalTech
Amhe
rst
Williams
Grin
nell
Furm
an
Rice
Bowdo
in
Notre Dam
e
Wellesley
Dartm
outh
Berea
Washington & Lee
U Richm
ond
Smith
Clarem
ont M
cKen
na
Emory
Penn
Cumulative Share of All En
dowmen
ts per Stude
nt
FY20
18 End
owmen
t pe
r Stude
nt FTE
($ M
illions)
R1 R2 BAS Cumulative Share

Like Nobody's Business298
that included several bull and bear markets as well as the Great Recession, inflation-adjusted endowment per student grew by a factor of 3 at private schools and by an astounding factor of 9 at public schools. As we’ll see in the next section (Section 13.4), a typical endowment keeps pace with inflation with the additional returns used for income, so the overall growth we see in this figure is mostly the accumulation of new endowment gifts. Therefore, since the late 1980s, public institutions grew their relative level of endowment giving at three times the rate of the privates. I mentioned in Section 13.1 on gifts that the medium and smaller public institutions are relative latecomers to fundraising and that’s the effect we’re seeing here. Within the average for public institutions in Figure 13.10, R1 schools grew at the same rate as the privates while the other types of institution all grew much faster than their private counterparts (not shown) because many of the medium and smaller publics were just starting their development programs. Of course, they still have a long way to go in absolute terms.
Figure 13.10. Growth in inflation-adjusted endowment per full-time equivalent student, by fiscal year, with averages for public and private institutions weighted by the number of institutions in each Carnegie classification. Values for 1990 at both types of institution and for 2002 at public institutions are interpolated as the average of neighboring years, while the 1997–2002 gap at private institutions is interpolated proportional to the
public institutions. Source: IPEDS (2020).
0
1
2
3
4
5
6
7
8
9
1987
1988
1989
1990
1991
1992
1993
1994
1995
1996
1997
1998
1999
2000
2001
2002
2003
2004
2005
2006
2007
2008
2009
2010
2011
2012
2013
2014
2015
2016
2017
2018
Growth in
End
owmen
t per Stude
nt FTE
(FY1
989 Ba
se Yea
r)
Public
Private

13. Fundraising 299
Box 13.1. State Support As “Endowment Income” for Public Universities
Endowments at public institutions are generally far smaller than at their private peers, about 10–20% after adjusting for enrollment. Unlike the privates, however, public universities receive state support. A thought experiment: if we think of state appropriations as revenue from a sort of “public endowment” then how might the size of public and private endowments compare?
Typical state appropriations down the four types of public institution from R1 to BAS are something like $300M, $110M, $45M and $10M. At a 4–5% payout rate, those revenues represent, in round numbers, pseudo-endowment sizes of $6.7B, $2.4B, $1B and $0.2B respectively. Interestingly, these amounts are larger than their private counterparts, several times so for the medium-sized schools. However, recall that tuition revenue at the publics is generally much lower than at the privates, serving to offset some of these differences in the context of overall institutional revenue. Nonetheless, this exercise shows that, financially speaking, state support is at least as important to public institutions as endowment income is to private institutions.
13.4 How does a university endowment work?
The core idea of a modern university endowment is to invest the gifted funds to produce annual income, known as the endowment return, while maintaining the original amount, called the principal or corpus (Latin for body), such that the endowment can produce income in perpetuity.6 Let’s run an example to see how this works in practice. We’ll assume an endowment of $1M starting in 1980 and that our returns track the S&P 500. Of course, depending on exactly how the funds are invested, any given endowment will have a unique set of returns—more on that later. As it happens, the S&P has performed at just under 8.5% on an annualized basis over the last four decades. If we’d invested our funds and simply reinvested any proceeds and let those grow, we would have seen the value of our investment follow the index curve in the upper panel of Figure 13.11, starting at a smidge over $3M ($1M adjusted for inflation to 2016 dollars) and ending at about $23.5M. Inflation over this period was just over 3% (it was high back in the early 1980s—see Section 3.7). Overall, the annualized
6 Endowments are as old as universities themselves. Although some of the philosophy schools in ancient Athens that predate universities had endowments in the sense of having independent wealth (Lynch 1972), the earliest endowments in the contemporary sense of an income-producing asset were in Europe. For example, in England, the early universities received tithes, 10% annual taxes on the produce of agricultural land, from acreage that passed to them from the dissolution of monasteries (Russell 2006). Early university endowments in the US originated from the wealth of multi-millionaires during the late 1800s and early 1900s, including Ezra Cornell, Benjamin Duke, Leland Stanford, Andrew Carnegie, and John D. Rockefeller (Kimball 2017). Since then, those endowments and may others have grown considerably from alumni contributions.

Like Nobody's Business300
inflation-adjusted rate of return is 5.24% over the four decades but with plenty of ups and downs on that journey.
Figure 13.11. Performance of an example endowment started in 1980 (upper panel) shown as a simple investment with returns tracking the S&P 500 index and as a revenue-generating endowment fund, and as components of the example endowment (lower panel) including annual return, payout, investment management fees, and a surplus (or deficit) for reinvestment (or withdrawal). Amounts are in FY2016 dollars; the inflation-adjusted initial endowment value of $3M corresponds to $1M in FY1980
dollars. See text for details.
$-
$5
$10
$15
$20
$25
1980
1981
1982
1983
1984
1985
1986
1987
1988
1989
1990
1991
1992
1993
1994
1995
1996
1997
1998
1999
2000
2001
2002
2003
2004
2005
2006
2007
2008
2009
2010
2011
2012
2013
2014
2015
2016
2017
2018
2019
2020
Endo
wm
ent (
FY20
16 $
Mill
ions
)
S&P 500 Index
Endowment
Initial Value
$(1.5)
$(1.0)
$(0.5)
$-
$0.5
$1.0
$1.5
$2.0
1980
1981
1982
1983
1984
1985
1986
1987
1988
1989
1990
1991
1992
1993
1994
1995
1996
1997
1998
1999
2000
2001
2002
2003
2004
2005
2006
2007
2008
2009
2010
2011
2012
2013
2014
2015
2016
2017
2018
2019
2020
Endo
wm
ent F
undi
ng C
ompo
nent
s (FY
2016
$ M
illio
ns)
ReinvestmentFeesPayoutReturn
$-
$5
$10
$15
$20
$25
1980
1981
1982
1983
1984
1985
1986
1987
1988
1989
1990
1991
1992
1993
1994
1995
1996
1997
1998
1999
2000
2001
2002
2003
2004
2005
2006
2007
2008
2009
2010
2011
2012
2013
2014
2015
2016
2017
2018
2019
2020
Endo
wm
ent (
FY20
16 $
Mill
ions
)
S&P 500 Index
Endowment
Initial Value
$(1.5)
$(1.0)
$(0.5)
$-
$0.5
$1.0
$1.5
$2.0
1980
1981
1982
1983
1984
1985
1986
1987
1988
1989
1990
1991
1992
1993
1994
1995
1996
1997
1998
1999
2000
2001
2002
2003
2004
2005
2006
2007
2008
2009
2010
2011
2012
2013
2014
2015
2016
2017
2018
2019
2020
Endo
wm
ent F
undi
ng C
ompo
nent
s (FY
2016
$ M
illio
ns)
ReinvestmentFeesPayoutReturn

13. Fundraising 301
Endowment management is all about taking advantage of the overall trend, while weathering short-term downturns, to simultaneously produce a dependable annual income stream and maintain the principal in the long run. Therefore, the question is what (fairly consistent) portion of the endowment can be withdrawn each year, allowing for investment management fees, that will leave enough returns to cover inflation and preserve the original investment? In practice that amount, known as the payout, is typically between 4% and 5%. In our example, we will take an annual endowment payout of 4.2%, and we will pay annual investment management fees of 1%. Those rates result in the endowment trend illustrated in the upper panel of Figure 13.11, which is essentially flat in the long run, just as we desire (it ends slightly up at $3.2M in inflation-adjusted terms). The notion of preserving the inflation-adjusted principal is known as intergenerational equity. This approach is debated in tough times, when some argue that the corpus should be invaded to prioritize institutional survival (Whitford 2020d), and in good times when managers keep payouts low and let the endowment grow, i.e., lowering future risk at current expense (Mehrling et al. 2006).
The components that constitute the endowment performance are illustrated in the lower panel of Figure 13.11, also in inflation-adjusted dollars. After one year, the $3M initial endowment returned 7.6% ($207,000) in FY 1981, allocated as $114,000 in payout (the 4.2%), $27,000 in management fees (at 1%), and a surplus to be reinvested of almost $66,000 (the remaining 2.4%). The next year, FY 1982, the market was down 18.2% and the endowment lost value with a negative return of $468,000. Despite the loss, we still allocated a 4.2% payout ($108,000) and we still needed to cover management fees (almost $26,000), meaning that the endowment actually decreased by a total of $602,000. Thus, we actually invaded the corpus to provide the payout; many real endowments would not have done so. Fortunately, 1983 was a strong year and the (now reduced) endowment returned nearly 52%, although it was not enough to restore the endowment to its initial value—that took until 1986 (see the upper panel of Figure 13.11). Our example endowment did very well during the late 1990s, reaching a peak of more than $6M in 1999 and 2000, and it promptly lost those gains in 2001 and 2002. It sunk to its lowest levels during the Great Recession, about $2.1M in 2009, taking until 2017 to again fully regain its initial value.
One can see the importance of having the intestinal fortitude to take the long view, resisting the temptations of panicking during short-term losses or of spending windfall gains. That said, this was a simple example and in practice university endowment managers do a number of other things to increase value and ameliorate loss. We stuck with a constant payout percentage in our example, but endowment managers evaluate and reaffirm or modify the payout rate every year, trying to keep the rate smooth but sometimes shifting it up or down by a few tenths of 1% after a run of good or bad years. Also, all individual endowment funds are usually comingled for investment purposes while keeping track of individual accounts, much like a bank. Payouts are made into accounts from which the funds are spent by university units, and if those

Like Nobody's Business302
accounts are well-budgeted then they provide a further small buffer against year to year fluctuations. I used the CPI to adjust for inflation as I’ve done throughout the book, but if this endowment was used to pay the salary of an endowed chair position, it would be more likely to rise at the HEPI which has recently run about 0.5% higher than the CPI (both are covered in Section 3.7). As it happens, the payout in our example increased at about that rate so it would be sufficient to maintain a salary commitment.
We tracked the S&P 500 in this example, but most university endowments are not invested in a simple consumer-oriented index fund. Instead, they are managed by a team that will often include investment consultants (a minority of endowments are wholly outsourced and managed by an investment firm). Also, depending on the type of investments in the portfolio there will be various associated costs and fees such as management fees, fund-of-fund fees, advisory fees, fund operating expenses, and custody fees for recordkeeping and reporting (Commonfund Institute 2017b). For simple investments these costs may be half or less of the 1% we assumed in our example, but for complex portfolios they can approach 1.5% (Skorina 2017).
University endowment managers invest the funds entrusted to them across a broad portfolio, as shown in Figure 13.12. Three quarters of the average institutional portfolio is invested in equities (i.e., stocks/shares), about 10% in fixed income investments such as bonds, and slightly more (about 14%) in real assets including real estate. This is the portfolio mix for the average institution, but the average dollars in each type of investment vary because large endowments (over $1B) tend to have a slightly different mix—about half as much in US stocks and bonds and roughly twice the share in private equity and venture capital, in cash, and in private real estate, energy and mining.
Figure 13.12. FY2019 equal-weighted average asset allocations for college and university endowments and higher education foundations. Source: NACUBO (2020).
0%
5%
10%
15%
20%
25%
30%
Ded
icated
US Eq
uitie
s
Ded
icated
Non
‐US Equ
ities
Globa
l Equ
ities
Marketable Alternatives
Private Equ
ity
Venture Cap
ital
US Bo
nds
Non
‐US Bo
nds
Private Deb
t
Cash & Equ
ivalen
ts <1 yr
Treasury In
flatio
n Protected Securities
Real Estate Investmen
t Trusts
Commod
ities/Futures
Publicly Trade
d Master Lim
ited
Partne
rships
Publicly Trade
d Natural Resou
rce
Equitie
s
Private Real Estate
Private Ene
rgy & M
ining
Private Ag
riculture and
Tim
ber
Other
Equities 74% Fixed Income 10% Real Assets 14% 2%
Share of Portfolio

13. Fundraising 303
13.5 Are fossil fuel divestment and socially responsible investing financially viable?
Universities are involved in studying and teaching about environmental, social and governance issues, and their institutional priorities on these topics are often plainly reflected in their official statement of values, usually right next to their mission and vision statements. One important way for institutions to demonstrate that their values have meaning is to align their endowment investments accordingly. The trend towards socially-responsible investing by university endowments began in the late 1970s as part of the divestment movement to boycott the apartheid regime in South Africa—the first was Hampshire College (Dayall n.d.). In 1990, Harvard and CUNY made front page news when they sold all their stocks in tobacco companies (Lewin 1990). Other disinvestment initiatives since then have included the prison industry, gun manufacturers, and companies employing sweatshop labor abroad (Elrod 2013; Chan 2015; Dyer 2018). Given the small portions of endowment portfolios that any such investments represented, and the strong university endowment performance in recent decades noted in Section 13.3, it is clear that those divestments had no appreciable financial effect on endowments while they simultaneously signaled the institution’s disapproval of an activity or industry.
However, by far the most prominent contemporary university divestment movement is against fossil fuel companies. Fossil fuels are the principal source of carbon dioxide and other greenhouse gases that are causing widespread climate and environmental change.7,8,9 The energy sector, including coal and oil companies, has historically been a standard and well-performing part of most investment portfolios. Therefore, quite reasonably as part of their fiduciary duty, endowment trustees and managers have raised questions about the possible risks of divesting from fossil fuel assets and consequent potential losses for the endowment. A minority have asked about the risks and potential losses of not divesting, given the downward prospects for the sector (Grantham 2018; Sanzillo et al. 2018).
Analyses by leading investment advisors and independent economists show that both the investment risks and endowment impact of not investing in fossil fuel
7 This statement doesn’t really need a citation nowadays. I’m a climate scientist and the evidence shows beyond a shadow of a doubt that climate change is happening, with alarmingly little substantive action to stop carbon emissions. If you’re interested, the most authoritative source on the science of climate change, including its consequences as well as adaptation options and mitigation, is the Intergovernmental Panel on Climate Change (www.ipcc.ch).
8 Why target the companies when we all use energy from fossil fuels? Beyond signaling the importance of moving away from fossil fuel consumption, those companies are targets of divestment because they knew about the perils of climate change as early as the 1970s, misrepresented the harm their products would bring about, and funded campaigns to discredit the science, spread disinformation, and influence policy (the same playbook used by tobacco companies), as described by Naomi Oreskes and Erik Conway in their book, Merchants of Doubt (2010).
9 As someone who grew up in South Africa, became a climate scientist, and served as a senior university administrator, there is no more apt section of this book for me to write than this one.

Like Nobody's Business304
energy companies are essentially neutral and possibly even positive. The bulk of most endowments is invested in companies on the stock market, as we saw in the previous section (Figure 13.12). The market is categorized into ten sectors, such as energy, financials, information technology, etc. with endowments typically holding a diverse portfolio across those sectors. We can calculate relative market performance by simply omitting a sector, such as energy, and comparing the non-energy market to the regular market. Figure 13.13 shows these comparisons for the non-energy portfolio and each of the other omitted sector portfolios for two periods, since 1957 and since 1989, as calculated by investment firm GMO (Grantham 2018). Omitting the energy sector makes the least difference of all sectors to overall returns, within 0.1% of the regular S&P 500 (10.18% return for the non-energy portfolio versus 10.25% for the regular S&P 500 from 1957 to 2017; likewise, 9.74% for non-energy versus 9.71% for the S&P 500 from 1989 to 2017). This means that if one was broadly invested across all other sectors, dropping energy was less risky than divesting from any other sector, and that the non-energy portfolio actually ended up doing slightly better than the overall market since 1989.
Figure 13.13. Annualized absolute returns of market portfolios excluding each of the ten market sectors, relative to the S&P 500 for 1957 to 2017 (10.25% annualized return) and for 1989 to 2017 (9.74% annualized return), with the non-energy portfolio highlighted.
Source: Grantham (2018).
Figure 13.14 illustrates the trends for the non-energy S&P 500 portfolio and the whole S&P 500, showing that there is virtually no difference between the two and that, because energy stocks have declined more than the overall market in recent years, the non-energy mix actually ends up slightly ahead. Much the same conclusions were reached in a recent peer-reviewed analysis that applied rigorous econometric
‐0.4%
‐0.3%
‐0.2%
‐0.1%
0.0%
0.1%
0.2%
0.3%
0.4%
0.5%
ExcludingHealth Care
ExcludingConsumerStaples
ExcludingIT
ExcludingEnergy
ExcludingIndustrials
ExcludingConsumer
Discretionary
ExcludingUtilities
ExcludingTelecom
ExcludingFinancials
ExcludingMaterials
Annu
alized
Returns Relative to S&P 50
0 (198
9‐20
17)
1957‐2017 1989‐2017

13. Fundraising 305
methods to assess the financial implications of fossil fuel divestment (Trinks et al. 2018). Another recent study evaluated the impact of divestment in two ways, first on almost 700 institutions that did and did not divest, and second by modeling four actual college and university endowments in detail (Pitzer, Dayton, Syracuse and Stanford); the authors found no consistent impact or negative effects, along with some limited positive effects of fossil fuel divestments on mid-size and large endowments (Ryan and Marsicano 2020). Unsurprisingly, there are papers sponsored by the fossil fuel industry that claim negative impacts as a result of fossil fuel divestment (Cornell 2015; Bessembinder 2017); sustainable-investment groups have provided detailed rebuttals as to why those arguments are not pertinent to the actual performance of fossil fuel investments (Sanzillo et al. 2018). To the question of whether fiduciary duty might prevent fossil fuel divestment, because that duty binds a trustee or endowment manager to make the best financial decisions for the funds they oversee, there is now plenty of evidence that the most prudent fiduciary path is to actively consider calls for fossil fuel divestment—those calls cannot be rejected merely because of uninformed worries about negative risks or losses. Fiduciary duty may even favor divestment: some analysts argue that while fossil fuel investments provided strong performance in the past, their current financial case and future prospects are far weaker (Grantham 2018; Sanzillo et al. 2018).
Figure 13.14. Performance of S&P 500 index with all sectors and excluding the energy sector since sector indices were launched by S&P in mid-1996. Source: S&P/Investing
(Investing.com 2020).
How does an endowment divest from fossil fuels? It’s a process rather than an event. The institution typically announces that it has decided to divest and that it will
0
1
2
3
4
5
6
1996
1997
1998
1999
2000
2001
2002
2003
2004
2005
2006
2007
2008
2009
2010
2011
2012
2013
2014
2015
2016
2017
2018
2019
2020
Mon
thly In
dex (July 19
96 = 1)
Non‐Energy
S&P 500

Like Nobody's Business306
complete the process within a year or two. A period of time is necessary because some investments have rules about when investors can get in or out, or they are only offered at certain times. Having that time enables the endowment managers to integrate the sale of direct and indirect investments in fossil fuels into the flow of transactions while they balance the portfolio through the purchase of other positions. Direct investments include, for example, shares in an oil company, while indirect investments include index funds and other instruments that commingle fossil fuel stocks with many others. Divestment initiatives sometimes include a commitment to shed only direct investments in fossil fuels (or even narrower, such as coal only), while others promise full divestment including indirect holdings. Figure 13.15 shows the mix of divestment at the 60 institutions that have made the commitment so far. About two thirds are in the process of fully divesting or are already fossil free, while institutions in the other third have committed to various permutations of limited divestment (e.g., partial divestment of direct investments only, or coal companies only). Together, all these schools represent about 5% of all universities and colleges; they include institutions of all types such as large public and private universities (e.g., University of California system, Johns Hopkins) as well as smaller public and private schools (e.g., Salem State, Middlebury). For institutions looking to evaluate whether or not to divest, and where to invest instead, there are several sustainable investment groups that offer frameworks and performance information (Cambridge Associates 2014; Dyer et al. 2020).
Figure 13.15. Number of US universities and colleges (or their affiliated foundations) with full and limited fossil fuel divestment, as of mid-2020. University systems are counted as the number of main campuses in the system. Source: Fossil Free/350.org (Fossil Free 2020).
Fully Divesting
Fossil Free
Coal Only
Coal and Tar Sands Only
Partial/Some Companies
0
5
10
15
20
25
30
35
40
45
Full Divestment Limited Divestment
Institu
tions

13. Fundraising 307
Divestment is not so much an investment strategy as it is a reaction and decision to not invest in something. A number of institutions have adopted active strategies to align their endowment investing with their priorities on environmental, social and governance issues (ESG investing). For example, not just divesting from fossil fuels but investing in renewable energy instead, or in companies with commitments to social responsibility. The irony of philanthropy is that it is needed to fix the very system that creates it. To that end, progressive groups in the philanthropy world are now advocating a rethinking of how social justice initiatives could be supported by what they term liberatory philanthropy, which acknowledges the inequalities that produced its wealth and commits to deconcentrating it, as well as making restorative investments in communities and programs that address environmental, social and governance issues aligned with their philanthropic mission (Foxworth 2019).
13.6 How does the business of university fundraising work?
For most people, the thought of asking for donations inspires a dread that rivals their fear of public speaking. Most professors have overcome the latter through their experience in teaching; the same kind of practice and familiarity is also how one overcomes the fear of fundraising and, in particular, making “the ask” (see Box 13.2 for a glossary of fundraising terms). Better yet, most universities employ professional fundraising staff who are not only able to make the actual request but are also invaluable at systematizing the process of raising money. Gift officers often say that fundraising is friend-raising, which underlines the simple truth that relationships are the cornerstone of any development effort. The business of creating and cultivating relationships, figuring how much to ask for, and stewarding the connection after a donor has made a gift take time and require organization—that is the role of the gift officer (or development officer). Lest this sound rather clinical, the magic ingredient is the student, faculty member, department chair, center director, or dean who has the opportunity to talk about what they love with a potential donor—someone who would like to share in that passion for advancing the program or unit and helping it to do good in the world. Like teaching, it’s actually a lot of fun once the anxiety of the unfamiliar is out of the way. So, relationships are key, but how does the money work?
Let’s say that we need to raise a million dollars, perhaps to endow a scholarship program in an emerging field. This scholarship will enable us to attract excellent students who will gain special skills and experiences and position them well for future studies and/or jobs. We have some friends of the department and college who we already know might be willing to support the new program (and if we’re smart, we’ve already mentioned to them our excitement about it). Some of them could even provide a substantial amount, but we’ll need to greatly expand the set of people involved to reach our fundraising goal. Figure 13.16 illustrates a simple gift table example, also known as a donor pyramid, that a gift officer might draw up as a planning tool to help

Like Nobody's Business308
us reach the goal. Working together, we think that we could land one principal gift of almost half the needed amount, we could get three major gifts in the $50,000 range, and a set of others down the pyramid that together will get us to our total. Notice that we need 184 donors across the plan and that we will need to approach three or four times that number of viable prospects in order to net the support we need.
Figure 13.16. Example gift table to raise $1M, showing the donor pyramid (shaded), estimated prospects needed to net those donors, gift amount at each level, total gifts per level, as
well as overall totals for each category. See text for details.
Importantly, these estimates are not arbitrary or a wish-list. They reflect what we know about our alumni, community members with a demonstrated interest in our other work, possible corporate support, and so on. The gift officer will have assessed the capacity of potential donors to give as a function of their connection, prior giving, potential interest, estimated wealth, and more, such that the amounts and timeline are realistic.
Box 13.2. University Fundraising Lingo—A Non-Exhaustive Glossary
THE PROCESS
Advancement — building broad awareness and support through development, alumni relations, government relations, and sometimes marketing and public relations
Ask, “The Ask” — the actual request for support from a donor; sometimes refers to the amount being requested
Amount
$450,000
$50,000
$10,000
$5,000
$2,000$1,000
Prospects
4
12
40
70
150
300
576
Donors
1
3
10
20
50
100
184
Total
$450,000
$150,000
$100,000
$100,000
$100,000
$100,000
$1,000,000

13. Fundraising 309
Campaign, Capital Campaign — a coordinated fundraising initiative to meet a stated financial goal, typically institution-wide; customarily begins with a quiet phase to raise a substantial portion of the goal, followed by a public (marketed) phase to achieve and subsequently celebrate it
Capacity — the estimated giving capability of a prospective donor; a combination of the individual’s disposable wealth and inclination to give to the specific cause
Case Statement — a donor-oriented document that makes the case for support of a fundraising initiative including the need or opportunity and potential impact; often a glossy brochure, possibly a website and/or video
Development — fostering understanding of, and obtaining private support for, an institution’s activities and programs; a subset of advancement
Fundraising — acquiring voluntary financial support from individuals and organizations; a subset of development
Gift Officer, Development Officer/Director — a staff member with primary fundraising responsibilities; typically works closely with an academic unit leader (e.g., dean, director)
Moves Management — the practice of progressing a donor through a five-step fundraising cycle:
(i) Identification — finding prospective donors, or prospects(ii) Qualification — wealth screening and estimating capacity
(iii) Cultivation — building a relationship (“fundraising is friend-raising”)(iv) Solicitation — making “the ask”(v) Stewardship — saying thank you and continuing cultivation
Wealth Screening — assessment of a potential donor’s assets to help estimate giving capacity; includes knowable and public data such as previous giving, real estate ownership, public stock ownership, political donations, and corporate/executive positions
THE GIFT
Alumni Giving — not only gifts from alumni but also the proportion of alumni who donate
Annual Giving — ongoing foundational fundraising program engaging a broad base of donors and prospects; typically generates many smaller donations from letter and email appeals
Bequest — gift made through a will or trust upon the donor’s decease
Charitable Contribution — a tax-deductible donation to a qualified nonprofit organization

Like Nobody's Business310
Donor Pyramid, Gift Table — planning tool that accounts for the many small donations and few large donations typically needed for a fundraising initiative
Legacy Gift — synonymous with bequest, sometimes announced as a gift with current gifts
Major/Principal Gift — large/extra-large gift at the upper end of the typical gift range for the institution
Philanthropy — literally “love of humanity” via the giving of money, expertise or time, often with a long-term or strategic connotation; a philanthropist is an individual giver; a philanthropy is a philanthropic organization or nonprofit foundation that can give and/or be given to
Planned Giving — major gift that is part of an individual’s financial and/or estate planning
Pledge — a promise to donate a specific sum to be fulfilled at a later date
Voluntary Support — broad and/or synonymous term for gifts, donations, bequests and philanthropy
Two further points on donor pyramids and gift tables. First, there’s an interesting trend in the shape of the donor pyramid towards a much narrower profile: the top 1% of donors now account for almost 80% of total giving, rising from 64% just a decade ago (Hasseltine 2017). This shift is likely related to rising wealth inequality and megagifts from the ultra-wealthy, the ultimate example of which is Michael Bloomberg’s $1.8B gift to Johns Hopkins (Bloomberg 2018).
The second point is about campaigns. Donor pyramids and gift tables are often used in institution-wide fundraising campaigns, and almost every university has had or will have a major fundraising campaign. Campaigns are, more or less, a large multi-year marketing wrapper around what is essentially the whole range of institutional fundraising priorities. In years past when university fundraising had a lower profile, a campaign denoted a substantial intensification of activity and sometimes a special target, but nowadays campaigns can be almost continuous and they involve all the colleges and schools. Because the campaign has an identity of its own that is seemingly separate from fundraising in local units within the university, it is not unusual for the campus (and donors) to think that the funds raised in a campaign are likewise separate. I’ve heard people ask, “Where’s that X million dollars the University raised in the campaign? They should give some to our department.” Generally, those funds are not separate; they represent the university-wide total of fundraising done by all the units across the university as part of the overall campaign effort. Campaigns typically have a quiet phase and a public phase. If our school is ordinarily raising about $1M per year, we might plan a five-year campaign to raise $6M: the expected annual amount

13. Fundraising 311
($5M over five years) plus a further $1M from the extra campaign activity. The first two years might be the quiet phase where we concentrate on the top of the pyramid to obtain leadership-level gifts, and then we announce the public phase and say that we’ve already raised $2.4M and we need to reach our $6M goal in the next three years. Of course, we expect to get $3M of that from our regular fundraising, but we need to try and average an extra $0.2M (20%) more per year ($0.6M over the three years) using the momentum of the campaign goal. If we’ve planned well, we’ll reach the goal on time (or early) and celebrate (and start planning the next campaign). If we were over-zealous in our estimates, we might move the timing goalposts and extend the campaign to complete it the next year.
Let’s shift now to how the money arrives, how it’s handled, and how we pay for the process. Most gifts are monetary and they can be made in many forms including credit cards, electronic transfer and checks, but gifts also include stock/shares, real estate, and personal property. Non-monetary gifts are typically sold and converted to cash prior to the institution taking possession—the institution or its foundation will have a policy on how it handles such gifts. Two common exceptions are artwork or manuscripts donated to the university’s scholarly collections—those gifts will usually be handled by the museum curator or special collections librarian and, of course, they are not counted as fundraising.
What happens next will vary somewhat by institution—the main difference being whether or not the gift goes into the accounts of the institution itself or those of its foundation. The presence of a foundation is largely (but not exclusively) a public/private university distinction. Public universities have separate foundations so that, in the memorable words of a trustee I know, “the State can’t get its hands on our endowment!” It’s also useful because the foundation will be a nonprofit for charitable contribution purposes while a public university is technically a state agency of some kind (nonetheless, many public universities will still accept gifts, and often they will be managed by the foundation). For private universities, the institution itself is a nonprofit (recall we are not focusing on for-profit private schools in this book) and only the more complex institutions might have multiple entities for handling various aspects of their finances.10
The role of a university foundation can also vary considerably: at a minimum it will almost certainly hold and invest endowed funds, it can include some or all of the professional fundraising staff (frontline gift officers as well as back-office data analysts and financial specialists), and it may provide some or all the additional functions of an advancement office (e.g., alumni relations; see Box 13.2). Public university foundations have boards of trustees/directors and, while the organization must preserve its legal and financial independence from the main institution, the foundation’s (typically
10 The more complex publics can also have multiple entities connected with fundraising. Examples at such public and private institutions can include real estate investment, foundations for sub-parts such as the law and medical schools, athletics foundations, and more.

Like Nobody's Business312
sole) mission is to support the university. Note that those on the foundation board are not the same as the regents (sometimes also confusingly known as trustees) who serve on the public university (or system) governing board.11
Whether via a foundation or in-house, the entire fundraising operation has costs that need to be covered. While they are sometimes allocated all or in-part from general institutional funds, in many institutions/foundations those costs will be recovered from gifts and/or endowment proceeds via a gift or administrative fee. Such fees are usually in the 1–15% range depending on the base they are applied to, which may variously be non-endowment gifts only, just the first X million dollars of major gifts, only endowment income, and so on.
A discussion of fundraising costs leads, almost inevitably, to the question of return on investment, often phrased as, “What does it cost to raise a dollar?” It’s a fair question, even an important one. But take just one more step and ask, “What is the right cost per dollar raised?” and you will find yourself slipping all the way down the rabbit-hole of seemingly-useful-but-completely-misleading metrics. The notion of a right cost per dollar is a myth that has afflicted the fundraising world for years;12 there is no magic number and it is no more useful than asking, “what is the right cost per student?” The myth stems from the preference of donors to have 100% of every dollar go to the cause, and the incorrect supposition that dollars spent to actually raise the funds are being diverted to activities that should mysteriously be paid for by someone else (tuition from students and families?). This erroneous belief not only undermines the strategic value of investing in growing philanthropic support for education and research, but it also distracts from the impact and effectiveness of the program.
Consequently, while one school might spend 10 cents to raise a dollar, another might spend 20 cents, and either one could be performing relatively better or worse depending on context: a new fundraising initiative will not yet be bearing fruit, or some programs will need to rely more on high-cost and lower margin activities (e.g., special events) instead of depending on major gifts from a few reliable donors. A healthy fundraising program will try to balance this tension between cost and dependency. By all means, we should compare costs per dollar across like programs and institutions, but a holistic range of effectiveness metrics is far better than boiling things down to a single number (BoardSource 2020).
11 As you might imagine, state governing boards, foundation boards, and presidents can have diverging priorities. The resulting politics will occasionally rise to a level that makes the news, such as during a recent chancellor search at Ole Miss (Ganucheau 2019).
12 The nonprofit overhead myth became so pervasive that three leading groups that provide information about charities issued an open letter to donors everywhere, urging them to pay attention to other performance factors (Taylor et al. 2013).

13. Fundraising 313
13.7 What role do alumni donors and associations fill in fundraising?
The quintessential donor is an alumna or alumnus13 but, as we discussed in Section 13.2, that is becoming less and less the case. While the dollar amount of alumni giving overall has continued to rise (Council for Advancement and Support of Education 2019), the number of alumni donors has not risen much at all, as shown in Figure 13.17. The result is that alumni giving participation has been falling since 1990, when it peaked at over 18%, to less than half of that at the current level below 8%. All is not what it seems, however, because technology has enabled us to make dramatic improvements in our databases of contactable alumni, the alumni of record, by a factor of almost two over the same period (Council for Advancement and Support of Education 2019). Thus, the denominator has doubled and this alumni participation metric, also known as the giving rate, has halved and lost its validity as a measure of alumni engagement. Also, a definitional note, alumni donors include those who have given any amount, even just $1. Still, the role of individual alumni giving is changing as the wealthiest alumni give through family foundations and donor-advised funds, as we saw in Figure 13.4.
Figure 13.17. Trends in alumni of record, alumni donors and alumni participation (giving rate) at colleges and universities. Records of contactable alumni have improved dramatically, driving down the participation/giving metric. Source: CASE (Council for Advancement
and Support of Education 2019).
13 I can’t stop myself, the Latin is: alumna (female, singular), alumnae (female, plural), alumnus (male, singular), and alumni (male, plural; or a mixed-gender group). I’m perfectly fine with the colloquial “alum” or “alums” to keep things easy, although I imagine there must be some sticklers out there for whom those terms or the incorrect usage of the others are like fingernails scratching on a Latin blackboard (in tabella unguibus scalpendo, so Google Translate informs me).
0%
2%
4%
6%
8%
10%
12%
14%
16%
18%
20%
0
10,000
20,000
30,000
40,000
50,000
60,000
70,000
80,000
90,000
100,000
1978
1980
1982
1984
1986
1988
1990
1992
1994
1996
1998
2000
2002
2004
2006
2008
2010
2012
2014
2016
2018
Giving Ra
te/Partic
ipation
Alum
ni (A
verage
per In
stitu
tion)
Alumni of RecordAlumni DonorsAlumni Participation

Like Nobody's Business314
To which activities do alumni give, relative to all donors? Figure 13.18 illustrates that mix for giving to current operations (typically lower dollar amounts than capital gifts, and strongly connected to annual giving). We see that alumni give proportionally more to academics, student aid and especially athletics, relative to giving from all donors. Those are all areas where institutional affinity makes a difference. Alumni appear to give relatively less to research, but this is likely not because alumni don’t support research and instead because research is where non-alumni tend to find relatively more affinity and provide the greatest proportion of their support.
Figure 13.18. FY2018 distributions of gifts to current operations from alumni and from all donors. Source: CASE (Council for Advancement and Support of Education 2019).
It’s worth stressing again that fundraising is a relationship practice—it has to be sincere and meaningful—and that fact applies as much to alumni donors as to all donors. If donors get the impression that the relationship is transactional, or if fundraising is managed with sales-type metrics alone (e.g., number of calls, quarterly targets) without those that incentivize relationship-building, then the institution’s fundraising success will be mediocre. Indeed, that mediocrity may be further doomed because the next generation of donors prioritizes the entire engagement experience and an investment impact mindset over the less-engaged institutional allegiance of previous generations. For young alumni it is particularly important to pursue multiple engagement paths: while their philanthropic capacity is small, they can volunteer their time and experience (career nights, outreach events), participate in experiences that celebrate achievement or create further engagement or excitement (athletics has this one figured out, but it’s a work in progress for the academic part of many universities),
0%
5%
10%
15%
20%
25%
30%
35%
Research Academic Divisions Student Financial Aid Athletics Unrestricted/Other
FY20
18 Sha
re of G
ifts to Cu
rren
t Ope
ratio
ns (R
estricted)
Alumni All Donors

13. Fundraising 315
and connect and interact via a relevant and regular set of communication tools (social media, even newsletters).
Alumni associations are evolving in this direction, whether they are free-standing or integrated within the development or advancement office. The old business model was based on limited membership with dues, along with sales of organized travel and cruises, affiliate credit cards, etc., whereas the contemporary business model is shifting away from exclusive membership to inclusive membership for all alumni, signaling the emphasis toward engagement (Fraser and LeMaster 2013; Vlahos 2016). Alumni associations are rarely completely self-sustaining and there is a wide range of institutional contribution to their budgets (The Napa Group 2010) to complement the specific permutation of business model (i.e., mainly dues, fee for service, alumni gifts or foundation support, mainly institutional funds, or some blend of these).


14. Outcomes & Futures
14.1 What are the financial benefits of a degree?
I am as eager as any professor to proclaim that the value of earning a degree is not primarily about earning money. Understanding our world, an educated citizenry, the life of the mind, solving society’s grand challenges, saving lives, and so forth, these are absolutely the good and right reasons to pursue higher education. The fact remains, however, that in today’s world a college education is the broadest, fastest, and straightest way to a higher-paying job and a rewarding career.1 Anecdotes about self-made millionaires who didn’t go to college notwithstanding, there are no rigorous studies that provide any evidence to the contrary—zip, zero, none. The title of a recent piece summed it up: “Please Stop Asking Whether College Is Worth It” (Newton 2018a). All the reliable evidence points plainly and repeatedly to the economic benefits of obtaining a university degree, including a liberal arts degree, and even of completing just some college, versus not gaining any post-secondary education at all. We’ll delve into all that in a minute, but why, then, do we see respected news media running articles that create doubt or directly contradict what we know? Well, many of those articles are about the high sticker price of elite private institutions and/or the associated student debt (and as we’ll see below, the payoff for attending an elite school versus any other isn’t as clear) and the headline-writers know that we are suckers for stories of individual exceptionalism (Steve Jobs was a college dropout, etc.) or ones implying that we can buck the system. So, anecdotes aside, completing a college or university degree, even with reasonable debt, bestows clear financial benefits.
The core point is illustrated in Figure 14.1, which shows the progression in annual earnings by education level. Bachelor’s degree recipients make 56% more than
1 Which, obviously, is why so many students choose to invest sizable sums of money and many years on our campuses. Despite our lofty goals, this is the essential value proposition of higher education, the sine qua non of the university’s existence. Consider this thought experiment: what if people with degrees earned no more or even less than those without, would students still be beating a path to our door? Of course not. Universities would be curious places outside of the mainstream, so few and far between that most current academics wouldn’t be working there. It’s worth mentioning again Clark Kerr’s observation that I noted in Chapter 1: contrary to conventional wisdom, the university did not descend from the Acropolis to the Agora, from the high ideals of learning to the commercial pursuits of the market, but rather the other way around—by serving a market we can create a place of scholarly learning—the university has always found itself in a tension between the two.
© Andrew C. Comrie, CC BY 4.0 https://doi.org/10.11647/OBP.0240.14

Like Nobody's Business318
individuals with only a high school diploma and they contribute 82% more in all forms of taxes. Advanced degree-holders can earn a lot more, especially people with professional degrees, while the situation is dire for those who don’t complete high school. The basic pattern of this chart is repeated for dozens of related metrics such as lifetime earnings, retirement income, charitable contributions, years of children’s education, volunteering, voting, and community involvement; exactly the opposite pattern is seen for measures such as unemployment, family income under the poverty line, lack of health insurance, smoking, and incarceration (Trostel 2015). Regarding unemployment, in 2018 the rate was 2% for people with a bachelor’s degree or higher and double that for those with just a high school diploma, while in 2010 at the height of post-recession unemployment those rates were 4.7% and 10.4% respectively (Ma et al. 2019). The premium of obtaining any kind of post-secondary qualification thus goes well beyond the purely financial benefit and is observed across a wide range of socio-economic variables.
Figure 14.1. 2018 median earnings and estimated tax payments of full-time year-round employees aged 25 and older, by education level. Estimated taxes paid at each income level include federal income, social security, Medicare, state and local income, sales, and property.
Source: College Board (Ma et al. 2019).
With the cost of attending a university increasing over recent decades, one might think that the college wage premium would show a matching decrease, but the opposite is true: the college wage premium has increased in real terms as the income gap has widened in recent decades (Figure 14.2). Wages for high-school graduates have been stagnant for fifty years while wages for college graduates have risen almost 20% in inflation-adjusted dollars. The difference between the two, the college wage premium,
$‐
$20,000
$40,000
$60,000
$80,000
$100,000
$120,000
$140,000
ProfessionalDegree
DoctoralDegree
Master’s Degree
Bachelor’s Degree
AssociateDegree
Some College,No Degree
High SchoolDiploma
Less than HighSchoolDiploma
2018
Med
ian Earnings & Taxes Paid
After‐Tax Income
Estimated Taxes

14. Outcomes & Futures 319
has consequently grown from about $20,000 in 1970 to about $30,000 in 2018, with most of that rise occurring during the economic expansion of the 1990s (which included the rise of technology sector). The premium lasts for an entire career, and it is possible to calculate the rate of return on the investment in a bachelor’s degree. Naturally, the cash flow is negative for the first several years while the individual is getting the degree and then it rises later. Taking these and other factors into account, the return on a college degree was about 8% in the 1970s, rising after that until reaching and staying in the 14–16% range since the turn of the millennium (Abel and Dietz 2019). Therefore, the investment in going to college is at least as good as the long-run stock market return and as much as double that rate in recent years—literally one of the best investments one can make.
Figure 14.2. Average annual wages of graduates holding only a bachelor’s degree and those holding only a high school diploma, as well as the college wage premium (i.e., the difference),
in 2018 dollars. Source: NY Fed (Abel and Dietz 2019).
So far, we’ve looked at the data overall, but the financial returns on higher education will of course vary with several other factors. What about the dueling propositions that (1) higher education is a pathway to the middle class or (2) that it merely reproduces inequality? As Figure 14.3 illustrates, getting a degree makes a positive difference on mobility at all income levels and, owing to their size, public institutions do most of the moving (Reber et al. 2020). Adult children from families in the lowest income quintile move to higher income quintiles themselves in roughly equal proportions if they receive college degrees, whereas they remain overwhelmingly in the lowest income quintiles if they do not obtain a college degree. Perhaps less expected, adult children from families in the highest income quintile move to lower income quintiles, also in
$-
$10,000
$20,000
$30,000
$40,000
$50,000
$60,000
$70,000
$80,000
$90,000
1970
1972
1974
1976
1978
1980
1982
1984
1986
1988
1990
1992
1994
1996
1998
2000
2002
2004
2006
2008
2010
2012
2014
2016
2018
Aver
age
Annu
al W
ages
of G
radu
ates
(201
8Do
llars
)
CollegeHigh SchoolPremium

Like Nobody's Business320
roughly equal proportions, if they do not receive college degrees, while those with college degrees remain overwhelmingly in the upper income quintiles. So, the positive and negative economic mobility induced by higher education is evident within one generation at all income levels—the first proposition is true. Regarding the second proposition, recall that college-going rates for students from low-income families are lower than for those from high-income families (see Section 7.2), so the income-based inequality of access to higher education ironically also reproduces that inequality (Witteveen and Attewell 2017a). Both are true simultaneously, and they underline the importance of increasing access to college for students from low-income families.
Figure 14.3. Economic mobility of adult children with and without a college degree from families with low and high income. Source: Brookings (Haskins 2016).
Obviously, the major subject of one’s degree can also make an appreciable difference in earnings. Humanities and liberal arts degrees, in particular, seem to attract unfair attention for lower salaries and/or high unemployment rates. Few of these stereotypes really hold water, as shown by the wage and unemployment data in Figure 14.4. Education majors dominate the lowest salary bands, especially in mid-career earnings—it’s no surprise that our K-12 school systems have such a challenge attracting and retaining teachers. While they are underpaid, education majors at least have the consolation of having the lowest unemployment rates. Other bachelor’s degrees with low compensation include the performing arts (with the lowest starting salaries), fine arts, theology and social services. Of those, the fine arts also have a high unemployment rate, so perhaps only the passion-of-the-starving-artist stereotype has any basis in the data. The upper end of the wage distribution is populated mostly by technical fields: engineering of many kinds, economics, finance, accounting, and
0%
10%
20%
30%
40%
50%
60%
Bottom Second Middle Fourth Top Bottom Second Middle Fourth Top
Income Quintile of Adult Child withParents in Bottom Income Quintile
Income Quintile of Adult Child withParents in Top Income Quintile
Share of Adu
lt Ch
ildren Re
aching
Income Quintile
Adult Child Without College Degree Adult Child Without College Degree
Adult Child With College Degree Adult Child With College Degree

14. Outcomes & Futures 321
information systems. General business and business management majors are pretty much at the median, not as high as many may think. It turns out that many liberal arts majors are in the middle of the pack salary-wise, along with some sciences. As recent studies have confirmed, financially, liberal arts majors are as good a choice as many others and negative perceptions about liberal arts colleges and liberal arts majors are not well-founded (Hill and Pisacreta 2019; Rossman et al. 2020).
Figure 14.4. FY2017 early career (ages 22–37) and mid-career (ages 35–45) median wages for full-time workers with a bachelor’s degree only, by major, with highest ten (H) and lowest ten (L) unemployment rates. Source: NY Fed (Federal Reserve Bank of New York 2019).
L LLL LL
HH
H
HH
H
H L L
H L
H
H L
$‐ $20,000 $40,000 $60,000 $80,000 $100,000 $120,000
Early Childhood EducationSocial Services
Elementary EducationGeneral Education
Theology and ReligionSpecial Education
Family and Consumer SciencesMiscellaneous Education
Secondary EducationPerforming Arts
Fine ArtsNutrition Sciences
PsychologyAnthropology
SociologyHealth Services
Leisure and HospitalityLiberal Arts
Ethnic StudiesAnimal and Plant Sciences
Mass MediaForeign LanguageEnglish Language
Miscellaneous Biological SciencesGeneral Social Sciences
Criminal JusticePhilosophyArt History
Interdisciplinary StudiesAgriculture
Public Policy and LawCommercial Art and Graphic Design
BiologyEnvironmental Studies
HistoryJournalism
Treatment TherapyEarth Sciences
Business ManagementMedical Technicians
Miscellaneous TechnologiesCommunications
GeographyAdvertising and Public Relations
General BusinessChemistry
BiochemistryMarketing
Political ScienceNursing
ArchitectureInternational Affairs
Miscellaneous Physical SciencesAccounting
Information Systems and ManagementMathematics
Engineering TechnologiesFinance
Construction ServicesPhysics
Miscellaneous EngineeringBusiness Analytics
EconomicsGeneral Engineering
Civil EngineeringIndustrial Engineering
PharmacyComputer Science
Mechanical EngineeringAerospace EngineeringElectrical EngineeringChemical EngineeringComputer Engineering
FY2019 Median Annual Wage
Early Career Mid‐Career

Like Nobody's Business322
A third subdimension to the financial returns of a degree is the institution from which one graduates (technically you can attend several institutions and transfer courses, but the university on your résumé that awarded the degree is typically the one that counts). More specifically, how much does graduating from a selective institution affect earnings? This is another one of those college and university issues where popular perception and evidence don’t always align. In certain economic classes the social pressure to attend the most selective institutions is intense and it can be a fraught process.2 There is a constant stream of media articles ranking institutions on their graduates’ earnings, and to make matters worse, even the US Department of Education’s College Scorecard website lists earnings after graduation; at least it provides a range rather than a single average (US Department of Education 2020a). Of course, those earnings summaries are strongly influenced by fields of study offered, family income, demographics, geography, and what is termed “signaling”—the premium employers will pay for a graduate from an institution that is hard to get into. Any of these factors and others can strongly bias simple tabulations of earnings by school, and not surprisingly in such lists we see an earnings premium at expensive, elite institutions, or state flagships over smaller regional colleges, and so on. These same factors also feed into the rankings game—that exasperating topic gets a section all of its own, coming up next (Section 14.2).
Still, beyond perceptions of prestige and supposed quality, what is the selectivity effect on earnings after controlling for the confounding factors? Because rigorous research that controls for potential biases requires specialized surveys or cohort data over many years, there is only a handful of such studies for the US. An influential study of 27 institutions, mostly elite privates and a few top public flagships, found that among that group the overall selectivity effect on earnings was effectively zero (Dale and Krueger 2014). The study did find that Blacks, Hispanics, and first-generation graduates earned more if they graduated from the most selective schools in the study. A follow-on study confirmed the overall non-effect for men, but also found that women graduates of selective colleges had higher earnings than those from the (somewhat) less selective institutions in that small set, due in part to their greater workforce participation (Ge et al. 2018). Moving to a much broader set of schools, a recent nationally representative study of the selectivity effect on earnings for two cohort surveys, ten years and four years after graduation, found important earnings differences attributable to selectivity, as illustrated in Figure 14.5. However, the authors stressed how uneven those earnings payoffs are, with strong gender differences at equivalent institutions, contrasts by major, and the effects of family background (Witteveen and Attewell 2017b). The upshot is that for those in the rarified air of being admitted to the
2 The 2019 college admissions scandal, which included a number of celebrities, and in which dozens of wealthy families are alleged to have committed fraud and provided millions of dollars in bribes, shows the intensity of the social pressure and the lengths to which some people will go for entry into the “right” school.

14. Outcomes & Futures 323
nation’s most elite institutions, there are positive financial effects for people of color and women, but for affluent parents and (generally white, male) students, the anxiety and almost absurd hair-splitting in choosing among those schools have essentially no financial (or academic, for that matter) benefit—it’s all about prestige and signaling. However, for most students planning to attend most universities and colleges there is some financial advantage to attending a highly selective institution, but choice of major, academic preparation and other factors are just as important.
Figure 14.5. Average effects of college selectivity on earnings after controlling for multiple pre-college, college, and post-college factors, for bachelor’s degree recipients representing a broad range of institutions four years and ten years after graduation. Source: Witteveen
and Attewell (2017b).
14.2 Do university rankings have a financial impact?
If you want to have some nerdy fun at a cocktail party with a bunch of academic types, simply toss college rankings into the conversation and then stand back to enjoy what happens next. I guarantee an opiniated exchange. As part of a professional and popular culture in which rankings are ubiquitous, universities have a love-hate relationship with college rankings aimed at potential students and their parents, as well as with those that purport to assess research performance. If our program or institution does well in some ranking, well-known or obscure, naturally we proclaim our greatness from the rooftops (or at least our websites and press releases); if we don’t appear as high as we believe we should, then we criticize the shallowness of the exercise, the terrible choices of metrics used, and how rankings can’t measure what really counts anyway. There’s more to it, of course, so allow me a brief dissertation on the pitfalls
0%
10%
20%
30%
40%
50%
60%
70%
80%
90%
100%
Most / Highly Selective Very selective Selective Less / non selective
Earnings Relative to M
ost/Highly Selective
After 4 Years After 10 Years

Like Nobody's Business324
of ranking as important context, and I promise we will return to our question about whether or not rankings have a financial impact.
The fundamental drawback with many kinds of ranking is that they reduce a multidimensional question to a one-dimensional answer. This is also why they are so appealing—they (appear to) make a complex decision simple and easy. What is the best restaurant in the nation? The best car? The best state to live in? Because it’s a matching problem, the soundest response is to determine best at what (attributes) and best for whom (needs). Unfortunately, websites and magazines that provide choice and complexity as the answer don’t sell nearly as well as those that impose a one-size-fits-all answer, as the college guide industry found out when US News & World Report did just that in the 1980s. Many emulators and alternative rankings have sprung up since then; reputational surveys were the main source of information early on, but US News and most others now include publicly available and/or survey-response metrics in their weighting schemes. Research rankings, while largely playing to the industry instead of students and families, have followed much the same path.
Reputational rankings were (and still are) widely criticized, and justly so. Although it seems to make intuitive sense to ask “experts” what they think of the competition, most are poorly informed about current characteristics at other institutions and instead they provide biased opinions relying on informal and uneven knowledge: for example, where their friends happen to be, their own field or group, and previous rankings (Bastedo and Bowman 2010); inappropriate information, such as research prowess rather than quality of undergraduate instruction, or vice versa; and lagging, self-reinforcing notions of prestige. This latter attribute is the most pernicious because it creates stereotypical groups at the top, middle and bottom of the ranking that resist change and confer a halo effect independent of the data.3
Using data is a well-intentioned improvement over reputation although it isn’t really possible to obtain comprehensive data on precisely what students and families would like to know. Beyond cost and location, they place primary importance on academic quality, something that is hard to pin down. The rankings partially approximate quality via metrics such as faculty/student ratios, amount of academic support, retention and graduation rates, alumni giving, and student selectivity (i.e., acceptance rate, yield, class rank, standardized test scores). Allocate some reasonable but completely arbitrary weights to each metric and, presto, you have a ranking that boils the “best” institutions down to a single number.
3 Where do you think Princeton Law School might rank against other law schools—probably in the top 20, like Princeton itself and many of its programs? Well, you’d be wrong, because Princeton doesn’t have a law school. This marvelous anecdote on the halo effect in reputational rankings was uttered derisively by John Sexton, then the law dean at NYU (and subsequently its president), when he suggested where survey recipients for law school rankings would place the fictitious program. His rhetorical point was later proved correct by the judge who started Cooley Law School in Michigan; he surveyed 100 of his colleagues to see where they might place it on a list of 10 schools that included some big-name schools and some lesser-known ones, including Cooley. Also on his list was Penn State, which they ranked roughly in the middle, even though Penn State did not have a law school at the time (Harper 2013).

14. Outcomes & Futures 325
The single number is a core critique, and it holds for alternative rankings that emphasize value or mobility too. There are other critiques. Consistency and false precision are often raised—change your weights or update the noisy data each year and you’ll find institutions moving up and down the rankings, sometimes dramatically. And you will be shocked—shocked—to learn that universities and programs attempt to manipulate their statistics in order to improve their standing.4 For example, the percentage of alumni giving can be improved by asking every recent graduate to donate even just $1, or class sizes can be changed to ensure that there is a greater proportion just under the threshold, etc. Yet other criticisms underline how college rankings further promote the economic inequality between campuses that we saw in Section 7.2 (Wermund 2017). There are so many rankings being published that, in a twist of (apparently unrealized) irony, there are now rankings of rankings.
University research rankings embraced the emergence of digital publication and citation data and have mostly dropped reputational components. Still, they likewise combine metrics using arbitrary weightings to produce their annual lists and many of the same critiques apply. An added complication for program and department rankings is that disciplines align differently at every institution, and there is no way to divide up the continuum of knowledge into a consistent set of discrete disciplinary fields, and when you try there are serious lumping/splitting issues. Are neuroscience and psychology one giant field or two, or should they be further subdivided? How does one count a research paper that falls into multiple areas? What about influential books in the humanities versus the rapid-fire and cutting-edge publications in computer science that don’t even make it into research journals anymore? Is a science-focused university “better” at research than one that is more oriented to the arts and humanities? The list goes on, but the rankings generally gloss over most of these issues, define their own fields and weightings, and drive on.
This can lead to meaningless comparisons and occasionally preposterous results. Two quick examples from my own university demonstrate the point. First, we are frequently top-ranked in water resources by one ranking, but in other rankings that field is variously within hydrology, civil engineering, earth science or environmental science. Our main department in this field used to be called Hydrology and Water Resources but it has since combined with another into Hydrology and Atmospheric
4 The film Casablanca contains dozens of delightful quotes including the one paraphrased here about gambling in Rick’s Café. Other notables include these six in the top 100 movie quotes (to stick with the ranking theme), more than any other film: “Here’s looking at you, kid.” (#5); “I think this is the beginning of a beautiful friendship.” (#20); “Play it, Sam. Play ‘As Time Goes By.’” (#28) that is often misquoted as “Play it again, Sam.”; “Round up the usual suspects.” (#32); “We’ll always have Paris.” (#43); and, “Of all the gin joints in all the towns in all the world, she walks into mine.” (#67). And now, because we cannot resist ranked lists, you want to know the same two things anyone else does—your favorite quote’s rank and which one came out on top. You can look up the former and all the rest on AFI’s website (American Film Institute 2019). For your edification and apropos our discussion of rankings, number one is “Frankly, my dear, I don’t give a damn.” from Gone with the Wind.

Like Nobody's Business326
Sciences. So, are we number 1 or 20 or 50? Indeed, we have strength and distinction in a wide range of interdisciplinary water issues, but our ranking is completely dependent on how finely the fields are defined and is unconnected to a campus unit, which is not much use to students, researchers or administrators. Second example, the Shanghai subject rankings came out just a few days before this writing (Shanghai Ranking Consultancy 2020), and a couple of my department colleagues in Geography were grousing about how some other universities’ programs could possibly be ranked higher than us. The most egregious case was Stanford at number 5 in the US—as one colleague pointed out in dismay, it has no Geography department and just one part-time card-carrying geographer. The rankings define the field so broadly as to be nonsensical for any practical purpose.
We are almost done with my exposition on important rankings issues before we discuss their financial impact. For the coup de grâce it is time to return to student-oriented rankings and face a straightforward fact revealed in the data. Despite the many variables that go into college rankings, the cold reality is that they basically measure just one thing: selectivity based on general academic preparation, i.e., standardized test scores (Wai et al. 2018a; 2018b). Figure 14.6 shows the overlapping distributions of 25th and 75th percentile SAT scores (combined Math plus Verbal, including the converted ACT equivalent where applicable) by institution rank in the US News ranking. The approximately 200 schools each in the National University ranking and Liberal Arts College ranking are plotted together. The relationship is simple and essentially linear, with correlations near 0.9, meaning that SAT selectivity explains 80% of the variance (R2) in US News rankings. The same study found essentially parallel results for 5 other college rankings, including some that don’t even use the SAT in their metrics (Wai et al. 2018a). So, important point number one, no matter the ranking approach, it will end up replicating the SAT distribution of colleges, which is to say the academic preparation of their students. Important point number two, which we know intuitively and also from Section 7.2, there is massive overlap in students’ general academic preparation up and down the rankings of the schools that generally end up in the top 200 lists, and therefore the rankings cannot provide any meaningful separation between them, at least not anything close to the rank order precision that they are selling. While the top 30 or so in each list are distinct in their profiles from the bottom 30, most schools in between are hard to tell apart. We can go beyond the top 200 lists and look back at the identical interquartile ranges for all the schools in our data set by type (Figure 7.4). We saw that the R3-M3 institutions (that generally do not appear in the top rankings lists) indeed have a student academic preparation profile that is distinct from the major research universities and private baccalaureate colleges, within an overall pattern that is consistent with the notion of broad differentials bracketing plenty of overlap.

14. Outcomes & Futures 327
Figure 14.6. Overlapping distribution of 25th and 75th percentile SAT (Math + Verbal) scores by institution rank in the 2014 US News & World Report rankings of National Universities and Liberal Arts Colleges, including percent variance explained (R2) for each. ACT scores were converted to SAT equivalents where applicable. Note that tied ranks have a
corresponding number of neighboring missing ranks. Source: Wai et al. (2018a).
Now that we know that rankings are fraught with issues and that they mostly replicate an institution’s underlying student academic preparation, one has to wonder why schools participate in the rankings and pay them attention at all. They do so because of the circular logic of an arms race: prospective students and parents use the rankings, which means they factor into the intense competition to gain and maintain prestige by recruiting the academically best-prepared students possible. Therefore, in addition to the benefits of bragging rights when an institution’s ranking ticks upward, it’s reasonable to hypothesize that schools might see an enrollment-related financial benefit or loss with a shift in rank, and they may change their spending as part of the jostling for position.
The research literature on the financial impacts of rankings is small, and those studies sometimes focus only on smaller subgroups of schools. Nonetheless, their findings are sufficient to help us understand the basic connections, as illustrated in Figure 14.7. Starting at the top, we know already about the very strong link between rankings and SAT, and not surprisingly the same goes for acceptance rate that is closely connected to academic preparation and selectivity (Meredith 2004; Wai et al. 2018a). As we might expect given what we learned about the earnings of graduates in the previous section (Section 14.1), absent the controls on all the biasing factors, there is a strong link between ranking and earnings (Dunlop 2018). Moving on to the heart of the question, there is a moderately strong statistical relationship to institutional expenditures, and
800
900
1000
1100
1200
1300
1400
1500
1600
0 10 20 30 40 50 60 70 80 90 100 110 120 130 140 150 160 170 180 190 200
SAT (M
+ V)
2014 US News Rank
75th Percentile National Universities (R² = 80%)
25th Percentile National Universities (R² = 77%)
75th Percentile Liberal Arts Colleges (R² = 78%)
25th Percentile Liberal Arts Colleges (R² = 78%)

Like Nobody's Business328
while there are differences between large universities and baccalaureate colleges, investment in instruction is the primary area in which institutions alter their spending (roughly 7–9% more) when they move to a higher category or rank (Kim 2018). The pay of many university presidents includes performance incentives, and a few explicitly call out improvements in rankings. Several studies find no generalizable link or only partial links depending on study design and controls, such as recent work (Yeung et al. 2019) that identified a roughly 1% increase in pay per rank increase for presidents at public universities (but not private universities or liberal arts colleges). Regarding price and cost, one of the original studies in this area focused on small top-ranked schools only and found no link to sticker price (presumably because lower price would signal lower quality for these schools) but it did identify a moderately strong link to discounted tuition after aid (a 1% reduction for each drop in rank of 2 to 3 places; this also reduced net tuition), which is a less visible way to recruit students from a pool that may see a quality or quantity decline with lower rankings (Monks and Ehrenberg 1999).
Figure 14.7. Summary of the strength of selected statistical relationships between institutional rankings and hypothesized related outcomes, based on the small literature of scholarly
articles. See text for details.
On a related note, a recent study found that random samples of alumni ratings were a better predictor of graduates’ income and well-being than popular college rankings and, interestingly, that higher total cost of attendance actually predicts lower satisfaction (Rothwell 2019). Additionally, if you’re wondering what kind of resources would be needed to make a large move in the rankings, say from 35 to the top 20, one study did that for the US News rankings and found, unsurprisingly, that it would
SAT & Acceptance Rate
Graduate Earnings(no bias control)
Spending on Instruction
Presidential Salaries
Decrease in Financial Aid
Sticker Price
None Weak Moderate Strong Very StrongStatistical Relationship to Higher Ranking

14. Outcomes & Futures 329
take hundreds of millions of dollars annually in highly focused investments (Gnolek et al. 2014). On a per-student FTE basis, this roughly aligns with the kind of money separating the highest-ranked schools from the rest.
After all this, you might be wondering if there are any rankings that are worth a look at all. There are, and they are the ones that provide categorical ratings rather than over-precise numerical rankings, often grouping schools into tiered bands or categories with transparent supporting information. Several popular college guides follow this model, as do the rankings for research universities that are still informally known as the Lombardi rankings after one of the originators (The Center for Measuring University Performance 2018). These all provide a good sense of where institutions are placed on various metrics without the headline-grabbing distractions of the latest questionable best-of lists.
14.3 What is the economic impact of a university?
It’s almost axiomatic that universities are understood to be economic engines, locally, regionally and nationally. When I worked in university tech transfer, a wise colleague once clarified that, technically, the university is not the engine—instead, it produces the fuel for the engine. The indirect nature of the link to economic vitality is a critically important distinction. The prime mission of a university is not to create a vibrant economy directly, it is to create and transmit knowledge, largely by producing educated graduates. Those graduates do the vast bulk of creating and adding value that enables the growth of companies and jobs. Yes, universities can grow their own workforces and they can have secondary missions to produce technologies and spinoff companies, but those things generally represent a drop in the proverbial bucket compared to the total activity of an institution’s graduates. Their knowledge and insights are the fuel required to run and grow the contemporary economy. In any case, the point of the metaphor is that universities bring intellectual, cultural, and other kinds of value to their community, including financial value, and many universities like to demonstrate what they are worth by calculating their economic impact.
We see these numbers all the time, whether it’s the travel industry or the local manufacturing sector that contributes X billion dollars annually to the local economy. Exactly the same kinds of calculations are made to estimate the local economic contribution of a university. Importantly, most economic impact models focus on measurable spending and they ignore those (difficult to measure) broader human capital benefits of an educated workforce. The estimation process involves enumerating the fate of every dollar the university spends (e.g., employees’ consumption spending, institutional contracts for services, contributions to state and local taxes) and using a multiplier to include the knock-on impacts. What’s a multiplier? Let’s say the university pays for some minor construction work performed by a local contractor: for every dollar spent on the contracting company, some of that dollar stays locally in

Like Nobody's Business330
the form of wages, taxes and materials, and some leaves the region as other taxes or materials not locally produced; of those local expenditures, the same cycle happens in turn, and so on in decreasing local amounts. That is the multiplier, and it is typically between 1 and 2. You may see incorrectly-labeled multipliers running as high as 10 or more, perhaps reflecting gross return to budget (“for every dollar the state spends at ABC State University, it sees 9 dollars in return” for an institution that gets 10% of its funding from the state), or the number of times the dollar cycles through the local economy, but those are not multipliers. Multipliers are derived from national studies and are adjusted for industry and location. The relevant multipliers, times the appropriate estimated contributions by category, will together add up to the total economic impact.
Ordinarily, an economic impact calculation is done by technical experts using complex estimation software, but the essence of the process can be shown using the simple worked example described in Table 14.1, which is based on a detailed example (Ambargis et al. 2014). In line 1, we can see that our example university has an operational expense budget of $750M. As we saw in Chapter 3, this set of expenses includes everything the institution spends on instruction, research, public service, academic support, student services, institutional support, financial aid, and auxiliary enterprises. Because we are using what is known as a Type II multiplier that accounts for between-sector effects and local household spending effects, we need to adjust the base amount to omit what local households spend at the university, thereby identifying just the new dollars entering the region. About 20% of the students are from the local region, so we multiply the base by 0.80 to reflect only the out-of-region students, resulting in an adjusted base of $600M. We will use a multiplier of 1.7 for university spending, which results in a total impact of $1,020M for this category.
Table 14.1. Simplified calculation of a university economic impact estimate. Dollar amounts in millions. Adapted and abridged from a BEA example (Ambargis et al. 2014).
Line Category Base ($M)
Local Margin
Adjusted Base ($M)
Multiplier Total Impact ($M)
1. Operational Expenses 750.0 0.80 600.0 1.7 1,020.02. Capital Investments 10.0 0.14 1.4 1.6 2.23. Student Spending 7.0 0.85 6.0 1.5 8.94. Visitor Spending 2.0 0.80 1.6 1.8 2.95. TOTAL 769.0 609.0 *1.7 1,034.0
*imputed overall multiplier
The next category is the university’s capital investment, which includes things like major equipment and building construction. For our example we’ll assume a $10M investment in a new computer system, shown in line 2 of Table 14.1. The purchase is

14. Outcomes & Futures 331
from a local vendor but the equipment is actually manufactured outside the region; based on typical wholesale margins we’ll use 14% as the local share, which represents $1.4M in local spending. We use a multiplier of 1.6 for this sector that results in an impact of $2.2M for the capital category, obviously far less than the impact from operational expenses because the computer hardware was produced outside of the region.
Line 3 captures the effect of student spending on items like books and supplies, restaurants, groceries, entertainment, housing, etc. This information can be gathered from the university’s survey of student spending, taking care to count only what is spent locally in the region and not at the university (i.e., excluding meal plans and residence halls). In practice we would use local margins, adjusted amounts and the relevant multipliers for each spending sub-category and add them up for an overall impact; for simplicity here, we’ll assume an average local adjustment of 85% retained locally that results in an adjusted base of $6M, with an average multiplier for the whole category of 1.5, giving us an estimate of $8.9M for the impact of student spending.
Visitor spending must be directly attributable to the university, such as visiting parents, conference attendees, or out-of-town patrons of campus sporting or arts events (those particular impacts are smaller and tougher to estimate because of their one-time nature). Visitor spending goes primarily to lodging and restaurants, the bulk of which are local in nature, while shopping purchases must be adjusted to the appropriate local retail margin. In line 4, we assume 80% on average across the category and apply it to base visitor spending of $2M (also estimated from survey data) for an adjusted amount of $1.6M. We use an average multiplier of 1.8 for the category, again for simplicity, which leads us to an impact of $2.9M for visitor spending.
The total amounts are on line 5, where total base spending of $769M ends up at $609M after adjustments to count only the funds that stay in the economy of the local region. The total estimated economic impact of that spending is $1,034M, which if we divide it by the adjusted base gives us an imputed multiplier of 1.7 overall. For our example university, it could claim that it contributed just over $1B to the economy of the local region. Naturally, that’s a relatively large proportion of economic activity if this campus is located in a college town versus it being located in a major city.
The impact calculation described above is the contribution-based version and it tends to be the most generous approach. Imagine adding up all the contribution-based impacts for every enterprise in a region—you would get a number larger than the local economy because you’d be double-counting (or triple or more) many of those multiplier effects across the different sectors. More sophisticated economic impact models can account for the input costs more conservatively, and they can calculate only the net new and retained dollars in the region attributable to the university—essentially what would be lost if it didn’t exist and those services were not consumed or spent elsewhere (Christophersen et al. 2014). Now, in that case, why would an institution want to decrease the estimated size of its impact—surely a university

Like Nobody's Business332
would want the biggest number possible, especially a public university that could use the impact number in its arguments for more resources from the state? It turns out, as I mentioned earlier, that decision-makers see these kinds of economic impact estimates from all quarters, and unrealistic numbers will simply produce disbelief. So, it’s important to present economic impact figures properly, noting assumptions, the definition of the local region, and avoiding the multiple pitfalls that can lead to double-counting (Siegfried et al. 2007). It’s also smart to augment the narrow economic impact number with additional economically-related data (e.g., patents, licenses, and startups) as well as information on graduates and knowledge production to address the fundamental point regarding development of human capital and its societal benefits. Unfortunately, it is hard to capture these effects in local regions (because, for example, graduates move away and are substituted in from other universities, and there is a scale mismatch in contribution to the number of people with degrees in the national economy), so these overall societal benefits of higher education tend to accrue at broader regional and national scales instead (Moretti 2004; Rothwell 2015; Florida 2016; Valero and Van Reenen 2019).
14.4 Our business model: what is it and how do we manage it?
The term “business model” came into vogue during the late 1990s as the dot.com boom was underway, although the concept has been around for much longer. The question “What is your business model?” is often a proxy for “How do you make money?” that in turn depends on the answer to “For whom do you add value?” For universities the answers are simple, at least on the surface: we add value for students and society and they pay us for it (although the relative proportions have changed considerably, see Chapters 2 and 4). Some universities rely on people paying more for prestige, others rely on volume at value pricing, others on niche specialties, and so on. Prestige can come from selectivity and/or research prowess—in other words, not just knowledge delivery, but knowledge discovery (by the way, the business model for research is for sponsors to offset the cost of research, as we saw in Chapter 8). Looking across the US higher education landscape, there are many permutations on the basic business model that has been in place seemingly forever.
But the winds of change are always blowing: correctly anticipating, or failing to anticipate, changes in the environment and how a university adds value can lead to greater success or to failure. Current examples of the former include schools that have embraced online education, while some non-elite small liberal arts colleges are examples of the latter (we’ll cover more on this in the following sections of this chapter). These changes can be evolutionary as above, or more revolutionary as we’ve seen with the digital revolution in other sectors (nobody wants to be Kodak making film when digital cameras took over). Much has been written on disruptive innovation since Clayton Christensen coined the term (Bower and Christensen 1995), which was based on the

14. Outcomes & Futures 333
observation that “one of the most consistent patterns in business is the failure of leading companies to stay at the top of their industries when technologies or markets change.” While established players are focused on sustaining innovation and becoming better in their own niche for those they currently serve, new upstarts, often with an initially lower-quality product, focus on an underserved niche or adding a new kind of value (remember when Netflix started, you had to wait days for the DVD to arrive in the mail, and even when they started streaming video it was relatively poorer quality—as the value improved, people switched away from neighborhood video rentals and we know what happened to Blockbuster in the end). The hard part is knowing what will be a fad versus what represents a deeper change: a recent example in higher education was the debut of MOOCs that fizzled initially but that haven’t yet disappeared either (see Section 6.11). There are dozens of essays in the technology-will-revolutionize-higher-ed’s-business-model genre, such as one topical piece wondering if universities will go the way of CDs and cable television (Smith 2020).
The most eloquent and insightful writing I know of regarding business models doesn’t use the term at all: Peter Drucker, the famous scholar of organizations and management, called it the Theory of the Business in a 1994 article (Drucker 1994). Paraphrasing him, at its core is the idea that what we call a business model is a set of assumptions upon which the university has been built, is being run, that shape its behavior, determine its choices about what to do and what not to do, and characterize what the university believes are valuable outcomes. It also includes assumptions about the markets in which the university operates, the students and stakeholders it serves versus its competitors, their values and behavior, the changing role of technology, the university’s own strengths and weaknesses, and assumptions about what society pays a university to do. Drucker’s point is that every organization has a theory of the business, and he cites the genesis of the modern comprehensive research university by Wilhelm von Humboldt in 1809 as a powerful example of what a clear, consistent, and focused theory can enable. He goes on to describe how checked and unchecked assumptions about the theory of the business explains successes and failures of well-known organizations.
With this broader view we can see that there are almost countless ways in which the business model assumptions of all universities and colleges, as well as individual institutions, are being challenged today. Can we assume that students and families will continue to want a four-year residential experience? Are we pricing ourselves out of the market? Who is serving the students (of all ages and backgrounds) who don’t attend our institution? Do we focus on the one thing we do best, or do we diversify our offerings and delivery channels? And of course, how is technology reshaping almost everything in higher education, and what does it mean for the sector and our institution?
Answering those questions for our own institutions will give us a clearer picture of our current business models and where they are headed, which brings us to

Like Nobody's Business334
something called the “iron triangle,” also known as the unattainable triangle or the triple constraint. The iron triangle is essentially a lay Theory of Production: it describes the principles by which a university selects the quantity and quality of outputs it wants (graduates, knowledge) and the quality and quantity of inputs it will employ (factors of production such as labor and facilities and their associated costs, as well as the number and academic preparedness of its students). The iron triangle of higher education is illustrated in Figure 14.8. It is essentially the higher education version of the faster-better-cheaper triangle from project management, except in our case it summarizes the constraints of access instead of time, along with quality, and cost.5 These three management constraints for higher education, quality, access, and low cost, constitute a three-way trade-off in which it is impossible to maximize all three vertices simultaneously. As Arne Duncan (2009), US Secretary of Education at the time, put it, “I often hear that managing the multiple missions of higher education today is akin to being caught in the infamous ‘iron triangle.’ Every college president and every governing board wants to simultaneously improve quality, increase access—and yet constrain costs. To college executives, these three sides of the iron triangle—quality, access, and cost—often seem like mutually conflicting choices. Elevating quality raises costs. Increasing access can dilute quality. And reducing costs impairs both quality and access. … In the standard formulation, the only way out of the iron triangle is to secure unlimited resources, either in the form of bigger endowments or state and federal support.”
Figure 14.8. Schematic of the iron triangle of higher education, illustrating the three-way trade-offs between improving quality of education, increasing access to the institution, and
constraining costs.
5 Healthcare has essentially the same iron triangle as higher education: improving quality of care, expanding access to patients, and lowering costs.
LOW COST
QUALITY
ACCESS
THE IRON TRIANGLE
Improve Quality, Increase Access, or Contain Costs?*
Inferio
r
*maximize only 2 orcompromise on all 3

14. Outcomes & Futures 335
In addition to external resources that can help buy an institution out of the dilemma, or at least ameliorate the compromise, many have touted the promise of technology to do the same. New instructional technologies definitely have the capacity to modify each corner of this triangular playing field but, more precisely, that change will depend on how higher education providers implement the technology in a business model. Revisiting my point above regarding disruption, new providers or existing institutions that want to shift their advantage in the iron triangle will often do so by focusing on an underserved market niche and/or by contributing a new kind of value. A successful new offering redefines the quality-access-cost proposition to students and families in such a way that they increasingly choose it over existing options (more on this in the following sections, 14.5 and 14.6).
There are also constant changes in the iron triangle as institutions adapt and compete in a dynamic market, so even if an institution chooses its point of compromise in the triangle, its relative position compared to other schools will therefore shift over time. Make no mistake, the compromise point is a deliberate choice, whether it is made actively or passively, overtly or covertly. Few institutions are upfront about the point or points of the triangle that they choose not to maximize: elite institutions are by definition highly selective/low access and expensive, but they can offset a small part of their access compromise and related perceptions by offering scholarships to increase access; a particular kind of for-profit school, many of which have since shrunk or closed, maximized access while they compromised on quality and used the availability of federal loans to offset cost. Most other types of institution are somewhere in the middle, such as large public universities that are able to balance moderate access with good quality at modest cost. As someone who works at such an institution, we would never say that out loud—we are proud to offer a world-class education for many qualified students at a very affordable rate (certainly for in-state students), but it is also true that we are not as accessible as a regional comprehensive campus, our students don’t get all the qualities of an elite private education, and our classes cost more than similar ones at the local community college.
Because institutions are continually evaluating and evolving their business models, experimenting with novel approaches and technologies while dealing with the realities of production in the iron triangle, and because US higher education is highly competitive and highly segmented across many dimensions of the market, there are good odds that the sector will be sufficiently innovative to survive and succeed. That’s the sector—individual schools are a different story as they do or don’t adapt to inevitable change—without doubt some new stars will emerge as others fade. But we should not be complacent about the sector either, because we all have blind spots: what if our highly regionalized sector is consumed by a national or international megabrand (think local mom and pop stores before and after Walmart, or local bookstores before and after Amazon). It’s worth closing with a caution to be vigilant about our business model, because as Drucker (1994) said, “Some theories of the business are so powerful that they last for a long time. But eventually every one becomes obsolete.”

Like Nobody's Business336
14.5 Which schools are most at risk for closing, especially with COVID-19?
Colleges and universities close for one simple reason: their revenues cannot keep up with expenses and eventually they run out of cash. Historically, the number of closures (and related mergers) is small relative to the size of the higher education sector, just a few per year when there is not a larger financial crisis underway (Education Dive 2020). While college closures make headlines, the typical annual rate represents just a fraction of 1%. College closures in recent years have been limited to small nonprofit private colleges, with the notable exceptions of several much larger for-profit institutions that collapsed after student loan scandals (see Sections 4.5 and 7.12). There are two broad reasons that small colleges have been the most affected: (i) structurally speaking, they are the most vulnerable size of institution because small institutions typically have a narrower revenue diversity than large institutions, which both limits income options and reduces their ability to downsize and cut expenses, and also because there are simply fewer functions and areas available to cut—a shrinking small college gets to the point where it is below a viable size before a large institution does; (ii) the market for non-elite small colleges has been challenging, more so for those in small towns “off the interstate” that have struggled to diversify into professional and other revenue-generating programs relative to their urban counterparts. Is it only small colleges that need to worry, or might another economic downturn increase the closure risk for other kinds of schools?
As I write, it is the fall of 2020 and the COVID-19 pandemic is still in full swing. Lots of financial unknowns remain, even as institutions manage their way through the academic year, hoping to keep as much of their tuition revenue intact as they can despite widespread shifts to online delivery and limited in-person classes, along with weaker enrollment. It’s only natural that talk of more widespread college closures has increased, just as it did during the Great Recession. There are some important differences between the two economic events for higher education. During and after the recession that began in FY2009, college enrollment-related revenues did not plummet despite other budgetary stresses, and therefore the college closure numbers were not especially large. As often happens in economic downturns, some people turned to higher education to obtain a first or second degree. which helped to bolster otherwise weaker institutional finances. However, the enrollment and tuition situation resulting from the COVID-19 pandemic is quite different, because the anticipated enrollment decreases directly affect tuition revenue, room and board revenue, in-state/out-of-state shifts, and discounting (Burke 2020). Any prognoses I utter here are made in the early days of the financial fallout for higher education, and by the time you see this in print as a reader you will have the considerable benefit of hindsight.
Whether caused by the pandemic or by more prosaic struggles with their financial situation in other years, institutions can undertake a variety of actions to shore up

14. Outcomes & Futures 337
revenue and to cut costs, many of which apply to both situations. At the moment these include special scholarships to keep students enrolled (Johnson and Edwards 2020), lowering tuition and moving to online instruction (Whitford 2020c), hoping for stimulus funding (Seltzer 2020c), adjusting to the reality of fundraising declines (Whitford 2020a), undertaking furloughs and layoffs (The Chronicle of Higher Education 2020), making cuts to athletics programs (Rishe 2020), and dealing with new costs for cleaning facilities and disease testing for students and employees (Lederman 2020). Other actions in the mix include early retirement/voluntary separation programs, reducing employee benefits, endowment drawdowns, elimination of administrator, staff and non-tenured faculty positions, and abolishing underperforming academic programs (Lederman 2020). On the revenue side, institutions that rely on endowments experienced a major drop in the stock market as the pandemic emerged, and although the market had largely recovered by summer of 2020, the future is murky with much market uncertainty. Discounting has also continued apace (Whitford 2020b). Public institutions are anticipating the effects of lower state revenues and associated appropriations to higher education, which are expected to be lower for several years as the pandemic-related economic downturn plays out. This pattern was the case during the Great Recession, when the market recovery (that dictates endowment income) happened much faster than for state budgets (and the revenue they supply for public universities), a contrast of one or two years versus five to ten, with some of the latter never returning to pre-recession levels (see Section 4.7).
It’s a fool’s errand to predict which specific institutions in poor financial shape will or will not actually close in the coming few years—even with the added financial stress of the pandemic—although it doesn’t stop some trying (Brown 2020). No analyst has access to sufficiently detailed and up-to-date financial information for every institution to make definitive pronouncements about exactly which institutions will close, and the specter of imminent closure can itself help bring about heroic measures that sometimes lead to a reprieve at the eleventh hour. For example, Sweet Briar College staved off an announced closure in 2015 with a historic fundraising effort, among other things (Woo 2018). However, it is possible to identify institutions exhibiting signs of serious financial risk using indicators from the comprehensive national-level data in IPEDS. Although that dataset has a reporting lag of a couple of years, it nonetheless enables assessments of financial risk for all institutions. Such studies appear from time to time, including ratings from the Federal Government and private companies that name names and that have been heavily criticized (Seltzer 2020b). A recent book on the topic specifically outlined key indicators and presented a financial stress test for colleges (Zemsky et al. 2020), and you can look up any institution using an online tool (D’Amato 2020). Understandably, there is now even wider interest in the possibility of campus closures given the anticipated financial fallout of the pandemic in FY2021 and beyond (Kelchen 2020).

Like Nobody's Business338
We’ve covered all the essential variables mentioned in such studies earlier in this book, and they each attempt to capture financial health using key factors and their trends (Lyken-Segosebe and Shepherd 2013; Parthenon-EY 2016; Raymond 2019; Zemsky et al. 2020). If you’ve read through the earlier chapters, you won’t be surprised to learn that there is no one-size-fits-all metric, and that it takes a set of indicators to make a fuller assessment. So, we’ll work through an example and do exactly that: assemble a set of relevant variables and trends that we will then combine to create an index of institutional financial risk. This is not a fully comprehensive list, but it does include a number of the main indicators mentioned in the literature:
• First-year enrollment: the size of the incoming class is a leading indicator of overall enrollment, and a shrinking first-year cohort (in the absence of higher net tuition per student) will lead to less income in the current year and subsequent years as the smaller cohort moves through;
• Overall enrollment: a measure of institution size and the basis of net tuition revenue, with a sustained declining trend portending serious income challenges;
• Retention rate: a low and/or decreasing retention rate directly affects overall enrollment and tuition revenue, and may signal additional issues with instruction or student support;
• Share of students enrolled in online programs: an institution without online programs has one less alternative revenue source;
• Discount rate: institutions struggling with enrollment often try to help recruitment by making larger financial aid offers, and thus a high or increasing discount rate reduces net revenue and can signal trouble;
• Share of total revenue from tuition: a high or increasing dependence on tuition revenue indicates low or diminishing income from other sources that could otherwise augment the revenue portfolio;
• Share of total revenue from auxiliary enterprises: some institutions can become overly reliant on residence hall and dining revenues, so a larger share of auxiliary revenue can flag problems;
• Expenditures per student: if enrollments are shrinking and the institution is not simultaneously cutting back on expenditures, the resulting rise in expenditures per FTE will be unsustainable;
• Endowment: the size of the endowment is a proxy for endowment payout, with a small endowment contributing little to overall revenue and a declining endowment relative to others likely signaling a drawdown to cover operating expenses.

14. Outcomes & Futures 339
For each of these indicators we can choose to use the value for the most currently available year (FY2018 as of this writing) as well as recent trend data—I’ve picked the five-year trend FY2014–FY2018. To make the data easily comparable, the basic amount and the slope of the trend for each indicator are converted into percentile ranks. It is then a simple matter of creating a composite index of financial risk, which in our example I’ve done by tallying the number of indicators falling into the riskiest decile (i.e., the worst 10% for that indicator across all institutions). So, for example, if the trend of an institution’s first-year enrollment placed it among the worst 10% of institutions, its index score would increase by 1 count. If that same institution also placed among the highest 10% in share of total revenue from tuition, its index score would increase by 1 more, for a total of 2 indices in the riskiest decile. There are multiple ways to construct such an index, using a weighting scheme for example, or going into the next decile bands. Bearing in mind that each indicator is noisy and imprecise, and therefore not wanting to over-engineer the exercise, I prefer something that is simple to understand and interpret. So, we’ll go with the straightforward tally in our example.
With our approach in place, the only thing left to decide is which indicators to include in the index. Again, there is no single correct answer and in practice one would construct a set of simpler and more complex combinations. I decided to go with the following for our example: the five-year trends for all of the above indicators except for online enrollment, and the basic amount for discount rate, shares of revenue from tuition and from auxiliaries, and the share of online enrollments. I didn’t select the remaining basic amounts because they would overly emphasize institution size, and I didn’t include the trend in online enrollment because there are many schools with no online programs and the current amount of online activity seems most relevant. Reasonable people may differ on these choices, but give or take an indicator or two the overall results are not dissimilar.
The results for our index as described are illustrated in Figure 14.9, which includes both the percentage and actual number of institutions with risk indicator tallies by type of institution. It’s important to see both the relative share of institutions at some financial risk as well as the absolute numbers of those institutions. Both public and private BAS institutions have high percentage counts on our index, but there are relatively few public baccalaureate colleges and about ten times as many private ones, with the result that there are dozens of private baccalaureate colleges with 3 or more indicators in the riskiest deciles. The same logic applies to the R3-M3 private universities—they are the most numerous of all the institution types in our data set (over 400) and even with a somewhat lower share of institutions at risk they have similarly high absolute numbers of those institutions. Although none of our indicators explicitly highlighted institution size, it’s clear that schools with a higher composite financial risk index are overwhelmingly comprised of smaller institutions. The combined number of R1 and R2 institutions on the risk radar is less than 10. Thus, as we’ve seen in many of the previous chapters, there are key market and business factors leading to a higher proportion of smaller institutions exhibiting indicators of financial stress.

Like Nobody's Business340
Figure 14.9. Composite index showing the share (upper panel) and number (lower panel) of institutions with counts of financial risk indicators in the riskiest decile, by Carnegie
classification and control. See text for details. Source: IPEDS (2020).
The obvious next question is how many of these schools registering on the index might actually close? One way to get a feel for that is to look at institutions in our data set that have indeed closed; there are 9 that have closed since 2016 (Education Dive 2020). As it happens, 1 was a public baccalaureate college while all the others were private, of which 6 were R3-M3 institutions and 2 were baccalaureate colleges.
0%
5%
10%
15%
20%
25%
30%
35%
40%
45%
R1 Public R2 Public R3-M3 Public BAS Public R1 Private R2 Private R3-M3 Private BAS Private
Shar
e of
Indi
cato
rs In
Risk
iest
Dec
ile
345+
0
10
20
30
40
50
60
70
80
90
R1 Public R2 Public R3-M3 Public BAS Public R1 Private R2 Private R3-M3 Private BAS Private
Num
ber o
f Ind
icato
rs In
Risk
iest
Dec
ile
345+

14. Outcomes & Futures 341
Four of the closed schools had 4 and 5 indicators in the riskiest deciles on our composite index, although the other scores range from 0 to 7 (the one with 0 was a separately-reporting branch campus that had several indicators in the second-riskiest decile). Scores of 4 or 5 are therefore concerning but imprecise—there are as many as 75 institutions with an index of 4 or more. Many of those institutions will be resourceful and will make the hard decisions to scope their expenditures to their revenues, and they will survive. Despite valiant attempts, others may not be able to generate enough cash to pay for minimal operations and they will have to close. That number is far smaller than 75, as we’ve only seen two or three closings per year for the period covered by the data and immediately afterwards. Thus, the imprecision in this sort of exercise is worth underlining again—just because dozens might be in the danger zone that caused others to close does not mean that those dozens will also close.6 That’s worth a follow-on repeat of something else already mentioned, that institution-specific details and behaviors make a critical difference to survival or closure when an institution is in an existential crisis.
Yet, if financial conditions suddenly worsen, as is currently anticipated with a decrease in tuition revenue due to the effects of COVID-19, then that will obviously ratchet up the financial stress for all institutions and it may be a “last straw that breaks the camel’s back” for a greater number of at-risk institutions than we would otherwise expect. It’s worth underlining the imprecision yet again, because a slight change in the construction of the index or the indicators will drive the overall assessment higher or lower, even if the broad patterns are similar. That said, if we see a couple of closings per year in “normal” years then a major revenue shortfall (say, 10%, 20% or even 30%) as a result of the pandemic will surely increase the number of closings.
14.6 What are the long-term financial futures for higher education?
As the quip says, it’s difficult to make predictions, especially about the future.7 It’s as true for the future of higher education as anything else, although that hasn’t slowed the production of articles and books on the topic that prognosticate on the future of the sector. Our time-focus here is the longer view, a decade or two, trying to understand the broader forces and trends at work that will affect both the academic and financial business of universities, intertwined as they inevitably are.
6 This mistake is a version of the ecological fallacy, which is to incorrectly infer conclusions about individuals based on group-level data. Here, it intersects with its cousin, the exception fallacy, which is to incorrectly infer conclusions about a group based on an unusual individual. Two respective examples to illustrate the distinction: small colleges have higher financial risk indicators overall, so a specific small college is at higher financial risk (ecological fallacy); this individual small college closed, so all small colleges are at risk of closure (exception fallacy).
7 Being trained in weather and climate where predictions are part of the trade, I heard this humorous saying early in my career. Although I’d always heard it attributed to Yogi Berra, the “philosopher of baseball,” it turns out that many people are alleged to have coined the phrase including Niels Bohr, Samuel Goldwyn, and Mark Twain, but it is likely a Danish proverb (O’Toole 2013).

Like Nobody's Business342
If we’ve seen anything in the trends that we’ve covered section by section in this book, it is that very few components of higher education have remained static—virtually every aspect of how the money works in and around universities has shifted and is shifting in some way. Whether it was the GI Bill, massive state investments and enrollment growth in the 1960s and 1970s, expansion of Pell grants, federal research investment, state funding decreases since the 1980s, the expanding role of philanthropy, or the online transformation currently underway, institutions are continually having to adapt and compete. In the international arena, the second half of the twentieth century saw the ascendancy of US higher education and research relative to the UK and Europe’s prior dominance, and although the US is still pre-eminent it seems that fast-growing China is an emerging and potentially even more dominant competitor.
Opinions on the future of higher education variously cover almost a dozen subtopics (and I say opinions as they are usually informed insights rather than representing results from the formal research literature). Most of them deal with the implications of several fairly obvious trends, while some commentators point out relevant but less-commonly mentioned elements; none of them will be a surprise for readers who have spent time with the earlier chapters of this book. Hyperbole is a defining feature of many of these opinion pieces because bold claims attract readers. Thus, as we go through them below, I have tried to temper the exuberance where necessary and highlight aspects that deserve consideration:
• Smaller institutions will struggle and more will close: Clayton Christensen’s claim of nearly a decade ago that half of the 4,000 colleges and universities in the US would be bankrupt by now (Lederman 2017) forces one to paraphrase Mark Twain’s famous line to say that rumors of higher education’s demise have been greatly exaggerated. Overstatement notwithstanding, he was calling attention to the potential for disruptive innovation as evidenced by the challenged business model and poor financial health indicators for smaller institutions, particularly for the non-elite privates, that we’ve seen throughout this book and especially in the previous section. Based on those data, it’s easy to see why several commentators believe that well-endowed, highly selective liberal arts colleges will survive while the private nonprofit sector overall will experience a decline, and that mergers are unlikely to save them either (Mintz 2019a; Witt and Coyne 2019).
• Demographic enrollment decreases: Traditional higher education can see its entering class coming with an eighteen-year advance notice as the demographic baby booms and busts make their way through the K-12 system. When demographers and enrollment managers model future class-sizes they include not only birth cohort size but likely college-going rates, geographic differences, immigration and more. Nationally, we are on a high school graduate plateau that began in about 2010 and that will start to decline around 2026, and for areas like the Northeast and Midwest the numbers

14. Outcomes & Futures 343
of college-going high school graduates will dip by 10–20% (Fox 2019). To the previous point on small institutions, these enrollment differences will fall unevenly across types of institutions (Conley 2019), so competition for recruitment is therefore likely to increase in that way as well as across geographic regions.
• Online and digital instructional technologies will continue to expand: As with almost every other sector, the digital revolution is transforming higher education. While the simplistic and overhyped early prophecies about online providers rapidly upending higher education in a parallel to the newspaper business were false, there are few observers that doubt the deep and widespread implications of digital instructional technologies for teaching and institutional business models. Interestingly, the COVID-19 pandemic has simultaneously accelerated adoption of hybrid online education and where it adds value, while also highlighting exactly what students dislike about online and what they value about the in-person experience. There will be shifting demand for both in the future and institutions will be jockeying for position accordingly—it’s all about which institutions adopt these technologies and approaches, how far the transformation goes, and how fast it occurs. Section 6.11 describes the changes underway in online education and how it is being incorporated complexly depending on each kind of institution’s market niche. We shouldn’t forget that it’s not just online delivery but other related technologies such as adaptive learning, interactive textbooks, virtual environments and more that are part of this transformation, even for in-person classes. One major unknown in the online space is the role of consolidation. Higher education is relatively unconsolidated compared to many other sectors because of its intrinsic structure (at least for public institutions), with several state systems representing the largest consolidated entities. There are no dominant national brands or chains, and it is unclear if higher education will continue in that mode (e.g., online news outlets although there is some consolidation) or if in the longer run the nature of online technology will produce a set of dominant players (e.g., retail with Amazon and Walmart).
• Credentialing and unbundling are not yet a major force: An in-person campus experience is the ultimate bundled service, with classes, a learning community, room and board, teaching, research, arts and culture events, athletics, and social life all in one package for four years (Roth 2020). At about the same time MOOCs burst on the scene, educational technology pundits were heralding the great unbundling of college (Selingo 2013) and promoting (digital) credentials for courses and even micro-credentials for the equivalent of course subtopics. This view seems to emanate most strongly from the technology sector and employers; for example, Apple’s Tim Cook

Like Nobody's Business344
has mentioned that coding is a skill that is easily credentialed and that only half of the company’s employees have a four-year degree (Eadicicco 2019). Universities are definitely offering one-off courses (and have for decades) and MOOCs are still evolving their niche now that the hype has died down (Impey 2020). While unbundling, like online more broadly, undoubtedly expands access to those who are wanting or able to undertake less than an entire degree, there are no strong signs yet of a great unbundling that realigns higher education and changes the core demand for degrees.
• Stratification and differentiation will continue: We’ve made distinctions between types of institutions throughout this book, and for good reason, because as we’ve seen, those differences have been intensifying over time. Universities that do well in their niches are likely to continue doing well, such as the top public and private research campuses, elite liberal arts colleges, and specialized institutes of technology: they have diverse revenue streams, more tenured faculty, impressive facilities, and an ability to recruit academically well-prepared students (Mintz 2019b). In contrast, the types of institutions with serious resource challenges are struggling, such as small private colleges and public regional campuses. The amplification of differences is seen in enrollments, student preparedness and selectivity, part-time and non-tenured versus tenured faculty ratios, private endowments versus public funding, and more. This situation has been termed higher education’s “gilded age” in which wealth and prestige are increasingly concentrated at elite campuses while the disparity grows between those institutions and the rest—essentially the middle class of US higher education will increasingly be divided between the rich getting richer and the poor getting poorer (Rosenberg 2019). Some think that institutions that succeed despite these pressures will be innovative and entrepreneurial in their approach to developing new niches in the higher education ecosystem, whether that be specialized training programs for industry, opening up national and international markets (physical or virtual), focusing on career-oriented majors and job skills, and changing delivery modes away from the fixed semester (Mintz 2019c).
• Research will need to be appropriately prioritized: Research is a net expense to universities and colleges, whether it is funded research or scholarship without external grants, as we saw in Chapter 8. Federal grants do not fully reimburse the complete overhead costs of research, and faculty workload allocation to research is subsidized from other revenue sources such as tuition, state, or investment income. While higher education’s research productivity and prowess has never been higher, the majority of institutions play a relatively minor role and they incur subsidy costs to do so. While it is in their academic interest to foreground research and scholarship,

14. Outcomes & Futures 345
the association of research with academic prestige is such that not many universities and colleges are willing to state outright that research is not their priority, even if that is the reality of their business model, niche, and financial situation. As a recent paper projected, smaller institutions in particular will need to restrict research activities in order to focus on the core educational mission (Rouse and Lombardi 2018).
• New models and brands will emerge: In the early days of online higher education, its low-cost and implied (but incorrect) low-quality image kept many top public and private universities out of the game. If MOOCs did anything, they associated the top university brands with low-cost online instruction in a way that arguably expanded rather than diluted their brands, preserving important aspects of their exclusivity (the elite in-person experience). There is some debate that this trend may be the equivalent of a luxury brand being sold at an outlet store, the very act of which undermines the high-price to high-quality equivalency that the market assumes (Newton 2018b). That narrow issue aside, a number of major universities have developed and are continuing to develop big names and market share in the domestic and international online space (e.g., Southern New Hampshire University, Maryland, and Purdue; more about international coming next), a trend that seems set to continue, especially in online professional master’s and continuing education (Mintz 2019a). A small number of new models are being tried as well, like Minerva and Foundry, both for-profit and out of Silicon Valley, the former in an elite mold and the latter aimed at basic management skills training (Blumenstyk 2018). Other possible models are pure speculation, such as dreamy elitist cyborg mashups between major tech companies and top institutions—think Apple-MIT, or Facebook-Harvard (Walsh 2020).
• Global education is still a growth market: While we may be reaching peak US higher education, there’s a long way to go until we reach peak global higher education, as it has been cleverly phrased (Kim 2019). Higher education enrollments are expected to double, triple and even quadruple in some parts of the world (Calderon 2018). Despite the ups and downs of domestic politics, international relations, pandemic travel restrictions, and economic conditions more broadly, some US universities have made the international market a significant part of their business strategy. The same is true of universities in many other high-income countries, with Australia being the most visible. While recruitment of international students to in-person (and online) programs in the US will continue, the international growth market is largely in-country rather than having students move to a university in the US or elsewhere. Based on experiences of the last decade or two, significant participation in satisfying international demand will probably

Like Nobody's Business346
not be satisfied via expensive physical campuses abroad that duplicate their home institutions (see Section 6.12). Instead, it appears that major scaling will more likely involve collaborations with local institutions and a blend of online and in-person delivery, such as the microcampus approach (Redden 2017; Calderon 2018).
• Climate change risks will need to be addressed: Climate change arrives not with the slow-moving averages but with extreme events. Campuses need to plan for the financial (and of course other) impacts of elevated climate risks, such as sea-level rise, floods, severe weather, record heat, wildfires, and disease, as well as less obvious impacts such as insurance changes, shifting utility costs, more frequent brownouts and blackouts, local water quality impacts for those with their own water supplies, and travel disruptions. Many of these risks involve physical infrastructure and thus they cannot be addressed overnight and they may require significant capital (Gardner 2019). In addition to fossil fuel divestment (see Section 13.5), many institutions have implemented recycling programs, added solar panels, and built or retrofitted energy-efficient buildings to mitigate future climate change. Of course, many universities are already involved in preparing their students and society for climate disruptions. Still, climate impacts to the institutional bottom line have not received as much attention. There is a strong business case for climate resilience planning (Holland 2015) and campuses will increasingly need to prioritize lowering climate risk as part of facilities and financial planning. For many, this will need to include collaboration with their neighboring communities (Woodside 2018).
• Universities will need to face athletics costs and football injuries: We covered athletics extensively in Chapter 12, and it’s plain that many institutions with challenging budgets will not be able to continue subsidizing athletics programs at current levels. This is as true for many Division I institutions as it is in lower divisions. For high-profile conferences, athlete compensation is on the horizon too (Anderson 2020a). Furthermore, it appears that the mounting evidence of health issues in football from concussion and subsequent brain disease is leading to mounting legal spending and the anticipation of greater risk of lawsuits and associated damages (Seltzer 2019c). Taken together, it appears that institutions will be facing tough decisions about athletics in the coming decades.
• Higher education’s trend towards a private good will be challenged: Although many people in US public higher education (and not a few outside it too) see it as a public good, one where all of society benefits from educating many individuals, the evident reality of decades of decreases in state funding per student underlines its increasing treatment as a private good, one where the

14. Outcomes & Futures 347
benefits of the education accrue primarily to the individual. Federal support for students and for research (at public and private institutions) has been much stronger, although not always keeping pace with need either. These trends were covered in Chapters 4 and 8. While the overall slide towards even less state support does not yet seem over, the related increases in costs to students, along with increased prices at private institutions, eventually brought calls for free or low-cost college education to the forefront of the national policy debate during the 2020 election cycle. There are a myriad policy details and plans, such as first-dollar, last-dollar, and debt-free, two-year versus four-year institutions, and more (Mangan 2019; see also Box 7.2). Unsurprisingly, the public-good/private-good view of who should pay for college has partisan dimensions (Kreighbaum 2019a), with candidates and think-tanks arraying their proposals and arguments on both sides (Anderson 2019; Whistle 2020). Whatever the immediate outcomes, it is clear that the policy battleground is established and won’t be going away in the foreseeable future.
Higher education is a large and complex sector with many examples of schools already inventing new approaches that both create and respond to the various trends I’ve mentioned. Some authors have even taken to blue-sky speculation about what kinds of new university might emerge (Jaschik 2019a). I am hopeful that institutions will face these futures as an ensemble of challenges and opportunities, adapting and innovating as they have always done.


Epilogue
I opened this book by saying that universities are fascinating institutions; I also posited that there is plenty of common knowledge on campuses about how their academic wheels turn, and that there is much written about managing people, but that an appreciation and understanding about how the money works in and around colleges and universities is not widespread and sometimes borders on the mythical. I hope I have shown you, gentle reader, that the business of universities and their financing can be as fascinating as almost any other question that these institutions address. Certainly, if you’ve made it from the introduction to this point, your understanding of how the money works is miles ahead of most people in and around a campus.
I want to stress that, although this book is all about money and the business of the university, I am most certainly not a proponent of a “corporate” university run as if it were a conventional business. Despite the absolute necessity for the academy to be focused on asking and answering the big questions and the teaching thereof, I am also, as you’ve seen, under no illusions that a contemporary US campus can exist as an intellectual collective that ignores financial realities. It is precisely this tension, in which we simultaneously seek Truth and underwrite that quest by providing access to the American dream through education, that makes our many colleges and universities so fascinating.
In closing, I trust I have provided you with valuable and practical insights into the multiplicity of funding flows and financial relationships that sustain our marvelous institutions of learning, showing you along the way how the money really works in and around them—how they function and grow, in all connotations of the saying, like nobody’s business.
© Andrew C. Comrie, CC BY 4.0 https://doi.org/10.11647/OBP.0240.15


Acknowledgements
I owe a debt of gratitude to my colleagues and friends, mentors and teachers all, for what I learned from them about the art and science of leading a university. Thanks to the many who explained to me, or asked me to explain, how the money flows (and sometimes doesn’t) to turn the giant waterwheel of the knowledge factory. It’s impossible to prioritize who to thank more, so my list below is instead loosely thematic. If I have provided any insights in this book it is, as Isaac Newton’s metaphor goes, by standing on the shoulders of these giants:
• The people of the University of Arizona, who literally are the University, for the opportunity to lead you and this wonderful institution that has been my professional home for almost three decades, and which afforded me a sabbatical during which I wrote much of this book;
• Allison Vaillancourt, for encouraging me to write a book, for speaking truth to power and asking important questions, and for countless enlightening discussions of leadership, institutional effectiveness and organizational change;
• Brad Story, for the many miles walked together that flew by with hours of fascinating conversations about so many topics in this book along with our research, teaching, the University, and life;
• Jim Florian, the virtuoso who gave me a six-year masterclass in institutional budgeting and finance, who was an invaluable partner as we implemented RCM, who also speaks truth to power, and who knows when to swim sideways;
• Dorian Voorhees, the guru of grad funding who always puts students first, who introduced me to how it all really works behind the scenes, and who first showed me that billionaire donors are just people too;
• Ed Frisch, the statesman of planning and budget who, together with Jim and Dorian back in 2006, explained to a then-new graduate dean how tuition waivers really worked—the genesis event that got me sucked into this whole topic;
• Caroline Garcia, second to none in research finance, who educated me in how financial administrators really enable research, and who grew talent

Like Nobody's Business352
with tough love as the informal dean of the Garcia school of university business management;
• Marilyn Taylor, for teaching me how the process of funding budgets and people is simultaneously about the big picture, the details, and creative problem-solving, and for always running towards the fire;
• Joel Hauff, from whom I absorbed all manner of entrepreneurial acumen about residence halls, bookstores, food concessions, and online pricing;
• Kathy Whisman, without whose knowledge and budget slides I would never have given the talks that fertilized this book, and who is living proof that the wisest are not the loudest;
• Hank Childers and Barry Brummund, who showed me how technical expertise, understanding people, and business sense can deliver critical projects on-budget, flawlessly (and who showed that it isn’t always easy to tell who’s the philosopher and who’s the IT expert);
• Rhoda Ray, who introduced me as a junior faculty member to the colors of money and from whom I learned that business managers are problem-solvers, not bookkeepers;
• Leslie Tolbert, for believing in me and for the opportunity to gain so much experience, and for demonstrating that erudition, grace and courage are inspiring qualities in science, in life, and in the messiness of academic leadership.
• George Davis, the philosopher-king of provosts, for how to think about the toughest decisions at the intersection of intellectual value and budgetary reality;
• Ann Weaver Hart, who took a chance on someone for whom, in her words, the glass is three-quarters full, who imparted so much to me about how universities work and how we pay for them, and who could boil it all down to the pithiness of a Dr. Seuss book;
• John Schaefer, Henry Koffler, Peter Likins, Robert Shelton, Gene Sander, and Bobby Robbins, who imparted their knowledge about battling budgets, leading change, and making tough decisions every day;
• Melissa Vito, for embodying the value of a creative business sensibility in higher education, for tremendous insights on student affairs, student success, enrollment and tuition-setting, as well as for recognizing the importance of 80s music and her commitment to keep doing epic $#!+;
• Gregg Goldman, who gave me an appreciation of private university affairs, business school finances, the challenges and complexities of health science

Acknowledgements 353
and hospital funding, and the importance of sometimes just spending the money on a worthy project;
• Bob Smith, who taught me how world-class buildings get built, and who is responsible for our beautiful campus and much of its remarkable architecture;
• Pat Jones, for introducing me to the world of tech transfer and innovation, David Purcell for the chance at growing a spinoff company, Bruce Wright for how tech parks work, Sherry Hoskinson for helping me understand entrepreneurship and that it can be taught, Nancy Smith for how to make corporate relations count, Nina Ossanna for illustrating that doing deals is fun, David Allen for how to build a tech innovation ecosystem, Grace Ratje for how to keep the whole business functioning, and special thanks to Doug Hockstad for providing national tech transfer data;
• Shane Burgess, for edifying me about Ag schools, cooperative extension, land grant legislation, and how to conceptualize and plan a new college from scratch, along with Jeff Ratje for showing how to keep that whole enterprise inside the rules and properly budgeted;
• Lynn Nadel, for asking tough questions and always pursuing robust debate in the pursuit of a better University, for enthusiastic engagement in designing and implementing a new budget model (even after seeing how winning research grants means losing money), and for the best foodie advice here in town and virtually anywhere on the planet;
• Ron Marx, Lisa Rulney, Vin del Casino, Lisa Ordóñez, Katie van Renterghem and everyone who served on the RCM committee, for all they helped me learn as we sought to understand and make understandable a university budget;
• Jenny Flynn, Vicki Fleischer, and JP Roczniak, who taught me almost everything I know about the business of fundraising, how a dedicated team can achieve change, and with whom 7:30 a.m. on Thursdays shall forever be associated, as well as Craig Barker for how one properly invests hundreds of millions of endowment dollars;
• Dick Silverman, Ted Hinderaker, Tom Keating, and Sarah Brown Smallhouse, for showing me the responsibility and passion that foundation trustees bring with their support of the University;
• Melinda Burke, for the many chances to speak with alumni leaders and for insightful discussions about changing alumni association business models;
• Chris Sigurdson, who put me in front of the press and encouraged me to be myself as I explained the issue du jour, oftentimes covering topics in this book;

Like Nobody's Business354
• Kathryn Conrad, for explaining how university presses work and for publishing advice;
• Even more colleagues who taught me how the money works, pushed me on how it should work, and helped me make it work, including Jacqueline Mok, Kim Espy, Leigh Neumayer, Skip Garcia, Jennifer Barton, Meredith Hay, JP Jones, Marc Miller, Jim Wyant, Kaye Rowan, Tom Koch, Joaquin Ruiz, Elliott Cheu, Jory Hancock, Sharon Young, the staff and board of UA Presents, Steve Goldschmid, Andrew Carnie, Diane Horgan, Maria Teresa Velez, Connie Garcia, Christina Mena, Mike Proctor, Suzanne Panferov, Brent White, Duc Ma and the finance team, Kasey Urquidez, Angela Baldesare, Simran Nirh, Michele Norin, Karen Williams, Jeff Goldberg, all of my other dean and associate/assistant dean colleagues, the leaders of Heads-Up, the Regents’ Professors and Distinguished Professors, Wanda Howell, the members of shared governance, and student leaders;
• Many members of that remarkable law practice in the basement known as the Office of General Counsel, including Laura Todd Johnson, Glenn George, Art Lee, Heather Gaines, Stephanie Rosenberg, David Wagner, Josh Estavillo, Celeste Steen, Bruce Skolnik, David Nix, and Steve Adamczyk for advice and counsel, sometimes on matters outside the law such as human nature, singing, and good food;
• Anne Marx, Clarisa Robles, and the Provost’s Office staff, all consummate professionals, for their tireless support and willingness to jump into whatever the rush or crisis demanded, and for putting up with me and all my talking as I experienced much of what is now distilled here;
• Gail Burd and Tom Miller, indefatigable colleagues who truly believe in and embody the value of higher education, who counseled wisely and cajoled when necessary, and who love the give-and-take debate of decision-making as much as I do;
• The regents, legislators, business and community leaders, and parents from whom I learned the many important ways in which society both values and questions the business of the University;
• Debra Stewart, the personification of smart and effective leadership, for the many opportunities to learn about the business of graduate education and international higher education, with a shout-out to the graduate deans and staff of the Council of Graduate Schools, who all created such a valuable professional development environment;
• David Payne, for showing me how an academic can combine intellectual rigor and business smarts in running a large nonprofit, and for giving me the chance to weigh in on the GRE;

Acknowledgements 355
• Fellow provosts in the AAU, the APLU and at our sister schools in Arizona, all of whom warmly shared their challenges, explanations, insights and advice;
• The International Council and staff of ITMO University in St. Petersburg who, with the visionary leadership of Vladimir Vasilyev and Daria Koslova, have taught me volumes about the business of international higher education and how far and fast a change-oriented institution can move;
• My colleagues in the School of Geography, Development and Environment, a marvelous academic home, who are too numerous for me to mention individually but amongst whom I must recognize Diana Liverman who has been a mentor and friend since our Penn State days, Dave Plane who hired me and subsequently empowered me to direct our graduate program in my first administrative role, Steve Yool who has been a friend since day one on the job and who introduced me to the delights of homebrewing, and Beth Mitchneck who, one fateful day, persuaded me to try central administration;
• The marvelous team at OBP who helped give life to this book, including Alessandra Tosi, Anna Gatti, Melissa Purkiss, Luca Baffa and Laura Rodriguez, who together with their colleagues prove that an academic press with a progressive business model can succeed intellectually and financially;
• Everyone else who helped make this a better book, including Roger Geiger who provided insightful and detailed comments on the manuscript, numerous colleagues listed above who taught me how finances worked in their particular corner of the academy, and Benjamin Dreyer, who doesn’t know me but whose erudite, elegant and witty gem of a book, Dreyer’s English, is indeed the utterly correct guide to clarity and style (Dreyer 2019).
I am also truly grateful for the sustenance of family and friends, who were always interested in the progress of the book and unfailingly encouraging at every turn:
• Lee, my wife, best friend, love of my life, and partner across continents and time;
• Our daughters Alison and Hayley, amazing and inspiring young women both, who as proud products of public higher education are, respectively, advancing the frontiers of neuroscience and saving lives in healthcare;
• My dad, Jock, who gave to me his love of thinking, reading and writing, my late mom, Yvonne, who passed to me her love of the creative life, and my brother, Stewart, whose enthusiasm for management and business eventually rubbed off on me;
• Harold and the recently departed Em, the warmest in-laws, who have always included me in their special family;

Like Nobody's Business356
• The partners and siblings of this whole group for creating a marvelous extended family;
• Friends, near and far, who wanted regular updates and cheered my progress.
To one and all, my deepest thanks.

About the Author
Andrew C. Comrie is a professor and former provost with over two decades of administrative experience at the University of Arizona. In addition to ongoing academic appointments in geography and interdisciplinary climate science, he has served in successive administrative positions as a Degree Program Director, Department Head, Associate Vice President for Research, Dean of the Graduate College, and as Senior Vice President for Academic Affairs and Provost. A graduate of the University of Cape Town and the Pennsylvania State University, he has served as a scientific journal editor and he is the author of over 100 professional publications.


Appendices
Appendix A: Institutions in the Data Set
The 1174 institutions and their institution-type characteristics used for analysis throughout this book. The Carnegie Classification is the 2015 Basic Carnegie Classification (Indiana University Center for Postsecondary Research 2015), as follows: R1, R2, R3—Doctoral Universities with Highest, Higher & Moderate research activity; M1, M2, M3—Master’s Colleges & Universities with Large, Medium & Smaller programs; BAS—Baccalaureate Colleges with an Arts & Sciences Focus.
Institution Name Location Control Carnegie
Abilene Christian University Abilene, TX Private M1Adams State University Alamosa, CO Public M1Adelphi University Garden City, NY Private R3Agnes Scott College Decatur, GA Private BASAlabama A&M University Normal, AL Public M1Alabama State University Montgomery, AL Public M2Alaska Pacific University Anchorage, AK Private M3Albany State University Albany, GA Public M2Albertus Magnus College New Haven, CT Private M2Albion College Albion, MI Private BASAlbright College Reading, PA Private BASAlcorn State University Alcorn State, MS Public M2Alfred University Alfred, NY Private M2Allegheny College Meadville, PA Private BASAllen University Columbia, SC Private BASAlma College Alma, MI Private BASAlvernia University Reading, PA Private M2Alverno College Milwaukee, WI Private M2American International College Springfield, MA Private R3American Jewish University Los Angeles, CA Private BASAmerican University Washington, DC Private R2Amherst College Amherst, MA Private BAS

Like Nobody's Business360
Institution Name Location Control Carnegie
Amridge University Montgomery, AL Private M3Anderson University Anderson, SC Private M2Anderson University Anderson, IN Private M2Andrews University Berrien Springs, MI Private R3Angelo State University San Angelo, TX Public M1Anna Maria College Paxton, MA Private M2Appalachian State University Boone, NC Public M1Aquinas College Grand Rapids, MI Private M3Arcadia University Glenside, PA Private M1Arizona State University-Tempe Tempe, AZ Public R1Arkansas State University-Main Campus Jonesboro, AR Public M1Arkansas Tech University Russellville, AR Public M1Armstrong State University Savannah, GA Public M1Asbury University Wilmore, KY Private M3Ashland University Ashland, OH Private R3Assumption College Worcester, MA Private M2Auburn University Auburn, AL Public R2Auburn University at Montgomery Montgomery, AL Public M1Augsburg University Minneapolis, MN Private M1Augusta University Augusta, GA Public R2Augustana College Rock Island, IL Private BASAurora University Aurora, IL Private M1Austin College Sherman, TX Private BASAustin Peay State University Clarksville, TN Public M1Ave Maria University Ave Maria, FL Private BASAvila University Kansas City, MO Private M2Azusa Pacific University Azusa, CA Private R3Baker University Baldwin City, KS Private M1Baldwin Wallace University Berea, OH Private M1Ball State University Muncie, IN Public R2Bard College Annandale-On-Hudson, NY Private BASBard College at Simon’s Rock Great Barrington, MA Private BASBarnard College New York, NY Private BASBarry University Miami, FL Private R3Bates College Lewiston, ME Private BASBay Path University Longmeadow, MA Private M1Baylor University Waco, TX Private R2Belhaven University Jackson, MS Private M1

Appendices 361
Institution Name Location Control Carnegie
Bellarmine University Louisville, KY Private M1Bellevue University Bellevue, NE Private M1Belmont University Nashville, TN Private M1Beloit College Beloit, WI Private BASBemidji State University Bemidji, MN Public M3Benedictine University Lisle, IL Private R3Bennington College Bennington, VT Private BASBentley University Waltham, MA Private M1Berea College Berea, KY Private BASBerry College Mount Berry, GA Private M3Bethany College Bethany, WV Private BASBethany Lutheran College Mankato, MN Private BASBethel College-Indiana Mishawaka, IN Private M3Bethel College-North Newton North Newton, KS Private BASBethel University McKenzie, TN Private M1Bethel University Saint Paul, MN Private M1Bethune-Cookman University Daytona Beach, FL Private BASBinghamton University Vestal, NY Public R2Biola University La Mirada, CA Private R3Birmingham Southern College Birmingham, AL Private BASBlack Hills State University Spearfish, SD Public M3Bloomfield College Bloomfield, NJ Private BASBloomsburg University of Pennsylvania Bloomsburg, PA Public M1Boise State University Boise, ID Public R3Boston College Chestnut Hill, MA Private R1Boston University Boston, MA Private R1Bowdoin College Brunswick, ME Private BASBowie State University Bowie, MD Public M1Bowling Green State University-Main Campus Bowling Green, OH Public R2Bradley University Peoria, IL Private M2Brandeis University Waltham, MA Private R1Brandman University Irvine, CA Private M1Brenau University Gainesville, GA Private M1Bridgewater College Bridgewater, VA Private BASBridgewater State University Bridgewater, MA Public M1Brigham Young University-Provo Provo, UT Private R2Brown University Providence, RI Private R1Bryan College-Dayton Dayton, TN Private M3

Like Nobody's Business362
Institution Name Location Control Carnegie
Bryant University Smithfield, RI Private M2Bryn Athyn College of the New Church Bryn Athyn, PA Private BASBryn Mawr College Bryn Mawr, PA Private BASBucknell University Lewisburg, PA Private BASButler University Indianapolis, IN Private M1Cabrini University Radnor, PA Private M1Cairn University-Langhorne Langhorne, PA Private M3Caldwell University Caldwell, NJ Private M2California Baptist University Riverside, CA Private M1California Institute of Technology Pasadena, CA Private R1California Lutheran University Thousand Oaks, CA Private M1California Polytechnic State University-San Luis
ObispoSan Luis Obispo, CA Public M1
California State Polytechnic University-Pomona Pomona, CA Public M1California State University-Bakersfield Bakersfield, CA Public M1California State University-Channel Islands Camarillo, CA Public M3California State University-Chico Chico, CA Public M1California State University-Dominguez Hills Carson, CA Public M1California State University-East Bay Hayward, CA Public M1California State University-Fresno Fresno, CA Public R3California State University-Fullerton Fullerton, CA Public R3California State University-Long Beach Long Beach, CA Public M1California State University-Los Angeles Los Angeles, CA Public M1California State University-Monterey Bay Seaside, CA Public M2California State University-Northridge Northridge, CA Public M1California State University-Sacramento Sacramento, CA Public M1California State University-San Bernardino San Bernardino, CA Public M1California State University-San Marcos San Marcos, CA Public M2California State University-Stanislaus Turlock, CA Public M1California University of Management and Sciences Anaheim, CA Private M2California University of Pennsylvania California, PA Public M1Calumet College of Saint Joseph Whiting, IN Private M3Cambridge College Cambridge, MA Private M1Cameron University Lawton, OK Public M2Campbell University Buies Creek, NC Private M1Campbellsville University Campbellsville, KY Private M1Canisius College Buffalo, NY Private M1Capital University Columbus, OH Private M2

Appendices 363
Institution Name Location Control Carnegie
Cardinal Stritch University Milwaukee, WI Private R3Carleton College Northfield, MN Private BASCarlow University Pittsburgh, PA Private M1Carnegie Mellon University Pittsburgh, PA Private R1Carroll University Waukesha, WI Private M3Carson-Newman University Jefferson City, TN Private M2Carthage College Kenosha, WI Private BASCase Western Reserve University Cleveland, OH Private R1Catholic University of America Washington, DC Private R2Centenary College of Louisiana Shreveport, LA Private BASCentenary University Hackettstown, NJ Private M2Central College Pella, IA Private BASCentral Connecticut State University New Britain, CT Public M1Central Michigan University Mount Pleasant, MI Public R2Central Washington University Ellensburg, WA Public M1Centre College Danville, KY Private BASChadron State College Chadron, NE Public M2Chaminade University of Honolulu Honolulu, HI Private M1Champlain College Burlington, VT Private M2Chapman University Orange, CA Private M1Charleston Southern University Charleston, SC Private M2Charter Oak State College New Britain, CT Public BASChatham University Pittsburgh, PA Private M1Chestnut Hill College Philadelphia, PA Private M1Cheyney University of Pennsylvania Cheyney, PA Public BASChicago State University Chicago, IL Public M2Christian Brothers University Memphis, TN Private M2Christopher Newport University Newport News, VA Public M3Citadel Military College of South Carolina Charleston, SC Public M1City University of Seattle Seattle, WA Private M1Claflin University Orangeburg, SC Private BASClaremont McKenna College Claremont, CA Private BASClarion University of Pennsylvania Clarion, PA Public M1Clark Atlanta University Atlanta, GA Private R2Clark University Worcester, MA Private R3Clarkson University Potsdam, NY Private R3Clayton State University Morrow, GA Public M2Clemson University Clemson, SC Public R1

Like Nobody's Business364
Institution Name Location Control Carnegie
Cleveland State University Cleveland, OH Public R2Coastal Carolina University Conway, SC Public M1Coe College Cedar Rapids, IA Private BASColby College Waterville, ME Private BASColgate University Hamilton, NY Private BASCollege of Charleston Charleston, SC Public M1College of Mount Saint Vincent Bronx, NY Private M3College of Our Lady of the Elms Chicopee, MA Private M3College of Saint Benedict Saint Joseph, MN Private BASCollege of Saint Elizabeth Morristown, NJ Private M2College of Saint Mary Omaha, NE Private M3College of Staten Island CUNY Staten Island, NY Public M1College of the Atlantic Bar Harbor, ME Private BASCollege of the Holy Cross Worcester, MA Private BASCollege of William and Mary Williamsburg, VA Public R2Colorado Christian University Lakewood, CO Private M2Colorado College Colorado Springs, CO Private BASColorado School of Mines Golden, CO Public R2Colorado State University-Fort Collins Fort Collins, CO Public R1Colorado State University-Pueblo Pueblo, CO Public M2Columbia College Columbia, SC Private M2Columbia College Columbia, MO Private M1Columbia College Chicago Chicago, IL Private M2Columbia International University Columbia, SC Private M2Columbia University in the City of New York New York, NY Private R1Columbus State University Columbus, GA Public M1Concord University Athens, WV Public M3Concordia College at Moorhead Moorhead, MN Private BASConcordia University-Chicago River Forest, IL Private M1Concordia University-Irvine Irvine, CA Private M1Concordia University-Nebraska Seward, NE Private M1Concordia University-Saint Paul Saint Paul, MN Private M1Concordia University-Texas Austin, TX Private M1Concordia University-Wisconsin Mequon, WI Private M1Connecticut College New London, CT Private BASConverse College Spartanburg, SC Private M2Coppin State University Baltimore, MD Public M3Corban University Salem, OR Private M3

Appendices 365
Institution Name Location Control Carnegie
Cornell College Mount Vernon, IA Private BASCornell University Ithaca, NY Private R1Cornerstone University Grand Rapids, MI Private M1Covenant College Lookout Mountain, GA Private BASCreighton University Omaha, NE Private M1Cumberland University Lebanon, TN Private M2CUNY Bernard M Baruch College New York, NY Public M1CUNY Brooklyn College Brooklyn, NY Public M1CUNY City College New York, NY Public M1CUNY Hunter College New York, NY Public M1CUNY John Jay College of Criminal Justice New York, NY Public M1CUNY Lehman College Bronx, NY Public M1CUNY Queens College Queens, NY Public M1Curry College Milton, MA Private M2D’Youville College Buffalo, NY Private M1Daemen College Amherst, NY Private M1Dakota State University Madison, SD Public M3Dallas Baptist University Dallas, TX Private R3Dartmouth College Hanover, NH Private R2Davenport University Grand Rapids, MI Private M1Davidson College Davidson, NC Private BASDavis & Elkins College Elkins, WV Private BASDelaware State University Dover, DE Public M2Delaware Valley University Doylestown, PA Private M3Delta State University Cleveland, MS Public M1Denison University Granville, OH Private BASDePaul University Chicago, IL Private R3DePauw University Greencastle, IN Private BASDeSales University Center Valley, PA Private M1Dickinson College Carlisle, PA Private BASDillard University New Orleans, LA Private BASDoane University-Arts & Sciences Crete, NE Private BASDoane University-Graduate and Professional
StudiesLincoln, NE Private M1
Dominican College of Blauvelt Orangeburg, NY Private M3Dominican University River Forest, IL Private M1Dominican University of California San Rafael, CA Private M2Drake University Des Moines, IA Private M1

Like Nobody's Business366
Institution Name Location Control Carnegie
Drew University Madison, NJ Private BASDrexel University Philadelphia, PA Private R2Drury University Springfield, MO Private M2Duke University Durham, NC Private R1Duquesne University Pittsburgh, PA Private R2Earlham College Richmond, IN Private BASEast Carolina University Greenville, NC Public R2East Central University Ada, OK Public M1East Stroudsburg University of Pennsylvania East Stroudsburg, PA Public M2East Tennessee State University Johnson City, TN Public R3East-West University Chicago, IL Private BASEastern Connecticut State University Willimantic, CT Public M3Eastern Illinois University Charleston, IL Public M1Eastern Kentucky University Richmond, KY Public M1Eastern Mennonite University Harrisonburg, VA Private M3Eastern Michigan University Ypsilanti, MI Public R3Eastern Nazarene College Quincy, MA Private M3Eastern New Mexico University-Main Campus Portales, NM Public M2Eastern Oregon University La Grande, OR Public M3Eastern University Saint Davids, PA Private M1Eastern Washington University Cheney, WA Public M1Eckerd College Saint Petersburg, FL Private BASEdgewood College Madison, WI Private R3Edinboro University of Pennsylvania Edinboro, PA Public M1Elizabeth City State University Elizabeth City, NC Public M3Elizabethtown College Elizabethtown, PA Private BASElmhurst College Elmhurst, IL Private M2Elmira College Elmira, NY Private BASElon University Elon, NC Private M2Embry-Riddle Aeronautical University-Daytona
BeachDaytona Beach, FL Private M1
Emerson College Boston, MA Private M1Emmanuel College Boston, MA Private BASEmory & Henry College Emory, VA Private BASEmory University Atlanta, GA Private R1Emporia State University Emporia, KS Public M1Endicott College Beverly, MA Private M1Erskine College Due West, SC Private BAS

Appendices 367
Institution Name Location Control Carnegie
Evangel University Springfield, MO Private M3Fairfield University Fairfield, CT Private M1Fairleigh Dickinson University-Metropolitan
CampusTeaneck, NJ Private M1
Fairmont State University Fairmont, WV Public M3Fashion Institute of Technology New York, NY Public M3Faulkner University Montgomery, AL Private M3Fayetteville State University Fayetteville, NC Public M2Felician University Lodi, NJ Private M3Ferris State University Big Rapids, MI Public M2Fisk University Nashville, TN Private BASFitchburg State University Fitchburg, MA Public M1Florida Agricultural and Mechanical University Tallahassee, FL Public R2Florida Atlantic University Boca Raton, FL Public R2Florida Gulf Coast University Fort Myers, FL Public M1Florida Institute of Technology Melbourne, FL Private R2Florida International University Miami, FL Public R1Florida Southern College Lakeland, FL Private M3Florida State University Tallahassee, FL Public R1Fontbonne University Saint Louis, MO Private M1Fordham University Bronx, NY Private R2Fort Hays State University Hays, KS Public M1Fort Lewis College Durango, CO Public BASFort Valley State University Fort Valley, GA Public M3Framingham State University Framingham, MA Public M1Francis Marion University Florence, SC Public M3Franciscan University of Steubenville Steubenville, OH Private M2Franklin and Marshall College Lancaster, PA Private BASFranklin College Franklin, IN Private BASFranklin Pierce University Rindge, NH Private M2Freed-Hardeman University Henderson, TN Private M3Fresno Pacific University Fresno, CA Private M1Friends University Wichita, KS Private M1Frostburg State University Frostburg, MD Public M1Furman Greenville, SC Private BASGallaudet University Washington, DC Private M2Gannon University Erie, PA Private M1Gardner-Webb University Boiling Springs, NC Private R3

Like Nobody's Business368
Institution Name Location Control Carnegie
Geneva College Beaver Falls, PA Private M2George Fox University Newberg, OR Private M1George Mason University Fairfax, VA Public R1George Washington University Washington, DC Private R1Georgetown College Georgetown, KY Private BASGeorgetown University Washington, DC Private R1Georgia College & State University Milledgeville, GA Public M1Georgia Institute of Technology-Main Campus Atlanta, GA Public R1Georgia Southern University Statesboro, GA Public R3Georgia Southwestern State University Americus, GA Public M2Georgia State University Atlanta, GA Public R1Georgian Court University Lakewood, NJ Private M2Gettysburg College Gettysburg, PA Private BASGoddard College Plainfield, VT Private M2Golden Gate University-San Francisco San Francisco, CA Private M1Gonzaga University Spokane, WA Private M1Gordon College Wenham, MA Private BASGoucher College Baltimore, MD Private BASGovernors State University University Park, IL Public M1Grace College and Theological Seminary Winona Lake, IN Private M3Graceland University-Lamoni Lamoni, IA Private M2Grambling State University Grambling, LA Public M1Grand Valley State University Allendale, MI Public M1Green Mountain College Poultney, VT Private M3Greenville University Greenville, IL Private M3Grinnell College Grinnell, IA Private BASGuilford College Greensboro, NC Private BASGustavus Adolphus College Saint Peter, MN Private BASGwynedd Mercy University Gwynedd Valley, PA Private M2Hamilton College Clinton, NY Private BASHamline University Saint Paul, MN Private M1Hampden-Sydney College Hampden-Sydney, VA Private BASHampshire College Amherst, MA Private BASHampton University Hampton, VA Private M2Hanover College Hanover, IN Private BASHardin-Simmons University Abilene, TX Private M2Harding University Searcy, AR Private M1Harrisburg University of Science and Technology Harrisburg, PA Private M3

Appendices 369
Institution Name Location Control Carnegie
Hartwick College Oneonta, NY Private BASHarvard University Cambridge, MA Private R1Harvey Mudd College Claremont, CA Private BASHaverford College Haverford, PA Private BASHawaii Pacific University Honolulu, HI Private M1Heidelberg University Tiffin, OH Private M3Henderson State University Arkadelphia, AR Public M2Hendrix College Conway, AR Private BASHeritage University Toppenish, WA Private M3Hiram College Hiram, OH Private BASHobart William Smith Colleges Geneva, NY Private BASHodges University Naples, FL Private M3Hofstra University Hempstead, NY Private R3Hollins University Roanoke, VA Private BASHoly Cross College Notre Dame, IN Private BASHoly Family University Philadelphia, PA Private M1Holy Names University Oakland, CA Private M2Hood College Frederick, MD Private M1Hope College Holland, MI Private BASHope International University Fullerton, CA Private M2Houghton College Houghton, NY Private BASHouston Baptist University Houston, TX Private M2Howard University Washington, DC Private R2Humboldt State University Arcata, CA Public M2Idaho State University Pocatello, ID Public R3Illinois College Jacksonville, IL Private BASIllinois Institute of Technology Chicago, IL Private R2Illinois State University Normal, IL Public R2Illinois Wesleyan University Bloomington, IL Private BASImmaculata University Immaculata, PA Private R3Indiana State University Terre Haute, IN Public R3Indiana University of Pennsylvania-Main Campus Indiana, PA Public R3Indiana University-Bloomington Bloomington, IN Public R1Indiana University-East Richmond, IN Public M3Indiana University-Northwest Gary, IN Public M2Indiana University-Purdue University-Fort
WayneFort Wayne, IN Public M1

Like Nobody's Business370
Institution Name Location Control Carnegie
Indiana University-Purdue University-Indianapolis
Indianapolis, IN Public R2
Indiana University-South Bend South Bend, IN Public M2Indiana University-Southeast New Albany, IN Public M1Indiana Wesleyan University-Marion Marion, IN Private M1Iona College New Rochelle, NY Private M1Iowa State University Ames, IA Public R1Ithaca College Ithaca, NY Private M1Jackson State University Jackson, MS Public R2Jacksonville State University Jacksonville, AL Public M1Jacksonville University Jacksonville, FL Private M1James Madison University Harrisonburg, VA Public M1Jefferson (Philadelphia University + Thomas
Jefferson University)Philadelphia, PA Private M1
John Brown University Siloam Springs, AR Private M2John Carroll University University Heights, OH Private M1Johns Hopkins University Baltimore, MD Private R1Johnson & Wales University-Providence Providence, RI Private M1Johnson C Smith University Charlotte, NC Private BASJohnson State College Johnson, VT Public M3Judson College Marion, AL Private BASJudson University Elgin, IL Private M3Juniata College Huntingdon, PA Private BASKalamazoo College Kalamazoo, MI Private BASKansas State University Manhattan, KS Public R1Kean University Union, NJ Public M1Keene State College Keene, NH Public M3Keiser University-Ft Lauderdale Fort Lauderdale, FL Private M1Kent State University at Kent Kent, OH Public R2Kenyon College Gambier, OH Private BASKettering University Flint, MI Private M2Keuka College Keuka Park, NY Private M2King University Bristol, TN Private M1King’s College Wilkes-Barre, PA Private M3Knox College Galesburg, IL Private BASKutztown University of Pennsylvania Kutztown, PA Public M1La Salle University Philadelphia, PA Private M1La Sierra University Riverside, CA Private M3

Appendices 371
Institution Name Location Control Carnegie
Lafayette College Easton, PA Private BASLaGrange College Lagrange, GA Private BASLake Erie College Painesville, OH Private M3Lake Forest College Lake Forest, IL Private BASLakeland University Plymouth, WI Private M1Lamar University Beaumont, TX Public R3Langston University Langston, OK Public M2Lasell College Newton, MA Private M2Lawrence Technological University Southfield, MI Private M1Lawrence University Appleton, WI Private BASLe Moyne College Syracuse, NY Private M1Lebanon Valley College Annville, PA Private M3Lee University Cleveland, TN Private M2Lehigh University Bethlehem, PA Private R2Lenoir-Rhyne University Hickory, NC Private M3Lesley University Cambridge, MA Private R3LeTourneau University Longview, TX Private M2Lewis & Clark College Portland, OR Private BASLewis University Romeoville, IL Private M1Liberty University Lynchburg, VA Private R3Lincoln Memorial University Harrogate, TN Private M1Lincoln University Jefferson City, MO Public M3Lincoln University Lincoln University, PA Public M2Lindenwood University Saint Charles, MO Private R3Lindsey Wilson College Columbia, KY Private M1Linfield College-McMinnville Campus McMinnville, OR Private BASLipscomb University Nashville, TN Private R3LIU Brooklyn Brooklyn, NY Private M1LIU Post Brookville, NY Private M1Lock Haven University Lock Haven, PA Public M2Longwood University Farmville, VA Public M2Louisiana College Pineville, LA Private M2Louisiana State University and Agricultural &
Mechanical CollegeBaton Rouge, LA Public R1
Louisiana State University-Alexandria Alexandria, LA Public BASLouisiana State University-Shreveport Shreveport, LA Public M2Louisiana Tech University Ruston, LA Public R3Lourdes University Sylvania, OH Private M2

Like Nobody's Business372
Institution Name Location Control Carnegie
Loyola Marymount University Los Angeles, CA Private M1Loyola University Chicago Chicago, IL Private R2Loyola University Maryland Baltimore, MD Private M1Loyola University New Orleans New Orleans, LA Private M1Lubbock Christian University Lubbock, TX Private M2Luther College Decorah, IA Private BASLycoming College Williamsport, PA Private BASLynchburg College Lynchburg, VA Private M2Lynn University Boca Raton, FL Private M1Lyon College Batesville, AR Private BASMacalester College Saint Paul, MN Private BASMadonna University Livonia, MI Private M1Maharishi University of Management Fairfield, IA Private M1Malone University Canton, OH Private M2Manhattan College Riverdale, NY Private M2Manhattanville College Purchase, NY Private M1Mansfield University of Pennsylvania Mansfield, PA Public M3Marian University Fond Du Lac, WI Private M2Marian University Indianapolis, IN Private M2Marist College Poughkeepsie, NY Private M1Marlboro College Marlboro, VT Private BASMarquette University Milwaukee, WI Private R2Marshall University Huntington, WV Public M1Martin University Indianapolis, IN Private BASMary Baldwin University Staunton, VA Private M2Marygrove College Detroit, MI Private M1Marymount Manhattan College New York, NY Private BASMarymount University Arlington, VA Private M1Maryville College Maryville, TN Private BASMaryville University of Saint Louis Saint Louis, MO Private R3Marywood University Scranton, PA Private M1Massachusetts College of Liberal Arts North Adams, MA Public BASMassachusetts Institute of Technology Cambridge, MA Private R1Massachusetts Maritime Academy Buzzards Bay, MA Public M3McDaniel College Westminster, MD Private BASMcKendree University Lebanon, IL Private M1McNeese State University Lake Charles, LA Public M1Medaille College Buffalo, NY Private M1

Appendices 373
Institution Name Location Control Carnegie
Mercer University Macon, GA Private R3Mercy College Dobbs Ferry, NY Private M1Mercyhurst University Erie, PA Private M2Meredith College Raleigh, NC Private BASMerrimack College North Andover, MA Private M2Methodist University Fayetteville, NC Private M3Metropolitan College of New York New York, NY Private M1Metropolitan State University Saint Paul, MN Public M1Metropolitan State University of Denver Denver, CO Public M2Miami University-Oxford Oxford, OH Public R2Michigan State University East Lansing, MI Public R1Michigan Technological University Houghton, MI Public R2Mid-America Christian University Oklahoma City, OK Private M2MidAmerica Nazarene University Olathe, KS Private M2Middle Tennessee State University Murfreesboro, TN Public R3Middlebury College Middlebury, VT Private BASMidway University Midway, KY Private M3Midwestern State University Wichita Falls, TX Public M2Millersville University of Pennsylvania Millersville, PA Public M1Mills College Oakland, CA Private M1Millsaps College Jackson, MS Private BASMilwaukee School of Engineering Milwaukee, WI Private M3Minnesota State University Moorhead Moorhead, MN Public M2Minnesota State University-Mankato Mankato, MN Public M1Minot State University Minot, ND Public M2Misericordia University Dallas, PA Private M2Mississippi College Clinton, MS Private M1Mississippi State University Mississippi State, MS Public R2Mississippi University for Women Columbus, MS Public M3Mississippi Valley State University Itta Bena, MS Public M3Missouri Baptist University Saint Louis, MO Private M1Missouri State University-Springfield Springfield, MO Public M1Missouri University of Science and Technology Rolla, MO Public R2Molloy College Rockville Centre, NY Private M1Monmouth College Monmouth, IL Private BASMonmouth University West Long Branch, NJ Private M1Montana State University Bozeman, MT Public R2Montana State University-Billings Billings, MT Public M2

Like Nobody's Business374
Institution Name Location Control Carnegie
Montclair State University Montclair, NJ Public R3Montreat College Montreat, NC Private M3Moravian College Bethlehem, PA Private BASMorehead State University Morehead, KY Public M1Morehouse College Atlanta, GA Private BASMorgan State University Baltimore, MD Public R3Morningside College Sioux City, IA Private M2Mount Holyoke College South Hadley, MA Private BASMount Marty College Yankton, SD Private M3Mount Mary University Milwaukee, WI Private M2Mount Mercy University Cedar Rapids, IA Private M2Mount Saint Joseph University Cincinnati, OH Private M2Mount Saint Mary College Newburgh, NY Private M2Mount Saint Mary’s University Los Angeles, CA Private M2Mount St. Mary’s University Emmitsburg, MD Private M2Mount Vernon Nazarene University Mount Vernon, OH Private M1Muhlenberg College Allentown, PA Private BASMurray State University Murray, KY Public M1Muskingum University New Concord, OH Private M2Naropa University Boulder, CO Private M1National Louis University Chicago, IL Private R3National University La Jolla, CA Private M1Nazareth College Rochester, NY Private M1Nebraska Wesleyan University Lincoln, NE Private M2Neumann University Aston, PA Private M2New College of Florida Sarasota, FL Public BASNew England College Henniker, NH Private M1New Jersey City University Jersey City, NJ Public M1New Jersey Institute of Technology Newark, NJ Public R2New Mexico Highlands University Las Vegas, NM Public M1New Mexico Institute of Mining and Technology Socorro, NM Public M3New Mexico State University-Main Campus Las Cruces, NM Public R2New York Institute of Technology Old Westbury, NY Private M1New York University New York, NY Private R1Newman University Wichita, KS Private M2Niagara University Niagara University, NY Private M1Nicholls State University Thibodaux, LA Public M2Norfolk State University Norfolk, VA Public M2

Appendices 375
Institution Name Location Control Carnegie
North Carolina A & T State University Greensboro, NC Public R2North Carolina Central University Durham, NC Public M1North Carolina State University at Raleigh Raleigh, NC Public R1North Central College Naperville, IL Private M2North Dakota State University-Main Campus Fargo, ND Public R2North Greenville University Tigerville, SC Private M3North Park University Chicago, IL Private M1Northeastern Illinois University Chicago, IL Public M1Northeastern State University Tahlequah, OK Public M1Northeastern University Boston, MA Private R1Northern Arizona University Flagstaff, AZ Public R2Northern Illinois University Dekalb, IL Public R2Northern Kentucky University Highland Heights, KY Public M1Northern Michigan University Marquette, MI Public M2Northern State University Aberdeen, SD Public M3Northland College Ashland, WI Private BASNorthwest Christian University Eugene, OR Private M3Northwest Missouri State University Maryville, MO Public M1Northwest Nazarene University Nampa, ID Private M1Northwest University Kirkland, WA Private M2Northwestern Oklahoma State University Alva, OK Public M3Northwestern State University of Louisiana Natchitoches, LA Public M1Northwestern University Evanston, IL Private R1Norwich University Northfield, VT Private M1Notre Dame College Cleveland, OH Private M3Notre Dame de Namur University Belmont, CA Private M1Notre Dame of Maryland University Baltimore, MD Private M1Nova Southeastern University Fort Lauderdale, FL Private R2Nyack College Nyack, NY Private M1Oakland University Rochester Hills, MI Public R3Oberlin College Oberlin, OH Private BASOccidental College Los Angeles, CA Private BASOglethorpe University Atlanta, GA Private BASOhio Dominican University Columbus, OH Private M2Ohio State University-Main Campus Columbus, OH Public R1Ohio University-Main Campus Athens, OH Public R2Ohio Wesleyan University Delaware, OH Private BASOklahoma Christian University Edmond, OK Private M1

Like Nobody's Business376
Institution Name Location Control Carnegie
Oklahoma City University Oklahoma City, OK Private M1Oklahoma State University-Main Campus Stillwater, OK Public R2Oklahoma Wesleyan University Bartlesville, OK Private M3Old Dominion University Norfolk, VA Public R2Olivet Nazarene University Bourbonnais, IL Private M1Oral Roberts University Tulsa, OK Private M2Oregon State University Corvallis, OR Public R1Otterbein University Westerville, OH Private M2Ouachita Baptist University Arkadelphia, AR Private BASOur Lady of the Lake University San Antonio, TX Private M1Pace University-New York New York, NY Private R3Pacific Lutheran University Tacoma, WA Private M2Pacific Union College Angwin, CA Private BASPacific University Forest Grove, OR Private M1Paine College Augusta, GA Private BASPalm Beach Atlantic University West Palm Beach, FL Private M1Park University Parkville, MO Private M2Pennsylvania State University-Main Campus University Park, PA Public R1Pepperdine University Malibu, CA Private R3Peru State College Peru, NE Public M3Pfeiffer University Misenheimer, NC Private M1Philander Smith College Little Rock, AR Private BASPiedmont College Demorest, GA Private M1Pine Manor College Chestnut Hill, MA Private BASPittsburg State University Pittsburg, KS Public M1Pitzer College Claremont, CA Private BASPlymouth State University Plymouth, NH Public M1Point Loma Nazarene University San Diego, CA Private M1Point Park University Pittsburgh, PA Private M1Pomona College Claremont, CA Private BASPortland State University Portland, OR Public R2Prairie View A&M University Prairie View, TX Public R3Presbyterian College Clinton, SC Private BASPrescott College Prescott, AZ Private M3Princeton University Princeton, NJ Private R1Providence Christian College Pasadena, CA Private BASProvidence College Providence, RI Private M1Purdue University-Main Campus West Lafayette, IN Public R1

Appendices 377
Institution Name Location Control Carnegie
Queens University of Charlotte Charlotte, NC Private M2Quincy University Quincy, IL Private M2Quinnipiac University Hamden, CT Private M1Radford University Radford, VA Public M1Ramapo College of New Jersey Mahwah, NJ Public M2Randolph College Lynchburg, VA Private BASRandolph-Macon College Ashland, VA Private BASReed College Portland, OR Private BASRegent University Virginia Beach, VA Private R3Regis University Denver, CO Private M1Rensselaer Polytechnic Institute Troy, NY Private R2Rhode Island College Providence, RI Public M1Rhodes College Memphis, TN Private BASRice University Houston, TX Private R1Rider University Lawrenceville, NJ Private M1Ripon College Ripon, WI Private BASRivier University Nashua, NH Private M1Roanoke College Salem, VA Private BASRobert Morris University Moon Township, PA Private R3Robert Morris University Illinois Chicago, IL Private M1Roberts Wesleyan College Rochester, NY Private M1Rochester Institute of Technology Rochester, NY Private R3Rockford University Rockford, IL Private M3Rockhurst University Kansas City, MO Private M1Roger Williams University Bristol, RI Private M2Rollins College Winter Park, FL Private M1Roosevelt University Chicago, IL Private M1Rosemont College Rosemont, PA Private M2Rowan University Glassboro, NJ Public R3Rutgers University-Camden Camden, NJ Public M1Rutgers University-New Brunswick New Brunswick, NJ Public R1Rutgers University-Newark Newark, NJ Public R2Sacred Heart University Fairfield, CT Private M1Saginaw Valley State University University Center, MI Public M1Saint Ambrose University Davenport, IA Private M1Saint Anselm College Manchester, NH Private BASSaint Cloud State University Saint Cloud, MN Public M1Saint Edward’s University Austin, TX Private M1

Like Nobody's Business378
Institution Name Location Control Carnegie
Saint Francis University Loretto, PA Private M1Saint John Fisher College Rochester, NY Private R3Saint John’s University Collegeville, MN Private BASSaint Joseph’s College of Maine Standish, ME Private M1Saint Joseph’s University Philadelphia, PA Private M1Saint Leo University Saint Leo, FL Private M1Saint Louis University Saint Louis, MO Private R2Saint Martin’s University Lacey, WA Private M2Saint Mary’s College Notre Dame, IN Private BASSaint Mary’s College of California Moraga, CA Private M1Saint Mary’s University of Minnesota Winona, MN Private M1Saint Michael’s College Colchester, VT Private BASSaint Norbert College De Pere, WI Private BASSaint Peter’s University Jersey City, NJ Private M1Saint Vincent College Latrobe, PA Private BASSaint Xavier University Chicago, IL Private M1Salem College Winston-Salem, NC Private BASSalem State University Salem, MA Public M1Salisbury University Salisbury, MD Public M1Salve Regina University Newport, RI Private M2Sam Houston State University Huntsville, TX Public R3Samford University Birmingham, AL Private M1San Diego State University San Diego, CA Public R2San Francisco State University San Francisco, CA Public R3San Jose State University San Jose, CA Public M1Santa Clara University Santa Clara, CA Private M1Sarah Lawrence College Bronxville, NY Private BASSavannah State University Savannah, GA Public M3Schreiner University Kerrville, TX Private BASScripps College Claremont, CA Private BASSeattle Pacific University Seattle, WA Private R3Seattle University Seattle, WA Private M1Seton Hall University South Orange, NJ Private R3Seton Hill University Greensburg, PA Private M2Sewanee-The University of the South Sewanee, TN Private BASShenandoah University Winchester, VA Private R3Shepherd University Shepherdstown, WV Public BASShippensburg University of Pennsylvania Shippensburg, PA Public M1

Appendices 379
Institution Name Location Control Carnegie
Shorter University-College of Adult & Professional Programs
Marietta, GA Private M2
Siena College Loudonville, NY Private BASSiena Heights University Adrian, MI Private M2Sierra Nevada College Incline Village, NV Private M2Silver Lake College of the Holy Family Manitowoc, WI Private M3Simmons College Boston, MA Private M1Simpson College Indianola, IA Private BASSimpson University Redding, CA Private M3Skidmore College Saratoga Springs, NY Private BASSlippery Rock University of Pennsylvania Slippery Rock, PA Public M1Smith College Northampton, MA Private BASSoka University of America Aliso Viejo, CA Private BASSonoma State University Rohnert Park, CA Public M1South Carolina State University Orangeburg, SC Public M2South Dakota State University Brookings, SD Public R2Southeast Missouri State University Cape Girardeau, MO Public M1Southeastern Baptist Theological Seminary Wake Forest, NC Private M1Southeastern Louisiana University Hammond, LA Public M1Southeastern Oklahoma State University Durant, OK Public M2Southeastern University Lakeland, FL Private M2Southern Adventist University Collegedale, TN Private M2Southern Arkansas University Main Campus Magnolia, AR Public M2Southern Connecticut State University New Haven, CT Public M1Southern Illinois University-Carbondale Carbondale, IL Public R2Southern Illinois University-Edwardsville Edwardsville, IL Public M1Southern Methodist University Dallas, TX Private R2Southern Nazarene University Bethany, OK Private M1Southern New Hampshire University Manchester, NH Private M1Southern Oregon University Ashland, OR Public M1Southern University and A&M College Baton Rouge, LA Public M1Southern University at New Orleans New Orleans, LA Public M2Southern Utah University Cedar City, UT Public M1Southern Virginia University Buena Vista, VA Private BASSouthern Wesleyan University Central, SC Private M1Southwest Baptist University Bolivar, MO Private M2Southwest Minnesota State University Marshall, MN Public M2Southwestern Assemblies of God University Waxahachie, TX Private M3

Like Nobody's Business380
Institution Name Location Control Carnegie
Southwestern College Winfield, KS Private M2Southwestern Oklahoma State University Weatherford, OK Public M1Southwestern University Georgetown, TX Private BASSpalding University Louisville, KY Private R3Spelman College Atlanta, GA Private BASSpring Arbor University Spring Arbor, MI Private M1Spring Hill College Mobile, AL Private BASSpringfield College Springfield, MA Private M1St Bonaventure University Saint Bonaventure, NY Private M2St Catherine University Saint Paul, MN Private M1St John’s University-New York Queens, NY Private R3St Lawrence University Canton, NY Private BASSt Mary’s College of Maryland St. Mary’s City, MD Public BASSt Olaf College Northfield, MN Private BASSt Thomas University Miami Gardens, FL Private M1St. John’s College Annapolis, MD Private BASSt. John’s College Santa Fe, NM Private BASSt. Joseph’s College-New York Brooklyn, NY Private M1St. Mary’s University San Antonio, TX Private M1St. Thomas Aquinas College Sparkill, NY Private M3Stanford University Stanford, CA Private R1State University of New York at New Paltz New Paltz, NY Public M1Stephen F Austin State University Nacogdoches, TX Public M1Stephens College Columbia, MO Private M3Sterling College Craftsbury Common, VT Private BASStetson University DeLand, FL Private M2Stevens Institute of Technology Hoboken, NJ Private R2Stevens-Henager College Murray, UT Private M2Stevenson University Stevenson, MD Private M2Stillman College Tuscaloosa, AL Private BASStockton University Galloway, NJ Public M1Stonehill College Easton, MA Private BASStony Brook University Stony Brook, NY Public R1Suffolk University Boston, MA Private R3Sul Ross State University Alpine, TX Public M1SUNY at Albany Albany, NY Public R1SUNY at Fredonia Fredonia, NY Public M2SUNY at Purchase College Purchase, NY Public BAS

Appendices 381
Institution Name Location Control Carnegie
SUNY Buffalo State Buffalo, NY Public M1SUNY College at Brockport Brockport, NY Public M1SUNY College at Geneseo Geneseo, NY Public M3SUNY College at Old Westbury Old Westbury, NY Public M3SUNY College at Oswego Oswego, NY Public M1SUNY College at Plattsburgh Plattsburgh, NY Public M1SUNY College at Potsdam Potsdam, NY Public M2SUNY College of Environmental Science and
ForestrySyracuse, NY Public R3
SUNY Cortland Cortland, NY Public M1SUNY Empire State College Saratoga Springs, NY Public M2SUNY Maritime College Throggs Neck, NY Public M3SUNY Oneonta Oneonta, NY Public M3SUNY Polytechnic Institute Utica, NY Public M2Susquehanna University Selinsgrove, PA Private BASSwarthmore College Swarthmore, PA Private BASSweet Briar College Sweet Briar, VA Private BASSyracuse University Syracuse, NY Private R1Tarleton State University Stephenville, TX Public M1Temple University Philadelphia, PA Public R1Tennessee State University Nashville, TN Public R3Tennessee Technological University Cookeville, TN Public R3Texas A&M International University Laredo, TX Public M1Texas A&M University-College Station College Station, TX Public R1Texas A&M University-Commerce Commerce, TX Public R2Texas A&M University-Corpus Christi Corpus Christi, TX Public R3Texas A&M University-Kingsville Kingsville, TX Public R3Texas A&M University-Texarkana Texarkana, TX Public M2Texas Christian University Fort Worth, TX Private R2Texas Southern University Houston, TX Public R3Texas State University San Marcos, TX Public R2Texas Tech University Lubbock, TX Public R1Texas Wesleyan University Fort Worth, TX Private M1Texas Woman’s University Denton, TX Public R3The College of Idaho Caldwell, ID Private BASThe College of New Jersey Ewing, NJ Public M1The College of New Rochelle New Rochelle, NY Private M1The College of Saint Rose Albany, NY Private M1

Like Nobody's Business382
Institution Name Location Control Carnegie
The College of Saint Scholastica Duluth, MN Private M1The College of Wooster Wooster, OH Private BASThe Evergreen State College Olympia, WA Public M2The King’s College New York, NY Private BASThe Master’s University and Seminary Santa Clarita, CA Private M3The New School New York, NY Private R2The Sage Colleges Troy, NY Private M1The University of Alabama Tuscaloosa, AL Public R2The University of Findlay Findlay, OH Private M1The University of Montana Missoula, MT Public R2The University of Tampa Tampa, FL Private M1The University of Tennessee-Chattanooga Chattanooga, TN Public M1The University of Tennessee-Knoxville Knoxville, TN Public R1The University of Tennessee-Martin Martin, TN Public M2The University of Texas at Arlington Arlington, TX Public R1The University of Texas at Austin Austin, TX Public R1The University of Texas at Dallas Richardson, TX Public R1The University of Texas at El Paso El Paso, TX Public R2The University of Texas at San Antonio San Antonio, TX Public R2The University of Texas at Tyler Tyler, TX Public M1The University of Texas of the Permian Basin Odessa, TX Public M2The University of Texas Rio Grande Valley Edinburg, TX Public R3The University of Virginia’s College at Wise Wise, VA Public BASThe University of West Florida Pensacola, FL Public R3Thiel College Greenville, PA Private BASThomas Aquinas College Santa Paula, CA Private BASThomas College Waterville, ME Private M3Thomas Edison State University Trenton, NJ Public M2Thomas More College Crestview Hills, KY Private M3Thomas More College of Liberal Arts Merrimack, NH Private BASThomas University Thomasville, GA Private M3Tiffin University Tiffin, OH Private M1Tougaloo College Tougaloo, MS Private BASTouro College New York, NY Private M1Touro University Worldwide Los Alamitos, CA Private M3Towson University Towson, MD Public M1Transylvania University Lexington, KY Private BASTrevecca Nazarene University Nashville, TN Private R3

Appendices 383
Institution Name Location Control Carnegie
Trinity College Hartford, CT Private BASTrinity International University-Illinois Deerfield, IL Private R3Trinity University San Antonio, TX Private M3Trinity Washington University Washington, DC Private M1Troy University Troy, AL Public M1Truman State University Kirksville, MO Public M2Tufts University Medford, MA Private R1Tulane University of Louisiana New Orleans, LA Private R1Tusculum College Greeneville, TN Private M2Tuskegee University Tuskegee, AL Private M3Union College Barbourville, KY Private M2Union College Schenectady, NY Private BASUnion Institute & University Cincinnati, OH Private R3Union University Jackson, TN Private R3University at Buffalo Buffalo, NY Public R1University of Akron Main Campus Akron, OH Public R2University of Alabama at Birmingham Birmingham, AL Public R1University of Alabama in Huntsville Huntsville, AL Public R2University of Alaska Anchorage Anchorage, AK Public M1University of Alaska Fairbanks Fairbanks, AK Public R2University of Alaska Southeast Juneau, AK Public M2University of Arizona Tucson, AZ Public R1University of Arkansas Fayetteville, AR Public R1University of Arkansas at Little Rock Little Rock, AR Public R3University of Arkansas at Monticello Monticello, AR Public M3University of Baltimore Baltimore, MD Public M1University of Bridgeport Bridgeport, CT Private M1University of California-Berkeley Berkeley, CA Public R1University of California-Davis Davis, CA Public R1University of California-Irvine Irvine, CA Public R1University of California-Los Angeles Los Angeles, CA Public R1University of California-Merced Merced, CA Public R2University of California-Riverside Riverside, CA Public R1University of California-San Diego La Jolla, CA Public R1University of California-Santa Barbara Santa Barbara, CA Public R1University of California-Santa Cruz Santa Cruz, CA Public R1University of Central Arkansas Conway, AR Public M1University of Central Florida Orlando, FL Public R1

Like Nobody's Business384
Institution Name Location Control Carnegie
University of Central Missouri Warrensburg, MO Public M1University of Central Oklahoma Edmond, OK Public M1University of Charleston Charleston, WV Private M3University of Chicago Chicago, IL Private R1University of Cincinnati-Main Campus Cincinnati, OH Public R1University of Colorado-Boulder Boulder, CO Public R1University of Colorado-Colorado Springs Colorado Springs, CO Public M1University of Colorado-Denver/Anschutz
Medical CampusDenver, CO Public R2
University of Connecticut Storrs, CT Public R1University of Dallas Irving, TX Private M1University of Dayton Dayton, OH Private R2University of Delaware Newark, DE Public R1University of Denver Denver, CO Private R2University of Detroit Mercy Detroit, MI Private M1University of Dubuque Dubuque, IA Private M3University of Evansville Evansville, IN Private M3University of Florida Gainesville, FL Public R1University of Georgia Athens, GA Public R1University of Hartford West Hartford, CT Private R3University of Hawaii at Hilo Hilo, HI Public M3University of Hawaii at Manoa Honolulu, HI Public R1University of Houston Houston, TX Public R1University of Houston-Clear Lake Houston, TX Public M1University of Houston-Downtown Houston, TX Public M3University of Houston-Victoria Victoria, TX Public M1University of Idaho Moscow, ID Public R2University of Illinois at Chicago Chicago, IL Public R1University of Illinois at Springfield Springfield, IL Public M1University of Illinois at Urbana-Champaign Champaign, IL Public R1University of Indianapolis Indianapolis, IN Private M1University of Iowa Iowa City, IA Public R1University of Kansas Lawrence, KS Public R1University of Kentucky Lexington, KY Public R1University of La Verne La Verne, CA Private R3University of Louisiana at Lafayette Lafayette, LA Public R2University of Louisiana at Monroe Monroe, LA Public R3University of Louisville Louisville, KY Public R1

Appendices 385
Institution Name Location Control Carnegie
University of Maine Orono, ME Public R2University of Maine at Machias Machias, ME Public BASUniversity of Mary Bismarck, ND Private M1University of Mary Hardin-Baylor Belton, TX Private M2University of Mary Washington Fredericksburg, VA Public M1University of Maryland Eastern Shore Princess Anne, MD Public R3University of Maryland-Baltimore County Baltimore, MD Public R2University of Maryland-College Park College Park, MD Public R1University of Maryland-University College Adelphi, MD Public M1University of Massachusetts-Amherst Amherst, MA Public R1University of Massachusetts-Boston Boston, MA Public R2University of Massachusetts-Dartmouth North Dartmouth, MA Public R2University of Massachusetts-Lowell Lowell, MA Public R2University of Memphis Memphis, TN Public R2University of Miami Coral Gables, FL Private R1University of Michigan-Ann Arbor Ann Arbor, MI Public R1University of Michigan-Dearborn Dearborn, MI Public M1University of Michigan-Flint Flint, MI Public M1University of Minnesota-Duluth Duluth, MN Public M1University of Minnesota-Morris Morris, MN Public BASUniversity of Minnesota-Twin Cities Minneapolis, MN Public R1University of Mississippi University, MS Public R1University of Missouri-Columbia Columbia, MO Public R1University of Missouri-Kansas City Kansas City, MO Public R2University of Missouri-St Louis Saint Louis, MO Public R2University of Montevallo Montevallo, AL Public M2University of Nebraska at Kearney Kearney, NE Public M1University of Nebraska at Omaha Omaha, NE Public R3University of Nebraska-Lincoln Lincoln, NE Public R1University of Nevada-Las Vegas Las Vegas, NV Public R2University of Nevada-Reno Reno, NV Public R2University of New England Biddeford, ME Private M1University of New Hampshire at Manchester Manchester, NH Public BASUniversity of New Hampshire-Main Campus Durham, NH Public R2University of New Haven West Haven, CT Private M1University of New Mexico-Main Campus Albuquerque, NM Public R1University of New Orleans New Orleans, LA Public R2University of North Alabama Florence, AL Public M1

Like Nobody's Business386
Institution Name Location Control Carnegie
University of North Carolina at Asheville Asheville, NC Public BASUniversity of North Carolina at Chapel Hill Chapel Hill, NC Public R1University of North Carolina at Charlotte Charlotte, NC Public R2University of North Carolina at Greensboro Greensboro, NC Public R2University of North Carolina at Pembroke Pembroke, NC Public M1University of North Carolina Wilmington Wilmington, NC Public M1University of North Dakota Grand Forks, ND Public R2University of North Florida Jacksonville, FL Public M1University of North Georgia Dahlonega, GA Public M2University of North Texas Denton, TX Public R1University of North Texas at Dallas Dallas, TX Public M3University of Northern Colorado Greeley, CO Public R2University of Northern Iowa Cedar Falls, IA Public M1University of Northwestern-St Paul Saint Paul, MN Private M3University of Notre Dame Notre Dame, IN Private R1University of Oklahoma-Norman Campus Norman, OK Public R1University of Oregon Eugene, OR Public R1University of Pennsylvania Philadelphia, PA Private R1University of Pikeville Pikeville, KY Private BASUniversity of Pittsburgh-Greensburg Greensburg, PA Public BASUniversity of Pittsburgh-Johnstown Johnstown, PA Public BASUniversity of Pittsburgh-Pittsburgh Campus Pittsburgh, PA Public R1University of Portland Portland, OR Private M2University of Puget Sound Tacoma, WA Private BASUniversity of Redlands Redlands, CA Private M1University of Rhode Island Kingston, RI Public R2University of Richmond Richmond, VA Private BASUniversity of Rochester Rochester, NY Private R1University of Saint Francis-Fort Wayne Fort Wayne, IN Private M2University of Saint Joseph West Hartford, CT Private M1University of Saint Mary Leavenworth, KS Private M2University of San Diego San Diego, CA Private R3University of San Francisco San Francisco, CA Private R3University of Science and Arts of Oklahoma Chickasha, OK Public BASUniversity of Scranton Scranton, PA Private M1University of Sioux Falls Sioux Falls, SD Private M2University of South Alabama Mobile, AL Public R2University of South Carolina-Columbia Columbia, SC Public R1

Appendices 387
Institution Name Location Control Carnegie
University of South Dakota Vermillion, SD Public R2University of South Florida-Main Campus Tampa, FL Public R1University of South Florida-Sarasota-Manatee Sarasota, FL Public M3University of South Florida-St Petersburg St. Petersburg, FL Public M2University of Southern California Los Angeles, CA Private R1University of Southern Indiana Evansville, IN Public M1University of Southern Maine Portland, ME Public M1University of Southern Mississippi Hattiesburg, MS Public R2University of St Francis Joliet, IL Private M1University of St Thomas Houston, TX Private M1University of St Thomas Saint Paul, MN Private R3University of the Cumberlands Williamsburg, KY Private R3University of the District of Columbia Washington, DC Public M3University of the Incarnate Word San Antonio, TX Private M1University of the Pacific Stockton, CA Private R3University of the Southwest Hobbs, NM Private M2University of Toledo Toledo, OH Public R2University of Tulsa Tulsa, OK Private R2University of Utah Salt Lake City, UT Public R1University of Vermont Burlington, VT Public R2University of Virginia-Main Campus Charlottesville, VA Public R1University of Washington-Seattle Campus Seattle, WA Public R1University of West Alabama Livingston, AL Public M1University of West Georgia Carrollton, GA Public R3University of Wisconsin-Eau Claire Eau Claire, WI Public M2University of Wisconsin-Green Bay Green Bay, WI Public M3University of Wisconsin-La Crosse La Crosse, WI Public M1University of Wisconsin-Madison Madison, WI Public R1University of Wisconsin-Milwaukee Milwaukee, WI Public R1University of Wisconsin-Oshkosh Oshkosh, WI Public M1University of Wisconsin-Parkside Kenosha, WI Public BASUniversity of Wisconsin-Platteville Platteville, WI Public M1University of Wisconsin-River Falls River Falls, WI Public M2University of Wisconsin-Stevens Point Stevens Point, WI Public M3University of Wisconsin-Stout Menomonie, WI Public M1University of Wisconsin-Whitewater Whitewater, WI Public M1University of Wyoming Laramie, WY Public R2Upper Iowa University Fayette, IA Private M2

Like Nobody's Business388
Institution Name Location Control Carnegie
Ursinus College Collegeville, PA Private BASUrsuline College Pepper Pike, OH Private M1Utah State University Logan, UT Public R2Utah Valley University Orem, UT Public M3Utica College Utica, NY Private M1Valdosta State University Valdosta, GA Public R3Valparaiso University Valparaiso, IN Private M1Vanderbilt University Nashville, TN Private R1Vanguard University of Southern California Costa Mesa, CA Private M3Vassar College Poughkeepsie, NY Private BASVillanova University Villanova, PA Private R3Virginia Commonwealth University Richmond, VA Public R1Virginia Military Institute Lexington, VA Public BASVirginia Polytechnic Institute and State University Blacksburg, VA Public R1Virginia State University Petersburg, VA Public M2Virginia Union University Richmond, VA Private BASVirginia Wesleyan University Norfolk, VA Private BASViterbo University La Crosse, WI Private M1Wabash College Crawfordsville, IN Private BASWagner College Staten Island, NY Private M2Wake Forest University Winston-Salem, NC Private R2Walla Walla University College Place, WA Private M2Walsh University North Canton, OH Private M3Warren Wilson College Swannanoa, NC Private BASWartburg College Waverly, IA Private BASWashburn University Topeka, KS Public M2Washington & Jefferson College Washington, PA Private BASWashington Adventist University Takoma Park, MD Private M2Washington and Lee University Lexington, VA Private BASWashington College Chestertown, MD Private BASWashington State University Pullman, WA Public R1Washington University in St Louis Saint Louis, MO Private R1Wayland Baptist University Plainview, TX Private M1Wayne State College Wayne, NE Public M2Wayne State University Detroit, MI Public R1Waynesburg University Waynesburg, PA Private M1Weber State University Ogden, UT Public M1Webster University Saint Louis, MO Private M1

Appendices 389
Institution Name Location Control Carnegie
Wellesley College Wellesley, MA Private BASWells College Aurora, NY Private BASWentworth Institute of Technology Boston, MA Private M2Wesleyan College Macon, GA Private BASWesleyan University Middletown, CT Private BASWest Chester University of Pennsylvania West Chester, PA Public M1West Texas A&M University Canyon, TX Public M1West Virginia State University Institute, WV Public BASWest Virginia University Morgantown, WV Public R1West Virginia Wesleyan College Buckhannon, WV Private M3Western Carolina University Cullowhee, NC Public M1Western Connecticut State University Danbury, CT Public M2Western Governors University Salt Lake City, UT Private M1Western Illinois University Macomb, IL Public M1Western Kentucky University Bowling Green, KY Public M1Western Michigan University Kalamazoo, MI Public R2Western New England University Springfield, MA Private M2Western New Mexico University Silver City, NM Public M2Western Oregon University Monmouth, OR Public M2Western State Colorado University Gunnison, CO Public M3Western Washington University Bellingham, WA Public M1Westfield State University Westfield, MA Public M2Westminster College Salt Lake City, UT Private M1Westminster College Fulton, MO Private BASWestminster College New Wilmington, PA Private BASWestmont College Santa Barbara, CA Private BASWheaton College Norton, MA Private BASWheaton College Wheaton, IL Private BASWheeling Jesuit University Wheeling, WV Private M2Wheelock College Boston, MA Private M2Whitman College Walla Walla, WA Private BASWhittier College Whittier, CA Private BASWhitworth University Spokane, WA Private M3Wichita State University Wichita, KS Public R2Widener University Chester, PA Private R3Wilkes University Wilkes-Barre, PA Private M1Willamette University Salem, OR Private BASWilliam Carey University Hattiesburg, MS Private M1

Like Nobody's Business390
Institution Name Location Control Carnegie
William Jewell College Liberty, MO Private BASWilliam Paterson University of New Jersey Wayne, NJ Public M1William Peace University Raleigh, NC Private BASWilliam Penn University Oskaloosa, IA Private M3William Woods University Fulton, MO Private M1Williams College Williamstown, MA Private BASWilmington University New Castle, DE Private R3Wingate University Wingate, NC Private M2Winona State University Winona, MN Public M2Winston-Salem State University Winston-Salem, NC Public M2Winthrop University Rock Hill, SC Public M1Wittenberg University Springfield, OH Private BASWofford College Spartanburg, SC Private BASWoodbury University Burbank, CA Private M2Worcester Polytechnic Institute Worcester, MA Private R2Worcester State University Worcester, MA Public M1Wright State University-Main Campus Dayton, OH Public R3Xavier University Cincinnati, OH Private M1Xavier University of Louisiana New Orleans, LA Private M3Yale University New Haven, CT Private R1Yeshiva University New York, NY Private R2York College of Pennsylvania York, PA Private M3Young Harris College Young Harris, GA Private BASYoungstown State University Youngstown, OH Public M1
Appendix B: Land Grant Institutions
Land-grant universities and colleges listed alphabetically for the three assigned legislative-year funding groups, state or territory, and institution (National Institute of Food and Agriculture 2019c; IPEDS 2020). There is currently a total of 113 institutions. Note that the year-groups do not necessarily correspond to year of establishment or authorization of land-grant status; for each group, some institutions were in the initial authorized set at the time of the legislation and others were added later. See Figure B9 for a map.

Appendices 391
Number Year State or Territory Institution Name
1 1862 Alabama Auburn University2 1862 Alaska University of Alaska Fairbanks3 1862 American Samoa (AS) American Samoa Community College4 1862 Arizona University of Arizona5 1862 Arkansas University of Arkansas6a 1862 California* University of California-Berkeley*6b 1862 California* University of California-Davis*6c 1862 California* University of California-Riverside*7 1862 Colorado Colorado State University-Fort Collins8 1862 Connecticut University of Connecticut9 1862 Delaware University of Delaware10 1862 District of Columbia (DC) University of the District of Columbia11 1862 Federated States of Micronesia (FM) College of Micronesia-FSM12 1862 Florida University of Florida13 1862 Georgia University of Georgia14 1862 Guam (GU) University of Guam15 1862 Hawaii University of Hawaii at Manoa16 1862 Idaho University of Idaho17 1862 Illinois University of Illinois at Urbana-Champaign18 1862 Indiana Purdue University-Main Campus19 1862 Iowa Iowa State University20 1862 Kansas Kansas State University21 1862 Kentucky University of Kentucky22 1862 Louisiana Louisiana State University and A&M College23 1862 Maine University of Maine24 1862 Maryland University of Maryland-College Park25 1862 Massachusetts University of Massachusetts-Amherst26 1862 Michigan Michigan State University27 1862 Minnesota University of Minnesota-Twin Cities28 1862 Mississippi Mississippi State University29 1862 Missouri University of Missouri-Columbia30 1862 Montana Montana State University31 1862 Nebraska University of Nebraska-Lincoln32 1862 Nevada University of Nevada-Reno33 1862 New Hampshire University of New Hampshire-Main Campus34 1862 New Jersey Rutgers University-New Brunswick35 1862 New Mexico New Mexico State University-Main Campus36 1862 New York Cornell University

Like Nobody's Business392
Number Year State or Territory Institution Name
37 1862 North Carolina North Carolina State University at Raleigh38 1862 North Dakota North Dakota State University-Main Campus39 1862 Northern Mariana Islands (NP) Northern Marianas College40 1862 Ohio The Ohio State University-Main Campus41 1862 Oklahoma Oklahoma State University-Main Campus42 1862 Oregon Oregon State University43 1862 Pennsylvania Pennsylvania State University-Main Campus44 1862 Puerto Rico (PR) University of Puerto Rico-Mayaguez45 1862 Rhode Island University of Rhode Island46 1862 South Carolina Clemson University47 1862 South Dakota South Dakota State University48 1862 Tennessee The University of Tennessee-Knoxville49 1862 Texas Texas A&M University-College Station50 1862 Utah Utah State University51 1862 Vermont University of Vermont52 1862 Virgin Islands (VI) University of the Virgin Islands53 1862 Virginia Virginia Polytechnic Institute and State
University54 1862 Washington Washington State University55 1862 West Virginia West Virginia University56 1862 Wisconsin University of Wisconsin-Madison57 1862 Wyoming University of Wyoming
1 1890 Alabama Alabama A&M University2 1890 Alabama Tuskegee University3 1890 Arkansas University of Arkansas at Pine Bluff4 1890 Delaware Delaware State University5 1890 Florida Florida Agricultural and Mechanical
University6 1890 Georgia Fort Valley State University7 1890 Kentucky Kentucky State University8 1890 Louisiana Southern University and A&M College9 1890 Maryland University of Maryland-Eastern Shore10 1890 Mississippi Alcorn State University11 1890 Missouri Lincoln University12 1890 North Carolina North Carolina A & T State University13 1890 Ohio Central State University14 1890 Oklahoma Langston University

Appendices 393
Number Year State or Territory Institution Name
15 1890 South Carolina South Carolina State University16 1890 Tennessee Tennessee State University17 1890 Texas Prairie View A&M University18 1890 Virginia Virginia State University19 1890 West Virginia West Virginia State University
1 1994 Alaska Ilisagvik College2 1994 Arizona Diné College3 1994 Arizona Tohono O’odham Community College4 1994 Kansas Haskell Indian Nations University5 1994 Michigan Bay Mills Community College6 1994 Michigan Keweenaw Bay Ojibwa Community College7 1994 Michigan Saginaw Chippewa Tribal College8 1994 Minnesota Fond du Lac Tribal and Community College9 1994 Minnesota Leech Lake Tribal College10 1994 Minnesota Red Lake Nation College11 1994 Minnesota White Earth Tribal and Community College12 1994 Montana Aaniiih Nakoda College13 1994 Montana Blackfeet Community College14 1994 Montana Chief Dull Knife College15 1994 Montana Fort Peck Community College16 1994 Montana Little Big Horn College17 1994 Montana Salish Kootenai College18 1994 Montana Stone Child College19 1994 Nebraska Little Priest Tribal College20 1994 Nebraska Nebraska Indian Community College21 1994 New Mexico Institute of American Indian Arts22 1994 New Mexico Navajo Technical University23 1994 New Mexico Southwestern Indian Polytechnic Institute24 1994 North Dakota Cankdeska Cikana Community College25 1994 North Dakota Nueta Hidatsa Sahnish College26 1994 North Dakota Sitting Bull College27 1994 North Dakota Turtle Mountain Community College28 1994 North Dakota United Tribes Technical College29 1994 Oklahoma College of the Muscogee Nation30 1994 South Dakota Oglala Lakota College31 1994 South Dakota Sinte Gleska University32 1994 South Dakota Sisseton Wahpeton College

Like Nobody's Business394
Number Year State or Territory Institution Name
33 1994 Washington Northwest Indian College34 1994 Wisconsin College of the Menominee Nation35 1994 Wisconsin Lac Courte Oreilles Ojibwa Community
College
*The University of California System is the designated land-grant institution for California; in practice, land-grant activities are associated with UC-Berkeley, UC-Davis and UC-Riverside.

References
AAPC. 2020a. “What Are Relative Value Units (RVUs)?” AAPC. Accessed April 6, 2020. https://www.aapc.com/practice-management/rvus.aspx
—. 2020b. “Work RVU Calculator (Relative Value Units).“ AAPC. Accessed April 6, 2020. https://www.aapc.com/practice-management/rvu-calculator.aspx
Abel, JR, and R Dietz. 2019, June 5. “Despite Rising Costs, College Is Still a Good Investment.“ Federal Reserve Bank of New York. Accessed July 10, 2020. https://libertystreeteconomics.newyorkfed.org/2019/06/despite-rising-costs-college-is-still-a-good-investment.html
ACT, Inc. 2019. “National Distributions of Cumulative Percents for ACT Test Scores: ACT-Tested High School Graduates from 2016, 2017 and 2018.“ ACT, Inc. Accessed April 12, 2019. http://www.act.org/content/dam/act/unsecured/documents/MultipleChoiceStemComposite.pdf
ACT, Inc. 2017. The ACT Technical Manual. Iowa City, IA: ACT, Inc. https://www.act.org/content/dam/act/unsecured/documents/ACT_Technical_Manual.pdf
Adams, OL, and DM Shannon. 2006. “Cost Control in Higher Education.“ University Business, September 1. Accessed December 17, 2018. https://www.universitybusiness.com/article/cost-control-higher-education
Allen, R. 2016. “LSU Only SEC School That Raises More in Donations for Athletics Than for Academics.“ The Advocate, October 29, 2016. Accessed June 15, 2020. https://www.theadvocate.com/baton_rouge/news/education/article_b4a952be-9bbc-11e6-be38-47586622ab87.html
Ambargis, ZO, CI Mead, and SJ Rzeznik. 2014. “University Contribution Studies Using Input-Output Analysis.“ In AAU-APLU Economic Impact Guidelines. Washington, DC: The Association of Public and Land-grant Universities. https://www.aau.edu/education-service/service/economic-impact
American Association of University Professors. 1940. “1940 Statement of Principles on Academic Freedom and Tenure.“ Accessed March 7, 2019. https://www.aaup.org/report/1940-statement-principles-academic-freedom-and-tenure
—. 2005. “On Professors Assigning Their Own Texts to Students.“ Accessed May 24, 2019. https://www.aaup.org/report/professors-assigning-their-own-texts-students
—. 2018. “The Annual Report on the Economic Status of the Profession, 2017–18.“ Accessed January 28, 2019. https://www.aaup.org/report/annual-report-economic-status- profession-2017-18
—. 2019a. “Contingent Faculty Positions.“ Accessed February 14, 2019. https://www.aaup.org/issues/contingency
—. 2019b. “Protecting Academic Freedom.“ Accessed March 7, 2019. https://www.aaup.org/our-work/protecting-academic-freedom

Like Nobody's Business396
—. 2019c. “Tenure.“ Accessed March 7, 2019. https://www.aaup.org/issues/tenure
American Film Institute. 2019, December. “AFI’s 100 Years…100 Movie Quotes: The 100 Greatest Movie Quotes of All Time.“ Accessed July 16, 2020. https://www.afi.com/afis-100-years-100-movie-quotes/
Anderson, G. 2019. “The Global Evidence Against Free College.“ Inside Higher Ed, August 8, 2019. Accessed August 5, 2020. https://www.insidehighered.com/news/2019/08/08/countries-often-sacrifice-postsecondary-attainment-when-they-expand-subsidies
—. 2020a. “College Athlete Pay Structure Takes Form.“ Inside Higher Ed, April 30, 2020. Accessed May 5, 2020. https://www.insidehighered.com/news/2020/04/30/ncaa-board-governors-approves-name-image-likeness-guidelines
—. 2020b. “Ohio State Economists Create Player Pay Model.“ Inside Higher Ed, April 17, 2020. Accessed May 6, 2020. https://www.insidehighered.com/quicktakes/2020/04/17/ohio-state-economists-create-player-pay-model
Anderson, ML. 2017. “The Benefits of College Athletic Success: An Application of the Propensity Score Design.“ The Review of Economics and Statistics 99 (1): 119–34. https://doi.org/10.1162/REST_a_00589
Anthony, M, Nichols, A, and JO Schak. 2019. How Affordable Are Public Colleges in Your State? Washington, DC: The Education Trust. December 17, 2019. Accessed February 4, 2020. https://edtrust.org/resource/affordability-gap/
APPA. 2019. 2017–18 Facilities Performance Indicators Report. Alexandria, VA: APPA. Accessed March 3, 2020. https://www.appa.org/wp-content/uploads/2019/04/Web-Report-2018.pdf
Archibald, RB, and DH Feldman. 2008. “Explaining Increases in Higher Education Costs.“ The Journal of Higher Education 79 (3): 268–95. https://doi.org/10.1080/00221546.2008.11772099
—. 2011. Why Does College Cost So Much? New York, NY: Oxford University Press
Armstrong, JK, A Urry, E Andrews, and M Cronin. 2016. “The Slideshow That Saved the World: An Oral History of An Inconvenient Truth.“ Grist Magazine, 2016. Accessed January 7, 2020. https://grist.org/feature/an-inconvenient-truth-oral-history/
Association of American Medical Colleges. 2019a. “AAMC Faculty Salary Survey — MD or Equivalent Faculty by Gender FY2013–FY2018.“ Accessed April 3, 2020. https://www.aamc.org/system/files/2019-09/aamcfacultysalarydata-md.pdf
—. 2019b. “U.S. Medical School Revenues.“ Accessed April 2, 2020. https://www.aamc.org/data-reports/faculty-institutions/report/us-medical-school-revenues
—. 2019c. “U.S. Medical School Revenues: IV. Revenue by Source, FY 1977 through FY 2018.“ Accessed April 2, 2020. https://www.aamc.org/data-reports/interactive-data/iv-revenue-source-fy-1977-through-fy-2018
—. 2020. “AAMC Medical School Members.“ Accessed March 30, 2020. https://members.aamc.org/eweb/DynamicPage.aspx?webcode=AAMCOrgSearchResult&orgtype=Medical%20School
Association of Art Museum Directors. 2019. “Salary Survey 2019.“ AAMD, May 10, 2019. Accessed January 20, 2020. https://aamd.org/our-members/from-the-field/salary-survey-2019
Association of Public & Land-Grant Universities. 2012. “The Land Grant Tradition.“ Washington, DC: Association of Public & Land-Grant Universities (APLU). https://www.aplu.org/library/the-land-grant-tradition/file

References 397
—. 2019. “Cooperative Extension Section (CES): How is Cooperative Extension Funded?” Accessed June 27, 2019. https://www.aplu.org/members/commissions/food-environment-and-renewable-resources/board-on-agriculture-assembly/cooperative-extension- section/
Association of Research Libraries. 2016. “ARL Statistics 2014–15, Table 4, Expenditure Trends in ARL Libraries 1986–2015.“ Accessed March 27, 2019. https://www.arl.org/storage/documents/web-t4.xls
Association of University Presses. 2019. 2018–2019 Annual Report. New York, NY: AUP. http://www.aupresses.org/about-aaup/aaup-governance/annual-report
AUTM. 2020. “STATT: Statistics Access for Technology Transfer Database.“ Accessed January 9, 2020. https://autm.net/surveys-and-tools/databases/statt/
Barclay, DA. 2015. “Academic Print Books Are Dying. What’s the Future?” The Conversation, November 10, 2015. Accessed January 27, 2020. https://theconversation.com/academic- print-books-are-dying-whats-the-future-46248
Barr, MJ, and GS McClellan. 2018. Budgets and Financial Management in Higher Education, 3rd Ed. San Francisco, CA: Jossey Bass
Bastedo, MN, and NA Bowman. 2010. “U.S. News & World Report College Rankings: Modeling Institutional Effects on Organizational Reputation.“ American Journal of Education 116 (2): 163–83. https://doi.org/10.1086/649437
Bauer-Wolf, J. 2019. “For Sale: Renowned Sports League?” Inside Higher Ed, January 4, 2019. Accessed May 6, 2020. https://www.insidehighered.com/news/2019/01/04/pac-12-conference-mulls-taking-private-equity-investors
Baum, S, J Ma, M Pender, and CJ Libassi. 2018a. Trends in Student Aid 2018. New York, NY: The College Board. https://trends.collegeboard.org/student-aid
Baum, S, J Ma, M Pender, and M Welch. 2017. Trends in Student Aid 2017. New York, NY: The College Board. https://research.collegeboard.org/trends/student-aid/resource-library
Baum, S, MS McPherson, B Braga, and S Minton. 2018b. Tuition and State Appropriations: Using Evidence and Logic to Gain Perspective. Washington, DC: Urban Institute. https://www.urban.org/research/publication/tuition-and-state-appropriations
Bauman, D. 2019. “A Public University With Too Much Money? Surpluses Are More Complicated Than That.“ The Chronicle of Higher Education, August 28, 2019. Accessed December 17, 2018. https://www.chronicle.com/article/a-public-university-with-too-much-money-surpluses-are-more-complicated-than-that/
—. 2020. “The Pandemic Has Pushed Hundreds of Thousands of Workers Out of Higher Education.“ The Chronicle of Higher Education, October 6, 2020. Accessed October 6, 2020. https://www.chronicle.com/article/how-the-pandemic-has-shrunk-higher-educations-work-force
Baumer, B, and A Zimbalist. 2019. “The Impact of College Athletic Success on Donations and Applicant Quality.“ International Journal of Financial Studies 7(2) (19): 1–23. https://doi.org/10.3390/ijfs7020019
Baumol, WJ. 2012. The Cost Disease: Why Computers Get Cheaper and Health Care Doesn’t. New Haven, CT: Yale University Press
Baumol, WJ, and WG Bowen. 1965. “On the Performing Arts: The Anatomy of Their Economic Problems.“ The American Economic Review 55 (1/2): 495–502. https://www.jstor.org/stable/1816292

Like Nobody's Business398
—. 1966. Performing Arts, the Economic Dilemma: A Study of Problems Common to Theater, Opera, Music and Dance. Cambridge, MA: M.I.T. Press
Berdahl, RM. 2000. “The Privatization of Public Universities.” University of California, Office of the Chancellor, May 23, 2000. Accessed January 8, 2019. https://chancellor.berkeley.edu/chancellors/berdahl/speeches/the-privatization-of-public-universities
Bergstrom, TC, PN Courant, RP McAfee, and MA Williams. 2014. “Evaluating Big Deal Journal Bundles.“ Proceedings of the National Academy of Sciences 111 (26): 9425–30. https://doi.org/10.1073/pnas.1403006111
Berkowitz, S, D Wolken, and T DeMeyer. 2019. “NCAA’s Power 5 Schools See Steep Raise in Pay for Non-Revenue Coaches.” USA Today, August 13, 2019. Accessed May 5, 2020. https://www.usatoday.com/story/sports/2019/08/12/ncaa-power-5-schools-steeply- raising-pay-non-revenue-sport-coaches/1946843001/
Berlatsky, N. 2014. “What is the Point of Academic Books.” Pacific Standard, December 16, 2014. Accessed Jauary 27, 2020. https://psmag.com/social-justice/point-academic-books- publishing-writing-literature-96610
Bessembinder, H. 2017. Fossil Fuel Divestment and Its Potential Impacts on Students, Faculty and Other University and Pension Stakeholders. Washington, DC: Independent Petroleum Association of America. https://divestmentfacts.com/wp-content/uploads/2017/04/Bessembinder-Report_Costs-for-Students-Faculty-and-Stakeholders_4_29.pdf
Bittman, M. 1998. How to Cook Everything: Simple Recipes for Great Food. New York, NY: Wiley
Blank, RM. 2015. “A Broader Perspective on Faculty Workload.” University of Wisconsin-Madison, April 2, 2015. Accessed March 11, 2019. https://chancellor.wisc.edu/blog/a- broader-perspective-on-faculty-workload/
Bloomberg, MR. 2018. “Michael Bloomberg: Why I’m Giving $1.8 Billion for College Financial Aid.” The New York Times, November 18, 2018. Accessed June 30, 2020. https://www.nytimes.com/2018/11/18/opinion/bloomberg-college-donation-financial-aid.html
Blumenstyk, G. 2018. “The Edge: Can an Innovative Online College Help Adults Stay Employed?” The Chronicle of Higher Education, October 16, 2018. Accessed August 4, 2020. https://www.chronicle.com/newsletter/the-edge/2018-10-16
—. 2019a. “College Leaders Are Getting Serious About Outsourcing. They Still Have Plenty of Concerns, Too.” The Chronicle of Higher Education, March 26, 2019. Accessed March 26, 2020. https://www.chronicle.com/newsletter/the-edge/2019-03-26
—. 2019b. “Planned Merger of Cengage and McGraw-Hill Could Remake College-Textbook Market.” The Chronicle of Higher Education, May 1, 2019. Accessed May 24, 2019. https://www.chronicle.com/article/planned-merger-of-cengage-and-mcgraw-hill-could-remake-college-textbook-market/
BoardSource. 2020. “Measuring Fundraising Effectiveness.” Accessed June 30, 2020. https://boardsource.org/research-critical-issues/measuring-fundraising-effectiveness/
Bok, D. 2013. Higher Education in America: Revised Edition. Princeton, NJ: Princeton University Press
Bound, J, B Braga, G Khanna, and S Turner. 2019. Public Universities: The Supply Side of Building a Skilled Workforce. NBER Working Paper No. 25945. Cambridge, MA: National Bureau of Economic Research. http://www.nber.org/papers/w25945

References 399
Bound, J, MF Lovenheim, and S Turner. 2010. “Why Have College Completion Rates Declined? An Analysis of Changing Student Preparation and Collegiate Resources.“ American Economic Journal: Applied Economics 2 (3): 129–57. https://doi.org/10.1257/app.2.3.129
Bowen, HR. 1980. The Costs of Higher Education: How Much Do Colleges and Universities Spend Per Student and How Much Should They Spend? San Francisco, CA: Jossey Bass
Bower, JL, and CM Christensen. 1995. “Disruptive Technologies: Catching the Wave.“ Harvard Business Review January-February 1995. Accessed September 25, 2018. https://hbr.org/1995/01/disruptive-technologies-catching-the-wave
Brint, S. 2019. Two Cheers for Higher Education: Why American Universities Are Stronger Than Ever―and How to Meet the Challenges They Face. Princeton, NJ: Princeton University Press
Brown, M. 2014. “The 30th Anniversary of Hail Flutie.” Inside The Pylon, November 21, 2014. Accessed May 8, 2020. http://insidethepylon.com/pylon-u/long-form-and-editorial/college-atmosphere/2014/11/21/30th-anniversary-of-hail-flutie/
—. 2020. “These Prestigious Well-Known Colleges on Every Kid’s Wish-List Could Close Because of the Pandemic.” Parents, July 29, 2020. Accessed August 6, 2020. https://www.parents.com/kids/education/college/these-tk-prestigious-colleges-could-close-because-of-the-pandemic/
Brown, S. 2017. The Role of Collegiate Performing Arts Centers: Exploring Business Models Used to Serve and Connect the Academic and Surrounding Community. Project for MS in Arts Management, Arts and Administration Program, University of Oregon. https://scholarsbank.uoregon.edu/xmlui/handle/1794/22494
Brummund, B, K Kelly, L Lang, J McGuthry, C Mitchell, and D Stack. 2015. Calculating the Costs of Distributed IT Staff and Applications. ECAR-COST Working Group Paper, August 20, 2015. Louisville, CO: EDUCAUSE. Accessed April 2, 2019. https://library.educause.edu/resources/2015/8/calculating-the-costs-of-distributed-it-staff-and-applications
Bulleit, TN, MM Caron, and D Peloquin. 2017. “New Frontiers in AMC Funding: Mission Support Alternatives Post-Halifax.” American Health Lawyers Association. https://www.ropesgray.com/~/media/Files/articles/2017/May/American-Health-Lawyers-Association-Academic-Medical-Centers-Funding-Article-May-2017.pdf
Bureau of Economic Analysis. 2018a. “National Income and Product Accounts, Table 1.1.6. Real Gross Domestic Product, Chained Dollars.” Accessed November 29, 2018. https://apps.bea.gov/iTable/iTable.cfm?reqid=19&step=2#reqid=19&step=2&isuri=1&1921=survey
—. 2018b. “National Income and Product Accounts, Table 3.3. State and Local Government Current Receipts and Expenditures.” Accessed November 29, 2018. https://apps.bea.gov/iTable/iTable.cfm?reqid=19&step=3&isuri=1&1921=survey&1903=86
Burke, L. 2020. ‘Rebates and Reversals.” Inside Higher Ed, July 24, 2020. Accessed August 6, 2020. https://www.insidehighered.com/news/2020/07/24/some-colleges-discount-tuition- prices-online-fall
Bush, V. 1945. Science—The Endless Frontier. Washington, DC: United States Government Printing Office. https://www.nsf.gov/od/lpa/nsf50/vbush1945.htm
Bushman, MF, and JE Dean. 2005. “Outsourcing of Non-Mission-Critical Functions: A Solution to the Rising Cost of College Attendance.“ In Course Corrections: Experts Offer Solutions to the College Cost Crisis, by Lumina Foundation, 7–19. Indianapolis, IN: Lumina Foundation. Accessed March 25, 2020. http://files.eric.ed.gov/fulltext/ED494195.pdf
Business Wire. 2018. “Student Spending on College Textbooks Declines for Third Consecutive Year (cites Student Monitor data).” Business Wire. August 27, 2018. Accessed

Like Nobody's Business400
May 22, 2019. https://www.businesswire.com/news/home/20180827005520/en/Student-Spending-College-Textbooks-Declines-Consecutive-Year
Calderon, A. 2018. “Massification Of Higher Education Revisited.” RMIT University, June 2018. Accessed August 4, 2020. https://www.academia.edu/36975860/Massification_of_ higher_education_revisited
Callahan, MK, K Meehan, and KM Shaw. 2017. Summary of OBF Impact on Student Outcomes in Tennessee and Indiana. Philadelphia, PA: Research for Action. Accessed January 7, 2019. https://www.researchforaction.org/publications/summary-obf-impact-student-outcomes- tennessee-indiana/
Cambridge Associates. 2014. The Fossil Fuel Divestment Discussion. Boston, MA: Cambridge Associates. https://www.cambridgeassociates.com/insight/fossil-fuel-divestment/
Campbell, T, and J Wescott. 2019. Profile of Undergraduate Students: Attendance, Distance and Remedial Education, Degree Program and Field of Study, Demographics, Financial Aid, Financial Literacy, Employment, and Military Status: 2015–16. Washington, DC: National Center for Education Statistics, National Postsecondary Student Aid Study (NPSAS). https://nces.ed.gov/pubsearch/pubsinfo.asp?pubid=2019467
Carey, K. 2019. “The Creeping Capitalist Takeover of Higher Education.” Huffpost, April 1, 2019. Accessed March 27, 2020. https://www.huffpost.com/highline/article/capitalist-takeover- college/
Cataldi, EF, EM Bradburn, and M Fahimi. 2005. 2004 National Study of Postsecondary Faculty (NSOPF:04): Background Characteristics, Work Activities, and Compensation of Instructional Faculty and Staff: Fall 2003 (NCES 2006–176). Washington, DC: US Department of Education, National Center for Education Statistics. https://nces.ed.gov/pubs2006/2006176.pdf
Champion, E. 2020. “Open Access Publishing Costs—Books.” May 17, 2020. Accessed October 6, 2020. https://erikchampion.wordpress.com/2020/05/17/open-access-publishing-costs-books/
Chan, W. 2015. “Columbia Becomes First U.S. University to Divest from Prisons.” CNN, June 24, 2015. Accessed June 25, 2020. https://www.cnn.com/2015/06/23/us/columbia-university-prison-divest/index.html
Charters, WW. 1942. “How Much do Professors Work?” The Journal of Higher Education 13 (6): 298–301. https://doi.org/10.2307/1975366
Cheslock, JJ, and DB Knight. 2015. “Diverging Revenues, Cascading Expenditures, and Ensuing Subsidies: The Unbalanced and Growing Financial Strain of Intercollegiate Athletics on Universities and Their Students.“ Journal of Higher Education 86 (3): 417–47
Chetty, R, J Friedman, E Saez, N Turner, and D Yagan. 2017. Mobility Report Cards: The Role of Colleges in Intergenerational Mobility. NBER Working Paper No. 23618. Cambridge, MA: National Bureau of Economic Research. https://www.nber.org/papers/w23618
Christensen, CM, and HJ Eyring. 2011. The Innovative University: Changing the DNA of Higher Education from the Inside Out. San Francisco, CA: Jossey Bass
Christophersen, K, T Nadreau, and A Olanie. 2014. “The Rights and Wrongs of Economic Impact Analysis for Colleges and Universities.” EMSI, January 7, 2014. Accessed July 20, 2020. https://www.economicmodeling.com/2014/01/07/the-rights-and-wrongs-of- economic-impact-analysis-for-colleges-and-universities/
Clotfelter, CT. 2017. Unequal Colleges in the Age of Disparity. Cambridge, MA: Belknap Press
Coetzee, JM. 1999. Disgrace: A Novel. London, UK: Secker & Warburg

References 401
Coffrin, C, L Corrin, P de Barba, and G Kennedy. 2014. “Visualizing Patterns of Student Engagement and Performance in MOOCs.“ Proceedings of the Fourth International Conference on Learning Analytics and Knowledge: LAK ‘14. New York, NY: Association for Computing Machinery. https://doi.org/10.1145/2567574.2567586
College and University Professional Association for Human Resources. 2019. “CUPA-HR Salary Data, 2017–18.” HigherEdJobs. Accessed March 4, 2019. https://www.higheredjobs.com/salary/
Commonfund Institute. 2017a. Commonfund Higher Education Price Index. Wilton, CT: Commonfund Institute. Accessed November 29, 2018. https://www.commonfund.org/higher-education-price-index
—. 2017b. “Viewpoint: Counting the Cost.” Commonfund, March 30, 2017. Accessed June 23, 2020. https://www.commonfund.org/news-research/article/investment-management- costs-viewpoint/
Conley, B. 2019. “The Great Enrollment Crash.” The Chronicle of Higher Education, September 6, 2019. Accessed August 3, 2020. https://www.chronicle.com/article/the-great-enrollment-crash/
Cook, B, and N Pullaro. 2010. College Graduation Rates: Behind the Numbers. Washington, DC: Amercian Council on Education. https://www.acenet.edu/news-room/Documents/College-Graduation-Rates-Behind-the-Numbers.pdf
Cornell, B. 2015. “The Divestment Penalty: Estimating the Costs of Fossil Fuel Divestment to Select University Endowments.” SSRN. https://dx.doi.org/10.2139/ssrn.2655603
Cotter, H. 2009. “Why University Museums Matter.” The New York Times, February 19, 2009. Accessed January 20, 2020. https://www.nytimes.com/2009/02/20/arts/design/20yale.html
Coudriet, C, and M Schifrin. 2019. “Forbes’ 2019 College Financial Health Grades: How Fit is Your School?” Forbes, November 27, 2019. Accessed March 24, 2020. https://www.forbes.com/sites/cartercoudriet/2019/11/27/how-fit-is-your-school-the-methodology-behind-forbes-2019-college-financial-health-grades
Council for Advancement and Support of Education. 2019. Voluntary Support of Education: Trends in Alumni Giving. Washington, DC: CASE. https://www.case.org/resources/voluntary-support-education-trends-alumni-giving
—. 2020. Voluntary Support of Education Key Findings, 2018–19. Washington, DC: CASE. https://www.case.org/resources/voluntary-support-education-key-findings-2018-19
Council on Government Relations. 2019. Excellence in Research: The Funding Model, F&A Reimbursement, and Why the System Works. Washington, DC: Council on Government Relations. https://www.cogr.edu/sites/default/files/ExcellenceInResearch4_12_19_0.pdf
Creighton University. 2018. “Creighton University Consolidated Financial Statements June 30, 2018 and 2017 and Schedule of Expenditures of Federal Awards June 30, 2018.” Accessed March 3, 2020. https://www.creighton.edu/fileadmin/user/AdminFinance/Controller/docs/Year_End/FY18_Final_FS.pdf
Crist, JT. 2017. “US Universities and International Branch Campuses.” NAFSA/IEM Spotlight Newsletter 14 (1), April 20, 2017. Accessed March 22, 2019. https://www.nafsa.org/Professional_Resources/Browse_by_Interest/International_Students_and_Scholars/Network_Resources/International_Enrollment_Management/U_S__Universities_and_International_Branch_Campuses/
Crockett, Z. 2013. “Why Are Textbooks So Expensive?” Priceonomics, December 18, 2013. Accessed May 24, 2019. https://priceonomics.com/why-are-textbooks-so-expensive/

Like Nobody's Business402
Cross-Border Education Research Team. 2017. “C-BERT Branch Campus Listing.” C-BERT, January 3, 2017. Accessed March 22, 2019. http://cbert.org/resources-data/intl-campus/
Cumming Corporation. 2019. “U.S. Construction Costs Per Square Foot.” Accessed February 17, 2020. https://ccorpinsights.com/costs-per-square-foot/
Curry, JR, AL Laws, and JC Strauss. 2013. Responsibility Center Management: A Guide to Balancing Academic Entrepreneurship with Fiscal Responsibility. Washington, DC: NACUBO
Cuseo, J. 2010. “Fiscal Benefits of Student Retention and First-Year Retention Initiatives.” ResearchGate, January 2010. Accessed May 14, 2019. https://www.researchgate.net/publication/252903476_Fiscal_Benefits_of_Student_Retention_and_First-Year_Retention_Initiatives
Dale, S, and A Krueger. 2014. “Estimating the Effects of College Characteristics Over the Career Using Administrative Earnings Data.“ Journal of Human Resources 49 (2): 323–58. https://www.doi.org/10.3368/jhr.49.2.323
D’Amato, P. 2020. “Search Your School: Put Your College Through a Financial Stress Test.” NBC/Hechinger Report, August 4, 2020. Accessed August 6, 2020. https://www.nbcnews.com/news/education/college-financial-fitness-tracker-n1235337
D’Angelo, J. 2016. “Comparing Higher Education Construction Costs.” The Higher Ed Facilities Forum, July 11, 2016. Accessed February 17, 2020. https://info.higheredfacilitiesforum.com/blog/comparing-higher-education-costs
Daniel, A, and C Wellmon. 2018. “The University Run Amok! Higher Education’s Insatiable Appetite for Doing More Will Be Its Undoing.” The Chronicle of Higher Education, July 29, 2018. Accessed September 17, 2019. https://www.chronicle.com/article/the-university-run-amok/
Daniel, K, JJ Esposito, and RC Schonfeld. 2019. Library Acquisition Patterns. New York, NY: Ithaka S+R. https://doi.org/10.18665/sr.310937
Dayall, SA. n.d. “A Documentary History of Hampshire College, Vol. 2: 1975–1985: Chapter 6: Divestment.” Hampshire College. Accessed June 25, 2020. https://www.hampshire.edu/library/chapter-6-divestment
De Comité, F. 2017. “Nobel Prize Parking.“ Flickr, June 12, 2017. Image: CC BY 2.0. Accessed September 22, 2020. https://www.flickr.com/photos/fdecomite/34688401634
Delisle, J. 2019. The Surprising Role of High-Income Families in Student Debt Trends: Examining Undergraduate Borrowing by Income, 1995–96 to 2015–16. Washington, DC: American Enterprise Institute. https://www.aei.org/research-products/report/the-surprising-role-of-high-income-families-in-student-debt-trends-examining-undergraduate-borrowing-by-income-1995-96-to-2015-16/
Delisle, J, and K Dancy. 2016. Do State Subsidies for Public Universities Favor the Affluent? Washington, DC: The Brookings Institution. https://www.brookings.edu/research/do-state-subsidies-for-public-universities-favor-the-affluent/
Dellas, H, and P Sakellaris. 2003. “On the Cyclicality of Schooling: Theory and Evidence.“ Oxford Economic Papers 55: 148–72. http://www.jstor.org/stable/3488876
Despart, Z. 2015. “UVM’s Incoming Class Has Fewer Vermonters.” Burlington Free Press, September 28, 2015. Accessed August 31, 2018. https://www.burlingtonfreepress.com/story/news/education/2015/09/28/uvms-incoming-class-has-fewer-vermonters/72566076/
Desrochers, DM, and R Kirshstein. 2014. Labor Intensive or Labor Expensive? Changing Staffing and Compensation Patterns in Higher Education. Washington, DC: Delta Cost Project at American Institutes for Research. https://deltacostproject.org/product-types/issue-briefs

References 403
DeVol, R, J Lee, and M Ratnatunga. 2017. Concept to Commercialization: The Best Universities for Technology Transfer. Santa Monica, CA: Milken Institute. https://milkeninstitute.org/reports/concept-commercialization-best-universities-technology-transfer
Dimeo, J. 2017. “National Survey of Computing, eLearning and Information Technology.” Inside Higher Ed, November 8, 2017. Accessed April 3, 2019. https://www.insidehighered.com/digital-learning/data/2017/11/08/campus-it-leaders-survey-reveals-low-usage- teaching-and-learning
Dougherty, KJ, SM Jones, H Lahr, RS Natow, L Pheatt, and V Reddy. 2014. Implementing Performance Funding in Three Leading States: Instruments, Outcomes, Obstacles, and Unintended Impacts. New York, NY: Community College Research Center, Columbia University. https://ccrc.tc.columbia.edu/publications/implementing-performance-funding-three-leading-states.html
Dreyer, B. 2019. Dreyer’s English: An Uttterly Correct Guide to Clarity and Style. New York, NY: Random House
Drucker, PF. 1994. “The Theory of the Business.“ Harvard Business Review, September-October 1994. Accessed September 24, 2018. https://hbr.org/1994/09/the-theory-of-the-business
Duncan, A. 2009. “HBCUs and Higher Education: Beyond the Iron Triangle.” US Department of Education, September 2, 2009. Accessed July 22, 2020. https://www.ed.gov/news/speeches/hbcus-and-higher-education-beyond-iron-triangle
Dunlop, M. 2018. “The College Scorecard, College Rankings, and Return on Investment.“ Archives of Business Research 6 (7): 119–35. https://doi.org/10.14738/abr.67.4903
Dyer, G, A DonnaSelva, and H Bowen. 2020. Financial Performance of Sustainable Investing: The State of the Field and Case Studies for Endowments. Andover, MA: Intentional Endowments Network. https://www.intentionalendowments.org/financial_performance_of_sustainable_investing
Dyer, R. 2018. “Academe vs. U.S. Gun Culture.” Inside Higher Ed, March 29, 2018. Accessed June 25, 2020. https://www.insidehighered.com/views/2018/03/29/growing-movement-divest- gun-manufacturers-opinion
EAB. 2017. Tackling the Deferred Maintenance Crisis. Washington, DC: EAB. https://attachment.eab.com/wp-content/uploads/2017/05/34671-01-FF-Tackling-the-Deferred-Maintenance-Crisis.pdf
Eadicicco, L. 2019. “Apple CEO Tim Cook Explains Why You Don’t Need a College Degree to Be Successful.” Business Insider, March 7, 2019. Accessed August 4, 2020. https://www.businessinsider.com/apple-ceo-tim-cook-why-college-degree-isnt-necessary-2019-3
Ebersole, J. 2014. “Going Private: Why Public Institutions Are Considering Crossing Over (Parts 1 & 2).” The EvoLLLution, November 3, 2014. Accessed January 7, 2019. https://evolllution.com/opinions/private-public-institutions-crossing-part-1/
Education Dive. 2020. “A Look at Trends in College Consolidation Since 2016.” Education Dive, July 9, 2020. Accessed July 29, 2020. https://www.educationdive.com/news/how-many-colleges-and-universities-have-closed-since-2016/539379/
EDUCAUSE. 2020. “Research Computing Services (IT domain).” Accessed December 7, 2020. https://www.educause.edu/research-and-publications/research/analytics-services/survey-glossary
Eggers, AF, PA Groothuis, and PT Redding. 2019. “The Flutie Effect: The Influence of College Football Upsets and National Championships on the Quantity and Quality of Students at a
https://ccrc.tc.columbia.edu/publications/implementing-performance-funding-three-leading-states.html
https://ccrc.tc.columbia.edu/publications/implementing-performance-funding-three-leading-states.html
https://ccrc.tc.columbia.edu/publications/implementing-performance-funding-three-leading-states.html
https://www.educationdive.com/news/how-many-colleges-and-universities-have-closed-since-2016/539379/

Like Nobody's Business404
University.” Working Papers 19-05, Department of Economics, Appalachian State University. https://ideas.repec.org/p/apl/wpaper/19-05.html
Ehrenberg, R. 2002. Studying Ourselves: The Academic Labor Market. NBER Working Paper No. 8965. Cambridge, MA: National Bureau of Economic Research. https://www.nber.org/papers/w8965
Ellis, L. 2019. “A Turning Point for Scholarly Publishing.” The Chronicle of Higher Education, February 18, 2019. Accessed March 29, 2019. https://www.chronicle.com/article/open-access-is-going-mainstream-heres-why-that-could-transform-academic-life/
Elrod, A. 2013. “Sweat Shop Workers Kick Off National Adidas Divestment Campaign at NYU.” NYU Local, February 5, 2013. Accessed June 25, 2020. https://nyulocal.com/sweat-shop-workers-kick-off-national-adidas-divestment-campaign-at-nyu-91f5584e865d
Else, H. 2020. “Nature Journals Reveal Terms of Landmark Open-Access Option.” Springer Nature, November 24, 2020. Accessed November 24, 2020. https://www.nature.com/articles/d41586-020-03324-y
EY-Parthenon. 2017. “Public-Private Partnerships in Higher Education: What is Right for Your Institution?” EY-Parthenon. Accessed March 25, 2020. https://cdn.ey.com/echannel/parthenon/pdf/perspectives/EY-Parthenon-P3s-business-of-Highered.pdf
Fain, P. 2015. “Next Phase for Gates’ Completion Agenda.” Inside Higher Ed, March 3, 2015. Accessed January 7, 2019. https://www.insidehighered.com/news/2015/03/11/gates-foundation-announces-four-priority-policy-areas-college-completion-data-system
—. 2019. “Competition for Employer Tuition Benefits.” Inside Higher Ed, May 30, 2019. Accessed May 30, 2019. https://www.insidehighered.com/digital-learning/article/2019/05/30/asu-spin-latest-arrival-20-billion-corporate-tuition-benefits
Federal Reserve Bank of New York. 2019. “Labor Market Outcomes of College Graduates by Major.” FRBNY, February 6, 2019. Accessed July 10, 2020. https://www.newyorkfed.org/research/college-labor-market/college-labor-market_compare-majors.html
Fischer, K. 2020. “Covid-19 Caused International Enrollments to Plummet This Fall. They Were Already Dropping.” The Chronicle of Higher Education, November 16, 2020. Accessed November 23, 2020. https://www.chronicle.com/article/covid-19-caused-international-enrollments-to-plummet-this-fall-they-were-already-dropping
Flood, S, M King, R Rodgers, S Ruggles, and JR Warren. 2018. Integrated Public Use Microdata Series, Current Population Survey: Version 6.0 [dataset]. Minneapolis, MN: IPUMS. Accessed April 18, 2019. https://doi.org/10.18128/D030.V6.0
Florida, R. 2016. “The Economic Impact of College Graduates on Local Economies.” Bloomberg, February 1, 2016. Accessed July 21, 2020. https://www.bloomberg.com/news/articles/2016-02-01/the-u-s-cities-that-gain-the-most-from-college-graduates
Fortune. 2018. “Fortune 500.” Fortune, May 2018. Accessed August 8, 2018. https://fortune.com/fortune500/
Fossil Free. 2020. “Divestment Commitments.” 350.org. Accessed June 26, 2020. https://gofossilfree.org/divestment/commitments/
Foundation Center. 2020. “Foundation Stats, Aggregate Fiscal Data of Independent Foundations in the U.S. from 2002 to 2015.” Accessed June 15, 2020. http://data.foundationcenter.org/#/foundations/independent/nationwide/total/trends:num_foundations/2015

References 405
Fox, J. 2019. “The Coming College Enrollment Bust.” Bloomberg, May 30, 2019. Accessed August 3, 2020. https://www.bloomberg.com/opinion/articles/2019-05-30/college-enrollment-bust- is-headed-this-way-by-2026
Foxworth, J. 2019. “How Liberatory Philanthropy and Restorative Investing Can Remake the Economy.” Nonprofit Quarterly, February 28, 2019. Accessed June 26, 2020. https://nonprofitquarterly.org/how-liberatory-philanthropy-and-restorative-investing-can-remake-the-economy/
Fraser, K, and J LeMaster. 2013. Organizational,Funding,and Governance Structures of Alumni Associations. Washington, DC: Education Advisory Board. https://www.uky.edu/ie/sites/www.uky.edu.ie/files/uploads/CF_Organizational%20Funding%20and%20Governance %20Structures%20of%20Alumni%20Associations.pdf
Frederick, G. 2006. “An Old-Fashioned Movie Theater That is Still Showing Movies!” Flickr, July 1, 2006. Image: CC BY 2.0. Accessed March 15, 2019. https://www.flickr.com/photos/galfred/180834829
Ganucheau, A. 2019. “Ole Miss Foundation, College Board Gridlocked Over $500K of New Chancellor Glenn Boyce’s Salary.” Mississippi Today, October 10, 2019. Accessed June 30, 2020. https://mississippitoday.org/2019/10/10/ole-miss-foundation-college-board-gridlocked-over-500k-of-new-chancellor-glenn-boyces-salary/
Gardner, L. 2019. “For Colleges, Climate Change Means Making Tough Choices.” The Chronicle of Higher Education, May 3, 2019. Accessed August 5, 2020. https://www.chronicle.com/article/for-colleges-climate-change-means-making-tough-choices/
Garrett, R. 2019. “Educational Attainment: Setting the Record Straight.” Encoura, July 16, 2019. Accessed October 2, 2020. https://encoura.org/where-america-really-goes-to-college-good- news-about-educational-attainment/
Garrett, R, K Kinser, and R Merola. 2016. “International Branch Campuses: Trends and Developments, 2016 (Presentation Slides).” Accessed March 22, 2019. http://www.obhe.ac.uk/documents/download?id=1049
Garthwaite, C, J Keener, MJ Notowidigdo, and NF Ozminkowski. 2020. Who Profits From Amateurism? Rent-Sharing in Modern College Sports. NBER Working Paper No. 27734. Cambridge, MA: National Bureau of Economic Research. https://www.nber.org/papers/w27734
Ge, S, E Isaac, and A Miller. 2018. Elite Schools and Opting In: Effects of College Selectivity on Career and Family Outcomes. NBER Working Paper 25315. Cambridge, MA: National Bureau of Economic Research. http://www.nber.org/papers/w25315
Geiger, RL. 2011. “Optimizing Research and Teaching.“ In The American Academic Profession, edited by JC Hermanowicz, 21–43. Baltimore, MD: Johns Hopkins University Press
—. 2019. American Higher Education since World War II: A History. Princeton, NJ: Princeton University Press
Getz, M, and JJ Siegfried. 1991. “Costs Per Student Over Time.“ In Economic Challenges in Higher Education, edited by CT Clotfelter, RG Ehrenberg, M Getz and JJ Siegfried, 357–92. Chicago, IL: University of Chicago Press. Accessed September 6, 2018. http://www.nber.org/chapters/c6091
Gilbert, C, and D Heller. 2010. The Truman Commission and its Impact on Federal Higher Education Policy From 1947 to 2010. Working paper #9, Center for the Study of Higher Education. University Park, PA: The Pennsylvania State University. Accessed November 30, 2018. https://ed.psu.edu/cshe/working-papers/wp-9

Like Nobody's Business406
Giving USA. 2020. “Giving USA 2020: Charitable Giving Showed Solid Growth, Climbing to $449.64 Billion in 2019, One of the Highest Years for Giving on Record.” The Giving Institute, June 16, 2020. Accessed June 16, 2020. https://givingusa.org/giving-usa-2020-charitable-giving-showed-solid-growth-climbing-to-449-64-billion-in-2019-one-of-the-highest-years-for-giving-on-record/
Givler, P. 2002. “University Press Publishing in the United States.“ In Scholarly Publishing: Books, Journals, Publishers and Libraries in the Twentieth Century, edited by RE Abel and LW Newman. Wiley. http://www.aupresses.org/about-aaup/about-university-presses/history-of-university-presses
Glesne, C. 2012. “Challenges and Conditions of Success for Campus Art Museums.“ In The Campus Art Museum: A Qualitative Study — A report to the Samuel H. Kress Foundation. New York, NY: Samuel H. Kress Foundation. http://www.kressfoundation.org/research/campus_art_museum/
Gnolek, SL, VT Falciano, and RW Kuncl. 2014. “Modeling Change and Variation in U.S. News & World Report College Rankings: What would it really take to be in the Top 20?” Research in Higher Education 55: 761–79. https://doi.org/10.1007/s11162-014-9336-9
Gordian. 2018. 2018 State of Facilities in Higher Education: 6th Annual Report. Guilford, CT: Gordian. http://www.gordian.com/uploads/2019/12/2018-State-of-Facilities-in-Higher-Education_FINAL_2020.pdf
Goucher College. 2018. “Goucher College Financial Statements June 30, 2018 and 2017.” Accessed March 3, 2020. https://www.goucher.edu/controller/documents/Goucher-College-2018-Audited-Financial-Statements.pdf
Grant, D. 2019. “Art Donors Increasingly Look to University Museums.” The Wall Street Journal, February 10, 2019. Accessed January 19, 2020. https://www.wsj.com/articles/art-donors-increasingly-look-to-university-museums-11549854060
Grantham, J. 2018. The Race of Our Lives Revisited. Boston, MA: GMO. https://www.gmo.com/americas/research-library/the-race-of-our-lives-revisited/
Green, KC. 2007–2018. The Campus Computing Survey. Encino, CA: Campus Computing. Accessed April 2, 2019. https://www.campuscomputing.net/survey
Grimme, S, and C Watkinson. 2020. “State of Open Monographs Series: The Economics of Open Access Monographs.” Digital Science, July 23, 2020. Accessed October 6, 2020. https://www.digital-science.com/blog/news/economics-of-open-access-monographs/
Guadagnolo, G. 2018. “Margin Pressures for Academic Medical Centers.” EAB, March 30, 2018. Accessed April 3, 2020. https://eab.com/insights/expert-insight/business-affairs/margin-pressures-for-academic-medical-centers/
Hager, MA, and TH Pollak. 2002. The Capacity of Performing Arts Presenting Organizations. Washington, DC: Urban Institute. https://www.urban.org/research/publication/capacity-performing-arts-presenting-organizations
Hall, S, and T Dudley. 2019. Dear Colleges: Take Control of Your Online Courses. New York, NY: The Century Foundation. https://tcf.org/content/report/dear-colleges-take-control-online-courses/
Harper, SJ. 2013. “Pop Goes the Law.” The Chronicle of Higher Education, March 11, 2013. Accessed July 16, 2020. https://www.chronicle.com/article/pop-goes-the-law/
Harris, A. 2019. “Millions of College Students Are Going Hungry.” The Atlantic, January 9, 2019. Accessed May 31, 2019. https://www.theatlantic.com/education/archive/2019/01/college-student-hunger/579877/

References 407
Harvard University. 2018. “Endowment.” Accessed August 27, 2018. https://www.harvard.edu/about-harvard/harvard-glance/endowment
Haskins, R. 2016. “Education and Economic Mobility.“ In Getting Ahead or Losing Ground: Economic Mobility In America, by JB Isaacs, IV Sawhill and R Haskins. Washington, DC: The Brookings Institution. https://www.brookings.edu/wp-content/uploads/2016/06/02_economic_mobility_sawhill.pdf
Hasseltine, D. 2017. “College Fundraising Gift Pyramid Narrows.” University Business, November 28, 2017. Accessed June 30, 2020. https://universitybusiness.com/college-fundraising-gift-pyramid-narrows/
Hearn, JC, DW Suggs, and J May-Trifiletti. 2018. Taking the Field: Intercollegiate Athletics on CIC Campuses. Washington, DC: Council of Independent Colleges. https://www.cic.edu/resources-research/charts-data/reports/athletics-report-2018
Helland, E, and A Tabarrok. 2019. Why Are The Prices So Damn High? Health, Education, and the Baumol Effect. Arlington, VA: Mercatus Center at George Mason University. https://www.mercatus.org/publications/healthcare/why-are-prices-so-damn-high
Hemelt, SW, KM Stange, F Furquim, A Simon, and JE Sawyer. 2018. Why is Math Cheaper than English? Understanding Cost Differences in Higher Education. NBER Working Paper 25314. Cambridge, MA: National Bureau of Economic Research. http://www.nber.org/papers/w25314
Henderson State University. 2018. “Operating Budget 2018–2019.” Accessed March 3, 2020. https://www.hsu.edu/uploads/pages/18_19_operating_budget.pdf
Henley, LD. 2016. “Managing Performing Arts Centers in a University Setting.“ In Performing Arts Center Management, edited by PD Lambert and R Williams, 148–61. New York, NY: Routledge. https://doi.org/10.4324/9781315525891
Higher Education Consortia. 2019. “The Cost Study at the University of Delaware.” Accessed February 26, 2019. https://ire.udel.edu/cost/
Hill, CB, and ED Pisacreta. 2019. The Economic Benefits and Costs of a Liberal Arts Education. New York, NY: The Andrew W. Mellon Foundation. https://mellon.org/news-blog/articles/economic-benefits-and-costs-liberal-arts-education/
Hill, P. 2015. “About the Diverging Textbook Prices and Student Expenditures.” e-Literate, March 30, 2015. Accessed May 24, 2019. https://mfeldstein.com/about-the- diverging-textbook-prices-and-student-expenditures/
—. 2019. “State of Higher Ed LMS Market for US and Canada: 2018 Year-End Edition.” e-Literate, February 5, 2019. Accessed April 3, 2019. https://mfeldstein.com/state-higher-ed-lms-market-us-canada-end-2018/
Hillman, N. 2016. Why Performance-Based College Funding Doesn’t Work. New York, NY: The Century Foundation, May 25, 2016. Accessed January 7, 2019. https://tcf.org/content/report/why-performance-based-college-funding-doesnt-work/
Hillman, NW, AH Fryar, and V Crespin-Trujillo. 2018. “Evaluating the Impact of Performance Funding in Ohio and Tennessee.“ American Educational Research Journal 55 (1): 144–70. https://doi.org/10.3102/0002831217732951
Hilltop Securities. 2018. “Overview of Proposed Capital Improvements 2019 Financing Plan.” Stephen F. Austin State University. Accessed March 23, 2020. http://www.sfasu.edu/docs/board-regents/supplemental-materials-bond-issue-presentation-10.28-29.2018.pdf

Like Nobody's Business408
Holland, K. 2015. “The State of Campus Resilience in the Face of a Changing Climate.“ Planning for Higher Education Journal 44 (1): 59–62. https://www.haleyaldrich.com/Portals/0/Downloads/SCUP-state-of-campus-resilience-climate-change.pdf
Hoxby, CM. 2014. “The Economics of Online Postsecondary Education: MOOCs, Nonselective Education, and Highly Selective Education.“ American Economic Review 104 (5): 528–33. https://www.aeaweb.org/articles?id=10.1257/aer.104.5.528
Hurlburt, S, and M McGarrah. 2016a. Cost Savings or Cost Shifting? The Relationship Between Part-Time Contingent Faculty and Institutional Spending. New York, NY: TIAA Institute. http://www.air.org/sites/default/files/downloads/report/Cost-Savings-or-Cost-Shifting-Contingent-Faculty-November-2016.pdf
—. 2016b. The Shifting Academic Workforce: Where Are the Contingent Faculty? New York, NY: TIAA Institute. http://www.air.org/sites/default/files/downloads/report/Shifting-Academic-Workforce-November-2016.pdf
Illinois State University, Center for the Study of Education Policy. 2018. “Grapevine: Historical Data.” Accessed November 29, 2018. https://education.illinoisstate.edu/grapevine/
Impey, C. 2020. “Massive Online Open Courses See Exponential Growth During COVID-19 Pandemic.” The Conversation, July 23, 2020. Accessed August 6, 2020. https://theconversation.com/massive-online-open-courses-see-exponential-growth-during-covid-19-pandemic-141859
Indiana University Center for Postsecondary Research. 2015. “The Carnegie Classification of Institutions of Higher Education.” Accessed August 3, 2018. http://carnegieclassifications.iu.edu/
Institute of International Education. 2019. Open Doors Report on International Educational Exchange. New York, NY: IIE. Accessed February 6, 2020. https://www.iie.org/opendoors
Investing.com. 2020. “S&P 500 Energy Historical Data.” Investing.com. Accessed June 25, 2020. https://www.investing.com/indices/s-p-500-energy-historical-data
IPEDS. 2020. See: US Department of Education (2020b)
Jarvis, W. 2019. “Florida Universities Have Turned Athletics Departments Into Quasi-Private Arms. What Does That Mean for Public Accountability?” The Chronicle of Higher Education, June 17, 2019. Accessed May 6, 2020. https://www.chronicle.com/article/florida-universities-have-turned-athletics-departments-into-quasi-private-arms-what-does-that-mean-for-public-accountability/
Jaschik, S. 2019a. “Alternative Universities.” Inside Higher Ed, March 12, 2019. Accessed August 5, 2020. https://www.insidehighered.com/news/2019/03/12/author-discusses-his-new- book-speculating-alternative-models-higher-education
—. 2019b. “Reprieve at Stanford.” Inside Higher Ed, May 1, 2019. Accessed January 27, 2020. https://www.insidehighered.com/news/2019/05/01/stanford-backs-down-year-ending- support-university-press
—. 2019c. “Why Alabama Returned the Gift.” Inside Higher Ed, June 10, 2019. Accessed June 19, 2020. https://www.insidehighered.com/news/2019/06/10/why-did-university-alabama- return-millions-donor
—. 2020. “Foundations Will Increase Support for Higher Ed.” Inside Higher Ed, June 12, 2020. Accessed June 15, 2020. https://www.insidehighered.com/quicktakes/2020/06/12/foundations-will-increase-support-higher-ed

References 409
Johnson, LM, and M Edwards. 2020. “USC Will Award $4,000 Scholarships Per Semester to Students Who Stay at Home.” CNN, July 15, 2020. Accessed July 31, 2020. https://www.cnn.com/2020/07/15/us/usc-to-award-scholarships-to-those-who-stay-home-trnd/
Johnson, N. 2012. The Institutional Costs of Student Attrition. Washington, DC: American Institutes for Research, Delta Cost Project. http://deltacostproject.org/sites/default/files/products/Delta-Cost-Attrition-Research-Paper.pdf
Johnson, S. 2019. “Colleges Lose a ‘Stunning’ 651 Foreign-Language Programs in 3 Years.” The Chronicle of Higher Education, January 22, 2019. Accessed February 28, 2019. https://www.chronicle.com/article/colleges-lose-a-stunning-651-foreign-language-programs-in-3-years/
Jones, JM. 2017. “Pro Football Losing Fans; Other Sports Holding Steady.” Gallup, October 13, 2017. Accessed April 22, 2020. https://news.gallup.com/poll/220562/pro-football-losing-fans-sports-holding-steady.aspx
Juniata College. 2018. “Juniata College Financial Statements May 31, 2018 and 2017.” Accessed March 3, 2020. https://cdn.juniata.edu/documents/offices/finance/audit-18.pdf
Kafka, AC. 2019. “Proposed Cut of Stanford U. Press’s Subsidy Sparks Outrage.” The Chronicle of Higher Education, April 26, 2019. Accessed May 2, 2019. https://www.chronicle.com/article/proposed-cut-of-stanford-u-presss-subsidy-sparks-outrage/
Kaiser Family Foundation. 2018. “2018 Employer Health Benefits Survey.” KFF, October 3, 2018. Accessed January 28, 2019. https://www.kff.org/health-costs/report/2018-employer- health-benefits-survey/
Kays, J, and A Phillips–Han. 2003. “Gatorade: The Idea That Launched An Industry.” Accessed January 18, 2020. https://research.ufl.edu/publications/explore/v08n1/gatorade.html
Kelchen, R. 2018. “Is Administrative Bloat Really a Big Problem?” May 10. Accessed May 13, 2020. https://robertkelchen.com/2018/05/10/is-administrative-bloat-a-problem/
—. 2020. “This Will Be One of the Worst Months in the History of Higher Education.” The Chronicle of Higher Education, July 7, 2020. Accessed July 7, 2020. https://www.chronicle.com/article/this-will-be-one-of-the-worst-months-in-the-history-of-higher-education
Keller, J. 2010. “Berkeley Will Eliminate 5 Teams After Faculty Outcry Over Athletics Subsidy.” The Chronicle of Higher Education, September 28, 2010. Accessed April 26, 2020. https://www.chronicle.com/article/berkeley-will-eliminate-5-teams-after-faculty-outcry-over-athletics-subsidy/
Kestenbaum, D. 2014. “How College Students Battled Textbook Publishers To A Draw, In 3 Graphs.” National Public Radio, October 9, 2014. Accessed May 24, 2019. https://www.npr.org/sections/money/2014/10/09/354647112/how-college-students-battled-textbook- publishers-to-a-draw-in-3-graphs
Kiley, K. 2011. “Letting Numbers Tell the Story.” Inside Higher Ed, November 15, 2011. Accessed March 24, 2020. https://www.insidehighered.com/news/2011/11/15/colleges-place-more- emphasis-liquidity-and-tracking-it
—. 2013. “A Home for Artifacts.” Inside Higher Ed, July 10, 2013. Accessed January 19, 2020. https://www.insidehighered.com/news/2013/07/10/museums-look-university-partners- put-them-viable-financial-path
Kim, J. 2018. “The Functions and Dysfunctions of College Rankings: An Analysis of Institutional Expenditure.“ Research in Higher Education 59: 54–87. https://doi.org/10.1007/s11162-017-9455-1
https://www.chronicle.com/article/colleges-lose-a-stunning-651-foreign-language-programs-in-3-years/

Like Nobody's Business410
—. 2019. “Thinking About ‘Massification of Higher Education Revisited’.” Inside Higher Ed, February 28, 2019. Accessed August 4, 2020. https://www.insidehighered.com/blogs/technology-and-learning/thinking-about-massification-higher-education-revisited%E2%80%99
Kimball, B. 2017. A “thoroughly satisfactory and permanent remedy”: the Twentieth Century Invention of the American University Endowment.” HistPhil, November 6, 2017. Accessed June 24, 2020. https://histphil.org/2017/11/06/a-thoroughly-satisfactory-and-permanent-remedy-the-twentieth-century-invention-of-the-american-university-endowment/
Kinser, K, and JE Lane. 2016. “International Branch Campuses: Evolution of a Phenomenon.“ International Higher Education (85): 3–5. https://doi.org/10.6017/ihe.2016.85.9232
Kizilcec, RF, J Reich, M Yeomans, C Dann, E Brunskill, G Lopez, S Turkay, JJ Williams, and D Tingley. 2020. “Scaling Up Behavioral Science Interventions in Online Education.“ Proceedings of the National Academy of Sciences 117 (26) 14900-05. https://doi.org/10.1073/pnas.1921417117
Koo, G-Y, and SW Dittmore. 2014. “Effects of Intercollegiate Athletics on Private Giving in Higher Education.“ Journal of Issues in Intercollegiate Athletics 7: 1–16. https://www.researchgate.net/publication/273319691_Effects_of_Intercollegiate_Athletics_on_Private_Giving_in_Higher_Education
Kosten, L, and CD Lovell. 2011. “Academic Deans’ Perspectives on the Effectiveness Of Responsibility Management.“ In Integrated Resource and Budget Planning at Colleges and Universities, edited by C Rylee, 85–101. Ann Arbor, MI: Society for College and University Planning. https://www.scup.org/resource/integrated-resource-and-budget-planning-at-colleges-and-universities/
Kreighbaum, A. 2017. “Push for ‘Unit Records’ Revived.” Inside Higher Ed, May 16, 2017. Accessed May 7, 2019. https://www.insidehighered.com/news/2017/05/16/bipartisan-bill-would-overturn-federal-ban-student-unit-record-database
—. 2018. “The Growing Loan Burden for Parents of College Students.” Inside Higher Ed, November 29, 2018. Accessed May 31, 2019. https://www.insidehighered.com/news/2018/11/29/report-finds-parents-college-students-taking-out-more-debt-and-repaying-slower-rates
—. 2019a. “The Real Divide Over Higher Ed? Cost.” Inside Higher Ed, September 10, 2019. Accessed August 5, 2020. https://www.insidehighered.com/news/2019/09/10/survey-suggests-who-pays-college-drives-partisan-divide
—. 2019b. “Top Higher Ed Debate in 2019? Big Solutions for Borrowers.” Inside Higher Ed, June 18, 2019. Accessed January 31, 2020. https://www.insidehighered.com/news/2019/06/18/student-debt-cancellation-pushes-mainstream-higher-ed-debate
Kretovics, MA. 2011. Business Practices in Higher Education: A Guide for Today’s Administrators. New York, NY: Routledge/Taylor & Francis
Krieger, LM. 2005. “Stanford Earns $336 Million Off Google Stock.” San Jose Mercury News, December 1, 2005. Accessed January 18, 2020. https://www.redorbit.com/news/education/318480/stanford_earns_336_million_off_google_stock/
Kroeger, T, C McNicholas, M von Wilpert, and J Wolfe. 2018. The State of Graduate Student Employee Unions. Washington, DC: Economic Policy Institute. Accessed January 29, 2019. https://www.epi.org/publication/graduate-student-employee-unions/
Lambert, MT. 2014. Privatization and the Public Good: Public Universities in the Balance. Cambridge, MA: Harvard Education Press

References 411
Lang, L. 2017. 2016 EDUCAUSE Core Data Service (CDS) Benchmarking Report. Louisville, CO: EDUCAUSE, April 11, 2017. Accessed April 2, 2019. https://library.educause.edu/resources/2017/4/2016-educause-core-data-service-cds-benchmarking-report
Lauer, M. 2018. “Open Mike — How Many Researchers, Revisited: A Look at Cumulative Investigator Funding Rates.” National Institutes of Health, March 7, 2018. Accessed June 7, 2019. https://nexus.od.nih.gov/all/2018/03/07/how-many-researchers-revisited-a-look-at-cumulative-investigator-funding-rates/
Lazerson, M. 2010. “The Making of Corporate U.” The Chronicle of Higher Education, October 17, 2010. Accessed January 19, 2020. https://www.chronicle.com/article/the-making-of-corporate-u/
Lederman, D. 2017. “Clay Christensen, Doubling Down.” Inside Higher Ed, April 28, 2017. Accessed March 14, 2019. https://www.insidehighered.com/digital-learning/article/2017/04/28/clay-christensen-sticks-predictions-massive-college-closures
—. 2019. “Major Football Coaches’ Salaries Rise 9%, to $2.67M.” Inside Higher Ed, October 23, 2019. Accessed May 5, 2020. https://www.insidehighered.com/quicktakes/2019/10/23/major-football-coaches-salaries-rise-9-267m
—. 2020. “COVID-19’s Forceful Financial Hit: A Survey of Business Officers.” Inside Higher Ed, July 10, 2020. Accessed July 31, 2020. https://www.insidehighered.com/news/survey/covid-19s-forceful-impact-shakes-college-business-officers-confidence
Lee, V, and A Looney. 2018. “Headwinds for Graduate Student Borrowers: Rising Balances and Slowing Repayment Rates.” The Brookings Institution, October 18, 2018. Accessed May 31, 2019. https://www.brookings.edu/research/headwinds-for-graduate-student- borrowers-rising-balances-and-slowing-repayment-rates/
Leeds, T. 2019. “Overview of P3 Literature for the BFA.” UC Berkeley Faculty Association, September 2, 2019. Accessed March 26, 2020. https://ucbfa.org/2019/09/overview-of-p3-literature-for-the-bfa/
Legon, R, and R Garrett. 2018. The Changing Landscape of Online Education (CHLOE) 2: A Deeper Dive. Annapolis, MD: Quality Matters & Eduventures. https://www.qualitymatters.org/qa-resources/resource-center/articles-resources/CHLOE-2-report-2018
Lehman, C. 2017. “Privatizing Oregon’s Largest Universities? Intriguing But Unlikely.” Oregon Public Broadcasting, November 12, 2017. Accessed January 8, 2019. https://www.opb.org/news/article/oregon-privatize-university-pension-debt/
Levine, P. 2019. “Dump the Discount Rate.” Inside Higher Ed, August 14, 2019. Accessed January 28, 2020. https://www.insidehighered.com/views/2019/08/14/why-discount-rate- flawed-statistic-tracking-college-finances-opinion
Levy, DC. 2018. “Global Private Higher Education: An Empirical Profile of Its Size and Geographical Shape.“ Higher Education 76: 701–15. https://doi.org/10.1007/s10734-018-0233-6
Lewin, T. 1990. “Harvard and CUNY Shedding Stocks in Tobacco.” The New York Times, May 24, 1990. Accessed June 25, 2020. https://www.nytimes.com/1990/05/24/us/harvard-and-cuny-shedding-stocks-in-tobacco.html
Li, A. 2018. Lessons Learned: A Case Study of Performance Funding in Higher Education. Washington, DC: Third Way. https://www.thirdway.org/report/lessons-learned-a-case- study-of-performance-funding-in-higher-education
Li, J, J McChesney, and J Bichsel. 2019. Impact of the Economic Recession on Student Enrollment and Faculty Composition in U.S. Higher Education: 2003–2018. Knoxville, TN: CUPA-HR. https://www.cupahr.org/surveys/research-briefs/

Like Nobody's Business412
Lombardi, JV. 2013. How Universities Work. Baltimore, MD: Johns Hopkins University Press
Looney, A, and V Lee. 2018. “Parents Are Borrowing More and More to Send Their Kids to College—and Many Are Struggling to Repay.” The Brookings Institution, November 27, 2018. Accessed May 31, 2019. https://www.brookings.edu/research/parents-are-borrowing-more-and-more-to-send-their-kids-to-college-and-many-are-struggling-to-repay/
Luminos. 2020. “A New Publishing Option for Authors.” University of California Press. Accessed October 6, 2020. https://www.luminosoa.org/site/for_authors/
Lyken-Segosebe, D, and JC Shepherd. 2013. Learning from Closed Institutions: Indicators of Risk for Small Private Colleges and Universities. Nashville, TN: Tennessee Independent Colleges and Universities Association. http://www.ticua.org.sitemason.com/public_policy/sm_files/Learning%20from%20Closed%20Institutions.pdf
Lynch, JP. 1972. Aristotle’s School: a Study of a Greek Educational Institution. Berkeley, CA: University of California Press. https://www.google.com/books/edition/_/VaYV57QiQDYC
Ma, J, M Pender, and M Welch. 2019. Education Pays 2019: The Benefits of Higher Education for Individuals and Society. New York, NY: The College Board. https://research.collegeboard.org/trends/education-pays
Ma, J, S Baum, M Pender, and CJ Libassi. 2018. Trends in College Pricing 2018. New York, NY: The College Board. https://research.collegeboard.org/pdf/trends-college-pricing-2018-full-report.pdf
Malekoff, R. 2005. The College Sports Project and the Reform of Division III Athletics. Cambridge, MA: Forum for the Future of Higher Education (MIT). Accessed April 28, 2020. http://forum.mit.edu/articles/the-college-sports-project-and-the-reform-of-division-iii-athletics/
Mangan, K. 2019. “Confused About How ‘Free College’ Programs Differ? This Primer Can Help.” The Chronicle of Higher Education, March 18, 2019. Accessed January 31, 2020. https://www. chronicle.com/article/confused-about-how-free-college-programs-differ-this-primer-can-help/
Marketplace. 2020. “Marketplace.” American Public Media. Accessed November 23, 2020. https://www.marketplace.org
MarketWatch. 2018. “Education ERP Market Analysis, Overview, Driver, Trends, Demand, Overview Forecast 2018–2024.” MarketWatch, October 26, 2018. Accessed April 3, 2019. https://www.marketwatch.com/press-release/education-erp-market-analysis-overview-driver-trends-demand-overview-forecast-2018---2024-2018-10-26
Maron, NL, C Mulhern, D Rossman, and K Schmelzinger. 2016. The Costs of Publishing Monographs: Toward a Transparent Methodology. New York, NY: Ithaka S+R. https://doi.org/10.18665/sr.276785
Martin, R, and A Gillen. 2009. “Breaking the Cost Spiral.” Inside Higher Ed, August 7, 2009. Accessed December 17, 2018. https://www.insidehighered.com/views/2009/08/07/breaking-cost- spiral
Martin, RE. 2009. The Revenue-to-Cost Spiral in Higher Education. Raleigh, NC: John W. Pope Center for Higher Education Policy. http://www.popecenter.org/acrobat/revenue-to-cost-spiral.pdf
Martin, RE, and RC Hill. 2014. “Baumol and Bowen Cost Effects in Research Universities.” SSRN. Accessed December 12, 2018. https://dx.doi.org/10.2139/ssrn.2153122
Massy, WF. 2003. Honoring the Trust: Quality and Containment in Higher Education. Bolton, MA: Anker Publishing Company

References 413
McCarthy, M. 1952. The Groves of Academe. New York, NY: Harcourt Brace
McDonald, B. 2003. “Phenomenology: The ’Flutie factor’ is Now Received Wisdom. But is it True?” Boston College Magazine. Accessed May 8, 2020. http://bcm.bc.edu/issues/spring_2003/ll_phenomenology.html
McKenzie, L. 2018a. “Shifting Focus of Publishers Signals Tough Times for Textbook Authors.” Inside Higher Ed, December 12, 2018. Accessed May 24, 2019. https://www.insidehighered.com/news/2018/12/12/switch-digital-first-products-publishers-are-signing-fewer-textbook-authors
—. 2018b. “The 100K Club.” Inside Higher Ed, April 23, 2018. Accessed March 15, 2019. https://www.insidehighered.com/news/2018/04/23/nonprofits-poised-unseat-u- phoenix-largest-online-university
—. 2019a. “Rival Publishers Join Forces.” Inside Higher Ed, May 2, 2019. Accessed May 24, 2019. https://www.insidehighered.com/digital-learning/article/2019/05/02/cengage-and- mcgraw-hill-merge
—. 2019b. “The Beginning of the End for the ‘Big Deal’?” Inside Higher Ed, March 27, 2019. Accessed March 29, 2019. https://www.insidehighered.com/news/2019/03/27/librarians-prepare-take-harder-line-publishers
—. 2019c. “UMUC 2.0.” Inside Higher Ed, March 13, 2019. Accessed March 15, 2019. https://www.insidehighered.com/digital-learning/article/2019/03/13/university-maryland- university-college-will-change-name-and
—. 2020a. “A Landmark Open-Access Agreement.” Inside Higher Ed, June 17, 2020. Accessed June 17, 2020. https://www.insidehighered.com/news/2020/06/17/university-california- system-strikes-landmark-open-access-deal-springer-nature
—. 2020b. “University of Arizona’s Big Online Push.” Inside Higher Ed, August 4, 2020. Accessed October 2, 2020. https://www.insidehighered.com/news/2020/08/04/university-arizona- acquires-ashford-university
McLendon, MK, and JC Hearn. 2013. “The Resurgent Interest in Performance-Based Funding for Higher Education.“ Academe November-December. https://www.aaup.org/article/resurgent-interest-performance-based-funding-higher-education
McMurtrie, B. 2019. “Why a Plagiarism-Detection Company Is Now a Billion-Dollar Business.” The Chronicle of Higher Education, March 6, 2019. Accessed April 3, 2019. https://www.chronicle.com/article/why-a-plagiarism-detection-company-is-now-a-billion-dollar-business/
Mehrling, P, P Goldstein, and V Sedlacek. 2006. Endowment Spending: Goals, Rates, and Rules. Cambridge, MA: Forum for the Future of Higher Education (MIT). Accessed June 23, 2020. http://forum.mit.edu/articles/endowment-spending-goals-rates-and-rules/
Meredith, M. 2004. “Why Do Universities Compete in the Ratings Game? An Empirical Analysis of the Effects of the U.S. News and World Report College Rankings.“ Research in Higher Education 45: 443–61. https://doi.org/10.1023/B:RIHE.0000032324.46716.f4
Merrill, D, B Migliozzi, and S Decker. 2016. “Billions at Stake in University Patent Fights.” Bloomberg, May 24, 2016. Accessed January 19, 2020. https://www.bloomberg.com/graphics/2016-university-patents/
Mintz, S. 2019a. “A Worrisome Glimpse Through a Spyglass.” Inside Higher Ed, February 18, 2019. Accessed August 3, 2020. https://www.insidehighered.com/blogs/higher-ed-gamma/worrisome-glimpse-through-spyglass

Like Nobody's Business414
—. 2019b. “The Right Model(s) for Higher Ed.” Inside Higher Ed, May 14, 2019. Accessed August 4, 2020. https://www.insidehighered.com/blogs/higher-ed-gamma/right-models-higher-ed
—. 2019c. “The Shape of Higher Ed to Come.” Inside Higher Ed, May 13, 2019. Accessed August 4, 2020. https://www.insidehighered.com/blogs/higher-ed-gamma/shape-higher-ed-come
Mitchell, BC. 2018. “Out-of-State Students Subsidize in-State Students. What’s the Right Mix?” Academe Blog, American Association of University Professors, April 18, 2018. Accessed September 17, 2018. https://academeblog.org/2018/04/18/out-of-state-students- subsidize-in-state-students-whats-right-mix/
Mitchell, M, M Leachman, and K Masterson. 2017. A Lost Decade in Higher Education Funding. Washington, DC: Center on Budget and Policy Priorities, 29. Accessed December 5, 2018. https://www.cbpp.org/research/state-budget-and-tax/a-lost-decade-in-higher-education-funding
Monks, J, and RG Ehrenberg. 1999. The Impact of US News and World Report College Rankings on Admission Outcomes and Pricing Decisions at Selective Private Institutions. NBER Working Paper No. 7227. Cambridge, MA: National Bureau of Economic Research. https://www.nber.org/papers/w7227
Moody’s Investors Service. 2018a. “Credit Opinion: Indiana University, IN.” Accessed March 23, 2020. https://www.indiana.edu/~iutreas/investor-disclosure/doc/moodys-rating-report.pdf
—. 2018b. “Credit Opinion: Loyola University of Chicago, IL.” Accessed March 23, 2020. https://www.luc.edu/media/lucedu/finance/pdfs/moodys_credit_report_03032018.pdf
—. 2018c. “Credit Opinion: Rollins College, FL.” Accessed March 23, 2020. https://www.rollins.edu/finance/documents/financial-information/moody-rating-notice-2018.pdf
—. 2018d. “Credit Opinion: University of New Mexico, NM.” Accessed March 23, 2020. https://budgetoffice.unm.edu/assets/documents/plant-funds/moodys-report.pdf
—. 2018e. “Credit Opinion: University of Notre Dame du Lac, IN.” Accessed March 23, 2020. https://treasury.nd.edu/assets/294452/notre_dame_moody_s_credit_opinion_report_dated_10_23_18.pdf
—. 2018f. “Credit Opinion: Vanderbilt University, TN.” Accessed March 23, 2020. https://finance.vanderbilt.edu/treasury/documents/Moodys_Investors_Service_Report_Vanderbilt_University.pdf
—. 2019. “Credit Opinion: Kent State University, OH.” Accessed March 23, 2020. https://www.kent.edu/controller/moodys-investors-service-credit-opinion-dec-19-2019
—. 2020a. “Credit Opinion: Kalamazoo College, MI.” Accessed March 23, 2020. https://reason.kzoo.edu/business/assets/Credit_Opinion___Kalamazoo_College_MI___14Jan20.pdf
—. 2020b. “Credit Opinion: University of Southern California, CA.” Accessed March 23, 2020. https://sites.usc.edu/treasury/files/2020/01/FINAL_Moodys-C-O-USC-CA-22Jan20.pdf
—. 2020c. “Rating Symbols and Definitions.” Moody’s Investors Service. Accessed March 2, 2020. https://www.moodys.com/Pages/amr002002.aspx
Moore, RW, K Chapman, B Huber, and M Shors. 2013. “Yes, But Can They Earn a Living? Methods for Creating an Effective System of Measuring Labor Market Outcomes in Higher Education.“ Research & Occasional Paper Series CSHE.5.13. Berkeley, CA: Center for Studies in Higher Education. https://cshe.berkeley.edu/publications/yes-can-they-earn-living-methods-creating-effective-system-measuring-labor-market

References 415
Moretti, E. 2004. “Human Capital Externalities in Cities.“ In Handbook of Regional and Urban Economics, Volume 4, edited by JV Henderson and J-F Thisse, 2241–91. Amsterdam, NL: Elsevier. https://www.sciencedirect.com/handbook/handbook-of-regional-and-urban-economics/vol/4/suppl/C
Morphew, CC, and PD Eckel. 2009. Privatizing the Public University: Perspectives from Across the Academy. Baltimore, MD: Johns Hopkins University Press
Mugglestone, K, K Dancy, and M Voight. 2019. Opportunity Lost: Net Price and Equity at Public Flagship Institutions. Washington, DC: Institute for Higher Education Policy. http://www.ihep.org/research/publications/opportunity-lost-net-price-and-equity-public-flagship-institutions
NACS. 2019a. “Higher Education Retail Market Facts & Figures.” National Association of College Stores. Accessed May 22, 2019. https://www.nacs.org/research/HigherEd RetailMarketFactsFigures.aspx
—. 2019b. “NACS Report Shows 14% Decrease in Spending on College Course Materials.” National Association of College Stores. Accessed August 29, 2019. http://www.nacs.org/advocacynewsmedia/pressreleases/tabid/1579/ArticleID/867/Student-Spending-on-Course-Materials-Declines.aspx
NACUBO. 2019. Key Facilities Metrics Report for 2017–18. Washington, DC: National Association of College and University Business Officers. Accessed February 11, 2020. https://www1.appa.org/NACUBOkeyfacilitiesmetrics19/index.cfm
—. 2020. Public NTSE Tables: 2019 NACUBO-TIAA Study of Endowments (NTSE) Results. Washington, DC: National Association of College and University Business Officers. February 4, 2020. Accessed June 23, 2020. https://www.nacubo.org/Research/2020/Public-NTSE-Tables
NASBO. 2018. State Expenditure Report — Historical Data and Archived Reports. Washington, DC: National Association of State Budget Officers. Accessed December 5, 2018. https://www.nasbo.org/reports-data/state-expenditure-report
NASSGAP. 2017. 47th Annual Survey Report on State-Sponsored Student Financial Aid (2015–2016 Academic Year). Washington, DC: National Association of State Student Grant and Aid Programs. Accessed October 5, 2018. https://www.nassgapsurvey.com/survey_reports.aspx
National Center for Education Statistics. 2008. Digest of Education Statistics, Table 315.30. Washington, DC: US Department of Education. Accessed March 8, 2019. https://nces.ed.gov/programs/digest/d17/tables/dt17_315.30.asp
—. 1991. Digest of Education Statistics, 1990. Washington, DC: US Department of Education. https://nces.ed.gov/pubsearch/pubsinfo.asp?pubid=91660
—. 1993. Digest of Education Statistics, Table 220, National Survey of Postsecondary Faculty (NSOPF). Washington, DC: US Department of Education. Accessed March 11, 2019. https://nces.ed.gov/programs/digest/d95/dtab220.asp
—. 2016. Digest of Education Statistics, Table 330.10. Washington, DC: US Department of Education. Accessed December 28, 2018. https://nces.ed.gov/programs/digest/d16/tables_3.asp#Ch3Sub30
—. 2017. Digest of Education Statistics, Table 303.10. Total fall enrollment in degree-granting postsecondary institutions, by attendance status, sex of student, and control of institution: Selected years, 1947 through 2027. Washington, DC: US Department of Education. Accessed November 29, 2018. https://nces.ed.gov/programs/digest/d17/tables/dt17_303.10.asp

Like Nobody's Business416
—. 2018a. 2015–16 National Postsecondary Student Aid Study (NPSAS:16). Washington, DC: US Department of Education. May 15, 2018. Accessed January 24, 2019. https://nces.ed.gov/datalab/powerstats/default.aspx
—. 2018b. Digest of Education Statistics, Table 314.20. Washington, DC: US Department of Education. https://nces.ed.gov/programs/digest/d18/tables/dt18_314.20.asp
—. 2018c. Digest of Education Statistics, Table 315.10. Washington, DC: US Department of Education. https://nces.ed.gov/programs/digest/d18/tables/dt18_315.10.asp
—. 2018d. Digest of Education Statistics, Table 322.10. Washington, DC: US Department of Education. Accessed February 26, 2019. https://nces.ed.gov/programs/digest/d18/tables/dt18_322.10.asp
—. 2018e. Digest of Education Statistics, Table 333.80. Washington, DC: US Department of Education. https://nces.ed.gov/programs/digest/d18/tables/dt18_333.80.asp
National Commission on the Cost of Higher Education. 1998. Straight Talk About College Costs and Prices. Phoenix, AZ: Oryx Press. Accessed December 17, 2018. https://eric.ed.gov/?id=ED416762
National Institute of Food and Agriculture. 2019a. Data Gateway: Award Trends. Washington, DC: US Department of Agriculture. Accessed June 26, 2019. https://nifa.usda.gov/data
—. 2019b. National and State Snapshots. Washington, DC: US Department of Agriculture. Accessed June 26, 2019. https://reeis.usda.gov/map
—. 2019c. Land-Grant University Website Directory. Washington, DC: US Department of Agriculture. Accessed June 29, 2019. https://nifa.usda.gov/land-grant-colleges-and- universities-partner-website-directory
National Institutes of Health. 2016. Ruth L. Kirschstein National Research Service Award (NRSA) Stipends, Tuition/Fees and Other Budgetary Levels Effective for Fiscal Year 2016. Washington, DC: US Department of Health & Human Services. Accessed January 25, 2019. https://grants.nih.gov/grants/guide/notice-files/not-od-16-062.html
—. 2018. Success Rates (Table 11: Research Project and R01-Equivalent Grants: Competing applications, awards, and success rates, 1970 to present). Washington, DC: US Department of Health & Human Services. December 13, 2018. Accessed June 7, 2019. https://report.nih.gov/success_rates/
—. 2019. Ruth L. Kirschstein National Research Service Award Stipend History, Augmented By Subsequent Notices. Washington, DC: US Department of Health & Human Services. Accessed February 13, 2019. https://researchtraining.nih.gov/sites/default/files/pdf/NRSA_Stipend_ History_Graph.pdf
—. 2020a. Budget. Washington, DC: US Department of Health & Human Services. Accessed April 7, 2020. https://www.nih.gov/about-nih/what-we-do/budget
—. 2020b. Estimates of Funding for Various Research, Condition, and Disease Categories. Washington, DC: US Department of Health & Human Services. Accessed April 7, 2020. https://report.nih.gov/categorical_spending.aspx
—. 2020c. NIH Awards by Location & Organization. Washington, DC: US Department of Health & Human Services. Accessed April 7, 2020. https://report.nih.gov/award/index.cfm
National Postdoctoral Association. 2019. NPA Recommendations for Postdoctoral Policies and Practices. Rockville, MD: National Postdoctoral Association. Accessed January 25, 2019. https://www.nationalpostdoc.org/page/recommpostdocpolicy

References 417
National Science Foundation. 2018. Reports to the National Science Board on the National Science Foundation’s Merit Review Process. Washington, DC: National Science Foundation. Accessed June 7, 2019. https://www.nsf.gov/nsb/publications/pubmeritreview.jsp
National Science Foundation, National Center for Science and Engineering Statistics. 2018a. Higher Education Research and Development Survey. Washington, DC: National Science Foundation. Accessed June 5, 2019. https://ncsesdata.nsf.gov/datatables/herd/2017/
—. 2018b. Survey of Federal Science and Engineering Support to Universities, Colleges, and Nonprofit Institutions: Fiscal Year 2017. Washington, DC: National Science Foundation. Accessed June 7, 2019. https://ncsesdata.nsf.gov/fedsupport/2017/
National Student Clearinghouse. 2019. “National Student Clearinghouse.” Accessed May 6, 2019. https://studentclearinghouse.org/
NCAA. 2019a. Finances of Intercollegiate Athletics Database. Indianapolis, IN: National Collegiate Athletic Association. Accessed April 24, 2020. https://www.ncaa.org/about/resources/research/finances-intercollegiate-athletics-database
—. 2019b. Graduation Rates. Indianapolis, IN: National Collegiate Athletic Association. Accessed April 28, 2020. http://www.ncaa.org/about/resources/research/graduation-rates
Nelson, VJ. 2008. “Crusader for Increased Campus Security After Daughter’s Murder.” Los Angeles Times, January 12, 2008. Accessed May 7, 2019. https://www.latimes.com/archives/la-xpm-2008-jan-12-me-clery12-story.html
Newfield, C. 2018. The Great Mistake: How We Wrecked Public Universities and How We Can Fix Them. Baltimore, MD: Johns Hopkins University Press
Newton, D. 2018a. “Please Stop Asking Whether College is Worth It.” Forbes, December 16, 2018. Accessed July 9, 2020. https://www.forbes.com/sites/dereknewton/2018/12/16/please-stop-asking-whether-college-is-worth-it/#6617d33d30d2
—. 2018b. “University Of Pennsylvania’s Louis Vuitton Problem.” Forbes, September 23, 2018. Accessed August 4, 2020. https://www.forbes.com/sites/dereknewton/2018/09/23/university-of-pennsylvanias-louis-vuitton-problem
Nowicki, A. 2014. “How March Madness Success Boosted Admissions for 5 Universities.” Education Dive, March 6, 2014. Accessed May 8, 2020. https://www.educationdive.com/news/how-march-madness-success-boosted-admissions-for-5-universities/234331/
Nyhan, B, and J Reifler. 2019. “The Roles of Information Deficits and Identity Threat in the Prevalence of Misperceptions.“ Journal of Elections, Public Opinion and Parties 29 (2): 222–44. https://doi.org/10.1080/17457289.2018.1465061
Obergfell, M. 2018. “Performance Based Funding Is Here to Stay.” New America, June 21, 2018. Accessed January 7, 2019. https://www.newamerica.org/education-policy/edcentral/performance-based-funding-here-stay/
Office of Postsecondary Education. 2020. Equity in Athletics Data Analysis (EADA). Washington, DC: US Department of Education. Accessed April 20, 2020. https://ope.ed.gov/athletics/#/
O’Neil, D. 2017. “How the Basketball Program Helped Gonzaga University Flourish.” ESPN, March 29, 2017. Accessed May 8, 2020. https://www.espn.com/blog/collegebasketballnation/post/_/id/119205/how-the-basketball-program-helped-gonzaga-university-flourish
Oreskes, N, and EM Conway. 2010. Merchants of Doubt: How a Handful of Scientists Obscured the Truth on Issues from Tobacco Smoke to Global Warming. New York, NY: Bloomsbury Press

Like Nobody's Business418
Osili, U. 2019. Key Issues Facing Higher Education Philanthropy. Washington, DC: American Council on Education. https://www.acenet.edu/Membership-Advancement/Pages/Advancement/Trends-in-Private-Giving-to-Colleges-and-Universities.aspx
O’Toole, G. 2013. “It’s Difficult to Make Predictions, Especially About the Future.” Quote Investigator, October 20, 2013. Accessed August 3, 2020. https://quoteinvestigator.com/2013/10/20/no-predict/
Pak, J. 2015. “Admissions Fact or Fiction: Yield Protection (aka Tufts Syndrome).” The Prospect. Accessed April 29, 2019. https://web.archive.org/web/20180814170405/http://www.theprospect.net/admissions-fact-or-fiction-yield-protection-aka-tufts-syndrome-40895
Parthenon-EY. 2016. “Strength in Numbers: Strategies for Collaborating in a New Era for Higher Education.” Parthenon-EY. http://cdn.ey.com/parthenon/pdf/perspectives/P-EY_Strength-in-Numbers-Collaboration-Strategies_Paper_Final_082016.pdf
Penier, I, MP Eve, and T Grady. 2020. COPIM — Revenue Models for Open Access Monographs 2020. Geneva: Zenodo. September 7, 2020. Accessed October 6, 2020. https://zenodo.org/record/4011836#.X3zBy-1lAuV
Perritano, J. 2010. The BIG Book of Why: Answers to the 1001 Most Asked Questions. New York, NY: TIME For Kids
Perry, R, and Y Katz. 2018. “Higher Ed, Inc.” The Chronicle of Higher Education, October 7, 2018. Accessed January 19, 2020. https://www.chronicle.com/article/higher-ed-inc/
Phipps, R, and J Merisotis. 2005. Is Outsourcing Part of the Solution to the Higher Education Cost Dilemma? Washington, DC: Institute for Higher Education Policy. Accessed March 25, 2020. http://www.ihep.org/research/publications/outsourcing-part-solution-higher-education-cost-dilemma
Pirmohamed, M. 2006. “Warfarin: Almost 60 Years Old and Still Causing Problems.“ British Journal of Clinical Pharmacology 62 (5): 509–11. https://www.ncbi.nlm.nih.gov/pmc/articles/PMC1885167/
Poulin, R, and T Strout. 2017. WCET Distance Education Price and Cost Report. Boulder, CO: WICHE Cooperative for Educational Technologies (WCET). https://wcet.wiche.edu/initiatives/research/price-cost-distance-ed
Prager & Co. 2019. “Lafayette College Financial Assessment for FY2018.” Lafayette College. Accessed March 23, 2020. https://finadmin.lafayette.edu/wp-content/uploads/sites/133/2019/02/FY18_Prager-LafayetteCollege-FinancialAssessment.pdf
Princeton University. 2020. “President Eisgruber’s Message to Community on Removal of Woodrow Wilson Name from Public Policy School and Wilson College.” Princeton University, June 27, 2020. Accessed June 29, 2020. https://www.princeton.edu/news/2020/06/27/president-eisgrubers-message-community-removal-woodrow-wilson-name-public-policy
Purdue University. 2018. “Transaction Complete for Purdue Global.” Purdue, March 23, 2018. Accessed October 2, 2020. https://www.purdue.edu/newsroom/releases/2018/Q1/transaction-complete-for-purdue-global.html
Quintana, C. 2018. “How These Professors Assign Their Own Books With a Clean Conscience.” The Chronicle of Higher Education, February 16, 2018. Accessed May 24, 2019. https://www.chronicle.com/article/how-these-professors-assign-their-own-books-with-a-clean-conscience/
Rampell, C. 2010. “Grading College Athletes.” The New York Times, October 15, 2010. Accessed April 28, 2020. https://economix.blogs.nytimes.com/2010/10/15/grading-college-athletes/

References 419
Raymond, C. 2019. “Cause for Pessimism?” Inside Higher Ed, July 11, 2019. Accessed July 31, 2020. https://www.insidehighered.com/views/2019/07/11/potential-indicator-colleges-may-face-major-financial-challenges-opinion
Reber, S, C Sinclair, and H Van Drie. 2020. “Public Colleges Are the Workhorses of Middle-Class Mobility.” The Brookings Institution, July 22, 2020. Accessed August 6, 2020. https://www.brookings.edu/blog/up-front/2020/07/22/public-colleges-are-the-workhorses-of-middle-class-mobility/
Redden, E. 2017. “Going Big Into ‘Microcampuses’.” Inside Higher Ed, May 23, 2017. Accessed March 22, 2019. https://www.insidehighered.com/news/2017/05/23/arizona-embarks- plan-develop-25-global-microcampuses
—. 2018. “As Pathway Market Expands, Enrollment Outcomes Diverge.” Inside Higher Ed, June 19, 2018. Accessed April 8, 2019. https://www.insidehighered.com/news/2018/06/19/more-colleges-hire-corporate-partners-international-student-pathway-programs-mixed
Reedsy. 2020. “How Much Does it Cost to Self-Publish a Book in 2020?” Reedsy, June 23, 2020. Accessed October 6, 2020. https://blog.reedsy.com/cost-to-self-publish-a-book/
Rishe, P. 2020. “As Stanford Cuts 11 Sports from Their Program, Expect Other Power 5 Schools to Follow Suit.” Forbes, July 8, 2020. Accessed July 31, 2020. https://www.forbes.com/sites/prishe/2020/07/08/as-stanford-cuts-11-sports-from-their-program-expect-other-power-5-schools-to-follow-suit/
Rockey, S. 2011. “Rock Talk — Update on Myth Busting: Number of Grants per Investigator.” National Institutes of Health, May 13, 2011. Accessed June 7, 2019. https://nexus.od.nih.gov/all/2011/05/13/update-on-myth-busting-number-of-grants-per-investigator/
—. 2012. “Rock Talk — Do More Applications Mean More Awards?” National Institutes of Health, August 29, 2012. Accessed June 7, 2019. https://nexus.od.nih.gov/all/2012/08/29/does-more-applications-mean-more-awards/
Rosenberg, B. 2019. “This Is Higher Education’s Gilded Age.” The Chronicle of Higher Education, February 3, 2019. Accessed August 4, 2020. https://www.chronicle.com/article/this-is-higher-educations-gilded-age/
Rosinger, K, J Ortagus, R Kelchen, A Cassell, and N Voorhees. 2020. “The Landscape of Performance-Based Funding in 2020.” InformEd States. https://informedstates.org/policy-briefs-feed/the-landscape-of-performance-based-funding-in-2020
Rossman, D, M Wilson, R Alamuddin, J Karon, J Joo, and CB Hill. 2020. Measuring a Liberal Education and its Relationship with Labor Market Outcomes. New York, NY: Ithaka S+R. https://doi.org/10.18665/sr.313872
Roth, MS. 2020. “Beware the Doyens of Disruption.” The Chronicle of Higher Education, May 27, 2020. Accessed August 4, 2020. https://www.chronicle.com/article/beware-the-doyens- of-disruption
Rothwell, J. 2015. “What Colleges Do for Local Economies: a Direct Measure Based on Consumption.” Washington, DC: The Brookings Institution. https://www.brookings.edu/research/what-colleges-do-for-local-economies-a-direct-measure-based-on-consumption/
—. 2019. “Assessing the Validity of Consumer Ratings for Higher Education: Evidence from a New Survey.“ The Journal of Consumer Affairs 53 (1): 167–200. https://doi.org/10.1111/joca.12201
Rouse, WB, and JV, Craig, DD Lombardi. 2018. “Modeling Research Universities: Predicting Probable Futures of Public vs. Private and Large vs. Small Research Universities.“

Like Nobody's Business420
Proceedings of the National Academy of Sciences 115 (50): 12582–89. https://doi.org/10.1073/pnas.1807174115
Ruffalo Noel Levitz. 2017a. 2017 Effective Practices Report for Student Success, Retention, and Completion. Cedar Rapids, IA: Ruffalo Noel Levitz. https://learn.ruffalonl.com/WEB2017EffectivePracticesforStudentSuccess_LandingPage.html
—. 2017b. High School Counselors and Their Role in College Planning. Cedar Rapids, IA: Ruffalo Noel Levitz. https://www.ruffalonl.com/papers-research-higher-education-fundraising/2017-report-high-school-counselors-and-their-role-in-college-planning/
—. 2018. 2018 Cost of Recruiting an Undergraduate Student Report. Cedar Rapids, IA: Ruffalo Noel Levitz. http://learn.ruffalonl.com/rs/395-EOG-977/images/RNL_2018_Cost_of_Recruiting_Report_EM-005.pdf
Russell, C. 2006. Trustee Investment Strategy for Endowments and Foundations. Chichester, UK: Wiley. https://www.google.com/books/edition/_/Y1jE3wWT0XoC
Russo, R. 1997. Straight Man. New York, NY: Random House
Ryan, CJ, and CR Marsicano. 2020. “Examining the Impact of Fossil Fuel Divestment on University Endowments.“ New York University Journal of Law and Business 17: 1–48. https://dx.doi.org/10.2139/ssrn.3501231
Sanzillo, T, K Hipple, and C Williams-Derry. 2018. The Financial Case for Fossil Fuel Divestment. Lakewood, OH: Institute for Energy Economics and Financial Analysis. https://ieefa.org/wp-content/uploads/2018/07/Divestment-from-Fossil-Fuels_The-Financial-Case_July-2018.pdf
Schmidt, E. 2018. Postsecondary Enrollment Before, During, and Since the Great Recession. Washington, DC: US Census Bureau. https://www.census.gov/library/publications/2018/demo/p20-580.html
Schneider, SL, KK Ness, S Rockwell, K Shaver, and R Brutkiewicz. 2014. Federal Demonstration Partnership 2012 Faculty Workload Survey Research Report. Washington, DC: Federal Demonstration Partnership & The National Academies of Sciences, Engineering, and Medicine. https://sites.nationalacademies.org/cs/groups/pgasite/documents/webpage/pga_087667.pdf
Schroeder, R. 2019. “Georgia Tech is Creating the Next in Education.” Inside Higher Ed, February 20, 2019. Accessed March 15, 2019. https://www.insidehighered.com/digital-learning/blogs/online-trending-now/georgia-techs-bid-be-leader-university-innovation-opinion
Schumacher, J. 2014. Dear Committee Members: A Novel. New York, NY: Doubleday
Schwencke, K, M Tigas, S Wei, A Glassford, and B Roberts. 2020. “Nonprofit Explorer.” ProPublica, April 14, 2020. Accessed April 24, 2020. https://projects.propublica.org/nonprofits
SCImago. 2018. “SJR — SCImago Journal & Country Rank.” Accessed September 18, 2018. https://www.scimagojr.com/countrysearch.php?country=us
Seaman, JE, and J Seaman. 2018. Freeing the Textbook: Educational Resources in US Higher Education, 2018. Oakland, CA: Babson Survey Research Group. https://www.onlinelearningsurvey.com/reports/freeingthetextbook2018.pdf
Seaman, JE, IE Allen, and J Seaman. 2018. Grade Increase: Tracking Distance Education in the United States. Oakland, CA: Babson Survey Research Group. https://www.onlinelearningsurvey.com/highered.html

References 421
Selingo, J. 2013. College (Un)bound: The Future of Higher Education and What It Means for Students. New York, NY: Houghton Mifflin
Seltzer, R. 2017. “State Funding Cuts Matter.” Inside Higher Ed, July 24, 2017. Accessed January 4, 2019. https://www.insidehighered.com/news/2017/07/24/new-study-attempts-show-how-much-state-funding-cuts-push-tuition
—. 2018. “Moody’s: Private-College Closures at 11 Per Year.” Inside Higher Ed, July 25, 2018. Accessed August 23, 2018. https://www.insidehighered.com/quicktakes/2018/07/25/moodys-private-college-closures-11-year
—. 2019a. “Wealthy Students’ Borrowing Spikes.” Inside Higher Ed, December 4, 2019. Accessed February 3, 2020. https://www.insidehighered.com/news/2019/12/04/wealthy-students-borrowing-more-college-over-last-two-decades-report-finds
—. 2019b. “Tufts Strikes Sackler Name From Campus.” Inside Higher Ed, December 6, 2019. Accessed June 19, 2020. https://www.insidehighered.com/news/2019/12/06/tufts-will-remove-sackler-name-medical-campus-drawing-rebuke-purdue-pharmas-owners
—. 2019c. “NCAA Lawyers Up.” Inside Higher Ed, July 16, 2019. Accessed August 5, 2020. https://www.insidehighered.com/news/2019/07/16/ncaa-spending-outside-lawyers-rises- 50-percent-two-years
—. 2019d. “What to Know About Lists of Financially Challenged Colleges.” Inside Higher Ed, November 19, 2019. Accessed March 24, 2020. https://www.insidehighered.com/news/2019/11/01/publishing-colleges-financial-information-has-long-history-and-raises-larger-set
—. 2019e. “Ratings Agencies Post Mixed Outlooks for Higher Education.” Inside Higher Ed, December 12, 2019. Accessed March 2, 2020. https://www.insidehighered.com/quicktakes/2019/12/11/ratings-agencies-post-mixed-outlooks-higher-education
—. 2020a. “S&P Issues Negative Outlook for Higher Ed.” Inside Higher Ed, January 17, 2020. Accessed March 2, 2020. https://www.insidehighered.com/quicktakes/2020/01/17/sp-issues-negative-outlook-higher-ed
—. 2020b. “Another Crack at Measuring Colleges’ Financial Strength.” Inside Higher Ed, May 8, 2020. Accessed July 31, 2002. https://www.insidehighered.com/news/2020/05/08/public-and-private-measures-colleges-financial-strength-spark-more-discussion
—. 2020c. “How Much Stimulus Will Your College Receive?” Inside Higher Ed, April 10, 2020. Accessed July 31, 2020. https://www.insidehighered.com/news/2020/04/10/listing-funds- each-college-can-expect-receive-under-federal-stimulus
Serna, GR, and SC Weiler. 2016. Higher Education, Fiscal Administration, and Budgeting: An Applied Approach. Lanham, MD: Rowman & Littlefield
Shaffer, S. 2019. “Moody’s Investors Service: Higher Education Outlook.“ AASCU 2019 Higher Education Government Relations Conference. Washington, DC: American Association of State Colleges and Universities. December 6, 2019. Accessed March 2, 2020. https://www.aascu.org/meetings/hegrc19/Shaffer.pdf
Shanghai Ranking Consultancy. 2020. “Academic Ranking of World Universities.” Accessed July 16, 2020. http://www.shanghairanking.com/index.html
Shapiro, D, A Dundar, F Huie, PK Wakhungu, A Bhimdiwala, and SE Wilson. 2018. Completing College: A National View of Student Completion Rates — Fall 2012 Cohort (Signature Report No. 16), Appendix C, Table 15. Herndon, VA: National Student Clearinghouse Research Center. https://nscresearchcenter.org/signaturereport16/

Like Nobody's Business422
Shea, A. 2011. “After Controversy, Brandeis Brings Back The Rose Art Museum.” WBUR News, October 28, 2011. Accessed January 21, 2020. https://www.wbur.org/news/2011/10/28/rose-art-museum
Shireman, R. 2017. The For-Profit College Story: Scandal, Regulate, Forget, Repeat. New York and Washington DC: The Century Foundation. Accessed October 2, 2018. https://tcf.org/content/report/profit-college-story-scandal-regulate-forget-repeat/
Sibson Consulting. 2018. College and University Benefits Study. New York, NY: The Segal Group. https://www.segalco.com/consulting-insights/archive/reports-and-surveys/2018/ 2018-university-employee-benefits
Siegfried, JJ, AR Sanderson, and P McHenry. 2007. “The Economic Impact of Colleges and Universities.“ Economics of Education Review 26 (5): 546–58. https://doi.org/10.1016/j.econedurev.2006.07.010
Sightlines. 2014. “State of Facilities in Higher Education.” Accessed March 3, 2020. https://www.utm.edu/departments/finadmin/_pdfs/The-State-of-Facilities-in-Higher-Education-2014-Benchmarks-Best-Practices-Trends-FINAL.pdf
Silber, JM, and HS Chien. 2016. Education and Training. Toronto: BMO Capital Markets. https://bmo.bluematrix.com/docs/pdf/c914a87e-5eef-4644-8f61-b9e5361bab54.pdf
Skorina, C. 2017. “Endowment costs: The secret history.” October 18, 2017. Accessed June 23, 2020. https://www.charlesskorina.com/?p=5211
Smiley, J. 1995. Moo. New York, NY: Knopf
Smith, AA. 2019. “Discrepancies in Estimates on Food Insecurity.” Inside Higher Ed, April 30, 2019. Accessed May 31, 2019. https://www.insidehighered.com/news/2019/04/30/new-research-finds-discrepancies-estimates-food-insecurity-among-college-students
Smith, DO. 2019. University Finances: Accounting and Budgeting Principles for Higher Education. Baltimore, MD: Johns Hopkins University Press
Smith, DR. 2019. “The Lure of Academic and Social Reputations Versus Athletic Success: Influences on Enrollment Yield at NCAA Division I Institutions.“ Research in Higher Education 60: 870–904. https://doi.org/10.1007/s11162-018-9537-8
Smith, MD. 2020. “Are Universities Going the Way of CDs and Cable TV?” The Atlantic, June 22, 2020. Accessed July 21, 2020. https://www.theatlantic.com/ideas/archive/2020/06/university-like-cd-streaming-age/613291/
Snyder, TD. 1993. 120 Years of American Education: A Statistical Portrait. Washington, DC: US Department of Education, National Center for Education Statistics, 115. https://nces.ed.gov/pubs93/93442.pdf
Soka University of America. 2020. “About: Soka University of America.” Accessed June 18, 2020. https://www.soka.edu/about
Sokol, C. 2020. “Eastern Washington University faculty members propose cutting sports to pay for academics.” The Spokesman-Review, February 17, 2020. Accessed April 26, 2020. https://www.spokesman.com/stories/2020/feb/17/eastern-washington-university- faculty-members-prop/
SPARC. 2019. “Big Deal Knowledge Base.” Accessed January 28, 2020. https://sparcopen.org/our-work/big-deal-knowledge-base/

References 423
Speicher, L, L Armando, M Bargheer, MP Eve, S Fund, D Leão, M Mosterd, F Pinter, and I Souyioultzoglou. 2018. OPERAS Open Access Business Models White Paper. Geneva: Zenodo. https://doi.org/10.5281/zenodo.1323708
St. Amour, M. 2020. Report: Living Expenses, Not Tuition, Are the Problem.” Inside Higher Ed, May 13, 2020. Accessed May 13, 2020. https://www.insidehighered.com/news/2020/05/13/living-expenses-are-larger-barrier-students-tuition-report-finds
Stanford University. 2017. “Budget Plan 2017/18.” Accessed March 3, 2020. https://budget.sites.stanford.edu/sites/g/files/sbiybj9886/f/budgetbookfy18_0.pdf
SHEEO-SHEF. 2017. “State Higher Education Finance.” State Higher Education Executive Officers Association. Accessed November 29, 2018. http://www.sheeo.org/projects/shef
Stempel, J. 2016. “Marvell Technology to Pay Carnegie Mellon $750 Million Over Patents.” Reuters, February 17, 2016. Accessed January 19, 2020. https://www.reuters.com/article/us-marvell-technlgy-carnegiemellon/marvell-technology-to-pay-carnegie- mellon-750-million-over-patents-idUSKCN0VQ2YE
Stokes, DE. 1997. Pasteur’s Quadrant: Basic Science and Technological Innovation. Washington, DC: Brookings Institution Press
Straumsheim, C. 2016. “Pressing Challenges.” Inside Higher Ed, August 1, 2016. Accessed January 27, 2020. https://www.insidehighered.com/news/2016/08/01/amid-declining-book-sales- university-presses-search-new-ways-measure-success
Student Achievement Measure. 2019. “Student Achievement Measure.” Accessed May 6, 2019. https://www.studentachievementmeasure.org/
Taylor, A, J Harold, and K Berger. 2013. “The Overhead Myth.” Nonprofit Quarterly, June 17, 2013. Accessed June 30, 2020. https://nonprofitquarterly.org/the-overhead-myth/
Tech Transfer Central. 2011. “For Northwestern TTO, Blockbuster Drug is a Double Edged Sword.” Tech Transfer Central. Accessed January 19, 2020. https://techtransfercentral.com/reprints/ipma/211-northwestern/
Texas A&M University. 2020. “History of Parking Permit Prices.” Accessed March 24, 2020. https://transport.tamu.edu/Parking/faqpermit/pricehistory.aspx
The Association of Academic Museums and Galleries . 2020. “Great Universities Have Great Museums.” Accessed January 19, 2020. https://www.aamg-us.org/wp/about-us/
The Center for Measuring University Performance. 2018. The Top American Research Universities. Amherst, MA: University of Massachusetts. Accessed July 17, 2020. https://mup.umass.edu
The Chronicle of Higher Education. 2020. “As Covid-19 Pummels Budgets, Colleges Are Resorting to Layoffs and Furloughs. Here’s the Latest.” The Chronicle of Higher Education, July 2, 2020. Accessed July 31, 2020. https://www.chronicle.com/article/were-tracking-employees-laid-off-or-furloughed-by-colleges/
The College Board. 2017. SAT Suite of Assessments Technical Manual. New York, NY: The College Board. https://collegereadiness.collegeboard.org/pdf/sat-suite-assessments-technical-manual.pdf
—. 2018. SAT Understanding Scores. New York, NY: The College Board. Accessed April 12, 2019. https://collegereadiness.collegeboard.org/pdf/understanding-sat-scores.pdf
The Editors of Encyclopedia Britannica. 2016. “University.” Britannica, October 10, 2016. Accessed July 5, 2018. https://www.britannica.com/topic/university

Like Nobody's Business424
The Lincoln Project: Excellence and Access in Public Higher Education. 2015. Public Research Universities: Changes in State Funding. Cambridge, MA: American Academy of Arts & Sciences. https://www.amacad.org/publication/public-research-universities-changes-state-funding
The Napa Group. 2010. “Alumni Association Funding Models: Summary Findings from 20 Universities.” Napa Group, November 15, 2010. Accessed July 1, 2020. https://napagroup.com/2010/11/alumni-association-funding-models-summary-findings-from-20-universities/
The OBHE and C-BERT at SUNY Albany. 2016. 2016 IBC Report Headline Findings. Redhill, UK and Albany, NY: The Observatory on Borderless Higher Education and the Cross-Border Education Research Team at the State University of New York at Albany. Accessed March 22, 2019. http://www.obhe.ac.uk/documents/view_details?id=1032
The Pew Charitable Trusts. 2015. Federal and State Funding of Higher Education: A Changing Landscape. Philadelphia, PA: The Pew Charitable Trusts. Accessed December 5, 2018. https://www.pewtrusts.org/en/research-and-analysis/issue-briefs/2015/06/federal-and-state-funding-of-higher-education
The World Bank. 2019. “World Bank Country and Lending Groups.” Accessed January 9, 2019. https://datahelpdesk.worldbank.org/knowledgebase/articles/906519
Thelin, J. 2017. “The Campus Buildings Name Game: Unfinished Business.” Inside Higher Ed, Febryary 27, 2017. Accessed June 19, 2020. https://www.insidehighered.com/views/2017/02/27/complexity-removing-names-controversial-people-campus-buildings-essay
—. 2018. “Why College Costs Soared As More Students Enrolled.” The Washington Post, October 14, 2018. Accessed December 17, 2018. https://www.washingtonpost.com/outlook/2018/10/14/why-college-costs-soared-more-students-enrolled
Thomason, A. 2018. “Is College President ‘the Toughest Job in the Nation’?” The Chronicle of Higher Education, May 1, 2018. Accessed April 5, 2019. https://www.chronicle.com/article/is-college-president-the-toughest-job-in-the-nation/
Tierney, W. 2012. “Privatizing the Public University.” The Chronicle of Higher Education, October 16, 2012. Accessed January 8, 2019. https://www.chronicle.com/blogs/conversation/2012/10/16/privatizing-the-public-university/
Trinks, A, B Scholtens, M Mulder, and L Dam. 2018. “Fossil Fuel Divestment and Portfolio Performance.“ Ecological Economics 146: 740–48. https://doi.org/10.1016/j.ecolecon.2017.11.036
Trostel, P. 2015. It’s Not Just The Money: The Benefits of College Education to Individuals and to Society. Indianapolis, IN: Lumina Foundation. https://www.luminafoundation.org/resource/its-not-just-the-money/
Uhler, A. 2020. “College Athletics Departments Cut Pay, Staff and Teams Because of COVID.” Marketplace, October 19, 2020. Accessed November 23, 2020. https://www.marketplace.org/2020/10/19/college-athletics-departments-cut-pay-staff-and-teams-because-of-covid/
UNC Charlotte. 2019. “The Truth About Parking.” Accessed March 24, 2020. https://pats.uncc.edu/parking/parking-tips/truth-about-parking
United Nations Children’s Fund (UNICEF). 2015. The Investment Case for Education and Equity. New York, NY: UNICEF. http://www.unicef.org/publications/files/Investment_Case_for_Education_and_Equity_FINAL.pdf
United Nations Educational, Scientific and Cultural Organization (UNESCO). 2019. “Welcome to UIS.Stat.” UNESCO Institute For Statistics. Accessed January 9, 2019. http://data.uis.unesco.org

References 425
University of Bologna. 2018. “The University from the 12th to the 20th century.” Accessed July 5, 2018. https://www.unibo.it/en/university/who-we-are/our-history/university-from-12th-to-20th-century
—. 2020. Alma Mater Studiorum — Università di Bologna. University Seal Image: Public Domain. Accessed September 22, 2020. https://www.unibo.it/en
University of North Carolina at Chapel Hill. 2019. “Comprehensive Annual Financial Report.” Accessed March 3, 2020. https://finance.unc.edu/files/2018/12/2018-CAFR.pdf
University of Padua. 2020. University of Padua. University Seal Image: Public Domain. Accessed September 22, 2020. https://www.unipd.it/en/
University of Wisconsin Madison. 2018. “About CALS: History.” Accessed June 27, 2019. https://cals.wisc.edu/about-cals/history/
Urist, J. 2016. “Why Do Colleges Have So Much Art?” The Atlantic, November 1, 2016. Accessed January 19, 2020. https://www.theatlantic.com/education/archive/2016/11/why-do-colleges-have-so-much-art/506039/
US Bureau of Labor Statistics. 2010. “Standard Occupational Classification.” Accessed January 23, 2019. https://www.bls.gov/soc/2010/
—. 2018a. “CPI Inlation Calculator.” Accessed August 13, 2018. https://www.bls.gov/data/inflation_calculator.htm/
—. 2018b. “Databases, Tables & Calculators by Subject, CPI-All Urban Consumers (Current Series), All items.” Accessed October 4, 2018. https://data.bls.gov/timeseries/cuur0000sa0
—. 2019a. “12-Month Percentage Change, Consumer Price Index, Selected Categories.” Accessed May 20, 2019. https://www.bls.gov/charts/consumer-price-index/consumer-price-index-by-category-line-chart.htm#
—. 2019b. “Databases, Tables & Calculators by Subject, CPI-All Urban Consumers (Current Series), Educational books and supplies.” Accessed May 21, 2019. https://data.bls.gov/timeseries/CUUR0000SEEA
US Census Bureau. 2018a. “Historical Income Tables: Families, Table F-1. Income Limits for Each Fifth and Top 5 Percent of Families.” US Census Bureau, August 28, 2018. Accessed May 20, 2019. https://www.census.gov/data/tables/time-series/demo/income-poverty/historical-income-families.html
—. 2018b. “Historical Income Tables: Families, Table F-6. Regions-Families (All Races) by Median and Mean Income.” US Census Bureau, August 28, 2018. Accessed May 20, 2019. https://www.census.gov/data/tables/time-series/demo/income-poverty/historical-income-families.html
—. 2019a. “CPS Historical Time Series Visualizations: Figure 2 - Percent of Population Age 25 and over by Educational Attainment: 1940–2018.” US Census Bureau, February 21, 2019. Accessed May 7, 2019. https://www.census.gov/content/dam/Census/library/visualizations/time-series/demo/fig2.jpg
—. 2019b. “Housing Vacancies and Homeownership: Table 11A/B. Quarterly Median Asking Rent and Sales Price of the US and Regions: 1988 to Present.” US Census Bureau, April 25, 2019. Accessed May 20, 2019. https://www.census.gov/housing/hvs/data/histtabs.html
US Centers for Medicare & Medicaid Services. 2018. “NHE Summary including share of GDP, CY 1960–2017.” Accessed December 28, 2018. https://www.cms.gov/Research-Statistics-Data-and-Systems/Statistics-Trends-and-Reports/NationalHealthExpendData/NationalHealthAccountsHistorical.html

Like Nobody's Business426
—. 2020. “Physician Fee Schedule Search.” Accessed April 6, 2020. https://www.cms.gov/apps/physician-fee-schedule/
US Department of Education. 2018. “IPEDS Finance Data FASB and GASB — What’s the Difference? A Guide for Data Users.” Accessed August 23, 2018. https://nces.ed.gov/ipeds/report-your-data/data-tip-sheet-distinguishing-finance-standards-fasb-gasb
—. 2019a. “College Scorecard Data.” May 21, 2019. Accessed May 31, 2019. https://collegescorecard.ed.gov/data/
—. 2019b. “IPEDS 2019–20 Data Collection System.” Accessed January 10, 2020. https://surveys.nces.ed.gov/ipeds/public/survey-materials/instructions?instructionid=30074
—. 2020a. “College Scorecard.” Accessed July 13, 2020. https://collegescorecard.ed.gov/
—. 2020b. “Integrated Postsecondary Education Data System (IPEDS).” Accessed November 25, 2020. https://nces.ed.gov/ipeds/use-the-data
US Department of Labor. 2016. “Fact Sheet #17A: Exemption for Executive, Administrative, Professional, Computer & Outside Sales Employees Under the Fair Labor Standards Act (FLSA). Washington, DC: US Department of Labor . Accessed March 11, 2019. https://www.dol.gov/whd/overtime/fs17a_overview.pdf
—. 2018. Fact Sheet #17S: Higher Education Institutions and Overtime Pay Under the Fair Labor Standards Act (FLSA)—Revised March 2018. Washington, DC: US Department of Labor . Accessed March 11, 2019. https://www.dol.gov/whd/overtime/whdfs17s.pdf
US Government Accountability Office. 2014. Higher Education: State Funding Trends and Policies on Affordability. Washington, DC: GAO. Accessed December 5, 2018. https://www.gao.gov/products/GAO-15-151
USA Today. 2020a. “NCAA Salaries — NCAAB Coaches.” USA Today. Accessed May 5, 2020. https://sports.usatoday.com/ncaa/salaries/mens-basketball/coach
—. 2020b. “NCAA Salaries — NCAAF Coaches.” USA Today. Accessed May 5, 2020. https://sports.usatoday.com/ncaa/salaries/football/coach
Usher, A. 2019. “The Four Logics of International Student Mobility.” Inside Higher Ed, February 10, 2019. Accessed March 21, 2019. https://www.insidehighered.com/blogs/world-view/four-logics-international-student-mobility
Valero, A, and J Van Reenen. 2019. “The Economic Impact of Universities: Evidence from Across the Globe.“ Economics of Education Review 68 (February): 53–67. https://doi.org/10.1016/j.econedurev.2018.09.001
Vanderbilt University. 2015. “The Cost of Federal Regulatory Compliance in Higher Education: A Multi-Institutional Study.” https://news.vanderbilt.edu/2015/10/19/regulatory-compliance/
Vlahos, C. 2016. “Are Alumni Membership Programs Still Worth It?” Marts & Lundy, May 12, 2016. Accessed July 1, 2020. http://www.martsandlundy.com/2016/05/12/are-alumni-membership-programs-still-worth-it/
Voluntary System of Accountability. 2019. “Voluntary System of Accountability.” Accessed May 6, 2019. https://www.voluntarysystem.org/
Wai, J, MI Brown, and CF Chabris. 2018a. “Using Standardized Test Scores to Include General Cognitive Ability in Education Research and Policy.“ Journal of Intelligence 6 (3), 37: 1–16. http://dx.doi.org/10.3390/jintelligence6030037
https://nces.ed.gov/ipeds/report-your-data/data-tip-sheet-distinguishing-finance-standards-fasb-gasb

References 427
—. 2018b. “What College Rankings Really Measure — Hint: It’s Not Quality Or Value.” The Conversation, September 12, 2018. Accessed July 16, 2020. https://theconversation.com/what-college-rankings-really-measure-hint-its-not-quality-or-value-102163
Walsh, JD. 2020. “The Coming Disruption: Scott Galloway Predicts a Handful of Elite Cyborg Universities Will Soon Monopolize Higher Education.” New York Magazine, May 11, 2020. Accessed August 4, 2020. https://nymag.com/intelligencer/2020/05/scott-galloway-future-of-college.html
Wang, M. 2013. “Breaking Away: Top Public Universities Push for ‘Autonomy’ From States.” ProPublica, October 7, 2013. Accessed January 8, 2019. https://www.propublica.org/article/breaking-away-top-public-universities-push-for-autonomy-from-states
Wang, SL. 2014. “Cooperative Extension System: Trends and Economic Impacts on U.S. Agriculture.“ Choices 29 (1): 1–8. http://www.choicesmagazine.org/choices-magazine/submitted-articles/cooperative-extension-system-trends-and-economic-impacts-on-us-agriculture
Webb, DM. 2016. “Trends in the Development and Operation of Performing Arts Centers.“ In Performing Arts Center Management, edited by PD Lambert and R Williams, 49–63. New York, NY: Routledge. https://doi.org/10.4324/9781315525891
Webber, D. 2017. “State Divestment and Tuition at Public Institutions.“ Economics of Education Review 60: 1–4. https://doi.org/10.1016/j.econedurev.2017.07.007
—. 2018. “Higher Ed, Lower Spending.“ Education Next (EdNext), Summer 2018. Accessed December 5, 2018. https://www.educationnext.org/higher-ed-lower-spending-as-states- cut-back-where-has-money-gone/
Weisbrod, BA, JP Ballou, and ED Asch. 2008. Mission and Money: Understanding the University. New York, NY: Cambridge University Press
Weisman, J. 2013. “A Truly Devastating Graph on State Higher Education Spending.” The Atlantic, March 20, 2013. Accessed December 4, 2018. https://www.theatlantic.com/business/archive/2013/03/a-truly-devastating-graph-on-state-higher-education-spending/274199/
Wermund, B. 2017. “How U.S. News College Rankings Promote Economic Inequality on Campus.” Politico, September 10, 2017. Accessed July 17, 2020. https://www.politico.com/interactives/2017/top-college-rankings-list-2017-us-news-investigation/
Whistle, W. 2020. “Joe Biden And Bernie Sanders: Free College, Student Loan Forgiveness, And Crack Down On For-Profit Colleges.” Forbes, July 8, 2020. Accessed August 5, 2020. https://www.forbes.com/sites/wesleywhistle/2020/07/08/biden-sanders-unity-task-force-free-college-student-debt-forgiveness-and-crack-down-on-for-profit-colleges/#7bf3c40d111a
Whitford, E. 2020a. “Survey Warns of ‘Dramatic Decline’ in Fundraising.” Inside Higher Ed, June 8, 2020. Accessed July 31, 2020. https://www.insidehighered.com/news/2020/06/08/survey-forecasts-%E2%80%98dramatic-decline%E2%80%99-fundraising-pandemic
—. 2020b. “Tuition Discount Rates Trend Upward.” Inside Higher Ed, May 21, 2020. Accessed August 6, 2020. https://www.insidehighered.com/news/2020/05/21/tuition-discount-rates-continue-rise-while-enrollment-stagnates-report-shows
—. 2020c. “Why Scripps College Went Online-Only for the Fall.” Inside Higher Ed, July 13, 2020. Accessed July 31, 2020. https://www.insidehighered.com/news/2020/07/13/scripps-goes-online-only-pandemic-worsens-california
—. 2020d. “Will Colleges Tap Large Endowments During Pandemic?” Inside Higher Ed, May 22, 2020. Accessed June 23, 2020. https://www.insidehighered.com/news/2020/05/22/colleges-faced-whether-increase-endowment-spending-finances-grow-more-dire

Like Nobody's Business428
Wikipedia. 2018. “Principal–Agent Problem.” Accessed December 17, 2018. https://en.wikipedia.org/wiki/Principal-agent_problem
—. 2019a. “Campus Novel.” Accessed March 14, 2019. https://en.wikipedia.org/wiki/Campus_novel
—. 2019b. “University.” Accessed April 5, 2019. https://en.wikipedia.org/wiki/University
—. 2020. “Flutie Effect.” Accessed May 8, 2020. https://en.wikipedia.org/wiki/Flutie_effect
Willey, E. 2019. “Lever Press: An Open Access Monograph Publisher.” Illinois State University, August 5, 2019. Accessed October 6, 2020. https://news.illinoisstate.edu/2019/08/lever-press-an-open-access-monograph-publisher/
Williams, K. 2013. “Leadership Transition: Ben Johnson Guided Emory With a Steady Hand and Wise Heart.” Emory University, November 13, 2013. Accessed April 5, 2019. https://news.emory.edu/stories/2013/11/er_ben_johnson_tribute/campus.html
Witt, R, and KP Coyne. 2019. “A Merger Won’t Save Your College.” The Chronicle of Higher Education, September 22, 2019. Accessed August 3, 2020. https://www.chronicle.com/article/a-merger-wont-save-your-college/
Witteveen, D, and P Attewell. 2017a. “Family Background and Earnings Inequality among College Graduates.“ Social Forces 95 (4): 1539–76. https://doi.org/10.1093/sf/sow109
—. 2017b. “The Earnings Payoff from Attending a Selective College.“ Social Science Research 66: 154–69. https://doi.org/10.1016/j.ssresearch.2017.01.005
Woo, M. 2018. “Letter to the community: SACS Announcement.” Sweet Briar College, June 15, 2018. Accessed July 31, 2020. https://sbc.edu/president/letter-to-the-community- sacs-announcement/
Woodside, R. 2018. “The Climate is Changing; Colleges and Universities Must Adapt.” Medium, December 3, 2018. Accessed August 5, 2020. https://medium.com/age-of-awareness/the-climate-is-changing-colleges-and-universities-must-adapt-1e4e4605b20a
Yang, D. 2013. “Are We MOOC’d Out?” Huffington Post, May 14, 2013. Accessed March 15, 2019. https://www.huffingtonpost.com/dennis-yang/post_4496_b_2877799.html
Yeung, R, P Gigliotti, and P Nguyen-Hoang. 2019. “The Impact of U.S. News College Rankings on the Compensation of College and University Presidents.“ Research in Higher Education 60: 1–17. https://doi.org/10.1007/s11162-018-9501-7
Young, CW. 2000. Background for Developing a System of Hispanic-Serving Land-Grant Colleges. San Antonio, TX: Hispanic Association of Colleges and Universities. http://www.hacu.net/images/hacu/young.pdf
Zemsky, R, S Shaman, and SC Baldridge. 2020. The College Stress Test: Tracking Institutional Futures Across a Crowded Market. Baltimore, MD: Johns Hopkins University Press
Ziker, J. 2014. “The Long, Lonely Job of Homo Academicus: Focusing the Research Lens on the Professor’s Own Schedule.” The Blue Review, March 31, 2014. Accessed March 11, 2019. https://www.boisestate.edu/bluereview/faculty-time-allocation/

Figures
1. Introduction
1.1 Schematic of the six major functional elements of the university. 81.2 Number of public and private institutions in each Carnegie category of the data
set used for analysis. See text for details. Source: IPEDS (2020).11
1.3 All 1174 universities and colleges in the data set, showing location, Carnegie Classification, and public or private control. Alaska and Hawaii are not to scale. Source: IPEDS (2020).
12
2. Institutional Revenues
2.1 Average total institutional budget (FY2017 non-hospital revenues) for the universities and colleges in the data set, by Carnegie classification and control. Source: IPEDS (2020).
13
2.2 FY2017 total non-hospital revenues compared to total FTE employees (upper) and twelve-month FTE student enrollment (lower) by Carnegie classification and control. Source: IPEDS (2020).
15
2.3 FY1987 and FY2017 total Fall enrollment (i.e., headcount, including part-time and full-time) of undergraduate students and graduate and first professional (e.g., JD, MD) students, averaged by Carnegie classification and control. Source: IPEDS (2020).
18
2.4 Growth in total enrollment (all undergraduate, graduate and first professional students) relative to FY1987, averaged by Carnegie classification and control. The vertical bar indicates the onset of the Great Recession. Source: IPEDS (2020).
19
2.5 Trends in revenues and expenses (current dollars not adjusted for inflation or enrollment) by fiscal year averaged across the four public and private institution types. The vertical bar indicates the onset of the Great Recession. Source: IPEDS (2020).
20
2.6 Share of FY2017 non-hospital revenues averaged across types of public and private institutions. Source: IPEDS (2020).
21
2.7 Share of FY2017 non-hospital revenues averaged by Carnegie classification and control. Source: IPEDS (2020).
24

Like Nobody's Business430
2.8 Published FY2018 annual undergraduate tuition and required fees by control and Carnegie classification, showing in-state tuition as well as combined additional tuition and fees for out-of-state students for the public institutions. Source: IPEDS (2020).
25
2.9 Inflation-adjusted trends in published annual undergraduate tuition and required fees at public (in-state and out-of-state amounts) and private institutions, FY1964–2018, in 2016 dollars. Prior to FY1988, private institution data include for-profit institutions. The vertical bar indicates the onset of the Great Recession. Source: NCES Digest (National Center for Education Statistics 2016) for pre-FY1988 data and IPEDS (2020).
26
2.10 Percentages of FY2016 gross tuition and fee budget (all degree levels) comprised of net tuition and fee revenue and associated financial aid expenditures, averaged across types of institutions. Source: IPEDS (2020).
27
2.11 Average FY2016 aid discounts (for all degree levels) averaged by Carnegie classification and control. Unrestricted and restricted institutional aid comprise the total institutional aid; Pell grants and other federal, state and local grants comprise government aid. Source: IPEDS (2020).
28
2.12 FY2017 core revenues per full-time equivalent (FTE) student enrollment averaged by control and Carnegie classification. Source: IPEDS (2020).
29
2.13 Trends in core revenues per FTE of student enrollment (2016 dollars) by fiscal year, averaged across public institutions (upper panel) and private institutions (lower panel). The vertical bar indicates the onset of the Great Recession. Gifts and investment return at public institutions were combined with other core revenue prior to FY2010; dashed lines indicate estimated amounts based on their FY2010 proportions. Investment return amounts below zero (losses) in FY2009 and FY2016 at private institutions are indicated in italics within the chart. Source: IPEDS (2020).
30
2.14 Trends in total core revenues per FTE of student enrollment (2016 dollars) by fiscal year, averaged across public institutions and private institutions. The vertical bar indicates the onset of the Great Recession. Source: IPEDS (2020).
31
2.15 Types of university revenue funds. Restricted funds are limited to externally stipulated uses. Unrestricted funds can be used for the general running of the institution. Some unrestricted funds may be designated by the university for special purposes.
33
2.16 Revenues broadly associated with primary activity (the educational mission) provide necessary leverage to enable other activities and their associated revenues. Revenue segments are for R1 public institutions illustrated in 2.7
35
2.17 Fall 2016 first-time undergraduate enrollment percentage mix of in-state, out-of-state and international students at institutions, averaged by control and Carnegie classification. Source: IPEDS (2020).
36

Figures 431
3. Institutional Expenditures
3.1 Percentages of FY2017 non-hospital expenditures averaged across institution types, by nature of expense. Source: IPEDS (2020).
39
3.2 Percentages of FY2017 non-hospital expenditures averaged across institution types, by function of expense. Source: IPEDS (2020).
40
3.3 Percentages of FY2017 non-hospital functional expenditures averaged by Carnegie classification and control. Source: IPEDS (2020).
42
3.4 FY2017 Educational and Related (E&R) expenditures per full-time equivalent student averaged by control and Carnegie classification. See text for estimate of R1 instructional spending without faculty research time. Source: IPEDS (2020).
44
3.5 Trends in Educational and Related (E&R), non-E&R and total expenditures per FTE of student enrollment (2016 dollars) averaged across public and private institutions. The vertical bar indicates the onset of the Great Recession. Source: IPEDS (2020).
45
3.6 FY2016 Net tuition and fee revenue and remaining subsidy portions of Educational and Related (E&R) expenditures averaged by control and Carnegie classification. Source: IPEDS (2020).
46
3.7 Trends in the net tuition and fee revenue portion of Educational and Related (E&R) expenditures averaged for public and private institutions (including the R1 and baccalaureate publics). The vertical bar indicates the onset of the Great Recession. Source: IPEDS (2020).
47
3.8 FY2016 breakout of net tuition and fee revenue (in-state and out-of-state) and subsidy portions (institutional and government aid plus other institutional subsidy) of Educational and Related (E&R) expenditures per FTE enrollment for public institutions averaged by Carnegie classification. Source: IPEDS (2020).
48
3.9 Student-oriented net price view of contribution to FY2016 total Educational and Related (E&R) costs per FTE enrollment for public institutions averaged by Carnegie classification. Net price is calculated using the assumptions of the model described in the text, including the same aid rate for in and out of state students. Source: IPEDS (2020).
48
3.10 Trends in the Higher Education Price Index (HEPI) and Consumer Price Index (CPI) set equal to 1.0 in 1961 (upper panel) and trends in the annual inflation rate for each index (lower panel). Sources: Commonfund Institute (2017a) and BLS (US Bureau of Labor Statistics 2018b).
53
3.11 Examples of cost-reduction approaches for higher education targeted at Baumol effects (Adams and Shannon 2006) and Bowen effects (Martin and Gillen 2009).
55

Like Nobody's Business432
4. Public Funding: Grant Aid, Loans and Appropriations
4.1 Public higher education funding flows with arrow thickness scaled to FY2012. State funding includes appropriations as well as grants and contracts for research. Federal and state flows represent aid to undergraduates. Federal grants to states include only higher education programs related to affordability. Land-grant appropriations and federally funded research projects are included as part of the funding from the Federal Government. Benefits from tax credits and deductions for higher education are not included. Source: redrafted from GAO (US Government Accountability Office 2014), Public domain, https://www.gao.gov/products/GAO-15-151.
60
4.2 Student financial aid and loans for FY2017. Source: College Board (Baum et al. 2017).
61
4.3 Average federal aid and non-federal loans per FTE undergraduate (upper panel) and graduate student (lower panel) in 2016 dollars by academic year. The shaded vertical bar indicates the onset of the Great Recession. Source: College Board (Baum et al. 2017).
62
4.4 State grant aid per FTE (in-state and out-of-state) undergraduate in 2015 dollars by academic year. The wider shaded bar indicates the onset of the Great Recession. Source: College Board (Baum et al. 2017).
63
4.5 FY2016 average grant aid per award and percentage of enrolled FTE awarded by state, including the District of Columbia (DC), Puerto Rico (PR), and the national average (USA). Source: NASSGAP (2017).
64
4.6 FY2016 average percentage of need-based and non-need-based state grant aid per award, including the District of Columbia (DC), Puerto Rico (PR), and the national average (USA). Source: NASSGAP (2017).
65
4.7 FY2016 government grant aid to first-time full-time (FTFT) undergraduates by average amount per student awarded and by percentage of students awarded from federal (upper panel) and state and local sources (lower panel), averaged by Carnegie classification and control. Categories are differentiated by circle size and color for easier comparison. Source: IPEDS (2020).
66
4.8 Trends in grant aid (by fiscal years in 2016 dollars) awarded to first-time full-time (FTFT) undergraduates by percentage of students awarded (upper panel) and by average amount per student receiving an award (lower panel) from federal and state and local sources, averaged for public and private universities. Source: IPEDS (2020).
68
4.9 FY2016 loan aid to first-time full-time (FTFT) undergraduates by average amount per student awarded and by percentage of students awarded from federal (upper panel) and all sources (lower panel), averaged by Carnegie classification and control. Categories are differentiated by circle size and color for easier comparison. Source: IPEDS (2020).
69

Figures 433
4.10 FY2016 other non-federal student loan aid to first-time full-time (FTFT) undergraduates by average amount per student awarded and by percentage of students awarded, averaged by Carnegie classification and control. Categories are differentiated by circle size and color for easier comparison. As a reference to highlight the different scales of these other loan data, the federal loan data from Figure 4.9 are plotted in the gray rectangle corresponding to the axis ranges used in that figure. Source: IPEDS (2020).
70
4.11 Trends in student loan aid (by fiscal years in 2016 dollars) awarded to first-time full-time (FTFT) undergraduates by percentage of students awarded (upper panel) and by average amount per student receiving an award (lower panel) from all, federal and other sources, averaged for public and private universities. Loan data broken out by category are only available from FY2008 onwards. Source: IPEDS (2020).
72
4.12 Historic trends in real (inflation-adjusted) GDP (calendar years) and all state expenditures (fiscal years, 2016 dollars). Sources: Bureau of Economic Analysis (2018a; 2018b).
73
4.13 Historic trends in all state higher education appropriations (2016 dollars) and total enrollment in all public degree-granting postsecondary institutions (four-year and two-year). Sources for appropriations: Snyder (1993) for FY1930–1959, odd years interpolated from even years; Grapevine for FY1960–1999 (Illinois State University, Center for the Study of Education Policy 2018); SHEEO-SHEF (2017) for FY2000–2017. Sources for enrollment: Snyder (1993) for FY1930–1947, odd years interpolated from even years; NCES (National Center for Education Statistics 2017) for FY1948–2017.
74
4.14 Historic trend in all state higher education appropriations per student in all degree-granting postsecondary institutions (four-year and two-year), in 2016 dollars using total enrollment. Sources for appropriations: Snyder (1993) for FY1930–1959, odd years interpolated from even years; Grapevine for FY1960–1999 (Illinois State University, Center for the Study of Education Policy 2018); SHEEO-SHEF (2017) for FY2000–2017. Sources for enrollment: Snyder (1993) for FY1930–1947, odd years interpolated from even years; NCES (National Center for Education Statistics 2017) for FY1948–2017.
76
4.15 Historic annual percentage change in all state higher education appropriations (2016 dollars). Sources: Snyder (1993) for FY1930–1959, odd years interpolated from even years; Grapevine for FY1960–1999 (Illinois State University, Center for the Study of Education Policy 2018); SHEEO-SHEF (2017) for FY2000–2017.
77
4.16 Historic trends in all state higher education appropriations as a percentage of real (inflation-adjusted) GDP and of all state expenditures (2016 dollars). Sources for appropriations: Snyder (1993) for FY1930–1959, odd years interpolated from even years; Grapevine for FY1960–1999 (Illinois State University, Center for the Study of Education Policy 2018); SHEEO-SHEF (2017) for FY2000–2017. Sources for state expenditures and GDP: Bureau of Economic Analysis (2018a; 2018b).
77

Like Nobody's Business434
4.17 Trends in state appropriations and enrollment at public institutions, averaged within and then across the four Carnegie classification groups. Amounts are in 2016 dollars by fiscal year and twelve-month full-time equivalent enrollment by academic year. To provide long-term trends prior to 2004 (dashed line), twelve-month FTE enrollment is estimated from total Fall enrollment (full-time plus part-time) by using the average 2004–2006 ratio of the two for each Carnegie group. Source: IPEDS (2020).
79
4.18 Trends in state appropriations per student at public institutions, averaged by Carnegie classification. Amounts are in 2016 dollars per twelve-month full-time equivalent enrollment by fiscal and academic year. To provide long-term trends prior to 2004 (dashed lines), twelve-month FTE enrollment is estimated from total Fall enrollment (full-time plus part-time) by using the average 2004–2006 ratio of the two for each Carnegie group. Source: IPEDS (2020).
79
4.19 Recent trends in state appropriations per FTE enrolled at public institutions as a percentage of Education and Related (E&R) expenditures, averaged by Carnegie classification and based on amounts in 2016 dollars per twelve-month full-time equivalent enrollment by fiscal and academic year. Source: IPEDS (2020).
80
4.20 FY2017 state and local funding for post-secondary education per student (upper panel) and ten-year change (FY2007–FY2017) in funding per student (lower panel), by state, in 2017 dollars. Source: College Board (Ma et al. 2018).
81
4.21 FY2018 general fund expenditures by category totaled for all states. Source: NASBO (2018).
82
4.22 Trends in percentage share of state general fund expenditures for higher education, Medicaid and corrections, FY1987–2018. Source: NASBO (2018).
83
4.23 Recent trends in state appropriations and net tuition revenue in 2016 dollars per FTE student at public institutions. Source: IPEDS (2020).
84
4.24 FY2017 state higher education appropriations as a percentage share of combined educational revenues (state higher education appropriation per FTE plus net tuition revenue per FTE). Source: SHEEO-SHEF (2017).
84
4.25 Annual percentage change in inflation-adjusted published tuition and fees (in-state) and state appropriations per FTE student enrolled at public institutions, by fiscal year. Source: IPEDS (2020).
85
4.26 The 21 states with performance funding for four-year public colleges and universities in FY2018, showing percentage share of state appropriations tied to performance funding and the mix of performance metric types (unweighted proportional count) within each share. Performance funding in Kansas, Oklahoma and Missouri applies to new state appropriations only and no new funds were allocated in FY2018. Source: Li (2018).
87
4.27 Government expenditures on public higher education as a percentage of GDP and per student in US$, both for 2014 and grouped by World Bank country income classification. Sources: UNESCO (2019) and The World Bank (2019)
91

Figures 435
5. Human Resources
5.1 A generalized high-level functional organizational structure for a large research university, showing the major vice-presidential areas and selected subareas within each. These major divisions are the fundamental management, budget and employment units of the institution.
94
5.2 FY2018 employee headcount by full-time (FT) and part-time (PT) status as well as instructional and non-instructional position, for medical and non-medical staff, all averaged by Carnegie classification and control. Source: IPEDS (2020).
95
5.3 Unadjusted trends in employee headcount by full-time and part-time status as well as instructional and non-instructional staff, averaged across all eight types of institution by fiscal year. Source: IPEDS (2020).
96
5.4 Trends in instructional and non-instructional staff adjusted by total fall student enrollment, expressed as staff per 1000 students, averaged across all eight types of institution by fiscal year. Source: IPEDS (2020).
97
5.5 FY2018 salaries of full-time non-medical staff, averaged by Carnegie classification and control. Annual amounts are for the typical contract period with instructional staff salaries equated to nine months and non-instructional salaries for twelve months. Source: IPEDS (2020).
98
5.6 FY2018 counts of full-time non-medical instructional staff, averaged by Carnegie classification and control. Source: IPEDS (2020).
100
5.7 Trends in full-time instructional staff adjusted by total fall student enrollment per fiscal year, expressed as instructional staff per 1000 students, averaged by Carnegie classification and control. Source: IPEDS (2020).
100
5.8 Trends in percentage share by rank of full-time instructional staff, averaged across all eight types of institution by fiscal year. Source: IPEDS (2020).
101
5.9 FY1998–FY2018 change in percentage share by rank of full-time instructional staff, averaged by Carnegie classification and control. Source: IPEDS (2020).
102
5.10 Trends in part-time instructional staff as a percentage share of total instructional staff, averaged by Carnegie classification and control per fiscal year. Complete data are unavailable for odd years FY1995–FY2015; those values are interpolated from neighboring even years. Source: IPEDS (2020).
103
5.11 Trends in part-time faculty as a percentage of total faculty across all degree-granting postsecondary institutions (four-year and two-year) and averaged for all institutions in 5.10 Sources: NCES Digest (National Center for Education Statistics 2018c) and IPEDS (2020).
104
5.12 FY2018 nine-month equated salaries of full-time non-medical instructional staff, averaged by Carnegie classification and control. Source: IPEDS (2020).
105
5.13 FY2018 percentage differences of nine-month equated salaries of full-time non-medical instructional staff at public institutions as compared to private institutions, averaged by Carnegie classification. Source: IPEDS (2020).
106
5.14 Trends in average inflation-adjusted faculty salaries by rank, equated to a nine-month contract, averaged across institution type by Carnegie classification and control. Source: IPEDS (2020).
107
5.15 FY2009–FY2018 percentage change in average inflation-adjusted faculty salaries by rank, equated to a nine-month contract. Source: IPEDS (2020).
107

Like Nobody's Business436
5.16 FY2018 counts of non-instructional support staff (full-time, non-medical) by type, averaged by Carnegie classification and control. Source: IPEDS (2020).
109
5.17 FY2018 twelve-month salaries for types of non-instructional support staff (full-time, non-medical), averaged by Carnegie classification and control. Source: IPEDS (2020).
110
5.18 Trends in executive/managerial administrators and professional support staff per faculty member (all full time) averaged across all eight types of institution by fiscal year. Data categories changed in FY2013 and were aligned to the closest match. Source: IPEDS (2020).
111
5.19 FY2018 total unadjusted counts of graduate assistants (teaching, research, other) as a share of full-time graduate student fall enrollment, averaged by Carnegie classification and control. Source: IPEDS (2020).
112
5.20 Trends in graduate assistant headcount adjusted by total fall student enrollment, expressed as graduate assistants per 1000 students, for public and private R1 and R2 institutions by fiscal year. Source: IPEDS (2020).
113
5.21 FY2016 half-time (0.5 FTE, non-summer) graduate assistantship amount for full-time, full-year research doctoral students averaged by Carnegie classification, academic field and control. Note that data for some categories are unreliable or unavailable because of small sample sizes. Source: NPSAS:16 (National Center for Education Statistics 2018a).
114
5.22 Trends in half-time (0.5 FTE, non-summer year) graduate assistantship amounts for full-time, full-year research doctoral students at public and private R1 and R2 institutions, and trend in the stipulated NIH pre-doctoral stipend amount for graduate research assistants (0.5 FTE, full-year), all by fiscal year in 2016 dollars. Sources: NPSAS:16 (National Center for Education Statistics 2018a) and NIH (National Institutes of Health 2016; 2019).
115
5.23 Most recently available (FY2011) per-employee fringe benefit expenditures (equated nine-month contract) for public and private institutions, in 2016 dollars. Retirement plans are within five years of appointment; tuition and other items include restricted and unrestricted expenditures. Source: IPEDS (2020).
116
5.24 Worker and employer contributions to health insurance premiums (single coverage) and year-to-year percentage changes in total premiums, in 2016 dollars. Source: Kaiser Family Foundation (2018).
117
6. Academic Affairs
6.1 Schematic comparison of annual budgeting under an incremental process versus responsibility center management.
125
6.2 Trends in Educational and Related (E&R) expenditures per total degrees awarded in 2016 dollars by fiscal year, averaged by Carnegie classification and control. Source: IPEDS (2020).
127

Figures 437
6.3 Instructional expenditures per student credit hour (SCH) by field of study, expressed relative to English for four cost drivers and the net overall difference, using 2013–2015 data from the Delaware Cost Study. Data are converted to percentages from the original modeled natural log cost differences. Source: Hemelt et al. (2018).
128
6.4 Trends in percentages of all bachelor’s degrees awarded by field of study at postsecondary institutions, per academic year at five-year intervals. Source: NCES Digest (National Center for Education Statistics 2018d).
131
6.5 FY2018 Tenured and tenure-track faculty salaries by discipline and faculty rank, sorted by the disciplinary three-rank average. Source: CUPA-HR (College and University Professional Association for Human Resources 2019).
136
6.6 Share of non-medical faculty in instruction, research and public service by tenure status in FY2018. Tenured and tenure track faculty are shown as combined full-time and part-time appointments (less than 3% are part-time), while contingent faculty not on the tenure track are shown by full-time (FT) and part-time (PT) appointment. Source: IPEDS (2020).
138
6.7 Work time distribution of full-time faculty and instructional staff by level and control of institution. Source: NCES Digest/NSOPF:04 (National Center for Education Statistics 2008).
142
6.8 All institutions with greater than 10,000 students in exclusively online (a.k.a. distance) enrollment for FY2019 (Fall 2018), by Carnegie classification and control, including private for-profit institutions, baccalaureate special-focus colleges, and two-year colleges. Source: IPEDS (2020).
146
6.9 Exclusively online (distance) and blended online/face-to-face enrollment as a share of total enrollment, as well as shares of exclusively online enrollment by degree level and by location, averaged by Carnegie classification and control for FY2018 (Fall 2017). Source: IPEDS (2020).
148
6.10 Survey responses of chief online officers at public and private four-year institutions regarding net cost or revenue generation of online programs, tuition rates charged, and whether online budget allocations are dedicated to online, split between online, academic departments and the general institution, or combined with all revenue for general use. Categories do not total 100 because of omitted responses and/or multiple rates at some institutions. Source: CHLOE 2 (Legon and Garrett 2018).
150
6.11 FY2018 undergraduate and graduate international enrollment as a share of total enrollment, averaged by Carnegie classification and control. Source: IPEDS (2020).
152
6.12 Trends in undergraduate and graduate international enrollment by fiscal year, totaled across the eight institution types. Values for FY1986, FY1988 and FY1990 are interpolated from neighboring years. Shaded bars indicate the onset of major changes in immigration policy (FY2002 and FY 2017) and the Great Recession (FY2009). Source: IPEDS (2020).
153
6.13 All international higher education students in the US and their primary source of funding, FY2019. Source: IIE (Institute of International Education 2019).
154

Like Nobody's Business438
6.14 Recent trends in international higher education students studying in the US by leading countries of origin, FY2018. Source: IIE (Institute of International Education 2019).
155
6.15 FY2017 share of library expenditures for personnel and other operations and for resource materials, including ongoing subscriptions (e.g., journals), one-time acquisitions (e.g., books), and other materials, averaged across institutional categories. Source: IPEDS (2020).
157
6.16 Trends in library expenditures for ongoing subscriptions (e.g., journals) and one-time acquisitions (e.g., books) for the median of Association of Research Libraries (ARL) and the average of R1 public and R1 private institutions respectively, by fiscal year in 2016 dollars. ARL data from FY2012 onward are adjusted to account for a survey methodology change. Note that R1 data are available only in even years before FY2014. Sources: ARL (2016) and IPEDS (2020).
157
6.17 Average cost per citation for journal subscription bundles from 19 nonprofit and 6 for-profit publishers. Source: Bergstrom et al. (2014).
158
6.18 FY2016 central IT expenditures per institutional FTE (full-time equivalent students, faculty and staff) divided into primary spending categories of personnel compensation and fringe benefits, infrastructure and services provided in-house (e.g., hardware software, network cabling), and those provided through external entities (e.g., third party email and web services), by classification (research, master’s, or baccalaureate) and control. Source: EDUCAUSE (Lang 2017).
160
6.19 FY2016 functional domain area spending as a percentage of central IT spending, averaged across all types of four-year institutions. Source: EDUCAUSE (Lang 2017).
162
6.20 FY2016 and FY2018 shares of annual expenditures for ERP, administrative and instructional software and services, averaged across all public and private four-year colleges and universities, sorted by growing (upper portion) or shrinking share (lower portion). Source: Campus Computing Survey (Green 2007–2018).
163
7. Student Affairs
7.1 Share of FY2018 recruiting budget allocated to specific marketing and recruitment activities from a survey of 126 four-year institutions, including public institutions of all sizes and predominantly smaller private institutions. Source: RNL (Ruffalo Noel Levitz 2018).
166
7.2 Percentage of admitted applicants and subset of those who enrolled for FY2018, averaged by Carnegie classification and control. Source: IPEDS (2020).
166
7.3 Yield, or percentage of admitted applicants that subsequently enrolled, for FY2018, averaged by Carnegie classification and control. Source: IPEDS (2020).
168

Figures 439
7.4 Range of 25th to 75th percentile values of standardized test scores of admitted applicants for FY2018, expressed as score percentiles for comparison, on the SAT Evidence-Based Reading and Writing (EBRW), SAT Mathematics, ACT Composite, ACT English and ACT Mathematics tests, averaged by Carnegie classification and control. Sources: IPEDS (2020), The College Board (2018) and ACT (2019).
169
7.5 FY2017 representation of first-time, full-time undergraduate degree-seeking students (including those awarded and not awarded aid) by family income level, expressed as percentage difference from the corresponding distributional share of the US average household income, averaged by Carnegie classification and control. Sources: IPEDS (2020) and IPUMS (Flood et al. 2018).
170
7.6 FY2017 share of first-time, full-time undergraduate degree-seeking students awarded grant and scholarship aid by family income level, averaged by Carnegie classification and control. Source: IPEDS (2020).
171
7.7 FY2017 amount of grant and scholarship aid and net price by family income level for first-time, full-time undergraduate degree-seeking students awarded Title IV aid, averaged by Carnegie classification and control. Amounts for public institutions are at in-state rates. Source: IPEDS (2020).
172
7.8 FY2016 undergraduate total aid amount partitioned into institutional and other aid, averaged by Carnegie classification and control. Source: NPSAS:16 (National Center for Education Statistics 2018a).
174
7.9 FY2016 share of undergraduate institutional aid partitioned into need-based, merit, and athletic scholarships, averaged by Carnegie classification and control. Source: NPSAS:16 (National Center for Education Statistics 2018a).
175
7.10 Trends in tuition discount rates for full-time first-time undergraduates, averaged by Carnegie classification and control. Values for public institutions are weighted to account for proportions of in-state and out-of-state students. Source: IPEDS (2020).
177
7.11 Full-time retention rate, defined as the percentage of the fall full-time first-time cohort from the prior year that re-enrolled at the same institution in the current year, for fiscal years 2005 and 2018, averaged by Carnegie classification and control. Source: IPEDS (2020).
179
7.12 FY2018 rates (Fall 2011 entering cohort) for completion of bachelor’s or equivalent degrees in four years or less, five years, and six years, students still enrolled, known transfers out to another institution, and individuals no longer enrolled, averaged by Carnegie classification and control. Source: IPEDS (2020).
181
7.13 Six-year outcomes by starting institution type for the Fall 2012 cohort based on National Student Clearinghouse data. Source: NSC Research Center (Shapiro et al. 2018).
182
7.14 Trends in two bachelor’s degree graduation metrics, the six-year graduation rate for the total cohort (available since FY2005) and degrees awarded per enrolled student (available since FY1987), both expressed relative to their starting values to enable comparison, averaged by fiscal year across public and private institutions. Source: IPEDS (2020).
183

Like Nobody's Business440
7.15 Trends in student services expenditures per student FTE (in 2016 dollars) and in the student services share of E&R expenditures averaged across public and private institutions, by fiscal year. Source: IPEDS (2020).
184
7.16 FY2017 share of first-time full-time students living on campus, off campus (not with family) and living with family. Source: IPEDS (2020).
185
7.17 FY2017 non-tuition costs of attendance for the full academic year by lodging arrangement for first-time full-time students, averaged across all types of institution. Room and board charges are shown separately for on-campus students and are not provided for students living with family. Source: IPEDS (2020).
186
7.18 FY2017 total cost of attendance and component costs of published tuition and required fees (left and right columns are in-state and out-of-state for public institutions), books and supplies, and weighted averages for room and board and other expenses (weighted by the mix of students staying on campus, off campus and with family), as well as net price (total cost after deducting total federal, state, local and institutional grant aid), for first-time full-time undergraduates for the full academic year. Total aid is the upper portion of each column not covered by net price. Source: IPEDS (2020).
187
7.19 Trends in component costs of attendance expressed relative to their FY2000 amounts in inflation-adjusted dollars, averaged across all types of institutions (using in-state amounts for publics). Source: IPEDS (2020).
188
7.20 Trends in median family income and in net price for four-year public and private institutions, by fiscal year (median family income is for the previous calendar year), in 2016 dollars. Sources: US Census Bureau (2018b) and College Board (Ma et al. 2018).
189
7.21 Trends in net price as a share of median family income for four-year public and private institutions, by fiscal year (median family income is for the previous calendar year), in 2016 dollars. Sources: US Census Bureau (2018b) and College Board (Ma et al. 2018).
190
7.22 FY2016 share of graduates with debt (upper) and average debt of those with debt (lower) by degree level, averaged by Carnegie classification and control. Professional practice degrees include the doctor degree in chiropractic, dentistry, law, medicine, optometry, pharmacy, podiatry, and veterinary medicine. Blanks indicate that minimum reporting standards were not met. Source: NPSAS 2016 (National Center for Education Statistics 2018a).
192
7.23 Five-year repayment rates on federal student loans by ending fiscal year for two-year averages (i.e., borrowers entering repayment in FY2006 and FY2007 comprise the FY2012 amount, and likewise those entering in FY2011 and FY2012 comprise the FY2017 amount), averaged by Carnegie classification and control. Repayment is defined as paying down at least one dollar of loan principal after five years. Source: College Scorecard (US Department of Education 2019a).
194

Figures 441
7.24 Five-year repayment rates on federal student loans for the two-year averages of borrowers entering repayment in FY2011 and FY2012 (i.e., five years ending FY2017), by degree completion status and dependency status, averaged by Carnegie classification and control. Repayment is defined as paying down at least one dollar of loan principal after five years. Source: College Scorecard (US Department of Education 2019a).
195
7.25 Inflation-adjusted price changes for educational books and supplies (relative to FY1967) and for college textbooks (relative to FY2002, starting at the matching value) from the consumer price index, and the price of new and used textbooks from college bookstore surveys (relative to FY2008, also starting at the matching value). Source: BLS (US Bureau of Labor Statistics 2019b) and NACS (2019a).
196
7.26 Student-reported spending on textbooks from three surveys, each averaged across all types of institution, by fiscal year in FY2016 dollars. Sources: Student Monitor/SM (Kestenbaum 2014; Business Wire 2018), NACS (2019b), and NPSAS 2016 (National Center for Education Statistics 2018a).
197
7.27 Share of student-reported spending on types of textbooks by fiscal year. Source: Student Monitor (Business Wire 2018).
197
7.28 Recent trends in inflation-adjusted US college store sales and sales per postsecondary student (Fall enrollment), by fiscal year. Sources: NACS (2019a) and IPEDS (2020).
199
8. Research
8.1 FY2017 revenues from all grants and contracts (research and non-research) by source, and expenditures on research from all sources (external and institutional), by Carnegie classification and control. Source: IPEDS (2020).
203
8.2 FY2017 total research and development expenditures for the 25 highest-ranked institutions. Source: NSF HERD (National Science Foundation, National Center for Science and Engineering Statistics 2018a).
203
8.3 Trend in higher education research and development expenditures from all sources, in FY 2016 dollars by fiscal year. Source: NSF HERD (National Science Foundation, National Center for Science and Engineering Statistics 2018a).
205
8.4 Trends in shares of higher education research and development expenditures by source, in FY 2016 dollars by fiscal year. Source: NSF HERD (National Science Foundation, National Center for Science and Engineering Statistics 2018a).
206
8.5 Trends in federal science and engineering research and development funding to universities by agency, in FY2016 dollars by fiscal year. Agency acronyms are for the Department of Health and Human Services (HHS, which includes the National Institutes of Health, NIH), the National Science Foundation (NSF), the Department of Defense (DOD), the Department of Energy (DOE), the National Aeronautics and Space Administration (NASA), and the US Department of Agriculture (USDA). Source: NSF Federal Support (National Science Foundation, National Center for Science and Engineering Statistics 2018b).
207

Like Nobody's Business442
8.6 FY2017 federal higher education research and development expenditures as shares (left) and total dollars (right), by agency and field. Source: NSF HERD (National Science Foundation, National Center for Science and Engineering Statistics 2018a).
209
8.7 Percent of faculty respondents reporting a substantial (some to very much) workload for those that experience the listed research compliance responsibility. Source: FDP (Schneider et al. 2014).
218
8.8 Gross license income averaged for public and private institutions by quintile of all R1 institutions in FY2015, FY2016 and FY2017 (current dollars). Source: AUTM (2020).
219
8.9 Invention disclosures, new patent applications and patents granted, averaged across R1 institutions by fiscal year. Source: AUTM (2020).
221
8.10 Total licenses and options, gross license income in FY2016 dollars and new start-up companies formed, averaged across R1 institutions by fiscal year. Source: AUTM (2020).
221
9. Public Service, Cooperative Extension, and Community Engagement
9.1 Example revenue sources budget for a typical cooperative extension service at a land grant university. Percentage ranges in parentheses are from APLU (Association of Public & Land-Grant Universities 2019).
224
9.2 Recent trends in federal and state funding for cooperative extension, including funding mechanism (stacked columns) and total expenditures (extension plus research) at the National Institute of Food and Agriculture (NIFA), by fiscal year. Sources: NIFA (National Institute of Food and Agriculture 2019a; 2019b).
225
9.3 Shares of example revenue and expenditure budgets for a moderate to large university performing arts center. Note that major capital and facilities costs are excluded.
229
9.4 Revenue mix for four example university museum budgets. See text for details. 2329.5 Expenditure mix for four example university museum budgets. See text for
details.233
9.6 Number of university presses and percentage of institutions with a university press, by Carnegie classification and control. Sources: Association of University Presses (2019) and IPEDS (2020).
235
9.7 FY2018 sources of university press funding. Source: AUP (Association of University Presses 2019).
235
9.8 FY2014 average staff and non-staff costs per monograph by core department, as well as general and administrative (G&A) costs, other overhead costs, and in-kind costs (e.g., contributed staff time, author-paid fees and office space) at the press level. Source: Ithaka S+R (Maron et al. 2016).
237

Figures 443
10. Facilities & Finance
10.1 Hard costs (construction and construction contingency) and soft costs (“everything else”) per gross square foot for a variety of campus building types from a 2016 study. Source: D’Angelo (2016).
241
10.2 2019 construction costs per square foot of gross floor area for selected sectors, calculated as the average of high and low values within the city limits of 20 US cities. Land, permits and other soft costs are excluded. Source: Cumming Corporation (2019).
243
10.3 Building construction age as a share of total gross square footage (GSF) across US higher education. Source: Gordian (2018).
244
10.4 Recent trends in rates of space expansion and enrollment growth across US higher education. Source: Gordian (2018).
245
10.5 FY2018 institutional debt (left axis) and interest on debt (right axis, note narrower scale) by Carnegie classification and control. Source: IPEDS (2020).
246
10.6 Trends in interest on institutional debt as a share of total non-hospital expenditures, averaged across Carnegie classifications for public and private institutions. Source: IPEDS (2020).
247
10.7 Moody’s credit rating distribution for 226 public and 256 private four-year institutions, as shares of each for December 2018. Source: Moody’s Investors Service (Shaffer 2019).
248
10.8 FY2018 utility activity per 1,000 gross square feet (GSF), with the scale for each indexed to 1 for comparison) by Carnegie classification of 172 institutions. The R3-M3 values are a weighted combination based on response count. Sources: NACUBO (2019) and APPA (2019).
249
10.9 Trends in simple liquidity ratios averaged by Carnegie classification and control. Note that the vertical scale in the upper panel (Private) is 4X the lower panel (Public); see text for details. Source: IPEDS (2020).
250
10.10 The ultimate academic accolade at UC Berkeley, winning a special reserved parking space along with the Nobel Prize. Source: De Comité (2017), Flickr, CC BY 2.0, https://www.flickr.com/photos/fdecomite/34688401634.
253
11. Health Sciences, Hospitals & Medical Schools
11.1 FY2018 numbers of higher education institutions with medical schools and with hospitals included in the reported institutional budget, by Carnegie classification and control. Source: IPEDS (2020).
258
11.2 FY2018 hospital and non-hospital portions of total institutional revenue for the 45 institutions reporting in-budget hospitals, by Carnegie classification and control. Source: IPEDS (2020).
258
11.3 FY2018 shares of revenue sources supporting 141 US medical schools. Source: AAMC (Association of American Medical Colleges 2019b).
260
11.4 FY2018 supporting revenue sources averaged across 85 public and 56 private US medical schools. Source: AAMC (Association of American Medical Colleges 2019b).
261

Like Nobody's Business444
11.5 Trends in the shares of three revenue sources for US medical schools, FY1977 to FY2018. Source: AAMC (Association of American Medical Colleges 2019c).
262
11.6 FY2018 total compensation averages for medical school faculty members (MD or equivalent) by rank and sorted by decreasing department/specialty average. Source: AAMC (Association of American Medical Colleges 2019a).
263
11.7 Share and cumulative share of FY2019 NIH spending on specific diseases and conditions for the top 50 of 292 categories. Source: NIH (National Institutes of Health 2020b).
265
11.8 FY2019 NIH funding awarded to higher education institutions, for the top 50 of 516 listed institutions. Data for multiple units on the same campus have been combined. Source: NIH (National Institutes of Health 2020c).
266
12. Athletics
12.1 FY2018 total athletics revenues from all sports per institution, averaged by Carnegie classification and control. Source: EADA (Office of Postsecondary Education 2020).
270
12.2 FY2018 total athletics revenues per institution averaged by athletic association, division, subdivision and control. Source: EADA (Office of Postsecondary Education 2020).
271
12.3 FY2018 total athletics revenue share of overall institutional non-hospital revenues by athletic association, division, subdivision and control. Source: EADA (Office of Postsecondary Education 2020).
271
12.4 FY2018 athletics revenue sources as a share of total athletic revenues by NCAA subdivision. Source NCAA (2019a).
275
12.5 FY2003 and FY2018 student athletes as a share of all undergraduates by Carnegie classification and control. Source: EADA (Office of Postsecondary Education 2020).
277
12.6 FY2003 and FY2018 student athletes as a share of all undergraduates by athletic association, division, subdivision and control. Source: EADA (Office of Postsecondary Education 2020).
277
12.7 FY2003 and FY2018 total institutional athletics expenditures per student athlete averaged by athletic association, division, and subdivision. Source: EADA (Office of Postsecondary Education 2020).
279
12.8 FY2018 athletics expense categories as a share of total athletic expenses by NCAA subdivision. Source NCAA (2019a).
279
12.9 FY2018 revenues, expenses and net revenue/loss by sport for all sports with over 1,000 participants in the NCAA Division I FBS. Source: EADA (Office of Postsecondary Education 2020).
281
12.10 FY2018 net revenue/loss as a share of expenses by sport for all sports with over 1,000 participants in the NCAA Division I FBS. Source: EADA (Office of Postsecondary Education 2020).
281

Figures 445
12.11 FY2019 football and men’s basketball head coach pay for the NCAA Division I FBS Power Five conferences, including base institutional salary, bonuses paid and athletically related compensation from non-university sources. Source: USA Today (2020a; 2020b).
283
12.12 Trends in inflation-adjusted average institutional head coach salary across all sports by athletic association, division, and subdivision. Source: EADA (Office of Postsecondary Education 2020).
283
12.13 Summary of the strength of statistical relationships between athletic success and hypothesized benefits, based on review of 28 scholarly articles. See text for details.
285
13. Fundraising
13.1 FY2018 gifts averaged per decile by Carnegie classification and control. Source: IPEDS (2020).
287
13.2 FY2018 gifts per full-time equivalent student averaged per decile by Carnegie classification and control. Source: IPEDS (2020).
288
13.3 Growth in inflation-adjusted total gifts averaged for the two smallest Carnegie classifications of private institution and for all other public and private institution types, by fiscal year. Values for 1997 and 1998 at private institutions are interpolated at the average rate of neighboring years; the average for other institutions is weighted by the number in each type. Source: IPEDS (2020).
289
13.4 Seven decades of voluntary support for degree-granting postsecondary institutions by source of gift, in FY2016 dollars. Sources: NCES (National Center for Education Statistics 2018e) and CASE (Council for Advancement and Support of Education 2020).
290
13.5 FY2018 distribution of gifts to higher education institutions by purpose. Source: CASE (Council for Advancement and Support of Education 2019; 2020).
292
13.6 FY2018 endowments averaged per decile by Carnegie classification and control. Source: IPEDS (2020).
294
13.7 Top 25 FY2018 university endowments and their cumulative share of all endowments in the data set. Amounts are for the main campus location and do not include branch campuses reporting separately. Source: IPEDS (2020).
295
13.8 FY2018 endowment per full-time equivalent student averaged per decile by Carnegie classification and control. Source: IPEDS (2020).
296
13.9 Top 25 FY2018 university endowments per full-time equivalent student and their cumulative share of all values in the data set, shaded by Carnegie classification (all are private institutions). Amounts are for the main campus location and do not include branch campuses reporting separately. Source: IPEDS (2020).
297

Like Nobody's Business446
13.10 Growth in inflation-adjusted endowment per full-time equivalent student, by fiscal year, with averages for public and private institutions weighted by the number of institutions in each Carnegie classification. Values for 1990 at both types of institution and for 2002 at public institutions are interpolated as the average of neighboring years, while the 1997–2002 gap at private institutions is interpolated proportional to the public institutions. Source: IPEDS (2020).
298
13.11 Performance of an example endowment started in 1980 (upper panel) shown as a simple investment with returns tracking the S&P 500 index and as a revenue-generating endowment fund, and as components of the example endowment (lower panel) including annual return, payout, investment management fees, and a surplus (or deficit) for reinvestment (or withdrawal). Amounts are in FY2016 dollars; the inflation-adjusted initial endowment value of $3M corresponds to $1M in FY1980 dollars. See text for details.
300
13.12 FY2019 equal-weighted average asset allocations for college and university endowments and higher education foundations. Source: NACUBO (2020).
302
13.13 Annualized absolute returns of market portfolios excluding each of the ten market sectors, relative to the S&P 500 for 1957 to 2017 (10.25% annualized return) and for 1989 to 2017 (9.74% annualized return), with the non-energy portfolio highlighted. Source: Grantham (2018).
304
13.14 Performance of S&P 500 index with all sectors and excluding the energy sector since sector indices were launched by S&P in mid-1996. Source: S&P/Investing (Investing.com 2020).
305
13.15 Number of US universities and colleges (or their affiliated foundations) with full and limited fossil fuel divestment, as of mid-2020. University systems are counted as the number of main campuses in the system. Source: Fossil Free/350.org (Fossil Free 2020).
306
13.16 Example gift table to raise $1M, showing the donor pyramid (shaded), estimated prospects needed to net those donors, gift amount at each level, total gifts per level, as well as overall totals for each category. See text for details.
308
13.17 Trends in alumni of record, alumni donors and alumni participation (giving rate) at colleges and universities. Records of contactable alumni have improved dramatically, driving down the participation/giving metric. Source: CASE (Council for Advancement and Support of Education 2019).
313
13.18 FY2018 distributions of gifts to current operations from alumni and from all donors. Source: CASE (Council for Advancement and Support of Education 2019).
314
14. Outcomes & Futures
14.1 2018 median earnings and estimated tax payments of full-time year-round employees aged 25 and older, by education level. Estimated taxes paid at each income level include federal income, social security, Medicare, state and local income, sales, and property. Source: College Board (Ma et al. 2019).
318

Figures 447
14.2 Average annual wages of graduates holding only a bachelor’s degree and those holding only a high school diploma, as well as the college wage premium (i.e., the difference), in 2018 dollars. Source: NY Fed (Abel and Dietz 2019).
319
14.3 Economic mobility of adult children with and without a college degree from families with low and high income. Source: Brookings (Haskins 2016).
320
14.4 FY2017 early career (ages 22–37) and mid-career (ages 35–45) median wages for full-time workers with a bachelor’s degree only, by major, with highest ten (H) and lowest ten (L) unemployment rates. Source: NY Fed (Federal Reserve Bank of New York 2019).
321
14.5 Average effects of college selectivity on earnings after controlling for multiple pre-college, college, and post-college factors, for bachelor’s degree recipients representing a broad range of institutions four years and ten years after graduation. Source: Witteveen and Attewell (2017b).
323
14.6 Overlapping distribution of 25th and 75th percentile SAT (Math + Verbal) scores by institution rank in the 2014 US News & World Report rankings of National Universities and Liberal Arts Colleges, including percent variance explained (R2) for each. ACT scores were converted to SAT equivalents where applicable. Note that tied ranks have a corresponding number of neighboring missing ranks. Source: Wai et al. (2018a).
327
14.7 Summary of the strength of selected statistical relationships between institutional rankings and hypothesized related outcomes, based on the small literature of scholarly articles. See text for details.
328
14.8 Schematic of the iron triangle of higher education, illustrating the three-way trade-offs between improving quality of education, increasing access to the institution, and constraining costs.
334
14.9 Composite index showing the share (upper panel) and number (lower panel) of institutions with counts of financial risk indicators in the riskiest decile, by Carnegie classification and control. See text for details. Source: IPEDS (2020).
340


Box Figures
1. Introduction
B1 Seals of the universities of Bologna (left) and Padua (right) including the year that each was established. Sources: University of Bologna, Image by Malinion (2016), Wikimedia, Public Domain, https://upload.wikimedia.org/wikipedia/commons/d/d0/Seal_of_the_University_of_Bologna.svg, and University of Padua, Image by OMT5500 (2017), Wikimedia, Public Domain, https://upload.wikimedia.org/wikipedia/it/5/53/Logo_Universit%C3%A0_Padova.svg.
7
2. Institutional Revenues
B2 The eight US universities with the highest revenues in FY2016 that exceeded the Fortune 500 threshold of $5.4B. Source: IPEDS (2020).
16
3. Institutional Expenditures
B3 Decade averages of annual percentage change in the Higher Education Price Index (HEPI) and inflation-adjusted National Healthcare Expenditures (NHE) per capita. Sources: Commonfund Institute (2017a) and CMS (US Centers for Medicare & Medicaid Services 2018).
54
B4 Degrees conferred (bachelor’s, master’s and doctor’s) by postsecondary institutions per academic year and citable documents published in all subject areas in the SCOPUS database per calendar year, both for the United States. Sources: IPEDS (2020) and SCImago (2018).
57

Like Nobody's Business450
5. Human Resources
B5 Simplified typology of faculty titles at US universities. 99
6. Academic Affairs
B6 This photograph from July 1, 2006 shows the County Theater in Doylestown, Pennsylvania, a glorious art deco building from 1938 that is still showing movies today. Source: Frederick (2006), Flickr, CC BY 2.0, https://www.flickr.com/photos/galfred/180834829.
147
7. Student Affairs
B7 Reasons cited for leaving higher education by students in the 2003–04 cohort of the Beginning Postsecondary Students Longitudinal Study who had left without a degree by 2008–09. Note the relatively low frequency of academic problems. Source: Delta Cost Project (Johnson 2012).
178
8. Research
B8 Overall research grant funding success rates at NIH and NSF (left) and associated proposal and award counts (right). NIH data show similar patterns for research project grants and all R01-equivalent grants, therefore they are combined here. Sources: NIH (National Institutes of Health 2018) and NSF (National Science Foundation 2018).
208
9. Public Service, Cooperative Extension, and Community Engagement
B9 Land-grant universities and colleges in the three legislation-year funding groups. Note that these year groups do not necessarily correspond to year of establishment or authorization of land-grant status. Alaska and the Pacific and Caribbean island states and territories are not to scale. See Appendix B for a detailed listing. Sources: IPEDS (2020) and National Institute of Food and Agriculture (2019c).
226

Box Figures 451
12. Athletics
B.10 Athletic association, division and subdivision membership in FY2018, by Carnegie classification and control. Source: EADA (Office of Postsecondary Education 2020).
273
B.11 NCAA Division I FBS conference membership for football (FB) and basketball (BB) in FY2018, by Carnegie classification and control. Source: IPEDS (2020).
274


Tables
2. Institutional Revenues
2.1 An illustrative estimate of the net tuition and fee revenue impact of in-state versus out-of-state students. See text for explanation.
37
5. Human Resources
5.1 Non-instructional support staff categories and selected examples of occupations and fields. Sources: IPEDS (2020) and US Bureau of Labor Statistics (2010).
108
6. Academic Affairs
6.1 Example annual college budget, showing major categories of revenues and expenditures, including shares of revenue and institutional costs. See text for explanations.
120
6.2 Example of the layers of cross-subsidization across disciplines. Amounts are in dollars per student credit hour (SCH).
129
6.3 Example of annual first-order costs of a modest PhD program (see text for explanation).
134
8. Research
8.1 Example of a simple one-year research grant budget, showing major categories including direct and indirect costs. See text for explanations.
211
8.2 Example comparative annual costs of graduate research assistants (for public and private institutions) and postdoctoral scholars. Round-number estimates of tuition are from Figure 2.8 with graduate and postdoc stipends rounded from FY2018 NIH rates (twelve-month).
216

Like Nobody's Business454
9. Public Service, Cooperative Extension, and Community Engagement
9.1 Example operating budget for a moderate to large university performing arts center. Note that major capital and facilities costs are excluded.
229
10. Facilities & Finance
10.1 Examples of institutional functions and services that may be provided through public-private partnerships.
255
14. Outcomes & Futures
14.1 Simplified calculation of a university economic impact estimate. Dollar amounts in millions. Adapted and abridged from a BEA example (Ambargis et al. 2014).
330

Boxes
1. Introduction
1.1 Early University Funding 6
2. Institutional Revenues
2.1 Universities in the Fortune 500? 162.2 Complicated Fund Sources and Pitfalls 34
3. Institutional Expenditures
3.1 Higher Education vs. Healthcare Cost Increases 543.2 The University’s Bottom Line(s) 57
5. Human Resources
5.1 Faculty Titles: A Primer for the Uninitiated 99
6. Academic Affairs
6.1 Competition in Faculty Hiring is (Sort-Of) Like Professional Sports 1396.2 A Parable for Online Higher Education 147

Like Nobody's Business456
7. Student Affairs
7.1 College Dropouts Get Mostly A’s and B’s 1787.2 How Free is Free College? 190
8. Research
8.1 Research Grant Funding Success Rates 208
9. Public Service, Cooperative Extension, and Community Engagement
9.1 Land Grant Universities 225
11. Health Sciences, Hospitals & Medical Schools
11.1 Relative Value Units (RVUs) 264
12. Athletics
12.1 Athletic Associations, Divisions and Conferences 272
13. Fundraising
13.1 State Support As “Endowment Income” for Public Universities 29913.2 University Fundraising Lingo—A Non-Exhaustive Glossary 308

Index
academic affairs 119academic freedom 6, 137, 155academic medical center 259, 263academic mission 2, 7, 140academic novel 144academic preparation 26, 167–168, 178, 323, 326ACC 272–273access
and affordability 28and equality in policy 75and financial aid 172applicants by family income 170income inequality 320in iron triangle 334library 156online 144to higher education 133, 349
acquisitionsinstitutional 145museum 232publishing mergers 199university press 236
ACT 168and college rankings 326
administrationmain aspects 2RCM 123research 204spending on 41structure 7, 93
administrative bloat 52, 110admissions 165, 178
athletics success and 285in student services spending 184need-blind 174race and land grant 226scandal 322staff 135
advancement 94, 308alumni 315foundation 311
affordability 189and access 28
All the President’s Men 5alumni
associations 313, 315donors 290, 313gifts 314giving 309participation (giving rate) 313
American Association of University Professors (AAUP) 137
American Athletic Conference (AAC) 273American Recovery and Reinvestment Act 205applicants
academic preparation 169admitted and enrolled 167family income 169online 145summer melt 168
applicationspatent 220research grant success 208
athletes 276compensation 282, 346numbers and trends 276
athletics 269alumni gifts 314association costs 272associations, divisions and conferences 272benefits of success 284budget 269, 280budgets by sport 280club sports 272coaches’ salaries 282compared to faculty hiring 139

Like Nobody's Business458
conference costs 272expenditures 278expenditures per athlete 278expenditure trends 278fee 25Flutie Factor 284gift revenue 274gifts 292in cost-cutting 54injuries and future costs 346institutional funding 274media revenue 274pandemic effects 278, 337player compensation 282, 346public vs. private spending 269revenue sports 280scholarship aid 278scholarships 174share of institutional budget 270student fee revenue 274subsidies 269, 274, 280success and gifts 285Title IX 280
attainment rate 181, 183attrition 177auxiliaries 23
athletics 23bookstores 23dining 23income in closure risk 339parking 23proportion of spending on 41residence halls 23
basketball 269, 275benefits of success 284coaches’ salaries 282compared to faculty hiring 139conference membership 273revenue sport 280
Baumol’s cost disease 50, 54Bayh-Dole Act 218benefits
economic 218expenditures 39fringe 115, 121, 211, 215inflation 52in outsourcing 254in privatization 88
of a degree 317of athletic success 284part-time 103public good 346retirement 117societal 332, 346tuition 112, 116, 151
Berra, Yogi 341Big 12 272–273Big Ten 272–273Bloomberg, Michael 310Bloomberg Philanthropies 290board
and lodging 51, 176, 185, 336designated funds 33foundation trustees or directors 311of regents or trustees 8, 204, 275, 334program productivity 134
bondscapital financing 245credit rating 247debt service 246in privatization 88investment in 302
books and supplies 185, 196, 198bookstores
outsourced 253privatized 89sales figures 198textbook costs 198
bottom line 9, 57athletics 284
Bowen’s Law 9, 51, 54, 56, 126principal-agent problem 52
Bradley, Bill 180budgets 9, 13, 20, 28, 32, 41
activity based 123athletics 269, 280college 119cutting 51education and general 43education and related 43graduate program 133hospital 257international programs 151museum 231RCM 123research 201

Index 459
retention 185size 16
Bush, Vannevar 201business model 2, 4, 35, 332
alumni associations 315challenges and closure 342graduate program 133in athletics 275iron triangle 334online technology 143, 343open access 237out-of-state tuition 37performing arts centers 227philanthropy in 287research costs in 214, 345revenue sources 25university presses 236
capital projectsfacilities 94financing 245information technology 160international branch campuses 155public-private partnerships 254
Carnegie Classification 10Casablanca 325cash on hand 249Christensen, Clayton 143, 332, 342classified work 207Clery Act 180climate change
academic freedom 137ESG investing 307fossil fuel divestment 303future risks 346
clinical revenue 259RVUs 264
closure of campuses 336coaches’ salaries 282Coetzee, JM 144college cost increases 50colors of money 32, 213competition 2, 51, 335
and cost reduction 56, 143discounting 177for enrollments 244, 343 for international graduate students 133for prestige 296, 327for research funding 201, 206, 208, 213
in faculty hiring 139in online program pricing 150in student aid awards 175with private-sector salaries 135, 160
compliance costsbiomedical research 261research 121, 202, 206, 212, 216time commitment 217unfunded mandate 52, 217
compliance functions 93, 216Conference USA (CUSA) 273construction cost 241
direct and total project 241fees 241hard and soft 241university vs. commercial 242wet lab vs. dry lab 242
construction growth trends 244consulting 141, 282Cook, Tim 343cooperative extension 223
budget 224expenditures 40funding 223funding trends 224in workload distribution 141land grant legislation 225revenue 223
corporation 1, 6, 14, 257giving by 290
costadministrative bloat 52, 110by discipline 127control 54iron triangle 334reasons for increasing 50reductions with COVID-19 337to produce a degree 126
cost of attendance 172, 185, 328cost of education 46
education and related 126financial aid role 173in-state and out-of-state 47labor 103net price 49rising 50
course materials 195COVID-19

Like Nobody's Business460
athletics 278emergency fund 249employee reductions 96impacts 4, 336international enrollments 152online 145, 148, 343residence hall revenue 246risk of closure 336tuition revenue 341
CPI 10, 52, 195, 302credentialing 144, 343credit rating 247cross-subsidies 123
athletics 280graduate program 135humanities vs. STEM 129in college budget 122medical school 259mission support 259research 210
data notes 9, 21days cash on hand 249debt
construction 245facilities 245service 246
degreecost by discipline 127cost to produce 126earnings after graduating 317financial benefits of 317
Delaware Cost Study 127department budget 122Department of Defense 207, 210Department of Energy 207depreciation 40dining
cost of attendance 185in student affairs 178outsourced 54, 253privatized 89
direct costsgraduate program budget 135in college budget 121in research grant budget 211restricted funds 32
disciplinecosts by 122, 126–127, 129
faculty salaries by 135faculty workload by 140in faculty hiring 139in university rankings 325medical faculty salaries by 262research funding by 208teaching vs. research assistants by 135trends by major field 130
discountfinancial aid 27, 173graduate tuition waiver 215in closure risk 336in-state and out-of-state 49rate 176to revenue 22tuition 37tuition and fee 27
divestmentESG investing 307fossil fuel 303, 346
Division I 269, 272, 274, 280Division II 270, 274Division III 270, 273–274donor-advised funds 291, 313donors 32, 290
alumni 313athletics 275endowments 294fundraising 307museums 231non-alumni 290, 295, 314performing arts 228privatization 89
Dr. Seuss 156Drucker, Peter 333Duncan, Arne 334
earningsafter graduation 317and debt 71, 193, 195and rankings 327by education level 317by major 320future and tuition 129, 133selectivity effect 322wage premium 318
ecological fallacy 341economic impact 329economic theories of cost 50

Index 461
educational technology 162, 343Education and Related (E&R) budget 43–45,
47, 80per degree 126student services spending share 184
emergency fund 249employees 2, 93, 95, 136
costs in college budget 121earnings as graduates 318exempt 140faculty 140faculty titles 99fringe benefits 115fundraising 307graduate assistants 215headcount 95hospital or medical 257information technology 159instructional staff 100layoffs 337library 156museum 232outsourcing 254parking 252postdocs 215professional staff 110recruiting and admissions 165salaries 97, 108student services 184support staff 93, 108tenured 136
endowment 293annual return 299divestment 303ESG investing 307fees 301–302intergenerational equity 301investment portfolio 302largest 295management 301multiple funds 294museum 231payout 296, 299, 301payout and closure risk 338performance 299size 294
endowment income 287university press 235
vs. state appropriations 299energy
costs 248efficiency 346sector 303
enrollment 16and state appropriations 74, 78athletes 276college rankings effect upon 327COVID-19 pandemic effect on 336definition 17FTE 17future demographic trend in 342growth 16headcount 17international 151online 145out-of-state and international 36trends by major 130
enrollment management 165iron triangle 176
equityfunding and access 86, 172in spinoff company 220intergenerational in endowments 301private investment 269, 302
Equity in Athletics Disclosure Act (EADA) 269Erasmus program 151ERP 160ESG investing 307ETOB 123expenditures 13, 39
academic support 40–41administration 41auxiliaries 40–41by function of expense 40–41by nature of expense 39depreciation 40institutional support 40instruction 40–41interest on debt 40library 156operation and maintenance 39per student 43public service 40–41public vs. private institutions 43research 40salaries and benefits 39

Like Nobody's Business462
scholarships and aid 41student services 40–41trends in 44university press 236
experiment stations 226
facilitiesage profile 244outsourced 254total value 242
facilities and administrationadministrative rate cap 212costs 121, 210, 261, 291cost waivers 213negotiated rate 211reduced rate 212
facilities and finance 241faculty 2
collective noun 9contingent 99, 103, 131, 138, 142costs in grant proposals 211employees 93fringe benefits 116headcount 98hiring 139in college budget 121inventors 220job titles 99medical school 259medical school salaries 262parking 252part-time 103practice plan 259rank and composition 101research compliance workload 216research funding 201research funding success 208salaries 105salaries by discipline 135space costs 122tenure 136textbooks authored by 199understanding of budget 125view of administrative bloat 110workload 140
FAFSA 61Fair Labor Standards Act (FLSA) 140FBS 269, 272, 278, 280FCS 271–272, 274, 278
federalaid by institution 67compliance costs 216facilities and administration costs 210financial aid 10, 27, 59, 61financial ratings 337funding and intellectual property 218funding compared to other countries 90funding of medical schools 260graduation rate 180grants and contracts 22health science funding 265land grant 223, 225loan repayment 193loans 51, 60–61, 69research funding 202, 205, 344research funding by field and agency 209research investments 1restricted funds 32spending on higher education 59work study 60
fees 25, 36article/book processing 238athletics 269, 274course 25designated funds 33gift 312in college budget 121in construction cost 241in cost of attendance 185investment management 301online 143parking 252performing artist 230program 25revenue from 27
fiduciary duty 303, 305financial aid
by income level 171by institution 65federal 59graduate 61graduate assistantship 112merit aid 26, 167, 173need-based 26, 64, 167, 173net tuition 119non-need-based 26, 64, 173Pell Grant 59

Index 463
per student 61public funding 59stackable 175state 59undergraduate 61
first professional degrees 18Fitch 247Flutie Factor 284follow the money 5football 269, 275, 278
benefits of success 284coaches’ salaries 282conference membership 273injuries 346revenue sport 280
for-profitacquired by nonprofit 145closures 336in iron triangle 335institutions 10journal bundles 157loan repayment 194medical schools 257new models 345online 145student loans 71vs. nonprofit margin 56
Fortune 500 16fossil fuel
academic freedom 137climate change risk 346divestment 303ESG investing 307usage 248
foundation 310at public vs. private institutions 311divestment 306donor-advised funds 291endowment management 302, 311family 313gift policy 311gift revenue 23gifts vs. grants 291giving 290grant-making 291growth in importance 290multiple endownments 294open access support 238
paying reduced F&A 210, 212support for performance funding 87
free college 190, 347fringe benefits 115
in college budget 121in research grant proposal 211
FTE 17, 29admission staff 165aid per student 61expenditures per 338graduate assistantship at 0.5 134, 215graduate assistants on college budget 121gross square footage per 242IT spending per 159personnel in college budget 121spending per 43state appropriations per 78, 83trends in spending per 44
Fulbright program 151fundraising 287, 307, 309
campaign 309–310costs 312gift officer 307glossary 308performing arts 228trends in giving 289
fundsrestricted, unrestricted and designated 34
future of higher education 341
Gates Foundation 290Gatorade 218GDP 73, 90GI Bill 1, 59, 75, 227, 342gift officer 307, 309gifts
alumni 290, 314amounts 287and athletic success 285as revenue source 23, 121athletics vs. academics 292by foundations 290cash vs. endowment 292donors 290endowment 291, 294fees 312for athletics 288, 292forms of 311for research 288

Like Nobody's Business464
glossary 309naming 293non-alumni 290, 314principal or major 308public vs. private 287restricted 291scholarships 291to capital 291to current operations 291to museums 231trends 289unrestricted 291
gift table 307, 310Gilman, Daniel Coit 234Gone with the Wind 325Google 218Gore, Al 137graduate assistants 112
cost vs. postdocs 214graduate program costs 134headcount 112in research grants 211international 153stipends 113, 121
Graduate Medical Education (GME) 261graduate program
and teaching 133association with research 210costs 133employee tuition benefit 112in college budget 119tuition and fees 25
graduation rate 180bias 180improving trend 183in enrollment management 165in perfomance funding 86in rankings 324six-year 180student success approach 179undercount 182vs. attainment rate 181
grants and contracts 22–23, 35compliance costs 217federal research funding trends 205fixed-price 213goverment funding 59grants vs. contracts 213
lose money 210medical school revenue 260research 202restricted funds 32supporting graduate students 133
GRE 169Great Depression 73Great Recession 4, 20, 56, 59, 73, 87, 101, 151,
189, 205, 220, 251, 301, 336gross square footage (GSF) 242
Hatch Act 225headcount 17health sciences 257
disciplines 210research funding 265
HEPI 52, 54, 116, 302HERD 202, 210hospitals 257human resources 93, 162Humboldt, Wilhelm von 333
incentiveemployee tuition benefit 116faculty summer salary 141indirect cost recovery 213institutional in IP licensing 220performance funding 86perverse in budgeting 124presidential pay 328principal-agent problem 52
incomeand affordability 189country 90, 345earnings by graduates 317economic mobility 317family 26, 51, 59, 71, 170, 189financial aid 171food insecurity 188gap 318inequality 189, 310, 319in rankings 328in retention 177need-based financial aid 173wage premium 318
incremental budgeting 123college budget 121vs. RCM 124
indirect cost

Index 465
graduate program budget 135recovery 210recovery in college budget 121research grant budget 212
inflation 10, 20, 50, 52information security 162information technology
centralization 161expenditures 159fee 25in construction costs 242infrastructure 159museum spending 232staff 109university press spending 236
in-state 35affordable world-class education 335cost of attendance 187enrollment 167, 336state aid 63students, marginal cost of 49students online 149students subsidized by out-of-state 47tuition 25tuition and state appropriations 80tuition discounting 28tuition for graduate assistants 211, 215tuition increases 26
institutional subsidy 45instruction
investment in 41instructional staff
by rank 101composition 101headcount 98part-time 103salaries 97, 105workload 140
intellectual property 218interest on debt 40international higher education 90
branch campuses 154, 346exchange 154future growth 345international programs 151microcampus 156, 346study abroad 154
international students
by country 153COVID-19 pandemic decline 152enrollment 36, 151funding 152global market 345international programs 151online 149revenue 35
investment income 22divestment 303endowment portfolio 302in revenue mix 23performing arts 230public vs. private institutions 23, 31subsidizing research 344unrestricted funds 34volatility in 32
investment returnsfrom attending college 319fundraising 312performing arts endowment 230per student 29, 31
IPEDS 10iron triangle 176, 334
Jobs, Steve 317
Kerr, Clark 4, 252, 317
land grant 223universities 225
Latin terms 1, 7, 171, 313, 317learning management systems (LMS) 162liberal arts
antebellum institutions 226baccalaureate colleges 14business model 332closure risk 342earnings after graduation 320economic benefits of degree 317future 344online market 145
library expenditures 156and open access 238Big Deal subscription bundling 158materials budget 156on university press materials 236
licensing income 219liquidity 249
ratios 251

Like Nobody's Business466
loanscollateral 51debt at graduation 191federal 51, 60–61federal by institution 67graduate student debt 193highest debt at graduation 193in free college plans 190institutional 246non-federal 70per student 69repayment 193trends 71
maintenancedeferred 160, 243in college facilities costs 121of athletics facilities 278of facilities 39, 243of outsourced facilities 254of parking facilities 252
margin 56–57athletics 278, 280auxiliaries 23by discipline 130from out-of-state 49fundraising 312in economic impact 331international programs 154myth of F&A overhead 212performing arts centers 228university presses 236
marketing 56, 89, 178fundraising campaigns 310in advancement 308in museum budget 232online 143performing arts 228recruitment and admissions 165university presses 236
materialsin research grant budget 211library budget 156
McCarthy, Mary 144McRaven, William 3Medicaid 82, 262medical school 257
causes of high salaries 263faculty practice plan 259
faculty salaries 262mission support 259revenue 260revenue trends 261supported by clinical activity 259tuition 259
Medicare 262, 264mergers
and closures 336, 342publishing 199
microcampus 156Mid-American Conference (MAC) 273mission support 259mobility
economic 319in rankings 325international student 151
MOOCs 144, 333, 343, 345Moody’s 247, 249Morrill Acts 225Mountain West Conference (MWC) 273movie quotes 5, 325MTDC 211museums 230
budgets 231business model 231endowment 231selling collection taboo 233staff 232
NAIA 270, 272naming
policy and practice 293NASA 207, 210National Healthcare Expenditures (NHE) 54NCAA 269, 272
coaches’ salaries 282conferences 272expenditures 278media and game income 274revenue sports 280scholarship aid 278
net assignable square footage (NASF) 242net price
affordability 189in cost of attendance 187in cost of education 49increase 50in financial aid 172

Index 467
NIHfunding by discipline 209funding by disease 265funding by institute 265funding by institution 267graduate stipends 115health science research funding 265research expenditures 202, 205research grant success 208vs. NSF funding 207
non-instructional staffadministrative bloat 111salaries 97, 108
nonprofitathletic associations 272bottom line 9Bowen’s Law 51closures 336, 342institutions 10journal bundles 158margin vs. profit 56online 145philanthropy 212, 309research funding 206restricted and unrestricted funds 32
NSF 210funding by discipline 209research expenditures 202research grant success 208vs. NIH funding 207
oldest universities 6online 143
blended or hybrid 149COVID-19 effects 148enrollment 145future expansion 343graduate students 149student profile 149vs. entertainment industry 147
open access 159, 236operation and maintenance 39OPM 146, 254Oreskes, Naomi 303organizational structure 6–7, 93
performing arts centers 228out-of-state 35
affluent students attending 173cost of attendance 187
enrollment 85, 167, 336students subsidizing in-state 47tuition 25tuition discounting 28tuition increases 26
outsourcing 54, 253commodity IT 161endowment management 302privatization 89public-private partnerships 253
Pac-12 272–273, 282parking
athletics 292costs 252Nobel prize reserved 253outsourced 89
patents 218, 332payroll 39Pell Grant 59, 62
access 51in performance funding 86in US higher education 1tuition and fees 27
performance funding 86performing arts center 227
budget 228business model 227
Pfizer 219philanthropy 310postdocs 214, 220
cost vs. graduate assistants 214Power Five 272, 274, 280practice plan 259president
appointment by board 8designated funds 33direct reports 93, 228fundraising 292iron triangle 334revenue profile 25salary 263, 282, 328
Presley, Elvis 201prestige
Bowen’s Law 51business model 332discounting 177endowment 295faculty hiring 139

Like Nobody's Business468
future stratification 344hospital 259rankings 324research 210scholarship awards 175selectivity 322university press 236
pricingbusiness model 332differences neutralized by exchange 154discounting 176online 143, 150
principal-agent problem 52principal investigator 135, 202, 204, 208, 211, 215
co-PI 202private good 4, 78, 346privatization 4
athletics 269entire institution 88public-private partnerships 89
productivityand tenure 137clinical and RVUs 264cost theories 50degree 127research 201, 344teaching 54
profit 9, 56–57media companies 272textbook 199
provost 93, 228public funding 4, 59, 344public good 4, 78, 317, 346public-private partnerships 253public service 223
technology transfer 222
qualityacademic 49, 56, 324assurance in performance funding 86Bowen’s Law 51brand 175, 345business model 333construction 254early land grant institutions 226graduate education 133incoming class 176in iron triangle 334of applicants 284
of education 57online 144research 210, 214selectivity 322tenure and scholarship 137university press books 237
rainy day fund 249rankings 323
athletics success 284effects 327enrollment yield 167financial indicators 251halo effect 324Lombardi 329research 201, 325selectivity in 322
RCM 123college budget 119vs. incremental budgeting 124
recruiting 165, 176, 178spending on 165, 185staff 165summer melt 168
research 201administration 204business model 332centers and institutes 202, 206, 213, 216, 263,
293, 297competition 206expenditures 202expenditures reflecting revenues 204federal funding 206funding 201funding by agency 207funding by discipline 208future role 344grants 202health sciences funding 265importance of 214loses money 210productivity 201quality 214revenues 202trends in expenditures 205
residence hallscost of attendance 186facilities costs 242in student affairs 178

Index 469
restricted funds 32endowment 294gifts 291
retentionbudgets 185cost 177enrollment management 165faculty 139improving graduation rate 177in rankings 324investing in 52rate 179rate and closure risk 338student services to improve 184underlying challenges 178, 182vs. attrition 177
retirementearly 337fringe benefit 115
revenue 13athletics 269, 274clinical 257, 259cooperative extension 223COVID-19 pandemic 336early universities 6endowment return 299hospital 257land grant 223licensing 219medical school 257mix 23per student FTE 29philanthropy 287research 205sources 21sports 280trends per FTE 31university press 234
riskathletics injury lawsuits 346climate change 346composite index 339credit rating 247divestment 303endowment management 301fixed-price contract 213indicators 338IP investment 222
of closure 23, 336, 342performing arts 228public-private partnerships 253reputation 89, 155
room and board 176, 185, 336Russo, Richard 144RVUs 264
salariesafter graduation 317, 320and benefits 39, 52anticipated vs. debt 193buy out of teaching 141by education level 317endowment support 294faculty 105, 135head coaches’ 282in college budget 121in cost by discipline 128–129in grant proposals 211in information technology 160in research costs 214medical school 262postdocs vs. graduate assistants 215staff 97, 108summer 141, 202tenure implications 137
SAM 181SAT 168
and college rankings 326SCH 119
and teaching assistants 135cost per 127, 129
scholarshipsathletic 174, 272, 291expenditures 41gifts 291in net tuition 22in pandemic 337to increase access 335
Schumacher, Julie 144SEC 272–273, 282selectivity 165, 332, 344
effect on earnings 322in rankings 324signaling 322
Sexton, John 324Smiley, Jane 144Smith-Lever Act 223, 225

Like Nobody's Business470
soft power 151S&P 500 299, 304space per student 242spinoff company 220, 329Standard & Poor’s 247startup funds 93, 216startups 155, 220, 332state aid 63–64
by institution 67per student 63trends 67
state appropriations 22–23and athletic success 285and performance funding 86and privatization 87as endowment income 299cuts and tuition increases 85decline 78history 73 in college budget 121in public higher education funding 59outside higher education 82per student 78per student by state 80primary revenue as leverage 34spread across institutions 106trends per student 75trends with enrollment 78unrestricted funds 33vs. tuition revenue 83
sticker price 25, 50, 176, 191, 317stimulus funding 205, 337Stokes, Donald 201student affairs 165, 178Student Right-to-Know and Campus Security
Act 180student services
expansion 52, 111expenditures 184
student spending, economic impact of 331student success
improving trend 183in enrollment management 165investing in 52student services spending 184vs. weeding out 179
subsidyacross disciplines 129across sports 280
departments in college budget 122in-state vs. out-of-state 47institutional 45medical school by practice plan 259of athletics 269, 274, 346research 210, 344state 173university press 235
subventions 123summer melt 168Sun Belt Conference (S-Belt) 273
Tax Cuts and Jobs Act 294technology transfer 218
economic impact 221, 329licensing income 219
tenuredefinition 136faculty job titles 99financial implications 136grants and publications 201just cause for dismissal 136share of faculty with 138
textbookauthor royalties 199bookstore sales 198digital 196, 199, 343faculty-authored 199prices 195publisher portion of price 199spending 195
ticket sales 228, 274, 278, 280time-to-degree 86, 126, 134, 193Title IX 280tribal colleges 227Truman Commission 75Tufts syndrome 167tuition 22
and college rankings 328and fees 27costs covered by 45COVID-19 pandemic 336discounting 176employee benefit 115free college 190graduate and professional 134graduate assistant vs. postdoc cost 215in college budget 119in cost of attendance 172, 187

Index 471
increase after funding cuts 85increases 26in medical school revenue 259in other countries 90in-state and out-of-state 35international 153online 143per FTE 31rates 25remission 211revenue in RCM 124revenue trends 47revenue vs. state revenue 83sticker price 25vs. institutional subsidy 45waivers 133
unbundling 144, 343unemployment
and enrollment 19benefit 115by education level 318by major 320faculty composition 101
universitiesearly 6size 16structure 7
University of Bologna 7University of Padua 7university presses 234
and open access 237business model 236expenditures 236revenue 234
unrestricted funds 32, 213gifts 291
USDA 207, 210, 224
utility costs 248utility usage and activity 248
valueacademic 231added in business model 332cultural 228, 231economic impact 329educational 145endowment 294, 299financial 51, 56financial, in rankings 325for money 49institutional values 303of a degree 317of facilities 242of philanthropy 312of research 214relative value units (RVUs) 264
value proposition 317, 332venture capital 302visitor spending, economic impact of 331VSA 181
wage premium 318Warfarin 218workload
distribution 141faculty 128, 140faculty research time 214medical faculty and RVUs 264research compliance 216teaching, research and service 141
work study 60World War II 73, 227
yield 167, 285in rankings 324protection 167


This book need not end here…
Share All our books—including the one you have just read—are free to access online so that students, researchers and members of the public who can’t afford a printed edition will have access to the same ideas. This title will be accessed online by hundreds of readers each month across the globe: why not share the link so that someone you know is one of them?
This book and additional content is available at:
https://doi.org/10.11647/OBP.0240
CustomisePersonalise your copy of this book or design new books using OBP and third-party material. Take chapters or whole books from our published list and make a special edition, a new anthology or an illuminating coursepack. Each customised edition will be produced as a paperback and a downloadable PDF.
Find out more at:
https://www.openbookpublishers.com/section/59/1
Like Open Book Publishers
Follow @OpenBookPublish
Read more at the Open Book Publishers

You may also be interested in:
Delivering on the Promise of DemocracyVisual Case Studies in Educational Equity and TransformationSukhwant Jhaj
https://doi.org/10.11647/OBP.0157
Open EducationInternational Perspectives in Higher EducationPatrick Blessinger and TJ Bliss (eds)
https://doi.org/10.11647/OBP.0103
Social Media in Higher EducationCase Studies, Reflections and AnalysisChris Rowell (ed.)
https://doi.org/10.11647/OBP.0162

ANDREW C. COMRIE
Like Nobody’s Business is a remarkable piece of work. The book describes all aspects of the enormously complicated business of higher educati on in terms of the fl ow and uti lizati on of resources—human but predominantly fi nancial. In doing so, the author addresses all the issues that are perennially discussed and contested in the popular media, in both governmental and nongovernmental policy forums, and in academic studies. This book simply provides a wealth of informati on on topics large and small, but especially on the chief foci of policy and controversy in American higher educati on.
— Roger Lewis Geiger, dis� nguished professor of educa� on at Pennsylvania State University
How do university fi nances really work?
From fl agship public research universi� es to small, private liberal arts colleges, there are few aspects of these ins� tu� ons associated with more confusion, myths or lack of understanding than how they fund themselves and func� on in the business of higher educa� on. Using simple, approachable explana� ons supported by clear illustra� ons, this book takes the reader on an engaging and enlightening tour of how the money fl ows. How does the university really pay for itself? Why do tui� on and fees rise so fast? Why do universi� es lose money on research? Do most dona� ons go to athle� cs?
Grounded in hard data, original analyses, and the prac� cal experience of a seasoned administrator, this book provides refreshingly clear answers and comprehensive insights for anyone on or off campus who is interested in the business of the university: how it earns its money, how it spends it, and how it all works.
As with all Open Book publica� ons, this en� re book is available to read for free on the publisher’s website. Printed and digital edi� ons, together with supplementary digital material, can also be found at www.openbookpublishers.com
Cover image: Photo by Tim Mossholder on Unsplash at htt ps://unsplash.com/photos/GmvH5v9l3K4Cover design: Anna Gatti
Like Nobody’s Business
AN
DREW
C. C
OM
RIE Like N
obody’s Busin
ess
OBP
An Insider’s Guide to How US University Finances Really Work
ANDREW C. COMRIE
Like Nobody’s Business
An Insider’s Guide to HowUS University Finances
Really WorkOPENACCESS
ebookebook and OA edi� ons
also available